Embed Size (px)
DESCRIPTION
Â
Citation preview
Consolidated Annual Report
dst – sgps, s.a.
December 31, 2014
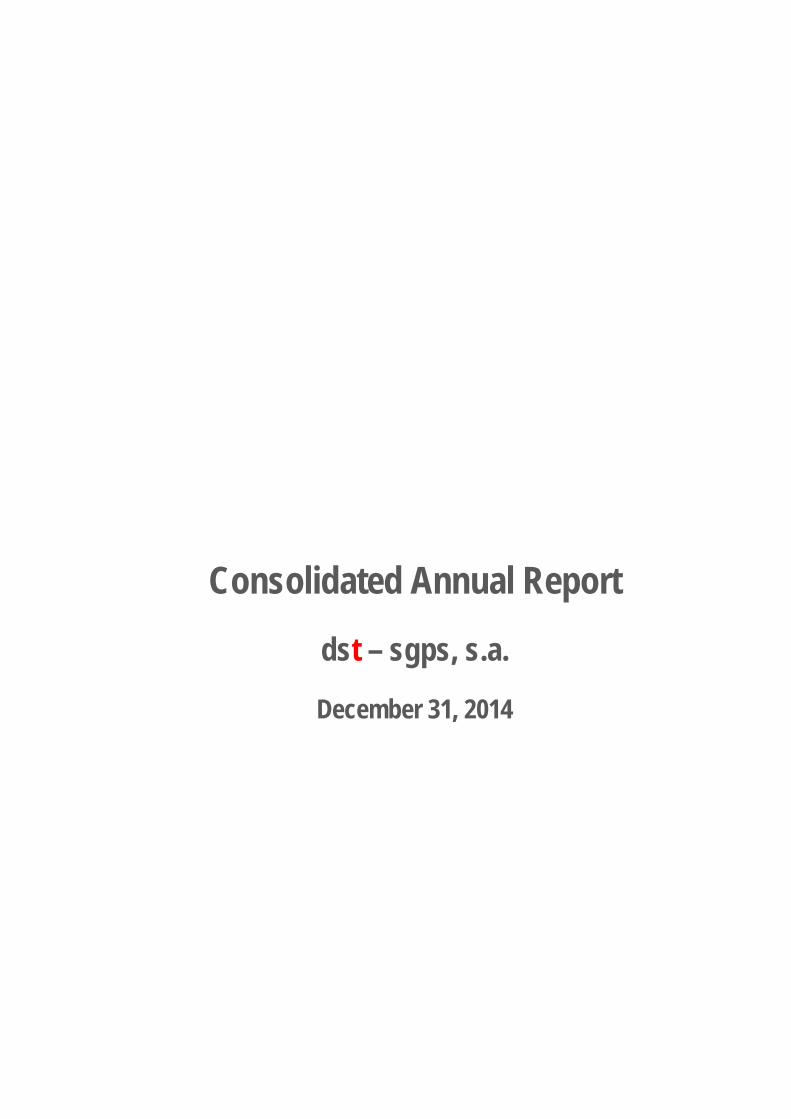
Index
A) CONSOLIDATED MANAGEMENT REPORT TO THE BOARD OF DIRECTORS 3
1. MACROECONOMICS FRAMEWORK 3 2. BUSINESS ACTIVITY 25 3. MATERIAL EVENTS OCCURRING AFTER THE END OF THE PERIOD 45 4. FINANCIAL RISK MANAGEMENT OBJECTIVES AND POLICIES 45 5. INFORMATION REQUIRED BY LEGISLATION 45 6. AUTHORIZED DISCLOSURE DATE FOR ISSUE THE FINANCIAL STATEMENTS 46 7. FINAL NOTE 46
B) CORPORATE SOCIAL RESPONSIBILITY 47
HUMAN RESOURCES 47 SAFETY, HYGIENE AND HEALTH 50 R&D AND INNOVATION 51 SOCIETY 52 ENVIRONMENT 53 QUALITY AND CERTIFICATIONS 56
C) ANNEX TO THE BOARD OF DIRECTORS CONSOLIDATED REPOR 58
D) CONSOLIDATED FINANCIAL INFORMATION 60
CONSOLIDATED BALANCE SHEET 60 CONSOLIDATED INCOME STATEMENT 61 CONSOLIDATED STATEMENT OF EQUITY CHANGES IN 2014 62 CONSOLIDATED STATEMENT OF EQUITY CHANGES IN 2013 63 CONSOLIDATED CASH FLOWS STATEMENT 64 ANNEX AT DECEMBER 31, 2014 65
E) LEGAL CERTIFICATION OF CONSOLIDATED ACCOUNTS 117
F) REPORT AND OPINION OF THE SOLE FISCAL AUDITOR 118
Consolidated Annual Report 2014
dst - sgps, s.a. Page 3 of 118
A) Consolidated Management Report to the Board of Directors
Dear Shareholders,
In compliance with the legal and statutory regulations, the Board of Directors presents the management report for 2014 fiscal year.
As the environment where we operate is directly related to the positive evolution or downturn of the global economy, before presenting the dst group’s financial information and its business centers we will do a slight approach to the most important national and international macroeconomic data.
1. Macroeconomics framework
1.1 International macroeconomics framework
The uncertainty associated with the global economic outlook remains high. During the last months, the world witnessed the increase in geopolitical tensions in Russia, culminating in the imposition of sanctions by the United States of America (USA) and the European Union (EU). This may affect the recovery of global economic growth and confidence, determining factors for the investment resumption. In addition, geopolitical conflicts installed in the main oil-producing countries (Iraq, Libya, Ukraine and Russia) may also cause disturbances in the oil supply and change prices, to rise, bucking the current downward trend. On the other hand, in the US, the recently decided end by the Federal Reserve of the monetary stimulus has brought some uncertainty in monetary policy. And, any rise in key interest rates could have an impact on the US economy growth rate and increase instability in international financial markets. Still, current projections point to an improvement of the world economy performance, based mainly on boosting growth of the advanced economies, which shows a relatively strong growth in the US, a more moderate one in the European economy, with a very distinct evolution between the members states (stronger in the UK, Sweden and Baltic countries; and weaker for the Eurozone countries). The group of emerging countries has a less strong growth, although still robust in some Asian countries (China and India), reflecting less expansionary economic policies, lower raw materials prices and the heightening of geopolitical tensions surrounding the crisis in Ukraine .
Consolidated Annual Report 2014
dst - sgps, s.a. Page 4 of 118
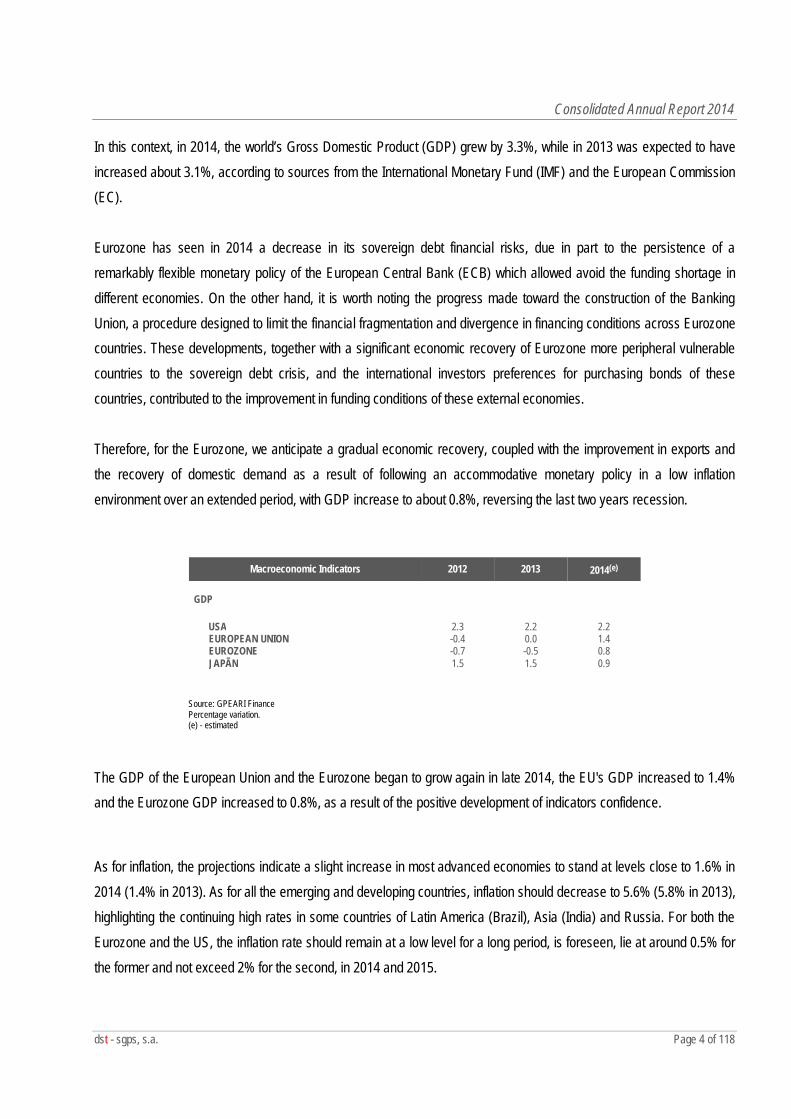
In this context, in 2014, the world’s Gross Domestic Product (GDP) grew by 3.3%, while in 2013 was expected to have increased about 3.1%, according to sources from the International Monetary Fund (IMF) and the European Commission (EC). Eurozone has seen in 2014 a decrease in its sovereign debt financial risks, due in part to the persistence of a remarkably flexible monetary policy of the European Central Bank (ECB) which allowed avoid the funding shortage in different economies. On the other hand, it is worth noting the progress made toward the construction of the Banking Union, a procedure designed to limit the financial fragmentation and divergence in financing conditions across Eurozone countries. These developments, together with a significant economic recovery of Eurozone more peripheral vulnerable countries to the sovereign debt crisis, and the international investors preferences for purchasing bonds of these countries, contributed to the improvement in funding conditions of these external economies. Therefore, for the Eurozone, we anticipate a gradual economic recovery, coupled with the improvement in exports and the recovery of domestic demand as a result of following an accommodative monetary policy in a low inflation environment over an extended period, with GDP increase to about 0.8%, reversing the last two years recession.
Source: GPEARI Finance Percentage variation. (e) - estimated
The GDP of the European Union and the Eurozone began to grow again in late 2014, the EU's GDP increased to 1.4% and the Eurozone GDP increased to 0.8%, as a result of the positive development of indicators confidence.
As for inflation, the projections indicate a slight increase in most advanced economies to stand at levels close to 1.6% in 2014 (1.4% in 2013). As for all the emerging and developing countries, inflation should decrease to 5.6% (5.8% in 2013), highlighting the continuing high rates in some countries of Latin America (Brazil), Asia (India) and Russia. For both the Eurozone and the US, the inflation rate should remain at a low level for a long period, is foreseen, lie at around 0.5% for the former and not exceed 2% for the second, in 2014 and 2015.
Macroeconomic Indicators 2012 2013 2014(e) GDP USA 2.3 2.2 2.2 EUROPEAN UNION -0.4 0.0 1.4 EUROZONE -0.7 -0.5 0.8 JAPÃN 1.5 1.5 0.9
Consolidated Annual Report 2014
dst - sgps, s.a. Page 5 of 118
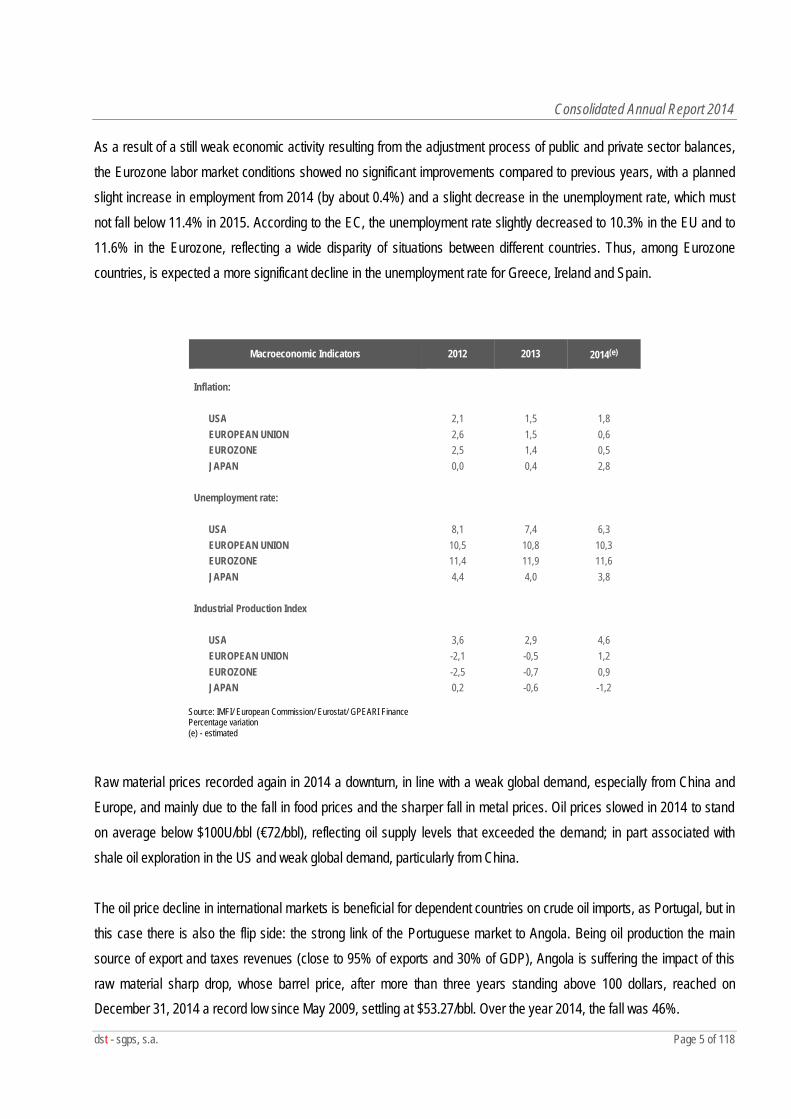
As a result of a still weak economic activity resulting from the adjustment process of public and private sector balances, the Eurozone labor market conditions showed no significant improvements compared to previous years, with a planned slight increase in employment from 2014 (by about 0.4%) and a slight decrease in the unemployment rate, which must not fall below 11.4% in 2015. According to the EC, the unemployment rate slightly decreased to 10.3% in the EU and to 11.6% in the Eurozone, reflecting a wide disparity of situations between different countries. Thus, among Eurozone countries, is expected a more significant decline in the unemployment rate for Greece, Ireland and Spain.
Macroeconomic Indicators 2012 2013 2014(e)
Inflation: USA 2,1 1,5 1,8 EUROPEAN UNION 2,6 1,5 0,6 EUROZONE 2,5 1,4 0,5 JAPAN 0,0 0,4 2,8 Unemployment rate: USA 8,1 7,4 6,3 EUROPEAN UNION 10,5 10,8 10,3 EUROZONE 11,4 11,9 11,6 JAPAN 4,4 4,0 3,8 Industrial Production Index USA 3,6 2,9 4,6 EUROPEAN UNION -2,1 -0,5 1,2 EUROZONE -2,5 -0,7 0,9 JAPAN 0,2
-0,6
-1,2
Source: IMFI/ European Commission/ Eurostat/ GPEARI Finance Percentage variation (e) - estimated
Raw material prices recorded again in 2014 a downturn, in line with a weak global demand, especially from China and Europe, and mainly due to the fall in food prices and the sharper fall in metal prices. Oil prices slowed in 2014 to stand on average below $100U/bbl (€72/bbl), reflecting oil supply levels that exceeded the demand; in part associated with shale oil exploration in the US and weak global demand, particularly from China. The oil price decline in international markets is beneficial for dependent countries on crude oil imports, as Portugal, but in this case there is also the flip side: the strong link of the Portuguese market to Angola. Being oil production the main source of export and taxes revenues (close to 95% of exports and 30% of GDP), Angola is suffering the impact of this raw material sharp drop, whose barrel price, after more than three years standing above 100 dollars, reached on December 31, 2014 a record low since May 2009, settling at $53.27/bbl. Over the year 2014, the fall was 46%.
Consolidated Annual Report 2014
dst - sgps, s.a. Page 6 of 118
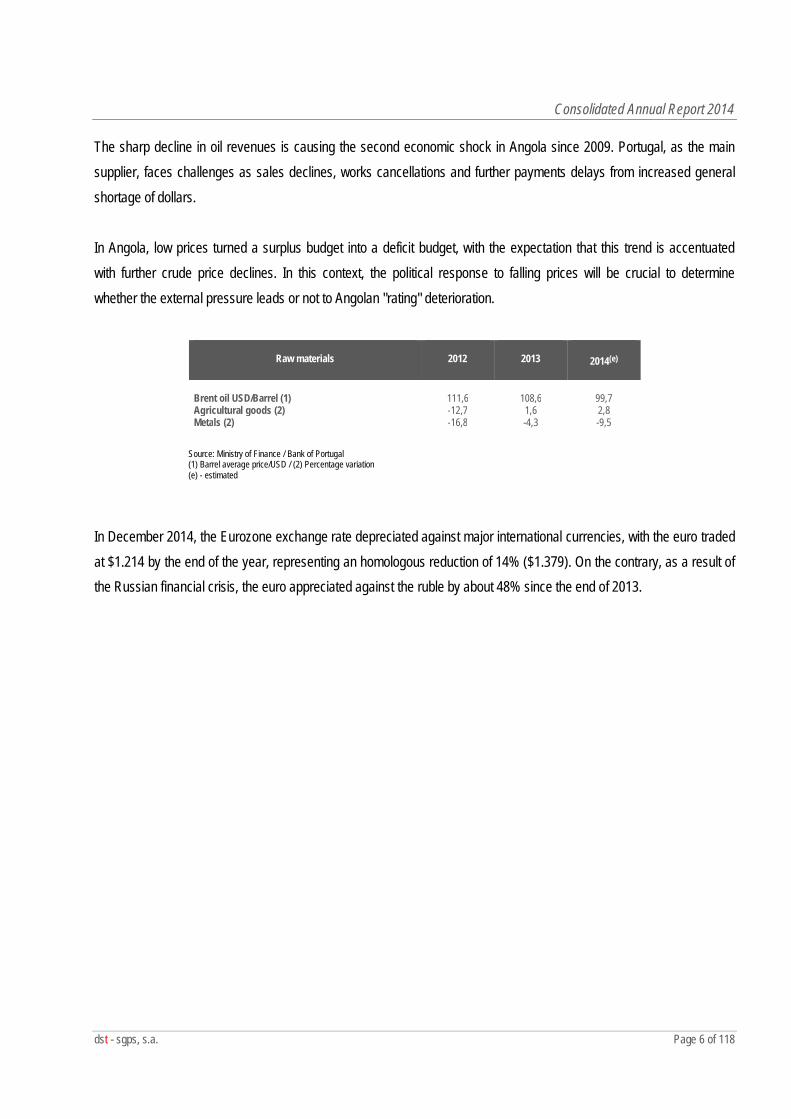
The sharp decline in oil revenues is causing the second economic shock in Angola since 2009. Portugal, as the main supplier, faces challenges as sales declines, works cancellations and further payments delays from increased general shortage of dollars. In Angola, low prices turned a surplus budget into a deficit budget, with the expectation that this trend is accentuated with further crude price declines. In this context, the political response to falling prices will be crucial to determine whether the external pressure leads or not to Angolan "rating" deterioration.
Raw materials
2012
2013
2014(e)
Brent oil USD/Barrel (1) 111,6 108,6 99,7 Agricultural goods (2) -12,7 1,6 2,8 Metals (2) -16,8 -4,3 -9,5
Source: Ministry of Finance / Bank of Portugal (1) Barrel average price/USD / (2) Percentage variation (e) - estimated
In December 2014, the Eurozone exchange rate depreciated against major international currencies, with the euro traded at $1.214 by the end of the year, representing an homologous reduction of 14% ($1.379). On the contrary, as a result of the Russian financial crisis, the euro appreciated against the ruble by about 48% since the end of 2013.
Consolidated Annual Report 2014
dst - sgps, s.a. Page 7 of 118
Source: Ministry of Finance / Bank of Portugal Foreign currencies parity at the end of the period
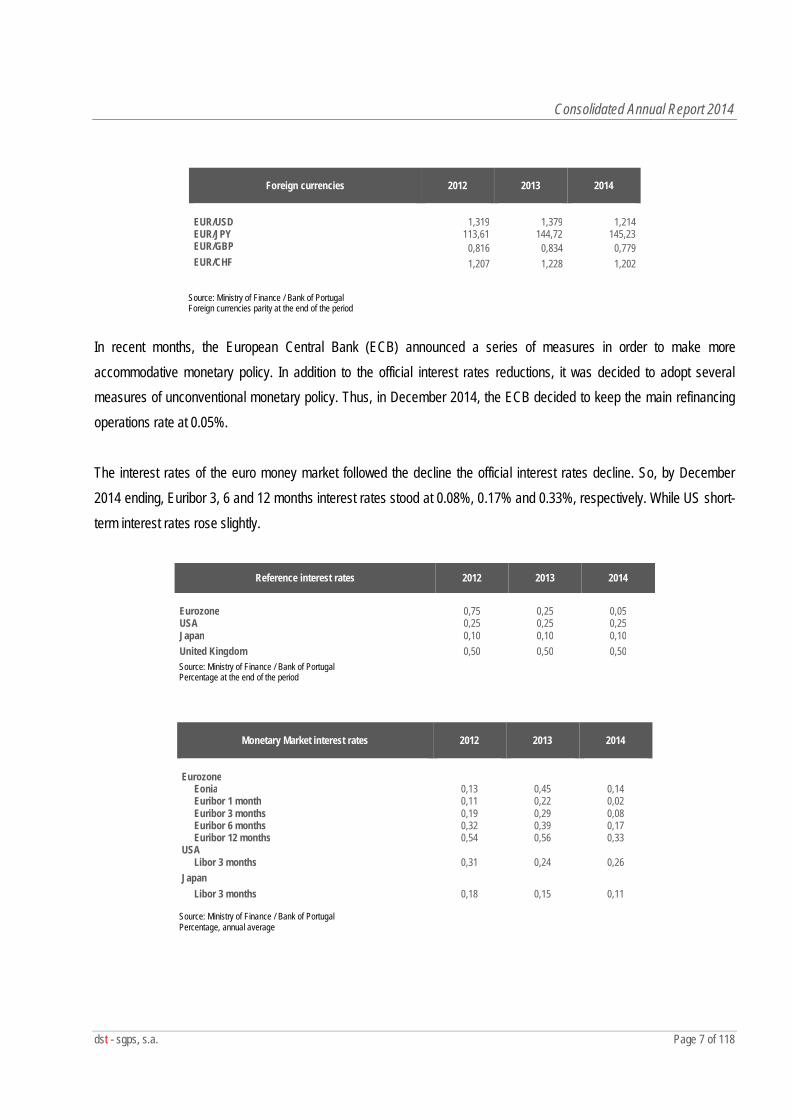
In recent months, the European Central Bank (ECB) announced a series of measures in order to make more accommodative monetary policy. In addition to the official interest rates reductions, it was decided to adopt several measures of unconventional monetary policy. Thus, in December 2014, the ECB decided to keep the main refinancing operations rate at 0.05%. The interest rates of the euro money market followed the decline the official interest rates decline. So, by December 2014 ending, Euribor 3, 6 and 12 months interest rates stood at 0.08%, 0.17% and 0.33%, respectively. While US short-term interest rates rose slightly.
Reference interest rates 2012 2013 2014
Eurozone 0,75 0,25 0,05 USA 0,25 0,25 0,25 Japan 0,10 0,10 0,10 United Kingdom 0,50 0,50 0,50 Source: Ministry of Finance / Bank of Portugal Percentage at the end of the period
Source: Ministry of Finance / Bank of Portugal Percentage, annual average
Foreign currencies 2012 2013 2014
EUR/USD 1,319 1,379 1,214 EUR/JPY 113,61 144,72 145,23 EUR/GBP 0,816 0,834 0,779 EUR/CHF 1,207 1,228 1,202
Monetary Market interest rates 2012 2013 2014
Eurozone Eonia 0,13 0,45 0,14 Euribor 1 month 0,11 0,22 0,02 Euribor 3 months 0,19 0,29 0,08 Euribor 6 months 0,32 0,39 0,17 Euribor 12 months 0,54 0,56 0,33 USA Libor 3 months 0,31 0,24 0,26 Japan Libor 3 months 0,18 0,15 0,11
Consolidated Annual Report 2014
dst - sgps, s.a. Page 8 of 118
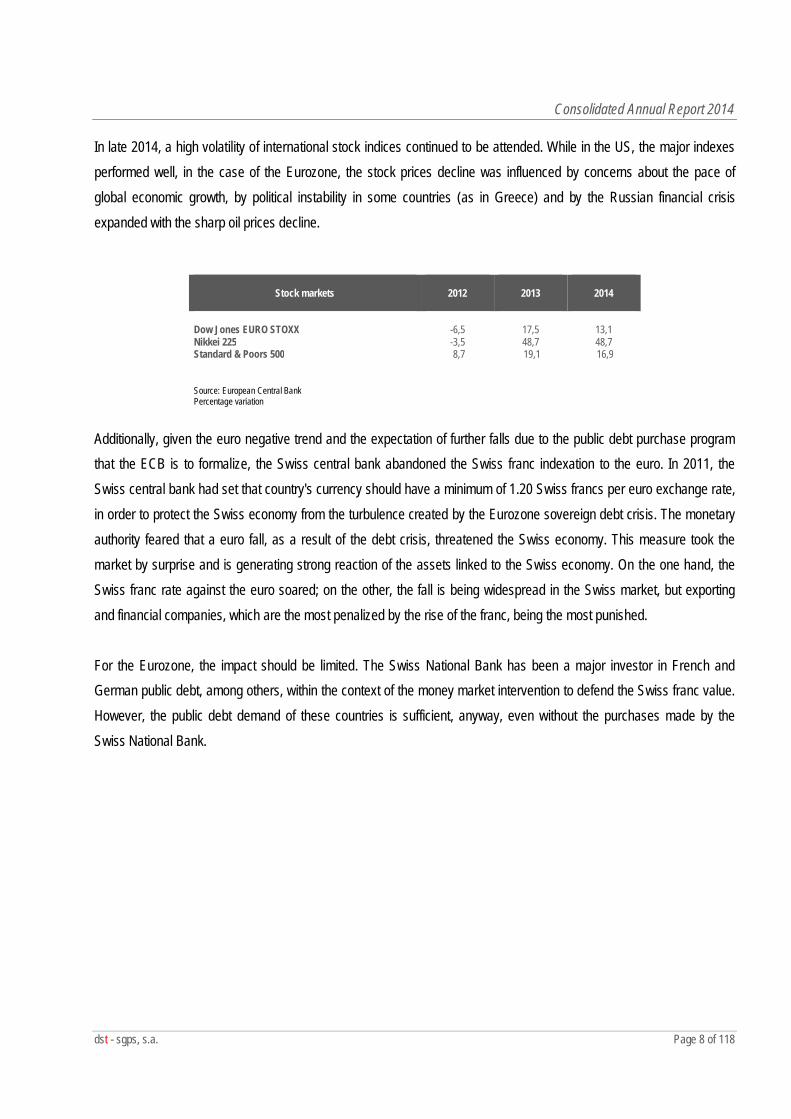
In late 2014, a high volatility of international stock indices continued to be attended. While in the US, the major indexes performed well, in the case of the Eurozone, the stock prices decline was influenced by concerns about the pace of global economic growth, by political instability in some countries (as in Greece) and by the Russian financial crisis expanded with the sharp oil prices decline.
Additionally, given the euro negative trend and the expectation of further falls due to the public debt purchase program that the ECB is to formalize, the Swiss central bank abandoned the Swiss franc indexation to the euro. In 2011, the Swiss central bank had set that country's currency should have a minimum of 1.20 Swiss francs per euro exchange rate, in order to protect the Swiss economy from the turbulence created by the Eurozone sovereign debt crisis. The monetary authority feared that a euro fall, as a result of the debt crisis, threatened the Swiss economy. This measure took the market by surprise and is generating strong reaction of the assets linked to the Swiss economy. On the one hand, the Swiss franc rate against the euro soared; on the other, the fall is being widespread in the Swiss market, but exporting and financial companies, which are the most penalized by the rise of the franc, being the most punished. For the Eurozone, the impact should be limited. The Swiss National Bank has been a major investor in French and German public debt, among others, within the context of the money market intervention to defend the Swiss franc value. However, the public debt demand of these countries is sufficient, anyway, even without the purchases made by the Swiss National Bank.
Stock markets
2012
2013
2014
Dow Jones EURO STOXX -6,5 17,5 13,1 Nikkei 225 -3,5 48,7 48,7 Standard & Poors 500 8,7 19,1 16,9 Source: European Central Bank Percentage variation
Consolidated Annual Report 2014
dst - sgps, s.a. Page 9 of 118
1.2 National macroeconomic framework
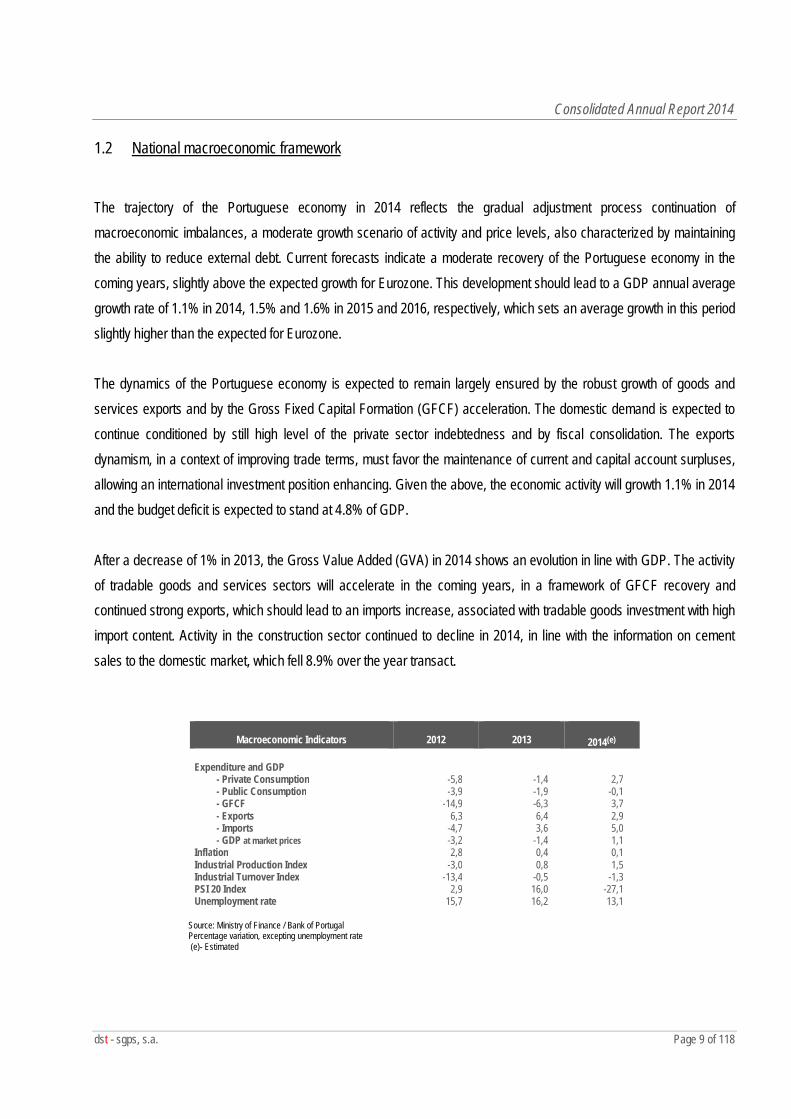
The trajectory of the Portuguese economy in 2014 reflects the gradual adjustment process continuation of macroeconomic imbalances, a moderate growth scenario of activity and price levels, also characterized by maintaining the ability to reduce external debt. Current forecasts indicate a moderate recovery of the Portuguese economy in the coming years, slightly above the expected growth for Eurozone. This development should lead to a GDP annual average growth rate of 1.1% in 2014, 1.5% and 1.6% in 2015 and 2016, respectively, which sets an average growth in this period slightly higher than the expected for Eurozone. The dynamics of the Portuguese economy is expected to remain largely ensured by the robust growth of goods and services exports and by the Gross Fixed Capital Formation (GFCF) acceleration. The domestic demand is expected to continue conditioned by still high level of the private sector indebtedness and by fiscal consolidation. The exports dynamism, in a context of improving trade terms, must favor the maintenance of current and capital account surpluses, allowing an international investment position enhancing. Given the above, the economic activity will growth 1.1% in 2014 and the budget deficit is expected to stand at 4.8% of GDP. After a decrease of 1% in 2013, the Gross Value Added (GVA) in 2014 shows an evolution in line with GDP. The activity of tradable goods and services sectors will accelerate in the coming years, in a framework of GFCF recovery and continued strong exports, which should lead to an imports increase, associated with tradable goods investment with high import content. Activity in the construction sector continued to decline in 2014, in line with the information on cement sales to the domestic market, which fell 8.9% over the year transact.
Macroeconomic Indicators
2012
2013
2014(e) Expenditure and GDP - Private Consumption -5,8 -1,4 2,7 - Public Consumption -3,9 -1,9 -0,1 - GFCF -14,9 -6,3 3,7 - Exports 6,3 6,4 2,9 - Imports -4,7 3,6 5,0 - GDP at market prices -3,2 -1,4 1,1 Inflation 2,8 0,4 0,1 Industrial Production Index -3,0 0,8 1,5 Industrial Turnover Index -13,4 -0,5 -1,3 PSI 20 Index 2,9 16,0 -27,1 Unemployment rate 15,7
16,2
13,1
Source: Ministry of Finance / Bank of Portugal Percentage variation, excepting unemployment rate (e)- Estimated
Consolidated Annual Report 2014
dst - sgps, s.a. Page 10 of 118
During the year 2014 there has been a recovery in private consumption, 2.7% compared to a fall of 1.4% in 2013, while still conditioned by high levels of debt. GFCF interrupted in mid-2013 its downward trend registered since 2009, projecting an increase of 3.7% in 2014. This development reflects largely the acceleration trajectory in business investment. The GFCF increase in GDP has been more moderate in the current recovery cycle as compared to previous recovery cycle periods. This moderate increase reflects the continued need to reduce the companies’ indebtedness level, which is expected to continue in the upcoming years, inasmuch as, notwithstanding the recent reduction, in the private sector, it remains very high compared to the Eurozone average. Consumer prices have been decelerating since 2012, in a context of cyclical position deterioration of the Portuguese economy. Thus, the Harmonised Index of Consumer Prices (HICP) slowed in 2014 to 0.1% (0.4% in 2013). Inflation is expected to remain at low levels, projecting a progressive increase in the coming years, in a framework of national and global economies moderate recovery. Additionally, there was a recovery in consumer confidence throughout 2014 and remained consistent at higher than the last ten years average values. This improvement was also found in most confidence indicators, leading to an increase in economic sentiment indicator. Also, in the labor market there are some signs of a moderate improvement in employment, reflecting the positive contribution of private employment. The unemployment rate stood at 13.1% at the end of 2014, compared with 16.2% in 2013. Despite the gradual recovery projections of the Portuguese economy, the expected growth potential is relatively limited. In fact, the deleveraging of the private and public sectors, limited levels of per worker productive capital, the low dynamism projected for key trading partners, especially those within Eurozone, will continue to influence the growth potential of the Portuguese economy in the future. In mid-2014 one of the major Portuguese banking groups falls. The crisis in Banco Espírito Santo (BES) naturally had a negative impact on businesses, individuals and the financial sector itself. The tightening of credit conditions for companies increased, while consumer confidence in the Portuguese banking system decreased. Once the BES damage was reported, putting the bank in a clear situation of insolvency, public intervention became necessary. The financial effort of the Portuguese State, through Resolution Fund, reached approximately EUR 4000 million. The impact of BES crisis on of the Portuguese economy growth next year is difficult to predict, but given the strength of the financial system, the economic and financial risk is more mitigated than if the crisis had occurred in previous times, during a more fragile financial system.
Consolidated Annual Report 2014
dst - sgps, s.a. Page 11 of 118
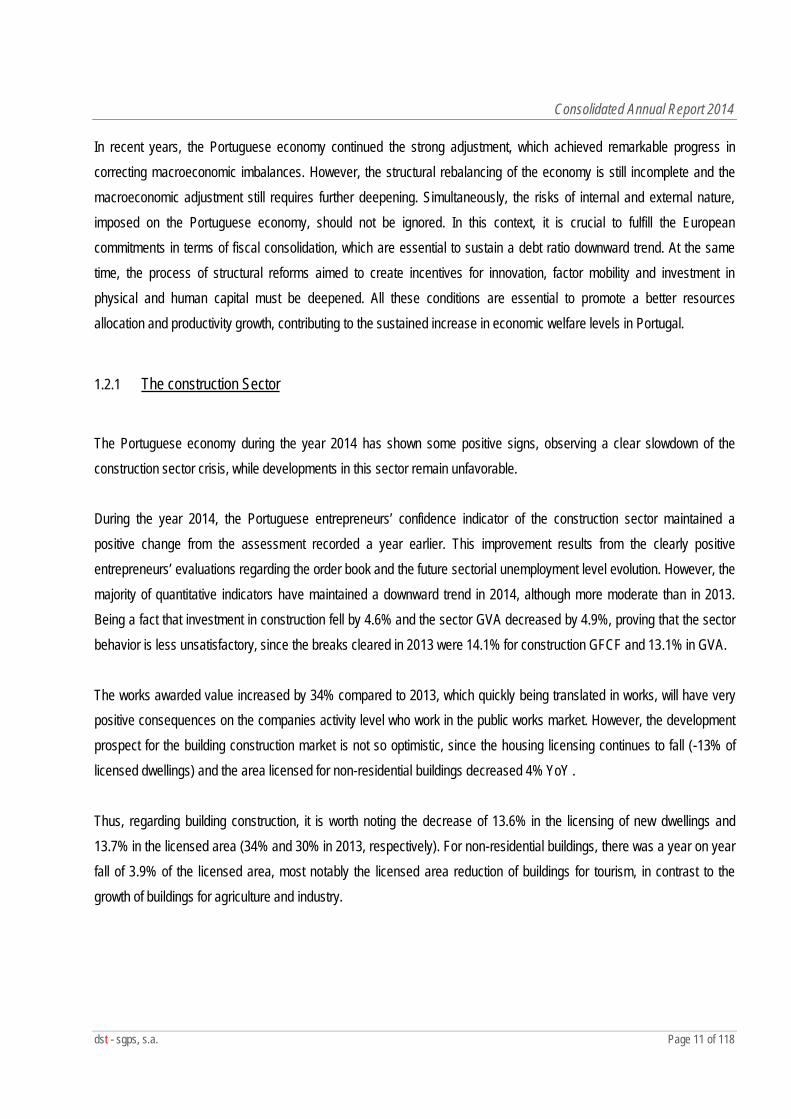
In recent years, the Portuguese economy continued the strong adjustment, which achieved remarkable progress in correcting macroeconomic imbalances. However, the structural rebalancing of the economy is still incomplete and the macroeconomic adjustment still requires further deepening. Simultaneously, the risks of internal and external nature, imposed on the Portuguese economy, should not be ignored. In this context, it is crucial to fulfill the European commitments in terms of fiscal consolidation, which are essential to sustain a debt ratio downward trend. At the same time, the process of structural reforms aimed to create incentives for innovation, factor mobility and investment in physical and human capital must be deepened. All these conditions are essential to promote a better resources allocation and productivity growth, contributing to the sustained increase in economic welfare levels in Portugal.
1.2.1 The construction Sector
The Portuguese economy during the year 2014 has shown some positive signs, observing a clear slowdown of the construction sector crisis, while developments in this sector remain unfavorable. During the year 2014, the Portuguese entrepreneurs’ confidence indicator of the construction sector maintained a positive change from the assessment recorded a year earlier. This improvement results from the clearly positive entrepreneurs’ evaluations regarding the order book and the future sectorial unemployment level evolution. However, the majority of quantitative indicators have maintained a downward trend in 2014, although more moderate than in 2013. Being a fact that investment in construction fell by 4.6% and the sector GVA decreased by 4.9%, proving that the sector behavior is less unsatisfactory, since the breaks cleared in 2013 were 14.1% for construction GFCF and 13.1% in GVA. The works awarded value increased by 34% compared to 2013, which quickly being translated in works, will have very positive consequences on the companies activity level who work in the public works market. However, the development prospect for the building construction market is not so optimistic, since the housing licensing continues to fall (-13% of licensed dwellings) and the area licensed for non-residential buildings decreased 4% YoY . Thus, regarding building construction, it is worth noting the decrease of 13.6% in the licensing of new dwellings and 13.7% in the licensed area (34% and 30% in 2013, respectively). For non-residential buildings, there was a year on year fall of 3.9% of the licensed area, most notably the licensed area reduction of buildings for tourism, in contrast to the growth of buildings for agriculture and industry.
Consolidated Annual Report 2014
dst - sgps, s.a. Page 12 of 118
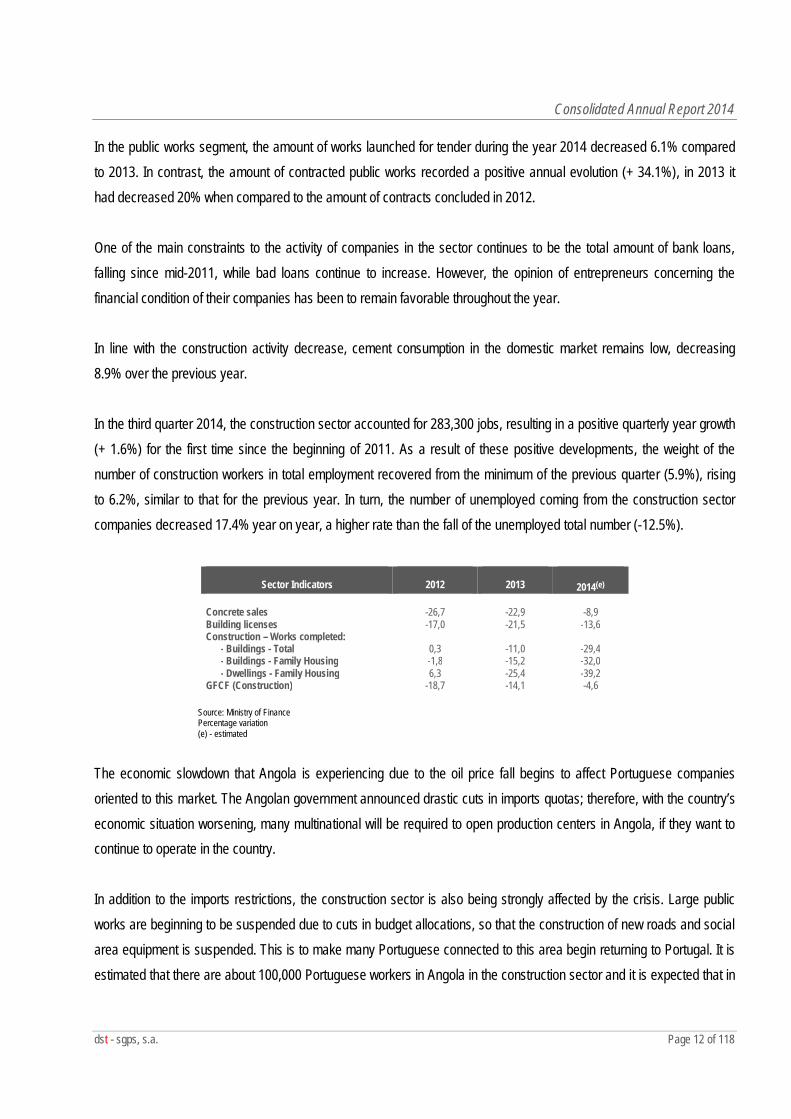
In the public works segment, the amount of works launched for tender during the year 2014 decreased 6.1% compared to 2013. In contrast, the amount of contracted public works recorded a positive annual evolution (+ 34.1%), in 2013 it had decreased 20% when compared to the amount of contracts concluded in 2012. One of the main constraints to the activity of companies in the sector continues to be the total amount of bank loans, falling since mid-2011, while bad loans continue to increase. However, the opinion of entrepreneurs concerning the financial condition of their companies has been to remain favorable throughout the year. In line with the construction activity decrease, cement consumption in the domestic market remains low, decreasing 8.9% over the previous year. In the third quarter 2014, the construction sector accounted for 283,300 jobs, resulting in a positive quarterly year growth (+ 1.6%) for the first time since the beginning of 2011. As a result of these positive developments, the weight of the number of construction workers in total employment recovered from the minimum of the previous quarter (5.9%), rising to 6.2%, similar to that for the previous year. In turn, the number of unemployed coming from the construction sector companies decreased 17.4% year on year, a higher rate than the fall of the unemployed total number (-12.5%).
Sector Indicators
2012
2013
2014(e) Concrete sales -26,7 -22,9 -8,9 Building licenses -17,0 -21,5 -13,6 Construction – Works completed: - Buildings - Total 0,3 -11,0 -29,4 - Buildings - Family Housing -1,8 -15,2 -32,0 - Dwellings - Family Housing 6,3 -25,4 -39,2 GFCF (Construction) -18,7 -14,1 -4,6
Source: Ministry of Finance Percentage variation (e) - estimated
The economic slowdown that Angola is experiencing due to the oil price fall begins to affect Portuguese companies oriented to this market. The Angolan government announced drastic cuts in imports quotas; therefore, with the country’s economic situation worsening, many multinational will be required to open production centers in Angola, if they want to continue to operate in the country. In addition to the imports restrictions, the construction sector is also being strongly affected by the crisis. Large public works are beginning to be suspended due to cuts in budget allocations, so that the construction of new roads and social area equipment is suspended. This is to make many Portuguese connected to this area begin returning to Portugal. It is estimated that there are about 100,000 Portuguese workers in Angola in the construction sector and it is expected that in
Consolidated Annual Report 2014
dst - sgps, s.a. Page 13 of 118
the coming months this number will be greatly reduced and that the vast majority of them will return to Portugal without any guarantee of finding new work. On the other hand, construction companies will experience late payments, recurring situation in Angola. The conversion of revenue in kwanza for dollars and its expatriation to Portugal will be a growing problem, due to the lack of foreign currency in the market. Consequently, the Angolan crisis will have a negative impact on the Portuguese companies’ margins, being that Angola is the largest market for Portuguese construction companies, representing 38% of total activity outside Portugal.
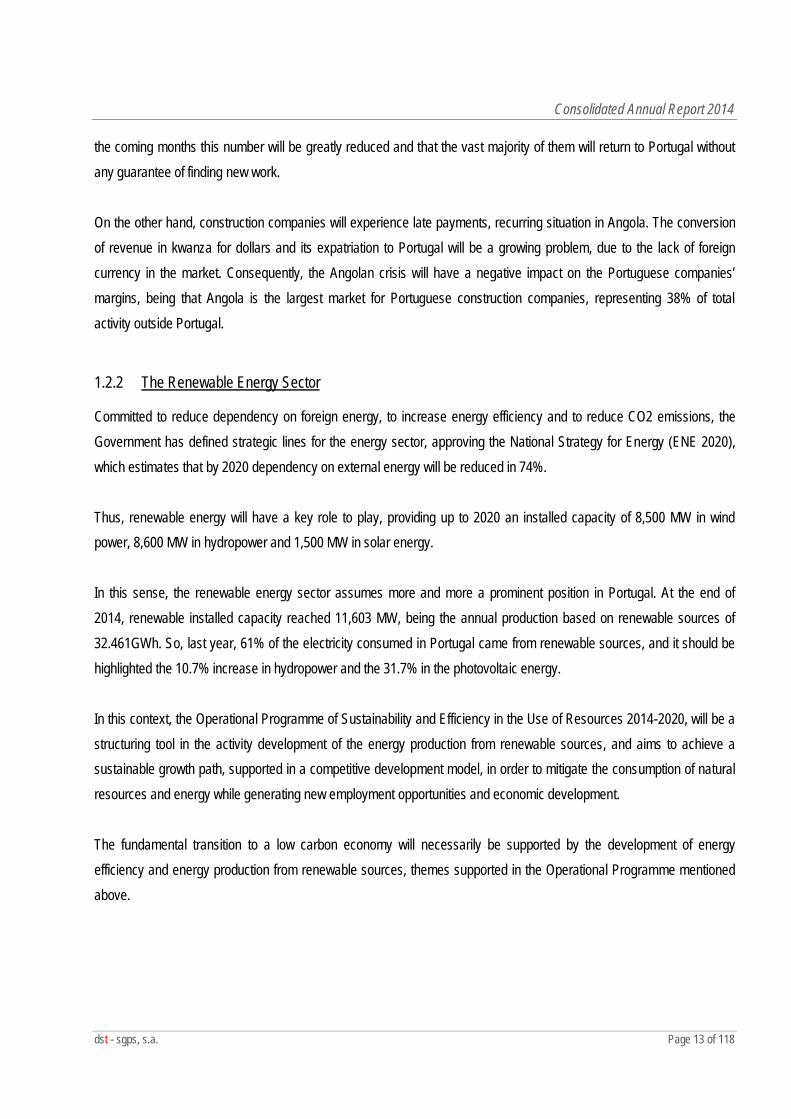
1.2.2 The Renewable Energy Sector
Committed to reduce dependency on foreign energy, to increase energy efficiency and to reduce CO2 emissions, the Government has defined strategic lines for the energy sector, approving the National Strategy for Energy (ENE 2020), which estimates that by 2020 dependency on external energy will be reduced in 74%. Thus, renewable energy will have a key role to play, providing up to 2020 an installed capacity of 8,500 MW in wind power, 8,600 MW in hydropower and 1,500 MW in solar energy. In this sense, the renewable energy sector assumes more and more a prominent position in Portugal. At the end of 2014, renewable installed capacity reached 11,603 MW, being the annual production based on renewable sources of 32.461GWh. So, last year, 61% of the electricity consumed in Portugal came from renewable sources, and it should be highlighted the 10.7% increase in hydropower and the 31.7% in the photovoltaic energy. In this context, the Operational Programme of Sustainability and Efficiency in the Use of Resources 2014-2020, will be a structuring tool in the activity development of the energy production from renewable sources, and aims to achieve a sustainable growth path, supported in a competitive development model, in order to mitigate the consumption of natural resources and energy while generating new employment opportunities and economic development. The fundamental transition to a low carbon economy will necessarily be supported by the development of energy efficiency and energy production from renewable sources, themes supported in the Operational Programme mentioned above.
Consolidated Annual Report 2014
dst - sgps, s.a. Page 14 of 118
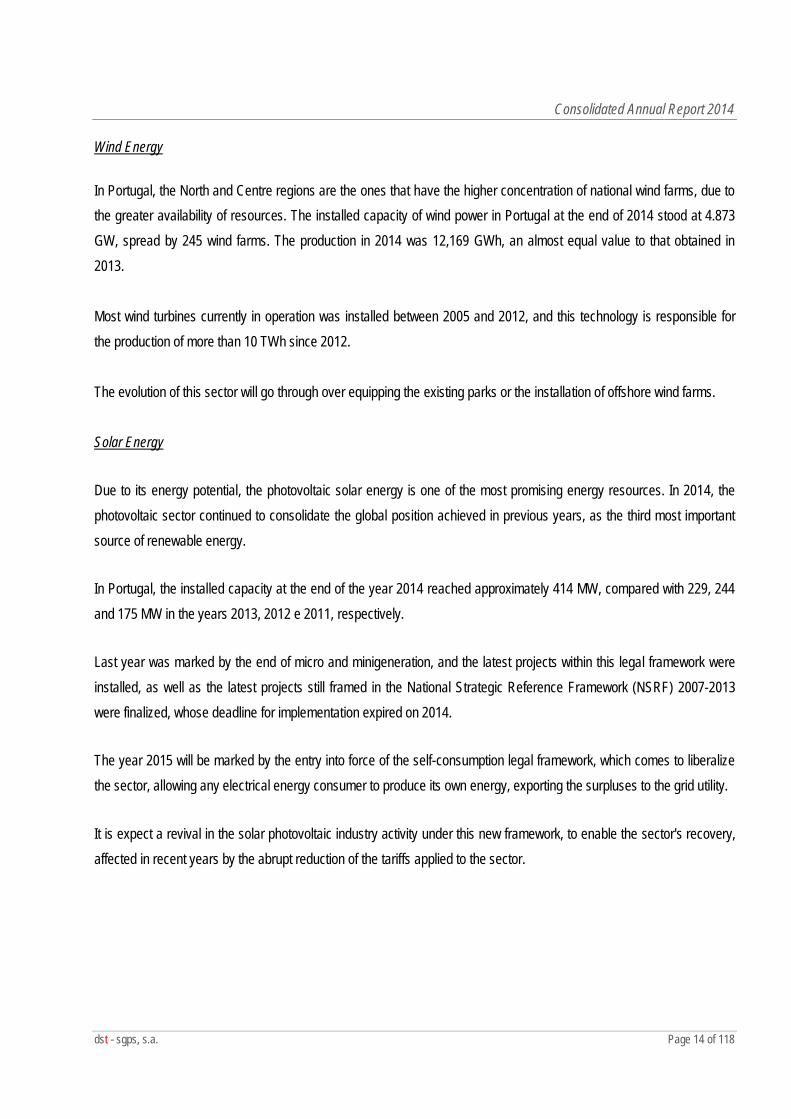
Wind Energy
In Portugal, the North and Centre regions are the ones that have the higher concentration of national wind farms, due to the greater availability of resources. The installed capacity of wind power in Portugal at the end of 2014 stood at 4.873 GW, spread by 245 wind farms. The production in 2014 was 12,169 GWh, an almost equal value to that obtained in 2013. Most wind turbines currently in operation was installed between 2005 and 2012, and this technology is responsible for the production of more than 10 TWh since 2012. The evolution of this sector will go through over equipping the existing parks or the installation of offshore wind farms. Solar Energy
Due to its energy potential, the photovoltaic solar energy is one of the most promising energy resources. In 2014, the photovoltaic sector continued to consolidate the global position achieved in previous years, as the third most important source of renewable energy.
In Portugal, the installed capacity at the end of the year 2014 reached approximately 414 MW, compared with 229, 244 and 175 MW in the years 2013, 2012 e 2011, respectively.
Last year was marked by the end of micro and minigeneration, and the latest projects within this legal framework were installed, as well as the latest projects still framed in the National Strategic Reference Framework (NSRF) 2007-2013 were finalized, whose deadline for implementation expired on 2014.
The year 2015 will be marked by the entry into force of the self-consumption legal framework, which comes to liberalize the sector, allowing any electrical energy consumer to produce its own energy, exporting the surpluses to the grid utility.
It is expect a revival in the solar photovoltaic industry activity under this new framework, to enable the sector's recovery, affected in recent years by the abrupt reduction of the tariffs applied to the sector.
Consolidated Annual Report 2014
dst - sgps, s.a. Page 15 of 118
The Hydropower
The hydropower is the worldwide leading source of renewable energy, being one of the most attractive for its maturity and predictability, as well as for its ability to compete economically with other non-renewable energy sources. China is by far the world largest producer of hydroelectric power, followed by Canada, USA, Brazil and Russia.
In Portugal, the installed capacity is stabilized with a value of approximately 5,566 MW, which, on an average year, corresponds to slightly more than 30% of the electricity consumed in Portugal is hydropower generated.
In 2007, the hydroelectric sector in Portugal was marked by the launch of the National Programme for High-Potential Hydroelectric Dams, which are currently running. This Programme foresees the Hydroelectric Exploitations implementation of Padroselos, Daivões, Vidago, Gouvães, Foz Tua, Pinhosão, Fridão, Girabolhos, Alvito and Almourol. The completion of these projects will result in an increase of installed capacity of 1.054 MW. By 2020, it is expected to reach 7,000 MW of installed capacity, according to the targets set.
Regarding the Law decree No. 25/2012, of February 6, that suspend the assignment of new injection points into the Public Service Electrical Network, and the Order 3316/2012 from the Ministry of the Economy and the Environment suspended all new hydro-electric licensing and extinguished the ongoing administrative licensing processes, which turns impossible all new hydro-electric licensing and extinguishes the ongoing administrative licensing processes, besides the Dams National Plan, there is no development perspective for this sector.
Despite not having been made any investment in new dams, the year 2014 was a very productive one regarding the water component, with a production of 16 456 GWh, as a result of a year with higher than average rainfall in more than 20%.
The industry has been waiting for some time the publish of new legal framework that will simplify the authorization of existing infrastructure use for the implementation of river SHP (Small Hydro plants) in order to enhance the energy production from renewable sources in rural areas, aiming the sustainable economic development and ensuring the preservation of the ecological ecosystems where these utilities are implemented.
Consolidated Annual Report 2014
dst - sgps, s.a. Page 16 of 118
1.2.3 The Telecommunications Sector
The year 2014, regarding telecommunications market, was essentially marked industry consolidation.
Therefore, it should be pinpointed the following events that took place during this year in the global context:
Comcast, an entity based in Philadelphia, USA, and the biggest American cable operator, bought the Time Warner Cable. This was a transaction valued at about 42.2 billion dollars in shares, equivalent to EUR 33 billion. Thus, the combination of the two biggest American operators results in a total of about 33 million subscribers. Note that Comcast, in addition to the cable TV business, still sells Internet and telephone services, still owns NBC Universal, which olds NBC television station NBC and Universal Studios;
The US telecommunications entity AT & T bought Directv. Known as the second largest mobile phone services provider in the US, AT & T acquired DirectTv by 49 billion dollars. Taken together, the two groups accounts for a total of about 26 million subscribers. One objective of this acquisition, according to AT & T, is to bring broadband to over 15 million homes, especially in the rural areas of the country.
As regards the European context, the following events pinpoints:
At the end of November, Altice, the owner of Portuguese Cabovisão and ONI, bought the French SFR - Société Française de Radiotelephone, a deal valued at 15 billion euros. This purchase will result in the creation of a new operator in France that will unite SFR and Numericable;
In Spain, and in order to strengthen the television and Internet offer in the domestic market, Vodafone bought ONO for a total value of 7.2 billion euros. This deal follows Vodafone's strategic line to expand its activity in Europe through acquisitions. To remember, even in 2013, the same group purchased Kabel Deutschland;
Orange, the French telecommunications group, launched a takeover bid for the Spanish Jazztel. The offer was approximately of EUR 3.4 billion. The French telecommunications group has the intention to finance this transaction through a capital increase over two billion euros;
As fiber optic network management is concerned, the Spanish ADIF was purchased by REE - Red Eléctrica de España, in a deal valued at EUR 525 million;
The neutral fiber optic operator, Gas Natural Fenosa Telecomunicaciones (GNFT) sold its telecommunications subsidiary to Cinven, a venture capital firm, for 510 million euros. Cinven will thus manage GNFT network, which operates in the Spanish market and in Latin America.
Consolidated Annual Report 2014
dst - sgps, s.a. Page 17 of 118
In the national context, the telecommunications sector was marked by the following events:
At May 5, 2014 Portugal Telecom increases its stake in Brazilian Oi from 23.2% to 39.7%;
Vodafone and PT signed a fiber optic sharing agreement. The goal is that each of the operators can access the 450,000 dwellings in geographical locations where the other entity has already invested or intends to invest. Therefore, and from this infrastructure point of view, it is expected to be in dispute for new customers.
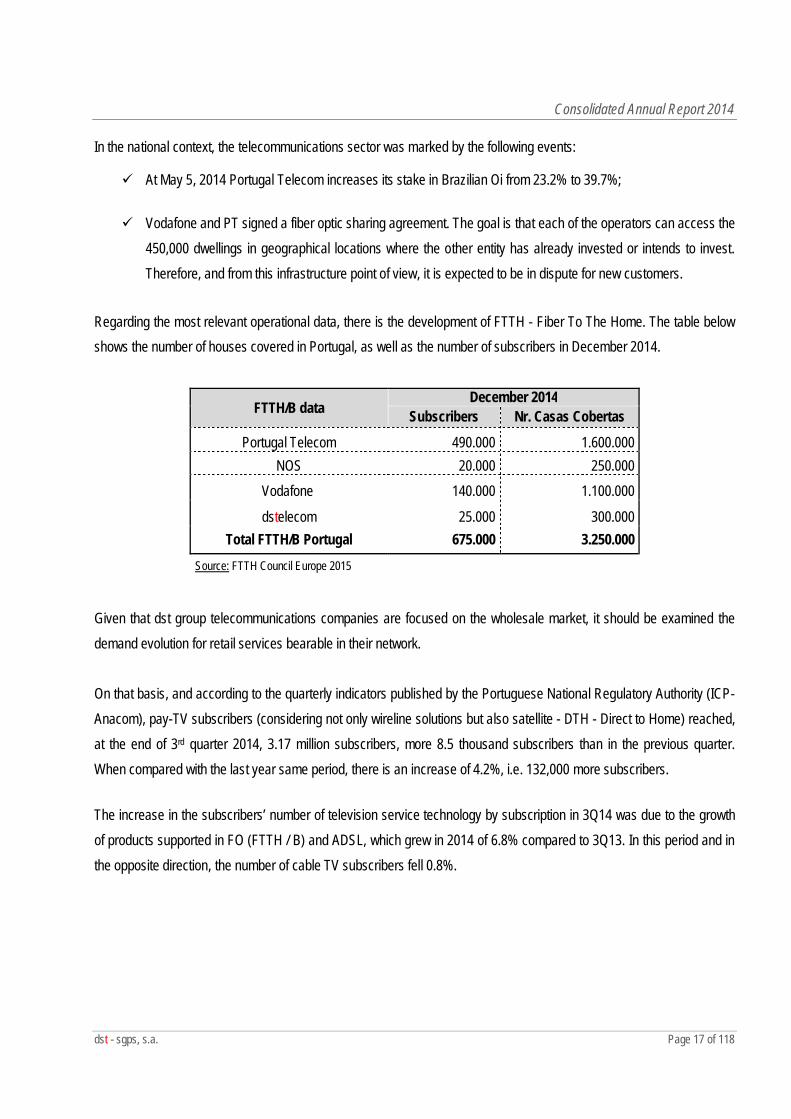
Regarding the most relevant operational data, there is the development of FTTH - Fiber To The Home. The table below shows the number of houses covered in Portugal, as well as the number of subscribers in December 2014.
Given that dst group telecommunications companies are focused on the wholesale market, it should be examined the demand evolution for retail services bearable in their network. On that basis, and according to the quarterly indicators published by the Portuguese National Regulatory Authority (ICP-Anacom), pay-TV subscribers (considering not only wireline solutions but also satellite - DTH - Direct to Home) reached, at the end of 3rd quarter 2014, 3.17 million subscribers, more 8.5 thousand subscribers than in the previous quarter. When compared with the last year same period, there is an increase of 4.2%, i.e. 132,000 more subscribers.
The increase in the subscribers’ number of television service technology by subscription in 3Q14 was due to the growth of products supported in FO (FTTH / B) and ADSL, which grew in 2014 of 6.8% compared to 3Q13. In this period and in the opposite direction, the number of cable TV subscribers fell 0.8%.
FTTH/B data December 2014
Subscribers Nr. Casas Cobertas
Portugal Telecom 490.000 1.600.000 NOS 20.000 250.000
Vodafone 140.000 1.100.000
dstelecom 25.000 300.000 Total FTTH/B Portugal 675.000 3.250.000
Source: FTTH Council Europe 2015
Consolidated Annual Report 2014
dst - sgps, s.a. Page 18 of 118
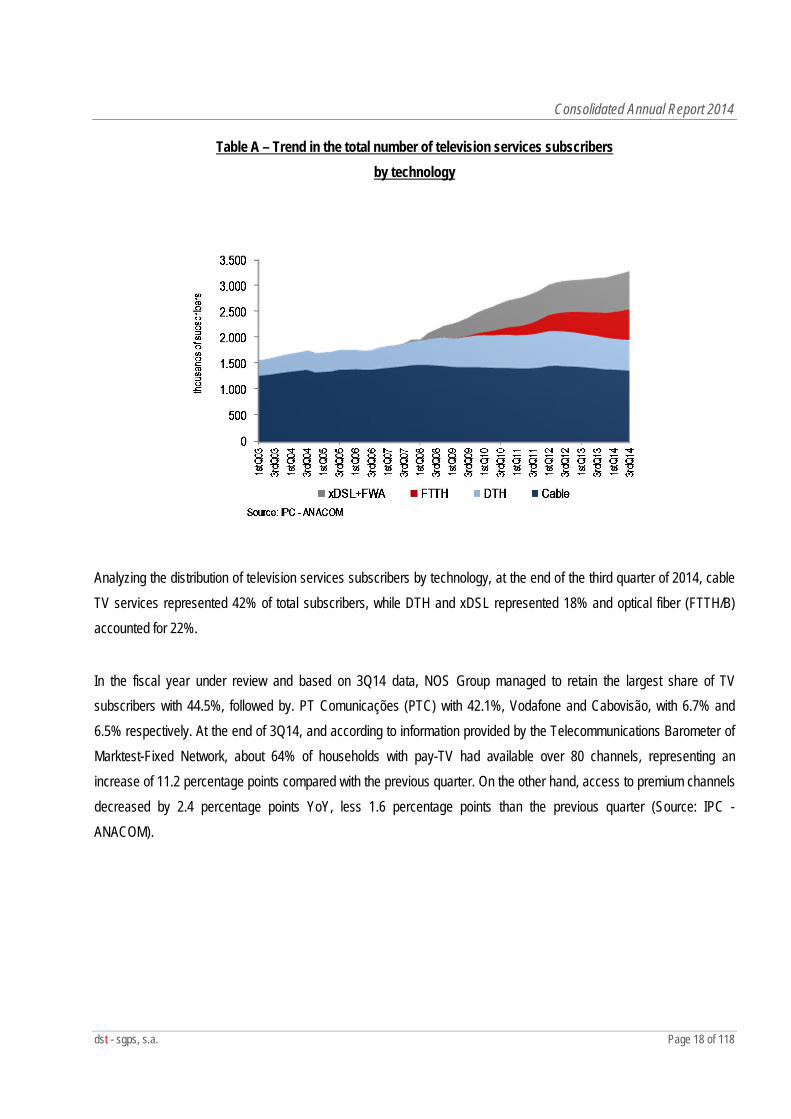
Table A – Trend in the total number of television services subscribers by technology
Analyzing the distribution of television services subscribers by technology, at the end of the third quarter of 2014, cable TV services represented 42% of total subscribers, while DTH and xDSL represented 18% and optical fiber (FTTH/B) accounted for 22%.
In the fiscal year under review and based on 3Q14 data, NOS Group managed to retain the largest share of TV subscribers with 44.5%, followed by. PT Comunicações (PTC) with 42.1%, Vodafone and Cabovisão, with 6.7% and 6.5% respectively. At the end of 3Q14, and according to information provided by the Telecommunications Barometer of Marktest-Fixed Network, about 64% of households with pay-TV had available over 80 channels, representing an increase of 11.2 percentage points compared with the previous quarter. On the other hand, access to premium channels decreased by 2.4 percentage points YoY, less 1.6 percentage points than the previous quarter (Source: IPC - ANACOM).
Consolidated Annual Report 2014
dst - sgps, s.a. Page 19 of 118
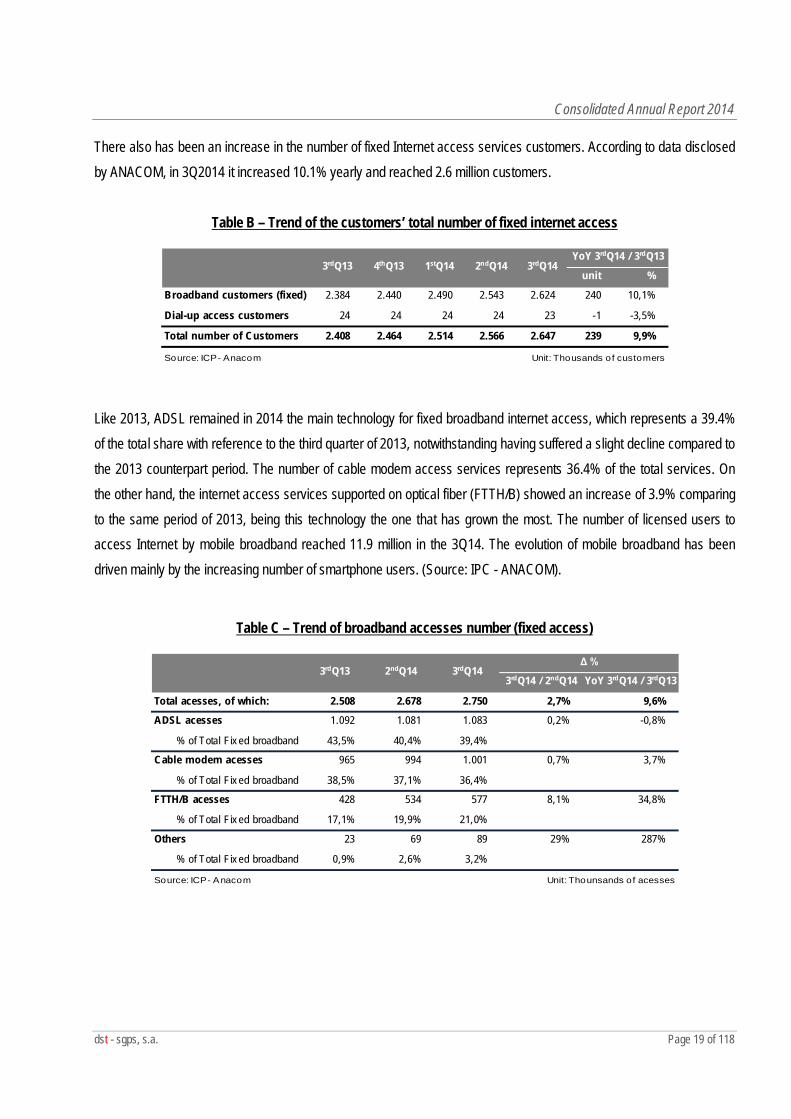
There also has been an increase in the number of fixed Internet access services customers. According to data disclosed by ANACOM, in 3Q2014 it increased 10.1% yearly and reached 2.6 million customers.
Table B – Trend of the customers’ total number of fixed internet access
Like 2013, ADSL remained in 2014 the main technology for fixed broadband internet access, which represents a 39.4% of the total share with reference to the third quarter of 2013, notwithstanding having suffered a slight decline compared to the 2013 counterpart period. The number of cable modem access services represents 36.4% of the total services. On the other hand, the internet access services supported on optical fiber (FTTH/B) showed an increase of 3.9% comparing to the same period of 2013, being this technology the one that has grown the most. The number of licensed users to access Internet by mobile broadband reached 11.9 million in the 3Q14. The evolution of mobile broadband has been driven mainly by the increasing number of smartphone users. (Source: IPC - ANACOM).
Table C – Trend of broadband accesses number (fixed access)
unit %
Broadband customers (fixed) 2.384 2.440 2.490 2.543 2.624 240 10,1%
Dial-up access customers 24 24 24 24 23 -1 -3,5%
Total number of Customers 2.408 2.464 2.514 2.566 2.647 239 9,9%
Source: ICP- Anacom Unit: Thousands of customers
YoY 3rdQ14 / 3rdQ133rdQ13 4thQ13 1stQ14 2ndQ14 3rdQ14
3rdQ14 / 2ndQ14 YoY 3rdQ14 / 3rdQ13
Total acesses, of which: 2.508 2.678 2.750 2,7% 9,6%
ADSL acesses 1.092 1.081 1.083 0,2% -0,8%
% of Total Fix ed broadband 43,5% 40,4% 39,4%
Cable modem acesses 965 994 1.001 0,7% 3,7%
% of Total Fix ed broadband 38,5% 37,1% 36,4%
FTTH/B acesses 428 534 577 8,1% 34,8%
% of Total Fix ed broadband 17,1% 19,9% 21,0%
Others 23 69 89 29% 287%
% of Total Fix ed broadband 0,9% 2,6% 3,2%
Source: ICP- Anacom Unit: Thounsands of acesses
3rdQ13 2ndQ14 3rdQ14Δ %
Consolidated Annual Report 2014
dst - sgps, s.a. Page 20 of 118
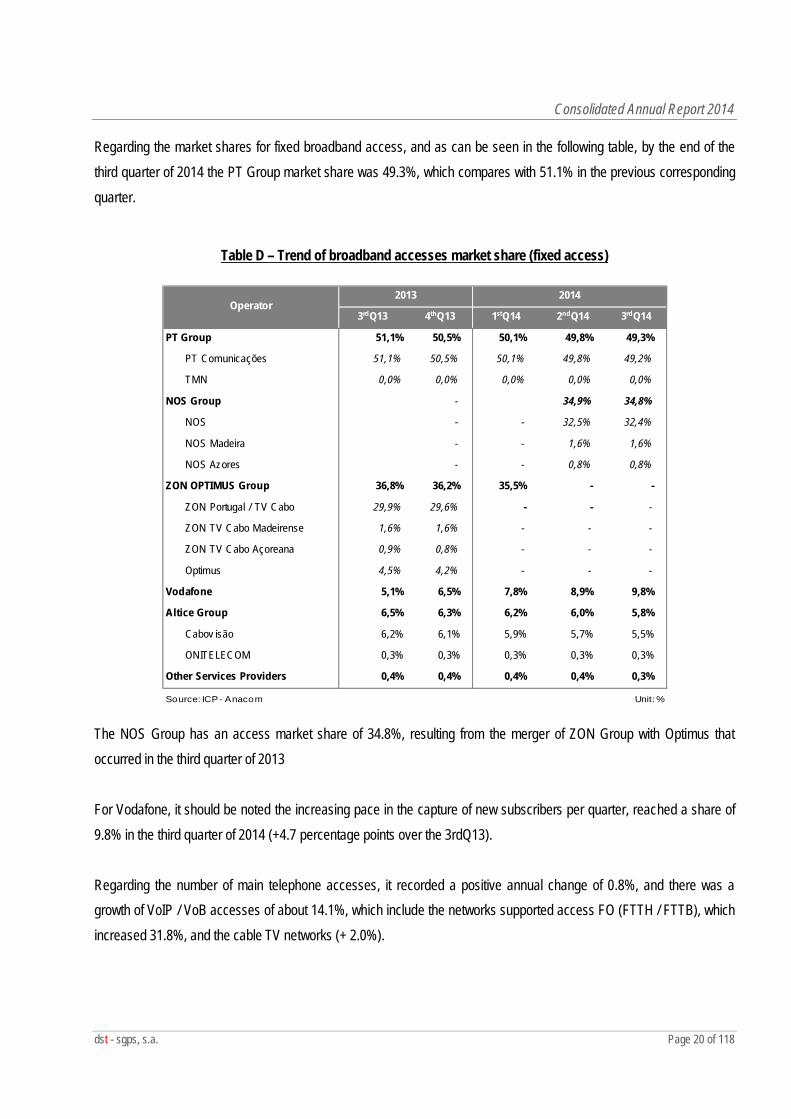
Regarding the market shares for fixed broadband access, and as can be seen in the following table, by the end of the third quarter of 2014 the PT Group market share was 49.3%, which compares with 51.1% in the previous corresponding quarter.
Table D – Trend of broadband accesses market share (fixed access)
The NOS Group has an access market share of 34.8%, resulting from the merger of ZON Group with Optimus that occurred in the third quarter of 2013 For Vodafone, it should be noted the increasing pace in the capture of new subscribers per quarter, reached a share of 9.8% in the third quarter of 2014 (+4.7 percentage points over the 3rdQ13). Regarding the number of main telephone accesses, it recorded a positive annual change of 0.8%, and there was a growth of VoIP / VoB accesses of about 14.1%, which include the networks supported access FO (FTTH / FTTB), which increased 31.8%, and the cable TV networks (+ 2.0%).
3rdQ13 4thQ13 1stQ14 2ndQ14 3rdQ14
PT Group 51,1% 50,5% 50,1% 49,8% 49,3%
PT Comunicações 51,1% 50,5% 50,1% 49,8% 49,2%
TMN 0,0% 0,0% 0,0% 0,0% 0,0%
NOS Group - 34,9% 34,8%
NOS - - 32,5% 32,4%
NOS Madeira - - 1,6% 1,6%
NOS Azores - - 0,8% 0,8%
ZON OPTIMUS Group 36,8% 36,2% 35,5% - -
ZON Portugal / TV Cabo 29,9% 29,6% - - -
ZON TV Cabo Madeirense 1,6% 1,6% - - -
ZON TV Cabo Açoreana 0,9% 0,8% - - -
Optimus 4,5% 4,2% - - -
Vodafone 5,1% 6,5% 7,8% 8,9% 9,8%
Altice Group 6,5% 6,3% 6,2% 6,0% 5,8%
Cabov isão 6,2% 6,1% 5,9% 5,7% 5,5%
ONITELECOM 0,3% 0,3% 0,3% 0,3% 0,3%
Other Services Providers 0,4% 0,4% 0,4% 0,4% 0,3%
Source: ICP- Anacom Unit: %
Operator2013 2014
Consolidated Annual Report 2014
dst - sgps, s.a. Page 21 of 118
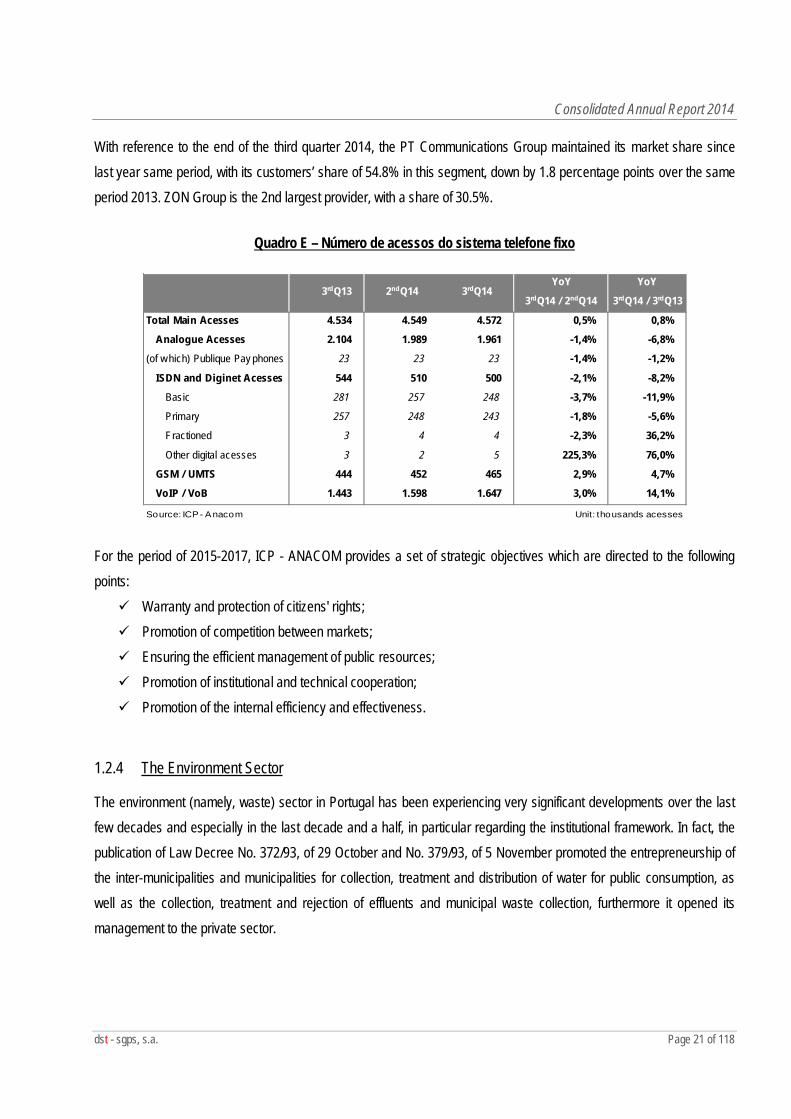
With reference to the end of the third quarter 2014, the PT Communications Group maintained its market share since last year same period, with its customers’ share of 54.8% in this segment, down by 1.8 percentage points over the same period 2013. ZON Group is the 2nd largest provider, with a share of 30.5%.
Quadro E – Número de acessos do sistema telefone fixo
For the period of 2015-2017, ICP - ANACOM provides a set of strategic objectives which are directed to the following points: Warranty and protection of citizens' rights; Promotion of competition between markets; Ensuring the efficient management of public resources; Promotion of institutional and technical cooperation; Promotion of the internal efficiency and effectiveness.
1.2.4 The Environment Sector
The environment (namely, waste) sector in Portugal has been experiencing very significant developments over the last few decades and especially in the last decade and a half, in particular regarding the institutional framework. In fact, the publication of Law Decree No. 372/93, of 29 October and No. 379/93, of 5 November promoted the entrepreneurship of the inter-municipalities and municipalities for collection, treatment and distribution of water for public consumption, as well as the collection, treatment and rejection of effluents and municipal waste collection, furthermore it opened its management to the private sector.
YoY YoY
3rdQ14 / 2ndQ14 3rdQ14 / 3rdQ13
Total Main Acesses 4.534 4.549 4.572 0,5% 0,8%
Analogue Acesses 2.104 1.989 1.961 -1,4% -6,8%
(of which) Publique Pay phones 23 23 23 -1,4% -1,2%
ISDN and Diginet Acesses 544 510 500 -2,1% -8,2%
Basic 281 257 248 -3,7% -11,9%
Primary 257 248 243 -1,8% -5,6%
Fractioned 3 4 4 -2,3% 36,2%
Other digital acesses 3 2 5 225,3% 76,0%
GSM / UMTS 444 452 465 2,9% 4,7%
VoIP / VoB 1.443 1.598 1.647 3,0% 14,1%
Source: ICP- Anacom Unit: thousands acesses
3rdQ13 2ndQ14 3rdQ14
Consolidated Annual Report 2014
dst - sgps, s.a. Page 22 of 118
The strategy outlined in the PEAASAR II defines that management entities along with the necessary implementation of infrastructure for achieving the desired service levels, with the required quality standards, should ensure that the price of services reflects the cost of water and sanitation, thus ensuring the sustainability of services, and promoting the efficient resources use through appropriate environmental practices. Furthermore, it should guarantee the complete compliance with legal obligations, without losing sight of the recommendations for the establishment of socially acceptable fares, in particular those related to the increase of territorial interventions and to the full exploitation of the project funds.
In Portugal, the water supply and wastewater sanitation sector is subdivided in two strands along their value chain: the "high" and "low":
“High” systems of wholesale activity: systems for capture, treatment and supply of water, and also systems for collection, treatment and rejection of waste water.
“Low” systems of retail activity: water distribution systems and domestic waste-water collection.
There are a large number of management entities operating in Portugal and its small size does not allow a desirable – and long-awaited – efficiency, optimization and scale in the water sector. The situation becomes more alarming when adding the dispersion and the small scale of those entities of the water short cycle that they manage.
Currently the imbalances in water sector are an unquestionable fact and recognized by all players in the industry, imposing the need to act urgently to achieve greater rationality, efficiency and optimization.
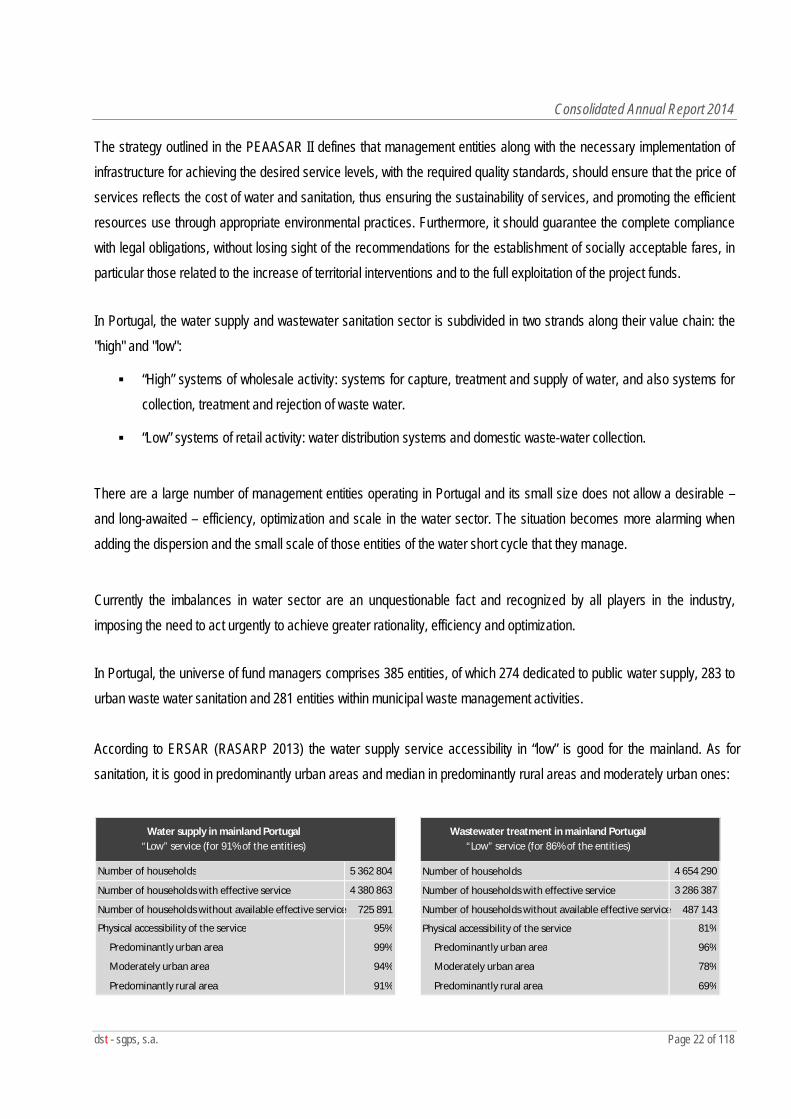
In Portugal, the universe of fund managers comprises 385 entities, of which 274 dedicated to public water supply, 283 to urban waste water sanitation and 281 entities within municipal waste management activities. According to ERSAR (RASARP 2013) the water supply service accessibility in “low” is good for the mainland. As for sanitation, it is good in predominantly urban areas and median in predominantly rural areas and moderately urban ones:
Number of households 5 362 804 Number of households
4 654 290
Number of households with effective service
4 380 863 Number of households with effective service
3 286 387
Number of households without available effective service
725 891 Number of households without available effective service
487 143
Physical accessibility of the service 95% Physical accessibility of the service
81%
Predominantly urban area 99% Predominantly urban area 96%
Moderately urban area 94% Moderately urban area 78%
Predominantly rural area 91% Predominantly rural area 69%
Water supply in mainland Portugal“Low” service (for 91% of the entities)
Wastewater treatment in mainland Portugal “Low” service (for 86% of the entities)
Consolidated Annual Report 2014
dst - sgps, s.a. Page 23 of 118
As for water losses, the mainland average unbilled water was 30.7% (RASARP 2013). A final note regarding consumption, which it has been consistently decreasing since 2007. The trend is widespread throughout the country and is related to several combined factors, namely:
Short-term Factors: - Economic and social crisis; - Emigration; - Unemployment.
Structural Factors: - Demographic reduction; - Population aging; - Environmental awareness; - Climate changes; - Tariffs increasing; - Technological innovations; - Public and building networks efficiency.
1.2.5 The Capital Venture Sector
The Portuguese venture capital industry after experienced a crisis, is currently on a growth phase. This fact mainly stemmed from markets short liquidity, which has led to greater demand for venture capital to strengthen companies’ equity. Consequently, there are new investment funds and different types of market participants. As happened in the '80s, venture capital companies (“VCC”) are currently averse to undertake investments in start-ups, unlike what happens, for example, in the U.S., where they continue to support the expansion of this type of investment
At the end of 2014, as in the previous year, Portugal had 79 venture capital funds ("VCF") and 34 VCC. Data disclosed by Portuguese Securities Market Commission (“CMVM”) indicate that the dynamism of venture capital activity over the last decade mainly results from the increase in VCF and not of VCC, a fact easily explained by the fact that funds hold about 90% of the total amount under management. The revitalization funds had the biggest highlight in transactions in 2014, which is not quite surprising, given that these transactions require greater capital investment, for which has also contributed a considerable increase of foreign private equity investments funds in Portuguese companies. This type of fund operates at a more operational level and they intend to privileged internationalization, cost reduction and consolidation (mergers between companies in the same industry), in order to make profitable companies. With regard to venture capital, more than 60% of this investment type in 2014 was held in internet and technology companies and it is estimated that in 2015 the trend will continue.
Consolidated Annual Report 2014
dst - sgps, s.a. Page 24 of 118
The venture capital investments in Portugal have shown an atypical behavior regarding its industry pattern, since investors rather than taking shareholders risks have instead chosen to make capital contributions through paid provisions, which greatly resembles a bank loan. Thus, the overall risk of operations is substantially reduced, since the return on equity ceases to depend solely on profits from activity or shares sales. The operational program COMPETE, under the Support Financing and Risk Sharing System of Innovation (SAFPRI), had a significant importance to the sector expansion since it continued to support, in 2014, about 22 VCF oriented to SMEs investments, both at the initial phase of its life cycle as in the expansion phase of its activity. On the European scene, like Portugal, funds raised by venture capital have mainly been directed to VCF, with private equity characteristics, specialized in buyout transactions involving the acquisition of an entity’s capital majority, with an eventually use of substantial debt amounts. The year 2014 was also marked by the first steps towards the transposition of Directive No. 2011/61 / EU and Directive No. 2013/14 / EU of the European Parliament and European Council of June 8, 2011 and May 21, 2013 respectively. The result was published by the Law No. 18/2015, of March 4, which substantially changes the regulatory framework for venture capital investment in Portugal, and to highlight the following aspects: (i) introduces regulation on investment in social entrepreneurship and specialized alternative investment; (ii) possibility of fund management regulation to predict funds background division in several independent compartments patrimonial rules; and (iii) a new more demanding regime that now large management companies are subject.
In short, it is still expected a growing influence in this industry, as there is a substantial capacity of funds raised
by operators that has not yet been invested in shares. Moreover, the European Community program Horizon 2020 predicts that about 2 billion euros are available for venture capital investments, primarily for projects in the seed or early stage phases.
Consolidated Annual Report 2014
dst - sgps, s.a. Page 25 of 118
2. Business activity
Global analysis of 2014 period
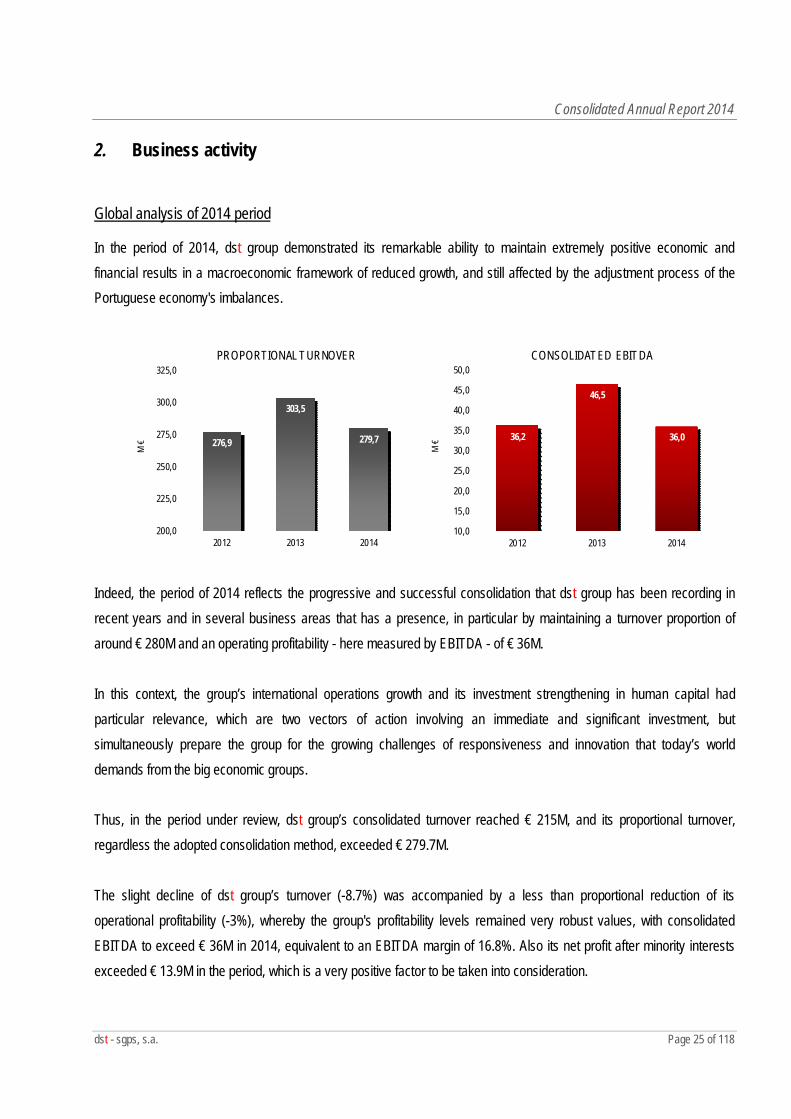
In the period of 2014, dst group demonstrated its remarkable ability to maintain extremely positive economic and financial results in a macroeconomic framework of reduced growth, and still affected by the adjustment process of the Portuguese economy's imbalances.
276,9
303,5
279,7
200,0
225,0
250,0
275,0
300,0
325,0
2012 2013 2014
M €
PROPORTIONAL TURNOVER
36,2
46,5
36,0
10,0
15,0
20,0
25,0
30,0
35,0
40,0
45,0
50,0
2012 2013 2014
M €
CONSOLIDATED EBITDA
Indeed, the period of 2014 reflects the progressive and successful consolidation that dst group has been recording in recent years and in several business areas that has a presence, in particular by maintaining a turnover proportion of around € 280M and an operating profitability - here measured by EBITDA - of € 36M. In this context, the group’s international operations growth and its investment strengthening in human capital had particular relevance, which are two vectors of action involving an immediate and significant investment, but simultaneously prepare the group for the growing challenges of responsiveness and innovation that today’s world demands from the big economic groups. Thus, in the period under review, dst group’s consolidated turnover reached € 215M, and its proportional turnover, regardless the adopted consolidation method, exceeded € 279.7M. The slight decline of dst group’s turnover (-8.7%) was accompanied by a less than proportional reduction of its operational profitability (-3%), whereby the group's profitability levels remained very robust values, with consolidated EBITDA to exceed € 36M in 2014, equivalent to an EBITDA margin of 16.8%. Also its net profit after minority interests exceeded € 13.9M in the period, which is a very positive factor to be taken into consideration.
Consolidated Annual Report 2014
dst - sgps, s.a. Page 26 of 118
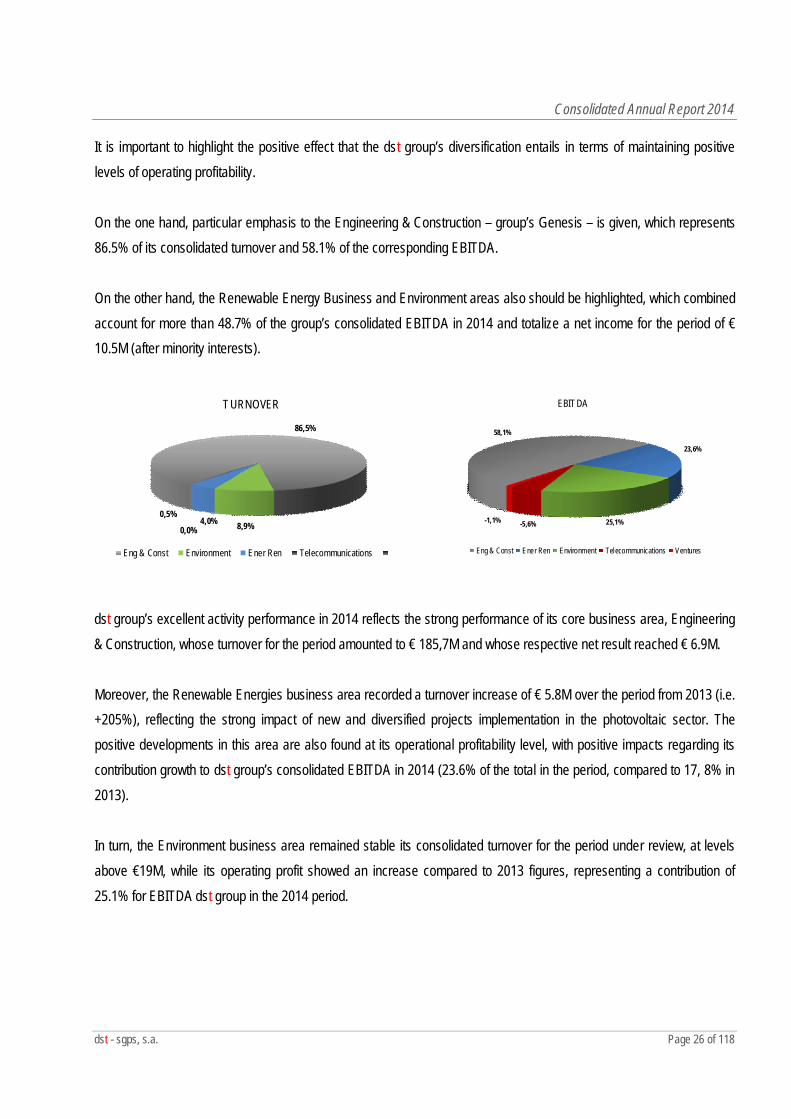
It is important to highlight the positive effect that the dst group’s diversification entails in terms of maintaining positive levels of operating profitability. On the one hand, particular emphasis to the Engineering & Construction – group’s Genesis – is given, which represents 86.5% of its consolidated turnover and 58.1% of the corresponding EBITDA. On the other hand, the Renewable Energy Business and Environment areas also should be highlighted, which combined account for more than 48.7% of the group’s consolidated EBITDA in 2014 and totalize a net income for the period of € 10.5M (after minority interests).
86,5%
8,9%4,0%0,0%
0,5%
TURNOVER
Eng & Const Environment Ener Ren Telecommunications
58,1%
23,6%
25,1%-5,6%-1,1%
EBITDA
Eng & Const Ener Ren Environment Telecommunications Ventures
dst group’s excellent activity performance in 2014 reflects the strong performance of its core business area, Engineering & Construction, whose turnover for the period amounted to € 185,7M and whose respective net result reached € 6.9M. Moreover, the Renewable Energies business area recorded a turnover increase of € 5.8M over the period from 2013 (i.e. +205%), reflecting the strong impact of new and diversified projects implementation in the photovoltaic sector. The positive developments in this area are also found at its operational profitability level, with positive impacts regarding its contribution growth to dst group’s consolidated EBITDA in 2014 (23.6% of the total in the period, compared to 17, 8% in 2013). In turn, the Environment business area remained stable its consolidated turnover for the period under review, at levels above €19M, while its operating profit showed an increase compared to 2013 figures, representing a contribution of 25.1% for EBITDA dst group in the 2014 period.
Consolidated Annual Report 2014
dst - sgps, s.a. Page 27 of 118
The year 2014 continued to be a great investment period in the Telecommunications business area, particularly in trade, so that, although this area does not yet present a relevant turnover on dst group’s global sphere, its turnover growth of 42.8% YoY is remarkable, exceeding in the year, the level of €1M. Nevertheless, the impact of depreciation and amortization from the high investments made by the group in this business implies that its net income for the period is necessarily negative, to the tune of € 2.1M. Moreover, it should be emphasized dst group’s presence in Ventures business area, which bet became intensified in 2014, with the implementation by 2bpartner – sociedade capital de risco, s.a., - the group’s venture capital company – of multiple analysis process and due diligence projects which materialized in the realization of different investments during the period under review, in parallel with the development, by innovationpoint – investigação e desenvolvimento, s.a., of several innovative projects. In this context, naturally, Ventures business area does not yet have a turnover that may be representative of its potential growth, remaining as a big bet vector in the future by dst group.
Economic and financial summary (year 2014)
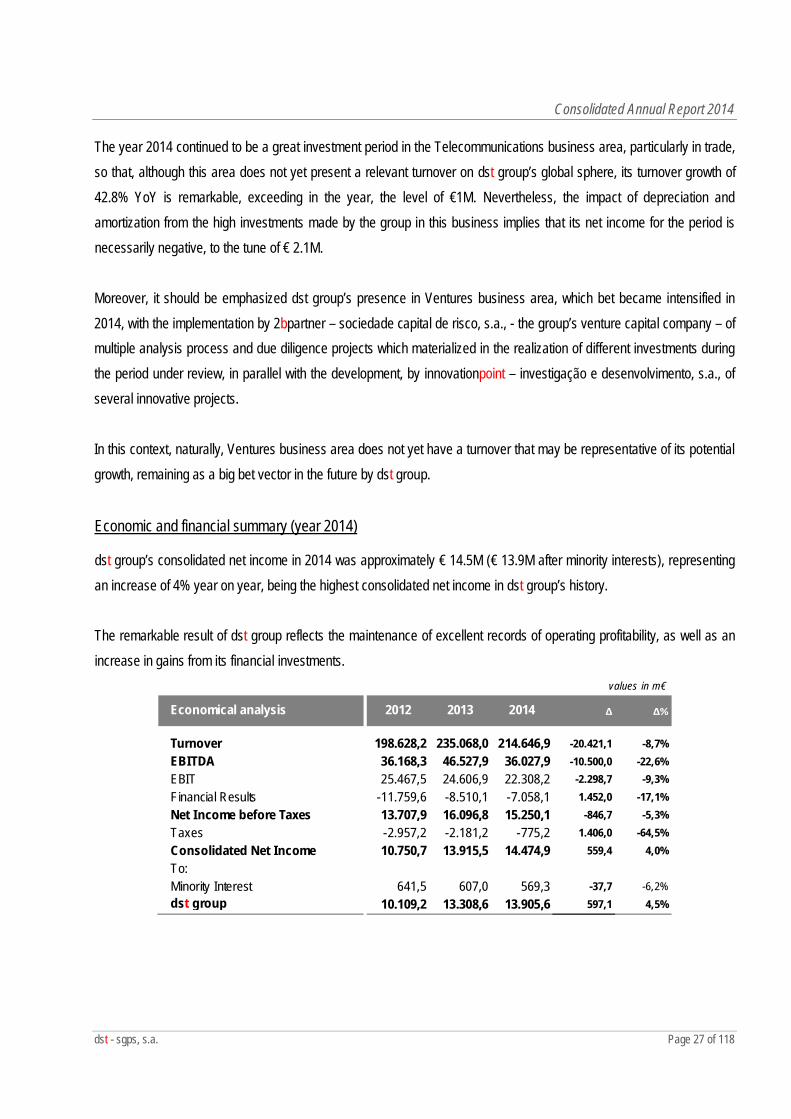
dst group’s consolidated net income in 2014 was approximately € 14.5M (€ 13.9M after minority interests), representing an increase of 4% year on year, being the highest consolidated net income in dst group’s history. The remarkable result of dst group reflects the maintenance of excellent records of operating profitability, as well as an increase in gains from its financial investments.
values in m€
Economical analysis 2012 2013 2014 ∆ ∆%
Turnover 198.628,2 235.068,0 214.646,9 -20.421,1 -8,7%EBITDA 36.168,3 46.527,9 36.027,9 -10.500,0 -22,6%EBIT 25.467,5 24.606,9 22.308,2 -2.298,7 -9,3%Financial Results -11.759,6 -8.510,1 -7.058,1 1.452,0 -17,1%Net Income before Taxes 13.707,9 16.096,8 15.250,1 -846,7 -5,3%Taxes -2.957,2 -2.181,2 -775,2 1.406,0 -64,5%Consolidated Net Income 10.750,7 13.915,5 14.474,9 559,4 4,0%To:Minority Interest 641,5 607,0 569,3 -37,7 -6,2%dst group 10.109,2 13.308,6 13.905,6 597,1 4,5%
Consolidated Annual Report 2014
dst - sgps, s.a. Page 28 of 118
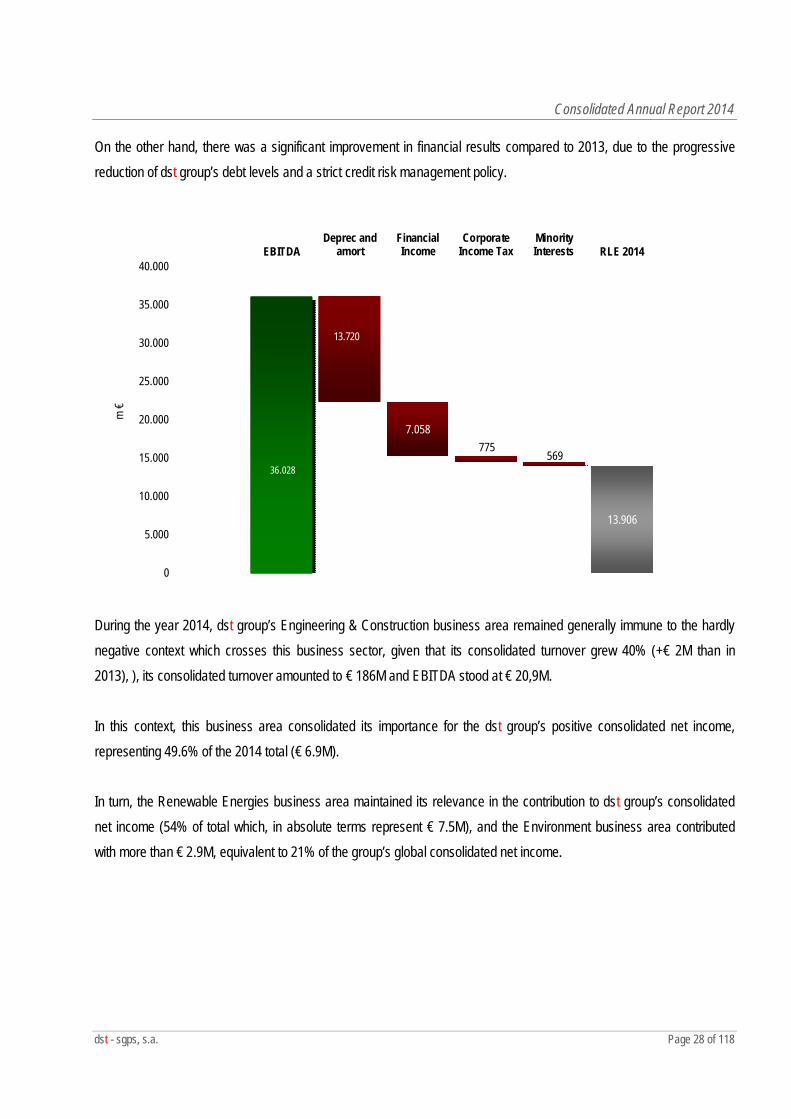
On the other hand, there was a significant improvement in financial results compared to 2013, due to the progressive reduction of dst group’s debt levels and a strict credit risk management policy.
13.906
7.058775
56936.028
0
5.000
10.000
15.000
20.000
25.000
30.000
35.000
40.000EBITDA
Deprec andamort
FinancialIncome
CorporateIncome Tax
MinorityInterests RLE 2014
m €
13.720
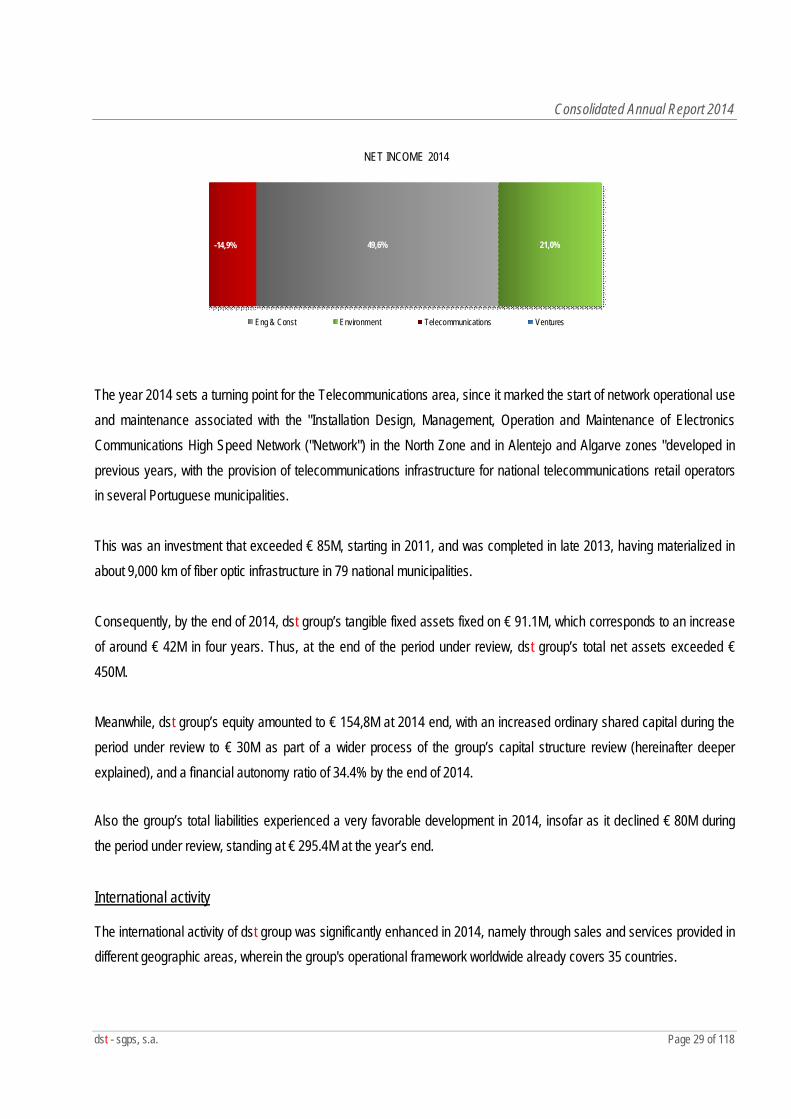
During the year 2014, dst group’s Engineering & Construction business area remained generally immune to the hardly negative context which crosses this business sector, given that its consolidated turnover grew 40% (+€ 2M than in 2013), ), its consolidated turnover amounted to € 186M and EBITDA stood at € 20,9M. In this context, this business area consolidated its importance for the dst group’s positive consolidated net income, representing 49.6% of the 2014 total (€ 6.9M). In turn, the Renewable Energies business area maintained its relevance in the contribution to dst group’s consolidated net income (54% of total which, in absolute terms represent € 7.5M), and the Environment business area contributed with more than € 2.9M, equivalent to 21% of the group’s global consolidated net income.
Consolidated Annual Report 2014
dst - sgps, s.a. Page 29 of 118
49,6% 21,0%-14,9%
NET INCOME 2014
Eng & Const Environment Telecommunications Ventures
The year 2014 sets a turning point for the Telecommunications area, since it marked the start of network operational use and maintenance associated with the "Installation Design, Management, Operation and Maintenance of Electronics Communications High Speed Network ("Network") in the North Zone and in Alentejo and Algarve zones "developed in previous years, with the provision of telecommunications infrastructure for national telecommunications retail operators in several Portuguese municipalities. This was an investment that exceeded € 85M, starting in 2011, and was completed in late 2013, having materialized in about 9,000 km of fiber optic infrastructure in 79 national municipalities. Consequently, by the end of 2014, dst group’s tangible fixed assets fixed on € 91.1M, which corresponds to an increase of around € 42M in four years. Thus, at the end of the period under review, dst group’s total net assets exceeded € 450M. Meanwhile, dst group’s equity amounted to € 154,8M at 2014 end, with an increased ordinary shared capital during the period under review to € 30M as part of a wider process of the group’s capital structure review (hereinafter deeper explained), and a financial autonomy ratio of 34.4% by the end of 2014.
Also the group’s total liabilities experienced a very favorable development in 2014, insofar as it declined € 80M during the period under review, standing at € 295.4M at the year’s end.
International activity
The international activity of dst group was significantly enhanced in 2014, namely through sales and services provided in different geographic areas, wherein the group's operational framework worldwide already covers 35 countries.
Consolidated Annual Report 2014
dst - sgps, s.a. Page 30 of 118
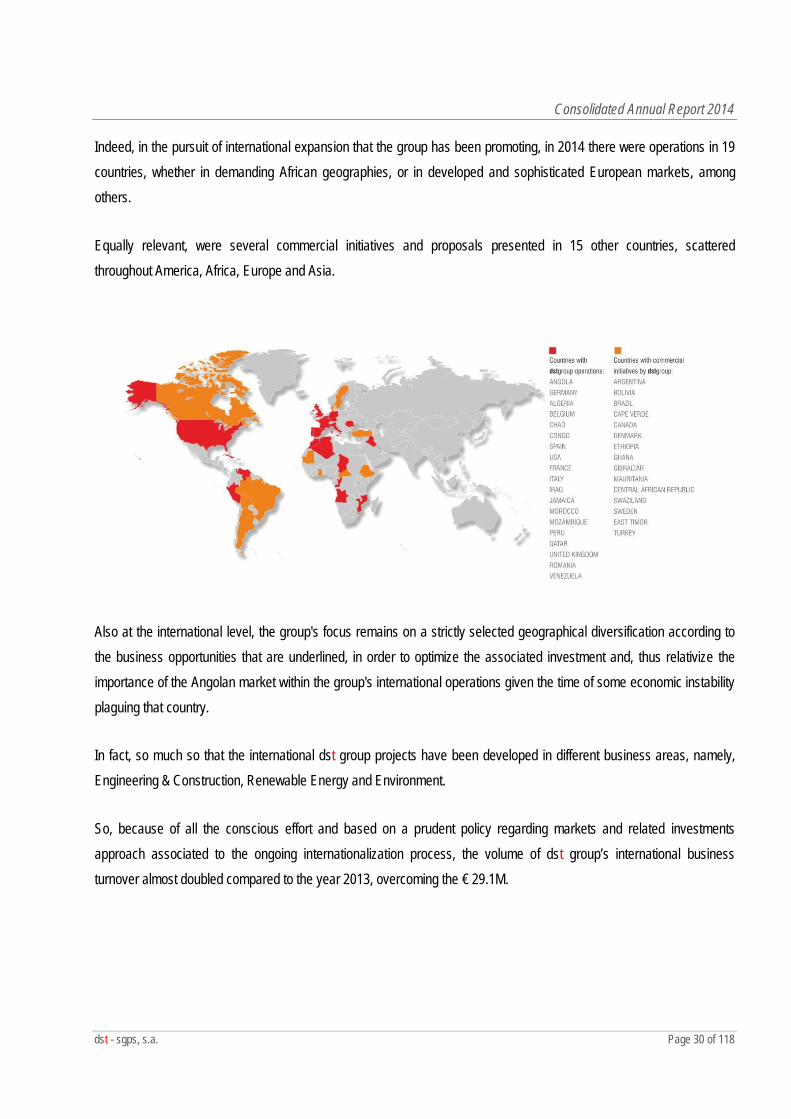
Indeed, in the pursuit of international expansion that the group has been promoting, in 2014 there were operations in 19 countries, whether in demanding African geographies, or in developed and sophisticated European markets, among others.
Equally relevant, were several commercial initiatives and proposals presented in 15 other countries, scattered throughout America, Africa, Europe and Asia.
Also at the international level, the group's focus remains on a strictly selected geographical diversification according to the business opportunities that are underlined, in order to optimize the associated investment and, thus relativize the importance of the Angolan market within the group's international operations given the time of some economic instability plaguing that country.
In fact, so much so that the international dst group projects have been developed in different business areas, namely, Engineering & Construction, Renewable Energy and Environment.
So, because of all the conscious effort and based on a prudent policy regarding markets and related investments approach associated to the ongoing internationalization process, the volume of dst group’s international business turnover almost doubled compared to the year 2013, overcoming the € 29.1M.
Consolidated Annual Report 2014
dst - sgps, s.a. Page 31 of 118
0%
10%
20%
30%
40%
50%
60%
70%
80%
90%
100%
2012 2013 2014
INTERNATIONAL TURNOVER
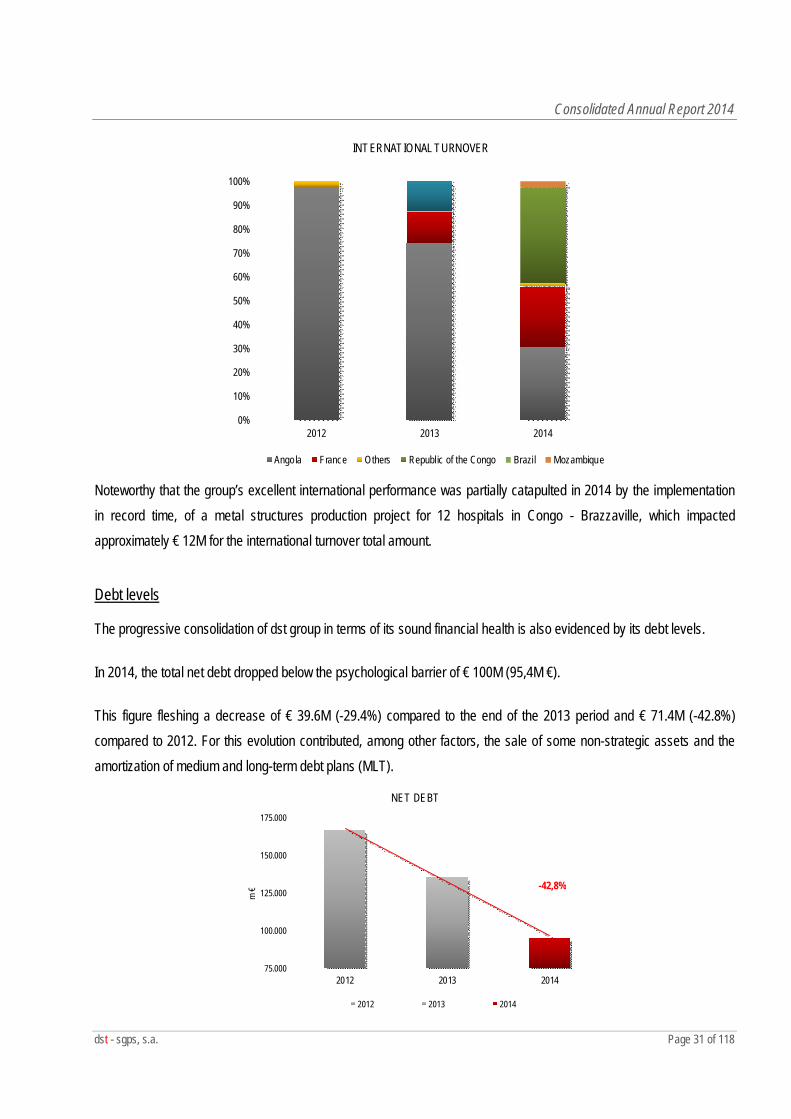
Angola France Others Republic of the Congo Brazil Mozambique Noteworthy that the group’s excellent international performance was partially catapulted in 2014 by the implementation in record time, of a metal structures production project for 12 hospitals in Congo - Brazzaville, which impacted approximately € 12M for the international turnover total amount.
Debt levels
The progressive consolidation of dst group in terms of its sound financial health is also evidenced by its debt levels.
In 2014, the total net debt dropped below the psychological barrier of € 100M (95,4M €).
This figure fleshing a decrease of € 39.6M (-29.4%) compared to the end of the 2013 period and € 71.4M (-42.8%) compared to 2012. For this evolution contributed, among other factors, the sale of some non-strategic assets and the amortization of medium and long-term debt plans (MLT).
75.000
100.000
125.000
150.000
175.000
2012 2013 2014
m €
NET DEBT
2012 2013 2014
-42,8%
Consolidated Annual Report 2014
dst - sgps, s.a. Page 32 of 118
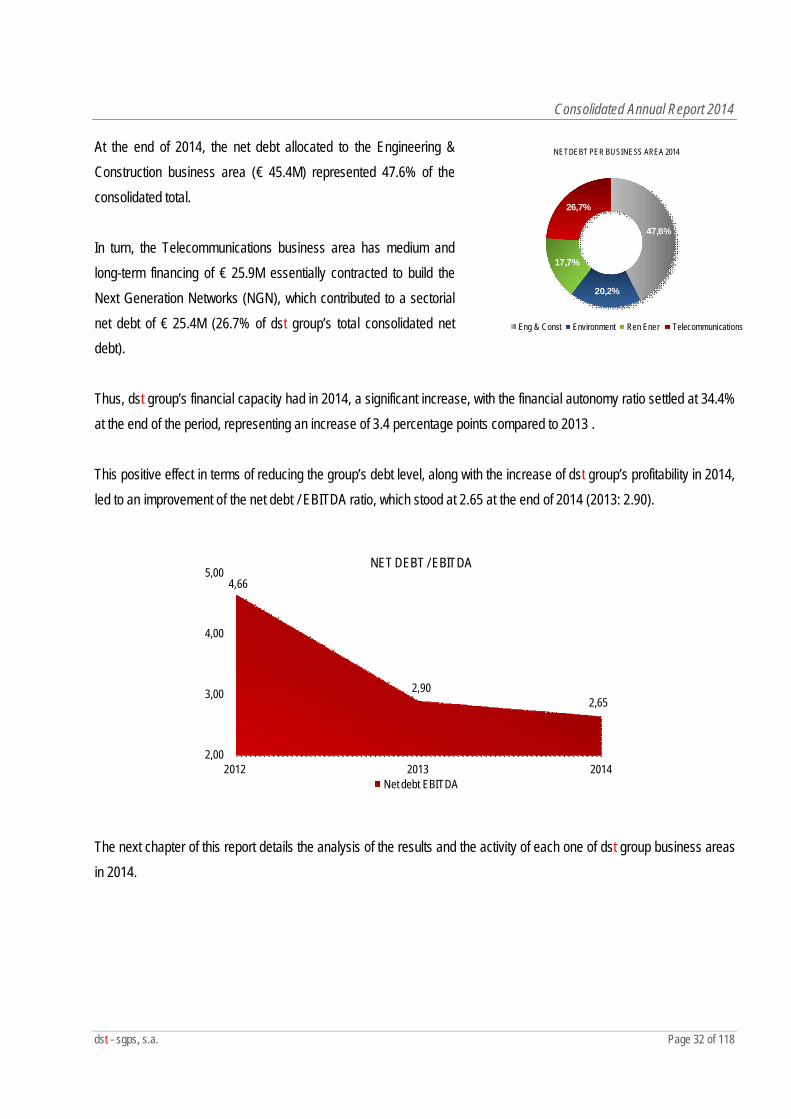
At the end of 2014, the net debt allocated to the Engineering & Construction business area (€ 45.4M) represented 47.6% of the consolidated total. In turn, the Telecommunications business area has medium and long-term financing of € 25.9M essentially contracted to build the Next Generation Networks (NGN), which contributed to a sectorial net debt of € 25.4M (26.7% of dst group’s total consolidated net debt). Thus, dst group’s financial capacity had in 2014, a significant increase, with the financial autonomy ratio settled at 34.4% at the end of the period, representing an increase of 3.4 percentage points compared to 2013 . This positive effect in terms of reducing the group’s debt level, along with the increase of dst group’s profitability in 2014, led to an improvement of the net debt / EBITDA ratio, which stood at 2.65 at the end of 2014 (2013: 2.90).
4,66
2,902,65
2,00
3,00
4,00
5,00
2012 2013 2014
NET DEBT / EBITDA
Net debt EBITDA
The next chapter of this report details the analysis of the results and the activity of each one of dst group business areas in 2014.
47,6%
20,2%
17,7%
26,7%
NET DEBT PER BUSINESS AREA 2014
Eng & Const Environment Ren Ener Telecommunications
Consolidated Annual Report 2014
dst - sgps, s.a. Page 33 of 118
Business Areas
ENGINEERING & CONSTRUCTION
221,3245,2
210,3
100,0
150,0
200,0
250,0
2012 2013 2014
M €
PROPORTIONAL TURNOVER
Turnover
4,3 5,0
6,9
0,0
1,0
2,0
3,0
4,0
5,0
6,0
7,0
8,0
2012 2013 2014
M €
NET INCOME
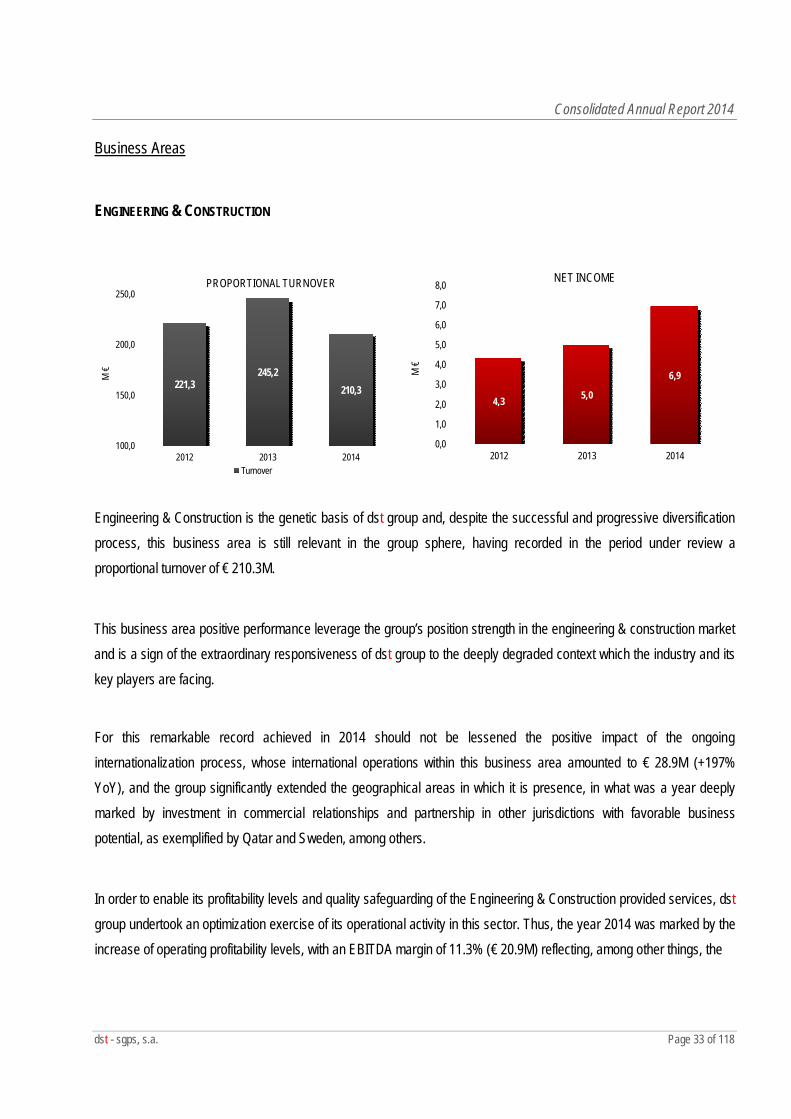
Engineering & Construction is the genetic basis of dst group and, despite the successful and progressive diversification process, this business area is still relevant in the group sphere, having recorded in the period under review a proportional turnover of € 210.3M.
This business area positive performance leverage the group’s position strength in the engineering & construction market and is a sign of the extraordinary responsiveness of dst group to the deeply degraded context which the industry and its key players are facing.
For this remarkable record achieved in 2014 should not be lessened the positive impact of the ongoing internationalization process, whose international operations within this business area amounted to € 28.9M (+197% YoY), and the group significantly extended the geographical areas in which it is presence, in what was a year deeply marked by investment in commercial relationships and partnership in other jurisdictions with favorable business potential, as exemplified by Qatar and Sweden, among others.
In order to enable its profitability levels and quality safeguarding of the Engineering & Construction provided services, dst group undertook an optimization exercise of its operational activity in this sector. Thus, the year 2014 was marked by the increase of operating profitability levels, with an EBITDA margin of 11.3% (€ 20.9M) reflecting, among other things, the
Consolidated Annual Report 2014
dst - sgps, s.a. Page 34 of 118
group's concern on maximizing its operations efficiency, as exemplified by the reduction of about € 17.2M in other external charges (including subcontractors). Moreover, it is noteworthy the continued reduction of this business area debt level, which in the period under review, the net financial expenses were reduced by € 2.1M, to a total of € 3M recorded in 2014. Also, this period registered significant impacts regarding impairment losses, particularly of receivables (with yearly net reversals of € 2.1M) and stocks (reinforcement of € 4.6M) in order to reflect, in a prudent and proper manner, the quality of its balance sheet balances related to trade debtors and with its stocks.
Consequently, the year 2014 was highlighted by the extraordinary contribution that this sector has to dst group’s consolidated net income, whose positive amount of € 6.9M recorded in this business area account for 49.6% of total earnings and show a € 2M growth compared to 2013. dst group has a wide scope of strong technical skills that allow it to be perceived by the market as a landmark of rigour and service quality in Engineering & Construction field. Not only this is taken for granted already for many years at the national market level as, increasingly, it is perceived by key international players with which the group works in its international operations. As such, in 2014, dst group made several works of recognized impact and technical complexity, as is the case, among others, the following contracts:
Block and Hydraulic Circuit Baleizão, in Beja Paper Production Factory of Fortissue, in Viana do CasteloRegional System of Carvoeiro New Headquarters building LIDL , in SintraWarehouse 10:11 Pole 2 Plat. Logistics, in Matosinhos Sanitation subsystem of Torres NovasLandfill Gestal, in Santa Maria da Feira Aeronautics Unit CEIIA, in MatosinhosSanitation networks of Santarém WWTP of PombalModel Continent of Quarteira APDL – Leixões Terminal
It should also be emphasized the unique know-how that dst group has at the level of building up new generation networks broadband, which was consolidated with the implementation of these networks in Rural areas of North and Alentejo and Algarve.
Consolidated Annual Report 2014
dst - sgps, s.a. Page 35 of 118
Moreover, dst group incorporates in its operations the entire value chain of the business sector, particularly in the award of electrical installations, heating, ventilation and air conditioning (HVAC), hydraulic works and telecommunications - through dte – instalações especiais, s.a. (“dte”) - and the construction and assembly of steel structures and roofs and facades coating through bysteel, s.a. (“bysteel”). Therefore, dst group has significant competitive advantages in relation to its main competitors in the Engineering & Construction area.
In 2014, the production unit of bysteel turned 7,796 tons of steel, representing an industrial production increase above 100% compared to 2013, while its turnover in the period under review rose to its historical high of € 26.8M (+82.4% compared to 2013).
bysteel keeps its focus on attracting international reference customers (e.g., Angola, France and the UK) as well as on geographies diversification in which is present reflecting the growing international reputation that has been achieving as a result of its rigor, service quality and responsiveness to customer needs.
Thus, 2014 was a positive year for bysteel particularly, to the extent that it’s international business turnover had a very significant growth, mainly with the production and assembly of metallic structures for 12 hospitals in Congo without, thereby, losing focus on the Angolan and French markets.
In this context, it was also awarded several project design, manufacture and execution contracts of steel structures for some European and worldwide reference customers, such as Bouygues and Vinci groups, among others, from which enhance the construction of a new plant for pharma multinational Lilly in Strasbourg, and the rehabilitation of the Hotel
Crillon in La Concorde square in Paris (France).
Notwithstanding the weight of bysteel international operations correspond to 46.4% and 77.9% of its turnover in 2013 and 2014, respectively, this does not neglect any business opportunities in the domestic market, continuing with similar major projects implementation, examples of which are the works of the Port Authority in Oporto and the new Modelo Continente in Quarteira.
Consolidated Annual Report 2014
dst - sgps, s.a. Page 36 of 118
In turn, in 2014, dte activity recorded an overall decrease in its turnover compared to 2013, due exclusively to a single purpose: its activity reduction within the telecommunications business area, resulting from the completion, in 2013, of the North Zone and Alentejo & Algarve NGN contracts.
Nevertheless, dte’s turnover in electricity, HVAC and plumbing areas grew 54% from €14.8M in 2013 to € 22.8M in 2014.
On the other hand, it is worth highlighting dte’s internationalization route that, in the period under review, had significant developments in particular by carrying out electrical works and HVAC in Angola and France.
Finally, it should be noted, that the dst group’s results recorded in this business area not only come from the performed work over the entire value chain of engineering and construction, but also from real estate projects and / or partnership schemes that since long, the group is pursuing.
Indeed, dst group decided to formalize these activities and projects, which nominated as Real Estate and Joint Ventures.
As mentioned, both these activities have been developed by dst group, the former has been the natural consequence of two factors combination that generate undeniable competitive advantages of the group compared to the market: (i) its long experience in urban regeneration work and (ii) its high financial capacity.
Consolidated Annual Report 2014
dst - sgps, s.a. Page 37 of 118
RENEWABLE ENERGIES
23,2 24,227,6
10,0
15,0
20,0
25,0
30,0
2012 2013 2014
M €
PROPORTIONAL TURNOVER
Turnover
4,9
7,4 7,5
0,0
1,0
2,0
3,0
4,0
5,0
6,0
7,0
8,0
2012 2013 2014
M €
NET INCOME
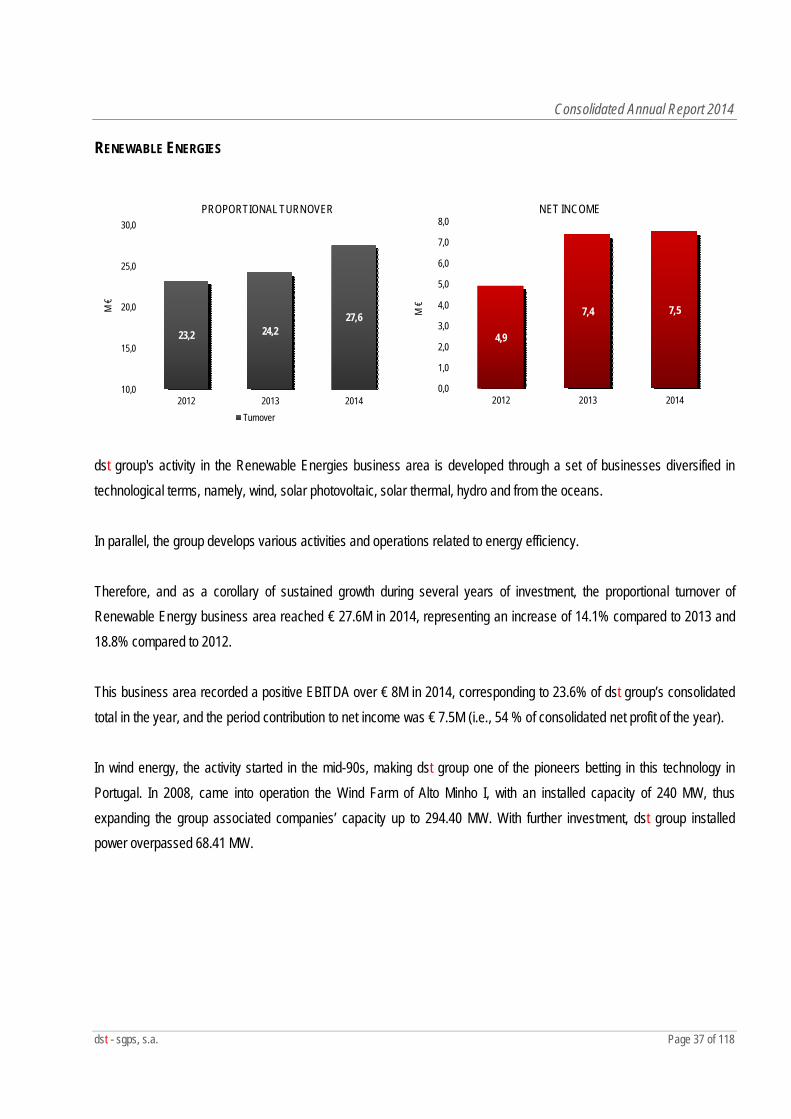
dst group's activity in the Renewable Energies business area is developed through a set of businesses diversified in technological terms, namely, wind, solar photovoltaic, solar thermal, hydro and from the oceans. In parallel, the group develops various activities and operations related to energy efficiency. Therefore, and as a corollary of sustained growth during several years of investment, the proportional turnover of Renewable Energy business area reached € 27.6M in 2014, representing an increase of 14.1% compared to 2013 and 18.8% compared to 2012. This business area recorded a positive EBITDA over € 8M in 2014, corresponding to 23.6% of dst group’s consolidated total in the year, and the period contribution to net income was € 7.5M (i.e., 54 % of consolidated net profit of the year). In wind energy, the activity started in the mid-90s, making dst group one of the pioneers betting in this technology in Portugal. In 2008, came into operation the Wind Farm of Alto Minho I, with an installed capacity of 240 MW, thus expanding the group associated companies’ capacity up to 294.40 MW. With further investment, dst group installed power overpassed 68.41 MW.
Consolidated Annual Report 2014
dst - sgps, s.a. Page 38 of 118
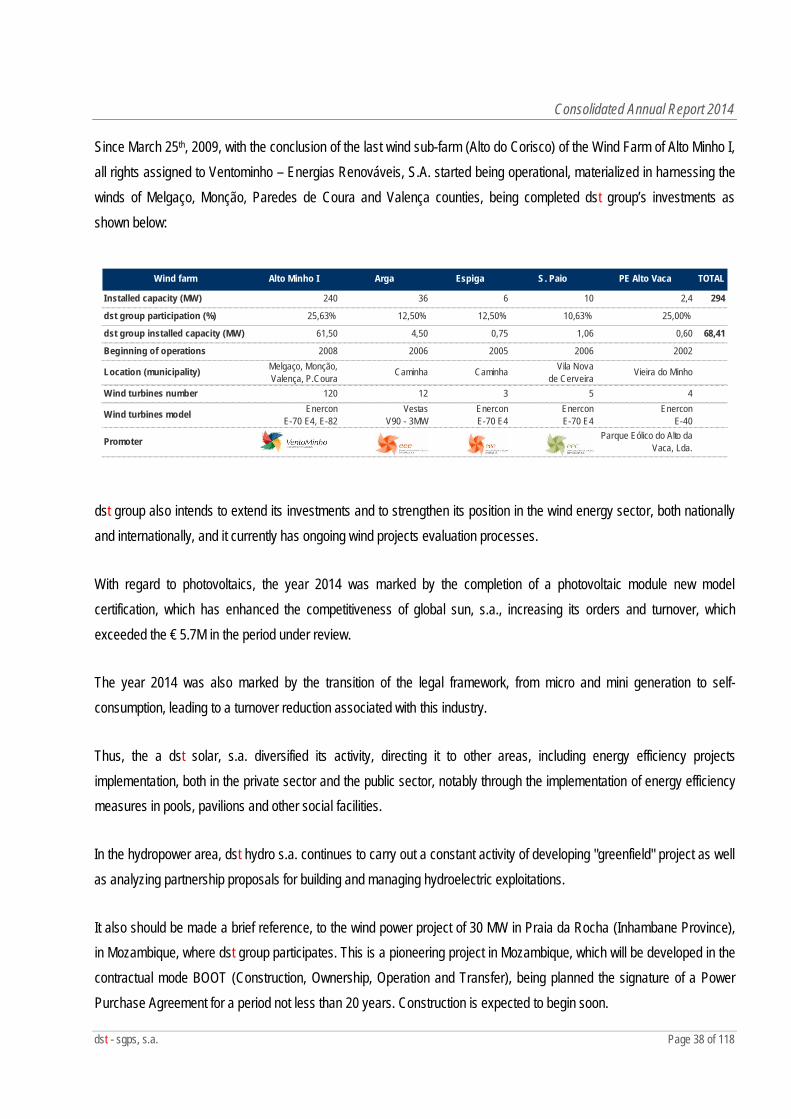
Since March 25th, 2009, with the conclusion of the last wind sub-farm (Alto do Corisco) of the Wind Farm of Alto Minho I, all rights assigned to Ventominho – Energias Renováveis, S.A. started being operational, materialized in harnessing the winds of Melgaço, Monção, Paredes de Coura and Valença counties, being completed dst group’s investments as shown below:
Wind farm Alto Minho I Arga Espiga S. Paio PE Alto Vaca TOTAL
Installed capacity (MW) 240 36 6 10 2,4 294
dst group participation (%) 25,63% 12,50% 12,50% 10,63% 25,00%
dst group installed capacity (MW) 61,50 4,50 0,75 1,06 0,60 68,41
Beginning of operations 2008 2006 2005 2006 2002
Location (municipality) Melgaço, Monção, Valença, P.Coura
Caminha Caminha Vila Novade Cerveira
Vieira do Minho
Wind turbines number 120 12 3 5 4
Wind turbines model EnerconE-70 E4, E-82
VestasV90 - 3MW
EnerconE-70 E4
EnerconE-70 E4
EnerconE-40
Promoter Parque Eólico do Alto da Vaca, Lda.
dst group also intends to extend its investments and to strengthen its position in the wind energy sector, both nationally and internationally, and it currently has ongoing wind projects evaluation processes.
With regard to photovoltaics, the year 2014 was marked by the completion of a photovoltaic module new model certification, which has enhanced the competitiveness of global sun, s.a., increasing its orders and turnover, which exceeded the € 5.7M in the period under review.
The year 2014 was also marked by the transition of the legal framework, from micro and mini generation to self-consumption, leading to a turnover reduction associated with this industry.
Thus, the a dst solar, s.a. diversified its activity, directing it to other areas, including energy efficiency projects implementation, both in the private sector and the public sector, notably through the implementation of energy efficiency measures in pools, pavilions and other social facilities.
In the hydropower area, dst hydro s.a. continues to carry out a constant activity of developing "greenfield" project as well as analyzing partnership proposals for building and managing hydroelectric exploitations.
It also should be made a brief reference, to the wind power project of 30 MW in Praia da Rocha (Inhambane Province), in Mozambique, where dst group participates. This is a pioneering project in Mozambique, which will be developed in the contractual mode BOOT (Construction, Ownership, Operation and Transfer), being planned the signature of a Power Purchase Agreement for a period not less than 20 years. Construction is expected to begin soon.
Consolidated Annual Report 2014
dst - sgps, s.a. Page 39 of 118
In 2014, dst group undertook a reflection about which ones are its projects and strategic assets in the Renewable Energy business area, and therefore divested from some projects, from which stands out the sale of its stake in Sure - Sustainable Renewable Energies, Corp., an US legal entity, with its registered office in the state of New York, in the United States.
ENVIRONMENT
31,5 33,0 33,1
0,0
5,0
10,0
15,0
20,0
25,0
30,0
35,0
2012 2013 2014
M €
PROPORTIONAL TURNOVER
Turnover
2,2 2,32,9
0,0
0,5
1,0
1,5
2,0
2,5
3,0
3,5
2012 2013 2014
M €
NET INCOME
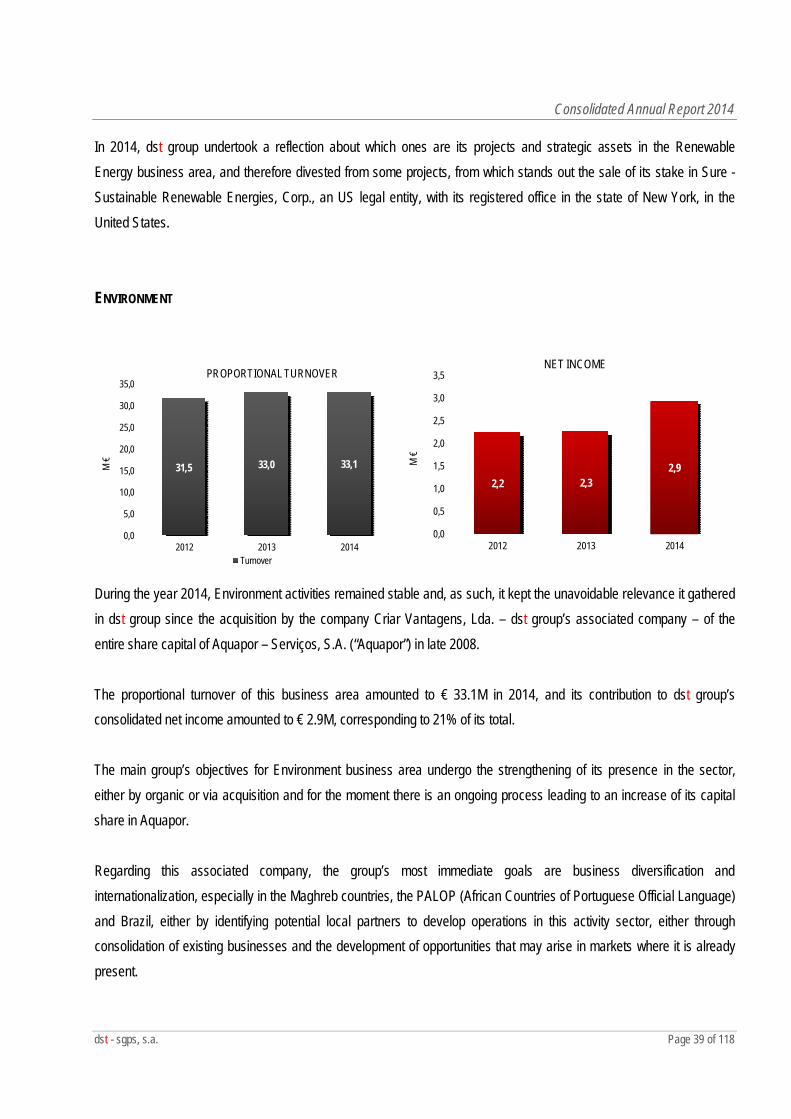
During the year 2014, Environment activities remained stable and, as such, it kept the unavoidable relevance it gathered in dst group since the acquisition by the company Criar Vantagens, Lda. – dst group’s associated company – of the entire share capital of Aquapor – Serviços, S.A. (“Aquapor”) in late 2008. The proportional turnover of this business area amounted to € 33.1M in 2014, and its contribution to dst group’s consolidated net income amounted to € 2.9M, corresponding to 21% of its total. The main group’s objectives for Environment business area undergo the strengthening of its presence in the sector, either by organic or via acquisition and for the moment there is an ongoing process leading to an increase of its capital share in Aquapor. Regarding this associated company, the group’s most immediate goals are business diversification and internationalization, especially in the Maghreb countries, the PALOP (African Countries of Portuguese Official Language) and Brazil, either by identifying potential local partners to develop operations in this activity sector, either through consolidation of existing businesses and the development of opportunities that may arise in markets where it is already present.
Consolidated Annual Report 2014
dst - sgps, s.a. Page 40 of 118
TELECOMMUNICATIONS
0,61,0
8,5
0,0
1,0
2,0
3,0
4,0
5,0
6,0
7,0
8,0
9,0
2012 2013 2014
M €
PROPORTIONAL TURNOVER
-0,7-1,1
-2,1
-2,2-2,0-1,8-1,6-1,4-1,2-1,0-0,8-0,6-0,4-0,20,0
2012 2013 2014
M €
NET INCOME
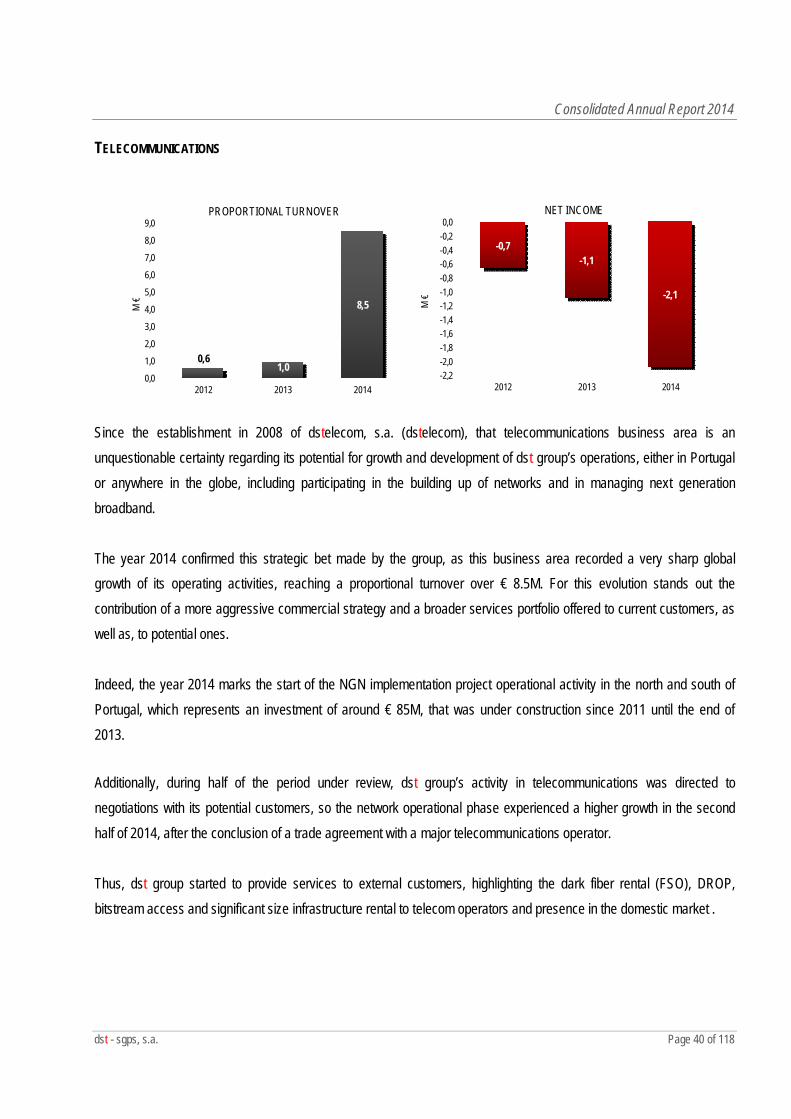
Since the establishment in 2008 of dstelecom, s.a. (dstelecom), that telecommunications business area is an unquestionable certainty regarding its potential for growth and development of dst group’s operations, either in Portugal or anywhere in the globe, including participating in the building up of networks and in managing next generation broadband. The year 2014 confirmed this strategic bet made by the group, as this business area recorded a very sharp global growth of its operating activities, reaching a proportional turnover over € 8.5M. For this evolution stands out the contribution of a more aggressive commercial strategy and a broader services portfolio offered to current customers, as well as, to potential ones. Indeed, the year 2014 marks the start of the NGN implementation project operational activity in the north and south of Portugal, which represents an investment of around € 85M, that was under construction since 2011 until the end of 2013.
Additionally, during half of the period under review, dst group’s activity in telecommunications was directed to negotiations with its potential customers, so the network operational phase experienced a higher growth in the second half of 2014, after the conclusion of a trade agreement with a major telecommunications operator. Thus, dst group started to provide services to external customers, highlighting the dark fiber rental (FSO), DROP, bitstream access and significant size infrastructure rental to telecom operators and presence in the domestic market .
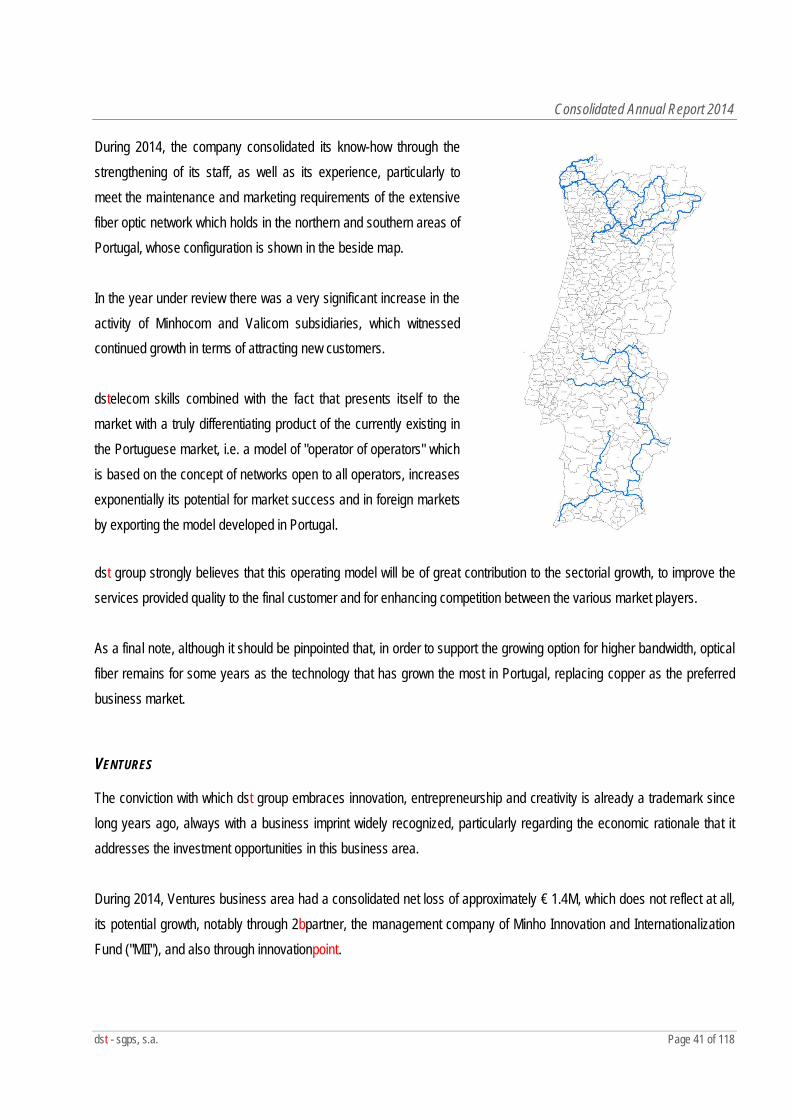
Consolidated Annual Report 2014
dst - sgps, s.a. Page 41 of 118
During 2014, the company consolidated its know-how through the strengthening of its staff, as well as its experience, particularly to meet the maintenance and marketing requirements of the extensive fiber optic network which holds in the northern and southern areas of Portugal, whose configuration is shown in the beside map. In the year under review there was a very significant increase in the activity of Minhocom and Valicom subsidiaries, which witnessed continued growth in terms of attracting new customers. dstelecom skills combined with the fact that presents itself to the market with a truly differentiating product of the currently existing in the Portuguese market, i.e. a model of "operator of operators" which is based on the concept of networks open to all operators, increases exponentially its potential for market success and in foreign markets by exporting the model developed in Portugal.
dst group strongly believes that this operating model will be of great contribution to the sectorial growth, to improve the services provided quality to the final customer and for enhancing competition between the various market players. As a final note, although it should be pinpointed that, in order to support the growing option for higher bandwidth, optical fiber remains for some years as the technology that has grown the most in Portugal, replacing copper as the preferred business market.
VENTURES
The conviction with which dst group embraces innovation, entrepreneurship and creativity is already a trademark since long years ago, always with a business imprint widely recognized, particularly regarding the economic rationale that it addresses the investment opportunities in this business area. During 2014, Ventures business area had a consolidated net loss of approximately € 1.4M, which does not reflect at all, its potential growth, notably through 2bpartner, the management company of Minho Innovation and Internationalization Fund ("MII"), and also through innovationpoint.
Consolidated Annual Report 2014
dst - sgps, s.a. Page 42 of 118
The main activity of 2bpartner is focused in carrying out venture capital investments and in venture capital funds management, through purchasing shares and units of venture capital funds, respectively. Having been established in 2007, 2bpartner took the first operational steps in 2011, by raising up Minho Inovação e Internacionalização (“MII”) fund, which aims to invest in start-ups, supporting their development and growth, with high reflexes in management, through the purchase of shares (usually minority) in the companies´ capital, with the expectation of earning capital gains from short or medium-term time investments horizon.
After having carried out several steps necessary for the effective start of its activity - including some changes in its shareholder structure, culminating in the acquisition of its share capital majority by dst group - 2bpartner effectively started their operations in 2013. In this context, during the year 2014, 6 investments were approved, have been contracted a total of 8 investments with an investment average of € 0.3M per project. Also under analysis are a very significant number of projects that resulted from the intensive prospection carried out during the period under review During 2014, the 2bpartner was present in the most important industry events, namely: 17th Entrepreneur Fair of ANJE – Invest Sessions; Startpoint UM – Entrepreneurship Fair of University of Minho; Pitch day – UPTEC; TECNET; International Congress of Venture Capital and Business Angels.
In addition, during the period under review it made partnerships with several sectorial prominent institutions, in particular, with Portugal Ventures, Startup Braga, IEMinho, the Centre for Computer Graphics, the Business Incubator at the University of Aveiro, IPN and the SpinLogic. The innovationpoint is a dst group company geared to enhance, evaluate, produce and commercialize innovative ideas in particular by creating new products, services or business models categories that challenge established paradigms and generate significant added value for consumers, for customers and for dst group itself.
Consolidated Annual Report 2014
dst - sgps, s.a. Page 43 of 118
The dynamism of innovationpoint is the basis of many innovative projects, examples of which are the following projects:
Shair – a platform supported by dst group for art and emerging artist dissemination and marketing. The platform concept provides an opportunity given to artists to exhibit their works subjecting them to public scrutiny, and the most voted ones will then be publically exhibited at the Emerging dst Gallery. The platform was developed in the beginning of the year 2014 and after its release has had more than a million visits, thousands of registered users and thousands of works available for sale;
PowerTracker – a monitoring platform for energy production from mini power plants and micro generation with real-time alerts to those stations caretakers via sms and e-mail, with the possibility to work on SaaS - Software As A Service;
MyPick – an application for smartphones that assists users in making simple decisions of their day-to-day life, and the result does not have major consequences and allowing the user to be released from the choice burden. The application already contains a number of lists for standard situations and allows the user to create their own lists, share them and get from the community;
Embedded systems – the development of an access control terminal with multi-factor access validation and detailed time control that the user is allowed to access and audit event log for access attempts;
Platform of construction proposals – a business intelligence platform for monitoring and reporting of contracts proposals;
Platform for investment project management - a web platform development for management and financial monitoring of investments projects of ventures companies.
Consolidated Annual Report 2014
dst - sgps, s.a. Page 44 of 118
innovationpoint is a certified entity in NP4457 standard (SGIDI), in line with dst group’s innovation commitment, which
has also been translated in support several group companies searching for innovative solutions for the daily challenges faced by them.
dst group reorganisation – the future preparation
For all that has been mentioned, the year 2014 was particularly positive for dst group, in that it managed to expand its
operations and expand its geographic scope, while maximized its operational efficiency and its financial strength, with a very sharp reduction in its debt levels (which, itself, was very low compared with the market benchmark). All this in a macroeconomic environment that remains extremely challenging for the future, particularly with the economic
instability of the Angolan market and other markets growing demand - Europe and Africa - where dst group is present, or
in assessing business opportunities. So, it was this success that stimulated dst group’s sense of surveillance with regard to the development of its future activities, with an attitude of sensible boldness, but critical and deeply analytical that always guided it. Therefore, during the year 2014, dst group undertook a review of its functional management structure in order to provide it with greater flexibility and responsiveness to expected challenges in particular by reviewing its organisational chart, emphasizing the shareholders / executive management binomial on a consolidated viewpoint, i.e., the conviction that dst group’s success as a whole, always, overlaps the success of any one of its business areas or companies. This is a project still under implementation, in which, the compositions of the Board of Directors of each business area sub-holdings have been extended with a greater number of professional managers with multi-disciplinary skills and experiences. Moreover, dst group will create an Investment, Audit and Risk Committee and Strategy Committee, whose compositions involve the participation of reputed professionals external to the group, in order to support decision-making process. Also dst group’s Corporate Services structure was revisited and widely communicated to all employees, aiming to promote a greater accessibility and efficiency of the services that they provide to all business areas and group companies.
Consolidated Annual Report 2014
dst - sgps, s.a. Page 45 of 118
At the same time, this internal reflection exercise is also being carried out at the group’s corporate structure level in order to approximate its formal structure to the practice of recent years. 3. Material events occurring after the end of the period
After the period end, and to date, there were no events that may have a significant impact on the financial statements at December 31, 2014.
4. Financial risk management objectives and policies
Within the economic and financial context in which the dst group operates is essential to have a risk management strategy fully integrated into the overall strategy of the organization that increase its degree of resilience and gradually become immune to unforeseen and adverse effects. Therefore, risk analysis is ensured by the group’s different business units in which the group operates. A prior identification study of the risks classified as the most critical is undercooked, and risk management strategies are defined for control procedures implementation that reduce them to an acceptable level. Through the control procedures implementation the dst group seeks to ensure the efficiency and effectiveness of its operations, as well as assets safeguarding, financial reporting reliability and compliance with laws and regulations. The ultimate goal will be the trade-off maximization between risks and business margins, in order to achieve, in a sustained way, the group’s strategic objectives in which it operates.
5. Information required by legislation
The Board of Directors advises that the group does not have debts in arrears to the State, in compliance with the terms of Law-decree number 534/80 of November 7. In compliance with the provisions of the Article 210th of the Contributory Code, published by the Law number 110/2014 of September 16, the Board advises that the situation of the group before the Social Security is regularized within the legally stipulated deadlines.
Consolidated Annual Report 2014
dst - sgps, s.a. Page 46 of 118
6. Authorized disclosure date for issue the financial statements
The consolidated financial statements for the period ended December 31, 2014 were approved by the Management Board for issue on April 17, 2015.
7. Final Note
The Management Board expresses a word of recognition to all employees and of gratitude to everyone who in one way or another cooperated with the dst group. Special gratitude is hereby expressed to the Sole Fiscal Auditor, trade creditors and banking entities that very much honor us with valuable relationship.
Braga, April 17, 2015
The Board of Directors,
José Gonçalves Teixeira; Executive Chairman
Avelino Gonçalves Teixeira; Executive Vice-Chairman
Joaquim Gonçalves Teixeira; Non-Executive Vice-Chairman
João Martins Negrais de Matos; Executive Member of the Board of Directors
Hernâni José Gonçalves Teixeira; Non-Executive Member of the Board of Directors
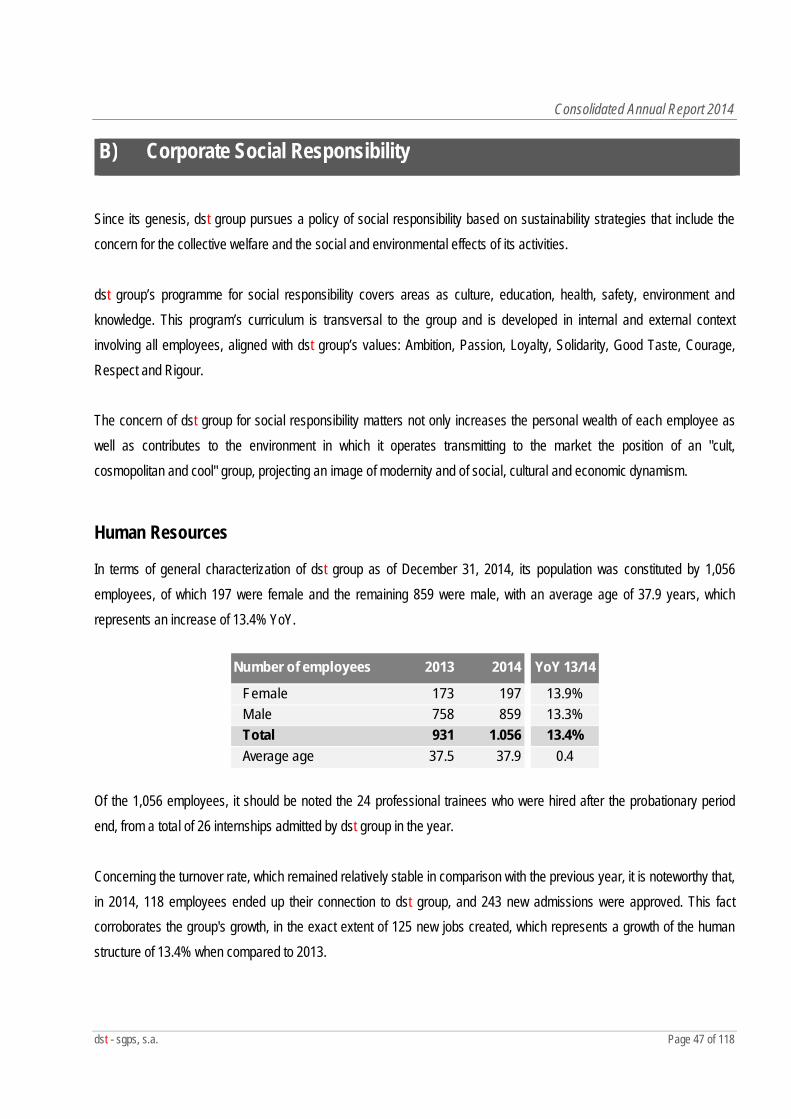
Consolidated Annual Report 2014
dst - sgps, s.a. Page 47 of 118
B) Corporate Social Responsibility
Since its genesis, dst group pursues a policy of social responsibility based on sustainability strategies that include the concern for the collective welfare and the social and environmental effects of its activities. dst group’s programme for social responsibility covers areas as culture, education, health, safety, environment and knowledge. This program’s curriculum is transversal to the group and is developed in internal and external context involving all employees, aligned with dst group’s values: Ambition, Passion, Loyalty, Solidarity, Good Taste, Courage, Respect and Rigour. The concern of dst group for social responsibility matters not only increases the personal wealth of each employee as well as contributes to the environment in which it operates transmitting to the market the position of an "cult, cosmopolitan and cool" group, projecting an image of modernity and of social, cultural and economic dynamism.
Human Resources
In terms of general characterization of dst group as of December 31, 2014, its population was constituted by 1,056 employees, of which 197 were female and the remaining 859 were male, with an average age of 37.9 years, which represents an increase of 13.4% YoY.
Number of employees 2013 2014 YoY 13/14
Female 173 197 13.9%Male 758 859 13.3%Total 931 1.056 13.4%Average age 37.5 37.9 0.4
Of the 1,056 employees, it should be noted the 24 professional trainees who were hired after the probationary period end, from a total of 26 internships admitted by dst group in the year. Concerning the turnover rate, which remained relatively stable in comparison with the previous year, it is noteworthy that, in 2014, 118 employees ended up their connection to dst group, and 243 new admissions were approved. This fact corroborates the group's growth, in the exact extent of 125 new jobs created, which represents a growth of the human structure of 13.4% when compared to 2013.
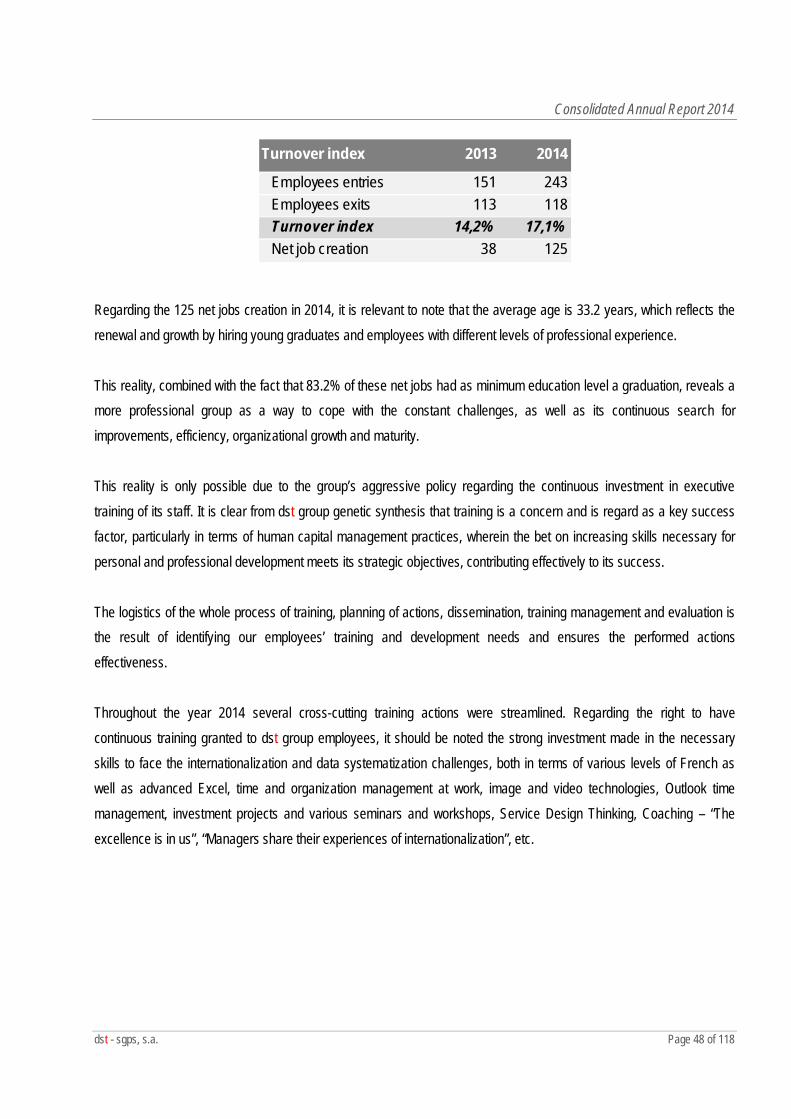
Consolidated Annual Report 2014
dst - sgps, s.a. Page 48 of 118
Turnover index 2013 2014
Employees entries 151 243Employees exits 113 118Turnover index 14,2% 17,1%Net job creation 38 125
Regarding the 125 net jobs creation in 2014, it is relevant to note that the average age is 33.2 years, which reflects the renewal and growth by hiring young graduates and employees with different levels of professional experience. This reality, combined with the fact that 83.2% of these net jobs had as minimum education level a graduation, reveals a more professional group as a way to cope with the constant challenges, as well as its continuous search for improvements, efficiency, organizational growth and maturity. This reality is only possible due to the group’s aggressive policy regarding the continuous investment in executive training of its staff. It is clear from dst group genetic synthesis that training is a concern and is regard as a key success factor, particularly in terms of human capital management practices, wherein the bet on increasing skills necessary for personal and professional development meets its strategic objectives, contributing effectively to its success. The logistics of the whole process of training, planning of actions, dissemination, training management and evaluation is the result of identifying our employees’ training and development needs and ensures the performed actions effectiveness. Throughout the year 2014 several cross-cutting training actions were streamlined. Regarding the right to have continuous training granted to dst group employees, it should be noted the strong investment made in the necessary skills to face the internationalization and data systematization challenges, both in terms of various levels of French as well as advanced Excel, time and organization management at work, image and video technologies, Outlook time management, investment projects and various seminars and workshops, Service Design Thinking, Coaching – “The excellence is in us”, “Managers share their experiences of internationalization”, etc.
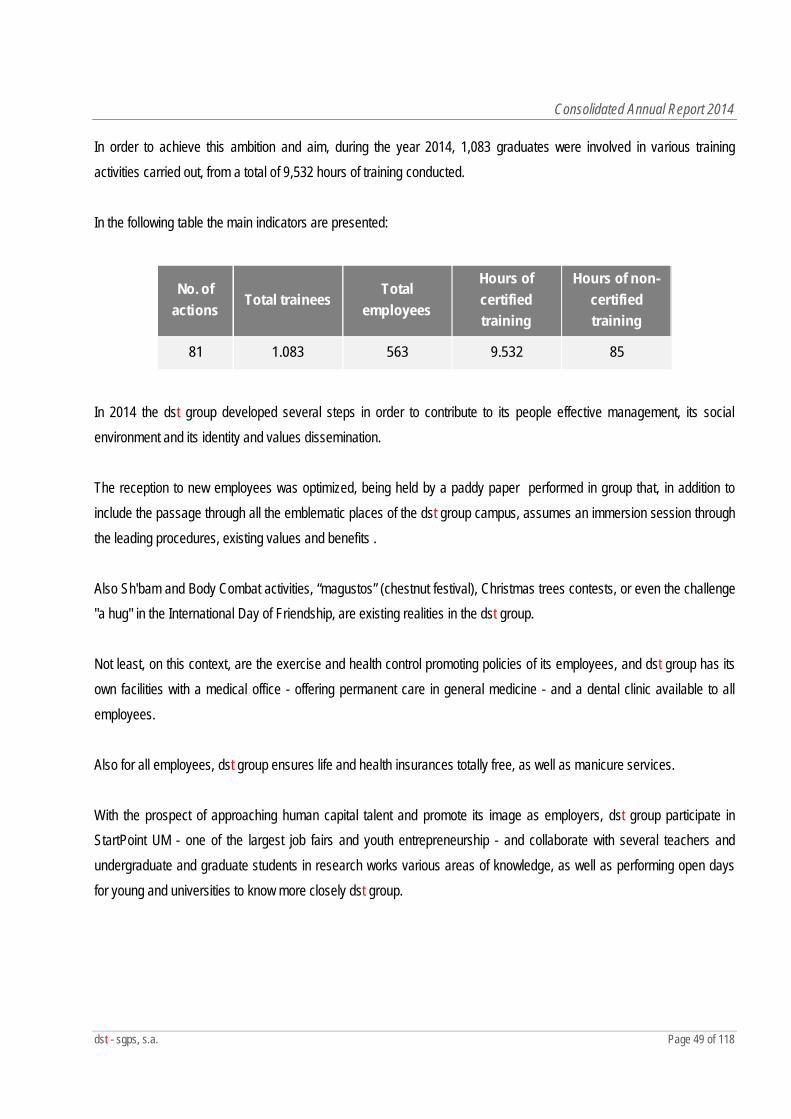
Consolidated Annual Report 2014
dst - sgps, s.a. Page 49 of 118
In order to achieve this ambition and aim, during the year 2014, 1,083 graduates were involved in various training activities carried out, from a total of 9,532 hours of training conducted. In the following table the main indicators are presented:
No. of actions
Total traineesTotal
employees
Hours of certified training
Hours of non-certified training
81 1.083 563 9.532 85
In 2014 the dst group developed several steps in order to contribute to its people effective management, its social environment and its identity and values dissemination. The reception to new employees was optimized, being held by a paddy paper performed in group that, in addition to include the passage through all the emblematic places of the dst group campus, assumes an immersion session through the leading procedures, existing values and benefits . Also Sh'bam and Body Combat activities, “magustos” (chestnut festival), Christmas trees contests, or even the challenge "a hug" in the International Day of Friendship, are existing realities in the dst group. Not least, on this context, are the exercise and health control promoting policies of its employees, and dst group has its own facilities with a medical office - offering permanent care in general medicine - and a dental clinic available to all employees. Also for all employees, dst group ensures life and health insurances totally free, as well as manicure services. With the prospect of approaching human capital talent and promote its image as employers, dst group participate in StartPoint UM - one of the largest job fairs and youth entrepreneurship - and collaborate with several teachers and undergraduate and graduate students in research works various areas of knowledge, as well as performing open days for young and universities to know more closely dst group.
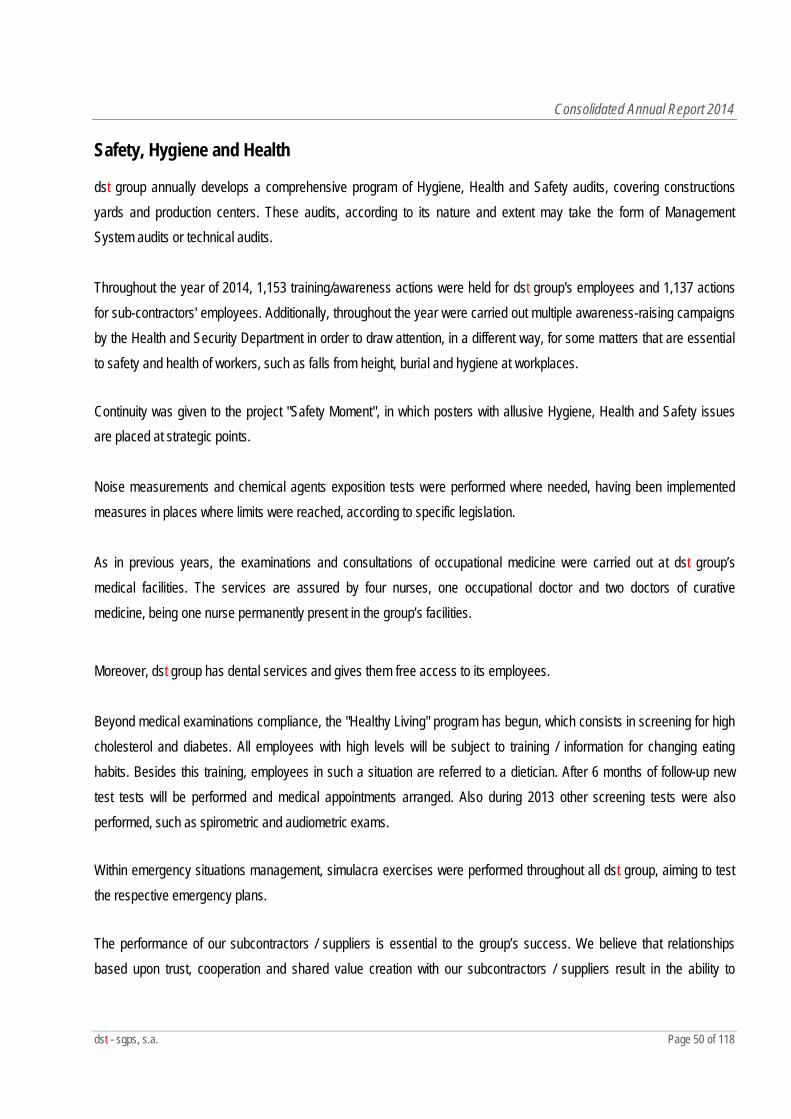
Consolidated Annual Report 2014
dst - sgps, s.a. Page 50 of 118
Safety, Hygiene and Health
dst group annually develops a comprehensive program of Hygiene, Health and Safety audits, covering constructions yards and production centers. These audits, according to its nature and extent may take the form of Management System audits or technical audits. Throughout the year of 2014, 1,153 training/awareness actions were held for dst group's employees and 1,137 actions for sub-contractors' employees. Additionally, throughout the year were carried out multiple awareness-raising campaigns by the Health and Security Department in order to draw attention, in a different way, for some matters that are essential to safety and health of workers, such as falls from height, burial and hygiene at workplaces.
Continuity was given to the project "Safety Moment", in which posters with allusive Hygiene, Health and Safety issues are placed at strategic points. Noise measurements and chemical agents exposition tests were performed where needed, having been implemented measures in places where limits were reached, according to specific legislation. As in previous years, the examinations and consultations of occupational medicine were carried out at dst group’s medical facilities. The services are assured by four nurses, one occupational doctor and two doctors of curative medicine, being one nurse permanently present in the group’s facilities.
Moreover, dst group has dental services and gives them free access to its employees. Beyond medical examinations compliance, the "Healthy Living" program has begun, which consists in screening for high cholesterol and diabetes. All employees with high levels will be subject to training / information for changing eating habits. Besides this training, employees in such a situation are referred to a dietician. After 6 months of follow-up new test tests will be performed and medical appointments arranged. Also during 2013 other screening tests were also performed, such as spirometric and audiometric exams.
Within emergency situations management, simulacra exercises were performed throughout all dst group, aiming to test the respective emergency plans.
The performance of our subcontractors / suppliers is essential to the group’s success. We believe that relationships based upon trust, cooperation and shared value creation with our subcontractors / suppliers result in the ability to
Consolidated Annual Report 2014
dst - sgps, s.a. Page 51 of 118
innovate and strengthen Safety, Hygiene and Health policies, and at the same time, improve the quality of the provided safety and health services.
Regardless the type and scale of the construction or the work involved, the use of subcontractors has always implied at each hiring stage, strictly service quality control, in which safety and health at work are determinant factors.
Therefore, security technicians interfered in all construction works, in order to regulate subcontractors / suppliers activity as follows: In the procurement procedures (binding obligations on Safety, Hygiene and Health); During works (subcontractors’ performance in terms of Safety, Hygiene and Health is accompanied by safety
technicians through methodologies for security level assessing and to verify compliance with legal requirements).
In general, the attribution of personal protective equipment (PPE) per worker follows the risk assessment process of the activities developed by him / her and that are in compliance with our risk assessment matrix. However, dst group emphasizes the organizational and collective protection measures in performed activities complemented with the use of PPE and appropriate clothing. The PPE's delivery action is preceded by an awareness session and training regarding their proper use, conducted by a Safety, Hygiene and Health technician.
R&D and Innovation
Since an early stage dst group embraced Research & Development as a key activity for its diversification strategy, which implies a clear commitment to new technologies. Accordingly, the group acquired innovationpoint, a company dedicated to enhance, evaluate, produce and commercialize innovative ideas. This company is focused on the creation of new product categories, services or business models that challenge established paradigms and generate significant added value for consumers, for customers and for dst group itself.
The dynamism of innovationpoint is the basis of many innovative projects, supra presented on the Ventures business area analysis.
Nevertheless, the research and development activity is not limited to innovationpoint. dst group has partnerships with research centres, universities or national and international companies.
Consolidated Annual Report 2014
dst - sgps, s.a. Page 52 of 118
It is also worth noting, that innovationpoint is currently preparing an application to HORIZON 2020 fund, as a consortium leader of entities from several European Union countries, which aims to develop a water distribution management system enabling efficiency gains, reducing waste and new business models introduction. The R&D component across the entire dst group remained particularly active in 2014, with 145 innovative ideas submitted in the group through its Innovation Box (electronic platform). The RDI certification renewal by five group companies previously certified attest the existing good practices within the group and the open cases quality. Crosswise to the whole group is fostered an active culture of innovation to all its employees, which the internal communication campaign "decidinovar" (I decided to innovate) and the encouragement given by the Board of Directors for all employees to devote at least half an hour a day exclusively to creativity and innovation are good examples.
Society
dst group's extensive program for social responsibility also kept the emphasis on patronage, focusing on promotion and on the dissemination of culture and education. As a group based under the triple C - cultured, cosmopolitan and cool concepts, it prioritizes cultural activities since its inception, raising its positioning and differentiating itself in the way of doing business.
Among various activities and initiatives undertaken in 2013, the following deserve recognition: Main Maecenas of the Theatre Company of Braga, and the two-year patronage protocol has been renewed by the
amount of € 50k; Main Maecenas of Braga Book Fair, which sponsored with € 7.5k; Award of dst Grand Literature Prize, with a monetary value of € 15k, to Armando Silva Carvalho, being the 2014
edition dedicated to poetry works published in 2012 and 2013; For the fifth consecutive time, dst group promoted the International Photography Award "Emergentes dst ", which
rewards every year the best international photographic work. The award is supported by "Encontros da Imagem", one of the largest initiatives in the field of visual arts in Portugal, which is also an original event born in Braga. This year, the first prize, with a value of € 7.5k, was awarded to the French photographer Marie-Pierre Cravedi, by her work “La Réunion”;
Protocol signature with University of Minho to implement a Merit Scholarship program for students who entered the Master course in Civil Engineering with the highest application notes, in order to stimulate the increase of that course annual applications number, also promoting these students subsequent placement in paid internships in the group;
Consolidated Annual Report 2014
dst - sgps, s.a. Page 53 of 118
Exclusive Maecenas, in 2014, of the OJ.COM - Youth Orchestra of the State Music Conservatories, which performed at Theatro do Circo and at the Cultural Centre of Vila Flor under the attentive direction of Maestro Cesário Costa;
Exclusive sponsor of "Portugal and the European Union" Debates Cycle organized by the Platform for Sustainable Growth, which allowed the discussion of topics such as "There is a European Citizenship?", "How to Promote Growth and Jobs in the European framework? "and "The European Union in the post-elections. And now?”;
Since the beginning of 2014, dst group has been working on a project that aims to help emerging artists to get the proper recognition and payment for their effort and work, allowing them to display their art works at a global level
through an online platform with real galleries associated: the shair project;
Continued development of books and reading support policy. A book is offered in the anniversary of each employee. dst group's newsletter is issued relying on the active contribution of employees who participate by submitting articles,
with unrestricted subjects;
Additionally, the group also promotes reading by offering books for school libraries, beyond internally provide its own library with all kinds of literary works for its employees disposal;
dst group strongly encourages the participation of its employees in voluntary work. Therefore, the group continues to actively collaborate with Habitat and with the Portuguese Institute of Blood and Transplant, wherewith in partnership a blood collection campaign was organized on dst group facilities.
Environment
Certificação Ambiental
dst group maintained in 2014 the environmental management system certification NP EN ISO 14001: 2004 in the areas of “construction and public works, maintenance of vehicles and equipment”, “manufacture of wood products and
furniture”, “production and assembly of metal structures”, and maintained the certification by the NP EN ISO 14001:2004 norm in “solar panels’ production”. Likewise, dst group renewed EMAS registration, in the areas of “maintenance of
vehicles and equipment”, “manufacture of wood products and furniture” and “design, development, production and
assembly of metal structures”. The certification and EMAS registration are sustained and improved through systematic audits from APCER (Portuguese Certification Association). Environmental claims related to EMAS registrations are available on the dst group website (www.dstsgps.com). Operational Control
In the bituminous central, covered by the EU ETS 3rd phase (2013 to 2020) (European Trade of Emission), the amount of CO2 emitted by that installation was approximately corresponding to the Emissions Allowances number awarded to the group for the year 2013 with partial cessation. In 2014 there was a resumption of the partial cessation, because the
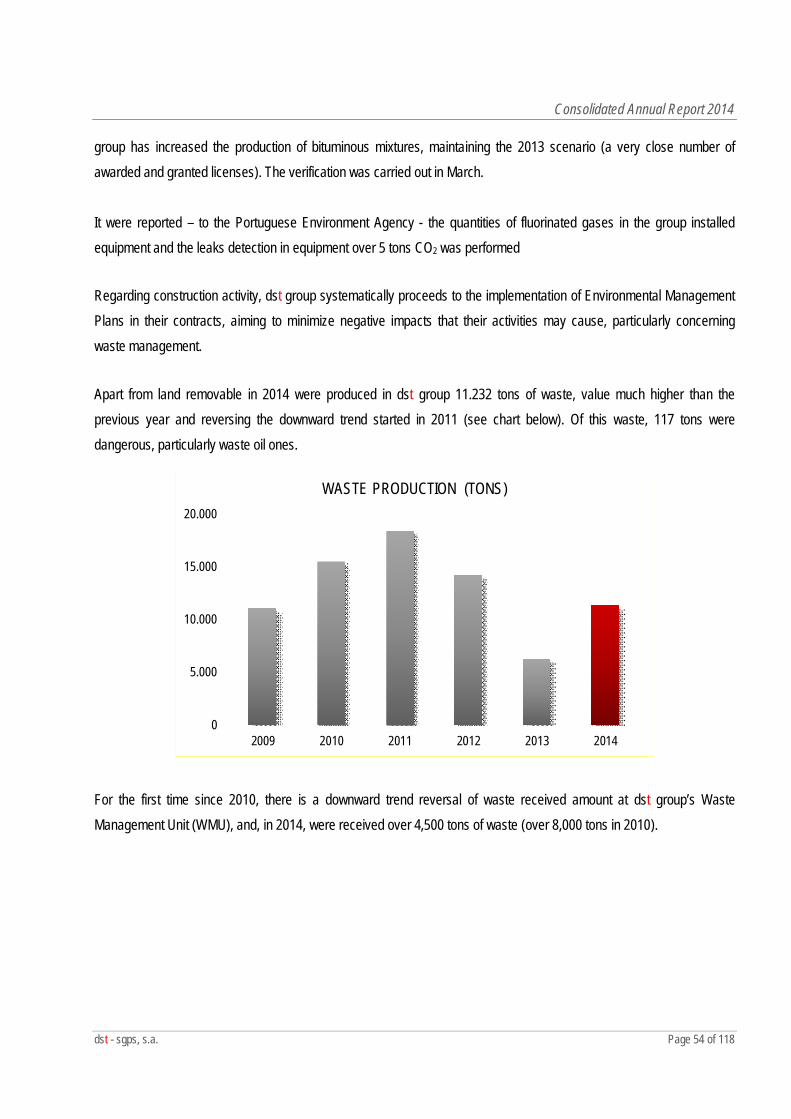
Consolidated Annual Report 2014
dst - sgps, s.a. Page 54 of 118
group has increased the production of bituminous mixtures, maintaining the 2013 scenario (a very close number of awarded and granted licenses). The verification was carried out in March. It were reported – to the Portuguese Environment Agency - the quantities of fluorinated gases in the group installed equipment and the leaks detection in equipment over 5 tons CO2 was performed
Regarding construction activity, dst group systematically proceeds to the implementation of Environmental Management Plans in their contracts, aiming to minimize negative impacts that their activities may cause, particularly concerning waste management.
Apart from land removable in 2014 were produced in dst group 11.232 tons of waste, value much higher than the previous year and reversing the downward trend started in 2011 (see chart below). Of this waste, 117 tons were dangerous, particularly waste oil ones.
0
5.000
10.000
15.000
20.000
2009 2010 2011 2012 2013 2014
WASTE PRODUCTION (TONS)
For the first time since 2010, there is a downward trend reversal of waste received amount at dst group’s Waste Management Unit (WMU), and, in 2014, were received over 4,500 tons of waste (over 8,000 tons in 2010).
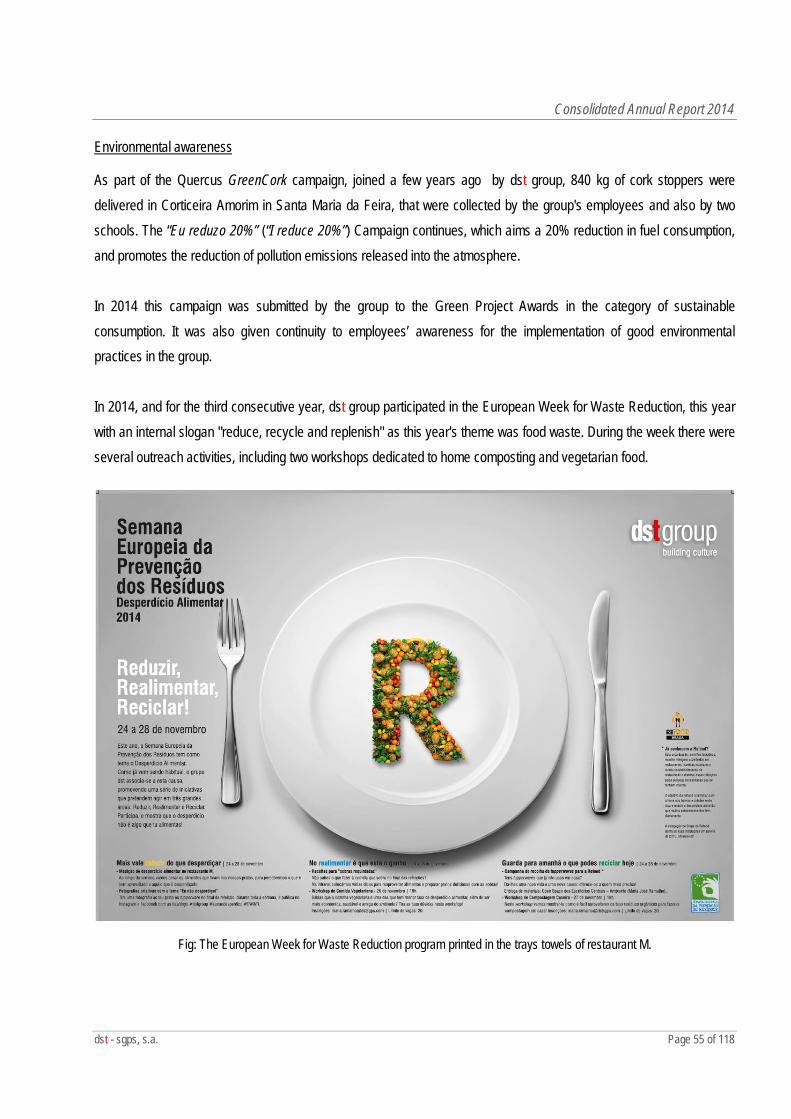
Consolidated Annual Report 2014
dst - sgps, s.a. Page 55 of 118
Environmental awareness
As part of the Quercus GreenCork campaign, joined a few years ago by dst group, 840 kg of cork stoppers were delivered in Corticeira Amorim in Santa Maria da Feira, that were collected by the group's employees and also by two schools. The “Eu reduzo 20%” (“I reduce 20%”) Campaign continues, which aims a 20% reduction in fuel consumption, and promotes the reduction of pollution emissions released into the atmosphere. In 2014 this campaign was submitted by the group to the Green Project Awards in the category of sustainable consumption. It was also given continuity to employees’ awareness for the implementation of good environmental practices in the group. In 2014, and for the third consecutive year, dst group participated in the European Week for Waste Reduction, this year with an internal slogan "reduce, recycle and replenish" as this year's theme was food waste. During the week there were several outreach activities, including two workshops dedicated to home composting and vegetarian food.
Fig: The European Week for Waste Reduction program printed in the trays towels of restaurant M.
Consolidated Annual Report 2014
dst - sgps, s.a. Page 56 of 118
dst group continues to participate in the Eco School Council of the Vila Verde Secondary School, participating in the Council meetings. In this context four interns of a vocational training course in environment were welcomed. Excluding waste management, which represents most of the expenses incurred by dst group in 2014, in its environmental management the remain costs correspond to works environmental licenses (49.4%), audits (25.3%), environmental monitoring (11.5%), fees (9.3%) and consulting services (4.1%).
Quality and certifications
The reason for the existence of organizations comes from its Mission, which should be framed by values that lead to a responsible performance at social, economic, financial, ethical and technological level. In summary, it must convey confidence in relations with stakeholders. Quality is a subjective concept that is directly related to each person perception, influenced by several factors, such as culture, way of thinking, type of product or service. That definition is also directly influenced by needs and expectations. One way or another, one can say that customer satisfaction is a primary condition of any organization, for that survive and develop within a competitive environment and rapid changes.
Quality can be defined as a way of being, of living and acting, to be a permanent search for better results, as from each actor´s better performance in the process. The strong commercial competition, competitiveness and profitability make dst group increasingly invest in rules and good construction practices, qualifications of its human resources and appropriate technological facilities.
In an increasingly demanding market, the confidence of our customers and partners is very important to us, so dst group works every day in a perspective of continuous improvement by changing, where necessary, our processes, in order to increase productivity, quality and reduced costs.
dst group objectives are consistent with the current management policy, with clear and measurable indicators and targets, providing a periodic review leading to an action plan implementation capable to define and detect improvement opportunities.
The concern for quality starts in budgeting. Quality Plans drawn up for tender are made with the accuracy required so that, in the project implementation phase, customer requirements and rules applied to the sector are fulfilled and, on the
Consolidated Annual Report 2014
dst - sgps, s.a. Page 57 of 118
other hand, customers’ expectations are always exceeded. In the year 2014, 77 quality plans for tenders were drown up by dst group.
Strengthening the culture of innovation supported by an enhanced creativity, surveillance, production and knowledge are also fundamental purposes for the sustainability of dst group.
dst group maintained during the 2014 year its quality certifications granted by APCER according to NP EN ISO 9001:2008 in the following areas:
Design, development, production and application of bituminous concrete;
Construction and public works, laboratory testing, maintenance of equipment and vehicles, design, development and manufacture of wood and products of wood, furniture and assembly work – dst_domingos da silva teixeira, s.a.;
Conception, development and production of concrete – tconcrete, s.a.;
Conception, development, production and assembly of metal structures and design of engineering projects – bysteel, s.a.;
Transformer stations installations and public lighting. Extension installation medium-voltage and low-voltage, electrical installations using electrical energy and heating installations, ventilation, air conditioning and refrigeration. Design and optical fiber installations – dte, instalações especiais, s.a.;
Production of photovoltaic panels: global sun, s.a.
Regarding bituminous mixtures, domingos da silva teixeira, s.a. complies with the Regulation (EU) No 305/2011, and the bituminous mixtures produced in its central hold the EC label, according to the norm EN 13108-1:2011.
Consolidated Annual Report 2014
dst - sgps, s.a. Page 58 of 118
C) Annex to the Board of Directors Consolidated Repor
In compliance with the terms and for the effects of the number 5 of article 447th and number 4 of article 448th of the Trading Companies Code (“CSC – Código das Sociedades Comerciais”), approved by Law-decree number 262/86 of September 2, hereby is presented the list of shares regulated by such diplomas:
1. The members of the Board of Directors covered by paragraph 5 of article 447th of CSC were holders on December 31, 2014 of the following shares:
José Gonçalves Teixeira held: 1.230.000 shares with a nominal value of six Euros each;
Joaquim Gonçalves Teixeira held: 1.230.000 shares with a nominal value of six Euros each;
Avelino Gonçalves Teixeira held: 1.230.000 shares with a nominal value of six Euros each;
Hernâni José Gonçalves Teixeira held: 1.230.000 shares with a nominal value of six Euros each.
2. The Statutory Auditor and the Deputy Statutory Auditor did not have any company’s shares at December 31, 2014, neither from companies with which the company is in a relationship of control or group.
Consolidated Annual Report 2014
dst - sgps, s.a. Page 59 of 118
3. The following shareholders covered by paragraph 4 of article 448th of the CSC, were the holders, a on December 31, 2014, at least one-tenth of the capital
José Gonçalves Teixeira, with 24,60% of the capital;
Joaquim Gonçalves Teixeira, with 24,60% of the capital;
Avelino Gonçalves Teixeira, with 24,60% of the capital;
Hernâni José Gonçalves Teixeira, with 24,60% of the capital.
Braga, April 17, 2015
The Board of Directors,
José Gonçalves Teixeira; Executive Chairman
Avelino Gonçalves Teixeira; Executive Vice-Chairman
Joaquim Gonçalves Teixeira; Non-Executive Vice-Chairman
João Martins Negrais de Matos; Executive Member of the Board of Directors
Hernâni José Gonçalves Teixeira; Non-Executive Member of the Board of Directors
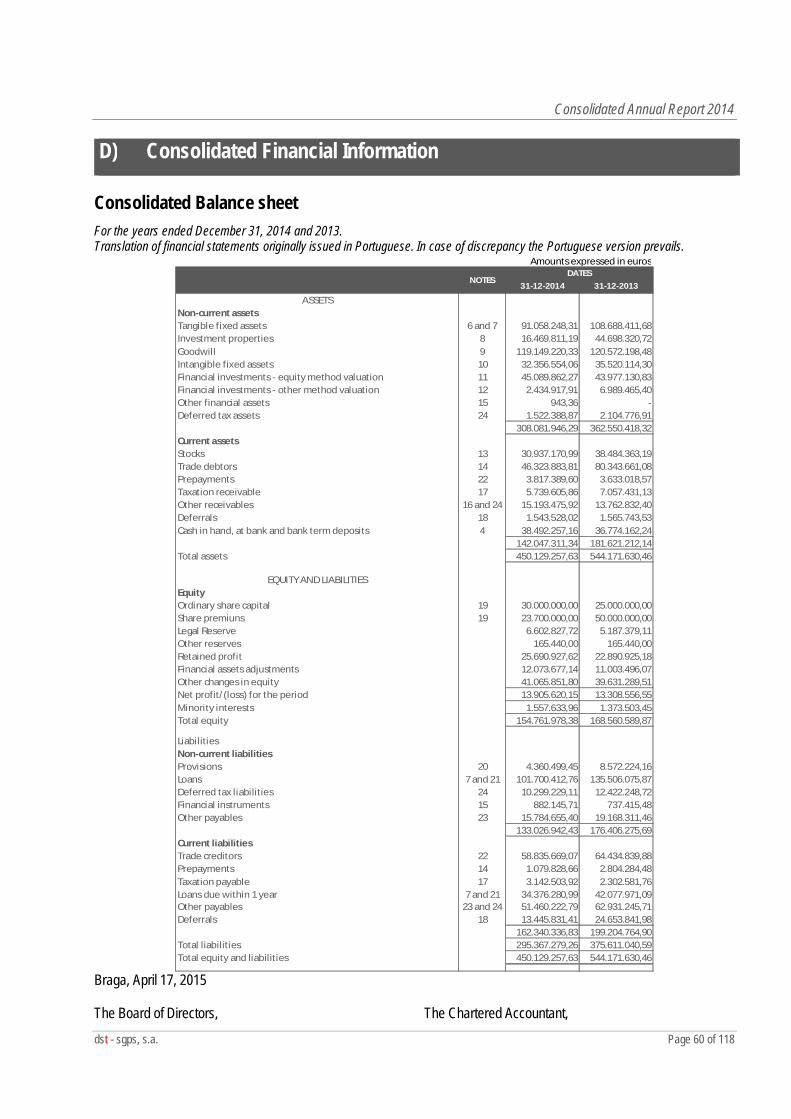
Consolidated Annual Report 2014
dst - sgps, s.a. Page 60 of 118
D) Consolidated Financial Information
Consolidated Balance sheet For the years ended December 31, 2014 and 2013. Translation of financial statements originally issued in Portuguese. In case of discrepancy the Portuguese version prevails.
31-12-2014 31-12-2013
ASSETSNon-current assetsTangible fixed assets 6 and 7 91.058.248,31 108.688.411,68Investment properties 8 16.469.811,19 44.698.320,72Goodwill 9 119.149.220,33 120.572.198,48Intangible fixed assets 10 32.356.554,06 35.520.114,30Financial investments - equity method valuation 11 45.089.862,27 43.977.130,83Financial investments - other method valuation 12 2.434.917,91 6.989.465,40Other financial assets 15 943,36 -Deferred tax assets 24 1.522.388,87 2.104.776,91
308.081.946,29 362.550.418,32Current assetsStocks 13 30.937.170,99 38.484.363,19Trade debtors 14 46.323.883,81 80.343.661,08Prepayments 22 3.817.389,60 3.633.018,57Taxation receivable 17 5.739.605,86 7.057.431,13Other receivables 16 and 24 15.193.475,92 13.762.832,40Deferrals 18 1.543.528,02 1.565.743,53Cash in hand, at bank and bank term deposits 4 38.492.257,16 36.774.162,24
142.047.311,34 181.621.212,14Total assets 450.129.257,63 544.171.630,46
EQUITY AND LIABILITIESEquityOrdinary share capital 19 30.000.000,00 25.000.000,00Share premiuns 19 23.700.000,00 50.000.000,00Legal Reserve 6.602.827,72 5.187.379,11Other reserves 165.440,00 165.440,00Retained profit 25.690.927,62 22.890.925,18Financial assets adjustments 12.073.677,14 11.003.496,07Other changes in equity 41.065.851,80 39.631.289,51Net profit/(loss) for the period 13.905.620,15 13.308.556,55Minority interests 1.557.633,96 1.373.503,45Total equity 154.761.978,38 168.560.589,87
LiabilitiesNon-current liabilitiesProvisions 20 4.360.499,45 8.572.224,16Loans 7 and 21 101.700.412,76 135.506.075,87Deferred tax liabilities 24 10.299.229,11 12.422.248,72Financial instruments 15 882.145,71 737.415,48Other payables 23 15.784.655,40 19.168.311,46
133.026.942,43 176.406.275,69Current liabilitiesTrade creditors 22 58.835.669,07 64.434.839,88Prepayments 14 1.079.828,66 2.804.284,48Taxation payable 17 3.142.503,92 2.302.581,76Loans due within 1 year 7 and 21 34.376.280,99 42.077.971,09Other payables 23 and 24 51.460.222,79 62.931.245,71Deferrals 18 13.445.831,41 24.653.841,98
162.340.336,83 199.204.764,90Total liabilities 295.367.279,26 375.611.040,59Total equity and liabilities 450.129.257,63 544.171.630,46
Amounts expressed in euros
NOTESDATES
Braga, April 17, 2015
The Board of Directors, The Chartered Accountant,
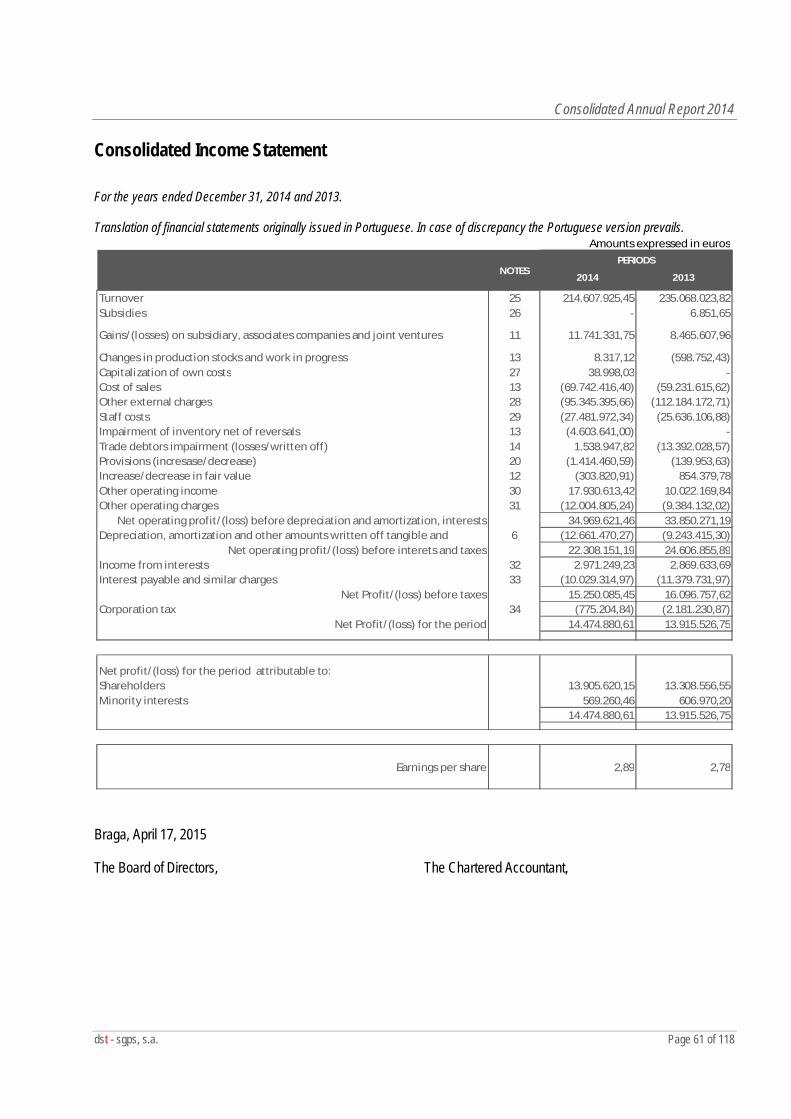
Consolidated Annual Report 2014
dst - sgps, s.a. Page 61 of 118
Consolidated Income Statement For the years ended December 31, 2014 and 2013. Translation of financial statements originally issued in Portuguese. In case of discrepancy the Portuguese version prevails.
2014 2013
Turnover 25 214.607.925,45 235.068.023,82Subsidies 26 - 6.851,65
Gains/(losses) on subsidiary, associates companies and joint ventures 11 11.741.331,75 8.465.607,96
Changes in production stocks and work in progress 13 8.317,12 (598.752,43)Capitalization of own costs 27 38.998,03 -Cost of sales 13 (69.742.416,40) (59.231.615,62)Other external charges 28 (95.345.395,66) (112.184.172,71)Staff costs 29 (27.481.972,34) (25.636.106,88)Impairment of inventory net of reversals 13 (4.603.641,00) -Trade debtors impairment (losses/written off) 14 1.538.947,82 (13.392.028,57)Provisions (incresase/decrease) 20 (1.414.460,59) (139.953,63)Increase/decrease in fair value 12 (303.820,91) 854.379,78Other operating income 30 17.930.613,42 10.022.169,84Other operating charges 31 (12.004.805,24) (9.384.132,02)
Net operating profit/(loss) before depreciation and amortization, interests 34.969.621,46 33.850.271,19Depreciation, amortization and other amounts written off tangible and 6 (12.661.470,27) (9.243.415,30)
Net operating profit/(loss) before interets and taxes 22.308.151,19 24.606.855,89Income from interests 32 2.971.249,23 2.869.633,69Interest payable and similar charges 33 (10.029.314,97) (11.379.731,97)
Net Profit/(loss) before taxes 15.250.085,45 16.096.757,62Corporation tax 34 (775.204,84) (2.181.230,87)
Net Profit/(loss) for the period 14.474.880,61 13.915.526,75
Net profit/(loss) for the period attributable to:Shareholders 13.905.620,15 13.308.556,55Minority interests 569.260,46 606.970,20
14.474.880,61 13.915.526,75
Earnings per share 2,89 2,78
PERIODSNOTES
Amounts expressed in euros
Braga, April 17, 2015
The Board of Directors, The Chartered Accountant,
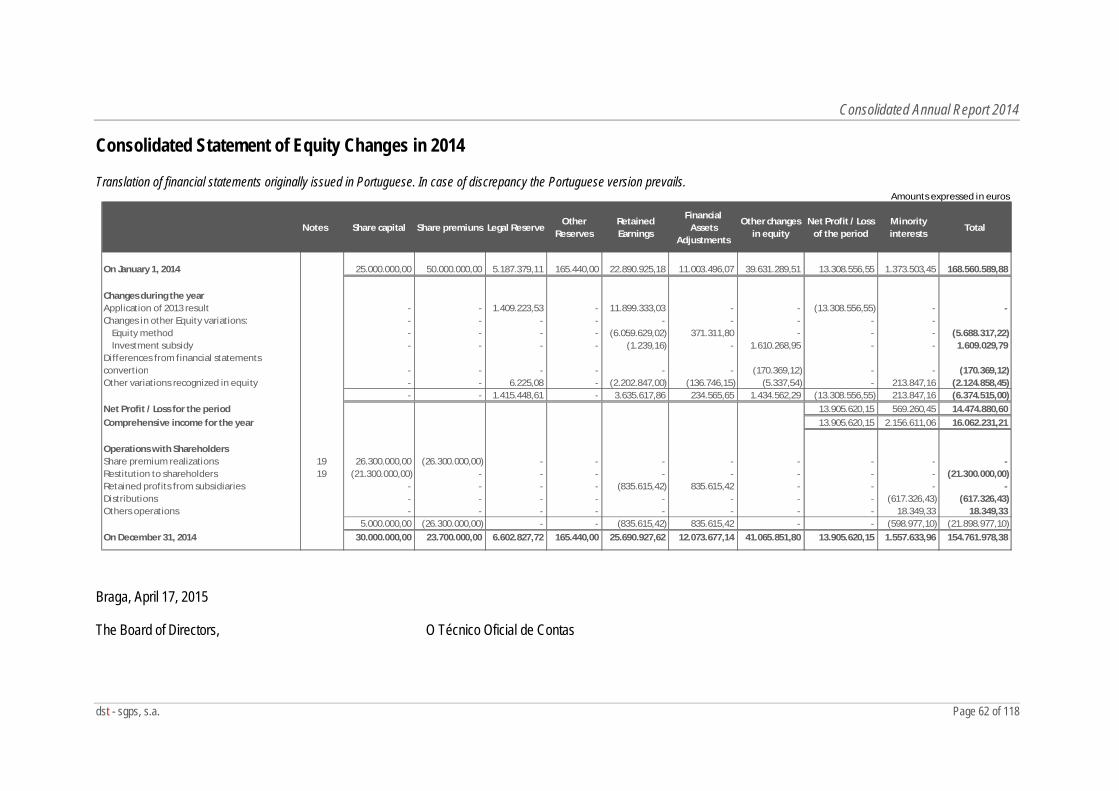
Consolidated Annual Report 2014
dst - sgps, s.a. Page 62 of 118
Consolidated Statement of Equity Changes in 2014
Translation of financial statements originally issued in Portuguese. In case of discrepancy the Portuguese version prevails. Amounts expressed in euros
Notes Share capital Share premiuns Legal ReserveOther
ReservesRetained Earnings
Financial Assets
Adjustments
Other changes in equity
Net Profit / Loss of the period
Minority interests
Total
On January 1, 2014 25.000.000,00 50.000.000,00 5.187.379,11 165.440,00 22.890.925,18 11.003.496,07 39.631.289,51 13.308.556,55 1.373.503,45 168.560.589,88
Changes during the yearApplication of 2013 result - - 1.409.223,53 - 11.899.333,03 - - (13.308.556,55) - - Changes in other Equity variations: - - - - - - - - -
Equity method - - - - (6.059.629,02) 371.311,80 - - - (5.688.317,22)Investment subsidy - - - - (1.239,16) - 1.610.268,95 - - 1.609.029,79
Differences from financial statements convertion - - - - - - (170.369,12) - - (170.369,12)Other variations recognized in equity - - 6.225,08 - (2.202.847,00) (136.746,15) (5.337,54) - 213.847,16 (2.124.858,45)
- - 1.415.448,61 - 3.635.617,86 234.565,65 1.434.562,29 (13.308.556,55) 213.847,16 (6.374.515,00)Net Profit / Loss for the period 13.905.620,15 569.260,45 14.474.880,60 Comprehensive income for the year 13.905.620,15 2.156.611,06 16.062.231,21
Operations with Shareholders Share premium realizations 19 26.300.000,00 (26.300.000,00) - - - - - - - - Restitution to shareholders 19 (21.300.000,00) - - - - - - - - (21.300.000,00)Retained profits from subsidiaries - - - - (835.615,42) 835.615,42 - - - - Distributions - - - - - - - - (617.326,43) (617.326,43)Others operations - - - - - - - - 18.349,33 18.349,33
5.000.000,00 (26.300.000,00) - - (835.615,42) 835.615,42 - - (598.977,10) (21.898.977,10)On December 31, 2014 30.000.000,00 23.700.000,00 6.602.827,72 165.440,00 25.690.927,62 12.073.677,14 41.065.851,80 13.905.620,15 1.557.633,96 154.761.978,38
Braga, April 17, 2015
The Board of Directors, O Técnico Oficial de Contas
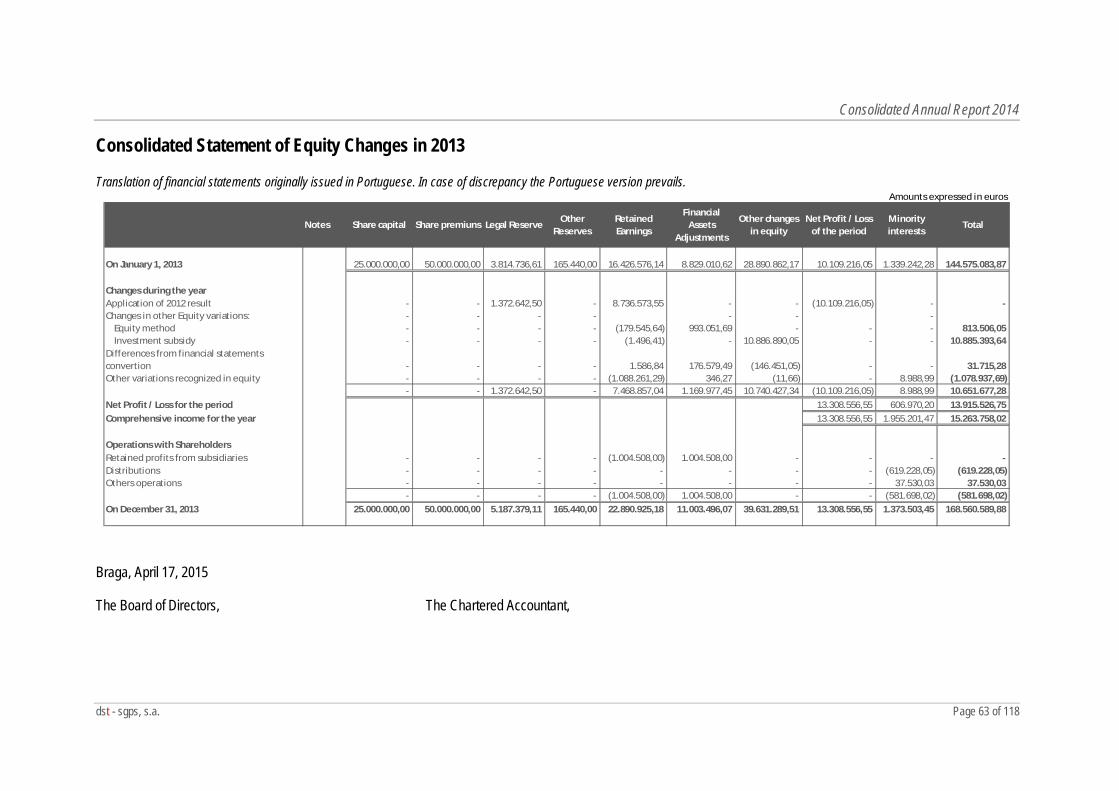
Consolidated Annual Report 2014
dst - sgps, s.a. Page 63 of 118
Consolidated Statement of Equity Changes in 2013
Translation of financial statements originally issued in Portuguese. In case of discrepancy the Portuguese version prevails. Amounts expressed in euros
Notes Share capital Share premiuns Legal ReserveOther
ReservesRetained Earnings
Financial Assets
Adjustments
Other changes in equity
Net Profit / Loss of the period
Minority interests
Total
On January 1, 2013 25.000.000,00 50.000.000,00 3.814.736,61 165.440,00 16.426.576,14 8.829.010,62 28.890.862,17 10.109.216,05 1.339.242,28 144.575.083,87
Changes during the yearApplication of 2012 result - - 1.372.642,50 - 8.736.573,55 - - (10.109.216,05) - - Changes in other Equity variations: - - - - - - -
Equity method - - - - (179.545,64) 993.051,69 - - - 813.506,05 Investment subsidy - - - - (1.496,41) - 10.886.890,05 - - 10.885.393,64
Differences from financial statements convertion - - - - 1.586,84 176.579,49 (146.451,05) - - 31.715,28 Other variations recognized in equity - - - - (1.088.261,29) 346,27 (11,66) - 8.988,99 (1.078.937,69)
- - 1.372.642,50 - 7.468.857,04 1.169.977,45 10.740.427,34 (10.109.216,05) 8.988,99 10.651.677,28 Net Profit / Loss for the period 13.308.556,55 606.970,20 13.915.526,75 Comprehensive income for the year 13.308.556,55 1.955.201,47 15.263.758,02
Operations with Shareholders Retained profits from subsidiaries - - - - (1.004.508,00) 1.004.508,00 - - - - Distributions - - - - - - - - (619.228,05) (619.228,05)Others operations - - - - - - - - 37.530,03 37.530,03
- - - - (1.004.508,00) 1.004.508,00 - - (581.698,02) (581.698,02)On December 31, 2013 25.000.000,00 50.000.000,00 5.187.379,11 165.440,00 22.890.925,18 11.003.496,07 39.631.289,51 13.308.556,55 1.373.503,45 168.560.589,88
Braga, April 17, 2015
The Board of Directors, The Chartered Accountant,
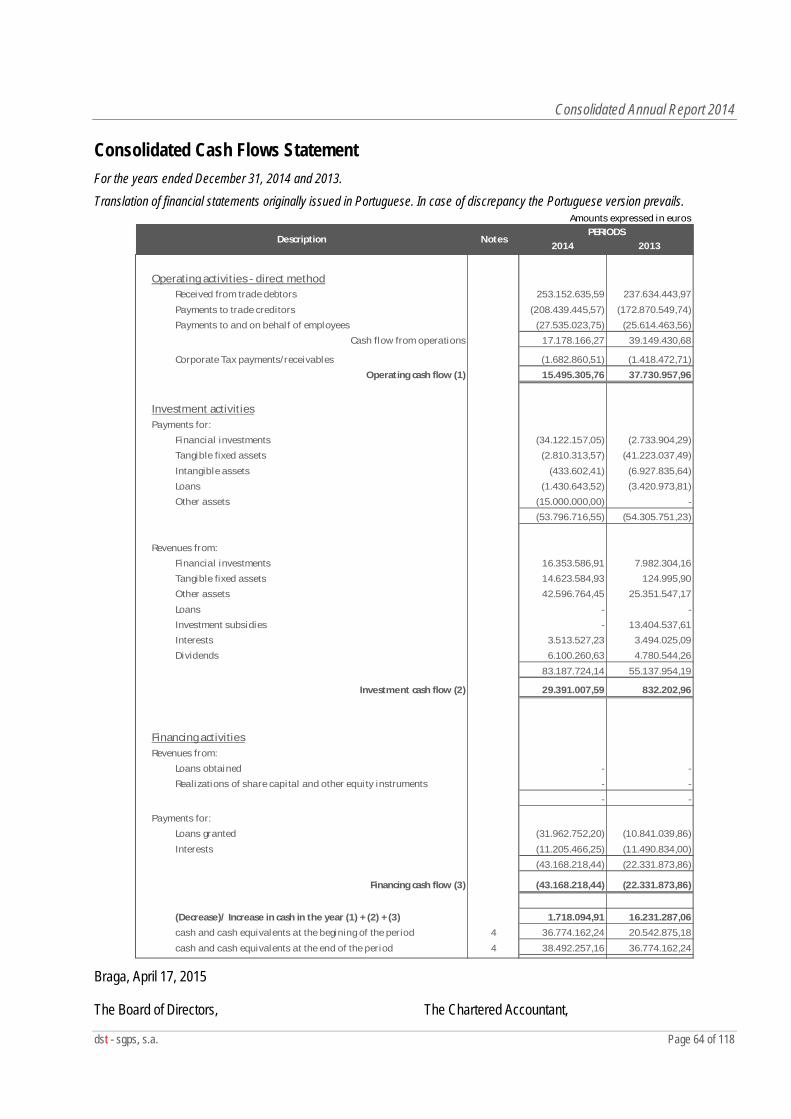
Consolidated Annual Report 2014
dst - sgps, s.a. Page 64 of 118
Consolidated Cash Flows Statement For the years ended December 31, 2014 and 2013. Translation of financial statements originally issued in Portuguese. In case of discrepancy the Portuguese version prevails.
Amounts expressed in euros
2014 2013
Operating activities - direct methodReceived from trade debtors 253.152.635,59 237.634.443,97
Payments to trade creditors (208.439.445,57) (172.870.549,74)
Payments to and on behalf of employees (27.535.023,75) (25.614.463,56)
Cash flow from operations 17.178.166,27 39.149.430,68
Corporate Tax payments/receivables (1.682.860,51) (1.418.472,71)
Operating cash flow (1) 15.495.305,76 37.730.957,96
Investment activitiesPayments for:
Financial investments (34.122.157,05) (2.733.904,29)
Tangible fixed assets (2.810.313,57) (41.223.037,49)
Intangible assets (433.602,41) (6.927.835,64)
Loans (1.430.643,52) (3.420.973,81)
Other assets (15.000.000,00) -
(53.796.716,55) (54.305.751,23)
Revenues from:
Financial investments 16.353.586,91 7.982.304,16
Tangible fixed assets 14.623.584,93 124.995,90
Other assets 42.596.764,45 25.351.547,17
Loans - -
Investment subsidies - 13.404.537,61
Interests 3.513.527,23 3.494.025,09
Dividends 6.100.260,63 4.780.544,26
83.187.724,14 55.137.954,19
Investment cash flow (2) 29.391.007,59 832.202,96
Financing activitiesRevenues from:
Loans obtained - -
Realizations of share capital and other equity instruments - -
- -
Payments for:
Loans granted (31.962.752,20) (10.841.039,86)
Interests (11.205.466,25) (11.490.834,00)
(43.168.218,44) (22.331.873,86)
Financing cash flow (3) (43.168.218,44) (22.331.873,86)
(Decrease)/ Increase in cash in the year (1) + (2) + (3) 1.718.094,91 16.231.287,06
cash and cash equivalents at the begining of the period 4 36.774.162,24 20.542.875,18
cash and cash equivalents at the end of the period 4 38.492.257,16 36.774.162,24
Description NotesPERIODS
Braga, April 17, 2015
The Board of Directors, The Chartered Accountant,
Consolidated Annual Report 2014
dst - sgps, s.a. Page 65 of 118
Annex at December 31, 2014
Translation of financial statements originally issued in Portuguese. In case of discrepancy the Portuguese version prevails. 1. Entity Identification
dst group was constituted in 1999, its registered office is in Palmeira – Braga, being the shareholder company DST – SGPS, S.A., which object is the management of shareholdings from other entities as an indirect form of exercises the economic activities in engineering and construction sector, water and sanitation, renewable energies, telecommunications and other services. These financial statements are the Entity's individual financial statements. All the amounts presented in these notes are expressed in Euros, unless otherwise stated.
2. Accounting referential for the financial statements preparation
2.1. Accounting Normalization System (“SNC – Sistema de Normalização Contabilística”)
The financial statements herewith were prepared in accordance with all standards comprised in the SNC. It should be considered that as part of SNC are the Basis for the presentation of financial statements, the Financial Statements Models, the Accounting Code, the Financial Reporting and Accounting Standards (“NCRF”) and the Interpretive Guidelines.
These standards of SNC are regulated by the following legislation:
Law-decree number 158/2009 of July 13 (SNC), with amendments introduced by law number 20/2010 of August 23;
Ordinance number 986/2009 of September 7 (Financial Statements Models);
Notice number 15652/2009 of September 7 (Conceptual Framework);
Notice number 15655/2009 of September 7 (Financial Reporting and Accounting Standards);
Ordinance number 1011/2009 of September 9 (Accounting Code).
In order to ensure the proper and true expression of the financial position and the entity’s performance, were used the standards that integrate the SNC, referred to above, in all aspects pertaining to the recognition, measurement and disclosure.
However where the SNC do not respond to particular aspects of transactions or situations are complementarily applied in the following order, the International Accounting Standards, as adopted pursuant to Regulation (EC)
Consolidated Annual Report 2014
dst - sgps, s.a. Page 66 of 118
number 1606/2002 of the European Parliament and Council of July 19, the International Accounting Standards (IAS) and International Financial Reporting Standards (IFRS) as issued by the IASB, and respective SIC-IFRIC interpretations.
3. Main accounting policies
The main accounting policies used for the preparation of the financial statements are stated below.
3.1. Presentation basis
The accompanying financial statements have been prepared assuming the business continuity, based on the historical cost convention and prepared from the entity’s accounting records, kept in accordance with IFRS in force at the date of the financial statements preparation.
The group adopted the provisions of IFRIC 12 - Service Concession Arrangements and SIC 29 - Disclosure - Service Concession Arrangements. The IFRIC 12 defines the rules to be followed in the concession arrangements, given the services provided and its control power over the concession assets.
Under the concession activity, the Group recognized an intangible asset that represents the right to the infrastructure use and exploitation provided by the Grantor.
Although it is the group responsibility to finance the infrastructure construction, since all goods are to integrate the concession and automatically will be subject to the non-transferability terms and assets reversal, are not considered as assets controlled by the Group, and therefore not recognized as tangible fixed assets. Through the analysis performed to the economic and financial rebalancing conditions provided on the concession agreement, it is founded that certain rebalancing conditions are directly associated with the demand risk, while others are on the Grantor’s dependence or other associated entities, and from the interest rates fluctuations in financial markets. And based on this analysis it was concluded that the rebalancing conditions act as a Grantor’s guarantee, limiting the margin earned by the Group and by placing a ceiling on the grant return. But that does not constitute a right to receive from the Grantor or his behalf, whereby the values invested in the concession were recognized as an intangible asset.
Based on the IFRS provisions and complementarily on the IFRIC 12, the accounting policies adopted by the Company were as follows:
Consolidated Annual Report 2014
dst - sgps, s.a. Page 67 of 118
3.1.1. Continuity assumption Under the continuity assumption, the Entity has evaluated the information available and its future expectations, taking into account the entity's ability to continue with your business. Of the evaluation resulted that the business is able to proceed assuming its continuity.
3.1.2. Accruals assumption (or economic periodization) The Entity records its income and expenses in accordance with the rules of the increase, by which income and expenses are recognized as they are generated, regardless of when they are received or paid.
The differences between the amounts received and paid and the corresponding income and expenses are recognized under "Deferrals" or "Other payables or Other receivables.
3.1.3. Consistency of presentation The items presentation and classification in the financial statements are consistent from one period to another.
3.1.4 Materiality and aggregation The materiality depends on the size and nature of the error or omission, sober in the circumstances that surround it. It is considered that the omissions or incorrect statements are materially relevant items if they can, individually or collectively, influence the economic decisions taken by users of financial statements. An item that is not materially relevant to justify its separate presentation on the face of the financial statements can however be relevant material to be presented separately in the notes to this annex.
3.1.5. Compensation The assets and liabilities, income and costs are reported separately in the respective items of the balance sheet and the income statement, so that no assets were compensated for any liability or any expense for any income, both vice-versa. Gains and losses arising from a group of similar transactions are reported on a net basis, ie, gains and losses from exchange rate differences and gains or losses arising on financial instruments held for trading. These gains and losses are reported separately if they are materially relevant.
Consolidated Annual Report 2014
dst - sgps, s.a. Page 68 of 118
3.1.6. Comparative Information The accounting policies and measurement bases adopted at December 31, 2014 are comparable with those used in preparing the financial statements for December 31, 2013. The comparability of the information between periods is continuously improvement object in order to be increasingly an instrument of help to users allowing them to take economic decisions and assessing the trends in financial information for forecasting purposes.
3.2. Recognition and measurement policies used in the preparation of financial statements
3.2.1. Transactions in foreign currency
The Entity’s financial statements are presented in euros; the euro is the functional and presentation currency.
The transactions in foreign currency (currency other than the functional currency of the entity) are recognized at exchange rates of the dates of the transactions. At each reporting date, the carrying amounts of monetary items denominated in foreign currency are updated at the exchange rates that date. The carrying amounts of non-monetary items are recognized at fair value denominated in a foreign currency are updated to the exchange rates of the dates on which the respective fair values were determined. The carrying amounts of non-monetary items are recognized at historical cost, denominated in a foreign currency are not upgraded.
Positive or negative exchange differences driven out from differences between the exchange rates in force at the transaction dates and at the dates of collection, payment or of balance sheet are recognized as income and/or expenses in the period’s income statement as foreign exchange gains and/or losses.
3.2.2. Tangible fixed assets
Tangible fixed assets are recognized at acquisition cost, net of related depreciation and any impairment losses. The acquisition cost includes all expenditure directly attributable to the acquisition of such assets and to their availability in local and operational conditions required.
Subsequent charges are included in the acquisition cost of the asset or recognized as separate assets, as appropriate, when it is probable that future economic benefits will flow to the entity through its use and its cost can be reliably measured.
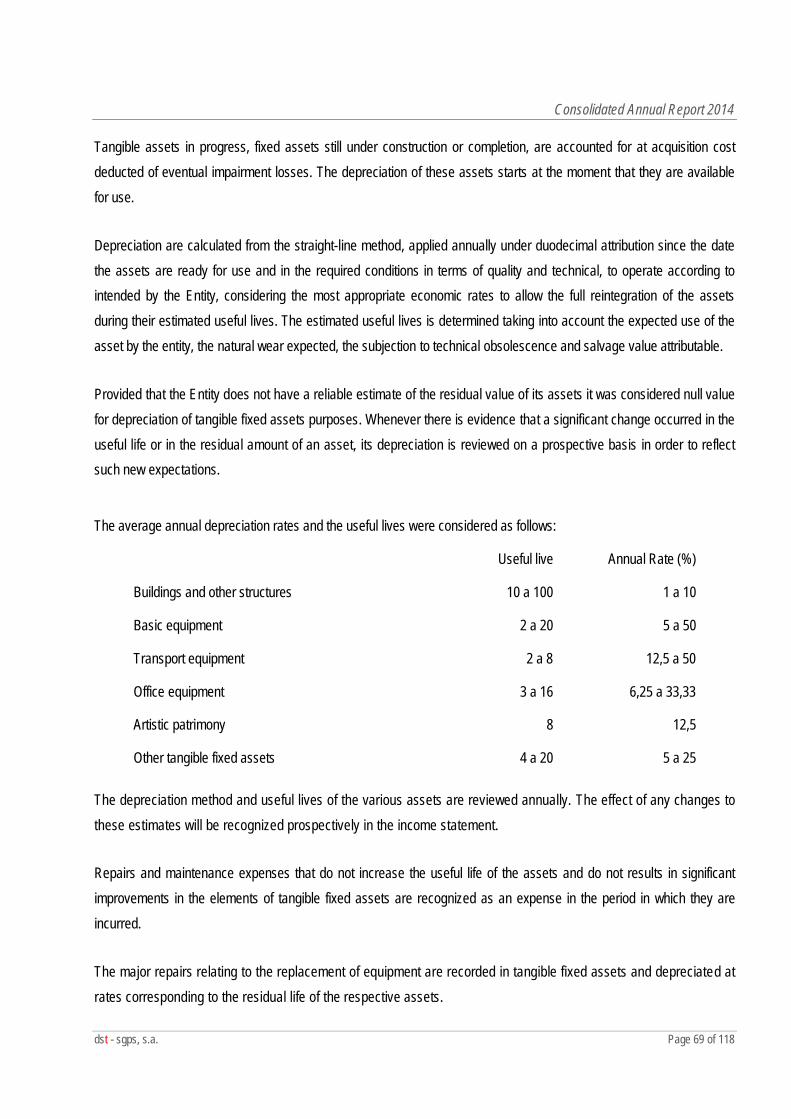
Consolidated Annual Report 2014
dst - sgps, s.a. Page 69 of 118
Tangible assets in progress, fixed assets still under construction or completion, are accounted for at acquisition cost deducted of eventual impairment losses. The depreciation of these assets starts at the moment that they are available for use.
Depreciation are calculated from the straight-line method, applied annually under duodecimal attribution since the date the assets are ready for use and in the required conditions in terms of quality and technical, to operate according to intended by the Entity, considering the most appropriate economic rates to allow the full reintegration of the assets during their estimated useful lives. The estimated useful lives is determined taking into account the expected use of the asset by the entity, the natural wear expected, the subjection to technical obsolescence and salvage value attributable.
Provided that the Entity does not have a reliable estimate of the residual value of its assets it was considered null value for depreciation of tangible fixed assets purposes. Whenever there is evidence that a significant change occurred in the useful life or in the residual amount of an asset, its depreciation is reviewed on a prospective basis in order to reflect such new expectations.
The average annual depreciation rates and the useful lives were considered as follows:
Useful live Annual Rate (%)
Buildings and other structures 10 a 100 1 a 10
Basic equipment 2 a 20 5 a 50
Transport equipment 2 a 8 12,5 a 50
Office equipment 3 a 16 6,25 a 33,33
Artistic patrimony 8 12,5
Other tangible fixed assets 4 a 20 5 a 25 The depreciation method and useful lives of the various assets are reviewed annually. The effect of any changes to these estimates will be recognized prospectively in the income statement.
Repairs and maintenance expenses that do not increase the useful life of the assets and do not results in significant improvements in the elements of tangible fixed assets are recognized as an expense in the period in which they are incurred.
The major repairs relating to the replacement of equipment are recorded in tangible fixed assets and depreciated at rates corresponding to the residual life of the respective assets.
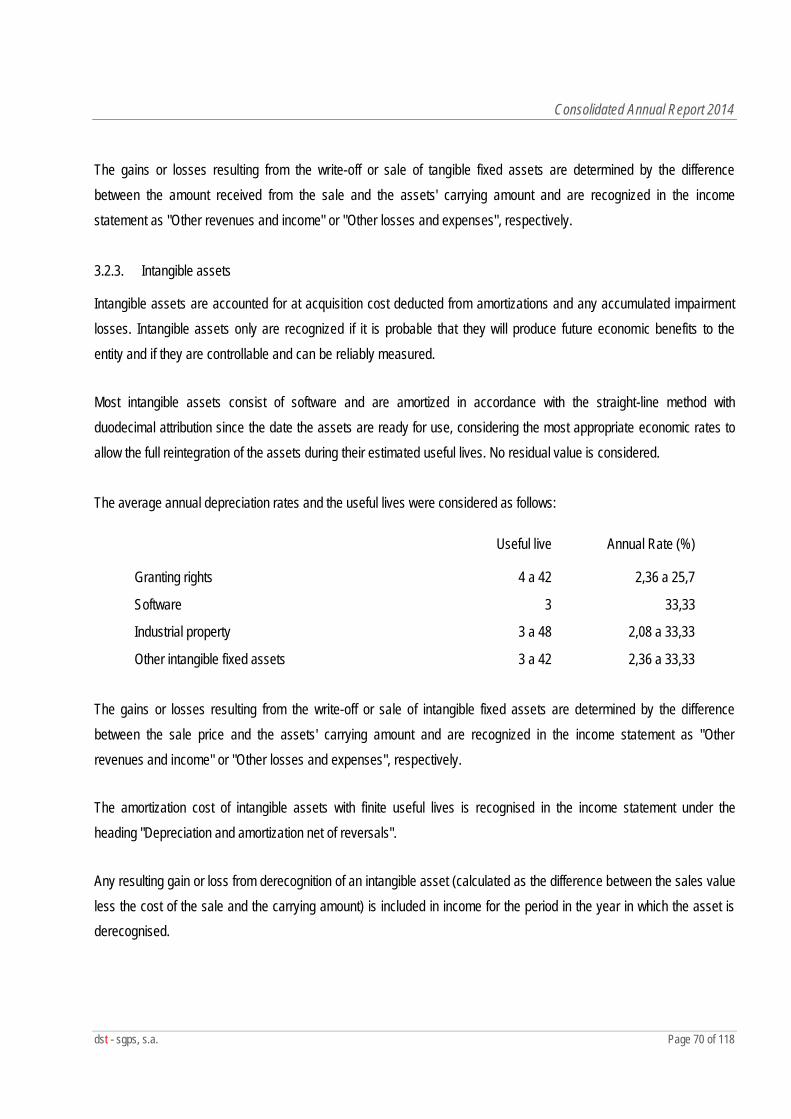
Consolidated Annual Report 2014
dst - sgps, s.a. Page 70 of 118
The gains or losses resulting from the write-off or sale of tangible fixed assets are determined by the difference between the amount received from the sale and the assets' carrying amount and are recognized in the income statement as "Other revenues and income" or "Other losses and expenses", respectively. 3.2.3. Intangible assets
Intangible assets are accounted for at acquisition cost deducted from amortizations and any accumulated impairment losses. Intangible assets only are recognized if it is probable that they will produce future economic benefits to the entity and if they are controllable and can be reliably measured.
Most intangible assets consist of software and are amortized in accordance with the straight-line method with duodecimal attribution since the date the assets are ready for use, considering the most appropriate economic rates to allow the full reintegration of the assets during their estimated useful lives. No residual value is considered. The average annual depreciation rates and the useful lives were considered as follows:
Useful live Annual Rate (%)
Granting rights 4 a 42 2,36 a 25,7
Software 3 33,33
Industrial property 3 a 48 2,08 a 33,33
Other intangible fixed assets 3 a 42 2,36 a 33,33
The gains or losses resulting from the write-off or sale of intangible fixed assets are determined by the difference between the sale price and the assets' carrying amount and are recognized in the income statement as "Other revenues and income" or "Other losses and expenses", respectively.
The amortization cost of intangible assets with finite useful lives is recognised in the income statement under the heading "Depreciation and amortization net of reversals".
Any resulting gain or loss from derecognition of an intangible asset (calculated as the difference between the sales value less the cost of the sale and the carrying amount) is included in income for the period in the year in which the asset is derecognised.
Consolidated Annual Report 2014
dst - sgps, s.a. Page 71 of 118
There are some details below regarding the concession rights:
Concession rights related to the concession activity
For the goods (which arise in infrastructure usage rights – IFRIC 12) with useful lives above the concession period, the amortization of initial investment or which may be subsequently adopted or imposed by the Grantor and that materialize in expansion or modernization of initial obligations, should normally be for a period of the concession. However, additional investments, modernization or expansion whose lifetime extends beyond the term of the concession, and that present residual value shall give rise to compensation equivalent to the amount not yet amortised at the date of the end of the concession.
Depreciation is calculated by the sum of units, i.e. by depreciation of contractual investment in economic and financial feasibility study used, based on effluent flow rates charged during this period and the effluent to invoice until the end of the concession provided for in the feasibility study.
3.2.4. Investment properties
Investment properties consist of properties whose purposes are to obtain rents and equity valorization and not for administrative purposes nor for sale in the course of the entity’s current activity.
Investment properties are measured at cost less any accumulated impairment losses.
The costs incurred with investment properties in use, such as maintenance, repairs, insurance and property taxes are recognized in the income statement of the period to which they relate. The improvements in respect of which it is estimated that generate future additional economic benefits are capitalized under investment properties.
The average annual depreciation rates and the useful lives were considered as follows:
Useful live Annual Rate (%)
Buildings and other constructions 10 to 100 1 to 10
Consolidated Annual Report 2014
dst - sgps, s.a. Page 72 of 118
3.2.5. Goodwill
The Goodwill corresponds to future economic benefits arising from assets which are not able to be individually identified and separately recognized. The Goodwill on Subsidiaries encompassed in the consolidation is reflected in their individualized heading in the balance sheet. The Goodwill on Subsidiaries not encompassed in the consolidation, the Associates and joint ventures is reflected in the value of the corresponding financial participation are presented in the balance sheet under the heading Financial investments – the equity method or Financial investments – other methods, as the case may be.
In January 1, 2009 (date of transition to the NCRF) the company has adopted the exemption of the NCRF 3 - first-time adoption of the NCRF, concerning Business Combinations and adopted as deemed cost at that date, the value of Goodwill in its accounts prepared in accordance with the POC (acquisition cost less accumulated depreciation until December 31, 2008 and less any impairment loss recorded on that date),rather than calculating goodwill retrospectively to the date of the combination on the basis of information available at that date. Full implementation of this exemption to specific cases did not result from:
Any adjustment to Goodwill arising:
From the recognition of intangible assets that were not recognized separately from Goodwill;
From the derecognition of intangible assets recognised separately from Goodwill incorrectly;
From the contingencies that might affect the price of the transaction and whose outcome could already be known at the date of transition.
Any adjustment in shareholders equity due to:
The derecognition of assets and liabilities that wouldn't qualify for recognition in the balance sheet of the acquiree;
The derecognition of assets and liabilities that do not qualify for recognition under the NCRF.
In the subsequent acquisitions January 1, 2009, Goodwill is measured at cost, which is the excess of the cost of business combinations which it concerns over the Group's interest in the fair value of the assets, liabilities and contingent liabilities identifiable at the time of concentration. Where the acquirer's interest in the fair value of the assets, liabilities and contingent liabilities identifiable exceeds the cost of the business combination, the difference is immediately recognized in the results of the period after re-
Consolidated Annual Report 2014
dst - sgps, s.a. Page 73 of 118
evaluation of the identification and measurement of assets, liabilities and contingent liabilities identifiable from the acquiree and the measurement of the cost of the concentration.
When Goodwill is part of a cash-generating unit and part of an operation within that unit is disposed, the Goodwill associated with the alienated operation is included in the book value of the transaction to determine the gain or loss of operation. Goodwill derecognised under these circumstances is measured on the basis of relative values between the alienated operation and portion of the cash-generating unit maintained.
Goodwill presented in the balance sheet is measured:
At the deemed cost less impairment, for business combinations that occurred before December 31, 2008;
At cost less impairment for Goodwill from business combinations occurring on or after January 1, 2009. Impairment Impairment of Goodwill is tested at least annually. If events or changes in circumstances indicate that it might be impaired according to the NCRF 12 — impairment of assets, impairment of Goodwill is tested more frequently, i.e., whenever conditions so determine. Impairment losses of Goodwill cannot be reversed.
3.2.6. Financial investments
a) Financial investments - equity method
Investments in subsidiaries and associates are valued according to the equity method, defining themselves as such entities over which the Group exercises control or significant influence, generally investments representing more than 20% of the capital of a company, and they are not Joint Ventures.
For the determination of control or significant influence are taken into consideration the interests existing at the present date in accordance with potential voting rights.
According to the equity method, the financial investments are recognized at their acquisition cost, adjusted by the amount corresponding to the company participation in the net results of associates and subsidiaries, against profit or loss for the period, and by the dividends received, net of accumulated impairment losses.
Consolidated Annual Report 2014
dst - sgps, s.a. Page 74 of 118
Any excess of the acquisition cost over the value of the equity percentage held is considered "Goodwill", being added to the value of the financial asset and its recovery analyzed annually as part of the investment, and if the difference is negative ("Badwill"), after reassessment of the valuation process and if it remains in the income statement.
Is performed an assessment of investments in subsidiaries and associated companies or other when there are indications that the asset may be impaired, and recognized a loss in the income statement whenever it is confirmed.
When the proportion of the Company in accumulated losses of associated company or subsidiary exceeds the value of the investment is recognized, the investment is reported at nil value while the equity of the associated company is not positive, except when the entity has made commitments to the associated our subsidiary company, registering such cases a provision under the liability item 'Provisions' to meet these obligations.
The unrealized gains on transactions with associated companies are eliminated in proportion to the interest of the company in the associated company against the investment in these companies. The unrealized losses are similarly disposed, but only to the extent that the loss does not evidence that the asset transferred is in impaired.
At the date of acquisition of the investment, the difference between the cost of the investment and the group's share in the fair value of the assets, liabilities and contingent liabilities identifiable of the acquired company was accounted in accordance with the NCRF 14 — business combinations. In this way:
The related Goodwill is included in the carrying amount of the investment. However, the amortisation of Goodwill is not permitted and is therefore not included in the determination of results resulting from reported;
The excess of the group's share in the fair value of the assets, liabilities and contingent liabilities identifiable from reported above the cost of the investment were excluded from the carrying amount of the investment and were included as income in the period in which the investment was acquired.
Subsequent to the date of acquisition, the carrying amount of investments:
Was increased or decreased to recognise the part on the results of the investee after the date of the acquisition;
Was reduced by distributions of received results;
Was increased or decreased to reflect, by contrast, changes in the equity of the group in the reported interest in proportion resulting from these changes in equity that are not recognised in their results.
Consolidated Annual Report 2014
dst - sgps, s.a. Page 75 of 118
In the measurement of these investments it was still respected the following provisions concerning the application of this method:
The financial statements of joint ventures were already prepared, or were adjusted extra accounting, in order to match the Group's accounting policies before they can be used in the determination of equity effects;
The financial statements of joint ventures used in determining the equity effects consist of the same date of the Group;
The results arising from transactions ' ascendants ' and ' descendants ' are recognised only insofar as they correspond to the interests of other investors in associated, not related to the investor.
When the value of the investment is reduced to zero, additional losses are taken into account by the recognition of a liability when the company incurs legal obligations or constructive. When later the joint ventures report profits, the Group invested resumes its recognition only after its share of the profits equals the share of losses not recognized.
Impairment Impairment of these assets was determined on the basis of the criteria described in note 3.2.2 - Tangible fixed assets. b) Financial investments - other methods
The company uses the cost model in relation to investments in other entities in which the equity or proportional consolidation methods are not mandatory and in which it is unable to reliably determine their fair value, namely investments in companies with securities out of a regulated market.
According to the cost model investments are initially recognized at acquisition cost, which includes transaction costs, and subsequently its value is decreased by eventual impairment losses.
The group uses the cost model for financial investments in:
Other entities in which are not mandatory the equity or proportional consolidation methods and in which it is unable to reliably determine their fair value, namely investments in companies with securities out of a regulated market.
According to the cost model investments are initially recognized at acquisition cost, which includes transaction costs, and subsequently its value is decreased by eventual impairment losses.
Consolidated Annual Report 2014
dst - sgps, s.a. Page 76 of 118
Impairment The company evaluated the impairment of these assets at the end of the year. Whenever there was an objective evidence of impairment, the company recognized an impairment loss in the income statement.
Objective evidence of impairment took into account observable data that called the attention about the following loss events:
Significant financial difficulty of the issuer;
The disappearance of an active market for financial asset due to financial difficulties of the debtor;
Observable data indicating that there is a decrease in the measurement of the estimated future cash flows of a financial group assets since its initial recognition;
Significant changes with an adverse effect occurring in the technological environment, market, economic or legal under which the issuer operates.
All equity instruments were individually assessed for impairment.
The company uses the fair value model in financial investments in companies listed on a regulated market and whose fair value can be obtained and reliably determined.
3.2.7. Inventories
Goods, raw materials, subsidiary and consumable materials are valued at the lower of their average acquisition cost and net realizable value (estimated sales price net of costs to be incurred for their disposal), using the FIFO as cost formula.
The finished and semi-finished products, by-products and products and work in progress are valued at production cost or net realizable value (if this is lower). The production costs include the cost of raw materials, direct labor and manufacturing overheads.
If the net realizable value is lower, in particular due to the decrease in the market price, deterioration or obsolescence, rising of finishing or necessary costs to perform the sale, or of the recoverable value by using the conversion into finished products whose market price has been reduced, it is justified the recognition of impairments in the periods that the adjustment needs are found, using replacement cost as a reference.
Consolidated Annual Report 2014
dst - sgps, s.a. Page 77 of 118
The reversal of impairment losses recognized in prior periods is recorded when there is evidence that impairment losses are no longer justified or decreased, being expressed in the income statement as "Impairment of inventory net of reversals". However, the reversal is only done up to the amount of the accumulated impairment losses.
The expenses related to inventory sold are recorded in the same reporting period in which revenue is recognized.
3.2.8. Leases
The classification as operating or financial leases depends on the respective contract’s substance and not on its form. Lease contracts are classified as finance leases, if through tem are substantially transferred all the risks and rewards of ownership of the asset leased or otherwise as operating leases.
Financial leases
Tangible fixed assets acquired through financial lease contracts and their correspondent liabilities are recognized in accordance with the provisions of NCRF 9 - Leases. According to this method the cost of the asset is recorded as tangible fixed asset, the correspondent responsibility is accounted for as a liability and the financial charges included in the rent and the depreciations of the leased assets are recognized as expenses in the income statement in the period to which they relate.
Operating leases In leases considered operational, the rents payable are recognized as expense in the income statement over the period of the lease and in accordance with the obligations inherent to these 3.2.9. Contingent assets and liabilities
Contingent assets are possible assets arising from past events and whose existence will only be confirmed if occurs, or not, one or more uncertain future events not wholly within the entity’s control. If it is probable the existence of future economic benefits, the entity does not recognize this contingent asset in its financial statements but promotes its disclosure.
Contingent liabilities are defined as: (i) possible obligations arising from past events and whose existence will only be confirmed if occurs, or not, one or more uncertain future events not wholly within the entity’s control; or (ii) current obligations arising from past events that are not recognized because it is unlikely that resources flows affecting economic benefits are required to offset the obligation or because the amount of the obligation cannot be measured with enough reliability.
Consolidated Annual Report 2014
dst - sgps, s.a. Page 78 of 118
Contingent liabilities are not recognized in the entity's financial statements but are disclosed unless the possibility of a funds outflow affecting future economic benefits is remote, in which case they are not even disclosed.
3.2.10. Provisions
Provisions are recognized in accordance with the effectively required amounts to cover estimated losses, are revised at each balance sheet date and are adjusted to reflect the best estimate at that date.
Provisions are recognized if and only if the entity has a present liability (legal or constructive) resulting from a past event and if it is probable that for the resolution of such obligation a resources outflow occurs and that the amount of the obligation can be reasonably estimated.
Provisions for future operating losses are not recognized.
3.2.11. Employee benefits
Short-term benefits The employees’ short-term benefits include wages, salaries, Social Security contributions, food allowances, holidays and Christmas subsidies and any other retribution eventually decided by the Board of Directors.
Obligations resulting from short-term benefits are accounted for as expenses in the period in which the employee has provided services on an undiscounted basis against a liability that is extinguished with the payment.
According to applicable labor legislation, the right to vacation and holiday allowance for the period, for this match the calendar year expires on 31 December of each year, being paid only during the following period, the corresponding expenses are recognized as short-term benefits and treated in accordance with the mentioned above.
The benefits resulting from the employment’s cessation, either by unilateral decision of the entity, or by mutual agreement, are recognized as an expense in the period in which they occurred.
Long-term benefits
The long-term benefits include a health insurance that covers all employees.
Consolidated Annual Report 2014
dst - sgps, s.a. Page 79 of 118
3.2.12. Financial assets and liabilities
The financial assets and liabilities are accounted for in accordance with the following criterions:
Trade debtors and other receivables
Trade debtors and other receivables balances are accounted for at their nominal value and disclosed in the balance sheet, deducted from any accumulated impairment losses, recognized under “Impairment on trade receivables net of reversals”, so as to reflect their net realizable value. These items when current do not include interest because they would be immaterial for the impact of discounting.
At the end of each reporting period trade debtors balances are analyzed in order to assess whether there is any objective evidence that they are not recoverable.
Impairment losses are recognized after events that indicate, objectively and in a quantifiable manner, that all or part of the balance will not be received. For this purpose, the Entity takes into consideration market information that demonstrates that the trade debtor is in breach of its responsibilities, as well as historical information of overdue and not received balances. Objective evidence of impairment for a portfolio of receivables could include past experience of collecting payments, an increase in the number of delayed payments in, as well as changes in national or local economic conditions that correlate with default on receivables.
The impairment loss is recognized as an expense in the income statement.
Whenever are settled with a customer payment conditions that foresee instalments, dst group considered such amount in accordance with its amortized cost, bearing in mind all conditions set forth in NCRF 27 regulation, namely:
- Having a defined maturity;
- Fixed amount reimbursements, with a variable interest rate indexed to a general market standard (Euribor), added up of a spread;
- Not having any clauses that may arm the nominal amount of the credit nor its interest (excluding general credit risk).
In this sense, the difference between the nominal amount of the credit and its initial fair value is recognized in the Profits & Loss statement in accordance with the effective interest method.
Consolidated Annual Report 2014
dst - sgps, s.a. Page 80 of 118
Advances to trade creditors
These balances are stated at their cost less impairment losses, whenever applicable.
Trade creditors and other payables
Debts to suppliers or other third parties are accounted for at nominal value as they do not bear interest and the effect of discounting is immaterial.
Its non- recognition only occurs when they cease their obligations under the contracts, particularly when there has been a liquidation, cancellation or expiration. Advances from customers
The Advances from customers are stated at nominal value.
Discounted bills The Entity writes-off financial assets from its financial statements only when it substantially transfers all the risks and benefits inherent to the ownership of such assets to a third party. If the entity substantially retains the risks and benefits inherent to the ownership of those assets, it continues recognizing them in its financial statements as liabilities related to obtained loans correspondent to the monetary counter-entry for the transferred assets.
State and others public entities
The balance assets and liabilities under this heading are established on the basis of existing legislation.
With regard to assets was not recognized any impairment by if it considers that this is not applicable given the specific nature of the relationship. Loans and other non-current payables
Loans and other non-current payables are accounted for at cost as liabilities, net of transaction costs that are directly attributable to the issuance of these liabilities, being expressed in the balance in current or non-current liabilities depending on their maturity occurs within or more than one year, respectively.
Consolidated Annual Report 2014
dst - sgps, s.a. Page 81 of 118
Its non- recognition only occurs when they cease their obligations under the contracts, particularly when there has been a liquidation, cancellation or expiration.
The interest and other costs incurred in financings are calculated according to the effective interest rate and recognized in the income statement for the period in accordance with the increase presupposition.
Financial assets
The Entity uses the fair value model in the valuation of shares held in companies listed on a regulated market, whose fair value can be obtained and determined viably.
Cash and cash equivalents
The cash and cash equivalents balance includes cash, bank deposits and other short-term investments that can be immediately mobilized without significant risk of value fluctuations.
Financial liabilities and equity instruments
Financial liabilities and equity instruments are classified according to the substance of the contractual transaction, regardless of their legal form.
A financial instrument is classified as a financial liability when there is a contractual obligation to their settlement to be effected by delivering cash or another financial asset. Financial liabilities are initially recorded at cost, net of transaction costs incurred.
An equity instrument is classified as such when there is not a contractual obligation to their settlement to be effected by delivering cash or another financial asset, evidences a residual interest in the assets of an entity after deducting all of its liabilities.
Costs directly attributable to issue of equity instruments are recognized in equity as a deduction of issue. Amounts paid or received for purchases and sales of equity instruments are recognized in equity, net of transaction costs. Other financial liabilities
This heading includes derivative financial instruments for which there is actual coverage under the NCRF 27.
Consolidated Annual Report 2014
dst - sgps, s.a. Page 82 of 118
Are only considered financial instruments to hedge the effective portion of derivatives that are designated as such and that the entity expects that the changes in fair value or cash flows attributable to the hedged item, that risk is being covered, will compensate for virtually any changes in fair value or cash flows of the hedging instrument.
Changes in the fair value of derivative instruments risk coverage of interest rate variability are recognized in equity in the rubric "Financial assets adjustments " in its effective component and in results, under the heading "Increase/decrease in fair value", in its actual not component. The values recorded under the heading "Financial assets adjustments" are transferred to results for the heading "Increase/decrease in fair value" in the period in which the hedged item has no effect on results.
Hedge accounting is discontinued when the hedging instrument reaches maturity, when it is sold or exercised or when the relationship ceases to meet the coverage requirements on NCRF 27 - Financial Instruments.
The effective portion of the hedge derivative instruments are presented in the balance sheet under "Other financial assets" or "Other financial liabilities" depending on their nature is, respectively, a debtor or creditor and as non-current or current depending on the heading where as their instruments covered are presented in the balance sheet.
3.2.13. Equity items
Financial assets adjustments
This account includes the adjustments related to the application of the equity method, namely the ownership of changes in equity of the subsidiaries and unassigned profits.
Minority interests
Minority interests are part of the results and of the net assets of subsidiaries attributable to equity interests which are not owned, directly or indirectly through subsidiaries, by the shareholder company.
This heading includes:
Capital;
Results for the period;
Other items of capital whose variations of the year, together with the results of the period, make up the full result.
Consolidated Annual Report 2014
dst - sgps, s.a. Page 83 of 118
3.2.14. Revenue
Revenue comprehends income associated with sales and services rendered. Revenue is recognized on sales when the buyer takes the risks and benefits inherent to the ownership of the goods sold and as what concerns to services revenue is recognized in the income statement when such services are rendered, taking into consideration the proportion of services rendered in the period and the total services agreed.
Revenue is not recognized when it is related to situations of uncertainty of acceptance or payment of those services.
Whereas invoiced services are higher than the services rendered, the difference is recorded as income to be recognized and is accounted for in the income statement at the time such services are rendered and the correspondent expenses are incurred.
3.2.15. Construction contracts
The Entity recognizes the construction works’ results contract per contract in accordance with the completion percentage method, which is understood to be as the relationship between the expenses incurred on each work at a determined date and the sum of those expenses with the expenses estimated to be incurred for its completion. The differences between the amounts resulting from the application of the completion percentage method with the estimated income and invoiced amounts are accounted for as non-invoiced production or advanced invoicing, which are included within as "Other receivables - Receivables from accrued income " (Asset) or "Deferred - Income to recognize" (Liability).
Changes in work from the amount of revenue settled in the correspondent contract are recognized in the period’s results when it is probable that the customer accepts the revenue amount arising from the variation and that this can be reliably measured.
Claims for costs reimbursement not included in the contract price are included in the contract’s revenue when negotiations are at such an advanced stage that it is probable that the customer accepts the complaint and that it is possible to measure it reliably.
When it is probable that the construction contract’s total expenses exceed the income defined therein, the expected loss is immediately recognized in the period’s income statement.
Consolidated Annual Report 2014
dst - sgps, s.a. Page 84 of 118
3.2.16. Subsidies and Government assistance
Government subsidies are recognized at their fair value when there is sure to be received and that the Entity will comply with the conditions of the grant.
Operational subsidies are intended to cover expenses incurred and recorded, particularly with the development of vocational training actions, and they are recognized as income as the expenses are incurred, regardless of the time of receipt of the grant.
The outright grants, to finance tangible and intangible assets are recognized in equity and recognized in the income statement in proportion to the respective depreciation and amortization of subsidized assets.
3.2.17. Impairment of assets
At each reporting date, and whenever are disclosed an event or changes in circumstances indicating that the asset’s recorded amount may not be recoverable an impairment of assets evaluation is assessed. Whenever the amount by which the asset is recorded is higher than its recoverable amount, is recognized as an impairment loss recorded in the income statement as "'Impairment of investments depreciables/amortizables net of reversals” or as "Impairment on trade receivables net of reversals", if it respects the non-depreciable assets. The recoverable amount is the higher of the net selling price and value in use. The net selling price is the amount obtainable from the sale of the asset in a transaction between independent entities, less the costs directly attributable to the sale. The value in use is the present value of estimated future cash flows that are expected to arise from the continued use of the asset and from its sale at the end of its useful life. The recoverable amount is estimated for each asset individually or, if not possible, to the unit generating cash flows to which the asset belongs. After the recognition of an impairment loss, the expense related to the amortization/depreciation of the asset is adjusted in future periods to allocate the asset's revised carrying amount, less its residual value (if any) on a systematic basis over the useful life remaining. Whenever events or changes in circumstances indicate that the carrying amount of an asset is recorded can not be retrieved, it made a new assessment of impairment.
Consolidated Annual Report 2014
dst - sgps, s.a. Page 85 of 118
Reversal of impairment losses recognized in previous years is registered when it is concluded that previously recognized impairment losses no longer exist or have decreased. A reversal of an impairment loss is recognized in the income statement under aforementioned. The reversal of the impairment loss is made up to the amount that would be recognized (net of amortization or depreciation) if the impairment loss had not been recorded in previous periods.
3.2.18. Income tax
The Entity is included in the special group taxation regime (RETGS), reason why the period’s income tax is accounted for as an offset to “Shareholders” and not to “State and other public entities”. In RETGS taxable profit of the group is calculated by the dominant society, through the sum of the taxable income and tax losses in periodic statements of each individual companies within the group, correcting the profits distributed among the members of the group who is included in taxable income individual The expense relating to period’s income tax corresponds to the sum of current and deferred taxes. Current income tax is based on the entity’s taxable profits in accordance with the enforceable tax regulations, whilst deferred taxes result from temporary differences between accounting and tax assets and liabilities. The taxable profit is different from the accounting result, provided that it excludes expenses and revenues that are taxable or deductible in other periods. The taxable profit also excludes expenses and revenues that will never be taxed or deducted. The Entity shall record deferred taxes related to temporary differences between the carrying amount of assets and liabilities and the corresponding tax base as provided in NCRF 25 - Deferred income taxes, whenever it is probable that future taxable profits will be generated against which the differences temporary and can be used based on the standard rate of corporation tax to the balance sheet date. Deferred taxes assets and liabilities are calculated and annually evaluated based under the tax rates in force or announced to be in force at the time of the expected reversal of temporary differences. The deferred tax assets are recognized only when there is a reasonable expectation of future taxable profits to be deducted from such assets, or in situations where there are taxable temporary differences to offset the deductible temporary differences in the period of its reversal. At each reporting date a review of those deferred tax assets is carried out and such are adjusted in accordance with the expectations concerning their future use.
Consolidated Annual Report 2014
dst - sgps, s.a. Page 86 of 118
Current and deferred taxes are accounted for in the income statement except when are related to items directly recognized as equity. In these cases, the correspondent deferred taxes are also recognized as equity. Tax returns may be subject to review and possible corrections by the tax authorities for a period of four years (ten years for Social Security). So corrections may be made for the years 2011 and following, not being expected, however, that the possible course corrections will significantly affect the financial statements. The above time limit may be extended or suspended provided that tax benefits have been obtained, there are inspections, claims or contestations ongoing, or has been tax losses, in which, over a period of six years after its occurrence, relatively to previous periods to 2010, four years for the period from 2010 to 2012 and five years for subsequent periods, these are susceptible of deduction to the taxable income that may be generated. The taxes are not paid, relating to the current period or the previous are recognized as a liability at the amount that is estimated to be paid based on the rates and tax laws applicable to the balance sheet date. However, if the amounts already paid in respect of such periods exceed the amounts due, are recognized as assets to the extent of the excess. Current tax is also conditioned by the adjustments, positive or negative, which are to be recognized in the period for current tax of previous periods. The tax effects of the transition adjustments resulting from the succession of accounting standards are regulated by article 5 of the Law-decree number 159/2009 of July 13, which provides that such adjustments contribute to the formation of profit taxable in a 5 year period, in equal parts, beginning in 2010 and ending in 2014.
3.3. Other significant accounting policies:
Basis of consolidation The consolidated financial statements include, as at December 31, 2014 and 2013, the assets, liabilities and results of group companies, understood as a set of dst group and its subsidiaries, which are presented in note 5.
As described in no. 6 of Law-Decree no. 158/July 13, 2009, approving the SNC, the entity presents the consolidated accounts of the group constituted by itself and by all subsidiaries on which: a) Regardless of the ownership of capital, it is found that, in alternative:
Is able to exercise, or actually exercises, dominant influence or control;
Pursuing the management as if the two constitute a single entity;
Consolidated Annual Report 2014
dst - sgps, s.a. Page 87 of 118
b) Being holder of capital, when one of the following situations occurs:
Has a majority of the voting rights, unless it is demonstrated that such rights do not confer the respective control;
Has the right to appoint or remove a majority of the members of the management board of an entity with the power to govern the financial and operating policies of that entity;
Exercises a dominant influence over an entity, pursuant to a contract celebrated with this entity or from another clause of this social contract;
Holds at least 20% of the voting rights and the majority of the holders of the management board of an entity empowered to govern the financial and operating policies of that entity, reports during the financial year to which the consolidated financial statements, as well as, in the preceding financial year and up to the moment they are prepared, have been appointed solely as a result of the exercise of its voting rights;
Available, by itself or by virtue of an agreement with other holders of the capital of this entity, a majority of its voting rights of capital holders.
Subsidiaries are companies controlled by the dst group and are consolidated by the full consolidation method since the date of acquisition, which is the date on which the group gets control, and continue to be consolidated until the date that control ceases to exist. In the consolidation process, transactions, balances and unrealised profits on intragroup transactions and dividends between group companies are eliminated. Unrealised losses are also eliminated, unless the transaction reveals evidence of the existence of impairment in assets transferred and not alienated. The jointly controlled financial investments are included in the consolidation by the proportional consolidation method, from the date that joint control is acquired until the date on which it actually ends. Under this method, assets, liabilities, income and expenses of these businesses were incorporated in consolidated financial statements, line by line, in proportion to the assigned control of dst group. Associated companies are entities over which the investor has significant influence and which are not considered subsidiaries or joint ventures. The financial participations in associated companies are consolidated by the equity method, that is, the financial statements include the Group's interest in the total of income and expense recognised of the associate, from the date that significant influence begins until the date on which it actually ends. The dividends received from these companies are recorded as a reduction in the value of financial holdings.
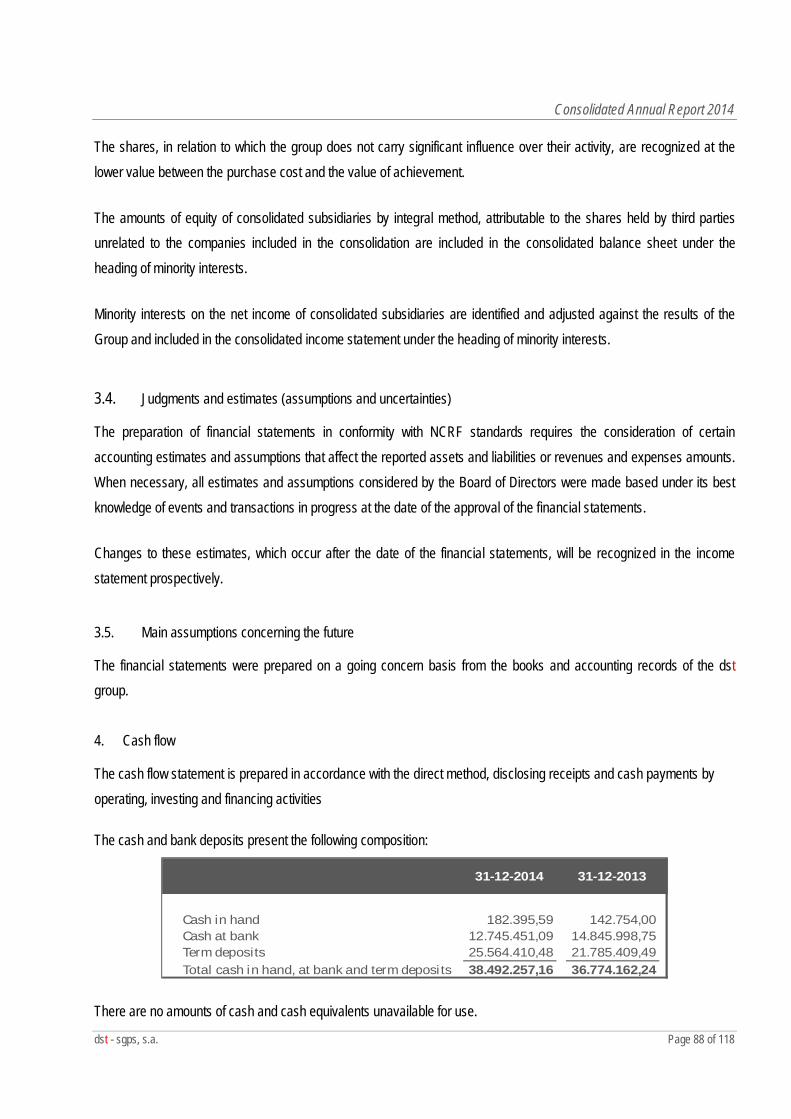
Consolidated Annual Report 2014
dst - sgps, s.a. Page 88 of 118
The shares, in relation to which the group does not carry significant influence over their activity, are recognized at the lower value between the purchase cost and the value of achievement.
The amounts of equity of consolidated subsidiaries by integral method, attributable to the shares held by third parties unrelated to the companies included in the consolidation are included in the consolidated balance sheet under the heading of minority interests.
Minority interests on the net income of consolidated subsidiaries are identified and adjusted against the results of the Group and included in the consolidated income statement under the heading of minority interests.
3.4. Judgments and estimates (assumptions and uncertainties)
The preparation of financial statements in conformity with NCRF standards requires the consideration of certain accounting estimates and assumptions that affect the reported assets and liabilities or revenues and expenses amounts. When necessary, all estimates and assumptions considered by the Board of Directors were made based under its best knowledge of events and transactions in progress at the date of the approval of the financial statements.
Changes to these estimates, which occur after the date of the financial statements, will be recognized in the income statement prospectively.
3.5. Main assumptions concerning the future
The financial statements were prepared on a going concern basis from the books and accounting records of the dst group.
4. Cash flow
The cash flow statement is prepared in accordance with the direct method, disclosing receipts and cash payments by operating, investing and financing activities
The cash and bank deposits present the following composition:
31-12-2014 31-12-2013
Cash in hand 182.395,59 142.754,00Cash at bank 12.745.451,09 14.845.998,75Term deposits 25.564.410,48 21.785.409,49Total cash in hand, at bank and term deposits 38.492.257,16 36.774.162,24
There are no amounts of cash and cash equivalents unavailable for use.
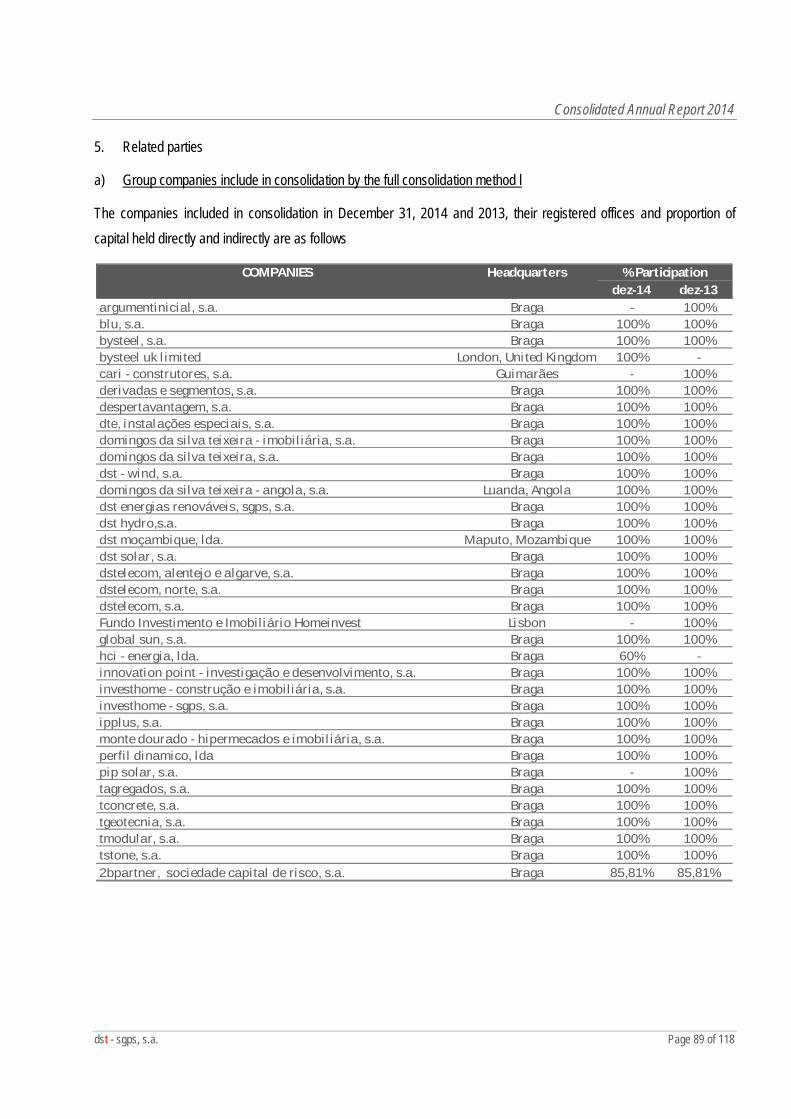
Consolidated Annual Report 2014
dst - sgps, s.a. Page 89 of 118
5. Related parties
a) Group companies include in consolidation by the full consolidation method l
The companies included in consolidation in December 31, 2014 and 2013, their registered offices and proportion of capital held directly and indirectly are as follows
dez-14 dez-13argumentinicial, s.a. Braga - 100%blu, s.a. Braga 100% 100%bysteel, s.a. Braga 100% 100%bysteel uk l imited London, United Kingdom 100% -cari - construtores, s.a. Guimarães - 100%derivadas e segmentos, s.a. Braga 100% 100%despertavantagem, s.a. Braga 100% 100%dte, instalações especiais, s.a. Braga 100% 100%domingos da silva teixeira - imobil iária, s.a. Braga 100% 100%domingos da silva teixeira, s.a. Braga 100% 100%dst - wind, s.a. Braga 100% 100%domingos da silva teixeira - angola, s.a. Luanda, Angola 100% 100%dst energias renováveis, sgps, s.a. Braga 100% 100%dst hydro,s.a. Braga 100% 100%dst moçambique, lda. Maputo, Mozambique 100% 100%dst solar, s.a. Braga 100% 100%dstelecom, alentejo e algarve, s.a. Braga 100% 100%dstelecom, norte, s.a. Braga 100% 100%dstelecom, s.a. Braga 100% 100%Fundo Investimento e Imobiliário Homeinvest Lisbon - 100%global sun, s.a. Braga 100% 100%hci - energia, lda. Braga 60% -innovation point - investigação e desenvolvimento, s.a. Braga 100% 100%investhome - construção e imobiliária, s.a. Braga 100% 100%investhome - sgps, s.a. Braga 100% 100%ipplus, s.a. Braga 100% 100%monte dourado - hipermecados e imobil iária, s.a. Braga 100% 100%perfil dinamico, lda Braga 100% 100%pip solar, s.a. Braga - 100%tagregados, s.a. Braga 100% 100%tconcrete, s.a. Braga 100% 100%tgeotecnia, s.a. Braga 100% 100%tmodular, s.a. Braga 100% 100%tstone, s.a. Braga 100% 100%2bpartner, sociedade capital de risco, s.a. Braga 85,81% 85,81%
Headquarters % ParticipationCOMPANIES
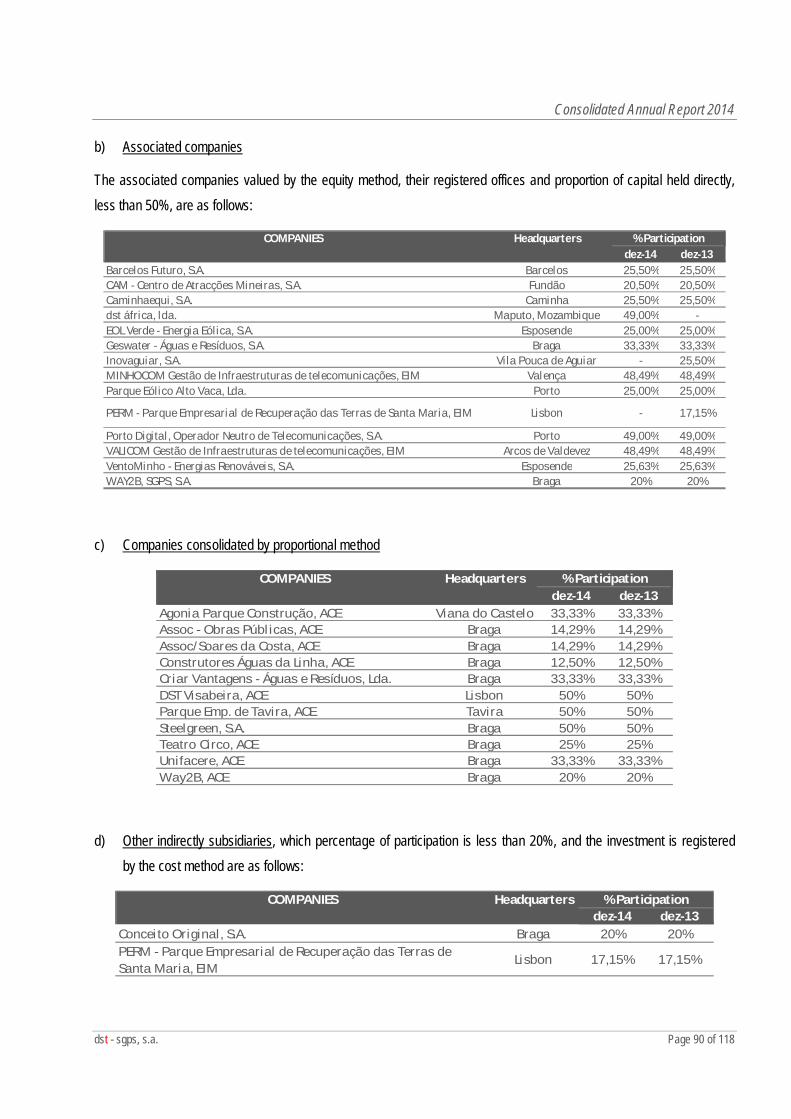
Consolidated Annual Report 2014
dst - sgps, s.a. Page 90 of 118
b) Associated companies
The associated companies valued by the equity method, their registered offices and proportion of capital held directly, less than 50%, are as follows:
dez-14 dez-13Barcelos Futuro, S.A. Barcelos 25,50% 25,50%CAM - Centro de Atracções Mineiras, S.A. Fundão 20,50% 20,50%Caminhaequi, S.A. Caminha 25,50% 25,50%dst áfrica, lda. Maputo, Mozambique 49,00% -EOL Verde - Energia Eólica, S.A. Esposende 25,00% 25,00%Geswater - Águas e Resíduos, S.A. Braga 33,33% 33,33%Inovaguiar, S.A. Vila Pouca de Aguiar - 25,50%MINHOCOM Gestão de Infraestruturas de telecomunicações, EIM Valença 48,49% 48,49%Parque Eólico Alto Vaca, Lda. Porto 25,00% 25,00%
PERM - Parque Empresarial de Recuperação das Terras de Santa Maria, EIM Lisbon - 17,15%
Porto Digital, Operador Neutro de Telecomunicações, S.A. Porto 49,00% 49,00%VALICOM Gestão de Infraestruturas de telecomunicações, EIM Arcos de Valdevez 48,49% 48,49%VentoMinho - Energias Renováveis, S.A. Esposende 25,63% 25,63%WAY2B, SGPS, S.A. Braga 20% 20%
COMPANIES Headquarters % Participation
c) Companies consolidated by proportional method
dez-14 dez-13Agonia Parque Construção, ACE Viana do Castelo 33,33% 33,33%Assoc - Obras Públ icas, ACE Braga 14,29% 14,29%Assoc/Soares da Costa, ACE Braga 14,29% 14,29%Construtores Águas da Linha, ACE Braga 12,50% 12,50%Criar Vantagens - Águas e Resíduos, Lda. Braga 33,33% 33,33%DST Visabeira, ACE Lisbon 50% 50%Parque Emp. de Tavira, ACE Tavira 50% 50%Steelgreen, S.A. Braga 50% 50%Teatro Circo, ACE Braga 25% 25%Unifacere, ACE Braga 33,33% 33,33%Way2B, ACE Braga 20% 20%
% ParticipationCOMPANIES Headquarters
d) Other indirectly subsidiaries, which percentage of participation is less than 20%, and the investment is registered by the cost method are as follows:
dez-14 dez-13Conceito Original, S.A. Braga 20% 20%PERM - Parque Empresarial de Recuperação das Terras de Santa Maria, EIM
Lisbon 17,15% 17,15%
COMPANIES Headquarters % Participation
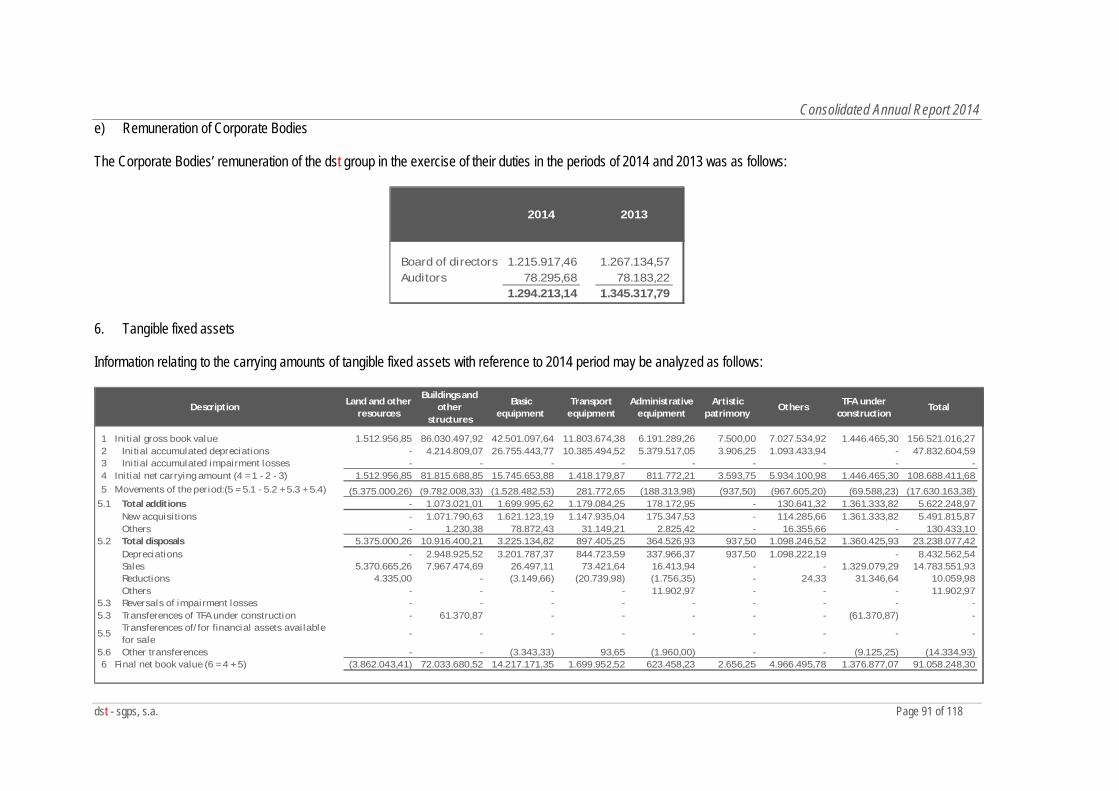
Consolidated Annual Report 2014
dst - sgps, s.a. Page 91 of 118
e) Remuneration of Corporate Bodies
The Corporate Bodies’ remuneration of the dst group in the exercise of their duties in the periods of 2014 and 2013 was as follows:
2014 2013
Board of directors 1.215.917,46 1.267.134,57Auditors 78.295,68 78.183,22
1.294.213,14 1.345.317,79
6. Tangible fixed assets
Information relating to the carrying amounts of tangible fixed assets with reference to 2014 period may be analyzed as follows:
Land and other resources
Buildings and other
structures
Basic equipment
Transport equipment
Administrative equipment
Artistic patrimony
Others TFA under construction
Total
1 Initial gross book value 1.512.956,85 86.030.497,92 42.501.097,64 11.803.674,38 6.191.289,26 7.500,00 7.027.534,92 1.446.465,30 156.521.016,272 Initial accumulated depreciations - 4.214.809,07 26.755.443,77 10.385.494,52 5.379.517,05 3.906,25 1.093.433,94 - 47.832.604,593 Initial accumulated impairment losses - - - - - - - - -4 Initial net carrying amount (4 = 1 - 2 - 3) 1.512.956,85 81.815.688,85 15.745.653,88 1.418.179,87 811.772,21 3.593,75 5.934.100,98 1.446.465,30 108.688.411,685 Movements of the period:(5 = 5.1 - 5.2 + 5.3 + 5.4) (5.375.000,26) (9.782.008,33) (1.528.482,53) 281.772,65 (188.313,98) (937,50) (967.605,20) (69.588,23) (17.630.163,38)
5.1 Total additions - 1.073.021,01 1.699.995,62 1.179.084,25 178.172,95 - 130.641,32 1.361.333,82 5.622.248,97New acquisitions - 1.071.790,63 1.621.123,19 1.147.935,04 175.347,53 - 114.285,66 1.361.333,82 5.491.815,87Others - 1.230,38 78.872,43 31.149,21 2.825,42 - 16.355,66 - 130.433,10
5.2 Total disposals 5.375.000,26 10.916.400,21 3.225.134,82 897.405,25 364.526,93 937,50 1.098.246,52 1.360.425,93 23.238.077,42Depreciations - 2.948.925,52 3.201.787,37 844.723,59 337.966,37 937,50 1.098.222,19 - 8.432.562,54Sales 5.370.665,26 7.967.474,69 26.497,11 73.421,64 16.413,94 - - 1.329.079,29 14.783.551,93Reductions 4.335,00 - (3.149,66) (20.739,98) (1.756,35) - 24,33 31.346,64 10.059,98Others - - - - 11.902,97 - - - 11.902,97
5.3 Reversals of impairment losses - - - - - - - - -5.3 Transferences of TFA under construction - 61.370,87 - - - - - (61.370,87) -
5.5 Transferences of/for financial assets available for sale
- - - - - - - - -
5.6 Other transferences - - (3.343,33) 93,65 (1.960,00) - - (9.125,25) (14.334,93)6 Final net book value (6 = 4 + 5) (3.862.043,41) 72.033.680,52 14.217.171,35 1.699.952,52 623.458,23 2.656,25 4.966.495,78 1.376.877,07 91.058.248,30
Description
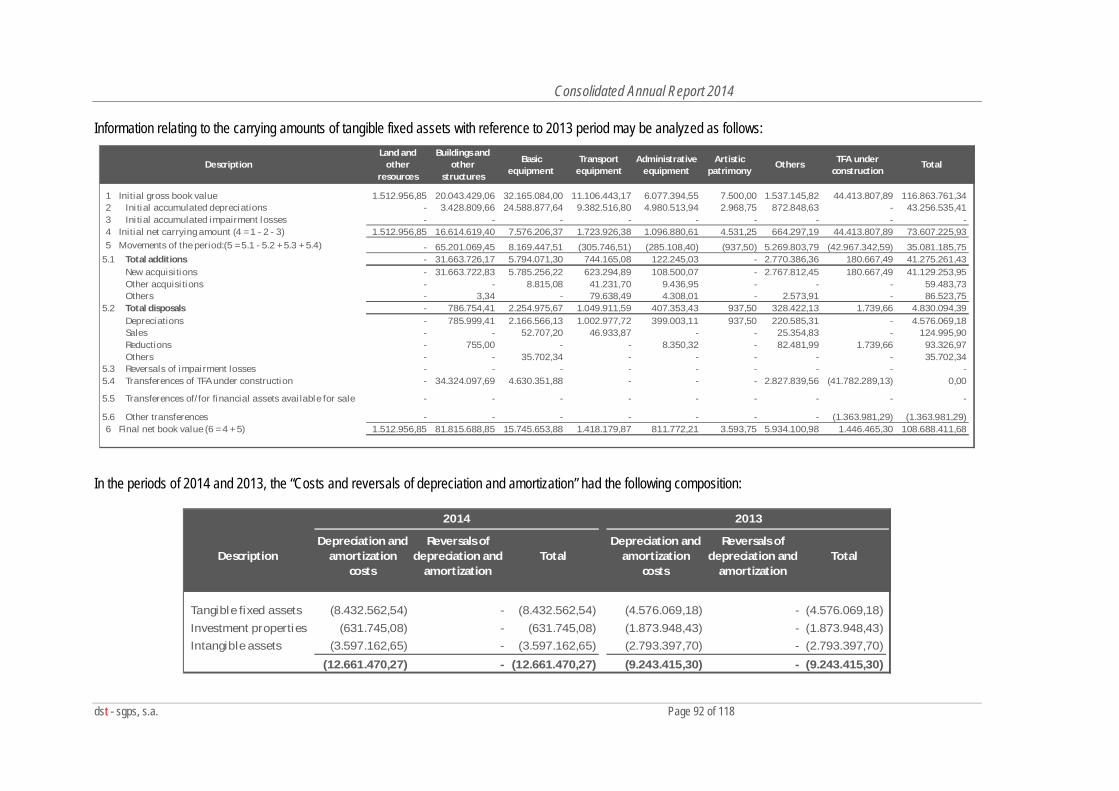
Consolidated Annual Report 2014
dst - sgps, s.a. Page 92 of 118
Information relating to the carrying amounts of tangible fixed assets with reference to 2013 period may be analyzed as follows: Land and
other resources
Buildings and other
structures
Basic equipment
Transport equipment
Administrative equipment
Artistic patrimony
Others TFA under construction
Total
1 Initial gross book value 1.512.956,85 20.043.429,06 32.165.084,00 11.106.443,17 6.077.394,55 7.500,00 1.537.145,82 44.413.807,89 116.863.761,342 Initial accumulated depreciations - 3.428.809,66 24.588.877,64 9.382.516,80 4.980.513,94 2.968,75 872.848,63 - 43.256.535,413 Initial accumulated impairment losses - - - - - - - - -4 Initial net carrying amount (4 = 1 - 2 - 3) 1.512.956,85 16.614.619,40 7.576.206,37 1.723.926,38 1.096.880,61 4.531,25 664.297,19 44.413.807,89 73.607.225,935 Movements of the period:(5 = 5.1 - 5.2 + 5.3 + 5.4) - 65.201.069,45 8.169.447,51 (305.746,51) (285.108,40) (937,50) 5.269.803,79 (42.967.342,59) 35.081.185,75
5.1 Total additions - 31.663.726,17 5.794.071,30 744.165,08 122.245,03 - 2.770.386,36 180.667,49 41.275.261,43New acquisitions - 31.663.722,83 5.785.256,22 623.294,89 108.500,07 - 2.767.812,45 180.667,49 41.129.253,95Other acquisitions - - 8.815,08 41.231,70 9.436,95 - - - 59.483,73Others - 3,34 - 79.638,49 4.308,01 - 2.573,91 - 86.523,75
5.2 Total disposals - 786.754,41 2.254.975,67 1.049.911,59 407.353,43 937,50 328.422,13 1.739,66 4.830.094,39Depreciations - 785.999,41 2.166.566,13 1.002.977,72 399.003,11 937,50 220.585,31 - 4.576.069,18Sales - - 52.707,20 46.933,87 - - 25.354,83 - 124.995,90Reductions - 755,00 - - 8.350,32 - 82.481,99 1.739,66 93.326,97Others - - 35.702,34 - - - - - 35.702,34
5.3 Reversals of impairment losses - - - - - - - - -5.4 Transferences of TFA under construction - 34.324.097,69 4.630.351,88 - - - 2.827.839,56 (41.782.289,13) 0,00
5.5 Transferences of/for financial assets avai lable for sale - - - - - - - - -
5.6 Other transferences - - - - - - - (1.363.981,29) (1.363.981,29)6 Final net book value (6 = 4 + 5) 1.512.956,85 81.815.688,85 15.745.653,88 1.418.179,87 811.772,21 3.593,75 5.934.100,98 1.446.465,30 108.688.411,68
Description
In the periods of 2014 and 2013, the “Costs and reversals of depreciation and amortization” had the following composition:
DescriptionDepreciation and
amortization costs
Reversals of depreciation and
amortizationTotal
Depreciation and amortization
costs
Reversals of depreciation and
amortizationTotal
Tangible fixed assets (8.432.562,54) - (8.432.562,54) (4.576.069,18) - (4.576.069,18)Investment properties (631.745,08) - (631.745,08) (1.873.948,43) - (1.873.948,43)Intangible assets (3.597.162,65) - (3.597.162,65) (2.793.397,70) - (2.793.397,70)
(12.661.470,27) - (12.661.470,27) (9.243.415,30) - (9.243.415,30)
2014 2013
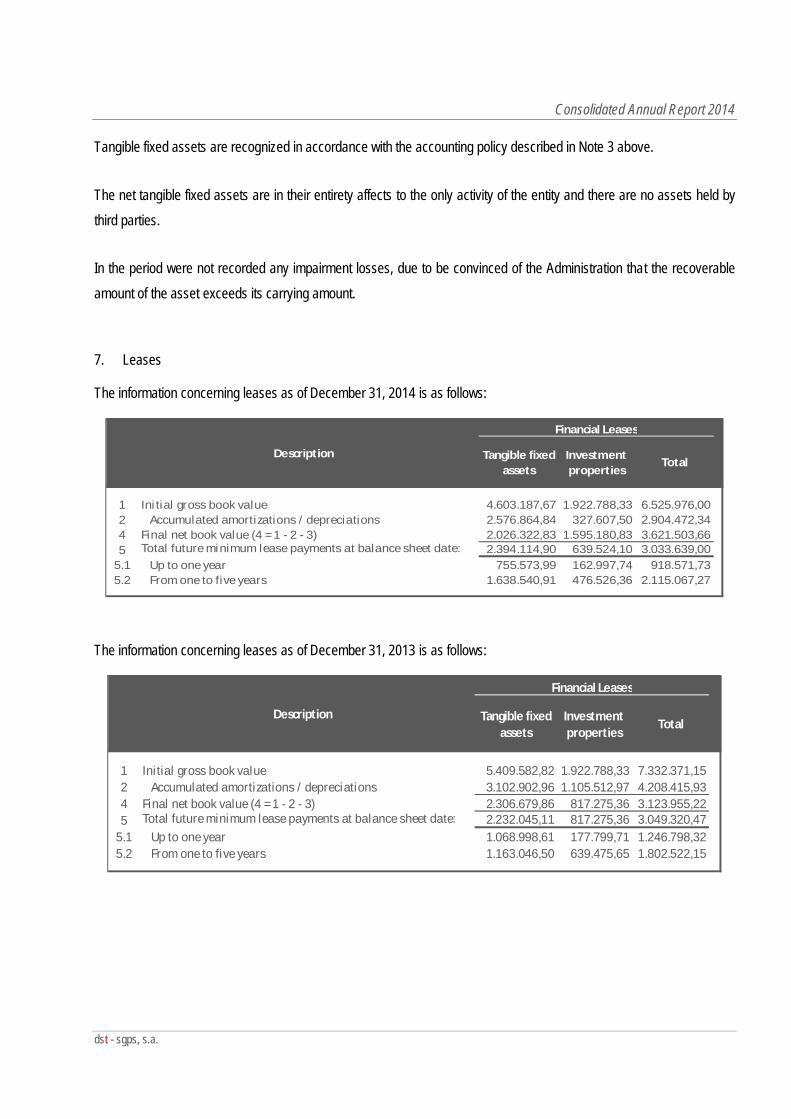
Consolidated Annual Report 2014
dst - sgps, s.a.
Tangible fixed assets are recognized in accordance with the accounting policy described in Note 3 above.
The net tangible fixed assets are in their entirety affects to the only activity of the entity and there are no assets held by third parties.
In the period were not recorded any impairment losses, due to be convinced of the Administration that the recoverable amount of the asset exceeds its carrying amount.
7. Leases
The information concerning leases as of December 31, 2014 is as follows:
Tangible fixed assets
Investment properties
Total
1 Initial gross book value 4.603.187,67 1.922.788,33 6.525.976,002 Accumulated amortizations / depreciations 2.576.864,84 327.607,50 2.904.472,344 Final net book value (4 = 1 - 2 - 3) 2.026.322,83 1.595.180,83 3.621.503,665 Total future minimum lease payments at balance sheet date: 2.394.114,90 639.524,10 3.033.639,00
5.1 Up to one year 755.573,99 162.997,74 918.571,735.2 From one to five years 1.638.540,91 476.526,36 2.115.067,27
Financial Leases
Description
The information concerning leases as of December 31, 2013 is as follows:
Tangible fixed assets
Investment properties
Total
1 Initial gross book value 5.409.582,82 1.922.788,33 7.332.371,152 Accumulated amortizations / depreciations 3.102.902,96 1.105.512,97 4.208.415,934 Final net book value (4 = 1 - 2 - 3) 2.306.679,86 817.275,36 3.123.955,225 Total future minimum lease payments at balance sheet date: 2.232.045,11 817.275,36 3.049.320,47
5.1 Up to one year 1.068.998,61 177.799,71 1.246.798,325.2 From one to five years 1.163.046,50 639.475,65 1.802.522,15
Description
Financial Leases
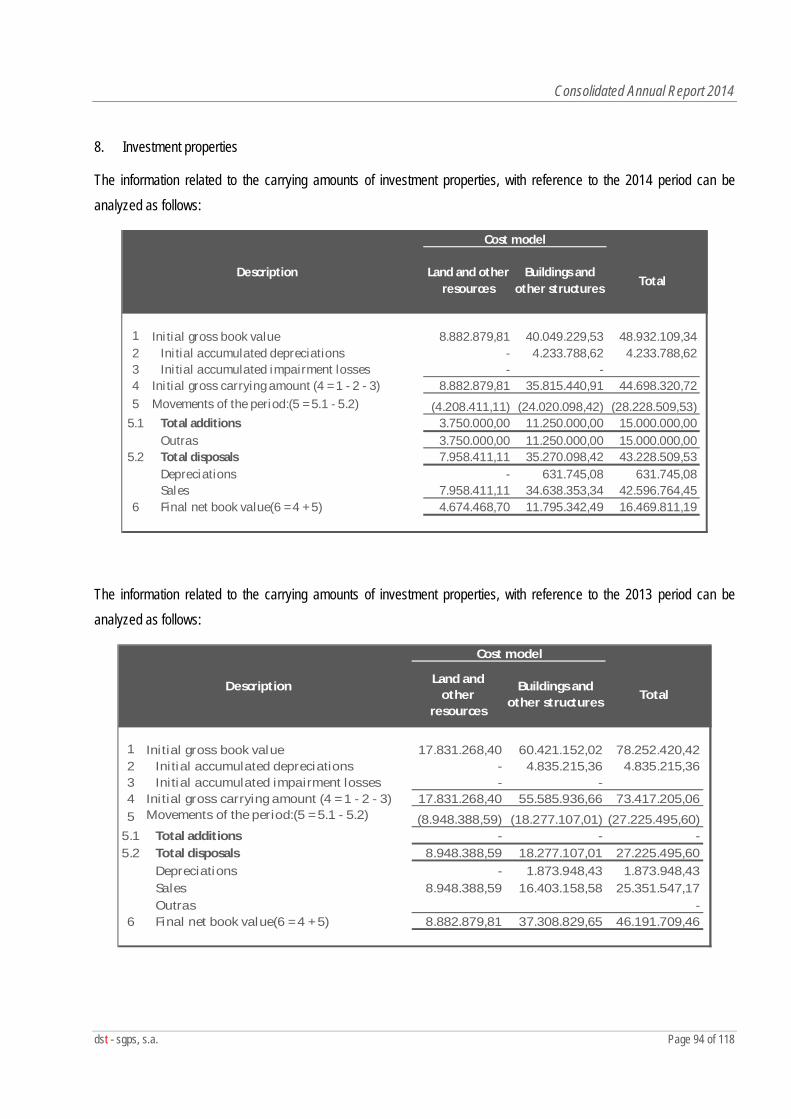
Consolidated Annual Report 2014
dst - sgps, s.a. Page 94 of 118
8. Investment properties
The information related to the carrying amounts of investment properties, with reference to the 2014 period can be analyzed as follows:
Land and other resources
Buildings and other structures Total
1 Initial gross book value 8.882.879,81 40.049.229,53 48.932.109,342 Initial accumulated depreciations - 4.233.788,62 4.233.788,623 Initial accumulated impairment losses - -4 Initial gross carrying amount (4 = 1 - 2 - 3) 8.882.879,81 35.815.440,91 44.698.320,725 Movements of the period:(5 = 5.1 - 5.2) (4.208.411,11) (24.020.098,42) (28.228.509,53)
5.1 Total additions 3.750.000,00 11.250.000,00 15.000.000,00Outras 3.750.000,00 11.250.000,00 15.000.000,00
5.2 Total disposals 7.958.411,11 35.270.098,42 43.228.509,53Depreciations - 631.745,08 631.745,08Sales 7.958.411,11 34.638.353,34 42.596.764,45
6 Final net book value(6 = 4 + 5) 4.674.468,70 11.795.342,49 16.469.811,19
Description
Cost model
The information related to the carrying amounts of investment properties, with reference to the 2013 period can be analyzed as follows:
Land and other
resources
Buildings and other structures Total
1 Initial gross book value 17.831.268,40 60.421.152,02 78.252.420,422 Initial accumulated depreciations - 4.835.215,36 4.835.215,363 Initial accumulated impairment losses - -4 Initial gross carrying amount (4 = 1 - 2 - 3) 17.831.268,40 55.585.936,66 73.417.205,065 Movements of the period:(5 = 5.1 - 5.2) +
5.3 + ..…+ 5.9)(8.948.388,59) (18.277.107,01) (27.225.495,60)
5.1 Total additions - - -5.2 Total disposals 8.948.388,59 18.277.107,01 27.225.495,60
Depreciations - 1.873.948,43 1.873.948,43Sales 8.948.388,59 16.403.158,58 25.351.547,17Outras -
6 Final net book value(6 = 4 + 5) 8.882.879,81 37.308.829,65 46.191.709,46
Cost model
Description
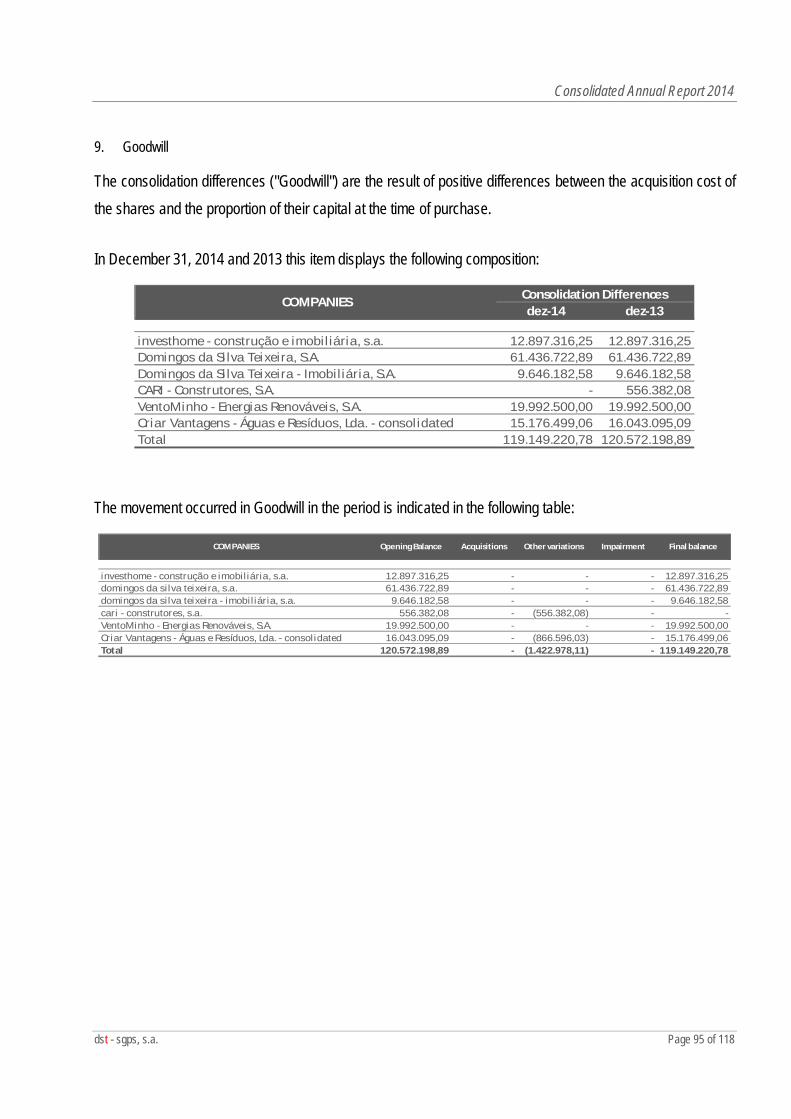
Consolidated Annual Report 2014
dst - sgps, s.a. Page 95 of 118
9. Goodwill
The consolidation differences ("Goodwill") are the result of positive differences between the acquisition cost of the shares and the proportion of their capital at the time of purchase.
In December 31, 2014 and 2013 this item displays the following composition:
dez-14 dez-13
investhome - construção e imobiliária, s.a. 12.897.316,25 12.897.316,25Domingos da Si lva Teixeira, S.A. 61.436.722,89 61.436.722,89Domingos da Si lva Teixeira - Imobiliária, S.A. 9.646.182,58 9.646.182,58CARI - Construtores, S.A. - 556.382,08VentoMinho - Energias Renováveis, S.A. 19.992.500,00 19.992.500,00Criar Vantagens - Águas e Resíduos, Lda. - consolidated 15.176.499,06 16.043.095,09Total 119.149.220,78 120.572.198,89
COMPANIES Consolidation Differences
The movement occurred in Goodwill in the period is indicated in the following table:
investhome - construção e imobiliária, s.a. 12.897.316,25 - - - 12.897.316,25domingos da silva teixeira, s.a. 61.436.722,89 - - - 61.436.722,89domingos da silva teixeira - imobiliária, s.a. 9.646.182,58 - - - 9.646.182,58cari - construtores, s.a. 556.382,08 - (556.382,08) - -VentoMinho - Energias Renováveis, S.A. 19.992.500,00 - - - 19.992.500,00Criar Vantagens - Águas e Resíduos, Lda. - consolidated 16.043.095,09 - (866.596,03) - 15.176.499,06Total 120.572.198,89 - (1.422.978,11) - 119.149.220,78
Other variations Impairment Final balanceCOMPANIES Opening Balance Acquisitions
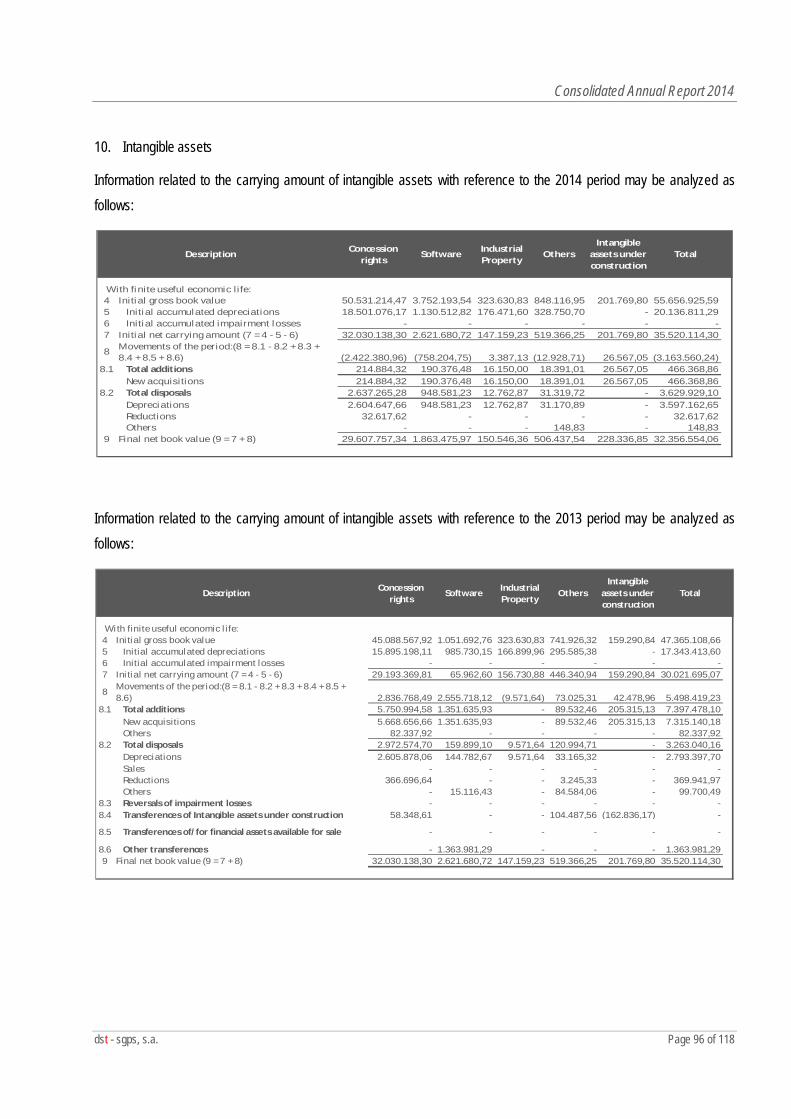
Consolidated Annual Report 2014
dst - sgps, s.a. Page 96 of 118
10. Intangible assets
Information related to the carrying amount of intangible assets with reference to the 2014 period may be analyzed as follows:
Concession rights
Software Industrial Property
OthersIntangible
assets under construction
Total
4 Initial gross book value 50.531.214,47 3.752.193,54 323.630,83 848.116,95 201.769,80 55.656.925,595 Initial accumulated depreciations 18.501.076,17 1.130.512,82 176.471,60 328.750,70 - 20.136.811,296 Initial accumulated impairment losses - - - - - -7 Initial net carrying amount (7 = 4 - 5 - 6) 32.030.138,30 2.621.680,72 147.159,23 519.366,25 201.769,80 35.520.114,30
8 Movements of the period:(8 = 8.1 - 8.2 + 8.3 + 8.4 + 8.5 + 8.6) (2.422.380,96) (758.204,75) 3.387,13 (12.928,71) 26.567,05 (3.163.560,24)
8.1 Total additions 214.884,32 190.376,48 16.150,00 18.391,01 26.567,05 466.368,86New acquisitions 214.884,32 190.376,48 16.150,00 18.391,01 26.567,05 466.368,86
8.2 Total disposals 2.637.265,28 948.581,23 12.762,87 31.319,72 - 3.629.929,10Depreciations 2.604.647,66 948.581,23 12.762,87 31.170,89 - 3.597.162,65Reductions 32.617,62 - - - - 32.617,62Others - - - 148,83 - 148,83
9 Final net book value (9 = 7 + 8) 29.607.757,34 1.863.475,97 150.546,36 506.437,54 228.336,85 32.356.554,06
Description
With finite useful economic life:
Information related to the carrying amount of intangible assets with reference to the 2013 period may be analyzed as follows:
Concession rights
Software Industrial Property
OthersIntangible
assets under construction
Total
4 Initial gross book value 45.088.567,92 1.051.692,76 323.630,83 741.926,32 159.290,84 47.365.108,665 Initial accumulated depreciations 15.895.198,11 985.730,15 166.899,96 295.585,38 - 17.343.413,606 Initial accumulated impairment losses - - - - - -7 Initial net carrying amount (7 = 4 - 5 - 6) 29.193.369,81 65.962,60 156.730,88 446.340,94 159.290,84 30.021.695,07
8 Movements of the period:(8 = 8.1 - 8.2 + 8.3 + 8.4 + 8.5 + 8.6) 2.836.768,49 2.555.718,12 (9.571,64) 73.025,31 42.478,96 5.498.419,23
8.1 Total additions 5.750.994,58 1.351.635,93 - 89.532,46 205.315,13 7.397.478,10New acquis itions 5.668.656,66 1.351.635,93 - 89.532,46 205.315,13 7.315.140,18Others 82.337,92 - - - - 82.337,92
8.2 Total disposals 2.972.574,70 159.899,10 9.571,64 120.994,71 - 3.263.040,16Depreciations 2.605.878,06 144.782,67 9.571,64 33.165,32 - 2.793.397,70Sales - - - - - -Reductions 366.696,64 - - 3.245,33 - 369.941,97Others - 15.116,43 - 84.584,06 - 99.700,49
8.3 Reversals of impairment losses - - - - - -8.4 Transferences of Intangible assets under construction 58.348,61 - - 104.487,56 (162.836,17) -
8.5 Transferences of/for financial assets available for sale - - - - - -
8.6 Other transferences - 1.363.981,29 - - - 1.363.981,299 Final net book value (9 = 7 + 8) 32.030.138,30 2.621.680,72 147.159,23 519.366,25 201.769,80 35.520.114,30
Description
With finite useful economic l ife:
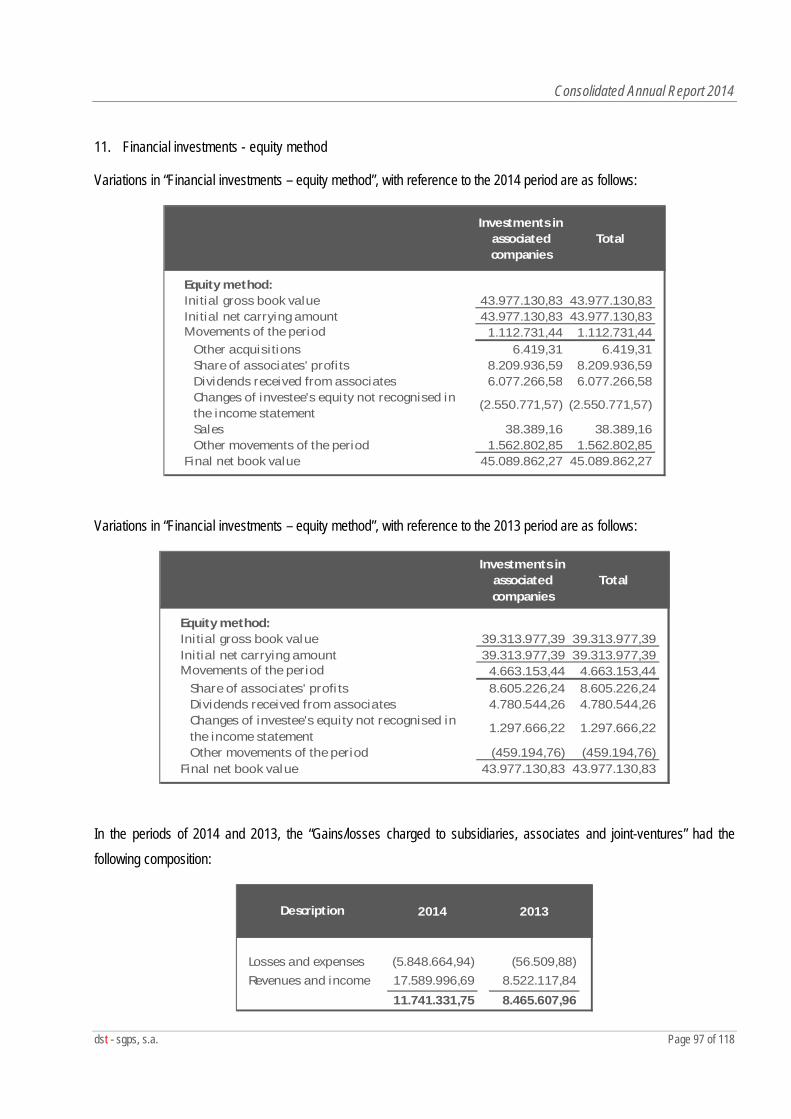
Consolidated Annual Report 2014
dst - sgps, s.a. Page 97 of 118
11. Financial investments - equity method
Variations in “Financial investments – equity method”, with reference to the 2014 period are as follows:
Investments in associated companies
Total
Equity method:Initial gross book value 43.977.130,83 43.977.130,83Initial net carrying amount 43.977.130,83 43.977.130,83Movements of the period 1.112.731,44 1.112.731,44
Other acquisitions 6.419,31 6.419,31Share of associates' profits 8.209.936,59 8.209.936,59Dividends received from associates 6.077.266,58 6.077.266,58Changes of investee's equity not recognised in the income statement
(2.550.771,57) (2.550.771,57)
Sales 38.389,16 38.389,16Other movements of the period 1.562.802,85 1.562.802,85
Final net book value 45.089.862,27 45.089.862,27
Variations in “Financial investments – equity method”, with reference to the 2013 period are as follows:
Investments in associated companies
Total
Equity method:Initial gross book value 39.313.977,39 39.313.977,39Initial net carrying amount 39.313.977,39 39.313.977,39Movements of the period 4.663.153,44 4.663.153,44
Share of associates' profi ts 8.605.226,24 8.605.226,24Dividends received from associates 4.780.544,26 4.780.544,26Changes of investee's equity not recognised in the income statement
1.297.666,22 1.297.666,22
Other movements of the period (459.194,76) (459.194,76)Final net book value 43.977.130,83 43.977.130,83
In the periods of 2014 and 2013, the “Gains/losses charged to subsidiaries, associates and joint-ventures” had the following composition:
Description 2014 2013
Losses and expenses (5.848.664,94) (56.509,88)Revenues and income 17.589.996,69 8.522.117,84
11.741.331,75 8.465.607,96
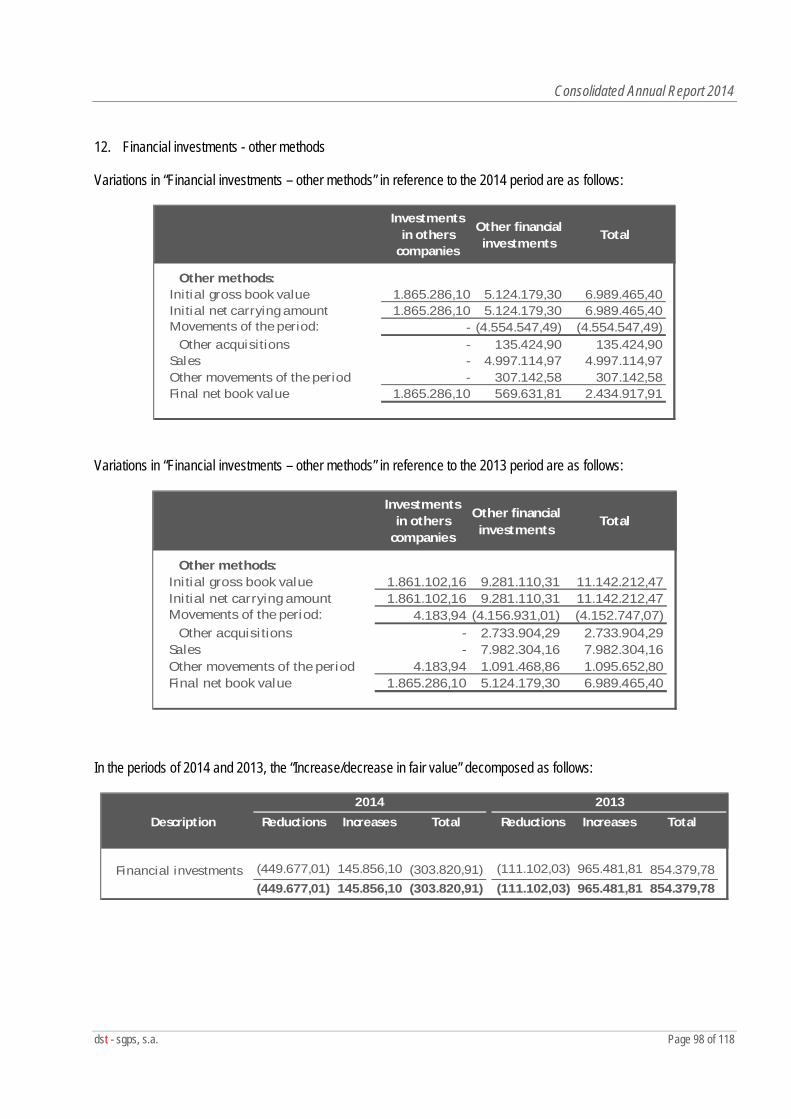
Consolidated Annual Report 2014
dst - sgps, s.a. Page 98 of 118
12. Financial investments - other methods
Variations in “Financial investments – other methods” in reference to the 2014 period are as follows:
Investments in others
companies
Other financial investments
Total
Other methods:Initial gross book value 1.865.286,10 5.124.179,30 6.989.465,40Initial net carrying amount 1.865.286,10 5.124.179,30 6.989.465,40Movements of the period: - (4.554.547,49) (4.554.547,49)
Other acquisitions - 135.424,90 135.424,90Sales - 4.997.114,97 4.997.114,97Other movements of the period - 307.142,58 307.142,58Final net book value 1.865.286,10 569.631,81 2.434.917,91
Variations in “Financial investments – other methods” in reference to the 2013 period are as follows:
Investments in others
companies
Other financial investments
Total
Other methods:Initial gross book value 1.861.102,16 9.281.110,31 11.142.212,47Initial net carrying amount 1.861.102,16 9.281.110,31 11.142.212,47Movements of the period: 4.183,94 (4.156.931,01) (4.152.747,07)
Other acquisitions - 2.733.904,29 2.733.904,29Sales - 7.982.304,16 7.982.304,16Other movements of the period 4.183,94 1.091.468,86 1.095.652,80Final net book value 1.865.286,10 5.124.179,30 6.989.465,40
In the periods of 2014 and 2013, the “Increase/decrease in fair value” decomposed as follows:
Description Reductions Increases Total Reductions Increases Total
Financial investments (449.677,01) 145.856,10 (303.820,91) (111.102,03) 965.481,81 854.379,78(449.677,01) 145.856,10 (303.820,91) (111.102,03) 965.481,81 854.379,78
2014 2013
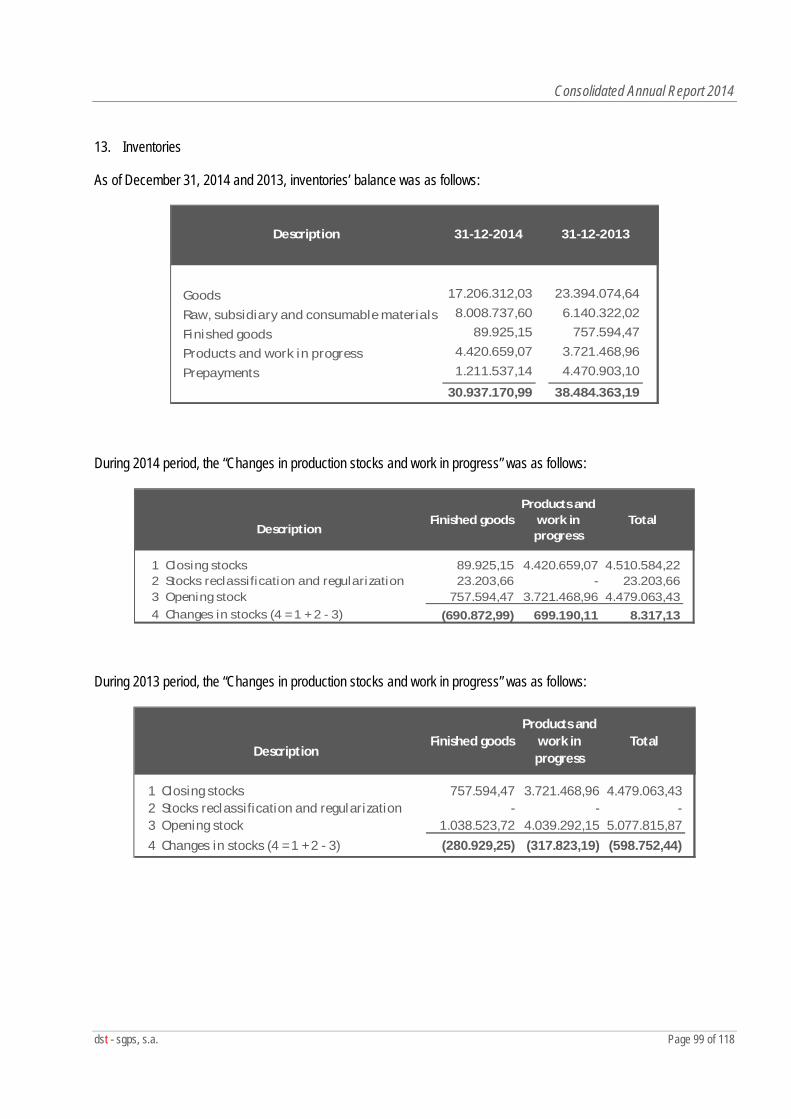
Consolidated Annual Report 2014
dst - sgps, s.a. Page 99 of 118
13. Inventories
As of December 31, 2014 and 2013, inventories’ balance was as follows:
Description 31-12-2014 31-12-2013
Goods 17.206.312,03 23.394.074,64
Raw, subsidiary and consumable materials 8.008.737,60 6.140.322,02
Finished goods 89.925,15 757.594,47
Products and work in progress 4.420.659,07 3.721.468,96
Prepayments 1.211.537,14 4.470.903,10
30.937.170,99 38.484.363,19
During 2014 period, the “Changes in production stocks and work in progress” was as follows:
Description
1 Closing stocks 89.925,15 4.420.659,07 4.510.584,222 Stocks reclassification and regularization 23.203,66 - 23.203,663 Opening stock 757.594,47 3.721.468,96 4.479.063,434 Changes in stocks (4 = 1 + 2 - 3) (690.872,99) 699.190,11 8.317,13
Finished goodsProducts and
work in progress
Total
During 2013 period, the “Changes in production stocks and work in progress” was as follows:
Description
1 Closing stocks 757.594,47 3.721.468,96 4.479.063,432 Stocks reclassification and regularization - - -3 Opening stock 1.038.523,72 4.039.292,15 5.077.815,874 Changes in stocks (4 = 1 + 2 - 3) (280.929,25) (317.823,19) (598.752,44)
Finished goodsProducts and
work in progress
Total
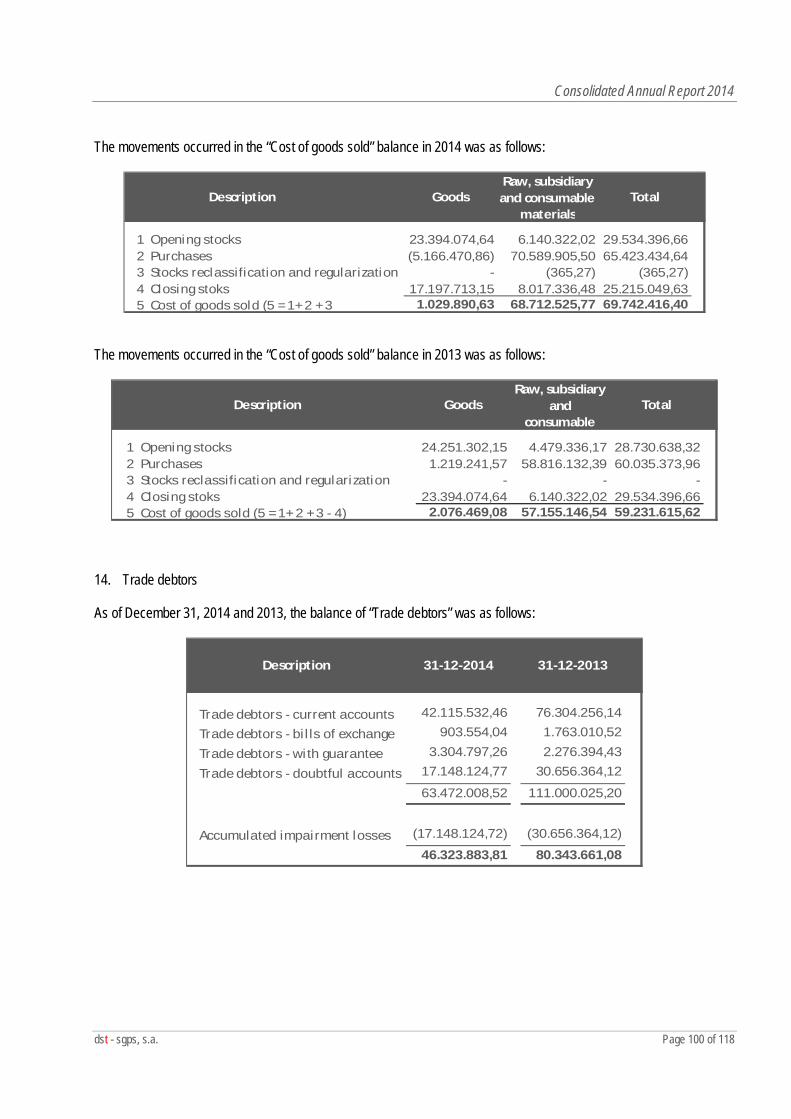
Consolidated Annual Report 2014
dst - sgps, s.a. Page 100 of 118
The movements occurred in the “Cost of goods sold” balance in 2014 was as follows:
1 Opening stocks 23.394.074,64 6.140.322,02 29.534.396,662 Purchases (5.166.470,86) 70.589.905,50 65.423.434,643 Stocks reclassification and regularization - (365,27) (365,27)4 Closing stoks 17.197.713,15 8.017.336,48 25.215.049,635 Cost of goods sold (5 = 1+ 2 + 3 1.029.890,63 68.712.525,77 69.742.416,40
Description GoodsRaw, subsidiary
and consumable materials
Total
The movements occurred in the “Cost of goods sold” balance in 2013 was as follows:
1 Opening stocks 24.251.302,15 4.479.336,17 28.730.638,322 Purchases 1.219.241,57 58.816.132,39 60.035.373,963 Stocks reclassification and regularization - - -4 Closing stoks 23.394.074,64 6.140.322,02 29.534.396,665 Cost of goods sold (5 = 1+ 2 + 3 - 4) 2.076.469,08 57.155.146,54 59.231.615,62
Description GoodsRaw, subsidiary
and consumable
Total
14. Trade debtors
As of December 31, 2014 and 2013, the balance of “Trade debtors” was as follows:
Description 31-12-2014 31-12-2013
Trade debtors - current accounts 42.115.532,46 76.304.256,14
Trade debtors - bi l ls of exchange 903.554,04 1.763.010,52
Trade debtors - with guarantee 3.304.797,26 2.276.394,43
Trade debtors - doubtful accounts 17.148.124,77 30.656.364,12
63.472.008,52 111.000.025,20
Accumulated impairment losses (17.148.124,72) (30.656.364,12)
46.323.883,81 80.343.661,08
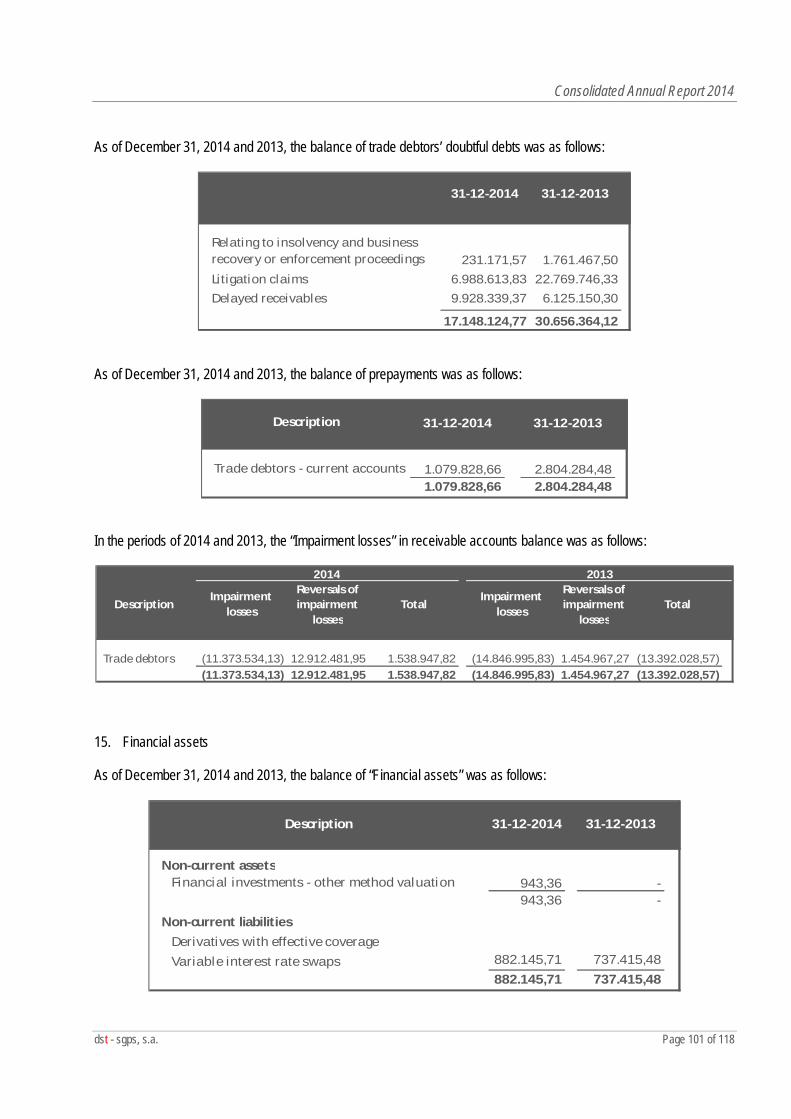
Consolidated Annual Report 2014
dst - sgps, s.a. Page 101 of 118
As of December 31, 2014 and 2013, the balance of trade debtors’ doubtful debts was as follows:
31-12-2014 31-12-2013
Relating to insolvency and business recovery or enforcement proceedings 231.171,57 1.761.467,50Litigation claims 6.988.613,83 22.769.746,33Delayed receivables 9.928.339,37 6.125.150,30
17.148.124,77 30.656.364,12 As of December 31, 2014 and 2013, the balance of prepayments was as follows:
Description 31-12-2014 31-12-2013
Trade debtors - current accounts 1.079.828,66 2.804.284,481.079.828,66 2.804.284,48
In the periods of 2014 and 2013, the “Impairment losses” in receivable accounts balance was as follows:
DescriptionImpairment
losses
Reversals of impairment
lossesTotal
Impairment losses
Reversals of impairment
lossesTotal
Trade debtors (11.373.534,13) 12.912.481,95 1.538.947,82 (14.846.995,83) 1.454.967,27 (13.392.028,57)(11.373.534,13) 12.912.481,95 1.538.947,82 (14.846.995,83) 1.454.967,27 (13.392.028,57)
20132014
15. Financial assets
As of December 31, 2014 and 2013, the balance of “Financial assets” was as follows:
Description 31-12-2014 31-12-2013
Non-current assetsFinancial investments - other method valuation 943,36 -
943,36 -
Non-current liabilitiesDerivatives with effective coverageVariable interest rate swaps 882.145,71 737.415,48
882.145,71 737.415,48
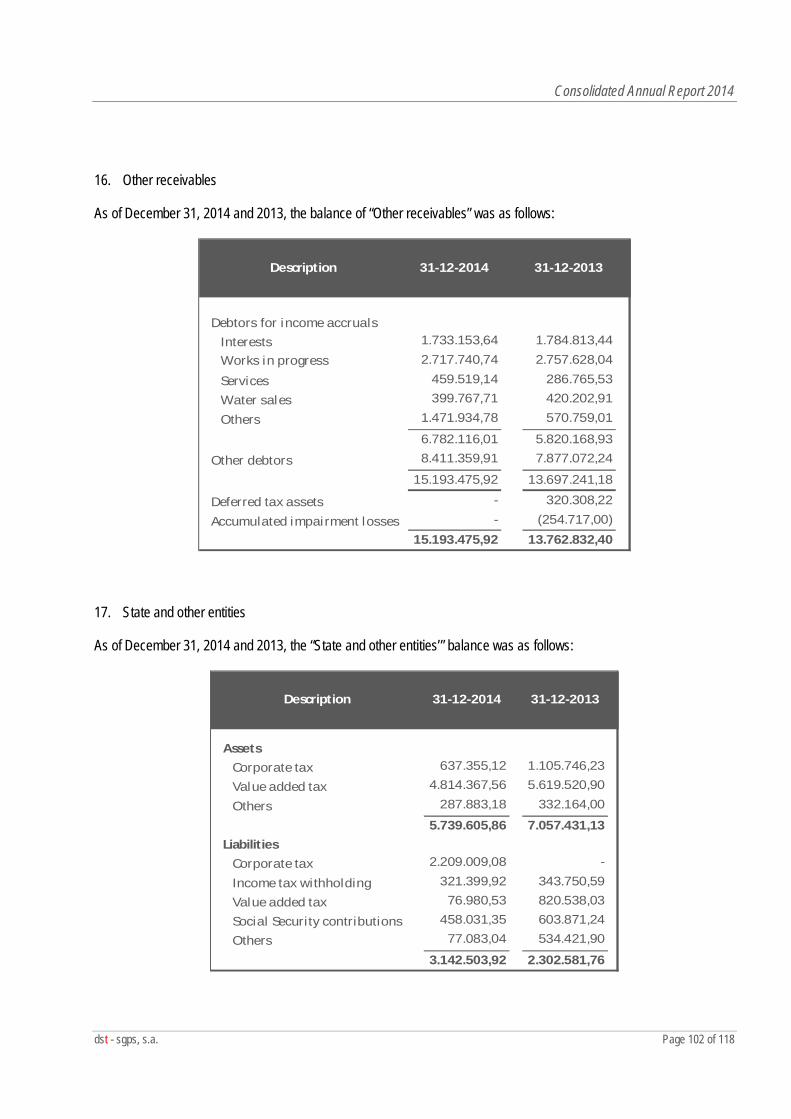
Consolidated Annual Report 2014
dst - sgps, s.a. Page 102 of 118
16. Other receivables
As of December 31, 2014 and 2013, the balance of “Other receivables” was as follows:
Description 31-12-2014 31-12-2013
Debtors for income accrualsInterests 1.733.153,64 1.784.813,44
Works in progress 2.717.740,74 2.757.628,04
Services 459.519,14 286.765,53
Water sales 399.767,71 420.202,91
Others 1.471.934,78 570.759,01
6.782.116,01 5.820.168,93
Other debtors 8.411.359,91 7.877.072,24
15.193.475,92 13.697.241,18
Deferred tax assets - 320.308,22
Accumulated impairment losses - (254.717,00)
15.193.475,92 13.762.832,40
17. State and other entities
As of December 31, 2014 and 2013, the “State and other entities’” balance was as follows:
Description 31-12-2014 31-12-2013
AssetsCorporate tax 637.355,12 1.105.746,23
Value added tax 4.814.367,56 5.619.520,90
Others 287.883,18 332.164,00
5.739.605,86 7.057.431,13Liabilities
Corporate tax 2.209.009,08 -
Income tax withholding 321.399,92 343.750,59
Value added tax 76.980,53 820.538,03
Social Security contributions 458.031,35 603.871,24
Others 77.083,04 534.421,90
3.142.503,92 2.302.581,76

Consolidated Annual Report 2014
dst - sgps, s.a. Page 103 of 118
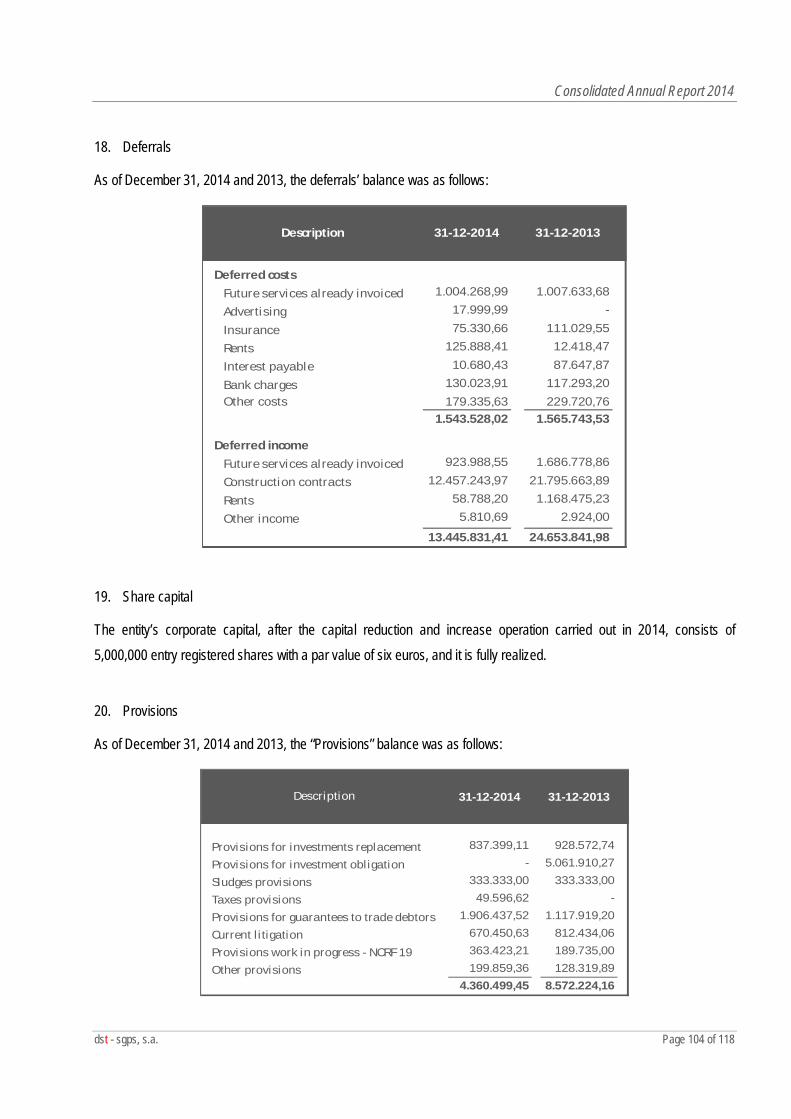
Consolidated Annual Report 2014
dst - sgps, s.a. Page 104 of 118
18. Deferrals
As of December 31, 2014 and 2013, the deferrals’ balance was as follows:
Description 31-12-2014 31-12-2013
Deferred costsFuture services already invoiced 1.004.268,99 1.007.633,68
Advertising 17.999,99 -
Insurance 75.330,66 111.029,55
Rents 125.888,41 12.418,47
Interest payable 10.680,43 87.647,87
Bank charges 130.023,91 117.293,20Other costs 179.335,63 229.720,76
1.543.528,02 1.565.743,53
Deferred incomeFuture services already invoiced 923.988,55 1.686.778,86
Construction contracts 12.457.243,97 21.795.663,89
Rents 58.788,20 1.168.475,23
Other income 5.810,69 2.924,00
13.445.831,41 24.653.841,98
19. Share capital
The entity’s corporate capital, after the capital reduction and increase operation carried out in 2014, consists of 5,000,000 entry registered shares with a par value of six euros, and it is fully realized.
20. Provisions
As of December 31, 2014 and 2013, the “Provisions” balance was as follows:
Description 31-12-2014 31-12-2013
Provis ions for investments replacement 837.399,11 928.572,74
Provis ions for investment obligation - 5.061.910,27
Sludges provisions 333.333,00 333.333,00
Taxes provisions 49.596,62 -
Provis ions for guarantees to trade debtors 1.906.437,52 1.117.919,20
Current l itigation 670.450,63 812.434,06
Provis ions work in progress - NCRF 19 363.423,21 189.735,00
Other provisions 199.859,36 128.319,894.360.499,45 8.572.224,16
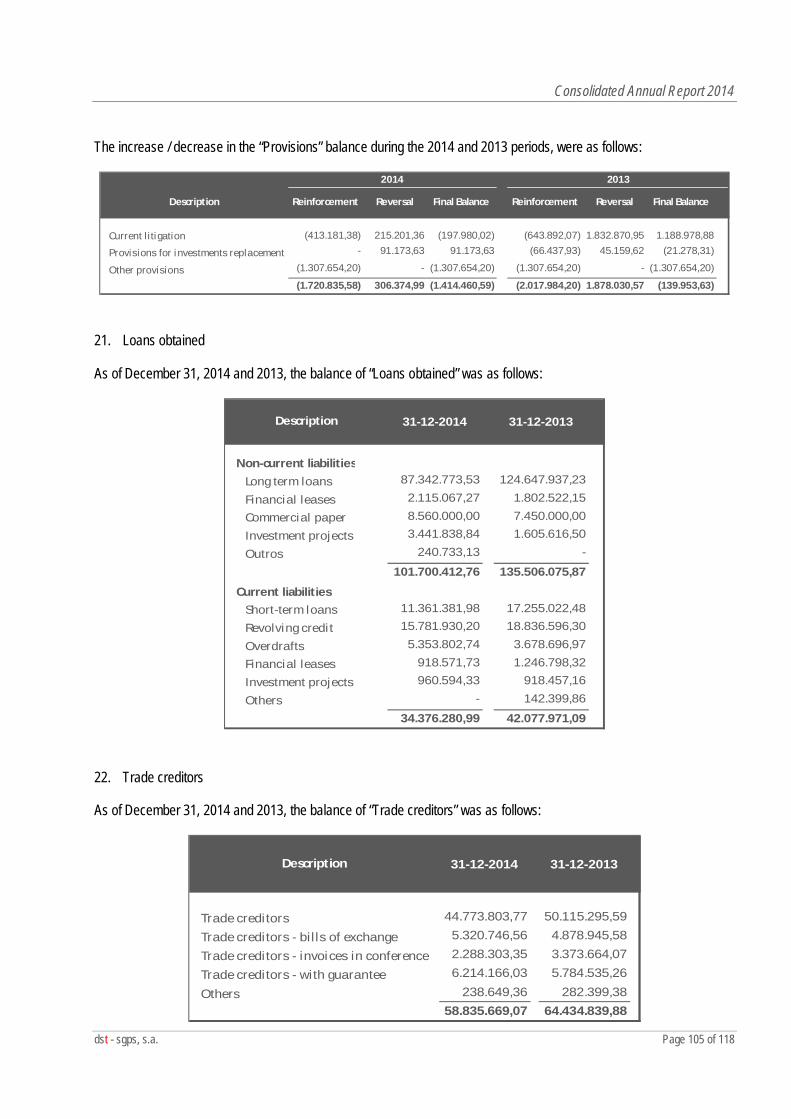
Consolidated Annual Report 2014
dst - sgps, s.a. Page 105 of 118
The increase / decrease in the “Provisions” balance during the 2014 and 2013 periods, were as follows:
Description Reinforcement Reversal Final Balance Reinforcement Reversal Final Balance
Current l itigation (413.181,38) 215.201,36 (197.980,02) (643.892,07) 1.832.870,95 1.188.978,88
Provis ions for investments replacement - 91.173,63 91.173,63 (66.437,93) 45.159,62 (21.278,31)
Other provisions (1.307.654,20) - (1.307.654,20) (1.307.654,20) - (1.307.654,20)
(1.720.835,58) 306.374,99 (1.414.460,59) (2.017.984,20) 1.878.030,57 (139.953,63)
2014 2013
21. Loans obtained
As of December 31, 2014 and 2013, the balance of “Loans obtained” was as follows:
Description 31-12-2014 31-12-2013
Non-current liabilitiesLong term loans 87.342.773,53 124.647.937,23
Financial leases 2.115.067,27 1.802.522,15
Commercial paper 8.560.000,00 7.450.000,00
Investment projects 3.441.838,84 1.605.616,50
Outros 240.733,13 -
101.700.412,76 135.506.075,87
Current liabilitiesShort-term loans 11.361.381,98 17.255.022,48
Revolving credit 15.781.930,20 18.836.596,30
Overdrafts 5.353.802,74 3.678.696,97
Financial leases 918.571,73 1.246.798,32
Investment projects 960.594,33 918.457,16
Others - 142.399,86
34.376.280,99 42.077.971,09
22. Trade creditors
As of December 31, 2014 and 2013, the balance of “Trade creditors” was as follows:
Description 31-12-2014 31-12-2013
Trade creditors 44.773.803,77 50.115.295,59
Trade creditors - bil ls of exchange 5.320.746,56 4.878.945,58
Trade creditors - invoices in conference 2.288.303,35 3.373.664,07
Trade creditors - with guarantee 6.214.166,03 5.784.535,26
Others 238.649,36 282.399,3858.835.669,07 64.434.839,88
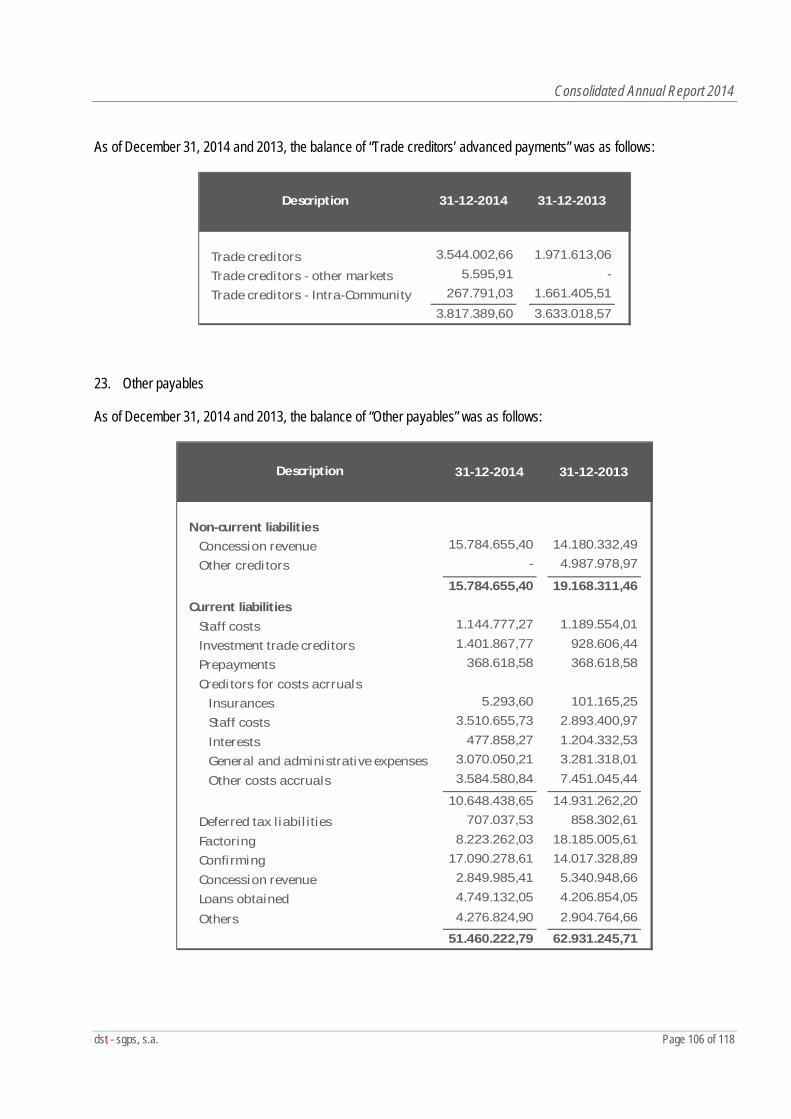
Consolidated Annual Report 2014
dst - sgps, s.a. Page 106 of 118
As of December 31, 2014 and 2013, the balance of “Trade creditors’ advanced payments” was as follows:
Description 31-12-2014 31-12-2013
Trade creditors 3.544.002,66 1.971.613,06
Trade creditors - other markets 5.595,91 -
Trade creditors - Intra-Community 267.791,03 1.661.405,51
3.817.389,60 3.633.018,57
23. Other payables
As of December 31, 2014 and 2013, the balance of “Other payables” was as follows:
Description 31-12-2014 31-12-2013
Non-current liabilitiesConcession revenue 15.784.655,40 14.180.332,49
Other creditors - 4.987.978,97
15.784.655,40 19.168.311,46
Current liabilitiesStaff costs 1.144.777,27 1.189.554,01
Investment trade creditors 1.401.867,77 928.606,44
Prepayments 368.618,58 368.618,58
Creditors for costs acrrualsInsurances 5.293,60 101.165,25
Staff costs 3.510.655,73 2.893.400,97
Interests 477.858,27 1.204.332,53
General and administrative expenses 3.070.050,21 3.281.318,01
Other costs accruals 3.584.580,84 7.451.045,44- -10.648.438,65 14.931.262,20
Deferred tax liabil ities 707.037,53 858.302,61
Factoring 8.223.262,03 18.185.005,61
Confirming 17.090.278,61 14.017.328,89
Concession revenue 2.849.985,41 5.340.948,66
Loans obtained 4.749.132,05 4.206.854,05
Others 4.276.824,90 2.904.764,66
51.460.222,79 62.931.245,71
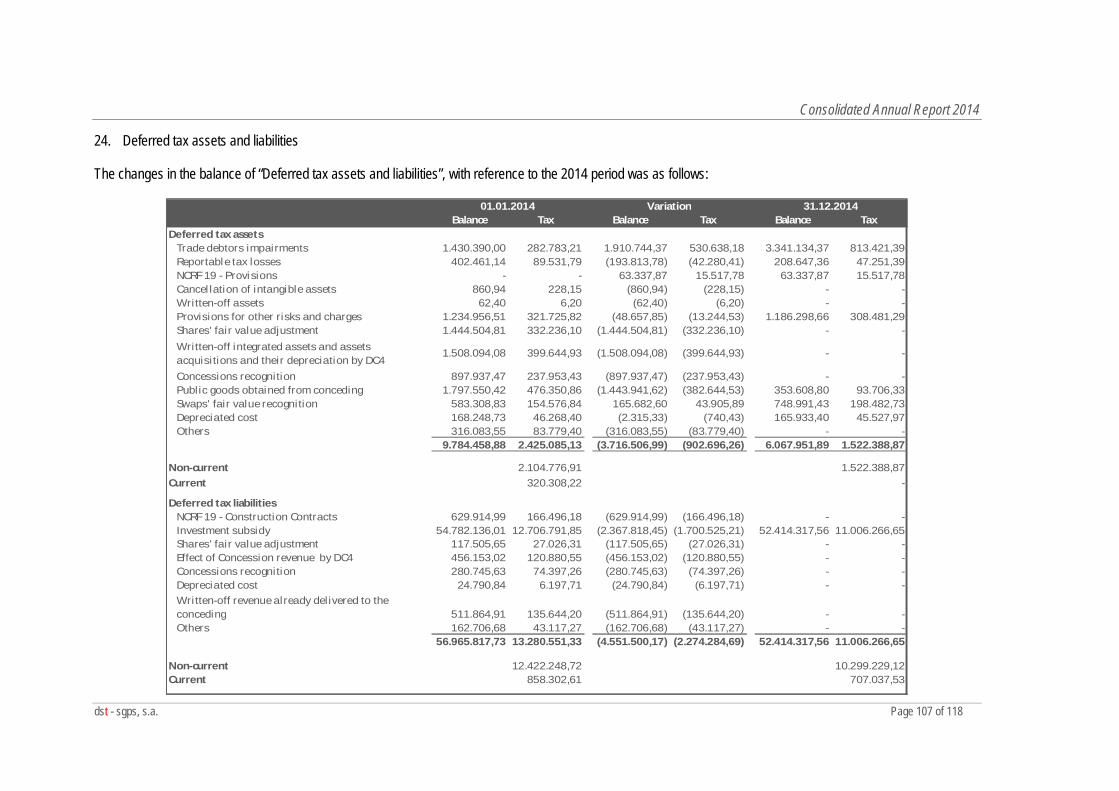
Consolidated Annual Report 2014
dst - sgps, s.a. Page 107 of 118
24. Deferred tax assets and liabilities
The changes in the balance of “Deferred tax assets and liabilities”, with reference to the 2014 period was as follows:
Balance Tax Balance Tax Balance TaxDeferred tax assets
Trade debtors impairments 1.430.390,00 282.783,21 1.910.744,37 530.638,18 3.341.134,37 813.421,39Reportable tax losses 402.461,14 89.531,79 (193.813,78) (42.280,41) 208.647,36 47.251,39NCRF 19 - Provisions - - 63.337,87 15.517,78 63.337,87 15.517,78Cancel lation of intangible assets 860,94 228,15 (860,94) (228,15) - -Written-off assets 62,40 6,20 (62,40) (6,20) - -Provisions for other risks and charges 1.234.956,51 321.725,82 (48.657,85) (13.244,53) 1.186.298,66 308.481,29Shares' fair value adjustment 1.444.504,81 332.236,10 (1.444.504,81) (332.236,10) - -Written-off integrated assets and assets acquisitions and their depreciation by DC4
1.508.094,08 399.644,93 (1.508.094,08) (399.644,93) - -
Concessions recognition 897.937,47 237.953,43 (897.937,47) (237.953,43) - -Public goods obtained from conceding 1.797.550,42 476.350,86 (1.443.941,62) (382.644,53) 353.608,80 93.706,33Swaps' fair value recognition 583.308,83 154.576,84 165.682,60 43.905,89 748.991,43 198.482,73Depreciated cost 168.248,73 46.268,40 (2.315,33) (740,43) 165.933,40 45.527,97Others 316.083,55 83.779,40 (316.083,55) (83.779,40) - -
9.784.458,88 2.425.085,13 (3.716.506,99) (902.696,26) 6.067.951,89 1.522.388,87
Non-current 2.104.776,91 1.522.388,87Current 320.308,22 -
Deferred tax liabilitiesNCRF 19 - Construction Contracts 629.914,99 166.496,18 (629.914,99) (166.496,18) - -Investment subsidy 54.782.136,01 12.706.791,85 (2.367.818,45) (1.700.525,21) 52.414.317,56 11.006.266,65Shares' fair value adjustment 117.505,65 27.026,31 (117.505,65) (27.026,31) - -Effect of Concession revenue by DC4 456.153,02 120.880,55 (456.153,02) (120.880,55) - -Concessions recognition 280.745,63 74.397,26 (280.745,63) (74.397,26) - -Depreciated cost 24.790,84 6.197,71 (24.790,84) (6.197,71) - -Written-off revenue already delivered to the conceding 511.864,91 135.644,20 (511.864,91) (135.644,20) - -Others 162.706,68 43.117,27 (162.706,68) (43.117,27) - -
56.965.817,73 13.280.551,33 (4.551.500,17) (2.274.284,69) 52.414.317,56 11.006.266,65
Non-current 12.422.248,72 10.299.229,12Current 858.302,61 707.037,53
31.12.201401.01.2014 Variation
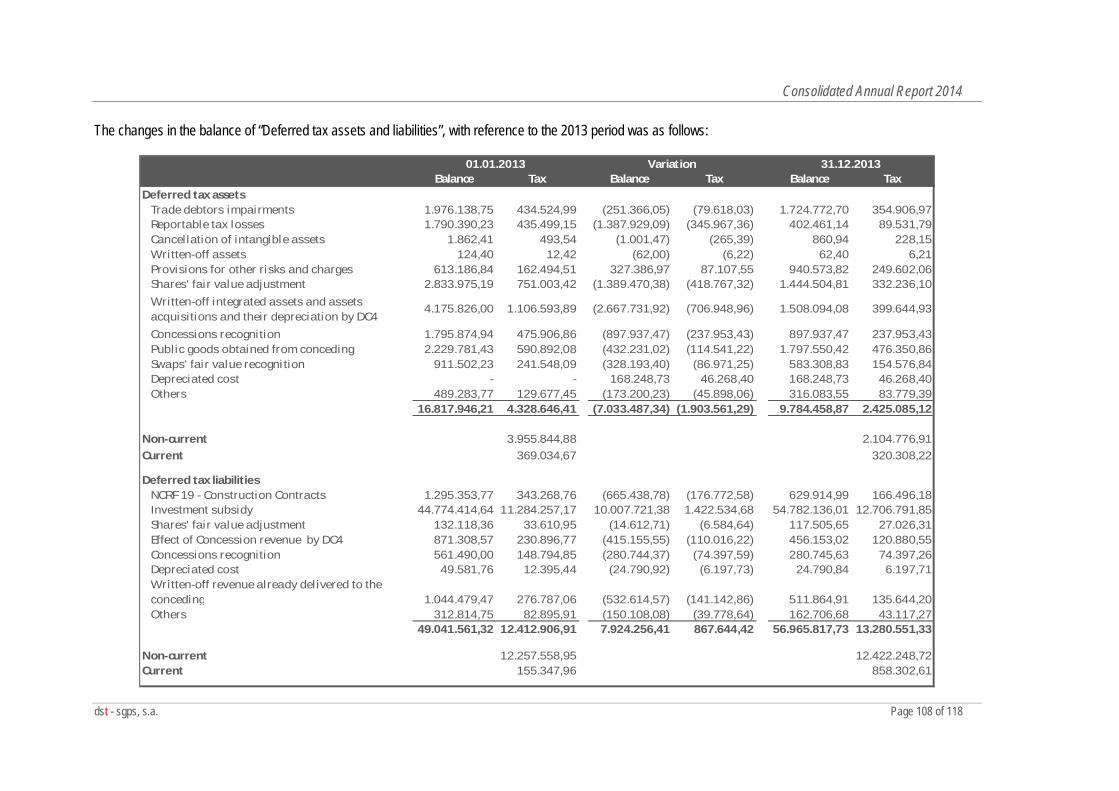
Consolidated Annual Report 2014
dst - sgps, s.a. Page 108 of 118
The changes in the balance of “Deferred tax assets and liabilities”, with reference to the 2013 period was as follows:
Balance Tax Balance Tax Balance TaxDeferred tax assets
Trade debtors impairments 1.976.138,75 434.524,99 (251.366,05) (79.618,03) 1.724.772,70 354.906,97Reportable tax losses 1.790.390,23 435.499,15 (1.387.929,09) (345.967,36) 402.461,14 89.531,79Cancellation of intangible assets 1.862,41 493,54 (1.001,47) (265,39) 860,94 228,15Written-off assets 124,40 12,42 (62,00) (6,22) 62,40 6,21Provisions for other risks and charges 613.186,84 162.494,51 327.386,97 87.107,55 940.573,82 249.602,06Shares' fair value adjustment 2.833.975,19 751.003,42 (1.389.470,38) (418.767,32) 1.444.504,81 332.236,10Written-off integrated assets and assets acquisitions and their depreciation by DC4
4.175.826,00 1.106.593,89 (2.667.731,92) (706.948,96) 1.508.094,08 399.644,93
Concessions recognition 1.795.874,94 475.906,86 (897.937,47) (237.953,43) 897.937,47 237.953,43Public goods obtained from conceding 2.229.781,43 590.892,08 (432.231,02) (114.541,22) 1.797.550,42 476.350,86Swaps' fair value recognition 911.502,23 241.548,09 (328.193,40) (86.971,25) 583.308,83 154.576,84Depreciated cost - - 168.248,73 46.268,40 168.248,73 46.268,40Others 489.283,77 129.677,45 (173.200,23) (45.898,06) 316.083,55 83.779,39
16.817.946,21 4.328.646,41 (7.033.487,34) (1.903.561,29) 9.784.458,87 2.425.085,12
Non-current 3.955.844,88 2.104.776,91Current 369.034,67 320.308,22
Deferred tax liabilitiesNCRF 19 - Construction Contracts 1.295.353,77 343.268,76 (665.438,78) (176.772,58) 629.914,99 166.496,18Investment subsidy 44.774.414,64 11.284.257,17 10.007.721,38 1.422.534,68 54.782.136,01 12.706.791,85Shares' fair value adjustment 132.118,36 33.610,95 (14.612,71) (6.584,64) 117.505,65 27.026,31Effect of Concession revenue by DC4 871.308,57 230.896,77 (415.155,55) (110.016,22) 456.153,02 120.880,55Concessions recognition 561.490,00 148.794,85 (280.744,37) (74.397,59) 280.745,63 74.397,26Depreciated cost 49.581,76 12.395,44 (24.790,92) (6.197,73) 24.790,84 6.197,71Written-off revenue already delivered to the conceding 1.044.479,47 276.787,06 (532.614,57) (141.142,86) 511.864,91 135.644,20Others 312.814,75 82.895,91 (150.108,08) (39.778,64) 162.706,68 43.117,27
49.041.561,32 12.412.906,91 7.924.256,41 867.644,42 56.965.817,73 13.280.551,33
Non-current 12.257.558,95 12.422.248,72Current 155.347,96 858.302,61
01.01.2013 Variation 31.12.2013
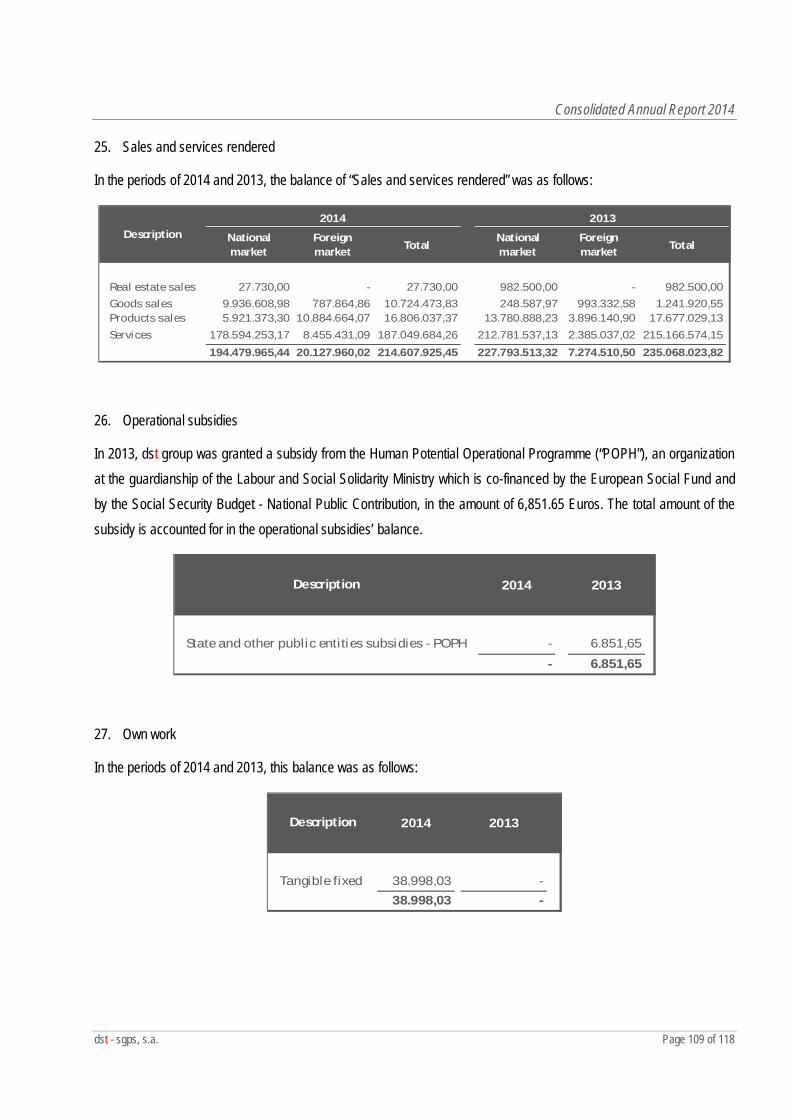
Consolidated Annual Report 2014
dst - sgps, s.a. Page 109 of 118
25. Sales and services rendered
In the periods of 2014 and 2013, the balance of “Sales and services rendered” was as follows:
National market
Foreign market Total
National market
Foreign market Total
Real estate sales 27.730,00 - 27.730,00 982.500,00 - 982.500,00Goods sales 9.936.608,98 787.864,86 10.724.473,83 248.587,97 993.332,58 1.241.920,55Products sales 5.921.373,30 10.884.664,07 16.806.037,37 13.780.888,23 3.896.140,90 17.677.029,13Services 178.594.253,17 8.455.431,09 187.049.684,26 212.781.537,13 2.385.037,02 215.166.574,15
194.479.965,44 20.127.960,02 214.607.925,45 227.793.513,32 7.274.510,50 235.068.023,82
Description2014 2013
26. Operational subsidies
In 2013, dst group was granted a subsidy from the Human Potential Operational Programme (“POPH”), an organization at the guardianship of the Labour and Social Solidarity Ministry which is co-financed by the European Social Fund and by the Social Security Budget - National Public Contribution, in the amount of 6,851.65 Euros. The total amount of the subsidy is accounted for in the operational subsidies’ balance.
Description 2014 2013
State and other public entities subsidies - POPH - 6.851,65
- 6.851,65
27. Own work
In the periods of 2014 and 2013, this balance was as follows:
Description 2014 2013
Tangible fixed 38.998,03 -38.998,03 -
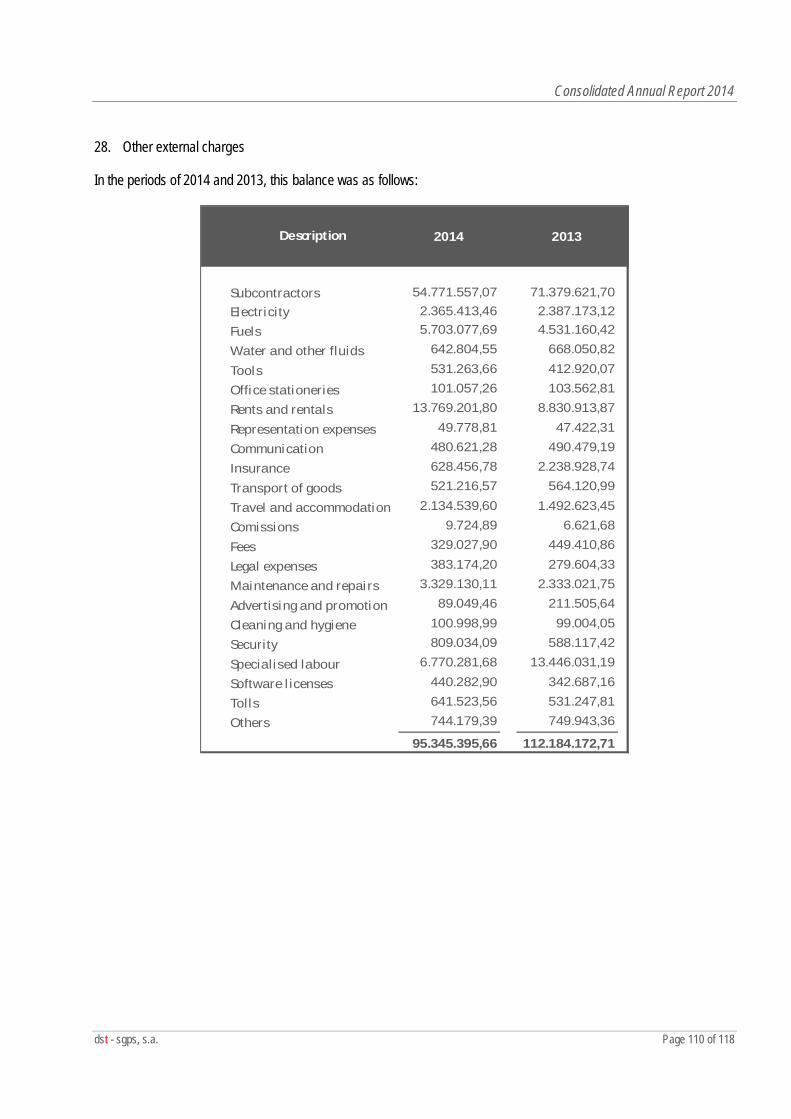
Consolidated Annual Report 2014
dst - sgps, s.a. Page 110 of 118
28. Other external charges
In the periods of 2014 and 2013, this balance was as follows:
Description 2014 2013
Subcontractors 54.771.557,07 71.379.621,70Electricity 2.365.413,46 2.387.173,12
Fuels 5.703.077,69 4.531.160,42
Water and other fluids 642.804,55 668.050,82
Tools 531.263,66 412.920,07
Office stationeries 101.057,26 103.562,81
Rents and rentals 13.769.201,80 8.830.913,87
Representation expenses 49.778,81 47.422,31
Communication 480.621,28 490.479,19
Insurance 628.456,78 2.238.928,74
Transport of goods 521.216,57 564.120,99
Travel and accommodation 2.134.539,60 1.492.623,45
Comissions 9.724,89 6.621,68
Fees 329.027,90 449.410,86
Legal expenses 383.174,20 279.604,33
Maintenance and repairs 3.329.130,11 2.333.021,75
Advertising and promotion 89.049,46 211.505,64
Cleaning and hygiene 100.998,99 99.004,05
Security 809.034,09 588.117,42
Specialised labour 6.770.281,68 13.446.031,19
Software l icenses 440.282,90 342.687,16
Tolls 641.523,56 531.247,81
Others 744.179,39 749.943,36
95.345.395,66 112.184.172,71
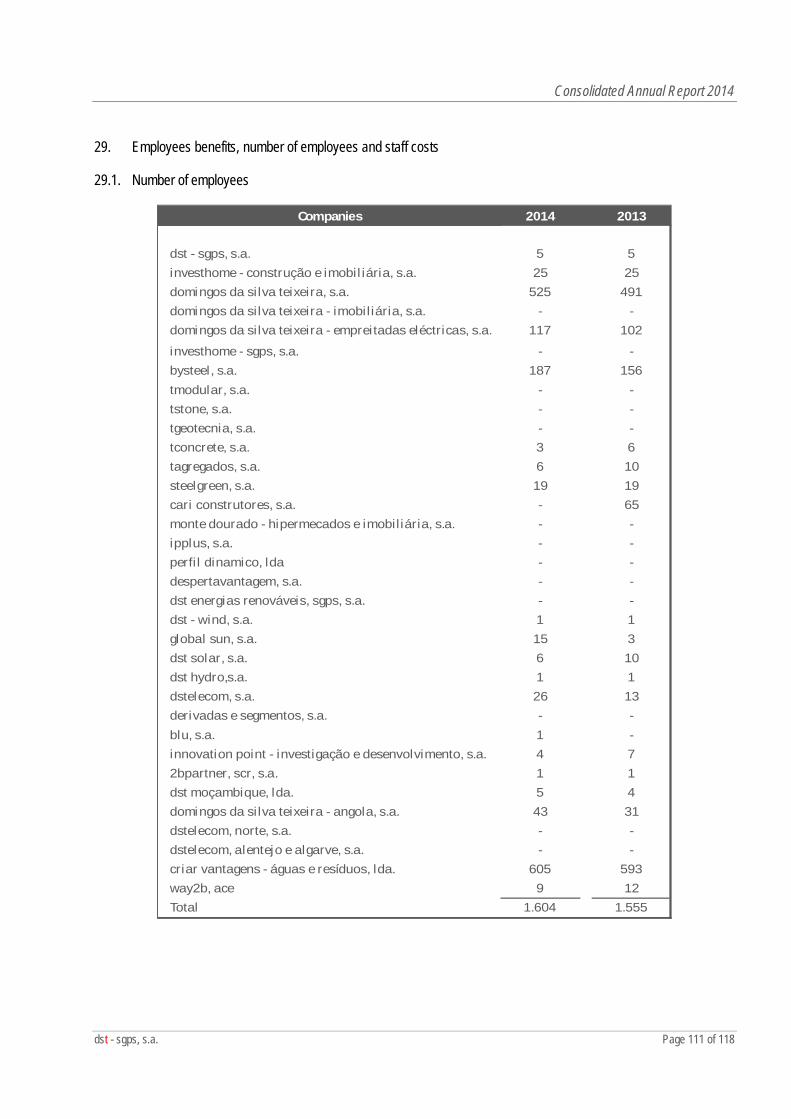
Consolidated Annual Report 2014
dst - sgps, s.a. Page 111 of 118
29. Employees benefits, number of employees and staff costs
29.1. Number of employees
Companies 2014 2013
dst - sgps, s.a. 5 5investhome - construção e imobil iária, s.a. 25 25domingos da silva teixeira, s.a. 525 491domingos da silva teixeira - imobiliária, s.a. - -domingos da silva teixeira - empreitadas eléctricas, s.a. 117 102
investhome - sgps, s.a. - -bysteel, s.a. 187 156tmodular, s.a. - -tstone, s.a. - -tgeotecnia, s.a. - -tconcrete, s.a. 3 6tagregados, s.a. 6 10steelgreen, s.a. 19 19cari construtores, s.a. - 65monte dourado - hipermecados e imobiliária, s.a. - -ipplus, s.a. - -perfil dinamico, lda - -despertavantagem, s.a. - -dst energias renováveis, sgps, s.a. - -dst - wind, s.a. 1 1global sun, s.a. 15 3dst solar, s.a. 6 10dst hydro,s.a. 1 1dstelecom, s.a. 26 13derivadas e segmentos, s.a. - -blu, s.a. 1 -innovation point - investigação e desenvolvimento, s.a. 4 72bpartner, scr, s.a. 1 1dst moçambique, lda. 5 4domingos da silva teixeira - angola, s.a. 43 31dstelecom, norte, s.a. - -dstelecom, alentejo e algarve, s.a. - -criar vantagens - águas e resíduos, lda. 605 593way2b, ace 9 12Total 1.604 1.555
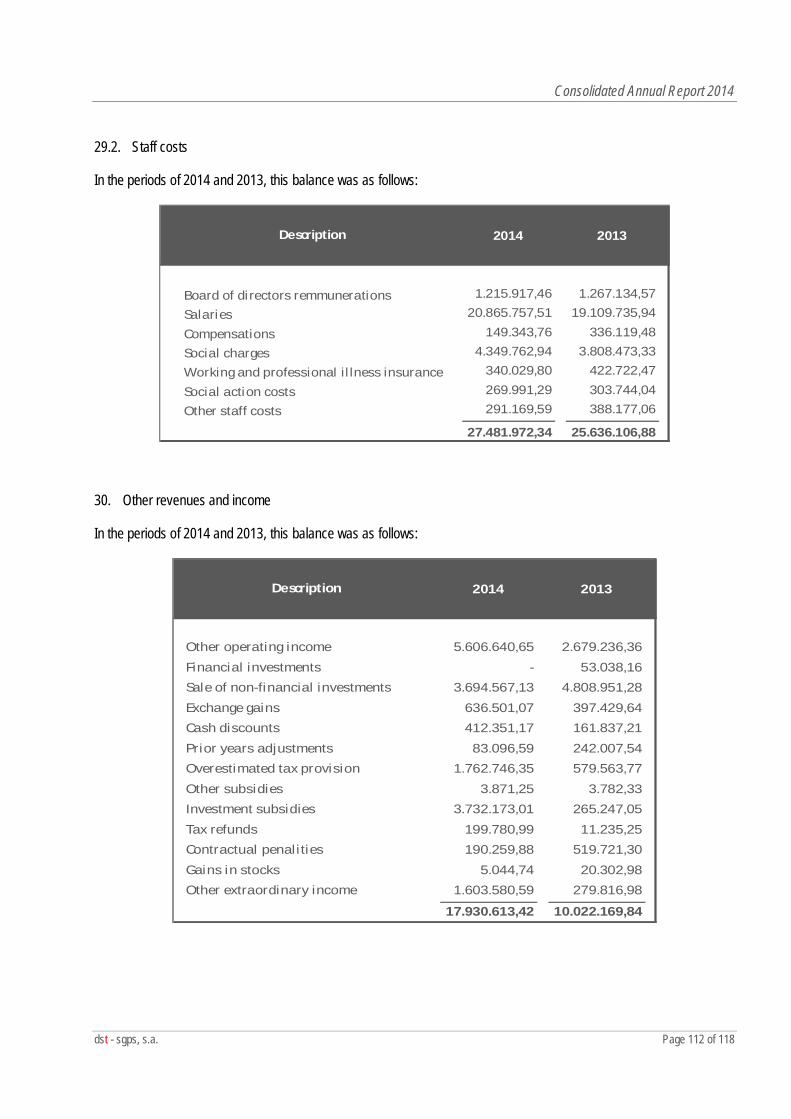
Consolidated Annual Report 2014
dst - sgps, s.a. Page 112 of 118
29.2. Staff costs
In the periods of 2014 and 2013, this balance was as follows:
Description 2014 2013
Board of directors remmunerations 1.215.917,46 1.267.134,57
Salaries 20.865.757,51 19.109.735,94
Compensations 149.343,76 336.119,48
Social charges 4.349.762,94 3.808.473,33
Working and professional il lness insurance 340.029,80 422.722,47
Social action costs 269.991,29 303.744,04
Other staff costs 291.169,59 388.177,06
27.481.972,34 25.636.106,88
30. Other revenues and income
In the periods of 2014 and 2013, this balance was as follows:
Description 2014 2013
Other operating income 5.606.640,65 2.679.236,36
Financial investments - 53.038,16
Sale of non-financial investments 3.694.567,13 4.808.951,28
Exchange gains 636.501,07 397.429,64
Cash discounts 412.351,17 161.837,21
Prior years adjustments 83.096,59 242.007,54
Overestimated tax provision 1.762.746,35 579.563,77
Other subsidies 3.871,25 3.782,33
Investment subsidies 3.732.173,01 265.247,05
Tax refunds 199.780,99 11.235,25
Contractual penalities 190.259,88 519.721,30
Gains in stocks 5.044,74 20.302,98
Other extraordinary income 1.603.580,59 279.816,98
17.930.613,42 10.022.169,84
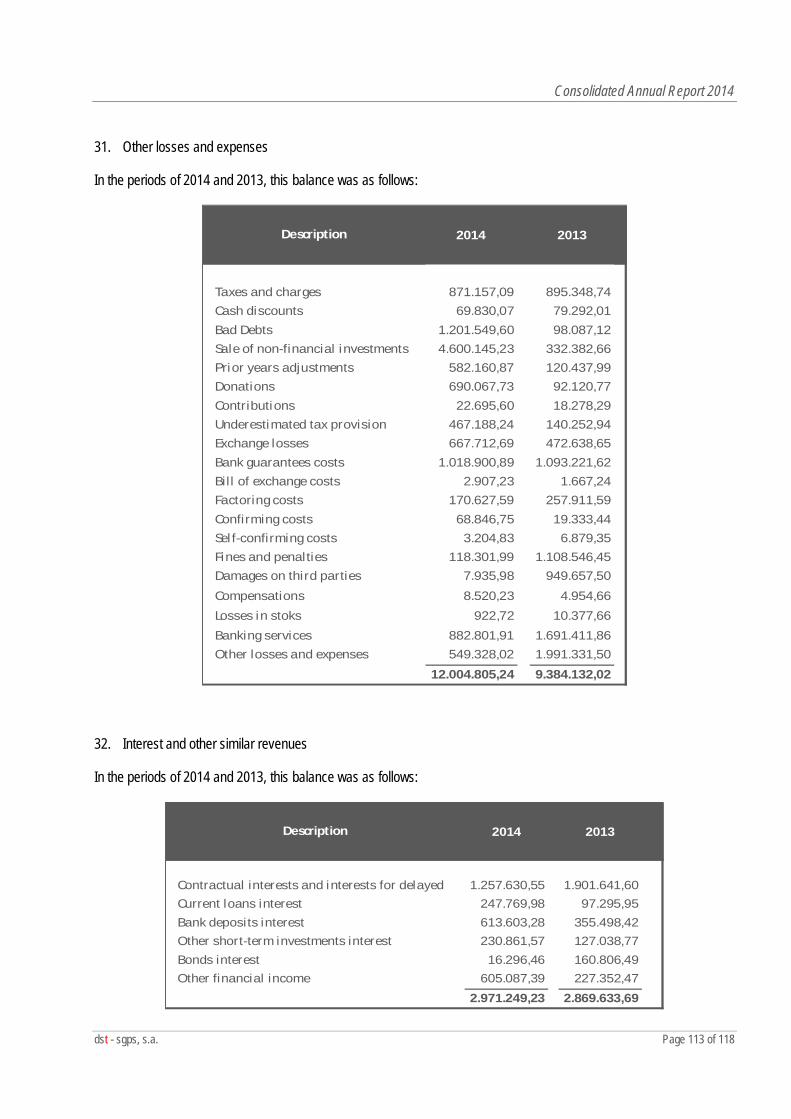
Consolidated Annual Report 2014
dst - sgps, s.a. Page 113 of 118
31. Other losses and expenses
In the periods of 2014 and 2013, this balance was as follows:
Description 2014 2013
Taxes and charges 871.157,09 895.348,74Cash discounts 69.830,07 79.292,01Bad Debts 1.201.549,60 98.087,12Sale of non-financial investments 4.600.145,23 332.382,66Prior years adjustments 582.160,87 120.437,99Donations 690.067,73 92.120,77Contributions 22.695,60 18.278,29Underestimated tax provision 467.188,24 140.252,94Exchange losses 667.712,69 472.638,65Bank guarantees costs 1.018.900,89 1.093.221,62Bill of exchange costs 2.907,23 1.667,24Factoring costs 170.627,59 257.911,59Confirming costs 68.846,75 19.333,44Self-confirming costs 3.204,83 6.879,35Fines and penalties 118.301,99 1.108.546,45Damages on third parties 7.935,98 949.657,50
Compensations 8.520,23 4.954,66
Losses in stoks 922,72 10.377,66
Banking services 882.801,91 1.691.411,86Other losses and expenses 549.328,02 1.991.331,50
12.004.805,24 9.384.132,02
32. Interest and other similar revenues
In the periods of 2014 and 2013, this balance was as follows:
Description 2014 2013
Contractual interests and interests for delayed receivables
1.257.630,55 1.901.641,60Current loans interest 247.769,98 97.295,95Bank deposits interest 613.603,28 355.498,42Other short-term investments interest 230.861,57 127.038,77Bonds interest 16.296,46 160.806,49Other financial income 605.087,39 227.352,47
2.971.249,23 2.869.633,69
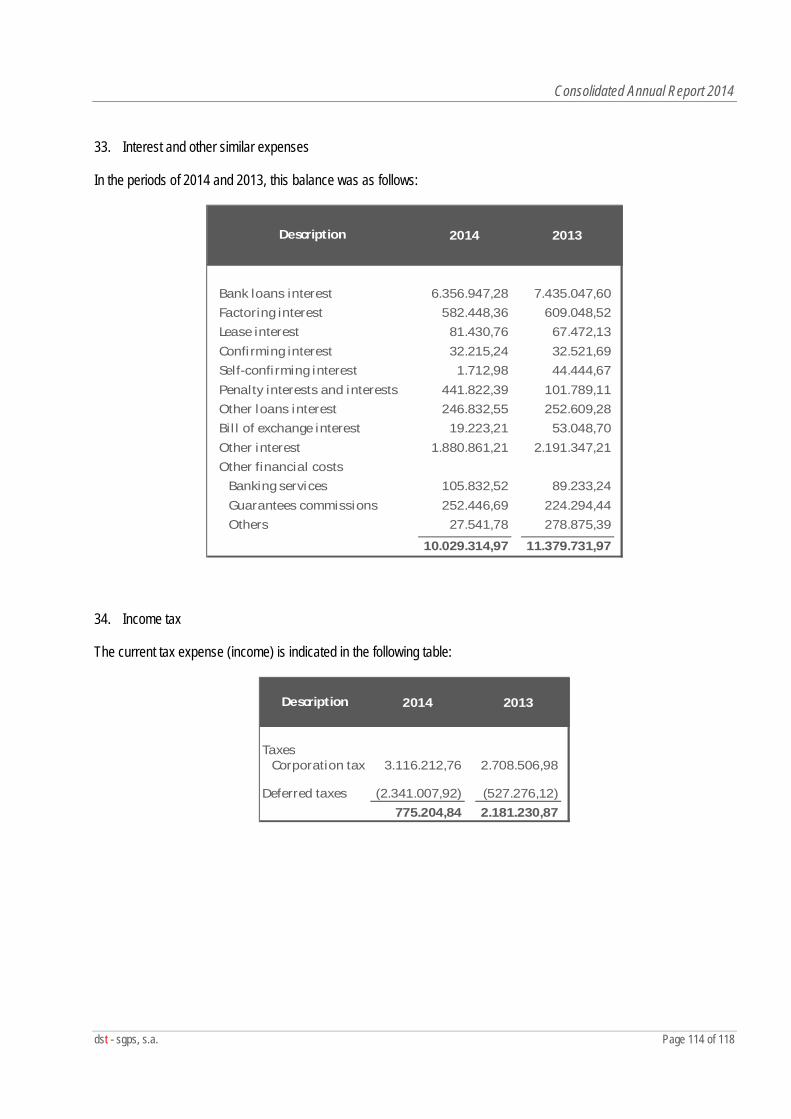
Consolidated Annual Report 2014
dst - sgps, s.a. Page 114 of 118
33. Interest and other similar expenses
In the periods of 2014 and 2013, this balance was as follows:
Description 2014 2013
Bank loans interest 6.356.947,28 7.435.047,60Factoring interest 582.448,36 609.048,52Lease interest 81.430,76 67.472,13Confirming interest 32.215,24 32.521,69Self-confirming interest 1.712,98 44.444,67Penalty interests and interests for delayed payments
441.822,39 101.789,11Other loans interest 246.832,55 252.609,28Bil l of exchange interest 19.223,21 53.048,70Other interest 1.880.861,21 2.191.347,21Other financial costs
Banking services 105.832,52 89.233,24Guarantees commissions 252.446,69 224.294,44Others 27.541,78 278.875,39
10.029.314,97 11.379.731,97
34. Income tax
The current tax expense (income) is indicated in the following table:
2014 2013
TaxesCorporation tax 3.116.212,76 2.708.506,98
Deferred taxes (2.341.007,92) (527.276,12)775.204,84 2.181.230,87
Description
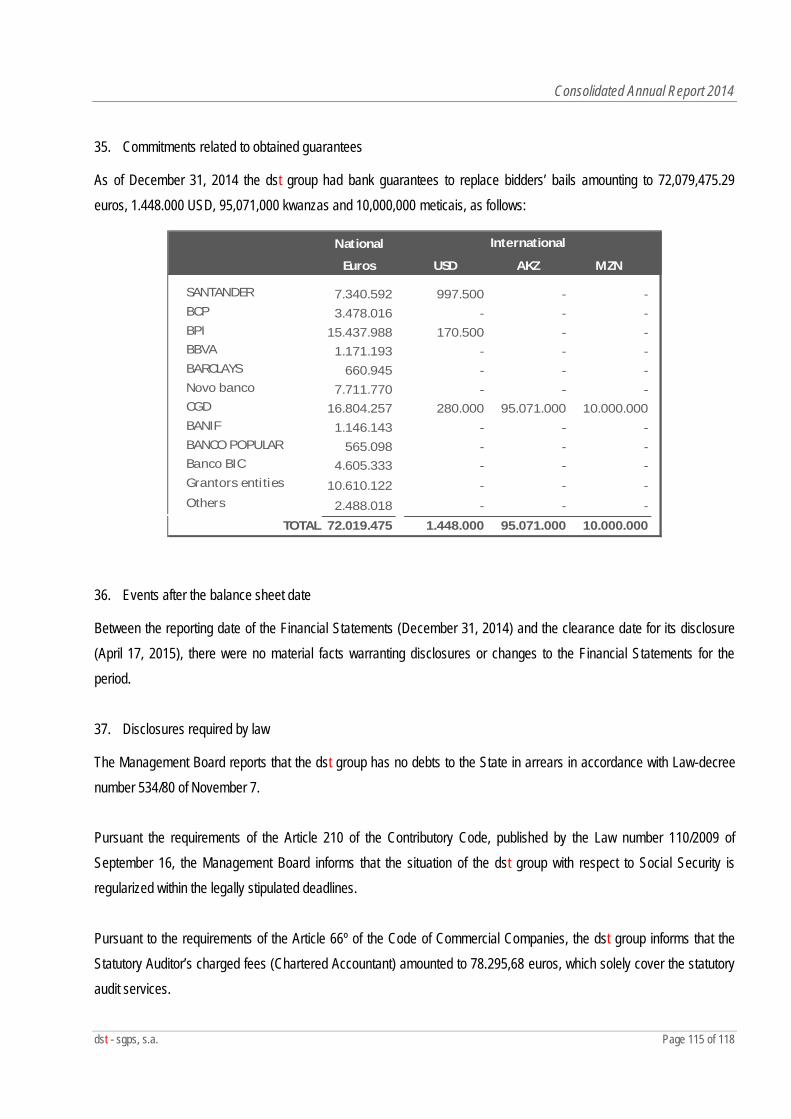
Consolidated Annual Report 2014
dst - sgps, s.a. Page 115 of 118
35. Commitments related to obtained guarantees
As of December 31, 2014 the dst group had bank guarantees to replace bidders’ bails amounting to 72,079,475.29 euros, 1.448.000 USD, 95,071,000 kwanzas and 10,000,000 meticais, as follows:
National
Euros USD AKZ MZN
SANTANDER 7.340.592 997.500 - - BCP 3.478.016 - - - BPI 15.437.988 170.500 - - BBVA 1.171.193 - - - BARCLAYS 660.945 - - - Novo banco 7.711.770 - - - CGD 16.804.257 280.000 95.071.000 10.000.000 BANIF 1.146.143 - - - BANCO POPULAR 565.098 - - - Banco BIC 4.605.333 - - - Grantors entities 10.610.122 - - - Others 2.488.018 - - -BARCLAYS
TOTAL 72.019.475 1.448.000 95.071.000 10.000.000
International
36. Events after the balance sheet date
Between the reporting date of the Financial Statements (December 31, 2014) and the clearance date for its disclosure (April 17, 2015), there were no material facts warranting disclosures or changes to the Financial Statements for the period. 37. Disclosures required by law
The Management Board reports that the dst group has no debts to the State in arrears in accordance with Law-decree number 534/80 of November 7. Pursuant the requirements of the Article 210 of the Contributory Code, published by the Law number 110/2009 of September 16, the Management Board informs that the situation of the dst group with respect to Social Security is regularized within the legally stipulated deadlines. Pursuant to the requirements of the Article 66º of the Code of Commercial Companies, the dst group informs that the Statutory Auditor’s charged fees (Chartered Accountant) amounted to 78.295,68 euros, which solely cover the statutory audit services.
Consolidated Annual Report 2014
dst - sgps, s.a. Page 116 of 118
Pursuant to paragraphs 1 and 2 of article 23 of the Investment Tax Code (IFC), the value of the tax benefit related to the Investment Support Fiscal Regime (ISFR) of 2014 reported by dst group was of € 19,167.73, corresponding to 25% of the year’s eligible investments (€ 76,670.91).
During the period ended December 31, 2014, the dst group has incurred in susceptible investments to be eligible for the use of the tax regime of the Tax Incentive System for Research and Business Development II (SIFIDE II), provided in Chapter V of the New Investment Tax Code, approved by Law-Decree No. 162/2014 of 31 October, and the amount of the tax benefit amounted to € 267,835.27, having been deducted in its entirety in this period. 38. Clearance date to financial statements disclosure
The financial statements for the period ended December 31, 2014 were approved by the Board of Directors and authorized to disclosure on April 17, 2015. Braga, April 17, 2015
The Board of Directors, The Chartered Accountant,
José Gonçalves Teixeira; Executive Chairman Susana Maria Macedo Queirós
Avelino Gonçalves Teixeira; Executive Vice-Chairman
Joaquim Gonçalves Teixeira; Non-Executive Vice-Chairman
João Martins Negrais de Matos; Executive Member of the Board of Directors
Hernâni José Gonçalves Teixeira; Non-Executive Member of the Board of Directors
Consolidated Annual Report 2014
dst - sgps, s.a. Page 117 of 118
E) Legal Certification of Consolidated Accounts
Consolidated Annual Report 2014
dst - sgps, s.a. Page 118 of 118
F) Report and Opinion of the Sole Fiscal Auditor