Embed Size (px)
Citation preview

ANNUAL REPORT 2014

Cover image REC TwinPeak Series multicrystalline solar panel Available up to 280 Wp
72 MW 292,608 REC solar panels Nakhon Pathom & Suphan Buri, Thailand

CONTENTS
Board of Directors 4
Board of Directors’ Report 5
Board of Directors’ Report on Corporate Governance 15
Financial Statements REC Group 24
Financial Statements REC Solar ASA 60
Auditor’s Report 70

4 REC Solar Annual Report 2014
Board of Directors
BOARD OF DIRECTORS
JAN CHRISTIAN OPSAHLMr. Opsahl has been a Member of the Board of Directors since November 2013 and was previously a Board Member of Renewable Energy Corporation ASA from May to November 2013. In his career, Mr. Opsahl has been Chairman of Tandberg ASA, Tandberg Television ASA and Tomra Systems ASA and Vice Chairman of Komplett ASA. He was President/CEO of Tomra Systems ASA and subsequently President/CEO of Tandberg ASA and Marketing Director at both Unitor AS and Dyno Industrier AS. Mr. Opsahl holds a degree in business and in computer science, both from the University of Strathclyde in Glasgow. He is also a Sloan Fellow from London Business School/M.I.T.
ØYSTEIN STRAY SPETALENBoard Member since August 2013 (and previously Board Member of Renewable Energy Corporation ASA from May to August 2013), Mr. Stray Spetalen owns and runs the investment firms Ferncliff AS and Tycoon Industrier AS. Earlier in his career, he has been Investment Director at Sveeas-Gruppen and CEO of companies such as Noka Securities AS, Oslo Securities AS, and Finanshuset. Mr. Stray Spetalen holds a Master of Science degree in petroleum technology from the Norwegian University of Science and Technology.
OLE ENGERChairman of the Board of Directors REC Solar ASA since July 2013, Mr. Enger was previously President & CEO of Renewable Energy Corporation ASA. Prior to this, he was President & CEO of SAPA AB and President & CEO of Elkem AS. Mr. Enger holds a degree from the Norwegian University of Life Sciences and a business degree from the Norwegian School of Economics.
MIMI K. BERDALMimi K. Berdal runs an independent legal and corporate counseling business. She was a member of the Board of Directors of REC Silicon ASA from May 2011 until November 2013, and Chairman between February 2013 and November 2013. She holds the following other directorships: Deputy Chairman of Gassco AS, Board Member of Itera ASA, Gjensidige Pensjon og Sparing Holding AS, Intex Resources ASA, Interoil Exploration & Production ASA and EMGS ASA. Ms. Berdal holds a Cand. jur. (law) degree from the University of Oslo and is admitted to the Bar, Norwegian Bar Association.
ANNE LISE MEYERBoard Member since November 2013, Ms. Meyer is currently CEO of the investment firm AS Hamang Papirfabrik. She is also Chairman of the Board of Berner Gruppen AS (former AS Avishuset Dagbladet) and a Board member of Bank2. She has previously been a Member of the Board in Komplett ASA, AS Dagbladet and DB Medialab. She has also previously been CEO of Gillette Group Norway and held several leading positions with Hewlett-Packard and NetCom. Ms. Meyer holds a Bachelor of Management from the Norwegian School of Management.
REC Solar Annual Report 2014 5 Board of Directors’ Report
BOARD OF DIRECTORS’ REPORT
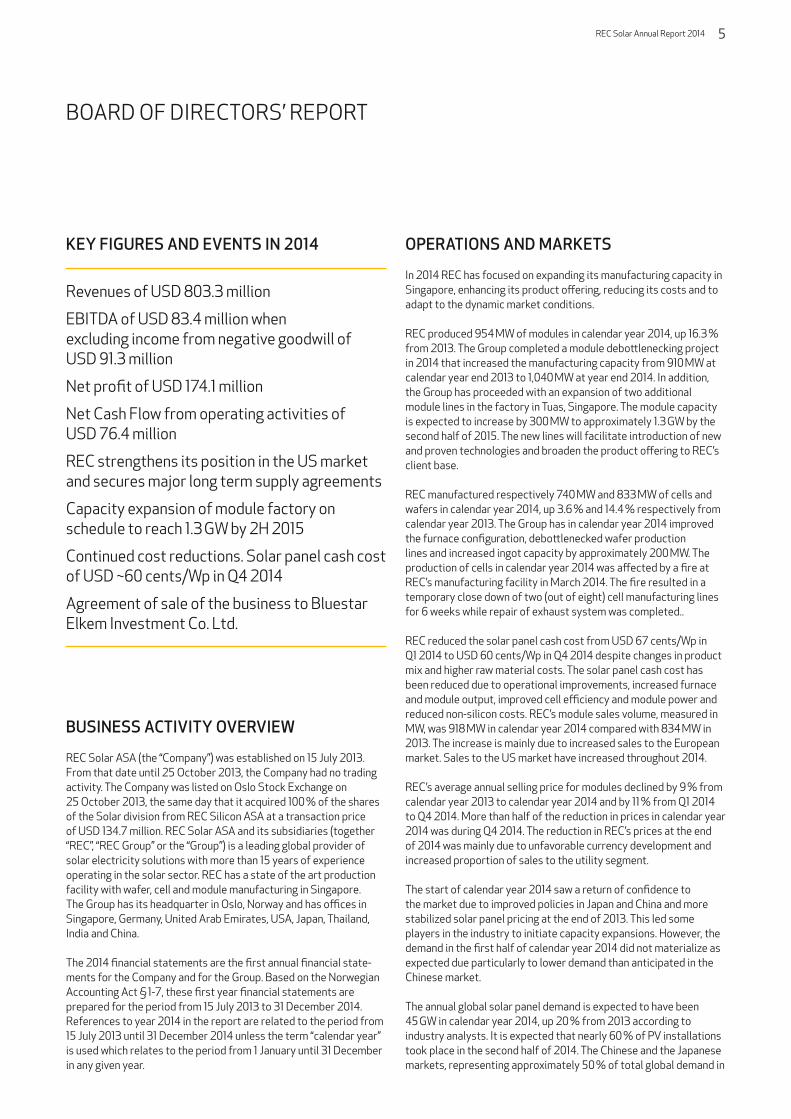
KEY FIGURES AND EVENTS IN 2014
Revenues of USD 803.3 million
EBITDA of USD 83.4 million when excluding income from negative goodwill of USD 91.3 million
Net profit of USD 174.1 million
Net Cash Flow from operating activities of USD 76.4 million
REC strengthens its position in the US market and secures major long term supply agreements
Capacity expansion of module factory on schedule to reach 1.3 GW by 2H 2015
Continued cost reductions. Solar panel cash cost of USD ~60 cents/Wp in Q4 2014
Agreement of sale of the business to Bluestar Elkem Investment Co. Ltd.
BUSINESS ACTIVITY OVERVIEW
REC Solar ASA (the “Company”) was established on 15 July 2013. From that date until 25 October 2013, the Company had no trading activity. The Company was listed on Oslo Stock Exchange on 25 October 2013, the same day that it acquired 100 % of the shares of the Solar division from REC Silicon ASA at a transaction price of USD 134.7 million. REC Solar ASA and its subsidiaries (together “REC”, “REC Group” or the “Group”) is a leading global provider of solar electricity solutions with more than 15 years of experience operating in the solar sector. REC has a state of the art production facility with wafer, cell and module manufacturing in Singapore. The Group has its headquarter in Oslo, Norway and has offices in Singapore, Germany, United Arab Emirates, USA, Japan, Thailand, India and China.
The 2014 financial statements are the first annual financial state-ments for the Company and for the Group. Based on the Norwegian Accounting Act § 1-7, these first year financial statements are prepared for the period from 15 July 2013 to 31 December 2014. References to year 2014 in the report are related to the period from 15 July 2013 until 31 December 2014 unless the term “calendar year” is used which relates to the period from 1 January until 31 December in any given year.
OPERATIONS AND MARKETS
In 2014 REC has focused on expanding its manufacturing capacity in Singapore, enhancing its product offering, reducing its costs and to adapt to the dynamic market conditions.
REC produced 954 MW of modules in calendar year 2014, up 16.3 % from 2013. The Group completed a module debottlenecking project in 2014 that increased the manufacturing capacity from 910 MW at calendar year end 2013 to 1,040 MW at year end 2014. In addition, the Group has proceeded with an expansion of two additional module lines in the factory in Tuas, Singapore. The module capacity is expected to increase by 300 MW to approximately 1.3 GW by the second half of 2015. The new lines will facilitate introduction of new and proven technologies and broaden the product offering to REC’s client base.
REC manufactured respectively 740 MW and 833 MW of cells and wafers in calendar year 2014, up 3.6 % and 14.4 % respectively from calendar year 2013. The Group has in calendar year 2014 improved the furnace configuration, debottlenecked wafer production lines and increased ingot capacity by approximately 200 MW. The production of cells in calendar year 2014 was affected by a fire at REC’s manufacturing facility in March 2014. The fire resulted in a temporary close down of two (out of eight) cell manufacturing lines for 6 weeks while repair of exhaust system was completed..
REC reduced the solar panel cash cost from USD 67 cents/Wp in Q1 2014 to USD 60 cents/Wp in Q4 2014 despite changes in product mix and higher raw material costs. The solar panel cash cost has been reduced due to operational improvements, increased furnace and module output, improved cell efficiency and module power and reduced non-silicon costs. REC’s module sales volume, measured in MW, was 918 MW in calendar year 2014 compared with 834 MW in 2013. The increase is mainly due to increased sales to the European market. Sales to the US market have increased throughout 2014.
REC’s average annual selling price for modules declined by 9 % from calendar year 2013 to calendar year 2014 and by 11 % from Q1 2014 to Q4 2014. More than half of the reduction in prices in calendar year 2014 was during Q4 2014. The reduction in REC’s prices at the end of 2014 was mainly due to unfavorable currency development and increased proportion of sales to the utility segment.
The start of calendar year 2014 saw a return of confidence to the market due to improved policies in Japan and China and more stabilized solar panel pricing at the end of 2013. This led some players in the industry to initiate capacity expansions. However, the demand in the first half of calendar year 2014 did not materialize as expected due particularly to lower demand than anticipated in the Chinese market.
The annual global solar panel demand is expected to have been 45 GW in calendar year 2014, up 20 % from 2013 according to industry analysts. It is expected that nearly 60 % of PV installations took place in the second half of 2014. The Chinese and the Japanese markets, representing approximately 50 % of total global demand in

6 REC Solar Annual Report 2014
Board of Directors’ Report
calendar year 2014, are forecasted to have achieved growth of 30 % and 50 % respectively in 2014.
The global average solar panel prices for the industry fell by 12 % during calendar year 2014 compared with a fall of 4 % during year 2013 based on data from PV Insight. The solar industry has moved towards a more balance supply–demand ratio, but it is still maintaining some excess production capacity. The relative attractiveness and pricing in different markets have been impacted by the significant currency movements and trade cases between US and China and Europe and China. The strengthening of the USD currency versus other currencies such as the EURO and YEN has increased the relative attractiveness of the US market.
REC is not directly impacted by the trade cases as its solar panels are trade-compliant both in Europe and the US. REC has responded to the market dynamics by expanding its product range by launching 72 cell panels dedicated for the US market and by targeting its ongoing 300 MW capacity expansion to facilitate a significant increase in shipments to the US market. REC has strengthened its position in the US market and has secured several major long term supply contracts with clients such as SolarCity, SunRun and Recurrent Energy. At year end 2014, REC has binding supply agreements totaling 622 MW for delivery in the US in 2015 and 2016.
STRATEGY AND OBJECTIVES
REC’s vision is that every person benefits from electricity from the sun. REC’s strategic focus is to build sustainable profitability in a PV industry that over the recent years, despite strong demand growth, has been hampered by excess investments, overcapacity and poor profitability. The PV industry has now reached a new level of maturity and cost competitiveness and is set to become a more important part of the global energy mix.
REC is well capitalized to take advantage of the strong market momentum due to our high end and cost efficient manufacturing operations in Singapore, trusted brand and track record and our operational flexibility to take advantage of the most attractive market niches globally.
REC’s ambition is to maintain and further improve its competitive position and margins in the fast growing solar industry by;
– Continuing to improve product quality and our product offering– Reducing solar panel cash cost continuously through improving
efficiencies, streamlining processes and technological development
– Developing strategic partnerships to enhance sales capabilities and broaden channels to market
– Focusing on high growth customer segments– Assessing M&A opportunities and be pro-active in industry
consolidation
REC’s fully automated integrated solar panel production plant Tuas, Singapore

REC Solar Annual Report 2014 7 Board of Directors’ Report
TECHNOLOGY
REC is a well established, large volume manufacturer of PV products with an integrated, highly automated plant for wafers, cells, and solar panels in Singapore. There are several proprietary manufacturing solutions in REC’s plant, making it one of the least labor intensive plants in the world. This plant consistently produces solar panels with leading performance in the multicrystalline silicon solar panel segment, even matching the performance of most monocrystalline silicon solar panel products, which some of REC’s competitors produce using more costly monocrystalline silicon wafers. REC has further strengthened its position as leader in terms of solar module reliability, performance and cost in 2014 through a series of engineering and technology improvements.
Through technology developments in the ingoting and wafering process, REC has been able to reduce the wafer cost and increase the cell efficiency significantly. Benchmarking with external wafer sources has confirmed the superior performance of REC wafers which is related to the unique technology and equipment platform. REC has through engineering improvements been able to further increase the utilization of the ingot and to equalize the wafer quality and cell efficiency performance throughout the ingot.
REC has achieved cost reduction and efficiency improvement in solar cell manufacturing. The Group has through fine line printing technology and paste optimization decreased material costs and increased cell efficiency. REC has increased the throughput of the solar cell manufacturing lines by 5 % in calendar year 2014 through engineering improvements. The Group has upgraded several cell lines with the PERC (“Passivated Emitter and Rear Cell”) rear side passivation technology. By Q1 2015 the conversion of three lines had been completed. The PERC technology has been improved by process optimizations and the efficiency gain compared with standard cells without PERC technology is now more than 0.5 %. Through extensive development and qualification work on 4 busbar cells and half-cut cell technology, REC has been able to increase cell efficiency. Future technology research work has been focused on low cost and high efficiency processes using monocrystalline wafers. Solar cell efficiencies in excess of 20 % have been achieved in Q4 2014 using a simple and low cost process sequence in REC research work.
Debottlenecking, engineering work on existing equipment and minor investments in new equipment enabled REC to increase the solar module production volume by 16 % from calendar year 2013 to 2014. REC has through extensive finite element simulations been able to optimize the frame design to reduce cost and create a more lightweight module that is equal in reliability and performance. To reduce cost further and increase module power significantly, REC has developed its unique half-cut cell TwinPeak module over the last 4 years. The design uses a split junction box that improves the junction box reliability and enables a simple interconnection of the half cut cell matrixes. The Twin Peak series has been in full production from Q1 2015.
Research and development expenses were USD 18.4 million in 2014.
REPORT FOR 2014
FINANCIAL STATEMENTSThe Group reports its consolidated financial statements in accordance with International Financial Reporting Standards as adopted by the European Union (IFRS) and the Norwegian Accounting Act. REC has only one reportable segment. Although the System business is not significant enough to constitute a separate operating segment, certain information is provided to separate the ordinary Module business from the System business in order to give the reader a better understanding of the different performance levels between the two operations. References to year 2014 in the report are related to the period from 15 July 2013 until 31 December 2014 unless term “calendar year” is used which relates to period from 1 January until 31 December in any given year.
REC Solar acquired 100 % of the shares of the Solar division from REC Silicon ASA at a transaction price of USD 134.7 million. The transaction is considered a business combination according to IFRS 3. Acquisition method is applied by netting the fair value of consideration given to the transferee (the “acquisition cost”), excluding costs related to the acquisition, with the fair value of the acquired assets, liabilities and contingent liabilities assumed at the acquisition date. The acquisition cost of a purchase is equal to the fair value of the assets transferred, the equity instruments issued and the liabilities incurred or assumed at the acquisition date. The fair values of assets and liabilities under contingent consideration agreements are likewise included.
REC’s management was required to allocate values in excess/deficit of the carrying amount of equity to assets acquired and liabilities assumed. The acquisition cost of USD 134.7 million is less than the proportional share of the acquired companies’ net assets measured at fair value, therefore bargain purchase gain (negative goodwill) of USD 91.3 million resulted from the purchase price allocation, finalized in Q4 2014, within 1 year window period from 25 October 2013. Please refer to note 5 of the financial statements for detailed information about the acquisition as well as the negative goodwill.
PROFIT AND LOSSTotal revenues were USD 803.3 million in 2014. The Module and System business earned revenues of respectively USD 782.3 million and USD 21.0 million in 2014. Revenues for Module business were impacted by increasing sales volumes to Europe and the US and reduced selling prices. The revenues for the System business was primarily related to the sale of a system project in the UK and the sale of an Italian roof top portfolio. The Board of Directors has decided that the European System business is not part of the future strategy of the Company.
Total EBITDA was USD 174.7 million reflecting an EBITDA margin of 21.7 % in 2014. Total EBITDA, excluding other income from negative goodwill, was USD 83.4 million. The Module business EBITDA excluding other income from negative goodwill was USD 84.8 million reflecting an EBITDA margin of 10.8 %. Module EBITDA excluding other income from negative goodwill is mainly related to the margin

8 REC Solar Annual Report 2014
Board of Directors’ Report
on the sale of modules and property tax reimbursement of USD 7.4 million.
The System business EBITDA excluding other income from negative goodwill was USD – 1.5 million and the EBITDA margin was –7.1 %. The negative EBITDA is mainly due to ongoing operating costs related to the exit from the European System business and employee termination benefit costs for the restructuring of the Systems business.
EBIT was USD 151.4 million in 2014. Depreciation and amortization amounts to USD 23.3 million in 2014.
Net financial items amount to a gain of USD 21.9 million in 2014. The gain is mainly due to net currency gains from mark-to-market valuation of forward currency exchange contracts and unrealized currency gains from revaluation of net assets.
Income tax expense for 2014 amounted to USD 1.7 million. The tax expense in 2014 is mainly related to consideration of income tax liability for REC’s European module sales. REC’s operations in Singapore have been granted an income tax free period (pioneer status) and therefore the corporate tax charge for the period is limited. Profits after tax were USD 174.1 million in 2014.
CASH FLOW, FINANCIAL POSITION, FINANCING AND INVESTMENTSNet cash provided by operating activities totaled USD 76.4 million in 2014. EBITDA excluding other income from negative goodwill were USD 83.4 million. The remaining outflow is primarily due to changes in working capital. Net cash outflow from investing activities was USD 107.1 million in 2014, mainly due to the acquisition of the solar entities previously owned by REC Silicon for an amount of USD 88.7 million net of cash acquired and investments in property, plant and equipment and intangible assets of USD 56.0 million. This is offset by net inflow from government grants and proceeds from equity accounted investments. Net cash flow from financing activities was USD 131.4 million in 2014 related to the equity issue on 25 October 2013.
Cash and cash equivalents totaled USD 89.9 million as of 31 December 2014.
Total shareholders’ equity was USD 268.7 million at 31 December 2014, corresponding to an equity ratio of 54.6 percent. REC had no interest bearing debt as of 31 December 2014.
GOING CONCERN
The Board of Directors confirms that the Financial Statements have been prepared under the assumption that the company is a going concern and that this assumption was realistic at the date of the accounts. REC Solar ASA has resolved to dispose of REC Solar
Holdings AS, and a sales and purchase agreement was concluded with Bluestar Elkem Investment Co. Ltd. in November 2014. The shareholders in REC Solar ASA approved the transfer of all assets and liabilities of REC Solar ASA at an extraordinary general meeting on 15 January 2015. Implementation of the transaction with Bluestar Elkem Investment Co. Ltd. is contingent upon fulfillment of certain final closing conditions, including Chinese regulatory approvals.
REC SOLAR ASA (NGAAP)
FINANCIAL REVIEWREC Solar ASA prepares its financial statements according to NGAAP. The Company is a holding company for the Group’s operations.
REC Solar ASA had a negative operating profit of NOK 95.9 million in 2014. The net loss was NOK 80.0 million in 2014. Total equity for the Company amounted to NOK 700.4 million at 31 December 2014.
ALLOCATION OF THE NET LOSSES FOR THE PARENT COMPANYThe Board proposes that the net loss for the year of NOK 80.0 million is allocated to share premium reserve.
ORGANIZATIONREC Solar ASA has its head quarter in Oslo, Norway. In addition to the Group CEO, the Company had 1 employee and 1 full time consultant at the end of 2014.
SUBSEQUENT EVENTS
At the EGM on the 15 January 2015, the shareholders in REC Solar ASA approved the transfer of all assets and liabilities of REC Solar ASA pursuant to an agreement with Bluestar Elkem Investment Co. Ltd. (“Bluestar Elkem”). The closing of the transaction is pending Chinese regulatory approvals. Under a master procurement contract entered into between REC Americas LLC and SolarCity Corporation relating to supply of solar modules, a change of control in REC Solar ASA is likely to be considered a change of control of REC Americas LLC which requires SolarCity Corporation’s prior written consent. Such a consent has been obtained from SolarCity Corporation in respect of the implementation of the transaction with Bluestar Elkem Investment Co. Ltd.
Bluestar Elkem has not yet received the necessary Chinese regu-latory approvals required for closing the transaction. Distribution of liquidation proceeds to investors is expected 14–16 weeks after final closing conditions have been fulfilled (i. e. Chinese approvals).

REC Solar Annual Report 2014 9 Board of Directors’ Report
In February 2015, REC entered into an agreement to sell a majority of its shares in REC Solar Commercial Corporation to Duke Energy. After the sale, REC will hold 7.6 % of the shares in REC Solar Commercial Corporation. The shares are subject to a put/call option.
In February 2015, REC announced that it has appointed Steven O’Neil, as CEO, effective from 25 March 2015.
RISK FACTORS
REC is exposed to a number of financial risk factors, including adverse changes in foreign currency exchange rates, credit and interest rates liquidity risk. In addition the Group is exposed to a large number of risk factors related to the market and its opera-tions. Selected risk factors are discussed below.
CURRENCY EXCHANGE RISKREC operates internationally and is exposed to currency risk, primarily to fluctuations in U.S. Dollar (USD), Euro (EUR), Singapore Dollar (SGD) and Japanese Yen (JPY), arising from commercial transaction and assets and liabilities in currencies other than the entity’s functional currencies. The Group sells its products and services predominantly in EUR in Europe, JPY in Japan and in USD in most other regions. Most of REC’s operating expenses are incurred in SGD. The relative development of REC’s main cost currencies and those of its competitors could significantly influence REC’s relative cost position.
In order to reduce the total risk to currency volatility, REC has entered into forward currency exchange contracts for a part of its future cash flows. The foreign exchange forward contracts are not designated as hedging instruments and are entered into with flexible maturity dates ranging from one month to 15 months. As of 31 December 2014, REC had net open forward contracts to sell EUR, AUD and JPY and to buy USD and SGD. The total nominal amount of these contracts was approximately USD 170 million. Outstanding contracts at year-end 2014 had a net positive fair value of USD 7.6 million.
Market values of the derivative contracts fluctuate with devel-opment of the underlying currency spot rates. This can result both in unrealized/realized currency gains and losses with positive and negative effects on liquidity and equity. Currency hedging activities are limited to plain vanilla products (FX forward transactions) and strictly used as an instrument to minimize currency risks for the Group in a structured way.
A 10 % depreciation of the EUR against all the currencies in which the Group holds derivate contracts would increase the fair value of these contracts by approximately USD 10 million.
CREDIT AND INTEREST RATE RISKWith no debt financing at 31 December 2014, the Group is not exposed to any interest rate risks related to credit. Credit risk is primarily related to accounts receivables and guarantees provided for. In accounts receivable, sources of credit risk include geographic, industry and customer concentrations; and risks related to the collection. Policies and procedures are in place for managing credit risk, including obtaining securities where possible. Market and customer specific developments affect credit risk.
LIQUIDITY RISKAs of 31 December 2014, REC has an unrestricted cash balance of USD 89.9 million. The Group has a structured approach to monitoring credit risks as to financial counterparties which reduces related default risks to a minimum but cannot fully avoid losses.
Based on the year-end cash balance, available liquidity resources and the current structure and terms of the Company’s liabilities, it is the Board’s opinion that REC has adequate funding and liquidity to support its operations and investment program.
MARKET, OPERATIONS AND OTHER RISKDemand for the Company’s products and services depend on the development in electricity prices, government subsidies and other support, legislation and regulatory framework, trade disputes, capital availability for financing PV projects, interest rates, expected investment returns on PV installations and PV industry competitiveness versus other sources of energy. The PV industry is not yet mature in terms of demand, market structure and technology and significant developments in technologies and changes in market structure supply and demand could significantly alter REC’s competitive position.
In addition to the risk of less demand for REC’s products and services, the Group is subject to a large number of other risk factors including, but not limited to increased competition, the attractiveness of its technology and products, ability to continu-ously improve its manufacturing processes and product qualities and failure by subcontractors/suppliers or equipment at the factory.
Contract for products and services are occasionally modified by mutual consent and in certain instances may be cancelled by clients on short notice without compensation. Consequently, the order book as of any particular date may not be indicative of actual operating results for any succeeding period.
For the production of its solar modules, the Group relies on supply of various raw materials such as silicon, aluminum, silver paste, glass and power for which prices cannot be secured on long-term basis. Accordingly the Group is subject to price increase risk for its key supplies.

10 REC Solar Annual Report 2014
Board of Directors’ Report
CORPORATE GOVERNANCE
Corporate governance is important to ensure that our business is operated in a way that protects the long-term interest of all stake-holders. The Board of Directors has approved and implemented corporate governance principles endorsing and complying with the Norwegian Accounting Act and the Norwegian Code of Practice for Corporate Governance (Code of Practice) issued by the Norwegian Corporate Governance Board. REC’s compliance with the Code of Practice is described in detail in the report on Corporate Governance for 2014 which is included in the Annual Report on page 15.
SOCIAL AND ENVIRONMENTAL RESPONSIBILITY
REC is committed to making safe and sustainable solar energy affordable and accessible globally. This means continuous focus on and enhancing the value of our products, while keeping safety at the forefront, and always striving for high environmental and governance standards.
Through close collaboration with our customers and partners, we create value by providing solutions that better meet their existing and future PV needs and demands globally. Sustainability is at the core of our business model, and we are committed to the environment, society and the local communities in which we operate.
To ensure compliance with policies, we monitor performance through specific KPIs, report results monthly and quarterly, and execute audits across all levels in the organization.
The REC Policies on Sustainability consist of the Business Conduct Policy, the Safety and Health Policy, the Environment and Climate Policy, and the Quality and Improvement Policy. They are governing documents for all our activities and are reviewed regularly by the Board of Directors.
THE ENVIRONMENTOur environment and climate policy commits us to maximize the positive contribution from our products, to minimize our negative environmental impacts, and reduce our carbon footprint. REC has attained and maintained its certification in ISO 14001 since calendar year 2011. REC sets clear environmental objectives and targets, monitors performance regularly, reports results, and audits to ensure continuous improvement.
REC used 277 GWh of electricity at its automated and integrated manufacturing facility in calendar year 2014 compared to 258 GWh in 2013. The consumption per kW of modules manufactured was 290 kWh/kW in calendar year 2014, down by 7.9 % compared to 2013. The reduction in energy consumption has been achieved in part through a solar installation on rooftops at our manufacturing
facilities, optimizing various utility area ventilation systems, utilising energy efficient lightings and optimizing chilled water system flow. REC complies with the Singapore Energy Conservation Act by annual submission of energy report detailing consumption and improvement plans for energy reduction.
Taking into account direct and indirect emissions from fuel usage and use of electricity respectively, overall green house gas emissions in CO2 equivalent as a result of our business operations has reduced every year.
360 � � � � � � � � � � � � � � � � � � � � � � � � � � � � � � � � � � � � � � � � � � � � � � � � � � � � � � � � � � � � � � � � � � � � � � � � � � � � �
340 � � � � � � � � � � � � � � � � � � � � � � � � � � � � � � � � � � � � � � � � � � � � � � � � � � � � � � � � � � � � � � � � � � � � � � � � � � � � �
320 � � � � � � � � � � � � � � � � � � � � � � � � � � � � � � � � � � � � � � � � � � � � � � � � � � � � � � � � � � � � � � � � � � � � � � � � � � � � �
300 � � � � � � � � � � � � � � � � � � � � � � � � � � � � � � � � � � � � � � � � � � � � � � � � � � � � � � � � � � � � � � � � � � � � � � � � � � � � �
280 � � � � � � � � � � � � � � � � � � � � � � � � � � � � � � � � � � � � � � � � � � � � � � � � � � � � � � � � � � � � � � � � � � � � � � � � � � � � �
260 � � � � � � � � � � � � � � � � � � � � � � � � � � � � � � � � � � � � � � � � � � � � � � � � � � � � � � � � � � � � � � � � � � � � � � � � � � � � �2012 2013 2014
Electricity Consumption (kWh/kW Produced)
200 � � � � � � � � � � � � � � � � � � � � � � � � � � � � � � � � � � � � � � � � � � � � � � � � � � � � � � � � � � � � � � � � � � � � � � � � � � � � �180 � � � � � � � � � � � � � � � � � � � � � � � � � � � � � � � � � � � � � � � � � � � � � � � � � � � � � � � � � � � � � � � � � � � � � � � � � � � � �160 � � � � � � � � � � � � � � � � � � � � � � � � � � � � � � � � � � � � � � � � � � � � � � � � � � � � � � � � � � � � � � � � � � � � � � � � � � � � �140 � � � � � � � � � � � � � � � � � � � � � � � � � � � � � � � � � � � � � � � � � � � � � � � � � � � � � � � � � � � � � � � � � � � � � � � � � � � � �120 � � � � � � � � � � � � � � � � � � � � � � � � � � � � � � � � � � � � � � � � � � � � � � � � � � � � � � � � � � � � � � � � � � � � � � � � � � � � �100 � � � � � � � � � � � � � � � � � � � � � � � � � � � � � � � � � � � � � � � � � � � � � � � � � � � � � � � � � � � � � � � � � � � � � � � � � � � � � 80 � � � � � � � � � � � � � � � � � � � � � � � � � � � � � � � � � � � � � � � � � � � � � � � � � � � � � � � � � � � � � � � � � � � � � � � � � � � � � 60 � � � � � � � � � � � � � � � � � � � � � � � � � � � � � � � � � � � � � � � � � � � � � � � � � � � � � � � � � � � � � � � � � � � � � � � � � � � � � 40 � � � � � � � � � � � � � � � � � � � � � � � � � � � � � � � � � � � � � � � � � � � � � � � � � � � � � � � � � � � � � � � � � � � � � � � � � � � � � 20 � � � � � � � � � � � � � � � � � � � � � � � � � � � � � � � � � � � � � � � � � � � � � � � � � � � � � � � � � � � � � � � � � � � � � � � � � � � � � 0 � � � � � � � � � � � � � � � � � � � � � � � � � � � � � � � � � � � � � � � � � � � � � � � � � � � � � � � � � � � � � � � � � � � � � � � � � � � � �
2012 2013 2014
Greenhouse Gas Emissions (MT CO2-eq/MW)
Material usage and waste management are important aspects of REC’s environmental policy and management system. We continually explore opportunities to enhance material reuse and recycling to minimize resource consumption and waste generation. Since 2013, all general waste from the manufacturing processes are sorted for recyclable items e. g. metal, aluminium, paper, wood, etc. This has resulted in an increase in the proportion of general waste recycled. The waste production in calendar year 2014 was 5.37 kg/MW, down 0.37 % from 2013.
During the production process, one type of waste which is generated is Hydrogen Fluoride HF sludge, a byproduct of the HF water treatment plant. The HF sludge cannot be incinerated and has to be disposed in a landfill. REC has reduced the HF sludge by 62 percent

REC Solar Annual Report 2014 11 Board of Directors’ Report
from calendar year 2011 to 2014 through optimization of the waste water treatment process and reduced consumption of hydrogen fluoride chemical in the cells production process. The HF sludge has to pass a toxicity characteristic leaching procedure before approval for landfill is granted by relevant authorities. This is an analytical method to simulate leaching through a landfill and is used to determine if a waste is characteristically hazardous.
7 � � � � � � � � � � � � � � � � � � � � � � � � � � � � � � � � � � � � � � � � � � � � � � � � � � � � � � � � � � � � � � � � � � � � � � � � � �6 � � � � � � � � � � � � � � � � � � � � � � � � � � � � � � � � � � � � � � � � � � � � � � � � � � � � � � � � � � � � � � � � � � � � � � � � � �5 � � � � � � � � � � � � � � � � � � � � � � � � � � � � � � � � � � � � � � � � � � � � � � � � � � � � � � � � � � � � � � � � � � � � � � � � � �4 � � � � � � � � � � � � � � � � � � � � � � � � � � � � � � � � � � � � � � � � � � � � � � � � � � � � � � � � � � � � � � � � � � � � � � � � � �3 � � � � � � � � � � � � � � � � � � � � � � � � � � � � � � � � � � � � � � � � � � � � � � � � � � � � � � � � � � � � � � � � � � � � � � � � � �2 � � � � � � � � � � � � � � � � � � � � � � � � � � � � � � � � � � � � � � � � � � � � � � � � � � � � � � � � � � � � � � � � � � � � � � � � � �1 � � � � � � � � � � � � � � � � � � � � � � � � � � � � � � � � � � � � � � � � � � � � � � � � � � � � � � � � � � � � � � � � � � � � � � � � � �0 � � � � � � � � � � � � � � � � � � � � � � � � � � � � � � � � � � � � � � � � � � � � � � � � � � � � � � � � � � � � � � � � � � � � � � � � � �
80 %
70 %
60 %
50 %
40 %
30 %
20 %
10 %
0 %2012 2013 2014
General Waste Production (kg/MW)
Recyclable Waste (kg)
5 � � � � � � � � � � � � � � � � � � � � � � � � � � � � � � � � � � � � � � � � � � � � � � � � � � � � � � � � � � � � � � � � � � � � � � � � � � � � � � � �
4 � � � � � � � � � � � � � � � � � � � � � � � � � � � � � � � � � � � � � � � � � � � � � � � � � � � � � � � � � � � � � � � � � � � � � � � � � � � � � � � �
3 � � � � � � � � � � � � � � � � � � � � � � � � � � � � � � � � � � � � � � � � � � � � � � � � � � � � � � � � � � � � � � � � � � � � � � � � � � � � � � � �
2 � � � � � � � � � � � � � � � � � � � � � � � � � � � � � � � � � � � � � � � � � � � � � � � � � � � � � � � � � � � � � � � � � � � � � � � � � � � � � � � �
1 � � � � � � � � � � � � � � � � � � � � � � � � � � � � � � � � � � � � � � � � � � � � � � � � � � � � � � � � � � � � � � � � � � � � � � � � � � � � � � � �
0 � � � � � � � � � � � � � � � � � � � � � � � � � � � � � � � � � � � � � � � � � � � � � � � � � � � � � � � � � � � � � � � � � � � � � � � � � � � � � � � �2012 2013 2014
HF Sludge going for Landfill (ton/MW)
4 � � � � � � � � � � � � � � � � � � � � � � � � � � � � � � � � � � � � � � � � � � � � � � � � � � � � � � � � � � � � � � � � � � � � � � � � � � � � � � � �
3 � � � � � � � � � � � � � � � � � � � � � � � � � � � � � � � � � � � � � � � � � � � � � � � � � � � � � � � � � � � � � � � � � � � � � � � � � � � � � � � �
2 � � � � � � � � � � � � � � � � � � � � � � � � � � � � � � � � � � � � � � � � � � � � � � � � � � � � � � � � � � � � � � � � � � � � � � � � � � � � � � � �
1 � � � � � � � � � � � � � � � � � � � � � � � � � � � � � � � � � � � � � � � � � � � � � � � � � � � � � � � � � � � � � � � � � � � � � � � � � � � � � � � �
0 � � � � � � � � � � � � � � � � � � � � � � � � � � � � � � � � � � � � � � � � � � � � � � � � � � � � � � � � � � � � � � � � � � � � � � � � � � � � � � � �2012 2013 2014
Water Consumption (m³/kW Produced)
REC’s water consumption was 2.54 m3/kW in calendar year 2014 versus 2.62 m3/kW in 2013. The reduction in water consumption was achieved through reuse of reclaim/reject deionised water instead of fresh water for dilution of the contents of REC’s waste water tank.
Hydrofluoric Acid HF and Nitric Acid HNO3 are two key and highly hazardous chemicals used in the solar cell manufacturing process. REC has reduced its HF and HNO3 consumption from respectively 2.02 m3/MW and 0.94 m3/MW in calendar year 2011 to 1.29 m3/MW and 0.88m3/MW in 2014.
3 � � � � � � � � � � � � � � � � � � � � � � � � � � � � � � � � � � � � � � � � � � � � � � � � � � � � � � � � � � � � � � � � � � � � � � � � � � � � � � � �
2 � � � � � � � � � � � � � � � � � � � � � � � � � � � � � � � � � � � � � � � � � � � � � � � � � � � � � � � � � � � � � � � � � � � � � � � � � � � � � � � �
1 � � � � � � � � � � � � � � � � � � � � � � � � � � � � � � � � � � � � � � � � � � � � � � � � � � � � � � � � � � � � � � � � � � � � � � � � � � � � � � � �
0 � � � � � � � � � � � � � � � � � � � � � � � � � � � � � � � � � � � � � � � � � � � � � � � � � � � � � � � � � � � � � � � � � � � � � � � � � � � � � � � �2011 20132012 2014
Chemical Consumption (m³/MW)
HF HNO3
OUR EMPLOYEESAt 31 December 2014 REC had 1,811 permanent employees. Of the total 1,811, 96 % were located in Singapore. They perform many diverse functions ranging from production specialists, technicians, engineers, maintenance, technologists, HR, Finance, IT and other support functions. The remaining employees are mainly involved in sales and marketing located across our offices in EMEA, USA, Asia Pacific and Japan.
REC is committed to equal opportunity employment and practices. We hire based on merits and all employees and applicants are treated without regard to age, gender, sexual orientation, nation-ality, race, religion, disability marital situation or any other protected status. REC has succeeded in recruiting individuals and teams globally with the necessary competence, potential and cultural fit needed. REC’s workforce comprises many nationalities from all over the world, hired from multi-diverse kinds of industries with a gender ratio of 42 % female and 58 % male. REC’s workforce is highly qualified and skilled with 93 % of our professional employees having a diploma, degree, Masters and/or PhDs. All production specialists/technicians have minimum high school qualifications.
REC’s HR policies and programs are designed to treat all employees fairly and consistently without regards to age, gender, sexual orientation, nationality, race, religion, disability, marital situation or any other protected status. This includes how benefits, rewards and recognitions, career progressions and development programs are managed and administered. HR professionals and managers in

12 REC Solar Annual Report 2014
Board of Directors’ Report
REC regularly undergo training to ensure that they understand these policies and guidelines.
REC believes in gender equality and this is demonstrated in it promotion policy where employees are promoted based on perfor-mance, ability and capability. REC’s workforce today comprises 58 % male and 42 % female. 33 % of the promotions to higher job levels were of female employees in calendar year 2014. Female employees constitute 28 % of the current pool of managers in REC. The REC senior management team consists of 9 people and 3 of these are female.
REC allows for freedom of association in line with international conventions, and works to ensure that employees are treated in a fair manner. REC in Singapore today, partners with the United Workers of Electronics & Electrical Industries (“UWEEI”) to enhance the welfare of REC employees.
In Singapore, all full-time employees are covered by group insurances covering life, health & surgical, permanent disabilities and death. In Europe REC provides insurance according to local legislation, and full-time and part-time employees are covered by the same benefits. All working Singaporeans and their employers make monthly contributions to the Central Provident Fund (CPF). In Europe, REC pays into public pension funds according to law.
REC also encourages that all employees have annual performance reviews with their manager, covering both specified tasks for the period and development activities. Managers must set goals and objectives at the start of the year and perform regular performance reviews with their employees. KPI discussions are mandatory and where development plans are required, both managers and employees establish the development plans through a personal development plan process.
Health and safety has always been the highest priority at REC. REC has attained and maintained its certification in OHSAS 18001 (Occupational Health and Safety Assessment Specification) since 2011 with zero non-conformity in annual external audits. To achieve a world-class safety culture, REC employees across all levels participate in health and safety-focused programs. This includes the monthly safety committee meeting, regular scheduled inspections and hazard observation cards etc. HSE promotion activities are organized and targeted at changing the safety mindset of employees and influence behavior to take responsibility for their own safety. All employees have the right and the responsibility to stop unsafe activities as needed.
The LTI-rate (number of Lost Time Injuries per million worked hours) was 0.84 for 2014 compared with 0.69 in 2013 and the TRI-rate (number of Total Recordable Injuries per million worked hours) was 1.05 in calendar year 2014 compared with 1.38 in 2013. These incidents rates are far lower than the Singapore average incident rates for similar industries.
The average sickness rate was 1.67 % in calendar year 2014, compared to 1.97 % in 2013.
5 � � � � � � � � � � � � � � � � � � � � � � � � � � � � � � � � � � � � � � � � � � � � � � � � � � � � � � � � � � � � � � � � � � � � � � � � � � � � � � � �
4 � � � � � � � � � � � � � � � � � � � � � � � � � � � � � � � � � � � � � � � � � � � � � � � � � � � � � � � � � � � � � � � � � � � � � � � � � � � � � � � �
3 � � � � � � � � � � � � � � � � � � � � � � � � � � � � � � � � � � � � � � � � � � � � � � � � � � � � � � � � � � � � � � � � � � � � � � � � � � � � � � � �
2 � � � � � � � � � � � � � � � � � � � � � � � � � � � � � � � � � � � � � � � � � � � � � � � � � � � � � � � � � � � � � � � � � � � � � � � � � � � � � � � �
1 � � � � � � � � � � � � � � � � � � � � � � � � � � � � � � � � � � � � � � � � � � � � � � � � � � � � � � � � � � � � � � � � � � � � � � � � � � � � � � � �
0 � � � � � � � � � � � � � � � � � � � � � � � � � � � � � � � � � � � � � � � � � � � � � � � � � � � � � � � � � � � � � � � � � � � � � � � � � � � � � � � �2010 2011 2012 2013 2014
LTI/TRI Rate
Lost Time Injury (LTI) rate Total Recordable Injuries (TRI) rate
BUSINESS CONDUCT & ANTI-CORRUPTIONREC sets high standards of integrity and believes that sound business requires value-based management and clear guidelines on ethics and sustainability.
The REC Code of Conduct is an integrity framework, built on the foundation of the REC Group policy of Business Conduct and the REC core values that describes the behavior expected of employees. Our core values are: Responsible, Experienced, Collaborative, and Straightforward.
The Code of Conduct contains practical instructions to help employees in their day-to-day work and is underpinned by standards and policies covering issues such as corruption and illegal payments. Every employee must be re-certified annually in the REC Code of Conduct to acknowledge their commitment to adherence. This is done through the eLearning platform, accessed from the REC intranet (“Direct”). REC takes this very seriously and tracks the re-certification completion rates and will not hesitate to withhold bonus and salary increases of any employee who does not complete this annual requirement.
REC has an Anti-Corruption Policy and related procedures in place. Similar to the REC Code of Conduct, all REC employees must be re-certified annually.
We have an internal whistleblower channel allowing our employees to report concerns or complaints related to REC’s business conduct. REC investigates all potential integrity concerns and cooperates fully with law enforcement agencies. The Audit Committee will be informed of all complaints related to accounting and auditing matters. The Board of Directors will be informed of specific complaints as required and will also be provided regularly with general updates of complaints received. No adverse action will be taken against an employee due to complaints submitted in good faith. Complaints can be made anonymously.
The REC Code of Conduct and human resources policies set out our commitment to human and labour rights to treat our employees

REC Solar Annual Report 2014 13 Board of Directors’ Report
and business partners with dignity, integrity and fairness. These are based around supporting our employees’ livelihoods, implementing ways in which employees can raise areas of concern and working closely with suppliers and partners to ensure standards are met. We uphold and promote human rights in our operations by upholding our REC values and standards, in our relationships with our suppliers and business partners and working through external initiatives such as with our labour union, UWEEI.
OUTLOOK
Outlook and targets are subject to changes in market conditions and operational performance. REC has entered calendar year 2015 with relative good visibility with almost half of its capacity already been booked mainly on long term supply contracts to US based clients.
MARKET OUTLOOKAverage globaI solar panel prices continued to drift in Q1 2015, with a reduction of 2.7 % from Q4 2014. Industry analysts expect prices to continue to fall in calendar year 2015 despite that the market balance is expected to improve due to stronger solar installation markets. Industry analysts expect expects global PV demand in calendar year 2015 to be around 53–57 GW, compared with around 45 GW in calendar year 2014. Foreign currency development and ongoing trade disputes and political uncertainties could influence the supply and pricing landscape.
MANUFACTURING TARGETSBased on the current operational forecast, REC expects to produce ~1200 MW of modules. REC is expanding its module capacity to reach 1.3 GW by 2H 2015. REC expects at the end of 2015 to have a wafer capacity of ~980 MW and cell capacity of ~810 MW. The capacity expansion will facilitate introduction of new and proven technologies and broaden the product offering to REC’s client base. REC is expected to improve its premium quality and realize next generation REC modules with lower cost, higher power and improved reliability.
COST DEVELOPMENT AND CAPEXQ4 2014 solar panel cash costs, excluding exceptional items, are down to ~USD 60 cents/Wp. REC targets 7–9 % reduction in solar panel cash costs from Q4 2014 to Q4 2015 (from ~60 to ~USD 55 cents/Wp). REC has negotiated a new electricity contract reducing the costs of solar panel cash cost by USD 1.5 cents/Wp effective in Q2 2015.
REC will continue its cost reductions in calendar year 2015 through:
– Reduced silicon feed stock and external block costs;– Increased furnace and module output;– Cell efficiency improvements;– Continued OMC reductions and operational improvements; and– Reduced electricity prices
Capex expenditures are expected to be ~USD 50 million in 2015 where USD 34 million is new capex and the balance is projects approved in calendar year 2014 that will be completed in 2015. The capex expenditures are expected to be financed through available cash. The main investments include:
– Enhancement of technologies– Operations improvements and factory maintenance– Two additional module lines in the factory to increase module
capacity by 300 MW
FORWARD LOOKING STATEMENTSREC emphasizes that the information included herein contains certain forward-looking statements that address activities, events or developments that the Group expects, projects, believes or antici-pates will or may occur in the future. These statements are based on various assumptions made by the Group, many of which are beyond its control and all of which are subject to risks and uncertainties. REC is subject to a large number of risk factors. For a description of risk factors, we refer to the risk factors described above. As a result of these and other risk factors, actual events and actual results may differ materially from those indicated in or implied by such forward-looking statements.
Oslo, 29 April 2015
Øystein Stray Spetalen Member of the Board
Ole Enger Chairman of the Board
Jan Christian Opsahl Member of the Board
Mimi K. Berdal Member of the Board
Steven O’Neil CEO
Anne Lise Meyer Member of the Board

14 REC Solar Annual Report 2014
Board of Directors’ Report
STATEMENT OF COMPLIANCE
The Board of Directors and the Chief Executive Officer (CEO) have today considered and approved the report from the Board of Directors, the financial statements for the Group and for the parent company REC Solar ASA (the Company) for the year ending 31 December 2014.
The consolidated financial statements of the Group have been prepared in accordance with International Financial Reporting Standards as adopted by the European Union and additional disclosure requirements as stated in the Norwegian Accounting Act that are applicable per 31 December 2014. The financial statements for the Company have been prepared in accordance with the Norwegian Accounting Act and Generally Accepted Accounting Principles in Norway that are applicable per 31 December 2014. The report from the Board of Directors and CEO, including the report on Corporate Governance and on Coroporate Social Responsibility, for the Group and the Company has been prepared in accordance
with the Norwegian Accounting Act and the Norwegian Accounting Standard no. 16 applicable per 31 December 2014.
We confirm that, to the best of our knowledge:
– The financial statements for the Group and the Company for the year ending 31 December 2014 have been prepared in accordance with applicable accounting standards, and
– The information in the financial statements gives a true and fair view of the Group’s and the Company’s assets, liabilities, financial position and results of operations for the year ending 31 December 2014, and
– The report from the Board of Directors for the year ending 31 December 2014 includes a fair review of:
– The development, results of operations and position for the Group and the Company, and
– The principal risks and uncertainties for the Group and the Company.
Oslo, 29 April 2015
Øystein Stray Spetalen Member of the Board
Ole Enger Chairman of the Board
Jan Christian Opsahl Member of the Board
Mimi K. Berdal Member of the Board
Steven O’Neil CEO
Anne Lise Meyer Member of the Board

REC Solar Annual Report 2014 15 Board of Directors’ Report on Corporate Governance
BOARD OF DIRECTORS’ REPORT ON CORPORATE GOVERNANCE
REC Solar ASA (the “Company”) and its subsid-iaries (together “REC”, “REC Group” or the “Group”), endorses the Norwegian Code of Practice for Corporate Governance (“Code of Practice”) issued by the Norwegian Corporate Governance Board. The latest amendments to the Code of Practice (last revised 30 October 2014) are also incorporated into the reporting requirements of the Accounting Act. The Board of Directors of the Company (“Board”) has adopted the following report that explains how the Group meets the requirements of the Code of Practice and the Accounting Act. In accor-dance with the Code of Practice, any deviation from the Code of Practice is explained.
1. IMPLEMENTATION AND REPORTING ON CORPORATE GOVERNANCEREC is a leading global provider of solar solutions. The Group’s objective is long-term value creation for its shareholders.
The Group believes sound business must be based on value-based management and clear guidelines on ethics and sustainability.
The Group’s ethical values and corporate social responsibility are also described in the Group’s Code of Conduct and other Group policies on sustainability. The Group’s Code of Conduct includes requirements for compliance with laws, ethical behavior and professional integrity for all employees and Board members of the Company and its subsidiaries. In addition, the Group has adopted the following policies:
– Anti-Corruption policy– Business conduct policy– Safety and health policy– Quality and improvement policy– Environment and climate policy
The Corporate Governance principles, the Code of Conduct and the Group policies have been adopted by the Board and are reviewed on a regular basis. Employees can access these polices and principles on the Group’s internal website.
REC solar panel production Tuas, Singapore

16 REC Solar Annual Report 2014
Board of Directors’ Report on Corporate Governance
2. BUSINESSThe purpose of the Company is described in the Articles of Association § 3:
“The Company’s purpose is development and sale of products and services related to renewable energy sources, and to perform other financial operations related to such. The Company may, through subscription of shares or in any other ways, including granting of loans, acquire interests in other companies with identical or similar purposes”.
The Group believes the solar industry plays a key role as a long-term supplier of sustainable energy and its business is focused on the production of wafers, solar cells and solar panels for the solar industry. To make solar electricity fully competitive with traditional energy sources, the Group focuses on cost reduction and improve-ments to products. This should be achieved through introduction of new process and product technologies as well as continuous productivity improvement and technology development. Strategies and goals are presented in the annual and quarterly reports at the various investor meetings.
3. EQUITY AND DIVIDENDSThe Group’s consolidated equity was USD 268.7 million as of 31 December 2014, which was equivalent to approximately 54.6 percent of total assets.
The Board considers the Group’s capital structure appropriate for the current objectives, strategy and risk profile. Reference is also made to note 3.3 to the consolidated financial statements regarding capital structure and financing and to the report of the Board of Directors.
The Group’s ambition is to give its shareholders a high and stable return on their investment and to be competitive compared with alternative investment opportunities with comparable risk.
To support committed investments and productivity improvements, the Board’s view so far has been that retained earnings should be put to profitable use within the Company.
Accordingly there has been no distribution of dividends to the shareholders since the Company was publicly listed in 2013.
The Board does not propose any dividend payments for the financial year from 15 July 2013 to 31 December 2014.
The Board will continue to assess the Group’s capital structure based on the goals and strategies and the financial situation of the Company.
At the Annual General Meeting (“AGM”) on 31 March 2014, the Board was granted the following authorities:
– Authority to acquire treasury shares in the Company (up to a maximum of ten percent of the nominal value of the existing share capital)
– Authority to increase the share capital (up to ten percent of the existing share capital).
Pursuant to the AGM, the authorizations were granted for one or more of the following purposes:
(a) In respect of the issuance of shares: (i) in connection with investments, mergers and acquisitions; (ii) in connection with obligations to issue shares and to carry
out consolidation of shares; and/or (iii) to provide the Company with financial flexibility.
(b) In respect of the acquisition of treasury shares: (i) to fulfil the Company’s obligations under share purchase
programs for its employees; (ii) in connection with share option programs for its employees;
and/or (iii) to increase return on investment for the Company’s
shareholders
The aforesaid resolutions were passed separately at the AGM and the authorizations were given for one year.
Refer to note 28 of the consolidated financial statements for a more detailed description of the mandates including defined purposes and time limits for utilization. There was separate voting for each purpose.
4. EQUAL TREATMENT OF SHAREHOLDERS AND TRANSACTIONS WITH CLOSE ASSOCIATESREC Solar ASA has one class of shares and each share confers one voting right at General Meetings of the Company. The Articles of Association contain no restrictions on voting rights and all shares have equal rights. The Company seeks to conform to the principles of equal treatment of shareholders and is generally cautious in transactions with shareholders, members of the Board, Group Management, or other related parties.
Existing shareholders have preferential rights when new shares are issued. With the approval of at least two-thirds of the total number of votes represented at the General Meeting, the General Meeting can decide to set aside the preferential rights. Grounds must be stated for any proposal to set aside preferential rights, and this must be documented in the case document submitted to the General Meeting.
In cases where the Board decides to issue new shares and the preferential rights are set aside on the basis of an authorization, the grounds will be disclosed in a stock exchange announcement in connection with the share issue.

REC Solar Annual Report 2014 17 Board of Directors’ Report on Corporate Governance
The Company did not acquire any of its own shares during the period 15 July 2013 to 31 December 2014. If the Company acquires or sells any of its own shares, trading must take place through Oslo Børs or in other ways at the prevailing stock exchange price.
There were related party relationships between the Company and its subsidiaries, associates, joint ventures and with its Senior Management and Board of Directors. Further information is presented in note 11 to the consolidated financial statements.
The Board has adopted guidelines to ensure that they will be informed of possible interests of Board members, members of Group Management or close associates in any transaction or matter dealt with by the Board, as well as guidelines for handling of such situations. The Board must review and approve all transactions between the Group and Group Management or the Board.
REC Solar ASA’s Rules of Procedures for the Board states, inter alia, that Directors may not participate in the discussion or decision of issues, which area is of such special importance to the Director, or to any person closely related to the Director, that the Director must be regarded as having a material personal or financial interest in the matter.
5. FREELY NEGOTIABLE SHARESThe Company’s shares are listed on the Oslo Stock Exchange and are freely negotiable. All shares are without any restrictions and are freely tradable.
The Articles of Association contain no restrictions on negotiability or voting rights and all shares have equal rights.
6. GENERAL MEETINGSThe Board has taken steps to ensure that as many shareholders as possible may exercise their rights at the Company’s General Meetings.
According to the Articles of Association, the AGM is to be held annually by the end of June every year.
The notice of the AGM and proposed resolutions are sent to shareholders and made available on the Company’s website no later than three weeks prior to the date of the AGM. Generally, in accordance with Article 9 of the Articles of Association, the AGM shall consider the following:
– Approval of the financial statements and the annual report, including the allocation of profits or deficits
– Determination of remuneration to the Board and approval of remuneration to the auditor
– Election of Board Members and auditor– Other issues that shall be considered by the General Meeting
according to the law or Articles of Association
The supporting documentation, including the recommendations of the Nomination Committee, is made available on the Company’s website no later than three weeks prior to the General Meeting.
According to the Articles of Association, when the documents relating to items to be handled at the General Meeting have been published on the Company’s website, the requirement in the Public Limited Liability Companies Act that such documents shall be distributed to the shareholders does not apply. A shareholder may, however, request to receive the documents by mail.
Efforts are made to ensure that proposed resolutions and supporting information are sufficiently detailed and comprehensive to allow the shareholders to form a view on all matters to be considered at the meeting. The invitation includes information about shareholders’ rights.
The Company regularly states in the notice of the meeting that shareholders wishing to participate at the General Meeting shall notify the Company within a specific time limit. The time limit cannot expire earlier than five days prior to the General Meeting. Shareholders who have not given notice within the time limit may be denied participation at the meeting. Registration of attendance may be done by mail, fax, or via the Company’s website.
The Chairman of the Board, the Board members and the members of the Nomination Committee are normally present at the General Meeting. The Company’s auditor is also present. All Board members are encouraged to participate at the meeting.
Shareholders who cannot attend the meeting may vote by proxy. They may elect a proxy of their choice, and the Company also nominates a person that shareholders may elect as a proxy. Information about the procedures shareholders must observe to participate and vote is given together with the notice of the meeting. A proxy form is prepared in a way that allows separate voting instructions to be given for each matter considered. It is not possible to vote separately on each candidate nominated to the Board by way of proxy as this may result in a board composition which does not comply with applicable requirements concerning inter alia gender representation and/or qualifications for board members and/or qualifications required in sub-committees. This is because the composition of the Board must be in accordance with applicable legislation regarding gender representation and qualifications for the audit committee. The Nomination Committee’s proposal is given with respect to such legislation. Should a situation arise where the composition of the Board might conflict with applicable legislation, the situation and consequences of electing a Board contrary to legislation should be discussed at the General Meeting and shareholders should base their votes on the views discussed.
The Articles of Association allow the Board to accept written advance votes subject to the existence of a satisfactory method for verifying the identity of the shareholder. The Articles of Association also allow the Board to accept votes cast through electronic communication. So far, no satisfactory solutions for written advance votes and electronic voting have been established, but the Board will continue to evaluate any solutions that become available.

18 REC Solar Annual Report 2014
Board of Directors’ Report on Corporate Governance
The General Meeting is opened by the Chairman of the Board who nominates an independent chair for election to lead the meeting.
The minutes of the General Meetings are available on the Company’s website.
7. NOMINATION COMMITTEEThe Articles of Association provide for a Nomination Committee consisting of three members. The members are elected by the AGM for a term of two years and the AGM appoints the Chairman of the Nomination Committee. The remuneration of the Nomination Committee is decided by the AGM. The Nomination Committee makes proposals to the AGM for members to be elected to the Nomination Committee.
The Nomination Committee is independent of the Board and the Company’s executive management. The composition of the current Nomination Committee is in accordance with the requirement of independence in the Code of Practice.
The duties of the Nomination Committee are to:
– Submit a recommendation to the General Meeting relating to the election of members and deputy members of the Company’s Board; and
– Submit a proposal for remuneration of members and deputy members of the Board.
The Nomination Committee’s recommendations provide relevant information of the candidates.
The Nomination Committee examines the annual report by the Board on the evaluation of its own work and takes its contents into consideration when making its recommendations on board composition. The Nomination Committee also consults with the Chief Executive Officer, the Chairman of the Board, the shareholder-elected Board members and the largest shareholders of the Company, in order to ensure the best possible basis and support for its conclusion, before submitting its proposals. Pursuant to the amended Code of Practice, the Nomination Committee should ensure that all shareholders may propose candidates e.g. through the Company’s website. As the Company has not had any Board elections since the amended Code of Practice was implemented, this recommendation has, to date, not been applied by the Company.
The Nomination Committee presents and provides the basis for the proposals by the Nomination Committee at the General Meeting and also reports on how its work has been carried out during the past year. The Rules of Procedures for the Nomination Committee of REC Solar ASA do not establish rules for rotation of the members of the Nomination Committee. The members of the Nomination Committee are currently Mr. Petter Qvam (chair), Mr. Glen Ole Rodland, and Mr. Harald Arnet.
8. CORPORATE ASSEMBLY AND BOARD OF DIRECTORS: COMPOSITION AND INDEPENDENCEThe Company has agreed with employees not to have a corporate assembly in the parent company or its subsidiaries. As of 31 December 2014, due to the number of employees in Norway, that is, below 30, there was no employee representative on the Board.
According to the Articles of Association, the Board shall consist of between three and twelve members. As of 31 December 2014, the Board consists of five directors. The Board members are elected for a term of one year at a time.
The directors are presented in the Annual Report with information about education and experience. Currently two of the five shareholder-elected members are women.
All members of the Board are independent of the Group Management. While not a deviation from the Code with respect to independence from Group Management, the Company has had a working chairman as a result of the Company wanting an active board in the current situation. A majority of the Board members are independent of material business contacts. The Company’s Board has a diverse composition and expertise tailored to meet the Company’s needs. Further information regarding the background, education and other board positions of each Board member is available on the Company’s website: www.recgroup.com/en/ir/Corporate-Governance/Board-of-directors/
All members of the Board are independent of the Company’s main shareholders.
The Board elects a Chairman according to the Articles of Association and the Public Limited Liability Companies Act § 6-1 (2).
Board members are encouraged to acquire shares of the Company with due consideration to the requirements of the Securities Trading Act and Company procedure for primary insiders. The Company assists Board members in complying with mandatory disclosure obligations. Primary insiders should abstain from short-term transactions in financial instruments, and they should apply due care and diligence with regard to ownership periods.
9. WORK OF THE BOARD OF DIRECTORSThe Board has the ultimate responsibility for the management of the Company and the Group and for supervising day-to-day management and the Company’s business in general.
The Board has adopted an annual plan for work with respect to fixed items. Other items are added as required. The Board evaluates its own work and work methods annually.
The Board held 16 board meetings during the period 15 July 2013 to 31 December 2014 which were well attended by all Board members with limited absences.
The Board has adopted “Rules of Procedures for the Board of Directors”. The rules describe Board responsibilities, duties and

REC Solar Annual Report 2014 19 Board of Directors’ Report on Corporate Governance
administrative procedures as well as the tasks and duties of the Chief Executive Officer. The Board has also adopted a Chart of Authority regulating matters that are to be decided by the Board and the matters that may be decided by Group Management with a description of the appropriate level of decision-maker. The Chart of Authority distinguishes between investment decisions, customer contracts, procurement contracts, compensation, and finance and is reviewed on an annual basis. The Board holds at least one meeting per year with the Company’s auditor and without any members of Group Management or administration present.
In matters of a material character in which the Chairman of the Board is or has been personally involved, the Board’s consideration of such matter is chaired by another member of the Board.
In order to ensure a thorough evaluation of specific issues, the Board has established two committees – an Audit Committee and a Compensation Committee.
Audit CommitteeThe Audit Committee consists of two members of the Board both of whom are independent of Group Management. The Audit Committee has collectively the competence required in the Public Limited Liability Companies Act § 6-42. Both members are independent according to § 6-42 Public Limited Liability Companies Act, and one member has the required accounting and auditing qualifications.
The Audit Committee supports the Board with respect to the assessment and control of financial risk, financial reporting, auditing, control, and prepares discussions and resolutions for Board meetings. It has no decision-making authority. In addition, under the whistleblower procedure, complaints from employees and other concerned parties are received and followed up by the Audit Committee. The Chief Financial Officer participates in the meetings of the Audit Committee. The Audit Committee holds at least one meeting per year with the auditor and without the Chief Financial Officer or any other members of the Group Management and administration present.
The Audit Committee held 5 meetings during the period 15 July 2013 to 31 December 2014. The Audit Committee has been in regular contact with the Company’s auditor regarding audits of the Company’s statutory accounts and it also assesses and monitors the auditor’s independence, including non-audit services provided by the auditor.
The Audit Committee makes recommendations to the Board with respect to appointment, retention and termination of the Company’s auditor as well as the auditor’s fees. The Audit Committee reviews complaints regarding accounting, internal controls, and auditing matters.
The tasks and rules of procedure of the Audit Committee are further regulated in the Audit Committee Charter.
The Audit Committee members are currently Ms. Anne-Lise Meyer (chair) and Ms. Mimi Berdal.
1.7 MW 7,056 REC solar panels
Yonago, Tottori, Japan

20 REC Solar Annual Report 2014
Board of Directors’ Report on Corporate Governance
Compensation CommitteeThe Compensation Committee consists of two members of the Board which are independent of the Group Management. The Compensation Committee supports the Board by preparing resolutions on the terms and conditions of employment for the Chief Executive Officer and the general principles and strategies for compensation of Group Management including bonus and share based compensation as well as other personnel matters. It also makes recommendations to the Board on employee share purchase programs.
The tasks and procedures of the Compensation Committee are further regulated in the Compensation Committee Charter.
The Compensation Committee held numerous meetings during the period 15 July 2013 to 31 December 2014 (which included at least 3 physical meetings and various conference calls).
The Compensation Committee members are currently Ms. Mimi Berdal (chair) and Mr. Ole Enger.
Other CommitteesThe Board decided not to form a Corporate Governance Committee for the period 15 July 2013 to 31 December 2014 as the reporting on corporate governance as described in the Accounting Act and the NUES principles should be prepared as part of the Audit Committee’s tasks.
10. RISK MANAGEMENT AND INTERNAL CONTROLThe Group’s risk management system shall ensure that the Group has a systematic and uniform approach to risk management. The system defines roles, responsibilities, processes and procedures, standards, tools and documentation. Group Management sets the context in which risks are managed and supervises the risk management process.
Group Management performs separate risk evaluations based on a top-down approach. Risk assessments are presented to the Audit Committee and the Board. The Board performs a review of risks in connection with the approval of the annual budget.
In addition, Group Management generates monthly reports that are sent to the Board including operational reviews, HSE (Health, Safety and Environment), financial highlights and key performance indicators. Group Management also periodically submits sustain-ability reports to the Board.
Because the Group operates internationally, it is required to comply with numerous national and international laws and regulations. All business activities and processes must be conducted in accordance with all relevant laws and regulations.
To strengthen internal control, the Group has established an Anti-Corruption Policy and procedures, provided training to employees and managers, and performed a fraud risk assessment. Business partners are also expected to have ethical standards that are consistent with the Group’s ethical requirements. Whistleblower
complaints and other internal control activities are presented to the Audit Committee according to the Audit Committee Charter.
To ensure consistent financial reporting throughout the Group, financial information is reported through the Group’s common web-based reporting system, Hyperion Financial Management (HFM). Subsidiaries report figures in HFM based on output from ERP systems. HFM has a chart of accounts and reports designed to meet the requirements of IFRS. HFM has built-in controls in the forms and reports designed to check that information is consistent. Quarterly and year end reporting processes are expanded to meet various supplementary requirements.
The quarterly and yearly reporting process and significant accounting and reporting issues are discussed with the Audit Committee in the presence of the external auditor.
The Group’s financial risk management is described in note 3 to the consolidated financial statements. Reference is also made to the report of the Board of Directors that includes an analysis of the financial statements and the risk factors.
11. REMUNERATION OF THE BOARD OF DIRECTORSThe members of the Board receive remuneration in accordance with their individual roles. Board members who participate in the Audit Committee or the Compensation Committee receive additional compensation. At the AGM of the Company held on 31 March 2014, the AGM adopted the following resolution: “The recommendation for remuneration of Board and Nomination Committee members provided by the Nomination Committee was approved.”
The Extraordinary General Meeting on 29 November 2013 electing new Board members approved the shareholders’ proposal to grant the Chairman an additional lump sum remuneration for his work upon the sale of the Company’s business.
Board remuneration is not linked to Company performance and members are not granted share options. During the period 15 July 2013 to 31 December 2014, shareholder-elected members have not taken on specific assignments in addition to their appointment as members of the Board.
Further information on the remuneration paid to each Board member is presented in note 11 to the consolidated financial statements.
12. REMUNERATION OF THE GROUP MANAGEMENTThe Board determines the remuneration of the Chief Executive Officer and prepares guidelines of the remuneration of the Group Management which are communicated to the General Meeting. The guidelines shall be presented in a separate document. Furthermore, it shall state which of the guidelines are only guiding and which are binding (e.g. performance-related remuneration) and the general meeting shall vote separately on the two sets of guidelines.
The remuneration of the Group Management consists of the following main elements:
REC Solar Annual Report 2014 21 Board of Directors’ Report on Corporate Governance
– Basic salary– Variable pay based on an annual performance-related compen-
sation system– Certain compensation in kind, e.g. telephone allowances– Pension and insurance schemes
In addition, retention bonus agreements have been entered into. For further information see note 11 to the consolidated financial statements.
The variable pay is linked to the Group’s financial performance over time and includes incentives related to performance which employees can influence. There are absolute limits for performance-related remuneration.
The remuneration of the Chief Executive Officer and other members of Group Management are disclosed in note 11 to the consolidated financial statements.
13. INFORMATION AND COMMUNICATIONThe Company treats its investors equally. Timely information is published simultaneously to all investors in accordance with applicable legislation and regulation in order to provide the best possible basis for evaluation of Company performance.
Presentations that are open to the public are conducted in connection with quarterly reports and are also made available through a webcast. The Chief Executive Officer and the Chief Financial Officer normally participate in quarterly presentations. The Investor Relations Officer participates at the quarterly presen-tations. Furthermore, the Company keeps an ongoing dialogue with its investors and makes presentations to analysts and investors through various conferences and events.
The Investor Relations (IR) function is in charge of coordinating the Company’s communications to the market and to existing and potential investors of the Company. The Investor Relations function of the Company ensures that contact with the Company’s shareholders is maintained outside the AGM, please see www.recgroup.com/en/ir.
The annual report of the Company is sent to shareholders on request. The annual and quarterly reports, Stock Exchange announcements, presentations, and the financial calendar are published on the Company’s website. All information distributed to shareholders of the Company is published on the Company’s website at the same time as it is sent to shareholders.
The Board has adopted an IR policy specifying, among other things, who is entitled to speak on behalf of the Company on various subjects and with guidelines for the Company’s contact with shareholders other than through General Meetings.
14. TAKE-OVERSThe Company has no defense mechanism to prevent take-over bids, nor has it implemented other measures that limit the opportunity to acquire shares in the Company. The Board is open to initiatives that are commercially and financially attractive for the shareholders. The Board assesses potential offers in accordance with applicable legislation and Code of Conduct requirements. No other guidelines have been established by the Board in the event of a take-over bid, which is a deviation from the Code of Practice. In the event of a take-over bid, the Board will, in addition to complying with relevant legislation and regulations, seek to comply with the recommenda-tions in the Code of Practice.
Any transaction that effectively constitutes a disposal of a majority of the Company’s activities will be decided by the General Meeting. At the Extraordinary General Meeting of the Company held on 15 January 2015, the General Meeting approved the authorization to divest the Company’s business.
15. AUDITORThe Company’s external auditor is independent from the Company and is elected by shareholders at the AGM.
The auditor participates at Board meetings with respect to the annual financial statements and provides comments related to the accounting principles and the financial statements. The auditor comments on any material changes in the Company’s accounting principles, material estimates used to calculate accounting figures, and reports disagreements between the auditor and Group Management.
The auditor presents the most significant identified weaknesses and proposals for improvements of the internal control procedures annually to the Board with an annual confirmation that the auditor had satisfied the requirements for independence together with a summary of all services provided to the Group. The auditor meets with the Audit Committee and the Board once a year without the Chief Executive Officer or any other member of the Group Management present.
The auditor participates in meetings of the Audit Committee and presents the main features of audit plan to the Committee.
Remuneration of the auditor is approved by the AGM. The auditor provides a break-down between audit and non-audit services, and the AGM is given information about non-audit services provided by the auditor. The Board has issued guidelines regarding Group Management’s use of the auditor for services other than audit.
The auditor participates at the AGM and presents the independent auditor’s report.

22 REC Solar Annual Report 2014
Board of Directors’ Report on Corporate Governance
402 kW 1,575 REC solar panels Port Melbourne, Australia

REC Solar Annual Report 2014 23 REC Group & REC Solar ASA
REC GROUP
Consolidated Statement of Financial Position 24
Consolidated Statement of Financial Position 25
Consolidated Statement of Income 26
Consolidated Statement of Comprehensive Income 27
Consolidated Statement of Changes in Equity 27
Consolidated Statement of Cash Flows 28
REC SOLAR ASA
Balance Sheet (NGAAP) 60
Balance Sheet (NGAAP) 61
Income Statement (NGAAP) 62
Statement of Cash Flows 63
REC GROUP & REC SOLAR ASAFINANCIAL STATEMENTS

24 REC Solar Annual Report 2014
Financial Statements REC Group
CONSOLIDATED STATEMENT OF FINANCIAL POSITIONREC
(USD IN MILLION) NOTES 31 DEC 2014 OPENING BALANCE 15 JUL 2013
ASSETSNon-current assetsOther intangible assets 7 14.1 0.0Intangible assets 14.1 0.0Land and buildings 7 31.1 0.0Machinery and production equipment 7 39.2 0.0Other tangible assets 7 3.3 0.0Assets under construction 7 27.7 0.0Property, plant and equipment 101.3 0.0
Prepaid lease, non-current 7 11.3 0.0Equity accounted investments 10 2.5 0.0Investments in shares (available for sale) 10 3.6 0.0Other non-current receivables 12 4.0 0.0Financial assets 10.1 0.0Deferred tax assets 15 0.2 0.0
Total non-current assets 137.0 0.0
Current assetsInventories 13 107.8 0.0Prepaid lease 7 0.5 0.0Prepayments 1.4 0.0Trade and other receivables 12 143.1 0.0Current tax assets 15 0.8 0.0Current derivatives 9 7.8 0.0Restricted bank accounts 4.0 0.0Cash and cash equivalents 14 89.9 0.2Total current assets 355.2 0.2Total assets 492.2 0.2
REC SOLAR ASA AND ITS SUBSIDIARIES CONSOLIDATED FINANCIAL STATEMENTS PERIOD FROM 15 JULY 2013 TO 31 DECEMBER 2014
FINANCIAL STATEMENTS REC GROUP

REC Solar Annual Report 2014 25 Financial Statements REC Group
CONSOLIDATED STATEMENT OF FINANCIAL POSITIONREC
(USD IN MILLION) NOTES 31 DEC 2014 OPENING BALANCE 15 JUL 2013
EQUITY AND LIABILITIESShareholders‘ equityShare capital 6.7 0.2Other paid-in capital 124.6 0.0Paid-in capital 131.4 0.2Total comprehensive income for the period 137.3 0.0Total shareholders‘ equity 268.7 0.2
Non-current liabilitiesProvisions 17 89.7 0.0Total non-current liabilities 89.7 0.0
Current liabilitiesTrade payables and other liabilities 17 129.8 0.0Provisions 17 2.1 0.0Current tax liabilities 15 1.7 0.0Other derivatives 9 0.2 0.0Total current liabilities 133.9 0.0Total liabilities 223.5 0.0
Total equity and liabilities 492.2 0.2
Oslo, 29 April 2015
Øystein Stray Spetalen Member of the Board
Ole Enger Chairman of the Board
Jan Christian Opsahl Member of the Board
Mimi K. Berdal Member of the Board
Steven O’Neil CEO
Anne Lise Meyer Member of the Board

26 REC Solar Annual Report 2014
Financial Statements REC Group
CONSOLIDATED STATEMENT OF INCOMEREC
(USD IN MILLION) NOTE 15 JUL 2013 TO 31 DEC 2014
Revenues 6 803.3Cost of materials 13 – 473.3Changes in inventories and write downs 13 1.6Employee benefit expenses 21 – 99.3Other operating expenses 19 – 153.0Other income and expenses 20 4.1EBITDA excluding other income from negative goodwill 83.4Other income from negative goodwill 5 91.3EBITDA 174.7Depreciation 7 – 17.9Amortization 7 – 5.4Total depreciation and amortization – 23.3EBIT 151.4Share of gain/(loss) of equity accounted investments 10 2.4Financial income 22 0.2Net financial expenses 22 – 1.8Net currency gains/losses 22 15.3Net gains/losses other fin instruments 22 8.3Net financial items 21.9
Profit before tax 175.8Income tax expense 15 – 1.7Profit 174.1
Attributable to: Owners of REC Solar ASA 174.1
Earnings per share (In USD) From total operations – basic 23 3.7– diluted 23 3.7
EBITDA is earnings before net financial items, income taxes, depreciation, amortization and impairment. EBIT is earnings before net financial items and income taxes.

REC Solar Annual Report 2014 27 Financial Statements REC Group
CONSOLIDATED STATEMENT OF COMPREHENSIVE INCOMEREC
(USD IN MILLION) 15 JUL 2013 TO 31 DEC 2014
Profit for the period 174.1Other comprehensive income, net of tax:currency translation differences of foreign operations taken to equity – 36.7Sum of items that may be reclassified to profit or loss – 36.7Total other comprehensive income for the period – 36.7Total comprehensive income for the period 137.3
Total comprehensive income for the period attributable to
Owners of REC Solar ASA 137.3
CONSOLIDATED STATEMENT OF CHANGES IN EQUITYREC
(USD IN MILLION) SHARE CAPITAL OTHER PAID-IN
CAPITAL TOTAL PAID-IN
CAPITAL COMPRE HENSIVE
INCOME TOTAL EQUITY
At 15 July 2013 0.2 0.0 0.2 0.0 0.2Repayment of equity – 0.2 – – 0.2 – – 0.2Share capital increased by IPO on 25 October 2013, net of costs 6.7 124.6 131.4 – 131.4Total comprehensive income for the period – – – 137.3 137.3At 31 December 2014 6.7 124.6 131.4 137.3 268.7

28 REC Solar Annual Report 2014
Financial Statements REC Group
CONSOLIDATED STATEMENT OF CASH FLOWSREC
(USD IN MILLION) 15 JUL 2013 TO 31 DEC 2014
Profit before tax for the period 175.8Adjustments for:Negative goodwill – 91.3Depreciation and amortization 23.3Writedown of inventories 2.0Loss on sales of property, plant and equipment 0.5Change in fair value of derivatives – 7.8Share of gain/loss of equity accounted investments – 2.7Changes in trade and other receivables – 54.9Changes in inventories – 7.5Changes in trade and other payables 33.6Changes in provisions 5.5Tax paid – 0.1Net cash flow from operating activities 76.4
Cash flows from investing activitiesAcquisition of subsidiaries and associates, net of cash acquired – 88.7Proceed from equity accounted investments 12.1Acquisition of property, plant and equipment and intangible assets – 56.0Proceeds from sales of property, plant and equipment 0.1Proceeds from government grants 24.4Insurance reimbursement 1.0Net cash used in investing activities – 107.1
Cash flows from financing activitiesProceeds from issue of share capital, net of transaction costs 131.4Net cash flow from financing activities 131.4
Net increase in cash and cash equivalents 100.7Effect of exchange rate fluctuations – 11.0
Cash and cash equivalents at the beginning of the period 0.2Cash and cash equivalents at the end of the period 89.9

REC Solar Annual Report 2014 29 Financial Statements REC Group
01. General Information 30
02. Summary of Significant Accounting Policies 30
03. Financial Risk Management 36
04. Critical Accounting Judgments and Key Sources of Estimation Uncertainty 37
05. Subsidiaries and Business Combination 40
06. Segment Information 41
07. Fixed Assets 43
08. Impairments of Cash-Generating Units 43
09. Derivatives 44
10. Equity Accounted Investments (Associates and Joint Ventures) and Investments 45
11. Related Party Transactions 45
12. Details Receivables and Construction Contracts in Progress 49
13. Inventories 50
14. Cash and Cash Equivalents 51
15. Income Tax Expense and Deferred Tax Assets and Liabilities 51
16. Retirement Benefit Obligations and Expenses 52
17. Trade Payables, Provisions and Other Liabilities 52
18. Government Grants 52
19. Other Operating Expenses 53
20. Other Income and Expenses 54
21. Employee Benefits 54
22. Financial Income and Expenses 54
23. Earnings per Share 54
24. Research and Development 55
25. Commitments, Guarantees 55
26. Other Information Financial Instruments 56
27. Contingent Liabilities and Contingent Assets 57
28. Shareholder Information 57
29. Events after the Reporting Period 58
NOTES TO THE CONSOLIDATED FINANCIAL STATEMENTS REC GROUP

30 REC Solar Annual Report 2014
Financial Statements REC Group
01. GENERAL INFORMATION
REC Solar ASA was incorporated on 15 July 2013 in Norway. The address of the Company’s registered office is Karenslyst allé 51, SKØYEN, 0279 OSLO, Norway. On 25 October 2013, REC Solar ASA acquired the solar entities previously owned by Renewable Energy Corporation ASA (now renamed to REC Silicon ASA).
REC Solar ASA and its subsidiaries (together, “REC”, “REC Group” or the “Group”) is principally involved in the manufacturing of solar panels and development of solar power systems.
REC’s first annual report is prepared for the period from 15 July 2013 to 31 December 2014. These consolidated financial statements was approved for issue by the Board of Directors of REC Solar ASA on 29 April 2015.
These consolidated financial statements have been prepared in accordance with International Financial Reporting Standards as adopted by European Union (“EU”) (IFRS) and the Norwegian Accounting Act, with the basis for preparation as described below. These are the REC Solar Group’s first financial statements prepared in accordance with IFRS and IFRS 1. First-time Adoption of International Financial Reporting Standards (IFRS 1) has been applied. The adoption of IFRS 1 has had no impact on the financial position, financial performance and cash flows of REC, as it formed part of the greater REC ASA group which already applied IFRS. Therefore, no reconciliations to previous financial statements or effects of implementation are relevant. REC did not present financial statements for previous periods.
These consolidated financial statements have been prepared under the historical cost convention, as modified by impairment of some assets. The preparation of financial statements in conformity with IFRS requires the use of certain critical accounting estimates. It also requires management to exercise its judgment in the process of applying REC’s accounting policies. The areas involving a higher degree of judgment or complexity, or areas where assumptions and estimates are significant to the consolidated financial statements are disclosed in note 4.
02. SUMMARY OF SIGNIFICANT ACCOUNTING POLICIESThe principal accounting policies applied in the preparation of these consolidated financial statements are set out below.
2.1 BASIS OF CONSOLIDATION(A) SubsidiariesSubsidiaries are all entities over which REC has the power to govern the financial and operating policies. Subsidiaries are fully consolidated from the date on which control is transferred to REC. They are de-consolidated from the date that control ceases.
The acquisition method of accounting is used to account for the acquisition of subsidiaries by REC. The consideration transferred of an acquisition is measured as the fair value of the assets given, equity instruments issued and liabilities incurred or assumed at the date of exchange. Identifiable assets acquired and liabilities and contingent liabilities assumed in a business combination are measured initially at their fair values at the acquisition date, irrespective of the extent of any non-controlling interest. The excess of the consideration transferred over the fair value of REC Group’s share of the identifiable net assets acquired is recorded as goodwill. If the consideration transferred is less than the fair value of the net assets of the subsidiary acquired, the difference is recognized directly in the statement of income. Step acquisitions: an increase in ownership of a jointly controlled entity or an associate that becomes a subsidiary is controlled entity or an associate that becomes a subsidiary is accounted for using the acquisition method as at the date of control. An increase in ownership in a subsidiary is accounted for in accordance with the requirements of IAS 27 Consolidated and Separate Financial Statements as a transaction with equity holders with no change in the carrying amounts of assets or liabilities. At the time control is lost, a gain or loss is calculated.
Intercompany transactions, balances and unrealised gains on transactions between group companies are eliminated. Unrealised gains have been present on intercompany sales of intermediate products.
(B) Jointly controlled entitiesREC’s interests in jointly controlled entities are accounted for by the equity method of accounting. Investments in jointly controlled entities are recognised initially at cost. REC’s share of the jointly controlled entities’ profits and losses are recorded on its consoli-dated Profit and Loss Statement as “Share of profit/loss of equity accounted investments”. An increase in ownership of a shareholding that becomes a jointly controlled entity is accounted for in accordance with the requirements of IFRS 3 Business Combinations with goodwill being recognised at each step of the acquisition when applicable. For the periods presented, REC had interests in two jointly controlled entities in the PV systems area.
(C) AssociatesAssociates are entities over which REC has significant influence but not control or joint control, generally encompassing a shareholding of between 20 percent and 50 percent of the voting rights. Investments in associates are accounted for by the equity method of accounting and are initially recognised at cost.
The cumulative investment movements are adjusted against the carrying amount of the investment. When REC’s share of losses in an associate equals or exceeds its interest in the associate, REC does not recognise further losses, unless it has incurred obligations or made payments on behalf of the associate. Unrealised gains on transactions between REC and its associates are eliminated to the extent of REC’s interest in the associates. Mainstream Energy Inc. and Sella Invest di ESB srl. & Co sas (Sella) have been treated as associates.
NOTES TO THE CONSOLIDATED FINANCIAL STATEMENTS REC

REC Solar Annual Report 2014 31 Financial Statements REC Group
2.2 SEGMENTSIt has been evaluated that REC has only one operating and reportable segment, which is the REC as a whole (see note 5).
2.3 FOREIGN CURRENCY TRANSLATION(A) Functional and presentation currencyItems included in the financial statements of each of the REC’s entities are measured using the currency of the primary economic environment in which the entity operates (“the functional currency”). The financial statements are presented in USD, rounded to the nearest 0.1 million, unless otherwise stated. As a result of rounding adjustments, the figures in one or more rows or columns included in the financial statements and notes may not add up to the total of that row or column.
(B) Transactions and balancesForeign currency transactions are translated into the respective group entities’ functional currencies using the exchange rates prevailing at the dates of the transactions. Monetary assets and liabilities denominated in foreign currencies are translated at the reporting date exchange rates. Foreign exchange gains and losses resulting from the settlement or the translation of monetary assets and liabilities are recognised in the statement of income, except when deferred in equity as qualifying cash flow hedges, qualifying net investment hedges or as a part of a net investment.
(C) Group companiesThe results and financial position of all REC entities that have a functional currency different from the presentation currency are translated into the presentation currency as follows:
(i) Assets and liabilities for each statement of financial position presented are translated at the closing rate;
(ii) Income and expenses for each statement of income are translated at average exchange rates for the year (based on monthly average rates);
(iii) All resulting exchange differences from translation are recognised as a separate component of other comprehensive income (OCI); and
(iv) Equity items (other than the net profit or loss for the period that is included in retained earnings) are translated at the transaction rates.
2.4 CURRENT/NON-CURRENTAn asset/liability is classified as current when it is expected/due to be realized or settled within twelve months after the reporting date.
2.5 PROPERTY, PLANT AND EQUIPMENTLand and buildings consist primarily of operating plants and offices. All property, plant and equipment are stated at historical cost less accumulated depreciation and un-reversed impairment losses. Historical cost includes expenditures that are directly attributable to the acquisition, construction or installation of the
3.2 MW 12,264 REC solar panels
Indianapolis, Indiana, USA

32 REC Solar Annual Report 2014
Financial Statements REC Group
items. Subsequent costs are included in the asset’s carrying amount or recognised as a separate asset, as appropriate, only when it is probable that future economic benefits associated with the item will flow to REC and the cost of the item can be measured reliably. All other costs are charged to the statement of income during the financial period in which they are incurred. Land is not depreciated. Depreciation on other assets is calculated using the straight-line method, to their residual values over their estimated useful lives. The assets’ residual values, if any, depreciation method and useful lives are reviewed at least annually and related depreciation rates are adjusted prospectively. Depreciation commences when the assets are ready for their intended use.
The estimated useful lives of the property, plant and equipment are as follows:
Buildings 10 to 28 years Machinery and equipment 5 to 8 years Office and IT equipment 3 to 7 years Furniture and Fittings 5 to 10 years Mechanical and electrical installation 2 to 10 years
2.6 INTANGIBLE ASSETS(A) GoodwillGoodwill represents the excess of the cost of an acquisition over the fair value of REC’s share of the net identifiable assets of the acquired subsidiary/associate/jointly controlled entity at the date of acquisition. Goodwill related to associates is included in the carrying value of investments in associates. Goodwill is carried at cost less accumulated impairment losses.
If the acquisition costs are less than the proportional share of the acquired Company’s net assets measured at fair value (negative goodwill), the matter is first reviewed again and any remaining difference is recognised directly in the consolidated statement of income (bargain purchase).
(B) Other intangible assetsOther intangible assets that have a finite useful life are carried at historical cost less accumulated amortisation and un-reversed impairment losses. Amortisation is calculated using the straight-line method to allocate the cost of other intangible assets over their estimated useful lives. Amortisation commences when the assets are ready for their intended use. REC has no intangible assets with indefinite useful lives. The assets’ residual values, if any, amortisation method and useful lives are reviewed at least annually and related amortisation rates are adjusted prospectively.
The estimated useful lives of the other intangible assets are as follows:
Software 3 to 7 years Customer relationships 5 years
(C) Research and developmentResearch expenditures are recognized as an expense as incurred. Costs incurred on development projects (relating to the design, construction and testing of a chosen alternative for new or improved materials, devices, products, processes or systems) are capitalized as intangible assets when it is probable that the project will be successful considering its commercial and technological feasibility, and costs can be measured reliably. Other development expen-ditures are recognized as an expense as incurred. Development costs previously recognized as an expense are not recognized as an asset in subsequent periods. Development costs with a finite useful life that have been capitalized are amortized from the time the assets are ready for their intended use, which normally is at commencement of the commercial use.
2.7 IMPAIRMENT AND DERECOGNITION OF NON-FINANCIAL ASSETSGoodwill and other intangible assets that have an indefinite useful life are not subject to amortisation and are tested at least annually for impairment. Assets that are subject to depreciation or amortisation are reviewed for impairment whenever events or changes in circumstances indicate that the carrying amount may not be recoverable. An impairment loss is recognised in a separate line item as a part of earnings before interest and taxes (“EBIT”) in the statement of income for the amount by which the asset’s carrying amount exceeds its estimated recoverable amount. The recoverable amount is the higher of an asset’s fair value less costs to sell and value in use.
For the purpose of assessing impairment, assets are grouped at the lowest level that based on judgment generates cash inflows that are largely independent of the cash inflows from other assets or groups of assets (cash-generating units). Goodwill is allocated to individual or groups of cash-generating units for the purpose of impairment testing. Generally, any indicated impairment for a specific cash-generating unit is first allocated to goodwill, then proportionately to other non-current assets in the cash-generating unit, but not lower than the individual or group of assets’ recoverable amount, if determinable. Assets other than goodwill that suffered impairment are reviewed for possible reversal of the impairment at each reporting date.
Losses on de-recognition include assets that are disposed of and assets with no foreseeable future economic benefits. Gains and losses on disposals are determined by comparing proceeds with carrying amount and are reported as a part of the statement of income. When applicable, gains and losses on the disposal of an entity include the carrying amount of goodwill relating to the disposed entity. Losses due to assets assessed as having no future economic benefits are reported as an impairment loss.
2.8 FINANCIAL ASSETSREC classifies its financial assets primarily as loans and receivables, available for sale financial assets and financial assets at fair value through profit or loss. The classification depends on the purpose for which the financial assets were acquired. Management determines the classification of its financial assets at initial recognition.

REC Solar Annual Report 2014 33 Financial Statements REC Group
The category loans and receivables are non-derivative financial assets with fixed or determinable payments that are not quoted in an active market. Loans and receivables are carried at amortised cost which for current receivables approximates to historical cost.
Available-for-sale financial assets (“AFS”) are non-derivative financial instruments measured at fair value in the statement of financial position. Fair value changes on AFS assets are recognised in other comprehensive income, through the statement of changes in equity, except for interest on AFS assets (which is recognised in income on an effective yield basis), impairment losses and foreign exchange gains or losses for interest-bearing AFS debt instruments. An entity is required to assess at each reporting date whether there is any objective evidence of impairment. Unquoted AFS whose fair value cannot be measured reliably are carried at cost less impairment. Accordingly, any impairment is recognised in profit or loss. Any subsequent recovery of impairment is not reversed. AFS comprise equity securities.
Investments are initially recognised at fair value plus transaction costs for all financial assets not carried at fair value through profit or loss. Investments are derecognised when the rights to receive cash flows from the investments have expired or have been trans-ferred and REC has transferred substantially all risks and rewards of ownership. In respect of AFS, the gain or loss accumulated in equity is reclassified to profit or loss.
2.9 ACCOUNTING FOR DERIVATIVE FINANCIAL INSTRUMENTS AND HEDGING ACTIVITIESREC has derivative financial instruments in the form of foreign exchange forward contracts. These contracts do not qualify for hedge accounting according to IAS 39. All changes in value (mark-to-market) are recognised directly through profit or loss.
2.10 LOAN AND RECEIVABLESLoans and receivables are recognised initially at fair value and subsequently measured at amortised cost, less provisions for impairment. A provision for impairment of loans and receivables is recognised in the statement of income and is established when there is objective evidence that REC will not be able to collect all amounts due according to the original terms of the receivables. Significant financial difficulties of the debtor, probability that the debtor will enter bankruptcy or financial reorganisation, and default or delinquency in payments, are considered indicators that the receivable is impaired.
All individually significant receivables found not to be specifically impaired are then collectively assessed for any impairment that has been incurred but not yet identified. Loans and receivables that are not individually significant are collectively assessed for impairment by grouping together loans and receivables with similar risk characteristics.
In assessing collective impairment, the Group uses historical trends of the probability of default, the timing of recoveries and the amount of loss incurred, adjusted for management’s judgement as to whether current economic and credit conditions are such that
the actual losses are likely to be greater or less than suggested by historical trends.
An impairment loss in respect of a financial asset measured at amortised cost is calculated as the difference between its carrying amount and the present value of the estimated future cash flows, discounted at the asset’s original effective interest rate. Losses are recognised in profit or loss and reflected in an allowance account against loans and receivables. Interest on the impaired asset continues to be recognised. When a subsequent event (e.g. repayment by a debtor) causes the amount of impairment loss to decrease, the decrease in impairment loss is reversed through profit or loss.
2.11 CASH AND CASH EQUIVALENTSCash and cash equivalents include cash in hand, demand deposits at banks and money market funds with term less than three months.
2.12 PAID-IN EQUITY CAPITALIncremental costs directly attributable to the issue of new shares are shown in equity as a deduction, net of any income tax, from the proceeds.
2.13 BORROWINGSBorrowings are recognised initially at fair value, net of transaction costs incurred unless it is at fair value through profit or loss. Borrowings are subsequently stated at amortised cost. Any difference between the proceeds (net of transaction costs) and the redemption value is recognised in the statement of income over the period the borrowings are outstanding using the effective interest method. Commitment fees for the bank credit facilities are recognised as part of interest expenses as incurred.
A financial liability (or a part of a financial liability) is removed from the statement of financial position when, and only when, it is extinguished - i.e. when the obligation specified in the contract is discharged or cancelled or expires.
An exchange between REC and an existing lender of debt instruments with substantially different terms shall be accounted for as an extinguishment of the original financial liability and the recognition of a new financial liability. Similarly, a substantial modi-fication of the terms of an existing financial liability or a part of it shall be accounted for as an extinguishment of the original financial liability and the recognition of a new financial liability. The difference between the carrying amount of a financial liability (or part of a financial liability) extinguished or transferred to another party and the consideration paid, including any non-cash assets transferred or liabilities assumed, shall be recognised in profit or loss.
2.14 INVENTORIES AND CONSTRUCTION CONTRACT COSTSInventories are stated at the lower of cost or net realisable value. Cost for inventory with different nature or use is determined using the first-in, first-out (“FIFO”) or average cost method. The cost of finished goods and work in progress comprises raw materials, direct labour, other direct costs and related production overheads (based on normal operating capacity). Net realisable value is the estimated

34 REC Solar Annual Report 2014
Financial Statements REC Group
selling price in the ordinary course of business, less the estimated variable and incremental costs to complete and sell the asset.
REC is integrated in the value chain, and REC entities sell goods to other REC entities.
Consequently, finished goods for one REC entity become raw materials or work in progress for another REC entity.
The classification by the separate entities is also used in the classification in REC’s consolidated financial statements.
Eligible costs relating to building of PV systems for sale in the ordinary course of business in REC Systems has been accounted for as inventories or construction contract costs, as applicable.
2.15 INCOME TAXIncome tax expense represents the total of the tax currently payable (current tax) and the change in deferred tax allocated to the statement of income. The current tax is based on taxable profit (and in some instances loss) for the year. Taxable profit/loss differs from profit/loss before tax as reported in the statement of income because it excludes items of income or expense that are taxable or deductible in other years (temporary differences) and it further excludes items that are never taxable or deductible (permanent differences). Deferred tax is provided in full, using the liability method, on temporary differences arising between the tax bases of assets and liabilities and their carrying amounts in the consolidated financial statements. Recognition of any deferred tax assets is based on REC on a stand-alone basis. However, if the deferred income tax arises from initial recognition of an asset or liability in a transaction other than a business combination, that at the time of the transaction affects neither accounting nor taxable profit nor loss, it is not recognised.
Current and deferred tax is determined using tax rates and laws that have been enacted or substantially enacted at the reporting date and are expected to apply when the related tax asset is realised or the tax liability is settled.
Deferred tax assets are recognised to the extent that it is probable that future taxable profit will be available against which the temporary differences can be utilised. Deferred income tax assets and liabilities are offset when there is a legally enforceable right to offset current tax assets against current tax liabilities and REC intends to settle its current tax assets and current tax liabilities on a net basis.
Deferred tax is provided on undistributed earnings in subsidiaries, associates and jointly controlled entities to the extent that the future dividend is taxable, except where the timing of any dividend is controlled by REC and it is probable that the dividend will not be distributed in the foreseeable future.
2.16 PROVISIONSProvisions for product warranties, onerous contracts, asset retirement obligations, restructuring costs and legal claims are recognised when: REC has a present legal or constructive obligation as a result of past events; it is probable that an outflow of resources will be required to settle the obligation; and the amount has been reliably estimated. Provisions are not recognised for future operating losses. Where there are a number of similar obligations, the likelihood that an outflow will be required in settlement is determined by considering the class of obligations as a whole. A provision is recognised even if the likelihood of an outflow with respect to any one item included in the same class of obligations may be small. Assessment of fair value and likelihood is made at each reporting date. Provisions are measured at the management’s best estimate of the expenditures expected to be required to settle the obligation at the reporting date, and are discounted to present value where the effect is material and the distribution in time can be reliably estimated.
2.17 PENSION/POST RETIREMENT OBLIGATIONSREC has no defined benefit pension plans. For defined contribution plans, REC has no further payment obligations once the contribu-tions have been paid. The contributions are recognised as employee benefit expense when they are due.
2.18 REVENUE RECOGNITIONRevenues are primarily generated from sale of goods consisting of solar panels and PV systems (Photovoltaic systems or installations offering electricity for commercial, residential or large-scale application).
Revenue comprises the fair value for the sale of goods and services, net of value-added tax, rebates, discounts and expected returns.
Revenues are normally reported gross with a separate recording of expenses to vendors of products or services. Revenue is recognised when persuasive evidence of an arrangement exists, delivery has occurred (transferred significant risks and rewards of ownership and control) or services have been rendered, the price is fixed or determinable, collectability is reasonably assured (probable that future economic benefits will be realised) and the costs can be measured reliably. Recognition of revenues from construction contracts are recognised according to percentage of completion.
REC’s opinion is that it has no significant difficulties in deciding when delivery has occurred, except to some extent for the PV systems projects. Delivery is normally according to terms in the relevant contracts. When REC products are sold with a right of return for damaged goods, experience is used to estimate and provide for such returns at the time of sale. For some of the PV systems projects, judgment is needed to decide if it is a construction contract or sale of goods and services, which affects when revenue shall be recognised. Sales of PV systems that are realised by sale of special purpose entities are also accounted for as mentioned above.
When sub-contractors are used to perform parts of the production, e.g. wafer cutting or cell or solar panel production, revenues are not

REC Solar Annual Report 2014 35 Financial Statements REC Group
recognised on the delivery to these sub-contractors. Instead a cost for the production service is recognised at the time the revenue for sale to the customer is recognised.
Solar panels and to some extent PV systems are sold with product warranties. The expected warranty amounts are recognised as an expense at the time of sale, and are adjusted for subsequent changes in estimates or actual outcomes.
2.19 INTEREST AND DIVIDEND INCOMEInterest income is accrued on a time basis. Dividend income from investments is recognized when the shareholders’ rights to receive payment have been established, normally on the declaration date.
2.20 LEASESLeases are classified as finance leases whenever the terms of the lease substantially transfer all the risks and rewards of ownership to the lessee. Other leases are classified as operating leases. The evaluation is based on the substance of the transaction. The criteria that primarily has been the decisive factor for REC in concluding that a finance lease exists is when the present value of the minimum lease payments amounts to at least substantially all of the fair value of the leased asset at the inception of the lease. In determining minimum lease terms and payments it has been taken into consideration the possibility of termination of contracts.
According to IFRIC 4 Determining whether an arrangement contains a lease REC may enter into an arrangement that does not take the legal form of a lease but conveys a right to use an asset in return for a payment or series of payments. Determining whether an arrangement is, or contains, a lease shall be based on the substance of the arrangement and requires an assessment of whether: (a) fulfilment of the arrangement is dependent on the use of a specific asset; and (b) the arrangement conveys a right to use the asset.
Assets held under finance leases are recognised as assets of REC at their estimated fair values at the inception of the lease or, if lower, at the present value of the minimum lease payments. The leased
assets are depreciated over the shorter of the useful life of the asset or the lease term. The corresponding liability to the lessor is included in the statement of financial position as an interest bearing liability. Payments made under operating leases (net of any incentives received from the lessor) are charged to the statement of income on a straight-line basis over the period of the lease.
Significant prepayments made in an operating lease for REC as the lessee are amortised over the minimum lease term and included as a part of amortisation in the statement of income.
2.21 GOVERNMENT GRANTSGovernment grants are recognised at their fair values when there is reasonable assurance that the grants will be received and REC will comply with all attached conditions. Government grants related to assets are presented in the statement of financial position as a reduction to the carrying amount of the assets and reduce depre-ciation in the statement of income. Government grants relating to income are deducted in reporting the related expenses.
2.22 STATEMENT OF CASH FLOWSThe Group presents the statement of cash flows using the indirect method. Cash inflows and outflows are shown separately for investing and financing activities, while operating activities include both cash and non-cash line items. Interest received and paid and dividends received are reported as a part of operating activities, except borrowing costs capitalized as part of the construction of a non-current asset, that are included in investing activities and, up-front and waiver loan fees that are reported as part of financing activities.
For the statement of cash flows, net currency gains or losses are split into items estimated to relate to borrowings (financing activities), non-current financial assets and investments (investing activities) and unrealized gains or losses on cash and cash equivalents held at the end of the periods. These amounts are included in the line item under operating activities “currency effects not cash flow or not related to operating activities” as an adjustment
REC SolarBox 20 Hybrid solar solution
Bantayan Island, Philippines

36 REC Solar Annual Report 2014
Financial Statements REC Group
to the amount reported in the statement of income and reclassified as relevant. The remaining currency gains or losses are consequently included as part of operating activities.
Investing activities include cash flows related to non-current receivables and non-current prepayments (assets), even if these originated due to purchase or sale of goods and services.
2.23 ADOPTION OF NEW AND REVISED STANDARDS AND INTERPRETATIONSThe accounting policies adopted are consistently used for all periods presented. Except for amendments to IAS 1 Presentation of Financial Statements, no standards or interpretations were adopted early by the Group.
A number of new accounting standards, amendments to standards and interpretations are effective for year ending 31 December 2014. They are:
– Investment Entities (Amendments to IFRS 10, IFRS12 and IAS 27)– Offsetting Financial Assets and Financial Liabilities (Amendments
to IAS 32)– Recoverable Amount Disclosures for Non-Financial Assets
(Amendments to IAS 36)– IFRIC 21 Levies– Novation of Derivatives and Continuation of Hedge Accounting
(Amendments to IAS 39)
New standards and interpretations not yet adoptedA number of new standards, amendments to standards, and interpretations have been published, but are not effective at 31 December 2014 and have not been applied in preparing these financial statements. The most relevant of these is:
Amendments to IFRS 10 and IAS 28: Sale or Contribution of Assets between an Investor and its Associate or Joint Venture was issued in September 2014 and is effective for periods beginning on or after 1 January 2016. Earlier application is permitted. Accounting Policies adopted by the Group are consistent with these amendments and adoption will not affect the accounting or disclosures of the Group.
IFRS 15, issued May 2014 and establishes a new five step model that will apply to revenue arising from con tracts with customers. Under IFRS 15 revenue is recognized at an amount that reflects the consid-eration to which an entity expects to be entitled to in exchange for goods or services to a customer. The principles in IFRS 15 provide a more structured to measuring and recognizing revenue. The new revenue standard is applicable to all entities and will supersede all current revenue recognition require ments under IFRS. Either a full or modified retrospective application is required for annual periods beginning on or after 1 January 2017 with early adoption permitted. The group is currently assessing the impact of IFRS 15 and plans to adopt the new standard on the required effective date.
Management intends to adopt new standards and interpretations at the effective dates provided the standards and interpretations are approved by the EU.
03. FINANCIAL RISK MANAGEMENT
3.1 FINANCIAL RISK FACTORSREC’s activities expose it to a variety of financial risks, including currency risk, interest-rate risk, liquidity risk, credit risk, refinancing risk and others.
Financial risks have been managed for REC as a whole, and not for the individual entities or regions. The goals for REC and the treasury operations are primarily to minimize the risk for financial distress, secure long term funding, hedge currency risk of expected future net cash flows and manage interest rate risk. REC’s finance policy sets the framework and limits for hedging activities in REC. It defines risk management objectives, responsibilities and operational requirements.
All hedging transactions are undertaken in order to reducing negative impacts of changes in financial markets on net cash flow for REC. REC uses financial instruments to hedge net exposures arising from operating, financing and investment activities. REC has centralized its treasury function and most planning and execution are performed by REC Group Tax and Treasury department.
REC has a set of finance policies. Accounting memo are prepared and discussed with auditor on the appropriate accounting treatment when REC finance policy does not cover the said topic.
(a) Currency riskREC operates internationally and is exposed to currency risk. REC is primarily exposed to fluctuations in US Dollar (USD), Euro (EUR), Singapore Dollar (SGD) and YEN, arising from commercial transac-tions in currencies other than the entities’ functional currencies, recognized assets and liabilities, and net investments in foreign operations.
REC manages the currency risk on an overall Group level and establishes external forward foreign exchange rate contracts with banks.
Currency developments will also affect translation of the statement of income and financial position of foreign entities, as well as other financial items in foreign currencies such as cash equivalents, receivables and debt.
(b) Credit riskREC has a concentration of its customers in the solar industry. Generally a more challenging and competitive market environment has increased, and may further increase, credit risk, in particular through sales to financially weak customers, extended payment terms and sales into new and immature markets. Policies are in place to ensure that sales of products are made to customers with an appropriate credit history in combination with requirements for various payment guarantees or prepayments and to some extent credit insurance. Credit risk may also increase by abrupt changes in market conditions by changes in government incentives. In 2014 REC expanded deliveries to existing customers and developed new customer relationships. The customer base of REC includes leading

REC Solar Annual Report 2014 37 Financial Statements REC Group
system integrators, installers and distributors in major markets such as Germany, United Kingdom, USA, Australia and Japan.
Cash transactions are limited to high-credit-quality financial institutions.
(c) Liquidity riskREC is debt free and fully equity financed. REC utilizes net cash flow from its ongoing business and operations to finance its capital need. Most of the liquidity is kept in the Singapore Production entity and holding company, while some minor positions are kept in sale office accounts for daily operating activities.
Prudent liquidity risk management implies maintaining sufficient cash and cash equivalents and having availability to funding due to the dynamic nature of the underlying businesses.
(d) Interest rate riskChanges in market interest rates affect the fair value of assets and liabilities or the variability in cash payments. REC is exposed to interest rate risk through funding and cash management activities. Cash in bank accounts and liabilities have historically primarily carried variable interest rates. REC Solar has currently no borrowings.
Interest income and interest expense in the statement of income, as well as interest receipts and payments, are influenced by interest rate changes for financial instruments that carry variable interest rates.
(e) Hedging of risk related to supply of raw material/commoditiesAccording to the finance policy, REC subsidiaries that have a high portion of total costs from a specific input factor may hedge the risk of significant negative movements in prices. The extent of a significant negative movement is evaluated in each case considering the effect of price increases and price volatility for the relevant input factor on the operating results for the subsidiary. Price risk for the input factor should be hedged primarily through long-term contracts. Financial instruments may also be used for hedging significant changes in the price of important input factors. Hedge accounting has not been applied.
3.2 FAIR VALUE ESTIMATIONFair value estimation is discussed in note 26.
3.3 CAPITAL STRUCTURE AND FINANCING (MANAGEMENT OF CAPITAL)REC Solar ASA was listed on Oslo Stock Exchange on 25 October 2013, where an amount of USD 131 million was raised. REC’s goal is to maintain sufficient capital to implement business strategies and financial flexibility expansion opportunities.
04. CRITICAL ACCOUNTING JUDGMENTS AND KEY SOURCES OF ESTIMATION UNCERTAINTY
4.1 CRITICAL JUDGMENTS IN APPLYING THE REC GROUP’S ACCOUNTING POLICIESManagement’s judgments in applying the REC Group’s accounting policies having the most significant effect on amounts recognized in the financial statements or reported as note disclosures are discussed below and in the relevant notes.
(A) Functional currenciesREC’s presentation currency is currently USD. The Management has evaluated the functional currency of the different REC Solar entities. For some entities the facts and circumstances are mixed and the conclusion is not readily apparent, as revenues and expenses currently are in several currencies and deliveries are made to several countries. Currently, pricing is determined by demand for products in several markets and from government incentives. Government incentives and the relative attractiveness of selling to different countries change over time. Europe has been the main market for REC Solar’s cells, wafer and solar panels entities, and it has been determined that EUR is the functional currency for these.
Functional currency affects the reporting of currency gains and losses and exchange differences as well as hedging strategies and effects. The evaluation of what is the functional currency for the separate entities may change over time if there are relevant and significant changes in facts or circumstances. A change in functional currency must be made prospectively from the date of the change.
(B) Development expendituresREC conducts numerous research and development activities and projects. Some costs incurred in the development phase of an intangible asset may be capitalized if the recognition criteria are fulfilled. Costs that do not fulfill the requirements at the time they are incurred are expensed and cannot be capitalized at a later stage. Consequently, there may be development costs that cannot be capitalized because the REC cannot demonstrate that all requirements are fulfilled at the relevant points in time. At year-end 2014, most development costs were expensed as incurred.
(C) LeasesIFRIC 4 Determining whether an Arrangement contains a Lease requires that the determination of whether an arrangement is or contains a lease should be based on the substance of the arrangement. If an arrangement contains a lease, the require-ments of IAS 17 Leases shall apply to the lease element of the arrangement. Other elements of the arrangement not within the scope of IAS 17 shall be accounted for in accordance with other standards.
Some arrangements to which REC is a party include payments for the right to use the assets and payments for other elements in the arrangement (e.g. for output from a facility). The fair value of the assets, the lease and other elements in the arrangement may not

38 REC Solar Annual Report 2014
Financial Statements REC Group
be available to REC, and REC has to make its best estimate of these values. This may also affect the determination of whether the leases are finance or operating leases. In some instances, REC is not able to reliably estimate these values. In addition, a contract may also require substantial judgment to decide if it contains the right to use an asset according to IFRIC 4 and consequently if it includes a lease.
(D) SegmentsREC has evaluated that the chief operating decision maker does not regularly review operating results for a lower level than REC Solar as a whole to allocate resources and assess performance. Allocation of resources and evaluation of performance are based on unit costs for the production of solar panels and sales prices/revenues for the sales organization. Consequently, no segments are reported.
4.2 KEY SOURCES OF ESTIMATION UNCERTAINTY – CRITICAL ACCOUNTING ESTIMATESThe preparation of financial statements in accordance with International Financial Reporting Standards requires management to make estimates and assumptions that affect the reported amounts of assets and liabilities (including Purchase Price Allocation for the acquisition of REC Solar Division, please refer to note 5), as well as the disclosure of contingent assets and liabilities at the date of the financial statements and the reported amounts of revenues and expenses during the reporting period. Actual results could differ from those estimates. Certain amounts included in or affecting the REC’s financial statements and related disclosures must be estimated, requiring management to make assumptions with respect to values or conditions which cannot be known with certainty at the time the financial statements are prepared. A ‘‘critical accounting estimate’’ is one which is both important to the portrayal of the company’s financial condition and results and requires management to make estimates about the effect of matters that are inherently uncertain, and which are subjective or complex. Management evaluates such estimates on an ongoing basis, based upon historical results and experience, consultation with experts, utilizing trends and other methods considered reasonable in the particular circumstances, as well as forecasts as to how these might change in the future.
(A) ImpairmentProperty, plant and equipment, other intangible and financial assets are tested for impairment when there are impairment indicators. Factors management considers important and which could trigger an impairment review include: significant fall in market values; a significant underperformance relative to historical or projected future operating results; significant changes in the use of the assets or the strategy for the overall business, including assets that are decided to be phased out or replaced and assets that are damaged or taken out of use; significant negative industry or economic trends; and significant cost overruns in the development of assets. In practice, the significant drop in sales prices during the last years has been a strong impairment indicator.
Changes in circumstances and in management’s evaluations and assumptions may give rise to further impairment losses, or reversals, in the relevant periods.
According to IAS 36 Impairment of assets, cash flow projections shall exclude any estimated future cash inflows or outflows expected to arise from future restructurings or from improving or enhancing the asset’s performance. To the best of management’s judgment, the cash flows do not include restructuring or effects from expansion and enhancement investments that are not committed.
Financial assets are also periodically reviewed for impairment. REC has a concentration of its customers in the solar industry. Generally a more challenging and competitive market environment has increased, and may further increase credit risk, in particular through sales to financially weak customers, extended payment terms and sales into new and immature markets. REC has a limited number of customers. Historically, relatively small amounts have been realized as losses on trade receivables. Provisions for losses on trade receivables have been made based on an individual evaluation, and there is not reliable historical or peer data to make an assessment of group of trade receivables. It is a risk that the actual losses will turn out significantly different from the evaluations made based on the knowledge and assumptions at the end of the relevant periods (see notes 3, 12 and 26).
(B) Depreciation and amortizationDepreciation and amortization are based on management estimates of the future useful lives of property, plant and equipment and intangible assets. Estimates may change due to technological developments, competition, changes in market conditions, expecta-tions for replacements or disposal of assets and other factors. Technological developments are difficult to predict and REC’s views on the trends and pace of development may change over time. Management periodically reviews the expected future useful lives of property, plant and equipment and intangible assets taking into consideration the factors mentioned above and other important factors. In case of significant changes in estimated useful lives, depreciation and amortization charges are adjusted prospectively. In the case of replacements or disposals any remaining carrying value will be recognized to the statement of income, net of any proceeds receivable.
(C) Income taxesREC is subject to income taxes in several jurisdictions. Recognition of any deferred tax assets is based on REC on a stand-alone basis. Judgment is required in determining the provision for income taxes. There are transactions and calculations for which the ultimate tax determination is uncertain during the ordinary course of business. REC recognizes liabilities for anticipated tax audit issues based on estimates of whether additional taxes will be due. Where the final tax outcome of these matters is different from the amounts that were initially recorded, such differences will impact the current income tax and deferred tax provisions in the period in which such

REC Solar Annual Report 2014 39 Financial Statements REC Group
determination is made. If the actual outcome differs from manage-ment’s current estimates, REC will need to increase or decrease current and deferred tax assets or liabilities.
REC companies perform significant transactions with each other and with other related parties. These are primarily sale of products to the next step in the production chain or to Sales or Systems companies, financing arrangements and to some extent services for the benefit of the other party. REC companies shall negotiate terms and conditions as between unrelated parties, including transfer prices. For some of the products there are limited directly comparable sales to external parties and the information on directly comparable transactions between external parties are limited. For some of the products, prices in the spot market and in long-term contracts are significantly different. In addition prices in long-term contracts vary significantly, among other things based on at which point in time the contracts were entered into and the length of the contracts. Tax authorities of the different countries may have different views on the transfer prices used with potential negative effects for REC.
Several entities in REC have reported losses over the latest years, giving rise to deferred tax assets. IAS 12 Income Taxes states that a deferred tax asset shall be recognized for all deductible temporary differences to the extent it is probable that taxable profit will be available against which the deductible temporary difference can be utilized. When an entity has a history of recent losses, the entity recognizes a deferred tax asset arising from unused tax losses only to the extent that the entity has sufficient taxable temporary differ-ences or there is convincing other evidence that sufficient taxable profit will be available against which the unused tax losses can be utilized by the entity. IAS 12 also states that unused tax losses are strong evidence that future taxable profit may not be available. The current history and the highly volatile and uncertain market development has increased uncertainty of future profit forecasts, and the REC has recognized very limited parts of the deferred tax assets.
(D) ProvisionsREC has provided warranties in connection with the sale of solar panels and PV systems. REC solar panels sold from 1 September, 2011 include a ten year limited product warranty and a 25 year linear power output warranty, that guarantees at least 97 percent output during the first year of performance and a maximum 0.7 percent reduction of power output per year from year 2–25 (“new warranty”). Solar panels sold prior to this have a five year limited warranty that the product is free of defects in materials and workmanship, a ten year limited warranty of 90 percent power output and a 25 year limited warranty of 80 percent power output of the solar panels (“old warranty”). Warranties are customary in the market for solar panels. The warranties are not sold stand alone. If a defect occurs or the product does not reach the warranted power output levels during the warranty period, for the new warranty REC will, at its sole option, repair or replace or supply additional solar panels, or refund the current market price of an equivalent product at the time of the claim (for the old warranty the original price, with annual reduction for the output warranty). REC believes that the materials in the solar
panels made by REC are capable of producing a relatively steady output for a period of at least 25 years. However, neither the REC nor any of its competitors have a 25-year history. Management’s estimates of warranty provisions take this into consideration.
During 2011 and 2012 additional tests were made, research was studied and REC believes the quality of its solar panels has improved. It is also expected that the cost of producing solar panels will be further reduced going forward, which will also reduce the outflow of economic resources needed to fulfill any warranty claims. REC believes the risk for claims under the warranties is low, but cannot rule out the possibility that a large claim may occur as there is past history for claims under the product warranty and new materials and production processes have been introduced. Historically, the largest claims under the warranties were recognized in 2008 and 2009 related to a design weakness that was discovered at the end of 2008 in the junction boxes in a series of Solar panels produced by REC ScanModule AB.
In estimating the provision, REC has made references to the estimates made by its competitors. As the estimates and timing are highly uncertain, REC has not discounted the provisions but instead estimated them as a percentage of revenues at the time of sale of the solar panels, 1.5 % of revenue for Solar Panels sold before 25 October 2013 and 0.8 % of revenue for Solar Panels sold after 25 October 2013.
REC guarantees minimum performance of some PV systems that are constructed and sold by REC (liquidated damages for any shortfall of guaranteed power output for twenty years), primarily measured during the second year of operation. REC has evaluated that it is not probable that the Company will incur outflow of economic resources under this guaranty, and has not recognized any provision. REC also has a limited warranty for faults and defects during the first two years of operation of a PV system, for which only a minor provision has been recognized.
REC has also recognized other provisions in the periods presented. Provisions for restructuring were primarily related to the restruc-turing of sale office in Europe. Provisions for asset retirement and restoration obligations primarily relate to the lease of land in Singapore after the end of the lease period. Provisions for legal case primary relates to REC’s subsidiary being a defendant in law suit initiated by the customer.
Management believes that the assumptions are reasonable, but they are inherently uncertain and unpredictable and, as a result, future estimates and actual results may differ significantly from the current estimates.

40 REC Solar Annual Report 2014
Financial Statements REC Group
05. SUBSIDIARIES AND BUSINESS COMBINATION
Below is the list of material subsidiaries for REC Solar ASA as at 31 December 2014.
REC Solar ASA (Norway)
REC Solar Holdings AS (Norway)
REC Solar Pte. Ltd. (Singapore)
REC ScanModule MidCo AB (Sweden)
REC ScanModule Sweden AB
(Sweden)
REC Systems AS (Norway)
REC Systems Germany GmbH
(Germany)
REC Systems Pte. Ltd.
(Singapore)
Renewable Energy Corporation (India)
Pvt. Ltd. (India)
REC Solar EMEA GmbH
(Germany)
REC Solar France SAS
(France)
REC US Holding Inc.
(USA)
REC Americas LLC
(USA)
REC Solar (Japan) Co., Ltd. (Japan)
Fourteen Creeper S.a.r.l (Luxembourg)
100 % 100 %
100 %
100 %
100 %
100 %
100 %
100 %0.0001 %99.9 %
100 % 100 % 100 %
100 %
REC Solar ASA is the parent company of REC Solar Holdings and the ultimate parent of all the operating subsidiaries of the group.
On 25 October 2013 (the “acquisition date”), REC acquired 100 % of the shares of the former Solar division from REC Silicon ASA at a transaction price of USD134.7 million (NOK 800 million).
This transaction is considered a business combination according to IFRS 3. Acquisition method is applied by netting the fair value of consideration given to the transferee (the “acquisition cost”), excluding costs related to the acquisition, with the fair value of the acquired assets, liabilities and contingent liabilities assumed at the acquisition date. The acquisition cost of a purchase is equal to the fair value of the assets transferred, the equity instruments issued and the liabilities incurred or assumed at the acquisition date. The fair values of assets and liabilities under contingent consideration agreements are likewise included.
REC’s management was required to allocate values in excess/deficit of the carrying amount of equity to assets acquired and liabilities assumed. The acquisition cost of USD134.7 million is less than the proportional share of the acquired companies’ net assets measured at fair value, therefore bargain purchase gain of USD91.3 million resulted from the purchase price allocation, finalised in Q4 2014, within 1 year window period from 25 October 2013.
Consideration transferred:The total consideration transferred, including acquisition-related costs, amounted to USD 134.7 million (NOK 800 million).

REC Solar Annual Report 2014 41 Financial Statements REC Group
Fair value of assets acquired and liabilities assumed:
USD MILLION
Intangible assets 19.9Property, plant and equipment 75.9Prepaid lease and capex non current 13.4Equity accounted investment 13.6Other non-current assets (including deferred tax assets) 4.0Inventories 115.1Trade and other current receivables 137.7Current tax assets 0.9Prepayments 0.6Other financial instruments 0.1Cash and bank deposit 42.4Provisions non current – 94.2Current financial liabilities, interest bearing – 1.2Trade and other payables – 63.7Current tax liabilities – 0.7Other current liabilities – 37.4Provisions current – 4.0Total identifiable net assets 222.4
Provision:The Provision current of USD3.2 million includes contingent liabilities made with regards to legal disputes in connection with the finalised purchase price allocation exercise from the business combination disclosed in note 5. Please refer to note 27 for details of the disputes.
Acquired receivables:The fair value of receivables of USD137.7 million is USD3.5 million lower than the gross contractual amount of receivables due to a provision for loss on trade receivables. At acquisition date and finalisation of purchase price allocation, management deems the contractual cash flows not expected to be collectible equal to the provision of USD3.5 million.
Bargain purchase gain:A bargain purchase gain was recognised through REC’s Consolidated Statement of Income as follows:
USD MILLION
Total consideration transferred 134.7Acquisition related costs – 3.6Fair value of identifiable net assets – 222.4Bargain purchase – 91.3
The significant deviation between the purchase consideration and the fair value of the identifiable assets acquired and liabilities assumed has many explanations. Firstly, the transaction price was agreed in June 2013 to ensure that the contemplated restructuring would be achievable. Hence, market outlook may differ due to the difference in time. So, relatively small changes e.g. in expected margins may change the value significantly. Short term view on volume and margin has changed during the months from June to the transaction date. This may affect investors view on future development and hence the value. Secondly, the deviation relates
to discounts in the transaction price such as an IPO discount and a timing discount as there are several months between the signing date and the closing date and listing of the company, and other potential discounts required by the guarantors in order to guarantee the IPO.
Acquisition-related costs:REC incurred acquisition-related costs of USD 3.6 million, related to external legal fees and due diligence costs. The amount of USD 3.3 million has been recognised to equity as directly attributable to issuance of shares relating to the IPO. USD 0.3 million has been included in the other operating expenses in the Group’s Consolidated Statement of Income.
For the period 15 July 2013 to 24 October 2013, the acquired REC Solar Division has revenue of USD 207.6 million and a profit of USD 5.2 million. The profit of USD 5.2 million excludes interest expenses of USD 9.9 million incurred for the same period for intercompany loans with REC Silicon ASA. There would be no intercompany loan outstanding and thus no interest expenses if the acquisition took place on 15 July 2013.
06. SEGMENT INFORMATION
The segment information presented shows the main components of the REC’s business that are evaluated on a regular basis by the chief operating decision maker.
The term “chief operating decision maker” (CODM) is taken from IFRS 8 Operating segments and identifies a function, not necessarily a manager with a specific title. That function is to allocate resources to and assess the performance of the operating segments of an entity. The Board of Directors is responsible for the overall strategy of the company, approving annual budgets and major investments, internal controls etc. The Board periodically receives information about the performance of the company. REC’s understanding is that the term CODM relates to an operating level, and not on a strategic decision level.
REC Management is based on the functions production and sales. REC Management is headed by the Chief Executive Officer (CEO) and is the one that makes decisions for REC. Consequently, REC regards the CEO as the CODM.
REC produces and sells solar panels worldwide. REC Group is comprised of an integrated plant in Singapore producing multicrys-taline wafers, cells and solar panels and development of PV systems. There are a number of legal entities (including for production in Singapore, for the utilities and land in Singapore, sales and Systems companies in a number of countries for tax purposes).
Production is conducted in Singapore in an integrated plant. Solar panels consist of solar cells that are made from wafers. The main

42 REC Solar Annual Report 2014
Financial Statements REC Group
raw material in wafers is polysilicon. The integrated plant produces the intermediate products wafer and cells. These wafers and cells are exclusively used in the panel production in Singapore. All operational and capital expenditure (capex) decisions in Singapore are made for the purpose of minimizing costs (per watt) of the panels. To achieve this, investments or adjustments may be made in the production of wafers and cells, as well as panels. KPIs for managers responsible for production are to minimize cash unit cost.
REC has established sales companies and offices in Europe, USA and Asia. Europe has traditionally been REC’s main market, Germany being the largest. Revenues are based on short term contracts and will therefore be influenced by market fluctuations. Sales are made to customers worldwide. The market is split into several regions with separate region managers responsible for sales. Their KPI is to maximize sales prices.
There is no management report focusing or following up on results for the production sites or regions. The CODM is the CEO. His KPIs are related to maximizing of sales prices/revenues, and minimizing production unit costs.
In total, REC has evaluated that it has no segments, other than REC Group as a whole.
Entity wide disclosures2 single customers represented 10 % to 16 % of the consolidated revenues for the REC in 2014.
Geographic distribution of non-current assets based on company location at December 31
(USD IN MILLION) 2014
Norway 13.0 Singapore 113.4 Other countries 0.3 Total non-current assets 1) 126.7
1) Non-current assets includes property, plant, equipment, intangibles and prepaid lease.
Geographic distribution of external revenues based on customer location for the period 15 Jul 2013 to 31 Dec 2014
(USD IN MILLION) 15 JUL 2013 TO 31 DEC 2014
USA 88.0 Singapore 179.8 Japan 46.0 India 16.0 Rest of Asia 7.6 Germany 108.9 United Kingdom 209.3 Netherlands 39.7 France 29.1 Italy 16.8 Romania 15.7 Rest of Europe 23.7 Middle East 0.7 Australia 21.6 Other countries 0.3 Total revenues 803.3
Customer location is based on the invoicing address. Customers may distribute the products to other countries.
Revenue by category
(USD IN MILLION) 15 JUL 2013 TO 31 DEC 2014
Wafers 3.6 Cells 3.9 Modules 771.7 PV Systems (excl. construction contracts) 17.3 Construction contract revenues 2.8 Rendering of services 1.0 Other revenues 3.0 Total revenues 803.3
7.99 kW 39 REC solar panels Hoher Dachstein, Austria

REC Solar Annual Report 2014 43 Financial Statements REC Group
07. FIXED ASSETS
Property, plant and equipment and intangibles
(USD IN MILLION)LAND AND
BUILDINGS
MACHINERY AND
EQUIPMENT
OTHER TANGIBLE FIXED
ASSETSASSETS UNDER
CONSTRUCTION
TOTAL PROPERTY, PLANT AND
EQUIPMENT
TOTAL INTANGIBLE
ASSETS TOTAL
Carrying value at 15 July 2013 – – – – – – – Exchange differences – 3.7 – 4.9 – 0.4 – 2.5 – 11.5 – 1.7 – 13.2Acquistion of Solar entities 33.2 39.4 3.3 0.0 75.9 19.9 95.8Net additions 1) 5.0 18.9 1.3 30.2 55.4 0.6 56.0Disposals – 0.3 – 0.2 0.0 0.0 – 0.5 0.0 – 0.5Depreciation and amortization 2) – 3.0 – 14.0 – 0.9 0.0 – 17.9 – 4.7 – 22.6Carrying value at 31 December 2014 31.1 39.2 3.3 27.7 101.3 14.1 115.4
At 31 December 2014Cost price 33.9 52.4 4.1 27.6 118.0 18.4 136.5Accumulated depreciation/amortization/impairment
– 2.7 – 13.2 – 0.8 0.0 – 16.7 – 4.3 – 21.0
Carrying value at 31 December 2014 31.1 39.2 3.3 27.7 101.3 14.1 115.4
1) Net additions include transfers from assets under construction2) Amortization for Total Intangible Assets does not include amortization of prepaid lease
Specification of useful lives and depreciationEstimated useful lives for the asset class other tangible fixed assets is 2-28 years. Assets under construction are not yet ready for their intended use, and depreciation has not started. Intangibles are primarily customer relationship with estimated useful lives of 5 years and software with estimated useful lives 3 – 7 years.
Prepaid Lease
(USD IN MILLION)
Carrying value at 15 July 2013 – Exchange differences – 1.5 Acquisitions of Solar entities 13.9 Amortization – 0.6 Carrying value at 31 December 2014 11.8
Distribution of total prepaid lease
(USD IN MILLION) 31 DEC 2014 15 JUL 2013
Current 0.5 –Non-current 11.3 –Total 11.8 –
08. IMPAIRMENTS OF CASH-GENERATING UNITS
Cash-generating unitsRecoverable amount shall be estimated for the individual asset. The recoverable amount of an individual asset cannot be determined if the asset’s value in use cannot be estimated to be close to its fair value less costs to sell and the asset does not generate cash inflows that are largely independent of those from other assets. In such cases, value in use and, therefore, recoverable amount, can be determined only for the asset’s cash-generating unit.
An asset’s cash-generating unit is the smallest group of assets that includes the asset and generates cash inflows that are largely independent of the cash inflows from other assets or groups of assets. Identification of an asset’s cash-generating unit involves judgment by the REC Management.
Management monitors the operations primarily by production cost of solar panels in Singapore. Sales are conducted by a number of sales companies worldwide, as well as directly from the production site to Asian customers.
REC Group produces intermediate products in its own value chains. If an active market exists for the output produced by an asset or group of assets, that asset or group of assets shall be identified as a cash-generating unit, even if some or all of the output is used internally. An active market is a market in which all the following conditions exist: (a) the items traded within the market are homogeneous; (b) willing buyers and sellers can normally be found at any time; and (c) prices are available to the public.
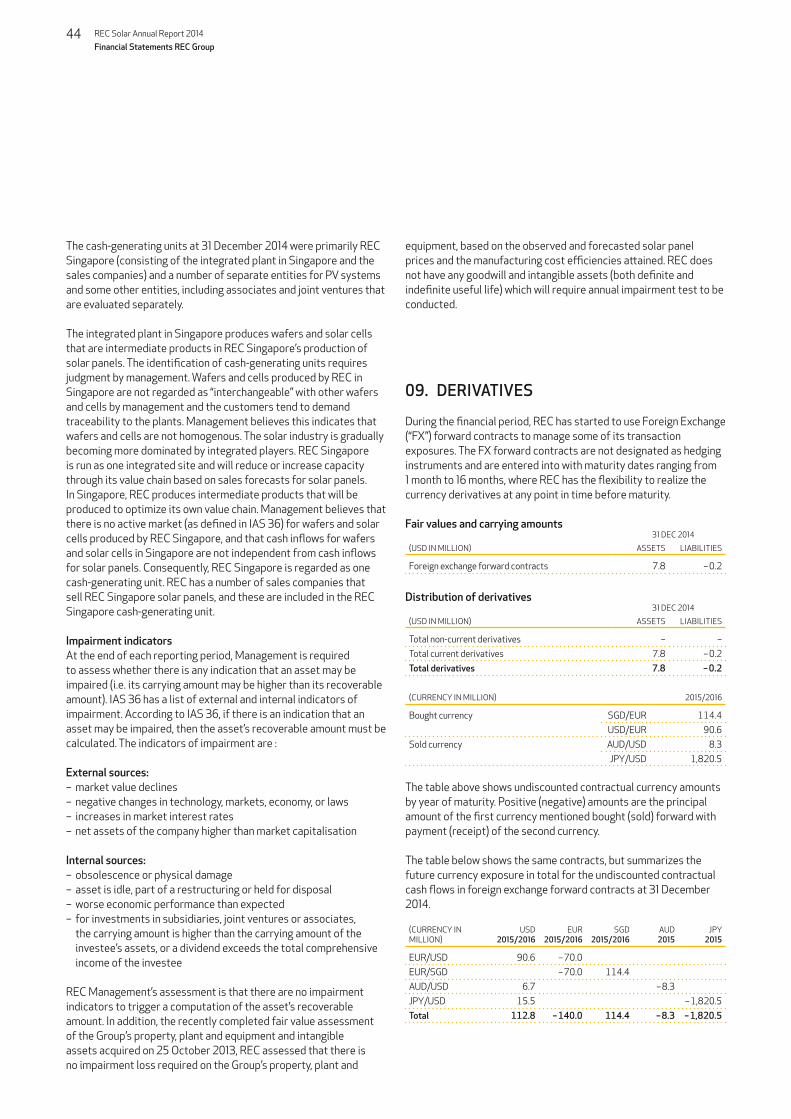
44 REC Solar Annual Report 2014
Financial Statements REC Group
The cash-generating units at 31 December 2014 were primarily REC Singapore (consisting of the integrated plant in Singapore and the sales companies) and a number of separate entities for PV systems and some other entities, including associates and joint ventures that are evaluated separately.
The integrated plant in Singapore produces wafers and solar cells that are intermediate products in REC Singapore’s production of solar panels. The identification of cash-generating units requires judgment by management. Wafers and cells produced by REC in Singapore are not regarded as “interchangeable” with other wafers and cells by management and the customers tend to demand traceability to the plants. Management believes this indicates that wafers and cells are not homogenous. The solar industry is gradually becoming more dominated by integrated players. REC Singapore is run as one integrated site and will reduce or increase capacity through its value chain based on sales forecasts for solar panels. In Singapore, REC produces intermediate products that will be produced to optimize its own value chain. Management believes that there is no active market (as defined in IAS 36) for wafers and solar cells produced by REC Singapore, and that cash inflows for wafers and solar cells in Singapore are not independent from cash inflows for solar panels. Consequently, REC Singapore is regarded as one cash-generating unit. REC has a number of sales companies that sell REC Singapore solar panels, and these are included in the REC Singapore cash-generating unit.
Impairment indicatorsAt the end of each reporting period, Management is required to assess whether there is any indication that an asset may be impaired (i.e. its carrying amount may be higher than its recoverable amount). IAS 36 has a list of external and internal indicators of impairment. According to IAS 36, if there is an indication that an asset may be impaired, then the asset’s recoverable amount must be calculated. The indicators of impairment are :
External sources:– market value declines– negative changes in technology, markets, economy, or laws– increases in market interest rates– net assets of the company higher than market capitalisation
Internal sources:– obsolescence or physical damage– asset is idle, part of a restructuring or held for disposal– worse economic performance than expected– for investments in subsidiaries, joint ventures or associates,
the carrying amount is higher than the carrying amount of the investee’s assets, or a dividend exceeds the total comprehensive income of the investee
REC Management’s assessment is that there are no impairment indicators to trigger a computation of the asset’s recoverable amount. In addition, the recently completed fair value assessment of the Group’s property, plant and equipment and intangible assets acquired on 25 October 2013, REC assessed that there is no impairment loss required on the Group’s property, plant and
equipment, based on the observed and forecasted solar panel prices and the manufacturing cost efficiencies attained. REC does not have any goodwill and intangible assets (both definite and indefinite useful life) which will require annual impairment test to be conducted.
09. DERIVATIVES
During the financial period, REC has started to use Foreign Exchange (“FX”) forward contracts to manage some of its transaction exposures. The FX forward contracts are not designated as hedging instruments and are entered into with maturity dates ranging from 1 month to 16 months, where REC has the flexibility to realize the currency derivatives at any point in time before maturity.
Fair values and carrying amounts
(USD IN MILLION)
31 DEC 2014
ASSETS LIABILITIES
Foreign exchange forward contracts 7.8 – 0.2
Distribution of derivatives
(USD IN MILLION)
31 DEC 2014
ASSETS LIABILITIES
Total non-current derivatives – – Total current derivatives 7.8 – 0.2Total derivatives 7.8 – 0.2
(CURRENCY IN MILLION) 2015/2016
Bought currency SGD/EUR 114.4USD/EUR 90.6
Sold currency AUD/USD 8.3JPY/USD 1,820.5
The table above shows undiscounted contractual currency amounts by year of maturity. Positive (negative) amounts are the principal amount of the first currency mentioned bought (sold) forward with payment (receipt) of the second currency.
The table below shows the same contracts, but summarizes the future currency exposure in total for the undiscounted contractual cash flows in foreign exchange forward contracts at 31 December 2014.
(CURRENCY IN MILLION)
USD 2015/2016
EUR 2015/2016
SGD 2015/2016
AUD 2015
JPY 2015
EUR/USD 90.6 – 70.0EUR/SGD – 70.0 114.4AUD/USD 6.7 – 8.3JPY/USD 15.5 – 1,820.5Total 112.8 – 140.0 114.4 – 8.3 – 1,820.5

REC Solar Annual Report 2014 45 Financial Statements REC Group
At 31 December 2014, REC had estimated net positive external future cash flows in EUR, Australian Dollar and Japanese Yen and net negative cash flows in USD and SGD. REC is economically hedging parts of these cash flows by entering into derivative transactions for purchase of USD/EUR, SGD/EUR, USD/AUD and USD/JPY.
Fair value of foreign exchange forward contracts as at 31 Dec 2014
(USD IN MILLION)
FLEXI FX FORWARD
2015/2016
Bought currency SGD/EUR 1.2USD/EUR 6.2
Sold currency AUD/USD – 0.1JPY/USD 0.2
Total 7.6
The table above shows a specification of fair values equaling carrying amounts, at 31 December 2014 of currency derivatives distributed by currency and year of maturity, where REC has the flexibility to realize the currency derivatives at any point in time before maturity.
10. EQUITY ACCOUNTED INVESTMENTS (ASSOCIATES AND JOINT VENTURES) AND INVESTMENTS
Items in the statement of financial position
(USD IN MILLION) 31 DEC 2014 15 JUL 2013
Investments in associates 1.9 – Investments in joint ventures 0.6 – Equity accounted investment 2.5 –
Items in the statement of income
(USD IN MILLION)15 JUL 2013 TO
31 DEC 2014
Share of gain/(loss) of equity accounted investments 2.4
Equity accounted investments in the statement of financial position
(USD IN MILLION)
At January 15 July 2013 – Acquisition of Solar Entities 13.6 Share of gain/loss of associates 2.4 Income expenses recognised for income on equity accounted investment
3.2
Disposal – 4.6Repayment from equity accounted investment – 12.1Exchange differences – 0.1At 31 December 2014 2.5
Investments in associatesOn 29 January 2014, Mainstream Energy Corporation (“Main-stream”), which is an associate of REC, has spun off its residential business from its commercial/industrial business and merged it into Sunrun Inc. (“Sunrun”). Sunrun is a Delaware corporation operating in the solar financing sector.
The fair value of Mainstream as per spin-off date was attributed in whole to the residential business. As a consideration, REC received a minority interest in Sunrun. REC’s ownership interest/voting rights in the remaining Mainstream business remained 20 percent.
Sella Invest di ESB srl. & Co. sas (Sella) is an associate of REC which was founded to develop solar rooftop projects in the north and middle Italy. REC System has a 20 percent ownership right and 33.3 percent interest in profit or loss.
Investments in Joint VenturesREC has an ownership interest in a joint venture entity in the USA which is active in project development in California. According to IFRS 11 Joint Arrangements, the Solar Group’s interest in jointly controlled entities is accounted for according to the equity method for total operations. It is disclosed in the Income statement in the line item “share of gain/loss of equity accounted investments” shown between EBIT and Net financial items. During the period, REC received milestones payment of about USD 12.1 million from the joint venture which reduced REC investment.
Investment in shares in the statement of financial position
(USD IN MILLION) 31 DEC 2014 15 JUL 2013
Investment in shares 3.6 –
Investments in shares (available for sale)Following Mainstream’s spin-off of its residential business and merger (as described above) with Sunrun, REC owns a minority interest in Sunrun. The investment is accounted for as an available-for-sale asset. As the fair value of this unquoted investment is unavailable, and there is no quoted market price in an active market and other methods of determining fair value do not result in a reasonable estimate, the investment is measured at cost less impairment.
11. RELATED PARTY TRANSACTIONS
REC has related party relationships with its subsidiaries, associates, joint ventures and with its Senior Management and Board of Directors. Transactions within REC are eliminated in the combined financial statements and are not reported as related party transac-tions in the combined financial statements for REC.

46 REC Solar Annual Report 2014
Financial Statements REC Group
Salary and other compensation to the Group’s Board of Directors and Management for 2014 are described below. With regards to the determination of salary and other compensation for leading employees for 2015, the Board of Directors will propose guidelines at the 2015 Annual General Meeting that include factors mentioned below.
The competencies, performance and dedication of our employees are critical success factors for the short term and long term value creation of REC. Hence, key compensation goals are to support attraction, development and retention of the right talent, reward past achievements, and incentivize future strong performance, world class operations capabilities, and practice of our REC Values. Compensation packages should be put together to support these goals.
Fixed base salary levels are determined locally and reflect local market average levels for corresponding positions and qualifica-tions in relevant businesses. Fixed base salaries are reviewed once a year and adjustments are effective 1st of January. Factors that are taken into consideration on decisions regards to salary adjustments are market competitiveness and projected salary movement in the local market, business performance and prospects, affordability and sustainability and employees’ current pay positions against the market. Annual performance evaluations are conducted on an annual basis and adjustments to individual employee’s base salary is dependent on employee’s performance and contributions for the year.
REC believes in rewarding employees for their contributions towards its success. Hence, REC’s compensation program incorporates a variable performance-based bonus, the pay-out of
921 kW 3,683 REC solar panels Den Bosch, Netherlands

REC Solar Annual Report 2014 47 Financial Statements REC Group
which is at the discretion of REC. Employees eligible to participate in the variable performance bonus have target bonus opportunities aligned to the market where bonus opportunities increase with level of responsibilities. Leading employees have target bonus opportunities ranging from 30 % to 60 % of annual base salaries.
The amount of variable bonus employees receive depends on REC’s financial performance and employees’ individual performance in achievement of performance objectives measured through clearly defined result parameters / Key Performance Indicators (KPIs).
Before any bonus can be paid out, it must first be established that REC is able to fund a bonus. Hence, under the bonus program, it is decided that REC’s EBITDA Gate must be passed before any bonus can be considered. This ensures that REC meets a minimum expected level of profitability before any bonus pool is created. There will be no bonus pay-outs if this minimum expected level of financial performance is not met. To encourage and motivate “stretch” and “over-achievement”, the higher the level of financial performance, the bigger the bonus pool for distribution. The pool is however capped at 150 % of employees’ target bonus opportunities. To allow recognition of differentiation of performance, high performing employees will have opportunity to earn greater relative rewards of the collective bonus pool. The over-achievement percentage when awarding to each leading employee is not a binding commitment, but at the full discretion of the Company.
To address attrition of critical employees during the uncertain times of REC and the solar industry in year 2012, certain leading employees have been offered, and have accepted and entered into, so-called “stay-on” agreements with REC, pursuant to which the relevant employees have agreed to stay in their current positions until 31 January 2015. All payments to leading employees have been paid out except for the SVP, US Sales and CFO who joined the scheme later where final payments will be made in April 2015 and April 2016 respectively. This “stay-on” agreement and compensation is a one-time exercise.
All the leading employees follow the normal standard pension/retirement contribution schemes for similar companies in the countries/states where they are employed.
In addition to the above mentioned compensation components, REC offers a car allowance, phone coverage and a limited number of other benefits to selected employees.
Certain leading employees are entitled to receive one-time payments in the event of a public takeover of the Company involving transfer of shares resulting in one shareholder holding more than 2⁄3 of the shares in REC. In addition, certain leading employees have been offered retention agreement in the event of any change of control where employment is lost due to the sale of the company.
There is currently no long term incentive program or any share purchase program in place.
The guidelines for determination of salary and other compensation for leading employees, as outlined for the Annual General Meeting in 2014, have been complied with in 2014.
KEY MANAGEMENT COMPENSATIONAt the date of approval of these combined financial statements, the Board of Directors for REC Solar ASA consists of Ole Enger as Chairman of the Board of Directors, as well as Board members Øystein Stray Spetalen, Jan Christian Opsahl, Mimi K. Berdal and Anne Lise Meyer. Ole Enger has received compensation as working chairman of REC Solar ASA.
Compensation of the Board of Directors paid in 2014
(AMOUNT IN USD)
NAMEBOARD
COMPENSATIONCOMPENSATION
FOR COMMITTEES
Ole Enger (Chairman) 62,516 – Mimi K. Berdal 16,671 – Anne Lise Meyer 16,671 2,778 Jan Christian Opsahl 16,671 2,778 Øystein Stray Spetalen 16,671 – Total period December 2013 to March 2014 129,199 5,557
(AMOUNT IN USD)
NAMEBOARD
COMPENSATIONCOMPENSATION
FOR COMMITTEES
Ole Enger (Chairman) 178,957 – Total period April 2014 to December 2014 178,957 –
Compensation of the Board of Directors earned, but not paid in 2014
(AMOUNT IN USD)
NAMEBOARD
COMPENSATIONCOMPENSATION
FOR COMMITTEES
Ole Enger (Chairman) * 1,908,876 –Mimi K. Berdal 41,863 –Anne Lise Meyer 41,863 –Jan Christian Opsahl 41,863 –Øystein Stray Spetalen 41,863 –Total 2,076,327 –
* A bonus agreement has been signed with Board Chairman Mr. Ole Enger in connection with sale of REC Solar Holdings AS to Bluestar Elkem Investment Co. Ltd. Upon successful completion of the sale, a bonus of NOK 12 million will be granted.
All amounts are exclusive of social security tax.
The other Board members have not received any compensation for the period April 2014 to December 2014 from REC, or had any related parties transactions with the REC Group.

48 REC Solar Annual Report 2014
Financial Statements REC Group
Compensation to REC Senior Management for the period 25 October 2013 to 31 December 2014
S/NO NAME DESIGNATIONBASE SALARY
(USD)
PERFOR-MANCE BONUS
TARGET %
PERFOR-MANCE BONUS
EARNED (USD)
RETENTION/OTHER
BONUSES EARNED
(USD)
PENSION CONTRIB-
UTIONS (USD)
OTHER ALLOW-ANCES /
TAXABLE BENEFITS
(USD)TOTAL (USD)
1 Øyvind Hasaas (left REC 30 June 2014)
President and CEO 280,744 60 % - 162,885 48,435 138,720 630,784
2 Martin Cooper CFO and Interim CEO 391,200 40 % 160,469 41,146 13,705 67,565 674,085 3 Ter Soon Kim SVP, Solar Operations 446,879 40 % 128,337 78,026 11,980 27,585 692,807 4 Chia Wai Leng VP, HR 329,399 30 % 67,788 39,723 10,482 27,585 474,977 5 Tan Jee Meng VP, Global/Sales Planning & CLC 285,561 30 % 62,659 7,881 11,980 27,585 395,666 6 Au Yan Shuk Shan Maria Chief Legal Officer 329,347 30 % 51,794 39,407 11,270 27,585 459,403 7 Gavin Adda VP, Merger & Acquisition 259,567 30 % 33,260 – – 26,469 319,296 8 Antonius Barry Aryanasvara
(joined Apr 2014)VP, Asia Pacific Sales 188,272 40 % 35,610 – 7,998 31,211 263,091
9 Arndt Lutz SVP, North America Sales 303,551 40 % 64,945 – 11,200 84,520 464,216 10 Luc Graré SVP, EMEA Sales & Global Marketing 360,684 40 % 84,174 – 51,175 45,606 541,639
Total 3,175,204 689,036 369,069 178,226 504,431 4,915,964
Compensation in foreign currencies has been translated to USD at average exchange rates for the reporting period. All amounts include payments and benefits from REC Solar ASA and its subsidiaries.
The members included in the table are part of the REC Management for the reporting period 25 October 2013 to 31 December 2014 and the amounts in the tables are for the months being employed by REC Solar ASA and its subsidiaries. Antonius Barry Aryanasvara joined REC in April 2014 and Øyvind Hasaas left REC in June 2014. Consequently no amounts are reported for them for the periods they were not employed by REC.
Base salary represents the amounts, including holiday pay that has been paid in the year. Base salary is normally adjusted at January 1. The base salaries are for months of employment. For employees in Singapore, annual base salary includes the Annual Wage Supplement (13th month) which is paid out together with the December pay.
The bonuses are annual performance bonuses. The amounts in the table above represent the bonuses earned for the period 25 October 2013 to 31 December 2014. These are normally paid and reported as taxable income for the employee in the subsequent year. The bonus amounts should be understood as the total of the bonus and vacation pay on the bonus, if appropriate. The purpose of the bonus scheme is to align to market practice and competitiveness in order to attract and retain the right talents. It is intended to award, incentivize and drive outstanding performance.
The amounts in the table for pension contributions for the Management in Singapore refer to employer’s contributions towards employees’ retirement in the Central Provident Fund. For Øyvind Hasaas it includes annual premiums paid by REC for a defined contribution plan for salaries up to the time he left REC. Arndt Lutz’s pension payment is computed on 3 percent of the annual salary while Luc Graré has a separate agreement where contributions are made to an insurance company.
The amounts in the table for other allowances/taxable benefits are the amounts that are reported as taxable income, based on rules and regulations in the relevant tax laws. The amounts refer primarily to the following:
– For Øyvind Hasaas: This includes mobility allowance, housing, utilities, company car and international medical insurance premiums in Singapore in 2013 till he left REC in June 2014.
– For Management in Singapore: This includes car allowance and housing allowance, if applicable.
– For Luc Graré in Europe: This includes car and rental subsidies.– For Arndt Lutz, this includes car, housing, school, utilities and
unemployment insurance allowance.
Where payments of retention/other bonuses earned have been made, the amount is reflected in the table. The Management who have signed stay-on agreement that entitle them to a range of 4 to 6 months base salary if they stay with the company until 31 January 2015 are Ter Soon Kim, Au Yan Shuk Shan Maria, Chia Wai Leng, Luc Graré and Arndt Lutz.
For the Management located in Singapore, these loyalty bonuses are paid in 4 payments, every 6 months commencing from 1 February 2013 and employees are obligated to repay the company the total of any amounts received if they resign before 31 January 2015. The amount reflected in the table is amount paid to-date as at 31 December 2014.
For Luc Graré and Arndt Lutz, who are located in Europe and US respectively, the loyalty bonus will be paid the full amount as a one-time payment at the end of the retention period on 31 January 2015. These are payable only in February 2015, hence no amount reflected in the table above. They shall not be eligible for payment if they leave the company before 31 January 2015.

REC Solar Annual Report 2014 49 Financial Statements REC Group
Øyvind Hasaas signed a stay-on agreement that entitles him to 12 months base salary if he is not under notice per 31 December 2013. The amount has been paid in 2014.
SHAREHOLDINGSThe number of shares owned by members of the Board of Directors and the Group Management, including their closely related parties, are shown in the table below.
NAME NO. OF SHARES
Ole Enger 1,430 Øystein Stray Spetalen 2,038,204 Jan Christian Opsahl 225,862 Mimi K. Berdal 2,068 Anne Lise Meyer –
As at 31 December 2014, there are no other outstanding loans or guarantees to members of Group Management, Board members or shareholders or their closely related parties.
OTHER RELATED PARTY TRANSACTIONSAssociatesOn 29 January 2014, Mainstream Energy Corporation (“Main-stream”), which is an associate of REC, has spun off its residential business from its commercial/industrial business and merged it into Sunrun Inc. (“Sunrun”). Sunrun is a Delaware corporation operating in the solar financing sector.
The fair value of Mainstream as per spin-off date was attributed in whole to the residential business. As a consideration, REC received a minority interest in Sunrun. REC’s ownership interest/voting rights in the remaining Mainstream business remained 20 percent. REC sold solar panels for USD 10.7 million to Mainstream for the period 15 July 2013 to 31 December 2014.
Sella Invest di ESB srl. & Co. sas (Sella) is an associate of REC which was founded to develop solar rooftop projects in the north and middle Italy. REC System has a 20 percent ownership right and 33.3 percent interest in profit or loss.
12. DETAILS RECEIVABLES AND CONSTRUCTION CONTRACTS IN PROGRESS
Trade and other current receivables and investments
(USD IN MILLION) 31 DEC 2014 15 JUL 2013
Trade receivables and accrued revenues 1) 130.7 – Provision for loss on trade recivables – 0.1 – VAT and other public taxes and duties receivables 2.6 – Government grant current receivables 3.6 – Other current receivables and investments 6.3 – Total trade and other current receivables and investments
143.1 –
1) Includes work in progress on construction contracts to be invoiced, see table below
Specification of provision for loss on trade and other receivables
(USD IN MILLION)
At 15 July 2013 – Change in provision for loss on receivables – 0.1 Provisions for loss on trade receivables – 0.2 Exchange difference 0.1 At 31 December 2014 – 0.2
Realized gain/(loss) on trade receivables in 2014 0.6 Change in provision for loss on receivables – Gain/(Loss) on trade receivables in the statement of income in from 15 July 2013 to 31 December 2014
0.6
The provision for impairment of trade receivables is recognized in the statement of income and is established when there is objective evidence that REC will not be able to collect all amounts due according to the original terms of receivables. Significant financial difficulties of the debtor, probability that the debtor will enter bankruptcy or financial reorganization, and default or delinquency in payments, are considered indicators that the trade receivable is impaired.
9.5 MW 40,896 REC solar panels
Mae Chan district, Chiang Rai province, Thailand

50 REC Solar Annual Report 2014
Financial Statements REC Group
Construction contracts in progress at year-end
(USD IN MILLION) 31 DEC 2014 15 JUL 2013
Value of work performed on uncompleted construction contracts
2.0 –
Invoiced amount on uncompleted construction contracts
– –
Work in progress on uncompleted constructions contracts to be invoiced
2.0 –
Trade receivables from uncompleted construction contracts
– –
Recoverable on uncompleted construction contracts
2.0 –
Advances from customers on uncompleted construction contracts
– –
Construction contract revenues amounted to USD 2.8 million for the reporting period. The percentage of completion method is used to determine the contract revenue recognized in the period. The stage of completion of a contract in progress is determined by weighting the progress of a number of work phases in the project, each having a predefined weight considering complexity and time components.
Other non-current receivables
(USD IN MILLION) 31 DEC 2014 15 JUL 2013
Government grant non-current receivables 3.4 – Other non-current receivables 0.5 – Total other non-current receivables and investments
4.0 –
13. INVENTORIES
REC is integrated in the value chain from wafers to solar panel, and to some extent to PV system, and REC entities sell goods to each other. Consequently, finished goods for one REC entity become raw materials or work in progress for another REC entity. The clas-sification by the separate entities is also used in the classification in REC’s consolidated financial statements.
Total cost of materials and changes in inventories and writedowns in the statement of income
(USD IN MILLION)15 JUL 2013 TO
31 DEC 2014
Cost of materials – 473.3 Change in goods in progress 2.1 Change in semi finished goods – 0.0 Change in finished goods 5.3 Write down of inventories – 5.8 Total cost of materials and changes in inventories and writedowns – 471.8
INVENTORIES AND ALLOCATION OF WRITEDOWNS IN THE STATEMENT OF FINANCIAL POSITION AT 31 DECEMBER
Allocation of writedowns of inventories at end of period
(USD IN MILLION)
31 DEC 2014
BEFORE WRITEDOWNS WRITEDOWNS 31 DEC 2014
Stock of materials, merchandise, production supplies
39.2 0.0 39.2
Spare parts 11.6 0.0 11.6Work in progress 2.1 0.0 2.1Finished goods 56.8 – 2.0 54.8Total 109.8 – 2.0 107.8
Inventories have been written down to estimated net realizable values on a monthly basis. Elimination of unrealized internal profits reduced the inventory values compared to the sum of the entities’ values by USD 11.6 million at 31 December 2014.
Below is a reconciliation of the change in write downs of inventories in the statement of financial position. The amounts reported as writedowns in the statement of income and as realized are affected by the frequency of the valuation and reporting of inventories and writedowns. Generally, inventory valuation is performed each month, and this increases the gross amounts reported as writedowns in the statement of income and as realized. Realization of write downs in a period may have to be estimated as this may not be generated by the inventory system. Inventories that have been sold at a loss (compared to the valuation at the end of the previous month or produced and sold during the same month) will be included in other line items and not as writedowns of inventories in the statement of income. Writedowns of inventories in the statement of income and realized writedowns are also affected by elimination of unrealized internal profits on consolidation, of which parts are recognized as a reduction to writedowns made by the separate entities, based on estimates of internal profits and how much has been realized in the periods.
Change in writedowns of inventories in the statement of financial position
(USD IN MILLION)
Writedowns of inventories at 15 July 2013 0.0Acquisition of solar entities – 5.9Additional writedowns during the period – 6.2Reversal of writedowns during the period 0.4Realization of written down inventories in the period 8.9Translation difference in the period 0.8Writedowns of inventories at 31 December 2014 – 2.0

REC Solar Annual Report 2014 51 Financial Statements REC Group
14. CASH AND CASH EQUIVALENTS
(USD IN MILLION) 31 DEC 2014 15 JUL 2013
Bank balances 89.9 0.2Cash and cash equivalents in the statement of financial position
89.9 0.2
15. INCOME TAX EXPENSE AND DEFERRED TAX ASSETS AND LIABILITIES
Recognized income tax expense
(USD IN MILLION)15 JUL 2013 TO
31 DEC 2014
Current income tax expense (–) / benefit (+) – 3.2 Adjustment of prior year‘s income tax expense (–) / benefit (+) – 0.4 Deferred tax expense (–) / benefit (+) 2.0 Total income tax expense (–) / benefit (+) in the statement of income
– 1.7
The tax on the Group’s profit/loss before tax differs from the theo-retical amount that would arise using the weighted average tax rate applicable to profits/losses of the consolidated and proportionally consolidated companies as follows :
(USD IN MILLION)15 JUL 2013 TO
31 DEC 2014
Profit/loss before tax from continuing operations 175,8 Tax calculated at domestic tax rates applicable to profits/losses in the respective countries
– 40,8
Income not subject to tax (Singapore) 12,1 Income from negative goodwill not subject to tax 25,6 Expenses not deductible for tax purposes 1,9 Effects of not recognized deferred tax assets, including reversal of previous years
– 0,1
Adjustment of prior year’s income taxes – 0,4 Total income tax expense (–) / benefit (+) in the statement of income
– 1,7
Effective tax rate 1 %
The income tax calculation for the REC is primarily based on corporate income tax rates of 17 percent in Singapore, 27 percent in Norway (the rate was changed from 28 to 27 percent effective 1 January 2014) and above 30 percent in a number of other European countries.
A 17 percent tax rate has been applied for profit or loss items related to Singapore in the table in the line item “tax calculated at domestic tax rates applicable to profits/losses in the respective countries”. However, only limited income tax has been recognized on the profits and on unrealized internal profits on inventories in the Singapore operations, due to a tax exempt period. This explains the main part of the amounts in the line item “results not taxable (Singapore)”.
The line item “adjustment of prior year’s income taxes” for the period 15 July 2013 to 31 December 2014 mainly relates to the sales office in Europe.
Income tax assets and liabilities in the statement of financial position
(USD IN MILLION) 31 DEC 2014 15 JUL 2013
Current tax assets – – Current tax liabilities 1.7 – Net current tax assets (+) / liabilities (–) – 1.7 – Deferred tax assets 0.2 – Deferred tax liabilities – – Net deferred tax assets (+) / liabilities (–) 0.2 –
ESTIMATION OF THE AMOUNTS OF DEFERRED TAX ASSETS AND LIABILITIES THAT MAY BE RECOVERED OR SETTLED WITHIN AND AFTER 12 MONTHS
(USD IN MILLION) 31 DEC 2014 15 JUL 2013
Deferred tax assetsDeferred tax asset to be recovered after 12 months – –Deferred tax asset to be recovered within 12 months 0.2 –Offset deferred tax assets and liabilities – –Total 0.2 –
Deferred tax liabilitiesDeferred tax liability to be settled after 12 months – –Deferred tax liability to be settled within 12 months – –Offset deferred tax assets and liabilities – –Total – –Net deferred tax assets 0.2 –
The following main deferred tax assets have not been recognized at
(USD IN MILLION) 31 DEC 2014 15 JUL 2013
Total non current assets 5.2 – Total current assets – – Total non current liabilities – – Total current liabilities – – Tax losses carry forward – not recognized 191.9 – Total 197.1 –
Tax losses carried forward and other deferred tax assets are not recognized due to requirements in IAS 12 for convincing evidence of future profits.

52 REC Solar Annual Report 2014
Financial Statements REC Group
16. RETIREMENT BENEFIT OBLIGATIONS AND EXPENSES
REC has no defined benefit pension plans. For defined contribution plans, REC has no further payment obligations once the contribu-tions have been paid. The contributions are monthly and required by law. The contributions are recognised as employee benefit expense when they are due.
REC companies in Singapore pay contributions to the Central Provident Fund (CPF), which is a comprehensive social security savings plan. Working Singaporeans and their employers make monthly contributions to the CPF at contribution rates set by the CPF Board.
17. TRADE PAYABLES, PROVISIONS AND OTHER LIABILITIES
Trade payables and other liabilities
(USD IN MILLION) 31 DEC 2014 15 JUL 2013
CurrentTrade payables 90.9 – Payables for capital expenditures 5.3 – VAT and other public taxes and duties payables 0.7 – Accrued operating costs 26.0 – Prepaid revenues/prepaid from customers - external
6.5 –
Other non-interest bearing liabilities 0.5 – Trade payables and other liabilities 129.8 –
Provision
(USD IN MILLION) 31 DEC 2014 15 JUL 2013
Current 2.1 – Non - current 89.7 – Total 91.8 –
Specification of provisions
(USD IN MILLION)
RESTRUC-TURING &
EMPLOYEE TERMINA-
TION BENEFITS
WAR-RAN-TIES
ASSET RETIRE-
MENT OBLIGA-
TIONS
ONER-OUS
CON-TRACTS LEGAL TOTAL
At 15 July 2013 – – – – – – Acquisition of Solar Entities
1.1 59.8 35.2 0.8 1.2 98.1
Additional provisions 1.5 8.5 0.3 – – 10.3 Unused amounts reversed
– 1.2 – 0.7 – – 0.1 – – 2.0
Exchange differences – – 10.0 – 1.7 – 0.2 – – 11.9 Increase in provisions due to interest
0.3 0.2 0.7 – – 1.2
Used during the year – 1.7 – 0.3 – 1.2 – – 0.8 – 4.0 At 31 December 2014 – 57.5 33.3 0.6 0.4 91.8
A provision is a liability of uncertain timing or amount. Current provisions are expected to be paid within one year. Non-current provisions are primarily warranties and asset retirement obliga-tions.
Warranties are primarily product and power output warranties related to the sale of solar panels. Asset retirement obligations are related to REC’s obligation to restore the land on which the Singapore manufacturing plant is currently operating.
18. GOVERNMENT GRANTS
(USD IN MILLION)15 JUL 2013 TO
31 DEC 2014
Recognized in the statement of financial position - grants related to assets
0.1
Recognized in the statement of income - grants related to income
4.2
Total 4.3
Grants are recognized in the statement of income over the period necessary to match them with the costs that they are intended to compensate. Grants related to assets are recognized in the statement of income at the same time as depreciation of the related assets, and are not included in the second line in the table above. Grants related to income are grants that compensate period expenses.
A government grant is not recognized until there is reasonable assurance that the entity will comply with the conditions attached to it, and that the grant will be received. To qualify for the grants recognized, several future conditions need to be fulfilled. Generally, in the event of breach of conditions, REC may have to repay grants. The future conditions include employment of a minimum number

REC Solar Annual Report 2014 53 Financial Statements REC Group
of selected employees in specific geographical areas for specified periods, retention period for some employees and restrictions on the disposal of assets and/or companies. The agreement underlying the government grants REC received for its investments in Singapore requires the consent of the Economic Development Board of Singapore and JTC Corporation for any change of control in REC Solar ASA or in the Singapore entities.
19. OTHER OPERATING EXPENSES
(USD IN MILLION)15 JUL 2013 TO
31 DEC 2014
Energy and water 58.1Total operating, service and maintenance costs 29.5Lease expenses 5.9Freight, postage and transportation 13.8IT and telecommunication costs 5.7Travel and entertainment costs 3.6Insurance costs 1.5Sales, marketing and advertising costs 2.5Consultancy and auditors fees 17.7Own work capitalized on fixed assets 0.0Warranty provision 1) 5.9Loss on receivables 2) – 0.2Other operating costs 9.2Other operating expenses 153.0
1) Warranty provision, see note 17.2) Loss on receivables, see note 12.
Auditor‘s remuneration
(USD IN MILLION)15 JUL 2013 TO
31 DEC 2014
Statutory Audit 1.6Other assurance services - from auditor 0.2Other non-audit services - from auditor 0.6Total auditor‘s remuneration 2.3
Amounts are exclusive of VAT.
Statutory audit fees contain: all procedures and work performed to ensure proper reporting and statutory audit, technical assistance with preparation of the reported figures and statutory financial statement, audit to be able to sign off tax papers (Norwegian specific mandatory work), and audit or agreed upon procedures for period accounts.
Other assurance services contain: all attestation services expected to be performed by the company’s auditor due to legal requirements or requirements from third party including performance of agreed upon procedures for period accounts.
Other non-audit services contain: extended audit based request from the management or general assembly that will result in any attestation, counseling to ensure that the client is able to report a financial statement; i.e. assistance with technical issues, agreed-upon procedures, and all other eligible auditor services not included in any of the above.
3.2 MW 12,264 REC solar panels
Indianapolis, Indiana, USA

54 REC Solar Annual Report 2014
Financial Statements REC Group
20. OTHER INCOME AND EXPENSES
(USD IN MILLION)15 JUL 2013 TO
31 DEC 2014
Restructuring cost and employee termination benefits – 0.8Onerous contracts 0.1Other income 5.0Gain/loss on disposal of non-current assets – 0.2 Total other income and expenses 4.1
Restructuring cost as well as employee termination benefit costs for the period relate mainly to the restructuring of the Systems business. Other income comprise USD 5.0 million relates to recognition of insurance reimbursement from the fire incident that occurred during the financial period that damaged certain property, plant and equipment by approximately USD 0.3 million.
21. EMPLOYEE BENEFITS
(USD IN MILLION)15 JUL 2013 TO
31 DEC 2014
Payroll 65.9Bonus 12.5Social security tax 1.4Pension costs incl. social security tax 5.1Other employee related costs 14.3Total employee benefit expenses 99.3
Average number employees in man years during the year 1,672 Number of employees year-end 1,811
22. FINANCIAL INCOME AND EXPENSES
(USD IN MILLION)15 JUL 2013 TO
31 DEC 2014
Financial income 0.2 Interest expenses - External – 0.9Other financial expenses – 0.2Calculated interest related to asset retirement obligations – 0.7Net financial expenses – 1.8Net currency gains/losses 15.3 Net gains/losses financial instr. fair value 8.3 Net financial items 21.9
Interest expenses mainly relates to the discounting of Trade Receivables for a customer who is on an installment plan and discounting for one of the subsidiaries’ VAT receivables where the VAT refund is only expected to be received in the next few years as it is filing for liquidation.
Calculated interest related to asset retirement obligation is REC’s obligation to restore the land on which the Singapore manufacturing plant in currently operating. Site restoration costs are provided at the present value of expected costs to settle the obligation using estimated cash flows. The cash flows are discounted at a current pre-tax rate that reflects the risks specific to the decommissioning liability. The unwinding of the discount is expensed as incurred and recognised in profit or loss as a finance cost.
Net currency gains are primarily related to currency gains on assets in currencies other than the functional currency for REC and its subsidiaries.
REC has entered into Foreign Exchange forward contracts to manage some of its transaction exposures, please refer to note 9. The net gains on financial instrument fair value is resulted from mark-to-market valuation of forward currency exchange contracts.
23. EARNINGS PER SHARE
Basic earnings per share (EPS) is calculated by dividing the profit/loss attributable to equity holders of the company by the weighted average number of ordinary shares in issue during the year, excluding treasury shares. Diluted earnings per share is calculated by adjusting the weighted average number of ordinary shares outstanding to assume conversion of all dilutive potential ordinary shares. There have been no dilutive effects in the periods presented.
REC Solar ASA was incorporated on 15 July 2013 and listed on Oslo Stock exchange on 25 October 2013. Thus, separate disclosure is made below to distinguish the number of shares between pre and post IPO in the calculation of EPS.
25 OCT 2013 TO 31 DEC 2014
15 JUL 2013 TO 24 OCT 2013
Profit/(Loss) for the period (USD IN MILLION) 174.8 – 0.7Number of shares – basic (IN MIILION) 40 1Number of shares – diluted (IN MIILION) 40 1
Earnings per share (In USD) – basic 4.4 – 0.7 – diluted 4.4 – 0.7

REC Solar Annual Report 2014 55 Financial Statements REC Group
24. RESEARCH AND DEVELOPMENT
(USD IN MILLION)15 JUL 2013 TO
31 DEC 2014
Research and development expenses 18.4
All costs in the relevant departments performing research and development are reported as research and development expenses for this note. These costs do not satisfied the recognition criteria for capitalizing as an intangible asset under IAS 38. Some of the development costs related to introduction of new technology into mass production were carried by the manufacturing plants and not reported as research and development expenses.
The research and development activities consist of continuous development of current production processes and equipment as well as next generation production technologies designed to enhance wafer quality, improve cell and solar panel efficiency, and reduce production cost throughout the value chain.
25. COMMITMENTS, GUARANTEES
The purchase obligation amounts consist of items for which REC is contractually obligated to purchase from a third party at 31 December 2014. Operating lease payments show contractual minimum future payments. Only larger contracts are included.
Possibilities for termination of contracts based on REC’s interpre-tation have been taken into account. In the case where contracts are interpreted as being possible to terminate with a lower amount, this amount has been used and shown as estimated payments in the first period subsequent to the reporting period. Consequently, the amounts presented in the table only constitute the estimated contracted unavoidable minimum portion of the REC’s expected future costs. It does not reflect the REC’s expected future cash outflows.
Contracts that are estimated to be onerous are not included in the tables for the amounts that are included in the estimates of provi-sions for onerous contracts in the statement of financial position. The committed payments above the estimated future economic benefits of the contracts are included as provision for onerous contracts, and the remaining are included in the table for committed purchase of goods and services or operating lease payments.
Contracts that are disputed or terminated are included in the table only to the extent they have not been recognized as onerous contracts and to the extent of REC’s best estimate of its minimum commitment.
The minimum amounts in some contracts may be subject to interpretations and the vendors may have other views than REC. If REC’s interpretations are not accepted, the minimum commitments or onerous contracts may increase.
(USD IN MILLION)
TOTAL FUTURE
PAYMENTS 2015 2016 2017 2018 2019AFTER
2019
Purchase of goods and servicesTotal purchase of goods and services
124.6 117.1 7.1 0.3 0.2 0.0 0.0
Minimum operating lease paymentsTotal minimum operating lease payments
4.4 1.4 1.2 0.8 0.6 0.4 0.0
CapexTotal capex 20.3 20.1 0.2 0.0 0.0 0.0 0.0
Contractual purchase obligationsThe contractually committed minimum purchases of goods and services for REC at 31 December 2014 relate primarily to the integrated production facility in Singapore. REC has entered into contracts with vendors in Singapore that contain delivery of products and services. REC is not able to separate the payments reliably, and has included the total amounts in the table for committed purchase of goods and services.
Operating leasesThe future minimum operating lease payments at 31 December 2014 in the table above mainly relates to lease of machinery and equipment as well as office space. Only signification contracts are included.
GuaranteesREC Silicon Group has provided bank guarantees and parent company guarantees primarily related to the performance of solar panels and systems. It is stipulated in the sale agreement between REC Silicon and REC Solar ASA, that for guarantees under which a formal substitution of REC Silicon as a guarantor or counter-guarantor is not possible, REC Solar ASA should indemnify REC Silicon for all losses incurred. The bank guarantees amount to USD 2.1 million and run through April 2015. The parent company guarantees are valid for the relevant warranty periods and are limited by warranties provided on solar panels and systems. It also includes a guarantee provided by REC Solar AS in 2011 in connection with the sale of the previous subsidiary REC ScanModule AB.

56 REC Solar Annual Report 2014
Financial Statements REC Group
26. OTHER INFORMATION FINANCIAL INSTRUMENTS
Refer also to note 3, Financial Risk Management.
FAIR VALUES OF FINANCIAL INSTRUMENTSThe following table shows the carrying amounts and fair values of financial assets and financial liabilities, including their levels in the
fair value hierarchy for financial instruments measured at fair value. It does not include fair value information for financial assets and financial liabilities not measured at fair value if the carrying amount is a reasonable approximation of fair value.
(USD IN MILLION)
CARRYING AMOUNT FAIR VALUE
NON– CURRENT ASSETS CURRENT ASSETS
TOTAL LEVEL 1 LEVEL 2 LEVEL 3 TOTAL
TRADE AND OTHER
RECEIVABLES
OTHER INVESTMENTS
INCLUDING DERIVATIVES
TRADE AND OTHER
RECEIVABLES
OTHER INVESTMENTS
INCLUDING DERIVATIVES
CASH AND CASH
EQUIVALENT
31 December 2014 Financial assets measured at fair valueForeign exchange forward contracts
– – – 7.8 – 7.8 – 7.8 – 7.8
Investment in shares (available for sale)
– 3.6 – – – 3.6 – – – –
Financial assets not measured at fair valueTrade and other receivables 4.0 – 143.1 – – 147.1 – – – – Restricted bank accounts – – 4.0 – – 4.0 – – – – Cash and cash equivalents – – – – 89.9 89.9 – – – –
4.0 3.6 147.1 7.8 89.9 252.4
(USD IN MILLION)
CARRYING AMOUNT FAIR VALUE
NON– CURRENT LIABILITIES CURRENT LIABILITIES
TOTAL LEVEL 1 LEVEL 2 LEVEL 3 TOTAL
TRADE AND OTHER
PAYABLES
OTHER INVESTMENTS
INCLUDING DERIVATIVES
TRADE AND OTHER
PAYABLES
OTHER INVESTMENTS
INCLUDING DERIVATIVES
31 December 2014 Financial liabilities measured at fair valueForeign exchange forward contracts – – – – 0.2 – 0.2 – – 0.2 – – 0.2Financial liabilities not measured at fair valueTrade and other payables – – – 129.8 – – 129.8 – – – –
– – – 129.8 – 0.2 – 130.0
The fair value hierarchy of foreign exchange forward contracts is level 2. Market values of these derivatives are calculated using mid-rates (excluding margins) as determined by the banks where the derivatives contracts are entered with, based on available market rates at present.
Investment in shares (available for sale) has been measured at cost less impairment (refer note 10).
The fair values of trade and other receivables, cash and cash equivalent, restricted bank accounts and trade and other payables approximate their respective carrying values in the Condensed Consolidated Balance Sheet due to the short-term contractual maturity of these items. For non-current Trade and other receiv-ables, the fair values are approximate to the carrying values because the receivables are due from the government authorities.
Analysis of aging of trade and other receivables at 31 December 2014
(USD IN MILLION)TOTAL CARRYING
AMOUNT
AGING OF RECEIVABLES THAT ARE NOT IMPAIRED PAST DUE
NOT DUE < 30 DAYS >30<90 DAYS >90<365 DAYS >365 DAYS IMPAIRED
Trade receivables and accrued revenues 130.7 114.3 15.5 0.2 0.5 0.2 0.0 Provision for loss on trade recivables – 0.1 – – – – – 0.1 – Other non-current and current receivables 15.8 15.3 – 0.1 0.0 0.4 0.0 Finance receivables and short-term loans 0.6 0.6 – – – – – Total 147.0 130.2 15.5 0.3 0.6 0.5 0.0
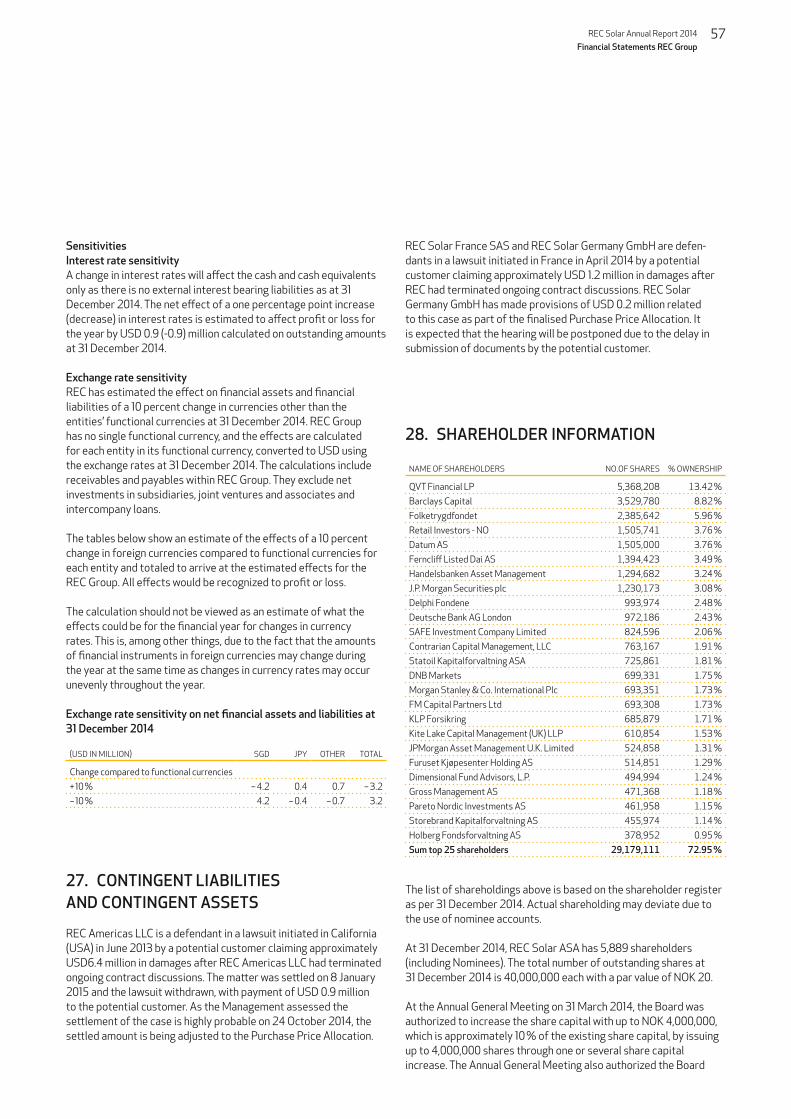
REC Solar Annual Report 2014 57 Financial Statements REC Group
SensitivitiesInterest rate sensitivityA change in interest rates will affect the cash and cash equivalents only as there is no external interest bearing liabilities as at 31 December 2014. The net effect of a one percentage point increase (decrease) in interest rates is estimated to affect profit or loss for the year by USD 0.9 (-0.9) million calculated on outstanding amounts at 31 December 2014.
Exchange rate sensitivityREC has estimated the effect on financial assets and financial liabilities of a 10 percent change in currencies other than the entities’ functional currencies at 31 December 2014. REC Group has no single functional currency, and the effects are calculated for each entity in its functional currency, converted to USD using the exchange rates at 31 December 2014. The calculations include receivables and payables within REC Group. They exclude net investments in subsidiaries, joint ventures and associates and intercompany loans.
The tables below show an estimate of the effects of a 10 percent change in foreign currencies compared to functional currencies for each entity and totaled to arrive at the estimated effects for the REC Group. All effects would be recognized to profit or loss.
The calculation should not be viewed as an estimate of what the effects could be for the financial year for changes in currency rates. This is, among other things, due to the fact that the amounts of financial instruments in foreign currencies may change during the year at the same time as changes in currency rates may occur unevenly throughout the year.
Exchange rate sensitivity on net financial assets and liabilities at 31 December 2014
(USD IN MILLION) SGD JPY OTHER TOTAL
Change compared to functional currencies + 10 % – 4.2 0.4 0.7 – 3.2– 10 % 4.2 – 0.4 – 0.7 3.2
27. CONTINGENT LIABILITIES AND CONTINGENT ASSETS
REC Americas LLC is a defendant in a lawsuit initiated in California (USA) in June 2013 by a potential customer claiming approximately USD6.4 million in damages after REC Americas LLC had terminated ongoing contract discussions. The matter was settled on 8 January 2015 and the lawsuit withdrawn, with payment of USD 0.9 million to the potential customer. As the Management assessed the settlement of the case is highly probable on 24 October 2014, the settled amount is being adjusted to the Purchase Price Allocation.
REC Solar France SAS and REC Solar Germany GmbH are defen-dants in a lawsuit initiated in France in April 2014 by a potential customer claiming approximately USD 1.2 million in damages after REC had terminated ongoing contract discussions. REC Solar Germany GmbH has made provisions of USD 0.2 million related to this case as part of the finalised Purchase Price Allocation. It is expected that the hearing will be postponed due to the delay in submission of documents by the potential customer.
28. SHAREHOLDER INFORMATION
NAME OF SHAREHOLDERS NO.OF SHARES % OWNERSHIP
QVT Financial LP 5,368,208 13.42 %Barclays Capital 3,529,780 8.82 %Folketrygdfondet 2,385,642 5.96 %Retail Investors - NO 1,505,741 3.76 %Datum AS 1,505,000 3.76 %Ferncliff Listed Dai AS 1,394,423 3.49 %Handelsbanken Asset Management 1,294,682 3.24 %J.P. Morgan Securities plc 1,230,173 3.08 %Delphi Fondene 993,974 2.48 %Deutsche Bank AG London 972,186 2.43 %SAFE Investment Company Limited 824,596 2.06 %Contrarian Capital Management, LLC 763,167 1.91 %Statoil Kapitalforvaltning ASA 725,861 1.81 %DNB Markets 699,331 1.75 %Morgan Stanley & Co. International Plc 693,351 1.73 %FM Capital Partners Ltd 693,308 1.73 %KLP Forsikring 685,879 1.71 %Kite Lake Capital Management (UK) LLP 610,854 1.53 %JPMorgan Asset Management U.K. Limited 524,858 1.31 %Furuset Kjøpesenter Holding AS 514,851 1.29 %Dimensional Fund Advisors, L.P. 494,994 1.24 %Gross Management AS 471,368 1.18 %Pareto Nordic Investments AS 461,958 1.15 %Storebrand Kapitalforvaltning AS 455,974 1.14 %Holberg Fondsforvaltning AS 378,952 0.95 %Sum top 25 shareholders 29,179,111 72.95 %
The list of shareholdings above is based on the shareholder register as per 31 December 2014. Actual shareholding may deviate due to the use of nominee accounts.
At 31 December 2014, REC Solar ASA has 5,889 shareholders (including Nominees). The total number of outstanding shares at 31 December 2014 is 40,000,000 each with a par value of NOK 20.
At the Annual General Meeting on 31 March 2014, the Board was authorized to increase the share capital with up to NOK 4,000,000, which is approximately 10 % of the existing share capital, by issuing up to 4,000,000 shares through one or several share capital increase. The Annual General Meeting also authorized the Board

58 REC Solar Annual Report 2014
Financial Statements REC Group
to acquire Treasury shares in REC Solar ASA up to 10 % of the face value of the share capital of the company. Both authorizations have not been utilized and are valid until the Annual General Meeting in 2015, but shall in any event expire at the latest 15 months from 31 March 2014.
29. EVENTS AFTER THE REPORTING PERIOD
On 15 January 2015, the shareholders of REC Solar ASA approved the sale of REC Solar Holdings AS and all of the assets and liabilities of REC Solar at a cash purchase price of NOK 4,340 million, pursuant to an agreement with Bluestar Elkem Investment Co. Ltd. The closing of the transaction is pending Chinese regulatory approvals.
In February 2015, REC entered into an agreement to sell a majority of its shares in REC Solar Commercial Corporation to Duke Energy for USD 4.6 million. After the sale, REC will hold 7.6 % of the shares in REC Solar Commercial Corporation. The remaining shares are subject to a put/call option.

REC Solar Annual Report 2014 59 Financial Statements REC Group
18 MW 69,252 REC solar panels
Whitland, UK

60 REC Solar Annual Report 2014
Financial Statements REC Solar ASA
BALANCE SHEET (NGAAP)REC SOLAR ASA
(NOK IN MILLION) NOTES 31 DEC 2014 15 JUL 2013
ASSETSNON-CURRENT ASSETSFinancial non-current assetsInvestments in subsidiaries 6 776.3 0.0Total financial non-current assets 776.3 0.0TOTAL NON-CURRENT ASSETS 776.3 0.0
CURRENT ASSETSReceivablesClaim for payment of share capital 1.0Intercompany receivables 6 17.3 0.0Other receivables 0.1 0.0Total current receivables 17.4 1.0Cash and cash equivalents 7 7.0 0.0TOTAL CURRENT ASSETS 24.3 1.0TOTAL ASSETS 800.7 1.0
FINANCIAL STATEMENTS 2014 FOR REC SOLAR ASA
FINANCIAL STATEMENTS REC SOLAR ASA

REC Solar Annual Report 2014 61 Financial Statements REC Solar ASA
BALANCE SHEET (NGAAP)REC SOLAR ASA
(NOK IN MILLION) NOTES 31 DEC 2014 15 JUL 2013
EQUITY AND LIABILITIESEQUITYPaid-in capitalShare capital 8, 9 40.0 1.0Share premium reserve 8, 9 660.4 0.0Total paid-in capital 700.4 1.0TOTAL SHAREHOLDERS’ EQUITY 700.4 1.0
LIABILITIESCURRENT LIABILITIESTrade payables 0.6 0.0Social security, VAT and other taxes 2.7 0.0Intercompany payables 6 50.4 0.0Other current liabilities 6 46.5 0.0TOTAL CURRENT LIABILITIES 100.2 0.0
TOTAL LIABILITIES 100.2 0.0
TOTAL EQUITY AND LIABILITIES 800.7 1.0
Oslo, 29 April 2015
Øystein Stray Spetalen Member of the Board
Ole Enger Chairman of the Board
Jan Christian Opsahl Member of the Board
Mimi K. Berdal Member of the Board
Steven O’Neil CEO
Anne Lise Meyer Member of the Board
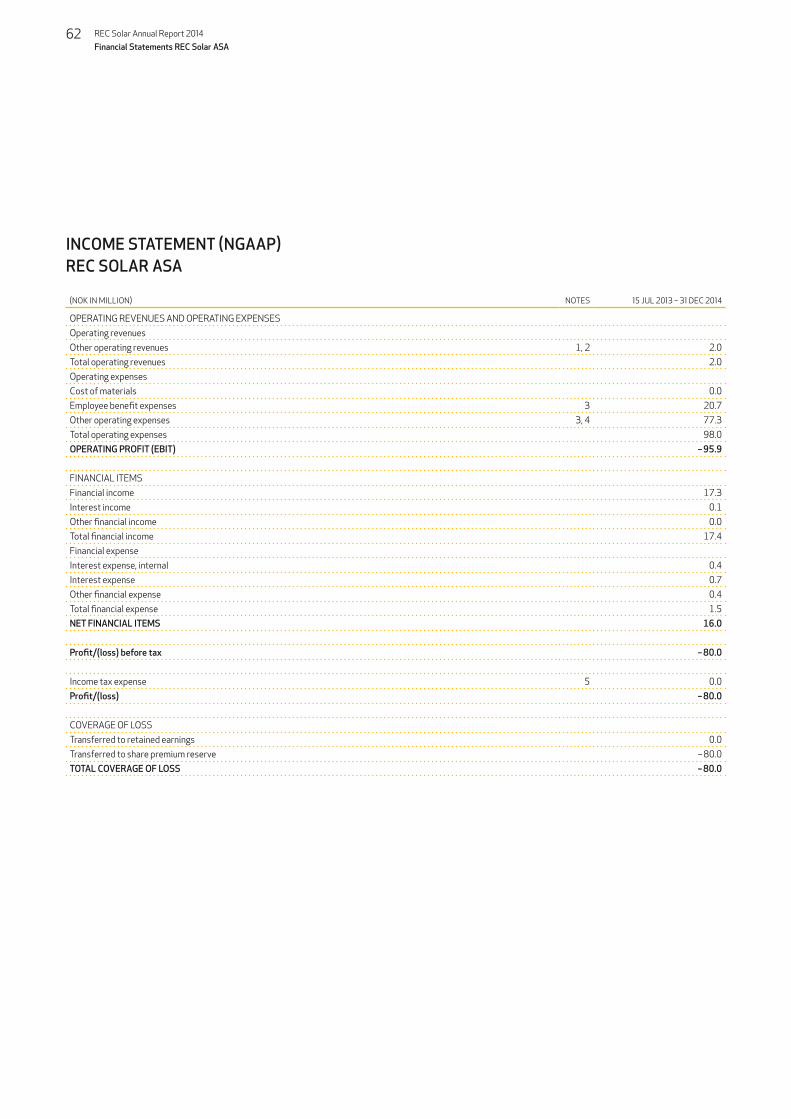
62 REC Solar Annual Report 2014
Financial Statements REC Solar ASA
INCOME STATEMENT (NGAAP)REC SOLAR ASA
(NOK IN MILLION) NOTES 15 JUL 2013 – 31 DEC 2014
OPERATING REVENUES AND OPERATING EXPENSESOperating revenuesOther operating revenues 1, 2 2.0Total operating revenues 2.0Operating expensesCost of materials 0.0Employee benefit expenses 3 20.7Other operating expenses 3, 4 77.3Total operating expenses 98.0OPERATING PROFIT (EBIT) – 95.9
FINANCIAL ITEMSFinancial income 17.3Interest income 0.1Other financial income 0.0Total financial income 17.4Financial expenseInterest expense, internal 0.4Interest expense 0.7Other financial expense 0.4Total financial expense 1.5NET FINANCIAL ITEMS 16.0
Profit/(loss) before tax – 80.0
Income tax expense 5 0.0Profit/(loss) – 80.0
COVERAGE OF LOSSTransferred to retained earnings 0.0Transferred to share premium reserve – 80.0TOTAL COVERAGE OF LOSS – 80.0

REC Solar Annual Report 2014 63 Financial Statements REC Solar ASA
STATEMENT OF CASH FLOWSREC SOLAR ASA
(NOK IN MILLION) 2014
Cash flows from operating activitiesProfit/(loss) – 80.0– Period’s paid tax –+/– Change in trade creditors 0.6+/– Change in other accruals 31.8= Net Cash flow from operating activities – 47.5
Cash flows from investing activities– Payments upon acquisition/establishment of shares and units 776.3= Net Cash flow from financing activities – 776.3
Cash flows from financing activities+ Share issuance 780.3+ Option plan (incl. as part of result, reversed) 0.1+ Change in loans from subsidiaries 50.4+/– Receipts/payments – group contributions –= Net Cash flow from financing activities 830.8
= Net change in cash and cash equivalents 7.0+ Cash and cash equivalents as at 1 Jan –= Cash and cash equivalents as at 31 Dec 7.0
Cash and cash equivalents determined as follows:Bank deposits as at 31 Dec 5.8+ Deducted tax deposits, etc. as at 31 Dec 1.2= Cash and cash equivalents as at 31 Dec 7.0

64 REC Solar Annual Report 2014
Financial Statements REC Solar ASA
REC Peak Energy Series multicrystalline solar panel Available up to 265 Wp

REC Solar Annual Report 2014 65 Financial Statements REC Solar ASA
NOTES TO THE FINANCIAL STATEMENTS OF REC SOLAR ASA
01. Accounting principles 66
02. Operating revenues 66
03. Employee benefit expenses 66
04. Other operating expenses 67
06. Investments and intercompany accounts 67
07. Cash and cash equivalents 68
08. Shareholders 68
09. Equity capital 68
10. Events after the reporting period 68

66 REC Solar Annual Report 2014
Financial Statements REC Solar ASA
01. ACCOUNTING PRINCIPLES
The Financial Statements comprising the statement of income, statement of financial position, statement of cash flows and notes have been prepared in compliance with the Norwegian Accounting Act and Norwegian Generally Accepted Accounting Principles (NGAAP) in effect 31 December 2014. The Financial Statements are based on fundamental principles and classification of assets and liabilities as described in the Accounting Act’s definitions. When applying the accounting principles and in the presentation of transactions and other matters, the financial realities are the focus, not simply the legal format. Contingent losses which are probable or quantifiable have been recognized based on best estimate. Investments in subsidiaries are valued at the lower of acquisition cost and estimated fair value.
The financial year runs from the date of formation on 15 July 2013 until 31 December 2014 as emitted under the Accounting Act, section 1-7, second paragraph. Since these are the accounts for the first financial year, there are no comparable figures available.
1.1 REVENUE RECOGNITIONThe income from sale of services are recognised at fair value of the consideration, net after deduction of VAT, returns, discounts and reductions. Sales are taken to income when the company has delivered its services to the customer and there are no unsatisfied commitments which may influence the customer’s acceptance of the product.
1.2 SHARES IN SUBSIDIARIES AND RELATED COMPANIESShares in subsidiaries and related companies are initially recognized at cost. In so far as the fair value is considered to be significantly lower than the acquisition price, the value is written down unless the impairment is expected to be temporary.
1.3 DEFERRED TAXES AND TAX COSTDeferred taxes are calculated on the basis of temporary differences between the accounting values and the taxable values at the end of the financial year. For this calculation a nominal tax rate is used. Positive and negative differences which are reversed or may be reversed in the same period, have been eliminated. Deferred tax asset arises in cases where a temporary difference will justify a tax deduction at some point in the future.
1.4 EMPLOYEE BENEFITSEmployee benefits are recognized as they incur. For bonuses which has not been settled and where there are some uncertainties related to the final outcome, expenses are accrued based on best estimate.
The company has no defined benefit pension plans. For defined contribution plans, the company has no further payment obligations once the contributions have been paid. The contributions are recognised as employee benefit expense when they are due.
For further specifications of employee benefits, please see note 3.
1.5 OTHER OPERATING EXPENSESOperating expenses are recognized as they incur. For expenses where the company has not yet received invoices, expenses are accrued based on best estimate. For further specifications of operating expenses, please see note 4.
1.6 FINANCIAL INCOMEFinancial income relates to group contribution received from REC Solar Holdings AS, as well as currency revaluations.
1.7 CURRENCYThe financial statements are presented in NOK million, rounded to the nearest 0.1 million, unless otherwise stated. Revenues and expenses in foreign currency are recognised in the income statement at the exchange rate on invoice date. Receivables and payables in foreign currency are converted at the exchange rate on balance sheet date, and any gains or losses resulting therefrom are taken to income/cost.
1.8 CASH-FLOW STATEMENTThe cash-flow statement has been prepared using an indirect method and is presented according to the following subdivisions:
– Operating activities– Investing activities– Financing activities
Operating activities are those that are part of the company’s cycle of business (goods and services), and other activities which cannot reasonably be defined as investments or financing. Investing activities include acquisition and disposal of assets which are not equivalent to cash, and which are not a part of the company’s goods and services cycle. Financing activities include the taking up and repayment of loans as well as the obtaining and servicing of equity capital.
02. OPERATING REVENUES
(NOK IN MILLION) 2014
Corporate services 2.0Total 2.0
03. EMPLOYEE BENEFIT EXPENSES
The company has recognised one man-year of work in the financial year.
NOTES TO THE FINANCIAL STATEMENTS REC SOLAR ASA

REC Solar Annual Report 2014 67 Financial Statements REC Solar ASA
3.1 SPECIFICATION OF EMPLOYEE BENEFIT EXPENSES
(NOK IN MILLION) 2014
Salaries 3.0Board emoluments taken to cost 2.7Employer’s tax (National Insurance contribution) 0.7Pension plan costs 0.1Other payroll related benefits* 14.2Total 20.7
The company is required to adopt a pension plan under the Act relating to Compulsory Occupational Pensions, and has adopted such a pension plan to meet the statutory requirements
3.2 COMPENSATION TO KEY PERSONNELPlease refer to note 11 of the Group Financial Statement for further information regarding compensation to key personnel and auditor
04. OTHER OPERATING EXPENSES
(NOK IN MILLION) 2014
Professional services * 28.3Travel costs 0.8Board meetings and General Meeting 0.5Rental costs ** 0.3Costs associated with patents and trademarks 0.1Other office overheads, membership fees and charges 4.4Transaction costs *** 42.9Total 77.3
* AUDIT REMUNERATION
Statutory audit 1.8Other non-audit services 1.1Total auditor’s remuneration expended 2.9
Amounts are inclusive VAT.
** LEASE AGREEMENTS ANNUAL LEASE
EXPIRATION OF LEASE
AGREEMENT
Office 0.2 3 months notice
Amount is inclusive VAT.
*** Transaction costs consist of cost of services acquired in connection with the sale of the solar business.
05. TAXES
(NOK IN MILLION)15.07.2013 –
31.12.2014
This year’s tax baseProfit/loss before tax – 80.0Permanent differences 37.0Taxable income – 43.0This year’s tax costTaxes payable 0.0Total ordinary tax cost 0.0Temporary differences and deferred taxes on balance sheetTaxable deficit to carry forward 43.0Total negative differences that increase taxes 43.0Differences not included in calculation of deferred taxes 43.0
06. INVESTMENTS AND INTERCOMPANY ACCOUNTS
The subsidiaries are accounted for in the financial statements based on initially recognised cost. The company has the following subsidiaries:
SUBSIDIARY ACQUISITION COST POSTED VALUE
REC Solar Holdings AS 776.2 776.2Fourteen Creeper S.à r.l. 0.1 0.1Total 776.3 776.3
SUBSIDIARYSHARE
HOLDINGOWNER-
SHIP %
THIS YEAR’S PROFIT/LOSS
2014
BALANCE SHEET EQUITY AT 31 DEC 2014
REC Solar Holdings AS 1,000 100 % – 12.3 559.0Fourteen Creeper S.à r.l. 12,500 100 % 0.0 0.0Total – 12.3 559.0
Intercompany receivables and liabilities are recognised with the following sums in the accounts:
6.1 CURRENT RECEIVABLES
(NOK IN MILLION) 31.12.2014
REC Solar Holdings AS 17.3
All receivables will be settled in 2015, no later than the date of winding up the company.
6.2 CURRENT LIABILITIES
(NOK IN MILLION) 31.12.2014
REC Solar Holdings AS 50.4
All liabilities will be settled in 2015, no later than the date of winding up the company.

68 REC Solar Annual Report 2014
Financial Statements REC Solar ASA
6.3 RETURN ON INTERCOMPANY RECEIVABLES AND LIABILITIES IN THE FINANCIAL YEAR
(NOK IN MILLION) 2014
Interest expense, REC Solar Holdings AS 0.4
07. CASH AND CASH EQUIVALENTS
The total bank deposits amount to NOK 7.0 million.
CURRENT RESTRICTED BANK ACCOUNTS 31.12.2014
Withholding tax at 31 December 2014 1.2
08. SHAREHOLDERS
The company has 40,000,000 shares each of face value NOK 1 (one kroner) amounting to a total share capital of NOK 40.0 million. There is only one class of shares.
Please refer to note 28 of the Group Financial Statement for further information regarding the company’s largest shareholders.
09. EQUITY CAPITAL
(NOK IN MILLION)SHARE
CAPITAL
SHARE PREMIUM RESERVE
RETAINED EARNINGS
TOTAL SHARE-
HOLDERS’ EQUITY
Share issues 40.0 740.3 0.0 780.3+ Profit for the year 0.0 – 80.0 – 80.0 – 80.0+/– Other transactions 0.0 0.1 0.0 0.1Total at 31 December 2014 40.0 660.4 0.0 700.4
10. EVENTS AFTER THE REPORTING PERIOD
On 15 January 2015, the shareholders approved the sale of the solar business. Please refer to note 29 of the Group Financial Statement for further information regarding this sale.

REC Solar Annual Report 2014 69 Financial Statements REC Solar ASA
5.8 MW 23,200 REC solar panels
Gajner, Bikaner, Rajasthan, India

70 REC Solar Annual Report 2014
Auditor’s Report
AUDITOR’S REPORT

REC Solar Annual Report 2014 71 Auditor’s Report

REC Solar ASA Karenslyst allé 51 0279 Oslo Norway P
UB
LIS
HE
D 2
015
BY
RE
C S
OLA
R A
SA
· TY
PO
GR
AP
HY
@C
OM
PLI
ZE
NW
ER
K.D
E
REC is a leading global provider of solar energy solutions. With more than 15 years of experience, we offer sustainable, high performing products, services and investments for the solar industry. Together with our partners, we create value by providing solutions that better meet the world’s growing energy needs. REC is headquartered in Norway and listed on the Oslo Stock Exchange (ticker: RECSOL). Our 1,800 employees worldwide generated revenues of USD 803 million in 2014. Find out more about REC at www.recgroup.com
REC
Sola
r ASA
A
nnua
l Rep
ort 2
014