Embed Size (px)
Citation preview

Annual Report 2014

Annual Report 2014
2
OuR Fleet (AS At 29 OCtOBeR 2014)
Aircraft type In Operation Ordered Options
Fokker 100 5 - -
AtR 72-500 6 - -
AtR 72-600 12 7 27
Airbus A320-200 2 - -
Airbus A321-200 3 2 -
total 28 9 27

3
Model Fokker F100 Airbus A320-200
Model Airbus A321-200 ATR 72-500
Model ATR 72-600

Annual Report 2014
4
COMPANY INFORMAtIONDIRECTORS: Robert Jeffries Chatfield
Bryant James McLarty (resigned on 6 December 2013)
Roderick Douglas Mahoney
Stephen John Fisher (appointed on 24 April 2014)
COMPANY SECRETARIES: Siobhan Mary MacGroarty Cool
Duncan Gerard Stephen Scott
Jason Francis Gollogly
REGISTERED OFFICE: 5th Floor Cheyne House
Crown Court 61-63 Cheapside
London EC2V 6AX
United Kingdom
PRINCIPAL PLACE OF BUSINESS: 510 Thomson Road #12-04
SLF Building
Singapore 298135
AUDITORS: Kingston Smith LLP
Devonshire House
60 Goswell Road
London EC1M 7AD
United Kingdom
SOLICITORS: Speechly Bircham LLP
6 New Street Square
London EC4A 3LX
United Kingdom
CORPORATE ADVISER: Loeb Aron & Company Ltd
Cheyne House
Crown Court 62-63 Cheapside
London EC2V 6AX
United Kingdom
REGISTRARS: Computershare Investor Services LLC
The Pavilions
Bridgewater Road
Bristol BS99 6ZZ
United Kingdom

5
tABle OF CONteNtS PAGe(S)
Company Information ................................................................................................................................. 4
Chairman’s Statement...........................................................................................................................6 – 7
Board of Directors .........................................................................................................................................8
Strategic Report .................................................................................................................................... 9 – 11
Directors’ Report .................................................................................................................................. 12– 14
Directors’ Remuneration Report ........................................................................................................15–19
Statement of Directors’ Responsibilities .............................................................................................. 20
Auditors’ Report ......................................................................................................................................... 21
Consolidated Statement of Profit or loss and Other Comprehensive Income ............................... 22
Company Statement of Profit or loss and Other Comprehensive Income ...................................... 23
Consolidated Statement of Financial Position ...................................................................................... 24
Company Statement of Financial Position ............................................................................................. 25
Consolidated Statement of Changes in equity ............................................................................ 26 – 27
Company Statement of Changes in equity ............................................................................................ 28
Consolidated Statement of Cash Flows ......................................................................................... 29– 30
Company Statement of Cash Flows ........................................................................................................ 31
Notes to the Financial Statements .................................................................................................. 32– 93

Annual Report 2014
6
ChAIRMAN’S StAteMeNtBackground and OutcomeYour Board is pleased to deliver another strong result in respect of the year ended 30 June 2014. the net profit after tax (attributable to equity holders) increased 27 per cent to uS$ 13,312,153 (2013: uS$ 10,515,901) on total income that also increased by 29 per cent
to uS$ 56,279,613 (2013: uS$ 43,763,642). this resulted in earnings per share increasing by 18 per cent to 27.40 uS cents (2013: 23.25 uS cents). total returns consist of income from aircraft lease payments plus the net asset value (capital) realisable from the sale of the aircraft after repayment of associated debt obligations.
Avation’s fleet is diverse, comprising young AtR aircraft and other aircraft including Airbus A321 and A320 along with a small investment in older aircraft. Avation targets growth as well as continual fleet renewal and financial management to ensure the retention of asset values and maximisation of earnings. the Avation fleet of 25 aircraft has an average age of 9.0 years, which is likely to reduce as we add new aircraft and dispose of old aircraft, and average lease term of 6.1 years with a current customer base of airlines in Australia, europe, North America and the Asia-Pacific region.
Key AchievementsIn the period to 30 June 2014, the Group:
• Added two new AtR 72-600 aircraft to the fleet;• Delivered two new AtR 72-600 aircraft direct to airlines; • Added new airline customers;• Re-financed two AtR 72-500 aircraft to significantly
lower the of cost of debt in respect of those aircraft;• Acquired one Airbus A320 through the conversion of
finance lease to operating lease;• lowered average cost of debt; and• extended leases on two A321 aircraft in the fleet to 2021.
As of 30 June 2014, the Company had increased net assets by 13 per cent to uS$ 110,766,984 (2013: uS$ 98,236,359). the Company has again been able to lower the average cost of debt during the period and obtain funding from new and existing lenders. Debt facilities on existing aircraft are primarily asset based and matched to the leases in terms of currency, term and loan servicing ensuring there is no “through lease term” re-financing risk.
the Company has continued to generate strong earnings with eBItDA increase of 27 per cent to uS$ 48,723,575 (2013 : uS$ 38,329,167). Purchasing aircraft typically requires a mixture of senior debt, a junior debt tier and equity. the equity may be self generated through internal cash flows. the Company continues to evaluate the state of both debt and equity markets in the context of its ongoing requirements. the directors seek to minimise the cost of funds and have successfully refinanced certain higher cost debt facilities during the year. the underlying results for the Group were extremely strong despite contributory profits from our 69 percent owned subsidiary Capital lease Aviation PlC during the period being less robust than expected. Since the year end we have increased our ownership of that subsidiary to 95.4% and we will be seeking to improve its performance going forward.
Outlookthe Directors believe they have demonstrated a sustainable business model and are committed to developing Avation as a differentiated aircraft operating lessor that delivers strong and predictable cash yields and attractive returns on invested capital.
Growth in the business is set to accelerate in 2015. the outlook for calendar year 2015 is 44 per cent growth in the aircraft fleet by way of committed deliveries. Avation is scheduled to deliver eight new AtR 72-600 aircraft before the end of FY2015 and an additional three AtR 72-600 aircraft in the second half of calendar year 2015. Avation is actively evaluating additional aircraft acquisition opportunities.

7
ChAIRMAN’S StAteMeNtthe Company has made substantial progress towards funding its 2015 deliveries and is developing formalised capital programmes to provide a diversified base with access to both debt and equity markets. the Company believes that it can obtain access to the necessary debt for the future purchase of aircraft. Access to funding nevertheless remains a risk, which is common to all businesses that are capital intensive. Specific aviation industry risks are also present and include the creditworthiness of client airlines. Other risks remain typical for an aircraft leasing industry that typically uses leverage to build the fleet, along with the finance risks and more particularly the residual value risk and impairment in aircraft assets. the Company has significant balance sheet exposure to Australian based aircraft. the Company is seeking to actively diversify away from Australian economic and geographic risk going forward by marketing to new airline customers.
Whilst the business is focused on funding its continued strong fleet growth, the Board overwhelmingly recognises the importance of rewarding shareholders and is recommending to shareholders to approve a final dividend payment of 2.01 uS cents per share (2013: 1.78 uS cents). the timetable for this final dividend will be set out in the notice of annual general meeting to be published in due course. the Company aims to maintain a progressive dividend policy. the record date for the final dividend will be announced in the meeting materials for the upcoming annual general meeting.
the Board and I are pleased to deliver another strong set of results and remain committed to building your Company into a respected, profitable, well diversified and strongly cash generative aircraft leasing business. the Board would like to thank the shareholders for their continued support and goodwill and look forward to the future with confidence in the successful development of Avation PlC.
Robert Jeffries Chatfield, executive Chairman
Singapore 17 October 2014

Annual Report 2014
8
BOARD OF DIReCtORSJeff ChatfieldChairmanMr Chatfield is the executive chairman of Avation PlC and has been instrumental in establishing and growing the Company. Mr Chatfield has a track record of leadership in a variety of profitable and successful businesses.
he is a qualified public company director and business executive experienced in the fields of commercial airlines, aviation, aircraft leasing and finance, electronic commerce, investment management, radio and tV broadcasting. Mr Chatfield holds both Bachelor’s and Master’s Degrees in engineering from the university of Western Australia where he graduated top of the class. he has been involved in a number of successful businesses both private and public, the majority of which have been strongly cash flow generative. In the recent past Mr Chatfield was chairman of Skywest Airlines ltd, a lSe-ASX dual-listed public company recently sold to Virgin Australia ltd. he is a member of the Australian Institute of Company Directors and a fellow of the Singapore Institute of Directors. Mr Chatfield was born in Perth, Australia and is a Permanent Resident of Singapore.
Rod MahoneyExecutive Director
Mr Mahoney is the Chief Operating Officer and an executive Director of the Company. Before this executive appointment, he was a fleet planning and aircraft procurement consultant to the Company. he has previously been a project advisor to
a variety of Asia-Pacific airlines, suppliers and other aviation businesses, including Virgin Blue and V Australia and also held various senior executive positions at Airbus for 23 years, largely within the sales divisions covering europe and Africa, China and the Pacific. he holds a Bachelor of Science Degree in Aeronautical engineering (BSc. hons), a Masters in Air transport (MSc.) and a Masters of Applied Finance (MAppFin). Mr Mahoney holds dual citizenship of the united Kingdom and Australia and resides in Singapore. Mr Mahoney is a graduate member of the Australian Institute of Company Directors and a member of the Singapore Institute of Directors.
Stephen Fisher PhD Non-Executive DirectorIn addition to his role at Avation PlC, Stephen is Chairman, Principal and Chief Investment Officer of First Degree Global Asset Management Pte. ltd., a privately owned asset management company in Singapore founded
in 2011. First Degree Global Asset Management operates a number of strategies for its clients including a Fixed Income focused hedge fund.
Stephen has had twenty-two years experience as an investment professional with leading investment management groups in the united States, Asia and Australia. From 2000 to 2011 he was Managing Director and head of Global Fixed Income Product – Asia Pacific at JPMorgan Asset Management. Stephen held the positions of Australian head of Capital Markets Research from 1992- 1996, and Asia Pacific Regional head of Capital Markets Research at J.P. Morgan Investment Management, Inc. from 1996-1998.
Stephen’s particular areas of expertise are in quantitative analysis of fixed income, equities, asset allocation and derivatives. he has advised Central Banks and Sovereign Wealth Funds on their reserves management practice, and his research on investment management issues has been widely published in academic and industry journals.
Stephen has a Master of Science (Finance) and a PhD (Finance) from the We Simon Graduate School of Business Administration, university of Rochester, New York and a Bachelor of economics (First Class honours) from the university of Sydney.

9
StRAteGIC RePORt
The Directors present their strategic report for the year ended 30 June 2014.
Business OverviewAvation PLC and its subsidiaries (“Avation”, the “Group”) is a specialist commercial passenger aircraft leasing group managing a fleet of 25 aircraft as at 30 June 2014 which it leases to airlines across the world. Avation’s customers include US Airways, Virgin Australia, Thomas Cook, Condor, Fiji Airways and UNI Air. The Company’s fleet includes Airbus A320 family and Fokker 100 jet and ATR 72 twin engine turboprop aircraft.
Avation operates from its headquarters in Singapore where it is tax resident and since 17 April 2014 a beneficiary of the Singapore Aircraft Leasing Scheme tax incentive.
Avation’s management team has extensive experience in all areas of the aviation industry and has the expertise to select aircraft to bring under Avation’s management that will deliver value to the company, performance to its customers and returns to its shareholders.
Coinciding with the expected future delivery of additional ATR 72s ordered from the manufacturer and potential acquisitions of other aircraft, Avation will continue to grow in terms of the size and quality of its managed fleet and the financial returns it generates.
Avation is listed on the main list of the London Stock Exchange under the ticker symbol LSE: AVAP.
Business modelAvation aims to generate growth in its fleet and build shareholder value by focussing on 2 sectors being a) new turbo-prop regional aircraft, principally the popular fuel efficient
ATR 72-600 model and b) second-hand narrow body jets in particular the popular Airbus A320/A321 family and Boeing 737NG aircraft. Owning different types of aircraft provides a benefit in terms of diversification of market and residual value risk.
The Group finances the acquisition of new aircraft using internally generated cash flows and a mixture of senior and junior debt finance. Debt is re-financed on older aircraft when there is an opportunity to reduce overall cost of debt funding and also to release equity for acquiring new aircraft.
The Board applies prudent financial management principles to manage risk when acquiring aircraft by seeking to match lease and financing duration, using mostly fixed interest rate debt and amortising debt aggressively over lease periods.
As the fleet grows the Group will also seek to diversify the customer base as part of the overall credit risk management policy.
The Avation fleet of 25 aircraft has an average age of 9.0 years, which is likely to reduce as the Group adds new aircraft and disposes of old aircraft, and average remaining lease term of 6.1 years with a current customer base of airlines in Australia, Europe, North America and the Asia-Pacific region.
Markets and trendsAircraft leasing is a growth industry with a growing market share of the world’s total commercial passenger aircraft fleet. Avation expects that the percentage of leased aircraft in the world fleet will continue to grow over the coming years due to the flexibility that the leasing model provides for airlines and also due to increased access to financial capital for leasing companies.
Annual Report 2014
10
StRAteGIC RePORt
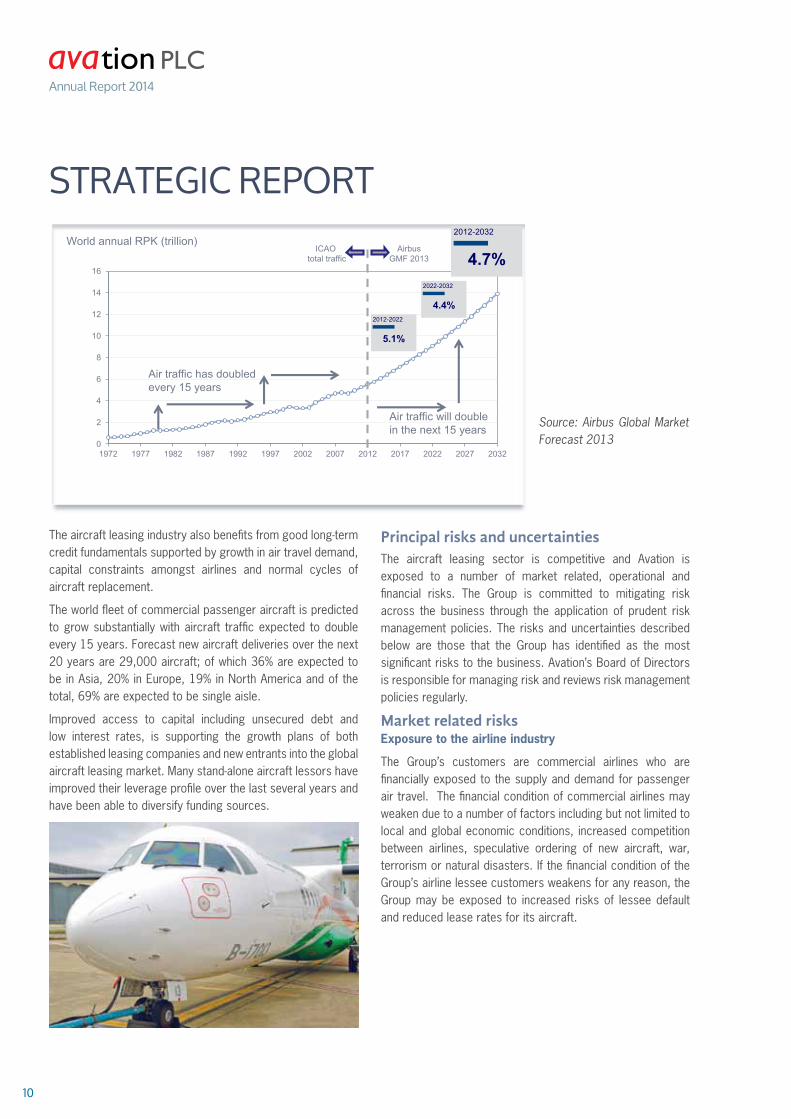
The aircraft leasing industry also benefits from good long-term credit fundamentals supported by growth in air travel demand, capital constraints amongst airlines and normal cycles of aircraft replacement.
The world fleet of commercial passenger aircraft is predicted to grow substantially with aircraft traffic expected to double every 15 years. Forecast new aircraft deliveries over the next 20 years are 29,000 aircraft; of which 36% are expected to be in Asia, 20% in Europe, 19% in North America and of the total, 69% are expected to be single aisle.
Improved access to capital including unsecured debt and low interest rates, is supporting the growth plans of both established leasing companies and new entrants into the global aircraft leasing market. Many stand-alone aircraft lessors have improved their leverage profile over the last several years and have been able to diversify funding sources.
Principal risks and uncertaintiesThe aircraft leasing sector is competitive and Avation is exposed to a number of market related, operational and financial risks. The Group is committed to mitigating risk across the business through the application of prudent risk management policies. The risks and uncertainties described below are those that the Group has identified as the most significant risks to the business. Avation’s Board of Directors is responsible for managing risk and reviews risk management policies regularly.
Market related risksexposure to the airline industry
The Group’s customers are commercial airlines who are financially exposed to the supply and demand for passenger air travel. The financial condition of commercial airlines may weaken due to a number of factors including but not limited to local and global economic conditions, increased competition between airlines, speculative ordering of new aircraft, war, terrorism or natural disasters. If the financial condition of the Group’s airline lessee customers weakens for any reason, the Group may be exposed to increased risks of lessee default and reduced lease rates for its aircraft.
Source: Airbus Global Market Forecast 2013
11
StRAteGIC RePORtAsset value risk
Fluctuations in the supply and demand for aircraft and aircraft travel may impact values and lease rates for the Group’s aircraft. Market forces and prevailing economic conditions may change over the economic lives of the Group’s aircraft and could have a positive or negative impact on valuations. Advances in aircraft technology may create obsolescence in the fleet before the end of the current estimated useful life. The Group regularly obtains independent third party valuations the fleet and may dispose of aircraft in order to reduce its exposure to certain aircraft types. Avation has a policy of investing in popular aircraft types on the basis that asset values and lease rates will be supported by continuing high demand for these aircraft.
Operational riskseconomic, legal and political risks
Avation leases aircraft to lessees in different jurisdictions. As such the Group is exposed to economic, legal and political risk in those jurisdictions. Avation’s aircraft are subject to operational risks specific to the aviation sector resulting from war, acts of terrorism or the threat of terrorism and natural disasters. The Group mitigates against these risks by requiring airline lessees to maintain adequate insurance over the aircraft.
Regulatory risks
Avation’s fleet operates in many jurisdictions and complies with tax and other regulatory requirements in those jurisdictions. There is a risk that changing tax and regulatory regimes may have an impact on the business and financial results.
lessee risks
Avation’s airline lessees are responsible for all maintenance and safety checks. The requirement for each airline lessee to service and maintain the aircraft are set out in the lease agreements. There is a risk that airlines may not properly maintain aircraft which may lead to an impairment of the aircraft’s value. In order to mitigate against this risk the Group closely monitors each airline’s usage of aircraft and their compliance with agreed maintenance schedules. Avation can require lessees to pay additional maintenance reserve payments in order to ensure that there is adequate funding at all time for proper maintenance of the aircraft.
Financial risksAvation’s financial risk management objectives and policies are set out in note 7 to the financial statements and are as follows:
• Airline industry risks• Credit risk• Interest rate risk• Foreign currency risk
PerformanceAn evaluation of Avation’s performance in the year ended 30 June 2014 is contained in the Chairman’s Statement.
EnvironmentAvation is committed to environmental responsibility as part of its business strategy. This is achieved by investing in technologically advanced designs of commercial aircraft that offer improved fuel efficiency and lower emissions. The majority of our fleet are modern regional turbo-prop aircraft which provide significant environmental benefits over comparable jet aircraft due to their more economical use of fuel and consequently lower carbon dioxide emissions.
EmployeesA breakdown by gender of the number of persons who were Directors of the Company, senior managers and other employees as at 30 June 2014 is set out below:
Male Female
Directors of the Company 3 –
Senior managers 2 –
Other employees 6 5
On behalf of the board
Robert Jeffries ChatfieldDirector
17 October 2014
Annual Report 2014
12
DIReCtORS’ RePORt
the directors have the pleasure in presenting their report and financial statements for the financial year ended 30 June 2014.
Principal activities and business reviewthe principal activities of the Group is leasing of aircraft. Details of activities carried out by subsidiary companies is set out in Note 22 to these financial statements.
the principal risks and uncertainties affecting the Group’s turnover are described in the Strategic Report on page 9.
the full business review including KPI’s can be found in the Strategic Report on page 9 and in Note 7 to these financial statements. the Group has reviewed the environmental
matters in the Strategic Report on page 11.
Results and dividendsthe consolidated statement of profit or loss and other comprehensive income for the year is set out on page 22. the directors have proposed to pay a 2.01 uS cents final dividend.
Directors and their intereststhe directors who served the Company during the year together with their interests and deemed interests in the shares of the Company and other Group companies at the beginning (or subsequent date of appointment) and end of the year, were as follows:
The Company direct interest(in name of director and nominee)
deemed interest
Ordinary Shares of £0.01 each 30 June 2014 1 July 2013 30 June 2014 1 July 2013
Robert Jeffries Chatfield 1 1 10,135,365 8,855,365
Bryant James Mclarty N/A 117,300 N/A -
Roderick Douglas Mahoney 240,000 158,138 - -
Stephen John Fisher 5,000 - - -

13
DIReCtORS’ RePORtSignificant Shareholdings
ordinary shares Percentage
Vidacos Nominees Limited 10,635,732 21.64%
Chase Nominees Limited 9,331,140 18.98%
Fitel Nominees Limited 4,707,702 9.58%
HSBC Global Custody Nominee (UK) Limited
3,569,916 7.26%
Chase Nominees Limited 2,870,000 5.84%
HSBC Global Custody Nominee (UK)
2,055,000 4.18%
equal opportunities Policy
It is the Group’s policy to employ individuals with the necessary qualifications without regard to sex, marital status, race, creed, colour, nationality or religion. Full and fair consideration is given to applications for employment made by disabled persons having regard to their particular aptitudes and abilities.
the Group recognises the great importance of the contribution made by all employees and aims to keep them informed of matters affecting them as employees and developments within the Group. Communication and consultation is achieved by a variety of means both within individual companies or branches and on a group-wide basis.
directors’ Insurance
the Group maintains insurance policies on behalf of all the directors against liability arising from negligence, breach of duty and breach of trust in relation to the Group. .
Green House Gas emissions Statement
It is not practical for the Company to calculate its green house gas emissions. usage of the Company’s aircraft is under the control of lessees who are not required to provide emissions data to the Company.
Capital Structure
Details of the issued share capital, together with details of the movements in the Company’s issued share capital during the financial year are shown in Note 30. the Company has one class of ordinary shares which carry no right to fixed income. each share carries the right to one vote at general meetings of the Company.
By a resolution passed at the AGM held on 4 December 2012 the Company’s Directors are authorised to buy back shares not exceeding 10 per cent of the total number of shares in issue on that date. Share buy backs may be at market prices but not under £0.50 and not above £3.00 per share, including commissions and other related expenses.there are no specific restrictions on the size of a holding nor on the transfer of shares, which are both governed by the general provisions of the Articles and Association and prevailing legislation. the directors are not aware of any agreements between holders of the Company’s shares that may result in restrictions on the transfers of securities or on voting rights.Details of employees share option schemes are set out in Note 31. No person has any special rights of control over the Company’s share capital and all issued shares are fully paid.With regards to the appointment and replacement of directors, the Company is governed by its Articles of Association, the uK Corporate Governance Code, the Companies Act and related legislation. the Articles themselves may be amended by special resolution of the shareholders. the powers of directors are described in the Main Board terms of Reference, copies of which are available on request, and the Corporate Governance Statement below.Corporate Governance Statement
The Board is accountable to the shareholders for good corporate governance of the group. The principles of corporate governance and a code of best practice are set out in the UK Corporate Governance Code issued in September 2012. The company is not required to comply in full with the code nor state any areas which it does not comply. The Board have adopted policies that they consider to be appropriate for the Company’s size and nature.
The Board acts as the administrative, management and supervisory body overseeing the operation of the Group. The Board consist of 2 executive directors (Robert Jeffries Chatfield and Roderick Douglas Mahoney) and 1 non-executive director (Stephen John Fisher), and the following senior personnel (Richard Wolanski, Duncan Scott). The Board meets at least six times a year, matters for discussion at formal meetings are clearly laid down and decisions recorded. The board is responsible for overall corporate strategy, the reviewing and approval of acquisition and divestment opportunities, the approval of significant capital expenditures, the review of

Annual Report 2014
14
DIReCtORS’ RePORt
budgets, trading performances and all significant financial and operational issues.
The Company operates the following committees whose members are detailed below:
• Audit Committee- Robert Jeffries Chatfield and Stephen John Fisher
• Risk Committee- Roderick Douglas Mahoney and Iain Cawte
The Board is responsible for identifying and evaluating the major business risks faced by the Company and for determining and monitoring the appropriate course of action to manage these risks. The key risks the Company faces are described in the risk assessment section of this annual report and accounts.
The Board conducts a review of the effectiveness of the Company’s systems of internal control and risk management on an annual basis. Following this review it has concluded that the Company’s financial, operational and compliance controls and risk management procedures are appropriate and suitable to enable the board to safeguard shareholders’ investments and the Company’s assets.
The process and systems of internal control are designed to manage, rather than eliminate, the risk of failure to achieve the Company’s objectives, and can therefore only provide reasonable and not absolute assurance against material misstatement or loss.
Statement as to disclosure of information to auditors
(a) so far as the directors are aware, there is no relevant audit information of which the Company’s auditors are unaware, and
(b) they have taken all the steps that they ought to have taken as directors in order to make themselves aware of any relevant audit information and to establish that the Company’s auditors are aware of that information.
Auditors
Kingston Smith llP have indicated their willingness to continue in office and in accordance with s489 of the Companies Act 2006. A resolution proposing that they be reappointed as auditors of the Company will be put to the Annual General Meeting.
Purchase of own sharess
During the year, the Company purchased 300,000 shares for uS$467,835. these were held as treasury shares and presented within shareholders equity.
On behalf of the board
Robert Jeffries ChatfieldDirector17 October 2014

Introduction
this report has been prepared in accordance with Part 15 Chapter 6 of the Companies Act 2006. As required a resolution to approve the Directors’ remuneration will be proposed at the forthcoming Annual General Meeting of the Company at which the financial statements will be approved. the vote will have advisory status, will be in respect of the remuneration policy and overall remuneration packages and will not be specific to the individual levels of remuneration.
Remuneration (audited)
the components of remuneration are:• Basic salary and benefits determined by the Remuneration Committee which are included in employment agreements
and reviewed annually;• Bonuses based upon performance of the Company and the individual concerned; and• Share options.Individual Director’s remuneration from the group was as follows:
Group
Salaries and fees
Bonuses expenses allowances
Taxable benefits
Total 2014
Total 2013
US$ US$ US$ US$ US$ US$
Executive directors
Robert Jeffries Chatfield 551,676 - - 86,740 638,416 266,844
Roderick Douglas Mahoney 211,690 108,496 - - 320,186 178,402
Non-executive directors
Stephen John Fisher 2,669 - - - 2,669 -
Andrew Baudinette (resigned on 3 December 2012)
N/A N/A N/A N/A N/A 105,448
Bryant James Mclarty (resigned 6 December 2013)
19,146 - - - 19,146 31,500
785,181 108,496 - 86,740 980,417 582,194
Taxable benefits mainly relate to housing expenses and children school fees.
Service contracts
the employment contracts of the executive directors with the Company are terminated by either party with no less than four weeks’ notice in writing to the other.
the service contracts of the directors are as follows:
date of contract Unexpired term
Notice period
Compensation payable on early termination
Robert Jeffries Chatfield 29 April 2013 Indefinite 4 months -
Roderick Douglas Mahoney 16 December 2011 Indefinite 4 weeks -
Bryant James Mclarty 28 November 2007 Indefinite 1 month -
15
DIReCtORS’ ReMuNeRAtION RePORt
Annual Report 2014
Share options and warrants
the Group has an ownership-based compensation scheme for directors and senior management of the Group.
each share warrant converts into one ordinary share of Avation PlC on exercise. No amounts are paid or are payable by the recipient on receipt of the warrant. the warrants carry neither rights to dividends nor voting rights. Warrants may be exercised at any time from the date of vesting to the date of their expiry for those granted on 12 December 2011. there are no performance conditions that need to be met before warrants can be exercised. the warrants granted on 4 November 2013 has a 3 years vesting schedule and the details are as follows:
Vesting period Proportion of total share options that are exercisable
Before 20 November 2014 0 per cent
On 20 November 2014 and before 20 November 2015
up to 33 per cent of the grant
On 20 November 2015 and before 20 November 2016
up to another 33 per cent of the grant Orup to 66 per cent of the grant if warrants were not exercised after the first vesting year
On 20 November 2016 Balance Or100 per cent of the grant if warrants were not exercised after the first and second vesting years
Warrants are granted to the directors and senior management of the Group to gain:
• Improvement in share price
• Improvement in net profit
• Improvement in return to shareholders
16
DIReCtORS’ ReMuNeRAtION RePORt

The following share warrants issued to directors existed at the year end:
director’s namedate
grantedWarrant
price
Balance at beginning
of year
Granted during the
year
exercised/ expired
during the year
Balance at end of year
Robert Jeffries Chatfield * 12 Dec 2011 110.5 p 400,000 - (400,000) -
Robert Jeffries Chatfield * 4 Nov 2013 110.5 p - 335,000 - 335,000
Roderick Douglas Mahoney** 4 Nov 2013 110.0 p - 300,000 - 300,000
* Robert Jeffries Chatfield was granted the share warrants via epsom Assets limited.** Roderick Douglas Mahoney was granted the share warrants via Douglas Aviation Pte ltd.
Company’s performance
The graph below shows the total shareholder return on a holding of shares in the Company as against the average total shareholder return of the companies comprising the FTSE100 index over the last five years. The FTSE 100 Index was selected because in the opinion of the Board it is the most appropriate for the Company for the purposes of a benchmark.
2014 2013 2012 2011 2010
Executive Chairman single figure remuneration
US$638,416 US$266,844 US$249,808 US$295,409 USA$208,430
Annual bonus pay-out (as % of maximum) – – – – –
Long term incentive vesting rates against maximum opportunity % NA NA NA NA NA
The above table shows the prescribed remuneration data for the Director, Robert Jeff Chatfield, the Executive Chairman undertaking the role of Group Chief Executive Officer during each of the last five financial years.
Notes:1) No bonus has been paid to the Executive Chairman
17
DIReCtORS’ ReMuNeRAtION RePORt
0
500
1000
1500
3000
2000
2500
3500
4000
4500
Nov 06 Mar 08 Aug 09 Dec 10 Apr 12 Sep 13
Avation FTSE 100

Annual Report 2014
Percentage change in remuneration of Chief executive officer
The table below sets out the percentage change in the remuneration of the Executive Chairman who is undertaking the role of Group Chief Executive Officer compared to that of all employees of the Group.
% change in remuneration from 2013 to 2014
% change in base salary
% change in annual bonus
% change in taxable benefits
Executive Chairman 107% – 100%
All employees 49% 320% 100%
Relative importance of spend on pay
The Chart below displays the relative expenditure of the Company on various matters, as required (in the case of remuneration for group employees and shareholder distributions) by the relevant remuneration regulations:
18
DIReCtORS’ ReMuNeRAtION RePORt

directors’ remuneration policy
The Company applies a policy for Directors’ remuneration which is designed to meet the following objectives:
• Provide a fair and transparent remuneration policy that is in alignment with shareholders’ interests;
• Provide both immediate and incentive remuneration that is sufficient to attract and retain executives;
• Be consistent with best practice for governance of stock exchange listed companies;
• Allow claw-back of incentives from executives should previous performance be found to have led to future adverse circumstances for the Company; and
• Always ensure an alignment between performance and compensation.
The Company’s targets the following outcomes in applying its policy to ensure alignment of Directors’ remuneration and shareholders’ interests:
• Share price appreciation;
• Increase in the Company’s earnings per share;
• Reliable and high quality financial reporting;
• Growth in asset value and profits; and
• Dividend growth.
Remuneration of the Company’s Executive Directors is comprised of the following components:
• Base salary;
• Short-term incentives in the form of a cash bonus for linked to performance against individual KPIs; and
• Long-term incentives in the form of share warrants and/or performance shares.
Remuneration of the Company’s Non-Executive Directors is comprised of fixed Directors’ Fees.
The Board as a whole considers the remuneration of the directors and there has been no external advisers used. The remuneration report was approved in the 2013 AGM on a show of hands.
On behalf of the Board
Robert Jeffries ChatfieldDirector
17 October 2014
19
DIReCtORS’ ReMuNeRAtION RePORt

Annual Report 2014
20
DIReCtORS’ ReSPONSIBIlItIeSPhoto: Airbus S.A.S.
Statement of directors’ responsibilities
the Directors are responsible for preparing the Directors’ Report and the financial statements in accordance with applicable law and regulations.
Company law requires the Directors to prepare financial statements for each financial year. under that law the Directors are required to prepare the Group financial statements in accordance with International Financial Reporting Standards (“IFRSs”) as adopted by the european union (“eu”) and Article 4 of the IAS Regulation and have also chosen to prepare the Parent Company financial statements under IFRSs as adopted by the eu.
under Company law the Directors must not approve the financial statements unless they are satisfied that they give a true and fair view of the state of affairs of the Company and of the Group and the financial performance and cash flows of the Group for that year. In preparing these financial statements, the Directors are required to:
• select suitable accounting policies and then apply them consistently;
• make judgements and accounting estimates that are reasonable and prudent;
• prepare the accounts on the going concern basis unless it is inappropriate to presume that the Company will continue in business.
• present information, including accounting policies, in a manner that provides relevant reliable, comparable and understandable information.
• provide additional disclosures when compliance with specific IFRSs are insufficient to enable the users to understand the impact of particular transactions, other events and conditions on the entity’s financial position and financial performance.
the Directors are responsible for keeping adequate accounting records that are sufficient to show and explain the Company and the Group’s transactions and disclose with reasonable accuracy at any time the financial position of the Company and the Group and enable them to ensure that the financial statements comply with the Companies Act 2006. they are also responsible for safeguarding the assets of the Company and the Group and hence for taking reasonable steps for the prevention and detection of fraud and other irregularities.
the Directors are responsible for the maintenance and integrity of the corporate and financial information included on the Company’s website. legislation in the united Kingdom governing the preparation and dissemination of the financial statements may differ from legislation in other jurisdictions.
We confirm that to the best of our knowledge:i. the financial statements, prepared in accordance with
IFRSs as adopted by the eu, give a true and fair view of the assets, liabilities, financial position and profit or loss of the Company and of the Group; and
ii. the strategic report includes a fair review of the development and performance of the business and the position of the Company and of the Group, together with a description of the principal risks and uncertainties that they face.
By order of the Board
Robert Jeffries ChatfieldDirector17 October 2014
21
RePORt OF the AuDItORSINdePeNdeNT AUdIToRS’ RePoRT To THe MeMBeRS oF AVATIoN PlC
We have audited the financial statements of Avation PlC for the year ended 30 June 2014 which comprise the Consolidated Statement of Profit or loss and other Comprehensive Income, the Company Statement of Profit or loss and other Comprehensive Income, the Consolidated Statement of Financial Position, the Company Statement of Financial Position, the Consolidated Statement of Changes in equity, the Company Statement of Changes in equity, the Consolidated Statement of Cash Flows, the Company Statement of Cash Flows and the related notes. the financial reporting framework that has been applied in their preparation is applicable law and International Financial Reporting Standards (“IFRSs”) as adopted by the european union and as regards the Parent Company financial statements, as applied in accordance with the provisions of the Companies Act 2006.this report is made solely to the Company’s members, as a body, in accordance with Chapter 3 of Part 16 of the Companies Act 2006. Our audit work has been undertaken for no purpose other than to draw to the attention of the Company’s members those matters which we are required to include in an auditors’ report addressed to them. to the fullest extent permitted by law, we do not accept or assume responsibility to any party other than the Company and Company’s members as a body, for our work, for this report, or for the opinions we have formed.Respective responsibilities of directors and auditors As explained more fully in the Directors’ Responsibilities Statement set out on page 20 the directors are responsible for the preparation of the financial statements and for being satisfied that they give a true and fair view. Our responsibility is to audit and express an opinion on the financial statements in accordance with applicable law and International Standards on Auditing (uK and Ireland). those standards require us to comply with the Auditing Practices Board’s (APB’s) ethical Standards for Auditors. Scope of the audit of the financial statementsAn audit involves obtaining evidence about the amounts and disclosures in the financial statements sufficient to give reasonable assurance that the financial statements are free from material misstatement, whether caused by fraud or error. this includes an assessment of: whether the accounting policies are appropriate to the Group’s and the Parent Company’s circumstances and have been consistently applied and adequately disclosed; the reasonableness of significant accounting estimates made by the directors; and the overall presentation of the financial statements. In addition, we read all the financial and non-financial information in the Annual Report to identify material inconsistencies with the audited financial statements and to identify any information that is apparently materially incorrect based on, or materially inconsistent with, the knowledge acquired by us in the course of performing the audit. If we became aware of any apparent material misstatements or inconsistencies we consider the implications in our report.opinion on the financial statementsIn our opinion:• the financial statements give a true and fair view of the state of
the Group’s and of the Parent Company’s affairs as at 30 June
2014 and of the Group’s profit for the year then ended;• the Group’s financial statements have been properly prepared
in accordance with IFRSs as adopted by the european union;• the parent company financial statements have been prepared
properly in accordance with IFRS as adopted by the european union and as applied in accordance with the provisions of the Companies Act 2006, and
• the financial statements have been prepared in accordance with the requirements of the Companies Act 2006 and, as regards the Group financial statements, Article 4 of the IAS Regulation.
opinion on other matters prescribed by the Companies Act 2006In our opinion:• the part of the Directors Remuneration Report to be audited
has been properly prepared in accordance with the Companies Act 2006;
• the information given in the Corporate Governance Statement included in the Directors’ report with respect to internal control and risk management systems in relation to financial reporting processes and about share capital structures is consistent with the financial statements; and
• the information given in the Directors’ Report for the financial year for which the financial statements are prepared is consistent with the financial statements.
Matters on which we are required to report by exception We have nothing to report in respect of the following matters where the Companies Act 2006 requires us to report to you if, in our opinion:
• adequate accounting records have not been kept by the Parent Company, or returns adequate for our audit have not been received from branches not visited by us; or
• the Parent Company financial statements are not in agreement with the accounting records and returns; or
• certain disclosures of directors’ remuneration specified by law are not made; or
• we have not received all the information and explanations we require for our audit; and
• a Corporate Governance Statement has not been prepared by the Company.
Mark Twum-Ampofo (Senior Statutory Auditor)For and on behalf of Kingston Smith llP, Statutory AuditorDevonshire house60 Goswell RoadlondoneC1M 7AD
17 October 2014

AVATION PLC CONSOLIDATED STATEMENT OF PROFIT OR LOSS AND OTHER COMPREHENSIVE INCOME FOR THE FINANCIAL YEAR ENDED 30 JUNE 2014 Note 2014 2013 US$ US$ Continuing operations Revenue 9 52,255,209 42,739,991 Cost of sales – (822,887) Gross profit 52,255,209 41,917,104 Other income 10 4,024,404 1,846,538 Total income 56,279,613 43,763,642 Other operating expenses 11 (15,857,335) (13,236,614) Expenses - Administrative expenses 12 (6,957,715) (3,564,798) - Finance expense 13 (16,906,001) (12,992,553) Profit before taxation 15 16,558,562 13,969,677 Taxation 16 (2,295,492) (2,004,684) Profit for the financial year 14,263,070 11,964,993 Other comprehensive income: Items that will not be reclassified to profit or loss: Revaluation loss on property, plant and equipment, net of tax – (1,780,368)
– (1,780,368) Items that may be reclassified subsequently to profit or loss:
Currency translation differences arising on consolidation 2,045 603 2,045 603 Other comprehensive income, net of tax 2,045 (1,779,765) Total comprehensive income for the financial year, all attributable to equity holders of the Company 14,265,115 10,185,228
Profit attributable to: Equity holders of the parent 13,312,153 10,515,901 Non-controlling interest 950,917 1,449,092 14,263,070 11,964,993 Total comprehensive income attributable to: Equity holders of the parent 13,313,550 9,365,487 Non-controlling interest 951,565 819,741 14,265,115 10,185,228 Earnings per share - Basic 17 27.40 cents 23.25 cents - Fully diluted 27.40 cents 23.25 cents
2222

AVATION PLC COMPANY STATEMENT OF PROFIT OR LOSS AND OTHER COMPREHENSIVE INCOME FOR THE FINANCIAL YEAR ENDED 30 JUNE 2014 2014 2013 US$ US$ Profit for the financial year 1,121,282 2,328,931 Other comprehensive income: Items that will not be reclassified to profit or loss: Revaluation gains on property, plant and equipment, net of tax – 2,839,584
Other comprehensive income, net of tax – 2,839,584 Total comprehensive income for the financial year 1,121,282 5,168,515 The Company is exempt from publishing its income statement pursuant to Section 408 of Companies Act 2006.
2323
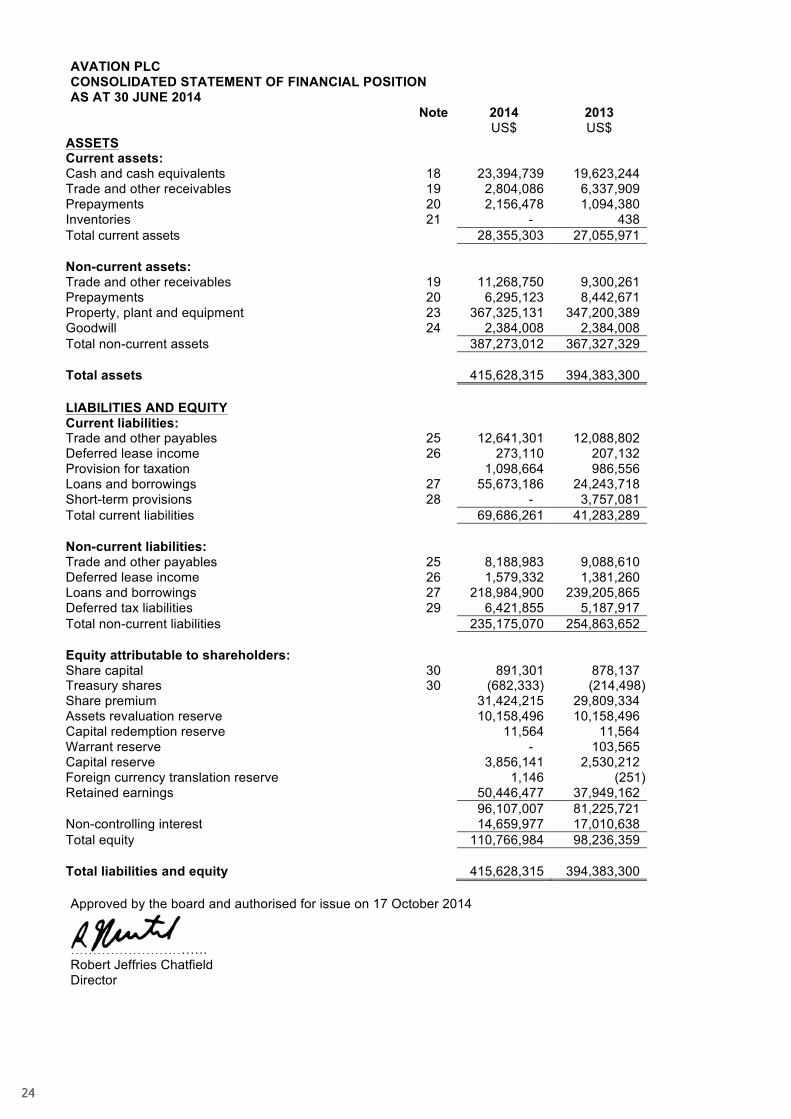
AVATION PLC CONSOLIDATED STATEMENT OF FINANCIAL POSITION AS AT 30 JUNE 2014
Note 2014 2013 US$ US$ ASSETS Current assets: Cash and cash equivalents 18 23,394,739 19,623,244 Trade and other receivables 19 2,804,086 6,337,909 Prepayments 20 2,156,478 1,094,380 Inventories 21 - 438 Total current assets 28,355,303 27,055,971 Non-current assets: Trade and other receivables 19 11,268,750 9,300,261 Prepayments 20 6,295,123 8,442,671 Property, plant and equipment 23 367,325,131 347,200,389 Goodwill 24 2,384,008 2,384,008 Total non-current assets 387,273,012 367,327,329 Total assets 415,628,315 394,383,300 LIABILITIES AND EQUITY Current liabilities: Trade and other payables 25 12,641,301 12,088,802 Deferred lease income 26 273,110 207,132 Provision for taxation 1,098,664 986,556 Loans and borrowings 27 55,673,186 24,243,718 Short-term provisions 28 - 3,757,081 Total current liabilities 69,686,261 41,283,289 Non-current liabilities: Trade and other payables 25 8,188,983 9,088,610 Deferred lease income 26 1,579,332 1,381,260 Loans and borrowings 27 218,984,900 239,205,865 Deferred tax liabilities 29 6,421,855 5,187,917 Total non-current liabilities 235,175,070 254,863,652 Equity attributable to shareholders: Share capital 30 891,301 878,137 Treasury shares 30 (682,333) (214,498) Share premium 31,424,215 29,809,334 Assets revaluation reserve 10,158,496 10,158,496 Capital redemption reserve 11,564 11,564 Warrant reserve - 103,565 Capital reserve 3,856,141 2,530,212 Foreign currency translation reserve 1,146 (251) Retained earnings 50,446,477 37,949,162 96,107,007 81,225,721 Non-controlling interest 14,659,977 17,010,638 Total equity 110,766,984 98,236,359 Total liabilities and equity 415,628,315 394,383,300 Approved by the board and authorised for issue on 17 October 2014 …………………………. Robert Jeffries Chatfield Director
2424

AVATION PLC COMPANY STATEMENT OF FINANCIAL POSITION AS AT 30 JUNE 2014
Note 2014 2013 US$ US$ ASSETS Current assets: Cash and cash equivalents 18 1,974,783 3,406,322 Trade and other receivables 19 31,578,274 19,096,712 Total current assets 33,553,057 22,503,034 Non-current assets: Trade and other receivables 20 11,268,750 9,264,244 Investment in subsidiaries 22 6,968,639 5,239,692 Property, plant and equipment 23 19,131,160 20,171,641 Total non-current assets 37,368,549 34,675,577 Total assets 70,921,606 57,178,611 LIABILITIES AND EQUITY Current liabilities: Trade and other payables 25 18,492,456 3,840,760 Provision for taxation - - Loans and borrowings 27 1,415,411 1,415,411 Total current liabilities 19,907,867 5,256,171 Non-current liabilities: Trade and other payables 25 958,091 2,071,487 Loan and borrowings 27 10,639,398 12,054,807 Deferred tax liabilities 29 623,548 366,533 Total non-current liabilities 12,221,037 14,492,827 Capital and reserves: Share capital 30 891,301 878,137 Treasury shares 30 (682,333) (214,498) Share premium 31,424,215 29,809,334 Assets revaluation reserve 2,873,147 2,873,147 Capital redemption reserve 11,564 11,564 Warrant reserve - 103,565 Retained earnings 4,274,808 3,968,364 Total equity 38,792,702 37,429,613 Total liabilities and equity 70,921,606 57,178,611 Approved by the board and authorised for issue on 17 October 2014 ………………………………. Robert Jeffries Chatfield Director
25

AVA
TIO
N P
LC
CO
NSO
LID
ATE
D S
TATE
MEN
T O
F C
HA
NG
ES IN
EQ
UIT
Y FO
R T
HE
FIN
AN
CIA
L YE
AR
EN
DED
30
JUN
E 20
14
Fo
reig
n
A
sset
s C
apita
l
cu
rren
cy
Non
-
Sh
are
Trea
sury
Sh
are
reva
luat
ion
Red
empt
ion
War
rant
C
apita
l tr
ansl
atio
n R
etai
ned
C
ontr
ollin
g To
tal
ca
pita
l sh
are
prem
ium
re
serv
e re
serv
e R
eser
ve
rese
rve
rese
rve
earn
ings
To
tal
Inte
rest
Eq
uity
US
$ U
S$
US
$ U
S$
US
$ U
S$
US
$ U
S$
US
$ U
S$
US
$ U
S$
Gro
up
B
alan
ce a
t 1 J
uly
2013
87
8,13
7 (2
14,4
98)
29,8
09,3
34
10,1
58,4
96
11,5
64
103,
565
2,53
0,21
2 (2
51)
37,9
49,1
62
81,2
25,7
21
17,0
10,6
38
98,2
36,3
59
P
rofit
for t
he y
ear
- -
- -
- -
-
13,3
12,1
53
13,3
12,1
53
950,
917
14,2
63,0
70
Oth
er c
ompr
ehen
sive
inco
me
- -
- -
- -
- 1,
397
- 1,
397
648
2,04
5 To
tal c
ompr
ehen
sive
inco
me
- -
- -
- -
- 1,
397
13,3
12,1
53
13,3
13,5
50
951,
565
14,2
65,1
15
D
ivid
end
rela
ted
to 2
013
paid
-
- -
- -
- -
- (8
66,6
21)
(866
,621
) -
(866
,621
) P
urch
ase
of tr
easu
ry s
hare
s -
(467
,835
) -
- -
- -
- -
(467
,835
) -
(467
,835
) Tr
easu
ry
shar
es
of
a su
bsid
iary
-
- -
- -
- 16
8,59
8 -
- 16
8,59
8 78
,830
24
7,42
8
Incr
ease
in
is
sued
sh
are
capi
tal
13,1
64
- 1,
625,
942
- -
(51,
782)
-
- -
1,58
7,32
4 -
1,58
7,32
4
Sha
re is
sue
expe
nses
-
- (1
1,06
1)
- -
- -
- -
(11,
061)
-
(11,
061)
W
arra
nt e
xpire
d -
-
- -
(51,
783)
-
- 51
,783
-
- -
Cha
nges
in o
wne
rshi
p in
tere
st
in a
sub
sidi
ary–
acq
uisi
tion
of
non-
cont
rolli
ng in
tere
sts
with
out a
cha
nge
in c
ontro
l
- -
- -
- -
1,15
7,33
1 -
- 1,
157,
331
(3,3
81,0
56)
(2,2
23,7
25)
Bal
ance
at 3
0 Ju
ne 2
014
891,
301
(682
,333
) 31
,424
,215
10
,158
,496
11
,564
-
3,85
6,14
1 1,
146
50,4
46,4
77
96,1
07,0
07
14,6
59,9
77
110,
766,
984
2626

AVA
TIO
N P
LC
CO
NSO
LID
ATE
D S
TATE
MEN
T O
F C
HA
NG
ES IN
EQ
UIT
Y FO
R T
HE
FIN
AN
CIA
L YE
AR
EN
DED
30
JUN
E 20
14
Fore
ign
Ass
ets
Cap
ital
curr
ency
N
on-
Shar
e Tr
easu
ry
Shar
e re
valu
atio
n R
edem
ptio
n W
arra
nt
Cap
ital
tran
slat
ion
Ret
aine
d
Con
trol
ling
Tota
l
capi
tal
shar
e pr
emiu
m
rese
rve
rese
rve
Res
erve
re
serv
e re
serv
e ea
rnin
gs
Tota
l In
tere
st
Equi
ty
U
S$
US
$ U
S$
US
$ U
S$
US
$ U
S$
US
$ U
S$
US
$ U
S$
US
$ G
roup
B
alan
ce a
t 1 J
uly-
2012
- In
pre
viou
s pr
esen
tatio
nal
Cur
renc
y (G
BP
)
42
3,74
5 -
14,1
92,2
67
5,46
5,20
6 7,
000
120,
779
1,63
6,51
1 2,
515,
434
17,7
90,1
85
42,1
51,1
27
10,3
69,9
29
52,5
21,0
56
Bal
ance
at 1
Jul
y 2
012-
in
cur
rent
pre
sent
atio
nal
curr
ency
(US
$)
77
9,61
8 -
23
,047
,234
11,3
09,2
84
11
,564
192,
946
2,
530,
212
(6
25)
28
,113
,618
65,9
83,8
51
16
,190
,897
82,1
74,7
48
P
rofit
for t
he y
ear
- -
- -
- -
-
10,5
15,9
01
10,5
15,9
01
1,44
9,09
2 11
,964
,993
O
ther
com
preh
ensi
ve in
com
e -
- -
(1,1
50,7
88)
- -
- 37
4 -
(1,1
50,4
14)
(629
,351
) (1
,779
,765
) To
tal c
ompr
ehen
sive
inco
me
- -
- (1
,150
,788
) -
- -
374
10,5
15,9
01
9,36
5,48
7 81
9,74
1 10
,185
,228
Div
iden
d re
late
d to
201
2 pa
id
- -
- -
- -
- -
(745
,618
) (7
45,6
18)
- (7
45,6
18)
Pur
chas
e of
trea
sury
sha
res
- (2
14,4
98)
- -
- -
- -
- (2
14,4
98)
- (2
14,4
98)
Incr
ease
in
is
sued
sh
are
capi
tal
98,5
19
- 7,
100,
985
- -
(24,
120)
-
- -
7,17
5,38
4 -
7,17
5,38
4
Sha
re is
sue
expe
nses
-
- (3
38,8
85)
- -
- -
- -
(338
,885
) -
(338
,885
) W
arra
nt e
xpen
ses
- -
- -
- (6
5,26
1)
- -
65,2
61
- -
-
Bal
ance
at 3
0 Ju
ne 2
013
878,
137
(214
,498
) 29
,809
,334
10
,158
,496
11
,564
10
3,56
5 2,
530,
212
(251
) 37
,949
,162
81
,225
,721
17
,010
,638
98
,236
,359
D
urin
g th
e cu
rrent
fina
ncia
l yea
r, th
e C
ompa
ny in
crea
sed
its s
hare
hold
ing
in it
s su
bsid
iary
, Cap
ital L
ease
Avi
atio
n P
LC fr
om 6
2.07
% to
68.
85%
. The
con
side
ratio
n fo
r th
e ac
quis
ition
of t
he C
LA s
hare
s is
by
way
of c
ash
cons
ider
atio
n of
US
$880
,917
and
thro
ugh
the
allo
tmen
t of 3
81,6
79 o
f the
Com
pany
’s o
rdin
ary
shar
es.
The
divi
dend
pai
d du
ring
the
year
was
for 1
.78
US
cen
ts (2
013:
1.0
4p) p
er s
hare
.
.
2727

AVATION PLC COMPANY STATEMENT OF CHANGES IN EQUITY FOR THE FINANCIAL YEAR ENDED 30 JUNE 2014
Asset Capital Share Treasury Share Revaluation redemption Warrant Retained capital Share premium Reserve Reserve Reserve earnings Total US$ US$ US$ US$ US$ US$ US$ US$ Company Balance at 1 July 2013 878,137 (214,498) 29,809,334 2,873,147 11,564 103,565 3,968,364 37,429,613
Profit for the year – – – – – – 1,121,282 1,121,282 Other comprehensive
income – – – – – – – –
Total comprehensive income – – – – – – 1,121,282 1,121,282
Dividend relating to 2013 paid – – – – – – (866,621) (866,621)
Purchase of treasury shares – (467,835) – – – – – (467,835)
Increase of issued share
capital 13,164 – 1,625,942 – – (51,782) – 1,587,324
Share issue expenses – – (11,061) – – – – (11,061)
Warrant expired – – – – – (51,783) 51,783 –
Balance at 30 June 2014 891,301 (682,333) 31,424,215 2,873,147 11,564 – 4,274,808 38,792,702
Balance at 1 July 2012
In previous presentational 423,745 – 14,192,267 22,158 7,000 120,779 2,031,677 16,797,626
Currency (GBP)
Balance at 1 July 2012 779,618 – 23,047,234 33,563 11,564 192,946 2,319,790 26,384,715
Profit for the year – – – – – – 2,328,931 2,328,931 Other comprehensive income
– – – 2,839,584 – – – 2,839,584
Total comprehensive income – – – 2,839,584 – – 2,328,931 5,168,515
Dividend relating to 2012 paid – – – – – – (745,618) (745,618)
Purchase of treasury shares – (214,498) – – – – – (214,498)
Increase of issued share capital
98,519 – 7,100,985 – – (24,120) – 7,175,384
Share issue expenses – – (338,885) – – – – (338,885)
Warrant expenses – – – – – (65,261) 65,261 –
Balance at 30 June 2013 878,137 (214,498) 29,809,334 2,873,147 11,564 103,565 3,968,364 37,429,613
The dividend paid during the year was for 1.78 US cents (2013: 1.04p) per share.
2828
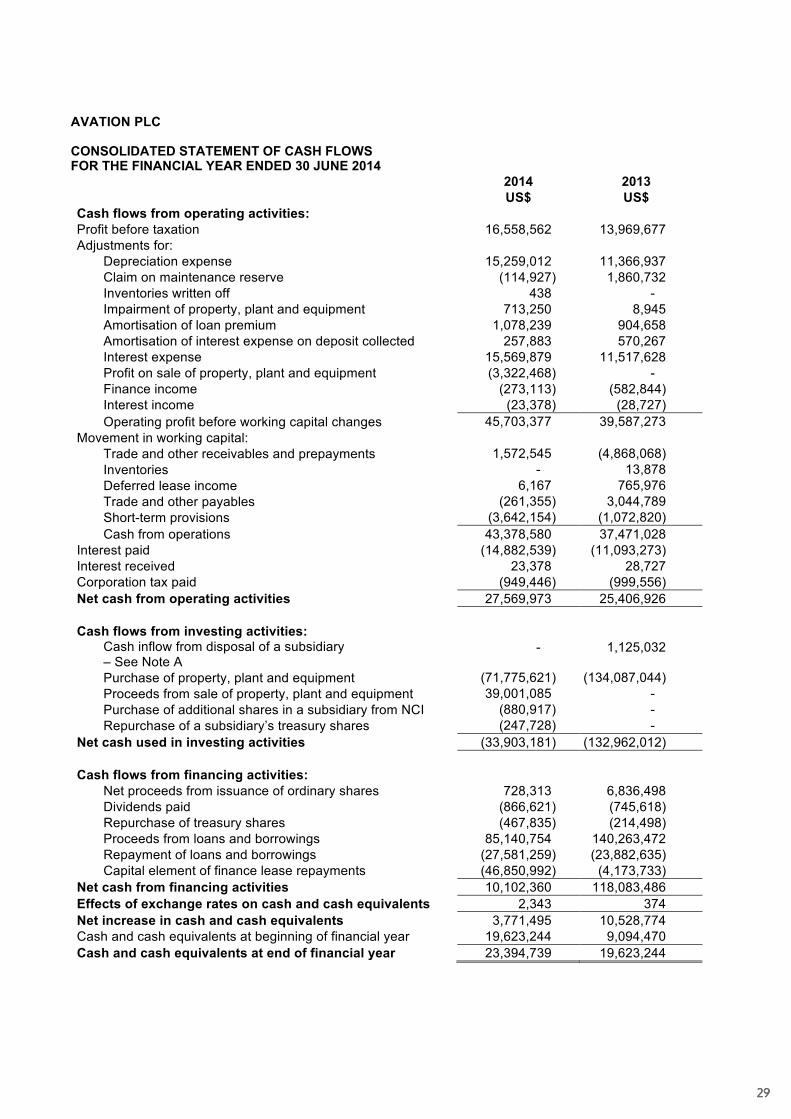
AVATION PLC CONSOLIDATED STATEMENT OF CASH FLOWS FOR THE FINANCIAL YEAR ENDED 30 JUNE 2014 2014 2013 US$ US$ Cash flows from operating activities: Profit before taxation 16,558,562 13,969,677 Adjustments for:
Depreciation expense 15,259,012 11,366,937 Claim on maintenance reserve (114,927) 1,860,732 Inventories written off 438 - Impairment of property, plant and equipment 713,250 8,945 Amortisation of loan premium 1,078,239 904,658 Amortisation of interest expense on deposit collected 257,883 570,267 Interest expense 15,569,879 11,517,628 Profit on sale of property, plant and equipment (3,322,468) - Finance income (273,113) (582,844) Interest income (23,378) (28,727) Operating profit before working capital changes 45,703,377 39,587,273
Movement in working capital: Trade and other receivables and prepayments 1,572,545 (4,868,068) Inventories - 13,878 Deferred lease income 6,167 765,976 Trade and other payables (261,355) 3,044,789 Short-term provisions (3,642,154) (1,072,820) Cash from operations 43,378,580 37,471,028
Interest paid (14,882,539) (11,093,273) Interest received 23,378 28,727 Corporation tax paid (949,446) (999,556) Net cash from operating activities 27,569,973 25,406,926 Cash flows from investing activities:
Cash inflow from disposal of a subsidiary – See Note A
- 1,125,032
Purchase of property, plant and equipment (71,775,621) (134,087,044) Proceeds from sale of property, plant and equipment 39,001,085 - Purchase of additional shares in a subsidiary from NCI (880,917) - Repurchase of a subsidiary’s treasury shares (247,728) -
Net cash used in investing activities (33,903,181) (132,962,012) Cash flows from financing activities:
Net proceeds from issuance of ordinary shares 728,313 6,836,498 Dividends paid (866,621) (745,618) Repurchase of treasury shares (467,835) (214,498) Proceeds from loans and borrowings 85,140,754 140,263,472 Repayment of loans and borrowings (27,581,259) (23,882,635) Capital element of finance lease repayments (46,850,992) (4,173,733)
Net cash from financing activities 10,102,360 118,083,486 Effects of exchange rates on cash and cash equivalents 2,343 374 Net increase in cash and cash equivalents 3,771,495 10,528,774 Cash and cash equivalents at beginning of financial year 19,623,244 9,094,470 Cash and cash equivalents at end of financial year 23,394,739 19,623,244
2929

AVATION PLC CONSOLIDATED STATEMENT OF CASH FLOWS FOR THE FINANCIAL YEAR ENDED 30 JUNE 2014 Note A – Disposal of a subsidiary, Capital Lease Australian Portfolio One Pty. Ltd.: The aggregate cash inflows arising from the disposal of Capital Lease Australian Portfolio One Pty. Ltd. during the previous year were: US$ Cash 199,839 Trade and other receivables 1,864,684 Property, plant and equipment 10,695,308 Trade and other payables (4,004,378) Borrowings (3,735,866) Provisions (2,552,604) Income tax payable (514,547) Identifiable net assets disposed 1,952,436 Loss on disposal (627,565) Cash proceeds from disposal 1,324,871 Less: cash and cash equivalents in subsidiary disposed (199,839) Net cash inflow on disposal, received during the year ended 30 June 2013 1,125,032
3030
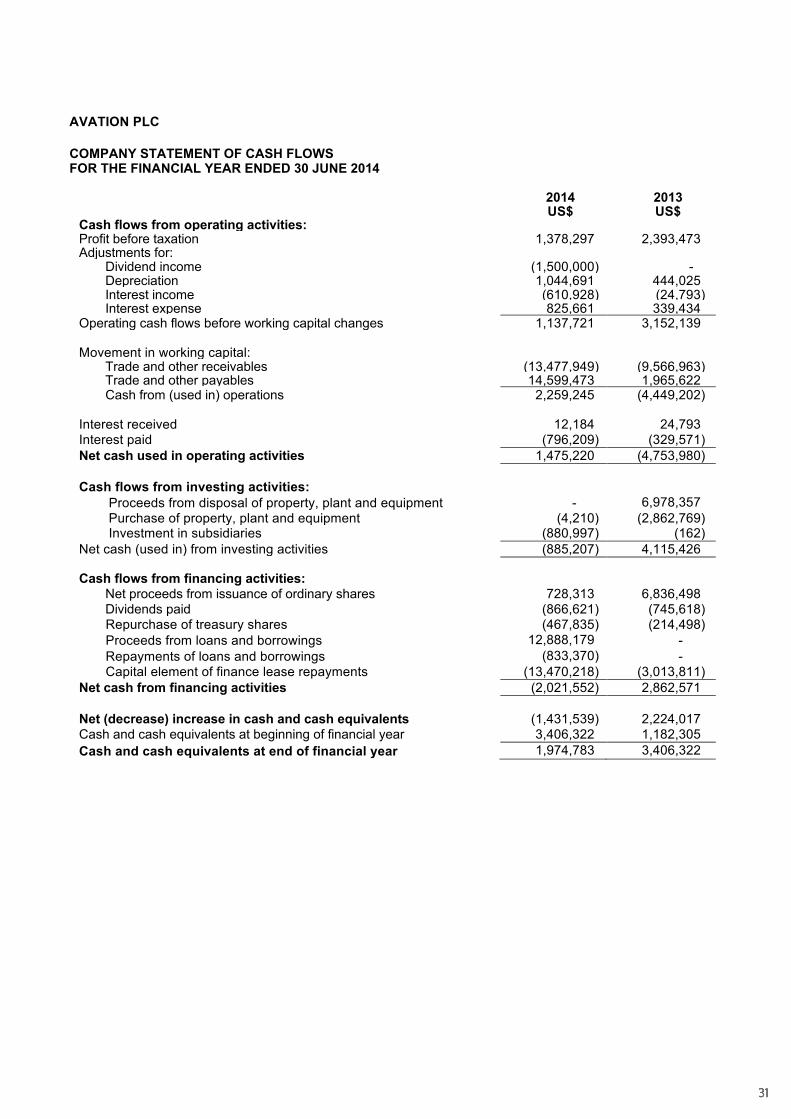
AVATION PLC COMPANY STATEMENT OF CASH FLOWS FOR THE FINANCIAL YEAR ENDED 30 JUNE 2014
2014 2013 US$ US$ Cash flows from operating activities: Profit before taxation 1,378,297 2,393,473 Adjustments for:
Dividend income (1,500,000) - Depreciation 1,044,691 444,025 Interest income (610,928) (24,793) Interest expense 825,661 339,434
Operating cash flows before working capital changes 1,137,721 3,152,139 Movement in working capital:
Trade and other receivables (13,477,949) (9,566,963) Trade and other payables 14,599,473 1,965,622 Cash from (used in) operations 2,259,245 (4,449,202)
Interest received 12,184 24,793 Interest paid (796,209) (329,571) Net cash used in operating activities 1,475,220 (4,753,980) Cash flows from investing activities:
Proceeds from disposal of property, plant and equipment - 6,978,357 Purchase of property, plant and equipment (4,210) (2,862,769) Investment in subsidiaries (880,997) (162)
Net cash (used in) from investing activities (885,207) 4,115,426 Cash flows from financing activities:
Net proceeds from issuance of ordinary shares 728,313 6,836,498 Dividends paid (866,621) (745,618) Repurchase of treasury shares (467,835) (214,498) Proceeds from loans and borrowings 12,888,179 - Repayments of loans and borrowings (833,370) - Capital element of finance lease repayments (13,470,218) (3,013,811)
Net cash from financing activities (2,021,552) 2,862,571 Net (decrease) increase in cash and cash equivalents (1,431,539) 2,224,017 Cash and cash equivalents at beginning of financial year 3,406,322 1,182,305 Cash and cash equivalents at end of financial year 1,974,783 3,406,322
3131

AVATION PLC NOTES TO THE FINANCIAL STATEMENTS FOR THE FINANCIAL YEAR ENDED 30 JUNE 2014 1 GENERAL
Avation PLC is a public limited company incorporated in England and Wales under the Companies Act 2006 (Registration Number 05872328) and is listed as a Standard Listing on the London Stock Exchange. The address of the registered office is given on page 1.
As disclosed in the Report of the Directors, The principal activities of the Group is leasing of aircraft. Details of activities carried out by subsidiary companies is set out in Note 22 to these financial statements.
2 STATEMENT OF COMPLIANCE
These financial statements have been prepared in accordance with International Financial Reporting Standards, International Accounting Standards and their interpretations issued or adopted by the International Accounting Standards Board as adopted by use in the European Union (“IFRS”).
3 SUMMARY OF SIGNIFICANT ACCOUNTING POLICIES
(a) BASIS OF PREPARATION – The financial statements have been prepared in accordance with IFRS including standards and interpretations issued by the International Accounting Standards Board (“IASB”), and have been prepared in accordance with the historical cost convention, as modified by the revaluation of aircraft.
The financial statements are presented in United States Dollars, rounded to the nearest Dollar. The year end exchange rate for Pounds Sterling to United States Dollars is 1.7048.
The preparation of financial statements in conformity with IFRS requires the use of estimates and
assumptions that affect the reported amounts of assets and liabilities and disclosure of contingent assets and liabilities at the date of the financial statements and the reported amounts of revenues and expenses during the financial period. Although these estimates are based on management’s best knowledge of current events and actions, actual results may ultimately differ from those estimates.
The accounting policies set out below have been applied consistently throughout the financial period
presented in these financial statements and the accounting policies have been applied consistently by the Company and its subsidiaries.
32

AVATION PLC NOTES TO THE FINANCIAL STATEMENTS FOR THE FINANCIAL YEAR ENDED 30 JUNE 2014 3 SUMMARY OF SIGNIFICANT ACCOUNTING POLICIES (CONT’D)
(b) BASIS OF CONSOLIDATION - The consolidated financial statements comprise the financial statements of the Company and its subsidiaries as at 30 June 2014. Control is achieved when the Group is exposed, or has rights, to variable returns from its involvement with the investee and has the ability to affect those returns through its power over the investee. Specifically, the Group controls an investee if and only if the Group has: • Power over the investee (i.e. existing rights that give it the current ability to direct the relevant
activities of the investee) • Exposure, or rights, to variable returns from its involvement with the investee, and • The ability to use its power over the investee to affect its returns When the Group has less than a majority of the voting or similar rights of an investee, the Group considers all relevant facts and circumstances in assessing whether it has power over an investee, including: • The contractual arrangement with the other vote holders of the investee • Rights arising from other contractual arrangements • The Group’s voting rights and potential voting rights Whether or not the Group controls, an investee is re-assessed if facts and circumstances indicate that there are changes to one or more of the three elements of control. Consolidation of a subsidiary begins when the Group obtains control over the subsidiary and ceases when the Group loses control of the subsidiary. Assets, liabilities, income and expenses of a subsidiary acquired or disposed of during the year are included in the statement of comprehensive income from the date the Group gains control until the date the Group ceases to control the subsidiary. Profit or loss and each component of other comprehensive income (OCI) are attributed to the equity holders of the parent of the Group and to the non-controlling interests, even if this results in the non-controlling interests having a deficit balance. When necessary, adjustments are made to the financial statements of subsidiaries to bring their accounting policies into line with the Group’s accounting policies. All intra-group assets and liabilities, equity, income, expenses and cash flows relating to transactions between members of the Group are eliminated in full on consolidation. A change in the ownership interest of a subsidiary, without a loss of control, is accounted for as an equity transaction. If the Group loses control over a subsidiary, it: • Derecognises the assets (including goodwill) and liabilities of the subsidiary
• Derecognises the carrying amount of any non-controlling interests
• Derecognises the cumulative translation differences recorded in equity
• Recognises the fair value of the consideration received
• Recognises the fair value of any investment retained
• Recognises any surplus or deficit in profit or loss
• Reclassifies the parent’s share of components previously recognised in OCI to profit or loss or retained earnings, as appropriate, as would be required if the Group had directly disposed of the related assets or liabilities.
In the Company’s separate financial statements investments in subsidiaries are stated at cost less impairment.
33

AVATION PLC NOTES TO THE FINANCIAL STATEMENTS FOR THE FINANCIAL YEAR ENDED 30 JUNE 2014 3 SUMMARY OF SIGNIFICANT ACCOUNTING POLICIES (CONT’D)
(c) BUSINESS COMBINATIONS - Business combinations are accounted for using the acquisition method. The cost of an acquisition is measured as the aggregate of the consideration transferred measured at acquisition date fair value and the amount of any non-controlling interests in the acquiree. For each business combination, the Group elects whether to measure the non-controlling interests in the acquiree at fair value or at the proportionate share of the acquiree’s identifiable net assets. Acquisition-related costs are expensed as incurred and included in administrative expenses. When the Group acquires a business, it assesses the financial assets and liabilities assumed for appropriate classification and designation in accordance with the contractual terms, economic circumstances and pertinent conditions as at the acquisition date. This includes the separation of embedded derivatives in host contracts held by the acquiree. If the business combination is achieved in stages, any previously held equity interest is re-measured at its acquisition date fair value and any resulting gain or loss is recognised in profit or loss. It is then considered in the determination of goodwill. Any contingent consideration to be transferred by the acquirer will be recognised at fair value at the acquisition date. Contingent consideration classified as an asset or liability that is a financial instrument and within the scope of IAS 39 Financial Instruments: Recognition and Measurement, is measured at fair value with changes in fair value recognised either in either profit or loss or as a change to OCI. If the contingent consideration is not within the scope of IAS 39, it is measured in accordance with the appropriate IFRS. Contingent consideration that is classified as equity is not re-measured and subsequent settlement is accounted for within equity.
(d) GOODWILL- Goodwill is initially measured at cost, being the excess of the aggregate of the consideration transferred and the amount recognised for non-controlling interests, and any previous interest held, over the net identifiable assets acquired and liabilities assumed. If the fair value of the net assets acquired is in excess of the aggregate consideration transferred, the Group re-assesses whether it has correctly identified all of the assets acquired and all of the liabilities assumed and reviews the procedures used to measure the amounts to be recognised at the acquisition date. If the re-assessment still results in an excess of the fair value of net assets acquired over the aggregate consideration transferred, then the gain is recognised in profit or loss. After initial recognition, goodwill is measured at cost less any accumulated impairment losses. For the purpose of impairment testing, goodwill acquired in a business combination is, from the acquisition date, allocated to each of the Group’s cash-generating units that are expected to benefit from the combination, irrespective of whether other assets or liabilities of the acquiree are assigned to those units. Where goodwill has been allocated to a cash-generating unit and part of the operation within that unit is disposed of, the goodwill associated with the disposed operation is included in the carrying amount of the operation when determining the gain or loss on disposal. Goodwill disposed in these circumstances is measured based on the relative values of the disposed operation and the portion of the cash-generating unit retained.
34

AVATION PLC NOTES TO THE FINANCIAL STATEMENTS FOR THE FINANCIAL YEAR ENDED 30 JUNE 2014 3 SUMMARY OF SIGNIFICANT ACCOUNTING POLICIES (CONT’D)
(e) FAIR VALUE MEASUREMENT – The Group measures financial instruments, such as derivatives, and non-financial assets such as aircraft, at fair values at each statement of reporting date. The fair values of debt instruments are not considered to be materially different from their amortised cost. Fair value is the price that would be received to sell an asset or paid to transfer a liability in an orderly transaction between market participants at the measurement date. The fair value measurement is based on the presumption that the transaction to sell the asset or transfer the liability takes place either: • In the principal market for the asset or liability, or • In the absence of a principal market, in the most advantageous market for the asset or liability The principal or the most advantageous market must be accessible by the Group.
The fair value of an asset or a liability is measured using the assumptions that market participants would use when pricing the asset or liability, assuming that market participants act in their economic best interest.
A fair value measurement of a non-financial asset takes into account a market participant's ability to generate economic benefits by using the asset in its highest and best use or by selling it to another market participant that would use the asset in its highest and best use.
The Group uses valuation techniques that are appropriate in the circumstances and for which sufficient data are available to measure fair value, maximising the use of relevant observable inputs and minimising the use of unobservable inputs.
In the case of aircraft, unless otherwise disclosed, the assets are valued using lease encumbered value (“LEV”). Under such a valuation, which reflects highest and best use given the fact that the aircraft are held for use in a leasing business, the income streams associated with the lease and the expected future market value of the aircraft at the end of the lease are discounted to current values. The valuers prepare their valuation report based on the market for second hand aircraft, which is active, known and measurable.
All assets and liabilities for which fair value is measured or disclosed in the financial statements are categorised within the fair value hierarchy, described as follows, based on the lowest level input that is significant to the fair value measurement as a whole:
• Level 1 – Quoted (unadjusted) market prices in active markets for identical assets or liabilities • Level 2 – Valuation techniques for which the lowest level input that is significant to the fair value measurement is directly or indirectly observable • Level 3 – Valuation techniques for which the lowest level input that is significant to the fair value measurement is unobservable
For assets and liabilities that are recognised in the financial statements on a recurring basis, the Group determines whether transfers have occurred between Levels in the hierarchy by re-assessing categorisation (based on the lowest level input that is significant to the fair value measurement as a whole) at the end of each reporting period.
The Group’s management determines the policies and procedures for both recurring fair value measurement, such as aircraft and unquoted AFS financial assets, and for non-recurring measurement, such as assets held for distribution in discontinued operations.
35
AVATION PLC NOTES TO THE FINANCIAL STATEMENTS FOR THE FINANCIAL YEAR ENDED 30 JUNE 2014 3 SUMMARY OF SIGNIFICANT ACCOUNTING POLICIES (CONT’D)
External valuers are involved for valuation of significant assets, such as aircraft and AFS financial assets, and significant liabilities, such as contingent consideration. At each reporting date, the management analyses the movements in the values of assets and liabilities which are required to be re-measured or re-assessed as per the Group’s accounting policies. For this analysis, the management verifies the major inputs applied in the latest valuation by agreeing the information in the valuation computation to contracts and other relevant documents so far as possible The management, in conjunction with the Group’s external valuers, also compares the changes in the fair value of each asset and liability with relevant external sources to determine whether the change is reasonable. For the purpose of fair value disclosures, the Group has determined classes of assets and liabilities on the basis of the nature, characteristics and risks of the asset or liability and the level of the fair value hierarchy as explained above.
(f) INVENTORIES – Inventories of consumable spare parts are stated at the lower of cost or market
value determined on a portfolio basis.
(g) PROPERTY, PLANT AND EQUIPMENT – All items of property, plant and equipment are initially recorded at cost. Such cost include the cost of replacing part of the property. The cost of an item of property, plant and equipment is recognised as an asset if, it is probable that future economic benefits associated with the item will flow to the Group and the cost of the item can be measured reliably.
Subsequent to recognition, the aircraft are stated in the statement of financial position at their fair value. All items of property plant and equipment other than aircraft are measured at cost less any accumulated depreciation and accumulated impairment losses. Revaluations are performed with sufficient regularity such that the carrying amount does not differ materially from that which would be determined using fair values at the reporting date. However, these aircraft have been reviewed for impairment.
Any revaluation increase arising on the revaluation of such aircraft is credited to the assets revaluation reserve, except to the extent that it reverses a revaluation decrease for the same asset previously recognised in profit or loss, in which case the increase is credited to profit or loss to the extent of the decrease previously charged. A decrease in carrying amount arising on the revaluation of such aircraft is charged to profit or loss to the extent that it exceeds the balance, if any, held in the assets revaluation reserve relating to a previous revaluation of that asset.
Depreciation on revalued aircraft is charged to profit or loss. On the subsequent sale or retirement
of a revalued aircraft, the attributable revaluation surplus remaining in the asset revaluation reserve is transferred directly to retained earnings.
36

AVATION PLC NOTES TO THE FINANCIAL STATEMENTS FOR THE FINANCIAL YEAR ENDED 30 JUNE 2014 3 SUMMARY OF SIGNIFICANT ACCOUNTING POLICIES (CONT’D) Depreciation is charged so as to write off the cost or valuation of assets less residual values, over
their estimated useful lives, using the straight-line method, on the following bases: Jets - 30 years from date of manufacture Turbo props - 30 years from date of manufacture Furniture and equipment - 3 years
The residual values, useful lives and depreciation methods are revised and adjusted if appropriate, at each reporting date. Residual value of aircraft are based on their estimated scrap value.
Fully depreciated assets still in use are retained in the financial statements.
The gain or loss arising on the disposal or retirement of an item of property, plant and equipment
is determined as the difference between the sales proceeds and the carrying amount of the asset and is recognised in profit or loss.
(h) IMPAIRMENT OF NON-FINANCIAL ASSETS - The Group assesses at each reporting date whether
there is an indication that an asset may be impaired. If any indication exists, or when an annual impairment testing for an asset is required, the Group makes an estimate of the asset's recoverable amount. An asset's recoverable amount is the higher of an asset's or cash-generating unit's fair value less costs of disposal and its value-in-use and is determined for an individual asset, unless the asset does not generate cash inflows that are largely independent of those from other assets or group of assets. Where the carrying amount of an asset or cash-generating unit exceeds its recoverable amount, the asset is considered impaired and is written down to its recoverable amount. In assessing value-in-use, the estimated future cash flows expected to be generated by the asset are discounted to their present value using a pre-tax discount rate that reflects current market assessments of the time value of money and the risks specific to the asset. In determining fair value less costs of disposal, recent market transactions are taken into account, if available. If no such costs can be identified, an appropriate valuation model is used. Impairment losses are recognised in profit or loss. An assessment is made at each reporting date as to whether there is any indication that previously recognised impairment losses may no longer exist or may have decreased. If such indication exists, the Group estimates the asset's or cash-generating unit's recoverable amount. A previously recognised impairment loss is reversed only if there has been a change in the estimates used to determine the asset's recoverable amount since the last impairment loss was recognised. If that is the case, the carrying amount of the asset is increased to its recoverable amount. That increase cannot exceed the carrying amount that would have been determined, net of depreciation, had no impairment loss been recognised previously. Such reversal is recognised in profit or loss. Impairment losses are recognised as an immediate expense. However, the impairment loss shall be recognised in other comprehensive income to the extent of any credit balance existing in the revaluation surplus in respect of that asset. The decrease recognised in other comprehensive income reduces the amount accumulated in equity under the heading of revaluation surplus
(i) JOINTLY CONTROLLED ASSETS – A jointly controlled asset involves joint control and ownership by the Group and other venturers of assets contributed to or acquired. The Group accounts for its share of the jointly controlled assets, any liabilities it has incurred, its share of any liabilities jointly incurred with other ventures, income from the sale or used of its share of the joint venture’s output, together with its share of the expense incurred by the joint venture, and any expenses it incurs in relation to tits interest in the joint venture.
37

AVATION PLC NOTES TO THE FINANCIAL STATEMENTS FOR THE FINANCIAL YEAR ENDED 30 JUNE 2014 3 SUMMARY OF SIGNIFICANT ACCOUNTING POLICIES (CONT’D)
(j) PROVISIONS - Provisions are recognised when the Group has a present obligation as a result of a past event, and it is probable that the Group will be required to settle that obligation. Provisions are measured at the directors’ best estimate of the expenditure required to settle the obligation at the reporting date, and are discounted to present value where the effect is material. In respect of maintenance rent, a corresponding provision is made in accordance with the expected maintenance costs that will be drawn in accordance with the lease conditions and lease term.
(k) SHARE-BASED PAYMENTS – The cost of share based payment arrangements whereby employees
receive remuneration in the form of warrants, is recognised as an employee benefit expense in profit or loss. The total expense to be apportioned over the vesting period of the benefit is determined by reference to the fair value at date of grant. The assumption underlying the number of warrants expected to vest are subsequently adjusted for the effects of non market-based vesting conditions prevailing at the reporting date. Fair value is measured by the use of the Black-Scholes method and is based on a reasonable expectation of the extent to which performance criteria will be met.
(l) LEASES – The Group leases aircraft to airlines under operating leases. Leases of aircraft where
the Group retains substantially all risks and rewards incidental to ownership are classified as operating leases. Rental income from operating leases (net of any incentives given to the lessees) is recognised in the profit or loss on a straight-line basis over the lease term.
The Group leases aircraft for use in the business. Where the Group bears substantially all the risk and rewards of ownership of the item, the lease is classified as a finance lease and the item is capitalised within the appropriate class of property, plant and equipment at the lower of the fair value of the leased item and the minimum lease payments. Each lease payment is allocated between the liability and finance charges so as to obtain a constant rate on the finance balance outstanding. The outstanding capital element of the lease payments are included within current and long-term payables as appropriate; the interest element of the lease payments is charged to profit or loss over the period of the lease so as to produce a constant periodic rate of interest on the remaining balance of the liability for each period.
38

AVATION PLC NOTES TO THE FINANCIAL STATEMENTS FOR THE FINANCIAL YEAR ENDED 30 JUNE 2014 3 SUMMARY OF SIGNIFICANT ACCOUNTING POLICIES (CONT’D)
(m) REVENUE RECOGNITION – Revenue is measured at the fair value of the consideration received or receivable and represents amounts receivable for goods and services provided in the normal course of business, net of discounts and sales related taxes.
(i) Aircraft rental income is recognised in the profit or loss on a straight line basis over the terms
of the lease. Lease incentives granted are recognised as an integral part of the total rental income.
(ii) Maintenance rental income recognised in the profit or loss is based on the number of flight
hours and cycles the Aircraft are operated during the term of the lease. Maintenance rents are set at levels which are designed to equal or exceed expected expense.
Where a maintenance reserve claim against a component in excess of the component's maintenance reserve balance is accepted by the company as being a payment of the maintenance rent in advance for that component, that excess is also recognised as maintenance rental income.
(iii) Interest income is accrued on a time basis, by reference to the principal outstanding and at the effective interest rate applicable, which is the rate that exactly discounts estimated future cash receipts through the expected life of the financial asset to that asset’s net carrying amount.
(iv) Sales of goods are recognised when goods are delivered and title has passed.
(v) Dividend income from investments is recognised when the shareholders’ right to receive
payment have been established.
(vi) Licence fees received are recognised over the life of the licence agreement. Ongoing royalties/commissions pursuant to the licence agreement are recognised as earned.
(n) BORROWING COSTS - Borrowing costs are capitalised as part of the cost of a qualifying asset if
they are directly attributable to the acquisition, construction or production of that asset. Capitalisation of borrowing costs commences when the activities to prepare the asset for its intended use or sale are in progress and the expenditures and borrowing costs are incurred. Borrowing costs are capitalised until the assets are substantially completed for their intended use or sale. All other borrowing costs are expensed in the period they occur. Borrowing costs consist of interest and other costs that an entity incurs in connection with the borrowing of funds.
(o) CONTINGENCIES – A contingent liability is:
(a) a possible obligation that arises from past events and whose existence will be confirmed only
by the occurrence or non-occurrence of one or more uncertain future events not wholly within the control of the Group; or
(b) a present obligation that arises from past events but is not recognised because:
(i) It is not probable that an outflow of resources embodying economic benefits will be required to settle the obligation; or
(ii) The amount of the obligation cannot be measured with sufficient reliability.
A contingent asset is a possible asset that arises from past events and whose existence will be confirmed only by the occurrence or non-occurrence of one or more uncertain future events not wholly within the control of the Group.
39

AVATION PLC NOTES TO THE FINANCIAL STATEMENTS FOR THE FINANCIAL YEAR ENDED 30 JUNE 2014
3 SUMMARY OF SIGNIFICANT ACCOUNTING POLICIES (CONT’D)
(p) TAXATION - Taxation expense represents the sum of the tax currently payable and deferred tax.
The tax currently payable is based on taxable profit for the financial period. Taxable profit differs from profit as reported in profit or loss because it excludes items of income or expense that are taxable or deductible in other years and it further excludes items that are never taxable or deductible. The Group’s liability for current tax is calculated using tax rates that have been enacted or substantively enacted by the reporting date.
Deferred tax is recognised on differences between the carrying amounts of assets and liabilities in
the financial statements and the corresponding tax bases used in the computation of taxable profit. Deferred tax liabilities are generally recognised for all taxable temporary differences and deferred tax assets are recognised to the extent that it is probable that taxable profits will be available against which deductible temporary differences can be utilised. Such assets and liabilities are not recognised if the temporary difference arises from goodwill or from the initial recognition (other than in a business combination) of other assets and liabilities in a transaction that affects neither the taxable profit nor the accounting profit.
Deferred tax liabilities are recognised for taxable temporary differences arising on investments in
subsidiaries, except where the Group is able to control the reversal of the temporary difference and it is probable that the temporary difference will not reverse in the foreseeable future.
The carrying amount of deferred tax assets is reviewed at each reporting date and reduced to the extent that it is no longer probable that sufficient taxable profits will be available to allow all or part of the asset to be recovered.
Deferred tax is calculated at the tax rates that are expected to apply in the period when the liability
is settled or the asset realised. Deferred tax is charged or credited to profit or loss, except when it relates to items charged or credited directly to equity, in which case the deferred tax is also dealt with in equity.
Deferred tax assets and liabilities are offset when there is a legally enforceable right to set off
current tax assets against current tax liabilities and when they relate to income taxes levied by the same taxation authority and the Group intends to settle its current tax assets and liabilities on a net basis.
With effect from 1 April 2011 the Company migrated its business to become Singapore resident for
tax purposes.
40

AVATION PLC NOTES TO THE FINANCIAL STATEMENTS FOR THE FINANCIAL YEAR ENDED 30 JUNE 2014 3 SUMMARY OF SIGNIFICANT ACCOUNTING POLICIES (CONT’D)
(q) FOREIGN CURRENCIES - The Group’s consolidated financial statements and Company financial statements are presented in United States dollars, which is the presentational currency. The individual financial statements of each Group entity are presented in the currency of the primary economic environment in which the entity operates (its functional currency) and United States Dollars is the functional currency of the each of the Group entity, including the parent company. In preparing the financial statements of the individual entities, transactions in currencies other than the entity’s functional currency (foreign currencies) are recorded at the rates of exchange prevailing on the dates of the transactions. At each reporting date, monetary items denominated in foreign currencies are retranslated at the rates prevailing on the reporting date. Non-monetary items carried at fair value that are denominated in foreign currencies are retranslated at the rates prevailing on the date when the fair value was determined. Non-monetary items that are measured in terms of historical cost in a foreign currency are not retranslated.
Exchange differences arising on the settlement of monetary items, and on the retranslation of
monetary items, are included in the profit or loss for the period. Exchange differences arising on the retranslation of non-monetary items carried at fair value are included in the profit or loss for the period except for differences arising on the retranslation of non-monetary items in respect of which gains and losses are recognised directly in equity. For such non-monetary items, any exchange component of that gain or loss is also recognised directly in equity.
For the purpose of presenting consolidated financial statements, the assets and liabilities of the
Group’s foreign operations are expressed in United States dollars using exchange rates prevailing on the reporting date. Income and expense items are translated at the average exchange rates for the period, unless exchange rates fluctuated significantly during that period, in which case the exchange rates at the dates of the transactions are used. Exchange differences arising, if any, are classified as equity and transferred to the Group’s translation reserve. Such translation differences are recognised in profit or loss in the period in which the foreign operation is disposed of.
Goodwill and fair value adjustments arising on the acquisition of a foreign operation are treated as
assets and liabilities of the foreign operation and translated at the closing rate.
41

AVATION PLC NOTES TO THE FINANCIAL STATEMENTS FOR THE FINANCIAL YEAR ENDED 30 JUNE 2014 3 SUMMARY OF SIGNIFICANT ACCOUNTING POLICIES (CONT’D)
(r) FINANCIAL INSTRUMENTS - Financial assets and financial liabilities are recognised on the Group’s statement of financial position when the Group becomes a party to the contractual provisions of the instrument.
(i) Trade and other receivables – Trade and other receivables are measured at initial
recognition at fair value, and are subsequently measured at amortised cost using the effective interest rate method. Appropriate allowances for estimated irrecoverable amounts are recognised in profit or loss when there is objective evidence that the asset is impaired. The allowance recognised is measured as the difference between the asset’s carrying amount and the present value of estimated future cash flows discounted at the effective interest rate computed at initial recognition.
(ii) Cash and cash equivalents - Cash and cash equivalents comprise cash at bank and on
hand and call deposits which are subject to an insignificant risk of changes in value.
(iii) Financial liabilities and equity - Financial liabilities and equity instruments issued by the Group are classified according to the substance of the contractual arrangements entered into and the definitions of a financial liability and an equity instrument. An equity instrument is any contract that evidences a residual interest in the assets of the Group after deducting all of its liabilities. The accounting policies adopted for specific financial liabilities and equity instruments are set out below.
(iv) Borrowings - Interest-bearing loans from banks and financial institutions are initially
measured at fair value, and are subsequently measured at amortised cost, using the effective interest rate method. Any difference between the proceeds (net of transaction costs) and the settlement or redemption of borrowings is recognised over the term of the borrowings in accordance with the Group’s accounting policy for borrowing costs (see above). Insurance premiums paid to export credit agencies independent of the lending bank or financial institution are not considered to constitute transaction costs and are accounted for separately.
(v) Trade and other payables - Trade payables are stated at their original invoiced value, as the
interest that would be recognised from discounting future cash payments over the short payment period is not considered to be material.
(vi) Equity instruments - Equity instruments issued by the Company are recorded at the
proceeds received, net of direct issue costs.
42

AVATION PLC NOTES TO THE FINANCIAL STATEMENTS FOR THE FINANCIAL YEAR ENDED 30 JUNE 2014 3 SUMMARY OF SIGNIFICANT ACCOUNTING POLICIES (CONT’D)
(s) IMPAIRMENT OF FINANCIAL ASSETS - The Group assesses at each end of the reporting date whether there is any objective evidence that a financial asset is impaired.
For financial assets carried at amortised cost, the Group first assesses individually whether objective evidence of impairment exists individually for financial assets that are individually significant, or collectively for financial assets that are not individually significant. If the Group determines that no objective evidence of impairment exists for an individually assessed financial asset, whether significant or not, it includes the asset in a group of financial assets with similar credit risk characteristics and collectively assesses them for impairment. Assets that are individually assessed for impairment and for which an impairment loss is, or continues to be recognised are not included in a collective assessment of impairment. If there is objective evidence that an impairment loss on financial assets carried at amortised cost has incurred, the amount of the loss is measured as the difference between the asset's carrying amount and the present value of estimated future cash flows discounted at the financial asset's original effective interest rate. If a loan has a variable interest rate, the discount rate for measuring any impairment loss is the current effective interest rate. The carrying amount of the asset is reduced through the use of an allowance account. The impairment loss is recognised in profit or loss. When the asset becomes uncollectible, the carrying amount of impaired financial assets is reduced directly or if an amount was charged to the allowance account, the amounts charged to the allowance account are written off against the carrying value of the financial asset. To determine whether there is objective evidence that an impairment loss on financial assets has incurred, the Group considers factors such as the probability of insolvency or significant financial difficulties of the debtor and default or significant delay in payments. If in a subsequent period, the amount of the impairment loss decreases and the decrease can be related objectively to an event occurring after the impairment was recognised, the previously recognised impairment loss is reversed to the extent that the carrying amount of the asset does not exceed its amortised cost at the reversal date. The amount of reversal is recognised in profit or loss.
(t) SEGMENTAL REPORTING - Operating segments are reported in a manner consistent with the internal reporting provided to the executive chairman who is responsible for allocating resources and assessing performance of operating segments.
43

AVATION PLC NOTES TO THE FINANCIAL STATEMENTS FOR THE FINANCIAL YEAR ENDED 30 JUNE 2014 4 CRITICAL ACCOUNTING ESTIMATES AND JUDGEMENTS
Estimates and assumptions concerning the future are made in the preparation of the financial statements. They affect the application of the Group’s accounting policies, reported amounts of assets, liabilities, income and expenses and disclosures made. They are assessed on an ongoing basis and are based on experience and relevant factors, including expectations of future events that are believed to be reasonable under the circumstances. The key assumptions concerning the future estimation uncertainty at the reporting date, that have a significant risk of causing a material adjustment to the carrying amounts of assets and liabilities within the next financial year are discussed below.
(i) Impairment of property, plant and equipment – aircraft
The Group periodically evaluates its aircraft for impairment. Factors that would indicate potential impairment would include, but not be limited to, significant decreases in the market value of aircraft or, a significant change in an aircraft’s physical condition or cash-flow associated with the use of the aircraft. The Group continues to record positive cash flows from its aircraft. The Group has identified impairment related to its existing aircraft fleet during the financial year.
(ii) Revaluation of property, plant and equipment – aircraft
The Group periodically revalues its aircraft using lease encumbered value (“LEV”). Under such a valuation, which reflects highest and best use given the fact that the aircraft are held for use in a leasing business, the income streams associated with the lease and the expected future market value of the aircraft at the end of the lease are discounted to current values. Critical assumptions made in determining LEV are the discount rate applied to cashflows associated with the lease and the expected future value of aircraft at the end of the lease.
(iii) Maintenance reserve claims and rent
The Group provides for maintenance reserve claims for certain aircraft. Management has relied on industry experience and information from aircraft manufacturers and airlines to estimate the provision for the maintenance reserve claims. These estimates can be subject to revisions depending on a number of factors such as the timing of the planned maintenance, the utilisation of the aircraft, changes to the manufacturer’s maintenance program or a change in the estimated costs. Management evaluates its estimates and assumptions and, when warranted, adjusts these assumptions which may impact the maintenance reserve claim expense in the profit or loss. As disclosed in note 3(m)(ii) maintenance rental income recognised in the profit or loss is based on the number of flight hours and cycles the Aircraft are operated during the term of the lease. The Group considers that the lessee acts as agent for the Group in performing the repair and therefore that it is appropriate to recognise income from maintenance rent as revenue and the cost of performing those repairs in expenses. There were no maintenance reserves at the year end.
44

AVATION PLC NOTES TO THE FINANCIAL STATEMENTS FOR THE FINANCIAL YEAR ENDED 30 JUNE 2014 4 CRITICAL ACCOUNTING ESTIMATES AND JUDGEMENTS (CONT’D)
(iv) Impairment of loans and receivables
The Group assesses at the end of each reporting period whether there is any objective evidence that a financial asset is impaired. To determine whether there is objective evidence of impairment, the Company considers factors such as the probability of insolvency or significant financial difficulties of the debtor and default or significant delay in payments. Where there is objective evidence of impairment, the amount and timing of future cash flows are estimated based on historical loss experience for assets with similar risk characteristics.
(v) Withholding taxes
During the current financial period, the Group’s Singapore subsidiaries have obtained interest bearing loans from foreign lenders. Under the Singapore Income Tax Act, the interest which is borne by the Group will be deemed to be derived from Singapore and the Group is required to withhold tax on the interest payables to the foreign lenders. Management is in the process of applying with the Ministry of Finance (“MOF”) for the withholding tax exemption under Section 13 of the Income Tax Act. Based on the management’s judgment, the Group is, more likely than not, to obtain the waiver from MOF for the withholding tax on its interest payments made to the lenders. Accordingly, the Group has not provided for the withholding tax payable as at the end of the reporting period. Had the Group provided for the withholding tax payable as at the end of the reporting period, profit for the period would be reduced by approximately US$223,000.
(vi) Income taxes
a) During the current financial period, Avation Group (S) Pte Ltd (“AGS”) and its
subsidiaries has been awarded a 5-year Aircraft Leasing Scheme (“ALS”) incentive from the Singapore Economic Development Board, where income from the leasing of aircraft and aircraft engines and qualifying activities will be taxed at a concessionary rate of 10%. The effective date is 17 April 2014. Accordingly, qualifying income derived from the period 17 April 2014 to 16 April 2019 will be taxed at the 10% concessionary rate subject to meeting the terms and conditions of the incentive. The Group is currently in the process of reorganising and planned to make Avation Eastern Fleet Pte Ltd and Avation Eastern Fleet IV Pte. Ltd. subsidiaries of AGS to enjoy the ALS. The directors are of the view that the Group’s reorganisation will be completed successfully and the Avation Eastern Fleet Pte Ltd and Avation Eastern Fleet IV Pte. Ltd will qualify for the ALS. Accordingly, in determining the carrying amount of the deferred tax liability as at the end of the reporting period, these 2 subsidiaries have applied the concessionary tax rate of 10%. Had these 2 subsidiaries applied the prevailing Singapore corporate tax rate of 17%, the profit for the year would have decreased by approximately US$1,056,000.
45

AVATION PLC NOTES TO THE FINANCIAL STATEMENTS FOR THE FINANCIAL YEAR ENDED 30 JUNE 2014 4 CRITICAL ACCOUNTING ESTIMATES AND JUDGEMENTS (CONT’D)
b) Significant judgment is required in determining the capital allowances and deductibility of certain expenses during the estimation of the provision for income taxes. There are many transactions and calculations for which the ultimate tax determination is uncertain during the ordinary course of business.
The Group recognises liabilities for anticipated tax issues based on estimates of whether additional taxes will be due. Where the final tax outcome of these matters is different from the amounts that were initially recorded, such differences will impact the income tax and deferred income tax provisions in the period in which the determination is made.
(vii) Consolidation of special purpose entity (“SPE”) – Avation Airframe Holdings Pte. Ltd.
The directors have considered whether this company, which was set up during the previous year and which forms part of a financing structure to facilitate the acquisition of certain new aircraft, should be consolidated as a subsidiary undertaking. Although the ultimate shareholder of the SPE is a trust, the directors consider that Avation PLC has the power to control the day to day activities of the SPE and indeed does so in practice through one of its wholly owned subsidiary undertakings. Furthermore, Avation PLC is entitled to the benefits and exposed to the risks of the activities of the SPE, which are entirely consistent with the ongoing major operations of the Avation Group, and are conducted on behalf of the Group according to the Group’s specific business needs. Accordingly the directors consider that the SPE is controlled by the Group and have consolidated it as a subsidiary in these financial statements. The Group would cease to control the SPE in the event of a “Relevant Event” as defined in the financing agreement, for example, a delay in payment of interest. Were this to occur consolidation would cease at that point although the Group has no intention, or anticipation, that any such event will occur.
46

AVATION PLC NOTES TO THE FINANCIAL STATEMENTS FOR THE FINANCIAL YEAR ENDED 30 JUNE 2014 5. NEW STANDARDS AND INTERPRETATIONS NOT APPLIED AND STANDARDS IN EFFECT IN
2014
a) New standards and interpretations not applied The IASB and IFRIC have issued the following standards and interpretations with an effective date after
the date of these financial statements. The Group intends to apply these standards and interpretations when they become effective. International Accounting Standards (IAS/IFRS) Effective Date (accounting periods commencing after) IFRS 9 Financial Instruments 1 January 2018 IFRS 10 Consolidated Financial Statements 1 January 2014 IFRS 12 Disclosure of Interest with Other Entities 1 January 2014 IAS 27 Separate Financial Statements 1 January 2014 Amendments to IAS32 Offsetting Financial Assets and Financial Liabilities 1 January 2014 IFRIC Interpretation 21 Levies 1 January 2014 Amendments to IAS 39 Novation of Derivatives and Continuation of Hedge Accounting 1 January 2014 The Group, however, expects no impact from the adoption of the amendments on its financial position or
performance.
b) Standards in effect in 2014
The Group has adopted all the new standards that has come into effect during the financial year.
47
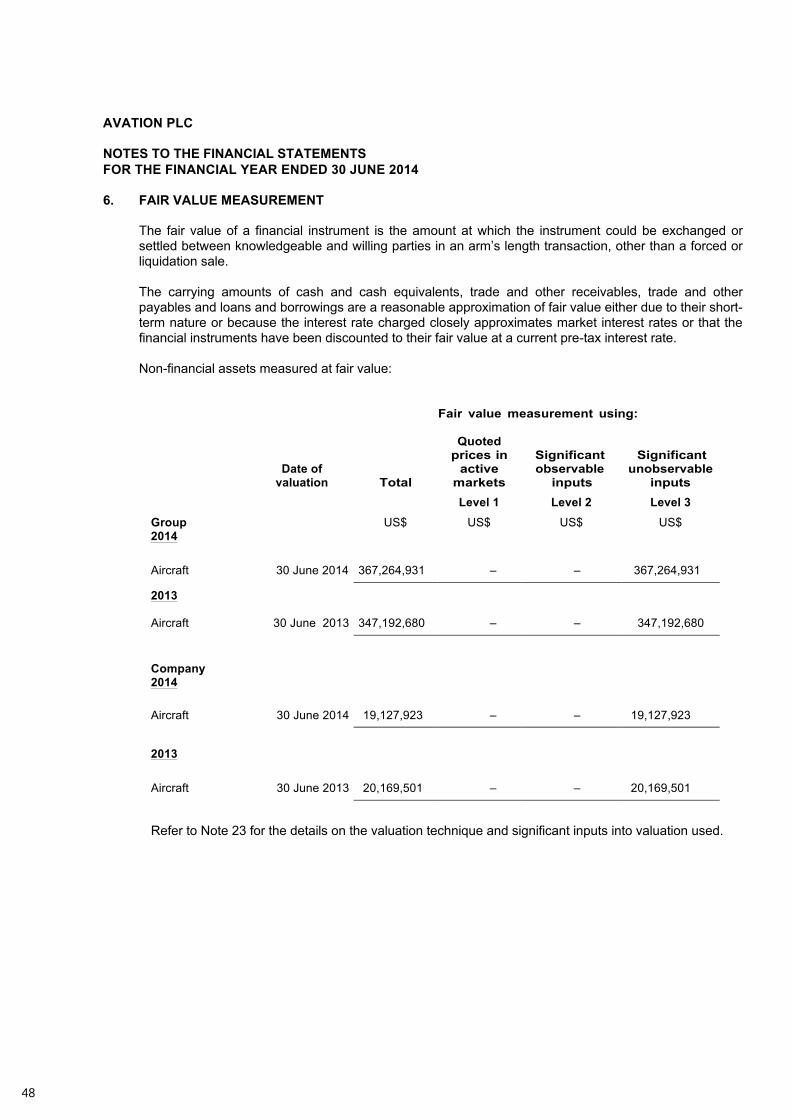
AVATION PLC NOTES TO THE FINANCIAL STATEMENTS FOR THE FINANCIAL YEAR ENDED 30 JUNE 2014 6. FAIR VALUE MEASUREMENT The fair value of a financial instrument is the amount at which the instrument could be exchanged or
settled between knowledgeable and willing parties in an arm’s length transaction, other than a forced or liquidation sale.
The carrying amounts of cash and cash equivalents, trade and other receivables, trade and other
payables and loans and borrowings are a reasonable approximation of fair value either due to their short-term nature or because the interest rate charged closely approximates market interest rates or that the financial instruments have been discounted to their fair value at a current pre-tax interest rate.
Non-financial assets measured at fair value:
Fair value measurement using:
Date of valuation Total
Quoted prices in
active markets
Significant observable
inputs
Significant unobservable
inputs Level 1 Level 2 Level 3 Group US$ US$ US$ US$ 2014 Aircraft 30 June 2014 367,264,931 – – 367,264,931 2013 Aircraft 30 June 2013 347,192,680 – – 347,192,680 Company 2014 Aircraft 30 June 2014 19,127,923 – – 19,127,923 2013 Aircraft 30 June 2013 20,169,501 – – 20,169,501
Refer to Note 23 for the details on the valuation technique and significant inputs into valuation used.
48

AVATION PLC NOTES TO THE FINANCIAL STATEMENTS FOR THE FINANCIAL YEAR ENDED 30 JUNE 2014 6. FAIR VALUE MEASUREMENT (CONT’D)
Classification of financial instruments Set out below is a comparison by category of carrying amounts of all the Group and Company's financial instruments that are carried in the financial statements which are considered to equate to fair value.
Loans and receivables
Financial liabilities
measured at amortised
cost Total GROUP US$ US$ US$ 2014 Assets Cash and cash equivalents 23,394,739 – 23,394,739 Trade and other receivables 13,127,397 – 13,127,397 36,522,136 – 36,522,136 Liabilities Trade and other payables – 17,299,980 17,299,980 Loans and borrowings – 274,658,086 274,658,086 – 291,958,066 291,958,066 2013 Assets Cash and cash equivalents 19,623,244 – 19,623,244 Trade and other receivables 14,349,584 – 14,349,584 33,972,828 – 33,972,828 Liabilities Trade and other payables – 17,750,571 17,750,571 Loans and borrowings – 263,449,583 263,449,583 – 281,200,154 281,200,154
49

AVATION PLC NOTES TO THE FINANCIAL STATEMENTS FOR THE FINANCIAL YEAR ENDED 30 JUNE 2014 6. FAIR VALUE MEASUREMENT (CONT’D)
Loans and receivables
Financial liabilities
measured at amortised
cost Total COMPANY US$ US$ US$ 2014 Assets Cash and cash equivalents 1,974,783 – 1,974,783 Trade and other receivables 42,784,692 – 42,784,692
44,759,475 – 44,759,475
Liabilities Trade and other payables – 19,337,306 19,337,306 Loans and borrowings – 12,054,809 12,054,809 – 31,392,115 31,392,115 2013 Assets Cash and cash equivalents 3,406,322 – 3,406,322 Trade and other receivables 28,301,227 – 28,301,227 31,707,549 – 31,707,549 Liabilities Trade and other payables – 5,799,006 5,799,006 Loans and borrowings – 13,470,218 13,470,218 – 19,269,224 19,269,224
50

AVATION PLC NOTES TO THE FINANCIAL STATEMENTS FOR THE FINANCIAL YEAR ENDED 30 JUNE 2014 7 FINANCIAL RISK MANAGEMENT OBJECTIVES AND POLICIES The main risks arising from the Group’s financial assets and liabilities are airline industry risks, credit risk,
interest rate risk, foreign exchange risk and liquidity risks.
(i) Airline Industry Risks The Group faces risks specific to the aviation sector, war, terrorism, and equipment failure. These
exposures are managed through the requirement for the airlines that lease the Group’s assets to maintain insurance, adequate maintenance policies and/or contribute to a maintenance reserve for the major maintenance on each aircraft.
(ii) Credit risk
Credit risk refers to the risk that debtors will default on their obligations to repay the amounts
owing to the Group, resulting in a loss to the Group. The Group has adopted prudent credit policy in extending credit terms to customers and in
monitoring its credit terms. The credit policy provides guidelines on extending credit terms to customers, including
monitoring the process. This includes assessing customers’ credit standing and periodic review of their financial status to determine the credit limits to be granted. The Company performs ongoing credit evaluation of its customers’ financial condition and generally, requires collateral from its customers.
The maximum exposure to credit risk in the event that the counterparties fail to perform their
obligations as at the end of the financial period in relation to each class of financial assets is the carrying amount of those assets as stated in the statement of financial position. The Group’s concentration of customers is disclosed in note 34. The risk is mitigated by the requirement that customers pay a 3 month deposit by way of cash or letter of credit and the Group is entitled to recover the aircraft and enter into a new lease with a third party if the customer defaults.
The maximum exposure to credit risk for trade receivables at the reporting date by geographical
area is:
Group 2014 2013
US$ US$
Australia 1,311,548 3,945,275 Others 222,810 588,975 1,534,358 4,534,250
51
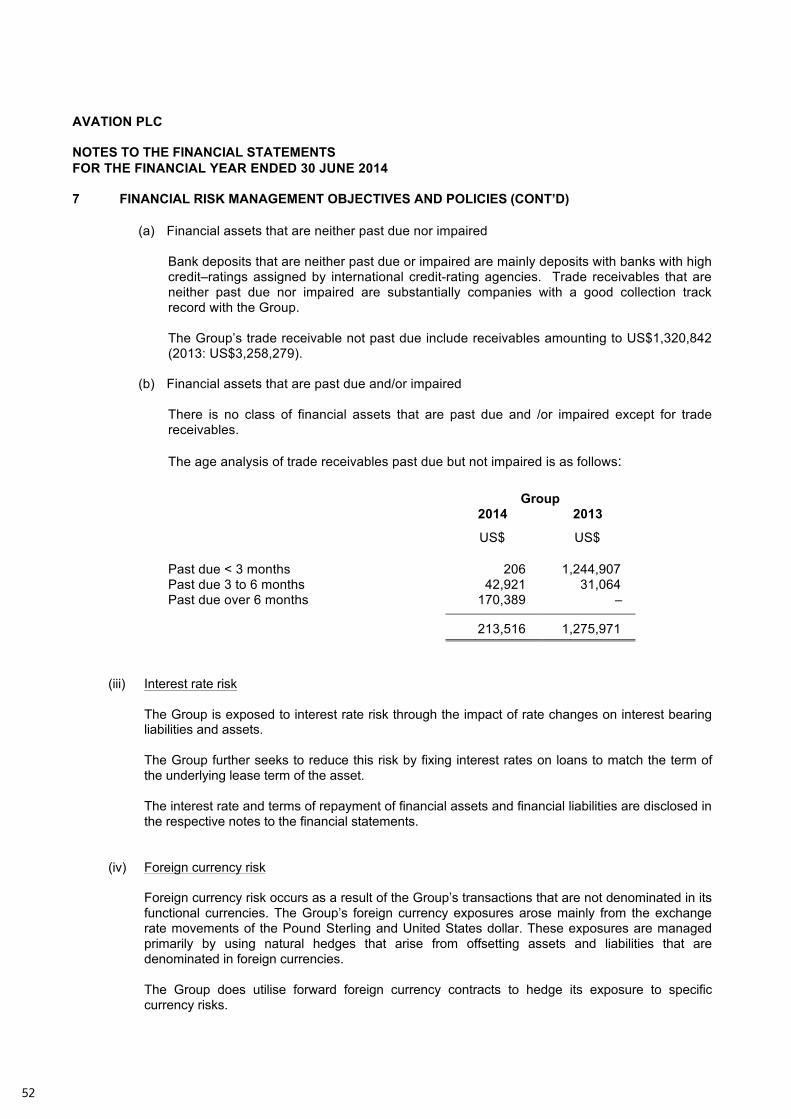
AVATION PLC NOTES TO THE FINANCIAL STATEMENTS FOR THE FINANCIAL YEAR ENDED 30 JUNE 2014 7 FINANCIAL RISK MANAGEMENT OBJECTIVES AND POLICIES (CONT’D)
(a) Financial assets that are neither past due nor impaired
Bank deposits that are neither past due or impaired are mainly deposits with banks with high credit–ratings assigned by international credit-rating agencies. Trade receivables that are neither past due nor impaired are substantially companies with a good collection track record with the Group. The Group’s trade receivable not past due include receivables amounting to US$1,320,842 (2013: US$3,258,279).
(b) Financial assets that are past due and/or impaired
There is no class of financial assets that are past due and /or impaired except for trade receivables. The age analysis of trade receivables past due but not impaired is as follows: Group
2014 2013
US$ US$
Past due < 3 months 206 1,244,907 Past due 3 to 6 months 42,921 31,064 Past due over 6 months 170,389 – 213,516 1,275,971
(iii) Interest rate risk
The Group is exposed to interest rate risk through the impact of rate changes on interest bearing liabilities and assets.
The Group further seeks to reduce this risk by fixing interest rates on loans to match the term of the underlying lease term of the asset. The interest rate and terms of repayment of financial assets and financial liabilities are disclosed in the respective notes to the financial statements.
(iv) Foreign currency risk
Foreign currency risk occurs as a result of the Group’s transactions that are not denominated in its functional currencies. The Group’s foreign currency exposures arose mainly from the exchange rate movements of the Pound Sterling and United States dollar. These exposures are managed primarily by using natural hedges that arise from offsetting assets and liabilities that are denominated in foreign currencies.
The Group does utilise forward foreign currency contracts to hedge its exposure to specific
currency risks.
52

AVATION PLC NOTES TO THE FINANCIAL STATEMENTS FOR THE FINANCIAL YEAR ENDED 30 JUNE 2014 7 FINANCIAL RISK MANAGEMENT OBJECTIVES AND POLICIES (CONT’D) The Group’s foreign currency exposure is as follows:
Group
Pounds Sterling
Australian Dollars
Euro
Singapore Dollars
Total
2014 US$ US$ US$ US$ US$
Cash and cash equivalents 360,990 5,562 14,211 251,272 632,035 Trade and other receivables – 1,416 7,357 36,628 45,401 Other financial liabilities (135,884) (6,256) (81,382) (91,604) (315,126) Currency exposure 225,106 722 (59,814) 196,296 362,310 2013 Cash and cash equivalents 2,898,583 19,708 10,992 141,414 3,070,697 Trade and other receivables 35,027 18,630 6,735 182,795 243,187 Other financial liabilities (45,263) (47,768) (9,322) (82,944) (185,297) Currency exposure 2,888,347 (9,430) 8,405 241,265 3,128,587
Company
Pounds Sterling
Australian Dollars
Euro
Singapore Dollars
Total
2014 US$ US$ US$ US$ US$ Cash and cash equivalents 262,455 – – 146,576 409,031 Trade and other receivables – 1,416 7,357 36,628 45,401 Other financial liabilities (91,379) (6,256) (75,979) (16,125) (189,739) Currency exposure 171,076 (4,840) (68,622) 167,079 264,693 2013 Cash and cash equivalents 2,788,225 – – 1,520 2,789,745 Trade and other receivables 838,120 4,573 88,767 60,963 992,423 Other financial liabilities (109,159) (25,750) (43,125) (96,689) (274,723) Currency exposure 3,517,186 (21,177) 45,642 (34,206) 3,507,445
53

AVATION PLC NOTES TO THE FINANCIAL STATEMENTS FOR THE FINANCIAL YEAR ENDED 30 JUNE 2014 7 FINANCIAL RISK MANAGEMENT OBJECTIVES AND POLICIES (CONT’D)
If the foreign currencies changes against the United States Dollars by 10% (2013: 10%) with all other variables including tax rate being held constant, the effects arising from the net financial liability/asset position will be as follows:
Increase/(Decrease) Increase/(Decrease) 2014 2014 2013 2013 Group Profit after tax Equity Profit after tax Equity US$ US$ US$ US$ GBP against US$ - strengthen 22,511 22,511 288,835 288,835 - weakened (22,511) (22,511) (288,835) (288,835) AUD against US$ - strengthen 72 72 (943) (943) - weakened (72) (72) 943 943 Euro against US$ - strengthen (5,981) (5,981) 840 840 - weakened 5,981 5,981 (840) (840) SGD against US$ - strengthen 19,630 19,630 24,126 24,126 - weakened (19,630) (19,630) (24,126) (24,126)
Increase/(Decrease) Increase/(Decrease) 2014 2014 2013 2013 Company Profit after tax Equity Profit after tax Equity US$ US$ US$ US$ GBP against US$ - strengthen 17,108 17,108 351,719 351,719 - weakened (17,108) (17,108) (351,719) (351,719) AUD against US$ - strengthen (484) (484) (2,118) (2,118) - weakened 484 484 2,118 2,118 Euro against US$ - strengthen (6,862) (6,862) 4,564 4,564 - weakened 6,862 6,862 (4,564) (4,564) SGD against US$ - strengthen 16,708 16,708 (3,421) (3,421) - weakened (16,708) (16,708) 3,421 3,421
54

AVATION PLC NOTES TO THE FINANCIAL STATEMENTS FOR THE FINANCIAL YEAR ENDED 30 JUNE 2014 7 FINANCIAL RISK MANAGEMENT OBJECTIVES AND POLICIES (CONT’D)
(v) Liquidity risk
Liquidity risk is the risk that the Group will encounter difficulty in meeting financial obligations due to shortage of funds. The Group’s exposure to liquidity risk arises primarily from mismatches of the maturities of financial assets and liabilities. The Group monitors and maintains a level of cash and cash equivalents deemed adequate by management to finance the Group’s operations and mitigate the effects of fluctuations in cash flows. Short-term funding is obtained from loan facilities.
Analysis of financial instruments by remaining contractual maturities The table below summarises the maturity profile of the Group’s financial assets and liabilities at the end of the reporting period based on contractual undiscounted repayment obligations:
One year or
less One to five
years Over five
years Total Group US$ US$ US$ US$ 2014 Financial assets Cash and cash equivalents 23,394,739 – – 23,394,739 Trade and other receivables 2,804,086 11,268,750 – 14,072,836 Total undiscounted financial assets 26,198,825 11,268,750 – 37,467,575
Financial liabilities Trade and other payables 12,641,301 1,548,440 8,548,516 22,738,257 Loans and borrowings 68,243,926 148,198,989 113,113,194 329,556,109 Total undiscounted financial liabilities 80,885,227 149,747,429 121,661,710 352,294,366
Total net undiscounted financial liabilities (54,686,402) (138,478,679) (121,661,710) (314,826,791)
2013 Financial assets Cash and cash equivalents 19,623,244 – – 19,623,244 Trade and other receivables 6,337,909 9,300,261 – 15,638,170 Total undiscounted financial assets 25,961,153 9,300,261 – 35,261,414
Financial liabilities Trade and other payables 12,088,802 3,550,487 7,146,468 22,785,757 Loans and borrowings 37,226,802 153,295,495 119,298,930 309,821,227 Total undiscounted financial liabilities 49,315,604 156,845,982
126,445,398 332,606,984
Total net undiscounted financial liabilities (23,354,451) (147,545,721) (126,445,398) (297,345,570)
5555

AVATION PLC NOTES TO THE FINANCIAL STATEMENTS FOR THE FINANCIAL YEAR ENDED 30 JUNE 2014 7 FINANCIAL RISK MANAGEMENT OBJECTIVES AND POLICIES (CONT’D)
One year or
less One to five
years Over five
years Total Company US$ US$ US$ US$ 2014 Financial assets Cash and cash equivalents 1,974,783 – – 1,974,783 Trade and other receivables 31,578,274 11,268,750 – 42,847,024 Total undiscounted financial assets 33,553,057 11,268,750 – 44,821,807
Financial liabilities Trade and other payables 18,492,456 978,440 – 19,470,896 Loans and borrowings 1,992,615 11,645,734 – 13,638,349 Total undiscounted financial liabilities 20,485,071 12,624,174 – 33,109,245
Total net undiscounted financial liabilities 13,067,986 (1,355,424) – 11,712,562
2013 Financial assets Cash and cash equivalents 3,406,322 – – 3,406,322 Trade and other receivables 19,096,712 9,264,244 – 28,360,956 Total undiscounted financial assets 22,503,034 9,264,244 – 31,767,278
Financial liabilities Trade and other payables 3,840,760 2,071,487 – 5,912,247 Loans and borrowings 1,992,615 13,638,357 – 15,630,972 Total undiscounted financial liabilities 5,833,375 15,709,844 – 21,543,219
Total net undiscounted financial liabilities 16,669,659 (6,445,600) – 10,224,059
56

AVATION PLC NOTES TO THE FINANCIAL STATEMENTS FOR THE FINANCIAL YEAR ENDED 30 JUNE 2014 7 FINANCIAL RISK MANAGEMENT OBJECTIVES AND POLICIES (CONT’D)
(vi) Capital risk
The Group’s objectives when managing capital are to safeguard the Group’s ability to continue as a going concern and to maintain a suitable capital structure so as to fund growth and maximise shareholder value. In order to maintain or achieve an optimal capital structure, the Group may adjust the amount of dividend payment, return capital to shareholders, issue new shares, buy back issued shares, obtain new borrowings or sell assets to reduce borrowings. Management monitors capital based on a gearing ratio. The gearing ratio is calculated as net debt divided by total capital. Net debt is calculated as borrowings plus trade and other payables less cash and cash equivalents. Group Company 2014 2013 2014 2013 US$ US$ US$ US$ Current Net debt 272,093,631 265,003,751 29,530,573 15,976,143 Total equity 111,766,984 98,236,359 39,568,496 37,429,613 Total capital 382,860,615 363,240,110 69,099,069 53,405,756 Gearing ratio 71% 73% 43% 30%
The Group and the Company are in compliance with all externally imposed capital requirements for the financial years ended 30 June 2014 and 30 June 2013.
(vii) Fair value of financial assets and financial liabilities
The fair values of financial assets and financial liabilities reported in the statement of financial
position approximate the carrying amount of those assets and liabilities.
57

AVATION PLC NOTES TO THE FINANCIAL STATEMENTS FOR THE FINANCIAL YEAR ENDED 30 JUNE 2014 8 RELATED PARTY TRANSACTIONS In addition to the related party information disclosed elsewhere in the financial statements, the
following transactions took place between the Group and related parties at terms agreed between the parties.
(a) Compensation of directors and key management personnel
The remuneration of directors and key management’s remuneration includes fees, salary, bonus,
commission and other emoluments (including benefits-in-kind) based on the cost incurred by the Company and the Group, and where the Company or Group did not incur any costs, the value of the benefits. The key management’s remuneration is as follows:
Group Company 2014 2013 2014 2013 US$ US$ US$ US$
Key management of the Group - Directors’ fee paid to directors of
the Company 21,815 81,983 21,815 81,983 - Directors’ fee paid to directors of
subsidiaries 537,192 471,045 – – - Superannuation paid for a
director of a subsidiary 18,430 20,600 – – - Salaries paid to directors of the
Company 652,844 306,433 332,658 41,643
The amount above includes remuneration in respect of the highest paid director as follows:
Group 2014 2013
US$ US$
Aggregate emoluments 638,416 266,844
No contributions were made on behalf of any directors to money purchase pension schemes.
58
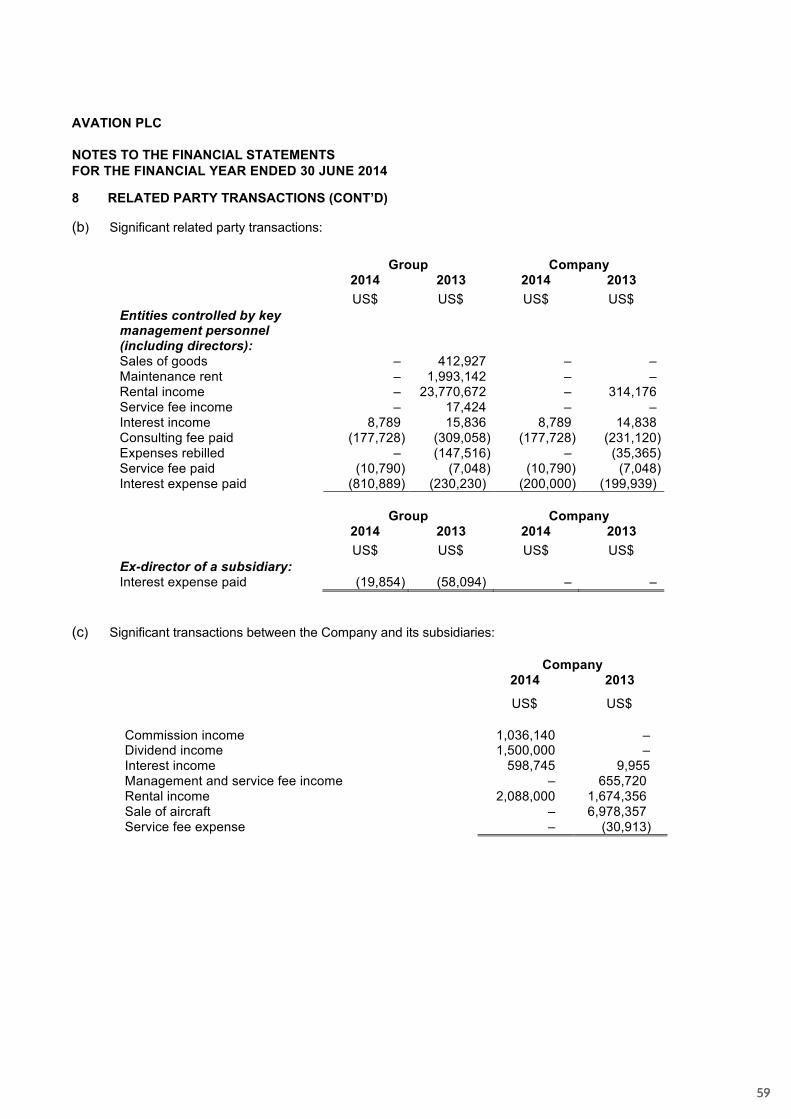
AVATION PLC NOTES TO THE FINANCIAL STATEMENTS FOR THE FINANCIAL YEAR ENDED 30 JUNE 2014 8 RELATED PARTY TRANSACTIONS (CONT’D) (b) Significant related party transactions:
Group Company 2014 2013 2014 2013
US$ US$ US$ US$ Entities controlled by key management personnel (including directors): Sales of goods – 412,927 – – Maintenance rent – 1,993,142 – – Rental income – 23,770,672 – 314,176 Service fee income – 17,424 – – Interest income 8,789 15,836 8,789 14,838 Consulting fee paid (177,728) (309,058) (177,728) (231,120) Expenses rebilled – (147,516) – (35,365) Service fee paid (10,790) (7,048) (10,790) (7,048) Interest expense paid (810,889) (230,230) (200,000) (199,939)
Group Company 2014 2013 2014 2013
US$ US$ US$ US$ Ex-director of a subsidiary: Interest expense paid (19,854) (58,094) – –
(c) Significant transactions between the Company and its subsidiaries:
Company 2014 2013
US$ US$ Commission income 1,036,140 – Dividend income 1,500,000 – Interest income 598,745 9,955 Management and service fee income – 655,720 Rental income 2,088,000 1,674,356 Sale of aircraft – 6,978,357 Service fee expense – (30,913)
5959
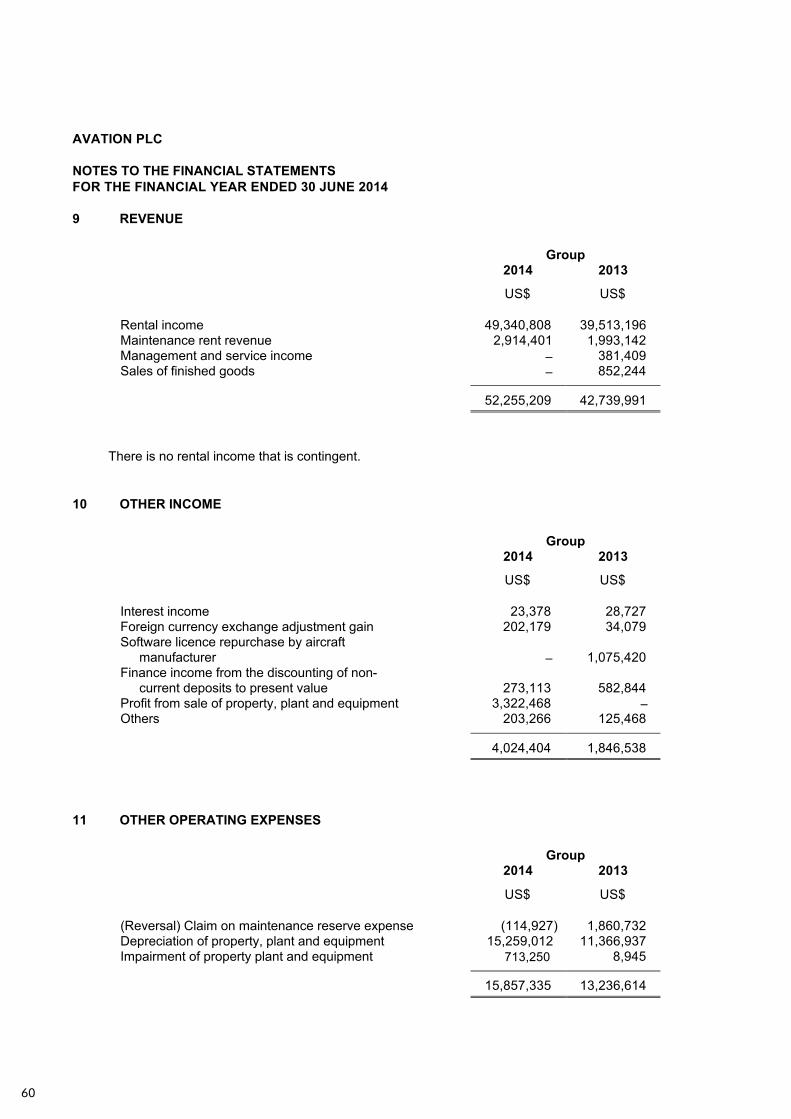
AVATION PLC NOTES TO THE FINANCIAL STATEMENTS FOR THE FINANCIAL YEAR ENDED 30 JUNE 2014 9 REVENUE
Group 2014 2013
US$ US$
Rental income 49,340,808 39,513,196 Maintenance rent revenue 2,914,401 1,993,142 Management and service income – 381,409 Sales of finished goods – 852,244 52,255,209 42,739,991
There is no rental income that is contingent. 10 OTHER INCOME
Group 2014 2013
US$ US$
Interest income 23,378 28,727 Foreign currency exchange adjustment gain 202,179 34,079 Software licence repurchase by aircraft
manufacturer
– 1,075,420 Finance income from the discounting of non-
current deposits to present value
273,113 582,844 Profit from sale of property, plant and equipment 3,322,468 – Others 203,266 125,468 4,024,404 1,846,538
11 OTHER OPERATING EXPENSES
Group 2014 2013
US$ US$
(Reversal) Claim on maintenance reserve expense (114,927) 1,860,732 Depreciation of property, plant and equipment 15,259,012 11,366,937 Impairment of property plant and equipment 713,250 8,945 15,857,335 13,236,614
60

AVATION PLC NOTES TO THE FINANCIAL STATEMENTS FOR THE FINANCIAL YEAR ENDED 30 JUNE 2014 12 ADMIINISTRATIVE EXPENSE
Group
Note 2014 2013
US$ US$
Staff costs 14 2,152,992 1,226,241 Other administrative expenses 4,804,723 2,338,557 6,957,715 3,564,798
13 FINANCE EXPENSE
Group 2014 2013
US$ US$
Interest expense on borrowings 15,569,879 11,517,628 Amortisation of loan insurance premium 1,078,239 904,658 Notional interest on deposit collected 257,883 570,267 16,906,001 12,992,553
14 STAFF COSTS
Group 2014 2013
US$ US$
Directors’ fee paid to directors of the Company 21,815 81,983 Directors’ fee paid to directors of the subsidiaries 537,192 471,045 Salaries paid to directors of Company 652,844 306,433 Wages and salaries 922,711 346,180 Superannuation paid for a director of a subsidiary 18,430 20,600 2,152,992 1,226,241
The average number of directors of the Company for the financial year is 3 (2013: 3). The average number of other employees for the financial year is 11 (2013: 4).
6161

AVATION PLC NOTES TO THE FINANCIAL STATEMENTS FOR THE FINANCIAL YEAR ENDED 30 JUNE 2014 15 PROFIT BEFORE TAXATION Profit before taxation for the year is stated after charging / (crediting) the following:
2014 2013
US$ US$ (Reversal)/Claim on maintenance reserve expense – Group (114,927) 1,860,732 Depreciation of property, plant and equipment – Group 15,259,012 11,104,963 Foreign currency exchange adjustment gain – Group 202,179 34,079 Fees payable to the Company’s auditor and their associates for the audit of the Company’s annual accounts 32,147 41,844
Fees payable to the Company’s auditor and their associates for other services to the Group - The audit of the Company’s subsidiaries 53,101 48,691
Total audit fees 85,248 90,535 Auditors’ remuneration for non-audit services:
- Tax compliance services 6,499 10,651 - Tax advisory services 3,249 – - Other services 5,399 –
15,147 10,651
62

AVATION PLC NOTES TO THE FINANCIAL STATEMENTS FOR THE FINANCIAL YEAR ENDED 30 JUNE 2014 16 TAXATION
Group 2014 2013
US$ US$ Current tax expense - United Kingdom 2,549 42,657 - Overseas 1,281,678 1,405,792 (Over)/Under provision in prior years tax expense - United Kingdom (228,875) – - Overseas 6,202 4,699 Deferred tax expense – United Kingdom (201,827) 25,575 Deferred tax expense – overseas 1,435,765 524,903 Other tax – overseas – current – 1,058 2,295,492 2,004,684
The income tax differs from amount of income tax expense determined by applying the Singapore tax rate of 17% to profit before income tax as a result of the following differences:
Group 2014 2013
US$ US$ Profit before income tax 16,558,562 13,969,677 Tax calculated at tax rate of 17% (2013: 17%) 2,814,956 2,374,845 Effects of: (Over)/Under provision in prior years tax expense - United Kingdom (228,875) – - Overseas 6,202 4,699 Non-deductible items 1,413,418 341,183 Income not subject to tax (387,554) (606,591) Different tax rates of other countries 2,817 (136,756) Effect of concessionary tax rate at 10% (1,267,000) – Singapore statutory stepped tax exemption (57,859) – Other tax – overseas – current – 1,058 Others (613) 26,246 Total income tax expense 2,295,492 2,004,684
63

AVATION PLC NOTES TO THE FINANCIAL STATEMENTS FOR THE FINANCIAL YEAR ENDED 30 JUNE 2014 17 EARNINGS PER SHARE
(a) Basic earnings per share (“EPS”)
EPS is calculated by dividing the net profit attributable to members of the Company by the weighted average number of ordinary shares in issue during the financial year.
Group
2014 2013
US$ US$ Net profit attributable to equity holders of the
Company 13,312,153 10,515,901 Weighted average number of ordinary shares 48,583,353 45,236,493 Basic earnings per share 27.40 cents 23.25 cents
Subsequent to the year end the number of ordinary shares in issue has increased to 52,877,666, of those 450,000 remain in treasury.
(b) Diluted earnings per share
For the purpose of calculating diluted earnings per share, profit attributable to equity holders of the Company and the weighted average number of ordinary shares outstanding are adjusted for the effects of all dilutive potential ordinary shares. The Company has one category of dilutive potential ordinary shares; warrants.
For warrants, the weighted average number of shares on issue has been adjusted as if all dilutive share options were exercised. The number of shares that could have been issued upon the exercise of all dilutive share option less the number of shares that could have been issued at fair value (determined as the Company’s average share price for the financial year) for the same total proceeds is added to the denominator as the number of shares issued for no consideration. None of the warrants in existence are dilutive as their exercise price is greater that the weighted average share price. No adjustment is made to the net profit. As detailed in note 31 there were 1,240,000 warrants exercisable at the reporting date which are potentially dilutive. No further potentially dilutive issues have occurred prior to the issue of the financial statements.
64

AVATION PLC NOTES TO THE FINANCIAL STATEMENTS FOR THE FINANCIAL YEAR ENDED 30 JUNE 2014 17 EARNINGS PER SHARE (CONT’D)
Diluted earnings per share attributable to equity holders of the Company is calculated as follows:
Group
2014 2013
US$ US$ Net profit attributable to equity holders of the
Company 13,312,153 10,515,901 Weighted average number of ordinary shares 48,583,353 45,236,493 Adjustment for: - Warrants – – Weighted average number of ordinary shares 48,583,353 45,236,493 Diluted earnings per share 27.40 cents 23.25 cents
18 CASH AND CASH EQUIVALENTS
Group Company 2014 2013 2014 2013
US$ US$ US$ US$ Cash at bank and on hand 19,626,881 19,623,244 1,974,783 3,406,322 Short term bank deposits 3,767,858 – – – 23,394,739 19,623,244 1,974,783 3,406,322 The rate of interest for the cash on interest earning accounts is approximately 0.14% to 2.5% (2013: 1.0% to 4.5%) per annum. These approximate the weighted average effective interest rate. Cash and cash equivalents denominated in foreign currencies are as follows:
Group Company 2014 2013 2014 2013
US$ US$ US$ US$ Pounds sterling 360,990 2,898,583 262,455 2,788,225 Australian dollars 5,562 19,708 – – Euro 14,211 10,992 – – Singapore dollars 251,272 141,414 146,576 1,520
65

AVATION PLC NOTES TO THE FINANCIAL STATEMENTS FOR THE FINANCIAL YEAR ENDED 30 JUNE 2014 19 TRADE AND OTHER RECEIVABLES
Group Company 2014 2013 2014 2013
US$ US$ US$ US$ Current: Trade receivables 1,534,358 4,534,250 591,762 195,965 Trade receivables - subsidiaries – – – 455,720 Non-trade receivables 120,144 99,743 44,094 35,343 Non-trade receivables - subsidiaries – – 30,277,045 18,036,838 Non-trade receivables – related
parties 455 – –
– Interest bearing receivable -
subsidiaries (a) & (b) – – 416,298 35,000 Interest receivable – subsidiaries – – 19,336 11,218 Interest bearing receivable –
related party (c) 124,273 232,554 124,273 232,554 Interest receivable – related party 43,134 34,345 43,134 34,345 Deposits 36,283 – – – Prepaid expense 945,439 1,288,586 62,332 59,729 Accrued income – 148,431 – – 2,804,086 6,337,909 31,578,274 19,096,712 Non-current: Deposits for aircraft 11,268,750 9,300,261 11,268,750 9,264,244 11,268,750 9,300,261 11,268,750 9,264,244
(a) Interest bearing receivable of US$381,298 (2013: US$Nil) due from a subsidiary. The receivable is unsecured, repayable upon demand. Interest is charged at 5.5% (2013 : Nil%) per annum.
(b) Interest bearing receivable of US$35,000 (2013: US$35,000) due from a subsidiary. The receivable is unsecured, repayable upon demand. Interest is charged at 1% (2013 : 1%) per annum.
(c) Interest bearing receivable of US$ US$124,273 (2013: US$232,544) is due from an entity
controlled by key management personnel. The receivable is unsecured, repayable upon demand. Interest is charged at 5% (2013: 5%) per annum.
The amounts due from subsidiaries and related parties are unsecured, interest-free and payable on demand unless otherwise stated. The average credit period generally granted to non-related trade receivables customers is 30 to 60 days. In respect to leased aircraft, rent is due in advance in accordance with the leases.
66

AVATION PLC NOTES TO THE FINANCIAL STATEMENTS FOR THE FINANCIAL YEAR ENDED 30 JUNE 2014 19 TRADE AND OTHER RECEIVABLES (CONT’D)
The trade and other receivables denominated in foreign currencies are as follows:
Group Company 2014 2013 2014 2013 US$ US$ US$ US$
Pounds sterling – 35,027 – 838,120 Australian dollars 1,416 18,630 – 4,573 Euro 7,357 6,735 5,342 88,767 Singapore dollars 36,628 182,795 – 60,963
20 PREPAYMENTS
Prepayments represent loan insurance premiums on amounts due to outside parties and are amortised over 10 years.
21 INVENTORIES
Group 2014 2013 US$ US$ Finished goods, at cost – 438
The cost of inventories recognised as an expense and included in the cost of sales amounts to US$Nil (2013: US$822,887).
67

AVATION PLC NOTES TO THE FINANCIAL STATEMENTS FOR THE FINANCIAL YEAR ENDED 30 JUNE 2014 22 INVESTMENT IN SUBSIDIARIES
Company 2014 2013
US$ US$ Unquoted equity shares, at cost 2,505,399 2,505,319 Quoted equity shares, at cost 4,463,240 2,734,373 6,968,639 5,239,692 Quoted equity shares, at market value 18,060,452 15,828,404
In the opinion of management, no impairment in the value of the investment in subsidiaries is necessary.
Details of the subsidiaries are as follows:
Name Country of
incorporation Principal activities
Proportion (%) of ownership
interest 2014 2013 Held directly by the Company: Avation.net Inc (a)
United States of America
Procurement
99.96
99.96
Capital Lease Aviation PLC (b)
United Kingdom
Leasing of aircraft
68.85
62.07
F100 Pty Ltd (c) Australia Leasing of aircraft 100.00 100.00 Avation Eastern Fleet Pte. Ltd. (e)
Singapore
Leasing of aircraft
100.00
100.00
Avation Eastern Fleet (II) Pte. Ltd. (a)
Singapore
Leasing of aircraft
-
100.00
Avation Airframe Holding Pte. Ltd. (e)
Singapore
Leasing of aircraft
-
-
Avation Eastern Fleet (III) Pte. Ltd. (e)
Singapore
Leasing of aircraft
-
100.00
Avation Eastern Fleet (IV) Pte. Ltd. (e)
Singapore
Leasing of aircraft
100.00
100.00
MSN1922 Pte. Ltd. (e) Singapore Leasing of aircraft 100.00 100.00 MSN429 Leaseco Limited (b) United Kingdom Leasing of aircraft 100.00 100.00
68

AVATION PLC NOTES TO THE FINANCIAL STATEMENTS FOR THE FINANCIAL YEAR ENDED 30 JUNE 2014 22 INVESTMENT IN SUBSIDIARIES (CONT’D)
Name Country of
incorporation Principal activities
Proportion (%) of ownership
interest 2014 2013 F100 Fleet Pte. Ltd. (e)
Singapore
Leasing of aircraft
100.00
100.00
AVAP Aircraft Trading Pte. Ltd.(e)
Singapore
Procurement
100.00
-
Avation Group (S) Pte. Ltd. (e)
Singapore
Leasing of aircraft
100.00
-
Held by Capital Lease Aviation PLC: Capital Lease Malta Ltd (d)
Malta Leasing of aircraft
68.85
62.07
Capital Lease (S) Pte Ltd (a)
Singapore Leasing of aircraft
68.85
62.07
MSN 1607 Pte. Ltd. (e) Singapore Leasing of aircraft 68.85 62.07 Held by Avation Eastern Fleet Pte. Ltd.: Airframe Leasing (S) Pte. Ltd. (e)
Singapore
Leasing of aircraft
100.00
100.00
Held by Avation Eastern Fleet II Pte. Ltd.: Airframe Leasing (S) II Pte. Ltd. (a)
Singapore
Leasing of aircraft
100.00
100.00
Held by Avation Eastern Fleet III Pte. Ltd.: Airframe Leasing (S) III Pte. Ltd. (e)
Singapore
Leasing of aircraft
100.00
100.00
Held by Avation Eastern Fleet IV Pte. Ltd.: Airframe Leasing (S) IV Pte. Ltd. (e)
Singapore
Leasing of aircraft
100.00
100.00
Held by MSN 429 Leaseco Limited: MSN 429 Limited (b) United Kingdom Leasing of aircraft 100.00 100.00 Held by F100 Fleet Pte. Ltd.: F100 Leasing Pte. Ltd.(e) Singapore Leasing of aircraft 100.00 100.00
69

AVATION PLC NOTES TO THE FINANCIAL STATEMENTS FOR THE FINANCIAL YEAR ENDED 30 JUNE 2014 22 INVESTMENT IN SUBSIDIARIES (CONT’D)
Name Country of
incorporation Principal activities
Proportion (%) of ownership
interest 2014 2013 Subsidiaries held by Avation Group (S) Pte. Ltd.: Avation Eastern Fleet II Pte. Ltd. (e)
Singapore
Leasing of aircraft
100.00
-
Avation Eastern Fleet III Pte. Ltd. (e)
Singapore
Leasing of aircraft
100.00
-
Avation Pacific Leasing Pte. Ltd.(e)
Singapore
Leasing of aircraft
100.00
-
(a) Audited by Jasmine Chua and Associates, Singapore (b) Audited by Kingston Smith LLP, London, United Kingdom (c) Audited by Moore Stephens, Perth, Australia (d) Audited by Nexia BT, Malta (e) Audited by Ernst & Young LLP, Singapore
70

AVATION PLC NOTES TO THE FINANCIAL STATEMENTS FOR THE FINANCIAL YEAR ENDED 30 JUNE 2014 23 PROPERTY, PLANT AND EQUIPMENT
Furniture and
equipment Jets Turbo Props Total Group US$ US$ US$ 2014 Cost or valuation: At beginning of year 20,120 177,595,796 217,015,882 394,631,798 Additions 113,031 71,662,590 71,775,621 Disposal – (35,678,617) (35,678,617) At end of year 133,151 177,595,796 252,999,855 430,728,802 Representing: At cost 133,151 – – 133,151 At valuation – 177,595,796 252,999,855 430,595,651 133,151 177,595,796 252,999,855 430,728,802 Accumulated depreciation and impairment:
At beginning of year 12,411 39,646,096 7,772,902 47,431,409 Depreciation charge 60,540 7,769,869 7,428,603 15,259,012 Impairment – 713,250 – 713,250 At end of year 72,951 48,129,215 15,201,505 63,403,671 Net carrying amount: At beginning of year 7,709 137,949,700 209,242,980 347,200,389 At end of year 60,200 129,466,581 237,798,350 367,325,131
No upwards change in the value of the aircraft was required to be recognised during the period as there was no material difference between the lease encumbered value as determined by an independent valuer and net book value at the year end. Included in Jets is an aircraft in which the group holds 39.22% ownership and is accounted for in accordance with the group’s policy for jointly controlled assets.
71

AVATION PLC NOTES TO THE FINANCIAL STATEMENTS FOR THE FINANCIAL YEAR ENDED 30 JUNE 2014 23 PROPERTY, PLANT AND EQUIPMENT (CONT’D)
Furniture and
equipment Jets Turbo Props Total Group US$ US$ US$ 2013 Cost or valuation: At beginning of year 14,922 134,960,092 108,274,256 243,249,270 Additions 5,198 39,040,220 108,741,626 147,787,044 Revaluation surplus – 3,595,484 – 3,595,484 At end of year 20,120 177,595,796 217,015,882 394,631,798 Representing: At cost 20,120 – 217,015,882 217,036,002 At valuation – 177,595,796 – 177,595,796 20,120 177,595,796 217,015,882 394,631,798 Accumulated depreciation and impairment:
At beginning of year 7,529 27,045,435 2,334,003 29,386,967 Depreciation for the year 4,882 5,923,156 5,438,899 11,366,937 Increase of revaluation – (26,646) – (26,646) Impairment loss – 6,704,151 – 6,704,151 At end of year 12,411 39,646,096 7,772,902 47,431,409 Net carrying amount: At beginning of year 7,393 107,914,657 105,940,253 213,862,303 At end of year 7,709 137,949,700 209,242,980 347,200,389
72

AVATION PLC NOTES TO THE FINANCIAL STATEMENTS FOR THE FINANCIAL YEAR ENDED 30 JUNE 2014 23 PROPERTY, PLANT AND EQUIPMENT (CONT’D)
Furniture and
equipment Jets Total Company US$ US$ US$ 2014 Cost or valuation: At beginning of year 3,839 20,452,194 20,456,033 Additions 4,210 – 4,210 At end of year 8,049 20,452,194 20,460,243 Representing: At cost 8,049 – 8,049 At valuation – 20,452,194 20,452,194 8,049 20,452,194 20,460,243 Accumulated depreciation: At beginning of year 1,699 282,693 284,392 Depreciation charge 2,513 1,042,178 1,044,691 At end of year 4,212 1,324,871 1,329,083 Net carrying amount: At beginning of year 2,140 20,169,501 20,171,641 At end of year 3,837 19,127,323 19,131,160 No change in the value of the company’s aircraft was required to be recognised during the period as there was no material difference between the lease encumbered value as determined by an independent valuer and net book value at the year end.
73

AVATION PLC NOTES TO THE FINANCIAL STATEMENTS FOR THE FINANCIAL YEAR ENDED 30 JUNE 2014 23 PROPERTY, PLANT AND EQUIPMENT (CONT’D)
Furniture and
equipment Jets Total Company US$ US$ US$ 2013 Cost or valuation: At beginning of year 1,886 9,077,560 9,079,446 Additions 1,953 16,560,816 16,562,769 Disposal – (7,999,120) (7,999,120) Revaluation surplus – 2,812,938 2,812,938 At end of year 3,839 20,452,194 20,456,033 Representing: At cost 3,839 – 3,839 At valuation – 20,452,194 20,452,194 3,839 20,452,194 20,456,033 Accumulated depreciation: At beginning of year 419 887,357 887,776 Depreciation charge 1,280 442,745 444,025 Disposal – (1,020,763) (1,020,763) Increase in revaluation surplus – (26,646) (26,646) At end of year 1,699 282,693 284,392 Net carrying amount: At beginning of year 1,467 8,190,203 8,191,670 At end of year 2,140 20,169,501 20,171,641
Assets held on trust On 25 March 2008, the subsidiary, Capital Lease Aviation PLC acquired the rights, title and interest
in the aircraft held on trust by Wilmington Trust Company (“Wilmington”), a US trust company. As the aircraft is registered in the US, legal title to the aircraft is held by Wilmington and Capital Lease Aviation PLC is the beneficial owner. The aircraft is leased by Wilmington to a US airline.
74

AVATION PLC NOTES TO THE FINANCIAL STATEMENTS FOR THE FINANCIAL YEAR ENDED 30 JUNE 2014 23 PROPERTY, PLANT AND EQUIPMENT (CONT’D)
Assets held under finance lease During the financial year, the Group acquired aircraft with an aggregated cost of US$Nil (2013: US$16,560,816) and the Company acquired aircraft with an aggregated cost of US$Nil (2013: US$16,560,816) by means of finance leases respectively. The carrying amount of aircraft held under finance leases at the end of the reporting period was US$Nil (2013: US$54,768,779). Assets pledged as security In addition to assets held under finance leases, the Group’s aircraft with carrying values of US$359,577,400 (2013: US$261,655,019) are mortgaged to secure the Group’s borrowings (Note 27).
Valuation The Group’s and Company’s aircraft were valued in June 2014 by independent valuers, on lease encumbered basis (“LEV’). LEV takes into account the current lease arrangements entered into in respect of the Group’s aircraft, utilising specific lease income streams and estimated residual values at lease termination. These have been discounted to present value using discounted rate of 6.5%per annum. For one of the Group’s aircraft, the lease encumbered value was not considered a true reflection of the aircraft’s fair value given the proximity to the end of the lease and the expected outcome. Under the terms of the lease, the Group is entitled to compensation from the lessee at the end of the lease based on the condition of the aircraft at that time. This compensation is material to the fair value of the asset but is not taken into account in determining lease encumbered value. The Group has engaged independent experts to assess best estimate of the lease compensation sum together with the recoverable value of the aircraft has been used to determine fair value. An impairment of US$713,250 has been made during the financial year.
If the aircraft were measured using the cost model, the carrying amounts would be as follows:
Group 2014 2013 Jets Turbo-props Jets Turbo-props US$ US$ US$ US$
Cost 157,190,077 252,999,855 157,188,424 217,015,882 Accumulated depreciation and impairment (35,214,829) (15,201,505) (27,427,748) (7,772,901) Net book value 121,975,248 237,798,350 129,760,676 209,242,981
Company 2014 2013 Jets Turbo-props Jets Turbo-props US$ US$ US$ US$
Cost 17,639,256 - 17,639,256 - Accumulated depreciation and impairment (1,152,667) - (309,339) - Net book value 16,486,589 - 17,329,917 -
75

AVATION PLC NOTES TO THE FINANCIAL STATEMENTS FOR THE FINANCIAL YEAR ENDED 30 JUNE 2014 24 GOODWILL
Company
2014 2013
US$ US$ Cost: Balance at beginning and at end of year 2,384,008 2,384,008
Impairment test of goodwill Goodwill is allocated to the cash generating unit ("CGU") Avation.net Inc which is in the procurement business. The recoverable amount of CGU has been determined based on value-in-use calculations. Cash flow projections used in the value-in-use calculations were based on financial budgets approved by management covering a three-year period. Key assumptions used for value-in-use calculations:
2014 2013
Average cash flow growth rate 2% 2% Terminal growth rate 2% 2% Discount rate 6.5% 6.5%
Management determined cash flow growth based on past performance and its expectations of the market development. The terminal growth rate of 2% that was used to extrapolate cash flows beyond the budget period did not exceed the long term average growth rate for the business in which the CGU operates. Management has estimated that the recoverable amount of CGU is US$2,758,841. Management believes that no reasonably possible change in any of the above key assumptions would cause the carrying value of the CGU to materially exceed its recoverable amount.
76

AVATION PLC NOTES TO THE FINANCIAL STATEMENTS FOR THE FINANCIAL YEAR ENDED 30 JUNE 2014 25 TRADE AND OTHER PAYABLES
Group Company 2014 2013 2014 2013
US$ US$ US$ US$ Current Trade payables 1,268,587 1,532,786 1,213,313 1,467,964 Trade payables – subsidiaries – – – 55,258 Non-trade payables 109,744 334,138 – – Non-trade payables - subsidiaries – – 15,030,014 2,111,843 Interest bearing loan – related parties (a) to (e) 6,500,000 6,000,000 2,000,000
–
Interest payable – related parties 27,917 35,265 9,863 9,863 Deferred income 3,530,305 3,426,841 14,641 14,641 Deferred income – subsidiaries – – 98,600 98,600 Accrued expenses 1,204,748 759,772 126,025 82,591 12,641,301 12,088,802 18,492,456 3,840,760 Non-current Deposits collected 8,188,983 7,088,610 958,091 71,487 Interest bearing loan – related
party (c) –
2,000,000
–
2,000,000 8,188,893 9,088,610 958,091 2,071,487
(a) Interest bearing loan due to an entity over which key management personnel have significant
influence of US$NIL (2013: US$1,200,000). The loan is unsecured and repayable upon demand. Interest is charged at 9.75% (2013: 9.75%) per annum.
(b) Interest bearing loan due an entity over which key management personnel have significant
influence of US$NIL (2013: US$1,000,000). The loan is unsecured and repayable upon demand. Interest is charged at 10% (2013: 10%) per annum.
(c) Interest bearing loan due to an entity over which key management personnel have significant
influence of US$2,000,000 (2013: US$2,000,000). The loan is unsecured and repayable by October 2014. Interest is charged at 10% (2013: 10%) per annum.
(d) Interest bearing loan due to an entity over which key management personnel have significant
influence of US$4,500,000 (2013: US$3,000,000). The loan is unsecured and repayable upon demand. Interest is charged at 9.75% (2013: 9.75%) per annum.
(e) Interest bearing loan due to an ex-director of a subsidiary of US$Nil (2013: US$800,000). The
loan is unsecured and repayable upon demand. Interest is charge at 9.75% (2013: 9.75%) per annum.
The amount due to subsidiaries and related parties are unsecured, interest free and without fixed repayment terms unless otherwise stated. The average credit period taken to settle non-related party trade payables is approximately 30 to 60 days. The deposits collected were from customers in respect of aircraft lease commitments, and have been discounted to their present value at a current pre-tax rate that reflect the risks specific to these deposits. These deposits will be refunded at the end of the lease terms.
77

AVATION PLC NOTES TO THE FINANCIAL STATEMENTS FOR THE FINANCIAL YEAR ENDED 30 JUNE 2014 25 TRADE AND OTHER PAYABLES (CONT’D) The trade and other payables denominated in foreign currencies are as follows:
Group Company 2014 2013 2014 2013 US$ US$ US$ US$
Pounds sterling 135,884 45,263 91,379 109,159 Australian dollars 6,256 47,768 6,256 25,750 Euro 81,382 9,322 75,979 43,125 Singapore dollars 91,604 82,944 16,125 96,689
26 DEFERRED LEASE INCOME
The deferred lease income is the difference between the present value and the principal amount of the deposits received from a customer. The deferred lease income is amortised through the statement of comprehensive income on a straight line basis over the lease term.
78

AVATION PLC NOTES TO THE FINANCIAL STATEMENTS FOR THE FINANCIAL YEAR ENDED 30 JUNE 2014 27 LOANS AND BORROWINGS
Group Company 2014 2013 2014 2013 US$ US$ US$ US$
Secured borrowings 253,706,304 202,561,756 12,054,809 – Junior secured borrowings 20,951,782 14,036,835 – – Obligations under finance lease – 46,850,992 – 13,470,218
Total 274,658,086 263,449,583 12,054,809 13,470,218 Less: current portion of borrowings (55,673,186) (24,243,718) (1,415,411) (1,415,411) 218,984,900 239,205,865 10,639,398 12,054,807
Maturity Weighted average
interest rate per annum 2014 2013 2014 2013 US$ US$ % %
Secured borrowings 2014-2026 2013-2022 4.9 4.7 Junior secured borrowings 2020-2023 2021-2022 6.4 6.6 Finance leases – 2018-2022 – 8.3 Total 5.1 5.4
Secured borrowings are secured by first ranking aircraft mortgages in respect of the aircraft purchased with the proceeds of the borrowings, security assignments of the Group’s right under the leases and other contractual documents relating to the aircraft, charged over the bank accounts in which lease payments relating to the aircraft are received and charged over the issued share capital of certain subsidiaries. Junior secured borrowings are secured by the second ranking aircraft mortgages, security assignments and charges over bank accounts. The carrying amounts of the borrowings approximate their fair values.
79

AVATION PLC NOTES TO THE FINANCIAL STATEMENTS FOR THE FINANCIAL YEAR ENDED 30 JUNE 2014 27 LOANS AND BORROWINGS (CONT’D) Obligations under finance lease
Group Company 2014 2013 2014 2013
US$ US$ US$ US$ Future minimum lease payments due: Within one year – 6,468,612 – 1,992,612 After more than one year but within 5 years – 31,542,346 – 13,638,346 More than 5 years – 33,001,700 – – Less: Finance charges – 71,012,658 – 15,630,958 Present value of minimum lease payments – (24,161,666) – (2,160,740) – 46,850,992 – 13,470,218 The present value of minimum lease payments is analysed as follows: Within one year – 2,694,958 – 1,415,411 After more than one year but within 5 years – 18,635,952 – 12,054,807 More than 5 years – 25,520,082 – – Balance at end of year – 46,850,992 – 13,470,218
80

AVATION PLC NOTES TO THE FINANCIAL STATEMENTS FOR THE FINANCIAL YEAR ENDED 30 JUNE 2014 28 SHORT-TERM PROVISIONS
Group 2014 2013 US$ US$ Maintenance reserve claim – 3,757,081 Group 2014 2013 US$ US$ Movement in provision for maintenance provisions claim is as follows: Balance at beginning of financial year 3,757,081 2,969,169 (Reversal) Provision made during the financial year (114,927) 1,860,732 Excess provision written back to profit or loss (2,914,401) – Provision used during the financial year (727,753) (1,072,820) Balance at end of financial year – 3,757,081
A provision of US$Nil (2013: US$1,860,732) was made during the year ended 30 June 2014. This provision is based on maintaining a sufficient balance to match expected drawdowns of reserves over the lease period of the aircraft.
There were drawdowns totalling US$727,753 (2013: US$1,072,820) on the reserves for the year ended 30 June 2014. At the end of the financial year, there was no provision for maintenance claim as the Group has revised the lease terms upon renewal of these leases during the year to exclude the collection of maintenance rent and there will be no future claims against the maintenance reserve funds. Any unclaimed balance as at the end of the lease is not refundable to the lessee and hence these were credited to the profit or loss as maintenance rent income.
81

AVATION PLC NOTES TO THE FINANCIAL STATEMENTS FOR THE FINANCIAL YEAR ENDED 30 JUNE 2014 29 DEFERRED TAX LIABILITIES
Recognised deferred tax assets and liabilities are attributable to the following:
Assets Liabilities Net Group 2014 2014 2014 US$ US$ US$ Property, plant and equipment – 6,463,743 6,463,743 Other items – (41,888) (41,888) Tax losses carried forward – – – Tax (assets)/ liabilities – 6,421,855 6,421,855 Set off tax – – – Net tax (assets)/ liabilities – 6,421,855 6,421,855 Assets Liabilities Net 2013 2013 2013 US$ US$ US$ Property, plant and equipment – 5,197,011 5,197,011 Other items – (9,094) (9,094) Tax losses carried forward – – – Tax assets – 5,187,917 5,187,917 Set off tax – – – Net tax (assets)/ liabilities – 5,187,917 5,187,917
Movement in temporary differences during the financial year:
Balance
1 July 2013
Recognised in profit or
loss Recognised
in equity
Balance 30 June
2014 US$ US$ US$ US$
Group Property, plant and
equipment 5,197,011
1,266,732 – 6,463,743
Other items (9,094) (32,794) – (41,888) Tax losses carried forward – – – – 5,187,917 1,233,938 – 6,421,855
Movement in temporary differences during the last financial year:
Balance
1 July 2012
Recognised in profit or
loss Recognised
in equity Exchange
adjustment
Balance 30 June
2013 US$ US$ US$ US$ US$
Group Property, plant and
equipment
5,268,872
1,233,900
(1,292,443) (13,318) 5,197,011 Other items 644,964 (654,058) – – (9,094) Tax losses carried forward 29,364 (29,364) – – – 5,943,200 550,478 (1,292,443) (13,318) 5,187,917
82

AVATION PLC NOTES TO THE FINANCIAL STATEMENTS FOR THE FINANCIAL YEAR ENDED 30 JUNE 2014 29 DEFERRED TAX LIABILITIES (CONT’D)
Recognised deferred tax assets and liabilities are attributable to the following:
Assets Liabilities Net Company 2014 2014 2014 US$ US$ US$ Property, plant and equipment – 623,548 623,548 Other items – – – Tax losses carried forward – – – Tax assets – 623,548 623,548 Set off tax – – – Net tax (assets)/ liabilities – 623,548 623,548 Assets Liabilities Net 2013 2013 2013 US$ US$ US$ Property, plant and equipment – 366,533 366,533 Other items – – – Tax losses carried forward – – – Tax assets – 366,533 366,533 Set off tax – – – Net tax (assets)/ liabilities – 366,533 366,533
Movement in temporary differences during the financial year:
Company Balance
1 July 2013
Recognised in profit and
loss Recognised
in equity
Balance 30 June
2014 US$ US$ US$ US$ Property, plant and equipment 366,533 257,015 – 623,548 Movement in temporary differences during the last financial year:
Balance
1 July 2012
Recognised in profit or
loss Recognised in equity
Exchange adjustment
Balance 30 June
2013 US$ US$ US$ US$ US$
Company Property, plant and equipment 315,043
65,542
– (13,318)
366,533
83
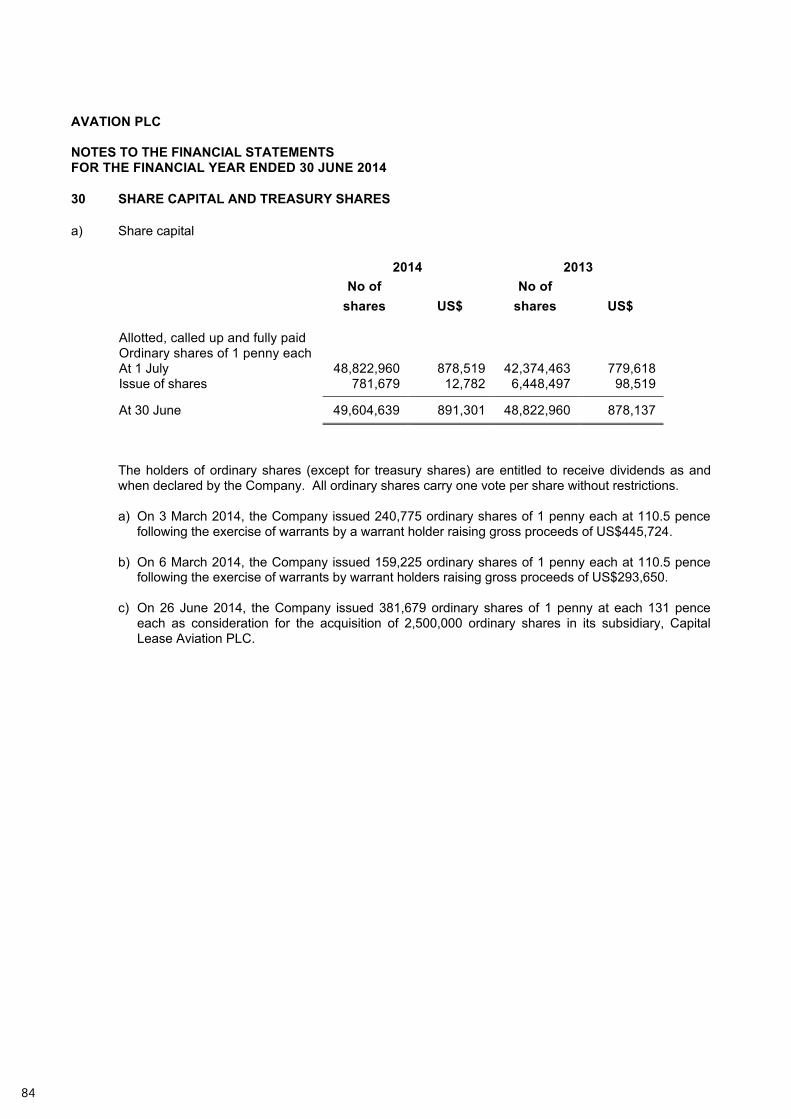
AVATION PLC NOTES TO THE FINANCIAL STATEMENTS FOR THE FINANCIAL YEAR ENDED 30 JUNE 2014 30 SHARE CAPITAL AND TREASURY SHARES a) Share capital
2014 2013
No of
shares US$ No of
shares US$ Allotted, called up and fully paid Ordinary shares of 1 penny each At 1 July 48,822,960 878,519 42,374,463 779,618 Issue of shares 781,679 12,782 6,448,497 98,519 At 30 June 49,604,639 891,301 48,822,960 878,137
The holders of ordinary shares (except for treasury shares) are entitled to receive dividends as and when declared by the Company. All ordinary shares carry one vote per share without restrictions.
a) On 3 March 2014, the Company issued 240,775 ordinary shares of 1 penny each at 110.5 pence
following the exercise of warrants by a warrant holder raising gross proceeds of US$445,724.
b) On 6 March 2014, the Company issued 159,225 ordinary shares of 1 penny each at 110.5 pence following the exercise of warrants by warrant holders raising gross proceeds of US$293,650.
c) On 26 June 2014, the Company issued 381,679 ordinary shares of 1 penny at each 131 pence
each as consideration for the acquisition of 2,500,000 ordinary shares in its subsidiary, Capital Lease Aviation PLC.
84

AVATION PLC NOTES TO THE FINANCIAL STATEMENTS FOR THE FINANCIAL YEAR ENDED 30 JUNE 2014 30 SHARE CAPITAL AND TREASURY SHARES (CONT’D) b) Treasury shares
2014 2013
No of treasury shares US$
No of treasury shares US$
At 1 July 150,000 214,498 – – Acquired during the year 300,000 467,835 150,000 214,498 At 30 June 450,000 682,333 150,000 214,498
a) On 19 September 2013, the Company acquired 150,000 of its shares at a price of 94 pence per ordinary share presenting approximately 0.31% of the Company’s issued ordinary share capital at that time. The total amount paid to acquire the shares was US$226,106 and this was presented as a component within shareholders’ equity.
b) On 24 September 2013, the Company acquired 150,000 of its shares at a price of 100 pence per
ordinary share representing 0.31% of the Company’s issued ordinary share capital at that time. The total amount paid to acquire the shares was US$241,729 and this was presented as a component within shareholders’ equity.
31 SHARE BASED PAYMENTS
The Group has an ownership-based compensation scheme for directors and senior management of the Group. Each share warrant converts into one ordinary share of Avation PLC on exercise. No amounts are paid or are payable by the recipient on receipt of the warrant. The warrants carry neither rights to dividends nor voting rights.
Warrants are granted to the directors and senior management of the Group to gain: • Improvement in share price • Improvement in net profit • Improvement in return to shareholders
85

AVATION PLC
NOTES TO THE FINANCIAL STATEMENTS FOR THE FINANCIAL YEAR ENDED 30 JUNE 2014
31 SHARE-BASED PAYMENTS (CONT’D)
Movement of warrants during the financial year The following table illustrates the number (No.) and weighted average exercise prices (WAEP) of, and movements in, warrants during the financial year:
2014 2013 No. WAEP No. WAEP Outstanding at 1 July 800,000 110.5 pence 1,275,000 94.5 pence
- Granted 1,240,000 110.0 pence – – - Exercised (400,000) 110.5 pence (110,510) 67.5 pence
- Lapsed/Cancelled (400,000) – (364,490) – Outstanding at 30 June 1,240,000 110.0 pence 800,000 110.5 pence
Exercisable at 30 June – – 800,000 110.5 pence
The weighted average fair value of the warrants granted during the financial year was 1.06 pence (2013: 8.17 pence). The fair value of the warrants granted during the current financial year was US$22,408 which has not been expensed in these accounts as it is not material. The charge recognised in the profit and loss account in respect of share based payments is $nil (2013: $nil). The weighted average share price at the date of exercise of the warrant exercised during the financial year was 110.5 pence (2013: 67.5 pence). All warrants are settled in equity. Warrants outstanding at the end of the year have the following expiry date and exercise price:
Warrants series signed on
Expiry date
Exercise price
No of warrants 2014 2013 (1) 14 Dec 2011 11 Dec 2013 110.5 p – 800,000 (2) 20 Nov 2013 21 Nov 2016 110.0 p 1,240,000 –
86

AVATION PLC NOTES TO THE FINANCIAL STATEMENTS FOR THE FINANCIAL YEAR ENDED 30 JUNE 2014
31 SHARE-BASED PAYMENTS (CONT’D)
The warrants granted on 4 November 2013 and signed on 20 November 2013 has a 3 year vesting schedule and the details are as follows:
Vesting period Proportion of total share options that are exercisable
Before 20 November 2014 0 per cent On 20 November 2014 and before 20 November 2015
Up to 33 per cent of the grant
On 20 November 2015 and before 20 November 2016
Up to another 33 per cent of the grant
Or
Up to 66 per cent of the grant if warrants were not exercised after the first vesting year
On 20 November 2016 Balance Or
100 per cent of the grant if warrants were not exercised after the first and second vesting years
The warrants were priced using the Black-Scholes option pricing model. Where relevant, the expected life used in the model has been adjusted based on the management’s best estimate for the effects of non-transferability, exercise restrictions (including the probability of meeting market conditions attached to the option), and behavioural considerations. Expected volatility is based on the historical share price volatility over the past four months.
Warrant series signed on
20 November 2013 Inputs into the model
Grant date share price 123.0 pence Exercise price 110.0 pence Expected volatility 20% Warrant life 3 years Dividend yield 1.01% Risk free interest rate 0.35%
The Company issued a total of 1,240,000 warrants during the financial year at 110.0 pence when the then market price was 123.0 pence.
87

AVATION PLC NOTES TO THE FINANCIAL STATEMENTS FOR THE FINANCIAL YEAR ENDED 30 JUNE 2014 32 CAPITAL COMMITMENTS Capital expenditure contracted for at the reporting date but not recognised in the financial statements
are as follows:
Group
2014 2013
US$ US$ Property, plant and equipment 201,841,915 175,229,908
The above capital commitments represent amounts due under contracts entered into by the group to purchase aircraft after exercising options. The company has paid deposits towards the cost of these aircraft which are included in trade and other receivables. In addition to the aircraft which the group has committed to purchasing, the group holds options to purchase an additional 10 aircraft at agreed prices. The options are held in the statement of financial position at cost as it is not possible to place a reliable estimate on their fair values. Uncertainties exist over the finance to exercise the options and the market price of the aircraft at the time of delivery, given aircraft are non-financial assets with no indexed market and long lead times. There is no open market on which to trade the options, accordingly it is not considered appropriate to recognise any potential gain on these options arising from potential increases in aircraft values over and above the option price.
33 OPERATING LEASE COMMITMENTS
a) Leases as Lessor
The Group and the Company lease out their aircraft held under operating leases. The future minimum lease payments under non-cancellable leases are as follows:
Group
2014 2013
US$ US$ Within one year 49,520,759 46,841,352 In the second to fifth years inclusive 175,180,914 138,519,513 More than five years 111,265,903 114,490,041
88

AVATION PLC NOTES TO FINANCIAL STATEMENTS FOR THE FINANCIAL YEAR ENDED 30 JUNE 2014 34 SEGMENT INFORMATION
Management has determined the operating segments based on the reports reviewed by the Executive Chairman (“Chief Operating Decision Maker” or “CODM”) that are used to make strategic decisions. The CODM considers the business from a business segment perspective. Management manages and monitors the business in the 2 primary business areas: aircraft leasing and business procurement.
a) Segment reporting policy
A segment is a distinguishable component of the Group within a particular economic environment (geographical segment) and to a particular industry (business segment) which is subject to risks and rewards that are different from those of other segments. The business segments, is based on the Group’s management and internal reporting structure. In presenting information on the basis of business segments, segment revenue and segment assets are based on the nature of the products or services provided by the Group, information for geographical segments is based on the geographical areas where the customers are located. Inter-segment pricing is determined on an arm’s length basis. Segment results, assets and liabilities include items directly attributable to a segment as well as those that can be allocated on a reasonable basis. Unallocated items comprise mainly of corporate assets and liabilities or profit or losses items that are not directly attributable to a segment or those that cannot be allocated on a reasonable basis. Common expenses were allocated based on revenue from the Group. Segment capital expenditure is the total cost incurred during the period to acquire segment assets that are expected to be used for more than one year.
b) Business segments
During the year ended 30 June 2014, the Group was organised into two main business segments which are aircraft leasing and business procurement. Other operations of the Group mainly comprise investment holding which does not constitute a separate reportable segment. There are no inter-segment transactions recorded during the financial period. The business procurement segment does not meet the quantitative thresholds and is not separately disclosed.
89

AVATION PLC NOTES TO FINANCIAL STATEMENTS FOR THE FINANCIAL YEAR ENDED 30 JUNE 2014 34 SEGMENT INFORMATION (CON’T)
c) Geographical analysis
2014 Europe North
America
Australia and
Oceania Asia Total US$ US$ US$ US$ US$
Revenue 11,700,000 650,000 39,905,209 – 52,255,209 Capital expenditure and valuation movements – – 36,095,859 35,679,762 71,775,621 Net book value - aircraft 79,215,923 6,841,366 281,207,642 – 367,264,931 Total assets 96,652,653 6,841,366 307,695,428 4,438,868 415,628,315
2013 Europe North
America
Australia and
Oceania Asia Total US$ US$ US$ US$ US$
Revenue 9,321,466 1,560,000 31,464,032 394,493 42,739,991 Capital expenditure and valuation movements 22,479,404 – 128,897,926 5,198 151,382,528 Net book value - aircraft 83,055,817 8,197,125 255,939,738 – 347,192,680 Total assets 105,139,334 8,197,159 258,760,998 22,285,809 394,383,300
During the year, certain customers accounted for greater than 10% of the Group’s total revenues. There is one customer that accounts for US$39,722,478 (76%) of the Group’s total revenues from continuing operations. These revenues were based in the Australia and Oceania geographical area. There is one customer that accounts for US$8,400,000 (16%) of the Group’s total revenue. These revenues were based in the European geographical area.
90

AVATION PLC NOTES TO FINANCIAL STATEMENTS FOR THE FINANCIAL YEAR ENDED 30 JUNE 2014 35 CONTINGENT LIABILITIES
i. Lease-end/re-delivery adjustment compensation
The Company’s subsidiary, MSN 1607 Pte Ltd owns an aircraft where there may be a contingent liability to pay amounts to the lessee dependent upon the return condition of the aircraft at the end of the lease term. It would only become payable by the subsidiary to the lessee in the event that the aircraft is returned at lease-end/re-delivery at the end of the lease in April 2018 in a condition which exceeds certain criteria agreed at the inception of the lease. Management is of the view that the return condition of the aircraft will be such that a sum will be due to the Group. Given that the lease continues until April 2018, the directors are of the opinion that it is impossible to accurately estimate the return condition of the aircraft given the number of variables such as aircraft usage and timing of maintenance events. The directors have assessed several different outcomes and consider that the likely outcome would result in a cash inflow from the lessee. On this basis, the directors have not recognised a contingent asset or liability in this set of financial statements.
ii. Withholding tax on interest paid to lenders
During the current financial year, the Group’s Singapore subsidiaries have obtained interest bearing loans from foreign lenders. Under the Singapore Income Tax Act, the Group is required to withhold tax on the interest payments made to the lenders. Management is in the process of applying to the Singapore Ministry of Finance (“MOF”) for a withholding tax exemption under Section 13 of the Income Tax Act. As management is of the view that the Group is, more likely than not, to obtain the withholding tax exemption from MOF and that it is not probable that the Group will make the withholding tax payments, the Group has not provided for the withholding tax payable at the end of the reporting period. Had the Group provided for withholding tax profit for the period would be reduced by approximately US$223,000.
iii. Guarantees
Group
2014 2013
US$ US$ Guarantees 274,658,086 216,598,591
The maximum estimated amount the Group could become liable is as shown above.
91
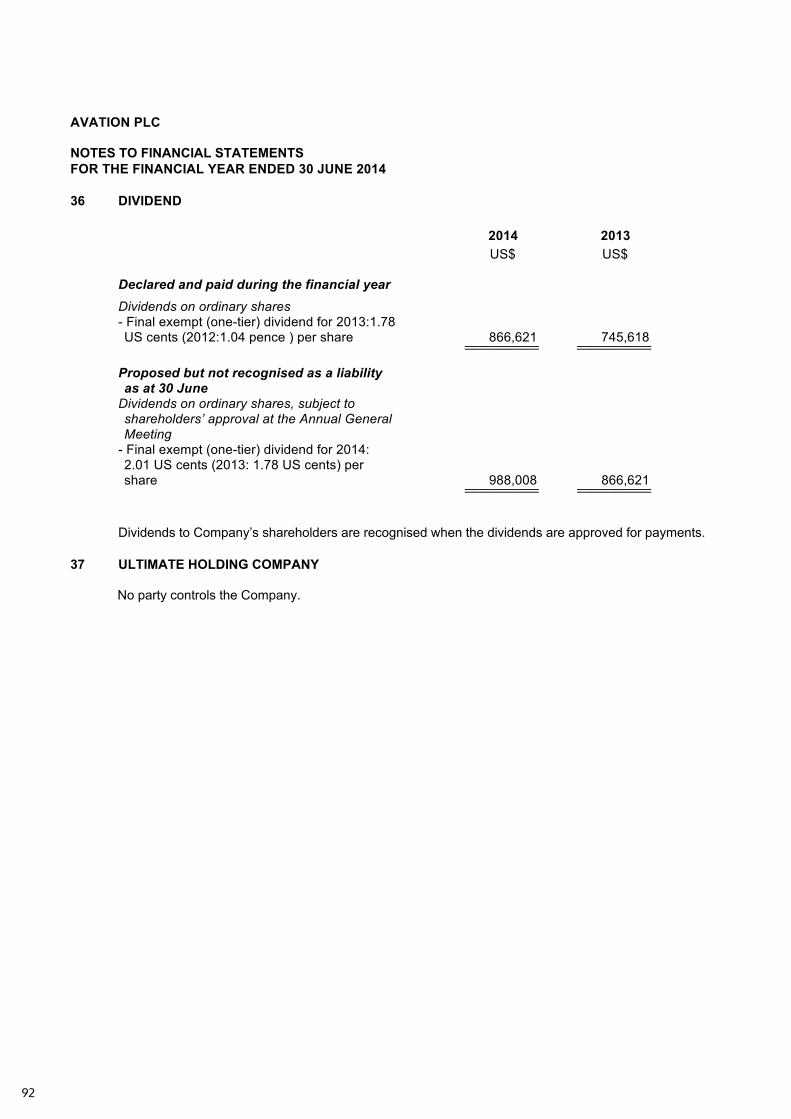
AVATION PLC NOTES TO FINANCIAL STATEMENTS FOR THE FINANCIAL YEAR ENDED 30 JUNE 2014 36 DIVIDEND
2014 2013 US$ US$ Declared and paid during the financial year Dividends on ordinary shares - Final exempt (one-tier) dividend for 2013:1.78 US cents (2012:1.04 pence ) per share 866,621 745,618 __________ __________ __________ __________
Proposed but not recognised as a liability as at 30 June
Dividends on ordinary shares, subject to shareholders’ approval at the Annual General Meeting
- Final exempt (one-tier) dividend for 2014: 2.01 US cents (2013: 1.78 US cents) per share 988,008 866,621 __________ __________ __________ __________
Dividends to Company’s shareholders are recognised when the dividends are approved for payments. 37 ULTIMATE HOLDING COMPANY
No party controls the Company.
92
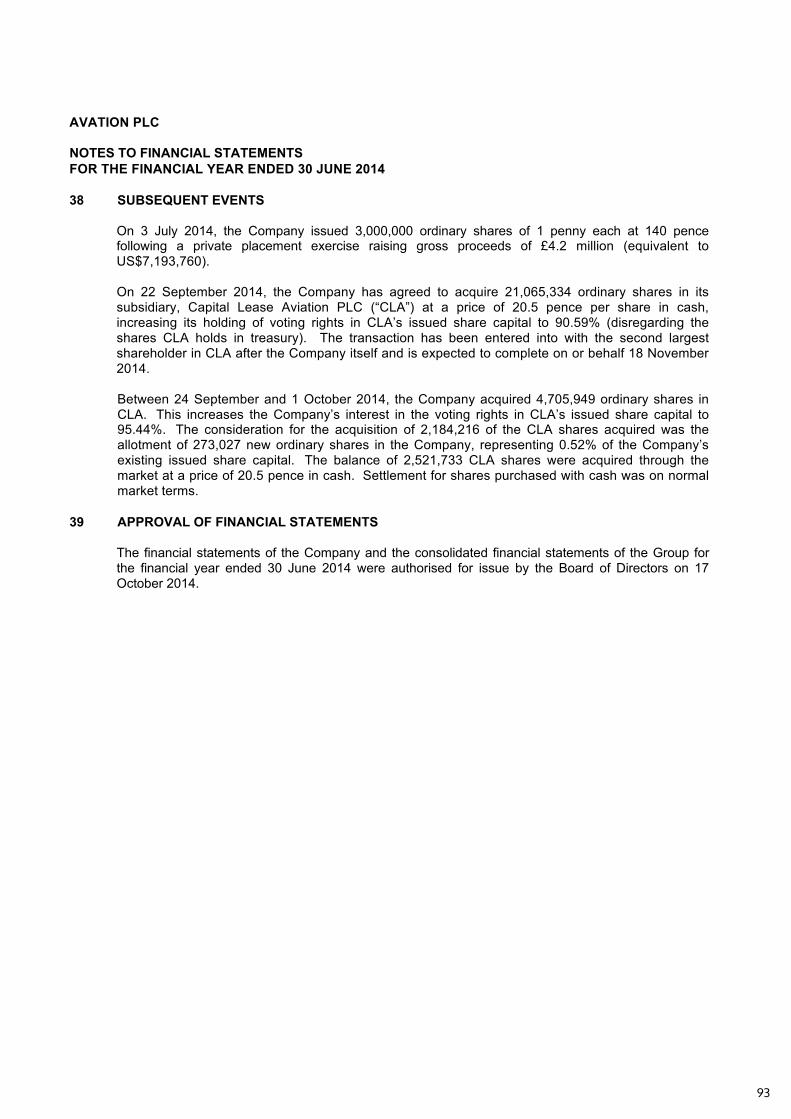
AVATION PLC NOTES TO FINANCIAL STATEMENTS FOR THE FINANCIAL YEAR ENDED 30 JUNE 2014 38 SUBSEQUENT EVENTS On 3 July 2014, the Company issued 3,000,000 ordinary shares of 1 penny each at 140 pence
following a private placement exercise raising gross proceeds of £4.2 million (equivalent to US$7,193,760).
On 22 September 2014, the Company has agreed to acquire 21,065,334 ordinary shares in its
subsidiary, Capital Lease Aviation PLC (“CLA”) at a price of 20.5 pence per share in cash, increasing its holding of voting rights in CLA’s issued share capital to 90.59% (disregarding the shares CLA holds in treasury). The transaction has been entered into with the second largest shareholder in CLA after the Company itself and is expected to complete on or behalf 18 November 2014.
Between 24 September and 1 October 2014, the Company acquired 4,705,949 ordinary shares in CLA. This increases the Company’s interest in the voting rights in CLA’s issued share capital to 95.44%. The consideration for the acquisition of 2,184,216 of the CLA shares acquired was the allotment of 273,027 new ordinary shares in the Company, representing 0.52% of the Company’s existing issued share capital. The balance of 2,521,733 CLA shares were acquired through the market at a price of 20.5 pence in cash. Settlement for shares purchased with cash was on normal market terms.
39 APPROVAL OF FINANCIAL STATEMENTS The financial statements of the Company and the consolidated financial statements of the Group for
the financial year ended 30 June 2014 were authorised for issue by the Board of Directors on 17 October 2014.
93
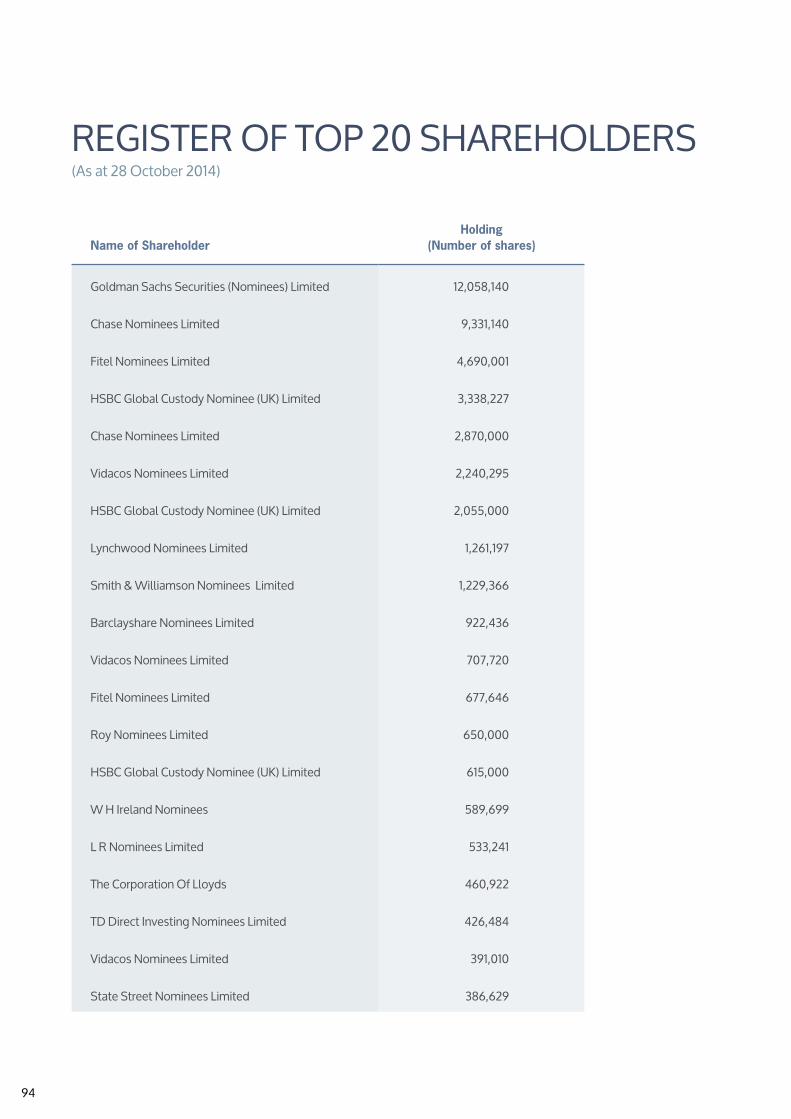
94
ReGISteR OF tOP 20 ShARehOlDeRS(As at 28 October 2014)
Name of ShareholderHolding
(Number of shares)
Goldman Sachs Securities (Nominees) limited 12,058,140
Chase Nominees limited 9,331,140
Fitel Nominees limited 4,690,001
hSBC Global Custody Nominee (uK) limited 3,338,227
Chase Nominees limited 2,870,000
Vidacos Nominees limited 2,240,295
hSBC Global Custody Nominee (uK) limited 2,055,000
lynchwood Nominees limited 1,261,197
Smith & Williamson Nominees limited 1,229,366
Barclayshare Nominees limited 922,436
Vidacos Nominees limited 707,720
Fitel Nominees limited 677,646
Roy Nominees limited 650,000
hSBC Global Custody Nominee (uK) limited 615,000
W h Ireland Nominees 589,699
l R Nominees limited 533,241
the Corporation Of lloyds 460,922
tD Direct Investing Nominees limited 426,484
Vidacos Nominees limited 391,010
State Street Nominees limited 386,629

Airbus A320 aircraft at Final Assembly line (FAl). (Photo: Airbus S.A.S.)

S T A N D A R DSHARES
L I S T E D
Annual Report 2014
Reuters/BBG AVAP.LN
Index: LSE AVAP
FTSE Sector: Industrial Transportation
FTSE Sub Sector: Transportation Services
510 Thomson Road
#12-04 SLF Building
Singapore 298135
www.avation.net