Embed Size (px)
Citation preview
ANNUAL REPORT 2014The year ended March 31, 2014
Corporate PhilosophyEarn the trust of society through corporate activity based in integrity
Forward-Looking Statements
The figures contained in this Annual Report with respect to AIFUL’s plans and strategies and
other statements that are not historical facts are forward-looking statements about the future
performance of AIFUL, which are based on management’s assumptions and beliefs in light of
the information currently available to it and involve risks and uncertainties and actual results may
differ from those in the forward-looking statements as a result of various factors.
Potential risks and uncertainties include, without limitation, general economic conditions in
AIFUL’s market and changes in the overall market for consumer loans, the rate of default by
customers, and the level of interest rates charged by AIFUL.
AIFUL was founded by President and CEO Yoshitaka Fukuda
in 1967 as a sole proprietorship consumer finance business
and established as a corporation in 1978 to bolster its
creditworthiness. In 1982 the corporate name was changed
to the current AIFUL CORPORATION. AIFUL has grown into a
comprehensive financial group handling such diverse businesses
as credit cards, small business lending, credit guarantees, loan
servicing and venture capital in addition to consumer finance.
Based on the corporate philosophy “Earn the trust of society
through corporate activity based in integrity” AIFUL aims to be a
company that is truly trusted by society.
C o n t e n t s
Five-Year Summary
Message from President and CEO,
Yoshitaka Fukuda
AIFUL Group at a Glance
Current Business Environment
Business Data
Corporate Governance
Board of Directors, Corporate
Auditors and Executive Officers
Consolidated Financial Statements
Independent Auditor’s Report
History
Group Network
Investor Information
1
2
4
5
10
12
15
16
46
47
48
49

1AIFUL CORPORATION Annual Report 2014
Millions of Yen Thousands of U.S. Dollars
2014 2013 2012 2011 2010 2014
For the Year:
Total income ¥100,541 ¥108,863 ¥120,034 ¥145,215 ¥218,375 $976,126
Total expenses 69,433 85,082 101,940 178,239 507,805 674,107
Provision for doubtful accounts 10,931 8,177 32,937 65,069 166,259 106,126
Income (loss) before income taxes and minority interests
31,108 23,601 18,094 (33,024) (289,430) 302,019
Net income (loss) 30,462 22,706 17,392 (31,936) (295,141) 295,748
At Year-End:
Loans ¥321,150 ¥390,635 ¥455,012 ¥594,527 ¥835,928 $3,117,961
Nonperforming loans 79,223 98,628 131,807 182,607 256,713 769,155
Loans in legal bankruptcy 35,135 37,598 43,033 44,136 48,849 341,117
Nonaccrual loans 27,290 36,906 55,427 88,221 137,021 264,951
Accruing loans contractually past due three months or more as to principal or interest payments
2,445 2,610 4,475 9,489 15,566 23,738
Restructured loans 14,353 21,514 28,872 40,761 55,277 139,349
Total assets 577,339 607,181 665,185 858,017 1,152,945 5,605,233
Allowance for doubtful accounts 102,522 119,428 156,346 192,434 236,303 995,360
Total liabilities 443,797 502,173 583,541 794,412 1,055,639 4,308,709
Interest-bearing debt 253,953 308,747 360,569 492,610 648,823 2,465,563
Total equity 133,542 105,008 81,644 63,605 97,306 1,296,524
Minority interests — 2,305 1,854 2,757 3,849 —
Per Share Data (Yen/U.S. dollars)
Net income (loss), basic ¥63.34 ¥47.21 ¥72.49 ¥(134.05) ¥(1,238.90) $0.61
Diluted net income 63.00 47.02 — — — 0.61
Total equity 276.80 213.41 331.59 255.32 392.30 2.69
Ratios (%):
Equity ratio 23.1 16.9 12.0 7.1 8.1
ROE 25.8 24.9 24.7 (41.4) (122.7)
ROA 5.1 3.6 2.3 (3.2) (21.1)
Other Data:
Number of shares outstanding at year-end
481,867,836 481,867,836 240,933,918 238,685,568 238,685,568
Number of employees at year-end 1,369 1,437 1,898 2,073 2,514
Notes: 1. Figures in the financial section are based on audited English-language statements.
2. The U.S. dollar amounts have been translated, for convenience only, at ¥103=$1, the approximate rate of exchange at March 31, 2014.
3. The Company implemented a stock split of 2 shares for each 1 share of common stock on October 1, 2013. Accordingly, “Per Share Data” have been calculated
as though the stock split had occurred at the beginning of the previous year.
Five-Year SummaryAIFUL CORPORATION and Consolidated Subsidiaries
Years Ended March 31, 2014, 2013, 2012, 2011 and 2010

2
I thank you for your continuing interest in and support for the AIFUL Group. I would like to
present the financial results of AIFUL CORPORATION and its consolidated subsidiaries for the
fiscal year ended March 2011. In addition, I will explain the steps we have taken to restructure
our business.
Financial Results for the Fiscal Year Ended March 2011
Consolidated total income decreased 34% year on year to ¥144.9 billion. Full enforcement
of the Money Lending Business Act resulted in reduced lending, and debt waivers associated
with interest refund claims remained at a high level. As a result, total loans outstanding
decreased ¥262.2 billion, or 31%, from a year earlier. In addition, interest on loans continued to
decrease due to the effect of reductions in interest rates.
Based on the Business Revitalization Plan approved under the ADR process, the AIFUL
Group reduced fixed costs including personnel and rental expenses through voluntary retirement
and other business restructuring initiatives. The Group also scaled back loans and other assets to
reduce variable costs. As a result, general and administrative expenses decreased ¥23.8 billion,
or 28%, year on year to ¥61.8 billion.
On the other hand, AIFUL CORPORATION expects that interest refund claims will rise to
a certain degree because a major consumer finance company is undergoing corporate
reorganization proceedings, and therefore recognized charge-offs and provision for doubtful
accounts related to interest refunds of ¥49.7 billion and provision for losses on interest
refunds of ¥27.2 billion, which together totaled ¥76.9 billion. As a result, operating loss was
¥24.1 billion, and ordinary loss was ¥24.9 billion.
Further, AIFUL recognized losses from a natural disaster of ¥6.6 billion to cover the
estimated impact of the Great East Japan Earthquake. Consequently, net loss was ¥31.9 billion.
Yoshitaka FukudaPresident and CEO
Message from President and CEO Yoshitaka Fukuda
AIFUL CORPORATION Annual Report 20142
Message from President and CEO, Yoshitaka Fukuda
Financial Results for the Fiscal Year Ended March 31, 2014
AIFUL Group’s consolidated operating revenue for the fiscal year ended March 31, 2014 (fiscal year 2013)
fell 8% from the previous fiscal year, to 91.8 billion yen.
In our loan business, the Group worked on increasing the number of new contracts and lending
volume through effective advertising campaigns mainly via the Internet and television, on an appropriate
scale, and through expansion of unstaffed branches. However, interest on loans to customers fell 18% year
on year to 50.5 billion yen due to the reduction in maximum interest rates and a drop in operating loans
outstanding owing to restrictions on total lending limits and a waiver of principal accompanying interest
repayment claims.
In contrast, credit guarantee tie-ups increased by seven new partners. The Group has been aiming
to increase the number of credit guarantee tie-ups and to provide new product proposals and sales
promotion support to existing credit guarantee customers, in order to expand credit guarantees
outstanding. In addition, due to guarantees on the loan liquidation of BUSINEXT, revenue from the credit
guarantee business rose 73%, to 7.9 billion yen.
Operating expenses fell 18% compared with the previous fiscal year, to 69.3 billion yen. This was
primarily due to a decline in expenses resulting from a reduction in interest-bearing liabilities and general
and administrative expenses, even though the expenses for doubtful accounts rose due to a conservative
estimate for its provision. Also, a 1.8 billion yen provision for losses on interest repayment (down 89% year
on year) was posted for subsidiary LIFECARD, due to the uncertain number of expected claims for interest
repayment going forward.
As a result, AIFUL Group’s consolidated operating income increased 53% year on year, to 22.4 billion
yen. In addition, ordinary income increased 40% year on year, to 24.7 billion yen, as a result of posting
foreign exchange gains, among others, as non-operating income. Net income increased 34% year on
year, to 30.4 billion yen, as a result of posting both a gain on negative goodwill and a gain on loan
extinguishment as extraordinary income.
Yoshitaka FukudaPresident and CEO
I would like to take this opportunity to express my gratitude to our stakeholders for their support. I’m pleased to report our financial results for the fiscal year ended March 31, 2014.

3AIFUL CORPORATION Annual Report 2014
Current Operating Environment
The consumer finance industry has been steadily moving toward recovery, with a solid number of new
contracts on the back of an economic turnaround and aggressive advertising by major players, and with
clearer signs of the operating loan balance bottoming out.
Although the industry’s biggest risk, interest repayment claims, is steadily trending downwards after
hitting a peak, the number of claims continues almost unchanged recently, leaving the future outlook still
unpredictable.
In this environment, on June 10, 2014, the AIFUL Group made the final repayments related to the
Business Revitalization Plan based on the alternative dispute resolution (ADR) process, and fulfilled the
Business Revitalization Plan on July 10, 2014.
Moreover, with the agreement of creditors at the meeting of creditors held on June 13, 2014, it was
determined that, while some of the debt has been repaid, continued financial assistance will be extended
for the outstanding debt as of July 10, 2014.
Going forward, while dealing with the principal management issue of interest repayment claims, the
AIFUL Group will steadily carry out the repayment plan set forth in the new business plan. Moreover, the
Group will strive to streamline its business efficiency across the Group, work to improve the quality of its
credit portfolio by acquiring sound credit, and aim to bolster the top line.
Yoshitaka Fukuda President and CEO
Representative Director
Important MattersThe AIFUL Group has traditionally raised short-term and long-term funds in a variety of ways, including borrowing from financial institutions, issuing bonds, and securitizing loan receivables. However, the AIFUL Group’s fund-raising capacity has been impacted by a difficult market environment that includes higher expenses as the result of increases in the claims for interest refunds in accordance with a ruling by Japan’s Supreme Court in 2006 as well as the rapid and sharp deterioration of the fund-raising environment. Accordingly, there have been concerns that the AIFUL Group may have difficulty in raising sufficient new funds to sustain its business.
Consequently, since the fiscal year ended March 31, 2010, conditions have been such as to cast substantial doubt on the AIFUL Group’s ability to continue as a going concern.
In order to resolve this situation, the AIFUL Group applied on September 24, 2009 for Business Revitalization Procedures using the Alternative Dispute Resolution (the “ADR”) process in order to improve its earning capacity and financial strength with the goal of revitalizing and reinforcing its business. At the meeting of participating creditors held on December 24, 2009, the Group gained approval for its Business Revitalization Plan, which includes a provision for financial support. As a result, Business Revitalization Procedures using the ADR process were adopted. The AIFUL Group has repaid a cumulative amount of ¥93,890 million ($911,553 thousand) to creditors in accordance with the Business Revitalization Plan since then.
At a meeting of creditors held on June 13, 2014, participating creditors decided to approve the proposal for continued financial assistance, with the provision on the partial repayment of the remaining obligation of ¥161,741 million ($1,570,301 thousand). By implementing concrete measures under our New Business Plan, the AIFUL Group believes there is little uncertainty about its ability to continue as a going concern.
Summary of financial assistanceThe Company has executed the partial repayment on July 10, 2014, by newly borrowing from financial institutions.Regarding the obligations that remain after the above repayment, the Company will(a) reschedule the obligations of ¥52,700 million ($511,650 thousand);(b) immediately pay back the obligations in a lump sum at a discounted rate; and(c) switch from obligations to corporate bonds, bearing an interest rate of 8% a year, with maturity on April 30, 2020.

AIFUL CORPORATION Annual Report 20144
REVIEW OF OPERATIONS
AIFUL Group at a Glance
AIFUL CORPORATION provides
consumer financing and consumer
credit services, which play a central
role in the AIFUL Group’s overall
business. The Company’s principal
services include unsecured loans,
mortgage loans and small business
loans. In addition, the Company
handles credit guarantee services in
tie-ups with commercial banks.
LIFECARD CO., LTD. is primarily
engaged in the credit card business.
The Company also handles the
V-Preca or prepaid Visa card, the
first of its kind in Japan, designed
exclusively for Internet users. Other
services include collection agency
services, credit guarantees and
insurance services.
BUSINEXT CORPORATION provides
financial services to private business
owners and small and medium-sized
enterprises (SMEs). The Company
handles a wide range of products
including card loans, business
loans, mortgage loans, and medical
institution loans.
Operating revenue
Operating revenue
Operating revenue
Ordinary income
Ordinary income
Ordinary income (loss)
Net income
Net income
Net income (loss)
AIFUL CORPORATION
LIFECARD CO., LTD.
BUSINEXT CORPORATION
0
10,000
20,000
30,000
40,000
50,000
60,000
70,000
80,000
FY2013FY2012FY20110
5,000
10,000
15,000
20,000
25,000
30,000
FY2013FY2012FY20110
5,000
10,000
15,000
20,000
25,000
30,000
FY2013FY2012FY2011
(Millions of Yen) (Millions of Yen) (Millions of Yen)
0
5,000
10,000
15,000
20,000
25,000
30,000
FY2013FY2012FY20110
1,000
2,000
3,000
4,000
5,000
FY2013FY2012FY20110
1,000
2,000
3,000
4,000
5,000
FY2013FY2012FY2011
(Millions of Yen) (Millions of Yen) (Millions of Yen)
0
1,000
2,000
3,000
4,000
5,000
6,000
7,000
8,000
9,000
10,000
FY2013FY2012FY2011
0
200
-200
-400
-600
400
600
800
1,000
1,200
1,400
FY2013FY2012FY2011
0
200
-200
-400
-600
400
600
800
1,000
1,200
1,400
FY2013FY2012FY2011
(Millions of Yen) (Millions of Yen) (Millions of Yen)

5AIFUL CORPORATION Annual Report 2014
Trends in the Industry
In light of the interest repayment issue and full
implementation of the Money Lending Business Act and
Capital Subscription Law in June 2010, restructuring and
attrition in the industry have continued, with a rapid shrinking
of the consumer finance market. Loans outstanding have
decreased by over 70% to 2.7 trillion yen since 2005, while
the number of registered lenders has plummeted by over 80%
to roughly 2,217.
In the current business environment, visible signs of
improvement are finally starting to appear as outstanding
business loans seem to be bottoming out together with
improving loan portfolios and an increase in the number of
new contracts due to an improvement in business sentiment
and aggressive advertising by major companies.
With respect to interest repayment claims, the largest
business risk, these amounted to roughly 3.3 trillion yen
over the last seven years, and waiver of principal came to
approximately 2.1 trillion yen. Interest repayments have
steadily decreased since hitting a peak, but even in fiscal year
2012, interest repayments were 370.2 billion yen while waiver
of principal amounted to 104.6 billion yen, causing major
financial strain on lending companies and still posing the
greatest risk in the industry.
In terms of new contracts for unsecured loans for the top
three firms in the industry, extension of credit tightened in
anticipation of the full implementation of the Money Lending
Business Act, borrowing was restrained, and advertising
expenditures for all firms were regulated, resulting in ongoing
decreases in new applications and contracts.
However, with improving business sentiment and proactive
advertising campaigns by major players, the number of
new applications and contracts for loans started to increase
after bottoming out in fiscal year 2010, and the business is
undergoing a recovery.
Moreover, although loans outstanding have continued
to decline significantly, due to the effects of restrictions on
total lending limits and the waiver of principal due to losses
on interest repayments, the pace of this decline has been
slowing, and the balance has started to rise in certain sectors,
indicating the start of an improvement.
Conversely, as a benefit of restrictions on total lending
limits, improvement in the quality of our loan portfolio
continues, and loan write-offs and non-performing loans
(NPL) are steadily decreasing. In fiscal year 2013, loan write-
offs decreased 16% compared with the previous period, far
above the 1% rate of decline for loans outstanding.
Current Business Environment
0
2
4
6
8
10
12
FY2012FY2011FY2010FY2009FY2008FY2007FY2006FY2005 0
2,500
5,000
7,500
10,000
12,500
15,000(Trillion yen)
Number of firms(right scale)
Lending volume(left scale)
Lending volume and number of registered lenders
Source: Financial Services Agency
FY2012FY2011FY2010FY2009FY2008FY2007FY2006
Waiver of principal(Billion yen)
Interest repayments
0
200
400
600
800
1,000
1,200
Interest repayments and waiver of principal (for the industry)
Source: The Japanese Financial Services Association
0
300
600
900
1,200
1,500
1,800
2,100
FY2013FY2012FY2011FY2010FY2009FY2008FY2007FY2006 0
10
20
30
40
50
60
70
Contract rate(right scale)
(Thousands) (%)Applications(left scale)New accounts(left scale)
Number of applications and new accounts for top three firms
Source: Compiled by Aiful from financial data of each company*Prepared by AIFUL based on financial documents of ACOM, Promise and AIFUL.
2014/32013/92013/32012/92012/32011/92011/32010/92010/3 0
1,000
2,000
3,000
4,000
5,000
6,000
7,000
Number of accounts(right scale)
Loans outstanding(left scale)
(Thousands)(Billion yen)
0
500
1,000
1,500
2,000
2,500
3,000
3,500
Loans outstanding for top three firms
Source: Compiled by Aiful from financial data of each company*Prepared by AIFUL based on financial documents of ACOM, Promise and AIFUL.

AIFUL CORPORATION Annual Report 20146
Moreover, the NPL ratio has now decreased to 10%,
which is below the level before the Money Lending Business
Act came into full effect.
Consolidated Results of Operations
In fiscal year 2013, the AIFUL Group’s consolidated operating
revenue fell 7.8% compared with the previous fiscal year, to
91,858 million yen. The principal components were interest on
loans, which contracted 17.9% year on year to 50,577 million
yen, revenue from the credit card business, which increased
7.3% to 13,426 million yen, and revenue from the credit
guarantee business, which increased 72.5% to 7,949 million yen.
In contrast, the collection of purchased receivables contracted
22.9% to 3,011 million yen while the recovery of loans previously
charged off edged down 10.9% to 9,663 million yen.
Operating expenses fell 18.3% compared with the previous
fiscal year, to 69,360 million yen, after accounting for an
allowance for losses on interest repayment of 1,885 million yen,
which decreased 89.1% year on year.
In addition, a 2,305 million yen gain on negative goodwill
and a 3,840 million yen gain on loan extinguishment
associated with the dissolution of the joint venture, BUSINEXT
CORPORATION, resulted in the posting of 6,398 million yen (up
6.0% year on year) of extraordinary income.
As the result of the above factors, for the consolidated fiscal
year under review, the AIFUL Group’s operating income was
22,498 million yen (up 52.9% year on year), ordinary income was
24,752 million yen (up 40.3% year on year) and net income was
30,461 million yen (up 34.2% year on year).
Business Results
The number of new applications and contracts concluded by
AIFUL has continued to fall, primarily because of the application
of strict credit controls ahead of the full implementation of the
Money Lending Business Act, customers’ restraint regarding
borrowing and tightening of advertising expenditures. However,
with an improvement in business sentiment and aggressive
advertising by major players, as well as AIFUL’s newly launched
advertising, mainly on television and the Internet, the number
of new applications and contracts concluded started to increase
from fiscal year 2010.
In fiscal year 2013, the number of new accounts for
unsecured loans was 117,000, up 34% year on year, and the
ratio of contracts to applications was 45.0%, an increase
of 7.0 points from the same period last year, owing to the
aggressive development of unstaffed branches as well as the
implementation of effective advertising mainly on the Internet
and television, befitting the scale of the business.
Although the operating loan balance has continued to
decline due to the effects of restrictions on total lending limits
and the waiver of principal due to interest repayments, the pace
of this decline has been slowing.
0
100
200
300
400
500
600
700
FY2013FY2012FY2011FY2010FY2009FY2008FY2007FY2006 0
10
20
30
40
50
60
70
Contract rate(right scale)
(Thousands) (%)Applications(left scale)New accounts(left scale)
New lending of unsecured loans (non-consolidated)
0
300
600
900
1,200
1,500
1,800
FY2013FY2012FY2011FY2010FY2009FY2008FY2007FY2006 0
10
20
30
40
50
60(%)
Ratio of lending volume to loans outstanding (right scale)
Loans outstanding (non-consolidated)(left scale)Lending volume(left scale)
(Billion yen)
Lending volume and loans outstanding (non-consolidated)
0
20
40
60
80
100
120
FY2013FY2012FY2011FY2010FY2009
(Billion yen)
Credit guarantees outstanding (consolidated)
0
50
100
150
200
250
300
FY2013FY2012FY2011FY2010FY2009FY2008FY2007FY2006
NPL ratio(right scale)
Loan write-offs(left scale)
0
3
6
9
12
15
18(%)(Billion yen)
Loan write-offs and NPL ratio for top three firms
Source: Compiled by Aiful from financial data of each company*Prepared by AIFUL based on financial documents of ACOM, Promise and AIFUL.
Current Business Environment

7AIFUL CORPORATION Annual Report 2014
0
20
40
60
80
100
120
140
FY2013FY2012FY2011FY2010FY2009
(Billion yen)
Installment receivables (consolidated)
*Commenced business on July 1, 2011.
The lending volume also started to increase after bottoming
out in fiscal year 2009.
In the credit guarantee business, guarantees for outstanding
loans bottomed out in fiscal year 2011 and have been rising
year on year since fiscal year 2012. In fiscal year 2013, the Group
forged new alliances and commenced sales with seven financial
institutions, while it carried out sales promotions to expand
guarantee partners and proposed new products and offered
support to promote sales. As a result, guarantees for outstanding
loans based on operating receivables reached 75,558 million yen,
up 2% from the end of the previous fiscal year.
As for the balance of installment receivables, LIFECARD Co.,
Ltd., a credit card subsidiary, has been leading an initiative mainly
through the Internet to improve convenience for cardholders and
increase transactions by enhancing the webpage functions as
well as by implementing campaigns aimed at existing members
and other measures.
As a result, the balance of installment receivables in the credit
card business on a consolidated basis started to increase year
on year from fiscal year 2012. In fiscal year 2013, the balance of
installment receivables stood at 85,264 million yen, up 4% from
the end of the previous fiscal year.
As a benefit of the restrictions on total lending limits, the
quality of our loan portfolio continues to improve, and write-offs
and nonperforming loans (NPL) are steadily decreasing.
The amount of total receivable write-offs for fiscal year 2013
was down 37% year on year, far greater than the 11% reduction
in loans outstanding.
In addition, the write-off ratio stood at 5%, down two points
year on year, and excluding the portion of the waiver of principal
due to interest repayments, the so-called general write-offs
improved to 3%.
The balance of NPL fell 20% year on year, to 79,222 million
yen, and the ratio of unsecured loans was also down three
points, to 10%, making for steady improvement.
On the other hand, with regard to interest repayments,
where the number of claims and attorney involvements are major
indicators, although the number of claims has decreased by 70%
since peaking in 2007 and by about half since 2011, when the
bankruptcy of a major competitor occurred, the situation remains
uncertain, with the current trend remaining flat.
Moreover, cash-out and the amount of debt waived due
to interest repayments have decreased by roughly half since
their peak, but still continue to exert major financial pressure,
amounting to a monthly average of over 2,500 million yen.
In light of this situation, the Group recorded a provision of
1.8 billion yen for LIFECARD in fiscal year 2013. As a result, the
allowance related to interest repayments came to 95.1 billion yen
at the end of the fiscal year under review.
0
50
100
150
200
250
FY2013FY2012FY2011FY2010FY2009FY2008FY2007FY2006 0
4
8
12
16
20
Ratio of write-offs (right scale)
(%)Write-offs (general) (left scale)Write-offs due to interest repayments (left scale)
(Billion yen)
Total receivable write-offs (consolidated)
0
70
140
210
280
350
FY2013FY2012FY2011FY2010FY2009FY2008FY2007FY2006 0
6
12
18
24
30(%)
Ratio of unsecured loans NPL (right scale)
Non-performing loans (NPL) (left scale)Unsecured loans NPL (left scale)
(Billion yen)
Non-performing loans (NPL) (consolidated)
0
10
20
30
40
50
4Q3Q2Q1Q4Q3Q2Q1Q4Q3Q2Q1QFY2011 FY2012 FY2013
0
12
24
36
48
60(%)
Attorney involvement (non-consolidated) (right scale)
Interest repayment claims (non-consolidated) (left scale)
(Thousands)
Interest repayment claims and attorney involvement (non-consolidated)
*Attorney involvement is based on comparison with the May 2007 peak value of 100%.
*Since July 1, 2011 portions of former LIFE and the other three firms were absorbed and amalgamated
Current Business Environment

AIFUL CORPORATION Annual Report 20148
This magnitude of financial pressure related to interest
repayment claims resulted in AIFUL implementing voluntary
retirement on four occasions in the seven years since fiscal year
2005, and the number of employees was reduced from 6,675
in fiscal year 2005 to 1,369 in fiscal year 2013. In addition, the
number of lending outlet locations was reduced from 2,722
in fiscal year 2005 to 704 in fiscal year 2013, as the Company
sought to radically reduce costs and streamline operations
by consolidating and eliminating bases and departments and
restructuring the Group.
Going forward, we will put all of our efforts into improving
our financial position and profitability by continuing to pursue
increased business efficiency and cost structure reforms across
the Group.
With respect to interest-bearing debt, payments, including
repayments to ADR creditors and the redemption of corporate
bonds, have been made in accordance with our Business
Revitalization Plan. As a result, interest-bearing debt amounting
to 698.5 billion yen in fiscal year 2009 was reduced over a
four-year period by 60% to the remaining interest-bearing debt
outstanding of 280.7 billion yen as of March 31, 2014.
The outstanding interest-bearing debt comprises borrowings
of 228,916 million yen, corporate bonds of 25,000 million yen
and liquidation of receivables of 26,860 million yen.
Cash Flows
Cash and cash equivalents (“funds”) were up 5,678 million yen,
or 9.3%, compared with the end of the previous fiscal year, to
66,876 million yen.
Cash flows from operating activities
Net cash provided by operating activities amounted to
55,066 million yen, an increase of 152.5% compared with the
corresponding period of the previous fiscal year. During the
period under review, the increase in funds caused by the decline
in operating receivables including loans to customers exceeded
the decline in funds due to the drop in allowance for doubtful
accounts and the decrease in allowance for losses on interest
payment.
Cash flows from investing activities
Net cash provided by investing activities totaled 1,524 million
yen (1,175 million yen in the previous fiscal year). This was mainly
attributable to the purchase of tangible fixed assets and proceeds
from long-term loans.
0
50
100
150
200
FY2013FY2012FY2011FY2010FY2009FY2008FY2007FY2006
(Billion yen)
Advertising expensesPersonnel expensesOthers
General and administrative expenses (consolidated)
FY2013FY2012FY2011FY2010FY2009FY2008FY2007FY20060
500
1,000
1,500
2,000
2,500
3,000
StaffedUnstaffed
Number of branches (consolidated)
0
1,000
2,000
3,000
4,000
5,000
6,000
7,000
8,000
FY2013FY2012FY2011FY2010FY2009FY2008FY2007FY2006
Number of full-time employees (consolidated)
0
50
100
150
FY2013FY2012FY2011FY2010FY2009FY2008FY2007
Debt waivedInterest repayment
(Billion yen)
Losses related to interest repayment claims (consolidated)
Current Business Environment

9AIFUL CORPORATION Annual Report 2014
0
500
1,000
1,500
2,000
FY2013FY2012FY2011FY2010FY2009FY2008FY2007FY2006
Commercial paper (CP)Liquidation of receivables
BorrowingsCorporate bonds
(Billion yen)
Interest-bearing debt (consolidated)
Cash and cashequivalents¥61.1 bn
Cash and cashequivalents
¥66.8 bn
Short-termborrowings¥543.8 bn
Loanrepaymentand bond
redemption,etc.
¥594.7 bn
Loancollection
¥188.6 bn
Liquidation ofreceivables¥26.8 bn
Interestincome, etc.¥91.8 bn
Cash Flows and Funding (Consolidated)
Cash flows fromoperating activities
Cash flows frominvesting activities
Cash flows fromfinancing activities
+¥55.0 bn + + =+¥1.5 bn +¥5.6 bn-¥50.9 bn
Loans tocustomers
¥168.4 bn
SG&A, etc.¥45.8 bn
Losses on interestrepayments¥32.2 bn
At the beginningof FY2013
At the end ofFY2013
Repayment of other debt, etc.
¥566.2 bn
Breakdown
Bond redemption¥8.7 bn
Repayment ofADR-related
dept obligations¥19.8 bn
Income due tosales of assets, etc.¥2.7 bn
Financial expenses ¥5.8bn
Expenses due to purchase of assets, etc.
¥1.2 bn
Current Business Environment
Cash flows from financing activities
Net cash used in financing activities amounted to 50,954 million
yen, up 10.3% year on year, due to the repayment of borrowings
and the redemption of bonds.

10 AIFUL CORPORATION Annual Report 2014
Business Data
LOANS OUTSTANDING(Millions of Yen)
2010 2011 2012 2013 2014Total Receivables Outstanding 603,088 422,004 408,167 348,353 350,681
Loans 553,476 381,368 344,455 286,316 260,776
Unsecured 423,733 289,361 265,617 224,669 216,072
Secured 120,821 83,422 66,607 52,708 37,611
Small Business 8,922 8,585 12,231 8,939 7,093
Installment Receivables – – 7,202 4,433 2,846
Credit Guarantees 45,249 36,969 48,397 51,078 80,489
Other 4,363 3,667 8,113 6,526 6,570
TOTAL INCOME/NET INCOME (LOSS)(Millions of Yen)
2010 2011 2012 2013 2014Total Income 130,278 90,751 79,757 69,655 63,779
Interest on Loans 113,069 74,020 57,657 47,402 42,066
Unsecured 92,854 60,194 46,374 38,126 34,472
Secured 18,353 12,511 9,554 7,655 6,233
Small Business 1,862 1,315 1,729 1,621 1,361
Credit Guarantees 4,136 3,349 3,051 3,215 6,654
Installment Receivables – – 316 306 226
Other 13,073 13,382 18,732 18,733 14,834
Net Income (Loss) (261,496) (70,169) 13,407 10,649 24,046
NUMBER OF CUSTOMER ACCOUNTS(Thousands)
2010 2011 2012 2013 2014Number of Customer Accounts 1,061 815 805 631 590
Unsecured 1,009 772 767 601 565
Secured 44 34 27 22 17
Small Business 7 9 12 9 7
AVERAGE LENDING INTEREST RATE(%)
2010 2011 2012 2013 2014Average Lending Interest Rate 16.2 15.8 15.9 15.0 15.4
AMOUNT OF WRITE-OFFS/RATIO OF WRITE-OFFS(Millions of Yen)
2010 2011 2012 2013 2014Total Receivables Write-offs 111,651 81,666 68,352 31,591 19,264
Unsecured Loans Write-offs 89,452 63,779 46,333 25,194 14,169
Ratio of Total Receivables Write-offs (%) 20.17 21.41 19.84 11.03 7.39
Ratio of Unsecured Loans Write-offs(%) 21.11 22.04 17.44 11.21 6.56
*On July 1, 2011, Group companies, formerly known as Life Co., Ltd. and Cities Co., Ltd., were absorbed by merger into AIFUL
AIFUL CORPORATION
TOTAL RECEIVABLES OUTSTANDING (Managed Asset Basis)(Millions of Yen)
2010 2011 2012 2013 2014Total Receivables Outstanding 1,105,057 768,342 618,220 556,032 515,960
Loans 856,763 594,527 455,012 390,635 348,011
Unsecured 634,249 425,400 318,785 272,980 261,222
Secured 138,650 99,650 77,115 64,345 41,268
Small Business 83,864 69,478 59,112 53,310 45,521
Installment Receivables 135,852 80,990 80,614 83,885 85,264
Credit Guarantees 100,153 82,134 74,148 74,441 75,559
Other 12,289 10,690 8,446 7,071 7,126
AVERAGE RATE OF BORROWINGS(%)
2010 2011 2012 2013 2014Average Rate of Borrowings 2.01 2.18 2.09 2.05 2.31
Indirect 2.15 2.15 2.07 1.99 1.98
Direct 1.84 2.26 2.19 2.60 3.72
Long-term Prime Rate(Reference) 1.60 1.60 1.35 1.15 1.20
TOTAL ASSETS/ROA/TOTAL EQUITY/ROE(Millions of Yen)
2010 2011 2012 2013 2014Total Assets 1,152,945 858,017 665,185 607,181 577,339
ROA (%) (21.1) (3.2) 2.3 3.6 5.1
Total Equity 97,306 63,605 81,644 105,008 133,542
ROE (%) (122.7) (41.4) 24.7 24.9 25.8
NUMBER OF CUSTOMER ACCOUNTS(Thousands)
2010 2011 2012 2013 2014Number of Customer Accounts 1,966 1,515 1,130 888 817
Unsecured 1,867 1,432 1,062 830 769
Secured 46 36 28 23 18
Small Business 54 47 40 36 31
Credit Card Holders 12,719 6,746 6,357 5,811 5,818
TOTAL INCOME/NET INCOME (LOSS)(Millions of Yen)
2010 2011 2012 2013 2014Total Income 218,375 145,215 120,034 108,683 100,541
Interest on Loans 170,662 103,784 75,993 61,607 50,578Unsecured 137,395 79,543 56,886 45,028 40,717Secured 20,027 13,976 10,581 8,690 7,064Small Business 13,241 10,265 8,526 7,889 2,797
Installment Receivables 19,550 13,021 11,719 12,746 13,613Credit Guarantees 7,035 5,759 4,798 4,610 7,950Other 21,128 22,652 27,524 29,720 28,401
Net Income (Loss) (295,141) (31,936) 17,392 22,706 30,462
AIFUL GROUP

11AIFUL CORPORATION Annual Report 2014
TOTAL RECEIVABLES OUTSTANDING (Managed Asset Basis)(Millions of Yen)
2010 2011 2012 2013 2014Total Receivables Outstanding 410,315 270,201 152,663 151,736 150,228
Installment Receivables 135,852 80,990 73,412 79,452 82,418
Loans (Cash Advance) 211,632 137,023 53,168 48,375 45,322
Credit Guarantees 54,904 45,165 25,750 23,363 21,931
Other 7,926 7,023 333 545 556
AVERAGE YIELD(%)
2010 2011 2012 2013 2014Average Yield 14.6 13.4 17.1 17.5 18.2
OPERATING REVENUE/NET INCOME (LOSS)(Millions of Yen)
2010 2011 2012 2013 2014Operating Revenue 73,371 44,675 19,711 26,402 27,347
Installment Receivables 19,955 13,267 8,657 12,509 13,387
Loans (Cash Advance) 41,265 19,559 6,084 6,904 6,260
Credit Guarantees 2,899 2,410 1,240 1,395 1,296
Other 9,252 9,439 3,730 5,593 6,403
Net Income (Loss) (27,750) (31,148) 2,207 3,320 2,419
NEW ACCOUNTS(Accounts)
2010 2011 2012 2013 2014New Accounts 51,757 60,434 63,296 87,575 117,072
Unsecured Loans 51,757 55,986 61,734 87,515 117,008
Contract Rate of Unsecured Loans (%) 21.9 27.3 29.9 38.0 45.0
TOTAL ASSETS/ROA/TOTAL EQUITY/ROE(Millions of Yen)
2010 2011 2012 2013 2014Total Assets 858,532 578,153 533,713 466,542 463,792
ROA (%) (24.9) (9.8) 2.4 2.1 5.2
Total Equity 135,536 64,835 79,761 90,411 114,807
ROE (%) (98.3) (70.0) 18.6 12.5 23.5
PURCHASE RESULTS(Millions of Yen)
2010 2011 2012 2013 2014Credit Card 863,975 491,804 341,491 496,088 539,051
Credit Card Shopping Loans 796,376 446,540 310,754 454,181 498,756
Credit Card Cashing Loans 67,599 45,263 30,737 40,906 40,295
NUMBER OF CARDHOLDERS(Thousands)
2010 2011 2012 2013 2014Number of Cardholders 12,719 6,746 6,357 5,811 5,818
LIFE Proper Card 2,219 2,762 2,489 2,021 1,911
Affinity Cards 10,499 3,984 3,869 3,790 3,907
AMOUNT OF WRITE-OFFS/RATIO OF WRITE-OFFS(Millions of Yen)
2010 2011 2012 2013 2014Total Receivables Write-offs 38,716 30,308 1,665 2,961 3,118
Ratio of Total Receivables Write-offs (%) 9.44 11.22 1.09 1.95 2.08
*LIFECARD CO., LTD. commenced business on July 1, 2011. As a result, performance figures for the fiscal year ended March 31, 2012 are for a nine-month period.
*Figures prior to the fiscal year ended March 31, 2011 are for Life Co., Ltd.
LIFECARD CO., LTD.
Business Data

12 AIFUL CORPORATION Annual Report 2014
Reinforcement of Corporate Governance
The AIFUL Group’s basic concept of corporate governance is
to improve the transparency of its management based on its
management principle of “Earn the trust of society through
corporate activity based in integrity.” To that end, the Group
has developed a management organization structure and
implemented the necessary measures to build a trustworthy
relationship with all its stakeholders, including customers,
shareholders, and investors, and discloses information
appropriately.
(1) Overview of the corporate governance structure
Board of Auditors and Corporate Auditors
The Board of Auditors consists of three corporate auditors
(including two outside corporate auditors). It determines the
audit policy and plan, and discusses and decides on important
audit matters based on the reports it receives. A meeting is
generally held every month and extraordinary meetings as
necessary.
Corporate auditors work with the Internal Auditing De-
partment and accounting auditors to enhance management’s
supervisory functions and share information with auditors of
affiliated companies in an effort to strengthen the auditing
structure in the operation of the entire Group.
To improve these audit functions, the Group has estab-
lished a Corporate Auditor’s Office as the exclusive body
supporting corporate auditors and taking any other steps
necessary to ensure independence, including, for example, the
requirement that the auditor’s office not follow any directions
or orders from directors.
Board of Directors and Directors
The Board of Directors consists of seven directors (as of
the date of submission of the Annual Securities Report). It
deliberates and decides on matters that cannot be delegated
to directors pursuant to the provisions of laws, regulations,
and the Articles of Incorporation, as well as important matters
such as management strategies, and monitors these matters
regularly. In addition to semi-monthly meetings, it holds
extraordinary meetings as necessary. The Company’s Articles
of Incorporation also stipulate that there be no more than
eleven directors.
Executive Officers
The Company introduced an executive officer system in June
2007 to speed up the decision-making process and execution
of duties, and enhance the separation of supervisory and
executive functions. The Board of Directors appoints executive
officers and delegates business by assigning responsibilities
and authority.
Management Committee
The Management Committee comprises all directors
and executive officers. It strives to promote the sharing
of information and mutual verification of matters to be
submitted to the Board of Directors, and issues and strategies
based on the policies resolved at Board of Directors meetings,
so that disagreements do not arise regarding decisions or the
performance of duties. It holds meetings on a weekly basis, in
general.
Compliance Committee
As a consultative body under the direct control of the Board
of Directors, a Compliance Committee has been established.
It is composed of an executive officer who oversees the
Compliance Department as the chairman, outside experts, and
executive officers in relevant divisions. It examines compliance
issues, designs training programs, and submits reports to the
Board of Directors to create a corporate culture that stresses
compliance, standards of corporate ethics, and compliance
programs. In addition to bimonthly meetings in general, it holds
extraordinary meetings as necessary.
Risk Management Committee
As an organization under the direct control of the Board
of Directors, a Risk Management Committee has been
established. Consisting of all directors, it assesses ongoing
risks based on the regular reports it receives on the status
of risks, continually reviews the risk management system,
and submits reports to the Board of Directors with the aim
of preventing risks from occurring and curbing losses in
times of crisis by creating an appropriate risk management
system. In addition to quarterly meetings in general, it holds
extraordinary meetings as necessary.
(2) Reasons for the current structure
As part of the auditor system, we appoint two outside
corporate auditors for a total of three corporate auditors.
We ensure independent audits with a system that has all
corporate auditors attend Board of Directors meetings, other
important meetings and committee meetings, including
Management Committee meetings, to express their opinions.
We have also established a Corporate Auditor’s Office as the
exclusive body for supporting the work of corporate auditors.
Some of our directors are from companies other than
financial institutions, although they do not fall into the
category of outside directors stipulated in Article 2, item (xv)
of the Companies Act. This ensures a business administration
that incorporates independent perspectives.
Further, we separate management’s supervisory functions
and business execution functions by implementing an
executive officer system and strengthening supervisory
Corporate Governance

13AIFUL CORPORATION Annual Report 2014
Internal Auditing
Internal Auditing
Cooperation
Subsidiaries
Subsidiaries’ Auditors
Every Section
Group Compliance Committee
Board of DirectorsBoard of AuditorsIndependent auditing firmDirectors (7)
(One-year term system)Corporate Auditors (3)(Outside Auditors (2))
Corporate Management Dept.
Compliance Dept.(Internal Control Department, Information Management Office)
Compliance Dept.(Customer Support Center)
Finance Dept.(IR and PR section)
Risk Management CommitteeChairperson: Representative Director (President)
Compliance Officers
Management of Operations
Compliance CommitteeChairperson: Executive Officer oversees the Compliance Dept.Members: Include Outside Attorneys
AuditingCooperation
Cooperation
Sharing Information
Auditing
AuditingAuditing
Reporting
Supervision
Reporting
Direction
Reporting
Direction
Direction
Reporting
Direction
Reporting
Reporting
Demand
Internal Auditing Department (Including Group Auditing)
Cooperation
Gathering and Sharing Information
Sharing Information
Reporting
General Meeting of Shareholders
External Com
pliance Reporting Desk
Questions / Advice / Complaints
Customers
Interaction
Shareholdersand Others
Advising / Consulting
Attorneysand Others
Management Committee (Directors and Executive Officers)
Corporate Auditors’ Office
In-houseCompliance
Reporting Desk
Chairperson: Executive Officer oversees the Compliance Dept.
Compliance Risk Subcommittee
functions with the establishment of a Compliance Committee
that includes outside experts and a Risk Management
Committee, among others.
We have adopted the current structure to achieve
corporate management that is transparent, fair, and efficient.
The diagram below illustrates the Group’s structures for
business execution, management supervision, internal control
and risk management as of the date of submission of the
Annual Securities Report.
Corporate Governance

14 AIFUL CORPORATION Annual Report 2014
Corporate Governance
Enhancement of Corporate Governance
(1) Development of a compliance framework
A Compliance Committee (meeting on a regular basis), with
an outside member (a lawyer), has been set up to establish
and manage compliance programs, conduct ongoing
management led by the person responsible for compliance
in each division, collect information and implement other
preventative measures, and determine policies for employee
training. In addition, the AIFUL Group Compliance Committee
has been established to disseminate a set of unified corporate
ethics throughout the entire Group and form a compliance
framework for the Group as a whole. In addition, the Group
has launched both internal and external hotlines offering
consultations on any violations of the Group’s management
principles, norms and other standards, as well as an internal
whistleblowing system, in an effort to develop a corporate
environment that encourages reporting and discussion of
violations.
(2) Development of a risk management framework
A Risk Management Committee has been set up to gain an
understanding of the Group’s risk factors and hold discussions
to determine responses. The Risk Management Committee
has a system in place whereby it collects risk information from
the Compliance Committee and other divisions on a regular
basis and conducts crisis management in coordination with
directors, corporate auditors, and other relevant divisions.
AIFUL CORPORATION and AIFUL Group have established
an action plan and manual in preparation for large-scale
disasters, issues relating to personal or corporate information,
and other risk events so as to be able to respond to potential
emergencies appropriately and promptly.
(3) Maintenance of accuracy in disclosure of financial
information and status of internal controls
As a system for maintaining the accuracy of financial
information, the AIFUL Group has developed an effective
mutual check system where the division in charge of
institutional accounting (the Accounting Department)
and the division in charge of management accounting
(the Management Planning Department) are separate, in
addition to a system of checks established by the Accounting
Department and accounting audits by independent auditors
in accordance with the Companies Act and the Financial
Instruments and Exchange Act. The Group also implements
initiatives for maintaining the accuracy of information
disclosure in the preparation and announcement of financial
reports by having the Accounting Department, the IR Section
of the Finance Department, and other relevant divisions
(including certain affiliated companies). apply a process of
cheeks.
(4) Improvement of disclosure and status of internal
controls
To enhance the transparency of management and achieve
effective corporate governance through the activation of
external checking functions, the Group endeavors to make
timely and straightforward disclosures in news releases,
account settlement data, annual reports, and other materials,
and holds briefing sessions for domestic and overseas
investors, analysts, and so forth, as appropriate. In addition,
we have a system in place whereby investors’ opinions and
inquiries about management can be relayed back to the
president, the Board of Directors, and the head of each
division on a regular basis.

15AIFUL CORPORATION Annual Report 2014
Yoshitaka Fukuda
President and Representative Director Chief Executive Officer
Apr. 1967: Founded Matsubara Sangyo as a sole proprietorship consumer finance company
Apr. 1980: Director of Marutaka, Inc. (established in 1978, now AIFUL CORPORATION)May 1982: President and Representative Director after merger of three related
companiesJun. 2011: Chairman and Representative Director of LIFECARD Co., Ltd (Current)Apr. 2014: President, Representative Director and Chief Executive Officer
Chairperson of the Risk Management Committee, Overseeing the Internal Auditing Department (Current)
Masayuki Sato
Representative DirectorSenior Managing Executive Officer
Aug.1982: Joined AIFUL CORPORATIONJun. 1999: Director
Assistant General Manager of the Loan Business Division and General Manager of the Promotion Department
Jun. 2008: Director and Managing Executive Officer In charge of the Business Development Department
Jun. 2011: Director and Senior Managing Executive Officer Senior General Manager of the Management Planning Division, Overseeing the Personnel Department and General Manager of the Personnel Department
Jun. 2014: Representative Director and Senior Managing Executive Officer Senior General Manager of the Management Planning Division, overseeing the Personnel Department (Current)
Nobuyuki Wakuta
DirectorManaging Executive Officer
Apr. 1975: Joined The Sumitomo Trust & Banking Co., Ltd. (now Sumitomo Mitsui Trust Bank, Limited)
Jun. 2004: Executive Officer Sales Manager at the Main Branch of The Sumitomo Trust & Banking Co., Ltd.
Jun. 2006: Managing Director Senior General Manager of the Management Planning Division, in charge of the IT Planning Division
Jun. 2007: Director and Managing Executive OfficerApr. 2014: Director and Managing Executive Officer
Chairperson of the Compliance Committee, Senior General Manager of the Accounting Division, supervising the General Affairs Department, Overseeing the Compliance Department, the Credit Assessment Department and the Information Systems Department (Current)
Masanobu HidakaFull-time Corporate Auditor (outside)
Minoru KobayashiFull-time Corporate Auditor
Masanori NagasawaCorporate Auditor (outside)
Shinichiro OkuyamaExecutive Officer In charge of the Marketing Department, General Manager of the Marketing Department
Kazuhiko TsudaExecutive Officer In charge of the Accounting Department and the General Affairs Department, General Manager of the Accounting Department
Keiji MasuiExecutive Officer In charge of Secure Rent Guarantor Service Co., Ltd.
Kazumitsu Oishi
Director Managing Executive Officer
Mar. 1979: Joined Marutaka, Inc. (now AIFUL CORPORATION)Jun. 2001: DirectorJun. 2005: Executive Officer
Senior General Manager of the Loan Business DivisionJun. 2011: Managing Executive Officer
Senior General Manager of the Loan Business DivisionJun. 2012: Director and Managing Executive Officer
Senior General Manager of the Loan Business Division (Current)
Tsuguo Nakagawa
DirectorManaging Executive Officer
Mar. 1976: Joined Oasa Inc. (Yoshitaka Fukuda’s sole proprietorship)Jun. 2004: Director
In charge of the Inspection Department and the Credit Assessment DepartmentJun. 2005: Executive Officer
Senior General Manager of the Credit Management DivisionJun. 2011: Managing Executive Officer
Senior General Manager of the Credit Management DivisionJun. 2012: Director and Managing Executive Officer
Senior General Manager of the Credit Management Division (Current)Apr. 2014: President of Astry Loan Services Corporation (Current)
Toshikazu Moriwaki
Director Managing Executive Officer
Apr. 1977: Joined The Nippon Fudosan Bank, Limited (now Aozora Bank, Ltd.)Apr. 2002: General Manager of the Main Branch’s Sixth Division of Aozora Bank, Ltd.Oct. 2007: Director and Assistant Senior General Manager of the Sales Department of
Astry Loan Services CorporationJun. 2009: President of Astry Loan Services CorporationJun. 2012: Director and Managing Executive Officer
In charge of the Finance Department (Current)
Mitsuhide Fukuda
DirectorManaging Executive Officer
Apr. 2003: Joined Daiwa Securities Co. Ltd.Apr. 2009: Joined OGI Capital Partners, Ltd.Jun. 2011: Executive Officer
In charge of the Corporate Management DepartmentJun. 2012: Director and Executive Officer
In charge of the Corporate Management DepartmentApr. 2014: President of BUSINEXT CORPORATION (Current)Jun. 2014: Director and Managing Executive Officer (Current)
Board of Directors, Corporate Auditors and Executive Officers(As of June 27, 2014)
Directors
Corporate Auditors Executive Officers

16 AIFUL CORPORATION Annual Report 2014
Consolidated Financial Statements
Consolidated Balance SheetMarch 31, 2014AIFUL CORPORATION and Consolidated Subsidiaries
Millions of YenThousands of U.S.
Dollars (Note 1)
ASSETS 2014 2013 2014
CURRENT ASSETS:
Cash and cash equivalents (Note 15) ¥ 66,877 ¥ 61,198 $ 649,291
Time deposits (Note 15) 4 4 39
Operational investment securities (Notes 6 and 15) 825 926 8,010
Allowance for investment losses (19) (19) (184)
Loans, credit guarantees and receivables:
Loans (Notes 3, 8 and 15) 321,150 390,635 3,117,961
Installment accounts receivable (Notes 4, 8 and 15) 85,264 83,885 827,806
Credit guarantees (Note 5) 102,420 74,441 994,369
Other receivables 9,360 10,215 90,874
Allowance for doubtful accounts (Notes 2.l and 15) (69,540) (84,715) (675,146)
Deferred tax assets (Note 13) 148 1,437
Other current assets (Note 8) 11,985 17,309 116,359
Total current assets 528,474 553,879 5,130,816
PROPERTY AND EQUIPMENT:
Land (Note 8) 8,895 8,895 86,359
Buildings and structures (Note 8) 23,287 23,496 226,087
Machinery and equipment (Note 8) 404 356 3,922
Furniture and fixtures 7,487 10,680 72,689
Lease assets 335 607 3,253
Construction in progress 40 673 389
Total 40,448 44,707 392,699
Accumulated depreciation (23,340) (25,906) (226,602)
Net property and equipment 17,108 18,801 166,097
INVESTMENTS AND OTHER ASSETS:
Investment securities (Notes 6 and 15) 779 1,136 7,563
Allowance for investment losses (9) (16) (87)
Investments in and advances to unconsolidated subsidiaries (Note 15) 1,349 2,402 13,097
Claims in bankruptcy (Notes 3 and 15) 36,854 39,832 357,806
Software, net 2,953 4,659 28,670
Lease and guarantee deposits 21,927 20,182 212,883
Other assets (Note 7) 886 1,019 8,602
Allowance for doubtful accounts (Note 15) (32,982) (34,713) (320,214)
Total investments and other assets 31,757 34,501 308,320
TOTAL ¥ 577,339 ¥ 607,181 $ 5,605,233
* Shares have been restated, as appropriate, to reflect a two-for-one stock split effected October 1, 2013.
See notes to consolidated financial statements.

17AIFUL CORPORATION Annual Report 2014
Millions of YenThousands of U.S.
Dollars (Note 1)
LIABILITIES AND EQUITY 2014 2013 2014
CURRENT LIABILITIES:
Short-term borrowings (Notes 8 and 15) ¥ 49,250 ¥ 40,900 $ 478,155
Current portion of long-term debt (Notes 8, 14 and 15) 16,837 52,772 163,466
Trade notes payable 46 124 447
Trade accounts payable 14,734 14,307 143,049
Obligation under credit guarantees (Note 5) 102,420 74,441 994,369
Income taxes payable 619 987 6,010
Accrued expenses 1,612 1,756 15,650
Allowance for credit card point redemption 3,200 2,830 31,068
Other current liabilities (Notes 4, 5 and 19) 3,780 3,814 36,699
Total current liabilities 192,498 191,931 1,868,913
LONG-TERM LIABILITIES:
Long-term debt (less current portion) (Notes 8 and 15) 187,866 215,075 1,823,942
Allowance for losses on interest refunds (Note 2.l) 59,882 91,422 581,379
Negative goodwill, net (Note 21) 218
Deferred tax liabilities (Note 13) 172 149 1,670
Other long-term liabilities 3,379 3,378 32,805
Total long-term liabilities 251,299 310,242 2,439,796
EQUITY (Notes 10 and 11):
Common stock - authorized, 1,136,280,000 shares;
issued, 481,867,836 shares in 2014 and in 2013* 143,325 143,325 1,391,505
Capital surplus 164,392 164,392 1,596,039
Stock acquisition rights 413 62 4,010
Retained earnings (171,652) (202,114) (1,666,524)
Treasury stock - at cost 916,568 shares in 2014 and 915,932 shares in 2013* (3,110) (3,110) (30,194)
Accumulated other comprehensive income (loss):
Unrealized gain on available-for-sale securities 174 148 1,688
Total 133,542 102,703 1,296,524
Minority interests 2,305
Total equity 133,542 105,008 1,296,524
TOTAL ¥ 577,339 ¥ 607,181 $ 5,605,233
Consolidated Balance Sheet

AIFUL CORPORATION Annual Report 201418
Consolidated Financial Statements
Consolidated Statement of IncomeYear Ended March 31, 2014AIFUL CORPORATION and Consolidated Subsidiaries
Millions of YenThousands of U.S.
Dollars (Note 1)
2014 2013 2014
INCOME:
Operating revenue:
Interest on loans ¥ 50,578 ¥ 61,607 $ 491,049
Revenue from credit card business 13,427 12,514 130,359
Revenue from credit guarantee 7,950 4,610 77,184
Recovery of loans previously charged off 9,663 10,840 93,816
Other operating revenue 10,241 10,048 99,427
Total operating revenue 91,859 99,619 891,835
Amortization of negative goodwill (Note 21) 218 218 2,117
Gain on purchase of borrowings (Note 21) 3,840 5,948 37,282
Gain on negative goodwill (Notes 20 and 21) 2,305 22,379
Other income (Note 19) 2,319 2,898 22,513
Total income 100,541 108,683 976,126
EXPENSES:
Interest on borrowings and bonds 5,449 6,878 52,903
Provision for doubtful accounts (Note 21) 10,931 8,177 106,126
Provision for losses on interest refunds (Note 21) 1,885 17,297 18,301
Salaries and other employees' benefits 13,041 13,129 126,612
Net periodic benefit costs (Note 9) 477 518 4,631
Advertising expenses 3,294 3,814 31,981
Provision for credit card point redemption (Note 21) 2,666 2,347 25,883
Rental expenses (Note 14) 2,260 2,448 21,942
Commissions and fees 10,468 9,753 101,631
Depreciation and amortization (Note 21) 3,761 6,021 36,515
Loss on impairment of long-lived assets (Note 7) 52
Loss on sale of investment securities (Note 21) 33 320
Loss from business restructuring (Notes 12 and 21) 10 97
Other expenses 15,158 14,648 147,165
Total expenses 69,433 85,082 674,107
INCOME BEFORE INCOME TAXES AND MINORITY INTERESTS 31,108 23,601 302,019
INCOME TAXES (Notes 13 and 21):
Current 764 414 7,417
Deferred (118) 30 (1,146)
Total income taxes 646 444 6,271
NET INCOME BEFORE MINORITY INTERESTS 30,462 23,157 295,748
MINORITY INTERESTS IN NET INCOME 451
NET INCOME ¥ 30,462 ¥ 22,706 $ 295,748
YenU.S. Dollars
(Note 1)
AMOUNTS PER COMMON SHARE (Notes 2.u and 18):
Basic net income ¥ 63.34 ¥ 47.21 * $0.61
Diluted net income 63.00 47.02 * 0.61
Cash dividends applicable to the year nil nil nil
* Per share figures have been restated, as appropriate, to reflect a two-for-one stock split effected October 1, 2013.
See notes to consolidated financial statements.

19AIFUL CORPORATION Annual Report 2014
Consolidated Financial Statements
Consolidated Statement of Comprehensive IncomeYear Ended March 31, 2014AIFUL CORPORATION and Consolidated Subsidiaries
Millions of YenThousands of U.S.
Dollars (Note 1)
2014 2013 2014
NET INCOME BEFORE MINORITY INTERESTS ¥ 30,462 ¥ 23,157 $ 295,748
OTHER COMPREHENSIVE INCOME (Note 17):
Unrealized gain on available-for-sale securities 26 196 251
Total other comprehensive income 26 196 251
COMPREHENSIVE INCOME ¥ 30,488 ¥ 23,353 $ 295,999
TOTAL COMPREHENSIVE INCOME ATTRIBUTABLE TO:
Owners of the parent ¥ 30,488 ¥ 22,902 $ 295,999
Minority interests nil 451 nil
See notes to consolidated financial statements.

AIFUL CORPORATION Annual Report 201420
Consolidated Financial Statements
Consolidated Statement of Changes in EquityYear Ended March 31, 2014AIFUL CORPORATION and Consolidated Subsidiaries
Thousands Millions of Yen
Number of Shares of Common
Stock Issued*
Common Stock
Capital Surplus
Stock Acquisition
Rights
RetainedEarnings
Treasury Stock
Accumulated Other
Comprehensive Income (Loss)
Total Minority Interests Total Equity
Unrealized Gain (Loss) on Available-for-sale Securities
BALANCE AT APRIL 1, 2012 481,868 ¥ 143,325 ¥ 164,392 ¥ 51 ¥(224,820) ¥ (3,110) ¥(48) ¥ 79,790 ¥ 1,854 ¥ 81,644
Net income 22,706 22,706 22,706
Net increase in treasury stock (142 shares)* (0) (0) (0)
Net change in the year 11 196 207 451 658
BALANCE AT MARCH 31, 2013 481,868 143,325 164,392 62 (202,114) (3,110) 148 102,703 2,305 105,008
Net income 30,462 30,462 30,462
Net increase in treasury stock (636 shares) (0) (0) (0) (0)
Net change in the year 351 26 377 (2,305) (1,928)
BALANCE AT MARCH 31, 2014 481,868 ¥ 143,325 ¥ 164,392 ¥ 413 ¥(171,652) ¥ (3,110) ¥ 174 ¥ 133,542 ¥ nil ¥ 133,542
Thousands of U.S. Dollars (Note 1)
CommonStock
Capital Surplus
Stock Acquisition
Rights
RetainedEarnings
Treasury Stock
Accumulated Other
Comprehensive Income (Loss)
Total Minority Interests Total Equity
Unrealized Gain (Loss) on Available-for-sale Securities
BALANCE AT MARCH 31, 2013 $1,391,505 $1,596,039 $602 $ (1,962,272) $ (30,194) $ 1,437 $997,117 $22,379 $1,019,496
Net income 295,748 295,748 295,748
Net increase in treasury stock (636 shares) (0) (0) (0) (0)
Net change in the year 3,408 251 3,659 (22,379) (18,720)
BALANCE AT MARCH 31, 2014 $1,391,505 $1,596,039 $4,010 $ (1,666,524) $ (30,194) $ 1,688 $1,296,524 $ nil $1,296,524
* Shares and per share figures have been restated, as appropriate, to reflect a two-for-one stock split effected October 1, 2013.
See notes to consolidated financial statements.

21AIFUL CORPORATION Annual Report 2014
Consolidated Financial Statements
Consolidated Statement of Cash FlowsYear Ended March 31, 2014AIFUL CORPORATION and Consolidated Subsidiaries
Millions of YenThousands of U.S.
Dollars (Note 1)
2014 2013 2014
OPERATING ACTIVITIES:
Income before income taxes and minority interests ¥ 31,108 ¥ 23,601 $ 302,019
Adjustments for:
Income taxes - paid (1,476) (288) (14,330)
Income taxes - refund 71 423 689
Depreciation and amortization 3,761 6,021 36,515
Amortization of negative goodwill (218) (218) (2,117)
Gain on negative goodwill (2,305) (22,379)
Loss on impairment of long-lived assets 52
Decrease in allowance for investment losses (8) (55) (78)
Decrease in allowance for doubtful accounts (16,906) (36,919) (164,136)
(Decrease) increase in allowance for bonuses (4) 52 (39)
Increase in allowance for credit card point redemption 370 520 3,592
Decrease in allowance for losses on interest refunds (31,540) (17,246) (306,214)
Decrease in allowance for losses from business restructuring (2,127)
Gain on purchase of borrowings (3,840) (5,948) (37,282)
Changes in assets and liabilities:
Decrease in loans 69,485 64,377 674,612
Increase in installment accounts receivable (1,379) (4,935) (13,388)
Decrease in purchased receivables 910 1,442 8,835
(Increase) decrease in other operating receivables (55) 1,375 (534)
Decrease in claims in bankruptcy 2,978 5,400 28,913
Increase in lease and guarantee deposits (1,745) (2,540) (16,942)
Decrease in other current assets 5,620 223 54,563
Increase (decrease) in other current liabilities 34 (11,367) 330
Other, net 206 (30) 2,002
Total adjustments 23,959 (1,788) 232,612
Net cash provided by operating activities 55,067 21,813 534,631
INVESTING ACTIVITIES:
Capital expenditures (1,272) (1,606) (12,350)
Proceeds from sales of property, plant and equipment 1,270 221 12,330
Proceeds from sales of investment securities 667 532 6,476
Other, net 860 (323) 8,350
Net cash provided by (used in) investing activities 1,525 (1,176) 14,806
FORWARD ¥ 56,592 ¥ 20,637 $ 549,437
(Continued)

AIFUL CORPORATION Annual Report 201422
Millions of YenThousands of U.S.
Dollars (Note 1)
2014 2013 2014
FORWARD ¥ 56,592 20,637 $ 549,437
FINANCING ACTIVITIES:
Net increase in short-term borrowings 8,350 5,900 81,068
Proceeds from long-term debt 1,500 10,351 14,563
Repayments of long-term debt (60,804) (62,432) (590,330)
Net cash used in financing activities (50,954) (46,181) (494,699)
FOREIGN CURRENCY TRANSLATION ADJUSTMENTS ONCASH AND CASH EQUIVALENTS
41 46 398
NET INCREASE (DECREASE) IN CASH AND CASH EQUIVALENTS 5,679 (25,498) 55,136
CASH AND CASH EQUIVALENTS, BEGINNING OF YEAR 61,198 86,696 594,155
CASH AND CASH EQUIVALENTS, END OF YEAR ¥ 66,877 ¥ 61,198 $ 649,291
See notes to consolidated financial statements.
Consolidated Statement of Cash Flows

23AIFUL CORPORATION Annual Report 2014
Consolidated Financial Statements
Notes to Consolidated Financial StatementsYear Ended March 31, 2014AIFUL CORPORATION and Consolidated Subsidiaries
a. Consolidation — The consolidated financial statements as of
March 31, 2014, include the accounts of AIFUL CORPORATION
(the “Company”) and its four (four in 2013) significant subsid-
iaries (together, the “Group”). Consolidation of the remaining
12 (12 in 2013) unconsolidated subsidiaries would not have a
material effect on the accompanying consolidated financial
statements.
Under the control or influence concept, those companies
in which the Company, directly or indirectly, is able to exercise
control over operations are fully consolidated, and those com-
panies over which the Group has the ability to exercise signifi-
cant influence are accounted for by the equity method.
Investments in six unconsolidated subsidiaries (six in 2013)
are stated at cost. Investments in the remaining six unconsoli-
dated subsidiaries (six in 2013), which are limited liability invest-
ment partnerships and similar partnerships, are initially record-
ed at cost, and the carrying amount is adjusted to recognize the
Company’s interests in earnings or losses in such partnerships
based on the most recent available financial statements of the
partnerships.
The difference between the cost of an acquisition and the
fair value of the net assets of the acquired subsidiary at the
date of acquisition is reported as goodwill or negative goodwill
in the accompanying consolidated balance sheet.
Goodwill on acquisition of subsidiaries is amortized us-
ing the straight-line method over the estimated period (not to
exceed 20 years) in which economic benefits are expected to
be realized. However, when the excess of cost over net assets
of subsidiaries acquired is not material, it is charged to income
when incurred. Negative goodwill on acquisition of subsidiar-
ies prior to March 31, 2010 is amortized using the straight-line
method over 10 years. See Note 2.b for the new accounting
standard of business combinations undertaken on or after
April 1, 2010.
All significant intercompany balances and transactions have
been eliminated in consolidation. All material unrealized profit
included in assets resulting from transactions within the Group
is eliminated.
b. Business Combinations — In October 2003, the Business
Accounting Council (the “BAC”) issued a Statement of Opinion,
“Accounting for Business Combinations”, and in December
2005, the ASBJ issued ASBJ Statement No. 7, “Accounting
Standard for Business Divestitures” and ASBJ Guidance No. 10,
“Guidance for Accounting Standard for Business Combinations
and Business Divestitures”. The accounting standard for busi-
ness combinations allowed companies to apply the pooling-
of-interests method of accounting only when certain specific
criteria are met such that the business combination is essentially
regarded as a uniting-of-interests. For business combinations
that do not meet the uniting-of-interests criteria, the busi-
ness combination is considered to be an acquisition and the
purchase method of accounting is required. This standard also
prescribes the accounting for combinations of entities under
common control and for joint ventures.
In December 2008, the ASBJ issued a revised accounting
standard for business combinations, ASBJ Statement No. 21,
“Accounting Standard for Business Combinations”. Major
accounting changes under the revised accounting standard
are as follows: (1) The revised standard requires accounting
for business combinations only by the purchase method. As
a result, the pooling of interests method of accounting is no
longer allowed. (2) The previous accounting standard accounts
The accompanying consolidated financial statements have been
prepared in accordance with the provisions set forth in the
Japanese Financial Instruments and Exchange Act and its related
accounting regulations, and in accordance with accounting
principles generally accepted in Japan (“Japanese GAAP”), which
are different in certain respects as to application and disclosure
requirements of International Financial Reporting Standards. The
consolidated financial statements are not intended to present
the financial position, results of operations and cash flows in
accordance with accounting principles generally accepted in
countries and jurisdictions other than Japan.
In preparing these consolidated financial statements, certain
reclassifications and rearrangements have been made to the
consolidated financial statements issued domestically in order to
present them in a form which is more familiar to readers outside
Japan. In addition, certain reclassifications have been made in
the 2013 consolidated financial statements to conform to the
classifications used in 2014.
The consolidated financial statements are stated in Japanese
yen, the currency of the country in which the Company is
incorporated and operates. The translations of Japanese yen
amounts into U.S. dollar amounts are included solely for the
convenience of readers outside Japan and have been made at
the rate of ¥103 to $1, the approximate rate of exchange at
March 31, 2014. Such translations should not be construed
as representations that the Japanese yen amounts could be
converted into U.S. dollars at that or any other rate.
BASIS OF PRESENTATION OF CONSOLIDATED FINANCIAL STATEMENTS1
SUMMARY OF SIGNIFICANT ACCOUNTING POLICIES2

AIFUL CORPORATION Annual Report 201424
for research and development costs to be charged to income as
incurred. Under the revised standard, in-process research and
development costs (IPR&D) acquired in the business combina-
tion are capitalized as an intangible asset. (3) The previous ac-
counting standard provided for a bargain purchase gain (nega-
tive goodwill) to be systematically amortized over a period not
exceeding 20 years. Under the revised standard, the acquirer
recognizes the bargain purchase gain in profit or loss immedi-
ately on the acquisition date after reassessing and confirming
that all of the assets acquired and all of the liabilities assumed
have been identified after a review of the procedures used in
the purchase price allocation. This standard was applicable to
business combinations undertaken on or after April 1, 2010.
As discussed in Note 20 to the consolidated financial state-
ments, effective March 29, 2013, the Company entered into the
agreement with Sumitomo Mitsui Trust Bank, Limited to dis-
solve their joint venture business of BUSINEXT CORPORATION
(“BN”) by transferring all shares and borrowings of BN to its
consolidated subsidiary of NEW FRONTIER PARTNERS Co., Ltd.
(“NFP”), which was completed on April 3, 2013.
c. Cash Equivalents — Cash equivalents are short-term invest-
ments that are readily convertible into cash and that are ex-
posed to insignificant risk of changes in value. Cash equivalents
include time deposits that mature or become due within three
months of the date of acquisition.
d. Operational Investment Securities Held by Venture
Capital Subsidiary and Investment Securities — Operation-
al investment securities held by a venture capital company and
investment securities, all of which are classified as available-
for-sale securities, are reported at fair value, with unrealized
gains and losses, net of applicable taxes, reported in a separate
component of equity. The cost of securities sold is determined
based on the moving-average cost method. Nonmarketable
available-for-sale securities are stated at cost determined by the
moving-average method. For other-than-temporary declines
in fair value, operational investment securities and investment
securities are reduced to net realizable value by a charge to
income.
Investments in limited liability investment partnerships and
similar partnerships are initially recorded at cost, and the car-
rying amount is adjusted to recognize the Company’s interests
in earnings or losses in such partnerships based on the most
recent available financial statements of the partnerships.
e. Property and Equipment — Property and equipment are
stated at cost. Depreciation of property and equipment of the
Company and its consolidated subsidiaries is computed by the
declining-balance method except that the straight-line method
is applied to the buildings of the Company’s consolidated
subsidiaries acquired on or after April 1, 1998. The range of
useful lives is principally from 2 to 62 years for buildings and
structures, from 4 to 17 years for machinery and equipment,
and from 2 to 20 years for furniture and fixtures.
f. Long-lived Assets — The Group reviews its long-lived assets
for impairment whenever events or changes in circumstance
indicate the carrying amount of an asset or asset group may
not be recoverable. An impairment loss is recognized if the
carrying amount of an asset or asset group exceeds the sum
of the undiscounted future cash flows expected to result from
the continued use and eventual disposition of the asset or asset
group. The impairment loss would be measured as the amount
by which the carrying amount of the asset exceeds its recover-
able amount, which is the higher of the discounted cash flows
from the continued use and eventual disposition of the asset or
the net selling price at disposition.
g. Software — Expenditures for the purchase of software, which
meet certain future tests, are capitalized as software and amor-
tized by the straight-line method over the estimated useful lives
of five years.
h. Allowance for Doubtful Accounts — The allowance for
doubtful accounts is stated in amounts considered to be appro-
priate based on the Group’s past credit loss experience and an
evaluation of potential losses in the accounts outstanding.
i. Allowance for Investment Losses — The allowance for
investment losses is stated in amounts considered to be appro-
priate based on the financial position of the investment destina-
tion and an evaluation of potential losses on nonmarketable
investment securities.
j. Allowance for Credit Card Point Redemption — The al-
lowance for credit card point redemption is provided at an
estimated amount of future costs related to credit card point
redemption. These points are granted to card members ac-
cording to the point system that is intended to promote the
usage of cards.
k. Allowance for Losses from Business Restructuring — The
allowance for losses from business restructuring is provided
at an estimated amount of future costs related to closure of
outlets and other restructuring activities.
l. Allowance for Losses on Interest Refunds — The limit of
interest rates in Japan is regulated by two laws - “Capital Sub-
scription Law” and “Interest Rate Restriction Act”. Under the
former law, interest rates on loans should not exceed 29.2%
(20.0% for customers who originate loans after June 18, 2010)
and the violation of law is considered to be a criminal penalty.
The latter law stipulates that interest payments for interest rates
that exceed the legal limit (20.0% for principal amounts under
¥100 thousand, 18.0% for principal amounts not less than
¥100 thousand and under ¥1 million and 15.0% for principal
amounts not less than ¥1 million) are void. However, under the
“Moneylending Business Control and Regulation Law”, such
interest payments are nonetheless considered to be valid if
moneylenders issue notices as prescribed by the law to debtors
and debtors pay the interests voluntarily (For customers who
originate loans after June 18, 2010, such system is abolished.).
Strict judgment by the Supreme Court of these requirements
has led to decisions against moneylenders and resulted in more
debtors claiming for the return of excess interest payments.
The Company and its certain consolidated subsidiaries have
loaned money at rates between the limits set by the two laws.
Allowance for losses on interest refunds is stated in amounts
considered to be appropriate based on the Company’s and its
Notes to Consolidated Financial Statements

25AIFUL CORPORATION Annual Report 2014
certain consolidated subsidiaries’ past refund loss experience,
the recent situation regarding interest refunds and other fac-
tors.
At March 31, 2014 and 2013, the Group recorded an al-
lowance of ¥59,882 million ($581,379 thousand) and ¥91,422
million, respectively, as “Allowance for losses on interest
refunds”. In addition, the estimated amount of interest refunds
of ¥35,291 million ($342,631 thousand) and ¥42,826 million
which were expected to be preferentially set off against loans
was recorded as “Allowance for doubtful accounts” for the
Company and its certain consolidated subsidiaries at March 31,
2014 and 2013, respectively.
m. Asset Retirement Obligations — In March 2008, the
ASBJ published ASBJ Statement No. 18 “Accounting Standard
for Asset Retirement Obligations” and ASBJ Guidance No.
21 “Guidance on Accounting Standard for Asset Retirement
Obligations”. Under this accounting standard, an asset retire-
ment obligation is defined as a legal obligation imposed either
by law or contract that results from the acquisition, construc-
tion, development and the normal operation of a tangible fixed
asset and is associated with the retirement of such tangible
fixed asset. The asset retirement obligation is recognized as the
sum of the discounted cash flows required for the future asset
retirement and is recorded in the period in which the obligation
is incurred if a reasonable estimate can be made. If a reason-
able estimate of the asset retirement obligation cannot be
made in the period the asset retirement obligation is incurred,
the liability should be recognized when a reasonable estimate
of the asset retirement obligation can be made. Upon initial
recognition of a liability for an asset retirement obligation, an
asset retirement cost is capitalized by increasing the carrying
amount of the related fixed asset by the amount of the liability.
The asset retirement cost is subsequently allocated to expense
through depreciation over the remaining useful life of the asset.
Over time, the liability is accreted to its present value each pe-
riod. Any subsequent revisions to the timing or the amount of
the original estimate of undiscounted cash flows are reflected
as an adjustment to the carrying amount of the liability and the
capitalized amount of the related asset retirement cost.
n. Stock Options — ASBJ Statement No. 8, “Accounting Stan-
dard for Stock Options” and related guidance are applicable
to stock options granted on and after May 1, 2006. This
standard requires companies to measure the cost of employee
stock options based on the fair value at the date of grant and
recognize compensation expense over the vesting period as
consideration for receiving goods or services. The standard
also requires companies to account for stock options granted
to non-employees based on the fair value of either the stock
option or the goods or services received. In the balance sheet,
the stock option is presented as a stock acquisition right as a
separate component of equity until exercised. The standard
covers equity-settled, share-based payment transactions, but
does not cover cash-settled, share-based payment transactions.
In addition, the standard allows unlisted companies to measure
options at their intrinsic value if they cannot reliably estimate
fair value.
o. Leases — In March 2007, the ASBJ issued ASBJ Statement
No. 13, “Accounting Standard for Lease Transactions”, which
revised the previous accounting standard for lease transactions.
The revised accounting standard for lease transactions was
effective for fiscal years beginning on or after April 1, 2008.
Under the previous accounting standard, finance leases
that were deemed to transfer ownership of the leased property
to the lessee were capitalized. However, other finance leases
were permitted to be accounted for as operating lease transac-
tions if certain “as if capitalized” information was disclosed
in the note to the lessee’s financial statements. The revised
accounting standard requires that all finance lease transactions
be capitalized by recognizing lease assets and lease obligations
in the balance sheet.
The Group applied the revised accounting standard effec-
tive April 1, 2008.
Lease assets related to finance lease transactions with
ownership transfer are depreciated on the methods which are
applied to the assets owned by the Group. Lease assets related
to finance lease transactions without ownership transfer are
depreciated over the leased periods on a straight-line basis,
with no residual value.
All other leases are accounted for as operating leases.
p. Income Taxes — The provision for income taxes is computed
based on the pretax income included in the consolidated state-
ment of income. The asset and liability approach is used to
recognize deferred tax assets and liabilities for the expected
future tax consequences of temporary differences between
the carrying amounts and the tax bases of assets and liabilities.
Deferred taxes are measured by applying currently enacted tax
laws to the temporary differences.
The Group files a tax return under the consolidated corpo-
rate tax system, which allows companies to base tax payments
on the combined profits or losses of the parent company and
its wholly owned domestic subsidiaries.
q. Foreign Currency Transactions — All short-term and
long-term monetary receivables and payables denominated
in foreign currencies are translated into Japanese yen at
the exchange rates at the balance sheet date. The foreign
exchange gains and losses from translation are recognized
in the consolidated statement of income to the extent that
they are not hedged by forward exchange contracts.
r. Revenue Recognition:
Interest on Loans —Interest on loans is recorded on an ac-
crual basis. In accordance with the practice prevailing in the
industry, the Company records accrued interest at either the
interest rate stipulated in the Interest Rate Restriction Act or
the contracted interest rate, whichever is lower.
Revenue from Credit Card Business, Revenue from
Installment Sales Finance Business — Fees from customers
and member stores applying the add-on method are generally
recorded collectively as unearned income when credit contracts
become effective and are recognized in equal installments
over the lives of contracts. Fees from customers applying the
Notes to Consolidated Financial Statements

AIFUL CORPORATION Annual Report 201426
remaining principal method or revolving method are generally
recognized in equal installments over the lives of contracts.
Revenue from Credit Guarantees — Revenue from credit
guarantees is recorded by the remaining principal method.
s. Interest on Borrowings — Interest on financial liabilities is
accounted for as operating expenses while other interest is
included in other expenses.
t. Derivatives and Hedging Activities — The Group uses
derivative financial instruments to manage its exposures to
fluctuations in interest rates and foreign exchange. Interest rate
swaps, interest rate caps and currency swaps contracts are uti-
lized by the Group to reduce interest rate and foreign currency
exchange risks. The Group does not enter into derivatives for
trading or speculative purposes.
Derivative financial instruments are classified and accounted
for as follows: a) all derivatives are recognized as either as-
sets or liabilities and measured at fair value, and gains or losses
on derivative transactions are recognized in the consolidated
statement of income; and b) for derivatives used for hedging
purposes, if derivatives qualify for hedge accounting because of
high correlation and effectiveness between the hedging instru-
ments and the hedged items, gains or losses on derivatives are
deferred until maturity of the hedged transactions.
Currency swaps contracts are utilized to hedge foreign
currency exposure in principal and interest payments of foreign-
currency-denominated straight bonds. Foreign-currency-de-
nominated straight bonds are translated at the contracted rates.
The interest rate swaps and caps which qualify for hedge
accounting and meet specific matching criteria are not remea-
sured at market value but the differential paid or received under
the swap or cap contracts is recognized and included in interest
expenses or income.
u. Per Share Information — Basic net income per share is com-
puted by dividing net income available to common shareholders
by the weighted-average number of common shares outstand-
ing for the period, retroactively adjusted for stock splits.
Diluted net income per share of common stock reflects the
potential dilution that could occur if securities were converted
into common stock and assumes full exercise of outstanding
stock options.
Cash dividends per share presented in the accompanying
consolidated statement of income are dividends applicable to
the respective years including dividends to be paid after the end
of the year.
On October 1, 2013, the Company effected a two-for-one
stock split by way of a free share distribution based on the reso-
lution of the Board of Directors meeting held on July 8, 2013.
All prior year share and per share figures have been restated
to reflect the impact of the stock split, and to provide data on
a basis comparable to the year ended March 31, 2014. Such
restatements include calculations regarding the Company’s
weighted-average number of common shares, basic net income
per share, diluted net income per share, and stock option data
of the Company’s common stock.
v. Accounting Changes and Error Corrections — In Decem-
ber 2009, ASBJ issued ASBJ Statement No. 24 “Accounting
Standard for Accounting Changes and Error Corrections” and
ASBJ Guidance No. 24 “Guidance on Accounting Standard for
Accounting Changes and Error Corrections”. Accounting treat-
ments under this standard and guidance are as follows:
(1) Changes in Accounting Policies - When a new accounting
policy is applied following revision of an accounting standard,
the new policy is applied retrospectively unless the revised
accounting standard includes specific transitional provisions,
which case the entity shall comply with the specific transitional
provisions. (2) Changes in Presentation - When the presenta-
tion of financial statements is changed, prior-period financial
statements are reclassified in accordance with the new pre-
sentation. (3) Changes in Accounting Estimates - A change in
an accounting estimate is accounted for in the period of the
change if the change affects that period only, and is accounted
for prospectively if the change affects both the period of the
change and future periods. (4) Corrections of Prior-Period
Errors - When an error in prior-period financial statements is
discovered, those statements are restated.
Notes to Consolidated Financial Statements

27AIFUL CORPORATION Annual Report 2014
Loans at March 31, 2014 and 2013, consisted of the following (before allowance for doubtful accounts):
Millions of Yen Thousands of U.S. Dollars
2014 2013 2014
Unsecured ¥ 261,222 ¥ 272,980 $ 2,536,136
Secured 41,268 64,345 400,660
Small-business loans 45,521 53,310 441,951
Total 348,011 390,635 3,378,747
Off-balance-sheet securitized loans (26,861) (260,786)
Net ¥ 321,150 ¥ 390,635 $ 3,117,961
Registered moneylenders are required to disclose the following information under the Non-Bank Bond Issuing Law:
Millions of Yen Thousands of U.S. Dollars
2014 2013 2014
Loans in legal bankruptcy ¥ 35,135 ¥ 37,598 $ 341,117
Nonaccrual loans 27,290 36,906 264,951
Accruing loans contractually past due three months or moreas to principal or interest payments 2,445 2,610 23,738
Restructured loans 14,353 21,514 139,349
Total ¥ 79,223 ¥ 98,628 $769,155
Loans in legal bankruptcy are loans in which accrual of
interest is discontinued (excluding the portion recognized as bad
debts), based on management’s judgment as to the collectability
of principal or interest resulting from the past-due payment of
interest or principal and other factors. Allowances for claims in
bankruptcy are stated at such amount less net realizable value of
collateral.
Nonaccrual loans are loans in which accrual of interest is
discontinued, other than loans in legal bankruptcy as well as
loans receiving regular payments in the case of granting deferral
of interest payment to the debtors in financial difficulties to assist
them in their recovery.
Accruing loans contractually past due three months or more
as to principal or interest payments are loans for which payments
of principal or interest have not been received for a period of
three months or more beginning with the next business day
following the last due date for such payments. Loans classified as
loans in legal bankruptcy and nonaccrual loans are excluded from
accruing loans contractually past due three months or more.
Restructured loans are loans on which creditors grant
concessions (e.g., reduction of the stated interest rate, deferral
of interest payment, extension of maturity date, waiver of the
face amount, or other concessive measures) to the debtors in
financial difficulties to assist them in their recovery and eventually
enable them to pay creditors. Loans classified as loans in legal
bankruptcy, nonaccrual loans and accruing loans contractually
past due three months or more are excluded.
At March 31, 2014 and 2013, including securitized loans,
the Group had balances related to revolving loan contracts
aggregating ¥267,679 million ($2,598,825 thousand) and
¥301,487 million, respectively, whereby the Group is obligated
to advance funds up to a predetermined amount upon request.
At March 31, 2014 and 2013, the balances of unadvanced
commitments were ¥682,314 million ($6,624,408 thousand)
and ¥678,908 million, respectively. The loan contract contains
provisions that allow the Group to reduce the contract amount
of the commitment or refuse to advance funds to loan customers
under certain conditions.
LOANS3
Notes to Consolidated Financial Statements

AIFUL CORPORATION Annual Report 201428
Operational investment and investment securities at March 31, 2014 and 2013, consisted of the following:
Millions of Yen Thousands of U.S. Dollars
2014 2013 2014
Current: Equity securities ¥ 825 ¥ 926 $ 8,010
Non-current:
Equity securities ¥ 603 ¥ 840 $ 5,854
Government and corporate bonds 152
Other 176 144 1,709
Total ¥ 779 ¥ 1,136 $ 7,563
The costs and aggregate fair values of available-for-sale securities included in investment securities with reliable determined fair value at
March 31, 2014 and 2013, were as follows:
Millions of Yen2014
Cost UnrealizedGains
Unrealized Losses Fair Value
Securities classified as:Available-for-sale securities ¥ 111 ¥ 203 ¥ 3 ¥ 311
Millions of Yen
2013
Cost UnrealizedGains
Unrealized Losses Fair Value
Securities classified as:Available-for-sale securities ¥ 427 ¥ 234 ¥ 12 ¥ 649
Thousands of U.S. Dollars2014
Cost UnrealizedGains
Unrealized Losses Fair Value
Securities classified as:Available-for-sale securities $ 1,078 $ 1,971 $ 29 $ 3,020
Installment accounts receivable and unearned income, included in other current liabilities, at March 31, 2014 and 2013, consisted of the
following:
Millions of Yen Thousands of U.S. Dollars
2014 2013 2014
Receivables UnearnedIncome Receivables Unearned
Income Receivables UnearnedIncome
Credit card business ¥ 84,382 ¥ 341 ¥ 82,439 ¥ 399 $ 819,243 $ 3,311
Installment sales finance business 882 1 1,446 8 8,563 9
Total ¥ 85,264 ¥ 342 ¥ 83,885 ¥ 407 $ 827,806 $ 3,320
In addition, the Group had unearned income of immaterial amounts at March 31, 2014 and 2013, which was included in other current
liabilities, related to loans other than those shown in the above table.
The Group, as guarantor, recorded credit guarantees as a contra account of obligations under credit guarantees. Unearned income relating
to credit guarantees was ¥32 million ($311 thousand) and ¥40 million at March 31, 2014 and 2013, respectively, which was included in
other current liabilities.
OPERATIONAL INVESTMENT SECURITIES HELD BY VENTURE CAPITAL SUBSIDIARY AND INVESTMENT SECURITIES6
INSTALLMENT ACCOUNTS RECEIVABLE4
CREDIT GUARANTEES AND OBLIGATION UNDER CREDIT GUARANTEES5
Notes to Consolidated Financial Statements

29AIFUL CORPORATION Annual Report 2014
Proceeds from sales of available-for-sale securities for the years ended March 31, 2014 and 2013, were ¥750 million ($7,282
thousand) and ¥84 million, respectively. Gross realized gains on these sales, computed on the moving-average cost basis, were
¥325 million ($3,155 thousand) and ¥38 million for the years ended March 31, 2014 and 2013, respectively, and gross realized
losses were ¥39 million ($379 thousand) for the year ended March 31, 2014.
The impairment losses on available-for-sale securities for the years ended March 31, 2014 and 2013, were ¥41 million
($398 thousand) and ¥31 million, respectively.
Year ended March 31, 2014
There was no impairment loss for the year ended March 31, 2014.
Year ended March 31, 2013
The following table summarizes the Group’s asset grouping:
Business Classification Asset Grouping
Financial services and venture capital Each business entity is the minimum unit. For assets related to business restructuring, each outlet and department which each company has decided to close is the minimum unit.
Right of telephone Each right of telephone which each company has decided to sell is the minimum unit.
The Group reviewed its long-lived assets for impairment for the year ended March 31, 2013. As a result, the Group recognized an
impairment loss for right of telephone which the Group decided to sell. The carrying amount of the relevant assets was written down to
the estimated recoverable amount. The estimated recoverable amount of each asset grouping was measured at the expected amount of
sale.
Impairment Loss
Description Classification Location Millions of Yen
The assets of expected sale
Other assets (Right of telephone) Kyoto Prefecture ¥ 52
The following table summarizes the components of the Group’s loss on impairment of long-lived assets for the year ended March 31,
2013:
Millions of Yen
Other assets ¥ 52
LONG-LIVED ASSETS7
Notes to Consolidated Financial Statements

AIFUL CORPORATION Annual Report 201430
Short-term borrowings at March 31, 2014 and 2013, consisted of the following:
Millions of Yen Thousands of U.S. Dollars
2014 2013 2014
Borrowings principally from certain credit card company,1.40% to 2.95% (1.35% to 2.95% at March 31, 2013)
¥ 49,250 ¥ 40,900 $ 478,155
Long-term debt at March 31, 2014 and 2013, consisted of the following:
Millions of Yen Thousands of U.S. Dollars
2014 2013 2014
Loans from banks, 1.90% to 2.975%* ¥ 106,197 ¥ 155,926 $1,031,039
Loans from other financial institutions, 1.90% to 3.75%* 20,986 24,928 203,748
Unsecured 1.74% yen straight bonds, due 2013 8,700
Unsecured 1.99% yen straight bonds, due 2015 10,000 10,000 97,087
Unsecured 3.50% medium-term notes, due 2015 15,000 15,000 145,631
Other debt (principally from securities companies), 1.90% to 2.475%* 52,483 52,896 509,544
Obligations under finance leases 37 397 359
Total 204,703 267,847 1,987,408
Less current portion (16,837) (52,772) (163,466)
Long-term debt, less current portion ¥ 187,866 ¥ 215,075 $1,823,942
* The final due dates for long-term debts subject to financial assistance cannot be identified.At March 31, 2014 and 2013, long-term debts subject to the financial assistance of ¥106,197 million ($1,031,039 thousand) and ¥120,280 million,
respectively, were included in “Loans from banks”, ¥19,561 million ($189,913 thousand) and ¥24,928 million, respectively, were included in “Loans from other financial institutions”, and ¥52,483 million ($509,544 thousand) and ¥52,896 million, respectively, were included in “Other debt” in the table above.
The final due date for “Loans from banks” other than those subject to financial assistance is 2018 (2015 at March 31, 2013). The Company and its certain consolidated subsidiaries had received financial assistance based on the Business Revitalization Plan subsequent to March 31,
2014. The participating creditors decided to approve the proposal regarding the continuous financial assistance, which includes the provision on the partial repayment of the remaining obligations of ¥161,741 million ($1,570,301 thousand), at the meeting of participating creditors held on June 13, 2014. But the repayment schedule and method still remain undefined.
SHORT-TERM BORROWINGS AND LONG-TERM DEBT8
Notes to Consolidated Financial Statements

31AIFUL CORPORATION Annual Report 2014
Annual maturities of long-term debt, excluding finance leases (see Note 14) at March 31, 2014, were as follows:
Year Ending March 31 Millions of Yen Thousands of U.S. Dollars
2015 ¥ 16,800 $ 163,107
2016 25,300 245,631
2017 300 2,913
2018 300 2,913
2019 225 2,184
Total ¥ 42,925 $ 416,748
Long-term debt whose repayment schedule is determined is included in the table above.
Long-term debt of ¥161,741 million ($1,570,301 thousand) whose repayment schedule is undetermined, such as obligations remaining
subject to the financial assistance, is not included in the table above.
At March 31, 2014, the following assets were pledged as collateral for short-term borrowings and long-term debt (including current
portion of long-term debt):
Millions of Yen Thousands of U.S. Dollars
Loans ¥ 223,555 $2,170,437
Installment accounts receivable 89,122 865,262
Other current assets 78 757
Land 8,523 82,748
Buildings and structures 4,803 46,631
Machinery and equipment 90 874
Total ¥ 326,171 $3,166,709
Related liabilities:
Short-term borrowings ¥ 49,250 $478,155
Long-term debt (including current portion of long-term debt) 179,666 1,744,330
Total ¥ 228,916 $2,222,485
The portion of the amount of “Loans” and “Installment accounts receivable” in the above table is the amount which the Company
reserved at the time of the registration of assignment of accounts receivable.
Notes to Consolidated Financial Statements

AIFUL CORPORATION Annual Report 201432
The Company and its certain consolidated subsidiaries have a defined contribution pension plan and a prepaid retirement benefits plan.
Contributions to the defined contribution plan and payments to the prepaid retirement benefits plan are charged to income when made.
The components of net periodic benefit costs for the years ended March 31, 2014 and 2013, were as follows:
Millions of Yen Thousands of U.S. Dollars
2014 2013 2014
Payments for the prepaid retirement benefits plan ¥ 206 ¥ 223 $ 2,000
Premiums for the defined contribution pension plan 271 292 2,631
Other 3
Net periodic benefit costs ¥ 477 ¥ 518 $ 4,631
RETIREMENT AND PENSION PLANS9
Japanese companies are subject to the Companies Act of
Japan (the “Companies Act”). The significant provisions in the
Companies Act that affect financial and accounting matters are
summarized below:
(a) Dividends
Under the Companies Act, companies can pay dividends at any
time during the fiscal year in addition to the year-end dividend
upon resolution at the shareholders meeting. For companies
that meet certain criteria including (1) having a Board of
Directors, (2) having independent auditors, (3) having an Audit &
Supervisory Board, and (4) the term of service of the directors is
prescribed as one year rather than two years of normal term by
its articles of incorporation, the Board of Directors may declare
dividends (except for dividends-in-kind) at any time during the
fiscal year if the company has prescribed so in its articles of
incorporation. The Company meets all the above criteria.
The Companies Act permits companies to distribute
dividends-in-kind (noncash assets) to shareholders subject
to a certain limitation and additional requirements.
Semiannual interim dividends may also be paid once a
year upon resolution by the Board of Directors if the articles
of incorporation of the company so stipulate. The Companies
Act provides certain limitations on the amounts available for
dividends or the purchase of treasury stock. The limitation
is defined as the amount available for distribution to the
shareholders, but the amount of net assets after dividends
must be maintained at no less than ¥3 million.
(b) Increases/Decreases and Transfer of Common Stock,
Reserve and Surplus
The Companies Act requires that an amount equal to 10% of
dividends must be appropriated as a legal reserve (a component
of retained earnings) or as additional paid-in capital (a
component of capital surplus), depending on the equity account
charged upon the payment of such dividends, until the aggregate
amount of legal reserve and additional paid-in capital equals
25% of the common stock. Under the Companies Act, the total
amount of additional paid-in capital and legal reserve may be
reversed without limitation. The Companies Act also provides
that common stock, legal reserve, additional paid-in capital, other
capital surplus and retained earnings can be transferred among
the accounts under certain conditions upon resolution of the
shareholders.
(c) Treasury Stock and Treasury Stock Acquisition Rights
The Companies Act also provides for companies to purchase
treasury stock and dispose of such treasury stock by resolution of
the Board of Directors. The amount of treasury stock purchased
cannot exceed the amount available for distribution to the
shareholders which is determined by specific formula. Under
the Companies Act, stock acquisition rights are presented as a
separate component of equity. The Companies Act also provides
that companies can purchase both treasury stock acquisition rights
and treasury stock. Such treasury stock acquisition rights are
presented as a separate component of equity or deducted directly
from stock acquisition rights.
On October 1, 2013, the Company effected a two-for-one
stock split by way of a free share distribution based on the
resolution of the Board of Directors meeting held on July 8, 2013.
EQUITY10
Notes to Consolidated Financial Statements

33AIFUL CORPORATION Annual Report 2014
The stock options outstanding as of March 31, 2014, are as follows:
Stock Option Persons GrantedNumber
of Options Granted*
Date of Grant Exercise Price* Exercise Period
2010 Stock Option
2,206 Company's and Subsidiaries' key employees
4,385,300 shares July 1, 2010¥64
($0.62)From August 1, 2014to July 31, 2016
2013 Stock Option
1,480 Company's and Subsidiaries' key employees
2,947,100 shares May 27, 2013¥501
($4.86)From May 1, 2015to April 30, 2017
* Number of options granted and exercise price have been restated, as appropriate, to reflect a two-for-one stock split effected October 1, 2013.
The stock option activity is as follows:
2010 Stock Option 2013 Stock Option
(shares) (shares)
For the year ended March 31, 2013*
Non-vested
March 31, 2012 - Outstanding 4,385,300
Granted
Canceled
Vested
March 31, 2013 - Outstanding 4,385,300
Vested
March 31, 2012 - Outstanding
Vested
Exercised
Canceled
March 31, 2013 - Outstanding
Exercise price ¥ 64
Fair value price at grant date ¥ 31
2010 Stock Option 2013 Stock Option
(shares) (shares)
For the year ended March 31, 2014*
Non-vested
March 31, 2013 - Outstanding 4,385,300
Granted 2,947,100
Canceled
Vested
March 31, 2014 - Outstanding 4,385,300 2,947,100
Vested
March 31, 2013 - Outstanding
Vested
Exercised
Canceled
March 31, 2014 - Outstanding
Exercise price¥ 64
($ 0.62)¥ 501
($ 4.86)
Fair value price at grant date¥ 31
($ 0.30)¥ 261
($ 2.53)
* Shares and prices have been restated, as appropriate, to reflect a two-for-one stock split effected October 1, 2013.
STOCK OPTION11
Notes to Consolidated Financial Statements

AIFUL CORPORATION Annual Report 201434
LOSS FROM BUSINESS RESTRUCTURING12
INCOME TAXES13
The following table summarizes the components of the Group’s loss from business restructuring for the year ended March 31, 2014:
Millions of Yen Thousands of U.S. Dollars
Loss from business restructuring:Voluntary retirement cost and other ¥ 10 $ 97
The Company and its domestic subsidiaries are subject to Japanese national and local income taxes which, in the aggregate, resulted in
normal effective statutory tax rates of approximately 36% for the years ended March 31, 2014 and 2013, respectively.
The tax effects of significant temporary differences and tax loss carry forward which resulted in deferred tax assets and liabilities at
March 31, 2014 and 2013, were as follows:
Millions of Yen Thousands of U.S. Dollars
2014 2013 2014
Deferred tax assets:
Allowance for doubtful accounts ¥ 23,563 ¥ 24,410 $ 228,767
Allowance for losses on interest refunds 21,339 32,547 207,175
Charge-offs for doubtful accounts 7,026 8,798 68,214
Accrued interest on loans 1,968 2,459 19,107
Tax loss carry forwards 189,241 182,348 1,837,291
Interest refunds payable 357 326 3,466
Other 5,960 7,360 57,863
Total 249,454 258,248 2,421,883
Less valuation allowance (249,306) (258,248) (2,420,446)
Total deferred tax assets ¥ 148 ¥ Nil ¥ 1,437
Deferred tax liabilities:
Unrealized gain on available-for-sale securities ¥ (1) ¥ (9) $ (10)
Costs of removal related to asset retirement obligations (171) (140) (1,660)
Total deferred tax liabilities ¥ (172) ¥ (149) $ (1,670)
Net deferred tax liabilities ¥ (24) ¥ (149) $ (233)
Notes to Consolidated Financial Statements
The assumptions used to measure fair value of 2010 Stock Option
Estimate method: Black-Scholes option pricing model
Volatility of stock price: 77.936%
Estimated remaining outstanding period: 5.08 years
Estimated dividend: ¥0 per share
Risk free interest rate: 0.3577%
The assumptions used to measure fair value of 2013 Stock Option
Estimate method: Black-Scholes option pricing model
Volatility of stock price: 82.512%
Estimated remaining outstanding period: 2.93 years
Estimated dividend: ¥0 per share
Risk free interest rate: 0.171%

35AIFUL CORPORATION Annual Report 2014
A valuation allowance is established to reduce certain deferred tax assets with respect to deductible temporary differences and net
operating loss carry forwards where it is more likely than not that they will not be realized.
A reconciliation between the normal effective statutory tax rates and the actual effective tax rates reflected in the accompanying
consolidated statement of income for the years ended March 31, 2014 and 2013, is as follows:
2014 2013
Normal effective statutory tax rate 36% 36%
Less valuation allowance (32) (33)
Income not taxable for income tax purposes (2) (0)
Others, net 0 (1)
Actual effective tax rate 2% 2%
At March 31, 2014, the Company and its wholly owned domestic subsidiaries had tax loss carry forwards aggregating approximately
¥527,383 million ($5,120,223 thousand) which were available for offset against taxable income of the Company and such subsidiaries in
future years. These tax loss carry forwards, if not utilized, will expire as follows:
Year Ending March 31 Millions of Yen Thousands of U.S. Dollars
2015 ¥ 39,866 $387,049
2016
2017
2018 59,408 576,777
2019 155,254 1,507,320
2020 and thereafter 272,855 2,649,077
Total ¥ 527,383 $5,120,223
The Group leases furniture and fixtures.
Total rental expenses including lease payments under finance leases for the years ended March 31, 2014 and 2013, were ¥2,260 million
($21,942 thousand) and ¥2,448 million, respectively.
Obligations under finance leases at March 31, 2014 were as follows:
Millions of Yen Thousands of U.S. Dollars
Due within one year ¥ 37 $ 359
Total ¥ 37 $ 359
LEASES14
Notes to Consolidated Financial Statements

AIFUL CORPORATION Annual Report 201436
(1) Group policy for financial instruments
The main business of the Group is finance. The Group is engaged
in the provision of unsecured loans for individual consumers,
secured loans, small business loans, shopping loans, credit
guarantee, debt collection and so on. To run these businesses,
the Group raises funds domestically and internationally. Indirect
financing by loans from banks and direct financing by bond issue
are used. The Group enters into derivative transactions as means
of managing its interest rate exposures and foreign currency
exposures on certain liabilities. Such derivative transactions are
entered into to hedge interest exposures and foreign currency
exposures inherent within its business. The Group does not hold
or issue derivatives for trading or speculative purposes.
(2) Nature and extent of risks arising from financial
instruments
Loans and installment accounts receivable for domestic consumers
and small businesses are the main financial assets of the Group
and are exposed to credit risk through default of contract by
customers. Other financial assets such as operational investment
securities and investment securities are mainly stock and
investments in limited liability investment partnerships. The Group
holds these securities to develop these businesses. The securities
are exposed to the issuer’s credit risk and the risk of market price
fluctuations.
Borrowings and debt including bonds are the main financial
liabilities of the Group. These liabilities are exposed to liquidity
risks, or risk that liabilities cannot be met when they fall due if the
Group is unable to participate in fund-raising markets in certain
circumstances. In addition, the Group raises funds at variable
interest rates or by bonds in foreign currency, and these are
exposed to the market risks of fluctuation in interest rates and
foreign currency exchange rates.
Derivatives include interest rate swaps and currency swaps
which are applicable to hedge accounting, and interest rate swaps
and caps which are not applicable to hedge accounting. These
derivatives are exposed to the market risks of fluctuation in interest
rates and foreign currency exchange rates, and counterparty
risks. See Note 16 for more details about derivatives and hedging
activities.
(3) Risk management for financial instruments
Credit risk management
Credit risk is the risk of economic loss arising from a counterparty’s
failure to repay or service debt according to the contractual
terms. The Group manages its credit risks according to internal
guidelines. In relation to loans, installments accounts receivable
and credit guarantees which are the Group’s major financial assets,
the Group conducts credit checks for each contract based on
data of the consumer data industry and its own credit standards,
maintaining its system to modify credit ceilings, set guarantees
or collateral. The Group manages its credit risks of issuers of
securities by checking credit information and market prices
periodically.
Because the counterparties to derivatives are limited to
major financial institutions, the Group does not anticipate any
losses arising from credit risk. The Group manages such credit
risks by relevant sections evaluating, analyzing and deliberating
countermeasures and reporting to the board of directors
accordingly.
See Note 16 for more details about derivatives.
Market risk management (foreign exchange risk and interest
rate risk)
The Group manages foreign exchange risk and interest rate risk
based on a “risk management manual” which was endorsed by
the Group’s risk management committee. The risk management
committee is directly controlled by the board of directors. The
finance department reports the conditions of foreign exchange
risk and interest rate risk to the internal control department.
The internal control department examines the reasonability
and adequacy of the finance department’s risk evaluation and
countermeasures, and reports to the board of directors. Also, the
Group utilizes interest rate swaps in order to hedge exposure to
risks from changes in interest rates and currency swaps to manage
exposure to risks from changes in foreign currency.
Market risk management (stock price volatility risk)
Most of the operational investment securities and investment
securities the Group holds are intended to develop business
including business alliances and capital alliances. Relevant sections
monitor the market environment and the financial situation of the
issuers, deliberate countermeasures and report to the board of
directors accordingly. The Group does not hold trading securities,
which are held for the purpose of earning capital gains in the near
term.
Market risk management (derivatives)
The Group manages market risk of derivatives according to internal
guidelines. Relevant sections conduct internal checks to make
sure that transactions, valuations of effectiveness of hedging and
management of affairs are performed in accordance with internal
guidelines.
Liquidity risk management regarding fund-raising
The Group manages liquidity risk by adequate financial planning of
the Group on a timely basis, diversifying means of fund-raising and
adjusting the ratio of long-term and short-term debt in the light of
market environment.
(4) Fair value of financial instruments
Fair values of financial instruments are based on quoted prices in
active markets. If a quoted price is not available, other rational
valuation techniques are used. There are possibilities that fair value
calculation results may differ when different assumptions are used.
FINANCIAL INSTRUMENTS AND RELATED DISCLOSURES15
Notes to Consolidated Financial Statements

37AIFUL CORPORATION Annual Report 2014
(a) Fair value of financial instruments
Millions of Yen
March 31, 2014 Carrying Amount Fair Value Unrealized Gain
Cash and cash equivalents ¥ 66,877 ¥ 66,877
Time deposits 4 4
Loans 321,150
Allowance for doubtful accounts (56,541)
264,609 317,143 ¥ 52,534
Installment accounts receivable 85,264
Unearned income (306)
Allowance for doubtful accounts (4,946)
80,012 81,121 1,109
Operational investment securities, investment securities and investments in unconsolidated subsidiaries 311 311
Claims in bankruptcy 36,854
Allowance for doubtful accounts (32,886)
3,968 3,968
Total ¥ 415,781 ¥ 469,424 ¥ 53,643
Short-term borrowings ¥ 49,250 ¥ 49,250
Long-term debt 26,425 25,728 ¥ 697
Total ¥ 75,675 ¥ 74,978 ¥ 697
Millions of Yen
March 31, 2013 Carrying Amount Fair Value Unrealized Gain
Cash and cash equivalents ¥ 61,198 ¥ 61,198
Time deposits 4 4
Loans 390,635
Allowance for doubtful accounts (73,522)
317,113 378,171 ¥ 61,058
Installment accounts receivable 83,885
Unearned income (361)
Allowance for doubtful accounts (5,167)
78,357 79,469 1,112
Operational investment securities, investment securities and investments in unconsolidated subsidiaries 649 649
Claims in bankruptcy 39,832
Allowance for doubtful accounts (34,573)
5,259 5,259
Total ¥ 462,580 ¥ 524,750 ¥ 62,170
Short-term borrowings ¥ 40,900 ¥ 40,900
Long-term debt 69,347 59,355 ¥ 9,992
Total ¥ 110,247 ¥ 100,255 ¥ 9,992
Notes to Consolidated Financial Statements

AIFUL CORPORATION Annual Report 201438
Thousands of U.S. Dollars
March 31, 2014 Carrying Amount Fair Value Unrealized Gain
Cash and cash equivalents $ 649,291 $ 649,291
Time deposits 39 39
Loans 3,117,961
Allowance for doubtful accounts (548,942)
2,569,019 3,079,058 $ 510,039
Installment accounts receivable 827,806
Unearned income (2,971)
Allowance for doubtful accounts (48,019)
776,816 787,583 10,767
Operational investment securities, investment securities and investments in unconsolidated subsidiaries 3,020 3,020
Claims in bankruptcy 357,806
Allowance for doubtful accounts (319,282)
38,524 38,524
Total $ 4,036,709 $ 4,557,515 $520,806
Short-term borrowings $ 478,155 $ 478,155
Long-term debt 256,553 249,786 $ 6,767
Total $ 734,708 $ 727,941 $ 6,767
Cash and cash equivalents
The carrying values of cash and cash equivalents approximate fair
value because of their short maturities.
Time deposits
The carrying values of time deposits approximate fair value
because of their short maturities.
Loans
The fair value of loans is determined based on the present value of
expected future cash flow, which consists of expected inflows of
principal and interest which is adjusted to reflect collectability and
outflows of costs of collection. The expected future cash flow is
discounted at a low-risk interest rate based on maturity length.
Installment accounts receivable
The carrying values of installment accounts receivable related
to the credit card business approximate fair value because most
transactions are single payments in the following month. The
fair value of installment accounts receivable related to installment
sales finance business is determined based on the present value
of expected future cash flow, which consists of expected inflows
of principal and fees which is adjusted to reflect collectability and
outflows of costs of collection. The expected future cash flow is
discounted at a low-risk interest rate based on maturity length.
Operational investment securities, investment securities and
investments in unconsolidated subsidiaries
The fair value of operational investment securities, investment
securities and investments in unconsolidated subsidiaries are
measured at the quoted market price of the stock exchange.
Claims in bankruptcy
The carrying values of claims in bankruptcy less allowances for
claims in bankruptcy approximate fair value because allowances
for claims in bankruptcy are stated taking net realizable value of
collateral into account.
Short-term borrowings
The carrying values of short-term borrowings approximate fair
value because of their short maturities.
Long-term debt
The fair values of marketable bonds issued by the Company are
measured at the quoted market price and those of nonmarketable
bonds issued by the Company are determined by discounting cash
flows of principal and interest, discounted at the rate that reflects
credit risk and the maturities of the bond. The carrying values of
long-term borrowings approximate fair value because the variable
rate reflects the market interest rate in a short period of time and
also all of the borrowings are those of a consolidated subsidiary
whose credit condition has not significantly changed since the
initial date of borrowing.
Derivatives
The fair values of derivatives are measured at prices indicated
by the correspondent financial institution because all derivative
transactions are nonmarketable. The information regarding the
fair value for derivatives is included in Note 16.
Notes to Consolidated Financial Statements

39AIFUL CORPORATION Annual Report 2014
(b) Financial instruments whose fair value cannot be reliably determined
Since the fair values of the items in the table below cannot be reliably determined, they are not included in operational investment securities,
investment securities and investments in unconsolidated subsidiaries and long-term debt in (4) (a).
Carrying Amount
March 31, 2014 Millions of Yen Thousands of U.S. Dollars
Operational investment securities, investment securities and investments in unconsolidated subsidiaries: *1
Unlisted stocks ¥ 1,693 $ 16,437
Investments in limited liability investment partnerships 272 2,641
Long-term debt *2 178,241 1,730,495
Carrying Amount
March 31, 2013 Millions of Yen
Operational investment securities, investment securities and investments in unconsolidated subsidiaries: *1
Unlisted stocks ¥ 1,843
Investments in limited liability investment partnerships 475
Long-term debt *2 198,104
*1. Since unlisted stocks and investments in limited liability investment partnerships do not have a quoted market price in an active market and their fair values cannot be reliably determined, they are not subject to fair value disclosure.
*2. The Company and its certain consolidated subsidiaries had received financial assistance based on the Business Revitalization Plan subsequent to March 31, 2014. The participating creditors decided to approve the proposal regarding the continuous financial assistance, which includes the provision on the partial repayment of the remaining obligations of ¥161,741 million ($1,570,301 thousand), at the meeting of participating creditors held on June 13, 2014. But the repayment schedule and method partially remain undefined. Under such circumstances, long-term debt which is subject to the financial assistance has significant uncertainties in estimates of future repayment plans. Also, increased credit risks of the Company and long repayment periods have substantial impact on discounted cash flows. Since it is difficult to make reasonable fair value calculations for such long-term debt, it is not subject to fair value disclosure.
(5) Maturity analysis for financial assets with contractual maturities
Millions of Yen
March 31, 2014 Due in One Year or Less
Due after One Year through Five Years
Due after Five Years
Cash and cash equivalents ¥ 66,877
Time deposits 4
Loans 131,697 ¥ 176,911 ¥ 12,542
Installment accounts receivable 82,131 3,132 1
Total ¥ 280,709 ¥ 180,043 ¥ 12,543
Thousands of U.S. Dollars
March 31, 2014 Due in One Year or Less
Due after One Year through Five Years
Due after Five Years
Cash and cash equivalents $ 649,291
Time deposits 39
Loans 1,278,612 $ 1,717,582 $ 121,767
Installment accounts receivable 797,388 30,408 10
Total $ 2,725,330 $ 1,747,990 $ 121,777
Claims in bankruptcy of ¥36,854 million ($357,806 thousand) whose amount of redemption cannot be determined are not included in the
table above.
Please see Note 8 for annual maturities of long-term debt and Note 14 for obligations under finance leases, respectively.
Notes to Consolidated Financial Statements
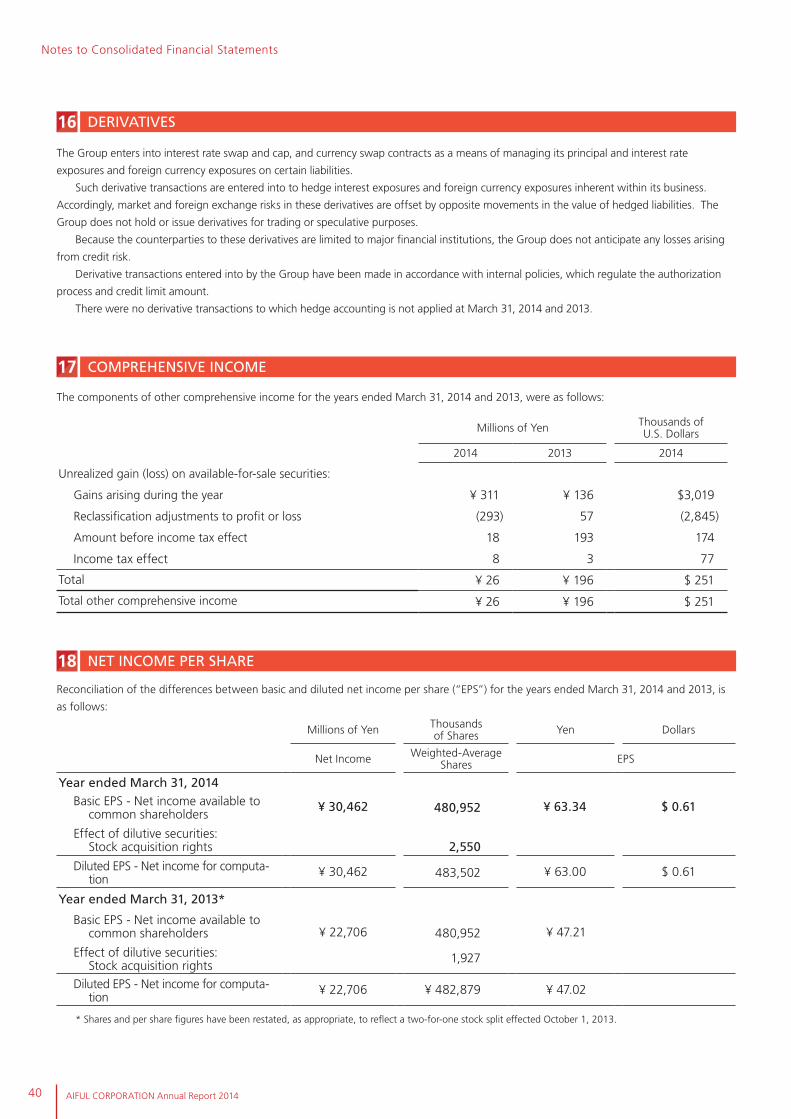
AIFUL CORPORATION Annual Report 201440
The Group enters into interest rate swap and cap, and currency swap contracts as a means of managing its principal and interest rate
exposures and foreign currency exposures on certain liabilities.
Such derivative transactions are entered into to hedge interest exposures and foreign currency exposures inherent within its business.
Accordingly, market and foreign exchange risks in these derivatives are offset by opposite movements in the value of hedged liabilities. The
Group does not hold or issue derivatives for trading or speculative purposes.
Because the counterparties to these derivatives are limited to major financial institutions, the Group does not anticipate any losses arising
from credit risk.
Derivative transactions entered into by the Group have been made in accordance with internal policies, which regulate the authorization
process and credit limit amount.
There were no derivative transactions to which hedge accounting is not applied at March 31, 2014 and 2013.
DERIVATIVES16
The components of other comprehensive income for the years ended March 31, 2014 and 2013, were as follows:
Millions of Yen Thousands of U.S. Dollars
2014 2013 2014
Unrealized gain (loss) on available-for-sale securities:
Gains arising during the year ¥ 311 ¥ 136 $3,019
Reclassification adjustments to profit or loss (293) 57 (2,845)
Amount before income tax effect 18 193 174
Income tax effect 8 3 77
Total ¥ 26 ¥ 196 $ 251
Total other comprehensive income ¥ 26 ¥ 196 $ 251
COMPREHENSIVE INCOME17
Reconciliation of the differences between basic and diluted net income per share (“EPS”) for the years ended March 31, 2014 and 2013, is
as follows:
Millions of Yen Thousands of Shares Yen Dollars
Net Income Weighted-Average Shares EPS
Year ended March 31, 2014
Basic EPS - Net income available to common shareholders
¥ 30,462 480,952 ¥ 63.34 $ 0.61
Effect of dilutive securities:Stock acquisition rights 2,550
Diluted EPS - Net income for computa-tion
¥ 30,462 483,502 ¥ 63.00 $ 0.61
Year ended March 31, 2013*
Basic EPS - Net income available to common shareholders ¥ 22,706 480,952 ¥ 47.21
Effect of dilutive securities:Stock acquisition rights
1,927
Diluted EPS - Net income for computa-tion
¥ 22,706 ¥ 482,879 ¥ 47.02
* Shares and per share figures have been restated, as appropriate, to reflect a two-for-one stock split effected October 1, 2013.
NET INCOME PER SHARE18
Notes to Consolidated Financial Statements
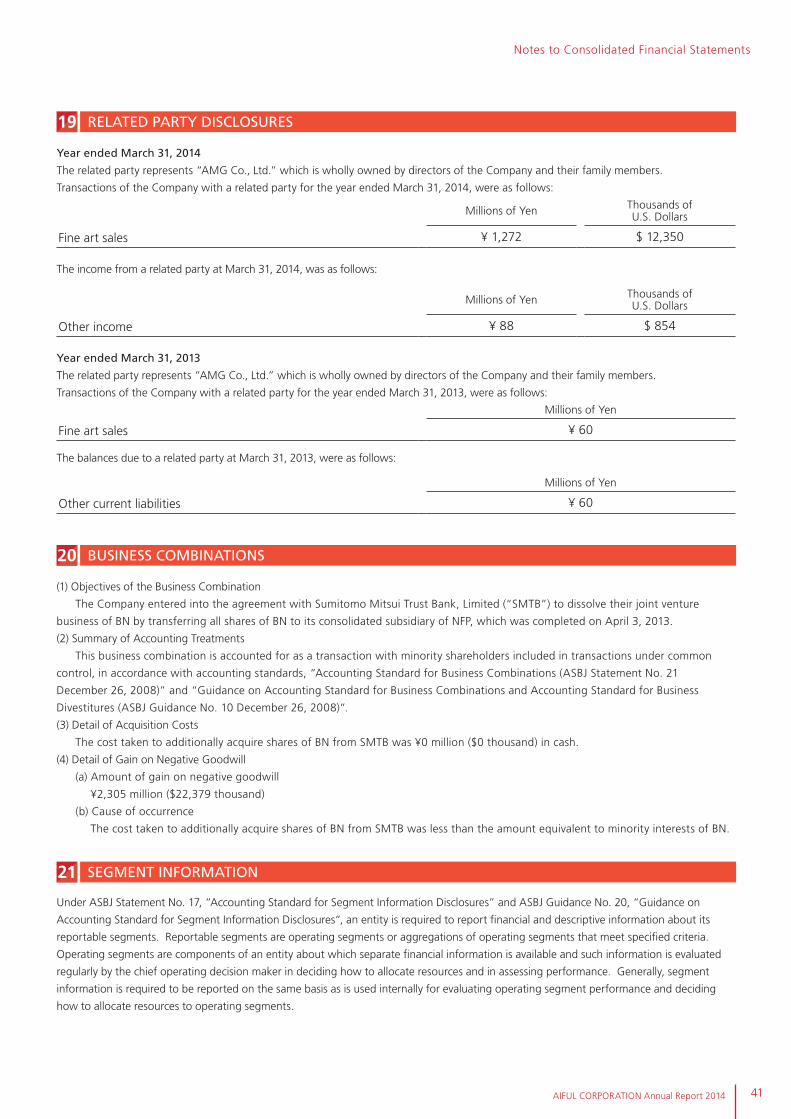
41AIFUL CORPORATION Annual Report 2014
Year ended March 31, 2014
The related party represents “AMG Co., Ltd.” which is wholly owned by directors of the Company and their family members.
Transactions of the Company with a related party for the year ended March 31, 2014, were as follows:
Millions of Yen Thousands of U.S. Dollars
Fine art sales ¥ 1,272 $ 12,350
The income from a related party at March 31, 2014, was as follows:
Millions of Yen Thousands of U.S. Dollars
Other income ¥ 88 $ 854
Year ended March 31, 2013
The related party represents “AMG Co., Ltd.” which is wholly owned by directors of the Company and their family members.
Transactions of the Company with a related party for the year ended March 31, 2013, were as follows:
Millions of Yen
Fine art sales ¥ 60
The balances due to a related party at March 31, 2013, were as follows:
Millions of Yen
Other current liabilities ¥ 60
RELATED PARTY DISCLOSURES 19
(1) Objectives of the Business Combination
The Company entered into the agreement with Sumitomo Mitsui Trust Bank, Limited (“SMTB”) to dissolve their joint venture
business of BN by transferring all shares of BN to its consolidated subsidiary of NFP, which was completed on April 3, 2013.
(2) Summary of Accounting Treatments
This business combination is accounted for as a transaction with minority shareholders included in transactions under common
control, in accordance with accounting standards, “Accounting Standard for Business Combinations (ASBJ Statement No. 21
December 26, 2008)” and “Guidance on Accounting Standard for Business Combinations and Accounting Standard for Business
Divestitures (ASBJ Guidance No. 10 December 26, 2008)”.
(3) Detail of Acquisition Costs
The cost taken to additionally acquire shares of BN from SMTB was ¥0 million ($0 thousand) in cash.
(4) Detail of Gain on Negative Goodwill
(a) Amount of gain on negative goodwill
¥2,305 million ($22,379 thousand)
(b) Cause of occurrence
The cost taken to additionally acquire shares of BN from SMTB was less than the amount equivalent to minority interests of BN.
BUSINESS COMBINATIONS20
Notes to Consolidated Financial Statements
Under ASBJ Statement No. 17, “Accounting Standard for Segment Information Disclosures” and ASBJ Guidance No. 20, “Guidance on
Accounting Standard for Segment Information Disclosures”, an entity is required to report financial and descriptive information about its
reportable segments. Reportable segments are operating segments or aggregations of operating segments that meet specified criteria.
Operating segments are components of an entity about which separate financial information is available and such information is evaluated
regularly by the chief operating decision maker in deciding how to allocate resources and in assessing performance. Generally, segment
information is required to be reported on the same basis as is used internally for evaluating operating segment performance and deciding
how to allocate resources to operating segments.
SEGMENT INFORMATION 21

AIFUL CORPORATION Annual Report 201442
Millions of Yen
2014
Reportable Segment
AIFUL LIFECARD NFP Total Other *1 Total Reconciliations Consolidated
Operating revenue:
Interest on loans ¥ 42,066 ¥ 6,260 ¥ 48,326 ¥ 2,252 ¥ 50,578 ¥ 50,578
Revenue from credit card business 47 13,380 13,427 13,427 13,427
Revenue from credit guarantee 6,654 1,296 7,950 7,950 7,950
Recovery of loans previously charged off 9,536 100 9,636 27 9,663 9,663
Other operating revenue 884 5,950 306 7,140 3,101 10,241 10,241
Operating revenue from external customers 59,187 26,986 306 86,479 5,380 91,859 91,859
Intersegment operating revenue or transfers 10 346 356 356 ¥ (356)
Total ¥ 59,197 ¥ 27,332 ¥ 306 ¥ 86,835 ¥ 5,380 ¥ 92,215 ¥ (356) ¥ 91,859
Segment profit (loss) ¥ 24,046 ¥ 2,419 ¥ 3,155 ¥ 29,620 ¥ (400) ¥ 29,220 ¥ 1,242*2 ¥ 30,462
Segment assets 463,792 181,814 5,549 651,155 20,831 671,986 (94,647)*3 577,339
Segment liabilities 348,984 149,410 4,926 503,320 4,578 507,898 (64,101)*4 443,797
Other:
Provision for credit card point redemption 2,666 2,666 2,666 2,666
Reversal of allowance for investment losses 4 4 4 4
Provision for doubtful accounts 8,579 2,997 11,576 960 12,536 (1,605) 10,931
Provision for losses on interest refunds 1,885 1,885 1,885 1,885
Provision for accrued bonuses 547 5 552 18 570 297 867
Depreciation and amortization 2,099 1,641 3,740 21 3,761 3,761
Interest on advances to subsidiaries and other 1,346 118 1,464 1,464 (1,461) 3
Dividend income 6 15 21 21 21
Reversal of allowance for doubtful accounts 2,636 2,636 2,636 (2,600) 36
Amortization of negative goodwill 218 218
Gain on negative goodwill 2,305 2,305
Interest on advances from parent company and other 2 2 39 41 (38) 3
Gain on purchase of borrowings 3,840 3,840 3,840 3,840
Loss on sale of investment securities 26 5 31 31 2 33
Loss from business restructuring 10 10 10
Income taxes:
Current (1,677) 1,229 991 543 221 764 764
Deferred 33 (405) (372) (2) (374) 256 (118)
Increase in property, plant and equipment and intangible assets 839 701 1,540 4 1,544 1,544
*1 “Other” items are business segments excluded from reportable segments, which include BN and AsTry Loan Services Corporation.*2 “Reconciliations” are elimination of intersegment transactions.*3 “Reconciliations” are elimination of intersegment assets.*4 “Reconciliations” are elimination of intersegment liabilities.
Notes to Consolidated Financial Statements
1. Description of reportable segments
The Group’s reportable segments are those for which separate financial information is available and regular evaluation by the Company’s
management is being performed in order to decide how resources are allocated among the Group. Therefore, the Group consists of
the Group’s major operating companies, “AIFUL CORPORATION” and “LIFECARD Co., Ltd.” and “NFP”. AIFUL CORPORATION engages
mainly in the loan business and the credit guarantee business. LIFECARD Co., Ltd. engages mainly in the credit card business and the credit
guarantee business. NFP engages mainly in the venture capital business.
Effective April 1, 2013, the Group changed its operating segments from “AIFUL CORPORATION” and “LIFECARD Co., Ltd.” to “AIFUL
CORPORATION”, “LIFECARD Co., Ltd.” and “NFP” because quantitative materiality of NFP to segment profit (loss) increased.
The segment information for the year ended March 31, 2013, is also disclosed using the new operating segments.
2. Methods of measurement for the amounts of sales, profit (loss), assets, liabilities and other items for each reportable
segment
The accounting policies of each reportable segment are consistent to those disclosed in Note 2, “Summary of Significant Accounting
Policies”.
3. Information about sales, profit (loss), assets, liabilities and other items is as follows.

43AIFUL CORPORATION Annual Report 2014
Notes to Consolidated Financial Statements
Millions of Yen
2013
Reportable Segment
AIFUL LIFECARD NFP Total Other *1 Total Reconciliations Consolidated
Operating revenue:
Interest on loans ¥ 47,402 ¥ 6,904 ¥ 54,306 ¥ 7,301 ¥ 61,607 ¥ 61,607
Revenue from credit card business 116 12,398 12,514 12,514 12,514
Revenue from credit guarantee 3,215 1,395 4,610 4,610 4,610
Recovery of loans previously charged off 10,789 22 10,811 29 10,840 10,840
Other operating revenue 776 5,221 ¥ 81 6,078 3,970 10,048 10,048
Operating revenue from external customers 62,298 25,940 81 88,319 11,300 99,619 99,619
Intersegment operating revenue or transfers 12 375 387 387 ¥ (387)
Total ¥ 62,310 ¥ 26,315 ¥ 81 ¥ 88,706 ¥ 11,300 ¥ 100,006 ¥ (387) ¥ 99,619
Segment profit (loss) ¥ 10,649 ¥ 3,319 ¥ (103) ¥ 13,865 ¥ 1,259 ¥ 15,124 ¥ 7,582*2 ¥ 22,706
Segment assets 466,542 185,639 1,479 653,660 61,587 715,247 (108,066)*3 607,181
Segment liabilities 376,131 95,434 4,049 475,614 44,907 520,521 (18,348)*4 502,173
Other:
Provision for credit card point redemption 2,347 2,347 2,347 2,347
Reversal of allowance (provision) for investment losses (760) 38 (722) (722) 762 40
Provision for doubtful accounts 513 2,616 3,129 3,343 6,472 1,705 8,177
Provision for losses on interest refunds 15,877 1,420 17,297 17,297 17,297
Provision for accrued bonuses 584 4 588 28 616 260 876
Depreciation and amortization 3,621 2,387 6,008 13 6,021 6,021
Interest on advances to subsidiaries and other 456 456 456 (452) 4
Dividend income 16 19 35 35 35
Amortization of negative goodwill 218 218
Interest on advances from parent company and other 71 71 (71)
Gain on purchase of borrowings 5,948 5,948 5,948 5,948
Loss on impairment of investment securities 28 28 28 28
Loss on impairment of long-lived assets 52 52 52 52
Loss on write-down of investments in subsidiaries 8,760 8,760 8,760 (8,760)
Income taxes:
Current (1,393) 1,611 (6) 212 202 414 414
Deferred 30 30 30 30
Increase in property, plant and equipment and intangible assets 1,648 449 2,097 6 2,103 2,103
*1 “Other” items are business segments excluded from reportable segments, which include BN and AsTry Loan Services Corporation.*2 “Reconciliations” are elimination of intersegment transactions.*3 “Reconciliations” are elimination of intersegment assets.*4 “Reconciliations” are elimination of intersegment liabilities.

AIFUL CORPORATION Annual Report 201444
Thousands of U.S. Dollars
2014
Reportable Segment
AIFUL LIFECARD NFP Total Other *1 Total Reconciliations Consolidated
Operating revenue:
Interest on loans $ 408,407 $ 60,777 $ 469,184 $ 21,865 $ 491,049 $ 491,049
Revenue from credit card business 456 129,903 130,359 130,359 130,359
Revenue from credit guarantee 64,602 12,582 77,184 77,184 77,184
Recovery of loans previously charged off 92,582 971 93,553 263 93,816 93,816
Other operating revenue 8,583 57,767 $ 2,970 69,320 30,107 99,427 99,427
Operating revenue from external customers 574,630 262,000 2,970 839,600 52,235 891,835 891,835
Intersegment operating revenue or transfers 98 3,359 3,457 3,457 $ (3,457)
Total $ 574,728 $ 265,359 $ 2,970 $ 843,057 $ 52,235 $ 895,292 $ (3,457) $ 891,835
Segment profit (loss) $ 233,456 $ 23,485 $ 30,632 $ 287,573 $ (3,884) $ 283,689 $ 12,059*2 $ 295,748
Segment assets 4,502,835 1,765,184 53,874 6,321,893 202,243 6,524,136 (918,903)*3 5,605,233
Segment liabilities 3,388,194 1,450,583 47,825 4,886,602 44,447 4,931,049 (622,340)*4 4,308,709
Other:
Provision for credit card point redemption 25,883 25,883 25,883 25,883
Reversal of allowance for investment losses 39 39 39 39
Provision for doubtful accounts 83,291 29,097 112,388 9,321 121,709 (15,583) 106,126
Provision for losses on interest refunds 18,301 18,301 18,301 18,301
Provision for accrued bonuses 5,310 49 5,359 175 5,534 2,883 8,417
Depreciation and amortization 20,379 15,932 36,311 204 36,515 36,515
Interest on advances to subsidiaries and other 13,068 1,146 14,214 14,214 (14,185) 29
Dividend income 58 146 204 204 204
Reversal of allowance for doubtful accounts 25,592 25,592 25,592 (25,242) 350
Amortization of negative goodwill 2,117 2,117
Gain on negative goodwill 22,379 22,379
Interest on advances from parent company
and other19 19 379 398 (369) 29
Gain on purchase of borrowings 37,282 37,282 37,282 37,282
Loss on sale of investment securities 252 49 301 301 19 320
Loss from business restructuring 97 97 97
Income taxes:
Current (16,282) 11,932 9,622 5,272 2,145 7,417 7,417
Deferred 320 (3,932) (3,612) (19) (3,631) 2,485 (1,146)
Increase in property, plant and equipment and intangible assets 8,145 6,806 14,951 39 14,990 14,990
*1 “Other” items are business segments excluded from reportable segments, which include BN and AsTry Loan Services Corporation.*2 “Reconciliations” are elimination of intersegment transactions.*3 “Reconciliations” are elimination of intersegment assets.*4 “Reconciliations” are elimination of intersegment liabilities.
Related Information
1. Information about products and services
Millions of Yen
2014
Loan Business Credit Card Business Other Total
Operating revenue from external customers ¥ 59,032 ¥ 13,930 ¥ 18,897 ¥ 91,859
Notes to Consolidated Financial Statements

45AIFUL CORPORATION Annual Report 2014
Millions of Yen
2013
Loan Business Credit Card Business Other Total
Operating revenue from external customers ¥ 71,290 ¥ 12,929 ¥ 15,400 ¥ 99,619
Thousands of U.S. Dollars
2014
Loan Business Credit Card Business Other Total
Operating revenue from external customers $ 573,126 $ 135,243 $ 183,466 $ 891,835
2. Information about geographical areas
(1) Operating revenue
Information about geographic area is omitted, as the Group did not operate outside Japan for the years ended March 31, 2014
and 2013.
(2) Property, plant and equipment
Information about geographic area is omitted, as no property, plant and equipment were located outside Japan for the years ended
March 31, 2014 and 2013.
3. Information about major customers
Information about major customers is omitted, as no single external customer accounted for more than 10% of operating revenue for
the years ended March 31, 2014 and 2013.
4. Information regarding amortization of negative goodwill and unamortized amount of each reportable segment.
Millions of Yen
2014
AIFUL LIFECARD NFP Other Elimination/Corporate Total
Amortization of negative goodwill ¥ 218 ¥ 218
Gain on negative goodwill *1 2,305 2,305
Negative goodwill at March 31, 2014
Millions of Yen
2013
AIFUL LIFECARD NFP Other Elimination/Corporate Total
Amortization of negative goodwill ¥ 218 ¥ 218
Negative goodwill at March 31, 2013 218 218
Notes to Consolidated Financial Statements
Thousands of U.S. Dollars
2014
AIFUL LIFECARD NFP Other Elimination/Corporate Total
Amortization of negative goodwill $ 2,117 $ 2,117
Gain on negative goodwill *1 22,379 22,379
Negative goodwill at March 31, 2014
*1 Gain on negative goodwill arose when the Company handed over BN securities to NFP on April 3, 2013.

AIFUL CORPORATION Annual Report 201446

47AIFUL CORPORATION Annual Report 2014
History
1967Apr Yoshitaka Fukuda, AIFUL CORPORATION’s
current president, established sole proprietorship as a consumer finance company
1978Feb Established Marutaka, Inc. (now AIFUL
CORPORATION) with capital of 9.0 million yen, in Sakyo-ku, KyotoBegan unsecured consumer loan business
1982May Marutaka, Inc. absorbs three related companies
(Oasa, Inc., Yamakatsu Sangyo, Inc., and Maruto, Inc.) and increases its equity capital to 500.0 million yenName simultaneously changed to AIFUL CORPORATION
Jul Began providing unsecured loans to sole proprietors
1984Feb Start of ATM operationsMar Registration of money lenders based on
enactment of the Money-Lending Business Control Law
Oct Began sales of real estate-secured loans
1994Nov Opened Heartful Center
1995Mar Installed automatic contract acceptance machine,
“Ojido-san”Nov Started a website
1997Jul Over-the-counter registration of company’s stock
with the Japan Securities Dealers AssociationOct Began full-scale sales of commercial loans to
consumers
1999May Registered as certified finance corporation
based on the Law Concerning the Issuance of Corporate Bonds in the Financial Industry Loan Business
2000Mar Listed on the First Section of the Tokyo Stock
Exchange, and the First Section of the Osaka Securities Exchange
2001Jan Established business finance company BUSINEXT
CORPORATION through a joint venture with Sumitomo Trust and Banking Co., Ltd.
Feb Completed new headquarters buildingMar Converted LIFE Co., Ltd. into 100% subsidiary
Jul Issued LIFE ETC CARDNov Established servicer company AsTry Loan Services
Corporation in joint venture with Aozora Bank, Ltd.
Nov Changed the form of invoicing (statement of charges) sent to cardholders to electronic and launched the LIFE-Web Desk service for card holders
2002Apr Established Compliance CommitteeSep Opened a contact centerOct Converted business finance company,
City’s Co. Ltd., into 100% subsidiary
2003Jan Received Listed Company Disclosure
Commendation from the Tokyo Stock Exchange
2004Mar Converted KOKUSAI Capital Co., Ltd. into 100%
subsidiaryJul KOKUSAI Capital Corporation changed its
name to New Frontier Partners Co., Ltd.
2006Apr Issued LIFECARD GOLD ;
issued LIFECARD exclusively for students
2007Apr Revised management philosophy. The new
management philosophy becomes “Earn the trust of society through corporate activity based in integrity”
Apr Established Risk Management Committee
2009Aug Opened a shopping mall
for members, L–Mall
2010Jul Established LIFE CARD Co., Ltd. (now a
consolidated subsidiary) to operate credit card and credit guarantee businesses, wholly funded by AIFUL subsidiary LIFE Co., Ltd. (now a consolidated subsidiary)
2011Jun Issued V-Preca, Japan’s first prepaid
Visa card available exclusively onlineJul Under the Group’s reorganization, the credit sales
business and the credit guarantee and insurance businesses of LIFE Co., Ltd., were transferred to LIFE CARD Co., Ltd. by way of corporate spinoff and merger. Also, four consolidated subsidiaries (LIFE Co., Ltd. (following its spin-off), City’s Corporation, City Green Corporation and Marutoh KK) were merged with AIFUL
2013Apr New Frontier Partners Co., Ltd. (currently a
consolidated subsidiary), a wholly owned subsidiary of the Company, acquired all shares of BUSINEXT CORPORATION (currently a consolidated subsidiary) owned by the Company and Sumitomo Mitsui Trust Bank Limited and made it a wholly owned subsidiary

48 AIFUL CORPORATION Annual Report 2014
Group Network (As of March 31, 2014)
http://aiful.jp (Japanese only)
Business Classification Unsecured loans Secured loans Small business loans Credit guarantees
Investor Relations Website
http://www.ir-aiful.com/english
http://www.lifecard.co.jp (Japanese only)
Business Classification Credit card shopping Credit guarantees
http://www.astry-s.co.jp (Japanese only)
Business Classification Debt collection (Servicer)
http://www.businext.co.jp (Japanese only)
Business Classification Secured loans Small business loans
http://www.nf-partners.co.jp (Japanese only)
Business Classification Venture capital
AIFUL CORPORATION
LIFECARD CO., LTD. BUSINEXT CORPORATION
Astry Loan Services Corporation New Frontier Partners Co., Ltd.

49AIFUL CORPORATION Annual Report 2014
Investor Information (As of March 31, 2014)
Principal Shareholders
Number of Shares
(Thousands)
Percentage of Total Shares Outstanding
AMG Co., Ltd. 94,814 19.68
Mitsuhide Fukuda 62,153 12.90
Marutaka Co., Ltd. 24,543 5.09
Japan Trustee Services Bank, Ltd. (trust account)
13,756 2.85
The Master Trust Bank of Japan, Ltd. (trust account)
10,258 2.13
Composition of Shareholders
Corporate Data
Corporate Name AIFUL CORPORATION
Address of Head Office 381-1, Takasago-cho,Gojo-Agaru, Karasuma-Dori,Shimogyo-ku,Kyoto 600-8420, Japan
Date of Establishment April 1967
Common Stock ¥143,324 million
Number of Employees Non-consolidated: 924Consolidated: 1,369
Stock Listing
Tokyo Stock Exchange The First Section
Securities Code 8515
Contact Address
P.R. and I.R. SectionTokyo Office2-31-19 Shiba, Minato-ku, Tokyo 105-0014, JapanE-mail: [email protected]
Shareholder Information
Number of Shares of Common Stock
Authorized 1,136,280,000 shares
Issued and Outstanding 481,867,836 shares
Number of Shareholders 44,856
Independent Auditors Deloitte Touche Tohmatsu LLC
Transfer Agent and Registrar
Sumitomo Mitsui Trust Bank, Limited
Domestic FinancialInstitutions12.2%
Foreign Investors9.3%
OtherDomesticInstitutions32.5%
Individualsand Others45.9%
*The Company split each share of common stock into 2 shares effective on October 1, 2013.

ANNUAL REPORT 2013The year ended March 31, 2013