Embed Size (px)
Citation preview
Colop
last A/S
- Annual rep
ort 2013/14
Annual report 2014/15
The Coloplast story begins back in 1954. Elise Sørensen is a nurse. Her sister Thorahas just had an ostomy operation and is afraid to go out in public, fearing that her stoma might leak. Listening to her sister’s problems, Elise conceives the idea of the world’s firstadhesive ostomy bag. Based on Elise’s idea,Aage Louis-Hansen created the ostomy bag.A bag that does not leak, giving Thora – and thousands of people like her – the chance to return to their normal life.
A simple solution with great significance.
Today, our business includes ostomy care, urology and continence care and wound and skin care. But our way of doing business stillfollows Elise’s and Aage’s example: we listen, we learn and we respond with products and services that make life easier for people with intimate healthcare needs.
Coloplast develops products and services that make life easier for people with very personal and private medical conditions. Working closely with the people who use our products, we create solutions that are sensitive to their special needs. We call this intimate healthcare. Our business includes ostomy care, urology and continence care and wound and skin care. We operate globally and employ more than 8,500 people.
The Coloplast logo is a registered trademark of Coloplast A/S. © 2014-10. All rights reserved Coloplast A/S, 3050 Humlebæk, Denmark.
Coloplast A/SHoltedam 1
3050 HumlebækDenmark
www.coloplast.comCompany registration (CVR) No. 69 74 99 17 Company registration (CVR) No. 69 74 99 17
Coloplast Annual Report.indd 1 26/09/14 11.10

Management’s Report - Five-year financial highlights and key ratios
2
DKK million 2014/15 2013/14 2012/13 2011/12 2010/11
Income statement
Revenue 13,909 12,428 11,635 11,023 10,172
Research and development costs -442 -390 -380 -342 -415
Operating profit before interest, tax, depreciation and amortisation 2,020 3,573 4,160 3,756 3,108
Operating profit before special items 4,535 4,147 3,672 3,255 2,581
Special items1) 3,000 1,000 0 0 0
Operating profit (EBIT) 1,535 3,147 3,672 3,255 2,581
Net financial income and expenses -289 46 -46 -300 -124
Profit before tax 1,245 3,191 3,625 2,954 2,456Net profit for the year 899 2,390 2,711 2,194 1,819
Revenue growth
Annual growth in revenue, % 12 7 6 8 7
Growth breakdown:
Organic growth, % 7 9 7 6 6Currency effect, % 5 -2 -1 2 1
Balance sheet
Total assets 10,817 10,379 9,564 10,176 9,218
Invested capital 4,702 6,088 6,320 6,295 6,312Equity at year end 4,706 6,283 6,769 6,042 4,478
Cash flows and investments
Cash flows from operating activities 3,337 3,149 3,136 2,649 2,205
Cash flows from investing activities -468 -777 -159 -390 -954
Investment in property, plant and equipment, gross -583 -505 -409 -317 -230
Free cash flow 2,869 2,372 2,977 2,259 1,251Cash flows from financing activities -2,963 -2,898 -3,430 -1,653 -1,461
Key ratios
Average number of employees, FTEs 9,303 8,741 8,143 7,624 7,328
Operating margin, EBIT, % 11 25 32 30 25
Operating margin, EBIT, before special items, % 33 33 32 30 25
Operating margin, EBITDA, % 15 29 36 34 31
Return on average invested capital before tax (ROIC), %2) 62 60 58 52 41
Return on average invested capital after tax (ROIC), %2) 48 49 44 38 30
Return on equity, % 16 37 42 42 46
Equity ratio, % 44 61 71 59 49Net asset value per outstanding share, DKK4) 22 30 32 29 21
Per share data
Share price, DKK4) 473 494 314 242 161
Share price/net asset value per share4) 22 17 10 9 8
Average number of outstanding shares, millions4) 211 211 211 210 210PE, price/earnings ratio 111 44 24 23 19
Dividend per share, DKK3) 4) 12.5 11.5 10.0 4.0 2.8
Pay-out ratio, %5) 82 77 78 38 32
Earnings per share (EPS), diluted4) 4 11 13 10 9Free cash flow per share4) 14 11 13 11 9
3) The figure show n for the 2014/15 f inancial year is the proposed dividend. 4) The 2012/13 f igure has been restated to ref lect a 1-to-5 split of the company's A and B shares in the 2012/13 f inancial year.5) For the 2014/15 and 2013/14 financial years, this item is before Special items. After Special items, the pay-out ratio is 294%/101%.
2) For the 2014/15 and 2013/14 financial years, this item is before Special items. After Special items, ROIC before tax is 28%/51%, and ROIC after tax is 21%/38%.
The key ratios have been calculated and applied in accordance w ith "Recommendations & Financial Ratios 2015" issued by the Danish Society of Financial Analysts.
1) Special items cover potential settlements and costs in connection w ith the law suits alleging injury resulting from the use of transvaginal surgical mesh products
3
Contents
Page
Management’s report 2
Statement by the Board of Directors and the Executive Management 21
Independent auditors' report 22
Statement of comprehensive income 23
Balance sheet 24
Statement of changes in equity 26
Cash flow statement 28
Notes 29
Shareholder information 68
Parent company annual report – Coloplast A/S 69
4
Management’s report Core business activity Coloplast develops and markets products and services that make life easier for people with very private and personal medical conditions. Coloplast works closely with users to develop solutions that consider their special needs. Coloplast calls this intimate healthcare. Coloplast markets and sell its products and services globally, and in most markets the products are eligi-ble for reimbursement from local healthcare authorities. Coloplast supplies its products to hospitals, insti-tutions as well as wholesalers and pharmacies. In selected markets, Coloplast is also a direct supplier to users (homecare). Coloplast has wholly owned sales subsidiaries in its principal markets and at the end of the financial year employed more than 9,500 people. Coloplast operates in these business areas: Ostomy Care A stoma is created in an operation made neces-sary because of intestinal dysfunction resulting from disease, an accident or a congenital disor-der. A part of the intestine is surgically redi-rected through an opening in the abdominal wall, enabling the patient to empty the colon (colos-tomy), the small intestine (ileostomy) or the uri-nary bladder (urostomy). Some 50-60% of stoma operations are performed because of cancer. Ostomy bags consist either of an adhe-sive base plate bonded together with a bag (1-piece system) or of two separate parts in which the bag is replaced more often than the base plate (2-piece system). It is important for users to avoid leakage, so they can live as normal a life as possible. As a result, the adhesive must ensure a constant and secure seal, and it must be easy to remove without causing damage or irritation to the skin. Coloplast markets a number of accessory prod-ucts for people with a stoma, such as the Brava® range. In addition to these products, Coloplast supports users through the Coloplast Care services, pro-viding them with the support and knowledge they need about living with a stoma.
The market The global market for ostomy care products is estimated at DKK 14bn and is influenced by the extent to which reimbursement is available for the products. Market growth is driven by the ageing Western population and the increased access to health-care services in Russia, China and other growth economies. The annual market growth is esti-mated at 4-5%, and Coloplast is the global mar-ket leader, holding a market share of 35-40%. Our largest market share is in Europe, while the smallest one is in the USA. The definition of the market for ostomy products also includes acces-sory products for people with a stoma. The ostomy accessories market is estimated at about DKK 2bn with annual market growth of 5-7%. Coloplast currently holds 20-25% of the accessories market. Continence Care This business area addresses two types of con-trol issues: people unable to empty their bladder or bowel, and people suffering from urinary or faecal incontinence. People unable to empty their bladder can use an intermittent catheter, which is inserted through the urinary tract to empty the bladder. The main group of users of intermittent catheters are people with spinal cord injury that very often is the result of an accident. Other user groups are people with multiple scle-

Management’s report
5
rosis and people with congenital Spina Bifida. Coloplast's portfolio of intermittent catheters spans the full range from uncoated catheters to discreet, compact, coated catheters ready to use in a saline solution. Urinary incontinence means that a person has lost the ability to hold urine resulting in uncon-trolled and involuntary release, also called stress urinary incontinence. Incontinence affects older people more often than younger people, be-cause the sphincter muscle and the pelvic mus-cles gradually weaken as people grow older. Coloplast has a wide range of urine bags and urisheaths for collecting urine. People unable to control their bowels or sphincter muscle can use the Peristeen® anal irrigation system for con-trolled emptying of the bowels. A typical Peristeen® user has a spinal cord injury and has lost the ability to control bowel movements. The market Coloplast is the global market leader in the con-tinence care market, with a market share of about 40%. The market is growing by 5-6% per year and is estimated at DKK 11bn. In the fast-est growing segment of the market, catheters, growth is driven by the increasing use of inter-mittent catheters as an alternative to permanent catheters and by a change in consumption pat-terns of users and professional care staff to-wards more advanced catheter solutions. The urisheath and urine bag segments are growing at a slower rate than catheters. Growth is supported by increased demand resulting from the growing population of older people and an increase in the use of urisheaths and urine bags as an alternative to adult diapers. This is a market with many suppliers, including low-cost providers. Urology Care Urology care involves diseases and symptoms of the urinary system, pelvic floor prolapse and the male reproductive system, such as urinary incontinence, kidney stones, enlarged prostate and impotence. The business area consists of a broad portfolio of products used in connection
with urological and gynaecological surgery pro-cedures and includes implants and disposable articles. Coloplast manufactures and markets its dispos-able products for use before, during and after surgery, such as prostate catheters and stents, some of them under the Porgès brand. The im-plant business manufactures vaginal slings used to restore continence and synthetic mesh prod-ucts used to treat weak pelvic floor. The busi-ness also includes penile implants for men ex-periencing severe impotence that cannot be treated by using drugs. The market Market growth in Urology is driven by the ageing population and lifestyle diseases, as well as ongoing innovation leading to more cost-efficient surgical procedures. Other drivers of market growth for implants are a growing awareness of the treatment options available for men with severe impotence and women with urological disorders. The part of the urology care market in which Coloplast products are represented is estimated at DKK 9-10bn. Market growth is estimated at 3-5% per year including the adverse impact of the updated Public Health Notification issued by the US Food and Drug Administration (FDA) on the use of transvaginal mesh therapies for pelvic organ prolapse and stress urinary incontinence. Coloplast currently holds an estimated 10-15% of the overall global market for urology products. Wound & Skin Care In Wound Care, patients are treated for exudat-ing or chronic wounds such as leg ulcers, which are typically caused by insufficient or impaired circulation in the veins of the leg, pressure ul-cers caused by extended bed rest, or diabetic foot ulcers. A good wound dressing should pro-vide optimum conditions for wound healing, be easy for healthcarers to change, and should ensure that patients are not inconvenienced by infection, exudate or odours. A moist wound environment provides the best conditions for
Management’s report
6
wound healing for optimum exudate absorption. The Coloplast product portfolio consists of ad-vanced foam dressings sold under the Biatain® brand and hydrocolloid dressings sold under the Comfeel® brand. Coloplast's skin care products consist of disin-fectant liquids and creams used to protect and treat the skin and to clean wounds. For treat-ment and prevention of skin fold problems such as fungal infections, damaged skin or odour nuisance, Coloplast produces Interdry®, a textile placed in a skin fold to absorb moisture. Coloplast mostly sells skin care products to hos-pitals and clinics in the US and Canadian mar-kets. The market Growth in the part of the global wound care segment in which Coloplast competes is ex-pected to be 3-5%, driven mainly by volume growth due to the increasing life expectancy, the growing diabetics population and a growing number of patients receiving preventive treat-ment. Intensifying competition between manu-facturers and pricing pressure originating from lower public healthcare budgets in Europe has had a negative impact on market growth. The market is estimated at DKK 16-17bn. Coloplast holds a 5-10% market share, making it the world's fifth-largest manufacturer of ad-vanced wound care products. There are a large number of direct competitors as well as various alternative options, such as negative pressure wound therapy and simple wound dressings. The market is defined as advanced wound care products other than the negative pressure wound therapy segment. The market for skin care products is estimated at DKK 7-8bn, and market growth is forecasted at 5%. Coloplast currently has around 5% of the market for skin care products.
Strategy Over the past few years, Coloplast has profes-sionalised the sales and marketing organisation and innovation processes, while also making significant efficiency improvements, especially in production and administrative functions. Coloplast announced an updated strategic direc-tion at its Capital Markets Day held in Copenha-gen on 4 June 2014. The strategy is focused on organic growth and centres on: Sustained growth in the core markets of
Europe. Engaging more in interacting and building
relations with end users. Increased growth in the developed markets
outside Europe (the USA, Canada, Japan and Australia).
Further expansion and growth in new mar-kets.
Market leadership in selected new markets and relevant opportunities in the European Wound Care business.
Globalising the urology care business. The strategy is supported by a strong pipeline of new products, sustained cost discipline and execution of the most recent plan for Global Operations.
Management’s report
7
Financial highlights of the year The full-year financial results did not meet the guidance provided in the 2013/14 Annual Report, but are in line with the updated guidance provided in company announcement no. 9/2014 of 22 September 2015, which provides a revision of the financial guidance.
Organic revenue growth was 7%. Revenue in DKK was up by 12% to DKK 13,909m.
Organic growth rates by business area: Ostomy Care 6%, Continence Care 8%, Urology Care 5% and Wound & Skin Care 9%.
Gross profit was up by 12% to DKK 9,533m, equal to a gross margin of 69%.
EBIT before special items was up by 9% to DKK 4,535m. The EBIT margin before special items was 33%, which was in line with last year. At constant exchange rates, the EBIT margin was 32%.
EBIT was affected by an increase in provisions of DKK 3,000m to cover potential settlements and costs in connection with the lawsuits alleging injury resulting from the use of transvaginal surgical mesh products.
EBIT after special items was DKK 1,535m. The EBIT margin after special items of 11%. At con-stant exchange rates, the EBIT margin was 10%.
Net profit for the year before special items was DKK 3,239m against DKK 3,166m last year. The diluted earnings per share (EPS) before special items were DKK 15.19 against DKK 14.80 last year.
Net profit for the year after special items was DKK 899m against DKK 2,390m last year.
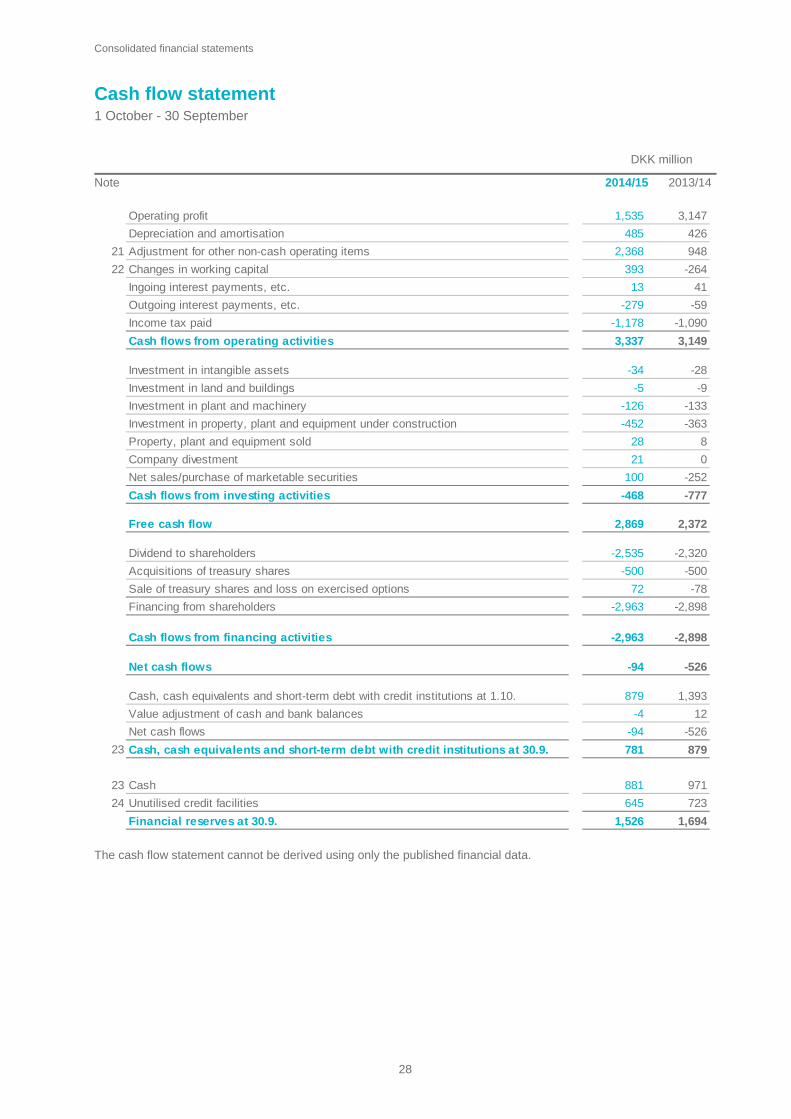
The free cash flow grew by 21% to DKK 2,869m, a DKK 497m increase over last year.
ROIC after tax before special items was 48% against 49% last year.
The Board of Directors recommends that the shareholders attending the general meeting to be held on 9 December 2015 approve a year-end dividend of DKK 8 per share. This brings the divi-dend paid for the year to DKK 12.5 per share, as compared with DKK 11.5 last year. The Board of Directors also recommends that 4,000,000 shares with a nominal value of DKK 1 be cancelled.

Management’s report
8
Sales performance Revenue in DKK was up by 12% to DKK 13,909m on 7% organic growth. Currency appreciation, espe-cially of USD and GBP against DKK, increased the reported growth rate by 5 percentage points. Sales performance by business area
2014/15 2013/14
Ostomy Care 5,567 5,091 6% 3% 9%
Continence Care 5,019 4,438 8% 5% 13%
Urology Care 1,359 1,199 5% 8% 13%
Wound & Skin Care 1,964 1,700 9% 7% 16%
Net revenue 13,909 12,428 7% 5% 12%
Growth composition
DKK million Organic growth
Exchange rates
Reported growth
Ostomy Care Sales of ostomy care products amounted to DKK 5,567m, equal to an increase in DKK of 9%. Organic growth, at 6%, remained driven mainly by the portfolio of SenSura® products and the Brava® accessory range. The portfolio of SenSura® products continued to generate highly satisfactory sales growth, driven in part by good sales growth in the Nordic mar-kets, the UK, Germany, Italy and France. The SenSura® Mio product range continues to con-tribute strongly to sales growth. The buying patterns of a major distributor im-pacted sales to the US market during the year. The performance of the Charter homecare busi-ness in the UK remains unsatisfactory, and in the Dutch market, the lower reimbursement rates had a negative impact on growth. In addi-tion, the German homecare company SIEWA remains challenged in a more competitive mar-ket. Assura® products generated satisfactory sales growth, mainly driven by China, Mexico and Argentina, whereas Algeria was a negative con-tributor due to a distributor’s inventory build-up last year.
The Brava® accessory range generated highly satisfactory growth in the USA and France. SenSura® Mio is now available in 18 countries. SenSura® Mio Convex is available in 7 coun-tries. Continence Care Continence Care revenue was DKK 5,019m, a 13% improvement in DKK and 8% organically. Sales of SpeediCath® intermittent catheters, especially the compact catheters, continued to drive growth. Compact catheters were a key growth driver, particularly in France, the USA and the UK. Saudi Arabia also contributed to the perform-ance due to delivery on a large tender win in the first quarter. The buying patterns of a major dis-tributor impacted the US market during the year. In the UK, the performance of the Charter homecare business remains unsatisfactory. SpeediCath® Compact Set continued the satis-factory growth following the December 2012 launch, and the SpeediCath® Compact Eve is now available in 13 countries. Sales growth for standard catheters was unsat-isfactory, mainly because last year’s comparator was boosted by a large tender win in Algeria in the first half of 2013/14, but also due to the
Management’s report
9
negative performance of standard catheter sales in the UK market. The sales growth for urine bags and urisheaths was not satisfactory, mainly due to the negative performance of urine bag sales in the more competitive Dutch, US and UK markets. Sales of the Peristeen® anal irrigation system grew at a fair rate, especially in the UK, France and Germany. Urology Care Sales of urology care products increased by 13% to DKK 1,359m, while the organic growth rate was 5%. Full-year growth was mainly driven by sales of disposable endourological products in France, Germany and Saudi Arabia. The sales performance of implant products remained unsatisfactory due to the weaker sales momen-tum for penile implants in the USA. The sales momentum in transvaginal surgical mesh prod-ucts designed to treat stress urinary inconti-nence and pelvic organ prolapse has weakened, because the satisfactory sales of Altis® slings and Restorelle® products have not fully offset the still declining sales of Aris®, an older sling prod-uct.
Wound & Skin Care Sales of wound and skin care products amounted to DKK 1,964m, equal to a 16% in-crease in DKK and 9% organic growth. The Wound Care business alone generated 11% organic growth. Growth was driven by sales of Biatain® foam dressings, especially by Biatain® Silicone in Europe and notably in the UK, German and French markets. Lower reimbursement rates in the French market taking effect on 1 October 2014 impacted growth. Growth in Emerging markets was driven by China and Greece and by sales on a large tender win in Saudi Arabia. Organic growth in the US Wound Care business improved. Contract production of Compeed® delivered weak full-year growth. The Biatain® Silicone launch continued to pro-duce highly satisfactory results, and the product is available in all core markets.
Sales performance by region
2014/15 2013/14
European markets 8,843 8,221 5% 3% 8%
Other developed markets 2,945 2,479 6% 13% 19%
Emerging markets 2,121 1,728 21% 2% 23%
Net revenue 13,909 12,428 7% 5% 12%
Growth composition
DKK million Organic growth
Exchange rates
Reported growth
European markets Revenue was up by 8% to DKK 8,843m on 5% organic growth. France, Southern Europe and the Nordic markets all reported highly satisfac-tory organic growth rates, whereas the Dutch market remains challenged by the above-mentioned changes to reimbursement rates in the ostomy care and continence care markets.
Growth in France, Southern Europe and the Nordics was driven mainly the continence care and ostomy care businesses. Lastly, the UK operations remain challenged by the perform-ance of the Charter homecare business, which is affecting the ostomy care and continence care businesses. Having implemented a number of operational initiatives, Charter has now brought
Management’s report
10
the quality of its service back to industry peer levels. In addition, the German homecare com-pany SIEWA continued to face a weaker growth momentum in a more competitive market. Other developed markets Revenue was DKK 2,945m, which translates into reported growth of 19%, while the underly-ing organic growth rate was 6%. Much of the performance was driven by the US ostomy care and continence care markets, and particularly by SpeediCath® intermittent catheters and the Brava® range of accessories. An industry-wide investigation of sales and mar-keting practices by the US Department of Jus-tice has impacted the US market in general in-cluding our sales activities. Also, the procure-ment patterns of a major distributor impacted growth in the US market. The growth perform-ance of Titan® penile implants in the USA was unsatisfactory due to a drop in market activity. Canada reported positive growth performance in Ostomy Care, Wound Care and Continence Care. In Australia, Continence Care was the main growth driver. Emerging markets Revenue increased by 23% to DKK 2,121m, while organic growth was 21%. The perform-ance was driven especially by China, Saudi Arabia, Greece and Argentina, whereas Algeria and Brazil were negative contributors. In addi-tion, Turkey, Mexico and South Korea all re-ported very strong growth rates. Performance in the Chinese market was driven by good momen-tum in Ostomy Care, especially for the Assura® portfolio, and in Wound Care, especially for Bi-atain®. In Saudi Arabia, tender wins in Continence Care, Wound Care and Urology Care in the first half of the year continued to support the growth performance. Greece reported decent growth in Continence Care for compact catheters and Wound Care for Biatain®. The performance in Argentina was driven by good momentum in Ostomy Care and Continence Care. The nega-tive growth in Algeria was due to an inventory buy-back coupled with an inventory build-up by
a new distributor second quarter last year. Re-duced tender activity impacted the growth per-formance in Brazil. Gross profit Gross profit was up by 12% to DKK 9,533m from DKK 8,538m last year. The gross margin was 69%, which was in line with last year. In the 2014/15 financial year, Coloplast took a DKK 25m writedown on the inventory of NPWT prod-ucts when discontinuing the partnership with Devon Medical. The performance was supported by the ongoing focus on efficiency improve-ments and costs, which offset the negative effect of new product launches with their high initial costs and increasing depreciations resulting from increased capital expenditure. Coloplast also incurred costs in connection with expanding the factory at Nyírbátor, Hungary, and relocating production from Denmark to Hungary. Costs Distribution costs amounted to DKK 3,962m, against DKK 3,519m last year. Distribution costs amounted to 28% of revenue, which was in line with last year. Included in costs were ongoing investments of about DKK 200m, mainly for sales and marketing initiatives in China, the USA, the UK, Germany and France. Lastly, Coloplast continue to invest in “522 Postmarket Surveillance” studies for products in Urology Care. Administrative expenses amounted to DKK 600m, against DKK 498m last year. The full-year financial statements contain provisions announced in the 9M interim report for a total of DKK 75m made in relation to the industry-wide investigation of sales and marketing practices in the USA by the US Department of Justice and for the greater risk of losses on trade receiv-ables in southern Europe. Administrative ex-penses accounted for 4% of revenue, which was in line with last year. R&D costs were DKK 442m, up from DKK 390m last year due to a general increase in business activity, restructuring costs relating to the organ-isational changes announced on the release of
Management’s report
11
the H1 interim report and an increase in depre-ciation charges. R&D costs amounted to 3% of revenue, which was in line with last year. Other operating income and other operating expenses amounted to a net income for the year of DKK 6m, against a net income of DKK 16m last year. Special items Coloplast took a further provision of DKK 3,000m to cover potential settlements and costs in connection with the lawsuits in the United States alleging injury resulting from the use of transvaginal surgical mesh products designed to treat pelvic organ prolapse and stress urinary incontinence. See note 18 to the consolidated financial statements for more details. Operating profit (EBIT) EBIT before special items was DKK 4,535m, a 9% increase from DKK 4,147m last year. The EBIT margin was 33% in DKK and 32% at con-stant exchange rates, against 33% last year both in DKK and at constant exchange rates. EBIT after special items was DKK 1,535m against DKK 3,147m last year. The EBIT margin was 11% in DKK and 10% at constant exchange rates, against 25% last year both in DKK and at constant exchange rates. Financial items and tax Financial items were a net expense of DKK 289m, compared to a net income of DKK 46m last year. The change was mainly due to net losses on realised forward exchange contracts, especially on USD and GBP, against a net gain last year. The tax rate was 28% against 25% last year, the change being due to the increased provision of DKK 3,000m taken in respect of the lawsuits in the USA, but partially offset by the lower corpo-rate tax rate in Denmark. The tax expense be-fore special items was DKK 1,006m against DKK 1,025m last year. The tax expense was reduced by DKK 660m due to special items against DKK 224m last year.
Net profit The net profit before special items was up by 2% to DKK 3,239m from DKK 3,166m last year. Special items after tax amounted to DKK 2,340m against DKK 776m last year. This brought the net profit (after special items) to DKK 899m against DKK 2,390m last year. The diluted earnings per share (EPS) before special items were DKK 15.19 against DKK 14.80 last year. The diluted earnings per share (EPS) after special items were DKK 4.20 against DKK 11.17 last year. Cash flows and investments Cash flows from operating activities Cash flows from operating activities amounted to DKK 3,337m, against DKK 3,149m last year. The change was due to an improvement in EBITDA before special items offset by payments made for currency hedging transactions. The cash flows relating to the lawsuits in the United Stated alleging injury resulting from the use of transvaginal surgical mesh products de-signed to treat pelvic organ prolapse and stress urinary incontinence have lifted cash flows from operating activities by about DKK 200m due to DKK 150m received in insurance payments and a currency hedge on the provision, offset by payments made from the escrow account. Investments Coloplast grew its net capital expenditure in property, plant and equipment and intangible assets by DKK 64m relative to last year, increas-ing CAPEX investments by 16% over the 2013/14 period to DKK 617m. As a result, CAPEX accounted for 4% of revenue. The fi-nancial statements include investment in ma-chinery to be used for new products, including for a new SenSura® Mio platform, added capac-ity for existing products and the expansion of the factory in Nyírbátor, which was inaugurated in April 2015. Changes in the securities portfolio lifted cash flows from investing activities by DKK 352m.
Management’s report
12
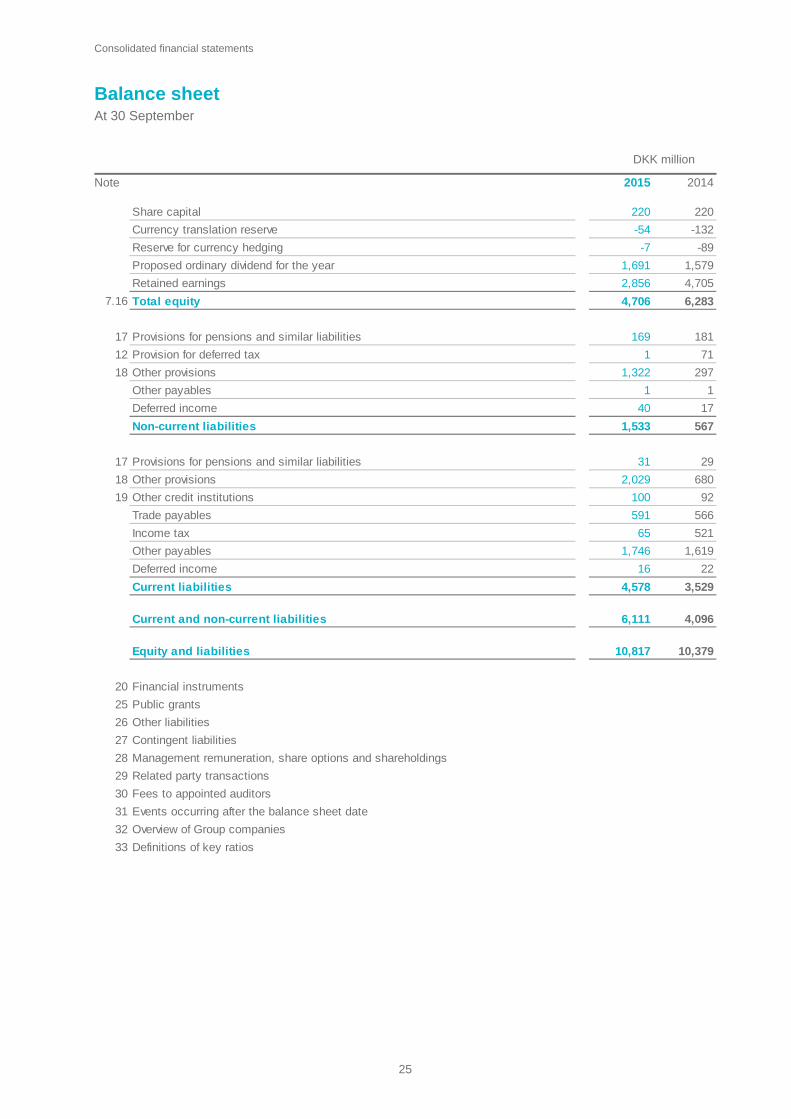
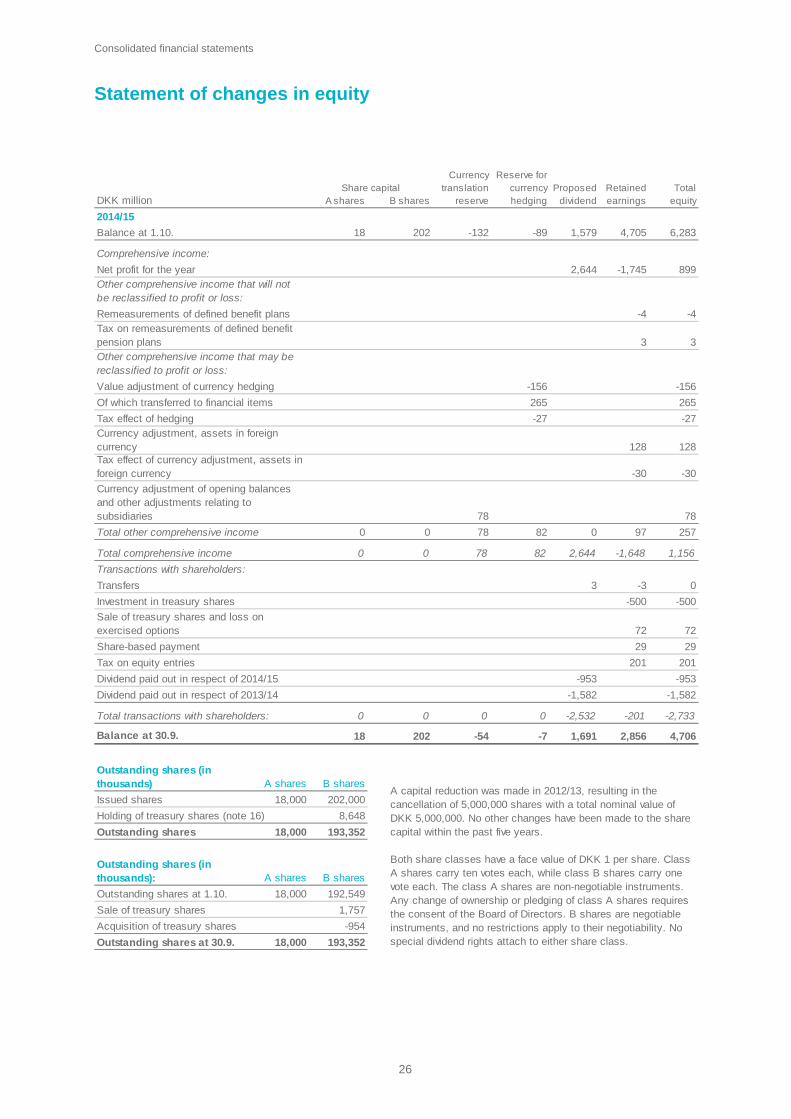
Free cash flow The free cash flow amounted to DKK 2,869m, against DKK 2,372m last year. Capital resources Interest-bearing net deposits at 30 September 2015 amounted to DKK 1,300m, against DKK 1,490m at 30 September 2014, the increase being mainly due to a smaller securities portfolio and a smaller holding of cash and cash equiva-lents. Statement of financial position and equity Balance sheet At DKK 10,817m, total assets increased by DKK 438m relative to last year. Intangible assets amounted to DKK 1,511m, which was DKK 30m more than at 30 Septem-ber 2014. The increase was attributable to an increase in goodwill resulting from the apprecia-tion of USD against DKK less amortisation of patents and trademarks. Investments in prop-erty, plant and equipment (CAPEX) increased by 10% to DKK 2,705m, driven by the ongoing in-vestments in Hungary. As a result, non-current assets increased by a total of DKK 720m to DKK 5,052m. Non-current assets increased by DKK 447m due to the deferred tax asset related to the lawsuits in the United States alleging injury resulting from the use of transvaginal surgical mesh products designed to treat pelvic organ prolapse and stress urinary incontinence. Relative to last year, inventories increased by 11% to DKK 1,473m due to inventory build-ups in connection with new product roll-outs, reloca-tion of production and weaker-than-expected sales. Trade receivables were up by 12% to DKK 2,467m, mirroring the revenue perform-ance. Trade payables amounted to DKK 591m, marking a 4% increase relative to last year. This brought net working capital to 24% of revenue, which was in line with the percentage at 30 Sep-tember 2014.
Amounts held in escrow decreased by DKK 346m from DKK 418m at 30 September 2014 to DKK 72m at 30 September 2015. The lower amount is due to settlement payments made in connection with lawsuits in the United States alleging injury resulting from the use of trans-vaginal surgical mesh. However, the lower amount was partly offset by an increase in es-crow deposits. The value of security holdings decreased by DKK 100m and cash and cash equivalents by 90m relative to the beginning of the financial year. As a result, current assets decreased by a total of DKK 282m relative to last year to stand at DKK 5,765m. An amount of DKK 3,992m is recognised under liabilities, of which DKK 3,335m is recognised under provisions and DKK 657m is recognised under other debt. Equity Equity decreased by DKK 1,577m to DKK 4,706m. Payment of dividends of DKK 2,535m and share buy-backs of DKK 500m were partly offset by the comprehensive income for the year of DKK 1,156m and the net effect of treasury shares sold and losses on share options exer-cised, share-based payment and related tax charges amounting to DKK 302m. In the second quarter of 2013/14, Coloplast’s Board of Directors resolved to complete a share buy-back programme for a total of up to DKK 1bn running until the end of the 2014/15 finan-cial year. The programme was completed in June 2015. Treasury shares At 30 September 2015, Coloplast’s holding of treasury shares consisted of 8,648,447 B shares, which was 802,516 fewer than at 30 September 2014. The holding was reduced due to the exercise of equity options, which was partly offset by the share buy-back programme. The Board of Directors recommends to the an-nual shareholders attending the general meeting to be held on 9 December 2015 that the share
Management’s report
13
capital be reduced by a nominal value of DKK 4m, equal to 4,000,000 shares with a nominal value of DKK 1. The capital reduction is recom-mended because Coloplast has bought more shares through the buy-back programmes than are needed to cover share option programmes for senior employees. Financial guidance for 2015/16 We expect organic revenue growth of 7-8%
at constant exchange rates and 8-9% in DKK.
We expect an EBIT margin of 33-34%, both at constant exchange rates and in DKK.
Capital expenditure is expected to be around DKK 700m.
The effective tax rate is expected to be about 23%.
Price pressures in 2015/16 are expected to be in line with those of 2014/15, for an annual price pressure of about 1%. Our financial guidance takes account of reforms with known effects. Also, the financial guidance assumes sustained and stable sales growth in Coloplast's core mar-kets and a continuation of the successful roll-out of new products. The EBIT margin guidance assumes that Coloplast, in addition to generating sales growth, can successfully deliver scale economies and efficiency improvements. The guidance for in-vestments in sales-enhancing initiatives remains at about DKK 150m. The capital investments will boost the production capacity for new and existing products and will provide for the completion of the factory expan-sion at Tatabánya in 2016. The provision made to cover costs relating to transvaginal surgical mesh products remains subject to a high degree of estimation. Coloplast's long-term financial guidance, as announced at the Capital Markets Day on 4 June 2014, remains to generate 7-10% sales growth per year and to improve the EBIT margin
by 0.5-1.0 percentage point per year. The over-all weighted market growth in Coloplast’s current markets is about 5%. Other matters Proposal for changes to the number of mem-bers and composition of the Board of Direc-tors The Board of Directors proposes that the Board be increased by two shareholder-elected mem-bers and recommends Executive Director Birgitte Nielsen and CEO Jette Nygaard-Andersen be elected to the Board at the annual general meeting on 9 December 2015. The Board recommends Birgitte Nielsen and Jette Nygaard-Andersen for the Board in order to complement the Board’s skills in general man-agement, marketing, sales and innovation. New factory in Hungary We have decided to expand the production ca-pacity at the Coloplast factory in Tatabánya, Hungary. The 20,000 sq.m. expansion is sched-uled for completion in the summer of 2016. The total investment will amount to around DKK 150m. Commercial partnership with Devon Medical discontinued Due to product safety issues involving the Devon Medical Extricare portfolio, Coloplast discontinued all commercial activities relating to NPWT end March 2015, including sales and marketing in Brazil, Switzerland and Greece, where the products had been launched. The decision put a final stop to the commercial part-nership with Devon Medical. Coloplast remains committed to selling and marketing NPWT prod-ucts as part of its product range. Wellcome Support Center divested Coloplast divested its Japanese homecare ac-tivities, which generated revenue of about DKK 85m and moderate earnings in the 2013/14 fi-nancial year. The divestment had no impact on the financial results for 2014/15.
Management’s report
14
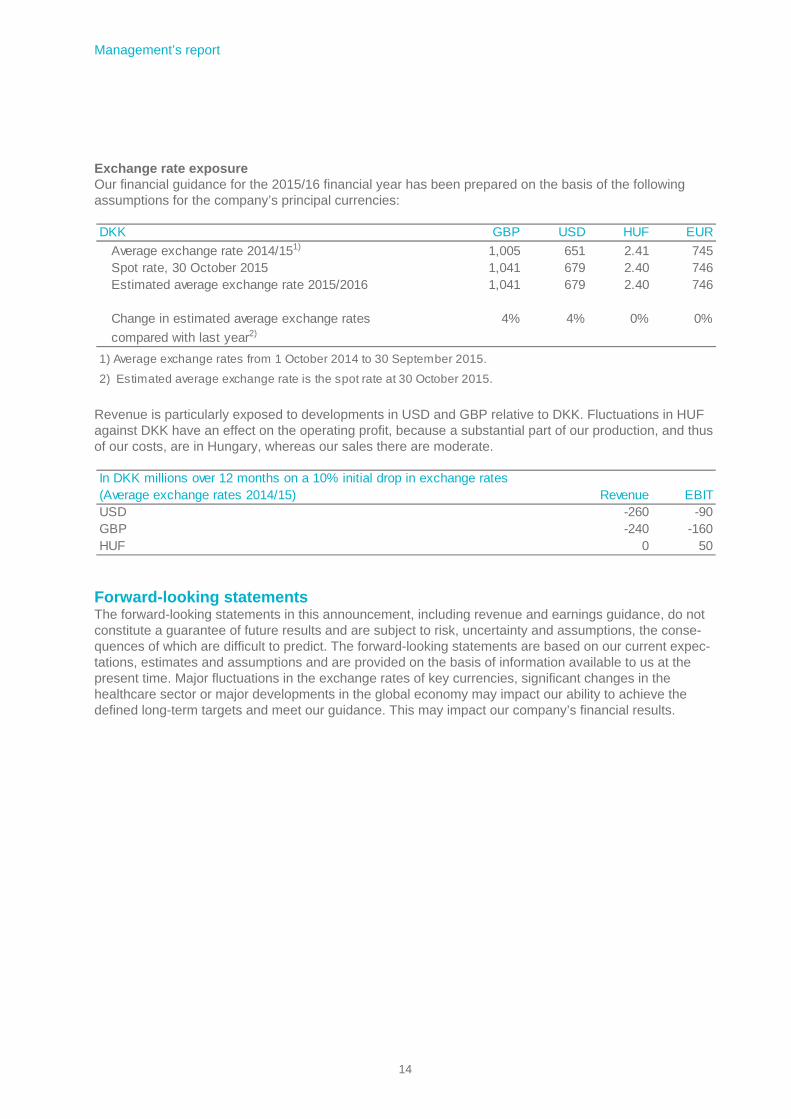
Exchange rate exposure Our financial guidance for the 2015/16 financial year has been prepared on the basis of the following assumptions for the company’s principal currencies:
Revenue is particularly exposed to developments in USD and GBP relative to DKK. Fluctuations in HUF against DKK have an effect on the operating profit, because a substantial part of our production, and thus of our costs, are in Hungary, whereas our sales there are moderate.
Forward-looking statements The forward-looking statements in this announcement, including revenue and earnings guidance, do not constitute a guarantee of future results and are subject to risk, uncertainty and assumptions, the conse-quences of which are difficult to predict. The forward-looking statements are based on our current expec-tations, estimates and assumptions and are provided on the basis of information available to us at the present time. Major fluctuations in the exchange rates of key currencies, significant changes in the healthcare sector or major developments in the global economy may impact our ability to achieve the defined long-term targets and meet our guidance. This may impact our company’s financial results.
DKK GBP USD HUF EUR
Average exchange rate 2014/151) 1,005 651 2.41 745Spot rate, 30 October 2015 1,041 679 2.40 746Estimated average exchange rate 2015/2016 1,041 679 2.40 746
Change in estimated average exchange rates 4% 4% 0% 0%
compared with last year2)
1) Average exchange rates from 1 October 2014 to 30 September 2015.
2) Estimated average exchange rate is the spot rate at 30 October 2015.
In DKK millions over 12 months on a 10% initial drop in exchange rates (Average exchange rates 2014/15) Revenue EBITUSD -260 -90GBP -240 -160HUF 0 50
Management’s report
15
Intellectual capital Coloplast develops its products and services in close interaction between employees, users, healthcare professionals and opinion-makers. Coloplast believes that retaining employees, developing their skills and empowering them to engage in this interaction is a prerequisite for safeguarding its position as a market leader. At Coloplast, innovation is a team effort between marketing, R&D, production and sales. Market-ing prepares market research and manages relationships with users so as to build an under-standing of their needs. This is then used to chart the course for innovation within the indi-vidual business areas. Next, Coloplast develops products and services consistent with that course. Concurrently with the development process, clinical tests are run and legal issues are clarified at an early stage, including prices and the potential for reimbursement. In 2014/15, Coloplast integrated the Chronic Care R&D de-partment in the Global Operation production unit to ensure greater integration in the innovation process and the right production set-up at the lowest possible cost. Human resources At 30 September 2015, Coloplast had 9,706 employees, of whom 8,226 were employed in international locations. During the financial year, the number of employees increased by 5%. Corporate responsibility at Coloplast In its Corporate Responsibility report, which is published along with the annual report, Coloplast communicates openly about social responsibility. The report has been prepared in compliance with the principles of the UN Global Compact. With respect to the statutory statement on cor-porate social responsibility in compliance with section 99a of the Danish Financial Statements Act, see the Corporate Responsibility Report for 2014/15, which is available at http://www.coloplast.com/About-Coloplast/Responsibility/Policies/
Risk management and internal con-trols The management of each of Coloplast's individ-ual business units and staff functions is in charge of identifying and managing risk factors in their specific parts of the organisation. The most significant risks are reported quarterly to Corporate Risk Management. The reporting process and risk interviews form the basis of the quarterly risk update submitted to the Executive Management and the Board of Directors. A central unit of the Corporate Finance depart-ment conducts regular control inspections at Coloplast subsidiaries to ensure that corporate standards for internal controls have been im-plemented and operate effectively. Conclusions from these inspections and any proposals for improvement are reported to the Executive Management, the audit committee and the inde-pendent auditors. The members of Coloplast’s audit committee are the chairman of the Board of Directors (commit-tee chairman), the deputy chairman and Board member Jørgen Tang-Jensen. The duties of the audit committee are to monitor the following: The financial reporting process; The company’s internal control system and
risk management systems; The statutory audit of the financial state-
ments; and The independence of the auditors, including
in particular the provision of non-audit ser-vices to the group.
The Board of Directors has resolved to follow the audit committee's recommendation not to establish an internal audit function. For more information, click the link below to go to our website and see “Monitoring”. The committee held five meetings in the 2014/15 financial year.
Management’s report
16
The Executive Management is responsible for Coloplast’s overall risk profile and for aligning it with the overall strategies and policies. The Ex-ecutive Management is also responsible for launching and validating projects and activities to cover the most significant risks. The Board of Directors reviews and considers, on a quarterly basis, the conclusions and recommendations submitted by the Executive Management. Additional information about risk management and major risk factors is available from our web-site: http://www.coloplast.com/internalcontrols
Share classes and authorisations Coloplast has two share classes: A and B. Both share classes have a denomination of DKK 1 per share. The 18 million class A shares entitle the holders to ten votes per A share and the 202 million class B shares entitle the holders to one vote per B share. The class A shares are non-negotiable instruments. The class B shares are negotiable instruments and were listed on the Copenhagen Stock Exchange (Nasdaq Copen-hagen) in 1983. Any change of ownership or pledging of class A shares requires the consent of the Board of Directors, whereas class B shares are freely negotiable. The Board of Directors may increase the com-pany's share capital by a nominal value of up to DKK 15m in one or more issues of class B shares. This authorisation is valid until the an-nual general meeting to be held in 2016. More-over, the Board of Directors has been authorised to acquire treasury shares for up to 10% of the company's share capital. The highest and lowest amount to be paid for the shares by the com-pany is the price applicable at the time of pur-chase +/- 10%. This authorisation is valid until the annual general meeting to be held in 2015. At general meetings, matters are decided by a simple majority of votes. Resolutions to amend the company's articles of association require that not less than half of the share capital is repre-sented and that the resolution is adopted by not less than two-thirds of the votes cast as well as
of the voting share capital represented at the general meeting. The resolution lapses if the above-mentioned share capital is not repre-sented, or if a resolution is not adopted by two-thirds of the votes cast. If a resolution is adopted by two-thirds of the votes cast, the Board of Directors must convene a new extraordinary general meeting within two weeks. If at this meeting the resolution is adopted by not less than two-thirds of the votes cast and of the vot-ing share capital represented, it will be passed irrespective of the amount of the share capital represented at the meeting. In the event of a change of control in the com-pany resulting from a change of ownership, share options may be exercised immediately. No other important agreements are in place that would be affected in the event of a change of control of the company resulting from a take-over, and no special agreements have been made between the company, its management or employees if their positions are discontinued due to change in ownership. There are no special provisions governing the election of members to Coloplast's Board of Directors. Ownership and shareholdings The company had 47,001 shareholders at the end of the financial year, which was 9,929 more than last year. Institutional investors based out-side Denmark held 29% of Coloplast's shares at 30 September 2014, compared with 33% a year earlier. Registered shareholders represented 95% of the entire share capital. Pursuant to the company's articles of association, shares must be regis-tered in the name of the holder in order to carry voting rights. Three shareholders have reported to the company, pursuant to section 55 of the Danish Companies Act, that at the date of this annual report they held 5% or more of the share capital or voting rights.
Management’s report
17
OwnershipName Residence %
Vedbæk 20.3% 40.6%
Nivå 11.1% 14.9%Benedicte Find Humlebæk 3.6% 5.4%
2) Wholly ow ned by Aage og Johanne Louis-Hansens Fond
Shareholders with ownership or voting rights of more than 5%Voting
rights %
Niels Peter Louis-Hansen1)
Aage og Johanne Louis-Hansens ApS2)
1) Niels Peter Louis-Hansen's w holly ow ned company N.P. Louis-Hansen ApS also has an additional 0.5% ow nership representing 0.3% of the votes.
Coloplast A/S held 8,648,447 treasury shares at 30 September 2015, equivalent to 4% of the share capi-tal. Coloplast's ownership
A shares B shares Ownership30 September 2015 1,000 units 1,000 units %
Holders of A shares and their families 18,000 81,521 45% 68%Danish institutionals 15,077 7% 4%Foreign institutionals 63,463 29% 17%
Coloplast A/S3) 8,648 4%Other shareholders 21,181 10% 6%
Non-registered shareholders3) 12,110 5%Total 18,000 202,000 100% 95%3) No voting rights
Voting rights %
Shareholdings
A shares B shares Number of30 September 2015 1,000 units 1,000 units insiders
Board of Directors 12,285 33,487 9- of which independent Board members 30 4Executive Management 162 4Total 12,285 33,649 13
Corporate governance at Coloplast At least once a year, Coloplast's Board of Direc-tors and Executive Management review the principles of corporate governance originating from legislation, custom and recommendations, among other things.
The Board of Directors and the Executive Man-agement assess the company’s business proc-esses, the definition and implementation of the mission, the organisation, stakeholder relations, strategy, risks, business objectives and controls. The Board of Directors determines the Group's objectives, strategies and overall action plans.

Management’s report
18
On behalf of the shareholders, the Board of Di-rectors supervises the company's organisation, day-to-day management and results. The Board of Directors also sets guidelines for the Execu-tive Management’s execution of the day-to-day management of the company and for assigning tasks among the individual executives. No one person is a member of both the Coloplast Board of Directors and the Executive Management and no Board member is a former member of the Coloplast Executive Management.
Recommendations on corporate governance in Denmark
The recommendations of the committee on cor-porate governance were revised in May 2013 and updated in May 2014, and Nasdaq Copen-hagen adopted the recommendations to take effect for financial years beginning on or after 1 January 2013. The Board of Directors and the Executive Management share the committee's views and generally follow the new recommen-dations. See our corporate website for a presen-tation of which recommendations Coloplast does not follow and the reasons why.
Objective of the reporting
Coloplast will account for views and activities relating to corporate governance in its annual report, at investor meetings and on the corpo-rate website. The purpose is: To ensure that investors receive information; To increase investor and employee insight
into the company's strategy, objectives and risks; and
To create stakeholder confidence in the company.
The full report 'Corporate governance at Coloplast' is available from the corporate web-site: “Statutory report on corporate governance”. http://www.coloplast.com/Investor-Relations/Corporate-
Governance
Openness and transparency
Investor relations Coloplast has established a policy for communi-cating information to shareholders and investors, under which the Executive Management and the Investor Relations team are in charge of com-munications pursuant to guidelines agreed with the Board of Directors. The communication of information complies with the rules laid down by Nasdaq Copenhagen, comprising: Full-year and interim financial statements and
the annual report Replies to enquiries from equity analysts,
investors and shareholders Site visits by investors and equity analysts Presentations to Danish and foreign investors Capital markets days for analysts and inves-
tors Conference calls in connection with the re-
lease of financial statements Dedicated investor relations section on the
Coloplast corporate website.
Duties and responsibilities of the Board of Directors
Rules of procedure A set of rules of procedure governs the work of Coloplast's Board of Directors. These proce-dures are reviewed annually by the Board of Directors and updated as necessary. The pro-cedures set out guidelines for the activities of the Board of Directors including the supervision of the company's organisation, day-to-day man-agement and results.Six board meetings were held in the 2014/15 financial year.
Composition of the Board of Directors
Board committees The Board of Directors has set up an audit committee consisting of the chairman and dep-uty chairman of the Board and an ordinary Board member. Assessment of the work performed by the Board of Directors At least every other year, the Board of Directors assesses its working procedures and method of approach. Based on this assessment, the or-
Management’s report
19
ganisation and efficiency of the Board of Direc-tors' work are discussed at a Board meeting where any proposals for improvement are con-sidered. The assessment has not given rise to any comments.
Remuneration to the Board of Directors and the Executive Management
Section 139 of the Danish Companies Act pro-vides that shareholders adopt, at a general meeting, general guidelines for incentive pay to members of a company's board of directors and its executive management before a specific agreement to this effect can be made. Coloplast amended its guidelines for incentive pay at the annual general meeting held on 1 December 2010. General guidelines for the company’s remunera-tion of members of the Board of Directors and the Executive Management Board of Directors Members of the Board of Directors receive a fixed annual fee. The Chairman and Deputy Chairman of the Board of Directors receive a supplement to this fee. The amounts of fees and supplements are approved by the shareholders in general meeting and disclosed in the annual report. Fees are fixed based on a comparison with fees paid by other companies. Members of the Board of Directors receive no incentive pay. Executive Management The Chairman and Deputy Chairman of the Board of Directors perform an annual review of the remuneration paid to members of the Execu-tive Management. The remuneration paid to members of the Executive Management consists of a fixed and a variable part. The fixed pay con-sists of a net salary, pension contribution and other benefits. The value of each of those com-ponents is disclosed in the annual report for each member of the Executive Management. As an element of the variable pay, members of the Executive Management may receive an annual bonus, subject to the achievement of certain benchmarks. The bonus proportion varies among the members of the Executive Manage-ment, but is subject to a maximum of 25% of the
annual remuneration. The actual bonus paid to each member of the Executive Management is disclosed in the Annual Report. At the date of adoption of these guidelines, the bonus bench-marks are based on value creation and profit-ability, but they may be changed by the Board of Directors. Any such change will be communi-cated in a company announcement. Another element of the variable pay is made up of options and is intended to ensure that the Executive Management's incentive correlates with the long-term creation of shareholder value. For that same reason, the option plan is revolv-ing and not subject to the achievement of de-fined benchmarks. Members of the Executive Management are awarded a number of options each year with a value equal to a maximum of 40% of the Execu-tive Management's remuneration. The value is calculated in accordance with the Black-Scholes formula. Options are awarded at a strike price which is 15% higher than the market price at the award date calculated as the average price of all trades on the last trading day of the calendar year. The options have a term of five years and are exercisable after three years. The number of options awarded to each member of the Execu-tive Management and their value is disclosed in the Company's annual report. Options in the Executive Management share option plan are covered by the Company's holding of treasury shares. In addition, the Chairman and Deputy Chairman of the Board perform an annual re-view of the remuneration paid to members of the Executive Management relative to the manage-ments of other Danish companies. Severance schemes As at 30 September 2015, a provision of DKK 1m had been made for a now discontinued post-service remuneration scheme for retired Board members. The scheme comprises one person. When current executives leave the company, the company will have an obligation of two years' pay.

20
Other executive functions Board of Directors Chairman Michael Pram Rasmussen (60) 10 years on the Board A.P. Møller - Mærsk A/S (C) and DC of one of its wholly owned subsidiaries Semler Holding (C) and C of one of its wholly owned subsidiaries Arp-Hansen Hotel Group A/S (BM) Louisiana Museum of Modern Art (BM) Museumsfonden af 7. december 1966 (BM) Danske Bank A/S (MBR) JPMorgan Chase International Council (MBR) Brian Petersen (53) 5 years on the Board Thomas Barfod (45)*
9 years on the Board Senior Controller Elected by the employees
Deputy Chairman Niels Peter Louis-Hansen (68)*
47 years on the Board N. P. Louis-Hansen ApS, Man-aging Director Aage og Johanne Louis-Hansen ApS, Managing Director Aage og Johanne Louis-Hansens Fond (C) Civiløkonom Niels Peter Louis-Hansen, Agriculture and forestry Jørgen Tang-Jensen (59) 8 years on the Board Velux A/S, CEO and C of 8 and DC in 1 of its wholly owned subsidiaries Altaterra Kft. (C) Geberit AG (BM) Martin Giørtz Müller (52)*
1 year on the Board Head of Ramp-up Elected by the employees
Per Magid (72)*
30 years on the Board Aage og Johanne Louis-Hansen ApS, Director Munksgaards Fondet (C) Vemmetofte Kloster (C) Ernst og Vibeke Husmans Fond (DC) Arktisk Institut (BM) Aage og Johanne Louis-Hansens Fond (BM) Sven Håkan Björklund (59) 9 years on the Board H. Lundbeck A/S (C) Acino Pharma AG (C) Trimb AB (C) Alere Inc. (BM) Atos AB (BM) Kibion AB (BM) Torben Rasmussen (55)*
5 years on the Board Electrician Elected by the employees * These board members are not consid-ered to be independent under the defini-tion provided in “Recommendations on Corporate Governance”.
Executive Management President, CEO Lars Rasmussen (56) AXCEL (BM) H. Lundbeck A/S (BM) Danske Bank A/S (MBR)
Executive Vice President Anders Lonning-Skovgaard (43)
Executive Vice President Allan Rasmussen (48)
Executive Vice President Kristian Villumsen (45) Chr. Hansen Holding A/S (BM)
Listed on this page are the board memberships of the members of the Board of Directors and the Executive Man-agement of Coloplast A/S as reported by them on 3 November 2015. CVs and other information about the individual board members and executives are available from the About Coloplast section on the Coloplast website. (C) Chairman (DC) Deputy Chairman (BM) Board member (MBR) Member of the Board of Representatives
21
Statement by the Board of Directors and the Executive Management The Board of Directors and the Executive man-agement have today considered and adopted the Annual Report of Coloplast A/S for the finan-cial year 1 October 2014 – 30 September 2015. The Consolidated Financial Statements are pre-pared in accordance with International Financial Reporting Standards as adopted by the EU, and the Financial Statements are prepared in accor-dance with the Danish Financial Statements Act. Moreover, the Consolidated Financial State-ments and the Financial Statements are pre-pared in accordance with additional Danish dis-closure requirements for listed companies. Man-agement’s report is also prepared in accordance with Danish disclosures requirements for listed companies.
In our opinion, the Consolidated Financial Statements and the Financial Statements give a true and fair view of the financial position at 30 September 2015 of the Group and the Company and of the results of the Group and Company operations and consolidated cash flows for the financial year 1 October 2014 to 30 September 2015. In our opinion, Management’s report includes a true and fair account of the development in the operations and financial circumstances of the Group and the Company, of the results for the year and of the financial position of the Group and the Company as well as a description of the most significant risks and elements of uncer-tainty facing the Group and the Company. We recommend that the Annual Report be adopted at the Annual General Meeting.
Humlebæk, 3 November 2015 Executive Management: Lars Rasmussen Anders Lonning-Skovgaard Allan Rasmussen Kristian Villumsen President, CEO Executive Vice President Executive Vice President Executive Vice President
Board of Directors: Michael Pram Rasmussen Niels Peter Louis-Hansen Per Magid Chairman Deputy Chairman
Brian Petersen Jørgen Tang-Jensen Sven Håkan Björklund Thomas Barfod Martin Giørtz Müller Torben Rasmussen Elected by the employees Elected by the employees Elected by the employees
22
Independent auditor’s report To the Shareholders of Coloplast A/S Report on Consolidated Financial Statements and Parent Company Financial Statements We have audited the Consolidated Financial Statements and the Parent Company Financial Statements of Coloplast A/S for the financial year 1 October 2014 to 30 September 2015, which comprise income statement, balance sheet, statement of changes in equity, and notes, including summary of significant accounting poli-cies, for both the Group and the Parent Company, as well as statement of comprehensive income, and cash flow statement for the Group. The Consolidated Financial Statements are prepared in accordance with International Financial Reporting Standards as adopted by the EU, and the Parent Company Financial Statements are pre-pared under the Danish Financial Statements Act. More-over, the Consolidated Financial Statements and the Parent Company Financial Statements are prepared in accordance with Danish disclosure requirements for listed companies. Management’s Responsibility for the Consolidated Fi-nancial Statements and the Parent Company Financial Statements Management is responsible for the preparation of Con-solidated Financial Statements that give a true and fair view in accordance with International Financial Reporting Standards as adopted by the EU and Danish disclosure requirements for listed companies and for preparing Parent Company Financial Statements that give a true and fair view in accordance with the Danish Financial Statements Act and Danish disclosure requirements for listed companies, and for such internal control as Man-agement determines is necessary to enable the prepara-tion of Consolidated Financial Statements and Parent Company Financial Statements that are free from mate-rial misstatement, whether due to fraud or error. Auditor’s Responsibility Our responsibility is to express an opinion on the Consol-idated Financial Statements and the Parent Company Financial Statements based on our audit. We conducted our audit in accordance with International Standards on Auditing and additional requirements under Danish audit regulation. This requires that we comply with ethical requirements and plan and perform the audit to obtain reasonable assurance whether the Consolidated Finan-cial Statements and the Parent Company Financial Statements are free from material misstatement. An audit involves performing procedures to obtain audit evidence
about the amounts and disclosures in the Consolidated Financial Statements and the Parent Company Financial Statements. The procedures selected depend on the auditor’s judgment, including the assessment of the risks of material misstatement of the Consolidated Financial Statements and the Parent Company Financial State-ments, whether due to fraud or error. In making those risk assessments, the auditor considers internal control relevant to the Company’s preparation of Consolidated Financial Statements and Parent Company Financial Statements that give a true and fair view in order to de-sign audit procedures that are appropriate in the circum-stances, but not for the purpose of expressing an opinion on the effectiveness of the Company’s internal control. An audit also includes evaluating the appropriateness of accounting policies used and the reasonableness of accounting estimates made by Management, as well as evaluating the overall presentation of the Consolidated Financial Statements and the Parent Company Financial Statements. We believe that the audit evidence we have obtained is sufficient and appropriate to provide a basis for our audit opinion. The audit has not resulted in any qualification. Opinion In our opinion, the Consolidated Financial Statements give a true and fair view of the Group’s financial position at 30 September 2015 and of the results of the Group’s operations and cash flows for the financial year 1 Octo-ber 2014 to 30 September 2015 in accordance with International Financial Reporting Standards as adopted by the EU and Danish disclosure requirements for listed companies. Moreover, in our opinion, the Parent Company Financial Statements give a true and fair view of the Parent Com-pany’s financial position at 30 September 2015 and of the results of the Parent Company’s operations for the financial year 1 October 2014 to 30 September 2015 in accordance with the Danish Financial Statements Act and Danish disclosure requirements for listed companies. Statement on Management’s Review We have read Management’s Review in accordance with the Danish Financial Statements Act. We have not per-formed any procedures additional to the audit of the Consolidated Financial Statements and the Parent Com-pany Financial Statements. On this basis, in our opinion, the information provided in Management’s Review is consistent with the Consolidated Financial Statements and the Parent Company Financial Statements.
Hellerup, 3 November 2015 PricewaterhouseCoopers Statsautoriseret Revisionspartnerselskab Fin T. Nielsen Kim Tromholt State Authorised Public Accountant State Authorised Public Accountant

Consolidated financial statements
Statement of comprehensive income 1 October - 30 September DKK million Note 2014/15 2013/14
23
Income statement:
2 Revenue 13,909 12,428
3,8,9 Cost of sales -4,376 -3,890
Gross profit 9,533 8,538
3,8,9 Distribution costs -3,962 -3,519
3,8,9 Administrative expenses -600 -498
3,8,9 Research and development costs -442 -390
Other operating income 38 43
Other operating expenses -32 -27
Operating profit before special items 4,535 4,147
10 Special items -3,000 -1,000
Operating profit (EBIT) 1,535 3,147
11 Profit/loss after tax on investments in associates -1 -2
4 Financial income 13 89
4 Financial expenses -302 -43
Profit before tax 1,245 3,191
5 Tax on profit for the year -346 -801
Net profit for the year 899 2,390
Other comprehensive income:
Items that will not be reclassified to profit or loss:
17 Remeasurements of defined benefit plans -4 -27
Tax on remeasurements of defined benefit pension plans 3 8
-1 -19
Items that may be reclassified to profit or loss:
Value adjustment of currency hedging -156 -131
Of which transferred to financial items 265 -33
Tax effect of hedging -27 40
Currency adjustment, assets in foreign currency 128 57
Tax effect of currency adjustment, assets in foreign currency -30 -14Currency adjustment of opening balances and other adjustments relating to subsidiaries 78 -43
258 -124
Total other comprehensive income 257 -143
Total comprehensive income 1,156 2,247
6 Earnings per Share (EPS), (A and B shares) 4 11
6 Earnings per Share (EPS), (A and B shares), diluted 4 11
Consolidated financial statements
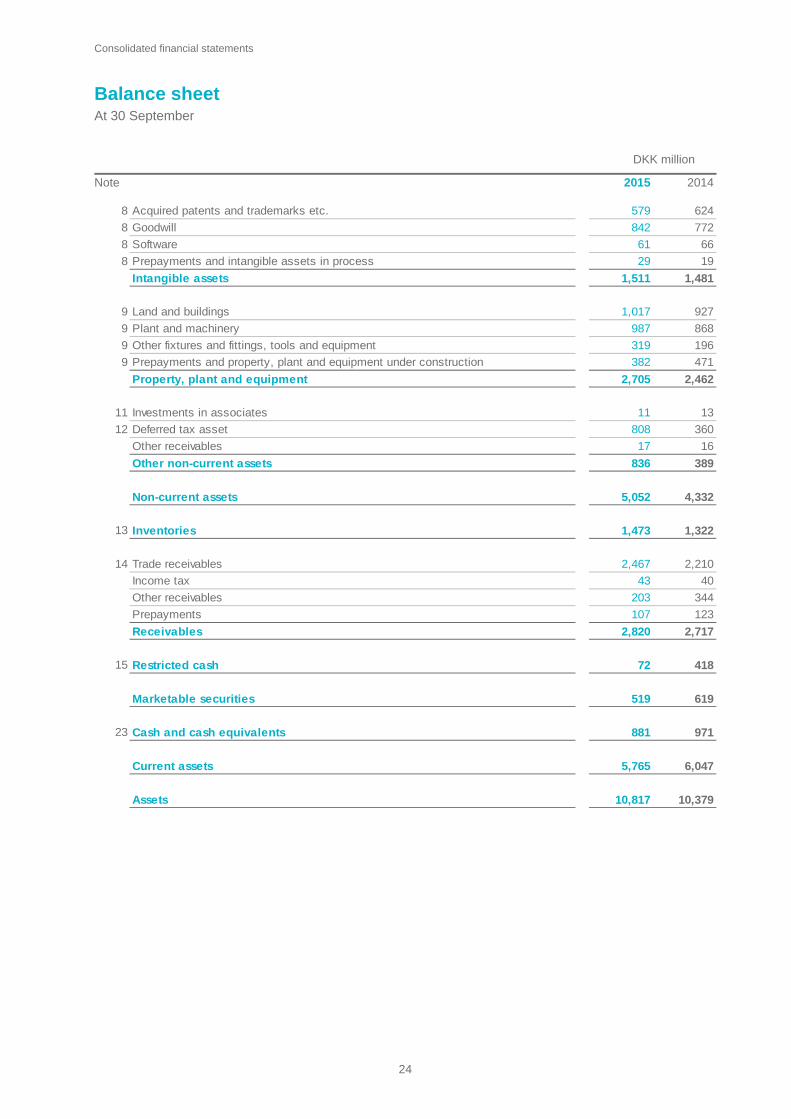
Balance sheet At 30 September DKK million Note 2015 2014
24
8 Acquired patents and trademarks etc. 579 624
8 Goodwill 842 772
8 Software 61 66
8 Prepayments and intangible assets in process 29 19
Intangible assets 1,511 1,481
9 Land and buildings 1,017 927
9 Plant and machinery 987 868
9 Other fixtures and fittings, tools and equipment 319 196
9 Prepayments and property, plant and equipment under construction 382 471
Property, plant and equipment 2,705 2,462
11 Investments in associates 11 13
12 Deferred tax asset 808 360
Other receivables 17 16
Other non-current assets 836 389
Non-current assets 5,052 4,332
13 Inventories 1,473 1,322
14 Trade receivables 2,467 2,210
Income tax 43 40
Other receivables 203 344
Prepayments 107 123
Receivables 2,820 2,717
15 Restricted cash 72 418
Marketable securities 519 619
23 Cash and cash equivalents 881 971
Current assets 5,765 6,047
Assets 10,817 10,379
Consolidated financial statements
Balance sheet At 30 September DKK million Note 2015 2014
25
Share capital 220 220
Currency translation reserve -54 -132
Reserve for currency hedging -7 -89
Proposed ordinary dividend for the year 1,691 1,579
Retained earnings 2,856 4,705
7.16 Total equity 4,706 6,283
17 Provisions for pensions and similar liabilities 169 181
12 Provision for deferred tax 1 71
18 Other provisions 1,322 297
Other payables 1 1
Deferred income 40 17
Non-current liabilities 1,533 567
17 Provisions for pensions and similar liabilities 31 29
18 Other provisions 2,029 680
19 Other credit institutions 100 92
Trade payables 591 566
Income tax 65 521
Other payables 1,746 1,619
Deferred income 16 22
Current liabilities 4,578 3,529
Current and non-current liabilities 6,111 4,096
Equity and liabilities 10,817 10,379
20 Financial instruments
25 Public grants
26 Other liabilities
27 Contingent liabilities
28 Management remuneration, share options and shareholdings
29 Related party transactions
30 Fees to appointed auditors
31 Events occurring after the balance sheet date
32 Overview of Group companies
33 Definitions of key ratios
Consolidated financial statements
Statement of changes in equity
26
DKK million A shares B shares
2014/15
Balance at 1.10. 18 202 -132 -89 1,579 4,705 6,283
Comprehensive income:
Net profit for the year 2,644 -1,745 899
-4 -4
3 3
-156 -156
265 265
-27 -27
128 128
-30 -30
78 78
Total other comprehensive income 0 0 78 82 0 97 257
Total comprehensive income 0 0 78 82 2,644 -1,648 1,156
Transactions with shareholders:
3 -3 0
-500 -500
72 72
29 29
201 201
-953 -953
Dividend paid out in respect of 2013/14 -1,582 -1,582
Total transactions with shareholders: 0 0 0 0 -2,532 -201 -2,733
Balance at 30.9. 18 202 -54 -7 1,691 2,856 4,706
A shares B shares
Issued shares 18,000 202,000
Holding of treasury shares (note 16) 8,648
Outstanding shares 18,000 193,352
A shares B shares
Outstanding shares at 1.10. 18,000 192,549
Sale of treasury shares 1,757
Acquisition of treasury shares -954
Outstanding shares at 30.9. 18,000 193,352
Currency adjustment of opening balances and other adjustments relating to subsidiaries
Transfers
Investment in treasury shares
Sale of treasury shares and loss on exercised options
Share-based payment
Tax on equity entries
Both share classes have a face value of DKK 1 per share. Class A shares carry ten votes each, while class B shares carry one vote each. The class A shares are non-negotiable instruments. Any change of ownership or pledging of class A shares requires the consent of the Board of Directors. B shares are negotiable instruments, and no restrictions apply to their negotiability. No special dividend rights attach to either share class.
A capital reduction was made in 2012/13, resulting in the cancellation of 5,000,000 shares with a total nominal value of DKK 5,000,000. No other changes have been made to the share capital within the past five years.
Dividend paid out in respect of 2014/15
Outstanding shares (in thousands)
Outstanding shares (in thousands):
Currency adjustment, assets in foreign currencyTax effect of currency adjustment, assets in foreign currency
Currency translation
reserveShare capital Total
equityRetained earnings
Other comprehensive income that will not be reclassified to profit or loss:
Other comprehensive income that may be reclassified to profit or loss:
Remeasurements of defined benefit plansTax on remeasurements of defined benefit pension plans
Value adjustment of currency hedging
Of which transferred to financial items
Tax effect of hedging
Proposed dividend
Reserve for currency hedging
Consolidated financial statements
Statement of changes in equity
27
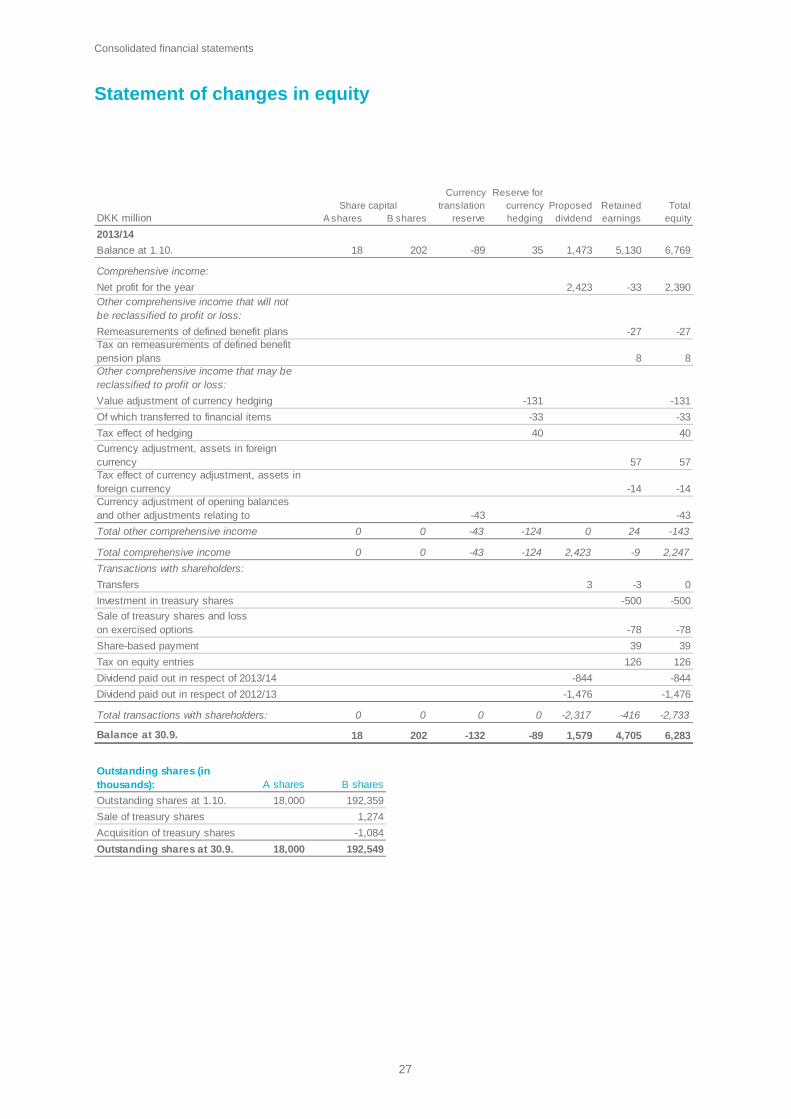
DKK million A shares B shares
2013/14
Balance at 1.10. 18 202 -89 35 1,473 5,130 6,769
Comprehensive income:
Net profit for the year 2,423 -33 2,390
-27 -27
8 8
-131 -131
-33 -33
40 40
57 57
-14 -14
-43 -43
Total other comprehensive income 0 0 -43 -124 0 24 -143
Total comprehensive income 0 0 -43 -124 2,423 -9 2,247
Transactions with shareholders:
3 -3 0
-500 -500
-78 -78
39 39
126 126
-844 -844
-1,476 -1,476
Total transactions with shareholders: 0 0 0 0 -2,317 -416 -2,733
Balance at 30.9. 18 202 -132 -89 1,579 4,705 6,283
A shares B shares
Outstanding shares at 1.10. 18,000
Sale of treasury shares
Acquisition of treasury shares
Outstanding shares at 30.9. 18,000
Share capitalReserve for
currency hedging
Proposed dividend
Retained earnings
Total equity
Currency translation
reserve
Tax effect of currency adjustment, assets in foreign currencyCurrency adjustment of opening balances and other adjustments relating to
Dividend paid out in respect of 2012/13
Dividend paid out in respect of 2013/14
Transfers
Other comprehensive income that will not be reclassified to profit or loss:
Currency adjustment, assets in foreign currency
Remeasurements of defined benefit plansTax on remeasurements of defined benefit pension plans
Value adjustment of currency hedging
Of which transferred to financial items
192,359
1,274
-1,084
Sale of treasury shares and loss on exercised options
Share-based payment
Tax on equity entries
192,549
Tax effect of hedging
Other comprehensive income that may be reclassified to profit or loss:
Outstanding shares (in thousands):
Investment in treasury shares
Consolidated financial statements
Cash flow statement 1 October - 30 September DKK million Note 2014/15 2013/14
28
Operating profit 1,535 3,147
Depreciation and amortisation 485 426
21 Adjustment for other non-cash operating items 2,368 948
22 Changes in working capital 393 -264
Ingoing interest payments, etc. 13 41
Outgoing interest payments, etc. -279 -59
Income tax paid -1,178 -1,090
Cash flows from operating activities 3,337 3,149
Investment in intangible assets -34 -28
Investment in land and buildings -5 -9
Investment in plant and machinery -126 -133
Investment in property, plant and equipment under construction -452 -363
Property, plant and equipment sold 28 8
Company divestment 21 0
Net sales/purchase of marketable securities 100 -252
Cash flows from investing activities -468 -777
Free cash flow 2,869 2,372
Dividend to shareholders -2,535 -2,320
Acquisitions of treasury shares -500 -500
Sale of treasury shares and loss on exercised options 72 -78
Financing from shareholders -2,963 -2,898
Cash flows from financing activities -2,963 -2,898
Net cash flows -94 -526
Cash, cash equivalents and short-term debt with credit institutions at 1.10. 879 1,393
Value adjustment of cash and bank balances -4 12
Net cash flows -94 -526
23 Cash, cash equivalents and short-term debt with credit institutions at 30.9. 781 879
23 Cash 881 971
24 Unutilised credit facilities 645 723
Financial reserves at 30.9. 1,526 1,694 The cash flow statement cannot be derived using only the published financial data.
Consolidated financial statements
List of notes
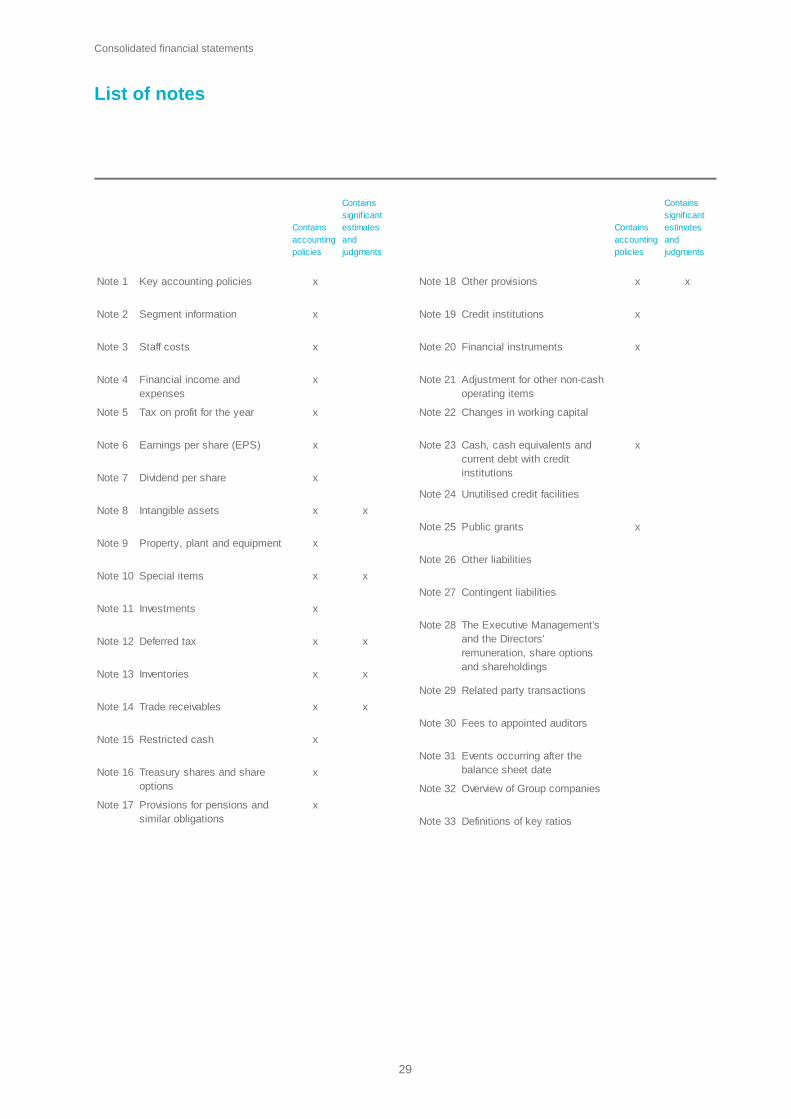
29
Note 1 x Note 18 Other provisions x x
Note 2 x Note 19 Credit institutions x
Note 3 x Note 20 Financial instruments x
Note 4 x Note 21
Note 5 x Note 22 Changes in working capital
Note 6 x Note 23 x
Note 7 x
Note 24 Unutilised credit facilities
Note 8 x x
Note 25 Public grants x
Note 9 x
Note 26 Other liabilities
Note 10 x x
Note 27 Contingent liabilities
Note 11 x
Note 28
Note 12 Deferred tax x x
Note 13 Inventories x x
Note 29 Related party transactions
Note 14 Trade receivables x x
Note 30
Note 15 Restricted cash x
Note 31
Note 16 x
Note 32 Overview of Group companies
Note 17 x
Note 33 Definitions of key ratios
Cash, cash equivalents and current debt with credit institutions
The Executive Management's and the Directors' remuneration, share options and shareholdings
Events occurring after the balance sheet date
Provisions for pensions and similar obligations
Adjustment for other non-cash operating items
Financial income and expenses
Earnings per share (EPS)
Intangible assets
Tax on profit for the year
Dividend per share
Treasury shares and share options
Fees to appointed auditors
Property, plant and equipment
Special items
Investments
Contains signif icant estimates and judgments
Key accounting policies
Staff costs
Contains accounting policies
Contains signif icant estimates and judgments
Contains accounting policies
Segment information
Consolidated financial statements
Notes Note
30
1. Key accounting policiesThis section provides a summary of significant accounting policies, new IFRS requirements and other general accounting policies. A detailed description of the accounting policies applied and the estimates made relative to each individual item is provided in relevant notes, such that all information about a specific accounting item can be found there.
Basis of preparationThe consolidated financial statements for 2014/2015 have been prepared in accordance with the International Financial Reporting Standards (IFRS) as adopted by the EU and additional Danish disclosure requirements applying to listed companies.
General information The annual report is prepared on the basis of the historical cost principle, modified in that certain financial assets and liabilities are measured at fair value. Subsequent to initial recognition, assets and liabilities are measured as described below in respect of each individual item or in the relevant note.
Accounting policy changesEffective from the 2014/15 financial year, the Coloplast group has implemented all new, updated or amended international financial reporting standards and interpretations (IFRSs) as issued by the IASB and IFRSs adopted by the EU that are effective for the 2014/15 financial year. The implementation did not affect the financial statements.
New financial reporting standards adoptedOther relevant standards or interpretations adopted by the IASB but not adopted by the EU have not been applied in this annual report. The amended IFRS 11 “Joint Arrangements” is expected to apply from the 2016/17 financial year. The new IFRS 9 “Financial instruments” is expected to apply from the 2018/19 financial year, while the new IFRS 15 “Revenue from Contracts with Customers” is expected to apply from the 2018/19 financial year. None of the mentioned standards or interpretations are expected to have a material effect on the consolidated financial statements.
Significant estimates and judgmentsIn connection with the practical use of the accounting policies described, it may be necessary for Management to make estimates in respect of the accounting items. The estimates and assumptions applied are based on historical experience and other factors that Management considers reasonable under the circumstances, but which are inherently uncertain and unpredictable. Such assumptions may be incomplete or inaccurate, and unexpected events or circumstances may arise. In addition, the company is subject to risks and uncertainties that may cause actual outcomes to deviate from these estimates.
It may be necessary to change previous estimates as a result of changes to the assumptions on which the estimates were based or due to new information or subsequent events.
Consolidated financial statements
Notes Note
31
1. Key accounting policies, continuedManagement has made significant estimates in respect of, among others, the following items: Special items, Intangible assets, Research and development, Inventories, Trade receivables, Deferred tax including Deferred tax assets and Other provisions. A further description of the principal accounting estimates and judgments is provided in the relevant notes.
Foreign currencyThe financial statement items of individual Group entities are measured in the currency used in the primary economic environment in which the entity operates (functional currency). The consolidated financial statements are presented in Danish kroner (DKK), which is the functional and presentation currency of the parent company. Other currencies are considered foreign currencies.
Foreign currency translationTransactions denominated in foreign currencies are translated into an entity’s functional currency at the exchange rate prevailing at the transaction date.
Monetary items denominated in foreign currencies are translated at the exchange rate prevailing at the balance sheet date. Exchange adjustments arising as the difference between exchange rates at the balance sheet date, and exchange rates at the transaction date of monetary items, are recognised in the income statement as financial income or expenses.
On translation of entities with a functional currency other than DKK, balance sheet items are translated at the exchange rates at the balance sheet date and income statement items are translated at the exchange rates at the transaction date. The resulting exchange adjustments are taken directly to other comprehensive income.
Consolidation, business combinations and associatesThe consolidated financial statements comprise Coloplast A/S (the parent company) and enterprises in which the Group holdsmore than 50% of the voting rights or otherwise exerts a controlling influence (subsidiaries).
The consolidated financial statements are prepared by aggregating the audited financial statements of the parent company and the individual subsidiaries, all of which are prepared in accordance with the Group’s accounting policies. Intra-group transactions, balances, dividends and unrealised gains and losses on transactions between group enterprises are eliminated.
Enterprises, which are not subsidiaries but in which the Group holds at least 20% of the voting rights or otherwise exerts a significant influence, are regarded as associates. The Group’s proportionate share of unrealised gains and losses on transactions between the Coloplast Group and associates is eliminated.
Enterprises recently acquired or divested are included in the consolidation in the period in which the Coloplast Group has control of the enterprise.
Comparative figures are not adjusted to reflect acquisitions. Divested activities are shown separately as discontinued operations.
Consolidated financial statements
Notes Note
32
1. Key accounting policies, continuedAcquisitions are accounted for using the purchase method, according to which the assets and liabilities and contingent liabilities of enterprises acquired are measured at fair value at the date of acquisition.
The excess value/goodwill on acquisition of subsidiaries or associates is calculated as the difference between the fair value of the consideration and the fair value of the group companies’ proportionate share of identifiable assets less liabilities and contingent liabilities at the date of acquisition.
The consideration for an enterprise consists of the fair value of the agreed consideration for the acquired enterprise. If part of the consideration is contingent on future events, such part is recognised at its fair value at the date of acquisition. Costs directly attributable to business combinations are recognised directly in the income statement as incurred.
In cases where the fair value of acquired identifiable assets, liabilities or contingent liabilities subsequently turns out to differ from the values calculated at the date of acquisition, the calculation, including goodwill is adjusted until up to 12 months after the date of acquisition. Subsequently, goodwill is not adjusted. Changes to estimates of contingent consideration are generally recognised in the income statement.
Goodwill arising in connection with the acquisition of subsidiaries is recognised in the balance sheet under intangible assets in the consolidated financial statements and tested annually for impairment.
RevenueRevenue comprises income from the sale of goods after deduction of any price reductions, quantity discounts or cash discounts. Sales are recognised in the income statement when the risk related to the goods passes to the customer, and the amounts can be reliably measured and are expected to be received.
Marketable securitiesThe fair value option is applied to marketable securities, because the securities form part of a portfolio managed and measured on a fair value basis.
Cash flow statement The consolidated cash flow statement, which is presented according to the indirect method, shows the Group’s cash flow from operating, investing and financing activities as well as the Group’s cash and cash equivalents and short-term debt to credit institutions at the beginning and end of the year. Cash and cash equivalents comprise cash and debt to credit institutions recognised under current assets and current liabilities, respectively. Marketable securities include bonds with maturities of more than three months and are therefore recognised under investing activities.

Consolidated financial statements
Notes Note
33
2. Segment information
Operating segmentsChanges to the management structure has led to changes in our management reporting and a change in the segment information for the 2014/15 financial year. Comparative figures have been restated accordingly.
The operating segments are defined on the basis of the monthly reporting to the Executive Management, which is considered the senior operational management, and the management structure. Reporting to Management is based on three operating segments: Chronic Care, Urology Care and Wound & Skin Care.
The operating segment Chronic Care covers the sale of ostomy care products and continence care products.The operating segment Urology Care covers the sale of urological products, including disposable products.The operating segment Wound & Skin Care covers the sale of wound and skin care products.
The reporting segments are also Chronic Care, Urology Care and Wound & Skin Care. The segmentation reflects the structure of reporting to the Executive Management.
Shared/non-allocated comprises support functions (Production units, R&D and Staff) and eliminations, as these functions do not generate revenue. Financial items and income tax are not allocated to the operating segments.
Management reviews each operating segment separately based on EBIT before internal items and eliminations (market contribution) and allocates resources on that background. Costs are allocated directly to segments. Certain immaterial indirect costs are allocated systematically to Shared/Non-allocated and the reporting segments.
Management does not receive reporting on asset and liabilities by the reporting segments. Accordingly, the reporting segments are not measured in this respect, nor are there resources allocated on this background. No single customer accounts for more than 10% of revenue.
Coloplast A/S' registered office is situated in Denmark. Revenue from external customers in Denmark amounted to DKK 308m (2013/14: DKK 286m), while revenue from external customers in other countries amounted to DKK 13,601m (2013/14: DKK 12,142m). Total non-current assets except for financial instruments and deferred tax assets (there are no pension assets or rights pursuant to insurance contracts) placed in Denmark amounted to DKK 3,081 million (2013/14: DKK 2,555m), while total non-current assets placed in other countries amounted to DKK 1,163m (2013/14: DKK 1,417m).
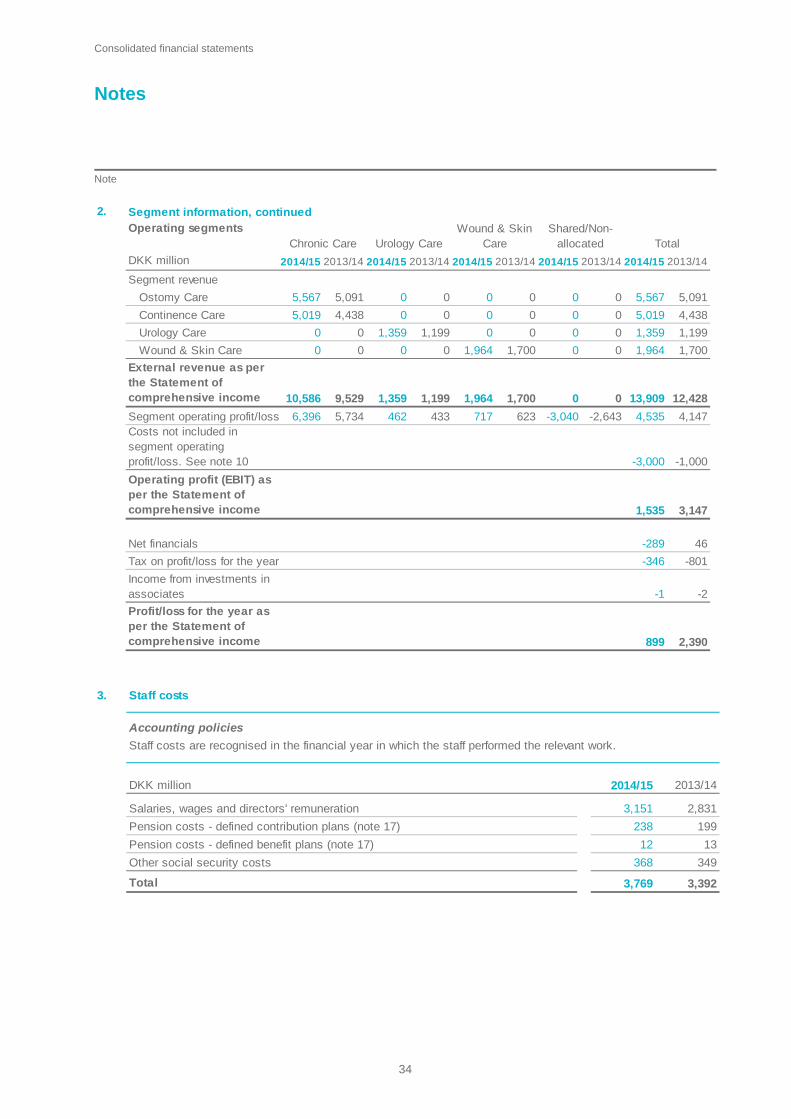
Consolidated financial statements
Notes Note
34
2. Segment information, continuedOperating segments
DKK million 2014/15 2013/14 2014/15 2013/14 2014/15 2013/14 2014/15 2013/14 2014/15 2013/14
Segment revenue
Ostomy Care 5,567 5,091 0 0 0 0 0 0 5,567 5,091
Continence Care 5,019 4,438 0 0 0 0 0 0 5,019 4,438
Urology Care 0 0 1,359 1,199 0 0 0 0 1,359 1,199
Wound & Skin Care 0 0 0 0 1,964 1,700 0 0 1,964 1,700
External revenue as per the Statement of comprehensive income 10,586 9,529 1,359 1,199 1,964 1,700 0 0 13,909 12,428
Segment operating profit/loss 6,396 5,734 462 433 717 623 -3,040 -2,643 4,535 4,147Costs not included in segment operating profit/loss. See note 10 -3,000 -1,000
Operating profit (EBIT) as per the Statement of comprehensive income 1,535 3,147
Net financials -289 46
Tax on profit/loss for the year -346 -801
Income from investments in associates -1 -2
Profit/loss for the year as per the Statement of comprehensive income 899 2,390
TotalChronic CareShared/Non-
allocatedUrology CareWound & Skin
Care
3. Staff costs
Accounting policies
DKK million 2014/15 2013/14
Salaries, wages and directors' remuneration 3,151 2,831
Pension costs - defined contribution plans (note 17) 238 199
Pension costs - defined benefit plans (note 17) 12 13
Other social security costs 368 349
Total 3,769 3,392
Staff costs are recognised in the financial year in which the staff performed the relevant work.
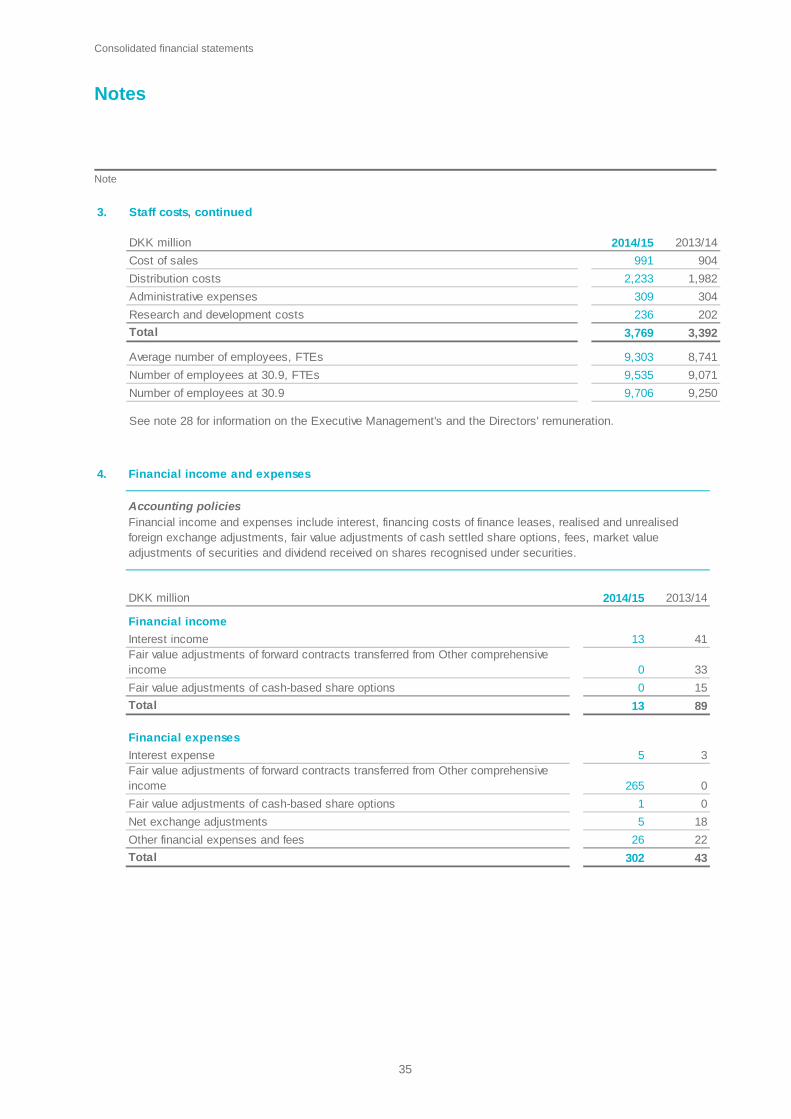
Consolidated financial statements
Notes Note
35
3. Staff costs, continued
DKK million 2014/15 2013/14
Cost of sales 991 904
Distribution costs 2,233 1,982
Administrative expenses 309 304
Research and development costs 236 202
Total 3,769 3,392
Average number of employees, FTEs 9,303 8,741
Number of employees at 30.9, FTEs 9,535 9,071
Number of employees at 30.9 9,706 9,250
See note 28 for information on the Executive Management's and the Directors' remuneration.
4. Financial income and expenses
Accounting policies
DKK million 2014/15 2013/14
Financial income
Interest income 13 41Fair value adjustments of forward contracts transferred from Other comprehensive income 0 33
Fair value adjustments of cash-based share options 0 15
Total 13 89
Financial expenses
Interest expense 5 3Fair value adjustments of forward contracts transferred from Other comprehensive income 265 0
Fair value adjustments of cash-based share options 1 0
Net exchange adjustments 5 18
Other financial expenses and fees 26 22
Total 302 43
Financial income and expenses include interest, financing costs of finance leases, realised and unrealised foreign exchange adjustments, fair value adjustments of cash settled share options, fees, market value adjustments of securities and dividend received on shares recognised under securities.
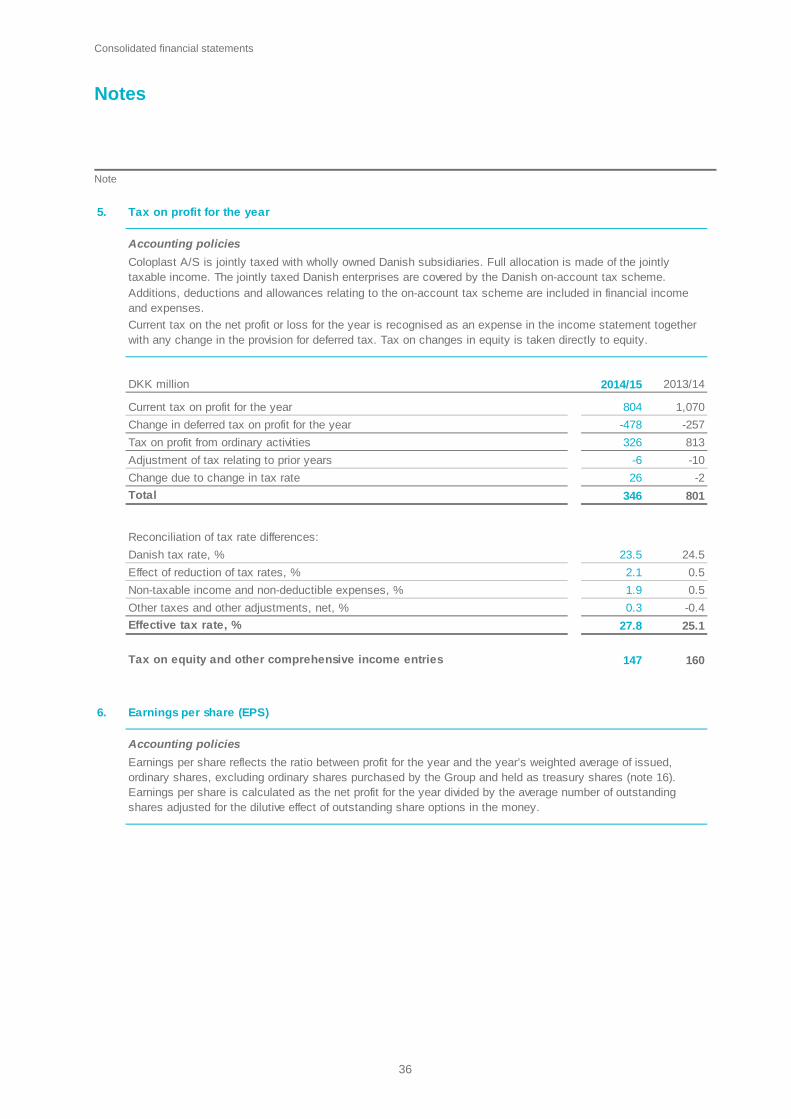
Consolidated financial statements
Notes Note
36
5. Tax on profit for the year
Accounting policies
DKK million 2014/15 2013/14
Current tax on profit for the year 804 1,070
Change in deferred tax on profit for the year -478 -257
Tax on profit from ordinary activities 326 813
Adjustment of tax relating to prior years -6 -10
Change due to change in tax rate 26 -2
Total 346 801
Reconciliation of tax rate differences:
Danish tax rate, % 23.5 24.5
Effect of reduction of tax rates, % 2.1 0.5
Non-taxable income and non-deductible expenses, % 1.9 0.5
Other taxes and other adjustments, net, % 0.3 -0.4
Effective tax rate, % 27.8 25.1
Tax on equity and other comprehensive income entries 147 160
Coloplast A/S is jointly taxed with wholly owned Danish subsidiaries. Full allocation is made of the jointly taxable income. The jointly taxed Danish enterprises are covered by the Danish on-account tax scheme.Additions, deductions and allowances relating to the on-account tax scheme are included in financial income and expenses.
Current tax on the net profit or loss for the year is recognised as an expense in the income statement together with any change in the provision for deferred tax. Tax on changes in equity is taken directly to equity.
6. Earnings per share (EPS)
Accounting policies
Earnings per share reflects the ratio between profit for the year and the year’s weighted average of issued, ordinary shares, excluding ordinary shares purchased by the Group and held as treasury shares (note 16). Earnings per share is calculated as the net profit for the year divided by the average number of outstanding shares adjusted for the dilutive effect of outstanding share options in the money.
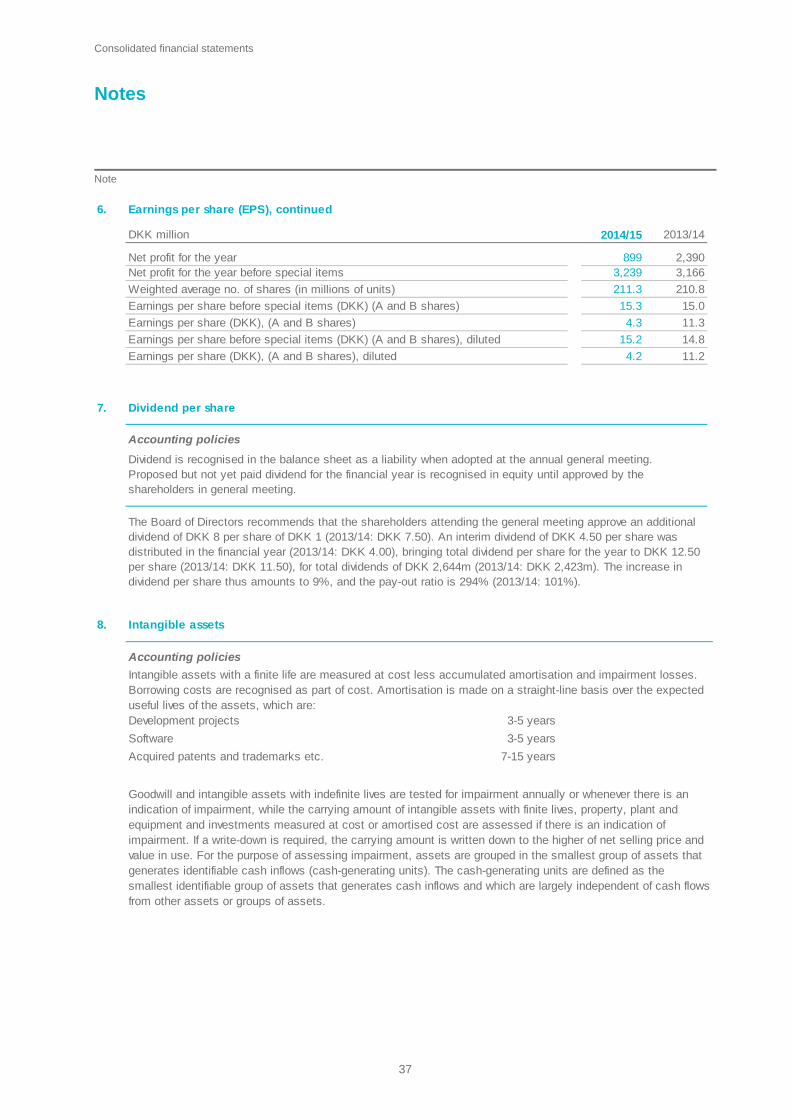
Consolidated financial statements
Notes Note
37
6. Earnings per share (EPS), continued
DKK million 2014/15 2013/14
Net profit for the year 899 2,390Net profit for the year before special items 3,239 3,166
Weighted average no. of shares (in millions of units) 211.3 210.8
Earnings per share before special items (DKK) (A and B shares) 15.3 15.0
Earnings per share (DKK), (A and B shares) 4.3 11.3
Earnings per share before special items (DKK) (A and B shares), diluted 15.2 14.8
Earnings per share (DKK), (A and B shares), diluted 4.2 11.2 7. Dividend per share
Accounting policies
The Board of Directors recommends that the shareholders attending the general meeting approve an additional dividend of DKK 8 per share of DKK 1 (2013/14: DKK 7.50). An interim dividend of DKK 4.50 per share was distributed in the financial year (2013/14: DKK 4.00), bringing total dividend per share for the year to DKK 12.50 per share (2013/14: DKK 11.50), for total dividends of DKK 2,644m (2013/14: DKK 2,423m). The increase in dividend per share thus amounts to 9%, and the pay-out ratio is 294% (2013/14: 101%).
Dividend is recognised in the balance sheet as a liability when adopted at the annual general meeting. Proposed but not yet paid dividend for the financial year is recognised in equity until approved by the shareholders in general meeting.
8. Intangible assets
Accounting policies
3-5 years
3-5 years
7-15 years
Intangible assets with a finite life are measured at cost less accumulated amortisation and impairment losses. Borrowing costs are recognised as part of cost. Amortisation is made on a straight-line basis over the expected useful lives of the assets, which are:Development projects
Software
Acquired patents and trademarks etc.
Goodwill and intangible assets with indefinite lives are tested for impairment annually or whenever there is an indication of impairment, while the carrying amount of intangible assets with finite lives, property, plant and equipment and investments measured at cost or amortised cost are assessed if there is an indication of impairment. If a write-down is required, the carrying amount is written down to the higher of net selling price and value in use. For the purpose of assessing impairment, assets are grouped in the smallest group of assets that generates identifiable cash inflows (cash-generating units). The cash-generating units are defined as the smallest identifiable group of assets that generates cash inflows and which are largely independent of cash flows from other assets or groups of assets.
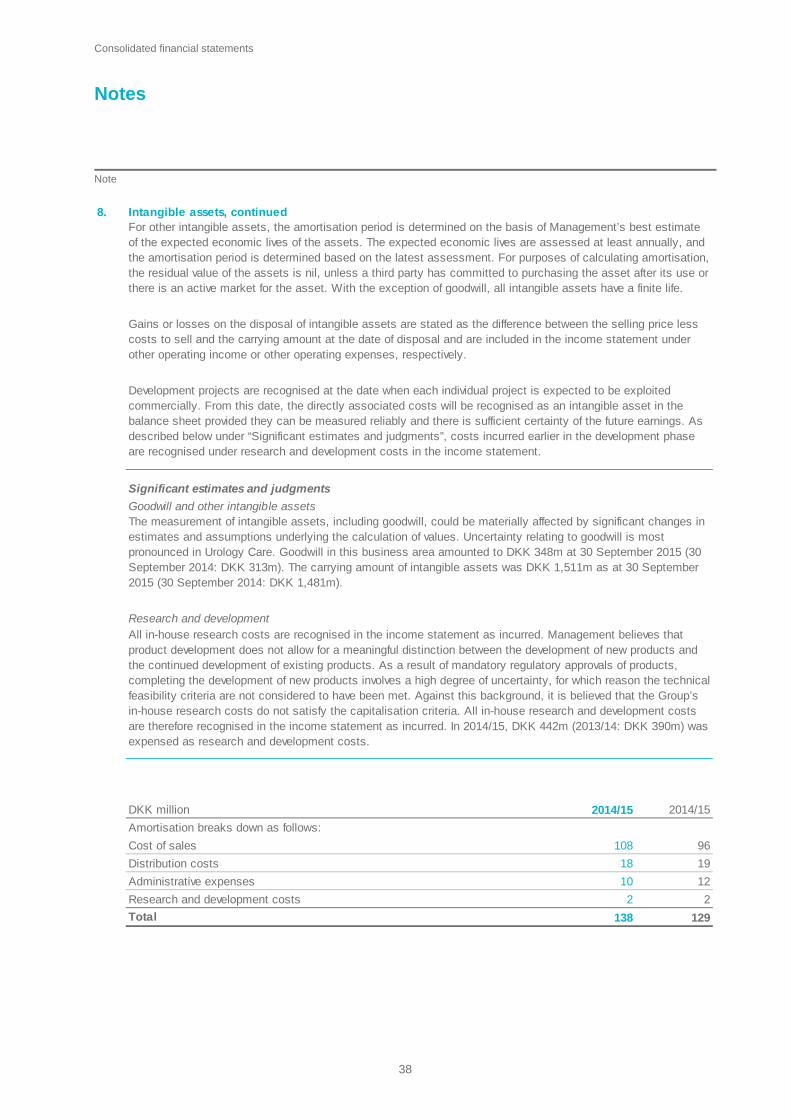
Consolidated financial statements
Notes Note
38
8. Intangible assets, continued
Significant estimates and judgments
Goodwill and other intangible assets
DKK million
Amortisation breaks down as follows:
Cost of sales
Distribution costs
Administrative expenses
Research and development costs
Total
For other intangible assets, the amortisation period is determined on the basis of Management’s best estimate of the expected economic lives of the assets. The expected economic lives are assessed at least annually, and the amortisation period is determined based on the latest assessment. For purposes of calculating amortisation, the residual value of the assets is nil, unless a third party has committed to purchasing the asset after its use or there is an active market for the asset. With the exception of goodwill, all intangible assets have a finite life.
Gains or losses on the disposal of intangible assets are stated as the difference between the selling price less costs to sell and the carrying amount at the date of disposal and are included in the income statement under other operating income or other operating expenses, respectively.
Development projects are recognised at the date when each individual project is expected to be exploited commercially. From this date, the directly associated costs will be recognised as an intangible asset in the balance sheet provided they can be measured reliably and there is sufficient certainty of the future earnings. As described below under “Significant estimates and judgments”, costs incurred earlier in the development phase are recognised under research and development costs in the income statement.
The measurement of intangible assets, including goodwill, could be materially affected by significant changes in estimates and assumptions underlying the calculation of values. Uncertainty relating to goodwill is most pronounced in Urology Care. Goodwill in this business area amounted to DKK 348m at 30 September 2015 (30 September 2014: DKK 313m). The carrying amount of intangible assets was DKK 1,511m as at 30 September 2015 (30 September 2014: DKK 1,481m).
Research and developmentAll in-house research costs are recognised in the income statement as incurred. Management believes that product development does not allow for a meaningful distinction between the development of new products and the continued development of existing products. As a result of mandatory regulatory approvals of products, completing the development of new products involves a high degree of uncertainty, for which reason the technical feasibility criteria are not considered to have been met. Against this background, it is believed that the Group’s in-house research costs do not satisfy the capitalisation criteria. All in-house research and development costs are therefore recognised in the income statement as incurred. In 2014/15, DKK 442m (2013/14: DKK 390m) was expensed as research and development costs.
138 129
10 12
2 2
2014/15 2014/15
108 96
18 19
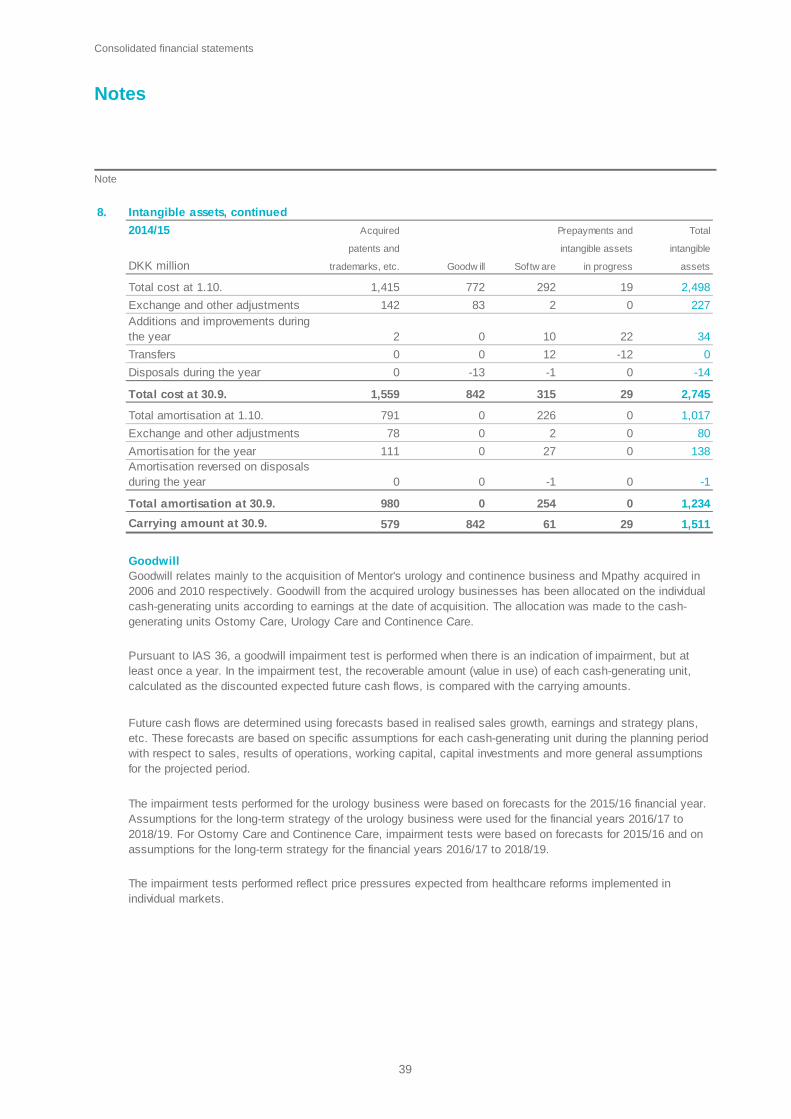
Consolidated financial statements
Notes Note
39
8. Intangible assets, continued
2014/15
DKK million Goodw ill Softw are
Total cost at 1.10. 772 292
Exchange and other adjustments 83 2
0 10
Transfers 0 12
Disposals during the year -13 -1
Total cost at 30.9. 842 315
Total amortisation at 1.10. 0 226
Exchange and other adjustments 0 2
Amortisation for the year 0 27
0 -1
Total amortisation at 30.9. 0 254
Carrying amount at 30.9. 842 61
Goodwill
Amortisation reversed on disposals during the year
Acquired Prepayments and Total
patents and intangible assets intangible
142 0 227Additions and improvements during the year 2 22 34
trademarks, etc. in progress assets
1,415 19 2,498
1,559 29 2,745
791 0 1,017
0 -12 0
0 0 -14
0 0 -1
980 0 1,234
78 0 80
111 0 138
The impairment tests performed for the urology business were based on forecasts for the 2015/16 financial year. Assumptions for the long-term strategy of the urology business were used for the financial years 2016/17 to 2018/19. For Ostomy Care and Continence Care, impairment tests were based on forecasts for 2015/16 and on assumptions for the long-term strategy for the financial years 2016/17 to 2018/19.
579 29 1,511
Goodwill relates mainly to the acquisition of Mentor's urology and continence business and Mpathy acquired in 2006 and 2010 respectively. Goodwill from the acquired urology businesses has been allocated on the individual cash-generating units according to earnings at the date of acquisition. The allocation was made to the cash-generating units Ostomy Care, Urology Care and Continence Care.
Pursuant to IAS 36, a goodwill impairment test is performed when there is an indication of impairment, but at least once a year. In the impairment test, the recoverable amount (value in use) of each cash-generating unit, calculated as the discounted expected future cash flows, is compared with the carrying amounts.
Future cash flows are determined using forecasts based in realised sales growth, earnings and strategy plans, etc. These forecasts are based on specific assumptions for each cash-generating unit during the planning period with respect to sales, results of operations, working capital, capital investments and more general assumptions for the projected period.
The impairment tests performed reflect price pressures expected from healthcare reforms implemented in individual markets.
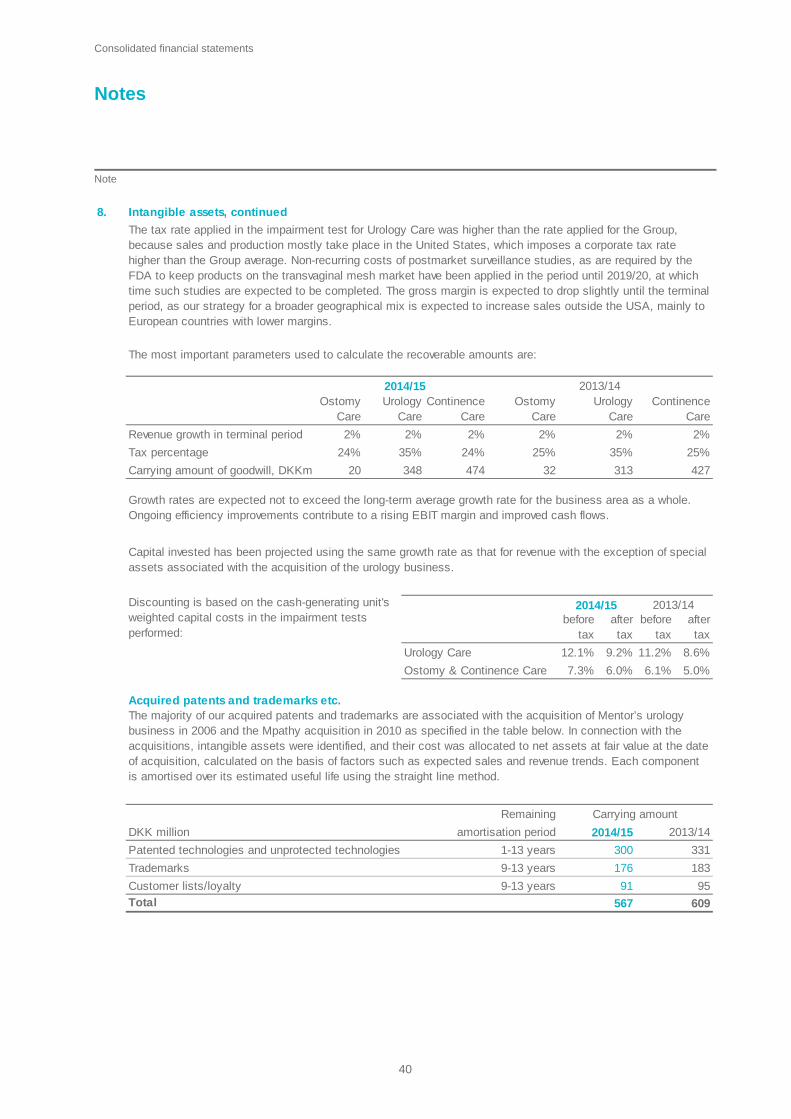
Consolidated financial statements
Notes Note
40
8. Intangible assets, continued
Continence Care
Ostomy Care
2% 2% 2%
24% 24% 25%
20 474 32
12.1% 9.2% 11.2% 8.6%
7.3% 6.0% 6.1% 5.0%
Remaining
DKK million
1-13 years
9-13 years
9-13 years
Total
Urology Care
Ostomy & Continence Care
The most important parameters used to calculate the recoverable amounts are:
2014/15 2013/14Urology
CareUrology
CareContinence
Care
The tax rate applied in the impairment test for Urology Care was higher than the rate applied for the Group, because sales and production mostly take place in the United States, which imposes a corporate tax rate higher than the Group average. Non-recurring costs of postmarket surveillance studies, as are required by the FDA to keep products on the transvaginal mesh market have been applied in the period until 2019/20, at which time such studies are expected to be completed. The gross margin is expected to drop slightly until the terminal period, as our strategy for a broader geographical mix is expected to increase sales outside the USA, mainly to European countries with lower margins.
Ostomy Care
Carrying amount of goodwill, DKKm 348 313 427
Growth rates are expected not to exceed the long-term average growth rate for the business area as a whole. Ongoing efficiency improvements contribute to a rising EBIT margin and improved cash flows.
Capital invested has been projected using the same growth rate as that for revenue with the exception of special assets associated with the acquisition of the urology business.
Revenue growth in terminal period 2% 2% 2%
Tax percentage 35% 35% 25%
Acquired patents and trademarks etc. The majority of our acquired patents and trademarks are associated with the acquisition of Mentor’s urology business in 2006 and the Mpathy acquisition in 2010 as specified in the table below. In connection with the acquisitions, intangible assets were identified, and their cost was allocated to net assets at fair value at the date of acquisition, calculated on the basis of factors such as expected sales and revenue trends. Each component is amortised over its estimated useful life using the straight line method.
Carrying amount
amortisation period 2014/15 2013/14
Discounting is based on the cash-generating unit's weighted capital costs in the impairment tests performed:
2014/15 2013/14before
taxafter tax
before tax
after tax
Trademarks 176 183
Customer lists/loyalty 91 95
Patented technologies and unprotected technologies 300 331
567 609
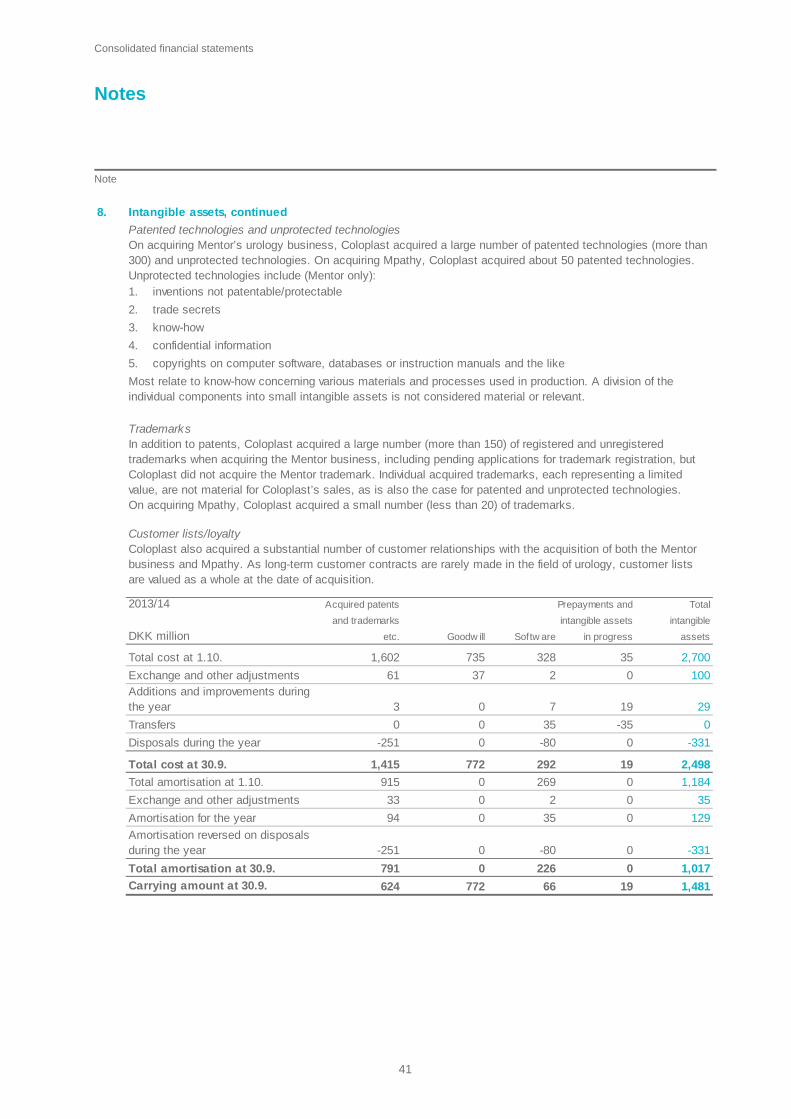
Consolidated financial statements
Notes Note
41
8. Intangible assets, continued
2013/14
DKK million Goodw ill Softw are
Total cost at 1.10. 735 328
Exchange and other adjustments 37 2
0 7
Transfers 0 35
Disposals during the year 0 -80
Total cost at 30.9. 772 292
Total amortisation at 1.10. 0 269
Exchange and other adjustments 0 2
Amortisation for the year 0 35
0 -80
Total amortisation at 30.9. 0 226
Carrying amount at 30.9. 772 66
Amortisation reversed on disposals during the year
On acquiring Mentor’s urology business, Coloplast acquired a large number of patented technologies (more than 300) and unprotected technologies. On acquiring Mpathy, Coloplast acquired about 50 patented technologies. Unprotected technologies include (Mentor only):1. inventions not patentable/protectable
2. trade secrets
3. know-how
4. confidential information
5. copyrights on computer software, databases or instruction manuals and the like
Patented technologies and unprotected technologies
and trademarks intangible assets intangible
etc. in progress assets
Most relate to know-how concerning various materials and processes used in production. A division of the individual components into small intangible assets is not considered material or relevant.
TrademarksIn addition to patents, Coloplast acquired a large number (more than 150) of registered and unregistered trademarks when acquiring the Mentor business, including pending applications for trademark registration, but Coloplast did not acquire the Mentor trademark. Individual acquired trademarks, each representing a limited value, are not material for Coloplast’s sales, as is also the case for patented and unprotected technologies. On acquiring Mpathy, Coloplast acquired a small number (less than 20) of trademarks.
Customer lists/loyaltyColoplast also acquired a substantial number of customer relationships with the acquisition of both the Mentor business and Mpathy. As long-term customer contracts are rarely made in the field of urology, customer lists are valued as a whole at the date of acquisition.
Acquired patents Prepayments and Total
Additions and improvements during the year 3 19 29
0 -35 0
1,602 35 2,700
61 0 100
915 0 1,184
33 0 35
-251 0 -331
1,415 19 2,498
791 0 1,017
624 19 1,481
94 0 129
-251 0 -331
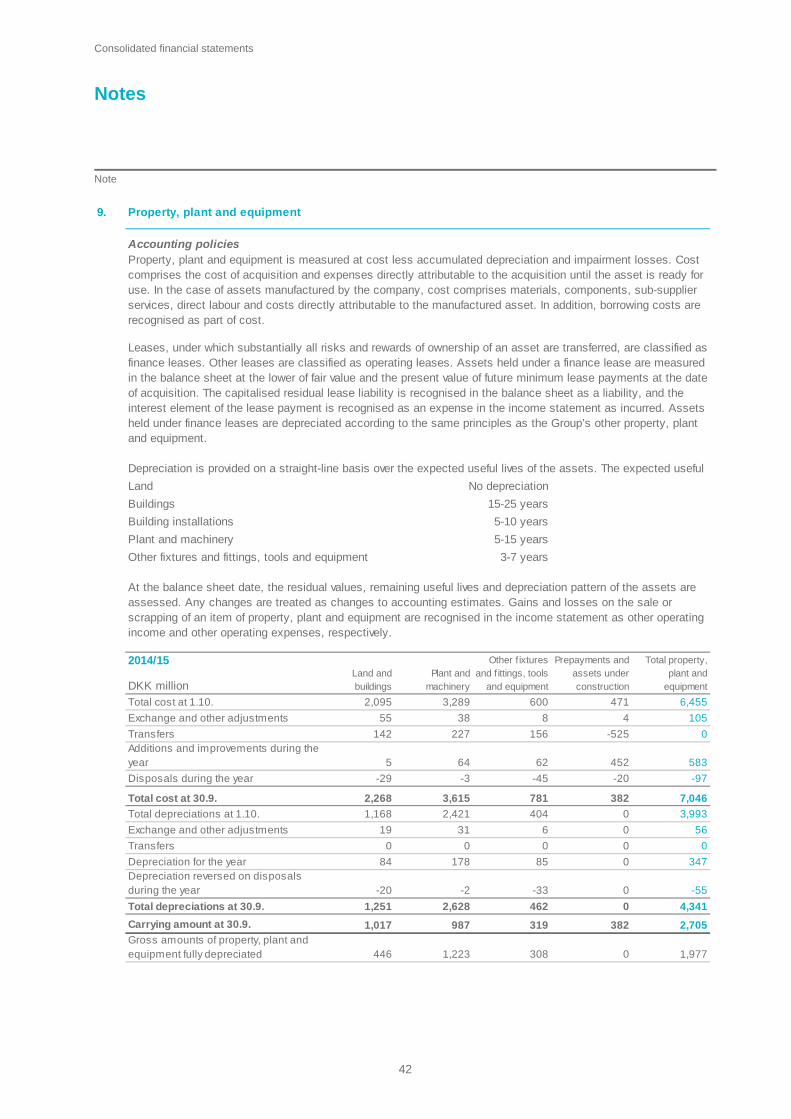
Consolidated financial statements
Notes Note
42
9. Property, plant and equipment
Accounting policies
Land No depreciation
Buildings 15-25 years
5-10 years
5-15 years
3-7 years
2014/15
Total cost at 1.10. 2,095 3,289 600 471 6,455
Exchange and other adjustments 55 38 8 4 105
Transfers 142 227 156 -525 0Additions and improvements during the year 5 64 62 452 583
Disposals during the year -29 -3 -45 -20 -97
Total cost at 30.9. 2,268 3,615 781 382 7,046
Total depreciations at 1.10. 1,168 2,421 404 0 3,993
Exchange and other adjustments 19 31 6 0 56
Transfers 0 0 0 0 0
Depreciation for the year 84 178 85 0 347Depreciation reversed on disposals during the year -20 -2 -33 0 -55
Total depreciations at 30.9. 1,251 2,628 462 0 4,341
Carrying amount at 30.9. 1,017 987 319 382 2,705Gross amounts of property, plant and equipment fully depreciated 446 1,223 308 0 1,977
Property, plant and equipment is measured at cost less accumulated depreciation and impairment losses. Cost comprises the cost of acquisition and expenses directly attributable to the acquisition until the asset is ready for use. In the case of assets manufactured by the company, cost comprises materials, components, sub-supplier services, direct labour and costs directly attributable to the manufactured asset. In addition, borrowing costs are recognised as part of cost.
Leases, under which substantially all risks and rewards of ownership of an asset are transferred, are classified as finance leases. Other leases are classified as operating leases. Assets held under a finance lease are measured in the balance sheet at the lower of fair value and the present value of future minimum lease payments at the date of acquisition. The capitalised residual lease liability is recognised in the balance sheet as a liability, and the interest element of the lease payment is recognised as an expense in the income statement as incurred. Assets held under finance leases are depreciated according to the same principles as the Group’s other property, plant and equipment.
Depreciation is provided on a straight-line basis over the expected useful lives of the assets. The expected useful
Other fixtures and fittings, tools and equipment
Building installations
Plant and machinery
At the balance sheet date, the residual values, remaining useful lives and depreciation pattern of the assets are assessed. Any changes are treated as changes to accounting estimates. Gains and losses on the sale or scrapping of an item of property, plant and equipment are recognised in the income statement as other operating income and other operating expenses, respectively.
Land and buildings
Plant and machinery
Other f ixtures and f ittings, tools
and equipment
Prepayments andassets under construction
Total property, plant and
equipmentDKK million
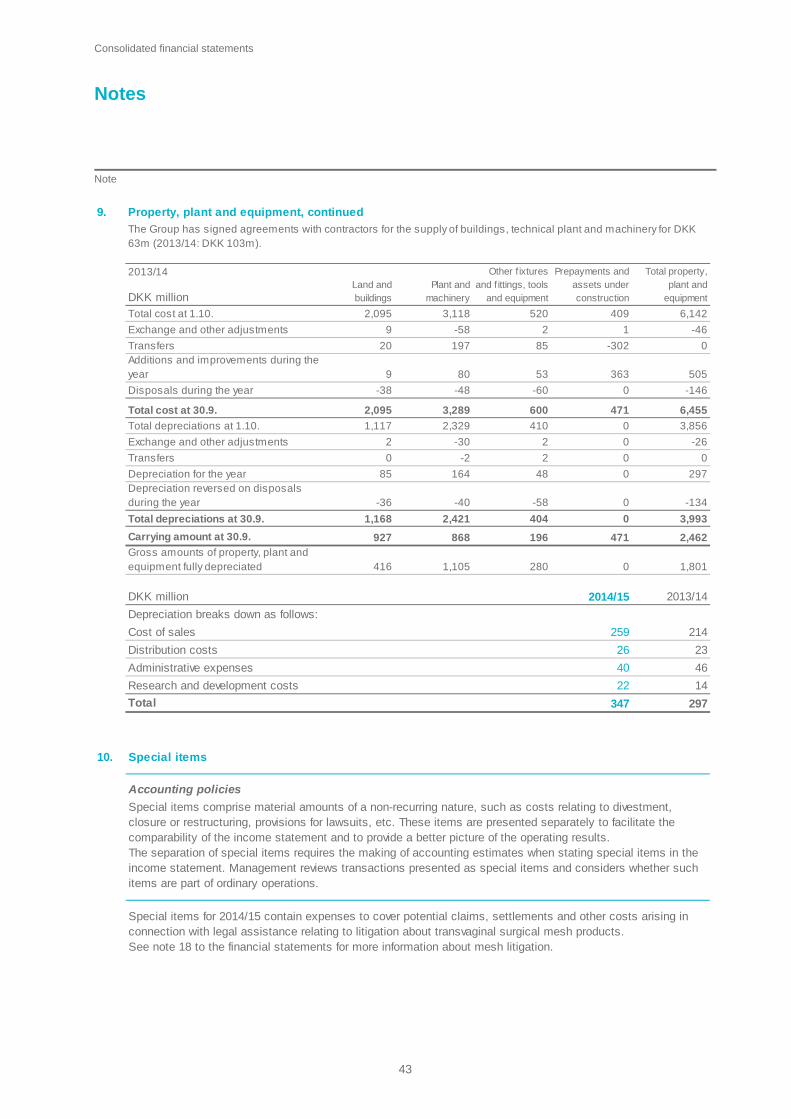
Consolidated financial statements
Notes Note
43
9. Property, plant and equipment, continued
2013/14
Total cost at 1.10. 2,095 3,118 520 409 6,142
Exchange and other adjustments 9 -58 2 1 -46
Transfers 20 197 85 -302 0Additions and improvements during the year 9 80 53 363 505
Disposals during the year -38 -48 -60 0 -146
Total cost at 30.9. 2,095 3,289 600 471 6,455
Total depreciations at 1.10. 1,117 2,329 410 0 3,856
Exchange and other adjustments 2 -30 2 0 -26
Transfers 0 -2 2 0 0
Depreciation for the year 85 164 48 0 297Depreciation reversed on disposals during the year -36 -40 -58 0 -134
Total depreciations at 30.9. 1,168 2,421 404 0 3,993
Carrying amount at 30.9. 927 868 196 471 2,462Gross amounts of property, plant and equipment fully depreciated 416 1,105 280 0 1,801
DKK million 2014/15 2013/14
Depreciation breaks down as follows:
Cost of sales 259 214
Distribution costs 26 23
Administrative expenses 40 46
Research and development costs 22 14
Total 347 297
Prepayments andassets under construction
Total property, plant and
equipmentDKK millionLand and buildings
Plant and machinery
Other f ixtures and f ittings, tools
and equipment
The Group has signed agreements with contractors for the supply of buildings, technical plant and machinery for DKK 63m (2013/14: DKK 103m).
10. Special items
Accounting policies
Special items for 2014/15 contain expenses to cover potential claims, settlements and other costs arising in connection with legal assistance relating to litigation about transvaginal surgical mesh products. See note 18 to the financial statements for more information about mesh litigation.
Special items comprise material amounts of a non-recurring nature, such as costs relating to divestment, closure or restructuring, provisions for lawsuits, etc. These items are presented separately to facilitate the comparability of the income statement and to provide a better picture of the operating results. The separation of special items requires the making of accounting estimates when stating special items in the income statement. Management reviews transactions presented as special items and considers whether such items are part of ordinary operations.
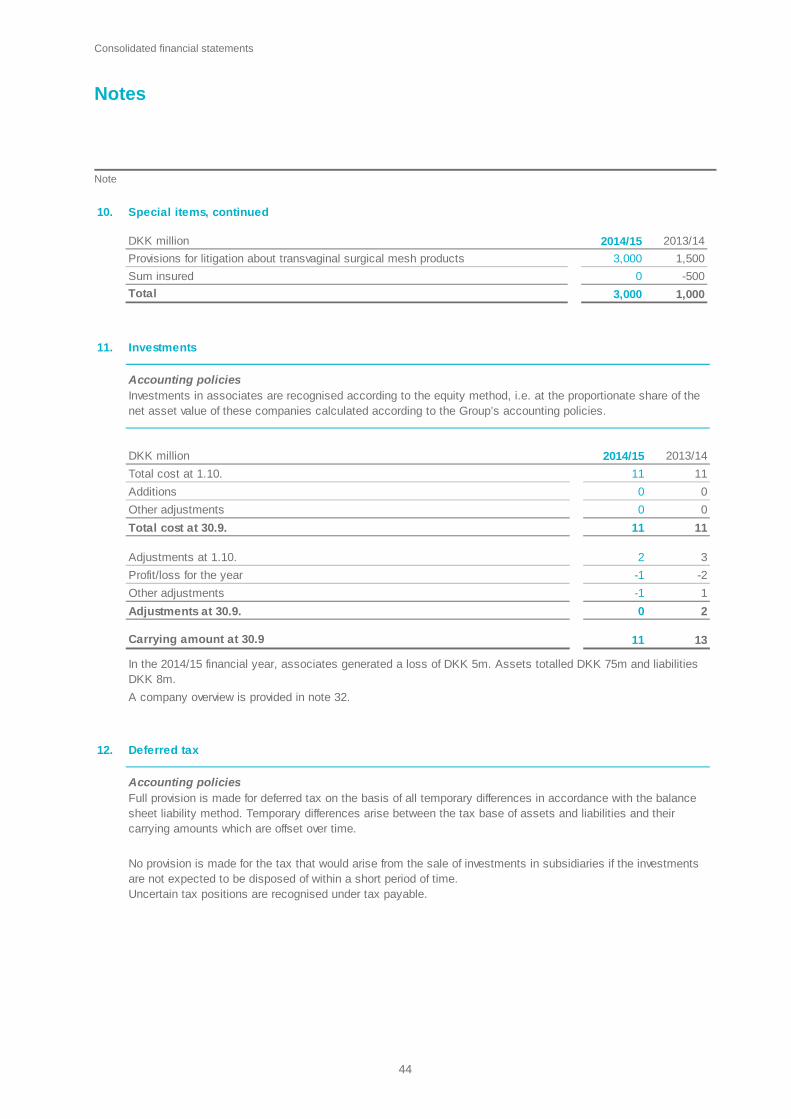
Consolidated financial statements
Notes Note
44
10. Special items, continued
DKK million 2014/15 2013/14
Provisions for litigation about transvaginal surgical mesh products 3,000 1,500
Sum insured 0 -500
Total 3,000 1,000 11. Investments
Accounting policies
DKK million 2014/15 2013/14
Total cost at 1.10. 11 11
Additions 0 0
Other adjustments 0 0
Total cost at 30.9. 11 11
Adjustments at 1.10. 2 3
Profit/loss for the year -1 -2
Other adjustments -1 1
Adjustments at 30.9. 0 2
Carrying amount at 30.9 11 13
In the 2014/15 financial year, associates generated a loss of DKK 5m. Assets totalled DKK 75m and liabilities DKK 8m.
A company overview is provided in note 32.
Investments in associates are recognised according to the equity method, i.e. at the proportionate share of the net asset value of these companies calculated according to the Group’s accounting policies.
12. Deferred tax
Accounting policiesFull provision is made for deferred tax on the basis of all temporary differences in accordance with the balance sheet liability method. Temporary differences arise between the tax base of assets and liabilities and their carrying amounts which are offset over time.
No provision is made for the tax that would arise from the sale of investments in subsidiaries if the investments are not expected to be disposed of within a short period of time.Uncertain tax positions are recognised under tax payable.

Consolidated financial statements
Notes Note
45
12. Deferred tax, continued
Significant estimates and judgments
DKK million 2014/15 2013/14
Deferred tax, beginning of year -289 -68
Exchange adjustments -2 0
Adjustment due to change in tax rate 26 -2
Prior-year adjustments 0 1
Other changes in deferred tax – charged to income statement -478 -257
Change in deferred tax - charged to equity -64 37
Total -807 -289
Of which deferred tax asset 808 360
Provision for deferred tax 1 71
Calculation of deferred tax is based on the following items:
Intangible assets 270 269
Property, plant and equipment 47 35
Indirect costs of sales 26 25
Unrealised gain from intra-group sale of goods -218 -168
Provisions -787 -279
Jointly taxed companies (recaptured balances) 10 13
Share options -19 -23
Tax losses carried forward and tax credits -84 -92
Other -52 -69Total -807 -289
Deferred tax is measured on the basis of the tax rates applicable at the balance sheet date.Deferred tax assets are recognised to the extent that it is probable that future positive taxable income will be generated, against which the temporary differences and tax losses can be offset. Deferred tax assets are measured at expected net realisable values.
The recognition of deferred tax assets, deferred tax liabilities and uncertain tax positions requires an assessment by management. Deferred tax assets, including the tax base of tax loss carry-forwards, are recognised if management estimates that the tax assets can be utilised within a foreseeable future by offsetting against future positive taxable income. The assessment is made annually on the basis of budgets and business plans for the following years, including any scheduled business measures. As the Group conducts business globally, transfer pricing disputes may arise with tax authorities in respect of settlement prices etc. Management assesses the possible outcomes of such disputes.
Taxable temporary differences regarding investments in subsidiaries, branches or associates are insignificant and no deferred tax has been provided, because the company controls the timing of the elimination of the temporary difference, and because it is probable that the temporary difference will not be eliminated in the foreseeable future.
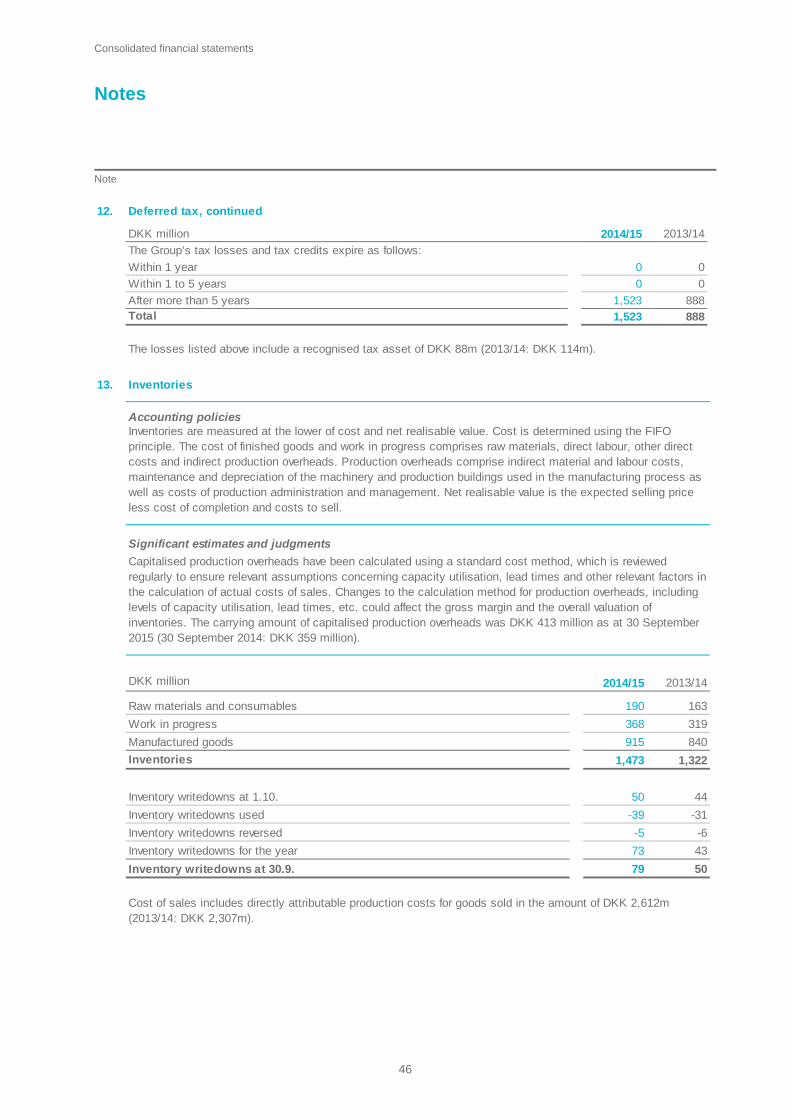
Consolidated financial statements
Notes Note
46
12. Deferred tax, continued
DKK million 2014/15 2013/14
The Group’s tax losses and tax credits expire as follows:
Within 1 year 0 0
Within 1 to 5 years 0 0
After more than 5 years 1,523 888Total 1,523 888
The losses listed above include a recognised tax asset of DKK 88m (2013/14: DKK 114m). 13. Inventories
Accounting policies
Significant estimates and judgments
DKK million 2014/15 2013/14
Raw materials and consumables 190 163
Work in progress 368 319
Manufactured goods 915 840
Inventories 1,473 1,322
Inventory writedowns at 1.10. 50 44
Inventory writedowns used -39 -31
Inventory writedowns reversed -5 -6
Inventory writedowns for the year 73 43
Inventory writedowns at 30.9. 79 50
Inventories are measured at the lower of cost and net realisable value. Cost is determined using the FIFO principle. The cost of finished goods and work in progress comprises raw materials, direct labour, other direct costs and indirect production overheads. Production overheads comprise indirect material and labour costs, maintenance and depreciation of the machinery and production buildings used in the manufacturing process as well as costs of production administration and management. Net realisable value is the expected selling price less cost of completion and costs to sell.
Capitalised production overheads have been calculated using a standard cost method, which is reviewed regularly to ensure relevant assumptions concerning capacity utilisation, lead times and other relevant factors in the calculation of actual costs of sales. Changes to the calculation method for production overheads, including levels of capacity utilisation, lead times, etc. could affect the gross margin and the overall valuation of inventories. The carrying amount of capitalised production overheads was DKK 413 million as at 30 September 2015 (30 September 2014: DKK 359 million).
Cost of sales includes directly attributable production costs for goods sold in the amount of DKK 2,612m (2013/14: DKK 2,307m).

Consolidated financial statements
Notes Note
47
14. Trade receivables
Accounting policies
Significant estimates and judgments
DKK million 2014/15 2013/14
Portion of receivables falling due after more than one year after the balance sheet date
Other long-term receivables 14 7
Provisions for bad and doubtful debts:
Provisions at 1.10. 98 128
Exchange adjustment -2 0
Change of provisions during the year 63 2
Losses realised during the year -25 -32Provisions at 30.9. 134 98
The provisions are generally due to customer bankruptcy or expected bankruptcy.
Receivables due are specified as follows:Up to 30 days 244 190Between 30 and 90 days 155 194More than 90 days 316 275Total receivables due 715 659
Receivables at 30 SeptemberDKK 139 110EUR 964 951GBP 337 369USD 432 319Other currencies 595 461Total carrying amount 2,467 2,210
Most of the long-term receivables fall due within three years of the balance sheet date. Interest accruing on receivables is 0%.
Receivables consist mainly of trade receivables. On initial recognition, receivables are measured at fair value and subsequently at amortised cost. Receivables are written down on the basis of an individual assessment.
Trade receivables are recognised at amortised cost less provisions for bad and doubtful debts. Provision is made for losses considered likely to arise if a customer proves unable to pay. If the financial position of customers deteriorates, making then unable to make payments, it may prove necessary to make additional provisions in future accounting periods. When assessing whether the Group has made adequate provisions for bad and doubtful debts, management analyses the receivables, including previous losses on trade receivables, the customer's creditworthiness, current economic conditions and changes to customer payment terms and conditions.

Consolidated financial statements
Notes Note
48
15. Restricted cash
Accounting policies
DKK million 2014/15 2013/14
Restricted cash 72 418
Amounts have been paid into escrow accounts in connection with pending litigation and not yet released by the courts. See note 18 to the financial statements for more information about mesh litigation.
Restricted cash consist of cash held in escrow with third parties for litigation purposes.
16. Treasury shares and share options
Accounting policies
2014/15 2013/14 2014/15 2013/14
Treasury shares
Holdings of treasury shares at 1.10. 9.5 9.6 4.7% 4.8%
Acquired during the year 1.0 1.1 0.5% 0.5%
Cancelled 0.0 0.0 0.0% 0.0%
Sold during the year -1.9 -1.2 -0.9% -0.6%
Holdings of treasury shares at 30.9. 8.6 9.5 4.3% 4.7%
Share-based payment
Accounting policies
Share options have affected the profit for the year as follows: 2014/15 2013/14
Staff costs - equity-settled programmes1) 29 39
Staff costs - cash-settled programmes 1 1
Financial costs - fair value adjustment of cash-settled programmes 1 -15
Total share option cost 31 251)In 2013/14, DKK 6m w as expensed in respect of former employees.
The price paid by Coloplast for treasury shares or the selling price on exercise of equity-based share remuneration is deducted from Retained earnings.
% of B share capitalMillion B shares of DKK 1
The Group does not hold A shares.
Share option programmes (B shares) have been set up for members of the Executive Management and executives.
Share options are granted to the Executive Management and executives.For equity-settled schemes, the fair value of options is determined at the grant date. The option value is subsequently recognised over the vesting period as staff costs. For cash-settled schemes, the fair value of options granted during the period is recognised as staff costs, whereas the fair value adjustment of granted options from previous periods is recognised under financial items. The purchase and selling price of treasury shares on exercise are deducted from or added to equity, as the case may be.
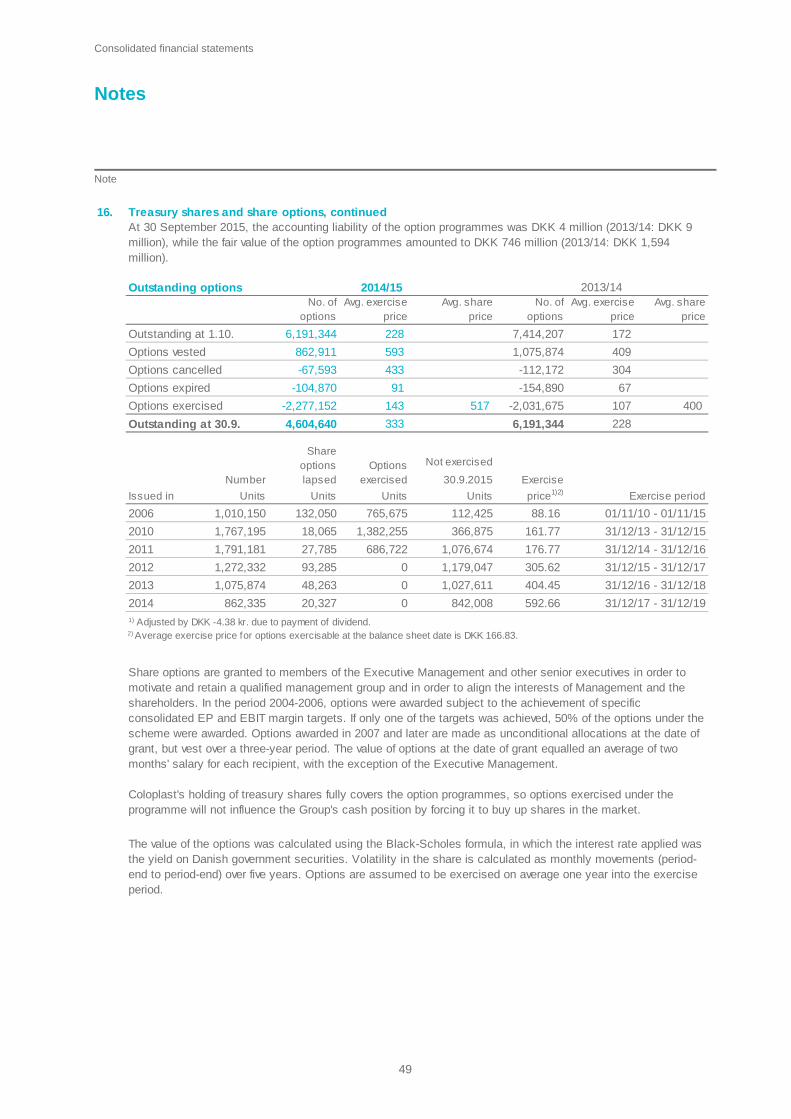
Consolidated financial statements
Notes Note
49
16. Treasury shares and share options, continued
Outstanding optionsNo. of
optionsAvg. exercise
priceAvg. share
priceNo. of
optionsAvg. exercise
priceAvg. share
price
Outstanding at 1.10. 6,191,344 228 7,414,207 172
Options vested 862,911 593 1,075,874 409
Options cancelled -67,593 433 -112,172 304
Options expired -104,870 91 -154,890 67
Options exercised -2,277,152 143 517 -2,031,675 107 400
Outstanding at 30.9. 4,604,640 333 6,191,344 228
Not exercised
Number 30.9.2015
Issued in Units Units Units Units price1)2)
2006 1,010,150 132,050 765,675 112,425 88.16
2010 1,767,195 18,065 1,382,255 366,875 161.77
2011 1,791,181 27,785 686,722 1,076,674 176.77
2012 1,272,332 93,285 0 1,179,047 305.62
2013 1,075,874 48,263 0 1,027,611 404.45
2014 862,335 20,327 0 842,008 592.66
2) Average exercise price for options exercisable at the balance sheet date is DKK 166.83.
Share options are granted to members of the Executive Management and other senior executives in order to motivate and retain a qualified management group and in order to align the interests of Management and the shareholders. In the period 2004-2006, options were awarded subject to the achievement of specific consolidated EP and EBIT margin targets. If only one of the targets was achieved, 50% of the options under the scheme were awarded. Options awarded in 2007 and later are made as unconditional allocations at the date of grant, but vest over a three-year period. The value of options at the date of grant equalled an average of two months' salary for each recipient, with the exception of the Executive Management.
1) Adjusted by DKK -4.38 kr. due to payment of dividend.
31/12/17 - 31/12/19
01/11/10 - 01/11/15
31/12/14 - 31/12/16
31/12/16 - 31/12/18
At 30 September 2015, the accounting liability of the option programmes was DKK 4 million (2013/14: DKK 9 million), while the fair value of the option programmes amounted to DKK 746 million (2013/14: DKK 1,594 million).
2014/15 2013/14
Coloplast's holding of treasury shares fully covers the option programmes, so options exercised under the programme will not influence the Group's cash position by forcing it to buy up shares in the market.
The value of the options was calculated using the Black-Scholes formula, in which the interest rate applied was the yield on Danish government securities. Volatility in the share is calculated as monthly movements (period-end to period-end) over five years. Options are assumed to be exercised on average one year into the exercise period.
31/12/15 - 31/12/17
31/12/13 - 31/12/15
Exercise period
Options exercised
Share options lapsed Exercise
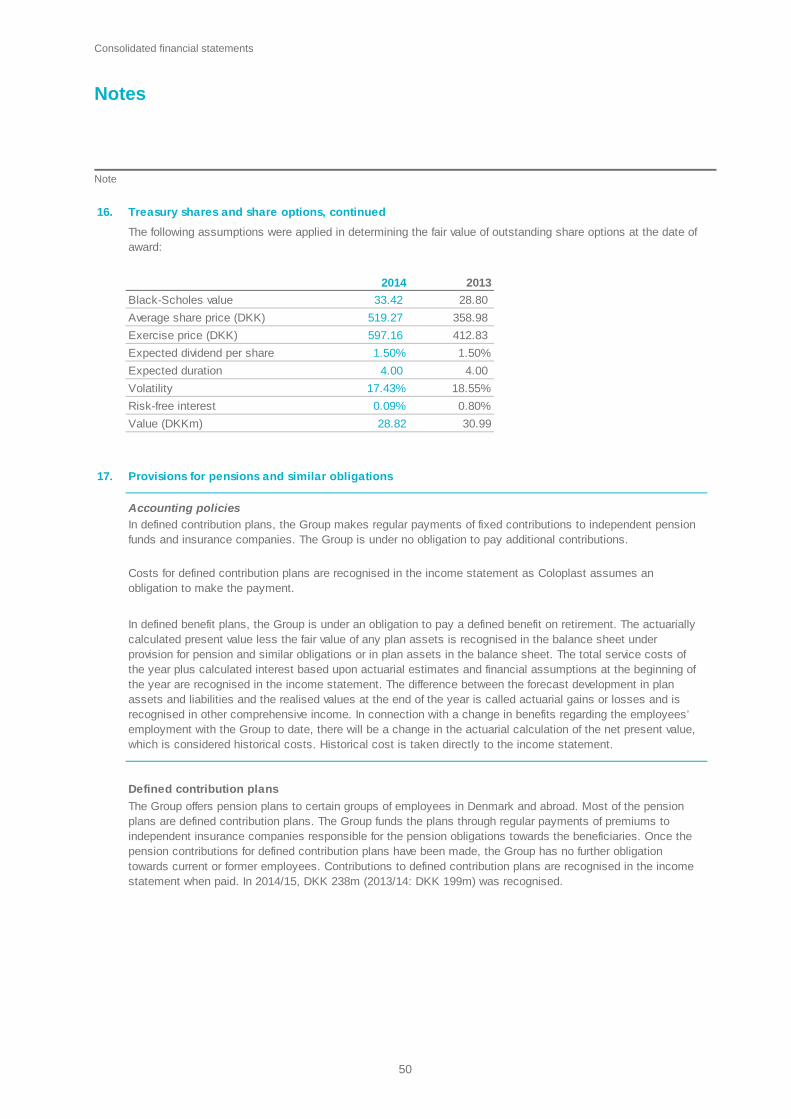
Consolidated financial statements
Notes Note
50
16. Treasury shares and share options, continued
2014 2013
Black-Scholes value 33.42 28.80
Average share price (DKK) 519.27 358.98
Exercise price (DKK) 597.16 412.83
Expected dividend per share 1.50% 1.50%
Expected duration 4.00 4.00
Volatility 17.43% 18.55%
Risk-free interest 0.09% 0.80%
Value (DKKm) 28.82 30.99
The following assumptions were applied in determining the fair value of outstanding share options at the date of award:
17. Provisions for pensions and similar obligations
Accounting policies
Defined contribution plans
In defined contribution plans, the Group makes regular payments of fixed contributions to independent pension funds and insurance companies. The Group is under no obligation to pay additional contributions.
The Group offers pension plans to certain groups of employees in Denmark and abroad. Most of the pension plans are defined contribution plans. The Group funds the plans through regular payments of premiums to independent insurance companies responsible for the pension obligations towards the beneficiaries. Once the pension contributions for defined contribution plans have been made, the Group has no further obligation towards current or former employees. Contributions to defined contribution plans are recognised in the income statement when paid. In 2014/15, DKK 238m (2013/14: DKK 199m) was recognised.
Costs for defined contribution plans are recognised in the income statement as Coloplast assumes an obligation to make the payment.
In defined benefit plans, the Group is under an obligation to pay a defined benefit on retirement. The actuarially calculated present value less the fair value of any plan assets is recognised in the balance sheet under provision for pension and similar obligations or in plan assets in the balance sheet. The total service costs of the year plus calculated interest based upon actuarial estimates and financial assumptions at the beginning of the year are recognised in the income statement. The difference between the forecast development in plan assets and liabilities and the realised values at the end of the year is called actuarial gains or losses and is recognised in other comprehensive income. In connection with a change in benefits regarding the employees’ employment with the Group to date, there will be a change in the actuarial calculation of the net present value, which is considered historical costs. Historical cost is taken directly to the income statement.
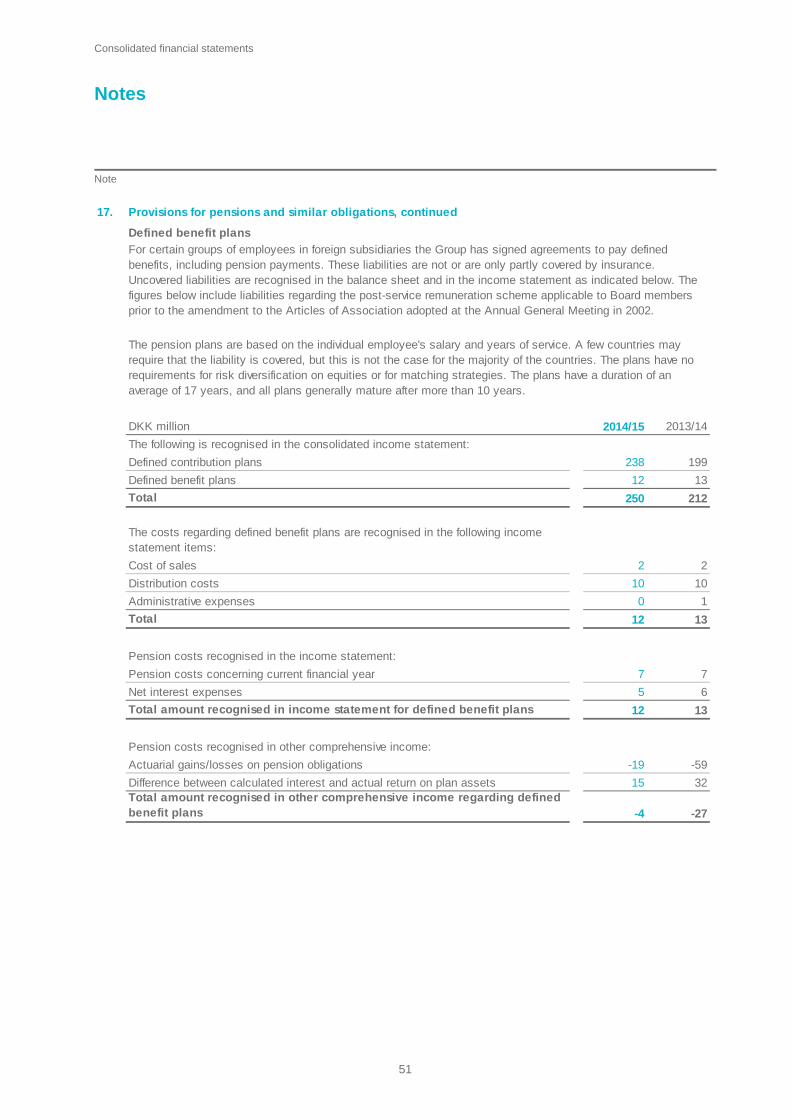
Consolidated financial statements
Notes Note
51
17. Provisions for pensions and similar obligations, continued
Defined benefit plans
DKK million 2014/15 2013/14
The following is recognised in the consolidated income statement:
Defined contribution plans 238 199
Defined benefit plans 12 13
Total 250 212
The costs regarding defined benefit plans are recognised in the following income statement items:
Cost of sales 2 2
Distribution costs 10 10
Administrative expenses 0 1
Total 12 13
Pension costs recognised in the income statement:
Pension costs concerning current financial year 7 7
Net interest expenses 5 6
Total amount recognised in income statement for defined benefit plans 12 13
Pension costs recognised in other comprehensive income:
Actuarial gains/losses on pension obligations -19 -59
Difference between calculated interest and actual return on plan assets 15 32Total amount recognised in other comprehensive income regarding defined benefit plans -4 -27
For certain groups of employees in foreign subsidiaries the Group has signed agreements to pay defined benefits, including pension payments. These liabilities are not or are only partly covered by insurance. Uncovered liabilities are recognised in the balance sheet and in the income statement as indicated below. The figures below include liabilities regarding the post-service remuneration scheme applicable to Board members prior to the amendment to the Articles of Association adopted at the Annual General Meeting in 2002.
The pension plans are based on the individual employee's salary and years of service. A few countries may require that the liability is covered, but this is not the case for the majority of the countries. The plans have no requirements for risk diversification on equities or for matching strategies. The plans have a duration of an average of 17 years, and all plans generally mature after more than 10 years.

Consolidated financial statements
Notes Note
52
17. Provisions for pensions and similar obligations, continued
DKK million 2014/15 2013/14
Plan assets at 1.10. 268 193
Exchange adjustments 15 16
Actual rate of interest 11 9
Difference between interest element and actual return on plan assets 15 32
Paid by the Coloplast Group 30 30
Benefit paid out -21 -12
Plan assets at 30.9. 318 268
Specification of plan assets:
Shares, listed 48 39
Bonds 263 224
Cash and similar assets 7 5
Plan assets at 30.9. 318 268
Specification of present value of defined benefit obligation:
Obligation at 1.10. 478 388
Exchange adjustments 19 21
Pension costs concerning current financial year 7 7
Calculated interest on liability 16 15
Actuarial gains/losses, financial assumptions 18 55
Actuarial gains/losses, demographic assumptions 0 4
Actuarial gains/losses, experience 1 0
Benefit paid out -21 -12
Present value of liability at 30.9. 518 478
Fair value of plan assets -318 -268
Net liability recognised in the balance sheet 200 210

Consolidated financial statements
Notes Note
53
17. Provisions for pensions and similar obligations, continued
DKK million 2014/15 2013/14
Net liability recognised in the balance sheet at 1.10. 210 195
Expenditure for the year 12 13
Other comprehensive income:
Actuarial gains and losses on pension obligation 19 59
Exchange adjustments 4 5
Difference between interest element and actual return on plan assets -15 -32
Payments received -30 -30
Net liability recognised in the balance sheet at 30.9. 200 210
The Group expects to pay DKK 32 million to the defined benefit plans in 2015/16.
Assumptions of actuarial calculations as at the balance sheet date are as follows (expressed as an average):
Discount rate, % 3 3
Future rate of salary increases, % 2 2
Inflation, % 2 2
The sensibility analysis shows that a given change in the main assumptions will trigger changes in the gross liability as follows: +1% -1%
Discount rate -17% 22%
Future rate of salary increases 3% -2%
Inflation 14% -12% 18. Other provisions
Accounting policiesProvisions are recognised when the Group has a legal or constructive obligation arising from a past event, and it is probable that an outflow of the Group’s financial resources will be required to settle the obligation.
Provisions are measured as Management's best estimate of the amount with which the liability is expected to be settled.
The Group recognises a provision for the replacement of products covered by warranties at the balance sheet date. This provision is calculated based on prior experience.
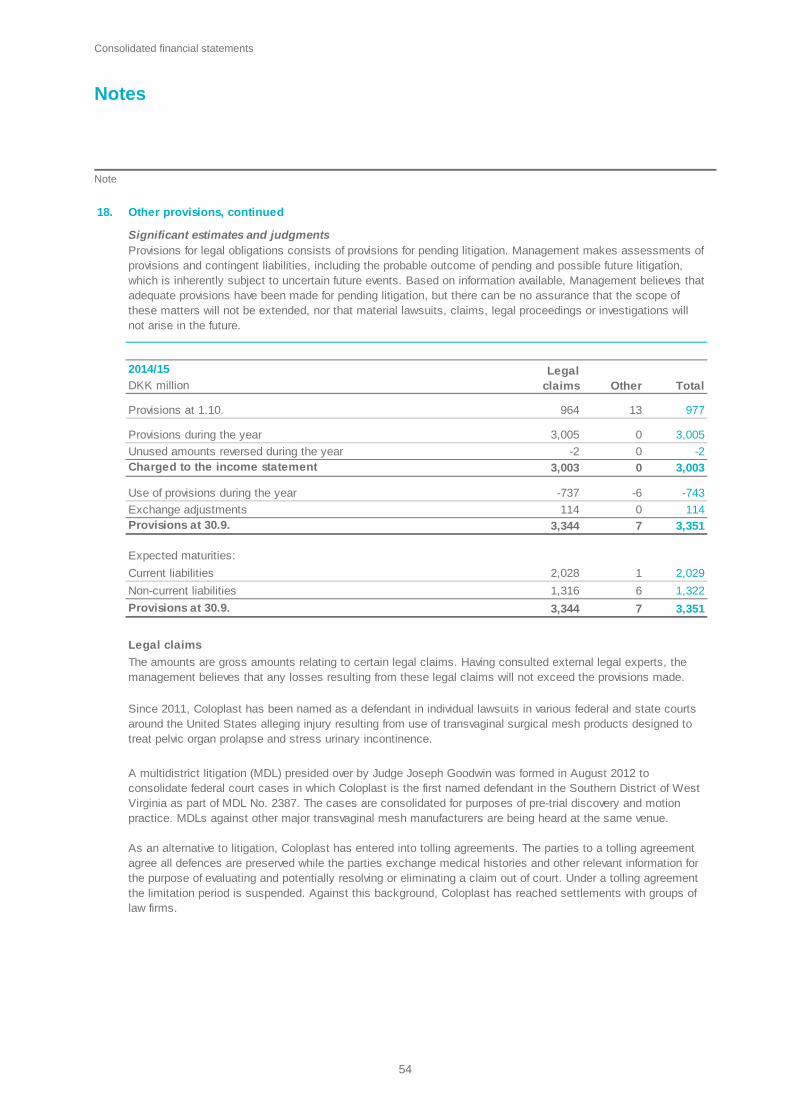
Consolidated financial statements
Notes Note
54
18. Other provisions, continued
Significant estimates and judgments
2014/15
DKK million Other Total
Provisions at 1.10. 964 13 977
Provisions during the year 3,005 0 3,005
Unused amounts reversed during the year -2 0 -2Charged to the income statement 3,003 0 3,003
Use of provisions during the year -737 -6 -743
Exchange adjustments 114 0 114Provisions at 30.9. 3,344 7 3,351
Expected maturities:
Current liabilities 2,028 1 2,029
Non-current liabilities 1,316 6 1,322
Provisions at 30.9. 3,344 7 3,351
Legal claims
The amounts are gross amounts relating to certain legal claims. Having consulted external legal experts, the management believes that any losses resulting from these legal claims will not exceed the provisions made.
Provisions for legal obligations consists of provisions for pending litigation. Management makes assessments of provisions and contingent liabilities, including the probable outcome of pending and possible future litigation, which is inherently subject to uncertain future events. Based on information available, Management believes that adequate provisions have been made for pending litigation, but there can be no assurance that the scope of these matters will not be extended, nor that material lawsuits, claims, legal proceedings or investigations will not arise in the future.
Since 2011, Coloplast has been named as a defendant in individual lawsuits in various federal and state courts around the United States alleging injury resulting from use of transvaginal surgical mesh products designed to treat pelvic organ prolapse and stress urinary incontinence.
A multidistrict litigation (MDL) presided over by Judge Joseph Goodwin was formed in August 2012 to consolidate federal court cases in which Coloplast is the first named defendant in the Southern District of West Virginia as part of MDL No. 2387. The cases are consolidated for purposes of pre-trial discovery and motion practice. MDLs against other major transvaginal mesh manufacturers are being heard at the same venue.
As an alternative to litigation, Coloplast has entered into tolling agreements. The parties to a tolling agreement agree all defences are preserved while the parties exchange medical histories and other relevant information for the purpose of evaluating and potentially resolving or eliminating a claim out of court. Under a tolling agreement the limitation period is suspended. Against this background, Coloplast has reached settlements with groups of law firms.
Legal claims
Consolidated financial statements
Notes Note
55
18. Other provisions, continued
OtherOther liabilities relate to provisions for expenses associated with the vacating of leased premises, restructuring, guarantees and other non-legal claims.
On September 14, 2015, Judge Joseph Goodwin ordered Coloplast to make substantial progress in the settlement process and to enter into the discovery phase of litigation with 200 cases.
Coloplast intends to dispute the current and any future litigation, and will continually consider which strategy and other steps that may serve the company’s best interests. Coloplast will amend its strategy as a result of Judge Goodwin’s order, and there is an increased probability that certain cases will proceed to trial.
An expense of DKK 3,000m was recognised in the 2014/15 financial year to cover potential claims and settlements and other costs arising in connection with legal assistance. The expense is recognised under special items in the income statement.
A similar provision, for DKK 1.5bn (before insurance cover of DKK 0.5bn), was recognised in the 2013/14 financial year, bringing the total expected cost of litigation in the USA including legal costs to DKK 4.5bn. The total expense is based on a number of estimates and assumptions and is therefore subject to substantial uncertainty. As a result, there can be no assurance that the amount will not change materially over time.
The remaining provision made for legal claims at 30 September 2015 amounted to DKK 3.3bn plus DKK 0.7bn recognised under other debt. In reference to the provisions of IAS 37, Coloplast will not disclose any further information about the assumptions for the provision, including any details about current and the expected number of claims and settlements.
The disclosure of such information is believed to be detrimental to Coloplast in connection with the ongoing confidential negotiations and could inflict financial losses on Coloplast and its shareholders.
19. Credit institutions
Accounting policies
DKK million
Breakdown of debt to financial institutions stated in the balance sheet:
Current liabilities
DKK
Other currencies
Total carrying amount
100 92
100 92
2014/15 2013/14
Debt is recognised at fair value less expenses paid and subsequently at amortised cost.
0 0
100 92
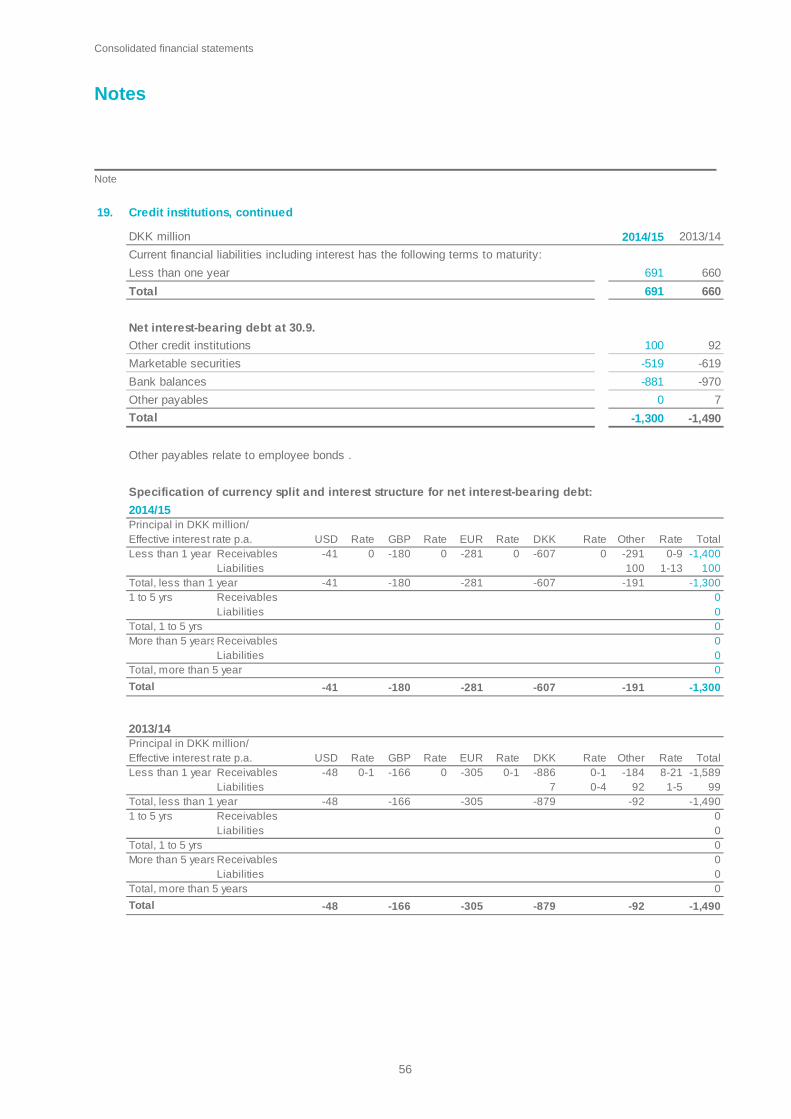
Consolidated financial statements
Notes Note
56
19. Credit institutions, continued
DKK million
Current financial liabilities including interest has the following terms to maturity:
Less than one year
Total
Net interest-bearing debt at 30.9.
Other credit institutions
Marketable securities
Bank balances
Other payables
Total
Specification of currency split and interest structure for net interest-bearing debt:
2014/15Principal in DKK million/Effective interest rate p.a.Less than 1 year Receivables
LiabilitiesTotal, less than 1 year1 to 5 yrs Receivables
LiabilitiesTotal, 1 to 5 yrsMore than 5 yearsReceivables
LiabilitiesTotal, more than 5 year
Total
2013/14Principal in DKK million/Effective interest rate p.a.Less than 1 year Receivables
LiabilitiesTotal, less than 1 year1 to 5 yrs Receivables
LiabilitiesTotal, 1 to 5 yrsMore than 5 yearsReceivables
LiabilitiesTotal, more than 5 years
Total -48 -1,490-92-879-305-166
-1,490-1,300
7
100
-519
-881
0
Other payables relate to employee bonds .
-1,400Total
-619
-970
92
691 660
691 660
2014/15 2013/14
0-9-291OtherGBP Rate EUR Rate DKK
-607-2810USD Rate
0
0
-1,300
000
1-13
0
100-1,300
0
-191
0
-191100
Rate Rate
-607
-607
-281
-281-41
USD-48
-41
-41
-1800
-180
-180
GBP
-166
-166Rate
0-1
-48
-886 0-10-4
DKK
-305 -879
0 -305 0-1Rate EUR Rate Rate
99-1,490
0
-92
0
7
00
0
Rate8-21
1-5
0
Other-184
92
Total-1,589
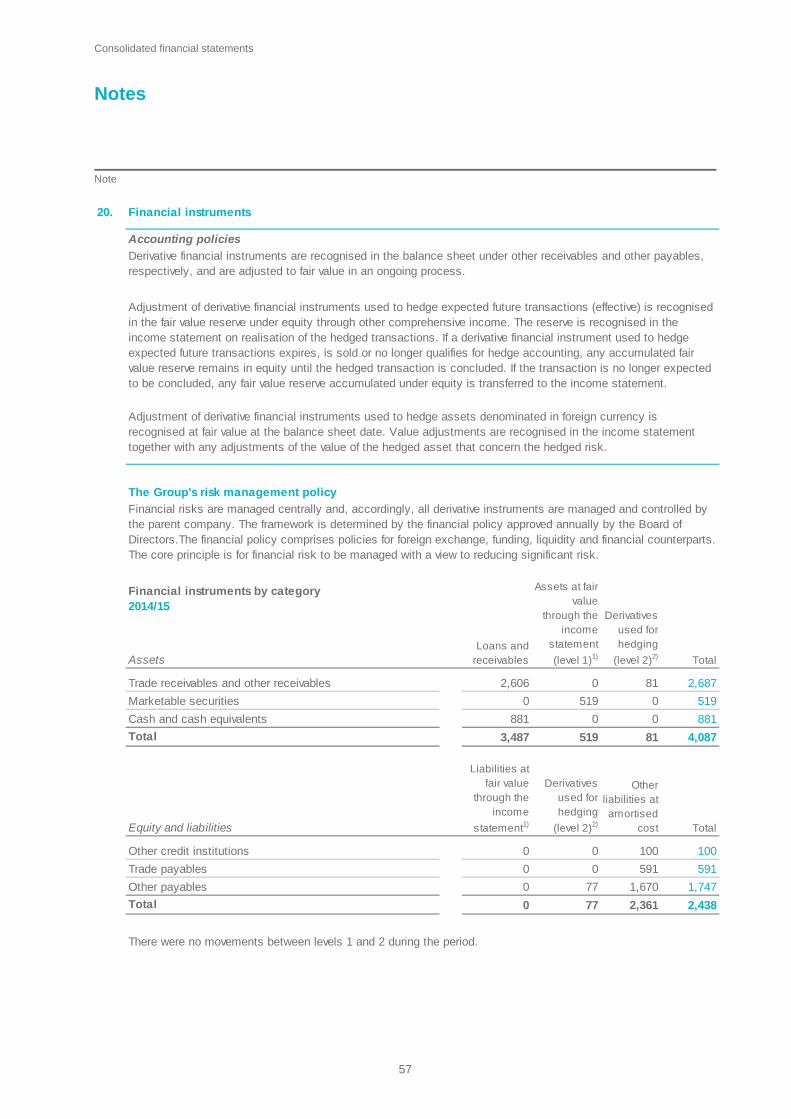
Consolidated financial statements
Notes Note
57
20. Financial instruments
Accounting policies
The Group's risk management policy
Financial instruments by category2014/15
Assets
Trade receivables and other receivables 81 2,687
Marketable securities 0 519
Cash and cash equivalents 0 881
Total 81 4,087
Equity and liabilities
Other credit institutions 100 100
Trade payables 591 591
Other payables 1,670 1,747
Total 2,361 2,438
0
0
0
There were no movements between levels 1 and 2 during the period.
0
Derivative financial instruments are recognised in the balance sheet under other receivables and other payables, respectively, and are adjusted to fair value in an ongoing process.
Adjustment of derivative financial instruments used to hedge expected future transactions (effective) is recognised in the fair value reserve under equity through other comprehensive income. The reserve is recognised in the income statement on realisation of the hedged transactions. If a derivative financial instrument used to hedge expected future transactions expires, is sold or no longer qualifies for hedge accounting, any accumulated fair value reserve remains in equity until the hedged transaction is concluded. If the transaction is no longer expected to be concluded, any fair value reserve accumulated under equity is transferred to the income statement.
Adjustment of derivative financial instruments used to hedge assets denominated in foreign currency is recognised at fair value at the balance sheet date. Value adjustments are recognised in the income statement together with any adjustments of the value of the hedged asset that concern the hedged risk.
0
77
77
Total
Total
Other liabilities at amortised
cost
Derivatives used for hedging
(level 2)2)
Liabilities at fair value
through the income
statement1)
Loans and receivables
Assets at fair value
through the income
statement
(level 1)1)
Derivatives used for hedging
(level 2)2)
519
519
0
0
Financial risks are managed centrally and, accordingly, all derivative instruments are managed and controlled by the parent company. The framework is determined by the financial policy approved annually by the Board of Directors.The financial policy comprises policies for foreign exchange, funding, liquidity and financial counterparts. The core principle is for financial risk to be managed with a view to reducing significant risk.
2,606
0
881
3,487
0

Consolidated financial statements
Notes Note
58
20.
Financial instruments by category2013/14
Assets
Trade receivables and other receivables 26 2,570
Marketable securities 0 619
Cash and cash equivalents 0 971
Total 26 4,160
Equity and liabilities
Other credit institutions 92 92
Trade payables 566 566
Other payables 1,488 1,620
Total 2,146 2,278
2) Financial instruments measured at fair value are broken dow n according to the follow ing measuring hierarchy:
Foreign exchange risk
0
02,544
619
Other liabilities at amortised
cost
Loans and receivables
Assets at fair value
through the income
statement
(level 1)1)
Derivatives used for hedging
(level 2)2)
971
6193,515
Liabilities at fair value
through the income
statement1)
Derivatives used for hedging
(level 2)2) Total
Total
0
0
0
0
132
1) The securities portfolio consists of mortgage bonds and corporate bonds. The bond portfolio carried an effective rate of interest of 1-6% (2013/14: 1-6%).
Financial instruments, continued
0
Level 1: Observable market prices of identical instruments Level 2: Valuation models primarily based on observable prices or traded prices of comparable instruments Level 3: Valuation models primarily based on non-observable prices
The fair value of derivative financial instruments is calculated on the basis of current market data.
The objective of the foreign exchange policy is to neutralise and delay the effect of exchange rate fluctuations in the income statement and thereby enhance the predictability of the financial results. This is done by hedging significant balance sheet items denominated in foreign currency and a part of the expected future cash flows. Currency hedging is achieved by means of forward contracts and options. As at 30 September 2015, an average of 85% of the following twelve months of expected net cash flows were hedged (2013/14: 87% of the following twelve months of cash flows). The Group does not hedge amounts in euro.
0
The fair value of forward exchange contracts and other derivative financial instruments are considered a level 2 fair value measurement as the fair value is determined directly based on the published exchange rates and quoted forward exchange rates at balance sheet dates.
0 132
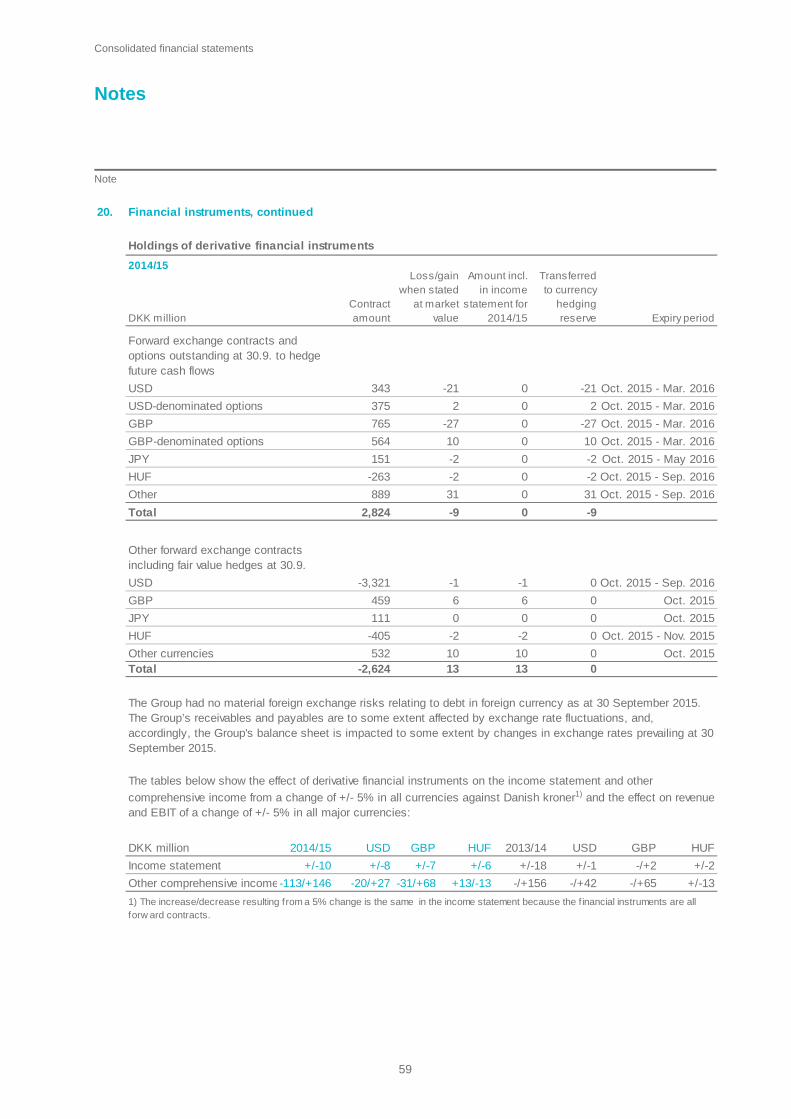
Consolidated financial statements
Notes Note
59
20. Financial instruments, continued
Holdings of derivative financial instruments
2014/15
DKK million
USD
USD-denominated options
GBP
GBP-denominated options
JPY
HUF
Other
Total
USD
GBP
JPY
HUF
Other currenciesTotal
DKK million 2014/15 USD USD GBP HUF
Income statement +/-10 +/-1 -/+2 +/-2
Other comprehensive income-113/+146 -/+42 -/+65 +/-13
Other forward exchange contracts including fair value hedges at 30.9.
Forward exchange contracts and options outstanding at 30.9. to hedge future cash flows
HUF
+/-6
+13/-13-20/+27
+/-8
343
-2
31
-1
0
0
0
0-3,321
10 10 Oct. 2015 - Mar. 2016
Oct. 2015 - Sep. 2016
Oct. 2015 - Mar. 2016
Oct. 2015
-405
6
0
-2
10
Oct. 2015
-2
13
111
0
Oct. 2015
Oct. 2015 - Nov. 2015
Oct. 2015 - Sep. 2016
Oct. 2015 - Sep. 2016
Oct. 2015 - Mar. 2016
Oct. 2015 - Mar. 2016
-21
31
Expiry period
Transferred to currency
hedging reserve
Amount incl. in income
statement for 2014/15
Loss/gain when stated
at market value
Contract amount
2 2
0
-2
Oct. 2015 - May 20160
459
2,824
-21
6
-27
0
0
375 0
13
-2
889
-9
10
0
532-2,624
765
151
-263
-1
-27
564 0
0
0
-2
-9
0
+/-7
The Group had no material foreign exchange risks relating to debt in foreign currency as at 30 September 2015. The Group’s receivables and payables are to some extent affected by exchange rate fluctuations, and, accordingly, the Group's balance sheet is impacted to some extent by changes in exchange rates prevailing at 30 September 2015.
The tables below show the effect of derivative financial instruments on the income statement and other
comprehensive income from a change of +/- 5% in all currencies against Danish kroner1) and the effect on revenue and EBIT of a change of +/- 5% in all major currencies:
+/-18
-/+156
2013/14GBP
-31/+68
1) The increase/decrease resulting from a 5% change is the same in the income statement because the f inancial instruments are all forw ard contracts.
Consolidated financial statements
Notes Note
60
20.
Interest rate risk
Liquidity risk
The Group's credit risk relating to trade receivables is diversified over a large number of customers and is therefore not material. The Group’s policy for undertaking credit risks involves an ongoing credit assessment of major customers and other key business partners.
Financial instruments, continued
Credit risk
Capital managementThe capital management objective of the Group is to raise new debt only for acquisition purposes or for other special purposes.
The Board of Directors generally intends to distribute excess cash to the shareholders by way of dividends and share buybacks. It is expected that dividends will be paid twice a year; after the annual general meeting and after the release of the half-year interim report. However, share buybacks and distribution of dividend will always be made with due consideration for the Group’s liquidity requirements and plans.
The Group assesses the capital on the basis of the solvency ratio, which is calculated in accordance with the guidelines issued by the Danish Society of Financial Analysts.
The Group’s cash reserve comprises cash and cash equivalents and securities.
Pursuant to the counterparty policy, credit risk is managed and mitigated by making money market deposits only with selected financial institutions holding a satisfactory credit rating. In addition, maximum credit limits have been defined for each financial counterparty. There is only a limited credit risk involved in bonds as investments are made in selected liquid bonds with a high credit rating.
The Group’s credit risks relate partly to receivables and cash holdings, partly to derivative financial instruments with a positive fair value. The maximum credit risk related to financial assets equals the values recognised in the balance sheet.
The funding policy is intended to ensure that the Group maintains a minimum cash reserve that will cover the Group's liquidity requirements from time to time.
The cash policy stipulates that the Group must obtain a competitive return and high liquidity when investing its excess cash. Cash pools is one of the means of achieving effective management of the Group’s cash.
As the Group's interest-bearing debt is insignificant, the interest rate risk is also considered insignificant. The Group's cash reserve is placed in money market deposits and bonds with selected financial counterparties. Cash reserves are placed at an average duration not exceeding four years. As a result, the interest rate risk is considered to be limited.
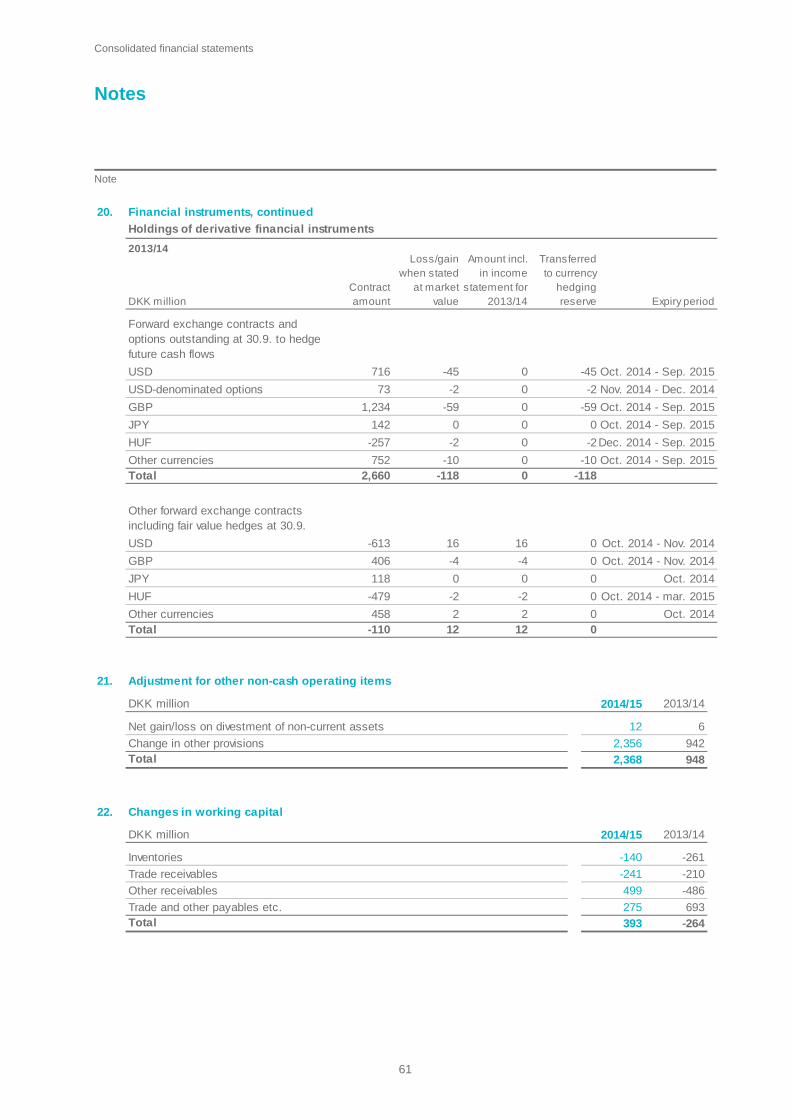
Consolidated financial statements
Notes Note
61
20.
Holdings of derivative financial instruments
2013/14
DKK million
USD
USD-denominated options
GBP
JPY
HUF
Other currenciesTotal
USD
GBP
JPY
HUF
Other currenciesTotal -110 12 12 0
16
Loss/gain when stated
at market value
Amount incl. in income
statement for 2013/14
Transferred to currency
hedging reserve
0
-2
0
-10
-613
Other forward exchange contracts including fair value hedges at 30.9.
-2 -2
0
Oct. 2014
Oct. 2014 - Nov. 2014
-479
0 -45716
Dec. 2014 - Sep. 2015
Oct. 2014 - Sep. 20152,660 -118
Oct. 2014 - Nov. 2014
1,234
73 -2 0 -2
Oct. 2014
0
-10752
-2 0
458
Oct. 2014 - mar. 2015
0-4
16
406 -4
118
2 2 0
0
0
-257
-118 0
0 0
142
Contract amount
Oct. 2014 - Sep. 2015
Nov. 2014 - Dec. 2014
-59 0 -59
0
-45
Oct. 2014 - Sep. 2015
Oct. 2014 - Sep. 2015
Financial instruments, continued
Forward exchange contracts and options outstanding at 30.9. to hedge future cash flows
Expiry period
21. Adjustment for other non-cash operating items
DKK million 2014/15 2013/14
Net gain/loss on divestment of non-current assets 12 6
Change in other provisions 2,356 942Total 2,368 948
22. Changes in working capital
DKK million 2014/15 2013/14
Inventories -140 -261
Trade receivables -241 -210
Other receivables 499 -486
Trade and other payables etc. 275 693Total 393 -264
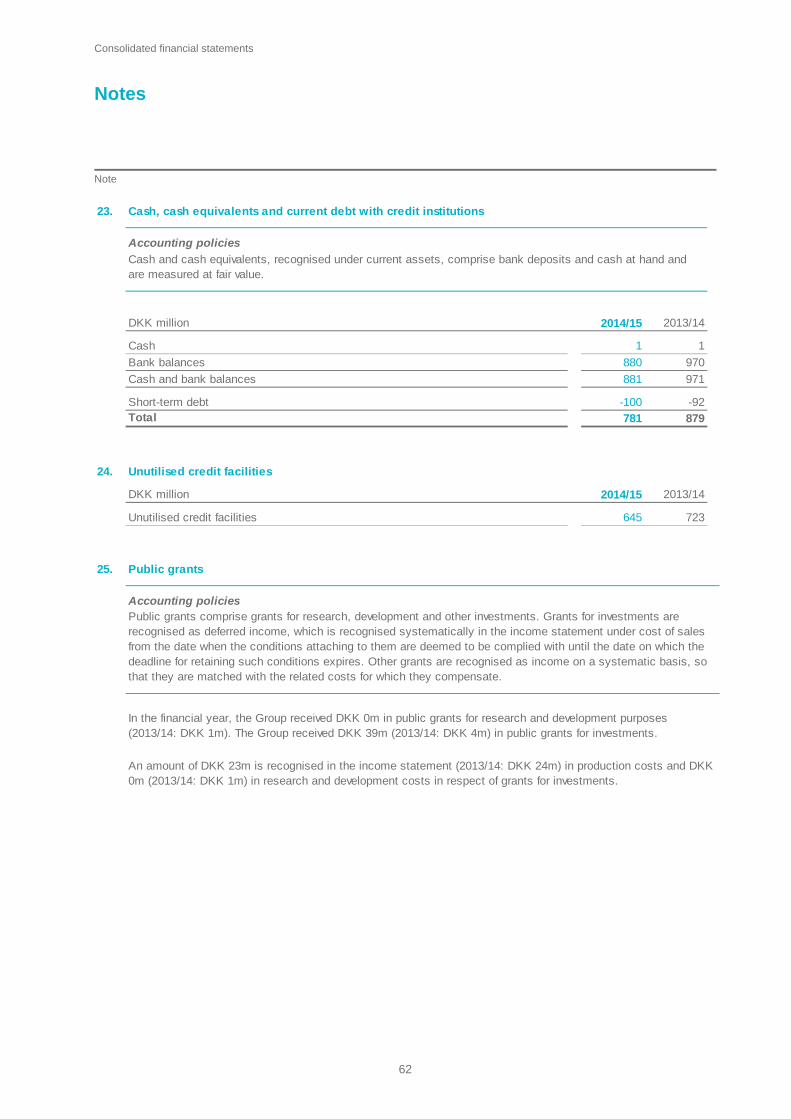
Consolidated financial statements
Notes Note
62
23. Cash, cash equivalents and current debt with credit institutions
Accounting policies
DKK million 2014/15 2013/14
Cash 1 1
Bank balances 880 970
Cash and bank balances 881 971
Short-term debt -100 -92Total 781 879
Cash and cash equivalents, recognised under current assets, comprise bank deposits and cash at hand and are measured at fair value.
24. Unutilised credit facilities
DKK million 2014/15 2013/14
Unutilised credit facilities 645 723 25. Public grants
Accounting policiesPublic grants comprise grants for research, development and other investments. Grants for investments are recognised as deferred income, which is recognised systematically in the income statement under cost of sales from the date when the conditions attaching to them are deemed to be complied with until the date on which the deadline for retaining such conditions expires. Other grants are recognised as income on a systematic basis, so that they are matched with the related costs for which they compensate.
In the financial year, the Group received DKK 0m in public grants for research and development purposes (2013/14: DKK 1m). The Group received DKK 39m (2013/14: DKK 4m) in public grants for investments.
An amount of DKK 23m is recognised in the income statement (2013/14: DKK 24m) in production costs and DKK 0m (2013/14: DKK 1m) in research and development costs in respect of grants for investments.

Consolidated financial statements
Notes Note
63
26. Other liabilities
DKK million 2014/15 2013/14
Operating leases fall due in
Less than one year 177 172
Within 1 to 5 years 529 347
After more than 5 years 37 13
Total 743 532
Operating lease payments recognised in the income statement amount to DKK 86m (2013/14: DKK 80m).
Operating leases represent primarily leasing of cars. There are no purchasing rights attaching to assets held under operating leases. Liabilities concerning rent and other operating leases are limited to the minimum lease payments.
27. Contingent liabilities
Other than as set out in Note 18 Other provisions, the Coloplast Group is a party to a few minor legal proceedings, which are not expected to influence the Group’s future earnings.
In February 2014 the Department of Justice in the United States initiated an investigation of Coloplast and other Durable Medical Equipment producers, focusing on marketing and promotion activities related to the ostomy and continence business. Coloplast has cooperated with the Department of Justice in this investigation by providing documents and participating in interviews, and in June 2015 Coloplast reached an agreement in principle with the Department of Justice. Coloplast has taken a provision to cover the agreement in question and related costs. As part of the agreement, Coloplast will pay a settlement of USD 3.1m plus legal fees.
28. The Executive Management's and the Directors' remuneration, share options and shareholdings
Remuneration
Board of Directors
It is Coloplast policy that the remuneration of members of the Board of Directors and the Executive Management should be competitive relative to that of other major Danish companies. The principles applied for the remuneration of members of the Executive Management are unchanged from last year, with adjustments made only in terms of amounts. Share options vest over a three-year period of employment, but are otherwise awarded as unconditional allocations and at a percentage premium to the market price at the date of grant. The option value is calculated according to the Black-Scholes formula. See note 16.
Board members receive a fee of DKK 400,000 each (2013/14: DKK 375,000). The Chairman receives the basic fee plus 200% (2013/14: 200%), while the Deputy Chairman receives the basic fee plus 75% (2013/14: 75%). Members of the Audit Committee also receive a fee corresponding to 50% of the basic directors’ fee (2013/14: 50%), while the chairman receives an additional fee of 50% of that amount. Members of the Board of Directors are not eligible for share option or bonus schemes.
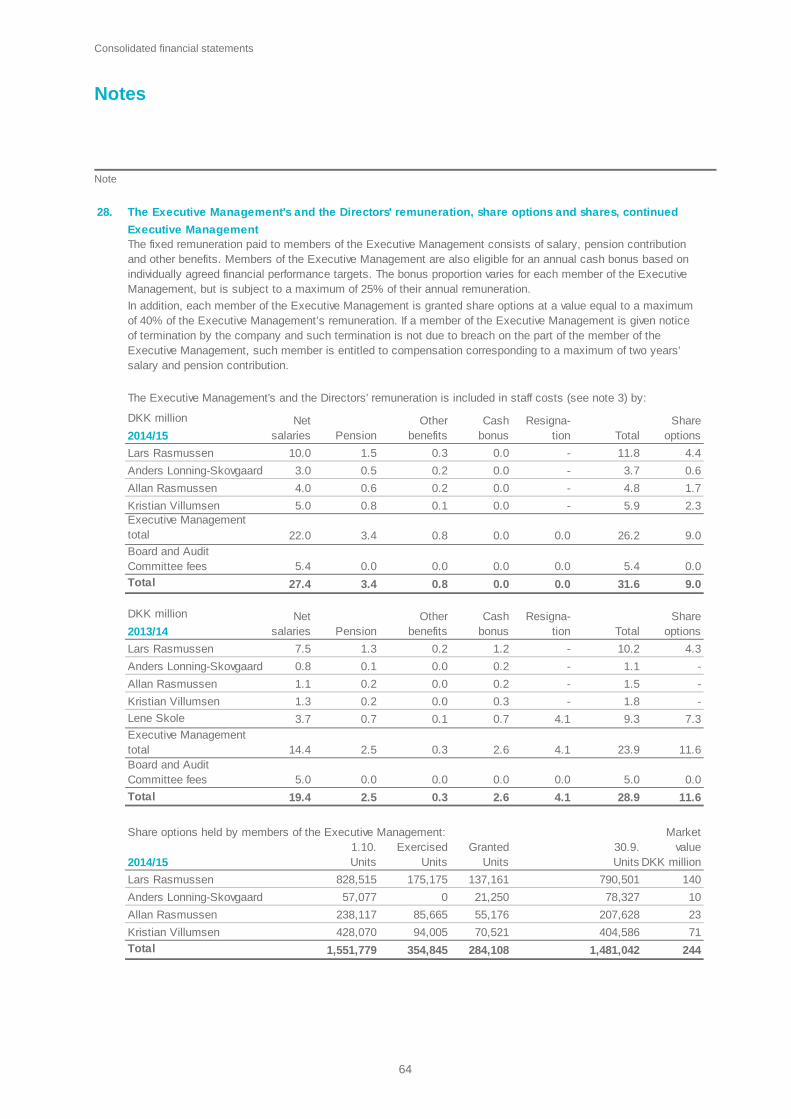
Consolidated financial statements
Notes Note
64
28. The Executive Management's and the Directors' remuneration, share options and shares, continued
Executive Management
DKK million
2014/15 Pension Total
Lars Rasmussen 10.0 1.5 0.3 0.0 - 11.8 4.4
Anders Lonning-Skovgaard 3.0 0.5 0.2 0.0 - 3.7 0.6
Allan Rasmussen 4.0 0.6 0.2 0.0 - 4.8 1.7
Kristian Villumsen 5.0 0.8 0.1 0.0 - 5.9 2.3Executive Management total 22.0 3.4 0.8 0.0 0.0 26.2 9.0Board and Audit Committee fees 5.4 0.0 0.0 0.0 0.0 5.4 0.0
Total 27.4 3.4 0.8 0.0 0.0 31.6 9.0
DKK million
2013/14 Pension Total
Lars Rasmussen 7.5 1.3 0.2 1.2 - 10.2 4.3
Anders Lonning-Skovgaard 0.8 0.1 0.0 0.2 - 1.1 -
Allan Rasmussen 1.1 0.2 0.0 0.2 - 1.5 -
Kristian Villumsen 1.3 0.2 0.0 0.3 - 1.8 -
Lene Skole 3.7 0.7 0.1 0.7 4.1 9.3 7.3Executive Management total 14.4 2.5 0.3 2.6 4.1 23.9 11.6Board and Audit Committee fees 5.0 0.0 0.0 0.0 0.0 5.0 0.0
Total 19.4 2.5 0.3 2.6 4.1 28.9 11.6
Share options held by members of the Executive Management:
2014/15 Units Units Units Units DKK million
Lars Rasmussen 828,515 175,175 137,161 790,501 140
Anders Lonning-Skovgaard 57,077 0 21,250 78,327 10
Allan Rasmussen 238,117 85,665 55,176 207,628 23
Kristian Villumsen 428,070 94,005 70,521 404,586 71
Total 1,551,779 284,108 1,481,042 244
Exercised Granted 30.9.
354,845
1.10.Market
value
The fixed remuneration paid to members of the Executive Management consists of salary, pension contribution and other benefits. Members of the Executive Management are also eligible for an annual cash bonus based on individually agreed financial performance targets. The bonus proportion varies for each member of the Executive Management, but is subject to a maximum of 25% of their annual remuneration.
In addition, each member of the Executive Management is granted share options at a value equal to a maximum of 40% of the Executive Management’s remuneration. If a member of the Executive Management is given notice of termination by the company and such termination is not due to breach on the part of the member of the Executive Management, such member is entitled to compensation corresponding to a maximum of two years' salary and pension contribution.
Other benefits
Cash bonus
Net salaries
Other benefits
Cash bonus
Share options
Share options
Resigna-tion
Resigna-tion
Net salaries
The Executive Management's and the Directors' remuneration is included in staff costs (see note 3) by:
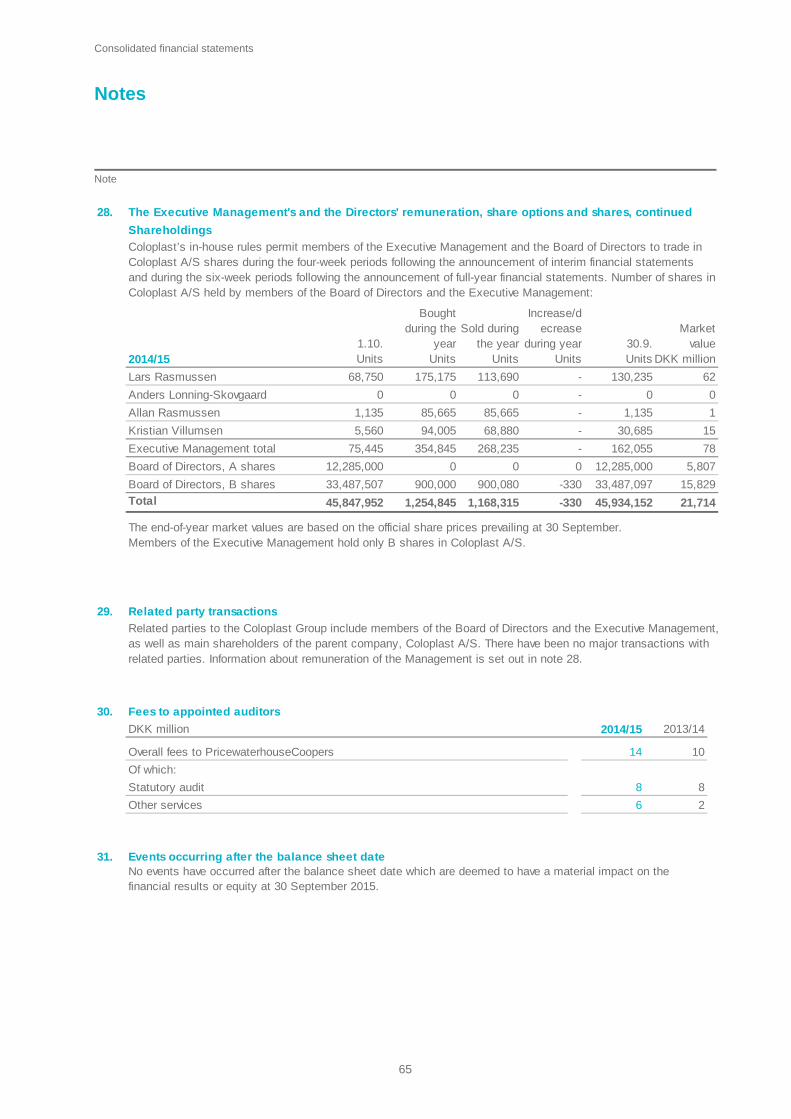
Consolidated financial statements
Notes Note
65
28. The Executive Management's and the Directors' remuneration, share options and shares, continued
Shareholdings
2014/15 Units Units Units Units Units DKK million
Lars Rasmussen 68,750 175,175 113,690 - 130,235 62
Anders Lonning-Skovgaard 0 0 0 - 0 0
Allan Rasmussen 1,135 85,665 85,665 - 1,135 1
Kristian Villumsen 5,560 94,005 68,880 - 30,685 15
Executive Management total 75,445 354,845 268,235 - 162,055 78
Board of Directors, A shares 12,285,000 0 0 0 12,285,000 5,807
Board of Directors, B shares 33,487,507 900,000 900,080 -330 33,487,097 15,829
Total 45,847,952 1,168,315 -330 45,934,152 21,714
Coloplast’s in-house rules permit members of the Executive Management and the Board of Directors to trade in Coloplast A/S shares during the four-week periods following the announcement of interim financial statements and during the six-week periods following the announcement of full-year financial statements. Number of shares in Coloplast A/S held by members of the Board of Directors and the Executive Management:
Market value
Sold during the year
Increase/decrease
during year 30.9.
Bought during the
year1.10.
The end-of-year market values are based on the official share prices prevailing at 30 September. Members of the Executive Management hold only B shares in Coloplast A/S.
1,254,845
29. Related party transactions
Related parties to the Coloplast Group include members of the Board of Directors and the Executive Management, as well as main shareholders of the parent company, Coloplast A/S. There have been no major transactions with related parties. Information about remuneration of the Management is set out in note 28.
30. Fees to appointed auditors
DKK million 2014/15 2013/14
Overall fees to PricewaterhouseCoopers 14 10
Of which:
Statutory audit 8 8
Other services 6 2 31. Events occurring after the balance sheet date
No events have occurred after the balance sheet date which are deemed to have a material impact on the financial results or equity at 30 September 2015.
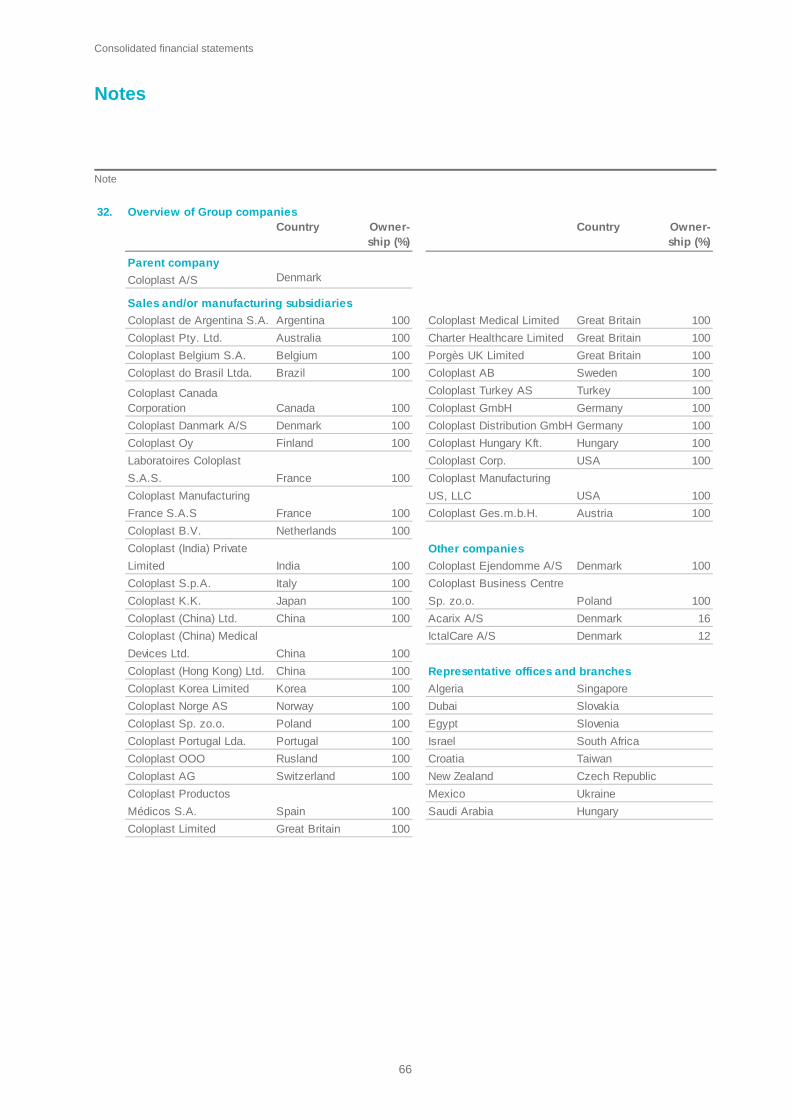
Consolidated financial statements
Notes Note
66
32. Overview of Group companiesCountry Owner-
ship (%)Country Owner-
ship (%)
Parent company
Coloplast A/S Denmark
Sales and/or manufacturing subsidiaries
Coloplast de Argentina S.A. Argentina 100 Coloplast Medical Limited Great Britain 100
Coloplast Pty. Ltd. Australia 100 Charter Healthcare Limited Great Britain 100
Coloplast Belgium S.A. Belgium 100 Porgès UK Limited Great Britain 100
Coloplast do Brasil Ltda. Brazil 100 Coloplast AB Sweden 100
Coloplast Turkey AS Turkey 100
Coloplast GmbH Germany 100
Coloplast Danmark A/S Denmark 100 Coloplast Distribution GmbH Germany 100
Coloplast Oy Finland 100 Coloplast Hungary Kft. Hungary 100
Laboratoires Coloplast Coloplast Corp. USA 100
S.A.S. Coloplast Manufacturing
Coloplast Manufacturing US, LLC USA 100
France S.A.S France 100 Coloplast Ges.m.b.H. Austria 100
Coloplast B.V. Netherlands 100
Coloplast (India) Private Other companies
Limited India 100 Coloplast Ejendomme A/S Denmark 100
Coloplast S.p.A. Italy 100 Coloplast Business Centre
Coloplast K.K. Japan 100 Sp. zo.o. Poland 100
Coloplast (China) Ltd. China 100 Acarix A/S Denmark 16
Coloplast (China) Medical IctalCare A/S Denmark 12
Devices Ltd. China 100
Coloplast (Hong Kong) Ltd. China 100 Representative offices and branches
Coloplast Korea Limited Korea 100 Algeria Singapore
Coloplast Norge AS Norway 100 Dubai Slovakia
Coloplast Sp. zo.o. Poland 100 Egypt Slovenia
Coloplast Portugal Lda. Portugal 100 Israel South Africa
Coloplast OOO Rusland 100 Croatia Taiwan
Coloplast AG Switzerland 100 New Zealand
Coloplast Productos Mexico Ukraine
Médicos S.A. Spain 100 Saudi Arabia Hungary
Coloplast Limited Great Britain 100
Czech Republic
100CanadaColoplast Canada Corporation
France 100
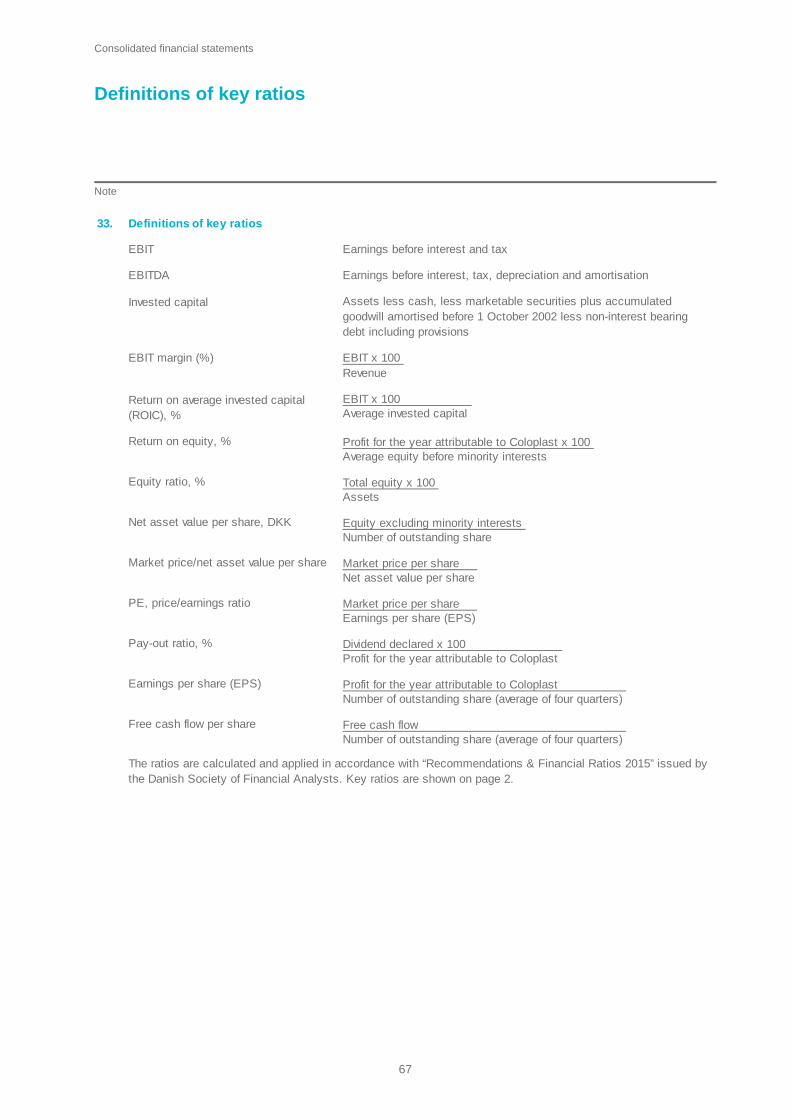
Consolidated financial statements
Definitions of key ratios Note
67
33. Definitions of key ratios
EBIT Earnings before interest and tax
EBITDA Earnings before interest, tax, depreciation and amortisation
Invested capital Assets less cash, less marketable securities plus accumulated goodwill amortised before 1 October 2002 less non-interest bearing debt including provisions
EBIT margin (%) EBIT x 100 Revenue
EBIT x 100 Average invested capital
Return on equity, % Profit for the year attributable to Coloplast x 100 Average equity before minority interests
Equity ratio, % Total equity x 100 Assets
Net asset value per share, DKK Equity excluding minority interests Number of outstanding share
Market price/net asset value per share Market price per share Net asset value per share
PE, price/earnings ratio Market price per share Earnings per share (EPS)
Pay-out ratio, % Dividend declared x 100 Profit for the year attributable to Coloplast
Earnings per share (EPS) Profit for the year attributable to Coloplast Number of outstanding share (average of four quarters)
Free cash flow per share Free cash flow Number of outstanding share (average of four quarters)
The ratios are calculated and applied in accordance with “Recommendations & Financial Ratios 2015” issued by the Danish Society of Financial Analysts. Key ratios are shown on page 2.
Return on average invested capital (ROIC), %
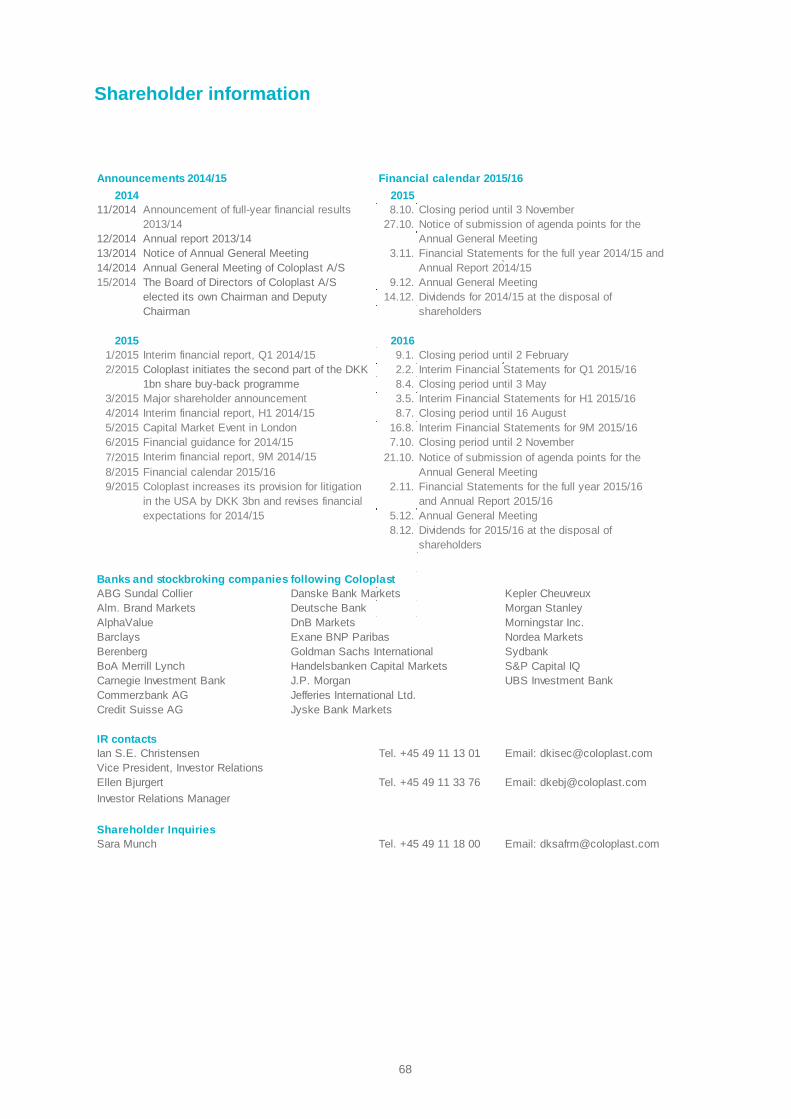
Shareholder information
68
Announcements 2014/15 Financial calendar 2015/16
2014 201511/2014 8.10.
27.10.12/201413/2014 3.11.14/201415/2014 9.12.
14.12.
2015 20161/2015 9.1.2/2015 2.2.
8.4.3/2015 3.5.4/2014 8.7.5/2015 16.8.6/2015 7.10.7/2015 21.10.8/20159/2015 2.11.
5.12.8.12.
Banks and stockbroking companies following ColoplastABG Sundal Collier Danske Bank Markets Kepler CheuvreuxAlm. Brand Markets Deutsche Bank Morgan StanleyAlphaValue DnB Markets Morningstar Inc.Barclays Exane BNP Paribas Nordea MarketsBerenberg Goldman Sachs International Sydbank BoA Merrill Lynch Handelsbanken Capital Markets S&P Capital IQCarnegie Investment Bank J.P. Morgan UBS Investment BankCommerzbank AG Jefferies International Ltd.Credit Suisse AG Jyske Bank Markets
IR contactsEmail: [email protected]
Email: [email protected]
Investor Relations Manager
Shareholder InquiriesSara Munch Email: [email protected]
Dividends for 2015/16 at the disposal of
Notice of submission of agenda points for the Annual General Meeting
The Board of Directors of Coloplast A/S elected its own Chairman and Deputy Chairman
Annual report 2013/14Notice of Annual General MeetingAnnual General Meeting of Coloplast A/S
Financial Statements for the full year 2014/15 and Annual Report 2014/15
Dividends for 2014/15 at the disposal of shareholders
Interim financial report, 9M 2014/15
Major shareholder announcementInterim financial report, H1 2014/15Capital Market Event in London
Financial calendar 2015/16
Interim financial report, Q1 2014/15
Financial guidance for 2014/15
Closing period until 3 NovemberNotice of submission of agenda points for the Annual General Meeting
Coloplast initiates the second part of the DKK 1bn share buy-back programme
Closing period until 16 August
Announcement of full-year financial results 2013/14
Closing period until 2 FebruaryInterim Financial Statements for Q1 2015/16Closing period until 3 May
Interim Financial Statements for 9M 2015/16Closing period until 2 November
Annual General Meeting
Ellen Bjurgert Tel. +45 49 11 33 76
Ian S.E. Christensen Tel. +45 49 11 13 01Vice President, Investor Relations
Financial Statements for the full year 2015/16 in the USA by DKK 3bn and revises financial and Annual Report 2015/16expectations for 2014/15
shareholders
Annual General Meeting
Coloplast increases its provision for litigation
Interim Financial Statements for H1 2015/16
Tel. +45 49 11 18 00

69
Coloplast A/S
Parent company
Financial statement
for 2014/15

Parent company financial statements
Income statement 1 October - 30 September DKK million Note 2014/15 2013/14
70
2 Revenue 10,098 8,869
3 Cost of sales -4,731 -4,309
Gross profit 5,367 4,560
3.5 Distribution costs -3,766 -1,808
3.4 Administrative expenses -351 -302
3 Research and development costs -468 -405
Other operating income 21 18
Other operating expenses -8 -10
Operating profit (EBIT) 795 2,053
11 Profit after tax on investment in subsidiaries 480 701
11 Profit/loss after tax on investment in associates -1 -2
6 Financial income 38 99
7 Financial expenses -276 -13
Profit before tax 1,036 2,838
8 Tax on profit/loss for the year -139 -537
Net profit for the year 897 2,301
Profit distribution
Retained earnings -1,747 -122
Dividend paid during the year 953 844
Proposed dividend for the year 1,691 1,579
Total 897 2,301
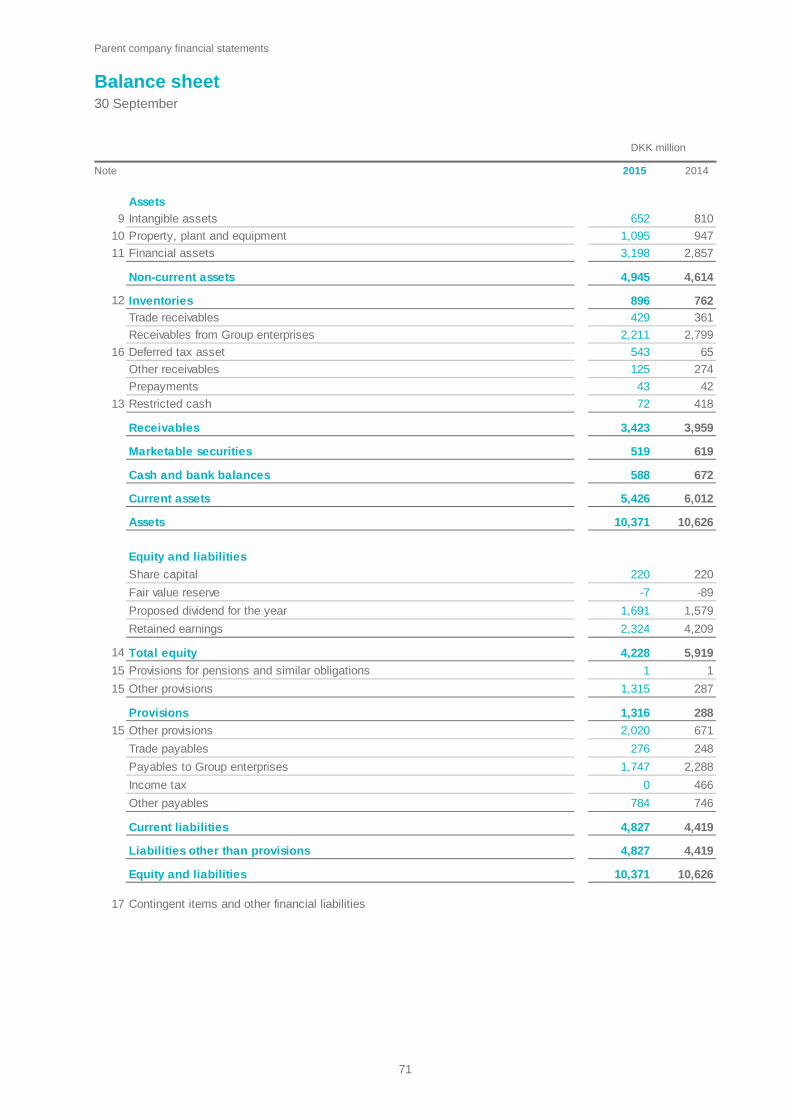
Parent company financial statements
Balance sheet 30 September DKK million Note 2015 2014
71
Assets
9 Intangible assets 652 810
10 Property, plant and equipment 1,095 947
11 Financial assets 3,198 2,857
Non-current assets 4,945 4,614
12 Inventories 896 762
Trade receivables 429 361
Receivables from Group enterprises 2,211 2,799
16 Deferred tax asset 543 65
Other receivables 125 274
Prepayments 43 42
13 Restricted cash 72 418
Receivables 3,423 3,959
Marketable securities 519 619
Cash and bank balances 588 672
Current assets 5,426 6,012
Assets 10,371 10,626
Equity and liabilities
Share capital 220 220
Fair value reserve -7 -89
Proposed dividend for the year 1,691 1,579
Retained earnings 2,324 4,209
14 Total equity 4,228 5,919
15 Provisions for pensions and similar obligations 1 1
15 Other provisions 1,315 287
Provisions 1,316 288
15 Other provisions 2,020 671
Trade payables 276 248
Payables to Group enterprises 1,747 2,288
Income tax 0 466
Other payables 784 746
Current liabilities 4,827 4,419
Liabilities other than provisions 4,827 4,419
Equity and liabilities 10,371 10,626
17 Contingent items and other financial liabilities
Parent company financial statements
Notes Note
72
1. Accounting policies
Basis of preparation
Cash flow statement
Intangible assets
Financial assets
Tax
In the parent company’s financial statements, investments in subsidiaries and associates are recognised according to the equity method. The share of the results of subsidiaries less unrealised intra-group gains is recognised in the parent company’s income statement. Net revaluation of investments in subsidiaries and associates exceeding the dividend declared by such enterprises is recognised in equity as reserve for net revaluation according to the equity method.
With reference to section 11(3) of the Danish Financial Statements Act, the company has derogated from the rules of the Act as it has in previous years. Accordingly, actuarial gains and losses are not recognised in the income statement but directly in equity. The derogation from the Danish Financial Statements Act is considered to provide a true and fair view and is within the scope of the IFRS. The change had a positive effect on profit/loss for the year in the amount of DKK 4m (2013/14: DKK 27m). Equity at 30 September 2015 and 30 September 2014 was not affected by the derogation.
The parent company is taxed jointly with its domestic subsidiaries. The jointly taxed Danish enterprises are covered by the Danish on-account tax scheme. Current tax for jointly taxed companies is recognised in each individual company.
The parent company financial statements are presented in accordance with the Danish Financial Statements Act (reporting class D enterprises) and additional Danish disclosure requirements for listed companies.The accounting policies of the parent company are the same as those of the Group, however, with the addition of the policies described below. The Group’s accounting policies are set out in note 1 to the financial statements on page 30.
Other than as set out above, there have been no changes to the accounting policies relative to last year.
No separate cash flow statement has been prepared for the parent company as per the exemption clause of section 86(4) of the Danish Financial Statements Act. The consolidated cash flow statement is set out on page 28.
Goodwill is measured at cost less accumulated amortisation and impairment. Amortisation is calculated using the straight-line method over the expected useful life, estimated at 10 years. This estimate was made on the basis of estimated useful lives of the other assets acquired in the transaction.
2. Revenue
DKK million 2014/15 2013/14
Business area
Intimate healthcare 10,098 8,869
Total 10,098 8,869
Geographical markets
Europe 7,325 6,606
North and South America 1,812 1,474
Rest of the world 961 789
Total 10,098 8,869
Parent company financial statements
Notes Note
73
3. Staff costs
DKK million 2014/15 2013/14
Salaries, wages and directors' remuneration 962 910
Pensions 77 73
Other social security costs 17 16
Total 1,056 999
Average number of employees, FTEs 1,563 1,478
See note 28 to the consolidated financial statements for information on the Executive Management's and the Directors' remuneration.
4. Fees to appointed auditors
DKK million 2014/15 2013/14
Overall fees to PricewaterhouseCoopers 7 4
Of which:
Statutory audit 3 3
Other services 4 1 5. Distribution costs
DKK million 2014/15 2013/14
Costs related to pending litigation 3,000 1,000
Distribution costs include expected costs relating to pending litigation. See note 18 to the consolidated financial statements for more information about mesh litigation.
6. Financial income
DKK million 2014/15 2013/14
Interest income, etc. 4 37
Interest income from Group enterprises 34 26
Fair value adjustments, forward contracts 0 32
Fair value adjustments, share options 0 4
Total 38 99

Parent company financial statements
Notes Note
74
7. Financial expenses
DKK million 2014/15 2013/14
Interest expense, etc. 6 5
Interest expense to Group enterprises 0 2
Net exchange adjustments 270 6
Total 276 13
8. Tax on profit for the year
DKK million 2014/15 2013/14
Current tax on profit for the year 713 803
Change in deferred tax on profit for the year -583 -266
Prior-year adjustments -3 0
Change due to change in tax rate 12 0
Total 139 537
Tax on equity entries 112 95
9. Intangible assets
Acquired Prepayments and
patents and ntangible assets 2014/15 2013/14
DKK million Goodw ill trademarks Softw are in progress Total Total
Total cost at 1.10. 587 1,425 240 14 2,266 2,547
Reclassification 0 0 6 -6 0 0Additions and improvements during the year 0 2 5 21 28 20
Disposals during the year 0 0 0 0 0 -301
Total cost at 30.9. 587 1,427 251 29 2,294 2,266
Total amortisation at 1.10. 459 820 177 0 1,456 1,563
Amortisation for the year 59 102 25 0 186 194Amortisation reversed on disposals during the year 0 0 0 0 0 -301
Total amortisation at 30.9. 518 922 202 0 1,642 1,456
Carrying amount at 30.9. 69 505 49 29 652 810
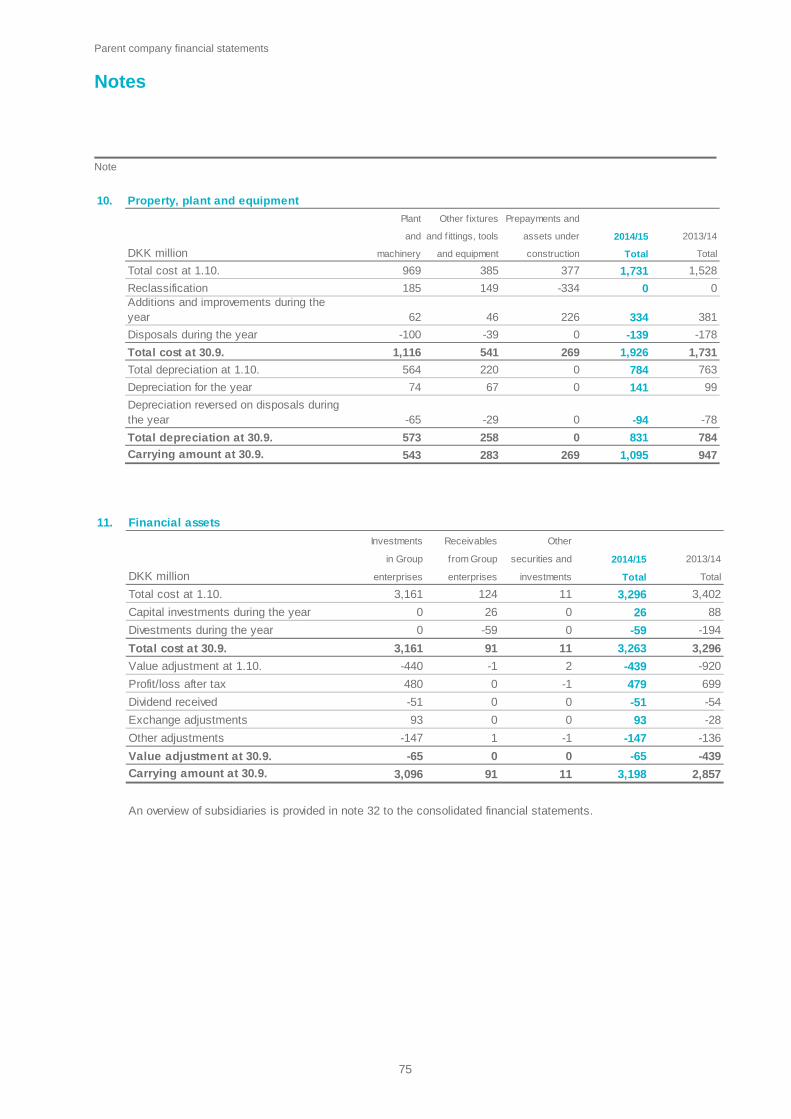
Parent company financial statements
Notes Note
75
10. Property, plant and equipment
Plant Other f ixtures Prepayments and
and and fittings, tools assets under 2014/15 2013/14
DKK million machinery and equipment construction Total Total
Total cost at 1.10. 969 385 377 1,731 1,528
Reclassification 185 149 -334 0 0
62 46 226 334 381
Disposals during the year -100 -39 0 -139 -178
Total cost at 30.9. 1,116 541 269 1,926 1,731
Total depreciation at 1.10. 564 220 0 784 763
Depreciation for the year 74 67 0 141 99
-65 -29 0 -94 -78
Total depreciation at 30.9. 573 258 0 831 784
Carrying amount at 30.9. 543 283 269 1,095 947
Additions and improvements during the year
Depreciation reversed on disposals during the year
11. Financial assets
Investments Receivables Other
in Group from Group securities and 2014/15 2013/14
DKK million enterprises enterprises investments Total Total
Total cost at 1.10. 3,161 124 11 3,296 3,402
Capital investments during the year 0 26 0 26 88
Divestments during the year 0 -59 0 -59 -194
Total cost at 30.9. 3,161 91 11 3,263 3,296
Value adjustment at 1.10. -440 -1 2 -439 -920
Profit/loss after tax 480 0 -1 479 699
Dividend received -51 0 0 -51 -54
Exchange adjustments 93 0 0 93 -28
Other adjustments -147 1 -1 -147 -136
Value adjustment at 30.9. -65 0 0 -65 -439
Carrying amount at 30.9. 3,096 91 11 3,198 2,857
An overview of subsidiaries is provided in note 32 to the consolidated financial statements.
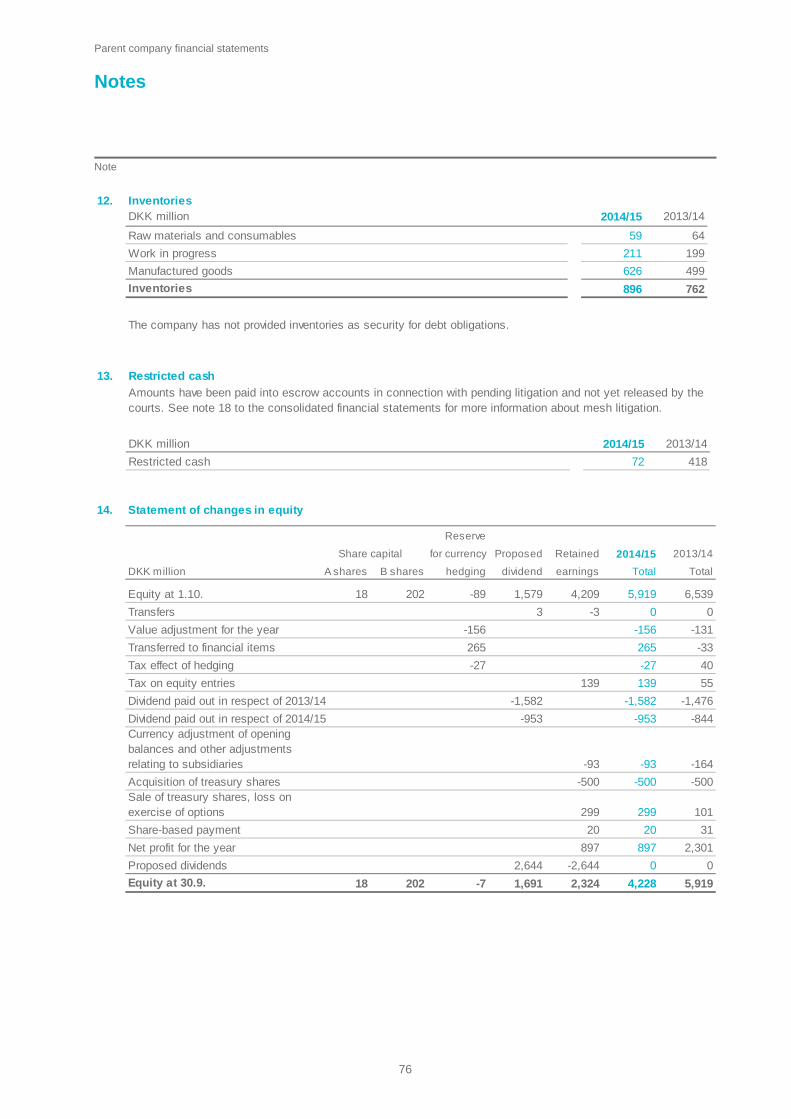
Parent company financial statements
Notes Note
76
12. InventoriesDKK million 2014/15 2013/14
Raw materials and consumables 59 64
Work in progress 211 199
Manufactured goods 626 499
Inventories 896 762
The company has not provided inventories as security for debt obligations.
13. Restricted cash
DKK million 2014/15 2013/14
Restricted cash 72 418
Amounts have been paid into escrow accounts in connection with pending litigation and not yet released by the courts. See note 18 to the consolidated financial statements for more information about mesh litigation.
14. Statement of changes in equity
Reserve
for currency Proposed Retained 2014/15 2013/14
DKK million A shares B shares hedging dividend earnings Total Total
Equity at 1.10. 18 202 -89 1,579 4,209 5,919 6,539
Transfers 3 -3 0 0
Value adjustment for the year -156 -156 -131
Transferred to financial items 265 265 -33
Tax effect of hedging -27 -27 40
Tax on equity entries 139 139 55
Dividend paid out in respect of 2013/14 -1,582 -1,582 -1,476
Dividend paid out in respect of 2014/15 -953 -953 -844Currency adjustment of opening balances and other adjustments relating to subsidiaries -93 -93 -164
Acquisition of treasury shares -500 -500 -500Sale of treasury shares, loss on exercise of options 299 299 101
Share-based payment 20 20 31
Net profit for the year 897 897 2,301
Proposed dividends 2,644 -2,644 0 0
Equity at 30.9. 18 202 -7 1,691 2,324 4,228 5,919
Share capital
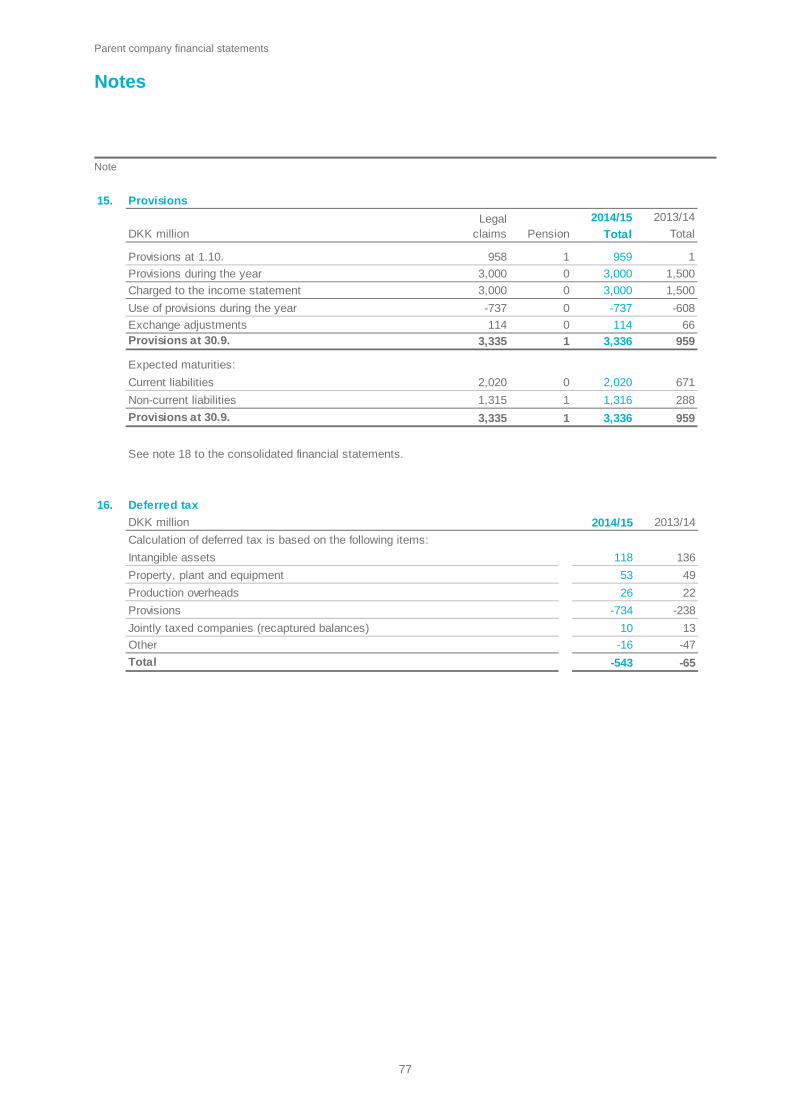
Parent company financial statements
Notes Note
77
15. Provisions
2014/15 2013/14
DKK million Pension Total Total
Provisions at 1.10. 958 1 959 1
Provisions during the year 3,000 0 3,000 1,500
Charged to the income statement 3,000 0 3,000 1,500
Use of provisions during the year -737 0 -737 -608
Exchange adjustments 114 0 114 66Provisions at 30.9. 3,335 1 3,336 959
Expected maturities:
Current liabilities 2,020 0 2,020 671
Non-current liabilities 1,315 1 1,316 288
Provisions at 30.9. 3,335 1 3,336 959
Legal claims
See note 18 to the consolidated financial statements.
16. Deferred tax
DKK million 2014/15 2013/14
Calculation of deferred tax is based on the following items:
Intangible assets 118 136
Property, plant and equipment 53 49
Production overheads 26 22
Provisions -734 -238
Jointly taxed companies (recaptured balances) 10 13
Other -16 -47
Total -543 -65
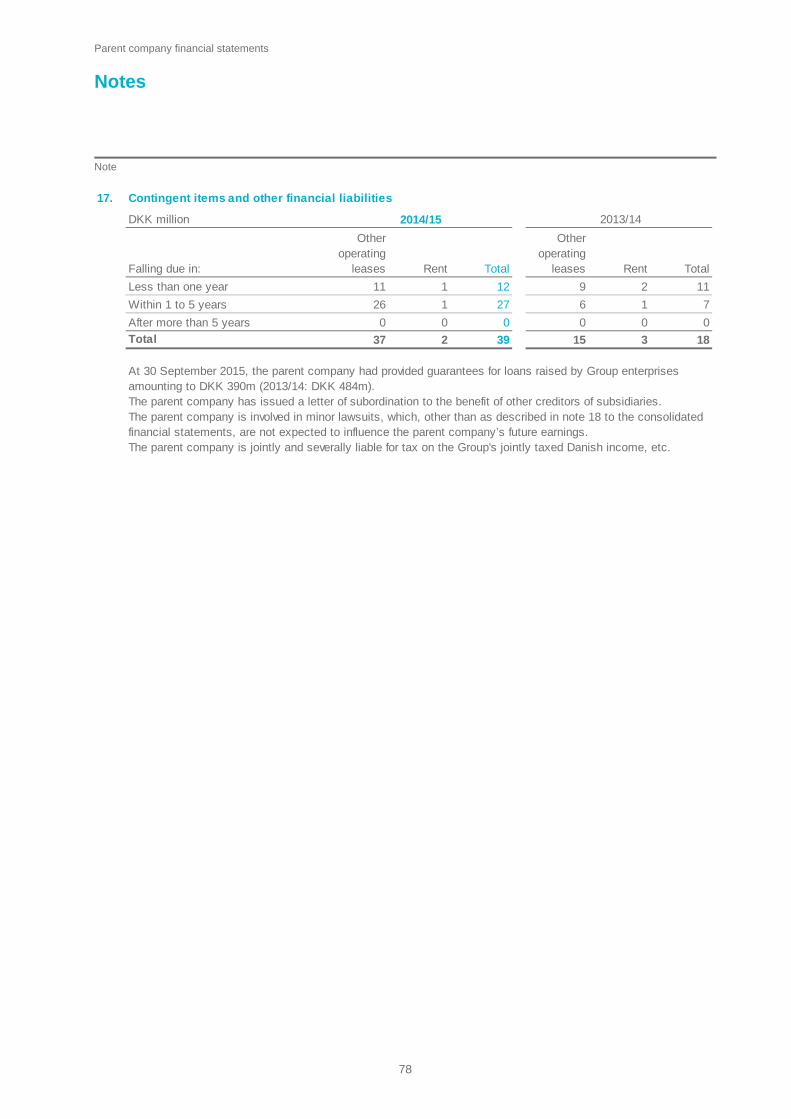
Parent company financial statements
Notes Note
78
17. Contingent items and other financial liabilities
DKK million
Falling due in:
Other operating
leases Rent Total
Other operating
leases Rent Total
Less than one year 11 1 12 9 2 11
Within 1 to 5 years 26 1 27 6 1 7
After more than 5 years 0 0 0 0 0 0
Total 37 2 39 15 3 18
The parent company has issued a letter of subordination to the benefit of other creditors of subsidiaries.
The parent company is jointly and severally liable for tax on the Group's jointly taxed Danish income, etc.
At 30 September 2015, the parent company had provided guarantees for loans raised by Group enterprises amounting to DKK 390m (2013/14: DKK 484m).
The parent company is involved in minor lawsuits, which, other than as described in note 18 to the consolidated financial statements, are not expected to influence the parent company’s future earnings.
2014/15 2013/14


Colop
last A/S
- Annual rep
ort 2013/14
Annual report 2013/14
The Coloplast story begins back in 1954. Elise Sørensen is a nurse. Her sister Thora has just had an ostomy operation and is afraid to go out in public, fearing that her stoma might leak. Listening to her sister’s problems, Elise conceives the idea of the world’s first adhesive ostomy bag. Based on Elise’s idea, Aage Louis-Hansen created the ostomy bag. A bag that does not leak, giving Thora – and thousands of people like her – the chance to return to their normal life.
A simple solution with great significance.
Today, our business includes ostomy care, urology and continence care and wound and skin care. But our way of doing business still follows Elise’s and Aage’s example: we listen, we learn and we respond with products and services that make life easier for people with intimate healthcare needs.
Coloplast develops products and services that make life easier for people with very personal and private medical conditions. Working closely with the people who use our products, we create solutions that are sensitive to their special needs. We call this intimate healthcare. Our business includes ostomy care, urology and continence care and wound and skin care. We operate globally and employ more than 10,000 people.
The Coloplast logo is a registered trademark of Coloplast A/S. © 2015-10. All rights reserved Coloplast A/S, 3050 Humlebæk, Denmark.
Coloplast A/SHoltedam 1
3050 HumlebækDenmark
www.coloplast.com Company registration (CVR) No. 69 74 99 17 Company registration (CVR) No. 69 74 99 17
Coloplast Annual Report.indd 1 29/09/14 13.24