Embed Size (px)
Citation preview
AnnuAl RepoRt 2013
An uneven CAnvAs Inequalities in Artistic Training and Careers
SNAAP ANNuAl RePoRt 2013 2
national Advisory BoardKenneth C. Fischer, ChairPresident, University Musical SocietyUniversity of MichiganAnn Arbor, Michigan
Antonia ControExecutive Director, MarwenChicago, Illinois
Sarah Bainter CunninghamExecutive Director of Research, School of the Arts, Virginia Commonwealth UniversityRichmond, Virginia
Douglas DempsterDean, College of Fine Arts, The University of Texas at AustinAustin, Texas
Chris FordDirector, Baltimore School for the ArtsBaltimore, Maryland
Barbara HauptmanFormer Executive Director, Society of Stage Directors and ChoreographersPurchase, New York
Samuel HoiPresident, Otis College of Art and DesignLos Angeles, California
Steven LavinePresident, California Institute of the ArtsValencia, California
Abel LopezAssociate Producing Director, GALA Hispanic Theatre Washington, D.C.
Ann R. Markusen Director, Arts Economy InitiativeHubert H. Humphrey Institute of Public Affairs University of Minnesota Minneapolis, Minnesota
Carlos Martinez Principal and Global Design Leader, Gensler Chicago, Illinois
M. Lee PeltonPresident, Emerson CollegeBoston, Massachusetts
Stephanie PerrinPreviously Head, Walnut Hill SchoolOrleans, Massachusetts
Susan PetryChair, Department of Dance, The Ohio State UniversityColumbus, Ohio
Robert SirotaComposerNew York, New York
James UndercoflerArtistic Director, National Orchestral InstituteIthaca, New York
FundersLead funding provided by:Surdna Foundation
Additional support from:Houston EndowmentBarr FoundationNational Endowment for the ArtsCleveland FoundationEducational Foundation of America
MissionThe Strategic National Arts Alumni Project (SNAAP) investigates the educational experiences and career paths of arts graduates nationally. SNAAP provides the findings to educators, policymakers, and philanthropic organizations to improve arts training, inform cultural policy, and support artists.
snAAp AnnuAl RepoRt 2013 3
table of Contents
SNAAP Fast Facts 4
Director’s Message 6
Executive Summary 8
Findings 10
Looking Forward 26
References and Notes 28
Participating Institutions 30
ANNuAL REPoRT 2013
An uneven CAnvAs Inequalities in Artistic Training and Careers
SNAAP ANNuAl RePoRt 2013 4
the ArtsSNAAP defines “the arts,” “art,” and “artist” to include a broad range of creative activity, including performance, design, architecture, creative writing, music composition, choreography, film, illustration, and fine art.
surveySNAAP is an annual survey administered online to the arts alumni of participating institutions. Completion time for the survey is generally 20 to 30 minutes. The results described in this report are based on data collected from the 2011 and 2012 survey administrations.
partnersSNAAP is based at the Indiana University Center for Postsecondary Research and conducted in cooperation with the Vanderbilt University Curb Center for Art,
Enterprise, and Public Policy. SNAAP was founded in 2008 and developed with start-up funding by the Surdna Foundation as well as additional support from the Houston Endowment, Barr Foundation, Cleveland Foundation, Educational Foundation of America, and the National Endowment for the Arts, a government agency. SNAAP is now primarily self-supporting, funded by fees from participating institutions.
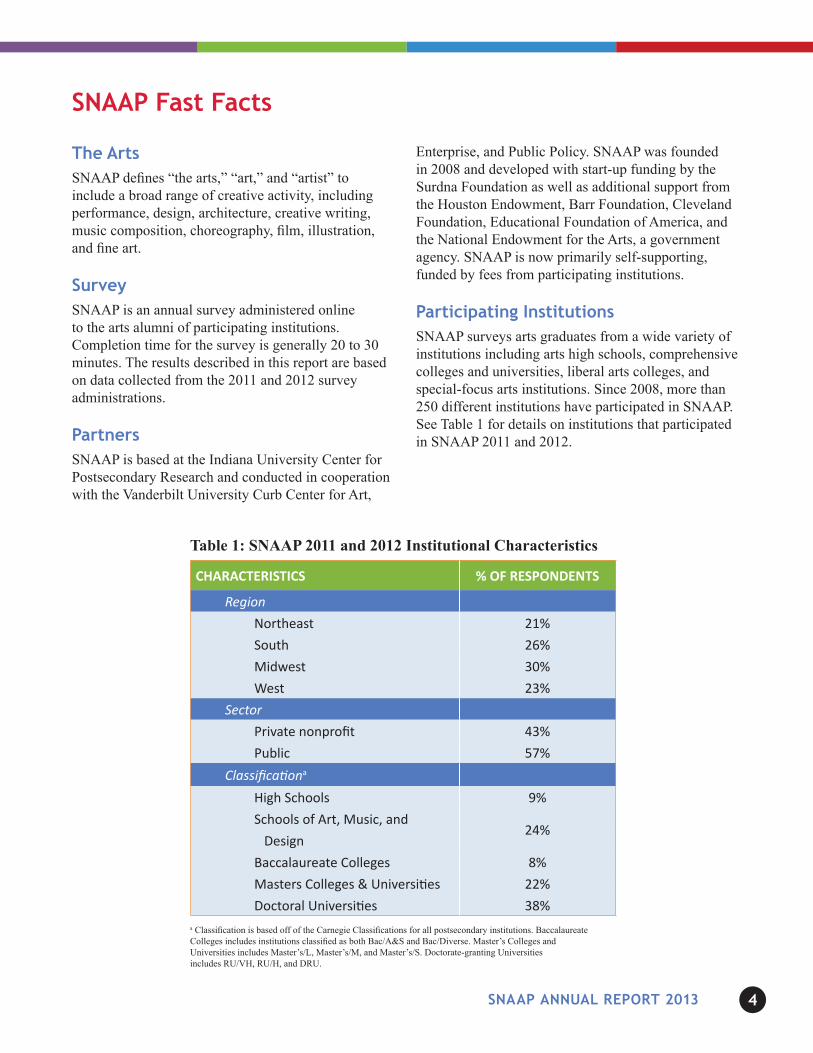
participating InstitutionsSNAAP surveys arts graduates from a wide variety of institutions including arts high schools, comprehensive colleges and universities, liberal arts colleges, and special-focus arts institutions. Since 2008, more than 250 different institutions have participated in SNAAP. See Table 1 for details on institutions that participated in SNAAP 2011 and 2012.
snAAp Fast Facts
Table 1: SNAAP 2011 and 2012 Institutional Characteristics
CHARACTERISTICS % OF RESPONDENTS
Region Northeast 21%South 26%Midwest 30%West 23%
Sector Private nonprofit 43%Public 57%
Classificationa High Schools 9%Schools of Art, Music, and
24% DesignBaccalaureate Colleges 8%Masters Colleges & Universities 22%Doctoral Universities 38%
a Classification is based off of the Carnegie Classifications for all postsecondary institutions. Baccalaureate Colleges includes institutions classified as both Bac/A&S and Bac/Diverse. Master’s Colleges and Universities includes Master’s/L, Master’s/M, and Master’s/S. Doctorate-granting Universities includes RU/VH, RU/H, and DRU.
SNAAP ANNuAl RePoRt 2013 5
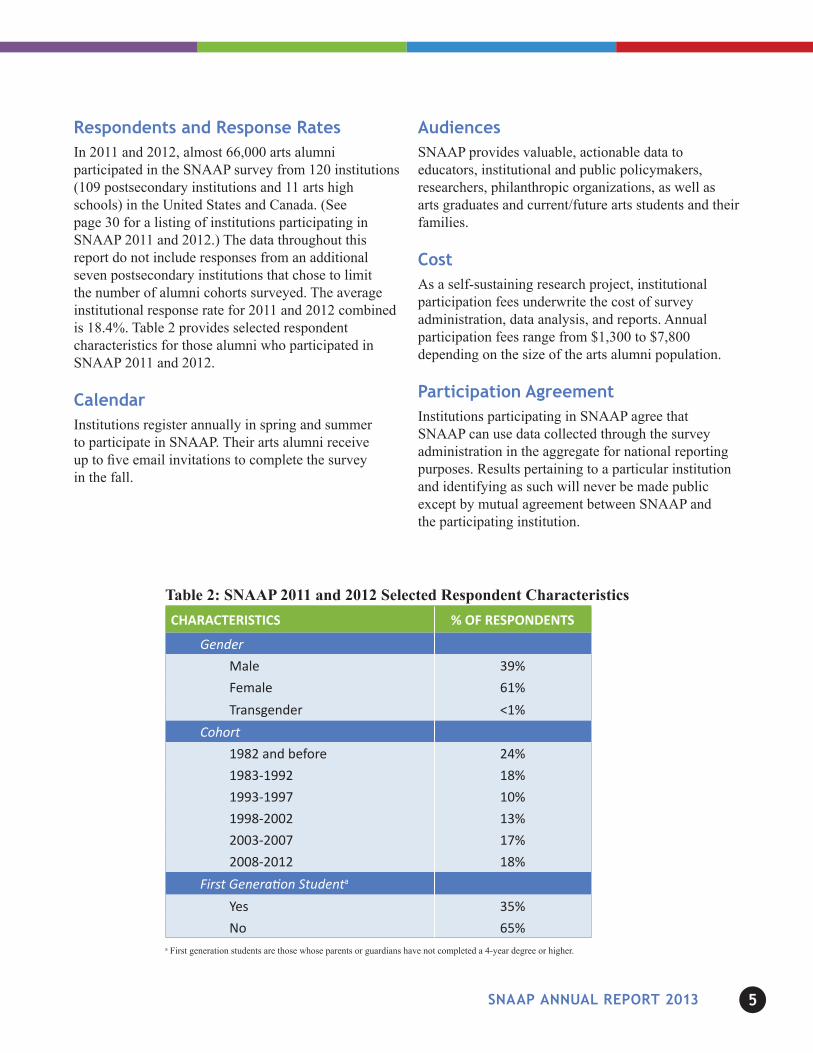
Table 2: SNAAP 2011 and 2012 Selected Respondent CharacteristicsCHARACTERISTICS % OF RESPONDENTS
Gender Male 39%Female 61%Transgender <1%
Cohort 1982 and before 24%1983-1992 18%1993-1997 10%1998-2002 13%2003-2007 17%2008-2012 18%
First Generation Studenta Yes 35%No 65%
a First generation students are those whose parents or guardians have not completed a 4-year degree or higher.
Respondents and Response RatesIn 2011 and 2012, almost 66,000 arts alumni participated in the SNAAP survey from 120 institutions (109 postsecondary institutions and 11 arts high schools) in the United States and Canada. (See page 30 for a listing of institutions participating in SNAAP 2011 and 2012.) The data throughout this report do not include responses from an additional seven postsecondary institutions that chose to limit the number of alumni cohorts surveyed. The average institutional response rate for 2011 and 2012 combined is 18.4%. Table 2 provides selected respondent characteristics for those alumni who participated in SNAAP 2011 and 2012.
CalendarInstitutions register annually in spring and summer to participate in SNAAP. Their arts alumni receive up to five email invitations to complete the survey in the fall.
AudiencesSNAAP provides valuable, actionable data to educators, institutional and public policymakers, researchers, philanthropic organizations, as well as arts graduates and current/future arts students and their families.
CostAs a self-sustaining research project, institutional participation fees underwrite the cost of survey administration, data analysis, and reports. Annual participation fees range from $1,300 to $7,800 depending on the size of the arts alumni population.
participation AgreementInstitutions participating in SNAAP agree that SNAAP can use data collected through the survey administration in the aggregate for national reporting purposes. Results pertaining to a particular institution and identifying as such will never be made public except by mutual agreement between SNAAP and the participating institution.
SNAAP ANNuAl RePoRt 2013 6
Director’s Message
Welcome to the third SNAAP Annual Report, in which we share findings from our national database of arts graduates. Thanks to the 136
institutions that participated in SNAAP in 2011 and 2012, we have amassed a current database of nearly 70,000 arts graduates of all ages and from all walks of life. Overall, SNAAP has surveyed more than 80,000 alumni from over 250 institutions since 2008.
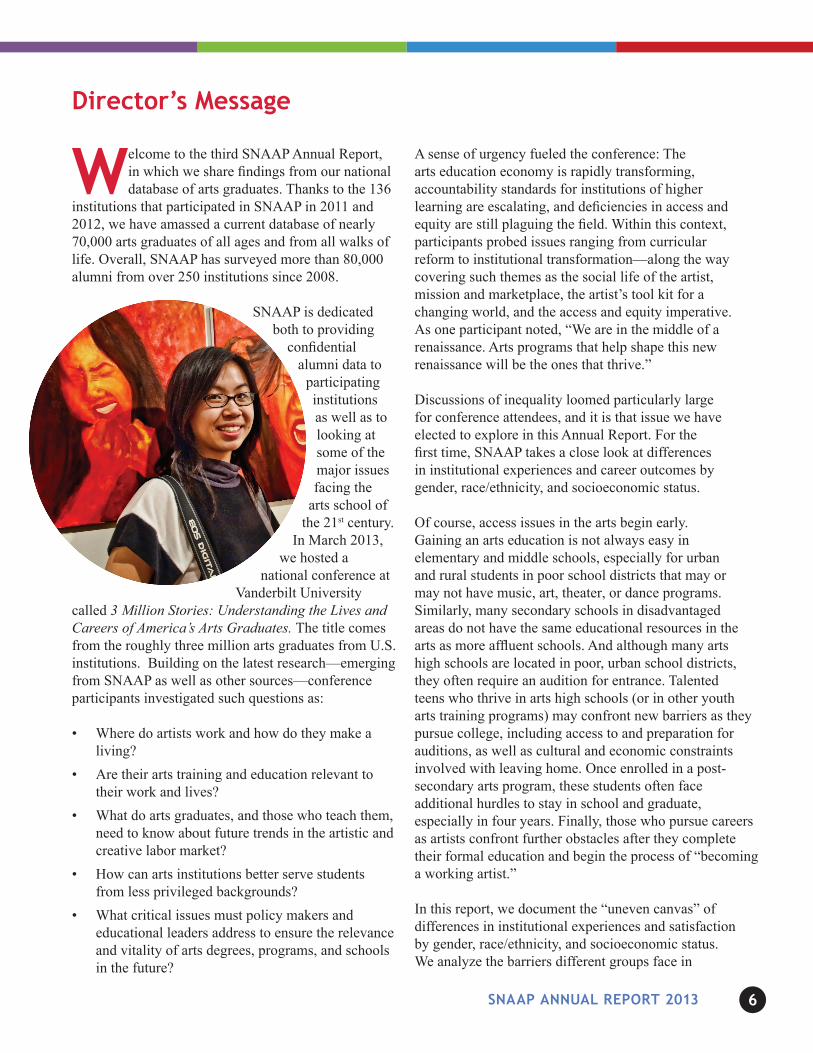
SNAAP is dedicated both to providing
confidential alumni data to
participating institutions as well as to looking at some of the major issues facing the
arts school of the 21st century.
In March 2013, we hosted a
national conference at Vanderbilt University
called 3 Million Stories: Understanding the Lives and Careers of America’s Arts Graduates. The title comes from the roughly three million arts graduates from U.S. institutions. Building on the latest research—emerging from SNAAP as well as other sources—conference participants investigated such questions as:
• Where do artists work and how do they make a living?
• Are their arts training and education relevant to their work and lives?
• What do arts graduates, and those who teach them, need to know about future trends in the artistic and creative labor market?
• How can arts institutions better serve students from less privileged backgrounds?
• What critical issues must policy makers and educational leaders address to ensure the relevance and vitality of arts degrees, programs, and schools in the future?
A sense of urgency fueled the conference: The arts education economy is rapidly transforming, accountability standards for institutions of higher learning are escalating, and deficiencies in access and equity are still plaguing the field. Within this context, participants probed issues ranging from curricular reform to institutional transformation—along the way covering such themes as the social life of the artist, mission and marketplace, the artist’s tool kit for a changing world, and the access and equity imperative. As one participant noted, “We are in the middle of a renaissance. Arts programs that help shape this new renaissance will be the ones that thrive.”
Discussions of inequality loomed particularly large for conference attendees, and it is that issue we have elected to explore in this Annual Report. For the first time, SNAAP takes a close look at differences in institutional experiences and career outcomes by gender, race/ethnicity, and socioeconomic status.
Of course, access issues in the arts begin early. Gaining an arts education is not always easy in elementary and middle schools, especially for urban and rural students in poor school districts that may or may not have music, art, theater, or dance programs. Similarly, many secondary schools in disadvantaged areas do not have the same educational resources in the arts as more affluent schools. And although many arts high schools are located in poor, urban school districts, they often require an audition for entrance. Talented teens who thrive in arts high schools (or in other youth arts training programs) may confront new barriers as they pursue college, including access to and preparation for auditions, as well as cultural and economic constraints involved with leaving home. Once enrolled in a post- secondary arts program, these students often face additional hurdles to stay in school and graduate,especially in four years. Finally, those who pursue careers as artists confront further obstacles after they complete their formal education and begin the process of “becoming a working artist.”
In this report, we document the “uneven canvas” of differences in institutional experiences and satisfaction by gender, race/ethnicity, and socioeconomic status. We analyze the barriers different groups face in
SNAAP ANNuAl RePoRt 2013 7
becoming and maintaining careers as professional artists. We also examine factors that mediate inequality, including artistic discipline, the type of sector (commercial, nonprofit, government), student debt, family background, and more. And finally, we offer a few suggestions for how arts schools might begin to “smooth the canvas” of inequalities among their students.
SNAAP data should always be put in context. While, we believe, SNAAP comprises the largest single database of information about arts graduates ever compiled, it is limited to the responses of those arts alumni who elect to complete the online questionnaire after being invited to do so at institutions that themselves have elected to participate in SNAAP. With the support of institutions that register to participate in the annual survey, the SNAAP database will continue to grow and yield new findings—both for these institutions and for the field at large. The primary author of this report is Danielle Lindemann, with whom we have had the good
fortune to work for the past two years in her role as SNAAP Postdoctoral Fellow at Vanderbilt. All of SNAAP’s publications are under the direction of Steven Tepper, SNAAP’s estimable Research Director at the Curb Center at Vanderbilt. At Indiana University, Angie Miller and Amber Lambert made valuable contributions to the report. I would like also to express my thanks to George Kuh, Founding Director of SNAAP; the members of our distinguished National Advisory Board; SNAAP staff at Indiana and Vanderbilt; and, finally, to Ellen B. Rudolph, who saw the need for SNAAP and worked collaboratively with the trustees and staff of the Surdna Foundation to make it happen.
Sally GaskillSNAAP DirectorIndiana University
SNAAP ANNuAl RePoRt 2013 8
this year’s annual report focuses on inequalities that persist in the training and careers of arts school graduates from diverse backgrounds.
In particular, the report explores gaps in school experience; career opportunities and barriers; and income based on gender, race/ethnicity, and socioeconomic status (SES). Based on the responses of 65,837 alumni who took the SNAAP survey in 2011 and 2012, we find that arts institutions afford some unique advantages for women, minorities, and lower-SES students, perhaps giving these institutions an advantage when it comes to supporting and advancing the training and careers of those who have historically faced discrimination. However, significant gaps remain and inequalities persist related to minority enrollment in postsecondary arts institutions, school debt, racial diversity within artistic occupations, and disparities in earnings by gender.
In terms of satisfaction with their experience in school, both minorities and White alumni report very high levels of overall satisfaction; between 86% and 93% of all graduates rate their overall institutional experience as good or excellent. When we look at particular experiences of alumni, however, we find meaningful gaps. Black and Hispanic students take longer to complete their degrees and generally report lower levels of satisfaction with their sense of belonging and encouragement to takes risks at their institutions.
The opportunity to network with classmates, alumni, and other artists is an important part of the undergraduate experience, influencing collaboration while at school as well as opportunities for career advancement after graduation. While only slightly more than half of alumni are generally satisfied with their opportunity to network while in school (a finding alone that might merit concern from schools), women and minorities are even less satisfied than White men. Importantly, some racial minorities report that those networks they do establish in school and after are quite influential in their success, possibly serving to mitigate some employment barriers. Graduates who come from lower-SES backgrounds, on the other hand, are less likely to report that their social network has been
important to their careers, perhaps reflecting the fact that their social networks are either generally smaller and/or contain fewer individuals with access to resources and jobs.
This report also explores which graduates work as artists at some point in their careers as well as those who currently work as professional artists. The findings demonstrate that women and minorities who attend arts school are less likely than White men to persist as artists in the workforce. Approximately 40% of SNAAP alumni who once intended to work as professional artists are no longer doing so. Women are 10% less likely than men to be working as artists. Blacks are 7% less likely than Whites to work as professional artists. Furthermore, compared to White respondents, women and Black and Hispanic alumni are much more likely to cite both lack of access to networks and debt (including student loan debt) as barriers to artistic careers. In fact, only 24% of White respondents cited debt as a barrier to their artistic careers, compared to 36% and 41% respectively for Hispanic and Black alumni.
In addition to having a greater chance of working as an artist, men also earn more money as artists. SNAAP data reveal sharp disparities in earnings by gender. Among alumni currently spending the majority of their work time in an arts-related job, men out-earn women. For example, among undergraduate-level respondents who currently work primarily within the arts, 56% of men earned more than $50,000 in the past year—compared to 36% of women.
While several key inequalities persist in the art world, examining levels of satisfaction reveals a somewhat more optimistic picture, with artistic workers from different social groups reporting relatively equal levels
executive summary
SNAAP ANNuAl RePoRt 2013 9
of satisfaction with their opportunities to be creative in their arts-related work. Importantly, several factors can either lessen or exacerbate the inequalities that do exist. These include the arts graduates’ fields and sectors of work, their levels of student loan debt, their family lives, their access to advantages such as private lessons, and their year of graduation.
Our findings show that men and women often pursue different occupational pathways, with greater proportions of men going into higher paying occupations, like architecture. Yet even within the same field, men continue to out-earn women, with a bigger gap in some fields than in others. The gap is small in interior design but large in the area of multimedia arts (including animation), for instance,
where 45% of male graduates compared to just 12% of female graduates earn more than $50,000 a year. Perhaps unexpectedly, this wage gap is still apparent for younger cohorts, who we might imagine would be less constrained than their parent’s generation by gender stereotypes.
Unsurprisingly, as mentioned above, school debt continues to be a factor that disadvantages Black
alumni more than White alumni. For Whites, having school debt does not seem to matter much in whether they persist as professional artists—about 60% of White graduates currently work as artists, regardless of whether they incurred debt. On the other hand, Blacks who carry school debt are much less likely to work as artists compared to Blacks with no debt (53% and 64%, respectively). While debt seems to affect Blacks more adversely than Whites, having had private art lessons at some point in their lives seems to benefit Blacks even more than Whites. In terms of working as professional artists, the gap between Blacks and Whites almost disappears when we consider only the advantage of having received private lessons.
While marriage and children typically exacerbate labor market inequalities in most other fields, women graduates who work in the arts seem to face no wage penalty for having children or dependents. One potential explanation for these results may be that artistic careers suit women who are juggling work and childcare comparatively well because within the arts flexible employment is pervasive.
In spite of enormous strides in recent years to become more accessible to diverse communities, arts institutions, like most American institutions, continue to face issues of inequality for their students and graduates. As demographic shifts continue to shape the composition of our schools, arts training institutions must be even more diligent in meeting the diverse needs of all students in the years to come.
SNAAP ANNuAl RePoRt 2013 10
FindingsBased on the Results of the 2011 and 2012 Strategic National Arts Alumni Project (SNAAP) Surveys
Over the last three years, the Strategic National Arts Alumni Project has collected surveys from more than 80,000 arts graduates. SNAAP’s first two annual
reports focused on dispelling many myths about arts alumni, demonstrating that
these graduates, in large part, have found meaningful employment, are satisfied with their lives, work in diverse settings, and are glad that they went to arts school. These reports also
reveal ways in which arts alumni feel their institutions could have improved
their experiences—for instance, by offering entrepreneurial and financial training and by expanding their career-related services.
This year’s report, based on the responses of 65,837 alumni who took the survey in 2011 and 2012, focuses on issues relating to inequality that all arts training institutions will need to confront. It asks whether experiences and outcomes are equal for males and females, different racial/ethnic groups, and graduates from privileged and less privileged backgrounds.
Since the arts are associated with more progressive attitudes (DiMaggio, 1996; Lipset, 1960) and alternative career structures marked by flexible employment (Menger, 1999), one might expect that the inequalities that exist in other fields would be less pronounced for arts alumni. Yet some research has suggested that inequalities by gender, race/ethnicity, and socioeconomic status (SES) persist in the arts and are sometimes even heightened. For instance, in 2011, only 7% of students enrolled in arts-focused colleges were Black or African-American—less than half the percentage of Black/African-American students at postsecondary institutions in general (18%) (National Center for Education Statistics, 2013). Furthermore, although women are more likely than men to major in the arts (National Center for Education Statistics, 2013; Zafar, 2009), data from the U.S. Census reveal that working artists are slightly more likely to be male. For example, about 54% of artists in 2000 were men, and there was no significant change by 2005 (National Endowment for the Arts, 2008). In addition, artists are less racially diverse than other professional groups. For
instance, in 2000, 78% of artists were White, compared to 66% of other professionals (Stern, 2005). Also, artists’ incomes are more unequal by gender and race than the labor force generally (Stern, 2005).
SNAAP data provide new answers to a variety of questions relating to inequality in artistic training and careers, including:• Do SNAAP respondents from different social
groups have different experiences at their institutions—experiences that might be the foundation for inequality later in life?
• Do they have different levels of satisfaction with their education?
• Which alumni go on to work as professional artists?• Do alumni encounter unequal barriers to careers in
the arts?• How is income in the arts patterned by gender,
race/ethnicity, and socioeconomic status (SES)?• How do different groups of alumni in artistic
careers rate their current job satisfaction?
Many arts graduates pursue non-arts careers in sectors such as management, law, medicine, and education—sectors where researchers have found persistent racial, ethnic, and gender inequalities in employment. Less research has established whether women and minorities in the arts face similar barriers. Hence, this report will employ SNAAP data to focus primarily on the experiences of graduates who work in the arts.1
Differences in Institutional experiences and satisfaction
[My institution] established such a strong learning environment that it made school something I loved…A truly amazing environment with some truly talented young individuals.[My] department could have been more up to date, relevant, and inclusive.2
Previous scholarship on inequalities in education indicates that underserved students, such as racial minorities and first-generation college students, have lower rates of postsecondary degree completion and
SNAAP ANNuAl RePoRt 2013 11
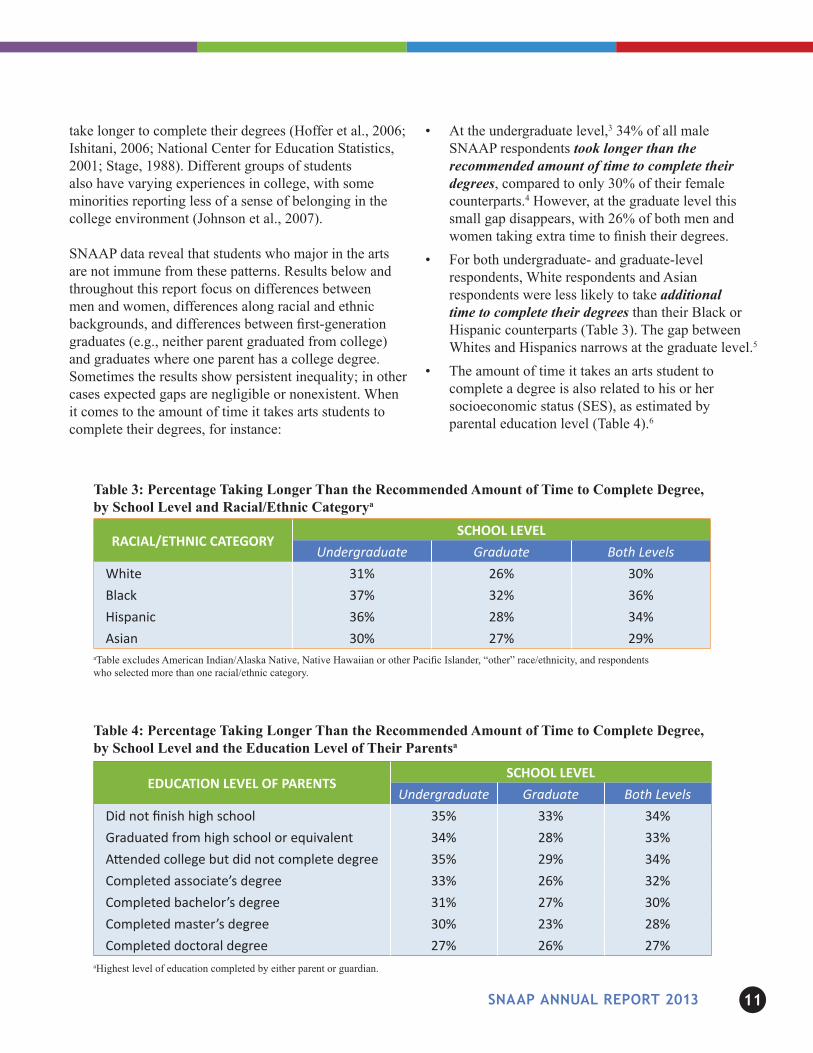
Table 3: Percentage Taking Longer Than the Recommended Amount of Time to Complete Degree, by School Level and Racial/Ethnic Categorya
RACIAL/ETHNIC CATEGORYSCHOOL LEVEL
Undergraduate Graduate Both Levels White 31% 26% 30% Black 37% 32% 36% Hispanic 36% 28% 34% Asian 30% 27% 29%
aTable excludes American Indian/Alaska Native, Native Hawaiian or other Pacific Islander, “other” race/ethnicity, and respondents who selected more than one racial/ethnic category.
Table 4: Percentage Taking Longer Than the Recommended Amount of Time to Complete Degree, by School Level and the Education Level of Their Parentsa
EDUCATION LEVEL OF PARENTSSCHOOL LEVEL
Undergraduate Graduate Both Levels Did not finish high school 35% 33% 34% Graduated from high school or equivalent 34% 28% 33% Attended college but did not complete degree 35% 29% 34% Completed associate’s degree 33% 26% 32% Completed bachelor’s degree 31% 27% 30% Completed master’s degree 30% 23% 28% Completed doctoral degree 27% 26% 27%
aHighest level of education completed by either parent or guardian.
take longer to complete their degrees (Hoffer et al., 2006; Ishitani, 2006; National Center for Education Statistics, 2001; Stage, 1988). Different groups of students also have varying experiences in college, with some minorities reporting less of a sense of belonging in the college environment (Johnson et al., 2007).
SNAAP data reveal that students who major in the arts are not immune from these patterns. Results below and throughout this report focus on differences between men and women, differences along racial and ethnic backgrounds, and differences between first-generation graduates (e.g., neither parent graduated from college) and graduates where one parent has a college degree. Sometimes the results show persistent inequality; in other cases expected gaps are negligible or nonexistent. When it comes to the amount of time it takes arts students to complete their degrees, for instance:
• At the undergraduate level,3 34% of all male SNAAP respondents took longer than the recommended amount of time to complete their degrees, compared to only 30% of their female counterparts.4 However, at the graduate level this small gap disappears, with 26% of both men and women taking extra time to finish their degrees.
• For both undergraduate- and graduate-level respondents, White respondents and Asian respondents were less likely to take additional time to complete their degrees than their Black or Hispanic counterparts (Table 3). The gap between Whites and Hispanics narrows at the graduate level.5
• The amount of time it takes an arts student to complete a degree is also related to his or her socioeconomic status (SES), as estimated by parental education level (Table 4).6
SNAAP ANNuAl RePoRt 2013 12
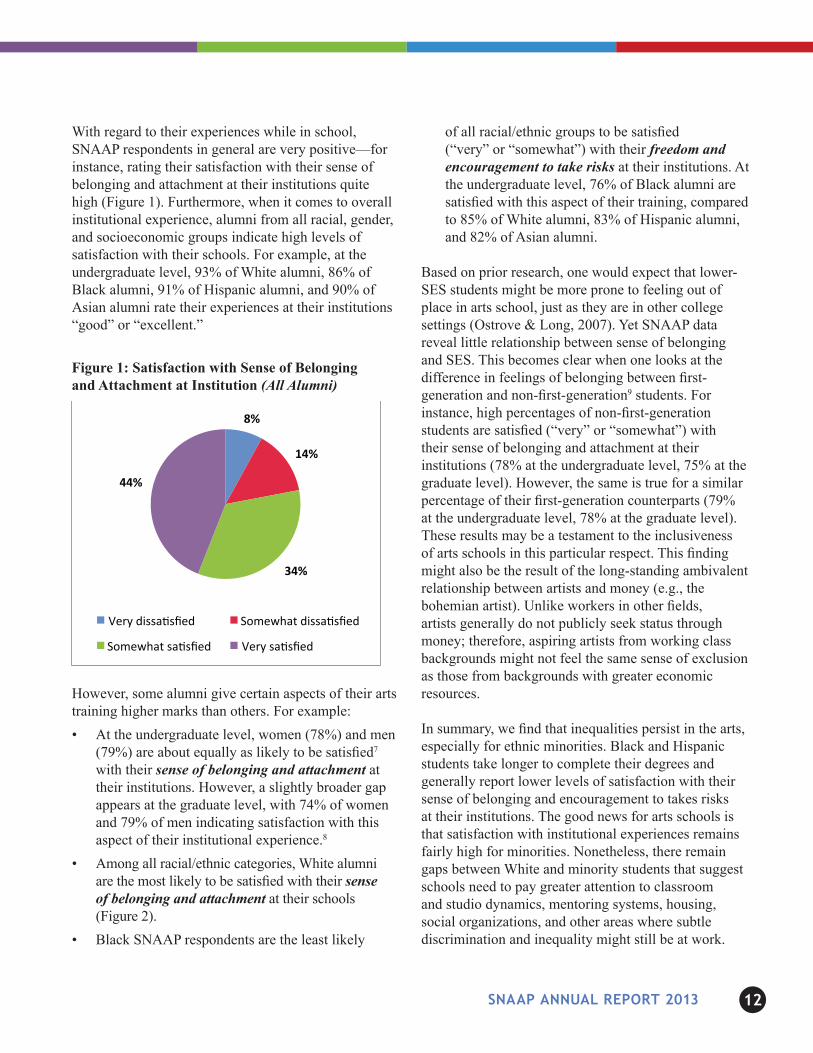
With regard to their experiences while in school, SNAAP respondents in general are very positive—for instance, rating their satisfaction with their sense of belonging and attachment at their institutions quite high (Figure 1). Furthermore, when it comes to overall institutional experience, alumni from all racial, gender, and socioeconomic groups indicate high levels of satisfaction with their schools. For example, at the undergraduate level, 93% of White alumni, 86% of Black alumni, 91% of Hispanic alumni, and 90% of Asian alumni rate their experiences at their institutions “good” or “excellent.”
However, some alumni give certain aspects of their arts training higher marks than others. For example:• At the undergraduate level, women (78%) and men
(79%) are about equally as likely to be satisfied7 with their sense of belonging and attachment at their institutions. However, a slightly broader gap appears at the graduate level, with 74% of women and 79% of men indicating satisfaction with this aspect of their institutional experience.8
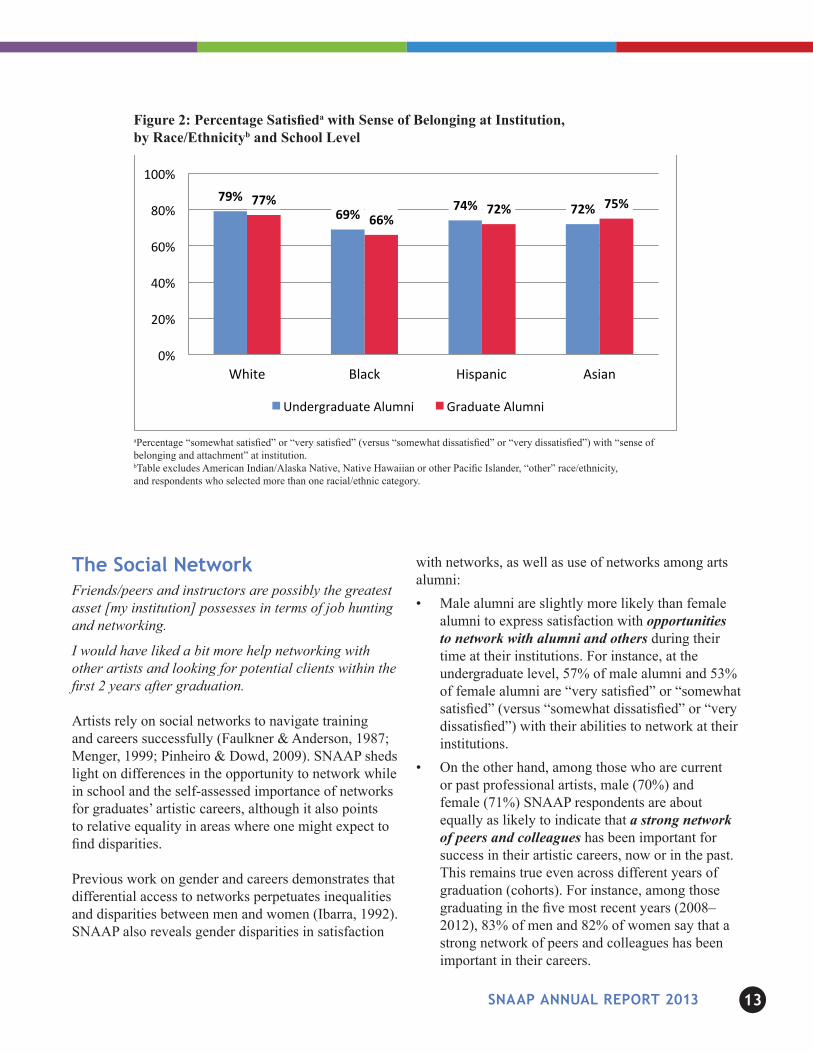
• Among all racial/ethnic categories, White alumni are the most likely to be satisfied with their sense of belonging and attachment at their schools (Figure 2).
• Black SNAAP respondents are the least likely
of all racial/ethnic groups to be satisfied (“very” or “somewhat”) with their freedom and encouragement to take risks at their institutions. At the undergraduate level, 76% of Black alumni are satisfied with this aspect of their training, compared to 85% of White alumni, 83% of Hispanic alumni, and 82% of Asian alumni.
Based on prior research, one would expect that lower-SES students might be more prone to feeling out of place in arts school, just as they are in other college settings (Ostrove & Long, 2007). Yet SNAAP data reveal little relationship between sense of belonging and SES. This becomes clear when one looks at the difference in feelings of belonging between first-generation and non-first-generation9 students. For instance, high percentages of non-first-generation students are satisfied (“very” or “somewhat”) with their sense of belonging and attachment at their institutions (78% at the undergraduate level, 75% at the graduate level). However, the same is true for a similar percentage of their first-generation counterparts (79% at the undergraduate level, 78% at the graduate level). These results may be a testament to the inclusiveness of arts schools in this particular respect. This finding might also be the result of the long-standing ambivalent relationship between artists and money (e.g., the bohemian artist). Unlike workers in other fields, artists generally do not publicly seek status through money; therefore, aspiring artists from working class backgrounds might not feel the same sense of exclusion as those from backgrounds with greater economic resources.
In summary, we find that inequalities persist in the arts, especially for ethnic minorities. Black and Hispanic students take longer to complete their degrees and generally report lower levels of satisfaction with their sense of belonging and encouragement to takes risks at their institutions. The good news for arts schools is that satisfaction with institutional experiences remains fairly high for minorities. Nonetheless, there remain gaps between White and minority students that suggest schools need to pay greater attention to classroom and studio dynamics, mentoring systems, housing, social organizations, and other areas where subtle discrimination and inequality might still be at work.
Figure 1: Satisfaction with Sense of Belonging and Attachment at Institution (All Alumni)
FIGURE HEADER: Figure 1: Satisfaction with Sense of Belonging and Attachment at Institution (All Alumni)
FIGURE HEADER: Figure 5: Satisfaction with Opportunities to Be Creative in Primary Job (Among Alumni Spending the Majority of Their Work Time within the Arts)
8%
14%
34%
44%
Very dissa*sfied Somewhat dissa*sfied
Somewhat sa*sfied Very sa*sfied
2% 7%
31%
60%
Very Dissatisfied Somewhat Dissatisfied
Somewhat Satisfied Very Satisfied
SNAAP ANNuAl RePoRt 2013 13
4
However, some alumni give certain aspects of their arts training higher marks than others. For example,
• At the undergraduate level, women (78%) and men (79%) are about equally as likely to be satisfiedvii with their sense of belonging and attachment at their institutions. However, a slightly broader gap appears at the graduate level, with 74% of women and 79% of men indicating satisfaction with this aspect of their institutional experience.viii
• Among all racial/ethnic categories, White alumni are the most likely to be satisfied with their sense of belonging and attachment at their schools (Figure 2).
• Black SNAAP respondents are the least likely of all racial/ethnic groups to be satisfied (“very” or “somewhat”) with their freedom and encouragement to take risks at their institutions. At the undergraduate level, 76% of Black alumni are satisfied with this aspect of their training, compared to 85% of White alumni, 83% of Hispanic alumni, and 82% of Asian alumni.
FIGURE HEADER: Figure 2: Percentage Satisfieda with Sense of Belonging at Institution, by Race/Ethnicityb and School Level
FIGURE FOOTNOTES: aPercentage “somewhat satisfied” or “very satisfied” (versus “somewhat dissatisfied” or “very dissatisfied”) with “sense of belonging and attachment” at institution. bTable excludes American Indian/Alaska Native, Native Hawaiian or other Pacific Islander, “other” race/ethnicity, and respondents who selected more than one racial/ethnic category. Based on prior research, one would expect that lower-SES students might be more prone to feeling out of place in arts school, just as they are in other college settings (Ostrove & Long, 2007). Yet SNAAP data reveal little relationship between sense of belonging and SES. This becomes clear when one looks at the difference in feelings of belonging between first-generation and non-first-generationix students. For instance, high percentages of non-first-generation students are satisfied (“very” or “somewhat”) with their sense of belonging and attachment at their institutions (78% at the undergraduate level, 75% at the graduate level). However, the same is true for a similar percentage of their first-generation counterparts (79% at the undergraduate
79% 69%
74% 72% 77%
66% 72% 75%
0%
20%
40%
60%
80%
100%
White Black Hispanic Asian
Undergraduate Alumni Graduate Alumni
aPercentage “somewhat satisfied” or “very satisfied” (versus “somewhat dissatisfied” or “very dissatisfied”) with “sense of belonging and attachment” at institution.bTable excludes American Indian/Alaska Native, Native Hawaiian or other Pacific Islander, “other” race/ethnicity, and respondents who selected more than one racial/ethnic category.
Figure 2: Percentage Satisfieda with Sense of Belonging at Institution, by Race/Ethnicityb and School Level
the social networkFriends/peers and instructors are possibly the greatest asset [my institution] possesses in terms of job hunting and networking.
I would have liked a bit more help networking with other artists and looking for potential clients within the first 2 years after graduation.
Artists rely on social networks to navigate training and careers successfully (Faulkner & Anderson, 1987; Menger, 1999; Pinheiro & Dowd, 2009). SNAAP sheds light on differences in the opportunity to network while in school and the self-assessed importance of networks for graduates’ artistic careers, although it also points to relative equality in areas where one might expect to find disparities.
Previous work on gender and careers demonstrates that differential access to networks perpetuates inequalities and disparities between men and women (Ibarra, 1992). SNAAP also reveals gender disparities in satisfaction
with networks, as well as use of networks among arts alumni:• Male alumni are slightly more likely than female
alumni to express satisfaction with opportunities to network with alumni and others during their time at their institutions. For instance, at the undergraduate level, 57% of male alumni and 53% of female alumni are “very satisfied” or “somewhat satisfied” (versus “somewhat dissatisfied” or “very dissatisfied”) with their abilities to network at their institutions.
• On the other hand, among those who are current or past professional artists, male (70%) and female (71%) SNAAP respondents are about equally as likely to indicate that a strong network of peers and colleagues has been important for success in their artistic careers, now or in the past. This remains true even across different years of graduation (cohorts). For instance, among those graduating in the five most recent years (2008–2012), 83% of men and 82% of women say that a strong network of peers and colleagues has been important in their careers.
SNAAP ANNuAl RePoRt 2013 14
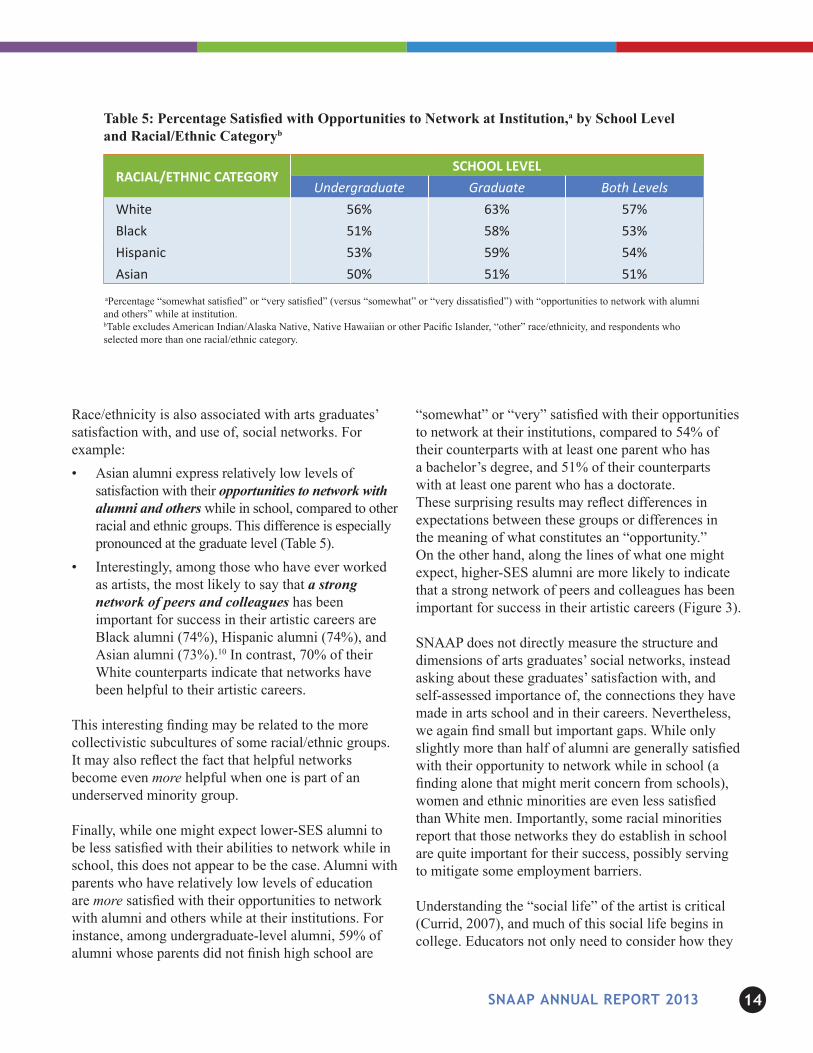
Table 5: Percentage Satisfied with Opportunities to Network at Institution,a by School Level and Racial/Ethnic Categoryb
RACIAL/ETHNIC CATEGORYSCHOOL LEVEL
Undergraduate Graduate Both Levels White 56% 63% 57% Black 51% 58% 53% Hispanic 53% 59% 54% Asian 50% 51% 51%
aPercentage “somewhat satisfied” or “very satisfied” (versus “somewhat” or “very dissatisfied”) with “opportunities to network with alumni and others” while at institution.bTable excludes American Indian/Alaska Native, Native Hawaiian or other Pacific Islander, “other” race/ethnicity, and respondents who selected more than one racial/ethnic category.
Race/ethnicity is also associated with arts graduates’ satisfaction with, and use of, social networks. For example:• Asian alumni express relatively low levels of
satisfaction with their opportunities to network with alumni and others while in school, compared to other racial and ethnic groups. This difference is especially pronounced at the graduate level (Table 5).
• Interestingly, among those who have ever worked as artists, the most likely to say that a strong network of peers and colleagues has been important for success in their artistic careers are Black alumni (74%), Hispanic alumni (74%), and Asian alumni (73%).10 In contrast, 70% of their White counterparts indicate that networks have been helpful to their artistic careers.
This interesting finding may be related to the more collectivistic subcultures of some racial/ethnic groups. It may also reflect the fact that helpful networks become even more helpful when one is part of an underserved minority group.
Finally, while one might expect lower-SES alumni to be less satisfied with their abilities to network while in school, this does not appear to be the case. Alumni with parents who have relatively low levels of education are more satisfied with their opportunities to network with alumni and others while at their institutions. For instance, among undergraduate-level alumni, 59% of alumni whose parents did not finish high school are
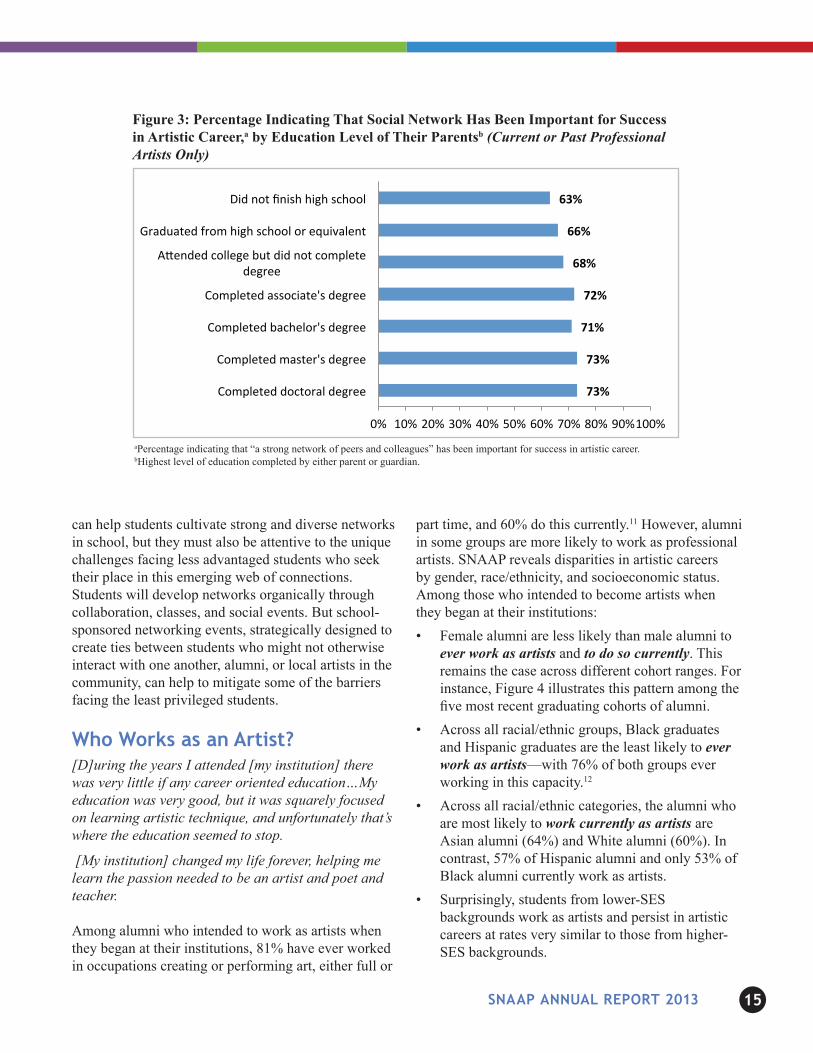
“somewhat” or “very” satisfied with their opportunities to network at their institutions, compared to 54% of their counterparts with at least one parent who has a bachelor’s degree, and 51% of their counterparts with at least one parent who has a doctorate. These surprising results may reflect differences in expectations between these groups or differences in the meaning of what constitutes an “opportunity.” On the other hand, along the lines of what one might expect, higher-SES alumni are more likely to indicate that a strong network of peers and colleagues has been important for success in their artistic careers (Figure 3).
SNAAP does not directly measure the structure and dimensions of arts graduates’ social networks, instead asking about these graduates’ satisfaction with, and self-assessed importance of, the connections they have made in arts school and in their careers. Nevertheless, we again find small but important gaps. While only slightly more than half of alumni are generally satisfied with their opportunity to network while in school (a finding alone that might merit concern from schools), women and ethnic minorities are even less satisfied than White men. Importantly, some racial minorities report that those networks they do establish in school are quite important for their success, possibly serving to mitigate some employment barriers.
Understanding the “social life” of the artist is critical (Currid, 2007), and much of this social life begins in college. Educators not only need to consider how they
SNAAP ANNuAl RePoRt 2013 15
can help students cultivate strong and diverse networks in school, but they must also be attentive to the unique challenges facing less advantaged students who seek their place in this emerging web of connections. Students will develop networks organically through collaboration, classes, and social events. But school-sponsored networking events, strategically designed to create ties between students who might not otherwise interact with one another, alumni, or local artists in the community, can help to mitigate some of the barriers facing the least privileged students.
Who Works as an Artist?[D]uring the years I attended [my institution] there was very little if any career oriented education…My education was very good, but it was squarely focused on learning artistic technique, and unfortunately that’s where the education seemed to stop.
[My institution] changed my life forever, helping me learn the passion needed to be an artist and poet and teacher.
Among alumni who intended to work as artists when they began at their institutions, 81% have ever worked in occupations creating or performing art, either full or
part time, and 60% do this currently.11 However, alumni in some groups are more likely to work as professional artists. SNAAP reveals disparities in artistic careers by gender, race/ethnicity, and socioeconomic status. Among those who intended to become artists when they began at their institutions:• Female alumni are less likely than male alumni to
ever work as artists and to do so currently. This remains the case across different cohort ranges. For instance, Figure 4 illustrates this pattern among the five most recent graduating cohorts of alumni.
• Across all racial/ethnic groups, Black graduates and Hispanic graduates are the least likely to ever work as artists—with 76% of both groups ever working in this capacity.12
• Across all racial/ethnic categories, the alumni who are most likely to work currently as artists are Asian alumni (64%) and White alumni (60%). In contrast, 57% of Hispanic alumni and only 53% of Black alumni currently work as artists.
• Surprisingly, students from lower-SES backgrounds work as artists and persist in artistic careers at rates very similar to those from higher-SES backgrounds.
7
FIGURE HEADER: Figure 3: Percentage Indicating That Social Network Has Been Important for Success in Artistic Career,a by Education Level of Their Parentsb (Current or Past Professional Artists Only)
FIGURE FOOTNOTES: aPercentage indicating that “a strong network of peers and colleagues” has been important for success in artistic career. bHighest level of education completed by either parent or guardian. SNAAP does not directly measure the structure and dimensions of arts graduates’ social networks, instead asking about these graduates’ satisfaction with, and self-assessed importance of, the connections they have made in arts school and in their careers. Nevertheless, we again find small but important gaps. While only slightly more than half of alumni are generally satisfied with their opportunity to network while in school (a finding alone that might merit concern from schools), women and ethnic minorities are even less satisfied than White men. Importantly, some racial minorities report that those networks they do establish in school are quite important for their success, possibly serving to mitigate some employment barriers. Understanding the “social life” of the artist is critical (Currid, 2007), and much of this social life begins in college. Educators not only need to consider how they can help students cultivate strong and diverse networks in school, but they must also be attentive to the unique challenges facing less advantaged students who seek their place in this emerging web of connections. Students will develop networks organically through collaboration, classes, and social events. But, school-sponsored networking events, strategically designed to create ties between students who might not otherwise interact with one another, alumni, or local artists in the community, can help to mitigate some of the barriers facing the least privileged students. HEADER: Who Works as an Artist? [D]uring the years I attended [my institution] there was very little if any career oriented education…My education was very good, but it was squarely focused on learning artistic technique, and unfortunately that’s where the education seemed to stop.
73%
73%
71%
72%
68%
66%
63%
0% 10% 20% 30% 40% 50% 60% 70% 80% 90% 100%
Completed doctoral degree
Completed master's degree
Completed bachelor's degree
Completed associate's degree
AQended college but did not complete degree
Graduated from high school or equivalent
Did not finish high school
Figure 3: Percentage Indicating That Social Network Has Been Important for Success in Artistic Career,a by Education Level of Their Parentsb (Current or Past Professional Artists Only)
aPercentage indicating that “a strong network of peers and colleagues” has been important for success in artistic career.bHighest level of education completed by either parent or guardian.
SNAAP ANNuAl RePoRt 2013 16
8
[My institution] changed my life forever, helping me learn the passion needed to be an artist and poet and teacher. Among alumni who intended to work as artists when they began at their institutions, 81% have ever worked in occupations creating or performing art, either full or part time, and 60% do this currently.xi However, alumni in some groups are more likely to work as professional artists. SNAAP reveals disparities in artistic careers by gender, race/ethnicity, and socioeconomic status. Among those who intended to become artists when they began at their institutions,
• Female alumni are less likely than male alumni to ever work as artists and to do so currently. This remains the case across different cohort ranges. For instance, Figure 4 illustrates this pattern among the five most recent graduating cohorts of alumni.
• Across all racial/ethnic groups, Black graduates and Hispanic graduates are the least likely to ever work as artists—with 76% of both groups ever working in this capacity.xii
• Across all racial/ethnic categories, the alumni who are most likely to work currently as artists are Asian alumni (64%) and White alumni (60%). In contrast, 57% of Hispanic alumni and only 53% of Black alumni currently work as artists.
• Surprisingly, students from lower-SES backgrounds work as artists and persist in artistic careers at rates very similar to those from higher-SES backgrounds.
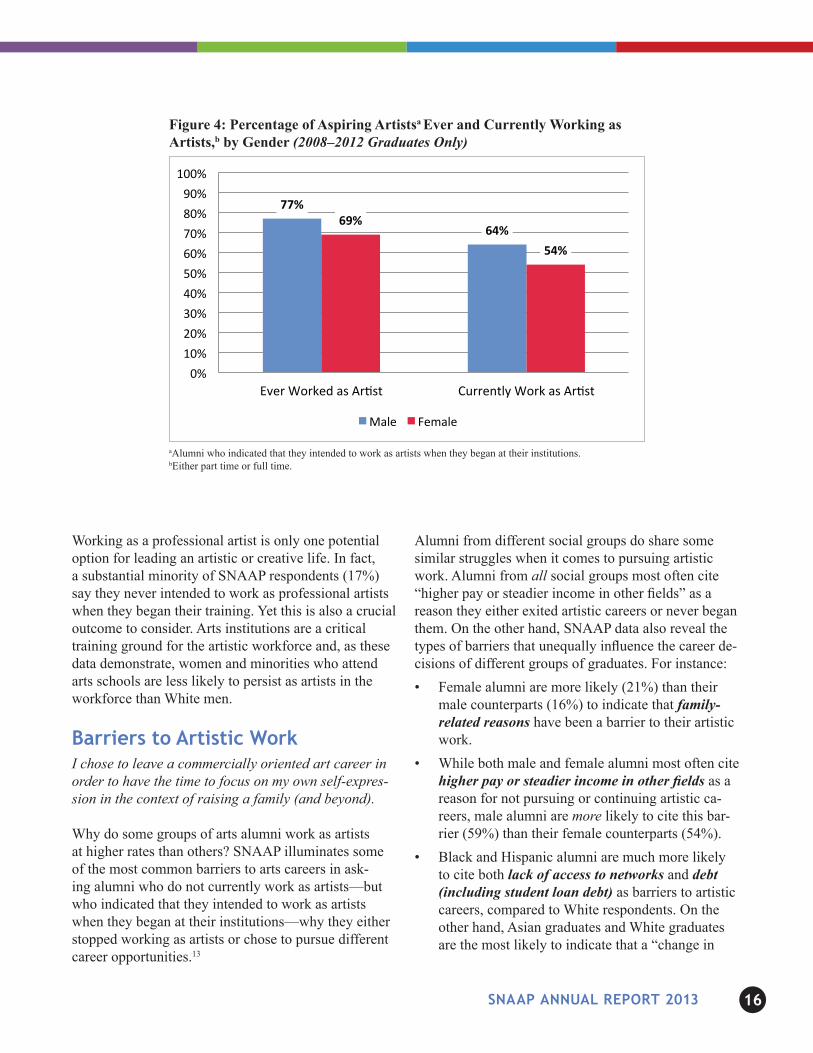
FIGURE HEADER: Figure 4: Percentage of Aspiring Artistsa Ever and Currently Working as Artists,b by Gender (2008–2012 Graduates Only)
FIGURE FOOTNOTES: aAlumni who indicated that they intended to work as artists when they began at their institutions. bEither part time or full time. Working as a professional artist is only one potential option for leading an artistic or creative life. In fact, a substantial minority of SNAAP respondents (17%) say they never intended to work as professional artists when they began their training. Yet this is also a crucial outcome to consider. Arts institutions are a critical training ground for the artistic workforce and, as these data demonstrate, women and minorities who attend arts schools are less likely to persist as artists in the workforce than White men.
77%
64% 69%
54%
0% 10% 20% 30% 40% 50% 60% 70% 80% 90%
100%
Ever Worked as ArLst Currently Work as ArLst
Male Female
Figure 4: Percentage of Aspiring Artistsa Ever and Currently Working as Artists,b by Gender (2008–2012 Graduates Only)
aAlumni who indicated that they intended to work as artists when they began at their institutions.bEither part time or full time.
Working as a professional artist is only one potential option for leading an artistic or creative life. In fact, a substantial minority of SNAAP respondents (17%) say they never intended to work as professional artists when they began their training. Yet this is also a crucial outcome to consider. Arts institutions are a critical training ground for the artistic workforce and, as these data demonstrate, women and minorities who attend arts schools are less likely to persist as artists in the workforce than White men.
Barriers to Artistic WorkI chose to leave a commercially oriented art career in order to have the time to focus on my own self-expres-sion in the context of raising a family (and beyond).
Why do some groups of arts alumni work as artists at higher rates than others? SNAAP illuminates some of the most common barriers to arts careers in ask-ing alumni who do not currently work as artists—but who indicated that they intended to work as artists when they began at their institutions—why they either stopped working as artists or chose to pursue different career opportunities.13
Alumni from different social groups do share some similar struggles when it comes to pursuing artistic work. Alumni from all social groups most often cite “higher pay or steadier income in other fields” as a reason they either exited artistic careers or never began them. On the other hand, SNAAP data also reveal the types of barriers that unequally influence the career de-cisions of different groups of graduates. For instance:• Female alumni are more likely (21%) than their
male counterparts (16%) to indicate that family-related reasons have been a barrier to their artistic work.
• While both male and female alumni most often cite higher pay or steadier income in other fields as a reason for not pursuing or continuing artistic ca-reers, male alumni are more likely to cite this bar-rier (59%) than their female counterparts (54%).
• Black and Hispanic alumni are much more likely to cite both lack of access to networks and debt (including student loan debt) as barriers to artistic careers, compared to White respondents. On the other hand, Asian graduates and White graduates are the most likely to indicate that a “change in
SNAAP ANNuAl RePoRt 2013 17
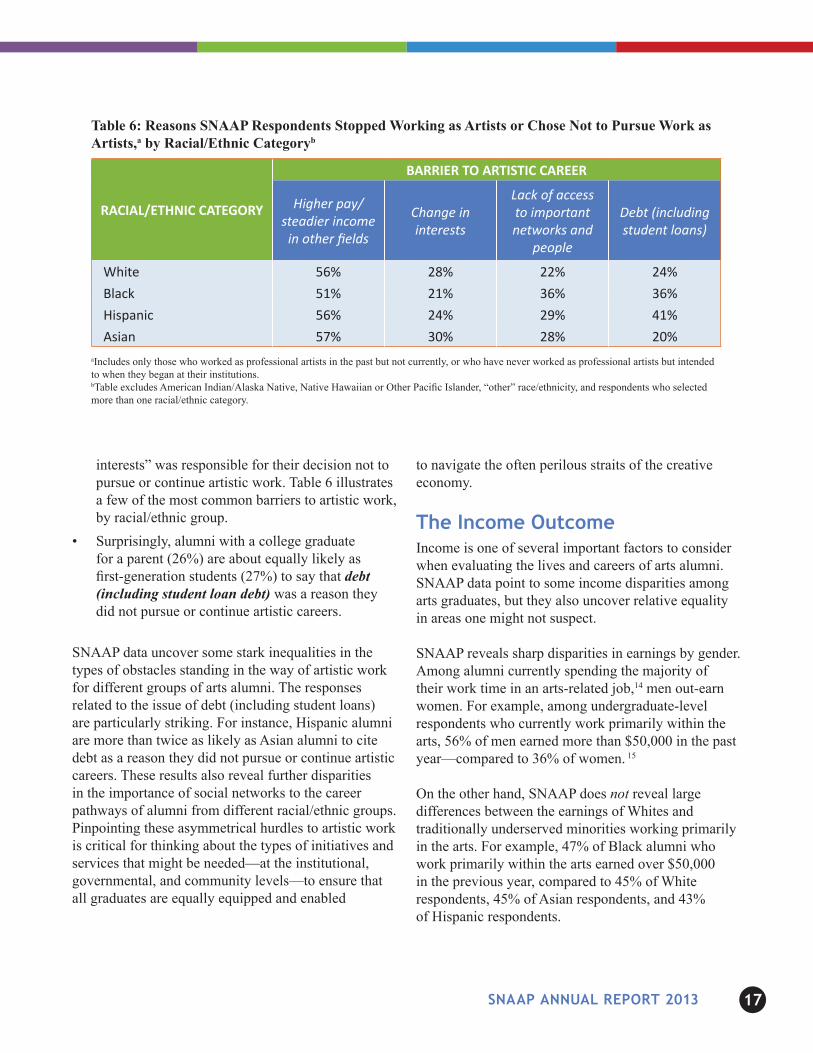
Table 6: Reasons SNAAP Respondents Stopped Working as Artists or Chose Not to Pursue Work as Artists,a by Racial/Ethnic Categoryb
RACIAL/ETHNIC CATEGORY
BARRIER TO ARTISTIC CAREER
Higher pay/steadier income in other fields
Change in interests
Lack of access to important networks and
people
Debt (including student loans)
White 56% 28% 22% 24% Black 51% 21% 36% 36% Hispanic 56% 24% 29% 41% Asian 57% 30% 28% 20%
aIncludes only those who worked as professional artists in the past but not currently, or who have never worked as professional artists but intended to when they began at their institutions.bTable excludes American Indian/Alaska Native, Native Hawaiian or Other Pacific Islander, “other” race/ethnicity, and respondents who selected more than one racial/ethnic category.
interests” was responsible for their decision not to pursue or continue artistic work. Table 6 illustrates a few of the most common barriers to artistic work, by racial/ethnic group.
• Surprisingly, alumni with a college graduate for a parent (26%) are about equally likely as first-generation students (27%) to say that debt (including student loan debt) was a reason they did not pursue or continue artistic careers.
SNAAP data uncover some stark inequalities in the types of obstacles standing in the way of artistic work for different groups of arts alumni. The responses related to the issue of debt (including student loans) are particularly striking. For instance, Hispanic alumni are more than twice as likely as Asian alumni to cite debt as a reason they did not pursue or continue artistic careers. These results also reveal further disparities in the importance of social networks to the career pathways of alumni from different racial/ethnic groups. Pinpointing these asymmetrical hurdles to artistic work is critical for thinking about the types of initiatives and services that might be needed—at the institutional, governmental, and community levels—to ensure that all graduates are equally equipped and enabled
to navigate the often perilous straits of the creative economy.
the Income outcomeIncome is one of several important factors to consider when evaluating the lives and careers of arts alumni. SNAAP data point to some income disparities among arts graduates, but they also uncover relative equality in areas one might not suspect.
SNAAP reveals sharp disparities in earnings by gender. Among alumni currently spending the majority of their work time in an arts-related job,14 men out-earn women. For example, among undergraduate-level respondents who currently work primarily within the arts, 56% of men earned more than $50,000 in the past year—compared to 36% of women. 15
On the other hand, SNAAP does not reveal large differences between the earnings of Whites and traditionally underserved minorities working primarily in the arts. For example, 47% of Black alumni who work primarily within the arts earned over $50,000 in the previous year, compared to 45% of White respondents, 45% of Asian respondents, and 43% of Hispanic respondents.
SNAAP ANNuAl RePoRt 2013 18
One potential explanation for this seemingly unexpected result may lie in the substantial barriers to artistic work that traditionally underserved students encounter. Perhaps the more tenacious and talented alumni are able to transcend these barriers, creating a kind of “selection effect”—with minority students who do “make it” in artistic careers, as a whole, comparatively better qualified perhaps than their nonminority counterparts. It is also possible that White alumni have broader access to financial resources, potentially enabling them to choose jobs that may not pay as well.
Another possible explanation may lie in the number of jobs worked by alumni in each racial/ethnic group. Some minorities who work in the arts are more likely than their White counterparts to be currently working in two or more jobs. Among those spending the majority of their work time in an arts-related job, 43% of Whites work at multiple jobs—compared to 48% of Blacks, 44% of Hispanics, and 39% of Asians. Thus, while Black alumni seem to be earning almost the same as Whites, some may be taking on additional jobs to accumulate the same amount of money.
Finally, these results may be related to the types of jobs in which arts graduates from different social groups end up working. Minority graduates may be more likely to go into more commercially oriented and higher paying careers, such as web design or graphic arts. For instance, among all SNAAP respondents who currently spend the majority of their work time as fine artists, 14% are non-White. However, among those spending the majority of their work time as web designers, 18% are non-White.
Regardless, one should be wary of interpreting these intriguing results as evidence of a lack of discrimination within the arts, particularly since SNAAP reveals that traditionally underserved groups of alumni are less likely to become artists. These data provide an important stepping stone for future work evaluating income disparities in the arts—for instance, drawing more fine-grained comparisons within specific
artistic occupations and considering how employment and wage gaps change over the life course.
Job satisfactionAll I can say is that I’m lucky to have pursued the life I have. I do have a good life. It is not an easy life being an artist, but it has a lot of advantages.
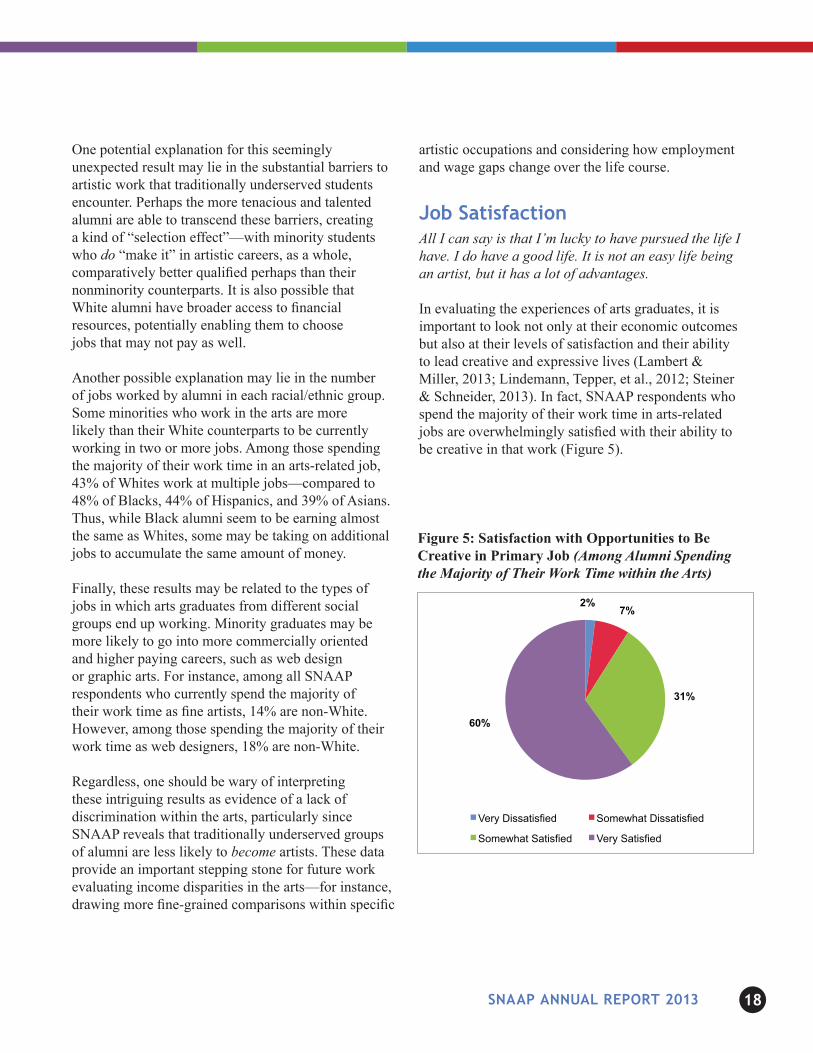
In evaluating the experiences of arts graduates, it is important to look not only at their economic outcomes but also at their levels of satisfaction and their ability to lead creative and expressive lives (Lambert & Miller, 2013; Lindemann, Tepper, et al., 2012; Steiner & Schneider, 2013). In fact, SNAAP respondents who spend the majority of their work time in arts-related jobs are overwhelmingly satisfied with their ability to be creative in that work (Figure 5).
Figure 5: Satisfaction with Opportunities to Be Creative in Primary Job (Among Alumni Spending the Majority of Their Work Time within the Arts)
FIGURE HEADER: Figure 1: Satisfaction with Sense of Belonging and Attachment at Institution (All Alumni)
FIGURE HEADER: Figure 5: Satisfaction with Opportunities to Be Creative in Primary Job (Among Alumni Spending the Majority of Their Work Time within the Arts)
8%
14%
34%
44%
Very dissa*sfied Somewhat dissa*sfied
Somewhat sa*sfied Very sa*sfied
2% 7%
31%
60%
Very Dissatisfied Somewhat Dissatisfied
Somewhat Satisfied Very Satisfied
SNAAP ANNuAl RePoRt 2013 19
Job satisfaction appears to be universal for arts alumni, regardless of gender, race/ethnicity, or parental level of education. Among graduates who currently spend the majority of their work time in an arts-related job:• Male and female alumni indicate roughly equal
levels of satisfaction with their ability to be creative in these jobs. These patterns are apparent even across different cohort ranges. For instance, among alumni who graduated between 2008 and 2012, 86% of men and 87% of women are satisfied with their ability to be creative in their primary job.
• Ninety-one percent of White alumni, 89% of Hispanic alumni, 89% of Black alumni, and 88% of Asian alumni say that they are “very” or “somewhat” satisfied with their ability to be creative in the arts job where they spend the majority of their work time.
• Ninety-two percent of first-generation students, and 91% of alumni with a college graduate for a parent, are “somewhat” or “very” satisfied with their ability to be creative at their primary job.
These results reveal why it is crucial to explore artistic workers’ happiness and quality of life in addition to their salaries and employment histories. While several key inequalities persist in the art world, examining levels of satisfaction reveals a somewhat more optimistic picture, with artistic workers from different social groups reporting relatively equal levels of satisfaction with their opportunities to be creative in their arts-related work.
What Matters?—Factors that Mediate InequalityArts alumni of different genders, races/ethnicities, and socioeconomic statuses experience inequalities in a variety of different outcomes such as their levels of satisfaction with their institutional experiences, their social network connections, whether or not they have ever worked as artists, and how much they earn in artistic careers. Yet several factors can lessen or exacerbate these inequalities. These include the arts graduates’ fields and sectors of work, their levels of student loan debt, their family lives, their access to advantages such as private lessons, and their year of graduation.
Field MattersDifferences in the artistic fields in which different arts alumni work partially account for some disparities between groups. A variety of social and individual forces drive alumni from different groups to major in different disciplines and pursue work in different types of occupations. For instance, among graduates from 2008–2012 who work primarily in the arts, 4% of females work primarily as musicians, compared to 10% of males. In contrast, 8% of females work primarily as arts administrators or managers, compared to 4% of males.
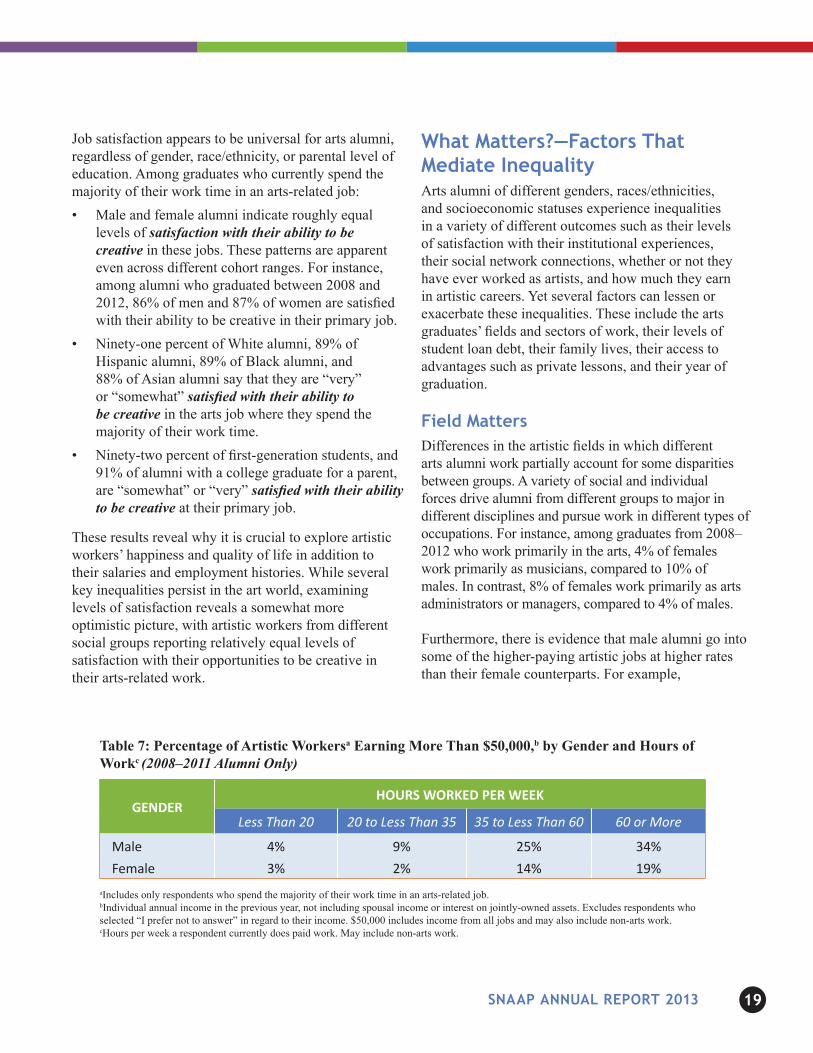
Furthermore, there is evidence that male alumni go into some of the higher-paying artistic jobs at higher rates than their female counterparts. For example,
Table 7: Percentage of Artistic Workersa Earning More Than $50,000,b by Gender and Hours of Workc (2008–2011 Alumni Only)
GENDERHOURS WORKED PER WEEK
Less Than 20 20 to Less Than 35 35 to Less Than 60 60 or More
Male 4% 9% 25% 34% Female 3% 2% 14% 19%
aIncludes only respondents who spend the majority of their work time in an arts-related job.bIndividual annual income in the previous year, not including spousal income or interest on jointly-owned assets. Excludes respondents who selected “I prefer not to answer” in regard to their income. $50,000 includes income from all jobs and may also include non-arts work.cHours per week a respondent currently does paid work. May include non-arts work.
SNAAP ANNuAl RePoRt 2013 20
males are more likely than females to work primarily as architects, a relatively well-paying artistic occupation.16 These patterns are apparent even across different cohort ranges. For instance, among graduates from the five most recent years (2008–2012) who work primarily within the arts, 5% of male SNAAP respondents currently work primarily as architects, compared to 2% of females. Yet field differences are not the sole reason for the gender income gap, as these disparities persist even within fields. For instance, among alumni who graduated between 2008 and 2011 and work primarily as architects, 21% of men but only 16% of women earned more than $50,000 in the prior year.17
Field also matters in the sense that in some occupations these gendered income gaps are wider than in others. Among alumni graduating between 2008 and 2011 who work primarily within the arts, 20% of males and 10% of females earned over $50,000 in the previous year. However, among graduates from these years who spend the majority of their work time as interior designers, this gap narrows, with 13% of males and 9% of females earning over $50,000. On the other hand, the widest gender gap within the arts occurs among those who work as multimedia artists or animators. Forty-five percent of male graduates from 2008–2011
who work primarily within this field earned more than $50,000 in the prior year—compared to only 14% of females.
Finally, these gender gaps in income remain when controlling18 for the number of hours an arts graduate works. For instance, among recent alumni who work primarily within the arts and work 60 or more hours per week, 34% of males earned $50,000 in the previous year—compared to 19% of females (Table 7). Female SNAAP respondents do not earn less money in the arts simply because they work in different jobs from male SNAAP respondents or because they are working fewer hours. While differences between men and women in field and hours worked account for some of the income disparity between male and female artistic workers, these results suggest that there are additional barriers, such as discrimination, that continue to stand in the way of gender equality.
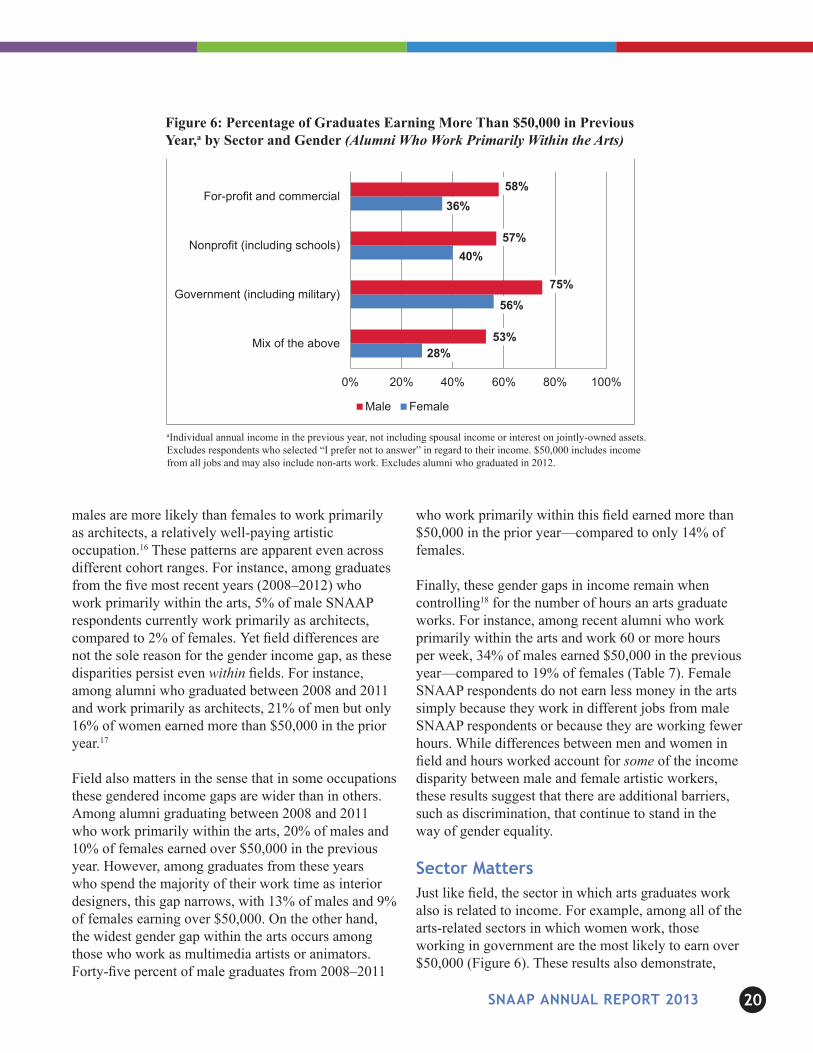
sector MattersJust like field, the sector in which arts graduates work also is related to income. For example, among all of the arts-related sectors in which women work, thoseworking in government are the most likely to earn over $50,000 (Figure 6). These results also demonstrate,
28%
56%
40%
36%
53%
75%
57%
58%
0% 20% 40% 60% 80% 100%
Mix of the above
Government (including military)
Nonprofit (including schools)
For-profit and commercial
Male Female
Figure 6: Percentage of Graduates Earning More Than $50,000 in Previous Year,a by Sector and Gender (Alumni Who Work Primarily Within the Arts)
aIndividual annual income in the previous year, not including spousal income or interest on jointly-owned assets. Excludes respondents who selected “I prefer not to answer” in regard to their income. $50,000 includes income from all jobs and may also include non-arts work. Excludes alumni who graduated in 2012.
SNAAP ANNuAl RePoRt 2013 21
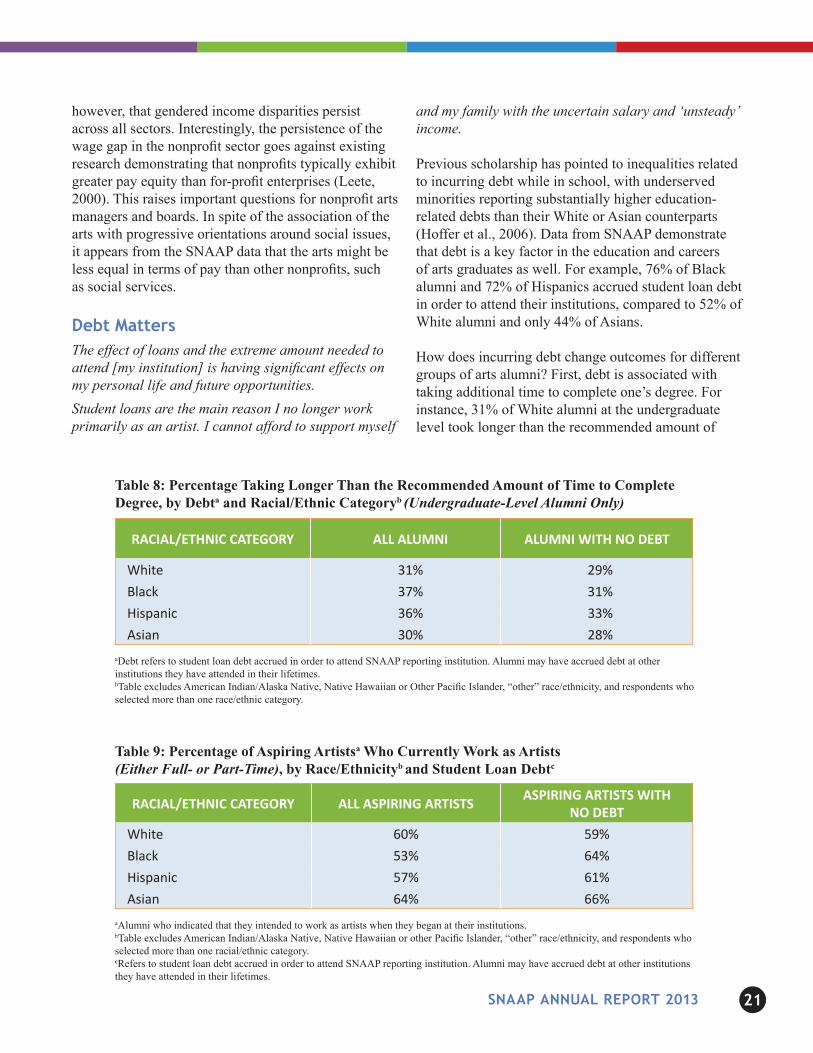
Table 8: Percentage Taking Longer Than the Recommended Amount of Time to Complete Degree, by Debta and Racial/Ethnic Categoryb (Undergraduate-Level Alumni Only)
RACIAL/ETHNIC CATEGORY ALL ALUMNI ALUMNI WITH NO DEBT
White 31% 29% Black 37% 31% Hispanic 36% 33% Asian 30% 28%
aDebt refers to student loan debt accrued in order to attend SNAAP reporting institution. Alumni may have accrued debt at other institutions they have attended in their lifetimes.bTable excludes American Indian/Alaska Native, Native Hawaiian or Other Pacific Islander, “other” race/ethnicity, and respondents who selected more than one race/ethnic category.
Table 9: Percentage of Aspiring Artistsa Who Currently Work as Artists (Either Full- or Part-Time), by Race/Ethnicityb and Student Loan Debtc
RACIAL/ETHNIC CATEGORY ALL ASPIRING ARTISTS ASPIRING ARTISTS WITH NO DEBT
White 60% 59% Black 53% 64% Hispanic 57% 61% Asian 64% 66%
aAlumni who indicated that they intended to work as artists when they began at their institutions.bTable excludes American Indian/Alaska Native, Native Hawaiian or other Pacific Islander, “other” race/ethnicity, and respondents who selected more than one racial/ethnic category.cRefers to student loan debt accrued in order to attend SNAAP reporting institution. Alumni may have accrued debt at other institutions they have attended in their lifetimes.
however, that gendered income disparities persist across all sectors. Interestingly, the persistence of the wage gap in the nonprofit sector goes against existing research demonstrating that nonprofits typically exhibit greater pay equity than for-profit enterprises (Leete, 2000). This raises important questions for nonprofit arts managers and boards. In spite of the association of the arts with progressive orientations around social issues, it appears from the SNAAP data that the arts might be less equal in terms of pay than other nonprofits, such as social services.
Debt MattersThe effect of loans and the extreme amount needed to attend [my institution] is having significant effects on my personal life and future opportunities.Student loans are the main reason I no longer work primarily as an artist. I cannot afford to support myself
and my family with the uncertain salary and ‘unsteady’ income.
Previous scholarship has pointed to inequalities related to incurring debt while in school, with underserved minorities reporting substantially higher education-related debts than their White or Asian counterparts (Hoffer et al., 2006). Data from SNAAP demonstrate that debt is a key factor in the education and careers of arts graduates as well. For example, 76% of Black alumni and 72% of Hispanics accrued student loan debt in order to attend their institutions, compared to 52% of White alumni and only 44% of Asians.
How does incurring debt change outcomes for different groups of arts alumni? First, debt is associated with taking additional time to complete one’s degree. For instance, 31% of White alumni at the undergraduate level took longer than the recommended amount of
SNAAP ANNuAl RePoRt 2013 22
time to complete their degrees, compared to 37% of Black alumni and 36% of Hispanics. However, among alumni who did not accrue any student loan debt at their institutions, these gaps narrow (Table 8). These results suggest that at least part of the gaps in time-to-degree related to race/ethnicity may be explained by White students’ generally greater access to financial resources.
Secondly, student loan debt is related to differences in which groups of alumni are more likely to work as artists. For instance, among those who intended to work as artists when they began at their institutions, 60% of White alumni currently work as artists, compared to 53% of Black alumni and 57% of Hispanic alumni. However, among aspiring artists who accrued no student loan debt at their institutions, Black respondents and Hispanic graduates are no less likely (and in fact are somewhat more likely) to work currently as artists than White graduates (Table 9).
These results uncover important information about the salience of debt as a potential factor blocking the pathway to artistic work. But, Table 9 also reveals that Blacks who have school debt might be at an even greater disadvantage than Whites who carry debt. For Whites, having school debt does not seem to matter much in whether they persist as professional artists—about 60% of White graduates currently work as artists, regardless of whether they incurred debt. On the other hand, Blacks who carry school debt are much less
likely to work as artists compared to Blacks with no debt (53% and 64%, respectively). Further research is necessary to understand why debt is a greater burden for Blacks than for Whites, but such a finding fits with theories of cumulative disadvantage, where multiple sources of disadvantage—financial resources, social exclusion, access, and exposure—build up and reinforce one another over time (Angela, 1996).
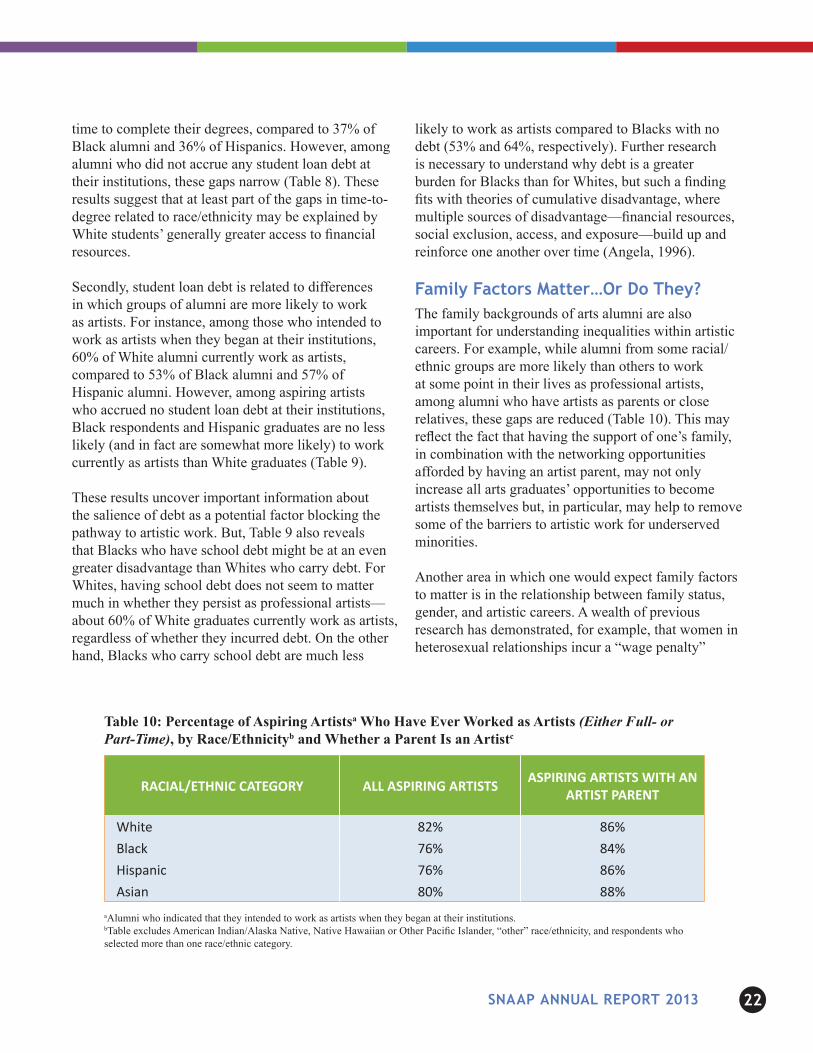
Family Factors Matter…or Do they?The family backgrounds of arts alumni are also important for understanding inequalities within artistic careers. For example, while alumni from some racial/ethnic groups are more likely than others to work at some point in their lives as professional artists, among alumni who have artists as parents or close relatives, these gaps are reduced (Table 10). This may reflect the fact that having the support of one’s family, in combination with the networking opportunities afforded by having an artist parent, may not only increase all arts graduates’ opportunities to become artists themselves but, in particular, may help to remove some of the barriers to artistic work for underserved minorities.
Another area in which one would expect family factors to matter is in the relationship between family status, gender, and artistic careers. A wealth of previous research has demonstrated, for example, that women in heterosexual relationships incur a “wage penalty”
Table 10: Percentage of Aspiring Artistsa Who Have Ever Worked as Artists (Either Full- or Part-Time), by Race/Ethnicityb and Whether a Parent Is an Artistc
RACIAL/ETHNIC CATEGORY ALL ASPIRING ARTISTS ASPIRING ARTISTS WITH AN ARTIST PARENT
White 82% 86% Black 76% 84% Hispanic 76% 86% Asian 80% 88%
aAlumni who indicated that they intended to work as artists when they began at their institutions.bTable excludes American Indian/Alaska Native, Native Hawaiian or Other Pacific Islander, “other” race/ethnicity, and respondents who selected more than one race/ethnic category.
SNAAP ANNuAl RePoRt 2013 23
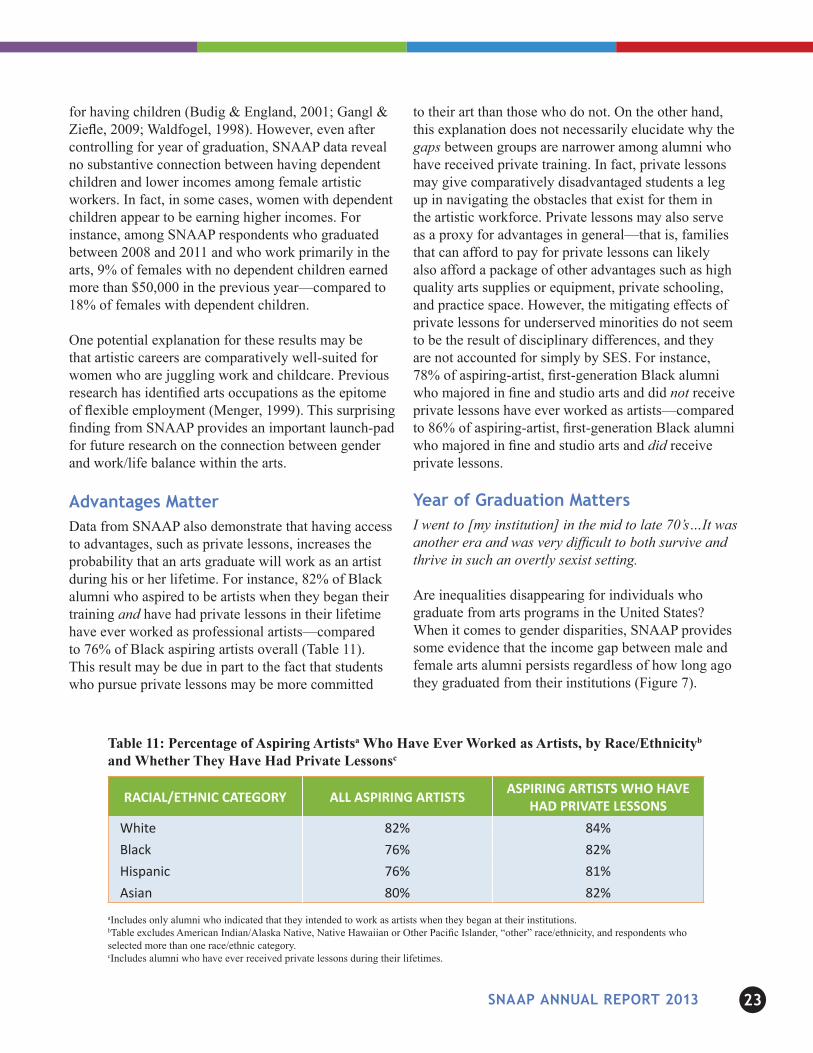
Table 11: Percentage of Aspiring Artistsa Who Have Ever Worked as Artists, by Race/Ethnicityb
and Whether They Have Had Private Lessonsc
RACIAL/ETHNIC CATEGORY ALL ASPIRING ARTISTS ASPIRING ARTISTS WHO HAVE HAD PRIVATE LESSONS
White 82% 84% Black 76% 82% Hispanic 76% 81% Asian 80% 82%
aIncludes only alumni who indicated that they intended to work as artists when they began at their institutions.bTable excludes American Indian/Alaska Native, Native Hawaiian or Other Pacific Islander, “other” race/ethnicity, and respondents who selected more than one race/ethnic category.cIncludes alumni who have ever received private lessons during their lifetimes.
for having children (Budig & England, 2001; Gangl & Ziefle, 2009; Waldfogel, 1998). However, even after controlling for year of graduation, SNAAP data reveal no substantive connection between having dependent children and lower incomes among female artistic workers. In fact, in some cases, women with dependent children appear to be earning higher incomes. For instance, among SNAAP respondents who graduated between 2008 and 2011 and who work primarily in the arts, 9% of females with no dependent children earned more than $50,000 in the previous year—compared to 18% of females with dependent children.
One potential explanation for these results may be that artistic careers are comparatively well-suited for women who are juggling work and childcare. Previous research has identified arts occupations as the epitome of flexible employment (Menger, 1999). This surprising finding from SNAAP provides an important launch-pad for future research on the connection between gender and work/life balance within the arts.
Advantages MatterData from SNAAP also demonstrate that having access to advantages, such as private lessons, increases the probability that an arts graduate will work as an artist during his or her lifetime. For instance, 82% of Black alumni who aspired to be artists when they began their training and have had private lessons in their lifetime have ever worked as professional artists—compared to 76% of Black aspiring artists overall (Table 11). This result may be due in part to the fact that students who pursue private lessons may be more committed
to their art than those who do not. On the other hand, this explanation does not necessarily elucidate why the gaps between groups are narrower among alumni who have received private training. In fact, private lessons may give comparatively disadvantaged students a leg up in navigating the obstacles that exist for them in the artistic workforce. Private lessons may also serve as a proxy for advantages in general—that is, families that can afford to pay for private lessons can likely also afford a package of other advantages such as high quality arts supplies or equipment, private schooling, and practice space. However, the mitigating effects of private lessons for underserved minorities do not seem to be the result of disciplinary differences, and they are not accounted for simply by SES. For instance, 78% of aspiring-artist, first-generation Black alumni who majored in fine and studio arts and did not receive private lessons have ever worked as artists—compared to 86% of aspiring-artist, first-generation Black alumni who majored in fine and studio arts and did receive private lessons.
Year of Graduation MattersI went to [my institution] in the mid to late 70’s…It was another era and was very difficult to both survive and thrive in such an overtly sexist setting.
Are inequalities disappearing for individuals who graduate from arts programs in the United States? When it comes to gender disparities, SNAAP provides some evidence that the income gap between male and female arts alumni persists regardless of how long ago they graduated from their institutions (Figure 7).
SNAAP ANNuAl RePoRt 2013 2418
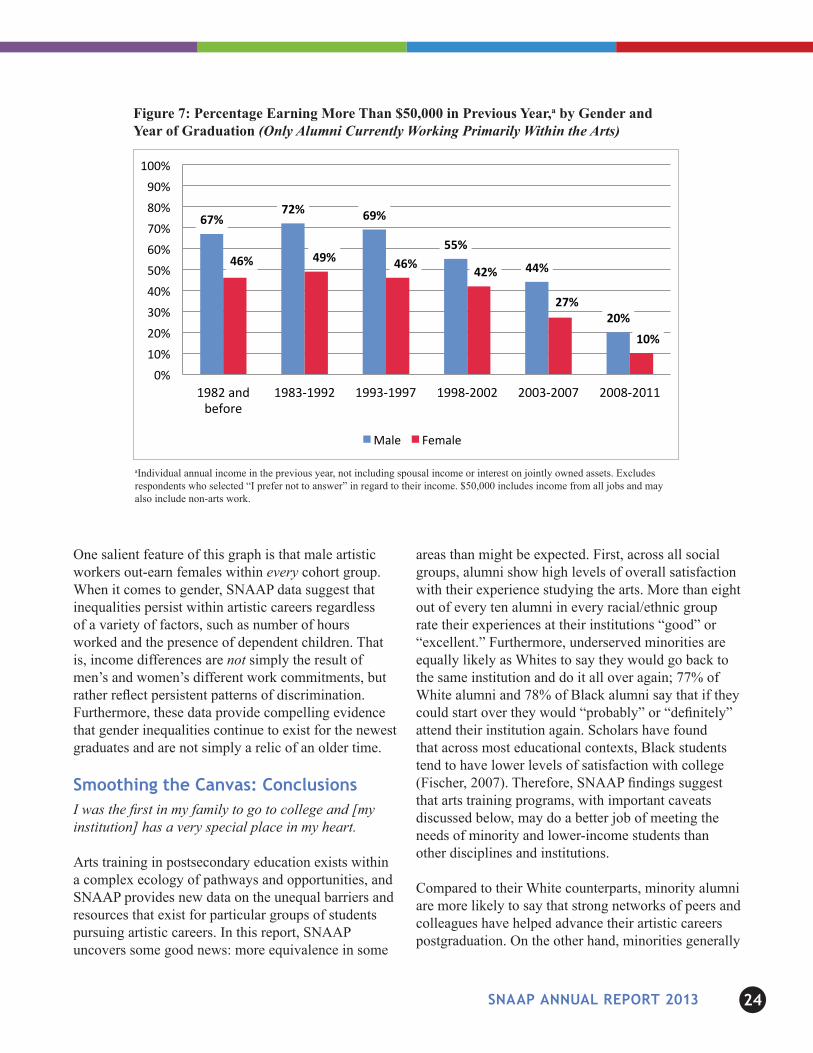
FIGURE HEADER: Figure 7: Percentage Earning More Than $50,000 in Previous Year,a by Gender and Year of Graduation (Only Alumni Currently Working Primarily Within the Arts)
FIGURE FOOTNOTE: aIndividual annual income in the previous year, not including spousal income or interest on jointly owned assets. Excludes respondents who selected “I prefer not to answer” in regard to their income. $50,000 includes income from all jobs and may also include non-arts work. One salient feature of this graph is that male artistic workers out-earn females within every cohort group. When it comes to gender, SNAAP data suggest that inequalities persist within artistic careers regardless of a variety of factors, such as number of hours worked and the presence of dependent children. That is, income differences are not simply the result of men’s and women’s different work commitments, but rather reflect persistent patterns of discrimination. Furthermore, these data provide compelling evidence that gender inequalities continue to exist for the newest graduates and are not simply a relic of an older time. HEADER: Smoothing the Canvas: Conclusions I was the first in my family to go to college and [my institution] has a very special place in my heart. Arts training in postsecondary education exists within a complex ecology of pathways and opportunities, and SNAAP provides new data on the unequal barriers and resources that exist for particular groups of students pursuing artistic careers. In this report, SNAAP uncovers some good news: more equivalence in some areas than might be expected. First, across all social groups, alumni show high levels of overall satisfaction with their experience studying the arts. More than eight out of every ten alumni in every racial/ethnic group rate their experiences at their institutions “good” or “excellent.” Furthermore, underserved minorities are equally likely as Whites to say they would go back to the same institution and do it all over again; 77% of White alumni and 78% of Black alumni say that if they could start over they would “probably” or “definitely” attend their institution again. Scholars have found that across most educational contexts, Black students tend to have lower levels of satisfaction with college (Fischer, 2007). Therefore, SNAAP findings suggest that arts training programs, with important caveats
67% 72% 69%
55%
44%
20%
46% 49% 46% 42%
27%
10%
0% 10% 20% 30% 40% 50% 60% 70% 80% 90%
100%
1982 and before
1983-‐1992 1993-‐1997 1998-‐2002 2003-‐2007 2008-‐2011
Male Female
Figure 7: Percentage Earning More Than $50,000 in Previous Year,a by Gender and Year of Graduation (Only Alumni Currently Working Primarily Within the Arts)
aIndividual annual income in the previous year, not including spousal income or interest on jointly owned assets. Excludes respondents who selected “I prefer not to answer” in regard to their income. $50,000 includes income from all jobs and may also include non-arts work.
One salient feature of this graph is that male artistic workers out-earn females within every cohort group. When it comes to gender, SNAAP data suggest that inequalities persist within artistic careers regardless of a variety of factors, such as number of hours worked and the presence of dependent children. That is, income differences are not simply the result of men’s and women’s different work commitments, but rather reflect persistent patterns of discrimination. Furthermore, these data provide compelling evidence that gender inequalities continue to exist for the newest graduates and are not simply a relic of an older time.
smoothing the Canvas: ConclusionsI was the first in my family to go to college and [my institution] has a very special place in my heart.
Arts training in postsecondary education exists within a complex ecology of pathways and opportunities, and SNAAP provides new data on the unequal barriers and resources that exist for particular groups of students pursuing artistic careers. In this report, SNAAP uncovers some good news: more equivalence in some
areas than might be expected. First, across all social groups, alumni show high levels of overall satisfaction with their experience studying the arts. More than eight out of every ten alumni in every racial/ethnic group rate their experiences at their institutions “good” or “excellent.” Furthermore, underserved minorities are equally likely as Whites to say they would go back to the same institution and do it all over again; 77% of White alumni and 78% of Black alumni say that if they could start over they would “probably” or “definitely” attend their institution again. Scholars have found that across most educational contexts, Black students tend to have lower levels of satisfaction with college (Fischer, 2007). Therefore, SNAAP findings suggest that arts training programs, with important caveats discussed below, may do a better job of meeting the needs of minority and lower-income students than other disciplines and institutions.
Compared to their White counterparts, minority alumni are more likely to say that strong networks of peers and colleagues have helped advance their artistic careers postgraduation. On the other hand, minorities generally
SNAAP ANNuAl RePoRt 2013 25
are less satisfied with the in-school networks available to them as students. In other words, it appears minority students might face more hurdles in developing their social and professional networks in school but, once networks are developed, these students might rely more on them than their White counterparts do to advance their careers.
SNAAP data also reveal little relationship between sense of belonging in school and socioeconomic status, as well as between SES and whether an arts graduate ever works as an artist. Again, this provides some evidence that arts training institutions might be breaking down barriers that still persist in many other educational contexts. Among those who work primarily within the arts, some underserved alumni such as Black alumni and first-generation college students do not earn less than their White and higher-SES counterparts. While women are more likely than men to cite “family-related reasons” as barriers to artistic careers, having children does not seem to be associated with lower earnings for women as it is with most other sectors. Finally, among those working primarily in the arts, gender, race, and socioeconomic status do not seem to matter in terms of the graduates’ satisfaction with their ability to be creative in their primary jobs.
In other respects, however, the inequalities by gender, race/ethnicity, and socioeconomic status that exist in other careers are also alive and well within the arts. Blacks, Hispanics, and first-generation students are more likely to take additional time to complete their arts degrees. Among those who intended to work as artists when they began at their institutions, Asians and Whites are more likely to ever and currently work as artists than their Black or Hispanic counterparts. Even across multiple cohort ranges, men are also more likely to ever and currently work as artists than their female counterparts—and to earn more money when they do. Additionally, Blacks and Hispanics are much more likely than either Whites or Asians to cite debt as a reason they never pursued, or stopped pursuing, careers in the arts.
What steps can be taken to smooth the way so that students from all groups can have equal chances to succeed at their institutions and within the artistic
workforce? By pointing to some circumstances in which inequalities are ameliorated or eliminated, SNAAP illuminates areas in which change can occur. Arts institutions are uniquely poised to help bring about this change—for instance, by providing access to non-loan forms of financial support such as grants and scholarships, by offering minorities and women more opportunities to network with alumni and others while at their institutions, and by considering strategies to increase access to important resources, such as private lessons in some disciplines. While discrimination and personal bias on the part of employers undoubtedly still play a role in the different career pathways of arts alumni, these changes at the level of educational institutions would likely help to reduce the disparities that continue to permeate the artistic sphere and to assist all groups of arts graduates in having equal opportunities to pursue artistic careers and lead creative lives.
Arts training programs offer many features that can counteract the barriers facing women, minorities, and first-generation students—including intensive mentoring and support and a tolerant and open environment for collaboration and experimentation. This intense and collaborative environment can work against the isolation that leads many disadvantaged students to disengage from school. But gaps still remain and inequality persists. As demographic shifts continue to shape the composition of our schools in the years to come, arts training institutions must be even more diligent in meeting the diverse needs of all of their students.
SNAAP ANNuAl RePoRt 2013 26
In the fall of 2012, SNAAP completed its fifth annual survey of arts graduates. Since 2008, SNAAP has worked with more than 250 different arts training
institutions and programs and has collected data from more than 80,000 alumni. These numbers are remarkable. In just a few years, SNAAP will become the largest arts-based survey ever conducted in the U.S., surpassing the National Endowment for the
Arts’ own Survey of Public Participation in the
Arts. It is the second largest survey of
college graduates ever conducted in the U.S., topped by only the National Science Foundation’s National
Survey of College Graduates
(NSCG), and in a few years it will
exceed even the NSCG.
These impressive numbers are well worth admiring and are a source of pride for the SNAAP team, which has worked hard for almost a decade building the survey and developing a system that arts training institutions, policy makers, and arts graduates value and use. More importantly, these numbers reflect the growing strength and sophistication of the data we are collecting. With every passing year, the data become more reliable as the number of respondents increases and the sample of participating institutions expands. Moreover, a larger sample allows us to conduct more fine-grained analysis, pulling out results for separate disciplines and different types of degrees and institutions. And with greater participation, institutions will be able to draw from a larger pool of peer institutions with which to compare their results.
While with every passing year we grow more confident in our analysis and results, the SNAAP team will continue to investigate whether alumni who respond to
our survey are somehow systematically different from those who choose not to respond or from those we are unable to reach by email. In 2009, we conducted pilot research to see whether doubling our response rate (from approximately 20% to 40%) would change our sample in important ways relevant to our findings and analysis. We discovered that even when we doubled the response rate, our results did not change significantly, suggesting that bias in our sample is minimal. In the coming year, we will go back to this early pilot study and issue a full report to help schools and users of the data more fully understand any possible bias.
Moreover, we will continue to publish reports and shorter occasional papers. Future topics include a deeper exploration of the reasons behind the wage gap between men and women working in the arts. Several forthcoming reports and papers will examine the notion of “creative identity” and the extent to which students in arts training institutions develop a creative identity that is portable across areas of their lives, across jobs, and throughout their lifetimes. We will also continue to examine patterns in where artists work and the nature of their migration from locale to locale.
In 2013, I will be guest-editing a special issue of the journal Work and Occupations focused on the future of the creative workforce and the changing nature of artistic jobs and featuring articles that draw on findings from the SNAAP survey. Meanwhile, an increasing number of scholarly articles in other peer-reviewed journals throughout education and the social sciences are also incorporating SNAAP data.
Our goals for the coming years are to continue working with institutions to identify effective ways to best use their data to mobilize and engage key stakeholders to discuss and take action on important questions around curricular reform and career support for graduates. We hope SNAAP becomes a source of data that schools regularly draw upon when meeting the requirements for accreditation.
An accountability movement is taking hold across the field of education, and arts schools and training programs would do well to get out ahead of this and
looking Forward
SNAAP ANNuAl RePoRt 2013 27
develop useful data-driven metrics before external stakeholders impose on them less meaningful types of metrics. SNAAP provides an invaluable tool for institutions in their ongoing quest for good and meaningful data for evaluating relevant school-based outcomes.
In March 2013, SNAAP hosted an incredibly successful conference of more than 250 arts leaders representing college and university arts programs as well as arts high schools. This meeting was extraordinary because for the first time it brought together leaders, administrators, and faculty from across the various artistic disciplines to discuss curricular reform and the nature of changing artistic jobs. An unintended outcome of the meeting was a groundswell of enthusiasm for reexamining how arts schools and programs train and prepare graduates. Several participants felt that this conference was
a launching pad for a national conversation about reinventing the 21st century arts training institution. How will training institutions look different 20 years from now? In an effort to keep this conversation alive, the SNAAP team will pursue the possibility of hosting a second national conference in 2015. We will also continue to deploy SNAAP data to inform our thinking about the transformative possibilities for arts training over the next several decades.
Steven J. TepperResearch Director, SNAAPAssociate Professor and Associate Director, Sociology and the Curb Center for Art, Enterprise and Public PolicyVanderbilt University
SNAAP ANNuAl RePoRt 2013 28
ReferencesAngela, M. O. (1996). The precious and the precocious: Understanding cumulative disadvantage and cumulative advantage over the life course. The Gerontologist, 36(2), 230–238.
Budig, M. J., & England, P. (2001). The wage penalty for motherhood. American Sociological Review, 66(2), 204–225.
Currid, E. (2007). The Warhol economy: How fashion, art, and music drive New York City. Princeton, NJ: Princeton University Press.
DiMaggio, P. (1996). Are art-museum visitors different from other people? The relationship between attendance and social and political attitudes in the United States. Poetics, 24, 161–180.
Donaldson, K., Lichtenstein, G., & Sheppard, S. (2007). Socioeconomic status and the undergraduate engineering experience: Preliminary findings from four American universities (AC 2008-1010). Retrieved from: http://es21c.okstate.edu/resources/Publications/1010_SOCIOECONOMIC_STATUS_AND_THE_UNDERGRADUA.pdf
Faulkner, R., & Anderson, A. (1987). Short-term projects and emergent careers: Evidence from Hollywood. The American Journal of Sociology, 92(4), 879–909.
Fischer, M. J. (2007). Settling into campus life: Differences by race/ethnicity in college involvement and outcomes. The Journal of Higher Education, 78(2), 125–156.
Gangl, M., & Ziefle, A. (2009). Motherhood, labor force behavior, and women’s careers: An empirical assessment of the wage penalty for motherhood in Britain, Germany, and the United States. Demography, 46(2), 341–369.
Hoffer, T. B., Welch, V., Webber, K., Williams, K., Lisek, B., Hess, M., Loew, D., & Guzman-Barron, I. (2006). Doctorate recipients from United States universities: Summary report 2005. Chicago, IL: National Opinion Research Center.
Ibarra, H. (1992). Homophily and differential returns: Sex differences in network structure and access in an advertising firm. Administrative Science Quarterly, 37(3), 422–447.
Ishitani, T. T. (2006). Studying attrition and degree completion behavior among first-generation college students in the United States. The Journal of Higher Education, 77(5), 861–885.
Johnson, D. R., Soldner, M., Leonard, J. B., Alvarez, P., Inkelas, K. K., Rowan-Kenyon, H. T., & Longerbeam, S. D. (2007). Examining sense of belonging among first-year undergraduates from different racial/ethnic groups. Journal of College Student Development, 48(5), 525–542.
Lambert, A. D., & Miller, A. L. (2013, April). Assessing alumni success: Income is NOT the only outcome! Paper presented at the Annual Meeting of the American Educational Research Association, San Francisco, CA.
Li, Y., Makel, M. C., Putallaz, M., & Wa, J. (2011). High-ability students’ time spent outside the classroom. Journal of Advanced Academics, 22(5), 720–749.
Leete, L. (2000). Wage equity and employee motivation in nonprofit and for-profit organizations. Journal of Economic Behavior & Organization, 43(4), 423–446.
Lindemann, D. J., & Tepper, S. J., et al. (2012). Painting with broader strokes: Reassessing the value of an arts education (SNAAP Special Report No. 1). Bloomington, IN: Strategic National Arts Alumni Project, Indiana University & Vanderbilt University.
Lipset, S. M. (1960). Political man. Garden City, NY: Doubleday.
Menger, P. (1999). Artistic labor markets and careers. Annual Review of Sociology, 25, 541–574.
National Center for Education Statistics. (2001). Percentage distribution of 1999–2000 bachelor’s degree recipients according to age at bachelor’s degree completion, by gender, race/ethnicity, and parents’ educational attainment. Retrieved from http://www.nces.ed.gov/quicktables/
National Center for Education Statistics. (2013). [Percentage of total enrollment by race and gender at schools of art, music, and design, 2011]. IPEDS data retrieved from http://nces.ed.gov/ipeds/datacenter/
National Endowment for the Arts. (2008). Artists in the workforce, 1990–2005. Retrieved from http://www.nea.gov/research/ArtistsInWorkforce.pdf
Ostrove, J. M., & Long, S. M. (2007). Social class and belonging: Implications for college adjustment. Review of Higher Education, 30(4), 363–389.
Pinheiro, D. L., & Dowd, T. J. (2009). All that jazz: The success of jazz musicians in three metropolitan areas. Poetics, 37(5), 490–506.
Stage, F. K. (1988). University attrition: LISREL with logistic regression for the persistence criterion. Research in Higher Education, 29(4), 343–357.
Steiner, L., & Schneider, L. (2013). The happy artist: An empirical application of the work-preference model. Journal of Cultural Economics, 37(2), 225–246.
Stern, M. J. (2005). Artists in the winner-take-all economy: Artists’ inequality in six U.S. metropolitan areas, 1980–2000 (Dynamics of Culture Working Paper #2005-3). College Park, PA: University of Pennsylvania. Retrieved from http://www.sp2.upenn.edu/siap/docs/dynamics_of_culture/artists_in_the_winner_take_all_economy.pdf
Waldfogel, J. (1998). Understanding the ‘family gap’ in pay for women with children. The Journal of Economic Perspectives, 12(1), 137–156.
Zafar, B. (2009). College major choice and the gender gap (Federal Reserve Bank of New York Staff Report). Retrieved from http://ssrn.com/abstract=1348219
References and notes
SNAAP ANNuAl RePoRt 2013 29
notes1Data are based on the responses of the individuals who took the SNAAP survey in 2011 and 2012 and do not necessarily reflect the attitudes and experiences of all individuals who have ever received arts degrees in the United States.
2All direct quotes in this document come from respondents who completed the SNAAP survey in 2011 or 2012.
3Because this section evaluates institutional experiences, it separates alumni who were enrolled in graduate level programs from alumni who were enrolled in undergraduate level programs within their SNAAP reporting institutions. It does not encompass any additional arts degree an individual may have received in his or her lifetime.
4The SNAAP survey includes “transgender” as an option. Because only a very small percentage (.2%) of alumni selected this option, these individuals are excluded from analyses involving gender in this report.
5Analyses involving race/ethnicity include only respondents who selected only one racial/ethnic category. “White” refers to respondents who selected only “White or Caucasian,” “Black” refers to respondents who selected only “Black or African American,” and “Hispanic” refers to respondents who selected only “Hispanic, Latino, or Spanish origin.”
6Using parental education as a proxy for SES is a common practice within the social sciences (Donaldson, Lichtenstein, & Sheppard, 2007; Li, Makel, Putallaz, & Wa, 2011).
7“Very satisfied” or “Somewhat satisfied,” versus “Somewhat dissatisfied” or “Very dissatisfied.”
8These trends remain consistent when controlling for cohort. We used binary logistic regression analysis to determine the probability of being “Somewhat satisfied” or “Very satisfied” with one’s sense of belonging and attachment at one’s institution. Logistic regression analysis is a statistical procedure that predicts the likelihood of a certain outcome based on particular criteria.
For example, for the 2008–2012 cohorts only, there was no significant (p≤.05)
association between gender and satisfaction with belonging at
the undergraduate level. At the graduate level, there was a significant negative association between being female and satisfaction with belonging.
9“First-generation college student” refers to an alumnus
who has at least one parent or guardian who graduated from
college (receiving an associate’s degree or higher).
10In addition, 85% of Native Hawaiian/Other Pacific Islander respondents who had ever worked as artists indicated that these networks were important to their careers; however, this figure should be interpreted with caution due to the low number of respondents in this category.
11SNAAP asks: “Have you ever worked, either full or part time, in an occupation as an artist (where you create or perform your art)? Remember, we consider a broad array of arts including designers, architects, writers, media producers, fine artists, filmmakers, performers, musicians, and others.”
12In contrast, among respondents who intended to work as professional artists when they began at their institutions, 82% of White alumni, 86% of American Indian/Native Alaskan alumni, 84% of Native Hawaiian/other Pacific Islander alumni, 82% of “other” alumni, and 77% of biracial/multiracial alumni have ever worked as professional artists.
13SNAAP provides respondents who do not currently work as artists with a list of eight potential reasons they either stopped working as artists or chose to pursue work as artists and asks them to check all that apply. These reasons include artistic work not available, higher pay or steadier income in other fields, current location not conducive to artistic career, change in interests, family-related reasons, lack of access to important networks and people, debt (including student loans), and lack of social support from family and friends. An open-ended text box is also provided to capture other reasons.
14Includes “artist” professions as well as other art-related jobs such as arts educator, arts administrator or manager, and museum or gallery worker (including curator).
15This analysis excludes alumni who graduated in 2012. “Income” refers to individual annual income earned in the previous year (2010 or 2011). It does not include spousal income or interest on jointly owned assets, and it excludes those who did not answer the question relating to income. Because this includes income from all jobs worked, for some respondents it may also include income from non-arts jobs.
16Alumni working primarily as architects are the artistic workers most likely to have earned more than $50,000 in the past year.
17$50,000 includes income from all jobs and may also include non-architect work. Excludes alumni who graduated in 2012 and respondents who did not indicate their income.
18Via binomial logistic regression.
SNAAP ANNuAl RePoRt 2013 30
AlabamaJudson CollegeUniversity of AlabamaUniversity of MobileUniversity of Montevallo
AlaskaUniversity of Alaska Anchorage *
ArizonaArizona State University *
ArkansasArkansas State University
CaliforniaAmerican Academy of Dramatic ArtsArt Center College of Design *
California Baptist University *
California College of the Arts *
California Institute of the Arts *
California Lutheran University *
California State University-Dominguez HillsChapman University *
The Colburn School *‡
Idyllwild Arts Academy *†
Los Angeles County High School for the Arts *†
Oakland School for the Arts †
Orange County High School for the Arts †
Otis College of Art and Design *
San Francisco Art Institute *
San Francisco Conservatory of MusicSan Francisco State UniversityUniversity of California-Berkeley *
University of California-Davis *
University of California-Irvine *
University of California-Los Angeles *
University of California-Merced *∞
University of California-Riverside *
University of California-San Diego *
University of California-Santa Barbara *
University of California-Santa Cruz *
University of Southern CaliforniaWoodbury University *∞
ColoradoColorado State UniversityColorado State University-PuebloUniversity of Colorado at Boulder *
University of Denver University of Northern Colorado *
ConnecticutCentral Connecticut State UniversityLyme Academy College of Fine ArtsUniversity of Hartford *
Western Connecticut State University
DelawareUniversity of Delaware
District of ColumbiaCorcoran College of Art & Design *
Duke Ellington School of the Arts †
FloridaDouglas Anderson School of the Arts *†
Florida Atlantic University *
Florida International University *
Florida State UniversityNew World School of the Arts ‡Palm Beach Atlantic University Ringling College of Art and Design *
Stetson University *
University of Miami University of South Florida
GeorgiaBerry CollegeColumbus State University Georgia College & State UniversityGeorgia Southern University *
Georgia State University * Kennesaw State University Shorter University Valdosta State University *
Wesleyan College
HawaiiUniversity of Hawaii at Manoa
IdahoBrigham Young University-Idaho *∞
University of Idaho
IllinoisChicago Academy for the Arts †
Chicago State University Columbia College Chicago *
DePaul University *
Knox College *
Loyola Chicago University Millikin University Roosevelt University School of the Art Institute of Chicago *
University of Illinois at Urbana-Champaign *
IndianaButler University *
Herron School of Art and Design, Indiana University-Purdue University Indianapolis *
Indiana University * Purdue University *
Saint Mary’s College
IowaDrake University Iowa State UniversityMorningside CollegeUniversity of Northern Iowa
KansasKansas State UniversityPittsburg State University *
The University of Kansas *
KentuckyBellarmine University *
Morehead State University Northern Kentucky University University of Kentucky Western Kentucky University *
LouisianaLouisiana School for Math, Science, and the Arts *†
Louisiana State University * New Orleans Center for Creative Arts †
University of Louisiana at Monroe *
University of New Orleans *
MaineMaine College of Art *
MarylandBaltimore School of the Arts *†
Maryland Institute College of Art *
Peabody Institute, Johns Hopkins University
MassachusettsArt Institute of Boston at Lesley University *
Boston Arts Academy *†
Boston ConservatoryBoston UniversityMassachusetts College of Art and Design *
New England ConservatoryNew England School of Art and Design, Suffolk UniversitySchool of the Museum of Fine Arts, Boston *
University of Massachusetts, Amherst *
University of Massachusetts, Dartmouth *
Walnut Hill School University of Massachusetts, Amherst *†
participating Institutions 2008-2012
SNAAP ANNuAl RePoRt 2013 31
MichiganAlbion College *
Alma CollegeCollege for Creative StudiesHope CollegeInterlochen Arts Academy *†
Kendall College of Art and Design at Ferris State University *
Oakland University *
University of Michigan *
Western Michigan University *
MinnesotaCollege of Visual Arts *
Minneapolis College of Art and Design *
St. Cloud State University *
St. Olaf CollegeUniversity of Minnesota Duluth Winona State University
MississippiDelta State University
MissouriColumbia CollegeCulver-Stockton CollegeEvangel University *
Kansas City Art Institute *
University of Missouri-Saint Louis University of Missouri-Kansas City *
Webster University
MontanaUniversity of Montana-Missoula
NebraskaUniversity of Nebraska at OmahaUniversity of Nebraska-Lincoln
New JerseyCollege of New Jersey Montclair State UniversityRowan University Seton Hall University *
William Paterson University of New Jersey
New MexicoSanta Fe University of Art and Design *
New YorkAlfred University * Barnard CollegeThe City College of New York *∞
The Cooper Union School of ArtHamilton College *
The Juilliard SchoolLaGuardia High School of Music & Art and the Performing Arts †
Manhattan School of Music *
New York School of Interior DesignNew York University *
Pace University *
Parsons The New School for DesignPratt Institute *
Purchase College School of Visual Arts *
Skidmore CollegeState University of New York at Fredonia State University of New York at New Paltz *∞
Syracuse University * University of Rochester Eastman School of Music
North CarolinaEast Carolina University Greensboro CollegeUniversity of North Carolina at Charlotte *
University of North Carolina at Greensboro University of North Carolina School of the Arts ‡Western Carolina University
North DakotaNorth Dakota State University *
University of North Dakota
OhioBaldwin-Wallace College Bluffton UniversityBowling Green State University Capital University ConservatoryCase Western Reserve University * Cleveland Institute of ArtCleveland Institute of MusicCleveland School of the Arts †
Cleveland State University Columbus College of Art & Design *
Hiram College Kent State University * Miami University *
Ohio Northern University *
The Ohio State University *
Ohio Wesleyan UniversityOtterbein UniversityUniversity of Akron, Main Campus Wittenberg University
OregonOregon College of Art and CraftPacific Northwest College of Art * Portland State University
PennsylvaniaBloomsburg University of Pennsylvania *
Bucknell UniversityCurtis Institute of Music
Indiana University of Pennsylvania *
Lehigh Valley Charter High School for the Performing Arts *†
Marywood University *
Moore College of Art and Design *
Penn State University Park Pennsylvania Academy of the Fine Arts *
Pennsylvania College of Art and DesignUniversity of the Arts *
Rhode IslandRhode Island School of Design *∞
University of Rhode Island
South CarolinaClemson UniversityCoker College *
College of Charleston * Converse College Fine Arts Center †
South Carolina Governor’s School for the Arts and Humanities *†
University of South Carolina Columbia * ∞
Winthrop University
South DakotaNorthern State University *
TennesseeBelmont University Maryville CollegeMemphis College of Art *
Vanderbilt University
TexasHigh School for the Performing and Visual Arts *†
Lamar University North East School of the Arts †
Rice University Southern Methodist University *
Texas Christian UniversityTexas State University * University of Houston *
University of Mary Hardin-Baylor University of North TexasThe University of Texas at Austin *
University of Texas at El Paso University of the Incarnate Word
UtahBrigham Young University University of Utah Utah State University *
Weber State University
SNAAP ANNuAl RePoRt 2013 32
VirginiaGeorge Mason University James Madison University * Old Dominion UniversityShenandoah University ConservatoryUniversity of Richmond *
Virginia Commonwealth University *
WashingtonCornish College of the ArtsPacific Lutheran University *
Washington State University Whitworth University
West VirginiaDavis & Elkins College Marshall UniversityWest Virginia University * West Virginia Wesleyan College
WisconsinMilwaukee Institute of Art and Design *
University of Wisconsin-Eau Claire University of Wisconsin-Green Bay University of Wisconsin-Whitewater *
WyomingUniversity of Wyoming
CanadaAlberta College of Art + Design *
Nova Scotia College of Art and DesignOCAD University *
* SNAAP 2011 and/or 2012 participant (data included in this report)† Arts high school
‡ Both secondary and postsecondary alumni∞ Excluded from analysis
photo Credits
Bucknell UniversityCleveland Institute of ArtCurtis Institute of MusicDePaul UniversityDuke Ellington School of the ArtsEvangel UniversityGreensboro CollegeKnox CollegeMoore College of Art and DesignNew York University Tisch School of the ArtsOakland School for the ArtsThe Ohio State UniversitySchool of the Museum of Fine Arts, BostonUniversity of Massachusetts AmherstUniversity of North Carolina School of the Arts
SNAAP ANNuAl RePoRt 2013 33
Indiana universityDirectorSally Gaskill
Senior AdvisorGeorge D. Kuh
Project CoordinatorRebecca F. Houghton
Research AnalystsAmber D. LambertAngie L. MillerRick Shoup
Project AssociateLauren Hime
vanderbilt university Curb Center for Art, enterprise, and public policySNAAP Research DirectorAssociate Director, Curb Center Associate Professor of SociologySteven J. Tepper
SNAAP Postdoctoral FellowDanielle J. Lindemann
SNAAP Research AssociateJennifer C. Lena
Indiana university Center for postsecondary Research DirectorVasti Torres
Finance ManagerMarilyn Gregory
Web DeveloperHien Nguyen
Office CoordinatorBarbara Stewart
Office SecretaryKatie Noel
Indiana university Center for survey Research DirectorAshley Bowers
Senior Research DirectorJohn Kennedy
Director, Survey Technologies Kevin Tharp
Associate Director, Research Data Management ServicesErica Moore
Senior Web ProgrammerJason Francis
Web ProgrammerBarb Gelwick
snAAp staff
Indiana university Center for Postsecondary Research
1900 E. Tenth Street, Suite 419
Bloomington, IN 47406-7512
Phone: 812-856-5824
Fax: 812-856-5150
Email: [email protected]