Embed Size (px)
DESCRIPTION
TransGrid Annual Report
Citation preview
Annual Report 2013
Committed | Enterprising | Collaborative | Caring
b TransGrid Annual Report 2013
About this report
TransGrid’s 2013 Annual Report outlines the organisation’s operational and financial performance against set strategies, objectives and targets during 2012/13.
The aim of this report is to provide accurate and relevant information to all of TransGrid’s stakeholders, including:
> Shareholding Ministers and Government
> Regulators
> Customers and end consumers of electricity
> Staff
> Suppliers and contractors
> The communities in which TransGrid operates
In addition to this report, TransGrid has also published an Annual Planning Report to provide advance information to market participants, customers and interested parties on the nature and location of emerging constraints in TransGrid’s transmission network. To view this report and other TransGrid publications and reports please visit: www.transgrid.com.au
TransGrid welcomes comments and feedback on the Annual Report via email: [email protected].
This Annual Report and previous reports can also be accessed by visiting www.transgrid.com.au or by calling TransGrid on 02 9284 3000.
Letter to shareholders
31 October 2013
Dear Ministers,
We are pleased to submit the TransGrid Annual Report 2013 to Parliament. The Annual Report includes the Income Statement for the year ending 30 June 2013 and the Balance Sheet as at that date certified by the Auditor-General of New South Wales (NSW).
The Annual Report was prepared in accordance with the requirements of Section 24A of the State Owned Corporations Act 1989 and the Annual Reports (Statutory Bodies) Act 1984 and the reporting requirements issued by NSW Treasury.
Sincerely,
Chum Darvall Chairman
Peter McIntyre Managing Director
Contents
Corporate profile 2
About TransGrid 2
TransGrid’s network 3
Where TransGrid fits in the market 4
TransGrid’s commitment 5
TransGrid’s expectations 6
TransGrid’s Board 8
TransGrid’s leadership team 10
Performance 12
Financials 12
Reliability 13
People 14
Staff numbers by category 14
Staff numbers by employment type 15
Staff numbers by location 15
Equal Employment Opportunity 16
Disability Action Plan 17
Industrial relations 17
Building program 18
Capital Projects 2012/13 18
Health, safety and the environment 19
Health and safety 19
Waste Reduction and Purchasing Policy (WRAPP) 19
Community 20
Community consultation 20
Community Partnership Program 24
Promotion 25
TransGrid online 25
Corporate governance 26
Shareholders 26
TransGrid’s Board of Directors 26
TransGrid’s Executive 29
Risk management 31
Insurance 31
Government Information (Public Access) Act 2009 (GIPA) 32
Reporting exemptions 36
Public Interest Disclosure 37
Overseas visits 37
Financials 2012/13 38
Notes to the Financial Statements 42
Statement by members of the board 70
Independent auditor’s report 71
Index 73
Glossary 74
Committed | Enterprising | Collaborative | Caring 1
2 TransGrid Annual Report 2013 | Corporate Profile
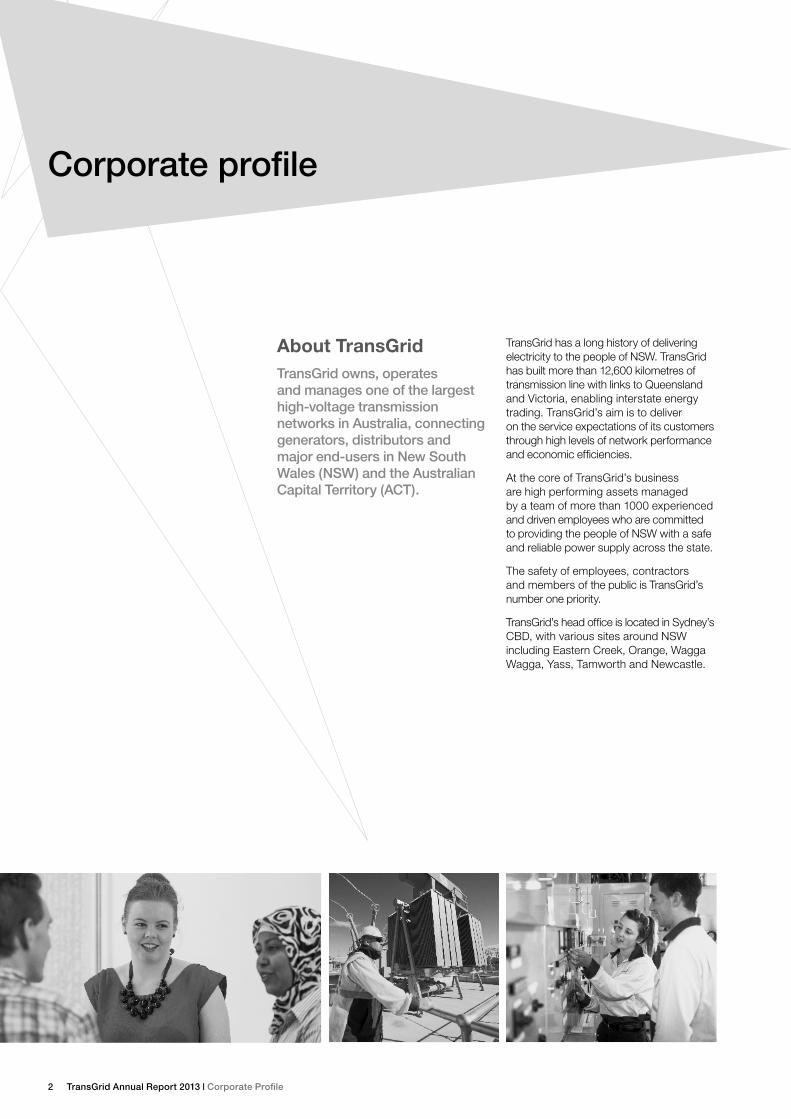
About TransGridTransGrid owns, operates and manages one of the largest high-voltage transmission networks in Australia, connecting generators, distributors and major end-users in New South Wales (NSW) and the Australian Capital Territory (ACT).
TransGrid has a long history of delivering electricity to the people of NSW. TransGrid has built more than 12,600 kilometres of transmission line with links to Queensland and Victoria, enabling interstate energy trading. TransGrid’s aim is to deliver on the service expectations of its customers through high levels of network performance and economic efficiencies.
At the core of TransGrid’s business are high performing assets managed by a team of more than 1000 experienced and driven employees who are committed to providing the people of NSW with a safe and reliable power supply across the state.
The safety of employees, contractors and members of the public is TransGrid’s number one priority.
TransGrid’s head office is located in Sydney’s CBD, with various sites around NSW including Eastern Creek, Orange, Wagga Wagga, Yass, Tamworth and Newcastle.
Corporate profile
Committed | Enterprising | Collaborative | Caring 3
Tomago
BHP (EA)
Eraring
Vales Point
Munmorah
Tuggerah
Sydney East
RegentvilleSydney West
Sydney South
NewcastleWaratah
West
Liverpool
Kemps Creek
Vineyard
Sydney North
Dapto
Ingleburn
Wallerawang
Yass Avon
Bayswater
Liddell
Beaconsfield West
Haymarket
INSET
Mt Druitt (IE)
Mt Colah (Ausgrid)
Macarthur
TumutBurrinjuck
Yanco
Griffith
Buronga
Broken Hill
FinleyDeniliquin
Darlington Point
AlburyHume
Cooma
Munyang
Snowy Adit
Queanbeyan
Canberra
Murrumburrah
Cowra
Kangaroo Valley
Panorama
Molong
Orange
Beryl
Parkes
Forbes
Wellington BayswaterLiddell
DaptoBannaby
Muswellbrook
Tamworth 330
Armidale
Dumaresq Lismore
Tamworth 132
Gunnedah
Narrabri
Moree
Inverell Glen Innes
Tenterfield
Koolkhan
Coffs Harbour
Nambucca
Kempsey
Port Macquarie
Taree
Balranald
Coleambally
Murray
Upper Tumut
Lower Tumut
ANM
Geehi
Jindera
Guthega
Mt Piper132
Mt Piper500/330
Avon
Wagga Wagga North132
330
Redcliffs
Dederang
Wodonga
Bulli CreekMudgeeraba
Uranquinty
Gadara
Raleigh
Macksville
Boambee South
Capital Wind Farm
Wollar
Wagga
INSET
YassMarulan
Wa llerawang
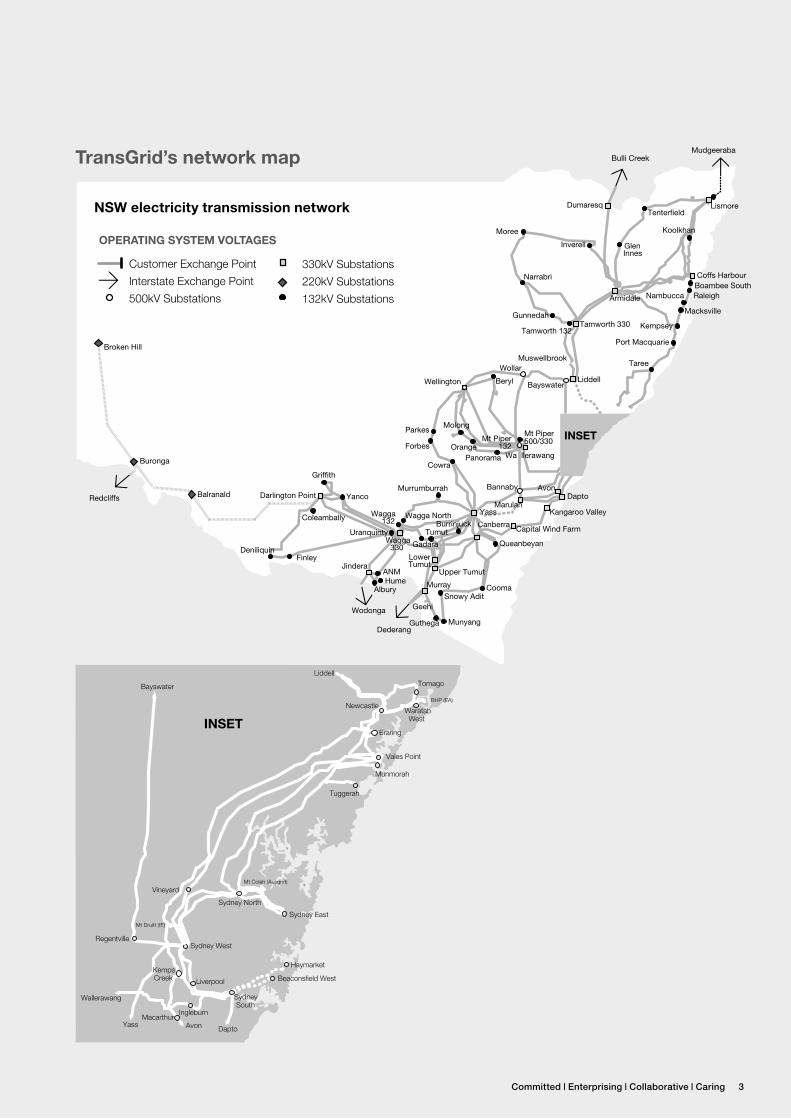
TransGrid’s network map
NSW electricity transmission network
OPERATING SYSTEM VOLTAGES 500kV Transmission Lines
330kV Transmission Lines
220kV Transmission Lines
132kV Transmission Lines
330kV Underground Cable
Customer Exchange Point
Interstate Exchange Point
500kV Substations
330kV Substations
220kV Substations
132kV Substations
OPERATING SYSTEM VOLTAGES 500kV Transmission Lines
330kV Transmission Lines
220kV Transmission Lines
132kV Transmission Lines
330kV Underground Cable
Customer Exchange Point
Interstate Exchange Point
500kV Substations
330kV Substations
220kV Substations
132kV Substations
OPERATING SYSTEM VOLTAGES 500kV Transmission Lines
330kV Transmission Lines
220kV Transmission Lines
132kV Transmission Lines
330kV Underground Cable
Customer Exchange Point
Interstate Exchange Point
500kV Substations
330kV Substations
220kV Substations
132kV Substations
4 TransGrid Annual Report 2013 | Corporate Profile
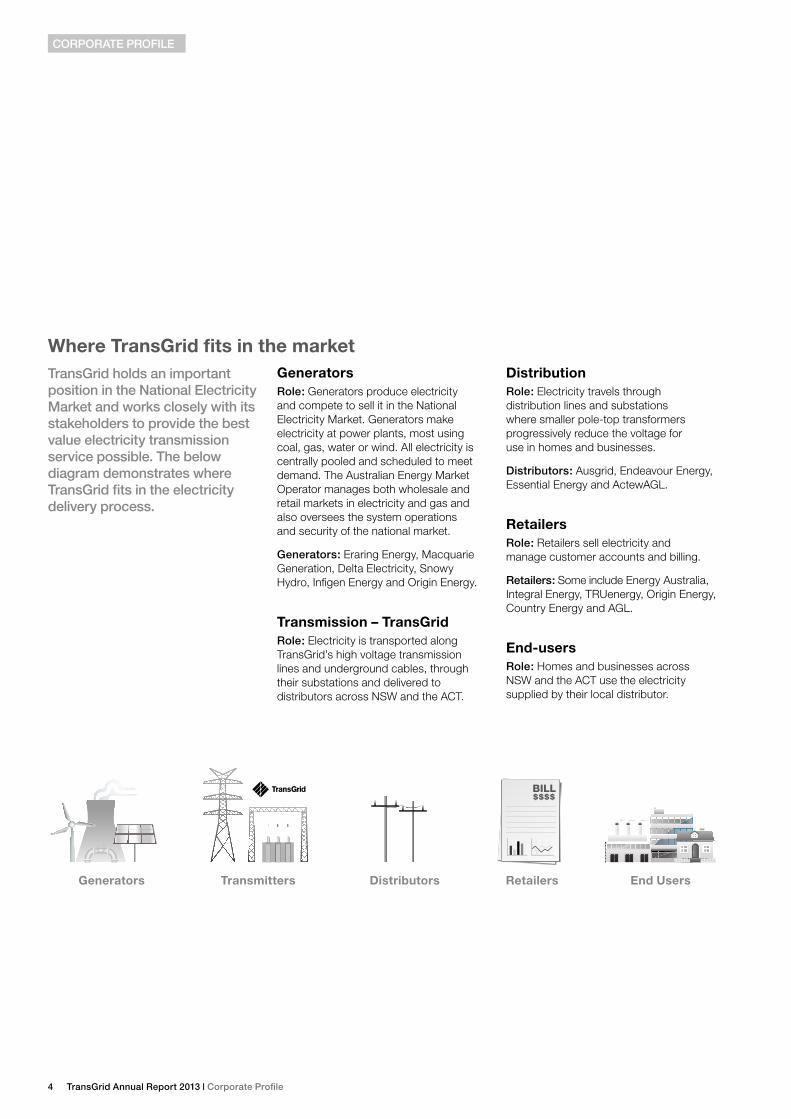
Where TransGrid fits in the marketTransGrid holds an important position in the National Electricity Market and works closely with its stakeholders to provide the best value electricity transmission service possible. The below diagram demonstrates where TransGrid fits in the electricity delivery process.
GeneratorsRole: Generators produce electricity and compete to sell it in the National Electricity Market. Generators make electricity at power plants, most using coal, gas, water or wind. All electricity is centrally pooled and scheduled to meet demand. The Australian Energy Market Operator manages both wholesale and retail markets in electricity and gas and also oversees the system operations and security of the national market.
Generators: Eraring Energy, Macquarie Generation, Delta Electricity, Snowy Hydro, Infigen Energy and Origin Energy.
Transmission – TransGridRole: Electricity is transported along TransGrid’s high voltage transmission lines and underground cables, through their substations and delivered to distributors across NSW and the ACT.
DistributionRole: Electricity travels through distribution lines and substations where smaller pole-top transformers progressively reduce the voltage for use in homes and businesses.
Distributors: Ausgrid, Endeavour Energy, Essential Energy and ActewAGL.
RetailersRole: Retailers sell electricity and manage customer accounts and billing.
Retailers: Some include Energy Australia, Integral Energy, TRUenergy, Origin Energy, Country Energy and AGL.
End-usersRole: Homes and businesses across NSW and the ACT use the electricity supplied by their local distributor.
Generators Transmitters Distributors End UsersRetailersGenerators Transmitters Distributors Retailers Consumers
BILL$$$$
CoRPoRATE PRofILE
Committed | Enterprising | Collaborative | Caring 5
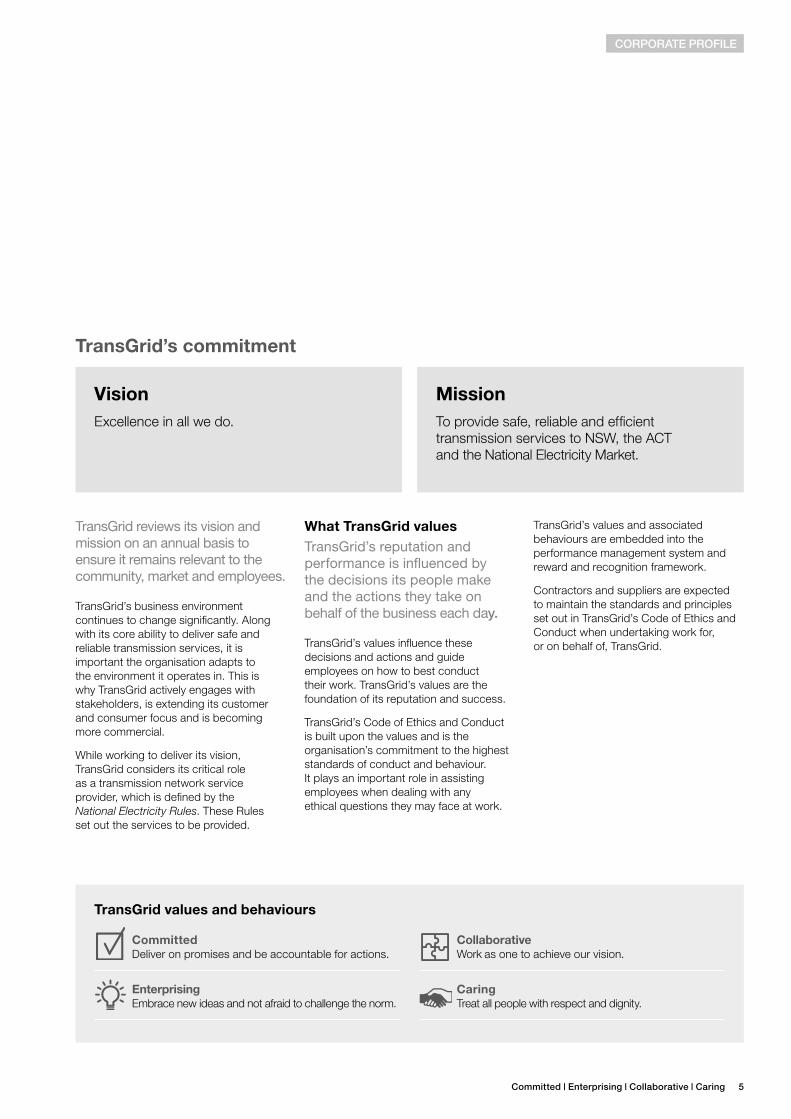
TransGrid’s commitment
VisionExcellence in all we do.
MissionTo provide safe, reliable and efficient transmission services to NSW, the ACT and the National Electricity Market.
TransGrid reviews its vision and mission on an annual basis to ensure it remains relevant to the community, market and employees.
TransGrid’s business environment continues to change significantly. Along with its core ability to deliver safe and reliable transmission services, it is important the organisation adapts to the environment it operates in. This is why TransGrid actively engages with stakeholders, is extending its customer and consumer focus and is becoming more commercial.
While working to deliver its vision, TransGrid considers its critical role as a transmission network service provider, which is defined by the National Electricity Rules. These Rules set out the services to be provided.
What TransGrid valuesTransGrid’s reputation and performance is influenced by the decisions its people make and the actions they take on behalf of the business each day.
TransGrid’s values influence these decisions and actions and guide employees on how to best conduct their work. TransGrid’s values are the foundation of its reputation and success.
TransGrid’s Code of Ethics and Conduct is built upon the values and is the organisation’s commitment to the highest standards of conduct and behaviour. It plays an important role in assisting employees when dealing with any ethical questions they may face at work.
TransGrid’s values and associated behaviours are embedded into the performance management system and reward and recognition framework.
Contractors and suppliers are expected to maintain the standards and principles set out in TransGrid’s Code of Ethics and Conduct when undertaking work for, or on behalf of, TransGrid.
TransGrid values and behaviours
Committed Deliver on promises and be accountable for actions.
Enterprising Embrace new ideas and not afraid to challenge the norm.
Collaborative Work as one to achieve our vision.
Caring Treat all people with respect and dignity.
CoRPoRATE PRofILE
6 TransGrid Annual Report 2013 | Corporate Profile
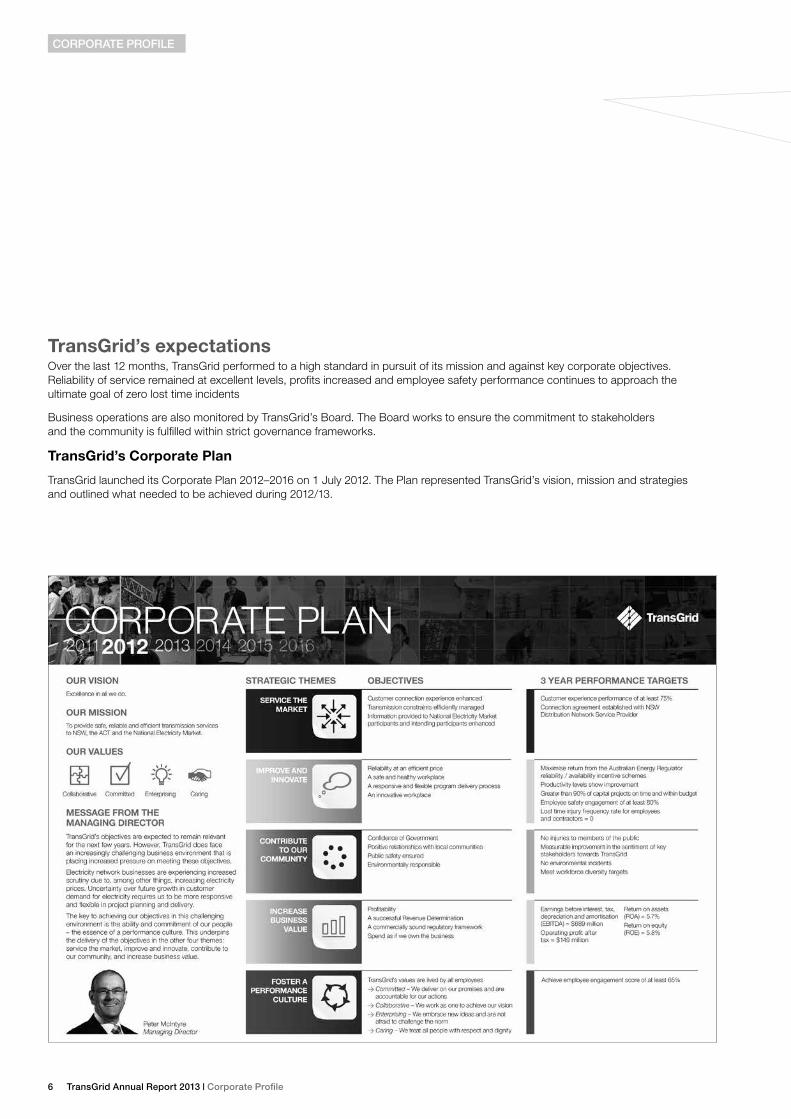
TransGrid’s expectationsOver the last 12 months, TransGrid performed to a high standard in pursuit of its mission and against key corporate objectives. Reliability of service remained at excellent levels, profits increased and employee safety performance continues to approach the ultimate goal of zero lost time incidents
Business operations are also monitored by TransGrid’s Board. The Board works to ensure the commitment to stakeholders and the community is fulfilled within strict governance frameworks.
TransGrid’s Corporate Plan
TransGrid launched its Corporate Plan 2012–2016 on 1 July 2012. The Plan represented TransGrid’s vision, mission and strategies and outlined what needed to be achieved during 2012/13.
CoRPoRATE PRofILE
Committed | Enterprising | Collaborative | Caring 7
CoRPoRATE PRofILE
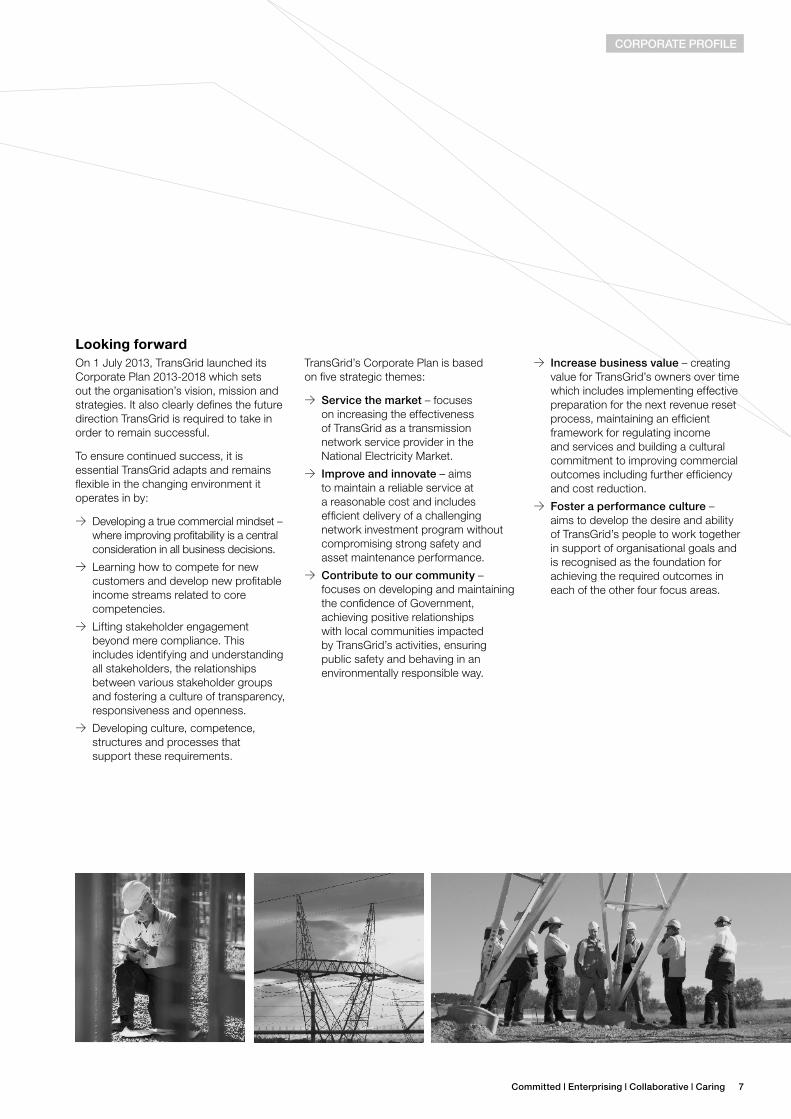
Looking forwardOn 1 July 2013, TransGrid launched its Corporate Plan 2013-2018 which sets out the organisation’s vision, mission and strategies. It also clearly defines the future direction TransGrid is required to take in order to remain successful.
To ensure continued success, it is essential TransGrid adapts and remains flexible in the changing environment it operates in by:
>> Developing a true commercial mindset – where improving profitability is a central consideration in all business decisions.
>> Learning how to compete for new customers and develop new profitable income streams related to core competencies.
>> Lifting stakeholder engagement beyond mere compliance. This includes identifying and understanding all stakeholders, the relationships between various stakeholder groups and fostering a culture of transparency, responsiveness and openness.
>> Developing culture, competence, structures and processes that support these requirements.
TransGrid’s Corporate Plan is based on five strategic themes:
>> Service the market – focuses on increasing the effectiveness of TransGrid as a transmission network service provider in the National Electricity Market.
>> Improve and innovate – aims to maintain a reliable service at a reasonable cost and includes efficient delivery of a challenging network investment program without compromising strong safety and asset maintenance performance.
>> Contribute to our community – focuses on developing and maintaining the confidence of Government, achieving positive relationships with local communities impacted by TransGrid’s activities, ensuring public safety and behaving in an environmentally responsible way.
>> Increase business value – creating value for TransGrid’s owners over time which includes implementing effective preparation for the next revenue reset process, maintaining an efficient framework for regulating income and services and building a cultural commitment to improving commercial outcomes including further efficiency and cost reduction.
>> foster a performance culture – aims to develop the desire and ability of TransGrid’s people to work together in support of organisational goals and is recognised as the foundation for achieving the required outcomes in each of the other four focus areas.
8 TransGrid Annual Report 2013 | Corporate Profile
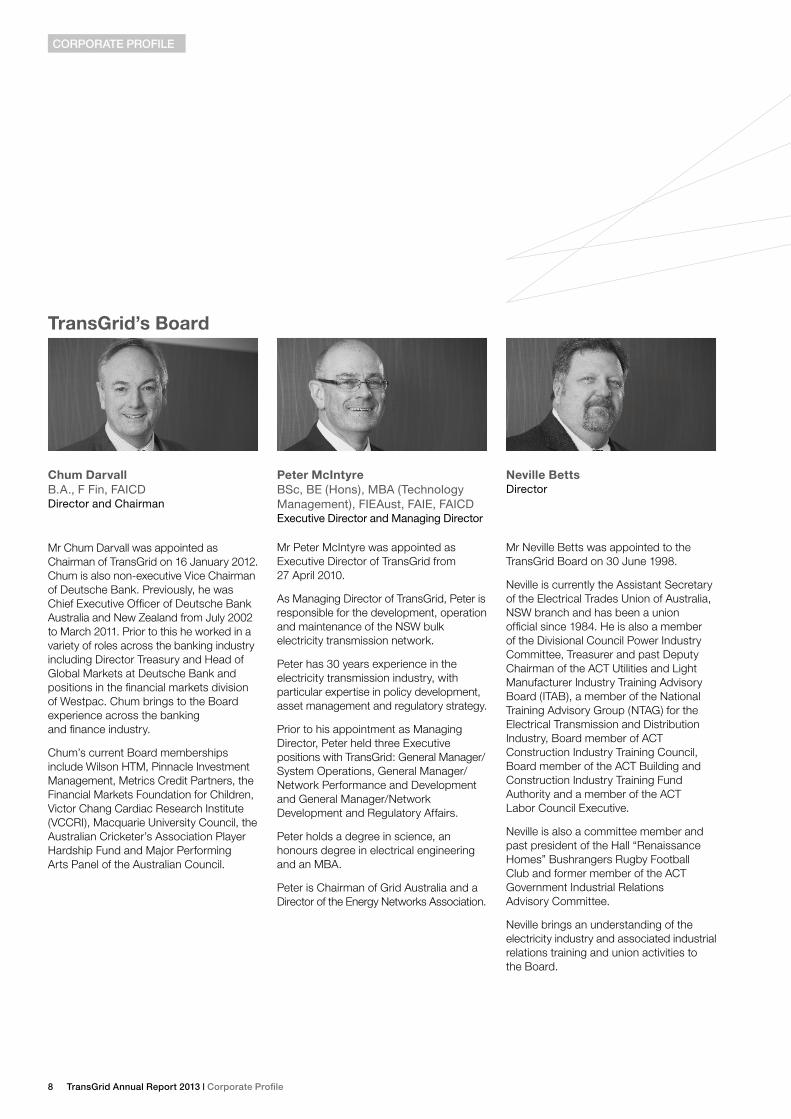
Chum Darvall B.A., F Fin, FAICDDirector and Chairman
Mr Chum Darvall was appointed as Chairman of TransGrid on 16 January 2012. Chum is also non-executive Vice Chairman of Deutsche Bank. Previously, he was Chief Executive Officer of Deutsche Bank Australia and New Zealand from July 2002 to March 2011. Prior to this he worked in a variety of roles across the banking industry including Director Treasury and Head of Global Markets at Deutsche Bank and positions in the financial markets division of Westpac. Chum brings to the Board experience across the banking and finance industry.
Chum’s current Board memberships include Wilson HTM, Pinnacle Investment Management, Metrics Credit Partners, the Financial Markets Foundation for Children, Victor Chang Cardiac Research Institute (VCCRI), Macquarie University Council, the Australian Cricketer’s Association Player Hardship Fund and Major Performing Arts Panel of the Australian Council.
Peter McIntyre BSc, BE (Hons), MBA (Technology Management), FIEAust, FAIE, FAICDExecutive Director and Managing Director
Mr Peter McIntyre was appointed as Executive Director of TransGrid from 27 April 2010.
As Managing Director of TransGrid, Peter is responsible for the development, operation and maintenance of the NSW bulk electricity transmission network.
Peter has 30 years experience in the electricity transmission industry, with particular expertise in policy development, asset management and regulatory strategy.
Prior to his appointment as Managing Director, Peter held three Executive positions with TransGrid: General Manager/System Operations, General Manager/Network Performance and Development and General Manager/Network Development and Regulatory Affairs.
Peter holds a degree in science, an honours degree in electrical engineering and an MBA.
Peter is Chairman of Grid Australia and a Director of the Energy Networks Association.
Neville Betts Director
Mr Neville Betts was appointed to the TransGrid Board on 30 June 1998.
Neville is currently the Assistant Secretary of the Electrical Trades Union of Australia, NSW branch and has been a union official since 1984. He is also a member of the Divisional Council Power Industry Committee, Treasurer and past Deputy Chairman of the ACT Utilities and Light Manufacturer Industry Training Advisory Board (ITAB), a member of the National Training Advisory Group (NTAG) for the Electrical Transmission and Distribution Industry, Board member of ACT Construction Industry Training Council, Board member of the ACT Building and Construction Industry Training Fund Authority and a member of the ACT Labor Council Executive.
Neville is also a committee member and past president of the Hall “Renaissance Homes” Bushrangers Rugby Football Club and former member of the ACT Government Industrial Relations Advisory Committee.
Neville brings an understanding of the electricity industry and associated industrial relations training and union activities to the Board.
TransGrid’s Board
CoRPoRATE PRofILE
Committed | Enterprising | Collaborative | Caring 9
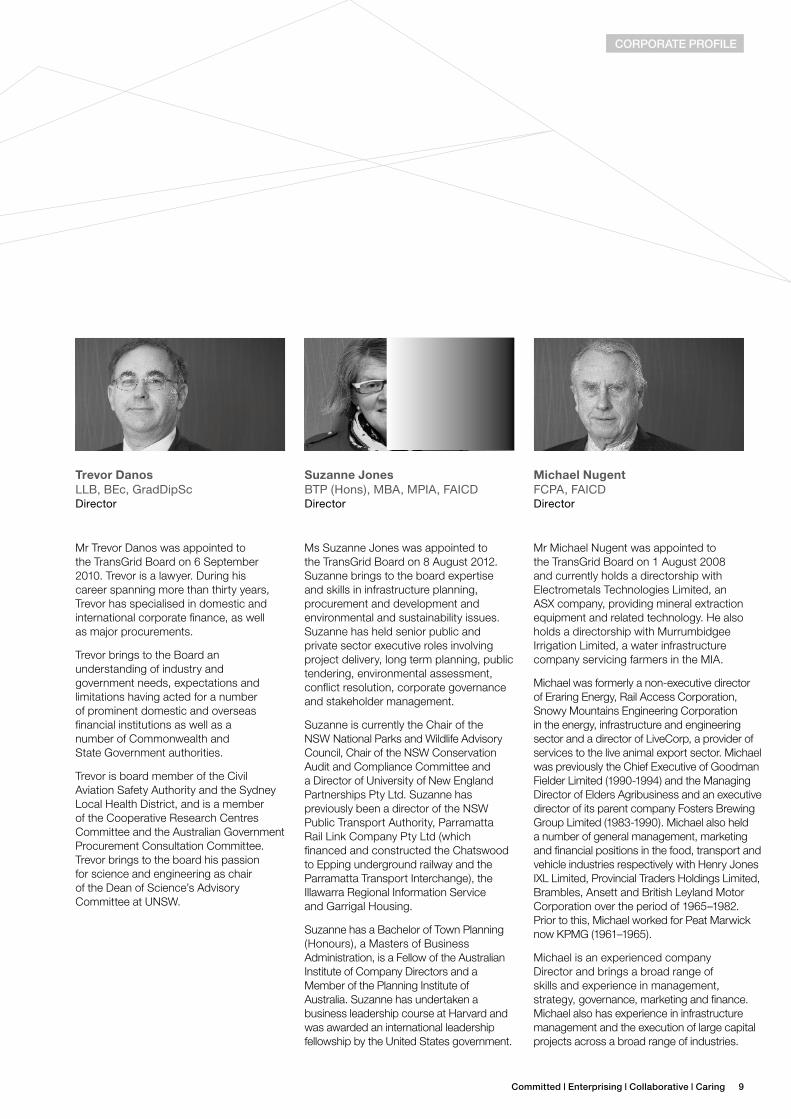
Trevor DanosLLB, BEc, GradDipScDirector
Mr Trevor Danos was appointed to the TransGrid Board on 6 September 2010. Trevor is a lawyer. During his career spanning more than thirty years, Trevor has specialised in domestic and international corporate finance, as well as major procurements.
Trevor brings to the Board an understanding of industry and government needs, expectations and limitations having acted for a number of prominent domestic and overseas financial institutions as well as a number of Commonwealth and State Government authorities.
Trevor is board member of the Civil Aviation Safety Authority and the Sydney Local Health District, and is a member of the Cooperative Research Centres Committee and the Australian Government Procurement Consultation Committee. Trevor brings to the board his passion for science and engineering as chair of the Dean of Science’s Advisory Committee at UNSW.
Suzanne JonesBTP (Hons), MBA, MPIA, FAICDDirector
Ms Suzanne Jones was appointed to the TransGrid Board on 8 August 2012. Suzanne brings to the board expertise and skills in infrastructure planning, procurement and development and environmental and sustainability issues. Suzanne has held senior public and private sector executive roles involving project delivery, long term planning, public tendering, environmental assessment, conflict resolution, corporate governance and stakeholder management.
Suzanne is currently the Chair of the NSW National Parks and Wildlife Advisory Council, Chair of the NSW Conservation Audit and Compliance Committee and a Director of University of New England Partnerships Pty Ltd. Suzanne has previously been a director of the NSW Public Transport Authority, Parramatta Rail Link Company Pty Ltd (which financed and constructed the Chatswood to Epping underground railway and the Parramatta Transport Interchange), the Illawarra Regional Information Service and Garrigal Housing.
Suzanne has a Bachelor of Town Planning (Honours), a Masters of Business Administration, is a Fellow of the Australian Institute of Company Directors and a Member of the Planning Institute of Australia. Suzanne has undertaken a business leadership course at Harvard and was awarded an international leadership fellowship by the United States government.
CoRPoRATE PRofILE
Michael Nugent FCPA, FAICDDirector
Mr Michael Nugent was appointed to the TransGrid Board on 1 August 2008 and currently holds a directorship with Electrometals Technologies Limited, an ASX company, providing mineral extraction equipment and related technology. He also holds a directorship with Murrumbidgee Irrigation Limited, a water infrastructure company servicing farmers in the MIA.
Michael was formerly a non-executive director of Eraring Energy, Rail Access Corporation, Snowy Mountains Engineering Corporation in the energy, infrastructure and engineering sector and a director of LiveCorp, a provider of services to the live animal export sector. Michael was previously the Chief Executive of Goodman Fielder Limited (1990-1994) and the Managing Director of Elders Agribusiness and an executive director of its parent company Fosters Brewing Group Limited (1983-1990). Michael also held a number of general management, marketing and financial positions in the food, transport and vehicle industries respectively with Henry Jones IXL Limited, Provincial Traders Holdings Limited, Brambles, Ansett and British Leyland Motor Corporation over the period of 1965–1982. Prior to this, Michael worked for Peat Marwick now KPMG (1961–1965).
Michael is an experienced company Director and brings a broad range of skills and experience in management, strategy, governance, marketing and finance. Michael also has experience in infrastructure management and the execution of large capital projects across a broad range of industries.
10 TransGrid Annual Report 2013 | Corporate Profile
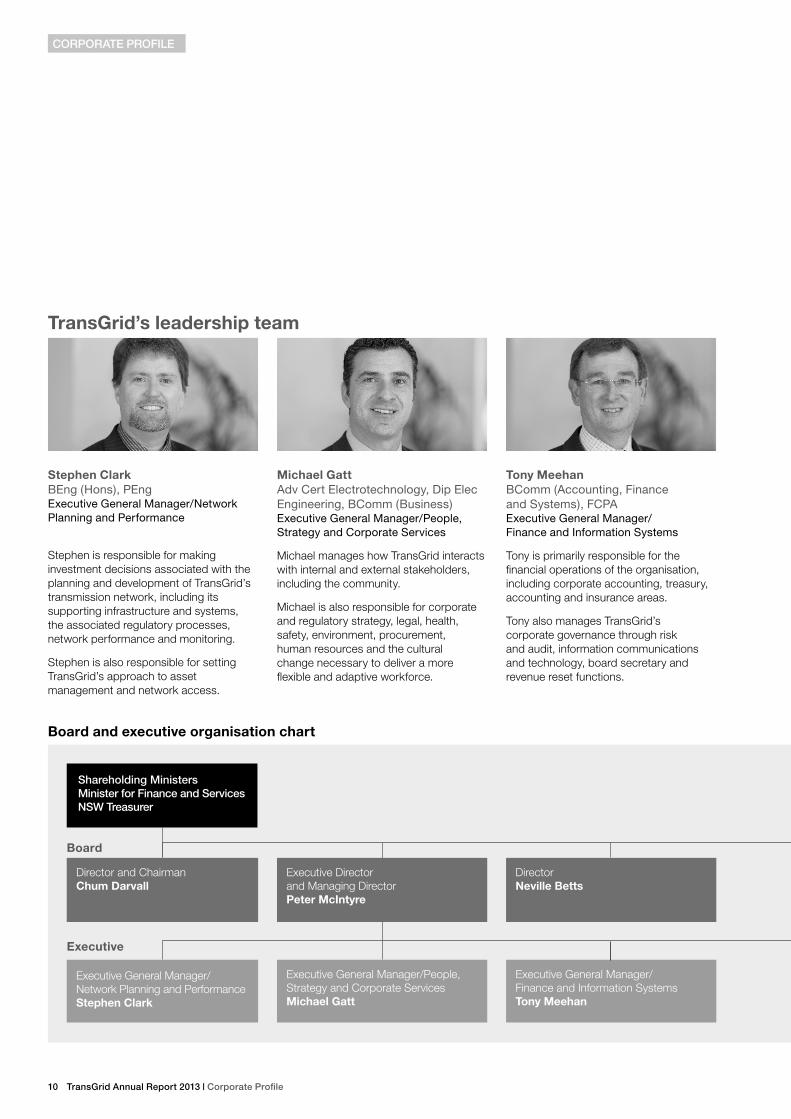
Stephen ClarkBEng (Hons), PEngExecutive General Manager/Network Planning and Performance
Stephen is responsible for making investment decisions associated with the planning and development of TransGrid’s transmission network, including its supporting infrastructure and systems, the associated regulatory processes, network performance and monitoring.
Stephen is also responsible for setting TransGrid’s approach to asset management and network access.
Michael GattAdv Cert Electrotechnology, Dip Elec Engineering, BComm (Business)Executive General Manager/People, Strategy and Corporate Services
Michael manages how TransGrid interacts with internal and external stakeholders, including the community.
Michael is also responsible for corporate and regulatory strategy, legal, health, safety, environment, procurement, human resources and the cultural change necessary to deliver a more flexible and adaptive workforce.
Tony MeehanBComm (Accounting, Finance and Systems), FCPAExecutive General Manager/ Finance and Information Systems
Tony is primarily responsible for the financial operations of the organisation, including corporate accounting, treasury, accounting and insurance areas.
Tony also manages TransGrid’s corporate governance through risk and audit, information communications and technology, board secretary and revenue reset functions.
TransGrid’s leadership team
Board and executive organisation chart
Executive Director and Managing DirectorPeter McIntyre
Director Neville Betts
Director and ChairmanChum Darvall
Executive General Manager/ Network Planning and PerformanceStephen Clark
Executive General Manager/ Finance and Information SystemsTony Meehan
Executive General Manager/People, Strategy and Corporate ServicesMichael Gatt
Shareholding MinistersMinister for finance and ServicesNSW Treasurer
Executive
Board
CoRPoRATE PRofILE

Committed | Enterprising | Collaborative | Caring 11
Gerard ReiterBEng (Hons), CPPD, RPEQExecutive General Manager/ Capital Program Delivery
Gerard is the project manager of TransGrid’s capital works program and is responsible for the timely and efficient delivery of capital works, contract management, property, engineering design, project development and environmental impact assessments.
Lionel SmythBEng (Elec), Grad Mgt Qual, GAICDExecutive General Manager/ Network Services and Operations
Lionel is responsible for managing TransGrid’s high voltage transmission assets and associated protection, metering, communication, property, easements, field management and field services.
Lionel also manages the commissioning of major capital projects and oversees external work consistent with TransGrid’s network expertise and capabilities.
Director Michael Nugent
Director Trevor Danos
DirectorSuzanne Jones
Executive General Manager/Capital Program DeliveryGerard Reiter
Executive General Manager/Network Services and OperationsLionel Smyth
CoRPoRATE PRofILE
12 TransGrid Annual Report 2013 | Performance
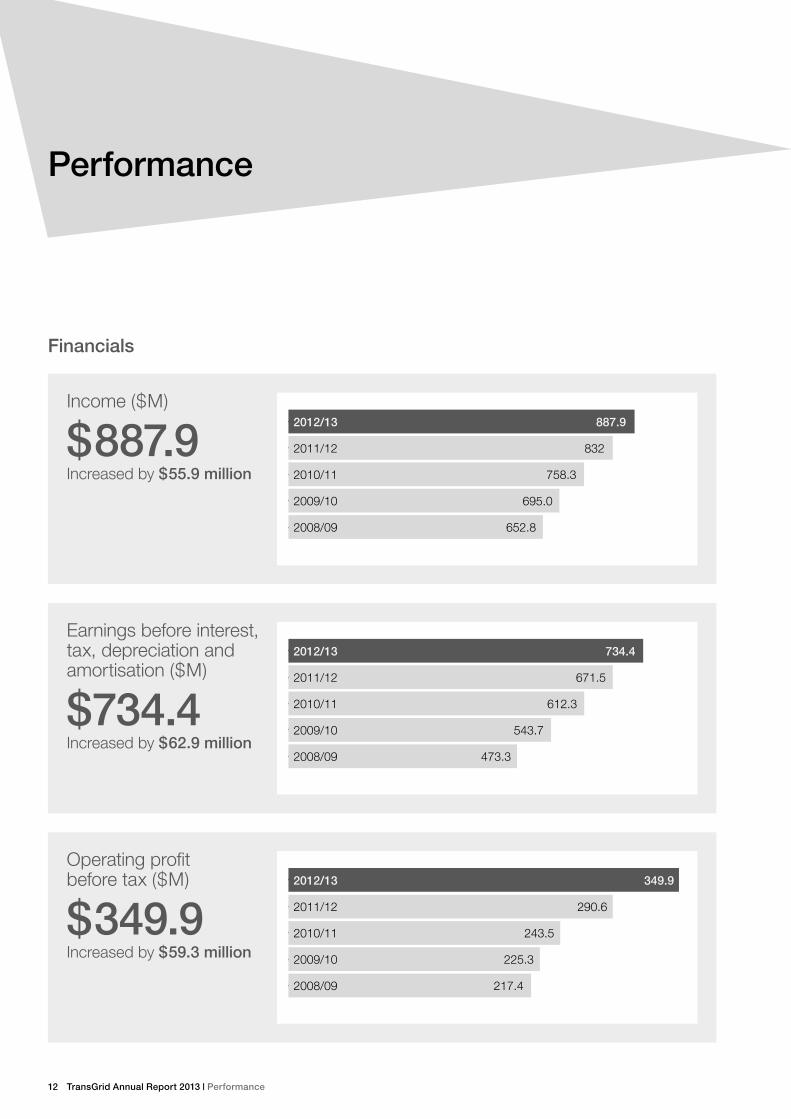
Operating profit before tax ($M)
$349.9Increased by $59.3 million
0.000000 72.650002 145.300003 217.950005 290.600006
2012/13
2011/12
2010/11
2009/10
2008/09
349.9
290.6
243.5
225.3
217.4
financials
Income ($M)
$887.9Increased by $55.9 million
0 208 416 624 832
2012/13
2011/12
2010/11
2009/10
2008/09
887.9
832
758.3
695.0
652.8
Earnings before interest, tax, depreciation and amortisation ($M)
$734.4Increased by $62.9 million
0.000000 167.875015 335.750031 503.625046
2012/13
2011/12
2010/11
2009/10
2008/09
734.4
671.5
612.3
543.7
473.3
Performance
Committed | Enterprising | Collaborative | Caring 13
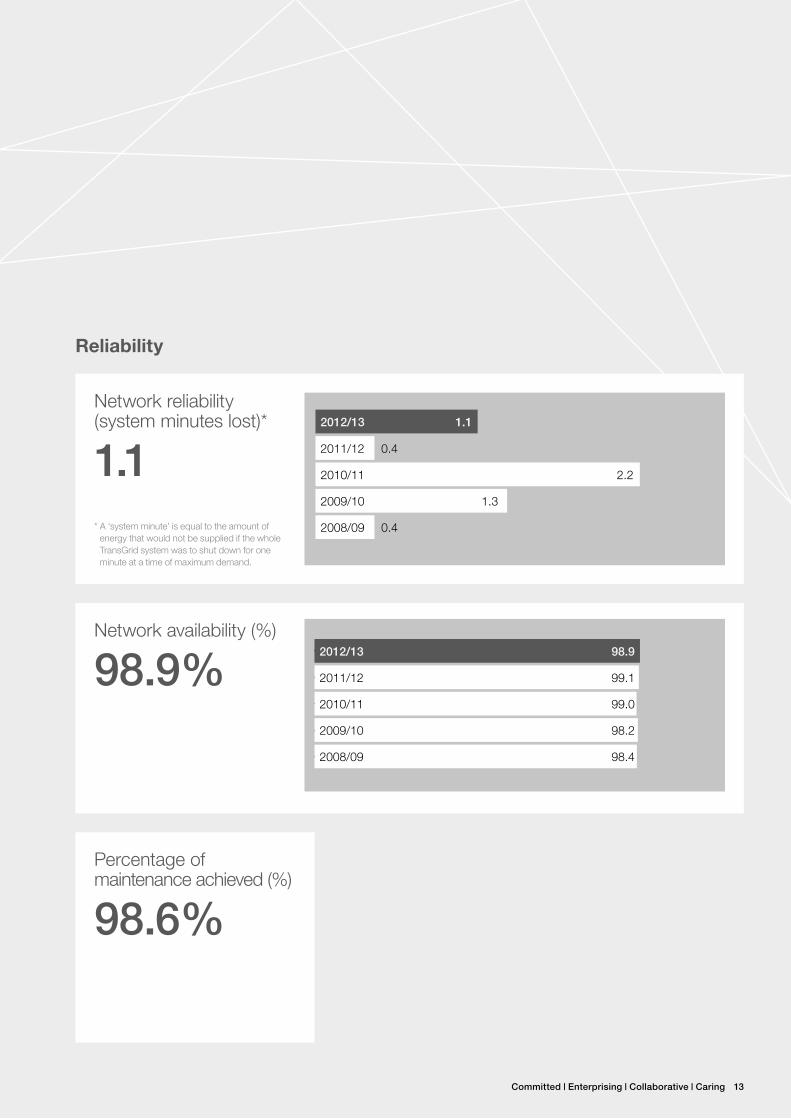
Network availability (%)
98.9%
0.000000 24.449999 48.899998 73.349997 97.799995
2012/13
2011/12
2010/11
2009/10
2008/09
98.9
99.1
99.0
98.2
98.4
Percentage of maintenance achieved (%)
98.6%
Reliability
Network reliability (system minutes lost)*
1.1
0.00 0.55 1.10 1.65 2.20
2010/11
2009/10
2008/09
2011/12 0.4
2012/13 1.1
2.2
1.3
0.4* A ‘system minute’ is equal to the amount of energy that would not be supplied if the whole TransGrid system was to shut down for one minute at a time of maximum demand.
14 TransGrid Annual Report 2013 | People
People
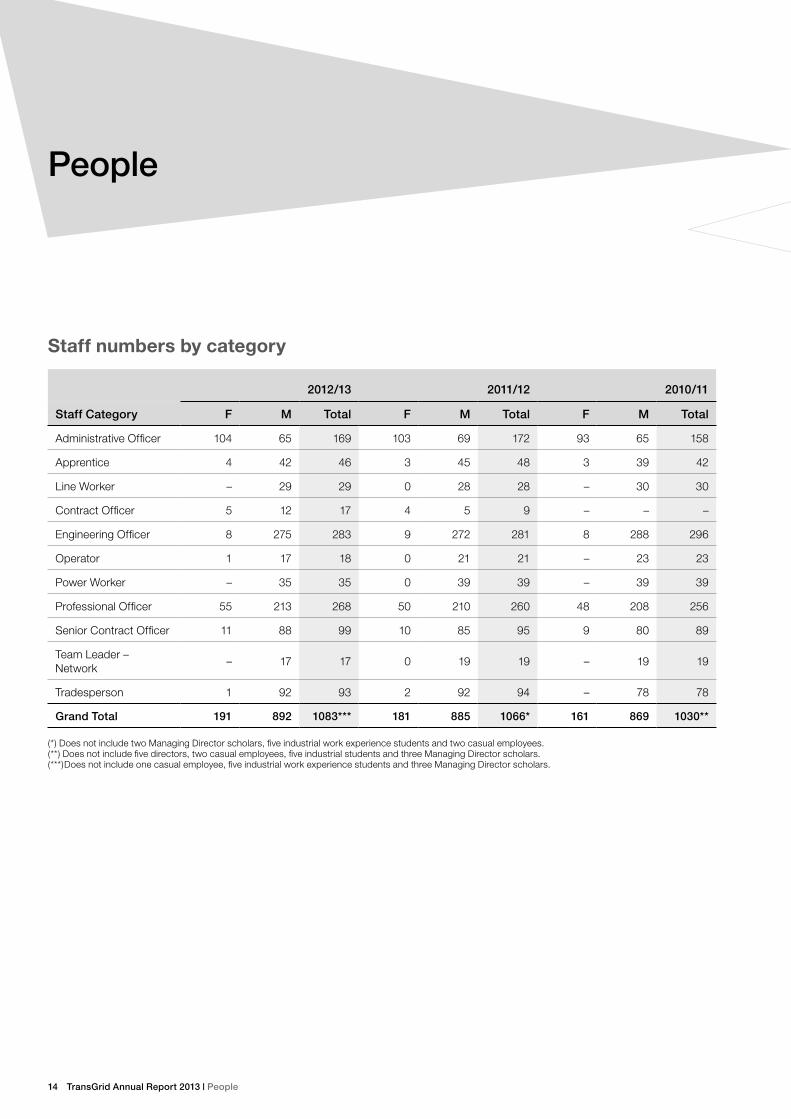
Staff numbers by category
2012/13 2011/12 2010/11
Staff Category f M Total f M Total f M Total
Administrative Officer 104 65 169 103 69 172 93 65 158
Apprentice 4 42 46 3 45 48 3 39 42
Line Worker – 29 29 0 28 28 – 30 30
Contract Officer 5 12 17 4 5 9 – – –
Engineering Officer 8 275 283 9 272 281 8 288 296
Operator 1 17 18 0 21 21 – 23 23
Power Worker – 35 35 0 39 39 – 39 39
Professional Officer 55 213 268 50 210 260 48 208 256
Senior Contract Officer 11 88 99 10 85 95 9 80 89
Team Leader – Network
– 17 17 0 19 19 – 19 19
Tradesperson 1 92 93 2 92 94 – 78 78
Grand Total 191 892 1083*** 181 885 1066* 161 869 1030**
(*) Does not include two Managing Director scholars, five industrial work experience students and two casual employees.(**) Does not include five directors, two casual employees, five industrial students and three Managing Director scholars. (***)Does not include one casual employee, five industrial work experience students and three Managing Director scholars.
Committed | Enterprising | Collaborative | Caring 15
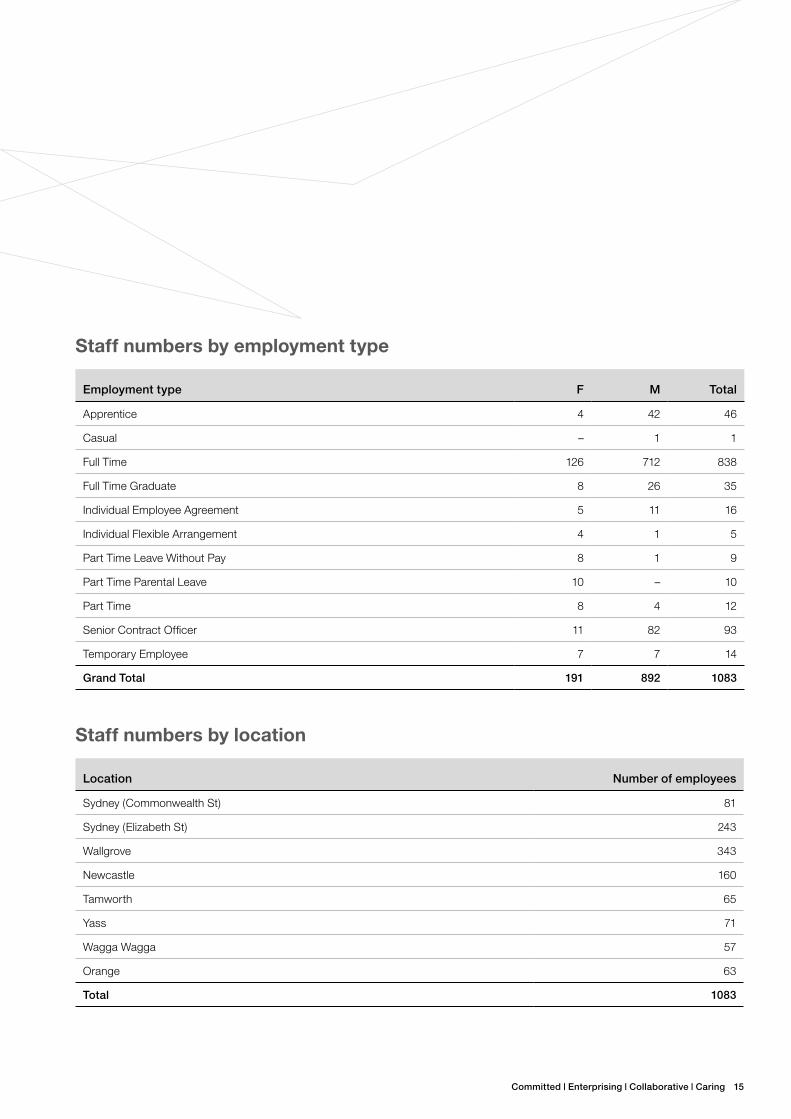
Staff numbers by employment type
Employment type f M Total
Apprentice 4 42 46
Casual – 1 1
Full Time 126 712 838
Full Time Graduate 8 26 35
Individual Employee Agreement 5 11 16
Individual Flexible Arrangement 4 1 5
Part Time Leave Without Pay 8 1 9
Part Time Parental Leave 10 – 10
Part Time 8 4 12
Senior Contract Officer 11 82 93
Temporary Employee 7 7 14
Grand Total 191 892 1083
Staff numbers by location
Location Number of employees
Sydney (Commonwealth St) 81
Sydney (Elizabeth St) 243
Wallgrove 343
Newcastle 160
Tamworth 65
Yass 71
Wagga Wagga 57
Orange 63
Total 1083
16 TransGrid Annual Report 2013 | People
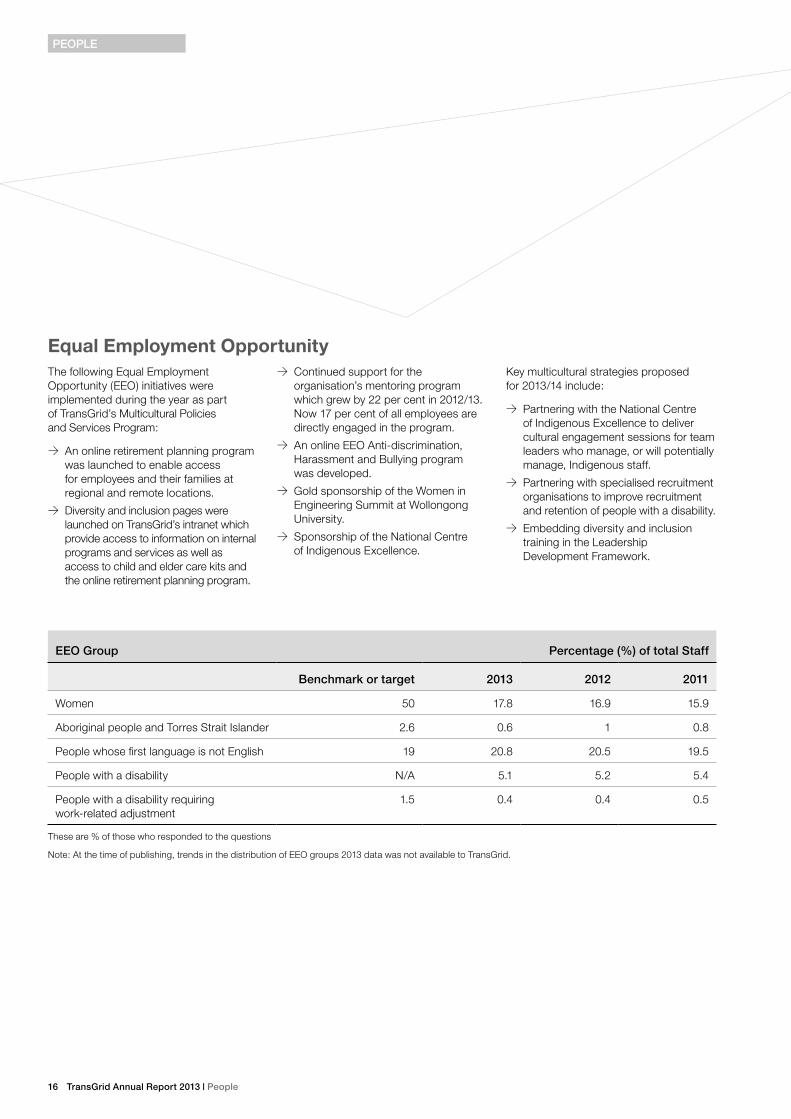
Equal Employment OpportunityThe following Equal Employment Opportunity (EEO) initiatives were implemented during the year as part of TransGrid’s Multicultural Policies and Services Program:
>> An online retirement planning program was launched to enable access for employees and their families at regional and remote locations.
>> Diversity and inclusion pages were launched on TransGrid’s intranet which provide access to information on internal programs and services as well as access to child and elder care kits and the online retirement planning program.
>> Continued support for the organisation’s mentoring program which grew by 22 per cent in 2012/13. Now 17 per cent of all employees are directly engaged in the program.
>> An online EEO Anti-discrimination, Harassment and Bullying program was developed.
>> Gold sponsorship of the Women in Engineering Summit at Wollongong University.
>> Sponsorship of the National Centre of Indigenous Excellence.
Key multicultural strategies proposed for 2013/14 include:
>> Partnering with the National Centre of Indigenous Excellence to deliver cultural engagement sessions for team leaders who manage, or will potentially manage, Indigenous staff.
>> Partnering with specialised recruitment organisations to improve recruitment and retention of people with a disability.
>> Embedding diversity and inclusion training in the Leadership Development Framework.
PEoPLE
EEo Group Percentage (%) of total Staff
Benchmark or target 2013 2012 2011
Women 50 17.8 16.9 15.9
Aboriginal people and Torres Strait Islander 2.6 0.6 1 0.8
People whose first language is not English 19 20.8 20.5 19.5
People with a disability N/A 5.1 5.2 5.4
People with a disability requiring work-related adjustment
1.5 0.4 0.4 0.5
These are % of those who responded to the questions
Note: At the time of publishing, trends in the distribution of EEO groups 2013 data was not available to TransGrid.
Committed | Enterprising | Collaborative | Caring 17
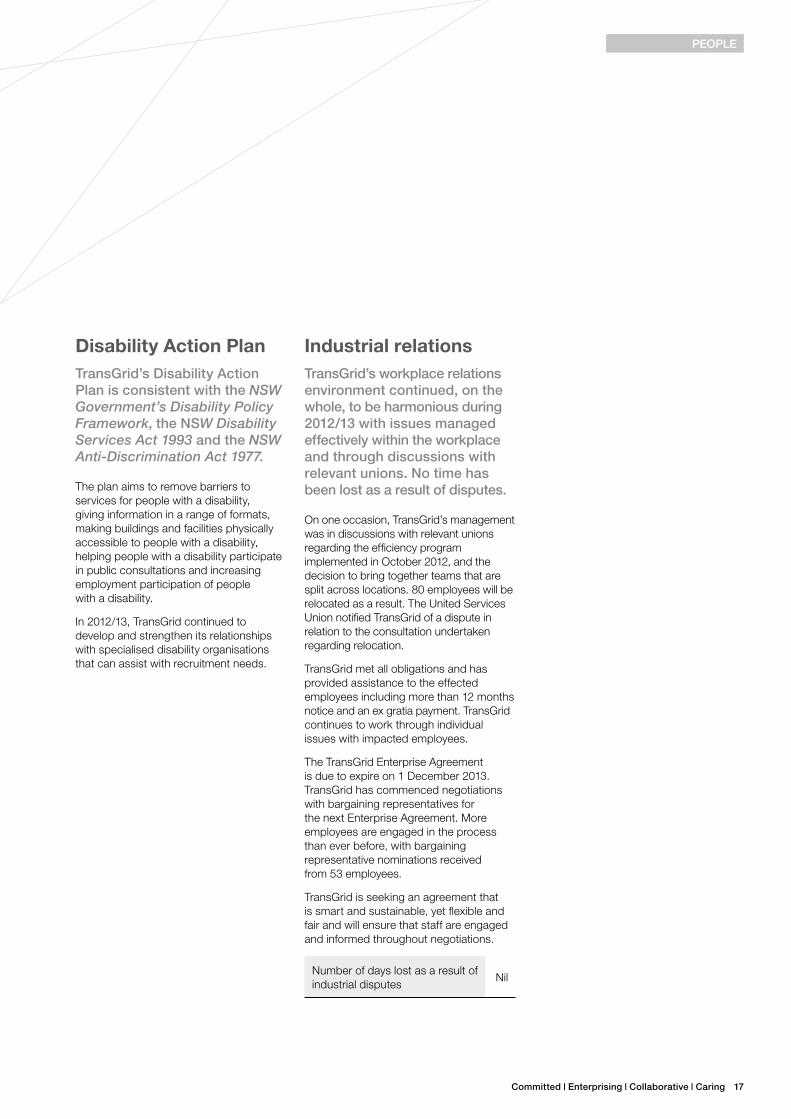
Disability Action PlanTransGrid’s Disability Action Plan is consistent with the NSW Government’s Disability Policy Framework, the NSW Disability Services Act 1993 and the NSW Anti-Discrimination Act 1977.
The plan aims to remove barriers to services for people with a disability, giving information in a range of formats, making buildings and facilities physically accessible to people with a disability, helping people with a disability participate in public consultations and increasing employment participation of people with a disability.
In 2012/13, TransGrid continued to develop and strengthen its relationships with specialised disability organisations that can assist with recruitment needs.
Industrial relationsTransGrid’s workplace relations environment continued, on the whole, to be harmonious during 2012/13 with issues managed effectively within the workplace and through discussions with relevant unions. No time has been lost as a result of disputes.
On one occasion, TransGrid’s management was in discussions with relevant unions regarding the efficiency program implemented in October 2012, and the decision to bring together teams that are split across locations. 80 employees will be relocated as a result. The United Services Union notified TransGrid of a dispute in relation to the consultation undertaken regarding relocation.
TransGrid met all obligations and has provided assistance to the effected employees including more than 12 months notice and an ex gratia payment. TransGrid continues to work through individual issues with impacted employees.
The TransGrid Enterprise Agreement is due to expire on 1 December 2013. TransGrid has commenced negotiations with bargaining representatives for the next Enterprise Agreement. More employees are engaged in the process than ever before, with bargaining representative nominations received from 53 employees.
TransGrid is seeking an agreement that is smart and sustainable, yet flexible and fair and will ensure that staff are engaged and informed throughout negotiations.
Number of days lost as a result of industrial disputes
Nil
PEoPLE
18 TransGrid Annual Report 2013 | Building program
Building program
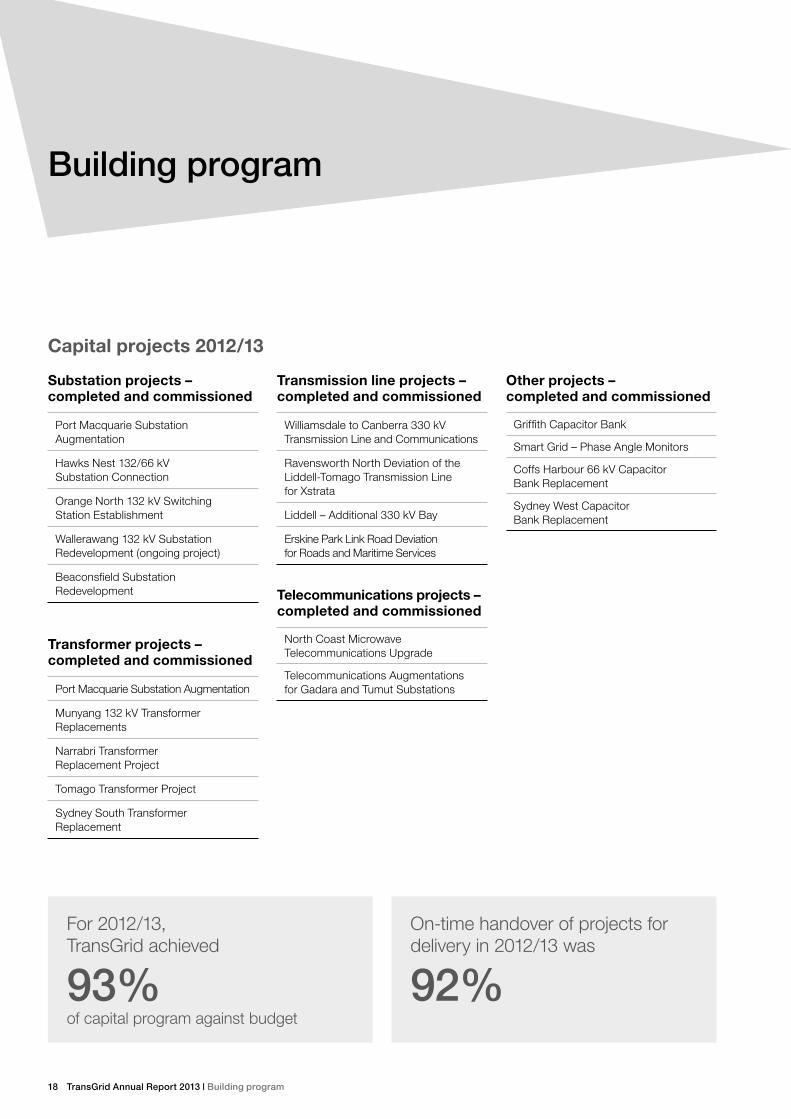
Capital projects 2012/13
Substation projects – completed and commissioned
Port Macquarie Substation Augmentation
Hawks Nest 132/66 kV Substation Connection
Orange North 132 kV Switching Station Establishment
Wallerawang 132 kV Substation Redevelopment (ongoing project)
Beaconsfield Substation Redevelopment
Transformer projects – completed and commissioned
Port Macquarie Substation Augmentation
Munyang 132 kV Transformer Replacements
Narrabri Transformer Replacement Project
Tomago Transformer Project
Sydney South Transformer Replacement
Transmission line projects – completed and commissioned
Williamsdale to Canberra 330 kV Transmission Line and Communications
Ravensworth North Deviation of the Liddell-Tomago Transmission Line for Xstrata
Liddell – Additional 330 kV Bay
Erskine Park Link Road Deviation for Roads and Maritime Services
Telecommunications projects – completed and commissioned
North Coast Microwave Telecommunications Upgrade
Telecommunications Augmentations for Gadara and Tumut Substations
Other projects – completed and commissioned
Griffith Capacitor Bank
Smart Grid – Phase Angle Monitors
Coffs Harbour 66 kV Capacitor Bank Replacement
Sydney West Capacitor Bank Replacement
For 2012/13, TransGrid achieved
93%of capital program against budget
On-time handover of projects for delivery in 2012/13 was
92%
Committed | Enterprising | Collaborative | Caring 19
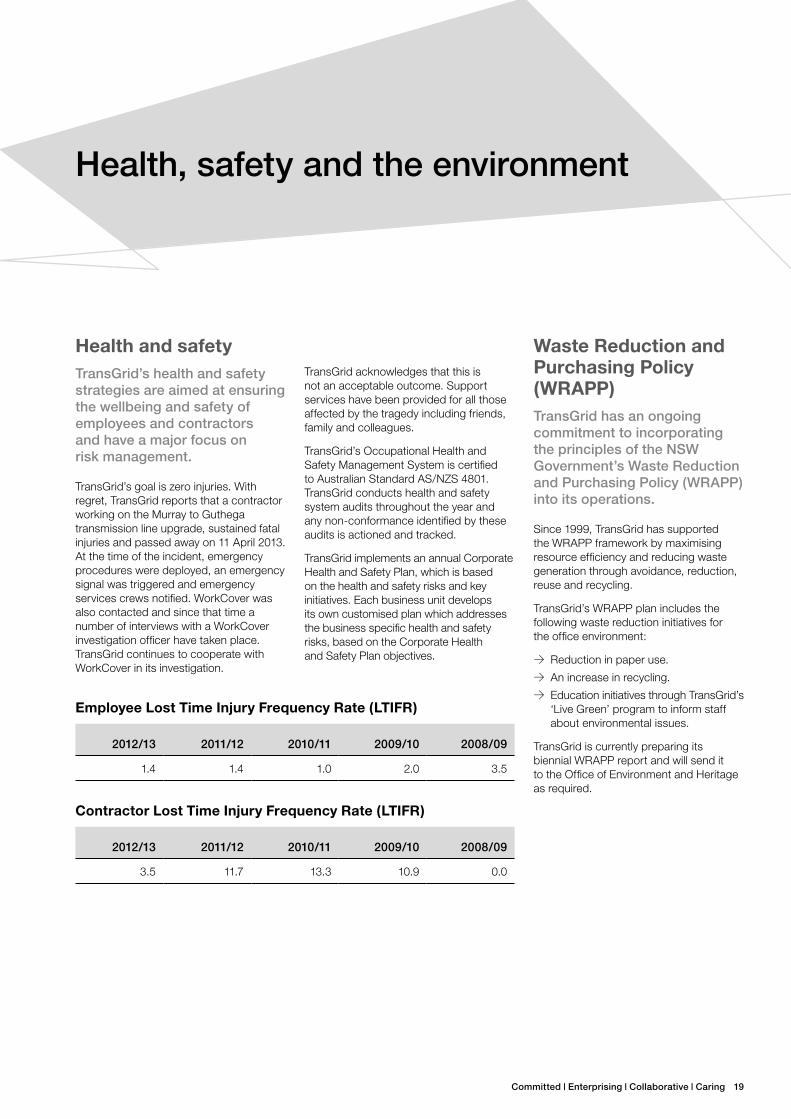
Health, safety and the environment
Health and safetyTransGrid’s health and safety strategies are aimed at ensuring the wellbeing and safety of employees and contractors and have a major focus on risk management.
TransGrid’s goal is zero injuries. With regret, TransGrid reports that a contractor working on the Murray to Guthega transmission line upgrade, sustained fatal injuries and passed away on 11 April 2013. At the time of the incident, emergency procedures were deployed, an emergency signal was triggered and emergency services crews notified. WorkCover was also contacted and since that time a number of interviews with a WorkCover investigation officer have taken place. TransGrid continues to cooperate with WorkCover in its investigation.
TransGrid acknowledges that this is not an acceptable outcome. Support services have been provided for all those affected by the tragedy including friends, family and colleagues.
TransGrid’s Occupational Health and Safety Management System is certified to Australian Standard AS/NZS 4801. TransGrid conducts health and safety system audits throughout the year and any non-conformance identified by these audits is actioned and tracked.
TransGrid implements an annual Corporate Health and Safety Plan, which is based on the health and safety risks and key initiatives. Each business unit develops its own customised plan which addresses the business specific health and safety risks, based on the Corporate Health and Safety Plan objectives.
Employee Lost Time Injury Frequency Rate (LTIFR)
2012/13 2011/12 2010/11 2009/10 2008/09
1.4 1.4 1.0 2.0 3.5
Contractor Lost Time Injury Frequency Rate (LTIFR)
2012/13 2011/12 2010/11 2009/10 2008/09
3.5 11.7 13.3 10.9 0.0
Waste Reduction and Purchasing Policy (WRAPP)TransGrid has an ongoing commitment to incorporating the principles of the NSW Government’s Waste Reduction and Purchasing Policy (WRAPP) into its operations.
Since 1999, TransGrid has supported the WRAPP framework by maximising resource efficiency and reducing waste generation through avoidance, reduction, reuse and recycling.
TransGrid’s WRAPP plan includes the following waste reduction initiatives for the office environment:
>> Reduction in paper use.>> An increase in recycling.>> Education initiatives through TransGrid’s ‘Live Green’ program to inform staff about environmental issues.
TransGrid is currently preparing its biennial WRAPP report and will send it to the Office of Environment and Heritage as required.
20 TransGrid Annual Report 2013 | Community
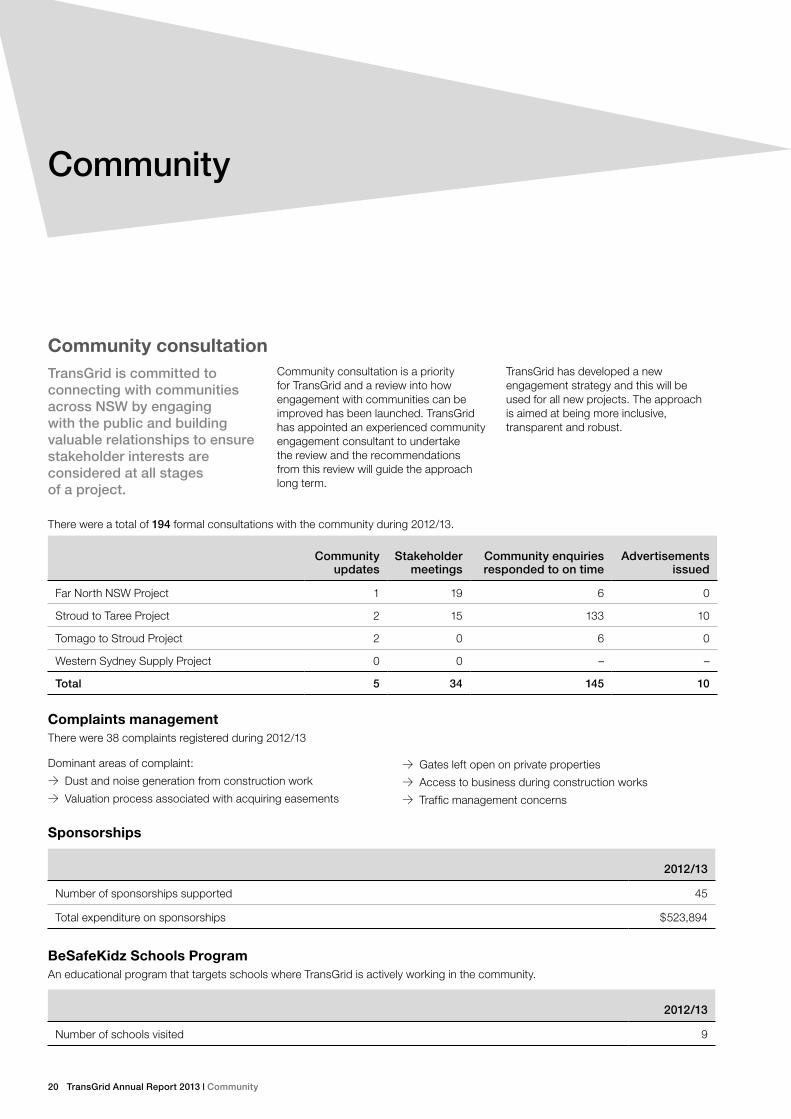
Community
Community consultationTransGrid is committed to connecting with communities across NSW by engaging with the public and building valuable relationships to ensure stakeholder interests are considered at all stages of a project.
Community consultation is a priority for TransGrid and a review into how engagement with communities can be improved has been launched. TransGrid has appointed an experienced community engagement consultant to undertake the review and the recommendations from this review will guide the approach long term.
TransGrid has developed a new engagement strategy and this will be used for all new projects. The approach is aimed at being more inclusive, transparent and robust.
There were a total of 194 formal consultations with the community during 2012/13.
Community updates
Stakeholder meetings
Community enquiries responded to on time
Advertisements issued
Far North NSW Project 1 19 6 0
Stroud to Taree Project 2 15 133 10
Tomago to Stroud Project 2 0 6 0
Western Sydney Supply Project 0 0 – –
Total 5 34 145 10
Complaints managementThere were 38 complaints registered during 2012/13
Dominant areas of complaint: >> Dust and noise generation from construction work>> Valuation process associated with acquiring easements
Sponsorships
2012/13
Number of sponsorships supported 45
Total expenditure on sponsorships $523,894
BeSafeKidz Schools Program An educational program that targets schools where TransGrid is actively working in the community.
2012/13
Number of schools visited 9
>> Gates left open on private properties>> Access to business during construction works>> Traffic management concerns
Committed | Enterprising | Collaborative | Caring 21
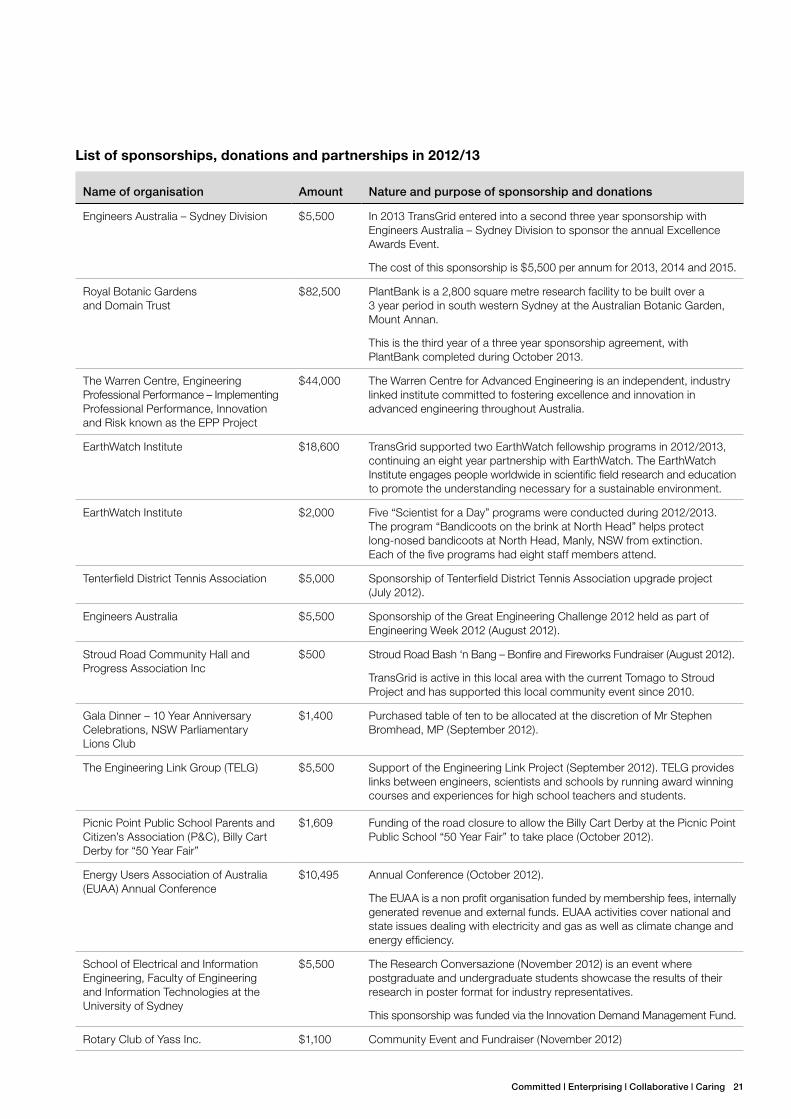
List of sponsorships, donations and partnerships in 2012/13
Name of organisation Amount Nature and purpose of sponsorship and donations
Engineers Australia – Sydney Division $5,500 In 2013 TransGrid entered into a second three year sponsorship with Engineers Australia – Sydney Division to sponsor the annual Excellence Awards Event.
The cost of this sponsorship is $5,500 per annum for 2013, 2014 and 2015.
Royal Botanic Gardens and Domain Trust
$82,500 PlantBank is a 2,800 square metre research facility to be built over a 3 year period in south western Sydney at the Australian Botanic Garden, Mount Annan.
This is the third year of a three year sponsorship agreement, with PlantBank completed during October 2013.
The Warren Centre, Engineering Professional Performance – Implementing Professional Performance, Innovation and Risk known as the EPP Project
$44,000 The Warren Centre for Advanced Engineering is an independent, industry linked institute committed to fostering excellence and innovation in advanced engineering throughout Australia.
EarthWatch Institute $18,600 TransGrid supported two EarthWatch fellowship programs in 2012/2013, continuing an eight year partnership with EarthWatch. The EarthWatch Institute engages people worldwide in scientific field research and education to promote the understanding necessary for a sustainable environment.
EarthWatch Institute $2,000 Five “Scientist for a Day” programs were conducted during 2012/2013. The program “Bandicoots on the brink at North Head” helps protect long-nosed bandicoots at North Head, Manly, NSW from extinction. Each of the five programs had eight staff members attend.
Tenterfield District Tennis Association $5,000 Sponsorship of Tenterfield District Tennis Association upgrade project (July 2012).
Engineers Australia $5,500 Sponsorship of the Great Engineering Challenge 2012 held as part of Engineering Week 2012 (August 2012).
Stroud Road Community Hall and Progress Association Inc
$500 Stroud Road Bash ‘n Bang – Bonfire and Fireworks Fundraiser (August 2012).
TransGrid is active in this local area with the current Tomago to Stroud Project and has supported this local community event since 2010.
Gala Dinner – 10 Year Anniversary Celebrations, NSW Parliamentary Lions Club
$1,400 Purchased table of ten to be allocated at the discretion of Mr Stephen Bromhead, MP (September 2012).
The Engineering Link Group (TELG) $5,500 Support of the Engineering Link Project (September 2012). TELG provides links between engineers, scientists and schools by running award winning courses and experiences for high school teachers and students.
Picnic Point Public School Parents and Citizen’s Association (P&C), Billy Cart Derby for “50 Year Fair”
$1,609 Funding of the road closure to allow the Billy Cart Derby at the Picnic Point Public School “50 Year Fair” to take place (October 2012).
Energy Users Association of Australia (EUAA) Annual Conference
$10,495 Annual Conference (October 2012).
The EUAA is a non profit organisation funded by membership fees, internally generated revenue and external funds. EUAA activities cover national and state issues dealing with electricity and gas as well as climate change and energy efficiency.
School of Electrical and Information Engineering, Faculty of Engineering and Information Technologies at the University of Sydney
$5,500 The Research Conversazione (November 2012) is an event where postgraduate and undergraduate students showcase the results of their research in poster format for industry representatives.
This sponsorship was funded via the Innovation Demand Management Fund.
Rotary Club of Yass Inc. $1,100 Community Event and Fundraiser (November 2012)
22 TransGrid Annual Report 2013 | Community
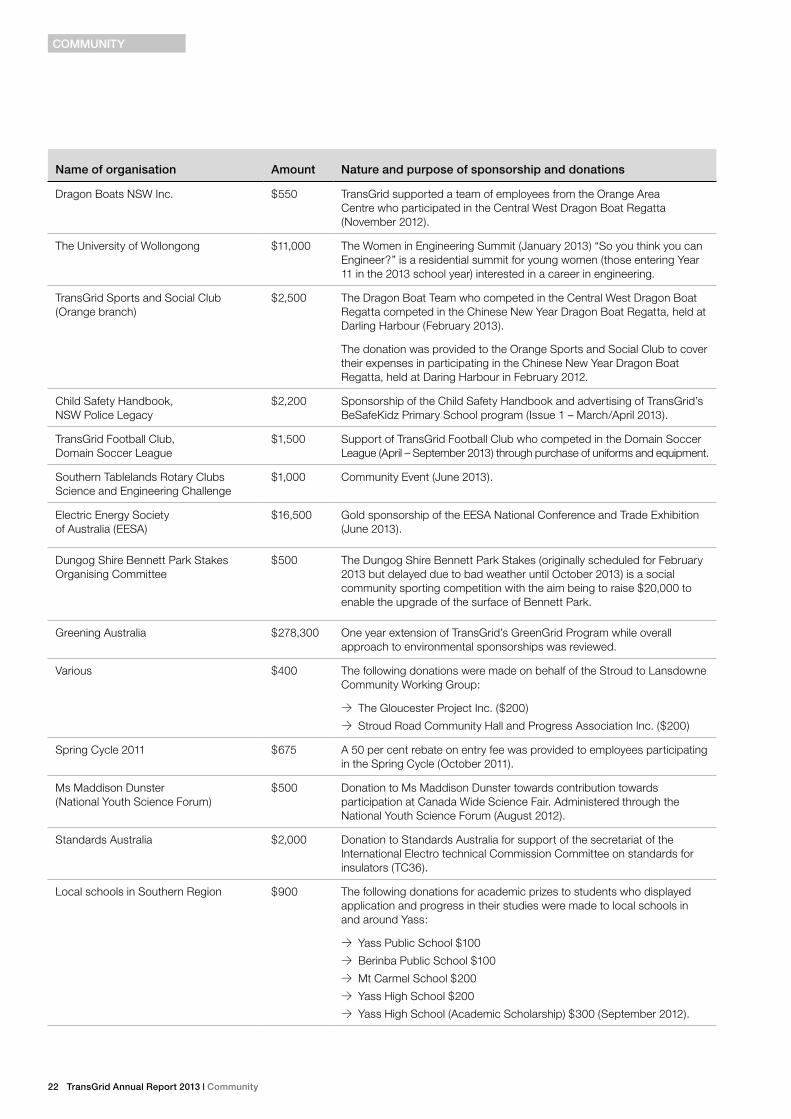
Name of organisation Amount Nature and purpose of sponsorship and donations
Dragon Boats NSW Inc. $550 TransGrid supported a team of employees from the Orange Area Centre who participated in the Central West Dragon Boat Regatta (November 2012).
The University of Wollongong $11,000 The Women in Engineering Summit (January 2013) “So you think you can Engineer?” is a residential summit for young women (those entering Year 11 in the 2013 school year) interested in a career in engineering.
TransGrid Sports and Social Club (Orange branch)
$2,500 The Dragon Boat Team who competed in the Central West Dragon Boat Regatta competed in the Chinese New Year Dragon Boat Regatta, held at Darling Harbour (February 2013).
The donation was provided to the Orange Sports and Social Club to cover their expenses in participating in the Chinese New Year Dragon Boat Regatta, held at Daring Harbour in February 2012.
Child Safety Handbook, NSW Police Legacy
$2,200 Sponsorship of the Child Safety Handbook and advertising of TransGrid’s BeSafeKidz Primary School program (Issue 1 – March/April 2013).
TransGrid Football Club, Domain Soccer League
$1,500 Support of TransGrid Football Club who competed in the Domain Soccer League (April – September 2013) through purchase of uniforms and equipment.
Southern Tablelands Rotary Clubs Science and Engineering Challenge
$1,000 Community Event (June 2013).
Electric Energy Society of Australia (EESA)
$16,500 Gold sponsorship of the EESA National Conference and Trade Exhibition (June 2013).
Dungog Shire Bennett Park Stakes Organising Committee
$500 The Dungog Shire Bennett Park Stakes (originally scheduled for February 2013 but delayed due to bad weather until October 2013) is a social community sporting competition with the aim being to raise $20,000 to enable the upgrade of the surface of Bennett Park.
Greening Australia $278,300 One year extension of TransGrid’s GreenGrid Program while overall approach to environmental sponsorships was reviewed.
Various $400 The following donations were made on behalf of the Stroud to Lansdowne Community Working Group:
>> The Gloucester Project Inc. ($200)>> Stroud Road Community Hall and Progress Association Inc. ($200)
Spring Cycle 2011 $675 A 50 per cent rebate on entry fee was provided to employees participating in the Spring Cycle (October 2011).
Ms Maddison Dunster (National Youth Science Forum)
$500 Donation to Ms Maddison Dunster towards contribution towards participation at Canada Wide Science Fair. Administered through the National Youth Science Forum (August 2012).
Standards Australia $2,000 Donation to Standards Australia for support of the secretariat of the International Electro technical Commission Committee on standards for insulators (TC36).
Local schools in Southern Region $900 The following donations for academic prizes to students who displayed application and progress in their studies were made to local schools in and around Yass:
>> Yass Public School $100>> Berinba Public School $100>> Mt Carmel School $200>> Yass High School $200>> Yass High School (Academic Scholarship) $300 (September 2012).
CoMMuNITy
Committed | Enterprising | Collaborative | Caring 23
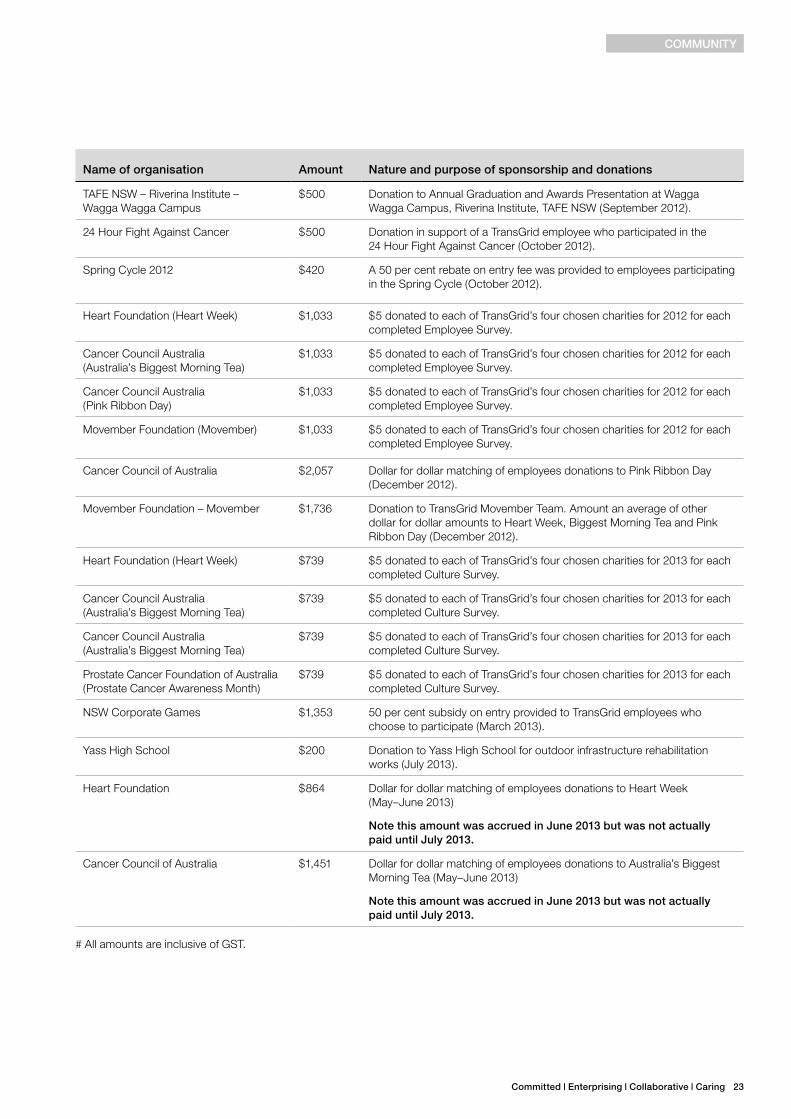
Name of organisation Amount Nature and purpose of sponsorship and donations
TAFE NSW – Riverina Institute – Wagga Wagga Campus
$500 Donation to Annual Graduation and Awards Presentation at Wagga Wagga Campus, Riverina Institute, TAFE NSW (September 2012).
24 Hour Fight Against Cancer $500 Donation in support of a TransGrid employee who participated in the 24 Hour Fight Against Cancer (October 2012).
Spring Cycle 2012 $420 A 50 per cent rebate on entry fee was provided to employees participating in the Spring Cycle (October 2012).
Heart Foundation (Heart Week) $1,033 $5 donated to each of TransGrid’s four chosen charities for 2012 for each completed Employee Survey.
Cancer Council Australia (Australia’s Biggest Morning Tea)
$1,033 $5 donated to each of TransGrid’s four chosen charities for 2012 for each completed Employee Survey.
Cancer Council Australia (Pink Ribbon Day)
$1,033 $5 donated to each of TransGrid’s four chosen charities for 2012 for each completed Employee Survey.
Movember Foundation (Movember) $1,033 $5 donated to each of TransGrid’s four chosen charities for 2012 for each completed Employee Survey.
Cancer Council of Australia $2,057 Dollar for dollar matching of employees donations to Pink Ribbon Day (December 2012).
Movember Foundation – Movember $1,736 Donation to TransGrid Movember Team. Amount an average of other dollar for dollar amounts to Heart Week, Biggest Morning Tea and Pink Ribbon Day (December 2012).
Heart Foundation (Heart Week) $739 $5 donated to each of TransGrid’s four chosen charities for 2013 for each completed Culture Survey.
Cancer Council Australia (Australia’s Biggest Morning Tea)
$739 $5 donated to each of TransGrid’s four chosen charities for 2013 for each completed Culture Survey.
Cancer Council Australia (Australia’s Biggest Morning Tea)
$739 $5 donated to each of TransGrid’s four chosen charities for 2013 for each completed Culture Survey.
Prostate Cancer Foundation of Australia (Prostate Cancer Awareness Month)
$739 $5 donated to each of TransGrid’s four chosen charities for 2013 for each completed Culture Survey.
NSW Corporate Games $1,353 50 per cent subsidy on entry provided to TransGrid employees who choose to participate (March 2013).
Yass High School $200 Donation to Yass High School for outdoor infrastructure rehabilitation works (July 2013).
Heart Foundation $864 Dollar for dollar matching of employees donations to Heart Week (May–June 2013)
Note this amount was accrued in June 2013 but was not actually paid until July 2013.
Cancer Council of Australia $1,451 Dollar for dollar matching of employees donations to Australia’s Biggest Morning Tea (May–June 2013)
Note this amount was accrued in June 2013 but was not actually paid until July 2013.
# All amounts are inclusive of GST.
CoMMuNITy
24 TransGrid Annual Report 2013 | Community
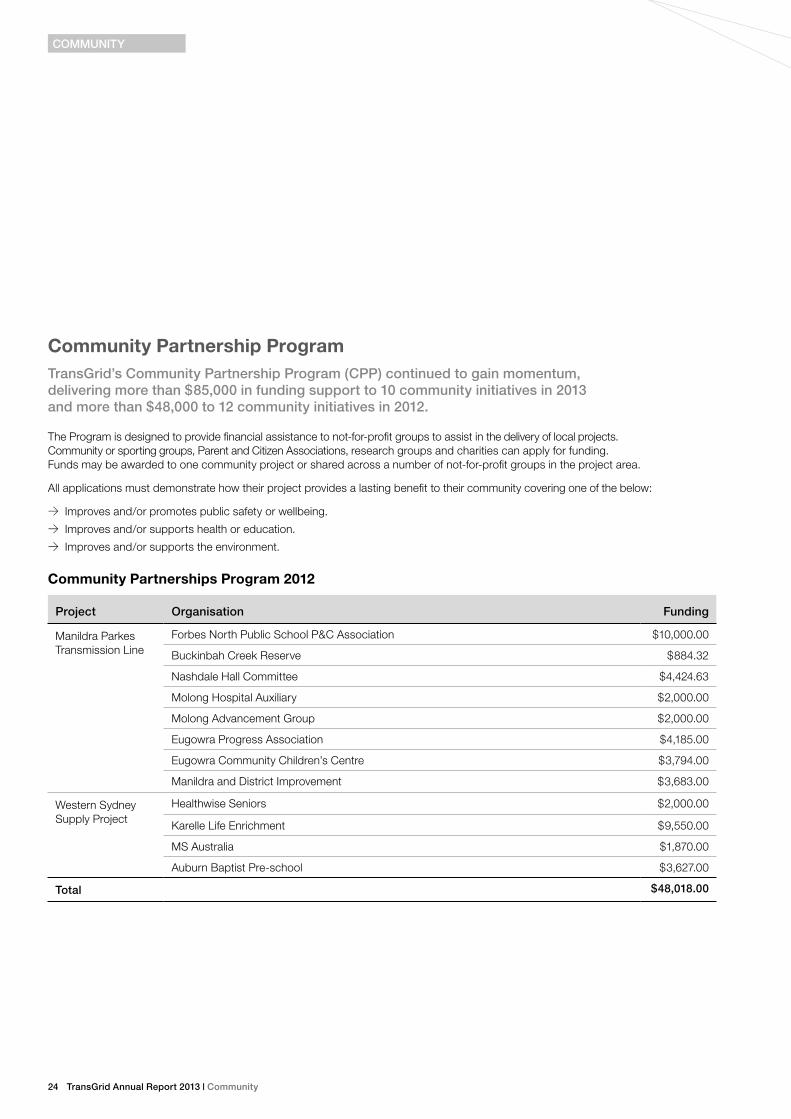
Community Partnership Program TransGrid’s Community Partnership Program (CPP) continued to gain momentum, delivering more than $85,000 in funding support to 10 community initiatives in 2013 and more than $48,000 to 12 community initiatives in 2012.
The Program is designed to provide financial assistance to not-for-profit groups to assist in the delivery of local projects. Community or sporting groups, Parent and Citizen Associations, research groups and charities can apply for funding. Funds may be awarded to one community project or shared across a number of not-for-profit groups in the project area.
All applications must demonstrate how their project provides a lasting benefit to their community covering one of the below:
>> Improves and/or promotes public safety or wellbeing.>> Improves and/or supports health or education. >> Improves and/or supports the environment.
Community Partnerships Program 2012
Project organisation funding
Manildra Parkes Transmission Line
Forbes North Public School P&C Association $10,000.00
Buckinbah Creek Reserve $884.32
Nashdale Hall Committee $4,424.63
Molong Hospital Auxiliary $2,000.00
Molong Advancement Group $2,000.00
Eugowra Progress Association $4,185.00
Eugowra Community Children’s Centre $3,794.00
Manildra and District Improvement $3,683.00
Western Sydney Supply Project
Healthwise Seniors $2,000.00
Karelle Life Enrichment $9,550.00
MS Australia $1,870.00
Auburn Baptist Pre-school $3,627.00
Total $48,018.00
CoMMuNITy
Committed | Enterprising | Collaborative | Caring 25
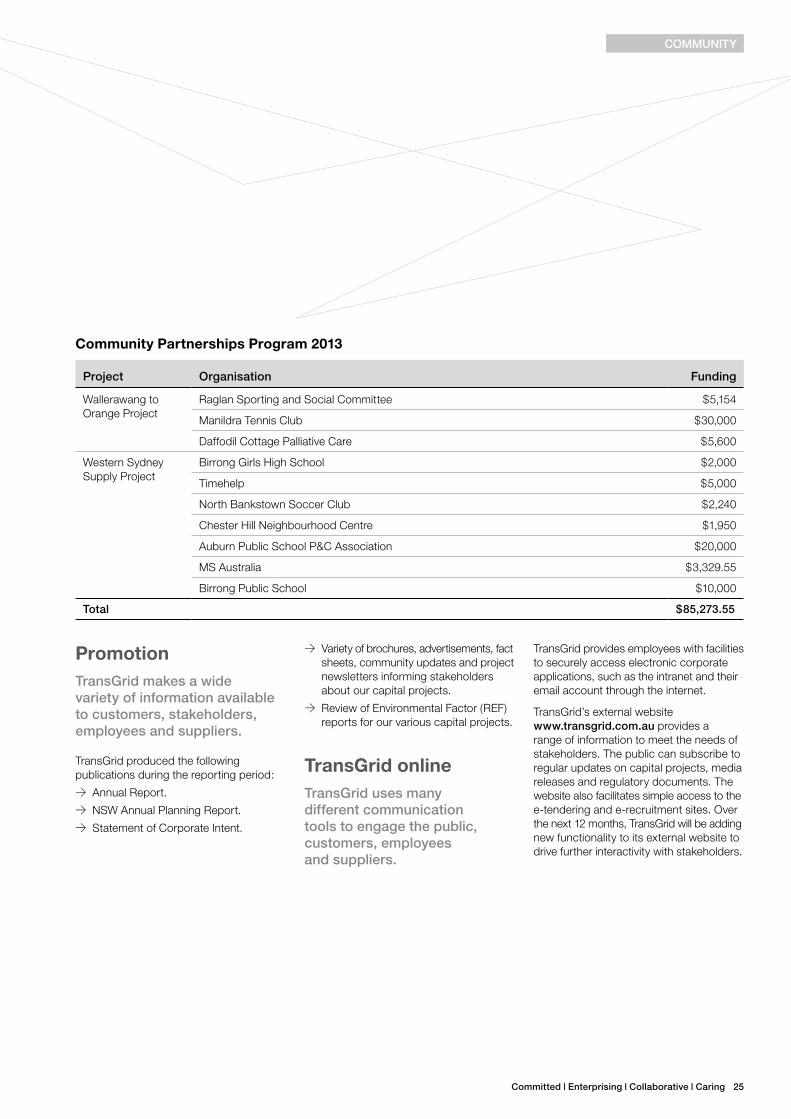
Community Partnerships Program 2013
Project organisation funding
Wallerawang to Orange Project
Raglan Sporting and Social Committee $5,154
Manildra Tennis Club $30,000
Daffodil Cottage Palliative Care $5,600
Western Sydney Supply Project
Birrong Girls High School $2,000
Timehelp $5,000
North Bankstown Soccer Club $2,240
Chester Hill Neighbourhood Centre $1,950
Auburn Public School P&C Association $20,000
MS Australia $3,329.55
Birrong Public School $10,000
Total $85,273.55
PromotionTransGrid makes a wide variety of information available to customers, stakeholders, employees and suppliers.
TransGrid produced the following publications during the reporting period:
>> Annual Report.>> NSW Annual Planning Report.>> Statement of Corporate Intent.
>> Variety of brochures, advertisements, fact sheets, community updates and project newsletters informing stakeholders about our capital projects.
>> Review of Environmental Factor (REF) reports for our various capital projects.
TransGrid online TransGrid uses many different communication tools to engage the public, customers, employees and suppliers.
TransGrid provides employees with facilities to securely access electronic corporate applications, such as the intranet and their email account through the internet.
TransGrid’s external website www.transgrid.com.au provides a range of information to meet the needs of stakeholders. The public can subscribe to regular updates on capital projects, media releases and regulatory documents. The website also facilitates simple access to the e-tendering and e-recruitment sites. Over the next 12 months, TransGrid will be adding new functionality to its external website to drive further interactivity with stakeholders.
CoMMuNITy
26 TransGrid Annual Report 2013 | Corporate Governance
Corporate governance
ShareholdersTransGrid’s Board is responsible and accountable to the voting shareholders, being the NSW Treasurer and the Minister for Finance and Services, who each hold one share for and on behalf of the NSW Government in accordance with the State Owned Corporations Act 1989.
TransGrid’s Board of Directors
Board Charter
The TransGrid Board has a charter which is reviewed annually and is available on the TransGrid website www.transgrid.com.au.
The Charter has been developed to align with the recommendations in the NSW Treasury Guidelines for Boards of Government Businesses as well as the ASX Corporate Governance Principles and Recommendations. The current Charter includes details on the role, powers and specific responsibilities of the Board as well as details of the key stakeholders and Board operations.
Board Responsibilities
In undertaking their responsibilities, directors are expected to adhere to the highest ethical and professional standards. A Directors Code of Conduct has been developed to guide directors in their role when required and is reviewed annually.
The responsibilities of the Board include:>> Providing strategic guidance and direction to the organisation, including contributing to the development of and approving the corporate strategy.
>> Reviewing and approving business plans, the annual budget and financial plans including capital expenditure initiatives.
>> Overseeing and monitoring:>− organisational performance and
achievement of strategic goals and objectives;
>− compliance with the organisation’s Code of Ethics and Conduct; and
>− progress on major capital expenditure and other significant corporate projects.
>> Monitoring financial performance.>> Ensuring there is an effective system of corporate governance.
>> Ensuring effective management including executive development and succession planning.
Board Structure
The Energy Services Corporations Act 1995 provides for the board to consist of:
a. the Managing Director;
b. one director to be appointed by the voting shareholders on the recommendation of a selection committee comprising:
i. two persons nominated by the Portfolio Minister;
ii. two persons nominated by the Labor Council of New South Wales, each being a person selected by the committee from a panel of three persons nominated by the Labor Council; and
c. at least two and not more than five other directors to be appointed by the voting shareholders at their discretion.
The period of appointment of non-executive directors is at the discretion of the voting shareholders.
Terms of OfficeIn accordance with Schedule 8, Clause 5 of the State Owned Corporations Act 1989, a director may be appointed to hold office for a period not exceeding five years.
Independent Professional Advice and Conflicts of Interest
Director independence plays an important role in ensuring good corporate governance. All TransGrid directors are considered independent.
On occasion a situation may arise where a director must disclose interests to the board (which includes positions and pecuniary interests) in corporations, partnerships or other businesses that may be relevant to the activities of the board or an associated Committee. A register of such interests is maintained by TransGrid and the process is clearly documented in the Code of Conduct.
In addition, directors and board committees have the right, in connection with their duties and responsibilities, to seek independent professional advice at TransGrid’s expense.
Remuneration
The remuneration of each non-executive director is paid out of TransGrid funds, and is determined by the shareholders.
The total income received, or due receivable, by all directors of TransGrid is listed in the Notes to the Financial Statements. The Managing Director is not entitled to any additional remuneration for being an Executive Director.
Committed | Enterprising | Collaborative | Caring 27
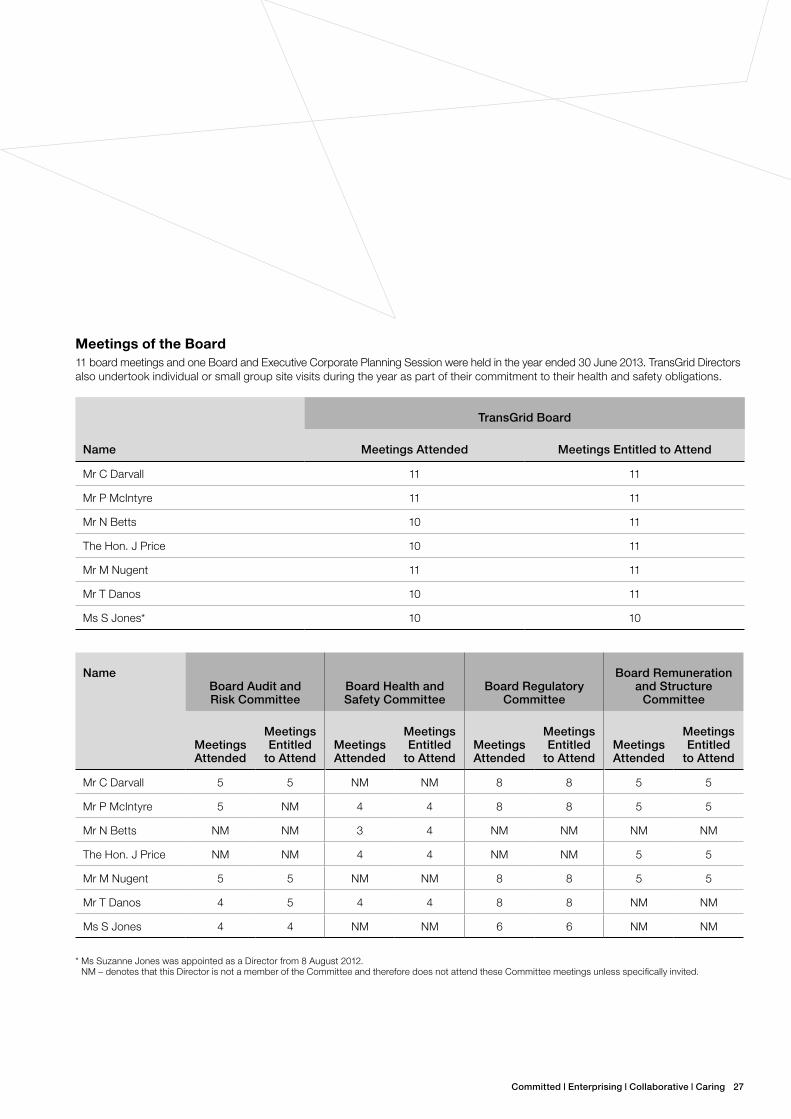
Meetings of the Board11 board meetings and one Board and Executive Corporate Planning Session were held in the year ended 30 June 2013. TransGrid Directors also undertook individual or small group site visits during the year as part of their commitment to their health and safety obligations.
Name
TransGrid Board
Meetings Attended Meetings Entitled to Attend
Mr C Darvall 11 11
Mr P McIntyre 11 11
Mr N Betts 10 11
The Hon. J Price 10 11
Mr M Nugent 11 11
Mr T Danos 10 11
Ms S Jones* 10 10
NameBoard Audit and Risk Committee
Board Health and Safety Committee
Board Regulatory Committee
Board Remuneration and Structure
Committee
Meetings Attended
Meetings Entitled
to AttendMeetings Attended
Meetings Entitled
to AttendMeetings Attended
Meetings Entitled
to AttendMeetings Attended
Meetings Entitled
to Attend
Mr C Darvall 5 5 NM NM 8 8 5 5
Mr P McIntyre 5 NM 4 4 8 8 5 5
Mr N Betts NM NM 3 4 NM NM NM NM
The Hon. J Price NM NM 4 4 NM NM 5 5
Mr M Nugent 5 5 NM NM 8 8 5 5
Mr T Danos 4 5 4 4 8 8 NM NM
Ms S Jones 4 4 NM NM 6 6 NM NM
* Ms Suzanne Jones was appointed as a Director from 8 August 2012. NM – denotes that this Director is not a member of the Committee and therefore does not attend these Committee meetings unless specifically invited.
28 TransGrid Annual Report 2013 | Corporate Governance
Board CommitteesTo assist the Board in fulfilling its responsibilities, the Board currently utilises four Committees as follows:
>> the Board Audit and Risk Committee.>> the Board Remuneration and Structure Committee.
>> the Board Health and Safety Committee.
>> the Board Regulatory Committee.
A charter governing each of these committees is available on the TransGrid website. Each Committee is chaired by a Non Executive Director and a report detailing the items considered by the committee is tabled at the following Board Meeting.
Executive Board CommitteeThe Board may also convene the Executive Board Committee usually consisting of the Managing Director and the Chairman however other directors may be invited to sit on this Committee as and when required or considered appropriate. The purpose of this Committee is to consider matters between Board Meetings which would otherwise require Board approval.
The Board Audit and Risk CommitteeChaired by Michael Nugent, the primary function of the Board Audit and Risk Committee is to assist the Board in fulfilling its oversight responsibilities by reviewing the overall audit process of the organisation, the systems of internal control which management and the Board of Directors have established, risk management process and determination of risk appetite for the organisation, the process for monitoring compliance with laws and the Code of Conduct and financial information which will be provided to the Board Audit and Risk Committee from time to time.
The Board Remuneration and Structure CommitteeChaired by Chum Darvall, the primary function of this Board Committee is to assist the Board in determining the remuneration and employment conditions of TransGrid’s executive and senior management and reviewing the organisational structure of TransGrid.
The Board Health and Safety CommitteeChaired by John Price, the primary function of this Board Committee is to assist the Board in fulfilling its responsibilities relating to the Health and Safety of the organisation’s employees and contractors.
The Board Regulatory CommitteeChaired by Trevor Danos, the primary function of the Committee is to assist the Board in preparing, verifying and signing off on the TransGrid’s Revenue Reset for the 2014/15 to 2018/19 regulatory period.
The Committee also has such other functions (if any) in relation to managing and reviewing regulatory changes and/or regulatory decisions arising from the National Electricity Law, Rules and Regulations as are delegated to it by the Board from time to time.
CoRPoRATE GovERNANCE
Committed | Enterprising | Collaborative | Caring 29
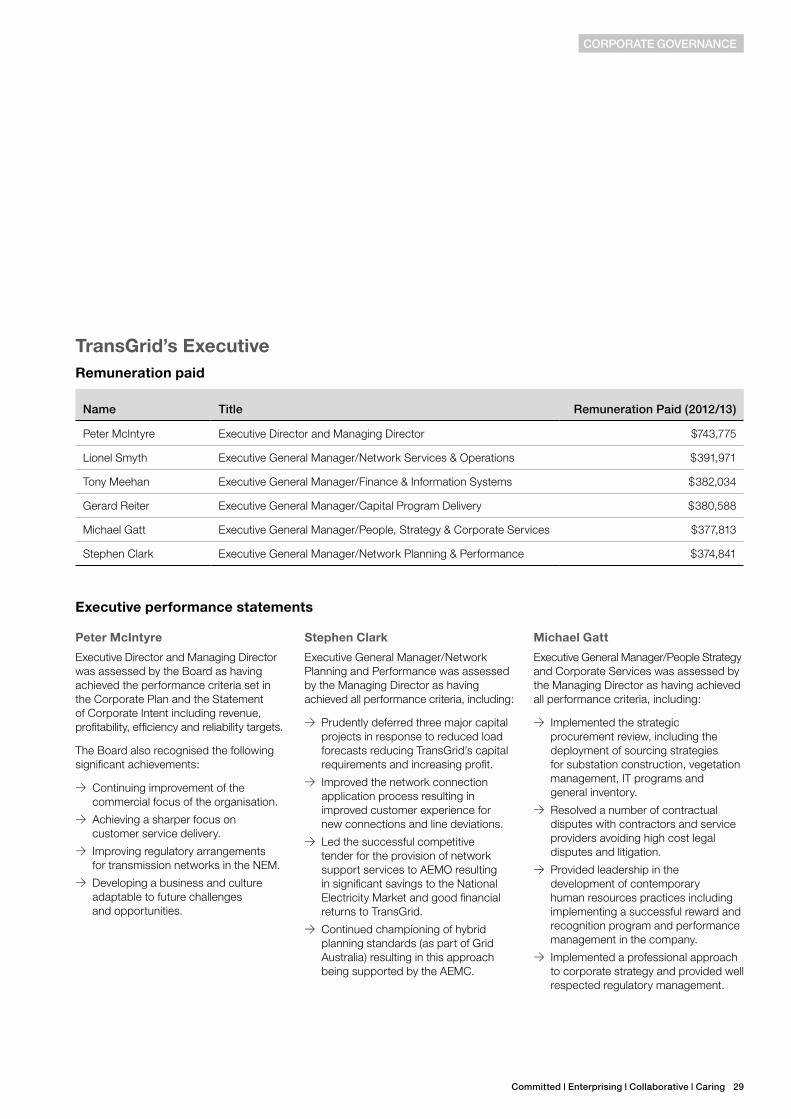
TransGrid’s Executive Remuneration paid
Name Title Remuneration Paid (2012/13)
Peter McIntyre Executive Director and Managing Director $743,775
Lionel Smyth Executive General Manager/Network Services & Operations $391,971
Tony Meehan Executive General Manager/Finance & Information Systems $382,034
Gerard Reiter Executive General Manager/Capital Program Delivery $380,588
Michael Gatt Executive General Manager/People, Strategy & Corporate Services $377,813
Stephen Clark Executive General Manager/Network Planning & Performance $374,841
Executive performance statements
Peter McIntyre
Executive Director and Managing Director was assessed by the Board as having achieved the performance criteria set in the Corporate Plan and the Statement of Corporate Intent including revenue, profitability, efficiency and reliability targets.
The Board also recognised the following significant achievements:
>> Continuing improvement of the commercial focus of the organisation.
>> Achieving a sharper focus on customer service delivery.
>> Improving regulatory arrangements for transmission networks in the NEM.
>> Developing a business and culture adaptable to future challenges and opportunities.
Stephen Clark
Executive General Manager/Network Planning and Performance was assessed by the Managing Director as having achieved all performance criteria, including:
>> Prudently deferred three major capital projects in response to reduced load forecasts reducing TransGrid’s capital requirements and increasing profit.
>> Improved the network connection application process resulting in improved customer experience for new connections and line deviations.
>> Led the successful competitive tender for the provision of network support services to AEMO resulting in significant savings to the National Electricity Market and good financial returns to TransGrid.
>> Continued championing of hybrid planning standards (as part of Grid Australia) resulting in this approach being supported by the AEMC.
Michael Gatt
Executive General Manager/People Strategy and Corporate Services was assessed by the Managing Director as having achieved all performance criteria, including:
>> Implemented the strategic procurement review, including the deployment of sourcing strategies for substation construction, vegetation management, IT programs and general inventory.
>> Resolved a number of contractual disputes with contractors and service providers avoiding high cost legal disputes and litigation.
>> Provided leadership in the development of contemporary human resources practices including implementing a successful reward and recognition program and performance management in the company.
>> Implemented a professional approach to corporate strategy and provided well respected regulatory management.
CoRPoRATE GovERNANCE
30 TransGrid Annual Report 2013 | Corporate Governance
Tony Meehan
Executive General Manager/Finance and Information Systems was assessed by the Managing Director as having achieved all performance criteria including:
>> Managed the financial performance of the corporation with a profit after tax result of $349.9 million, $26 million above budget.
>> Actively worked on opportunities for forward start transactions and debt restructures to lower the long term profile and costs of debt.
>> Provided Executive sponsorship of the 2014/15 to 2018/19 Revenue Reset project with the development of the revenue proposal and new AER guidelines.
>> Oversaw the outsourcing tender for ICT with a new provider selected that will lower the costs of ICT into the future whilst contracted to provide the same service levels.
>> Developed the business diversification strategy and targets for the growth of non prescribed business.
Gerard Reiter
Executive General Manager/Capital Program Delivery was assessed by the Managing Director as having achieved all performance criteria, including:
>> Delivered an ‘on time and on budget’ performance of major capital projects with improvements up from 67 per cent to 72 per cent.
>> The Better Project Delivery initiative was completed during the year. This initiative which was carried out in collaboration with Network Services and Operations, and People, Strategy and Corporate Services will ensure that the project delivery process is streamlined. The initiative removed significant amounts of excess non-productive paperwork from the process.
>> Ensured the substation panel continued to deliver projects to a high quality. The panel arrangement has also lead to improvements in workplace health and safety as well as improvements to the construction and environment management plans.
>> Progressed the $470 million Western Sydney Supply Project with the project on track to achieve ‘on time’ and ‘on budget’ delivery.
>> Created and implemented a safety in design to ensure TransGrid’s compliance with the new Workplace Health and Safety Act. An audit of the process has also shown the new process to be compliant with the Act.
Lionel Smyth
Executive General Manager/Network Services and Operations was assessed by the Managing Director as having achieved all performance criteria including:
>> Implemented version 5.1 of the Power System Safety Rules to significantly improve the clarity of the Rules.
>> Exceeded the maintenance achievement target with an achievement of 98.6 per cent. This is the highest ever recorded annual maintenance achievement.
>> Delivered customer satisfaction ratings between 74 and 82 per cent.
>> Oversaw the construction of Ultimo Building Project, currently running on time and budget for occupancy in February 2014.
>> Achieved significant incentive payments from the AER service and market incentive schemes ($8.3 million to December 2012).
CoRPoRATE GovERNANCE
Committed | Enterprising | Collaborative | Caring 31
Risk managementThe Executive Audit and Risk Committee supports the Board Audit and Risk Committee and is responsible for ensuring risks are identified and effectively managed.
Implementation of risk management strategies is the responsibility of all levels of management and a framework exists to ensure that all risks are proactively and explicitly managed on an ongoing basis.
The Corporate Audit and Risk Group provides assistance in the development and monitoring of enterprise-wide risk management plans, training employees in risk management processes and the ongoing verification and review of risk mitigation actions across the organisation.
Enhancements to Risk Management StrategiesDuring the year, TransGrid revised its Risk Management Framework to include guidance from the NSW Treasury Risk Management Toolkit.
TransGrid also undertook a risk management maturity assessment, to drive continuous improvement. The results indicated that TransGrid had a mid to high level of maturity.
Over the next two years, TransGrid will focus reaching a consistently high level of maturity. TransGrid will improve risk management maturity through further employee education and training, improving the interaction of project and enterprise risk reporting and undertaking a review of appropriate technology solutions to support the risk management processes.
Improvements in the internal control framework are undertaken by management as a result of process improvements or internal audit recommendations. During the year, TransGrid updated its Corporate Governance Framework to include a ‘three lines of defence’ model which provides greater clarity around roles and responsibilities for control implementation and monitoring.
The Board Audit and Risk Committee and Executive Audit and Risk Committee undertake a regular review of TransGrid’s fraud and corruption risk indicators and make changes to business processes to improve the fraud control framework where required. In 2013/14 TransGrid will undertake a three-yearly fraud risk assessment and an employee fraud awareness health check.
Insurance TransGrid’s insurance strategy is to obtain the most comprehensive insurance coverage available at the most economical cost.
Each year, TransGrid looks at the risks for which it is prepared to seek cover, the available insurance coverage or other means to meet the remaining risks and the costs of covering these risks.
CoRPoRATE GovERNANCE
32 TransGrid Annual Report 2013 | Corporate Governance
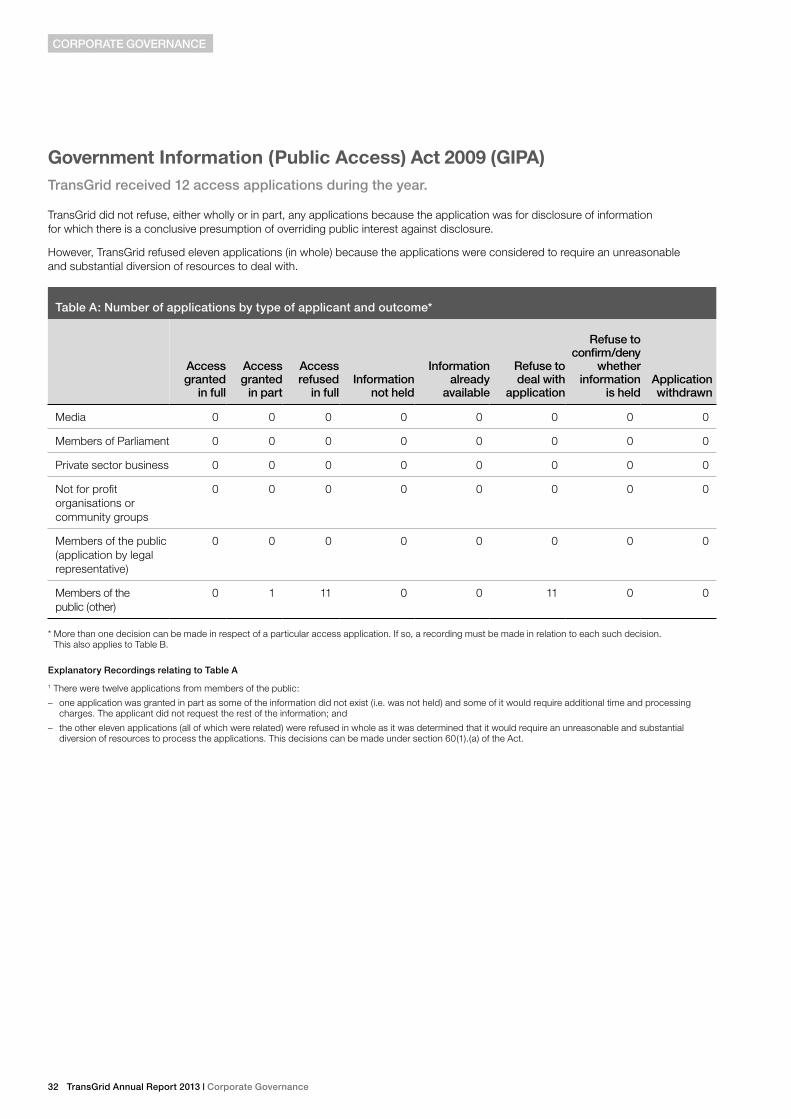
Government Information (Public Access) Act 2009 (GIPA)TransGrid received 12 access applications during the year.
TransGrid did not refuse, either wholly or in part, any applications because the application was for disclosure of information for which there is a conclusive presumption of overriding public interest against disclosure.
However, TransGrid refused eleven applications (in whole) because the applications were considered to require an unreasonable and substantial diversion of resources to deal with.
Table A: Number of applications by type of applicant and outcome*
Access granted
in full
Access granted
in part
Access refused
in fullInformation
not held
Information already
available
Refuse to deal with
application
Refuse to confirm/deny
whether information
is heldApplication withdrawn
Media 0 0 0 0 0 0 0 0
Members of Parliament 0 0 0 0 0 0 0 0
Private sector business 0 0 0 0 0 0 0 0
Not for profit organisations or community groups
0 0 0 0 0 0 0 0
Members of the public (application by legal representative)
0 0 0 0 0 0 0 0
Members of the public (other)
0 1 11 0 0 11 0 0
* More than one decision can be made in respect of a particular access application. If so, a recording must be made in relation to each such decision. This also applies to Table B.
Explanatory Recordings relating to Table A
1 There were twelve applications from members of the public:
– one application was granted in part as some of the information did not exist (i.e. was not held) and some of it would require additional time and processing charges. The applicant did not request the rest of the information; and
– the other eleven applications (all of which were related) were refused in whole as it was determined that it would require an unreasonable and substantial diversion of resources to process the applications. This decisions can be made under section 60(1).(a) of the Act.
CoRPoRATE GovERNANCE
Committed | Enterprising | Collaborative | Caring 33
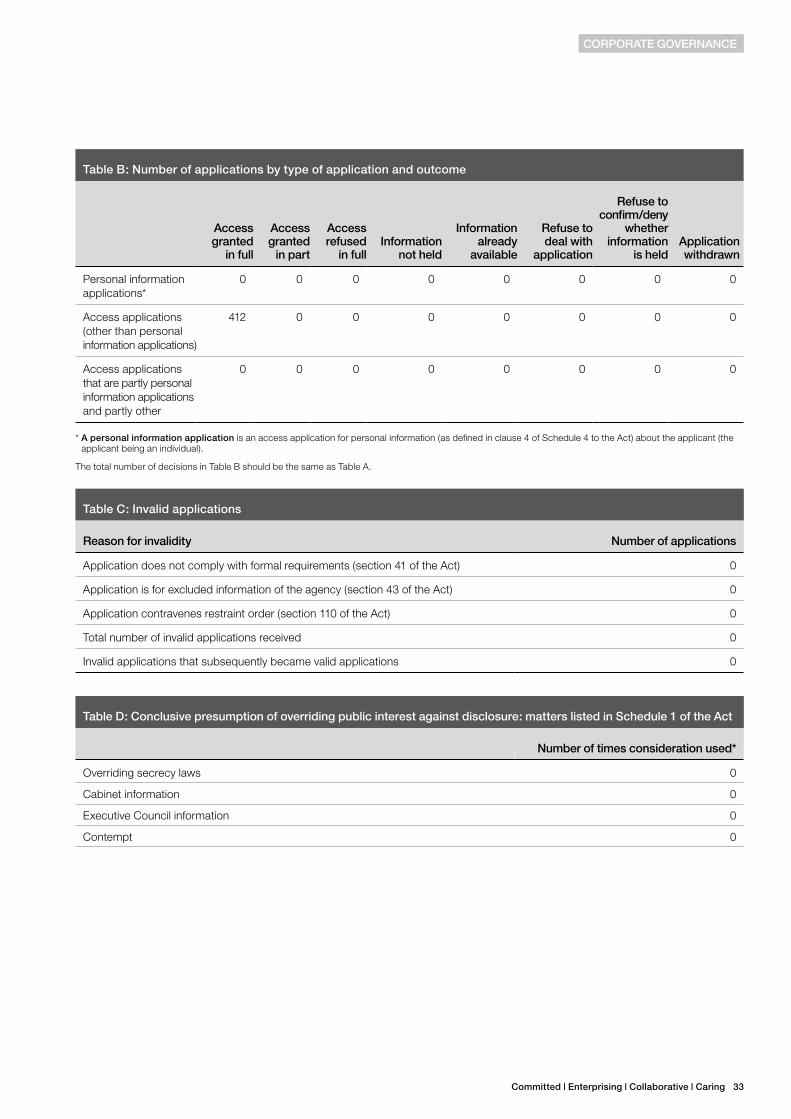
Table B: Number of applications by type of application and outcome
Access granted
in full
Access granted
in part
Access refused
in fullInformation
not held
Information already
available
Refuse to deal with
application
Refuse to confirm/deny
whether information
is heldApplication withdrawn
Personal information applications*
0 0 0 0 0 0 0 0
Access applications (other than personal information applications)
412 0 0 0 0 0 0 0
Access applications that are partly personal information applications and partly other
0 0 0 0 0 0 0 0
* A personal information application is an access application for personal information (as defined in clause 4 of Schedule 4 to the Act) about the applicant (the applicant being an individual).
The total number of decisions in Table B should be the same as Table A.
Table C: Invalid applications
Reason for invalidity Number of applications
Application does not comply with formal requirements (section 41 of the Act) 0
Application is for excluded information of the agency (section 43 of the Act) 0
Application contravenes restraint order (section 110 of the Act) 0
Total number of invalid applications received 0
Invalid applications that subsequently became valid applications 0
Table D: Conclusive presumption of overriding public interest against disclosure: matters listed in Schedule 1 of the Act
Number of times consideration used*
Overriding secrecy laws 0
Cabinet information 0
Executive Council information 0
Contempt 0
CoRPoRATE GovERNANCE
34 TransGrid Annual Report 2013 | Corporate Governance
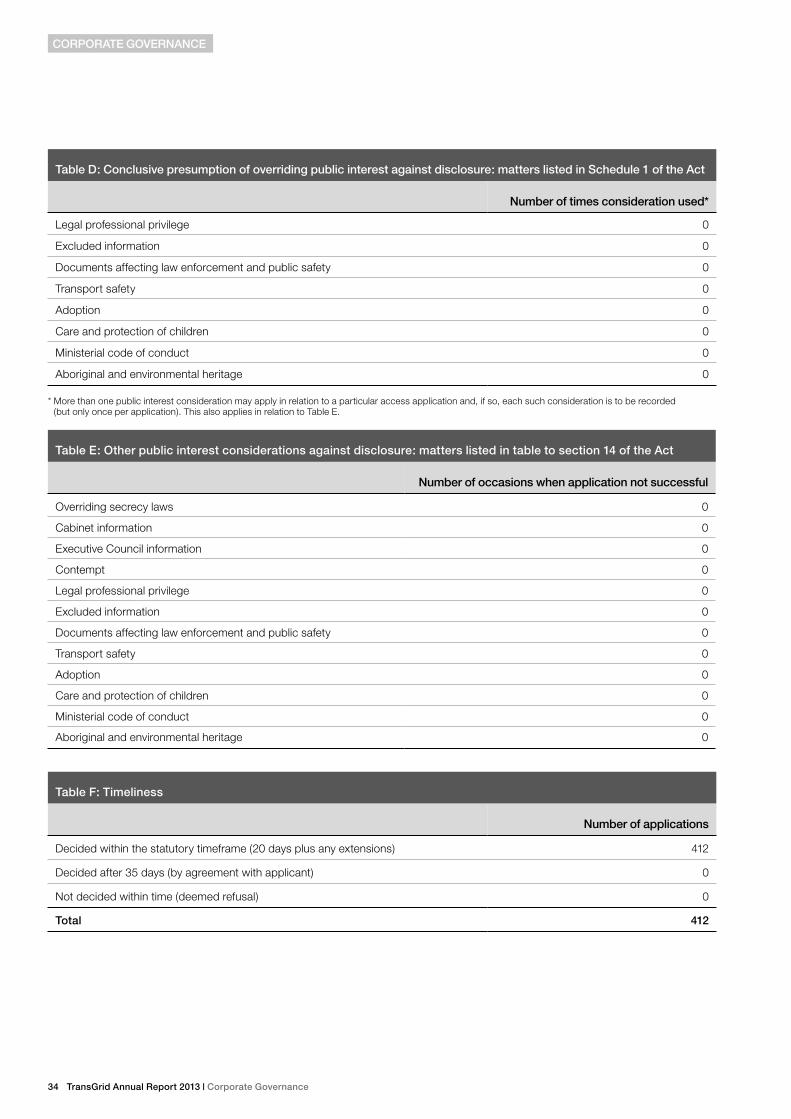
Table D: Conclusive presumption of overriding public interest against disclosure: matters listed in Schedule 1 of the Act
Number of times consideration used*
Legal professional privilege 0
Excluded information 0
Documents affecting law enforcement and public safety 0
Transport safety 0
Adoption 0
Care and protection of children 0
Ministerial code of conduct 0
Aboriginal and environmental heritage 0
* More than one public interest consideration may apply in relation to a particular access application and, if so, each such consideration is to be recorded (but only once per application). This also applies in relation to Table E.
Table E: other public interest considerations against disclosure: matters listed in table to section 14 of the Act
Number of occasions when application not successful
Overriding secrecy laws 0
Cabinet information 0
Executive Council information 0
Contempt 0
Legal professional privilege 0
Excluded information 0
Documents affecting law enforcement and public safety 0
Transport safety 0
Adoption 0
Care and protection of children 0
Ministerial code of conduct 0
Aboriginal and environmental heritage 0
Table f: Timeliness
Number of applications
Decided within the statutory timeframe (20 days plus any extensions) 412
Decided after 35 days (by agreement with applicant) 0
Not decided within time (deemed refusal) 0
Total 412
CoRPoRATE GovERNANCE
Committed | Enterprising | Collaborative | Caring 35
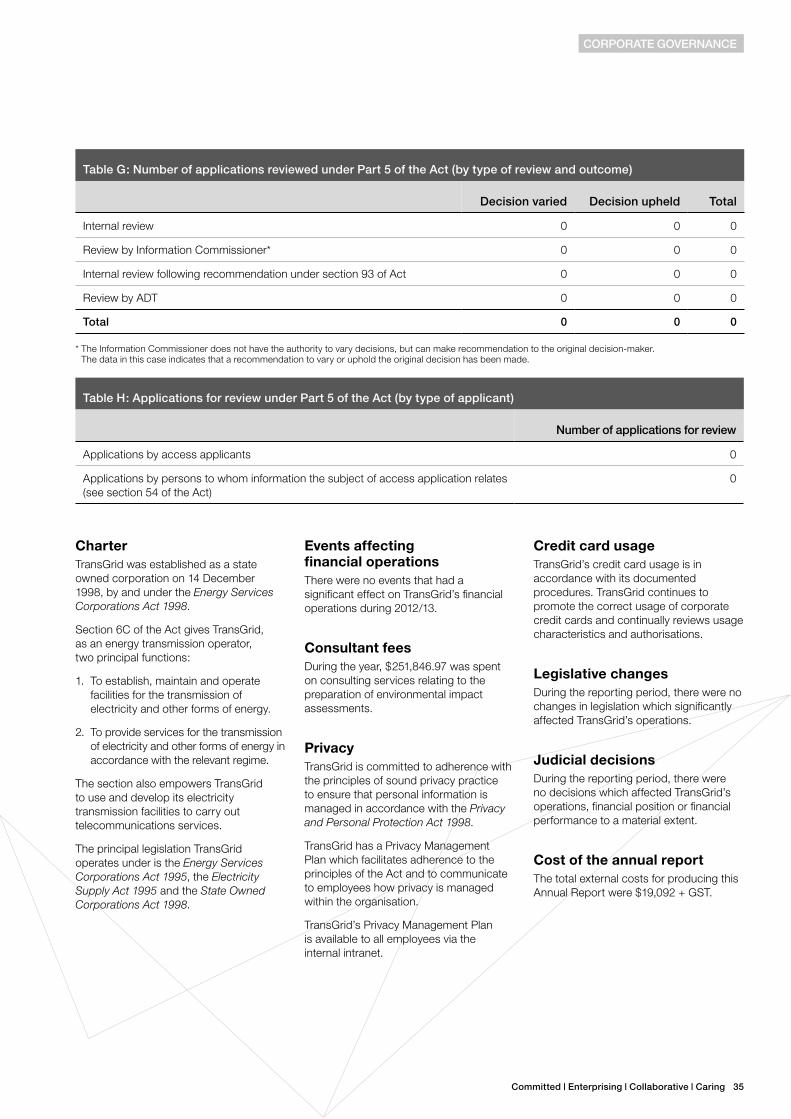
Table G: Number of applications reviewed under Part 5 of the Act (by type of review and outcome)
Decision varied Decision upheld Total
Internal review 0 0 0
Review by Information Commissioner* 0 0 0
Internal review following recommendation under section 93 of Act 0 0 0
Review by ADT 0 0 0
Total 0 0 0
* The Information Commissioner does not have the authority to vary decisions, but can make recommendation to the original decision-maker. The data in this case indicates that a recommendation to vary or uphold the original decision has been made.
Table H: Applications for review under Part 5 of the Act (by type of applicant)
Number of applications for review
Applications by access applicants 0
Applications by persons to whom information the subject of access application relates (see section 54 of the Act)
0
Charter TransGrid was established as a state owned corporation on 14 December 1998, by and under the Energy Services Corporations Act 1998.
Section 6C of the Act gives TransGrid, as an energy transmission operator, two principal functions:
1. To establish, maintain and operate facilities for the transmission of electricity and other forms of energy.
2. To provide services for the transmission of electricity and other forms of energy in accordance with the relevant regime.
The section also empowers TransGrid to use and develop its electricity transmission facilities to carry out telecommunications services.
The principal legislation TransGrid operates under is the Energy Services Corporations Act 1995, the Electricity Supply Act 1995 and the State Owned Corporations Act 1998.
Events affecting financial operationsThere were no events that had a significant effect on TransGrid’s financial operations during 2012/13.
Consultant feesDuring the year, $251,846.97 was spent on consulting services relating to the preparation of environmental impact assessments.
PrivacyTransGrid is committed to adherence with the principles of sound privacy practice to ensure that personal information is managed in accordance with the Privacy and Personal Protection Act 1998.
TransGrid has a Privacy Management Plan which facilitates adherence to the principles of the Act and to communicate to employees how privacy is managed within the organisation.
TransGrid’s Privacy Management Plan is available to all employees via the internal intranet.
Credit card usageTransGrid’s credit card usage is in accordance with its documented procedures. TransGrid continues to promote the correct usage of corporate credit cards and continually reviews usage characteristics and authorisations.
Legislative changesDuring the reporting period, there were no changes in legislation which significantly affected TransGrid’s operations.
Judicial decisionsDuring the reporting period, there were no decisions which affected TransGrid’s operations, financial position or financial performance to a material extent.
Cost of the annual reportThe total external costs for producing this Annual Report were $19,092 + GST.
CoRPoRATE GovERNANCE
36 TransGrid Annual Report 2013 | Corporate Governance
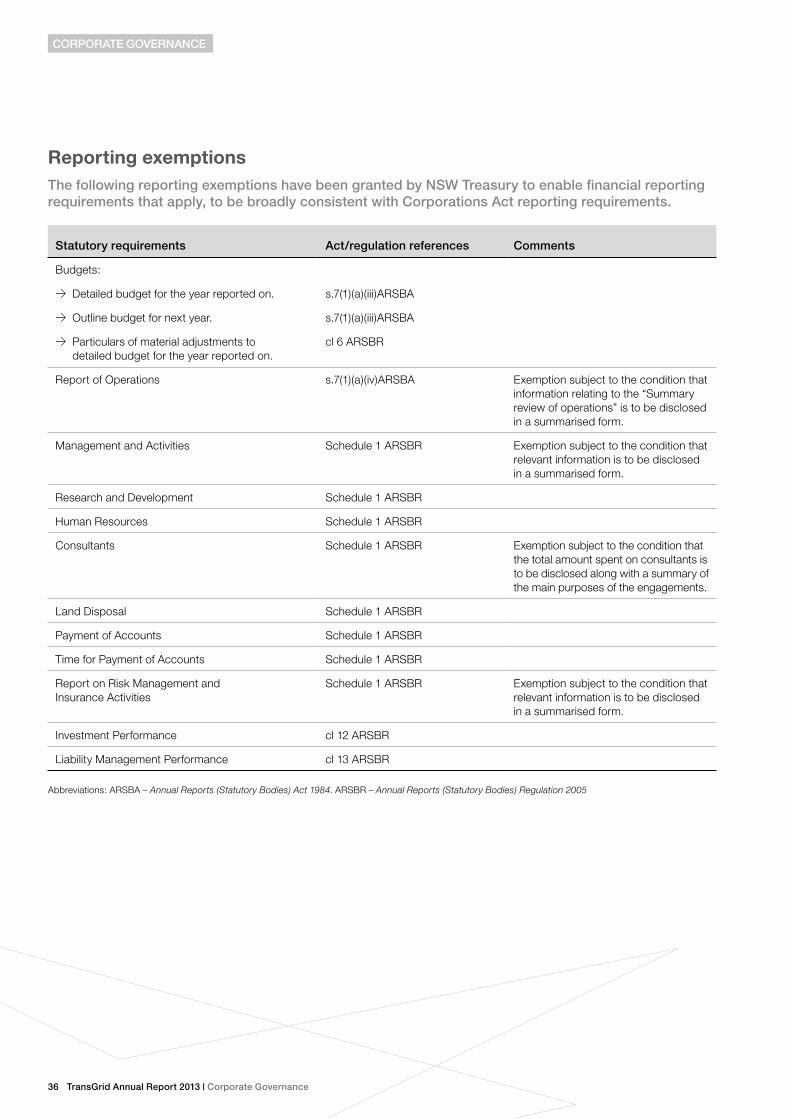
Reporting exemptionsThe following reporting exemptions have been granted by NSW Treasury to enable financial reporting requirements that apply, to be broadly consistent with Corporations Act reporting requirements.
Statutory requirements Act/regulation references Comments
Budgets:
>> Detailed budget for the year reported on. s.7(1)(a)(iii)ARSBA
>> Outline budget for next year. s.7(1)(a)(iii)ARSBA
>> Particulars of material adjustments to detailed budget for the year reported on.
cl 6 ARSBR
Report of Operations s.7(1)(a)(iv)ARSBA Exemption subject to the condition that information relating to the “Summary review of operations” is to be disclosed in a summarised form.
Management and Activities Schedule 1 ARSBR Exemption subject to the condition that relevant information is to be disclosed in a summarised form.
Research and Development Schedule 1 ARSBR
Human Resources Schedule 1 ARSBR
Consultants Schedule 1 ARSBR Exemption subject to the condition that the total amount spent on consultants is to be disclosed along with a summary of the main purposes of the engagements.
Land Disposal Schedule 1 ARSBR
Payment of Accounts Schedule 1 ARSBR
Time for Payment of Accounts Schedule 1 ARSBR
Report on Risk Management and Insurance Activities
Schedule 1 ARSBR Exemption subject to the condition that relevant information is to be disclosed in a summarised form.
Investment Performance cl 12 ARSBR
Liability Management Performance cl 13 ARSBR
Abbreviations: ARSBA – Annual Reports (Statutory Bodies) Act 1984. ARSBR – Annual Reports (Statutory Bodies) Regulation 2005
CoRPoRATE GovERNANCE
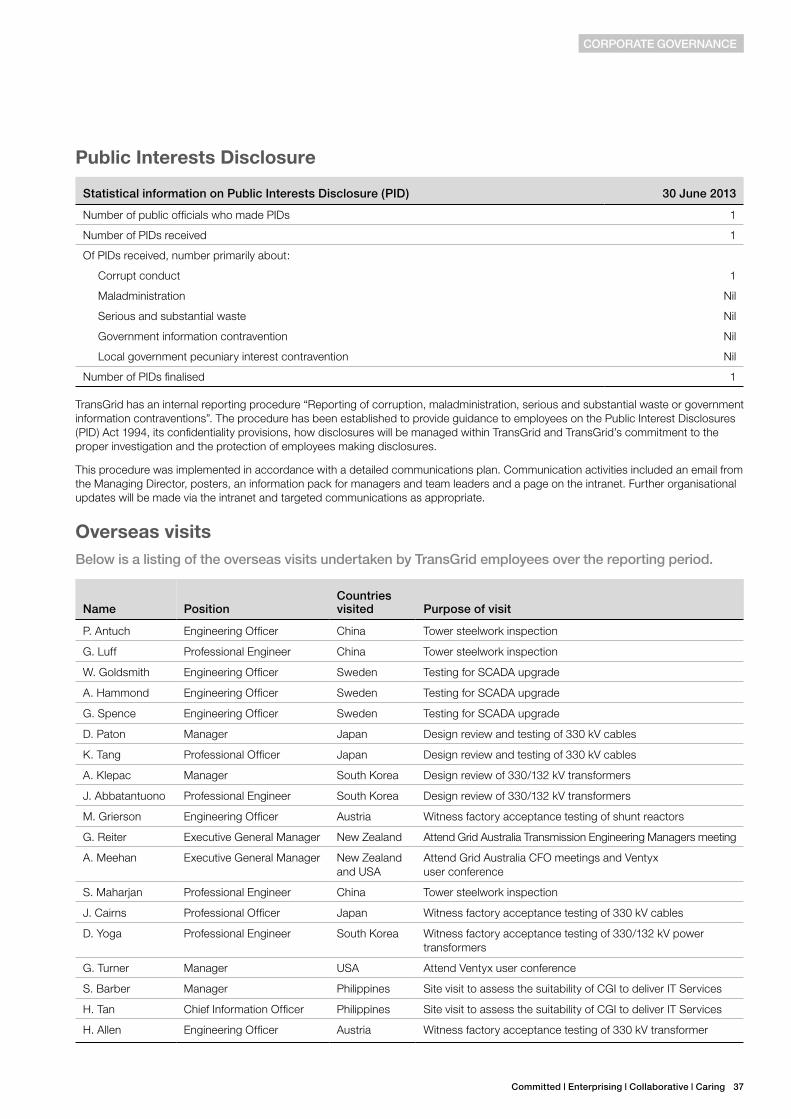
Committed | Enterprising | Collaborative | Caring 37
Public Interests Disclosure
Statistical information on Public Interests Disclosure (PID) 30 June 2013
Number of public officials who made PIDs 1
Number of PIDs received 1
Of PIDs received, number primarily about:
Corrupt conduct 1
Maladministration Nil
Serious and substantial waste Nil
Government information contravention Nil
Local government pecuniary interest contravention Nil
Number of PIDs finalised 1
TransGrid has an internal reporting procedure “Reporting of corruption, maladministration, serious and substantial waste or government information contraventions”. The procedure has been established to provide guidance to employees on the Public Interest Disclosures (PID) Act 1994, its confidentiality provisions, how disclosures will be managed within TransGrid and TransGrid’s commitment to the proper investigation and the protection of employees making disclosures.
This procedure was implemented in accordance with a detailed communications plan. Communication activities included an email from the Managing Director, posters, an information pack for managers and team leaders and a page on the intranet. Further organisational updates will be made via the intranet and targeted communications as appropriate.
Overseas visitsBelow is a listing of the overseas visits undertaken by TransGrid employees over the reporting period.
Name PositionCountries visited Purpose of visit
P. Antuch Engineering Officer China Tower steelwork inspection
G. Luff Professional Engineer China Tower steelwork inspection
W. Goldsmith Engineering Officer Sweden Testing for SCADA upgrade
A. Hammond Engineering Officer Sweden Testing for SCADA upgrade
G. Spence Engineering Officer Sweden Testing for SCADA upgrade
D. Paton Manager Japan Design review and testing of 330 kV cables
K. Tang Professional Officer Japan Design review and testing of 330 kV cables
A. Klepac Manager South Korea Design review of 330/132 kV transformers
J. Abbatantuono Professional Engineer South Korea Design review of 330/132 kV transformers
M. Grierson Engineering Officer Austria Witness factory acceptance testing of shunt reactors
G. Reiter Executive General Manager New Zealand Attend Grid Australia Transmission Engineering Managers meeting
A. Meehan Executive General Manager New Zealand and USA
Attend Grid Australia CFO meetings and Ventyx user conference
S. Maharjan Professional Engineer China Tower steelwork inspection
J. Cairns Professional Officer Japan Witness factory acceptance testing of 330 kV cables
D. Yoga Professional Engineer South Korea Witness factory acceptance testing of 330/132 kV power transformers
G. Turner Manager USA Attend Ventyx user conference
S. Barber Manager Philippines Site visit to assess the suitability of CGI to deliver IT Services
H. Tan Chief Information Officer Philippines Site visit to assess the suitability of CGI to deliver IT Services
H. Allen Engineering Officer Austria Witness factory acceptance testing of 330 kV transformer
CoRPoRATE GovERNANCE
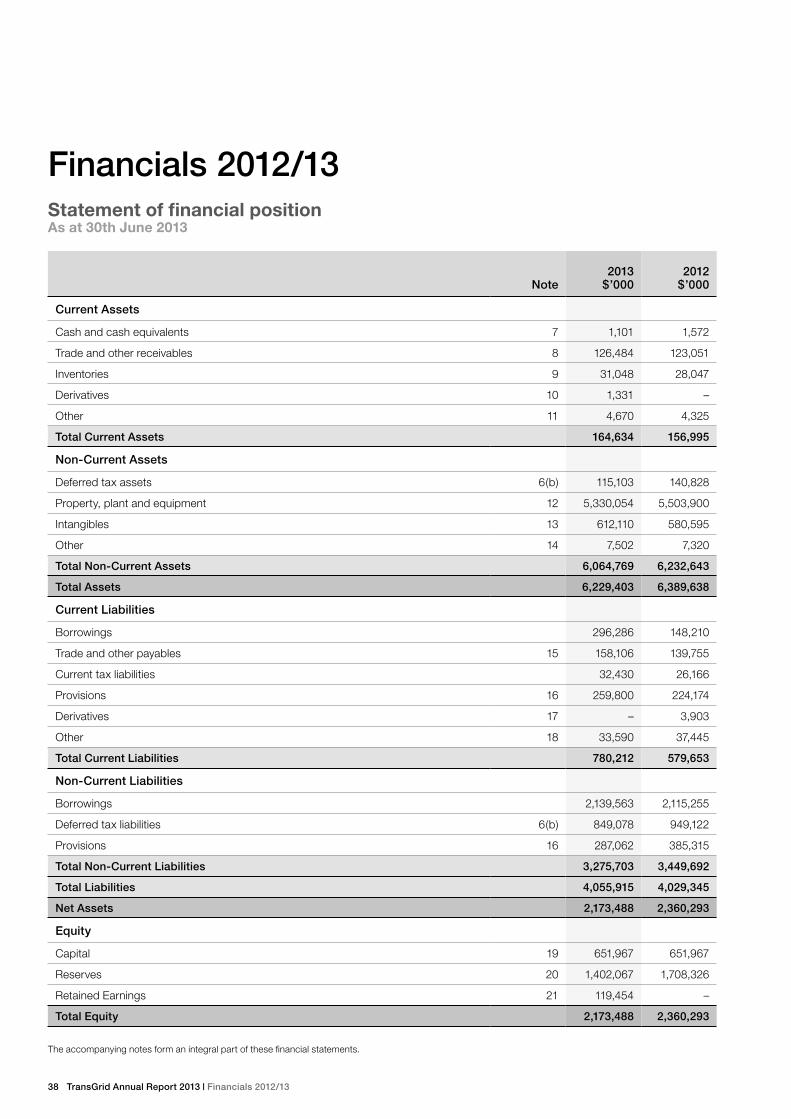
38 TransGrid Annual Report 2013 | financials 2012/13
financials 2012/13Statement of financial positionAs at 30th June 2013
Note
2013 $’000
2012 $’000
Current Assets
Cash and cash equivalents 7 1,101 1,572
Trade and other receivables 8 126,484 123,051
Inventories 9 31,048 28,047
Derivatives 10 1,331 –
Other 11 4,670 4,325
Total Current Assets 164,634 156,995
Non-Current Assets
Deferred tax assets 6(b) 115,103 140,828
Property, plant and equipment 12 5,330,054 5,503,900
Intangibles 13 612,110 580,595
Other 14 7,502 7,320
Total Non-Current Assets 6,064,769 6,232,643
Total Assets 6,229,403 6,389,638
Current Liabilities
Borrowings 296,286 148,210
Trade and other payables 15 158,106 139,755
Current tax liabilities 32,430 26,166
Provisions 16 259,800 224,174
Derivatives 17 – 3,903
Other 18 33,590 37,445
Total Current Liabilities 780,212 579,653
Non-Current Liabilities
Borrowings 2,139,563 2,115,255
Deferred tax liabilities 6(b) 849,078 949,122
Provisions 16 287,062 385,315
Total Non-Current Liabilities 3,275,703 3,449,692
Total Liabilities 4,055,915 4,029,345
Net Assets 2,173,488 2,360,293
Equity
Capital 19 651,967 651,967
Reserves 20 1,402,067 1,708,326
Retained Earnings 21 119,454 –
Total Equity 2,173,488 2,360,293
The accompanying notes form an integral part of these financial statements.
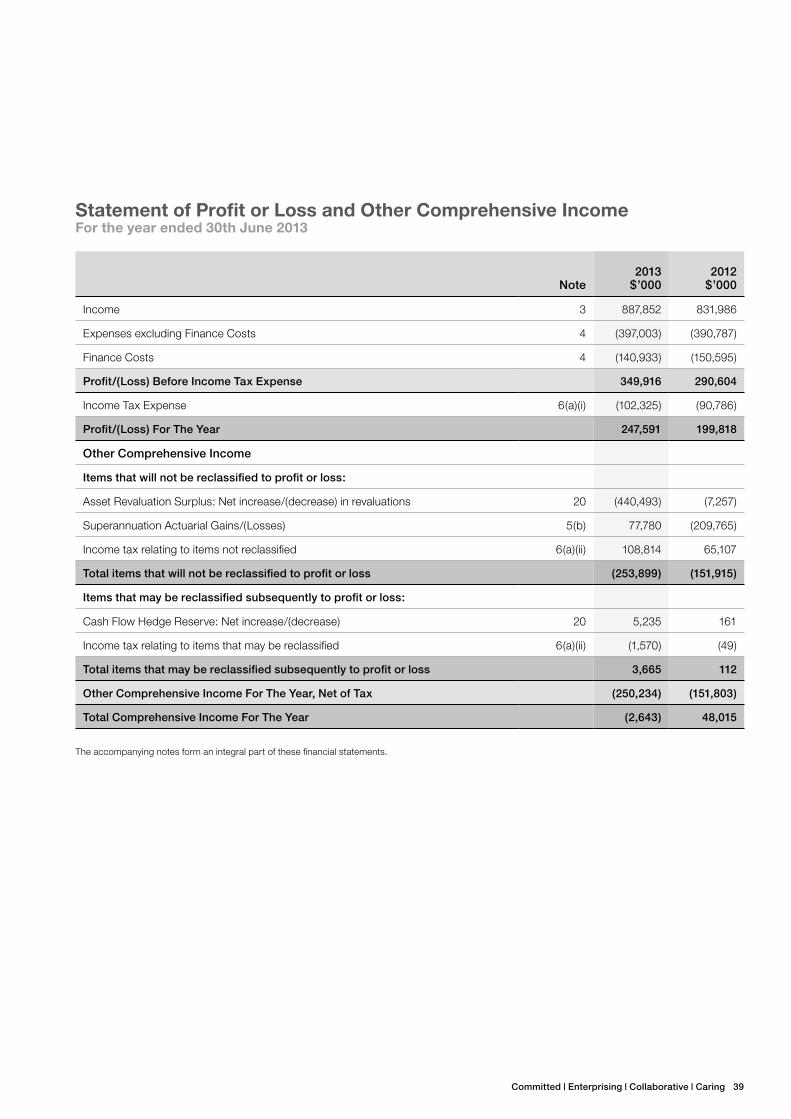
Committed | Enterprising | Collaborative | Caring 39
Statement of Profit or Loss and Other Comprehensive IncomeFor the year ended 30th June 2013
Note2013
$’0002012
$’000
Income 3 887,852 831,986
Expenses excluding Finance Costs 4 (397,003) (390,787)
Finance Costs 4 (140,933) (150,595)
Profit/(Loss) Before Income Tax Expense 349,916 290,604
Income Tax Expense 6(a)(i) (102,325) (90,786)
Profit/(Loss) for The year 247,591 199,818
other Comprehensive Income
Items that will not be reclassified to profit or loss:
Asset Revaluation Surplus: Net increase/(decrease) in revaluations 20 (440,493) (7,257)
Superannuation Actuarial Gains/(Losses) 5(b) 77,780 (209,765)
Income tax relating to items not reclassified 6(a)(ii) 108,814 65,107
Total items that will not be reclassified to profit or loss (253,899) (151,915)
Items that may be reclassified subsequently to profit or loss:
Cash Flow Hedge Reserve: Net increase/(decrease) 20 5,235 161
Income tax relating to items that may be reclassified 6(a)(ii) (1,570) (49)
Total items that may be reclassified subsequently to profit or loss 3,665 112
other Comprehensive Income for The year, Net of Tax (250,234) (151,803)
Total Comprehensive Income for The year (2,643) 48,015
The accompanying notes form an integral part of these financial statements.
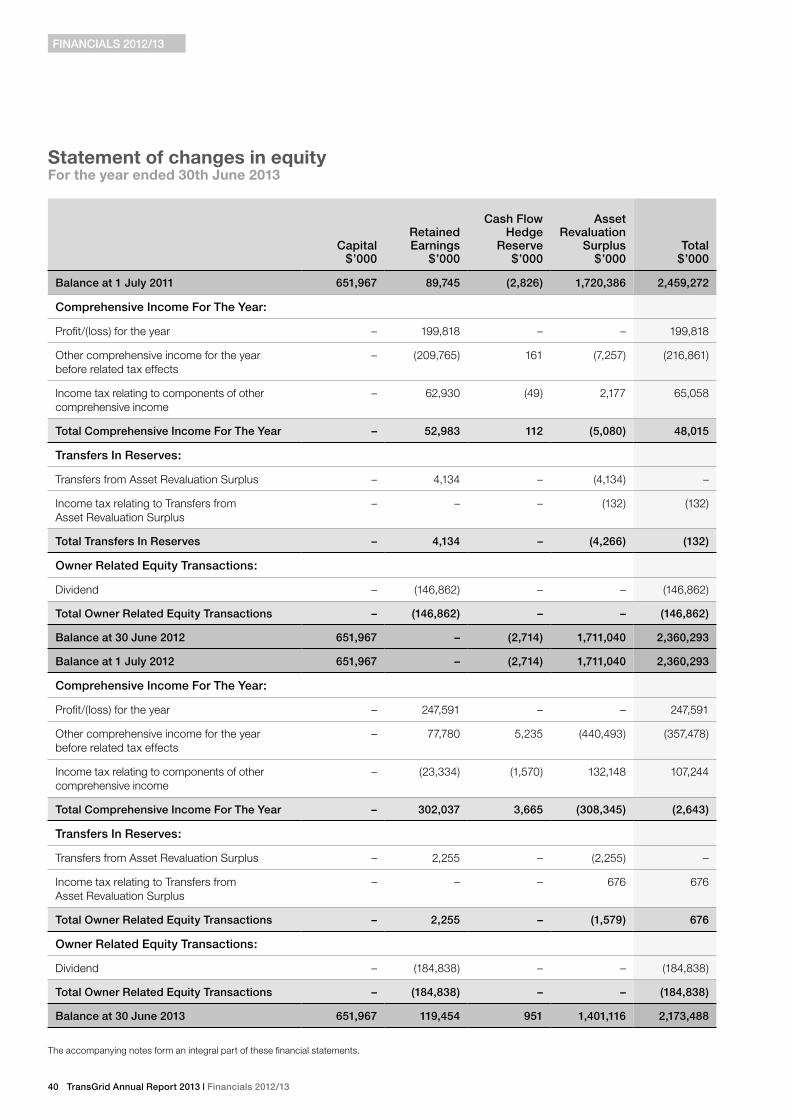
40 TransGrid Annual Report 2013 | financials 2012/13
Statement of changes in equityFor the year ended 30th June 2013
Capital $’000
Retained Earnings
$’000
Cash flow Hedge
Reserve $’000
Asset Revaluation
Surplus $’000
Total $’000
Balance at 1 July 2011 651,967 89,745 (2,826) 1,720,386 2,459,272
Comprehensive Income for The year:
Profit/(loss) for the year – 199,818 – – 199,818
Other comprehensive income for the year before related tax effects
– (209,765) 161 (7,257) (216,861)
Income tax relating to components of other comprehensive income
– 62,930 (49) 2,177 65,058
Total Comprehensive Income for The year – 52,983 112 (5,080) 48,015
Transfers In Reserves:
Transfers from Asset Revaluation Surplus – 4,134 – (4,134) –
Income tax relating to Transfers from Asset Revaluation Surplus
– – – (132) (132)
Total Transfers In Reserves – 4,134 – (4,266) (132)
owner Related Equity Transactions:
Dividend – (146,862) – – (146,862)
Total owner Related Equity Transactions – (146,862) – – (146,862)
Balance at 30 June 2012 651,967 – (2,714) 1,711,040 2,360,293
Balance at 1 July 2012 651,967 – (2,714) 1,711,040 2,360,293
Comprehensive Income for The year:
Profit/(loss) for the year – 247,591 – – 247,591
Other comprehensive income for the year before related tax effects
– 77,780 5,235 (440,493) (357,478)
Income tax relating to components of other comprehensive income
– (23,334) (1,570) 132,148 107,244
Total Comprehensive Income for The year – 302,037 3,665 (308,345) (2,643)
Transfers In Reserves:
Transfers from Asset Revaluation Surplus – 2,255 – (2,255) –
Income tax relating to Transfers from Asset Revaluation Surplus
– – – 676 676
Total owner Related Equity Transactions – 2,255 – (1,579) 676
owner Related Equity Transactions:
Dividend – (184,838) – – (184,838)
Total owner Related Equity Transactions – (184,838) – – (184,838)
Balance at 30 June 2013 651,967 119,454 951 1,401,116 2,173,488
The accompanying notes form an integral part of these financial statements.
fINANCIALS 2012/13
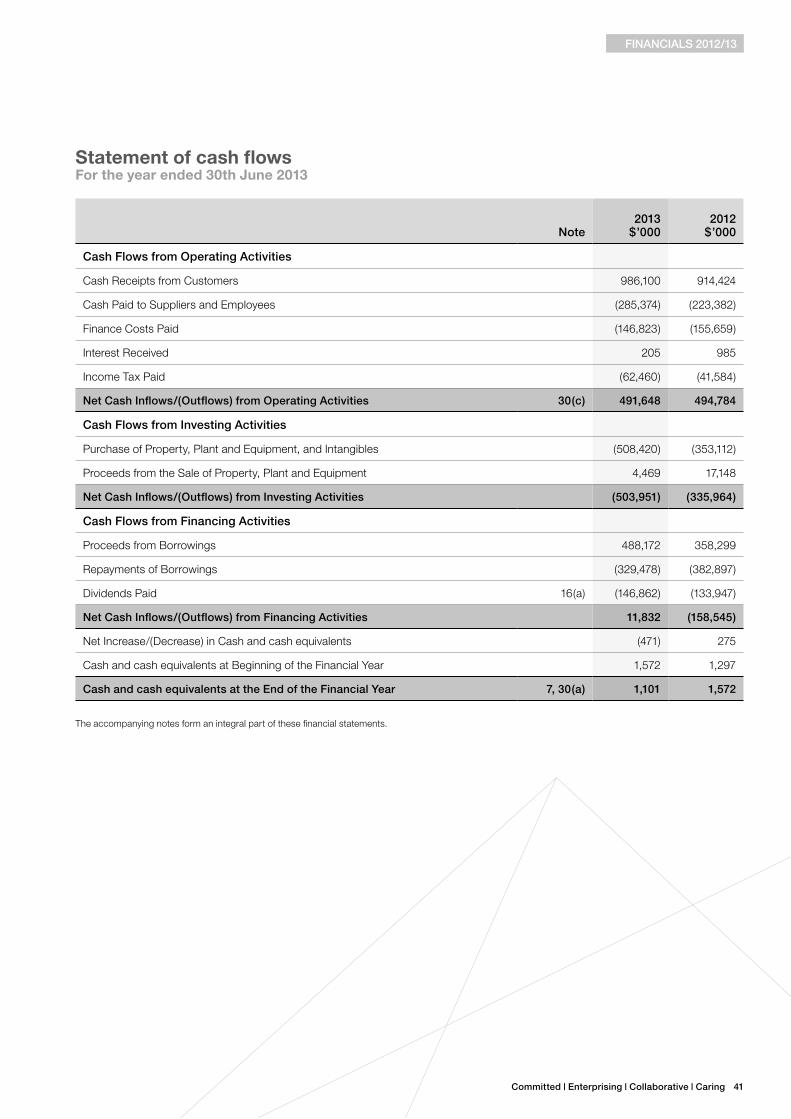
Committed | Enterprising | Collaborative | Caring 41
Statement of cash flowsFor the year ended 30th June 2013
Note2013
$’0002012
$’000
Cash flows from operating Activities
Cash Receipts from Customers 986,100 914,424
Cash Paid to Suppliers and Employees (285,374) (223,382)
Finance Costs Paid (146,823) (155,659)
Interest Received 205 985
Income Tax Paid (62,460) (41,584)
Net Cash Inflows/(outflows) from operating Activities 30(c) 491,648 494,784
Cash flows from Investing Activities
Purchase of Property, Plant and Equipment, and Intangibles (508,420) (353,112)
Proceeds from the Sale of Property, Plant and Equipment 4,469 17,148
Net Cash Inflows/(outflows) from Investing Activities (503,951) (335,964)
Cash flows from financing Activities
Proceeds from Borrowings 488,172 358,299
Repayments of Borrowings (329,478) (382,897)
Dividends Paid 16(a) (146,862) (133,947)
Net Cash Inflows/(outflows) from financing Activities 11,832 (158,545)
Net Increase/(Decrease) in Cash and cash equivalents (471) 275
Cash and cash equivalents at Beginning of the Financial Year 1,572 1,297
Cash and cash equivalents at the End of the financial year 7, 30(a) 1,101 1,572
The accompanying notes form an integral part of these financial statements.
fINANCIALS 2012/13
42 TransGrid Annual Report 2013 | Notes to the financial Statements
1. Reporting EntityThe financial statements of TransGrid for the year ended 30 June 2013 were authorised for issue in accordance with a resolution of the Directors on 17 September 2013.
TransGrid is a Statutory State Owned Corporation under the State Owned Corporations Act 1989 and was corporatised under the Energy Services Corporations Amendment (TransGrid Corporatisation) Act 1998.
2. Summary of Significant Accounting Policies
(a) Basis of Preparation
The financial statements are general-purpose financial statements, and have been prepared in accordance with Australian Accounting Standards including Accounting Interpretations, the requirements of the Public Finance and Audit Act 1983, the Public Finance and Audit Regulation 2010, the State Owned Corporations Act 1989 and relevant Treasury Circulars.
TransGrid is classified as a for-profit entity for the purposes of the application of Australian Accounting Standards and New South Wales Treasury Policy TPP 05-4 Distinguishing For-Profit from Not-For-Profit Entities.
Property, plant and equipment and derivative financial instruments are measured at fair value. Other financial statement items are prepared in accordance with the historical cost convention, except as otherwise stated in the financial statements.
Comparative information is disclosed in respect of the previous period for all amounts reported in the financial statements. Where necessary, comparative information has been reclassified to conform to the current year’s presentation.
All amounts are rounded to the nearest thousand dollars ($’000) and are expressed in Australian dollars (AUD).
(b) Statement of Compliance
The financial statements comply with the International Financial Reporting Standards (IFRS) as issued by the International Accounting Standards Board (IASB).
(c) New Australian Accounting Standards and Interpretations not yet adopted
Australian Accounting Standards and Interpretations that have recently been issued or amended, but are not yet effective, have not been adopted by TransGrid in preparing the financial statements in accordance with Treasury Circular NSW TC 13-02 Mandates of Options and Major Policy Decisions under Australian Accounting Standards.
The following standards, amendments to standards and interpretations included in the table below have been identified as those which may impact TransGrid in the period of initial application. It is considered that the impact of these new standards in future periods will primarily be to the presentation of the financial statements and associated note disclosures.
Notes to the financial StatementsFor the Year Ended 30th June 2013
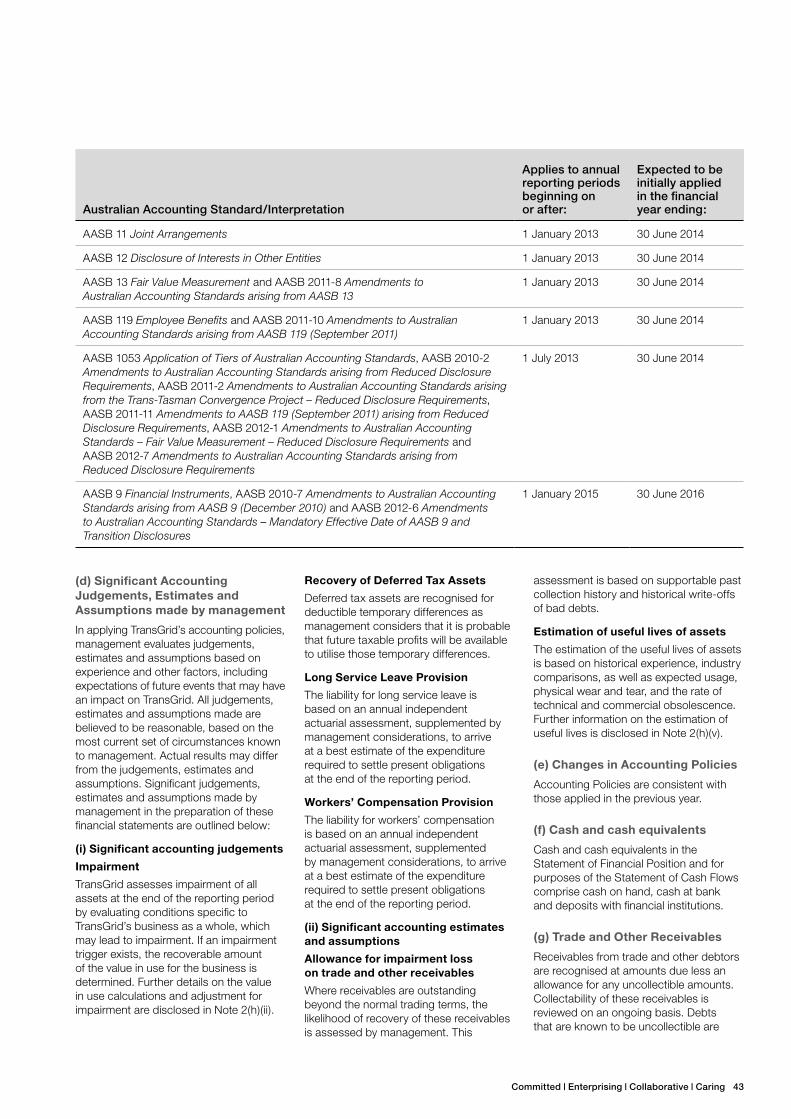
Committed | Enterprising | Collaborative | Caring 43
Australian Accounting Standard/Interpretation
Applies to annual reporting periods beginning on or after:
Expected to be initially applied in the financial year ending:
AASB 11 Joint Arrangements 1 January 2013 30 June 2014
AASB 12 Disclosure of Interests in Other Entities 1 January 2013 30 June 2014
AASB 13 Fair Value Measurement and AASB 2011-8 Amendments to Australian Accounting Standards arising from AASB 13
1 January 2013 30 June 2014
AASB 119 Employee Benefits and AASB 2011-10 Amendments to Australian Accounting Standards arising from AASB 119 (September 2011)
1 January 2013 30 June 2014
AASB 1053 Application of Tiers of Australian Accounting Standards, AASB 2010-2 Amendments to Australian Accounting Standards arising from Reduced Disclosure Requirements, AASB 2011-2 Amendments to Australian Accounting Standards arising from the Trans-Tasman Convergence Project – Reduced Disclosure Requirements, AASB 2011-11 Amendments to AASB 119 (September 2011) arising from Reduced Disclosure Requirements, AASB 2012-1 Amendments to Australian Accounting Standards – Fair Value Measurement – Reduced Disclosure Requirements and AASB 2012-7 Amendments to Australian Accounting Standards arising from Reduced Disclosure Requirements
1 July 2013 30 June 2014
AASB 9 Financial Instruments, AASB 2010-7 Amendments to Australian Accounting Standards arising from AASB 9 (December 2010) and AASB 2012-6 Amendments to Australian Accounting Standards – Mandatory Effective Date of AASB 9 and Transition Disclosures
1 January 2015 30 June 2016
(d) Significant Accounting Judgements, Estimates and Assumptions made by management
In applying TransGrid’s accounting policies, management evaluates judgements, estimates and assumptions based on experience and other factors, including expectations of future events that may have an impact on TransGrid. All judgements, estimates and assumptions made are believed to be reasonable, based on the most current set of circumstances known to management. Actual results may differ from the judgements, estimates and assumptions. Significant judgements, estimates and assumptions made by management in the preparation of these financial statements are outlined below:
(i) Significant accounting judgements
Impairment
TransGrid assesses impairment of all assets at the end of the reporting period by evaluating conditions specific to TransGrid’s business as a whole, which may lead to impairment. If an impairment trigger exists, the recoverable amount of the value in use for the business is determined. Further details on the value in use calculations and adjustment for impairment are disclosed in Note 2(h)(ii).
Recovery of Deferred Tax Assets
Deferred tax assets are recognised for deductible temporary differences as management considers that it is probable that future taxable profits will be available to utilise those temporary differences.
Long Service Leave Provision
The liability for long service leave is based on an annual independent actuarial assessment, supplemented by management considerations, to arrive at a best estimate of the expenditure required to settle present obligations at the end of the reporting period.
Workers’ Compensation Provision
The liability for workers’ compensation is based on an annual independent actuarial assessment, supplemented by management considerations, to arrive at a best estimate of the expenditure required to settle present obligations at the end of the reporting period.
(ii) Significant accounting estimates and assumptions
Allowance for impairment loss on trade and other receivables
Where receivables are outstanding beyond the normal trading terms, the likelihood of recovery of these receivables is assessed by management. This
assessment is based on supportable past collection history and historical write-offs of bad debts.
Estimation of useful lives of assets
The estimation of the useful lives of assets is based on historical experience, industry comparisons, as well as expected usage, physical wear and tear, and the rate of technical and commercial obsolescence. Further information on the estimation of useful lives is disclosed in Note 2(h)(v).
(e) Changes in Accounting Policies
Accounting Policies are consistent with those applied in the previous year.
(f) Cash and cash equivalents
Cash and cash equivalents in the Statement of Financial Position and for purposes of the Statement of Cash Flows comprise cash on hand, cash at bank and deposits with financial institutions.
(g) Trade and Other Receivables
Receivables from trade and other debtors are recognised at amounts due less an allowance for any uncollectible amounts. Collectability of these receivables is reviewed on an ongoing basis. Debts that are known to be uncollectible are
44 TransGrid Annual Report 2013 | Notes to the financial Statements
written off when identified. An allowance for impairment loss on trade and other receivables is raised when there is objective evidence that TransGrid will not be able to collect the debt.
Short-term receivables are measured at their original invoice amount.
(h) Property, Plant and Equipment
(i) Acquisition of Assets
The cost method of accounting is used for the initial recording of all acquisitions of assets controlled by TransGrid. Cost is the amount of cash or cash equivalents paid at the time of acquisition or construction. Cost includes interest on borrowings related to Qualifying Assets as detailed in Note 2(h)(iv).
Assets acquired at no cost, or for nominal consideration, are initially recognised at their fair value at the date of acquisition.
(ii) Revaluations
Property, plant and equipment is recognised at fair value less accumulated depreciation in accordance with AASB 116 Property, Plant and Equipment and New South Wales Treasury Policy TPP 07-1 Valuation of Physical Non-Current Assets at Fair Value. The valuation of property, plant and equipment is determined in a two-step process. First, fair value is determined in accordance with AASB 116 Property, Plant and Equipment. Second, the fair value is subject to a separate impairment test in accordance with AASB 136 Impairment of Assets.
Fair Value
In March 2012, NSW Treasury Policy TPP 07-1 Valuation of Physical Non-Current Assets at Fair Value was amended to allow the option in AASB 116 Property, Plant and Equipment to measure the fair value of assets using either depreciated replacement cost or an income approach. In previous years, TransGrid has measured the fair value of its assets using the depreciated replacement cost approach.
In the current year, TransGrid has elected to adopt the option to measure the fair value of its assets using the income approach. TransGrid’s view is that the income approach better reflects the nature of the current regulatory regime. The allowed revenue from the Australian Energy Regulator (AER) is consistent with the principles of valuing specialised assets under the income approach.
The effect of this change in accounting estimate will reduce depreciation expense and increase profit/(loss) before income tax expense by approximately $21.0 million per annum in future years.
The accumulated depreciation for the revalued asset is restated proportionately with the change in the gross carrying amount of the asset, so that the carrying amount of the asset after revaluation equals its revalued amount, in line with NSW Treasury Policy.
TransGrid assesses at the end of the reporting period whether there is any indication that an asset’s carrying amount differs materially from fair value. If any indication exists, the asset is revalued.
Where an asset’s carrying amount is increased as a result of a revaluation, the increase is recognised in Other Comprehensive Income and accumulated in Equity under the heading of Asset Revaluation Surplus.
Where an asset’s carrying amount is decreased as a result of a revaluation, the decrease is recognised in Other Comprehensive Income to the extent of any credit balance existing in the Asset Revaluation Surplus in respect of that asset. The decrease recognised in Other Comprehensive Income reduces the amount accumulated in Equity under the heading of Asset Revaluation Surplus.
Impairment Assessment
Each year, TransGrid’s specialised plant and infrastructure assets, land and buildings, and easements are tested for impairment. Should there be any indication that the cash generating unit may be impaired, TransGrid makes an estimate of the recoverable amount. TransGrid as a whole represents a cash generating unit.
The recoverable amount is based on the value in use for the business as a whole. In assessing value in use, the estimated future cash flows for the business are discounted to their present value using a discount rate that reflects the risks specific to the business and relevant market assessments.
If the carrying amounts of the assets, as represented by the current depreciated replacement cost, exceed the recoverable amount of the business, the assets comprising the business as a whole are considered to be impaired. The assets are written down proportionately to
ensure their carrying amounts reflect the recoverable amount and a corresponding impairment loss is recognised as a revaluation decrease.
At the end of each year, an assessment is made as to whether there is any indication that an impairment loss recognised in prior periods for an asset may no longer exist or may have decreased. If any such indication exists, TransGrid estimates the recoverable amount of that asset. An impairment loss is reversed if there has been a change in the estimates used to determine the recoverable amount since the last impairment loss was recognised. A reversal of an impairment loss is allocated proportionately to the assets to ensure their carrying amounts reflect the recoverable amount. A corresponding amount is recognised as a revaluation increase.
Retirements or Disposals
Upon retirement or disposal, any revaluation surplus relating to the particular asset is transferred to Retained Earnings.
(iii) Categories
Property, plant and equipment comprise the following types of assets:
>> Prescribed Assets
Prescribed Assets comprise property, plant and equipment used by TransGrid to provide electricity transmission services that are regulated by the AER. Prescribed assets as disclosed in Notes 12(a) and (b) are:
>− Network Asset; and>− Other Assets.
The Network Asset is a complex infrastructure asset that works together as an integrated whole to provide regulated electricity transmission services. It includes the following major parts:
>− Land;>− Buildings;>− System Plant and Equipment; and>− Communication Equipment.
>> Negotiated Transmission Assets
Negotiated transmission assets include those assets relating to some connection services between TransGrid and:
>− Generators; and>− Large load customers.
NoTES To THE fINANCIAL STATEMENTS
Committed | Enterprising | Collaborative | Caring 45
>> Non-regulated Assets
Non-regulated Assets comprise property, plant and equipment used by TransGrid to provide services other than prescribed and negotiated electricity transmission services. Non-regulated assets as disclosed in Notes 11(a) and (b) are:
>− Network Asset; and>− Other Assets.
(iv) Capitalisation
Capital expenditure is defined as expenditure in relation to:
>> acquisition of a new unit of plant;>> installation of a new unit of plant;>> work performed on a unit of plant, where the need for the work existed at the time the unit was acquired and the work was carried out prior to it being put into operation;
>> replacement of a unit of plant, or of a substantial part of a unit of plant;
>> an addition or alteration to a unit of plant, which results in an increase in economic benefits.
Interest on borrowings is capitalised against Qualifying Assets in accordance
with AASB 123 Borrowing Costs. Qualifying Assets are assets which take more than 12 months to be ready for their intended use.
Expenditure is not capitalised below a minimum threshold of $3,000.
(v) Depreciation
Property, plant and equipment, excluding land, are depreciated over their estimated useful lives. The straight-line depreciation method is used. Assets are depreciated from the month of acquisition or in respect of constructed assets, from the time the asset reaches practical completion and is ready for use.
Asset lives are reviewed annually in accordance with AASB 116 Property, Plant and Equipment, and where required, adjustments have been made to the remaining useful lives of separately identifiable parts of assets having regard to factors such as asset usage and the rate of technical and commercial obsolescence.
Within the Prescribed, Non-regulated and Negotiated Transmission Asset base the following sub-categories have been established. The useful lives presently assigned to these assets are:
Prescribed & Non-regulated Assets
Network Asset Buildings 40 years
System Plant and Equipment
20 – 50 years
Communication Equipment
7 – 35 years
Other Assets 2 – 10 years
Negotiated Transmission Assets
Network Asset System Plant and Equipment
20 – 40 years
(i) Intangible assets
Intangible assets are measured at cost and comprise Easements and Computer software as disclosed in Notes 13(a) and (b).
Capital expenditure on intangible assets is defined as expenditure in relation to:
>> acquisition of computer software or easements;
>> installation of computer software;>> an addition or alteration to computer software, which results in an increase in economic benefits.
Easements are a component of TransGrid’s infrastructure assets that
provide electricity transmission services that are regulated by the AER. Easements are assessed for impairment on an annual basis and are not amortised as they are granted for an unlimited time, and thus have an indefinite useful life.
Computer software is amortised over a period of 5 years using the straight-line amortisation method. Amortisation expense is included in the “Expenses excluding Finance Costs” line item of the Statement of Profit or Loss and Other Comprehensive Income. The useful life for software is reviewed annually, and adjustments where applicable, are made on a prospective basis.
Expenditure is not capitalised below a minimum threshold of $3,000.
(j) Inventories
Inventories of Stores and Materials are valued at the lower of cost and net realisable value. Cost is determined by TransGrid to be the weighted average cost of items in store. TransGrid’s inventories relate mostly to specialist equipment. As there is no active market in respect of the majority of TransGrid’s inventories, TransGrid recognises the weighted average cost of items as a proxy for lower of cost and net realisable value.
(k) Borrowings
All borrowings are measured at amortised cost using the effective interest method. Furthermore, TransGrid’s overall debt portfolio includes a number of Consumer Price Index (CPI) linked bonds which are subject to a quarterly CPI adjustment.
Interest on borrowings is recognised as an expense in the period in which it is incurred unless it relates to qualifying assets. Qualifying assets are assets, which take more than 12 months to get ready for their intended use. Where funds are borrowed generally, interest on the borrowings is capitalised to qualifying assets in accordance with AASB 123 Borrowing Costs.
The amount of interest attributed to qualifying assets during the year was $24.9m (2012 – $24.2m) at a weighted average rate of 6.8 per cent (2012 – 7.2 per cent).
Loans are classified as current when they have a maturity of less than one year from the end of the reporting period.
(l) Payables
Accounts payable, including accruals not yet billed, are recognised when TransGrid has an obligation to pay as a result of the completion of a work or service.
(m) Dividends
Provision is made for the amount of dividend payable in relation to the current financial year, in accordance with the dividend recognition policy set out in Treasury Circular NSW TC 10-16 Accounting for Dividends. Accordingly, a dividend in relation to the financial year is taken to be determined before the end of the reporting period, consistent with the requirements
NoTES To THE fINANCIAL STATEMENTS
46 TransGrid Annual Report 2013 | Notes to the financial Statements
of AASB 137 Provisions, Contingent Liabilities and Contingent Assets.
The dividend is calculated in accordance with TPP 09-6 Financial Distribution Policy for Government Businesses. The dividend payable of $184.8m (2012: $146.9m) is calculated based on profit for the year. The dividends are determined by TransGrid’s Board after negotiation with NSW Treasury.
(n) Employee Benefits
A calculation in accordance with AASB 119 Employee Benefits and Treasury Circular NSW TC 12/06 Accounting for Long Service Leave and Annual Leave is made each year in respect of TransGrid’s liability at the end of the reporting period for employee benefits relating to long service leave, annual leave and short term incentive schemes, and an annual contribution is made to adjust the provision to an amount which is considered adequate to meet that liability.
(i) Annual Leave
The provision for employee benefits relating to annual leave represents the amount which TransGrid has a present obligation to pay resulting from employees’ services provided up to the end of the reporting period.
The provision has been calculated at nominal amounts based on the remuneration rates that are expected to be paid when the leave is taken.
(ii) Long Service Leave
The liability for employee benefits relating to long service leave has been calculated on the basis of current salary rates to be paid by TransGrid resulting from employees’ services provided up to the end of the reporting period and includes related on-costs. The liability for long service leave is recognised and measured as the present value of expected future payments to be made in respect of services provided by employees up to the reporting date. Expected future payments are discounted using market yields at the reporting date on Commonwealth Government bonds with terms to maturity that match, as closely as possible, the estimated future cash outflows.
(o) Superannuation
TransGrid contributes to the Energy Industries Superannuation Scheme (EISS) Pool B which is a defined benefit superannuation scheme for which liabilities accrue.
TransGrid also contributes to a number of accumulation superannuation schemes for which no long-term liability accrues.
With the defined benefit schemes, a component of the final benefit is derived from a multiple of member salary and years of membership. All the defined benefit schemes are closed to new members.
The EISS advises the level of liability in respect of TransGrid’s superannuation commitments to its employees who are members of the various divisions of the schemes. The calculation of the superannuation position is based upon actuarial reviews independent of TransGrid’s ongoing activities and involvement. Various actuarial assumptions underpin the determination of TransGrid’s defined benefit obligations. These assumptions and the related carrying amounts are disclosed in Note 5.
TransGrid recognises the net total of the following as an asset or a liability in its Statement of Financial Position:
>> Present value of the defined benefit obligation at the end of the reporting period; and
>> Fair value of plan assets in the defined benefit schemes at the end of the reporting period.
The total of the net superannuation expense (or revenue) for the year, including amounts recognised in the accounts, is the difference between the opening and closing balances of the net defined superannuation liability (or prepaid superannuation contributions) plus the contributions paid by TransGrid to the EISS.
In accordance with NSW Treasury Circular NSW TC 11/04 Accounting for Superannuation, actuarial gains and losses are recognised in Other Comprehensive Income while non-actuarial gains and losses are recognised in profit or loss.
(p) Insurance
TransGrid maintains a mix of external insurance policies and internal provisioning in accordance with AASB 137 Provisions, Contingent Liabilities and Contingent Assets. The treatment of risks and associated liabilities are determined in conjunction with independent insurance advisers and loss adjusters.
Prior to 1 July 2012, TransGrid was a self-insurer for Worker’s Compensation. The liability for claims made, or to be made, against the Insurance Provision was determined by reference to the Worker’s Compensation Act 1987 and the WorkCover Authority’s guidelines to self-insurers. From 1 July 2012, TransGrid’s insurance arrangements, including Worker’s Compensation, are provided by the NSW Treasury Managed Fund (TMF).
Insurable incidents occurring prior to 1 July 2012 are treated in accordance with the previous insurance arrangements, while incidents from 1 July 2012 onwards are managed under the TMF arrangements. This development will reduce TransGrid’s need to self-insure and provides broader commercial protection for the period post 30 June 2012.
(q) Electricity Creditors
Electricity Creditors relate to monies received for electricity transmission services that are above the revenue cap as determined by the AER and from the National Electricity Market settlement residues process.
In the event that these residues cause the total revenue received during the year to exceed TransGrid’s revenue cap, the excess is held in Electricity Creditors and is taken into account when setting the next period’s transmission service prices, resulting in those prices being lower than they would have otherwise been.
(r) Derivative Financial Instruments
TransGrid uses derivative financial instruments such as forward foreign currency contracts to hedge its risks associated with foreign currency fluctuations.
For the purposes of hedge accounting, TransGrid classifies its hedges as cash flow hedges. The hedges are undertaken to address exposure to variability in cash flows that is either attributable to a particular risk associated with a recognised asset or liability or a forecasted transaction.
NoTES To THE fINANCIAL STATEMENTS
Committed | Enterprising | Collaborative | Caring 47
In relation to cash flow hedges to hedge firm commitments which meet the specific conditions for hedge accounting, the portion of the gain or loss on the hedging instrument that is determined to be an effective hedge is recognised directly in Other Comprehensive Income and the ineffective portion, subject to a materiality threshold, is recognised in profit or loss.
When the underlying transaction results in the recognition of an asset or liability, then at the same time the associated gains or losses from the hedge that had previously been recognised in Other Comprehensive Income are included in the initial measurement of the acquisition cost or other carrying amount of the asset or liability.
AASB 7 Financial Instruments: Disclosures requires classification of fair value measurements using a fair value hierarchy that reflects the significance of the inputs used in making the measurements. The fair value hierarchy is made up of the following levels:
>> Level 1 – quoted prices (unadjusted) in active markets for identical assets or liabilities;
>> Level 2 – inputs, other than quoted prices included within level 1, that are observable for the asset or liability, either directly (i.e. as prices) or indirectly (i.e. derived from prices); and
>> Level 3 – inputs for the asset or liability that are not based on observable market data (unobservable inputs).
In accordance with the requirements of AASB 7 Financial Instruments: Disclosures, all of TransGrid’s derivative financial instruments fall within the Level 2 category of the fair value hierarchy. There were no transfers between categories during the year.
(s) Revenue
Revenue is recognised to the extent that it is probable that the economic benefits will flow to TransGrid and the revenue can be reliably measured. The following specific recognition criteria must also be met before revenue is recognised:
(i) Sale of goods
Revenue is recognised when the significant risks and rewards of ownership of the goods have passed to the buyer and can be measured reliably. Risks and rewards are considered passed to the buyer at the time of delivery of the goods to the customer.
(ii) Rendering of services
Revenue from electricity transmission services is subject to the application of an AER determined Maximum Allowable Revenue (MAR) for the financial year. TransGrid is in the fourth year of the current five year regulatory determination which operates from July 2009 to June 2014. The transmission service prices are set at the beginning of the financial year in accordance with the MAR.
Revenue from the rendering of other services is recognised when the service is provided or by reference to the stage of completion. Where the contract outcome cannot be measured reliably, revenue is recognised only to the extent of the expenses recognised that are recoverable.
(iii) Interest
Interest revenue is recognised as it is earned, using the effective interest method.
(iv) Contributions for Capital Works
Cash and non-cash capital contributions are recognised in accordance with Accounting Interpretation 18 Transfers of Assets from Customers.
Contributions of non-current assets are recognised as revenue and an asset when TransGrid gains control of the asset. The amount recognised is the fair value of the contributed asset at the date on which control is gained.
Cash capital contributions are recognised as revenue when the network is extended or modified, consistent with the terms of the contribution.
(t) Income Tax
TransGrid is subject to the National Tax Equivalent Regime (NTER) administered by the Australian Taxation Office (ATO). The NTER is based on application of federal income tax laws under which TransGrid pays income tax equivalents to NSW Treasury.
Deferred income tax is provided on all temporary differences at the end of the reporting period between the tax bases of assets and liabilities and their carrying amounts for financial reporting purposes.
Deferred income tax liabilities are recognised for all taxable temporary differences except where the deferred income tax liability arises from the initial recognition of an asset or liability, and at the time of the transaction, affects neither the accounting profit nor taxable profit or loss.
Deferred income tax assets are recognised for all deductible temporary differences, carry-forward of unused tax assets and unused tax losses, to the extent that it is probable that taxable profit will be available against which the deductible temporary differences, and the carry-forward of unused tax assets and unused tax losses can be utilised, except where the deferred income tax asset arises from the initial recognition of an asset or liability, and at the time of the transaction, affects neither the accounting profit nor taxable profit or loss.
The carrying amount of deferred income tax assets is reviewed at the end of each reporting period and reduced to the extent that it is no longer probable that sufficient taxable profit will be available to allow all or part of the deferred income tax asset to be utilised.
Deferred income tax assets and liabilities are measured at the tax rate that is expected to apply to the year when the asset is realised or the liability is settled, based on tax rate (and tax laws) that have been enacted or substantively enacted at the end of each reporting period.
Income taxes relating to items recognised directly in equity (such as asset revaluation surplus, cash flow hedges and superannuation actuarial gains and losses) are recognised in equity and not in profit or loss.
(u) Goods and Services Tax
Revenues, expenses and assets are recognised net of the amount of Goods and Services Tax (GST), with the following exceptions:
>> Where the amount of GST incurred is not recoverable from the ATO. In these circumstances, the GST is recognised as part of the cost of acquisition of the asset or as part of an item of the expense; and
>> Receivables and payables are stated with the amount of GST included.
The net amount of GST recoverable from, or payable to, the ATO is included as a current asset or current liability in the Statement of Financial Position.
Cash flows are included in the Statement of Cash Flows on a gross basis. The GST component of cash flows arising from investing and financing activities which are recoverable from, or payable to, the ATO are classified as operating cash flows.
NoTES To THE fINANCIAL STATEMENTS
48 TransGrid Annual Report 2013 | Notes to the financial Statements
(v) Financial Risk Management
Overview
TransGrid has exposure to the following risks from its use of financial instruments:
>> Credit risk;>> Liquidity and funding risk;>> Interest rate risk;>> Foreign exchange risk;>> Commodity risk; and>> Operational risk.
Credit Risk
Credit risk is the risk that arises if a financial loss is suffered due to the inability of the counterparty being able to meet its financial obligations to TransGrid.
The risk is managed by only undertaking transactions with government owned financial institutions and commercial banks with a minimum credit rating threshold. Monetary limits apply to contain the exposure within reasonable levels.
>> Trade and other receivables
TransGrid’s exposure to credit risk is influenced mainly by the individual characteristics of each customer. The demographics of TransGrid’s customer base, including the default risk of the industry and country in which customers operate, has less of an influence on credit risk.
TransGrid considers a concentration of credit risk to exist when an individual customer’s outstanding trade receivable balance exceeds 10 per cent of the total trade receivables balance. Approximately 88 per cent (2012 – 88 per cent) of TransGrid’s trade receivables balance is attributable to three distribution customers who have individual trade receivable balances in excess of 10 per cent of the total balance. All of TransGrid’s distribution customers have been transacting with the organisation since its inception, with no credit losses occurring during that time.
Liquidity and Funding Risk
The main objective of liquidity risk management is to ensure that TransGrid has sufficient funds available to meet its financial obligations and in a timely manner.
TransGrid maintains detailed cash flow forecasts and uses approved instruments with liquidity limits to maintain adequate cash flow. Borrowing limits are monitored to ensure funding commitments for major capital works are in place. The debt portfolio is managed in such a way that no more than 20 per cent of the total projected portfolio will mature in any 12 month period.
TransGrid has entered into forward start borrowing agreements with the NSW Treasury Corporation to manage liquidity and funding risk.
As at 30 June 2013, TransGrid had 6 forward start borrowings with an aggregate face value of $291.4m which will be drawn during the 2013/14 financial year.
Interest Rate Risk
Interest rate risk is the risk of a material change in earnings as a consequence of adverse movements in interest rates.
The objective in managing interest rate risk is to minimise interest expense volatility whilst ensuring that an appropriate level of flexibility exists to accommodate potential changes in funding requirements and movements in market interest rates. To achieve this, TransGrid’s overall debt portfolio comprises nominal, floating rate, Consumer Price Index (CPI) linked and working capital facilities.
As TransGrid’s debt portfolio includes CPI linked bonds, a component of the interest rate risk relates to the risk from CPI movements.
Foreign Exchange Risk
Foreign Exchange risk is the risk that TransGrid suffers financial loss due to a change in foreign exchange rates.
TransGrid’s policy is to hedge all foreign currency exposures in excess of AUD 0.5 million equivalent.
Commodity Risk
TransGrid may be exposed to commodity price risk typically in relation to adverse and unexpected increases in costs for infrastructure related capital expenditure. TransGrid’s preferred position in relation to commodity risk is to negotiate fixed price contracts with its suppliers. In addition, appropriate policies are in place to monitor movements in commodity prices with hedging strategies to mitigate risk.
Operational Risk
Operational risk is the risk that TransGrid suffers financial loss due to mismanagement, error, fraud or unauthorised use of financial products.
Appropriate segregation of duties and maintenance of control systems are in place to mitigate operational risk.
(w) Capital Management
TransGrid has been subject to the NSW Government’s Financial Distribution Policy since its inception and is fully committed to providing an adequate return to its Shareholder. This objective must be managed within the regulatory framework provided by the NER, given that the majority of TransGrid’s revenue is subject to regulation.
TransGrid’s return on capital is based on a Weighted Average Cost of Capital (WACC) set by the AER, as part of the revenue cap determination process at five-year intervals. The regulatory rate of return is set at a level deemed sufficient to ensure the continuing viability of TransGrid’s business and to encourage necessary investment in new and replacement assets. The WACC applicable to TransGrid for the current five-year regulatory period ending 30 June 2014 is 10.05 per cent.
There were no changes in TransGrid’s approach to capital management during the year.
TransGrid is not subject to externally imposed capital requirements.
(x) Joint Ventures
TransGrid has entered into an Unincorporated Joint Venture Agreement for the future provision of telecommunications services.
In accordance with AASB 131 Interests in Joint Ventures, the joint venture is deemed to be a jointly controlled operation as each venturer uses its own assets in pursuit of the joint operations. The joint venture has not traded.
NoTES To THE fINANCIAL STATEMENTS
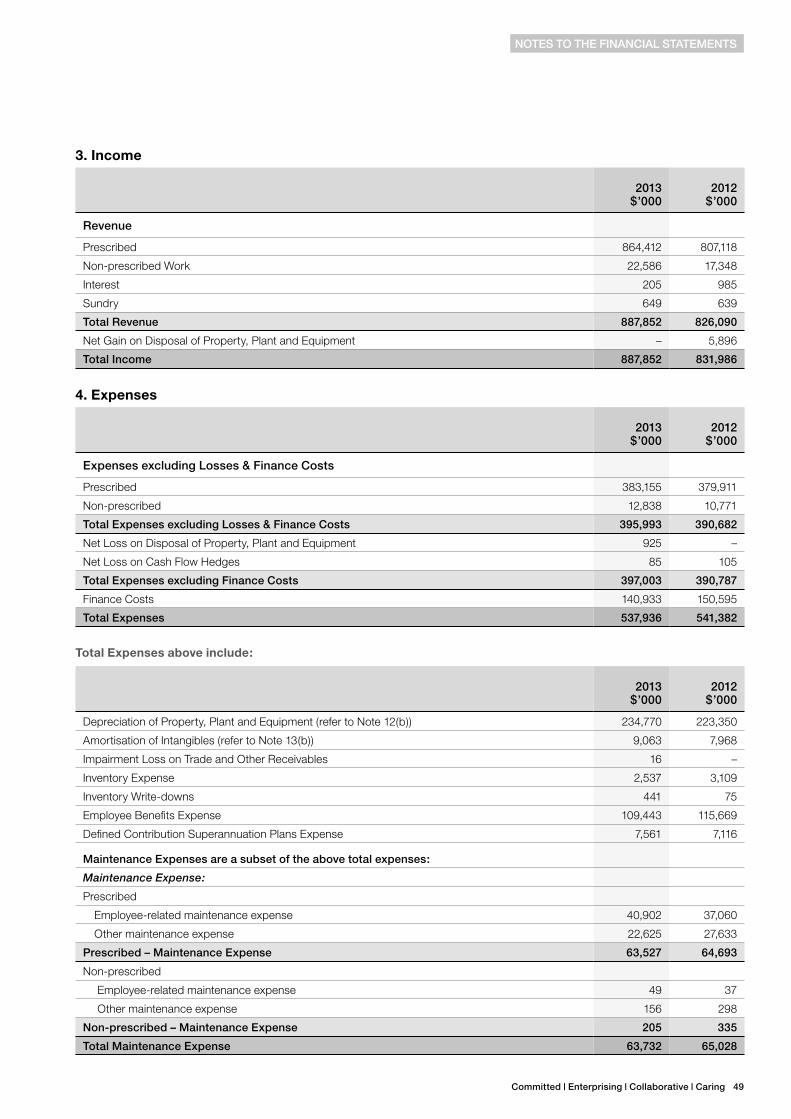
Committed | Enterprising | Collaborative | Caring 49
3. Income
2013 $’000
2012 $’000
Revenue
Prescribed 864,412 807,118
Non-prescribed Work 22,586 17,348
Interest 205 985
Sundry 649 639
Total Revenue 887,852 826,090
Net Gain on Disposal of Property, Plant and Equipment – 5,896
Total Income 887,852 831,986
4. Expenses
2013 $’000
2012 $’000
Expenses excluding Losses & finance Costs
Prescribed 383,155 379,911
Non-prescribed 12,838 10,771
Total Expenses excluding Losses & finance Costs 395,993 390,682
Net Loss on Disposal of Property, Plant and Equipment 925 –
Net Loss on Cash Flow Hedges 85 105
Total Expenses excluding finance Costs 397,003 390,787
Finance Costs 140,933 150,595
Total Expenses 537,936 541,382
Total Expenses above include:
2013 $’000
2012 $’000
Depreciation of Property, Plant and Equipment (refer to Note 12(b)) 234,770 223,350
Amortisation of Intangibles (refer to Note 13(b)) 9,063 7,968
Impairment Loss on Trade and Other Receivables 16 –
Inventory Expense 2,537 3,109
Inventory Write-downs 441 75
Employee Benefits Expense 109,443 115,669
Defined Contribution Superannuation Plans Expense 7,561 7,116
Maintenance Expenses are a subset of the above total expenses:
Maintenance Expense:
Prescribed
Employee-related maintenance expense 40,902 37,060
Other maintenance expense 22,625 27,633
Prescribed – Maintenance Expense 63,527 64,693
Non-prescribed
Employee-related maintenance expense 49 37
Other maintenance expense 156 298
Non-prescribed – Maintenance Expense 205 335
Total Maintenance Expense 63,732 65,028
NoTES To THE fINANCIAL STATEMENTS
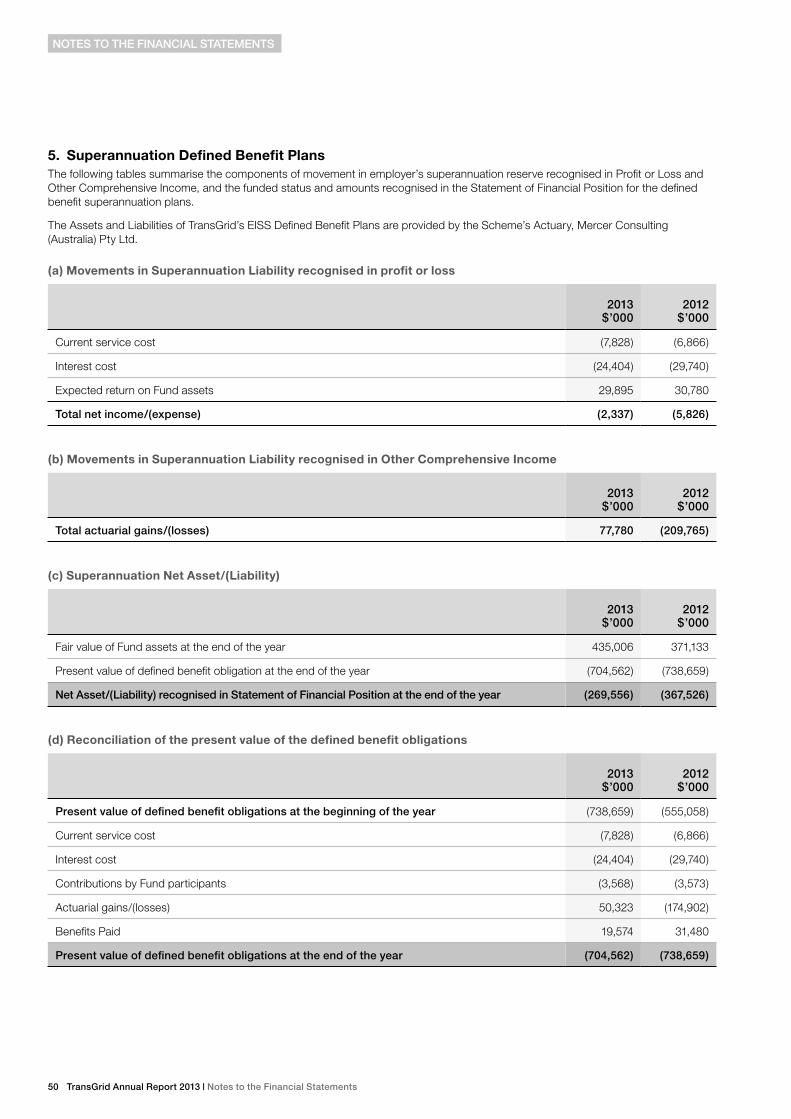
50 TransGrid Annual Report 2013 | Notes to the financial Statements
5. Superannuation Defined Benefit PlansThe following tables summarise the components of movement in employer’s superannuation reserve recognised in Profit or Loss and Other Comprehensive Income, and the funded status and amounts recognised in the Statement of Financial Position for the defined benefit superannuation plans.
The Assets and Liabilities of TransGrid’s EISS Defined Benefit Plans are provided by the Scheme’s Actuary, Mercer Consulting (Australia) Pty Ltd.
(a) Movements in Superannuation Liability recognised in profit or loss
2013 $’000
2012 $’000
Current service cost (7,828) (6,866)
Interest cost (24,404) (29,740)
Expected return on Fund assets 29,895 30,780
Total net income/(expense) (2,337) (5,826)
(b) Movements in Superannuation Liability recognised in Other Comprehensive Income
2013 $’000
2012 $’000
Total actuarial gains/(losses) 77,780 (209,765)
(c) Superannuation Net Asset/(Liability)
2013 $’000
2012 $’000
Fair value of Fund assets at the end of the year 435,006 371,133
Present value of defined benefit obligation at the end of the year (704,562) (738,659)
Net Asset/(Liability) recognised in Statement of financial Position at the end of the year (269,556) (367,526)
(d) Reconciliation of the present value of the defined benefit obligations
2013 $’000
2012 $’000
Present value of defined benefit obligations at the beginning of the year (738,659) (555,058)
Current service cost (7,828) (6,866)
Interest cost (24,404) (29,740)
Contributions by Fund participants (3,568) (3,573)
Actuarial gains/(losses) 50,323 (174,902)
Benefits Paid 19,574 31,480
Present value of defined benefit obligations at the end of the year (704,562) (738,659)
NoTES To THE fINANCIAL STATEMENTS
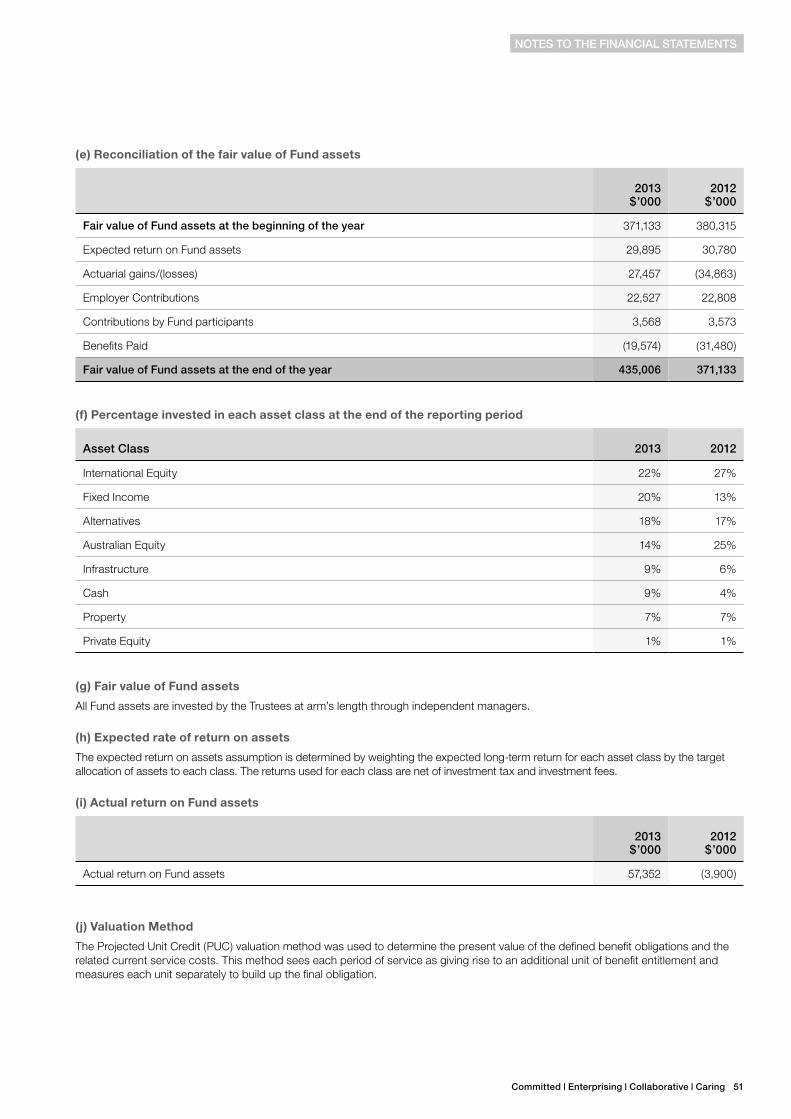
Committed | Enterprising | Collaborative | Caring 51
(e) Reconciliation of the fair value of Fund assets
2013 $’000
2012 $’000
fair value of fund assets at the beginning of the year 371,133 380,315
Expected return on Fund assets 29,895 30,780
Actuarial gains/(losses) 27,457 (34,863)
Employer Contributions 22,527 22,808
Contributions by Fund participants 3,568 3,573
Benefits Paid (19,574) (31,480)
fair value of fund assets at the end of the year 435,006 371,133
(f) Percentage invested in each asset class at the end of the reporting period
Asset Class 2013 2012
International Equity 22% 27%
Fixed Income 20% 13%
Alternatives 18% 17%
Australian Equity 14% 25%
Infrastructure 9% 6%
Cash 9% 4%
Property 7% 7%
Private Equity 1% 1%
(g) Fair value of Fund assets
All Fund assets are invested by the Trustees at arm’s length through independent managers.
(h) Expected rate of return on assets
The expected return on assets assumption is determined by weighting the expected long-term return for each asset class by the target allocation of assets to each class. The returns used for each class are net of investment tax and investment fees.
(i) Actual return on Fund assets
2013 $’000
2012 $’000
Actual return on Fund assets 57,352 (3,900)
(j) Valuation Method
The Projected Unit Credit (PUC) valuation method was used to determine the present value of the defined benefit obligations and the related current service costs. This method sees each period of service as giving rise to an additional unit of benefit entitlement and measures each unit separately to build up the final obligation.
NoTES To THE fINANCIAL STATEMENTS
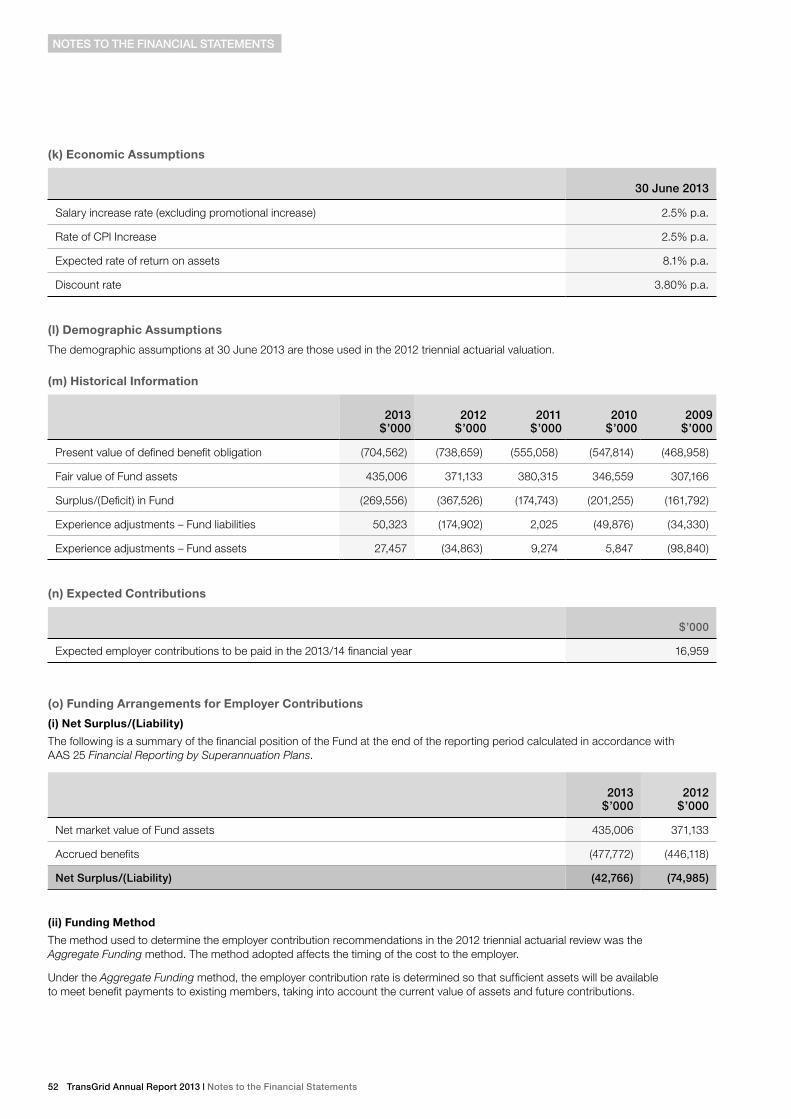
52 TransGrid Annual Report 2013 | Notes to the financial Statements
(k) Economic Assumptions
30 June 2013
Salary increase rate (excluding promotional increase) 2.5% p.a.
Rate of CPI Increase 2.5% p.a.
Expected rate of return on assets 8.1% p.a.
Discount rate 3.80% p.a.
(l) Demographic Assumptions
The demographic assumptions at 30 June 2013 are those used in the 2012 triennial actuarial valuation.
(m) Historical Information
2013 $’000
2012 $’000
2011 $’000
2010 $’000
2009 $’000
Present value of defined benefit obligation (704,562) (738,659) (555,058) (547,814) (468,958)
Fair value of Fund assets 435,006 371,133 380,315 346,559 307,166
Surplus/(Deficit) in Fund (269,556) (367,526) (174,743) (201,255) (161,792)
Experience adjustments – Fund liabilities 50,323 (174,902) 2,025 (49,876) (34,330)
Experience adjustments – Fund assets 27,457 (34,863) 9,274 5,847 (98,840)
(n) Expected Contributions
$’000
Expected employer contributions to be paid in the 2013/14 financial year 16,959
(o) Funding Arrangements for Employer Contributions
(i) Net Surplus/(Liability)
The following is a summary of the financial position of the Fund at the end of the reporting period calculated in accordance with AAS 25 Financial Reporting by Superannuation Plans.
2013 $’000
2012 $’000
Net market value of Fund assets 435,006 371,133
Accrued benefits (477,772) (446,118)
Net Surplus/(Liability) (42,766) (74,985)
(ii) Funding Method
The method used to determine the employer contribution recommendations in the 2012 triennial actuarial review was the Aggregate Funding method. The method adopted affects the timing of the cost to the employer.
Under the Aggregate Funding method, the employer contribution rate is determined so that sufficient assets will be available to meet benefit payments to existing members, taking into account the current value of assets and future contributions.
NoTES To THE fINANCIAL STATEMENTS
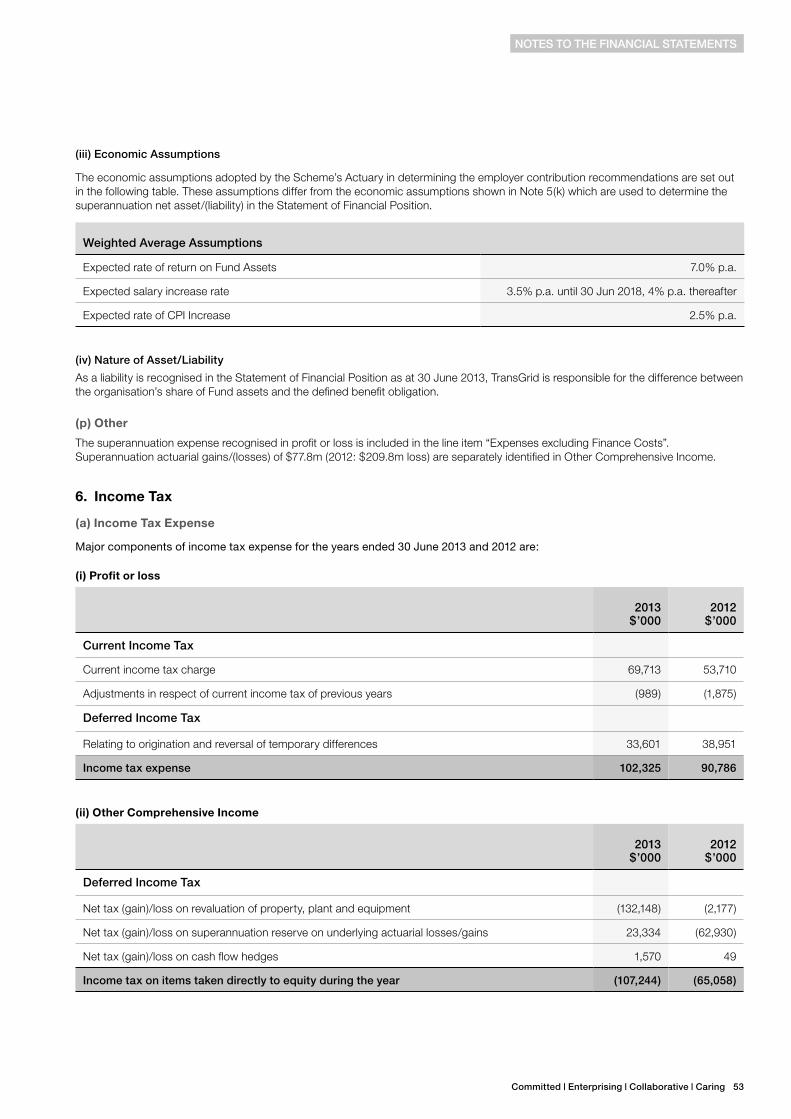
Committed | Enterprising | Collaborative | Caring 53
(iii) Economic Assumptions
The economic assumptions adopted by the Scheme’s Actuary in determining the employer contribution recommendations are set out in the following table. These assumptions differ from the economic assumptions shown in Note 5(k) which are used to determine the superannuation net asset/(liability) in the Statement of Financial Position.
Weighted Average Assumptions
Expected rate of return on Fund Assets 7.0% p.a.
Expected salary increase rate 3.5% p.a. until 30 Jun 2018, 4% p.a. thereafter
Expected rate of CPI Increase 2.5% p.a.
(iv) Nature of Asset/Liability
As a liability is recognised in the Statement of Financial Position as at 30 June 2013, TransGrid is responsible for the difference between the organisation’s share of Fund assets and the defined benefit obligation.
(p) Other
The superannuation expense recognised in profit or loss is included in the line item “Expenses excluding Finance Costs”. Superannuation actuarial gains/(losses) of $77.8m (2012: $209.8m loss) are separately identified in Other Comprehensive Income.
6. Income Tax
(a) Income Tax Expense
Major components of income tax expense for the years ended 30 June 2013 and 2012 are:
(i) Profit or loss
2013 $’000
2012 $’000
Current Income Tax
Current income tax charge 69,713 53,710
Adjustments in respect of current income tax of previous years (989) (1,875)
Deferred Income Tax
Relating to origination and reversal of temporary differences 33,601 38,951
Income tax expense 102,325 90,786
(ii) Other Comprehensive Income
2013 $’000
2012 $’000
Deferred Income Tax
Net tax (gain)/loss on revaluation of property, plant and equipment (132,148) (2,177)
Net tax (gain)/loss on superannuation reserve on underlying actuarial losses/gains 23,334 (62,930)
Net tax (gain)/loss on cash flow hedges 1,570 49
Income tax on items taken directly to equity during the year (107,244) (65,058)
NoTES To THE fINANCIAL STATEMENTS
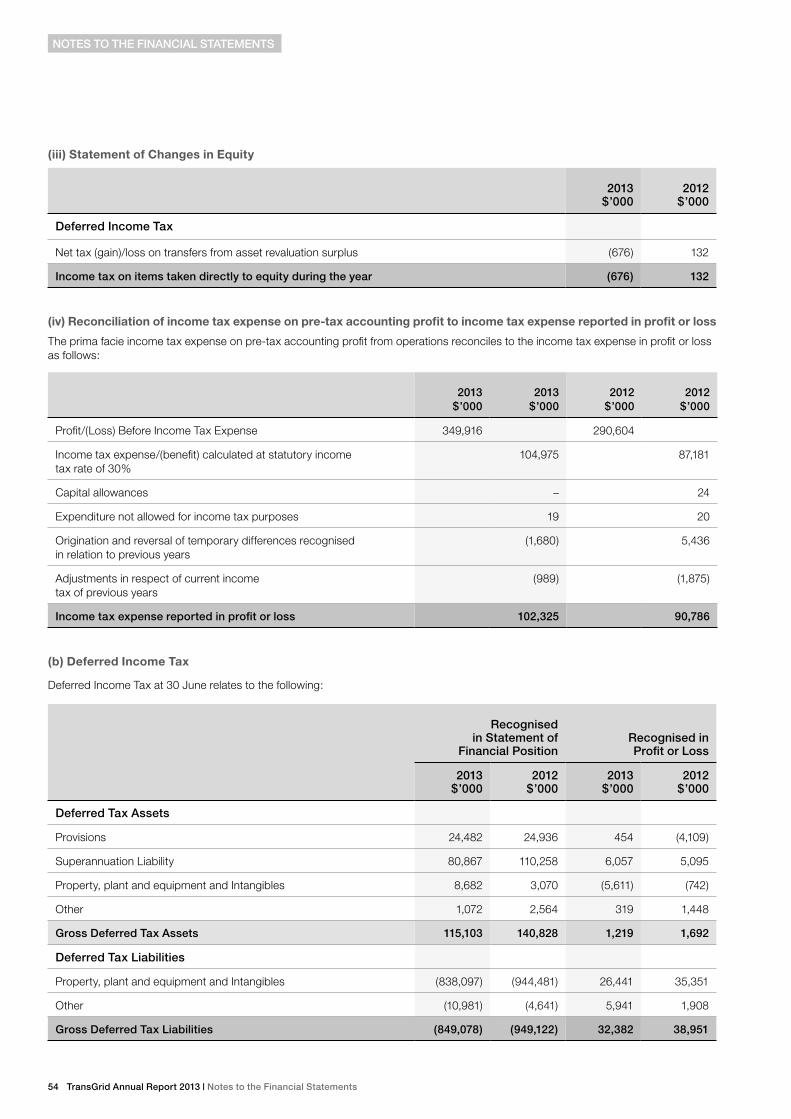
54 TransGrid Annual Report 2013 | Notes to the financial Statements
(iii) Statement of Changes in Equity
2013 $’000
2012 $’000
Deferred Income Tax
Net tax (gain)/loss on transfers from asset revaluation surplus (676) 132
Income tax on items taken directly to equity during the year (676) 132
(iv) Reconciliation of income tax expense on pre-tax accounting profit to income tax expense reported in profit or loss
The prima facie income tax expense on pre-tax accounting profit from operations reconciles to the income tax expense in profit or loss as follows:
2013 $’000
2013 $’000
2012 $’000
2012 $’000
Profit/(Loss) Before Income Tax Expense 349,916 290,604
Income tax expense/(benefit) calculated at statutory income tax rate of 30%
104,975 87,181
Capital allowances – 24
Expenditure not allowed for income tax purposes 19 20
Origination and reversal of temporary differences recognised in relation to previous years
(1,680) 5,436
Adjustments in respect of current income tax of previous years
(989) (1,875)
Income tax expense reported in profit or loss 102,325 90,786
(b) Deferred Income Tax
Deferred Income Tax at 30 June relates to the following:
Recognised in Statement of
financial Position Recognised in Profit or Loss
2013 $’000
2012 $’000
2013 $’000
2012 $’000
Deferred Tax Assets
Provisions 24,482 24,936 454 (4,109)
Superannuation Liability 80,867 110,258 6,057 5,095
Property, plant and equipment and Intangibles 8,682 3,070 (5,611) (742)
Other 1,072 2,564 319 1,448
Gross Deferred Tax Assets 115,103 140,828 1,219 1,692
Deferred Tax Liabilities
Property, plant and equipment and Intangibles (838,097) (944,481) 26,441 35,351
Other (10,981) (4,641) 5,941 1,908
Gross Deferred Tax Liabilities (849,078) (949,122) 32,382 38,951
NoTES To THE fINANCIAL STATEMENTS
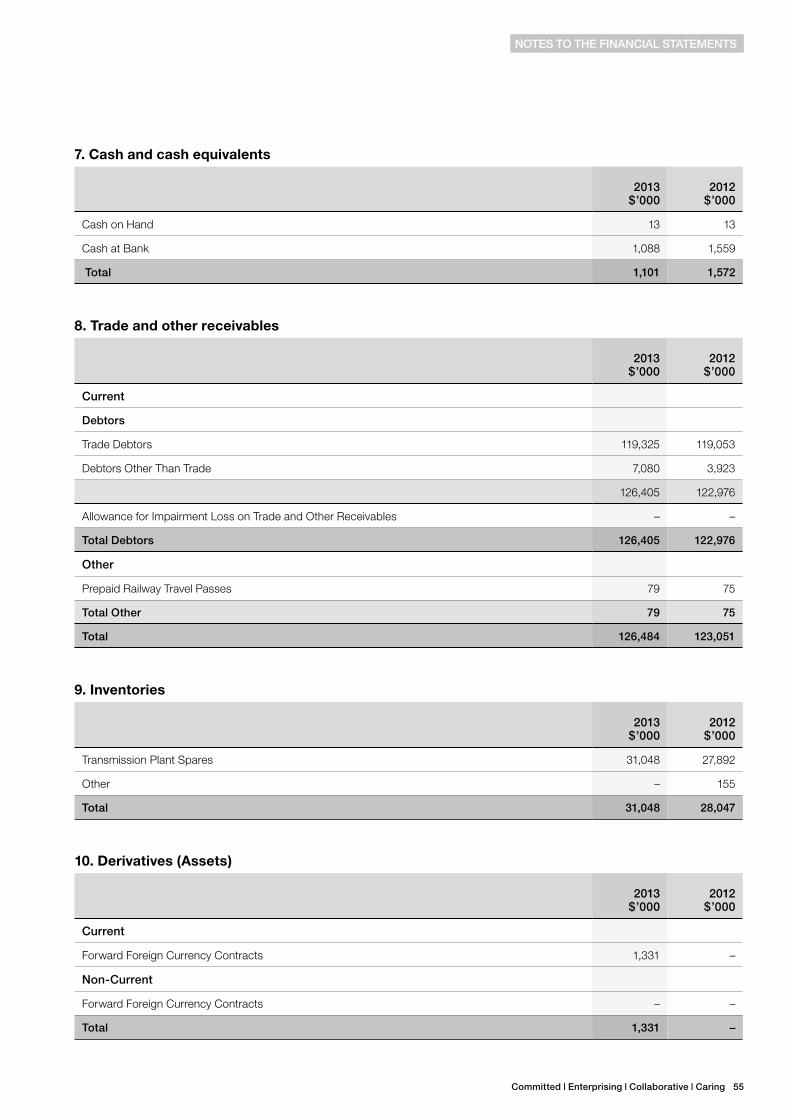
Committed | Enterprising | Collaborative | Caring 55
7. Cash and cash equivalents
2013 $’000
2012 $’000
Cash on Hand 13 13
Cash at Bank 1,088 1,559
Total 1,101 1,572
8. Trade and other receivables
2013 $’000
2012 $’000
Current
Debtors
Trade Debtors 119,325 119,053
Debtors Other Than Trade 7,080 3,923
126,405 122,976
Allowance for Impairment Loss on Trade and Other Receivables – –
Total Debtors 126,405 122,976
other
Prepaid Railway Travel Passes 79 75
Total other 79 75
Total 126,484 123,051
9. Inventories
2013 $’000
2012 $’000
Transmission Plant Spares 31,048 27,892
Other – 155
Total 31,048 28,047
10. Derivatives (Assets)
2013 $’000
2012 $’000
Current
Forward Foreign Currency Contracts 1,331 –
Non-Current
Forward Foreign Currency Contracts – –
Total 1,331 –
NoTES To THE fINANCIAL STATEMENTS
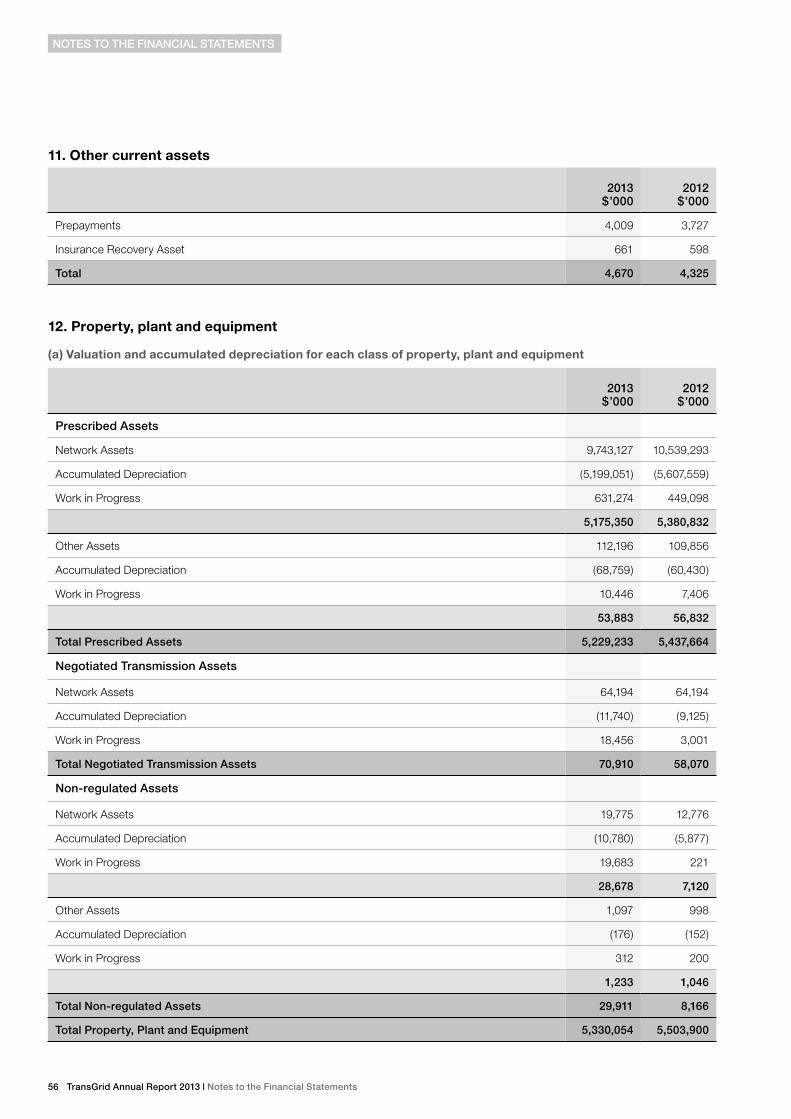
56 TransGrid Annual Report 2013 | Notes to the financial Statements
11. Other current assets
2013 $’000
2012 $’000
Prepayments 4,009 3,727
Insurance Recovery Asset 661 598
Total 4,670 4,325
12. Property, plant and equipment
(a) Valuation and accumulated depreciation for each class of property, plant and equipment
2013 $’000
2012 $’000
Prescribed Assets
Network Assets 9,743,127 10,539,293
Accumulated Depreciation (5,199,051) (5,607,559)
Work in Progress 631,274 449,098
5,175,350 5,380,832
Other Assets 112,196 109,856
Accumulated Depreciation (68,759) (60,430)
Work in Progress 10,446 7,406
53,883 56,832
Total Prescribed Assets 5,229,233 5,437,664
Negotiated Transmission Assets
Network Assets 64,194 64,194
Accumulated Depreciation (11,740) (9,125)
Work in Progress 18,456 3,001
Total Negotiated Transmission Assets 70,910 58,070
Non-regulated Assets
Network Assets 19,775 12,776
Accumulated Depreciation (10,780) (5,877)
Work in Progress 19,683 221
28,678 7,120
Other Assets 1,097 998
Accumulated Depreciation (176) (152)
Work in Progress 312 200
1,233 1,046
Total Non-regulated Assets 29,911 8,166
Total Property, Plant and Equipment 5,330,054 5,503,900
NoTES To THE fINANCIAL STATEMENTS
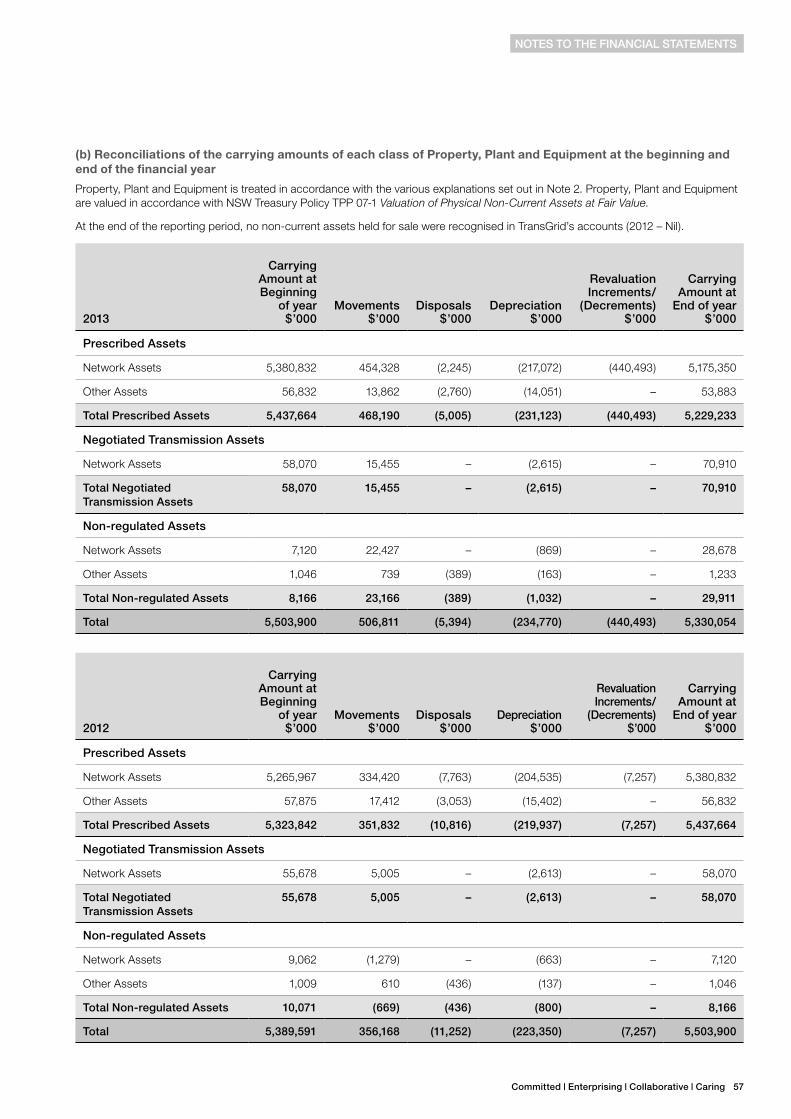
Committed | Enterprising | Collaborative | Caring 57
(b) Reconciliations of the carrying amounts of each class of Property, Plant and Equipment at the beginning and end of the financial year
Property, Plant and Equipment is treated in accordance with the various explanations set out in Note 2. Property, Plant and Equipment are valued in accordance with NSW Treasury Policy TPP 07-1 Valuation of Physical Non-Current Assets at Fair Value.
At the end of the reporting period, no non-current assets held for sale were recognised in TransGrid’s accounts (2012 – Nil).
2013
Carrying Amount at Beginning
of year $’000
Movements $’000
Disposals $’000
Depreciation $’000
Revaluation Increments/
(Decrements) $’000
Carrying Amount at
End of year $’000
Prescribed Assets
Network Assets 5,380,832 454,328 (2,245) (217,072) (440,493) 5,175,350
Other Assets 56,832 13,862 (2,760) (14,051) – 53,883
Total Prescribed Assets 5,437,664 468,190 (5,005) (231,123) (440,493) 5,229,233
Negotiated Transmission Assets
Network Assets 58,070 15,455 – (2,615) – 70,910
Total Negotiated Transmission Assets
58,070 15,455 – (2,615) – 70,910
Non-regulated Assets
Network Assets 7,120 22,427 – (869) – 28,678
Other Assets 1,046 739 (389) (163) – 1,233
Total Non-regulated Assets 8,166 23,166 (389) (1,032) – 29,911
Total 5,503,900 506,811 (5,394) (234,770) (440,493) 5,330,054
2012
Carrying Amount at Beginning
of year $’000
Movements $’000
Disposals $’000
Depreciation $’000
Revaluation Increments/
(Decrements) $’000
Carrying Amount at
End of year $’000
Prescribed Assets
Network Assets 5,265,967 334,420 (7,763) (204,535) (7,257) 5,380,832
Other Assets 57,875 17,412 (3,053) (15,402) – 56,832
Total Prescribed Assets 5,323,842 351,832 (10,816) (219,937) (7,257) 5,437,664
Negotiated Transmission Assets
Network Assets 55,678 5,005 – (2,613) – 58,070
Total Negotiated Transmission Assets
55,678 5,005 – (2,613) – 58,070
Non-regulated Assets
Network Assets 9,062 (1,279) – (663) – 7,120
Other Assets 1,009 610 (436) (137) – 1,046
Total Non-regulated Assets 10,071 (669) (436) (800) – 8,166
Total 5,389,591 356,168 (11,252) (223,350) (7,257) 5,503,900
NoTES To THE fINANCIAL STATEMENTS
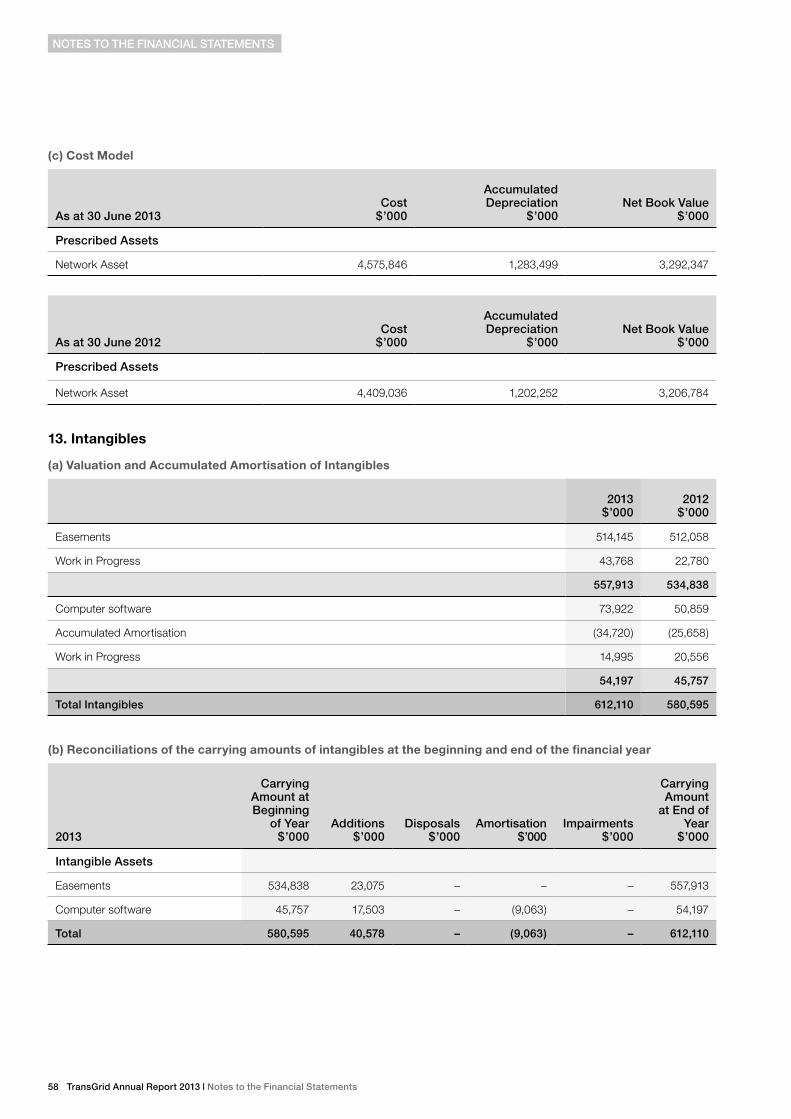
58 TransGrid Annual Report 2013 | Notes to the financial Statements
(c) Cost Model
As at 30 June 2013Cost
$’000
Accumulated Depreciation
$’000Net Book value
$’000
Prescribed Assets
Network Asset 4,575,846 1,283,499 3,292,347
As at 30 June 2012Cost
$’000
Accumulated Depreciation
$’000Net Book value
$’000
Prescribed Assets
Network Asset 4,409,036 1,202,252 3,206,784
13. Intangibles
(a) Valuation and Accumulated Amortisation of Intangibles
2013 $’000
2012 $’000
Easements 514,145 512,058
Work in Progress 43,768 22,780
557,913 534,838
Computer software 73,922 50,859
Accumulated Amortisation (34,720) (25,658)
Work in Progress 14,995 20,556
54,197 45,757
Total Intangibles 612,110 580,595
(b) Reconciliations of the carrying amounts of intangibles at the beginning and end of the financial year
2013
Carrying Amount at Beginning
of year $’000
Additions $’000
Disposals $’000
Amortisation $’000
Impairments $’000
Carrying Amount
at End of year
$’000
Intangible Assets
Easements 534,838 23,075 – – – 557,913
Computer software 45,757 17,503 – (9,063) – 54,197
Total 580,595 40,578 – (9,063) – 612,110
NoTES To THE fINANCIAL STATEMENTS
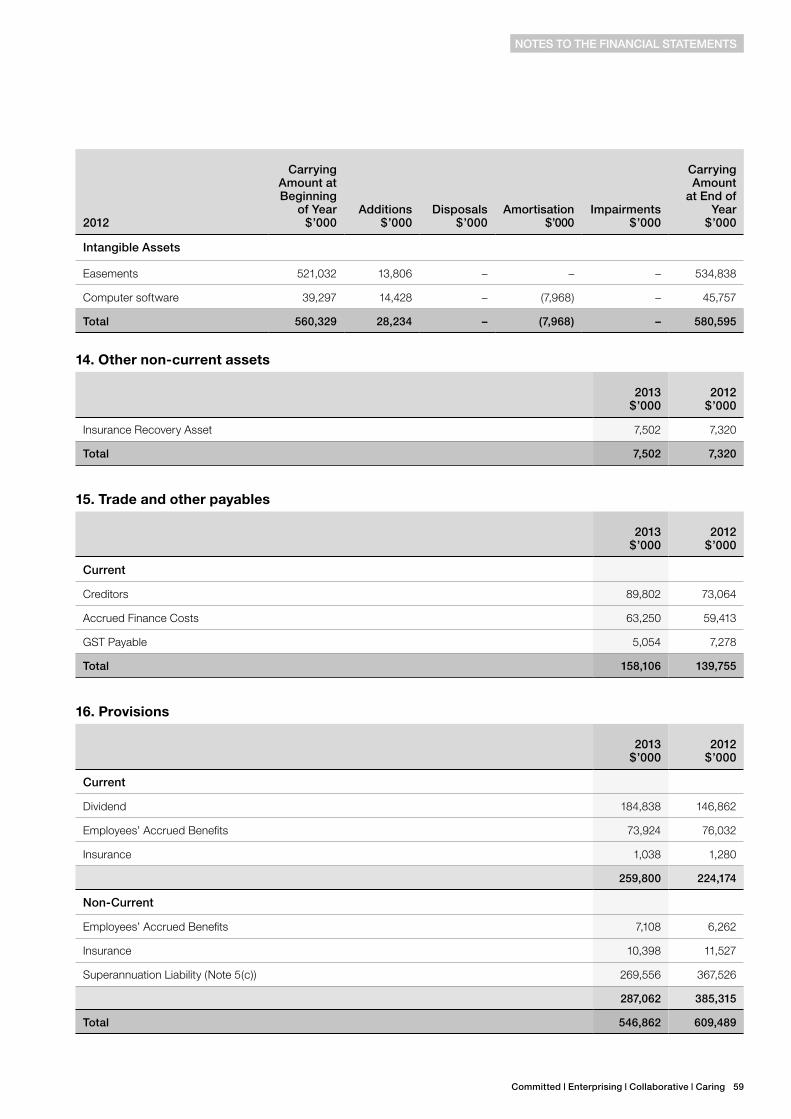
Committed | Enterprising | Collaborative | Caring 59
2012
Carrying Amount at Beginning
of year $’000
Additions $’000
Disposals $’000
Amortisation $’000
Impairments $’000
Carrying Amount
at End of year
$’000
Intangible Assets
Easements 521,032 13,806 – – – 534,838
Computer software 39,297 14,428 – (7,968) – 45,757
Total 560,329 28,234 – (7,968) – 580,595
14. Other non-current assets
2013 $’000
2012 $’000
Insurance Recovery Asset 7,502 7,320
Total 7,502 7,320
15. Trade and other payables
2013 $’000
2012 $’000
Current
Creditors 89,802 73,064
Accrued Finance Costs 63,250 59,413
GST Payable 5,054 7,278
Total 158,106 139,755
16. Provisions
2013 $’000
2012 $’000
Current
Dividend 184,838 146,862
Employees’ Accrued Benefits 73,924 76,032
Insurance 1,038 1,280
259,800 224,174
Non-Current
Employees’ Accrued Benefits 7,108 6,262
Insurance 10,398 11,527
Superannuation Liability (Note 5(c)) 269,556 367,526
287,062 385,315
Total 546,862 609,489
NoTES To THE fINANCIAL STATEMENTS
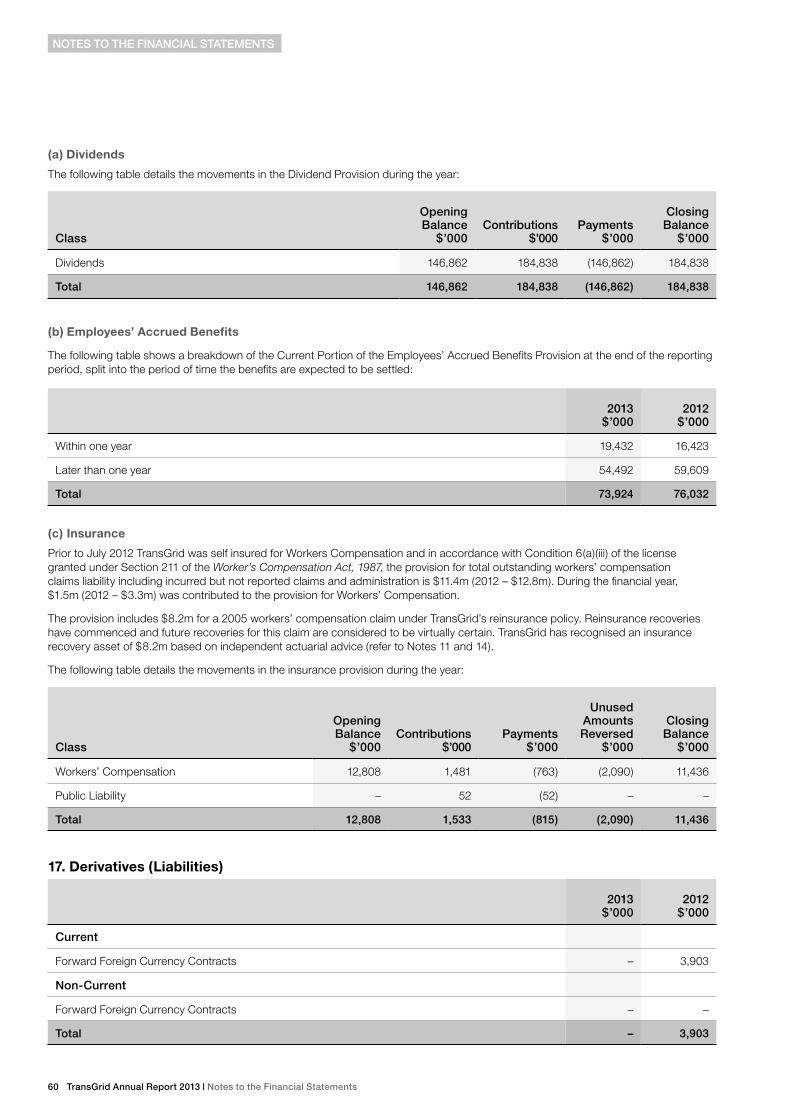
60 TransGrid Annual Report 2013 | Notes to the financial Statements
(a) Dividends
The following table details the movements in the Dividend Provision during the year:
Class
opening Balance
$’000Contributions
$’000Payments
$’000
Closing Balance
$’000
Dividends 146,862 184,838 (146,862) 184,838
Total 146,862 184,838 (146,862) 184,838
(b) Employees’ Accrued Benefits
The following table shows a breakdown of the Current Portion of the Employees’ Accrued Benefits Provision at the end of the reporting period, split into the period of time the benefits are expected to be settled:
2013 $’000
2012 $’000
Within one year 19,432 16,423
Later than one year 54,492 59,609
Total 73,924 76,032
(c) Insurance
Prior to July 2012 TransGrid was self insured for Workers Compensation and in accordance with Condition 6(a)(iii) of the license granted under Section 211 of the Worker’s Compensation Act, 1987, the provision for total outstanding workers’ compensation claims liability including incurred but not reported claims and administration is $11.4m (2012 – $12.8m). During the financial year, $1.5m (2012 – $3.3m) was contributed to the provision for Workers’ Compensation.
The provision includes $8.2m for a 2005 workers’ compensation claim under TransGrid’s reinsurance policy. Reinsurance recoveries have commenced and future recoveries for this claim are considered to be virtually certain. TransGrid has recognised an insurance recovery asset of $8.2m based on independent actuarial advice (refer to Notes 11 and 14).
The following table details the movements in the insurance provision during the year:
Class
opening Balance
$’000Contributions
$’000Payments
$’000
unused Amounts Reversed
$’000
Closing Balance
$’000
Workers’ Compensation 12,808 1,481 (763) (2,090) 11,436
Public Liability – 52 (52) – –
Total 12,808 1,533 (815) (2,090) 11,436
17. Derivatives (Liabilities)
2013 $’000
2012 $’000
Current
Forward Foreign Currency Contracts – 3,903
Non-Current
Forward Foreign Currency Contracts – –
Total – 3,903
NoTES To THE fINANCIAL STATEMENTS
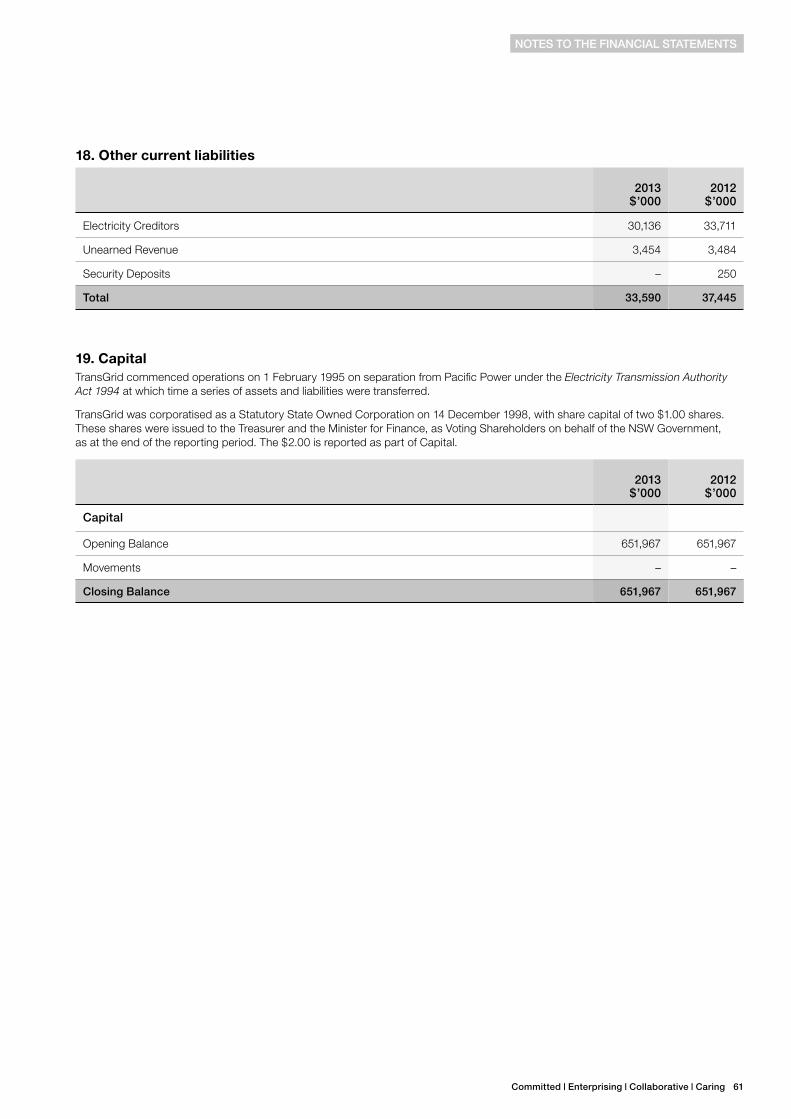
Committed | Enterprising | Collaborative | Caring 61
18. Other current liabilities
2013 $’000
2012 $’000
Electricity Creditors 30,136 33,711
Unearned Revenue 3,454 3,484
Security Deposits – 250
Total 33,590 37,445
19. Capital TransGrid commenced operations on 1 February 1995 on separation from Pacific Power under the Electricity Transmission Authority Act 1994 at which time a series of assets and liabilities were transferred.
TransGrid was corporatised as a Statutory State Owned Corporation on 14 December 1998, with share capital of two $1.00 shares. These shares were issued to the Treasurer and the Minister for Finance, as Voting Shareholders on behalf of the NSW Government, as at the end of the reporting period. The $2.00 is reported as part of Capital.
2013 $’000
2012 $’000
Capital
Opening Balance 651,967 651,967
Movements – –
Closing Balance 651,967 651,967
NoTES To THE fINANCIAL STATEMENTS
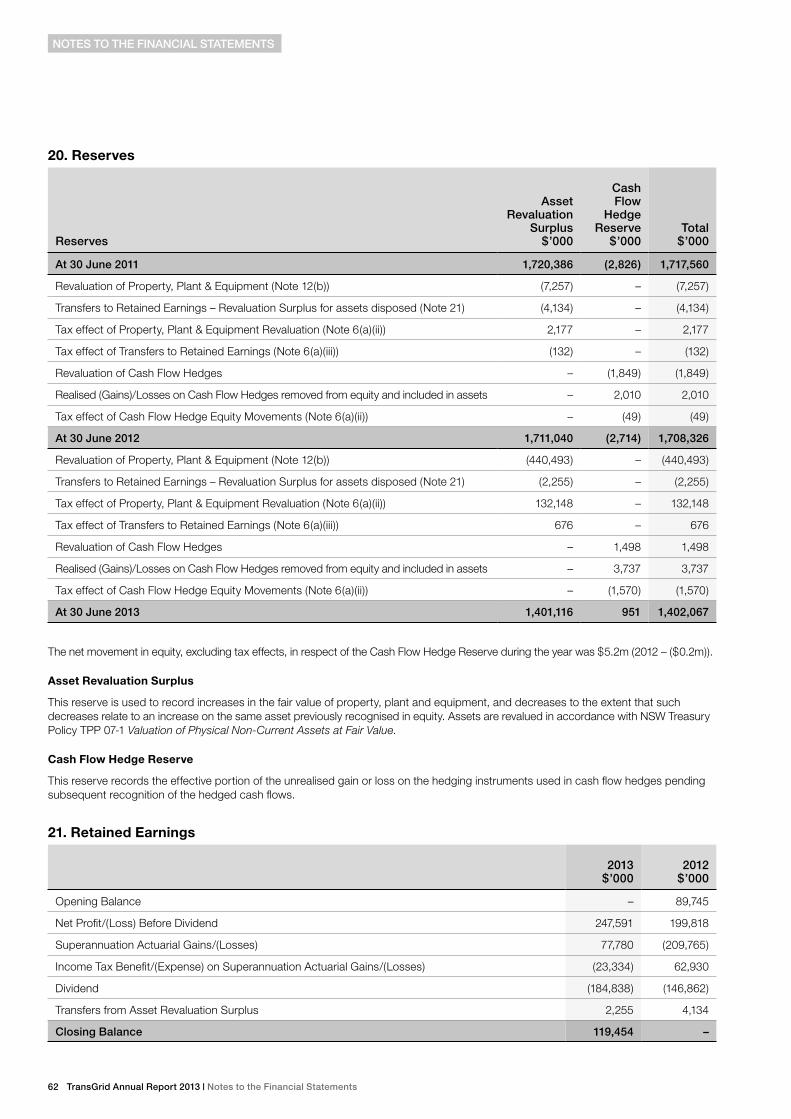
62 TransGrid Annual Report 2013 | Notes to the financial Statements
20. Reserves
Reserves
Asset Revaluation
Surplus $’000
Cash flow
Hedge Reserve
$’000Total
$’000
At 30 June 2011 1,720,386 (2,826) 1,717,560
Revaluation of Property, Plant & Equipment (Note 12(b)) (7,257) – (7,257)
Transfers to Retained Earnings – Revaluation Surplus for assets disposed (Note 21) (4,134) – (4,134)
Tax effect of Property, Plant & Equipment Revaluation (Note 6(a)(ii)) 2,177 – 2,177
Tax effect of Transfers to Retained Earnings (Note 6(a)(iii)) (132) – (132)
Revaluation of Cash Flow Hedges – (1,849) (1,849)
Realised (Gains)/Losses on Cash Flow Hedges removed from equity and included in assets – 2,010 2,010
Tax effect of Cash Flow Hedge Equity Movements (Note 6(a)(ii)) – (49) (49)
At 30 June 2012 1,711,040 (2,714) 1,708,326
Revaluation of Property, Plant & Equipment (Note 12(b)) (440,493) – (440,493)
Transfers to Retained Earnings – Revaluation Surplus for assets disposed (Note 21) (2,255) – (2,255)
Tax effect of Property, Plant & Equipment Revaluation (Note 6(a)(ii)) 132,148 – 132,148
Tax effect of Transfers to Retained Earnings (Note 6(a)(iii)) 676 – 676
Revaluation of Cash Flow Hedges – 1,498 1,498
Realised (Gains)/Losses on Cash Flow Hedges removed from equity and included in assets – 3,737 3,737
Tax effect of Cash Flow Hedge Equity Movements (Note 6(a)(ii)) – (1,570) (1,570)
At 30 June 2013 1,401,116 951 1,402,067
The net movement in equity, excluding tax effects, in respect of the Cash Flow Hedge Reserve during the year was $5.2m (2012 – ($0.2m)).
Asset Revaluation Surplus
This reserve is used to record increases in the fair value of property, plant and equipment, and decreases to the extent that such decreases relate to an increase on the same asset previously recognised in equity. Assets are revalued in accordance with NSW Treasury Policy TPP 07-1 Valuation of Physical Non-Current Assets at Fair Value.
Cash Flow Hedge Reserve
This reserve records the effective portion of the unrealised gain or loss on the hedging instruments used in cash flow hedges pending subsequent recognition of the hedged cash flows.
21. Retained Earnings
2013 $’000
2012 $’000
Opening Balance – 89,745
Net Profit/(Loss) Before Dividend 247,591 199,818
Superannuation Actuarial Gains/(Losses) 77,780 (209,765)
Income Tax Benefit/(Expense) on Superannuation Actuarial Gains/(Losses) (23,334) 62,930
Dividend (184,838) (146,862)
Transfers from Asset Revaluation Surplus 2,255 4,134
Closing Balance 119,454 –
NoTES To THE fINANCIAL STATEMENTS
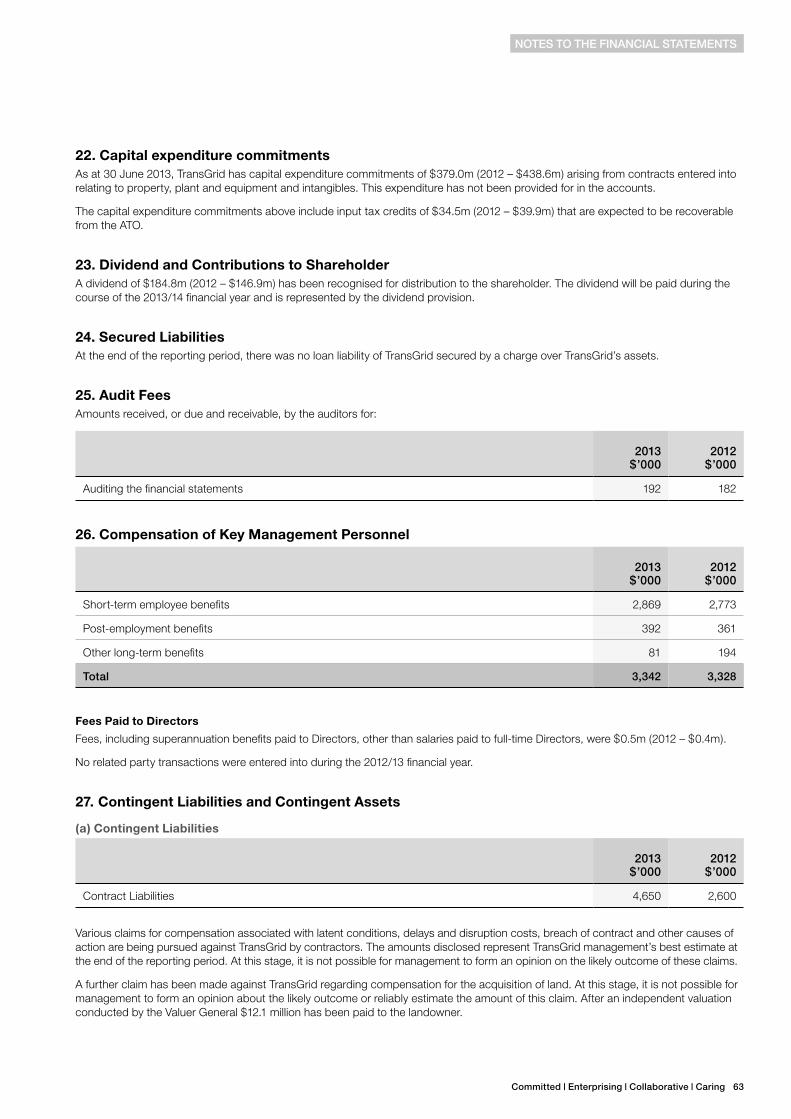
Committed | Enterprising | Collaborative | Caring 63
22. Capital expenditure commitments As at 30 June 2013, TransGrid has capital expenditure commitments of $379.0m (2012 – $438.6m) arising from contracts entered into relating to property, plant and equipment and intangibles. This expenditure has not been provided for in the accounts.
The capital expenditure commitments above include input tax credits of $34.5m (2012 – $39.9m) that are expected to be recoverable from the ATO.
23. Dividend and Contributions to ShareholderA dividend of $184.8m (2012 – $146.9m) has been recognised for distribution to the shareholder. The dividend will be paid during the course of the 2013/14 financial year and is represented by the dividend provision.
24. Secured LiabilitiesAt the end of the reporting period, there was no loan liability of TransGrid secured by a charge over TransGrid’s assets.
25. Audit FeesAmounts received, or due and receivable, by the auditors for:
2013 $’000
2012 $’000
Auditing the financial statements 192 182
26. Compensation of Key Management Personnel
2013 $’000
2012 $’000
Short-term employee benefits 2,869 2,773
Post-employment benefits 392 361
Other long-term benefits 81 194
Total 3,342 3,328
Fees Paid to Directors
Fees, including superannuation benefits paid to Directors, other than salaries paid to full-time Directors, were $0.5m (2012 – $0.4m).
No related party transactions were entered into during the 2012/13 financial year.
27. Contingent Liabilities and Contingent Assets
(a) Contingent Liabilities
2013 $’000
2012 $’000
Contract Liabilities 4,650 2,600
Various claims for compensation associated with latent conditions, delays and disruption costs, breach of contract and other causes of action are being pursued against TransGrid by contractors. The amounts disclosed represent TransGrid management’s best estimate at the end of the reporting period. At this stage, it is not possible for management to form an opinion on the likely outcome of these claims.
A further claim has been made against TransGrid regarding compensation for the acquisition of land. At this stage, it is not possible for management to form an opinion about the likely outcome or reliably estimate the amount of this claim. After an independent valuation conducted by the Valuer General $12.1 million has been paid to the landowner.
NoTES To THE fINANCIAL STATEMENTS
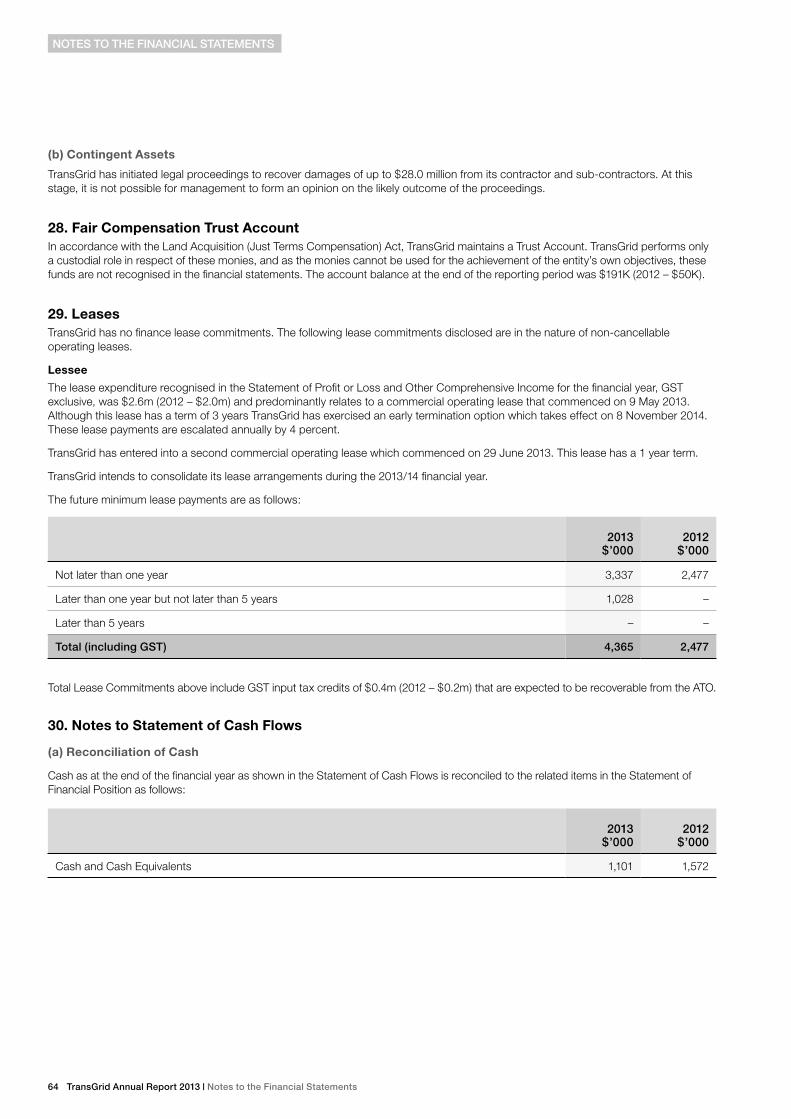
64 TransGrid Annual Report 2013 | Notes to the financial Statements
(b) Contingent Assets
TransGrid has initiated legal proceedings to recover damages of up to $28.0 million from its contractor and sub-contractors. At this stage, it is not possible for management to form an opinion on the likely outcome of the proceedings.
28. Fair Compensation Trust AccountIn accordance with the Land Acquisition (Just Terms Compensation) Act, TransGrid maintains a Trust Account. TransGrid performs only a custodial role in respect of these monies, and as the monies cannot be used for the achievement of the entity’s own objectives, these funds are not recognised in the financial statements. The account balance at the end of the reporting period was $191K (2012 – $50K).
29. Leases TransGrid has no finance lease commitments. The following lease commitments disclosed are in the nature of non-cancellable operating leases.
Lessee
The lease expenditure recognised in the Statement of Profit or Loss and Other Comprehensive Income for the financial year, GST exclusive, was $2.6m (2012 – $2.0m) and predominantly relates to a commercial operating lease that commenced on 9 May 2013. Although this lease has a term of 3 years TransGrid has exercised an early termination option which takes effect on 8 November 2014. These lease payments are escalated annually by 4 percent.
TransGrid has entered into a second commercial operating lease which commenced on 29 June 2013. This lease has a 1 year term.
TransGrid intends to consolidate its lease arrangements during the 2013/14 financial year.
The future minimum lease payments are as follows:
2013 $’000
2012 $’000
Not later than one year 3,337 2,477
Later than one year but not later than 5 years 1,028 –
Later than 5 years – –
Total (including GST) 4,365 2,477
Total Lease Commitments above include GST input tax credits of $0.4m (2012 – $0.2m) that are expected to be recoverable from the ATO.
30. Notes to Statement of Cash Flows
(a) Reconciliation of Cash
Cash as at the end of the financial year as shown in the Statement of Cash Flows is reconciled to the related items in the Statement of Financial Position as follows:
2013 $’000
2012 $’000
Cash and Cash Equivalents 1,101 1,572
NoTES To THE fINANCIAL STATEMENTS
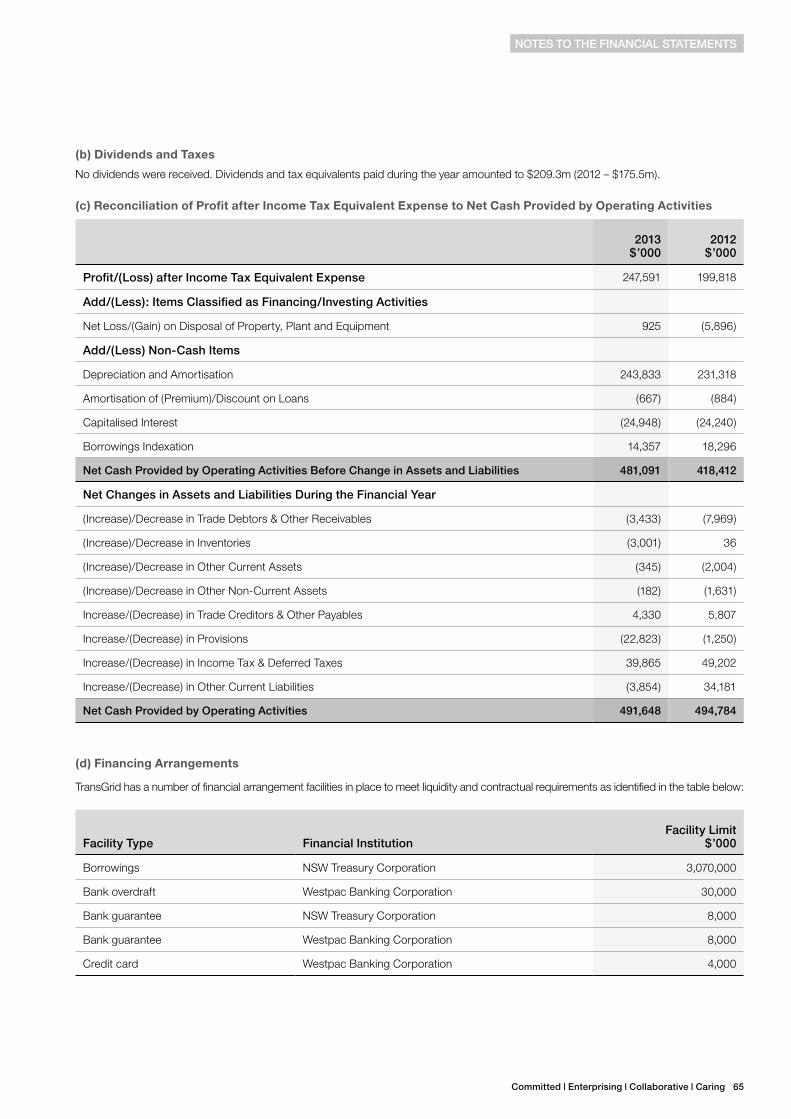
Committed | Enterprising | Collaborative | Caring 65
(b) Dividends and Taxes
No dividends were received. Dividends and tax equivalents paid during the year amounted to $209.3m (2012 – $175.5m).
(c) Reconciliation of Profit after Income Tax Equivalent Expense to Net Cash Provided by Operating Activities
2013 $’000
2012 $’000
Profit/(Loss) after Income Tax Equivalent Expense 247,591 199,818
Add/(Less): Items Classified as financing/Investing Activities
Net Loss/(Gain) on Disposal of Property, Plant and Equipment 925 (5,896)
Add/(Less) Non-Cash Items
Depreciation and Amortisation 243,833 231,318
Amortisation of (Premium)/Discount on Loans (667) (884)
Capitalised Interest (24,948) (24,240)
Borrowings Indexation 14,357 18,296
Net Cash Provided by operating Activities Before Change in Assets and Liabilities 481,091 418,412
Net Changes in Assets and Liabilities During the financial year
(Increase)/Decrease in Trade Debtors & Other Receivables (3,433) (7,969)
(Increase)/Decrease in Inventories (3,001) 36
(Increase)/Decrease in Other Current Assets (345) (2,004)
(Increase)/Decrease in Other Non-Current Assets (182) (1,631)
Increase/(Decrease) in Trade Creditors & Other Payables 4,330 5,807
Increase/(Decrease) in Provisions (22,823) (1,250)
Increase/(Decrease) in Income Tax & Deferred Taxes 39,865 49,202
Increase/(Decrease) in Other Current Liabilities (3,854) 34,181
Net Cash Provided by operating Activities 491,648 494,784
(d) Financing Arrangements
TransGrid has a number of financial arrangement facilities in place to meet liquidity and contractual requirements as identified in the table below:
facility Type financial Institutionfacility Limit
$’000
Borrowings NSW Treasury Corporation 3,070,000
Bank overdraft Westpac Banking Corporation 30,000
Bank guarantee NSW Treasury Corporation 8,000
Bank guarantee Westpac Banking Corporation 8,000
Credit card Westpac Banking Corporation 4,000
NoTES To THE fINANCIAL STATEMENTS
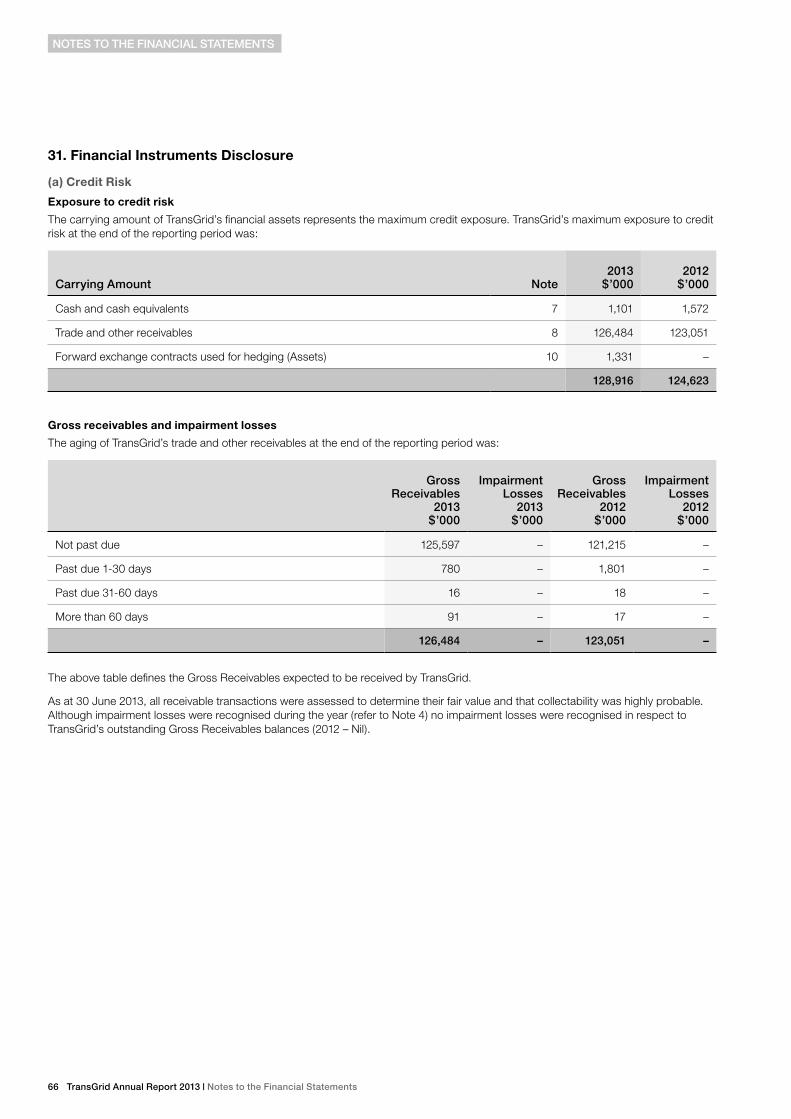
66 TransGrid Annual Report 2013 | Notes to the financial Statements
31. Financial Instruments Disclosure
(a) Credit Risk
Exposure to credit risk
The carrying amount of TransGrid’s financial assets represents the maximum credit exposure. TransGrid’s maximum exposure to credit risk at the end of the reporting period was:
Carrying Amount
Note2013
$’000 2012
$’000
Cash and cash equivalents 7 1,101 1,572
Trade and other receivables 8 126,484 123,051
Forward exchange contracts used for hedging (Assets) 10 1,331 –
128,916 124,623
Gross receivables and impairment losses
The aging of TransGrid’s trade and other receivables at the end of the reporting period was:
Gross Receivables
2013 $’000
Impairment Losses
2013 $’000
Gross Receivables
2012 $’000
Impairment Losses
2012 $’000
Not past due 125,597 – 121,215 –
Past due 1-30 days 780 – 1,801 –
Past due 31-60 days 16 – 18 –
More than 60 days 91 – 17 –
126,484 – 123,051 –
The above table defines the Gross Receivables expected to be received by TransGrid.
As at 30 June 2013, all receivable transactions were assessed to determine their fair value and that collectability was highly probable. Although impairment losses were recognised during the year (refer to Note 4) no impairment losses were recognised in respect to TransGrid’s outstanding Gross Receivables balances (2012 – Nil).
NoTES To THE fINANCIAL STATEMENTS
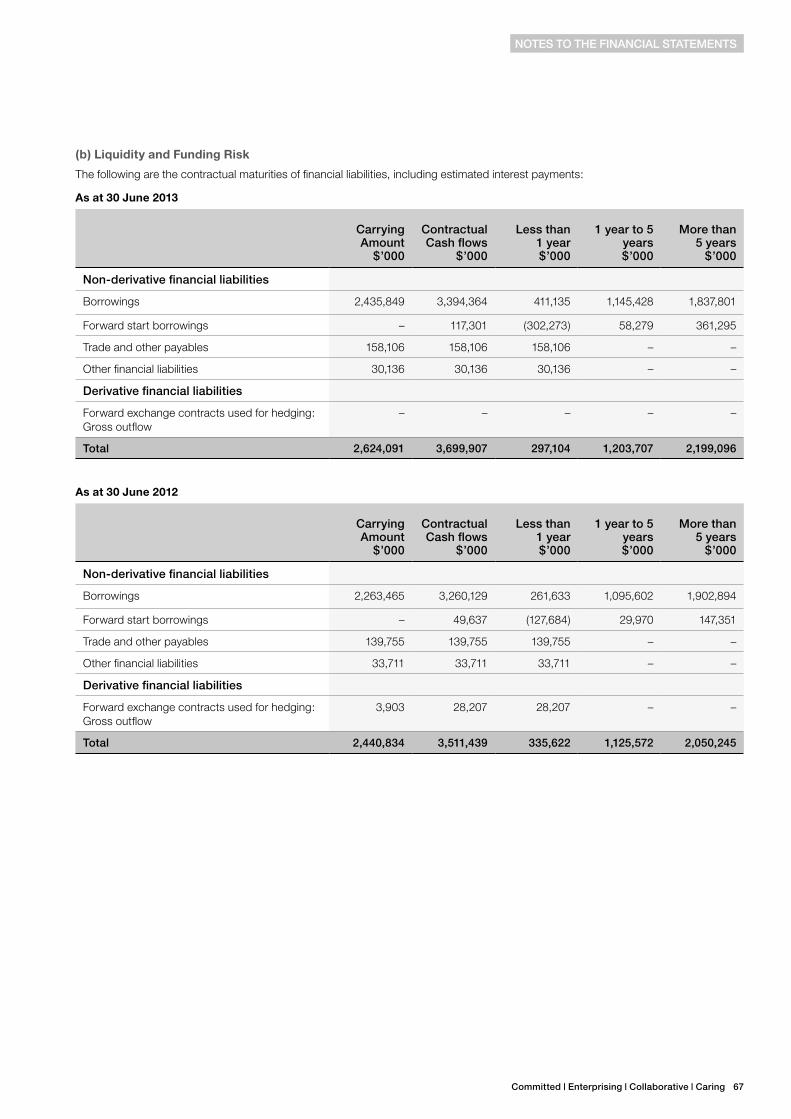
Committed | Enterprising | Collaborative | Caring 67
(b) Liquidity and Funding Risk
The following are the contractual maturities of financial liabilities, including estimated interest payments:
As at 30 June 2013
Carrying Amount
$’000
Contractual Cash flows
$’000
Less than 1 year $’000
1 year to 5 years $’000
More than 5 years
$’000
Non-derivative financial liabilities
Borrowings 2,435,849 3,394,364 411,135 1,145,428 1,837,801
Forward start borrowings – 117,301 (302,273) 58,279 361,295
Trade and other payables 158,106 158,106 158,106 – –
Other financial liabilities 30,136 30,136 30,136 – –
Derivative financial liabilities
Forward exchange contracts used for hedging: Gross outflow
– – – – –
Total 2,624,091 3,699,907 297,104 1,203,707 2,199,096
As at 30 June 2012
Carrying Amount
$’000
Contractual Cash flows
$’000
Less than 1 year $’000
1 year to 5 years $’000
More than 5 years
$’000
Non-derivative financial liabilities
Borrowings 2,263,465 3,260,129 261,633 1,095,602 1,902,894
Forward start borrowings – 49,637 (127,684) 29,970 147,351
Trade and other payables 139,755 139,755 139,755 – –
Other financial liabilities 33,711 33,711 33,711 – –
Derivative financial liabilities
Forward exchange contracts used for hedging: Gross outflow
3,903 28,207 28,207 – –
Total 2,440,834 3,511,439 335,622 1,125,572 2,050,245
NoTES To THE fINANCIAL STATEMENTS
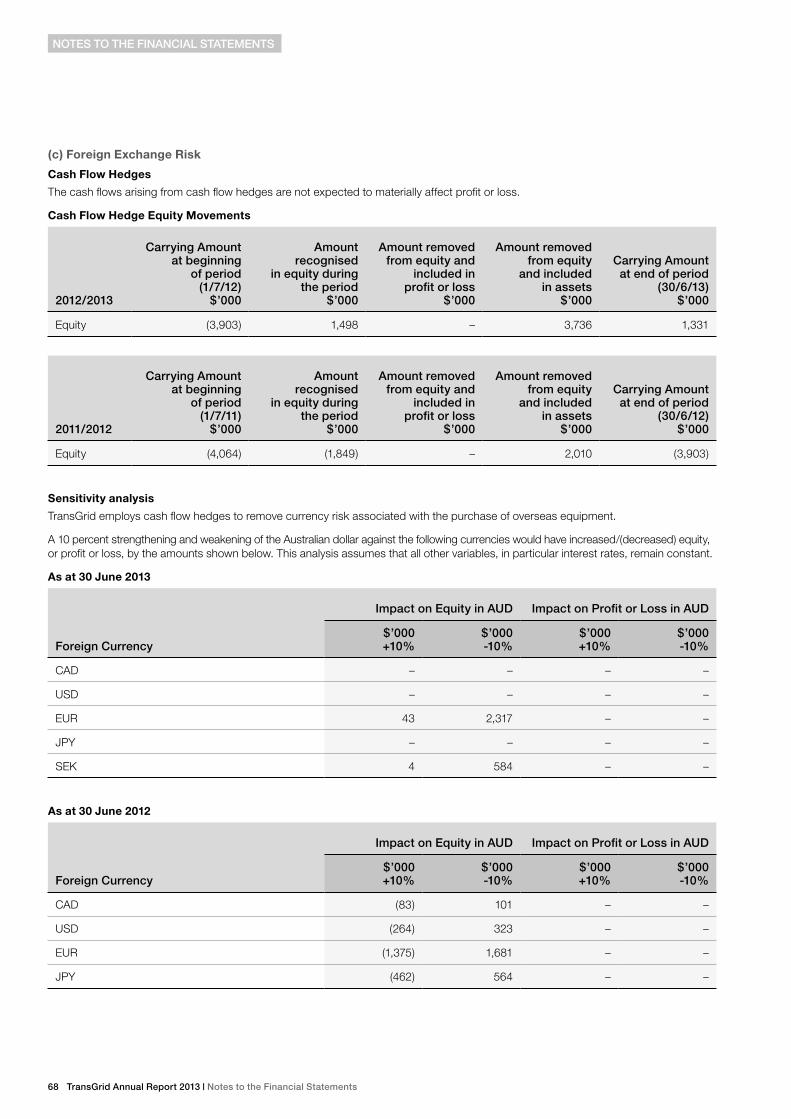
68 TransGrid Annual Report 2013 | Notes to the financial Statements
(c) Foreign Exchange Risk
Cash Flow Hedges
The cash flows arising from cash flow hedges are not expected to materially affect profit or loss.
Cash Flow Hedge Equity Movements
2012/2013
Carrying Amount at beginning
of period (1/7/12)
$’000
Amount recognised
in equity during the period
$’000
Amount removed from equity and
included in profit or loss
$’000
Amount removed from equity
and included in assets
$’000
Carrying Amount at end of period
(30/6/13) $’000
Equity (3,903) 1,498 – 3,736 1,331
2011/2012
Carrying Amount at beginning
of period (1/7/11)
$’000
Amount recognised
in equity during the period
$’000
Amount removed from equity and
included in profit or loss
$’000
Amount removed from equity
and included in assets
$’000
Carrying Amount at end of period
(30/6/12) $’000
Equity (4,064) (1,849) – 2,010 (3,903)
Sensitivity analysis
TransGrid employs cash flow hedges to remove currency risk associated with the purchase of overseas equipment.
A 10 percent strengthening and weakening of the Australian dollar against the following currencies would have increased/(decreased) equity, or profit or loss, by the amounts shown below. This analysis assumes that all other variables, in particular interest rates, remain constant.
As at 30 June 2013
foreign Currency
Impact on Equity in AuD Impact on Profit or Loss in AuD
$’000 +10%
$’000 -10%
$’000 +10%
$’000 -10%
CAD – – – –
USD – – – –
EUR 43 2,317 – –
JPY – – – –
SEK 4 584 – –
As at 30 June 2012
foreign Currency
Impact on Equity in AuD Impact on Profit or Loss in AuD
$’000 +10%
$’000 -10%
$’000 +10%
$’000 -10%
CAD (83) 101 – –
USD (264) 323 – –
EUR (1,375) 1,681 – –
JPY (462) 564 – –
NoTES To THE fINANCIAL STATEMENTS
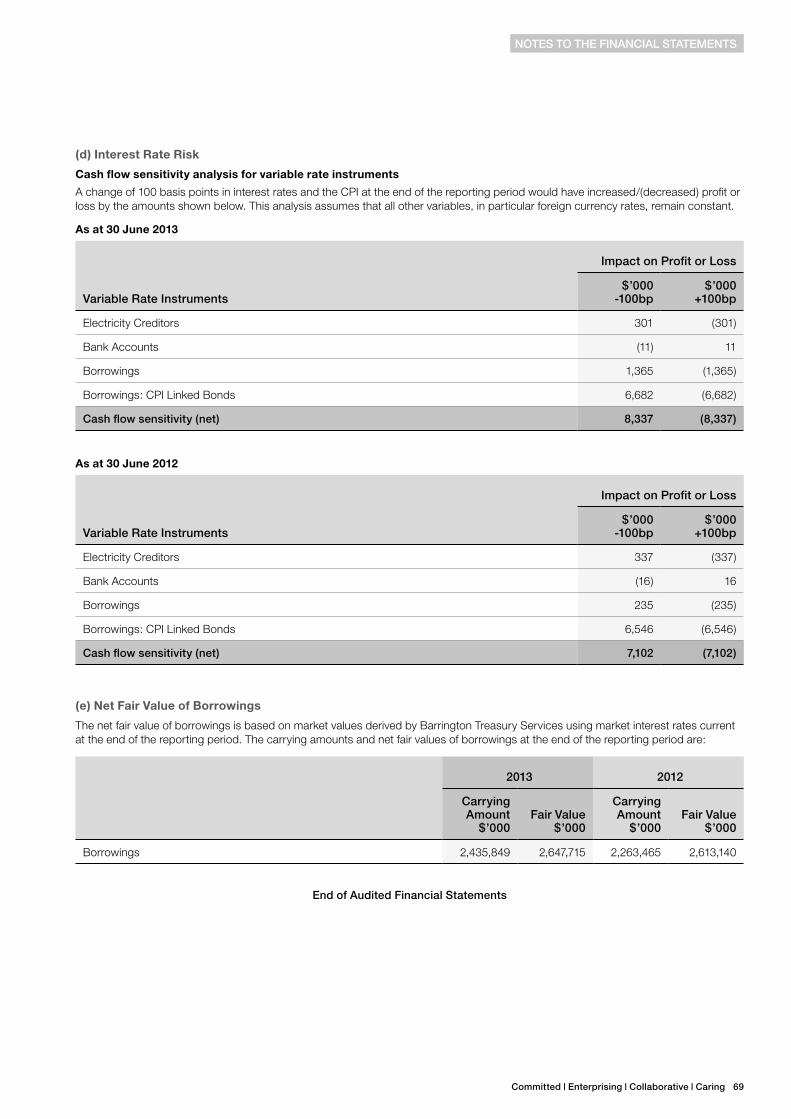
Committed | Enterprising | Collaborative | Caring 69
(d) Interest Rate Risk
Cash flow sensitivity analysis for variable rate instruments
A change of 100 basis points in interest rates and the CPI at the end of the reporting period would have increased/(decreased) profit or loss by the amounts shown below. This analysis assumes that all other variables, in particular foreign currency rates, remain constant.
As at 30 June 2013
variable Rate Instruments
Impact on Profit or Loss
$’000 -100bp
$’000 +100bp
Electricity Creditors 301 (301)
Bank Accounts (11) 11
Borrowings 1,365 (1,365)
Borrowings: CPI Linked Bonds 6,682 (6,682)
Cash flow sensitivity (net) 8,337 (8,337)
As at 30 June 2012
variable Rate Instruments
Impact on Profit or Loss
$’000 -100bp
$’000 +100bp
Electricity Creditors 337 (337)
Bank Accounts (16) 16
Borrowings 235 (235)
Borrowings: CPI Linked Bonds 6,546 (6,546)
Cash flow sensitivity (net) 7,102 (7,102)
(e) Net Fair Value of Borrowings
The net fair value of borrowings is based on market values derived by Barrington Treasury Services using market interest rates current at the end of the reporting period. The carrying amounts and net fair values of borrowings at the end of the reporting period are:
2013 2012
Carrying Amount
$’000fair value
$’000
Carrying Amount
$’000fair value
$’000
Borrowings 2,435,849 2,647,715 2,263,465 2,613,140
End of Audited financial Statements
NoTES To THE fINANCIAL STATEMENTS

70 TransGrid Annual Report 2013
Statement by members of the board
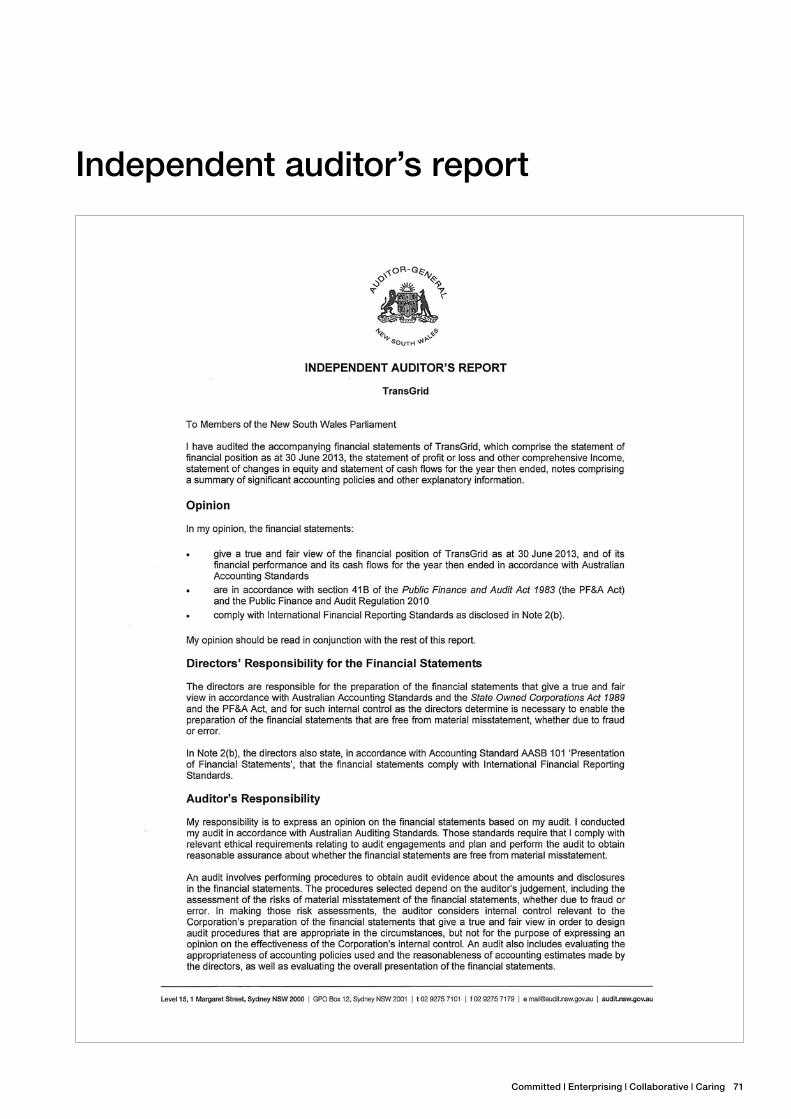
Committed | Enterprising | Collaborative | Caring 71
Independent auditor’s report

72 TransGrid Annual Report 2013
Independent auditor’s report (continued)
Committed | Enterprising | Collaborative | Caring 73
Index
BBoard of Directors: Committees 28
Board of Directors: Meetings 27
Board of Directors: Profiles 8
Building program 18
CCharter 35
Community 20
Consultant fees 35
Contact details Back cover
Contents 1
Corporate governance 26
Corporate Plan 2013/18 6
Corporate profile 2
Cost of Annual Report 35
Credit card usage 35
DDisability Action Plan 17
EEarnings before interest and tax ($Million) 12
Equal Employment Opportunity 16
Executive Leadership Team: Performance Statements 29
Executive Leadership Team: Executive Profiles 10
Executive Leadership Team: Qualifications 10
Executive Leadership Team: Remuneration 29
FFinancials 2011/12 38
GGlossary 74
Government Information and Public Access (GIPA) Act 2009 32
IIncome ($Million) 12
Independent Auditor’s Report 71
Index 73
Industrial relations 17
Insurance 31
Internet contact details Inside cover
JJudicial decisions 35
LLegislative changes 35
Letter to shareholders Inside cover
Lost-Time Injury Frequency Rate – Contractors 19
Lost-Time Injury Frequency Rate – Employees 19
MMaintenance achieved (%) 13
NNetwork availability (%) 13
Network map 3
Network reliability (System Minutes Lost) 13
Notes to the Financial Statements 42
OOverseas visits 37
PPrivacy 35
Profit before tax ($Million) 12
Promotion 25
RReporting exemptions 36
Return on equity (%) 38
Risk management 31
SShareholders 26
Sponsorship, donations and partnerships 21
Staff numbers 14
Statement by members of the Board 70
Statement of cash flows 41
Statement of changes in equity 40
Statement of Comprehensive Income 39
Statement of financial position 38
WWaste Reduction and Purchasing Policy (WRAPP) 19
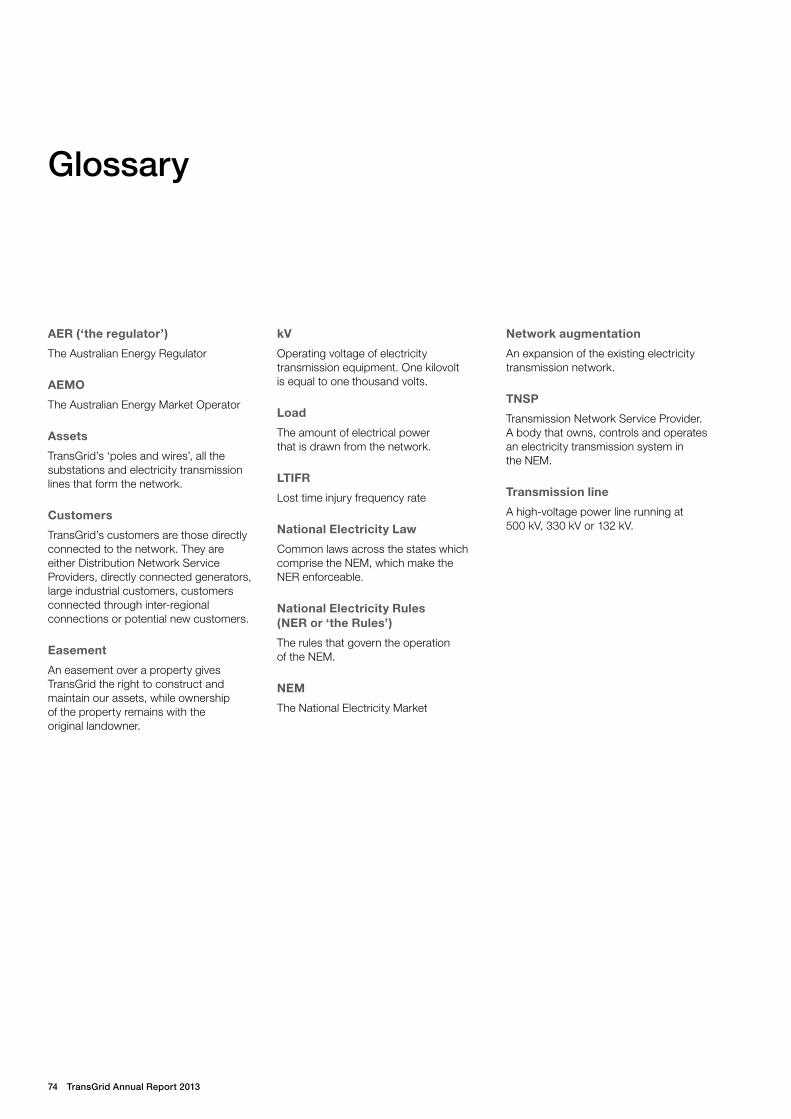
74 TransGrid Annual Report 2013
Glossary
AER (‘the regulator’)
The Australian Energy Regulator
AEMO
The Australian Energy Market Operator
Assets
TransGrid’s ‘poles and wires’, all the substations and electricity transmission lines that form the network.
Customers
TransGrid’s customers are those directly connected to the network. They are either Distribution Network Service Providers, directly connected generators, large industrial customers, customers connected through inter-regional connections or potential new customers.
Easement
An easement over a property gives TransGrid the right to construct and maintain our assets, while ownership of the property remains with the original landowner.
kV
Operating voltage of electricity transmission equipment. One kilovolt is equal to one thousand volts.
Load
The amount of electrical power that is drawn from the network.
LTIFR
Lost time injury frequency rate
National Electricity Law
Common laws across the states which comprise the NEM, which make the NER enforceable.
National Electricity Rules (NER or ‘the Rules’)
The rules that govern the operation of the NEM.
NEM
The National Electricity Market
Network augmentation
An expansion of the existing electricity transmission network.
TNSP
Transmission Network Service Provider. A body that owns, controls and operates an electricity transmission system in the NEM.
Transmission line
A high-voltage power line running at 500 kV, 330 kV or 132 kV.

Committed | Enterprising | Collaborative | Caring 75
Notes

76 TransGrid Annual Report 2013
Notes

TransGrid contact details
Sydney 201 Elizabeth Street PO Box A1000 Sydney South NSW 1235
Telephone +61 2 9284 3000 Facsimile +61 2 9284 3522
Business Hours 8:30am – 5:00pm
Western SydneyTelephone +61 2 9620 0777
orangeTelephone +61 2 6360 8711
NewcastleTelephone +61 2 4967 8678
TamworthTelephone +61 2 6765 1666
WaggaTelephone +61 2 6922 0222
yassTelephone +61 2 6226 966
TransGrid ABN: 19 622 755 774
@transgrid facebook.com/TransGrid