Embed Size (px)
Citation preview
Annual Report 2012

2FNB NAMIBIA GROUP Annual Report 2012
1FNB NAMIBIA GROUP Annual Report 2012
FNB by numbersfor the year ended 30 June 2012
ATM transactions
(number)
18.7 million
Total assets N$ 19.7 billion
OUTsurance policyholders
(number)
22 113
Internet banking
transactions (number)
14 millionInternet banking
transactions (value)
N$ 236 billion
Cellphone banking
transactions (number)
9 million
Total workforce
(number)
1 837
ATM transactions (value)
N$ 9 billion
Branches & agencies (number)
50
Speedpoint machines
(number)
1 567
ATMs (number)
177
Contents
FNB by numbers 1
Features of the group results 2
Board of directors 4
Group executive committee 8
Economic review 12
Chairman’s report 15
Abridged sustainability report 18
Chief executive officer’s report 25
Chief financial officer’s report 34
Ten year review 40
Glossary of terms 43
Annual financial statements 45
Corporate governance report 168
Risk report 180
Shareholders’ information 189
The preservation of biodiversity is not just a job for governments. International and non-governmental organisations, the private sector and each and every individual have a role to play in changing entrenched outlooks and ending destructive patterns of behaviour.
Kofi Annan, UN Secretary General on the 2003 International Day of Biological Diversity
FNB Namibia – our pride
FNB Namibia Holdings Limited is the oldest financial services group in the country and the largest locally listed company on the Namibian Stock Exchange with a market capitalisation of N$4 billion. The company is a subsidiary of FirstRand EMA Holdings Limited and its holdings company, FirstRand Limited, which is dual listed in South Africa and Namibia
FNB is proud of its continued business successes that create shareholder wealth by serving the whole Namibian community in an integrated way. This allows the group to reinvest in the development of the country. We are, however, conscious of the fact that our approach needs to be sustainable. This we do by keeping a long term view and by playing a leading role in growing the Namibian economy through proper financial and risk management processes, keeping our systems and business processes up to date, fairly rewarding, training and caring for our staff, paying taxes and being sensitive towards the impact our business operations may have on our environment.
We are particularly aware of the importance in maintaining the delicate balance in the Namibian environment. Our approach to business is to consider the impact of our actions on the environment – whether expanding our network or considering financing propositions. With this in mind, we have highlighted a diversity of Namibian landscapes in this annual report.
2FNB NAMIBIA GROUP Annual Report 2012
3FNB NAMIBIA GROUP Annual Report 2012
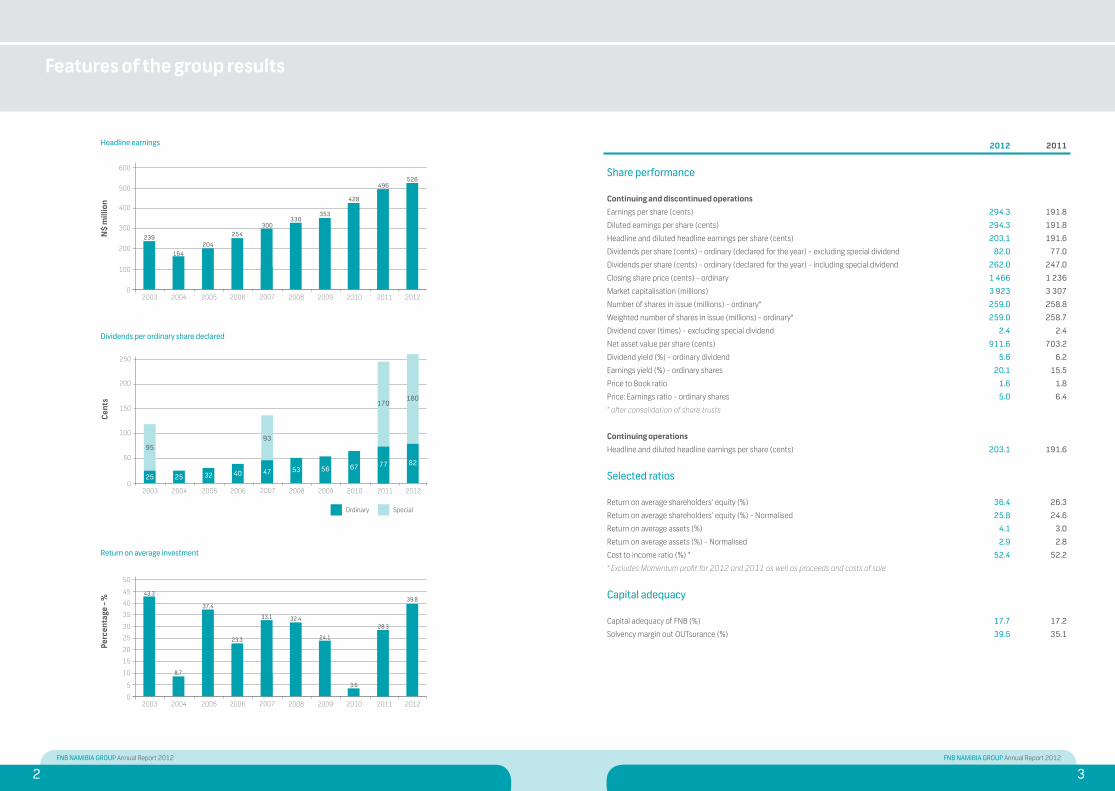
Headline earnings
0
100
200
300
500
600
2003 2004 2005 2006 2007 2008 2009 2010 2011 2012
239N$
mill
ion
400
164204
254300
330353
428
496526
Features of the group results
2012 2011
Share performance
Continuing and discontinued operations
Earnings per share (cents) 294.3 191.8
Diluted earnings per share (cents) 294.3 191.8
Headline and diluted headline earnings per share (cents) 203.1 191.6
Dividends per share (cents) - ordinary (declared for the year) - excluding special dividend 82.0 77.0
Dividends per share (cents) - ordinary (declared for the year) - including special dividend 262.0 247.0
Closing share price (cents) - ordinary 1 466 1 236
Market capitalisation (millions) 3 923 3 307
Number of shares in issue (millions) - ordinary* 259.0 258.8
Weighted number of shares in issue (millions) - ordinary* 259.0 258.7
Dividend cover (times) - excluding special dividend 2.4 2.4
Net asset value per share (cents) 911.6 703.2
Dividend yield (%) - ordinary dividend 5.6 6.2
Earnings yield (%) - ordinary shares 20.1 15.5
Price to Book ratio 1.6 1.8
Price: Earnings ratio - ordinary shares 5.0 6.4
* after consolidation of share trusts
Continuing operations
Headline and diluted headline earnings per share (cents) 203.1 191.6
Selected ratios
Return on average shareholders’ equity (%) 36.4 26.3
Return on average shareholders’ equity (%) - Normalised 25.8 24.6
Return on average assets (%) 4.1 3.0
Return on average assets (%) - Normalised 2.9 2.8
Cost to income ratio (%) * 52.4 52.2
* Excludes Momentum profit for 2012 and 2011 as well as proceeds and costs of sale
Capital adequacy
Capital adequacy of FNB (%) 17.7 17.2
Solvency margin out OUTsurance (%) 39.5 35.1
Dividends per ordinary share declared
0
50
100
150
200
250
2003 2004 2005 2006 2007 2008
93
2009 2010 2011 2012
170
95
180
25 25 32 40 47 53 56 67 77 82
Ordinary Special
Cent
s
Return on average investment
0
5
30
35
45
50
2003 2004 2005 2006 2007 2008 2009 2010 2011 2012
43.3
Perc
enta
ge -
% 40
8.7
37.4
23.3
33.1 32.4
24.1
3.6
28.3
39.8
10
15
25
20

4FNB NAMIBIA GROUP Annual Report 2012
5FNB NAMIBIA GROUP Annual Report 2012
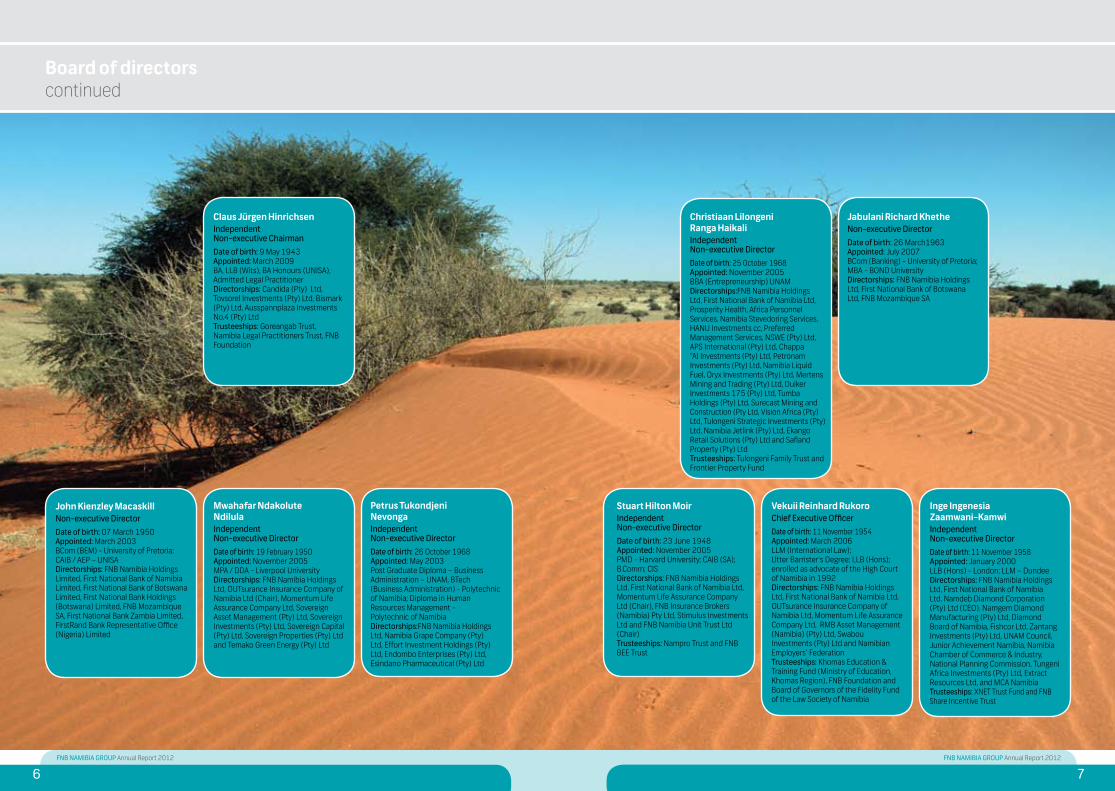
Board of directors
Christiaan Lilongeni Ranga Haikali
Jabulani Richard Khethe
John Kienzley Macaskill Mwahafar Ndakolute Ndilula Petrus Tukondjeni Nevonga Stuart Hilton Moir Vekuii Reinhard Rukoro Inge Ingenesia Zaamwani-Kamwi
Claus Jürgen Hinrichsen
6FNB NAMIBIA GROUP Annual Report 2012
7FNB NAMIBIA GROUP Annual Report 2012
Christiaan Lilongeni Ranga Haikali IndependentNon-executive DirectorDate of birth: 25 October 1968Appointed: November 2005BBA (Entrepreneurship) UNAM Directorships:FNB Namibia Holdings Ltd, First National Bank of Namibia Ltd, Prosperity Health, Africa Personnel Services, Namibia Stevedoring Services, HANU Investments cc, Preferred Management Services, NSWE (Pty) Ltd, APS International (Pty) Ltd, Chappa “AI Investments (Pty) Ltd, Petronam Investments (Pty) Ltd, Namibia Liquid Fuel, Oryx Investments (Pty) Ltd, Mertens Mining and Trading (Pty) Ltd, Duiker Investments 175 (Pty) Ltd, Tumba Holdings (Pty) Ltd, Surecast Mining and Construction (Pty Ltd, Vision Africa (Pty) Ltd, Tulongeni Strategic Investments (Pty) Ltd, Namibia Jetlink (Pty) Ltd, Ekango Retail Solutions (Pty) Ltd and Safland Property (Pty) LtdTrusteeships: Tulongeni Family Trust and Frontier Property Fund
Jabulani Richard KhetheNon-executive DirectorDate of birth: 26 March1963Appointed: July 2007BCom (Banking) - University of Pretoria; MBA - BOND UniversityDirectorships: FNB Namibia Holdings Ltd, First National Bank of Botswana Ltd, FNB Mozambique SA
Stuart Hilton MoirIndependentNon-executive DirectorDate of birth: 23 June 1948Appointed: November 2005PMD - Harvard University; CAIB (SA); B.Comm; CISDirectorships: FNB Namibia Holdings Ltd, First National Bank of Namibia Ltd, Momentum Life Assurance Company Ltd (Chair), FNB Insurance Brokers (Namibia) Pty Ltd, Stimulus Investments Ltd and FNB Namibia Unit Trust Ltd (Chair)Trusteeships: Nampro Trust and FNB BEE Trust
Vekuii Reinhard RukoroChief Executive OfficerDate of birth: 11 November 1954Appointed: March 2006LLM (International Law); Utter Barrister’s Degree; LLB (Hons); enrolled as advocate of the High Court of Namibia in 1992Directorships: FNB Namibia Holdings Ltd, First National Bank of Namibia Ltd, OUTsurance Insurance Company of Namibia Ltd, Momentum Life Assurance Company Ltd, RMB Asset Management (Namibia) (Pty) Ltd, Swabou Investments (Pty) Ltd and Namibian Employers’ FederationTrusteeships: Khomas Education & Training Fund (Ministry of Education, Khomas Region), FNB Foundation and Board of Governors of the Fidelity Fund of the Law Society of Namibia
Inge Ingenesia Zaamwani-KamwiIndependentNon-executive DirectorDate of birth: 11 November 1958Appointed: January 2000LLB (Hons) - London; LLM – DundeeDirectorships: FNB Namibia Holdings Ltd, First National Bank of Namibia Ltd, Namdeb Diamond Corporation (Pty) Ltd (CEO), Namgem Diamond Manufacturing (Pty) Ltd, Diamond Board of Namibia, Fishcor Ltd, Zantang Investments (Pty) Ltd, UNAM Council, Junior Achievement Namibia, Namibia Chamber of Commerce & Industry, National Planning Commission, Tungeni Africa Investments (Pty) Ltd, Extract Resources Ltd, and MCA Namibia Trusteeships: XNET Trust Fund and FNB Share Incentive Trust
Board of directorscontinued
Claus Jürgen HinrichsenIndependentNon-executive ChairmanDate of birth: 9 May 1943Appointed: March 2009BA, LLB (Wits), BA Honours (UNISA),Admitted Legal Practitioner Directorships: Candida (Pty) Ltd, Tovsorel Investments (Pty) Ltd, Bismark (Pty) Ltd, Ausspannplaza Investments No.4 (Pty) Ltd Trusteeships: Goreangab Trust, Namibia Legal Practitioners Trust, FNB Foundation
John Kienzley MacaskillNon-executive DirectorDate of birth: 07 March 1950Appointed: March 2003BCom (BEM) - University of Pretoria; CAIB / AEP – UNISADirectorships: FNB Namibia Holdings Limited, First National Bank of Namibia Limited, First National Bank of Botswana Limited, First National Bank Holdings (Botswana) Limited, FNB Mozambique SA, First National Bank Zambia Limited, FirstRand Bank Representative Office (Nigeria) Limited
Mwahafar Ndakolute NdilulaIndependentNon-executive DirectorDate of birth: 19 February 1950Appointed: November 2005MPA / DDA - Liverpool UniversityDirectorships: FNB Namibia Holdings Ltd, OUTsurance Insurance Company of Namibia Ltd (Chair), Momentum Life Assurance Company Ltd, Sovereign Asset Management (Pty) Ltd, Sovereign Investments (Pty) Ltd, Sovereign Capital (Pty) Ltd, Sovereign Properties (Pty) Ltd and Temako Green Energy (Pty) Ltd
Petrus Tukondjeni NevongaIndependentNon-executive DirectorDate of birth: 26 October 1968Appointed: May 2003Post Graduate Diploma – Business Administration – UNAM, BTech (Business Administration) - Polytechnic of Namibia; Diploma in Human Resources Management -Polytechnic of NamibiaDirectorships:FNB Namibia Holdings Ltd, Namibia Grape Company (Pty) Ltd, Effort Investment Holdings (Pty) Ltd, Endombo Enterprises (Pty) Ltd, Esindano Pharmaceutical (Pty) Ltd
8FNB NAMIBIA GROUP Annual Report 2012
9FNB NAMIBIA GROUP Annual Report 2012
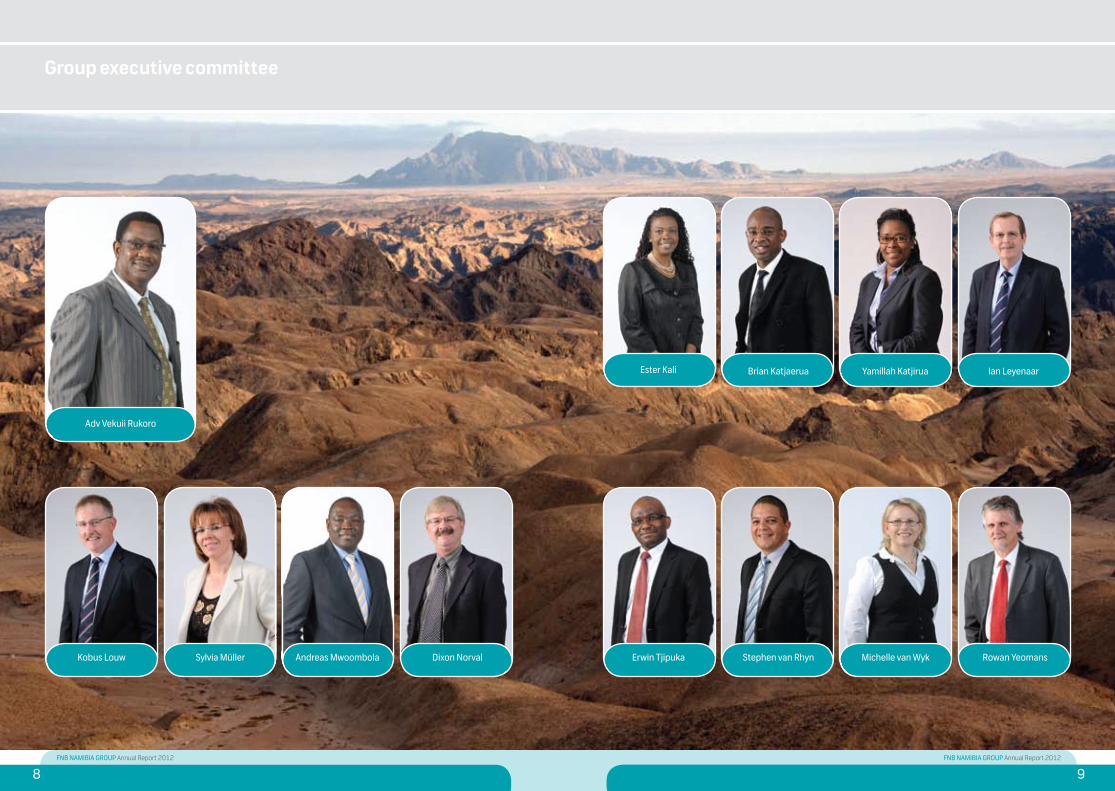
Group executive committee
Kobus Louw
Ester Kali Ian Leyenaar
Erwin TjipukaDixon Norval Michelle van Wyk Rowan YeomansStephen van RhynSylvia Müller Andreas Mwoombola
Yamillah KatjiruaBrian Katjaerua
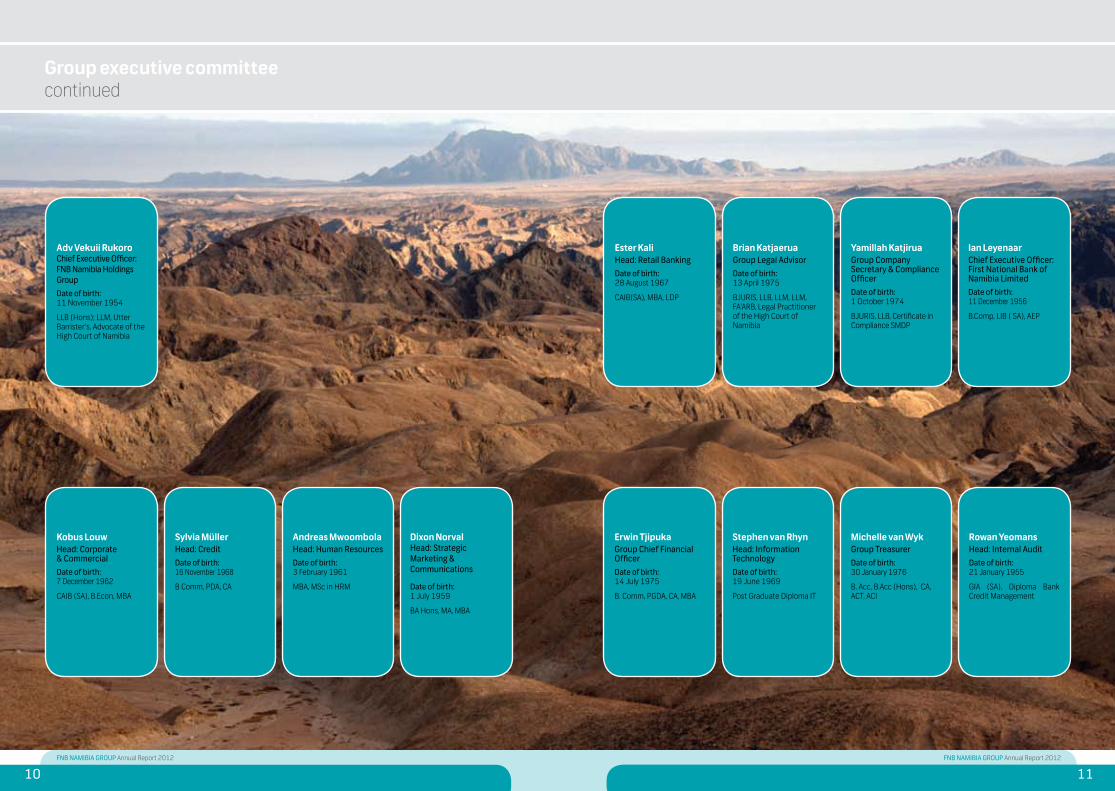
Adv Vekuii Rukoro
10FNB NAMIBIA GROUP Annual Report 2012
11FNB NAMIBIA GROUP Annual Report 2012
Ester KaliHead: Retail BankingDate of birth: 28 August 1967
CAIB(SA), MBA, LDP
Brian KatjaeruaGroup Legal AdvisorDate of birth: 13 April 1975
BJURIS, LLB, LLM, LLM, FA’ARB, Legal Practitioner of the High Court of Namibia
Yamillah KatjiruaGroup Company Secretary & Compliance OfficerDate of birth: 1 October 1974
BJURIS, LLB, Certificate in Compliance SMDP
Ian LeyenaarChief Executive Officer: First National Bank of Namibia LimitedDate of birth: 11 December 1956
B.Comp, LIB ( SA), AEP
Stephen van RhynHead: Information TechnologyDate of birth: 19 June 1969
Post Graduate Diploma IT
Rowan YeomansHead: Internal AuditDate of birth: 21 January 1955
GIA (SA), Diploma Bank Credit Management
Erwin TjipukaGroup Chief Financial OfficerDate of birth: 14 July 1975
B. Comm, PGDA, CA, MBA
Michelle van WykGroup TreasurerDate of birth: 30 January 1976
B. Acc, B.Acc (Hons), CA, ACT, ACI
Group executive committeecontinued
Adv Vekuii Rukoro Chief Executive Officer: FNB Namibia Holdings GroupDate of birth: 11 November 1954
LLB (Hons); LLM, Utter Barrister’s, Advocate of the High Court of Namibia
Kobus LouwHead: Corporate & CommercialDate of birth: 7 December 1962
CAIB (SA), B.Econ, MBA
Sylvia Müller Head: CreditDate of birth: 16 November 1968
B Comm, PDA, CA
Andreas Mwoombola Head: Human ResourcesDate of birth: 3 February 1961
MBA, MSc in HRM
Dixon Norval Head: Strategic Marketing & Communications
Date of birth: 1 July 1959
BA Hons, MA, MBA
12FNB NAMIBIA GROUP Annual Report 2012
13FNB NAMIBIA GROUP Annual Report 2012
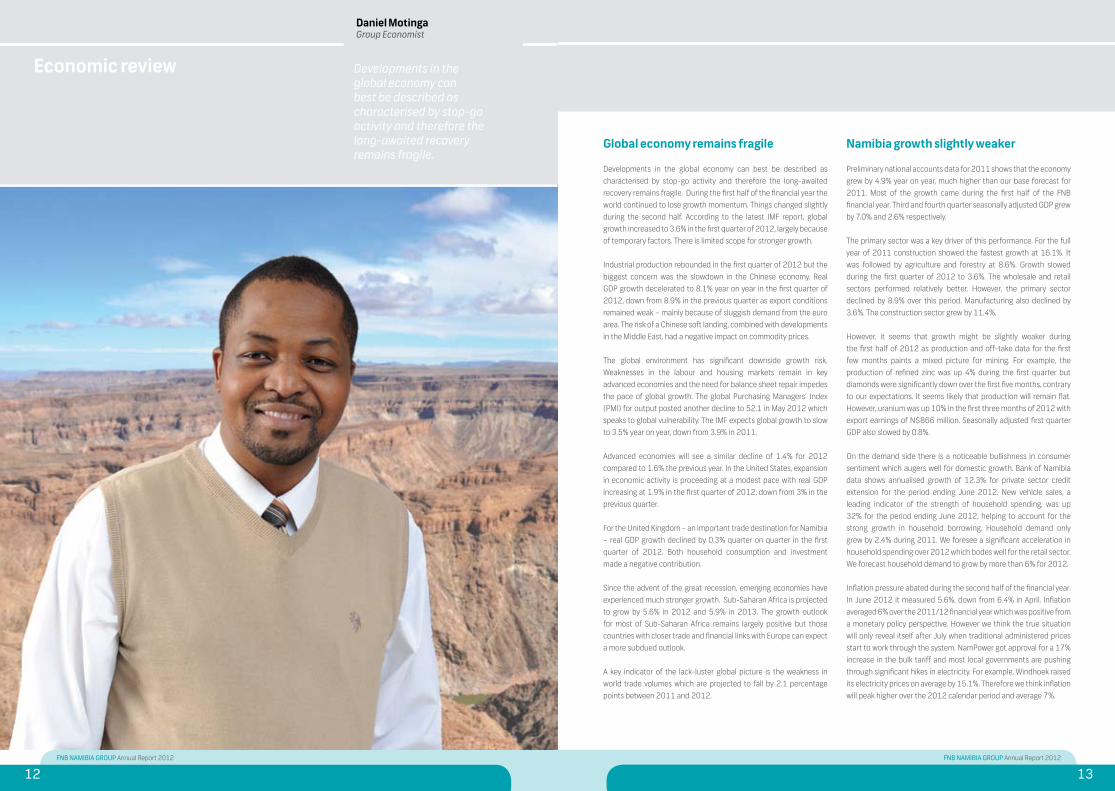
Developments in the global economy can best be described as characterised by stop-go activity and therefore the long-awaited recovery remains fragile.
Daniel MotingaGroup Economist
Economic review
Global economy remains fragile
Developments in the global economy can best be described as characterised by stop-go activity and therefore the long-awaited recovery remains fragile. During the first half of the financial year the world continued to lose growth momentum. Things changed slightly during the second half. According to the latest IMF report, global growth increased to 3.6% in the first quarter of 2012, largely because of temporary factors. There is limited scope for stronger growth.
Industrial production rebounded in the first quarter of 2012 but the biggest concern was the slowdown in the Chinese economy. Real GDP growth decelerated to 8.1% year on year in the first quarter of 2012, down from 8.9% in the previous quarter as export conditions remained weak – mainly because of sluggish demand from the euro area. The risk of a Chinese soft landing, combined with developments in the Middle East, had a negative impact on commodity prices.
The global environment has significant downside growth risk. Weaknesses in the labour and housing markets remain in key advanced economies and the need for balance sheet repair impedes the pace of global growth. The global Purchasing Managers’ Index (PMI) for output posted another decline to 52.1 in May 2012 which speaks to global vulnerability. The IMF expects global growth to slow to 3.5% year on year, down from 3.9% in 2011.
Advanced economies will see a similar decline of 1.4% for 2012 compared to 1.6% the previous year. In the United States, expansion in economic activity is proceeding at a modest pace with real GDP increasing at 1.9% in the first quarter of 2012, down from 3% in the previous quarter.
For the United Kingdom – an important trade destination for Namibia – real GDP growth declined by 0.3% quarter on quarter in the first quarter of 2012. Both household consumption and investment made a negative contribution.
Since the advent of the great recession, emerging economies have experienced much stronger growth. Sub-Saharan Africa is projected to grow by 5.6% in 2012 and 5.9% in 2013. The growth outlook for most of Sub-Saharan Africa remains largely positive but those countries with closer trade and financial links with Europe can expect a more subdued outlook.
A key indicator of the lack-luster global picture is the weakness in world trade volumes which are projected to fall by 2.1 percentage points between 2011 and 2012.
Namibia growth slightly weaker
Preliminary national accounts data for 2011 shows that the economy grew by 4.9% year on year, much higher than our base forecast for 2011. Most of the growth came during the first half of the FNB financial year. Third and fourth quarter seasonally adjusted GDP grew by 7.0% and 2.6% respectively.
The primary sector was a key driver of this performance. For the full year of 2011 construction showed the fastest growth at 16.1%. It was followed by agriculture and forestry at 8.6%. Growth slowed during the first quarter of 2012 to 3.6%. The wholesale and retail sectors performed relatively better. However, the primary sector declined by 8.9% over this period. Manufacturing also declined by 3.6%. The construction sector grew by 11.4%.
However, it seems that growth might be slightly weaker during the first half of 2012 as production and off-take data for the first few months paints a mixed picture for mining. For example, the production of refined zinc was up 4% during the first quarter but diamonds were significantly down over the first five months, contrary to our expectations. It seems likely that production will remain flat. However, uranium was up 10% in the first three months of 2012 with export earnings of N$866 million. Seasonally adjusted first quarter GDP also slowed by 0.8%.
On the demand side there is a noticeable bullishness in consumer sentiment which augers well for domestic growth. Bank of Namibia data shows annualised growth of 12.3% for private sector credit extension for the period ending June 2012. New vehicle sales, a leading indicator of the strength of household spending, was up 32% for the period ending June 2012, helping to account for the strong growth in household borrowing. Household demand only grew by 2.4% during 2011. We foresee a significant acceleration in household spending over 2012 which bodes well for the retail sector. We forecast household demand to grow by more than 6% for 2012.
Inflation pressure abated during the second half of the financial year. In June 2012 it measured 5.6%, down from 6.4% in April. Inflation averaged 6% over the 2011/12 financial year which was positive from a monetary policy perspective. However we think the true situation will only reveal itself after July when traditional administered prices start to work through the system. NamPower got approval for a 17% increase in the bulk tariff and most local governments are pushing through significant hikes in electricity. For example, Windhoek raised its electricity prices on average by 15.1%. Therefore we think inflation will peak higher over the 2012 calendar period and average 7%.
14FNB NAMIBIA GROUP Annual Report 2012
15FNB NAMIBIA GROUP Annual Report 2012
Economic reviewcontinued
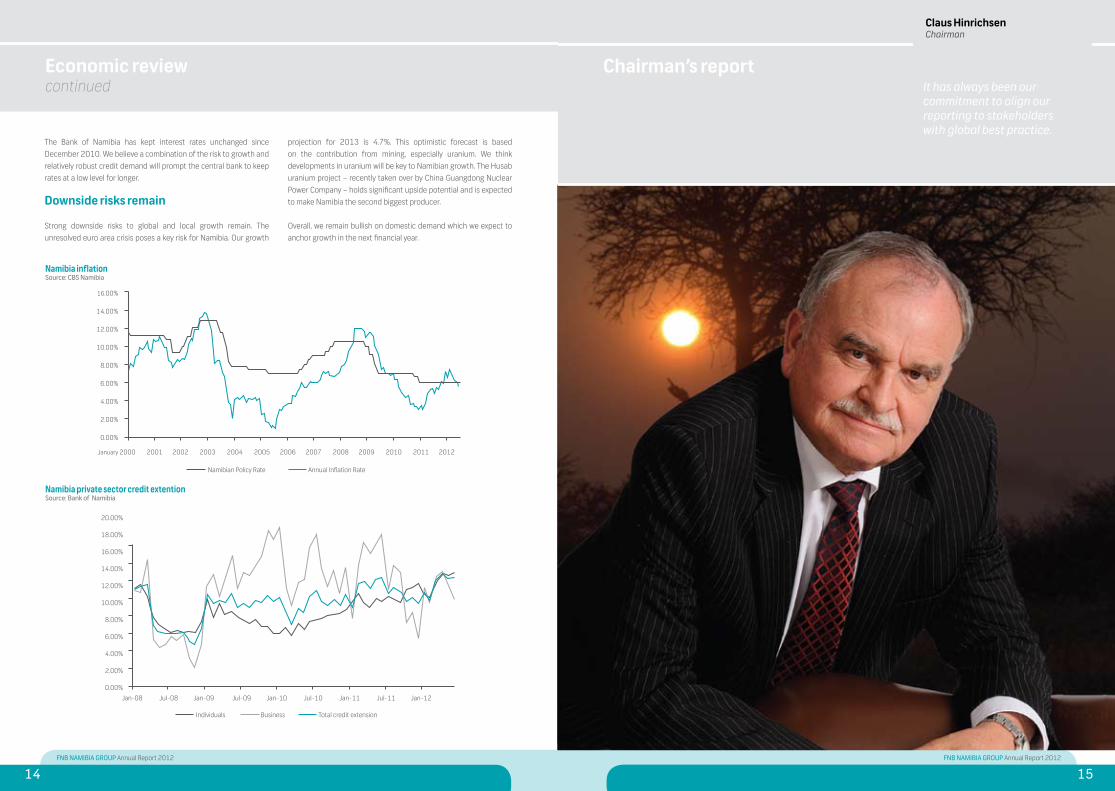
The Bank of Namibia has kept interest rates unchanged since December 2010. We believe a combination of the risk to growth and relatively robust credit demand will prompt the central bank to keep rates at a low level for longer.
Downside risks remain
Strong downside risks to global and local growth remain. The unresolved euro area crisis poses a key risk for Namibia. Our growth
projection for 2013 is 4.7%. This optimistic forecast is based on the contribution from mining, especially uranium. We think developments in uranium will be key to Namibian growth. The Husab uranium project – recently taken over by China Guangdong Nuclear Power Company – holds significant upside potential and is expected to make Namibia the second biggest producer.
Overall, we remain bullish on domestic demand which we expect to anchor growth in the next financial year.
16.00%
14.00%
12.00%
10.00%
8.00%
6.00%
4.00%
2.00%
0.00%
January 2000 2001 2002 2003 2004 2005 2006 2007 2008 2009 2010 2011 2012
Namibian Policy Rate Annual Inflation Rate
20.00%
18.00%
16.00%
14.00%
12.00%
10.00%
8.00%
6.00%
4.00%
2.00%
0.00%
Jan-08 Jul-08 Jan-09 Jul-09 Jan-10 Jul-10 Jan-11 Jul-11 Jan-12
Individuals Business Total credit extension
It has always been our commitment to align our reporting to stakeholders with global best practice.
Claus HinrichsenChairman
Chairman’s report
Namibia inflation Source: CBS Namibia
Namibia private sector credit extention Source: Bank of Namibia
16FNB NAMIBIA GROUP Annual Report 2012
17FNB NAMIBIA GROUP Annual Report 2012
The FNB Board’s culture of good corporate governance serves the needs of stakeholders by directing management to follow good business savvy, objectivity, accountability and integrity, applying appropriate corporate governance policies and practices in each business unit.
It has always been our commitment to align our reporting to stakeholders with global best practice. This is an evolving process and our 2012 annual report once again strives to present an integrated view of the FNB Namibia Holdings Group (FNB). A systematic approach was adopted to provide a comprehensive view, encompassing economic, social, environmental and financial performance, within the corporate governance and risk frameworks. The report is structured to provide information useful for understanding our business, its performance, the opportunities that exist and the challenges we have identified.
Operating with integrity and ensuring trust
As chairman I am particularly interested in our governance and decision-making processes, the ethical behavior of the group and the principles and values that govern our leadership. These I believe are vital ingredients for long-term sustainability.
After recent developments abroad in the international banking industry it is likely that we will continue to see changes in regulations for some time. The changes will be necessary to restore trust that banks act with integrity and operate transparently in dealing with all stakeholders. FNB will continue to play a leading role to ensure that such regulatory changes do not have unintended negative consequences. We will also maintain our focus on building a cooperative relationship with our regulators, promoting transparency and trust in our reporting and communications.
Good governance and sustainability, inextricably intertwined, are essential. Our decision-making processes within the group are robust and the corporate governance and risk reports reflect this.
I believe that fundamental to ensuring a sustainable business, the group must act ethically towards each of its stakeholders. Central to this is institutionalising FNB’s values by instilling them in every staff member. A highlight of the year was an initiative to embed behaviour that reflects the values of accountability, integrity, innovation, respect and passion throughout the organisation. This drive will continue into the next financial year. As our values are a key component of our strategy, the board is proud to reflect that FNB remains principle-based - a critical ingredient for sustainable growth. Leadership is
another important element of our success. The group continued to embark on various leadership development initiatives and the coming year will see a greater focus on developing junior leadership.
Market environment
The first half of the financial year was dominated by the Euro debt crisis, with the risk of disorderly defaults in Greece and Italy influencing the economic environment. Rating agencies have downgraded several economies in the light of the debt risk. Spain, one of our major trading partners, appears to follow the trend.
The IMF has downgraded the global growth outlook to 3.5% for 2012, mainly because of significant slowdown in Europe, which faces an uncertain future. However, the risk of an imminent collapse of European growth and the financial sector seems to be receding.
While indirectly impacted by the global market, we remain optimistic about Namibia and anticipate 4% growth in 2012 and 4.7% in 2013. A slowdown in mining production is likely but we expect good uranium production and a positive investment outlook over the medium term.
Household consumption and investment expenditure show signs of strength and vehicle sales reached the highest levels since November 2007. Growth in both business and household mortgage financing remains strong. We foresee good opportunities for business over the next financial year.
It was great news that financial exclusion in Namibia has reduced from 51% in 2007, to 31% in 2011 according to the latest FinScope figures. FNB Namibia worked closely with the Bank of Namibia (BoN) and the Ministry of Finance to bring wider access to banking services by developing and implementing low cost, safe and easy-to-use products for individuals and small businesses.
Our Group Economist reflects on global and local economic environments in more detail on pages 12 to 14 of this report.
Regulatory environment
On the issue of local ownership BoN has proposed a maximum foreign shareholding of 55%. Discussions continue.
BoN has also asked for comment on proposed guidelines for consumer protection. These cover issues of disclosure, complaints-handling procedures and reporting requirements. The guidelines set out general conduct standards as contained in a draft Code on Banking Practice. Discussions are ongoing.
A determination stipulating capital and other requirements for branches of foreign banking institutions to operate in Namibia was issued in January 2012 and came into effect on the 1 April 2012.
Overall the year under review was characterised by good cooperation between the group and BoN with an agreement to ensure a sustainable, strong and stable banking system in Namibia which will support the objectives of the Government’s Vision 2030.
Financial inclusion remains high on the Government and BoN’s agenda and FNB continues to play a leading role in giving effect to these requirements. Our efforts include participation in national campaigns such as the Ministry of Finance’s Financial Literacy Initiative, to being the first Namibian bank to offer a basic bank account that exceeds BoN’s minimum requirements.
Strategic initiatives
The 2012 financial year has seen FNB make good progress in achieving its objective of moving from the preferred to the most valued financial services provider in Namibia. This strategic plan continues to chart FNB’s path through the global economic turmoil. It ensured we were not distracted by the many uncontrollable factors we had to contend with and enabled the group to achieve commendable financial results. Having such a strategy allowed FNB staff to focus on the important issues guided by our value system. This was supported by solid management information that allowed for performance-tracking on a regular basis.
The strategy was updated in one special area - business banking. It positioned FNB as more than a retail bank and focused on building relationships that add value to clients. This focus saw the launch of RMB Namibia and the development of a more integrated service approach to larger business customers from RMB Namibia, Corporate Division and Treasury.
With fierce competition in the financial services market, both by traditional and non-traditional players, and pressure on fees and margins, we continue to focus on that which will set us apart: our service excellence, the value we add and the relationships we build.
The Group CEO’s report further discusses our performance against our strategy.
Group structure changes
The long pending sale of Momentum was concluded at the close of this financial year, following the unbundling of Momentum Group Limited out of the FirstRand Group in South Africa. Strategically, it paves the way for FNB to focus on core banking business and free-up equity while offering clients long-term insurance products through an arrangement with Metropolitan Life Namibia, on a fully commercial basis.
Dividend
The group’s capital has benefitted from a windfall following the sale of Momentum as mentioned above. A special dividend of 180 cents was therefore declared to return this excess capital to shareholders. In addition, we are pleased to announce a final dividend for the year ending 30 June 2012 of 41 cents per ordinary share. Taking into account the dividend of 41 cents paid in April 2012, as well as the special dividend of 180 cents, ordinary shareholders will received a total dividend for the year of N$2.62 per ordinary share.
Appreciation
I wish to commend the Government for its commitment to maintaining political stability, thus creating a peaceful environment in which to conduct business. This commitment gives FNB great peace of mind. It encourages continued investment and injects impetus into the economy in all sectors, enabling Namibia to remain on course to achieve its Vision 2030.
In conclusion, I extend my appreciation and gratitude to my fellow directors, to all levels of management and, most importantly, to the employees of FNB who implement the strategic objectives set and approved by the board. You have done us proud by your sterling financial performance while upholding our corporate values.
Claus J. HinrichsenChairperson
Chairman’s reportcontinued
18FNB NAMIBIA GROUP Annual Report 2012
19FNB NAMIBIA GROUP Annual Report 2012
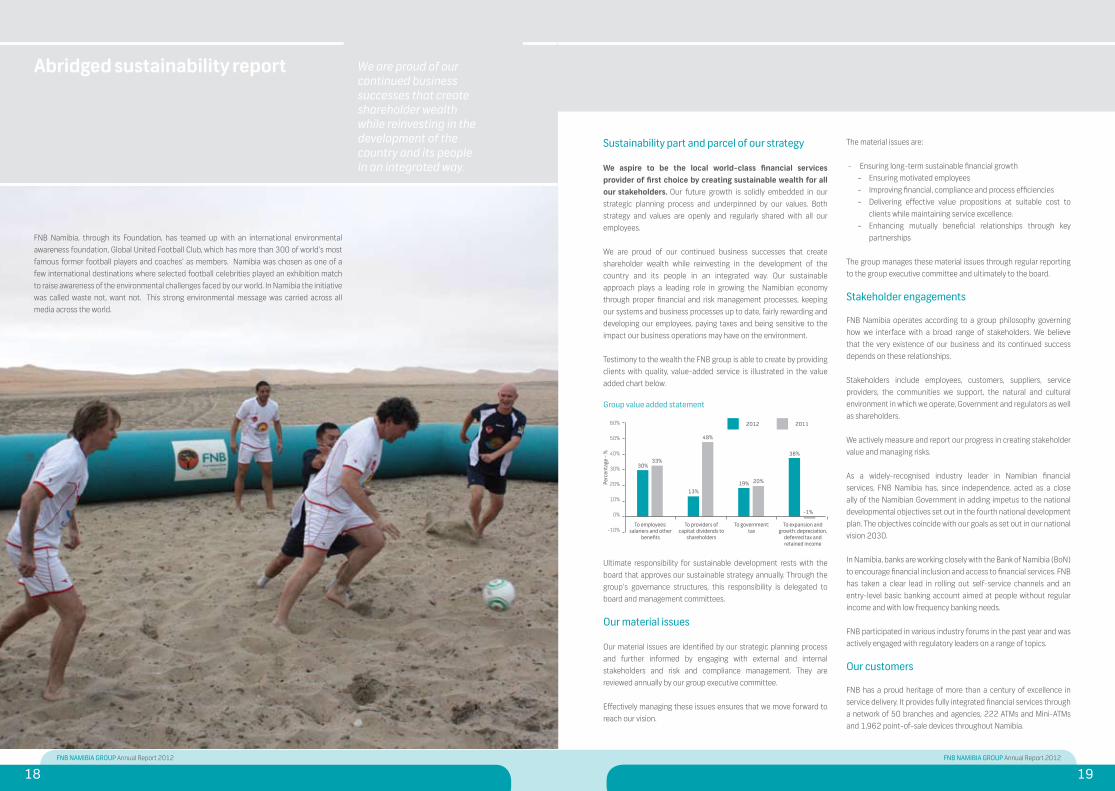
We are proud of our continued business successes that create shareholder wealth while reinvesting in the development of the country and its people in an integrated way.
Abridged sustainability report
FNB Namibia, through its Foundation, has teamed up with an international environmental awareness foundation, Global United Football Club, which has more than 300 of world’s most famous former football players and coaches’ as members. Namibia was chosen as one of a few international destinations where selected football celebrities played an exhibition match to raise awareness of the environmental challenges faced by our world. In Namibia the initiative was called waste not, want not. This strong environmental message was carried across all media across the world.
Sustainability part and parcel of our strategy
We aspire to be the local world-class financial services provider of first choice by creating sustainable wealth for all our stakeholders. Our future growth is solidly embedded in our strategic planning process and underpinned by our values. Both strategy and values are openly and regularly shared with all our employees.
We are proud of our continued business successes that create shareholder wealth while reinvesting in the development of the country and its people in an integrated way. Our sustainable approach plays a leading role in growing the Namibian economy through proper financial and risk management processes, keeping our systems and business processes up to date, fairly rewarding and developing our employees, paying taxes and being sensitive to the impact our business operations may have on the environment.
Testimony to the wealth the FNB group is able to create by providing clients with quality, value-added service is illustrated in the value added chart below.
Ultimate responsibility for sustainable development rests with the board that approves our sustainable strategy annually. Through the group’s governance structures, this responsibility is delegated to board and management committees.
Our material issues
Our material issues are identified by our strategic planning process and further informed by engaging with external and internal stakeholders and risk and compliance management. They are reviewed annually by our group executive committee.
Effectively managing these issues ensures that we move forward to reach our vision.
The material issues are:
- Ensuring long-term sustainable financial growth- Ensuring motivated employees- Improving financial, compliance and process efficiencies- Delivering effective value propositions at suitable cost to
clients while maintaining service excellence. - Enhancing mutually beneficial relationships through key
partnerships
The group manages these material issues through regular reporting to the group executive committee and ultimately to the board.
Stakeholder engagements
FNB Namibia operates according to a group philosophy governing how we interface with a broad range of stakeholders. We believe that the very existence of our business and its continued success depends on these relationships.
Stakeholders include employees, customers, suppliers, service providers, the communities we support, the natural and cultural environment in which we operate, Government and regulators as well as shareholders.
We actively measure and report our progress in creating stakeholder value and managing risks.
As a widely-recognised industry leader in Namibian financial services, FNB Namibia has, since independence, acted as a close ally of the Namibian Government in adding impetus to the national developmental objectives set out in the fourth national development plan. The objectives coincide with our goals as set out in our national vision 2030.
In Namibia, banks are working closely with the Bank of Namibia (BoN) to encourage financial inclusion and access to financial services. FNB has taken a clear lead in rolling out self-service channels and an entry-level basic banking account aimed at people without regular income and with low frequency banking needs.
FNB participated in various industry forums in the past year and was actively engaged with regulatory leaders on a range of topics.
Our customers
FNB has a proud heritage of more than a century of excellence in service delivery. It provides fully integrated financial services through a network of 50 branches and agencies, 222 ATMs and Mini-ATMs and 1,962 point-of-sale devices throughout Namibia.
13%
Perc
enta
ge -
%
60%
50%
40%
30%
20%
10%
0%
-10%
30%33%
48%
19% 20%
38%
-1%
To employees:salariers and other
benefits
To providers of capital: dividends to
shareholders
To government:tax
To expansion and growth: depreciation,
deferred tax and retained income
Group value added statement
2012 2011
20FNB NAMIBIA GROUP Annual Report 2012
21FNB NAMIBIA GROUP Annual Report 2012
Abridged sustainability reportcontinued
Our most important contribution to sustainable development is to support and facilitate economic growth. This is achieved through a range of credit, savings, investment and risk products for individuals and businesses.
Our banking products and services go to economically active and even inactive Namibians. Customers include entry-level consumers and high net-worth individuals. Our core focus is on delivering effective value propositions at suitable cost while maintaining service excellence.
The group’s banking operation established a specialised division to advance credit and provide mentoring support for small and medium entrepreneurs. The division has grown considerably during the period under review, both in its mandate and in the number of loans advanced. Cooperation with international organisations has also expanded.
As part of an innovations programme, FNB Namibia’s staff developed a unique system for customers wanting to provide their staff with a pension-backed home loan scheme. The improved system was implemented in 2011 and helped FNB to gain or retain business by delivering a substantial cost saving.
Account-holders with a Lifestyle Account with FNB have access to funeral cover of N$3 000. During the year 983 families made use of the benefits at N$2.5 million.
We continued to promote the use of cost-effective electronic self-help channels and have maintained our free cellphone and online banking facility.
For more information, see the Chief Executive Officer’s report.
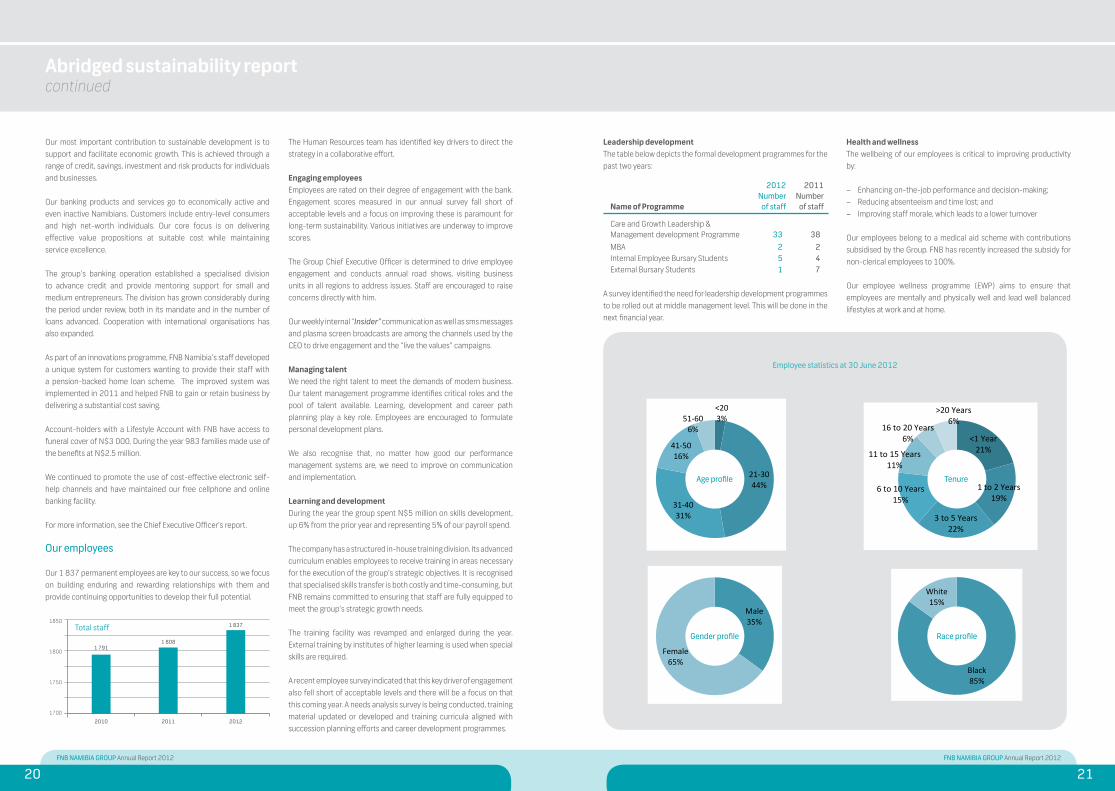
Our employees
Our 1 837 permanent employees are key to our success, so we focus on building enduring and rewarding relationships with them and provide continuing opportunities to develop their full potential.
The Human Resources team has identified key drivers to direct the strategy in a collaborative effort.
Engaging employeesEmployees are rated on their degree of engagement with the bank. Engagement scores measured in our annual survey fall short of acceptable levels and a focus on improving these is paramount for long-term sustainability. Various initiatives are underway to improve scores.
The Group Chief Executive Officer is determined to drive employee engagement and conducts annual road shows, visiting business units in all regions to address issues. Staff are encouraged to raise concerns directly with him.
Our weekly internal “Insider” communication as well as sms messages and plasma screen broadcasts are among the channels used by the CEO to drive engagement and the “live the values” campaigns.
Managing talentWe need the right talent to meet the demands of modern business. Our talent management programme identifies critical roles and the pool of talent available. Learning, development and career path planning play a key role. Employees are encouraged to formulate personal development plans.
We also recognise that, no matter how good our performance management systems are, we need to improve on communication and implementation.
Learning and developmentDuring the year the group spent N$5 million on skills development, up 6% from the prior year and representing 5% of our payroll spend.
The company has a structured in-house training division. Its advanced curriculum enables employees to receive training in areas necessary for the execution of the group’s strategic objectives. It is recognised that specialised skills transfer is both costly and time-consuming, but FNB remains committed to ensuring that staff are fully equipped to meet the group’s strategic growth needs.
The training facility was revamped and enlarged during the year. External training by institutes of higher learning is used when special skills are required.
A recent employee survey indicated that this key driver of engagement also fell short of acceptable levels and there will be a focus on that this coming year. A needs analysis survey is being conducted, training material updated or developed and training curricula aligned with succession planning efforts and career development programmes.
Leadership developmentThe table below depicts the formal development programmes for the past two years:
A survey identified the need for leadership development programmes to be rolled out at middle management level. This will be done in the next financial year.
Health and wellnessThe wellbeing of our employees is critical to improving productivity by:
- Enhancing on-the-job performance and decision-making; - Reducing absenteeism and time lost; and- Improving staff morale, which leads to a lower turnover
Our employees belong to a medical aid scheme with contributions subsidised by the Group. FNB has recently increased the subsidy for non-clerical employees to 100%.
Our employee wellness programme (EWP) aims to ensure that employees are mentally and physically well and lead well balanced lifestyles at work and at home.
Name of Programme
2012Number
of staff
2011Number
of staff
Care and Growth Leadership & Management development Programme 33 38
MBA 2 2Internal Employee Bursary Students 5 4External Bursary Students 1 7
Black 85%
White 15%
Race profile at June 2012
Race profile
<20 3%
21-30 44%
31-40 31%
41-50 16%
51-60 6%
Age profile at 30 June 2012
Age profile
Male 35%
Female 65%
Gender profile at 30 June 2012
Gender profile
<1 Year 21%
1 to 2 Years 19%
3 to 5 Years 22%
6 to 10 Years 15%
11 to 15 Years 11%
16 to 20 Years 6%
>20 Years 6%
Tenure at 30 June 2012
Tenure
1850
1800
1750
1700
1 791
1 837
2010 2011 2012
Total staff
1 808
Employee statistics at 30 June 2012
22FNB NAMIBIA GROUP Annual Report 2012
23FNB NAMIBIA GROUP Annual Report 2012
Abridged sustainability reportcontinued
A wellness coordinator works with educators across the country and in each business unit to encourage employees to take responsibility for their own health. We offer health screening assessments and health education initiatives and support national and international wellness drives tackling AIDS, cancer, malaria, drug abuse, illicit trafficking and gender violence.
Partnering with LifeAssist, our employees, their spouses / partners and immediate family can get advice by phone at any time of the day or night or use email or the web to seek help on health and wellness, or to get advice on financial and legal matters. Qualified experts are made available for face-to-face attention.
Transformation
Diversification of ownership base FNB is listed on the Namibian Stock Exchange and is further diversifying its ownership base by implementing BEE and share incentive schemes. Please refer to pages 115 for further information.
Our BEE programme aims at wealth distribution and empowering the previously disadvantaged. It caters for staff members and BEE partners. The BEE programme started in 2005 and about 5% of equity in FNB Namibia Holdings was earmarked for transformation. This investment was valued at N$78 million in December 2004. It now stands at N$165 million. One percent was dedicated to black non-executive directors and a staff share trust. A total of 500 000 shares have been transferred to the Staff Assistance Trust, which uses annual dividends to help needy staff pay medical bills, cover educational needs or for any other deserving reason.
The company has 2 530 registered shareholders of which approximately 2 426 are Namibian. They own more than 110 million shares. The Namibian ownership was valued at approximately N$1.6 billion.
Diversification of leadershipThe FNB Namibia Holdings Board has adopted the principle that the board needs to reflect Namibian society in respect of race and gender. Currently it compromises nine members of which six are black and one is female. Sixty per cent of board members are Namibian. Namibians make up 85% of executive management - 53% are black and 30% are female.
Our suppliers
There is no formal accreditation process in place, making it a challenge to monitor the allocation of contracts to BEE and SME accredited suppliers. Suppliers are urged to accredit themselves at the Namibian Preferential Procurement Council to enable FNB to build up a database and so meet its BEE spend targets.
In the last financial year a concerted effort was made to broaden our supplier base, especially in respect of building and renovation projects and daily repair and maintenance. An invitation to supply was placed in newspapers and bids for building projects were invited on open tender. Several new suppliers were identified and major renovation projects were allocated to new suppliers.
We will remain focused on accelerating our local procurement spend as part of our commitment to supporting local enterprises. We will also engage actively in supplier and product sourcing and research.
Our environment
In terms of current legislation, and within the Namibian operating environment, we endeavour to be environmentally aware in everything we do and to set new trends where we can.In the last financial year, the light bulbs in the Talas East and City Centre buildings were replaced with more energy-efficient light bulbs. This remains a work in progress. We will keep on refining our environmental strategy.
During the year the air conditioning plant in head office was upgraded and coolant replaced with an ozone-friendly refrigerant. All new air conditioners are ozone friendly and existing units will be ungraded.
In the past two years FNB has facilitated a United Nations Development Programme backed initiative whereby 300 low-interest loans were granted to fund installation of solar power.
We continue to promote reduced paper use in branches and foresee that simplified account-opening procedures and an emphasis on electronic banking will lead to even greater paper savings.
Our communities
We spent N$2 813 684 on corporate social responsibility (CSR) initiatives in 2012. Under a new policy, the FNB Foundation brought together a series of operating principles as a guide to employees and a reference to other stakeholders like suppliers, beneficiaries and charity organisations. The CSR initiative embraces codes of corporate governance and best practice.
While the main focus is to support the group’s strategy, cognisance is taken of national documents such as Namibia’s Vision 2030 and international documents like the Millennium Development Goals as well as the UN Global Compact’s guidelines on sustainability.
The group recognises the importance of CSR and has always been actively involved in social benefit activities. Its business behaviours are aimed not only at delivering commercial objectives but also to making a positive social impact. This means taking into account the interests of all stakeholders, the wider community and the environment.
The CSR philosophy is to meet the needs of present stakeholders without engaging in any activity that compromises the ability of a future generation to meet its own needs. It is closely aligned to its mission to create sustainable wealth for all stakeholders.
Effectively, this policy is a commitment to implementing sustainable business practices that enhance the company’s credibility and reputation and support Namibia’s development challenges. It enables the Group to incorporate CSR in its overall business strategy, achieving higher levels of performance and generating enhanced value.
It is based on a holistic approach (triple bottom line), defining CSR as an evolving but integrated method that considers sustainability first n all its core business activities. It includes a focus on social and environmental responsibilities. It identifies certain projects that have a high positive impact on society, while also providing long-term business benefits. Charity is not excluded, but such activities usually have a minimal business benefit and therefore receive less attention.
For the group, the policy is about moving beyond legal obligations and core responsibilities to social investments in the community and environment. The investments are long-term, sustainable and strategic in nature, and focus on projects that have direct or indirect business benefits and are responsive to national challenges.
FNB’s Corporate Social Responsibility focal areas
The following seven areas have a significant relevance for its workforce, community, market and environment:
All business units are responsible for their core business activities (including recycling, waste reduction, staff development, financial returns and risk management). The Foundation is responsible for monitoring and approving all CSI and charity initiatives.
Key Focus Area
Educational developmentProgrammes to improve school-level management and other skills in education – in support of Vision 2030 and, to a lesser extent, support to individual schools.
Skills developmentProgrammes that enhance SME management skills, promote entrepreneurship and raise awareness of good corporate governance. They include relevant bursaries.
Community and health development & environmental guardianshipAny programmes with regional or national focus that uplift and empower communities and protect the environment. They can be partnerships.
Consumer education, protection and financial inclusionAny programmes that advance consumer knowledge, access to finance and financial literacy.
Arts and cultureInitiatives that preserve local artistic heritage while giving Namibians access to it, as well as supporting current artistic developments.
Sports developmentTeam events, inside the borders of Namibia, premier league clubs, where possible working with national bodies.
Customer hospitalityActivities that enhance customer relationships and the brand position of the group.
24FNB NAMIBIA GROUP Annual Report 2012
25FNB NAMIBIA GROUP Annual Report 2012
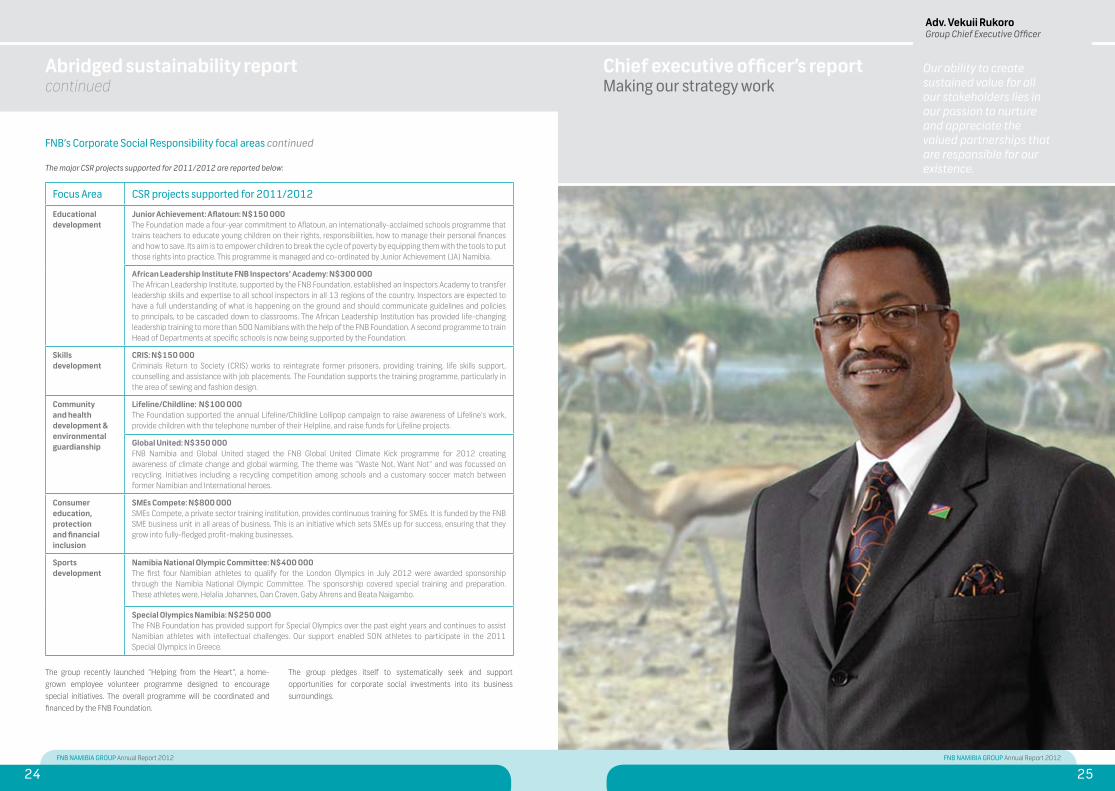
Chief executive officer’s reportMaking our strategy work
Our ability to create sustained value for all our stakeholders lies in our passion to nurture and appreciate the valued partnerships that are responsible for our existence.
Adv. Vekuii RukoroGroup Chief Executive Officer
Abridged sustainability reportcontinued
Focus Area CSR projects supported for 2011/2012
Educational development
Junior Achievement: Aflatoun: N$150 000The Foundation made a four-year commitment to Aflatoun, an internationally-acclaimed schools programme that trains teachers to educate young children on their rights, responsibilities, how to manage their personal finances and how to save. Its aim is to empower children to break the cycle of poverty by equipping them with the tools to put those rights into practice. This programme is managed and co-ordinated by Junior Achievement (JA) Namibia.
African Leadership Institute FNB Inspectors’ Academy: N$300 000The African Leadership Institute, supported by the FNB Foundation, established an Inspectors Academy to transfer leadership skills and expertise to all school inspectors in all 13 regions of the country. Inspectors are expected to have a full understanding of what is happening on the ground and should communicate guidelines and policies to principals, to be cascaded down to classrooms. The African Leadership Institution has provided life-changing leadership training to more than 500 Namibians with the help of the FNB Foundation. A second programme to train Head of Departments at specific schools is now being supported by the Foundation.
Skills development
CRIS: N$150 000Criminals Return to Society (CRIS) works to reintegrate former prisoners, providing training, life skills support, counselling and assistance with job placements. The Foundation supports the training programme, particularly in the area of sewing and fashion design.
Community and health development & environmental guardianship
Lifeline/Childline: N$100 000The Foundation supported the annual Lifeline/Childline Lollipop campaign to raise awareness of Lifeline’s work, provide children with the telephone number of their Helpline, and raise funds for Lifeline projects.
Global United: N$350 000FNB Namibia and Global United staged the FNB Global United Climate Kick programme for 2012 creating awareness of climate change and global warming. The theme was “Waste Not, Want Not” and was focussed on recycling. Initiatives including a recycling competition among schools and a customary soccer match between former Namibian and International heroes.
Consumer education, protection and financial inclusion
SMEs Compete: N$800 000SMEs Compete, a private sector training institution, provides continuous training for SMEs. It is funded by the FNB SME business unit in all areas of business. This is an initiative which sets SMEs up for success, ensuring that they grow into fully-fledged profit-making businesses.
Sports development
Namibia National Olympic Committee: N$400 000The first four Namibian athletes to qualify for the London Olympics in July 2012 were awarded sponsorship through the Namibia National Olympic Committee. The sponsorship covered special training and preparation. These athletes were, Helalia Johannes, Dan Craven, Gaby Ahrens and Beata Naigambo.
Special Olympics Namibia: N$250 000The FNB Foundation has provided support for Special Olympics over the past eight years and continues to assist Namibian athletes with intellectual challenges. Our support enabled SON athletes to participate in the 2011 Special Olympics in Greece.
FNB’s Corporate Social Responsibility focal areas continued
The major CSR projects supported for 2011/2012 are reported below:
The group recently launched “Helping from the Heart”, a home-grown employee volunteer programme designed to encourage special initiatives. The overall programme will be coordinated and financed by the FNB Foundation.
The group pledges itself to systematically seek and support opportunities for corporate social investments into its business surroundings.
26FNB NAMIBIA GROUP Annual Report 2012
27FNB NAMIBIA GROUP Annual Report 2012
Chief executive officer’s reportMaking our strategy work continued
Our ability to create sustained value for all our stakeholders lies in our passion to nurture and appreciate the valued partnerships that are responsible for our existence.
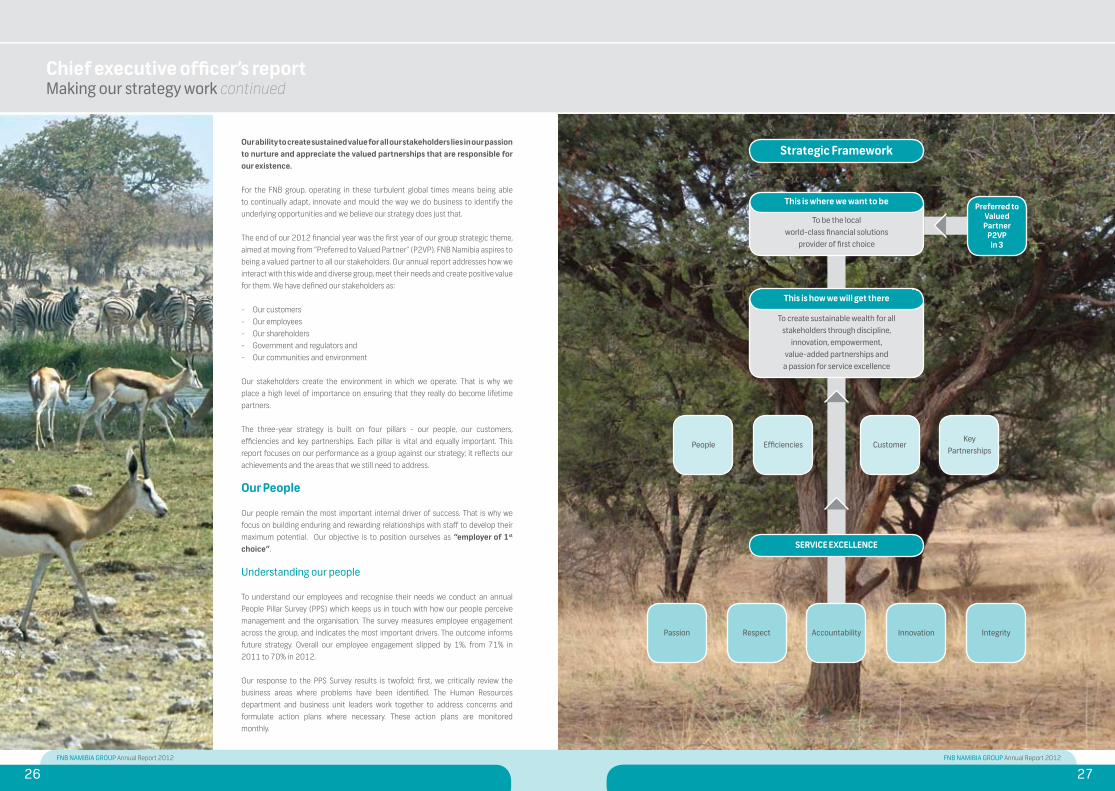
For the FNB group, operating in these turbulent global times means being able to continually adapt, innovate and mould the way we do business to identify the underlying opportunities and we believe our strategy does just that.
The end of our 2012 financial year was the first year of our group strategic theme, aimed at moving from “Preferred to Valued Partner” (P2VP). FNB Namibia aspires to being a valued partner to all our stakeholders. Our annual report addresses how we interact with this wide and diverse group, meet their needs and create positive value for them. We have defined our stakeholders as:
- Our customers- Our employees- Our shareholders- Government and regulators and- Our communities and environment
Our stakeholders create the environment in which we operate. That is why we place a high level of importance on ensuring that they really do become lifetime partners.
The three-year strategy is built on four pillars - our people, our customers, efficiencies and key partnerships. Each pillar is vital and equally important. This report focuses on our performance as a group against our strategy; it reflects our achievements and the areas that we still need to address.
Our People
Our people remain the most important internal driver of success. That is why we focus on building enduring and rewarding relationships with staff to develop their maximum potential. Our objective is to position ourselves as “employer of 1st choice”.
Understanding our people
To understand our employees and recognise their needs we conduct an annual People Pillar Survey (PPS) which keeps us in touch with how our people perceive management and the organisation. The survey measures employee engagement across the group, and indicates the most important drivers. The outcome informs future strategy. Overall our employee engagement slipped by 1%, from 71% in 2011 to 70% in 2012. Our response to the PPS Survey results is twofold; first, we critically review the business areas where problems have been identified. The Human Resources department and business unit leaders work together to address concerns and formulate action plans where necessary. These action plans are monitored monthly.
This is how we will get there
To create sustainable wealth for all stakeholders through discipline,
innovation, empowerment, value-added partnerships and
a passion for service excellence
This is where we want to be
To be the local world-class financial solutions
provider of first choice
SERVICE EXCELLENCE
Preferred toValued
PartnerP2VP
in 3
People Efficiencies CustomerKey
Partnerships
Passion Respect Accountability Innovation Integrity
Strategic Framework
28FNB NAMIBIA GROUP Annual Report 2012
29FNB NAMIBIA GROUP Annual Report 2012
Understanding our people continued
Secondly, where a bigger concern is obvious, specific group initiatives are driven from the centre.
Although the group scored well in the drivers of strategy, direction and leadership, the biggest single cause of lower engagement was a generational gap of employees aged between 25-34 years, representing about half the total staff complement. Recognizing their needs
We recognise that the youth in our organisation will play an important role in the FNB of tomorrow. Future leaders are incubated here. By targeting core focus areas we believe we will positively engage this younger generation, making them part of the solution by driving positive change among their peers.
Senior management has identified these focus areas:
Leadership:
- Promote a culture of value-driven leadership by continuing to drive “living the FNB values” throughout all levels.- Enhance the value of current junior and middle management leadership programmes. This involves bringing together the brightest and best of the younger staff to ensure their voices are heard – and acted upon. - Communicate pertinent information to staff through more relevant social media platforms.
Generational Diversity:
- A programme of cross-generational engagement to break down barriers. This includes learning how best to communicate and manage across the generation gap.- Align all staff around FNB’s brand mantra of helpfulness.
People Processes:
- Training and development, utilising our new HR Training Centre to its maximum, differentiating training, coaching and mentoring needs for routine, skilled and specialist areas.- Ensuring that performance management and reward are consistent.
Another important aspect of our strategy is to ensure that we have the right people in the right jobs. We have appointed a talent sourcing official whose job is to identify and, through the talent
management framework, manage the talent pool and critical roles throughout the organisation. Responsibilities include identifying potential successors and assisting with personal development plans. Our links with the greater FNB Africa enable us to give our people the chance to grow and learn across the borders in many other African countries.
FNB Namibia has also committed to participating in the Deloitte “Best Company To Work For” Survey. This, we hope, will help us to benchmark ourselves against other industries and better understand reported employment priorities. These insights will help us to optimise our people strategy and improve staff engagement.
Our customers
Our customers - the man on the street, the entrepreneurial business or the large corporate - have one common characteristic: they are dynamic, changing and adapting to volatile environments. Servicing customers is the reason why we exist; we need to understand and adapt to their changing needs.
We listen to what our customers have to say
Every year we use a Buzz Barometer survey to measure customer loyalty. The 2011 results indicate that we have made tremendous strides in this direction. The loyalty (net promoter score) for the group has, in a mere three years, more than doubled while that of Retail trebled. Net promoter scores in the challenging environment of Corporate did very well.
Every second year we carry out a “voice of the customer” survey, the most recent of which was at the end of 2011. The purpose is to determine customer response to the Buzz Barometer, understanding why customers remain loyal.
Each business unit is surveyed separately and is responsible for acting on the results. Our group service champion monitors the process.
FNB Namibia divides its market into two main segments, personal and business, each with a number of sub-segments. This enables the Group to identify opportunities and recruit or train staff with appropriate knowledge and experience, resulting in superior service and improved relationships. Customers get a bouquet of tailor-made products and services, ranging from transactional, investment and savings to lending and risk.
We also listen to the industry, government and regulators so that we can help them responsibly to attain their goals.
We respond
Firstly, adapting to where and how our customers transact
At FNB we are constantly looking at ways to make banking easier – and bring banking to customers. Exciting developments on the technology front this year include:
A truly mobile speedpoint, powered by a back-up battery pack charged by a solar panel. It operates wherever a GPRS signal is available. It was launched successfully at the Uis Hot Air Balloon Festival and was used by the Namibian Broadcasting Corporation in its campaign to persuade Namibians to pay their TV licenses.
Our FNB Speedpoints also pioneered perhaps the biggest Merchant setup via wireless links at the Hart van Windhoek festival, which was the largest “cash-less” event in Namibia until now.
In August 2011 FNB Namibia led the way in launching Debit and Credit Card for fuel ahead of an Industry solution. We believe that this bold step, which was met with both positive and negative feedback, acted as an ice-breaker. Debit and Credit cards are now an accepted payment mechanism for fuel.
Pre-Paid airtime for MTC was old hat, but we facilitated Post-Paid airtime for MTC customers, as well as airtime payments for Leo.
FNB Namibia is the only bank currently that facilitates high value payments on line. Amounts of N$5,000,000 and more can be processed from the Online Banking Enterprise platform, with no further manual action required by customers.
FNB Namibia was also the first bank to offer pre-paid electricity for Windhoek via its cellphone, online banking and ATM facilities. Plans are to extend the service to other areas until all Namibians have access to it.
Using the catch-phrase “from bricks to clicks”, we continue to educate customers on more cost-effective electronic ways of transacting and believe that our cellphone and online banking channels are key. Our sales van criss-crosses the Namibian landscape to bring banking to the people. To make cellphone banking even more convenient to the largest language group in Namibia, brochures were translated into Oshiwambo.
Due to the ever increasing risk of fraud, and an overall increase in card swopping, FNB Namibia introduced PIN Guards for all our ATMs. This makes it much more difficult for “shoulder surfers” to look at
PIN numbers when customers are transacting. Our Online Banking Enterprise platform (Business Use) has also enhanced security by introducing Management User Access, ensuring only “trusted PC’s” can log onto the online system.
We continued to extend our footprint and enhance our FNB brand. During the year we opened a new representation point in Mondesa; invested in upgrading branch infrastructure; added eight ATM’s; and made progress with our mini-ATM solution.
Secondly, a strong focus on building enduring and rewarding customer relationships
Traditionally FNB Namibia has been strongly positioned in the retail market. A major thrust is to increase our competitive advantage in the business and corporate sector, in particular the large corporate and SOE segment. Increasingly, we can deliver a more comprehensive range of products and services. The newly launched RMB Namibia, with its team of experts specialising in investment and merchant banking, has been set up to address the needs of existing and potential clients as well as local and international private sector investors.
This in turn means a focus on the Corporate and Investment Banking segment. Specific but aligned strategies for Corporate, International Banking and Global Market divisions which include all matters relating to the management and growth of business in a variety of industries.
Our corporate team is positioning itself competitively by concentrating on the unique needs within each industry segment and then identifying dedicated relationship managers to service them. Collaborating closely with RMB and the global markets division, we can create unique customer value propositions.
We have also increased our focus on the corporate property market, increasing the number of relationship managers to meet demand.
From a global market perspective, 2012 was characterised by severe volatility in currency and commodity prices following global and especially European turmoil. The global markets’ division (previously known as Fixed Income, Currency and Commodities division of Treasury) generates mainly foreign exchange and fixed income revenues. Foreign exchange income growth was mainly generated from improved margins. However, turnover from existing and new client bases was depressed as a result of uncertainty in international markets. The fixed income desk solidified a strong performance by increasing local debt instruments. We will continue
Chief executive officer’s reportMaking our strategy work continued

30FNB NAMIBIA GROUP Annual Report 2012
31FNB NAMIBIA GROUP Annual Report 2012
Secondly, a strong focus on building enduring and rewarding customer relationships continued
to drive current strategies, which include selling structured solutions. In addition, we foresee that the positive outlook on debt origination opportunities from RMB Namibia will enhance revenue and skill transfer to the global market’s distribution activities.
The trade division’s revenue, albeit small, has shown solid growth, mainly from foreign guarantees on construction contracts. The exchange control division continues to provide excellent and speedy service. Our custody and trustee services division increased assets under management and continues its efforts to further its presence in the market.
Acknowledging the gap in our offering within the business segment, our strategy includes ensuring we have sufficient skilled relationship managers to focus on growth and provide a better service. Our business, agriculture and tourism strategy has been taking shape through a thorough process of understanding these segments individually but also aligning them to gain maximum benefit. Although agriculture and tourism strategies are well entrenched the third leg, business, now needs to be incorporated so that synergies can be achieved, driving down costs and maximising efficiencies.
Our networking platform called Biz Network, has reached new heights with customers enjoying the interaction with relationship managers as well as discussion on topical information to assist them in expanding. They are also able to share ideas and best practice with similar businesses across Southern Africa. This is just one of the advantages we offer business segment clients.
To further align with group strategy, WesBank continued to strengthen its corporate team and invest in training, especially in customer relations. Corporate breakfasts were introduced to encourage networking among clients. The continuing efforts paid off and this year WesBank celebrated attaining the N$2 billion mark in assets financed.
A continued shortage in structural supply and a fiercely competitive environment put pressure on margins and affected growth in home loans. FNB home loans maintain its strategy to write quality business. It regards it as important to strengthen relationships with the estate agents industry, which provides a channel for new business and rewards agents through the “Realtors Millionaire Club”, an annual competition. We also continue to provide construction and management training, together with a “Basics for Building” booklet for contractors in the SME sector.
The PMR Golden Arrow was awarded to our property valuators department for “Institutions doing most in their sector to stimulate economic growth and development” for the fourth year in a row.
During the year OUTsurance launched its business insurance offering to the Namibian market. It can tailor a package to meet the unique needs of any business. Large or small..
Thirdly by delivering service excellence
In 2011 we reported that a group service champion had been appointed. Our service champion and team have been driving the following three critical factors in our quest to achieve service excellence.
Improved product knowledge to ensure staff can offer the correct products and services to meet individual needs – a tailor-made service.
Reduced service failures and improved query resolution through a customised electronic system. We actively log, resolve and monitor trends and service levels across the business to identify areas for further improvement. Customers can also log their own queries directly onto the system and they will receive SMS notifications on progress in resolving the query through our FNB in-contact messaging system.
Improving the group-wide service culture through training and rewarding service excellence.
And lastly, responding to the call from Government and regulators in support of their consumer initiatives
FNB Namibia formed a smart partnership with Government, through the Ministry of Finance, assisted by the Federal Republic of Germany and the Deutsche Gesellschaft für Internationale Zusammenarbeit GIZ, to be an active partner in driving the Financial Literacy Initiative (FLI). Officially launched in March 2012, the FLI was founded to assist Namibians to make informed judgments on managing their finances by embarking on an educational initiative (Bewise / Savewise / Spendwise).
FNB is also involved in the internationally acclaimed Aflatoun (empowering children) programme, which aims to improve social and financial skills in schools.
In June 2012 our bank proudly launched the revised CardWise Zero product, which is fully compliant with new requirements set for the Basic Bank Account by the Bank of Namibia (BoN) and implemented more than three months ahead of the October 2012 deadline set by BoN. The introduction of the CardWise Zero product is another step in FNB’s efforts to keep to our brand promise: “How can we help you?”. It is part of a drive to 100% financial inclusion, You do not need a regular income to bank with FNB.
To allow more SMEs to be included in the mainstream economy and address the shortage of skills, we enhanced our partnership with SME’s Compete to train entrepreneurs. FNB Namibia also has a fully-fledged unit attending to the needs of SMEs.
Recognising that cost increases for food, transport and electricity keep household budgets under pressure, we have once again kept fee increases for 2012/2013 on average below inflation and in some cases we have even reduced them. We still offer significant value to customers with the Unlimited Electronic Pricing Option (UEPO) on Lifestyle accounts. This fee hasn’t changed for five years.
Efficiencies
Why is this so important to us?
For the group to sustain success we need to adapt. Improving our organisation’s efficiency will help ensure continued sustainable growth and development. One measure we use to evaluate our efficiency is the cost to income ratio. This is at 52.4%, making FNB a very efficient financial institution.
How we achieve efficiency
Our annual innovations campaign generates ideas that benefit efficiencies. Innovation is a core value of the group, and the campaign encourages staff to participate, and rewards those whose ideas are implemented.
Other efficiencies came from new or enhanced systems and re-engineering of processes.
System efficiencies
The introduction of Account Opening Optimisation (AOO) will have far-reaching benefits by reducing the time taken to open accounts as well as the paper load. The rollout of AOO started in May 2012 and will continue across the country until the end of September.
FNB Cellphone Banking is also linked directly with MTC and Leo for In-Contact messages, streamlining delivery and making trouble-shooting easier since no third party is involved any more.
Customer education is key to driving efficiencies. This year we introduced educational SMS messages which go out automatically to account-holders. The messages provide a reminder that electronic channels cost less and are triggered when customers: withdraw cash or make a balance enquiry at another bank’s ATM; make multiple withdrawals on one day; withdraw or deposit cash from a FNB Branch; and when insufficient funds are in the account for debit orders.
Process efficiencies
The group has established operational and credit process review committees responsible for critically reviewing internal processes and recommending improvements. They also review key group expenditure items to find ways to reduce costs.
Our retail business segment embarked on a capacity modeling process to determine the optimum number of staff within a branch operation and hence ensure effective utilisation of human resources.
Continuing our drive to convert from print to electronics, FNB Speedpoints division introduced e-mailing of merchant statements, saving costs and making the operation greener.
Customers still using manual branch processes like issuing bank cheques and paying salaries manually were contacted and introduced to Online banking, making the process simpler, faster and less costly for all.
Various efficiency projects in Treasury Support were successfully launched to enhance the service, improve risk management and raise overall compliance measures to even higher standards. With the introduction of Global Transactional Services support from FirstRand, we envisage further growth and optimisation opportunities in the Trade and Custody divisions.
Other efficiencies
A new head office development in Windhoek’s CBD will house staff presently located in four buildings and unlock efficiencies – saving support and delivery costs, reducing travelling costs, centralising communication and energy resources, cutting telecommunication and external rental costs. The project should be completed in the second half of 2015.
Chief executive officer’s reportMaking our strategy work continued
32FNB NAMIBIA GROUP Annual Report 2012
33FNB NAMIBIA GROUP Annual Report 2012
Key Partnerships
Understanding who our partners are
In our 2011 annual report we introduced a fourth pillar to our strategic framework: Key Partnerships. Identifying them as a strategic focus area was fundamental to creating a sustainable business model due to the synergies they bring.
Because our partners have diverse and sometimes conflicting interests and different expectations, it was important to engage with them and understand their needs and concerns.
Key partners include government, regulators, main shareholder, board members, trade unions, consumer lobby groups, industry bodies and the general public.
We have various policies and methodologies to govern communica-tions and conduct with them. They are informed by best practice, corporate governance and legislative requirements as well as risk and compliance management principles.
Below in more detail we describe our key partnerships, how and why we engage with them, and the platforms we use to respond.
Responding and contributing towards a valued partnership
The Namibian Government and its line ministries create the conducive business environment in which we operate. It is important for us to understand their vision for Namibia and how the group can proactively contribute to it.
We achieve this by engaging with line ministers as and when issues are raised. A regular platform we use is our annual budget synopsis which we co-host with Deloitte’s. The Minister of Finance is our keynote speaker.
We engage with our regulators, both the Bank of Namibia and NAMFISA, on a continuing basis, both formally and informally, either in reply to specific questions or in response to draft determinations and legislation. We actively participate in working groups and forums and apply our minds when providing written responses in consultation processes.
Our people represent the FNB group in the following industry forums:
- The Banker’s Association- Payment Association of Namibia (PAN)
- Payment Clearing House (PCH) Card, Code line Clearing (CLC), Electronic Funds Transfer (EFT)- Namibian Insurance Brokers Association- Namibian Insurance Association - We are also an industry leader on SADC Bankers Association Payment Integration Project.
Other than the regulatory and compliance engagements with our board members, we also hold quarterly board lunches where we invite a broad spectrum of stakeholders and create a platform for networking.
Excluding board level, engagement with our main shareholder is largely decentralised and takes place at business unit level. Business units sign service level agreements with their counterparts in SA, which informs the level of involvement in ongoing processes and new developments. The main focus is to leverage off skills and expertise and to ensure we are at the forefront of technological developments.
To cement our relationship with trade unions, we have undertaken to meet quarterly with union leaders. We will also establish a discussion forum between our HR department and the union, which will meet more regularly to discuss all other industrial relations matters.
Various open days are held with editors of newspapers and analysts to create a transparent platform for them to pose questions and understand the dynamics of our group better. Another forum is our annual results presentation in September.
FNB also seeks opportunities to engage in smart partnerships with members of the general public, to drive specific initiatives. Some examples include:
FNB Namibia, as a tourism industry partner, realised that reliable and up-to-date information pertaining to this industry’s performance was not frequently available, hampering planning. So FNB Namibia, in partnership with FENATA, created the FNB Tourism Index to help individual businesses understand the tourism environment and enable them to plan ahead. -The index will come out in alternate months and will be factual, accurate and timely.
FNB’s Housing index covers developments in the national housing market and measures the movement of house prices and volumes in different regions.
Other key partnerships are with our vendors, without whom it would be challenging to meet customer expectations.
Although we have sold our stake in Momentum Life Insurance Namibia, we remain strategic partners to enable us to continue to
offer customers a comprehensive range of long-term insurance products, maintaining our role as a diversified financial services group. Looking ahead
We continue the momentum of our core strategy P2VPin3 – preferred to valued partner in three years. The focus remains on our four strategic pillars and the specific imperatives which we believe will continue to ensure sustainable growth. The world we live in is a fast changing space. We need to remain innovative, ready to adapt, change and mould strategy as the landscape in which we operate changes and that our executive management team is up for the challenge.
Accolades
During the year under review FNB Namibia received the following accolades:
On 30 November 2011, for the third year in a row, FNB Namibia was selected as the best bank in Namibia and received the Bracken Award from the Banker Magazine for the fourth time.
FNB Namibia was selected one of the top five banks in Africa in the category “Best Local Bank in Africa” by an independent panel of respected judges. The awards are made by the African Banker Magazine and supported by multi-national corporations like VISA, the Private Sector Operations of the African Development Bank and the Corporate Council on Africa
FNB Namibia was ranked number one bank in Namibia, number 13 in Southern Africa and number 72 in Africa – up five places from last year – among the top 100 banks in Africa by the African Business Magazine.
We became the first Namibian financial services group to be awarded the “Best Banking Group in Namibia” title for 2012 by the World Finance banking awards.
RMB Namibia scooped the “Best Investment Bank in Namibia” title for 2012 by the World Finance banking awards after only being launched in September 2011.
Appreciation
I would like to thank our chairman, Claus Hinrichsen, for his leadership and my fellow board colleagues who play a vital role in governance, oversight and strategic guidance. I thank them for their ongoing commitment, participation and support in guiding the group to achieve sustainable wealth for all its stakeholders.
I would especially like to acknowledge and thank our staff as well as our customers for making us the preferred banking group in Namibia.
And lastly, I would like to thank the senior leadership and the rest of the team whose continued efforts, dedication and loyalty shaped an excellent group performance once again.
Adv. Vekuii RukoroGroup Chief Executive Officer
Chief executive officer’s reportMaking our strategy work continued
34FNB NAMIBIA GROUP Annual Report 2012
35FNB NAMIBIA GROUP Annual Report 2012
Group overview
The 2012 results reflect the sale, concluded on 29 June 2012, of the group’s 51% shareholding in Momentum Namibia to Metropolitan Life Namibia. The financial performance is therefore more accurately reflected by considering the performance of continuing operations, excluding the profit from the sale and the Momentum earnings contribution for the current and previous year.
After the Momentum sale, the group has two main operating entities: First National Bank of Namibia Limited (“FNB”) and OUTsurance Insurance Company of Namibia Limited (“OUTsurance”). Both were profitable. FNB profit for the year was up 17% to N$509 million and OUTsurance profit rose by 48% to N$18 million. The group purchased the remaining 60% shareholding in FNB Insurance Brokers (Namibia) (Pty) Ltd (FNBIB) with effect from 1 July 2011, and is now a fully consolidated subsidiary. FNBIB is included in the other segment.
Profit from continuing operations increased by a healthy 16% to N$539 million (2011: N$464 million), underpinned by satisfactory advances growth, a continued reversal of bad debts and solid growth in non interest revenue. Operating expenses were well managed.
Taking the Momentum sale into account, profit for the year increased by 43% to N$772 million (2011: N$539 million). A profit of N$232 million on disposal of a subsidiary was recognised and the sale proceeds of N$342 million have contributed to the special dividend being declared. The profit attributable to discontinued operations amounted to N$2 million (2011: N$75 million). The decline is mainly due to a change in assumptions used to value policyholder liabilities. Following is a summary illustrating the effect of this on group headline earnings. Headline earnings from continuing operations increased by 15%.
Earnings per share rose to 294.3 cents (2011: 191.8 cents). Headline earnings were at 203.1 cents (2011: 191.6 cents). Return on average equity from continuing operations improved to 26% (2011: 25%). The cost to income ratio was 52.4% (2011: 52.2%), impacted by the inclusion of FNB Insurance Brokers in the current year.
Statement of comprehensive income
Interest incomeNet interest income increased by 6% to N$889 million (2011: N$840 million). However, FNB’s Investment Banking Division concluded a transaction which, for accounting purposes, is designated at fair value through profit and loss. Fair value income of N$41 million is therefore reflected under non interest income rather than interest income. If this had not been so, growth in interest income would have been close to the 11% growth in average advances.
Continued pressure on margins stemmed not only from the competitive Namibian market - both lending and funding - but also from prolonged low interest rates. FNB’s compliance with Bank of Namibia’s requirement to reduce the margin between prime and the bank rate by 50 basis points twice – in October 2009 and again in October 2010 - is still being felt. Margin was also sacrificed by the negative endowment effect on capital after the payment of a special dividend of N$379 million in May 2011. As in the prior year, some relief was obtained from the release of interest previously suspended. This was achieved by the on-going effort of our centralised recovery team to collect non-performing advances.
Impairment losses
The net impairment reversal of N$42 million for the year against a reversal of N$12 million in 2011 was on the back of the continued healthy profile of the advances book. Rigorous actuarial calculations based on historical data resulted in a considerable portfolio impairment release. Recoveries of previously impaired loans continued, albeit on a much smaller scale than in the previous year, although there has been recognition of new specific impairments. The prevailing lower interest rates together with the benefits of a centralised credit-collections team, effective early delinquency detection and a consistent and sound lending policy continued to pay off.
Chief Financial Officer’s ReportChief financial officer’s reportReporting on our success
The financial performance is more accurately reflected by considering the performance of continuing operations, excluding the profit from the sale and the Momentum earnings contribution for the current and previous year.
Erwin TjipukaGroup Chief Financial Officer
Headline earnings contribution per segment
N$m 2012 2011 % change
FNB 501 434 15%OUTsurance 9 6 50%Other 15 17 -12%
Headline earnings from: continuing operations 525 457 15%
discontinued operations 1 38 -97%
Headline earnings 526 495 6%
2012 2011
N$m
% of average
advances N$m
% of average
advances
Specific impairment (reversal)/recognition (1.7) 0.0% (17.4) (0.1%)
PV of securities on non-performing loans 4.8 5.0
Total specific impairments 3.1 0.0% (12.4) (0.1%)
Portfolio impairment (45.0)
Total impairment (reversal)/charge (41.9) (0.3%) (12.4) (0.1%)
36FNB NAMIBIA GROUP Annual Report 2012
37FNB NAMIBIA GROUP Annual Report 2012
The year-to-date ratio for non performing loans to average gross advances continues to improve, reducing to 1.2% (2011: 1.7%). Non performing loans reduced by 17% to N$177 million (2011: N$212 million).
Year on year deposits increased by 22% to N$16 billion, while average deposits increased by a slightly lower 18%. Year on year balances indicate increased surplus liquidity compared to the previous year. Diversification of sources of funding as well as term is monitored. Efforts to increase retail funding are meeting with success and the percentage of retail funding to total funding has increased.
In terms of the banking group’s domestic medium term note programme, N$390 million Tier 2 capital was raised with a new bond issue in March 2012, replacing a N$260 million bond which was called on the same day. Fixed rate notes (FNBX22) to the value of N$110 million and floating rate notes (FNBJ22) to the value of N$280 million were issued. The additional N$130 million raised will allow the group to optimise on the mix between Tier 1 and Tier 2 capital.
Non interest income
Non interest revenue increased by 22% to N$740 million. Banking fee and commission income grew by 16% to N$630 million, despite pricing pressures. This is attributable to good growth in accounts and transaction volumes, as well as an annual price increase, mostly for inflation. The number of customers using the Unlimited Electronic Pricing Option, capped at N$98 a month, increased by 39%. There has been a 73% growth in cellphone banking users. Overall the volumes reflect FNB’s strategy to promote less expensive electronic delivery channels. This puts revenue under pressure, making volume growth essential.
Fair value income contributed N$80 million (2011: N$66 million). This encompasses:
- foreign exchange trading of N$68 million for the year, an increase of N$5 million;
- a negative derivative revaluation of N$34 million mainly attributable to an interest rate swap; and
- designated at fair value through profit and loss income of N$41 million (2011: nil) stemming from a fair value advance.
There was a N$9 million gain under investment income resulting from the disposal of FNB’s shares in Visa Incorporated during the year.
Following the incorporation of FNBIB during the year as a wholly owned subsidiary, the share of profit from associates reflects a decrease. However, the non interest income contribution attributable to FNBIB is N$37 million.
To come into line with industry practice, during the year the group reclassified fee and commission expenses that are incremental or directly attributable to the generation of fee and commission income from various operating expenses to the appropriate fee and commission categories. The prior year has been reclassified accordingly. The effect was a 1.5% improvement in the cost income ratio. Net insurance premium income and net claims and benefits paid
OUTsurance’s premium income increased by 17%. It has levelled off as the business matures after the high initial take-off recorded on the launch of the personal lines products. A lower home owners’ building loss ratio following a more moderate rainy season contributed to a reduction in net claims and benefits.
Operating expenses
Non interest expenditure increased by 15% to N$884 million. The year on year increase was negatively impacted by abnormalities, the largest of which was the inclusion for the first time of FNBIB’s costs of N$34 million. Excluding abnormalities, the year on year increase was 8% which demonstrates sensible cost control. At the same time we continued to invest in new representation points and technology to improve efficiencies, leading to an improved customer experience.
The positive trend in the relationship between total revenue growth and the increase in operating costs in the banking group is illustrated below:
Statement of financial position
The group’s total assets reflect growth of 15%. In 2011 the pending sale of Momentum resulted in assets and liabilities attributable to that company being classified as held for sale. As the sale was concluded prior to year end, the balances relating to Momentum are not consolidated in the statement of financial position for the current year.
The sizeable increase in cash and cash equivalents, balances due from banks and investment securities relate to short term investments by FNB employing funds accumulated on corporate demand accounts, due to the surplus liquidity in the market.
Gross average advances reflect a year on year increase of 11% to N$13.4 billion. Overdrafts grew by 18%, WesBank 17% and mortgage loans 9%. Mortgage loans constitute an average of 51% of FNB’s advances book. This is not considered a concentration risk due to the stable Namibian property market. The relative composition of the various categories of advance is illustrated in the chart on the following page.
Chief financial officer’s reportcontinued
Operating “jaws” - banking group
2005 2006 2007 2008 2009 2010 2011 2012
N$
mill
ion
1 8001 6001 4001 2001 000
800600400200
0
Total revenue Total operating expenses
638768
9121060
831757726627555480426380
11861314
14231571
Fair value advances Other advances Term loans
Advances composition
2005 2006 2007 2008 2009 2010 2011 2012
N$
mill
ion
16 000
14 000
12 000
10 000
8 000
6 000
4 000
2 000
0
Mortgage loans Instalment debtors Overdrafts
Gross advances vs. NPL’s and impairments
Perc
enta
ge -
%
6%
5%
4%
3%
2%
1%
0%
-1%
Gross advances (YTD avg) NPL’s as % of gross averagesTotal impairment charge as % of gross advances
16 000
14 000
12 000
10 000
8 000
6 000
4 000
2 000 N$
mill
ion
13 472
2005 2006 2007 2008 2009 2010 2011 2012
6 4007 497
8 3749 036
11 03212 158
10 032
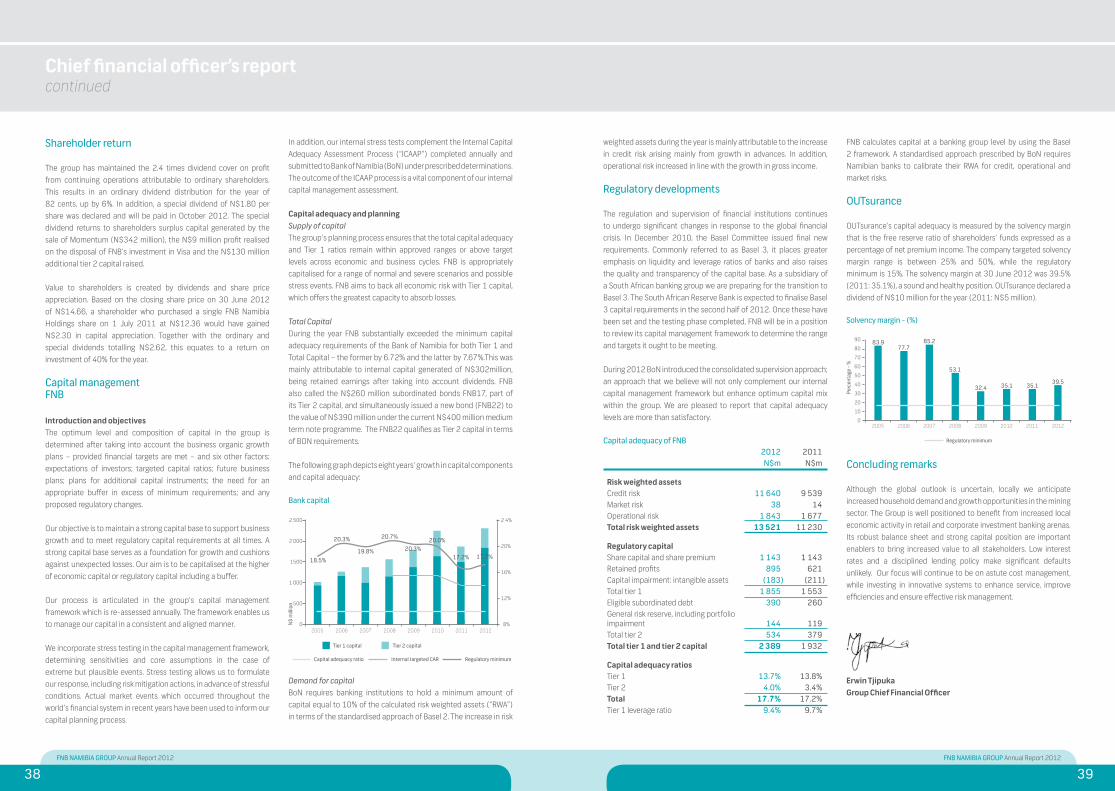
38FNB NAMIBIA GROUP Annual Report 2012
39FNB NAMIBIA GROUP Annual Report 2012
Chief financial officer’s reportcontinued
Shareholder return
The group has maintained the 2.4 times dividend cover on profit from continuing operations attributable to ordinary shareholders. This results in an ordinary dividend distribution for the year of 82 cents, up by 6%. In addition, a special dividend of N$1.80 per share was declared and will be paid in October 2012. The special dividend returns to shareholders surplus capital generated by the sale of Momentum (N$342 million), the N$9 million profit realised on the disposal of FNB’s investment in Visa and the N$130 million additional tier 2 capital raised.
Value to shareholders is created by dividends and share price appreciation. Based on the closing share price on 30 June 2012 of N$14.66, a shareholder who purchased a single FNB Namibia Holdings share on 1 July 2011 at N$12.36 would have gained N$2.30 in capital appreciation. Together with the ordinary and special dividends totalling N$2.62, this equates to a return on investment of 40% for the year.
Capital managementFNB
Introduction and objectivesThe optimum level and composition of capital in the group is determined after taking into account the business organic growth plans – provided financial targets are met – and six other factors: expectations of investors; targeted capital ratios; future business plans; plans for additional capital instruments; the need for an appropriate buffer in excess of minimum requirements; and any proposed regulatory changes.
Our objective is to maintain a strong capital base to support business growth and to meet regulatory capital requirements at all times. A strong capital base serves as a foundation for growth and cushions against unexpected losses. Our aim is to be capitalised at the higher of economic capital or regulatory capital including a buffer.
Our process is articulated in the group’s capital management framework which is re-assessed annually. The framework enables us to manage our capital in a consistent and aligned manner.
We incorporate stress testing in the capital management framework, determining sensitivities and core assumptions in the case of extreme but plausible events. Stress testing allows us to formulate our response, including risk mitigation actions, in advance of stressful conditions. Actual market events which occurred throughout the world’s financial system in recent years have been used to inform our capital planning process.
In addition, our internal stress tests complement the Internal Capital Adequacy Assessment Process (“ICAAP”) completed annually and submitted to Bank of Namibia (BoN) under prescribed determinations. The outcome of the ICAAP process is a vital component of our internal capital management assessment.
Capital adequacy and planningSupply of capitalThe group’s planning process ensures that the total capital adequacy and Tier 1 ratios remain within approved ranges or above target levels across economic and business cycles. FNB is appropriately capitalised for a range of normal and severe scenarios and possible stress events. FNB aims to back all economic risk with Tier 1 capital, which offers the greatest capacity to absorb losses.
Total Capital During the year FNB substantially exceeded the minimum capital adequacy requirements of the Bank of Namibia for both Tier 1 and Total Capital – the former by 6.72% and the latter by 7.67%.This was mainly attributable to internal capital generated of N$302million, being retained earnings after taking into account dividends. FNB also called the N$260 million subordinated bonds FNB17, part of its Tier 2 capital, and simultaneously issued a new bond (FNB22) to the value of N$390 million under the current N$400 million medium term note programme. The FNB22 qualifies as Tier 2 capital in terms of BON requirements.
The following graph depicts eight years’ growth in capital components and capital adequacy:
Demand for capitalBoN requires banking institutions to hold a minimum amount of capital equal to 10% of the calculated risk weighted assets (“RWA”) in terms of the standardised approach of Basel 2. The increase in risk
weighted assets during the year is mainly attributable to the increase in credit risk arising mainly from growth in advances. In addition, operational risk increased in line with the growth in gross income.
Regulatory developments
The regulation and supervision of financial institutions continues to undergo significant changes in response to the global financial crisis. In December 2010, the Basel Committee issued final new requirements. Commonly referred to as Basel 3, it places greater emphasis on liquidity and leverage ratios of banks and also raises the quality and transparency of the capital base. As a subsidiary of a South African banking group we are preparing for the transition to Basel 3. The South African Reserve Bank is expected to finalise Basel 3 capital requirements in the second half of 2012. Once these have been set and the testing phase completed, FNB will be in a position to review its capital management framework to determine the range and targets it ought to be meeting.
During 2012 BoN introduced the consolidated supervision approach; an approach that we believe will not only complement our internal capital management framework but enhance optimum capital mix within the group. We are pleased to report that capital adequacy levels are more than satisfactory.
FNB calculates capital at a banking group level by using the Basel 2 framework. A standardised approach prescribed by BoN requires Namibian banks to calibrate their RWA for credit, operational and market risks.
OUTsurance
OUTsurance’s capital adequacy is measured by the solvency margin that is the free reserve ratio of shareholders’ funds expressed as a percentage of net premium income. The company targeted solvency margin range is between 25% and 50%, while the regulatory minimum is 15%. The solvency margin at 30 June 2012 was 39.5% (2011: 35.1%), a sound and healthy position. OUTsurance declared a dividend of N$10 million for the year (2011: N$5 million).
Concluding remarks
Although the global outlook is uncertain, locally we anticipate increased household demand and growth opportunities in the mining sector. The Group is well positioned to benefit from increased local economic activity in retail and corporate investment banking arenas. Its robust balance sheet and strong capital position are important enablers to bring increased value to all stakeholders. Low interest rates and a disciplined lending policy make significant defaults unlikely. Our focus will continue to be on astute cost management, while investing in innovative systems to enhance service, improve efficiencies and ensure effective risk management.
Erwin TjipukaGroup Chief Financial Officer
Capital adequacy of FNB 2012 2011 N$m N$m
Risk weighted assets Credit risk 11 640 9 539 Market risk 38 14 Operational risk 1 843 1 677 Total risk weighted assets 13 521 11 230
Regulatory capitalShare capital and share premium 1 143 1 143 Retained profits 895 621 Capital impairment: intangible assets (183) (211)Total tier 1 1 855 1 553 Eligible subordinated debt 390 260 General risk reserve, including portfolio impairment 144 119 Total tier 2 534 379 Total tier 1 and tier 2 capital 2 389 1 932
Capital adequacy ratiosTier 1 13.7% 13.8%Tier 2 4.0% 3.4%Total 17.7% 17.2%Tier 1 leverage ratio 9.4% 9.7%
Tier 1 capital Tier 2 capital
Bank capital
2005 2006 2007 2008 2009 2010 2011 2012
N$
mill
ion
2 500
2 000
1500
1 000
500
0
Capital adequacy ratio Internal targeted CAR Regulatory minimum
2 4%
20%
16%
12%
8%
18.5%
20.3%
19.8%
20.7%
20.3%20.0%
17.2% 17.7%
Solvency margin - (%)
Perc
enta
ge -
%
90
80
70
60
50
40
30
20
10
0
Regulatory minimum
2005 2006 2007 2008 2009 2010 2011 2012
32.4 35.1 35.139.5
53.1
85.277.7
83.9
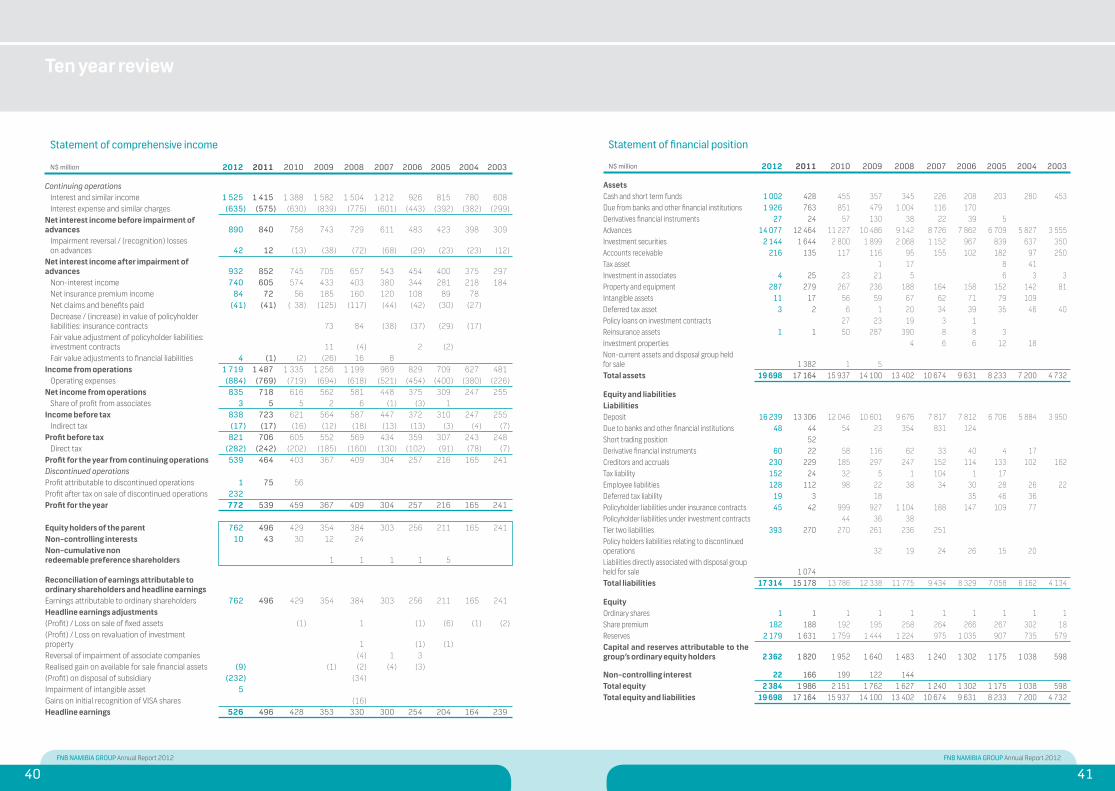
40FNB NAMIBIA GROUP Annual Report 2012
41FNB NAMIBIA GROUP Annual Report 2012
Ten year review
Statement of financial position
N$ million 2012 2011 2010 2009 2008 2007 2006 2005 2004 2003
AssetsCash and short term funds 1 002 428 455 357 345 226 208 203 280 453 Due from banks and other financial institutions 1 926 763 851 479 1 004 116 170 Derivatives financial instruments 27 24 57 130 38 22 39 5 Advances 14 077 12 464 11 227 10 486 9 142 8 726 7 862 6 709 5 827 3 555 Investment securities 2 144 1 644 2 800 1 899 2 068 1 152 967 839 637 350 Accounts receivable 216 135 117 116 95 155 102 182 97 250 Tax asset 1 17 8 41 Investment in associates 4 25 23 21 5 6 3 3 Property and equipment 287 279 267 236 188 164 158 152 142 81 Intangible assets 11 17 56 59 67 62 71 79 109 Deferred tax asset 3 2 6 1 20 34 39 35 46 40 Policy loans on investment contracts 27 23 19 3 1 Reinsurance assets 1 1 50 287 390 8 8 3 Investment properties 4 6 6 12 18 Non-current assets and disposal group held for sale 1 382 1 5 Total assets 19 698 17 164 15 937 14 100 13 402 10 674 9 631 8 233 7 200 4 732
Equity and liabilitiesLiabilitiesDeposit 16 239 13 306 12 046 10 601 9 676 7 817 7 812 6 706 5 884 3 950 Due to banks and other financial institutions 48 44 54 23 354 831 124 Short trading position 52 Derivative financial instruments 60 22 58 116 62 33 40 4 17 Creditors and accruals 230 229 185 297 247 152 114 133 102 162 Tax liability 152 24 32 5 1 104 1 17 Employee liabilities 128 112 98 22 38 34 30 28 26 22 Deferred tax liability 19 3 18 35 46 36 Policyholder liabilities under insurance contracts 45 42 999 927 1 104 188 147 109 77 Policyholder liabilities under investment contracts 44 36 38 Tier two liabilities 393 270 270 261 236 251 Policy holders liabilities relating to discontinued operations 32 19 24 26 15 20 Liabilities directly associated with disposal group held for sale 1 074 Total liabilities 17 314 15 178 13 786 12 338 11 775 9 434 8 329 7 058 6 162 4 134
EquityOrdinary shares 1 1 1 1 1 1 1 1 1 1 Share premium 182 188 192 195 258 264 266 267 302 18 Reserves 2 179 1 631 1 759 1 444 1 224 975 1 035 907 735 579 Capital and reserves attributable to the group’s ordinary equity holders 2 362 1 820 1 952 1 640 1 483 1 240 1 302 1 175 1 038 598
Non-controlling interest 22 166 199 122 144 Total equity 2 384 1 986 2 151 1 762 1 627 1 240 1 302 1 175 1 038 598 Total equity and liabilities 19 698 17 164 15 937 14 100 13 402 10 674 9 631 8 233 7 200 4 732
Statement of comprehensive income
N$ million 2012 2011 2010 2009 2008 2007 2006 2005 2004 2003
Continuing operationsInterest and similar income 1 525 1 415 1 388 1 582 1 504 1 212 926 815 780 608 Interest expense and similar charges (635) (575) (630) (839) (775) (601) (443) (392) (382) (299)
Net interest income before impairment of advances 890 840 758 743 729 611 483 423 398 309
Impairment reversal / (recognition) losses on advances 42 12 (13) (38) (72) (68) (29) (23) (23) (12)
Net interest income after impairment of advances 932 852 745 705 657 543 454 400 375 297
Non-interest income 740 605 574 433 403 380 344 281 218 184 Net insurance premium income 84 72 56 185 160 120 108 89 78 Net claims and benefits paid (41) (41) ( 38) (125) (117) (44) (42) (30) (27)Decrease / (increase) in value of policyholder liabilities: insurance contracts 73 84 (38) (37) (29) (17)Fair value adjustment of policyholder liabilities: investment contracts 11 (4) 2 (2)Fair value adjustments to financial liabilities 4 (1) (2) (26) 16 8
Income from operations 1 719 1 487 1 335 1 256 1 199 969 829 709 627 481 Operating expenses (884) (769) (719) (694) (618) (521) (454) (400) (380) (226)
Net income from operations 835 718 616 562 581 448 375 309 247 255 Share of profit from associates 3 5 5 2 6 (1) (3) 1
Income before tax 838 723 621 564 587 447 372 310 247 255 Indirect tax (17) (17) (16) (12) (18) (13) (13) (3) (4) (7)
Profit before tax 821 706 605 552 569 434 359 307 243 248 Direct tax (282) (242) (202) (185) (160) (130) (102) (91) (78) (7)
Profit for the year from continuing operations 539 464 403 367 409 304 257 216 165 241 Discontinued operationsProfit attributable to discontinued operations 1 75 56 Profit after tax on sale of discontinued operations 232 Profit for the year 772 539 459 367 409 304 257 216 165 241
Equity holders of the parent 762 496 429 354 384 303 256 211 165 241 Non-controlling interests 10 43 30 12 24 Non-cumulative non redeemable preference shareholders 1 1 1 1 5
Reconciliation of earnings attributable to ordinary shareholders and headline earningsEarnings attributable to ordinary shareholders 762 496 429 354 384 303 256 211 165 241 Headline earnings adjustments(Profit) / Loss on sale of fixed assets (1) 1 (1) (6) (1) (2)(Profit) / Loss on revaluation of investment property 1 (1) (1)Reversal of impairment of associate companies (4) 1 3 Realised gain on available for sale financial assets (9) (1) (2) (4) (3)(Profit) on disposal of subsidiary (232) (34)Impairment of intangible asset 5 Gains on initial recognition of VISA shares (16)Headline earnings 526 496 428 353 330 300 254 204 164 239
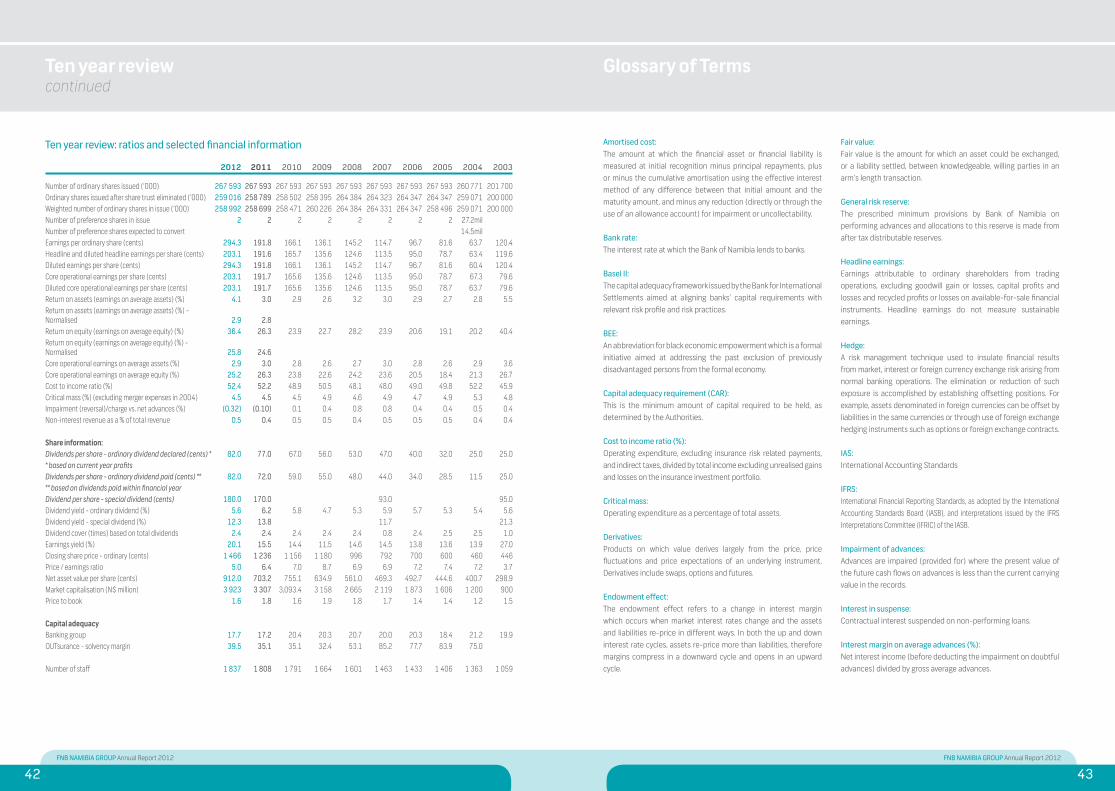
42FNB NAMIBIA GROUP Annual Report 2012
43FNB NAMIBIA GROUP Annual Report 2012
Ten year reviewcontinued
Glossary of Terms
Ten year review: ratios and selected financial information
2012 2011 2010 2009 2008 2007 2006 2005 2004 2003
Number of ordinary shares issued (‘000) 267 593 267 593 267 593 267 593 267 593 267 593 267 593 267 593 260 771 201 700 Ordinary shares issued after share trust eliminated (‘000) 259 016 258 789 258 502 258 395 264 384 264 323 264 347 264 347 259 071 200 000 Weighted number of ordinary shares in issue (‘000) 258 992 258 699 258 471 260 226 264 384 264 331 264 347 258 496 259 071 200 000 Number of preference shares in issue 2 2 2 2 2 2 2 2 27.2milNumber of preference shares expected to convert 14.5milEarnings per ordinary share (cents) 294.3 191.8 166.1 136.1 145.2 114.7 96.7 81.6 63.7 120.4Headline and diluted headline earnings per share (cents) 203.1 191.6 165.7 135.6 124.6 113.5 95.0 78.7 63.4 119.6Diluted earnings per share (cents) 294.3 191.8 166.1 136.1 145.2 114.7 96.7 81.6 60.4 120.4Core operational earnings per share (cents) 203.1 191.7 165.6 135.6 124.6 113.5 95.0 78.7 67.3 79.6Diluted core operational earnings per share (cents) 203.1 191.7 165.6 135.6 124.6 113.5 95.0 78.7 63.7 79.6Return on assets (earnings on average assets) (%) 4.1 3.0 2.9 2.6 3.2 3.0 2.9 2.7 2.8 5.5Return on assets (earnings on average assets) (%) - Normalised 2.9 2.8 Return on equity (earnings on average equity) (%) 36.4 26.3 23.9 22.7 28.2 23.9 20.6 19.1 20.2 40.4Return on equity (earnings on average equity) (%) - Normalised 25.8 24.6 Core operational earnings on average assets (%) 2.9 3.0 2.8 2.6 2.7 3.0 2.8 2.6 2.9 3.6Core operational earnings on average equity (%) 25.2 26.3 23.8 22.6 24.2 23.6 20.5 18.4 21.3 26.7Cost to income ratio (%) 52.4 52.2 48.9 50.5 48.1 48.0 49.0 49.8 52.2 45.9Critical mass (%) (excluding merger expenses in 2004) 4.5 4.5 4.5 4.9 4.6 4.9 4.7 4.9 5.3 4.8Impairment (reversal)/charge vs. net advances (%) (0.32) (0.10) 0.1 0.4 0.8 0.8 0.4 0.4 0.5 0.4Non-interest revenue as a % of total revenue 0.5 0.4 0.5 0.5 0.4 0.5 0.5 0.5 0.4 0.4
Share information:Dividends per share - ordinary dividend declared (cents) * 82.0 77.0 67.0 56.0 53.0 47.0 40.0 32.0 25.0 25.0* based on current year profitsDividends per share - ordinary dividend paid (cents) ** 82.0 72.0 59.0 55.0 48.0 44.0 34.0 28.5 11.5 25.0** based on dividends paid within financial yearDividend per share - special dividend (cents) 180.0 170.0 93.0 95.0Dividend yield - ordinary dividend (%) 5.6 6.2 5.8 4.7 5.3 5.9 5.7 5.3 5.4 5.6Dividend yield - special dividend (%) 12.3 13.8 11.7 21.3Dividend cover (times) based on total dividends 2.4 2.4 2.4 2.4 2.4 0.8 2.4 2.5 2.5 1.0Earnings yield (%) 20.1 15.5 14.4 11.5 14.6 14.5 13.8 13.6 13.9 27.0Closing share price - ordinary (cents) 1 466 1 236 1 156 1 180 996 792 700 600 460 446Price / earnings ratio 5.0 6.4 7.0 8.7 6.9 6.9 7.2 7.4 7.2 3.7Net asset value per share (cents) 912.0 703.2 755.1 634.9 561.0 469.3 492.7 444.6 400.7 298.9Market capitalisation (N$ million) 3 923 3 307 3,093.4 3 158 2 665 2 119 1 873 1 606 1 200 900 Price to book 1.6 1.8 1.6 1.9 1.8 1.7 1.4 1.4 1.2 1.5
Capital adequacyBanking group 17.7 17.2 20.4 20.3 20.7 20.0 20.3 18.4 21.2 19.9OUTsurance - solvency margin 39.5 35.1 35.1 32.4 53.1 85.2 77.7 83.9 75.0
Number of staff 1 837 1 808 1 791 1 664 1 601 1 463 1 433 1 406 1 363 1 059
Amortised cost:The amount at which the financial asset or financial liability is measured at initial recognition minus principal repayments, plus or minus the cumulative amortisation using the effective interest method of any difference between that initial amount and the maturity amount, and minus any reduction (directly or through the use of an allowance account) for impairment or uncollectability.
Bank rate:The interest rate at which the Bank of Namibia lends to banks.
Basel II:The capital adequacy framework issued by the Bank for International Settlements aimed at aligning banks’ capital requirements with relevant risk profile and risk practices.
BEE: An abbreviation for black economic empowerment which is a formal initiative aimed at addressing the past exclusion of previously disadvantaged persons from the formal economy.
Capital adequacy requirement (CAR): This is the minimum amount of capital required to be held, as determined by the Authorities.
Cost to income ratio (%): Operating expenditure, excluding insurance risk related payments, and indirect taxes, divided by total income excluding unrealised gains and losses on the insurance investment portfolio.
Critical mass: Operating expenditure as a percentage of total assets.
Derivatives: Products on which value derives largely from the price, price fluctuations and price expectations of an underlying instrument. Derivatives include swaps, options and futures.
Endowment effect: The endowment effect refers to a change in interest margin which occurs when market interest rates change and the assets and liabilities re-price in different ways. In both the up and down interest rate cycles, assets re-price more than liabilities, therefore margins compress in a downward cycle and opens in an upward cycle.
Fair value: Fair value is the amount for which an asset could be exchanged, or a liability settled, between knowledgeable, willing parties in an arm’s length transaction.
General risk reserve: The prescribed minimum provisions by Bank of Namibia on performing advances and allocations to this reserve is made from after tax distributable reserves.
Headline earnings: Earnings attributable to ordinary shareholders from trading operations, excluding goodwill gain or losses, capital profits and losses and recycled profits or losses on available-for-sale financial instruments. Headline earnings do not measure sustainable earnings.
Hedge:A risk management technique used to insulate financial results from market, interest or foreign currency exchange risk arising from normal banking operations. The elimination or reduction of such exposure is accomplished by establishing offsetting positions. For example, assets denominated in foreign currencies can be offset by liabilities in the same currencies or through use of foreign exchange hedging instruments such as options or foreign exchange contracts.
IAS: International Accounting Standards
IFRS: International Financial Reporting Standards, as adopted by the International Accounting Standards Board (IASB), and interpretations issued by the IFRS Interpretations Committee (IFRIC) of the IASB.
Impairment of advances: Advances are impaired (provided for) where the present value of the future cash flows on advances is less than the current carrying value in the records.
Interest in suspense: Contractual interest suspended on non-performing loans.
Interest margin on average advances (%): Net interest income (before deducting the impairment on doubtful advances) divided by gross average advances.
44FNB NAMIBIA GROUP Annual Report 2012
45FNB NAMIBIA GROUP Annual Report 2012
Glossary of Termscontinued
Annual financial statements
Interest margin on average total assets (%): Net interest income (before deducting the impairment on doubtful advances) divided by average total assets.
Irrevocable facilities: Commitments to extend credit where the group does not have the right to terminate the facilities by written notice. Commitments generally have expiry dates. Since commitments may expire without being drawn upon, the total contract amounts do not necessarily represent future cash requirements.
Loss given default (LGD): The economic loss that will be suffered on an exposure following default of the counterparty, expressed as a percentage of the amount outstanding at the time of default.
Market capitalisation: The group’s closing share price multiplied by the number of shares in issue.
Mark-to-market: Valuation at an appropriate market price, set at arms length between informed, knowledgeable parties, with unrealised profit and losses reflected in income or equity depending on the classification of the instrument.
Non performing loan (NPL): A loan on which the recovery of the contractual interest and capital is doubtful.
Notional value: The principal amount stated in a contract on which future payments will be made or benefits be received.
Off market loans: Loans granted to staff members at lower than market related rates.
Organic growth: Non-acquisition growth.
Portfolio impairments: Impairments to a specific portfolio within the performing lending book, exposed to similar risks.
Present value (PV): The present value of future cash flow discounted at a specific discounting rate.
Return on average equity (ROE) (%): Earnings attributable to ordinary shareholders divided by average ordinary shareholders’ funds.
Probability of default (PD): The probability that a counterparty will default within the next year and considers the likelihood of the counterparty to repay.
Return on average total assets (ROA) (%): Earnings attributable to ordinary shareholders divided by average total assets.
Share based payments: Transfers of a company’s equity instruments by its shareholders to parties that have supplied goods or services to the company (including employees).
Shareholder value: The underlying principle used by management in making business decisions which ensures that returns exceed the cost of capital for shareholders.
SME: Small and medium enterprise
Strike price: The price at which employees, allocated share options, can buy their shares from the share incentive trust.
46FNB NAMIBIA GROUP Annual Report 2012
47FNB NAMIBIA GROUP Annual Report 2012
Directors’ responsibility statement 47
Report of the audit committee to shareholders 48
Independent auditor’s report to the members of FNB Namibia Holdings Ltd 49
Directors’ report 50
Principal accounting policies 52
Group annual financial statements 72
Company annual financial statements 158
Directors’ responsibility statement
To the members of FNB Namibia Holdings Limited
These consolidated annual financial statements are the responsibility of the company’s directors. We also acknowledge responsibility for establishing accounting procedures that provide for the maintenance of documentation sufficient to support the consolidated annual financial statements. These consolidated annual financial statements present fairly the financial position, results of operations and cash flows of the group and company in accordance with International Financial Reporting Standards (“IFRS”) and in the manner required by the Companies Act of Namibia and have been prepared on bases consistent with those of the prior year, except where specifically disclosed in the consolidated annual financial statements. The consolidated annual financial statements incorporate full and responsible disclosure in line with the group’s philosophy on corporate governance and as required by the Namibian Stock Exchange.
The directors have reviewed the appropriateness of the accounting policies, and concluded that estimates and judgements are prudent.
The directors report that the group’s internal controls are designed to provide reasonable assurance as to the integrity and reliability of the financial statements, to adequately safeguard, verify and maintain accountability of assets and to prevent and detect fraudulent financial reporting. Such controls are based on established written policies and procedures. They are implemented by trained, skilled personnel with an appropriate segregation of duties and are monitored throughout the group.
The board members and employees are required to maintain the highest ethical standards and the group’s business practices are required to be conducted in a manner that is above reproach. The board has adopted and is committed to the principles in the King III report on Corporate Governance. The board is responsible for internal controls. The controls throughout the group are directed towards
risk areas. These areas are identified by operational management, confirmed by group management and tested by the internal auditors. All controls relating to these critical risk areas are closely monitored and subject to audit.
Nothing has come to the attention of the directors to indicate that any material breakdown in the functioning of these internal financial controls occurred during the year.
The directors have reviewed the group’s budget for the year to 30 June 2013. On the basis of this review and in the light of the current financial position, the directors have no reason to believe that FNB Namibia Holdings Limited and its subsidiaries will not be a going concern for the foreseeable future. The going concern basis has therefore been adopted in preparing the financial statements.
The group’s external auditors, Deloitte & Touche, have audited the financial statements and their report appears on page 49. The consolidated annual financial statements of the group and company, which appear on pages 45 to 167 have been approved by the board of directors and are signed on its behalf by:
C J Hinrichsen Chairman
Adv VR RukoroChief Executive Officer
Windhoek16 August 2012
Contents
48FNB NAMIBIA GROUP Annual Report 2012
49FNB NAMIBIA GROUP Annual Report 2012
The audit committee comprises of a majority of independent non-executive directors and it meets no less than four times a year. The chairperson of the audit committee is an independent non-executive director and not the chairperson of the board.
The primary function of the audit committee is to assist the board in fulfilling its responsibilities by monitoring decisions and processes designed to ensure that the group’s financial and computer system provide reliable, accurate and up-to-date information to support the current financial position and that the published consolidated annual financial statements represent a fair reflection of its financial position. It also ensures that appropriate accounting policies, control and compliance procedures are in place. The head of internal audit and the external auditors attend its meetings and have unrestricted access to the chairman of the committee.
In carrying out its responsibilities the committee has full authority to investigate all matters that fall within its terms of reference. Accordingly, the committee may:
- Obtain independent professional advice in the satisfaction of its duties at the cost of the group; and
- Have such direct access to the resources of the group as it may reasonably require including the external and internal auditors.
The primary objectives of the committee are:
1. To assist the board of directors in its evaluation of the adequacy and efficiency of the internal control systems, accounting
practices, information systems and auditing processes applied in a day-to-day management of the business;
2. To review accounting principles, policies and practices adopted in preparation of public financial information;
3. To review with external auditors the scope and results of their audit, as well as the review and approval of audit fee’s and nomination of auditors for appointment by shareholders;
4. To provide a forum for communication between the board of directors, management and the internal and external auditors; and
5. To introduce such measures as in the committee’s opinion may serve to enhance the credibility and objectivity of the consolidated annual financial statements and affairs of the group.
The committee has met its objectives, has found no material weaknesses in controls, and is satisfied with the level of disclosure to it and to the stakeholders.
S H MoirChairman
Windhoek15 August 2012
Report of the audit committee to shareholders
We have audited the group annual financial statements and the annual financial statements of FNB Namibia Holdings Limited, which comprise the consolidated and separate statements of financial position as at 30 June 2012, and the consolidated and separate statements of comprehensive income, the consolidated and separate statements of changes in equity and consolidated and separate statements of cash flows for the year then ended, a summary of significant accounting policies and other explanatory notes and the directors’ report, as set out on pages 50 to 167.
Directors’ responsibility for the financial statements
The company’s directors are responsible for the preparation and fair presentation of these financial statements in accordance with International Financial Reporting Standards, and in the manner required by the Companies Act of Namibia, and for such internal control as the directors determine is necessary to enable the preparation of financial statements that are free from material misstatement, whether due to fraud or error.
Auditor’s responsibility
Our responsibility is to express an opinion on these financial statements based on our audit. We conducted our audit in accordance with International Standards on Auditing. Those standards require that we comply with ethical requirements and plan and perform the audit to obtain reasonable assurance whether the financial statements are free from material misstatement.
An audit involves performing procedures to obtain audit evidence about the amounts and disclosures in the financial statements. The procedures selected depend on the auditor’s judgement, including the assessment of the risks of material misstatement of the financial statements, whether due to fraud or error. In making those risk assessments, the auditor considers internal control relevant to the entity’s preparation and fair presentation of the financial statements in order to design audit procedures that are appropriate in the circumstances, but not for the purpose of expressing an opinion on the effectiveness of the entity’s internal control. An audit also includes evaluating the appropriateness of accounting policies
used and the reasonableness of accounting estimates made by management, as well as evaluating the overall presentation of the financial statements.
We believe that the audit evidence we have obtained is sufficient and appropriate to provide a basis for our audit opinion.
Opinion
In our opinion, these financial statements present fairly, in all material respects, the consolidated and separate financial position of FNB Namibia Holdings Limited as at 30 June 2012, and its consolidated and separate financial performance and consolidated and separate cash flows for the year then ended in accordance with International Financial Reporting Standards, and in the manner required by the Companies Act in Namibia.
Deloitte & ToucheRegistered Accountants and AuditorsChartered Accountants (Namibia)ICAN practice number: 9407
Per RH Mc DonaldPartner
PO Box 47, Windhoek, Namibia3 September 2012
Regional executives: LL Bam (Chief Executive), A Swiegers (Chief Operating Officer), GM Pinnock
Resident partners: VJ Mungunda (Managing Partner), RH Mc Donald, J Kock, H de Bruin, J Cronje, A Akayombokwa
Director:G Brand
Independent auditor’s report To the members of FNB Namibia Holdings Limited
50FNB NAMIBIA GROUP Annual Report 2012
51FNB NAMIBIA GROUP Annual Report 2012
Nature of business
FNB Namibia Holdings Limited is the holding company of the FNB Namibia group of companies. Its main investments remain unchanged from the prior year, except for the sale of Momentum Life Assurance Namibia Limited on 29 June 2012 and the additional 60% acquisition of FNB Insurance Brokers (Pty) Ltd on 1 July 2011, increasing the group’s holding in the company from 40% to 100%.
The shareholdings are:
* First Asset Management & Trust Company of Namibia (Pty) Ltd’s name was changed to FNB Trust Services Namibia (Pty) Ltd
Share capital
The company’s authorised share capital remained unchanged at N$ 5 million.
The company’s authorised share capital at year-end consists of 990 000 000 (2011: 990 000 000) ordinary shares of 0,5 cents each and 10 000 000 (2011: 10 000 000) cumulative convertible redeemable preference shares of 0,5 cents each.
The issued ordinary share capital remained unchanged at 267 593 250 ordinary shares and 2 cumulative convertible redeemable preference shares.
At the annual general meeting to be held on 28 November 2012, members will be asked to consider an ordinary resolution placing the number of un-issued ordinary and preference shares, exclusive of the number of shares reserved for purposes of the share incentive scheme as at that date, under the control of the directors as is currently the case, until the next annual general meeting.
Share analysis – ordinary shares
Based on information disclosed by the Namibian Stock Exchange and investigations conducted on behalf of the company, the following shareholders have a beneficial interest of 5% or more in the issued ordinary shares of the company:
FirstRand EMA Holdings Ltd 58.4% (2011: 58.4%)Government Institutions Pension Fund 14.8% (2011: 14.7%)
A detailed analysis of shareholders is set out on page 192.
Share analysis – preference shares
RMB-SI Investments (Pty) Ltd 100% (2011: 100%)
FNB Share Incentive Scheme (the trust)
No new shares were allocated during the year by the company to the trust (2011: nil). Staff exercised options on 2 056 000 (2011: 1 294 000) shares during the year. The total number of shares held by the trust at 30 June 2012 amounts to 8 077 465 (2011: 8 304 597). Also refer to notes 8.2 and 31 of the annual financial statements.
Dividends
The following dividends were declared in respect of the current and previous financial years:
Director’s interest in FNB Namibia Holdings Ltd
Details of the directors’ holdings in the issued ordinary shares of FNB Namibia Holdings Limited are reflected in note 6.3 to the annual financial statements.
Directors’ report
N$’000 2012 2011
Ordinary dividends
Final dividend of 41 cents (2011: 41 cents) 109 713 109 713
Interim dividend of 41 cents (2011: 36 cents) 109 713 96 334
Total distribution for the 12 months of 82 cents per ordinary share (2011: 77 cents per ordinary share) 219 426 206 047
Special dividends
A special dividend of 180 (2011: 170 cents) cents per ordinary share 481 668 454 909
- First National Bank of Namibia Ltd: a registered bank offering a full range of banking services
100%
- FNB Insurance Brokers (Namibia) (Pty) Ltd: a short-term insurance broking company
100%
- OUTsurance Insurance Company Ltd: a short-term insurance company
51%
- Talas Properties (Windhoek) (Pty) Ltd: a property-owning company
100%
- FNB Trust Services (Namibia) (Pty) Ltd: administration of deceased estates*
100%
- FNB Namibia Unit Trusts Ltd: a unit trusts management company
100%
Interest of directors
At no time during the financial year were any contracts of significance entered into relative to the group’s business in which a director had an interest.
Group results
The financial statements on pages 72 to 167 set out fully the financial position, results of operations and cash flows of the company and the group. Your attention is also drawn to the chairman’s report, the chief executive officer’s report and the chief financial officer’s report on the financial results on pages 34 to 39.
Directorate
At the group’s annual general meeting held on 24 November 2011, directors J R Kethe, M N Ndilula and P T Nevonga, who retired by rotation in accordance with the provisions of the company’s articles of association, made themselves available for re-election and were duly re-elected. The composition of the board of FNB Namibia Holdings Limited is as follows:
• C J Hinrichsen # (Chair) • C L R Haikali• J R Khethe* • J K Macaskill * • S H Moir * • M N Ndilula• P T Nevonga • Adv VR Rukoro (CEO) • I I Zaamwani-Kamwi (Ms)
# German * South African
All directors appointed since the last annual general meeting have to be confirmed at the next annual general meeting.
Directors’ emoluments
Directors’ emoluments are disclosed in note 6.1 to the annual financial statements.
Management by third parties
No part of the business of the company or of its subsidiary companies has been managed by a third party or by a company in which a director had a direct or indirect interest during this financial year.
Insurance
Comprehensive cover in respect of the bankers’ bond, computer crime and professional indemnity risk is in place.Property and equipment
There was no material change in the nature of property and equipment or in the policy regarding its use during the year.
Holding company
The holding company of FNB Namibia Holdings Limited is FirstRand EMA Holdings Limited and its ultimate holding company is FirstRand Limited, both of which are incorporated in the Republic of South Africa.
Subsidiaries
Interest in and aggregate profits of subsidiaries are set out in note 36.6 to the annual financial statements.
Special resolutions
A special resolution is proposed at the AGM on 28 November 2012 to retract Clause 26.1 of the Articles of Association and replace with:
26.1 The Directors may from time to time declare a dividend in accordance with Section 28 of the Banking Institutions Act, to be paid to the shareholders in proportion to the number of shares held by them in each class, as appear to the directors to be justified by the profits of the company. Dividends shall be declared payable to members registered as such on a date subsequent to the date of the declaration of the dividend or the date of confirmation of the dividend, whichever is later, in further compliance with any rules of the Namibian Stock Exchange or rules of any stock exchange to which the company is listed.
Reason: To align the companies articles with current legislation and developments in Corporate Governance.
Effect: The effect of the above change in the Articles of Association of the company would be that the Articles of Association would be aligned with current legislation and Corporate Governance practices.
Company secretary and registered offices
Company secretary: Y KatjiruaRegistered office: 209 Independence Avenue, Windhoek, NamibiaPostal address: P O Box 195, Windhoek, Namibia
Events subsequent to the reporting date
There are no material events subsequent to the reporting date to report.