Embed Size (px)
Citation preview
Annual Report 2011/2012VOTE 35
Department of Tourism
1
Table of Contents
1. Foreword by the Director-General 2
2. Statement by the Minister 3
3. Statement by the Deputy Minister 5
4. Information on the Ministry 7
5. Legal and Constitutional Mandate 14
6. Vision, Mission and Values 16
7. Executive Management 17
8. AccountingOfficer’sOverview 18
9. Public Entity Reporting to the Minister of Tourism 20
10. Programme Performance Report 22
11. Programme 1: Administration 22
12. Programme 2: Tourism Development 28
13. Programme 3: Tourism Growth 35
14. Programme 4: Policy, Research,
Monitoring and Evaluation 43
15. Annual Financial Statements 52
16. Human Resources Oversight 123
17. Acronyms and Abbreviations 151
18. Contact Details 154
FRONT COVER PICTURE: Tourism House, Department of Tourism - Pretoria
NDT Annual Report 2011/12
NDT Annual Report 2011/12
2
In terms of section 40 (1) (d) of the Public
Finance Management Act (PFMA), 1999 and
the Treasury Regulations paragraph 18.2,1 the
accounting authority of a department must
submit an annual report with audited financial
statementsand theAuditor-General’s report,
to the relevant executive authority, for tabling
in Parliament.
This report complies with all statutory reporting
requirements for the National Department
of Tourism (NDT). It gives assurance that
government resources were used in a
manner consistent with applicable corporate
governance principles to deliver services for
which the resources were allocated.
In my capacity as the accounting officer of
the National Department of Tourism, I hereby
formally submit to you as the Executive
Authority, the NDT’s annual report with
audited financial statements and the Auditor-
General’s report for the 2011/2012 financial
year for tabling in Parliament.
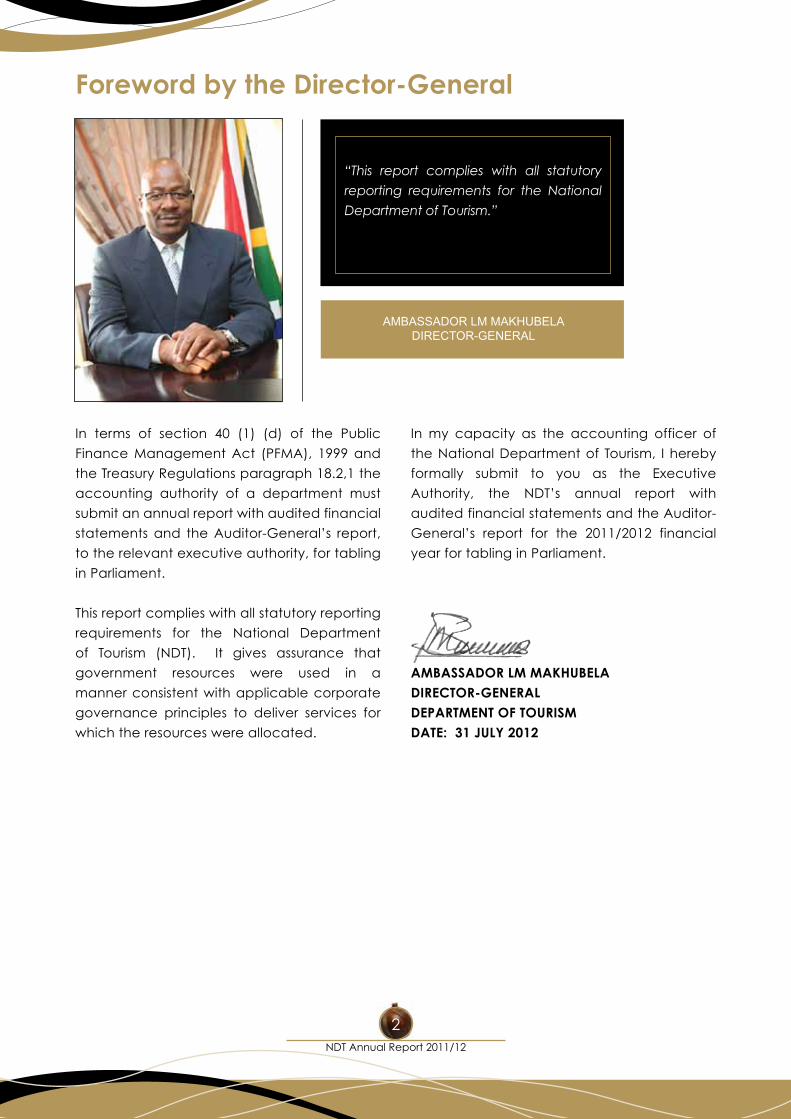
AMBASSADOR LM MAKHUBELADIRECTOR-GENERALDEPARTMENT OF TOURISMDATE: 31 JULY 2012
AMBASSADOR LM MAKHUBELADIRECTOR-GENERAL
“This report complies with all statutory
reporting requirements for the National
Department of Tourism.”
Foreword by the Director-General
3
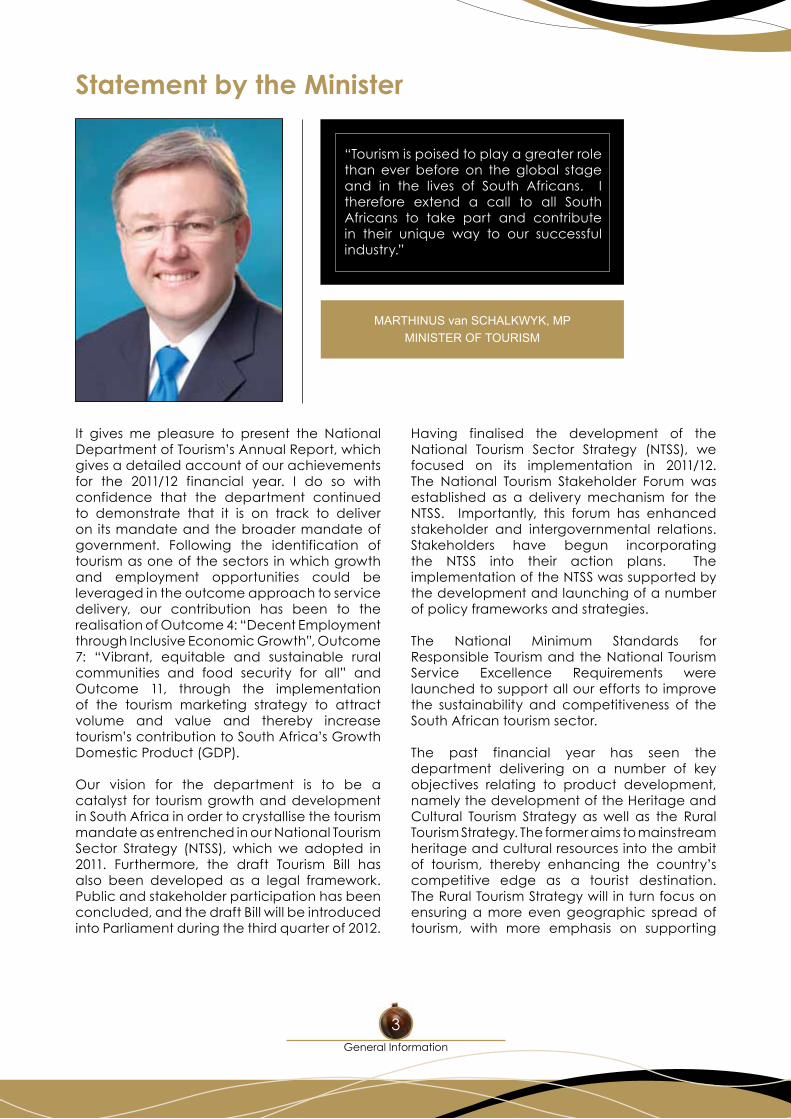
MARTHINUS van SCHALKWYK, MPMINISTER OF TOURISM
“Tourism is poised to play a greater role than ever before on the global stage and in the lives of South Africans. I therefore extend a call to all South Africans to take part and contribute in their unique way to our successful industry.”
Statement by the Minister
It gives me pleasure to present the National DepartmentofTourism’sAnnualReport,whichgives a detailed account of our achievements for the 2011/12 financial year. I do so with confidence that the department continued to demonstrate that it is on track to deliver on its mandate and the broader mandate of government. Following the identification of tourism as one of the sectors in which growth and employment opportunities could be leveraged in the outcome approach to service delivery, our contribution has been to the realisation of Outcome 4: “Decent Employment through Inclusive Economic Growth”, Outcome 7: “Vibrant, equitable and sustainable rural communities and food security for all” and Outcome 11, through the implementation of the tourism marketing strategy to attract volume and value and thereby increase tourism’scontributiontoSouthAfrica’sGrowthDomestic Product (GDP).
Our vision for the department is to be a catalyst for tourism growth and development in South Africa in order to crystallise the tourism mandate as entrenched in our National Tourism Sector Strategy (NTSS), which we adopted in 2011. Furthermore, the draft Tourism Bill has also been developed as a legal framework. Public and stakeholder participation has been concluded, and the draft Bill will be introduced into Parliament during the third quarter of 2012.
Having finalised the development of the National Tourism Sector Strategy (NTSS), we focused on its implementation in 2011/12. The National Tourism Stakeholder Forum was established as a delivery mechanism for the NTSS. Importantly, this forum has enhanced stakeholder and intergovernmental relations. Stakeholders have begun incorporating the NTSS into their action plans. The implementation of the NTSS was supported by the development and launching of a number of policy frameworks and strategies.
The National Minimum Standards for Responsible Tourism and the National Tourism Service Excellence Requirements were launched to support all our efforts to improve the sustainability and competitiveness of the South African tourism sector.
The past financial year has seen the department delivering on a number of key objectives relating to product development, namely the development of the Heritage and Cultural Tourism Strategy as well as the Rural Tourism Strategy. The former aims to mainstream heritage and cultural resources into the ambit of tourism, thereby enhancing the country’scompetitive edge as a tourist destination. The Rural Tourism Strategy will in turn focus on ensuring a more even geographic spread of tourism, with more emphasis on supporting
General Information
NDT Annual Report 2011/12
4
tourism growth in rural areas. Through this strategy, the department will provide support with tourism infrastructure development, particularly where community-led initiatives emerge. The department will further support the tourism skills base and will assist with market access in support of sustainable, community-led economies and labour absorption into the market.
The department continued with the implementation of Social Responsibility Implementation projects as part of the Expanded Public Works Programme (EPWP), focussing on the implementation of labour intensive tourism infrastructure projects and skills development targeting the unemployed, youth, women and people living with disability.
Tourism Enterprise Partnership (TEP) continued to yield positive results on enterprise development and small, medium and micro enterprises (SMME) support focusing on small rural enterprises and Historically Disadvantaged Enterprises (HDE). The growth of such enterprises was supported through, amongst other initiatives, skills development training and market access.
We have launched the Domestic Tourism Growth Strategy to assert the role of domestic tourism as an anchor for tourism growth in South Africa. The main objective is to promote local travel, motivate for the provision of affordable tourism products and packages that encourage low to medium income earners to take more holidays. The strategy aims to increase domestic tourism revenue, expand domestic tourism volume, enhance efforts to address seasonality and equitable geographic spread of domestic travel, and entrench a culture of tourism among South Africans.
As a department we continued maximising the value of our participation in a number of international and regional tourism platforms. Our cooperation with African partners continued in order to contribute to the economic prosperity of our continent through tourism. We participated at multilateral tourism forums such as the United Nations World
Tourism Organisation (UNWTO) and T20 as part of our contribution in building a better Africa and a better world.
In May 2011, President Jacob Zuma signed the United Nations World Tourism Organisation’s“Golden Book” on the sidelines of the World Economic Forum on Africa, which was attended by more than 900 participants from 60 countries. This initiative is aimed at mobilising recognition and support for the tourism sector from world leaders by demonstrating travel andtourism’scrucialroleineconomicgrowth,job creation and development. The signing of the “Golden Book” took promotion of the growing South African tourism industry to new heights.
Interaction and cooperation with our neighbouring countries continue to yield positive results for both parties as we learn from and support each other in implementing our respective programmes. During the period under review we had mutual beneficial engagements with Lesotho, Mozambique, Swaziland and Zimbabwe.
I would like to thank the department’smanagement and its entire staff for these achievements. The significant role that is played by all our partners in the tourism sector is much appreciated. Tourism is poised to play a greater role than ever before on the global stage and in the lives of South Africans. I therefore extend a call to all South Africans to take part and contribute in their unique way to our successful industry. As we have always said, achievement of the National Tourism Sector Strategy (NTSS) targets is only possible through a collaborative effort by all tourism stakeholders. We have to take hands to leverage the strength and depth of our industry.
MARTHINUS van SCHALKWYKMINISTER OF TOURISMREPUBLIC OF SOUTH AFRICA
5
This Annual Report presents an account of the implementation of the department’s AnnualPerformance Plan for the year under review, with a clear indication of achievements and reasons for variance where necessary. The report affords the department an opportunity to reflect on the work done in realising our objectives and goals, to learn from our experiences and also to improve our performance.
On the basis that Tourism is one of the key priority sectors identified in driving economic growth and job creation, the National Department of Tourism (NDT) played an important role in coordinating the participation of both the private and public sectors to contribute to the development of an inclusive and transformed economy. The department’s achievementswere possible through collaboration with a wide range of role players in the tourism sector, as well as the dedication and hard work of the NDT’smanagementandstaff.
As a labour-intensive sector with a potential to create jobs, tourism is participating in the Expanded Public Works Programme (EPWP). Through this programme, the department has created 5 036 Full Time Equivalent jobs. The department, together with all relevant
stakeholders, will continue to accelerate efforts to increase job and entrepreneurial opportunities in the tourism sector.
In recognition of the long-term goal of establishing South Africa as the world’sdestination of choice in terms of excellent customer service, the National Tourism Service Excellence Requirements were developed and launched. The aim of these Requirements is to set national standards, which will create a platform for service providers to deliver and maintain quality service, and create an experience that equals or surpasses world standards for tourists.
The National Tourism Sector Strategy (NTSS) requires us to promote responsible tourism best practice. In response to this, the National Responsible Tourism Strategy and the Universal Accessibility Action Plan were developed and successfully launched. Furthermore, systems have been put in place to support the sector to be Universal Access (UA) compliant. The UA grading has been integrated to form part of the standard of the Tourism Grading Council of South Africa (TGCSA). These will enhance SouthAfrica’sglobalcompetitivenessasaUAdestination.
“The report affords the department an opportunity to reflect on the work done in realising our objectives and goals, to learn from our experiences and also to improve our performance.”
TOKOZILE XASA, MPDEPUTY MINISTER OF TOURISM
Statement by the Deputy Minister
General Information
NDT Annual Report 2011/12
6
The department, in partnership with the sector, education and training authority has implemented various training interventions targeted at improving skills in the tourism sector with the aim of creating a competitive skills base. In recognition of this, the department hosted the National Tourism Careers Expo (NTCE), which is an annual event where young people from high schools, Further Education Training (FET) colleges and universities are exposed to existing professional and career opportunities within the tourism industry. The event also exposes the tourism industry to the skills of our young people, skills that the industry could harness and benefit from.
The department also implemented the National Youth Chefs Training Programme (NYCTP) in partnership with the South African Chefs Association (SACA). A total of 818 youth were enrolled into the programme and 536 graduated from the programme. In addition, 422 unemployed young people were trained and placed in the various hospitality fields, 1 221 were enrolled and 1 170 placed for experiential learning as Tourist Buddies.
As a result of the department’s programmeto encourage public sector organisations to report on levers they use to drive transformation, 44 reports were received. The system for monitoring compliance with BEE rating was piloted and is now operational. In addition, the department conducted nationwide workshops for Supply Chain Management officials, as well as public and private sector tourism associations on the implementation of the aligned BBBEE and Preferential Procurement Policy Framework Act (PPPFA) policies.
To support the participation and growth of Small Medium and Micro Enterprises, the department initiated a mentorship programme in which two black owned tourism enterprises were mentored as a pilot project. Twenty SMMEs were subsequently recruited into the programme. These enterprises will be mentored by retired business executives,
facilitated by African Management Services Corporation (AMSCO).
The Rural Tourism Strategy and Heritage and Cultural Tourism Strategy were developed in order to ensure the geographic spread of tourism to rural areas and the involvement of rural communities. Designated groups and rural enterprises were supported.
In recognising the importance of Local Government participation in the successful implementation of our strategies and in promoting synergy across the three spheres of government, a Local Government Tourism Development and Growth Support Programme were developed in consultation with a Working Group structure. The department also hosted National Stakeholder Forums to improve integration and alignment.
The department developed communications initiatives to keep in touch with South Africans as well as to reach out and raise awareness of the opportunities in the tourism sector.
In conclusion, the department is looking forward to continue working with our partners and role-players in pursuit of the objectives of the National Tourism Sector Strategy and to enhance our endeavours in making South Africa a global competitive destination.
MS TOKOZILE XASA, MPDEPUTY MINISTER OF TOURISM
7
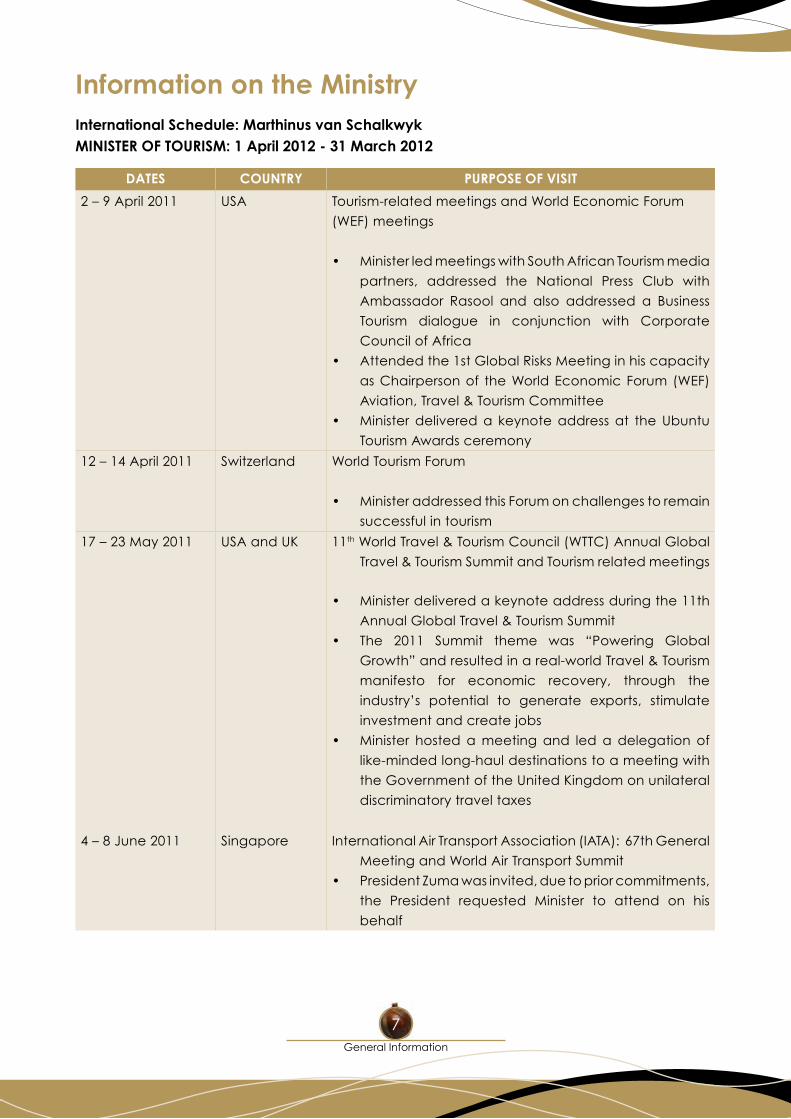
International Schedule: Marthinus van SchalkwykMINISTER OF TOURISM: 1 April 2012 - 31 March 2012
DATES COUNTRY PURPOSE OF VISIT
2 – 9 April 2011 USA Tourism-related meetings and World Economic Forum
(WEF) meetings
• MinisterledmeetingswithSouthAfricanTourismmedia
partners, addressed the National Press Club with
Ambassador Rasool and also addressed a Business
Tourism dialogue in conjunction with Corporate
Council of Africa
• Attendedthe1stGlobalRisksMeetinginhiscapacity
as Chairperson of the World Economic Forum (WEF)
Aviation, Travel & Tourism Committee
• Ministerdelivereda keynoteaddressat theUbuntu
Tourism Awards ceremony
12 – 14 April 2011 Switzerland World Tourism Forum
• MinisteraddressedthisForumonchallengestoremain
successful in tourism
17 – 23 May 2011 USA and UK 11th World Travel & Tourism Council (WTTC) Annual Global
Travel & Tourism Summit and Tourism related meetings
• Ministerdeliveredakeynoteaddressduringthe11th
Annual Global Travel & Tourism Summit
• The 2011 Summit theme was “Powering Global
Growth” and resulted in a real-world Travel & Tourism
manifesto for economic recovery, through the
industry’s potential to generate exports, stimulate
investment and create jobs
• Minister hostedameetingand ledadelegation of
like-minded long-haul destinations to a meeting with
the Government of the United Kingdom on unilateral
discriminatory travel taxes
4 – 8 June 2011 Singapore International Air Transport Association (IATA): 67th General
Meeting and World Air Transport Summit
• PresidentZumawasinvited,duetopriorcommitments,
the President requested Minister to attend on his
behalf
Information on the Ministry
General Information
NDT Annual Report 2011/12
8
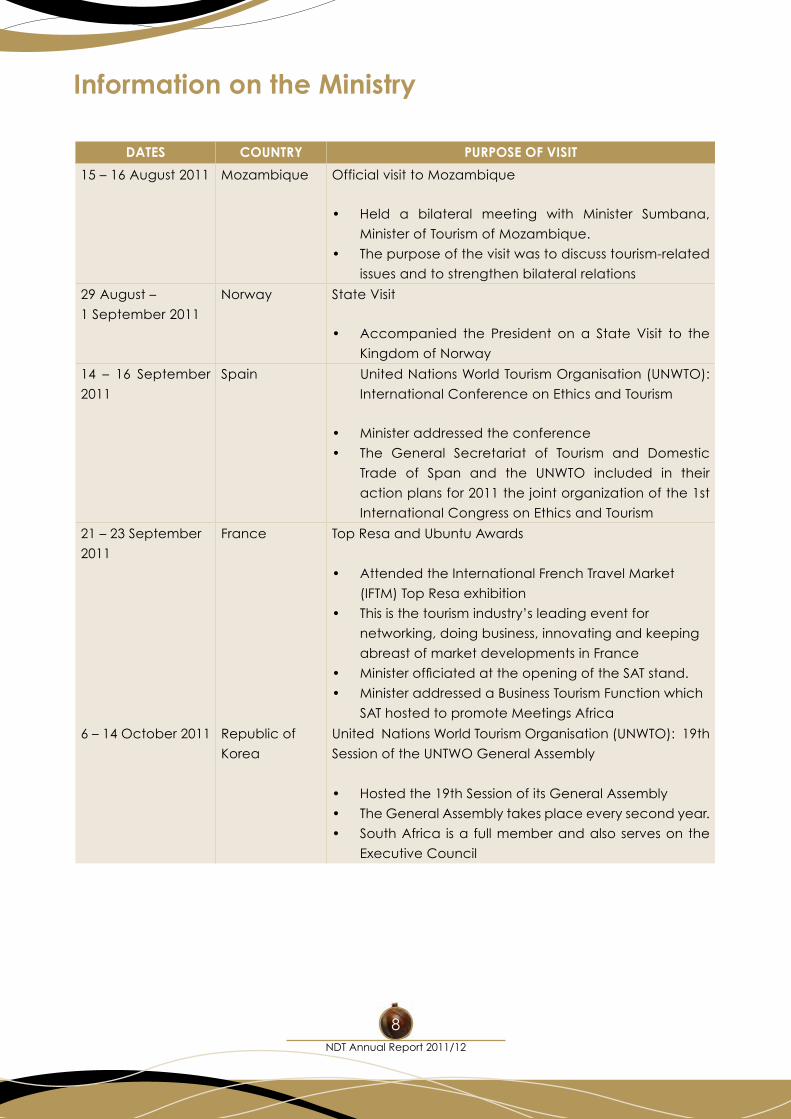
DATES COUNTRY PURPOSE OF VISIT
15 – 16 August 2011 Mozambique Official visit to Mozambique
• Held a bilateral meeting with Minister Sumbana,
Minister of Tourism of Mozambique.
• Thepurposeofthevisitwastodiscusstourism-related
issues and to strengthen bilateral relations
29 August –
1 September 2011
Norway State Visit
• Accompanied the President on a State Visit to the
Kingdom of Norway
14 – 16 September
2011
Spain United Nations World Tourism Organisation (UNWTO):
International Conference on Ethics and Tourism
• Ministeraddressedtheconference
• The General Secretariat of Tourism and Domestic
Trade of Span and the UNWTO included in their
action plans for 2011 the joint organization of the 1st
International Congress on Ethics and Tourism
21 – 23 September
2011
France Top Resa and Ubuntu Awards
• AttendedtheInternationalFrenchTravelMarket
(IFTM) Top Resa exhibition
• Thisisthetourismindustry’sleadingeventfor
networking, doing business, innovating and keeping
abreast of market developments in France
• MinisterofficiatedattheopeningoftheSATstand.
• MinisteraddressedaBusinessTourismFunctionwhich
SAT hosted to promote Meetings Africa
6 – 14 October 2011 Republic of
Korea
United Nations World Tourism Organisation (UNWTO): 19th
Session of the UNTWO General Assembly
• Hostedthe19thSessionofitsGeneralAssembly
• TheGeneralAssemblytakesplaceeverysecondyear.
• SouthAfrica isa fullmemberandalsoserveson the
Executive Council
Information on the Ministry
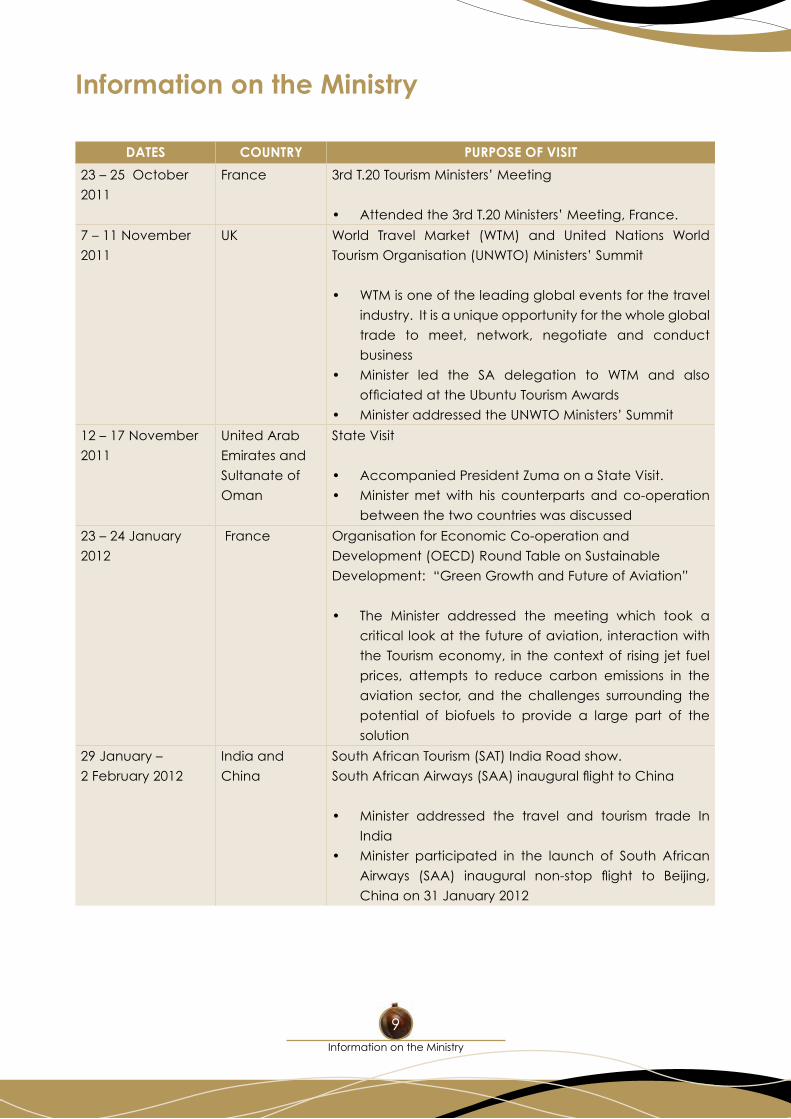
9
DATES COUNTRY PURPOSE OF VISIT
23 – 25 October
2011
France 3rdT.20TourismMinisters’Meeting
• Attendedthe3rdT.20Ministers’Meeting,France.
7 – 11 November
2011
UK World Travel Market (WTM) and United Nations World
TourismOrganisation(UNWTO)Ministers’Summit
• WTMisoneoftheleadingglobaleventsforthetravel
industry. It is a unique opportunity for the whole global
trade to meet, network, negotiate and conduct
business
• Minister led the SA delegation to WTM and also
officiatedattheUbuntuTourismAwards
• MinisteraddressedtheUNWTOMinisters’Summit
12 – 17 November
2011
United Arab
Emirates and
Sultanate of
Oman
State Visit
• AccompaniedPresidentZumaonaStateVisit.
• Ministermetwith his counterparts and co-operation
between the two countries was discussed
23 – 24 January
2012
France Organisation for Economic Co-operation and
Development (OECD) Round Table on Sustainable
Development: “Green Growth and Future of Aviation”
• The Minister addressed the meeting which took a
critical look at the future of aviation, interaction with
the Tourism economy, in the context of rising jet fuel
prices, attempts to reduce carbon emissions in the
aviation sector, and the challenges surrounding the
potential of biofuels to provide a large part of the
solution
29 January –
2 February 2012
India and
China
South African Tourism (SAT) India Road show.
SouthAfricanAirways(SAA)inauguralflighttoChina
• Minister addressed the travel and tourism trade In
India
• Minister participated in the launch of South African
Airways (SAA) inaugural non-stop flight to Beijing,
China on 31 January 2012
Information on the Ministry
Information on the Ministry
NDT Annual Report 2011/12
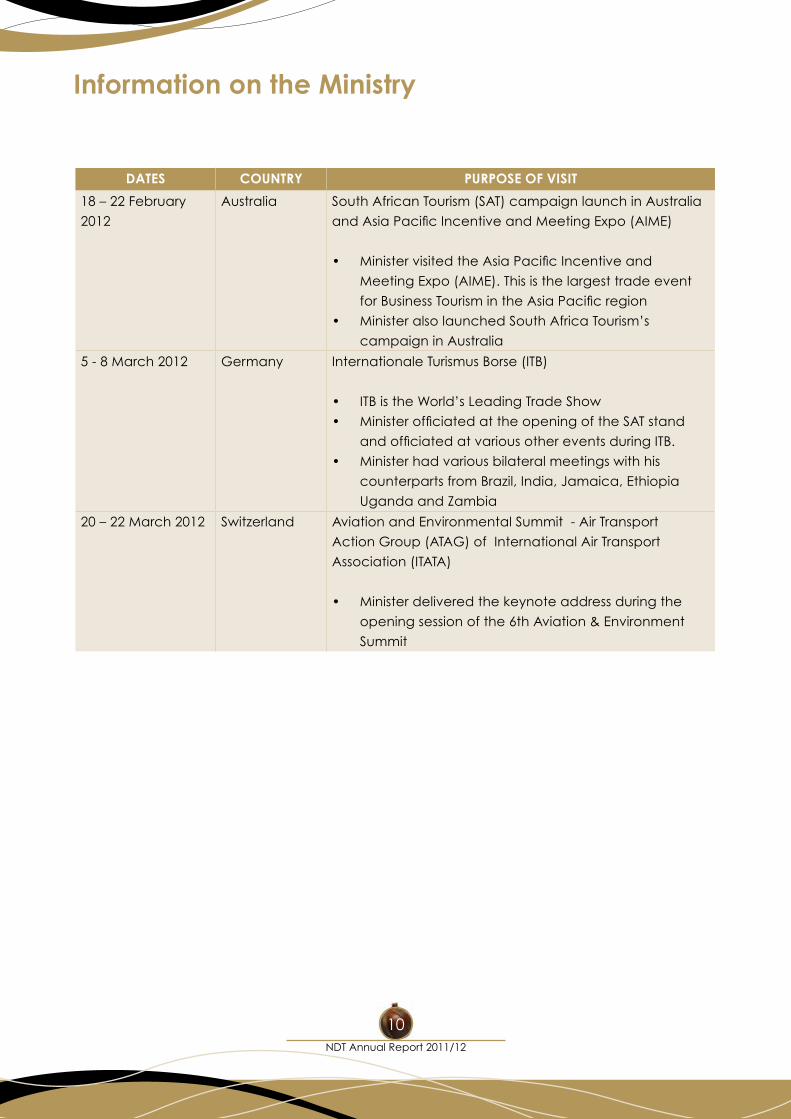
10
DATES COUNTRY PURPOSE OF VISIT
18 – 22 February
2012
Australia South African Tourism (SAT) campaign launch in Australia
andAsiaPacificIncentiveandMeetingExpo(AIME)
• MinistervisitedtheAsiaPacificIncentiveand
Meeting Expo (AIME). This is the largest trade event
forBusinessTourismintheAsiaPacificregion
• MinisteralsolaunchedSouthAfricaTourism’s
campaign in Australia
5 - 8 March 2012 Germany Internationale Turismus Borse (ITB)
• ITBistheWorld’sLeadingTradeShow
• MinisterofficiatedattheopeningoftheSATstand
andofficiatedatvariousothereventsduringITB.
• Ministerhadvariousbilateralmeetingswithhis
counterparts from Brazil, India, Jamaica, Ethiopia
Uganda and Zambia
20 – 22 March 2012 Switzerland Aviation and Environmental Summit - Air Transport
Action Group (ATAG) of International Air Transport
Association (ITATA)
• Ministerdeliveredthekeynoteaddressduringthe
opening session of the 6th Aviation & Environment
Summit
Information on the Ministry
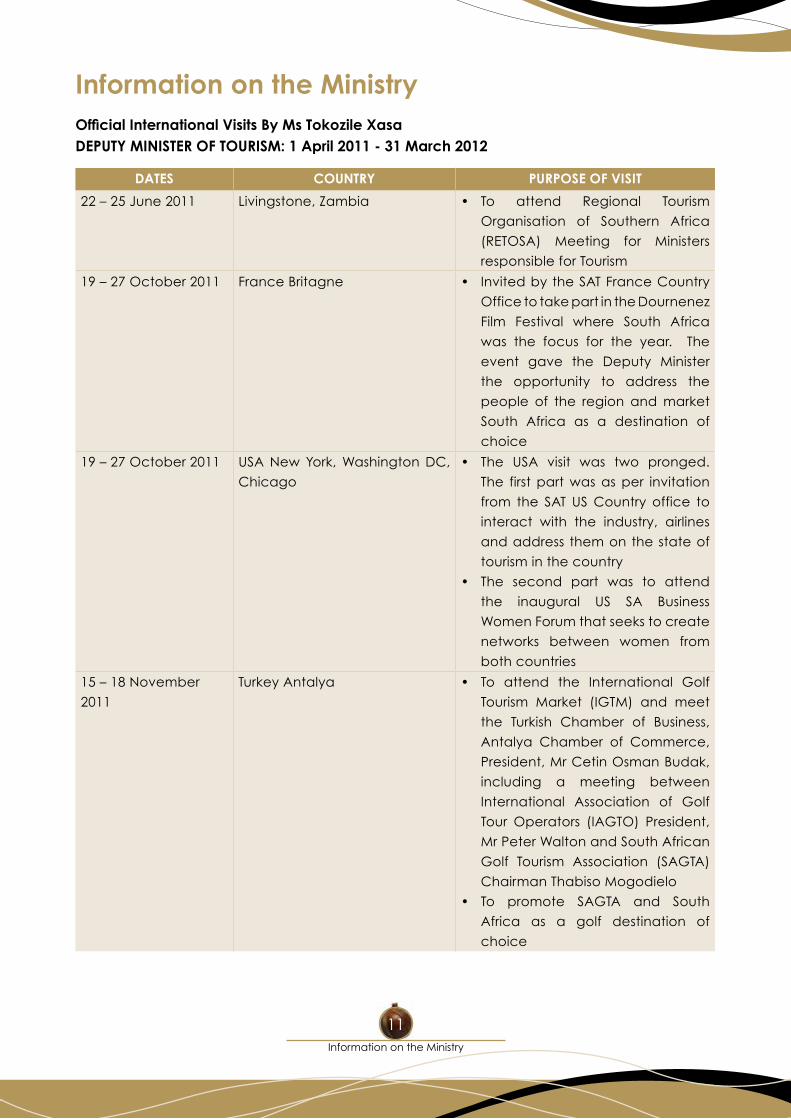
11
Official International Visits By Ms Tokozile XasaDEPUTY MINISTER OF TOURISM: 1 April 2011 - 31 March 2012
DATES COUNTRY PURPOSE OF VISIT
22 – 25 June 2011 Livingstone, Zambia • To attend Regional Tourism
Organisation of Southern Africa
(RETOSA) Meeting for Ministers
responsible for Tourism
19 – 27 October 2011 France Britagne • InvitedbytheSATFranceCountry
Office to take part in the Dournenez
Film Festival where South Africa
was the focus for the year. The
event gave the Deputy Minister
the opportunity to address the
people of the region and market
South Africa as a destination of
choice
19 – 27 October 2011 USA New York, Washington DC,
Chicago
• The USA visit was two pronged.
The first part was as per invitation
from the SAT US Country office to
interact with the industry, airlines
and address them on the state of
tourism in the country
• The second part was to attend
the inaugural US SA Business
Women Forum that seeks to create
networks between women from
both countries
15 – 18 November
2011
Turkey Antalya • To attend the International Golf
Tourism Market (IGTM) and meet
the Turkish Chamber of Business,
Antalya Chamber of Commerce,
President, Mr Cetin Osman Budak,
including a meeting between
International Association of Golf
Tour Operators (IAGTO) President,
Mr Peter Walton and South African
Golf Tourism Association (SAGTA)
Chairman Thabiso Mogodielo
• To promote SAGTA and South
Africa as a golf destination of
choice
Information on the Ministry
Information on the Ministry
NDT Annual Report 2011/12
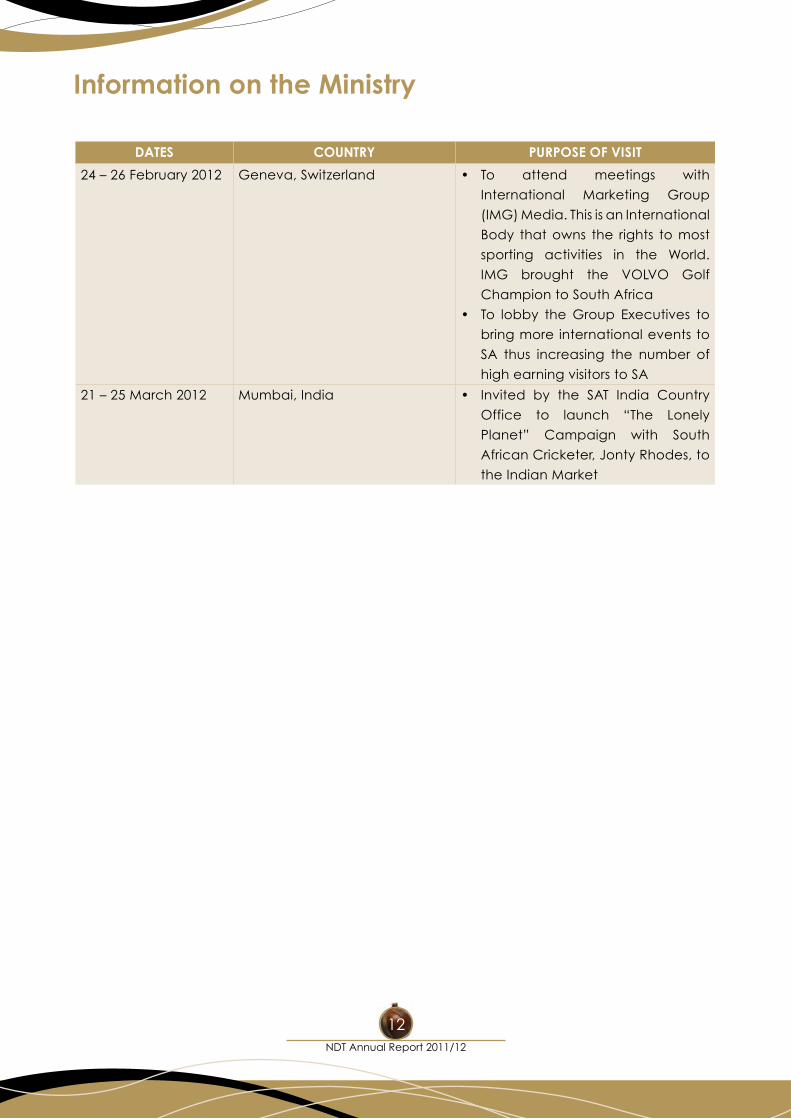
12
DATES COUNTRY PURPOSE OF VISIT
24 – 26 February 2012 Geneva, Switzerland • To attend meetings with
International Marketing Group
(IMG) Media. This is an International
Body that owns the rights to most
sporting activities in the World.
IMG brought the VOLVO Golf
Champion to South Africa
• To lobby theGroup Executives to
bring more international events to
SA thus increasing the number of
high earning visitors to SA
21 – 25 March 2012 Mumbai, India • Invited by the SAT India Country
Office to launch “The Lonely
Planet” Campaign with South
African Cricketer, Jonty Rhodes, to
the Indian Market
Information on the Ministry
13
Legal and Constitutional Mandate
Picture: Union Buildings - Pretoria, South Africa
Information on the Ministry
NDT Annual Report 2011/12
14
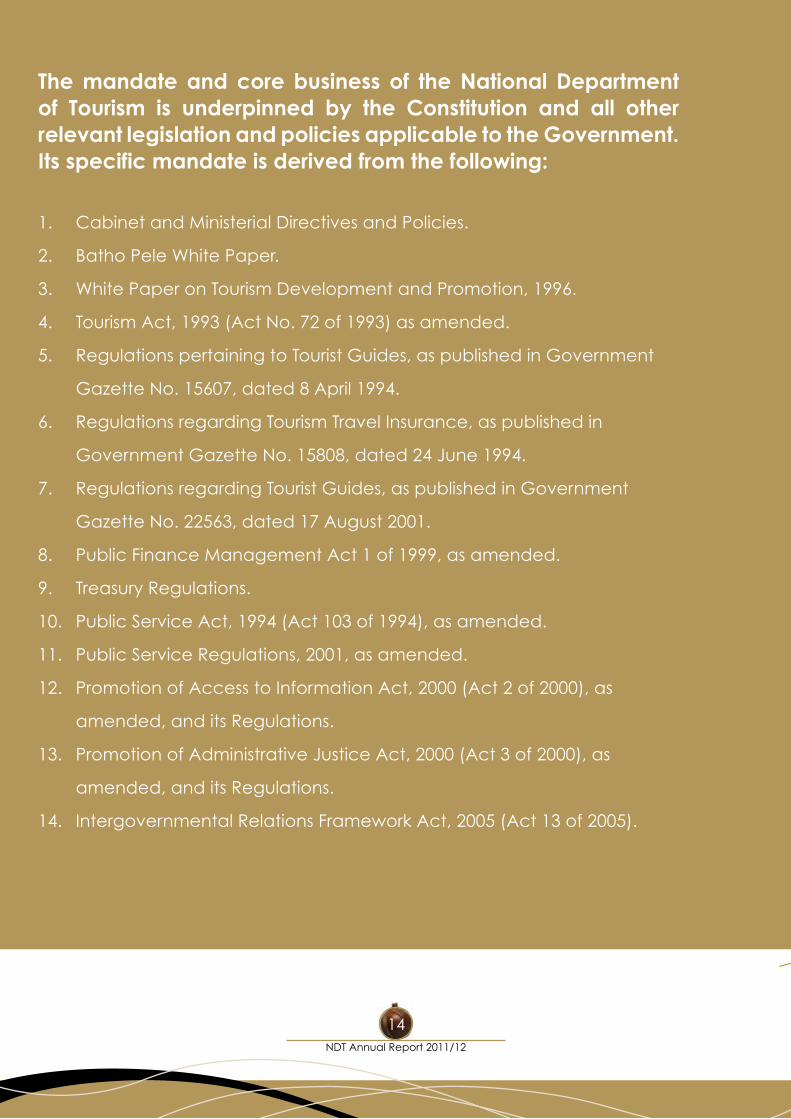
The mandate and core business of the National Department of Tourism is underpinned by the Constitution and all other relevant legislation and policies applicable to the Government. Its specific mandate is derived from the following:
1. Cabinet and Ministerial Directives and Policies.
2. Batho Pele White Paper.
3. White Paper on Tourism Development and Promotion, 1996.
4. Tourism Act, 1993 (Act No. 72 of 1993) as amended.
5. Regulations pertaining to Tourist Guides, as published in Government
Gazette No. 15607, dated 8 April 1994.
6. Regulations regarding Tourism Travel Insurance, as published in
Government Gazette No. 15808, dated 24 June 1994.
7. Regulations regarding Tourist Guides, as published in Government
Gazette No. 22563, dated 17 August 2001.
8. Public Finance Management Act 1 of 1999, as amended.
9. Treasury Regulations.
10. Public Service Act, 1994 (Act 103 of 1994), as amended.
11. Public Service Regulations, 2001, as amended.
12. Promotion of Access to Information Act, 2000 (Act 2 of 2000), as
amended, and its Regulations.
13. Promotion of Administrative Justice Act, 2000 (Act 3 of 2000), as
amended, and its Regulations.
14. Intergovernmental Relations Framework Act, 2005 (Act 13 of 2005).

15
Vision, Mission and Values
Picture: Reception Area of the Department of Tourism
Information on the Ministry
NDT Annual Report 2011/12
16
VISION To be globally celebrated as a leader in tourism excellence.
MISSION Collectively and boldly promoting responsible and sustainable tourism
for the benefit of all South Africans.
VALUESThe following departmental values (Prosper) are based on the broader South
African value of Ubuntu and Public Service Batho Pele principles:
• AResponsible government department,
• ThatisResponsive to the needs of the people,
• Serving them with Pride and Excellence,
• WithasenseofProfessionalism
• andOpenness.

17
Executive Management
Mr. Dirk van SchalkwykChief Operations Officer
Ms. Aneme MalanDeputy Director-General
Tourism Growth
Ms. Morongoe RamphelaDeputy Director-General
Tourism Development
Mr. Victor TharageDeputy Director-General
Policy, Research, Monitoringand Evaluation
Ambassador LM MakhubelaDirector-General
Information on the Ministry
NDT Annual Report 2011/12
18
Accounting Officer’s OverviewI appreciate the opportunity given to present
my department’s Annual Report for the
financial year 2011/12 which gives a detailed
account of our achievements to Parliament and
to all the people of South Africa. The progress
we have made in achieving the departmental
goals outlined in the department’s Annual
Performance Plan 2011/12-2013/2014 is
contained in some detail in this Annual Report.
In 2011/12 the department reduced the
vacancy rate from 21.6% in March 2011 to
9.42% in March 2012. We implemented human
resource programmes to attract, develop
and retain a skilled and capable workforce
and also address employment equity within
the department. We focused on providing
physical and technical resources to facilitate
efficient service delivery. To streamline our
business processes we implemented the Master
Systems Plan and began a project to model
our business processes. We implemented a
Communication Strategy to increase access
to tourism information by our stakeholders.
We concluded the public and stakeholder
participation process for the new Tourism Draft
Bill which will provide a legal framework for
the growth and development of sustainable
tourism in South Africa.
To support job creation, we implemented
the department’s Social Responsibility
Implementation (SRI) programme which is the
department’s contribution to government’s
Expanded Public Works Programme. The
programme implements labour intensive
projects to support tourism development. In
addition the Tourism Enterprise Partnership
has managed to support and coach rural
enterprises, and provide linkages that gave
market access opportunities to tourism
enterprises. The SRI programme is currently
receiving our attention to improve governance
of the programme and to ensure increased
value for money in what we fund.
To implement the findings of the Tourism Sector
Skills Audit which identified Chefs as a critical
and scarce skill in the sector, we implemented
the Young Chef’s Training Programme which
saw over 536 young people graduate as chefs.
The department has focused on developing
policy frameworks and strategies that support
the achievement of the tourism sector
priorities. We identified and mapped rural
tourism projects/nodes and developed tourism
Product Development Master Plan Framework,
the Cultural and Heritage Strategy, the Draft
Domestic Tourism Strategy, the National
Visitors Information Centres and Gateways
Framework and Brand, the Tourism Crisis
Management Strategy, the Intergovernmental
and Stakeholder Engagement framework and
the Events Strategy. We finalised the National
Minimum Standards for Responsible Tourism
and the National Tourism Service Excellence
Requirements which both provide a consistent
yardstick for the tourism sector.
Eight hundred and eighteen (818) unemployed
youth beneficiaries participated in the pilot
training project during this reporting period.
Successful learners are trained and placed
nationwide for work experience at local
establishments.TheNationalTourismCareers’
Expo was held on the 23rd-25th September 2011
at Moses Mabhida Stadium and was attended
by some 20 000 people including learners,
unemployed graduates and educators.
We continued to work with Provincial and
Local government spheres to encourage the
alignment of tourism initiatives at all levels
19
with the National Tourism Sector Strategy. We
also developed a model to estimate direct
and indirect jobs created. We partnered with
Universities, both previously disadvantaged
and established ones, to develop intellectual
property and to undertake research on behalf
of the department that would support the
development of tourism. The 2009/10 state of
tourism report was developed.
During 2011/12 audit, it was encouraging to see
progress made by the department on matters
raised by the Auditor-General in 2010/11.
Amongst others, these relate to payment of
suppliers (within an average of 8 days in 2011/12),
improvements in leave records management
(reduced from 30 to 15 days) and the rating
of the department on leadership provided
to improve internal controls in financial
management and compliance with laws and
regulations. Management as a collective in
the department is committed to implementing
further improvements that address the matters
that have been raised by the Auditor-General.
I would like to express my sincere appreciation
of the excellent work and wonderful
commitment of the staff in the department
and trust that we can rely on this continuing in
2012 and beyond. Detailed progress is outlined
in this Annual Report.
Ambassador LM Makhubela
Director-General
Information on the Ministry
NDT Annual Report 2011/12
20
Public Entity
Reporting to the Minister of Tourism
The following Public Entity reports to the
Minister:
South African Tourism
South African Tourism is the national tourism
agency responsible for marketing South
Africa as a tourism destination of choice
internationally and domestically. It was
established in terms of the Tourism Act of 1993
(Act No.72 of 1993).
Some of the key achievements of South African Tourism during the 2011/12 financial year include:
• Contributingtoanall-timehighof
8 339 354 international tourist arrivals in
2011 (an increase of 3,3% on the 2010
tourism figures). International arrivals to
South Africa grew by 7,5 % from 11,4 million
in the 2010 calendar year to 12 225 155
million in the 2011 calendar year.
• Contributingto26.4milliondomestictrips
in 2011, with travel for the primary purpose
of holidaying increasing to 15%.
• Reaching over 1.2 billion consumers
in the 2011/12 financial year through a
combination of brand and channel-
specific commercials and online and
programme sponsorships.
• SouthAfricanTourismgeneratedover
R7 billion worth of media coverage for the
destination in the 2011/12 financial year.
• South African Tourism’s e-Marketing
division delivered a 7,1% growth in online
traffic to its website, www.southafrica.net,
with partnerships with the likes of Wayn.
com, TripAdvisor.com, and Expedia.com
collectively delivering more than
254 176 690 page impressions on its web
platforms.
• South African Tourism’s search engine
marketing and paid search campaigns
globally delivered more than 427 815 208
search results for the destination.
• Meetings Africa, South African Tourism’s
premier business tourism trade platform
attracted almost 3 000 attendees.
• INDABA2011wasthebiggesteventonthe
African tourism calendar, attracting 1 813
exhibitors in 2011.
• Withthenewgradingcriteria,theTourism
Grading Council of South Africa reported
4 886 graded establishments for the 2011/12
financial year.
21
Programme Performance Report
Picture: Department of Tourism - Reception Area
Programme Performance Report
NDT Annual Report 2011/12
22
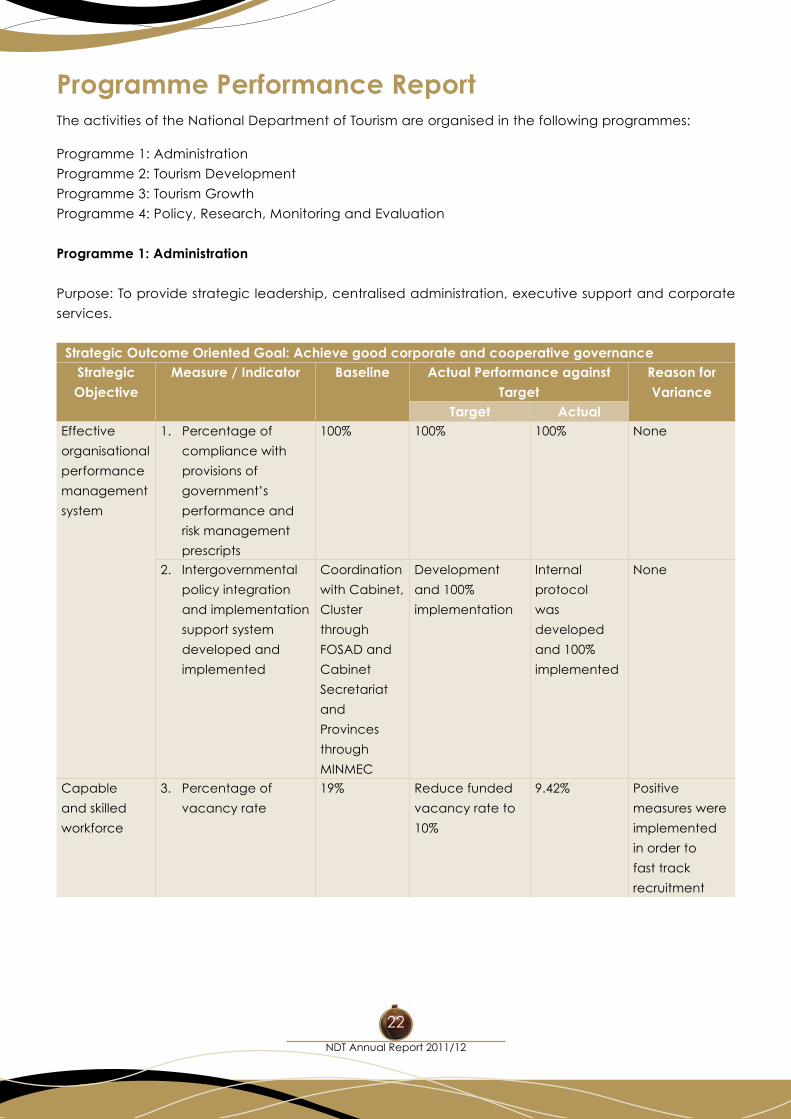
Programme Performance ReportThe activities of the National Department of Tourism are organised in the following programmes:
Programme 1: Administration
Programme 2: Tourism Development
Programme 3: Tourism Growth
Programme 4: Policy, Research, Monitoring and Evaluation
Programme 1: Administration
Purpose: To provide strategic leadership, centralised administration, executive support and corporate
services.
Strategic Outcome Oriented Goal: Achieve good corporate and cooperative governance
Strategic Objective
Measure / Indicator Baseline Actual Performance against Target
Reason for Variance
Target ActualEffective
organisational
performance
management
system
1. Percentage of
compliance with
provisions of
government’s
performance and
risk management
prescripts
100% 100% 100% None
2. Intergovernmental
policy integration
and implementation
support system
developed and
implemented
Coordination
with Cabinet,
Cluster
through
FOSAD and
Cabinet
Secretariat
and
Provinces
through
MINMEC
Development
and 100%
implementation
Internal
protocol
was
developed
and 100%
implemented
None
Capable
and skilled
workforce
3. Percentage of
vacancy rate
19% Reduce funded
vacancy rate to
10%
9.42% Positive
measures were
implemented
in order to
fast track
recruitment
Programme Performance Report
23
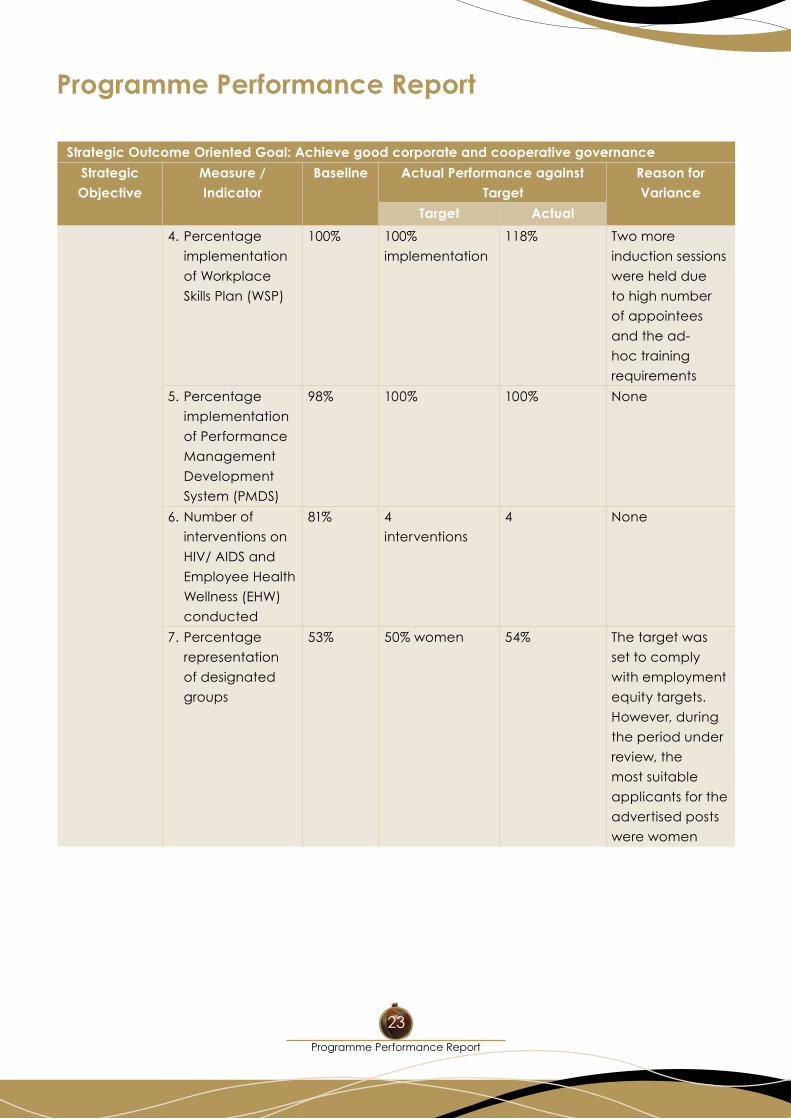
Programme Performance Report
Strategic Outcome Oriented Goal: Achieve good corporate and cooperative governance
Strategic Objective
Measure / Indicator
Baseline Actual Performance against Target
Reason for Variance
Target Actual
4. Percentage
implementation
of Workplace
Skills Plan (WSP)
100% 100%
implementation
118% Two more
induction sessions
were held due
to high number
of appointees
and the ad-
hoc training
requirements
5. Percentage
implementation
of Performance
Management
Development
System (PMDS)
98% 100% 100% None
6. Number of
interventions on
HIV/ AIDS and
Employee Health
Wellness (EHW)
conducted
81% 4
interventions
4 None
7. Percentage
representation
of designated
groups
53% 50% women 54% The target was
set to comply
with employment
equity targets.
However, during
the period under
review, the
most suitable
applicants for the
advertised posts
were women
NDT Annual Report 2011/12
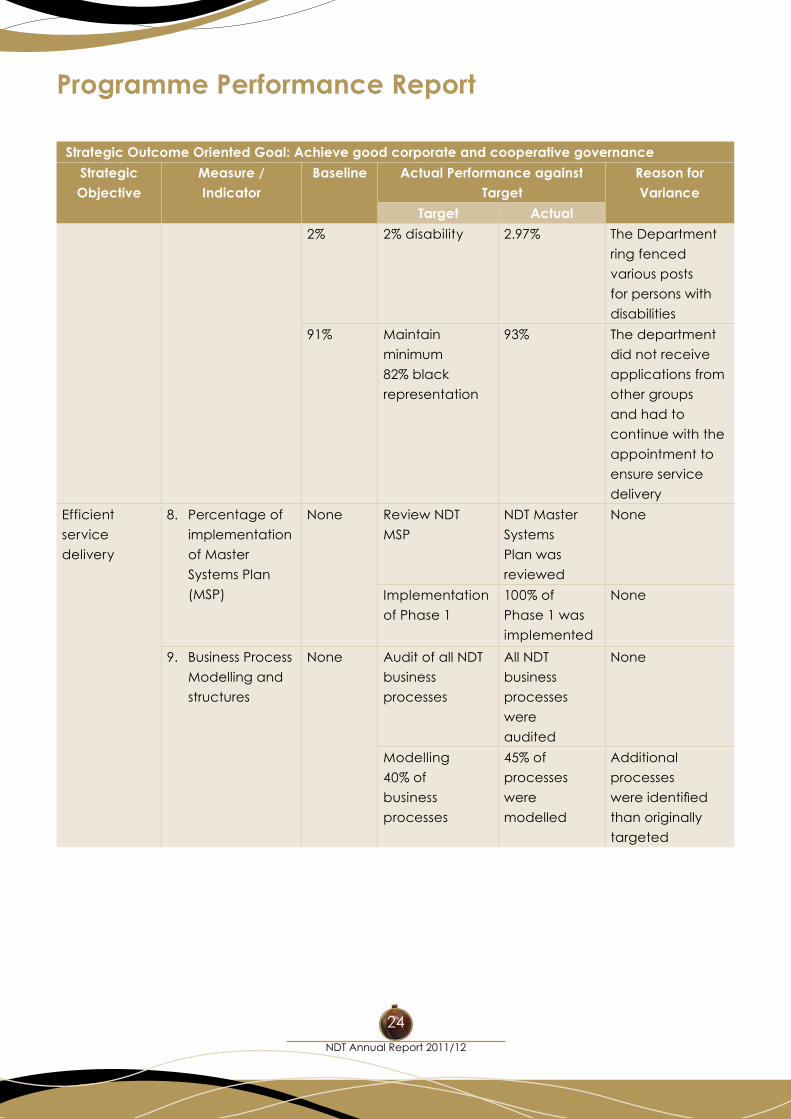
24
Programme Performance Report
Strategic Outcome Oriented Goal: Achieve good corporate and cooperative governance
Strategic Objective
Measure / Indicator
Baseline Actual Performance against Target
Reason for Variance
Target Actual
2% 2% disability 2.97% The Department
ring fenced
various posts
for persons with
disabilities
91% Maintain
minimum
82% black
representation
93% The department
did not receive
applications from
other groups
and had to
continue with the
appointment to
ensure service
delivery
Efficient
service
delivery
8. Percentage of
implementation
of Master
Systems Plan
(MSP)
None Review NDT
MSP
NDT Master
Systems
Plan was
reviewed
None
Implementation
of Phase 1
100% of
Phase 1 was
implemented
None
9. Business Process
Modelling and
structures
None Audit of all NDT
business
processes
All NDT
business
processes
were
audited
None
Modelling
40% of
business
processes
45% of
processes
were
modelled
Additional
processes
wereidentified
than originally
targeted
Programme Performance Report
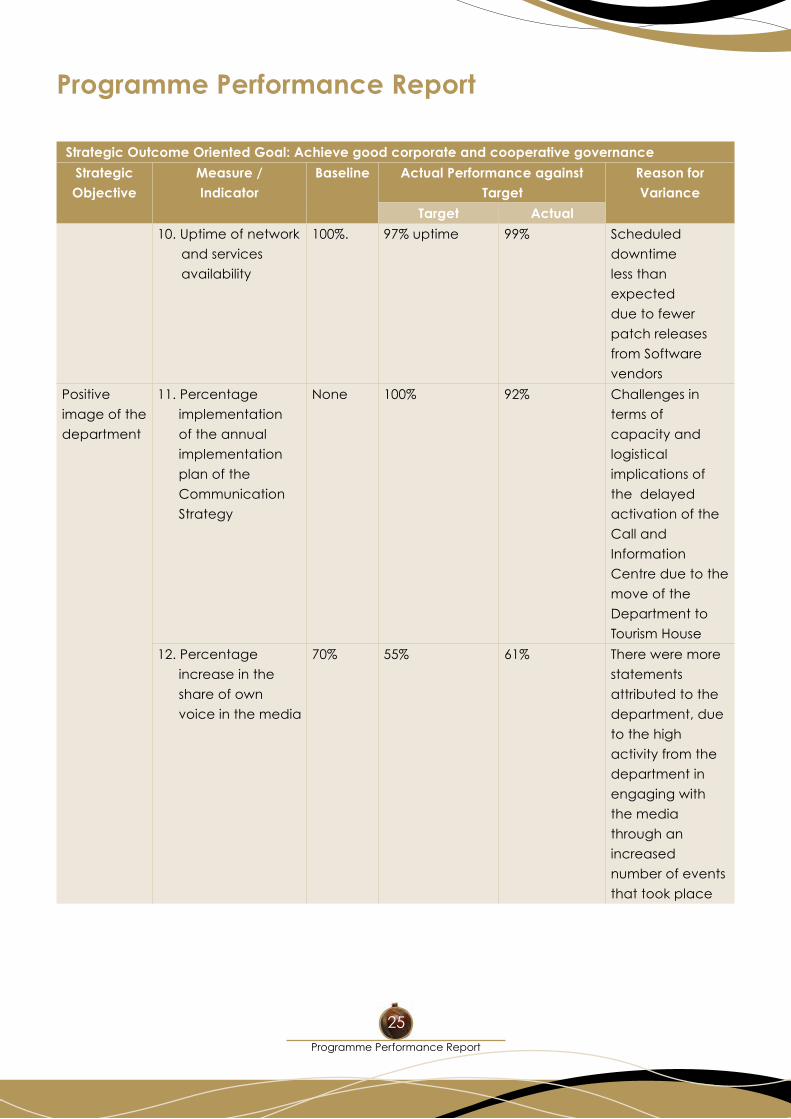
25
Programme Performance Report
Strategic Outcome Oriented Goal: Achieve good corporate and cooperative governance
Strategic Objective
Measure / Indicator
Baseline Actual Performance against Target
Reason for Variance
Target Actual
10. Uptime of network
and services
availability
100%. 97% uptime 99% Scheduled
downtime
less than
expected
due to fewer
patch releases
from Software
vendors
Positive
image of the
department
11. Percentage
implementation
of the annual
implementation
plan of the
Communication
Strategy
None 100% 92% Challenges in
terms of
capacity and
logistical
implications of
the delayed
activation of the
Call and
Information
Centre due to the
move of the
Department to
Tourism House
12. Percentage
increase in the
share of own
voice in the media
70% 55% 61% There were more
statements
attributed to the
department, due
to the high
activity from the
department in
engaging with
the media
through an
increased
number of events
that took place
NDT Annual Report 2011/12
26
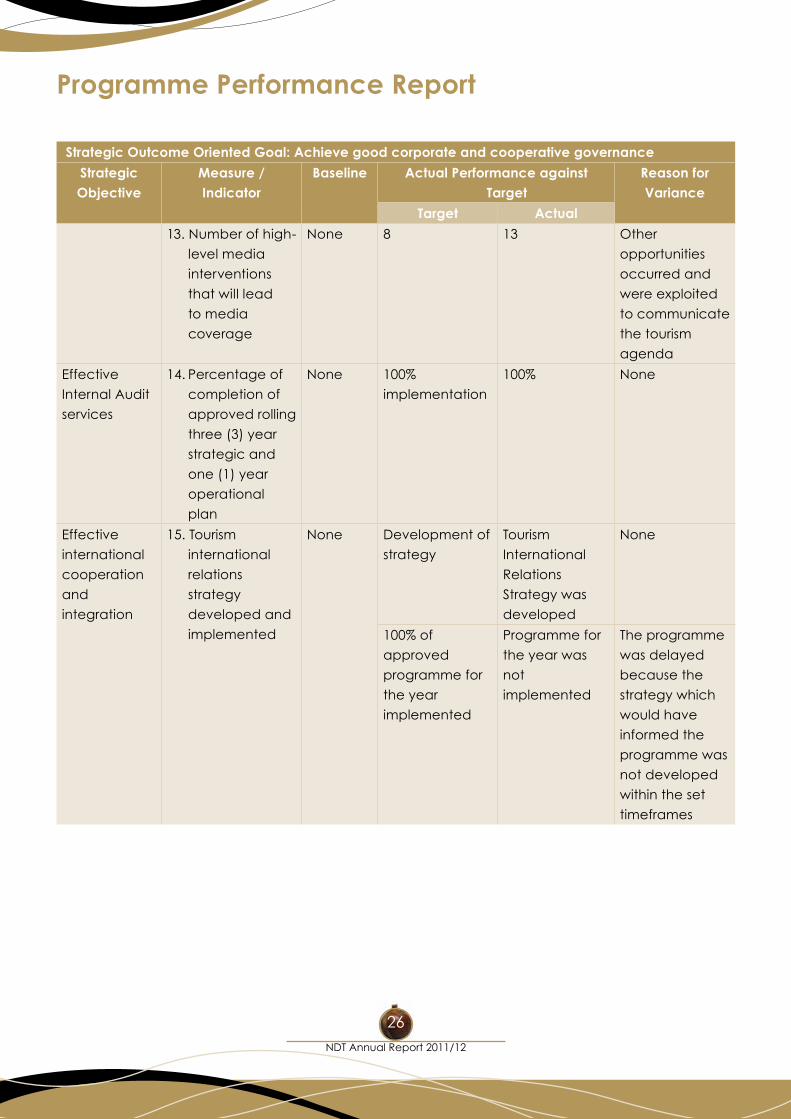
Programme Performance Report
Strategic Outcome Oriented Goal: Achieve good corporate and cooperative governance
Strategic Objective
Measure / Indicator
Baseline Actual Performance against Target
Reason for Variance
Target Actual
13. Number of high-
level media
interventions
that will lead
to media
coverage
None 8 13 Other
opportunities
occurred and
were exploited
to communicate
the tourism
agenda
Effective
Internal Audit
services
14. Percentage of
completion of
approved rolling
three (3) year
strategic and
one (1) year
operational
plan
None 100%
implementation
100% None
Effective
international
cooperation
and
integration
15. Tourism
international
relations
strategy
developed and
implemented
None Development of
strategy
Tourism
International
Relations
Strategy was
developed
None
100% of
approved
programme for
the year
implemented
Programme for
the year was
not
implemented
The programme
was delayed
because the
strategy which
would have
informed the
programme was
not developed
within the set
timeframes
Programme Performance Report
27
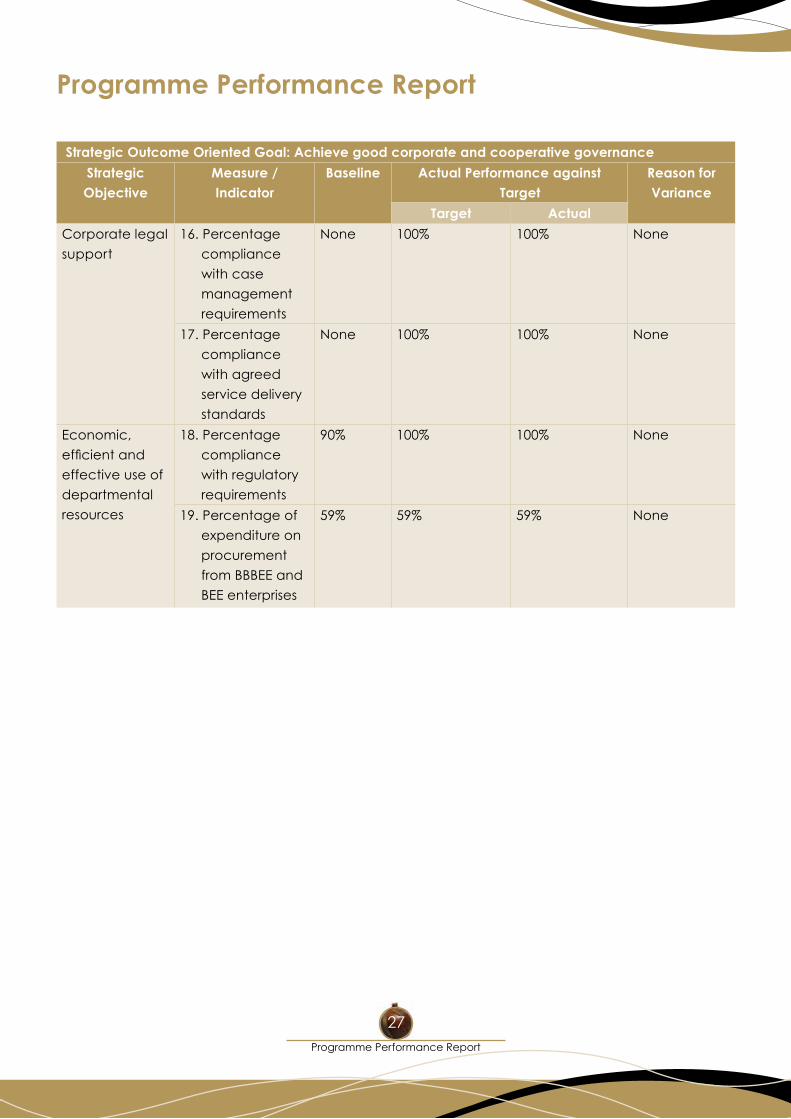
Programme Performance Report
Strategic Outcome Oriented Goal: Achieve good corporate and cooperative governance
Strategic Objective
Measure / Indicator
Baseline Actual Performance against Target
Reason for Variance
Target Actual
Corporate legal
support
16. Percentage
compliance
with case
management
requirements
None 100% 100% None
17. Percentage
compliance
with agreed
service delivery
standards
None 100% 100% None
Economic,
efficientand
effective use of
departmental
resources
18. Percentage
compliance
with regulatory
requirements
90% 100% 100% None
19. Percentage of
expenditure on
procurement
from BBBEE and
BEE enterprises
59% 59% 59% None
NDT Annual Report 2011/12
28
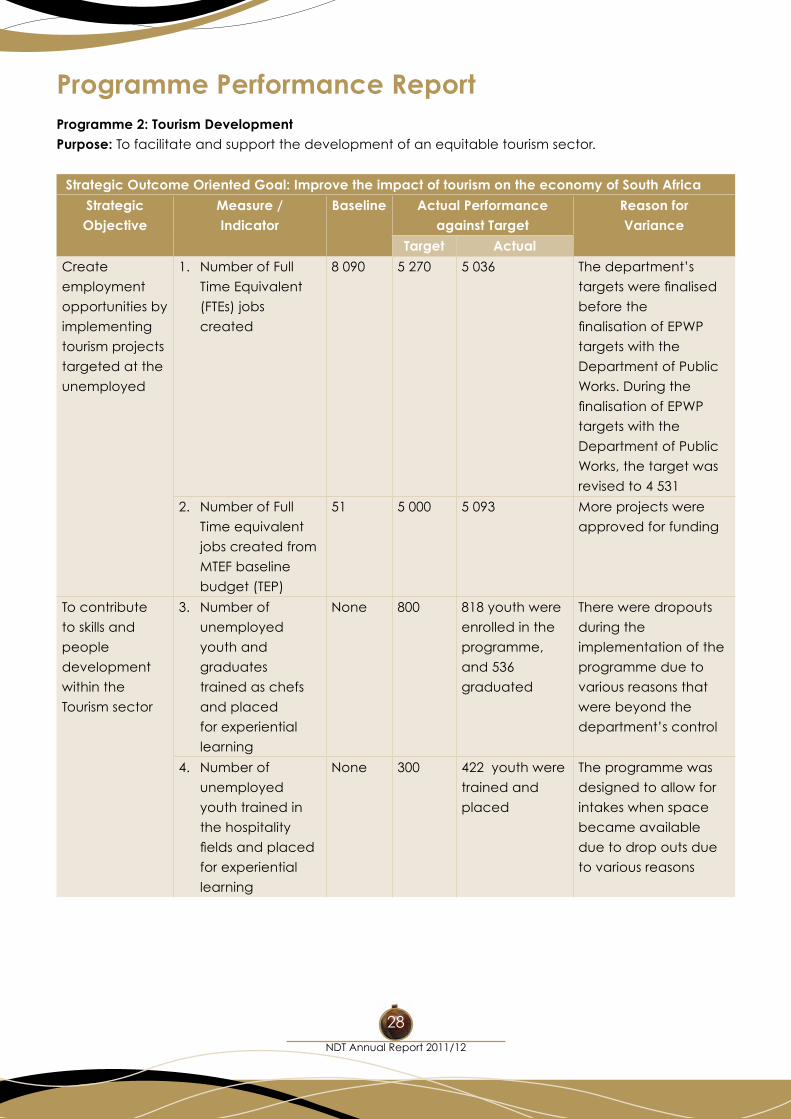
Programme Performance ReportProgramme 2: Tourism DevelopmentPurpose: To facilitate and support the development of an equitable tourism sector.
Strategic Outcome Oriented Goal: Improve the impact of tourism on the economy of South Africa
Strategic Objective
Measure / Indicator
Baseline Actual Performance against Target
Reason for Variance
Target Actual
Create
employment
opportunities by
implementing
tourism projects
targeted at the
unemployed
1. Number of Full
Time Equivalent
(FTEs) jobs
created
8 090 5 270 5 036 Thedepartment’s
targetswerefinalised
before the
finalisationofEPWP
targets with the
Department of Public
Works. During the
finalisationofEPWP
targets with the
Department of Public
Works, the target was
revised to 4 531
2. Number of Full
Time equivalent
jobs created from
MTEF baseline
budget (TEP)
51 5 000 5 093 More projects were
approved for funding
To contribute
to skills and
people
development
within the
Tourism sector
3. Number of
unemployed
youth and
graduates
trained as chefs
and placed
for experiential
learning
None 800 818 youth were
enrolled in the
programme,
and 536
graduated
There were dropouts
during the
implementation of the
programme due to
various reasons that
were beyond the
department’scontrol
4. Number of
unemployed
youth trained in
the hospitality
fieldsandplaced
for experiential
learning
None 300 422 youth were
trained and
placed
The programme was
designed to allow for
intakes when space
became available
due to drop outs due
to various reasons
Programme Performance Report
29
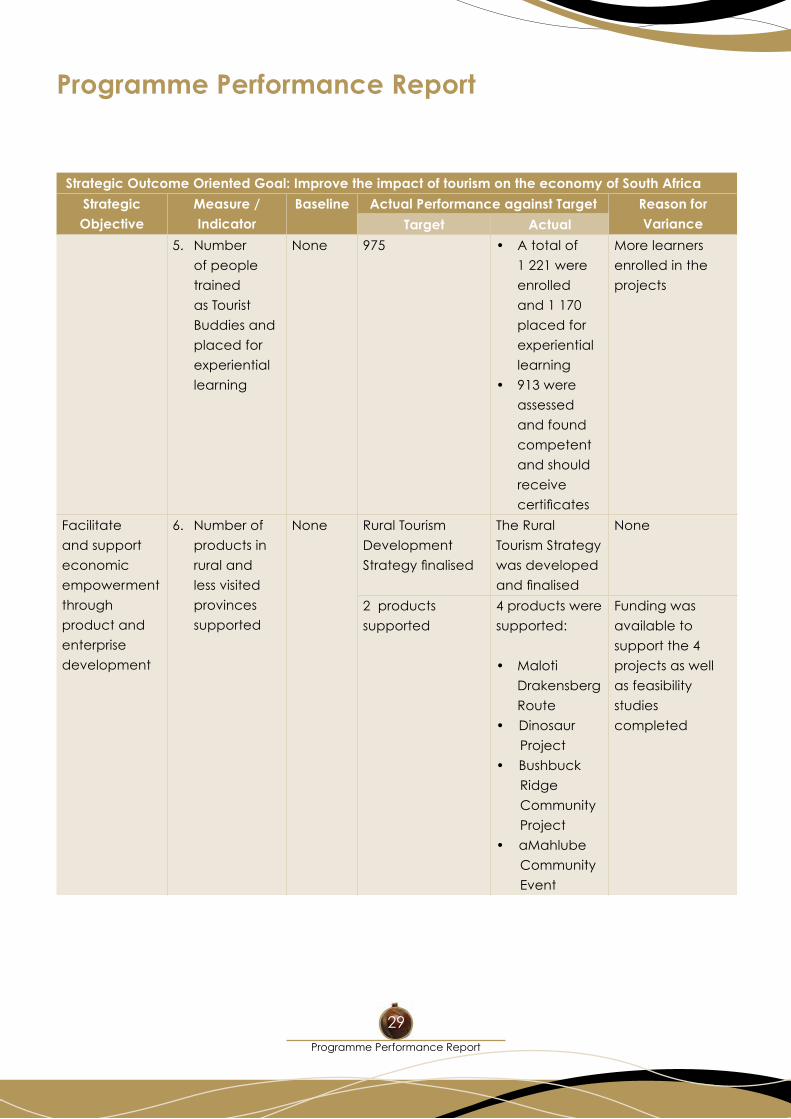
Programme Performance Report
Strategic Outcome Oriented Goal: Improve the impact of tourism on the economy of South Africa
Strategic Objective
Measure / Indicator
Baseline Actual Performance against Target Reason for VarianceTarget Actual
5. Number
of people
trained
as Tourist
Buddies and
placed for
experiential
learning
None 975 • Atotalof
1 221 were
enrolled
and 1 170
placed for
experiential
learning
• 913were
assessed
and found
competent
and should
receive
certificates
More learners
enrolled in the
projects
Facilitate
and support
economic
empowerment
through
product and
enterprise
development
6. Number of
products in
rural and
less visited
provinces
supported
None Rural Tourism
Development
Strategyfinalised
The Rural
Tourism Strategy
was developed
andfinalised
None
2 products
supported
4 products were
supported:
• Maloti
Drakensberg
Route
• Dinosaur
Project
• Bushbuck
Ridge
Community
Project
• aMahlube
Community
Event
Funding was
available to
support the 4
projects as well
as feasibility
studies
completed
NDT Annual Report 2011/12
30
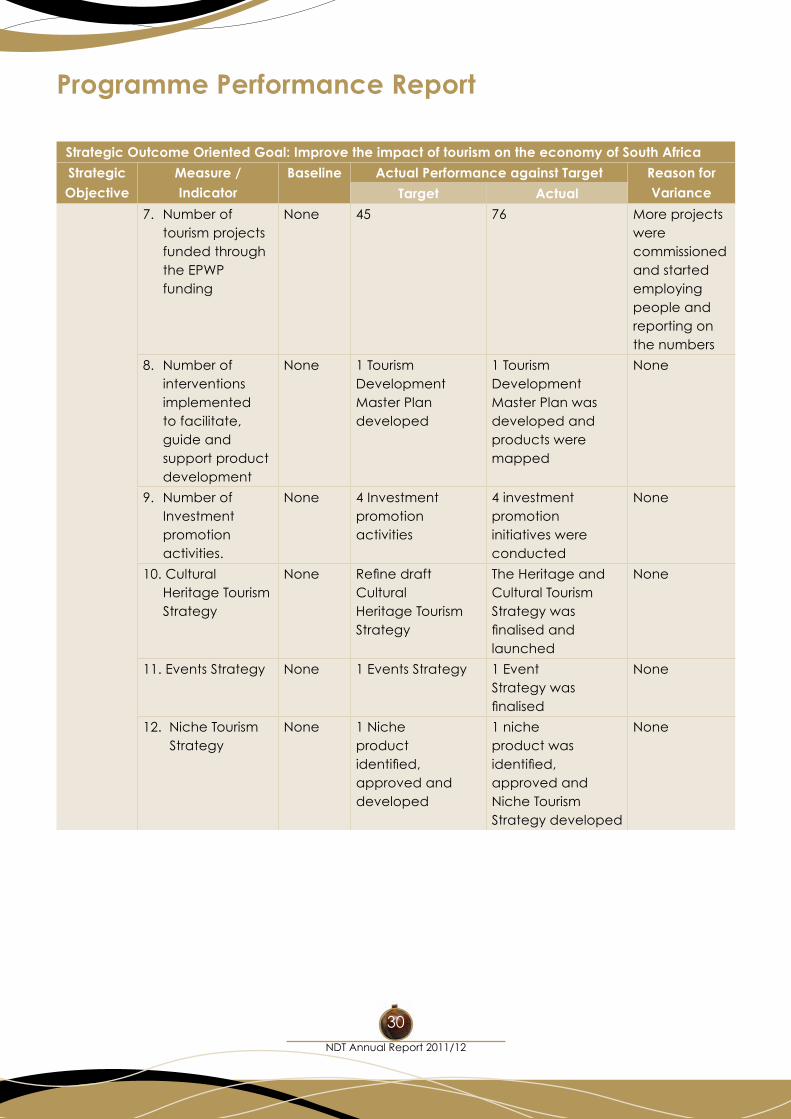
Programme Performance Report
Strategic Outcome Oriented Goal: Improve the impact of tourism on the economy of South Africa
Strategic Objective
Measure / Indicator
Baseline Actual Performance against Target Reason for VarianceTarget Actual
7. Number of tourism projects funded through the EPWP funding
None 45 76 More projects were commissioned and started employing people and reporting on the numbers
8. Number of interventions implemented to facilitate, guide and support product development
None 1 Tourism DevelopmentMaster Plan developed
1 Tourism Development Master Plan was developed and products were mapped
None
9. Number of Investment promotion activities.
None 4 Investment promotionactivities
4 investment promotion initiatives were conducted
None
10. Cultural Heritage Tourism Strategy
None RefinedraftCulturalHeritage TourismStrategy
The Heritage and Cultural Tourism Strategy was finalisedandlaunched
None
11. Events Strategy None 1 Events Strategy 1 Event Strategy was finalised
None
12. Niche Tourism Strategy
None 1 Niche productidentified,approved anddeveloped
1 niche product was identified,approved and Niche Tourism Strategy developed
None
Programme Performance Report
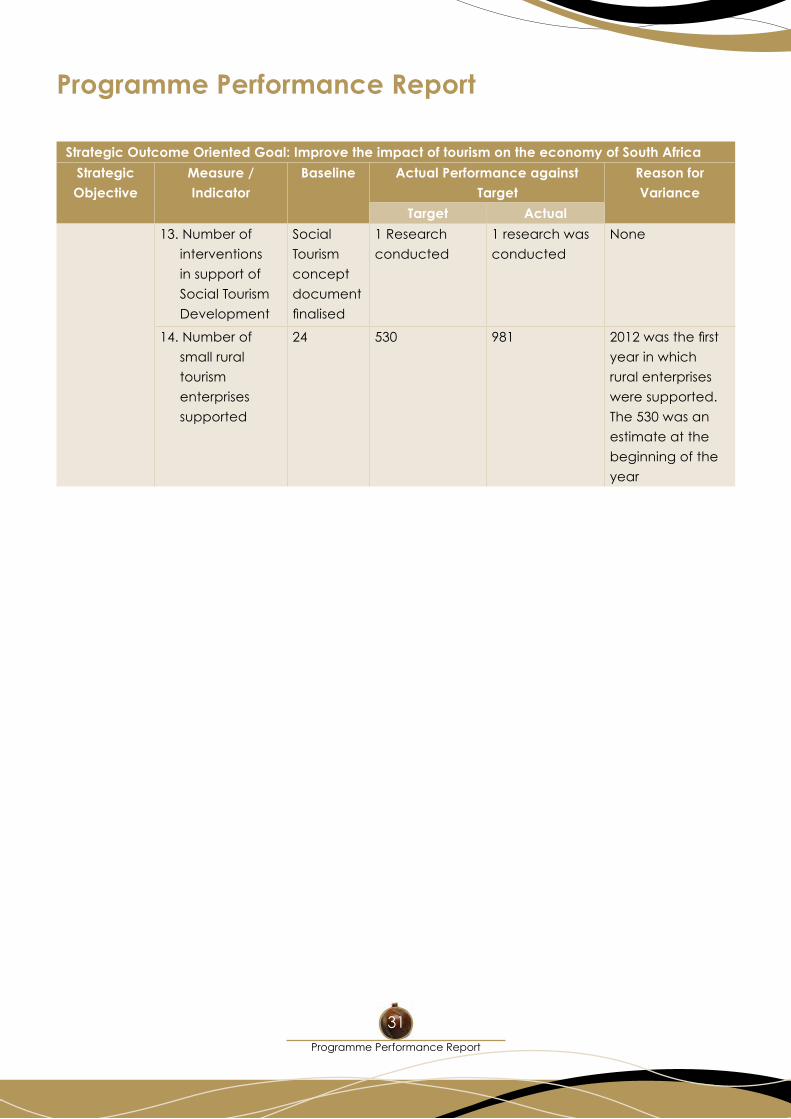
31
Programme Performance Report
Strategic Outcome Oriented Goal: Improve the impact of tourism on the economy of South Africa
Strategic Objective
Measure / Indicator
Baseline Actual Performance against Target
Reason for Variance
Target Actual
13. Number of
interventions
in support of
Social Tourism
Development
Social
Tourism
concept
document
finalised
1 Research
conducted
1 research was
conducted
None
14. Number of
small rural
tourism
enterprises
supported
24 530 981 2012wasthefirst
year in which
rural enterprises
were supported.
The 530 was an
estimate at the
beginning of the
year
NDT Annual Report 2011/12
32
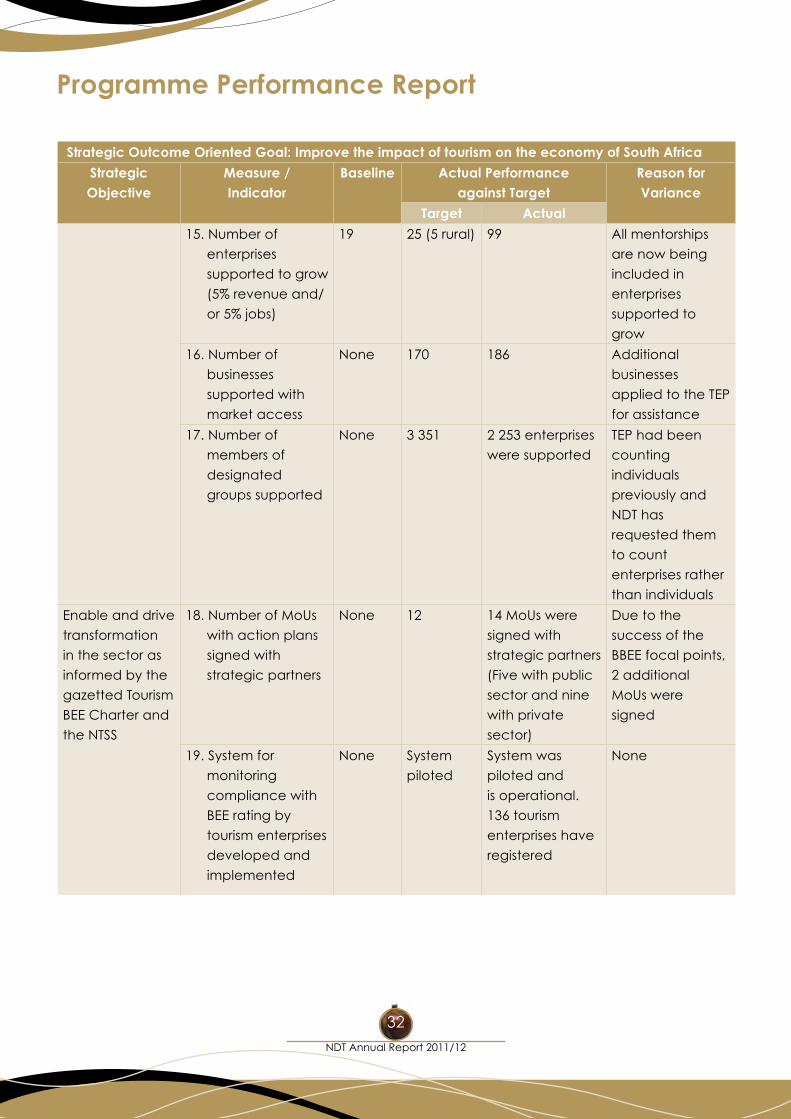
Programme Performance Report
Strategic Outcome Oriented Goal: Improve the impact of tourism on the economy of South Africa
Strategic Objective
Measure / Indicator
Baseline Actual Performance against Target
Reason for Variance
Target Actual
15. Number of
enterprises
supported to grow
(5% revenue and/
or 5% jobs)
19 25 (5 rural) 99 All mentorships
are now being
included in
enterprises
supported to
grow
16. Number of
businesses
supported with
market access
None 170 186 Additional
businesses
applied to the TEP
for assistance
17. Number of
members of
designated
groups supported
None 3 351 2 253 enterprises
were supported
TEP had been
counting
individuals
previously and
NDT has
requested them
to count
enterprises rather
than individuals
Enable and drive
transformation
in the sector as
informed by the
gazetted Tourism
BEE Charter and
the NTSS
18. Number of MoUs
with action plans
signed with
strategic partners
None 12 14 MoUs were
signed with
strategic partners
(Five with public
sector and nine
with private
sector)
Due to the
success of the
BBEE focal points,
2 additional
MoUs were
signed
19. System for
monitoring
compliance with
BEE rating by
tourism enterprises
developed and
implemented
None System
piloted
System was
piloted and
is operational.
136 tourism
enterprises have
registered
None
Programme Performance Report
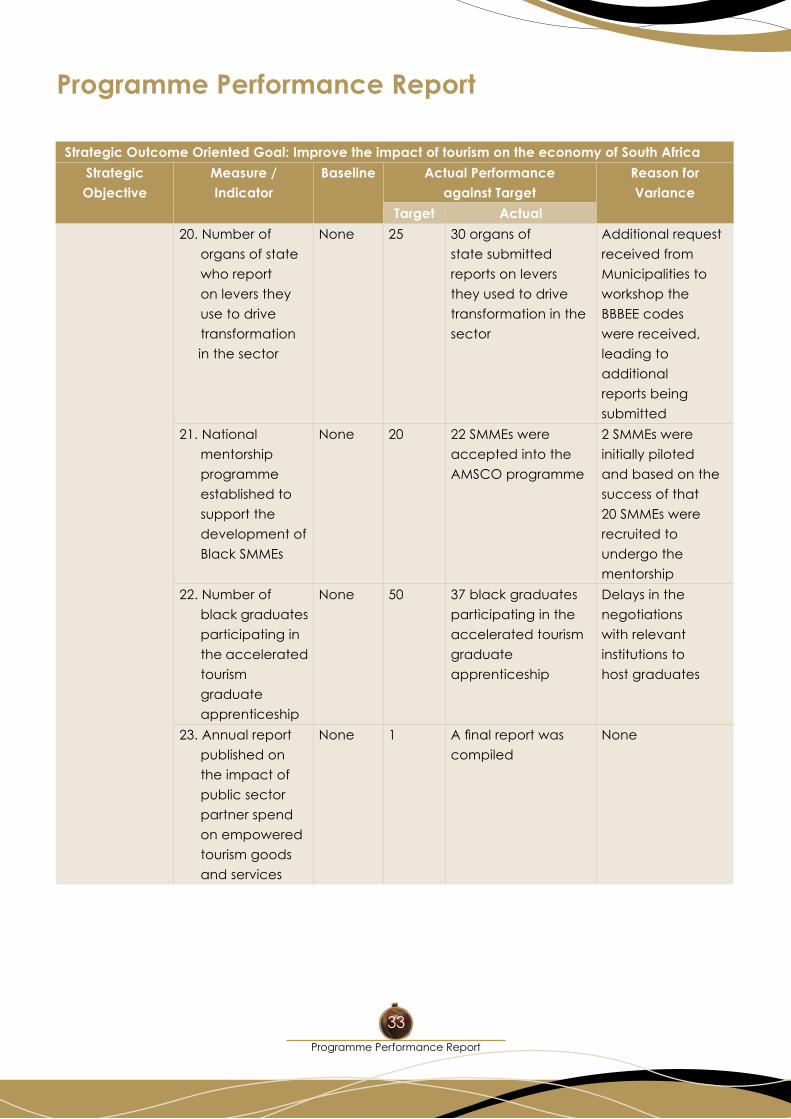
33
Programme Performance Report
Strategic Outcome Oriented Goal: Improve the impact of tourism on the economy of South Africa
Strategic Objective
Measure / Indicator
Baseline Actual Performance against Target
Reason for Variance
Target Actual
20. Number of
organs of state
who report
on levers they
use to drive
transformation
in the sector
None 25 30 organs of
state submitted
reports on levers
they used to drive
transformation in the
sector
Additional request
received from
Municipalities to
workshop the
BBBEE codes
were received,
leading to
additional
reports being
submitted
21. National
mentorship
programme
established to
support the
development of
Black SMMEs
None 20 22 SMMEs were
accepted into the
AMSCO programme
2 SMMEs were
initially piloted
and based on the
success of that
20 SMMEs were
recruited to
undergo the
mentorship
22. Number of
black graduates
participating in
the accelerated
tourism
graduate
apprenticeship
None 50 37 black graduates
participating in the
accelerated tourism
graduate
apprenticeship
Delays in the
negotiations
with relevant
institutions to
host graduates
23. Annual report
published on
the impact of
public sector
partner spend
on empowered
tourism goods
and services
None 1 Afinalreportwas
compiled
None
NDT Annual Report 2011/12
34
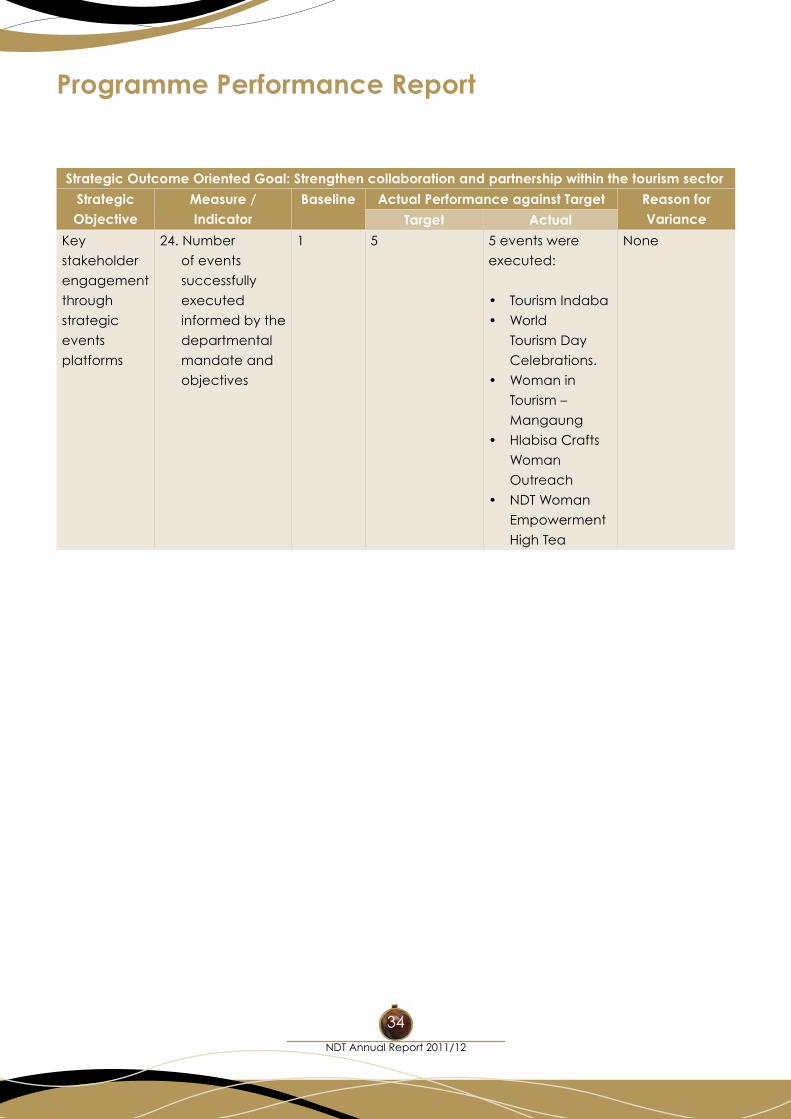
Programme Performance Report
Strategic Outcome Oriented Goal: Strengthen collaboration and partnership within the tourism sector
Strategic Objective
Measure / Indicator
Baseline Actual Performance against Target Reason for VarianceTarget Actual
Key
stakeholder
engagement
through
strategic
events
platforms
24. Number
of events
successfully
executed
informed by the
departmental
mandate and
objectives
1 5 5 events were
executed:
• TourismIndaba
• World
Tourism Day
Celebrations.
• Womanin
Tourism –
Mangaung
• HlabisaCrafts
Woman
Outreach
• NDTWoman
Empowerment
High Tea
None
Programme Performance Report
35
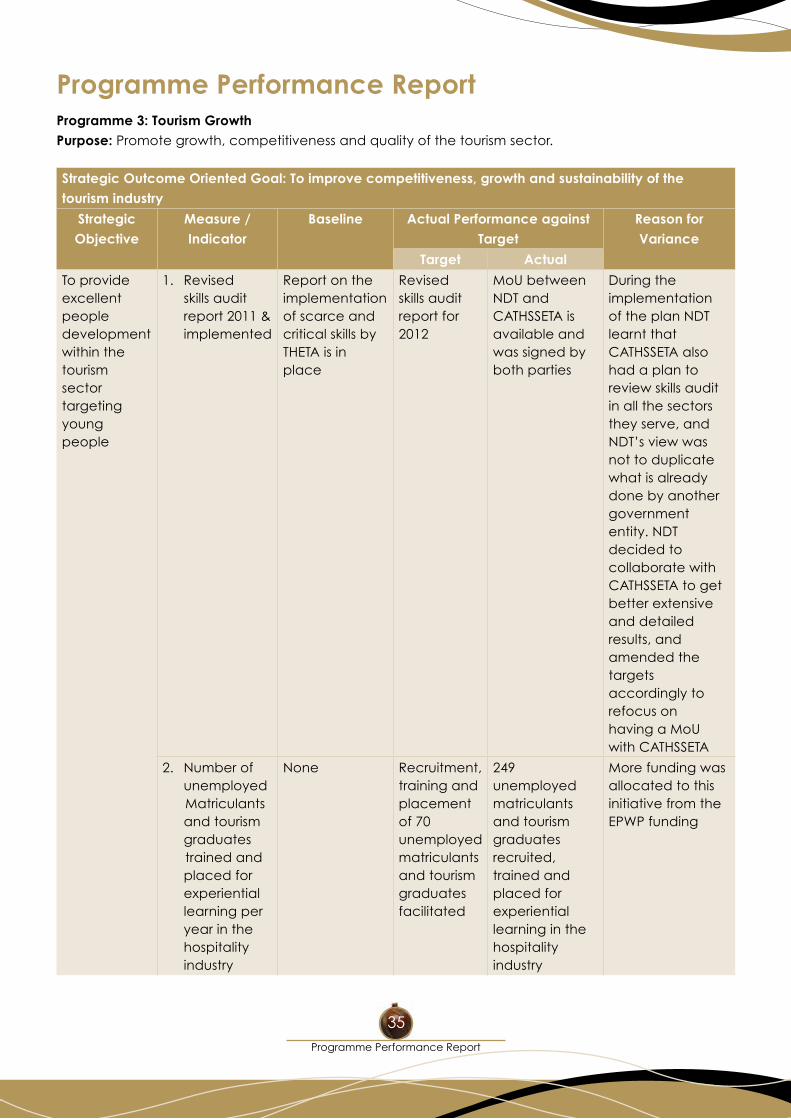
Programme Performance ReportProgramme 3: Tourism GrowthPurpose: Promote growth, competitiveness and quality of the tourism sector.
Strategic Outcome Oriented Goal: To improve competitiveness, growth and sustainability of the tourism industry
Strategic Objective
Measure / Indicator
Baseline Actual Performance against Target
Reason for Variance
Target Actual
To provide excellent people development within the tourism sector targeting young people
1. Revised skills audit report 2011 & implemented
Report on the implementation of scarce and critical skills by THETA is in place
Revisedskills audit report for 2012
MoU between NDT and CATHSSETA is available and was signed by both parties
During the implementation of the plan NDTlearnt that CATHSSETA also had a plan to review skills audit in all the sectors they serve, and NDT’sviewwasnot to duplicate what is already done by another government entity. NDT decided to collaborate with CATHSSETA to get better extensive and detailed results, and amended the targets accordingly to refocus on having a MoU with CATHSSETA
2. Number of unemployed
Matriculants and tourism graduates
trained and placed for experiential learning per year in the hospitality industry
None Recruitment, training and placement of 70 unemployed matriculants and tourism graduates facilitated
249 unemployed matriculants and tourism graduates recruited, trained and placed for experiential learning in the hospitality industry
More funding was allocated to this initiative from the EPWP funding
NDT Annual Report 2011/12
36
Programme Performance Report
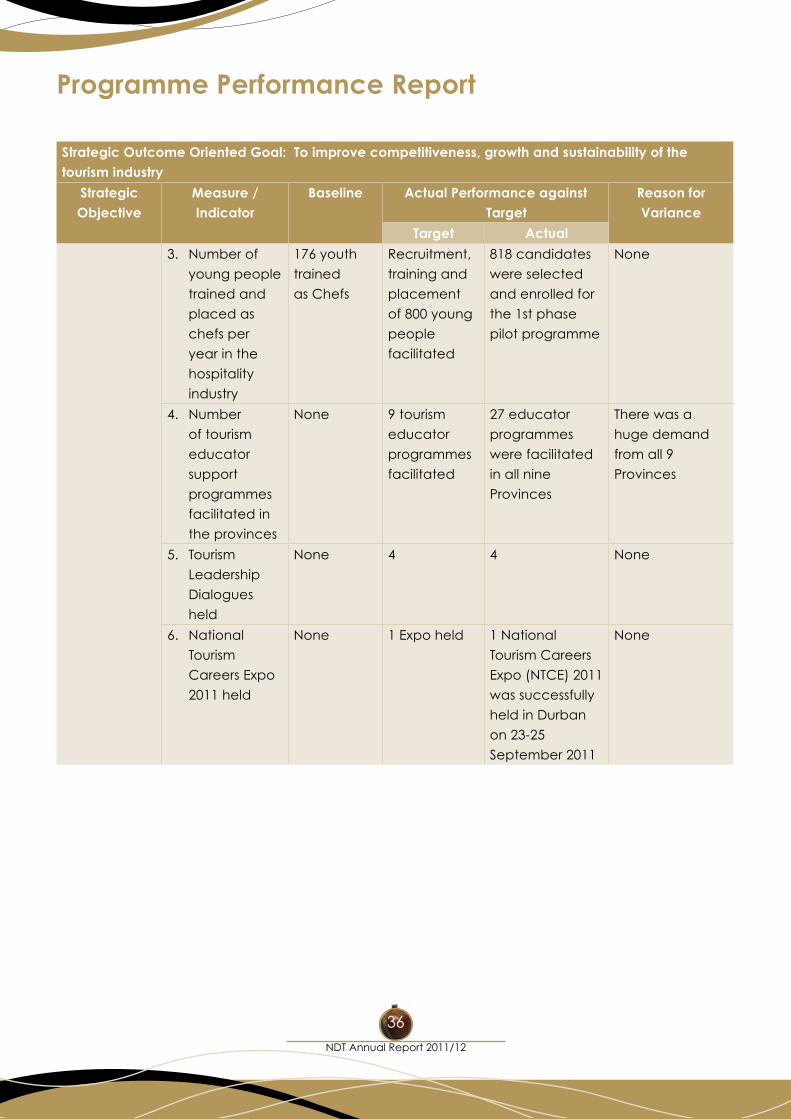
Strategic Outcome Oriented Goal: To improve competitiveness, growth and sustainability of the tourism industry
Strategic Objective
Measure / Indicator
Baseline Actual Performance against Target
Reason for Variance
Target Actual
3. Number of
young people
trained and
placed as
chefs per
year in the
hospitality
industry
176 youth
trained
as Chefs
Recruitment,
training and
placement
of 800 young
people
facilitated
818 candidates
were selected
and enrolled for
the 1st phase
pilot programme
None
4. Number
of tourism
educator
support
programmes
facilitated in
the provinces
None 9 tourism
educator
programmes
facilitated
27 educator
programmes
were facilitated
in all nine
Provinces
There was a
huge demand
from all 9
Provinces
5. Tourism
Leadership
Dialogues
held
None 4 4 None
6. National
Tourism
Careers Expo
2011 held
None 1 Expo held 1 National
Tourism Careers
Expo (NTCE) 2011
was successfully
held in Durban
on 23-25
September 2011
None
Programme Performance Report
37
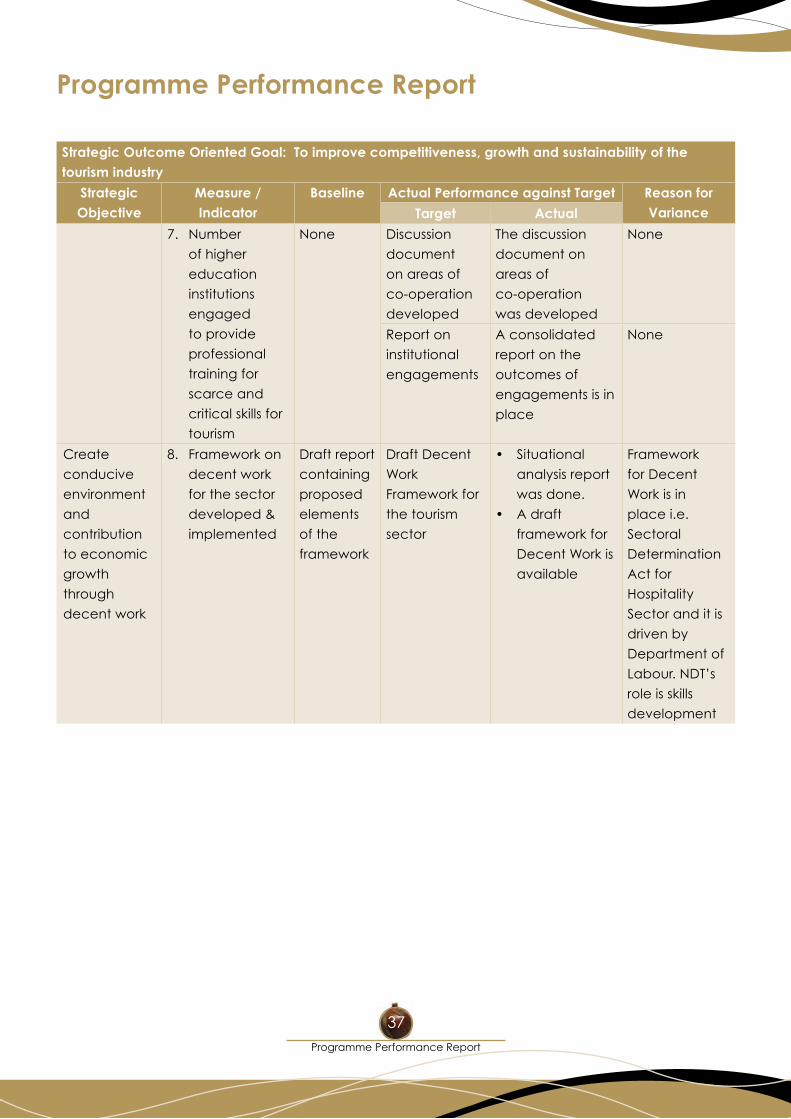
Programme Performance Report
Strategic Outcome Oriented Goal: To improve competitiveness, growth and sustainability of the tourism industry
Strategic Objective
Measure / Indicator
Baseline Actual Performance against Target Reason for VarianceTarget Actual
7. Number
of higher
education
institutions
engaged
to provide
professional
training for
scarce and
critical skills for
tourism
None Discussion
document
on areas of
co-operation
developed
The discussion
document on
areas of
co-operation
was developed
None
Report on
institutional
engagements
A consolidated
report on the
outcomes of
engagements is in
place
None
Create
conducive
environment
and
contribution
to economic
growth
through
decent work
8. Framework on
decent work
for the sector
developed &
implemented
Draft report
containing
proposed
elements
of the
framework
Draft Decent
Work
Framework for
the tourism
sector
• Situational
analysis report
was done.
• Adraft
framework for
Decent Work is
available
Framework
for Decent
Work is in
place i.e.
Sectoral
Determination
Act for
Hospitality
Sector and it is
driven by
Department of
Labour.NDT’s
role is skills
development
NDT Annual Report 2011/12
38
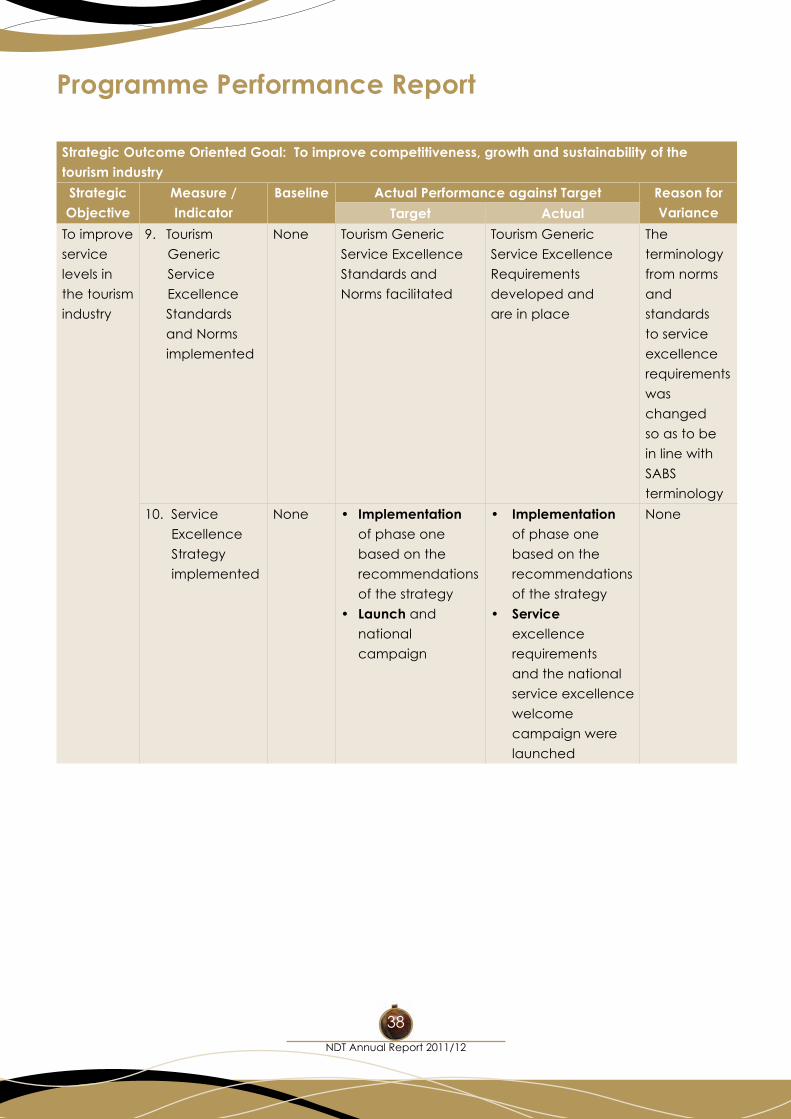
Programme Performance Report
Strategic Outcome Oriented Goal: To improve competitiveness, growth and sustainability of the tourism industry
Strategic Objective
Measure / Indicator
Baseline Actual Performance against Target Reason forVarianceTarget Actual
To improve
service
levels in
the tourism
industry
9. Tourism
Generic
Service
Excellence
Standards
and Norms
implemented
None Tourism Generic
Service Excellence
Standards and
Norms facilitated
Tourism Generic
Service Excellence
Requirements
developed and
are in place
The
terminology
from norms
and
standards
to service
excellence
requirements
was
changed
so as to be
in line with
SABS
terminology
10. Service
Excellence
Strategy
implemented
None • Implementation
of phase one
based on the
recommendations
of the strategy
• Launch and
national
campaign
• Implementation of phase one
based on the
recommendations
of the strategy
• Service excellence
requirements
and the national
service excellence
welcome
campaign were
launched
None
Programme Performance Report
39
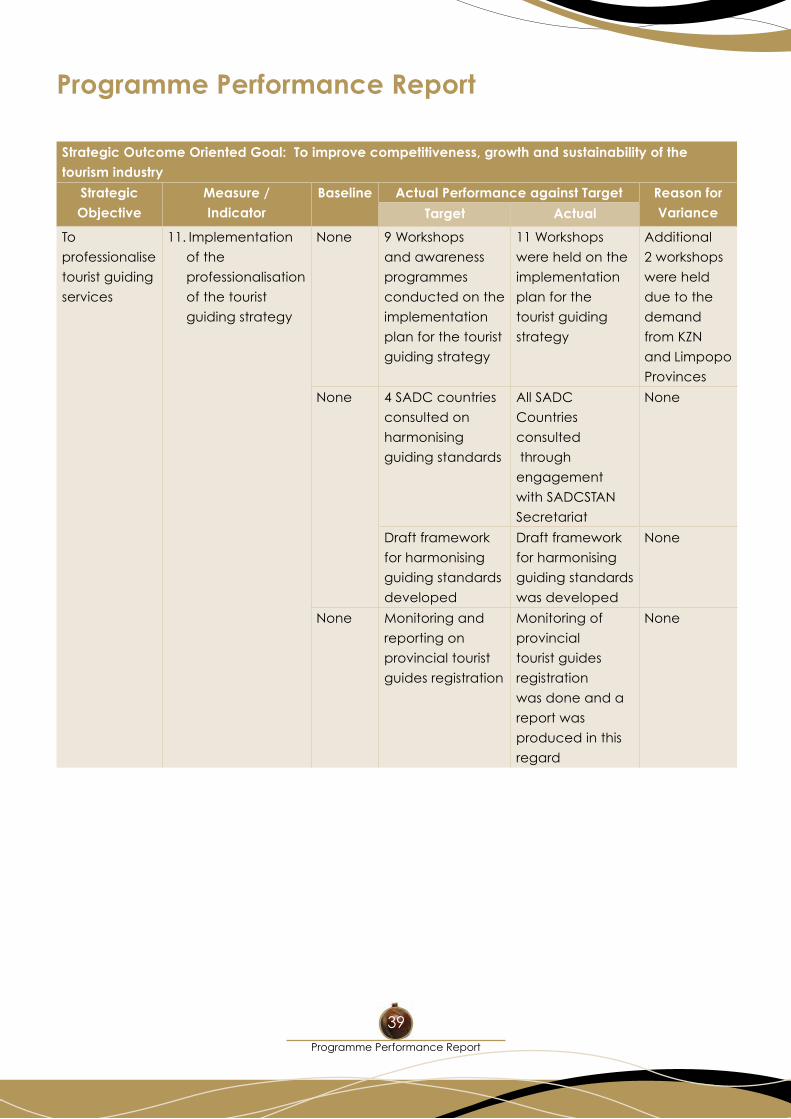
Programme Performance Report
Strategic Outcome Oriented Goal: To improve competitiveness, growth and sustainability of the tourism industry
Strategic Objective
Measure / Indicator
Baseline Actual Performance against Target Reason for VarianceTarget Actual
To
professionalise
tourist guiding
services
11. Implementation
of the
professionalisation
of the tourist
guiding strategy
None 9 Workshops
and awareness
programmes
conducted on the
implementation
plan for the tourist
guiding strategy
11 Workshops
were held on the
implementation
plan for the
tourist guiding
strategy
Additional
2 workshops
were held
due to the
demand
from KZN
and Limpopo
Provinces
None 4 SADC countries
consulted on
harmonising
guiding standards
All SADC
Countries
consulted
through
engagement
with SADCSTAN
Secretariat
None
Draft framework
for harmonising
guiding standards
developed
Draft framework
for harmonising
guiding standards
was developed
None
None Monitoring and
reporting on
provincial tourist
guides registration
Monitoring of
provincial
tourist guides
registration
was done and a
report was
produced in this
regard
None
NDT Annual Report 2011/12
40
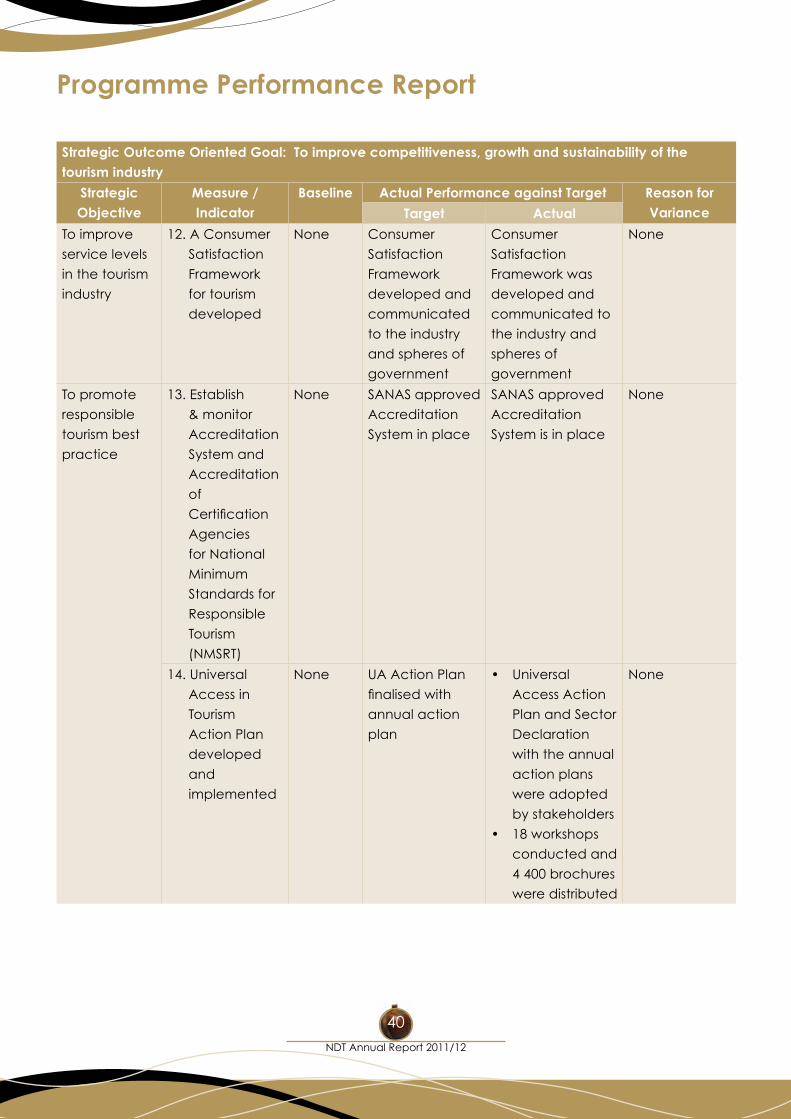
Programme Performance Report
Strategic Outcome Oriented Goal: To improve competitiveness, growth and sustainability of the tourism industry
Strategic Objective
Measure / Indicator
Baseline Actual Performance against Target Reason for VarianceTarget Actual
To improve
service levels
in the tourism
industry
12. A Consumer
Satisfaction
Framework
for tourism
developed
None Consumer
Satisfaction
Framework
developed and
communicated
to the industry
and spheres of
government
Consumer
Satisfaction
Framework was
developed and
communicated to
the industry and
spheres of
government
None
To promote
responsible
tourism best
practice
13. Establish
& monitor
Accreditation
System and
Accreditation
of
Certification
Agencies
for National
Minimum
Standards for
Responsible
Tourism
(NMSRT)
None SANAS approved
Accreditation
System in place
SANAS approved
Accreditation
System is in place
None
14. Universal
Access in
Tourism
Action Plan
developed
and
implemented
None UA Action Plan
finalisedwith
annual action
plan
• Universal
Access Action
Plan and Sector
Declaration
with the annual
action plans
were adopted
by stakeholders
• 18workshops
conducted and
4 400 brochures
were distributed
None
Programme Performance Report
41
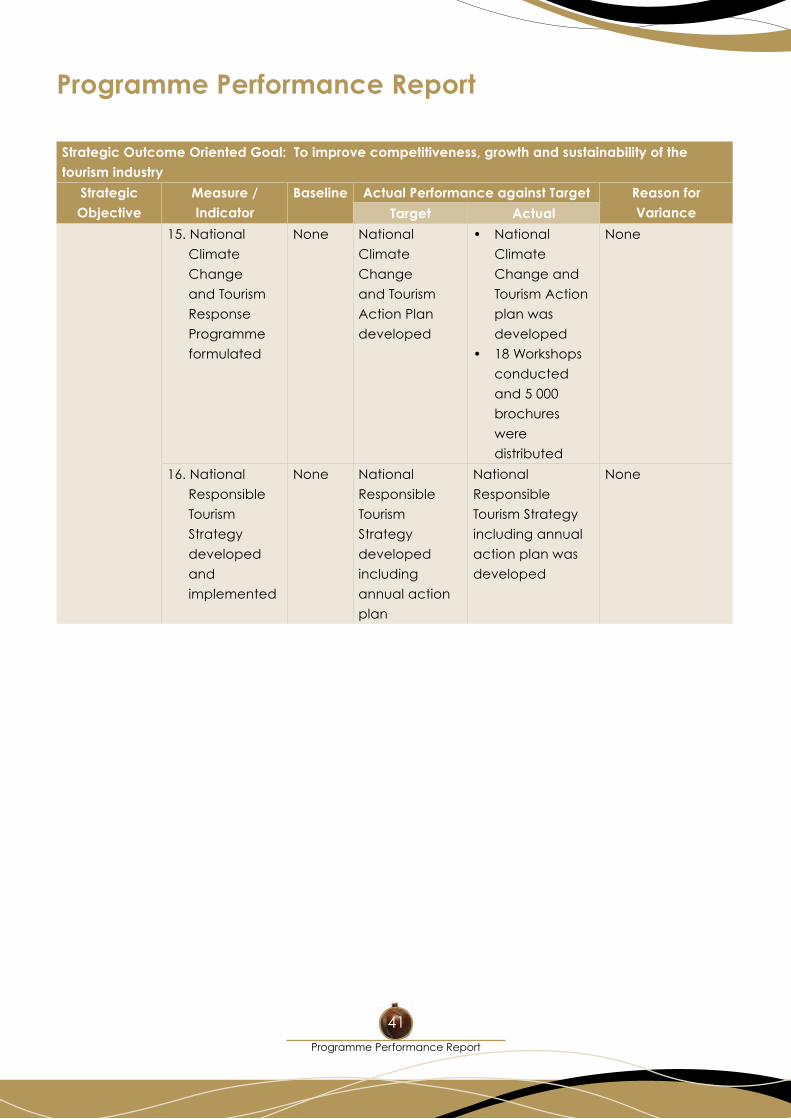
Programme Performance Report
Strategic Outcome Oriented Goal: To improve competitiveness, growth and sustainability of the tourism industry
Strategic Objective
Measure / Indicator
Baseline Actual Performance against Target Reason for VarianceTarget Actual
15. National
Climate
Change
and Tourism
Response
Programme
formulated
None National
Climate
Change
and Tourism
Action Plan
developed
• National
Climate
Change and
Tourism Action
plan was
developed
• 18Workshops
conducted
and 5 000
brochures
were
distributed
None
16. National
Responsible
Tourism
Strategy
developed
and
implemented
None National
Responsible
Tourism
Strategy
developed
including
annual action
plan
National
Responsible
Tourism Strategy
including annual
action plan was
developed
None
NDT Annual Report 2011/12
42
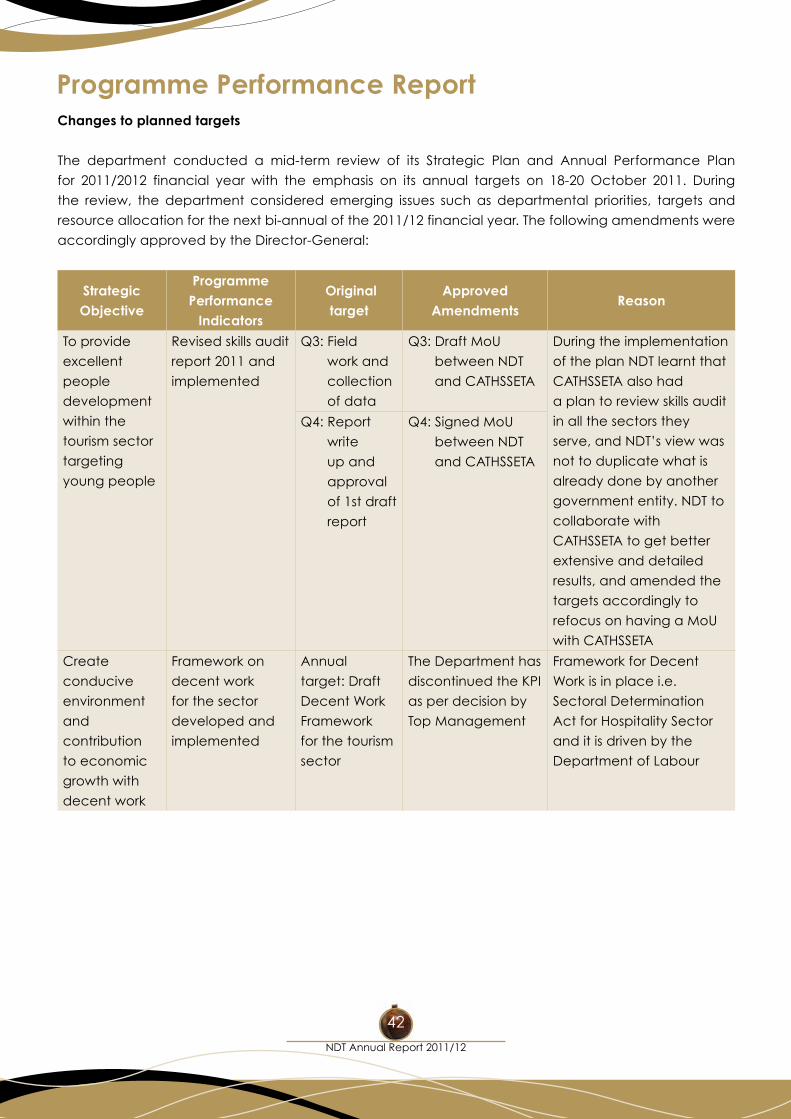
Programme Performance ReportChanges to planned targets
The department conducted a mid-term review of its Strategic Plan and Annual Performance Plan
for 2011/2012 financial year with the emphasis on its annual targets on 18-20 October 2011. During
the review, the department considered emerging issues such as departmental priorities, targets and
resource allocation for the next bi-annual of the 2011/12 financial year. The following amendments were
accordingly approved by the Director-General:
Strategic Objective
Programme Performance
Indicators
Original target
Approved Amendments
Reason
To provide
excellent
people
development
within the
tourism sector
targeting
young people
Revised skills audit
report 2011 and
implemented
Q3: Field
work and
collection
of data
Q3: Draft MoU
between NDT
and CATHSSETA
During the implementation
of the plan NDT learnt that
CATHSSETA also had
a plan to review skills audit
in all the sectors they
serve,andNDT’sviewwas
not to duplicate what is
already done by another
government entity. NDT to
collaborate with
CATHSSETA to get better
extensive and detailed
results, and amended the
targets accordingly to
refocus on having a MoU
with CATHSSETA
Q4: Report
write
up and
approval
of 1st draft
report
Q4: Signed MoU
between NDT
and CATHSSETA
Create
conducive
environment
and
contribution
to economic
growth with
decent work
Framework on
decent work
for the sector
developed and
implemented
Annual
target: Draft
Decent Work
Framework
for the tourism
sector
The Department has
discontinued the KPI
as per decision by
Top Management
Framework for Decent
Work is in place i.e.
Sectoral Determination
Act for Hospitality Sector
and it is driven by the
Department of Labour
Programme Performance Report
43
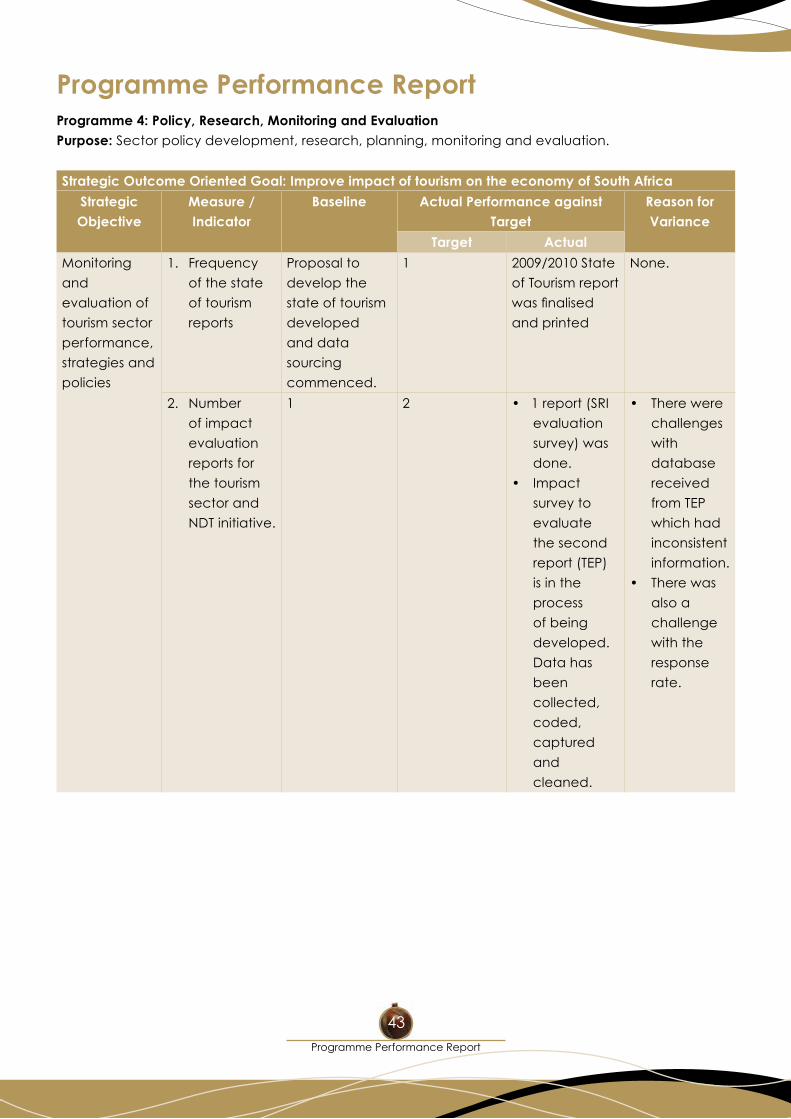
Programme Performance ReportProgramme 4: Policy, Research, Monitoring and EvaluationPurpose: Sector policy development, research, planning, monitoring and evaluation.
Strategic Outcome Oriented Goal: Improve impact of tourism on the economy of South Africa
Strategic Objective
Measure / Indicator
Baseline Actual Performance against Target
Reason for Variance
Target Actual
Monitoring
and
evaluation of
tourism sector
performance,
strategies and
policies
1. Frequency
of the state
of tourism
reports
Proposal to
develop the
state of tourism
developed
and data
sourcing
commenced.
1 2009/2010 State
of Tourism report
wasfinalised
and printed
None.
2. Number
of impact
evaluation
reports for
the tourism
sector and
NDT initiative.
1 2 •1report(SRI
evaluation
survey) was
done.
• Impact
survey to
evaluate
the second
report (TEP)
is in the
process
of being
developed.
Data has
been
collected,
coded,
captured
and
cleaned.
• Therewere
challenges
with
database
received
from TEP
which had
inconsistent
information.
• Therewas
also a
challenge
with the
response
rate.
NDT Annual Report 2011/12
44
Programme Performance Report
Strategic Outcome Oriented Goal: Improve impact of tourism on the economy of South Africa
Strategic Objective
Measure / Indicator
Baseline Actual Performance against Target
Reason for Variance
Target Actual
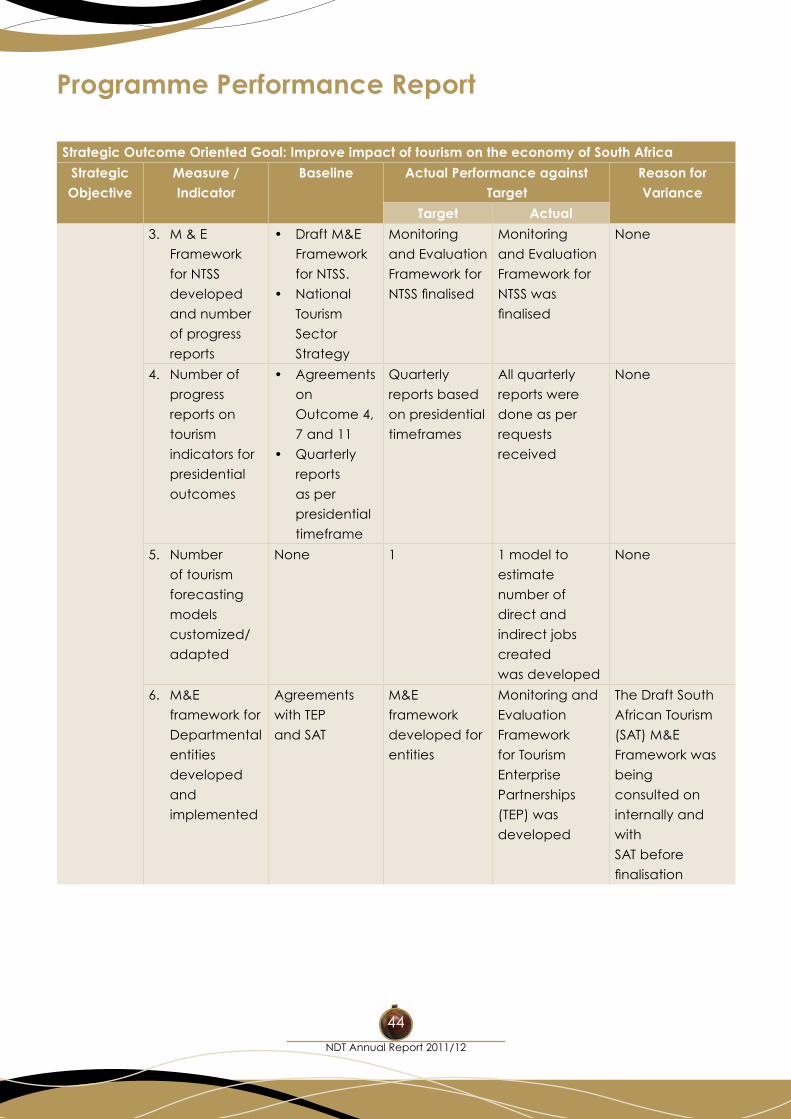
3. M & E
Framework
for NTSS
developed
and number
of progress
reports
• DraftM&E
Framework
for NTSS.
• National
Tourism
Sector
Strategy
Monitoring
and Evaluation
Framework for
NTSSfinalised
Monitoring
and Evaluation
Framework for
NTSS was
finalised
None
4. Number of
progress
reports on
tourism
indicators for
presidential
outcomes
• Agreements
on
Outcome 4,
7 and 11
• Quarterly
reports
as per
presidential
timeframe
Quarterly
reports based
on presidential
timeframes
All quarterly
reports were
done as per
requests
received
None
5. Number
of tourism
forecasting
models
customized/
adapted
None 1 1 model to
estimate
number of
direct and
indirect jobs
created
was developed
None
6. M&E
framework for
Departmental
entities
developed
and
implemented
Agreements
with TEP
and SAT
M&E
framework
developed for
entities
Monitoring and
Evaluation
Framework
for Tourism
Enterprise
Partnerships
(TEP) was
developed
The Draft South
African Tourism
(SAT) M&E
Framework was
being
consulted on
internally and
with
SAT before
finalisation
Programme Performance Report
45
Programme Performance Report
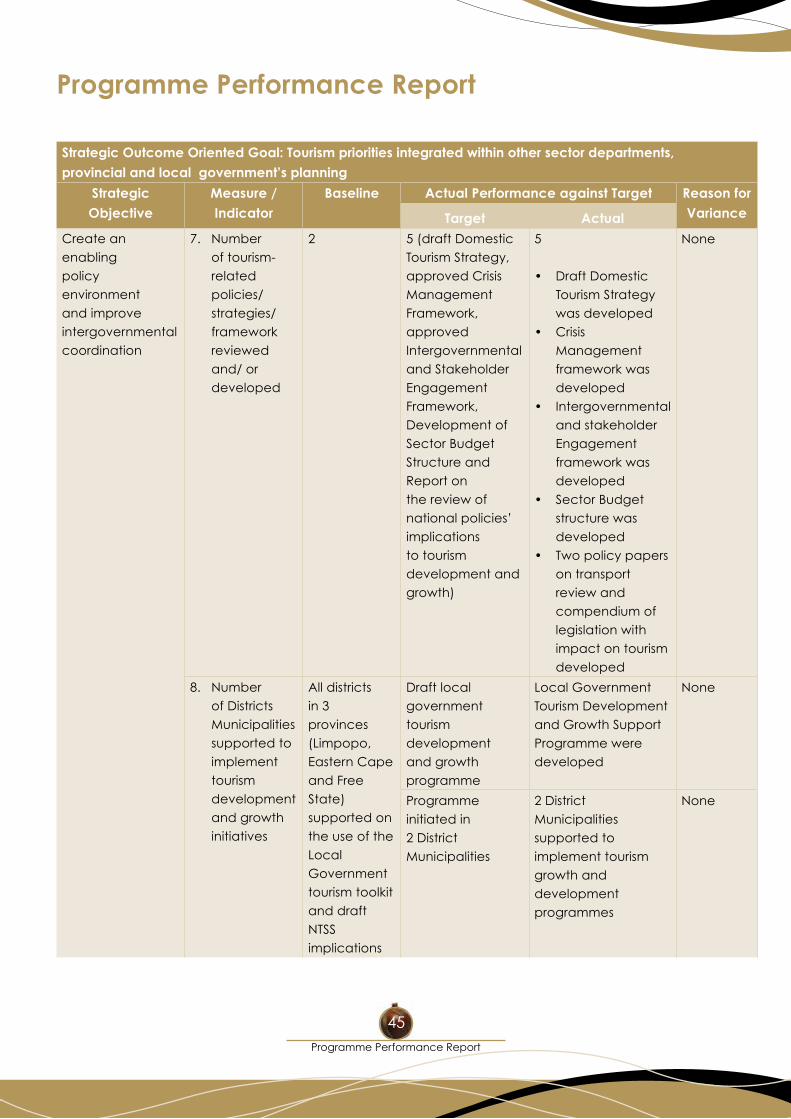
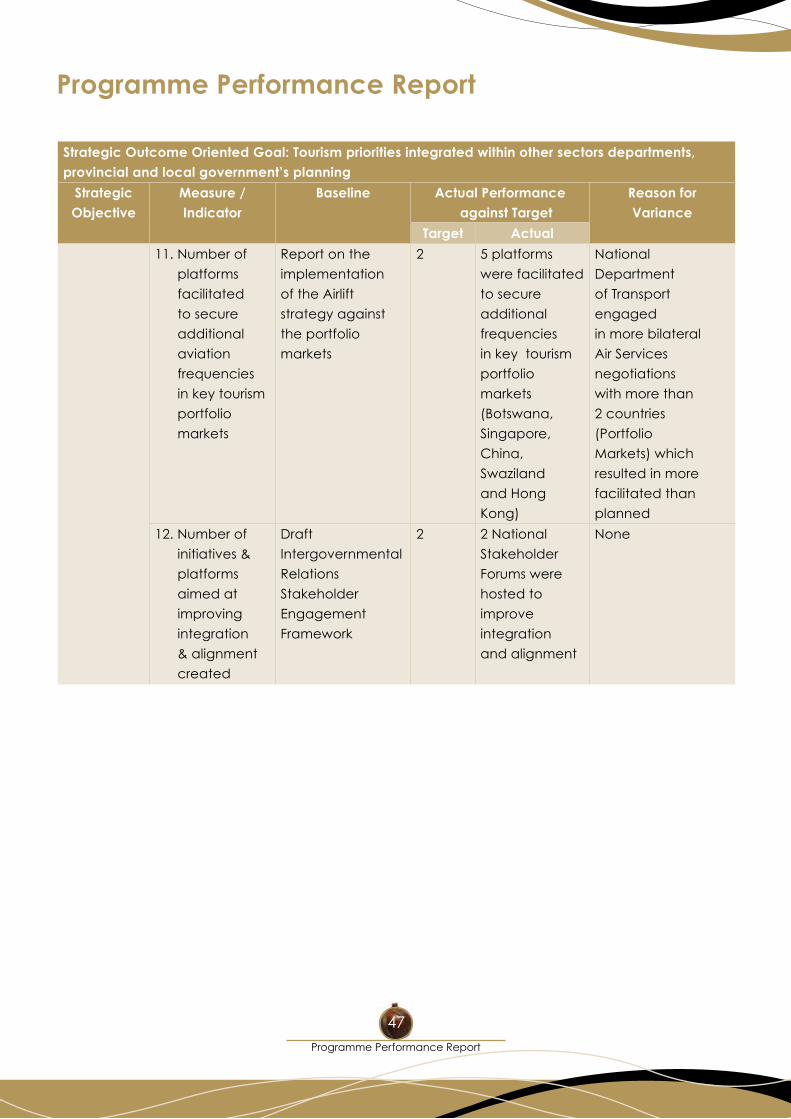
Strategic Outcome Oriented Goal: Tourism priorities integrated within other sector departments,provincial and local government’s planning
Strategic Objective
Measure / Indicator
Baseline Actual Performance against Target Reason for VarianceTarget Actual
Create an enabling policy environment and improve intergovernmental coordination
7. Number of tourism-related policies/ strategies/ framework reviewed and/ or developed
2 5 (draft Domestic Tourism Strategy, approved Crisis Management Framework, approved Intergovernmental and Stakeholder Engagement Framework, Development of Sector Budget Structure and Report on the review of nationalpolicies’implications to tourism development and growth)
5
• DraftDomesticTourism Strategy was developed
• CrisisManagement framework was developed
• Intergovernmentaland stakeholder Engagement framework was developed
• SectorBudgetstructure was developed
• Twopolicypaperson transport review and compendium of legislation with impact on tourism developed
None
8. Number of Districts Municipalities supported to implement tourism development and growth initiatives
All districts in 3provinces (Limpopo, Eastern Cape and Free State) supported on the use of the Local Government tourism toolkit and draft NTSS implications
Draft local government tourism development and growth programme
Local Government Tourism Development and Growth Support Programme were developed
None
Programme initiated in 2 District Municipalities
2 District Municipalities supported to implement tourism growth and development programmes
None
NDT Annual Report 2011/12
46
Programme Performance Report
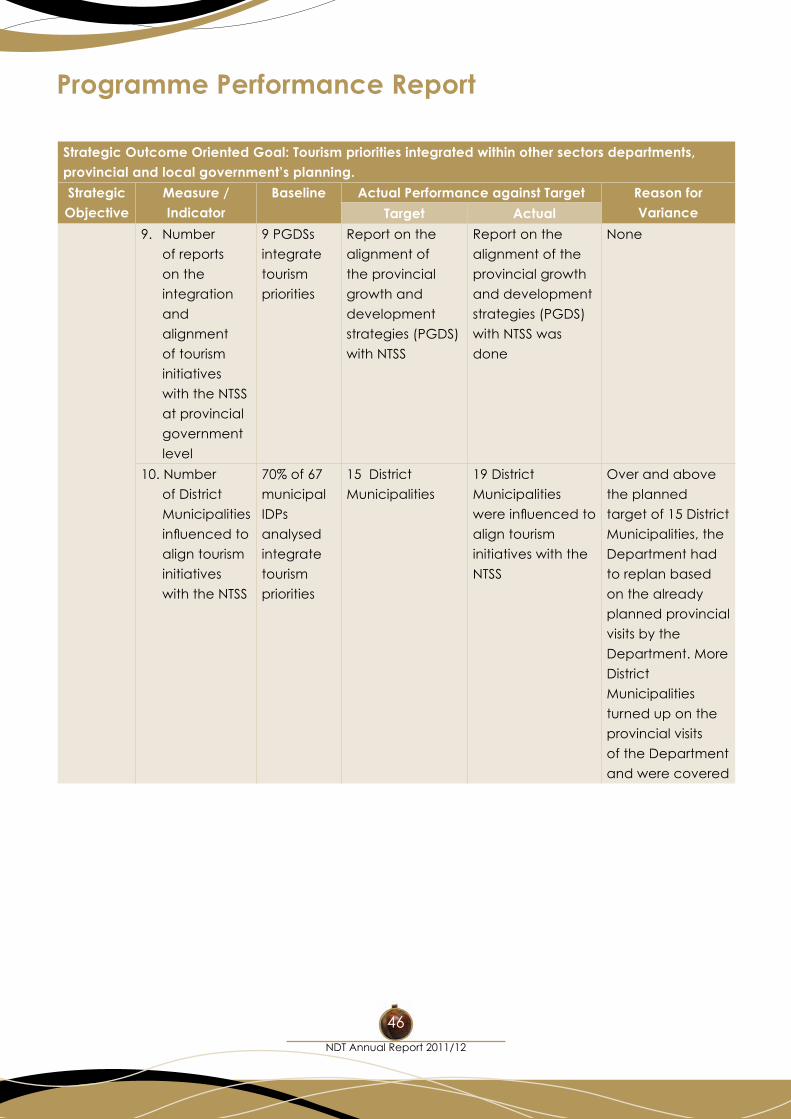
Strategic Outcome Oriented Goal: Tourism priorities integrated within other sectors departments, provincial and local government’s planning.
Strategic Objective
Measure / Indicator
Baseline Actual Performance against Target Reason for VarianceTarget Actual
9. Number
of reports
on the
integration
and
alignment
of tourism
initiatives
with the NTSS
at provincial
government
level
9 PGDSs
integrate
tourism
priorities
Report on the
alignment of
the provincial
growth and
development
strategies (PGDS)
with NTSS
Report on the
alignment of the
provincial growth
and development
strategies (PGDS)
with NTSS was
done
None
10. Number
of District
Municipalities
influencedto
align tourism
initiatives
with the NTSS
70% of 67
municipal
IDPs
analysed
integrate
tourism
priorities
15 District
Municipalities
19 District
Municipalities
wereinfluencedto
align tourism
initiatives with the
NTSS
Over and above
the planned
target of 15 District
Municipalities, the
Department had
to replan based
on the already
planned provincial
visits by the
Department. More
District
Municipalities
turned up on the
provincial visits
of the Department
and were covered
Programme Performance Report
47
Programme Performance Report
Strategic Outcome Oriented Goal: Tourism priorities integrated within other sectors departments, provincial and local government’s planning
Strategic Objective
Measure / Indicator
Baseline Actual Performance against Target
Reason for Variance
Target Actual
11. Number of
platforms
facilitated
to secure
additional
aviation
frequencies
in key tourism
portfolio
markets
Report on the
implementation
of the Airlift
strategy against
the portfolio
markets
2 5 platforms
were facilitated
to secure
additional
frequencies
in key tourism
portfolio
markets
(Botswana,
Singapore,
China,
Swaziland
and Hong
Kong)
National
Department
of Transport
engaged
in more bilateral
Air Services
negotiations
with more than
2 countries
(Portfolio
Markets) which
resulted in more
facilitated than
planned
12. Number of
initiatives &
platforms
aimed at
improving
integration
& alignment
created
Draft
Intergovernmental
Relations
Stakeholder
Engagement
Framework
2 2 National
Stakeholder
Forums were
hosted to
improve
integration
and alignment
None
NDT Annual Report 2011/12
48
Programme Performance Report
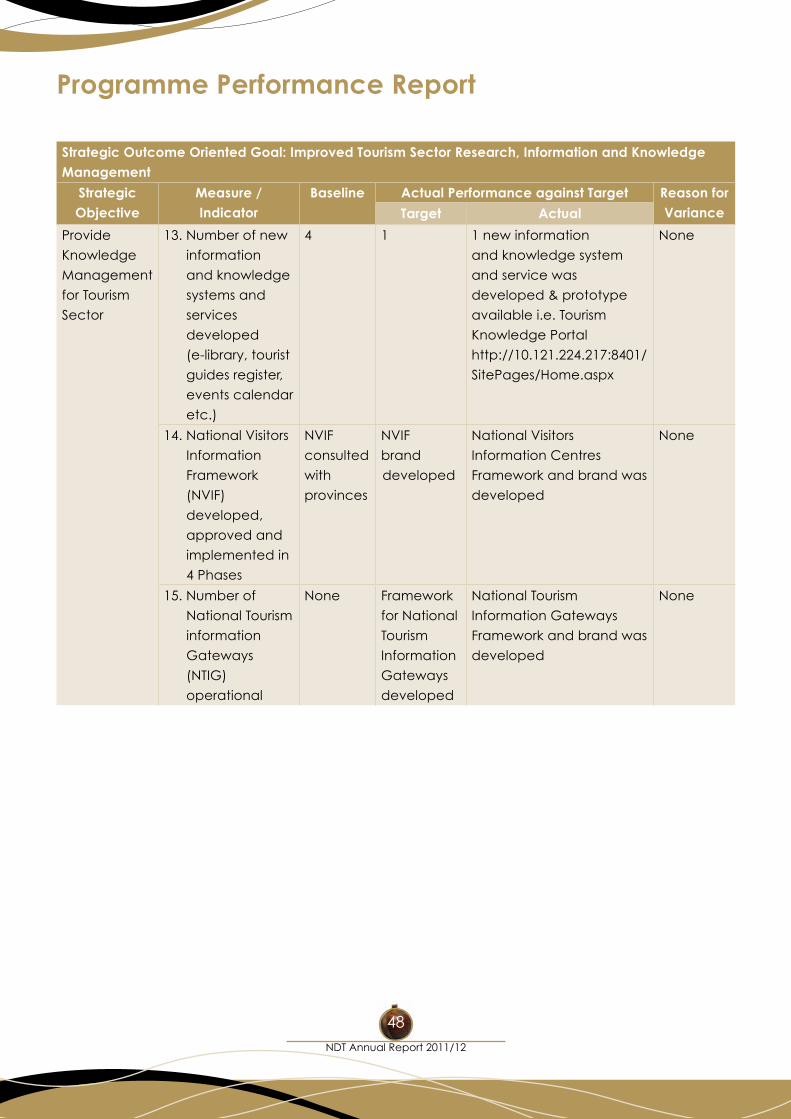
Strategic Outcome Oriented Goal: Improved Tourism Sector Research, Information and Knowledge Management
Strategic Objective
Measure / Indicator
Baseline Actual Performance against Target Reason for VarianceTarget Actual
Provide
Knowledge
Management
for Tourism
Sector
13. Number of new
information
and knowledge
systems and
services
developed
(e-library, tourist
guides register,
events calendar
etc.)
4 1 1 new information
and knowledge system
and service was
developed & prototype
available i.e. Tourism
Knowledge Portal
http://10.121.224.217:8401/
SitePages/Home.aspx
None
14. National Visitors
Information
Framework
(NVIF)
developed,
approved and
implemented in
4 Phases
NVIF
consulted
with
provinces
NVIF
brand
developed
National Visitors
Information Centres
Framework and brand was
developed
None
15. Number of
National Tourism
information
Gateways
(NTIG)
operational
None Framework
for National
Tourism
Information
Gateways
developed
National Tourism
Information Gateways
Framework and brand was
developed
None
Programme Performance Report
49
Programme Performance Report
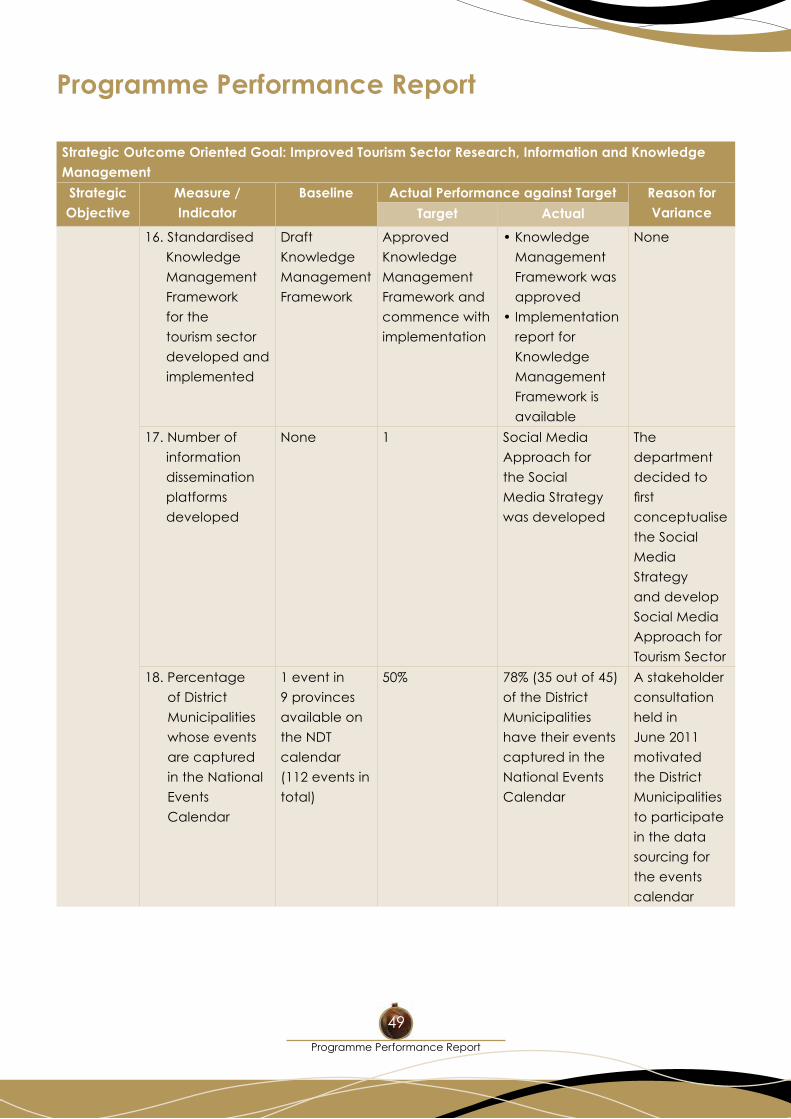
Strategic Outcome Oriented Goal: Improved Tourism Sector Research, Information and Knowledge Management
Strategic Objective
Measure / Indicator
Baseline Actual Performance against Target Reason for VarianceTarget Actual
16. Standardised
Knowledge
Management
Framework
for the
tourism sector
developed and
implemented
Draft
Knowledge
Management
Framework
Approved
Knowledge
Management
Framework and
commence with
implementation
•Knowledge
Management
Framework was
approved
•Implementation
report for
Knowledge
Management
Framework is
available
None
17. Number of
information
dissemination
platforms
developed
None 1 Social Media
Approach for
the Social
Media Strategy
was developed
The
department
decided to
first
conceptualise
the Social
Media
Strategy
and develop
Social Media
Approach for
Tourism Sector
18. Percentage
of District
Municipalities
whose events
are captured
in the National
Events
Calendar
1 event in
9 provinces
available on
the NDT
calendar
(112 events in
total)
50% 78% (35 out of 45)
of the District
Municipalities
have their events
captured in the
National Events
Calendar
A stakeholder
consultation
held in
June 2011
motivated
the District
Municipalities
to participate
in the data
sourcing for
the events
calendar
NDT Annual Report 2011/12
50
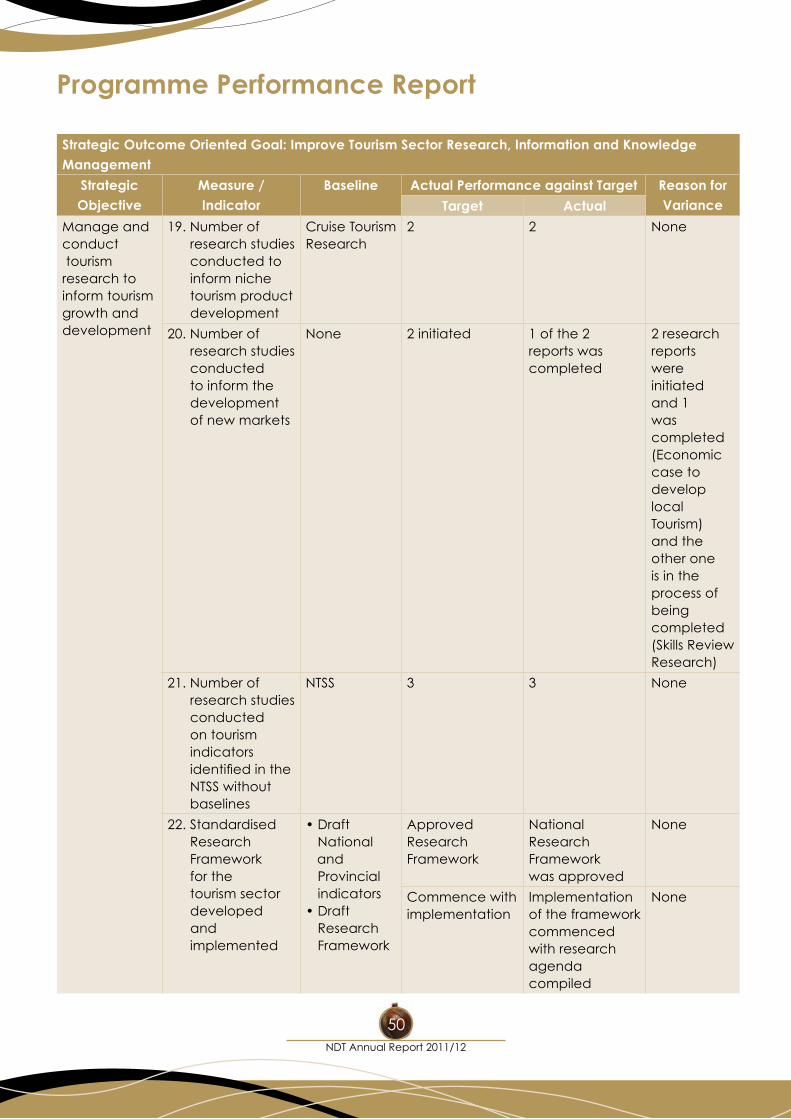
Strategic Outcome Oriented Goal: Improve Tourism Sector Research, Information and Knowledge Management
Strategic Objective
Measure / Indicator
Baseline Actual Performance against Target Reason for VarianceTarget Actual
Manage and conduct tourism research toinform tourism growth and development
19. Number of research studies conducted to inform niche tourism product development
Cruise TourismResearch
2 2 None
20. Number of research studies conducted to inform the development of new markets
None 2 initiated 1 of the 2 reports was completed
2 researchreports were initiated and 1 was completed (Economic case to develop local Tourism) and the other one is in the process of being completed (Skills Review Research)
21. Number of research studies conducted on tourism indicators identifiedintheNTSS without baselines
NTSS 3 3 None
22. Standardised Research Framework for the tourism sector developed
and implemented
•DraftNational
and Provincial indicators
•DraftResearch Framework
Approved ResearchFramework
National Research Framework was approved
None
Commence withimplementation
Implementation of the framework commenced with research agenda compiled
None
Programme Performance Report
51
Annual Financial Statementsfor the Department of Tourism
Picture: Tourism House - Pretoria
Annual Financial Statements
Department of Tourism Vote 35
for the year ended 31 March 2012
NDT Annual Report 2011/12
52
Report of the Audit Committee 53
ReportoftheAccountingOfficer 56
Report of the Auditor-General 65
Appropriation Statement 70
Notes to the Appropriation Statement 80
Statement of Financial Performance 84
Statement of Financial Position 85
Statement of Changes in Net Assets 86
Cash Flow Statement 87
Notes to the Annual Financial Statements (including Accounting Policies) 88
Disclosure Notes to the Annual Financial Statements 106
Annexures 115
Table of Contents
Annual Financial Statements
Report of the Audit Committee
Annual Report 2011/12
for the year ended 31 March 2012
Report of the Audit Committee
53
Wearepleasedtopresentourreportforthefinancialyearended31March2012.
Audit Committee members and attendance
The Audit Committee consists of the members listed hereunder and meets at least four times per annum as per its approved terms of reference.
During the year under review four meetings were held.
Name of member Number of meetings attended
Prof H de Jager (Chairperson) (external) 4
Mr J Rapoo (external) 4
Mr T Bouwer (external) 4
Mr R Rajcoomar (external) 4
Ms KT Rapoo (external) 4
TheAuditor-GeneralSouthAfrica(AGSA),NationalTreasury,InternalAuditandtheAccountingOfficerwereinvitedtothemeetings.TheChiefFinancialOfficerandChiefOperatingOfficerattendedthemeetingsex-officioandtheAccountingOfficerattendedoccasionally.
Audit Committee responsibility
The Audit Committee reports that it has complied with its responsibilities arising from sections 38(1) (a) of the PFMA and Treasury Regulations 3.1.
The Audit Committee also reports that it has adopted appropriate formal terms of reference as its Audit Committee Charter, has regulated its affairs in compliance with this charter and has discharged all its responsibilities as contained therein.
The effectiveness of internal control
Thedepartment’ssystemof internalcontrol isdesignedtoprovidereasonableassurance, interalia,thatassets are safeguardedand that liabilities andworking capital are efficientlymanaged. Based on theapproved annual internal audit plan setting out the scope, control objectives and risks, for the period covered, various reports were submitted by the internal auditors.
TheManagement Report of the AGSA on the annual financial statements was also submitted to anddiscussed by the committee. The results of the internal and external audits indicated that controls have been operating as intended in certain areas, while in others attention should be given to strengthen, improve and monitor the controls. Where control weaknesses and other matters were reported, the Audit Committee has consideredmanagement’s responses and action plans to address thematters and tofacilitate corrective actions, improvements and monitoring the controls and procedures. Implementation of such corrective actions is monitored through the implementation of an issue tracking report and the follow-up review reports submitted to the committee on a regular basis.
Report of the Audit Committee
Department of Tourism Vote 35
for the year ended 31 March 2012
NDT Annual Report 2011/12
54
The quality of management monthly reports submitted in terms of the PFMA
TheAuditCommitteeissatisfiedwiththecontentandqualityofmonthlyandquarterlyreportspreparedandissued by the department during the year under review. Evaluation of financial statements
The Audit Committee has: • reviewedanddiscussedtheauditedannualfinancialstatementstobeincludedintheannualreport with the AGSA and management; • reviewedtheAGSAmanagementreportandmanagement’sresponsethereto;• reviewedthedepartment’scompliancewithlegalandregulatoryprovisionsbasedonthefindingsof the AGSA and internal audit; and • notedthattherewerenoadjustmentsresultingfromtheaudit.
The Audit Committee concurs and accepts the Auditor-General’s conclusion on the annual financialstatements, and is of theopinion that theauditedannual financial statementsbeacceptedand readtogether with the report of the AGSA.
The Audit Committee would like to impress upon management to give attention to the matter raised under non compliance with laws and regulations, to ensure that appropriate corrective action is taken to prevent a reoccurrence in the future.
The Committee believes that the adoption of the going concern concept assertion in the preparation of the Annual Financial Statements is appropriate.
ManagementiscommendedthattheAuditReportisunqualifiedandfortheirattitudetotakecorrectiveactions.
Internal audit
The Internal Audit Unit conducts its affairs in terms of an approved Internal Audit Charter. The charter is reviewed on an annual basis. The Internal Audit Unit follows a risk-based audit approach, whereby the department’sRiskStrategyandtheInternalAuditUnit’sassessmentoftherisksdriversaretakenintoaccount.
The Internal Audit Plan was formally adopted and approved by the Audit Committee.
Progress on the execution of the plan was monitored and reported on at each Audit Committee meeting. VariationsandamendmentstotheplanwerejustifiedandsubsequentlyapprovedbytheAuditCommittee.TheAuditCommitteeisthereforesatisfiedthattheinternalauditfunctionisoperatingeffectivelyandthatithas addressed the risks pertinent to the department in its Audit Plan.
Report of the Audit Committee
Annual Report 2011/12
for the year ended 31 March 2012
Report of the Audit Committee
55
Risk strategy
The Department has a risk management strategy in place and keeps a risk register.
Auditor-General South Africa
The Audit Committee has met with the Auditor- General South Africa to ensure that there are no unresolved issues.
Chairperson of the Audit Committee Date: 30 July 2012
Report of the Accounting Officer
Department of Tourism Vote 35
for the year ended 31 March 2012
NDT Annual Report 2011/12
56
ReportbytheAccountingOfficertotheExecutiveAuthorityandParliamentoftheRepublicofSouthAfrica.
1. General review of the state of financial affairs
The aim of the National Department of Tourism is to promote and support the growth and development of an equitable, competitive and sustainable tourism sector, enhancing its contribution to national priorities.
Policy decisions and strategic issues facing the department
The core mandate of the Department of Tourism is to create conditions for the sustainable growth and development of tourism in South Africa. In terms of the Constitution, tourism is a functional area of concurrent national and provincial legislative competence.
The Tourism Act (1993) provides for the promotion of tourism to and in South Africa, and for the regulation and rationalisation of the tourism industry. This includes measures aimed at enhancing and maintaining the standards of facilities and services used by tourists; and the coordination and rationalisation of the activities of those who are active in the tourism industry.
The 1996 White Paper on the Development and Promotion of Tourism in South Africa provides a framework and guidelines for the development and promotion of tourism in South Africa. Its vision is to develop the tourism sector as a national political and economic priority to maximise its contribution to improving the quality of life of all South Africans.
The IndustrialPolicyActionPlan(IPAP2) identifiestourismasan importantdriverofbothdomesticconsumer spending and foreign exchange earnings, underpinned by a sustainable resource base and relatively low barriers to entry for entrepreneurs.
Tourism is named in the New Growth Path (NGP) as one of six key sectors for economic growth in South Africa. It is labour intensive, with the potential to stimulate economic growth and create jobs.Toenhancetourism’scontributiontoeconomicgrowthandjobcreationthenewgrowthpathdefines the following measures: expand tourism infrastructure and services; promote targetedmarketing campaigns, manage costs, provide quality assurance and logistics; improve training; identify employment and entrepreneurial opportunities for the youth; enhance support measures to encouragediversificationanddevelopacomprehensiveprogrammetosupportculturalindustries.The New Growth Path commits the sector to the creation of 225 000 jobs by 2020. The national tourism sector strategy fosters coordination of all role players to achieve these objectives.
In the outcomes approach to service delivery, tourism contributes to the realisation of outcome 4 (decent employment through inclusive economic growth), and outcome 7 (vibrant, equitable and sustainable rural communities and food security for all). It is anticipated that, in conjunction with other departments, the department will make a major contribution to achieving the growth and employment targets set for outcome 4, through activities involving skills development, continuous improvement in the quality of tourism products and services, support for small, medium and micro enterprises (SMMEs), and other measures.
Thedepartment’scontributiontooutcome7willbetoleadthebuildingofadynamictourismsector,inthecontextofSouthAfrica’ssocioeconomicdevelopment.Withitsentity,SouthAfricanTourism,the department is also committed to creating a better South Africa and contributing to a better and
Report of the Accounting Officer
Annual Report 2011/12
for the year ended 31 March 2012
ReportoftheAccountingOfficer
57
safer Africa and world (outcome 11) by implementing a tourism marketing strategy that attracts volumeandvalue,therebyincreasingtourism’scontributiontoSouthAfrica’sGDP.
Significant events that have taken place during the year
National Tourism Sector Strategy (NTSS) The development of the NTSS has succeeded in getting all role-players from the private and the
public sector to rally around the development of tourism. Its main goal is to drive the tourism economy, enhance visitor experience, position South Africa as a destination of choice and sustain good governance of the sector. The NTSS was compiled through a comprehensive consultative process including stakeholder contributions from the ministerial road shows undertaken in July and August2009andspecificstrategystakeholderworkshopsheldineveryprovinceinJuly,AugustandSeptember 2009. To guide the development of the NTSS, a panel of 32 experts from across all major stakeholder groups was appointed by the Minister.
The NTSS implementation has guided the consolidation of the tourism sector efforts to increase tourism’s contribution to job creation and economic growth, in line with the NGP, are beingcoordinated through theNTSS. It identifiedandprioritisedactionsbyall roleplayers thatwouldsupport the NGP targets. Implementation of the strategy is well underway. The National Tourism Stakeholder Forum was established as a delivery mechanism for the NTSS. Importantly this forum has enhanced stakeholder and intergovernmental relations and stakeholders have begun incorporating the NTSS in their action plans. Provisions in the NTSS provide for development of a rural, culture, heritage, crisis management and domestic tourism strategy through which tourism performance is gradually getting enhanced.
A number of policy frameworks have already been developed and launched. The Tourism Marketing Strategy by South African Tourism (SAT) is implemented to generate tourist arrivals that bring targeting volume and value, and creates a culture of tourism in South Africa. Service Excellence requirements and a quality assurance system are being implemented. Domestic tourism is receiving due attention as the backbone for a sustainable tourism sector. Regional tourism has received additional funding to grow the African Market. Business and events tourism is being supported by the newly established National Conventions Bureau. The department continues to enjoy the support and cooperation of other enabling departments and public sectors agencies to implement the NTSS.
Tourism Draft Bill
To crystallise the tourism mandate, the Tourism Draft Bill has been developed as a legal framework for the development and promotion of sustainable tourism for the social, economic and environmental benefitofSouthAfricancitizensandfortheenjoymentofallitsresidentsandforeignvisitors.Publicand stakeholder participation has been concluded and the Draft Bill will be introduced into Parliament during the third quarter of this year.
Report of the Accounting Officer
Department of Tourism Vote 35
for the year ended 31 March 2012
NDT Annual Report 2011/12
58
Policy Frameworks
The department has focused on developing policy frameworks and strategies that support the achievement of the tourism sector priorities. These include:
• RuralTourismStrategy • HeritageTourismStrategy • DomesticTourismStrategy • ProductDevelopmentMasterPlan • NicheTourismFrameworkandAvitourismStrategy • EventsStrategy • HumanResourceDevelopmentStrategy • ServiceExcellencestrategy
Domestic Tourism
Domestic tourism is now receiving the attention that supports its stature as the backbone for a sustainable tourism sector in South Africa. The Domestic Tourism Strategy is its final stages ofdevelopment. It is supported by additional allocation of resources for the domestic tourism marketing strategy by South African Tourism (SAT).
Marketing Strategy and Arrivals
SouthAfrica’stourismsectorhasmanagedtobuildonthemomentumachievedduringarecord-breaking 2010, by attracting 12 255 155 international arrivals in 2011.
The Tourism Marketing Strategy is implemented by SAT. With the levels of resources available for marketing Destination SA, the marketing strategy is informed by a process of portfolio review that identifiesselectedmarketstoinvestin.TheAfricanmarkethasreceivedadditionalfundingfromthe2012/13financialyeartounlockthepotentialandgrowarrivalsandspendfromthesecountries.SATwill implement a marketing strategy in Africa to achieve this.
Perceptions of stakeholders
The tourism industry continues to engage robustly with government on the issue of tourism growth. Wecontinuetoreceivepositivefeedbackfromindustryongovernment’sdecisiontocreateastand-alone Department of Tourism. The Tourism Ministry and Department maintain regular interactions with the private sector to enable government to keep in touch with the knowledge base within the sector to improve sector performance.
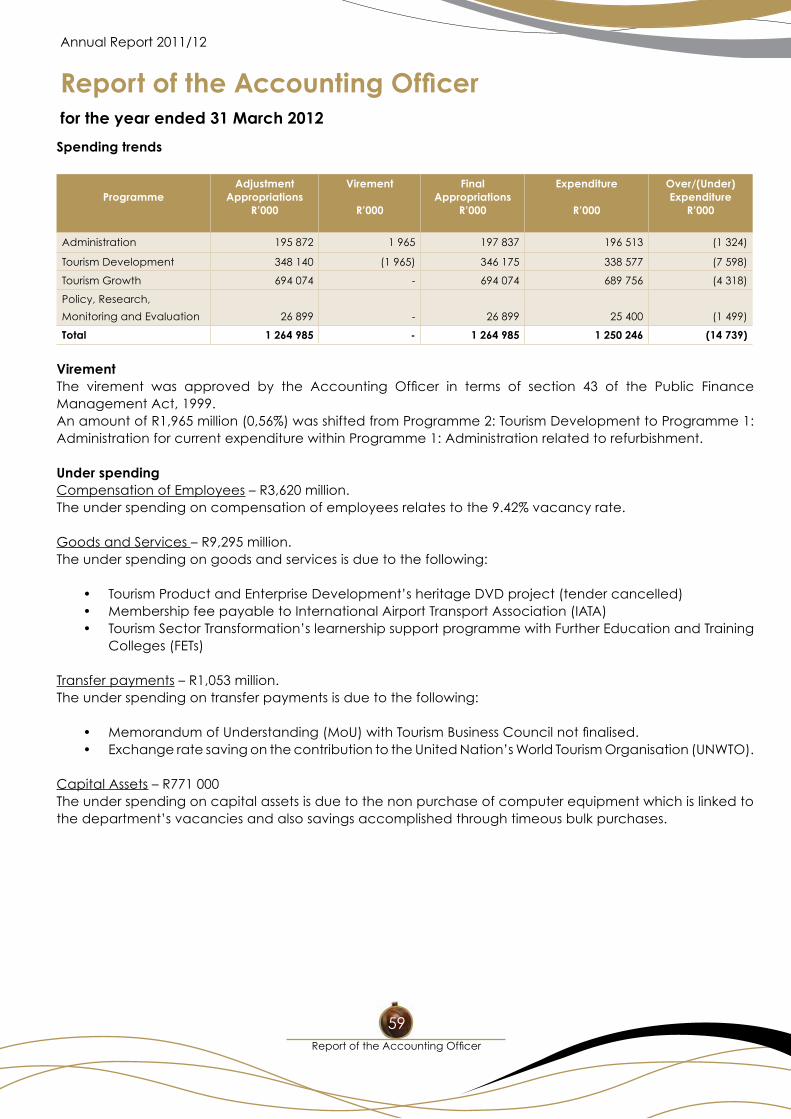
Report of the Accounting Officer
Annual Report 2011/12
for the year ended 31 March 2012
ReportoftheAccountingOfficer
59
Spending trends
ProgrammeAdjustment
AppropriationsR’000
Virement
R’000
FinalAppropriations
R’000
Expenditure
R’000
Over/(Under) Expenditure
R’000
Administration 195 872 1 965 197 837 196 513 (1 324)
Tourism Development 348 140 (1 965) 346 175 338 577 (7 598)
Tourism Growth 694 074 - 694 074 689 756 (4 318)
Policy, Research,
Monitoring and Evaluation 26 899 - 26 899 25 400 (1 499)
Total 1 264 985 - 1 264 985 1 250 246 (14 739)
VirementThe virement was approved by the Accounting Officer in terms of section 43 of the Public FinanceManagement Act, 1999.An amount of R1,965 million (0,56%) was shifted from Programme 2: Tourism Development to Programme 1: Administration for current expenditure within Programme 1: Administration related to refurbishment.
Under spendingCompensation of Employees – R3,620 million.The under spending on compensation of employees relates to the 9.42% vacancy rate.
Goods and Services – R9,295 million.The under spending on goods and services is due to the following:
• TourismProductandEnterpriseDevelopment’sheritageDVDproject(tendercancelled) • MembershipfeepayabletoInternationalAirportTransportAssociation(IATA) • TourismSectorTransformation’slearnershipsupportprogrammewithFurtherEducationandTraining
Colleges (FETs)
Transfer payments – R1,053 million.The under spending on transfer payments is due to the following:
• MemorandumofUnderstanding(MoU)withTourismBusinessCouncilnotfinalised. • ExchangeratesavingonthecontributiontotheUnitedNation’sWorldTourismOrganisation(UNWTO).
Capital Assets – R771 000 The under spending on capital assets is due to the non purchase of computer equipment which is linked to thedepartment’svacanciesandalsosavingsaccomplishedthroughtimeousbulkpurchases.
Report of the Accounting Officer
Department of Tourism Vote 35
for the year ended 31 March 2012
NDT Annual Report 2011/12
60
2. Service rendered by the department 2.1 Services Rendered The services rendered by the department are aimed at making the tourism industry more
competitive, promoting international and domestic tourism, promoting transformation, supporting job creation, supporting small town and rural tourism, reviewing existing legislation and improving tourism infrastructure.
2.2 Tariff policy The department does not charge tariffs for goods sold and/or services rendered.
2.3 Free services The department is not a direct service delivery department and does not provide direct
services.
2.4 Inventories The inventories on hand at the year will be included in Annexure 5 and reported in the
annualfinancialstatements.Mostofthepurchasesincludedintheinventoriesare direct from the service providers.
3. Capacity constraints
To meet the National Tourism Sector Strategy (NTSS) targets, the department has to focus on supporting the growth of both domestic and international markets; the department requested the Department of Public Service and Administration to approve a new departmental structure to be implemented from 1 April 2012. The structure with 602 posts was approved and will be funded in a phased-in approach over the Medium Term Expenditure Framework (MTEF). 127 posts are currently unfunded.
4. Utilisation of donor funds
The department received no donor funding.
5. Public Entities
The core business of South African Tourism, established in terms of the Tourism Act (1993), is to position and market South Africa as a tourism destination of choice. Key activities include the promotion of tourism by encouraging potential visitors to undertake travels to and in South Africa, and ensuring the highest attainable quality standards of tourism services and facilities. Key objectives include increasing the annual volume of international tourists visiting the country; the average spend per tourist; the international brand awareness of South Africa as a travel destination, and increasing the number of graded accommodation establishments. Funding is primarily used for running marketing officesintargetedcountries;promotinglocaltourism(whichhelpsreduceseasonalityintheindustry);and facilitating the grading of products and services. The entity engages various marketing initiatives such as media hosting, participating in various exhibitions both domestic and international in order to promote tourism to South Africa. Exhibitions would include Indaba and Meetings Africa held annually which improves trade to South Africa.
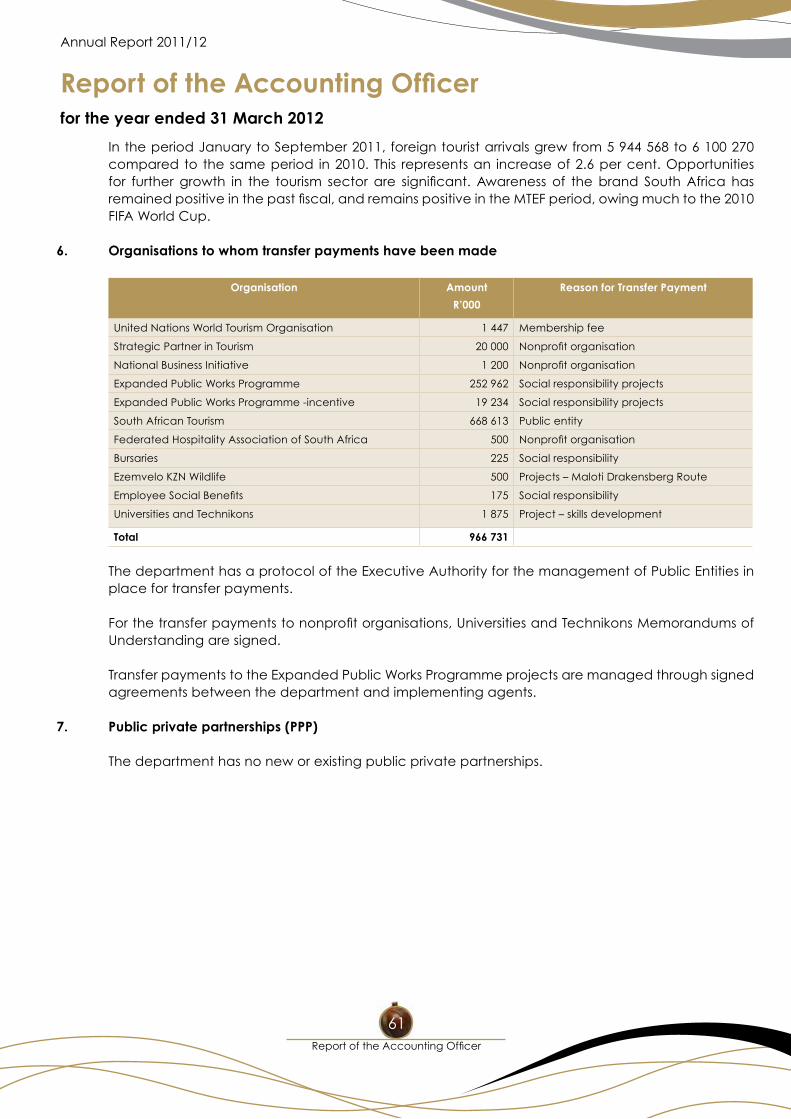
Report of the Accounting Officer
Annual Report 2011/12
for the year ended 31 March 2012
ReportoftheAccountingOfficer
61
In the period January to September 2011, foreign tourist arrivals grew from 5 944 568 to 6 100 270 compared to the same period in 2010. This represents an increase of 2.6 per cent. Opportunities for further growth in the tourism sector are significant. Awareness of thebrand SouthAfrica hasremainedpositiveinthepastfiscal,andremainspositiveintheMTEFperiod,owingmuchtothe2010FIFA World Cup.
6. Organisations to whom transfer payments have been made
Organisation Amount
R’000
Reason for Transfer Payment
United Nations World Tourism Organisation 1 447 Membership fee
Strategic Partner in Tourism 20 000 Nonprofitorganisation
National Business Initiative 1 200 Nonprofitorganisation
Expanded Public Works Programme 252 962 Social responsibility projects
Expanded Public Works Programme -incentive 19 234 Social responsibility projects
South African Tourism 668 613 Public entity
Federated Hospitality Association of South Africa 500 Nonprofitorganisation
Bursaries 225 Social responsibility
Ezemvelo KZN Wildlife 500 Projects – Maloti Drakensberg Route
EmployeeSocialBenefits 175 Social responsibility
Universities and Technikons 1 875 Project – skills development
Total 966 731
The department has a protocol of the Executive Authority for the management of Public Entities in place for transfer payments.
Forthetransferpaymentstononprofitorganisations,UniversitiesandTechnikonsMemorandumsofUnderstanding are signed.
Transfer payments to the Expanded Public Works Programme projects are managed through signed agreements between the department and implementing agents.
7. Public private partnerships (PPP)
The department has no new or existing public private partnerships.
Report of the Accounting Officer
Department of Tourism Vote 35
for the year ended 31 March 2012
NDT Annual Report 2011/12
62
8. Corporate governance arrangements
Inthe2011/2012financialyeartheAuditCommitteeoftheDepartmentwasfullyfunctional,executedits duties and responsibilities in accordance with the Public Finance Management Act (PFMA) of 1999, and the Treasury Regulations (regulation 3). The Chairperson of the Audit Committee was Prof. H. de Jager. The other four audit committee members were:
Member Institution Position
Mr JR Rapoo Consultant
Mr R Rajcoomar FoodBev SETA ChiefFinancialOfficer
Mr T Bouwer Department of Water Affairs Seconded
Ms KT Rapoo SouthAfricanPostOffice General Manager: Risk Manager
Inthe2011/2012financialyearinternalauditswereperformedbythein-houseinternalauditteam
and KPMG in accordance with the co-source arrangement. A risk assessment was conducted for theperiod2011/2012.TheAuditCommitteemetfourtimesduringthefinancialyear,19May2011,27 July 2011, 1 December 2011 and 28 March 2012.
9. Discontinued activities / activities to be discontinued
The department has no discontinued activities or activities to be discontinued. The departmental programme structure has however been amended to be implemented on 1 April 2012. The structure is as follows:
Programme 1 : Administration Programme 2 : Policy and Knowledge Services Programme 3 : International Tourism Programme 4 : Domestic Tourism
10. New / proposed activities
The department has begun the process of taking over the tourism incentive programme from the Department of Trade and Industry. Cabinet took a decision which is outlined in the Industrial Policy Action Plan 2011/12 to 2013/14 for this tourism function to be transferred.
11. Asset management
The Department of Tourism transferred assets back to the Department of Environmental Affairs, and received assets from the Department of Trade and Industry in accordance with section 42 of the Public Finance Management Act, 1999 as amended. This was based on cabinet decision to centralisetourismfunctions.Duringthefinancialyear2011/2012,theAssetManagementUnit,inlinewith the Department of Tourism Asset Management Policy undertook the disposal of asset and asset verification.
In terms of the Treasury Regulations 16A.7.1 on disposal and letting of state assets, and sub-section 38(1)(b)ofthePublicFinanceManagementAct(1of1999)asamended,theAccountingOfficerofthedepartmentisresponsiblefortheefficient,effective,economicalandtransparentuseoftheresources of the Department. The assets of the department are accounted for, updated in the asset registerandreportedintheannualfinancialstatements.
Report of the Accounting Officer
Annual Report 2011/12
for the year ended 31 March 2012
ReportoftheAccountingOfficer
63
12. Inventories
The only store items managed by the department are cleaning materials and government printing works forms. All other inventories are direct purchases from the suppliers.
13. Events after the reporting date
InthepreviousAnnualReportitwasreportedthattheAccountingOfficerinitiatedaforensicauditinvestigation concerning the project implementers for misuse of state funds in respect of projects for the Expanded Public Works Programme. The forensic audit investigation had been completed and criminal cases have been opened and have been handed over to the South African Police Service (SAPS).IrregularexpenditurewasidentifiedandisincludedintheAnnualFinancialStatements.Theirregular expenditure relates to the non approval of item shifts and changes to the business plans without approval. This irregular expenditure has been condoned.
14. Information on predetermined objectives
Each Branch within the department must ensure that its predetermined objectives are measurable and are reported on a quarterly basis to the management meetings as well as to the Executive Authority on progress.
15. SCOPA resolutions
The department has no SCOPA resolutions.
16. Prior modifications to audit reports Thedepartmenthadnoqualifications,disclaimeroradverseopinioninthepreviousfinancialyear. The transfer of funds to Expanded Public Works Programme projects was raised as a non-compliance
withlawsandregulations.TheOfficeoftheAuditor-GeneralSouthAfricaaudited51projectsinthe2011/12financialyear.Thedepartmentimplementedthecorrectiveactionsidentifiedandwillalsoinstitute further forensic investigations into 11 projects. At this stage no expenditure can be regarded as fruitless and wasteful, pending the outcome of these investigations. Irregular expenditure was identifiedandisincludedintheAnnualFinancialStatements.
Report of the Accounting Officer
Department of Tourism Vote 35
for the year ended 31 March 2012
NDT Annual Report 2011/12
64
17. Exemptions and deviations received from the National Treasury
None
18. Interim Financial Statements
The interim financial statements provided the department the opportunity to assess expenditurecontrolandcashflowmanagementaswellastheclearingofsuspenseaccountsduringthefinancialyear.
19. Other No other material facts or circumstances to be reported.
20. Approval
The Annual Financial Statements set out on pages 70 to 121 have been approved by the AccountingOfficer.
Ambassador L M MakhubelaDirector-GeneralDate: 31 May 2012
Report of the Auditor-General to Parliamenton Vote No. 35: Department of Tourism
Annual Report 2011/12
for the year ended 31 March 2012
Report of the Auditor-General
65
Introduction
1. IhaveauditedthefinancialstatementsoftheDepartmentofTourismsetoutonpages70to121,whichcomprise theappropriation statement, the statementof financial positionasat 31March 2012, thestatementoffinancialperformance,statementofchangesinnetassetsandthecashflowstatementfortheyearthenended,andthenotes,comprisingasummaryofsignificantaccountingpoliciesandother explanatory information.
Accounting officer’s responsibility for the financial statements 2. The accounting officer is responsible for the preparation and fair presentation of these financial
statements in accordance with The Departmental Financial Reporting Framework prescribed by the National Treasury and the requirements of the Public Finance Management Act of South Africa, 1999 (Act No. 1 of 1999) (PFMA), and for such internal control as management determines necessary to enablethepreparationoffinancialstatementsthatarefreefrommaterialmisstatement,whetherdueto fraud or error.
Auditor-General’s responsibility
3. Myresponsibilityistoexpressanopiniononthesefinancialstatementsbasedonmyaudit.Iconductedmy audit in accordance with the Public Audit Act of South Africa, 2004 (Act No. 25 of 2004) (PAA), the General Notice issued in terms thereof and International Standards on Auditing. Those standards require that I comply with ethical requirements and plan and perform the audit to obtain reasonable assurance aboutwhetherthefinancialstatementsarefreefrommaterialmisstatement.
4. An audit involves performing procedures to obtain audit evidence about the amounts and disclosures in thefinancial statements. Theproceduresselecteddependontheauditor’s judgement, includingtheassessmentoftherisksofmaterialmisstatementofthefinancialstatements,whetherduetofraudorerror.Inmakingthoseriskassessments,theauditorconsidersinternalcontrolrelevanttotheentity’spreparation and fair presentation of the financial statements in order to design audit proceduresthat are appropriate in the circumstances, but not for the purpose of expressing an opinion on the effectivenessoftheentity’s internalcontrol.Anauditalsoincludesevaluatingtheappropriatenessofaccounting policies used and the reasonableness of accounting estimates made by management, as wellasevaluatingtheoverallpresentationofthefinancialstatements.
5. IbelievethattheauditevidenceIhaveobtainedissufficientandappropriatetoprovideabasisformyaudit opinion.
Opinion
6. Inmyopinion,thefinancialstatementspresentfairly,inallmaterialrespects,thefinancialpositionoftheDepartmentofTourismasat31March2012,anditsfinancialperformanceandcashflowsfortheyearthen ended in accordance with The Departmental Financial Reporting Framework prescribed by the National Treasury and the requirements of the Public Finance Management Act of South Africa, 1999 (Act No. 1 of 1999) (PFMA).
REPORT ON THE FINANCIAL STATEMENTS
Report of the Auditor-General to Parliamenton Vote No. 35: Department of Tourism
Department of Tourism Vote 35
for the year ended 31 March 2012
NDT Annual Report 2011/12
66
Additional matter
Idrawattentiontothematterbelow.Myopinionisnotmodifiedinrespectofthismatter.
Financial reporting framework
7. ThefinancialreportingframeworkprescribedbytheNationalTreasuryandappliedbythedepartmentisacomplianceframework.Thewordingofmyopiniononacomplianceframeworkshouldreflectthatthefinancialstatementshavebeenpreparedinaccordancewiththisframework.Section20(2)(a)ofthePAA,however,requiresmetoexpressanopiniononthefairpresentationofthefinancialstatements.Thewordingofmyopinionthereforereflectsthisrequirement.O
N OTHER LEGAL AND REGULATORY REPORT ON OTHER LEGAL AND REGULATORTY REQUIRMENTS
8. In accordance with the PAA and the General Notice issuedintermsthereof,Ireportthefollowingfindingsrelevant to performance against predetermined objectives, compliance with laws and regulations and internal control, but not for the purpose of expressing an opinion.
Predetermined objectives
9. I performed procedures to obtain evidence about the usefulness and reliability of the information in the programme performance report as set out on pages 22 to 50 of the annual report.
10. The reported performance against predetermined objectives was evaluated against the overall criteria of usefulness and reliability. The usefulness of information in the annual performance report relates to whether it is presented in accordance with the National Treasury annual reporting principles and whether the reported performance is consistent with the planned objectives. The usefulness of informationfurtherrelatestowhetherindicatorsandtargetsaremeasurable(i.e.welldefined,verifiable,specific,measurableandtimebound)andrelevantasrequiredbytheNational Treasury Framework for managing programme performance information.
The reliability of the information in respect of the selected programmes is assessed to determine whether itadequatelyreflectsthefacts(i.e.whetheritisvalid,accurateandcomplete).
11. Therewerenomaterialfindingsontheprogrammeperformancereportconcerningtheusefulnessandreliability of the information.
Additional matter
12. Idrawattentiontothefollowingmatterbelow.Myconclusionisnotmodifiedinrespectofthismatter.
Report of the Auditor-General to Parliamenton Vote No. 35: Department of Tourism
Annual Report 2011/12
for the year ended 31 March 2012
Report of the Auditor-General
67
Material adjustments to the programme performance report
13. Materialauditadjustmentsintheannualperformancereportwereidentifiedduringtheaudit,ofwhichall but two were corrected by management.
Compliance with laws and regulation
14. I performed procedures to obtain evidence that the entity has complied with applicable laws and regulationsregardingfinancialmatters,financialmanagementandotherrelatedmatters.Myfindingsonmaterialnon-compliancewithspecificmattersinkeyapplicablelawsandregulationsassetoutinthe General Notice issued in terms of the PAA are as follows:
Transfer of funds
15. TheaccountingofficerisstillintheprocessofaddressingweaknessesininternalcontrolsrelatingtotheExpanded Public Works Programme as a result non-compliance with TR 8.4.1 is still reportable in the 2011/12 audit report. The audit of these projects revealed the following discrepancies:
• provincialprojectmanagersandprojectimplementersdidnotcomplywithrequiredregular reporting procedures
• projectimplementersdidnotsubmitexternalauditreports • provincialprojectmanagersdidnotcomplywithregularmonitoringproceduresanddid
not execute regular inspection visits or review of performance as required by their performance agreement.O
INTERNAL CONTROL
16. Iconsideredinternalcontrolrelevanttomyauditofthefinancialstatements,programmeperformancereport and compliance with laws and regulations. The matters reported below under the fundamentals ofinternalcontrolarelimitedtothesignificantdeficienciesthatresultedinthefindingsoncompliancewith laws and regulations included in this report.
Leadership
17. The monitoring controls to ensure adherence to contractual requirements and the internal controls over theExpandedPublicWorksProgrammewerenotsufficient todetectandpreventcontroldeviationsand non-compliance with laws and regulations.
Financial and performance management
18. Monthly progress reports from some provincial project managers on progress at Expanded Public Works Programme projects to ensure that expenditure incurred is aligned with actual progress and to ensure that funds are applied for their intended purpose are not always accurate and complete.
NDT Annual Report 2011/12
68
Report of the Auditor-General to Parliamenton Vote No. 35: Department of Tourism
Department of Tourism Vote 35
for the year ended 31 March 2012
19. Non-compliance with laws and regulations could have been prevented had compliance been properly reviewed and monitored in terms of the Expanded Public Works Programme projects. Stricter enforcement of mitigating controls to address non-compliance and internal control deviations is required.
OTHER REPORTS
Investigations
20. Investigations are in progress into the conduct of various service providers acting as implementers on Expanded Public Works Programme projects. The outcome of these investigations cannot be determinedatpresent.Possibleirregular,fruitlessandwastefulexpenditurecanonlybequantifiedoncetheinvestigationshavebeenfinalised.
Pretoria30 July 2012
Appropriation Statement
Annual Report 2011/12
for the year ended 31 March 2012
Appropriation Statement
69
Appropriation Statementfor the year ended 31 March 2012
Picture: South African Parliament in Cape Town
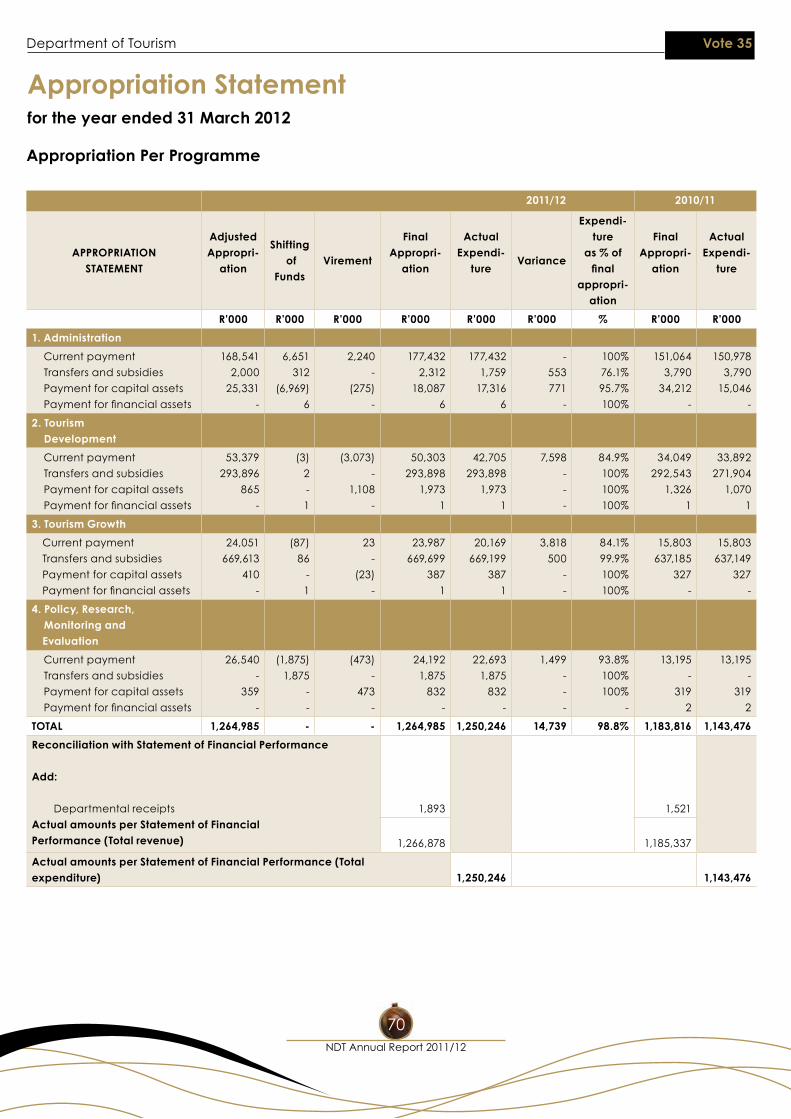
Appropriation Statement
Department of Tourism Vote 35
for the year ended 31 March 2012
NDT Annual Report 2011/12
70
2011/12 2010/11
APPROPRIATION STATEMENT
AdjustedAppropri-
ation
Shifting of
FundsVirement
FinalAppropri-
ation
ActualExpendi-
tureVariance
Expendi-ture
as % of final
appropri-ation
FinalAppropri-
ation
ActualExpendi-
ture
R'000 R'000 R'000 R'000 R'000 R'000 % R'000 R'000
1. Administration
Current payment
Transfers and subsidies
Payment for capital assets
Paymentforfinancialassets
168,541
2,000
25,331
-
6,651
312
(6,969)
6
2,240
-
(275)
-
177,432
2,312
18,087
6
177,432
1,759
17,316
6
-
553
771
-
100%
76.1%
95.7%
100%
151,064
3,790
34,212
-
150,978
3,790
15,046
-
2. Tourism Development
Current payment
Transfers and subsidies
Payment for capital assets
Paymentforfinancialassets
53,379
293,896
865
-
(3)
2
-
1
(3,073)
-
1,108
-
50,303
293,898
1,973
1
42,705
293,898
1,973
1
7,598
-
-
-
84.9%
100%
100%
100%
34,049
292,543
1,326
1
33,892
271,904
1,070
1
3. Tourism Growth
Current payment
Transfers and subsidies
Payment for capital assets
Paymentforfinancialassets
24,051
669,613
410
-
(87)
86
-
1
23
-
(23)
-
23,987
669,699
387
1
20,169
669,199
387
1
3,818
500
-
-
84.1%
99.9%
100%
100%
15,803
637,185
327
-
15,803
637,149
327
-
4. Policy, Research, Monitoring and
Evaluation
Current payment
Transfers and subsidies
Payment for capital assets
Paymentforfinancialassets
26,540
-
359
-
(1,875)
1,875
-
-
(473)
-
473
-
24,192
1,875
832
-
22,693
1,875
832
-
1,499
-
-
-
93.8%
100%
100%
-
13,195
-
319
2
13,195
-
319
2
TOTAL 1,264,985 - - 1,264,985 1,250,246 14,739 98.8% 1,183,816 1,143,476
Reconciliation with Statement of Financial Performance
Add:
Departmental receipts
Actual amounts per Statement of Financial Performance (Total revenue)
1,893 1,521
1,266,878 1,185,337
Actual amounts per Statement of Financial Performance (Total expenditure) 1,250,246 1,143,476
Appropriation Per Programme
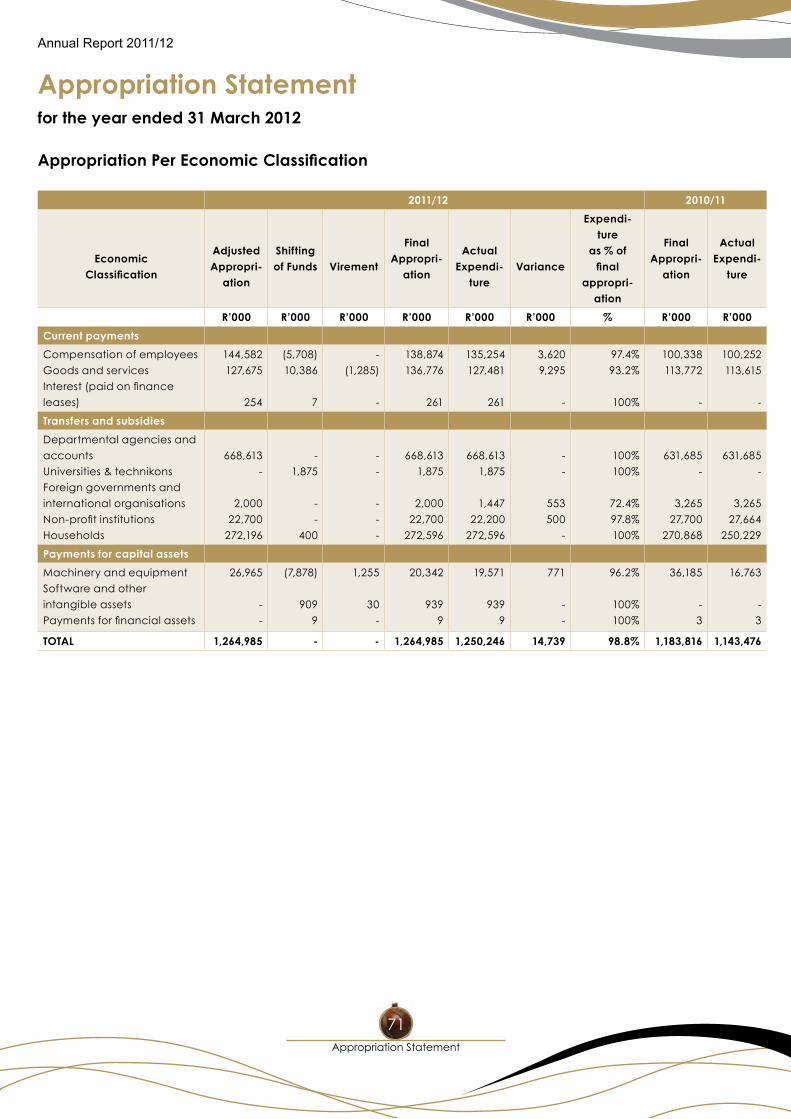
Appropriation Statement
Annual Report 2011/12
for the year ended 31 March 2012
Appropriation Statement
71
2011/12 2010/11
Economic Classification
AdjustedAppropri-
ation
Shifting of Funds Virement
FinalAppropri-
ation
ActualExpendi-
tureVariance
Expendi-ture
as % of final
appropri-ation
FinalAppropri-
ation
ActualExpendi-
ture
R’000 R’000 R’000 R’000 R’000 R’000 % R’000 R’000
Current payments
Compensation of employees
Goods and services
Interest(paidonfinance
leases)
144,582
127,675
254
(5,708)
10,386
7
-
(1,285)
-
138,874
136,776
261
135,254
127,481
261
3,620
9,295
-
97.4%
93.2%
100%
100,338
113,772
-
100,252
113,615
-
Transfers and subsidies
Departmental agencies and
accounts
Universities & technikons
Foreign governments and
international organisations
Non-profitinstitutions
Households
668,613
-
2,000
22,700
272,196
-
1,875
-
-
400
-
-
-
-
-
668,613
1,875
2,000
22,700
272,596
668,613
1,875
1,447
22,200
272,596
-
-
553
500
-
100%
100%
72.4%
97.8%
100%
631,685
-
3,265
27,700
270,868
631,685
-
3,265
27,664
250,229
Payments for capital assets
Machinery and equipment
Software and other
intangible assets
Paymentsforfinancialassets
26,965
-
-
(7,878)
909
9
1,255
30
-
20,342
939
9
19,571
939
9
771
-
-
96.2%
100%
100%
36,185
-
3
16,763
-
3
TOTAL 1,264,985 - - 1,264,985 1,250,246 14,739 98.8% 1,183,816 1,143,476
Appropriation Per Economic Classification
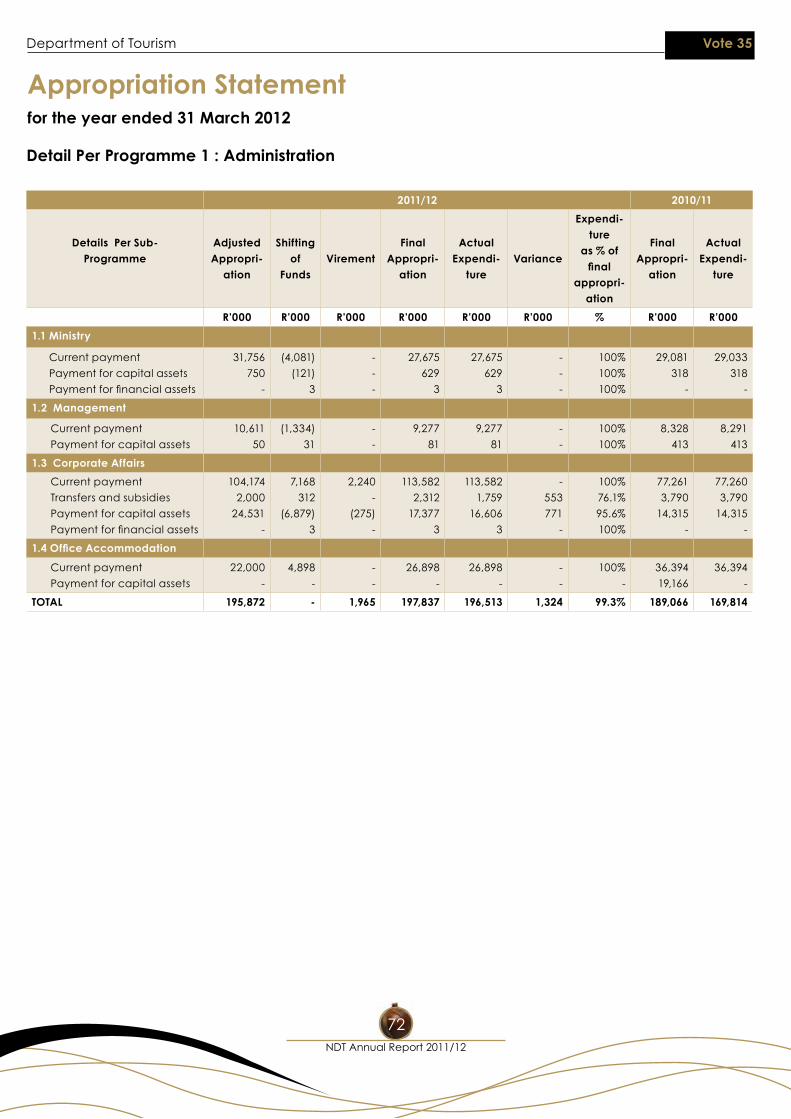
Appropriation Statement
Department of Tourism Vote 35
for the year ended 31 March 2012
NDT Annual Report 2011/12
72
2011/12 2010/11
Details Per Sub-Programme
AdjustedAppropri-
ation
Shifting of
FundsVirement
FinalAppropri-
ation
ActualExpendi-
tureVariance
Expendi-ture
as % of final
appropri-ation
FinalAppropri-
ation
ActualExpendi-
ture
R'000 R'000 R'000 R'000 R'000 R'000 % R'000 R'000
1.1 Ministry
Current payment
Payment for capital assets
Paymentforfinancialassets
31,756
750
-
(4,081)
(121)
3
-
-
-
27,675
629
3
27,675
629
3
-
-
-
100%
100%
100%
29,081
318
-
29,033
318
-
1.2 Management
Current payment
Payment for capital assets
10,611
50
(1,334)
31
-
-
9,277
81
9,277
81
-
-
100%
100%
8,328
413
8,291
413
1.3 Corporate Affairs
Current payment
Transfers and subsidies
Payment for capital assets
Paymentforfinancialassets
104,174
2,000
24,531
-
7,168
312
(6,879)
3
2,240
-
(275)
-
113,582
2,312
17,377
3
113,582
1,759
16,606
3
-
553
771
-
100%
76.1%
95.6%
100%
77,261
3,790
14,315
-
77,260
3,790
14,315
-
1.4 Office Accommodation
Current payment
Payment for capital assets
22,000
-
4,898
-
-
-
26,898
-
26,898
-
-
-
100%
-
36,394
19,166
36,394
-
TOTAL 195,872 - 1,965 197,837 196,513 1,324 99.3% 189,066 169,814
Detail Per Programme 1 : Administration
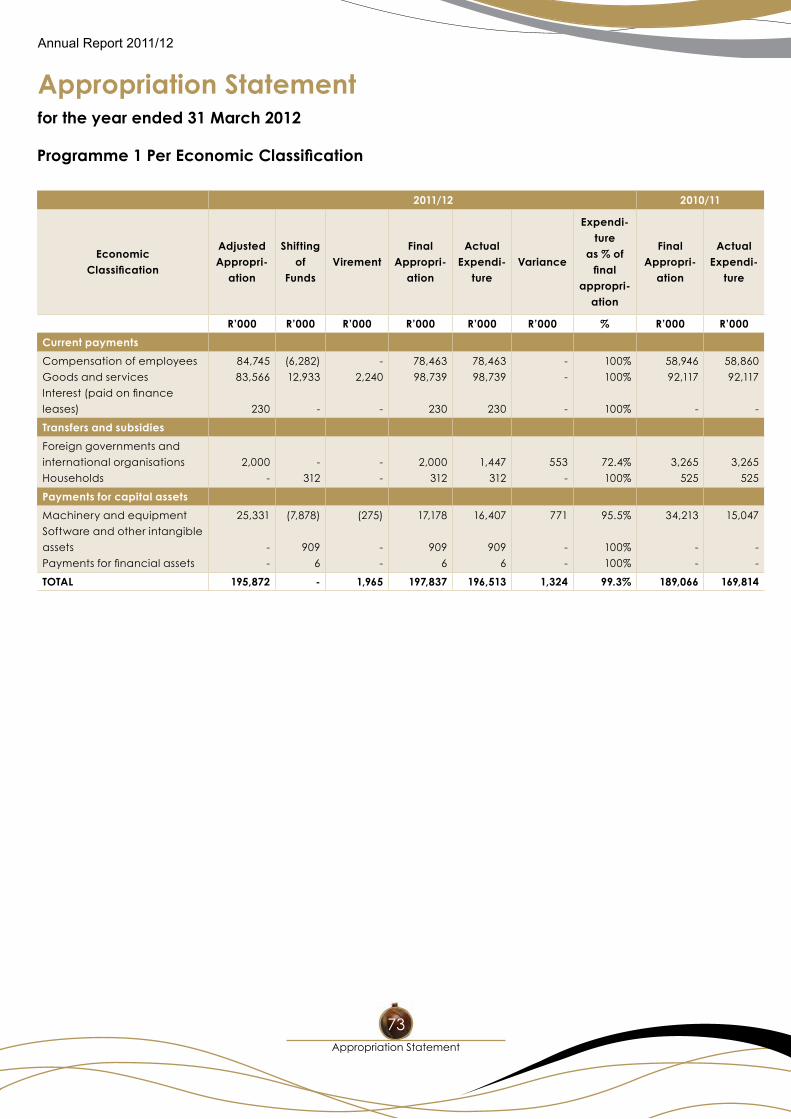
Appropriation Statement
Annual Report 2011/12
for the year ended 31 March 2012
Appropriation Statement
73
2011/12 2010/11
EconomicClassification
AdjustedAppropri-
ation
Shifting of
FundsVirement
FinalAppropri-
ation
ActualExpendi-
tureVariance
Expendi-ture
as % of final
appropri-ation
FinalAppropri-
ation
ActualExpendi-
ture
R’000 R’000 R’000 R’000 R’000 R’000 % R’000 R’000
Current payments
Compensation of employees
Goods and services
Interest(paidonfinance
leases)
84,745
83,566
230
(6,282)
12,933
-
-
2,240
-
78,463
98,739
230
78,463
98,739
230
-
-
-
100%
100%
100%
58,946
92,117
-
58,860
92,117
-
Transfers and subsidies
Foreign governments and
international organisations
Households
2,000
-
-
312
-
-
2,000
312
1,447
312
553
-
72.4%
100%
3,265
525
3,265
525
Payments for capital assets
Machinery and equipment
Software and other intangible
assets
Paymentsforfinancialassets
25,331
-
-
(7,878)
909
6
(275)
-
-
17,178
909
6
16,407
909
6
771
-
-
95.5%
100%
100%
34,213
-
-
15,047
-
-
TOTAL 195,872 - 1,965 197,837 196,513 1,324 99.3% 189,066 169,814
Programme 1 Per Economic Classification
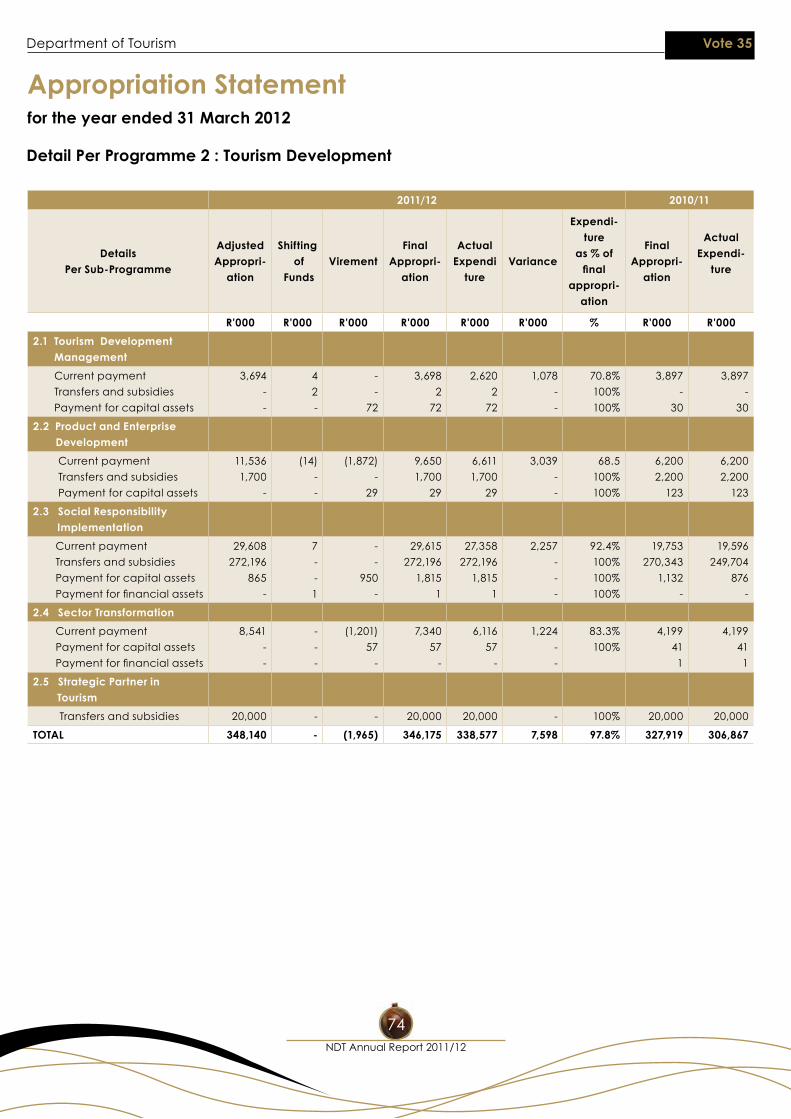
Appropriation Statement
Department of Tourism Vote 35
for the year ended 31 March 2012
NDT Annual Report 2011/12
74
2011/12 2010/11
Details Per Sub-Programme
AdjustedAppropri-
ation
Shifting of
FundsVirement
FinalAppropri-
ation
ActualExpendi
tureVariance
Expendi-ture
as % of final
appropri-ation
FinalAppropri-
ation
ActualExpendi-
ture
R'000 R'000 R'000 R'000 R'000 R'000 % R'000 R'000
2.1 Tourism Development Management
Current payment
Transfers and subsidies
Payment for capital assets
3,694
-
-
4
2
-
-
-
72
3,698
2
72
2,620
2
72
1,078
-
-
70.8%
100%
100%
3,897
-
30
3,897
-
30
2.2 Product and Enterprise Development
Current payment
Transfers and subsidies
Payment for capital assets
11,536
1,700
-
(14)
-
-
(1,872)
-
29
9,650
1,700
29
6,611
1,700
29
3,039
-
-
68.5
100%
100%
6,200
2,200
123
6,200
2,200
123
2.3 Social Responsibility Implementation
Current payment
Transfers and subsidies
Payment for capital assets
Paymentforfinancialassets
29,608
272,196
865
-
7
-
-
1
-
-
950
-
29,615
272,196
1,815
1
27,358
272,196
1,815
1
2,257
-
-
-
92.4%
100%
100%
100%
19,753
270,343
1,132
-
19,596
249,704
876
-
2.4 Sector Transformation
Current payment
Payment for capital assets
Paymentforfinancialassets
8,541
-
-
-
-
-
(1,201)
57
-
7,340
57
-
6,116
57
-
1,224
-
-
83.3%
100%
4,199
41
1
4,199
41
1
2.5 Strategic Partner in Tourism
Transfers and subsidies 20,000 - - 20,000 20,000 - 100% 20,000 20,000
TOTAL 348,140 - (1,965) 346,175 338,577 7,598 97.8% 327,919 306,867
Detail Per Programme 2 : Tourism Development
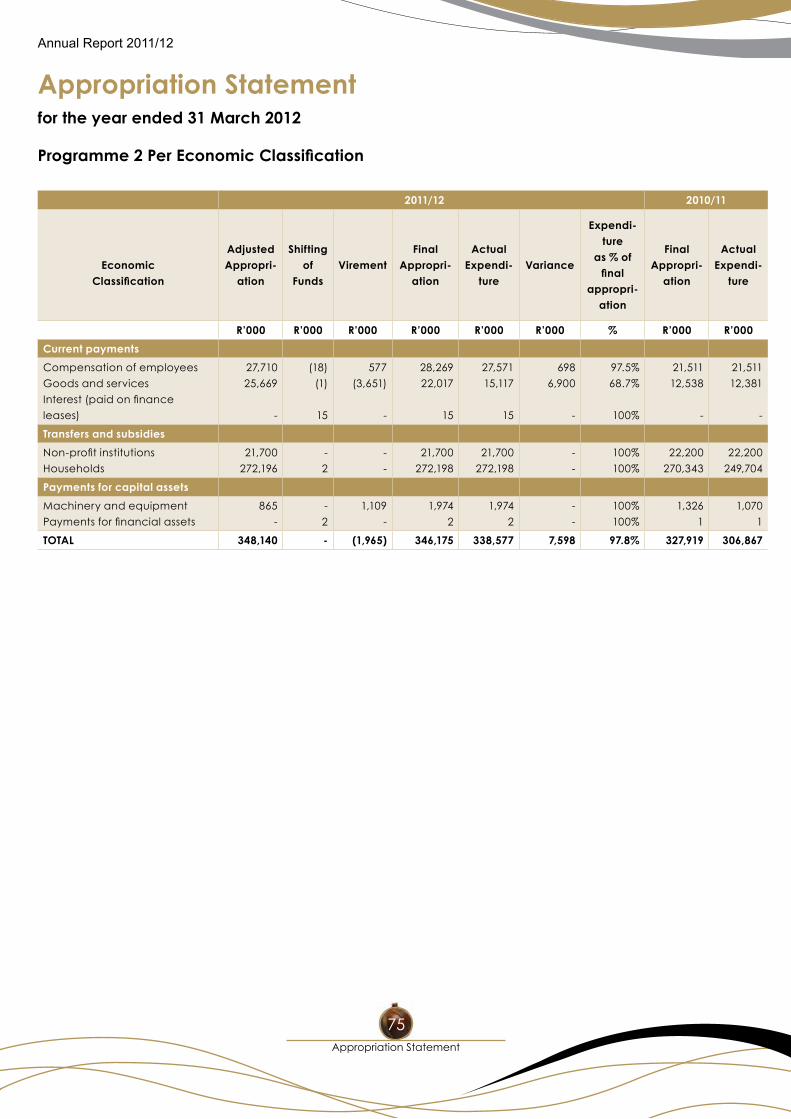
Appropriation Statement
Annual Report 2011/12
for the year ended 31 March 2012
Appropriation Statement
75
Programme 2 Per Economic Classification
2011/12 2010/11
Economic Classification
AdjustedAppropri-
ation
Shifting of
FundsVirement
FinalAppropri-
ation
ActualExpendi-
tureVariance
Expendi-ture
as % of final
appropri-ation
FinalAppropri-
ation
ActualExpendi-
ture
R’000 R’000 R’000 R’000 R’000 R’000 % R’000 R’000
Current payments
Compensation of employees
Goods and services
Interest(paidonfinance
leases)
27,710
25,669
-
(18)
(1)
15
577
(3,651)
-
28,269
22,017
15
27,571
15,117
15
698
6,900
-
97.5%
68.7%
100%
21,511
12,538
-
21,511
12,381
-
Transfers and subsidies
Non-profitinstitutions
Households
21,700
272,196
-
2
-
-
21,700
272,198
21,700
272,198
-
-
100%
100%
22,200
270,343
22,200
249,704
Payments for capital assets
Machinery and equipment
Paymentsforfinancialassets
865
-
-
2
1,109
-
1,974
2
1,974
2
-
-
100%
100%
1,326
1
1,070
1
TOTAL 348,140 - (1,965) 346,175 338,577 7,598 97.8% 327,919 306,867
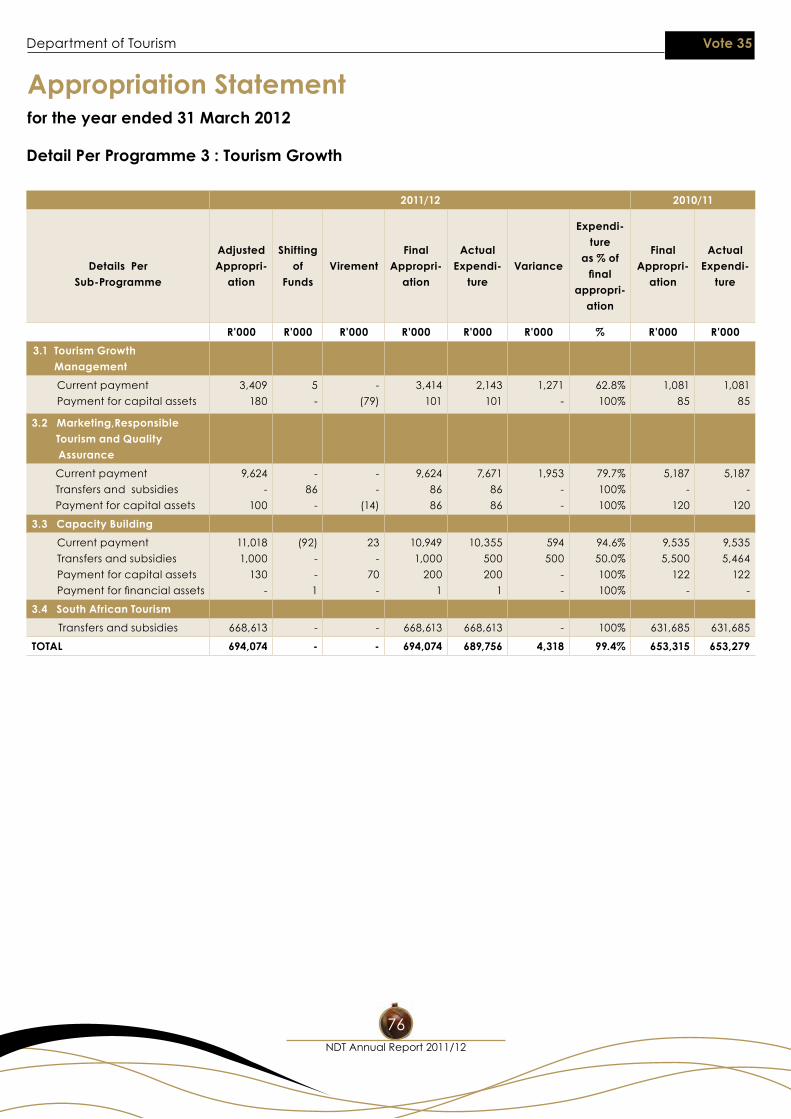
Appropriation Statement
Department of Tourism Vote 35
for the year ended 31 March 2012
NDT Annual Report 2011/12
76
2011/12 2010/11
Details Per Sub-Programme
AdjustedAppropri-
ation
Shifting of
FundsVirement
FinalAppropri-
ation
ActualExpendi-
tureVariance
Expendi-ture
as % of final
appropri-ation
FinalAppropri-
ation
ActualExpendi-
ture
R'000 R'000 R'000 R'000 R'000 R'000 % R'000 R'000
3.1 Tourism Growth Management
Current payment
Payment for capital assets
3,409
180
5
-
-
(79)
3,414
101
2,143
101
1,271
-
62.8%
100%
1,081
85
1,081
85
3.2 Marketing,Responsible Tourism and Quality
Assurance
Current payment
Transfers and subsidies
Payment for capital assets
9,624
-
100
-
86
-
-
-
(14)
9,624
86
86
7,671
86
86
1,953
-
-
79.7%
100%
100%
5,187
-
120
5,187
-
120
3.3 Capacity Building
Current payment
Transfers and subsidies
Payment for capital assets
Paymentforfinancialassets
11,018
1,000
130
-
(92)
-
-
1
23
-
70
-
10,949
1,000
200
1
10,355
500
200
1
594
500
-
-
94.6%
50.0%
100%
100%
9,535
5,500
122
-
9,535
5,464
122
-
3.4 South African Tourism
Transfers and subsidies 668,613 - - 668,613 668,613 - 100% 631,685 631,685
TOTAL 694,074 - - 694,074 689,756 4,318 99.4% 653,315 653,279
Detail Per Programme 3 : Tourism Growth
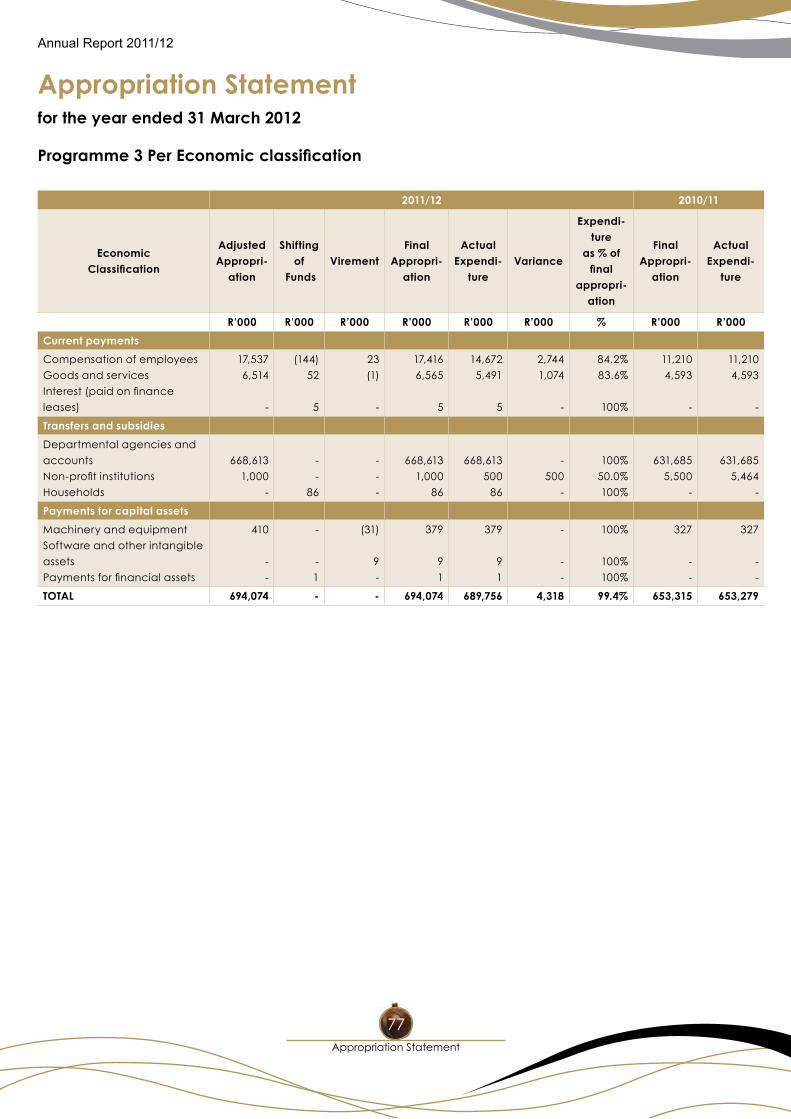
Appropriation Statement
Annual Report 2011/12
for the year ended 31 March 2012
Appropriation Statement
77
Programme 3 Per Economic classification
2011/12 2010/11
Economic Classification
AdjustedAppropri-
ation
Shifting of
FundsVirement
FinalAppropri-
ation
ActualExpendi-
tureVariance
Expendi-ture
as % of final
appropri-ation
FinalAppropri-
ation
ActualExpendi-
ture
R’000 R’000 R’000 R’000 R’000 R’000 % R’000 R’000
Current payments
Compensation of employees
Goods and services
Interest(paidonfinance
leases)
17,537
6,514
-
(144)
52
5
23
(1)
-
17,416
6,565
5
14,672
5,491
5
2,744
1,074
-
84.2%
83.6%
100%
11,210
4,593
-
11,210
4,593
-
Transfers and subsidies
Departmental agencies and
accounts
Non-profitinstitutions
Households
668,613
1,000
-
-
-
86
-
-
-
668,613
1,000
86
668,613
500
86
-
500
-
100%
50.0%
100%
631,685
5,500
-
631,685
5,464
-
Payments for capital assets
Machinery and equipment
Software and other intangible
assets
Paymentsforfinancialassets
410
-
-
-
-
1
(31)
9
-
379
9
1
379
9
1
-
-
-
100%
100%
100%
327
-
-
327
-
-
TOTAL 694,074 - - 694,074 689,756 4,318 99.4% 653,315 653,279
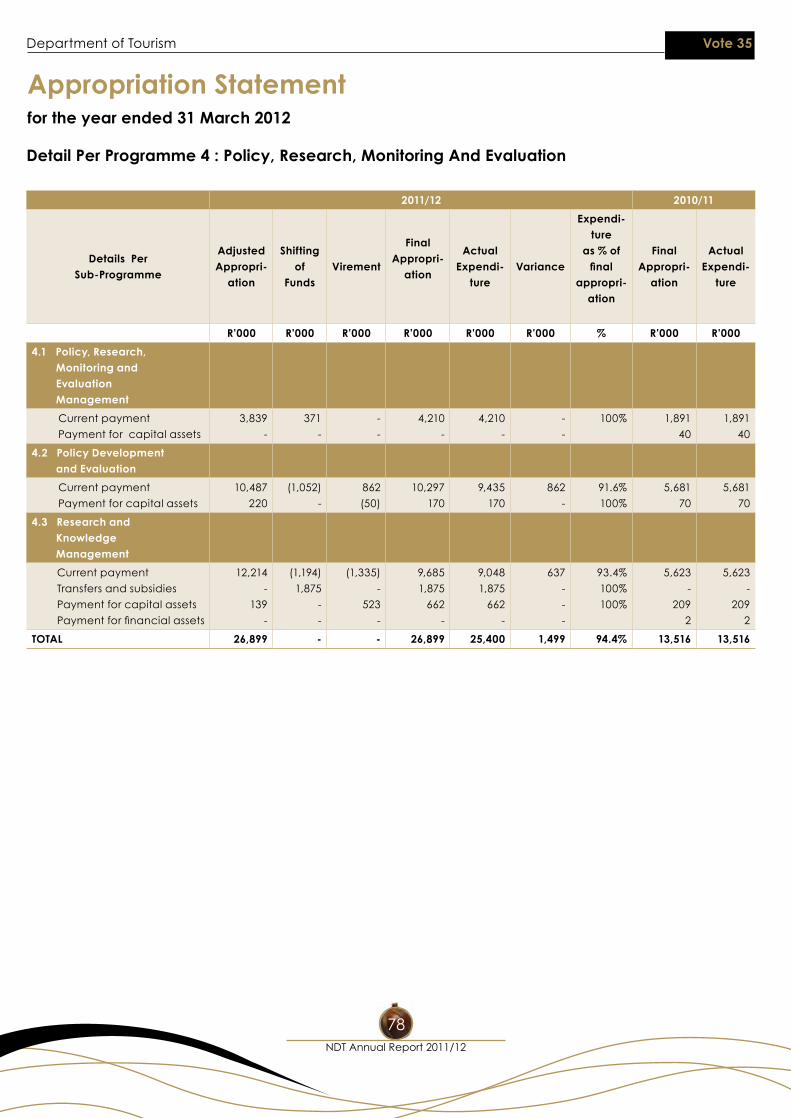
Appropriation Statement
Department of Tourism Vote 35
for the year ended 31 March 2012
NDT Annual Report 2011/12
78
2011/12 2010/11
Details Per Sub-Programme
AdjustedAppropri-
ation
Shifting of
FundsVirement
FinalAppropri-
ation
ActualExpendi-
tureVariance
Expendi-ture
as % of final
appropri-ation
FinalAppropri-
ation
ActualExpendi-
ture
R'000 R'000 R'000 R'000 R'000 R'000 % R'000 R'000
4.1 Policy, Research, Monitoring and Evaluation Management
Current payment
Payment for capital assets
3,839
-
371
-
-
-
4,210
-
4,210
-
-
-
100% 1,891
40
1,891
40
4.2 Policy Development and Evaluation
Current payment
Payment for capital assets
10,487
220
(1,052)
-
862
(50)
10,297
170
9,435
170
862
-
91.6%
100%
5,681
70
5,681
70
4.3 Research and Knowledge Management
Current payment
Transfers and subsidies
Payment for capital assets
Paymentforfinancialassets
12,214
-
139
-
(1,194)
1,875
-
-
(1,335)
-
523
-
9,685
1,875
662
-
9,048
1,875
662
-
637
-
-
-
93.4%
100%
100%
5,623
-
209
2
5,623
-
209
2
TOTAL 26,899 - - 26,899 25,400 1,499 94.4% 13,516 13,516
Detail Per Programme 4 : Policy, Research, Monitoring And Evaluation
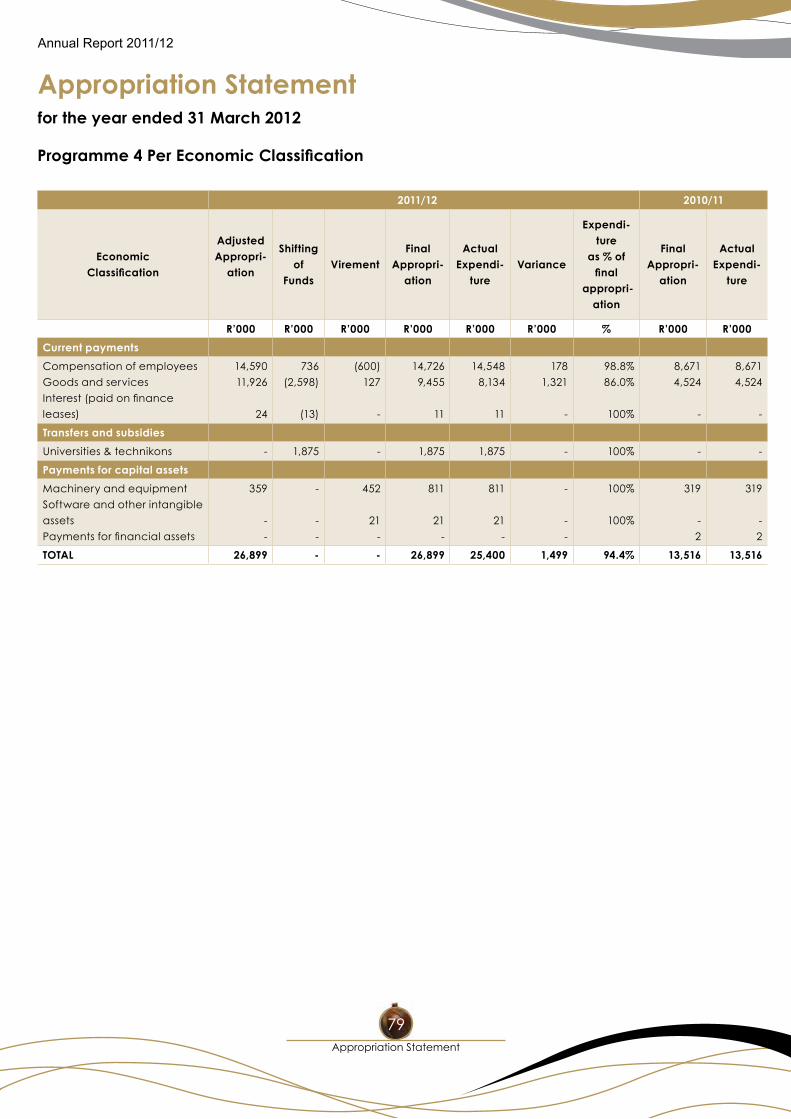
Appropriation Statement
Annual Report 2011/12
for the year ended 31 March 2012
Appropriation Statement
79
2011/12 2010/11
EconomicClassification
AdjustedAppropri-
ation
Shifting of
FundsVirement
FinalAppropri-
ation
ActualExpendi-
tureVariance
Expendi-ture
as % of final
appropri-ation
FinalAppropri-
ation
ActualExpendi-
ture
R’000 R’000 R’000 R’000 R’000 R’000 % R’000 R’000
Current payments
Compensation of employees
Goods and services
Interest(paidonfinance
leases)
14,590
11,926
24
736
(2,598)
(13)
(600)
127
-
14,726
9,455
11
14,548
8,134
11
178
1,321
-
98.8%
86.0%
100%
8,671
4,524
-
8,671
4,524
-
Transfers and subsidies
Universities & technikons - 1,875 - 1,875 1,875 - 100% - -
Payments for capital assets
Machinery and equipment
Software and other intangible
assets
Paymentsforfinancialassets
359
-
-
-
-
-
452
21
-
811
21
-
811
21
-
-
-
-
100%
100%
319
-
2
319
-
2
TOTAL 26,899 - - 26,899 25,400 1,499 94.4% 13,516 13,516
Programme 4 Per Economic Classification
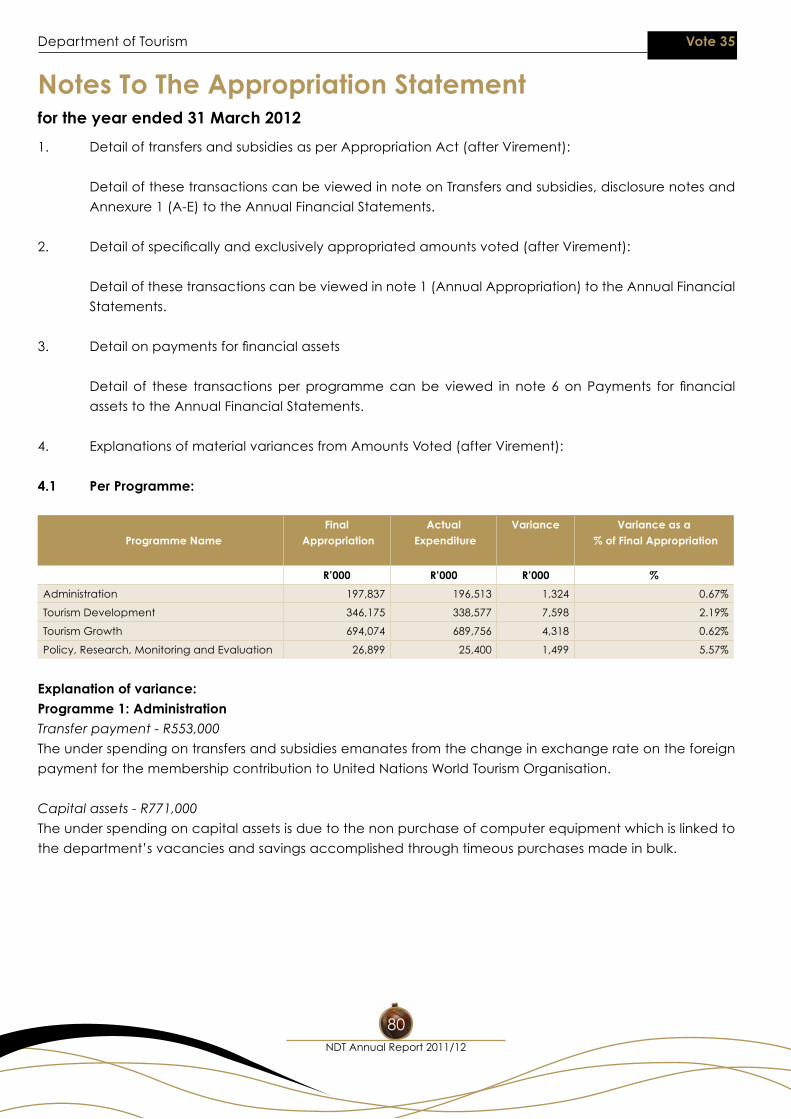
Department of Tourism Vote 35
for the year ended 31 March 2012
NDT Annual Report 2011/12
80
Notes To The Appropriation Statement
1. Detail of transfers and subsidies as per Appropriation Act (after Virement):
Detail of these transactions can be viewed in note on Transfers and subsidies, disclosure notes and
An nexure 1 (A-E) to the Annual Financial Statements.
2. Detailofspecificallyandexclusivelyappropriatedamountsvoted(afterVirement):
Detail of these transactions can be viewed in note 1 (Annual Appropriation) to the Annual Financial
Statements.
3. Detailonpaymentsforfinancialassets
Detail of these transactionsperprogrammecanbeviewed in note 6onPayments for financial
assets to the Annual Financial Statements.
4. Explanations of material variances from Amounts Voted (after Virement):
4.1 Per Programme:
Programme NameFinal
AppropriationActual
ExpenditureVariance Variance as a
% of Final Appropriation
R’000 R’000 R’000 %
Administration 197,837 196,513 1,324 0.67%
Tourism Development 346,175 338,577 7,598 2.19%
Tourism Growth 694,074 689,756 4,318 0.62%
Policy, Research, Monitoring and Evaluation 26,899 25,400 1,499 5.57%
Explanation of variance: Programme 1: AdministrationTransfer payment - R553,000
The under spending on transfers and subsidies emanates from the change in exchange rate on the foreign
payment for the membership contribution to United Nations World Tourism Organisation.
Capital assets - R771,000
The under spending on capital assets is due to the non purchase of computer equipment which is linked to
thedepartment’svacanciesandsavingsaccomplishedthroughtimeouspurchasesmadeinbulk.
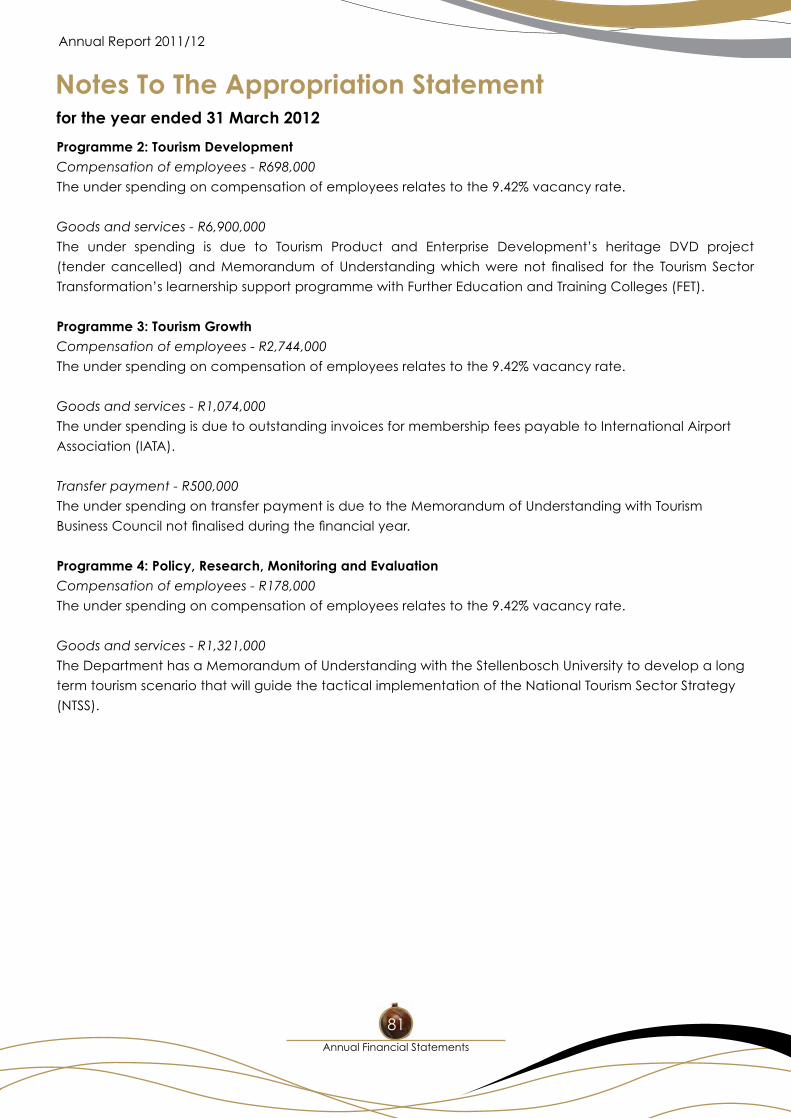
Annual Report 2011/12
for the year ended 31 March 2012
Annual Financial Statements
81
Programme 2: Tourism DevelopmentCompensation of employees - R698,000
The under spending on compensation of employees relates to the 9.42% vacancy rate.
Goods and services - R6,900,000
The under spending is due to Tourism Product and Enterprise Development’s heritage DVD project
(tendercancelled)andMemorandumofUnderstandingwhichwerenot finalised for the Tourism Sector
Transformation’slearnershipsupportprogrammewithFurtherEducationandTrainingColleges(FET).
Programme 3: Tourism GrowthCompensation of employees - R2,744,000
The under spending on compensation of employees relates to the 9.42% vacancy rate.
Goods and services - R1,074,000
The under spending is due to outstanding invoices for membership fees payable to International Airport
Association (IATA).
Transfer payment - R500,000
The under spending on transfer payment is due to the Memorandum of Understanding with Tourism
BusinessCouncilnotfinalisedduringthefinancialyear.
Programme 4: Policy, Research, Monitoring and EvaluationCompensation of employees - R178,000
The under spending on compensation of employees relates to the 9.42% vacancy rate.
Goods and services - R1,321,000
The Department has a Memorandum of Understanding with the Stellenbosch University to develop a long
term tourism scenario that will guide the tactical implementation of the National Tourism Sector Strategy
(NTSS).
Notes To The Appropriation Statement
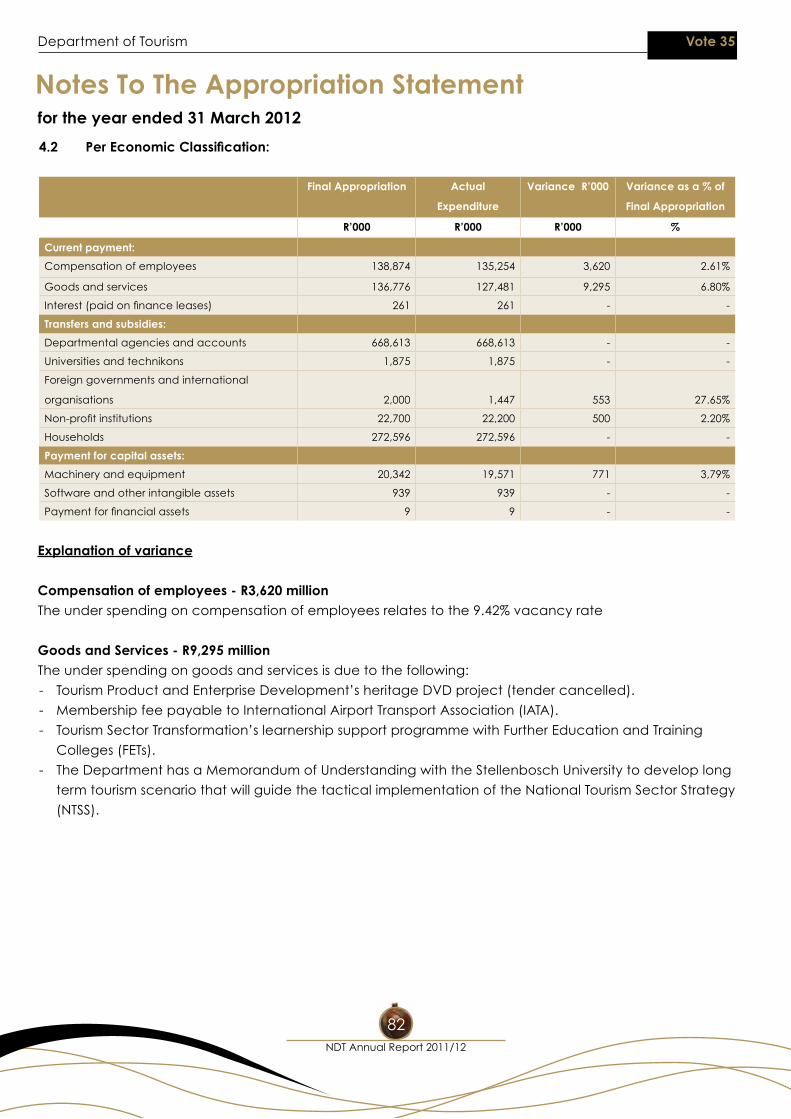
Department of Tourism Vote 35
for the year ended 31 March 2012
NDT Annual Report 2011/12
82
4.2 Per Economic Classification:
Final Appropriation Actual
Expenditure
Variance R’000 Variance as a % of
Final Appropriation
R’000 R’000 R’000 %
Current payment:
Compensation of employees 138,874 135,254 3,620 2.61%
Goods and services 136,776 127,481 9,295 6.80%
Interest(paidonfinanceleases) 261 261 - -
Transfers and subsidies:
Departmental agencies and accounts 668,613 668,613 - -
Universities and technikons 1,875 1,875 - -
Foreign governments and international
organisations 2,000 1,447 553 27.65%
Non-profitinstitutions 22,700 22,200 500 2.20%
Households 272,596 272,596 - -
Payment for capital assets:
Machinery and equipment 20,342 19,571 771 3,79%
Software and other intangible assets 939 939 - -
Paymentforfinancialassets 9 9 - -
Explanation of variance
Compensation of employees - R3,620 millionThe under spending on compensation of employees relates to the 9.42% vacancy rate
Goods and Services - R9,295 millionThe under spending on goods and services is due to the following:
- TourismProductandEnterpriseDevelopment’sheritageDVDproject(tendercancelled).
- Membership fee payable to International Airport Transport Association (IATA).
- TourismSectorTransformation’slearnershipsupportprogrammewithFurtherEducationandTraining
Colleges (FETs).
- The Department has a Memorandum of Understanding with the Stellenbosch University to develop long
term tourism scenario that will guide the tactical implementation of the National Tourism Sector Strategy
(NTSS).
Notes To The Appropriation Statement
Annual Report 2011/12
for the year ended 31 March 2012
Annual Financial Statements
83
Transfer payments - R1,053 million The under spending on transfer payments is due to the following:
- MemorandumofUnderstandingwithTourismBusinessCouncilnotfinalised.
- ExchangeratesavingonthemembershipcontributiontotheUnitedNation’sWorldTourism
Organisation (UNWTO).
Capital assets - R771,000The under spending on capital assets is due to the non purchase of computer equipment which is linked to
thedepartment’svacanciesandsavingsaccomplishedthroughtimeouspurchasesmadeinbulk.
Notes To The Appropriation Statement
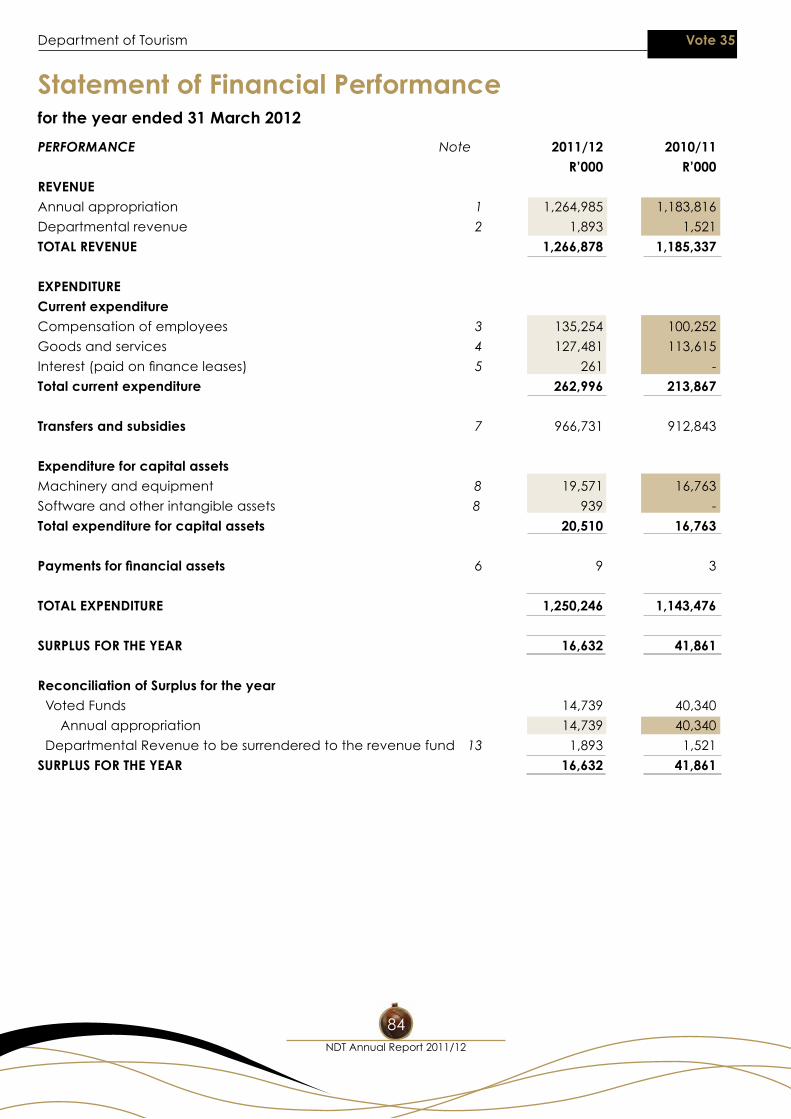
Department of Tourism Vote 35
for the year ended 31 March 2012
NDT Annual Report 2011/12
84
PERFORMANCE Note 2011/12 2010/11 R’000 R’000REVENUE Annual appropriation 1 1,264,985 1,183,816
Departmental revenue 2 1,893 1,521
TOTAL REVENUE 1,266,878 1,185,337
EXPENDITURE Current expenditure Compensation of employees 3 135,254 100,252
Goods and services 4 127,481 113,615
Interest(paidonfinanceleases) 5 261 -
Total current expenditure 262,996 213,867
Transfers and subsidies 7 966,731 912,843
Expenditure for capital assets Machinery and equipment 8 19,571 16,763
Software and other intangible assets 8 939 -
Total expenditure for capital assets 20,510 16,763 Payments for financial assets 6 9 3
TOTAL EXPENDITURE 1,250,246 1,143,476
SURPLUS FOR THE YEAR 16,632 41,861
Reconciliation of Surplus for the year Voted Funds 14,739 40,340
Annual appropriation 14,739 40,340
Departmental Revenue to be surrendered to the revenue fund 13 1,893 1,521
SURPLUS FOR THE YEAR 16,632 41,861
Statement of Financial Performance
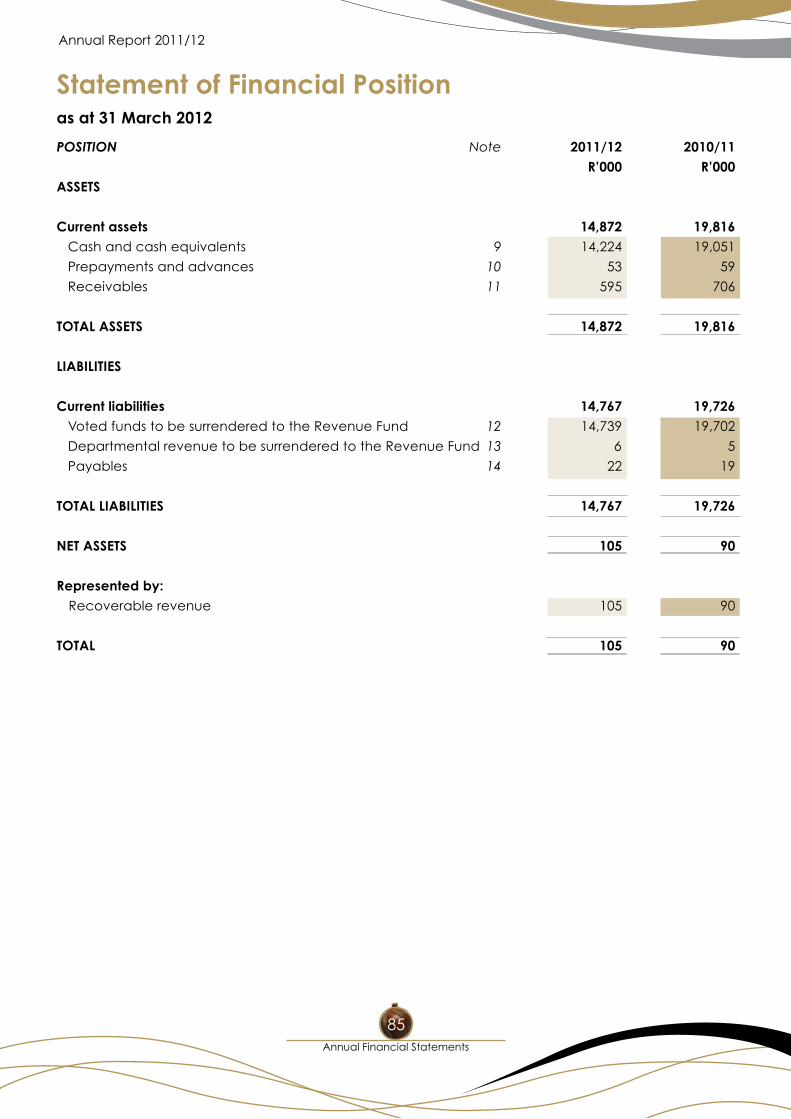
Annual Report 2011/12
as at 31 March 2012
85
POSITION Note 2011/12 2010/11 R’000 R’000ASSETS Current assets 14,872 19,816
Cash and cash equivalents 9 14,224 19,051
Prepayments and advances 10 53 59
Receivables 11 595 706
TOTAL ASSETS 14,872 19,816
LIABILITIES Current liabilities 14,767 19,726
Voted funds to be surrendered to the Revenue Fund 12 14,739 19,702
Departmental revenue to be surrendered to the Revenue Fund 13 6 5
Payables 14 22 19
TOTAL LIABILITIES 14,767 19,726
NET ASSETS 105 90
Represented by: Recoverable revenue 105 90
TOTAL 105 90
Statement of Financial Position
Annual Financial Statements
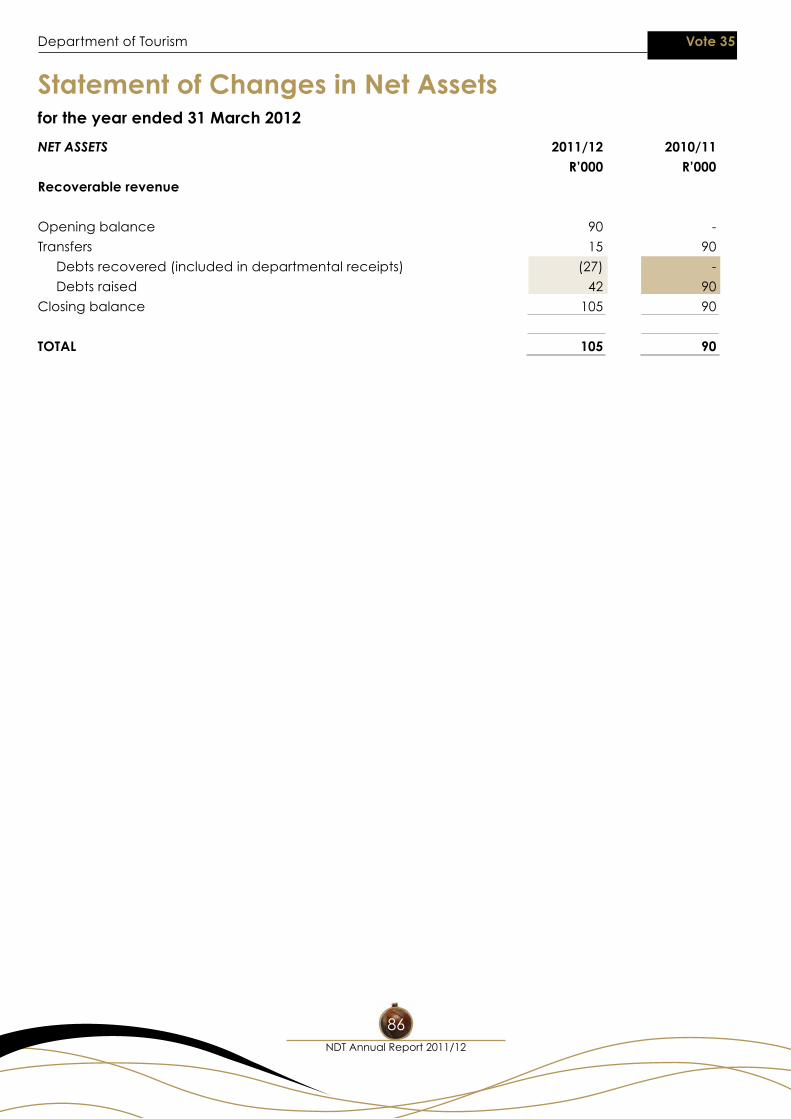
Department of Tourism Vote 35
for the year ended 31 March 2012
NDT Annual Report 2011/12
86
NET ASSETS 2011/12 2010/11 R’000 R’000 Recoverable revenue Opening balance 90 -
Transfers 15 90
Debts recovered (included in departmental receipts) (27) -
Debts raised 42 90
Closing balance 105 90
TOTAL 105 90
Statement of Changes in Net Assets
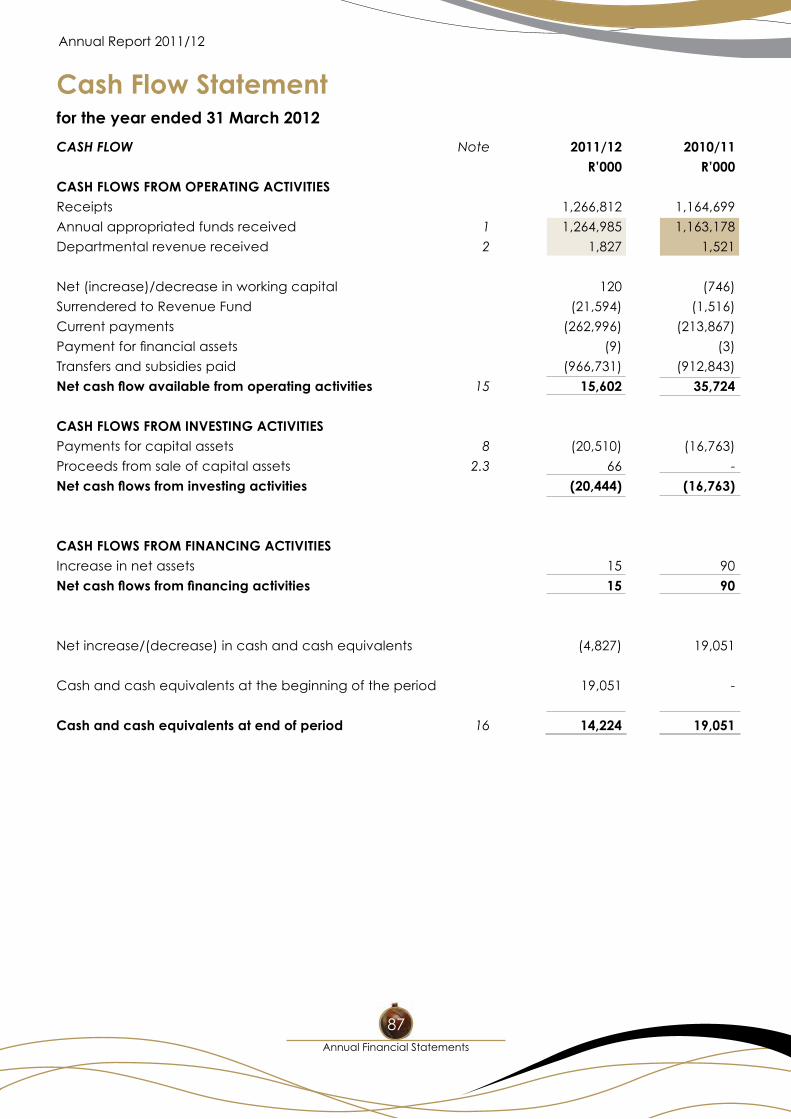
Annual Report 2011/12
for the year ended 31 March 2012
Annual Financial Statements
87
CASH FLOW Note 2011/12 2010/11 R’000 R’000CASH FLOWS FROM OPERATING ACTIVITIES Receipts 1,266,812 1,164,699
Annual appropriated funds received 1 1,264,985 1,163,178
Departmental revenue received 2 1,827 1,521
Net (increase)/decrease in working capital 120 (746)
Surrendered to Revenue Fund (21,594) (1,516)
Current payments (262,996) (213,867)
Paymentforfinancialassets (9) (3)
Transfers and subsidies paid (966,731) (912,843)
Net cash flow available from operating activities 15 15,602 35,724
CASH FLOWS FROM INVESTING ACTIVITIES Payments for capital assets 8 (20,510) (16,763)
Proceeds from sale of capital assets 2.3 66 -
Net cash flows from investing activities (20,444) (16,763)
CASH FLOWS FROM FINANCING ACTIVITIES Increase in net assets 15 90
Net cash flows from financing activities 15 90
Net increase/(decrease) in cash and cash equivalents (4,827) 19,051
Cash and cash equivalents at the beginning of the period 19,051 -
Cash and cash equivalents at end of period 16 14,224 19,051
Cash Flow Statement
Accounting Policies
Department of Tourism Vote 35
for the year ended 31 March 2012
NDT Annual Report 2011/12
88
The Financial Statements have been prepared in accordance with the following policies, which have been
applied consistently in all material aspects, unless otherwise indicated. However, where appropriate and
meaningful, additional information has been disclosed to enhance the usefulness of the Financial Statements
and to comply with the statutory requirements of the Public Finance Management Act, Act 1 of 1999 (as
amended by Act 29 of 1999), and the Treasury Regulations issued in terms of the Act.
1. PRESENTATION OF THE FINANCIAL STATEMENTS
1.1 Basis of preparation TheFinancialStatementshavebeenpreparedonamodifiedcashbasisofaccounting,except
where stated otherwise. The modified cash basis constitutes the cash basis of accounting
supplemented with additional disclosure items. Under the cash basis of accounting transactions
and other events are recognised when cash is received or paid.
1.2 Presentation currency All amounts have been presented in the currency of the South African Rand (ZAR) which is also
the functional currency of the department.
1.3 Rounding Unlessotherwisestatedallfinancialfigureshavebeenroundedtothenearestonethousand Rand(R’000).
1.4 Comparative figuresPriorperiodcomparativeinformationhasbeenpresentedinthecurrentyear’sfinancialstatements.
Wherenecessaryfiguresincludedinthepriorperiodfinancialstatementshavebeenreclassified
to ensure that the format in which the information is presented is consistent with the format of the
currentyear’sfinancialstatements.
1.5 Comparative figures - Appropriation Statement Acomparisonbetweenactualamountsandfinalappropriationpermajorclassificationof
expenditure is included in the Appropriation Statement.
Accounting Policies
Annual Report 2011/12
for the year ended 31 March 2012
Accounting Policies
89
2. REVENUE
2.1 Appropriated funds Appropriated funds comprises of departmental allocations as well as direct charges against
revenuefund(i.e.statutoryappropriation).Appropriatedfundsarerecognisedinthe financial
records on the date the appropriation becomes effective. Adjustments made in terms of the
adjustmentsbudgetprocessarerecognisedinthefinancialrecordsonthedatetheadjustments
become effective.
Unexpended appropriated funds are surrendered to the National Revenue Fund. Any amounts
owingtotheNationalRevenueFundattheendofthefinancialyeararerecognisedaspayable
inthestatementoffinancialposition.
AnyamountduefromtheNationalRevenueFundattheendofthefinancialyearisrecognised
asareceivableinthestatementoffinancialposition.
2.2 Departmental revenue Alldepartmentalrevenueisrecognisedinthestatementoffinancialperformancewhenreceived
and is subsequently paid into the National Revenue Fund, unless stated otherwise.
AnyamountowingtotheNationalRevenueFundattheendofthefinancialyearisrecognised
asapayableinthestatementoffinancialposition.
No accrual is made for amounts receivable from the last receipt date to the end of the reporting
period. Theseamounts are howeverdisclosed in thedisclosure notes to theannual financial
statements.
2.3 Direct Exchequer receipts Alldirectexchequer receiptsare recognised in the statementoffinancialperformancewhen
the cash is received and is subsequently paid into the National Revenue Fund, unless stated
otherwise.
AnyamountowingtotheNationalRevenueFundattheendofthefinancialyearisrecognised
asapayableinthestatementoffinancialposition.
2.4 Direct Exchequer payments Alldirectexchequerpaymentsarerecognisedinthestatementoffinancialperformancewhen
finalauthorisationforpaymentiseffectedonthesystem(bynolaterthan31Marchofeachyear).
Accounting Policies
Department of Tourism Vote 35
for the year ended 31 March 2012
NDT Annual Report 2011/12
90
3. EXPENDITURE
3.1 Compensation of employees
3.1.1 Salaries and wages Salariesandwagesareexpensedinthestatementoffinancialperformancewhenthefinal
authorisation for payment is effected on the system (by no later than 31 March of each year).
Otheremployeebenefitsthatgiverisetoapresentlegalorconstructiveobligationaredisclosed
inthedisclosurenotestothefinancialstatementsatitsfacevalueandarenotrecognisedinthe
statementoffinancialperformanceorposition.
3.1.2 Social contributionsEmployercontributionstopostemploymentbenefitplansinrespectofcurrentemployeesare
expensedinthestatementoffinancialperformancewhenthefinalauthorisationforpaymentis
effected on the system (by no later than 31 March of each year).
Noprovisionismadeforretirementbenefitsinthefinancialstatementsofthedepartment.Any
potentialliabilitiesaredisclosedinthefinancialstatementsoftheNationalRevenueFundand
notinthefinancialstatementsoftheemployerdepartment.
Employercontributionsmadebythedepartmentforcertainofitsex-employeesareclassifiedas
transferstohouseholdsinthestatementoffinancialperformance.
3.2 Goods and servicesPayments made during the year for goods and/or services are recognised as an expense in the
statementoffinancialperformancewhenthefinalauthorisationforpaymentiseffectedonthe
system (by no later than 31 March of each year).
Theexpenseisclassifiedascapitalifthegoodsand/orserviceswereacquiredforacapital
project or if the total purchase price exceeds the capitalisation threshold (currently R5,000).
Allotherexpendituresareclassifiedascurrent.
Rentalpaidfortheuseofbuildingsorotherfixedstructuresisclassifiedasgoods and services
and not as rent on land.
Accounting Policies
Annual Report 2011/12
for the year ended 31 March 2012
Accounting Policies
91
3.3 Interest on finance leases Interestpaymentsarerecognisedasanexpenseinthestatementoffinancialperformance
whenthefinalauthorisationforpaymentiseffectedonthesystem(bynolaterthan31March
ofeachyear).Thisitemexcludesrentalfortheuseofbuildingsorotherfixedstructures.Ifitis
notpossibletodistinguishbetweenpaymentfortheuseoflandandthefixedstructuresonit,
the whole amount should be recorded under goods and services.
3.4 Payments for financial assetsDebts arewritten offwhen identifiedas irrecoverable. Debtswritten-off are limited to the
amount of savings and/or underspending of appropriated funds. The write off occurs at year-
end or when funds are available. No provision is made for irrecoverable amounts but an
estimateisincludedinthedisclosurenotestothefinancialstatementsamounts.
All other losses are recognised when authorisation has been granted for the recognition
thereof.
3.5 Transfers and subsidiesTransfersandsubsidiesarerecognisedasanexpensewhenthefinalauthorisationforpayment
is effected on the system (by no later than 31 March of each year).
3.6 Unauthorised expenditure When confirmed unauthorised expenditure is recognised as an asset in the statement of
financialpositionuntilsuchtimeastheexpenditureiseitherapprovedbytherelevantauthority,
recovered from the responsible person or written off as irrecoverable in the statement of
financialperformance.
Unauthorised expenditure approved with funding is derecognised from the statement of
financialpositionwhentheunauthorisedexpenditureisapprovedandtherelatedfundsare
received.
Where the amount is approved without funding it is recognised as expenditure in the statement
offinancialperformanceonthedateofapproval.
3.7 Fruitless and wasteful expenditure Fruitlessandwastefulexpenditureisrecognisedasexpenditureinthestatementoffinancial
performance according to the nature of the payment and not as a separate line item on
the face of the statement. If the expenditure is recoverable it is treated as an asset until it
is recovered from the responsible person or written off as irrecoverable in the statement of
financialperformance.
Accounting Policies
Department of Tourism Vote 35
for the year ended 31 March 2012
NDT Annual Report 2011/12
92
3.8 Irregular expenditure Irregularexpenditureisrecognisedasexpenditureinthestatementoffinancialperformance.
If the expenditure is not condoned by the relevant authority it is treated as an asset until it is recovered
or written off as irrecoverable.
4. ASSETS
4.1 Cash and cash equivalents Cashandcashequivalentsarecarriedinthestatementoffinancialpositionatcost.
Bankoverdraftsareshownseparatelyonthefaceofthestatementoffinancialposition.
Forthepurposesofthecashflowstatement,cashandcashequivalentscomprisecashonhand,
deposits held and bank overdrafts.
4.2 Other financial assets Otherfinancialassetsarecarriedinthestatementoffinancialpositionatcost.
4.3 Prepayments and advances Amountsprepaidoradvancedarerecognisedinthestatementoffinancialpositionwhenthe
payments are made and are derecognised as and when the goods/services are received or
the funds are utilised.
Prepayments and advances outstanding at the end of the year are carried in the statement of
financialpositionatcost.
4.4 Receivables Receivablesincludedinthestatementoffinancialpositionarisefromcashpaymentsmadethat
are recoverable from another party (including departmental employees) and are derecognised
upon recovery or write-off.
Receivablesoutstandingatyear-endarecarriedinthestatementoffinancialpositionatcost
plus any accrued interest. Amounts that are potentially irrecoverable are included in the disclosure
notes.
Accounting Policies
Annual Report 2011/12
for the year ended 31 March 2012
Accounting Policies
93
4.5 Inventory Inventoriesthatqualifyforrecognitionmustbeinitiallyreflectedatcost.Whereinventoriesare
acquired at no cost, or for nominal consideration, their cost shall be their fair value at the date
of acquisition.
Allinventoryitemsatyear-endarereflectedusingtheweightedaveragecostorFIFOcost
formula.
4.6 Capital assets
4.6.1 Movable assets Initial recognition
A capital asset is recorded in the asset register on receipt of the item at cost. Cost of an asset
isdefinedasthetotalcostofacquisition.Wherethecostcannotbedeterminedaccurately,
the movable capital asset is stated at fair value. Where fair value cannot be determined, the
capital asset is included in the asset register at R1.
All assets acquired prior to 1 April 2002 are included in the register R1.
Subsequent recognition Subsequentexpenditureofacapitalnatureisrecordedinthestatementoffinancial
performance as “expenditure for capital assets” and is capitalised in the asset register of the
department on completion of the project.
Repairs and maintenance is expensed as current “goods and services” in the statement of
financialperformance.
4.6.2 Intangible assetsInitial recognitionAn intangible asset is recorded in the asset register on receipt of the item at cost. Cost of an
intangibleassetisdefinedasthetotalcostofacquisition.Wherethecostcannotbedetermined
accurately, the intangible asset is stated at fair value. Where fair value cannot be determined,
the intangible asset is included in the asset register at R1.
All intangible assets acquired prior to 1 April 2002 can be included in the asset register at R1.
Accounting Policies
Department of Tourism Vote 35
for the year ended 31 March 2012
NDT Annual Report 2011/12
94
Subsequent expenditureSubsequent expenditure of a capital nature is recorded in the statement of financial
performance as “expenditure for capital asset” and is capitalised in the asset register of the
department.
Maintenance is expensed as current “goods and services” in the statement of financial
performance.
5. LIABILITIES
5.1 Payables Recognised payables mainly comprise of amounts owing to other governmental entities. These
payablesarecarriedatcostinthestatementoffinancialposition.
5.2 Contingent liabilities Contingent liabilitiesare included in thedisclosurenotes to thefinancial statementswhen it is
possiblethateconomicbenefitswillflowfromthedepartment,orwhenanoutflowofeconomic
benefitsorservicepotentialisprobablebutcannotbemeasuredreliably.
5.3 Contingent assets Contingentassetsareincludedinthedisclosurenotestothefinancialstatementswhenitis
probablethataninflowofeconomicbenefitswillflowtotheentity.
5.4 Commitments Commitmentsarenotrecognisedinthestatementoffinancialpositionasaliabilityoras
expenditureinthestatementoffinancialperformancebutareincludedinthedisclosurenotes.
5.5 Accruals Accrualsarenotrecognisedinthestatementoffinancialpositionasaliabilityorasexpenditure
inthestatementoffinancialperformancebutareincludedinthedisclosurenotes.
5.6 Employee benefits Short-term employee benefits that give rise to a present legal or constructive obligation are
disclosedinthedisclosurenotestothefinancialstatements.Theseamountsarenotrecognised
inthestatementoffinancialperformanceorthestatementoffinancialposition.
Accounting Policies
Annual Report 2011/12
for the year ended 31 March 2012
Accounting Policies
95
5.7 Lease commitments Finance lease
Finance leasesarenot recognisedasassetsand liabilities in the statementoffinancialposition.
Financeleasepaymentsarerecognisedasanexpenseinthestatementoffinancialperformance
and are apportioned between the capital and interest portions. The finance lease liability is
disclosedinthedisclosurenotestothefinancialstatements.
5.8 Impairment The department tests for impairment where there is an indication that a receivable, loan or investment
may be impaired. An assessment of whether there is an indication of possible impairment is done
at each reporting date. An estimate is made for doubtful loans and receivables based on a review
of all outstanding amounts at year-end. Impairments on investments are calculated as being the
differencebetweenthecarryingamountandthepresentvalueoftheexpectedfuturecashflows
/servicepotentialflowingfromtheinstrument.
6. RECEIVABLES FOR DEPARTMENTAL REVENUE
Receivablesfordepartmentalrevenuearedisclosedinthedisclosurenotestotheannualfinancial
statements.
7. NET ASSETS
7.1 Recoverable revenueAmountsarerecognisedasrecoverablerevenuewhenapaymentmadeinapreviousfinancial
year becomes recoverable from a debtor in the current financial year. Amounts are either
transferred to the National Revenue Fund when recovered or are transferred to the statement of
financialperformancewhenwritten-off.
8. RELATED PARTY TRANSACTIONS
Nospecificinformationwithregardstorelatedpartytransactionsforthereportingperiod.
9. KEY MANAGEMENT PERSONNEL
Compensation paid to key management personnel including their family members where
relevant, is included in the disclosure notes.
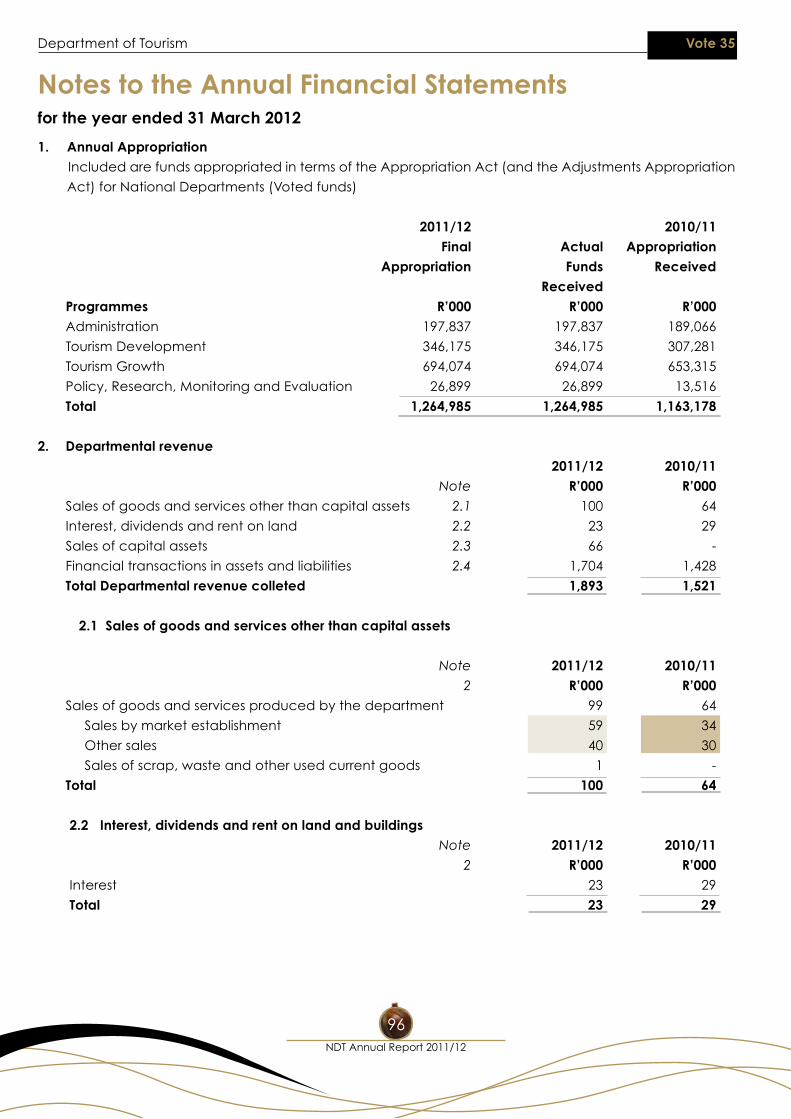
Notes to the Annual Financial Statements
Department of Tourism Vote 35
for the year ended 31 March 2012
NDT Annual Report 2011/12
96
1. Annual Appropriation Included are funds appropriated in terms of the Appropriation Act (and the Adjustments Appropriation
Act) for National Departments (Voted funds)
2011/12 2010/11 Final Actual Appropriation Appropriation Funds Received Received Programmes R’000 R’000 R’000 Administration 197,837 197,837 189,066
Tourism Development 346,175 346,175 307,281
Tourism Growth 694,074 694,074 653,315
Policy, Research, Monitoring and Evaluation 26,899 26,899 13,516
Total 1,264,985 1,264,985 1,163,178
2. Departmental revenue 2011/12 2010/11 Note R’000 R’000 Sales of goods and services other than capital assets 2.1 100 64
Interest, dividends and rent on land 2.2 23 29
Sales of capital assets 2.3 66 -
Financial transactions in assets and liabilities 2.4 1,704 1,428
Total Departmental revenue colleted 1,893 1,521
2.1 Sales of goods and services other than capital assets
Note 2011/12 2010/11 2 R’000 R’000 Sales of goods and services produced by the department 99 64
Sales by market establishment 59 34
Other sales 40 30
Sales of scrap, waste and other used current goods 1 -
Total 100 64
2.2 Interest, dividends and rent on land and buildings Note 2011/12 2010/11 2 R’000 R’000 Interest 23 29
Total 23 29
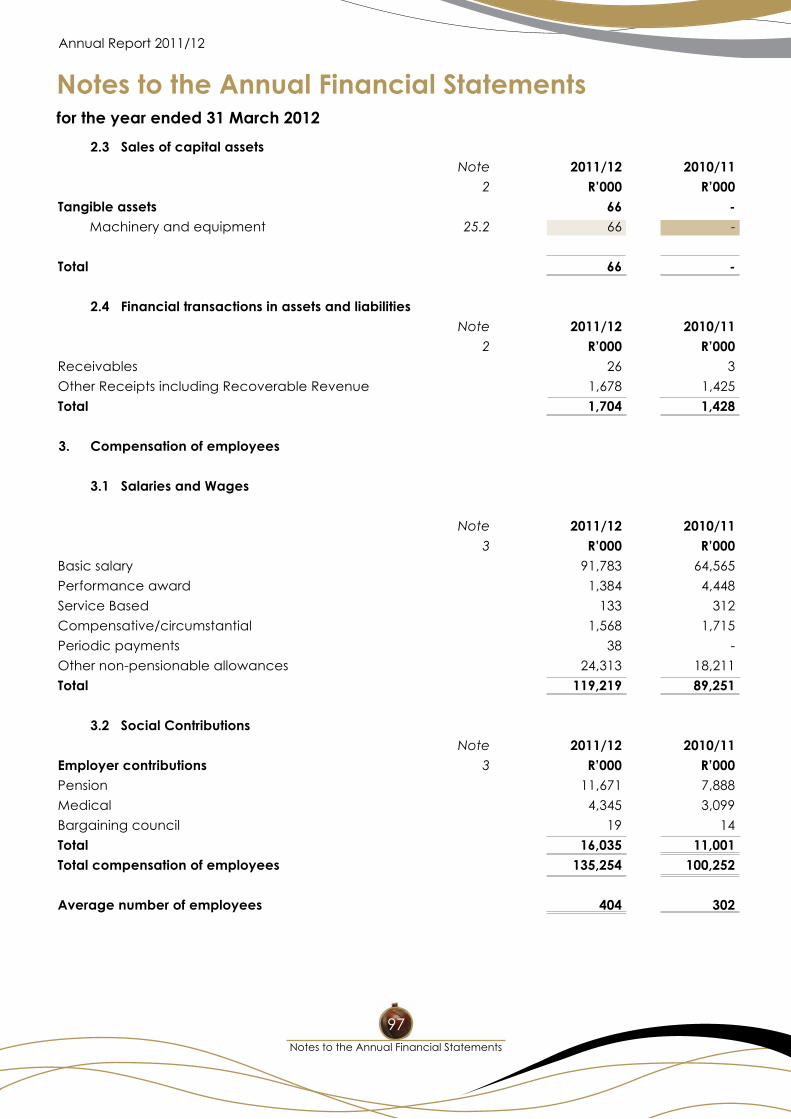
Notes to the Annual Financial Statements
Annual Report 2011/12
for the year ended 31 March 2012
Notes to the Annual Financial Statements
97
2.3 Sales of capital assets Note 2011/12 2010/11 2 R’000 R’000Tangible assets 66 - Machinery and equipment 25.2 66 -
Total 66 -
2.4 Financial transactions in assets and liabilities Note 2011/12 2010/11 2 R’000 R’000Receivables 26 3
Other Receipts including Recoverable Revenue 1,678 1,425
Total 1,704 1,428
3. Compensation of employees
3.1 Salaries and Wages
Note 2011/12 2010/11 3 R’000 R’000Basic salary 91,783 64,565
Performance award 1,384 4,448
Service Based 133 312
Compensative/circumstantial 1,568 1,715
Periodic payments 38 -
Other non-pensionable allowances 24,313 18,211
Total 119,219 89,251
3.2 Social Contributions Note 2011/12 2010/11Employer contributions 3 R’000 R’000Pension 11,671 7,888
Medical 4,345 3,099
Bargaining council 19 14
Total 16,035 11,001Total compensation of employees 135,254 100,252
Average number of employees 404 302
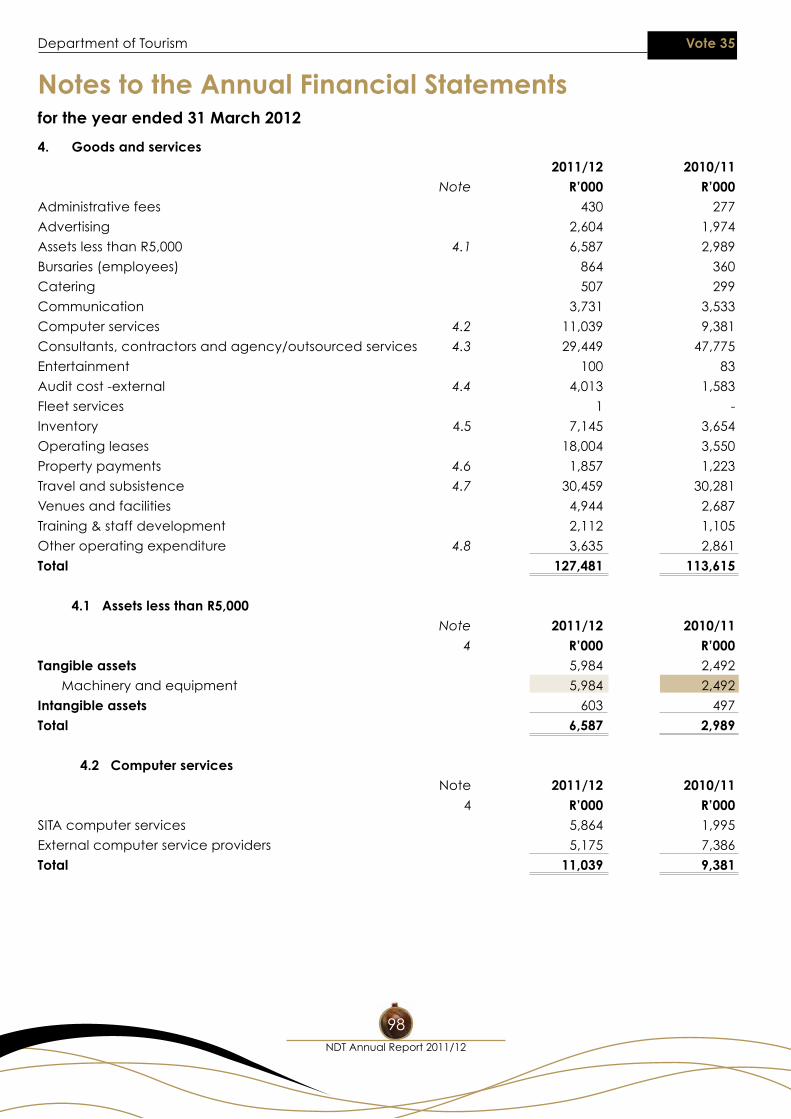
Notes to the Annual Financial Statements
Department of Tourism Vote 35
for the year ended 31 March 2012
NDT Annual Report 2011/12
98
4. Goods and services 2011/12 2010/11 Note R’000 R’000Administrative fees 430 277
Advertising 2,604 1,974
Assets less than R5,000 4.1 6,587 2,989
Bursaries (employees) 864 360
Catering 507 299
Communication 3,731 3,533
Computer services 4.2 11,039 9,381
Consultants, contractors and agency/outsourced services 4.3 29,449 47,775
Entertainment 100 83
Audit cost -external 4.4 4,013 1,583
Fleet services 1 -
Inventory 4.5 7,145 3,654
Operating leases 18,004 3,550
Property payments 4.6 1,857 1,223
Travel and subsistence 4.7 30,459 30,281
Venues and facilities 4,944 2,687
Training & staff development 2,112 1,105
Other operating expenditure 4.8 3,635 2,861
Total 127,481 113,615
4.1 Assets less than R5,000 Note 2011/12 2010/11 4 R’000 R’000Tangible assets 5,984 2,492
Machinery and equipment 5,984 2,492
Intangible assets 603 497
Total 6,587 2,989
4.2 Computer services Note 2011/12 2010/11 4 R’000 R’000SITA computer services 5,864 1,995
External computer service providers 5,175 7,386
Total 11,039 9,381
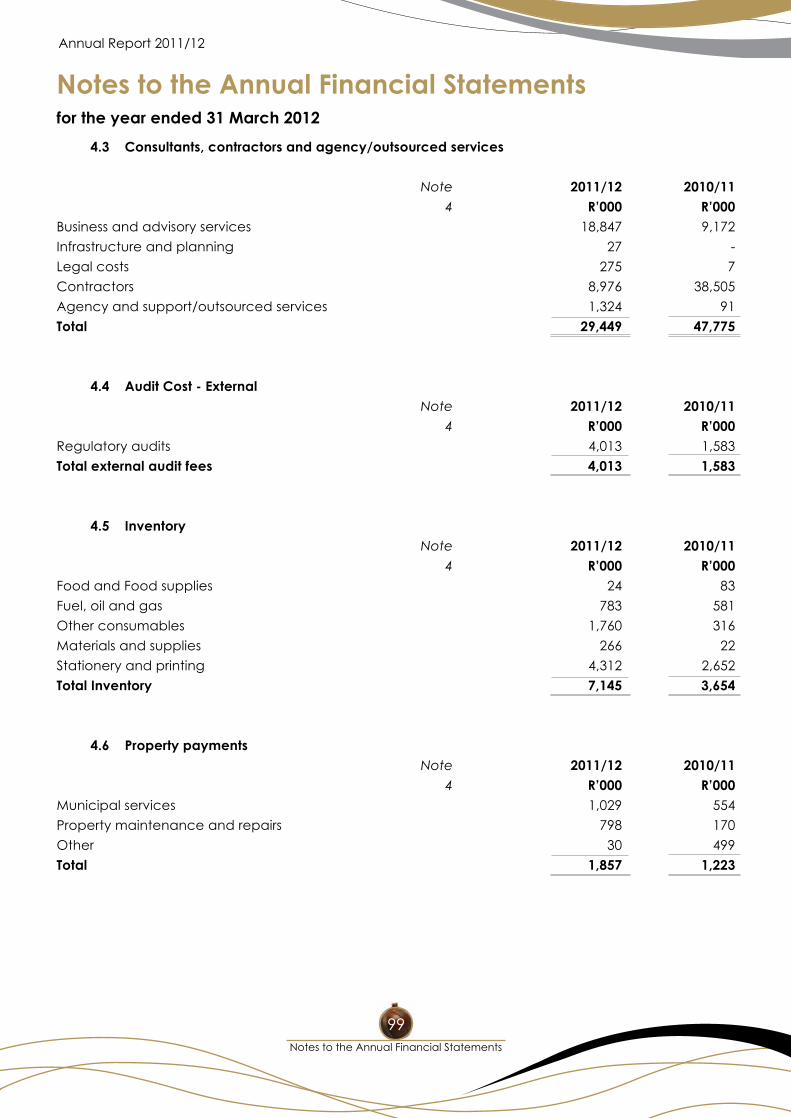
Notes to the Annual Financial Statements
Annual Report 2011/12
for the year ended 31 March 2012
Notes to the Annual Financial Statements
99
4.3 Consultants, contractors and agency/outsourced services
Note 2011/12 2010/11 4 R’000 R’000Business and advisory services 18,847 9,172
Infrastructure and planning 27 -
Legal costs 275 7
Contractors 8,976 38,505
Agency and support/outsourced services 1,324 91
Total 29,449 47,775
4.4 Audit Cost - External Note 2011/12 2010/11 4 R’000 R’000Regulatory audits 4,013 1,583
Total external audit fees 4,013 1,583
4.5 Inventory Note 2011/12 2010/11 4 R’000 R’000Food and Food supplies 24 83
Fuel, oil and gas 783 581
Other consumables 1,760 316
Materials and supplies 266 22
Stationery and printing 4,312 2,652
Total Inventory 7,145 3,654
4.6 Property payments Note 2011/12 2010/11 4 R’000 R’000Municipal services 1,029 554
Property maintenance and repairs 798 170
Other 30 499
Total 1,857 1,223
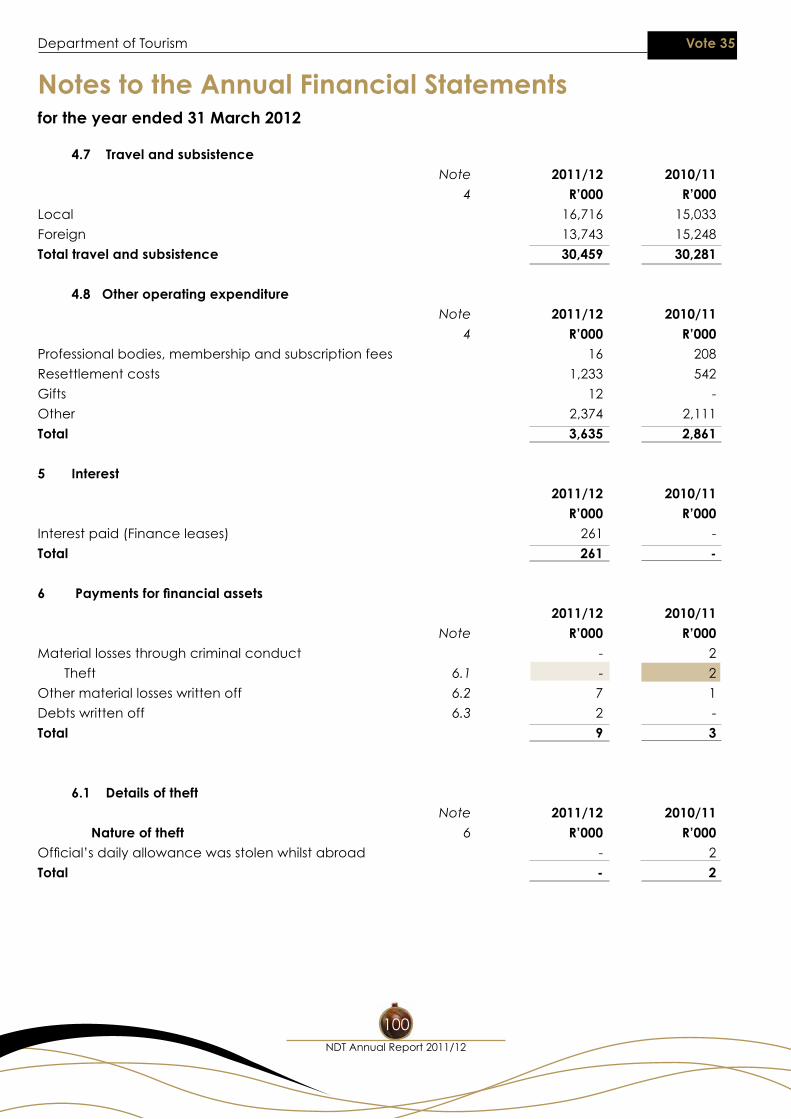
Notes to the Annual Financial Statements
Department of Tourism Vote 35
for the year ended 31 March 2012
NDT Annual Report 2011/12
100
4.7 Travel and subsistence Note 2011/12 2010/11 4 R’000 R’000Local 16,716 15,033
Foreign 13,743 15,248
Total travel and subsistence 30,459 30,281
4.8 Other operating expenditure Note 2011/12 2010/11 4 R’000 R’000Professional bodies, membership and subscription fees 16 208
Resettlement costs 1,233 542
Gifts 12 -
Other 2,374 2,111
Total 3,635 2,861
5 Interest 2011/12 2010/11
R’000 R’000Interest paid (Finance leases) 261 -
Total 261 -
6 Payments for financial assets 2011/12 2010/11 Note R’000 R’000Material losses through criminal conduct - 2
Theft 6.1 - 2
Other material losses written off 6.2 7 1
Debts written off 6.3 2 -
Total 9 3
6.1 Details of theft Note 2011/12 2010/11 Nature of theft 6 R’000 R’000Official’sdailyallowancewasstolenwhilstabroad - 2
Total - 2
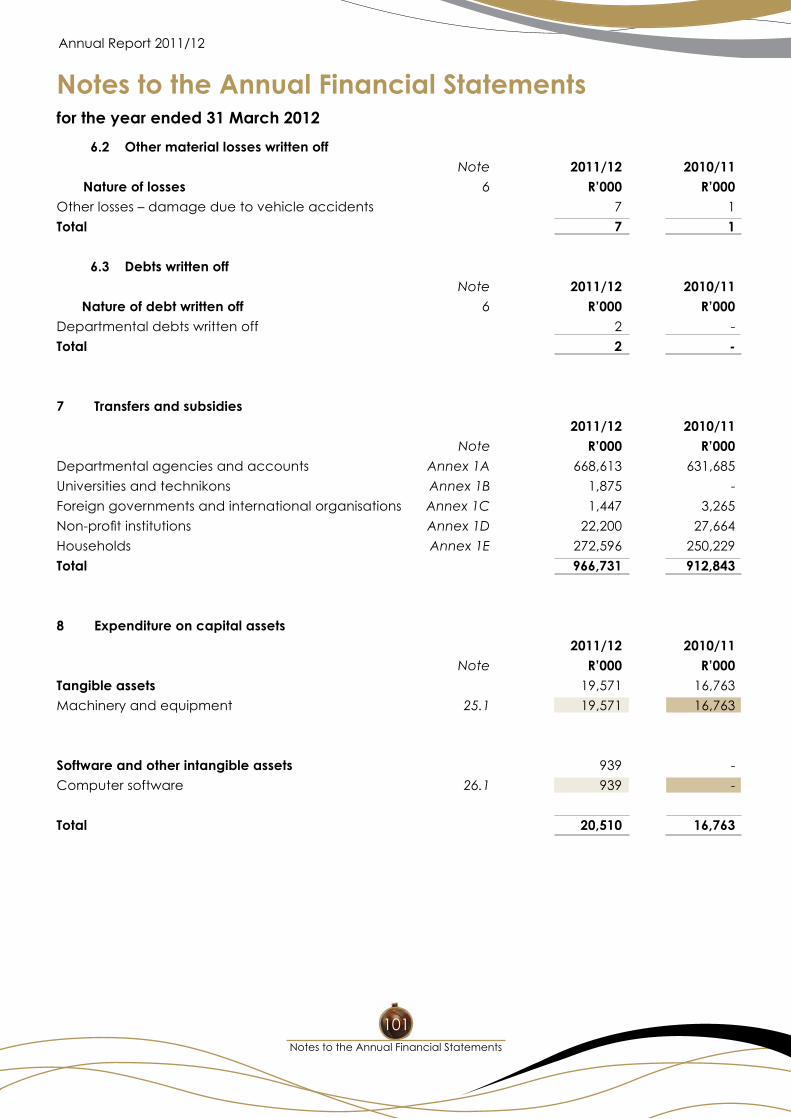
Notes to the Annual Financial Statements
Annual Report 2011/12
for the year ended 31 March 2012
Notes to the Annual Financial Statements
101
6.2 Other material losses written off Note 2011/12 2010/11 Nature of losses 6 R’000 R’000Other losses – damage due to vehicle accidents 7 1
Total 7 1
6.3 Debts written off Note 2011/12 2010/11 Nature of debt written off 6 R’000 R’000Departmental debts written off 2 -
Total 2 -
7 Transfers and subsidies 2011/12 2010/11 Note R’000 R’000Departmental agencies and accounts Annex 1A 668,613 631,685
Universities and technikons Annex 1B 1,875 -
Foreign governments and international organisations Annex 1C 1,447 3,265
Non-profitinstitutions Annex 1D 22,200 27,664
Households Annex 1E 272,596 250,229
Total 966,731 912,843
8 Expenditure on capital assets 2011/12 2010/11 Note R’000 R’000Tangible assets 19,571 16,763
Machinery and equipment 25.1 19,571 16,763
Software and other intangible assets 939 -
Computer software 26.1 939 -
Total 20,510 16,763
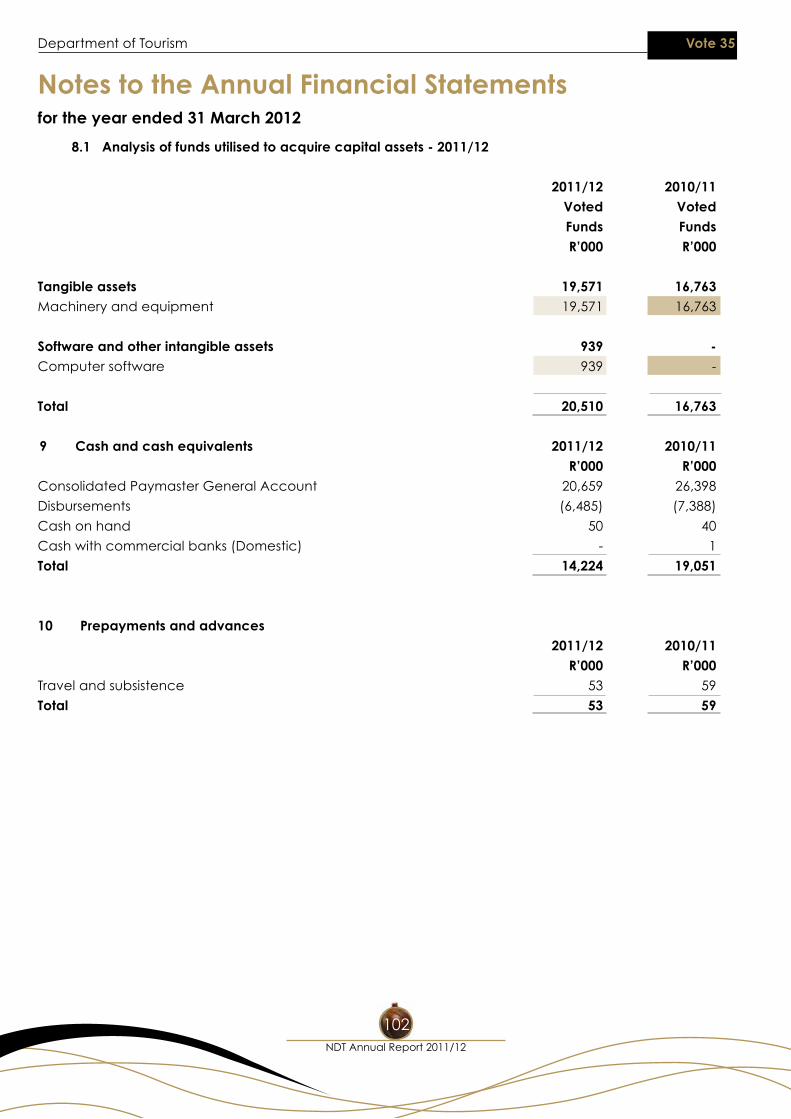
Notes to the Annual Financial Statements
Department of Tourism Vote 35
for the year ended 31 March 2012
NDT Annual Report 2011/12
102
8.1 Analysis of funds utilised to acquire capital assets - 2011/12
2011/12 2010/11 Voted Voted Funds Funds R’000 R’000
Tangible assets 19,571 16,763Machinery and equipment 19,571 16,763
Software and other intangible assets 939 -Computer software 939 -
Total 20,510 16,763
9 Cash and cash equivalents 2011/12 2010/11 R’000 R’000Consolidated Paymaster General Account 20,659 26,398
Disbursements (6,485) (7,388)
Cash on hand 50 40
Cash with commercial banks (Domestic) - 1
Total 14,224 19,051
10 Prepayments and advances 2011/12 2010/11 R’000 R’000Travel and subsistence 53 59
Total 53 59
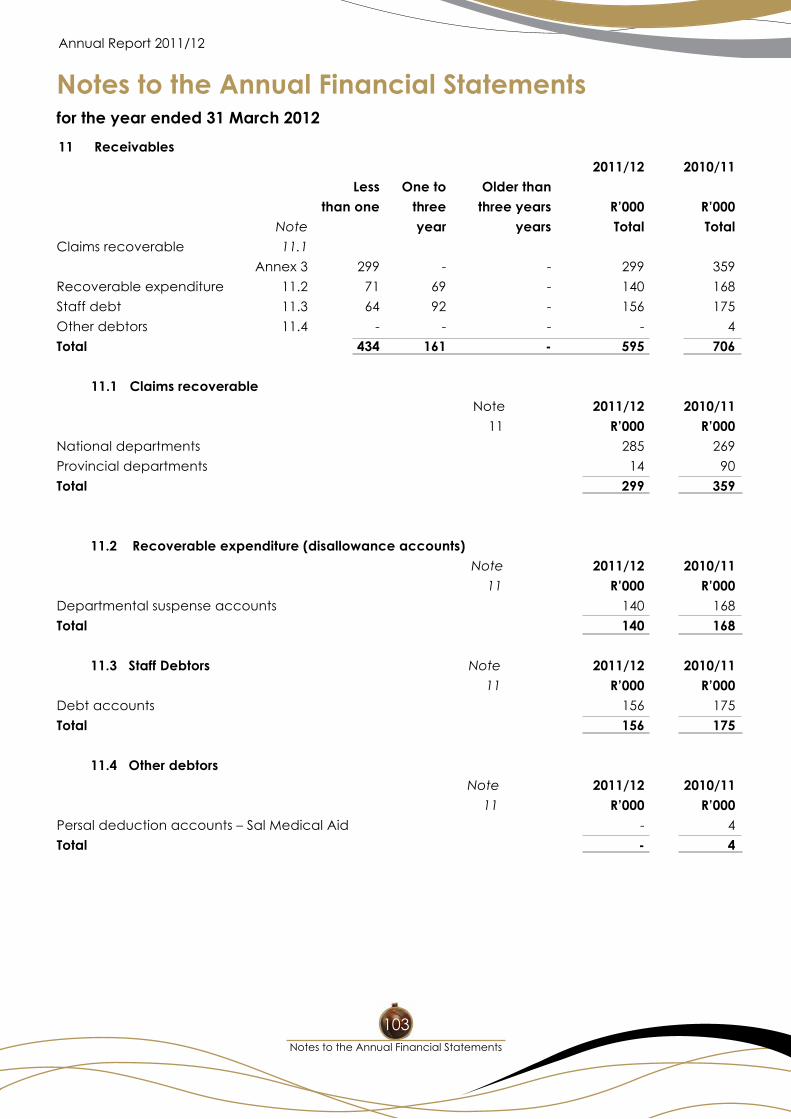
Notes to the Annual Financial Statements
Annual Report 2011/12
for the year ended 31 March 2012
Notes to the Annual Financial Statements
103
11 Receivables 2011/12 2010/11 Less One to Older than than one three three years R’000 R’000 Note year years Total TotalClaims recoverable 11.1
Annex 3 299 - - 299 359
Recoverable expenditure 11.2 71 69 - 140 168
Staff debt 11.3 64 92 - 156 175
Other debtors 11.4 - - - - 4
Total 434 161 - 595 706
11.1 Claims recoverable Note 2011/12 2010/11 11 R’000 R’000National departments 285 269
Provincial departments 14 90
Total 299 359
11.2 Recoverable expenditure (disallowance accounts)
Note 2011/12 2010/11 11 R’000 R’000Departmental suspense accounts 140 168
Total 140 168
11.3 Staff Debtors Note 2011/12 2010/11 11 R’000 R’000Debt accounts 156 175
Total 156 175
11.4 Other debtors Note 2011/12 2010/11 11 R’000 R’000Persal deduction accounts – Sal Medical Aid - 4
Total - 4
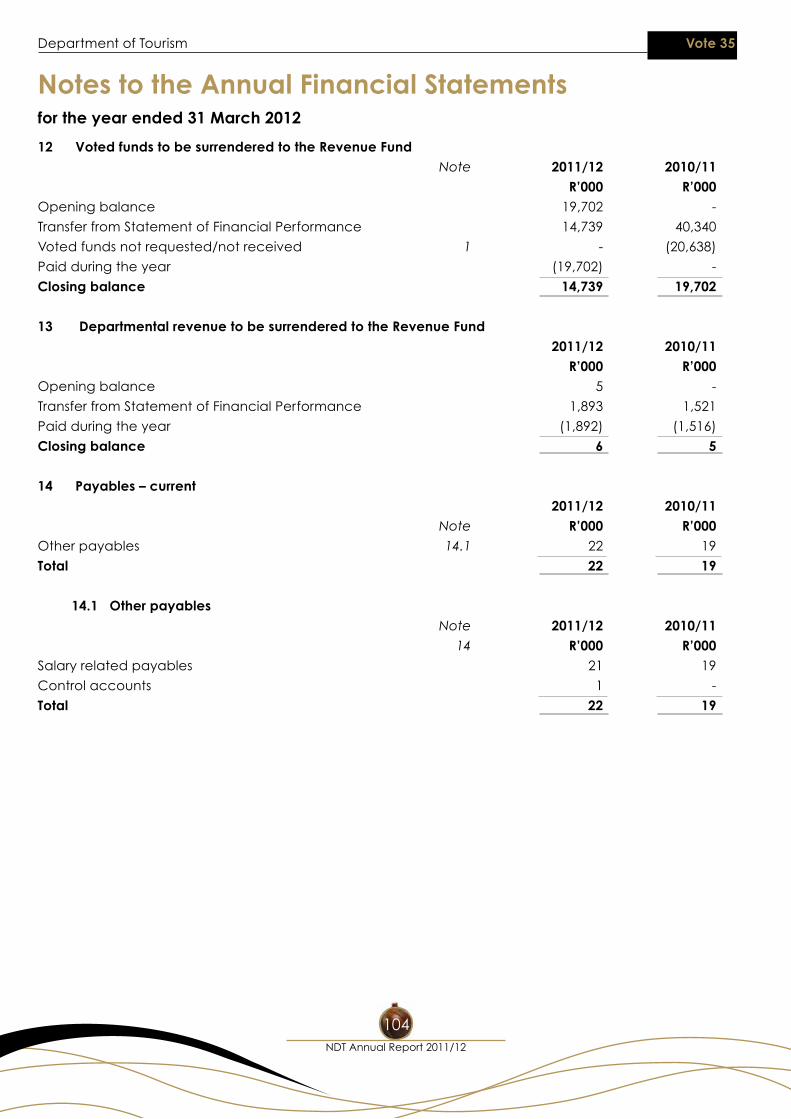
Notes to the Annual Financial Statements
Department of Tourism Vote 35
for the year ended 31 March 2012
NDT Annual Report 2011/12
104
12 Voted funds to be surrendered to the Revenue Fund Note 2011/12 2010/11 R’000 R’000Opening balance 19,702 -
Transfer from Statement of Financial Performance 14,739 40,340
Voted funds not requested/not received 1 - (20,638)
Paid during the year (19,702) -
Closing balance 14,739 19,702
13 Departmental revenue to be surrendered to the Revenue Fund 2011/12 2010/11 R’000 R’000Opening balance 5 -
Transfer from Statement of Financial Performance 1,893 1,521
Paid during the year (1,892) (1,516)
Closing balance 6 5
14 Payables – current 2011/12 2010/11 Note R’000 R’000Other payables 14.1 22 19
Total 22 19
14.1 Other payables Note 2011/12 2010/11 14 R’000 R’000Salary related payables 21 19
Control accounts 1 -
Total 22 19
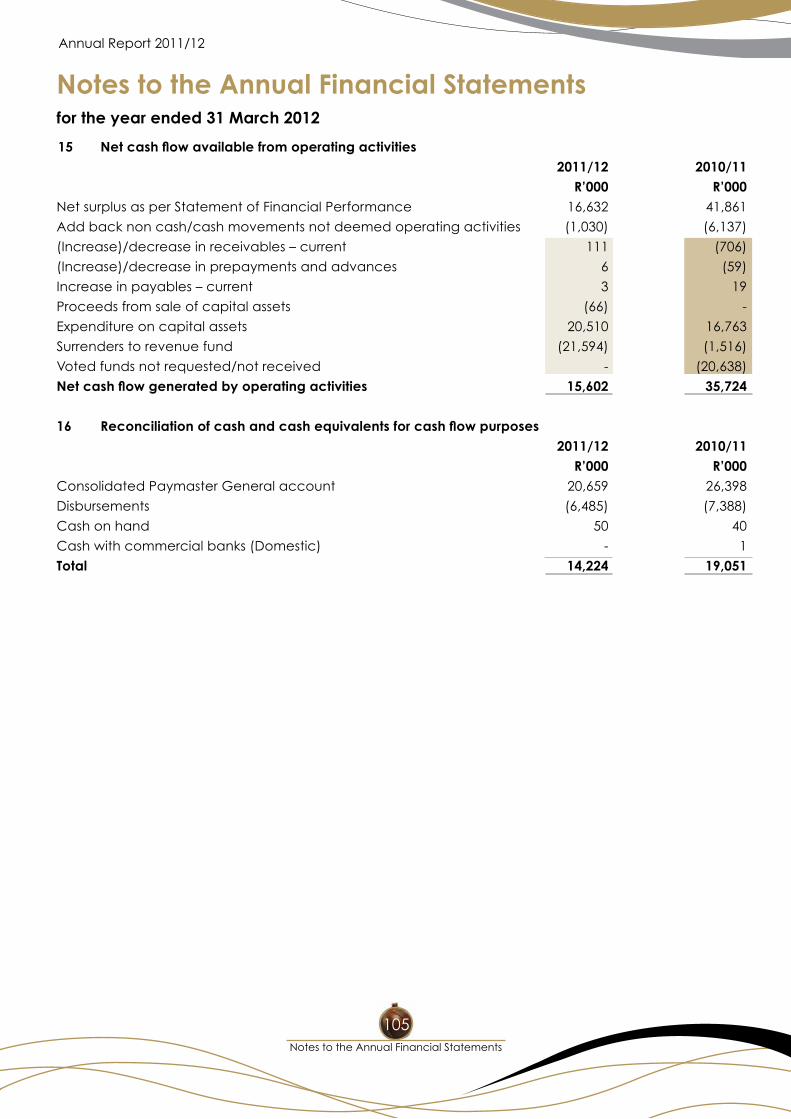
Notes to the Annual Financial Statements
Annual Report 2011/12
for the year ended 31 March 2012
Notes to the Annual Financial Statements
105
15 Net cash flow available from operating activities 2011/12 2010/11 R’000 R’000Net surplus as per Statement of Financial Performance 16,632 41,861
Add back non cash/cash movements not deemed operating activities (1,030) (6,137)
(Increase)/decrease in receivables – current 111 (706)
(Increase)/decrease in prepayments and advances 6 (59)
Increase in payables – current 3 19
Proceeds from sale of capital assets (66) -
Expenditure on capital assets 20,510 16,763
Surrenders to revenue fund (21,594) (1,516)
Voted funds not requested/not received - (20,638)
Net cash flow generated by operating activities 15,602 35,724
16 Reconciliation of cash and cash equivalents for cash flow purposes 2011/12 2010/11 R’000 R’000Consolidated Paymaster General account 20,659 26,398
Disbursements (6,485) (7,388)
Cash on hand 50 40
Cash with commercial banks (Domestic) - 1
Total 14,224 19,051
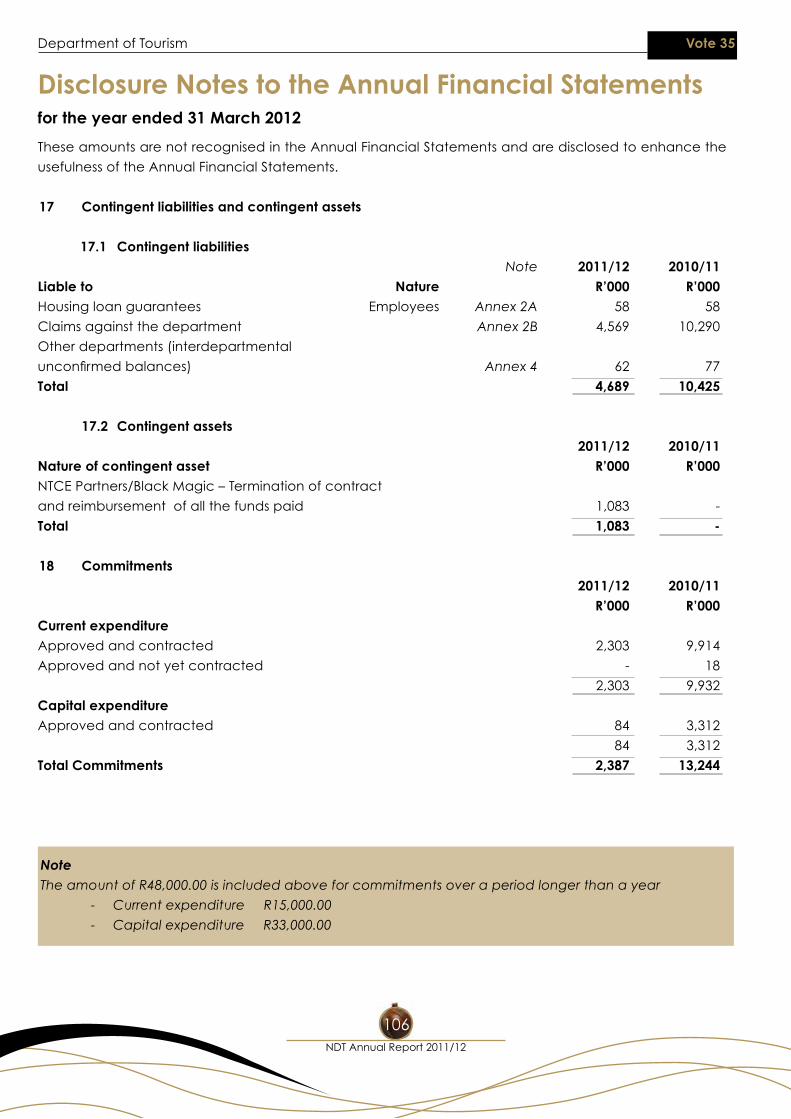
Disclosure Notes to the Annual Financial Statements
Department of Tourism Vote 35
for the year ended 31 March 2012
NDT Annual Report 2011/12
106
These amounts are not recognised in the Annual Financial Statements and are disclosed to enhance the
usefulness of the Annual Financial Statements.
17 Contingent liabilities and contingent assets
17.1 Contingent liabilities Note 2011/12 2010/11Liable to Nature R’000 R’000Housing loan guarantees Employees Annex 2A 58 58
Claims against the department Annex 2B 4,569 10,290
Other departments (interdepartmental
unconfirmedbalances) Annex 4 62 77
Total 4,689 10,425
17.2 Contingent assets 2011/12 2010/11Nature of contingent asset R’000 R’000NTCE Partners/Black Magic – Termination of contract
and reimbursement of all the funds paid 1,083 -
Total 1,083 -
18 Commitments 2011/12 2010/11 R’000 R’000Current expenditure Approved and contracted 2,303 9,914
Approved and not yet contracted - 18
2,303 9,932
Capital expenditure Approved and contracted 84 3,312
84 3,312
Total Commitments 2,387 13,244
NoteThe amount of R48,000.00 is included above for commitments over a period longer than a year
- Current expenditure R15,000.00
- Capital expenditure R33,000.00
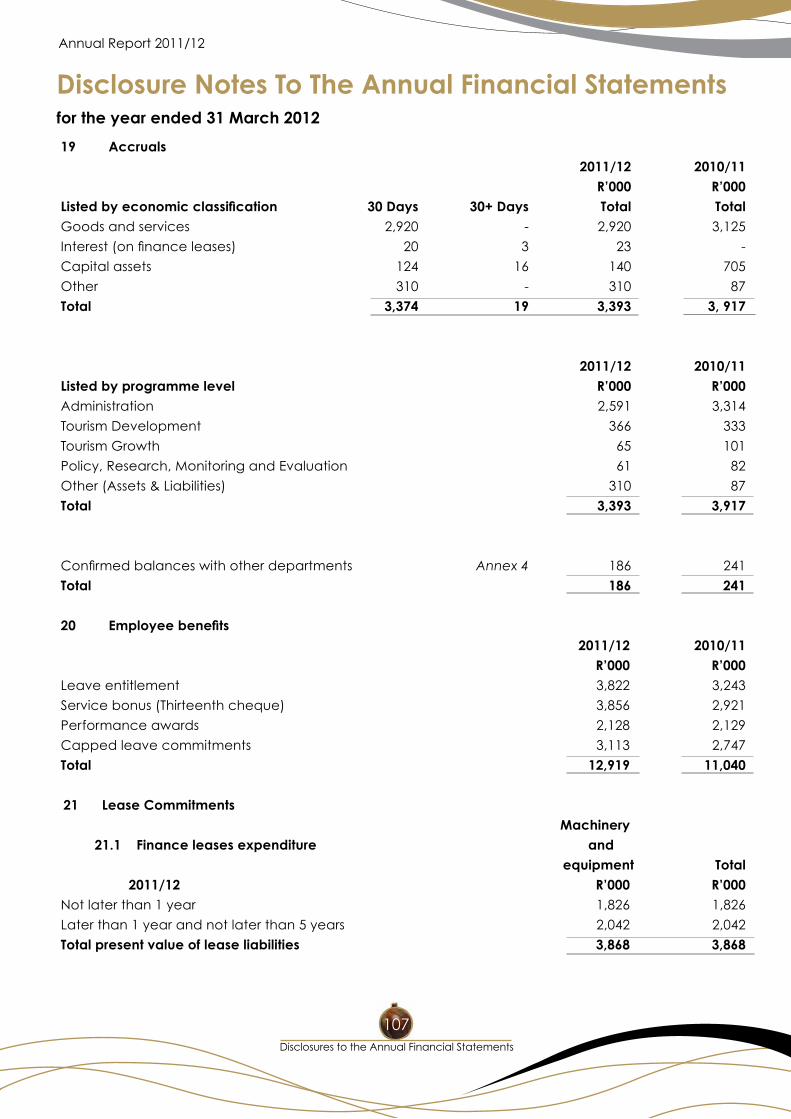
Disclosure Notes To The Annual Financial Statements
Annual Report 2011/12
for the year ended 31 March 2012
Disclosures to the Annual Financial Statements
107
19 Accruals 2011/12 2010/11 R’000 R’000Listed by economic classification 30 Days 30+ Days Total TotalGoods and services 2,920 - 2,920 3,125
Interest(onfinanceleases) 20 3 23 -
Capital assets 124 16 140 705
Other 310 - 310 87
Total 3,374 19 3,393 3, 917
2011/12 2010/11Listed by programme level R’000 R’000Administration 2,591 3,314
Tourism Development 366 333
Tourism Growth 65 101
Policy, Research, Monitoring and Evaluation 61 82
Other (Assets & Liabilities) 310 87
Total 3,393 3,917
Confirmedbalanceswithotherdepartments Annex 4 186 241
Total 186 241
20 Employee benefits 2011/12 2010/11 R’000 R’000Leave entitlement 3,822 3,243
Service bonus (Thirteenth cheque) 3,856 2,921
Performance awards 2,128 2,129
Capped leave commitments 3,113 2,747
Total 12,919 11,040
21 Lease Commitments Machinery 21.1 Finance leases expenditure and equipmen t Total
2011/12 R’000 R’000Not later than 1 year 1,826 1,826
Later than 1 year and not later than 5 years 2,042 2,042
Total present value of lease liabilities 3,868 3,868
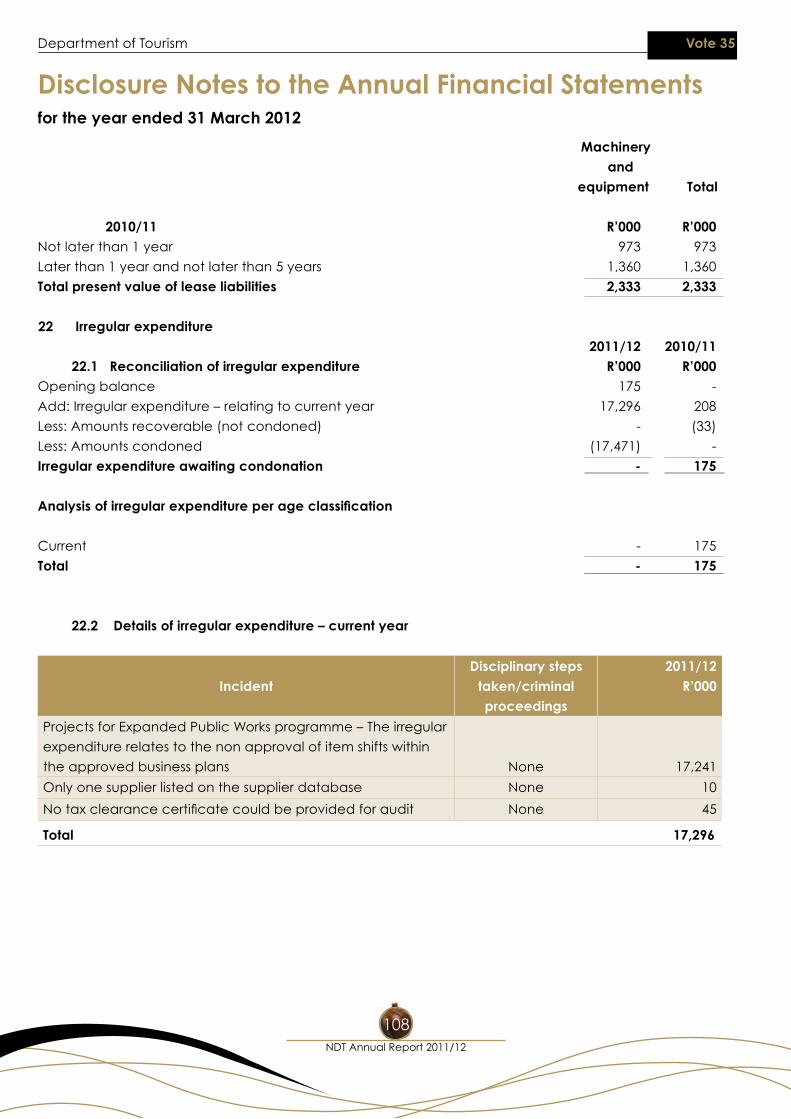
Disclosure Notes to the Annual Financial Statements
Department of Tourism Vote 35
for the year ended 31 March 2012
NDT Annual Report 2011/12
108
Machinery and equipment Total
2010/11 R’000 R’000
Not later than 1 year 973 973
Later than 1 year and not later than 5 years 1,360 1,360
Total present value of lease liabilities 2,333 2,333 22 Irregular expenditure 2011/12 2010/11 22.1 Reconciliation of irregular expenditure R’000 R’000Opening balance 175 -
Add: Irregular expenditure – relating to current year 17,296 208
Less: Amounts recoverable (not condoned) - (33)
Less: Amounts condoned (17,471) -
Irregular expenditure awaiting condonation - 175 Analysis of irregular expenditure per age classification Current - 175
Total - 175
22.2 Details of irregular expenditure – current year
IncidentDisciplinary steps
taken/criminal proceedings
2011/12 R’000
Projects for Expanded Public Works programme – The irregular
expenditure relates to the non approval of item shifts within
the approved business plans None 17,241
Only one supplier listed on the supplier database None 10
Notaxclearancecertificatecouldbeprovidedforaudit None 45
Total 17,296
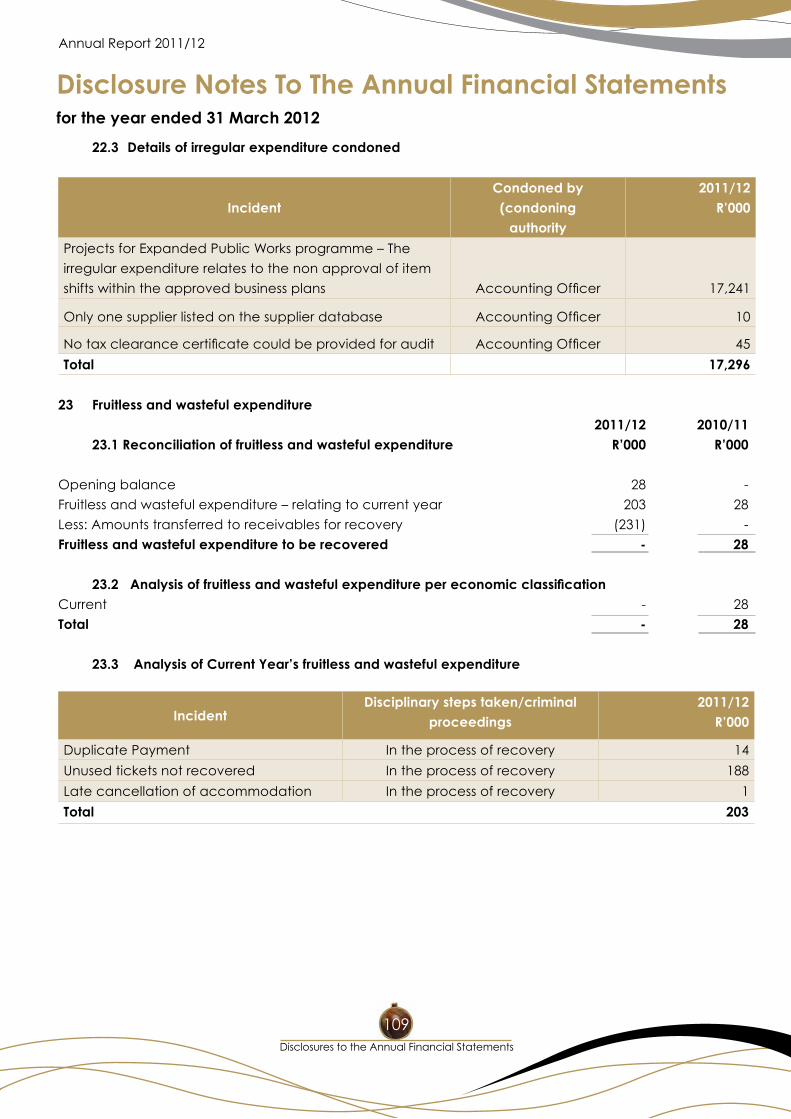
Disclosure Notes To The Annual Financial Statements
Annual Report 2011/12
for the year ended 31 March 2012
Disclosures to the Annual Financial Statements
109
22.3 Details of irregular expenditure condoned
IncidentCondoned by (condoning
authority
2011/12R’000
Projects for Expanded Public Works programme – The
irregular expenditure relates to the non approval of item
shifts within the approved business plans AccountingOfficer 17,241
Only one supplier listed on the supplier database AccountingOfficer 10
Notaxclearancecertificatecouldbeprovidedforaudit AccountingOfficer 45
Total 17,296
23 Fruitless and wasteful expenditure 2011/12 2010/11 23.1 Reconciliation of fruitless and wasteful expenditure R’000 R’000
Opening balance 28 -
Fruitless and wasteful expenditure – relating to current year 203 28
Less: Amounts transferred to receivables for recovery (231) -
Fruitless and wasteful expenditure to be recovered - 28
23.2 Analysis of fruitless and wasteful expenditure per economic classification Current - 28
Total - 28
23.3 Analysis of Current Year’s fruitless and wasteful expenditure
IncidentDisciplinary steps taken/criminal
proceedings2011/12
R’000
Duplicate Payment In the process of recovery 14
Unused tickets not recovered In the process of recovery 188
Late cancellation of accommodation In the process of recovery 1
Total 203
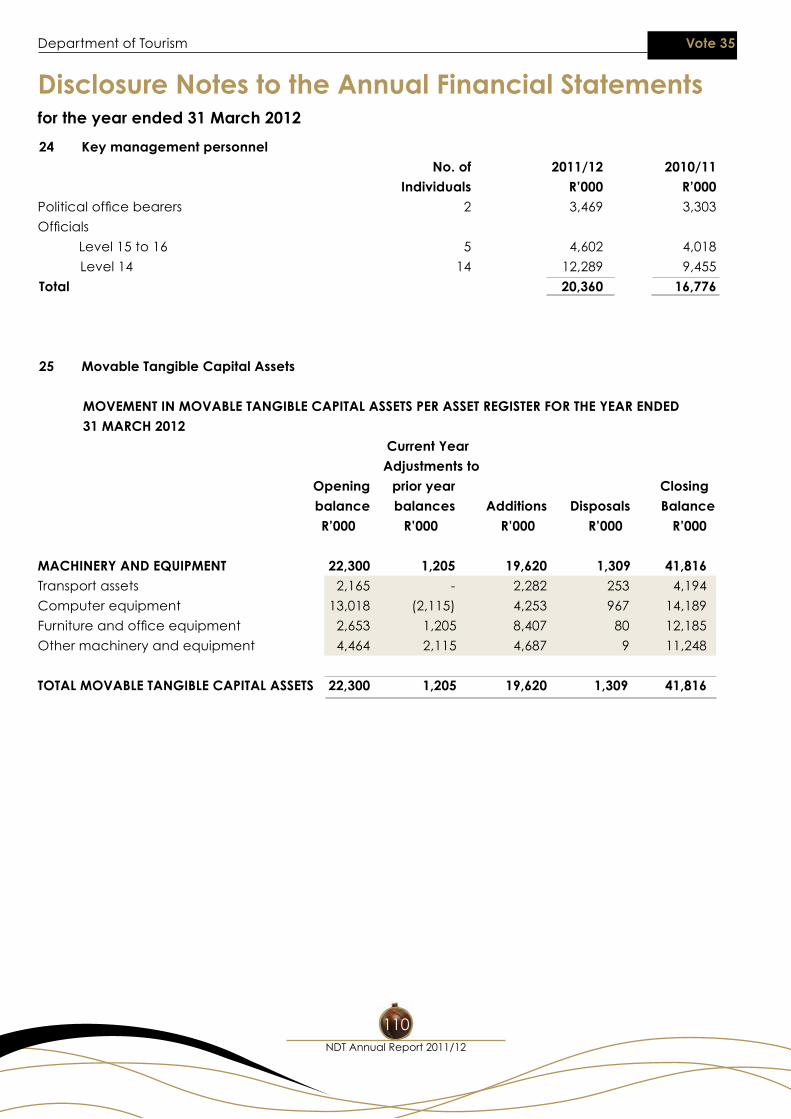
Disclosure Notes to the Annual Financial Statements
Department of Tourism Vote 35
for the year ended 31 March 2012
NDT Annual Report 2011/12
110
24 Key management personnel No. of 2011/12 2010/11 Individuals R’000 R’000Politicalofficebearers 2 3,469 3,303
Officials
Level 15 to 16 5 4,602 4,018
Level 14 14 12,289 9,455
Total 20,360 16,776
25 Movable Tangible Capital Assets
MOVEMENT IN MOVABLE TANGIBLE CAPITAL ASSETS PER ASSET REGISTER FOR THE YEAR ENDED 31 MARCH 2012 Current Year Adjustments to Opening prior year Closing balance balances Additions Disposals Balance R’000 R’000 R’000 R’000 R’000
MACHINERY AND EQUIPMENT 22,300 1,205 19,620 1,309 41,816Transport assets 2,165 - 2,282 253 4,194
Computer equipment 13,018 (2,115) 4,253 967 14,189
Furnitureandofficeequipment 2,653 1,205 8,407 80 12,185
Other machinery and equipment 4,464 2,115 4,687 9 11,248
TOTAL MOVABLE TANGIBLE CAPITAL ASSETS 22,300 1,205 19,620 1,309 41,816
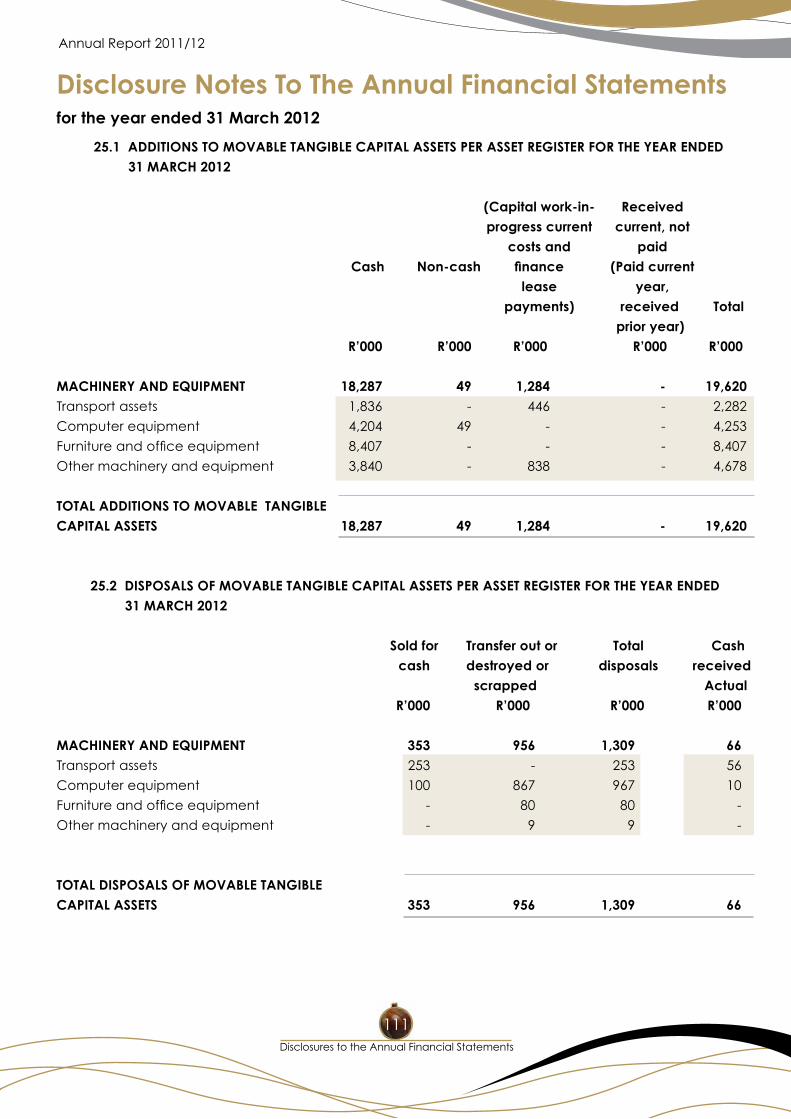
Disclosure Notes To The Annual Financial Statements
Annual Report 2011/12
for the year ended 31 March 2012
Disclosures to the Annual Financial Statements
111
25.1 ADDITIONS TO MOVABLE TANGIBLE CAPITAL ASSETS PER ASSET REGISTER FOR THE YEAR ENDED 31 MARCH 2012
(Capital work-in- Received progress current current, not costs and paid Cash Non-cash finance (Paid current lease year, payments) received Total prior year) R’000 R’000 R’000 R’000 R’000
MACHINERY AND EQUIPMENT 18,287 49 1,284 - 19,620Transport assets 1,836 - 446 - 2,282
Computer equipment 4,204 49 - - 4,253
Furnitureandofficeequipment 8,407 - - - 8,407
Other machinery and equipment 3,840 - 838 - 4,678
TOTAL ADDITIONS TO MOVABLE TANGIBLE CAPITAL ASSETS 18,287 49 1,284 - 19,620
25.2 DISPOSALS OF MOVABLE TANGIBLE CAPITAL ASSETS PER ASSET REGISTER FOR THE YEAR ENDED 31 MARCH 2012
Sold for Transfer out or Total Cash cash destroyed or disposals received scrapped Actual R’000 R’000 R’000 R’000
MACHINERY AND EQUIPMENT 353 956 1,309 66Transport assets 253 - 253 56
Computer equipment 100 867 967 10
Furnitureandofficeequipment - 80 80 -
Other machinery and equipment - 9 9 -
TOTAL DISPOSALS OF MOVABLE TANGIBLE CAPITAL ASSETS 353 956 1,309 66
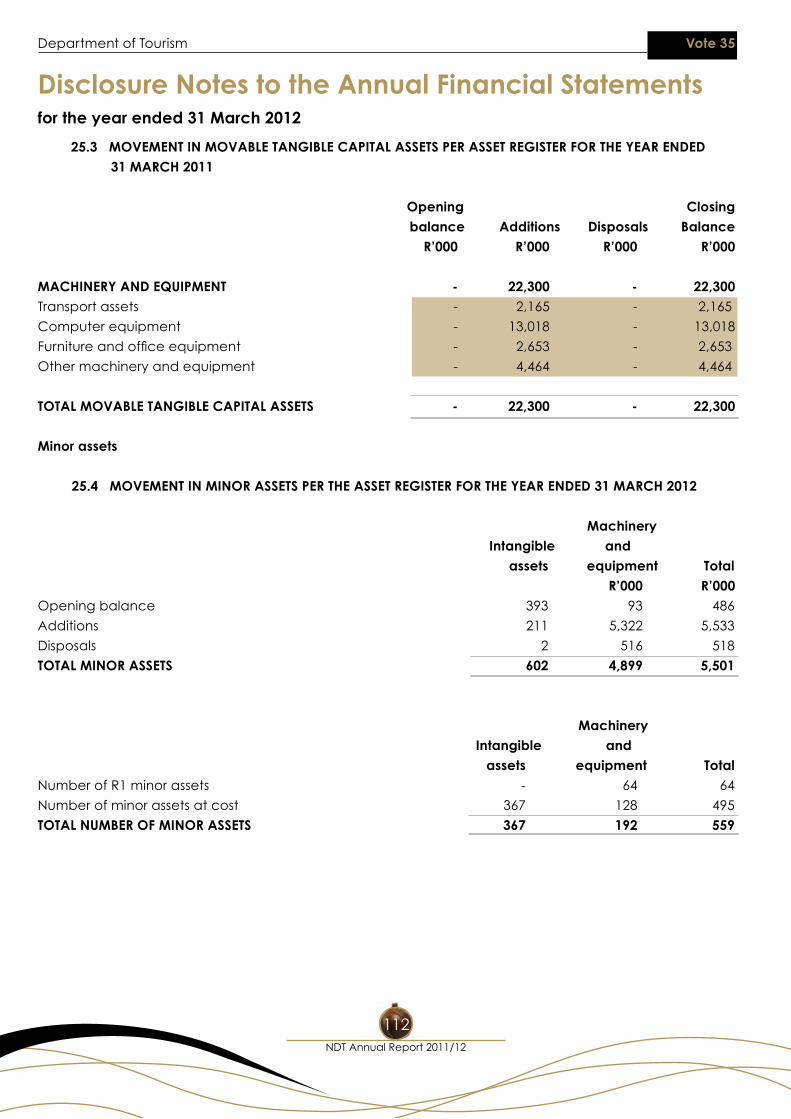
Disclosure Notes to the Annual Financial Statements
Department of Tourism Vote 35
for the year ended 31 March 2012
NDT Annual Report 2011/12
112
25.3 MOVEMENT IN MOVABLE TANGIBLE CAPITAL ASSETS PER ASSET REGISTER FOR THE YEAR ENDED 31 MARCH 2011
Opening Closing balance Additions Disposals Balance R’000 R’000 R’000 R’000
MACHINERY AND EQUIPMENT - 22,300 - 22,300Transport assets - 2,165 - 2,165
Computer equipment - 13,018 - 13,018
Furnitureandofficeequipment - 2,653 - 2,653
Other machinery and equipment - 4,464 - 4,464
TOTAL MOVABLE TANGIBLE CAPITAL ASSETS - 22,300 - 22,300
Minor assets
25.4 MOVEMENT IN MINOR ASSETS PER THE ASSET REGISTER FOR THE YEAR ENDED 31 MARCH 2012 Machinery Intangible and assets equipment Total R’000 R’000Opening balance 393 93 486
Additions 211 5,322 5,533
Disposals 2 516 518
TOTAL MINOR ASSETS 602 4,899 5,501
Machinery Intangible and assets equipment TotalNumber of R1 minor assets - 64 64
Number of minor assets at cost 367 128 495
TOTAL NUMBER OF MINOR ASSETS 367 192 559
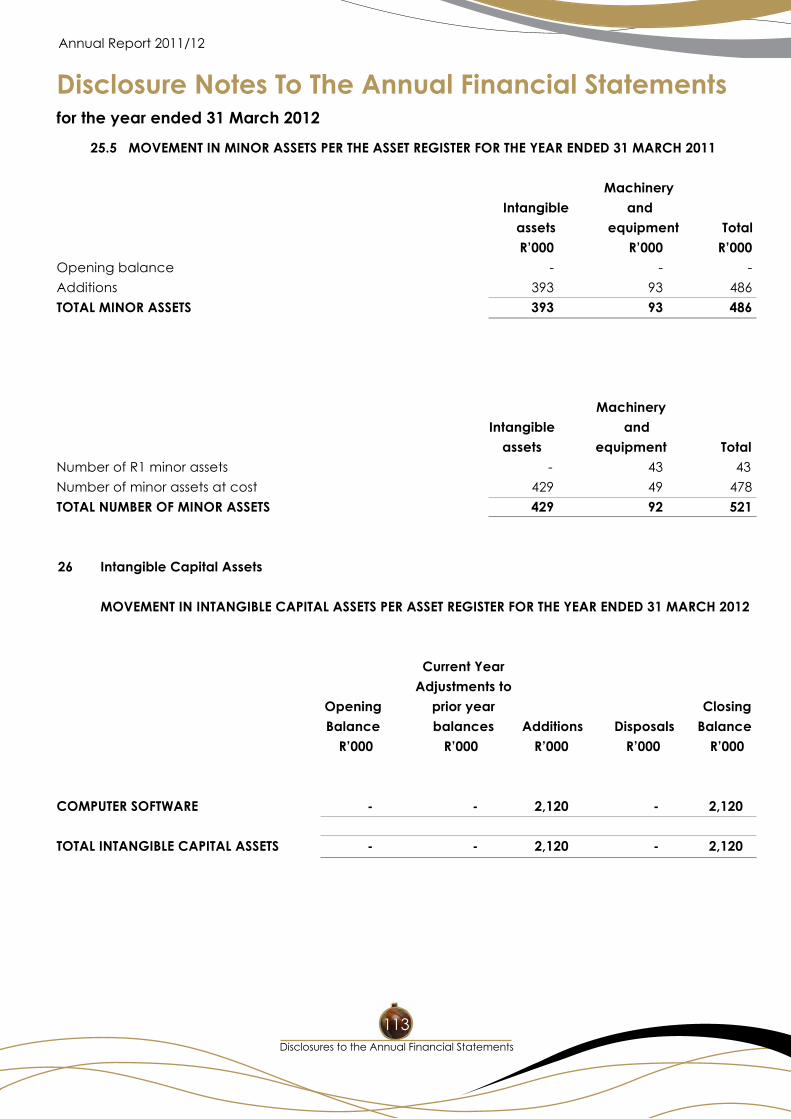
Disclosure Notes To The Annual Financial Statements
Annual Report 2011/12
for the year ended 31 March 2012
Disclosures to the Annual Financial Statements
113
25.5 MOVEMENT IN MINOR ASSETS PER THE ASSET REGISTER FOR THE YEAR ENDED 31 MARCH 2011
Machinery Intangible and assets equipment Total R’000 R’000 R’000Opening balance - - -
Additions 393 93 486
TOTAL MINOR ASSETS 393 93 486
Machinery Intangible and assets equipment TotalNumber of R1 minor assets - 43 43
Number of minor assets at cost 429 49 478
TOTAL NUMBER OF MINOR ASSETS 429 92 521
26 Intangible Capital Assets
MOVEMENT IN INTANGIBLE CAPITAL ASSETS PER ASSET REGISTER FOR THE YEAR ENDED 31 MARCH 2012 Current Year Adjustments to Opening prior year Closing Balance balances Additions Disposals Balance R’000 R’000 R’000 R’000 R’000
COMPUTER SOFTWARE - - 2,120 - 2,120 TOTAL INTANGIBLE CAPITAL ASSETS - - 2,120 - 2,120
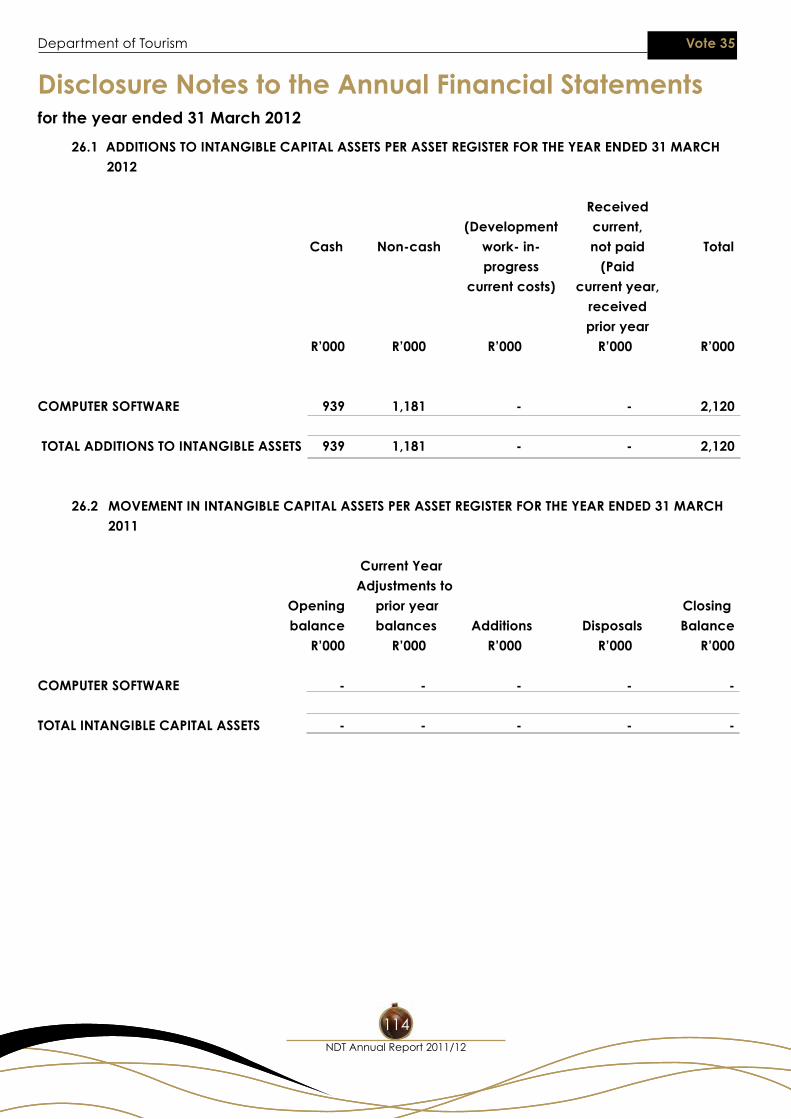
Disclosure Notes to the Annual Financial Statements
Department of Tourism Vote 35
for the year ended 31 March 2012
NDT Annual Report 2011/12
114
26.1 ADDITIONS TO INTANGIBLE CAPITAL ASSETS PER ASSET REGISTER FOR THE YEAR ENDED 31 MARCH 2012 Received (Development current, Cash Non-cash work- in- not paid Total progress (Paid current costs) current year, received prior year R’000 R’000 R’000 R’000 R’000
COMPUTER SOFTWARE 939 1,181 - - 2,120
TOTAL ADDITIONS TO INTANGIBLE ASSETS 939 1,181 - - 2,120
26.2 MOVEMENT IN INTANGIBLE CAPITAL ASSETS PER ASSET REGISTER FOR THE YEAR ENDED 31 MARCH 2011 Current Year Adjustments to Opening prior year Closing balance balances Additions Disposals Balance R’000 R’000 R’000 R’000 R’000
COMPUTER SOFTWARE - - - - -
TOTAL INTANGIBLE CAPITAL ASSETS - - - - -
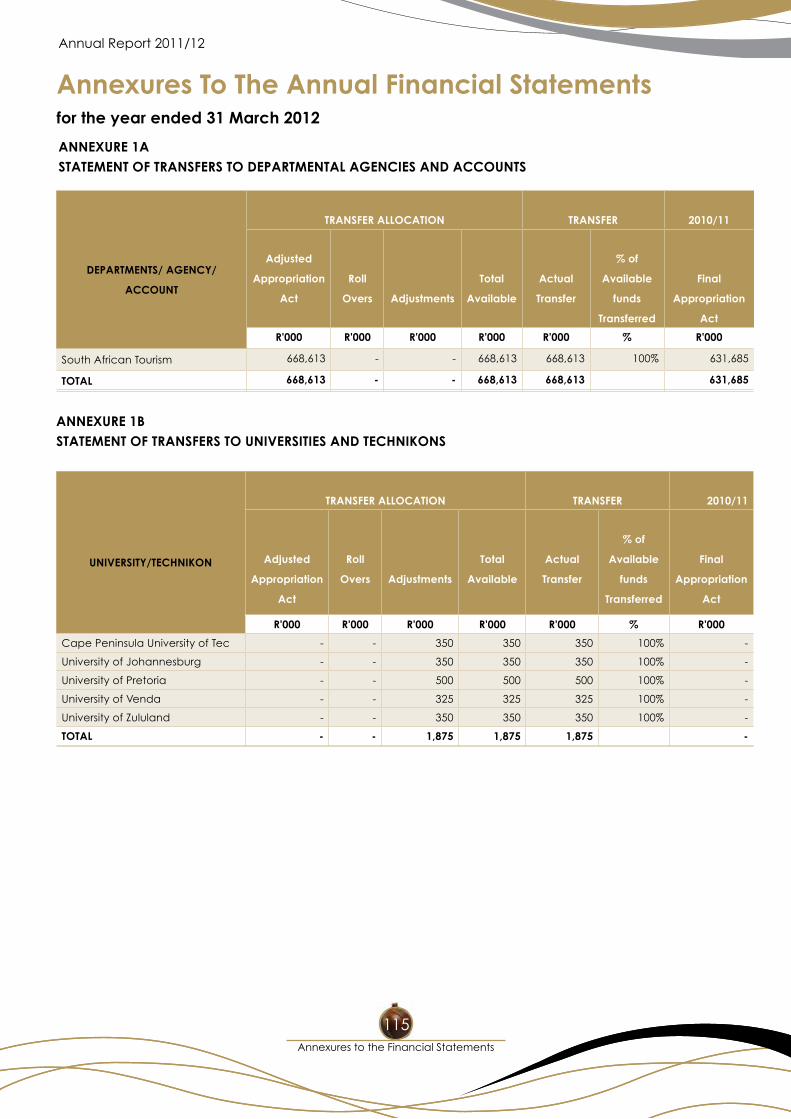
Annexures To The Annual Financial Statements
Annual Report 2011/12
for the year ended 31 March 2012
Annexures to the Financial Statements
115
ANNEXURE 1ASTATEMENT OF TRANSFERS TO DEPARTMENTAL AGENCIES AND ACCOUNTS
DEPARTMENTS/ AGENCY/
ACCOUNT
TRANSFER ALLOCATION TRANSFER 2010/11
Adjusted
Appropriation
Act
Roll
Overs Adjustments
Total
Available
Actual
Transfer
% of
Available
funds
Transferred
Final
Appropriation
Act
R'000 R'000 R'000 R'000 R'000 % R'000
South African Tourism 668,613 - - 668,613 668,613 100% 631,685
TOTAL 668,613 - - 668,613 668,613 631,685
ANNEXURE 1BSTATEMENT OF TRANSFERS TO UNIVERSITIES AND TECHNIKONS
UNIVERSITY/TECHNIKON
TRANSFER ALLOCATION TRANSFER 2010/11
Adjusted
Appropriation
Act
Roll
Overs Adjustments
Total
Available
Actual
Transfer
% of
Available
funds
Transferred
Final
Appropriation
Act
R'000 R'000 R'000 R'000 R'000 % R'000
Cape Peninsula University of Tec - - 350 350 350 100% -
University of Johannesburg - - 350 350 350 100% -
University of Pretoria - - 500 500 500 100% -
University of Venda - - 325 325 325 100% -
University of Zululand - - 350 350 350 100% -
TOTAL - - 1,875 1,875 1,875 -
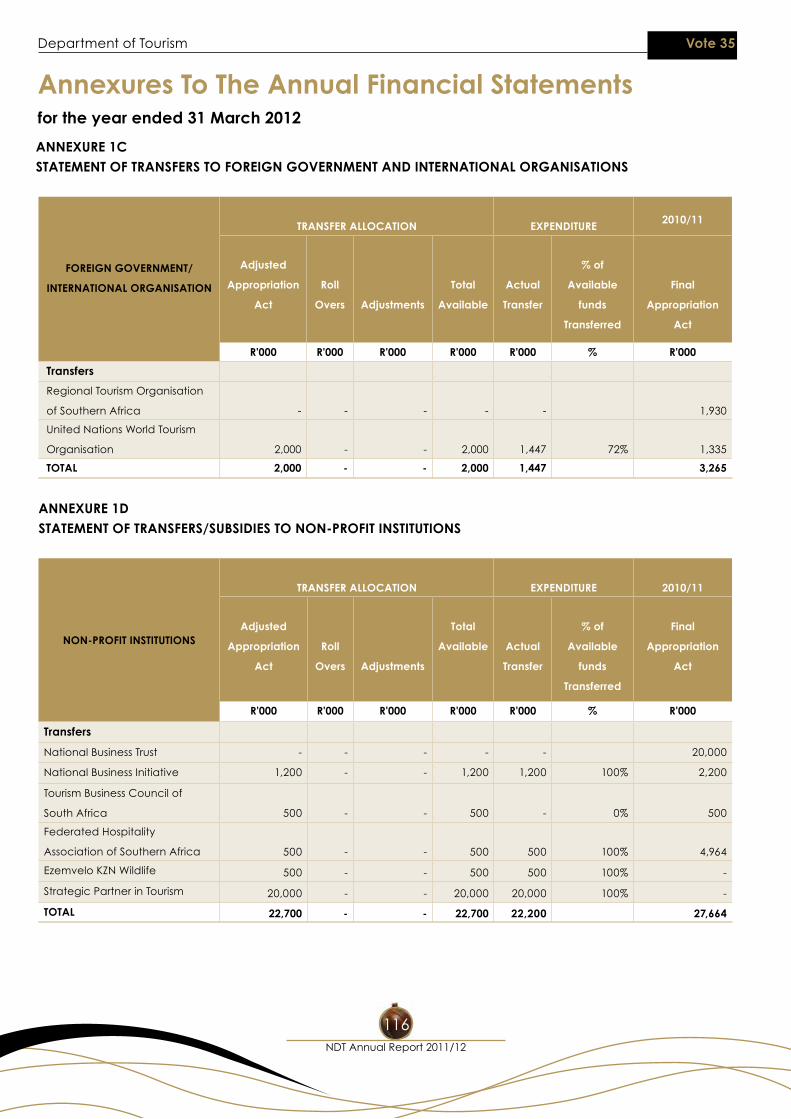
Annexures To The Annual Financial Statements
Department of Tourism Vote 35
for the year ended 31 March 2012
NDT Annual Report 2011/12
116
ANNEXURE 1CSTATEMENT OF TRANSFERS TO FOREIGN GOVERNMENT AND INTERNATIONAL ORGANISATIONS
FOREIGN GOVERNMENT/
INTERNATIONAL ORGANISATION
TRANSFER ALLOCATION EXPENDITURE2010/11
Adjusted
Appropriation
Act
Roll
Overs Adjustments
Total
Available
Actual
Transfer
% of
Available
funds
Transferred
Final
Appropriation
Act
R'000 R'000 R'000 R'000 R'000 % R'000
Transfers
Regional Tourism Organisation
of Southern Africa - - - - - 1,930
United Nations World Tourism
Organisation 2,000 - - 2,000 1,447 72% 1,335
TOTAL 2,000 - - 2,000 1,447 3,265
ANNEXURE 1DSTATEMENT OF TRANSFERS/SUBSIDIES TO NON-PROFIT INSTITUTIONS
NON-PROFIT INSTITUTIONS
TRANSFER ALLOCATION EXPENDITURE 2010/11
Adjusted
Appropriation
Act
Roll
Overs Adjustments
Total
Available Actual
Transfer
% of
Available
funds
Transferred
Final
Appropriation
Act
R'000 R'000 R'000 R'000 R'000 % R'000
Transfers
National Business Trust - - - - - 20,000
National Business Initiative 1,200 - - 1,200 1,200 100% 2,200
Tourism Business Council of
South Africa 500 - - 500 - 0% 500
Federated Hospitality
Association of Southern Africa 500 - - 500 500 100% 4,964
Ezemvelo KZN Wildlife 500 - - 500 500 100% -
Strategic Partner in Tourism 20,000 - - 20,000 20,000 100% -
TOTAL 22,700 - - 22,700 22,200 27,664
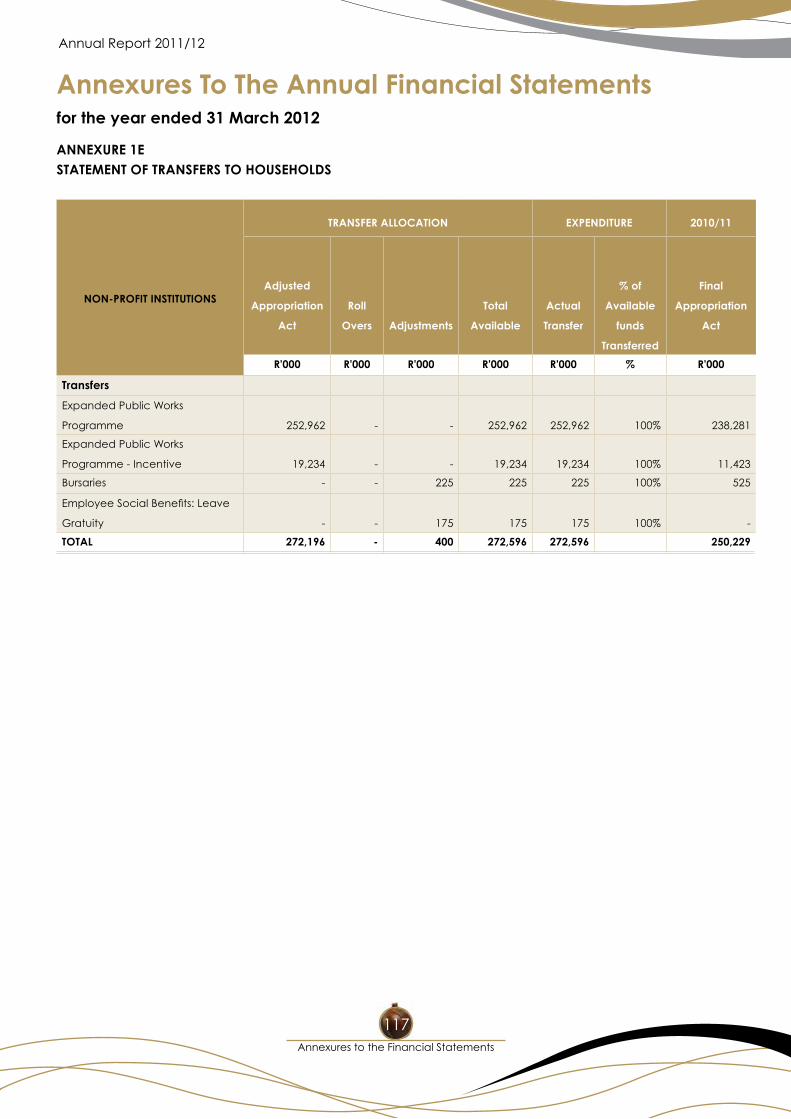
Annexures To The Annual Financial Statements
Annual Report 2011/12
for the year ended 31 March 2012
Annexures to the Financial Statements
117
ANNEXURE 1ESTATEMENT OF TRANSFERS TO HOUSEHOLDS
NON-PROFIT INSTITUTIONS
TRANSFER ALLOCATION EXPENDITURE 2010/11
Adjusted
Appropriation
Act
Roll
Overs Adjustments
Total
Available
Actual
Transfer
% of
Available
funds
Transferred
Final
Appropriation
Act
R'000 R'000 R'000 R'000 R'000 % R'000
Transfers
Expanded Public Works
Programme 252,962 - - 252,962 252,962 100% 238,281
Expanded Public Works
Programme - Incentive 19,234 - - 19,234 19,234 100% 11,423
Bursaries - - 225 225 225 100% 525
EmployeeSocialBenefits:Leave
Gratuity - - 175 175 175 100% -
TOTAL 272,196 - 400 272,596 272,596 250,229
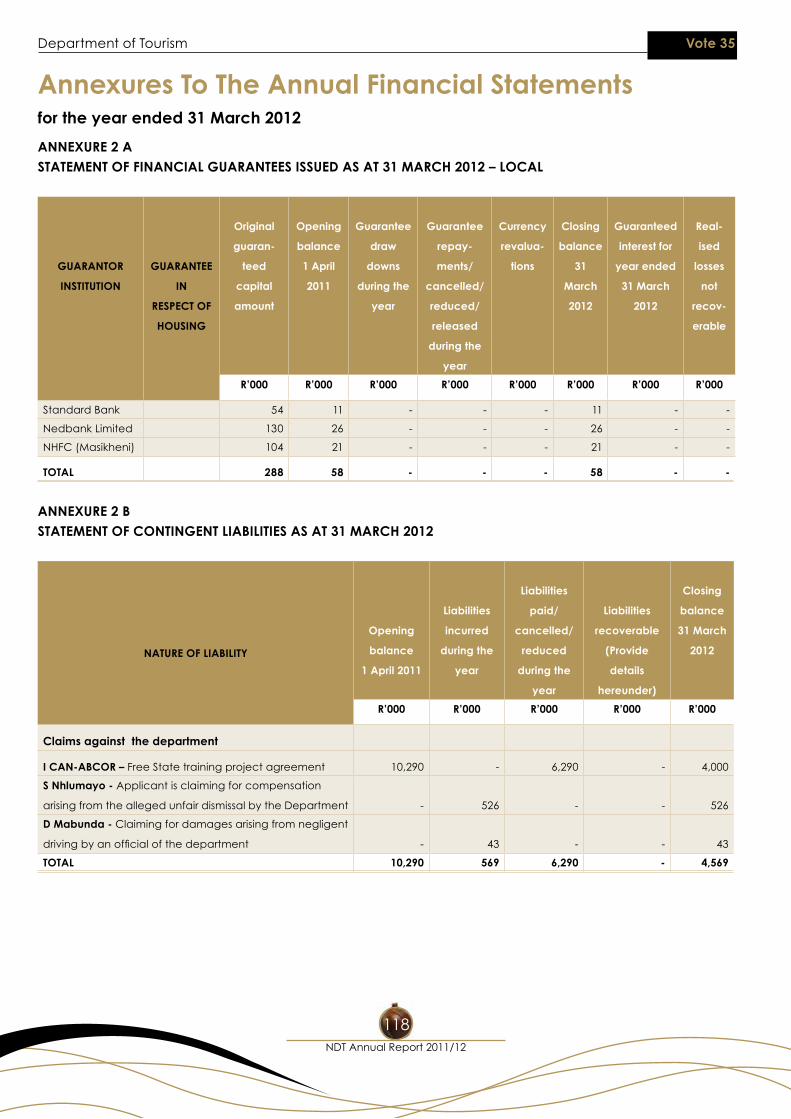
Annexures To The Annual Financial Statements
Department of Tourism Vote 35
for the year ended 31 March 2012
NDT Annual Report 2011/12
118
ANNEXURE 2 ASTATEMENT OF FINANCIAL GUARANTEES ISSUED AS AT 31 MARCH 2012 – LOCAL
GUARANTOR
INSTITUTION
GUARANTEE
IN
RESPECT OF
HOUSING
Original
guaran-
teed
capital
amount
Opening
balance
1 April
2011
Guarantee
draw
downs
during the
year
Guarantee
repay-
ments/
cancelled/
reduced/
released
during the
year
Currency
revalua-
tions
Closing
balance
31
March
2012
Guaranteed
interest for
year ended
31 March
2012
Real-
ised
losses
not
recov-
erable
R’000 R’000 R’000 R’000 R’000 R’000 R’000 R’000
Standard Bank 54 11 - - - 11 - -
Nedbank Limited 130 26 - - - 26 - -
NHFC (Masikheni) 104 21 - - - 21 - -
TOTAL 288 58 - - - 58 - -
ANNEXURE 2 B STATEMENT OF CONTINGENT LIABILITIES AS AT 31 MARCH 2012
NATURE OF LIABILITY
Opening
balance
1 April 2011
Liabilities
incurred
during the
year
Liabilities
paid/
cancelled/
reduced
during the
year
Liabilities
recoverable
(Provide
details
hereunder)
Closing
balance
31 March
2012
R’000 R’000 R’000 R’000 R’000
Claims against the department
I CAN-ABCOR – Free State training project agreement 10,290 - 6,290 - 4,000
S Nhlumayo - Applicant is claiming for compensation
arising from the alleged unfair dismissal by the Department - 526 - - 526
D Mabunda - Claiming for damages arising from negligent
drivingbyanofficialofthedepartment - 43 - - 43
TOTAL 10,290 569 6,290 - 4,569
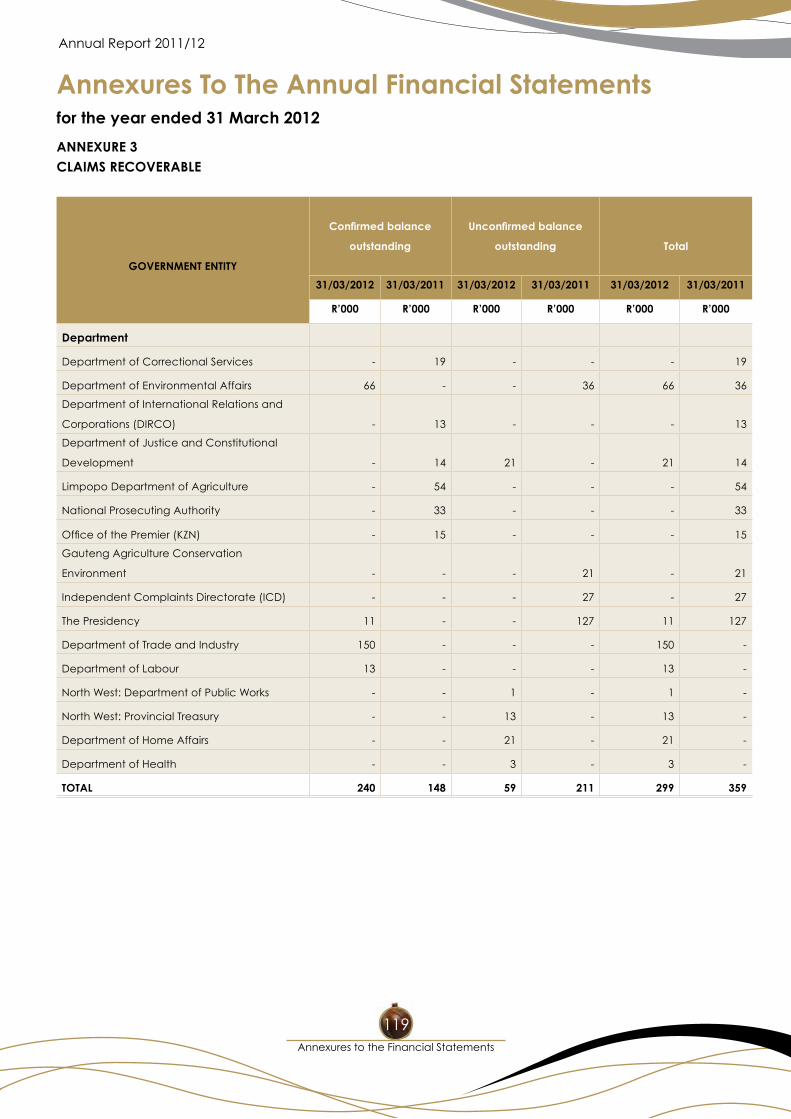
Annexures To The Annual Financial Statements
Annual Report 2011/12
for the year ended 31 March 2012
Annexures to the Financial Statements
119
ANNEXURE 3CLAIMS RECOVERABLE
GOVERNMENT ENTITY
Confirmed balance
outstanding
Unconfirmed balance
outstanding Total
31/03/2012 31/03/2011 31/03/2012 31/03/2011 31/03/2012 31/03/2011
R’000 R’000 R’000 R’000 R’000 R’000
Department
Department of Correctional Services - 19 - - - 19
Department of Environmental Affairs 66 - - 36 66 36
Department of International Relations and
Corporations (DIRCO) - 13 - - - 13
Department of Justice and Constitutional
Development - 14 21 - 21 14
Limpopo Department of Agriculture - 54 - - - 54
National Prosecuting Authority - 33 - - - 33
OfficeofthePremier(KZN) - 15 - - - 15
Gauteng Agriculture Conservation
Environment - - - 21 - 21
Independent Complaints Directorate (ICD) - - - 27 - 27
The Presidency 11 - - 127 11 127
Department of Trade and Industry 150 - - - 150 -
Department of Labour 13 - - - 13 -
North West: Department of Public Works - - 1 - 1 -
North West: Provincial Treasury - - 13 - 13 -
Department of Home Affairs - - 21 - 21 -
Department of Health - - 3 - 3 -
TOTAL 240 148 59 211 299 359
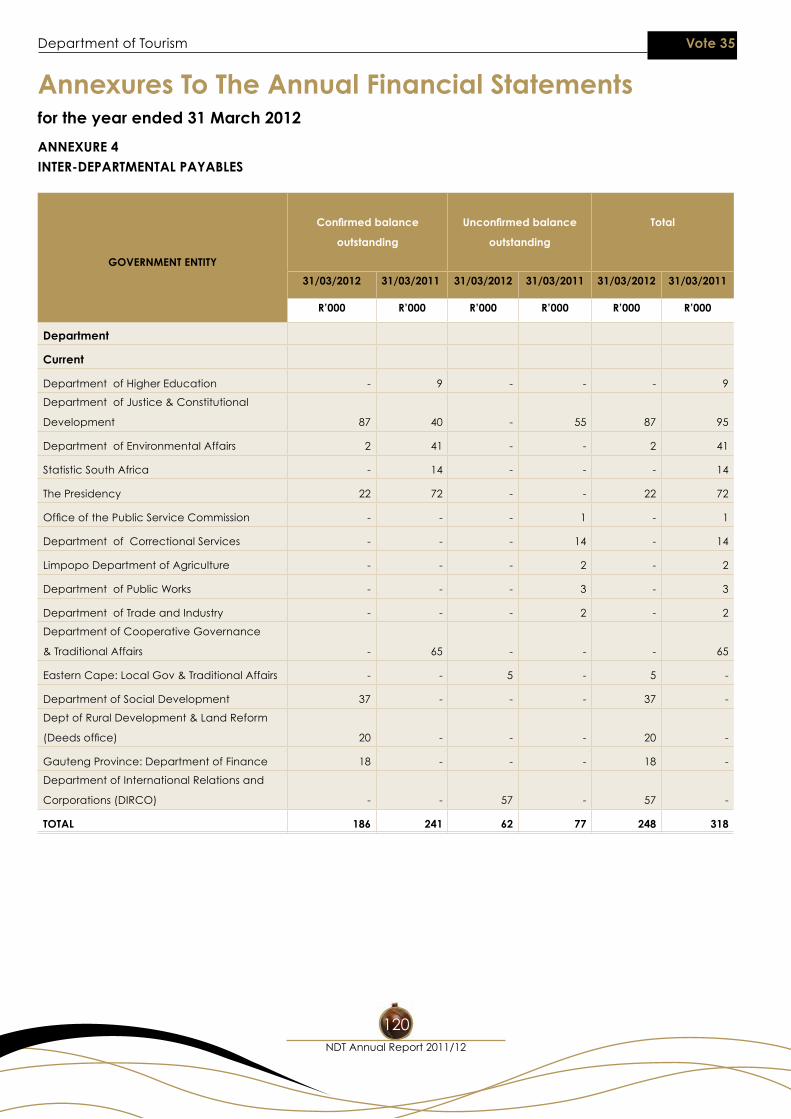
Annexures To The Annual Financial Statements
Department of Tourism Vote 35
for the year ended 31 March 2012
NDT Annual Report 2011/12
120
ANNEXURE 4INTER-DEPARTMENTAL PAYABLES
GOVERNMENT ENTITY
Confirmed balance
outstanding
Unconfirmed balance
outstanding
Total
31/03/2012 31/03/2011 31/03/2012 31/03/2011 31/03/2012 31/03/2011
R’000 R’000 R’000 R’000 R’000 R’000
Department
Current
Department of Higher Education - 9 - - - 9
Department of Justice & Constitutional
Development 87 40 - 55 87 95
Department of Environmental Affairs 2 41 - - 2 41
Statistic South Africa - 14 - - - 14
The Presidency 22 72 - - 22 72
OfficeofthePublicServiceCommission - - - 1 - 1
Department of Correctional Services - - - 14 - 14
Limpopo Department of Agriculture - - - 2 - 2
Department of Public Works - - - 3 - 3
Department of Trade and Industry - - - 2 - 2
Department of Cooperative Governance
& Traditional Affairs - 65 - - - 65
Eastern Cape: Local Gov & Traditional Affairs - - 5 - 5 -
Department of Social Development 37 - - - 37 -
Dept of Rural Development & Land Reform
(Deedsoffice) 20 - - - 20 -
Gauteng Province: Department of Finance 18 - - - 18 -
Department of International Relations and
Corporations (DIRCO) - - 57 - 57 -
TOTAL 186 241 62 77 248 318
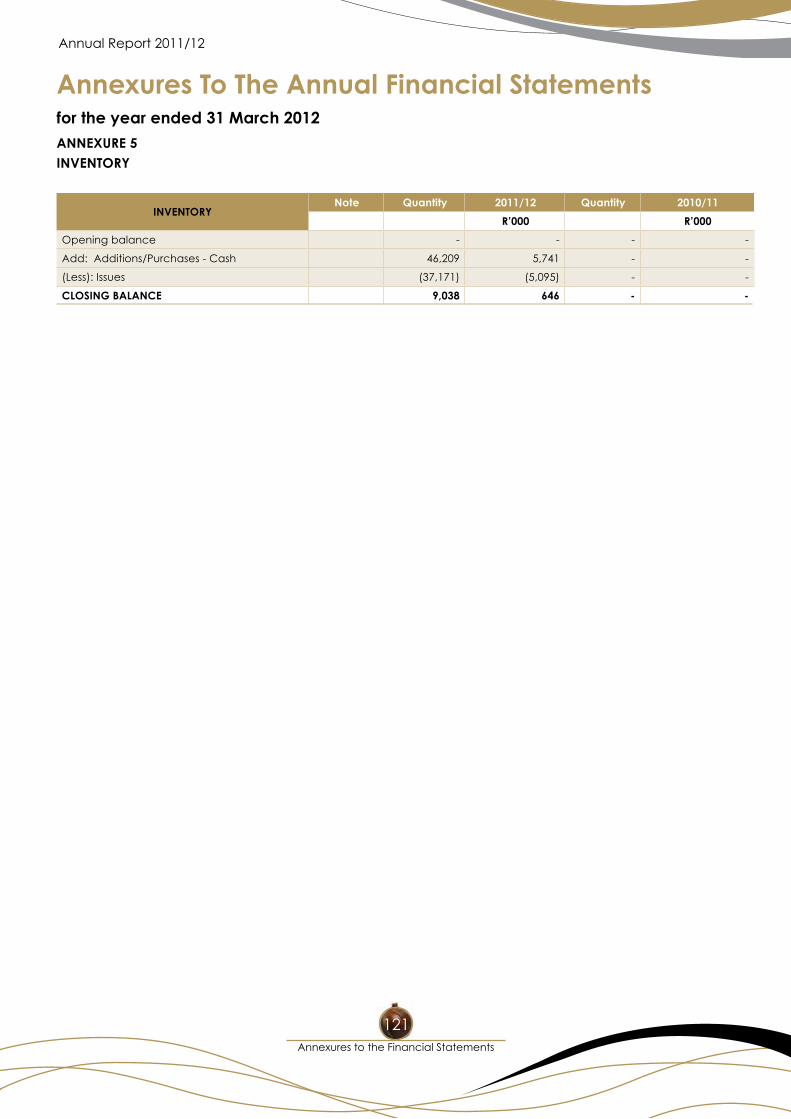
Annexures To The Annual Financial Statements
Annual Report 2011/12
for the year ended 31 March 2012
Annexures to the Financial Statements
121
ANNEXURE 5INVENTORY
INVENTORYNote Quantity 2011/12 Quantity 2010/11
R’000 R’000
Opening balance - - - -
Add: Additions/Purchases - Cash 46,209 5,741 - -
(Less): Issues (37,171) (5,095) - -
CLOSING BALANCE 9,038 646 - -
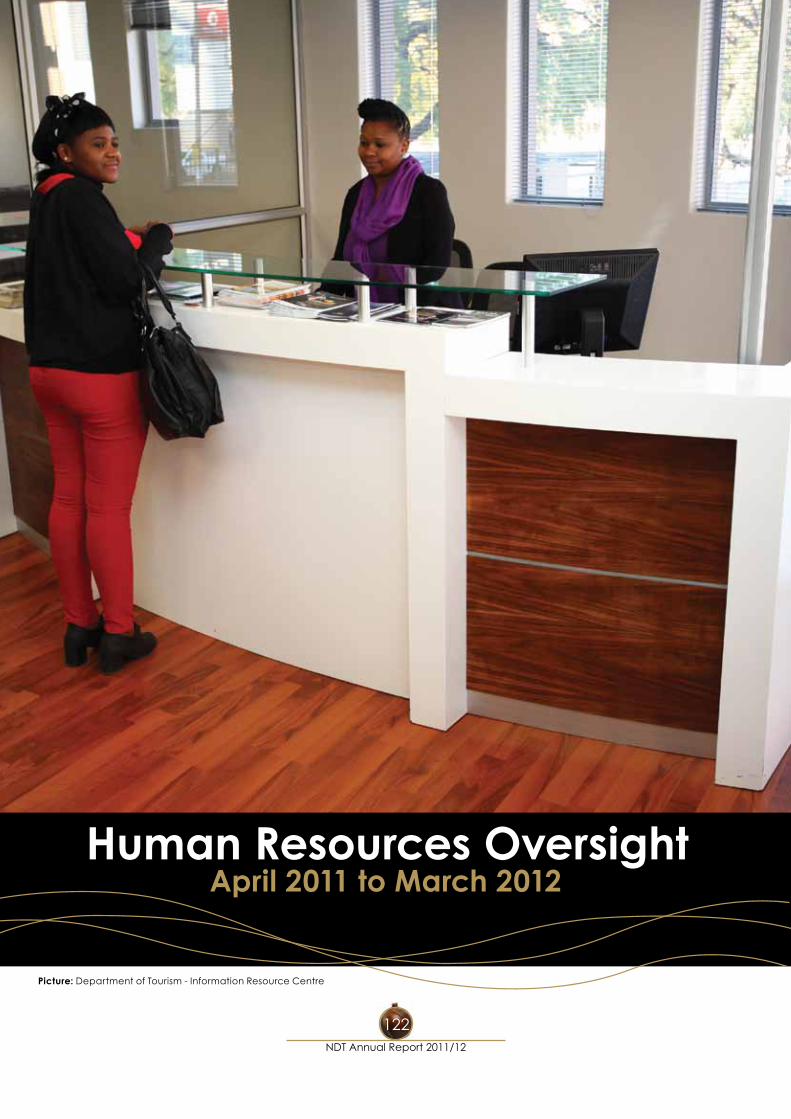
Annexures To The Annual Financial Statements
Department of Tourism Vote 35
for the year ended 31 March 2012
NDT Annual Report 2011/12
122
Human Resources OversightApril 2011 to March 2012
Picture: Department of Tourism - Information Resource Centre
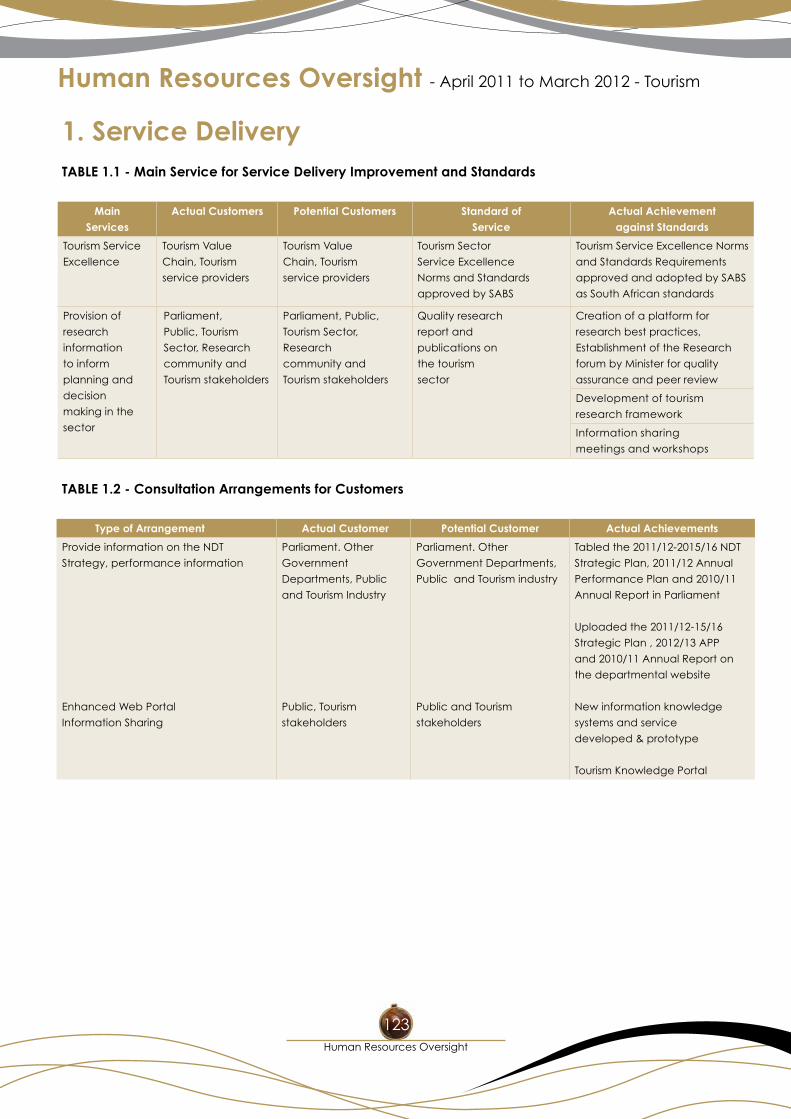
123
Human Resources Oversight - April 2011 to March 2012 - Tourism
1. Service DeliveryTABLE 1.1 - Main Service for Service Delivery Improvement and Standards
Main Services
Actual Customers Potential Customers Standard of Service
Actual Achievement against Standards
Tourism Service
Excellence
Tourism Value
Chain, Tourism
service providers
Tourism Value
Chain, Tourism
service providers
Tourism Sector
Service Excellence
Norms and Standards
approved by SABS
Tourism Service Excellence Norms
and Standards Requirements
approved and adopted by SABS
as South African standards
Provision of
research
information
to inform
planning and
decision
making in the
sector
Parliament,
Public, Tourism
Sector, Research
community and
Tourism stakeholders
Parliament, Public,
Tourism Sector,
Research
community and
Tourism stakeholders
Quality research
report and
publications on
the tourism
sector
Creation of a platform for
research best practices,
Establishment of the Research
forum by Minister for quality
assurance and peer review
Development of tourism
research framework
Information sharing
meetings and workshops
TABLE 1.2 - Consultation Arrangements for Customers
Type of Arrangement Actual Customer Potential Customer Actual Achievements
Provide information on the NDT
Strategy, performance information
Enhanced Web Portal
Information Sharing
Parliament. Other
Government
Departments, Public
and Tourism Industry
Public, Tourism
stakeholders
Parliament. Other
Government Departments,
Public and Tourism industry
Public and Tourism
stakeholders
Tabled the 2011/12-2015/16 NDT
Strategic Plan, 2011/12 Annual
Performance Plan and 2010/11
Annual Report in Parliament
Uploaded the 2011/12-15/16
Strategic Plan , 2012/13 APP
and 2010/11 Annual Report on
the departmental website
New information knowledge
systems and service
developed & prototype
Tourism Knowledge Portal
Human Resources Oversight
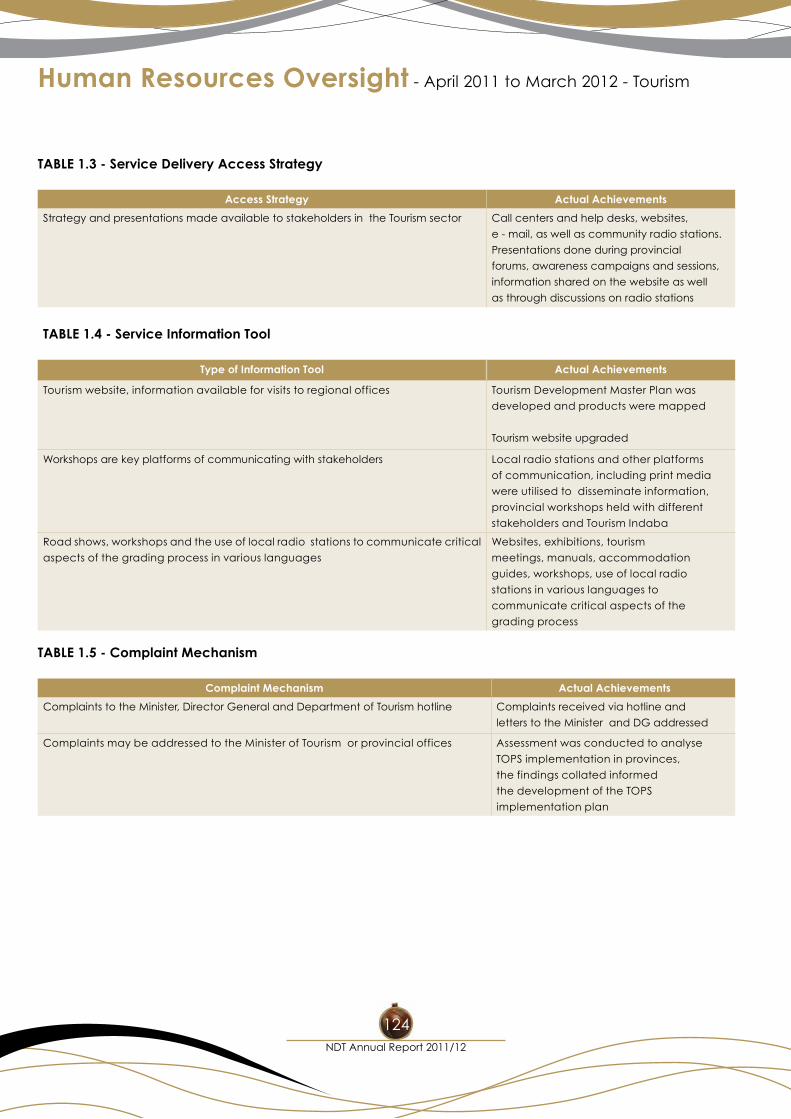
Human Resources Oversight - April 2011 to March 2012 - Tourism
NDT Annual Report 2011/12
124
TABLE 1.3 - Service Delivery Access Strategy
Access Strategy Actual Achievements
Strategy and presentations made available to stakeholders in the Tourism sector Call centers and help desks, websites,
e - mail, as well as community radio stations.
Presentations done during provincial
forums, awareness campaigns and sessions,
information shared on the website as well
as through discussions on radio stations
TABLE 1.4 - Service Information Tool
Type of Information Tool Actual Achievements
Tourism website, information available for visits to regional offices Tourism Development Master Plan was
developed and products were mapped
Tourism website upgraded
Workshops are key platforms of communicating with stakeholders Local radio stations and other platforms
of communication, including print media
were utilised to disseminate information,
provincial workshops held with different
stakeholders and Tourism Indaba
Road shows, workshops and the use of local radio stations to communicate critical
aspects of the grading process in various languages
Websites, exhibitions, tourism
meetings, manuals, accommodation
guides, workshops, use of local radio
stations in various languages to
communicate critical aspects of the
grading process
TABLE 1.5 - Complaint Mechanism
Complaint Mechanism Actual Achievements
Complaints to the Minister, Director General and Department of Tourism hotline Complaints received via hotline and
letters to the Minister and DG addressed
Complaints may be addressed to the Minister of Tourism or provincial offices Assessment was conducted to analyse
TOPS implementation in provinces,
the findings collated informed
the development of the TOPS
implementation plan
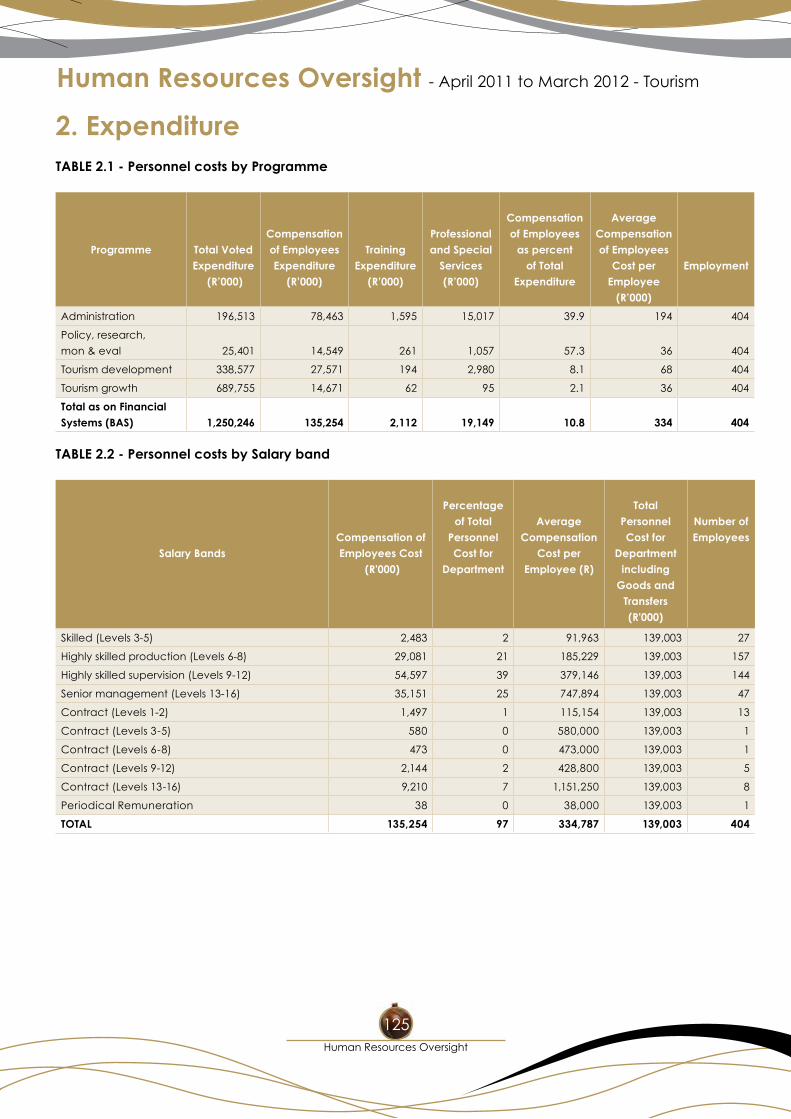
Human Resources Oversight - April 2011 to March 2012 - Tourism
Human Resources Oversight
125
2. ExpenditureTABLE 2.1 - Personnel costs by Programme
Programme Total Voted Expenditure
(R’000)
Compensation of Employees Expenditure
(R’000)
Training Expenditure
(R’000)
Professional and Special
Services (R’000)
Compensation of Employees
as percent of Total
Expenditure
Average Compensation of Employees
Cost per Employee
(R’000)
Employment
Administration 196,513 78,463 1,595 15,017 39.9 194 404
Policy, research,
mon & eval 25,401 14,549 261 1,057 57.3 36 404
Tourism development 338,577 27,571 194 2,980 8.1 68 404
Tourism growth 689,755 14,671 62 95 2.1 36 404
Total as on Financial Systems (BAS) 1,250,246 135,254 2,112 19,149 10.8 334 404
TABLE 2.2 - Personnel costs by Salary band
Salary BandsCompensation of Employees Cost
(R'000)
Percentage of Total
Personnel Cost for
Department
Average Compensation
Cost per Employee (R)
Total Personnel Cost for
Department including
Goods and Transfers (R'000)
Number of Employees
Skilled (Levels 3-5) 2,483 2 91,963 139,003 27
Highly skilled production (Levels 6-8) 29,081 21 185,229 139,003 157
Highly skilled supervision (Levels 9-12) 54,597 39 379,146 139,003 144
Senior management (Levels 13-16) 35,151 25 747,894 139,003 47
Contract (Levels 1-2) 1,497 1 115,154 139,003 13
Contract (Levels 3-5) 580 0 580,000 139,003 1
Contract (Levels 6-8) 473 0 473,000 139,003 1
Contract (Levels 9-12) 2,144 2 428,800 139,003 5
Contract (Levels 13-16) 9,210 7 1,151,250 139,003 8
Periodical Remuneration 38 0 38,000 139,003 1
TOTAL 135,254 97 334,787 139,003 404
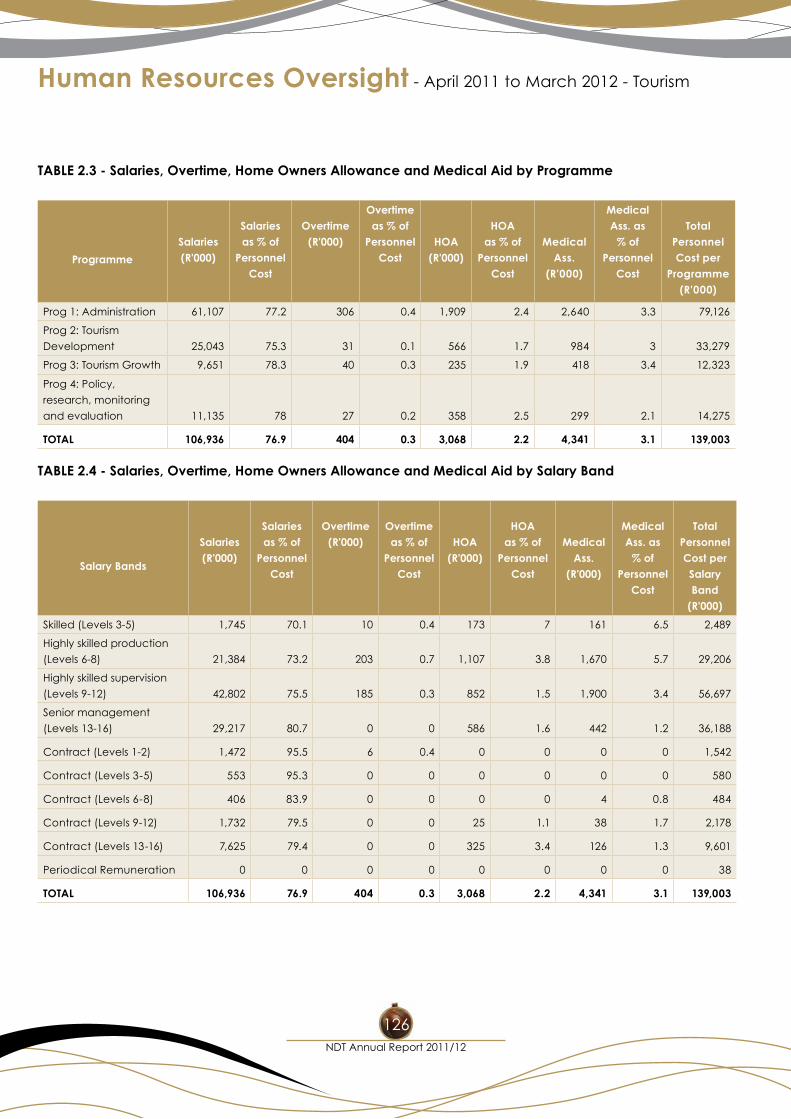
Human Resources Oversight - April 2011 to March 2012 - Tourism
NDT Annual Report 2011/12
126
TABLE 2.3 - Salaries, Overtime, Home Owners Allowance and Medical Aid by Programme
Programme
Salaries (R'000)
Salaries as % of
Personnel Cost
Overtime (R'000)
Overtime as % of
Personnel Cost
HOA (R'000)
HOA as % of
Personnel Cost
Medical Ass.
(R'000)
Medical Ass. as
% of Personnel
Cost
Total Personnel Cost per
Programme (R'000)
Prog 1: Administration 61,107 77.2 306 0.4 1,909 2.4 2,640 3.3 79,126
Prog 2: Tourism
Development 25,043 75.3 31 0.1 566 1.7 984 3 33,279
Prog 3: Tourism Growth 9,651 78.3 40 0.3 235 1.9 418 3.4 12,323
Prog 4: Policy,
research, monitoring
and evaluation 11,135 78 27 0.2 358 2.5 299 2.1 14,275
TOTAL 106,936 76.9 404 0.3 3,068 2.2 4,341 3.1 139,003
TABLE 2.4 - Salaries, Overtime, Home Owners Allowance and Medical Aid by Salary Band
Salary Bands
Salaries (R'000)
Salaries as % of
Personnel Cost
Overtime (R'000)
Overtime as % of
Personnel Cost
HOA (R'000)
HOA as % of
Personnel Cost
Medical Ass.
(R'000)
Medical Ass. as
% of Personnel
Cost
Total Personnel Cost per Salary Band
(R'000)
Skilled (Levels 3-5) 1,745 70.1 10 0.4 173 7 161 6.5 2,489
Highly skilled production
(Levels 6-8) 21,384 73.2 203 0.7 1,107 3.8 1,670 5.7 29,206
Highly skilled supervision
(Levels 9-12) 42,802 75.5 185 0.3 852 1.5 1,900 3.4 56,697
Senior management
(Levels 13-16) 29,217 80.7 0 0 586 1.6 442 1.2 36,188
Contract (Levels 1-2) 1,472 95.5 6 0.4 0 0 0 0 1,542
Contract (Levels 3-5) 553 95.3 0 0 0 0 0 0 580
Contract (Levels 6-8) 406 83.9 0 0 0 0 4 0.8 484
Contract (Levels 9-12) 1,732 79.5 0 0 25 1.1 38 1.7 2,178
Contract (Levels 13-16) 7,625 79.4 0 0 325 3.4 126 1.3 9,601
Periodical Remuneration 0 0 0 0 0 0 0 0 38
TOTAL 106,936 76.9 404 0.3 3,068 2.2 4,341 3.1 139,003
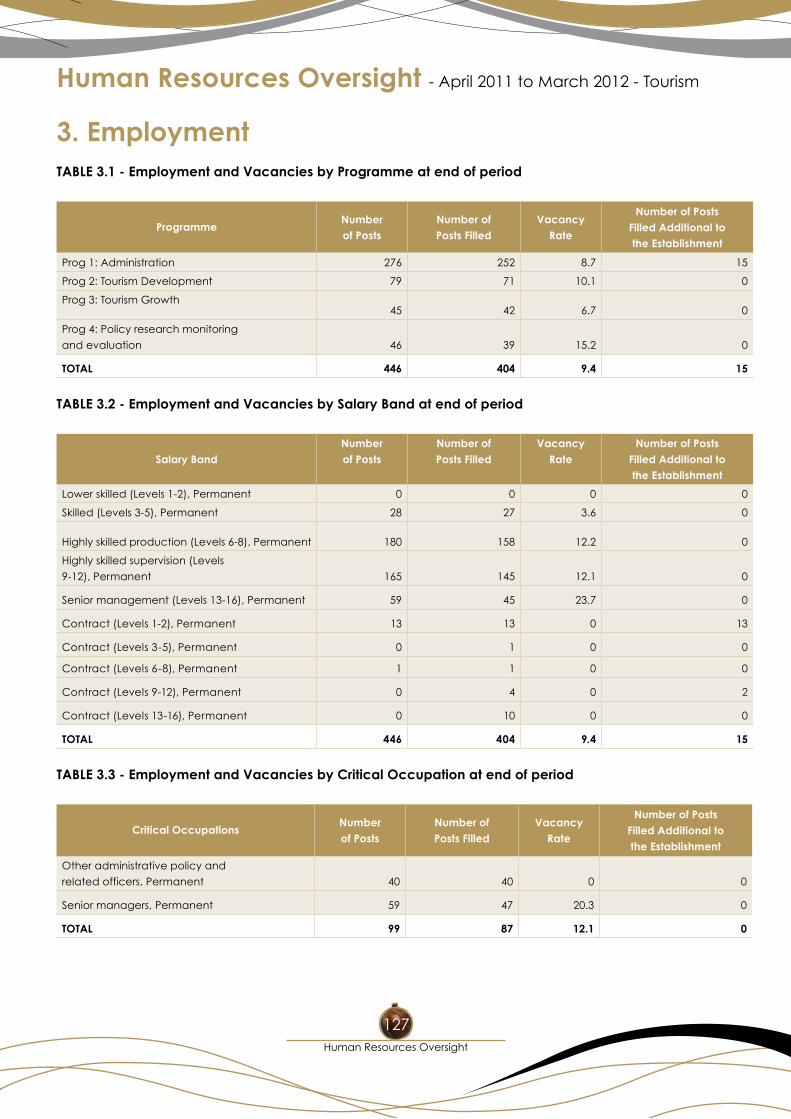
Human Resources Oversight - April 2011 to March 2012 - Tourism
Human Resources Oversight
127
3. EmploymentTABLE 3.1 - Employment and Vacancies by Programme at end of period
ProgrammeNumber of Posts
Number of Posts Filled
Vacancy Rate
Number of Posts Filled Additional to the Establishment
Prog 1: Administration 276 252 8.7 15
Prog 2: Tourism Development 79 71 10.1 0
Prog 3: Tourism Growth 45 42 6.7 0
Prog 4: Policy research monitoring
and evaluation 46 39 15.2 0
TOTAL 446 404 9.4 15
TABLE 3.2 - Employment and Vacancies by Salary Band at end of period
Salary BandNumber of Posts
Number of Posts Filled
Vacancy Rate
Number of Posts Filled Additional to the Establishment
Lower skilled (Levels 1-2), Permanent 0 0 0 0
Skilled (Levels 3-5), Permanent 28 27 3.6 0
Highly skilled production (Levels 6-8), Permanent 180 158 12.2 0
Highly skilled supervision (Levels
9-12), Permanent 165 145 12.1 0
Senior management (Levels 13-16), Permanent 59 45 23.7 0
Contract (Levels 1-2), Permanent 13 13 0 13
Contract (Levels 3-5), Permanent 0 1 0 0
Contract (Levels 6-8), Permanent 1 1 0 0
Contract (Levels 9-12), Permanent 0 4 0 2
Contract (Levels 13-16), Permanent 0 10 0 0
TOTAL 446 404 9.4 15
TABLE 3.3 - Employment and Vacancies by Critical Occupation at end of period
Critical OccupationsNumber of Posts
Number of Posts Filled
Vacancy Rate
Number of Posts Filled Additional to the Establishment
Other administrative policy and
related officers, Permanent 40 40 0 0
Senior managers, Permanent 59 47 20.3 0
TOTAL 99 87 12.1 0
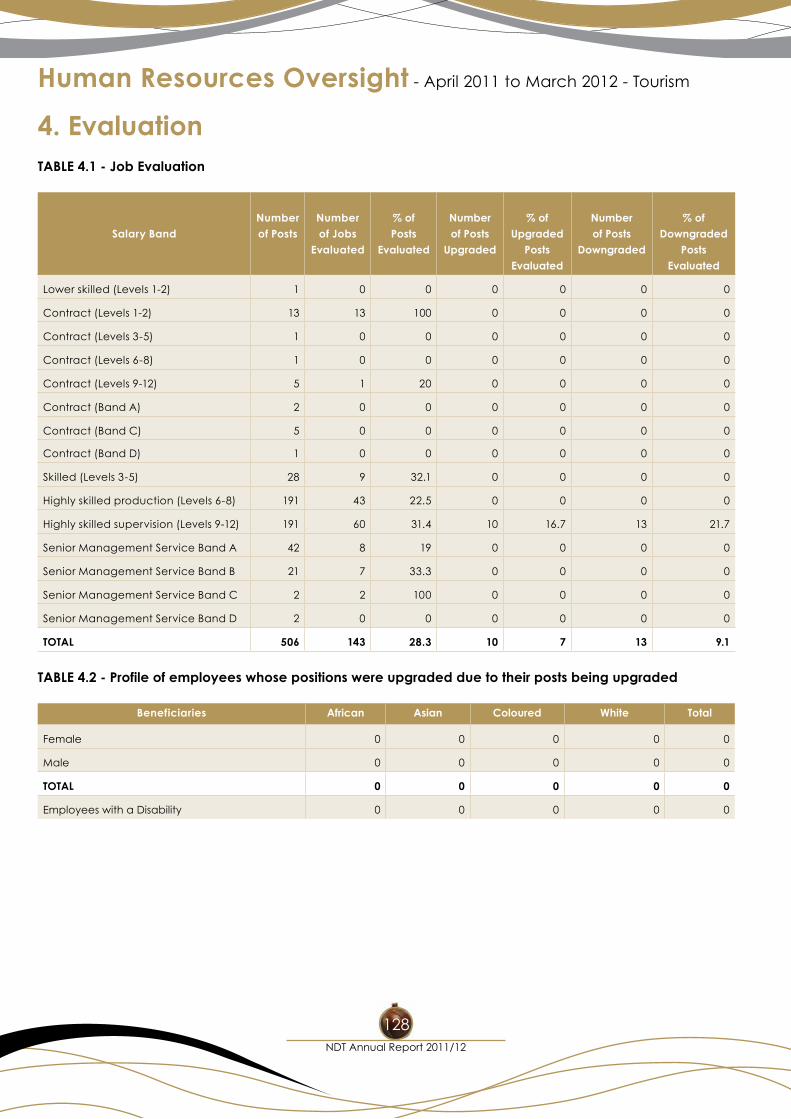
Human Resources Oversight - April 2011 to March 2012 - Tourism
NDT Annual Report 2011/12
128
4. EvaluationTABLE 4.1 - Job Evaluation
Salary BandNumber of Posts
Number of Jobs
Evaluated
% of Posts
Evaluated
Number of Posts
Upgraded
% of Upgraded
Posts Evaluated
Number of Posts
Downgraded
% of Downgraded
Posts Evaluated
Lower skilled (Levels 1-2) 1 0 0 0 0 0 0
Contract (Levels 1-2) 13 13 100 0 0 0 0
Contract (Levels 3-5) 1 0 0 0 0 0 0
Contract (Levels 6-8) 1 0 0 0 0 0 0
Contract (Levels 9-12) 5 1 20 0 0 0 0
Contract (Band A) 2 0 0 0 0 0 0
Contract (Band C) 5 0 0 0 0 0 0
Contract (Band D) 1 0 0 0 0 0 0
Skilled (Levels 3-5) 28 9 32.1 0 0 0 0
Highly skilled production (Levels 6-8) 191 43 22.5 0 0 0 0
Highly skilled supervision (Levels 9-12) 191 60 31.4 10 16.7 13 21.7
Senior Management Service Band A 42 8 19 0 0 0 0
Senior Management Service Band B 21 7 33.3 0 0 0 0
Senior Management Service Band C 2 2 100 0 0 0 0
Senior Management Service Band D 2 0 0 0 0 0 0
TOTAL 506 143 28.3 10 7 13 9.1
TABLE 4.2 - Profile of employees whose positions were upgraded due to their posts being upgraded
Beneficiaries African Asian Coloured White Total
Female 0 0 0 0 0
Male 0 0 0 0 0
TOTAL 0 0 0 0 0
Employees with a Disability 0 0 0 0 0
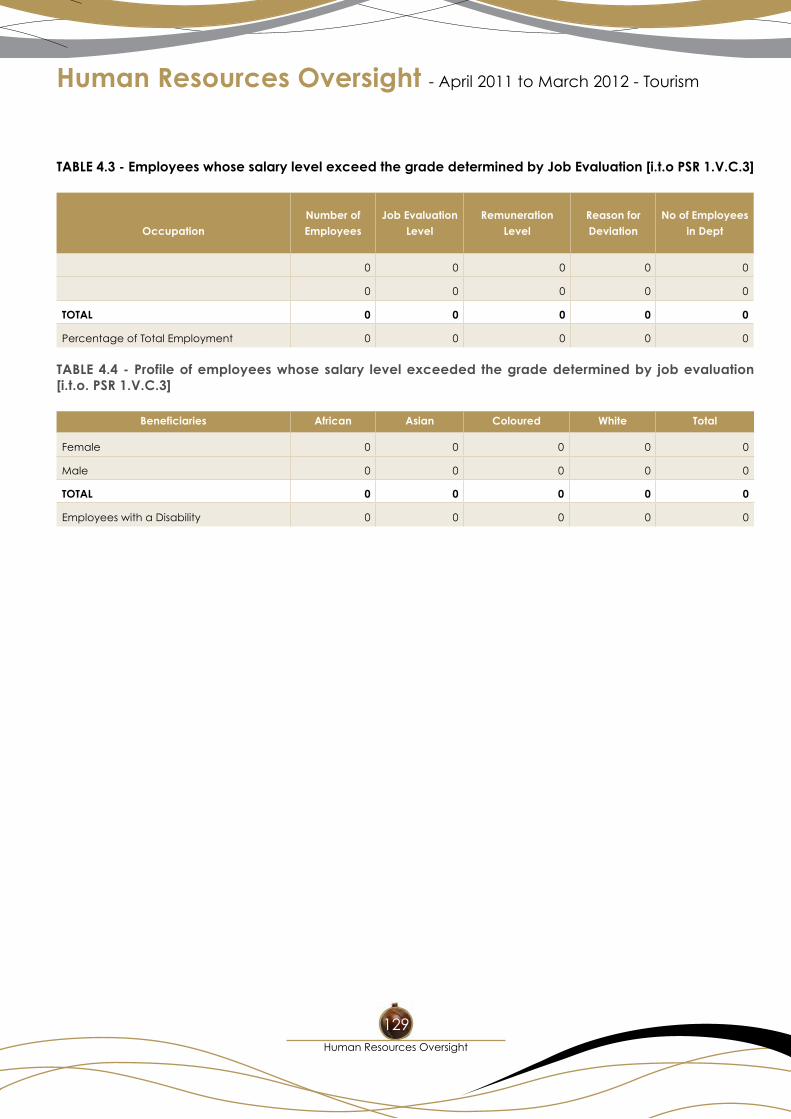
Human Resources Oversight - April 2011 to March 2012 - Tourism
Human Resources Oversight
129
TABLE 4.3 - Employees whose salary level exceed the grade determined by Job Evaluation [i.t.o PSR 1.V.C.3]
OccupationNumber of Employees
Job Evaluation Level
Remuneration Level
Reason for Deviation
No of Employees in Dept
0 0 0 0 0
0 0 0 0 0
TOTAL 0 0 0 0 0
Percentage of Total Employment 0 0 0 0 0
TABLE 4.4 - Profile of employees whose salary level exceeded the grade determined by job evaluation [i.t.o. PSR 1.V.C.3]
Beneficiaries African Asian Coloured White Total
Female 0 0 0 0 0
Male 0 0 0 0 0
TOTAL 0 0 0 0 0
Employees with a Disability 0 0 0 0 0
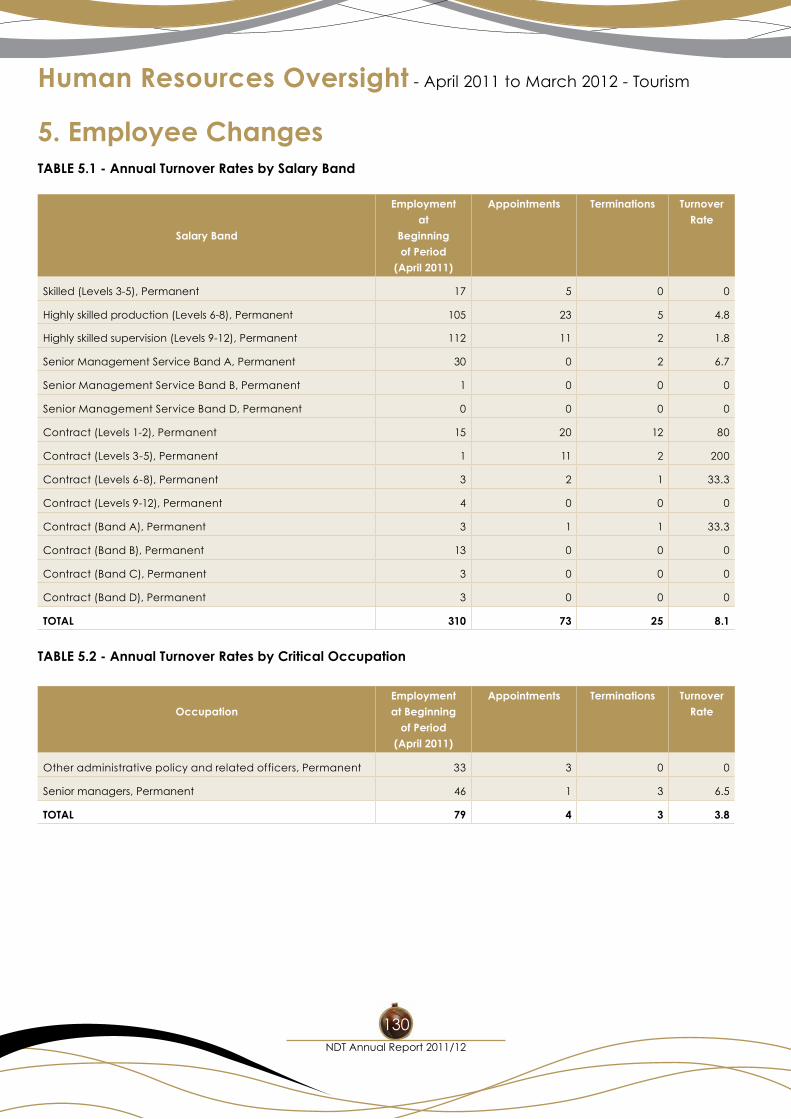
Human Resources Oversight - April 2011 to March 2012 - Tourism
NDT Annual Report 2011/12
130
5. Employee ChangesTABLE 5.1 - Annual Turnover Rates by Salary Band
Salary Band
Employment at
Beginning of Period
(April 2011)
Appointments Terminations Turnover Rate
Skilled (Levels 3-5), Permanent 17 5 0 0
Highly skilled production (Levels 6-8), Permanent 105 23 5 4.8
Highly skilled supervision (Levels 9-12), Permanent 112 11 2 1.8
Senior Management Service Band A, Permanent 30 0 2 6.7
Senior Management Service Band B, Permanent 1 0 0 0
Senior Management Service Band D, Permanent 0 0 0 0
Contract (Levels 1-2), Permanent 15 20 12 80
Contract (Levels 3-5), Permanent 1 11 2 200
Contract (Levels 6-8), Permanent 3 2 1 33.3
Contract (Levels 9-12), Permanent 4 0 0 0
Contract (Band A), Permanent 3 1 1 33.3
Contract (Band B), Permanent 13 0 0 0
Contract (Band C), Permanent 3 0 0 0
Contract (Band D), Permanent 3 0 0 0
TOTAL 310 73 25 8.1
TABLE 5.2 - Annual Turnover Rates by Critical Occupation
OccupationEmployment at Beginning
of Period (April 2011)
Appointments Terminations Turnover Rate
Other administrative policy and related officers, Permanent 33 3 0 0
Senior managers, Permanent 46 1 3 6.5
TOTAL 79 4 3 3.8
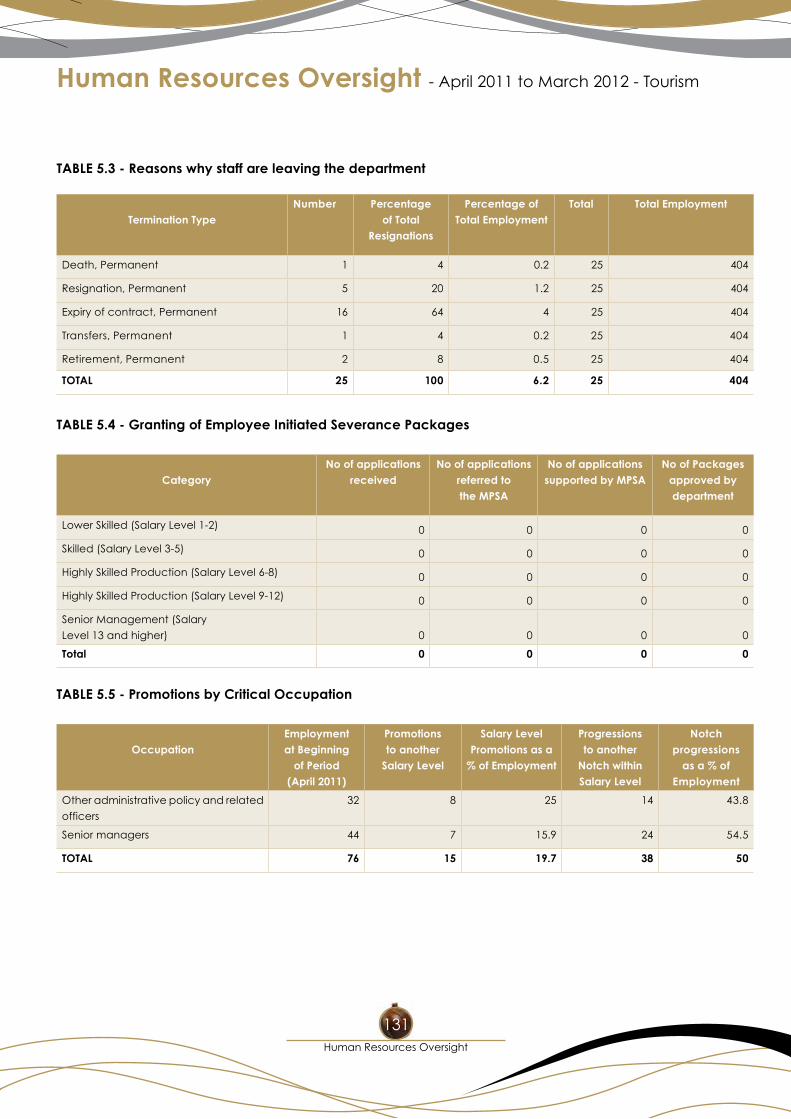
Human Resources Oversight - April 2011 to March 2012 - Tourism
Human Resources Oversight
131
TABLE 5.3 - Reasons why staff are leaving the department
Termination TypeNumber Percentage
of Total Resignations
Percentage of Total Employment
Total Total Employment
Death, Permanent 1 4 0.2 25 404
Resignation, Permanent 5 20 1.2 25 404
Expiry of contract, Permanent 16 64 4 25 404
Transfers, Permanent 1 4 0.2 25 404
Retirement, Permanent 2 8 0.5 25 404
TOTAL 25 100 6.2 25 404
TABLE 5.4 - Granting of Employee Initiated Severance Packages
CategoryNo of applications
receivedNo of applications
referred to the MPSA
No of applications supported by MPSA
No of Packages approved by department
Lower Skilled (Salary Level 1-2) 0 0 0 0
Skilled (Salary Level 3-5) 0 0 0 0
Highly Skilled Production (Salary Level 6-8) 0 0 0 0
Highly Skilled Production (Salary Level 9-12) 0 0 0 0
Senior Management (Salary
Level 13 and higher) 0 0 0 0
Total 0 0 0 0
TABLE 5.5 - Promotions by Critical Occupation
OccupationEmployment at Beginning
of Period (April 2011)
Promotions to another
Salary Level
Salary Level Promotions as a
% of Employment
Progressions to another
Notch within Salary Level
Notch progressions
as a % of Employment
Other administrative policy and related
officers
32 8 25 14 43.8
Senior managers 44 7 15.9 24 54.5
TOTAL 76 15 19.7 38 50
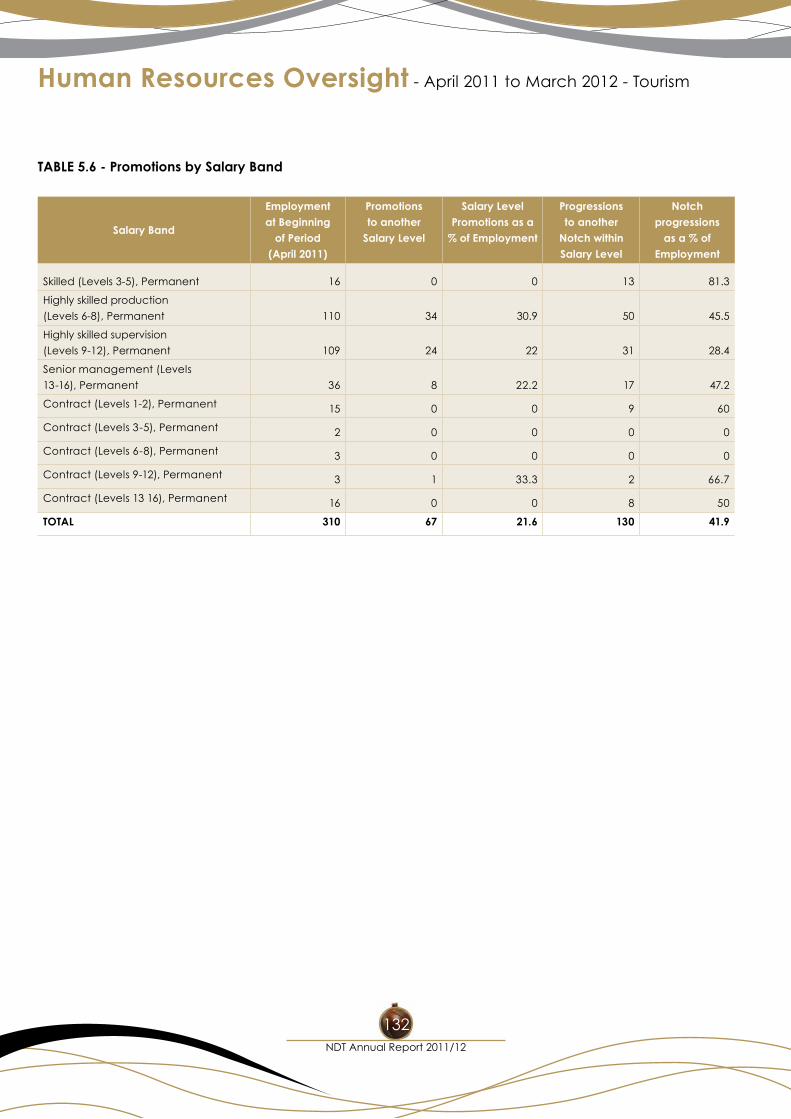
Human Resources Oversight - April 2011 to March 2012 - Tourism
NDT Annual Report 2011/12
132
TABLE 5.6 - Promotions by Salary Band
Salary Band
Employment at Beginning
of Period (April 2011)
Promotions to another
Salary Level
Salary Level Promotions as a
% of Employment
Progressions to another
Notch within Salary Level
Notch progressions
as a % of Employment
Skilled (Levels 3-5), Permanent 16 0 0 13 81.3
Highly skilled production
(Levels 6-8), Permanent 110 34 30.9 50 45.5
Highly skilled supervision
(Levels 9-12), Permanent 109 24 22 31 28.4
Senior management (Levels
13-16), Permanent 36 8 22.2 17 47.2
Contract (Levels 1-2), Permanent 15 0 0 9 60
Contract (Levels 3-5), Permanent 2 0 0 0 0
Contract (Levels 6-8), Permanent 3 0 0 0 0
Contract (Levels 9-12), Permanent 3 1 33.3 2 66.7
Contract (Levels 13 16), Permanent 16 0 0 8 50
TOTAL 310 67 21.6 130 41.9
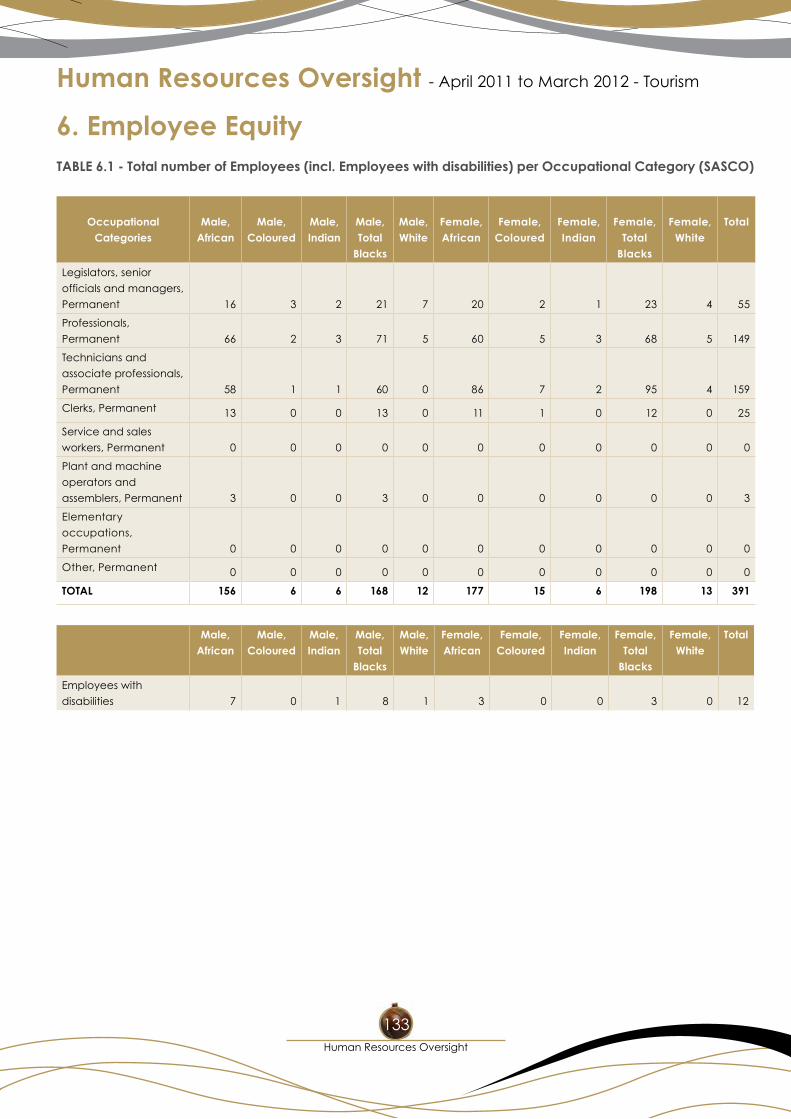
Human Resources Oversight - April 2011 to March 2012 - Tourism
Human Resources Oversight
133
6. Employee EquityTABLE 6.1 - Total number of Employees (incl. Employees with disabilities) per Occupational Category (SASCO)
Occupational Categories
Male, African
Male, Coloured
Male, Indian
Male, Total
Blacks
Male, White
Female, African
Female, Coloured
Female, Indian
Female, Total
Blacks
Female, White
Total
Legislators, senior
officials and managers,
Permanent 16 3 2 21 7 20 2 1 23 4 55
Professionals,
Permanent 66 2 3 71 5 60 5 3 68 5 149
Technicians and
associate professionals,
Permanent 58 1 1 60 0 86 7 2 95 4 159
Clerks, Permanent 13 0 0 13 0 11 1 0 12 0 25
Service and sales
workers, Permanent 0 0 0 0 0 0 0 0 0 0 0
Plant and machine
operators and
assemblers, Permanent 3 0 0 3 0 0 0 0 0 0 3
Elementary
occupations,
Permanent 0 0 0 0 0 0 0 0 0 0 0
Other, Permanent 0 0 0 0 0 0 0 0 0 0 0
TOTAL 156 6 6 168 12 177 15 6 198 13 391
Male,
AfricanMale,
ColouredMale, Indian
Male, Total
Blacks
Male, White
Female, African
Female, Coloured
Female, Indian
Female, Total
Blacks
Female, White
Total
Employees with
disabilities 7 0 1 8 1 3 0 0 3 0 12
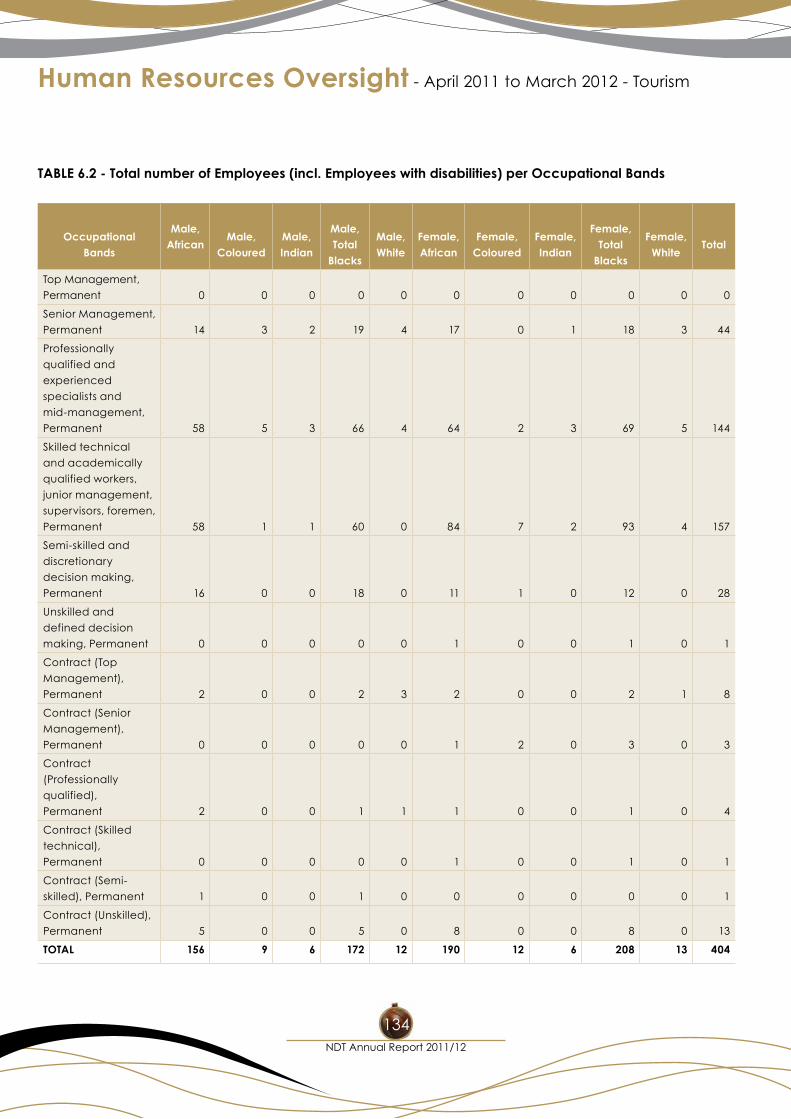
Human Resources Oversight - April 2011 to March 2012 - Tourism
NDT Annual Report 2011/12
134
TABLE 6.2 - Total number of Employees (incl. Employees with disabilities) per Occupational Bands
Occupational Bands
Male, African
Male, Coloured
Male, Indian
Male, Total
Blacks
Male, White
Female, African
Female, Coloured
Female, Indian
Female, Total
Blacks
Female, White
Total
Top Management,
Permanent 0 0 0 0 0 0 0 0 0 0 0
Senior Management,
Permanent 14 3 2 19 4 17 0 1 18 3 44
Professionally
qualified and
experienced
specialists and
mid-management,
Permanent 58 5 3 66 4 64 2 3 69 5 144
Skilled technical
and academically
qualified workers,
junior management,
supervisors, foremen,
Permanent 58 1 1 60 0 84 7 2 93 4 157
Semi-skilled and
discretionary
decision making,
Permanent 16 0 0 18 0 11 1 0 12 0 28
Unskilled and
defined decision
making, Permanent 0 0 0 0 0 1 0 0 1 0 1
Contract (Top
Management),
Permanent 2 0 0 2 3 2 0 0 2 1 8
Contract (Senior
Management),
Permanent 0 0 0 0 0 1 2 0 3 0 3
Contract
(Professionally
qualified),
Permanent 2 0 0 1 1 1 0 0 1 0 4
Contract (Skilled
technical),
Permanent 0 0 0 0 0 1 0 0 1 0 1
Contract (Semi-
skilled), Permanent 1 0 0 1 0 0 0 0 0 0 1
Contract (Unskilled),
Permanent 5 0 0 5 0 8 0 0 8 0 13
TOTAL 156 9 6 172 12 190 12 6 208 13 404
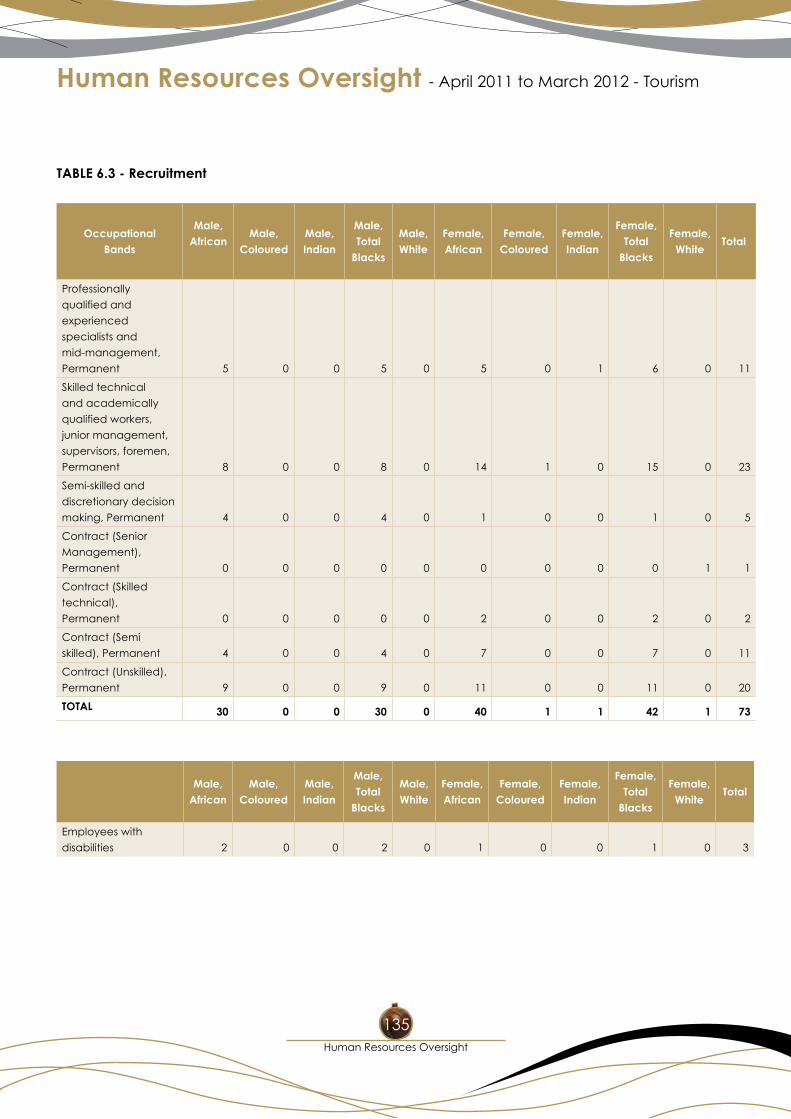
Human Resources Oversight - April 2011 to March 2012 - Tourism
Human Resources Oversight
135
TABLE 6.3 - Recruitment
Occupational Bands
Male, African
Male, Coloured
Male, Indian
Male, Total
Blacks
Male, White
Female, African
Female, Coloured
Female, Indian
Female, Total
Blacks
Female, White
Total
Professionally
qualified and
experienced
specialists and
mid-management,
Permanent 5 0 0 5 0 5 0 1 6 0 11
Skilled technical
and academically
qualified workers,
junior management,
supervisors, foremen,
Permanent 8 0 0 8 0 14 1 0 15 0 23
Semi-skilled and
discretionary decision
making, Permanent 4 0 0 4 0 1 0 0 1 0 5
Contract (Senior
Management),
Permanent 0 0 0 0 0 0 0 0 0 1 1
Contract (Skilled
technical),
Permanent 0 0 0 0 0 2 0 0 2 0 2
Contract (Semi
skilled), Permanent 4 0 0 4 0 7 0 0 7 0 11
Contract (Unskilled),
Permanent 9 0 0 9 0 11 0 0 11 0 20
TOTAL 30 0 0 30 0 40 1 1 42 1 73
Male,
AfricanMale,
ColouredMale, Indian
Male, Total
Blacks
Male, White
Female, African
Female, Coloured
Female, Indian
Female, Total
Blacks
Female, White
Total
Employees with
disabilities 2 0 0 2 0 1 0 0 1 0 3
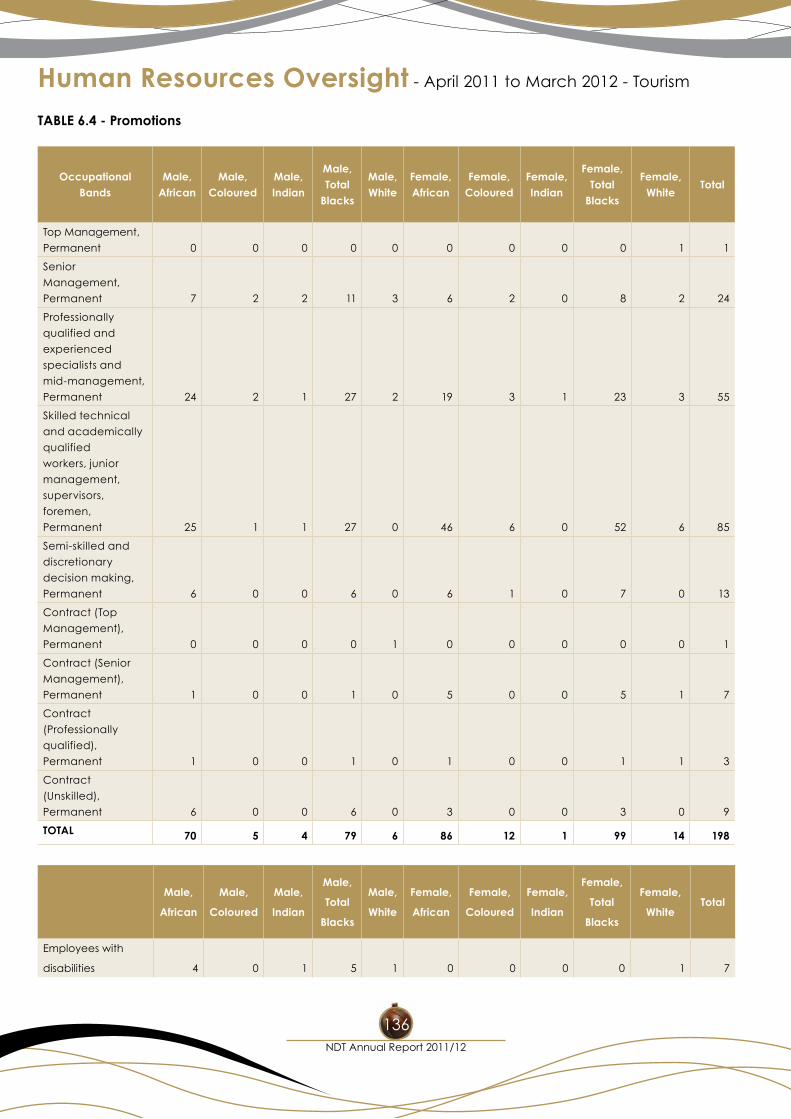
Human Resources Oversight - April 2011 to March 2012 - Tourism
NDT Annual Report 2011/12
136
TABLE 6.4 - Promotions
Occupational Bands
Male, African
Male, Coloured
Male, Indian
Male, Total
Blacks
Male, White
Female, African
Female, Coloured
Female, Indian
Female, Total
Blacks
Female, White
Total
Top Management,
Permanent 0 0 0 0 0 0 0 0 0 1 1
Senior
Management,
Permanent 7 2 2 11 3 6 2 0 8 2 24
Professionally
qualified and
experienced
specialists and
mid-management,
Permanent 24 2 1 27 2 19 3 1 23 3 55
Skilled technical
and academically
qualified
workers, junior
management,
supervisors,
foremen,
Permanent 25 1 1 27 0 46 6 0 52 6 85
Semi-skilled and
discretionary
decision making,
Permanent 6 0 0 6 0 6 1 0 7 0 13
Contract (Top
Management),
Permanent 0 0 0 0 1 0 0 0 0 0 1
Contract (Senior
Management),
Permanent 1 0 0 1 0 5 0 0 5 1 7
Contract
(Professionally
qualified),
Permanent 1 0 0 1 0 1 0 0 1 1 3
Contract
(Unskilled),
Permanent 6 0 0 6 0 3 0 0 3 0 9
TOTAL 70 5 4 79 6 86 12 1 99 14 198
Male,
African
Male,
Coloured
Male,
Indian
Male,
Total
Blacks
Male,
White
Female,
African
Female,
Coloured
Female,
Indian
Female,
Total
Blacks
Female,
WhiteTotal
Employees with
disabilities 4 0 1 5 1 0 0 0 0 1 7
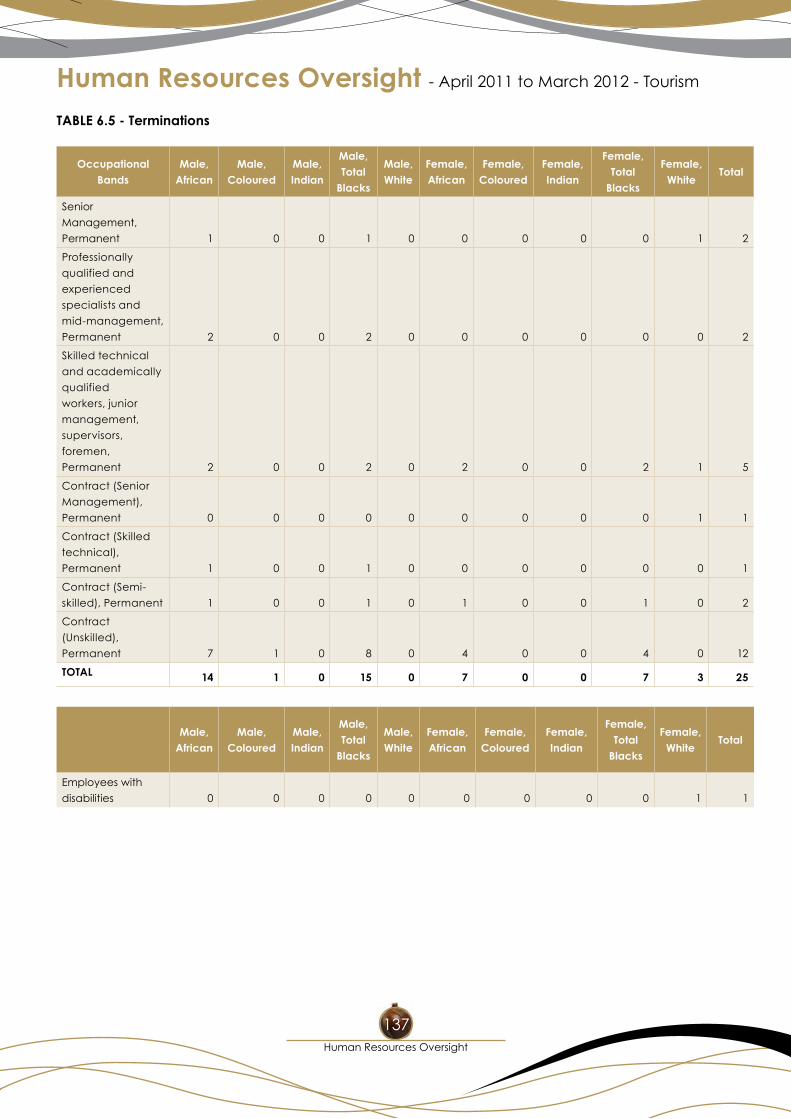
Human Resources Oversight - April 2011 to March 2012 - Tourism
Human Resources Oversight
137
TABLE 6.5 - Terminations
Occupational Bands
Male, African
Male, Coloured
Male, Indian
Male, Total
Blacks
Male, White
Female, African
Female, Coloured
Female, Indian
Female, Total
Blacks
Female, White
Total
Senior
Management,
Permanent 1 0 0 1 0 0 0 0 0 1 2
Professionally
qualified and
experienced
specialists and
mid-management,
Permanent 2 0 0 2 0 0 0 0 0 0 2
Skilled technical
and academically
qualified
workers, junior
management,
supervisors,
foremen,
Permanent 2 0 0 2 0 2 0 0 2 1 5
Contract (Senior
Management),
Permanent 0 0 0 0 0 0 0 0 0 1 1
Contract (Skilled
technical),
Permanent 1 0 0 1 0 0 0 0 0 0 1
Contract (Semi-
skilled), Permanent 1 0 0 1 0 1 0 0 1 0 2
Contract
(Unskilled),
Permanent 7 1 0 8 0 4 0 0 4 0 12
TOTAL 14 1 0 15 0 7 0 0 7 3 25
Male,
AfricanMale,
ColouredMale, Indian
Male, Total
Blacks
Male, White
Female, African
Female, Coloured
Female, Indian
Female, Total
Blacks
Female, White
Total
Employees with
disabilities 0 0 0 0 0 0 0 0 0 1 1
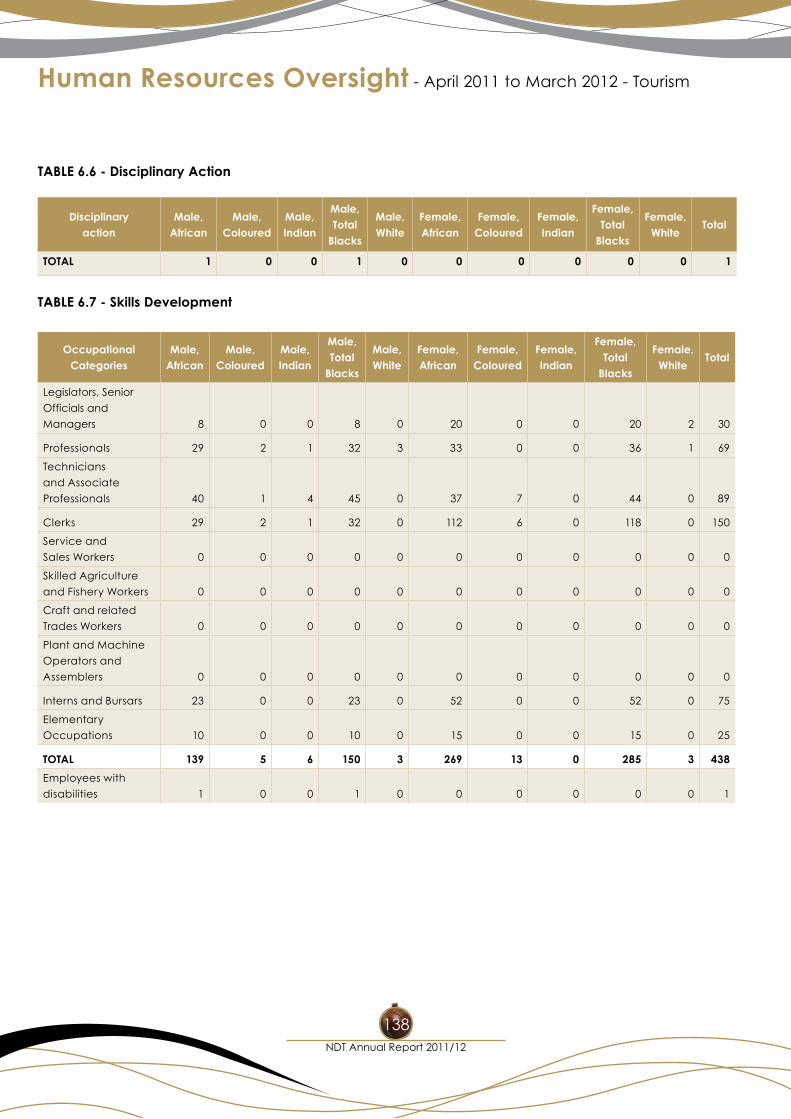
Human Resources Oversight - April 2011 to March 2012 - Tourism
NDT Annual Report 2011/12
138
TABLE 6.6 - Disciplinary Action
Disciplinary action
Male, African
Male, Coloured
Male, Indian
Male, Total
Blacks
Male, White
Female, African
Female, Coloured
Female, Indian
Female, Total
Blacks
Female, White
Total
TOTAL 1 0 0 1 0 0 0 0 0 0 1
TABLE 6.7 - Skills Development
Occupational Categories
Male, African
Male, Coloured
Male, Indian
Male, Total
Blacks
Male, White
Female, African
Female, Coloured
Female, Indian
Female, Total
Blacks
Female, White
Total
Legislators, Senior
Officials and
Managers 8 0 0 8 0 20 0 0 20 2 30
Professionals 29 2 1 32 3 33 0 0 36 1 69
Technicians
and Associate
Professionals 40 1 4 45 0 37 7 0 44 0 89
Clerks 29 2 1 32 0 112 6 0 118 0 150
Service and
Sales Workers 0 0 0 0 0 0 0 0 0 0 0
Skilled Agriculture
and Fishery Workers 0 0 0 0 0 0 0 0 0 0 0
Craft and related
Trades Workers 0 0 0 0 0 0 0 0 0 0 0
Plant and Machine
Operators and
Assemblers 0 0 0 0 0 0 0 0 0 0 0
Interns and Bursars 23 0 0 23 0 52 0 0 52 0 75
Elementary
Occupations 10 0 0 10 0 15 0 0 15 0 25
TOTAL 139 5 6 150 3 269 13 0 285 3 438
Employees with
disabilities 1 0 0 1 0 0 0 0 0 0 1
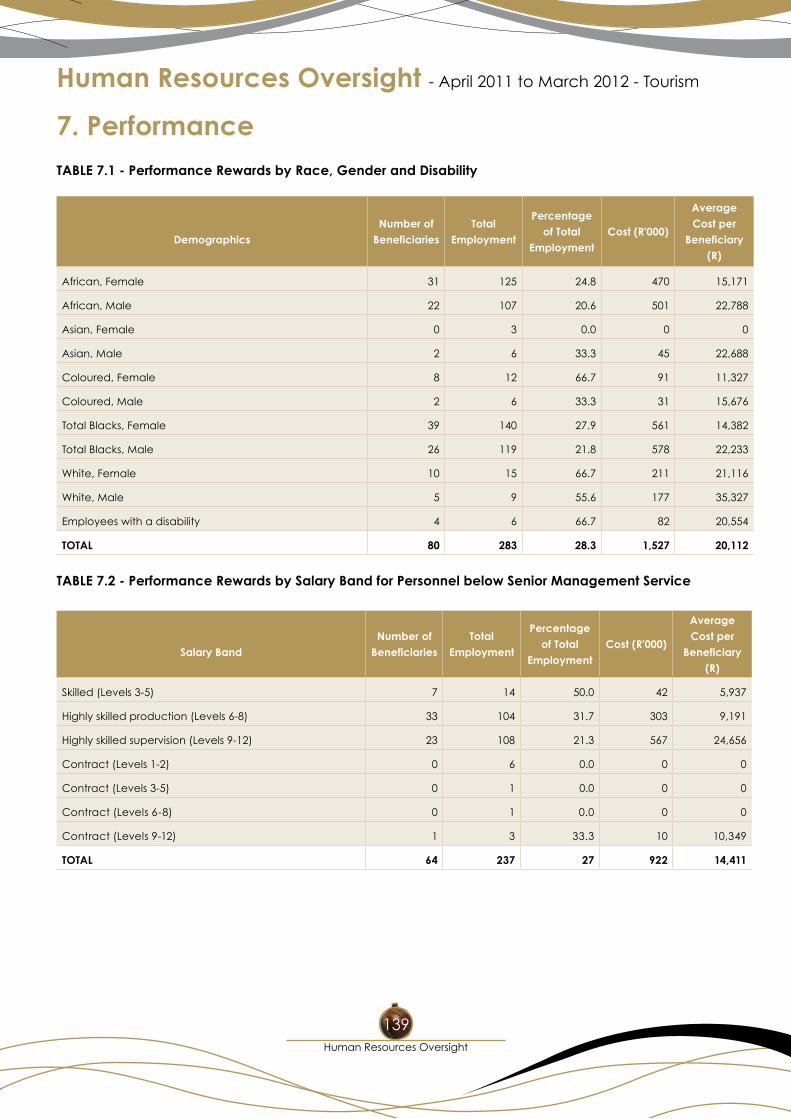
Human Resources Oversight - April 2011 to March 2012 - Tourism
Human Resources Oversight
139
7. PerformanceTABLE 7.1 - Performance Rewards by Race, Gender and Disability
DemographicsNumber of
BeneficiariesTotal
Employment
Percentage of Total
EmploymentCost (R'000)
Average Cost per
Beneficiary (R)
African, Female 31 125 24.8 470 15,171
African, Male 22 107 20.6 501 22,788
Asian, Female 0 3 0.0 0 0
Asian, Male 2 6 33.3 45 22,688
Coloured, Female 8 12 66.7 91 11,327
Coloured, Male 2 6 33.3 31 15,676
Total Blacks, Female 39 140 27.9 561 14,382
Total Blacks, Male 26 119 21.8 578 22,233
White, Female 10 15 66.7 211 21,116
White, Male 5 9 55.6 177 35,327
Employees with a disability 4 6 66.7 82 20,554
TOTAL 80 283 28.3 1,527 20,112
TABLE 7.2 - Performance Rewards by Salary Band for Personnel below Senior Management Service
Salary BandNumber of
BeneficiariesTotal
Employment
Percentage of Total
EmploymentCost (R'000)
Average Cost per
Beneficiary (R)
Skilled (Levels 3-5) 7 14 50.0 42 5,937
Highly skilled production (Levels 6-8) 33 104 31.7 303 9,191
Highly skilled supervision (Levels 9-12) 23 108 21.3 567 24,656
Contract (Levels 1-2) 0 6 0.0 0 0
Contract (Levels 3-5) 0 1 0.0 0 0
Contract (Levels 6-8) 0 1 0.0 0 0
Contract (Levels 9-12) 1 3 33.3 10 10,349
TOTAL 64 237 27 922 14,411
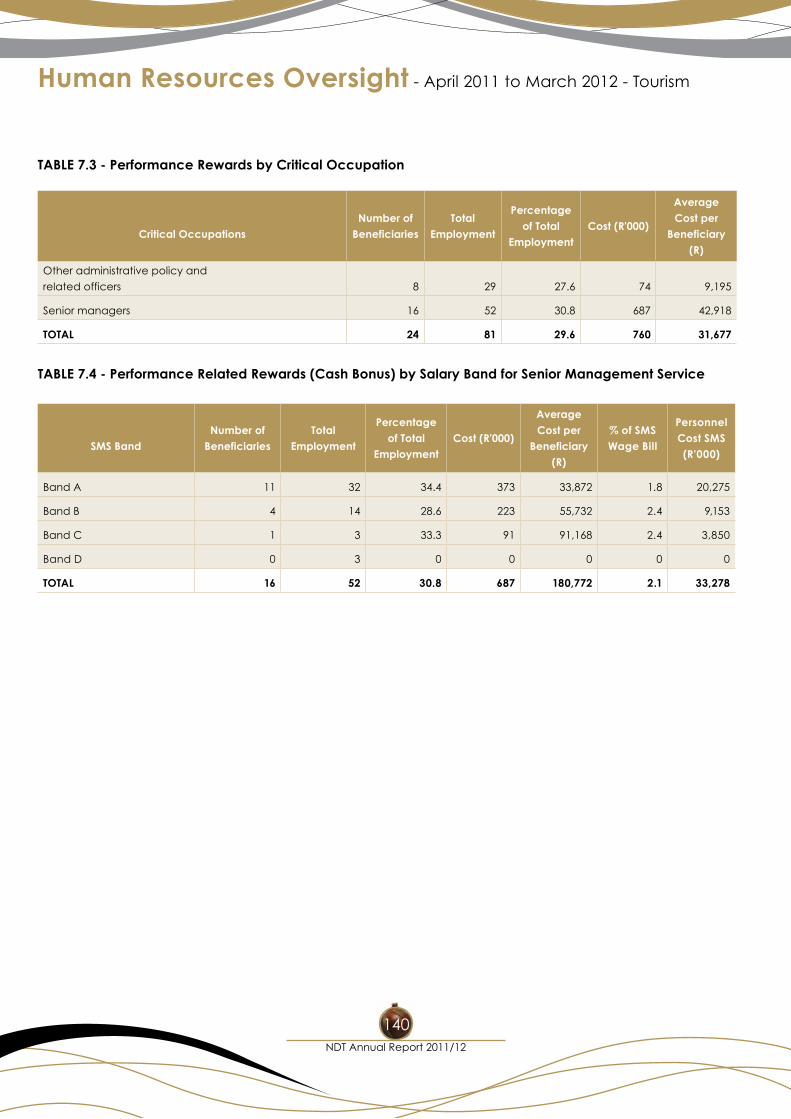
Human Resources Oversight - April 2011 to March 2012 - Tourism
NDT Annual Report 2011/12
140
TABLE 7.3 - Performance Rewards by Critical Occupation
Critical OccupationsNumber of
BeneficiariesTotal
Employment
Percentage of Total
EmploymentCost (R'000)
Average Cost per
Beneficiary (R)
Other administrative policy and
related officers 8 29 27.6 74 9,195
Senior managers 16 52 30.8 687 42,918
TOTAL 24 81 29.6 760 31,677
TABLE 7.4 - Performance Related Rewards (Cash Bonus) by Salary Band for Senior Management Service
SMS BandNumber of
BeneficiariesTotal
Employment
Percentage of Total
EmploymentCost (R'000)
Average Cost per
Beneficiary (R)
% of SMS Wage Bill
Personnel Cost SMS (R'000)
Band A 11 32 34.4 373 33,872 1.8 20,275
Band B 4 14 28.6 223 55,732 2.4 9,153
Band C 1 3 33.3 91 91,168 2.4 3,850
Band D 0 3 0 0 0 0 0
TOTAL 16 52 30.8 687 180,772 2.1 33,278
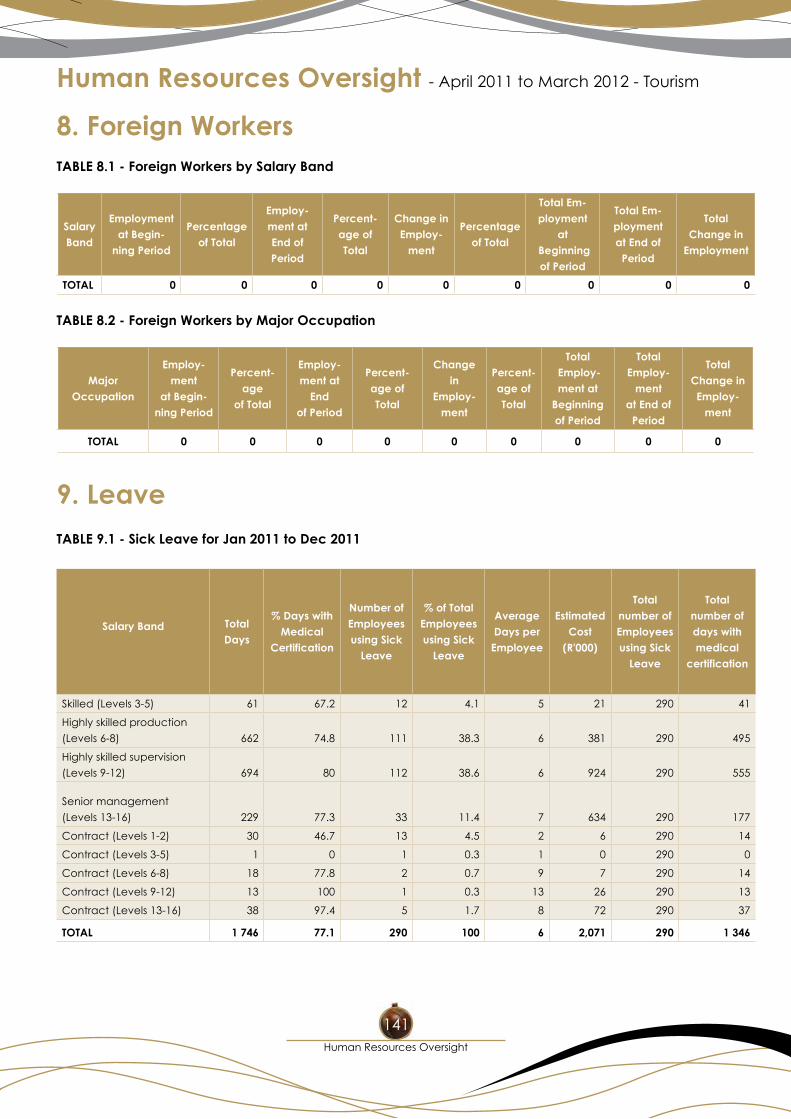
Human Resources Oversight - April 2011 to March 2012 - Tourism
Human Resources Oversight
141
8. Foreign WorkersTABLE 8.1 - Foreign Workers by Salary Band
Salary Band
Employment at Begin-
ning Period
Percentage of Total
Employ-ment at End of Period
Percent-age of Total
Change in Employ-
ment
Percentage of Total
Total Em-ployment
at Beginning of Period
Total Em-ployment at End of
Period
Total Change in
Employment
TOTAL 0 0 0 0 0 0 0 0 0
TABLE 8.2 - Foreign Workers by Major Occupation
Major Occupation
Employ-ment
at Begin-ning Period
Percent-age
of Total
Employ-ment at
End of Period
Percent-age of Total
Change in
Employ-ment
Percent-age of Total
Total Employ-ment at
Beginning of Period
Total Employ-
ment at End of
Period
Total Change in Employ-
ment
TOTAL 0 0 0 0 0 0 0 0 0
9. LeaveTABLE 9.1 - Sick Leave for Jan 2011 to Dec 2011
Salary Band Total Days
% Days with Medical
Certification
Number of Employees using Sick
Leave
% of Total Employees using Sick
Leave
Average Days per
Employee
Estimated Cost
(R'000)
Total number of Employees using Sick
Leave
Total number of days with medical
certification
Skilled (Levels 3-5) 61 67.2 12 4.1 5 21 290 41
Highly skilled production
(Levels 6-8) 662 74.8 111 38.3 6 381 290 495
Highly skilled supervision
(Levels 9-12) 694 80 112 38.6 6 924 290 555
Senior management
(Levels 13-16) 229 77.3 33 11.4 7 634 290 177
Contract (Levels 1-2) 30 46.7 13 4.5 2 6 290 14
Contract (Levels 3-5) 1 0 1 0.3 1 0 290 0
Contract (Levels 6-8) 18 77.8 2 0.7 9 7 290 14
Contract (Levels 9-12) 13 100 1 0.3 13 26 290 13
Contract (Levels 13-16) 38 97.4 5 1.7 8 72 290 37
TOTAL 1 746 77.1 290 100 6 2,071 290 1 346
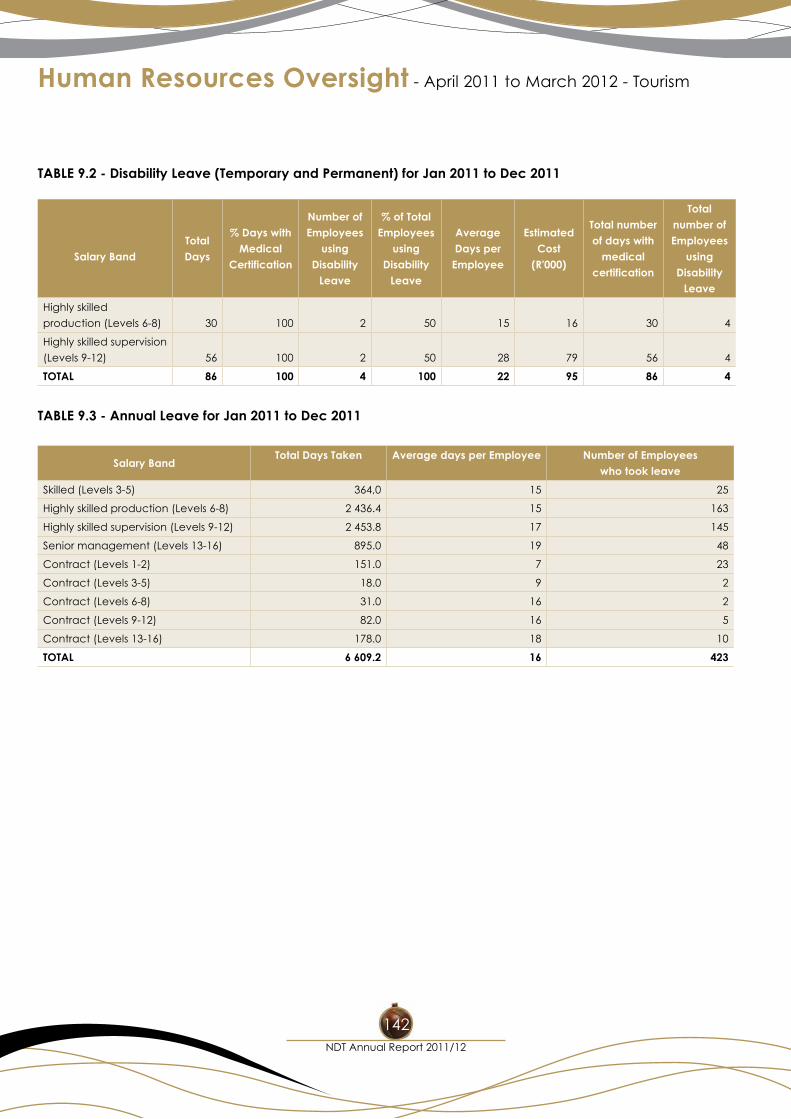
Human Resources Oversight - April 2011 to March 2012 - Tourism
NDT Annual Report 2011/12
142
TABLE 9.2 - Disability Leave (Temporary and Permanent) for Jan 2011 to Dec 2011
Salary BandTotal Days
% Days with Medical
Certification
Number of Employees
using Disability
Leave
% of Total Employees
using Disability
Leave
Average Days per
Employee
Estimated Cost
(R'000)
Total number of days with
medical certification
Total number of Employees
using Disability
Leave
Highly skilled
production (Levels 6-8) 30 100 2 50 15 16 30 4
Highly skilled supervision
(Levels 9-12) 56 100 2 50 28 79 56 4
TOTAL 86 100 4 100 22 95 86 4
TABLE 9.3 - Annual Leave for Jan 2011 to Dec 2011
Salary BandTotal Days Taken Average days per Employee Number of Employees
who took leave
Skilled (Levels 3-5) 364,0 15 25
Highly skilled production (Levels 6-8) 2 436.4 15 163
Highly skilled supervision (Levels 9-12) 2 453.8 17 145
Senior management (Levels 13-16) 895.0 19 48
Contract (Levels 1-2) 151.0 7 23
Contract (Levels 3-5) 18.0 9 2
Contract (Levels 6-8) 31.0 16 2
Contract (Levels 9-12) 82.0 16 5
Contract (Levels 13-16) 178.0 18 10
TOTAL 6 609.2 16 423
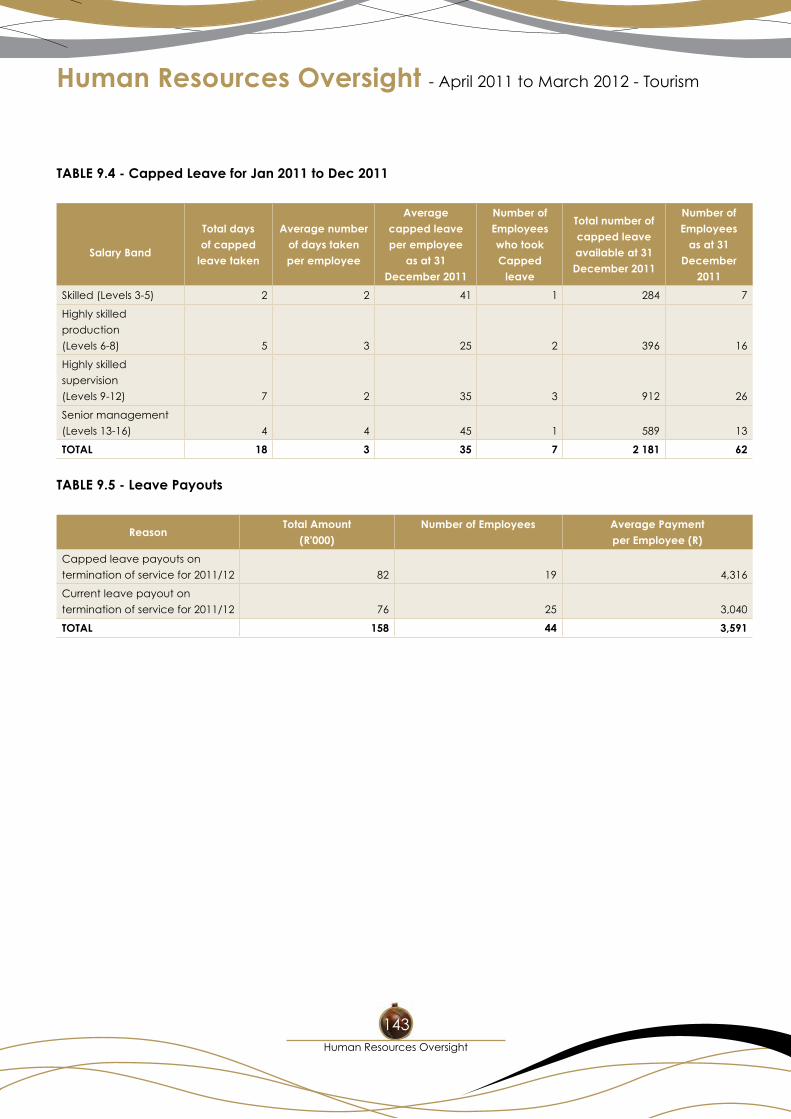
Human Resources Oversight - April 2011 to March 2012 - Tourism
Human Resources Oversight
143
TABLE 9.4 - Capped Leave for Jan 2011 to Dec 2011
Salary Band
Total days of capped
leave taken
Average number of days taken per employee
Average capped leave per employee
as at 31 December 2011
Number of Employees who took Capped
leave
Total number of capped leave available at 31 December 2011
Number of Employees
as at 31 December
2011
Skilled (Levels 3-5) 2 2 41 1 284 7
Highly skilled
production
(Levels 6-8) 5 3 25 2 396 16
Highly skilled
supervision
(Levels 9-12) 7 2 35 3 912 26
Senior management
(Levels 13-16) 4 4 45 1 589 13
TOTAL 18 3 35 7 2 181 62
TABLE 9.5 - Leave Payouts
ReasonTotal Amount
(R'000)Number of Employees Average Payment
per Employee (R)
Capped leave payouts on
termination of service for 2011/12 82 19 4,316
Current leave payout on
termination of service for 2011/12 76 25 3,040
TOTAL 158 44 3,591
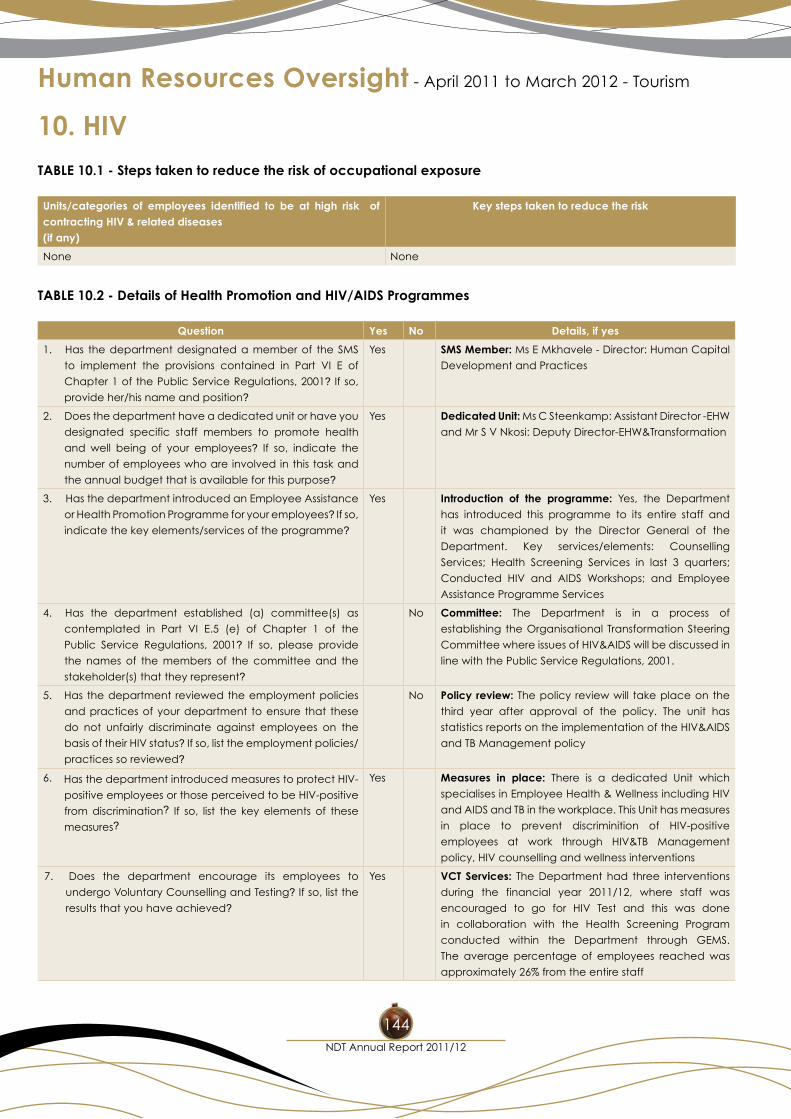
Human Resources Oversight - April 2011 to March 2012 - Tourism
NDT Annual Report 2011/12
144
10. HIVTABLE 10.1 - Steps taken to reduce the risk of occupational exposure
Units/categories of employees identified to be at high risk of contracting HIV & related diseases (if any)
Key steps taken to reduce the risk
None None
TABLE 10.2 - Details of Health Promotion and HIV/AIDS Programmes
Question Yes No Details, if yes
1. Has the department designated a member of the SMS
to implement the provisions contained in Part VI E of
Chapter 1 of the Public Service Regulations, 2001? If so,
provide her/his name and position?
Yes SMS Member: Ms E Mkhavele - Director: Human Capital
Development and Practices
2. Does the department have a dedicated unit or have you
designated specific staff members to promote health
and well being of your employees? If so, indicate the
number of employees who are involved in this task and
the annual budget that is available for this purpose?
Yes Dedicated Unit: Ms C Steenkamp: Assistant Director -EHW
and Mr S V Nkosi: Deputy Director-EHW&Transformation
3. Has the department introduced an Employee Assistance
or Health Promotion Programme for your employees? If so,
indicate the key elements/services of the programme?
Yes Introduction of the programme: Yes, the Department
has introduced this programme to its entire staff and
it was championed by the Director General of the
Department. Key services/elements: Counselling
Services; Health Screening Services in last 3 quarters;
Conducted HIV and AIDS Workshops; and Employee
Assistance Programme Services
4. Has the department established (a) committee(s) as
contemplated in Part VI E.5 (e) of Chapter 1 of the
Public Service Regulations, 2001? If so, please provide
the names of the members of the committee and the
stakeholder(s) that they represent?
No Committee: The Department is in a process of
establishing the Organisational Transformation Steering
Committee where issues of HIV&AIDS will be discussed in
line with the Public Service Regulations, 2001.
5. Has the department reviewed the employment policies
and practices of your department to ensure that these
do not unfairly discriminate against employees on the
basis of their HIV status? If so, list the employment policies/
practices so reviewed?
No Policy review: The policy review will take place on the
third year after approval of the policy. The unit has
statistics reports on the implementation of the HIV&AIDS
and TB Management policy
6. Has the department introduced measures to protect HIV-
positive employees or those perceived to be HIV-positive
from discrimination? If so, list the key elements of these
measures?
Yes Measures in place: There is a dedicated Unit which
specialises in Employee Health & Wellness including HIV
and AIDS and TB in the workplace. This Unit has measures
in place to prevent discriminition of HIV-positive
employees at work through HIV&TB Management
policy, HIV counselling and wellness interventions
7. Does the department encourage its employees to
undergo Voluntary Counselling and Testing? If so, list the
results that you have achieved?
Yes VCT Services: The Department had three interventions
during the financial year 2011/12, where staff was
encouraged to go for HIV Test and this was done
in collaboration with the Health Screening Program
conducted within the Department through GEMS.
The average percentage of employees reached was
approximately 26% from the entire staff
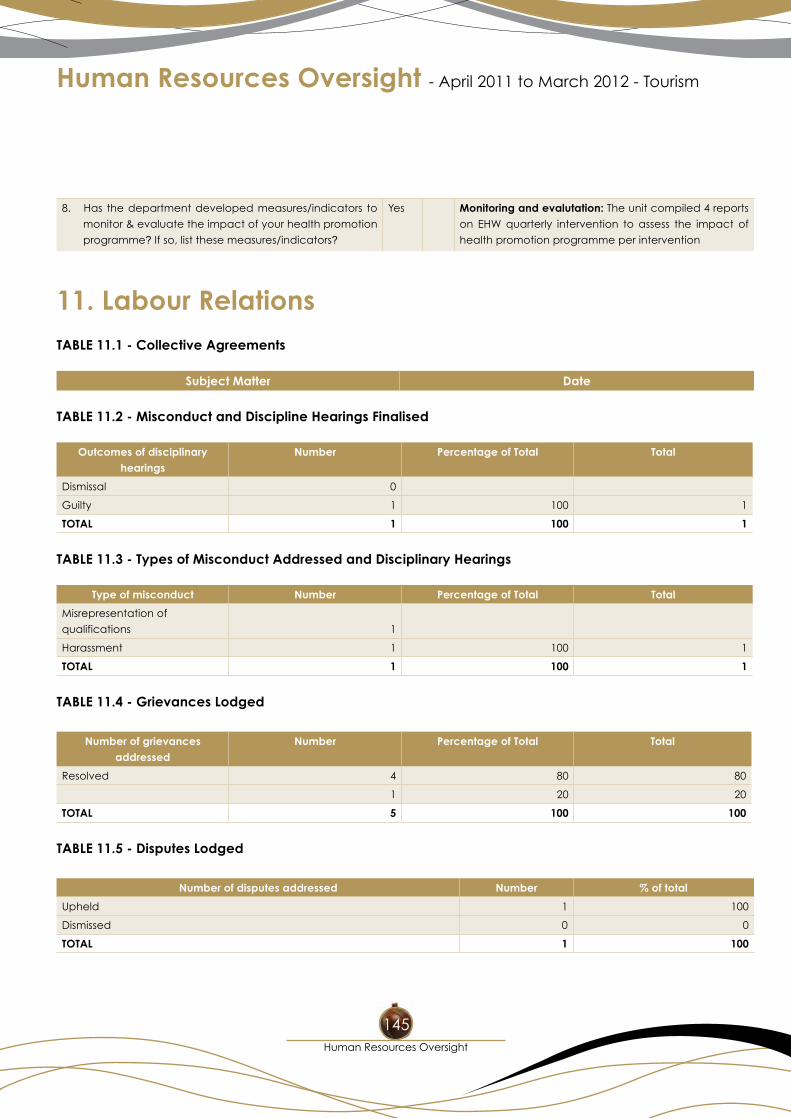
Human Resources Oversight - April 2011 to March 2012 - Tourism
Human Resources Oversight
145
8. Has the department developed measures/indicators to
monitor & evaluate the impact of your health promotion
programme? If so, list these measures/indicators?
Yes Monitoring and evalutation: The unit compiled 4 reports
on EHW quarterly intervention to assess the impact of
health promotion programme per intervention
11. Labour RelationsTABLE 11.1 - Collective Agreements
Subject Matter Date
TABLE 11.2 - Misconduct and Discipline Hearings Finalised
Outcomes of disciplinary hearings
Number Percentage of Total Total
Dismissal 0
Guilty 1 100 1
TOTAL 1 100 1
TABLE 11.3 - Types of Misconduct Addressed and Disciplinary Hearings
Type of misconduct Number Percentage of Total Total
Misrepresentation of
qualifications 1
Harassment 1 100 1
TOTAL 1 100 1
TABLE 11.4 - Grievances Lodged
Number of grievances addressed
Number Percentage of Total Total
Resolved 4 80 80
1 20 20
TOTAL 5 100 100
TABLE 11.5 - Disputes Lodged
Number of disputes addressed Number % of total
Upheld 1 100
Dismissed 0 0
TOTAL 1 100
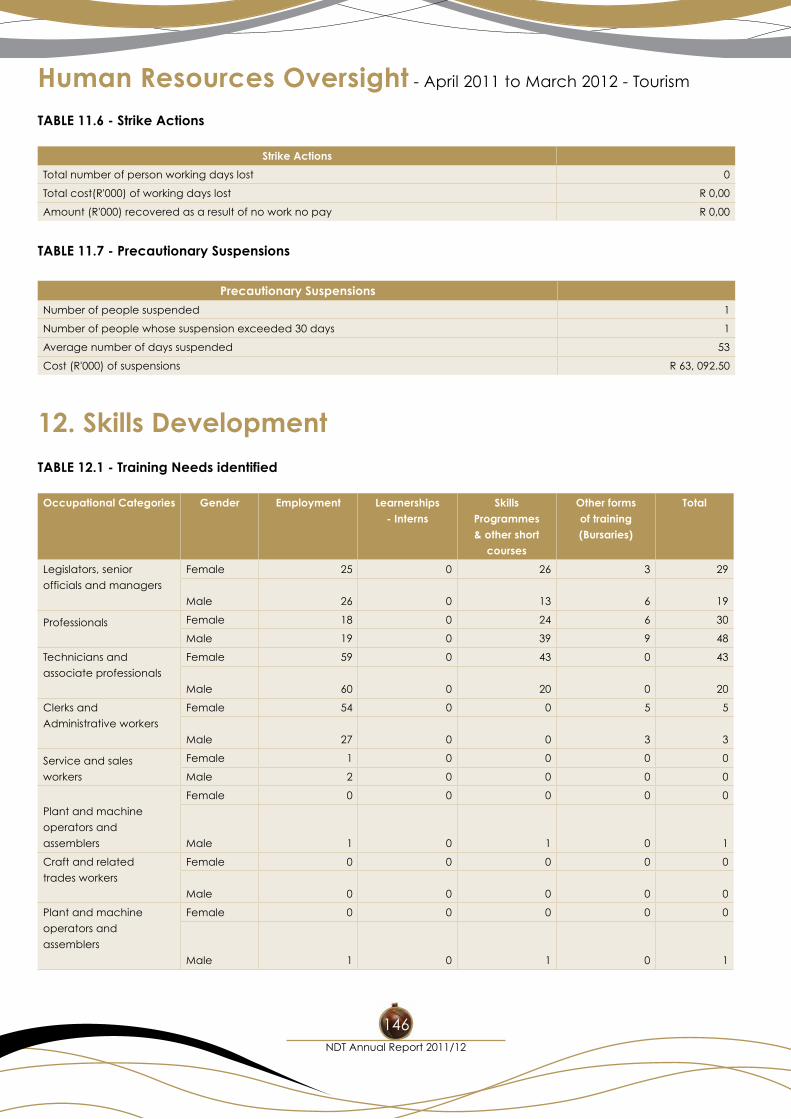
Human Resources Oversight - April 2011 to March 2012 - Tourism
NDT Annual Report 2011/12
146
TABLE 11.6 - Strike Actions
Strike Actions
Total number of person working days lost 0
Total cost(R'000) of working days lost R 0,00
Amount (R'000) recovered as a result of no work no pay R 0,00
TABLE 11.7 - Precautionary Suspensions
Precautionary Suspensions
Number of people suspended 1
Number of people whose suspension exceeded 30 days 1
Average number of days suspended 53
Cost (R'000) of suspensions R 63, 092.50
12. Skills DevelopmentTABLE 12.1 - Training Needs identified
Occupational Categories Gender Employment Learnerships - Interns
Skills Programmes & other short
courses
Other forms of training (Bursaries)
Total
Legislators, senior
officials and managers
Female 25 0 26 3 29
Male 26 0 13 6 19
Professionals
Female 18 0 24 6 30
Male 19 0 39 9 48
Technicians and
associate professionals
Female 59 0 43 0 43
Male 60 0 20 0 20
Clerks and
Administrative workers
Female 54 0 0 5 5
Male 27 0 0 3 3
Service and sales
workers
Female 1 0 0 0 0
Male 2 0 0 0 0
Plant and machine
operators and
assemblers
Female 0 0 0 0 0
Male 1 0 1 0 1
Craft and related
trades workers
Female 0 0 0 0 0
Male 0 0 0 0 0
Plant and machine
operators and
assemblers
Female 0 0 0 0 0
Male 1 0 1 0 1
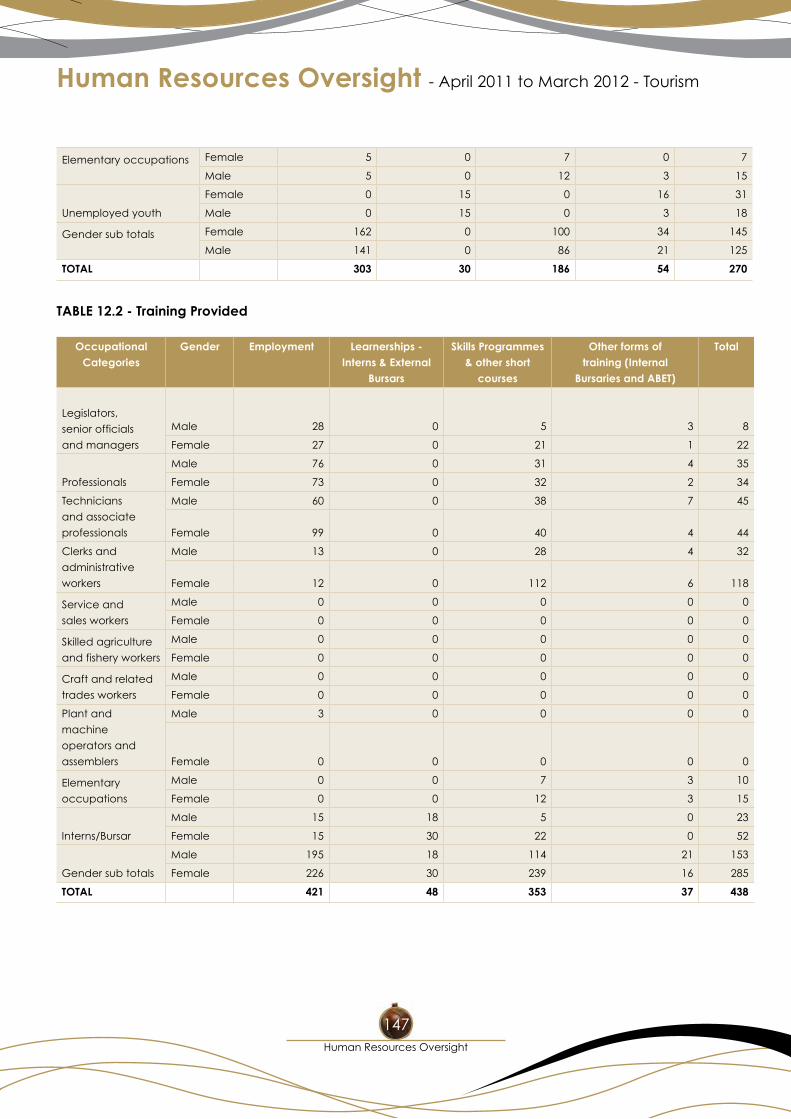
Human Resources Oversight - April 2011 to March 2012 - Tourism
Human Resources Oversight
147
Elementary occupations
Female 5 0 7 0 7
Male 5 0 12 3 15
Unemployed youth
Female 0 15 0 16 31
Male 0 15 0 3 18
Gender sub totals
Female 162 0 100 34 145
Male 141 0 86 21 125
TOTAL 303 30 186 54 270
TABLE 12.2 - Training Provided
Occupational Categories
Gender Employment Learnerships - Interns & External
Bursars
Skills Programmes & other short
courses
Other forms of training (Internal
Bursaries and ABET)
Total
Legislators,
senior officials
and managers
Male 28 0 5 3 8
Female 27 0 21 1 22
Professionals
Male 76 0 31 4 35
Female 73 0 32 2 34
Technicians
and associate
professionals
Male 60 0 38 7 45
Female 99 0 40 4 44
Clerks and
administrative
workers
Male 13 0 28 4 32
Female 12 0 112 6 118
Service and
sales workers
Male 0 0 0 0 0
Female 0 0 0 0 0
Skilled agriculture
and fishery workers
Male 0 0 0 0 0
Female 0 0 0 0 0
Craft and related
trades workers
Male 0 0 0 0 0
Female 0 0 0 0 0
Plant and
machine
operators and
assemblers
Male 3 0 0 0 0
Female 0 0 0 0 0
Elementary
occupations
Male 0 0 7 3 10
Female 0 0 12 3 15
Interns/Bursar
Male 15 18 5 0 23
Female 15 30 22 0 52
Gender sub totals
Male 195 18 114 21 153
Female 226 30 239 16 285
TOTAL 421 48 353 37 438
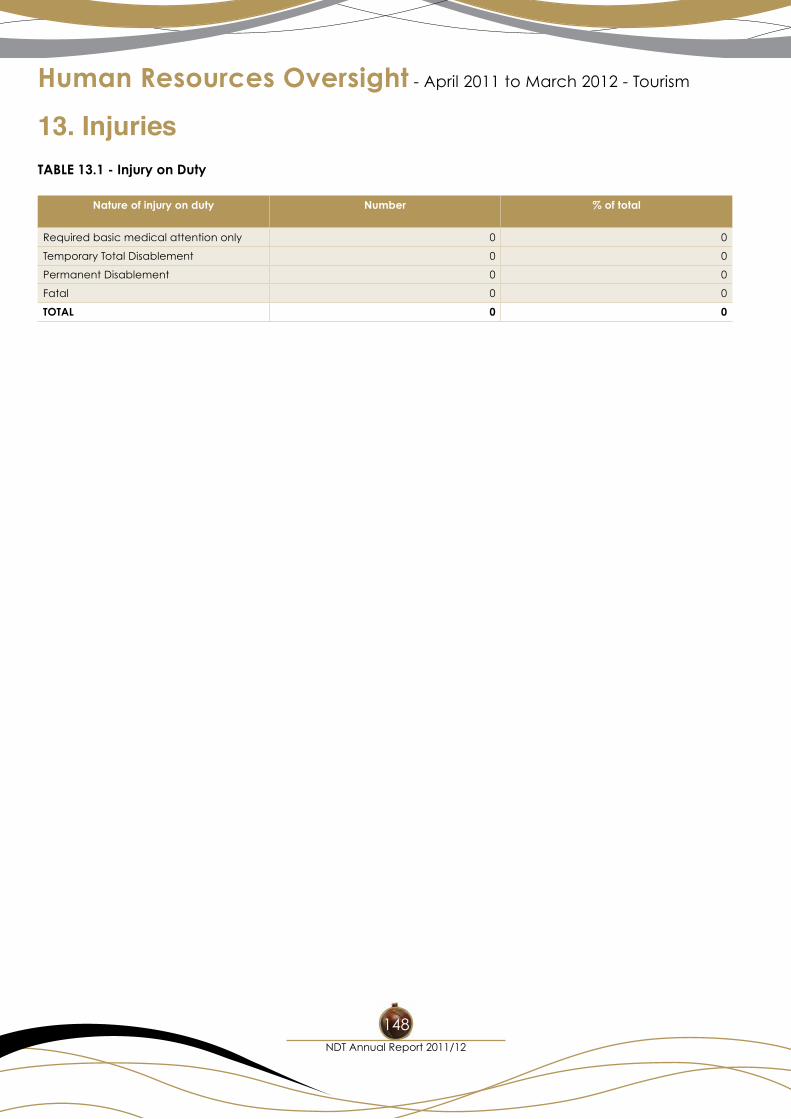
Human Resources Oversight - April 2011 to March 2012 - Tourism
NDT Annual Report 2011/12
148
13. InjuriesTABLE 13.1 - Injury on Duty
Nature of injury on duty Number % of total
Required basic medical attention only 0 0
Temporary Total Disablement 0 0
Permanent Disablement 0 0
Fatal 0 0
TOTAL 0 0
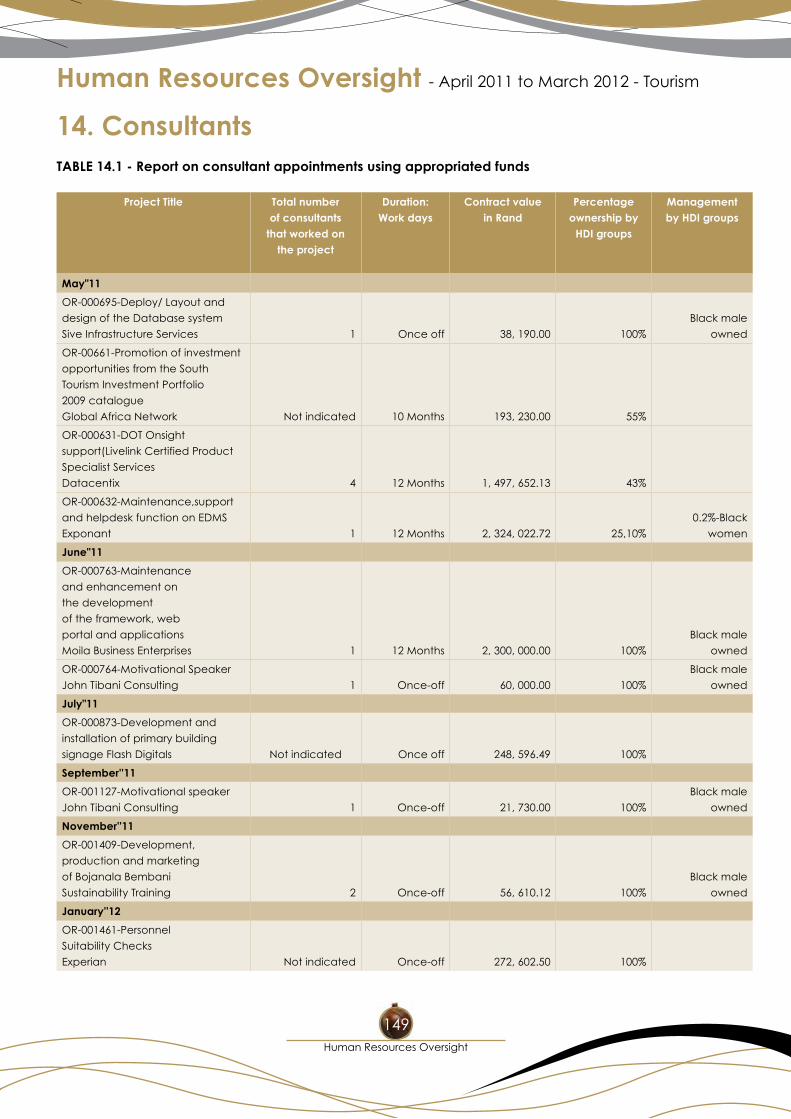
Human Resources Oversight - April 2011 to March 2012 - Tourism
Human Resources Oversight
149
14. ConsultantsTABLE 14.1 - Report on consultant appointments using appropriated funds
Project Title Total number of consultants
that worked on the project
Duration: Work days
Contract value in Rand
Percentage ownership by
HDI groups
Management by HDI groups
May"11
OR-000695-Deploy/ Layout and
design of the Database system
Sive Infrastructure Services 1 Once off 38, 190.00 100%
Black male
owned
OR-00661-Promotion of investment
opportunities from the South
Tourism Investment Portfolio
2009 catalogue
Global Africa Network Not indicated 10 Months 193, 230.00 55%
OR-000631-DOT Onsight
support(Livelink Certified Product
Specialist Services
Datacentix 4 12 Months 1, 497, 652.13 43%
OR-000632-Maintenance,support
and helpdesk function on EDMS
Exponant 1 12 Months 2, 324, 022.72 25,10%
0.2%-Black
women
June"11
OR-000763-Maintenance
and enhancement on
the development
of the framework, web
portal and applications
Moila Business Enterprises 1 12 Months 2, 300, 000.00 100%
Black male
owned
OR-000764-Motivational Speaker
John Tibani Consulting 1 Once-off 60, 000.00 100%
Black male
owned
July"11
OR-000873-Development and
installation of primary building
signage Flash Digitals Not indicated Once off 248, 596.49 100%
September''11
OR-001127-Motivational speaker
John Tibani Consulting 1 Once-off 21, 730.00 100%
Black male
owned
November''11
OR-001409-Development,
production and marketing
of Bojanala Bembani
Sustainability Training 2 Once-off 56, 610.12 100%
Black male
owned
January''12
OR-001461-Personnel
Suitability Checks
Experian Not indicated Once-off 272, 602.50 100%
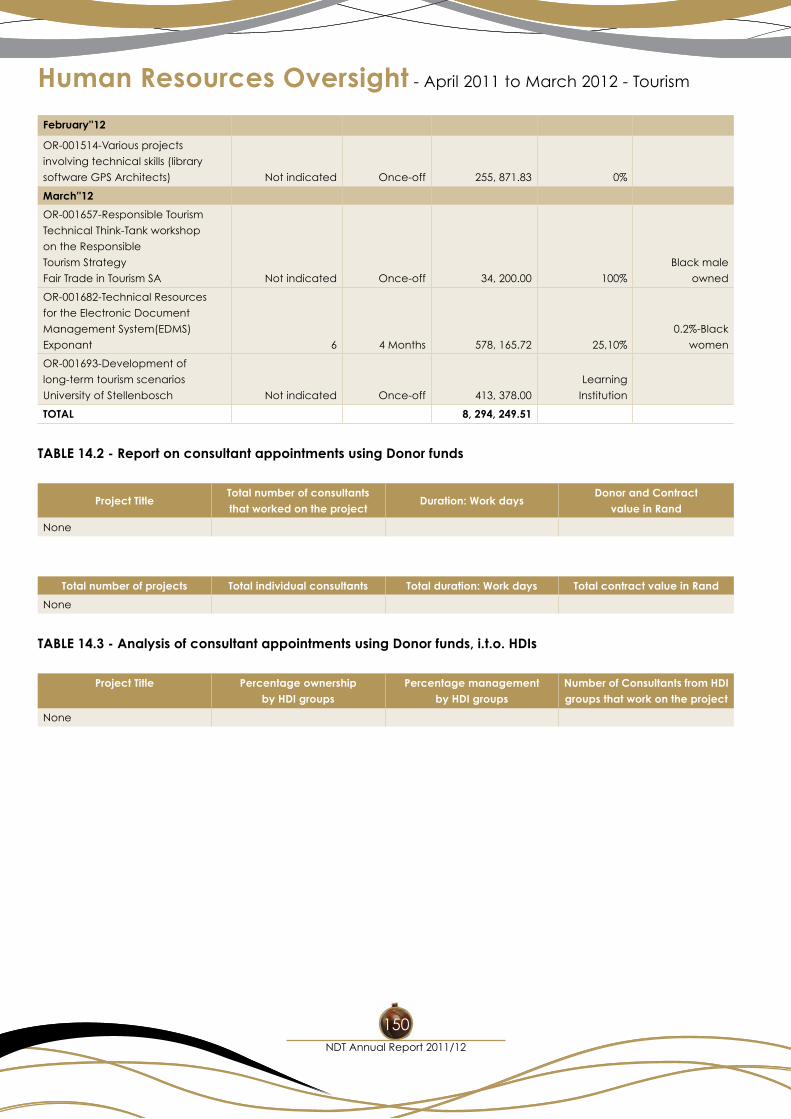
Human Resources Oversight - April 2011 to March 2012 - Tourism
NDT Annual Report 2011/12
150
February''12
OR-001514-Various projects
involving technical skills (library
software GPS Architects) Not indicated Once-off 255, 871.83 0%
March''12
OR-001657-Responsible Tourism
Technical Think-Tank workshop
on the Responsible
Tourism Strategy
Fair Trade in Tourism SA Not indicated Once-off 34, 200.00 100%
Black male
owned
OR-001682-Technical Resources
for the Electronic Document
Management System(EDMS)
Exponant 6 4 Months 578, 165.72 25,10%
0.2%-Black
women
OR-001693-Development of
long-term tourism scenarios
University of Stellenbosch Not indicated Once-off 413, 378.00
Learning
Institution
TOTAL 8, 294, 249.51
TABLE 14.2 - Report on consultant appointments using Donor funds
Project TitleTotal number of consultants that worked on the project
Duration: Work daysDonor and Contract
value in Rand
None
Total number of projects Total individual consultants Total duration: Work days Total contract value in Rand
None
TABLE 14.3 - Analysis of consultant appointments using Donor funds, i.t.o. HDIs
Project Title Percentage ownership by HDI groups
Percentage management by HDI groups
Number of Consultants from HDI groups that work on the project
None
Acronyms and Abbreviations
Acronyms and Abbreviations
151151
1. AGSA Auditor General of South Africa
2. AIME Asia Pacific Incentive and Meeting Expo
3. AMSCO African Management Services Corporation
4. ATAG Air Transport Action Group
5. BBBEE Broad-Based Black Economic Empowerment
6. BEE Black Economic Empowerment
7. CATHSSETA Culture, Arts, Tourism, Hospitality and Sports Sector Education and Training Authority
8. DEA Department of Environmental Affairs
9. DIRCO Department of International Relations and Cooperation
10. DRDLR Department of Rural Development and Land Reform
11. DTI Department of Trade and Industry
12. EDMS Electronic Document Management System
13. EHW Employee Health Wellness
14. EME Exempt Micro Enterprises
15. EPWP Extended Public Works Programme
16. ETEYA Emerging Tourism Entrepreneur of the Year Awards
17. EU European Union
18. FEDHASA Federated Hospitality Association of South Africa
19. FET Further Education and Training
20. FIFA Federation of International Football Associations
21. FOSAD Forum of South African Director-General
22. FTE Full Time Equivalent
23. GDP Gross Domestic Product
24. GPSSBC General Public Service Sector Bargaining Council
25. GSP Growth Support Programme
26. HDE Historically Disadvantaged Enterprises
27. HRD Human Resource Development
28. IATA International Air Transport Association
29. ICD Independent Complaints Directorate
30. IDPs Integrated Development Plans
31. IFTM International French Travel Market
32. IGTM International Golf Tourism Market
33. IMG International Marketing Group
34. IPAP Industrial Policy Action Plan
35. ITB Internationale Turismus Borse
36. KPI Key Performance Indicator
37. KZN Kwa-Zulu Natal
38. LGTD Local Government Tourism Development
39. M&E Monitoring and Evaluation
40. MINMEC Ministers and Members of Executive Council
41. MoU Memorandum of Understanding
42. MSP Master Systems Plan
43. MTEF Medium – Term Expenditure Framework
Acronyms and Abbreviations
Acronyms and Abbreviations
152152
44. NBI National Business Initiative
45. NBT National Business Trust
46. NDT National Department of Tourism
47. NGP National Growth Path
48. NHFC National Housing Finance Corporation
49. NMSRT National Minimum Standards for Responsible Tourism
50. NRF National Revenue Fund
51. NTCE National Tourism Careers Expo
52. NTIG National Tourism Information Gateways
53. NTSS National Tourism Sector Strategy
54. NVIF National Visitors Information Framework
55. NYCTP National Youth Chefs Training Programme
56. OECD Organisation for Economic Co-operation and Development
57. PAA Public Audit Act
58. PFMA Public Finance Management Act
59. PGDSs Provincial Growth and Development Strategies
60. PMDS Performance Management Development System
61. PPP Public Private Partnerships
62. PPPFA Preferential Procurement Policy Framework Act
63. RETOSA Regional Tourism Organisation of Southern Africa
64. SAA South African Airways
65. SABS South African Bureau of Standards
66. SACA South African Chefs Association
67. SADC Southern African Development Community
68. SADCSTAN Southern African Development Community Standardisation
69. SAGTA South African Golf Tourism Association
70. SANAS South African National Standards
71. SAPS South African Police Services
72. SAT South African Tourism
73. SCM Supply Chain Management
74. SCOPA Standing Committee on Public Accounts
75. SER Service Excellence Requirements
76. SETA Sector Education and Training Authority
77. SITA State Information Technology Agency
78. SMMEs Small, medium and micro enterprises
79. SRI Social Responsibility Implementation
80. TBCSA Tourism Business Council of South Africa
81. TEP Tourism Enterprise Partnership
82. TGCSA Tourism Grading Council of South Africa
83. THETA Tourism, Hospitality and Sport Education Training Authority
84. TOPS Threatened or protected species
85. TR Treasury Regulations
86. UA Universal Access
Acronyms and Abbreviations
Acronyms and Abbreviations
153153
87. UNFCCC United Nations Framework Convention on Climate Change
88. UNWTO United Nations World Tourism Organisation
89. VIC Visitor Information Centres
90. WEF World Economic Forum
91. WSP Workplace Skills Plan
92. WSSD World Summit on Sustainable Development
93. WTF World Tourism Forum
94. WTM World Travel Market
95. WTTC World Travel and Tourism Council
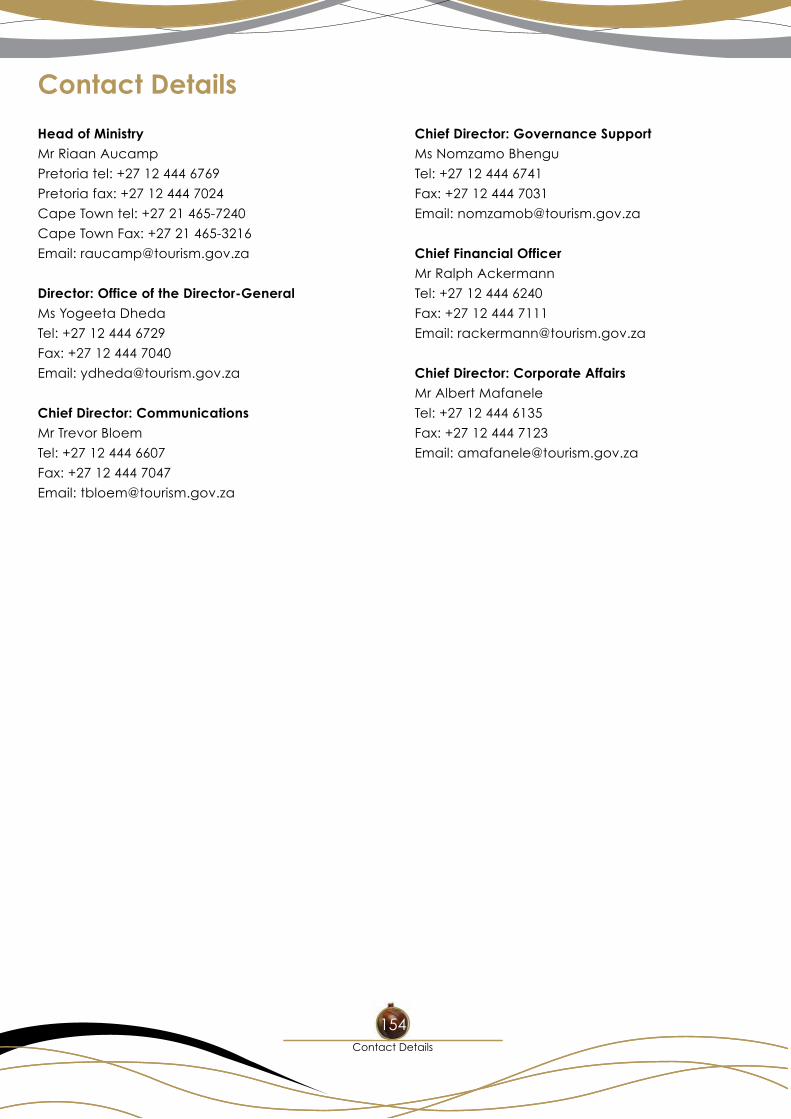
Contact Details
Contact Details
154154
Head of Ministry Mr Riaan Aucamp
Pretoria tel: +27 12 444 6769
Pretoria fax: +27 12 444 7024
Cape Town tel: +27 21 465-7240
Cape Town Fax: +27 21 465-3216
Email: [email protected]
Director: Office of the Director-GeneralMs Yogeeta Dheda
Tel: +27 12 444 6729
Fax: +27 12 444 7040
Email: [email protected]
Chief Director: CommunicationsMr Trevor Bloem
Tel: +27 12 444 6607
Fax: +27 12 444 7047
Email: [email protected]
Chief Director: Governance SupportMs Nomzamo Bhengu
Tel: +27 12 444 6741
Fax: +27 12 444 7031
Email: [email protected]
Chief Financial OfficerMr Ralph Ackermann
Tel: +27 12 444 6240
Fax: +27 12 444 7111
Email: [email protected]
Chief Director: Corporate AffairsMr Albert Mafanele
Tel: +27 12 444 6135
Fax: +27 12 444 7123
Email: [email protected]

Notes

Notes
Department of Tourism
Tourism Call Centre Number: 0860 121 929
Tourism Call Centre Email: [email protected]
Switch board Number: (012) 444 6000
Website: www.tourism.gov.za
Physical Address (Head Office Pretoria)
Tourism House 17 Trevenna Street, Sunnyside
Postal Address: (Head Office Pretoria)
Private Bag X424, Pretoria 0001
RP: 259/2012
ISBN: 978-0-621-41171-3