Embed Size (px)
Citation preview

Annual Report 2011


Content
Address by the Chairman of the VUB Supervisory Board 2
Address by the Chairman of the VUB Management Board 3
VUB Management Board Report on the business activities of the Company 6
Development of the External Environment 6
VUB’s 2011 Commercial Performance 10
Review of the Economic and Financial Position of VUB 14
Information on the Expected Economic and Financial Situation for 2012 16
Structure of VUB Shareholders 17
Subsidiaries with VUB majority stake 18
Statement on Compliance with the Corporate Governance Code 20
Basic indicators 27
Consolidated fi nancial statements 28
Separate fi nancial statements 107
Information on Securities issued by the Bank 182
List of VUB Retail Branches 184
List of VUB Corporate Branches 190
Organization Chart of VUB as at 31 December 2011 192

2
Address by the Chairman of the VUB Supervisory Board
Dear Shareholders, Clients and Business Partners, Employees
VUB has had a successful year in 2011. The Bank has managed to further strengthen its position on the core credit and deposit markets, and at the same time further improve its already outstanding profi tability and cost effi ciency. Even when judged by independent outside observers, VUB’s superior performance clearly stands out. In particular, the fi nancial magazine Global Finance ranked VUB bank as the safest bank in Central and Eastern Europe. On behalf of the Supervisory Board, I would like to thank the management and employees for these excellent achievements.
The year 2011 marked an anniversary, as for VUB it has been the tenth full year under the strategic ownership of Intesa Sanpaolo. During these ten years, VUB has undergone tremendous changes that have turned
the Bank completely around to become an undisputed leader on the Slovak market, as well as among its Intesa Sanpaolo sister banks. Looking at our common 10-year journey, I see evolution and progress. In terms of size, for example, the loan book of VUB has nearly quadrupled over this time period. In terms of effi ciency, the cost-to-income ratio has improved from levels close to 75% to the current 43%. In terms of quality, I now see a modern distribution network, with well accessible branches, and friendly and competent personnel for whom superior service to clients is the utmost priority. Finally, I would like to mention the value VUB creates for its stakeholders and society as a whole. Indeed, I now see a well-respected institution, an upstanding corporate citizen, who respects rules, and with a deep sense of responsibility promotes sustainable development and the cohesion of the community in which it operates.
Looking ahead, a diffi cult year 2012 is in front of us. Distress on the fi nancial markets and the euro debt crisis undermine the Eurozone’s growth prospects. Although the outlook for Slovakia’s key trading partner, Germany, appears relatively positive, other trading partners are sliding into recession, which inevitably worsens its own growth prospects and
the operating environment for banks in Slovakia. Still, I remain an optimist. Our successful common 10-year partnership has revealed the talent and dedication of VUB management and employees in the good as well as less benign times. I am confi dent that with the continued trust of its clients and business partners, VUB will continue to deliver and fi rmly remain the best bank in Slovakia.
György SurányiChairman of the Supervisory Board
2

3
Dear Shareholders, Clients and Business Partners,
VUB has had a successful year in 2011. We have outgrown the market in banking assets, and improved our share of both the credit and deposit markets. We have also continued to deliver fi ne results in terms of profi tability and effi ciency, our long standing strengths. VUB has been presented with the prestigious award for the best banking institution in Slovakia by the magazine Trend for the third year in a row. And independent customer surveys again ranked VUB as the number one in Slovakia for customer satisfaction. This tells best of the professionalism, daily commitment and enthusiasm of VUB’s employees in the front line. Indeed, it is thanks primarily to our VUB staff that I can present in this report the great results we have achieved also this past year.
Before doing so, let me start with a brief overview of the external environment. The year 2011 as a whole was benign for the Slovak economy and banking industry. The positive momentum, however, has been slipping as the year was coming to a close. Indeed, in the full year, real GDP expanded by about three percent, but this growth owed primarily to the solid fi rst half of the year. In the latter part of 2011, the weight of the Eurozone debt crisis and uncertainty about global growth prospects also grounded the small, open Slovak economy. Hence, while in the fi rst year half fi rms’ profi ts, investments, and jobs all posted positive increments, in the second half, these positive trends reversed. In particular, by end-2011, twenty thousand more people had registered with labor offi ces than a year ago. Resumed increase in unemployment unsettled job security once again, affecting households’ demand for consumer durables and housing. In contrast to buoyant demand for mortgage loans in the fi rst half of the year, the latter part thus saw the market nearly stall.
Looking at developments in the banking sector through numbers, I notice an acceleration in loan growth, from 5% a year ago to 9%, well distributed among retail and corporate sectors. Deposit growth, on the other hand, slowed down markedly, to less than 2% from 6% in 2010. In volume terms, the increase in primary deposits amounted to a mere quarter of new loan volume. Constricted liquidity is a new development in Slovakia, as loan growth in past years was funded almost solely by primary deposits. The slowdown in deposit volume in 2011 owed to the corporate and public sectors, which drew down funds from the banks as their own fi nancial situation began to worsen in the latter part of the year. Households, on the other hand, were still able to grow their deposits with the banks at a solid 7% rate. This growth, however, was achieved partially at the expense of the mutual funds industry, which saw assets under its management plunge by 16% – the result of the turmoil on the global fi nancial markets erupting in the summer. Taken together, growth of household deposits and mutual fund assets halved compared to a year earlier, to just 3%.
Address by the Chairman of the VUB Management Board
3

4
Against this backdrop, VUB did well. We were able to outgrow the market in primary deposits, loans and assets volume overall. To be sure, however, while fi ne overall, our commercial results continue to vary by segments. As liquidity became the top priority for the banking industry, the market remained especially tough on the household deposit front, in which we were losing position at the beginning of the year. Later on, however, we adopted several corrective measures and were able to turn the tide, ending the year 2011 with 17.2% market share of household deposits, the same as in 2010. On the corporate deposit front, we improved our market share to 18.7%, from 17.3% a year ago. This increase, though, owes primarily to rather volatile public and fi nancial sector deposits. In the more stable, but recently contracting deposit market of nonfi nancial fi rms, we saw our position worsen and market share decline. A similar statement holds true for our asset management arm, which saw its share of the market – contracting in volume terms – decrease. Overall though, we held 18.0% share of the combined volume of primary bank deposits and assets under management at the end of 2011, up from 17.7% a year earlier.
Our activities in managing personal fi nancial assets in Slovakia extend also to pension savings, in which we are active together with our joint venture partner Generali Slovensko. Also in 2011, we managed to deliver to our almost 200 thousand clients the highest increase in the value of their pension assets of the operators on this market. By year end, their assets under our management grew 24%, accounting for a stable 14.5% market share.
On the loan market, we utilized our healthy fi nancial position and continued to improve our market share steadily, to 18.7%, from 18.0% in 2010 and 17.6% in 2009, respectively. The improvement in 2011 though owed solely to our corporate banking arm, which saw its loan book on the Slovak market increase by one fi fth, outgrowing the sector nearly three times. As a result, our share of credit extended to nonfi nancial fi rms thus increased from 15% in 2010 to 16.6%, a record high in the post-privatization era of VUB. Importantly, besides SMEs we were able to grow loan volumes in the segment of large corporate clients, unlike the previous two years. On the retail market, to be sure, we also continued to grow volumes, expanding evenly both mortgages and consumer loans, by 10% each. The market, though, grew even faster and thus pulled our share of bank loans extended to households down a bit, from 23.6% at the end of 2010 to 23.0%. Unlike our main competitors, though, besides banking loans we expanded on the consumer fi nance market also via our specialized subsidiary Consumer Finance Holding, which increased its loan book by 9% and further established itself as the market leader in this segment. Last but not least, on the group level, we managed to grow nicely the volume of leased assets via our leasing subsidiary, VUB Leasing, which improved its share of the relevant market to 8.5% from 7.3% a year ago.
In terms of fi nancial results, on the consolidated basis the VUB Group in 2011 grew net operating margin by 9% and total operating costs by 4%, respectively. Our the cost-to-income ratio thus fell from 46% in 2010 to an all-time low of 45%. On the group level, we generated net operating profi t of € 289.6 million, 9.3% more than a year ago. After adjustment for provisions, impairment losses, and income tax, the Group posted in the year 2011 net profi t of € 176.9 million, 17.7% more than a year earlier.
In addition to the quantitative results, I would also like this year to turn your attention to our efforts to transmit the principles of Corporate Social Responsibility (CSR) in the business community in Slovakia. As you will read in our 2011 CSR Annual Report attached to this Financial Report, there is a lot be proud of in this area too. Equally important is the fact that VUB is a pioneer in using the Global Reporting Initiative Standards in CSR reporting, and our Bank is still the only fi nancial institution in Slovakia that adheres to such a commitment.
Looking ahead, 2012 appears an exceptionally diffi cult year for the banking industry. Uncertainty runs high. On the macro front, economic slowdown will pose a challenge, but a relatively predictable one for which banks can prepare. Much less predictable and manageable appears the uncertainty related to the political interference in the banking industry and regulatory zeal, driven in particular by the still unresolved sovereign debt crisis in Europe. As to the Slovak political environment, the government decided to charge banks operating in Slovakia an additional levy. Originally aimed to siphon € 50 million cash from the banks, the effective tax is now double that amount and even a further increase is fl agged in the future. Taxing bank deposits on one hand and asking banks to strengthen their capital on the other may be counter-
Address by the Chairman of the VUB Management Board
4

5
productive. Furthermore, the tax, basically a levy on wholesale funding, threatens to undermine the stability of the corporate deposit base just at a time when liquidity is becoming an issue also for the Slovak banking sector. Against this backdrop, previously agreed growth targets will have to be carefully monitored and reassessed.
To close the speech, I would like to thank our employees for their commitment, hard work, and great results of 2011. I also would like to thank VUB clients and business partners for the trust they hold in the Bank, and the shareholders for their support. Clearly, the year 2012 will be extremely challenging. I nonetheless fi rmly believe that the VUB team will continue to deliver the best possible performance for the benefi t of our clients.
Ignacio Jaquotot CEO and Chairman of the Management Board
Address by the Chairman of the VUB Management Board
5

6
Development of the External Environment
External Environment
For the Slovak economy, the year 2011 was a year of two halves. The fi rst half continued the positive growth momentum from late 2010, which allowed the overall economic output to surpass its pre-crisis peak. Firms’ profi ts, investments, and, importantly, number of jobs all continued to post positive increments. The ongoing recovery of the real economy lifted the volumes of both bank deposits and loans sizably in the fi rst half of the year, allowing banks to deliver healthy improvements in revenues and profi tability.
Unfortunately, the positive momentum did not last through the second half of 2011. Sentiment turned sour as fi nancial markets froze over the lingering euro periphery debt crisis. Increased uncertainty induced many fi rms and households to postpone investment decisions. The threat of renewed recession in the Eurozone led to a marked slowdown of export orders for manufacturing – the backbone of the Slovak economy. Profi tability of fi rms stopped improving and unemployment began to rise again. These developments have in the second half of 2011 slowed demand for credit down, and stalled primary deposit creation.
In terms of interest rates too, the year was split into opposite halves. The fi rst half saw offi cial interest rates set by the ECB increase by 50 basis points as infl ation picked up. In contrast, the second half saw offi cial rates fall back the same 50 bps as downside risks to the Eurozone economy began to materialize. In terms of long-term yields, Slovakia, thanks to its relatively still low indebtedness, was lucky to be spared investor concern and actually saw its 10-year government bond yields decline slightly in the fi rst half the of year. In the latter part of the year, however, bonds were sold off as investors saw the risk of fi scal slippage increase due to the government break-up in October, and the abandonment of agreed budget plans thereafter. As a result, 10-year yield Slovak sovereign bonds yielded 4.7% at the end-2011, compared to 4.1% a year ago.
Evaluating the year as a whole, the cumulative result of its two dichotomous halves for the banking sector was actually not entirely negative. GDP increased over 2010 by about three percent in real terms and nearly fi ve percent in nominal terms, respectively. Volumes of bank loans increased by 9%, and volumes of leased assets, spurred by investments in green energy, by 14%, respectively. Volumes of primary deposits increased over the previous year too, albeit only at a rate of less than 2%. Growth of loans was refl ected in revenues, which for the whole banking sector increased last year by 11%. Banks meanwhile continued to control their costs, allowing them to increase by a mere 1% over the year. As a result, the cost-to-income ratio of the banking sector decreased below 50% for the fi rst time ever. The operating profi t and net profi t of the Slovak banking sector increased in 2011 over 2010 by a quarter and a third, respectively, in absolute terms both reaching record levels.
VUB Management Board Report on the business activities of the Company
6

7
VUB Management Board Report on the business activities of the Company
Outlook 2012
The outlook for 2012 is exceptionally uncertain. Several Eurozone countries are sliding into recession, which will weigh heavily on the export-dependent Slovak economy. It appears that our key trading partner, Germany, may sustain positive growth. This could help to maintain positive real GDP growth also in Slovakia, albeit at a slow 1% rate. At this forecast growth rate, though, the unemployment rate will continue to increase, which will impact negatively on household confi dence and demand for fi nancial products. Corporates, with a few exceptions such as car manufacturers, appear cautious to expand. Several sectors linked to domestic demand, such as construction and retail trade, have been contracting now for three years and there appears little chance of a turnaround soon. For the banks, besides a slowing economy, the year 2012 is also bringing new regulations governing capital adequacy and liquidity, as well as a special bank levy. Against this background, any growth expectations for the banking sector have to be scaled down or even revised.
7

8
-6
-4
-20
2
4
6
810
12
14
1Q00
4Q00
3Q01
2Q02
1Q03
4Q03
3Q04
2Q05
1Q06
4Q06
3Q07
2Q08
1Q09
4Q09
3Q10
2Q11
0,50
1,50
2,50
3,50
4,50
5,50
XI-07
II-08
V-08
VIII-08
XI-08
II-09
V-09
VIII-09
XI-09
II-10
V-10
VIII-10
XI-10
II-11
V-11
VIII-11
VUB Management Board Report on the business activities of the Company
8
Real GDP growth (% y/y)
3M Euribor and ECB’s refi rate
Euro area
3M Euribor
Slovakia
EU Refi rate

9
6
8
10
12
14
16
18
I-03
VII-0
3
I-04
VII-0
4
I-05
VII-0
5
I-06
VII-0
6
I-07
VII-0
7
I-08
VII-0
8
I-09
VII-0
9
I-10
VII-1
0
I-11
VII-1
1
20
24
28
32
36
40
44
I-07
V-07
IX-07
I-08
V-08
IX-08
I-09
V-09
IX-09
I-10
V-10
IX-10
I-11
V-11
IX-11
VUB Management Board Report on the business activities of the Company
9
Registered unemployment rate (%)
Development of bank volume (EUR bn)
Deposits Loans

10
VUB Management Board Report on the business activities of the Company
VUB’s 2011 Commercial Performance
The previous year was infl uenced by economic growth slowdown, along with infl ation pressures and growing fears of the potentially returning crisis. Especially the second half of the year was an extraordinarily turbulent period, with the fi nancial markets, exhibiting intensive uncertainty as investors were facing the issue of Eurozone countries’ capability to curb their fi scal debts. For VUB as well as the whole banking sector in Slovakia, the key point was the impact of such developments and the respective expectations on the loan and deposit markets. Due to the increased risk of further economic contraction, the key interest rates on fi nancial markets remained unchanged as the historically lowest, while interest rates on customer loans followed the similar development in turn. On the other hand, interest rates on customer deposits were going up in line with increasing demand of banks for these funds. The attention of banks was concentrated on the collection of stable funding through deposits as the most appreciated funds for business growth. As a result, there was fi erce competition since demand of banks exceeded the supply of customers’ savings. Owing to a suitably chosen strategy, VUB Bank managed to achieve successful performance.
Also, the mortgage market was marked by uncertainty as banks were behaving more prudently and cautiously. Although demand on the real estate market and mortgage loans rose as well in the fi rst half of the year, the new production of such loans began to stagnate as the year end was coming closer. Interest rates on mortgages started to go up slowly due to rising liquidity costs having an impact on demand for mortgages. Unlike the rest of the market, VUB was focused on mortgage lending funded by mortgage backed bonds, while we sustained the position of the leader in this kind of market and increase market share to 46.5% from 44.1%. Despite underperforming the market in other housing loans, VUB remained the biggest mortgage lender on the market.
By contrast, consumer lending posted a better performance in 2011 than one year ago. It seems the effort of households to maintain required consumption behaviour was at the back of higher consumer loan demand. In parallel, this unsecured lending priced by higher margins was one of the most attractive channels to gain higher income, in turn. As a result, consumer loans grew faster last year. In contrast, overdrafts and credit card loans shrank over the year due to lower demand. Also in VUB, the pace of the consumer loans’ growth accelerated. However, it was below the market due to a more prudential approach compared to the competition as a whole. In addition, we have retained one of the lowest default rates on the market.
The corporate segment of the loan market exhibited quite solid performance, though the macroeconomic development uncertainty was threatening fi rms. Corporate profi t growth deceleration along with the fall of the confi dence of the industry had no signifi cant effect on corporate loan demand. As regards corporate loan growth, the basically picked up from the low bottom of 2010. And only VUB bank achieved remarkable results in corporate lending, posting almost three times stronger growth than the market, notably thanks to the segment of large corporations. Undoubtedly, this improvement stems from the Bank’s corporate culture, laying emphasis predominantly on the satisfaction of clients with the quality of service provision and the enhancement of their trust. To make a breakthrough in a market marked by fi erce competition has required an ever greater focus on the client.
At VUB Bank, the customer approach is an intrinsic strategic priority within the joint project with our parent company Intesa Sanpaolo: “Listening 100%“ with the basic goal of further enhancing customer service. Therefore, the Bank continued to further improve its processes, innovating products, redesigning its broad business network consisting of 207 retail, 32 corporate branches, and 11 mortgage centres, and developing its alternative distribution channels. Evidence of a successful business policy is the winning of several awards in various categories of the Golden Coin competition in 2011. And last but not least, VUB was awarded by TREND, the local economic magazine, as the Bank of the Year for the third time in a row.
Deposits
The volume of bank deposits in VUB at the end of 2011 amounted to EUR 7.5 bn, 3% up against the previous year, mainly fuelled by retail deposits as well as those from fi nancial institutions and non-residents. Higher saving rate of individuals and mainly attractive interest rates on term deposits was refl ected on the retail
11
VUB Management Board Report on the business activities of the Company
deposit market. Deposits of retail clients, i.e. individuals and sole traders, increased in VUB Bank by more than 6%, i.e. only marginally less than the whole market, which was dominated by aggressive price competition. Notwithstanding, VUB managed to maintain its market share in retail deposits at 17.5%. However, extremely turbulent fi nancial markets affected mutual funds very promptly and heavily. Deteriorated expectations and redemptions of mutual funds caused the net asset value of the funds managed by our subsidiary VÚB Asset management, správ. spol. to fall by 25% over the year. Nevertheless, thanks to a higher demand of individuals for term deposits because of more attractive interest rates on such deposits, most of the mutual funds’ decline was switched into term accounts. Thus, the market share in total deposits received from retail clients including mutual funds amounted to 17.5%, i.e. 0.4 percentage point lower than one year ago.
It appears that the slowdown of the economy and worries about slipping into recession undermined confi dence indicators and caused corporate deposits to shrink by 1% over the year, in turn, notably in the segment of small and medium enterprises. Large nonfi nancial corporations’ deposits overall even grew by 1.5% last year. The loss of the funds of nonfi nancial corporations was more than compensated by the increase of deposits from fi nancial institutions by a robust 25%. Market share in the whole corporate (nonfi nancial and fi nancial institutions) deposits jumped to 18.7% from 17.3% over the year.
Electronic Banking
In 2011, VUB Bank continued to improve the quality of its non-stop banking services, including Kontakt Service, Internet Banking, Internet Banking Plus, Mobile Banking and Business Banking.
As at 31 December 2011, the Bank had over 737,000 clients with activated electronic banking services. Compared to 2010, we posted a growth in the number of clients with activated services of non-stop banking, and an increase in the number of transactions performed through electronic channels by more than 34%.
Last year the security of non-stop banking services in the area of Internet Banking Plus was enhanced by an improvement of the special encryption algorithm. Also, SMS authorization was enabled as a way of payment confi rmation through the Kontakt Service also including foreign phone lines. The system of answers to client questions, as well as the system of receiving a new feedback form from customers within the Internet Banking was improved and is much faster.
In the Contact Centre, we handled nearly 1 million calls (inbound and outbound) and 42,000 e-mails. Based on these data it is apparent that the trend of preferring email communication went on continued further. We kept specializing operators in specifi c product fi elds to be able in order to meet customer requirements by phone or email so that they could receive complete information in one place. In addition, new technology was implemented in the Contact Centre last year.
In 2011, we were focused on new selling activities directed to customers without the need to visit a branch of the bank. There are intensions to continue this way and extend the portfolio of services and products being able to arrange without visiting a branch.
The Contact Centre also deals with the intermediation of customer requirements being processed in branches. In this fi eld, growth of almost 50% was posted in 2011.
Bank Cards
Last year VUB was among the fi rst banks, that started to sell the non-embossed debit payment card known as Bratislavská mestská karta to the residents of the capital city Bratislava in association with the city. This multi-function card is an international payment card, as well as an identifi cation card with chip technology serving as an electronic wallet in public transport or library card and bringing many benefi ts and discounts on public services provided in Bratislava. This card is issued in VUB without any fee and its main benefi t is a discount on public transport.

12
VUB Management Board Report on the business activities of the Company
Another new common card issued by VUB bank within the whole Intesa Sanpaolo Group called VISA Inspire is a non-embossed international contactless debit card bringing simpler and faster payments. The main benefi t is no fee for cash withdrawals in the ATMs of Intesa Sanpaolo abroad, including countries such as Albania, Bosna and Herzegovina, Egypt, Croatia, Hungary, Romania, Russia, Slovenia, Serbia, Italy and the Ukraine.
We continued improving the quality of our services and adopted full (100%) encashment referring to other credit cards such as MasterCard and American Express. So far this kind of service was linked to American Express Gold and corporate credit cards.
VUB also started to issue the new international embossed payment card called VISA Euro 26 in association with travel agency CKM SYTS and is offered to students and young people up to 26 years old. The specifi c feature is that this payment card also provides the benefi ts of the traditional card Euro 26, and monthly fees instead of an annual fee are imposed on such card.
As of the end of 2011, VUB’s market share in the number of ATMs amounted to 23.3 % with 560 ATMs, while 6 of them were absolutely new ones placed in new locations and 10 were replaced. At the same time, 52 old ATMs were exchanged for new ones. In addition, all ATMs started to offer new services, i.e. credit renewal for cards known as Funfón and Disney.
Also, higher security for setting PIN code when using ATMs was implemented last year as new more secure screens were installed with a new anti-skimming technology giving instructions on how to safely set the PIN code.
A total number of 1,664 new EFT POS terminals was installed for business customers during the year 2011. VUB’s market share posted 20.2 % at the end of the year, with the total number of EFT POS terminals amounting 7,689, while 24% share on the market was achieved in the volume of transactions made through these terminals.
Loans
Individuals – Mortgage and Consumer Loans
After a year of solid growth, uncertainty returned to the mortgage market-weighing down development of market demand and supply. While the increasing trend continued in the fi rst half of the year, the growth came to a halt. There was no room to achieve the excellent results from 2010 since liquidity sources started to become considerably expensive. In turn, it was refl ected by lower performance in mortgage lending than one year ago. Total mortgages (including 'American mortgages') grew by 10% compared to 13% on the whole market. With a market share exceeding 25%, the Bank kept its strong position on the mortgage loan market. In addition, we continued to outperform the rest of the market separately in typical mortgages with mortgage backed bonds’ funding. Thanks to the successful sale of Flexi mortgages amounting to EUR 549 million, VUB increased market share in mortgages provided to households by 2.4 percentage points to 46.5%. A similar trend was followed by consumer loans. Due to remarkably higher demand, consumer loan growth in VUB accelerated to 9% from 7% one year ago, while EUR 550 million of Flexiloans were extended to households. In addition, the new production of Flexiloans posted growth of 25% compared to 13% one year ago, while the number of contracts rose by 14% last year. In contrast to these quite successful results, the market position of the Bank has weakened by approx. 1%. However, we still keep the position of the second largest bank in terms of consumer fi nance on the Slovak market with 25% market share. Besides, our subsidiary Consumer Finance Holding separately provided consumers with EUR 262 million, i.e. almost 9% more than a year ago, which represents a slight recovery (7% in 2010).
Corporate Finance
Last year, VUB bank successfully benefi ted from the increase of corporate loan demand continuing on further. While corporate loans grew by 7% on the market, the pace of growth even posted 20% in VUB

13
VUB Management Board Report on the business activities of the Company
thanks mainly to the lending to large corporations with growth of 19.5% over the year. As a result, VUB’s market share in loans to nonfi nancial corporations went up to 17% from 15%. Project fi nance as well as real estate and trade fi nance loans accounted for such improvement. In parallel, loans to small and medium enterprises grew by a solid 8% over the year. Moreover, lending to municipalities is worth a mention since the bank strengthened its position to nearly 12% from 7% one year ago, or just 4% before. On the other hand, VUB Leasing, another VUB subsidiary, achieved solid performance on the leasing market with the growth of leasing assets by a robust 27% compared to the drop of 5.5% one year ago.
Domestic and International Payments
Throughout 2011, VUB Bank mediated domestic payments in the volume approaching nearly EUR 59 bn, and international payments in the volume of nearly EUR 19.5 bn, maintaining a signifi cant market position in the fi eld of payment services provision. While in domestic payments VUB Bank reached a market share at 17%, in international payments the bank mediated 9% of all payments performed in the banking sector.

14
VUB Management Board Report on the business activities of the Company
Review of the Economic and Financial Position of VUB
For 2011, the Bank set itself a target of sustaining its leading position in the banking sector and continuing the trend of increasing its profi tability and effi ciency, which it effectively managed to meet. At a time of fragile economic growth undermined by infl ation pressures and growing fears for its further development brought by more serious problems about the upcoming debt crisis in Eurozone, VUB became one of the most profi table banks on the Slovak market. While the operating income of the VUB Group grew by nearly 7%, total operating costs rose by 4%. The increase in profi tability was thus mainly driven by revenues, mostly net interest income increased by 8.7%. The net fee and commissions income growth by almost 1% together with other income from banking activities overall, which was higher by 3% than a year ago, contributed to the profi t growth only marginally. The Group closed the year ending 31 December 2011 with a consolidated operating profi t before impairment based on IFRS up by more than 9% compared to the previous year, and its effi ciency kept improving over the year, when its cost-income ratio was cut below 45% from the 46% one year ago.
The stronger fi nancial condition of the VUB Group, i.e. including VUB bank and its subsidiaries stems from its successful performance on the market, even though last year’s progress still remained somehow limited. There was a greater opportunity in terms of increased loan demand, especially in the fi rst half of 2011, the scope for potential growth was fi nally narrowed as banks in general were short on the funding side, missing particularly supply of the most liquid deposit funds from customers as it was required for faster business growth. As a result, slower total asset growth was on the market as well as in VUB in 2011 than one year ago. In this context, VUB’s consolidated assets overall grew by 3.5% compared to 9% in 2010, outperforming the market, and having increased the market share in total assets to 19% from 18.7% over the year. The key effort of that time was to maintain high bank liquidity as well as resilience against the potential adverse impact of external environment could not be achieved together with more robust growth as well. Moreover, uncertainty on fi nancial markets concerning future development in the Eurozone brought an impact on the Slovak bank market during the second half of the year, as the expectations of banks primarily as well as of households and fi rms worsened, affecting credit standards and loan demand. Nevertheless, VUB even managed to obtain customer loans growth of nearly one third faster than one year ago. The largest kind of assets with a share of 65% on the balance sheet overall went up by almost 13% in 2011 against 10% one year ago. We also successfully outpaced the competition as a whole and increased market share in this fi eld by 0.7 percentage point to 18.7%. Since there was substantially weaker growth in funding, mainly customer deposits, faster growth of customer loans was derived from a re-allocation of other assets. This refers to the decline of securities’ investments unexpectedly getting bad due to turmoil on the fi nancial markets. However, VUB managed to adjust and outperform the market in customer loans and total assets growth thanks to a well-tailored strategy. By this, VUB confi rmed its strong position on the Slovak market. At the same time, the nonperforming loan ratio was cut slightly more than the market average. Thus, VUB successfully kept maintaining one of the lowest key credit risk ratios, confi rming VUB as the bank with one of the highest credit portfolio qualities on the Slovak market. Undoubtedly, this was also driven by intensifi ed client-centered and an even more thorough approach to the satisfaction of clients’ fi nancial needs.
The Bank’s subsidiary, Consumer Finance Holding, which takes its share in the expansion of the loan portfolio by an ever increasing spectrum of retail clients, granted this year 8% more loans to households compared to growth of 2% a year ago and remained a leader on the consumer fi nancing market. On the other hand, VUB leasing, another VUB subsidiary, achieved solid performance on the leasing market with the growth of leasing assets by a robust 27% compared to a fall of 5.5% one year ago.
It seems the slowdown of economic growth in the second half of the year, as well as growing worries about its next performance caused by lost confi dence on the fi nancial markets about the ability of some Eurozone countries in fi scal troubles to curb their sovereign debt burden, were very quickly refl ected by the deposit market. As a result, a considerable deceleration of customer deposits emerged due to the slowing down of corporate profi t growth as well as the decline of real household incomes and savings. The VUB Group managed to increase customer deposits by 3% over the last year compared to 10% a year ago. However, VUB successfully strengthened its position on the deposit market with fi erce competition especially in the

15
VUB Management Board Report on the business activities of the Company
retail segment, to 18% from 17.4%. This improvement was driven by corporate deposits as we outpaced the market in deposits from fi nancial institutions and corporate non-residents. At the same time, deposits from nonfi nancial corporations and the public sector declined on the whole market as well as in VUB. On the other hand, although household deposits went up faster than one year ago, this growth came mostly from the redemption of mutual funds as a result of household savings reallocation. The volume of assets managed by VUB Asset Management at year-end of 2011 was up to one fourth lower than one year ago and amounted to EUR 683 million. The pension management company VUB Generali, d.s.s., which is a 50% subsidiary of the Bank, has been successful in maintaining its position in the pension saving market (14.5%), posting year-end assets under management of EUR 666 million.

16
VUB Management Board Report on the business activities of the Company
Information about the Expected Economic and Financial Situation for 2012
Slowdown of economic growth or even potential recession, stricter regulation of capital adequacy and liquidity, and the new bank levy are conditions that the banking sector as well as VUB will have to face in 2012. There is a very diffi cult year ahead of us marked by high uncertainty, hence the key point will be to achieve the best possible performance on the market. From year to year, increased competition requires a more thorough approach to clients, and better satisfaction with the Bank’s services is the direction the Bank plans to head. The already started-up joint project with the parent company ’Listening 100%’ is precisely aimed at improving the quality of services and ultimately also market shares, which remains the Bank’s priority for 2012. The key element for the Bank is to explore clients’ needs even deeper, being able to respond to them in the fastest and simplest way possible, and thus remain from the clients’ perspective the market leader. Higher trust of clients should also be achieved through the improvement of processes, product innovation, and the enhancement of the Bank’s distribution channels.
The strategic objective in the retail segment remains increasing the attractiveness of key products in the area of loans and deposits. In the interest of sustaining higher liquidity, the Bank shall continue to pay intensifi ed attention to demand for deposit products, mainly on the part of individuals. Even higher competitiveness of loan products in the retail market will also be decisive for the Bank.
The fi rst and foremost priority in corporate banking will be deposits and related cash management and payments. It is essential that the Bank maintains its position in the shrinking corporate deposit market. However, the Bank will focus on the corporate sector fi nancing as well, and aims to strengthen its position on the corporate loan market.
The default risk could go up subject to the actual economic development, hence signifi cant emphasis will be laid on risk management and the further improvement of its quality also next year.
Last but not least, an important task will be sustaining the effi ciency achieved in control and support functions and processes. Also in 2012, the Bank’s aim will be to keep the cost-income ratio under control and thus remain one of the most effi cient banks in the sector.
The year 2012 will be marked by extreme uncertainty in terms of economic development and fi nancial markets, thus forcing VUB to monitor and potentially also review its planned fi nancial targets. However, we expect a further increase in revenues and subsequently also profi tability, a goal towards which the Bank directs its business objectives and priorities.

17
VUB Management Board Report on the business activities of the Company
Structure of VUB Shareholders
Information regarding VÚB shareholders is published quarterly, within 30 days from the end of the relevant quarter. Below is the status as at December 31, 2011.
Structure by Owner Type Shares ths. EUR * Stake %
Intesa Sanpaolo Holding International S.A. – majority owner 416,876 96.764
Other legal entities 3,848 0.893
Individuals 10,095 2.343
TOTAL (Registered Share Capital of VÚB, a.s.) 430,819 100.00
Structure by Nationality Shares ths. EUR * Stake %
Intesa Sanpaolo Holding International S.A. – majority owner 416,876 96.764
Domestic shareholders 12,507 2.903
Other foreign shareholders 1,436 0.333
TOTAL (Registered Share Capital of VÚB, a.s.) 430,819 100.00
* Shares (EUR) mean a value of held shares of VÚB, a.s. expressed in the nominal value of euro multiplied by number of held
shares.
There were 43,486 shareholders as at December 31, 2011. Foreign VÚB shareholders come from the following countries: Luxembourg (96.764%), the Czech Republic (0.127%), Germany (0.077%), Switzerland (0.074%), Austria (0.049%), the United Kingdom (0.004%), U.S.A. (0.002%), Canada, Romania, Poland and Cyprus.

18
VUB Management Board Report on the business activities of the Company
Subsidiaries with VUB majority stake
Consumer Finance Holding, a.s.Registered offi ce: Hlavné nám. 12, 060 01 Kežmarok
Shareholders: VÚB, a.s.
VÚB stake in registered capital: 100%
Core business: Non-banking loans
Tel: +421 52 787 6710
Fax: +421 52 786 1764
General Manager: Ing. Jaroslav Kiska
VÚB Asset Management, správ. spol., a.s.Registered offi ce: Mlynské nivy 1, 820 04 Bratislava
Shareholders: VÚB, a.s.
VÚB stake in registered capital: 100%
Core business: Collective investments, Portfolio management
Tel: +421 2 5055 2839
Fax: +421 2 5055 2006
General Manager: Ing. RNDr. Marian Matušovič, PhD.
VÚB Leasing, a.s.Registered offi ce: Mlynské nivy 1, 820 05 Bratislava
Shareholders: VÚB, a.s.
VÚB’s stake in registered capital: 100%
Core business: Financial and operating leasing
Tel: +421 2 4855 3601
Fax: +421 2 5542 3176
General Manager: Ing. Miloš Bikár, PhD.
VÚB Factoring, a.s.Registered offi ce: Mlynské nivy 1, 829 90 Bratislava
Shareholders: VÚB, a.s.
VÚB stake in registered capital: 100%
Core business: Factoring and forfeiting
Tel: +421 2 5055 2784
Fax: +421 2 5055 2012
General Manager: Ing. Dušan Čižmárik

19
VUB Management Board Report on the business activities of the Company
Recovery, a.s.Registered offi ce: Mlynské nivy 1, 829 90 Bratislava
Shareholders: VÚB, a.s.
VÚB stake in registered capital: 100%
Core business: Administration and recovery of receivables
Tel.: +421 2 5055 2843
Fax: +421 2 5055 8635
General Manager: Ing. Dionýz Földes
VÚB Poisťovací maklér, s. r. o.The company voluntarily dissolved as of 22 December 2011 for the purpose of merger. As a result of a merger the company ceased
to exist on 1 January 2012. The successor company is VÚB Leasing, a.s.
Registered offi ce: Mlynské nivy 1, 820 05 Bratislava
Partner of the Company: VÚB Leasing, a.s.
VÚB Leasing, a.s. stake in registered capital: 100%
Core business: Brokerage activities in insurance
VÚB Leasingová, a.s. v likvidácii (in liquidation)The Company ceased to exist on 19 January 2011 following its voluntary de-registration from the Slovak Companies Register.
Registered offi ce: Dunajská 24, 812 38 Bratislava
Shareholders: VÚB, a.s.
VÚB stake in registered capital: 100%
Core business: Leasing business

20
VUB Management Board Report on the business activities of the Company
Statement on Compliance with the Corporate Governance Code
A. Company Organization
The structure of VÚB, a.s. bodies:
a) the General Meeting;b) the Supervisory Board;c) the Management Board.
General Meeting
The General Meeting is the main decision making body of VÚB, a.s. The General Meeting has the power to decide on issues that are in line with the mandatory provisions of legal regulations and VÚB Articles of Association.
The Ordinary General Meeting of the company was held on April 4, 2011. The shareholders at this meeting approved the 2010 Annual Report of VÚB, a.s., the 2010 Statutory Individual Financial Statements prepared in accordance with IFRS and Consolidated Financial Statements prepared in accordance with IFRS for a previous year as submitted by the Management Board of the bank. The shareholders also decided on distributing the profi t earned in 2010 in the amount of € 149,377,048 by dividends to shareholders in the amount of € 59,691,798 and by retained earnings in the amount of € 89,685,250.
Supervisory Board
Members of the Supervisory Board in 2011
György Surányi – Chairman of the Supervisory Board• Resident Regional Manager, International Subsidiary Banks Division, Intesa Sanpaolo, Italy
Fabrizio Centrone – Vice Chairman of the Supervisory Board • Head of Central Eastern Europe (CEE) Area Department, International Subsidiary Banks Division, Intesa
Sanpaolo, Italy
Adriano Arietti – Member of the Supervisory Board• Independent member
Antonio Furesi – Member of the Supervisory Board • Head of Coordination of VÚB Bank (Slovakia) and CIB Bank (Hungary) – International Subsidiary Banks
Division, Intesa Sanpaolo, Italy
Massimo Malagoli – Member of the Supervisory Board• Head of Planning & Control and Corporate Development Department – International Subsidiary Banks
Division, Intesa Sanpaolo, Italy
Jana Finková – Member of the Supervisory Board • Employee representative
Ján Gallo – Member of the Supervisory Board • Employee representative
Juraj Jurenka – Member of the Supervisory Board • Employee representative
21
The Supervisory Board is authorized to review the following issues, in particular:
a) Management Board proposal regarding termination of trading with the Company securities on stock exchange, and the decision on whether the Company should cease to operate as a public joint-stock company;
b) information by the Management Board on the major objectives related to the Company business management for the upcoming period, and expected development in VÚB assets, liabilities and revenues;
c) report by the Management Board on business activities and assets of the Company, with related projected developments.
Upon the Management Board’s proposal, the Supervisory Board approves the following documents:
a) any increase or decrease in the registered capital of VÚB, a. s.;b) any substantial change in the nature of VÚB business or in the way this business is executed, if not
previously approved in the business and fi nancial forecasts for the relevant year;c) the Charter of the Management Board, mainly specifying the distribution of powers and responsibilities
amongst the Management Board members, defi ning important fi nancial and business transactions of VÚB, important transfers of VÚB real estates, key acquisition and disposal of equity interests including those in commercial companies, co-operatives and other enterprises that shall be subject to approval by the Supervisory Board, as well as delegating powers to the lower management levels and assigning proxies;
d) compensation policy applied to the managing staff directly reporting to the Management Board and the Supervisory Board, members of the Management Board, and members of the Supervisory Board;
e) material benefi ts for the Management Board members and parties related to them;f) service agreements with Management Board members.
General
1. Supervisory Board members are elected by the General Meeting. The VÚB Management Board is elected by the Supervisory Board.
2. The below mentioned curricula vitae contain information on professional qualifi cation of Supervisory Board members and Management Board members in the area of fi nance and banking, as well as information on their practical experience serving as assurance for the effi cient management of the company.
3. All relevant information is available to all members of the Management Board and Supervisory Board in time. In the course of the fi nancial year 2011, the VÚB Management Board held 26 meetings (thereof 25 regular and 1 extraordinary) and adopted three decisions on a per rollam basis. The VÚB Supervisory Board held 4 meetings and adopted three decisions on a per rollam basis during the 2011 fi nancial year. Documents with detailed information are distributed suffi ciently in advance – in the case of the Management Board usually 3 working days, in the case of the Supervisory Board 2 weeks prior to the meeting, ensuring the ability of members of the Supervisory and Management Boards to decide individual matters competently. If necessary, presentations are delivered in support of individual documents.
4. Currently, none of the Supervisory Board members is a member of the VÚB Management Board nor holds any other top managerial position in the Bank. Save for members of the Supervisory Board elected by the VÚB employees, a Supervisory Board member may not be an employee of VÚB.
VUB Management Board Report on the business activities of the Company

22
Management Board
1. Management Board Members in 2011
Ignacio Jaquotot Chairman of the Management Board and CEOElena Kohútiková Member of the Management Board and Deputy CEO for SupportTomislav Lazarić Member of the Management Board and Deputy CEO for Business Domenico Cristarella Member of the Management Board (until July 19, 2011)Andrea De Michelis Member of the Management Board (since August 1, 2011)Daniele Fanin Member of the Management BoardJozef Kausich Member of the Management BoardSilvia Púchovská Member of the Management BoardAlexander Resch Member of the Management BoardAdrián Ševčík Member of the Management Board
Ignacio Jaquotot – Chairman of the Management Board and CEO of VÚB, a. s.
Mr. Jaquotot was appointed Chairman of the Management Board and CEO of Všeobecná úverová banka, a. s. in July 2007. Mr. Jaquotot’s career with Intesa Sanpaolo Group (formerly Banca Intesa) started in 1984. First he held the positions of Deputy General Manager and General Manager at the former Banca Commerciale Italiana branches in Madrid and Barcelona, respectively. In 1999, he went on to serve in South America as the General Manager in Banco Sudameris Uruguay, then Banco Sudameris Chile, and Banco Sudameris Paraguay. In Chile and Paraguay, he was involved in restructuring the banks’ operations and later assisted as the local coordinator for the sale processes of the banks.
Elena Kohútiková – Member of the Management Board and Deputy CEO for Support
Ms. Kohútiková was appointed as Management Board Member and Head of the Financial and Capital Markets Division in October 2006. Since March 2009 Ms. Elena Kohútiková was appointed Deputy CEO for Support and at the same time she ceased acting as the Executive Director of Financial and Capital Markets Division. The main responsibilities related to the position of Deputy CEO for Support are in the areas of Risk Management, Finance, Planning and Controlling, Payments, Information Technologies, Compliance, Legal Services and Operational Services. She ranks amongst the top experts on Euro introduction in Slovakia. In 1994 she became a member of the Bank Board of the National Bank of Slovakia. From 2000 until 2006, she held the position of Deputy Governor of NBS and was in charge of the monetary policy management, transactions in the free market, management of foreign exchange assets and risk management, management of the IT division and Research. Furthermore, she represented the Central Bank in the Economic and Financial Committee of the European Commission (EFC), acted as a member of the International Relations Committee (IRC) of the European Central Bank and Alternate Governor of NBS in both the Directorate General of the European Central Bank and the World Bank. She was also a member of the Committee for Economic Policy of OECD. Prior to her career of central banker, Ms. Kohútiková entered the banking sector by her engagement in the State Bank of Czechoslovakia during 1990 – 1993 after 8 years spent in research at the Institute of Economics of the Slovak Academy of Sciences in Bratislava where she started working in 1982.
Tomislav Lazarić – Member of the Management Board, Deputy CEO for Business
Mr. Tomislav Lazarić was appointed as Deputy Chief Executive Offi cer for business, new Member of the Management Board and Executive Director of Retail Banking Division in February 2009. He has been working in the position of the Executive Director until April 2000. Prior to his current affi liation with VÚB Bank, Mr. Lazarić acted as a Deputy Chief Executive Offi cer and a member of the Management Board of Privredna Banka Zagreb (PBZ), the second largest bank in Croatia. He was responsible for developing a comprehensive retail strategy including its implementation and also was in charge of coordinating SME customers and foreign market development. Before 1997, Mr. Lazarić headed the Research and Development unit in Raiffeisenbank Austria in Croatia, where he conducted retail banking research and analysis.
VUB Management Board Report on the business activities of the Company

23
Domenico Cristarella – Member of the Management Board and Executive Director of the Finance, Planning & Controlling Division (until July 19, 2011)
Mr. Domenico Cristarella was appointed Member of the VÚB Management Board and Executive Director responsible for the Administration, Accounting and Budget Control Division in December 2001. Mr. Cris-tarella came from Banca Commerciale Italiana (BCI) Milan Headquarters International Division, where since 1998 he had been in the position of Senior Manager responsible for budgeting and performance measurement for the whole foreign network of BCI (now Intesa Sanpaolo) – including subsidiaries, branches and representative offi ces. Mr. Cristarella spent most of his professional life with BCI. He originally started in the Turin Branch, which he joined in 1970. In 1976 he joined the HQ Organization Division and in 1978 he got his fi rst overseas assignment as Deputy Chief Financial Offi cer of BCI Singapore, following which he was consecutively appointed as Chief Financial Offi cer of BCI branches in Abu Dhabi, Tokyo and New York. In 1993 he was appointed manager in charge of budgeting and performance measurement for foreign subsidiaries and Chief Financial Offi cer of Comit Holding International, Luxembourg.
Andrea De Michelis – Member of the Management Board and Executive Director of the Finance, Planning & Controlling Division (since August 1, 2011)
VÚB, a.s. Supervisory Board appointed Mr. Andrea De Michelis for the position of the Management Board member and Chief Financial Offi cer on its 3rd meeting held on July 19, 2011.Mr. De Michelis has spent most of his professional life in the banking sector. Before starting working with VÚB he worked since 2007 for Bank of Alexandria, Cairo, Egypt as the Chief Financial Offi cer and Head of Accounting, Planning & Control. His responsibilities were focused mainly on preparation of Business Plans and Budgets, development of the Management Reporting, introduction of the Fund Transfer Pricing establishment of Cost Control, implementation of the new IFRS oriented Egyptian Accounting Standards.
During the period of 1989 and 2007 Mr. De Michelis worked for Inter-Europa Bank Rt. (IEB) Budapest, Hungary as the Executive Director – Head of Risk Management, Head of Planning and Control; Advisor to the Management Board for Banka Koper in Slovenia; Director and Head of Planning and Control and Accounting Sanpaolo for Wealth Management Milan Italy as well as for Sanpaolo IMI London Branch and Sanpaolo in Torino.
Daniele Fanin – Member of the Management Board and Head of VÚB Branch in Prague
In July 2008, the Supervisory Board of VÚB appointed Daniele Fanin, Head of the Czech Branch of VÚB since June 2008, as Member of the Management Board. The Prague-based operations of VÚB provide an extensive range of banking services to local and international corporations based in the Czech Republic. Daniele Fanin obtained a Law Degree (1982) and Political Sciences Degree (1987) both from the University of Padova. After his fi rst graduation in 1982 he started practising law with two legal fi rms specialised respectively in Civil and Industrial Law. Two years later, he moved to the banking sector and joined Banca Commerciale Italiana, subsequently merged to form Intesa Sanpaolo, working fi rst in the domestic network in his hometown and from 1989 at the HQs International Department as Area Manager for French-speaking countries such as France, Belgium and Luxembourg. From 1991 he was assigned to the London Branch being responsible for the Italian business in the U.K. and in 1995 he took over Abu Dhabi Branch and its hub role for the Group in the Gulf region. From 2003 to 2007 he was the Managing Director of the Group Hungarian subsidiary CIB Bank, Budapest (a 100% subsidiary of Intesa Sanpaolo, the former Banca Intesa) and after a brief and special assignment to the Group operations in Romania, he is presently heading from Prague the Czech activities of VÚB.
VUB Management Board Report on the business activities of the Company

24
Jozef Kausich – Member of the Management Board and Executive Director of the Corporate Banking Division
Mr. Kausich has been heading the Corporate Banking Division in VÚB since April 2005. His banking experience includes mainly mergers and acquisitions, credit analysis and lending decision-making processes. In 1996, he joined Tatra banka as a branch account manager, and from 1997 he assumed the same position at the headquarters of Bank Austria – Creditanstalt Slovakia. In 2001, engaged with the new HVB Bank Slovakia, Mr. Kausich was appointed Head of the Corporate Customer and Product Management Division, and fi nally Head of Corporate Client Division.
Silvia Púchovská – Member of the Management Board and Executive Director of the Human Resources Division
Ms. Púchovská assumed the position of the Member of the Management Board and Executive Director of the Human Resources Division in February 2008. In the period 2003 – 2007, Silvia Púchovská worked for Emerson as an HR Director in Nové Mesto nad Váhom, and later in Moscow. Her responsibilities involved reporting for Emerson Headquarters in St. Louis, coordination of HR processes for Emerson Process Management and its acquisitions in CIS and Baltic countries, and management of all HR functions in Eastern Europe. In 1999 – 2003, as an HR and Training Manager in Generali Poisťovňa a. s., Bratislava, she was in charge of internal rules regulation, recruitment, remuneration policy and training programs for staff in Slovakia. In 1993 – 1996, Ms. Púchovská worked in Jagers Training & Consultancy, s. r. o. as a Training and Project Manager. She was responsible for sales of training programs, and managed and conducted different types of training projects.
Alexander Resch – Member of the Management Board and Executive Director of the Risk Management Division
In April 2008, the VÚB Supervisory Board appointed Alexander Resch to the position of Member of the VÚB Management Board and Executive Director of the Risk Management Division. Before his appointment to the position, Mr. Resch was the Vice Chairman of the Management Board of VÚB’s subsidiary – Consumer Finance Holding. In the period 2004 – 2005 he was in charge of the acquisition of the TatraCredit group by VÚB bank. After this successful acquisition, Mr. Resch was appointed to the position of Vice Chairman of the Management Board and CFO of the newly established company Consumer Finance Holding, based in Poprad. Since 2007, Mr. Resch was responsible for risk management and operations in CFH. Alexander Resch studied economics at the Universita Cattolica del Sacro Cuore in Milan. After graduation in 1996, he worked as a Financial Controller for Bankhaus Lobbecke & Co. – a member of the Cariplo Group, one of the founders of Banca Intesa (today, Intesa Sanpaolo). In 1999, he was appointed Director of the Planning, Controlling and Reporting unit. In 2002, in addition to the existing terms of reference of the Executive Director, Mr. Resch also assumed responsibilities for areas such as risk management and IFRS and Basel II implementation.
Adrián Ševčík – Member of the Management Board and Executive Director of the Retail Banking Division
In April 2009, the VÚB Supervisory Board appointed Adrián Ševčík to the position of member of the Management Board. In March he assumed responsibilities of the Executive Director of the Retail Banking Division where he substituted Tomislav Lazarić. Adrián Ševčík is the fi rst manager directly trained in VÚB to assume position in top management. Having graduated from the Slovak University of Agriculture in Nitra with master degree in Mechanization and Technology of Production Processes and Services (1995), he started his carrier in sales and marketing within production sector. At fi rst, Mr. Ševčík worked for Chirana Prema, a.s., Stará Turá (1997) at the Marketing unit of the Medical Technology Plant and later for Medmilk Trade, a.s., Velký Meder (1997), where he was in charge of production and sales operations. Mr. Ševčík gained his banking experience as a head of the branch in Tatra banka (1999), where he started-up a new branch in Nové Mesto nad Váhom. In 2003, VÚB acquired him for position of the Regional Manager of the Trenčín region. Four years later, Mr. Ševčík was appointed Head of the Retail Branch Management Department and assumed responsibility for all branches in Slovakia.
VUB Management Board Report on the business activities of the Company

25
2. The Management Board is authorized to manage the activities of VÚB, a. s. and to take decisions over any matters related to VÚB, which, under the legal regulations or Articles of Association have not been reserved for the authority of other VÚB bodies. The Management Board is primarily responsible for the following matters:
a) implementing decisions taken by the General Meeting and the Supervisory Board;b) ensuring the accuracy of the mandatory bookkeeping and other records, trade books and other
documentation of VÚB, a. s.;c) managing the issuer‘s securities registry; VÚB Management Board Report on the business activities of
the Company;d) after prior approval by and upon a proposal of the Supervisory Board, submitting the following matters
to the General Meeting for approval:
• amendments to the Articles of Association;• proposals for increasing / decreasing registered capital and bond issues;• ordinary, extraordinary, or consolidated fi nancial statements;• proposals for distribution of current or retained profi ts and/or proposals for settlement of outstanding
losses from the current and/or previous years; and• the annual report.
B. Relations between the Company and its Shareholders
1. The Bank observes the provisions of the Commercial Code and other relevant valid legislation applicable to the protection of shareholders’ rights, as well as the regulation on timely provision of all relevant information on the company and provisions on convening and conducting its General Meetings.
2. The company applies the principle of shareholders rights, equal access to information for all shareholders and other relevant principles pursuant to the Corporate Governance Code.
C. Disclosure of Information and Transparency
1. The Bank applies strict rules in the area of insider dealing, and continually maintains and updates a list of insiders.
2. Members of the Management Board and Supervisory Board do not have any personal interest in the business activities of the Bank. The Bank strictly observes the provisions of the Banking Act No. 483/2001 Coll. (hereinafter ‘Banking Act‘) as amended, applicable to the provision of deals to Bank’s related parties. Under the Banking Act, the closing of such a deal requires the unanimous consent of all the Management Board members based on a written analysis of the respective deal; from a decision-making role is expelled a person with a personal interest in the given deal. The Bank does not perform with its related parties any such deals, which owing to their nature, purpose or risk, would not be performed with other clients.
3. The Bank abides by both the Code and the rules of the Bratislava Stock Exchange governing disclosure of all substantial information. The fact that the company observes the mentioned regulations ensures that all the shareholders and potential shareholders have access to information on fi nancial standing, performance, ownership and management of the company, enabling them to take competent investment decisions.
4. The company actively supports constructive dialogue with institutional investors and promptly informs all shareholders of General Meetings and notices via its web page in Slovak and English languages. In this way it enables both foreign and local investors to actively participate in the meetings.
VUB Management Board Report on the business activities of the Company

26
5. The Bank applies changes arising from Act No. 566/2001 Coll. on Securities (hereinafter ‘Securities Act’), at European level, MiFID (Markets in Financial Instruments Directive), and has proceeded in activities towards investor protection and the strengthening of client trust in the provision of investment services. The aim of MiFID comprises the new categorization of clients according to their knowledge and experience with investments, the obligation to provide clients with best execution of their investments, in higher market transparency, and organization of the Bank as a securities trader, which shall secure internal control systems and the prevention of confl ict of interests.
6. The Bank continuously informs clients on concluded deals related to quoted shares and bonds on its web page.
7. The Bank continues to provide the payment services according to the payment law, PSD (Payment Services Directive). The aim of this law is the provision of high level clear information about payment services for consumers in order to make well-informed choices and be able to shop around within the EU. In the interests of transparency are laid down the harmonized requirements needed for ensuring the necessary and sufi cient information to payment service users with regard to the payment service contract and payment transactions.
D. Audit Committee and Compensation Committee
The Audit Committee comprised of three members (including the Chairman) as of December 2011, who were appointed by the General Meeting on 7 April 2010. One member of the Audit Committee is a Member of the Supervisory Board. The Audit Committee held four meetings during 2011. The issues discussed at the meetings mainly related to: preparation of the fi nancial statements and observation of the special regulations; efi ciency of internal control and risk management system in the Bank; audit of the individual fi nancial statements and audit of the consolidated fi nancial statements. Further, the Audit Committee examines and monitors the independency of the auditor, especially services provided by the auditor according to a special regulation, recommends an auditor for appointment for carrying out the audit of the Bank, and sets a date for an auditor to submit a statutory declaration about his independency. The Audit Committee invited an external auditor to attend its meetings.
The Supervisory Board invited the Members of the Audit Committee to attend its meetings in 2011. The Internal Audit and Control Department, the authorities and duties of which are de_ned by the Supervisory Board, excluding those de_ned by law, performs the control function. The Head of the Internal Audit and Control Department may be appointed to/withdrawn from the position upon the recommendation and prior consent issued by the Supervisory Board. Furthermore, the Supervisory Board also de_nes the remuneration and compensation scheme for this position.
The Remuneration Committee was founded in VUB in June 2008. It has 5 members including the CEO of VÚB. The committee meets twice a year and approves the issues related to setting and evaluating of KPIs, base salary adjustment, remuneration, nominations to the Retention Program and amendments to the performance evaluation policy.
E. The Company’s Approach to Shareholders
Principles of the corporate governance of the company ensure, facilitate and protect exercising of shareholders rights. The company duly and timely performs all its duties and obligations towards shareholders in compliance with relevant legislation and the Corporate Governance Code. The Company enables to duly and transparently exercise shareholders rights in compliance with relevant valid legislation.
VUB Management Board Report on the business activities of the Company
26

27
Individual fi nancial statements
prepared in accordance with IFRS
Consolidated fi nancial statements
prepared in accordance with IFRS
2011 2010 2009 2011 2010 2009
Statement of fi nancial position
Loans and advances to customers 6,917,544 6,141,301 5,549,836 7,266,546 6,437,675 5,863,647
Due to customers 7,498,151 7,276,689 6,613,327 7,487,408 7,265,367 6,609,926
Equity 1,072,459 1,020,205 963,790 1,115,258 1,043,758 986,394
Total assets 10,801,682 10,492,816 9,550,173 11,131,298 10,758,949 9,852,397
Income statement
Operating income 464,931 422,838 419,918 525,893 492,707 481,183
Operating expenses (199,940) (191,511) (190,135) (236,269) (227,671) (228,124)
Operating profi t before
impairment 264,991 231,327 229,783 289,624 265,036 253,059
Profi t from operations 197,693 183,270 162,187 221,689 188,541 160,029
Net profi t for the year 157,664 149,377 146,240 176,903 150,323 141,671
Commercial indicators 2011 2010 2009
ATMs 560 554 558
EFT POS Terminals 7,689 7,147 6,543
Payment cards 1,327,282 1,299,871 1,290,415
there of Credit cards 407,656 405,166 408,812
Mortgage loans (€ thousand) 2,716,118 2,476,074 2,114,581
Consumer loans (€ thousand) 702,796 644,061 600,503
Number of employees (VUB group) 4,062 3,970 3,959
Number of branches in Slovakia (VUB Bank) 250 250 254
Rating (status as at 31 December 2011)
Moody’s
Long-term deposits A2
Short-term deposits P-1
Financial strength C–
Negative outlook
Basic indicatorsSelected Indicators (In thousands of euro)
27

2828
Consolidated fi nancial statements prepared in accordance with International Financial
Reporting Standards and Independent Auditors’ Report
for the year ended 31 December 2011

29
Note 2011 2010
Assets
Cash and balances with central banks 4 90,977 179,093
Due from banks 5 502,291 108,843
Financial assets held for trading 6 273,962 253,025
Derivative fi nancial instruments 7 80,399 45,205
Available-for-sale fi nancial assets 8 1,455,626 1,615,823
Non-current assets held for sale 15 3 3,374
Loans and advances to customers 9 7,266,546 6,437,675
Held-to-maturity investments 11 1,137,540 1,788,263
Associates and jointly controlled entities 12 7,077 6,219
Intangible assets 13 41,486 41,342
Goodwill 14 29,305 29,305
Property and equipment 15 146,732 148,921
Current income tax assets 20 2,791 8,931
Deferred income tax assets 20 77,463 66,154
Other assets 16 19,100 26,776
11,131,298 10,758,949
Liabilities
Due to central and other banks 17 688,469 662,523
Derivative fi nancial instruments 7 57,382 60,729
Due to customers 18 7,487,408 7,265,367
Debt securities in issue 19 1,660,487 1,624,253
Provisions 21 27,328 24,256
Other liabilities 22 94,966 78,063
10,016,040 9,715,191
Equity
Share capital 23 430,819 430,819
Share premium 23 13,368 13,368
Reserves 17,887 61,891
Retained earnings 653,184 537,680
1,115,258 1,043,758
11,131,298 10,758,949
Financial commitments and contingencies 24 2,691,354 2,588,428
The accompanying notes on pages 33 to 106 form an integral part of these fi nancial statements.
These fi nancial statements were authorised for issue by the Management Board on 21 February 2012.
Ignacio Jaquotot Andrea De Michelis Chairman of the Management Board Member of the Management Board
Consolidated statement of fi nancial position at 31 December 2011 (In thousands of euro)
29

30
Note 2011 2010
Interest and similar income 541,281 485,077
Interest expense and similar charges (138,403) (114,275)
Net interest income 25 402,878 370,802
Fee and commission income 141,406 143,344
Fee and commission expense (32,979) (35,602)
Net fee and commission income 26 108,427 107,742
Net trading income 27 942 6,303
Other operating income 28 13,646 7,860
Operating income 525,893 492,707
Salaries and employee benefi ts 29 (103,844) (97,195)
Other operating expenses 30 (99,814) (91,996)
Amortisation 13 (14,297) (17,495)
Depreciation 15 (18,314) (20,985)
Operating expenses (236,269) (227,671)
Operating profi t before impairment 289,624 265,036
Impairment losses on fi nancial assets 31 (67,935) (76,495)
Profi t from operations 221,689 188,541
Share of profi t of associates and jointly controlled entities 12 850 596
Profi t before tax 222,539 189,137
Income tax expense 32 (45,636) (38,814)
NET PROFIT FOR THE YEAR 176,903 150,323
Other comprehensive income for the year, after tax:
Exchange difference on translating foreign operation (38) 485
Available-for-sale fi nancial assets (45,012) (33,613)
Cash fl ow hedges (1,006) (1,437)
Other comprehensive income for the year, net of tax 33, 34 (46,056) (34,565)
TOTAL COMPREHENSIVE INCOME FOR THE YEAR 130,847 115,758
Basic and diluted earnings per € 33.2 share in € 23 13.63 11.58
All of the Net profi t and Total comprehensive income is attributable to owners of the parent.
The accompanying notes on pages 33 to 106 form an integral part of these fi nancial statements.
Consolidated statement of comprehensive income for the year ended 31 December 2011(In thousands of euro)

31
Share
capital
Share
premium
Legal
reserve
fund
Retained
earnings
Transla-
tion
of foreign
operation
Available
for sale
fi nancial
assets
Cash fl ow
hedgesTotal
At 1 January 2010 430,819 13,368 91,541 447,959 (1,649) 5,995 (1,639) 986,394
Total comprehensive
income for the year - - - 150,323 485 (33,613) (1,437) 115,758
Dividends to shareholders - - - (58,394) - - - (58,394)
Legal reserve fund - - 1,549 (1,549) - - - -
Other* - - - (1,188) 1,188 - - -
Effect of FX hedge* - - - 529 - - (529) -
At 31 December 2010 430,819 13,368 93,090 537,680 24 (27,618) (3,605) 1,043,758
At 1 January 2011 430,819 13,368 93,090 537,680 24 (27,618) (3,605) 1,043,758
Total comprehensive
income for the year - - - 176,903 (38) (45,012) (1,006) 130,847
Dividends to shareholders - - - (59,692) - - - (59,692)
Reversal of dividends
distributed but not
collected - - - 346 - - - 346
Legal reserve fund - - 2,203 (2,203) - - - -
Liquidation
of VUB Leasingová, a.s.
v likvidácii (in liquidation) - - (32) 31 - - - (1)
Other* - - - 139 (139) - - -
Effect of FX hedge* - - - (20) - - 20 -
At 31 December 2011 430,819 13,368 95,261 653,184 (153) (72,630) (4,591) 1,115,258
* The foreign currency difference disclosed under Translation of foreign operation was settled within the transfer of retained earnings
and profi t for 2009 and 2010 from the foreign branch. Retained earnings were originally generated in Czech Crowns (‘CZK’) and
the foreign exchange effect of this translation was hedged.
The accompanying notes on pages 33 to 106 form an integral part of these fi nancial statements.
Consolidated statement of changes in equity for the year ended 31 December 2011(In thousands of euro)
32
Note 2011 2010
Cash fl ows from operating activities
Profi t before tax 222,539 189,137
Adjustments for:
Amortisation 14,297 17,495
Depreciation 18,314 20,985
Securities held for trading, available-for-sale securities (1,282) 4,952
and FX differences
Share of profi t of associates and jointly controlled entities (858) (599)
Interest income (541,281) (485,077)
Interest expense 138,403 114,275
Sale of property and equipment (277) (141)
Impairment losses on fi nancial assets and similar charges 69,183 75,765
Interest received 535,640 467,041
Interest paid (129,214) (114,407)
Tax paid (50,805) (60,029)
Due from banks (396,920) (8,931)
Financial assets held for trading (24,389) (86,425)
Derivative fi nancial instruments (assets) (36,180) (4,388)
Available-for-sale fi nancial assets 113,544 (635,523)
Loans and advances to customers (894,979) (634,555)
Other assets 8,246 (8)
Due to central and other banks 25,201 (133,364)
Derivative fi nancial instruments (liabilities) (3,347) 8,258
Due to customers 215,138 654,883
Other liabilities 19,588 (10,269)
Net cash used in operating activities (699,439) (620,925)
Cash fl ows from investing activities
Purchase of held-to-maturity investments - (19,083)
Repayments of held-to-maturity investments 650,449 261,962
Purchase of intangible assets and property and equipment (31,891) (24,515)
Disposal of property and equipment 6,259 1,932
Net cash from investing activities 624,817 220,296
Cash fl ows from fi nancing activities
Proceeds from issue of debt securities 311,504 487,050
Repayments of debt securities (274,070) (166,239)
Dividends paid (59,692) (58,394)
Net cash from/(used in) fi nancing activities (22,258) 262,417
Net change in cash and cash equivalents (96,880) (138,212)
Cash and cash equivalents at the beginning of the year 3 195,128 333,340
Cash and cash equivalents at the end of the year 3 98,248 195,128
The accompanying notes on pages 33 to 106 form an integral part of these fi nancial statements.
Consolidated statement of cash fl ows for the year ended 31 December 2011(In thousands of euro)

33
1. General information
1.1 The Bank
Všeobecná úverová banka, a.s. (‘the Bank’ or ‘VUB’) provides retail and commercial banking services. The Bank is domiciled in the Slovak Republic with its registered offi ce at Mlynské nivy 1, 829 90 Bratislava 25 and has the identifi cation number (IČO) 313 20 155.
At 31 December 2011, the Bank had a network of 250 points of sale (including Retail Branches, Corporate Branches and Mortgage centres) located throughout Slovakia (December 2010: 250). The Bank also has one branch in the Czech Republic.
The members of the Management Board are: Ignacio Jaquotot (Chairman), Andrea De Michelis, Daniele Fanin, Jozef Kausich, Elena Kohútiková, Tomislav Lazarić, Silvia Púchovská, Alexander Resch and Adrián Ševčík.
The members of the Supervisory Board are: György Surányi (Chairman), Fabrizio Centrone (Vice Chairman), Adriano Arietti, Jana Finková, Antonio Furesi, Ján Gallo, Juraj Jurenka and Massimo Malagoli.
1.2 The VUB Group
The consolidated fi nancial statements comprise the Bank and its subsidiaries (together referred to as ‘the VUB Group’ or ‘the Group’) and the Group’s interest in associates and jointly controlled entities as follows:
Share 2011
Share2010
Principal business activity
Subsidiaries
Consumer Finance Holding, a.s. (‘CFH’) 100% 100% Consumer fi nance business
VÚB Leasing, a. s. (‘VÚB Leasing’) 100% 100% Finance and operating leasing
VÚB poisťovací maklér s. r. o. 100% 100% Insurance mediation
VÚB Asset Management, správ. spol. a.s. 100% 100% Asset management
VÚB Factoring, a.s. 100% 100% Factoring of receivables
VÚB Leasingová, a.s. v likvidácii (in liquidation) * - 100% Finance leasing
Recovery, a.s. 100% 100% Finance leasing
Associates
Slovak Banking Credit Bureau, s.r.o. 33.3% 33.3% Credit database administration
Jointly controlled entities
VÚB Generali DSS, a.s. 50% 50% Pension fund administration
* On 19 January 2011, VÚB Leasingová, a.s. v likvidácii (in liquidation) was removed from the Business Register of the Slovak
Republic. This act concluded the process of liquidation and resulted in the loss of control of VUB Group over the subsidiary. The
subsidiary was properly deconsolidated within the VUB Group as at the date when control was lost. No profi t or loss on disposal
of the subsidiary has been recognized in the consolidated fi nancial statements.
Effective from 1 January 2012, VÚB poisťovací maklér s.r.o., the subsidiary of VÚB Leasing, a.s., was dissolved without liquidation as a result of a merger. The successor company is VÚB Leasing, a.s.
Notes to the consolidated fi nancial statementsfor the year ended 31 December 2011 prepared in accordance with IFRS
34
Consolidated fi nancial statements
All entities are incorporated in the Slovak Republic.
At 31 December 2011, the VUB Group had a total network of 251 points of sale (31 December 2010: 255).
The VUB Group’s ultimate parent company is Intesa Sanpaolo S.p.A., which is a joint-stock company and is incorporated and domiciled in Italy. The address of its registered offi ce is Piazza San Carlo 156, 10121 Torino, Italy.
2. Summary of signifi cant accounting policies
2.1 Basis of preparation
The consolidated fi nancial statements of the VUB Group (‘the fi nancial statements’) have been prepared in accordance with International Financial Reporting Standards (‘IFRS’) issued by the International Accounting Standards Board (‘IASB’) and with interpretations issued by the International Financial Reporting Interpretations Committee of the IASB (‘IFRIC’) as approved by the Commission of European Union in accordance with the Regulation of European Parliament and Council of European Union and in accordance with the Act No. 431/2002 Collection on Accounting.
The separate fi nancial statements of the Bank were issued on 21 February 2012 and are available at the legal offi ce of the Bank.
The fi nancial statements have been prepared under the historical cost convention, as modifi ed by the revaluation of available-for-sale fi nancial assets, fi nancial assets held for trading and all derivative fi nancial instruments to fair value.
The fi nancial statements are presented in thousands of euro (‘€’), unless indicated otherwise.
Negative balances are presented in brackets.
2.2 Changes in accounting policies
Standards and interpretations relevant to VUB Group’s operations, effective in the current period
The following amendments to the existing standards issued by the IASB and adopted by the EU are effective for the current accounting period:
IAS 24 Related Party Disclosures (Amendment)
The amended standard is effective for annual periods beginning on or after 1 January 2011. It clarifi ed the defi nition of a related party to simplify the identifi cation of such relationships and to eliminate inconsistencies in its application. The revised standard introduces a partial exemption of disclosure requirements for government related entities. The amendment to IAS 24 does not have any impact on the fi nancial performance or position of the VUB Group.
IAS 32 Financial Instruments: Presentation – Classifi cation of Rights Issues (Amendment)
The amendment to IAS 32 is effective for annual periods beginning on or after 1 February 2010 and amended the defi nition of a fi nancial liability in order to classify rights issues (and certain options or warrants) as equity instruments in cases where such rights are given pro rata to all of the existing owners of the same class of an entity’s non-derivative equity instruments, or to acquire a fi xed number of the entity’s own equity instruments for a fi xed amount in any currency. This amendment has no impact on the VUB Group’s fi nancial position or performance.

35
Consolidated fi nancial statements
IFRIC 14 Prepayments of a minimum funding requirement (Amendment)
The amendment to IFRIC 14 is effective for annual periods beginning on or after 1 January 2011 with retrospective application. The amendment provides guidance on assessing the recoverable amount of a net pension asset. The amendment permits an entity to treat the prepayment of a minimum funding requirement as an asset. The amendment is deemed to have no impact on the fi nancial statements of the VUB Group.
IFRIC 19 Extinguishing Financial Liabilities with Equity Instruments
IFRIC 19 is effective for annual periods beginning on or after 1 July 2010. The interpretation clarifi es that equity instruments issued to a creditor to extinguish a fi nancial liability qualify as consideration paid. The equity instruments issued are measured at their fair value. In cases where this cannot be reliably measured, the instruments are measured at the fair value of the liability extinguished. Any gain or loss is recognized immediately in profi t or loss. The adoption of this interpretation has no effect on the fi nancial statements of the VUB Group.
Improvements to IFRSs (issued in May 2010)
In May 2010, the IASB issued its third omnibus of amendments to its standards, primarily with a view to removing inconsistencies and clarifying wording. There are separate transitional provisions for each standard. The adoption of the following amendments resulted in changes to accounting policies, but no impact on the fi nancial position or performance of the VUB Group.
• IFRS 7 Financial Instruments — Disclosures: The amendment was intended to simplify the disclosures provided by reducing the volume of disclosures around collateral held and improving disclosures by requiring qualitative information to put the quantitative information in context.
• IAS 1 Presentation of Financial Statements: The amendment clarifi es that an entity may present an analysis of each component of other comprehensive income either in the statement of changes in equity or in the notes to the fi nancial statements.
Other amendments resulting from Improvements to IFRSs to the following standards did not have any impact on the accounting policies, fi nancial position or performance of the VUB Group:
• IFRS 3 Business Combinations• IAS 27 Consolidated and Separate Financial Statements• IAS 34 Interim Financial Statements
The following interpretation and amendments to interpretations did not have any impact on the accounting policies, fi nancial position or performance of the VUB Group:
• IFRIC 13 Customer Loyalty Programmes• IFRIC 19 Extinguishing Financial Liabilities with Equity Instruments
Standards and interpretations relevant to VUB Group’s operations issued but not yet effective
Standards issued but not yet effective or not yet adopted by the EU up to the date of issuance of the VUB Group’s fi nancial statements are listed below. This listing of standards and interpretations issued are those that the VUB Group reasonably expects to have an impact on disclosures, fi nancial position or performance when applied at a future date. The Group intends to adopt these standards when they become effective.
IAS 1 Financial Statement Presentation – Presentation of Items of Other Comprehensive Income (‘OCI’)

36
Consolidated fi nancial statements
The amendments to IAS 1 change the grouping of items presented in OCI. Items that could be reclassifi ed (or ‘recycled’) to profi t or loss at a future point in time (for example, upon derecognition or settlement) would be presented separately from items that will never be reclassifi ed. The amendment affects presentation only and has there no impact on the Group’s fi nancial position or performance. The amendment becomes effective for annual periods beginning on or after 1 July 2012.
IAS 19 Employee Benefi ts (Amendment)
The IASB has issued numerous amendments to IAS 19. These range from fundamental changes such as removing the corridor mechanism and the concept of expected returns on plan assets to simple clarifi cations and re-wording. The application of this amendment will have no impact on the fi nancial position of the VUB Group. The amendment becomes effective for annual periods beginning on or after 1 January 2013.
IAS 27 Separate Financial Statements (as revised in 2011)
As a consequence of the new IFRS 10 and IFRS 12, what remains of IAS 27 is limited to accounting for subsidiaries, jointly controlled entities, and associates in separate fi nancial statements. The amendment becomes effective for annual periods beginning on or after 1 January 2013.
IAS 28 Investments in Associates and Joint Ventures (as revised in 2011)
As a consequence of the new IFRS 11 and IFRS 12, IAS 28 has been renamed to IAS 28 Investments in Associates and Joint Ventures, and describes the application of the equity method to investments in joint ventures in addition to associates. The amendment becomes effective for annual periods beginning on or after 1 January 2013.
IFRS 7 Financial Instruments: Disclosures— Transfers of Financial Assets (Amendments to IFRS 7)
The IASB has amended the required disclosures relating to transfers of fi nancial assets. The objective of the amendments is to help users of fi nancial statements evaluate the risk exposures relating to such transfers and the effect of those risks on an entity’s fi nancial position. The amendment becomes effective for annual periods beginning on or after 1 July 2011.
IFRS 7 Financial Instruments: Disclosures — Enhanced Derecognition Disclosure Requirements
The amendment requires additional disclosure about fi nancial assets that have been transferred but not derecognised to enable the user of the Group’s fi nancial statements to understand the relationship with those assets that have not been derecognised and their associated liabilities. In addition, the amendment requires disclosures about continuing involvement in derecognised assets to enable the user to evaluate the nature of, and risks associated with, the entity’s continuing involvement in those derecognised assets. The amendment becomes effective for annual periods beginning on or after 1 July 2011. The amendment affects disclosure only and has no impact on the VUB Group’s fi nancial position or performance.
IFRS 9 Financial Instruments: Classifi cation and Measurement
IFRS 9 as issued refl ects the fi rst phase of the IASB’s work on the replacement of IAS 39 and applies to classifi cation and measurement of fi nancial assets and fi nancial liabilities as defi ned in IAS 39. The standard is effective for annual periods beginning on or after 1 January 2015. In subsequent phases, the IASB will address hedge accounting and impairment of fi nancial assets. The completion of this project is expected over the course of 2012. The adoption of the fi rst phase of IFRS 9 will have an effect on the classifi cation and measurement of the VUB Group’s fi nancial assets and on classifi cation and measurements of fi nancial liabilities. The Group will quantify the effect in conjunction with the other phases, when issued, to present a comprehensive picture.

37
Consolidated fi nancial statements
IFRS 10 Consolidated Financial Statements
IFRS 10 replaces the portion of IAS 27 Consolidated and Separate Financial Statements that addresses the accounting for consolidated fi nancial statements. It also includes the issues raised in SIC-12 Consolidation – Special Purpose Entities.
IFRS 10 establishes a single control model that applies to all entities including special purpose entities. The changes introduced by IFRS 10 will require management to exercise signifi cant judgement to determine which entities are controlled, and therefore, are required to be consolidated by a parent, compared with the requirements that were in IAS 27. This standard becomes effective for annual periods beginning on or after 1 January 2013.
IFRS 11 Joint Arrangements
IFRS 11 replaces IAS 31 Interests in Joint Ventures and SIC-13 Jointly-controlled Entities — Non-monetary Contributions by Venturers. IFRS 11 removes the option to account for jointly controlled entities (‘JCEs’) using proportionate consolidation. Instead, JCEs that meet the defi nition of a joint venture must be accounted for using the equity method. The application of this new standard will have no impact on the fi nancial position of the VUB Group. This standard becomes effective for annual periods beginning on or after 1 January 2013.
IFRS 12 Disclosure of Involvement with Other Entities
IFRS 12 includes all of the disclosures that were previously in IAS 27 related to consolidated fi nancial statements, as well as all of the disclosures that were previously included in IAS 31 and IAS 28. These disclosures relate to an entity’s interests in subsidiaries, joint arrangements, associates and structured entities. A number of new disclosures are also required. This standard becomes effective for annual periods beginning on or after 1 January 2013.
IFRS 13 Fair Value Measurement
IFRS 13 establishes a single source of guidance under IFRS for all fair value measurements. IFRS 13 does not change when an entity is required to use fair value, but rather provides guidance on how to measure fair value under IFRS when fair value is required or permitted. The Group is currently assessing the impact that this standard will have on the fi nancial position and performance. This standard becomes effective for annual periods beginning on or after 1 January 2013.
The VUB Group has elected not to adopt these standards, revisions and interpretations in advance of their effective dates.
2.3 Basis of consolidation
(a) SubsidiariesSubsidiaries are entities controlled by the Bank. Control exists when the Bank has the power, directly or indirectly, to govern the fi nancial and operating policies of an enterprise so as to obtain benefi ts from its activities. The fi nancial statements of subsidiaries are included in the consolidated fi nancial statements from the date at which effective control commences until the date at which control ceases.
The fi nancial statements of the Bank and its subsidiaries are combined on a line-by-line basis by adding together like items of assets, liabilities, equity, income and expenses. Intra-group balances, transactions and resulting profi ts are eliminated in full.
The purchase method of accounting is used to account for the acquisition of subsidiaries by the VUB Group. The cost of an acquisition is measured as the fair value of the assets acquired, equity instruments issued and liabilities

38
Consolidated fi nancial statements
incurred or assumed at the date of exchange, plus costs directly attributable to the acquisition. Identifi able assets acquired and liabilities and contingent liabilities assumed in a business combination are measured initially at their fair values at the acquisition date, irrespective of the extent of any non-controlling interest.
The excess of the cost of the acquisition over the fair value of the VUB Group’s share of the identifi able net assets acquired is recognised as goodwill.
(b) AssociatesAssociates are entities, in which the Group has signifi cant infl uence, but not control, over the fi nancial and operating policies. The fi nancial statements include the Group’s share of the total recognised gains and losses of associates on an equity accounted basis, from the date that signifi cant infl uence commences until the date that signifi cant infl uence ceases.
(c) Jointly controlled entitiesJointly controlled entities are entities over whose activities the Group has joint control, established by contractual agreement. The fi nancial statements include the Group’s share of the total recognised gains and losses of jointly controlled entities on an equity accounted basis, from the date that joint control commences until the date that joint control ceases.
2.4 Segment reporting
The Group reports fi nancial and descriptive information about its operating segments in these fi nancial statements. An operating segment is a component of the Group that engages in business activities from which it may earn revenues and incur expenses (including revenues and expenses relating to transactions with other components of the Group), whose operating results are regularly reviewed by the Group’s management to make decisions about resources to be allocated to the segment and to assess its performance, and for which separate fi nancial information is available.
The Group operates in three operating segments – Retail Banking, Corporate Banking and Central Treasury. Each segment is exposed to different risks and differs in the nature of its services, business processes and types of customers for its products and services.
For all segments the Group reports a measure of segment assets and liabilities and income and expense items, a reconciliation of total reportable segment revenues, total profi t or loss, total assets, liabilities and other amounts disclosed for reportable segments to corresponding amounts in the Group’s fi nancial statements.
Most of the transactions of the VUB Group are related to the Slovak market. Due to the market size, the VUB Group operates as a single geographical segment unit.
2.5 Foreign currency transactions
Monetary assets and liabilities in foreign currencies are translated to euro at the offi cial European Central Bank (’ECB’) or National Bank of Slovakia (’NBS’) exchange rates prevailing at the end of the reporting period. Income and expenses denominated in foreign currencies are reported at the ECB or NBS exchange rates prevailing at the date of the transaction.
The difference between the contractual exchange rate of a transaction and the ECB or NBS exchange rate prevailing at the date of the transaction is included in ‘Net trading income’, as well as gains and losses arising from movements in exchange rates after the date of the transaction.
2.6 Foreign operations
The fi nancial statements include foreign operations in the Czech Republic. The assets and liabilities of foreign operations are translated to euro at the foreign exchange rate prevailing at the end of the reporting

39
Consolidated fi nancial statements
period. The revenues and expenses of foreign operations are translated to euro at rates approximating the foreign exchange rates prevailing at the dates of the transactions. Foreign exchange differences arising on these translations are recognised directly in equity.
2.7 Cash and balances with central banks
Cash and balances with central banks comprise cash in hand and balances with the NBS and other central banks, including compulsory minimum reserves.
2.8 Treasury bills and other eligible bills
Treasury bills and other eligible bills represent highly liquid securities that could be used for rediscounting in the NBS in the case of Slovak treasury bills or in a central bank of a foreign country in the case of foreign treasury bills without any time or other constraints.
2.9 Due from banks
Due from banks include receivables from current accounts in other than central banks, term deposits and loans provided to commercial banks.
Balances are presented at amortised cost including interest accruals less any impairment losses. An impairment loss is established if there is objective evidence that the VUB Group will not be able to collect all amounts due.
2.10 Debt securities
Debt securities held by the VUB Group are categorised into portfolios in accordance with the VUB Group’s intent on the acquisition date and pursuant to the investment strategy. The VUB Group has developed security investment strategies and, refl ecting the intent on acquisition, allocated securities into the following portfolios:
(a) Held for trading(b) Available-for-sale(c) Held-to-maturity
The principal differences among the portfolios relate to the measurement and recognition of fair values in the fi nancial statements. All securities held by the VUB Group are recognised using settlement date accounting and are initially measured at fair value plus, in the case of fi nancial assets not held for trading, any directly attributable incremental costs of acquisition. Securities purchased, but not settled, are recorded in the off-balance sheet and changes in their fair values, for purchases into the trading and the available-for-sale portfolios, are recognised in the Statement of comprehensive income and in equity respectively.
(a) Securities held for tradingThese securities are fi nancial assets acquired by the VUB Group for the purpose of generating profi ts from short-term fl uctuations in prices. Subsequent to their initial recognition these assets are accounted for and re-measured at fair value.
The fair value of securities held for trading, for which an active market exists, and a market value can be estimated reliably, is measured at quoted market prices. In circumstances where the quoted market prices are not readily available, the fair value is estimated using the present value of future cash fl ows.
The VUB Group monitors changes in fair values on a daily basis and recognises unrealised gains and losses in the Statement of comprehensive income in ‘Net trading income’. Interest earned on securities held for
40
Consolidated fi nancial statements
trading is accrued on a daily basis and reported in the Statement of comprehensive income in ‘Interest and similar income’.
Day 1 profi t or loss
When the transaction price is different to the fair value from other observable current market transactions in the same instrument or based on a valuation technique whose variables include only data from observable markets, the Group immediately recognises the difference between the transaction price and fair value (a ‘Day 1 profi t or loss’) in ‘Net trading income’ if the ‘Day 1 profi t or loss’ is not signifi cant. In cases where ‘Day 1 profi t or loss’ is signifi cant, the difference is amortised over the period of the respective deals. In cases where fair value is determined using data which is not observable, the difference between the transaction price and model value is only recognised in the Statement of comprehensive income when the inputs become observable, or when the instrument is derecognised.
(b) Available-for-sale securities‘Available-for-sale’ securities are those fi nancial assets that are not classifi ed as ‘held for trading’ or ‘held-to-maturity’. Subsequent to their initial recognition, these assets are accounted for and re-measured at fair value.
Unrealised gains and losses arising from changes in the fair value of ‘available-for-sale’ securities are recognised on a daily basis in the ‘Available-for-sale fi nancial assets’ in equity.
Interest earned whilst holding ‘available-for-sale’ securities is accrued on a daily basis and reported in the Statement of comprehensive income in ‘Interest and similar income’.
The fair value of ‘available-for-sale’ securities, for which an active market exists, and a market value can be estimated reliably, is measured at quoted market prices. In circumstances where the quoted market prices are not readily available, the fair value is estimated using the present value of future cash fl ows.
Equity investments whose fair value cannot be reliably measured are held at cost less impairment. For ‘available-for-sale’ equity investments, the Group assesses at each reporting date whether there is objective evidence that an investment or a group of investments is impaired.
In the case of debt instruments classifi ed as ‘available-for-sale’, impairment is assessed based on the same criteria as fi nancial assets carried at amortised cost. If, in a subsequent year, the fair value of a debt instrument increases and the increase can be objectively related to an event occurring after the impairment loss was recognised in ‘Impairment losses on fi nancial assets’ in the Statement of comprehensive income, the impairment loss is reversed through the Statement of comprehensive income.
In the case of equity investments classifi ed as ‘available-for-sale’, objective evidence would include a signifi cant or prolonged decline in the fair value of the investment below its cost. Where there is evidence of impairment, the cumulative loss – measured as the difference between the acquisition cost and the current fair value, less any impairment loss on that investment previously recognised in profi t or loss – is removed from equity and recognised in ‘Impairment losses on fi nancial assets’ in the Statement of comprehensive income. Impairment losses on equity investments are not reversed through Statement of comprehensive income; increases in their fair value after impairment are recognised directly in Other comprehensive income.
(c) Held-to-maturity investments‘Held-to-maturity’ investments are fi nancial assets with fi xed or determinable payments and maturities that the VUB Group has the positive intent and ability to hold to maturity.
‘Held-to-maturity’ investments are carried at amortised cost less any impairment losses. Amortised cost is the amount at which the asset was initially measured minus principal repayments, plus or minus the

41
Consolidated fi nancial statements
cumulative amortisation using the effective interest method of any difference between that initial amount and the maturity amount. The amortisation is recognised in the Statement of comprehensive income in ‘Interest and similar income’.
The VUB Group assesses on a regular basis whether there is any objective evidence that a ‘held-to-maturity’ investment may be impaired. A fi nancial asset is impaired if its carrying amount is greater than its estimated recoverable amount.
2.11 Repurchase and reverse repurchase agreements
Securities sold under sale and repurchase agreements (‘repo transactions’) remain as assets in the Statement of fi nancial position under the original caption and the liability from the received loan is included in ‘Due to central and other banks’ or ‘Due to customers’.
Securities purchased under agreements to purchase and resell (‘reverse repo transactions’) are recorded only in the off-balance sheet and the loan provided is reported in the Statement of fi nancial position in ‘Due from banks’ or ‘Loans and advances to customers’, as appropriate.
The price differential between the purchase and sale price of securities is treated as interest income or expense and deferred over the life of the agreement.
2.12 Derivative fi nancial instruments
In the normal course of business, the VUB Group is a party to contracts with derivative fi nancial instruments, which represent a very low initial investment compared to the notional value of the contract. The derivative fi nancial instruments used include foreign exchange forwards, interest rate/foreign exchange swaps and options, forward rate agreements and cross currency swaps. The VUB Group also uses fi nancial instruments to hedge interest rate risk and currency exposures associated with its transactions in the fi nancial markets. They are accounted for as trading derivatives if they do not fully comply with the defi nition of a hedging derivative as prescribed by IFRS. The VUB Group also acts as an intermediary provider of these instruments to certain customers.
Derivative fi nancial instruments are initially recognised and subsequently re-measured in the Statement of fi nancial position at fair value. All derivatives are carried as assets when the fair value is positive and as liabilities when the fair value is negative. Changes in the fair value of derivatives are included in ‘Net trading income’.
Fair values are obtained from quoted market prices, discounted cash fl ow models and option pricing models as appropriate. The fair values of derivative positions are computed using standard formulas and prevailing interest rates applicable for respective currencies available on the market at reporting dates.
In the normal course of business, the VUB Group enters into derivative fi nancial instrument transactions to hedge its liquidity, foreign exchange and interest rate risks. The Group also enters into proprietary derivative fi nancial transactions for the purpose of generating profi ts from short-term fl uctuations in market prices. The VUB Group operates a system of market risk and counterparty limits, which are designed to restrict exposure to movements in market prices and counterparty concentrations. The VUB Group also monitors adherence to these limits on a daily basis.
Credit risk of fi nancial derivatives
Credit exposure or the replacement cost of derivative fi nancial instruments represents the VUB Group’s credit exposure from contracts with a positive fair value, that is, it indicates the estimated maximum potential losses of the VUB Group in the event that counterparties fail to perform their obligations. It is usually a small proportion of the notional amounts of the contracts. The credit exposure of each contract is indicated by the
42
Consolidated fi nancial statements
credit equivalent calculated pursuant to the generally applicable methodology using the current exposure method and involves the market value of the contract (only if positive, otherwise a zero value is taken into account) and a portion of the nominal value, which indicates the potential change in market value over the term of the contract. The credit equivalent is established depending on the type of contract and its maturity. The VUB Group assesses the credit risk of all fi nancial instruments on a daily basis.
The VUB Group is selective in its choice of counterparties and sets limits for transactions with customers. As such, the VUB Group considers that the actual credit risk associated with fi nancial derivatives is substantially lower than the exposure calculated pursuant to credit equivalents.
Embedded derivatives
The VUB Group assesses whether any embedded derivatives contained in the contract are required to be separated from the host contract and accounted for as derivatives under IAS 39. An embedded derivative is a component of a hybrid (combined) instrument that also includes a non-derivative host contract-with the effect that some of the cash fl ows of the combined instrument vary in a way similar to a stand-alone derivative.
The VUB Group accounts for embedded derivatives separately from the host contract if: the economic characteristics and risks of the embedded derivative are not closely related to the economic characteristics and risks of the host contract; a separate instrument with the same terms as the embedded derivative would meet the defi nition of a derivative; and the hybrid (combined) instrument is not measured at fair value with changes in fair value recognised in the Statement of comprehensive income.
Hedging derivatives
The Group makes use of derivative instruments to manage exposures to interest rate, foreign currency and credit risks, including exposures arising from expected transactions. In order to manage individual risks, the Group applies hedge accounting for transactions which meet the specifi ed criteria.
At the inception of the hedge relationship, the Group formally documents the relationship between the hedged item and the hedging instrument, including the nature of the risk, the objective and strategy for undertaking the hedge and the method that will be used to assess the effectiveness of the hedging relationship.
Also at the inception of the hedge relationship, a formal assessment is undertaken to ensure the hedging instrument is expected to be highly effective in offsetting the designated risk in the hedged item. Hedges are formally assessed each month. A hedge is regarded as highly effective if the changes in fair value or cash fl ows attributable to the hedged risk during the period for which the hedge is designated are expected to offset in a range of 80% to 125%.
In situations where that hedged item is an expected transaction, the Group assesses whether the transaction is highly probable and presents an exposure to variations in cash fl ows that could ultimately affect the Statement of comprehensive income.
Cash fl ow hedges
For designated and qualifying cash fl ow hedges, the effective portion of the gain or loss on the hedging instrument is initially recognised in other comprehensive income as ‘Cash fl ow hedges’. The ineffective portion of the gain or loss on the hedging instrument is recognised immediately as gain or loss in the Statement of comprehensive income in ‘Net trading income’.
When the hedged cash fl ow affects profi t or loss, the gain or loss on the hedging instrument is reclassifi ed from other comprehensive income to profi t or loss as a reclassifi cation adjustment. When a hedging

43
Consolidated fi nancial statements
instrument expires, or is sold, terminated, exercised, or when a hedge no longer meets the criteria for hedge accounting, any cumulative gain or loss that has been recognised in other comprehensive income remains separately in equity and is reclassifi ed from other comprehensive income to profi t or loss as a reclassifi cation adjustment when the hedged expected transaction is ultimately recognised. When an expected transaction is no longer expected to occur, the cumulative gain or loss that was reported in equity is immediately reclassifi ed from other comprehensive income to profi t or loss as a reclassifi cation adjustment.
Fair value hedges
For designated and qualifying fair value hedges, the change in the fair value of a hedging derivative is recognised in the Statement of comprehensive income in ‘Net trading income’. Meanwhile, the change in the fair value of the hedged item attributable to the risk hedged is recorded as part of the carrying value of the hedged item and is also recognised in the Statement of comprehensive income in ‘Net trading income’.
If the hedging instrument expires or is sold, terminated or exercised, or where the hedge no longer meets the criteria for hedge accounting, the hedge relationship is terminated. For hedged items recorded at amortised cost, the difference between the carrying value of the hedged item on termination and the face value is amortised over the remaining term of the original hedge using the effective interest rate (‘EIR’). If the hedged item is derecognised, the unamortised fair value adjustment is reclassifi ed from other comprehensive income to profi t or loss as a reclassifi cation adjustment.
2.13 Offsetting fi nancial instruments
Financial assets and fi nancial liabilities are offset and the net amount reported in the Statement of fi nancial position, if, and only if, there is an intention to settle on a net basis, or to realize the asset and settle the liability simultaneously. This is not generally the case with master netting agreements, and the related assets and liabilities are presented gross in the Statement of fi nancial position.
2.14 Non-current assets held for sale
Non-current assets held for sale are assets where the carrying amount will be recovered principally through a sale transaction rather than through continuing use. Non-current assets held for sale comprise buildings, which are available for immediate sale in their present condition and their sale is considered to be highly probable.
Assets classifi ed as held for sale are measured at the lower of their carrying amount and fair value less cost to sell.
2.15 Loans and advances to customers and impairment losses
Loans and advances are fi nancial assets with fi xed or determinable payments and fi xed maturities that are not quoted in an active market and are recorded at amortised cost less any impairment losses. All loans and advances to customers are recognised in the Statement of fi nancial position when cash is advanced to borrowers.
Loans and advances to customers are subject to periodic impairment testing. An impairment loss for a loan, or a group of similar loans, is established if their carrying amount is greater than their estimated recoverable amount. The recoverable amount is the present value of expected future cash fl ows, including amounts recoverable from guarantees and collaterals, discounted based on the loan’s original effective interest rate. The amount of the impairment loss is included in the Statement of comprehensive income.
Impairment and uncollectability is measured and recognised individually for loans that are individually signifi cant. Impairment and uncollectability for a group of similar loans that are not individually identifi ed as impaired or loans that are not individually signifi cant are measured and recognised on a portfolio basis.

44
Consolidated fi nancial statements
The VUB Group writes off loans and advances when it determines that the loans and advances are uncollectible. Loans and advances are written off against the reversal of the related impairment losses. Any recoveries of written off loans are credited to the Statement of comprehensive income on receipt.
2.16 Intangible assets
Intangible assets are recorded at historical cost less accumulated amortisation and impairment losses. Amortisation is calculated on a straight-line basis in order to write off the cost of each asset to its residual value over its estimated useful economic life as follows:
Years
Software 5 – 10
Other intangible assets 5 – 10
Intangible assets acquired in a business combination are capitalised at fair values as at the date of acquisition and tested for impairment annually or whenever events or changes in circumstances indicate that the carrying amount may not be recoverable. Acquired intangible assets are amortised in line with their future cash fl ows over the estimated useful economic lives as follows:
Years
Software 3
Customer contracts and relationships including brand names 3 – 9
Amortisation methods, useful lives and residual values are reassessed at the reporting date.
2.17 Goodwill
Goodwill represents the excess of the cost of an acquisition over the fair value of the Group’s share of the identifi able assets, liabilities and contingent liabilities of the acquired subsidiary at the date of acquisition.
Goodwill is measured at cost less impairment, if any. Goodwill is tested for impairment annually or more frequently if events or changes in circumstances indicate that the carrying amount may be impaired.
2.18 Property and equipment
Property and equipment are recorded at historical cost less accumulated depreciation and impairment losses. Acquisition cost includes the purchase price plus other costs related to acquisition such as freight, duties or commissions. The costs of expansion, modernisation or improvements leading to increased productivity, capacity or effi ciency are capitalised. Repairs and renovations are charged to the Statement of comprehensive income when the expenditure is incurred.
Depreciation is calculated on a straight-line basis in order to write off the cost of each asset to its residual value over its estimated useful economic life as follows:
Years
Buildings 20 – 40
Equipment 4, 6, 10, 12
Other tangibles 4, 6, 12

45
Consolidated fi nancial statements
Land, assets in progress and art collections are not depreciated. The depreciation of assets in progress begins when the related assets are put into use.
The VUB Group periodically tests its assets for impairment. Where the carrying amount of an asset is greater than its estimated recoverable amount, it is written down to this recoverable amount.
Depreciation methods, useful lives and residual values are reassessed at the reporting date.
2.19 Leasing
The determination of whether an arrangement is a fi nance lease is based on the substance of the arrangement and requires an assessment of whether:
– the fulfi lment of the arrangement is dependent on the use of a specifi c asset or assets that could only be used by the lessee without major modifi cations being made;
– the lease transfers ownership of the asset at the end of the lease term;– the VUB Group has the option to purchase the asset at a price suffi ciently below fair value at exercise
date,– it is reasonably certain the option will be exercised;– the lease term is for a major part of the asset’s economic life even if title is not transferred; – the present value of minimum lease payments substantially equals the asset’s fair value at inception.
VUB Group as a lessee
Finance leases, which transfer to the VUB Group substantially all the risks and benefi ts incidental to ownership of the leased item, are capitalised at the inception of the lease at the fair value of the leased property or, if lower, at the present value of the minimum lease payments and included in ‘Property and equipment’ with the corresponding liability to the lessor included in ‘Other liabilities’. Lease payments are apportioned between the fi nance charges and reduction of the lease liability so as to achieve a constant rate of interest on the remaining balance of the liability. Finance charges are charged directly against income in ‘Interest expense and similar charges’.
Capitalised leased assets are depreciated over the shorter of the estimated useful life of the asset and the lease term, if there is no reasonable certainty that the VUB Group will obtain ownership by the end of the lease term.
Operating lease payments are not recognised in the Statement of fi nancial position. Any rentals payable are accounted for on a straight-line basis over the lease term and included in ‘Other operating expenses’.
VUB Group as a lessor
Leases where the VUB Group transfers substantially all the risk and benefi ts of ownership of the asset are classifi ed as fi nance leases. Leases are recognised upon acceptance of the asset by the customer at an amount equal to the net investment in the lease. The sum of future minimum lease payments and initial origination fees equate to the gross investment in the lease. The difference between the gross and net investment in the lease represents unearned fi nance income, which is recognised as revenue in ‘Interest and similar income’ over the lease term at a constant periodic rate of return on the net investment in the lease.
2.20 Provisions
Provisions are recognised when the VUB Group has a present obligation (legal or constructive) as a result of a past event, and it is probable that an outfl ow of resources embodying economic benefi ts will be required to settle the obligation and a reliable estimate can be made of the amount of the obligation.

46
Consolidated fi nancial statements
2.21 Provisions for employee benefi ts
The Group’s obligation in respect of retirement and jubilee employee benefi ts is the amount of future benefi t that employees have earned in return for their service in the current and prior periods. That benefi t is discounted to determine its present value. The discount rate is determined by reference to a risk-free curve, with a term consistent with the estimated term of the benefi t obligation. The calculation is performed using the projected unit credit method. Any actuarial gains or losses are recognised in profi t or loss in the period in which they arise. All employees of the Group are covered by the retirement and jubilee employee benefi ts program.
The calculation for the respective program takes into account the following parameters:
Jubilee
benefi ts
Retirement
benefi ts
Discount rate 1.7 % 2.6 %
Future growth of wages n/a 2.5 %
Fluctuation of employees (based on age) 8 – 45% 8 – 45%
Retirement age Based on valid legislation
Mortality Based on mortality tables issued by the Statistical Offi ce of the Slovak Republic
The Group also calculates a reserve for retention applicable to employees that are subject to the retention program using the projected unit credit method.
All gains or losses in relation to the employee benefi ts are recognised in ‘Salaries and employee benefi ts’. Employee benefi t reserves are disclosed in the Statement of fi nancial position in ‘Other liabilities’.
2.22 Financial guarantees
Financial guarantees are contracts that require the VUB Group to make specifi ed payments to reimburse the holder for a loss it incurs because a specifi ed debtor fails to make a payment when it falls due, in accordance with the terms of a debt instrument consisting of letters of credit, guarantees and acceptances.
Financial guarantee liabilities are initially recognised at their fair value, and the initial fair value is amortised over the life of the fi nancial guarantee in the Statement of comprehensive income in ‘Fee and commission income’ on a straight line basis. The guarantee liability is subsequently carried at the higher of this amortised amount and the present value of any expected payment (when a payment under the guarantee has become probable). Financial guarantees are included within ‘Other liabilities’. Any increase in the liability relating to fi nancial guarantees is recorded in the Statement of comprehensive income in ‘Impairment losses on fi nancial assets’.
2.23 Legal reserve fund
In accordance with the law and statutes of the VUB Group companies, the VUB Group companies are obliged to contribute at least 10% of its annual net profi t to the ‘Legal reserve fund’ until it reaches 20% of their share capital. Usage of the ‘Legal reserve fund’ is restricted by the law and the fund can be used for the coverage of the losses of VUB Group companies.
2.24 Equity reserves
The reserves recorded in equity that are disclosed in the Statement of fi nancial position include:
47
Consolidated fi nancial statements
‘Translation of foreign operation’ reserve which is used to record exchange differences arising from the translation of the net investment in foreign operations.
‘Available-for-sale fi nancial assets’ reserve which comprises changes in the fair value of available-for-sale investments.
‘Cash fl ow hedges’ reserve which comprises the portion of the gain or loss on a hedging instrument in a cash fl ow hedge that is determined to be an effective hedge.
2.25 Interest income
Interest income and expense is recognised in the Statement of comprehensive income on an accrual basis using the effective interest rate method. Interest income and expense includes the amortisation of any discount or premium on fi nancial instruments. Interest income also includes up-front and commitment fees, which are subject to the effective interest rate calculation and are amortised over the life of the loan.
2.26 Fee and commission income
Fee and commission income arises on fi nancial services provided by the VUB Group including account maintenance, cash management services, brokerage services, investment advice and fi nancial planning, investment banking services, project fi nance transactions and asset management services. Fee and commission income is recognised when the corresponding service is provided.
2.27 Net trading income
Net trading income includes gains and losses arising from purchases, disposals and changes in the fair value of fi nancial assets and liabilities including securities and derivative instruments. It also includes the result of all foreign currency transactions.
2.28 Dividend income
Dividend income is recognised in the Statement of comprehensive income on the date that the dividend is declared.
2.29 Income tax
Income tax is calculated in accordance with the regulations of the Slovak Republic and other jurisdictions, in which the VUB Group operates.
Deferred tax assets and liabilities are recognised, using the balance sheet method, for all temporary differences arising between tax bases of assets or liabilities and their carrying amounts for fi nancial reporting purposes. Expected tax rates, applicable for the periods when assets and liabilities are realised, are used to determine deferred tax.
The Group is also subject to various indirect operating taxes, which are included in ‘Other operating expenses’.
2.30 Fiduciary assets
Assets held in a fi duciary capacity are not reported in the fi nancial statements, as such are not the assets of the VUB Group.

48
Consolidated fi nancial statements
2.31 Signifi cant accounting judgements and estimates
Judgements
In the process of applying the VUB Group’s accounting policies, management has made judgements, apart from those involving estimations, that signifi cantly affect the amounts recognised in the fi nancial statements. The most signifi cant judgements relate to the classifi cation of fi nancial instruments.
Held-to-maturity investments
The VUB Group follows the guidance of IAS 39 on classifying non-derivative fi nancial assets with fi xed or determinable payments and fi xed maturity as held-to-maturity. This classifi cation requires signifi cant judgement. In making this judgement, the VUB Group evaluates its intention and ability to hold such investments to maturity. If the VUB Group fails to hold these investments to maturity other than for a specifi c circumstance, for example selling a higher than insignifi cant amount close to maturity, it will be required to reclassify the entire class as available for sale. The investments would therefore be measured at fair value and not at amortised cost.
Financial assets held for trading
The VUB Group classifi es a fi nancial asset as ‘held for trading’ if it is acquired principally for the purpose of selling it in the near term, or if it is part of a portfolio of identifi ed fi nancial instruments that are managed together and for which there is evidence of recent actual pattern of short-term profi t taking, or if it is a derivative.
Estimates
The preparation of the fi nancial statements requires management to make certain estimates and assumptions, which impact the carrying amounts of the VUB Group’s assets and liabilities and the disclosure of contingent items at the end of reporting period and reported revenues and expenses for the period then ended.
Estimates are used for, but not limited to: fair values of fi nancial instruments, impairment losses on loans and advances to customers, impairment losses for off-balance sheet risks, depreciable lives and residual values of tangible and intangible assets, impairment losses on tangible and intangible assets, liabilities from employee benefi ts and provisions for legal claims.
Fair value of fi nancial instruments
Where the fair values of fi nancial assets and fi nancial liabilities recorded on the Statement of fi nancial position cannot be derived from active markets, they are determined using a variety of valuation techniques which include the use of mathematical models. The input to these models is taken from observable markets where possible, but where this is not feasible, a degree of judgement is required in establishing fair values. The judgements include considerations of liquidity and model inputs such as correlation and volatility for longer dated fi nancial instruments.
Impairment losses on loans and advances
The VUB Group reviews its loans and advances at each reporting date to assess whether a specifi c allowance for impairment should be recorded in the Statement of comprehensive income. In particular, judgement by management is required in the estimation of the amount and timing of future cash fl ows when determining the level of allowance required. Such estimates are based on assumptions about a number of factors and actual results may differ, resulting in future changes to the specifi c allowance.
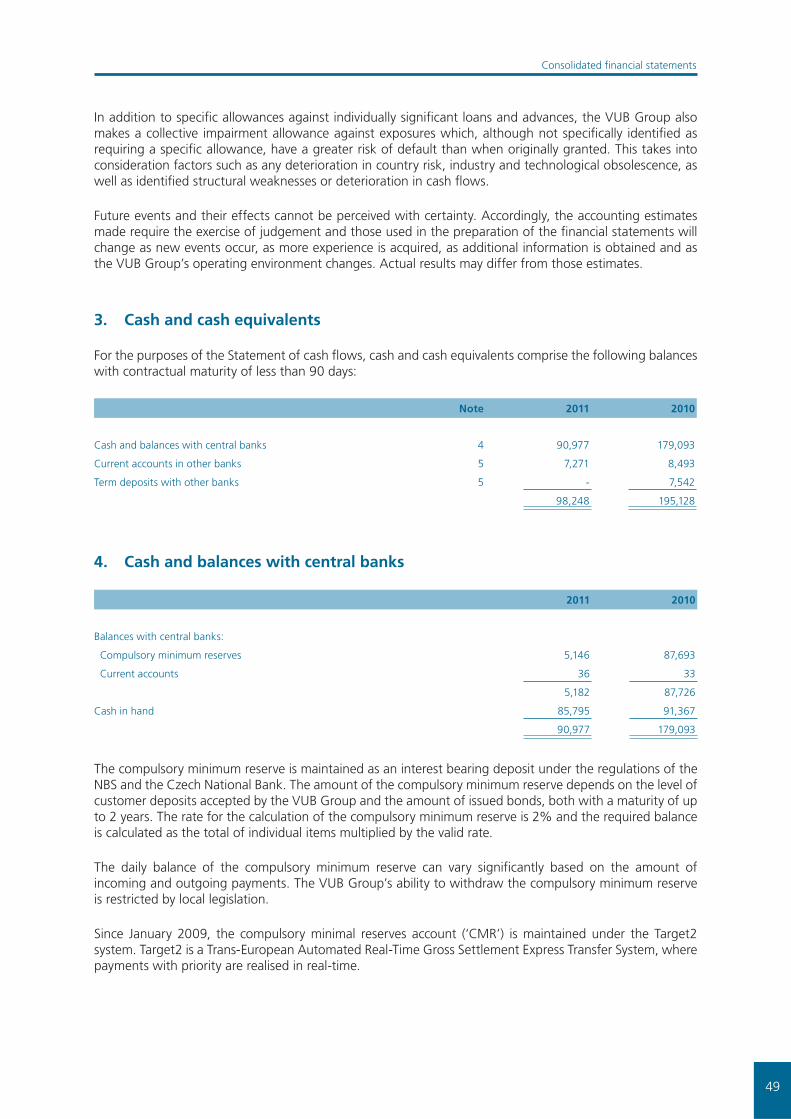
49
Consolidated fi nancial statements
In addition to specifi c allowances against individually signifi cant loans and advances, the VUB Group also makes a collective impairment allowance against exposures which, although not specifi cally identifi ed as requiring a specifi c allowance, have a greater risk of default than when originally granted. This takes into consideration factors such as any deterioration in country risk, industry and technological obsolescence, as well as identifi ed structural weaknesses or deterioration in cash fl ows.
Future events and their effects cannot be perceived with certainty. Accordingly, the accounting estimates made require the exercise of judgement and those used in the preparation of the fi nancial statements will change as new events occur, as more experience is acquired, as additional information is obtained and as the VUB Group’s operating environment changes. Actual results may differ from those estimates.
3. Cash and cash equivalents
For the purposes of the Statement of cash fl ows, cash and cash equivalents comprise the following balances with contractual maturity of less than 90 days:
Note 2011 2010
Cash and balances with central banks 4 90,977 179,093
Current accounts in other banks 5 7,271 8,493
Term deposits with other banks 5 - 7,542
98,248 195,128
4. Cash and balances with central banks
2011 2010
Balances with central banks:
Compulsory minimum reserves 5,146 87,693
Current accounts 36 33
5,182 87,726
Cash in hand 85,795 91,367
90,977 179,093
The compulsory minimum reserve is maintained as an interest bearing deposit under the regulations of the NBS and the Czech National Bank. The amount of the compulsory minimum reserve depends on the level of customer deposits accepted by the VUB Group and the amount of issued bonds, both with a maturity of up to 2 years. The rate for the calculation of the compulsory minimum reserve is 2% and the required balance is calculated as the total of individual items multiplied by the valid rate.
The daily balance of the compulsory minimum reserve can vary signifi cantly based on the amount of incoming and outgoing payments. The VUB Group’s ability to withdraw the compulsory minimum reserve is restricted by local legislation.
Since January 2009, the compulsory minimal reserves account (‘CMR’) is maintained under the Target2 system. Target2 is a Trans-European Automated Real-Time Gross Settlement Express Transfer System, where payments with priority are realised in real-time.
50
Consolidated fi nancial statements
5. Due from banks
Note 2011 2010
Current accounts 3 7,271 8,493
Term deposits
with contractual maturity less than 90 days 3 - 7,542
with contractual maturity over 90 days 3,141 5,081
Loans and advances
with contractual maturity over 90 days 492,081 87,878
Impairment losses 10 (202) (151)
502,291 108,843
At 31 December 2011, the balance of ‘Loans and advances’ comprises of a short term reverse repo trade in the nominal amount of € 399,587 thousand concluded with Intesa Sanpaolo S.p.A, maturing in May 2012 (at 31 December 2010: nil). The repo trade is secured by state bonds and cash collateral.
6. Financial assets held for trading
2011 2010
Treasury bills and other eligible bills
with contractual maturity over 90 days 192,233 174,201
State bonds
with contractual maturity over 90 days 77,619 75,772
Mutual funds 4,110 3,052
273,962 253,025
At 31 December 2011 and 31 December 2010, no fi nancial assets held for trading were pledged by the VUB Group to secure transactions with counterparties.
7. Derivative fi nancial instruments
2011
Assets
2010
Assets
2011
Liabilities
2010
Liabilities
Trading derivatives 80,255 45,179 42,424 46,834
Cash fl ow hedges of interest rate risk - - 5,668 4,451
Fair value hedges of interest rate risk 144 26 9,290 9,444
80,399 45,205 57,382 60,729
Trading derivatives also include hedge instruments that are non-qualifying according to IAS 39, which are held for risk management purposes rather than for trading. The instruments used include cross-currency interest rate swaps. At 31 December 2011, the total positive fair value of such derivatives was € 4,346 thousand (31 December 2010: € 6,386 thousand) and the negative fair value was nil (31 December 2010: nil).

51
Consolidated fi nancial statements
2011
Assets
2010
Assets
2011
Liabilities
2010
Liabilities
Trading derivatives – Fair values
Interest rate instruments
Swaps 18,035 21,632 19,489 23,780
Options 4,224 1,806 4,248 1,813
22,259 23,438 23,737 25,593
Foreign currency instruments
Forwards and swaps 45,773 2,059 10,794 7,894
Cross currency swaps 4,346 6,386 - -
Options 6,152 8,842 6,168 8,893
56,271 17,287 16,962 16,787
Equity and commodity instruments
Equity options 1,725 4,047 1,725 4,047
Commodity options - 407 - 407
1,725 4,454 1,725 4,454
80,255 45,179 42,424 46,834
2011
Assets
2010
Assets
2011
Liabilities
2010
Liabilities
Trading derivatives – Notional values
Interest rate instruments
Swaps 1,045,710 954,181 1,045,710 954,181
Options 145,649 78,991 145,649 78,991
1,191,359 1,033,172 1,191,359 1,033,172
Foreign currency instruments
Forwards and swaps 824,781 280,758 790,494 288,177
Cross currency swaps 69,803 71,825 65,433 65,433
Options 45,481 50,266 45,395 49,754
940,065 402,849 901,322 403,364
Equity and commodity instruments
Equity options 23,297 22,630 23,297 22,630
Commodity options 234 3,280 234 3,280
23,531 25,910 23,531 25,910
2,154,955 1,461,931 2,116,212 1,462,446
52
Consolidated fi nancial statements
Cash fl ow hedges of interest rate risk
The VUB Group uses four interest rate swaps to hedge the interest rate risk arising from the issuance of four variable rate mortgage bonds. The cash fl ows on the fl oating legs of these interest rate swaps substantially match the cash fl ow profi les of the variable rate mortgage bonds.
Below is a schedule indicating as at 31 December 2011, the periods when the hedged cash fl ows are expected to occur. The cash fl ows of mortgage bonds represent the future undiscounted value of coupons:
Up to 1 year 1 to 5 years Over 5 years
2011
Mortgage bonds – interest rate risk 4,982 12,848 1,674
2010
Mortgage bonds – interest rate risk 5,070 22,413 3,218
The net expense on cash fl ow hedges reclassifi ed from ‘Other comprehensive income’ to the ‘Net interest income’ during 2011 was € 2,455 thousand (2010: € 3,468 thousand).
Fair value hedges of interest rate risk
The VUB Group uses three interest rate swaps to hedge the interest rate risk of three fi xed rate bonds from the available-for-sale ('AFS') portfolio. The changes in fair value of these interest rate swaps substantially offset the changes in fair value of AFS portfolio bonds, both in relation to changes of interest rates.
Furthermore, the VUB Group uses one interest rate swap to hedge the interest rate risk arising from the issuance of one fi xed rate mortgage bond. The changes in fair value of this interest rate swap substantially offset the changes in fair value of the mortgage bond, both in relation to changes of interest rates.
In 2011, the Group recognised a net gain of € 455 thousand (2010: net loss of € 3,465 thousand) in relation to the fair value hedging instruments above. The net loss on hedged items attributable to the hedged risks amounted to € 300 thousand (2010: net gain of € 3,564 thousand). Both items are disclosed within ‘Net trading income’.
During 2011, interest and similar income from hedged AFS securities in the amount of € 8,038 thousand (2010: € 8,024 thousand) was compensated by interest expense from interest rate swaps hedging instruments in the amount of € 2,559 thousand (2010: € 3,807 thousand).
At 31 December 2011, interest expense from a hedged mortgage bond in the amount of € 163 thousand (31 December 2010: nil) was compensated by interest income from an interest rate swap hedging instrument in the amount of € 17 thousand (31 December 2010: nil).
The foreign branch of VUB uses four interest rate swaps to hedge the interest rate risk of four fi xed income loans originated in the Czech Republic. The changes in fair value of these interest rate swaps substantially offset the changes in fair value of the loans, both in relation to changes of interest rates.
In 2011, the Group recognised in relation to the fair value hedging instruments of the foreign branch of VUB a net loss of € 275 thousand (2010: net gain of € 48 thousand). The net gain on hedged items attributable to the hedged risks amounted to € 287 thousand (2010: net loss of € 47 thousand). Both items are disclosed within ‘Net trading income’.
In 2011, interest and similar income from hedged fi xed income loans in the amount of € 463 thousand (2010: € 29 thousand) was compensated by interest expense from interest rate swaps hedging instruments in the amount of € 86 thousand (2010: € 8 thousand).

53
Consolidated fi nancial statements
8. Available-for-sale fi nancial assets
Share 2011 Share 2010 2011 2010
State bonds 1,439,321 1,595,839
Bank bonds 15,666 19,345
Equity shares at cost
RVS, a.s. 8.38% 8.38% 574 574
S.W.I.F.T. 0.06% 0.06% 65 65
1,455,626 1,615,823
At 31 December 2011 and 31 December 2010, no available-for-sale fi nancial assets were pledged by the VUB Group to secure transactions with counterparties.
9. Loans and advances to customers
31 December 2011 Amortized
cost
Impairment
losses
(note 10)
Carrying
amount
Sovereigns
Municipalities 150,654 (294) 150,360
Corporate
Large Corporates 960,423 (8,943) 951,480
Specialized lending 738,004 (31,765) 706,239
Small and medium enterprises (‘SME’) 691,524 (36,853) 654,671
Other Financial Institutions 270,187 (588) 269,599
Private Sector Entities 102,304 (706) 101,598
Leasing 221,804 (20,592) 201,212
Factoring 191,559 (3,091) 188,468
3,175,805 (102,538) 3,073,267
Retail
Small business 200,154 (15,538) 184,616
Small business – Leasing 19,376 (1,643) 17,733
Consumer Loans 962,405 (116,013) 846,392
Mortgages 2,716,118 (34,102) 2,682,016
Credit Cards 252,728 (43,861) 208,867
Overdrafts 104,731 (17,788) 86,943
Leasing 4,928 (219) 4,709
Flat Owners Associations 3,811 (63) 3,748
Other 8,267 (372) 7,895
4,272,518 (229,599) 4,042,919
7,598,977 (332,431) 7,266,546
The segmentation of Loans and advances to customers in both 2011 and 2010 is based on the internal defi nition of segments which is continuously being improved to refl ect the Group’s needs. The revised segment defi nition caused transfers among the individual sectors.

54
Consolidated fi nancial statements
Restated 31 December 2010 Amortized
cost
Impairment
losses
(note 10)
Carrying
amount
Sovereigns
Municipalities 101,730 (205) 101,525
Municipalities – Leasing 65 - 65
101,795 (205) 101,590
Corporate
Large Corporates 847,014 (17,011) 830,003
Specialized lending 651,086 (16,443) 634,643
Small and medium enterprises (‘SME’) 636,480 (39,651) 596,829
Other Financial Institutions 295,550 (203) 295,347
Private Sector Entities 3,253 (39) 3,214
Leasing 177,715 (22,324) 155,391
Factoring 85,581 (3,032) 82,549
2,696,679 (98,703) 2,597,976
Retail
Small business 188,861 (14,053) 174,808
Small business – Leasing 20,342 (2,035) 18,307
Consumer Loans 882,232 (121,528) 760,704
Mortgages 2,476,074 (26,690) 2,449,384
Credit Cards 260,141 (39,763) 220,378
Overdrafts 112,084 (13,736) 98,348
Leasing 5,168 (282) 4,886
Flat Owners Associations 3,534 (42) 3,492
Other 7,963 (161) 7,802
3,956,399 (218,290) 3,738,109
6,754,873 (317,198) 6,437,675
At 31 December 2011, the 20 largest corporate customers represented a total balance of € 808,010 thousand (2010: € 660,240 thousand) or 10.63% (2010: 9.8%) of the gross loan portfolio.
Maturities of gross fi nance lease receivables are as follows:
2011 2010
Up to 1 year 77,554 72,136
1 to 5 years 155,255 125,221
Over 5 years 53,426 39,175
286,235 236,532
Unearned future fi nance income on fi nance leases (40,127) (33,241)
Impairment losses (22,454) (24,642)
223,654 178,649

55
Consolidated fi nancial statements
Maturities of net fi nance lease receivables are as follows:
2011 2010
Up to 1 year 65,481 60,944
1 to 5 years 133,002 106,932
Over 5 years 47,625 35,415
246,108 203,291
Impairment losses (22,454) (24,642)
223,654 178,649
10. Impairment losses
Note 1 Jan 2011
Creation/
(Reversal)
(note 31)
Loans
written-
off/sold
(note 31)
FX losses/
(gains) Other*31 Dec 2011
Due from banks 5 151 51 - - - 202
Non-current assets held for
sale 15 1,272 - - - (1,272) -
Loans and advances to
customers 9 317,198 67,721 (46,050) 194 (6,632) 332,431
Held-to-maturity investments 11 249 92 - - - 341
Property and equipment 15 770 (14) - - - 756
Other assets 16 16,625 482 - 19 (1,052) 16,074
336,265 68,332 (46,050) 213 (8,956) 349,804
* ’Other’ represents the following movements:
– Release of impairment loss to sold buildings in the amount of € 1,272 thousand (see also note 15)
– Interest portion (unwinding of interest) in the amount of € 6,632 thousand
– Release of impairment loss to other receivables written off in the amount of € 1,052 thousand
Note 1 Jan 2010
Creation/
(Reversal)
(note 31)
Loans
written-
off/sold
(note 31)
FX losses/
(gains) Other*31 Dec 2010
Due from banks 5 151 - - - - 151
Non-current assets held for
sale 15 - 1,272 - - - 1,272
Loans and advances to
customers 9 265,777 65,069 (12,718) 413 (1,343) 317,198
Held-to-maturity investments 11 377 (128) - - - 249
Property and equipment 15 305 461 - - 4 770
Other assets 16 10,752 5,411 - 49 413 16,625
277,362 72,085 (12,718) 462 (926) 336,265
* Interest portion (unwinding of interest)
56
Consolidated fi nancial statements
11. Held-to-maturity investments
Note 2011 2010
State restructuring bonds - 617,613
State bonds 1,125,948 1,123,031
Bank bonds and other bonds issued by fi nancial sector 10,052 9,974
Corporate notes and bonds with contractual maturity over 90 days 1,881 37,894
1,137,881 1,788,512
Impairment losses 10 (341) (249)
1,137,540 1,788,263
At 31 December 2011, state bonds in the total nominal amount of € 230,058 thousand were pledged by the Group (31 December 2010: € 106,460 thousand) to secure transactions with counterparties.
The last two 10-year state restructuring bonds held in the held-to-maturity portfolio at 31 December 2010, with nominal values of € 366,594 thousand and € 248,855 thousand were fully redeemed on 30 January 2011 and 29 March 2011, respectively.
12. Associates and jointly controlled entities
Share % Cost Revaluation
Carrying
amount
At 31 December 2011
Slovak Banking Credit Bureau, s.r.o. 33.3 3 39 42
VÚB Generali DSS, a.s. 50.0 16,597 (9,562) 7,035
16,600 (9,523) 7,077
At 31 December 2010
Slovak Banking Credit Bureau, s.r.o. 33.3 3 31 34
VÚB Generali DSS, a.s. 50.0 16,597 (10,412) 6,185
16,600 (10,381) 6,219
The share of profi t and revaluation reserves of associates and jointly controlled entities reported in the Statement of comprehensive income is as follows:
2011 2010
Revaluation at 1 January (10,381) (10,980)
Share of profi t 850 596
Share of revaluation reserves 8 3
Revaluation at 31 December (9,523) (10,381)

57
Consolidated fi nancial statements
The aggregate amounts of the VUB Group’s interest in VÚB Generali DSS, a.s. are as follows:
2011 2010
Assets 7,266 6,374
Liabilities 231 189
Equity 7,035 6,185
Net profi t for the year 842 591
Change of revaluation reserves for the year (31) (39)
The aggregate amounts of the VUB Group’s interest in Slovak Banking Credit Bureau, s.r.o. are as follows:
2011 2010
Assets 200 163
Liabilities 158 129
Equity 42 34
Net profi t for the year 8 5
13. Intangible assets
Software
Other
intangible
assets
Assets
in progressTotal
Cost
At 1 January 2011 150,167 52,439 5,187 207,793
Additions 8 - 14,439 14,447
Disposals (3,671) (22) (6) (3,699)
Transfers 6,536 648 (7,184) -
FX differences (12) (1) - (13)
At 31 December 2011 153,028 53,064 12,436 218,528
Accumulated amortisation
At 1 January 2011 (123,971) (42,480) - (166,451)
Amortisation for the year (8,908) (5,389) - (14,297)
Disposals 3,671 22 - 3,693
FX differences 12 1 - 13
At 31 December 2011 (129,196) (47,846) - (177,042)
Carrying amount
At 1 January 2011 26,196 9,959 5,187 41,342
At 31 December 2011 23,832 5,218 12,436 41,486
Assets in progress include mainly the costs for development of new software applications that have not yet been put to use.

58
Consolidated fi nancial statements
Software
Other
intangible
assets
Assets
in progressTotal
Cost
At 1 January 2010 159,778 55,258 3,697 218,733
Additions - - 11,863 11,863
Disposals (19,392) (3,386) (48) (22,826)
Transfers 9,759 566 (10,325) -
FX differences 22 1 - 23
At 31 December 2010 150,167 52,439 5,187 207,793
Accumulated amortisation
At 1 January 2010 (134,847) (36,864) - (171,711)
Amortisation for the year (8,494) (9,001) - (17,495)
Disposals 19,392 3,386 - 22,778
FX differences (22) (1) - (23)
At 31 December 2010 (123,971) (42,480) - (166,451)
Carrying amount
At 1 January 2010 24,931 18,394 3,697 47,022
At 31 December 2010 26,196 9,959 5,187 41,342
Gross book value of fully depreciated assets that are still used by the Group amounts to € 81,256 thousand (€ 76,919 thousand as at 31 December 2010).
14. Goodwill
2011 2010
VÚB Leasing, a.s. 10,434 10,434
Consumer Finance Holding, a.s. 18,871 18,871
29,305 29,305
Goodwill related to VÚB Leasing, a. s. includes both goodwill related to the majority (70%) shareholding in the amount of € 7,304 thousand (Sk 219 million) and goodwill arising from the purchase of the remaining 30% shareholding in the amount of € 3,130 thousand (Sk 96 million). Goodwill related to Consumer Finance Holding, a.s. (‘CFH’) arose in 2005 on the acquisition of CFH, the VUB Group’s sales fi nance subsidiary.
Goodwill is tested for impairment semi-annually or more frequently, if events or changes in circumstances indicate that the carrying value may be impaired. Management considers VÚB Leasing, a. s. and CFH to be separate cash generating units for the purposes of impairment testing.
The basis on which the recoverable amount of VÚB Leasing, a. s. and CFH has been determined is the value in use calculation, using cash fl ow projections based on the most recent fi nancial budgets approved by senior management covering a 5-year period. The discount rates applied to cash fl ow projections beyond the fi ve year period are adjusted by the projected growth rate.
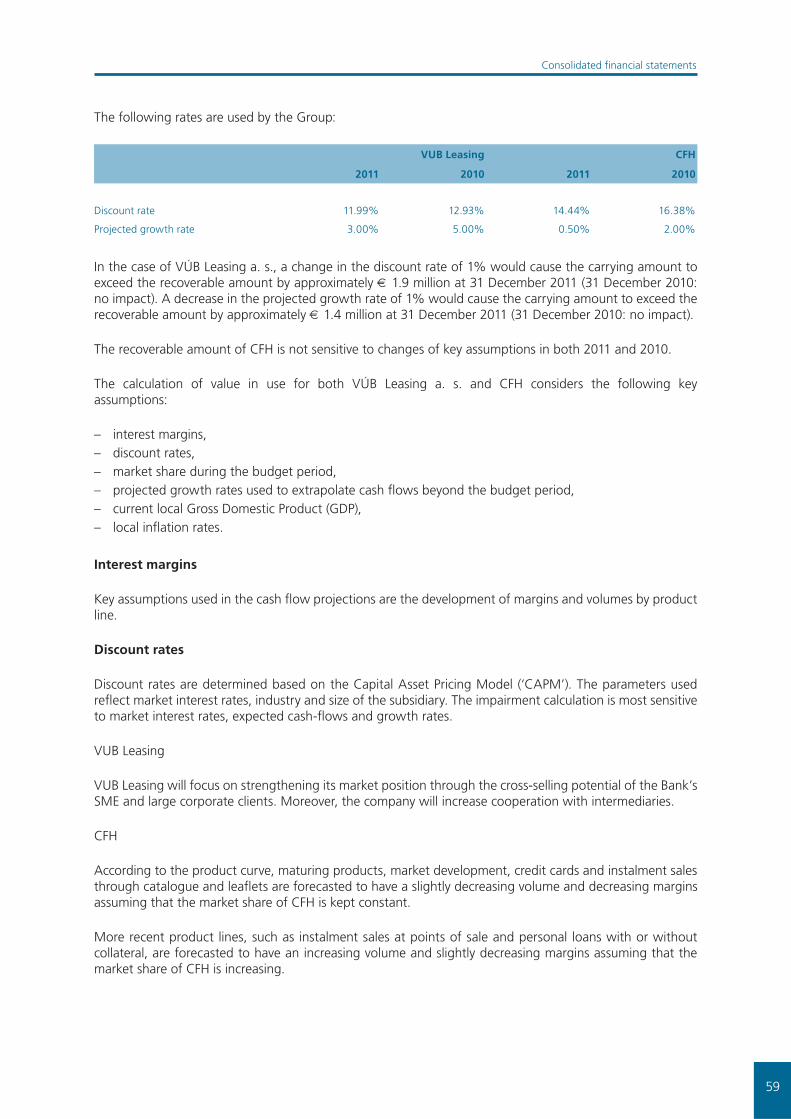
59
Consolidated fi nancial statements
The following rates are used by the Group:
VUB Leasing CFH
2011 2010 2011 2010
Discount rate 11.99% 12.93% 14.44% 16.38%
Projected growth rate 3.00% 5.00% 0.50% 2.00%
In the case of VÚB Leasing a. s., a change in the discount rate of 1% would cause the carrying amount to exceed the recoverable amount by approximately € 1.9 million at 31 December 2011 (31 December 2010: no impact). A decrease in the projected growth rate of 1% would cause the carrying amount to exceed the recoverable amount by approximately € 1.4 million at 31 December 2011 (31 December 2010: no impact).
The recoverable amount of CFH is not sensitive to changes of key assumptions in both 2011 and 2010.
The calculation of value in use for both VÚB Leasing a. s. and CFH considers the following key assumptions:
– interest margins,– discount rates,– market share during the budget period,– projected growth rates used to extrapolate cash fl ows beyond the budget period,– current local Gross Domestic Product (GDP),– local infl ation rates.
Interest margins
Key assumptions used in the cash fl ow projections are the development of margins and volumes by product line.
Discount rates
Discount rates are determined based on the Capital Asset Pricing Model (‘CAPM’). The parameters used refl ect market interest rates, industry and size of the subsidiary. The impairment calculation is most sensitive to market interest rates, expected cash-fl ows and growth rates.
VUB Leasing
VUB Leasing will focus on strengthening its market position through the cross-selling potential of the Bank’s SME and large corporate clients. Moreover, the company will increase cooperation with intermediaries.
CFH
According to the product curve, maturing products, market development, credit cards and instalment sales through catalogue and leafl ets are forecasted to have a slightly decreasing volume and decreasing margins assuming that the market share of CFH is kept constant.
More recent product lines, such as instalment sales at points of sale and personal loans with or without collateral, are forecasted to have an increasing volume and slightly decreasing margins assuming that the market share of CFH is increasing.

60
Consolidated fi nancial statements
15. Property and equipment and Non-current assets held for sale
NoteBuildings
and landEquipment
Other
tangibles
Assets
in progressTotal
Cost
At 1 January 2011 198,847 94,275 41,006 3,866 337,994
Additions - - - 17,328 17,328
Disposals (934) (18,710) (4,931) (270) (24,845)
Transfers 3,267 7,208 6,676 (17,152) (1)
FX differences (2) (4) (3) - (9)
At 31 December 2011 201,178 82,769 42,748 3,772 330,467
Accumulated depreciation
At 1 January 2011 (80,431) (76,723) (31,149) - (188,303)
Depreciation for the year (6,822) (7,836) (3,656) - (18,314)
Disposals 805 18,569 4,255 - 23,629
FX differences 3 4 2 - 9
At 31 December 2011 (86,445) (65,986) (30,548) - (182,979)
Impairment losses 10
At 1 January 2011 (504) - (266) - (770)
Additions - - 14 - 14
At 31 December 2011 (504) - (252) - (756)
Carrying amount
At 1 January 2011 117,912 17,552 9,591 3,866 148,921
At 31 December 2011 114,229 16,783 11,948 3,772 146,732

61
Consolidated fi nancial statements
NoteBuildings
and landEquipment
Other
tangibles
Assets
in progressTotal
Cost
At 1 January 2010 207,287 97,028 40,507 3,783 348,605
Additions - - - 14,074 14,074
Disposals (10,637) (10,434) (3,645) - (24,716)
Transfers 2,192 7,660 4,139 (13,991) -
FX differences 5 21 5 - 31
At 31 December 2010 198,847 94,275 41,006 3,866 337,994
Accumulated depreciation
At 1 January 2011 (76,614) (79,155) (28,427) - (184,196)
Depreciation for the year (9,092) (7,864) (4,029) - (20,985)
Disposals 5,280 10,316 1,311 - 16,907
FX differences (5) (20) (4) - (29)
At 31 December 2010 (80,431) (76,723) (31,149) - (188,303)
Impairment losses 10
At 1 January 2010 (43) - (262) - (305)
Additions (461) - (4) - (465)
At 31 December 2010 (504) - (266) - (770)
Carrying amount
At 1 January 2010 130,630 17,873 11,818 3,783 164,104
At 31 December 2010 117,912 17,552 9,591 3,866 148,921
Gross book value of fully depreciated assets that are still used by the Group amounts to € 69,367 thousand (€ 68,838 thousand as at 31 December 2010).
The Bank’s insurance covers all standard risks to tangible and intangible assets (theft, robbery, natural hazards, vandalism, and other damages).
At 31 December 2011 and 31 December 2010, the VUB Group held in its portfolio of non-current assets held for sale buildings as follows:
Note 2011 2010
Cost 6 7,768
Accumulated depreciation (3) (3,122)
Impairment 10 - (1,272)
3 3,374

62
Consolidated fi nancial statements
16. Other assets
Note 2011 2010
Operating receivables and advances 10,102 15,296
Inventories (incl. repossessed leased assets) 8,249 10,873
Receivables from termination of leasing 7,505 7,233
Prepayments and accrued income 4,857 4,803
Other tax receivables 2,626 4,490
Settlement of operations with fi nancial instruments 1,517 185
Other 318 521
35,174 43,401
Impairment losses 10 (16,074) (16,625)
19,100 26,776
Impairment losses for ‘Other assets’ relates mostly to inventories and receivables from the termination of leasing.
17. Due to central and other banks
2011 2010
Due to central banks
Current accounts 68,111 53,019
Loans received 115,947 -
184,058 53,019
Due to other banks
Current accounts 9,600 8,374
Term deposits 110,561 330,642
Loans received 384,250 270,488
504,411 609,504
688,469 662,523
Due to central banks include loan received from the NBS with maturity less than one month.
18. Due to customers
2011 2010
Current accounts 2,909,565 3,057,737
Term deposits 3,750,924 3,328,893
Savings accounts 247,784 285,567
Government and municipal deposits 327,652 434,586
Loans received 159,642 75,180
Promissory notes 56,767 58,136
Other deposits 35,074 25,268
7,487,408 7,265,367

63
Consolidated fi nancial statements
19. Debt securities in issue
2011 2010
Bonds 41,986 59,663
Mortgage bonds 1,410,797 1,383,033
Mortgage bonds subject to cash fl ow hedges 180,232 181,557
Mortgage bonds subject to fair value hedge 27,278 -
1,618,307 1,564,590
Revaluation of fair value hedged mortgage bonds 194 -
1,660,487 1,624,253
The repayment of mortgage bonds is funded by the mortgage loans provided to customers of the Group (see also note 9).
Name Interest rate ( %) CCY
Number of
mortgage
bonds
issued
at 31 Dec
2011
Nominal
value in
CCY per
piece
Issue dateMaturity
date2011 2010
Mortgage bonds VÚB, a.s. VII. 5.10 EUR 10,000 3,319 15.4.2003 15.4.2013 34,398 34,398
Mortgage bonds VÚB, a.s. VIII. 5.10 EUR 1,000 33,194 29.5.2003 29.5.2013 34,191 34,191
Mortgage bonds VÚB, a.s. XVII. 1.58 EUR 1,678 33,194 28.11.2005 28.11.2015 55,780 55,757
Mortgage bonds VÚB, a.s. XX. 4.30 EUR 50 331,939 9.3.2006 9.3.2021 17,176 17,176
Mortgage bonds VÚB, a.s. XXI. 1.10 EUR 500 33,194 10.3.2006 10.3.2011 - 16,608
Mortgage bonds VÚB, a.s. XXII. 1.18 EUR 1,200 50,000 29.6.2006 29.6.2011 - 60,004
Mortgage bonds VÚB, a.s. XXIII. 1.18 EUR 60 1,000,000 26.10.2006 26.10.2011 - 60,128
Mortgage bonds VÚB, a.s. XXIV. 1.35 EUR 1,500 33,194 24.11.2006 24.11.2011 - 49,860
Mortgage bonds VÚB, a.s. XXV. 1.19 EUR 30 1,000,000 5.12.2006 5.12.2011 - 30,026
Mortgage bonds VÚB, a.s. XXVIII. 1.95 CZK 1,000 1,000,000 20.6.2007 20.6.2012 38,905 40,240
Mortgage bonds VÚB, a.s. XXIX. 1.80 EUR 500 33,194 16.10.2007 16.10.2012 16,657 16,637
Mortgage bonds VÚB, a.s. XXX. 5.00 EUR 1,000 33,194 5.9.2007 5.9.2032 33,346 33,327
Mortgage bonds VÚB, a.s. XXXI. 4.90 EUR 600 33,194 29.11.2007 29.11.2037 19,638 19,624
Mortgage bonds VÚB, a.s. 32. 2.95 CZK 800 1,000,000 17.12.2007 17.12.2017 33,412 34,791
Mortgage bonds VÚB, a.s. 35. 4.40 EUR 630 33,194 19.3.2008 19.3.2016 21,257 21,167
Mortgage bonds VÚB, a.s. 36. 4.75 EUR 560 33,194 31.3.2008 31.3.2020 18,846 18,796
Mortgage bonds VÚB, a.s. 37. 1.47 EUR 40 1,000,000 30.4.2008 30.4.2011 - 40,103
Mortgage bonds VÚB, a.s. 39. 2.10 EUR 60 1,000,000 26.6.2008 26.6.2015 60,017 60,012
Mortgage bonds VÚB, a.s. 40. 2.21 EUR 70 1,000,000 28.8.2008 28.8.2015 70,146 70,117
Mortgage bonds VÚB, a.s. 41. 5.63 USD 34 1,000,000 30.9.2008 30.9.2013 26,651 25,807
Mortgage bonds VÚB, a.s. 42. 4.00 EUR 400 50,000 28.4.2009 28.4.2012 20,540 20,540
Mortgage bonds VÚB, a.s. 43. 5.10 EUR 500 33,194 26.9.2008 26.9.2025 15,484 15,387
Mortgage bonds VÚB, a.s. 44. 4.75 EUR 300 50,000 11.2.2009 11.2.2012 15,633 15,633
Mortgage bonds VÚB, a.s. 46. 4.61 EUR 150 1,000,000 19.5.2009 19.5.2016 154,264 154,264
Mortgage bonds VÚB, a.s. 48. 4.00 EUR 19,961 1,000 11.5.2009 11.5.2013 20,472 20,511
Mortgage bonds VÚB, a.s. 49. 3.92 EUR 100 1,000,000 28.7.2009 28.7.2014 101,666 101,666
64
Consolidated fi nancial statements
Mortgage bonds VÚB, a.s. 50. 3.40 EUR 8,391 1,000 2.11.2009 2.11.2013 8,438 8,454
Mortgage bonds VÚB, a.s. 51. 2.14 EUR 100 1,000,000 8.4.2010 8.4.2014 100,492 100,355
Mortgage bonds VÚB, a.s. 52. 2.16 EUR 161 50,000 15.3.2010 15.3.2014 8,101 8,102
Mortgage bonds VÚB, a.s. 53. 2.28 EUR 100 1,000,000 8.4.2010 8.4.2017 100,525 100,387
Mortgage bonds VÚB, a.s. 54. 3.00 EUR 15,000 1,000 1.7.2010 1.7.2014 15,225 15,225
Mortgage bonds VÚB, a.s. 55. 2.85 EUR 14,000 1,000 1.10.2010 1.10.2015 14,100 14,100
Mortgage bonds VÚB, a.s. 56. 3.07 EUR 70 1,000,000 30.9.2010 30.9.2017 70,543 70,434
Mortgage bonds VÚB, a.s. 57. 3.06 EUR 100 1,000,000 30.9.2010 30.9.2018 100,772 100,620
Mortgage bonds VÚB, a.s. 58. 3.50 EUR 80 1,000,000 10.12.2010 10.12.2019 80,164 80,143
Mortgage bonds VÚB, a.s. 59. 3.00 EUR 25,000 1,000 1.3.2011 1.3.2015 25,625 -
Mortgage bonds VÚB, a.s. 60. 2.05 CZK 4,345 100,000 20.5.2011 20.5.2014 16,856 -
Mortgage bonds VÚB, a.s. 61. 3.10 EUR 467 10,000 7.6.2011 7.6.2015 4,666 -
Mortgage bonds VÚB, a.s. 62. 3.82 EUR 100 1,000,000 28.7.2011 28.7.2018 101,624 -
Mortgage bonds VÚB, a.s. 63. 3.75 EUR 35,000 1,000 16.9.2011 16.3.2016 35,383 -
Mortgage bonds VÚB, a.s. 64. 3.25 CZK 7,000 100,000 26.9.2011 26.9.2016 27,278 -
Mortgage bonds VÚB, a.s. 65. 2.19 EUR 60 1,000,000 26.10.2011 26.10.2012 59,362 -
Mortgage bonds VÚB, a.s. 66. 3.40 EUR 517 50,000 28.11.2011 28.11.2014 25,603 -
Mortgage bonds VÚB, a.s. 67. 5.35 EUR 300 50,000 29.11.2011 29.11.2030 15,071 -
1,618,307 1,564,590
20. Current and deferred income taxes
2011 2010
Current income tax assets 2,791 8,931
2011 2010
Deferred income tax assets 77,463 66,154
Deferred income taxes are calculated on all temporary differences using a tax rate of 19% (31 December 2010: 19%) as follows:
2011
Profi t/
(loss)
(note 32)
Equity 2010
Due from banks 38 9 - 29
Derivative fi nancial instruments
designated as cash fl ow hedges 1,077 - 231 846
Available-for-sale fi nancial assets 17,029 - 10,560 6,469
Loans and advances to customers 60,218 2,036 - 58,182
Held-to-maturity investments 65 18 - 47
Intangible assets identifi ed on acquisition (501) 809 - (1,310)
Property and equipment (3,303) (729) - (2,574)
Other liabilities 4,367 (146) - 4,513
Other (1,527) (1,479) - (48)
Deferred income tax assets 77,463 518 10,791 66,154
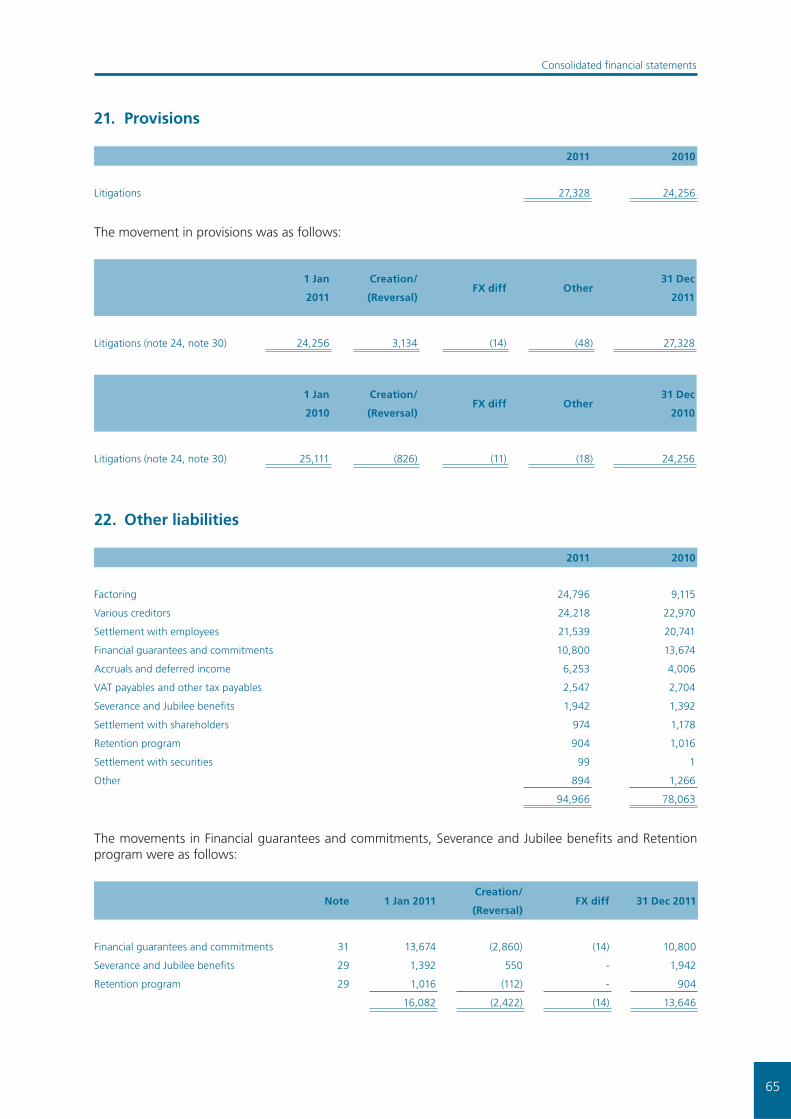
65
Consolidated fi nancial statements
21. Provisions
2011 2010
Litigations 27,328 24,256
The movement in provisions was as follows:
1 Jan
2011
Creation/
(Reversal)FX diff Other
31 Dec
2011
Litigations (note 24, note 30) 24,256 3,134 (14) (48) 27,328
1 Jan
2010
Creation/
(Reversal)FX diff Other
31 Dec
2010
Litigations (note 24, note 30) 25,111 (826) (11) (18) 24,256
22. Other liabilities
2011 2010
Factoring 24,796 9,115
Various creditors 24,218 22,970
Settlement with employees 21,539 20,741
Financial guarantees and commitments 10,800 13,674
Accruals and deferred income 6,253 4,006
VAT payables and other tax payables 2,547 2,704
Severance and Jubilee benefi ts 1,942 1,392
Settlement with shareholders 974 1,178
Retention program 904 1,016
Settlement with securities 99 1
Other 894 1,266
94,966 78,063
The movements in Financial guarantees and commitments, Severance and Jubilee benefi ts and Retention program were as follows:
Note 1 Jan 2011Creation/
(Reversal)FX diff 31 Dec 2011
Financial guarantees and commitments 31 13,674 (2,860) (14) 10,800
Severance and Jubilee benefi ts 29 1,392 550 - 1,942
Retention program 29 1,016 (112) - 904
16,082 (2,422) (14) 13,646

66
Consolidated fi nancial statements
Note 1 Jan 2010Creation/
(Reversal)FX diff 31 Dec 2010
Financial guarantees and commitments 31 9,595 4,079 - 13,674
Severance and Jubilee benefi ts 29 1,286 106 - 1,392
Retention program 29 1,026 (10) - 1,016
11,907 4,175 - 16,082
23. Share capital
2011 2010
Authorized, issued and fully paid:
89 ordinary shares of € 3,319,391.89 each, not traded 295,426 295,426
4,078,108 ordinary shares of € 33.2 each, publicly traded 135,393 135,393
430,819 430,819
Net profi t for the year attributable to shareholders 176,903 150,323
Divided by 12,976,478 ordinary shares of € 33.2 each
Basic and diluted earnings per € 33.2 share in Euro 13.63 11.58
The principal rights attached to shares are to take part in and vote at the general meeting of shareholders and to receive dividends.
The structure of shareholders is as follows:
2011 2010
Intesa Holding International S.A. 96.76% 96.76%
Domestic shareholders 2.91% 2.97%
Foreign shareholders 0.33% 0.27%
100.00% 100.00%
The primary objectives of the Group’s capital management are to ensure that the Group complies with externally imposed capital requirements and that the Group maintains strong credit ratings and healthy capital ratios in order to support its business and to maximise shareholders’ value.
The Group manages its capital structure and makes adjustments to it in the light of changes in economic conditions and the risk characteristics of its activities. In order to maintain or adjust the capital structure, the Group may adjust the amount of dividend payments to shareholders, return capital to shareholders or issue capital securities. No changes have yet been made in the objectives, policies and processes from the previous years, however, it is under the constant scrutiny of the Board.

67
Consolidated fi nancial statements
The VUB Group’s regulatory capital position at 31 December 2011 and 31 December 2010 was as follows:
2011 2010
Tier 1 capital
Share capital 430,819 430,819
Share premium 13,368 13,368
Retained earnings without net profi t for the year 476,281 387,357
Legal reserve fund 95,261 93,090
Less goodwill and software (including software in Assets in progress) (65,573) (60,688)
Less negative revaluation of available-for-sale fi nancial assets* (85,726) -
Less expected loss (57,073) -
807,357 863,946
Tier 2 capital
Positive revaluation of available-for-sale fi nancial assets* 759 -
Regulatory adjustment
Associates and jointly controlled entities (7,035) (6,185)
Expected loss (incl. equity instruments) (4,286) -
(11,321) (6,185)
Total regulatory capital 796,795 857,761
* Calculated based on NBS regulatory requirement.
Regulatory capital includes items forming the value of basic own funds (ordinary share capital, share premium, retained earnings, legal reserve fund) and items decreasing the value of basic own funds (intangible assets, goodwill and investments with signifi cant infl uence). Since 1 January 2011, a new item is deducted from regulatory capital – the difference between the expected loss and impairment losses on exposures treated under the standardised approach. The methodology is prescribed by NBS decree 11/2010 stipulating methods of valuing banking book positions and details of the valuation of banking book positions, including the frequency of such valuations. Since February 2011, the VUB Group is also obliged to deduct difference between the expected loss and impairment losses if positive for the IRB portfolio (Corporate segment) and the expected loss for equities (Simple IRB approach). Furthermore, according to the amendment to NBS decree 4/2007 (amendment number 3/2011), since 30 May 2011 the VUB Group is obliged to decrease the value of regulatory capital by the negative revaluation differences arising from the revaluation of available-for-sale fi nancial assets.
2011 2010
Tier 1 capital 807,357 863,946
Tier 2 capital 759 -
Regulatory adjustment (11,321) (6,185)
Total regulatory capital 796,795 857,761
Total Risk Weighted Assets 7,508,276 6,854,299
Tier 1 capital ratio 10.75% 12.60%
Total capital ratio 10.61% 12.51%

68
Consolidated fi nancial statements
Regulatory capital consists of Tier 1 capital, which comprises share capital, share premium, retained earnings without profi t for the current year, foreign currency translation and reserves. Certain adjustments are made to IFRS-based results and reserves, as prescribed by the NBS. The other component of regulatory capital is Tier 2 capital, which includes subordinated long term debt, preference shares and available-for-sale reserves relating capital instruments.
The VUB Group must maintain a capital adequacy ratio of at least 8% according to the act on banks. The capital adequacy ratio is the ratio between the Group’s capital and the risk-weighted assets. Risk weighted assets include risk weighted assets from positions recorded in the trading book and risk weighted assets from positions recorded in the banking book. The VUB Group complied with the Act on Banks requirement for the capital adequacy ratio as at 31 December 2011 and 31 December 2010.
In addition to the requirement of the Act on Banks, from December 2011 the Group is obliged to fulfi l also the additional requirement due to the joint decision of the NBS and Banca d’Italia supervision authorities, issued on 21 December 2011. Based on this decision the Group is obliged to maintain the Total capital ratio of at least 10% for both the separate and consolidated level. The VUB Group complied with this requirement as at 31 December 2011.
24. Financial commitments and contingencies
2011 2010
Issued guarantees 549,239 594,173
Commitments and undrawn credit facilities 2,142,115 1,994,255
2,691,354 2,588,428
(a) Issued guaranteesCommitments from guarantees represent irrevocable assurances that the VUB Group will make payments in the event that a borrower cannot meet its obligations to third parties. These assurances carry the same credit risk as loans and therefore the VUB Group books liabilities against these instruments on a similar basis as is applicable to loans.
(b) Commitments and undrawn credit facilitiesThe primary purpose of commitments to extend credit is to ensure that funds are available to the customer as required. Commitments to extend credit issued by the VUB Group represent undrawn portions of commitments and approved overdraft loans.
(c) Lease obligationsIn the normal course of business, the VUB Group enters into operating lease agreements for branch facilities and cars. The total value of future payments arising from non-cancellable operating leasing contracts at 31 December 2011 and 31 December 2010 was as follows:
2011 2010
Up to 1 year 577 1,615
1 to 5 years 282 1,313
Over 5 years - -
859 2,928

69
Consolidated fi nancial statements
(d) Operating lease – the Group as a lessorThe VUB Group has entered into a number of non-cancellable operating lease contracts with its customers. Future minimum rentals receivable under such contracts as at 31 December 2011 and 31 December 2010 are as follows:
2011 2010
Up to 1 year 598 2,443
1 to 5 years 1,683 3,025
Over 5 years - -
2,281 5,468
e) LegalIn the normal course of business the VUB Group is subject to a variety of legal actions. The VUB Group conducted a review of legal proceedings outstanding against it as of 31 December 2011. Pursuant to this review, management has recorded total provisions of € 27,328 thousand (31 December 2010: € 24,256 thousand) in respect of such legal proceedings (see also note 21). The VUB Group will continue to defend its position in respect of each of these legal proceedings. In addition to the legal proceedings covered by provisions, there are contingent liabilities arising from legal proceedings in the total amount of € 21,078 thousand, as at 31 December 2011 (31 December 2010: € 19,039 thousand). This amount represents existing legal proceedings against the VUB Group that in the opinion of the Legal Department of the VUB will most probably not result in any payments due by the VUB Group.
The particular requirements pursuant to IAS 37.85 are not disclosed in accordance with IAS 37.92 in order not to compromise the Group’s position in the ongoing legal proceedings and disputes.
25. Net interest income
2011 2010
Interest and similar income
Due from banks 16,397 8,822
Loans and advances to customers 413,022 362,670
Bonds, treasury bills and other securities:
Financial assets held for trading 8,969 9,386
Available-for-sale fi nancial assets 53,348 44,830
Held-to-maturity investments 49,545 59,369
541,281 485,077
Interest expense and similar charges
Due to banks (9,004) (9,272)
Due to customers (76,213) (62,005)
Debt securities in issue (53,186) (42,998)
(138,403) (114,275)
402,878 370,802
Interest income on individually impaired loans and advances to customers for 2011 amounted to € 9,964 thousand (2010: € 15,024 thousand).
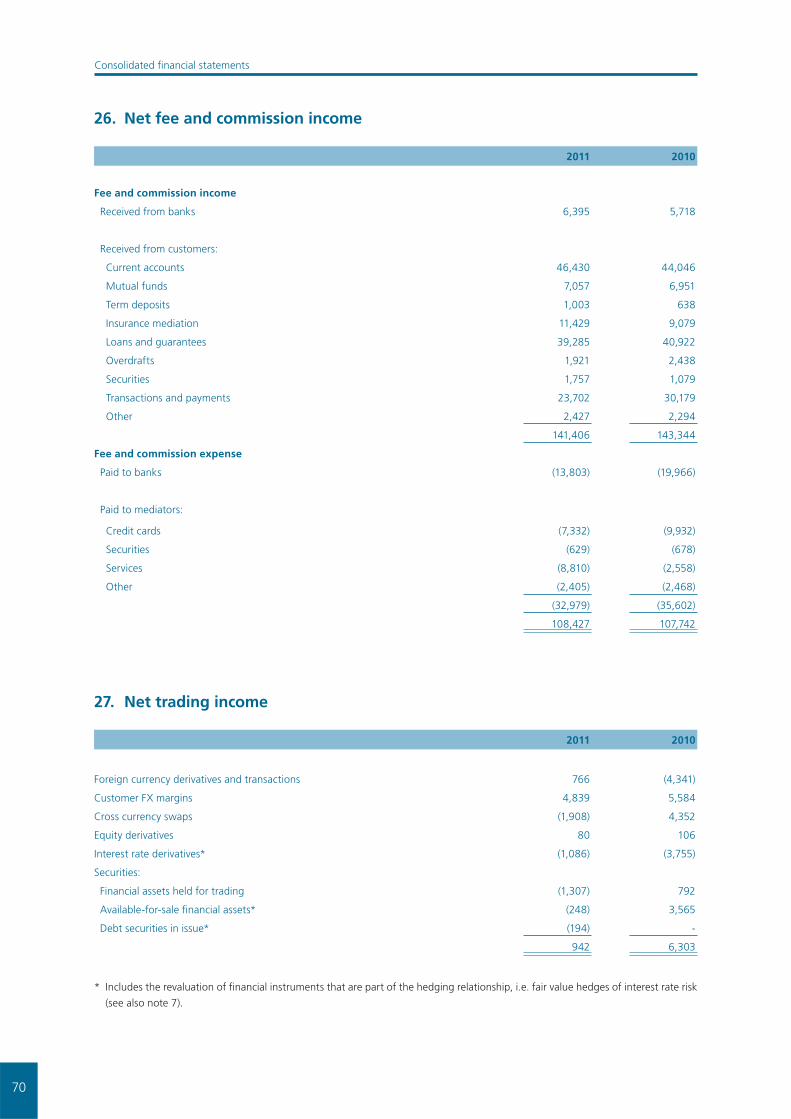
70
Consolidated fi nancial statements
26. Net fee and commission income
2011 2010
Fee and commission income
Received from banks 6,395 5,718
Received from customers:
Current accounts 46,430 44,046
Mutual funds 7,057 6,951
Term deposits 1,003 638
Insurance mediation 11,429 9,079
Loans and guarantees 39,285 40,922
Overdrafts 1,921 2,438
Securities 1,757 1,079
Transactions and payments 23,702 30,179
Other 2,427 2,294
141,406 143,344
Fee and commission expense
Paid to banks (13,803) (19,966)
Paid to mediators:
Credit cards (7,332) (9,932)
Securities (629) (678)
Services (8,810) (2,558)
Other (2,405) (2,468)
(32,979) (35,602)
108,427 107,742
27. Net trading income
2011 2010
Foreign currency derivatives and transactions 766 (4,341)
Customer FX margins 4,839 5,584
Cross currency swaps (1,908) 4,352
Equity derivatives 80 106
Interest rate derivatives* (1,086) (3,755)
Securities:
Financial assets held for trading (1,307) 792
Available-for-sale fi nancial assets* (248) 3,565
Debt securities in issue* (194) -
942 6,303
* Includes the revaluation of fi nancial instruments that are part of the hedging relationship, i.e. fair value hedges of interest rate risk
(see also note 7).
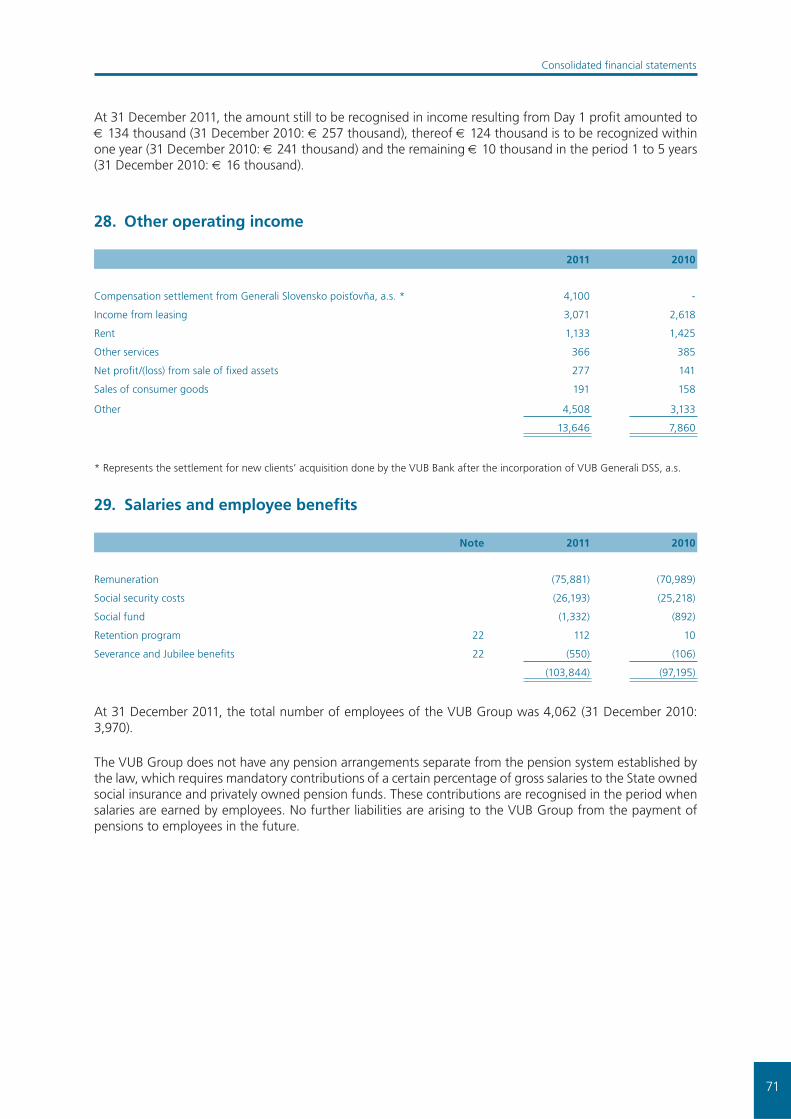
71
Consolidated fi nancial statements
At 31 December 2011, the amount still to be recognised in income resulting from Day 1 profi t amounted to € 134 thousand (31 December 2010: € 257 thousand), thereof € 124 thousand is to be recognized within one year (31 December 2010: € 241 thousand) and the remaining € 10 thousand in the period 1 to 5 years (31 December 2010: € 16 thousand).
28. Other operating income
2011 2010
Compensation settlement from Generali Slovensko poisťovňa, a.s. * 4,100 -
Income from leasing 3,071 2,618
Rent 1,133 1,425
Other services 366 385
Net profi t/(loss) from sale of fi xed assets 277 141
Sales of consumer goods 191 158
Other 4,508 3,133
13,646 7,860
* Represents the settlement for new clients’ acquisition done by the VUB Bank after the incorporation of VUB Generali DSS, a.s.
29. Salaries and employee benefi ts
Note 2011 2010
Remuneration (75,881) (70,989)
Social security costs (26,193) (25,218)
Social fund (1,332) (892)
Retention program 22 112 10
Severance and Jubilee benefi ts 22 (550) (106)
(103,844) (97,195)
At 31 December 2011, the total number of employees of the VUB Group was 4,062 (31 December 2010: 3,970).
The VUB Group does not have any pension arrangements separate from the pension system established by the law, which requires mandatory contributions of a certain percentage of gross salaries to the State owned social insurance and privately owned pension funds. These contributions are recognised in the period when salaries are earned by employees. No further liabilities are arising to the VUB Group from the payment of pensions to employees in the future.
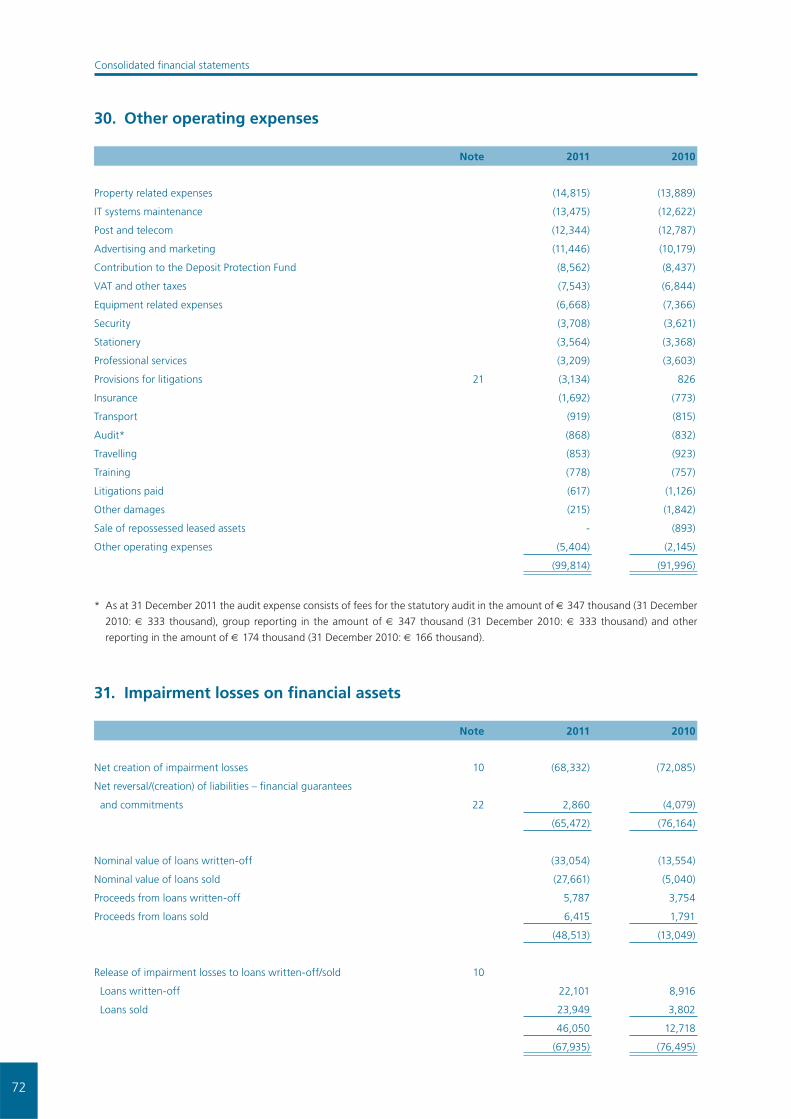
72
Consolidated fi nancial statements
30. Other operating expenses
Note 2011 2010
Property related expenses (14,815) (13,889)
IT systems maintenance (13,475) (12,622)
Post and telecom (12,344) (12,787)
Advertising and marketing (11,446) (10,179)
Contribution to the Deposit Protection Fund (8,562) (8,437)
VAT and other taxes (7,543) (6,844)
Equipment related expenses (6,668) (7,366)
Security (3,708) (3,621)
Stationery (3,564) (3,368)
Professional services (3,209) (3,603)
Provisions for litigations 21 (3,134) 826
Insurance (1,692) (773)
Transport (919) (815)
Audit* (868) (832)
Travelling (853) (923)
Training (778) (757)
Litigations paid (617) (1,126)
Other damages (215) (1,842)
Sale of repossessed leased assets - (893)
Other operating expenses (5,404) (2,145)
(99,814) (91,996)
* As at 31 December 2011 the audit expense consists of fees for the statutory audit in the amount of € 347 thousand (31 December
2010: € 333 thousand), group reporting in the amount of € 347 thousand (31 December 2010: € 333 thousand) and other
reporting in the amount of € 174 thousand (31 December 2010: € 166 thousand).
31. Impairment losses on fi nancial assets
Note 2011 2010
Net creation of impairment losses 10 (68,332) (72,085)
Net reversal/(creation) of liabilities – fi nancial guarantees
and commitments 22 2,860 (4,079)
(65,472) (76,164)
Nominal value of loans written-off (33,054) (13,554)
Nominal value of loans sold (27,661) (5,040)
Proceeds from loans written-off 5,787 3,754
Proceeds from loans sold 6,415 1,791
(48,513) (13,049)
Release of impairment losses to loans written-off/sold 10
Loans written-off 22,101 8,916
Loans sold 23,949 3,802
46,050 12,718
(67,935) (76,495)

73
Consolidated fi nancial statements
32. Income tax expense
Note 2011 2010
Current income tax (46,154) (48,787)
Deferred income tax 20 518 9,973
(45,636) (38,814)
The movement in the Statement of comprehensive income in deferred taxes is as follows:
2011 2010
Due from banks 9 1
Loans and advances to customers 2,036 7,496
Held-to-maturity investments 18 (24)
Property and equipment (729) 193
Other liabilities and provisions (146) 835
Intangible assets identifi ed on acquisition 809 1,489
Other (1,479) (17)
518 9,973
The effective tax rate differs from the statutory tax rate in 2011 and in 2010.
Reconciliation of the VUB Group’s profi t before tax with the actual corporate income tax is as follows:
2011 2010
Profi t before tax 222,539 189,137
Applicable tax rate 19% 19%
Theoretical tax charge (42,282) (35,936)
Tax non-deductible items (3,426) (3,070)
Adjustments for current tax of prior periods 72 192
Tax expense (45,636) (38,814)
Effective tax rate 20.51% 20.52%

74
Consolidated fi nancial statements
33. Components of other comprehensive income
2011 2010
Exchange differences on translating foreign operations (38) 485
Available-for-sale fi nancial assets:
Revaluation losses arising during the year (55,572) (41,498)
Cash fl ow hedges:
Revaluation losses arising during the year (1,242) (1,774)
Total other comprehensive income (56,852) (42,787)
Income tax relating to components of other comprehensive income 10,796 8,222
Other comprehensive income for the year (46,056) (34,565)
34. Income tax effects relating to comprehensive income
2011 2010
Before
tax
amount
Tax
benefi t
Net of
tax
amount
Before
tax
amount
Tax
benefi t
Net of
tax
amount
Exchange differences on
translating foreign operations (38) - (38) 485 - 485
Available-for-sale
fi nancial assets (55,572) 10,560 (45,012) (41,498) 7,885 (33,613)
Net movement
on cash fl ow hedges (1,242) 236 (1,006) (1,774) 337 (1,437)
(56,852) 10,796 (46,056) (42,787) 8,222 (34,565)

75
Consolidated fi nancial statements
35. Estimated fair value of fi nancial assets and liabilities
The fair value of fi nancial instruments is the amount for which an asset could be exchanged, or a liability settled, between knowledgeable, willing parties in an arm’s length transaction. Where available, fair value estimates are made based on quoted market prices. However, no readily available market prices exist for a signifi cant portion of the Group’s fi nancial instruments. In circumstances where the quoted market prices are not readily available, the fair value is estimated using discounted cash fl ow models or other pricing models as appropriate. Changes in underlying assumptions, including discount rates and estimated future cash fl ows, signifi cantly affect the estimates. Therefore, the calculated fair market estimates might not be realised in a current sale of the fi nancial instrument.
In estimating the fair value of the Group’s fi nancial instruments, the following methods and assumptions were used:
(a) Cash and balances with central banksThe carrying values of cash and cash equivalents are generally deemed to approximate their fair value.
(b) Due from banksThe fair value of due from banks balances with longer maturities and material amounts is estimated using discounted cash fl ow analyses, based upon the risk free interest rate curve. By shorter maturities and not signifi cant balances, the estimated fair value of amounts due from banks approximates their carrying amounts. Impairment losses are taken into consideration when calculating fair values.
(c) Loans and advances to customersThe fair value of loans and advances to customers is estimated using discounted cash fl ow analyses, based upon the risk free interest rate curve. Impairment losses and liquidity premiums are taken into consideration when calculating fair values.
(d) Held-to-maturity investmentsThe fair value of securities carried in the ‘Held-to-maturity investments’ portfolio is based on quoted market prices. Where no market prices are available, the fair value is calculated by discounting future cash fl ows using risk free interest rate curve adjusted to refl ect credit risk.
(e) Due to banks and customersThe estimated fair value of due to banks approximates their carrying amounts. The fair value of due to customers with short term maturity (under one year, including current accounts) is estimated by discounting their future expected cash fl ows using the risk free interest rate curve. The fair value of deposits with maturity over one year is discounted using the risk free interest rate curve adjusted by credit spreads refl ecting the credit quality of the Group as the borrower.
(f) Debt securities in issueThe fair value of debt securities issued by the Group is based on quoted market prices. Where no market prices are available, the fair value was calculated by discounting future cash fl ows using the risk free interest rate curve adjusted by credit spreads refl ecting the credit quality of VUB as the issuer.
The Group uses the following hierarchy for determining and disclosing the fair value of fi nancial instruments by valuation technique:
Level 1: quoted (unadjusted) prices in active markets for identical assets or liabilities;
Level 2: other techniques for which all inputs which have a signifi cant effect on the recorded fair value are observable, either directly or indirectly; and
Level 3: techniques which use inputs which have a signifi cant effect on the recorded fair value that are not based on observable market data.

76
Consolidated fi nancial statements
31 December 2011 Note TradingHeld–to–
maturity
Loans
and
receiva-
bles
Availa-
ble–for–
sale
Other
amor-
tized
cost
Total
carrying
amount
Fair
value
Cash and balances with central banks 4 - - 90,977 - - 90,977 90,977
Due from banks 5 - - 502,291 - - 502,291 503,177
Financial assets held for trading 6 273,962 - - - - 273,962 273,962
Derivative fi nancial instruments 7 80,399 - - - - 80,399 80,399
Available-for-sale fi nancial assets 8 - - - 1,455,626 - 1,455,626 1,455,626
Loans and advances to customers 9 - - 7,266,546 - - 7,266,546 7,471,031
Held-to-maturity investments 11 - 1,137,540 - - - 1,137,540 1,116,000
354,361 1,137,540 7,859,814 1,455,626 - 10,807,341 10,991,172
Due to central and other banks 17 - - - - (688,469) (688,469) (688,469)
Derivative fi nancial instruments 7 (57,382) - - - - (57,382) (57,382)
Due to customers 18 - - - - (7,487,408) (7,487,408) (7,305,140)
Debt securities in issue 19 - - - - (1,660,487) (1,660,487) (1,498,658)
(57,382) - - - (9,836,364) (9,893,746) (9,549,649)
31 December 2010 Note TradingHeld–to–
maturity
Loans
and
receiva-
bles
Availa-
ble–for–
sale
Other
amor-
tized
cost
Total
carrying
amount
Fair
value
Cash and balances with central banks 4 - - 179,093 - - 179,093 179,093
Due from banks 5 - - 108,843 - - 108,843 108,843
Financial assets held for trading 6 253,025 - - - - 253,025 253,025
Derivative fi nancial instruments 7 45,205 - - - - 45,205 45,205
Available-for-sale fi nancial assets 8 - - - 1,615,823 - 1,615,823 1,615,823
Loans and advances to customers 9 - - 6,437,675 - - 6,437,675 6,899,879
Held-to-maturity investments 11 - 1,788,263 - - - 1,788,263 1,819,302
298,230 1,788,263 6,725,611 1,615,823 - 10,427,927 10,921,170
Due to central and other banks 17 - - - - (662,523) (662,523) (662,523)
Derivative fi nancial instruments 7 (60,729) - - - - (60,729) (60,729)
Due to customers 18 - - - - (7,265,367) (7,265,367) (6,887,012)
Debt securities in issue 19 - - - - (1,624,253) (1,624,253) (1,550,718)
(60,729) - - - (9,552,143) (9,612,872) (9,160,982)

77
Consolidated fi nancial statements
The following table shows an analysis of fi nancial instruments recorded at fair value by level of the fair value hierarchy:
2011 2010
Note Level 1 Level 2 Level 3 Total Level 1 Level 2 Level 3 Total
Financial assets
Financial assets held for trading 6
Treasury bills and other eligible bills 23,098 169,135 - 192,233 - 174,201 - 174,201
State bonds 47,279 30,340 - 77,619 75,772 - - 75,772
Mutual funds 4,110 - - 4,110 - 3,052 - 3,052
74,487 199,475 - 273,962 75,772 177,253 - 253,025
Derivative fi nancial instruments 7
Interest rate instruments - 22,403 - 22,403 - 23,464 - 23,464
Foreign currency instruments - 56,271 - 56,271 - 17,287 - 17,287
Equity and commodity instruments - 1,725 - 1,725 - 4,454 - 4,454
- 80,399 - 80,399 - 45,205 - 45,205
Available-for-sale fi nancial assets 8
State bonds 256,449 1,182,872 - 1,439,321 272,747 1,323,092 - 1,595,839
Bank bonds - 15,666 - 15,666 - 19,345 - 19,345
Equity shares - 639 - 639 - 639 - 639
256,449 1,199,177 - 1,455,626 272,747 1,343,076 - 1,615,823
Financial liabilities
Derivative fi nancial instruments 7
Interest rate instruments - 38,695 - 38,695 - 39,488 - 39,488
Foreign currency instruments - 16,962 - 16,962 - 16,787 - 16,787
Equity and commodity instruments - 1,725 - 1,725 - 4,454 - 4,454
- 57,382 - 57,382 - 60,729 - 60,729
There were no signifi cant transfers of fi nancial instruments among the levels during 2011 and 2010.

78
Consolidated fi nancial statements
36. Financial risk management
Introduction and overview
The Group has exposure to the following risks from its use of fi nancial instruments:
(a) credit risk,(b) market risk,(c) liquidity risk,(d) operational risk.
This note presents information about the Group’s exposure to each of the above risks, the Group’s objectives, policies and processes for measuring and managing risk.
Risk management framework
The Management Board is the statutory body governing the executive management of the Bank, and has absolute authority over all matters concerning risk. The Management Board has primary responsibility for the creation and dissolution of risk related governance bodies. The primary governance bodies overseeing risk issues are:
– Asset/Liability Committee (‘ALCO’),– Credit Risk Committee (‘CRC’),– Operational Risk Committee (‘ORC’).
The Management Board delegates its risk authority to these governance bodies in the form of statutes, which identify members of the governance bodies, competencies and responsibilities of the members. The competency of each governance body is established in relevant Charters.
The Group’s risk management policies are established to identify and analyze the risks faced by the Group, to set appropriate risk limits and controls and to monitor risks and adherence to limits. Risk management policies and systems are reviewed regularly to refl ect changes in market conditions, products and services offered. The Group, through its training and management standards and procedures, aims to develop a disciplined and constructive control environment, in which all employees understand their roles and obligations. The Group’s Internal Audit Department is responsible for monitoring compliance with the Group’s risk management policies and procedures, and for reviewing the adequacy of the risk management framework in relation to the risks faced by the Group. Internal Audit undertakes both regular and ad-hoc reviews of risk management controls and procedures.
(a) Credit risk
The credit risk is the risk of a fi nancial loss to the Group if a customer or counterparty to a fi nancial instrument fails to meet its contractual obligations, and arises principally from the Group’s loans and advances to customers and banks as well as investment securities. For risk management reporting purposes, the Group considers and consolidates all elements of credit risk exposure (such as individual obligor default risk, country and sector risk). For risk management purposes, the credit risk arising on trading securities is managed independently, but reported as a component of market risk exposure.
Credit Risk Charter establishes the guidelines for measurement, control and management of credit risk by defi ning the legal framework, main responsibilities, policies and methodologies that support the credit risk management process of VUB Group.
More specifi cally, the Credit Risk Charter defi nes both the general and specifi c (retail, corporate) credit risk

79
Consolidated fi nancial statements
requirements for applied methodologies and procedures, and includes, as separate sections, the policies governing the key aspects of the Group’s credit risk management process:
– Authorized Approval Authority,– Collateral Management Policy, – Loan, Non Credit Receivables And Off Balance Sheet Credit Products Loss Provisioning Policy, – Credit Concentration Limits, – Default Defi nition, – Risk Management Client Segmentation Policy, – Corporate Credit Policy, Retail Credit Policy, – Retail and Corporate Remedial Management and Collections.
Management of credit risk
The Risk Management Division is established within the Bank as a Control Unit and managed by the Chief Risk Offi cer, who is a member of the Bank’s Management Board. The Risk Management Division is organisationally structured to provide support to the Business Units, as well as to provide reporting of credit, market and operational risks to the Supervisory Board and Management Board. The Risk Management Division is responsible for overseeing the Group’s credit risk including:
– The development of credit risk strategies, policies, processes and procedures covering rules for credit assessment, collateral requirements, risk grading and reporting.
– Setting limits for the concentration of exposure to counterparties, related parties, countries and total assets and monitoring compliance with those limits.
– Establishment of the authorisation structure for the approval and renewal of credit facilities. Authorisation limits are set in the Credit Risk Charter.
– Credit risk assessment according to defi ned policy.– Monitoring of quality portfolio performance and its compliance with set limits (regulatory, internal).
Regular reports are provided to Management Board and CRC on the credit quality of Group’s portfolios and appropriate corrective measures are taken.
– Development, maintenance and validation of scoring and rating models – both application and behavioural.
– Development, maintenance and back-testing of impairment losses model (the Markov chains methodology is used).
Allowances for impairment
The Group establishes an allowance for impairment losses, which represents its estimate of incurred losses in its loan portfolio.
If there is evidence of impairment for any individually signifi cant client of the Group, such as a breach of contract, problems with repayments or collateral, the Group transfers such a client to the Recovery Department, for pursuing collection activities. Such clients are considered to be individually impaired. For collective impairment, the Group uses historical evidence of impairment on a portfolio basis, mainly based on the payment discipline of clients.
Impairment losses are calculated individually for individually signifi cant clients for which evidence of impairment exists and collectively for individually signifi cant clients without evidence of impairment and for individually insignifi cant client groups of homogeneous assets. Collective impairment losses are calculated for each group using a mathematical model (IRB approach as well as the Markov chains methodology is used).

80
Consolidated fi nancial statements
Rules for Identifying signifi cant clients and methodology for calculation are set in Credit Risk Charter or can be found in the Internal Provisioning Policy procedure.
From September 2010, the VUB Group implemented the defi nitions of non-performing loans derived from the Harmonisation project. The Harmonisation project is driven by Intesa Sanpaolo in order to unify the defi nitions and categories of non-performing loans across the foreign subsidiaries of the Intesa Sanpaolo Group. The defi nition covers non-performing (past due, substandard, doubtful) loans as well as the restructured exposures. The defi nition of non-performing loans is based on delinquency (days past due - DPD) and materiality threshold of client (corporate clients) respectively of the loan (retail clients). Generally, all credit receivables with a delinquency of higher than or equal to 90 days and a materiality threshold of higher than or equal to 5% of outstanding total credit exposures to client (corporate clients) respectively 50 € (retail clients) are considered to be non-performing.
Credit risk measurement
The Bank generally uses the standardised approach for the calculation of the capital requirement. However, for the calculation of credit and counterparty risk capital requirements, the Bank, having received authorisation from the Supervisory Authority, uses the Foundation IRB approach for the Corporate segment from February 2011. The Bank is also proceeding with the development of the rating models for other segments, to which the standard methods are currently applied, and also with the extension of the scope of subsidiaries in accordance with the gradual rollout plan for the advanced approaches presented to the Supervisory Authority.
The following table describes the Group’s credit portfolio in terms of classifi cation categories:
2011 Restated 2010
Category
Amor-
tized
cost
Impair-
ment
losses
Carrying
amount
Amor-
tized
cost
Impair-
ment
losses
Carrying
amount
Banks
Performing 502,342 (51) 502,291 108,666 - 108,666
Doubtful 151 (151) - 328 (151) 177
502,493 (202) 502,291 108,994 (151) 108,843
Sovereigns
Performing 149,881 (172) 149,709 100,865 (163) 100,702
Past due 307 - 307 95 - 95
Substandard 173 (5) 168 835 (42) 793
Doubtful 293 (117) 176 - - -
150,654 (294) 150,360 101,795 (205) 101,590
Corporate
Performing 2,968,757 (25,640) 2,943,117 2,516,292 (32,243) 2,484,049
Past due 430 (186) 244 287 (61) 226
Restructured 17,974 (5,997) 11,977 19,719 (4,352) 15,367
Substandard 137,387 (35,791) 101,596 102,025 (24,592) 77,433
Doubtful 51,257 (34,924) 16,333 58,356 (37,455) 20,901
3,175,805 (102,538) 3,073,267 2,696,679 (98,703) 2,597,976
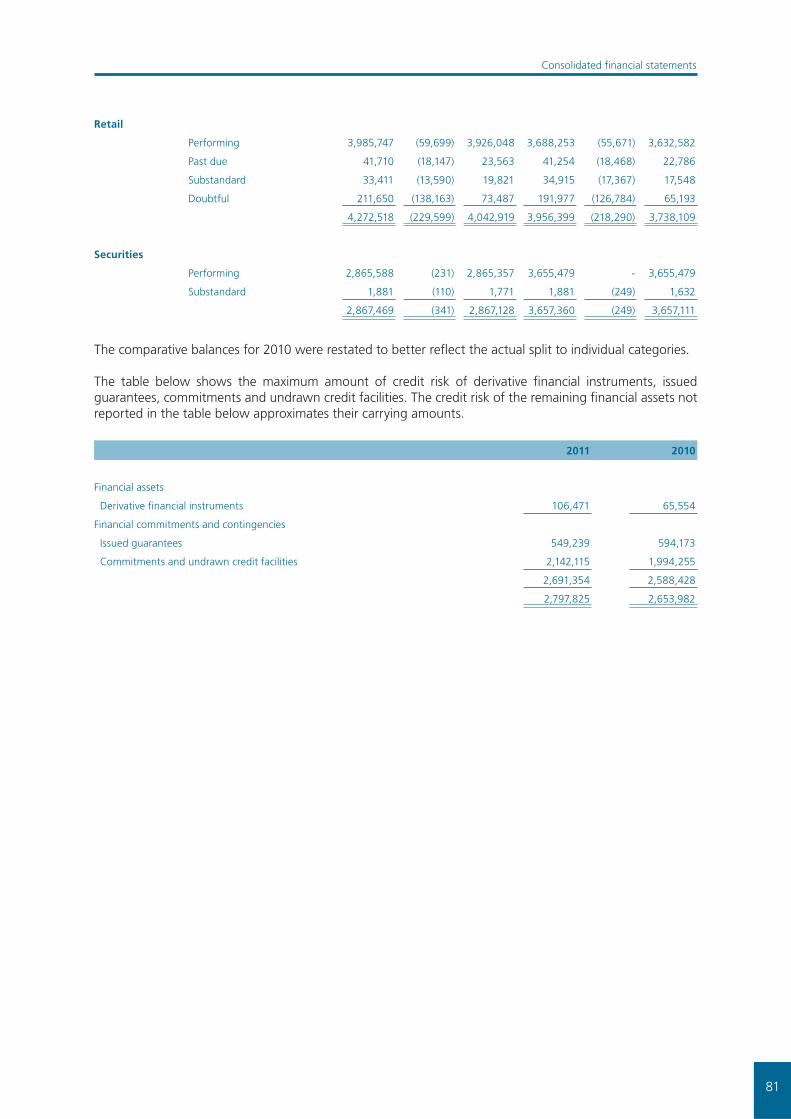
81
Consolidated fi nancial statements
Retail
Performing 3,985,747 (59,699) 3,926,048 3,688,253 (55,671) 3,632,582
Past due 41,710 (18,147) 23,563 41,254 (18,468) 22,786
Substandard 33,411 (13,590) 19,821 34,915 (17,367) 17,548
Doubtful 211,650 (138,163) 73,487 191,977 (126,784) 65,193
4,272,518 (229,599) 4,042,919 3,956,399 (218,290) 3,738,109
Securities
Performing 2,865,588 (231) 2,865,357 3,655,479 - 3,655,479
Substandard 1,881 (110) 1,771 1,881 (249) 1,632
2,867,469 (341) 2,867,128 3,657,360 (249) 3,657,111
The comparative balances for 2010 were restated to better refl ect the actual split to individual categories.
The table below shows the maximum amount of credit risk of derivative fi nancial instruments, issued guarantees, commitments and undrawn credit facilities. The credit risk of the remaining fi nancial assets not reported in the table below approximates their carrying amounts.
2011 2010
Financial assets
Derivative fi nancial instruments 106,471 65,554
Financial commitments and contingencies
Issued guarantees 549,239 594,173
Commitments and undrawn credit facilities 2,142,115 1,994,255
2,691,354 2,588,428
2,797,825 2,653,982
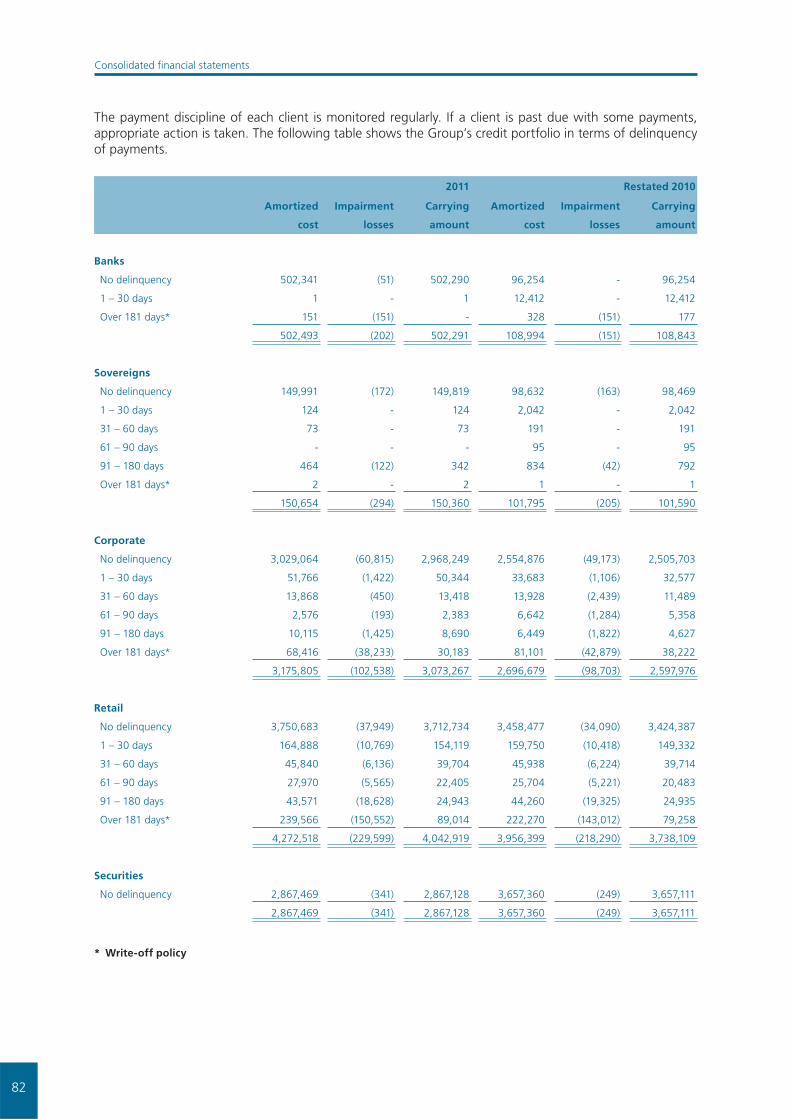
82
Consolidated fi nancial statements
The payment discipline of each client is monitored regularly. If a client is past due with some payments, appropriate action is taken. The following table shows the Group’s credit portfolio in terms of delinquency of payments.
2011 Restated 2010
Amortized
cost
Impairment
losses
Carrying
amount
Amortized
cost
Impairment
losses
Carrying
amount
Banks
No delinquency 502,341 (51) 502,290 96,254 - 96,254
1 – 30 days 1 - 1 12,412 - 12,412
Over 181 days* 151 (151) - 328 (151) 177
502,493 (202) 502,291 108,994 (151) 108,843
Sovereigns
No delinquency 149,991 (172) 149,819 98,632 (163) 98,469
1 – 30 days 124 - 124 2,042 - 2,042
31 – 60 days 73 - 73 191 - 191
61 – 90 days - - - 95 - 95
91 – 180 days 464 (122) 342 834 (42) 792
Over 181 days* 2 - 2 1 - 1
150,654 (294) 150,360 101,795 (205) 101,590
Corporate
No delinquency 3,029,064 (60,815) 2,968,249 2,554,876 (49,173) 2,505,703
1 – 30 days 51,766 (1,422) 50,344 33,683 (1,106) 32,577
31 – 60 days 13,868 (450) 13,418 13,928 (2,439) 11,489
61 – 90 days 2,576 (193) 2,383 6,642 (1,284) 5,358
91 – 180 days 10,115 (1,425) 8,690 6,449 (1,822) 4,627
Over 181 days* 68,416 (38,233) 30,183 81,101 (42,879) 38,222
3,175,805 (102,538) 3,073,267 2,696,679 (98,703) 2,597,976
Retail
No delinquency 3,750,683 (37,949) 3,712,734 3,458,477 (34,090) 3,424,387
1 – 30 days 164,888 (10,769) 154,119 159,750 (10,418) 149,332
31 – 60 days 45,840 (6,136) 39,704 45,938 (6,224) 39,714
61 – 90 days 27,970 (5,565) 22,405 25,704 (5,221) 20,483
91 – 180 days 43,571 (18,628) 24,943 44,260 (19,325) 24,935
Over 181 days* 239,566 (150,552) 89,014 222,270 (143,012) 79,258
4,272,518 (229,599) 4,042,919 3,956,399 (218,290) 3,738,109
Securities
No delinquency 2,867,469 (341) 2,867,128 3,657,360 (249) 3,657,111
2,867,469 (341) 2,867,128 3,657,360 (249) 3,657,111
* Write-off policy
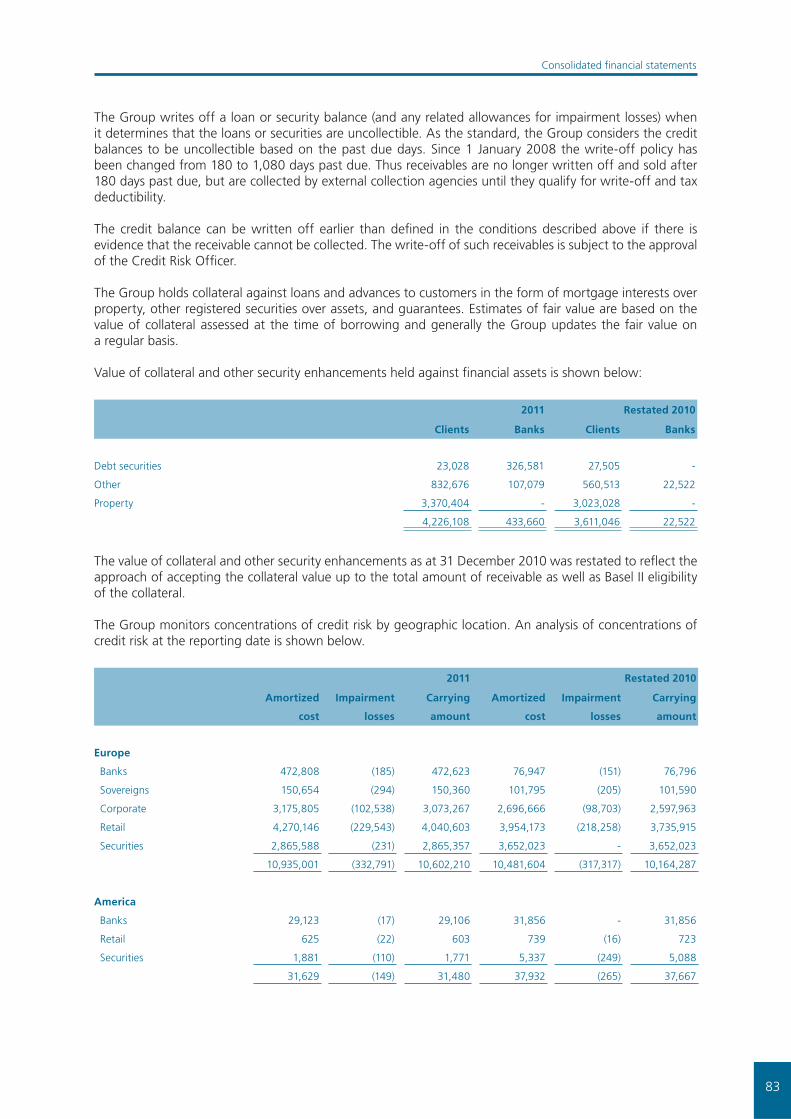
83
Consolidated fi nancial statements
The Group writes off a loan or security balance (and any related allowances for impairment losses) when it determines that the loans or securities are uncollectible. As the standard, the Group considers the credit balances to be uncollectible based on the past due days. Since 1 January 2008 the write-off policy has been changed from 180 to 1,080 days past due. Thus receivables are no longer written off and sold after 180 days past due, but are collected by external collection agencies until they qualify for write-off and tax deductibility.
The credit balance can be written off earlier than defi ned in the conditions described above if there is evidence that the receivable cannot be collected. The write-off of such receivables is subject to the approval of the Credit Risk Offi cer.
The Group holds collateral against loans and advances to customers in the form of mortgage interests over property, other registered securities over assets, and guarantees. Estimates of fair value are based on the value of collateral assessed at the time of borrowing and generally the Group updates the fair value on a regular basis.
Value of collateral and other security enhancements held against fi nancial assets is shown below:
2011 Restated 2010
Clients Banks Clients Banks
Debt securities 23,028 326,581 27,505 -
Other 832,676 107,079 560,513 22,522
Property 3,370,404 - 3,023,028 -
4,226,108 433,660 3,611,046 22,522
The value of collateral and other security enhancements as at 31 December 2010 was restated to refl ect the approach of accepting the collateral value up to the total amount of receivable as well as Basel II eligibility of the collateral.
The Group monitors concentrations of credit risk by geographic location. An analysis of concentrations of credit risk at the reporting date is shown below.
2011 Restated 2010
Amortized
cost
Impairment
losses
Carrying
amount
Amortized
cost
Impairment
losses
Carrying
amount
Europe
Banks 472,808 (185) 472,623 76,947 (151) 76,796
Sovereigns 150,654 (294) 150,360 101,795 (205) 101,590
Corporate 3,175,805 (102,538) 3,073,267 2,696,666 (98,703) 2,597,963
Retail 4,270,146 (229,543) 4,040,603 3,954,173 (218,258) 3,735,915
Securities 2,865,588 (231) 2,865,357 3,652,023 - 3,652,023
10,935,001 (332,791) 10,602,210 10,481,604 (317,317) 10,164,287
America
Banks 29,123 (17) 29,106 31,856 - 31,856
Retail 625 (22) 603 739 (16) 723
Securities 1,881 (110) 1,771 5,337 (249) 5,088
31,629 (149) 31,480 37,932 (265) 37,667
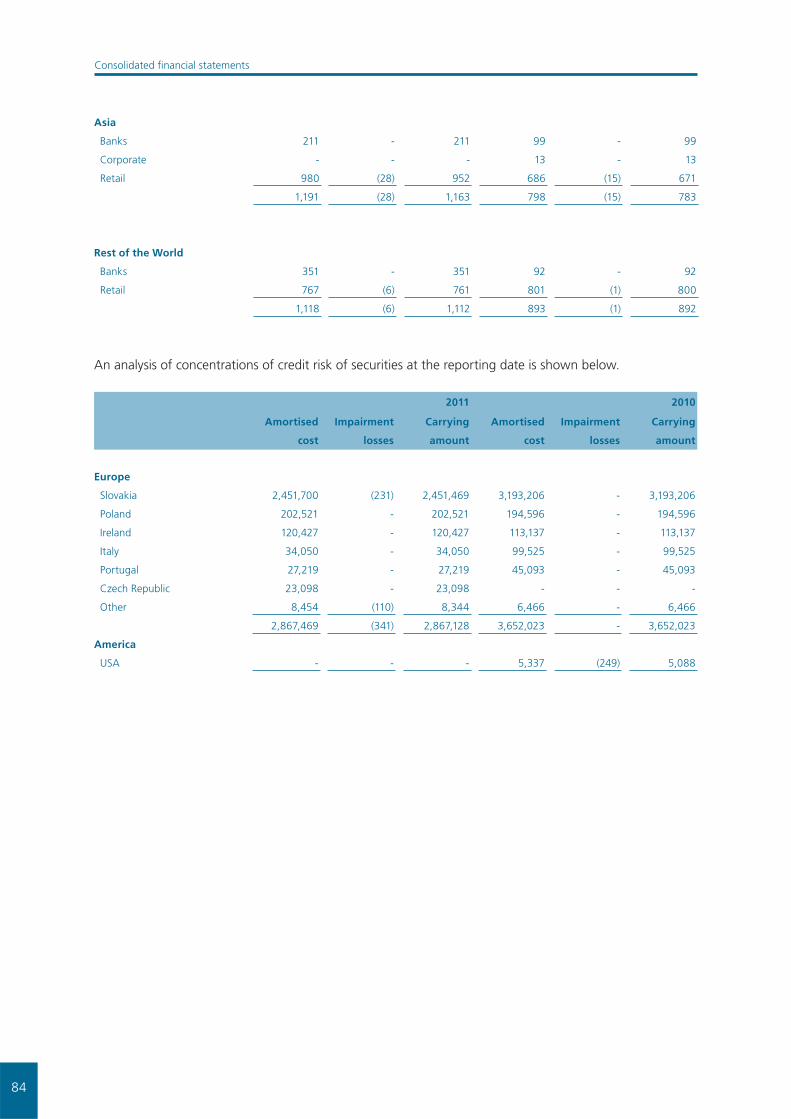
84
Consolidated fi nancial statements
Asia
Banks 211 - 211 99 - 99
Corporate - - - 13 - 13
Retail 980 (28) 952 686 (15) 671
1,191 (28) 1,163 798 (15) 783
Rest of the World
Banks 351 - 351 92 - 92
Retail 767 (6) 761 801 (1) 800
1,118 (6) 1,112 893 (1) 892
An analysis of concentrations of credit risk of securities at the reporting date is shown below.
2011 2010
Amortised
cost
Impairment
losses
Carrying
amount
Amortised
cost
Impairment
losses
Carrying
amount
Europe
Slovakia 2,451,700 (231) 2,451,469 3,193,206 - 3,193,206
Poland 202,521 - 202,521 194,596 - 194,596
Ireland 120,427 - 120,427 113,137 - 113,137
Italy 34,050 - 34,050 99,525 - 99,525
Portugal 27,219 - 27,219 45,093 - 45,093
Czech Republic 23,098 - 23,098 - - -
Other 8,454 (110) 8,344 6,466 - 6,466
2,867,469 (341) 2,867,128 3,652,023 - 3,652,023
America
USA - - - 5,337 (249) 5,088
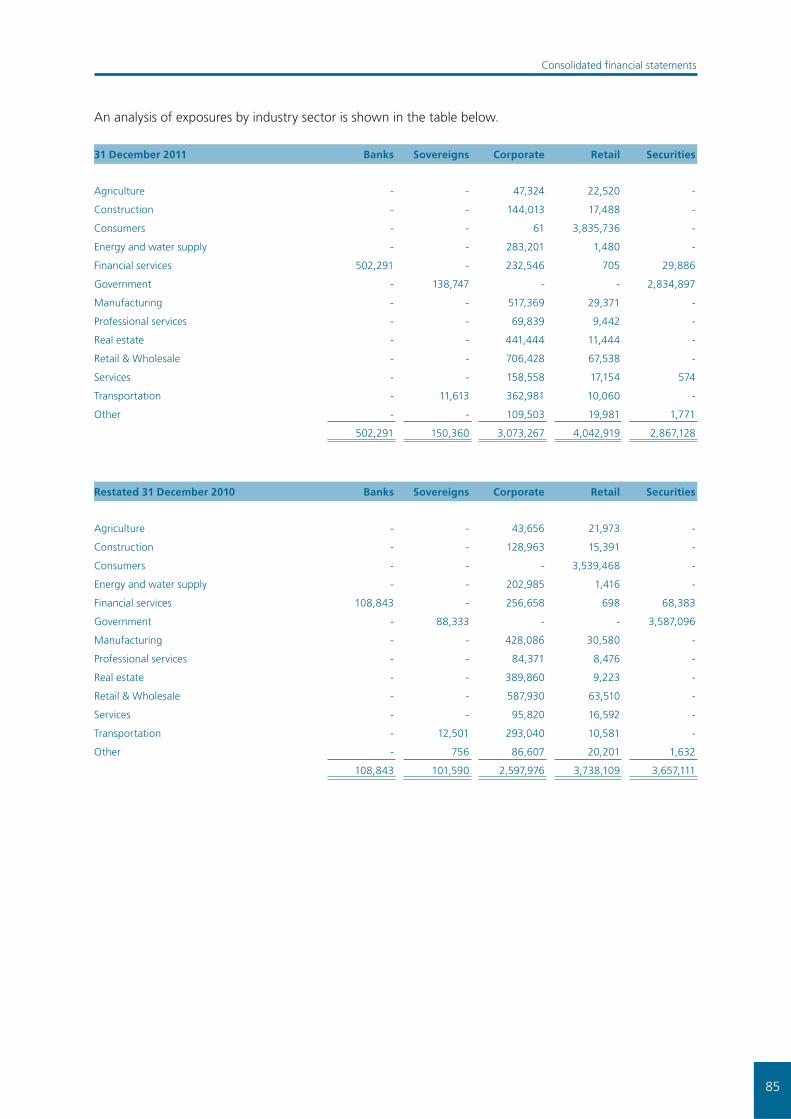
85
Consolidated fi nancial statements
An analysis of exposures by industry sector is shown in the table below.
31 December 2011 Banks Sovereigns Corporate Retail Securities
Agriculture - - 47,324 22,520 -
Construction - - 144,013 17,488 -
Consumers - - 61 3,835,736 -
Energy and water supply - - 283,201 1,480 -
Financial services 502,291 - 232,546 705 29,886
Government - 138,747 - - 2,834,897
Manufacturing - - 517,369 29,371 -
Professional services - - 69,839 9,442 -
Real estate - - 441,444 11,444 -
Retail & Wholesale - - 706,428 67,538 -
Services - - 158,558 17,154 574
Transportation - 11,613 362,981 10,060 -
Other - - 109,503 19,981 1,771
502,291 150,360 3,073,267 4,042,919 2,867,128
Restated 31 December 2010 Banks Sovereigns Corporate Retail Securities
Agriculture - - 43,656 21,973 -
Construction - - 128,963 15,391 -
Consumers - - - 3,539,468 -
Energy and water supply - - 202,985 1,416 -
Financial services 108,843 - 256,658 698 68,383
Government - 88,333 - - 3,587,096
Manufacturing - - 428,086 30,580 -
Professional services - - 84,371 8,476 -
Real estate - - 389,860 9,223 -
Retail & Wholesale - - 587,930 63,510 -
Services - - 95,820 16,592 -
Transportation - 12,501 293,040 10,581 -
Other - 756 86,607 20,201 1,632
108,843 101,590 2,597,976 3,738,109 3,657,111

86
Consolidated fi nancial statements
The table below shows the credit quality by class of assets for all fi nancial assets exposed to credit risk, based on the Group’s internal credit rating system. The amounts presented are gross of impairment allowances. Past due but not impaired fi nancial assets are more than one day overdue.
Neither past due
nor impairedImpaired (non-performing)
Past due but
not impaired
31 December 2011Amor-
tised cost
Impair-
ment
losses
Carrying
amount
Amor-
tised cost
Impair-
ment
losses
Carrying
amount
Amor-
tised cost
Impair-
ment
losses
Carrying
amount
Banks 502,341 (51) 502,290 151 (151) - 1 - 1
Sovereigns
Municipalities 149,776 (172) 149,604 773 (122) 651 105 - 105
Corporate
Large Corporates 942,886 (5,472) 937,414 9,757 (3,448) 6,309 7,780 (23) 7,757
Specialized lending 645,585 (6,608) 638,977 90,743 (25,066) 65,677 1,676 (91) 1,585
SME 617,813 (7,691) 610,122 71,152 (29,218) 41,934 2,685 (70) 2,615
Other Fin. Institutions 270,186 (588) 269,598 1 - 1 - - -
Private Sector Entities 102,291 (706) 101,585 8 - 8 5 - 5
Leasing 144,734 (2,154) 142,580 31,982 (16,705) 15,277 44,962 (1,607) 43,355
Factoring 179,023 (608) 178,415 3,405 (2,461) 944 9,131 (22) 9,109
2,902,518 (23,827) 2,878,691 207,048 (76,898) 130,150 66,239 (1,813) 64,426
Retail
Small business 175,705 (4,513) 171,192 19,555 (10,256) 9,299 4,895 (770) 4,125
Small business – Leasing 11,297 (168) 11,129 2,243 (1,315) 928 5,836 (160) 5,676
Consumer Loans 747,976 (16,092) 731,884 127,637 (88,170) 39,467 86,791 (11,750) 75,041
Mortgages 2,534,845 (8,954) 2,525,891 66,925 (19,709) 47,216 114,348 (5,439) 108,909
Credit Cards 177,153 (3,719) 173,434 52,603 (36,349) 16,254 22,972 (3,793) 19,179
Overdrafts 85,221 (3,707) 81,514 17,077 (13,587) 3,490 2,433 (494) 1,939
Leasing 3,851 (29) 3,822 180 (145) 35 897 (45) 852
Flat Owners Associations 3,796 (63) 3,733 - - - 15 - 15
Other 7,716 (3) 7,713 551 (369) 182 - - -
3,747,560 (37,248) 3,710,312 286,771 (169,900) 116,871 238,187 (22,451) 215,736
Securities
Trading 273,962 - 273,962 - - - - - -
AFS 1,455,626 - 1,455,626 - - - - - -
HTM 1,136,000 (231) 1,135,769 1,881 (110) 1,771 - - -
2,865,588 (231) 2,865,357 1,881 (110) 1,771 - - -

87
Consolidated fi nancial statements
Neither past due
nor impairedImpaired (non-performing)
Past due but
not impaired
Restated 31 December 2010Amor-
tised cost
Impair-
ment
losses
Carrying
amount
Amor-
tised cost
Impair-
ment
losses
Carrying
amount
Amor-
tised cost
Impair-
ment
losses
Carrying
amount
Banks 96,254 - 96,254 328 (151) 177 12,412 - 12,412
Sovereigns
Municipalities 98,586 (163) 98,423 930 (42) 888 2,214 - 2,214
Municipalities – Leasing 65 - 65 - - - - - -
98,651 (163) 98,488 930 (42) 888 2,214 - 2,214
Corporate
Large Corporates 808,778 (5,682) 803,096 38,236 (11,329) 26,907 - - -
Specialized lending 619,057 (11,272) 607,785 31,436 (5,123) 26,313 593 (48) 545
SME 561,233 (11,542) 549,691 70,242 (27,932) 42,310 5,131 (303) 4,828
Other Fin. Institutions 295,549 (203) 295,346 1 - 1 - - -
Private Sector Entities 3,224 (39) 3,185 7 - 7 22 - 22
Leasing 102,945 (1,351) 101,594 36,290 (19,724) 16,566 38,354 (1,123) 37,231
Factoring 78,594 (673) 77,921 4,175 (2,352) 1,823 2,812 (7) 2,805
2,469,380 (30,762) 2,438,618 180,387 (66,460) 113,927 46,912 (1,481) 45,431
Retail
Small business 164,804 (1,484) 163,320 18,158 (11,473) 6,685 5,899 (1,096) 4,803
Small business – Leasing 13,040 (195) 12,845 2,351 (1,597) 754 4,951 (243) 4,708
Consumer Loans 674,552 (21,707) 652,845 125,113 (87,535) 37,578 82,567 (12,286) 70,281
Mortgages 2,312,865 (7,604) 2,305,261 56,756 (14,633) 42,123 106,453 (4,453) 102,000
Credit Cards 184,798 (1,701) 183,097 48,406 (33,567) 14,839 26,937 (4,495) 22,442
Overdrafts 94,201 (959) 93,242 15,179 (12,410) 2,769 2,704 (367) 2,337
Leasing 4,211 (24) 4,187 290 (232) 58 667 (26) 641
Flat Owners Associations 3,534 (42) 3,492 - - - - - -
Other 7,796 (17) 7,779 161 (144) 17 6 - 6
3,459,801 (33,733) 3,426,068 266,414 (161,591) 104,823 230,184 (22,966) 207,218
Securities
Trading 253,025 - 253,025 - - - - - -
AFS 1,615,824 - 1,615,824 - - - - - -
HTM 1,786,630 - 1,786,630 1,881 (249) 1,632 - - -
3,655,479 - 3,655,479 1,881 (249) 1,632 - - -
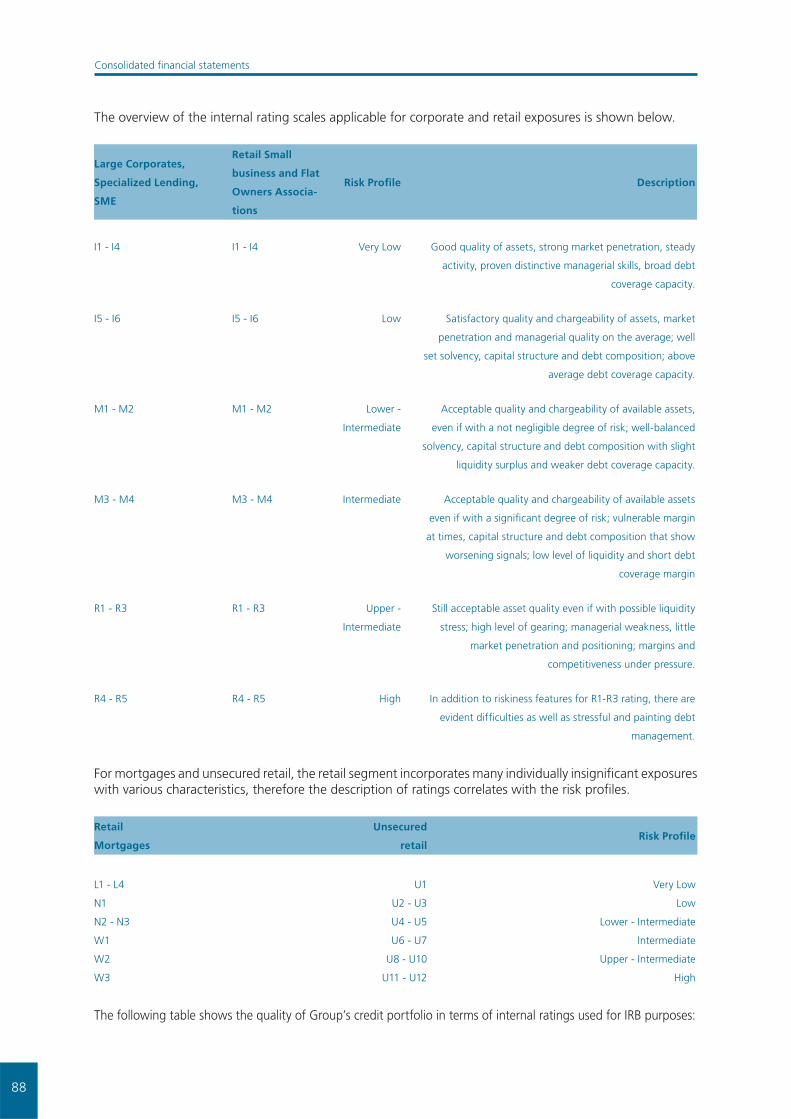
88
Consolidated fi nancial statements
The overview of the internal rating scales applicable for corporate and retail exposures is shown below.
Large Corporates,
Specialized Lending,
SME
Retail Small
business and Flat
Owners Associa-
tions
Risk Profi le Description
I1 - I4 I1 - I4 Very Low Good quality of assets, strong market penetration, steady
activity, proven distinctive managerial skills, broad debt
coverage capacity.
I5 - I6 I5 - I6 Low Satisfactory quality and chargeability of assets, market
penetration and managerial quality on the average; well
set solvency, capital structure and debt composition; above
average debt coverage capacity.
M1 - M2 M1 - M2 Lower -
Intermediate
Acceptable quality and chargeability of available assets,
even if with a not negligible degree of risk; well-balanced
solvency, capital structure and debt composition with slight
liquidity surplus and weaker debt coverage capacity.
M3 - M4 M3 - M4 Intermediate Acceptable quality and chargeability of available assets
even if with a signifi cant degree of risk; vulnerable margin
at times, capital structure and debt composition that show
worsening signals; low level of liquidity and short debt
coverage margin
R1 - R3 R1 - R3 Upper -
Intermediate
Still acceptable asset quality even if with possible liquidity
stress; high level of gearing; managerial weakness, little
market penetration and positioning; margins and
competitiveness under pressure.
R4 - R5 R4 - R5 High In addition to riskiness features for R1-R3 rating, there are
evident diffi culties as well as stressful and painting debt
management.
For mortgages and unsecured retail, the retail segment incorporates many individually insignifi cant exposures with various characteristics, therefore the description of ratings correlates with the risk profi les.
Retail
Mortgages
Unsecured
retailRisk Profi le
L1 - L4 U1 Very Low
N1 U2 - U3 Low
N2 - N3 U4 - U5 Lower - Intermediate
W1 U6 - U7 Intermediate
W2 U8 - U10 Upper - Intermediate
W3 U11 - U12 High
The following table shows the quality of Group’s credit portfolio in terms of internal ratings used for IRB purposes:
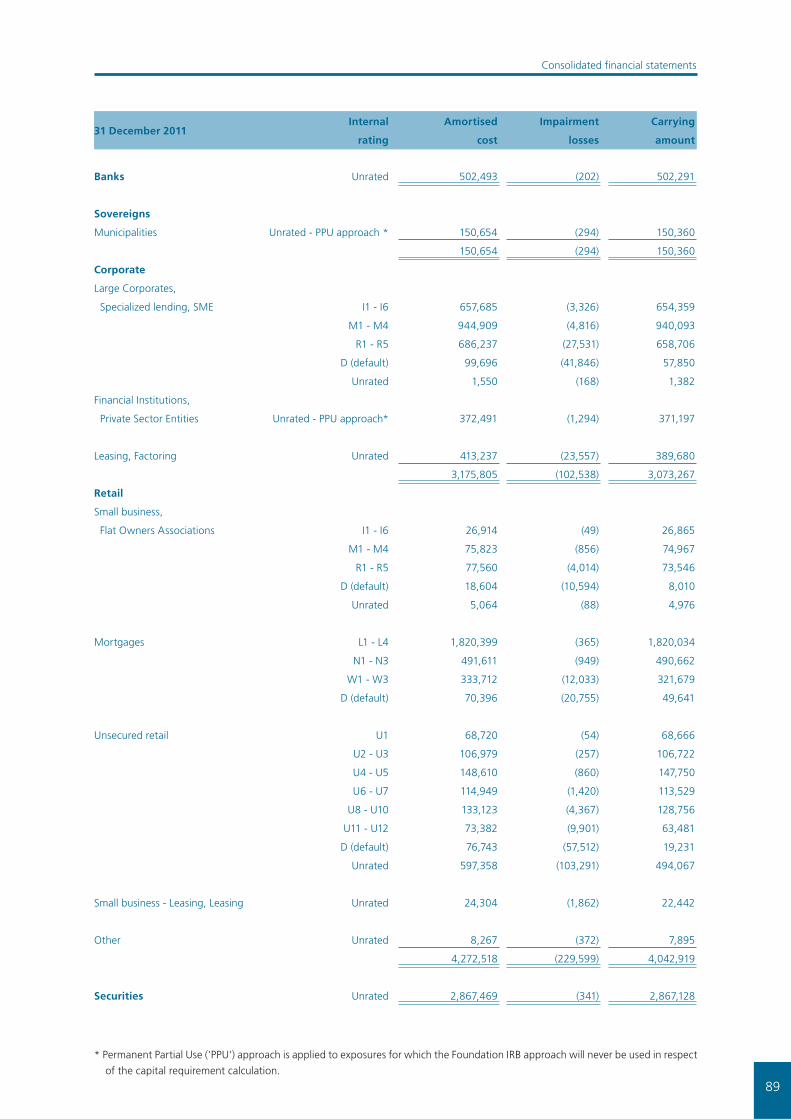
89
Consolidated fi nancial statements
31 December 2011Internal
rating
Amortised
cost
Impairment
losses
Carrying
amount
Banks Unrated 502,493 (202) 502,291
Sovereigns
Municipalities Unrated - PPU approach * 150,654 (294) 150,360
150,654 (294) 150,360
Corporate
Large Corporates,
Specialized lending, SME I1 - I6 657,685 (3,326) 654,359
M1 - M4 944,909 (4,816) 940,093
R1 - R5 686,237 (27,531) 658,706
D (default) 99,696 (41,846) 57,850
Unrated 1,550 (168) 1,382
Financial Institutions,
Private Sector Entities Unrated - PPU approach* 372,491 (1,294) 371,197
Leasing, Factoring Unrated 413,237 (23,557) 389,680
3,175,805 (102,538) 3,073,267
Retail
Small business,
Flat Owners Associations I1 - I6 26,914 (49) 26,865
M1 - M4 75,823 (856) 74,967
R1 - R5 77,560 (4,014) 73,546
D (default) 18,604 (10,594) 8,010
Unrated 5,064 (88) 4,976
Mortgages L1 - L4 1,820,399 (365) 1,820,034
N1 - N3 491,611 (949) 490,662
W1 - W3 333,712 (12,033) 321,679
D (default) 70,396 (20,755) 49,641
Unsecured retail U1 68,720 (54) 68,666
U2 - U3 106,979 (257) 106,722
U4 - U5 148,610 (860) 147,750
U6 - U7 114,949 (1,420) 113,529
U8 - U10 133,123 (4,367) 128,756
U11 - U12 73,382 (9,901) 63,481
D (default) 76,743 (57,512) 19,231
Unrated 597,358 (103,291) 494,067
Small business - Leasing, Leasing Unrated 24,304 (1,862) 22,442
Other Unrated 8,267 (372) 7,895
4,272,518 (229,599) 4,042,919
Securities Unrated 2,867,469 (341) 2,867,128
* Permanent Partial Use ('PPU') approach is applied to exposures for which the Foundation IRB approach will never be used in respect
of the capital requirement calculation.

90
Consolidated fi nancial statements
Due to the phased development of the internal rating models, comparative data as of 31 December 2010 is available only for the corporate segment and mortgages.
31 December 2010 Internal ratingAmortised
costs
Impairment
losses
Carrying
amount
Corporate
Large Corporates,
Specialized lending, SME I1 - I6 523,608 (580) 523,028
M1 - M4 890,205 (7,443) 882,762
R1 - R5 639,043 (28,921) 610,122
D (default) 81,724 (36,161) 45,563
Financial Institutions,
Private Sector Entities Unrated - PPU approach 298,803 (242) 298,561
Leasing, Factoring Unrated 263,296 (25,356) 237,940
2,696,679 (98,703) 2,597,976
Retail
Mortgages L1 - L4 1,604,361 (344) 1,604,017
N1 - N3 474,088 (969) 473,119
W1 - W3 337,903 (10,026) 327,877
D (default) 59,722 (15,351) 44,371
2,476,074 (26,690) 2,449,384
(b) Market risk
Market risk is the risk that changes in market prices, such as interest rate, equity prices or foreign exchange rate will affect the Group’s income or the value of its holdings of fi nancial instruments. The objective of market risk management is to manage and control market risk exposures within acceptable parameters, while optimizing the return on risk.
Management of market risk
The Group separates its exposures to market risk between trading (‘trading book’) and non-trading portfolios (‘banking book’). Trading portfolios are held by the Trading department and include positions arising from market-making and proprietary position taking. All foreign exchange risk within the Group is transferred each day to the Trading department and forms part of the trading portfolio for risk management purposes. The non-trading portfolios are managed by the ALM department, and include all positions which are not intended for trading.
Overall authority for market risk is vested in ALCO. The Enterprise Risk Management Division is responsible for the development of detailed risk management policies (subject to review and approval by ALCO) and for their implementation and day-to-day risk monitoring and reporting.
Exposure to market risk – trading portfolios
The principal tool used to measure and control market risk exposures within the Group’s trading portfolio is Value at Risk (VaR). The VaR of a trading portfolio is the estimated loss that will arise on the portfolio over
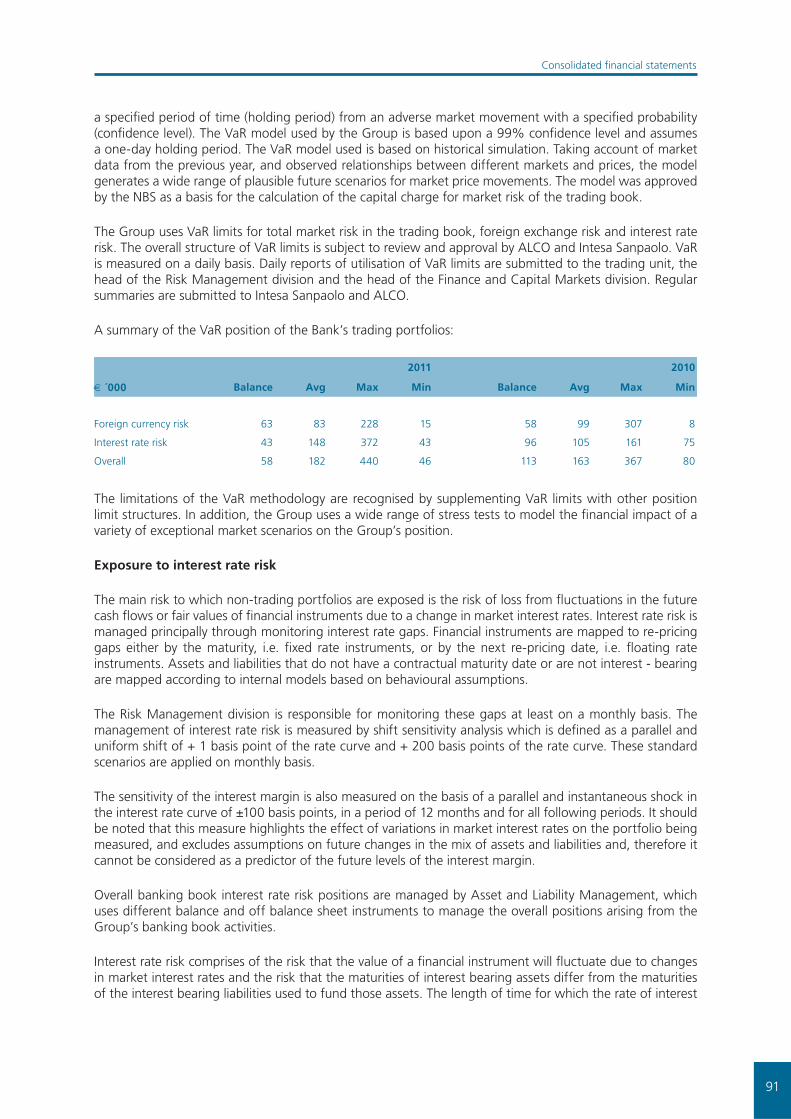
91
Consolidated fi nancial statements
a specifi ed period of time (holding period) from an adverse market movement with a specifi ed probability (confi dence level). The VaR model used by the Group is based upon a 99% confi dence level and assumes a one-day holding period. The VaR model used is based on historical simulation. Taking account of market data from the previous year, and observed relationships between different markets and prices, the model generates a wide range of plausible future scenarios for market price movements. The model was approved by the NBS as a basis for the calculation of the capital charge for market risk of the trading book.
The Group uses VaR limits for total market risk in the trading book, foreign exchange risk and interest rate risk. The overall structure of VaR limits is subject to review and approval by ALCO and Intesa Sanpaolo. VaR is measured on a daily basis. Daily reports of utilisation of VaR limits are submitted to the trading unit, the head of the Risk Management division and the head of the Finance and Capital Markets division. Regular summaries are submitted to Intesa Sanpaolo and ALCO.
A summary of the VaR position of the Bank’s trading portfolios:
2011 2010
€ ´000 Balance Avg Max Min Balance Avg Max Min
Foreign currency risk 63 83 228 15 58 99 307 8
Interest rate risk 43 148 372 43 96 105 161 75
Overall 58 182 440 46 113 163 367 80
The limitations of the VaR methodology are recognised by supplementing VaR limits with other position limit structures. In addition, the Group uses a wide range of stress tests to model the fi nancial impact of a variety of exceptional market scenarios on the Group’s position.
Exposure to interest rate risk
The main risk to which non-trading portfolios are exposed is the risk of loss from fl uctuations in the future cash fl ows or fair values of fi nancial instruments due to a change in market interest rates. Interest rate risk is managed principally through monitoring interest rate gaps. Financial instruments are mapped to re-pricing gaps either by the maturity, i.e. fi xed rate instruments, or by the next re-pricing date, i.e. fl oating rate instruments. Assets and liabilities that do not have a contractual maturity date or are not interest - bearing are mapped according to internal models based on behavioural assumptions.
The Risk Management division is responsible for monitoring these gaps at least on a monthly basis. The management of interest rate risk is measured by shift sensitivity analysis which is defi ned as a parallel and uniform shift of + 1 basis point of the rate curve and + 200 basis points of the rate curve. These standard scenarios are applied on monthly basis.
The sensitivity of the interest margin is also measured on the basis of a parallel and instantaneous shock in the interest rate curve of ±100 basis points, in a period of 12 months and for all following periods. It should be noted that this measure highlights the effect of variations in market interest rates on the portfolio being measured, and excludes assumptions on future changes in the mix of assets and liabilities and, therefore it cannot be considered as a predictor of the future levels of the interest margin.
Overall banking book interest rate risk positions are managed by Asset and Liability Management, which uses different balance and off balance sheet instruments to manage the overall positions arising from the Group’s banking book activities.
Interest rate risk comprises of the risk that the value of a fi nancial instrument will fl uctuate due to changes in market interest rates and the risk that the maturities of interest bearing assets differ from the maturities of the interest bearing liabilities used to fund those assets. The length of time for which the rate of interest
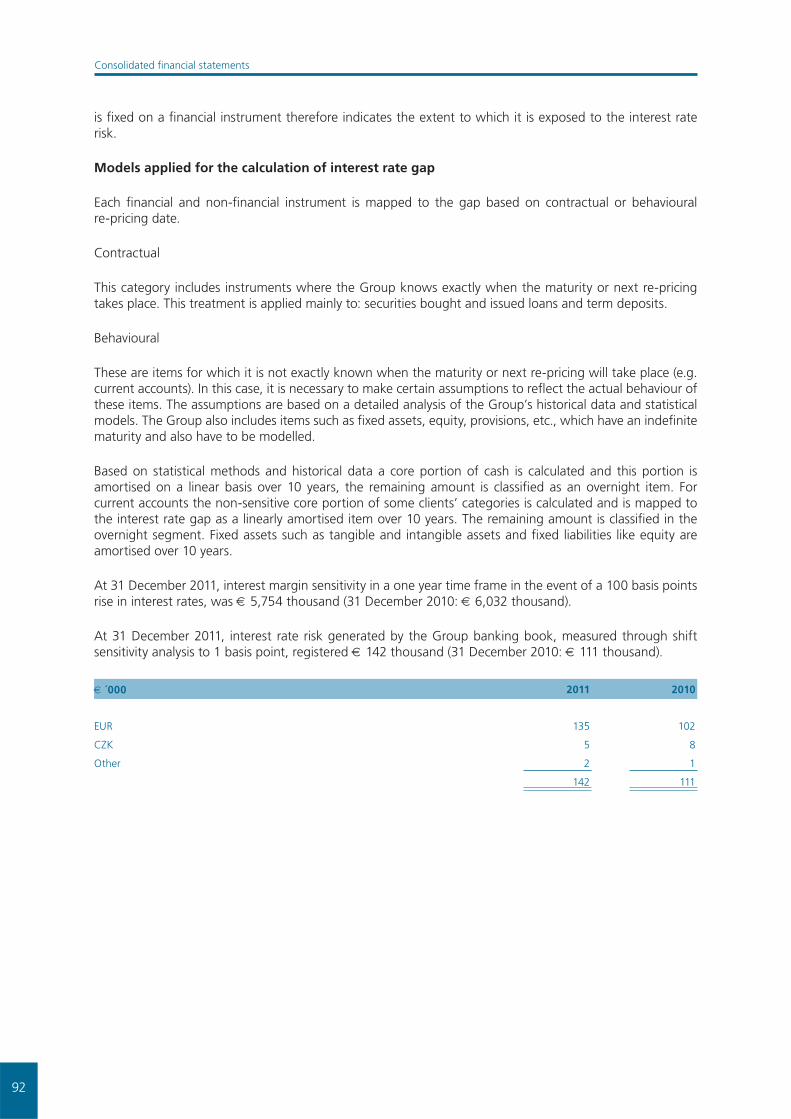
92
Consolidated fi nancial statements
is fi xed on a fi nancial instrument therefore indicates the extent to which it is exposed to the interest rate risk.
Models applied for the calculation of interest rate gap
Each fi nancial and non-fi nancial instrument is mapped to the gap based on contractual or behavioural re-pricing date.
Contractual
This category includes instruments where the Group knows exactly when the maturity or next re-pricing takes place. This treatment is applied mainly to: securities bought and issued loans and term deposits.
Behavioural
These are items for which it is not exactly known when the maturity or next re-pricing will take place (e.g. current accounts). In this case, it is necessary to make certain assumptions to refl ect the actual behaviour of these items. The assumptions are based on a detailed analysis of the Group’s historical data and statistical models. The Group also includes items such as fi xed assets, equity, provisions, etc., which have an indefi nite maturity and also have to be modelled.
Based on statistical methods and historical data a core portion of cash is calculated and this portion is amortised on a linear basis over 10 years, the remaining amount is classifi ed as an overnight item. For current accounts the non-sensitive core portion of some clients’ categories is calculated and is mapped to the interest rate gap as a linearly amortised item over 10 years. The remaining amount is classifi ed in the overnight segment. Fixed assets such as tangible and intangible assets and fi xed liabilities like equity are amortised over 10 years.
At 31 December 2011, interest margin sensitivity in a one year time frame in the event of a 100 basis points rise in interest rates, was € 5,754 thousand (31 December 2010: € 6,032 thousand).
At 31 December 2011, interest rate risk generated by the Group banking book, measured through shift sensitivity analysis to 1 basis point, registered € 142 thousand (31 December 2010: € 111 thousand).
€ ´000 2011 2010
EUR 135 102
CZK 5 8
Other 2 1
142 111
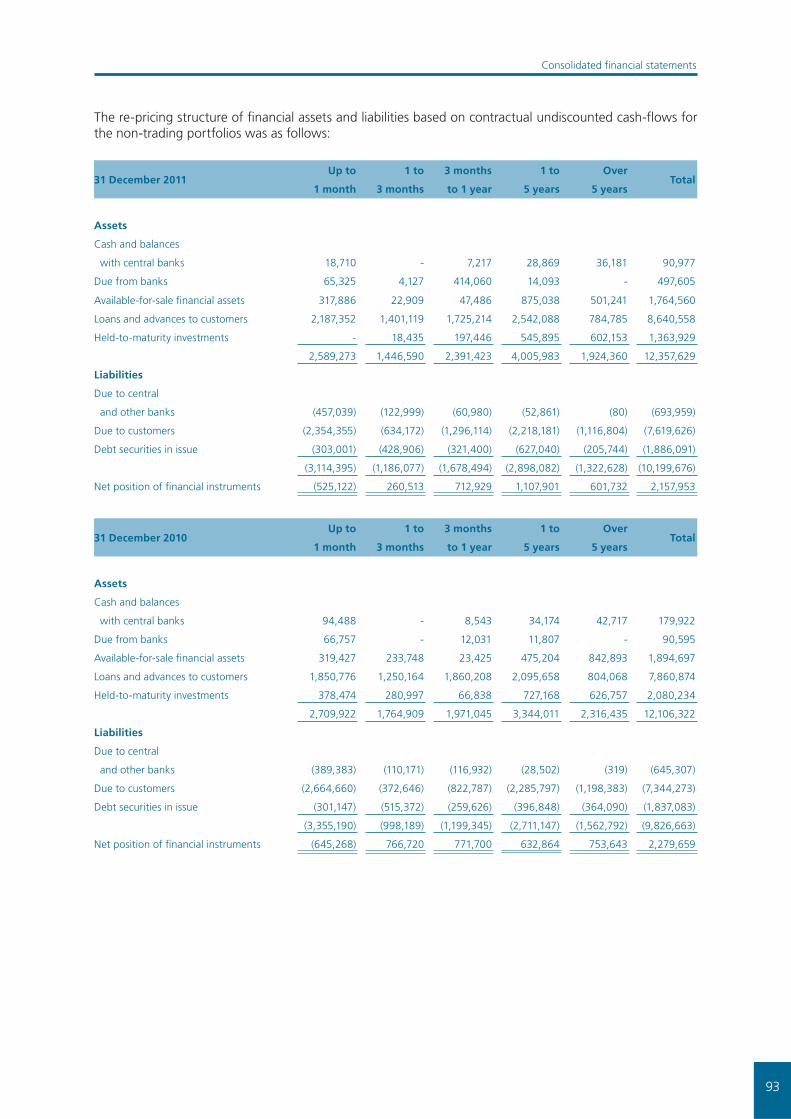
93
Consolidated fi nancial statements
The re-pricing structure of fi nancial assets and liabilities based on contractual undiscounted cash-fl ows for the non-trading portfolios was as follows:
31 December 2011Up to
1 month
1 to
3 months
3 months
to 1 year
1 to
5 years
Over
5 yearsTotal
Assets
Cash and balances
with central banks 18,710 - 7,217 28,869 36,181 90,977
Due from banks 65,325 4,127 414,060 14,093 - 497,605
Available-for-sale fi nancial assets 317,886 22,909 47,486 875,038 501,241 1,764,560
Loans and advances to customers 2,187,352 1,401,119 1,725,214 2,542,088 784,785 8,640,558
Held-to-maturity investments - 18,435 197,446 545,895 602,153 1,363,929
2,589,273 1,446,590 2,391,423 4,005,983 1,924,360 12,357,629
Liabilities
Due to central
and other banks (457,039) (122,999) (60,980) (52,861) (80) (693,959)
Due to customers (2,354,355) (634,172) (1,296,114) (2,218,181) (1,116,804) (7,619,626)
Debt securities in issue (303,001) (428,906) (321,400) (627,040) (205,744) (1,886,091)
(3,114,395) (1,186,077) (1,678,494) (2,898,082) (1,322,628) (10,199,676)
Net position of fi nancial instruments (525,122) 260,513 712,929 1,107,901 601,732 2,157,953
31 December 2010Up to
1 month
1 to
3 months
3 months
to 1 year
1 to
5 years
Over
5 yearsTotal
Assets
Cash and balances
with central banks 94,488 - 8,543 34,174 42,717 179,922
Due from banks 66,757 - 12,031 11,807 - 90,595
Available-for-sale fi nancial assets 319,427 233,748 23,425 475,204 842,893 1,894,697
Loans and advances to customers 1,850,776 1,250,164 1,860,208 2,095,658 804,068 7,860,874
Held-to-maturity investments 378,474 280,997 66,838 727,168 626,757 2,080,234
2,709,922 1,764,909 1,971,045 3,344,011 2,316,435 12,106,322
Liabilities
Due to central
and other banks (389,383) (110,171) (116,932) (28,502) (319) (645,307)
Due to customers (2,664,660) (372,646) (822,787) (2,285,797) (1,198,383) (7,344,273)
Debt securities in issue (301,147) (515,372) (259,626) (396,848) (364,090) (1,837,083)
(3,355,190) (998,189) (1,199,345) (2,711,147) (1,562,792) (9,826,663)
Net position of fi nancial instruments (645,268) 766,720 771,700 632,864 753,643 2,279,659

94
Consolidated fi nancial statements
The average interest rates for fi nancial assets and liabilities were as follows:
2011
%
2010
%
Assets
Cash and balances with central banks 1.22 1.04
Due from banks 2.80 2.10
Financial assets held for trading 3.64 3.96
Available-for-sale fi nancial assets 3.43 2.94
Loans and advances to customers 5.85 5.73
Held-to-maturity investments 4.02 3.21
Liabilities
Due to central and other banks 1.51 1.16
Due to customers 1.04 0.88
Debt securities in issue 3.06 2.87
Currency denominations of assets and liabilities
Foreign exchange rate risk comprises the risk that the value of fi nancial assets and liabilities will fl uctuate due to changes in market foreign exchange rates. It is the policy of the Group to manage its exposure to fl uctuations in exchange rates through the regular monitoring and reporting of open positions and the application of a matrix of exposure and position limits.
31 December 2011 EUR USD CZK Other Total
Assets
Cash and balances with central banks 80,458 1,050 7,261 2,208 90,977
Due from banks 478,374 19,635 3,206 1,076 502,291
Financial assets held for trading 68,601 - 23,098 182,263 273,962
Derivative fi nancial instruments 80,394 - 5 - 80,399
Available-for-sale fi nancial assets 1,455,626 - - - 1,455,626
Loans and advances to customers 6,823,077 141,605 270,645 31,219 7,266,546
Held-to-maturity investments 1,137,540 - - - 1,137,540
10,124,070 162,290 304,215 216,766 10,807,341
Liabilities
Due to central and other banks (487,990) (127,950) (65,880) (6,649) (688,469)
Derivative fi nancial instruments (57,146) - (236) - (57,382)
Due to customers (7,121,122) (140,250) (160,732) (65,304) (7,487,408)
Debt securities in issue (1,517,385) (26,651) (116,451) - (1,660,487)
(9,183,643) (294,851) (343,299) (71,953) (9,893,746)
Net position 940,427 (132,561) (39,084) 144,813 913,595

95
Consolidated fi nancial statements
31 December 2010 EUR USD CZK Other Total
Assets
Cash and balances with central banks 168,955 1,251 6,556 2,331 179,093
Due from banks 79,019 19,156 1,538 9,130 108,843
Financial assets held for trading 78,824 - - 174,201 253,025
Derivative fi nancial instruments 45,179 - 26 - 45,205
Available-for-sale fi nancial assets 1,615,823 - - - 1,615,823
Loans and advances to customers 6,026,871 90,147 302,637 18,020 6,437,675
Held-to-maturity investments 1,788,263 - - - 1,788,263
9,802,934 110,554 310,757 203,682 10,427,927
Liabilities
Due to central and other banks (450,569) (101,110) (83,810) (27,034) (662,523)
Derivative fi nancial instruments (60,730) - 1 - (60,729)
Due to customers (6,887,318) (120,467) (216,181) (41,401) (7,265,367)
Debt securities in issue (1,523,415) (25,807) (75,031) - (1,624,253)
(8,922,032) (247,384) (375,021) (68,435) (9,612,872)
Net position 880,902 (136,830) (64,264) 135,247 815,055
(c) Liquidity risk
Liquidity risk is defi ned as the risk that the Group is not able to meet its payment obligations when they fall due (funding liquidity risk). Normally, the Group is able to cover cash outfl ows with cash infl ows, highly liquid assets and its ability to obtain credit. With regard to the highly liquid assets in particular, there may be strains in the market that make them diffi cult (or even impossible) to sell or be used as collateral in exchange for funds. From this perspective, the Group’s liquidity risk is closely tied to the market liquidity conditions (market liquidity risk).
The Guidelines for Liquidity Risk Management adopted by the VUB Group outline the set of principles, methods, regulations and control processes required to prevent the occurrence of a liquidity crisis and call for the Group to develop prudential approaches to liquidity management, making it possible to maintain the overall risk profi le at extremely low levels.
The basic principles underpinning the Liquidity Policy of the VUB Group are:
– the existence of an operating structure that works within set limits and of a control structure that is independent from the operating structure;
– a prudential approach to the estimate of the cash infl ow and outfl ow projections for all the balance sheet and off-balance sheet items, especially those without a contractual maturity;
– an assessment of the impact of various scenarios, including stress testing scenarios, on the cash infl ows and outfl ows over time;
– the maintenance of an adequate level of unencumbered highly liquid assets, capable of enabling ordinary operations, also on an intraday basis, and overcoming the initial stages of a shock involving the Group’s liquidity or system liquidity.
The VUB Group directly manages its own liquidity and coordinates its management at VUB Group level, ensures the adoption of adequate control techniques and procedures, and provides complete and accurate information to ALCO and the Statutory Bodies.
The departments of the Bank that are responsible for ensuring the correct application of the Guidelines are the Treasury Department, responsible for short term liquidity management, the ALM department

96
Consolidated fi nancial statements
(responsible for medium and long term liquidity management) and the Market Risk Department (responsible for monitoring indicators and verifying the observation of limits).
These Guidelines are broken down into three macro areas: ‘Short term Liquidity Policy’, ‘Structural Liquidity Policy’ and ‘Contingency Liquidity Plan’.
The Short term Liquidity Policy includes the set of parameters, limits and observation thresholds that enable measurement, both under normal market conditions and under conditions of stress, of liquidity risk exposure over the short term, setting the maximum amount of risk to be assumed and ensuring the utmost prudence in its management.
The Structural Liquidity Policy of the VUB Group incorporates the set of measures and limits designed to control and manage the risks deriving from the mismatch of the medium to long-term maturities of the assets and liabilities, essential for the strategic planning of liquidity management. This involves the adoption of internal limits for the transformation of maturity dates aimed at preventing the medium to long-term operations from giving rise to excessive imbalances to be fi nanced in the short term.
Rule 1: Real Estate + Equity Investments <= Regulatory Capital
Rule 2: Medium term assets + 0.5 x Long Term Assets <= Long term liabilities + 0.5 x Medium term liabilities + 0.25 x (short term customer liabilities + interbank liabilities) + excess in Rule 1
Together with the Short term and Structural Liquidity Policy, the Guidelines provide for the management methods of a potential liquidity crisis, defi ned as a situation of diffi culty or inability of the Group to meet its cash commitments falling due, without implementing procedures and/or employing instruments that, due to their intensity or manner of use, do not qualify as ordinary administration.
The Contingency Liquidity Plan sets the objectives of safeguarding the Group’s capital and, at the same time, guarantees the continuity of operations under conditions of extreme liquidity emergency. It also ensures the identifi cation of the pre-warning signals and their ongoing monitoring, the defi nition of procedures to be implemented in situations of liquidity stress, the immediate lines of action, and intervention measures for the resolution of emergencies. The pre-warning indices, aimed at identifying signs of a potential liquidity strain, both systemic and specifi c, are continuously recorded and reported to the departments responsible for the management and monitoring of liquidity.
The liquidity position of the Bank and the subsidiaries is regularly presented by Market Risk Department and discussed during the ALCO meetings.

97
Consolidated fi nancial statements
The remaining maturities of assets and liabilities based on contractual undiscounted cash-fl ows were as follows:
31 December 2011Up to
1 month
1 to 3
months
3 months
to 1 year
1 to 5
years
Over
5 years
Not
specifi edTotal
Assets
Cash and balances
with central banks 90,977 - - - - - 90,977
Due from banks 10,914 591 422,887 65,283 32,208 - 531,883
Financial assets
held for trading 11,000 170,481 91,222 115 - 4,110 276,928
Available-for-sale
fi nancial assets 6,610 22,909 53,110 1,207,657 501,241 - 1,791,527
Loans and advances
to customers 482,445 355,029 1,331,352 3,108,586 4,223,002 12,296 9,512,710
Held-to-maturity investments - 18,435 187,474 556,232 602,052 - 1,364,193
601,946 567,445 2,086,045 4,937,873 5,358,503 16,406 13,568,218
Liabilities
Due to central
and other banks (456,992) (1,845) (86,203) (170,248) (35,028) - (750,316)
Due to customers (4,399,295) (726,411) (1,173,994) (1,202,070) (88,363) (66) (7,590,199)
Debt securities in issue (3,001) (22,524) (220,624) (993,096) (711,089) - (1,950,334)
(4,859,288) (750,780) (1,480,821) (2,365,414) (834,480) (66) (10,290,849)
Net position of fi nancial instruments (4,257,342) (183,335) 605,224 2,572,459 4,524,023 16,340 3,277,369
Cash infl ows from derivatives 315,300 305,479 335,645 170,188 161,261 - 1,287,873
Cash outfl ows from derivatives (316,359) (282,394) (322,662) (183,002) (160,687) - (1,265,104)
Net position from derivatives (1,059) 23,085 12,983 (12,814) 574 - 22,769
Total net position (4,258,401) (160,250) 618,207 2,559,645 4,524,597 16,340 3,300,138

98
Consolidated fi nancial statements
31 December 2010Up to
1 month
1 to 3
months
3 months
to 1 year
1 to 5
years
Over
5 years
Not
specifi edTotal
Assets
Cash and balances
with central banks 179,923 - - - - - 179,923
Due from banks 20,135 2,929 51,666 23,208 32,435 - 130,373
Financial assets
held for trading 25,161 62,894 90,584 77,748 25 3,052 259,464
Available-for-sale
fi nancial assets 5,509 229,579 28,059 823,133 842,893 - 1,929,173
Loans and advances
to customers 515,930 576,230 1,167,536 2,726,188 4,203,875 1,647 9,191,406
Held-to-maturity investments 368,397 268,514 63,263 737,753 626,757 - 2,064,684
1,115,055 1,140,146 1,401,108 4,388,030 5,705,985 4,699 13,755,023
Liabilities
Due to central
and other banks (396,565) (137,426) (138,219) (97,918) (36,777) - (806,905)
Due to customers (4,925,390) (453,290) (570,538) (1,271,639) (50,137) (25,208) (7,296,202)
Debt securities in issue (1,146) (23,201) (295,641) (843,750) (787,847) - (1,951,585)
(5,323,101) (613,917) (1,004,398) (2,213,307) (874,761) (25,208) (10,054,692)
Net position of fi nancial instruments (4,208,046) 526,229 396,710 2,174,723 4,831,224 (20,509) 3,700,331
Cash infl ows from derivatives 26,404 103,025 180,837 200,101 98,132 - 608,499
Cash outfl ows from derivatives (28,242) (104,400) (186,119) (203,652) (96,838) - (619,251)
Net position from derivatives (1,838) (1,375) (5,282) (3,551) 1,294 - (10,752)
Total net position (4,209,884) 524,854 391,428 2,171,172 4,832,518 (20,509) 3,689,579

99
Consolidated fi nancial statements
The table below shows an analysis of assets and liabilities according to when they are expected to be recovered or settled.
31 December 2011Less than 12
months
Over 12
monthsTotal
Assets
Cash and balances with central banks 90,977 - 90,977
Due from banks 431,489 70,802 502,291
Financial assets held for trading 269,743 4,219 273,962
Derivative fi nancial instruments 80,399 - 80,399
Available-for-sale fi nancial assets 65,397 1,390,229 1,455,626
Non-current assets held for sale 3 - 3
Loans and advances to customers 2,280,026 4,986,520 7,266,546
Held-to-maturity investments 192,576 944,964 1,137,540
Associates and jointly controlled entities - 7,077 7,077
Intangible assets 501 40,985 41,486
Goodwill - 29,305 29,305
Property and equipment - 146,732 146,732
Current income tax assets 2,791 - 2,791
Deferred income tax assets - 77,463 77,463
Other assets 19,100 - 19,100
3,433,002 7,698,296 11,131,298
Liabilities
Due to central and other banks (591,254) (97,215) (688,469)
Derivative fi nancial instruments (57,382) - (57,382)
Due to customers (6,410,500) (1,076,908) (7,487,408)
Debt securities in issue (211,326) (1,449,161) (1,660,487)
Provisions - (27,328) (27,328)
Other liabilities (92,694) (2,272) (94,966)
(7,363,156) (2,652,884) (10,016,040)
(3,930,154) 5,045,412 1,115,258

100
Consolidated fi nancial statements
31 December 2010Less than 12
months
Over 12
monthsTotal
Assets
Cash and balances with central banks 179,093 - 179,093
Due from banks 71,199 37,644 108,843
Financial assets held for trading 176,187 76,838 253,025
Derivative fi nancial instruments 45,205 - 45,205
Available-for-sale fi nancial assets 244,614 1,371,209 1,615,823
Non-current assets held for sale 3,374 - 3,374
Loans and advances to customers 1,993,131 4,444,544 6,437,675
Held-to-maturity investments 687,236 1,101,027 1,788,263
Associates and jointly controlled entities - 6,219 6,219
Intangible assets 490 40,852 41,342
Goodwill - 29,305 29,305
Property and equipment - 148,921 148,921
Current income tax assets 8,931 - 8,931
Deferred income tax assets - 66,154 66,154
Other assets 26,776 - 26,776
3,436,236 7,322,713 10,758,949
Liabilities
Due to central and other banks (602,085) (60,438) (662,523)
Derivative fi nancial instruments (60,729) - (60,729)
Due to customers (5,994,063) (1,271,304) (7,265,367)
Debt securities in issue (290,108) (1,334,145) (1,624,253)
Provisions - (24,256) (24,256)
Other liabilities (76,302) (1,761) (78,063)
(7,023,287) (2,691,904) (9,715,191)
(3,587,051) 4,630,809 1,043,758
(d) Operational risk
Operational risk management strategies and processes
The VUB Group, in coordination with Intesa Sanpaolo, has defi ned the overall operational risk management framework by setting up a Group policy and organisational process for measuring, managing and controlling operational risk.
The control of operational risk was attributed to the Group Operational Risk Committee, which identifi es risk management policies. The Supervisory and Management Board of the Bank ensures the functionality, effi ciency and effectiveness of the risk management and controls system.
The Group Operational Risk Committee (composing of the heads of the areas of the governance centre and of the business areas more involved in operational risk management), has the task of periodically reviewing the Group’s overall operational risk profi le, authorising any corrective actions, coordinating and monitoring the effectiveness of the main mitigation activities and approving the operational risk transfer strategies.

101
Consolidated fi nancial statements
Organisational structure of the associated risk management function
For some time, the Group has had a centralised function within the Risk Management Division for the management of the Group’s operational risks. This function is responsible, in coordination with the parent company, for the defi nition, implementation and monitoring of the methodological and organisational framework, as well as for the measurement of the risk profi le, the verifi cation of mitigation effectiveness and reporting to senior Management. In compliance with current requirements, the individual organisational units participated in the process and each of them was assigned the responsibility for the identifi cation, assessment, management and mitigation of its operational risks. Specifi c offi ces and departments have been identifi ed within these organisational units to be responsible for Operational Risk Management. These functions are responsible for the collection and structured census of information relating to operational events, scenario analyses and evaluation of the level of risk associated with the business environment. The Risk Management Division carries out second level monitoring of these activities.
Scope of application and characteristics of the risk measurement and reporting system
Upon the request of the parent company, VUB Bank as part of the Group request has received in February 2010, from the relevant Supervisory authorities, approval for usage and thus adopted the Advanced Measurement Approach (AMA), for Operational Risk management and measurement.
As such, the VUB Group uses a combination of the Advanced Measurement Approach (for the Bank), and the Standardized and Basic Indicator Approach (for Bank’s subsidiaries).
For the use of the AMA, the VUB Group has set up, in addition to the corporate governance mechanisms required by the Supervisory regulations, an effective system for the management of operational risk certifi ed by the process of annual self-assessment carried out by the Bank and VUB Group Companies that fall within the scope of AMA and TSA. This self-assessment is verifi ed by the Internal Audit Department and submitted to the Management Board for the annual certifi cation of compliance with the requirements established by the regulation.
Under the AMA approach, the capital requirement is calculated by internal model, which combines all elements stipulated in Supervisory regulation, allowing to measure the exposure in a more risk sensitive way. Monitoring of operational risks is performed by an integrated reporting system, which provides management with the information necessary for the management and/or mitigation of the operational risk.
Policies for hedging and mitigating risk
The VUB Group, in coordination with its parent company, has set up a traditional operational risk transfer policy (insurance) aimed at mitigating the impact of any unexpected losses. The AMA calculation does not currently include the benefi t from this transfer of operational risk through insurance policies, however, it is due to be included in the future, after its validation by the Supervisory authority, so that it can contribute to reducing the risk capital calculated through the internal models. The process required to obtain this approval is planned to start in 2012.
37. Segment reporting
Segment information is presented in respect of the Group’s operating segments, based on the management and internal reporting structure.
Operating segments pay and receive interest to and from the Central Treasury on an arm’s length basis in order to refl ect the costs of funding.

102
Consolidated fi nancial statements
The Group comprises the following main operating segments:
– Retail Banking– Corporate Banking– Central Treasury
Retail Banking includes loans, deposits and other transactions and balances with households, entrepreneurs and small business segment.
Corporate Banking comprises Small and Medium Enterprises (‘SME’) and the Corporate Customer Desk (‘CCD’). SME includes loans, deposits and other transactions and balances with small and medium enterprises (company revenue in the range of € 1 million to € 40 million; if revenue information is not available, bank account turnover is used). The CCD includes loans, deposits and other transactions and balances with large corporate customers (company revenue over € 40 million).
Central Treasury undertakes the Group’s funding, HTM Securities portfolio management, issues of debt securities as well as trading book operations. The Group also has a central Governance Centre that manages the Group’s premises, equity investments and own equity funds as well as Risk Management that operates the workout loan portfolio.
31 December 2011Retail
Banking
Corporate
Banking
Central
TreasuryOther Total
External revenue
Interest income 302,269 101,223 129,067 8,722 541,281
Interest expense (50,286) (14,316) (72,481) (1,320) (138,403)
Inter-segment revenue (2,443) (11,619) (12,649) 26,711 -
Net interest income 249,540 75,288 43,937 34,113 402,878
Net fee and commission income 67,398 40,955 2,587 (2,513) 108,427
Net trading income 3,335 4,840 (7,297) 64 942
Other operating income 5,171 3,859 - 4,616 13,646
Total segment operating income 325,444 124,942 39,227 36,280 525,893
Depreciation and amortisation (19,140) (2,643) (196) (10,632) (32,611)
Operating expenses (203,658)
Operating profi t before impairment 289,624
Impairment losses on fi nancial assets (51,786) (15,664) (574) 89 (67,935)
Share of profi t of associates and jointly controlled entities 850
Income tax expense (45,636)
Net profi t for the year 176,903
Segment assets 4,062,560 3,203,892 3,256,231 608,615 11,131,298
Segment liabilities 4,796,796 2,032,282 3,131,908 1,170,312 11,131,298
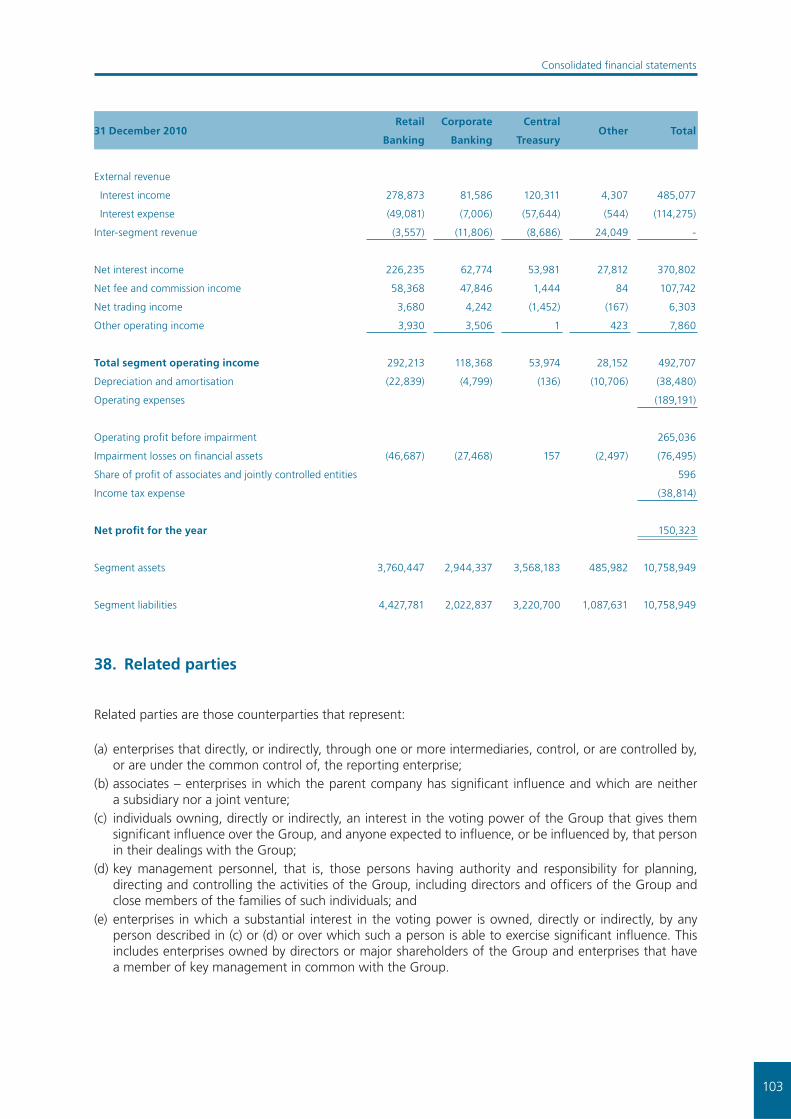
103
Consolidated fi nancial statements
31 December 2010Retail
Banking
Corporate
Banking
Central
TreasuryOther Total
External revenue
Interest income 278,873 81,586 120,311 4,307 485,077
Interest expense (49,081) (7,006) (57,644) (544) (114,275)
Inter-segment revenue (3,557) (11,806) (8,686) 24,049 -
Net interest income 226,235 62,774 53,981 27,812 370,802
Net fee and commission income 58,368 47,846 1,444 84 107,742
Net trading income 3,680 4,242 (1,452) (167) 6,303
Other operating income 3,930 3,506 1 423 7,860
Total segment operating income 292,213 118,368 53,974 28,152 492,707
Depreciation and amortisation (22,839) (4,799) (136) (10,706) (38,480)
Operating expenses (189,191)
Operating profi t before impairment 265,036
Impairment losses on fi nancial assets (46,687) (27,468) 157 (2,497) (76,495)
Share of profi t of associates and jointly controlled entities 596
Income tax expense (38,814)
Net profi t for the year 150,323
Segment assets 3,760,447 2,944,337 3,568,183 485,982 10,758,949
Segment liabilities 4,427,781 2,022,837 3,220,700 1,087,631 10,758,949
38. Related parties
Related parties are those counterparties that represent:
(a) enterprises that directly, or indirectly, through one or more intermediaries, control, or are controlled by, or are under the common control of, the reporting enterprise;
(b) associates – enterprises in which the parent company has signifi cant infl uence and which are neither a subsidiary nor a joint venture;
(c) individuals owning, directly or indirectly, an interest in the voting power of the Group that gives them signifi cant infl uence over the Group, and anyone expected to infl uence, or be infl uenced by, that person in their dealings with the Group;
(d) key management personnel, that is, those persons having authority and responsibility for planning, directing and controlling the activities of the Group, including directors and offi cers of the Group and close members of the families of such individuals; and
(e) enterprises in which a substantial interest in the voting power is owned, directly or indirectly, by any person described in (c) or (d) or over which such a person is able to exercise signifi cant infl uence. This includes enterprises owned by directors or major shareholders of the Group and enterprises that have a member of key management in common with the Group.

104
Consolidated fi nancial statements
In considering each possible related party relationship, attention is directed to the substance of the relationship, and not merely the legal form. The majority of the stated transactions have been made under arms-length commercial and banking conditions.
In 2011, the remuneration and other benefi ts provided to members of the Supervisory Board and the Management Board were € 5,404 thousand (2010: € 4,301 thousand).
At 31 December 2011, signifi cant outstanding balances with related parties comprised:
KMP *
Close
members
of KMP
Affi liated
companies
Intesa
Sanpaolo
Group
Total
Assets
Due from banks - - - 458,321 458,321
Derivative fi nancial instruments - - - 9,596 9,596
Loans and advances to customers 1,229 584 - - 1,813
Other assets - - 5 1,509 1,514
1,229 584 5 469,426 471,244
Liabilities
Due to central and other banks - - - 356,281 356,281
Derivative fi nancial instruments - - - 4,176 4,176
Due to customers 2,365 - 113 - 2,478
Debt securities in issue
Bonds - - 6,928 - 6,928
Mortgage bonds - - - 1,027,101 1,027,101
2,365 - 7,041 1,387,558 1,396,964
Received guarantees - - - 77,075 77,075
Derivative transactions
(notional amount – receivable) - - - 376,035 376,035
Income and expense items
Interest and similar income 46 3 - 12,312 12,361
Interest expense and similar charges (46) - (165) (35,569) (35,780)
Fee and commission income 3 - - - 3
Fee and commission expense - - - (4,750) (4,750)
Net trading income - - - (7,225) (7,225)
Operating income - - 96 73 169
Operating expenses - - - (71) (71)
3 3 (69) (35,230) (35,293)
* Key management personnel
During the year 2011, VUB Group has purchased performing loans from an Intesa Sanpaolo Group bank in the total amount of € 116,973 thousand and HUF 3,505,620 thousand. The transaction was realised at fair value.

105
Consolidated fi nancial statements
At 31 December 2010, signifi cant outstanding balances with related parties comprised:
KMP
Close
members
of KMP
Affi liated
companies
Intesa
Sanpaolo
Group
Total
Assets
Due from banks - - - 65,319 65,319
Derivative fi nancial instruments - - - 6,260 6,260
Loans and advances to customers 931 878 - - 1,809
Other assets - - 10 - 10
931 878 10 71,579 73,398
Liabilities
Due to central and other banks - - - 349,167 349,167
Derivative fi nancial instruments - - - 1,537 1,537
Due to customers 1,567 - 114 - 1,681
Debt securities in issue
Bonds 97 - 6,726 - 6,823
Mortgage bonds - - - 1,054,067 1,054,067
1,664 - 6,840 1,404,771 1,413,275
Received guarantees - - - 35,000 35,000
Derivative transactions
(notional amount – receivable) - - - 136,382 136,382
Income and expense items
Interest and similar income 40 48 - 5,567 5,655
Interest expense and similar charges (49) (59) (124) (25,278) (25,510)
Fee and commission income 4 - 6 - 10
Fee and commission expense - - - (1,422) (1,422)
Net trading income - - - 1,408 1,408
Operating income - - 100 232 332
Operating expense - (23) - - (23)
(5) (34) (18) (19,493) (19,550)

106
Consolidated fi nancial statements
39. Events after the end of the reporting period
Commencing 1 January 2012, banks operating in the Slovak Republic are subject to special levy of 0.4% of selected liabilities presented at the end of each quarter. The levy will be recognized in the statement of comprehensive income on an accrual basis and is payable at the beginning of the quarter.
From 31 December 2011 up to the date of issue of these fi nancial statements there were no further events identifi ed that would require adjustments to or disclosure in these fi nancial statements

107
Separate fi nancial statements prepared in accordance with International Financial
Reporting Standards and Independent Auditors’ Report
for the year ended 31 December 2011
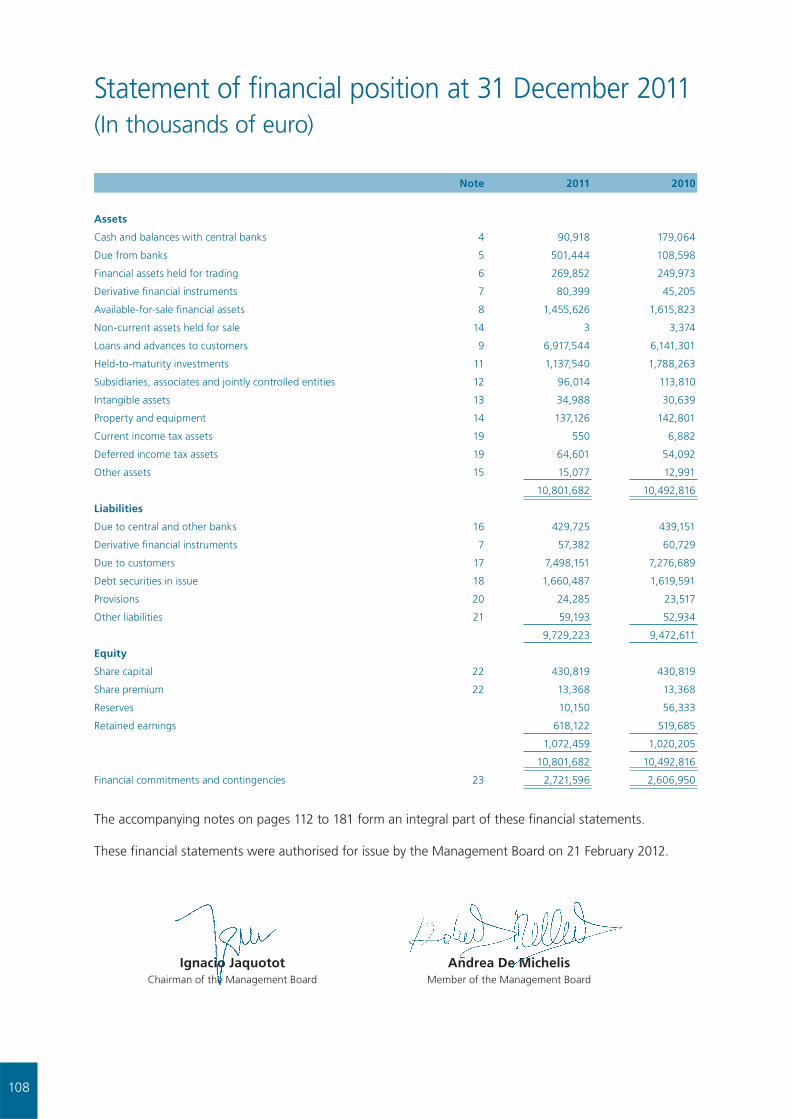
108
Note 2011 2010
Assets
Cash and balances with central banks 4 90,918 179,064
Due from banks 5 501,444 108,598
Financial assets held for trading 6 269,852 249,973
Derivative fi nancial instruments 7 80,399 45,205
Available-for-sale fi nancial assets 8 1,455,626 1,615,823
Non-current assets held for sale 14 3 3,374
Loans and advances to customers 9 6,917,544 6,141,301
Held-to-maturity investments 11 1,137,540 1,788,263
Subsidiaries, associates and jointly controlled entities 12 96,014 113,810
Intangible assets 13 34,988 30,639
Property and equipment 14 137,126 142,801
Current income tax assets 19 550 6,882
Deferred income tax assets 19 64,601 54,092
Other assets 15 15,077 12,991
10,801,682 10,492,816
Liabilities
Due to central and other banks 16 429,725 439,151
Derivative fi nancial instruments 7 57,382 60,729
Due to customers 17 7,498,151 7,276,689
Debt securities in issue 18 1,660,487 1,619,591
Provisions 20 24,285 23,517
Other liabilities 21 59,193 52,934
9,729,223 9,472,611
Equity
Share capital 22 430,819 430,819
Share premium 22 13,368 13,368
Reserves 10,150 56,333
Retained earnings 618,122 519,685
1,072,459 1,020,205
10,801,682 10,492,816
Financial commitments and contingencies 23 2,721,596 2,606,950
The accompanying notes on pages 112 to 181 form an integral part of these fi nancial statements.
These fi nancial statements were authorised for issue by the Management Board on 21 February 2012.
Ignacio Jaquotot Andrea De Michelis Chairman of the Management Board Member of the Management Board
Statement of fi nancial position at 31 December 2011(In thousands of euro)
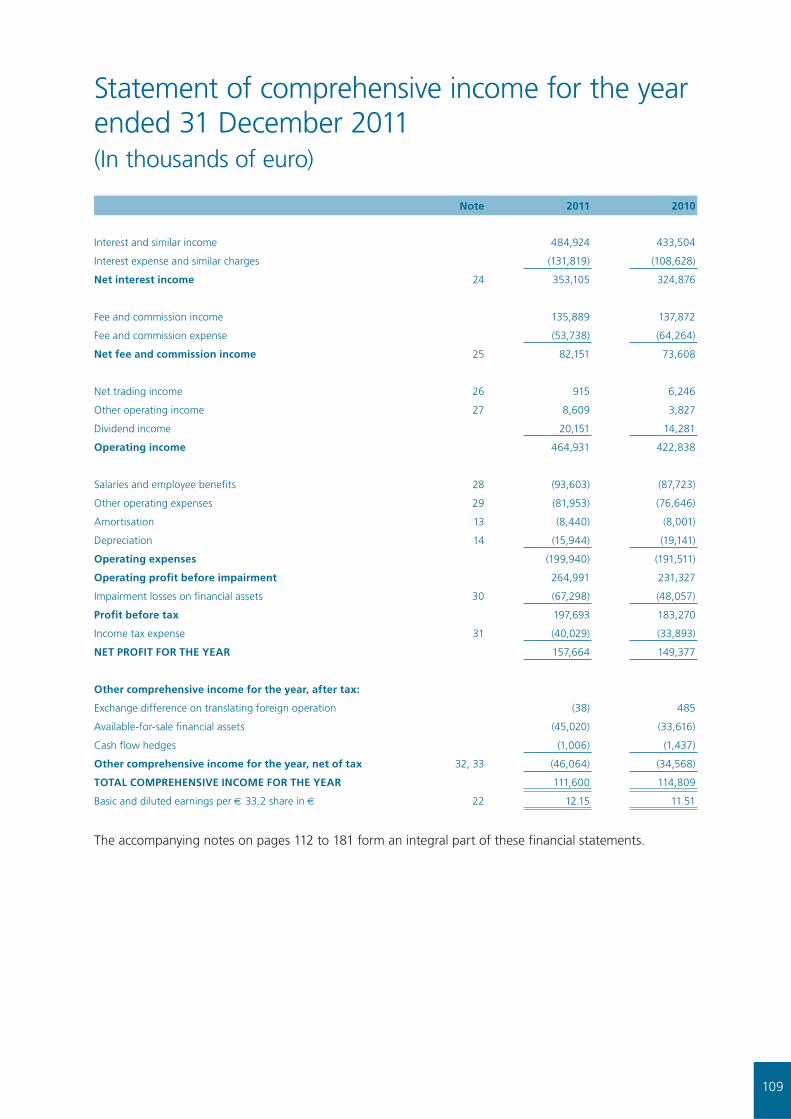
109
Note 2011 2010
Interest and similar income 484,924 433,504
Interest expense and similar charges (131,819) (108,628)
Net interest income 24 353,105 324,876
Fee and commission income 135,889 137,872
Fee and commission expense (53,738) (64,264)
Net fee and commission income 25 82,151 73,608
Net trading income 26 915 6,246
Other operating income 27 8,609 3,827
Dividend income 20,151 14,281
Operating income 464,931 422,838
Salaries and employee benefi ts 28 (93,603) (87,723)
Other operating expenses 29 (81,953) (76,646)
Amortisation 13 (8,440) (8,001)
Depreciation 14 (15,944) (19,141)
Operating expenses (199,940) (191,511)
Operating profi t before impairment 264,991 231,327
Impairment losses on fi nancial assets 30 (67,298) (48,057)
Profi t before tax 197,693 183,270
Income tax expense 31 (40,029) (33,893)
NET PROFIT FOR THE YEAR 157,664 149,377
Other comprehensive income for the year, after tax:
Exchange difference on translating foreign operation (38) 485
Available-for-sale fi nancial assets (45,020) (33,616)
Cash fl ow hedges (1,006) (1,437)
Other comprehensive income for the year, net of tax 32, 33 (46,064) (34,568)
TOTAL COMPREHENSIVE INCOME FOR THE YEAR 111,600 114,809
Basic and diluted earnings per € 33.2 share in € 22 12.15 11.51
The accompanying notes on pages 112 to 181 form an integral part of these fi nancial statements.
Statement of comprehensive income for the year ended 31 December 2011(In thousands of euro)

110
Share
capital
Share
premium
Legal
reserve
fund
Retained
earnings
Transla-
tion
of foreign
operation
Available
for sale
fi nancial
assets
Cash fl ow
hedgesTotal
At 1 January 2010 430,819 13,368 87,493 429,361 (1,649) 6,037 (1,639) 963,790
Total comprehensive
income for the year - - - 149,377 485 (33,616) (1,437) 114,809
Dividends to shareholders - - - (58,394) - - - (58,394)
Other* - - - (1,188) 1,188 - - -
Effect of FX hedge * - - - 529 - - (529) -
At 31 December 2010 430,819 13,368 87,493 519,685 24 (27,579) (3,605) 1,020,205
At 1 January 2011 430,819 13,368 87,493 519,685 24 (27,579) (3,605) 1,020,205
Total comprehensive
income for the year - - - 157,664 (38) (45,020) (1,006) 111,600
Dividends to shareholders - - - (59,692) - - - (59,692)
Reversal of dividends
distributed but not
collected - - - 346 - - - 346
Other* - - - 139 (139) - - -
Effect of FX hedge* - - - (20) - - 20 -
At 31 December 2011 430,819 13,368 87,493 618,122 (153) (72,599) (4,591) 1,072,459
* The foreign currency difference disclosed under Translation of foreign operation was settled within the transfer of retained
earnings and profi t for 2009 and 2010 from the foreign branch. Retained earnings were originally generated in Czech Crowns
(‘CZK’) and the foreign exchange effect of this translation was hedged.
The accompanying notes on pages 112 to 181 form an integral part of these fi nancial statements.
Statement of changes in equity for the year ended 31 December 2011(In thousands of euro)
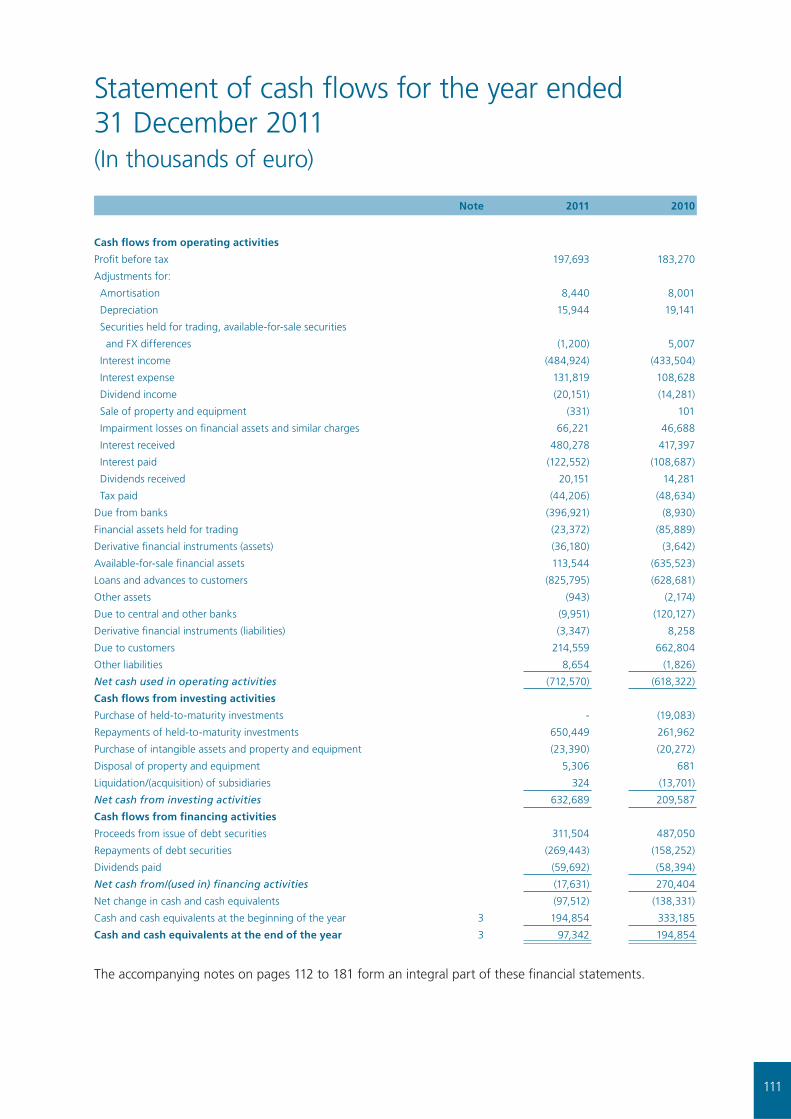
111
Note 2011 2010
Cash fl ows from operating activities
Profi t before tax 197,693 183,270
Adjustments for:
Amortisation 8,440 8,001
Depreciation 15,944 19,141
Securities held for trading, available-for-sale securities
and FX differences (1,200) 5,007
Interest income (484,924) (433,504)
Interest expense 131,819 108,628
Dividend income (20,151) (14,281)
Sale of property and equipment (331) 101
Impairment losses on fi nancial assets and similar charges 66,221 46,688
Interest received 480,278 417,397
Interest paid (122,552) (108,687)
Dividends received 20,151 14,281
Tax paid (44,206) (48,634)
Due from banks (396,921) (8,930)
Financial assets held for trading (23,372) (85,889)
Derivative fi nancial instruments (assets) (36,180) (3,642)
Available-for-sale fi nancial assets 113,544 (635,523)
Loans and advances to customers (825,795) (628,681)
Other assets (943) (2,174)
Due to central and other banks (9,951) (120,127)
Derivative fi nancial instruments (liabilities) (3,347) 8,258
Due to customers 214,559 662,804
Other liabilities 8,654 (1,826)
Net cash used in operating activities (712,570) (618,322)
Cash fl ows from investing activities
Purchase of held-to-maturity investments - (19,083)
Repayments of held-to-maturity investments 650,449 261,962
Purchase of intangible assets and property and equipment (23,390) (20,272)
Disposal of property and equipment 5,306 681
Liquidation/(acquisition) of subsidiaries 324 (13,701)
Net cash from investing activities 632,689 209,587
Cash fl ows from fi nancing activities
Proceeds from issue of debt securities 311,504 487,050
Repayments of debt securities (269,443) (158,252)
Dividends paid (59,692) (58,394)
Net cash from/(used in) fi nancing activities (17,631) 270,404
Net change in cash and cash equivalents (97,512) (138,331)
Cash and cash equivalents at the beginning of the year 3 194,854 333,185
Cash and cash equivalents at the end of the year 3 97,342 194,854
The accompanying notes on pages 112 to 181 form an integral part of these fi nancial statements.
Statement of cash fl ows for the year ended 31 December 2011(In thousands of euro)
112
1. General information
Všeobecná úverová banka, a.s. (‘the Bank’ or ‘VUB’) provides retail and commercial banking services. The Bank is domiciled in the Slovak Republic with its registered offi ce at Mlynské nivy 1, 829 90 Bratislava 25 and has the identifi cation number (IČO) 313 20 155.
At 31 December 2011, the Bank had a network of 250 points of sale (including Retail Branches, Corporate Branches and Mortgage centres) located throughout Slovakia (December 2010: 250). The Bank also has one branch in the Czech Republic.
The Bank’s ultimate parent company is Intesa Sanpaolo S.p.A., which is a joint-stock company and which is incorporated and domiciled in Italy. The address of its registered offi ce is Piazza San Carlo 156, 10121 Torino, Italy.
The members of the Management Board are: Ignacio Jaquotot (Chairman), Andrea De Michelis, Daniele Fanin, Jozef Kausich, Elena Kohútiková, Tomislav Lazarić, Silvia Púchovská, Alexander Resch and Adrián Ševčík.
The members of the Supervisory Board are: György Surányi (Chairman), Fabrizio Centrone (Vice Chairman), Adriano Arietti, Jana Finková, Antonio Furesi, Ján Gallo, Juraj Jurenka and Massimo Malagoli.
2. Summary of signifi cant accounting policies
2.1 Basis of preparation
The separate fi nancial statements of the Bank (‘the fi nancial statements’) have been prepared in accordance with International Financial Reporting Standards (‘IFRS’) issued by the International Accounting Standards Board (‘IASB’) and with interpretations issued by the International Financial Reporting Interpretations Committee of the IASB (‘IFRIC’) as approved by the Commission of European Union in accordance with the Regulation of European Parliament and Council of European Union and in accordance with the Act No. 431/2002 Collection on Accounting.
The consolidated fi nancial statements of the Bank were issued on 21 February 2012 and are available at the legal offi ce of the Bank.
The fi nancial statements have been prepared under the historical cost convention, as modifi ed by the revaluation of available-for-sale fi nancial assets, fi nancial assets held for trading and all derivative fi nancial instruments to fair value.
The fi nancial statements are presented in thousands of euro (‘€’), unless indicated otherwise.
Negative balances are presented in brackets.
2.2 Changes in accounting policies
Standards and interpretations relevant to Bank’s operations, effective in the current period
The following amendments to the existing standards issued by the IASB and adopted by the EU are effective for the current accounting period:
Notes to the separate fi nancial statementsfor the year ended 31 December 2011prepared in accordance with IFRS

113
Separate fi nancial statements
IAS 24 Related Party Disclosures (Amendment)
The amended standard is effective for annual periods beginning on or after 1 January 2011. It clarifi ed the defi nition of a related party to simplify the identifi cation of such relationships and to eliminate inconsistencies in its application. The revised standard introduces a partial exemption of disclosure requirements for government related entities. The amendment to IAS 24 does not have any impact on the fi nancial performance or position of the Bank.
IAS 32 Financial Instruments: Presentation – Classifi cation of Rights Issues (Amendment)
The amendment to IAS 32 is effective for annual periods beginning on or after 1 February 2010 and amended the defi nition of a fi nancial liability in order to classify rights issues (and certain options or warrants) as equity instruments in cases where such rights are given pro rata to all of the existing owners of the same class of an entity’s non-derivative equity instruments, or to acquire a fi xed number of the entity’s own equity instruments for a fi xed amount in any currency. This amendment has no impact on the Bank’s fi nancial position or performance.
IFRIC 14 Prepayments of a minimum funding requirement (Amendment)
The amendment to IFRIC 14 is effective for annual periods beginning on or after 1 January 2011 with retrospective application. The amendment provides guidance on assessing the recoverable amount of a net pension asset. The amendment permits an entity to treat the prepayment of a minimum funding requirement as an asset. The amendment is deemed to have no impact on the fi nancial statements of the Bank.
IFRIC 19 Extinguishing Financial Liabilities with Equity Instruments
IFRIC 19 is effective for annual periods beginning on or after 1 July 2010. The interpretation clarifi es that equity instruments issued to a creditor to extinguish a fi nancial liability qualify as consideration paid. The equity instruments issued are measured at their fair value. In cases where this cannot be reliably measured, the instruments are measured at the fair value of the liability extinguished. Any gain or loss is recognized immediately in profi t or loss. The adoption of this interpretation has no effect on the fi nancial statements of the Bank.
Improvements to IFRSs (issued in May 2010)
In May 2010, the IASB issued its third omnibus of amendments to its standards, primarily with a view to removing inconsistencies and clarifying wording. There are separate transitional provisions for each standard. The adoption of the following amendments resulted in changes to accounting policies, but no impact on the fi nancial position or performance of the Bank.
• IFRS 7 Financial Instruments — Disclosures: The amendment was intended to simplify the disclosures provided by reducing the volume of disclosures around collateral held and improving disclosures by requiring qualitative information to put the quantitative information in context.
• IAS 1 Presentation of Financial Statements: The amendment clarifi es that an entity may present an analysis of each component of other comprehensive income either in the statement of changes in equity or in the notes to the fi nancial statements.
Other amendments resulting from Improvements to IFRSs to the following standards did not have any impact on the accounting policies, fi nancial position or performance of the Bank:
• IFRS 3 Business Combinations• IAS 27 Consolidated and Separate Financial Statements• IAS 34 Interim Financial Statements

114
Separate fi nancial statements
The following interpretation and amendments to interpretations did not have any impact on the accounting policies, fi nancial position or performance of the Bank:
• IFRIC 13 Customer Loyalty Programmes• IFRIC 19 Extinguishing Financial Liabilities with Equity Instruments
Standards and interpretations relevant to Bank’s operations issued but not yet effective
Standards issued but not yet effective or not yet adopted by the EU up to the date of issuance of the Bank’s fi nancial statements are listed below. This listing of standards and interpretations issued are those that the Bank reasonably expects to have an impact on disclosures, fi nancial position or performance when applied at a future date. The Bank intends to adopt these standards when they become effective.
IAS 1 Financial Statement Presentation – Presentation of Items of Other Comprehensive Income (‘OCI’)
The amendments to IAS 1 change the grouping of items presented in OCI. Items that could be reclassifi ed (or ‘recycled’) to profi t or loss at a future point in time (for example, upon derecognition or settlement) would be presented separately from items that will never be reclassifi ed. The amendment affects presentation only and has no impact on the Bank’s fi nancial position or performance. The amendment becomes effective for annual periods beginning on or after 1 July 2012.
IAS 19 Employee Benefi ts (Amendment)
The IASB has issued numerous amendments to IAS 19. These range from fundamental changes such as removing the corridor mechanism and the concept of expected returns on plan assets to simple clarifi cations and re-wording. The application of this amendment will have no impact on the fi nancial position of the Bank. The amendment becomes effective for annual periods beginning on or after 1 January 2013.
IAS 27 Separate Financial Statements (as revised in 2011)
As a consequence of the new IFRS 10 and IFRS 12, what remains of IAS 27 is limited to accounting for subsidiaries, jointly controlled entities, and associates in separate fi nancial statements. The amendment becomes effective for annual periods beginning on or after 1 January 2013.
IAS 28 Investments in Associates and Joint Ventures (as revised in 2011)
As a consequence of the new IFRS 11 and IFRS 12, IAS 28 has been renamed to IAS 28 Investments in Associates and Joint Ventures, and describes the application of the equity method to investments in joint ventures in addition to associates. The amendment becomes effective for annual periods beginning on or after 1 January 2013.
IFRS 7 Financial Instruments: Disclosures— Transfers of Financial Assets (Amendments to IFRS 7)
The IASB has amended the required disclosures relating to transfers of fi nancial assets. The objective of the amendments is to help users of fi nancial statements evaluate the risk exposures relating to such transfers and the effect of those risks on an entity’s fi nancial position. The amendment becomes effective for annual periods beginning on or after 1 July 2011.
IFRS 7 Financial Instruments: Disclosures — Enhanced Derecognition Disclosure Requirements
The amendment requires additional disclosure about fi nancial assets that have been transferred but not derecognised to enable the user of the Bank’s fi nancial statements to understand the relationship with those assets that have not been derecognised and their associated liabilities. In addition, the amendment

115
Separate fi nancial statements
requires disclosures about continuing involvement in derecognised assets to enable the user to evaluate the nature of, and risks associated with, the entity’s continuing involvement in those derecognised assets. The amendment becomes effective for annual periods beginning on or after 1 July 2011. The amendment affects disclosure only and has no impact on the Bank’s fi nancial position or performance.
IFRS 9 Financial Instruments: Classifi cation and Measurement
IFRS 9 as issued refl ects the fi rst phase of the IASB’s work on the replacement of IAS 39 and applies to classifi cation and measurement of fi nancial assets and fi nancial liabilities as defi ned in IAS 39. The standard is effective for annual periods beginning on or after 1 January 2015. In subsequent phases, the IASB will address hedge accounting and impairment of fi nancial assets. The completion of this project is expected over the course of 2012. The adoption of the fi rst phase of IFRS 9 will have an effect on the classifi cation and measurement of the Bank’s fi nancial assets and on classifi cation and measurements of fi nancial liabilities. The Bank will quantify the effect in conjunction with the other phases, when issued, to present a comprehensive picture.
IFRS 10 Consolidated Financial Statements
IFRS 10 replaces the portion of IAS 27 Consolidated and Separate Financial Statements that addresses the accounting for consolidated fi nancial statements. It also includes the issues raised in SIC-12 Consolidation – Special Purpose Entities.
IFRS 10 establishes a single control model that applies to all entities including special purpose entities. The changes introduced by IFRS 10 will require management to exercise signifi cant judgement to determine which entities are controlled, and therefore, are required to be consolidated by a parent, compared with the requirements that were in IAS 27. This standard becomes effective for annual periods beginning on or after 1 January 2013.
IFRS 11 Joint Arrangements
IFRS 11 replaces IAS 31 Interests in Joint Ventures and SIC-13 Jointly-controlled Entities — Non-monetary Contributions by Venturers. IFRS 11 removes the option to account for jointly controlled entities (‘JCEs’) using proportionate consolidation. Instead, JCEs that meet the defi nition of a joint venture must be accounted for using the equity method. The application of this new standard will have no impact on the fi nancial position of the Bank. This standard becomes effective for annual periods beginning on or after 1 January 2013.
IFRS 12 Disclosure of Involvement with Other Entities
IFRS 12 includes all of the disclosures that were previously in IAS 27 related to consolidated fi nancial statements, as well as all of the disclosures that were previously included in IAS 31 and IAS 28. These disclosures relate to an entity’s interests in subsidiaries, joint arrangements, associates and structured entities. A number of new disclosures are also required. This standard becomes effective for annual periods beginning on or after 1 January 2013.
IFRS 13 Fair Value Measurement
IFRS 13 establishes a single source of guidance under IFRS for all fair value measurements. IFRS 13 does not change when an entity is required to use fair value, but rather provides guidance on how to measure fair value under IFRS when fair value is required or permitted. The Bank is currently assessing the impact that this standard will have on the fi nancial position and performance. This standard becomes effective for annual periods beginning on or after 1 January 2013.
The Bank has elected not to adopt these standards, revisions and interpretations in advance of their effective dates.

116
Separate fi nancial statements
2.3 Segment reporting
The Bank reports fi nancial and descriptive information about its operating segments in these fi nancial statements. An operating segment is a component of the Bank that engages in business activities from which it may earn revenues and incur expenses (including revenues and expenses relating to transactions with other components of the Bank), whose operating results are regularly reviewed by the Bank’s management to make decisions about resources to be allocated to the segment and to assess its performance, and for which separate fi nancial information is available.
The Bank operates in three operating segments – Retail Banking, Corporate Banking and Central Treasury. Each segment is exposed to different risks and differs in the nature of its services, business processes and types of customers for its products and services.
For all segments the Bank reports a measure of segment assets and liabilities and income and expense items, a reconciliation of total reportable segment revenues, total profi t or loss, total assets, liabilities and other amounts disclosed for reportable segments to corresponding amounts in the Bank’s fi nancial statements.
Most of the transactions of the Bank are related to the Slovak market. Due to the market size, the Bank operates as a single geographical segment unit.
2.4 Foreign currency transactions
Monetary assets and liabilities in foreign currencies are translated to euro at the offi cial European Central Bank (’ECB’) or National Bank of Slovakia (’NBS’) exchange rates prevailing at the end of the reporting period. Income and expenses denominated in foreign currencies are reported at the ECB or NBS exchange rates prevailing at the date of the transaction.
The difference between the contractual exchange rate of a transaction and the ECB or NBS exchange rate prevailing at the date of the transaction is included in ‘Net trading income’, as well as gains and losses arising from movements in exchange rates after the date of the transaction.
2.5 Foreign operations
The fi nancial statements include foreign operations in the Czech Republic. The assets and liabilities of foreign operations are translated to euro at the foreign exchange rate prevailing at the end of the reporting period. The revenues and expenses of foreign operations are translated to euro at rates approximating the foreign exchange rates prevailing at the dates of the transactions. Foreign exchange differences arising on these translations are recognised directly in equity.
2.6 Cash and balances with central banks
Cash and balances with central banks comprise cash in hand and balances with the NBS and other central banks, including compulsory minimum reserves.
2.7 Treasury bills and other eligible bills
Treasury bills and other eligible bills represent highly liquid securities that could be used for rediscounting in the NBS in the case of Slovak treasury bills or in a central bank of a foreign country in the case of foreign treasury bills without any time or other constraints.
2.8 Due from banks
Due from banks include receivables from current accounts in other than central banks, term deposits and loans provided to commercial banks.

117
Separate fi nancial statements
Balances are presented at amortised cost including interest accruals less any impairment losses. An impairment loss is established if there is objective evidence that the Bank will not be able to collect all amounts due.
2.9 Debt securities
Debt securities held by the Bank are categorised into portfolios in accordance with the intent on the acquisition date and pursuant to the investment strategy. The Bank has developed security investment strategies and, refl ecting the intent on acquisition, allocated securities into the following portfolios:
(a) Held for trading(b) Available-for-sale(c) Held-to-maturity
The principal differences among the portfolios relate to the measurement and recognition of fair values in the fi nancial statements. All securities held by the Bank are recognised using settlement date accounting and are initially measured at fair value plus, in the case of fi nancial assets not held for trading, any directly attributable incremental costs of acquisition. Securities purchased, but not settled, are recorded in the off-balance sheet and changes in their fair values, for purchases into the trading and the available-for-sale portfolios, are recognised in the Statement of comprehensive income and in equity respectively.
(a) Securities held for tradingThese securities are fi nancial assets acquired by the Bank for the purpose of generating profi ts from short-term fl uctuations in prices. Subsequent to their initial recognition these assets are accounted for and re-measured at fair value.
The fair value of securities held for trading, for which an active market exists, and a market value can be estimated reliably, is measured at quoted market prices. In circumstances where the quoted market prices are not readily available, the fair value is estimated using the present value of future cash fl ows.
The Bank monitors changes in fair values on a daily basis and recognises unrealised gains and losses in the Statement of comprehensive income in ‘Net trading income’. Interest earned on securities held for trading is accrued on a daily basis and reported in the Statement of comprehensive income in ‘Interest and similar income’.
Day 1 profi t or loss
When the transaction price is different to the fair value from other observable current market transactions in the same instrument or based on a valuation technique whose variables include only data from observable markets, the Bank immediately recognises the difference between the transaction price and fair value (a ‘Day 1 profi t or loss’) in ‘Net trading income’ if the ‘Day 1 profi t or loss’ is not signifi cant. In cases where ‘Day 1 profi t or loss’ is signifi cant, the difference is amortised over the period of the respective deals. In cases where fair value is determined using data which is not observable, the difference between the transaction price and model value is only recognised in the Statement of comprehensive income when the inputs become observable, or when the instrument is derecognised.
(b) Available-for-sale securities‘Available-for-sale’ securities are those fi nancial assets that are not classifi ed as ‘held for trading’ or ‘held-to-maturity’. Subsequent to their initial recognition, these assets are accounted for and re-measured at fair value.
Unrealised gains and losses arising from changes in the fair value of ‘available-for-sale’ securities are recognised on a daily basis in the ‘Available-for-sale fi nancial assets’ in equity.

118
Separate fi nancial statements
Interest earned whilst holding ‘available-for-sale’ securities is accrued on a daily basis and reported in the Statement of comprehensive income in ‘Interest and similar income’.
The fair value of ‘available-for-sale’ securities, for which an active market exists, and a market value can be estimated reliably, is measured at quoted market prices. In circumstances where the quoted market prices are not readily available, the fair value is estimated using the present value of future cash fl ows.
Equity investments whose fair value cannot be reliably measured are held at cost less impairment. For ‘available-for-sale’ equity investments, the Bank assesses at each reporting date whether there is objective evidence that an investment or a group of investments is impaired.
In the case of debt instruments classifi ed as ‘available-for-sale’, impairment is assessed based on the same criteria as fi nancial assets carried at amortised cost. If, in a subsequent year, the fair value of a debt instrument increases and the increase can be objectively related to an event occurring after the impairment loss was recognised in ‘Impairment losses on fi nancial assets’ in the Statement of comprehensive income, the impairment loss is reversed through the Statement of comprehensive income.
In the case of equity investments classifi ed as ‘available-for-sale’, objective evidence would include a signifi cant or prolonged decline in the fair value of the investment below its cost. Where there is evidence of impairment, the cumulative loss – measured as the difference between the acquisition cost and the current fair value, less any impairment loss on that investment previously recognised in profi t or loss – is removed from equity and recognised in ‘Impairment losses on fi nancial assets’ in the Statement of comprehensive income. Impairment losses on equity investments are not reversed through Statement of comprehensive income; increases in their fair value after impairment are recognised directly in Other comprehensive income.
(c) Held-to-maturity investments‘Held-to-maturity’ investments are fi nancial assets with fi xed or determinable payments and maturities that the Bank has the positive intent and ability to hold to maturity.
‘Held-to-maturity’ investments are carried at amortised cost less any impairment losses. Amortised cost is the amount at which the asset was initially measured minus principal repayments, plus or minus the cumulative amortisation using the effective interest method of any difference between that initial amount and the maturity amount. The amortisation is recognised in the Statement of comprehensive income in ‘Interest and similar income’.
The Bank assesses on a regular basis whether there is any objective evidence that a ‘held-to-maturity’ investment may be impaired. A fi nancial asset is impaired if its carrying amount is greater than its estimated recoverable amount.
2.10 Repurchase and reverse repurchase agreements
Securities sold under sale and repurchase agreements (‘repo transactions’) remain as assets in the Statement of fi nancial position under the original caption and the liability from the received loan is included in ‘Due to central and other banks’ or ‘Due to customers’.
Securities purchased under agreements to purchase and resell (‘reverse repo transactions’) are recorded only in the off-balance sheet and the loan provided is reported in the Statement of fi nancial position in ‘Due from banks’ or ‘Loans and advances to customers’, as appropriate.
The price differential between the purchase and sale price of securities is treated as interest income or expense and deferred over the life of the agreement.
119
Separate fi nancial statements
2.11 Derivative fi nancial instruments
In the normal course of business, the Bank is a party to contracts with derivative fi nancial instruments, which represent a very low initial investment compared to the notional value of the contract. The derivative fi nancial instruments used include foreign exchange forwards, interest rate/foreign exchange swaps and options, forward rate agreements and cross currency swaps. The Bank also uses fi nancial instruments to hedge interest rate risk and currency exposures associated with its transactions in the fi nancial markets. They are accounted for as trading derivatives if they do not fully comply with the defi nition of a hedging derivative as prescribed by IFRS. The Bank also acts as an intermediary provider of these instruments to certain customers.
Derivative fi nancial instruments are initially recognised and subsequently re-measured in the Statement of fi nancial position at fair value. All derivatives are carried as assets when the fair value is positive and as liabilities when the fair value is negative. Changes in the fair value of derivatives are included in ‘Net trading income’.
Fair values are obtained from quoted market prices, discounted cash fl ow models and option pricing models as appropriate. The fair values of derivative positions are computed using standard formulas and prevailing interest rates applicable for respective currencies available on the market at reporting dates.
In the normal course of business, the Bank enters into derivative fi nancial instrument transactions to hedge its liquidity, foreign exchange and interest rate risks. The Bank also enters into proprietary derivative fi nancial transactions for the purpose of generating profi ts from short-term fl uctuations in market prices. The Bank operates a system of market risk and counterparty limits, which are designed to restrict exposure to movements in market prices and counterparty concentrations. The Bank also monitors adherence to these limits on a daily basis.
Credit risk of fi nancial derivatives
Credit exposure or the replacement cost of derivative fi nancial instruments represents the Bank’s credit exposure from contracts with a positive fair value, that is, it indicates the estimated maximum potential losses in the event that counterparties fail to perform their obligations. It is usually a small proportion of the notional amounts of the contracts. The credit exposure of each contract is indicated by the credit equivalent calculated pursuant to the generally applicable methodology using the current exposure method and involves the market value of the contract (only if positive, otherwise a zero value is taken into account) and a portion of the nominal value, which indicates the potential change in market value over the term of the contract. The credit equivalent is established depending on the type of contract and its maturity. The Bank assesses the credit risk of all fi nancial instruments on a daily basis.
The Bank is selective in its choice of counterparties and sets limits for transactions with customers. As such, the Bank considers that the actual credit risk associated with fi nancial derivatives is substantially lower than the exposure calculated pursuant to credit equivalents.
Embedded derivatives
The Bank assesses whether any embedded derivatives contained in the contract are required to be separated from the host contract and accounted for as derivatives under IAS 39. An embedded derivative is a component of a hybrid (combined) instrument that also includes a non-derivative host contract with the effect that some of the cash fl ows of the combined instrument vary in a way similar to a stand-alone derivative.
The Bank accounts for embedded derivatives separately from the host contract if: the economic characteristics and risks of the embedded derivative are not closely related to the economic characteristics and risks of the host contract; a separate instrument with the same terms as the embedded derivative would meet the

120
Separate fi nancial statements
defi nition of a derivative; and the hybrid (combined) instrument is not measured at fair value with changes in fair value recognised in the Statement of comprehensive income.
Hedging derivatives
The Bank makes use of derivative instruments to manage exposures to interest rate, foreign currency and credit risks, including exposures arising from expected transactions. In order to manage individual risks, the Bank applies hedge accounting for transactions which meet the specifi ed criteria.
At the inception of the hedge relationship, the Bank formally documents the relationship between the hedged item and the hedging instrument, including the nature of the risk, the objective and strategy for undertaking the hedge and the method that will be used to assess the effectiveness of the hedging relationship.
Also, at the inception of the hedge relationship, a formal assessment is undertaken to ensure the hedging instrument is expected to be highly effective in offsetting the designated risk in the hedged item. Hedges are formally assessed each month. A hedge is regarded as highly effective if the changes in fair value or cash fl ows attributable to the hedged risk during the period for which the hedge is designated are expected to offset in a range of 80% to 125%.
In situations where that hedged item is an expected transaction, the Bank assesses whether the transaction is highly probable and presents an exposure to variations in cash fl ows that could ultimately affect the Statement of comprehensive income.
Cash fl ow hedges
For designated and qualifying cash fl ow hedges, the effective portion of the gain or loss on the hedging instrument is initially recognised in other comprehensive income as ‘Cash fl ow hedges’. The ineffective portion of the gain or loss on the hedging instrument is recognised immediately as gain or loss in the Statement of comprehensive income in ‘Net trading income’.
When the hedged cash fl ow affects profi t or loss, the gain or loss on the hedging instrument is reclassifi ed from other comprehensive income to profi t or loss as a reclassifi cation adjustment. When a hedging instrument expires, or is sold, terminated, exercised, or when a hedge no longer meets the criteria for hedge accounting, any cumulative gain or loss that has been recognised in other comprehensive income remains separately in equity and is reclassifi ed from other comprehensive income to profi t or loss as a reclassifi cation adjustment when the hedged expected transaction is ultimately recognised. When an expected transaction is no longer expected to occur, the cumulative gain or loss that was reported in equity is immediately reclassifi ed from other comprehensive income to profi t or loss as a reclassifi cation adjustment.
Fair value hedges
For designated and qualifying fair value hedges, the change in the fair value of a hedging derivative is recognised in the Statement of comprehensive income in ‘Net trading income’. Meanwhile, the change in the fair value of the hedged item attributable to the risk hedged is recorded as part of the carrying value of the hedged item and is also recognised in the Statement of comprehensive income in ‘Net trading income’.
If the hedging instrument expires or is sold, terminated or exercised, or where the hedge no longer meets the criteria for hedge accounting, the hedge relationship is terminated. For hedged items recorded at amortised cost, the difference between the carrying value of the hedged item on termination and the face value is amortised over the remaining term of the original hedge using the effective interest rate (‘EIR’). If the hedged item is derecognised, the unamortised fair value adjustment is reclassifi ed from other comprehensive income to profi t or loss as a reclassifi cation adjustment.
121
Separate fi nancial statements
2.12 Offsetting fi nancial instruments
Financial assets and fi nancial liabilities are offset and the net amount reported in the Statement of fi nancial position, if, and only if, there is an intention to settle on a net basis, or to realize the asset and settle the liability simultaneously. This is not generally the case with master netting agreements, and the related assets and liabilities are presented gross in the Statement of fi nancial position.
2.13 Non-current assets held for sale
Non-current assets held for sale are assets where the carrying amount will be recovered principally through a sale transaction rather than through continuing use. Non-current assets held for sale comprise buildings, which are available for immediate sale in their present condition and their sale is considered to be highly probable.
Assets classifi ed as held for sale are measured at the lower of their carrying amount and fair value less cost to sell.
2.14 Loans and advances to customers and impairment losses
Loans and advances are fi nancial assets with fi xed or determinable payments and fi xed maturities that are not quoted in an active market and are recorded at amortised cost less any impairment losses. All loans and advances to customers are recognised in the Statement of fi nancial position when cash is advanced to borrowers.
Loans and advances to customers are subject to periodic impairment testing. An impairment loss for a loan, or a group of similar loans, is established if their carrying amount is greater than their estimated recoverable amount. The recoverable amount is the present value of expected future cash fl ows, including amounts recoverable from guarantees and collaterals, discounted based on the loan’s original effective interest rate. The amount of the impairment loss is included in the Statement of comprehensive income.
Impairment and uncollectability is measured and recognised individually for loans that are individually signifi cant. Impairment and uncollectability for a group of similar loans that are not individually identifi ed as impaired or loans that are not individually signifi cant are measured and recognised on a portfolio basis.
The Bank writes off loans and advances when it determines that the loans and advances are uncollectible. Loans and advances are written off against the reversal of the related impairment losses. Any recoveries of written off loans are credited to the Statement of comprehensive income on receipt.
2.15 Subsidiaries, associates and jointly controlled entities
Subsidiaries, associates and jointly controlled entities are recorded at cost less impairment losses. The impairment loss is measured using the Dividend discount model.
Dividend discount model
The Management of the companies which are subject to the impairment test provide projection of dividends that are expected to be paid out by their companies in a period of 5 years. The model calculates the present value of these cash fl ows discounting them at the interest rate resulting from the CAPM (Capital Asset Pricing Model). Cash fl ows after the period are determined by a present value of the perpetuity with the particular estimated growth rate, provided by the Management of the companies.
CAPM uses as parameters the Risk free interest rate, Market/Risk Premium in the range of 5% – 7%, Size risk premium in the range of 1% – 1.8% and Business sector risk premium in the range of 0% – 6%.

122
Separate fi nancial statements
2.16 Intangible assets
Intangible assets are recorded at historical cost less accumulated amortisation and impairment losses. Amortisation is calculated on a straight-line basis in order to write off the cost of each asset to its residual value over its estimated useful economic life as follows:
Years
Software 5 – 10
Other intangible assets 5 – 10
Amortisation methods, useful lives and residual values are reassessed at the reporting date.
2.17 Property and equipment
Property and equipment are recorded at historical cost less accumulated depreciation and impairment losses. Acquisition cost includes the purchase price plus other costs related to acquisition such as freight, duties or commissions. The costs of expansion, modernisation or improvements leading to increased productivity, capacity or effi ciency are capitalised. Repairs and renovations are charged to the Statement of comprehensive income when the expenditure is incurred.
Depreciation is calculated on a straight-line basis in order to write off the cost of each asset to its residual value over its estimated useful economic life as follows:
Years
Buildings 20 – 40
Equipment 4, 6, 10, 12
Other tangibles 4, 6, 12
Land, assets in progress and art collections are not depreciated. The depreciation of assets in progress begins when the related assets are put into use.
The Bank periodically tests its assets for impairment. Where the carrying amount of an asset is greater than its estimated recoverable amount, it is written down to this recoverable amount.
Depreciation methods, useful lives and residual values are reassessed at the reporting date.
2.18 Provisions
Provisions are recognised when the Bank has a present obligation (legal or constructive) as a result of a past event, and it is probable that an outfl ow of resources embodying economic benefi ts will be required to settle the obligation and a reliable estimate can be made of the amount of the obligation.
2.19 Provisions for employee benefi ts
The Bank’s obligation in respect of retirement and jubilee employee benefi ts is the amount of future benefi t that employees have earned in return for their service in the current and prior periods. That benefi t is discounted to determine its present value. The discount rate is determined by reference to a risk-free curve, with a term consistent with the estimated term of the benefi t obligation. The calculation is performed using the projected unit credit method. Any actuarial gains or losses are recognised in profi t or loss in the period in which they arise. All employees of the Bank are covered by the retirement and jubilee employee benefi ts program.
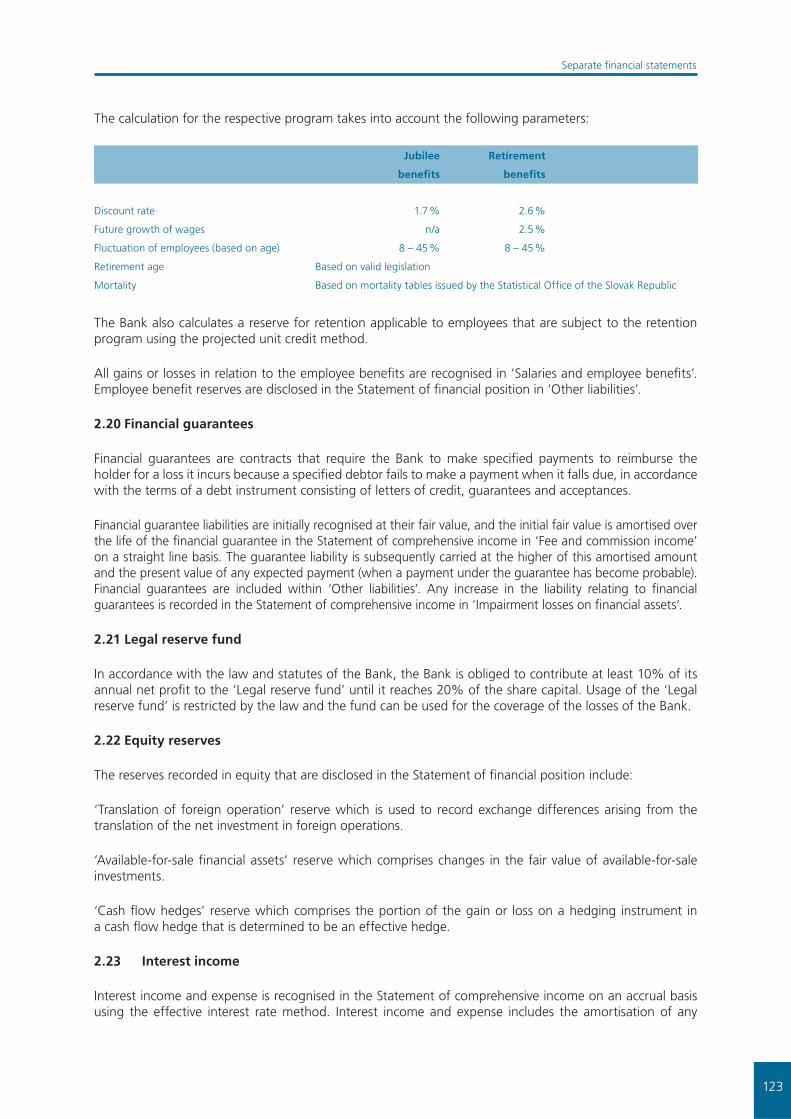
123
Separate fi nancial statements
The calculation for the respective program takes into account the following parameters:
Jubilee
benefi ts
Retirement
benefi ts
Discount rate 1.7 % 2.6 %
Future growth of wages n/a 2.5 %
Fluctuation of employees (based on age) 8 – 45 % 8 – 45 %
Retirement age Based on valid legislation
Mortality Based on mortality tables issued by the Statistical Offi ce of the Slovak Republic
The Bank also calculates a reserve for retention applicable to employees that are subject to the retention program using the projected unit credit method.
All gains or losses in relation to the employee benefi ts are recognised in ‘Salaries and employee benefi ts’. Employee benefi t reserves are disclosed in the Statement of fi nancial position in ‘Other liabilities’.
2.20 Financial guarantees
Financial guarantees are contracts that require the Bank to make specifi ed payments to reimburse the holder for a loss it incurs because a specifi ed debtor fails to make a payment when it falls due, in accordance with the terms of a debt instrument consisting of letters of credit, guarantees and acceptances.
Financial guarantee liabilities are initially recognised at their fair value, and the initial fair value is amortised over the life of the fi nancial guarantee in the Statement of comprehensive income in ‘Fee and commission income’ on a straight line basis. The guarantee liability is subsequently carried at the higher of this amortised amount and the present value of any expected payment (when a payment under the guarantee has become probable). Financial guarantees are included within ‘Other liabilities’. Any increase in the liability relating to fi nancial guarantees is recorded in the Statement of comprehensive income in ‘Impairment losses on fi nancial assets’.
2.21 Legal reserve fund
In accordance with the law and statutes of the Bank, the Bank is obliged to contribute at least 10% of its annual net profi t to the ‘Legal reserve fund’ until it reaches 20% of the share capital. Usage of the ‘Legal reserve fund’ is restricted by the law and the fund can be used for the coverage of the losses of the Bank.
2.22 Equity reserves
The reserves recorded in equity that are disclosed in the Statement of fi nancial position include:
‘Translation of foreign operation’ reserve which is used to record exchange differences arising from the translation of the net investment in foreign operations.
‘Available-for-sale fi nancial assets’ reserve which comprises changes in the fair value of available-for-sale investments.
‘Cash fl ow hedges’ reserve which comprises the portion of the gain or loss on a hedging instrument in a cash fl ow hedge that is determined to be an effective hedge.
2.23 Interest income
Interest income and expense is recognised in the Statement of comprehensive income on an accrual basis using the effective interest rate method. Interest income and expense includes the amortisation of any

124
Separate fi nancial statements
discount or premium on fi nancial instruments. Interest income also includes up-front and commitment fees, which are subject to the effective interest rate calculation and are amortised over the life of the loan.
2.24 Fee and commission income
Fee and commission income arises on fi nancial services provided by the Bank including account maintenance, cash management services, brokerage services, investment advice and fi nancial planning, investment banking services, project fi nance transactions and asset management services. Fee and commission income is recognised when the corresponding service is provided.
2.25 Net trading income
Net trading income includes gains and losses arising from purchases, disposals and changes in the fair value of fi nancial assets and liabilities including securities and derivative instruments. It also includes the result of all foreign currency transactions.
2.26 Dividend income
Dividend income is recognised in the Statement of comprehensive income on the date that the dividend is declared.
2.27 Income tax
Income tax is calculated in accordance with the regulations of the Slovak Republic and other jurisdictions, in which the Bank operates.
Deferred tax assets and liabilities are recognised, using the balance sheet method, for all temporary differences arising between tax bases of assets or liabilities and their carrying amounts for fi nancial reporting purposes. Expected tax rates, applicable for the periods when assets and liabilities are realised, are used to determine deferred tax.
The Bank is also subject to various indirect operating taxes, which are included in ‘Other operating expenses’.
2.28 Fiduciary assets
Assets held in a fi duciary capacity are not reported in the fi nancial statements, as such are not the assets of the Bank.
2.29 Signifi cant accounting judgements and estimates
Judgements
In the process of applying the Bank’s accounting policies, management has made judgements, apart from those involving estimations, that signifi cantly affect the amounts recognised in the fi nancial statements. The most signifi cant judgements relate to the classifi cation of fi nancial instruments.
Held-to-maturity investments
The Bank follows the guidance of IAS 39 on classifying non-derivative fi nancial assets with fi xed or determinable payments and fi xed maturity as held-to-maturity. This classifi cation requires signifi cant judgement. In making this judgement, the Bank evaluates its intention and ability to hold such investments to maturity. If the Bank fails to hold these investments to maturity other than for a specifi c circumstance, for example selling a higher than insignifi cant amount close to maturity, it will be required to reclassify the
125
Separate fi nancial statements
entire class as available-for-sale. The investments would therefore be measured at fair value and not at amortised cost.
Financial assets held for trading
The Bank classifi es a fi nancial asset as ‘held for trading’ if it is acquired principally for the purpose of selling it in the near term, or if it is part of a portfolio of identifi ed fi nancial instruments that are managed together and for which there is evidence of recent actual pattern of short-term profi t taking, or if it is a derivative.
Estimates
The preparation of the fi nancial statements requires management to make certain estimates and assumptions, which impact the carrying amounts of the Bank’s assets and liabilities and the disclosure of contingent items at the end of reporting period and reported revenues and expenses for the period then ended.
Estimates are used for, but not limited to: fair values of fi nancial instruments, impairment losses on loans and advances to customers, impairment losses for off-balance sheet risks, depreciable lives and residual values of tangible and intangible assets, impairment losses on tangible and intangible assets, liabilities from employee benefi ts and provisions for legal claims.
Fair value of fi nancial instruments
Where the fair values of fi nancial assets and fi nancial liabilities recorded on the Statement of fi nancial position cannot be derived from active markets, they are determined using a variety of valuation techniques which include the use of mathematical models. The input to these models is taken from observable markets where possible, but where this is not feasible, a degree of judgement is required in establishing fair values. The judgements include considerations of liquidity and model inputs such as correlation and volatility for longer dated fi nancial instruments.
Impairment losses on loans and advances
The Bank reviews its loans and advances at each reporting date to assess whether a specifi c allowance for impairment should be recorded in the Statement of comprehensive income. In particular, judgement by management is required in the estimation of the amount and timing of future cash fl ows when determining the level of allowance required. Such estimates are based on assumptions about a number of factors and actual results may differ, resulting in future changes to the specifi c allowance.
In addition to specifi c allowances against individually signifi cant loans and advances, the Bank also makes a collective impairment allowance against exposures which, although not specifi cally identifi ed as requiring a specifi c allowance, have a greater risk of default than when originally granted. This takes into consideration factors such as any deterioration in country risk, industry and technological obsolescence, as well as identifi ed structural weaknesses or deterioration in cash fl ows.
Future events and their effects cannot be perceived with certainty. Accordingly, the accounting estimates made require the exercise of judgement and those used in the preparation of the fi nancial statements will change as new events occur, as more experience is acquired, as additional information is obtained and as the Bank’s operating environment changes. Actual results may differ from those estimates.

126
Separate fi nancial statements
3. Cash and cash equivalents
For the purposes of the Statement of cash fl ows, cash and cash equivalents comprise the following balances with contractual maturity of less than 90 days:
Note 2011 2010
Cash and balances with central banks 4 90,918 179,064
Current accounts in other banks 5 6,424 8,248
Term deposits with other banks 5 - 7,542
97,342 194,854
4. Cash and balances with central banks
2011 2010
Balances with central banks:
Compulsory minimum reserves 5,146 87,693
Current accounts 36 33
5,182 87,726
Cash in hand 85,736 91,338
90,918 179,064
The compulsory minimum reserve is maintained as an interest bearing deposit under the regulations of the NBS and the Czech National Bank. The amount of the compulsory minimum reserve depends on the level of customer deposits accepted by the Bank and the amount of issued bonds, both with a maturity of up to 2 years. The rate for the calculation of the compulsory minimum reserve is 2% and the required balance is calculated as the total of individual items multiplied by the valid rate.
The daily balance of the compulsory minimum reserve can vary signifi cantly based on the amount of incoming and outgoing payments. The Bank’s ability to withdraw the compulsory minimum reserve is restricted by local legislation.
Since January 2009, the compulsory minimal reserves account (‘CMR’) is maintained under the Target2 system. Target2 is a Trans-European Automated Real-Time Gross Settlement Express Transfer System, where payments with priority are realised in real-time.

127
Separate fi nancial statements
5. Due from banks
Note 2011 2010
Current accounts 3 6,424 8,248
Term deposits
with contractual maturity less than 90 days 3 - 7,542
with contractual maturity over 90 days 3,141 5,081
Loans and advances
with contractual maturity over 90 days 492,081 87,878
Impairment losses 10 (202) (151)
501,444 108,598
At 31 December 2011 the balance of ‘Loans and advances’ comprises of a short term reverse repo trade in the nominal amount of € 399,587 thousand concluded with Intesa Sanpaolo S.p.A, maturing in May 2012 (at 31 December 2010: nil). The repo trade is secured by state bonds and cash collateral.
6. Financial assets held for trading
2011 2010
Treasury bills and other eligible bills
with contractual maturity over 90 days 192,233 174,201
State bonds
with contractual maturity over 90 days 77,619 75,772
269,852 249,973
At 31 December 2011 and 31 December 2010, no fi nancial assets held for trading were pledged by the Bank to secure transactions with counterparties.
7. Derivative fi nancial instruments
2011
Assets
2010
Assets
2011
Liabilities
2010
Liabilities
Trading derivatives 80,255 45,179 42,424 46,834
Cash fl ow hedges of interest rate risk - - 5,668 4,451
Fair value hedges of interest rate risk 144 26 9,290 9,444
80,399 45,205 57,382 60,729
Trading derivatives also include hedge instruments that are non-qualifying according to IAS 39, which are held for risk management purposes rather than for trading. The instruments used include cross-currency interest rate swaps. At 31 December 2011, the total positive fair value of such derivatives was € 4,346 thousand (31 December 2010: € 6,386 thousand) and the negative fair value was nil (31 December 2010: nil).
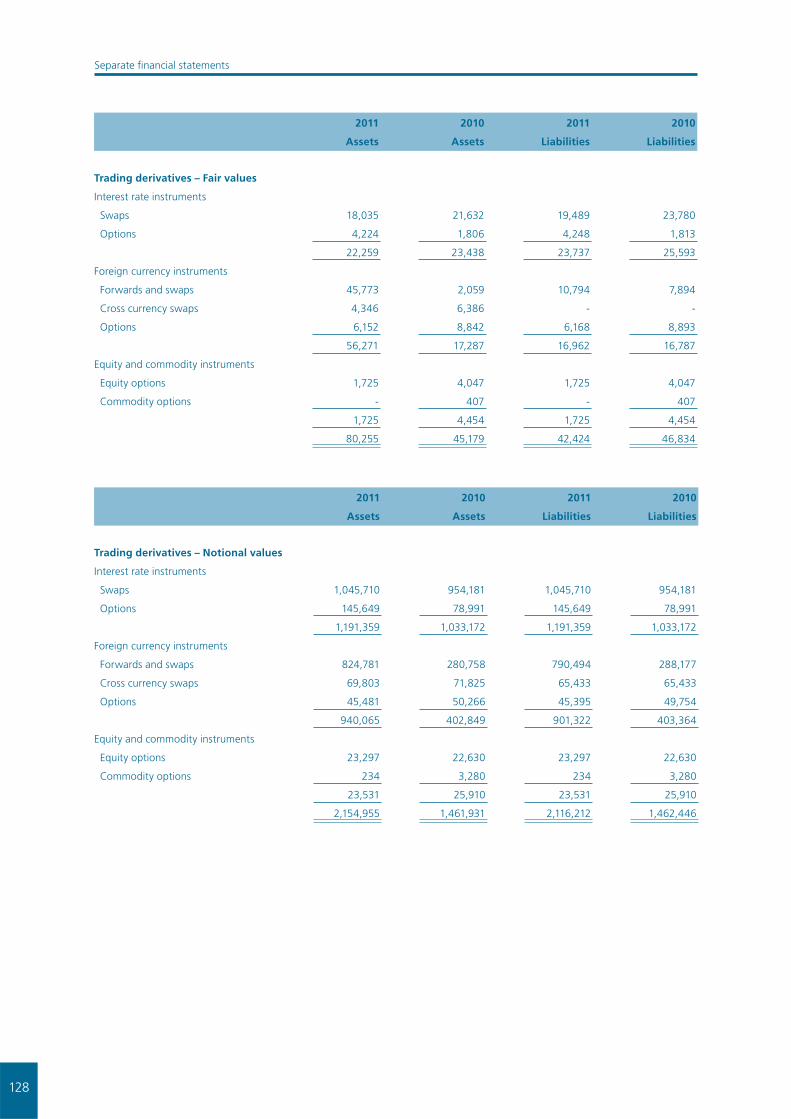
128
Separate fi nancial statements
2011
Assets
2010
Assets
2011
Liabilities
2010
Liabilities
Trading derivatives – Fair values
Interest rate instruments
Swaps 18,035 21,632 19,489 23,780
Options 4,224 1,806 4,248 1,813
22,259 23,438 23,737 25,593
Foreign currency instruments
Forwards and swaps 45,773 2,059 10,794 7,894
Cross currency swaps 4,346 6,386 - -
Options 6,152 8,842 6,168 8,893
56,271 17,287 16,962 16,787
Equity and commodity instruments
Equity options 1,725 4,047 1,725 4,047
Commodity options - 407 - 407
1,725 4,454 1,725 4,454
80,255 45,179 42,424 46,834
2011
Assets
2010
Assets
2011
Liabilities
2010
Liabilities
Trading derivatives – Notional values
Interest rate instruments
Swaps 1,045,710 954,181 1,045,710 954,181
Options 145,649 78,991 145,649 78,991
1,191,359 1,033,172 1,191,359 1,033,172
Foreign currency instruments
Forwards and swaps 824,781 280,758 790,494 288,177
Cross currency swaps 69,803 71,825 65,433 65,433
Options 45,481 50,266 45,395 49,754
940,065 402,849 901,322 403,364
Equity and commodity instruments
Equity options 23,297 22,630 23,297 22,630
Commodity options 234 3,280 234 3,280
23,531 25,910 23,531 25,910
2,154,955 1,461,931 2,116,212 1,462,446

129
Separate fi nancial statements
Cash fl ow hedges of interest rate risk
The Bank uses four interest rate swaps to hedge the interest rate risk arising from the issuance of four variable rate mortgage bonds. The cash fl ows on the fl oating legs of these interest rate swaps substantially match the cash fl ow profi les of the variable rate mortgage bonds.
Below is a schedule indicating as at 31 December 2011, the periods when the hedged cash fl ows are expected to occur. The cash fl ows of mortgage bonds represent the future undiscounted value of coupons:
Up to 1 year 1 to 5 years Over 5 years
2011
Mortgage bonds – interest rate risk 4,982 12,848 1,674
2010
Mortgage bonds – interest rate risk 5,070 22,413 3,218
The net expense on cash fl ow hedges reclassifi ed from ‘Other comprehensive income’ to the ‘Net interest income’ during 2011 was € 2,455 thousand (2010: € 3,468 thousand).
Fair value hedges of interest rate risk
The Bank uses three interest rate swaps to hedge the interest rate risk of three fi xed rate bonds from the available-for-sale ('AFS') portfolio. The changes in fair value of these interest rate swaps substantially offset the changes in fair value of AFS portfolio bonds, both in relation to changes of interest rates.
Furthermore, the Bank uses one interest rate swap to hedge the interest rate risk arising from the issuance of one fi xed rate mortgage bond. The changes in fair value of this interest rate swap substantially offset the changes in fair value of the mortgage bond, both in relation to changes of interest rates.
In 2011, the Bank recognised a net gain of € 455 thousand (2010: net loss of € 3,465 thousand) in relation to the fair value hedging instruments above. The net loss on hedged items attributable to the hedged risks amounted to € 300 thousand (2010: net gain of € 3,564 thousand). Both items are disclosed within ‘Net trading income’.
During 2011, interest and similar income from hedged AFS securities in the amount of € 8,038 thousand (2010: € 8,024 thousand) was compensated by interest expense from interest rate swaps hedging in struments in the amount of € 2,559 thousand (2010: € 3,807 thousand).
At 31 December 2011, interest expense from a hedged mortgage bond in the amount of € 163 thousand (31 December 2010: nil) was compensated by interest income from an interest rate swap hedging instrument in the amount of € 17 thousand (31 December 2010: nil).
The foreign branch of VUB uses four interest rate swaps to hedge the interest rate risk of four fi xed income loans originated in the Czech Republic. The changes in fair value of these interest rate swaps substantially offset the changes in fair value of the loans, both in relation to changes of interest rates.
In 2011, the Bank recognised in relation to the fair value hedging instruments of the foreign branch of VUB a net loss of € 275 thousand (2010: net gain of € 48 thousand). The net gain on hedged items attributable to the hedged risks amounted to € 287 thousand (2010: net loss of € 47 thousand). Both items are disclosed within ‘Net trading income’.
In 2011, interest and similar income from hedged fi xed income loans in the amount of € 463 thousand (2010: € 29 thousand) was compensated by interest expense from interest rate swaps hedging instruments in the amount of € 86 thousand (2010: € 8 thousand).

130
Separate fi nancial statements
8. Available-for-sale fi nancial assets
Share
2011
Share
20102011 2010
State bonds 1,439,321 1,595,839
Bank bonds 15,666 19,345
Equity shares at cost
RVS, a.s. 8.38% 8.38% 574 574
S.W.I.F.T. 0.06% 0.06% 65 65
1,455,626 1,615,823
At 31 December 2011 and 31 December 2010, no available-for-sale fi nancial assets were pledged by the Bank to secure transactions with counterparties.
9. Loans and advances to customers
31 December 2011 Amortized
cost
Impairment
losses
(note 10)
Carrying
amount
Sovereigns
Municipalities 150,654 (294) 150,360
Corporate
Large Corporates 960,423 (8,943) 951,480
Specialized lending 738,004 (31,765) 706,239
Small and medium enterprises (‘SME’) 690,100 (36,811) 653,289
Other Financial Institutions 413,213 (588) 412,625
Private Sector Entities 102,304 (706) 101,598
Factoring 123,479 (612) 122,867
3,027,523 (79,425) 2,948,098
Retail
Small business 199,625 (15,522) 184,103
Consumer Loans 702,796 (55,588) 647,208
Mortgages 2,716,118 (34,102) 2,682,016
Credit Cards 252,728 (43,861) 208,867
Overdrafts 104,731 (17,788) 86,943
Flat Owners Associations 3,811 (63) 3,748
Other 6,204 (3) 6,201
3,986,013 (166,927) 3,819,086
7,164,190 (246,646) 6,917,544
The segmentation of Loans and advances to customers in both 2011 and 2010 is based on the internal defi nition of segments which is continuously being improved to refl ect the Bank’s needs. The revised segment defi nition caused transfers among the individual sectors.

131
Separate fi nancial statements
Restated 31 December 2010 Amortized
cost
Impairment
losses
(note 10)
Carrying
amount
Sovereigns
Municipalities 101,730 (205) 101,525
Corporate
Large Corporates 847,014 (17,011) 830,003
Specialized lending 651,086 (16,443) 634,643
Small and medium enterprises (‘SME’) 636,480 (39,651) 596,829
Other Financial Institutions 393,177 (203) 392,974
Private Sector Entities 3,253 (39) 3,214
Factoring 53,756 (695) 53,061
2,584,766 (74,042) 2,510,724
Retail
Small business 188,861 (14,053) 174,808
Consumer Loans 644,061 (67,635) 576,426
Mortgages 2,476,074 (26,690) 2,449,384
Credit Cards 260,141 (39,763) 220,378
Overdrafts 112,084 (13,736) 98,348
Flat owners associations 3,534 (42) 3,492
Other 6,216 - 6,216
3,690,971 (161,919) 3,529,052
6,377,467 (236,166) 6,141,301
At 31 December 2011, the 20 largest corporate customers represented a total balance of € 879,452 thousand (2010: € 701,128 thousand) or 12.28% (2010: 10.99%) of the gross loan portfolio.
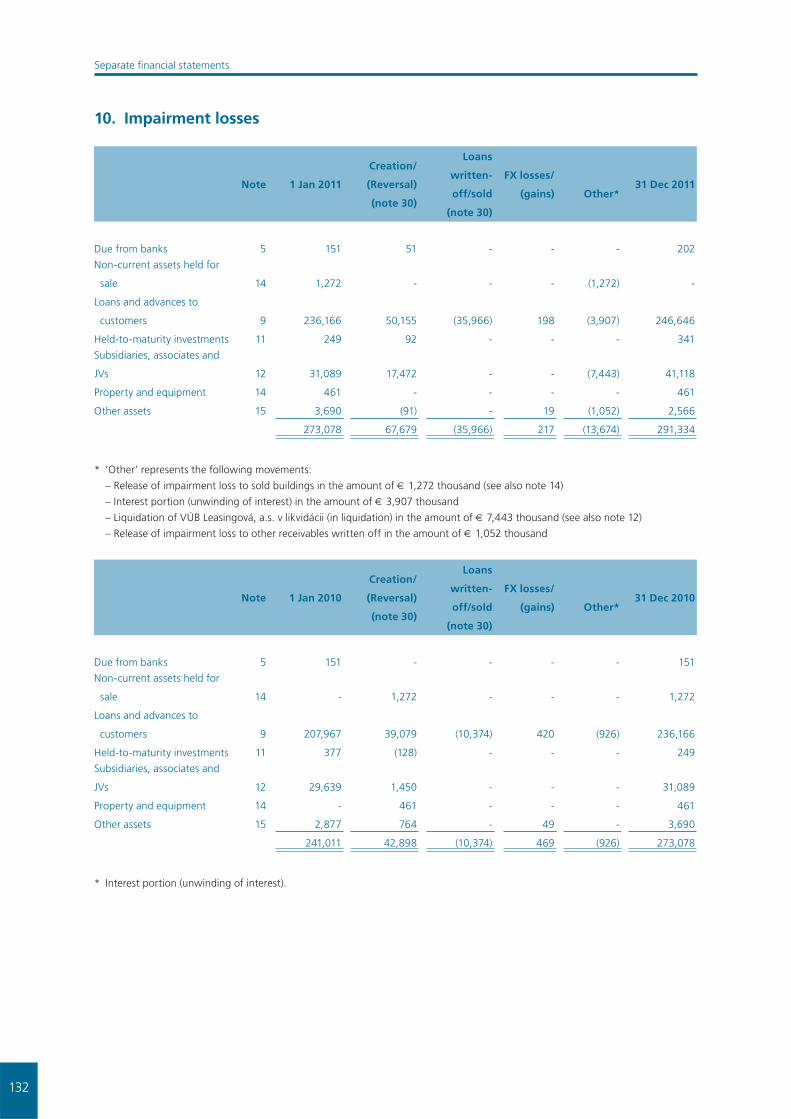
132
Separate fi nancial statements
10. Impairment losses
Note 1 Jan 2011
Creation/
(Reversal)
(note 30)
Loans
written-
off/sold
(note 30)
FX losses/
(gains) Other*31 Dec 2011
Due from banks 5 151 51 - - - 202
Non-current assets held for
sale 14 1,272 - - - (1,272) -
Loans and advances to
customers 9 236,166 50,155 (35,966) 198 (3,907) 246,646
Held-to-maturity investments 11 249 92 - - - 341
Subsidiaries, associates and
JVs 12 31,089 17,472 - - (7,443) 41,118
Property and equipment 14 461 - - - - 461
Other assets 15 3,690 (91) - 19 (1,052) 2,566
273,078 67,679 (35,966) 217 (13,674) 291,334
* ’Other’ represents the following movements:
– Release of impairment loss to sold buildings in the amount of € 1,272 thousand (see also note 14)
– Interest portion (unwinding of interest) in the amount of € 3,907 thousand
– Liquidation of VÚB Leasingová, a.s. v likvidácii (in liquidation) in the amount of € 7,443 thousand (see also note 12)
– Release of impairment loss to other receivables written off in the amount of € 1,052 thousand
Note 1 Jan 2010
Creation/
(Reversal)
(note 30)
Loans
written-
off/sold
(note 30)
FX losses/
(gains) Other*31 Dec 2010
Due from banks 5 151 - - - - 151
Non-current assets held for
sale 14 - 1,272 - - - 1,272
Loans and advances to
customers 9 207,967 39,079 (10,374) 420 (926) 236,166
Held-to-maturity investments 11 377 (128) - - - 249
Subsidiaries, associates and
JVs 12 29,639 1,450 - - - 31,089
Property and equipment 14 - 461 - - - 461
Other assets 15 2,877 764 - 49 - 3,690
241,011 42,898 (10,374) 469 (926) 273,078
* Interest portion (unwinding of interest).

133
Separate fi nancial statements
11. Held-to-maturity investments
Note 2011 2010
State restructuring bonds - 617,613
State bonds 1,125,948 1,123,031
Bank bonds and other bonds issued by fi nancial sector 10,052 9,974
Corporate notes and bonds with contractual maturity over 90 days 1,881 37,894
1,137,881 1,788,512
Impairment losses 10 (341) (249)
1,137,540 1,788,263
At 31 December 2011, state bonds in the total nominal amount of € 230,058 thousand were pledged by the Bank (31 December 2010: € 106,460 thousand) to secure transactions with counterparties.
The last two 10-year state restructuring bonds held in the held-to-maturity portfolio at 31 December 2010 with nominal values of € 366,594 thousand and € 248,855 thousand were fully redeemed on 30 January 2011 and 29 March 2011, respectively.
12. Subsidiaries, associates and jointly controlled entities
Share
%Cost
Impairment
losses
(note 10)
Carrying
amount
At 31 December 2011
VÚB Factoring, a.s. 100.0 16,535 (10,533) 6,002
Recovery, a.s. 100.0 3,652 (3,204) 448
VÚB Asset Management, správ. spol. a.s. 100.0 2,821 - 2,821
Consumer Finance Holding, a.s. 100.0 53,114 - 53,114
VÚB Leasing, a. s. 100.0 44,410 (27,381) 17,029
VÚB Generali DSS, a.s. 50.0 16,597 - 16,597
Slovak Banking Credit Bureau, s.r.o. 33.3 3 - 3
137,132 (41,118) 96,014
At 31 December 2010
VÚB Factoring, a.s. 100.0 16,535 (12,300) 4,235
VÚB Leasingová, a.s. v likvidácii (in liquidation) 100.0 7,767 (7,443) 324
Recovery, a.s. 100.0 3,652 (3,194) 458
VÚB Asset Management, správ. spol. a.s. 100.0 2,821 - 2,821
Consumer Finance Holding, a.s. 100.0 53,114 - 53,114
VÚB Leasing, a. s. 100.0 44,410 (8,152) 36,258
VÚB Generali DSS, a.s. 50.0 16,597 - 16,597
Slovak Banking Credit Bureau, s.r.o. 33.3 3 - 3
144,899 (31,089) 113,810
In January 2011, VÚB Leasingová, a.s. v likvidácii (in liquidation) was removed from the Business Register of the Slovak Republic. This act concluded the process of liquidation.

134
Separate fi nancial statements
13. Intangible assets
Software
Other
intangible
assets
Assets
in progressTotal
Cost
At 1 January 2011 140,687 7,246 4,679 152,612
Additions - - 12,789 12,789
Disposals (3,597) - - (3,597)
Transfers 5,398 648 (6,046) -
FX differences (12) (1) - (13)
At 31 December 2011 142,476 7,893 11,422 161,791
Accumulated amortisation
At 1 January 2011 (117,790) (4,183) - (121,973)
Amortisation for the year (7,313) (1,127) - (8,440)
Disposals 3,597 - - 3,597
FX differences 12 1 - 13
At 31 December 2011 (121,494) (5,309) - (126,803)
Carrying amount
At 1 January 2011 22,897 3,063 4,679 30,639
At 31 December 2011 20,982 2,584 11,422 34,988
Assets in progress include mainly the costs for development of new software applications that have not yet been put to use.
Software
Other
intangible
assets
Assets
in progressTotal
Cost
At 1 January 2010 151,702 10,013 3,160 164,875
Additions - - 10,433 10,433
Disposals (19,385) (3,334) - (22,719)
Transfers 8,348 566 (8,914) -
FX differences 22 1 - 23
At 31 December 2010 140,687 7,246 4,679 152,612
Accumulated amortisation
At 1 January 2010 (130,322) (6,346) - (136,668)
Amortisation for the year (6,831) (1,170) - (8,001)
Disposals 19,385 3,334 - 22,719
FX differences (22) (1) - (23)
At 31 December 2010 (117,790) (4,183) - (121,973)
Carrying amount
At 1 January 2010 21,380 3,667 3,160 28,207
At 31 December 2010 22,897 3,063 4,679 30,639
Gross book value of fully depreciated assets that are still used by the bank amounts to € 77,878 thousand (€ 75,732 thousand as at 31 December 2010).

135
Separate fi nancial statements
14. Property and equipment and Non-current assets held for sale
Buildings
and landEquipment
Other
tangibles
Assets
in progressTotal
Cost
At 1 January 2011 197,348 91,537 31,565 3,492 323,942
Additions - - - 10,606 10,606
Disposals (930) (18,568) (1,417) - (20,915)
Transfers 3,267 7,037 487 (10,791) -
FX differences (2) (4) (3) - (9)
At 31 December 2011 199,683 80,002 30,632 3,307 313,624
Accumulated depreciation
At 1 January 2011 (79,807) (74,499) (26,374) - (180,680)
Depreciation for the year (6,752) (7,489) (1,703) - (15,944)
Disposals 801 18,426 1,351 - 20,578
FX differences 3 4 2 - 9
At 31 December 2011 (85,755) (63,558) (26,724) - (176,037)
Impairment losses (note 10)
At 1 January 2011 (461) - - - (461)
Additions - - - - -
At 31 December 2011 (461) - - - (461)
Carrying amount
At 1 January 2011 117,080 17,038 5,191 3,492 142,801
At 31 December 2011 113,467 16,444 3,908 3,307 137,126

136
Separate fi nancial statements
Buildings
and landEquipment
Other
tangibles
Assets
in progressTotal
Cost
At 1 January 2010 205,604 93,904 31,830 3,759 335,097
Additions - - - 9,931 9,931
Disposals (10,453) (9,898) (766) - (21,117)
Transfers 2,192 7,510 496 (10,198) -
FX differences 5 21 5 - 31
At 31 December 2010 197,348 91,537 31,565 3,492 323,942
Accumulated depreciation
At 1 January 2010 (75,910) (76,881) (24,314) - (177,105)
Depreciation for the year (9,014) (7,393) (2,734) - (19,141)
Disposals 5,122 9,795 678 - 15,595
FX differences (5) (20) (4) - (29)
At 31 December 2010 (79,807) (74,499) (26,374) - (180,680)
Impairment losses (note 10)
At 1 January 2010 - - - - -
Additions (461) - - - (461)
At 31 December 2010 (461) - - - (461)
Carrying amount
At 1 January 2010 129,694 17,023 7,516 3,759 157,992
At 31 December 2010 117,080 17,038 5,191 3,492 142,801
Gross book value of fully depreciated assets that are still used by the bank amounts to € 67,566 thousand (€ 67,729 thousand as at 31 December 2010).
The Bank’s insurance covers all standard risks to tangible and intangible assets (theft, robbery, natural hazards, vandalism, and other damages).
At 31 December 2011 and 31 December 2010, the Bank held in its portfolio of non-current assets held for sale buildings as follows:
Note 2011 2010
Cost 6 7,768
Accumulated depreciation (3) (3,122)
Impairment 10 - (1,272)
3 3,374

137
Separate fi nancial statements
15. Other assets
Note 2011 2010
Operating receivables and advances 9,886 10,834
Prepayments and accrued income 4,058 3,940
Settlement of operations with fi nancial instruments 1,517 185
Other tax receivables 1,453 1,274
Inventories 729 448
17,643 16,681
Impairment losses 10 (2,566) (3,690)
15,077 12,991
16. Due to central and other banks
2011 2010
Due to central banks
Current accounts 68,111 53,019
Loans received 115,947 -
184,058 53,019
Due to other banks
Current accounts 9,600 8,374
Term deposits 110,561 330,642
Loans received 125,506 47,116
245,667 386,132
429,725 439,151
Due to central banks include loan received from the NBS with maturity less than one month.
17. Due to customers
2011 2010
Current accounts 2,919,666 3,067,880
Term deposits 3,751,566 3,330,072
Savings accounts 247,784 285,567
Government and municipal deposits 327,652 434,586
Loans received 159,642 75,180
Promissory notes 56,767 58,136
Other deposits 35,074 25,268
7,498,151 7,276,689

138
Separate fi nancial statements
18. Debt securities in issue
2011 2010
Bonds 41,986 55,001
Mortgage bonds 1,410,797 1,383,033
Mortgage bonds subject to cash fl ow hedges 180,232 181,557
Mortgage bonds subject to fair value hedge 27,278 -
1,618,307 1,564,590
Revaluation of fair value hedged mortgage bonds 194 -
1,660,487 1,619,591
The repayment of mortgage bonds is funded by the mortgage loans provided to customers of the Bank (see also note 9).
Name Interest rate (%) CCY
Number of
mortgage
bonds
issued at
31 Dec 2011
Nominal
value in
CCY per
piece
Issue dateMaturity
date2011 2010
Mortgage bonds VÚB, a.s. VII. 5.10 EUR 10,000 3,319 15.4.2003 15.4.2013 34,398 34,398
Mortgage bonds VÚB, a.s. VIII. 5.10 EUR 1,000 33,194 29.5.2003 29.5.2013 34,191 34,191
Mortgage bonds VÚB, a.s. XVII. 1.58 EUR 1,678 33,194 28.11.2005 28.11.2015 55,780 55,757
Mortgage bonds VÚB, a.s. XX. 4.30 EUR 50 331,939 9.3.2006 9.3.2021 17,176 17,176
Mortgage bonds VÚB, a.s. XXI. 1.10 EUR 500 33,194 10.3.2006 10.3.2011 - 16,608
Mortgage bonds VÚB, a.s. XXII. 1.18 EUR 1,200 50,000 29.6.2006 29.6.2011 - 60,004
Mortgage bonds VÚB, a.s. XXIII. 1.18 EUR 60 1,000,000 26.10.2006 26.10.2011 - 60,128
Mortgage bonds VÚB, a.s. XXIV. 1.35 EUR 1,500 33,194 24.11.2006 24.11.2011 - 49,860
Mortgage bonds VÚB, a.s. XXV. 1.19 EUR 30 1,000,000 5.12.2006 5.12.2011 - 30,026
Mortgage bonds VÚB, a.s. XXVIII. 1.95 CZK 1,000 1,000,000 20.6.2007 20.6.2012 38,905 40,240
Mortgage bonds VÚB, a.s. XXIX. 1.80 EUR 500 33,194 16.10.2007 16.10.2012 16,657 16,637
Mortgage bonds VÚB, a.s. XXX. 5.00 EUR 1,000 33,194 5.9.2007 5.9.2032 33,346 33,327
Mortgage bonds VÚB, a.s. XXXI. 4.90 EUR 600 33,194 29.11.2007 29.11.2037 19,638 19,624
Mortgage bonds VÚB, a.s. 32. 2.95 CZK 800 1,000,000 17.12.2007 17.12.2017 33,412 34,791
Mortgage bonds VÚB, a.s. 35. 4.40 EUR 630 33,194 19.3.2008 19.3.2016 21,257 21,167
Mortgage bonds VÚB, a.s. 36. 4.75 EUR 560 33,194 31.3.2008 31.3.2020 18,846 18,796
Mortgage bonds VÚB, a.s. 37. 1.47 EUR 40 1,000,000 30.4.2008 30.4.2011 - 40,103
Mortgage bonds VÚB, a.s. 39. 2.10 EUR 60 1,000,000 26.6.2008 26.6.2015 60,017 60,012
Mortgage bonds VÚB, a.s. 40. 2.21 EUR 70 1,000,000 28.8.2008 28.8.2015 70,146 70,117
Mortgage bonds VÚB, a.s. 41. 5.63 USD 34 1,000,000 30.9.2008 30.9.2013 26,651 25,807
Mortgage bonds VÚB, a.s. 42. 4.00 EUR 400 50,000 28.4.2009 28.4.2012 20,540 20,540
Mortgage bonds VÚB, a.s. 43. 5.10 EUR 500 33,194 26.9.2008 26.9.2025 15,484 15,387
Mortgage bonds VÚB, a.s. 44. 4.75 EUR 300 50,000 11.2.2009 11.2.2012 15,633 15,633
Mortgage bonds VÚB, a.s. 46. 4.61 EUR 150 1,000,000 19.5.2009 19.5.2016 154,264 154,264
Mortgage bonds VÚB, a.s. 48. 4.00 EUR 19,961 1,000 11.5.2009 11.5.2013 20,472 20,511
Mortgage bonds VÚB, a.s. 49. 3.92 EUR 100 1,000,000 28.7.2009 28.7.2014 101,666 101,666
Mortgage bonds VÚB, a.s. 50. 3.40 EUR 8,391 1,000 2.11.2009 2.11.2013 8,438 8,454

139
Separate fi nancial statements
Mortgage bonds VÚB, a.s. 51. 2.14 EUR 100 1,000,000 8.4.2010 8.4.2014 100,492 100,355
Mortgage bonds VÚB, a.s. 52. 2.16 EUR 161 50,000 15.3.2010 15.3.2014 8,101 8,102
Mortgage bonds VÚB, a.s. 53. 2.28 EUR 100 1,000,000 8.4.2010 8.4.2017 100,525 100,387
Mortgage bonds VÚB, a.s. 54. 3.00 EUR 15,000 1,000 1.7.2010 1.7.2014 15,225 15,225
Mortgage bonds VÚB, a.s. 55. 2.85 EUR 14,000 1,000 1.10.2010 1.10.2015 14,100 14,100
Mortgage bonds VÚB, a.s. 56. 3.07 EUR 70 1,000,000 30.9.2010 30.9.2017 70,543 70,434
Mortgage bonds VÚB, a.s. 57. 3.06 EUR 100 1,000,000 30.9.2010 30.9.2018 100,772 100,620
Mortgage bonds VÚB, a.s. 58. 3.50 EUR 80 1,000,000 10.12.2010 10.12.2019 80,164 80,143
Mortgage bonds VÚB, a.s. 59. 3.00 EUR 25,000 1,000 1.3.2011 1.3.2015 25,625 -
Mortgage bonds VÚB, a.s. 60. 2.05 CZK 4,345 100,000 20.5.2011 20.5.2014 16,856 -
Mortgage bonds VÚB, a.s. 61. 3.10 EUR 467 10,000 7.6.2011 7.6.2015 4,666 -
Mortgage bonds VÚB, a.s. 62. 3.82 EUR 100 1,000,000 28.7.2011 28.7.2018 101,624 -
Mortgage bonds VÚB, a.s. 63. 3.75 EUR 35,000 1,000 16.9.2011 16.3.2016 35,383 -
Mortgage bonds VÚB, a.s. 64. 3.25 CZK 7,000 100,000 26.9.2011 26.9.2016 27,278 -
Mortgage bonds VÚB, a.s. 65. 2.19 EUR 60 1,000,000 26.10.2011 26.10.2012 59,362 -
Mortgage bonds VÚB, a.s. 66. 3.40 EUR 517 50,000 28.11.2011 28.11.2014 25,603 -
Mortgage bonds VÚB, a.s. 67. 5.35 EUR 300 50,000 29.11.2011 29.11.2030 15,071 -
1,618,307 1,564,590
19. Current and deferred income taxes
2011 2010
Current income tax assets 550 6,882
2011 2010
Deferred income tax assets 64,601 54,092
Deferred income taxes are calculated on all temporary differences using a tax rate of 19% (31 December 2010: 19%) as follows:
2011
Profi t/
(loss)
(note 31)
Equity 2010
Due from banks 38 9 - 29
Derivative fi nancial instruments designated as cash
fl ow hedges 1,077 - 231 846
Available-for-sale fi nancial assets 17,029 - 10,560 6,469
Loans and advances to customers 46,707 1,996 - 44,711
Held-to-maturity investments 65 18 - 47
Property and equipment (2,762) (644) - (2,118)
Other liabilities 3,966 (142) - 4,108
Other (1,519) (1,519) - -
Deferred income tax assets 64,601 (282) 10,791 54,092

140
Separate fi nancial statements
20. Provisions
2011 2010
Litigations 24,285 23,517
The movement in provisions was as follows:
1 jan
2011
Creation/
(Reversal)FX diff
31 Dec
2011
Litigations (note 23, note 29) 23,517 782 (14) 24,285
1 jan
2010
Creation/
(Reversal)FX diff
31 Dec
2010
Litigations (note 23, note 29) 24,993 (1,465) (11) 23,517
21. Other liabilities
2011 2010
Settlement with employees 19,861 19,160
Various creditors 18,249 11,927
Financial guarantees and commitments 10,800 13,674
Accruals and deferred income 3,901 1,976
VAT payable and other tax payables 2,507 2,681
Severance and Jubilee benefi ts 1,898 1,321
Settlement with shareholders 974 1,178
Retention program 904 1,016
Settlement with securities 99 1
59,193 52,934
The movements in Financial guarantees and commitments, Severance and Jubilee benefi ts and Retention program were as follows:
Note 1 Jan 2011Creation/
(Reversal)FX diff 31 Dec 2011
Financial guarantees and commitments 30 13,674 (2,860) (14) 10,800
Severance and Jubilee benefi ts 28 1,321 577 - 1,898
Retention program 28 1,016 (112) - 904
16,011 (2,395) (14) 13,602

141
Separate fi nancial statements
Note 1 Jan 2010Creation/
(Reversal)FX diff 31 Dec 2010
Financial guarantees and commitments 30 9,595 4,079 - 13,674
Severance and Jubilee benefi ts 28 1,215 106 - 1,321
Retention program 28 1,026 (10) - 1,016
11,836 4,175 - 16,011
22. Share capital
2011 2010
Authorized, issued and fully paid:
89 ordinary shares of € 3,319,391.89 each, not traded 295,426 295,426
4,078,108 ordinary shares of € 33.2 each, publicly traded 135,393 135,393
430,819 430,819
Net profi t for the year attributable to shareholders 157,664 149,377
Divided by 12,976,478 ordinary shares of € 33.2 each
Basic and diluted earnings per € 33.2 share in Euro 12.15 11.51
The principal rights attached to shares are to take part in and vote at the general meeting of shareholders and to receive dividends.
The structure of shareholders is as follows:
2011 2010
Intesa Holding International S.A. 96.76% 96.76%
Domestic shareholders 2.91% 2.97%
Foreign shareholders 0.33% 0.27%
100.00% 100.00%
The primary objectives of the Bank’s capital management are to ensure that the Bank complies with externally imposed capital requirements and that the Bank maintains strong credit ratings and healthy capital ratios in order to support its business and to maximise shareholders’ value.
The Bank manages its capital structure and makes adjustments to it in the light of changes in economic conditions and the risk characteristics of its activities. In order to maintain or adjust the capital structure, the Bank may adjust the amount of dividend payment to shareholders, return capital to shareholders or issue capital securities. No changes have yet been made in the objectives, policies and processes from the previous years, however, it is under the constant scrutiny of the Board.
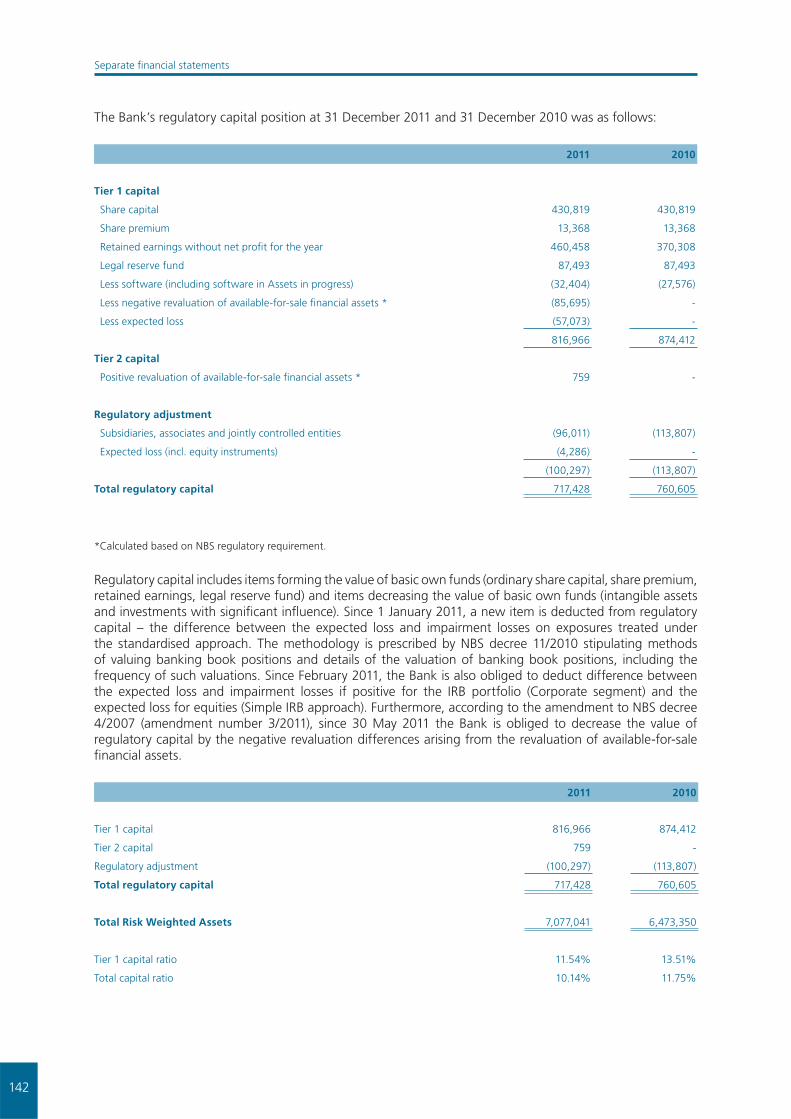
142
Separate fi nancial statements
The Bank’s regulatory capital position at 31 December 2011 and 31 December 2010 was as follows:
2011 2010
Tier 1 capital
Share capital 430,819 430,819
Share premium 13,368 13,368
Retained earnings without net profi t for the year 460,458 370,308
Legal reserve fund 87,493 87,493
Less software (including software in Assets in progress) (32,404) (27,576)
Less negative revaluation of available-for-sale fi nancial assets * (85,695) -
Less expected loss (57,073) -
816,966 874,412
Tier 2 capital
Positive revaluation of available-for-sale fi nancial assets * 759 -
Regulatory adjustment
Subsidiaries, associates and jointly controlled entities (96,011) (113,807)
Expected loss (incl. equity instruments) (4,286) -
(100,297) (113,807)
Total regulatory capital 717,428 760,605
*Calculated based on NBS regulatory requirement.
Regulatory capital includes items forming the value of basic own funds (ordinary share capital, share premium, retained earnings, legal reserve fund) and items decreasing the value of basic own funds (intangible assets and investments with signifi cant infl uence). Since 1 January 2011, a new item is deducted from regulatory capital – the difference between the expected loss and impairment losses on exposures treated under the standardised approach. The methodology is prescribed by NBS decree 11/2010 stipulating methods of valuing banking book positions and details of the valuation of banking book positions, including the frequency of such valuations. Since February 2011, the Bank is also obliged to deduct difference between the expected loss and impairment losses if positive for the IRB portfolio (Corporate segment) and the expected loss for equities (Simple IRB approach). Furthermore, according to the amendment to NBS decree 4/2007 (amendment number 3/2011), since 30 May 2011 the Bank is obliged to decrease the value of regulatory capital by the negative revaluation differences arising from the revaluation of available-for-sale fi nancial assets.
2011 2010
Tier 1 capital 816,966 874,412
Tier 2 capital 759 -
Regulatory adjustment (100,297) (113,807)
Total regulatory capital 717,428 760,605
Total Risk Weighted Assets 7,077,041 6,473,350
Tier 1 capital ratio 11.54% 13.51%
Total capital ratio 10.14% 11.75%
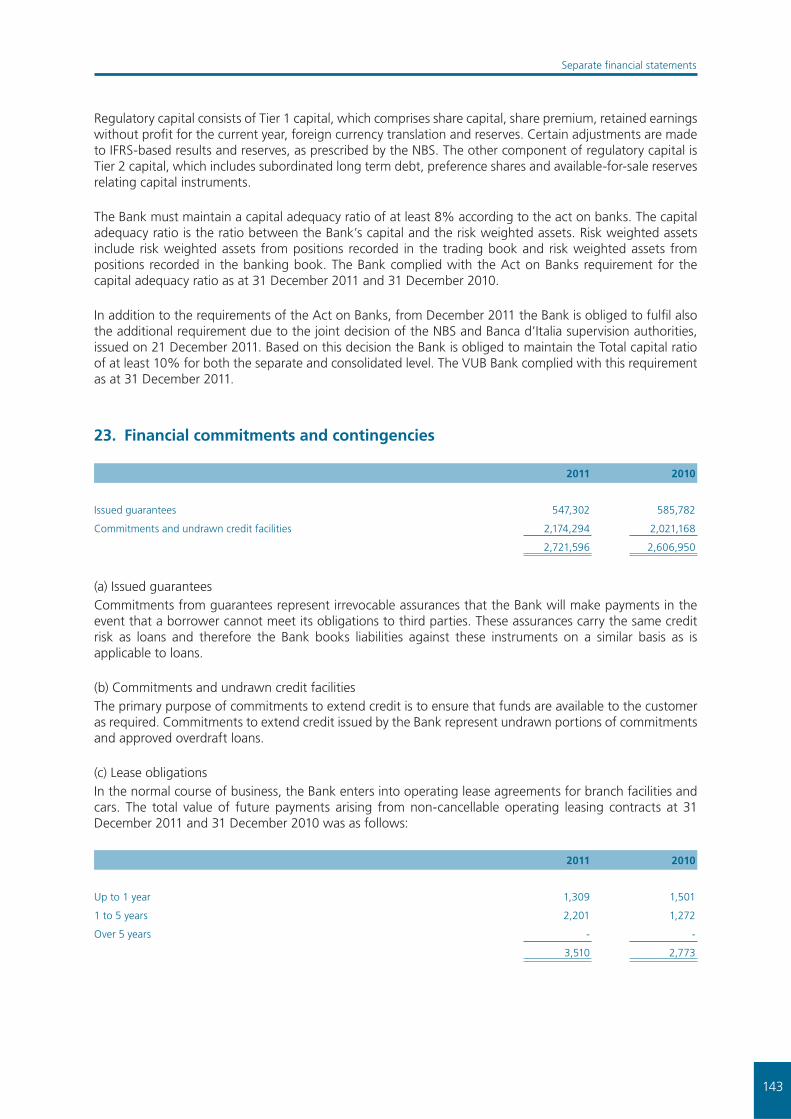
143
Separate fi nancial statements
Regulatory capital consists of Tier 1 capital, which comprises share capital, share premium, retained earnings without profi t for the current year, foreign currency translation and reserves. Certain adjustments are made to IFRS-based results and reserves, as prescribed by the NBS. The other component of regulatory capital is Tier 2 capital, which includes subordinated long term debt, preference shares and available-for-sale reserves relating capital instruments.
The Bank must maintain a capital adequacy ratio of at least 8% according to the act on banks. The capital adequacy ratio is the ratio between the Bank’s capital and the risk weighted assets. Risk weighted assets include risk weighted assets from positions recorded in the trading book and risk weighted assets from positions recorded in the banking book. The Bank complied with the Act on Banks requirement for the capital adequacy ratio as at 31 December 2011 and 31 December 2010.
In addition to the requirements of the Act on Banks, from December 2011 the Bank is obliged to fulfi l also the additional requirement due to the joint decision of the NBS and Banca d’Italia supervision authorities, issued on 21 December 2011. Based on this decision the Bank is obliged to maintain the Total capital ratio of at least 10% for both the separate and consolidated level. The VUB Bank complied with this requirement as at 31 December 2011.
23. Financial commitments and contingencies
2011 2010
Issued guarantees 547,302 585,782
Commitments and undrawn credit facilities 2,174,294 2,021,168
2,721,596 2,606,950
(a) Issued guaranteesCommitments from guarantees represent irrevocable assurances that the Bank will make payments in the event that a borrower cannot meet its obligations to third parties. These assurances carry the same credit risk as loans and therefore the Bank books liabilities against these instruments on a similar basis as is applicable to loans.
(b) Commitments and undrawn credit facilitiesThe primary purpose of commitments to extend credit is to ensure that funds are available to the customer as required. Commitments to extend credit issued by the Bank represent undrawn portions of commitments and approved overdraft loans.
(c) Lease obligationsIn the normal course of business, the Bank enters into operating lease agreements for branch facilities and cars. The total value of future payments arising from non-cancellable operating leasing contracts at 31 December 2011 and 31 December 2010 was as follows:
2011 2010
Up to 1 year 1,309 1,501
1 to 5 years 2,201 1,272
Over 5 years - -
3,510 2,773

144
Separate fi nancial statements
d) LegalIn the normal course of business, the Bank is subject to a variety of legal actions. The Bank conducted a review of legal proceedings outstanding against it as of 31 December 2011. Pursuant to this review, management has recorded total provisions of € 24,285 thousand (31 December 2010: € 23,517 thousand) in respect of such legal proceedings (see also note 20). The Bank will continue to defend its position in respect of each of these legal proceedings. In addition to the legal proceedings covered by provisions, there are contingent liabilities arising from legal proceedings in the total amount of € 21,078 thousand, as at 31 December 2011 (31 December 2010: € 19,039 thousand). This amount represents existing legal proceedings against the Bank that in the opinion of the Legal Department of the Bank will most probably not result in any payments due by the Bank.
The particular requirements pursuant to IAS 37.85 are not disclosed in accordance with IAS 37.92 in order not to compromise the Bank’s position in the ongoing legal proceedings and disputes.
24. Net interest income
2011 2010
Interest and similar income
Due from banks 16,397 8,822
Loans and advances to customers 356,665 311,097
Bonds, treasury bills and other securities:
Financial assets held for trading 8,969 9,386
Available-for-sale fi nancial assets 53,348 44,830
Held-to-maturity investments 49,545 59,369
484,924 433,504
Interest expense and similar charges
Due to banks (2,557) (3,849)
Due to customers (76,143) (61,991)
Debt securities in issue (53,119) (42,788)
(131,819) (108,628)
353,105 324,876
Interest income on individually impaired loans and advances to customers for 2011 amounted to € 8,006 thousand (2010: € 13,119 thousand).

145
Separate fi nancial statements
25. Net fee and commission income
2011 2010
Fee and commission income
Received from banks 6,395 5,718
Received from customers:
Current accounts 46,430 44,046
Term deposits 1,003 638
Insurance mediation 10,134 9,079
Loans and guarantees 37,525 38,042
Overdrafts 1,921 2,438
Securities 6,310 5,491
Transactions and payments 23,753 30,211
Other 2,418 2,209
135,889 137,872
Fee and commission expense
Paid to banks (13,775) (19,956)
Paid to mediators:
Credit cards (32,869) (39,919)
Securities (629) (678)
Services (5,417) (2,455)
Other (1,048) (1,256)
(53,738) (64,264)
82,151 73,608
26. Net trading income
2011 2010
Foreign currency derivatives and transactions 769 (4,375)
Customer FX margins 4,839 5,584
Cross currency swaps (1,908) 4,352
Equity derivatives 80 106
Interest rate derivatives* (1,086) (3,755)
Securities:
Financial assets held for trading (1,337) 769
Available-for-sale fi nancial assets* (248) 3,565
Debt securities in issue* (194) -
915 6,246
* Includes the revaluation of fi nancial instruments that are part of the hedging relationship, i.e. fair value hedges of interest rate risk
(see also note 7).
At 31 December 2011, the amount still to be recognised in income resulting from Day 1 profi t amounted to € 134 thousand (31 December 2010: € 257 thousand), thereof € 124 thousand is to be recognized within one year (31 December 2010: € 241 thousand) and the remaining € 10 thousand in the period 1 to 5 years (31 December 2010: € 16 thousand).

146
Separate fi nancial statements
27. Other operating income
2011 2010
Compensation settlement from Generali Slovensko poisťovňa, a.s.* 4,100 -
Rent 1,427 1,643
Net profi t/(loss) from sale of fi xed assets 331 (101)
Other 2,751 2,285
8,609 3,827
* Represents the settlement for new clients’ acquisition done by the VUB Bank after the incorporation of VUB Generali DSS, a.s.
28. Salaries and employee benefi ts
Note 2011 2010
Remuneration (68,199) (63,894)
Social security costs (23,714) (22,951)
Social fund (1,225) (782)
Retention program 21 112 10
Severance and Jubilee benefi ts 21 (577) (106)
(93,603) (87,723)
At 31 December 2011, the total number of employees of the Bank was 3,542 (31 December 2010: 3,487).
The Bank does not have any pension arrangements separate from the pension system established by the law, which requires mandatory contributions of a certain percentage of gross salaries to the State owned social insurance and privately owned pension funds. These contributions are recognised in the period when salaries are earned by employees. No further liabilities are arising to the Bank from the payment of pensions to employees in the future.

147
Separate fi nancial statements
29. Other operating expenses
Note 2011 2010
Property related expenses (13,848) (13,325)
IT systems maintenance (11,151) (10,245)
Post and telecom (9,546) (9,716)
Contribution to the Deposit Protection Fund (8,562) (8,437)
Advertising and marketing (7,286) (6,140)
Equipment related expenses (6,849) (7,030)
VAT and other taxes (5,912) (5,817)
Security (3,678) (3,587)
Professional services (2,837) (3,296)
Stationery (2,656) (2,614)
Provisions for litigations 20 (782) 1,465
Insurance (776) (724)
Travelling (684) (747)
Training (631) (623)
Audit* (583) (538)
Litigations paid (583) (1,084)
Transport (531) (451)
Other damages (215) (1,832)
Other operating expenses (4,843) (1,905)
(81,953) (76,646)
* As at 31 December 2011, the audit expense consists of fees for the statutory audit in the amount of € 233 thousand (31 December
2010: € 215 thousand), group reporting in the amount of € 233 thousand (31 December 2010: € 215 thousand) and other
reporting in the amount of € 117 thousand (31 December 2010: € 108 thousand).
30. Impairment losses on fi nancial assets
Note 2011 2010
Net creation of impairment losses 10 (67,679) (42,898)
Net reversal/(creation) of liabilities – fi nancial guarantees
and commitments 21 2,860 (4,079)
(64,819) (46,977)
Nominal value of loans written-off (26,917) (10,324)
Nominal value of loans sold (21,732) (5,040)
Proceeds from loans written-off 5,035 2,119
Proceeds from loans sold 5,169 1,791
(38,445) (11,454)
Release of impairment losses to loans written-off/sold 10
Loans written-off 17,954 6,672
Loans sold 18,012 3,702
35,966 10,374
(67,298) (48,057)
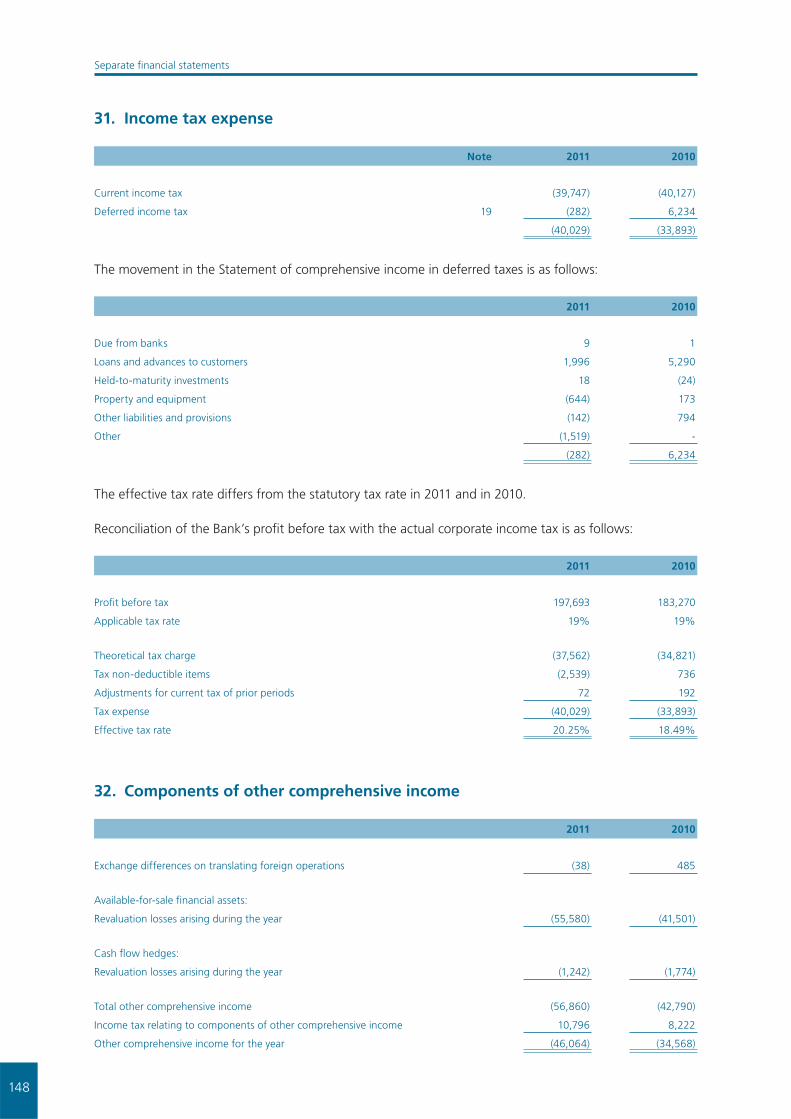
148
Separate fi nancial statements
31. Income tax expense
Note 2011 2010
Current income tax (39,747) (40,127)
Deferred income tax 19 (282) 6,234
(40,029) (33,893)
The movement in the Statement of comprehensive income in deferred taxes is as follows:
2011 2010
Due from banks 9 1
Loans and advances to customers 1,996 5,290
Held-to-maturity investments 18 (24)
Property and equipment (644) 173
Other liabilities and provisions (142) 794
Other (1,519) -
(282) 6,234
The effective tax rate differs from the statutory tax rate in 2011 and in 2010.
Reconciliation of the Bank’s profi t before tax with the actual corporate income tax is as follows:
2011 2010
Profi t before tax 197,693 183,270
Applicable tax rate 19% 19%
Theoretical tax charge (37,562) (34,821)
Tax non-deductible items (2,539) 736
Adjustments for current tax of prior periods 72 192
Tax expense (40,029) (33,893)
Effective tax rate 20.25% 18.49%
32. Components of other comprehensive income
2011 2010
Exchange differences on translating foreign operations (38) 485
Available-for-sale fi nancial assets:
Revaluation losses arising during the year (55,580) (41,501)
Cash fl ow hedges:
Revaluation losses arising during the year (1,242) (1,774)
Total other comprehensive income (56,860) (42,790)
Income tax relating to components of other comprehensive income 10,796 8,222
Other comprehensive income for the year (46,064) (34,568)
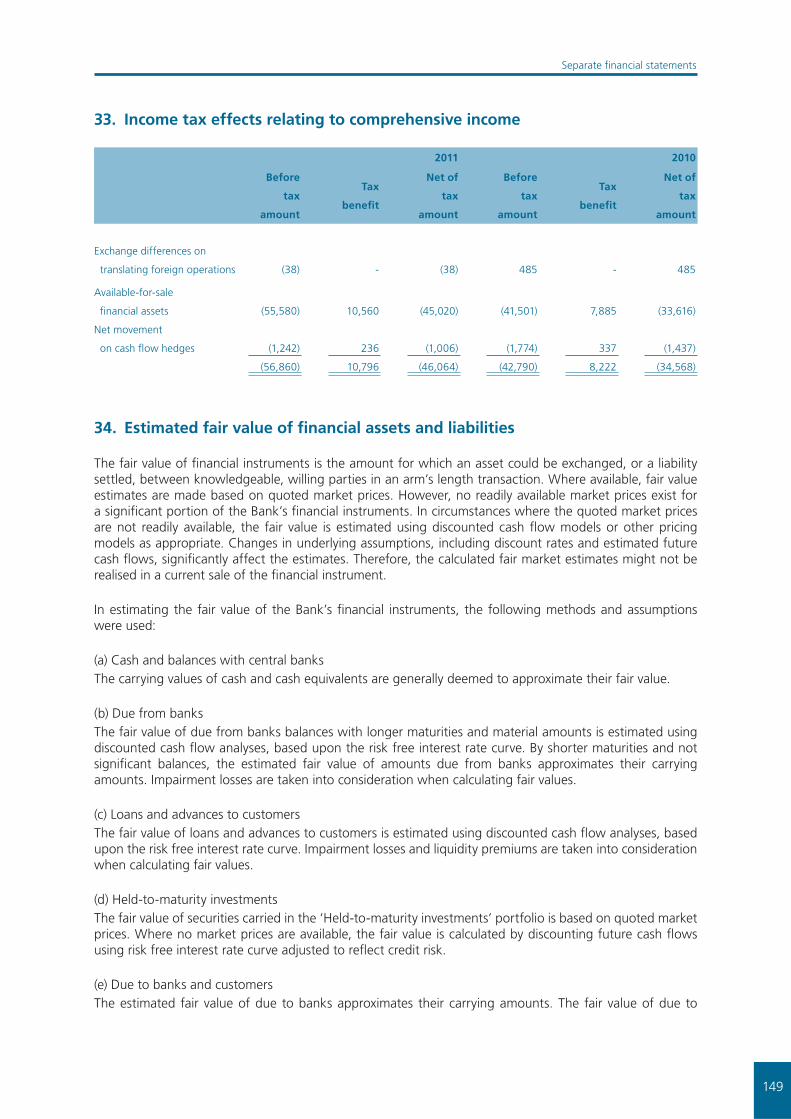
149
Separate fi nancial statements
33. Income tax effects relating to comprehensive income
2011 2010
Before
tax
amount
Tax
benefi t
Net of
tax
amount
Before
tax
amount
Tax
benefi t
Net of
tax
amount
Exchange differences on
translating foreign operations (38) - (38) 485 - 485
Available-for-sale
fi nancial assets (55,580) 10,560 (45,020) (41,501) 7,885 (33,616)
Net movement
on cash fl ow hedges (1,242) 236 (1,006) (1,774) 337 (1,437)
(56,860) 10,796 (46,064) (42,790) 8,222 (34,568)
34. Estimated fair value of fi nancial assets and liabilities
The fair value of fi nancial instruments is the amount for which an asset could be exchanged, or a liability settled, between knowledgeable, willing parties in an arm’s length transaction. Where available, fair value estimates are made based on quoted market prices. However, no readily available market prices exist for a signifi cant portion of the Bank’s fi nancial instruments. In circumstances where the quoted market prices are not readily available, the fair value is estimated using discounted cash fl ow models or other pricing models as appropriate. Changes in underlying assumptions, including discount rates and estimated future cash fl ows, signifi cantly affect the estimates. Therefore, the calculated fair market estimates might not be realised in a current sale of the fi nancial instrument.
In estimating the fair value of the Bank’s fi nancial instruments, the following methods and assumptions were used:
(a) Cash and balances with central banksThe carrying values of cash and cash equivalents are generally deemed to approximate their fair value.
(b) Due from banksThe fair value of due from banks balances with longer maturities and material amounts is estimated using discounted cash fl ow analyses, based upon the risk free interest rate curve. By shorter maturities and not signifi cant balances, the estimated fair value of amounts due from banks approximates their carrying amounts. Impairment losses are taken into consideration when calculating fair values.
(c) Loans and advances to customersThe fair value of loans and advances to customers is estimated using discounted cash fl ow analyses, based upon the risk free interest rate curve. Impairment losses and liquidity premiums are taken into consideration when calculating fair values.
(d) Held-to-maturity investmentsThe fair value of securities carried in the ‘Held-to-maturity investments’ portfolio is based on quoted market prices. Where no market prices are available, the fair value is calculated by discounting future cash fl ows using risk free interest rate curve adjusted to refl ect credit risk.
(e) Due to banks and customersThe estimated fair value of due to banks approximates their carrying amounts. The fair value of due to

150
Separate fi nancial statements
customers with short term maturity (under one year, including current accounts) is estimated by discounting their future expected cash fl ows using the risk free interest rate curve. The fair value of deposits with maturity over one year is discounted using the risk free interest rate curve adjusted by credit spreads refl ecting the credit quality of VUB as the borrower.
(f) Debt securities in issueThe fair value of debt securities issued by the Bank is based on quoted market prices. Where no market prices are available, the fair value was calculated by discounting future cash fl ows using the risk free interest rate curve adjusted by credit spreads refl ecting the credit quality of VUB as the issuer.
The Bank uses the following hierarchy for determining and disclosing the fair value of fi nancial instruments by valuation technique:
Level 1: quoted (unadjusted) prices in active markets for identical assets or liabilities;Level 2: other techniques for which all inputs which have a signifi cant effect on the recorded fair value
are observable, either directly or indirectly; andLevel 3: techniques which use inputs which have a signifi cant effect on the recorded fair value that are
not based on observable market data.
31 December 2011 Note TradingHeld–to–
maturity
Loans and
receiva-
bles
Available–
for–sale
Other
amortized
cost
Total
carrying
amount
Fair
value
Cash and balances with central banks 4 - - 90,918 - - 90,918 90,918
Due from banks 5 - - 501,444 - - 501,444 502,330
Financial assets held for trading 6 269,852 - - - - 269,852 269,852
Derivative fi nancial instruments 7 80,399 - - - - 80,399 80,399
Available-for-sale fi nancial assets 8 - - - 1,455,626 - 1,455,626 1,455,626
Loans and advances to customers 9 - - 6,917,544 - - 6,917,544 7,086,626
Held-to-maturity investments 11 - 1,137,540 - - - 1,137,540 1,116,000
350,251 1,137,540 7,509,906 1,455,626 - 10,453,323 10,601,751
Due to central and other banks 16 - - - - (429,725) (429,725) (429,725)
Derivative fi nancial instruments 7 (57,382) - - - - (57,382) (57,382)
Due to customers 17 - - - - (7,498,151) (7,498,151) (7,315,883)
Debt securities in issue 18 - - - - (1,660,487) (1,660,487) (1,498,658)
(57,382) - - - (9,588,363) (9,645,745) (9,301,648)

151
Separate fi nancial statements
31 December 2010 Note TradingHeld–to–
maturity
Loans and
receiva-
bles
Available–
for–sale
Other
amortized
cost
Total
carrying
amount
Fair
value
Cash and balances with central banks 4 - - 179,064 - - 179,064 179,064
Due from banks 5 - - 108,598 - - 108,598 108,598
Financial assets held for trading 6 249,973 - - - - 249,973 249,973
Derivative fi nancial instruments 7 45,205 - - - - 45,205 45,205
Available-for-sale fi nancial assets 8 - - - 1,615,823 - 1,615,823 1,615,823
Loans and advances to customers 9 - - 6,141,301 - - 6,141,301 6,575,787
Held-to-maturity investments 11 - 1,788,263 - - - 1,788,263 1,819,302
295,178 1,788,263 6,428,963 1,615,823 - 10,128,227 10,593,752
Due to central and other banks 16 - - - - (439,151) (439,151) (439,151)
Derivative fi nancial instruments 7 (60,729) - - - - (60,729) (60,729)
Due to customers 17 - - - - (7,276,689) (7,276,689) (6,898,324)
Debt securities in issue 18 - - - - (1,619,591) (1,619,591) (1,546,017)
(60,729) - - - (9,335,431) (9,396,160) (8,944,221)
The following table shows an analysis of fi nancial instruments recorded at fair value by level of the fair value hierarchy:
2011 2010
Note Level 1 Level 2 Level 3 Total Level 1 Level 2 Level 3 Total
Financial assets
Financial assets held for trading 6
Treasury bills and other eligible bills 23,098 169,135 - 192,233 - 174,201 - 174,201
State bonds 47,279 30,340 - 77,619 75,772 - - 75,772
70,377 199,475 - 269,852 75,772 174,201 - 249,973
Derivative fi nancial instruments 7
Interest rate instruments - 22,403 - 22,403 - 23,464 - 23,464
Foreign currency instruments - 56,271 - 56,271 - 17,287 - 17,287
Equity and commodity instruments - 1,725 - 1,725 - 4,454 - 4,454
- 80,399 - 80,399 - 45,205 - 45,205
Available-for-sale fi nancial assets 8
State bonds 256,449 1,182,872 - 1,439,321 272,747 1,323,092 - 1,595,839
Bank bonds - 15,666 - 15,666 - 19,345 - 19,345
Equity shares 639 - 639 - 639 - 639
256,449 1,199,177 - 1,455,626 272,747 1,343,076 - 1,615,823
Financial liabilities
Derivative fi nancial instruments 7
Interest rate instruments - 38,695 - 38,695 - 39,488 - 39,488
Foreign currency instruments - 16,962 - 16,962 - 16,787 - 16,787
Equity and commodity instruments - 1,725 - 1,725 - 4,454 - 4,454
- 57,382 - 57,382 - 60,729 - 60,729
There were no signifi cant transfers of fi nancial instruments among the levels during 2011 and 2010.
152
Separate fi nancial statements
35. Financial risk management
Introduction and overview
The Bank has exposure to the following risks from its use of fi nancial instruments:
(a) credit risk,(b) market risk,(c) liquidity risk,(d) operational risk.
This note presents information about the Bank’s exposure to each of the above risks, the Bank’s objectives, policies and processes for measuring and managing risk.
Risk management framework
The Management Board is the statutory body governing the executive management of the Bank, and has absolute authority over all matters concerning risk. The Management Board has primary responsibility for the creation and dissolution of risk related governance bodies. The primary governance bodies overseeing risk issues are:
– Asset/Liability Committee (‘ALCO’),– Credit Risk Committee (‘CRC’),– Operational Risk Committee (‘ORC’).
The Management Board delegates its risk authority to these governance bodies in the form of statutes, which identify members of the governance bodies, competencies and responsibilities of the members. The competency of each governance body is established in relevant Charters.
The Bank’s risk management policies are established to identify and analyze the risks faced by the Bank, to set appropriate risk limits and controls and to monitor risks and adherence to limits. Risk management policies and systems are reviewed regularly to refl ect changes in market conditions, products and services offered. The Bank, through its training and management standards and procedures, aims to develop a disciplined and constructive control environment, in which all employees understand their roles and obligations. The Bank’s Internal Audit Department is responsible for monitoring compliance with the Bank’s risk management policies and procedures, and for reviewing the adequacy of the risk management framework in relation to the risks faced by the Bank. Internal Audit undertakes both regular and ad-hoc reviews of risk management controls and procedures.
(a) Credit risk
The Credit risk is the risk of a fi nancial loss to the Bank if a customer or counterparty to a fi nancial instrument fails to meet its contractual obligations, and arises principally from the Bank’s loans and advances to customers and banks as well as investment securities. For risk management reporting purposes, the Bank considers and consolidates all elements of credit risk exposure (such as individual obligor default risk, country and sector risk). For risk management purposes, the credit risk arising on trading securities is managed independently, but reported as a component of market risk exposure.
Credit Risk Charter establishes the guidelines for measurement, control and management of credit risk by defi ning the legal framework, main responsibilities, policies and methodologies that support the credit risk management process of VUB Bank.
More specifi cally, the Credit Risk Charter defi nes both the general and specifi c (retail, corporate) credit risk requirements for applied methodologies and procedures, and includes, as separate sections, the policies governing the key aspects of the Bank’s credit risk management process:

153
Separate fi nancial statements
– Authorized Approval Authority,– Collateral Management Policy, – Loan, Non Credit Receivables And Off Balance Sheet Credit Products Loss Provisioning Policy, – Credit Concentration Limits, – Default Defi nition, – Risk Management Client Segmentation Policy, – Corporate Credit Policy, Retail Credit Policy, – Retail and Corporate Remedial Management and Collections.
Management of credit risk
The Risk Management Division is established within the Bank as a Control Unit and managed by the Chief Risk Offi cer, who is a member of the Bank’s Management Board. The Risk Management Division is organisationally structured to provide support to the Business Units, as well as to provide reporting of credit, market and operational risks to the Supervisory Board and Management Board. The Risk Management Division is responsible for overseeing the Bank’s credit risk including:
– The development of credit risk strategies, policies, processes and procedures covering rules for credit assessment, collateral requirements, risk grading and reporting.
– Setting limits for the concentration of exposure to counterparties, related parties, countries and total assets and monitoring compliance with those limits.
– Establishment of the authorisation structure for the approval and renewal of credit facilities. Authorisation limits are set in the Credit Risk Charter.
– Credit risk assessment according to defi ned policy.– Monitoring of quality portfolio performance and its compliance with set limits (regulatory, internal).
Regular reports are provided to Management Board and CRC on the credit quality of Bank’s portfolios and appropriate corrective measures are taken.
– Development, maintenance and validation of scoring and rating models – both application and behavioural.
– Development, maintenance and back-testing of impairment losses model (the Markov chains methodology is used).
Allowances for impairment
The Bank establishes an allowance for impairment losses, which represents its estimate of incurred losses in its loan portfolio.
If there is evidence of impairment for any individually signifi cant client of the Bank, such as a breach of contract, problems with repayments or collateral, the Bank transfers such a client to the Recovery Department, for pursuing collection activities. Such clients are considered to be individually impaired. For collective impairment, the Bank uses historical evidence of impairment on a portfolio basis, mainly based on the payment discipline of clients.
Impairment losses are calculated individually for individually signifi cant clients for which evidence of impairment exists and collectively for individually signifi cant clients without evidence of impairment and for individually insignifi cant client groups of homogeneous assets. Collective impairment losses are calculated for each group using a mathematical model (IRB approach as well as the Markov chains methodology is used).
Rules for identifying signifi cant clients and methodology for calculation are set in Credit Risk Charter or can be found in the Internal Provisioning Policy procedure.
From September 2010, the Bank implemented the defi nitions of non-performing loans derived from

154
Separate fi nancial statements
the Harmonisation project. The Harmonisation project is driven by Intesa Sanpaolo in order to unify the defi nitions and categories of non-performing loans across the foreign subsidiaries of the Intesa Sanpaolo Group. The defi nition covers non-performing (past due, substandard, doubtful) loans as well as the restructured exposures. The defi nition of non-performing loans is based on delinquency (days past due - DPD) and materiality threshold of client (corporate clients) respectively of the loan (retail clients). Generally, all credit receivables with a delinquency of higher than or equal to 90 days and a materiality threshold of higher than or equal to 5% of outstanding total credit exposures to client (corporate clients) respectively 50 € (retail clients) are considered to be non-performing.
Credit risk measurement
The bank generally uses the standardised approach for the calculation of the capital requirement. However, for the calculation of credit and counterparty risk capital requirements, the Bank, having received authorisation from the Supervisory Authority, uses the Foundation IRB approach for the Corporate segment from February 2011. The Bank is also proceeding with the development of the rating models for other segments, to which the standard methods are currently applied, and also with the extension of the scope of companies in accordance with the gradual rollout plan for the advanced approaches presented to the Supervisory Authority.
The following table describes the Bank’s credit portfolio in terms of classifi cation categories:
2011 Restated 2010
Category
Amor-
tized
cost
Impair-
ment
losses
Carrying
amount
Amor-
tized
cost
Impair-
ment
losses
Carrying
amount
Banks
Performing 501,495 (51) 501,444 108,421 - 108,421
Doubtful 151 (151) - 328 (151) 177
501,646 (202) 501,444 108,749 (151) 108,598
Sovereigns
Performing 149,881 (172) 149,709 100,800 (163) 100,637
Past due 307 - 307 95 - 95
Substandard 173 (5) 168 835 (42) 793
Doubtful 293 (117) 176 - - -
150,654 (294) 150,360 101,730 (205) 101,525
Corporate
Performing 2,855,988 (21,819) 2,834,169 2,444,800 (29,764) 2,415,036
Past due 221 (133) 88 115 (15) 100
Restructured 17,974 (5,997) 11,977 19,332 (4,314) 15,018
Substandard 113,864 (27,409) 86,455 74,189 (12,643) 61,546
Doubtful 39,476 (24,067) 15,409 46,330 (27,306) 19,024
3,027,523 (79,425) 2,948,098 2,584,766 (74,042) 2,510,724
Retail
Performing 3,765,940 (47,776) 3,718,164 3,485,614 (45,762) 3,439,852
Past due 34,471 (13,946) 20,525 33,551 (14,048) 19,503
Substandard 27,298 (10,311) 16,987 27,353 (12,199) 15,154
Doubtful 158,304 (94,894) 63,410 144,453 (89,910) 54,543
3,986,013 (166,927) 3,819,086 3,690,971 (161,919) 3,529,052
Securities
Performing 2,861,478 (231) 2,861,247 3,652,427 - 3,652,427
Substandard 1,881 (110) 1,771 1,881 (249) 1,632
2,863,359 (341) 2,863,018 3,654,308 (249) 3,654,059
The comparative balances for 2010 were restated to better refl ect the actual split to individual categories.

155
Separate fi nancial statements
The table below shows the maximum amount of credit risk of derivative fi nancial instruments, issued guarantees, commitments and undrawn credit facilities. The credit risk of the remaining fi nancial assets not reported in the table below approximates their carrying amounts.
2011 2010
Financial assets
Derivative fi nancial instruments 106,471 65,528
Financial commitments and contingencies
Issued guarantees 547,302 585,782
Commitments and undrawn credit facilities 2,174,294 2,021,168
2,721,596 2,606,950
2,828,067 2,672,478
The payment discipline of each client is monitored regularly. If a client is past due with some payments, appropriate action is taken. The following table shows the Bank’s credit portfolio in terms of delinquency of payments.
2011 Restated 2010
Amortized
cost
Impairment
losses
Carrying
amount
Amortized
cost
Impairment
losses
Carrying
amount
Banks
No delinquency 501,494 (51) 501,443 96,009 - 96,009
1 – 30 days 1 - 1 12,412 - 12,412
Over 181 days* 151 (151) - 328 (151) 177
501,646 (202) 501,444 108,749 (151) 108,598
Sovereigns
No delinquency 149,991 (172) 149,819 98,586 (163) 98,423
1 – 30 days 124 - 124 2,023 - 2,023
31 – 60 days 73 - 73 191 - 191
61 – 90 days - - - 95 - 95
91 – 180 days 464 (122) 342 834 (42) 792
Over 181 days* 2 - 2 1 - 1
150,654 (294) 150,360 101,730 (205) 101,525
Corporate
No delinquency 2,963,155 (53,571) 2,909,584 2,519,206 (43,309) 2,475,897
1 – 30 days 9,777 (162) 9,615 6,924 (496) 6,428
31 – 60 days 6,075 (224) 5,851 3,099 (1,821) 1,278
61 – 90 days 35 (8) 27 965 (449) 516
91 – 180 days 2,979 (681) 2,298 837 (516) 321
Over 181 days* 45,502 (24,779) 20,723 53,735 (27,451) 26,284
3,027,523 (79,425) 2,948,098 2,584,766 (74,042) 2,510,724

156
Separate fi nancial statements
Retail
No delinquency 3,569,981 (32,843) 3,537,138 3,294,635 (29,907) 3,264,728
1 – 30 days 138,346 (7,906) 130,440 134,639 (8,167) 126,472
31 – 60 days 37,317 (3,977) 33,340 36,934 (4,406) 32,528
61 – 90 days 23,472 (3,639) 19,833 20,992 (3,582) 17,410
91 – 180 days 35,985 (14,373) 21,612 36,275 (14,749) 21,526
Over 181 days* 180,912 (104,189) 76,723 167,496 (101,108) 66,388
3,986,013 (166,927) 3,819,086 3,690,971 (161,919) 3,529,052
Securities
No delinquency 2,863,359 (341) 2,863,018 3,654,308 (249) 3,654,059
2,863,359 (341) 2,863,018 3,654,308 (249) 3,654,059
* Write-off Policy
The Bank writes off a loan or security balance (and any related allowances for impairment losses) when it determines that the loans or securities are uncollectible. As the standard, the Bank considers the credit balances to be uncollectible based on the past due days. Since 1 January 2008, the write-off policy has been changed from 180 to 1,080 days past due. Thus receivables are no longer written off and sold after 180 days past due, but are collected by external collection agencies until they qualify for write-off and tax deductibility.
The credit balance can be written off earlier than defi ned in the conditions described above if there is evidence that the receivable cannot be collected. The write-off of such receivables is subject to the approval of the Credit Risk Offi cer.
The Bank holds collateral against loans and advances to customers in the form of mortgage interests over property, other registered securities over assets, and guarantees. Estimates of fair value are based on the value of collateral assessed at the time of borrowing and generally the Bank updates the fair value on a regular basis.
Value of collateral and other security enhancements held against fi nancial assets is shown below:
2011 Restated 2010
Clients Banks Clients Banks
Debt securities 23,028 326,581 27,505 -
Other 549,169 107,079 381,418 22,522
Property 3,370,404 - 3,023,028 -
3,942,601 433,660 3,431,951 22,522
The value of collateral and other security enhancements as at 31 December 2010 was restated to refl ect the approach of accepting the collateral value up to the total amount of receivable as well as Basel II eligibility of the collateral.

157
Separate fi nancial statements
The Bank monitors concentrations of credit risk by geographic location. An analysis of concentrations of credit risk at the reporting date is shown below.
2011 Restated 2010
Amortized
cost
Impairment
losses
Carrying
amount
Amortized
cost
Impairment
losses
Carrying
amount
Europe
Banks 471,961 (185) 471,776 76,702 (151) 76,551
Sovereigns 150,654 (294) 150,360 101,730 (205) 101,525
Corporate 3,027,523 (79,425) 2,948,098 2,584,753 (74,042) 2,510,711
Retail 3,983,641 (166,871) 3,816,770 3,688,745 (161,887) 3,526,858
Securities 2,861,478 (231) 2,861,247 3,648,971 - 3,648,971
10,495,257 (247,006) 10,248,251 10,100,901 (236,285) 9,864,616
America
Banks 29,123 (17) 29,106 31,856 - 31,856
Retail 625 (22) 603 739 (16) 723
Securities 1,881 (110) 1,771 5,337 (249) 5,088
31,629 (149) 31,480 37,932 (265) 37,667
Asia
Banks 211 - 211 99 - 99
Corporate - - - 13 - 13
Retail 980 (28) 952 686 (15) 671
1,191 (28) 1,163 798 (15) 783
Rest of the World
Banks 351 - 351 92 - 92
Retail 767 (6) 761 801 (1) 800
1,118 (6) 1,112 893 (1) 892
An analysis of concentrations of credit risk of securities at the reporting date is shown below.
2011 2010
Amortised
cost
Impairment
losses
Carrying
amount
Amortised
cost
Impairment
losses
Carrying
amount
Europe
Slovakia 2,447,590 (231) 2,447,359 3,190,154 - 3,190,154
Poland 202,521 - 202,521 194,596 - 194,596
Ireland 120,427 - 120,427 113,137 - 113,137
Italy 34,050 - 34,050 99,525 - 99,525
Portugal 27,219 - 27,219 45,093 - 45,093
Czech Republic 23,098 - 23,098 - - -
Other 8,454 (110) 8,344 6,466 - 6,466
2,863,359 (341) 2,863,018 3,648,971 - 3,648,971
America
USA - - - 5,337 (249) 5,088

158
Separate fi nancial statements
An analysis of exposures by industry sector is shown in the table below.
31 December 2011 Banks Sovereigns Corporate Retail Securities
Agriculture - - 43,835 21,581 -
Construction - - 136,568 15,254 -
Consumers - - - 3,630,383 -
Energy and water supply - - 274,011 1,354 -
Financial services 501,444 - 375,438 584 25,776
Government - 138,747 - - 2,834,897
Manufacturing - - 458,549 28,395 -
Professional services - - 69,122 9,442 -
Real estate - - 427,891 9,433 -
Retail & Wholesale - - 659,940 65,214 -
Services - - 130,200 14,948 574
Transportation - 11,613 330,379 8,018 -
Other - - 42,165 14,480 1,771
501,444 150,360 2,948,098 3,819,086 2,863,018
Restated 31 December 2010 Banks Sovereigns Corporate Retail Securities
Agriculture - - 40,910 21,133 -
Construction - - 120,514 13,046 -
Consumers - - - 3,348,756 -
Energy and water supply - - 197,858 1,213 -
Financial services 108,598 - 353,414 616 65,331
Government - 88,268 - - 3,587,096
Manufacturing - - 395,130 29,579 -
Professional services - - 82,965 8,476 -
Real estate - - 379,476 9,211 -
Retail & Wholesale - - 555,124 61,623 -
Services - - 68,908 14,077 -
Transportation - 12,501 270,726 7,264 -
Other - 756 45,699 14,058 1,632
108,598 101,525 2,510,724 3,529,052 3,654,059

159
Separate fi nancial statements
The table below shows the credit quality by class of assets for all fi nancial assets exposed to credit risk, based on the Bank’s internal credit rating system. The amounts presented are gross of impairment allowances. Past due but not impaired fi nancial assets are more than one day overdue.
Neither past due nor impaired Impaired (non-performing) Past due but not impaired
31 December 2011Amortised
cost
Impair-
ment
losses
Carrying
amount
Amor-
tised cost
Impair-
ment
losses
Carrying
amount
Amor-
tised cost
Impair-
ment
losses
Carrying
amount
Banks 501,494 (51) 501,443 151 (151) - 1 - 1
Sovereigns
Municipalities 149,776 (172) 149,604 773 (122) 651 105 - 105
Corporate
Large Corporates 942,886 (5,472) 937,414 9,757 (3,448) 6,309 7,780 (23) 7,757
Specialized lending 645,585 (6,608) 638,977 90,743 (25,066) 65,677 1,676 (91) 1,585
SME 616,620 (7,658) 608,962 71,026 (29,092) 41,934 2,454 (61) 2,393
Other Fin. Institutions 413,212 (588) 412,624 1 - 1 - - -
Private Sector Entities 102,291 (706) 101,585 8 - 8 5 - 5
Factoring 121,211 (608) 120,603 - - - 2,268 (4) 2,264
2,841,805 (21,640) 2,820,165 171,535 (57,606) 113,929 14,183 (179) 14,004
Retail
Small business 175,281 (4,501) 170,780 19,555 (10,256) 9,299 4,789 (765) 4,024
Consumer Loans 584,824 (11,333) 573,491 63,909 (39,250) 24,659 54,063 (5,005) 49,058
Mortgages 2,534,845 (8,954) 2,525,891 66,925 (19,709) 47,216 114,348 (5,439) 108,909
Credit Cards 177,153 (3,719) 173,434 52,603 (36,349) 16,254 22,972 (3,793) 19,179
Overdrafts 85,221 (3,707) 81,514 17,077 (13,587) 3,490 2,433 (494) 1,939
Flat Owners Associations 3,796 (63) 3,733 - - - 15 - 15
Other 6,200 (3) 6,197 4 - 4 - - -
3,567,320 (32,280) 3,535,040 220,073 (119,151) 100,922 198,620 (15,496) 183,124
Securities
Trading 269,852 - 269,852 - - - - - -
AFS 1,455,626 - 1,455,626 - - - - - -
HTM 1,136,000 (231) 1,135,769 1,881 (110) 1,771 - - -
2,861,478 (231) 2,861,247 1,881 (110) 1,771 - - -

160
Separate fi nancial statements
Neither past due nor impaired Impaired (non-performing) Past due but not impaired
Restated
31 December 2010
Amor-
tised cost
Impair-
ment
losses
Carrying
amount
Amor-
tised cost
Impair-
ment
losses
Carrying
amount
Amor-
tised cost
Impair-
ment
losses
Carrying
amount
Banks 96,009 - 96,009 328 (151) 177 12,412 - 12,412
Sovereigns
Municipalities 98,586 (163) 98,423 930 (42) 888 2,214 - 2,214
Corporate
Large Corporates 808,778 (5,682) 803,096 38,236 (11,329) 26,907 - - -
Specialized lending 619,057 (11,272) 607,785 31,436 (5,123) 26,313 593 (48) 545
SME 561,233 (11,542) 549,691 70,116 (27,806) 42,310 5,131 (303) 4,828
Other Fin. Institutions 393,176 (203) 392,973 1 - 1 - - -
Private Sector Entities 3,224 (39) 3,185 7 - 7 22 - 22
Factoring 53,507 (673) 52,834 170 (20) 150 79 (2) 77
2,438,975 (29,411) 2,409,564 139,966 (44,278) 95,688 5,825 (353) 5,472
Retail
Small business 164,804 (1,484) 163,320 18,158 (11,473) 6,685 5,899 (1,096) 4,803
Consumer Loans 526,745 (17,789) 508,956 65,124 (43,046) 22,078 52,192 (6,800) 45,392
Mortgages 2,312,865 (7,604) 2,305,261 56,756 (14,633) 42,123 106,453 (4,453) 102,000
Credit Cards 184,798 (1,701) 183,097 48,406 (33,567) 14,839 26,937 (4,495) 22,442
Overdrafts 94,201 (959) 93,242 15,179 (12,410) 2,769 2,704 (367) 2,337
Flat owners associations 3,534 (42) 3,492 - - - - - -
Other 6,208 - 6,208 2 - 2 6 - 6
3,293,155 (29,579) 3,263,576 203,625 (115,129) 88,496 194,191 (17,211) 176,980
Securities
Trading 249,973 - 249,973 - - - - - -
AFS 1,615,824 - 1,615,824 - - - - - -
HTM 1,786,630 - 1,786,630 1,881 (249) 1,632 - - -
3,652,427 - 3,652,427 1,881 (249) 1,632 - - -
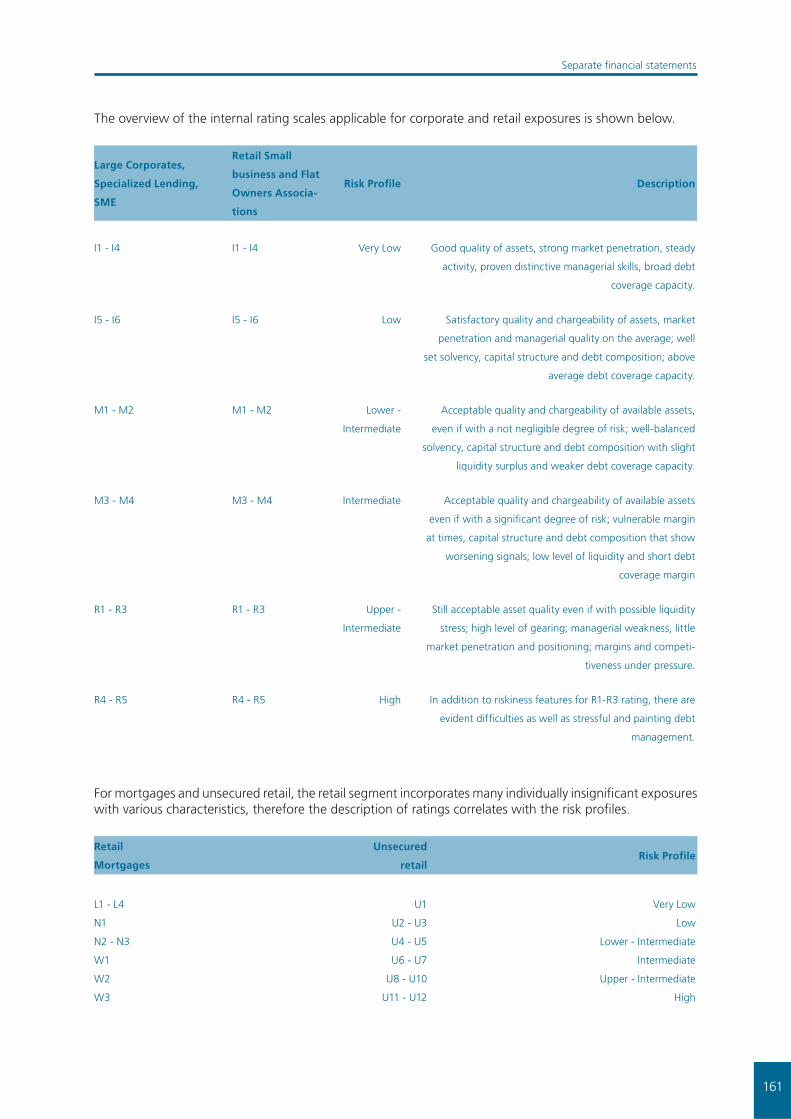
161
Separate fi nancial statements
The overview of the internal rating scales applicable for corporate and retail exposures is shown below.
Large Corporates,
Specialized Lending,
SME
Retail Small
business and Flat
Owners Associa-
tions
Risk Profi le Description
I1 - I4 I1 - I4 Very Low Good quality of assets, strong market penetration, steady
activity, proven distinctive managerial skills, broad debt
coverage capacity.
I5 - I6 I5 - I6 Low Satisfactory quality and chargeability of assets, market
penetration and managerial quality on the average; well
set solvency, capital structure and debt composition; above
average debt coverage capacity.
M1 - M2 M1 - M2 Lower -
Intermediate
Acceptable quality and chargeability of available assets,
even if with a not negligible degree of risk; well-balanced
solvency, capital structure and debt composition with slight
liquidity surplus and weaker debt coverage capacity.
M3 - M4 M3 - M4 Intermediate Acceptable quality and chargeability of available assets
even if with a signifi cant degree of risk; vulnerable margin
at times, capital structure and debt composition that show
worsening signals; low level of liquidity and short debt
coverage margin
R1 - R3 R1 - R3 Upper -
Intermediate
Still acceptable asset quality even if with possible liquidity
stress; high level of gearing; managerial weakness, little
market penetration and positioning; margins and competi-
tiveness under pressure.
R4 - R5 R4 - R5 High In addition to riskiness features for R1-R3 rating, there are
evident diffi culties as well as stressful and painting debt
management.
For mortgages and unsecured retail, the retail segment incorporates many individually insignifi cant exposures with various characteristics, therefore the description of ratings correlates with the risk profi les.
Retail
Mortgages
Unsecured
retailRisk Profi le
L1 - L4 U1 Very Low
N1 U2 - U3 Low
N2 - N3 U4 - U5 Lower - Intermediate
W1 U6 - U7 Intermediate
W2 U8 - U10 Upper - Intermediate
W3 U11 - U12 High
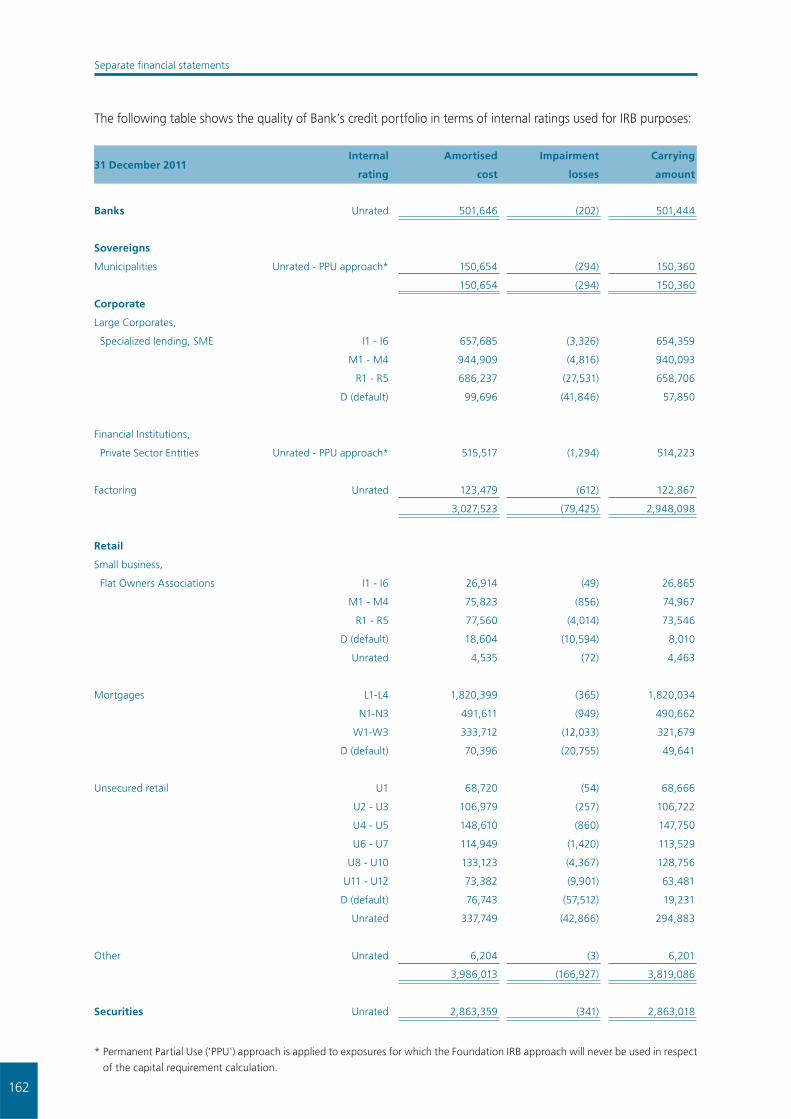
162
Separate fi nancial statements
The following table shows the quality of Bank’s credit portfolio in terms of internal ratings used for IRB purposes:
31 December 2011Internal
rating
Amortised
cost
Impairment
losses
Carrying
amount
Banks Unrated 501,646 (202) 501,444
Sovereigns
Municipalities Unrated - PPU approach* 150,654 (294) 150,360
150,654 (294) 150,360
Corporate
Large Corporates,
Specialized lending, SME I1 - I6 657,685 (3,326) 654,359
M1 - M4 944,909 (4,816) 940,093
R1 - R5 686,237 (27,531) 658,706
D (default) 99,696 (41,846) 57,850
Financial Institutions,
Private Sector Entities Unrated - PPU approach* 515,517 (1,294) 514,223
Factoring Unrated 123,479 (612) 122,867
3,027,523 (79,425) 2,948,098
Retail
Small business,
Flat Owners Associations I1 - I6 26,914 (49) 26,865
M1 - M4 75,823 (856) 74,967
R1 - R5 77,560 (4,014) 73,546
D (default) 18,604 (10,594) 8,010
Unrated 4,535 (72) 4,463
Mortgages L1-L4 1,820,399 (365) 1,820,034
N1-N3 491,611 (949) 490,662
W1-W3 333,712 (12,033) 321,679
D (default) 70,396 (20,755) 49,641
Unsecured retail U1 68,720 (54) 68,666
U2 - U3 106,979 (257) 106,722
U4 - U5 148,610 (860) 147,750
U6 - U7 114,949 (1,420) 113,529
U8 - U10 133,123 (4,367) 128,756
U11 - U12 73,382 (9,901) 63,481
D (default) 76,743 (57,512) 19,231
Unrated 337,749 (42,866) 294,883
Other Unrated 6,204 (3) 6,201
3,986,013 (166,927) 3,819,086
Securities Unrated 2,863,359 (341) 2,863,018
* Permanent Partial Use ('PPU') approach is applied to exposures for which the Foundation IRB approach will never be used in respect
of the capital requirement calculation.

163
Separate fi nancial statements
Due to the phased development of the internal rating models, comparative data as of 31 December 2010 is available only for the corporate segment and mortgages.
31 December 2010 Internal ratingAmortised
costs
Impairment
losses
Carrying
amount
Corporate
Large Corporates,
Specialized lending, SME I1 - I6 523,608 (580) 523,028
M1 - M4 890,205 (7,443) 882,762
R1 - R5 639,043 (28,921) 610,122
D (default) 81,724 (36,161) 45,563
Financial Institutions,
Private Sector Entities Unrated - PPU approach 396,430 (242) 396,188
Factoring Unrated 53,756 (695) 53,061
2,584,766 (74,042) 2,510,724
Retail
Mortgages L1 - L4 1,604,361 (344) 1,604,017
N1 - N3 474,088 (969) 473,119
W1 - W3 337,903 (10,026) 327,877
D (default) 59,722 (15,351) 44,371
2,476,074 (26,690) 2,449,384
(b) Market risk
Market risk is the risk that changes in market prices, such as interest rate, equity prices or foreign exchange rate will affect the Bank’s income or the value of its holdings of fi nancial instruments. The objective of market risk management is to manage and control market risk exposures within acceptable parameters, while optimizing the return on risk.
Management of market risk
The Bank separates its exposures to market risk between trading (‘trading book’) and non-trading portfolios (‘banking book’). Trading portfolios are held by the Trading department and include positions arising from market-making and proprietary position taking. All foreign exchange risk within the Bank is transferred each day to the Trading department and forms part of the trading portfolio for risk management purposes. The non-trading portfolios are managed by the ALM department, and include all positions which are not intended for trading.
Overall authority for market risk is vested in ALCO. The Enterprise Risk Management Division is responsible for the development of detailed risk management policies (subject to review and approval by ALCO) and for their implementation and day-to-day risk monitoring and reporting.
Exposure to market risk – trading portfolios
The principal tool used to measure and control market risk exposures within the Bank’s trading portfolio is Value at Risk (VaR). The VaR of a trading portfolio is the estimated loss that will arise on the portfolio over a specifi ed period of time (holding period) from an adverse market movement with a specifi ed probability

164
Separate fi nancial statements
(confi dence level). The VaR model used by the Bank is based upon a 99% confi dence level and assumes a one-day holding period. The VaR model used is based on historical simulation. Taking account of market data from the previous year, and observed relationships between different markets and prices, the model generates a wide range of plausible future scenarios for market price movements. The model was approved by the NBS as a basis for the calculation of the capital charge for market risk of the trading book.
The Bank uses VaR limits for total market risk in the trading book, foreign exchange risk and interest rate risk. The overall structure of VaR limits is subject to review and approval by ALCO and Intesa Sanpaolo. VaR is measured on a daily basis. Daily reports of utilisation of VaR limits are submitted to the trading unit, the head of the Risk Management division and the head of the Finance and Capital Markets division. Regular summaries are submitted to Intesa Sanpaolo and ALCO.
A summary of the VaR position of the Bank’s trading portfolios:
2011 2010
€ ´000 Balance Avg Max Min Balance Avg Max Min
Foreign currency risk 63 83 228 15 58 99 307 8
Interest rate risk 43 148 372 43 96 105 161 75
Overall 58 182 440 46 113 163 367 80
The limitations of the VaR methodology are recognised by supplementing VaR limits with other position limit structures. In addition, the Bank uses a wide range of stress tests to model the fi nancial impact of a variety of exceptional market scenarios on the Bank’s position.
Exposure to interest rate risk
The main risk to which non-trading portfolios are exposed is the risk of loss from fl uctuations in the future cash fl ows or fair values of fi nancial instruments due to a change in market interest rates. Interest rate risk is managed principally through monitoring interest rate gaps. Financial instruments are mapped to re-pricing gaps either by the maturity, i.e. fi xed rate instruments, or by the next re-pricing date, i.e. fl oating rate instruments. Assets and liabilities that do not have a contractual maturity date or are not interest - bearing are mapped according to internal models based on behavioural assumptions.
The Risk Management division is responsible for monitoring these gaps at least on a monthly basis. The management of interest rate risk is measured by shift sensitivity analysis which is defi ned as a parallel and uniform shift of + 1 basis point of the rate curve and + 200 basis points of the rate curve. These standard scenarios are applied on monthly basis.
The sensitivity of the interest margin is also measured on the basis of a parallel and instantaneous shock in the interest rate curve of ±100 basis points, in a period of 12 months and for all following periods. It should be noted that this measure highlights the effect of variations in market interest rates on the portfolio being measured, and excludes assumptions on future changes in the mix of assets and liabilities and, therefore it cannot be considered as a predictor of the future levels of the interest margin.
Overall banking book interest rate risk positions are managed by Asset and Liability Management, which uses different balance and off balance sheet instruments to manage the overall positions arising from the Bank’s banking book activities.
Interest rate risk comprises of the risk that the value of a fi nancial instrument will fl uctuate due to changes in market interest rates and the risk that the maturities of interest bearing assets differ from the maturities of the interest bearing liabilities used to fund those assets. The length of time for which the rate of interest is fi xed on a fi nancial instrument therefore indicates the extent to which it is exposed to the interest rate risk.
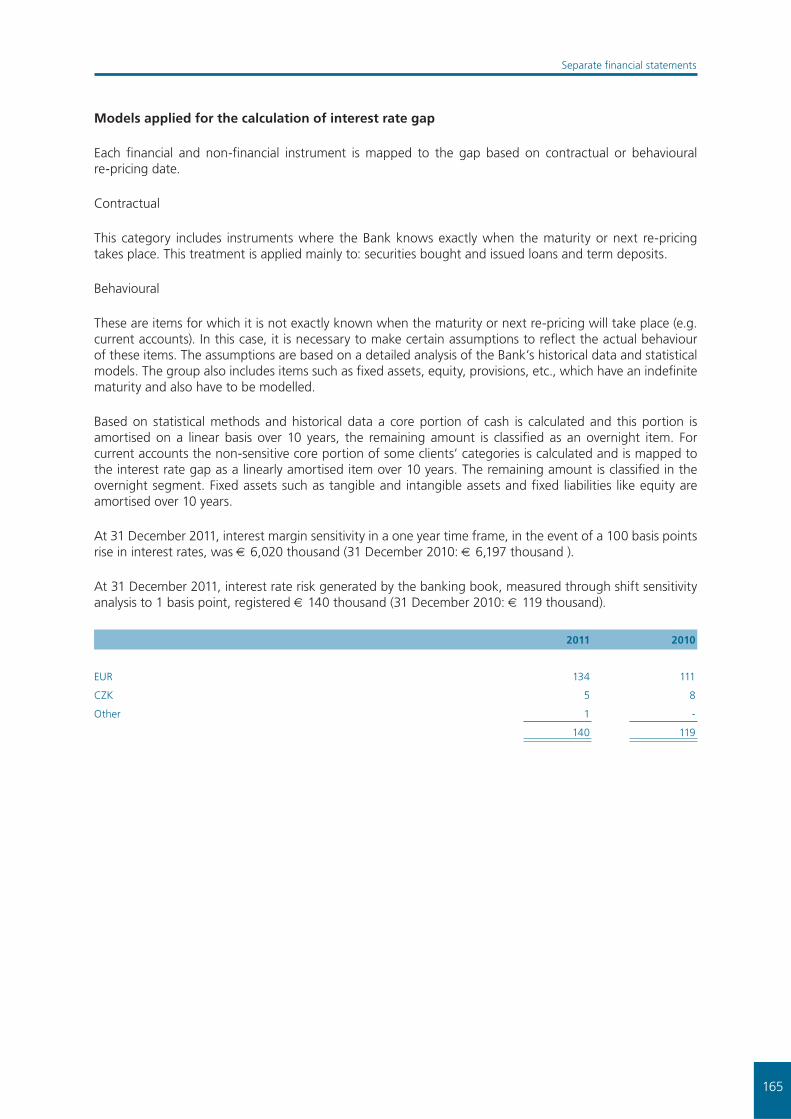
165
Separate fi nancial statements
Models applied for the calculation of interest rate gap
Each fi nancial and non-fi nancial instrument is mapped to the gap based on contractual or behavioural re-pricing date.
Contractual
This category includes instruments where the Bank knows exactly when the maturity or next re-pricing takes place. This treatment is applied mainly to: securities bought and issued loans and term deposits.
Behavioural
These are items for which it is not exactly known when the maturity or next re-pricing will take place (e.g. current accounts). In this case, it is necessary to make certain assumptions to refl ect the actual behaviour of these items. The assumptions are based on a detailed analysis of the Bank’s historical data and statistical models. The group also includes items such as fi xed assets, equity, provisions, etc., which have an indefi nite maturity and also have to be modelled.
Based on statistical methods and historical data a core portion of cash is calculated and this portion is amortised on a linear basis over 10 years, the remaining amount is classifi ed as an overnight item. For current accounts the non-sensitive core portion of some clients’ categories is calculated and is mapped to the interest rate gap as a linearly amortised item over 10 years. The remaining amount is classifi ed in the overnight segment. Fixed assets such as tangible and intangible assets and fi xed liabilities like equity are amortised over 10 years.
At 31 December 2011, interest margin sensitivity in a one year time frame, in the event of a 100 basis points rise in interest rates, was € 6,020 thousand (31 December 2010: € 6,197 thousand ).
At 31 December 2011, interest rate risk generated by the banking book, measured through shift sensitivity analysis to 1 basis point, registered € 140 thousand (31 December 2010: € 119 thousand).
2011 2010
EUR 134 111
CZK 5 8
Other 1 -
140 119

166
Separate fi nancial statements
The re-pricing structure of fi nancial assets and liabilities based on contractual undiscounted cash-fl ows for the non-trading portfolios was as follows:
31 December 2011Up to
1 month
1 to 3
months
3 months to
1 year1 to 5 years
Over
5 yearsTotal
Assets
Cash and balances
with central banks 18,651 - 7,217 28,869 36,181 90,918
Due from banks 64,478 4,127 414,060 14,093 - 496,758
Available-for-sale fi nancial assets 317,886 22,909 47,486 875,038 501,241 1,764,560
Loans and advances to customers 2,043,800 1,437,558 1,622,117 2,374,377 773,480 8,251,332
Held-to-maturity investments - 18,435 197,446 545,895 602,153 1,363,929
2,444,815 1,483,029 2,288,326 3,838,272 1,913,055 11,967,497
Liabilities
Due to central
and other banks (393,073) (33,093) (1,397) (2,083) (80) (429,726)
Due to customers (2,365,098) (634,172) (1,296,114) (2,218,181) (1,116,804) (7,630,369)
Debt securities in issue (303,001) (428,906) (321,400) (627,040) (205,744) (1,886,091)
(3,061,172) (1,096,171) (1,618,911) (2,847,304) (1,322,628) (9,946,186)
Net position of fi nancial instruments (616,357) 386,858 669,415 990,968 590,427 2,021,311
31 December 2010Up to
1 month
1 to
3 months
3 months
to 1 year
1 to
5 years
Over
5 yearsTotal
Assets
Cash and balances
with central banks 93,630 - 8,543 34,174 42,717 179,064
Due from banks 67,561 - 12,031 11,807 - 91,399
Available-for-sale fi nancial assets 319,427 233,748 23,425 475,204 842,893 1,894,697
Loans and advances to customers 1,771,880 1,259,913 1,754,659 1,940,181 797,324 7,523,957
Held-to-maturity investments 378,474 280,997 66,838 727,168 626,757 2,080,234
2,630,972 1,774,658 1,865,496 3,188,534 2,309,691 11,769,351
Liabilities
Due to central
and other banks (360,726) (53,759) (701) (2,465) (319) (417,970)
Due to customers (2,667,761) (372,333) (822,410) (2,285,594) (1,198,383) (7,346,481)
Debt securities in issue (301,147) (510,676) (259,626) (396,848) (364,090) (1,832,387)
(3,329,634) (936,768) (1,082,737) (2,684,907) (1,562,792) (9,596,838)
Net position of fi nancial instruments (698,662) 837,890 782,759 503,627 746,899 2,172,513
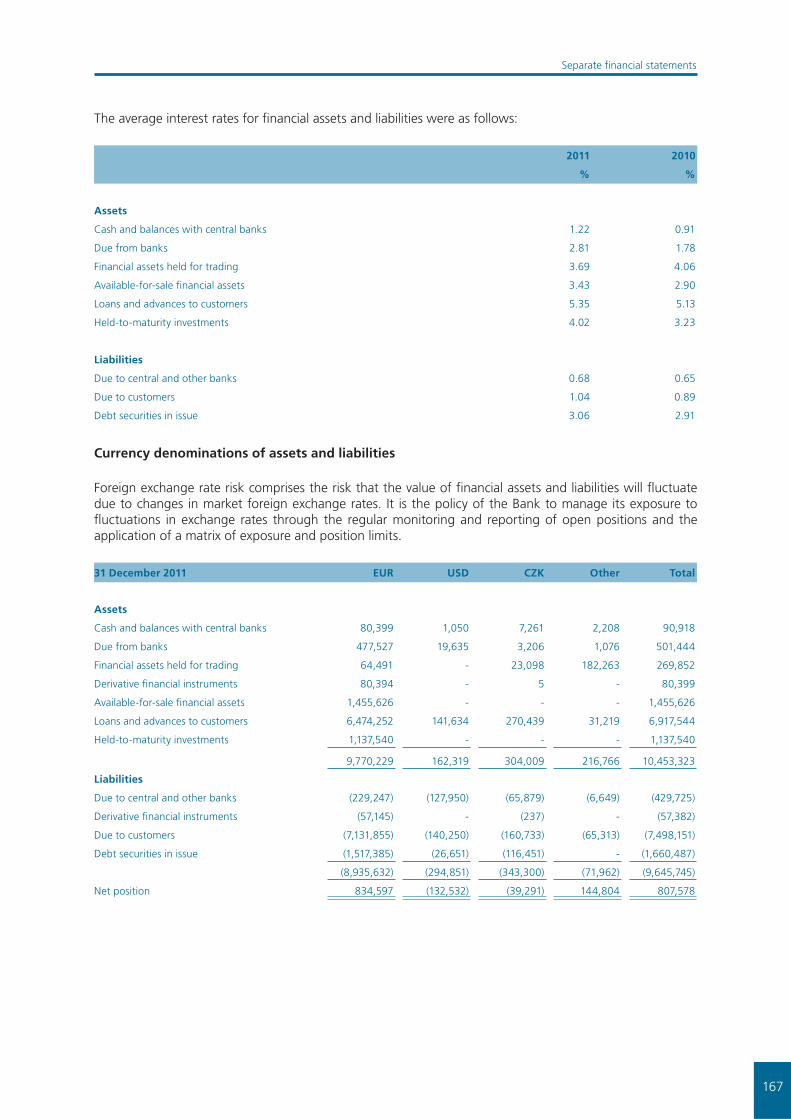
167
Separate fi nancial statements
The average interest rates for fi nancial assets and liabilities were as follows:
2011
%
2010
%
Assets
Cash and balances with central banks 1.22 0.91
Due from banks 2.81 1.78
Financial assets held for trading 3.69 4.06
Available-for-sale fi nancial assets 3.43 2.90
Loans and advances to customers 5.35 5.13
Held-to-maturity investments 4.02 3.23
Liabilities
Due to central and other banks 0.68 0.65
Due to customers 1.04 0.89
Debt securities in issue 3.06 2.91
Currency denominations of assets and liabilities
Foreign exchange rate risk comprises the risk that the value of fi nancial assets and liabilities will fl uctuate due to changes in market foreign exchange rates. It is the policy of the Bank to manage its exposure to fl uctuations in exchange rates through the regular monitoring and reporting of open positions and the application of a matrix of exposure and position limits.
31 December 2011 EUR USD CZK Other Total
Assets
Cash and balances with central banks 80,399 1,050 7,261 2,208 90,918
Due from banks 477,527 19,635 3,206 1,076 501,444
Financial assets held for trading 64,491 - 23,098 182,263 269,852
Derivative fi nancial instruments 80,394 - 5 - 80,399
Available-for-sale fi nancial assets 1,455,626 - - - 1,455,626
Loans and advances to customers 6,474,252 141,634 270,439 31,219 6,917,544
Held-to-maturity investments 1,137,540 - - - 1,137,540
9,770,229 162,319 304,009 216,766 10,453,323
Liabilities
Due to central and other banks (229,247) (127,950) (65,879) (6,649) (429,725)
Derivative fi nancial instruments (57,145) - (237) - (57,382)
Due to customers (7,131,855) (140,250) (160,733) (65,313) (7,498,151)
Debt securities in issue (1,517,385) (26,651) (116,451) - (1,660,487)
(8,935,632) (294,851) (343,300) (71,962) (9,645,745)
Net position 834,597 (132,532) (39,291) 144,804 807,578
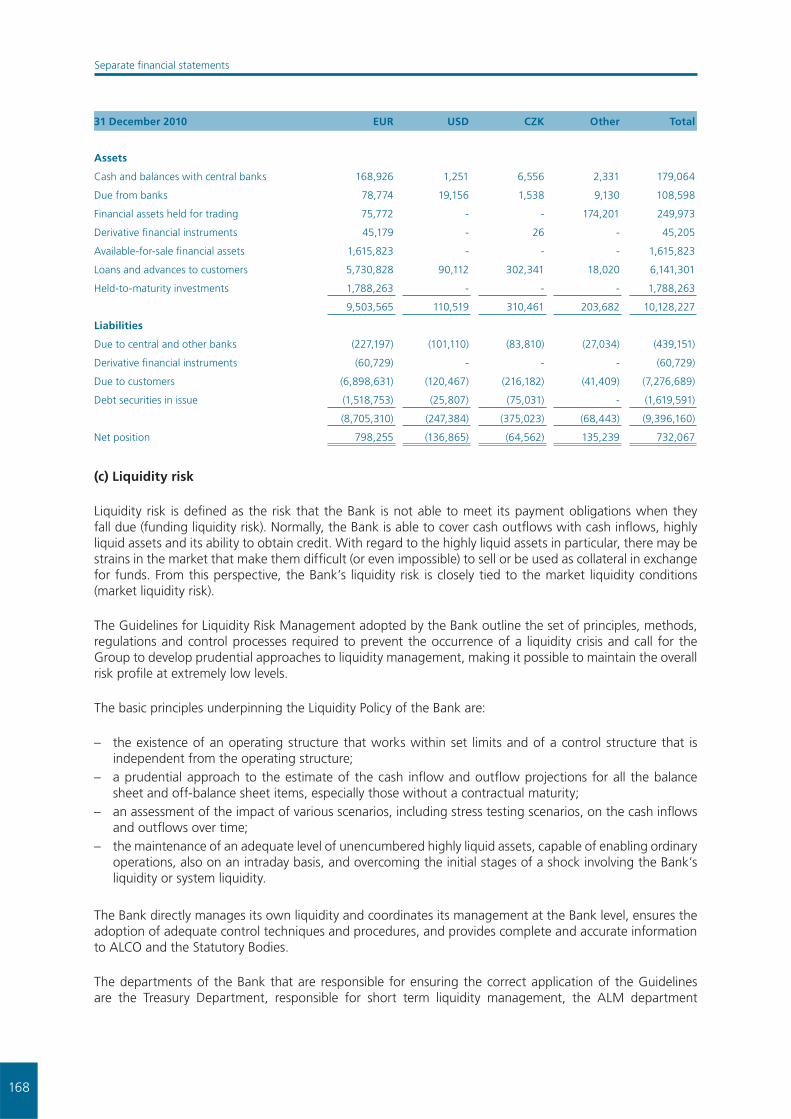
168
Separate fi nancial statements
31 December 2010 EUR USD CZK Other Total
Assets
Cash and balances with central banks 168,926 1,251 6,556 2,331 179,064
Due from banks 78,774 19,156 1,538 9,130 108,598
Financial assets held for trading 75,772 - - 174,201 249,973
Derivative fi nancial instruments 45,179 - 26 - 45,205
Available-for-sale fi nancial assets 1,615,823 - - - 1,615,823
Loans and advances to customers 5,730,828 90,112 302,341 18,020 6,141,301
Held-to-maturity investments 1,788,263 - - - 1,788,263
9,503,565 110,519 310,461 203,682 10,128,227
Liabilities
Due to central and other banks (227,197) (101,110) (83,810) (27,034) (439,151)
Derivative fi nancial instruments (60,729) - - - (60,729)
Due to customers (6,898,631) (120,467) (216,182) (41,409) (7,276,689)
Debt securities in issue (1,518,753) (25,807) (75,031) - (1,619,591)
(8,705,310) (247,384) (375,023) (68,443) (9,396,160)
Net position 798,255 (136,865) (64,562) 135,239 732,067
(c) Liquidity risk
Liquidity risk is defi ned as the risk that the Bank is not able to meet its payment obligations when they fall due (funding liquidity risk). Normally, the Bank is able to cover cash outfl ows with cash infl ows, highly liquid assets and its ability to obtain credit. With regard to the highly liquid assets in particular, there may be strains in the market that make them diffi cult (or even impossible) to sell or be used as collateral in exchange for funds. From this perspective, the Bank’s liquidity risk is closely tied to the market liquidity conditions (market liquidity risk).
The Guidelines for Liquidity Risk Management adopted by the Bank outline the set of principles, methods, regulations and control processes required to prevent the occurrence of a liquidity crisis and call for the Group to develop prudential approaches to liquidity management, making it possible to maintain the overall risk profi le at extremely low levels.
The basic principles underpinning the Liquidity Policy of the Bank are:
– the existence of an operating structure that works within set limits and of a control structure that is independent from the operating structure;
– a prudential approach to the estimate of the cash infl ow and outfl ow projections for all the balance sheet and off-balance sheet items, especially those without a contractual maturity;
– an assessment of the impact of various scenarios, including stress testing scenarios, on the cash infl ows and outfl ows over time;
– the maintenance of an adequate level of unencumbered highly liquid assets, capable of enabling ordinary operations, also on an intraday basis, and overcoming the initial stages of a shock involving the Bank’s liquidity or system liquidity.
The Bank directly manages its own liquidity and coordinates its management at the Bank level, ensures the adoption of adequate control techniques and procedures, and provides complete and accurate information to ALCO and the Statutory Bodies.
The departments of the Bank that are responsible for ensuring the correct application of the Guidelines are the Treasury Department, responsible for short term liquidity management, the ALM department

169
Separate fi nancial statements
(responsible for medium and long term liquidity management) and the Market Risk Department (responsible for monitoring indicators and verifying the observation of limits).
These Guidelines are broken down into three macro areas: ‘Short term Liquidity Policy’, ‘Structural Liquidity Policy’ and ‘Contingency Liquidity Plan’.
The Short term Liquidity Policy includes the set of parameters, limits and observation thresholds that enable measurement, both under normal market conditions and under conditions of stress, of liquidity risk exposure over the short term, setting the maximum amount of risk to be assumed and ensuring the utmost prudence in its management.
The Structural Liquidity Policy of the Bank incorporates the set of measures and limits designed to control and manage the risks deriving from the mismatch of the medium to long-term maturities of the assets and liabilities, essential for the strategic planning of liquidity management. This involves the adoption of internal limits for the transformation of maturity dates aimed at preventing the medium to long-term operations from giving rise to excessive imbalances to be fi nanced in the short term.
Rule 1: Real Estate + Equity Investments <= Regulatory Capital
Rule 2: Medium term assets + 0.5 x Long Term Assets <= Long term liabilities + 0.5 x Medium term liabilities + 0.25 x (short term customer liabilities + interbank liabilities) + excess in Rule 1
Together with the Short term and Structural Liquidity Policy, the Guidelines provide for the management methods of a potential liquidity crisis, defi ned as a situation of diffi culty or inability of the Bank to meet its cash commitments falling due, without implementing procedures and/or employing instruments that, due to their intensity or manner of use, do not qualify as ordinary administration.
The Contingency Liquidity Plan sets the objectives of safeguarding the Bank’s capital and, at the same time, guarantees the continuity of operations under conditions of extreme liquidity emergency. It also ensures the identifi cation of the pre-warning signals and their ongoing monitoring, the defi nition of procedures to be implemented in situations of liquidity stress, the immediate lines of action, and intervention measures for the resolution of emergencies. The pre-warning indices, aimed at identifying signs of a potential liquidity strain, both systemic and specifi c, are continuously recorded and reported to the departments responsible for the management and monitoring of liquidity.
The liquidity position of the Bank and the subsidiaries is regularly presented by Market Risk Department and discussed during the ALCO meetings.

170
Separate fi nancial statements
The remaining maturities of assets and liabilities based on contractual undiscounted cash-fl ows were as follows:
31 December 2011Up to
1 month
1 to
3 months
3 months
to 1 year
1 to
5 years
Over
5 years
Not
specifi edTotal
Assets
Cash and balances
with central banks 90,918 - - - - - 90,918
Due from banks 10,067 591 422,887 65,283 32,208 - 531,036
Financial assets
held for trading 11,000 170,481 91,222 115 - - 272,818
Available-for-sale
fi nancial assets 6,610 22,909 53,110 1,207,657 501,241 - 1,791,527
Loans and advances
to customers 457,066 362,477 1,210,797 2,895,314 4,167,852 12,296 9,105,802
Held-to-maturity investments - 18,435 187,474 556,232 602,052 - 1,364,193
575,661 574,893 1,965,490 4,724,601 5,303,353 12,296 13,156,294
Liabilities
Due to central
and other banks (451,021) (1,163) (4,109) (16,086) (240) - (472,619)
Due to customers (4,410,038) (726,411) (1,173,994) (1,202,070) (88,363) (66) (7,600,942)
Debt securities in issue (3,001) (22,524) (220,624) (993,096) (711,089) - (1,950,334)
(4,864,060) (750,098) (1,398,727) (2,211,252) (799,692) (66) (10,023,895)
Net position
of fi nancial instruments (4,288,399) (175,205) 566,763 2,513,349 4,503,661 12,230 3,132,399
Cash infl ows
from derivatives 315,300 305,479 335,645 170,188 161,261 - 1,287,873
Cash outfl ows
from derivatives (316,359) (282,394) (322,662) (183,002) (160,687) - (1,265,104)
Net position from
derivatives (1,059) 23,085 12,983 (12,814) 574 - 22,769
Total net position (4,289,458) (152,120) 579,746 2,500,535 4,504,235 12,230 3,155,168
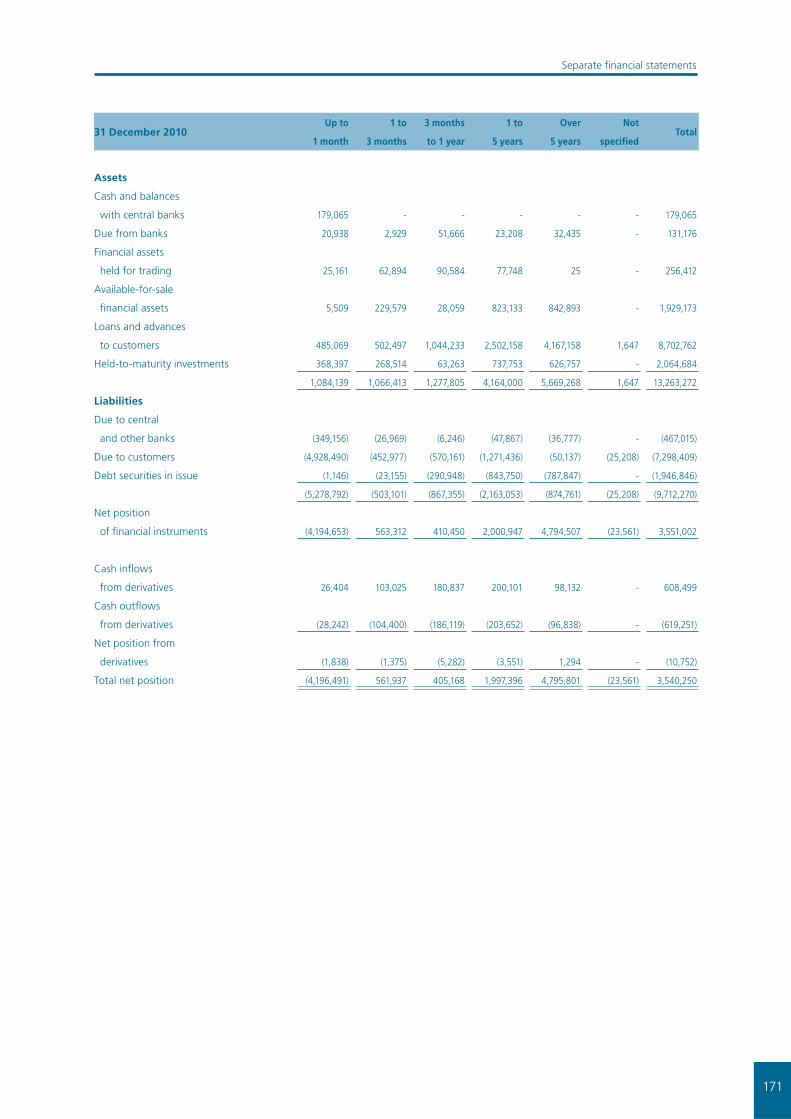
171
Separate fi nancial statements
31 December 2010Up to
1 month
1 to
3 months
3 months
to 1 year
1 to
5 years
Over
5 years
Not
specifi edTotal
Assets
Cash and balances
with central banks 179,065 - - - - - 179,065
Due from banks 20,938 2,929 51,666 23,208 32,435 - 131,176
Financial assets
held for trading 25,161 62,894 90,584 77,748 25 - 256,412
Available-for-sale
fi nancial assets 5,509 229,579 28,059 823,133 842,893 - 1,929,173
Loans and advances
to customers 485,069 502,497 1,044,233 2,502,158 4,167,158 1,647 8,702,762
Held-to-maturity investments 368,397 268,514 63,263 737,753 626,757 - 2,064,684
1,084,139 1,066,413 1,277,805 4,164,000 5,669,268 1,647 13,263,272
Liabilities
Due to central
and other banks (349,156) (26,969) (6,246) (47,867) (36,777) - (467,015)
Due to customers (4,928,490) (452,977) (570,161) (1,271,436) (50,137) (25,208) (7,298,409)
Debt securities in issue (1,146) (23,155) (290,948) (843,750) (787,847) - (1,946,846)
(5,278,792) (503,101) (867,355) (2,163,053) (874,761) (25,208) (9,712,270)
Net position
of fi nancial instruments (4,194,653) 563,312 410,450 2,000,947 4,794,507 (23,561) 3,551,002
Cash infl ows
from derivatives 26,404 103,025 180,837 200,101 98,132 - 608,499
Cash outfl ows
from derivatives (28,242) (104,400) (186,119) (203,652) (96,838) - (619,251)
Net position from
derivatives (1,838) (1,375) (5,282) (3,551) 1,294 - (10,752)
Total net position (4,196,491) 561,937 405,168 1,997,396 4,795,801 (23,561) 3,540,250
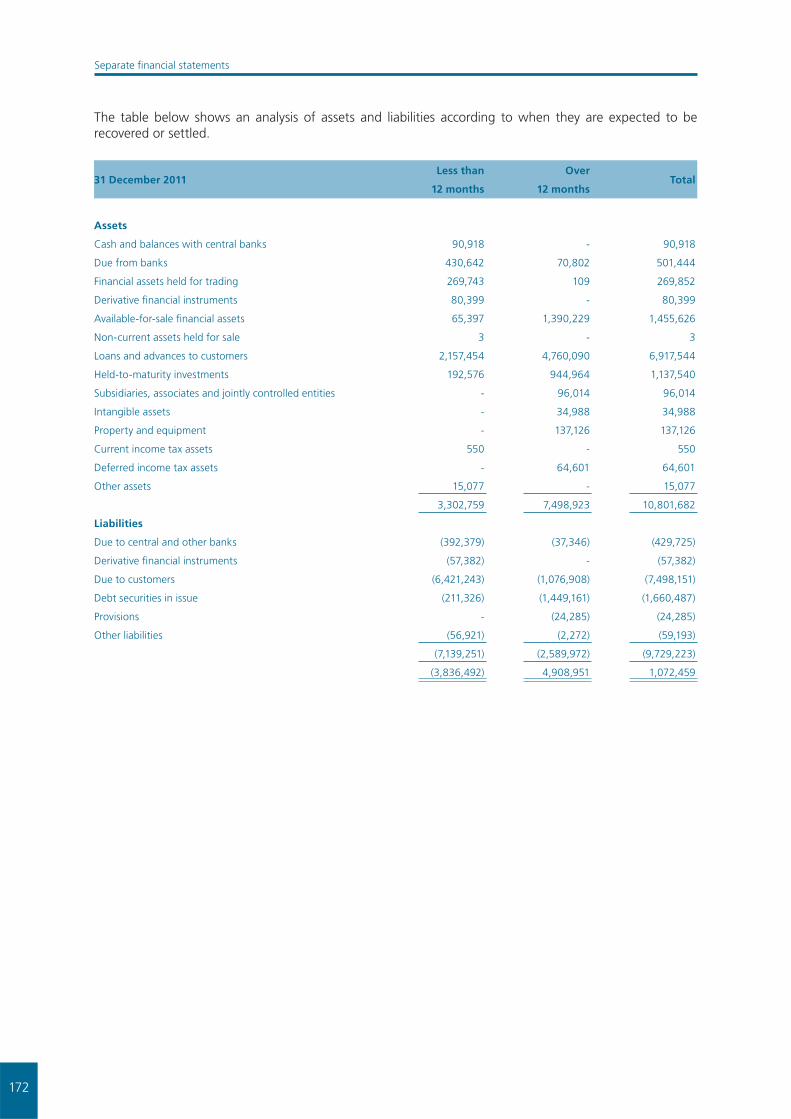
172
Separate fi nancial statements
The table below shows an analysis of assets and liabilities according to when they are expected to be recovered or settled.
31 December 2011Less than
12 months
Over
12 monthsTotal
Assets
Cash and balances with central banks 90,918 - 90,918
Due from banks 430,642 70,802 501,444
Financial assets held for trading 269,743 109 269,852
Derivative fi nancial instruments 80,399 - 80,399
Available-for-sale fi nancial assets 65,397 1,390,229 1,455,626
Non-current assets held for sale 3 - 3
Loans and advances to customers 2,157,454 4,760,090 6,917,544
Held-to-maturity investments 192,576 944,964 1,137,540
Subsidiaries, associates and jointly controlled entities - 96,014 96,014
Intangible assets - 34,988 34,988
Property and equipment - 137,126 137,126
Current income tax assets 550 - 550
Deferred income tax assets - 64,601 64,601
Other assets 15,077 - 15,077
3,302,759 7,498,923 10,801,682
Liabilities
Due to central and other banks (392,379) (37,346) (429,725)
Derivative fi nancial instruments (57,382) - (57,382)
Due to customers (6,421,243) (1,076,908) (7,498,151)
Debt securities in issue (211,326) (1,449,161) (1,660,487)
Provisions - (24,285) (24,285)
Other liabilities (56,921) (2,272) (59,193)
(7,139,251) (2,589,972) (9,729,223)
(3,836,492) 4,908,951 1,072,459

173
Separate fi nancial statements
31 December 2010Less than
12 months
Over
12 monthsTotal
Assets
Cash and balances with central banks 179,064 - 179,064
Due from banks 70,954 37,644 108,598
Financial assets held for trading 176,187 73,786 249,973
Derivative fi nancial instruments 45,205 - 45,205
Available-for-sale fi nancial assets 244,614 1,371,209 1,615,823
Non-current assets held for sale 3,374 - 3,374
Loans and advances to customers 1,902,745 4,238,556 6,141,301
Held-to-maturity investments 687,236 1,101,027 1,788,263
Subsidiaries, associates and jointly controlled entities - 113,810 113,810
Intangible assets - 30,639 30,639
Property and equipment - 142,801 142,801
Current income tax assets 6,882 - 6,882
Deferred income tax assets - 54,092 54,092
Other assets 12,991 - 12,991
3,329,252 7,163,564 10,492,816
Liabilities
Due to central and other banks (395,694) (43,457) (439,151)
Derivative fi nancial instruments (60,729) - (60,729)
Due to customers (6,005,385) (1,271,304) (7,276,689)
Debt securities in issue (285,446) (1,334,145) (1,619,591)
Provisions - (23,517) (23,517)
Other liabilities (51,173) (1,761) (52,934)
(6,798,427) (2,674,184) (9,472,611)
(3,469,175) 4,489,380 1,020,205
(d) Operational risk
Operational risk management strategies and processes
The Bank, in coordination with Intesa Sanpaolo, has defi ned the overall operational risk management framework by setting up a Group policy and organisational process for measuring, managing and controlling operational risk.
The control of operational risk was attributed to the Operational Risk Committee, which identifi es risk management policies. The Supervisory and Management Board of the Bank ensures the functionality, effi ciency and effectiveness of the risk management and controls system.
The Operational Risk Committee (composing of the heads of the areas of the governance centre and of the business areas more involved in operational risk management), has the task of periodically reviewing the Bank’s overall operational risk profi le, authorising any corrective actions, coordinating and monitoring the effectiveness of the main mitigation activities and approving the operational risk transfer strategies.
Organisational structure of the associated risk management function
For some time, the Bank has had a centralised function within the Risk Management Division for the management of the Bank’s operational risks. This function is responsible, in coordination with the parent

174
Separate fi nancial statements
company, for the defi nition, implementation and monitoring of the methodological and organisational framework, as well as for the measurement of the risk profi le, the verifi cation of mitigation effectiveness and reporting to senior Management. In compliance with current requirements, the individual organisational units participated in the process and each of them was assigned the responsibility for the identifi cation, assessment, management and mitigation of its operational risks. Specifi c offi ces and departments have been identifi ed within these organisational units to be responsible for Operational Risk Management. These functions are responsible for the collection and structured census of information relating to operational events, scenario analyses and evaluation of the level of risk associated with the business environment. The Risk Management Division carries out second level monitoring of these activities.
Scope of application and characteristics of the risk measurement and reporting system
Upon the request of the parent company, the Bank as part of the Group request has received in February 2010, from the relevant Supervisory authorities, approval for usage and thus adopted the Advanced Measurement Approach (AMA), for Operational Risk management and measurement.
As such, the VUB Group uses a combination of the Advanced Measurement Approach (for the Bank), and the Standardized and Basic Indicator Approach (for Bank’s subsidiaries).
For the use of the AMA, the Bank has set up, in addition to the corporate governance mechanisms required by the Supervisory regulations, an effective system for the management of operational risk certifi ed by the process of annual self-assessment carried out by the Bank and VUB Group Companies that fall within the scope of AMA and TSA. This self-assessment is verifi ed by the Internal Audit Department and submitted to the Management Board for the annual certifi cation of compliance with the requirements established by the regulation.
Under the AMA approach, the capital requirement is calculated by internal model, which combines all elements stipulated in Supervisory regulation, allowing to measure the exposure in a more risk sensitive way. Monitoring of operational risks is performed by an integrated reporting system, which provides management with the information necessary for the management and/or mitigation of the operational risk.
Policies for hedging and mitigating risk
The Bank, in coordination with its parent company, has set up a traditional operational risk transfer policy (insurance) aimed at mitigating the impact of any unexpected losses. The AMA calculation does not currently include the benefi t from this transfer of operational risk through insurance policies, however, it is due to be included in the future, after its validation by the Supervisory authority, so that it can contribute to reducing the risk capital calculated through the internal models. The process required to obtain this approval is planned to start in 2012.

175
Separate fi nancial statements
36. Segment reporting
Segment information is presented in respect of the Bank’s operating segments, based on the management and internal reporting structure.
Operating segments pay and receive interest to and from the Central Treasury on an arm’s length basis in order to refl ect the costs of funding.
The Bank comprises the following main operating segments:
– Retail Banking– Corporate Banking– Central Treasury
Retail Banking includes loans, deposits and other transactions and balances with households, entrepreneurs and small business segment.
Corporate Banking comprises Small and Medium Enterprises (‘SME’) and the Corporate Customer Desk (‘CCD’). SME includes loans, deposits and other transactions and balances with small and medium enterprises (company revenue in the range of € 1 million to € 40 million; if revenue information is not available, bank account turnover is used). The CCD includes loans, deposits and other transactions and balances with large corporate customers (company revenue over € 40 million).
Central Treasury undertakes the Bank’s funding, HTM Securities portfolio management, issues of debt securities as well as trading book operations. The Bank also has a central Governance Centre that manages the Bank’s premises, equity investments and own equity funds as well as Risk Management that operates the workout loan portfolio.
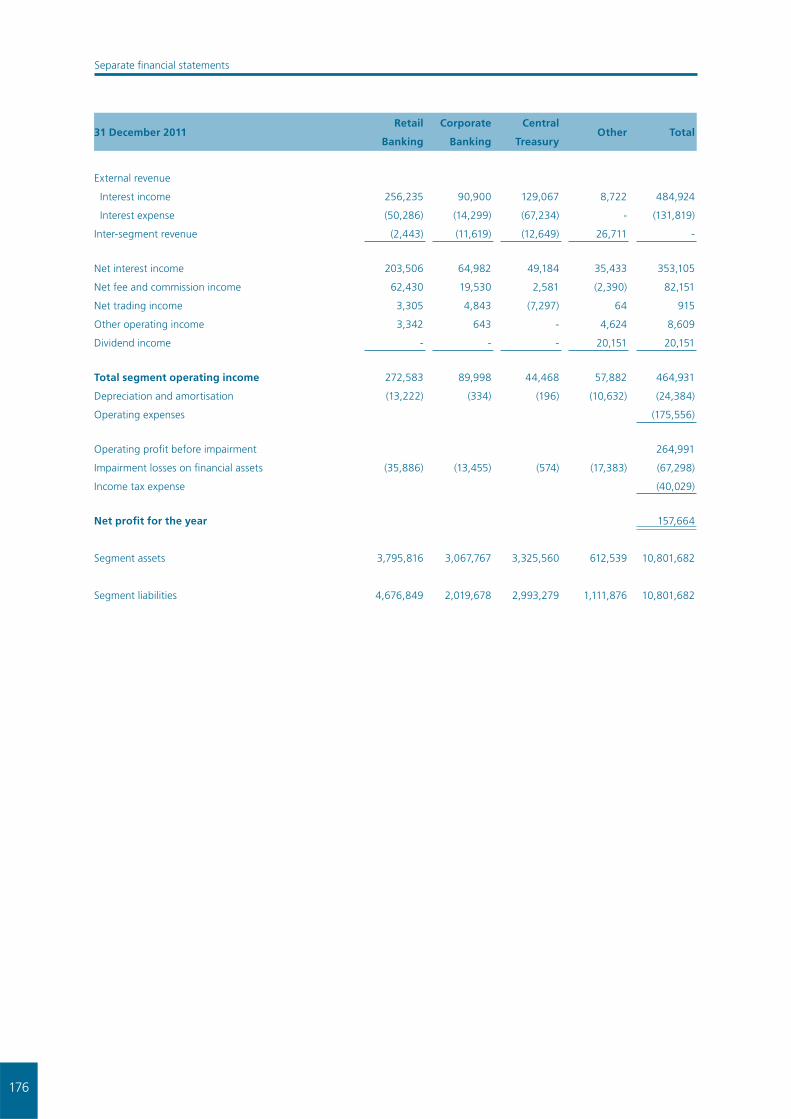
176
Separate fi nancial statements
31 December 2011Retail
Banking
Corporate
Banking
Central
TreasuryOther Total
External revenue
Interest income 256,235 90,900 129,067 8,722 484,924
Interest expense (50,286) (14,299) (67,234) - (131,819)
Inter-segment revenue (2,443) (11,619) (12,649) 26,711 -
Net interest income 203,506 64,982 49,184 35,433 353,105
Net fee and commission income 62,430 19,530 2,581 (2,390) 82,151
Net trading income 3,305 4,843 (7,297) 64 915
Other operating income 3,342 643 - 4,624 8,609
Dividend income - - - 20,151 20,151
Total segment operating income 272,583 89,998 44,468 57,882 464,931
Depreciation and amortisation (13,222) (334) (196) (10,632) (24,384)
Operating expenses (175,556)
Operating profi t before impairment 264,991
Impairment losses on fi nancial assets (35,886) (13,455) (574) (17,383) (67,298)
Income tax expense (40,029)
Net profi t for the year 157,664
Segment assets 3,795,816 3,067,767 3,325,560 612,539 10,801,682
Segment liabilities 4,676,849 2,019,678 2,993,279 1,111,876 10,801,682

177
Separate fi nancial statements
31 December 2010Retail
Banking
Corporate
Banking
Central
TreasuryOther Total
External revenue
Interest income 238,576 70,310 120,311 4,307 433,504
Interest expense (49,081) (6,977) (52,653) 83 (108,628)
Inter-segment revenue (3,557) (11,806) (8,686) 24,049 -
Net interest income 185,938 51,527 58,972 28,439 324,876
Net fee and commission income 52,868 19,113 1,432 195 73,608
Net trading income 3,655 4,210 (1,452) (167) 6,246
Other operating income 2,855 564 1 407 3,827
Dividend income - - - 14,281 14,281
Total segment operating income 245,316 75,414 58,953 43,155 422,838
Depreciation and amortisation (15,930) (370) (136) (10,706) (27,142)
Operating expenses (164,369)
Operating profi t before impairment 231,327
Impairment losses on fi nancial assets (34,895) (9,372) 157 (3,947) (48,057)
Income tax expense (33,893)
Net profi t for the year 149,377
Segment assets 3,507,033 2,849,441 3,654,916 481,426 10,492,816
Segment liabilities 4,413,635 2,027,719 2,958,884 1,092,578 10,492,816
178
Separate fi nancial statements
37. Related parties
Related parties are those counterparties that represent:
(a) enterprises that directly, or indirectly, through one or more intermediaries, control, or are controlled by, or are under the common control of, the reporting enterprise;
(b) associates – enterprises in which the parent company has signifi cant infl uence and which are neither a subsidiary nor a joint venture;
(c) individuals owning, directly or indirectly, an interest in the voting power of the Bank that gives them signifi cant infl uence over the Bank, and anyone expected to infl uence, or be infl uenced by, that person in their dealings with the Bank;
(d) key management personnel, that is, those persons having authority and responsibility for planning, directing and controlling the activities of the Bank, including directors and offi cers of the Bank and close members of the families of such individuals; and
(e) enterprises in which a substantial interest in the voting power is owned, directly or indirectly, by any person described in (c) or (d) or over which such a person is able to exercise signifi cant infl uence. This includes enterprises owned by directors or major shareholders of the Bank and enterprises that have a member of key management in common with the Bank.
In considering each possible related party relationship, attention is directed to the substance of the relationship, and not merely the legal form. The majority of the stated transactions have been made under arms-length commercial and banking conditions.
In 2011, the remuneration and other benefi ts provided to members of the Supervisory Board and the Management Board were € 4,338 thousand (2010: € 3,144 thousand).
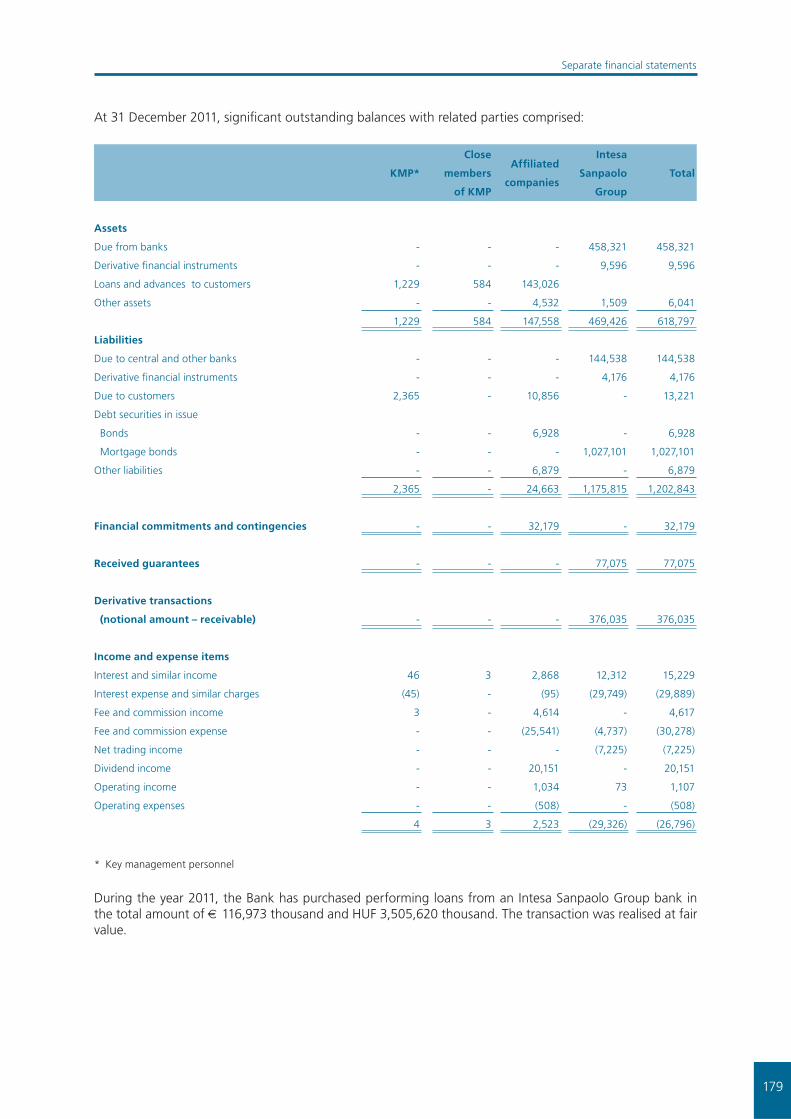
179
Separate fi nancial statements
At 31 December 2011, signifi cant outstanding balances with related parties comprised:
KMP*
Close
members
of KMP
Affi liated
companies
Intesa
Sanpaolo
Group
Total
Assets
Due from banks - - - 458,321 458,321
Derivative fi nancial instruments - - - 9,596 9,596
Loans and advances to customers 1,229 584 143,026
Other assets - - 4,532 1,509 6,041
1,229 584 147,558 469,426 618,797
Liabilities
Due to central and other banks - - - 144,538 144,538
Derivative fi nancial instruments - - - 4,176 4,176
Due to customers 2,365 - 10,856 - 13,221
Debt securities in issue
Bonds - - 6,928 - 6,928
Mortgage bonds - - - 1,027,101 1,027,101
Other liabilities - - 6,879 - 6,879
2,365 - 24,663 1,175,815 1,202,843
Financial commitments and contingencies - - 32,179 - 32,179
Received guarantees - - - 77,075 77,075
Derivative transactions
(notional amount – receivable) - - - 376,035 376,035
Income and expense items
Interest and similar income 46 3 2,868 12,312 15,229
Interest expense and similar charges (45) - (95) (29,749) (29,889)
Fee and commission income 3 - 4,614 - 4,617
Fee and commission expense - - (25,541) (4,737) (30,278)
Net trading income - - - (7,225) (7,225)
Dividend income - - 20,151 - 20,151
Operating income - - 1,034 73 1,107
Operating expenses - - (508) - (508)
4 3 2,523 (29,326) (26,796)
* Key management personnel
During the year 2011, the Bank has purchased performing loans from an Intesa Sanpaolo Group bank in the total amount of € 116,973 thousand and HUF 3,505,620 thousand. The transaction was realised at fair value.

180
Separate fi nancial statements
At 31 December 2010, signifi cant outstanding balances with related parties comprised:
KMP
Close
members
of KMP
Affi liated
companies
Intesa
Sanpaolo
Group
Total
Assets
Due from banks - - - 65,319 65,319
Derivative fi nancial instruments - - - 6,260 6,260
Loans and advances to customers 931 878 97,627 - 99,436
Other assets - - 535 - 535
931 878 98,162 71,579 171,550
Liabilities
Due to central and other banks - - - 132,787 132,787
Derivative fi nancial instruments - - - 1,537 1,537
Due to customers 1,567 - 11,438 - 13,005
Debt securities in issue
Bonds - - 6,726 - 6,726
Mortgage bonds - - - 1,054,067 1,054,067
Other liabilities - - 3,182 - 3,182
1,567 - 21,346 1,188,391 1,211,304
Financial commitments and contingencies - - 26,913 - 26,913
Received guarantees - - - 35,000 35,000
Derivative transactions
(notional amount – receivable) - - - 136,382 136,382
Income and expense items
Interest and similar income 40 48 1,275 5,567 6,930
Interest expense and similar charges (36) - (133) (20,525) (20,694)
Fee and commission income 4 - 4,464 - 4,468
Fee and commission expense - - (32,821) (1,422) (34,243)
Net trading income - - - 1,408 1,408
Dividend income - - 14,281 - 14,281
Operating income - - 1,016 232 1,248
Operating expenses - - (73) - (73)
8 48 (11,991) (14,740) (26,675)

181
Separate fi nancial statements
38. Profi t distribution
On 4 April 2011, the Bank’s shareholders approved the following profi t distribution for 2010.
Dividends to shareholders (€ 4.60 per € 33.2 share) 59,692
Retained earnings 89,685
149,377
The Management Board will propose the following 2011 profi t distribution:
Dividends to shareholders (€ 3.65 per € 33.2 share) 47,364
Retained earnings 110,300
157,664
39. Events after the end of the reporting period
Commencing 1 January 2012, banks operating in the Slovak Republic are subject to special levy of 0.4% of selected liabilities presented at the end of each quarter. The levy will be recognized in the statement of comprehensive income on an accrual basis and is payable at the beginning of the quarter.
From 31 December 2011 up to the date of issue of these fi nancial statements there were no further events identifi ed that would require adjustments to or disclosure in these fi nancial statements.

182
In 2011 VÚB, a.s., issued nine mortgage bond issues:
FLEXI Mortgage bonds VÚB, a.s., 59Name of Security: FLEXI Mortgage bond VÚB, a.s., 59ISIN: SK4120007782 series 01Type and form: Bearer bond, book-entryTotal issue amount: EUR 25,000,000.00 Number and nominal value: 25 000 units per EUR 1,000.00Issue Date: March 1, 2011Maturity: March 1, 2015Coupon: 3.00% p.a.Coupon payment: Annually
Mortgage bonds VÚB, a.s., 60Name of Security: Mortgage bond VÚB, a.s., 60ISIN: SK4120007899 series 01Type and form: Bearer bond, book-entryTotal issue amount: CZK 500,000,000.00 Number and nominal value: 5 000 units per CZK 100,000.00Issue Date: May 20, 2011Maturity: May 20, 2014Coupon: 6M PRIBOR + 0.55% p.a. Coupon payment: Semiannually
Mortgage bonds VÚB, a.s., 61Name of Security: Mortgage bond VÚB, a.s., 61ISIN: SK4120007923 series 01Type and form: Bearer bond, book-entryTotal issue amount: EUR 10,000,000.00Number and nominal value: 1 000 units per EUR 10,000.00Issue Date: June 7, 2011Maturity: June 7, 2015Coupon: 3.10% p.a., from issue date to 7.6.2013 (excluding), 6M EURIBOR + 0.90% p.a., from 7.6.2013 (including) to maturity date Coupon payment: Semiannually
Mortgage bonds VÚB, a.s., 62Name of Security: Mortgage bond VÚB, a.s., 62ISIN: SK4120008004 series 01Type and form: Bearer bond, book-entryTotal issue amount: EUR 100,000,000.00 Number and nominal value: 100 units per EUR 1,000,000.00Issue Date: July 28, 2011Maturity: July 28, 2018Coupon: 6M EURIBOR + 1.99% p.a.Coupon payment: Semiannually
Mortgage bonds VÚB, a.s., 63Name of Security: Mortgage bond VÚB, a.s., 63ISIN: SK4120008061 series 01Type and form: Bearer bond, book-entryTotal issue amount: EUR 35,000,000.00Number and nominal value: 35 000 units per EUR 1,000.00Issue Date: September 16, 2011Maturity: March 16, 2016Coupon: 3.75% p.a.Coupon payment: Annually
Information on Securities issued by the Bank

183
Mortgage bonds VÚB, a.s., 64Name of Security: Mortgage bond VÚB, a.s., 64ISIN: SK4120008129 series 01Type and form: Bearer bond, book-entryTotal issue amount: CZK 700,000,000.00 Number and nominal value: 7 000 units per CZK 100,000.00Issue Date: September 26, 2011Maturity: September 26, 2016Coupon: 3.25% p.a.Coupon payment: Annually
Mortgage bonds VÚB, a.s., 65Name of Security: Mortgage bond VÚB, a.s., 65ISIN: SK4120008152 series 01Type and form: Bearer bond, book-entryTotal issue amount: EUR 60,000,000.00 Number and nominal value: 60 units per EUR 1,000,000.00Issue Date: October 26, 2011Maturity: October 26, 2012Coupon: 6M EURIBOR + 0.40% p.a.Coupon payment: Semiannually
Mortgage bonds VÚB, a.s., 66Name of Security: Mortgage bond VÚB, a.s., 66ISIN: SK4120008236 series 01Type and form: Bearer bond, book-entryTotal issue amount: EUR 35,000,000.00 Number and nominal value: 700 units per EUR 50,000.00Issue Date: November 28, 2011Maturity: November 28, 2014Coupon: 6M EURIBOR + 1.70% p.a.Coupon payment: Semiannually
Mortgage bonds VÚB, a.s., 67Name of Security: Mortgage bond VÚB, a.s., 67ISIN: SK4120008228 series 01Type and form: Bearer bond, book-entryTotal issue amount: EUR 15,000,000.00 Number and nominal value: 300 units per EUR 50,000.00Issue Date: November 29, 2011Maturity: November 29, 2030Coupon: 5.35% p.a.Coupon payment: Annually
Information on Securities issued by the Bank
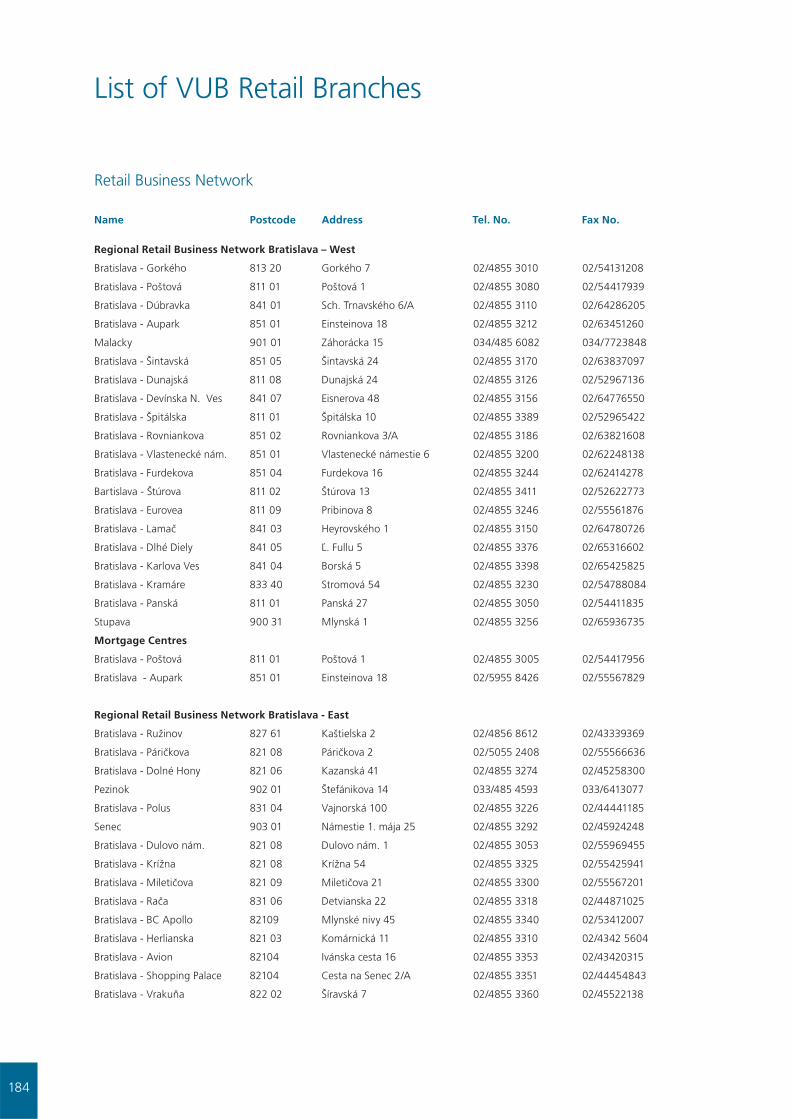
184
Retail Business Network
Name Postcode Address Tel. No. Fax No.
Regional Retail Business Network Bratislava – West
Bratislava - Gorkého 813 20 Gorkého 7 02/4855 3010 02/54131208
Bratislava - Poštová 811 01 Poštová 1 02/4855 3080 02/54417939
Bratislava - Dúbravka 841 01 Sch. Trnavského 6/A 02/4855 3110 02/64286205
Bratislava - Aupark 851 01 Einsteinova 18 02/4855 3212 02/63451260
Malacky 901 01 Záhorácka 15 034/485 6082 034/7723848
Bratislava - Šintavská 851 05 Šintavská 24 02/4855 3170 02/63837097
Bratislava - Dunajská 811 08 Dunajská 24 02/4855 3126 02/52967136
Bratislava - Devínska N. Ves 841 07 Eisnerova 48 02/4855 3156 02/64776550
Bratislava - Špitálska 811 01 Špitálska 10 02/4855 3389 02/52965422
Bratislava - Rovniankova 851 02 Rovniankova 3/A 02/4855 3186 02/63821608
Bratislava - Vlastenecké nám. 851 01 Vlastenecké námestie 6 02/4855 3200 02/62248138
Bratislava - Furdekova 851 04 Furdekova 16 02/4855 3244 02/62414278
Bartislava - Štúrova 811 02 Štúrova 13 02/4855 3411 02/52622773
Bratislava - Eurovea 811 09 Pribinova 8 02/4855 3246 02/55561876
Bratislava - Lamač 841 03 Heyrovského 1 02/4855 3150 02/64780726
Bratislava - Dlhé Diely 841 05 Ľ. Fullu 5 02/4855 3376 02/65316602
Bratislava - Karlova Ves 841 04 Borská 5 02/4855 3398 02/65425825
Bratislava - Kramáre 833 40 Stromová 54 02/4855 3230 02/54788084
Bratislava - Panská 811 01 Panská 27 02/4855 3050 02/54411835
Stupava 900 31 Mlynská 1 02/4855 3256 02/65936735
Mortgage Centres
Bratislava - Poštová 811 01 Poštová 1 02/4855 3005 02/54417956
Bratislava - Aupark 851 01 Einsteinova 18 02/5955 8426 02/55567829
Regional Retail Business Network Bratislava - East
Bratislava - Ružinov 827 61 Kaštielska 2 02/4856 8612 02/43339369
Bratislava - Páričkova 821 08 Páričkova 2 02/5055 2408 02/55566636
Bratislava - Dolné Hony 821 06 Kazanská 41 02/4855 3274 02/45258300
Pezinok 902 01 Štefánikova 14 033/485 4593 033/6413077
Bratislava - Polus 831 04 Vajnorská 100 02/4855 3226 02/44441185
Senec 903 01 Námestie 1. mája 25 02/4855 3292 02/45924248
Bratislava - Dulovo nám. 821 08 Dulovo nám. 1 02/4855 3053 02/55969455
Bratislava - Krížna 821 08 Krížna 54 02/4855 3325 02/55425941
Bratislava - Miletičova 821 09 Miletičova 21 02/4855 3300 02/55567201
Bratislava - Rača 831 06 Detvianska 22 02/4855 3318 02/44871025
Bratislava - BC Apollo 82109 Mlynské nivy 45 02/4855 3340 02/53412007
Bratislava - Herlianska 821 03 Komárnická 11 02/4855 3310 02/4342 5604
Bratislava - Avion 82104 Ivánska cesta 16 02/4855 3353 02/43420315
Bratislava - Shopping Palace 82104 Cesta na Senec 2/A 02/4855 3351 02/44454843
Bratislava - Vrakuňa 822 02 Šíravská 7 02/4855 3360 02/45522138
List of VUB Retail Branches

185
Bratislava - Račianska 831 03 Račianska 54 02/4855 3071 02/44453888
Ivanka pri Dunaji 900 28 Štefánikova 25/A 02/4855 3405 02/45945042
Bratislava - Krížna 12 811 07 Krížna 12 02/4855 3423 02/55644241
Modra 900 01 Štúrova 68 033/485 4585 033/6475535
Mortgage Centres
Bratislava - Páričkova 821 08 Páričkova 2 02/5055 2264 02/55567829
Regional Retail Business Network Trnava
Trnava - Dolné bašty 917 68 Dolné bašty 2 033/485 4411 033/5333056
Trnava - Hlavná 917 68 Hlavná 31 033/485 4490 033/5511560
Dunajská Streda 929 35 Alžbetínske nám. 328 031/485 4000 031/5570159
Galanta 924 41 Mierové námestie 2 031/485 4041 031/7806029
Hlohovec 920 01 Podzámska 37 033/485 4521 033/7424329
Piešťany 921 01 Námestie slobody 11 033/485 4535 033/7721080
Senica 905 01 Nám. oslobodenia 8 034/485 6000 034/6943984
Skalica 909 01 Potočná 20 034/485 6048 034/6646778
Sereď 926 00 Cukrovarská 3013/1 031/485 4082 031/7894650
Šamorín 931 01 Hlavná 64 031/485 4097 031/5624305
Trnava - Arkadia 917 01 Veterná 40/A 033/485 4556 033/5936643
Holíč 908 51 Bratislavská 1518/7 034/485 6067 034/6684473
Gabčíkovo 930 05 Mlynársky rad 185/1 031/485 4106 031/5594844
Kúty 908 01 Nám. Radlinského 981 034/485 6076 031/6597790
Trnava - Štefánikova 91 768 Štefánikova 32 033/485 4626 033/5513 343
Leopoldov 920 41 Hollého 649/1 033/485 4560 033/7342290
Smolenice 919 04 SNP 81 033/485 4562 033/5586610
Sládkovičovo 925 21 Fučíkova 131 031/485 4108 031/7841835
Šaštín - Stráže 908 41 Námestie slobody 648 034/485 6079 034/6580591
Veľký Meder 932 01 Komárňanská 135/22 031/485 4116 031/5553300
Vrbové 922 03 Nám. Slobody 285/9 033/485 4577 033/7792696
Zlaté Klasy 930 39 Hlavná 836/17 031/485 4117 031/5692073
Dunajská Lužná 900 42 Nové Košariská 02/4855 3370 02/45981239
Mortgage Centres
Trnava - Dolné bašty 917 68 Dolné bašty 2 033/485 4440 033/5333055
Regional Retail Business Network Trenčín
Trenčín 911 62 Mierové námestie 37 032/485 4235 032/7431450
Dubnica nad Váhom 018 41 Nám. Matice slov. 1712/7 042/485 6543 042/4425027
Nové Mesto nad Váhom 915 01 Hviezdoslavova 19 032/485 4291 032/7715070
Považská Bystrica 017 21 Nám. A. Hlinku 23/28 042/485 6500 042/4309841
Prievidza 971 01 Námestie slobody 10 046/485 7100 046/5426878
Púchov 020 01 Námestie slobody 1657 042/485 6578 042/4642368
Bánovce nad Bebravou 957 01 Námestie Ľ. Štúra 5/5 038/485 6269 038/7602993
Partizánske 958 01 L. Svobodu 4 038/485 6288 038/7497247
Trenčín - Legionárska 911 01 Legionárska 7158/5 032/485 4205 032/6401649
Nová Dubnica 018 51 Mierove námestie 29/34 042/485 6581 042/4434032
Prievidza - Bojnická cesta 971 01 Bojnická cesta 15 046/485 7130 046/5482436
Stará Turá 916 01 SNP 275/67 032/485 4301 032/7763445
Myjava 907 01 Nám. M.R.Štefánika 525/21 034/485 6057 034/6212595
List of VUB Retail Branches

186
Ilava 019 01 Mierové námestie 77 042/485 6595 042/4465902
Bojnice 972 01 Hurbanovo námestie 10 046/485 7142 046/5430571
Handlová 972 51 SNP 1 046/485 7146 046/5476418
Lednické Rovne 020 61 Námestie slobody 32 042/485 6598 042/4693217
Nitrianske Pravno 972 13 Námestie SNP 389 046/485 7152 046/5446439
Nováky 972 71 Andreja Hlinku 457 046/485 7156 046/5461145
Trenčín - Zámostie 911 05 Zlatovská 2610 032/485 4312 032/6523321
Dolné Vestenice 972 23 M. R. Štefánika 300 046/485 7162 046/5498308
Trenčianske Teplice 914 51 T. G. Masaryka 3 032/485 4316 032/6553444
Mortgage Centres
Trenčín 911 01 Legionárska 7158/5 032/485 4218 032/7434947
Regional Retail Business Network Nitra
Nitra - Štefánikova 44 949 31 Štefánikova 44 037/485 4807 037/6528754
Komárno 945 23 Tržničné námestie 1 035/485 4745 035/7730652
Levice 934 01 Štúrova 21 036/485 6118 036/6312600
Nové Zámky 940 33 Hlavné námestie 5 035/485 4700 035/6400841
Topoľčany - Moyzesova 955 19 Moyzesova 585/2 038/485 6214 038/5228061
Topoľčany - Pribinova 955 01 Pribinova 2 038/485 6243 038/5326900
Šaľa 927 00 Hlavná 5 031/485 4062 031/7704576
Zlaté Moravce 953 00 Župná 10 037/485 4889 037/6321266
Nitra - Štefánikova 7 949 31 Štefánikova 7 037/485 4901 037/7412057
Nitra - OC Mlyny 949 01 Štefánikova trieda 61 037/485 4877 037/4854930
Štúrovo 943 01 Hlavná 59 036/485 6147 036/7511308
Šurany 942 01 SNP 25 035/485 4768 035/6500044
Vráble 952 01 Levická 1288/16 037/485 4907 037/7833023
Centro Nitra 949 01 Akademická 1/A 037/485 4918 037/6512013
Hurbanovo 947 01 Komárňanská 98 035/485 4783 035/7602216
Šahy 936 01 Hlavné námestie 27 036/485 6152 036/7411723
Želiezovce 937 01 Komenského 8 036/485 6164 036/7711088
Kolárovo 946 03 Palkovicha 34 035/485 4785 035/7772550
OC MAX Nitra 949 01 Chrenovská 1661/30 037/485 4922 037/7331028
Nitrianska Blatnica 956 04 Obecný úrad 038/485 6261 038/5394194
Tvrdošovce 941 10 Bratislavská cesta 3 035/485 4796 035/6492201
Mortgage Centres
Nitra 949 31 Štefánikova 44 037/485 4838 037/6528754
Regional Retail Business Network Žilina
Žilina 010 43 Na bráne 1 041/485 6306 041/7247136
Čadca 022 24 Fraňa Kráľa 1504 041/485 6375 041/4331095
Dolný Kubín 026 01 Radlinského 1712/34 043/485 6683 043/5864006
Martin 036 53 M. R. Štefánika 2 043/485 6627 043/4247297
Liptovský Mikuláš 031 31 Štúrova 19 044/485 7009 044/5514925
Ružomberok 034 01 Podhora 48 044/485 7037 044/4323146
Bytča 014 01 Sidónie Sakalovej 138/1 041/485 6409 041/5533579
Námestovo 029 01 Hviezdoslavovo nám. 200/5 043/485 6709 043/5523175
Žilina - Nám. A. Hlinku 010 43 Nám. A. Hlinku 1 041/485 6413 041/5626194
Žilina - Dubeň 010 08 Vysokoškolákov 52 041/485 6417 041/5000316
List of VUB Retail Branches
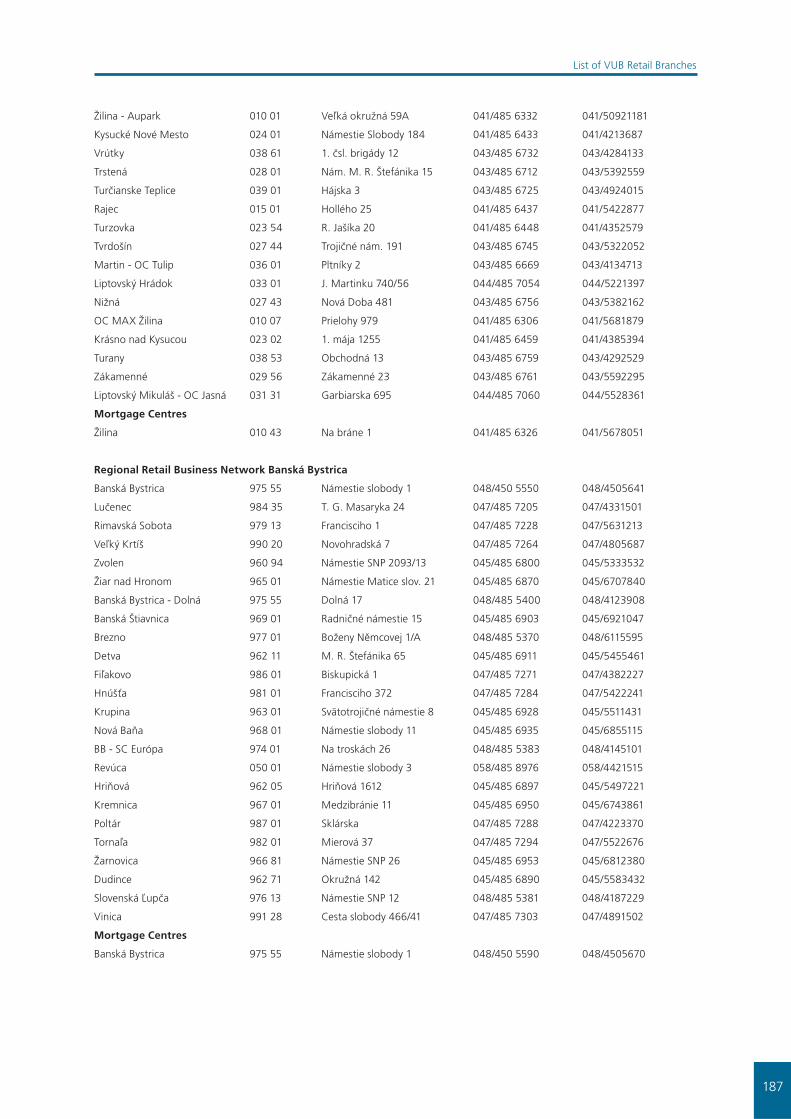
187
Žilina - Aupark 010 01 Veľká okružná 59A 041/485 6332 041/50921181
Kysucké Nové Mesto 024 01 Námestie Slobody 184 041/485 6433 041/4213687
Vrútky 038 61 1. čsl. brigády 12 043/485 6732 043/4284133
Trstená 028 01 Nám. M. R. Štefánika 15 043/485 6712 043/5392559
Turčianske Teplice 039 01 Hájska 3 043/485 6725 043/4924015
Rajec 015 01 Hollého 25 041/485 6437 041/5422877
Turzovka 023 54 R. Jašíka 20 041/485 6448 041/4352579
Tvrdošín 027 44 Trojičné nám. 191 043/485 6745 043/5322052
Martin - OC Tulip 036 01 Pltníky 2 043/485 6669 043/4134713
Liptovský Hrádok 033 01 J. Martinku 740/56 044/485 7054 044/5221397
Nižná 027 43 Nová Doba 481 043/485 6756 043/5382162
OC MAX Žilina 010 07 Prielohy 979 041/485 6306 041/5681879
Krásno nad Kysucou 023 02 1. mája 1255 041/485 6459 041/4385394
Turany 038 53 Obchodná 13 043/485 6759 043/4292529
Zákamenné 029 56 Zákamenné 23 043/485 6761 043/5592295
Liptovský Mikuláš - OC Jasná 031 31 Garbiarska 695 044/485 7060 044/5528361
Mortgage Centres
Žilina 010 43 Na bráne 1 041/485 6326 041/5678051
Regional Retail Business Network Banská Bystrica
Banská Bystrica 975 55 Námestie slobody 1 048/450 5550 048/4505641
Lučenec 984 35 T. G. Masaryka 24 047/485 7205 047/4331501
Rimavská Sobota 979 13 Francisciho 1 047/485 7228 047/5631213
Veľký Krtíš 990 20 Novohradská 7 047/485 7264 047/4805687
Zvolen 960 94 Námestie SNP 2093/13 045/485 6800 045/5333532
Žiar nad Hronom 965 01 Námestie Matice slov. 21 045/485 6870 045/6707840
Banská Bystrica - Dolná 975 55 Dolná 17 048/485 5400 048/4123908
Banská Štiavnica 969 01 Radničné námestie 15 045/485 6903 045/6921047
Brezno 977 01 Boženy Němcovej 1/A 048/485 5370 048/6115595
Detva 962 11 M. R. Štefánika 65 045/485 6911 045/5455461
Fiľakovo 986 01 Biskupická 1 047/485 7271 047/4382227
Hnúšťa 981 01 Francisciho 372 047/485 7284 047/5422241
Krupina 963 01 Svätotrojičné námestie 8 045/485 6928 045/5511431
Nová Baňa 968 01 Námestie slobody 11 045/485 6935 045/6855115
BB - SC Európa 974 01 Na troskách 26 048/485 5383 048/4145101
Revúca 050 01 Námestie slobody 3 058/485 8976 058/4421515
Hriňová 962 05 Hriňová 1612 045/485 6897 045/5497221
Kremnica 967 01 Medzibránie 11 045/485 6950 045/6743861
Poltár 987 01 Sklárska 047/485 7288 047/4223370
Tornaľa 982 01 Mierová 37 047/485 7294 047/5522676
Žarnovica 966 81 Námestie SNP 26 045/485 6953 045/6812380
Dudince 962 71 Okružná 142 045/485 6890 045/5583432
Slovenská Ľupča 976 13 Námestie SNP 12 048/485 5381 048/4187229
Vinica 991 28 Cesta slobody 466/41 047/485 7303 047/4891502
Mortgage Centres
Banská Bystrica 975 55 Námestie slobody 1 048/450 5590 048/4505670
List of VUB Retail Branches
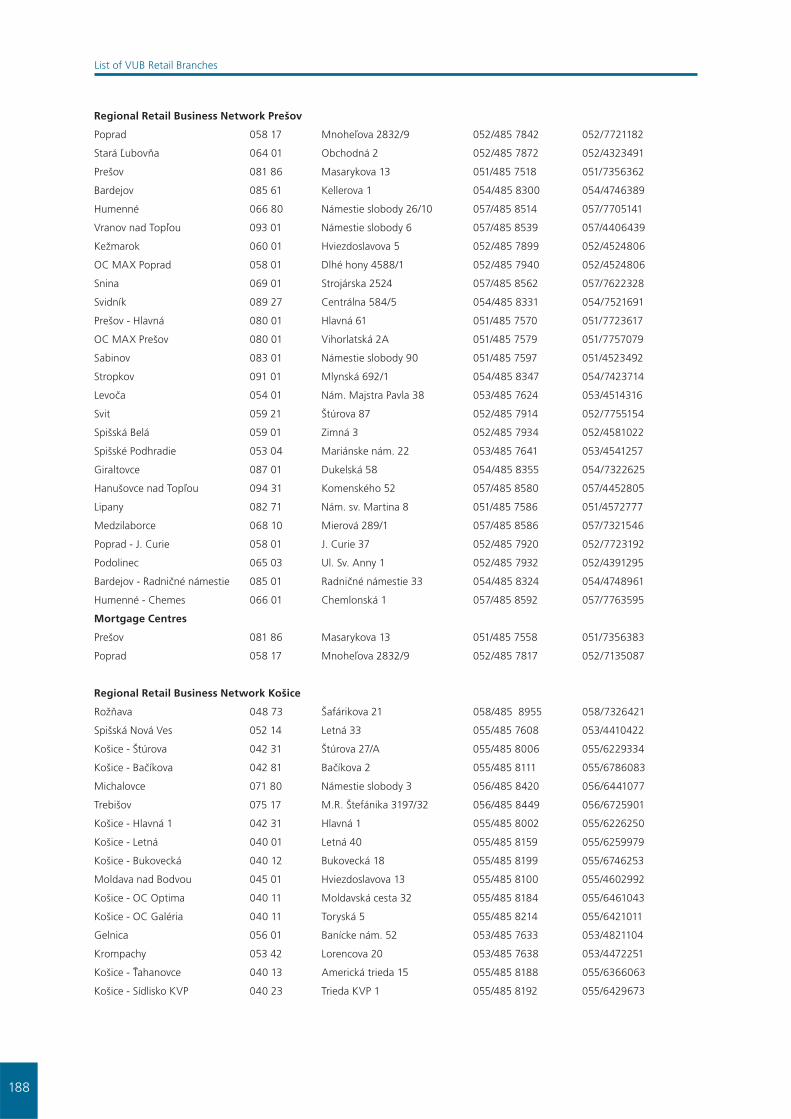
188
Regional Retail Business Network Prešov
Poprad 058 17 Mnoheľova 2832/9 052/485 7842 052/7721182
Stará Ľubovňa 064 01 Obchodná 2 052/485 7872 052/4323491
Prešov 081 86 Masarykova 13 051/485 7518 051/7356362
Bardejov 085 61 Kellerova 1 054/485 8300 054/4746389
Humenné 066 80 Námestie slobody 26/10 057/485 8514 057/7705141
Vranov nad Topľou 093 01 Námestie slobody 6 057/485 8539 057/4406439
Kežmarok 060 01 Hviezdoslavova 5 052/485 7899 052/4524806
OC MAX Poprad 058 01 Dlhé hony 4588/1 052/485 7940 052/4524806
Snina 069 01 Strojárska 2524 057/485 8562 057/7622328
Svidník 089 27 Centrálna 584/5 054/485 8331 054/7521691
Prešov - Hlavná 080 01 Hlavná 61 051/485 7570 051/7723617
OC MAX Prešov 080 01 Vihorlatská 2A 051/485 7579 051/7757079
Sabinov 083 01 Námestie slobody 90 051/485 7597 051/4523492
Stropkov 091 01 Mlynská 692/1 054/485 8347 054/7423714
Levoča 054 01 Nám. Majstra Pavla 38 053/485 7624 053/4514316
Svit 059 21 Štúrova 87 052/485 7914 052/7755154
Spišská Belá 059 01 Zimná 3 052/485 7934 052/4581022
Spišské Podhradie 053 04 Mariánske nám. 22 053/485 7641 053/4541257
Giraltovce 087 01 Dukelská 58 054/485 8355 054/7322625
Hanušovce nad Topľou 094 31 Komenského 52 057/485 8580 057/4452805
Lipany 082 71 Nám. sv. Martina 8 051/485 7586 051/4572777
Medzilaborce 068 10 Mierová 289/1 057/485 8586 057/7321546
Poprad - J. Curie 058 01 J. Curie 37 052/485 7920 052/7723192
Podolinec 065 03 Ul. Sv. Anny 1 052/485 7932 052/4391295
Bardejov - Radničné námestie 085 01 Radničné námestie 33 054/485 8324 054/4748961
Humenné - Chemes 066 01 Chemlonská 1 057/485 8592 057/7763595
Mortgage Centres
Prešov 081 86 Masarykova 13 051/485 7558 051/7356383
Poprad 058 17 Mnoheľova 2832/9 052/485 7817 052/7135087
Regional Retail Business Network Košice
Rožňava 048 73 Šafárikova 21 058/485 8955 058/7326421
Spišská Nová Ves 052 14 Letná 33 055/485 7608 053/4410422
Košice - Štúrova 042 31 Štúrova 27/A 055/485 8006 055/6229334
Košice - Bačíkova 042 81 Bačíkova 2 055/485 8111 055/6786083
Michalovce 071 80 Námestie slobody 3 056/485 8420 056/6441077
Trebišov 075 17 M.R. Štefánika 3197/32 056/485 8449 056/6725901
Košice - Hlavná 1 042 31 Hlavná 1 055/485 8002 055/6226250
Košice - Letná 040 01 Letná 40 055/485 8159 055/6259979
Košice - Bukovecká 040 12 Bukovecká 18 055/485 8199 055/6746253
Moldava nad Bodvou 045 01 Hviezdoslavova 13 055/485 8100 055/4602992
Košice - OC Optima 040 11 Moldavská cesta 32 055/485 8184 055/6461043
Košice - OC Galéria 040 11 Toryská 5 055/485 8214 055/6421011
Gelnica 056 01 Banícke nám. 52 053/485 7633 053/4821104
Krompachy 053 42 Lorencova 20 053/485 7638 053/4472251
Košice - Ťahanovce 040 13 Americká trieda 15 055/485 8188 055/6366063
Košice - Sídlisko KVP 040 23 Trieda KVP 1 055/485 8192 055/6429673
List of VUB Retail Branches

189
List of VUB Retail Branches
Košice - Trieda L. Svobodu 040 22 Trieda L. Svobodu 12 055/485 8199 055/6718160
Michalovce - mesto 071 01 Nám. Osloboditeľov 2 056/485 8467 056/6424281
Sobrance 073 01 Štefánikova 9 056/485 8494 056/6523300
Strážske 072 22 Nám.A.Dubčeka 300 056/485 8470 056/6491633
Kráľovský Chlmec 077 01 Hlavná 710 056/485 8475 056/6321045
Veľké Kapušany 079 01 Sídl.P.O.Hviezdoslava 79 056/485 8482 056/6383043
Sečovce 078 01 Nám.Sv.Cyrila a Metoda 41/23 056/485 8487 056/6782277
Košice - Hlavná 41 040 01 Hlavná 41 055/480 8210 055/6223987
Košice - Moldavská 040 11 Werferova 3 055/485 8117 055/6420814
Mortgage Centres
Košice 042 31 Štúrova 27/A 055/485 8031 055/6229334

190
List of VUB Corporate Branches
Corporate Business Center Bratislava
BRATISLAVA Mlynské nivy 1 +421 2 50552770
Corporate Business Center Bratislava 2
BRATISLAVA Mlynské nivy 1 +421 2 50552600
Corporate Business Center Trnava
TRNAVA Dolné bašty 2 +421 33 4854447
SENICA Nám. oslobodenia 8 +421 34 4856037
Corporate Business Center Nitra
NITRA Štefánikova 44 +421 37 4854844
TOPOĽČANY Moyzesova 585/2 +421 38 4856237
LEVICE Štúrova 21 +421 36 4856135
Corporate Business Center Nové Zámky
NOVÉ ZÁMKY Hlavné námestie 5 +421 35 4854738
KOMÁRNO Tržničné nám. 1 +421 35 4854764
GALANTA Mierové námestie 2 +421 31 4854054
DUNAJSKÁ STREDA Alžbetínske nám. 328 +421 31 4854024
Corporate Business Center Trenčín
TRENČÍN Legionárska 7158/5 +421 32 4854230
POVAŽSKÁ BYSTRICA Nám. A. Hlinku 23/28 +421 42 4856537
Corporate Business Center Žilina
ŽILINA Na bráne 1 +421 41 4856346
MARTIN M. R. Štefánika 2 +421 43 4856661
ČADCA Fraňa Kráľa 1504 +421 41 4856399
DOLNÝ KUBÍN Radlinského 1712/34 +421 43 4856694
Corporate Business Center Zvolen
ZVOLEN Námestie SNP 2093/13 +421 45 4856842
BANSKÁ BYSTRICA Námestie slobody 1 +421 48 4505487
Corporate Business Center Žiar nad Hronom
ŽIAR NAD HRONOM Nám. Matice slovenskej 21 +421 45 4856883
PRIEVIDZA Námestie slobody 6 +421 46 4857137
Corporate Business Center Lučenec
LUČENEC T.G. Masaryka 24 +421 47 4857224
RIMAVSKÁ SOBOTA Francisciho 1 +421 47 4857247
Corporate Business Center Poprad
POPRAD Mnoheľova 2832/9 +421 52 4857866
LIPTOVSKÝ MIKULÁŠ Štúrova 19 +421 44 4857032
SPIŠSKÁ NOVÁ VES Letná 33 +421 53 4857621

191
Corporate Business Center Prešov
PREŠOV Masarykova 13 +421 51 4857564
BARDEJOV Kellerova 1 +421 54 4858328
VRANOV NAD TOPĽOU Námestie slobody 6 +421 57 4858560
HUMENNÉ Námestie slobody 26/10 +421 57 4858530
Corporate Business Center Košice
KOŠICE Štúrova 27/A +421 55 4858046
MICHALOVCE Námestie slobody 3 +421 56 4858430
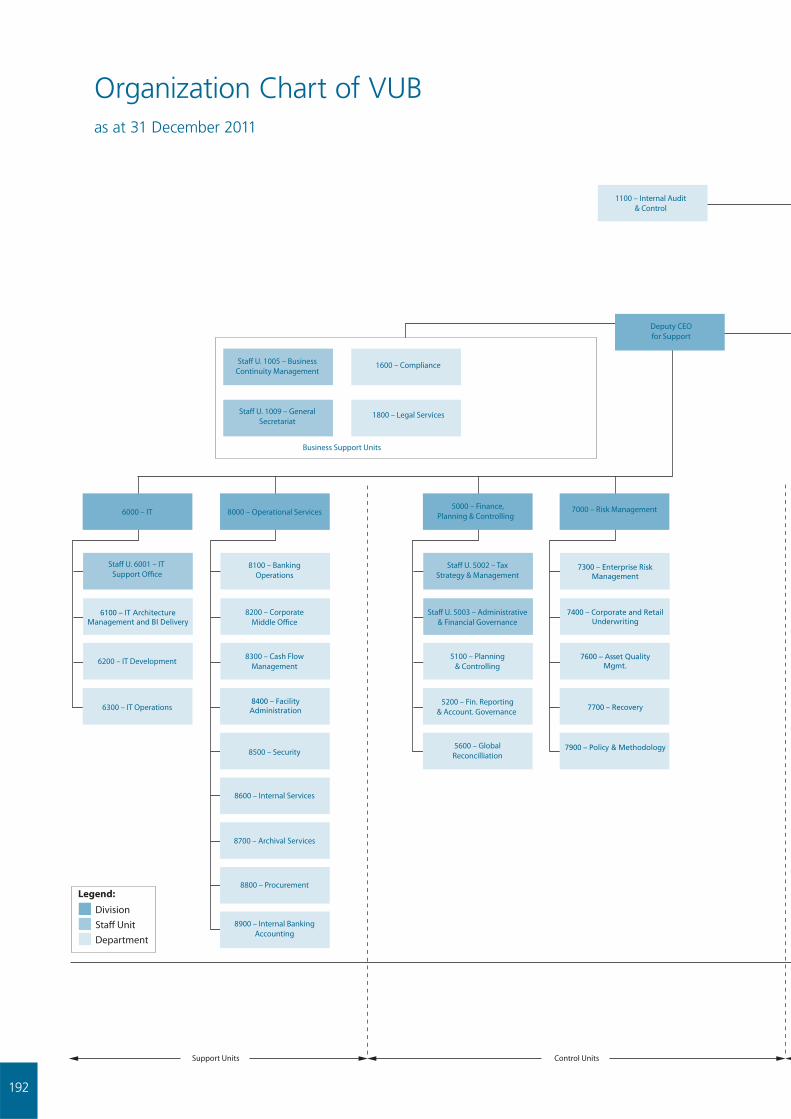
192
Organization Chart of VUBas at 31 December 2011
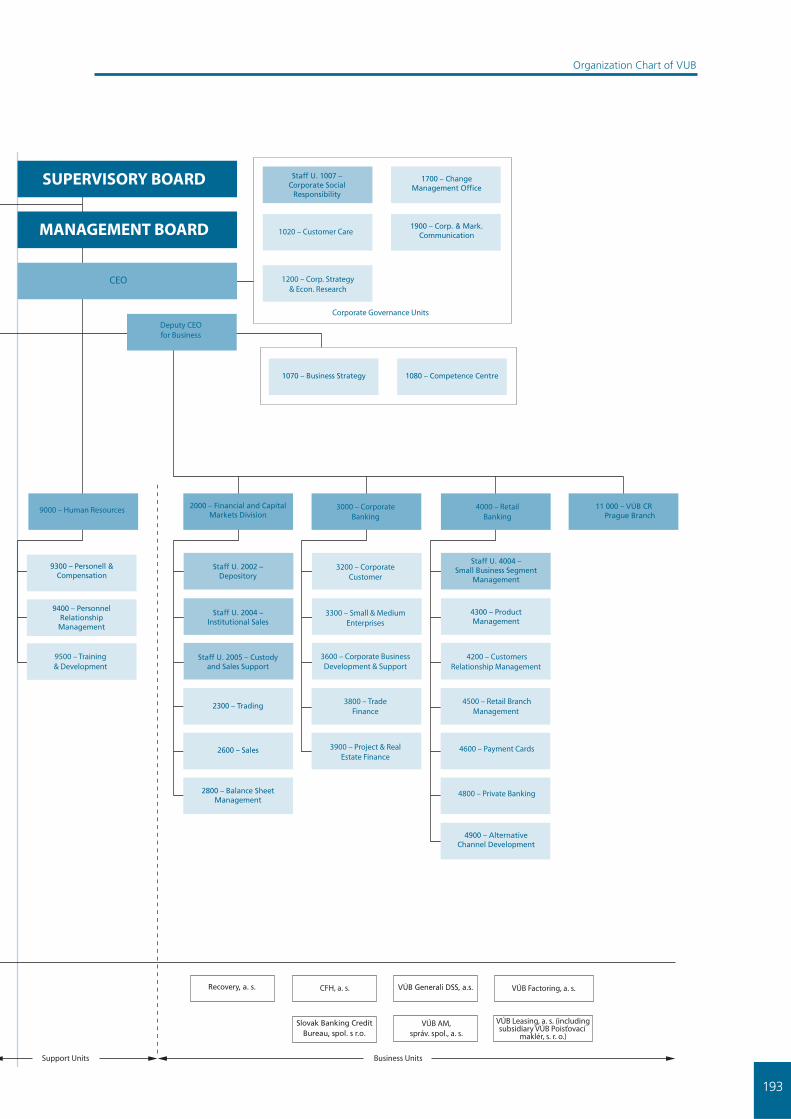
193
Organization Chart of VUB

194
Notes

195
Notes


VUB, a bank of