Embed Size (px)
Citation preview

TCL
Com
mun
icat
ion
Tech
nolo
gy H
oldi
ngs
Limite
d A
nnua
l Rep
ort 2
011
Annual Report 2011For more information, please visit the Group’s website:
http://tclcom.tcl.com
TCL Communication Technology Holdings LimitedStock Code: 02618

BE IN THE KNOW
GET APPS

2 T C L C O M M U N I C A T I O N T E C H N O L O G Y H O L D I N G S L I M I T E D
different
3AnnuAl report 2011
simple
TCL Communication Technology Holdings Limited (“TCL Communication” or the “Company”) together with its subsidiaries (collectively the “Group”) designs, manufactures and markets an expanding portfolio of mobile and internet products worldwide under two key brands - ALCATEL ONE TOUCH and TCL. The Group’s portfolio of products is currently sold in China and over 120 countries throughout the Americas, Europe, the Middle East and Africa. TCL Communication operates its highly efficient manufacturing plants and R&D centres in various provinces of China with headquarters in Shenzhen, China. Currently, TCL Corporation (“TCL Corp.”) is the Group’s largest shareholder.
For more information, please visit the Group’s website: http://tclcom.tcl.com
4 T C L C O M M U N I C A T I O N T E C H N O L O G Y H O L D I N G S L I M I T E D
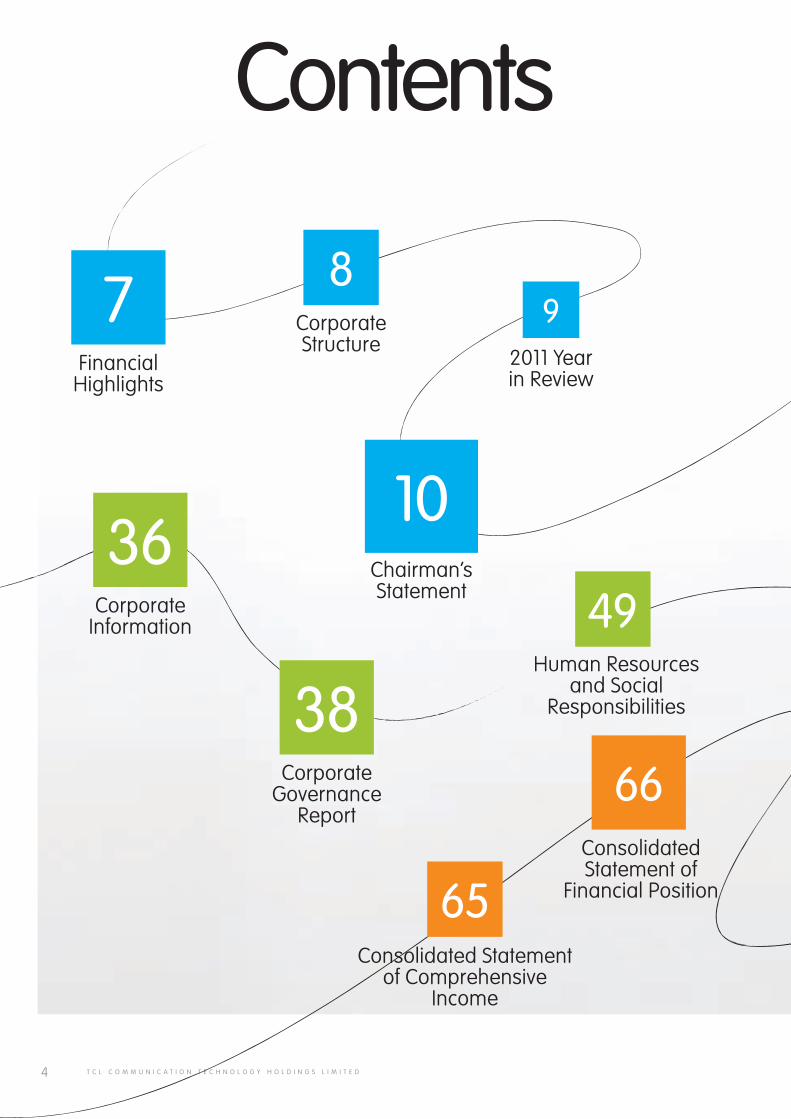
Contents
Financial Highlights
Corporate Structure
2011 Year in Review
Chairman’s Statement
Corporate Governance
Report
Human Resources and Social
Responsibilities
Consolidated Statement of
Financial Position
7 89
10
38
49
66
Corporate Information
36
Consolidated Statement of Comprehensive
Income
65
5AnnuAl report 2011
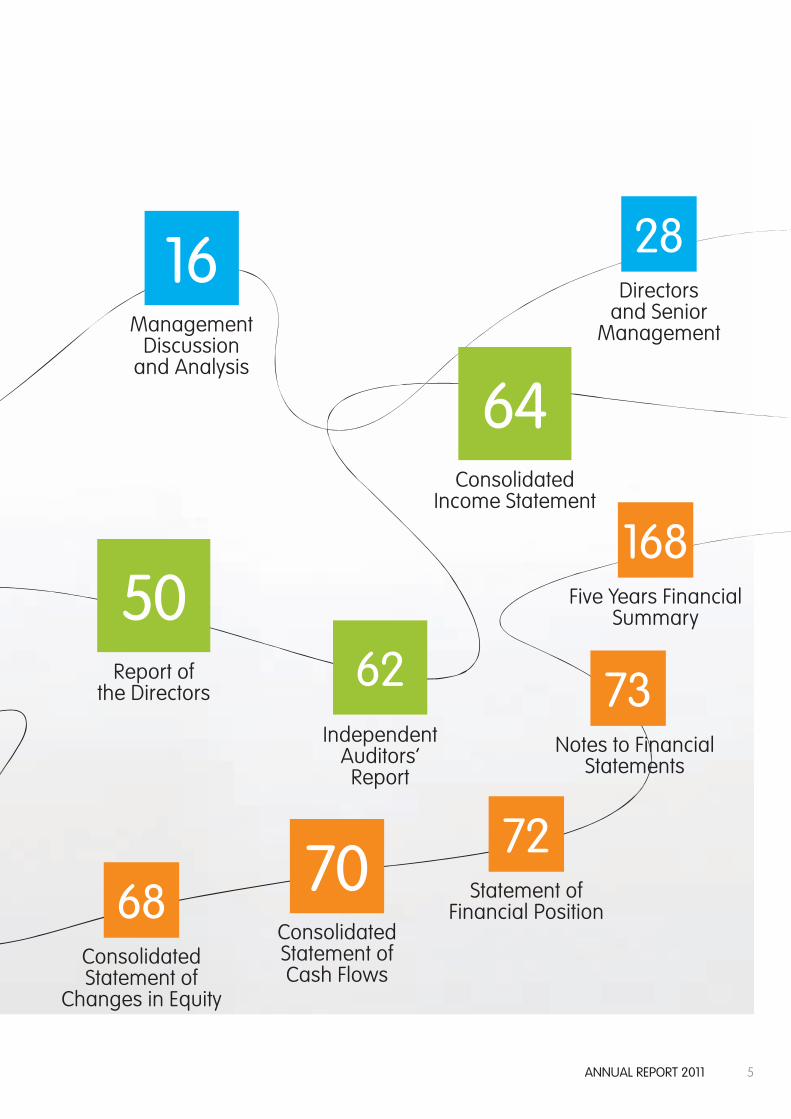
Management Discussion
and Analysis
Directors and Senior
Management
Report of the Directors
Consolidated Statement of
Changes in Equity
Statement of Financial Position
Consolidated Statement ofCash Flows
Independent Auditors’
Report
16 28
50
687270
62
Consolidated Income Statement
64
Notes to Financial Statements
73
Five Years Financial Summary
168
6 T C L C O M M U N I C A T I O N T E C H N O L O G Y H O L D I N G S L I M I T E D
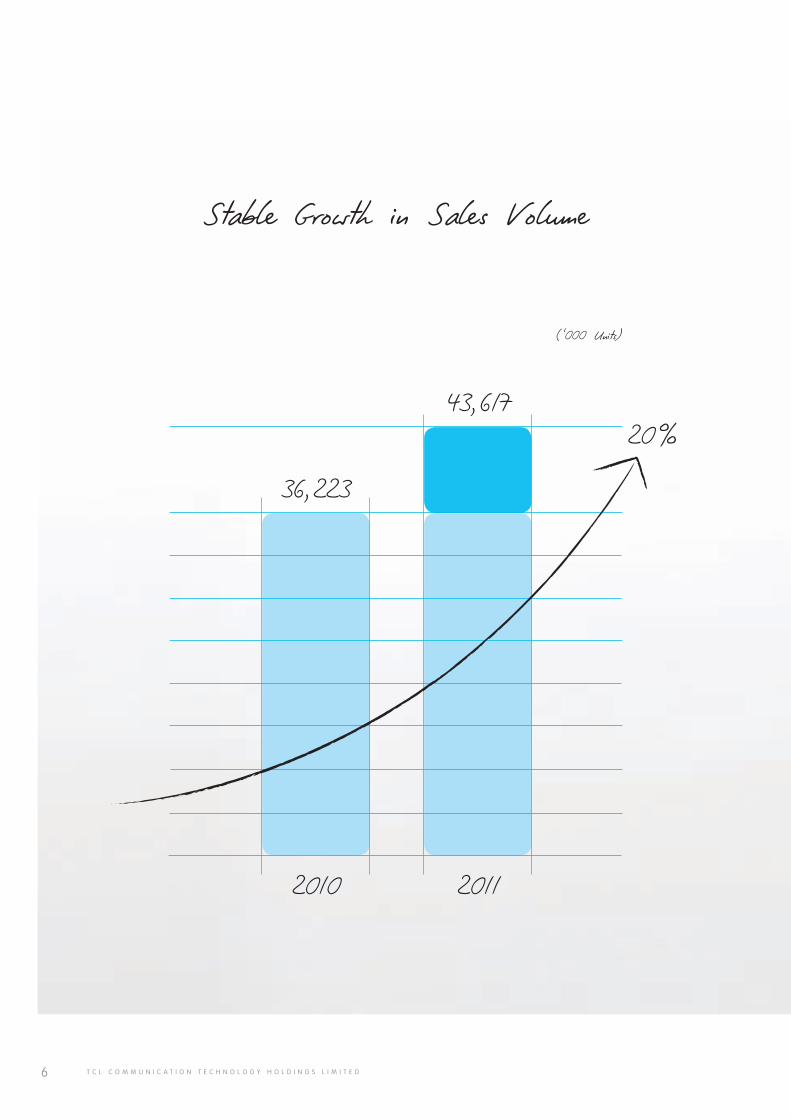
2010 2011
43,61720%
36,223
Stable Growth in Sales Volume
(‘000 Units)
7AnnuAl report 2011
FinancialHighlights
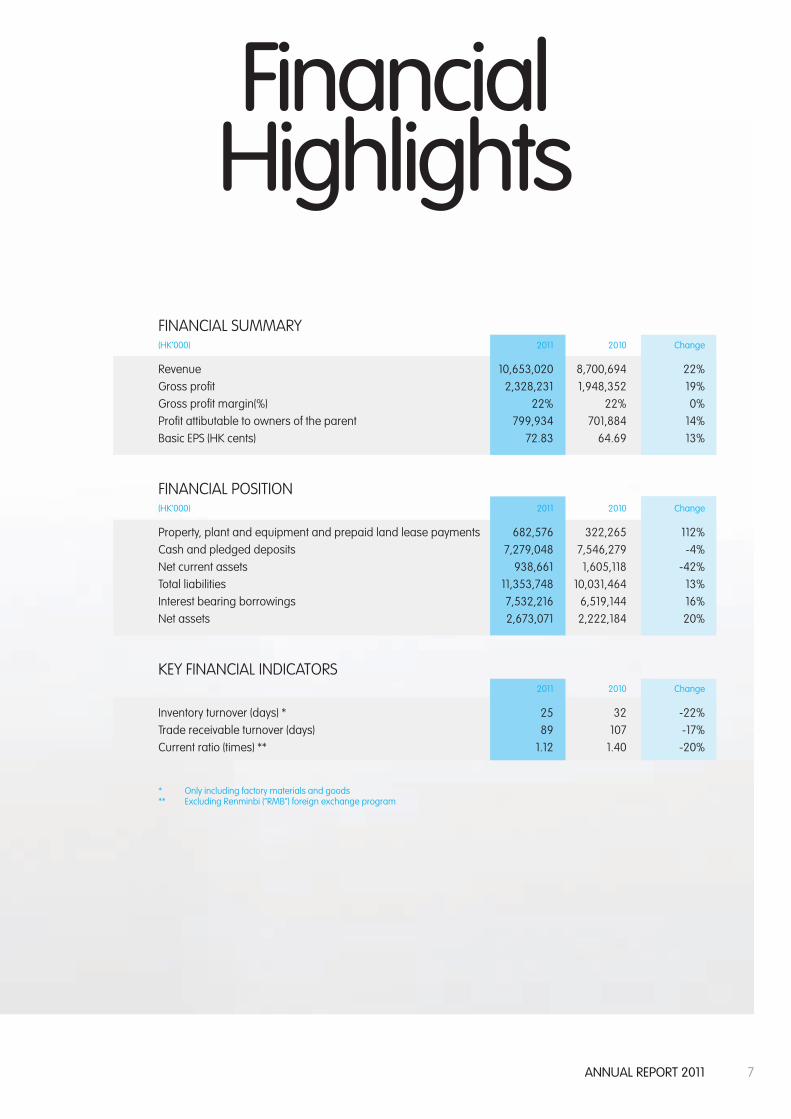
FINANCIAL SUMMARY (HK’000) 2011 2010 Change
Revenue 10,653,020 8,700,694 22%Gross profit 2,328,231 1,948,352 19%Gross profit margin(%) 22% 22% 0%Profit attibutable to owners of the parent 799,934 701,884 14%Basic EPS (HK cents) 72.83 64.69 13%
FINANCIAL POSITION (HK’000) 2011 2010 Change
Property, plant and equipment and prepaid land lease payments 682,576 322,265 112%Cash and pledged deposits 7,279,048 7,546,279 -4%Net current assets 938,661 1,605,118 -42%Total liabilities 11,353,748 10,031,464 13%Interest bearing borrowings 7,532,216 6,519,144 16%Net assets 2,673,071 2,222,184 20%
KEY FINANCIAL INDICATORS 2011 2010 Change
Inventory turnover (days) * 25 32 -22%Trade receivable turnover (days) 89 107 -17%Current ratio (times) ** 1.12 1.40 -20%
* Only including factory materials and goods** Excluding Renminbi (“RMB”) foreign exchange program
8 T C L C O M M U N I C A T I O N T E C H N O L O G Y H O L D I N G S L I M I T E D
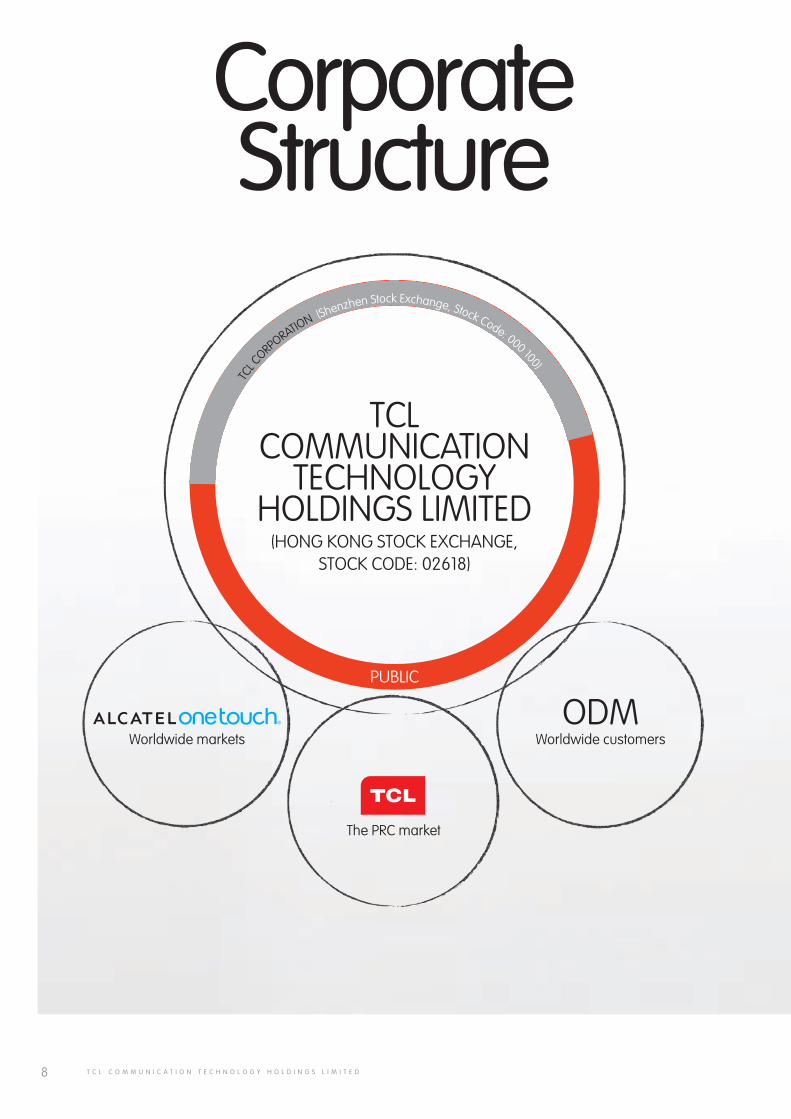
Corporate Structure
TCL C
ORPORATION (Shenzhen Stock Exchange, Stock Code: 000 100)
PUBLIC
So much to share...
Stock code: 02618
2009
Worldwide customers
The PRC market
Worldwide markets
TCLCOMMUNICATION
TECHNOLOGYHOLDINGS LIMITED
(HONG KONG STOCK EXCHANGE,STOCK CODE: 02618)
ODM
9AnnuAl report 2011
2011YEAR IN REVIEW
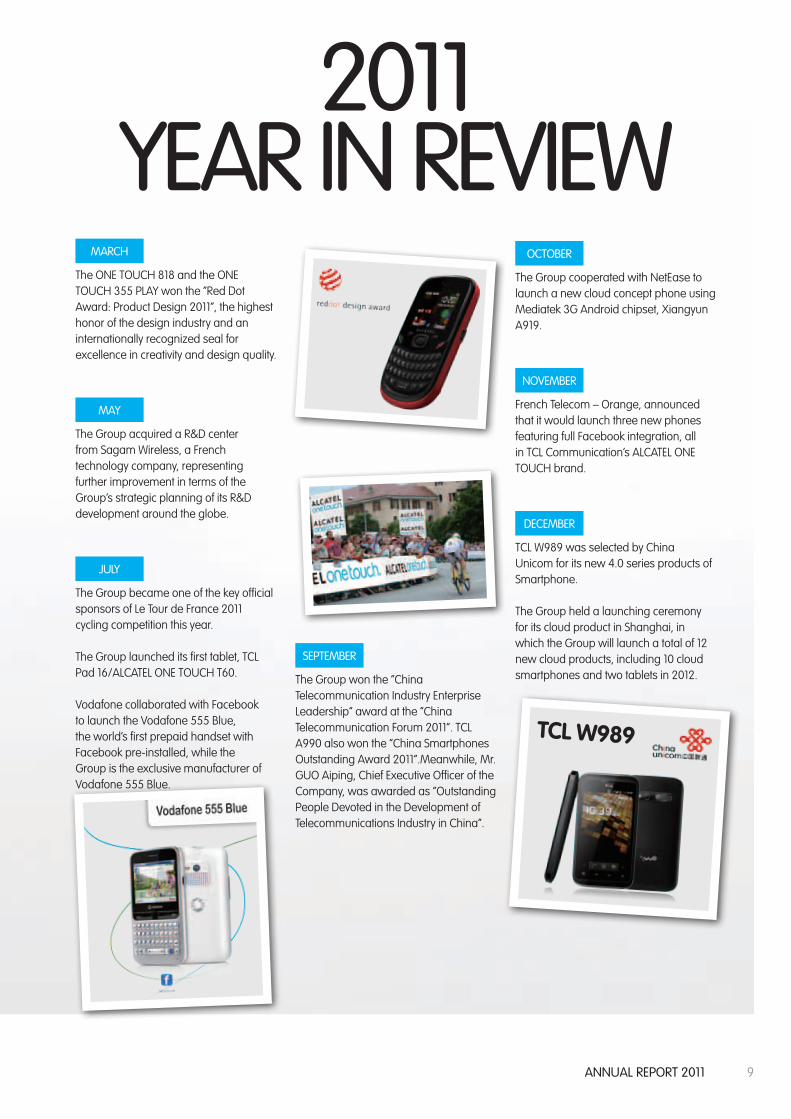
MARCH
The ONE TOUCH 818 and the ONE TOUCH 355 PLAY won the “Red Dot Award: Product Design 2011”, the highest honor of the design industry and an internationally recognized seal for excellence in creativity and design quality.
MAY
The Group acquired a R&D center from Sagam Wireless, a French technology company, representing further improvement in terms of the Group’s strategic planning of its R&D development around the globe.
JULY
The Group became one of the key official sponsors of Le Tour de France 2011 cycling competition this year.
The Group launched its first tablet, TCL Pad 16/ALCATEL ONE TOUCH T60.
Vodafone collaborated with Facebook to launch the Vodafone 555 Blue, the world’s first prepaid handset with Facebook pre-installed, while the Group is the exclusive manufacturer of Vodafone 555 Blue.
OCTOBER
The Group cooperated with NetEase to launch a new cloud concept phone using Mediatek 3G Android chipset, Xiangyun A919.
NOVEMBER
French Telecom – Orange, announced that it would launch three new phones featuring full Facebook integration, all in TCL Communication’s ALCATEL ONE TOUCH brand.
DECEMBER
TCL W989 was selected by China Unicom for its new 4.0 series products of Smartphone.
The Group held a launching ceremony for its cloud product in Shanghai, in which the Group will launch a total of 12 new cloud products, including 10 cloud smartphones and two tablets in 2012.
SEPTEMBER
The Group won the “China Telecommunication Industry Enterprise Leadership” award at the “China Telecommunication Forum 2011”. TCL A990 also won the “China Smartphones Outstanding Award 2011”.Meanwhile, Mr. GUO Aiping, Chief Executive Officer of the Company, was awarded as “Outstanding People Devoted in the Development of Telecommunications Industry in China”.
TCL w989
10 T C L C O M M U N I C A T I O N T E C H N O L O G Y H O L D I N G S L I M I T E D
Chairman’sStatement
Mr. LI Dongsheng
Dear Shareholders,
On behalf of the Board, I am delighted to report that 2011 was another record-setting year for TCL Communication, which hit new heights in both income and profits. Despite the volatile global economy and increasingly intense competition in many markets, the Group continued to perform well and sustained its growth momentum in terms of both sales of handsets and revenue, which was mainly attributable to the Group’s successful geographical expansion into new markets, the Group’s proven “Step-up” product strategy and its continued brand building efforts and channel penetration in open market. Our performance in 2011 once again demonstrates our ability to sustain growth and to consistently deliver value to our shareholders.
11AnnuAl report 2011
Sales VolumeIncreased
over 2010
20%
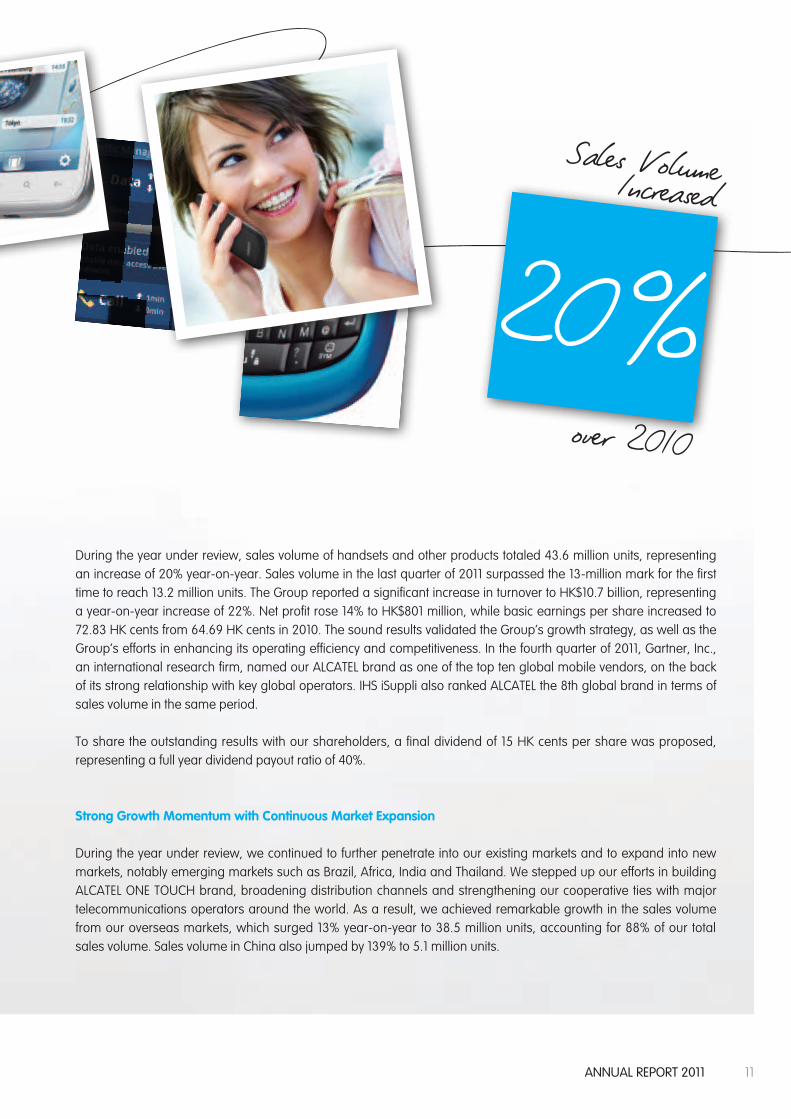
During the year under review, sales volume of handsets and other products totaled 43.6 million units, representing an increase of 20% year-on-year. Sales volume in the last quarter of 2011 surpassed the 13-million mark for the first time to reach 13.2 million units. The Group reported a significant increase in turnover to HK$10.7 billion, representing a year-on-year increase of 22%. Net profit rose 14% to HK$801 million, while basic earnings per share increased to 72.83 HK cents from 64.69 HK cents in 2010. The sound results validated the Group’s growth strategy, as well as the Group’s efforts in enhancing its operating efficiency and competitiveness. In the fourth quarter of 2011, Gartner, Inc., an international research firm, named our ALCATEL brand as one of the top ten global mobile vendors, on the back of its strong relationship with key global operators. IHS iSuppli also ranked ALCATEL the 8th global brand in terms of sales volume in the same period.
To share the outstanding results with our shareholders, a final dividend of 15 HK cents per share was proposed, representing a full year dividend payout ratio of 40%.
Strong Growth Momentum with Continuous Market Expansion
During the year under review, we continued to further penetrate into our existing markets and to expand into new markets, notably emerging markets such as Brazil, Africa, India and Thailand. We stepped up our efforts in building ALCATEL ONE TOUCH brand, broadening distribution channels and strengthening our cooperative ties with major telecommunications operators around the world. As a result, we achieved remarkable growth in the sales volume from our overseas markets, which surged 13% year-on-year to 38.5 million units, accounting for 88% of our total sales volume. Sales volume in China also jumped by 139% to 5.1 million units.
12 T C L C O M M U N I C A T I O N T E C H N O L O G Y H O L D I N G S L I M I T E D
Chairman’s Statement
BESMART
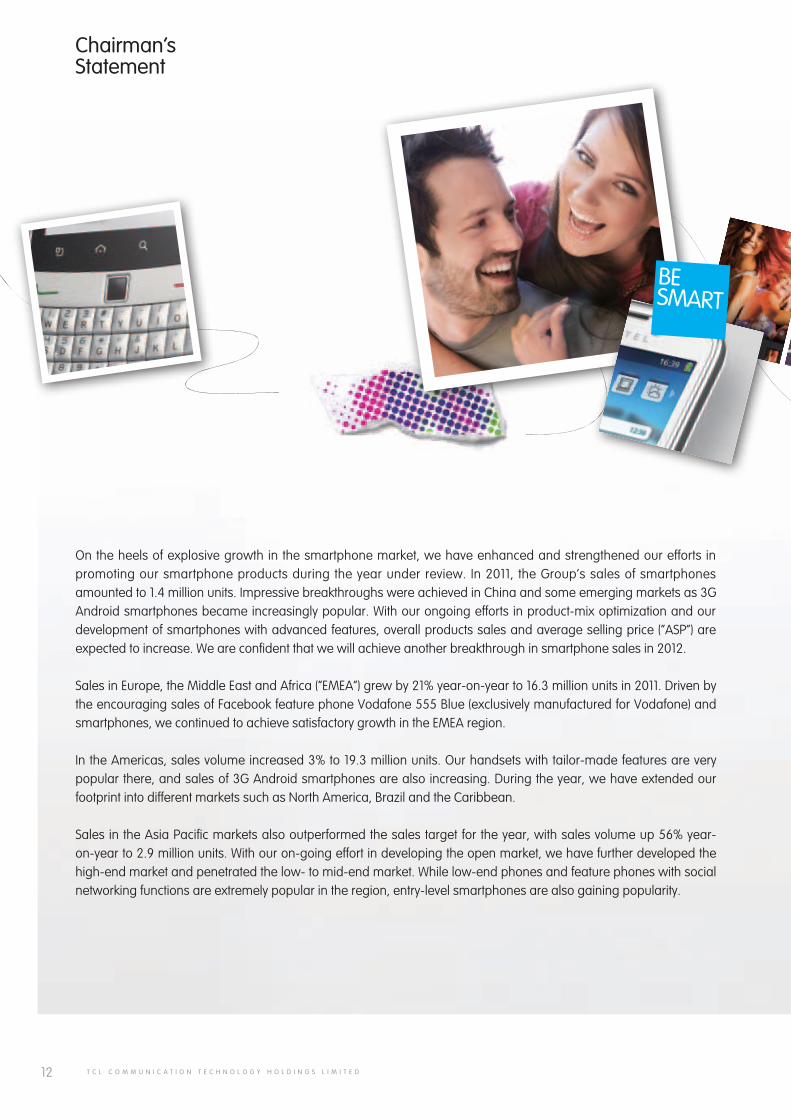
On the heels of explosive growth in the smartphone market, we have enhanced and strengthened our efforts in promoting our smartphone products during the year under review. In 2011, the Group’s sales of smartphones amounted to 1.4 million units. Impressive breakthroughs were achieved in China and some emerging markets as 3G Android smartphones became increasingly popular. With our ongoing efforts in product-mix optimization and our development of smartphones with advanced features, overall products sales and average selling price (“ASP”) are expected to increase. We are confident that we will achieve another breakthrough in smartphone sales in 2012.
Sales in Europe, the Middle East and Africa (“EMEA”) grew by 21% year-on-year to 16.3 million units in 2011. Driven by the encouraging sales of Facebook feature phone Vodafone 555 Blue (exclusively manufactured for Vodafone) and smartphones, we continued to achieve satisfactory growth in the EMEA region.
In the Americas, sales volume increased 3% to 19.3 million units. Our handsets with tailor-made features are very popular there, and sales of 3G Android smartphones are also increasing. During the year, we have extended our footprint into different markets such as North America, Brazil and the Caribbean.
Sales in the Asia Pacific markets also outperformed the sales target for the year, with sales volume up 56% year-on-year to 2.9 million units. With our on-going effort in developing the open market, we have further developed the high-end market and penetrated the low- to mid-end market. While low-end phones and feature phones with social networking functions are extremely popular in the region, entry-level smartphones are also gaining popularity.
13AnnuAl report 2011
ACTIONCAM
Sales VolumeIncreased
in China
139%
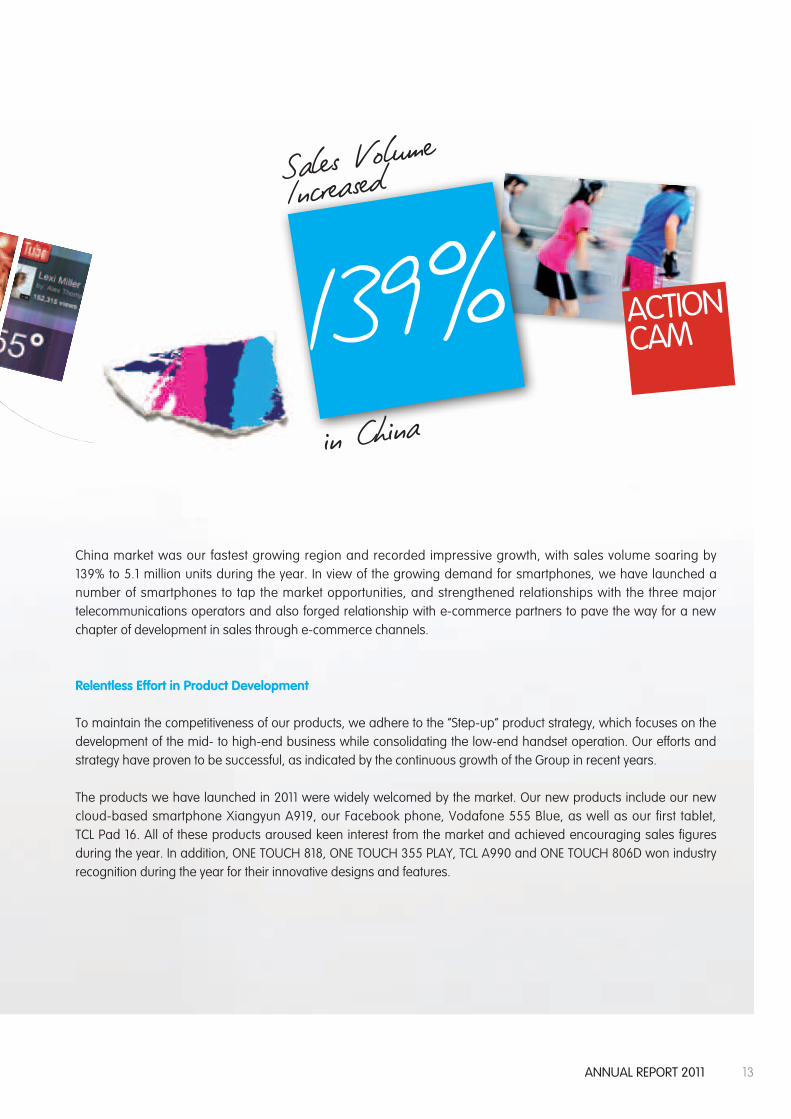
China market was our fastest growing region and recorded impressive growth, with sales volume soaring by 139% to 5.1 million units during the year. In view of the growing demand for smartphones, we have launched a number of smartphones to tap the market opportunities, and strengthened relationships with the three major telecommunications operators and also forged relationship with e-commerce partners to pave the way for a new chapter of development in sales through e-commerce channels.
Relentless Effort in Product Development
To maintain the competitiveness of our products, we adhere to the “Step-up” product strategy, which focuses on the development of the mid- to high-end business while consolidating the low-end handset operation. Our efforts and strategy have proven to be successful, as indicated by the continuous growth of the Group in recent years.
The products we have launched in 2011 were widely welcomed by the market. Our new products include our new cloud-based smartphone Xiangyun A919, our Facebook phone, Vodafone 555 Blue, as well as our first tablet, TCL Pad 16. All of these products aroused keen interest from the market and achieved encouraging sales figures during the year. In addition, ONE TOUCH 818, ONE TOUCH 355 PLAY, TCL A990 and ONE TOUCH 806D won industry recognition during the year for their innovative designs and features.
14 T C L C O M M U N I C A T I O N T E C H N O L O G Y H O L D I N G S L I M I T E D
Chairman’s Statement
Sustainable Growth
Looking ahead to 2012, we believe the operating environment of the handset industry will remain challenging as a result of economic uncertainty and fierce competition. We will be watchful of the latest market trend and seize every opportunity that may arise. With our strong business foundation, the group is confident of achieving sustainable growth going forward, and we believe our business in China and sales of smartphones to be our main growth drivers.
The Group will continue to strengthen our hold on markets where we have already achieved market leadership while expand into new markets with high potential quickly. To sustain long-term growth, we will continue our efforts in brand building, enhancing our R&D capabilities and fostering close relationships with operators and retailers.
All-in-all, our performance in 2011 has demonstrated that we have the right strategy and the right geographical footprint to sustain our long-term growth. Building on the growth momentum we achieved in previous years, we are poised for further growth in 2012. On behalf of the Board of Directors, I would like to express my gratitude to our shareholders, customers, suppliers and business partners for their unwavering support. Also, I would like to thank the Board, management and staffs for their wholehearted commitment. Their excellent work and team spirit will lead us to exciting new heights and opportunities.
LI DongshengChairman
27 February 2012
GET APPS

15AnnuAl report 2011
Net ProfitIncreased
over 2010
14%
FOLLOW FRIENDS
16 T C L C O M M U N I C A T I O N T E C H N O L O G Y H O L D I N G S L I M I T E D
Management Discussion
and Analysis
TUNES TO GO LOUD
AND CLEAR
17AnnuAl report 2011
Operational Highlights
• Salesvolumeofhandsetsandaccessoriesin2011totaled43.6millionunits,up20%year-on-year(YoY); thefourth quarter sales volume up 5% YoY to 13.2 million units.
• Revenue in2011surgedby22%YoY toHK$10.7billion;grossprofitmargin remainedstableat22%ascompared to last year. Net profit increased by 14% YoY to HK$801 million. Basic earnings per share increased to 72.83 HK cents from 64.69 HK cents last year.
• Theimpressiveresultsareattributabletothreemainreasons:greatereffortsingeographicalexpansionintonew and high potential markets globally, successful “Step-up” product strategy and enhanced brand building and channel penetration in open market.
• Afinaldividendof15.0HKcentsperordinaryshareisrecommended.
• Tomaintainsustainablegrowththroughtheexpansionofproductdiversification,productmix,marketshareand distribution network.
Industry Overview
Despite the unfavorable macro-economic environment, the global handset market continued to grow in 2011 as consumers continued to replace older handsets with upgraded models featuring the newest technologies and design. Holiday promotion toward the end of the year and the launch of a number of new products in the market also propelled sales of handsets in 2011.
Sales of smartphones continued to record substantial growth and became a key growth driver for the industry over the past year. While sales of mid- to high-end smartphones continued to gain significant market share in mature markets, low- to mid-end smartphones with lower average selling price (“ASP”) have become increasingly popular in emerging markets. On the other hand, feature phones continued to perform well, driven by demand for lower-cost devices in emerging markets such as Latin America, Middle East and Africa. Feature phones that carry social networking functions are also becoming popular in those markets.
18 T C L C O M M U N I C A T I O N T E C H N O L O G Y H O L D I N G S L I M I T E D
Management Discussion and Analysis
China, in which the number of users of 3G telecommunication services is growing rapidly, remains as one of the world’s strongest smartphone markets. Its improving 3G networks and the launch of affordable products with versatile features and applications have persuaded more people to buy smartphones.
Business Review
During the year under review, the Group was able to sustain growth momentum despite economic volatility worldwide as well as intensive competition in the industry. Significant breakthroughs were achieved in both sales and operational performance as the Group continued to make progress in its geographical expansion into new and high potential markets, as well as the success of its “Step-up” product strategy and brand building efforts.
During the year under review, the Group sustained growth momentum in sales volume of handsets and other products. A total of 43.6 million units of handsets and other products were sold, representing a 20% increase from the previous year. Throughout the year, 5.1 million units were sold in China market, representing a remarkable growth of 139%.
According to global telecommunications consultancy, Gartner, ALCATEL brand successfully entered the top 10 global mobile vendors ranking in the fourth quarter of 2011, because of its strong relationship with key global operators.
In 2011, the Group’s revenue rose to HK$10.7 billion, representing a 22% increase year-on-year. Overall ASP was kept stable at US$31. Nevertheless, gross profit margin remained stable at 22% as compared to last year thanks to the Group’s effort in improving cost control, raising operational efficiency, and enhancing product mix following the launch of more mid to high end products which yield higher margin.
As a result, profit attributable to owners of the parent in 2011 increased by 14% year-on-year to HK$800 million. Basic earnings per share increased to 72.83 HK cents from 64.69 HK cents last year. In view of this, the Board of Directors has recommended the payment of a final dividend of 15.0 HK cents per ordinary share, after taking into account of interim dividend of 13.8 HK cents, it represents a payout ratio of 40% of the profit attributable to owners of the parent during the year.
19AnnuAl report 2011
Thanks to its continuous efforts in boosting awareness of the ALCATEL ONE TOUCH brand, as well as in broadening distribution channels and establishing closer cooperation with major telecommunication operators, the Group continued to achieve measurable progress in expanding its existing markets in the Americas, Europe, the Middle East, Africa and the Asia Pacific region. The Group has also deepened its penetration into high potential emerging markets such as Brazil, Africa, India and Thailand. In view of the encouraging response to the Group’s sponsorship of Le Tour de France 2011 cycling competition, the Group was appointed as the official partner of the Amaury Sport Organisation in France for the years from 2011 to 2013, especially for the 100th Le Tour de France tournament in 2013. This sponsorship arrangement will further boost the global image of the ALCATEL ONE TOUCH brand.
Looking into China, the Group has successfully grasped market opportunities arising from the growing demand for smartphones and has launched a number of new 3G Android products during the year. To further propel sales growth, the Group has continued to expand its nation-wide distribution network and to establish closer cooperation with the country’s three major telecommunication operators, as well as major online media enterprises such as Sohu, Sina, NetEase and Tencent.
Building on its successful “Step-up” product strategy, the Group has further enhanced its R&D and product design capabilities to consolidate its leadership in the low- to mid-level markets while at the same time continuing to enhance its presence in the high-end markets. In February 2011, the Group entered into an acquisition agreement to acquire a R&D center from Sagem Wireless, a French technology company, and established an additional R&D center in Chengdu in May 2011, in order to enhance its R&D capabilities for the development of high-end smartphones. Shortly after launching a new cloud concept phone using the Mediatek 3G Android chipset, Xiangyun A919, in October 2011, the Group unveiled a total of 12 cloud products (including 10 cloud smartphones and two tablets) in Shanghai, China in December 2011. The Group also continued to launch new handset models with features tailor-made for local markets. Following the Group’s successful launch of the Facebook phone Vodafone 555 Blue (exclusively manufactured for Vodafone), French Telecom-Orange launched three new ALCATEL ONE TOUCH Facebook phones, namely, ONE TOUCH 585F, ONE TOUCH 813F and ONE TOUCH 908F, across Africa and Europe in November 2011. All of these new products have consistently received positive feedback from the market.
Moreover, in view of its sustainable growth momentum and the continuous expansion of its product portfolio, the Group entered into an extended license fee agreement for the use of certain trademarks owned by Alcatel-Lucent in September 2011. The Group would pay Alcatel-Lucent a US$40 million (equivalent to approximately HK$312 million) license fee for the use of the ALCATEL brand name for the next 13.5 years. The scope of use will be extended beyond mobile phones to include smartphones, tablets, mobile broadband modems and wireless network appliances, devices and equipment. This favorable arrangement will enable the Group to save a substantial amount of royalty expenses in its future business developments.
20 T C L C O M M U N I C A T I O N T E C H N O L O G Y H O L D I N G S L I M I T E D
Management Discussion and Analysis
Europe, the Middle East and Africa (“EMEA”)During the year under review, despite the debt crisis took place in Europe, shipments to EMEA totaled 16.3 million units, surging 21% increase year-on-year. Shipments in the fourth quarter were 4.7 million units. During the year, EMEA continued to record satisfactory growth as the Group’s products, including ONE TOUCH 355, ONE TOUCH 306, ONE TOUCH 213 and the Facebook phone Vodafone 555 Blue, received positive responses in different markets. The ONE TOUCH 355, which won “Red Dot Design Award” in 2011, was the best seller among similar models because of its innovative design and attractive price.
In 2011, the Group stepped up its efforts in promoting its ALCATEL ONE TOUCH brand in the EMEA region. The Group launched a major marketing event in Italy for a range of dual-SIM phones, as well as an event in Russia for its Android smartphone, ONE TOUCH 990. The Group delivered robust performance across the United Kingdom, Italy, France, Russia and South Africa, and successfully expanded into new markets including Armenia, the Czech Republic, Turkey and Ghana during the year.
In the coming year, the Group will continue to strengthen its existing markets in the EMEA region and strive to break into new and emerging markets, for example, Pakistan. Meanwhile the Group will introduce more smartphone models in order to further penetrate into the smartphone market.
AmericasDuring the year under review, in spite of the weakened local purchasing power as a result of currency fluctuation in some emerging markets, shipments to the Americas grew to 19.3 million units, representing 3% increase year-on-year. This growth was mainly driven by the increase in market share with new sales channels which include tier-1 carriers such as T-Mobile in the prepaid market, as well as the shift in sales from low-end phones to mid-high end feature phones and entry-level smartphones with higher margins.
With the Group’s continuous efforts in broadening its distribution channels and reinforcing its partnerships with various operators, the Group has successfully expanded its CDMA and GSM market in North America, as well as extending its reach to Costa Rica in the fourth quarter of 2011.
ALCATEL ONE TOUCH currently ranked No. 4 brand in Latin America region, especially No. 2 in Columbia and No. 3 in Brazil.
In the coming year, the Group will continue to strengthen its markets in North America, Canada, and Brazil by further enhancing its sales channels and product mix. In view of the growing demand for smartphones, the Group will also introduce more smartphones with advanced functions in order to sustain long-term growth.
21AnnuAl report 2011
Asia Pacific (“APAC”)Sales volume across the APAC region surged 56% year-on-year to 2.9 million units. Shipments in the fourth quarter grew by 146% to 1.3 million units over the same period in 2010. The robust growth was mainly attributable to the Group’s open market development and its growing market share in the low to mid-end product segment and at the same time its development in the high-end market. The Group achieved strong results in India and Israel during the year and reinforced its marketing efforts in existing markets such as India, the Philippines and Vietnam. The Group was also successful in expanding into new markets including Bangladesh, Indonesia and Thailand.
In the coming year, the Group will continue to strengthen its strategic partnership with operators and retailers in order to broaden its customer base and expand into new markets. The Group will also enhance its brand building efforts and introduce more smartphones and feature phones in the region.
ChinaDuring the year under review, the sales volume of handsets in China market reached 5.1 million units, surging a year-on-year increase of 139%, exceeding the sales target for 2011. Achievements were made in a number of areas such as the launch of new products, market expansion, brand building and closer relationships with operators.
On the back of growing demand for smartphones, the Group continuously launched a number of smartphone products to strengthen and enhanced its product portfolio of smartphones. As a result, the Group has established a good reputation and generated positive feedback in China’s smartphone market. The Group’s products received overwhelming response from the market. In particular, the Xiangyun A919, a new cloud concept phone that features a number of innovative cloud applications, received great response since its launch in October 2011, and on top of the Group’s TCL W989 being selected by China Unicom in December 2011, TCL E906 smartphone has been successfully bid in China Mobile’s 2012 first G3 smart terminal centralized procurement in January 2012. Other products such as TCL A990 were also well-received by consumers. Meanwhile, the Group also launched new 3G products with customized features to suit the demand of local customers. The sales of the Group’s 3G products such as the TCL S188 and T218 also went very well.
The Group continued its effort in penetrating into the China market and deepened its cooperation with the country’s three major telecommunications operators. The Group was able to broaden its sales channels and achieve breakthroughs in Guangdong, Sichuan, Fujian, Shandong, Jiangsu and Zhejiang. The Group also deepened its cooperation with its e-commerce partners such as Sohu, Sina, NetEase and Tencent, and established online sales channels on 360buy.com, Tmall (previously named as Taobao Mall) and Suning.com. During the year, the Group’s ALCATEL ONE TOUCH online flagship store on Tmall was ranked one of the top 10 virtual stores in China.
22 T C L C O M M U N I C A T I O N T E C H N O L O G Y H O L D I N G S L I M I T E D
Management Discussion and Analysis
In the year 2012, smartphones will be the key growth driver in China market. The Group plans to launch several new 3G Android smartphones with advanced features in order to expand its market share and enhance profit margin in the first quarter. The Group will also allocate more resources to marketing and promotion and has placed a number of TV advertisements in the pipeline. In addition, the Group will continue to expand its nationwide sales network in order to sustain growth.
Product Research & Development
During the year, the Group remained committed to distinguishing itself through its product development capabilities. Many new models were launched during the year, including ONE TOUCH 990, ONE TOUCH 910, ONE TOUCH 918 and TCL A919. All of these new products were selected by major telecommunications operators around the world such as China Unicom, Orange, Vodafone, Telefonica and America Movil, and received positive market response.
In October 2011, the Group cooperated with NetEase to launch the Xiangyun A919, a new cloud-based smartphone that features the Mediatek 3G Android chipset. Featuring a number of innovative cloud applications, the Xiangyun A919 symbolizes the beginning of the Group’s development of cloud-based smartphones. In November, French Telecom-Orange launched three new phones featuring full Facebook integration, all of which were in TCL Communication’s ALCATEL ONE TOUCH brand lineup. The phones came into the spotlight at the “2011 GSM Mobile Asia Congress”, held in Hong Kong in November. Meanwhile, following the launch of the TCL Pad16, the Group’s first tablet, in July, the Group has also introduced Spark and TULI, two 7-inches display tablets, in December. With their impressive design and highly flexible customization features, the new tablets are set to be an important milestone in the Group’s expansion into the tablet market.
TCL Communication’s distinguished design capabilities and its role in the development of China’s telecommunication industry were recognized by numerous prestigious industry awards during the year. These awards include the “RedDotDesignAward–ProductDesign2011”,awarded toONETOUCH818andONETOUCH355; the“ChinaTelecommunicationIndustryEnterpriseLeadership”awardpresentedatthe“ChinaTelecommunicationForum2011”;the“ChinaSmartphonesOutstandingAward2011”awardedtoTCLA990;aswellasthe“MostImpressiveRadiationFree Handset Award” awarded to ONE TOUCH 806D in India.
23AnnuAl report 2011
Outlook
Looking forward to 2012, the global economy will likely remain volatile due to the weakening US and European economies. The operating environment will be challenging as consumer spending power will weaken in some countries and competition among handset manufacturers will intensify. However, the Group is confident about the future based on its solid results that have been achieved over the previous years, its reputable brand, strong R&D capabilities, diversified product portfolio and extensive market presence.
The Group is confident that it will continue to sustain its growth momentum in the coming year with its business in China and sales of smartphones being its main growth drivers. The Group will continue to enhance its market penetration in China by launching more new products customized for local consumers, expanding its distribution network by strengthening cooperation with large retail chain stores, and fostering its partnerships with three major telecommunication operators and major online media enterprises in China. In the meantime, the Group will hold some tremendous sales promotion events in certain important holidays in order to boost the sales.
The Group will continue to engage in its proven “Step-up” product strategy in order to optimize its product mix. Meanwhile, it will closely monitor the global trend of convergence of voice, video and data technology in order to seize further market opportunities. The Group will continue to develop more new models, especially smartphones, in future. With more resources devoted to enhancing R&D capabilities and brand promotion, as well as the strengthened sales channels with operators and the open market, the Group expects that the new products will continue to receive positive response from the market and that the sales of smartphones will achieve another breakthrough in the coming year. The increasing proportion of smartphone sales is expected to further propel the overall ASP in the near future.
In overseas market, the Group will continue to deepen its penetration into the existing markets while expanding into new, high-potential emerging markets. Backed by its strong R&D capabilities, the Group will boost its efforts in diversifying its product in order to solidify its leadership position in the low to mid-end handset markets and to further improve its position in the mid to high-end markets. The Group will also strengthen its strategic alliances with major telecommunication operators worldwide, as well as broaden its sales channels with operators and in the open market.
24 T C L C O M M U N I C A T I O N T E C H N O L O G Y H O L D I N G S L I M I T E D
Management Discussion and Analysis
Riding on its continued geographical expansion into new and high-potential markets, together with the successes of the Group’s “Step-up” product strategy and brand building efforts, the Group is confident that it will sustain long-term growth of its business. The Group will also continue to improve its operational efficiency and enhance its cost control and risk management in order to maximize returns to its shareholders.
Financial Review
ResultsFor the year ended 31 December 2011, the Group’s audited consolidated revenue amounted to HK$10,653 million (2010: HK$8,701 million), representing a year-on-year increase of 22% as compared to that of last year.
The Group’s gross profit margin remained stable at 22% as compared to the previous year, despite the keen competition and general declining product prices.
EBITDA and profit attributable to owners of the parent were HK$835 million (2010: HK$785 million) and HK$800 million (2010: HK$702 million) respectively. Basic earnings per share were 72.83 HK cents (2010: 64.69 HK cents).
InventoryThe Group’s inventory (including factory materials and goods only) turnover period was 25 days (2010: 32 days).
Trade ReceivablesCredit period was 30 to 90 days on average and the trade receivable (excluding factored trade receivables) turnover was 89 days (2010: 107 days).
Significant Investments and AcquisitionsOn 1 April 2011, the Group acquired fixed line telephone business from TCL Communication Equipment (Huizhou) Co., Ltd. with aggregate purchase consideration of RMB 120 million (equivalent to approximately HK$144 million) which was satisfied in the form of cash.
25AnnuAl report 2011
On 25 May 2011, the Group acquired 100% interest in Ningbo Research & Development Hong Kong Limited and its wholly owned subsidiary TCL Communication (Ningbo) Limited (formerly known as “Sagem Mobiles Research and Development (Ningbo) Co., Ltd.”). The aggregate purchase consideration of Euro 11 million (equivalent to approximately HK$123 million) was paid in the form of cash.
On 19 September 2011, the Group entered into the Amended License Agreement with Alcatel-Lucent as the licensor and a consideration of US$40 million (equivalent to approximately HK$312 million) was paid in form of cash as license fee for the use of the “ALCATEL” brand name for certain of its products for the period from 1 July 2011 to 31 December 2024.
Except for the aforesaid acquisitions, there were no other significant investments and acquisitions during the year ended 31 December 2011 and up to the date of this annual report.
Fund RaisingThere had been no fund raising for the year ended 31 December 2011 and up to the date of this annual report.
Liquidity and Financial ResourcesThe Group maintained a healthy liquidity position during the year. The Group’s principal financial instruments comprise cash and cash equivalents, interest bearing bank and other borrowings and bank advances on factored trade receivables. The cash and cash equivalents balances as at 31 December 2011 amounted to HK$1,187 million, of which 48% were in RMB, 37% in US dollars, 8% in Euro and 7% in Hong Kong dollars and other currencies for the operations. The Group’s total interest-bearing borrowings as at 31 December 2011 were HK$7,532 million, in which the interest bearing bank and other borrowings were HK$7,222 million and bank advances on factored trade receivables were HK$310 million. The Group’s financial position remained healthy, with equity attributable to owners of the parent of HK$2,669 million (31 December 2010: HK$2,218 million). The Group had a gearing ratio of 54% at the end of the year (31 December 2010: 53%). The gearing ratio is calculated based on the Group’s total interest-bearing borrowings over total assets.
26 T C L C O M M U N I C A T I O N T E C H N O L O G Y H O L D I N G S L I M I T E D
Management Discussion and Analysis
Pledge DepositsDeposit balance of HK$6,092 million (31 December 2010: HK$6,201 million) represented the pledged deposit for interest bearing bank borrowings, banking facilities and other financial instruments of HK$6,070 million (31 December 2010: HK$6,176 million) and retention guarantee for factored trade receivables of HK$22 million (31 December 2010: HK$25 million).
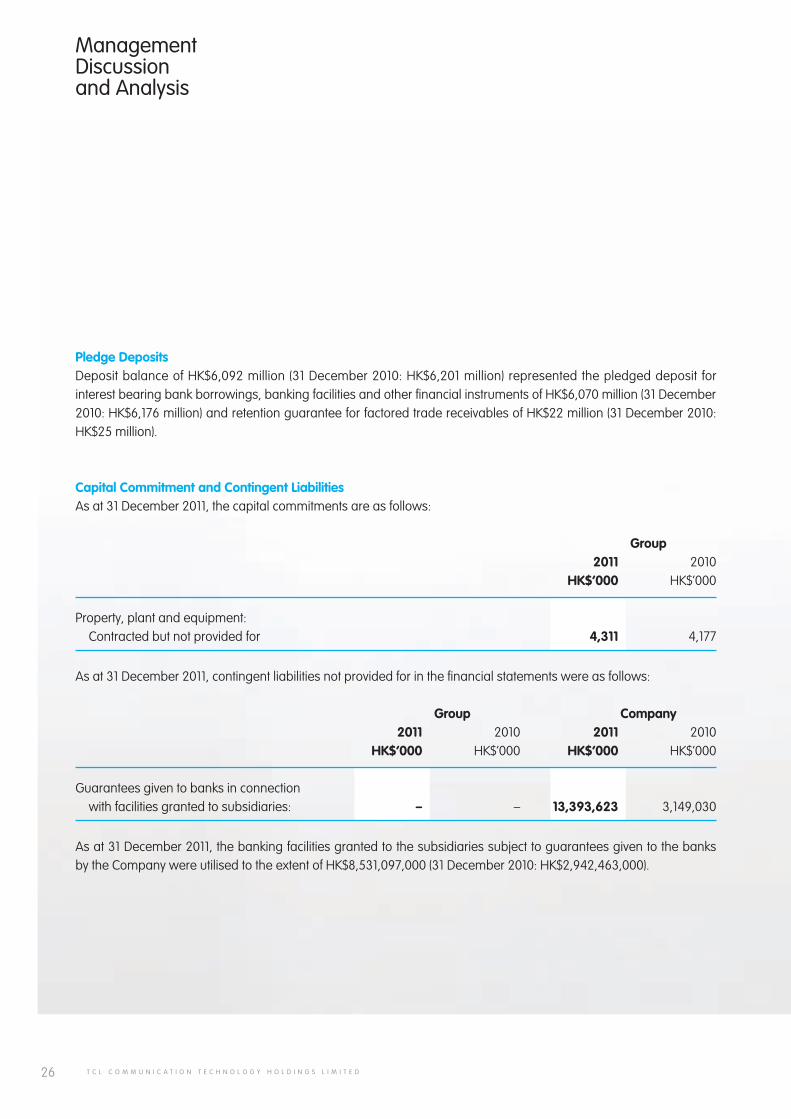
Capital Commitment and Contingent LiabilitiesAs at 31 December 2011, the capital commitments are as follows:
Group 2011 2010 HK$’000 HK$’000
Property, plant and equipment: Contracted but not provided for 4,311 4,177
As at 31 December 2011, contingent liabilities not provided for in the financial statements were as follows:
Group Company 2011 2010 2011 2010 HK$’000 HK$’000 HK$’000 HK$’000
Guarantees given to banks in connection with facilities granted to subsidiaries: – – 13,393,623 3,149,030
As at 31 December 2011, the banking facilities granted to the subsidiaries subject to guarantees given to the banks by the Company were utilised to the extent of HK$8,531,097,000 (31 December 2010: HK$2,942,463,000).
27AnnuAl report 2011
Foreign Exchange ExposureThe Group has transactional currency exposures. These exposures arise from sales or purchases by operating units in currencies other than the units’ functional currency, where the revenue is predominated in Euro, United States dollar and RMB. The Group tends to accept foreign currency exchange risk avoidance or allocation terms when arriving at purchase and sales contracts. The Group takes rolling forecast on foreign currency revenue and expenses, matches the currency and amount incurred, so as to alleviate the impact on business due to exchange rate fluctuation. In line with the aim of prudent financial management, the Group does not engage in any high risk derivative trading or leveraged foreign exchange contracts.
Employees and Remuneration PolicyThe Group had over 9,600 employees as at 31 December 2011. Total staff costs for the year under review were HK$941 million (2010: HK$692 million). The remuneration policy was in line with current legislation, market conditions and both individual and company performance.
28 T C L C O M M U N I C A T I O N T E C H N O L O G Y H O L D I N G S L I M I T E D
Directors and Senior
Management
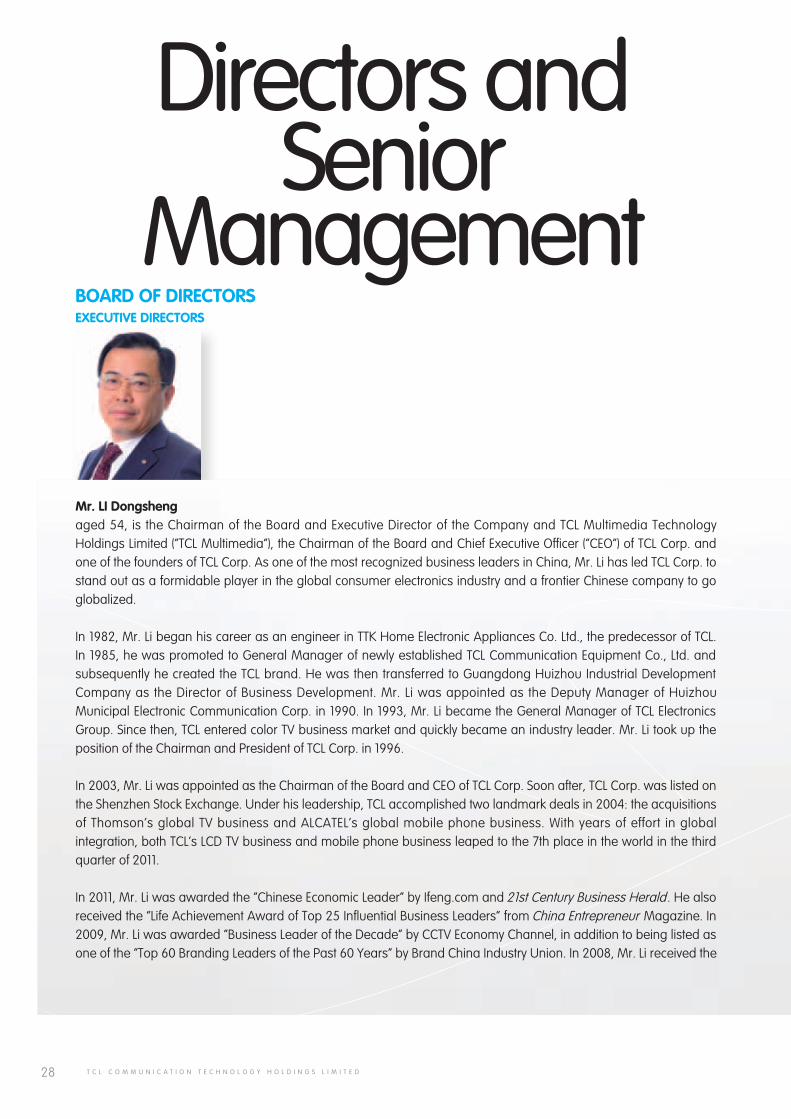
Mr. LI Dongshengaged 54, is the Chairman of the Board and Executive Director of the Company and TCL Multimedia Technology Holdings Limited (“TCL Multimedia”), the Chairman of the Board and Chief Executive Officer (“CEO”) of TCL Corp. and one of the founders of TCL Corp. As one of the most recognized business leaders in China, Mr. Li has led TCL Corp. to stand out as a formidable player in the global consumer electronics industry and a frontier Chinese company to go globalized.
In 1982, Mr. Li began his career as an engineer in TTK Home Electronic Appliances Co. Ltd., the predecessor of TCL. In 1985, he was promoted to General Manager of newly established TCL Communication Equipment Co., Ltd. and subsequently he created the TCL brand. He was then transferred to Guangdong Huizhou Industrial Development Company as the Director of Business Development. Mr. Li was appointed as the Deputy Manager of Huizhou Municipal Electronic Communication Corp. in 1990. In 1993, Mr. Li became the General Manager of TCL Electronics Group. Since then, TCL entered color TV business market and quickly became an industry leader. Mr. Li took up the position of the Chairman and President of TCL Corp. in 1996.
In 2003, Mr. Li was appointed as the Chairman of the Board and CEO of TCL Corp. Soon after, TCL Corp. was listed on the Shenzhen Stock Exchange. Under his leadership, TCL accomplished two landmark deals in 2004: the acquisitions of Thomson’s global TV business and ALCATEL’s global mobile phone business. With years of effort in global integration, both TCL’s LCD TV business and mobile phone business leaped to the 7th place in the world in the third quarter of 2011.
In 2011, Mr. Li was awarded the “Chinese Economic Leader” by Ifeng.com and 21st Century Business Herald. He also received the “Life Achievement Award of Top 25 Influential Business Leaders” from China Entrepreneur Magazine. In 2009, Mr. Li was awarded “Business Leader of the Decade” by CCTV Economy Channel, in addition to being listed as one of the “Top 60 Branding Leaders of the Past 60 Years” by Brand China Industry Union. In 2008, Mr. Li received the
BOARD OF DIRECTORSEXECUTIVE DIRECTORS
29AnnuAl report 2011
Deloitte Prize in Barcelona for entrepreneurship and was honored as an “Economic Figure” in 30 years’ reform and opening up. In 2008, Mr. Li was also named in China Times as China’s “Top Ten Outstanding CEOs”. He was also awarded “Brand Founder” over 30 years’ reform and opening up by a New York brand consulting agency. In 2007, Mr. Li received the Corporate Leadership award from the US-China Forum in Chicago. He was also named as “one of the most influential business leaders” by China Entrepreneur Magazine in 2006 and 2005, “CCTV man of the Year in the Chinese Economy” in 2004, “Asia Businessman of the Year” by Fortune Magazine in 2004 and one of the Top 25 Global Business Leaders by Time Magazine and CNN in 2004. Mr. Li received a medal of OFFICER DE LA LEGION D’HONNEUR (French national honor) from French President Mr. Jacques Chirac in 2004.
Mr. Li was elected as a delegate to the 16th National Congress of the Communist Party of China, and a deputy to the 10th and 11th National People’s Congress. Mr. Li holds a number of prestigious positions including Chairman of China Electronic Imaging Industry Association, Vice Chairman of China Chamber of International Commerce, Chairman of Guangdong Household Electrical Appliances Chamber of Commerce, Honorary Chairman of Shenzhen Flat Panel Display Industry Association and Adjunct Professor of Wuhan University.
Mr. Li is also an Independent Non-Executive Director of Tencent Holdings Limited, a company listed on the Stock Exchange.
Mr. Li graduated with a Bachelor’s Degree in Department of Radio Technology from South China University of Technology.
30 T C L C O M M U N I C A T I O N T E C H N O L O G Y H O L D I N G S L I M I T E D
Directors and Senior Management
EXECUTIVE DIRECTORS (continued)
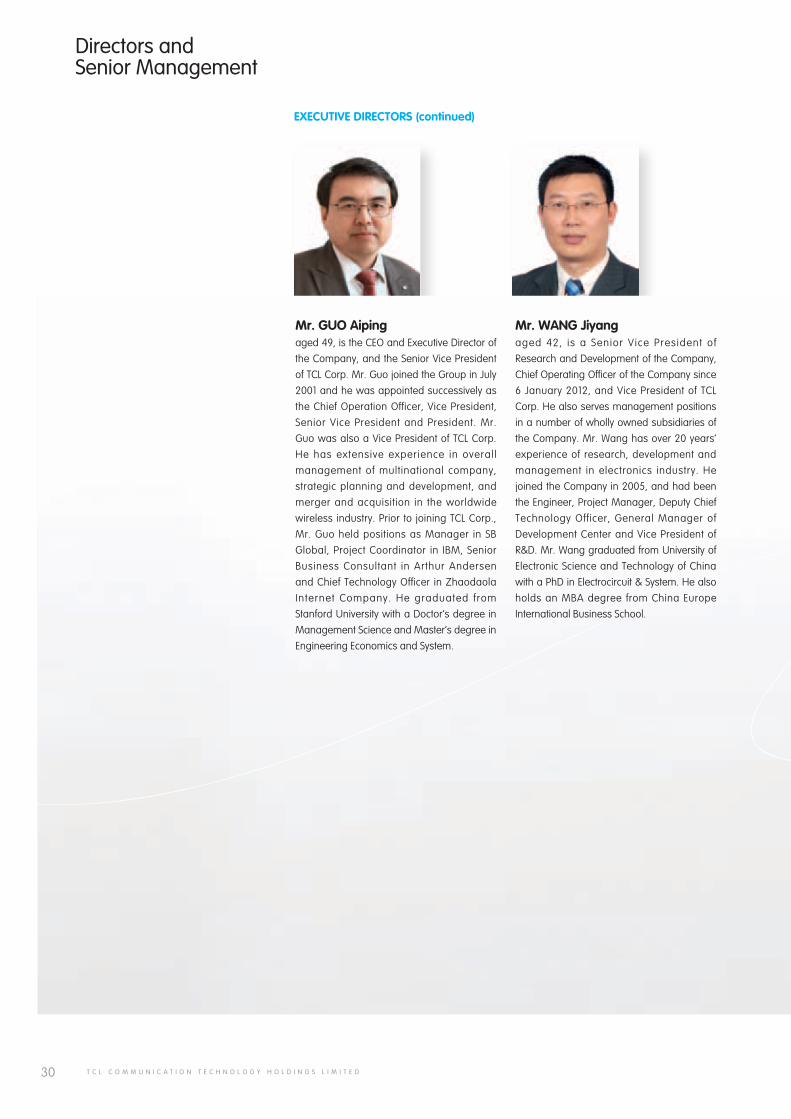
Mr. GUO Aipingaged 49, is the CEO and Executive Director of the Company, and the Senior Vice President of TCL Corp. Mr. Guo joined the Group in July 2001 and he was appointed successively as the Chief Operation Officer, Vice President, Senior Vice President and President. Mr. Guo was also a Vice President of TCL Corp. He has extensive experience in overall management of multinational company, strategic planning and development, and merger and acquisition in the worldwide wireless industry. Prior to joining TCL Corp., Mr. Guo held positions as Manager in SB Global, Project Coordinator in IBM, Senior Business Consultant in Arthur Andersen and Chief Technology Officer in Zhaodaola Internet Company. He graduated from Stanford University with a Doctor’s degree in Management Science and Master’s degree in Engineering Economics and System.
Mr. wANG Jiyangaged 42, is a Senior Vice President of Research and Development of the Company, Chief Operating Officer of the Company since 6 January 2012, and Vice President of TCL Corp. He also serves management positions in a number of wholly owned subsidiaries of the Company. Mr. Wang has over 20 years’ experience of research, development and management in electronics industry. He joined the Company in 2005, and had been the Engineer, Project Manager, Deputy Chief Technology Officer, General Manager of Development Center and Vice President of R&D. Mr. Wang graduated from University of Electronic Science and Technology of China with a PhD in Electrocircuit & System. He also holds an MBA degree from China Europe International Business School.
31AnnuAl report 2011
NON-EXECUTIVE DIRECTORS
Mr. HUANG Xubinaged 46, is a Non-Executive Director of the Company, Chief Financial Officer of TCL Corp., a Non-Executive Director and a member of the audit committee of TCL Multimedia. Mr. Huang joined TCL Corp. in March 2001 and served as Officer and General Manager of the Financial Settlement Centre of TCL Corp. He was the Chief Economist of TCL Corp. from June 2004 to June 2008, General Manager of TCL Finance Co. Ltd. from October 2006 to December 2008. He has been a member of the executive committee of TCL Corp. since July 2007. Mr. Huang was Vice President of TCL Corp. from April 2008 to January 2011, and Financial Director of TCL Corp. from June 2008 to January 2011. He has been Chairman of TCL Finance Co. Ltd. since November 2009. Before joining TCL Corp., Mr. Huang served as Head of Credit Facilities Department of China Construction Bank, Guangdong Branch, the Deputy Manager and Manager of Fund Management Division and Securities Division of Guotai Junan Securities Co. Ltd., Guangdong Branch, and Senior Manager of the representative office of China Cinda Asset Management Co., Ltd. in Guangzhou. Mr. Huang graduated from Hunan College of Finance and Economics, majoring in Finance, and obtained a Master’s degree in Economy at Research Institute for Fiscal Science, Ministry of Finance, PRC, and holds an EMBA degree from China Europe International Business School.
Mr. BO Lianmingaged 49, is a Non-Executive Director of the Company, an Executive Director of TCL Multimedia, and an Executive Director, President and Chief Operating Officer of TCL Corp. He previously served as the Vice Chairman of the board of TCL Multimedia and the Chairman of Huizhou TCL Home-Appliance Co., Ltd. Mr. Bo also held a number of management positions including Vice President and Financial Director of TCL IT Industrial Group, Vice President of TCL Components Strategic Business Unit, and Executive Vice President of TTE Corporation, as well as Human Resources Director, Vice President and Senior Vice President of TCL Corp. He has over 11 years’ experience in the consumer electronics products industry. Before joining TCL Corp. in 2000, he was the Chief Accountant of Shenzhen Airlines Ltd. Mr. Bo holds a Doctor’s degree in Business Administration from Xi’an Jiaotong University.
Ms. XU Fangaged 49, is a Non-Executive Director of the Company, Vice President and Human Resources Director of TCL Corp., an Executive Director of TCL Multimedia and a member of the remuneration committee thereof. Ms. Xu joined TCL Institute of Training of TCL Corp. as the Dean in February 2004. Ms. Xu became the Deputy Dean of TCL Institute of Leadership Development in February 2006 and the Dean in April 2007. Ms. Xu has been the Human Resources Director of TCL Corp. since September 2007. From September 2007 to May 2010, she concurrently held the position of General Manager of the Human Resources Management Centre of TCL Corp. She has been the Vice President of TCL Corp. since October 2010. From September 2010 to June 2011, she also held the position of Chief Human Resources Officer of the TCL Multimedia. She is also a parttime lecturer at Shenzhen Graduate School of Peking University, a distinguished professor at Shantou University and a distinguished research fellow at Sun Yat-Sen University. Ms. Xu obtained a Bachelor’s degree in English Linguistics from Nanjing Normal University, and a Master’s degree in Business Administration from New York Institute of Technology.
32 T C L C O M M U N I C A T I O N T E C H N O L O G Y H O L D I N G S L I M I T E D
Directors and Senior Management
INDEPENDENT NON-EXECUTIVE DIRECTORS
Mr. LAU Siu Kiaged 53, is an Independent Non-Executive Director of the Company. Mr. Lau joined the Company in April 2004 and save for his directorship in the Company, he does not hold any directorship in any member of the Group. Mr. Lau is a fellow member of both the Hong Kong Institute of Certified Public Accountants and the Association of Chartered Certified Accountants (“ACCA”). He has over 30 years’ experience in corporate finance, financial advisory and management, accounting and auditing and had worked for an international accounting firm for over 15 years. Mr. Lau was a member of the ACCA worldwide Council from May 2002 to September 2011, and was the Chairman of the Hong Kong branch of ACCA in 2000/2001. He is also a consultant in the financial advisory field and an Independent Non-Executive Director of COL Capital Limited, Comba Telecom Systems Holdings Limited, Foxconn International Holdings Limited, Samson Holding Limited, Embry Holdings Limited and Binhai Investment Company Limited, all being companies listed on the Stock Exchange. In the past three years, Mr. Lau had been an Independent Non-Executive Director of Carry Wealth Holdings Limited, Greenfield Chemical Holdings Limited and Proview International Holdings Limited, all being companies listed on the Stock Exchange.
Mr. LOOK Andrewaged 47, is an Independent Non-Executive Director of the Company. He has over 20 years’ experience in the equity investment analysis of Hong Kong and China stock markets. From 2000 to 2008, Mr. Look served in Union Bank of Switzerland (“UBS”) as the head of Hong Kong research, strategy and product and he is now an external consultant to UBS. Prior to joining UBS, Mr. Look was the regional director of PPM Worldwide, the fund management arm of the Prudential Corporation of the United Kingdom, where he managed pension and life insurance funds investing in Asia ex-Japan markets. He was also a consultant of Opes Asia Development Limited, which shares are listed on the Stock Exchange. Mr. Look is currently the Chief Investment Officer and Managing Director of Look’s Asset Management Limited, a SFC licensed asset management company which is based in Hong Kong and founded and solely owned by him. He is also an Independent Non-Executive Director of Ka Shui International Holdings Limited, which shares are listed on the Stock Exchange. He holds a Bachelor of Commerce degree from the University of Toronto.
Mr. KwOK Hoi Singaged 61 , i s the Cha i r P ro fessor o f the D e p a r t m e n t o f E l e c t r o n i c & C o m p u t e r Engineering at the Hong Kong University of Science and Technology (the “HKUST”). He is also Dr. William Mong Chair Professor of Nanotechnology and Director of Center for Display Research at HKUST. Before joining HKUST, he worked at the Lawrence Berkeley Laboratory from 1978 to 1980, he then taught at the Department of Electrical and Computer Engineering, State University of New York at Buffalo from 1980 to 1992, where he became a tenured Full Professor in 1985. He joined HKUST in 1992 with his research interests in display technologies and emitting thin film materials.
Mr. Kwok enjoys a good reputation in his professional area. He is a member of program committees of many international conferences and had been a Chairman. He was awarded a number of honors including the US Presidential Young Investigator Award in 1984 and the New York State/UUP Excellence Award in 1991. He is a Fellow of the Optical Society of America, a Fellow of Institute of Electrical and Electronics Engineers (the “IEEE”) and a Fellow of Society for Information Display. Mr. Kwok has over 500 publications in internationally renowned academic journals and also holds more than 50 patents.
Mr. Kwok was an Independent Non-Executive Director of Diguang International Development Co., Ltd., a company listed on the NASDAQ Exchange (Stock Code: DGNG.OB).
Mr. Kwok holds a Bachelor of Science degree in Electrical Engineering from Northwestern University in the United States in 1973. He then pursued further studies at Harvard University where he received his MSc and PhD degrees in Applied Physics in 1974 and 1978 respectively.
33AnnuAl report 2011
EXECUTIVE COMMITTEE
Mr. GUO Aipingaged 49, is the CEO and Executive Director of the Company, and the Senior Vice President of TCL Corp. Mr. Guo joined the Group in July 2001 and he was appointed successively as the Chief Operation Officer, Vice President, Senior Vice President and President. Mr. Guo was also a Vice President of TCL Corp. He has extensive experience in overall management of multinational company, strategic planning and development, and merger and acquisition in the worldwide wireless industry. Prior to joining TCL Corp., Mr. Guo held positions as Manager in SB Global, Project Coordinator in IBM, Senior Business Consultant in Arthur Andersen and Chief Technology Officer in Zhaodaola Internet Company. He graduated from Stanford University with a Doctor’s degree in Management Science and Master’s degree in Engineering Economics and System.
Mr. LIU Yuk Tung, Thomasaged 49, is a Senior Vice President and Chief Financial Officer of the Company. Mr. Liu has about 26 years of experience in fields of audit, international finance and trading business. Prior to joining the Company, he was the Asia Pacific Regional Financial Controller of Stratus Corporation in US, Sales and Marketing Director and General Manager of Neo-Neon Holdings Limited, a company with its shares listed on the Stock Exchange. He is also a CPA of HKICPA, Charted Accountant of ICAEW and fellow member of ACCA. Mr. Liu holds a Bachelor’s degree in Economics from the University of Hong Kong, a MBA from the University of New South Wales, Australia and a Master’s Degree in Accounting from Jinan University, PRC.
Mr. wANG Jiyangaged 42, is a Senior Vice President of Research and Development of the Company, Chief Operating Officer of the Company since 6 January 2012, and Vice President of TCL Corp. He also serves management positions in a number of wholly owned subsidiaries of the Company. Mr. Wang has over 20 years’ experience of research, development and management in electronics industry. He joined the Company in 2005, and had been the Engineer, Project Manager, Deputy Chief Technology Officer, General Manager of Development Center and Vice President of R&D. Mr. Wang graduated from University of Electronic Science and Technology of China with a PhD in Electrocircuit & System. He also holds an MBA degree from China Europe International Business School.
SENIOR MANAGEMENT
34 T C L C O M M U N I C A T I O N T E C H N O L O G Y H O L D I N G S L I M I T E D
Directors and Senior Management
EXECUTIVE COMMITTEE (continued)
Mr. LV Xiaobina g e d 4 1 , i s a S e n i o r V i c e President of the Company and General Manager of Global Manufacturing Center. Mr. Lv jo ined TCL Communica t ion Equipment Co. , L td . in Ju ly 1993 and joined the Company i n M a r c h 2 0 0 2 a n d w a s appo in ted success i ve l y as Depar tment Head, Fac to ry Director, Vice General Manager o f M a n u f a c t u r i n g C e n t e r , Production Director and Vice President of the Company. Mr. Lv has about 18 years’ experience in communicat ion terminal manufacturing industry, with rich and professional experience a n d s k i l l s i n o p e r a t i o n management fields including manufactur ing engineer ing technologies and management, p r o d u c t i o n m a n a g e m e n t , quality management, supply chain management, and he also has been through a 7-year international baptism. Mr. Lv g radua ted f rom Un ivers i t y o f E l e c t r o n i c S c i e n c e a n d Technology of China with a Bachelor degree in Science, majoring in computer, minoring in applied mathematics, and also holds an EMBA Degree from China Europe International Business School.
Mr. wONG Kwok Chung, Albertaged 40, is an Executive Vice President and General Manager of Sales & Marketing (APAC) of the Company. Mr. Wong joined the Company in 2005. He has 14 years of experience in computers and electronics industry in Hong Kong, Canada and Mainland China. He had been the Senior Sof tware Engineer of KEGO T e c h n o l o g y L i m i t e d , C h i e f Information Officer of Inmobo Limited, CEO and Chief Operation Officer of JCT Mobile. Mr. Wong graduated from the University of Toronto with a Bachelor’s Degree in Science and obtained his Master’s degree in Electrical and Electronics Engineering at the Hong Kong University of Science & Technology.
Mr. Yves MORELa g e d 5 1 , i s a S e n i o r V i c e President of the Company and General Manager of EMEA, responsible for the Company’s business in Europe, Middle East and Africa. Mr. Morel has 27 years sales and marketing experience in telecommunication industries. Mr. Morel was a Sales Area Director for ALCATEL mobile phones from 2001 to 2005. He contributed to develop sales area such as Russia, Central Europe, Middle East, Africa and Western Europe. Prior to that he held several positions in sales at the Private Mobile Radio division for ALCATEL.
Mr. Nicolas ZIBELLa g e d 4 4 , i s a S e n i o r V i c e P r e s i d e n t o f t h e C o m p a n y a n d G e n e r a l M a n a g e r o f Americas, responsible for the Company’s business in the Americas. Mr. Zibell has over 21 years of experience in sales, marketing, product strategy and management in automotive and telecommunications industries in Europe and the Americas. He graduated from École Superieure de Commerce de Lyon and ESADE Business School with an MBA in 1990.
35AnnuAl report 2011
OTHER SENIOR MANAGEMENT
Mr. HUANG wanquanaged 47, is a Senior Vice President of the Company, responsible for overall domestic operations since November 2009. From 1990 to 2002, Mr. Huang served in TCL Multimedia, responsible for marketing management. He was one of the earliest pioneers of the TCL’s TV business marketing network. From 2002 to 2003, he served as an International Business Unit General Manager of the Company, responsible for developing the first overseas business. In November 2003, he was appointed as a Vice President of the Company, in charge of domestic sales and marketing operations management. Mr. Huang holds a Master’s Degree in inorganic non-metallic materials from Zhejiang University and an EMBA degree from South Polytechnic University.
Mr. wANG Kailongaged 44, is a Senior Vice President of the Company and a Vice President of TCL Corporate Research. Mr. Wang joined TCL Corp. in February 1999, and served as the Deputy General Manager and the Chief Engineer of HuiZhou TCL Mobile Communication Co., Ltd. Before joining TCL Corp., Mr. Wang worked in Xi’an Institute of Space Radio Technology as a Senior Test Engineer of satellite transponder for six years. During the period he participated in the launch of China “FY-II” weather satellite, and has rich experience in the satellite transponder research, development and design. Mr. Wang graduated from WuHan Univers i t y , major ing in Antenna and Microwave Propagation in 1990, and obtained a Master’s degree in Electromagnetic and Microwave Technology at China Academy of Space Technology in 1993.
36 T C L C O M M U N I C A T I O N T E C H N O L O G Y H O L D I N G S L I M I T E D
CorporateInformation
BOARD OF DIRECTORSExecutive DirectorsMr. LI Dongsheng (Chairman)Mr. GUO AipingMr. WANG Jiyang (Appointed as executive director on 9 May 2011 and Chief Operation Officer on 6 January 2012)
Non-Executive DirectorsMr. BO LianmingMr. HUANG XubinMs. XU Fang
Independent Non-Executive DirectorsMr. LAU Siu KiMr. LOOK AndrewMr. KWOK Hoi Sing (Appointed on 9 May 2011)Mr. SHI Cuiming (Resigned on 9 May 2011)Mr. LIU Chung Laung (Resigned on 9 May 2011)
AUDIT COMMITTEEMr. LAU Siu Ki (Chairman)Mr. LOOK AndrewMr. KWOK Hoi Sing (Appointed on 9 May 2011)Mr. HUANG Xubin (Appointed on 24 October 2011)Mr. SHI Cuiming (Resigned on 9 May 2011)Mr. BO Lianming (Resigned on 24 October 2011)
REMUNERATION COMMITTEEMr. LAU Siu Ki (Chairman)Mr. LOOK AndrewMr. KWOK Hoi Sing (Appointed on 9 May 2011)Ms. XU Fang (Appointed on 24 October 2011)Mr. SHI Cuiming (Resigned on 9 May 2011)Mr. BO Lianming (Resigned on 24 October 2011)
37AnnuAl report 2011
CorporateInformation
COMPANY SECRETARYMs. PANG Siu Yin
AUTHORISED REPRESENTATIVESMr. GUO AipingMs. PANG Siu Yin
PRINCIPAL BANKERSThe Hongkong and Shanghai Banking Corporation LimitedLevel 9, HSBC Main Building1 Queen’s RoadCentralHong Kong
Standard Chartered Bank (Hong Kong) Limited13/F, Standard Chartered Bank Building4-4A Des Voeux RoadCentralHong Kong
Societe GeneraleLevel 38, 3 Pacific Place1 Queen’s Road EastHong Kong
SOLICITORSCheung Tong & Rosa SolicitorsRoom 501, 5/F.Sun Hung Kai Centre30 Harbour RoadHong Kong
AUDITORSErnst & YoungCertified Public Accountants22/F, CITIC Tower1 Tim Mei AvenueCentralHong Kong
PRINCIPAL SHARE REGISTRARButterfield Fulcrum Group (Cayman) LimitedButterfield House68 Fort StreetP.O. Box 609Grand Cayman KY1-1107Cayman Islands
BRANCH SHARE REGISTRARTricor Investor Services Limited26/F, Tesbury Centre28 Queen’s Road EastWanchaiHong Kong
REGISTERED OFFICECricket SquareHutchins DriveP.O. Box 2681Grand Cayman KY1-1111Cayman Islands
PRINCIPAL PLACE OF BUSINESS IN HONG KONGRooms 1910-12A, 19/F, Tower 3China Hong Kong City33 Canton RoadTsimshatsui, KowloonHong Kong
INVESTOR AND MEDIA RELATIONSHill & Knowlton Asia Limited36th Floor, PCCW TowerTaikoo Place, 979 King’s RoadQuarry BayHong Kong
TICKER SYMBOLListed on The Stock Exchange of Hong Kong Limited under the share ticker number 02618
WEBSITEhttp://tclcom.tcl.com
38 T C L C O M M U N I C A T I O N T E C H N O L O G Y H O L D I N G S L I M I T E D
CorporateGovernanceReport
The Board is committed to enhancing the Group’s corporate governance standards by improving corporate
transparency through effective channels of information disclosure. The Board believes that good corporate
governance is beneficial for maintaining close and trustful relationships with its employees, business partners,
shareholders and investors.
CODE ON CORPORATE GOVERNANCE PRACTICES
The Board has adopted the code provisions (the “Code Provisions”) of the Code on Corporate Governance Practices
(the “CG Code”) set out in Appendix 14 to the Rules Governing the Listing of Securities on The Stock Exchange of
Hong Kong Limited (“the Stock Exchange”) (“Listing Rules”) as guidelines for corporate governance of the Group,
and has taken steps to comply with the CG Code wherever appropriate.
The CG Code has been revised and renamed as “Corporate Governance Code and Corporate Governance Report”
(the “Revised Code”) by the Stock Exchange in October 2011. On 24 February 2012, the Board has adopted the
Revised Code as the guidelines for corporate governance of the Group.
Throughout the year ended 31 December 2011, the Group complied fully with the CG Code.
THE BOARD
(1) The Board of Directors
The Board currently comprises 9 Directors, 3 of whom are executive Directors, 3 are non-executive Directors
(“NEDs”) and 3 are independent non-executive Directors (“INEDs”). The composition of the Board is set out
as follows:
Executive Directors: LI Dongsheng (Chairman)
GUO Aiping (Chief Executive Officer)
WANG Jiyang (Appointed as executive director
on 9 May 2011 and Chief Operation Officer
on 6 January 2012)
Non-Executive Directors: BO Lianming
HUANG Xubin
XU Fang
Independent Non-Executive Directors: LAU Siu Ki
LOOK Andrew
KWOK Hoi Sing (appointed on 9 May 2011)
SHI Cuiming (resigned on 9 May 2011)
LIU Chung Laung (resigned on 9 May 2011)
The biographies of the Directors are set out in the “Directors and Senior Management” on pages 28 to 35 of
this annual report.
The members of the Board, all being industry veterans, are responsible to the shareholders for formulating the
overall business development targets and long-term company strategies, assessing results of management
policies and monitoring performance of the management.
39AnnuAl report 2011
CorporateGovernanceReport
The non-executive Directors play an important role on the Board. Accounting for more than half of the Board
members, they are experienced professionals in their respective fields. They are responsible for ensuring that
the Board maintains high standards of financial and other mandatory reporting as well as providing adequate
checks and balances for safeguarding the interest of shareholders and the Group as a whole. Throughout the
year of 2011, the Board at all times met the requirements for having at least 3 INEDs, and that at least one
of them had appropriate professional qualifications of accounting or related financial management expertise.
Pursuant to Rule 3.13 of the Listing Rules, the Group has received written confirmations from each INED of
his independence to the Group. The Group considers all of the INEDs to be independent in accordance with
the Listing Rules.
There are no relationships (including financial, business, family or other material or relevant relationships)
among members of the Board.
The Directors meet regularly to review the Group’s financial and operational performance and to discuss and
formulate future development plans. Regular Board meetings are attended to by a majority of the Directors in
person or through other electronic means of communication.
Besides the regular Board meetings, special Board meetings are convened from time to time for the Board to
discuss major issues that require the Board’s timely attention and decisions. As the Board highly values the
independent opinions and diversified perspectives from the INEDs, they, in addition to the executive Directors,
very often participate in the special Board meetings. During 2011, apart from holding board meetings, the
Board also passed resolutions in writing to approve certain matters.
40 T C L C O M M U N I C A T I O N T E C H N O L O G Y H O L D I N G S L I M I T E D
CorporateGovernanceReport
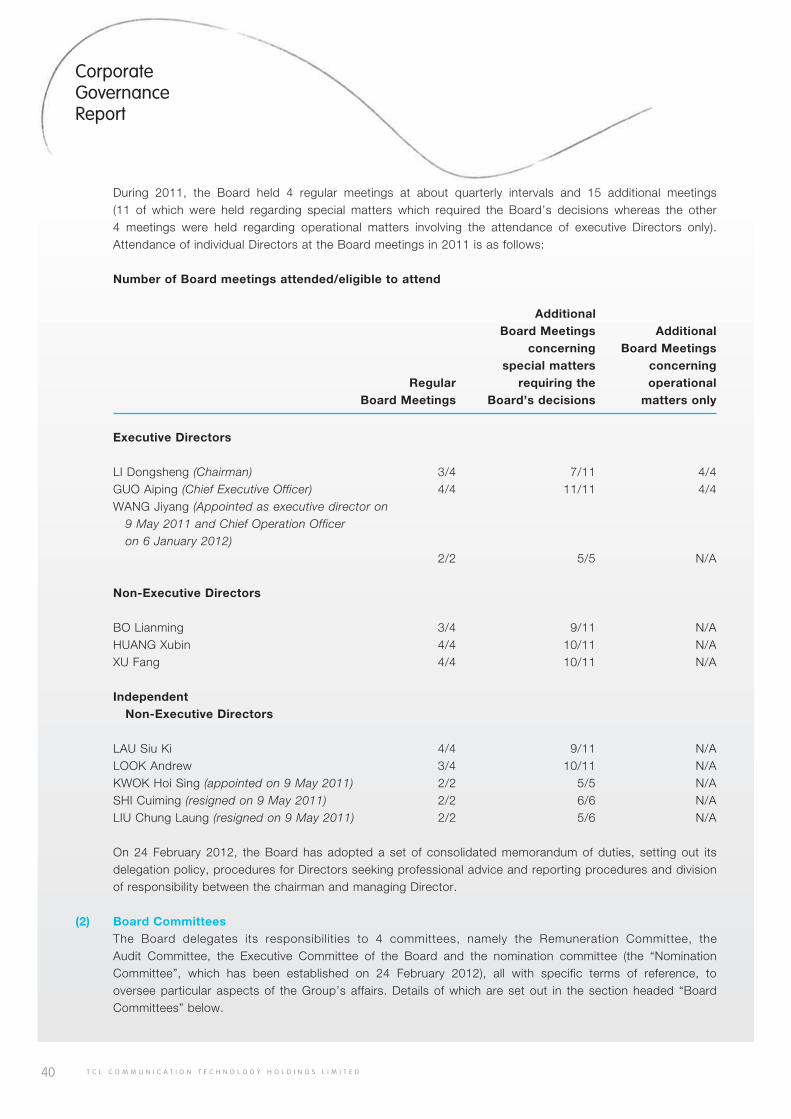
During 2011, the Board held 4 regular meetings at about quarterly intervals and 15 additional meetings (11 of which were held regarding special matters which required the Board’s decisions whereas the other 4 meetings were held regarding operational matters involving the attendance of executive Directors only). Attendance of individual Directors at the Board meetings in 2011 is as follows:
Number of Board meetings attended/eligible to attend
Additional Board Meetings Additional concerning Board Meetings special matters concerning Regular requiring the operational Board Meetings Board’s decisions matters only
Executive Directors
LI Dongsheng (Chairman) 3/4 7/11 4/4GUO Aiping (Chief Executive Officer) 4/4 11/11 4/4WANG Jiyang (Appointed as executive director on 9 May 2011 and Chief Operation Officer on 6 January 2012) 2/2 5/5 N/A
Non-Executive Directors
BO Lianming 3/4 9/11 N/AHUANG Xubin 4/4 10/11 N/AXU Fang 4/4 10/11 N/A
Independent Non-Executive Directors
LAU Siu Ki 4/4 9/11 N/ALOOK Andrew 3/4 10/11 N/AKWOK Hoi Sing (appointed on 9 May 2011) 2/2 5/5 N/ASHI Cuiming (resigned on 9 May 2011) 2/2 6/6 N/ALIU Chung Laung (resigned on 9 May 2011) 2/2 5/6 N/A
On 24 February 2012, the Board has adopted a set of consolidated memorandum of duties, setting out its delegation policy, procedures for Directors seeking professional advice and reporting procedures and division of responsibility between the chairman and managing Director.
(2) Board CommitteesThe Board delegates its responsibilities to 4 committees, namely the Remuneration Committee, the Audit Committee, the Executive Committee of the Board and the nomination committee (the “Nomination Committee”, which has been established on 24 February 2012), all with specific terms of reference, to oversee particular aspects of the Group’s affairs. Details of which are set out in the section headed “Board Committees” below.
41AnnuAl report 2011
CorporateGovernanceReport
(3) Management Functions
The types of decisions which are to be taken by the Board include those relating to:
• corporateandcapitalstructure;
• corporatestrategy;
• significantpoliciesaffectingtheGroupasawhole;
• businessplan,budgetsandpublicannouncements;
• delegationtotheChairman,anddelegationtoandbyBoardCommittees;
• keyfinancialmatters;
• appointment,removalorreappointmentofBoardmembers,seniormanagementandauditors;
• remunerationofDirectorsandseniormanagement;and
• communicationwithkeystakeholders,includingshareholdersandregulatorybodies.
(4) Operation
To effectively manage the business affairs of the Group, the Executive Committee was set up for
implementation of the objectives and strategic plans as approved by the Board or the Executive Committee of
the Board. Currently the Executive Committee comprises seven members, all of whom are senior executives
from various units of the Company, and one secretary. The composition of the Executive Committee is set
out as follows:
Members
GUO Aiping
LIU Yuk Tung, Thomas
Yves MOREL
WONG Kwok Chung, Albert
Nicolas ZIBELL
WANG Jiyang
LV Xiaobin (appointed on 6 January 2012)
Secretary
SUN Wubin
The Executive Committee is responsible for overseeing the day-to-day operations of the Group. Normally, the
Executive Committee meets once a month, and may convene additional meetings when necessary to handle
urgent matters.
42 T C L C O M M U N I C A T I O N T E C H N O L O G Y H O L D I N G S L I M I T E D
CorporateGovernanceReport
(5) Nomination of Directors
In 2011, the Board had not established a Nomination Committee, and the Board itself was responsible for
the selection and approval of new Directors. When there was a nomination to directorship, the Board would
assess the suitability of the nominee and decide whether to accept the nomination. A Director appointed by
the Board was subject to re-election by shareholders at the next annual general meeting (the “AGM”) after
their appointment.
On 24 February 2012, the Board has established a Nomination Committee pursuant to the requirements of
the Revised Code. It considers matters regarding the nomination and/or appointment or reappointment of
Director(s). The terms of reference of the Nomination Committee, which are closely aligned with the Revised
Code, are currently available on the Group’s website at http://tclcom.tcl.com and will also be available on
HKEx’s website at www.hkex.com.hk from 1 April 2012.
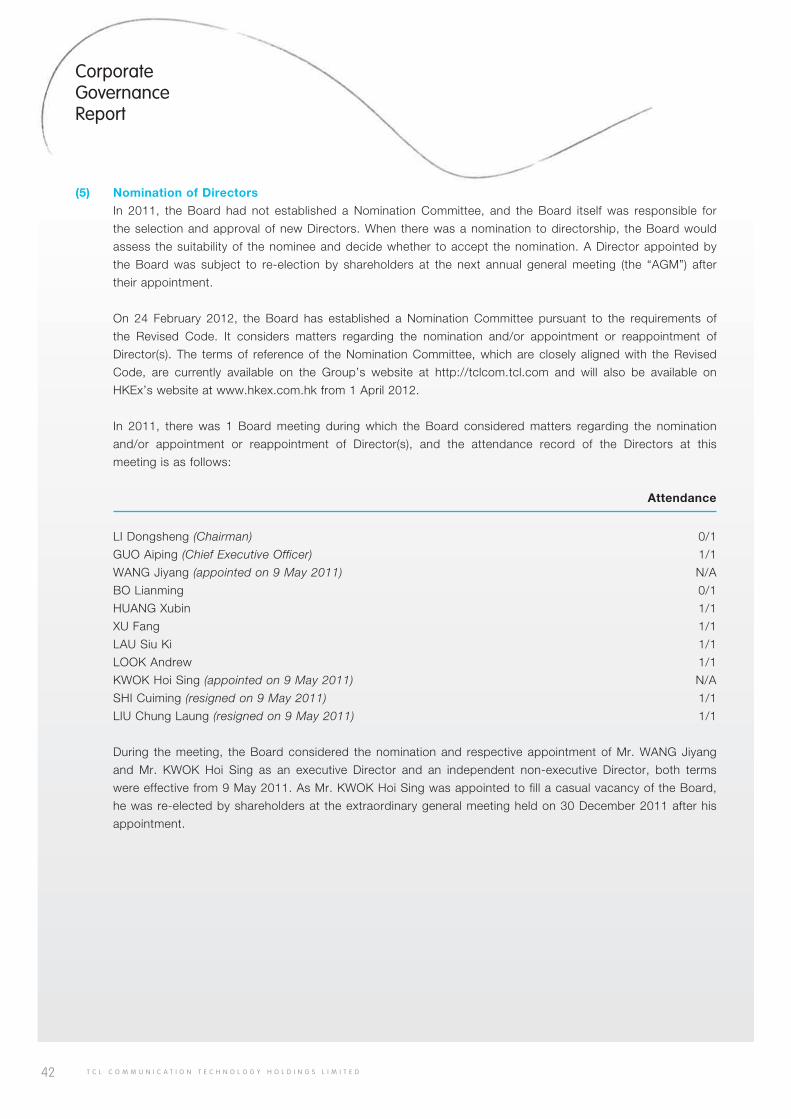
In 2011, there was 1 Board meeting during which the Board considered matters regarding the nomination
and/or appointment or reappointment of Director(s), and the attendance record of the Directors at this
meeting is as follows:
Attendance
LI Dongsheng (Chairman) 0/1
GUO Aiping (Chief Executive Officer) 1/1
WANG Jiyang (appointed on 9 May 2011) N/A
BO Lianming 0/1
HUANG Xubin 1/1
XU Fang 1/1
LAU Siu Ki 1/1
LOOK Andrew 1/1
KWOK Hoi Sing (appointed on 9 May 2011) N/A
SHI Cuiming (resigned on 9 May 2011) 1/1
LIU Chung Laung (resigned on 9 May 2011) 1/1
During the meeting, the Board considered the nomination and respective appointment of Mr. WANG Jiyang
and Mr. KWOK Hoi Sing as an executive Director and an independent non-executive Director, both terms
were effective from 9 May 2011. As Mr. KWOK Hoi Sing was appointed to fill a casual vacancy of the Board,
he was re-elected by shareholders at the extraordinary general meeting held on 30 December 2011 after his
appointment.
43AnnuAl report 2011
CorporateGovernanceReport
The Board adopted a procedure and criteria for nomination of Directors, the details of which are set out
below:
Procedures for Nomination of Directors
1. When there is a vacancy in the Board, the Board evaluates the balance of skills, knowledge and
experience of the Board, and identifies any special requirements for the vacancy (e.g. independence
status in the case of an INED).
2. Prepare a description of the role and capabilities required for the particular vacancy.
3. Identify a list of candidates through personal contacts/recommendations by Board members, senior
management, business partners or investors.
4. Arrange interview(s) with each candidate for the Board to evaluate whether he/she meets the
established written criteria for nomination of Directors. One or more members of the Board will attend
the interview.
5. Conduct verification on information provided by the candidate.
6. Convene a Board meeting to discuss and vote on which candidate to nominate or appoint to the
Board.
Criteria for Nomination of Directors
1. Common criteria applicable to all Directors
(a) Character and integrity candidate
(b) The willingness to assume Board fiduciary responsibility
(c) Present needs of the Board for particular experience or expertise and whether the candidate
would satisfy those needs
(d) Relevant experience, including experience at the strategy/policy setting level, high level
managerial experience in a complex organization, industry experience and familiarity with the
products and processes used by the Company
(e) Significant business or public experience relevant and beneficial to the Board and the Company
(f) Breadth of knowledge about issues affecting the Company
(g) Ability to objectively analyse complex business problems and exercise sound business judgment
(h) Ability and willingness to contribute special competencies to Board activities
(i) Fit with the Company’s culture
44 T C L C O M M U N I C A T I O N T E C H N O L O G Y H O L D I N G S L I M I T E D
CorporateGovernanceReport
2. Criteria applicable to NEDs/INEDs
(a) Willingness and ability to make a sufficient time commitment to the affairs of the Company
in order to effectively perform the duties of a Director, including attendance at and active
participation in Board and committee meetings
(b) Accomplishments of the candidate in his or her field
(c) Outstanding professional and personal reputation
(d) The candidate’s ability to meet the independence criteria for Directors established in the Listing
Rules
(6) Appointment, Re-election and Removal
Pursuant to Rule 3.13 of the Listing Rules, the Board has received a written confirmation from each
independent non-executive Director of his independence to the Company. The Board considers all of the
independent non-executive Directors to be independent in accordance with the Code Provision A.4.3 and
confirms that year of service of all INEDs is less than 9 years.
One third (or such number nearest to and not less than one-third) of the Directors are subject to retirement by
rotation at the AGM each year, and the NEDs are elected to hold office for a specific term until the conclusion
of the AGM which takes place in the third year of their respective appointments.
At the last AGM held on 9 May 2011, one-third of the Directors (namely Mr. LI Dongsheng, Mr. HUANG Xubin
and Mr. BO Lianming) were subject to retirement by rotation and were re-elected. Ms. XU Fang, being non-
executive Director, Mr. LAU Siu Ki and Mr. LOOK Andrew, both being INEDs, were elected to hold office for a
specific term until the conclusion of the AGM to be held in 2014.
(7) Roles of Chairman and Chief Executive Officer
The position of the Chairman is held by Mr. LI Dongsheng, while the position of the Chief Executive Officer is
held by Mr. GUO Aiping. This ensures a clear distinction between the Chairman’s duty to manage the Board
and the Chief Executive Officer’s duty to oversee the overall internal operation of the Group.
(8) Directors’ Securities Transactions
The Board has adopted a code of conduct regarding Directors’ securities transaction on terms no less
exacting than the required standard as set out in the Model Code for Securities Transactions by Directors of
Listed Issuers (the “Model Code”) as set out in Appendix 10 to the Listing Rules.
Specific enquiries have been made with all Directors who have confirmed that throughout year 2011,
they complied with the required standard set out in the Model Code and the Company’s code of conduct
regarding Directors’ securities transactions.
The Directors’ interests in shares of the Group as at 31 December 2011 are set out on pages 53 to 55 of this
annual report.
45AnnuAl report 2011
CorporateGovernanceReport
BOARD COMMITTEES
In 2011, the Board had three Board Committees. The three committees under the Board are the Remuneration
Committee, the Audit Committee and the Executive Committee of the Board, all with specific terms of reference, to
oversee particular aspects of the Group’s affairs. In addition to the existing three committees, on 24 February 2012,
the Board has set up the Nomination Committee to consider matters regarding the nomination and/or appointment
or reappointment of Directors.
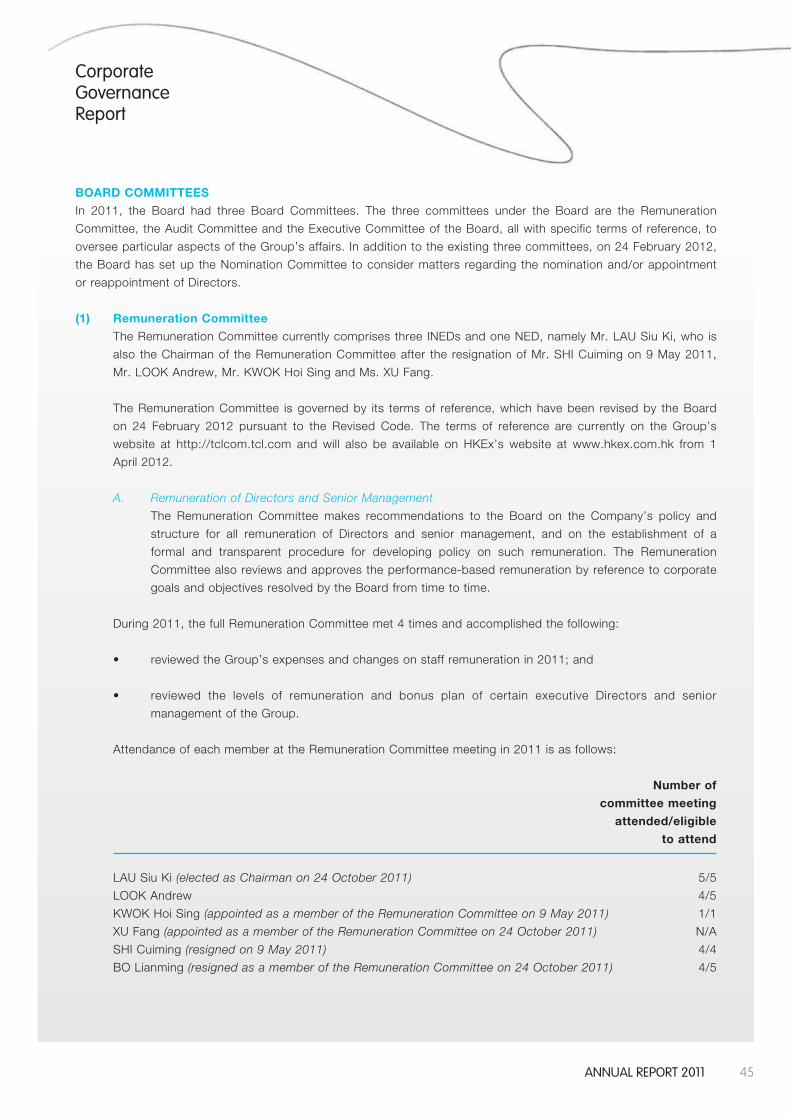
(1) Remuneration Committee
The Remuneration Committee currently comprises three INEDs and one NED, namely Mr. LAU Siu Ki, who is
also the Chairman of the Remuneration Committee after the resignation of Mr. SHI Cuiming on 9 May 2011,
Mr. LOOK Andrew, Mr. KWOK Hoi Sing and Ms. XU Fang.
The Remuneration Committee is governed by its terms of reference, which have been revised by the Board
on 24 February 2012 pursuant to the Revised Code. The terms of reference are currently on the Group’s
website at http://tclcom.tcl.com and will also be available on HKEx’s website at www.hkex.com.hk from 1
April 2012.
A. Remuneration of Directors and Senior Management
The Remuneration Committee makes recommendations to the Board on the Company’s policy and
structure for all remuneration of Directors and senior management, and on the establishment of a
formal and transparent procedure for developing policy on such remuneration. The Remuneration
Committee also reviews and approves the performance-based remuneration by reference to corporate
goals and objectives resolved by the Board from time to time.
During 2011, the full Remuneration Committee met 4 times and accomplished the following:
• reviewedtheGroup’sexpensesandchangesonstaffremunerationin2011;and
• reviewed the levels of remuneration and bonus plan of certain executive Directors and senior
management of the Group.
Attendance of each member at the Remuneration Committee meeting in 2011 is as follows:
Number of
committee meeting
attended/eligible
to attend
LAU Siu Ki (elected as Chairman on 24 October 2011) 5/5
LOOK Andrew 4/5
KWOK Hoi Sing (appointed as a member of the Remuneration Committee on 9 May 2011) 1/1
XU Fang (appointed as a member of the Remuneration Committee on 24 October 2011) N/A
SHI Cuiming (resigned on 9 May 2011) 4/4
BO Lianming (resigned as a member of the Remuneration Committee on 24 October 2011) 4/5
46 T C L C O M M U N I C A T I O N T E C H N O L O G Y H O L D I N G S L I M I T E D
CorporateGovernanceReport
Emolument Policy and Long-Term Incentive Plan
The Group provides a competitive remuneration package to its Directors to attract and retain talents. A large
portion of the package for executive Directors is linked to their performance, which in turn is aligned with the
interests of the shareholders, so as to provide an incentive for the executive Directors to achieve the best
performance. Part of the remuneration of executive Directors may comprise of long-term incentive plan which
comprises the share option scheme and the share award scheme. The emoluments payable to the Directors
are determined with reference to their duties and responsibilities with the Company and the market rate for
the positions.
The purpose of the long-term incentive plan of the Group is to reward outstanding performance that is
measured by achieved targets, and is closely linked with the performance of the Group. The benefit or
award granted under the plan will only be vested over a period of time so as to provide an incentive for the
executives or employees to consistently perform at a high standard and bring along long-term benefits to the
Group.
The non-executive Directors’ compensation relates to the time commitment and responsibilities. They receive
fees which comprise the following components:
• Directors’fee,whichisusuallypaidannually;
• additionalfeeforadditionalresponsibilitiessuchasdirectorshipinBoardCommittees;and
• awardedsharesorshareoptionsoftheGroupunderthelongtermincentiveplan,which are awarded
subject to the discretion of the Board.
The details of the fees and any other reimbursement or emolument payable to the Directors are set out in
details on note 11 to the financial statements.
B. Remuneration of Auditors
During 2011, the fees in respect of audit and non-audit services payable by the Company to the
auditors, Ernst & Young, amounted to HK$6,505,000 and HK$1,762,000 respectively. Non-audit
services provided by Ernst & Young included mainly tax services.
(2) Audit Committee
The Audit Committee currently comprises three INEDs and one NED, namely Mr. LAU Siu Ki, Mr. LOOK
Andrew, Mr KWOK Hoi Sing and Mr. HUANG Xubin. Mr. LAU Siu Ki, the Chairman of the Audit Committee, is
a professional accountant with profound financial and accounting expertise.
The Audit Committee is governed by its terms of reference, which have been revised by the Board on 24
February 2012 pursuant to the Revised Code. The terms of reference are currently available on the Group’s
website at http://tclcom.tcl.com and will also be available on HKEx’s website at www.hkex.com.hk from 1
April 2012.
The Audit Committee usually meets 4 times a year to review the truthfulness, completeness and accuracy
of the Group’s financial statements. It is accountable to the Board and assists the Board in meeting its
responsibilities in ensuring an effective and adequate system of internal controls and for meeting its external
financial reporting obligations and compliance with other legal and regulatory requirements. The Audit
Committee also oversees the scope of work of external auditors.
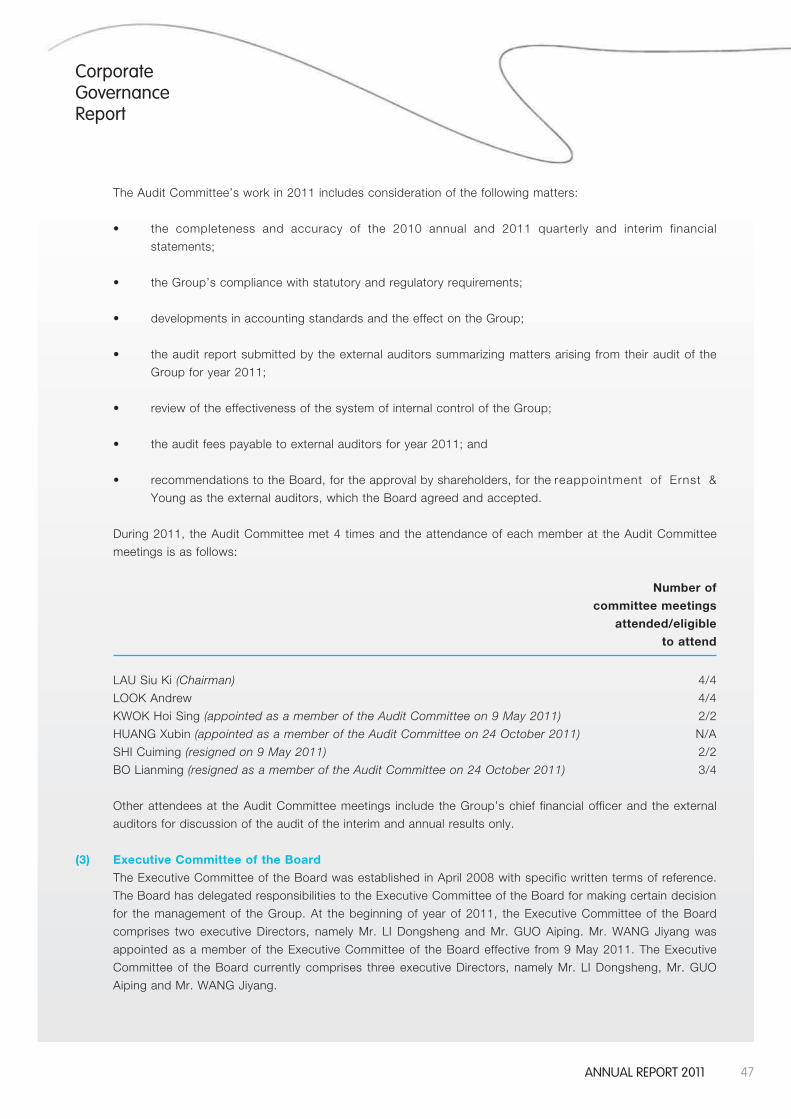
47AnnuAl report 2011
CorporateGovernanceReport
The Audit Committee’s work in 2011 includes consideration of the following matters:
• the completeness and accuracy of the 2010 annual and 2011 quarterly and interim financial
statements;
• theGroup’scompliancewithstatutoryandregulatoryrequirements;
• developmentsinaccountingstandardsandtheeffectontheGroup;
• theaudit reportsubmittedby theexternalauditorssummarizingmattersarising fromtheirauditof the
Groupforyear2011;
• reviewoftheeffectivenessofthesystemofinternalcontroloftheGroup;
• theauditfeespayabletoexternalauditorsforyear2011;and
• recommendationstotheBoard,fortheapprovalbyshareholders,forthereappointment of Ernst &
Young as the external auditors, which the Board agreed and accepted.
During 2011, the Audit Committee met 4 times and the attendance of each member at the Audit Committee
meetings is as follows:
Number of
committee meetings
attended/eligible
to attend
LAU Siu Ki (Chairman) 4/4
LOOK Andrew 4/4
KWOK Hoi Sing (appointed as a member of the Audit Committee on 9 May 2011) 2/2
HUANG Xubin (appointed as a member of the Audit Committee on 24 October 2011) N/A
SHI Cuiming (resigned on 9 May 2011) 2/2
BO Lianming (resigned as a member of the Audit Committee on 24 October 2011) 3/4
Other attendees at the Audit Committee meetings include the Group’s chief financial officer and the external
auditors for discussion of the audit of the interim and annual results only.
(3) Executive Committee of the Board
The Executive Committee of the Board was established in April 2008 with specific written terms of reference.
The Board has delegated responsibilities to the Executive Committee of the Board for making certain decision
for the management of the Group. At the beginning of year of 2011, the Executive Committee of the Board
comprises two executive Directors, namely Mr. LI Dongsheng and Mr. GUO Aiping. Mr. WANG Jiyang was
appointed as a member of the Executive Committee of the Board effective from 9 May 2011. The Executive
Committee of the Board currently comprises three executive Directors, namely Mr. LI Dongsheng, Mr. GUO
Aiping and Mr. WANG Jiyang.
48 T C L C O M M U N I C A T I O N T E C H N O L O G Y H O L D I N G S L I M I T E D
CorporateGovernanceReport
(4) Nomination Committee
The Nomination Committee has been established on 24 February 2012 in compliance with the CG Code.
It currently comprises three INEDs and one NED, namely, Mr. KWOK Hoi Sing, Mr. LAU Siu Ki, Mr. LOOK
Andrew and Ms. XU Fang, with Mr. KWOK Hoi Sing as the Chairman of the Nomination Committee.
The principal duties of the Nomination Committee are to identify and nominate suitable candidates for
the appointment of the Directors and make recommendations to the Board on succession planning for
the Directors. Its specific written terms of reference are currently available on the Group’s website at
http://tclcom.tcl.com and will also be available on HKEX’s website at www.hkex.com.hk from 1 April 2012.
ACCOUNTABILITY AND AUDIT
(1) Financial Reporting
The Board is responsible for the integrity of financial information. The Directors acknowledge their
responsibility for the preparation of the accounts for each financial period which give a true and fair view of
the state of affairs of the Group and of the results and cash flows for that period.
The Directors, having made appropriate enquiries, consider that the Group has adequate resources to
continue in operational existence for the foreseeable future and that, for this reason, it is appropriate to adopt
the going concern basis in preparing the financial statements for the year 2011.
(2) Internal Controls
Each year, the Audit Committee of the Company reviews the findings made by the external auditors in respect
of issues encountered by them in preparation of the audit report, which often cover issues relating to internal
control. The Audit Committee also reviews the internal control report submitted by the Company’s internal
audit department. The Audit Committee will then review the actions performed or the plans to be carried out
by the management in addressing the issues. The issues identified and the corresponding remedial plans
and recommendations are then submitted to the Board for consideration. During the year under review, the
Company conducted a review of the effectiveness of the internal control system of the Group. For the year of
2011, no critical internal control issues have been identified.
INVESTOR RELATIONS
All published information, including all the statutory announcements, press releases and event calendars, is promptly
posted on the Group’s website at http://tclcom.tcl.com. Viewers can also send enquiries to the Board or senior
management by email at [email protected] or directly by raising questions at the general meeting of the Company.
49AnnuAl report 2011
Human Resources and SocialResponsibilities
As a responsible corporate citizen, the Company strives to bear its social responsibilities while undertaking steady
business operation. As such, the Company strictly complies with the business convention and the Code of Ethics,
dedicates to improve business environment and promote environmental protection as well as energy saving, and
proactively participates in charity work.
As a primary member of TCL Group (TCL Corp. together with its subsidiaries, are collectively known as the “TCL
Group”), the Company has actively participated in the TCL Group’s charity work. The Company endeavour to make
more contribution and show wider responsibility towards charitable education, assistance to the weak & poverty
reduction, employee welfare and environment protection through sponsorship and donation. Since 1996, TCL Group
and employees have donated cash and supplies equivalent to RMB100 million to the society.
The Company has also been undertaking Corporate Social Responsibility (CSR) initiatives with a focus on education.
The Company actively founded and initiated cooperation with universities and institutions from China and overseas
by way of joint lab, joint club, internship base etc., organised various college – enterprise activities, and strived to
become a leading development base for innovative and practical talents.
The Company has always regarded the employees as the most valuable asset. As at 31 December 2011, there were
a total of over 9,600 employees in the Company. The Company is committed to the compliance of relevant laws and
regulations, strives to provide the employees with a safe and pleasant working environment, continuously improves
the working conditions, and offers competitive remuneration package.
The Company has always committed to build up an excellent talent team with highly concentration on developing a
better career path for each individual. Since April 2010, the Company has continuously established and implemented
the “Job Qualification Program” which was also known as “Staff Career Development Channel Program”. The
program, which was a professional and rigorous system established for the gradual development of the employees’
capability, helps employees realise their development directions and widen their development paths through
continuous capability assessment. With this program, the Company offers opportunities of learning and promotion,
and helps break through the bottleneck of individual career development so as to achieve a win-win situation
between employees and the Company. In 2011, the Company also offered a wide range of training programs for
junior, middle management and newly promoted managers to help them improve leadership. A total of over 200
managerial employees completed the one-year training program.
The Company strives to enhance employees’ awareness in promoting the Green and Environmental Protection
concept. In 2011 the Company organized a Children Painting Competition with the theme of “Protect the
Environment, Treat the Earth” among the children of the Company’s employees. Over 50 children from different
countries participated in the competition and shared their genuine belief and wishes toward the earth and
environmental protection.
50 T C L C O M M U N I C A T I O N T E C H N O L O G Y H O L D I N G S L I M I T E D
Reportof the Directors
The directors of the Company (the “Directors”) are pleased to present their annual report and the audited financial
statements of the Company and the Group for the year ended 31 December 2011.
PRINCIPAL ACTIVITIES
The Company is an investment holding company. The principal activities of its principal subsidiaries comprise
manufacturing and sale of mobile and internet products. There were no significant changes in the nature of the
Group’s principal activities during the year.
RESULTS AND DIVIDENDS
The Group’s profit for the year ended 31 December 2011 and the state of affairs of the Company and the Group as
at that date are set out in the financial statements on pages 64 to 167.
An interim dividend of 13.8 HK cents (first half of 2010: special dividend of 8.0 HK cents) per ordinary share was
paid on 16 September 2011. The Directors recommended the payment of a final dividend of 15.0 HK cents (2010:
16.8 HK cents) per share in respect of the year ended 31 December 2011 to shareholders whose names appear
on the Register of Members at the close of business on 16 May 2012. Subject to the Company’s shareholders’
approval at the forthcoming annual general meeting (“AGM”) to be held on 8 May 2012, the said final dividend will
be paid on or about 25 May 2012.
SUMMARY FINANCIAL INFORMATION
A summary of the published results and assets, liabilities and non-controlling interests of the Group for the last five
financial years, as extracted from the audited financial statements and reclassified as appropriate, is set out on page
168. This summary does not form part of the audited financial statements.
PROPERTY, PLANT AND EQUIPMENT
Details of movements in the property, plant and equipment of the Company and the Group during the year are set
out in note 16 to the financial statements.
SHARE CAPITAL AND SHARE OPTIONS
Details of movements in the Company’s share capital and share options during the year are disclosed in notes 36
and 37 to the financial statements and “Directors’ and Chief Executive’s Interests and Short Positions in Shares,
Underlying Shares and Debentures” in the Report of the Directors respectively.
PRE-EMPTIVE RIGHTS
There is no provision for pre-emptive rights under the Company’s Articles of Association or the laws of the Cayman
Islands which would oblige the Company to offer new shares on a pro rata basis to the existing shareholders.
PURCHASE, SALE OR REDEMPTION OF SECURITIES
During the year under review, the Company repurchased 973,000 shares on the Stock Exchange at an aggregate
consideration (before repurchase expense) of approximately HK$4,128,000, and these shares were subsequently
cancelled by the Company. The share buyback reflected management’s confidence in the future development of the
Group’s business. Except as disclosed above, neither the Company nor any of its subsidiaries purchased, sold or
redeemed any of the Company’s listed securities during the year under review.
51AnnuAl report 2011
Reportof the Directors
RESERVES
Details of movements in the reserves of the Company and the Group during the year are set out in note 39 to the
financial statements and in the consolidated statement of changes in equity respectively.
DISTRIBUTABLE RESERVES
As at 31 December 2011, the Company had distributable reserves of HK$276,695,000 standing to credit of its
share premium account and HK$669,907,000 standing to the credit of its contributed surplus account. As the
Company intends to pay out the proposed final dividend out of its retained earnings, the amount of share premium
account and contributed surplus account would remain the same as aforesaid after the payment of the proposed
final dividend.
MAJOR CUSTOMERS AND SUPPLIERS
In the year under review, sales to the Group’s five largest customers accounted for 19% of the total sales for the
year and sales to the largest customer included therein amounted to 5%. Purchases from the Group’s five largest
suppliers accounted for 21% of the total purchases for the year and purchase from the largest supplier included
therein amounted to 6%.
None of the Directors or any of their associates or any shareholders (which, to the best knowledge of the Directors,
own more than 5% of the Company’s issued share capital) had any beneficial interest in the Group’s five largest
customers or five largest suppliers, except that disclosed in note 44(a) to the financial statements.
DIRECTORS
The Directors during the year 2011 and up to the date of this annual report were:
EXECUTIVE DIRECTORS:
Mr. LI Dongsheng (Chairman)
Mr. GUO Aiping (Chief Executive Officer)
Mr. WANG Jiyang (Appointed on 9 May 2011)
NON-EXECUTIVE DIRECTORS:
Mr. BO Lianming
Mr. HUANG Xubin
Ms. XU Fang
INDEPENDENT NON-EXECUTIVE DIRECTORS:
Mr. LAU Siu Ki
Mr. LOOK Andrew
Mr. KWOK Hoi Sing (Appointed on 9 May 2011)
Mr. SHI Cuiming (Resigned on 9 May 2011)
Mr. LIU Chung Laung (Resigned on 9 May 2011)
52 T C L C O M M U N I C A T I O N T E C H N O L O G Y H O L D I N G S L I M I T E D
Reportof the Directors
Mr. KWOK Hoi Sing was appointed by the Board as an independent non-executive Director effective from 9 May
2011. As Mr. KWOK Hoi Sing was appointed to fill a casual vacancy of the Board, he was elected by shareholders
at the extraordinary general meeting held on 30 December 2011 to hold office until the conclusion of the forthcoming
AGM of the Company, which is to be held on 8 May 2012, and he will also offer himself for re-election at the AGM.
Mr. WANG Jiyang, who was appointed by the Board as an executive Director effective from 9 May 2011, will hold
office until the conclusion of the forthcoming AGM of the Company. Mr. WANG Jiyang will retire by rotation at the
conclusion of the forthcoming AGM and be subject to election by the shareholders at the AGM.
In accordance with article 87(1) of the Company’s Articles of Association, Mr. LI Dongsheng and Mr. GUO Aiping
will retire by rotation at the conclusion of the forthcoming AGM of the Company. They will hold their office until the
conclusion of the AGM and will offer themselves for re-election at the AGM.
Mr. KWOK Hoi Sing, being an independent non-executive Director, if re-elected, will hold office until the conclusion
of the AGM to be held in 2015.
Each of the independent non-executive Directors has confirmed his independence to the Company pursuant to
Rule 3.13 of the Listing Rules and the Company considers all the independent non-executive Directors to be
independent.
DIRECTORS’ AND SENIOR MANAGEMENT’S BIOGRAPHIES
Biographical details of the Directors and the senior management of the Group are set out on pages 28 to 35 of this
annual report.
DIRECTORS’ SERVICE CONTRACTS
As at 31 December 2011, none of the Directors had any existing or proposed service contract with the Company or
any of its subsidiaries which will not expire or is not determinable by the Company within one year without payment
of compensation, other than statutory compensation.
DIRECTORS’ REMUNERATION AND FIVE HIGHEST PAID EMPLOYEES
Particulars of the Directors’ remuneration and the five highest paid employees during the financial year are set out in
note 11 to the financial statements.
EMOLUMENT POLICY AND LONG-TERM INCENTIVE SCHEMES
Details of the Group’s emolument policy and long-term incentive schemes, as well as the basis for determining
the emolument payable to the Directors are set out in “Emolument Policy and Long-Term Incentive Plan” of the
Corporate Governance Report.
PENSION SCHEME
Particulars of the Group’s pension schemes are set out in note 5 to the financial statements.
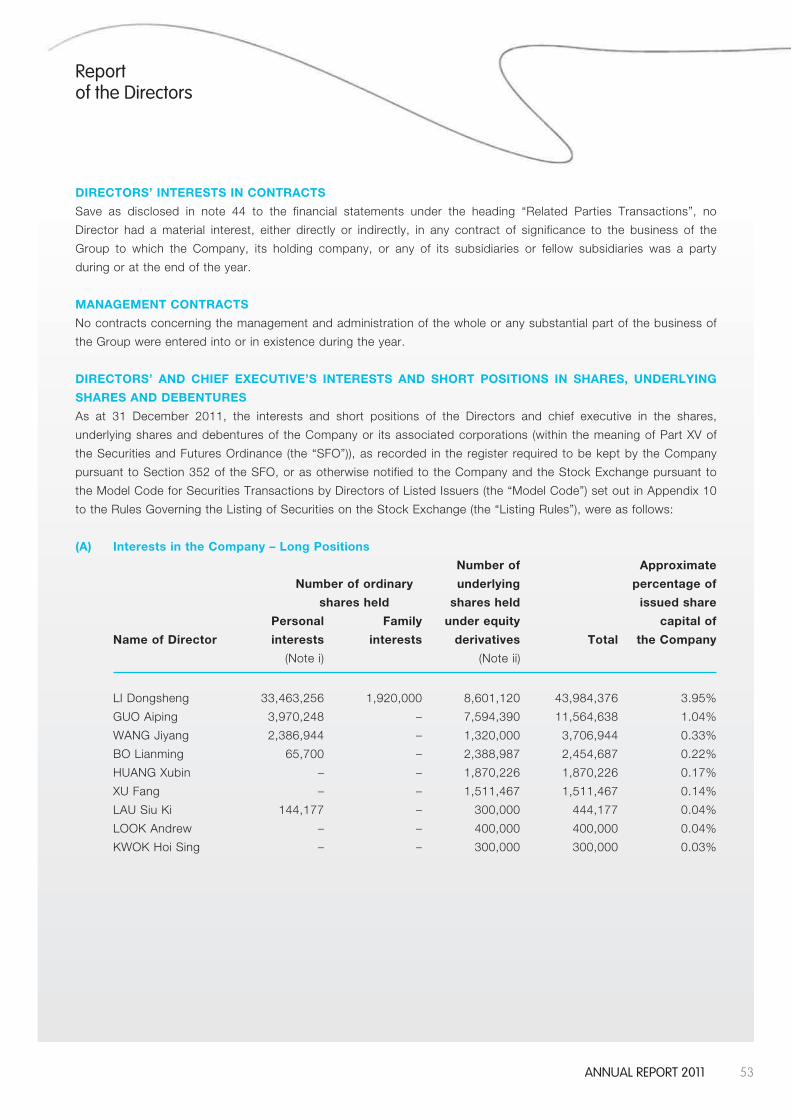
53AnnuAl report 2011
Reportof the Directors
DIRECTORS’ INTERESTS IN CONTRACTS
Save as disclosed in note 44 to the financial statements under the heading “Related Parties Transactions”, no
Director had a material interest, either directly or indirectly, in any contract of significance to the business of the
Group to which the Company, its holding company, or any of its subsidiaries or fellow subsidiaries was a party
during or at the end of the year.
MANAGEMENT CONTRACTS
No contracts concerning the management and administration of the whole or any substantial part of the business of
the Group were entered into or in existence during the year.
DIRECTORS’ AND CHIEF EXECUTIVE’S INTERESTS AND SHORT POSITIONS IN SHARES, UNDERLYING
SHARES AND DEBENTURES
As at 31 December 2011, the interests and short positions of the Directors and chief executive in the shares,
underlying shares and debentures of the Company or its associated corporations (within the meaning of Part XV of
the Securities and Futures Ordinance (the “SFO”)), as recorded in the register required to be kept by the Company
pursuant to Section 352 of the SFO, or as otherwise notified to the Company and the Stock Exchange pursuant to
the Model Code for Securities Transactions by Directors of Listed Issuers (the “Model Code”) set out in Appendix 10
to the Rules Governing the Listing of Securities on the Stock Exchange (the “Listing Rules”), were as follows:
(A) Interests in the Company – Long Positions
Number of Approximate
Number of ordinary underlying percentage of
shares held shares held issued share
Personal Family under equity capital of
Name of Director interests interests derivatives Total the Company
(Note i) (Note ii)
LI Dongsheng 33,463,256 1,920,000 8,601,120 43,984,376 3.95%
GUO Aiping 3,970,248 – 7,594,390 11,564,638 1.04%
WANG Jiyang 2,386,944 – 1,320,000 3,706,944 0.33%
BO Lianming 65,700 – 2,388,987 2,454,687 0.22%
HUANG Xubin – – 1,870,226 1,870,226 0.17%
XU Fang – – 1,511,467 1,511,467 0.14%
LAU Siu Ki 144,177 – 300,000 444,177 0.04%
LOOK Andrew – – 400,000 400,000 0.04%
KWOK Hoi Sing – – 300,000 300,000 0.03%
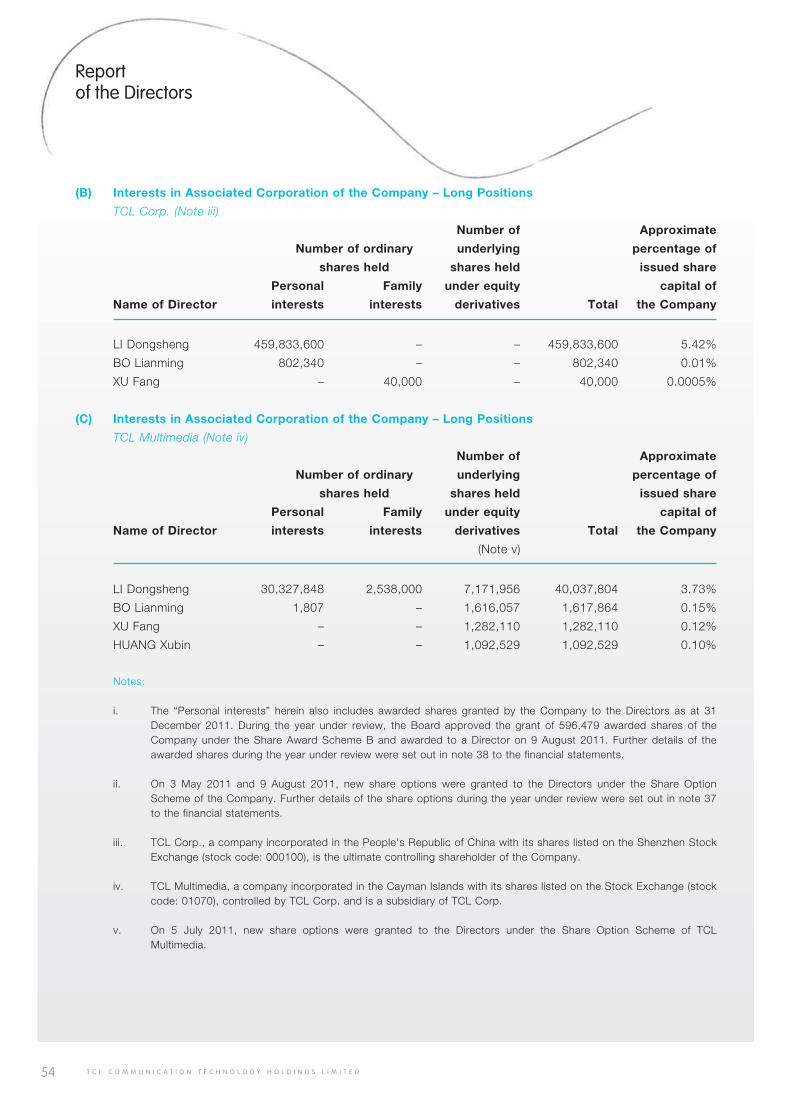
54 T C L C O M M U N I C A T I O N T E C H N O L O G Y H O L D I N G S L I M I T E D
Reportof the Directors
(B) Interests in Associated Corporation of the Company – Long Positions
TCL Corp. (Note iii)
Number of Approximate
Number of ordinary underlying percentage of
shares held shares held issued share
Personal Family under equity capital of
Name of Director interests interests derivatives Total the Company
LI Dongsheng 459,833,600 – – 459,833,600 5.42%
BO Lianming 802,340 – – 802,340 0.01%
XU Fang – 40,000 – 40,000 0.0005%
(C) Interests in Associated Corporation of the Company – Long Positions
TCL Multimedia (Note iv)
Number of Approximate
Number of ordinary underlying percentage of
shares held shares held issued share
Personal Family under equity capital of
Name of Director interests interests derivatives Total the Company
(Note v)
LI Dongsheng 30,327,848 2,538,000 7,171,956 40,037,804 3.73%
BO Lianming 1,807 – 1,616,057 1,617,864 0.15%
XU Fang – – 1,282,110 1,282,110 0.12%
HUANG Xubin – – 1,092,529 1,092,529 0.10%
Notes:
i. The “Personal interests” herein also includes awarded shares granted by the Company to the Directors as at 31 December 2011. During the year under review, the Board approved the grant of 596,479 awarded shares of the Company under the Share Award Scheme B and awarded to a Director on 9 August 2011. Further details of the awarded shares during the year under review were set out in note 38 to the financial statements.
ii. On 3 May 2011 and 9 August 2011, new share options were granted to the Directors under the Share Option Scheme of the Company. Further details of the share options during the year under review were set out in note 37 to the financial statements.
iii. TCL Corp., a company incorporated in the People’s Republic of China with its shares listed on the Shenzhen Stock Exchange (stock code: 000100), is the ultimate controlling shareholder of the Company.
iv. TCL Multimedia, a company incorporated in the Cayman Islands with its shares listed on the Stock Exchange (stock code: 01070), controlled by TCL Corp. and is a subsidiary of TCL Corp.
v. On 5 July 2011, new share options were granted to the Directors under the Share Option Scheme of TCL Multimedia.
55AnnuAl report 2011
Reportof the Directors
Save as disclosed above, as at 31 December 2011, none of the Directors and chief executive of the Company and
their associates had any interests or short positions in the shares, underlying shares or debentures of the Company
or any of its associated corporations (within the meaning of the SFO) which were required (i) to be notified to the
Company and the Stock Exchange pursuant to Divisions 7 and 8 of Part XV of the SFO (including interests or short
positionswhich theywere taken or deemed to have under such provisions of theSFO); or (ii) pursuant to section
352oftheSFO,tobeenteredintheregisterreferredtotherein;or(iii)pursuanttotheModelCodecontainedinthe
Listing Rules, to be notified to the Company and the Stock Exchange.
DIRECTORS’ RIGHTS TO ACQUIRE SHARES, UNDERLYING SHARES OR DEBENTURES
Save as disclosed above and in the “Share Option Scheme” and “Share Award Scheme” disclosed in notes 37
and 38 to the financial statements respectively, at no time during the year was the Company, its holding company,
or any of its subsidiaries or fellow subsidiaries a party to any arrangement to enable any Director, their respective
spouse or children under 18 years of age to acquire benefits by means of an acquisition of shares or underlying
shares in or debentures of the Company or its associated corporations.
SUBSTANTIAL SHAREHOLDERS’ INTERESTS IN SHARES AND UNDERLYING SHARES
As at 31 December 2011, the interests and short positions of the persons other than a Director or chief executive of
the Company in shares and underlying shares of the Company as recorded in the register of interests required to be
kept by the Company pursuant to Section 336 of the SFO were as follows:
Interest in Approximate
shares and percentage of
underlying the issued
Name Type of interest shares held shares capital Notes
TCL Corp. Interest of controlled corporation 531,445,544 47.70% i
Mr. WONG Toe Yeung Beneficial owner/Interest of 91,098,138 8.18% ii
spouse/Interest held jointly
with his spouse/Interest of
controlled corporation
Ms. LEUNG Lai Bing Beneficial owner/Interest of 91,098,138 8.18% ii
spouse/Interest held jointly
with his spouse/Interest of
controlled corporation
Notes:
i. Under the SFO, as at 31 December 2011, TCL Corp. was deemed to be interested in 531,445,544 shares of the Company held by T.C.L. Industries Holdings (H.K.) Limited, a direct wholly-owned subsidiary of TCL Corp.
ii. As at 31 December 2011, each of Mr. Wong Toe Yeung and Ms. Leung Lai Bing as husband and wife is deemed to be interested in 91,098,138 shares, comprising (a) 17,992,950 shares which are held by Norrell Overseas Invest Ltd. as beneficial owner for the benefit of the MAG Foundation in which Ms. Leung is interested; (b) 37,640,000 shares whichareheldbyMs.Leung; (c)3,390,888shareswhichareheldbyMr.Wong; (d)7,734,300shareswhichare jointlyheldbyMr.WongandMs.Leung; (e)19,340,000shareswhichareheldbyTopScaleCo.Ltd.,acompanywhollyownedbyMr.Wong;and(f)optionsoftheCompanyheldbyMr.Wongforsubscribing5,000,000shares.
56 T C L C O M M U N I C A T I O N T E C H N O L O G Y H O L D I N G S L I M I T E D
Reportof the Directors
Save as disclosed above, there is no person (not being a Director or chief executive of the Company) known to the
Directors or chief executive of the Company, who, as at 31 December 2011, had, or were deemed or taken to have
interests or short positions in the shares or underlying shares of the Company that was required to be recorded
pursuant to Section 336 of the SFO.
CONNECTED TRANSACTIONS
During the year ended 31 December 2011, the Group entered into the following connected transactions (other
than connected transactions that are exempted under Rule 14A.31 of the Listing Rules) and continuing connected
transactions (other than continuing connected transactions that are exempted under Rule 14A.33 of the Listing
Rules) with TCL Corp. (being the ultimate controlling shareholder of the Company) and its subsidiaries (which are
regarded as connected persons as defined in the Listing Rules):
a) On 27 October 2006, a three-year term financial service framework agreement was entered into among
the Company, TCL Corp. and TCL Group Finance Co., Ltd. (the “Finance Company”, a non-wholly owned
subsidiary of TCL Corp.), pursuant to which the Company may from time to time utilize the financial services
provided by the Finance Company including deposit services, finance services and other financial services.
On 9 September 2008, the Company renewed the agreement for a further three-year term to 31 December
2011.
As it wishes to continue the continuing connected transactions contemplated thereunder, the Company
entered into a master financial services agreement on 26 October 2011, which becomes effective from 1
January 2012 to 31 December 2014. The terms of the said agreement are substantially the same as its
predecessors with some minor modifications.
Further details of the said agreement were set out in the announcement of the Company dated 26 October
2011 and the circular of the Company dated 13 December 2011.
The deposit services under the said agreement and its proposed caps thereunder were duly approved by the
shareholders of the Company in an extraordinary general meeting held on 30 December 2011.
During the year under review, the maximum total outstanding daily ending balances of deposits (including
interest receivable in respect of these deposits) due from the Finance Company was HK$897,147,000 and
HK$28,000 fee and commission in respect of other financial services has been paid by the Group.
b) On 29 December 2006, a brand promotion agreement was entered into between the Company and TCL
Corp., pursuant to which the Group agreed to contribute a certain percentage of the Group’s net sales (before
value added tax) from the sale of mobile communication products bearing the “TCL” name and products sold
for each of our financial quarters for a period of thirty-six calendar months effective on 1 March 2007 to the
TCL Brand Common Fund. The abovementioned agreement was a renewal of the original brand promotion
agreement which was entered into between the Company and the TCL Corp. on 13 September 2004 with
substantial same terms.
57AnnuAl report 2011
Reportof the Directors
On 25 November 2009, the Company has entered into the brand promotion (renewal) agreement which
becomes effective and supersedes the previous brand promotion agreements from 1 January 2010 to
31 December 2012, the terms of which are substantially the same as its predecessors with some minor
modifications.
Further details of the said brand promotion (renewal) agreement were set out in the announcement of the
Company dated 26 November 2009.
During the year under review, the Group contributed HK$5,636,000 under the said brand promotion (renewal)
agreement.
c) On 29 December 2006, a master supply agreement was entered into between the Company and TCL Corp.
regarding the following for a term of 3 years. The abovementioned agreement was a renewal of the original
master supply agreement which was entered into between the Company and the TCL Corp. on 13 September
2004 with substantial same terms.
i) purchase by the Group of overseas raw materials through TCL Corp., only if at the request of the
PRC subsidiaries of the Company, and resale of such goods to the relevant PRC subsidiaries of the
CompanybyTCLCorp.;and
ii) purchase by the Group of PRC manufactured raw materials from members of the TCL Group (other
than the Group).
On 25 November 2009, the Company has entered into the master supply (renewal) agreement which
becomes effective and supersedes the previous master supply agreements from 1 January 2010 to 31
December 2012, the terms of which are substantially the same as its predecessors with some minor
modifications.
During the year under review, the existing annual caps in relation to the above two purchases of raw materials
for the three years ending 31 December 2012 have been revised. Further details regarding the revised annual
caps were set out in the announcement and circular of the Company dated 25 February 2011 and 31 March
2011 respectively.
The transactions under the said agreement and its proposed revised caps thereunder were duly approved by
the shareholders of the Company in an extraordinary general meeting held on 26 April 2011.
During the year under review, the considerations paid by the Group for the above mentioned services (i)
and (ii) were HK$343,073,000 and HK$441,796,000 respectively under the said master supply (renewal)
agreement.
58 T C L C O M M U N I C A T I O N T E C H N O L O G Y H O L D I N G S L I M I T E D
Reportof the Directors
d) On 8 August 2011, a master supply (sale) agreement was entered into between the Company as seller and
TCL Corp. as purchaser for a term from 8 August 2011 to 31 December 2013. Pursuant to which, the Group
could regulate the existing and future sales contracts (both finished goods and materials) with TCL Corp.
Group (TCL Corp. and its subsidiaries and any entity that may become subsidiary of TCL Corp. from time
to time during the term of the master supply (sale) agreement but not include the Group) under a common
framework agreement.
Further details of the said master supply (sale) agreement were set out in the announcement of the Company
dated 8 August 2011.
During the year under review, the consideration received by the Group for the above mentioned transactions
was HK$3,026,000 under the said master supply (sale) agreement.
e) On 25 November 2009, superseding the previous lease agreements, three lease agreements were entered
into between JRD Communication (Shenzhen) Ltd (“JRD Shenzhen”, a wholly-owned subsidiary of the
Company) as lessee and Shenzhen TCL Central R&D Co., Ltd. (“Industrial Institute”, a subsidiary of TCL
Corp.) as landlord, pursuant to which premises at Floors 8, 15, 16, 17, Room 302 of Block B, Floor 9 (part
only) of Block A and Block B, and B1 warehouse of TCL Tower, Shenzhen, the PRC were leased to the
Group for office, R&D and warehouse use. All the three leases are substantially on the same terms for a term
from 1 January 2010 to 31 December 2011.
On 1 April 2011, Industrial Institute entered into a lease agreement as landlord with JRD Shenzhen as lessee,
pursuant to which premises at 7th Floor and Exhibition hall of 2nd Floor, Block A of TCL Tower, Shenzhen,
the PRC. On the same date, TCL Optoelectronics (Huizhou) Co., Ltd. (“TCL Optoelectronics”, a wholly-
owned subsidiary of TCL Corp.), entered into a lease agreement as landlord with Huizhou TCL Mobile
Communication Co., Ltd., which is a wholly-owned subsidiary of the Company, as the lessee, pursuant to
which premises at dormitory phase II of TCL Optoelectronics for staff quarter use. Both lease agreements are
for a term from 1 April 2011 to 31 December 2011. Further details of the said lease agreements were set out
in the announcement of the Company dated 1 April 2011.
As they wish to continue the existing leases and may enter into new leases in the future, the Company and
TCL Corp. entered into a master lease agreement on 8 August 2011 for the purpose of regulating the existing
leases and leases to be contemplated between two groups.
Further details of the master lease agreement were set out in the announcement of the Company dated 8
August 2011.
During the year, the total rental borne by the Company under the master lease agreement (including all
existing leases) amounted to HK$16,593,000.
59AnnuAl report 2011
Reportof the Directors
f) On 1 April 2011, TCL Mobile Communication (Hohhot) Co., Ltd. (“TCL Mobile Hohhot”, a wholly-owned
subsidiary of the Company) and TCL Communication Equipment (Huizhou) Co., Ltd., a wholly-owned
subsidiary of TCL Corp., has entered into a business transfer agreement for the purchase of the fixed line
telephone business. The consideration for the acquisition is RMB120,000,000 (equivalent to approximately
HK$143,928,000)
Further details of the said business transfer agreement were set out in the announcement of the Company
dated 1 April 2011.
During the year under review, TCL Mobile Hohhot paid HK$143,928,000 under the said business transfer
agreement.
The independent non-executive Directors have reviewed the continuing connected transactions set out above and
have confirmed that these continuing connected transactions were entered into:
(i) intheordinaryandusualcourseofbusinessoftheGroup;
(ii) on normal commercial terms or on terms no less favourable to the Group than those available to or from
independentthirdparties;and
(iii) in accordance with the terms of the relevant agreements governing such transactions on terms that were fair
and reasonable and in the interests of the shareholders of the Company as a whole.
Ernst & Young, the Company’s auditors, were engaged to report on the Group’s continuing connected transactions
in accordance with Hong Kong Standard on Assurance Engagements 3000 Assurance Engagements Other Than
Audits or Reviews of Historical Financial Information and with reference to Practice Note 740 Auditor’s Letter
on Continuing Connected Transactions under the Hong Kong Listing Rules issued by the Hong Kong Institute
of Certified Public Accountants. Ernst & Young have issued their unqualified letter containing their findings and
conclusions in respect of the continuing connected transactions disclosed above by the Group in accordance with
Rule 14A.38 of the Listing Rules. A copy of the auditors’ letter has been provided by the Company to the Stock
Exchange.
Ernst & Young have confirmed to the Board that the above continuing connected transactions:
(i) havebeenapprovedbytheBoard;
(ii) havebeenenteredintoinaccordancewiththetermsoftherelevantagreementsgoverningthetransactions;
(iii) have not exceeded the relevant caps disclosed in the relevant announcements and/or circulars of the
Company(whereapplicable);and
(iv) are in accordance with the pricing policies of the Group where the transactions involved provision of goods or
services by the Group.
60 T C L C O M M U N I C A T I O N T E C H N O L O G Y H O L D I N G S L I M I T E D
Reportof the Directors
CORPORATE GOVERNANCE
Details of the Group’s governance practices can be found in the Corporate Governance Report contained on pages
38 to 48 in this annual report.
MODEL CODE FOR SECURITIES TRANSACTIONS BY DIRECTORS
The Board has adopted a code of conduct regarding directors’ securities transactions on terms no less exacting
than the required standard set out in the Model Code as set out in Appendix 10 to the Listing Rules. Specific
enquiries have been made with all Directors who have confirmed that they have complied with the required standard
set out in the Model Code and the Company’s code of conduct regarding directors’ securities transactions during
the year under review.
DIRECTORS’ INTERESTS IN A COMPETING BUSINESS
During the year under review, no Directors are considered to have interests in a business which competes or is likely
to compete, either directly or indirectly, with the businesses of the Group, as defined in the Listing Rules.
EVENTS AFTER THE REPORTING PERIOD
Details of the significant events after the reporting period of the Group are set out in note 48 to the financial
statements.
SUFFICIENCY OF PUBLIC FLOAT
Based on information that is publicly available to the Company and within the knowledge of the Directors, at least
25% of the Company’s total issued share capital was held by the public as at the date of this annual report.
AUDIT COMMITTEE
The Company has an audit committee (the “Audit Committee”) for the purposes of reviewing and providing
supervision over the Group’s financial reporting process and internal controls. The audited annual results have been
reviewed by the Audit Committee established in compliance with Rule 3.21 of the Listing Rules and the relevant
code provisions of the Code on Corporate Governance Practices as set out in Appendix 14 to the Listing Rules.
The Audit Committee comprises four members, including Mr. LAU Siu Ki (Chairman), Mr. LOOK Andrew and Mr.
KWOK Hoi Sing, all being independent non-executive Directors of the Company, and Mr. HUANG Xubin, a non-
executive Director of the Company and was appointed as a member of Audit Committee on 24 October 2011.
Mr. BO Lianming, a non-executive Director of the Company, has resigned as a member of Audit Committee with
effect from 24 October 2011. Mr. KWOK Hoi Sing was appointed as an independent non-executive Director of the
Company on 9 May 2011. He has also been appointed as a member of the Audit Committee and the Remuneration
Committee of the Company with effect from 9 May 2011.
61AnnuAl report 2011
Reportof the Directors
AUDITORS
The accounts for the year ended 31 December 2011 have been audited by Ernst & Young, who shall retire and,
being eligible, shall offer themselves for reappointment as auditors of the Company at the forthcoming AGM.
On behalf of the Board
LI Dongsheng
Chairman
Hong Kong
27 February 2012
62 T C L C O M M U N I C A T I O N T E C H N O L O G Y H O L D I N G S L I M I T E D
IndependentAuditors’Report
To the shareholders of TCL Communication Technology Holdings Limited
(Incorporated in the Cayman Islands with limited liability)
We have audited the consolidated financial statements of TCL Communication Technology Holdings Limited
(the “Company”) and its subsidiaries (together, the “Group”) set out on pages 64 to 167, which comprise the
consolidated and company statements of financial position as at 31 December 2011, and the consolidated income
statement, the consolidated statement of comprehensive income, the consolidated statement of changes in equity
and the consolidated statement of cash flows for the year then ended, and a summary of significant accounting
policies and other explanatory information.
DIRECTORS’ RESPONSIBILITY FOR THE CONSOLIDATED FINANCIAL STATEMENTS
The directors of the Company are responsible for the preparation of consolidated financial statements that give a
true and fair view in accordance with Hong Kong Financial Reporting Standards issued by the Hong Kong Institute
of Certified Public Accountants and the disclosure requirements of the Hong Kong Companies Ordinance, and for
such internal control as the directors determine is necessary to enable the preparation of consolidated financial
statements that are free from material misstatement, whether due to fraud or error.
AUDITORS’ RESPONSIBILITY
Our responsibility is to express an opinion on these consolidated financial statements based on our audit. Our report
is made solely to you, as a body, and for no other purpose. We do not assume responsibility towards or accept
liability to any other person for the contents of this report.
We conducted our audit in accordance with Hong Kong Standards on Auditing issued by the Hong Kong Institute
of Certified Public Accountants. Those standards require that we comply with ethical requirements and plan and
perform the audit to obtain reasonable assurance about whether the consolidated financial statements are free from
material misstatement.
An audit involves performing procedures to obtain audit evidence about the amounts and disclosures in the
consolidated financial statements. The procedures selected depend on the auditors’ judgment, including the
assessment of the risks of material misstatement of the consolidated financial statements, whether due to fraud or
error. In making those risk assessments, the auditors consider internal control relevant to the entity’s preparation
of consolidated financial statements that give a true and fair view in order to design audit procedures that are
appropriate in the circumstances, but not for the purpose of expressing an opinion on the effectiveness of the
entity’s internal control. An audit also includes evaluating the appropriateness of accounting policies used and the
reasonableness of accounting estimates made by the directors, as well as evaluating the overall presentation of the
consolidated financial statements.
We believe that the audit evidence we have obtained is sufficient and appropriate to provide a basis for our audit
opinion.
63AnnuAl report 2011
IndependentAuditors’Report
To the shareholders of TCL Communication Technology Holdings Limited
(Incorporated in the Cayman Islands with limited liability)
OPINION
In our opinion, the consolidated financial statements give a true and fair view of the state of affairs of the Company
and of the Group as at 31 December 2011, and of the Group’s profit and cash flows for the year then ended in
accordance with Hong Kong Financial Reporting Standards and have been properly prepared in accordance with
the disclosure requirements of the Hong Kong Companies Ordinance.
Ernst & Young
Certified Public Accountants
22/F, CITIC Tower
1 Tim Mei Avenue, Central
Hong Kong
27 February 2012
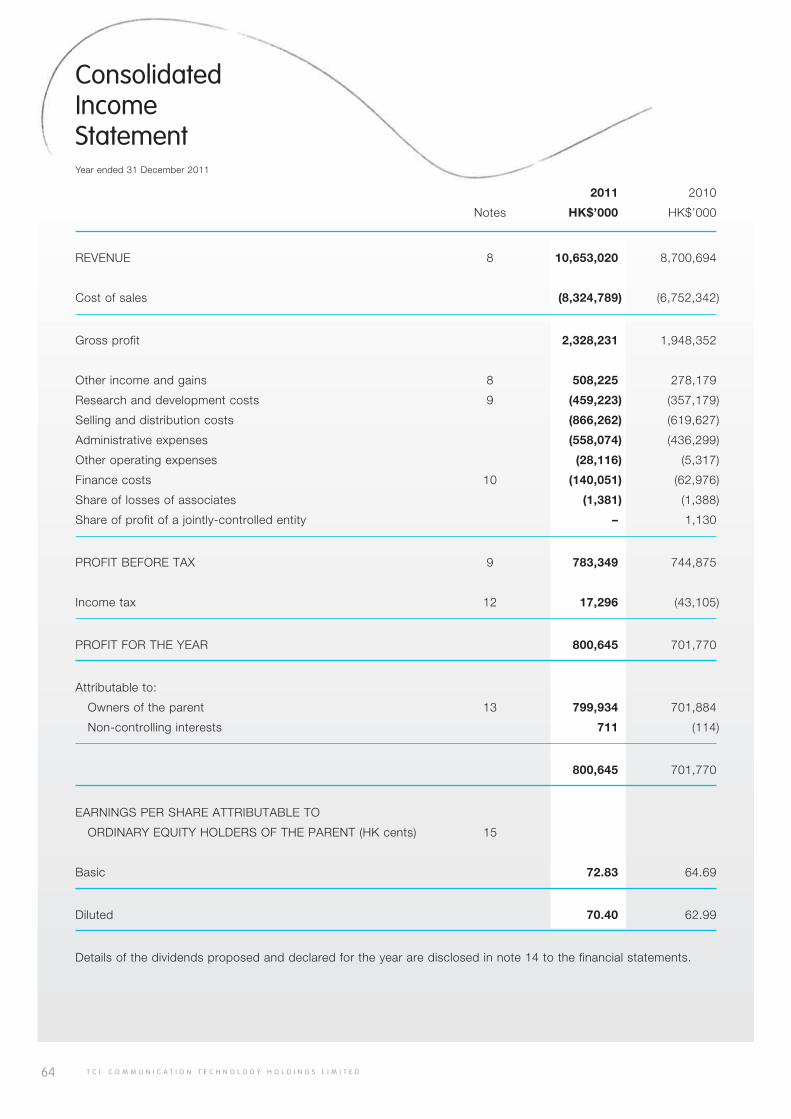
64 T C L C O M M U N I C A T I O N T E C H N O L O G Y H O L D I N G S L I M I T E D
ConsolidatedIncomeStatement Year ended 31 December 2011
2011 2010
Notes HK$’000 HK$’000
REVENUE 8 10,653,020 8,700,694
Cost of sales (8,324,789) (6,752,342)
Gross profit 2,328,231 1,948,352
Other income and gains 8 508,225 278,179
Research and development costs 9 (459,223) (357,179)
Selling and distribution costs (866,262) (619,627)
Administrative expenses (558,074) (436,299)
Other operating expenses (28,116) (5,317)
Finance costs 10 (140,051) (62,976)
Share of losses of associates (1,381) (1,388)
Share of profit of a jointly-controlled entity – 1,130
PROFIT BEFORE TAX 9 783,349 744,875
Income tax 12 17,296 (43,105)
PROFIT FOR THE YEAR 800,645 701,770
Attributable to:
Owners of the parent 13 799,934 701,884
Non-controlling interests 711 (114)
800,645 701,770
EARNINGS PER SHARE ATTRIBUTABLE TO
ORDINARY EQUITY HOLDERS OF THE PARENT (HK cents) 15
Basic 72.83 64.69
Diluted 70.40 62.99
Details of the dividends proposed and declared for the year are disclosed in note 14 to the financial statements.
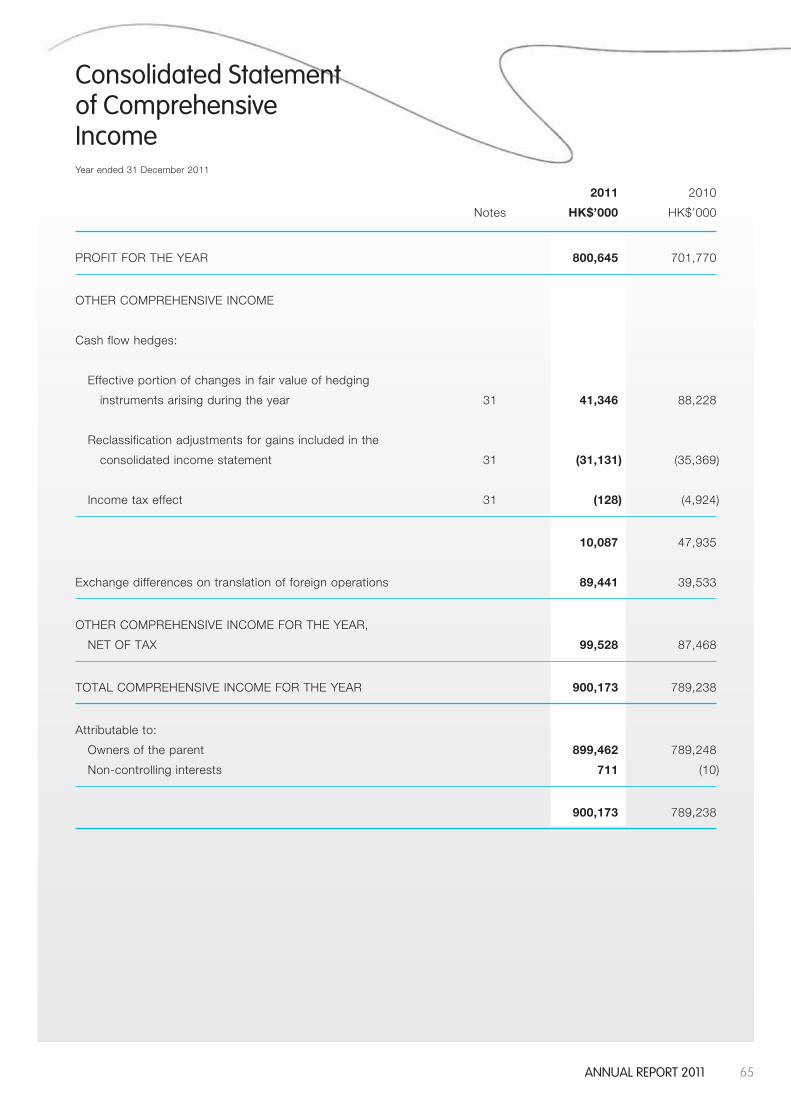
65AnnuAl report 2011
Consolidated Statementof ComprehensiveIncomeYear ended 31 December 2011
2011 2010
Notes HK$’000 HK$’000
PROFIT FOR THE YEAR 800,645 701,770
OTHER COMPREHENSIVE INCOME
Cash flow hedges:
Effective portion of changes in fair value of hedging
instruments arising during the year 31 41,346 88,228
Reclassification adjustments for gains included in the
consolidated income statement 31 (31,131) (35,369)
Income tax effect 31 (128) (4,924)
10,087 47,935
Exchange differences on translation of foreign operations 89,441 39,533
OTHER COMPREHENSIVE INCOME FOR THE YEAR,
NET OF TAX 99,528 87,468
TOTAL COMPREHENSIVE INCOME FOR THE YEAR 900,173 789,238
Attributable to:
Owners of the parent 899,462 789,248
Non-controlling interests 711 (10)
900,173 789,238
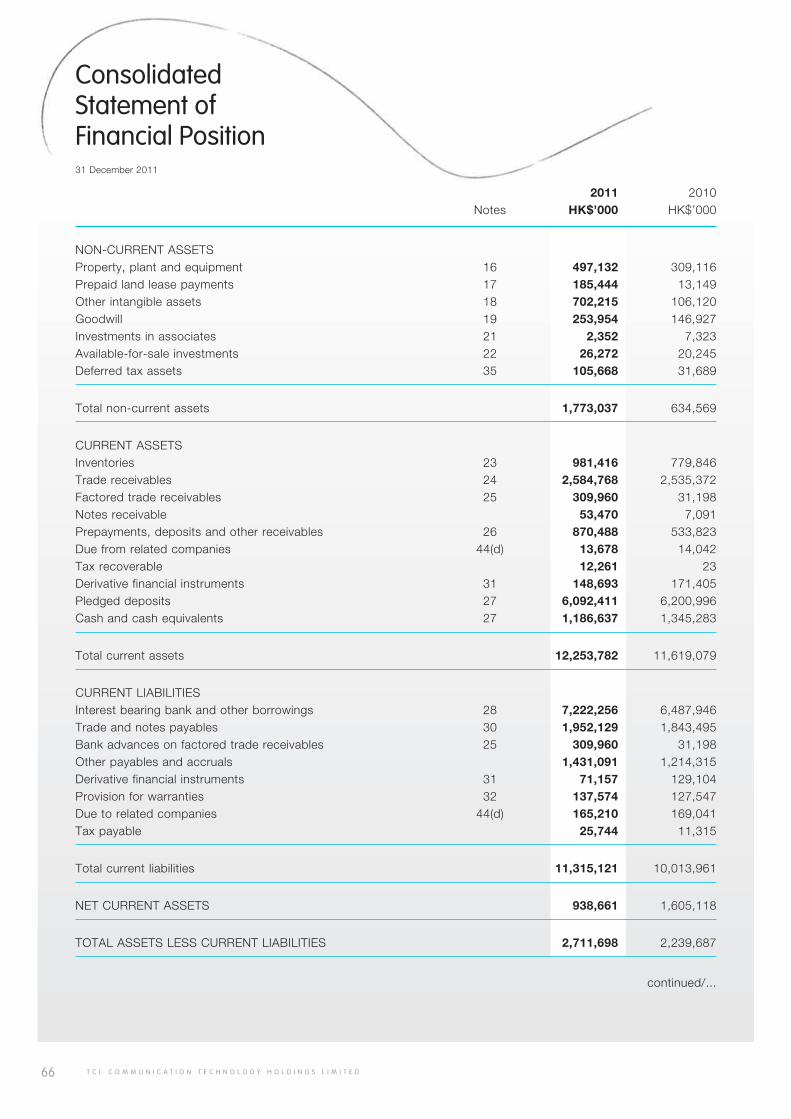
66 T C L C O M M U N I C A T I O N T E C H N O L O G Y H O L D I N G S L I M I T E D
ConsolidatedStatement ofFinancial Position31 December 2011
2011 2010 Notes HK$’000 HK$’000
NON-CURRENT ASSETSProperty, plant and equipment 16 497,132 309,116Prepaid land lease payments 17 185,444 13,149Other intangible assets 18 702,215 106,120Goodwill 19 253,954 146,927Investments in associates 21 2,352 7,323Available-for-sale investments 22 26,272 20,245Deferred tax assets 35 105,668 31,689
Total non-current assets 1,773,037 634,569
CURRENT ASSETSInventories 23 981,416 779,846Trade receivables 24 2,584,768 2,535,372Factored trade receivables 25 309,960 31,198Notes receivable 53,470 7,091Prepayments, deposits and other receivables 26 870,488 533,823Due from related companies 44(d) 13,678 14,042Tax recoverable 12,261 23Derivative financial instruments 31 148,693 171,405Pledged deposits 27 6,092,411 6,200,996Cash and cash equivalents 27 1,186,637 1,345,283
Total current assets 12,253,782 11,619,079
CURRENT LIABILITIESInterest bearing bank and other borrowings 28 7,222,256 6,487,946Trade and notes payables 30 1,952,129 1,843,495Bank advances on factored trade receivables 25 309,960 31,198Other payables and accruals 1,431,091 1,214,315Derivative financial instruments 31 71,157 129,104Provision for warranties 32 137,574 127,547Due to related companies 44(d) 165,210 169,041Tax payable 25,744 11,315
Total current liabilities 11,315,121 10,013,961
NET CURRENT ASSETS 938,661 1,605,118
TOTAL ASSETS LESS CURRENT LIABILITIES 2,711,698 2,239,687
continued/...
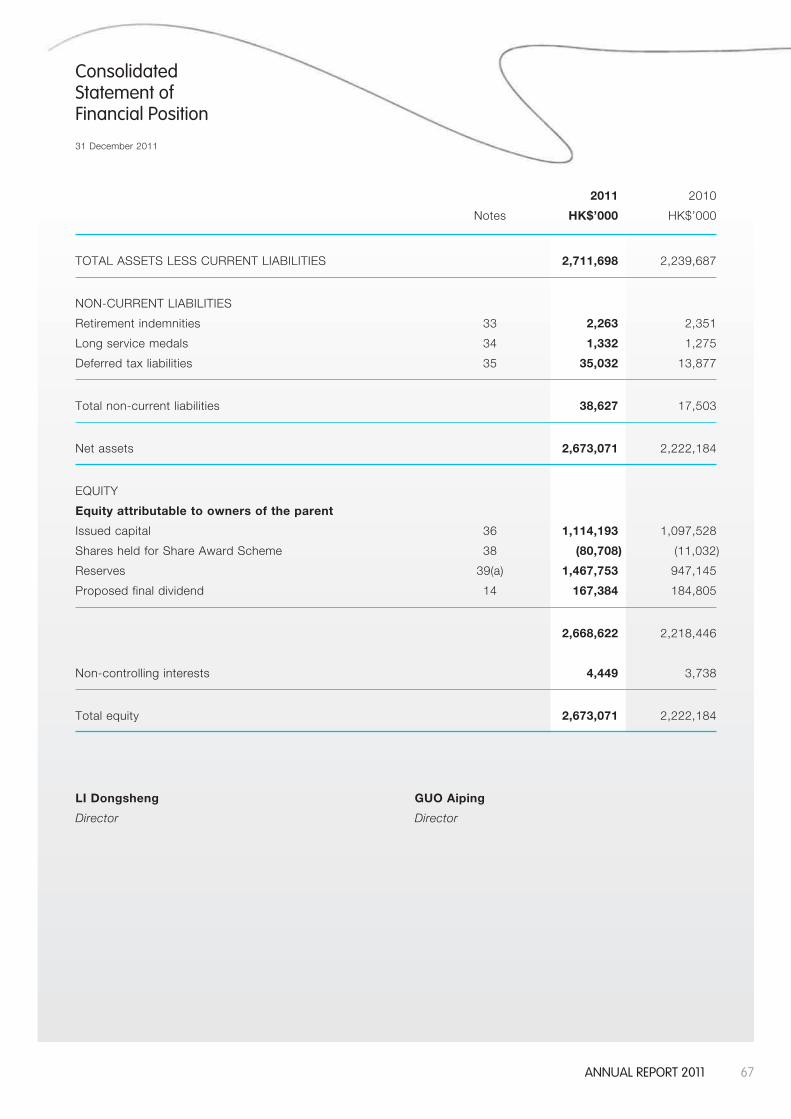
67AnnuAl report 2011
Consolidated Statement of Financial Position
31 December 2011
2011 2010
Notes HK$’000 HK$’000
TOTAL ASSETS LESS CURRENT LIABILITIES 2,711,698 2,239,687
NON-CURRENT LIABILITIES
Retirement indemnities 33 2,263 2,351
Long service medals 34 1,332 1,275
Deferred tax liabilities 35 35,032 13,877
Total non-current liabilities 38,627 17,503
Net assets 2,673,071 2,222,184
EQUITY
Equity attributable to owners of the parent
Issued capital 36 1,114,193 1,097,528
Shares held for Share Award Scheme 38 (80,708) (11,032)
Reserves 39(a) 1,467,753 947,145
Proposed final dividend 14 167,384 184,805
2,668,622 2,218,446
Non-controlling interests 4,449 3,738
Total equity 2,673,071 2,222,184
LI Dongsheng GUO Aiping
Director Director
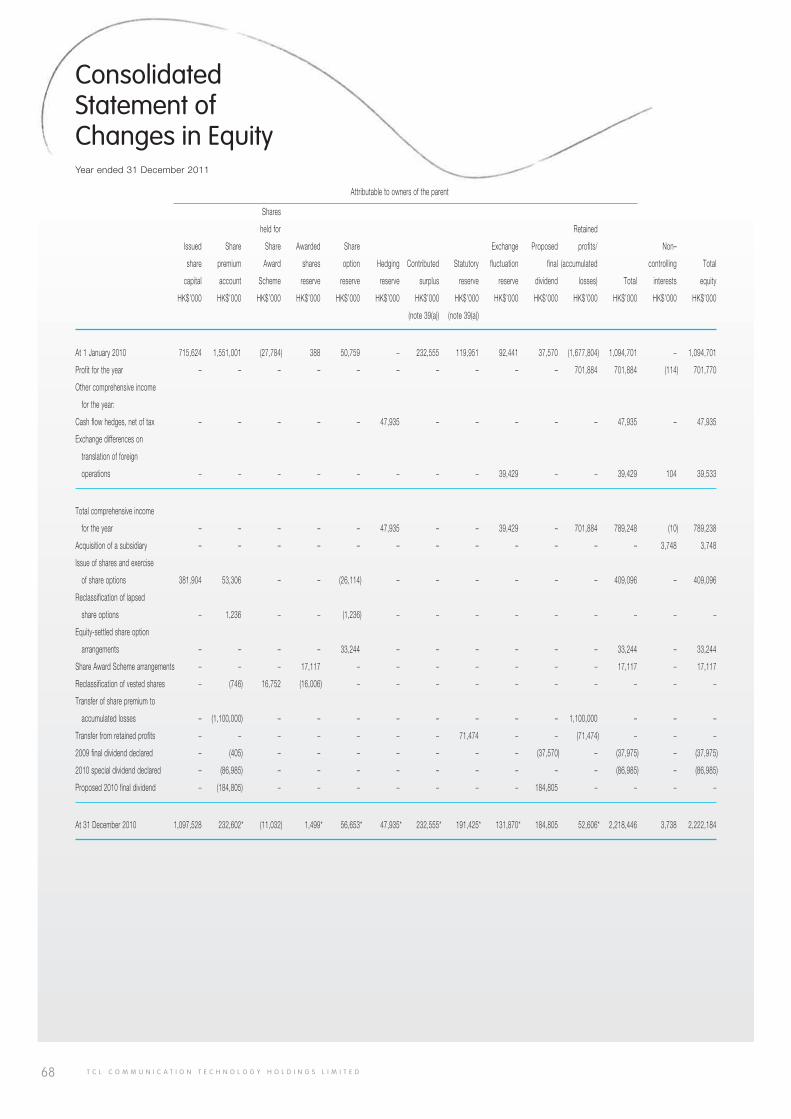
68 T C L C O M M U N I C A T I O N T E C H N O L O G Y H O L D I N G S L I M I T E D
ConsolidatedStatement ofChanges in Equity Year ended 31 December 2011
Attributable to owners of the parent
Shares
held for Retained
Issued Share Share Awarded Share Exchange Proposed profits/ Non–
share premium Award shares option Hedging Contributed Statutory fluctuation final (accumulated controlling Total
capital account Scheme reserve reserve reserve surplus reserve reserve dividend losses) Total interests equity
HK$’000 HK$’000 HK$’000 HK$’000 HK$’000 HK$’000 HK$’000 HK$’000 HK$’000 HK$’000 HK$’000 HK$’000 HK$’000 HK$’000
(note 39(a)) (note 39(a))
At 1 January 2010 715,624 1,551,001 (27,784) 388 50,759 – 232,555 119,951 92,441 37,570 (1,677,804) 1,094,701 – 1,094,701
Profit for the year – – – – – – – – – – 701,884 701,884 (114) 701,770
Other comprehensive income
for the year:
Cash flow hedges, net of tax – – – – – 47,935 – – – – – 47,935 – 47,935
Exchange differences on
translation of foreign
operations – – – – – – – – 39,429 – – 39,429 104 39,533
Total comprehensive income
for the year – – – – – 47,935 – – 39,429 – 701,884 789,248 (10) 789,238
Acquisition of a subsidiary – – – – – – – – – – – – 3,748 3,748
Issue of shares and exercise
of share options 381,904 53,306 – – (26,114) – – – – – – 409,096 – 409,096
Reclassification of lapsed
share options – 1,236 – – (1,236) – – – – – – – – –
Equity-settled share option
arrangements – – – – 33,244 – – – – – – 33,244 – 33,244
Share Award Scheme arrangements – – – 17,117 – – – – – – – 17,117 – 17,117
Reclassification of vested shares – (746) 16,752 (16,006) – – – – – – – – – –
Transfer of share premium to
accumulated losses – (1,100,000) – – – – – – – – 1,100,000 – – –
Transfer from retained profits – – – – – – – 71,474 – – (71,474) – – –
2009 final dividend declared – (405) – – – – – – – (37,570) – (37,975) – (37,975)
2010 special dividend declared – (86,985) – – – – – – – – – (86,985) – (86,985)
Proposed 2010 final dividend – (184,805) – – – – – – – 184,805 – – – –
At 31 December 2010 1,097,528 232,602* (11,032) 1,499* 56,653* 47,935* 232,555* 191,425* 131,870* 184,805 52,606* 2,218,446 3,738 2,222,184
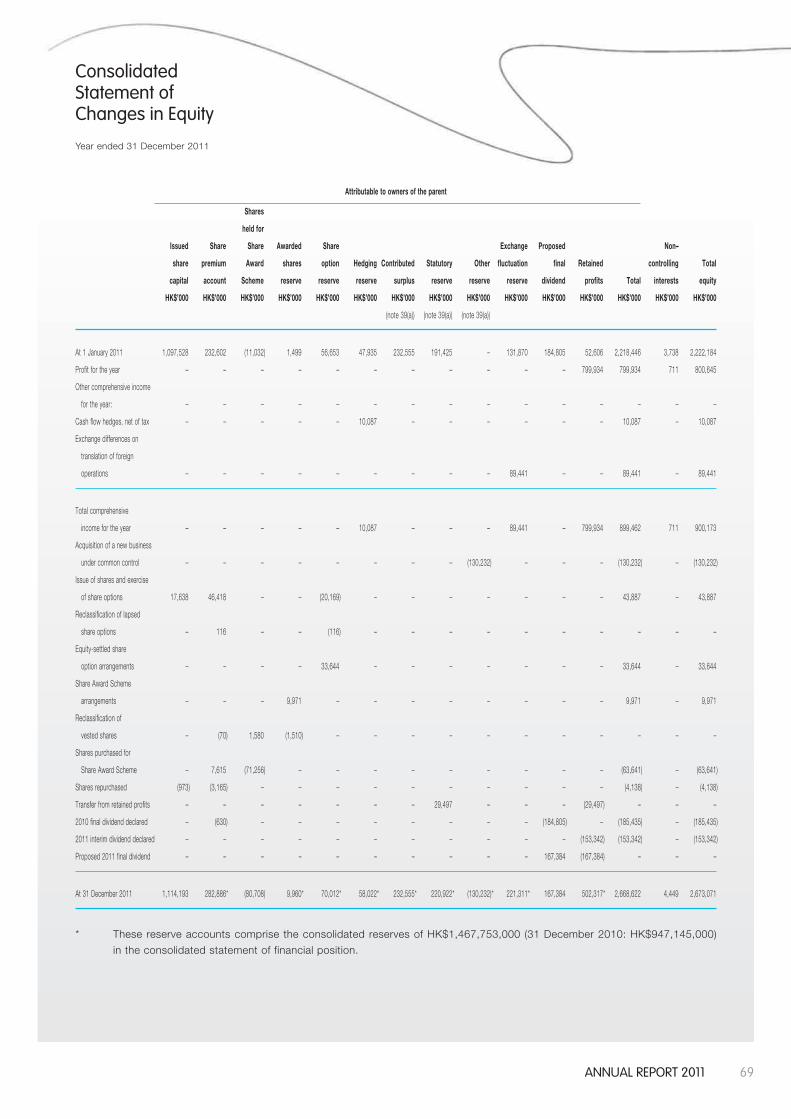
69AnnuAl report 2011
Consolidated Statement of Changes in Equity
Year ended 31 December 2011
Attributable to owners of the parent
Shares
held for
Issued Share Share Awarded Share Exchange Proposed Non–
share premium Award shares option Hedging Contributed Statutory Other fluctuation final Retained controlling Total
capital account Scheme reserve reserve reserve surplus reserve reserve reserve dividend profits Total interests equity
HK$’000 HK$’000 HK$’000 HK$’000 HK$’000 HK$’000 HK$’000 HK$’000 HK$’000 HK$’000 HK$’000 HK$’000 HK$’000 HK$’000 HK$’000
(note 39(a)) (note 39(a)) (note 39(a))
At 1 January 2011 1,097,528 232,602 (11,032) 1,499 56,653 47,935 232,555 191,425 – 131,870 184,805 52,606 2,218,446 3,738 2,222,184
Profit for the year – – – – – – – – – – – 799,934 799,934 711 800,645
Other comprehensive income
for the year: – – – – – – – – – – – – – – –
Cash flow hedges, net of tax – – – – – 10,087 – – – – – – 10,087 – 10,087
Exchange differences on
translation of foreign
operations – – – – – – – – – 89,441 – – 89,441 – 89,441
Total comprehensive
income for the year – – – – – 10,087 – – – 89,441 – 799,934 899,462 711 900,173
Acquisition of a new business
under common control – – – – – – – – (130,232) – – – (130,232) – (130,232)
Issue of shares and exercise
of share options 17,638 46,418 – – (20,169) – – – – – – – 43,887 – 43,887
Reclassification of lapsed
share options – 116 – – (116) – – – – – – – – – –
Equity-settled share
option arrangements – – – – 33,644 – – – – – – – 33,644 – 33,644
Share Award Scheme
arrangements – – – 9,971 – – – – – – – – 9,971 – 9,971
Reclassification of
vested shares – (70) 1,580 (1,510) – – – – – – – – – – –
Shares purchased for
Share Award Scheme – 7,615 (71,256) – – – – – – – – – (63,641) – (63,641)
Shares repurchased (973) (3,165) – – – – – – – – – – (4,138) – (4,138)
Transfer from retained profits – – – – – – – 29,497 – – – (29,497) – – –
2010 final dividend declared – (630) – – – – – – – – (184,805) – (185,435) – (185,435)
2011 interim dividend declared – – – – – – – – – – – (153,342) (153,342) – (153,342)
Proposed 2011 final dividend – – – – – – – – – – 167,384 (167,384) – – –
At 31 December 2011 1,114,193 282,886* (80,708) 9,960* 70,012* 58,022* 232,555* 220,922* (130,232)* 221,311* 167,384 502,317* 2,668,622 4,449 2,673,071
* These reserve accounts comprise the consolidated reserves of HK$1,467,753,000 (31 December 2010: HK$947,145,000)
in the consolidated statement of financial position.
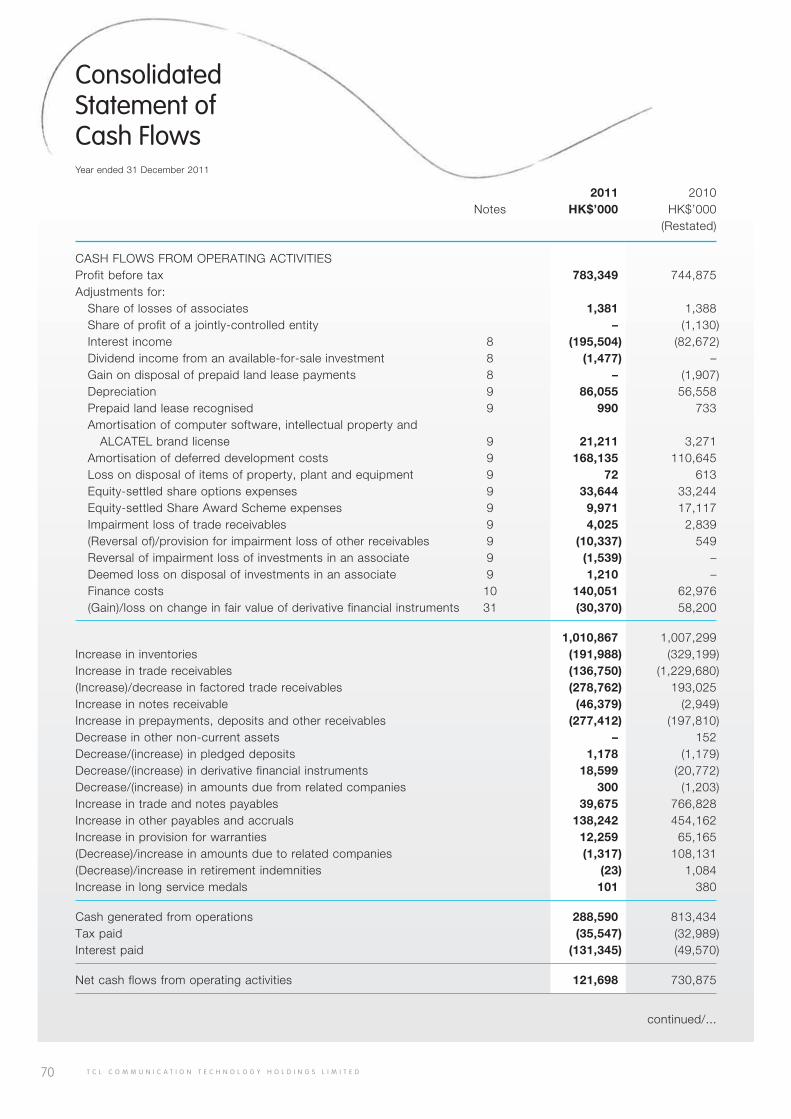
70 T C L C O M M U N I C A T I O N T E C H N O L O G Y H O L D I N G S L I M I T E D
ConsolidatedStatement ofCash FlowsYear ended 31 December 2011
2011 2010 Notes HK$’000 HK$’000 (Restated)
CASH FLOWS FROM OPERATING ACTIVITIESProfit before tax 783,349 744,875Adjustments for: Share of losses of associates 1,381 1,388 Share of profit of a jointly-controlled entity – (1,130) Interest income 8 (195,504) (82,672) Dividend income from an available-for-sale investment 8 (1,477) – Gain on disposal of prepaid land lease payments 8 – (1,907) Depreciation 9 86,055 56,558 Prepaid land lease recognised 9 990 733 Amortisation of computer software, intellectual property and ALCATEL brand license 9 21,211 3,271 Amortisation of deferred development costs 9 168,135 110,645 Loss on disposal of items of property, plant and equipment 9 72 613 Equity-settled share options expenses 9 33,644 33,244 Equity-settled Share Award Scheme expenses 9 9,971 17,117 Impairment loss of trade receivables 9 4,025 2,839 (Reversal of)/provision for impairment loss of other receivables 9 (10,337) 549 Reversal of impairment loss of investments in an associate 9 (1,539) – Deemed loss on disposal of investments in an associate 9 1,210 – Finance costs 10 140,051 62,976 (Gain)/loss on change in fair value of derivative financial instruments 31 (30,370) 58,200
1,010,867 1,007,299Increase in inventories (191,988) (329,199)Increase in trade receivables (136,750) (1,229,680)(Increase)/decrease in factored trade receivables (278,762) 193,025Increase in notes receivable (46,379) (2,949)Increase in prepayments, deposits and other receivables (277,412) (197,810)Decrease in other non-current assets – 152Decrease/(increase) in pledged deposits 1,178 (1,179)Decrease/(increase) in derivative financial instruments 18,599 (20,772)Decrease/(increase) in amounts due from related companies 300 (1,203)Increase in trade and notes payables 39,675 766,828Increase in other payables and accruals 138,242 454,162Increase in provision for warranties 12,259 65,165(Decrease)/increase in amounts due to related companies (1,317) 108,131(Decrease)/increase in retirement indemnities (23) 1,084Increase in long service medals 101 380
Cash generated from operations 288,590 813,434Tax paid (35,547) (32,989)Interest paid (131,345) (49,570)
Net cash flows from operating activities 121,698 730,875
continued/...
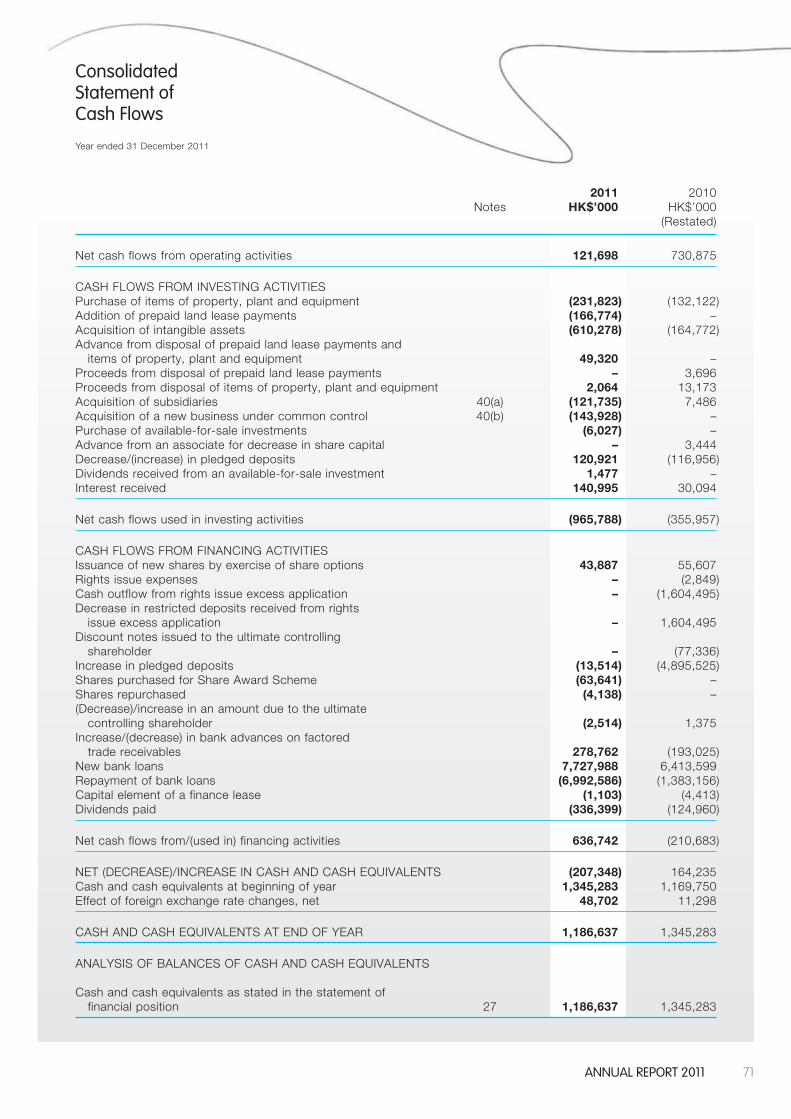
71AnnuAl report 2011
Consolidated Statement ofCash Flows
Year ended 31 December 2011
2011 2010 Notes HK$’000 HK$’000 (Restated)
Net cash flows from operating activities 121,698 730,875
CASH FLOWS FROM INVESTING ACTIVITIESPurchase of items of property, plant and equipment (231,823) (132,122)Addition of prepaid land lease payments (166,774) –Acquisition of intangible assets (610,278) (164,772)Advance from disposal of prepaid land lease payments and items of property, plant and equipment 49,320 –Proceeds from disposal of prepaid land lease payments – 3,696Proceeds from disposal of items of property, plant and equipment 2,064 13,173Acquisition of subsidiaries 40(a) (121,735) 7,486Acquisition of a new business under common control 40(b) (143,928) –Purchase of available-for-sale investments (6,027) –Advance from an associate for decrease in share capital – 3,444Decrease/(increase) in pledged deposits 120,921 (116,956)Dividends received from an available-for-sale investment 1,477 –Interest received 140,995 30,094
Net cash flows used in investing activities (965,788) (355,957)
CASH FLOWS FROM FINANCING ACTIVITIESIssuance of new shares by exercise of share options 43,887 55,607Rights issue expenses – (2,849)Cash outflow from rights issue excess application – (1,604,495)Decrease in restricted deposits received from rights issue excess application – 1,604,495Discount notes issued to the ultimate controlling shareholder – (77,336)Increase in pledged deposits (13,514) (4,895,525)Shares purchased for Share Award Scheme (63,641) –Shares repurchased (4,138) –(Decrease)/increase in an amount due to the ultimate controlling shareholder (2,514) 1,375Increase/(decrease) in bank advances on factored trade receivables 278,762 (193,025)New bank loans 7,727,988 6,413,599Repayment of bank loans (6,992,586) (1,383,156)Capital element of a finance lease (1,103) (4,413)Dividends paid (336,399) (124,960)
Net cash flows from/(used in) financing activities 636,742 (210,683)
NET (DECREASE)/INCREASE IN CASH AND CASH EQUIVALENTS (207,348) 164,235Cash and cash equivalents at beginning of year 1,345,283 1,169,750Effect of foreign exchange rate changes, net 48,702 11,298
CASH AND CASH EQUIVALENTS AT END OF YEAR 1,186,637 1,345,283
ANALYSIS OF BALANCES OF CASH AND CASH EQUIVALENTS
Cash and cash equivalents as stated in the statement of financial position 27 1,186,637 1,345,283
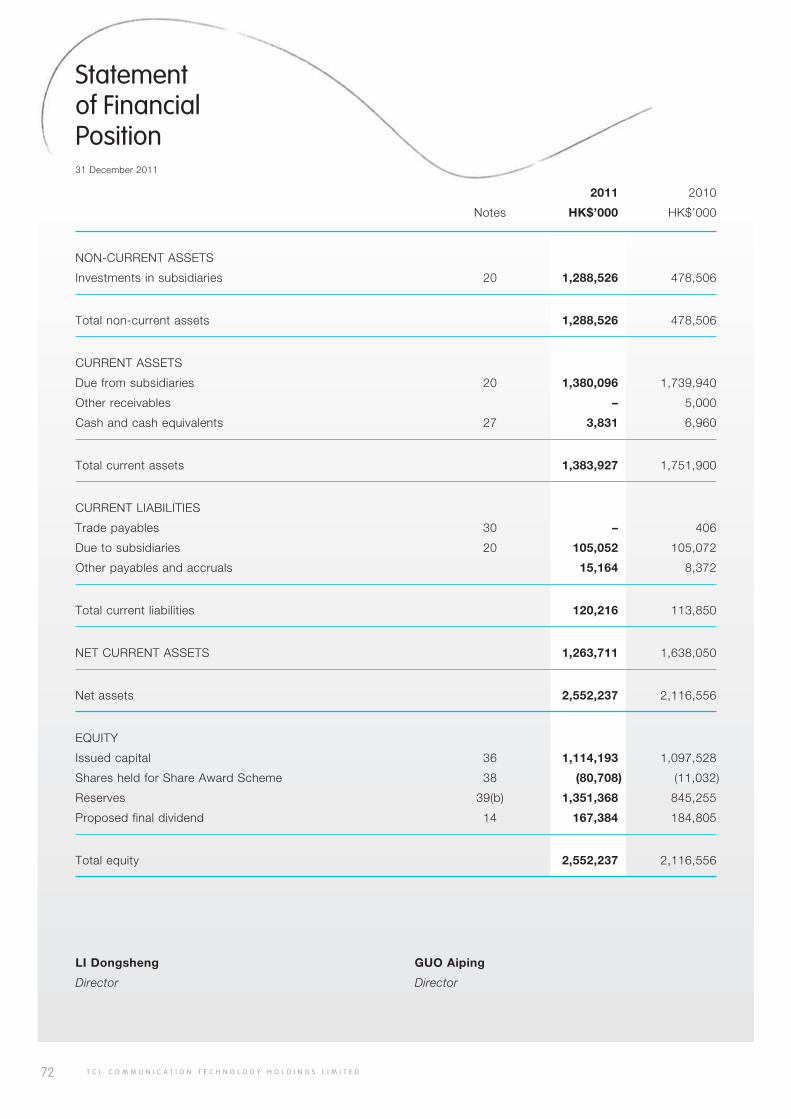
72 T C L C O M M U N I C A T I O N T E C H N O L O G Y H O L D I N G S L I M I T E D
Statementof FinancialPosition31 December 2011
2011 2010
Notes HK$’000 HK$’000
NON-CURRENT ASSETS
Investments in subsidiaries 20 1,288,526 478,506
Total non-current assets 1,288,526 478,506
CURRENT ASSETS
Due from subsidiaries 20 1,380,096 1,739,940
Other receivables – 5,000
Cash and cash equivalents 27 3,831 6,960
Total current assets 1,383,927 1,751,900
CURRENT LIABILITIES
Trade payables 30 – 406
Due to subsidiaries 20 105,052 105,072
Other payables and accruals 15,164 8,372
Total current liabilities 120,216 113,850
NET CURRENT ASSETS 1,263,711 1,638,050
Net assets 2,552,237 2,116,556
EQUITY
Issued capital 36 1,114,193 1,097,528
Shares held for Share Award Scheme 38 (80,708) (11,032)
Reserves 39(b) 1,351,368 845,255
Proposed final dividend 14 167,384 184,805
Total equity 2,552,237 2,116,556
LI Dongsheng GUO Aiping
Director Director
73AnnuAl report 2011
Notes toFinancialStatements31 December 2011
1. CORPORATE INFORMATION
The Company was incorporated as an exempted company with limited liability in the Cayman Islands on
26 February 2004 under the Companies Law, Cap.22 (Law 3 of 1961, as consolidated and revised) of the
Cayman Islands. The principal office of the Company is located at Rooms 1910-12A, Tower 3, China Hong
Kong City, 33 Canton Road, Tsimshatsui, Kowloon, Hong Kong.
During the year, the Group was principally engaged in the research and development, manufacture and sale
of mobile phones and other products.
In the opinion of the directors, the holding company and the ultimate holding company of the Company is
TCL Corporation, a limited liability company registered in the People’s Republic of China (the “PRC”) and
listed on the Shenzhen Stock Exchange.
2. BASIS OF PREPARATION
These financial statements have been prepared in accordance with Hong Kong Financial Reporting Standards
(“HKFRSs”) (which include all Hong Kong Financial Reporting Standards, Hong Kong Accounting Standards
(“HKASs”) and Interpretations) issued by the Hong Kong Institute of Certified Public Accountants, accounting
principles generally accepted in Hong Kong and the disclosure requirements of the Hong Kong Companies
Ordinance. They have been prepared under the historical cost convention, except for the Group’s forward
contracts and interest rate swap, which have been measured at fair value. These financial statements are
presented in Hong Kong dollars and all values are rounded to the nearest thousand except when otherwise
indicated.
Basis of consolidation
The consolidated financial statements include the financial statements of the Company and its subsidiaries for
the year ended 31 December 2011. The financial statements of the subsidiaries are prepared for the same
reporting period as the Company, using consistent accounting policies. The results of subsidiaries and a
trust (“the Share Award Scheme Trust”), a controlled special purpose entity, are consolidated from the date
of acquisition, being the date on which the Group obtains control, and continue to be consolidated until the
date that such control ceases. All intra-group balances, transactions, unrealised gains and losses resulting
from intra-group transactions and dividends are eliminated on consolidation in full.
Adjustments are made to bring into line any dissimilar accounting policies that may exist.
Total comprehensive income within a subsidiary is attributed to the non-controlling interest even if that results
in a deficit balance.
A change in the ownership interest of a subsidiary, without a loss of control, is accounted for as an equity
transaction.
If the Group loses control over a subsidiary, it derecognises (i) the assets (including goodwill) and liabilities
of the subsidiary, (ii) the carrying amount of any non-controlling interest and (iii) the cumulative translation
differencesrecordedinequity;andrecognises(i) thefairvalueoftheconsiderationreceived,(ii) thefairvalue
of any investment retained and (iii) any resulting surplus or deficit in profit or loss. The Group’s share of
components previously recognised in other comprehensive income is reclassified to profit or loss or retained
profits, as appropriate.
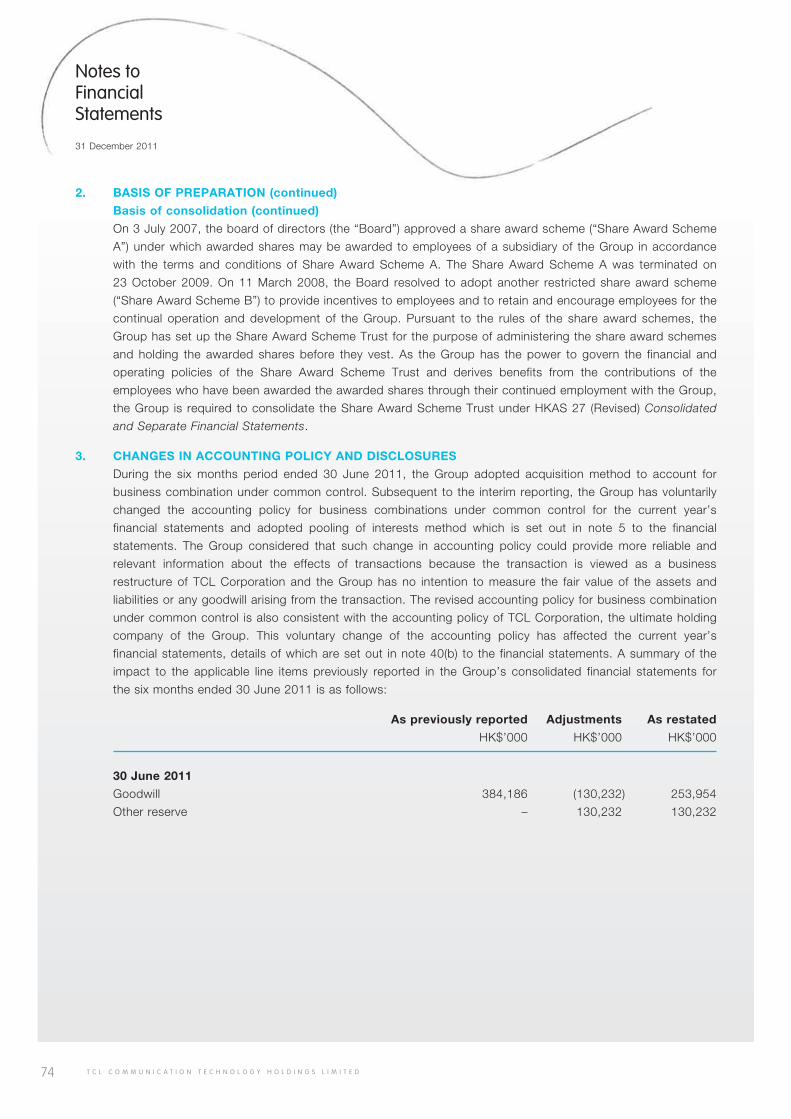
74 T C L C O M M U N I C A T I O N T E C H N O L O G Y H O L D I N G S L I M I T E D
Notes to Financial Statements
31 December 2011
2. BASIS OF PREPARATION (continued)
Basis of consolidation (continued)
On 3 July 2007, the board of directors (the “Board”) approved a share award scheme (“Share Award Scheme
A”) under which awarded shares may be awarded to employees of a subsidiary of the Group in accordance
with the terms and conditions of Share Award Scheme A. The Share Award Scheme A was terminated on
23 October 2009. On 11 March 2008, the Board resolved to adopt another restricted share award scheme
(“Share Award Scheme B”) to provide incentives to employees and to retain and encourage employees for the
continual operation and development of the Group. Pursuant to the rules of the share award schemes, the
Group has set up the Share Award Scheme Trust for the purpose of administering the share award schemes
and holding the awarded shares before they vest. As the Group has the power to govern the financial and
operating policies of the Share Award Scheme Trust and derives benefits from the contributions of the
employees who have been awarded the awarded shares through their continued employment with the Group,
the Group is required to consolidate the Share Award Scheme Trust under HKAS 27 (Revised) Consolidated
and Separate Financial Statements.
3. CHANGES IN ACCOUNTING POLICY AND DISCLOSURES
During the six months period ended 30 June 2011, the Group adopted acquisition method to account for
business combination under common control. Subsequent to the interim reporting, the Group has voluntarily
changed the accounting policy for business combinations under common control for the current year’s
financial statements and adopted pooling of interests method which is set out in note 5 to the financial
statements. The Group considered that such change in accounting policy could provide more reliable and
relevant information about the effects of transactions because the transaction is viewed as a business
restructure of TCL Corporation and the Group has no intention to measure the fair value of the assets and
liabilities or any goodwill arising from the transaction. The revised accounting policy for business combination
under common control is also consistent with the accounting policy of TCL Corporation, the ultimate holding
company of the Group. This voluntary change of the accounting policy has affected the current year’s
financial statements, details of which are set out in note 40(b) to the financial statements. A summary of the
impact to the applicable line items previously reported in the Group’s consolidated financial statements for
the six months ended 30 June 2011 is as follows:
As previously reported Adjustments As restated
HK$’000 HK$’000 HK$’000
30 June 2011
Goodwill 384,186 (130,232) 253,954
Other reserve – 130,232 130,232
75AnnuAl report 2011
Notes to Financial Statements
31 December 2011
3. CHANGES IN ACCOUNTING POLICY AND DISCLOSURES (continued)
In addition, the Group has adopted the following new and revised HKFRSs for the first time for the current
year’s financial statements.
HKFRS 1 Amendment Amendment to HKFRS 1 First-time Adoption of Hong Kong
Financial Reporting Standards – Limited Exemption from
Comparative HKFRS 7 Disclosures for First-time Adopters
HKAS 24 (Revised) Related Party Disclosures
HKAS 32 Amendment Amendment to HKAS 32 Financial instruments:
Presentation – Classification of Rights Issues
HK (IFRIC) – Int 14 Amendments Amendments to HK (IFRIC) – Int 14 Prepayments of a
Minimum Funding Requirement
HK (IFRIC) – Int 19 Extinguishing Financial Liabilities with Equity Instruments
Improvements to HKFRSs 2010 Amendments to a number of HKFRSs issued in May 2010
Other than as further explained below regarding the impact of HKAS 24 (Revised), and amendments to
HKFRS 3, HKAS 1 and HKAS 27 included in Improvements to HKFRSs 2010, the adoption of the new and
revised HKFRSs has had no significant financial effect on these financial statements.
The principal effects of adopting these HKFRSs are as follows:
(a) HKAS 24 (Revised) Related Party Disclosures
HKAS 24 (Revised) clarifies and simplifies the definitions of related parties. The new definitions
emphasise a symmetrical view of related party relationships and clarify the circumstances in which
persons and key management personnel affect related party relationships of an entity. The revised
standard also introduces an exemption from the general related party disclosure requirements for
transactions with a government and entities that are controlled, jointly controlled or significantly
influenced by the same government as the reporting entity. The accounting policy for related parties
has been revised to reflect the changes in the definitions of related parties under the revised standard.
The adoption of the revised standard did not have any impact on the financial position or performance
of the Group. Details of the related party transactions, including the related comparative information,
are included in note 44 to the financial statements.
76 T C L C O M M U N I C A T I O N T E C H N O L O G Y H O L D I N G S L I M I T E D
Notes to Financial Statements
31 December 2011
3. CHANGES IN ACCOUNTING POLICY AND DISCLOSURES (continued)
(b) Improvements to HKFRSs 2010 issued in May 2010 sets out amendments to a number of HKFRSs.
There are separate transitional provisions for each standard. While the adoption of some of the
amendments results in changes in accounting policies, none of these amendments has had a
significant financial impact on the financial position or performance of the Group. Details of the key
amendments most applicable to the Group are as follows:
• HKFRS3Business Combinations: The amendment clarifies that the amendments to HKFRS 7,
HKAS 32 and HKAS 39 that eliminate the exemption for contingent consideration do not apply
to contingent consideration that arose from business combinations whose acquisition dates
precede the application of HKFRS 3 (as revised in 2008).
In addition, the amendment limits the scope of measurement choices for non-controlling
interests. Only the components of non-controlling interests that are present ownership
interests and entitle their holders to a proportionate share of the acquiree’s net assets in the
event of liquidation are measured at either fair value or at the present ownership instruments’
proportionate share of the acquiree’s identifiable net assets. All other components of non-
controlling interests are measured at their acquisition date fair value, unless another
measurement basis is required by another HKFRS.
The amendment also added explicit guidance to clarify the accounting treatment for non-
replaced and voluntarily replaced share-based payment awards.
• HKAS 1 Presentation of Financial Statements: The amendment clarifies that an analysis of
each component of other comprehensive income can be presented either in the statement of
changes in equity or in the notes to the financial statements. The Group elects to present the
analysis of each component of other comprehensive income in the statement of changes in
equity.
• HKAS 27Consolidated and Separate Financial Statements: The amendment clarifies that the
consequential amendments from HKAS 27 (as revised in 2008) made to HKAS 21, HKAS 28
and HKAS 31 shall be applied prospectively for annual periods beginning on or after 1 July
2009 or earlier if HKAS 27 is applied earlier.
77AnnuAl report 2011
Notes to Financial Statements
31 December 2011
4. ISSUED BUT NOT YET EFFECTIVE HONG KONG FINANCIAL REPORTING STANDARDS
The Group has not applied the following new and revised HKFRSs, which have been issued but are not yet
effective, in these financial statements.
HKFRS 1 Amendments Amendments to HKFRS 1 First-time Adoption of
Hong Kong Financial Reporting Standards – Severe
Hyperinflation and Removal of Fixed Dates for First-time
Adopters1
HKFRS 7 Amendments Amendments to HKFRS 7 Financial Instruments:
Disclosures – Transfers of Financial Assets1
HKFRS 7 Amendments Amendments to HKFRS 7 Financial Instruments:
Disclosures – Offsetting Financial Assets and
Financial Liabilities4
HKFRS 9 Financial Instruments6
HKFRS 10 Consolidated Financial Statements4
HKFRS 11 Joint Arrangements4
HKFRS 12 Disclosure of Interests in Other Entities4
HKFRS 13 Fair Value Measurement4
HKAS 1 Amendments Amendments to HKAS 1 Presentation of Financial Statements –
Presentation of Items of Other Comprehensive Income3
HKAS 12 Amendments Amendments to HKAS 12 Income Taxes – Deferred Tax:
Recovery of Underlying Assets2
HKAS 19 (2011) Employee Benefits4
HKAS 27 (2011) Separate Financial Statements4
HKAS 28 (2011) Investments in Associates and Joint Ventures4
HKAS 32 Amendments Amendments to HKAS 32 Financial Instruments:
Presentation – Offsetting Financial Assets and
Financial Liabilities5
HK(IFRIC)-Int 20 Stripping Costs in the Production Phase of a Surface Mine4
1 Effective for annual periods beginning on or after 1 July 20112 Effective for annual periods beginning on or after 1 January 20123 Effective for annual periods beginning on or after 1 July 20124 Effective for annual periods beginning on or after 1 January 20135 Effective for annual periods beginning on or after 1 January 20146 Effective for annual periods beginning on or after 1 January 2015
Further information about those changes that are expected to significantly affect the Group is as follows:
HKFRS 9 issued in November 2009 is the first part of phase 1 of a comprehensive project to entirely replace
HKAS 39 Financial Instruments: Recognition and Measurement. This phase focuses on the classification and
measurement of financial assets. Instead of classifying financial assets into four categories, an entity shall
classify financial assets as subsequently measured at either amortised cost or fair value, on the basis of both
the entity’s business model for managing the financial assets and the contractual cash flow characteristics of
the financial assets. This aims to improve and simplify the approach for the classification and measurement of
financial assets compared with the requirements of HKAS 39.
78 T C L C O M M U N I C A T I O N T E C H N O L O G Y H O L D I N G S L I M I T E D
Notes to Financial Statements
31 December 2011
4. ISSUED BUT NOT YET EFFECTIVE HONG KONG FINANCIAL REPORTING STANDARDS (continued)
In November 2010, the HKICPA issued additions to HKFRS 9 to address financial liabilities (the “Additions”)
and incorporated in HKFRS 9 the current derecognition principles of financial instruments of HKAS 39.
Most of the Additions were carried forward unchanged from HKAS 39, while changes were made to the
measurement of financial liabilities designated at fair value through profit or loss using the fair value option
(“FVO”). For these FVO liabilities, the amount of change in the fair value of a liability that is attributable to
changes in credit risk must be presented in other comprehensive income (“OCI”). The remainder of the
change in fair value is presented in profit or loss, unless presentation of the fair value change in respect of
the liability’s credit risk in OCI would create or enlarge an accounting mismatch in profit or loss. However,
loan commitments and financial guarantee contracts which have been designated under the FVO are scoped
out of the Additions.
HKAS 39 is aimed to be replaced by HKFRS 9 in its entirety. Before this entire replacement, the guidance in
HKAS 39 on hedge accounting and impairment of financial assets continues to apply. The Group expects to
adopt HKFRS 9 from 1 January 2015.
HKFRS 10 establishes a single control model that applies to all entities including special purpose entities
or structured entities. It includes a new definition of control which is used to determine which entities are
consolidated. The changes introduced by HKFRS 10 require management of the Group to exercise significant
judgment to determine which entities are controlled, compared with the requirements in HKAS 27 and
HK (SIC) – Int 12 Consolidation – Special Purpose Entities. HKFRS 10 replaces the portion of HKAS 27
Consolidated and Separate Financial Statements that addresses the accounting for consolidated financial
statements. It also includes the issues raised in HK (SIC) – Int 12.
HKFRS 12 includes the disclosure requirements for subsidiaries, joint arrangements, associates and
structured entities that are previously included in HKAS 27 Consolidated and Separate Financial Statements,
HKAS 31 Interests in Joint Ventures and HKAS 28 Investments in Associates. It also introduces a number of
new disclosure requirements for these entities.
Consequential amendments were made to HKAS 27 and HKAS 28 as a result of the issuance of HKFRS 10
and HKFRS 12. The Group expects to adopt HKFRS 10, HKFRS 12, and the consequential amendments to
HKAS 27 and HKAS 28 from 1 January 2013.
HKFRS 13 provides a precise definition of fair value and a single source of fair value measurement and
disclosure requirements for use across HKFRSs. The standard does not change the circumstances in
which the Group is required to use fair value, but provides guidance on how fair value should be applied
where its use is already required or permitted under other HKFRSs. The Group expects to adopt HKFRS 13
prospectively from 1 January 2013.
Amendments to HKAS 1 change the grouping of items presented in OCI. Items that could be reclassified to
profit or loss at a future point in time (for example, upon derecognition or settlement) would be presented
separately from items which will never be reclassified. The Group expects to adopt the amendments from 1
January 2013.
79AnnuAl report 2011
Notes to Financial Statements
31 December 2011
4. ISSUED BUT NOT YET EFFECTIVE HONG KONG FINANCIAL REPORTING STANDARDS (continued)
HKAS 12 Amendments clarify the determination of deferred tax for investment property measured at fair
value. The amendments introduce a rebuttable presumption that deferred tax on investment property
measured at fair value should be determined on the basis that its carrying amount will be recovered through
sale. Furthermore, the amendments incorporate the requirement previously in HK(SIC)-Int 21 Income Taxes
– Recovery of Revalued Non – Depreciable Assets that deferred tax on non-depreciable assets, measured
using the revaluation model in HKAS 16, should always be measured on a sale basis. The Group expects to
adopt HKAS 12 Amendments from 1 January 2012. Since the Group has no investment property measured
at fair value, the adoption of HKAS 12 has no financial impact on the Group.
HKAS 19 (2011) includes a number of amendments that range from fundamental changes to simple
clarifications and re-wording. The revised standard introduces significant changes in the accounting for
defined benefit pension plans including removing the choice to defer the recognition of actuarial gains
and losses. Other changes include modifications to the timing of recognition for termination benefits, the
classification of short-term employee benefits and disclosures of defined benefit plans. The Group expects to
adopt HKAS 19 (2011) from 1 January 2013.
5. SUMMARY OF SIGNIFICANT ACCOUNTING POLICIES
Subsidiaries
A subsidiary is an entity whose financial and operating policies the Company controls, directly or indirectly, so
as to obtain benefits from its activities.
The results of subsidiaries are included in the Company’s income statement to the extent of dividends
received and receivable. The Company’s investments in subsidiaries are stated at cost less any impairment
losses.
Joint ventures
A joint venture is an entity set up by contractual arrangement, whereby the Group and other parties undertake
an economic activity. The joint venture operates as a separate entity in which the Group and the other parties
have an interest.
The joint venture agreement between the venturers stipulates the capital contributions of the joint venture
parties, the duration of the joint venture and the basis on which the assets are to be realised upon its
dissolution. The profits and losses from the joint venture’s operations and any distributions of surplus assets
are shared by the venturers, either in proportion to their respective capital contributions, or in accordance
with the terms of the joint venture agreement.
A joint venture is treated as:
(a) asubsidiary,iftheGroup/Companyhasunilateralcontrol,directlyorindirectly,overthejointventure;
(b) a jointly-controlled entity, if the Group does not have unilateral control, but has joint control, directly or
indirectly,overthejointventure;
(c) an associate, if the Group does not have unilateral or joint control, but holds, directly or indirectly,
generally not less than 20% of the joint venture’s registered capital and is in a position to exercise
significantinfluenceoverthejointventure;or
80 T C L C O M M U N I C A T I O N T E C H N O L O G Y H O L D I N G S L I M I T E D
Notes to Financial Statements
31 December 2011
5. SUMMARY OF SIGNIFICANT ACCOUNTING POLICIES (continued)
Joint ventures (continued)
(d) an equity investment accounted for in accordance with HKAS 39, if the Group holds, directly or
indirectly, less than 20% of the joint venture’s registered capital and has neither joint control of, nor is
in a position to exercise significant influence over, the joint venture.
Associates
An associate is an entity, not being a subsidiary or a jointly-controlled entity, in which the Group has a long-
term interest of generally not less than 20% of the equity voting rights and over which it is in a position to
exercise significant influence.
The Group’s investments in associates are stated in the consolidated statement of financial position at the
Group’s share of net assets under the equity method of accounting, less any impairment losses. Adjustments
are made to bring into line any dissimilar accounting policies that may exist. The Group’s share of the post-
acquisition results and reserves of its associates is included in the consolidated income statement and
consolidated reserves, respectively. Unrealised gains and losses resulting from transactions between the
Group and its associates are eliminated to the extent of the Group’s investments in associates, except where
unrealised losses provide evidence of an impairment of the asset transferred. Goodwill arising from the
acquisition of associates is included as part of the Group’s investments in associates and is not individually
tested for impairment.
Business combinations (other than business combinations of entities under common control) and
goodwill
Business combinations are accounted for using the acquisition method. The consideration transferred is
measured at the acquisition date fair value which is the sum of the acquisition date fair values of assets
transferred by the Group, liabilities assumed by the Group to the former owners of the acquiree and the
equity interests issued by the Group in exchange for control of the acquiree. For each business combination,
the Group elects whether it measures the non-controlling interests in the acquiree that are present ownership
interests and entitle their holders to a proportionate share of net assets in the event of liquidation either at
fair value or at the proportionate share of the acquiree’s identifiable net assets. All other components of non-
controlling interests are measured at fair value. Acquisition costs are expensed as incurred.
When the Group acquires a business, it assesses the financial assets and liabilities assumed for appropriate
classification and designation in accordance with the contractual terms, economic circumstances and
pertinent conditions as at the acquisition date. This includes the separation of embedded derivatives in host
contracts by the acquiree.
If the business combination is achieved in stages, the acquisition date fair value of the acquirer’s previously
held equity interest in the acquiree is remeasured to fair value as at the acquisition date through profit or loss.
Any contingent consideration to be transferred by the acquirer is recognised at fair value at the acquisition
date. Subsequent changes to the fair value of the contingent consideration which is deemed to be an asset
or liability will be recognised in accordance with HKAS 39 either in profit or loss or as a change to other
comprehensive income. If the contingent consideration is classified as equity, it will not be remeasured.
Subsequent settlement is accounted for within equity. In instances where the contingent consideration does
not fall within the scope of HKAS 39, it is measured in accordance with the appropriate HKFRS.
81AnnuAl report 2011
Notes to Financial Statements
31 December 2011
5. SUMMARY OF SIGNIFICANT ACCOUNTING POLICIES (continued)
Business combinations (other than business combinations of entities under common control) and
goodwill (continued)
Goodwill is initially measured at cost, being the excess of the aggregate of the consideration transferred,
the amount recognised for non-controlling interests and any fair value of the Group’s previously held equity
interests in the acquiree over the identifiable net assets acquired and liabilities assumed. If the sum of this
consideration and other items is lower than the fair value of the net assets of the subsidiary acquired, the
difference is, after reassessment, recognised in profit or loss as a gain on bargain purchase.
After initial recognition, goodwill is measured at cost less any accumulated impairment losses. Goodwill
is tested for impairment annually or more frequently if events or changes in circumstances indicate that
the carrying value may be impaired. The Group performs its annual impairment test of goodwill as at 31
December. For the purpose of impairment testing, goodwill acquired in a business combination is, from the
acquisition date, allocated to each of the Group’s cash-generating units, or groups of cash-generating units,
that are expected to benefit from the synergies of the combination, irrespective of whether other assets or
liabilities of the Group are assigned to those units or groups of units.
Impairment is determined by assessing the recoverable amount of the cash-generating unit (group of cash-
generating units) to which the goodwill relates. Where the recoverable amount of the cash-generating unit
(group of cash-generating units) is less than the carrying amount, an impairment loss is recognised. An
impairment loss recognised for goodwill is not reversed in a subsequent period.
Where goodwill forms part of a cash-generating unit (group of cash-generating units) and part of the
operation within that unit is disposed of, the goodwill associated with the operation disposed of is included in
the carrying amount of the operation when determining the gain or loss on disposal of the operation. Goodwill
disposed of in this circumstance is measured based on the relative values of the operation disposed of and
the portion of the cash-generating unit retained.
Business combinations of entities under common control
Business combinations of entities under common control are accounted for using the pooling of interests
method with no restatement of financial information in the consolidated financial statements for periods prior
to the completion of the combination under common control. Under the pooling of interests method, the
assets and liabilities of the combining entities are reflected at their existing carrying values at the date of
combination. No amount is recognised in respect of goodwill or excess of the acquirer’s interest in the net
fair value of acquiree’s identifiable assets, liabilities and contingent liabilities over cost at the time of common
control combination, which, instead, is recorded as part of equity.
Impairment of non-financial assets
Where an indication of impairment exists, or when annual impairment testing for an asset is required
(other than inventories, deferred tax assets, financial assets, goodwill and non-current assets), the asset’s
recoverable amount is estimated. An asset’s recoverable amount is the higher of the asset’s or cash-
generating unit’s value in use and its fair value less costs to sell, and is determined for an individual asset,
unless the asset does not generate cash inflows that are largely independent of those from other assets or
groups of assets, in which case the recoverable amount is determined for the cash-generating unit to which
the asset belongs.
82 T C L C O M M U N I C A T I O N T E C H N O L O G Y H O L D I N G S L I M I T E D
Notes to Financial Statements
31 December 2011
5. SUMMARY OF SIGNIFICANT ACCOUNTING POLICIES (continued)
Impairment of non-financial assets (continued)
An impairment loss is recognised only if the carrying amount of an asset exceeds its recoverable amount.
In assessing value in use, the estimated future cash flows are discounted to their present value using a pre-
tax discount rate that reflects current market assessments of the time value of money and the risks specific
to the asset. An impairment loss is charged to the income statement in the period in which it arises in those
expense categories consistent with the function of the impaired asset.
An assessment is made at the end of each reporting period as to whether there is any indication that
previously recognised impairment losses may no longer exist or may have decreased. If such an indication
exists, the recoverable amount is estimated. A previously recognised impairment loss of an asset other than
goodwill is reversed only if there has been a change in the estimates used to determine the recoverable
amount of that asset, but not to an amount higher than the carrying amount that would have been determined
(net of any depreciation/amortisation) had no impairment loss been recognised for the asset in prior years. A
reversal of such an impairment loss is credited to the income statement in the period in which it arises, unless
the asset is carried at a revalued amount, in which case the reversal of the impairment loss is accounted for
in accordance with the relevant accounting policy for that revalued asset.
Related parties
A party is considered to be related to the Group if:
(a) the party is a person or a close member of that person’s family and that person,
(i) hascontrolsorjointcontrolovertheGroup;
(ii) hassignificantinfluenceovertheGroup;or
(iii) isamemberofthekeymanagementpersonneloftheGrouporofaparentoftheGroup;
or
(b) the party is an entity where any of the following conditions applies:
(i) theentityandtheGrouparemembersofthesamegroup;
(ii) one entity is an associate or joint venture of the other entity (or of a parent, subsidiary or fellow
subsidiaryoftheotherentity);
(iii) theentityandtheGrouparejointventuresofthesamethirdparty;
(iv) one entity is a joint venture of a third entity and the other entity is an associate of the third
entity;
(v) the entity is a post-employment benefit plan for the benefit of employees of either the Group or
anentityrelatedtotheGroup;
(vi) theentityiscontrolledorjointlycontrolledbyapersonidentifiedin(a);and
(vii) a person identified in (a)(i) has significant influence over the entity or is a member of the key
management personnel of the entity (or of a parent of the entity).
83AnnuAl report 2011
Notes to Financial Statements
31 December 2011
5. SUMMARY OF SIGNIFICANT ACCOUNTING POLICIES (continued)
Property, plant and equipment and depreciation
Property, plant and equipment, other than construction in progress, are stated at cost less accumulated
depreciation and any impairment losses. The cost of an item of property, plant and equipment comprises its
purchase price and any directly attributable costs of bringing the asset to its working condition and location
for its intended use.
Expenditure incurred after items of property, plant and equipment have been put into operation, such as
repairs and maintenance, is normally charged to the income statement in the period in which it is incurred. In
situations where the recognition criteria are satisfied, the expenditure for a major inspection is capitalised in
the carrying amount of the asset as a replacement. Where significant parts of property, plant and equipment
are required to be replaced at intervals, the Group recognises such parts as individual assets with specific
useful lives and depreciates them accordingly.
Depreciation is calculated on the straight-line basis to write off the cost of each item of property, plant and
equipment to its residual value over its estimated useful life. The principal annual rates used for this purpose
are as follows:
Buildings 2.0% to 6.0%
Plant and machinery 9.0% to 18.0%
Furniture, fixtures, office equipment and research and development equipment 18.0% to 30.0%
Motor vehicles 15.0% to 22.5%
Where parts of an item of property, plant and equipment have different useful lives, the cost of that item is
allocated on a reasonable basis among the parts and each part is depreciated separately. Residual values,
useful lives and the depreciation method are reviewed, and adjusted if appropriate, at least at each financial
year end.
An item of property, plant and equipment and any significant part initially recognised is derecognised upon
disposal or when no future economic benefits are expected from its use or disposal. Any gain or loss on
disposal or retirement recognised in the income statement in the year the asset is derecognised is the
difference between the net sales proceeds and the carrying amount of the relevant asset.
Construction in progress represents a building under construction, which is stated at cost less any
impairment losses, and is not depreciated. Cost comprises the direct costs of construction and capitalised
borrowing costs on related borrowed funds during the period of construction. Construction in progress is
reclassified to the appropriate category of property, plant and equipment when completed and ready for use.
84 T C L C O M M U N I C A T I O N T E C H N O L O G Y H O L D I N G S L I M I T E D
Notes to Financial Statements
31 December 2011
5. SUMMARY OF SIGNIFICANT ACCOUNTING POLICIES (continued)Intangible assets (other than goodwill)Intangible assets acquired separately are measured on initial recognition at cost. The cost of intangible assets acquired in a business combination using the acquisition method is the fair value as at the date of acquisition. The useful lives of intangible assets are assessed to be either finite or indefinite. Intangible assets with finite lives are subsequently amortised over the useful economic life and assessed for impairment whenever there is an indication that the intangible asset may be impaired. The amortisation period and the amortisation method for an intangible asset with a finite useful life are reviewed at least at each financial year end.
Intangible assets with indefinite useful lives are tested for impairment annually either individually or at the cash-generating unit level. Such intangible assets are not amortised. The useful life of an intangible asset with an indefinite life is reviewed annually to determine whether the indefinite life assessment continues to be supportable. If not, the change in the useful life assessment from indefinite to finite is accounted for on a prospective basis.
Golf club membershipGolf club membership has an indefinite useful life and is stated at cost, less any identified impairment losses.
Computer softwarePurchased computer software is stated at cost, less any impairment losses, and is amortised on the straight-line basis over its estimated useful life of five years.
Intellectual propertyPurchased intellectual property is stated at cost, less any impairment losses, and is amortised on the straight-line basis over its estimated useful life.
Research and development costsAll research costs are charged to the income statement as incurred.
Expenditure incurred on projects to develop new products is capitalised and deferred only when the Group can demonstrate the technical feasibility of completing the intangible asset so that it will be available for use or sale, its intention to complete and its ability to use or sell the asset, how the asset will generate future economic benefits, the availability of resources to complete the project and the ability to measure reliably the expenditure during the development. Product development expenditure which does not meet these criteria is expensed when incurred.
Deferred development costs are stated at cost less impairment losses and are amortised on a systematic basis with reference to projected revenue, ranging from 12 to 24 months, upon sales of related products.
ALCATEL brand licenseAlCATEL brand license is stated at cost, less any impairment losses, and is amortised on the straight-line basis over its contracted useful life.
LeasesLeases that transfer substantially all the rewards and risks of ownership of assets to the Group, other than legal title, are accounted for as finance leases. At the inception of a finance lease, the cost of the leased asset is capitalised at the present value of the minimum lease payments and recorded together with the obligation, excluding the interest element, to reflect the purchase and financing. Assets held under capitalised finance leases, including prepaid land lease payments under finance leases, are included in property, plant and equipment, and depreciated over the period consistent with that for depreciable assets that are owned. If there is no reasonable certainty that the lessee will obtain ownership by the end of the lease term, the asset shall be fully depreciated over the shorter of the lease term and its useful life. The finance costs of such leases are charged to the income statement so as to provide a constant periodic rate of charge over the lease terms.
85AnnuAl report 2011
Notes to Financial Statements
31 December 2011
5. SUMMARY OF SIGNIFICANT ACCOUNTING POLICIES (continued)
Leases (continued)
Leases where substantially all the rewards and risks of ownership of assets remain with the lessor are
accounted for as operating leases. Where the Group is the lessee, rentals payable under operating leases net
of any incentives received from the lessor are charged to the income statement on the straight-line basis over
the lease terms.
Prepaid land lease payments under operating leases are initially stated at cost and subsequently recognised
on the straight-line basis over the lease terms.
Investments and other financial assets
Initial recognition and measurement
Financial assets within the scope of HKAS 39 are classified as financial assets at fair value through profit
or loss, loans and receivables and available-for-sale financial investments, or as derivatives designated as
hedging instruments in an effective hedge, as appropriate. The Group determines the classification of its
financial assets at initial recognition. When financial assets are recognised initially, they are measured at fair
value, plus transaction costs, except in the case of financial assets recorded at fair value through profit or
loss.
All regular way purchases and sales of financial assets are recognised on the trade date, that is, the date
that the Group commits to purchase or sell the asset. Regular way purchases or sales are purchases or
sales of financial assets that require delivery of assets within the period generally established by regulation or
convention in the marketplace.
The Group’s financial assets include cash and bank balances, pledged deposits, trade and notes receivables,
factored trade receivables, deposits and other receivables, due from related companies, available-for-sale
investments, and derivative financial instruments.
Subsequent measurement
The subsequent measurement of financial assets depends on their classification as follows:
Financial assets at fair value through profit or loss
Financial assets at fair value through profit or loss include financial assets held for trading and financial assets
designated upon initial recognition as at fair value through profit or loss. Financial assets are classified as
held for trading if they are acquired for the purpose of sale in the near term. Derivatives, including separated
embedded derivatives, are also classified as held for trading unless they are designated as effective hedging
instruments as defined by HKAS 39.
Financial assets at fair value through profit or loss are carried in the statement of financial position at fair value
with net changes in fair value recognised in other income and gains in the income statement. These net fair
value changes do not include any dividends on these financial assets, which are recognised in accordance
with the policy set out for “Revenue recognition” below.
Financial assets designated upon initial recognition at fair value through profit or loss are designated at the
date of initial recognition and only if the criteria under HKAS 39 are satisfied.
86 T C L C O M M U N I C A T I O N T E C H N O L O G Y H O L D I N G S L I M I T E D
Notes to Financial Statements
31 December 2011
5. SUMMARY OF SIGNIFICANT ACCOUNTING POLICIES (continued)
Investments and other financial assets (continued)
Financial assets at fair value through profit or loss (continued)
The Group evaluates its financial assets at fair value through profit or loss (held for trading) to assess
whether the intent to sell them in the near term is still appropriate. When, in rare circumstances, the Group
is unable to trade these financial assets due to inactive markets and management’s intent to sell them in
the foreseeable future significantly changes, the Group may elect to reclassify these financial assets. The
reclassification from financial assets at fair value through profit or loss to loans and receivables, available-
for-sale financial assets or held-to-maturity investments depends on the nature of the assets. This evaluation
does not affect any financial assets designated at fair value through profit or loss using the fair value option at
designation as these instruments cannot be reclassified after initial recognition.
Derivatives embedded in host contracts are accounted for as separate derivatives and recorded at fair value
if their economic characteristics and risks are not closely related to those of the host contracts and the
host contracts are not held for trading or designated at fair value through profit or loss. These embedded
derivatives are measured at fair value with changes in fair value recognised in the income statement.
Reassessment only occurs if there is a change in the terms of the contract that significantly modifies the cash
flows that would otherwise be required.
Loans and receivables
Loans and receivables are non-derivative financial assets with fixed or determinable payments that are not
quoted in an active market. After initial measurement, such assets are subsequently measured at amortised
cost using the effective interest rate method less any allowance for impairment. Amortised cost is calculated
by taking into account any discount or premium on acquisition and includes fees or costs that are an integral
part of the effective interest rate. The effective interest rate amortisation is included in other income and gains
in the income statement. The loss arising from impairment is recognised in the income statement in finance
costs for loans and in other expenses for receivables.
Available-for-sale financial investments
Available-for-sale financial investments are non-derivative financial assets in listed and unlisted equity
investments and debt securities. Equity investments classified as available for sale are those which are neither
classified as held for trading nor designated at fair value through profit or loss. Debt securities in this category
are those which are intended to be held for an indefinite period of time and which may be sold in response to
needs for liquidity or in response to changes in market conditions.
After initial recognition, available-for-sale financial investments are subsequently measured at fair value, with
unrealised gains or losses recognised as other comprehensive income in the available-for-sale investment
revaluation reserve until the investment is derecognised, at which time the cumulative gain or loss is
recognised in the income statement in other income, or until the investment is determined to be impaired,
when the cumulative gain or loss is reclassified from the available-for-sale investment revaluation reserve to
the income statement in other expenses. Interest and dividends earned whilst holding the available-for-sale
financial investments are reported as interest income and dividend income, respectively and are recognised
in the income statement as other income in accordance with the policies set out for “Revenue recognition”
below.
87AnnuAl report 2011
Notes to Financial Statements
31 December 2011
5. SUMMARY OF SIGNIFICANT ACCOUNTING POLICIES (continued)
Investments and other financial assets (continued)
Available-for-sale financial investments (continued)
When the fair value of unlisted equity investments cannot be reliably measured because (a) the variability in
the range of reasonable fair value estimates is significant for that investment or (b) the probabilities of the
various estimates within the range cannot be reasonably assessed and used in estimating fair value, such
investments are stated at cost less any impairment losses.
The Group evaluates whether the ability and intention to sell its available-for-sale financial assets in the near
term are still appropriate. When, in rare circumstances, the Group is unable to trade these financial assets
due to inactive markets and management’s intent to do so significantly changes in the foreseeable future,
the Group may elect to reclassify these financial assets. Reclassification to loans and receivables is permitted
when the financial assets meet the definition of loans and receivables and the Group has the intent and ability
to hold these assets for the foreseeable future or to maturity. Reclassification to the held-to-maturity category
is permitted only when the Group has the ability and intent to hold until the maturity date of the financial
asset.
For a financial asset reclassified from the available-for-sale category, the fair value carrying amount at the
date of reclassification becomes its new amortised cost and any previous gain or loss on that asset that
has been recognised in equity is amortised to profit or loss over the remaining life of the investment using
the effective interest rate. Any difference between the new amortised cost and the maturity amount is also
amortised over the remaining life of the asset using the effective interest rate. If the asset is subsequently
determined to be impaired, then the amount recorded in equity is reclassified to the income statement.
Derecognition of financial assets
A financial asset (or, where applicable, a part of a financial asset or part of a group of similar financial assets)
is derecognised when:
• therightstoreceivecashflowsfromtheassethaveexpired;or
• theGrouphastransferreditsrightstoreceivecashflowsfromtheassetorhasassumedanobligation
to pay the received cash flows in full without material delay to a third party under a “pass-through”
arrangement; and either (a) the Group has transferred substantially all the risks and rewards of the
asset, or (b) the Group has neither transferred nor retained substantially all the risks and rewards of
the asset, but has transferred control of the asset.
When the Group has transferred its rights to receive cash flows from an asset or has entered into a pass-
through arrangement, it evaluates if and to what extent it has retained the risk and rewards of ownership of
the asset. When it has neither transferred nor retained substantially all the risks and rewards of the asset nor
transferred control of the asset, the asset is recognised to the extent of the Group’s continuing involvement
in the asset. In that case, the Group also recognises an associated liability. The transferred asset and the
associated liability are measured on a basis that reflects the rights and obligations that the Group has
retained.
Continuing involvement that takes the form of a guarantee over the transferred asset is measured at the lower
of the original carrying amount of the asset and the maximum amount of consideration that the Group could
be required to repay.
88 T C L C O M M U N I C A T I O N T E C H N O L O G Y H O L D I N G S L I M I T E D
Notes to Financial Statements
31 December 2011
5. SUMMARY OF SIGNIFICANT ACCOUNTING POLICIES (continued)
Impairment of financial assets
The Group assesses at the end of each reporting period whether there is any objective evidence that a
financial asset or a group of financial assets is impaired. A financial asset or a group of financial assets is
deemed to be impaired if, and only if, there is objective evidence of impairment as a result of one or more
events that occurred after the initial recognition of the asset (an incurred “loss event”) and that loss event has
an impact on the estimated future cash flows of the financial asset or the group of financial assets that can
be reliably estimated. Evidence of impairment may include indications that a debtor or a group of debtors
is experiencing significant financial difficulty, default or delinquency in interest or principal payments, the
probability that they will enter bankruptcy or other financial reorganisation and observable data indicating that
there is a measurable decrease in the estimated future cash flows, such as changes in arrears or economic
conditions that correlate with defaults.
Financial assets carried at amortised cost
For financial assets carried at amortised cost, the Group first assesses individually whether objective evidence
of impairment exists for financial assets that are individually significant, or collectively for financial assets that
are not individually significant. If the Group determines that no objective evidence of impairment exists for an
individually assessed financial asset, whether significant or not, it includes the asset in a group of financial
assets with similar credit risk characteristics and collectively assesses them for impairment. Assets that are
individually assessed for impairment and for which an impairment loss is, or continues to be, recognised are
not included in a collective assessment of impairment.
If there is objective evidence that an impairment loss has been incurred, the amount of the loss is measured
as the difference between the asset’s carrying amount and the present value of estimated future cash flows
(excluding future credit losses that have not yet been incurred). The present value of the estimated future
cash flows is discounted at the financial asset’s original effective interest rate (i.e., the effective interest rate
computed at initial recognition). If a loan has a variable interest rate, the discount rate for measuring any
impairment loss is the current effective interest rate.
The carrying amount of the asset is reduced through the use of an allowance account and the amount of the
loss is recognised in the income statement. Interest income continues to be accrued on the reduced carrying
amount and is accrued using the rate of interest used to discount the future cash flows for the purpose of
measuring the impairment loss. Loans and receivables together with any associated allowance are written
off when there is no realistic prospect of future recovery and all collateral has been realised or has been
transferred to the Group.
If, in a subsequent period, the amount of the estimated impairment loss increases or decreases because
of an event occurring after the impairment was recognised, the previously recognised impairment loss is
increased or reduced by adjusting the allowance account. If a future write-off is later recovered, the recovery
is credited to other expenses in the income statement.
89AnnuAl report 2011
Notes to Financial Statements
31 December 2011
5. SUMMARY OF SIGNIFICANT ACCOUNTING POLICIES (continued)
Impairment of financial assets (continued)
Assets carried at cost
If there is objective evidence that an impairment loss has been incurred on an unquoted equity instrument
that is not carried at fair value because its fair value cannot be reliably measured, or on a derivative asset that
is linked to and must be settled by delivery of such an unquoted equity instrument, the amount of the loss is
measured as the difference between the asset’s carrying amount and the present value of estimated future
cash flows discounted at the current market rate of return for a similar financial asset. Impairment losses on
these assets are not reversed.
Available-for-sale financial investments
For available-for-sale financial investments, the Group assesses at the end of each reporting period whether
there is objective evidence that an investment or a group of investments is impaired.
If an available-for-sale asset is impaired, an amount comprising the difference between its cost (net of any
principal payment and amortisation) and its current fair value, less any impairment loss previously recognised
in the income statement, is removed from other comprehensive income and recognised in the income
statement.
In the case of equity investments classified as available for sale, objective evidence would include a
significant or prolonged decline in the fair value of an investment below its cost. The determination of what
is “significant” or “prolonged” requires judgement. “Significant” is evaluated against the original cost of the
investment and “prolonged” against the period in which the fair value has been below its original cost. Where
there is evidence of impairment, the cumulative loss – measured as the difference between the acquisition
cost and the current fair value, less any impairment loss on that investment previously recognised in the
income statement – is removed from other comprehensive income and recognised in the income statement.
Impairment losses on equity instruments classified as available for sale are not reversed through the income
statement. Increases in their fair value after impairment are recognised directly in other comprehensive
income.
Financial liabilities
Initial recognition and measurement
Financial liabilities within the scope of HKAS 39 are classified as financial liabilities at fair value through profit
or loss, loans and borrowings, or as derivatives designated as hedging instruments in an effective hedge, as
appropriate. The Group determines the classification of its financial liabilities at initial recognition.
All financial liabilities are recognised initially at fair value plus, in the case of loans and borrowings, directly
attributable transaction costs.
The Group’s financial liabilities include trade and notes payables, bank advances on factored trade
receivables, other payables and accruals, due to related companies, derivative financial instruments and
interest bearing bank and other borrowings.
Subsequent measurement
The subsequent measurement of financial liabilities depends on their classification as follows:
90 T C L C O M M U N I C A T I O N T E C H N O L O G Y H O L D I N G S L I M I T E D
Notes to Financial Statements
31 December 2011
5. SUMMARY OF SIGNIFICANT ACCOUNTING POLICIES (continued)
Financial liabilities (continued)
Financial liabilities at fair value through profit or loss
Financial liabilities at fair value through profit or loss include financial liabilities held for trading and financial
liabilities designated upon initial recognition as at fair value through profit or loss.
Financial liabilities are classified as held for trading if they are acquired for the purpose of selling in the near
term. This category includes derivative financial instruments entered into by the Group that are not designated
as hedging instruments in hedge relationships as defined by HKAS 39. Separated embedded derivatives,
are also classified as held for trading unless they are designated as effective hedging instruments. Gains or
losses on liabilities held for trading are recognised in the income statement. The net fair value gain or loss
recognised in the income statement does not include any interest charged on these financial liabilities.
Financial liabilities designated upon initial recognition at fair value through profit or loss are designated at the
date of initial recognition and only if the criteria of HKAS 39 are satisfied.
Loans and borrowings
After initial recognition, interest bearing loans and borrowings are subsequently measured at amortised cost,
using the effective interest rate method unless the effect of discounting would be immaterial, in which case
they are stated at cost. Gains and losses are recognised in the income statement when the liabilities are
derecognised as well as through the effective interest rate amortisation process.
Amortised cost is calculated by taking into account any discount or premium on acquisition and fees or costs
that are an integral part of the effective interest rate. The effective interest rate amortisation is included in
finance costs in the income statement.
Derecognition of financial liabilities
A financial liability is derecognised when the obligation under the liability is discharged or cancelled, or
expires.
When an existing financial liability is replaced by another from the same lender on substantially different terms,
or the terms of an existing liability are substantially modified, such an exchange or modification is treated
as a derecognition of the original liability and a recognition of a new liability, and the difference between the
respective carrying amounts is recognised in the income statement.
Offsetting of financial instruments
Financial assets and financial liabilities are offset and the net amount is reported in the statement of financial
position if, and only if, there is a currently enforceable legal right to offset the recognised amounts and there
is an intention to settle on a net basis, or to realise the assets and settle the liabilities simultaneously.
Fair value of financial instruments
The fair value of financial instruments that are traded in active markets is determined by reference to quoted
market prices or dealer price quotations (bid price for long positions and ask price for short positions),
without any deduction for transaction costs. For financial instruments where there is no active market, the
fair value is determined using appropriate valuation techniques. These techniques include using recent arm’s
length market transactions, and/or reference to the current market value of another instrument which is
substantiallythesame;adiscountedcashflowanalysis;andoptionpricingmodels.
91AnnuAl report 2011
Notes to Financial Statements
31 December 2011
5. SUMMARY OF SIGNIFICANT ACCOUNTING POLICIES (continued)
Derivative financial instruments and hedge accounting
Initial recognition and subsequent measurement
The Group uses derivative financial instruments, such as forward currency contracts and interest rate swaps,
to hedge its foreign currency risk and interest rate risk, respectively. Such derivative financial instruments
are initially recognised at fair value on the date on which a derivative contract is entered into and are
subsequently remeasured at fair value. Derivatives are carried as assets when the fair value is positive and as
liabilities when the fair value is negative.
Any gains or losses arising from changes in fair value of derivatives are taken directly to the income
statement, except for the effective portion of cash flow hedges, which is recognised in other comprehensive
income.
For the purpose of hedge accounting, hedges are classified as:
• fair value hedges when hedging the exposure to changes in the fair value of a recognised asset or
liabilityoranunrecognisedfirmcommitment;or
• cashflowhedgeswhenhedgingtheexposuretovariability incashflowsthat iseitherattributabletoa
particular risk associated with a recognised asset or liability or a highly probable forecast transaction,
oraforeigncurrencyriskinanunrecognisedfirmcommitment;or
• hedgesofanetinvestmentinaforeignoperation.
At the inception of a hedge relationship, the Group formally designates and documents the hedge relationship
to which the Group wishes to apply hedge accounting, the risk management objective and its strategy for
undertaking the hedge. The documentation includes identification of the hedging instrument, the hedged item
or transaction, the nature of the risk being hedged and how the Group will assess the hedging instrument’s
effectiveness of changes in the hedging instrument’s fair value in offsetting the exposure to changes in the
hedged item’s fair value or cash flows attributable to the hedged risk. Such hedges are expected to be highly
effective in achieving offsetting changes in fair value or cash flows and are assessed on an on-going basis
to determine that they actually have been highly effective throughout the financial reporting periods for which
they were designated.
Hedges which meet the strict criteria for hedge accounting are accounted for as follows:
Fair value hedges
The change in the fair value of hedging derivative is recognised in the income statement in other expenses.
The change in the fair value of the hedged item attributable to the risk hedged is recorded as a part of the
carrying amount of the hedged item and is also recognised in the income statement in other expenses.
For fair value hedges relating to items carried at amortised cost, the adjustment to carrying value is amortised
through the income statement over the remaining term of the hedge using the effective interest rate method.
Effective interest rate amortisation may begin as soon as an adjustment exists and shall begin no later
than when the hedged item ceases to be adjusted for changes in its fair value attributable to the risk being
hedged. If the hedged item is derecognised, the unamortised fair value is recognised immediately in the
income statement.
92 T C L C O M M U N I C A T I O N T E C H N O L O G Y H O L D I N G S L I M I T E D
Notes to Financial Statements
31 December 2011
5. SUMMARY OF SIGNIFICANT ACCOUNTING POLICIES (continued)
Derivative financial instruments and hedge accounting (continued)
Fair value hedges (continued)
When an unrecognised firm commitment is designated as a hedged item, the subsequent cumulative change
in the fair value of the firm commitment attributable to the hedged risk is recognised as an asset or liability
with a corresponding gain or loss recognised in the income statement. The changes in the fair value of the
hedging instrument are also recognised in the income statement.
Cash flow hedges
The effective portion of the gain or loss on the hedging instrument is recognised directly in other
comprehensive income in the hedging reserve, while any ineffective portion is recognised immediately in the
income statement in other expenses.
Amounts recognised in other comprehensive income are transferred to the income statement when the
hedged transaction affects profit or loss, such as when hedged financial income or financial expense is
recognised or when a forecast sale occurs. Where the hedged item is the cost of a non-financial asset or
non-financial liability, the amounts recognised in other comprehensive income are transferred to the income
statement in the same period or periods during which the asset acquired or liability assumed affects the
income statement.
If the forecast transaction or firm commitment is no longer expected to occur, the cumulative gain or loss
previously recognised in equity are transferred to the income statement. If the hedging instrument expires or
is sold, terminated or exercised without replacement or rollover, or if its designation as a hedge is revoked,
the amounts previously recognised in other comprehensive income remain in other comprehensive income
until the forecast transaction or firm commitment affects profit or loss.
Current versus non-current classification
Derivative instruments that are not designated as effective hedging instruments are classified as current or
non-current or separated into a current or non-current portion based on an assessment of the facts and
circumstances (i.e., the underlying contracted cash flows).
• WheretheGroupwillholdaderivativeasaneconomichedge (anddoesnotapplyhedgeaccounting)
for a period beyond 12 months after the end of the reporting period, the derivative is classified as non-
current (or separated into current and non-current portions) consistently with the classification of the
underlying item.
• Embeddedderivatives thatarenotclosely related to thehostcontractareclassifiedconsistentlywith
the cash flows of the host contract.
• Derivative instruments that are designated as, and are effective hedging instruments, are classified
consistently with the classification of the underlying hedged item. The derivative instruments are
separated into current portions and non-current portions only if a reliable allocation can be made.
93AnnuAl report 2011
Notes to Financial Statements
31 December 2011
5. SUMMARY OF SIGNIFICANT ACCOUNTING POLICIES (continued)
Inventories
Inventories are stated at the lower of cost and net realisable value. Cost is determined on the weighted
average or standard costing basis and, in the case of work in progress and finished goods, comprises
direct materials, direct labour and an appropriate proportion of overheads. Net realisable value is based on
estimated selling prices less any estimated costs to be incurred to completion and disposal.
Cash and cash equivalents
For the purpose of the consolidated statement of cash flows, cash and cash equivalents comprise cash
on hand and demand deposits, and short-term highly liquid investments that are readily convertible into
known amounts of cash, are subject to an insignificant risk of changes in value and have a short maturity of
generally within three months when acquired, less bank overdrafts which are repayable on demand and form
an integral part of the Group’s cash management.
For the purpose of the statement of financial position, cash and cash equivalents comprise cash on hand and
at banks, including term deposits, and assets similar in nature to cash, which are not restricted as to use.
Provisions
A provision is recognised when a present obligation (legal or constructive) has arisen as a result of a past
event and it is probable that a future outflow of resources will be required to settle the obligation, provided
that a reliable estimate can be made of the amount of the obligation.
When the effect of discounting is material, the amount recognised for a provision is the present value at the
end of the reporting period of the future expenditures expected to be required to settle the obligation. The
increase in the discounted present value amount arising from the passage of time is included in finance costs
in the income statement.
Provisions for product warranties granted by the Group on certain products are recognised based on
sales volume and past experience of the level of repairs and returns, discounted to their present values as
appropriate.
Income tax
Income tax comprises current and deferred tax. Income tax relating to items recognised outside profit or loss
is recognised outside profit or loss, either in other comprehensive income or directly in equity.
Current tax assets and liabilities for the current and prior periods are measured at the amount expected to be
recovered from or paid to the taxation authorities, based on tax rates (and tax laws) that have been enacted
or substantively enacted by the end of the reporting period, taking into consideration interpretations and
practices prevailing in the countries in which the Group operates.
Deferred tax is provided, using the liability method, on all temporary differences at the end of the reporting
period between the tax bases of assets and liabilities and their carrying amounts for financial reporting
purposes.
94 T C L C O M M U N I C A T I O N T E C H N O L O G Y H O L D I N G S L I M I T E D
Notes to Financial Statements
31 December 2011
5. SUMMARY OF SIGNIFICANT ACCOUNTING POLICIES (continued)
Income tax (continued)
Deferred tax liabilities are recognised for all taxable temporary differences, except:
• when thedeferred tax liabilityarises from the initial recognitionofgoodwill oranassetor liability ina
transaction that is not a business combination and, at the time of the transaction, affects neither the
accountingprofitnortaxableprofitorloss;and
• inrespectoftaxabletemporarydifferencesassociatedwithinvestmentsinsubsidiaries,associatesand
a joint venture, when the timing of the reversal of the temporary differences can be controlled and it is
probable that the temporary differences will not reverse in the foreseeable future.
Deferred tax assets are recognised for all deductible temporary differences, the carryforward of unused tax
credits and any unused tax losses. Deferred tax assets are recognised to the extent that it is probable that
taxable profit will be available against which the deductible temporary differences, the carryforward of unused
tax credits and unused tax losses can be utilised, except:
• when the deferred tax asset relating to the deductible temporary differences arises from the initial
recognition of an asset or liability in a transaction that is not a business combination and, at the time
ofthetransaction,affectsneithertheaccountingprofitnortaxableprofitorloss;and
• in respectofdeductible temporarydifferencesassociatedwith investments insubsidiaries,associates
and a joint venture, deferred tax assets are only recognised to the extent that it is probable that the
temporary differences will reverse in the foreseeable future and taxable profit will be available against
which the temporary differences can be utilised.
The carrying amount of deferred tax assets is reviewed at the end of each reporting period and reduced
to the extent that it is no longer probable that sufficient taxable profit will be available to allow all or part of
the deferred tax asset to be utilised. Unrecognised deferred tax assets are reassessed at the end of each
reporting period and are recognised to the extent that it has become probable that sufficient taxable profit
will be available to allow all or part of the deferred tax asset to be recovered.
Deferred tax assets and liabilities are measured at the tax rates that are expected to apply to the period when
the asset is realised or the liability is settled, based on tax rates (and tax laws) that have been enacted or
substantively enacted by the end of the reporting period.
Deferred tax assets and deferred tax liabilities are offset if a legally enforceable right exists to set off current
tax assets against current tax liabilities and the deferred taxes relate to the same taxable entity and the same
taxation authority.
95AnnuAl report 2011
Notes to Financial Statements
31 December 2011
5. SUMMARY OF SIGNIFICANT ACCOUNTING POLICIES (continued)
Government grants
Government grants are recognised at their fair value where there is reasonable assurance that the grant will
be received and all attaching conditions will be complied with. When the grant relates to an expense item, it
is recognised as income over the periods necessary to match the grant on a systematic basis to the costs
that it is intended to compensate. Where the grant relates to an asset, the fair value is credited to a deferred
income account and is released to the income statement over the expected useful life of the relevant asset
by equal annual instalments or deducted from the carrying amount of the asset and released to the income
statement by way of a reduced depreciation charge.
Revenue recognition
Revenue is recognised when it is probable that the economic benefits will flow to the Group and when the
revenue can be measured reliably, on the following bases:
(a) from the sale of goods, when the significant risks and rewards of ownership have been transferred
to the buyer, provided that the Group maintains neither managerial involvement to the degree usually
associatedwithownership,noreffectivecontroloverthegoodssold;
(b) interest income, on an accrual basis using the effective interest method by applying the rate that
discounts the estimated future cash receipts through the expected life of the financial instrument to
thenetcarryingamountofthefinancialasset;
(c) value-addedserviceincome,uponprovisionoftherelevantservices;and
(d) dividend income, when the shareholders’ right to receive payment has been established.
Employee benefits
Share-based payment transactions
Currently, the Company operates a share option scheme and a share award scheme for the purpose of
providing incentives and rewards to eligible participants who contribute to the success of the Group’s
operations. Employees (including directors) of the Group receive remuneration in the form of share-based
payment transactions, whereby employees render services as consideration for equity instruments (“equity-
settled transactions”).
The cost of equity-settled transactions with employees for grants after 7 November 2002 is measured by
reference to the fair value at the date at which they are granted. The fair value is determined by an external
valuer using a binomial model, further details of which are given in note 37 to the financial statements.
The cost of equity-settled transactions is recognised, together with a corresponding increase in equity,
over the period in which the performance and/or service conditions are fulfilled. The cumulative expense
recognised for equity-settled transactions at the end of each reporting period until the vesting date reflects
the extent to which the vesting period has expired and the Group’s best estimate of the number of equity
instruments that will ultimately vest. The charge or credit to the income statement for a period represents the
movement in the cumulative expense recognised as at the beginning and end of that period.
96 T C L C O M M U N I C A T I O N T E C H N O L O G Y H O L D I N G S L I M I T E D
Notes to Financial Statements
31 December 2011
5. SUMMARY OF SIGNIFICANT ACCOUNTING POLICIES (continued)
Employee benefits (continued)
Share-based payment transactions (continued)
No expense is recognised for awards that do not ultimately vest, except for equity-settled transactions where
vesting is conditional upon a market or non-vesting condition, which are treated as vesting irrespective of
whether or not the market or non-vesting condition is satisfied, provided that all other performance and/or
service conditions are satisfied.
Where the terms of an equity-settled award are modified, as a minimum an expense is recognised as if the
terms had not been modified, if the original terms of the award are met. In addition, an expense is recognised
for any modification that increases the total fair value of the share-based payment transaction, or is otherwise
beneficial to the employee as measured at the date of modification.
Where an equity-settled award is cancelled, it is treated as if it had vested on the date of cancellation, and
any expense not yet recognised for the award is recognised immediately. This includes any award where
non-vesting conditions within the control of either the Group or the employee are not met. However, if a new
award is substituted for the cancelled award, and is designated as a replacement award on the date that it
is granted, the cancelled and new awards are treated as if they were a modification of the original award, as
described in the previous paragraph.
The dilutive effect of outstanding options is reflected as additional share dilution in the computation of
earnings per share.
Shares held for the Share Award Scheme
As disclosed in note 38 to the financial statements, the Group has set up the Share Award Scheme Trust for
the share award schemes, where the the Share Award Scheme Trust purchases shares issued by the Group,
the consideration paid by the Company, including any directly attributable incremental costs, is presented as
“Shares held for the Share Award Scheme” and deducted from the Group’s equity.
Central Pension Scheme
Subsidiaries operating in Mainland China have participated in the central pension scheme (the “CPS”)
operated by the PRC government for all of their staff. These PRC subsidiaries are required to contribute a
certain percentage of their covered payroll to the CPS to fund the benefits. The only obligation of the Group
with respect to the CPS is to pay the on-going required contributions under the CPS. Contributions under the
CPS are charged to the income statement as they become payable in accordance with the rules of the CPS.
Mandatory Provident Fund
The Company’s subsidiaries, incorporated in Hong Kong, operate a defined contribution Mandatory Provident
Fund retirement benefit scheme (the “Scheme”) under the Mandatory Provident Fund Schemes Ordinance for
all of its employees in Hong Kong. Contributions are made based on a percentage of the employees’ basic
salaries and are charged to the income statement as they become payable in accordance with the rules of
the Scheme. The assets of the Scheme are held separately from those of the Group in an independently
administered fund. The employer contributions vest fully with the employees when contributed into the
Scheme except for the employer voluntary contributions, which are refunded to the Company’s subsidiaries
which are incorporated in Hong Kong when an employee leaves employment prior to the contributions vesting
fully, in accordance with the rules of the Scheme.
97AnnuAl report 2011
Notes to Financial Statements
31 December 2011
5. SUMMARY OF SIGNIFICANT ACCOUNTING POLICIES (continued)
Employee benefits (continued)
Retirement indemnities
TCT Mobile Europe SAS (“TCT SAS”), which was incorporated in France, operates a defined contribution
plan (the “contribution plan”) and a defined benefit pension plan (the “pension plan”). For the contribution
plan, TCT SAS is not liable for any legal or constructive obligations under the contribution plan beyond the
contributions paid, and no provision as such is made. For the pension plan, corresponding to retirement
indemnities relating to TCT SAS’s employees, liabilities and prepaid expenses are determined as follows:
• using theprojectedunit creditmethod,with theprojected final salary,which takes intoconsideration
each period of service giving rise to an additional unit of benefit entitlement and measures each unit
separately to build up the final obligation. Actuarial assumptions comprise mortality, rates of employee
turnoverandprojectionoffuturesalarylevels;and
• actuarialgainsandlossesarerecognisedasincomeorexpensewhenthenetcumulativeunrecognised
actuarial gains and losses for the pension plan at the end of the previous period exceed 10% of the
higher of the defined benefit obligation and the fair value of plan assets at that date. These gains
or losses are recognised over the expected average remaining service periods of the employees
participating in the pension plan.
Borrowing costs
Borrowing costs directly attributable to the acquisition, construction or production of qualifying assets,
i.e., assets that necessarily take a substantial period of time to get ready for their intended use or sale, are
capitalised as part of the cost of those assets. The capitalisation of such borrowing costs ceases when the
assets are substantially ready for their intended use or sale. Investment income earned on the temporary
investment of specific borrowings pending their expenditure on qualifying assets is deducted from the
borrowing costs capitalised. All other borrowing costs are expensed in the period in which they are incurred.
Borrowing costs consist of interest and other costs that an entity incurs in connection with the borrowing of
funds.
Dividends
Final dividends proposed by the directors are classified as a separate allocation of share premium or retained
profits within the equity section of the statement of financial position, until they have been approved by the
shareholders in a general meeting. When these dividends have been approved by the shareholders and
declared, they are recognised as a liability.
Interim dividends and special dividends are simultaneously proposed and declared, because the Company’s
memorandum and articles of association grant the directors the authority to declare such dividends.
Consequently, such dividends are recognised immediately as a liability when they are proposed and declared.
98 T C L C O M M U N I C A T I O N T E C H N O L O G Y H O L D I N G S L I M I T E D
Notes to Financial Statements
31 December 2011
5. SUMMARY OF SIGNIFICANT ACCOUNTING POLICIES (continued)
Foreign currencies
These financial statements are presented in Hong Kong dollars, which is the Company’s functional and
presentation currency. Each entity in the Group determines its own functional currency and items included
in the financial statements of each entity are measured using that functional currency. Foreign currency
transactions recorded by the entities in the Group are initially recorded using their respective functional
currency rates ruling at the dates of the transactions. Monetary assets and liabilities denominated in foreign
currencies are retranslated at the functional currency rates of exchange ruling at the end of the reporting
period. All differences arising on settlement or translation of monetary items are taken to the income
statement.
Non-monetary items that are measured in terms of historical cost in a foreign currency are translated using
the exchange rates at the dates of the initial transactions. Non-monetary items measured at fair value in a
foreign currency are translated using the exchange rates at the date when the fair value was determined. The
gain or loss arising on retranslation of a non-monetary item is treated in line with the recognition of the gain
or loss on change in fair value of the item (i.e., translation difference on item whose fair value gain or loss is
recognised in other comprehensive income or profit or loss is also recognised in other comprehensive income
or profit or loss, respectively).
The functional currencies of certain overseas subsidiaries and associates are currencies other than the Hong
Kong dollar. As at the end of the reporting period, the assets and liabilities of these entities are translated into
the presentation currency of the Company at the exchange rates ruling at the end of the reporting period and
their income statements are translated into Hong Kong dollars at the weighted average exchange rates for
the year.
The resulting exchange differences are recognised in other comprehensive income and accumulated in the
exchange fluctuation reserve. On disposal of a foreign operation, the component of other comprehensive
income relating to that particular foreign operation is recognised in the income statement.
Any goodwill arising on the acquisition of a foreign operation and any fair value adjustments to the carrying
amounts of assets and liabilities arising on acquisition are treated as assets and liabilities of the foreign
operation and translated at the closing rate.
For the purpose of the consolidated statement of cash flows, the cash flows of overseas subsidiaries are
translated into Hong Kong dollars at the exchange rates ruling at the dates of the cash flows. Frequently
recurring cash flows of overseas subsidiaries, which arise throughout the year are translated into Hong Kong
dollars at the weighted average exchange rates for the year.
99AnnuAl report 2011
Notes to Financial Statements
31 December 2011
6. SIGNIFICANT ACCOUNTING JUDGEMENTS AND ESTIMATES
The preparation of the Group’s financial statements requires management to make judgements, estimates
and assumptions that affect the reported amounts of revenues, expenses, assets and liabilities, and the
disclosure of contingent liabilities, at the end of the reporting period. However, uncertainty about these
assumptions and estimates could result in outcomes that could require a material adjustment to the carrying
amounts of the assets or liabilities affected in the future.
Estimation uncertainty
The key assumptions concerning the future and other key sources of estimation uncertainty at the end of
the reporting period, that have a significant risk of causing a material adjustment to the carrying amounts of
assets and liabilities within the next financial year, are described below:
Impairment of property, plant and equipment
The Group determines whether property, plant and equipment are impaired when there is an indication of
impairment. This requires an estimation of the value in use of the cash-generating units to which the property,
plant and equipment were allocated. Estimating the value in use requires the Group to make an estimate
of the expected future cash flows from the cash-generating unit and also to choose a suitable discount
rate in order to calculate the present value of those cash flows. The carrying amount of property, plant and
equipment at 31 December 2011 was HK$497,132,000 (31 December 2010: HK$309,116,000). More details
are set out in note 16 to the financial statements.
Management carries out the impairment review on property, plant and equipment by comparing the carrying
amount and the recoverable amount of property, plant and equipment.
An impairment loss is recognised when the carrying amount of property, plant and equipment exceeds
the recoverable amount. An impairment loss is charged to the income statement in the period in which it
arises. Management assesses the recoverable amount by comparing the fair value less costs to sell and the
expected value in use which is determined by the expected useful life and the expected discounted net cash
flows of property, plant and equipment.
Warranty claims
The Group generally offers warranties for its products for 12 to 24 months. Management estimates the
related provision for future warranty claims based on historical warranty claim information, as well as recent
trends that might suggest that past cost information may differ from future claims.
As the Group is continually upgrading its product designs and launching new models, it is possible that
the past experience of the level of repairs and returns is not indicative of future claims that it will receive in
respect of past sales. Any increase or decrease in the actual claims would affect profit or loss in future years.
As at 31 December 2011, the carrying amount of warranty provisions was HK$137,574,000 (31 December
2010: HK$127,547,000). Further details are included in note 32 to the financial statements.
100 T C L C O M M U N I C A T I O N T E C H N O L O G Y H O L D I N G S L I M I T E D
Notes to Financial Statements
31 December 2011
6. SIGNIFICANT ACCOUNTING JUDGEMENTS AND ESTIMATES (continued)Estimation uncertainty (continued)Impairment of goodwillThe Group determines whether goodwill is impaired at least on an annual basis. This requires an estimation of the value in use of the cash-generating units to which the goodwill is allocated. Estimating the value in use requires the Group to make an estimate of the expected future cash flows from the cash-generating units and also to choose a suitable discount rate in order to calculate the present value of those cash flows. The carrying amount of goodwill at 31 December 2011 was HK$253,954,000 (31 December 2010: HK$146,927,000). Further details are given in note 19 to the financial statements.
Impairment of trade receivables and other receivablesImpairment of trade receivables and other receivables are made based on assessment of the recoverability of receivables due from customers. The identification of impairment requires management judgements and estimates. Where the actual outcome or expectation in future is different from the original estimate, such differences will impact on the carrying amount of the receivables and impairment losses/reversal of impairment losses in the period in which such estimate has been changed. The carrying amount of trade receivables and other receivables at 31 December 2011 was HK$2,584,768,000 and HK$771,941,000, respectively (31 December 2010: HK$2,535,372,000 and HK$444,555,000 respectively). Further details are given in note 24 and note 26 to the financial statements.
Provision against obsolete and slow-moving inventoriesThe Group reviews the condition of its inventories and makes provision against obsolete and slow-moving inventory items which are identified as no longer suitable for sale or use. Management estimates the net realisable value for such inventories based primarily on the latest invoice prices and current market conditions. The Group carries out an inventory review at the end of the reporting and makes provision against obsolete and slow-moving items. Management reassesses the estimation at the end of the reporting period.
The provision against obsolete and slow-moving inventories requires the use of judgements and estimates. Where the expectation is different from the original estimate, such difference will impact on the carrying value of inventories and the write-down of inventories recognised in the periods in which such estimates have been changed. The carrying amount of inventory at 31 December 2011 was HK$981,416,000 (31 December 2010: HK$779,846,000). Further details are given in note 23 to the financial statements.
Deferred tax assetsDeferred tax assets are recognised for unused tax losses and deductible temporary differences to the extent that it is probable that taxable profit will be available against which the losses can be utilised. Significant management judgement is required to determine the amount of deferred tax assets that can be recognised, based upon the likely timing and level of future taxable profits together with future tax planning strategy. The carrying value of deferred tax assets at 31 December 2011 was HK$105,668,000 (31 December 2010: HK$31,689,000). The amount of unrecognised tax losses at 31 December 2011 was HK$1,104,496,000 (31 December 2010: HK$1,110,691,000). Further details are included in note 35 to the financial statements.
Development costsDevelopment costs are capitalised in accordance with the accounting policy for research and development costs in note 5 to the financial statements. Determining the amounts to be capitalised requires management to make assumptions regarding the expected future cash generation of the assets, discount rates to be applied and the expected period of benefits. At 31 December 2011, the best estimate of the carrying amount of capitalised development costs was HK$320,327,000 (31 December 2010: HK$59,688,000). Further details are included in note 18 to the financial statements.

101AnnuAl report 2011
Notes to Financial Statements
31 December 2011
7. OPERATING SEGMENT INFORMATION
For management purpose, the management does not review the performance of the business in China
and overseas segments separately, but considers there is only one of segment which is research and
development, manufacture and sales of mobile phones and other products. Such changes have been
restated for comparative amounts in prior year. All of the Group’s products are of a similar nature and subject
to similar risk and returns.
Because majority of its revenue was generated in overseas and majority of its non-current assets and capital
expenditure were located/incurred in China, accordingly, no geographical information is presented.
Information about a major customer
For the year ended 31 December 2011, no revenue from a single customer accounted for 10% or more of
the total revenue of the Group.
For the year ended 31 December 2010, revenue of HK$937,152,000 was derived from a single customer,
which accounted for 11% of the total revenue of the Group.
8. REVENUE, OTHER INCOME AND GAINS
Revenue, which is also the Group’s turnover, represents the net invoiced value of mobile phones and other
products sold during the year, after deducting allowances for returns and trade discounts. All significant intra-
group transactions have been eliminated on consolidation.
An analysis of revenue, other income and gains is as follows:
2011 2010
Note HK$’000 HK$’000
Revenue
Sale of mobile phones and other products 10,653,020 8,700,694
Other income and gains
Interest income 195,504 82,672
Subsidy income* 30,863 10,650
Value-added-tax (“VAT”) refunds** 102,020 59,905
Value-added service income 10,293 832
Exchangegains,net; 135,040 115,795
Including: exchange losses on derivative financial instruments (44,079) (12,010)
Gain on disposal of prepaid land lease payments 9 – 1,907
Dividend income from an available-for-sale investment 1,477 –
Others 33,028 6,418
508,225 278,179
* Subsidy income represented various government grants received by the Group in the PRC. There are no unfulfilled conditions or contingencies relating to these grants.
** During the years ended 31 December 2011 and 2010, JRD Communication (Shenzhen) Ltd (“JRD Shenzhen”) and JRD Communication Technology (Shanghai) Limited (“JRD Shanghai”) (newly designated as software enterprise in 2011) recognised VAT refunds, which were calculated on the effective VAT rates in excess of 3% after the payment of statutory net output VAT of 17%.
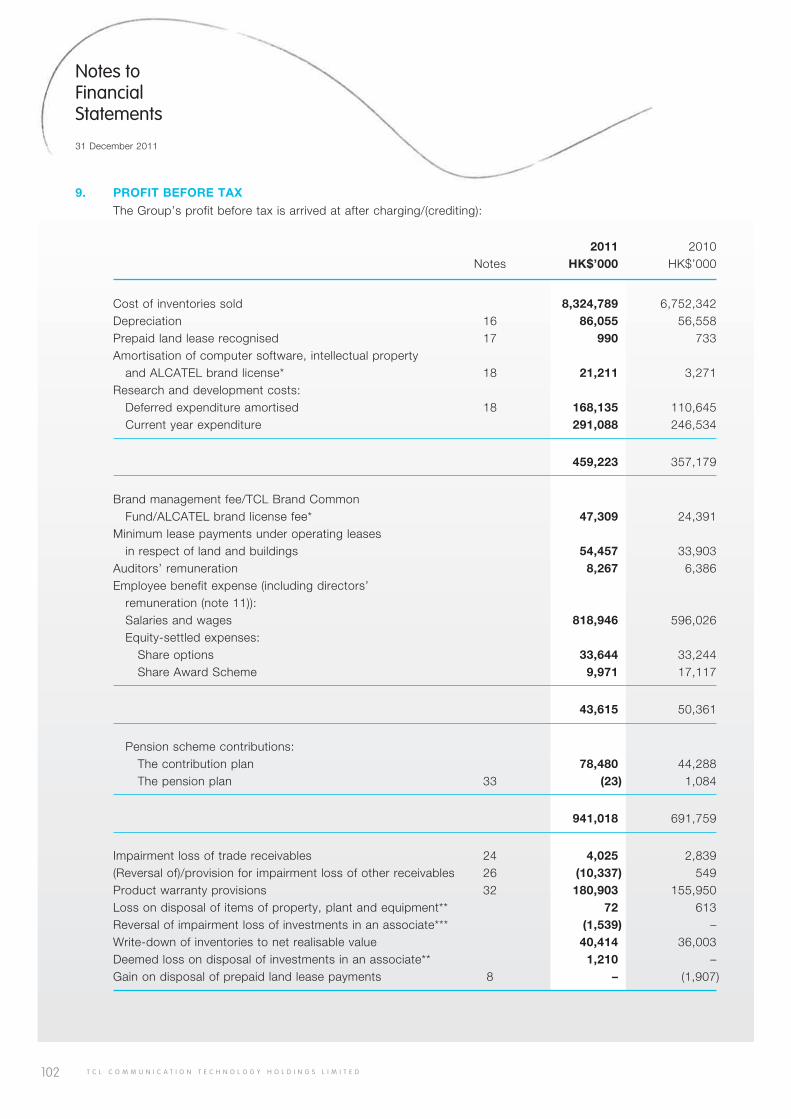
102 T C L C O M M U N I C A T I O N T E C H N O L O G Y H O L D I N G S L I M I T E D
Notes to Financial Statements
31 December 2011
9. PROFIT BEFORE TAX
The Group’s profit before tax is arrived at after charging/(crediting):
2011 2010 Notes HK$’000 HK$’000
Cost of inventories sold 8,324,789 6,752,342Depreciation 16 86,055 56,558Prepaid land lease recognised 17 990 733Amortisation of computer software, intellectual property and ALCATEL brand license* 18 21,211 3,271Research and development costs: Deferred expenditure amortised 18 168,135 110,645 Current year expenditure 291,088 246,534
459,223 357,179
Brand management fee/TCL Brand Common Fund/ALCATEL brand license fee* 47,309 24,391Minimum lease payments under operating leases in respect of land and buildings 54,457 33,903Auditors’ remuneration 8,267 6,386Employee benefit expense (including directors’ remuneration (note 11)): Salaries and wages 818,946 596,026 Equity-settled expenses: Share options 33,644 33,244 Share Award Scheme 9,971 17,117
43,615 50,361
Pension scheme contributions: The contribution plan 78,480 44,288 The pension plan 33 (23) 1,084
941,018 691,759
Impairment loss of trade receivables 24 4,025 2,839(Reversal of)/provision for impairment loss of other receivables 26 (10,337) 549Product warranty provisions 32 180,903 155,950Loss on disposal of items of property, plant and equipment** 72 613Reversal of impairment loss of investments in an associate*** (1,539) –Write-down of inventories to net realisable value 40,414 36,003Deemed loss on disposal of investments in an associate** 1,210 –Gain on disposal of prepaid land lease payments 8 – (1,907)
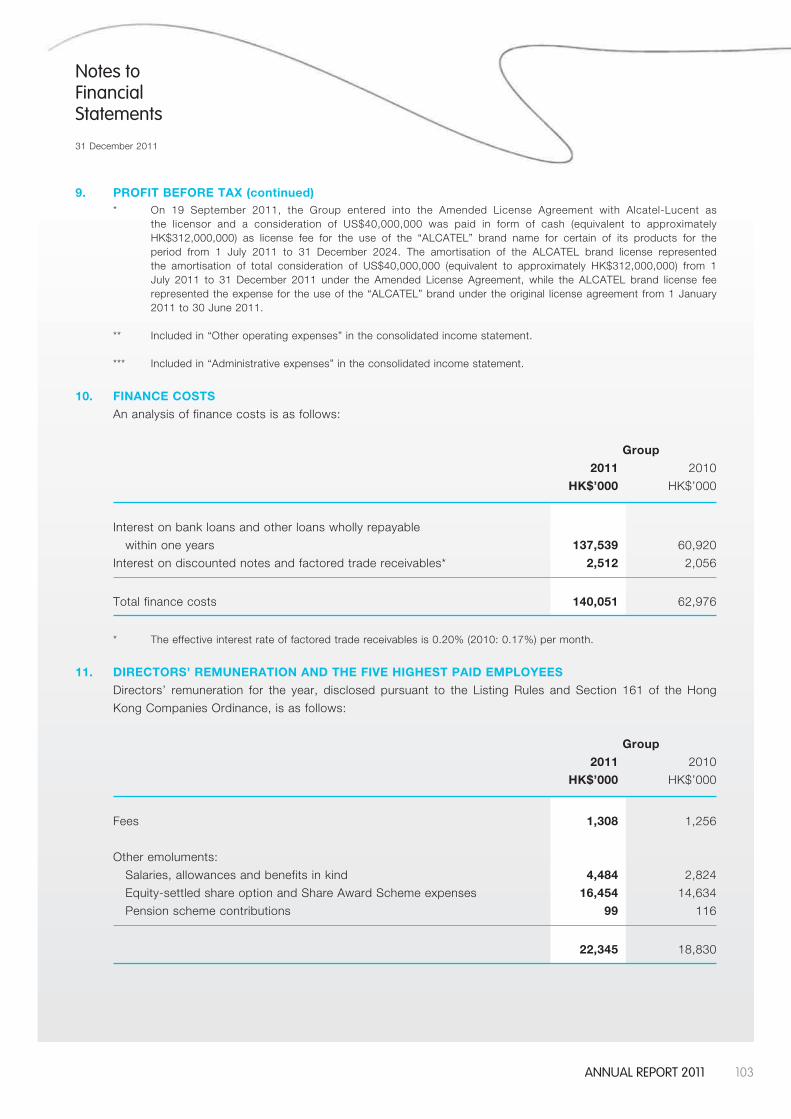
103AnnuAl report 2011
Notes to Financial Statements
31 December 2011
9. PROFIT BEFORE TAX (continued)* On 19 September 2011, the Group entered into the Amended License Agreement with Alcatel-Lucent as
the licensor and a consideration of US$40,000,000 was paid in form of cash (equivalent to approximately HK$312,000,000) as license fee for the use of the “ALCATEL” brand name for certain of its products for the period from 1 July 2011 to 31 December 2024. The amortisation of the ALCATEL brand license represented the amortisation of total consideration of US$40,000,000 (equivalent to approximately HK$312,000,000) from 1 July 2011 to 31 December 2011 under the Amended License Agreement, while the ALCATEL brand license fee represented the expense for the use of the “ALCATEL” brand under the original license agreement from 1 January 2011 to 30 June 2011.
** Included in “Other operating expenses” in the consolidated income statement.
*** Included in “Administrative expenses” in the consolidated income statement.
10. FINANCE COSTS
An analysis of finance costs is as follows:
Group
2011 2010
HK$’000 HK$’000
Interest on bank loans and other loans wholly repayable
within one years 137,539 60,920
Interest on discounted notes and factored trade receivables* 2,512 2,056
Total finance costs 140,051 62,976
* The effective interest rate of factored trade receivables is 0.20% (2010: 0.17%) per month.
11. DIRECTORS’ REMUNERATION AND THE FIVE HIGHEST PAID EMPLOYEES
Directors’ remuneration for the year, disclosed pursuant to the Listing Rules and Section 161 of the Hong
Kong Companies Ordinance, is as follows:
Group
2011 2010
HK$’000 HK$’000
Fees 1,308 1,256
Other emoluments:
Salaries, allowances and benefits in kind 4,484 2,824
Equity-settled share option and Share Award Scheme expenses 16,454 14,634
Pension scheme contributions 99 116
22,345 18,830
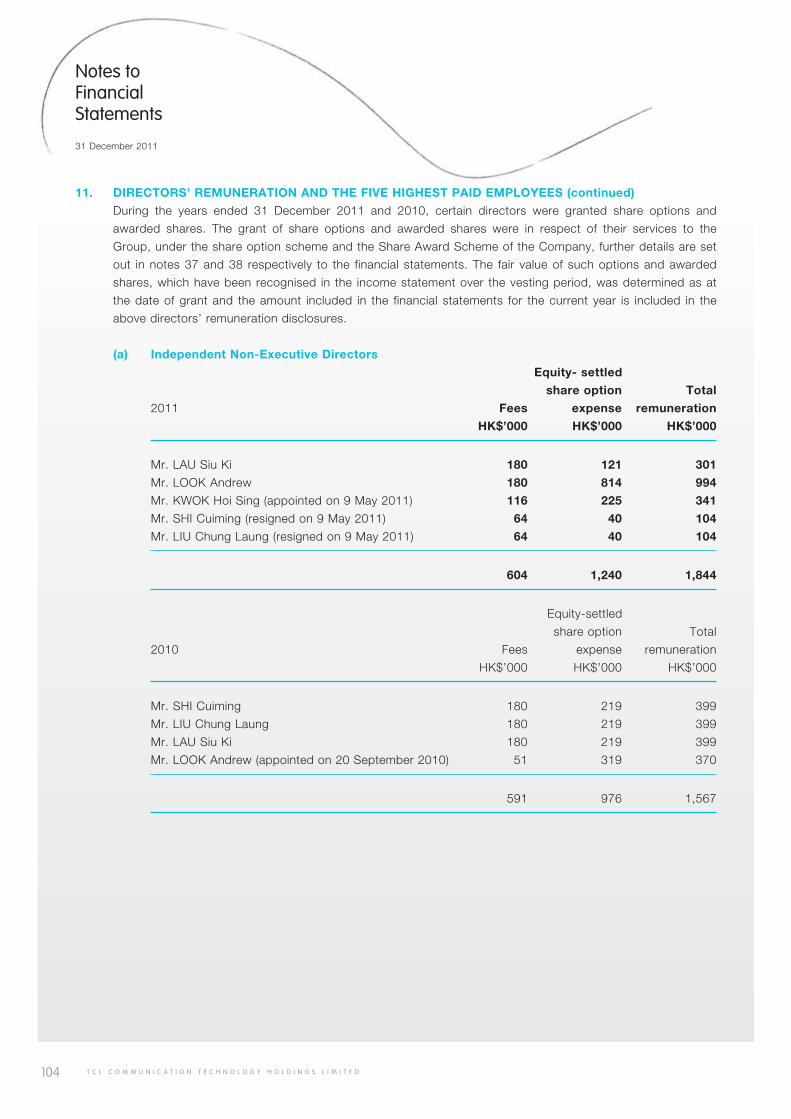
104 T C L C O M M U N I C A T I O N T E C H N O L O G Y H O L D I N G S L I M I T E D
Notes to Financial Statements
31 December 2011
11. DIRECTORS’ REMUNERATION AND THE FIVE HIGHEST PAID EMPLOYEES (continued)
During the years ended 31 December 2011 and 2010, certain directors were granted share options and
awarded shares. The grant of share options and awarded shares were in respect of their services to the
Group, under the share option scheme and the Share Award Scheme of the Company, further details are set
out in notes 37 and 38 respectively to the financial statements. The fair value of such options and awarded
shares, which have been recognised in the income statement over the vesting period, was determined as at
the date of grant and the amount included in the financial statements for the current year is included in the
above directors’ remuneration disclosures.
(a) Independent Non-Executive Directors
Equity- settled
share option Total
2011 Fees expense remuneration
HK$’000 HK$’000 HK$’000
Mr. LAU Siu Ki 180 121 301
Mr. LOOK Andrew 180 814 994
Mr. KWOK Hoi Sing (appointed on 9 May 2011) 116 225 341
Mr. SHI Cuiming (resigned on 9 May 2011) 64 40 104
Mr. LIU Chung Laung (resigned on 9 May 2011) 64 40 104
604 1,240 1,844
Equity-settled
share option Total
2010 Fees expense remuneration
HK$’000 HK$’000 HK$’000
Mr. SHI Cuiming 180 219 399
Mr. LIU Chung Laung 180 219 399
Mr. LAU Siu Ki 180 219 399
Mr. LOOK Andrew (appointed on 20 September 2010) 51 319 370
591 976 1,567
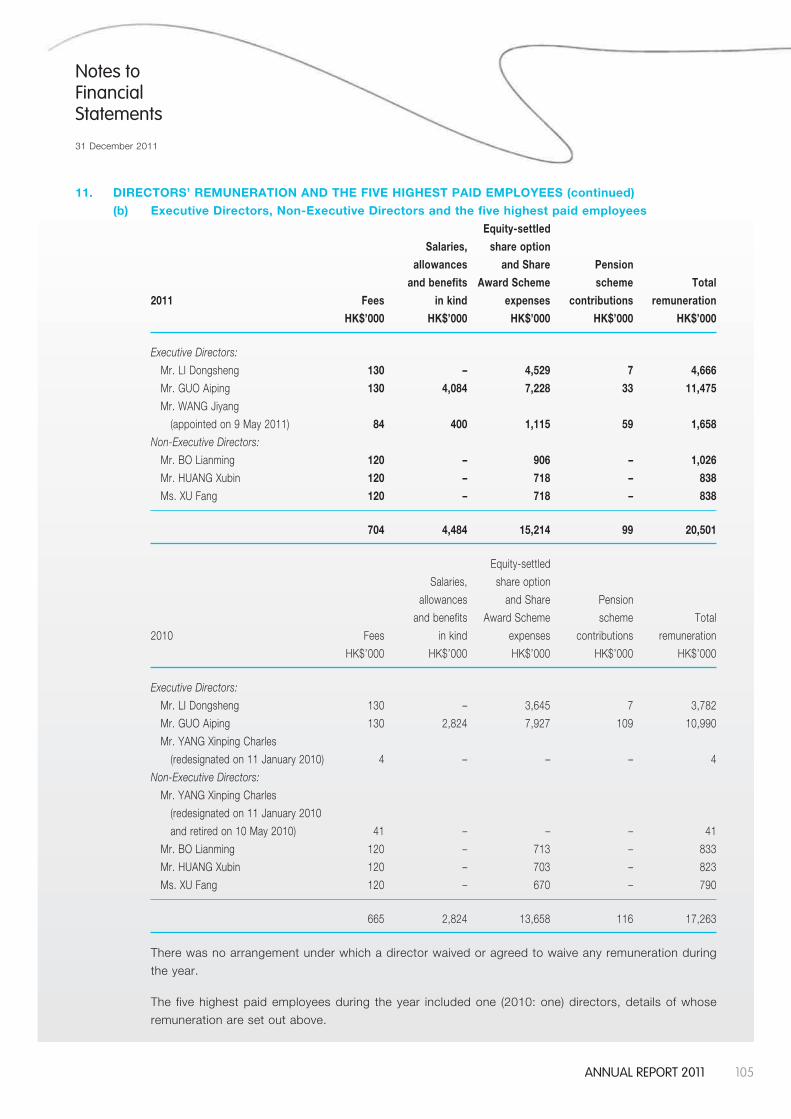
105AnnuAl report 2011
Notes to Financial Statements
31 December 2011
11. DIRECTORS’ REMUNERATION AND THE FIVE HIGHEST PAID EMPLOYEES (continued)
(b) Executive Directors, Non-Executive Directors and the five highest paid employees
Equity-settled
Salaries, share option
allowances and Share Pension
and benefits Award Scheme scheme Total
2011 Fees in kind expenses contributions remuneration
HK$’000 HK$’000 HK$’000 HK$’000 HK$’000
Executive Directors:
Mr. LI Dongsheng 130 – 4,529 7 4,666
Mr. GUO Aiping 130 4,084 7,228 33 11,475
Mr. WANG Jiyang
(appointed on 9 May 2011) 84 400 1,115 59 1,658
Non-Executive Directors:
Mr. BO Lianming 120 – 906 – 1,026
Mr. HUANG Xubin 120 – 718 – 838
Ms. XU Fang 120 – 718 – 838
704 4,484 15,214 99 20,501
Equity-settled
Salaries, share option
allowances and Share Pension
and benefits Award Scheme scheme Total
2010 Fees in kind expenses contributions remuneration
HK$’000 HK$’000 HK$’000 HK$’000 HK$’000
Executive Directors:
Mr. LI Dongsheng 130 – 3,645 7 3,782
Mr. GUO Aiping 130 2,824 7,927 109 10,990
Mr. YANG Xinping Charles
(redesignated on 11 January 2010) 4 – – – 4
Non-Executive Directors:
Mr. YANG Xinping Charles
(redesignated on 11 January 2010
and retired on 10 May 2010) 41 – – – 41
Mr. BO Lianming 120 – 713 – 833
Mr. HUANG Xubin 120 – 703 – 823
Ms. XU Fang 120 – 670 – 790
665 2,824 13,658 116 17,263
There was no arrangement under which a director waived or agreed to waive any remuneration during
the year.
The five highest paid employees during the year included one (2010: one) directors, details of whose
remuneration are set out above.
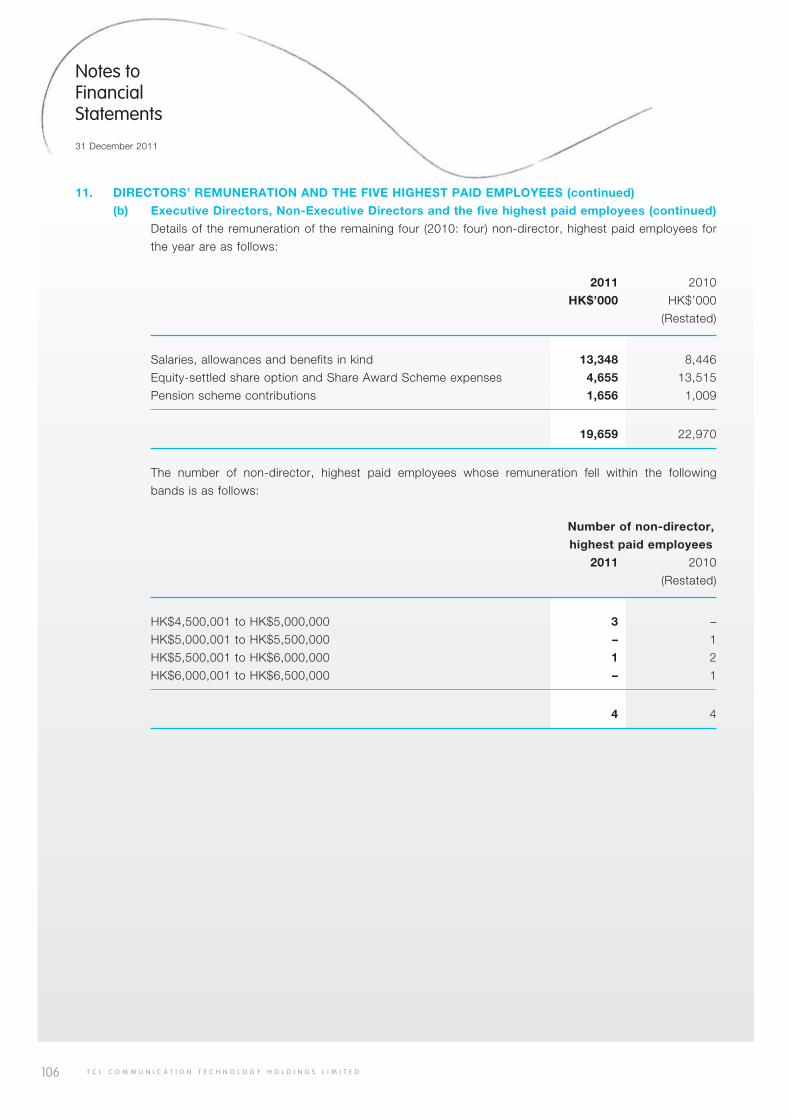
106 T C L C O M M U N I C A T I O N T E C H N O L O G Y H O L D I N G S L I M I T E D
Notes to Financial Statements
31 December 2011
11. DIRECTORS’ REMUNERATION AND THE FIVE HIGHEST PAID EMPLOYEES (continued)
(b) Executive Directors, Non-Executive Directors and the five highest paid employees (continued)
Details of the remuneration of the remaining four (2010: four) non-director, highest paid employees for
the year are as follows:
2011 2010
HK$’000 HK$’000
(Restated)
Salaries, allowances and benefits in kind 13,348 8,446
Equity-settled share option and Share Award Scheme expenses 4,655 13,515
Pension scheme contributions 1,656 1,009
19,659 22,970
The number of non-director, highest paid employees whose remuneration fell within the following
bands is as follows:
Number of non-director,
highest paid employees
2011 2010
(Restated)
HK$4,500,001 to HK$5,000,000 3 –
HK$5,000,001 to HK$5,500,000 – 1
HK$5,500,001 to HK$6,000,000 1 2
HK$6,000,001 to HK$6,500,000 – 1
4 4
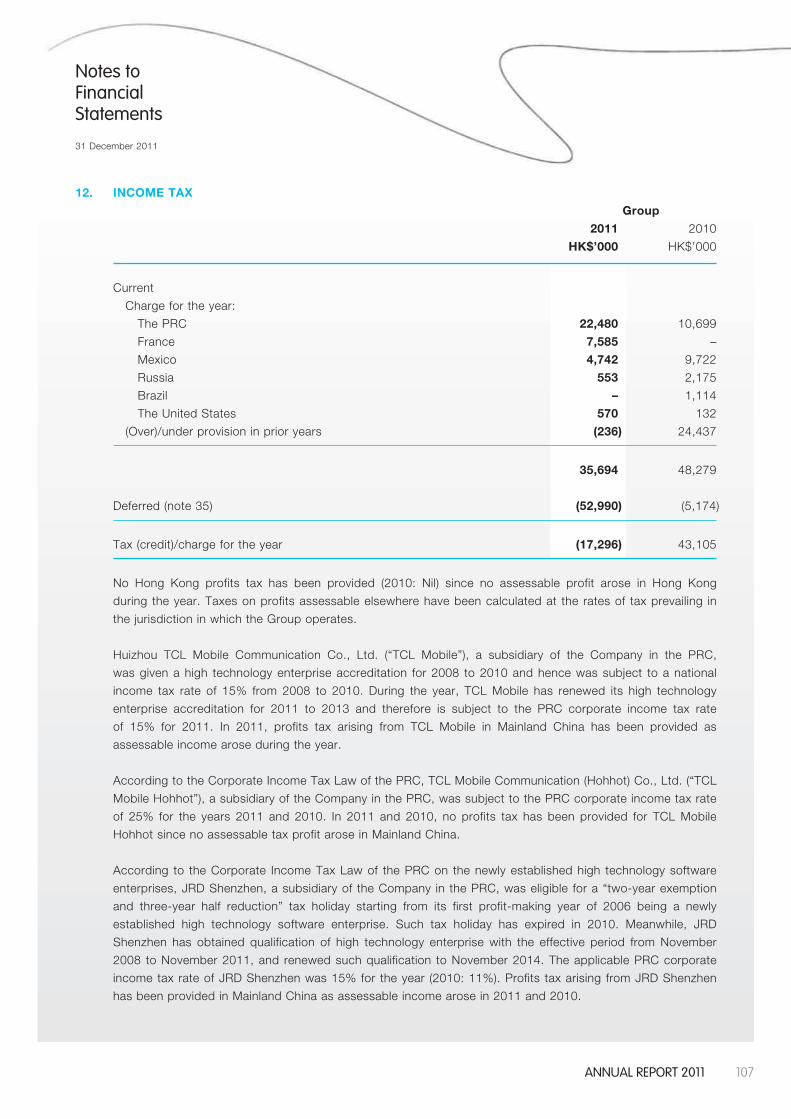
107AnnuAl report 2011
Notes to Financial Statements
31 December 2011
12. INCOME TAX
Group
2011 2010
HK$’000 HK$’000
Current
Charge for the year:
The PRC 22,480 10,699
France 7,585 –
Mexico 4,742 9,722
Russia 553 2,175
Brazil – 1,114
The United States 570 132
(Over)/under provision in prior years (236) 24,437
35,694 48,279
Deferred (note 35) (52,990) (5,174)
Tax (credit)/charge for the year (17,296) 43,105
No Hong Kong profits tax has been provided (2010: Nil) since no assessable profit arose in Hong Kong
during the year. Taxes on profits assessable elsewhere have been calculated at the rates of tax prevailing in
the jurisdiction in which the Group operates.
Huizhou TCL Mobile Communication Co., Ltd. (“TCL Mobile”), a subsidiary of the Company in the PRC,
was given a high technology enterprise accreditation for 2008 to 2010 and hence was subject to a national
income tax rate of 15% from 2008 to 2010. During the year, TCL Mobile has renewed its high technology
enterprise accreditation for 2011 to 2013 and therefore is subject to the PRC corporate income tax rate
of 15% for 2011. In 2011, profits tax arising from TCL Mobile in Mainland China has been provided as
assessable income arose during the year.
According to the Corporate Income Tax Law of the PRC, TCL Mobile Communication (Hohhot) Co., Ltd. (“TCL
Mobile Hohhot”), a subsidiary of the Company in the PRC, was subject to the PRC corporate income tax rate
of 25% for the years 2011 and 2010. In 2011 and 2010, no profits tax has been provided for TCL Mobile
Hohhot since no assessable tax profit arose in Mainland China.
According to the Corporate Income Tax Law of the PRC on the newly established high technology software
enterprises, JRD Shenzhen, a subsidiary of the Company in the PRC, was eligible for a “two-year exemption
and three-year half reduction” tax holiday starting from its first profit-making year of 2006 being a newly
established high technology software enterprise. Such tax holiday has expired in 2010. Meanwhile, JRD
Shenzhen has obtained qualification of high technology enterprise with the effective period from November
2008 to November 2011, and renewed such qualification to November 2014. The applicable PRC corporate
income tax rate of JRD Shenzhen was 15% for the year (2010: 11%). Profits tax arising from JRD Shenzhen
has been provided in Mainland China as assessable income arose in 2011 and 2010.
108 T C L C O M M U N I C A T I O N T E C H N O L O G Y H O L D I N G S L I M I T E D
Notes to Financial Statements
31 December 2011
12. INCOME TAX (continued)
According to the Corporate Income Tax Law of the PRC on the newly established high technology software
enterprises, JRD Shanghai, a subsidiary of the Company in the PRC, was eligible for a “two-year exemption
and three-year half reduction” tax holiday starting from its first profit-making year being a newly established
high technology software enterprise. In the current year, no PRC profit tax has been provided for JRD
Shanghai.
“TMC Rus” Limited Liability Company, a subsidiary of the Company in Russia, is subject to corporate income
tax at a rate of 20% for the years 2011 and 2010. Profits tax arising from Russia has been provided as
assessable income arose in 2011 and 2010.
TCT SAS, a subsidiary of the Company in France, is subject to a corporate income tax rate of 33.33% in
2011 and 2010. According the new French tax policy, entity needs to pay income tax whereas the entity has
tax losses carry forwards. French profits tax has been provided during the year (2010: Nil) as assessable
income arose during the year.
Since 2008, TCT Mobile SA DE CV, a subsidiary of the Company in Mexico, was subject to Flat Rate
Business Tax (“IETU”) and income tax (“ISR”). IETU applies to the sale of goods, the provision of independent
services and the granting of use or enjoyment of goods, less certain authorised deductions. IETU payable is
calculated by subtracting certain tax credits from the tax determined. Revenue, deductions and certain tax
credits are determined based on cash flows generated starting from 1 January 2008. The tax rate of IETU
is 17.5% from the year 2010 onwards. ISR is calculated as a certain percentage of net tax income which is
determined based on all revenues minus expenses (deductions) as defined by Income Tax Law. The ISR rate
is 30% for 2011 and 2010. In all cases, the payment of IETU is required only to the extent that it exceeds the
ISR for the same period. In the current year, Mexico ISR has been provided since assessable income arose
and IETU did not exceed the ISR.
TCT Mobile-Telefones LTDA., a subsidiary of the Company in Brazil, was subject to corporate income tax
at a rate of 25% and social contribution tax at a rate of 9% on the same taxable income (except for certain
specific adjustments), according to Articles 17 of Law #11.727 and Articles 228 of Decree #3.000 of the
Income Tax Regulation in Brazil. In the current year, no Brazilian profits tax has been provided since no
assessable tax profit arose in Brazil.
TCT Mobile, Inc., a subsidiary of the Company in the United States, is subject to the United States Federal
tax rate of 35%, the California State tax rate of 8.84% in 2011 and 2010. Profits tax arising from TCT Mobile,
Inc. has been provided as assessable income arose in 2011 and 2010.
109AnnuAl report 2011
Notes to Financial Statements
31 December 2011
12. INCOME TAX (continued)
A reconciliation of the tax expense applicable to profit before tax at the statutory rate for the countries in
which the Company and the majority of its subsidiaries, are domiciled to the tax expense at the effective tax
rate, and a reconciliation of the applicable rate (i.e. the statutory tax rate) to the effective tax rate, are as
follows:
2011 2010
HK$’000 % HK$’000 %
(Restated)
Profit before tax 783,349 744,875
Tax at the applicable rates 160,786 20.5 192,185 25.7
Lower tax rates for specific provinces or
enacted by local authorities (51,635) (6.6) (75,393) (10.1)
Adjustment in respect of current tax of
previous periods (236) – 24,437 3.3
Income not subject to tax (65,269) (8.3) (15,225) (2.0)
Expenses not deductible for tax 81,249 10.3 70,068 9.4
Tax effect of expenses that are entitled to
additional deduction (31,641) (4.0) (9,877) (1.3)
Tax losses utilised from previous periods (131,157) (16.7) (151,763) (20.4)
Tax losses not recognised 70,607 9.0 8,673 1.2
Others* (50,000) (6.4) – –
Tax (credit)/charge at the Group’s effective rate (17,296) (2.2) 43,105 5.8
* Representing deferred tax asset recognised from unused tax losses arising from a subsidiary in France. As the management considered the subsidiary had commenced profit-making for some time to the extent that it is probable that taxable profit will be available against which such tax losses can be utilised.
13. PROFIT ATTRIBUTABLE TO OWNERS OF THE PARENT
The consolidated profit attributable to owners of the parent for the year ended 31 December 2011 includes a
profit of HK$754,735,000 (2010: HK$797,896,000) which has been dealt with in the financial statements of
the Company (note 39(b)).
110 T C L C O M M U N I C A T I O N T E C H N O L O G Y H O L D I N G S L I M I T E D
Notes to Financial Statements
31 December 2011
14. DIVIDENDS
2011 2010
HK$’000 HK$’000
Interim – 13.8 HK cents (2010: Nil) per ordinary share 153,342 –
Special – Nil (2010: 8.0 HK cents) per ordinary share – 86,985
Proposed final –15.0 HK cents (2010: 16.8 HK cents)
per ordinary share 167,384 184,805
320,726 271,790
The proposed final dividend for the year is to be paid and subject to the approval of the Company’s
shareholders at the forthcoming annual general meeting.
15. EARNINGS PER SHARE ATTRIBUTABLE TO ORDINARY EQUITY HOLDERS OF THE PARENT
The calculations of basic and diluted earnings per share are based on:
2011 2010
HK$’000 HK$’000
Profit
Profit attributable to ordinary equity holders of the parent,
used in the basic and diluted earnings per share calculation 799,934 701,884
Number of shares
Shares 2011 2010
Weighted average number of ordinary shares in issue
during the year used in the basic earnings per share calculation 1,098,290,458 1,084,935,282
Effect of dilution – weighted average number of ordinary shares:
Assumed issuance upon the exercise of share options and
allotment and issuance of awarded shares 37,913,583 29,408,177
Weighted average number of ordinary shares in issue
during the year used in the diluted earnings per share calculation 1,136,204,041 1,114,343,459
The calculation of the basic earnings per share is based on the profit for the year attributable to ordinary
equity holders of the parent, and the weighted average number of ordinary shares in issue during the year.
The calculation of the diluted earnings per share is based on the profit for the year attributable to ordinary
equity holders of the parent. The weighted average number of ordinary shares used in the calculation is the
number of ordinary shares in issue during the year, as used in the basic earnings per share calculation, and
the weighted average number of ordinary shares assumed to have been issued at no consideration on the
deemed exercise or conversion of all the dilutive potential ordinary shares into ordinary shares.
111AnnuAl report 2011
Notes to Financial Statements
31 December 2011
16. PROPERTY, PLANT AND EQUIPMENT
Group
Furniture, fixtures, office equipment and research Plant and and development Motor Construction Buildings machinery equipment vehicles in progress Total HK$’000 HK$’000 HK$’000 HK$’000 HK$’000 HK$’000
31 December 2011
At 31 December 2010 and at 1 January 2011: Cost 102,429 620,580 156,817 12,962 708 893,496 Accumulated depreciation and impairment (23,093) (454,667) (100,532) (6,088) – (584,380)
Net carrying amount 79,336 165,913 56,285 6,874 708 309,116
At 1 January 2011, net of accumulated depreciation and impairment 79,336 165,913 56,285 6,874 708 309,116Additions 811 179,652 33,278 2,987 17,034 233,762Acquisition of subsidiaries (note 40(a)) – 8,041 15,402 187 – 23,630Acquisition of a new business under common control (note 40(b)) – 1,766 679 51 – 2,496Disposals – (1,416) (466) (254) – (2,136)Depreciation provided during the year (note 9) (3,560) (53,184) (26,921) (2,390) – (86,055)Transfer 6,025 2,402 2,832 – (11,259) –Exchange realignments 3,541 9,935 2,625 68 150 16,319
At 31 December 2011, net of accumulated depreciation and impairment 86,153 313,109 83,714 7,523 6,633 497,132
At 31 December 2011: Cost 113,950 842,243 246,326 15,454 6,633 1,224,606 Accumulated depreciation and impairment (27,797) (529,134) (162,612) (7,931) – (727,474)
Net carrying amount 86,153 313,109 83,714 7,523 6,633 497,132
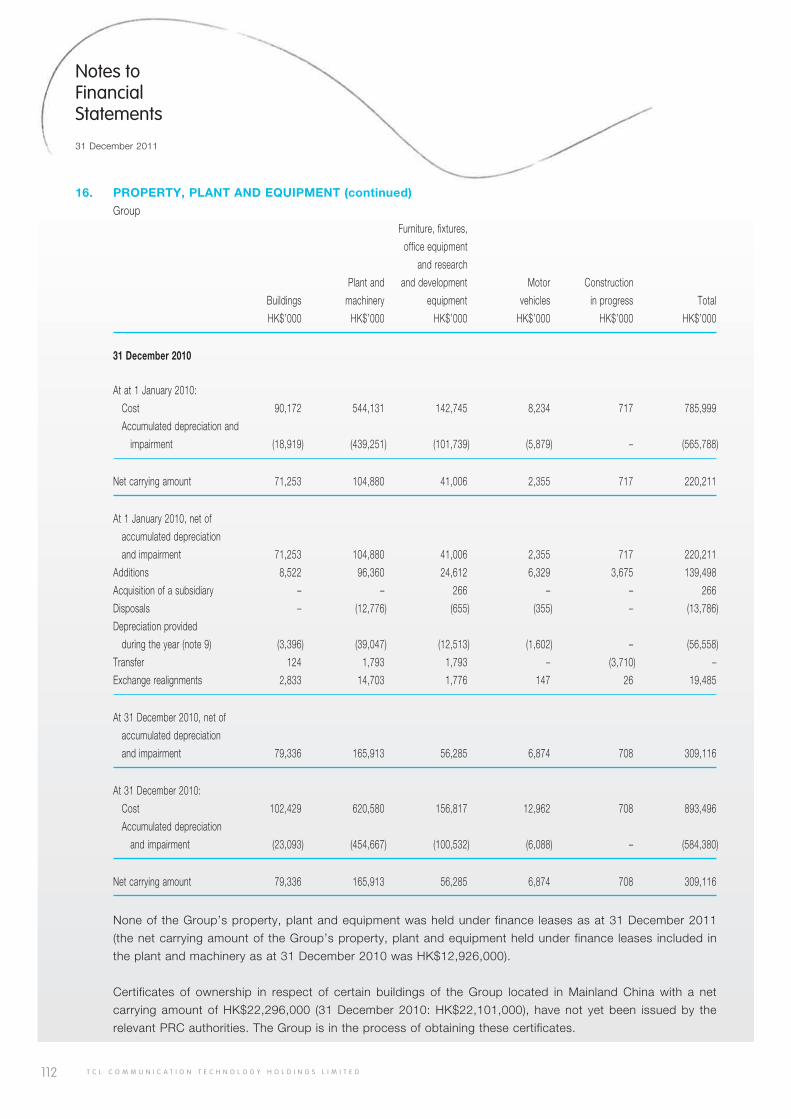
112 T C L C O M M U N I C A T I O N T E C H N O L O G Y H O L D I N G S L I M I T E D
Notes to Financial Statements
31 December 2011
16. PROPERTY, PLANT AND EQUIPMENT (continued)
Group
Furniture, fixtures,
office equipment
and research
Plant and and development Motor Construction
Buildings machinery equipment vehicles in progress Total
HK$’000 HK$’000 HK$’000 HK$’000 HK$’000 HK$’000
31 December 2010
At at 1 January 2010:
Cost 90,172 544,131 142,745 8,234 717 785,999
Accumulated depreciation and
impairment (18,919) (439,251) (101,739) (5,879) – (565,788)
Net carrying amount 71,253 104,880 41,006 2,355 717 220,211
At 1 January 2010, net of
accumulated depreciation
and impairment 71,253 104,880 41,006 2,355 717 220,211
Additions 8,522 96,360 24,612 6,329 3,675 139,498
Acquisition of a subsidiary – – 266 – – 266
Disposals – (12,776) (655) (355) – (13,786)
Depreciation provided
during the year (note 9) (3,396) (39,047) (12,513) (1,602) – (56,558)
Transfer 124 1,793 1,793 – (3,710) –
Exchange realignments 2,833 14,703 1,776 147 26 19,485
At 31 December 2010, net of
accumulated depreciation
and impairment 79,336 165,913 56,285 6,874 708 309,116
At 31 December 2010:
Cost 102,429 620,580 156,817 12,962 708 893,496
Accumulated depreciation
and impairment (23,093) (454,667) (100,532) (6,088) – (584,380)
Net carrying amount 79,336 165,913 56,285 6,874 708 309,116
None of the Group’s property, plant and equipment was held under finance leases as at 31 December 2011
(the net carrying amount of the Group’s property, plant and equipment held under finance leases included in
the plant and machinery as at 31 December 2010 was HK$12,926,000).
Certificates of ownership in respect of certain buildings of the Group located in Mainland China with a net
carrying amount of HK$22,296,000 (31 December 2010: HK$22,101,000), have not yet been issued by the
relevant PRC authorities. The Group is in the process of obtaining these certificates.
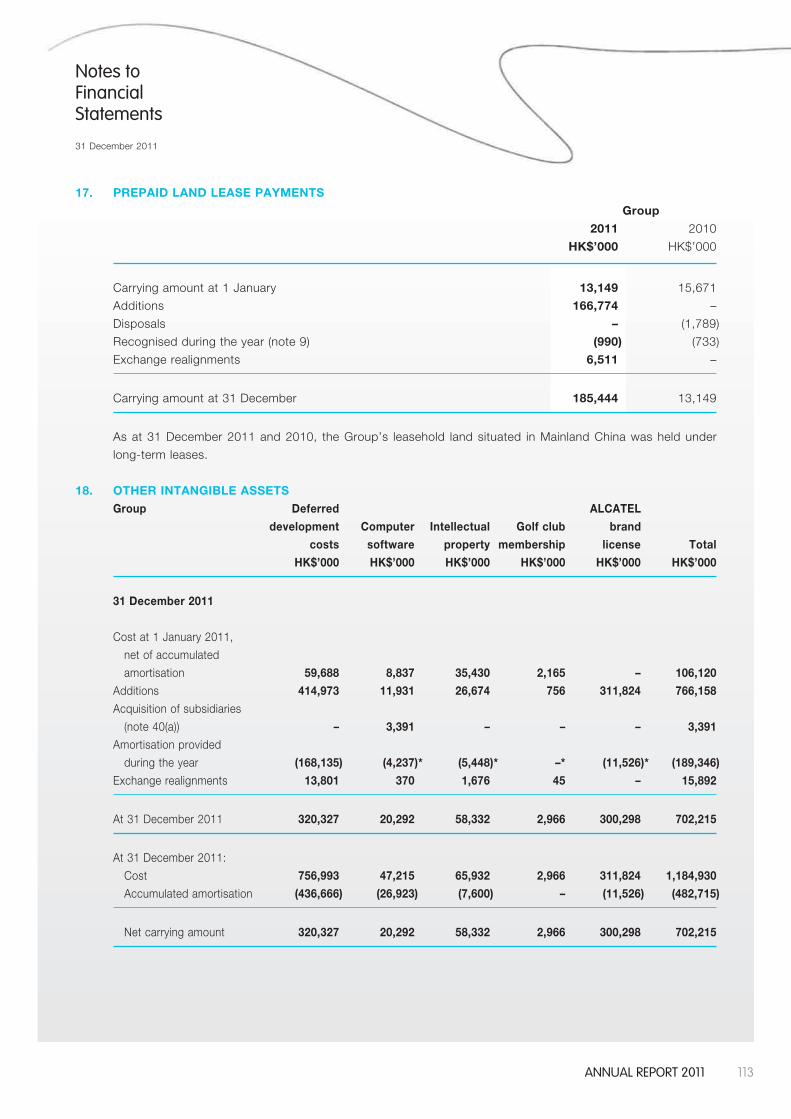
113AnnuAl report 2011
Notes to Financial Statements
31 December 2011
17. PREPAID LAND LEASE PAYMENTS
Group
2011 2010
HK$’000 HK$’000
Carrying amount at 1 January 13,149 15,671
Additions 166,774 –
Disposals – (1,789)
Recognised during the year (note 9) (990) (733)
Exchange realignments 6,511 –
Carrying amount at 31 December 185,444 13,149
As at 31 December 2011 and 2010, the Group’s leasehold land situated in Mainland China was held under
long-term leases.
18. OTHER INTANGIBLE ASSETS
Group Deferred ALCATEL
development Computer Intellectual Golf club brand
costs software property membership license Total
HK$’000 HK$’000 HK$’000 HK$’000 HK$’000 HK$’000
31 December 2011
Cost at 1 January 2011,
net of accumulated
amortisation 59,688 8,837 35,430 2,165 – 106,120
Additions 414,973 11,931 26,674 756 311,824 766,158
Acquisition of subsidiaries
(note 40(a)) – 3,391 – – – 3,391
Amortisation provided
during the year (168,135) (4,237)* (5,448)* –* (11,526)* (189,346)
Exchange realignments 13,801 370 1,676 45 – 15,892
At 31 December 2011 320,327 20,292 58,332 2,966 300,298 702,215
At 31 December 2011:
Cost 756,993 47,215 65,932 2,966 311,824 1,184,930
Accumulated amortisation (436,666) (26,923) (7,600) – (11,526) (482,715)
Net carrying amount 320,327 20,292 58,332 2,966 300,298 702,215
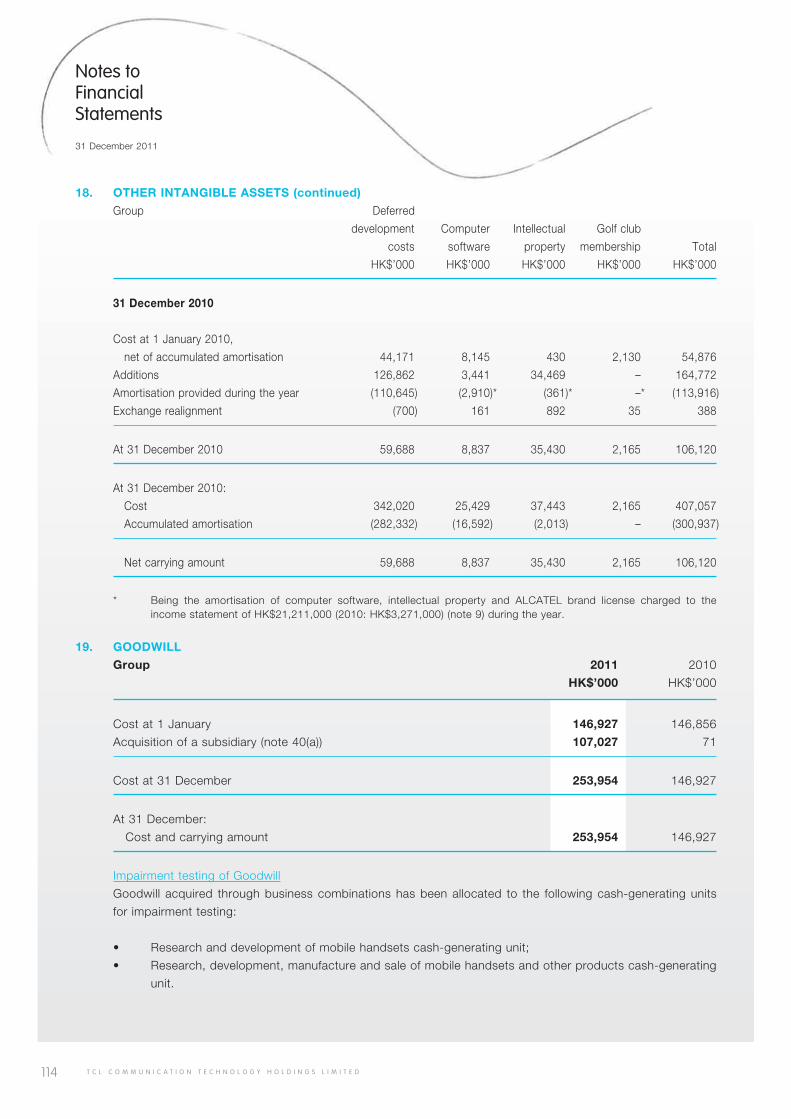
114 T C L C O M M U N I C A T I O N T E C H N O L O G Y H O L D I N G S L I M I T E D
Notes to Financial Statements
31 December 2011
18. OTHER INTANGIBLE ASSETS (continued)
Group Deferred
development Computer Intellectual Golf club
costs software property membership Total
HK$’000 HK$’000 HK$’000 HK$’000 HK$’000
31 December 2010
Cost at 1 January 2010,
net of accumulated amortisation 44,171 8,145 430 2,130 54,876
Additions 126,862 3,441 34,469 – 164,772
Amortisation provided during the year (110,645) (2,910)* (361)* –* (113,916)
Exchange realignment (700) 161 892 35 388
At 31 December 2010 59,688 8,837 35,430 2,165 106,120
At 31 December 2010:
Cost 342,020 25,429 37,443 2,165 407,057
Accumulated amortisation (282,332) (16,592) (2,013) – (300,937)
Net carrying amount 59,688 8,837 35,430 2,165 106,120
* Being the amortisation of computer software, intellectual property and ALCATEL brand license charged to the income statement of HK$21,211,000 (2010: HK$3,271,000) (note 9) during the year.
19. GOODWILL
Group 2011 2010
HK$’000 HK$’000
Cost at 1 January 146,927 146,856
Acquisition of a subsidiary (note 40(a)) 107,027 71
Cost at 31 December 253,954 146,927
At 31 December:
Cost and carrying amount 253,954 146,927
Impairment testing of Goodwill
Goodwill acquired through business combinations has been allocated to the following cash-generating units
for impairment testing:
• Researchanddevelopmentofmobilehandsetscash-generatingunit;
• Research,development,manufactureandsaleofmobilehandsetsandotherproductscash-generating
unit.
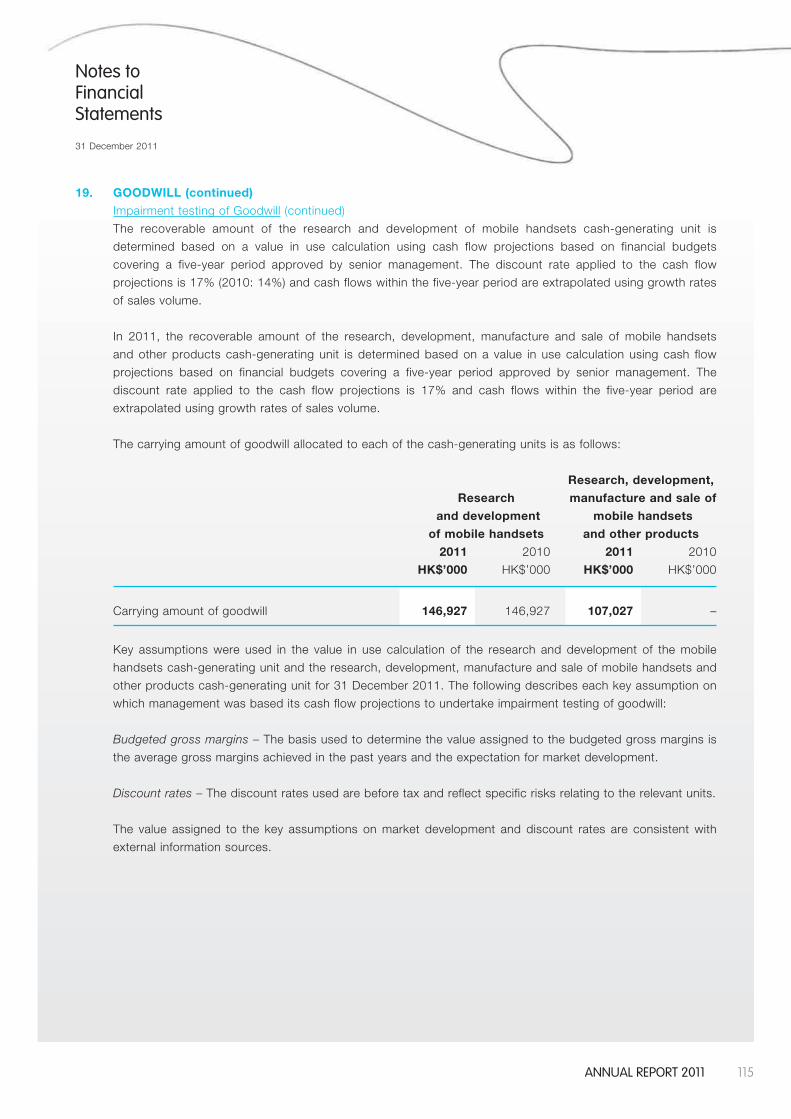
115AnnuAl report 2011
Notes to Financial Statements
31 December 2011
19. GOODWILL (continued)
Impairment testing of Goodwill (continued)
The recoverable amount of the research and development of mobile handsets cash-generating unit is
determined based on a value in use calculation using cash flow projections based on financial budgets
covering a five-year period approved by senior management. The discount rate applied to the cash flow
projections is 17% (2010: 14%) and cash flows within the five-year period are extrapolated using growth rates
of sales volume.
In 2011, the recoverable amount of the research, development, manufacture and sale of mobile handsets
and other products cash-generating unit is determined based on a value in use calculation using cash flow
projections based on financial budgets covering a five-year period approved by senior management. The
discount rate applied to the cash flow projections is 17% and cash flows within the five-year period are
extrapolated using growth rates of sales volume.
The carrying amount of goodwill allocated to each of the cash-generating units is as follows:
Research, development,
Research manufacture and sale of
and development mobile handsets
of mobile handsets and other products
2011 2010 2011 2010
HK$’000 HK$’000 HK$’000 HK$’000
Carrying amount of goodwill 146,927 146,927 107,027 –
Key assumptions were used in the value in use calculation of the research and development of the mobile
handsets cash-generating unit and the research, development, manufacture and sale of mobile handsets and
other products cash-generating unit for 31 December 2011. The following describes each key assumption on
which management was based its cash flow projections to undertake impairment testing of goodwill:
Budgeted gross margins – The basis used to determine the value assigned to the budgeted gross margins is
the average gross margins achieved in the past years and the expectation for market development.
Discount rates – The discount rates used are before tax and reflect specific risks relating to the relevant units.
The value assigned to the key assumptions on market development and discount rates are consistent with
external information sources.
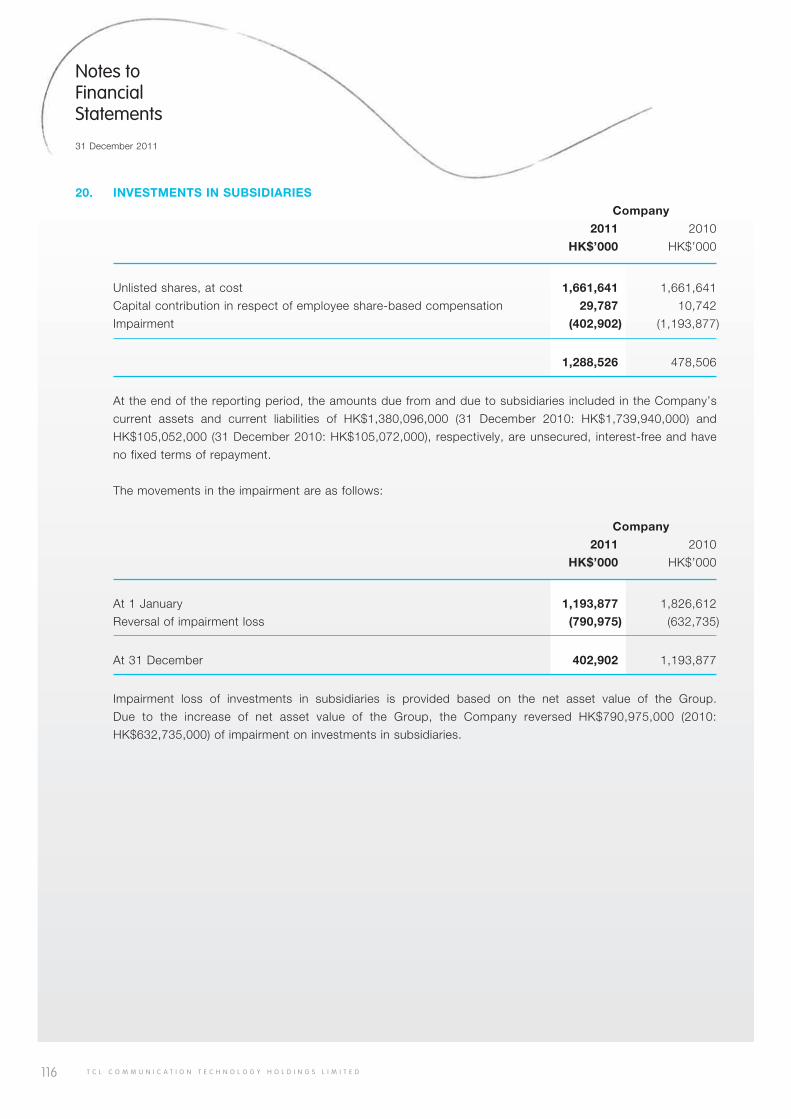
116 T C L C O M M U N I C A T I O N T E C H N O L O G Y H O L D I N G S L I M I T E D
Notes to Financial Statements
31 December 2011
20. INVESTMENTS IN SUBSIDIARIES
Company
2011 2010
HK$’000 HK$’000
Unlisted shares, at cost 1,661,641 1,661,641
Capital contribution in respect of employee share-based compensation 29,787 10,742
Impairment (402,902) (1,193,877)
1,288,526 478,506
At the end of the reporting period, the amounts due from and due to subsidiaries included in the Company’s
current assets and current liabilities of HK$1,380,096,000 (31 December 2010: HK$1,739,940,000) and
HK$105,052,000 (31 December 2010: HK$105,072,000), respectively, are unsecured, interest-free and have
no fixed terms of repayment.
The movements in the impairment are as follows:
Company
2011 2010
HK$’000 HK$’000
At 1 January 1,193,877 1,826,612
Reversal of impairment loss (790,975) (632,735)
At 31 December 402,902 1,193,877
Impairment loss of investments in subsidiaries is provided based on the net asset value of the Group.
Due to the increase of net asset value of the Group, the Company reversed HK$790,975,000 (2010:
HK$632,735,000) of impairment on investments in subsidiaries.
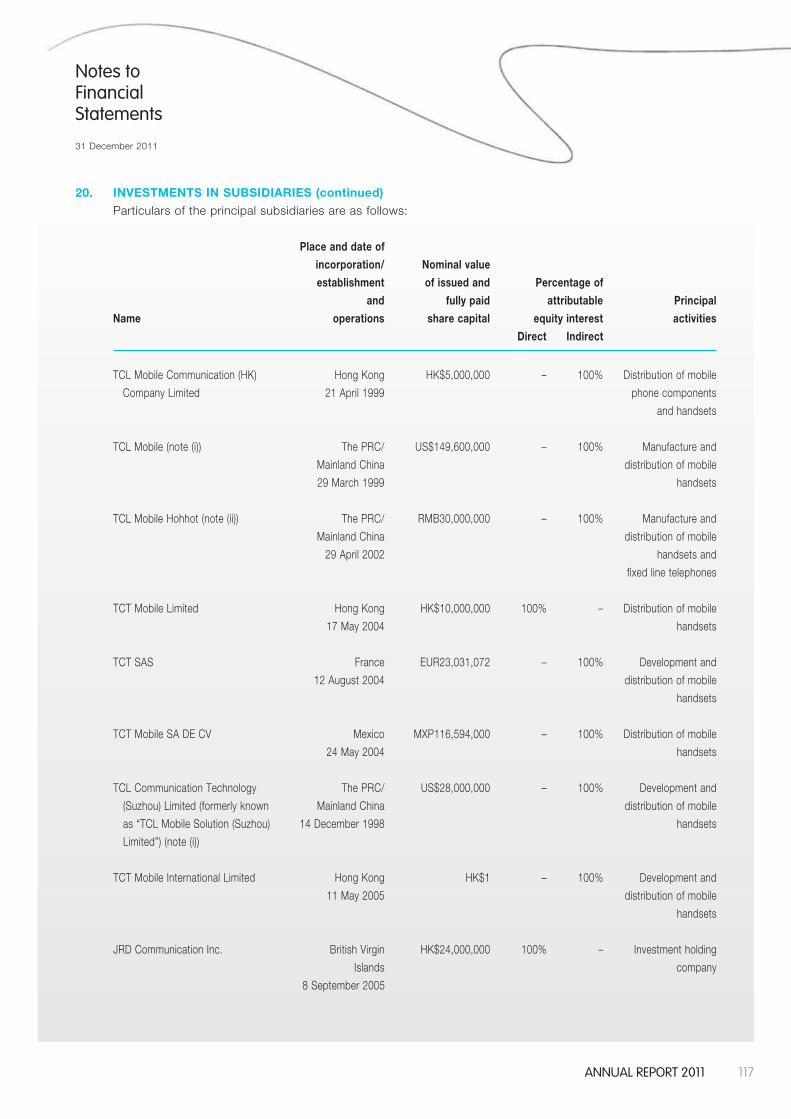
117AnnuAl report 2011
Notes to Financial Statements
31 December 2011
20. INVESTMENTS IN SUBSIDIARIES (continued)
Particulars of the principal subsidiaries are as follows:
Place and date of
incorporation/ Nominal value
establishment of issued and Percentage of
and fully paid attributable Principal
Name operations share capital equity interest activities
Direct Indirect
TCL Mobile Communication (HK) Hong Kong HK$5,000,000 – 100% Distribution of mobile
Company Limited 21 April 1999 phone components
and handsets
TCL Mobile (note (i)) The PRC/ US$149,600,000 – 100% Manufacture and
Mainland China distribution of mobile
29 March 1999 handsets
TCL Mobile Hohhot (note (ii)) The PRC/ RMB30,000,000 – 100% Manufacture and
Mainland China distribution of mobile
29 April 2002 handsets and
fixed line telephones
TCT Mobile Limited Hong Kong HK$10,000,000 100% – Distribution of mobile
17 May 2004 handsets
TCT SAS France EUR23,031,072 – 100% Development and
12 August 2004 distribution of mobile
handsets
TCT Mobile SA DE CV Mexico MXP116,594,000 – 100% Distribution of mobile
24 May 2004 handsets
TCL Communication Technology The PRC/ US$28,000,000 – 100% Development and
(Suzhou) Limited (formerly known Mainland China distribution of mobile
as “TCL Mobile Solution (Suzhou) 14 December 1998 handsets
Limited”) (note (i))
TCT Mobile International Limited Hong Kong HK$1 – 100% Development and
11 May 2005 distribution of mobile
handsets
JRD Communication Inc. British Virgin HK$24,000,000 100% – Investment holding
Islands company
8 September 2005
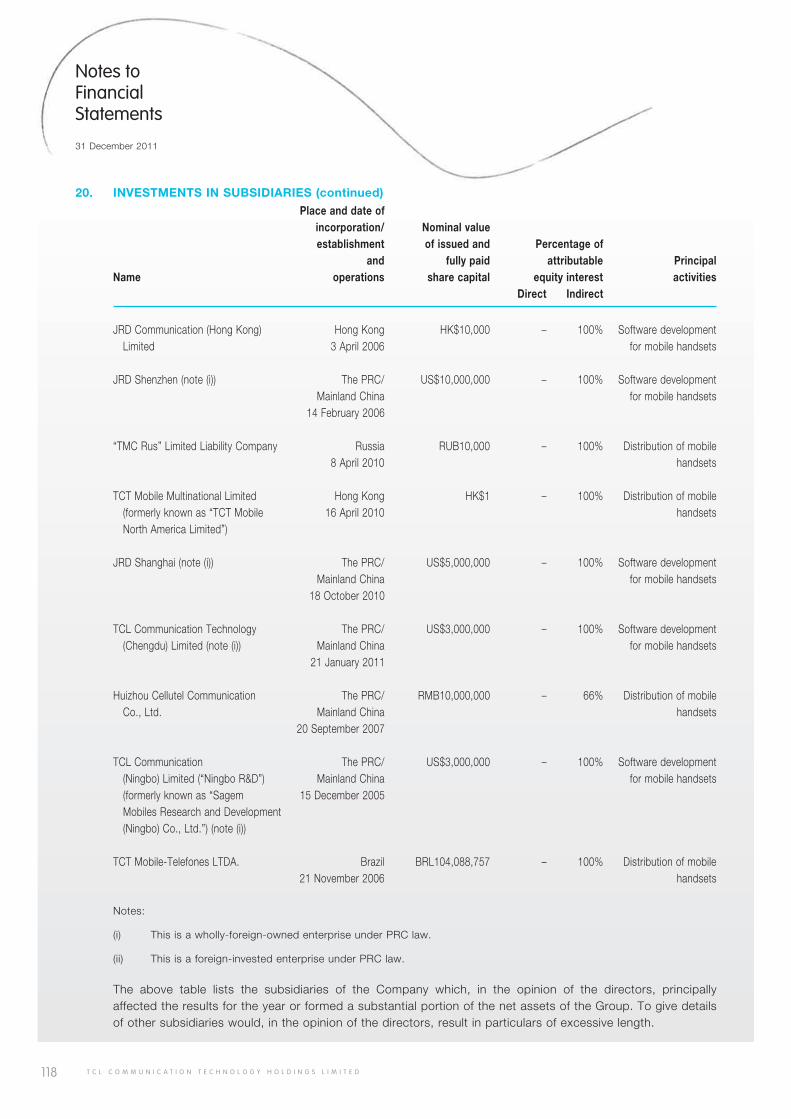
118 T C L C O M M U N I C A T I O N T E C H N O L O G Y H O L D I N G S L I M I T E D
Notes to Financial Statements
31 December 2011
20. INVESTMENTS IN SUBSIDIARIES (continued)
Place and date of incorporation/ Nominal value establishment of issued and Percentage of and fully paid attributable PrincipalName operations share capital equity interest activities Direct Indirect
JRD Communication (Hong Kong) Hong Kong HK$10,000 – 100% Software development Limited 3 April 2006 for mobile handsets
JRD Shenzhen (note (i)) The PRC/ US$10,000,000 – 100% Software development Mainland China for mobile handsets 14 February 2006
“TMC Rus” Limited Liability Company Russia RUB10,000 – 100% Distribution of mobile 8 April 2010 handsets
TCT Mobile Multinational Limited Hong Kong HK$1 – 100% Distribution of mobile (formerly known as “TCT Mobile 16 April 2010 handsets North America Limited”)
JRD Shanghai (note (i)) The PRC/ US$5,000,000 – 100% Software development Mainland China for mobile handsets 18 October 2010
TCL Communication Technology The PRC/ US$3,000,000 – 100% Software development (Chengdu) Limited (note (i)) Mainland China for mobile handsets 21 January 2011
Huizhou Cellutel Communication The PRC/ RMB10,000,000 – 66% Distribution of mobile Co., Ltd. Mainland China handsets 20 September 2007
TCL Communication The PRC/ US$3,000,000 – 100% Software development (Ningbo) Limited (“Ningbo R&D”) Mainland China for mobile handsets (formerly known as “Sagem 15 December 2005 Mobiles Research and Development (Ningbo) Co., Ltd.”) (note (i))
TCT Mobile-Telefones LTDA. Brazil BRL104,088,757 – 100% Distribution of mobile 21 November 2006 handsets
Notes:
(i) This is a wholly-foreign-owned enterprise under PRC law.
(ii) This is a foreign-invested enterprise under PRC law.
The above table lists the subsidiaries of the Company which, in the opinion of the directors, principally affected the results for the year or formed a substantial portion of the net assets of the Group. To give details of other subsidiaries would, in the opinion of the directors, result in particulars of excessive length.
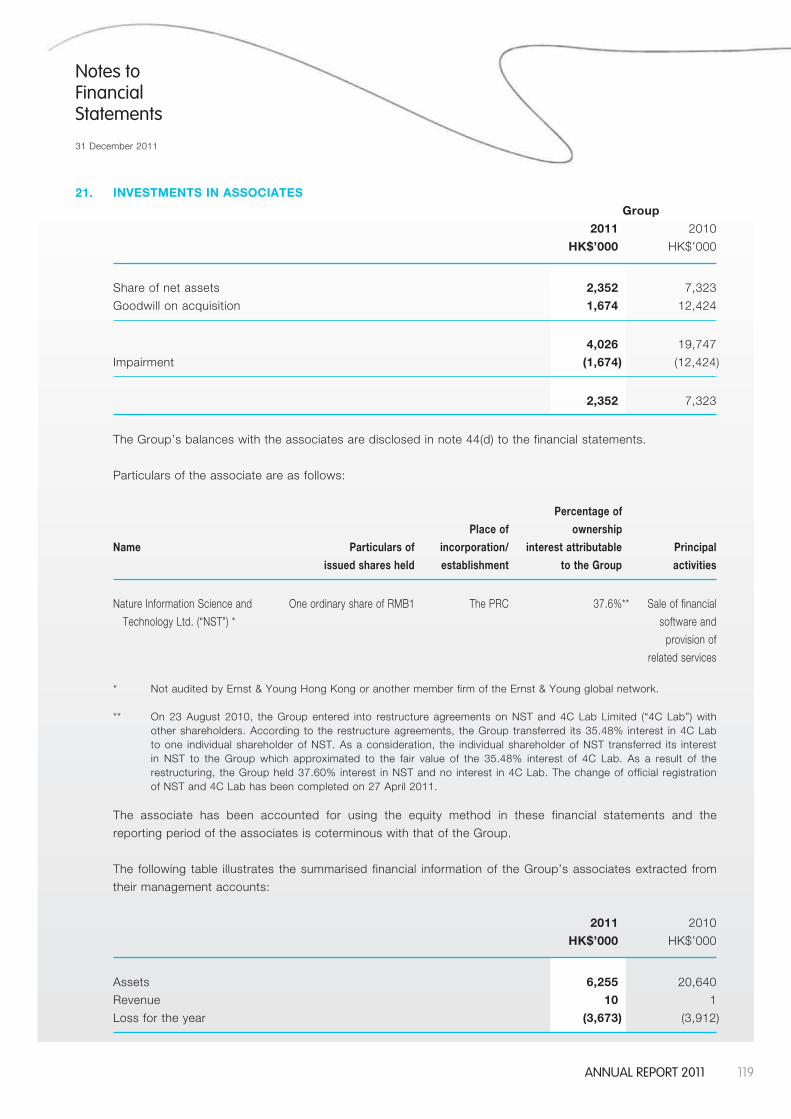
119AnnuAl report 2011
Notes to Financial Statements
31 December 2011
21. INVESTMENTS IN ASSOCIATES
Group
2011 2010
HK$’000 HK$’000
Share of net assets 2,352 7,323
Goodwill on acquisition 1,674 12,424
4,026 19,747
Impairment (1,674) (12,424)
2,352 7,323
The Group’s balances with the associates are disclosed in note 44(d) to the financial statements.
Particulars of the associate are as follows:
Percentage of
Place of ownership
Name Particulars of incorporation/ interest attributable Principal
issued shares held establishment to the Group activities
Nature Information Science and One ordinary share of RMB1 The PRC 37.6%** Sale of financial
Technology Ltd. (“NST”) * software and
provision of
related services
* Not audited by Ernst & Young Hong Kong or another member firm of the Ernst & Young global network.
** On 23 August 2010, the Group entered into restructure agreements on NST and 4C Lab Limited (“4C Lab”) with other shareholders. According to the restructure agreements, the Group transferred its 35.48% interest in 4C Lab to one individual shareholder of NST. As a consideration, the individual shareholder of NST transferred its interest in NST to the Group which approximated to the fair value of the 35.48% interest of 4C Lab. As a result of the restructuring, the Group held 37.60% interest in NST and no interest in 4C Lab. The change of official registration of NST and 4C Lab has been completed on 27 April 2011.
The associate has been accounted for using the equity method in these financial statements and the
reporting period of the associates is coterminous with that of the Group.
The following table illustrates the summarised financial information of the Group’s associates extracted from
their management accounts:
2011 2010
HK$’000 HK$’000
Assets 6,255 20,640
Revenue 10 1
Loss for the year (3,673) (3,912)
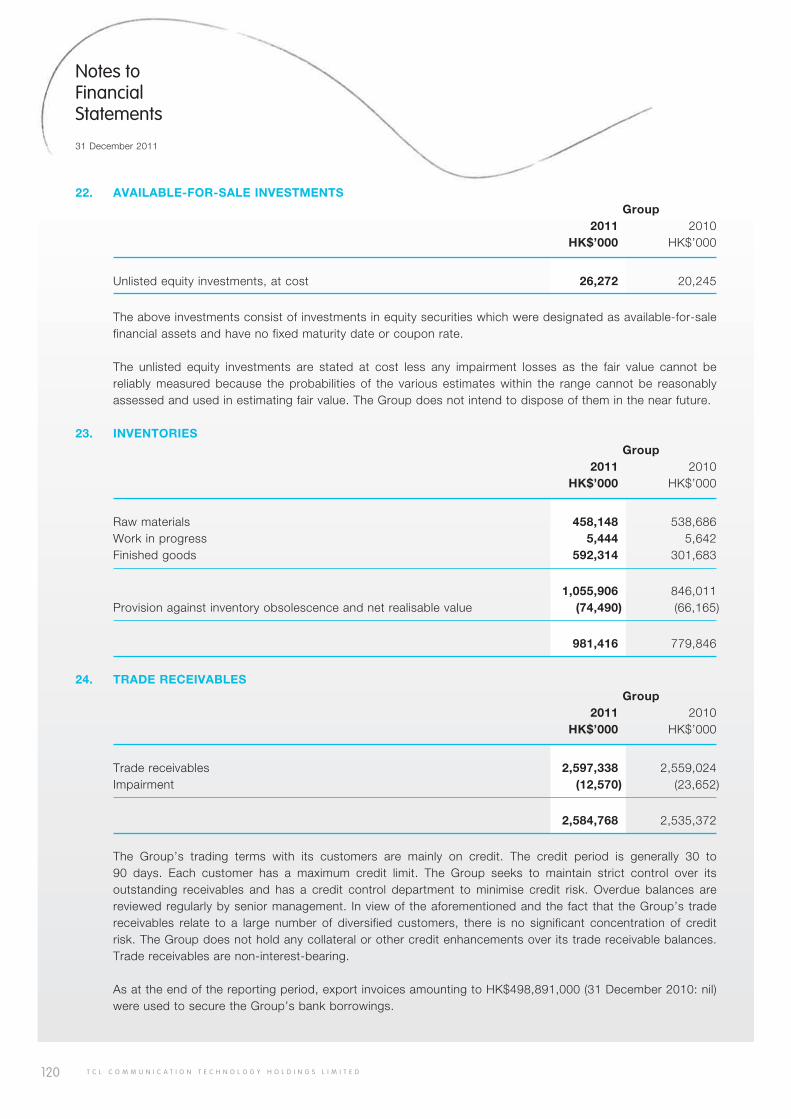
120 T C L C O M M U N I C A T I O N T E C H N O L O G Y H O L D I N G S L I M I T E D
Notes to Financial Statements
31 December 2011
22. AVAILABLE-FOR-SALE INVESTMENTS Group 2011 2010 HK$’000 HK$’000
Unlisted equity investments, at cost 26,272 20,245
The above investments consist of investments in equity securities which were designated as available-for-sale financial assets and have no fixed maturity date or coupon rate.
The unlisted equity investments are stated at cost less any impairment losses as the fair value cannot be reliably measured because the probabilities of the various estimates within the range cannot be reasonably assessed and used in estimating fair value. The Group does not intend to dispose of them in the near future.
23. INVENTORIES Group 2011 2010 HK$’000 HK$’000
Raw materials 458,148 538,686Work in progress 5,444 5,642Finished goods 592,314 301,683
1,055,906 846,011Provision against inventory obsolescence and net realisable value (74,490) (66,165)
981,416 779,846
24. TRADE RECEIVABLES Group 2011 2010 HK$’000 HK$’000
Trade receivables 2,597,338 2,559,024Impairment (12,570) (23,652)
2,584,768 2,535,372
The Group’s trading terms with its customers are mainly on credit. The credit period is generally 30 to 90 days. Each customer has a maximum credit limit. The Group seeks to maintain strict control over its outstanding receivables and has a credit control department to minimise credit risk. Overdue balances are reviewed regularly by senior management. In view of the aforementioned and the fact that the Group’s trade receivables relate to a large number of diversified customers, there is no significant concentration of credit risk. The Group does not hold any collateral or other credit enhancements over its trade receivable balances. Trade receivables are non-interest-bearing.
As at the end of the reporting period, export invoices amounting to HK$498,891,000 (31 December 2010: nil) were used to secure the Group’s bank borrowings.
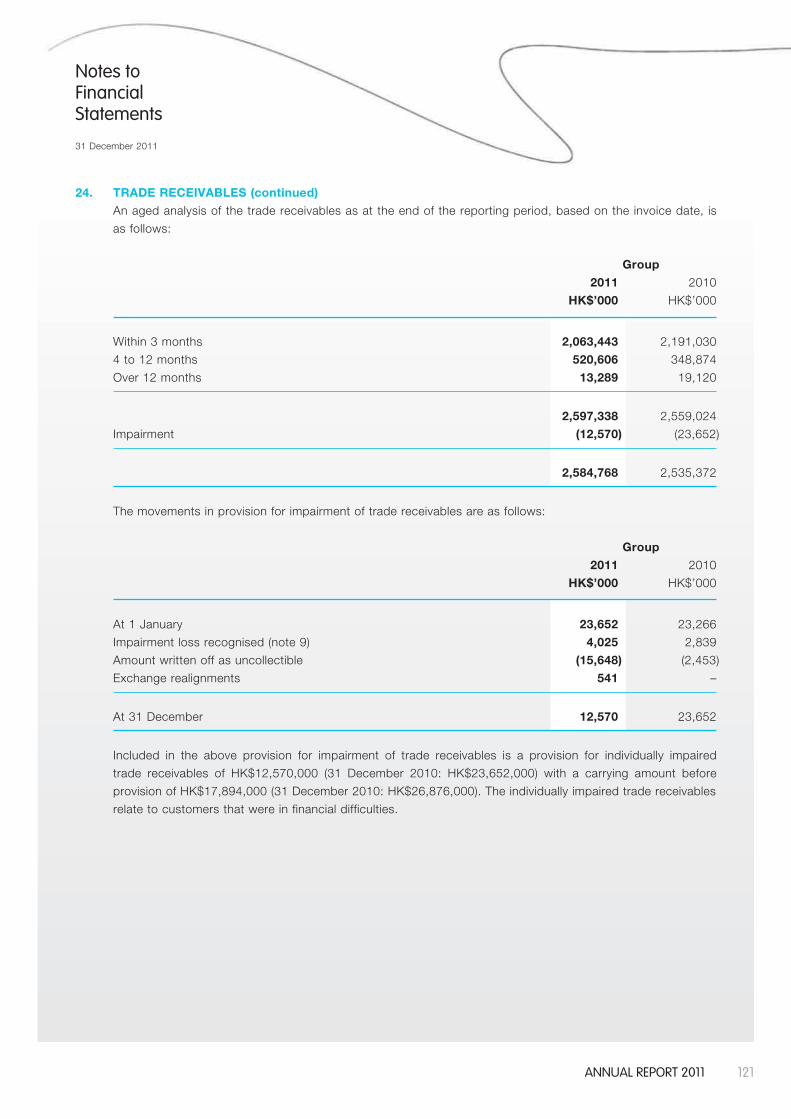
121AnnuAl report 2011
Notes to Financial Statements
31 December 2011
24. TRADE RECEIVABLES (continued)
An aged analysis of the trade receivables as at the end of the reporting period, based on the invoice date, is
as follows:
Group
2011 2010
HK$’000 HK$’000
Within 3 months 2,063,443 2,191,030
4 to 12 months 520,606 348,874
Over 12 months 13,289 19,120
2,597,338 2,559,024
Impairment (12,570) (23,652)
2,584,768 2,535,372
The movements in provision for impairment of trade receivables are as follows:
Group
2011 2010
HK$’000 HK$’000
At 1 January 23,652 23,266
Impairment loss recognised (note 9) 4,025 2,839
Amount written off as uncollectible (15,648) (2,453)
Exchange realignments 541 –
At 31 December 12,570 23,652
Included in the above provision for impairment of trade receivables is a provision for individually impaired
trade receivables of HK$12,570,000 (31 December 2010: HK$23,652,000) with a carrying amount before
provision of HK$17,894,000 (31 December 2010: HK$26,876,000). The individually impaired trade receivables
relate to customers that were in financial difficulties.
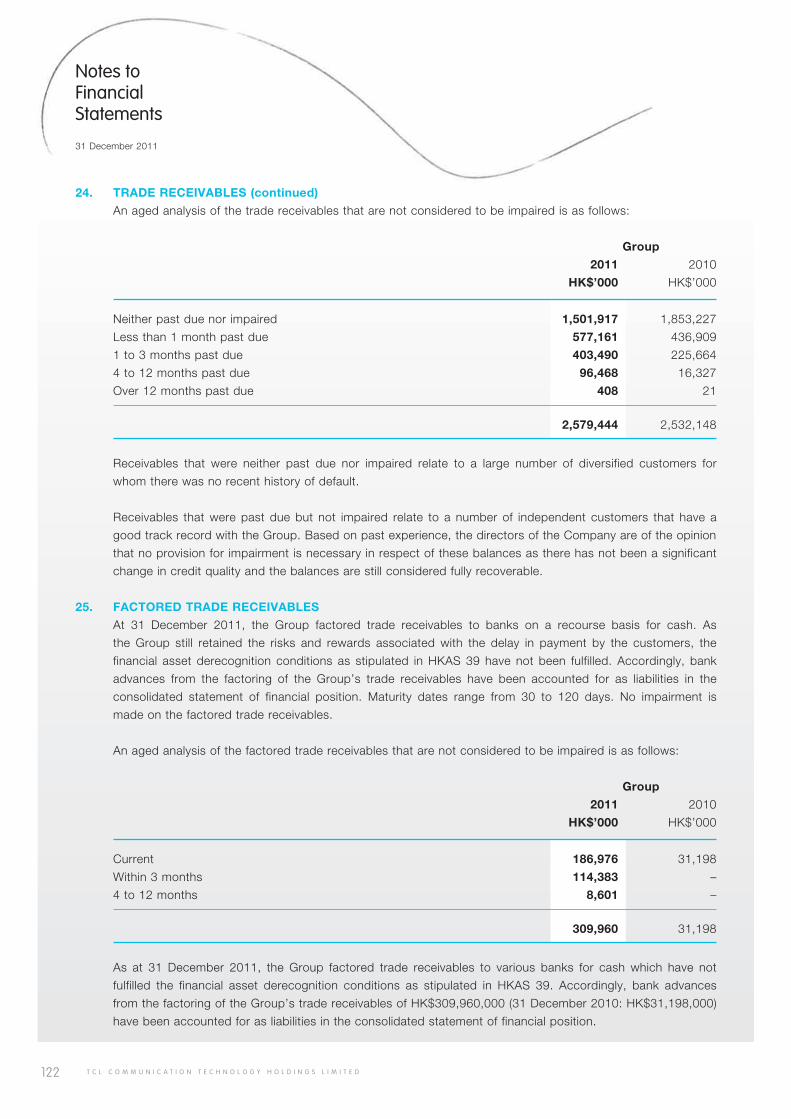
122 T C L C O M M U N I C A T I O N T E C H N O L O G Y H O L D I N G S L I M I T E D
Notes to Financial Statements
31 December 2011
24. TRADE RECEIVABLES (continued)
An aged analysis of the trade receivables that are not considered to be impaired is as follows:
Group
2011 2010
HK$’000 HK$’000
Neither past due nor impaired 1,501,917 1,853,227
Less than 1 month past due 577,161 436,909
1 to 3 months past due 403,490 225,664
4 to 12 months past due 96,468 16,327
Over 12 months past due 408 21
2,579,444 2,532,148
Receivables that were neither past due nor impaired relate to a large number of diversified customers for
whom there was no recent history of default.
Receivables that were past due but not impaired relate to a number of independent customers that have a
good track record with the Group. Based on past experience, the directors of the Company are of the opinion
that no provision for impairment is necessary in respect of these balances as there has not been a significant
change in credit quality and the balances are still considered fully recoverable.
25. FACTORED TRADE RECEIVABLES
At 31 December 2011, the Group factored trade receivables to banks on a recourse basis for cash. As
the Group still retained the risks and rewards associated with the delay in payment by the customers, the
financial asset derecognition conditions as stipulated in HKAS 39 have not been fulfilled. Accordingly, bank
advances from the factoring of the Group’s trade receivables have been accounted for as liabilities in the
consolidated statement of financial position. Maturity dates range from 30 to 120 days. No impairment is
made on the factored trade receivables.
An aged analysis of the factored trade receivables that are not considered to be impaired is as follows:
Group
2011 2010
HK$’000 HK$’000
Current 186,976 31,198
Within 3 months 114,383 –
4 to 12 months 8,601 –
309,960 31,198
As at 31 December 2011, the Group factored trade receivables to various banks for cash which have not
fulfilled the financial asset derecognition conditions as stipulated in HKAS 39. Accordingly, bank advances
from the factoring of the Group’s trade receivables of HK$309,960,000 (31 December 2010: HK$31,198,000)
have been accounted for as liabilities in the consolidated statement of financial position.
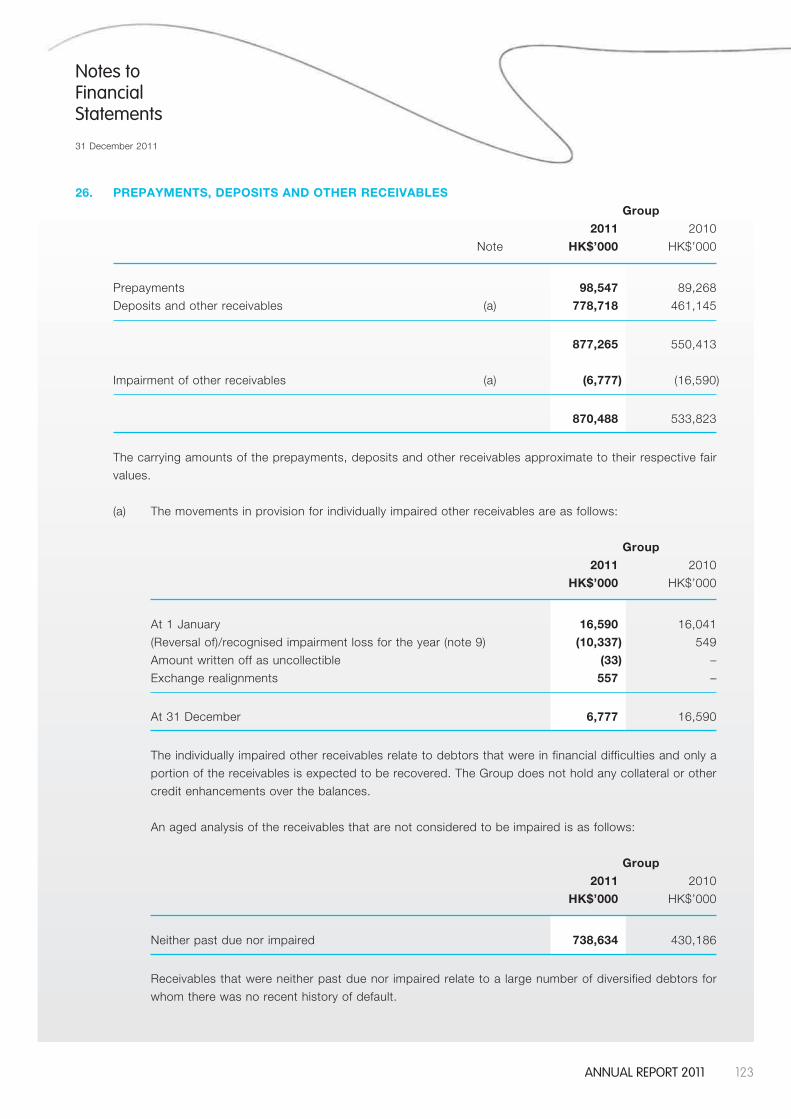
123AnnuAl report 2011
Notes to Financial Statements
31 December 2011
26. PREPAYMENTS, DEPOSITS AND OTHER RECEIVABLES
Group
2011 2010
Note HK$’000 HK$’000
Prepayments 98,547 89,268
Deposits and other receivables (a) 778,718 461,145
877,265 550,413
Impairment of other receivables (a) (6,777) (16,590)
870,488 533,823
The carrying amounts of the prepayments, deposits and other receivables approximate to their respective fair
values.
(a) The movements in provision for individually impaired other receivables are as follows:
Group
2011 2010
HK$’000 HK$’000
At 1 January 16,590 16,041
(Reversal of)/recognised impairment loss for the year (note 9) (10,337) 549
Amount written off as uncollectible (33) –
Exchange realignments 557 –
At 31 December 6,777 16,590
The individually impaired other receivables relate to debtors that were in financial difficulties and only a
portion of the receivables is expected to be recovered. The Group does not hold any collateral or other
credit enhancements over the balances.
An aged analysis of the receivables that are not considered to be impaired is as follows:
Group
2011 2010
HK$’000 HK$’000
Neither past due nor impaired 738,634 430,186
Receivables that were neither past due nor impaired relate to a large number of diversified debtors for
whom there was no recent history of default.
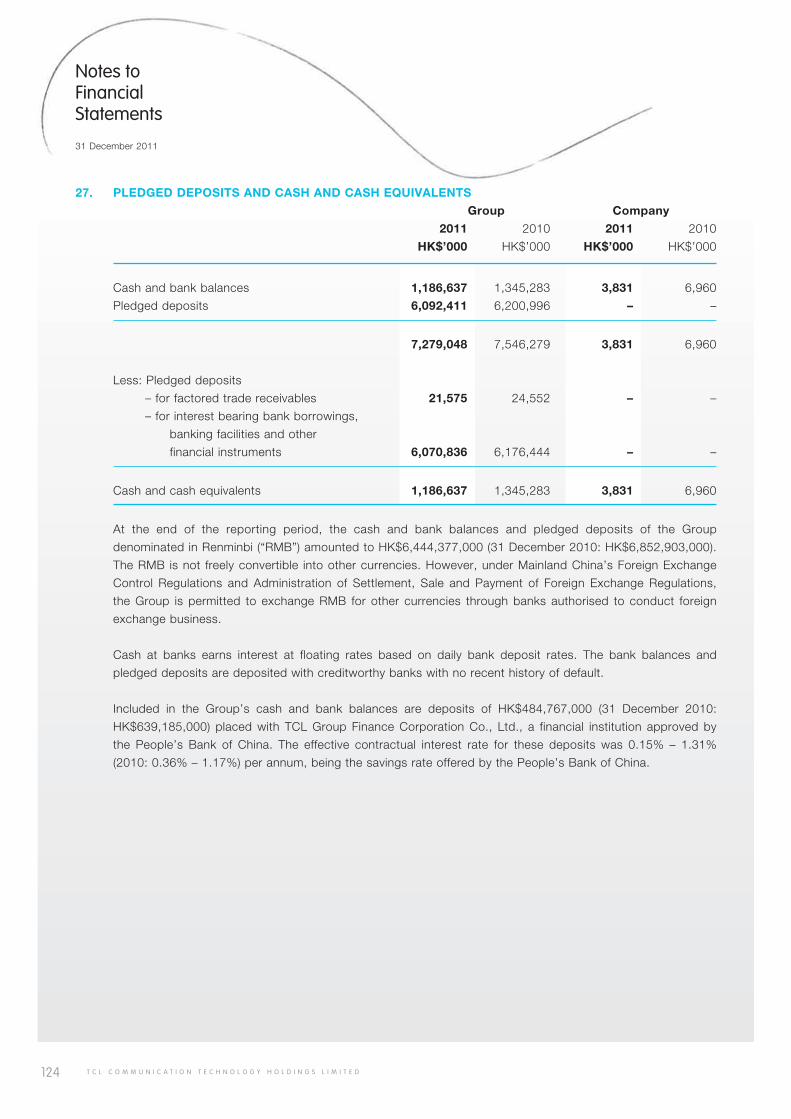
124 T C L C O M M U N I C A T I O N T E C H N O L O G Y H O L D I N G S L I M I T E D
Notes to Financial Statements
31 December 2011
27. PLEDGED DEPOSITS AND CASH AND CASH EQUIVALENTS
Group Company
2011 2010 2011 2010
HK$’000 HK$’000 HK$’000 HK$’000
Cash and bank balances 1,186,637 1,345,283 3,831 6,960
Pledged deposits 6,092,411 6,200,996 – –
7,279,048 7,546,279 3,831 6,960
Less: Pledged deposits
– for factored trade receivables 21,575 24,552 – –
– for interest bearing bank borrowings,
banking facilities and other
financial instruments 6,070,836 6,176,444 – –
Cash and cash equivalents 1,186,637 1,345,283 3,831 6,960
At the end of the reporting period, the cash and bank balances and pledged deposits of the Group
denominated in Renminbi (“RMB”) amounted to HK$6,444,377,000 (31 December 2010: HK$6,852,903,000).
The RMB is not freely convertible into other currencies. However, under Mainland China’s Foreign Exchange
Control Regulations and Administration of Settlement, Sale and Payment of Foreign Exchange Regulations,
the Group is permitted to exchange RMB for other currencies through banks authorised to conduct foreign
exchange business.
Cash at banks earns interest at floating rates based on daily bank deposit rates. The bank balances and
pledged deposits are deposited with creditworthy banks with no recent history of default.
Included in the Group’s cash and bank balances are deposits of HK$484,767,000 (31 December 2010:
HK$639,185,000) placed with TCL Group Finance Corporation Co., Ltd., a financial institution approved by
the People’s Bank of China. The effective contractual interest rate for these deposits was 0.15% – 1.31%
(2010: 0.36% – 1.17%) per annum, being the savings rate offered by the People’s Bank of China.
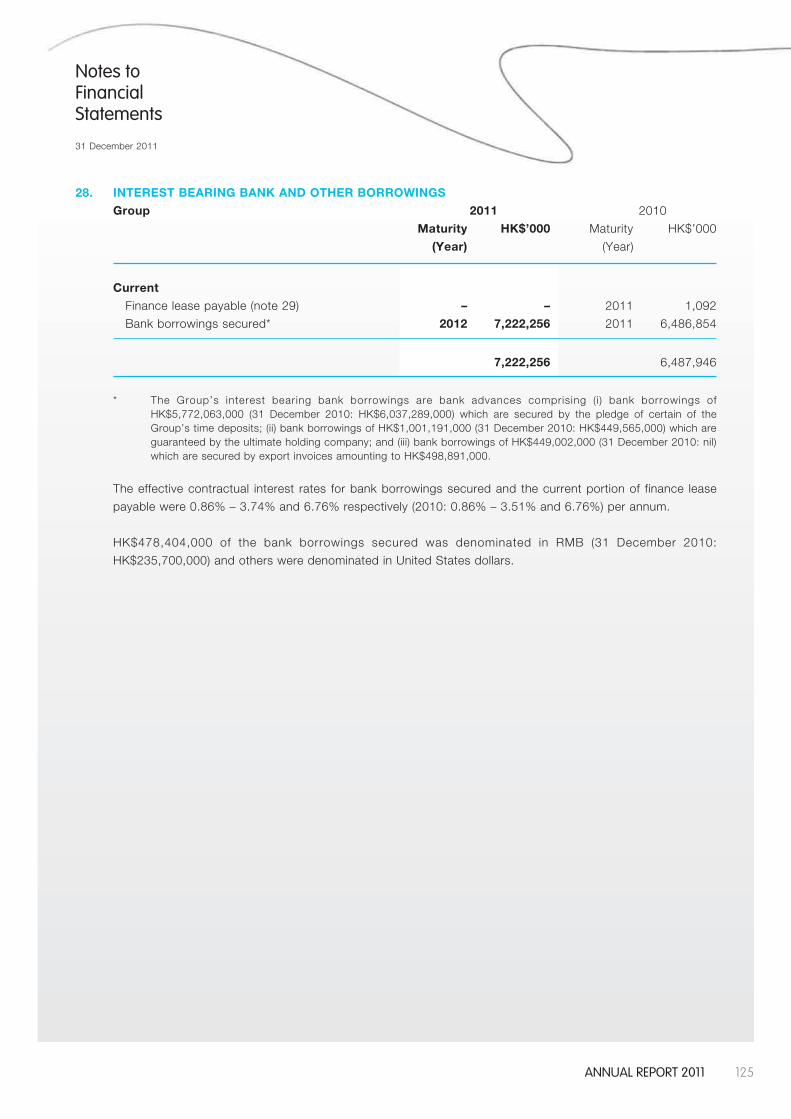
125AnnuAl report 2011
Notes to Financial Statements
31 December 2011
28. INTEREST BEARING BANK AND OTHER BORROWINGS
Group 2011 2010
Maturity HK$’000 Maturity HK$’000
(Year) (Year)
Current
Finance lease payable (note 29) – – 2011 1,092
Bank borrowings secured* 2012 7,222,256 2011 6,486,854
7,222,256 6,487,946
* The Group’s interest bearing bank borrowings are bank advances comprising ( i ) bank borrowings of HK$5,772,063,000 (31 December 2010: HK$6,037,289,000) which are secured by the pledge of certain of the Group’stimedeposits;(ii)bankborrowingsofHK$1,001,191,000(31December2010:HK$449,565,000)whichareguaranteedbytheultimateholdingcompany;and(iii)bankborrowingsofHK$449,002,000(31December2010:nil)which are secured by export invoices amounting to HK$498,891,000.
The effective contractual interest rates for bank borrowings secured and the current portion of finance lease
payable were 0.86% – 3.74% and 6.76% respectively (2010: 0.86% – 3.51% and 6.76%) per annum.
HK$478,404,000 of the bank borrowings secured was denominated in RMB (31 December 2010:
HK$235,700,000) and others were denominated in United States dollars.
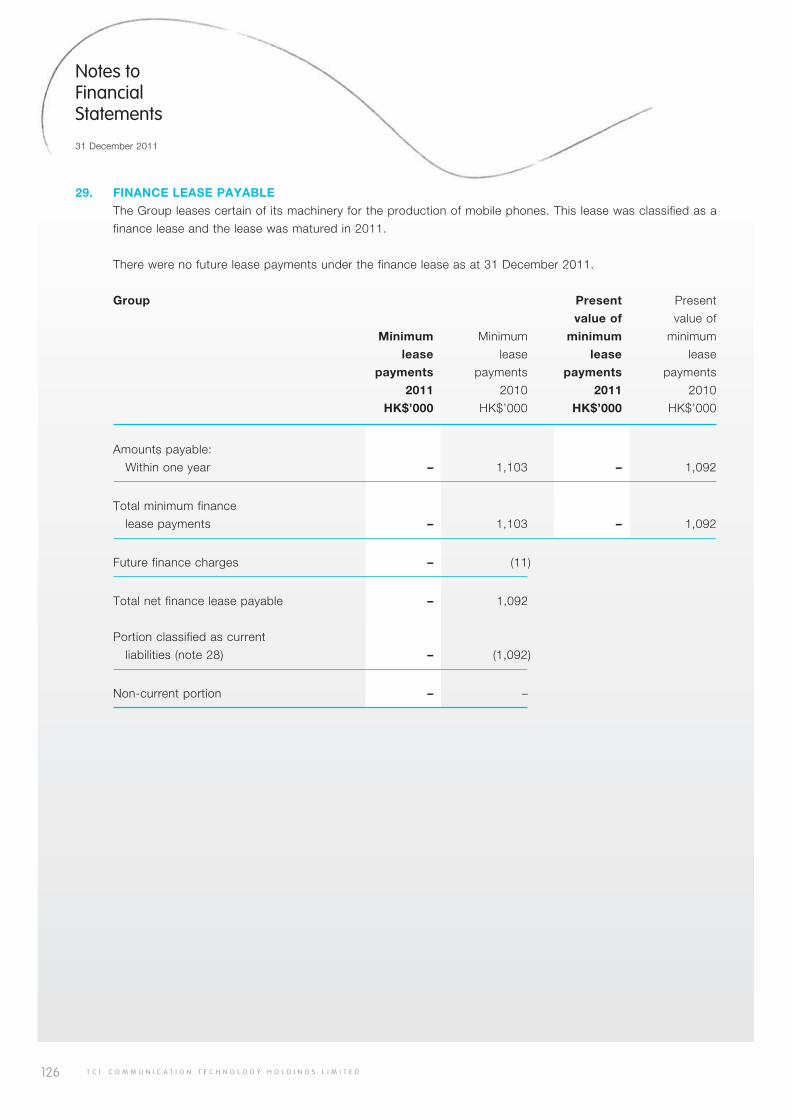
126 T C L C O M M U N I C A T I O N T E C H N O L O G Y H O L D I N G S L I M I T E D
Notes to Financial Statements
31 December 2011
29. FINANCE LEASE PAYABLE
The Group leases certain of its machinery for the production of mobile phones. This lease was classified as a
finance lease and the lease was matured in 2011.
There were no future lease payments under the finance lease as at 31 December 2011.
Group Present Present
value of value of
Minimum Minimum minimum minimum
lease lease lease lease
payments payments payments payments
2011 2010 2011 2010
HK$’000 HK$’000 HK$’000 HK$’000
Amounts payable:
Within one year – 1,103 – 1,092
Total minimum finance
lease payments – 1,103 – 1,092
Future finance charges – (11)
Total net finance lease payable – 1,092
Portion classified as current
liabilities (note 28) – (1,092)
Non-current portion – –
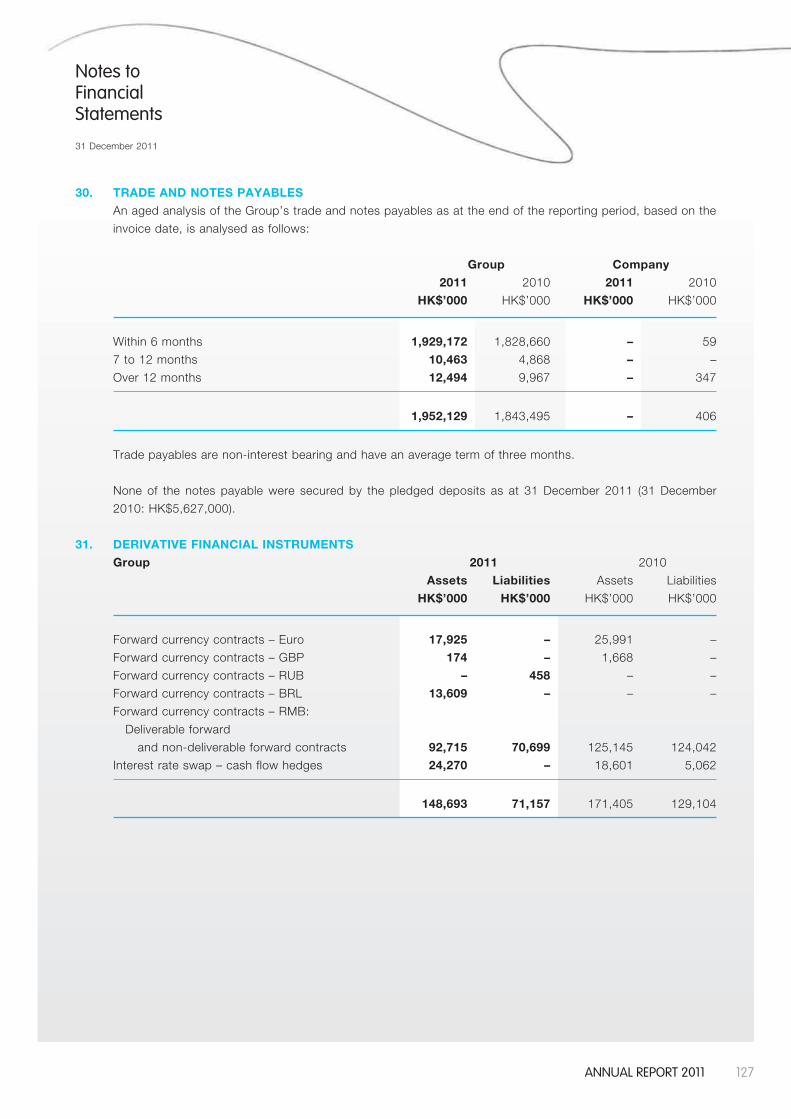
127AnnuAl report 2011
Notes to Financial Statements
31 December 2011
30. TRADE AND NOTES PAYABLES
An aged analysis of the Group’s trade and notes payables as at the end of the reporting period, based on the
invoice date, is analysed as follows:
Group Company
2011 2010 2011 2010
HK$’000 HK$’000 HK$’000 HK$’000
Within 6 months 1,929,172 1,828,660 – 59
7 to 12 months 10,463 4,868 – –
Over 12 months 12,494 9,967 – 347
1,952,129 1,843,495 – 406
Trade payables are non-interest bearing and have an average term of three months.
None of the notes payable were secured by the pledged deposits as at 31 December 2011 (31 December
2010: HK$5,627,000).
31. DERIVATIVE FINANCIAL INSTRUMENTS
Group 2011 2010
Assets Liabilities Assets Liabilities
HK$’000 HK$’000 HK$’000 HK$’000
Forward currency contracts – Euro 17,925 – 25,991 –
Forward currency contracts – GBP 174 – 1,668 –
Forward currency contracts – RUB – 458 – –
Forward currency contracts – BRL 13,609 – – –
Forward currency contracts – RMB:
Deliverable forward
and non-deliverable forward contracts 92,715 70,699 125,145 124,042
Interest rate swap – cash flow hedges 24,270 – 18,601 5,062
148,693 71,157 171,405 129,104
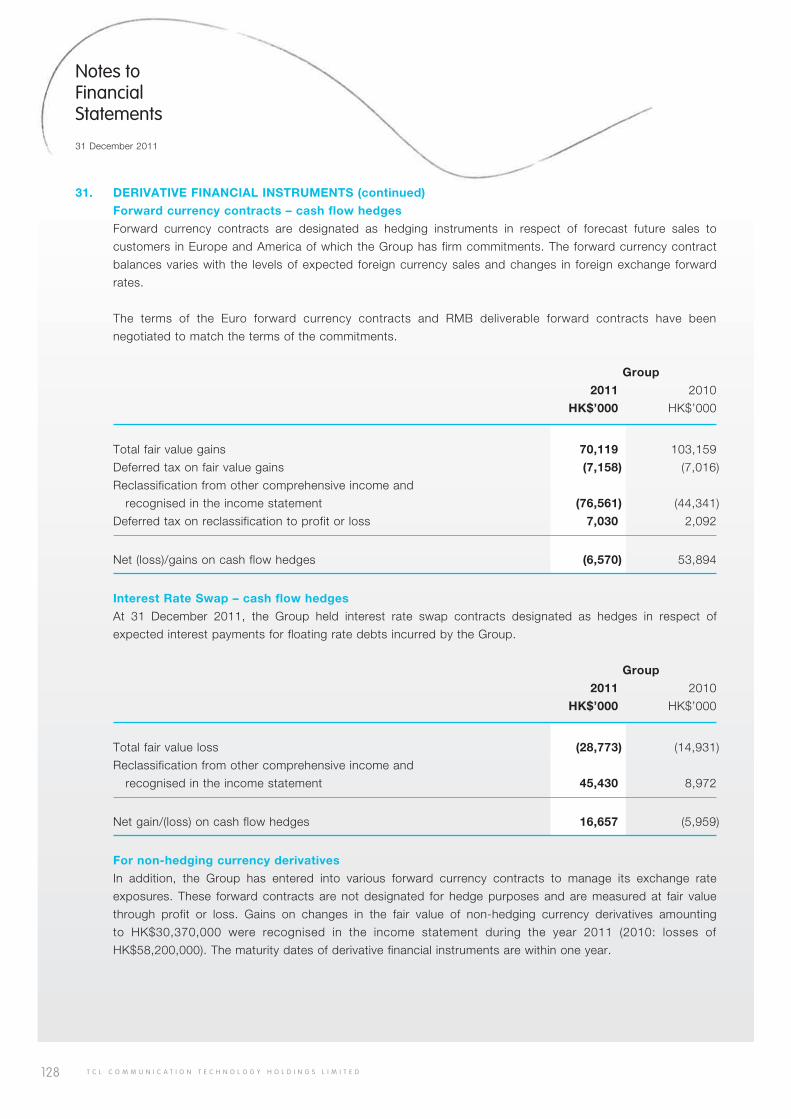
128 T C L C O M M U N I C A T I O N T E C H N O L O G Y H O L D I N G S L I M I T E D
Notes to Financial Statements
31 December 2011
31. DERIVATIVE FINANCIAL INSTRUMENTS (continued)
Forward currency contracts – cash flow hedges
Forward currency contracts are designated as hedging instruments in respect of forecast future sales to
customers in Europe and America of which the Group has firm commitments. The forward currency contract
balances varies with the levels of expected foreign currency sales and changes in foreign exchange forward
rates.
The terms of the Euro forward currency contracts and RMB deliverable forward contracts have been
negotiated to match the terms of the commitments.
Group
2011 2010
HK$’000 HK$’000
Total fair value gains 70,119 103,159
Deferred tax on fair value gains (7,158) (7,016)
Reclassification from other comprehensive income and
recognised in the income statement (76,561) (44,341)
Deferred tax on reclassification to profit or loss 7,030 2,092
Net (loss)/gains on cash flow hedges (6,570) 53,894
Interest Rate Swap – cash flow hedges
At 31 December 2011, the Group held interest rate swap contracts designated as hedges in respect of
expected interest payments for floating rate debts incurred by the Group.
Group
2011 2010
HK$’000 HK$’000
Total fair value loss (28,773) (14,931)
Reclassification from other comprehensive income and
recognised in the income statement 45,430 8,972
Net gain/(loss) on cash flow hedges 16,657 (5,959)
For non-hedging currency derivatives
In addition, the Group has entered into various forward currency contracts to manage its exchange rate
exposures. These forward contracts are not designated for hedge purposes and are measured at fair value
through profit or loss. Gains on changes in the fair value of non-hedging currency derivatives amounting
to HK$30,370,000 were recognised in the income statement during the year 2011 (2010: losses of
HK$58,200,000). The maturity dates of derivative financial instruments are within one year.
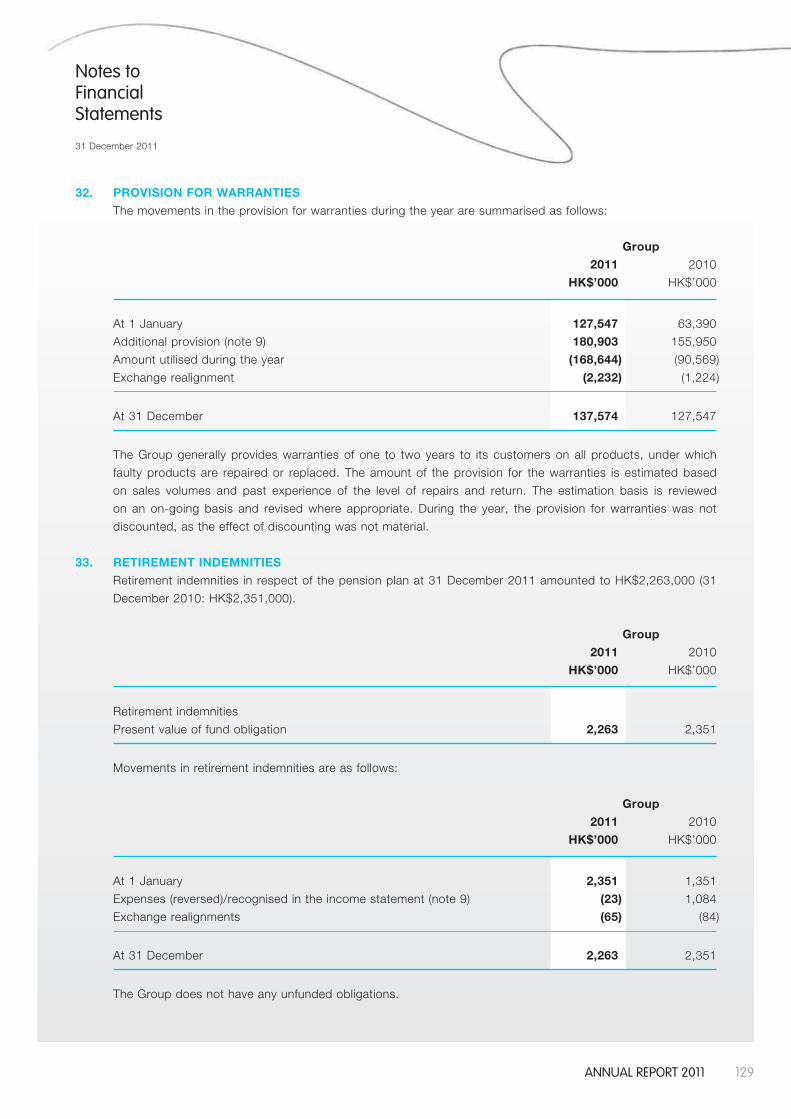
129AnnuAl report 2011
Notes to Financial Statements
31 December 2011
32. PROVISION FOR WARRANTIES
The movements in the provision for warranties during the year are summarised as follows:
Group
2011 2010
HK$’000 HK$’000
At 1 January 127,547 63,390
Additional provision (note 9) 180,903 155,950
Amount utilised during the year (168,644) (90,569)
Exchange realignment (2,232) (1,224)
At 31 December 137,574 127,547
The Group generally provides warranties of one to two years to its customers on all products, under which
faulty products are repaired or replaced. The amount of the provision for the warranties is estimated based
on sales volumes and past experience of the level of repairs and return. The estimation basis is reviewed
on an on-going basis and revised where appropriate. During the year, the provision for warranties was not
discounted, as the effect of discounting was not material.
33. RETIREMENT INDEMNITIES
Retirement indemnities in respect of the pension plan at 31 December 2011 amounted to HK$2,263,000 (31
December 2010: HK$2,351,000).
Group
2011 2010
HK$’000 HK$’000
Retirement indemnities
Present value of fund obligation 2,263 2,351
Movements in retirement indemnities are as follows:
Group
2011 2010
HK$’000 HK$’000
At 1 January 2,351 1,351
Expenses (reversed)/recognised in the income statement (note 9) (23) 1,084
Exchange realignments (65) (84)
At 31 December 2,263 2,351
The Group does not have any unfunded obligations.
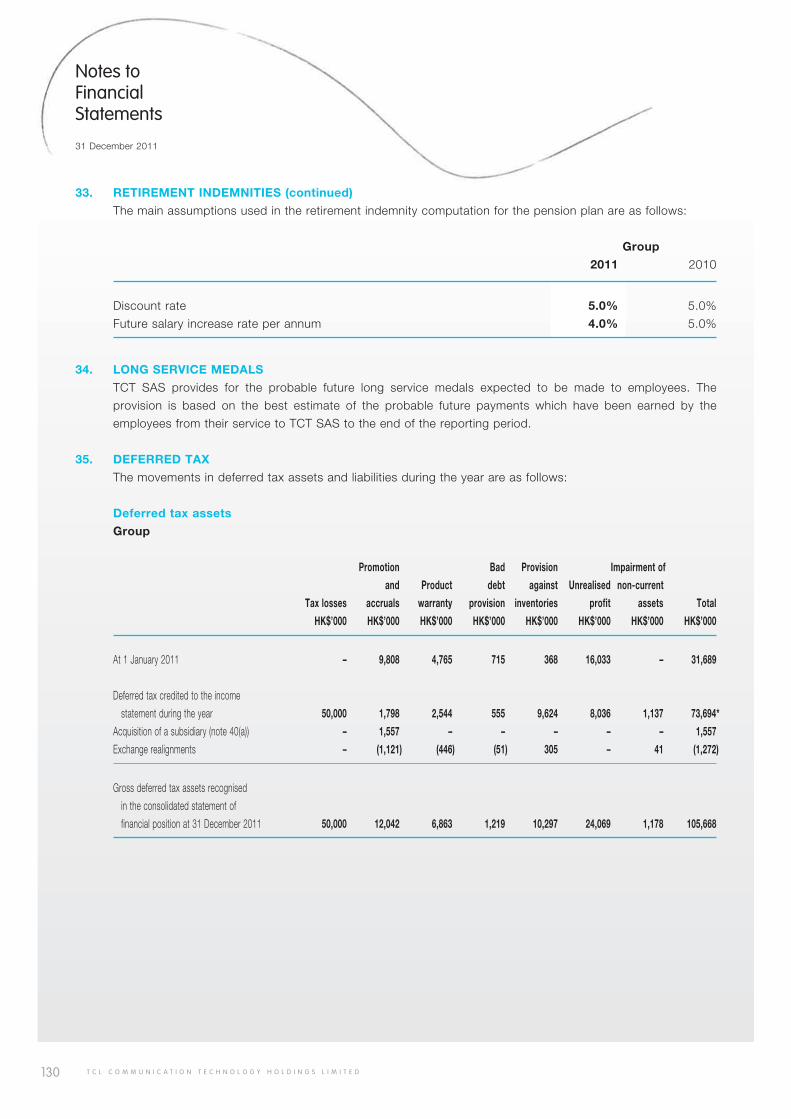
130 T C L C O M M U N I C A T I O N T E C H N O L O G Y H O L D I N G S L I M I T E D
Notes to Financial Statements
31 December 2011
33. RETIREMENT INDEMNITIES (continued)
The main assumptions used in the retirement indemnity computation for the pension plan are as follows:
Group
2011 2010
Discount rate 5.0% 5.0%
Future salary increase rate per annum 4.0% 5.0%
34. LONG SERVICE MEDALS
TCT SAS provides for the probable future long service medals expected to be made to employees. The
provision is based on the best estimate of the probable future payments which have been earned by the
employees from their service to TCT SAS to the end of the reporting period.
35. DEFERRED TAX
The movements in deferred tax assets and liabilities during the year are as follows:
Deferred tax assets
Group
Promotion Bad Provision Impairment of
and Product debt against Unrealised non-current
Tax losses accruals warranty provision inventories profit assets Total
HK$’000 HK$’000 HK$’000 HK$’000 HK$’000 HK$’000 HK$’000 HK$’000
At 1 January 2011 – 9,808 4,765 715 368 16,033 – 31,689
Deferred tax credited to the income
statement during the year 50,000 1,798 2,544 555 9,624 8,036 1,137 73,694*
Acquisition of a subsidiary (note 40(a)) – 1,557 – – – – – 1,557
Exchange realignments – (1,121) (446) (51) 305 – 41 (1,272)
Gross deferred tax assets recognised
in the consolidated statement of
financial position at 31 December 2011 50,000 12,042 6,863 1,219 10,297 24,069 1,178 105,668
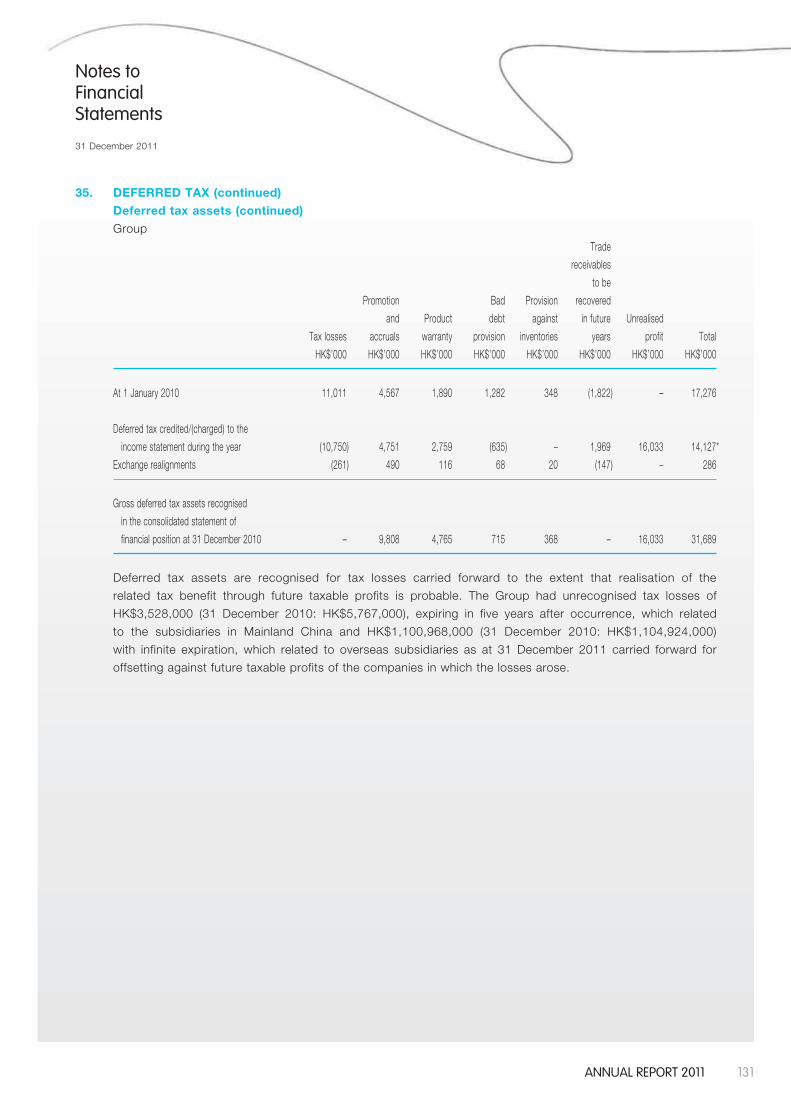
131AnnuAl report 2011
Notes to Financial Statements
31 December 2011
35. DEFERRED TAX (continued)
Deferred tax assets (continued)
Group
Trade
receivables
to be
Promotion Bad Provision recovered
and Product debt against in future Unrealised
Tax losses accruals warranty provision inventories years profit Total
HK$’000 HK$’000 HK$’000 HK$’000 HK$’000 HK$’000 HK$’000 HK$’000
At 1 January 2010 11,011 4,567 1,890 1,282 348 (1,822) – 17,276
Deferred tax credited/(charged) to the
income statement during the year (10,750) 4,751 2,759 (635) – 1,969 16,033 14,127*
Exchange realignments (261) 490 116 68 20 (147) – 286
Gross deferred tax assets recognised
in the consolidated statement of
financial position at 31 December 2010 – 9,808 4,765 715 368 – 16,033 31,689
Deferred tax assets are recognised for tax losses carried forward to the extent that realisation of the
related tax benefit through future taxable profits is probable. The Group had unrecognised tax losses of
HK$3,528,000 (31 December 2010: HK$5,767,000), expiring in five years after occurrence, which related
to the subsidiaries in Mainland China and HK$1,100,968,000 (31 December 2010: HK$1,104,924,000)
with infinite expiration, which related to overseas subsidiaries as at 31 December 2011 carried forward for
offsetting against future taxable profits of the companies in which the losses arose.
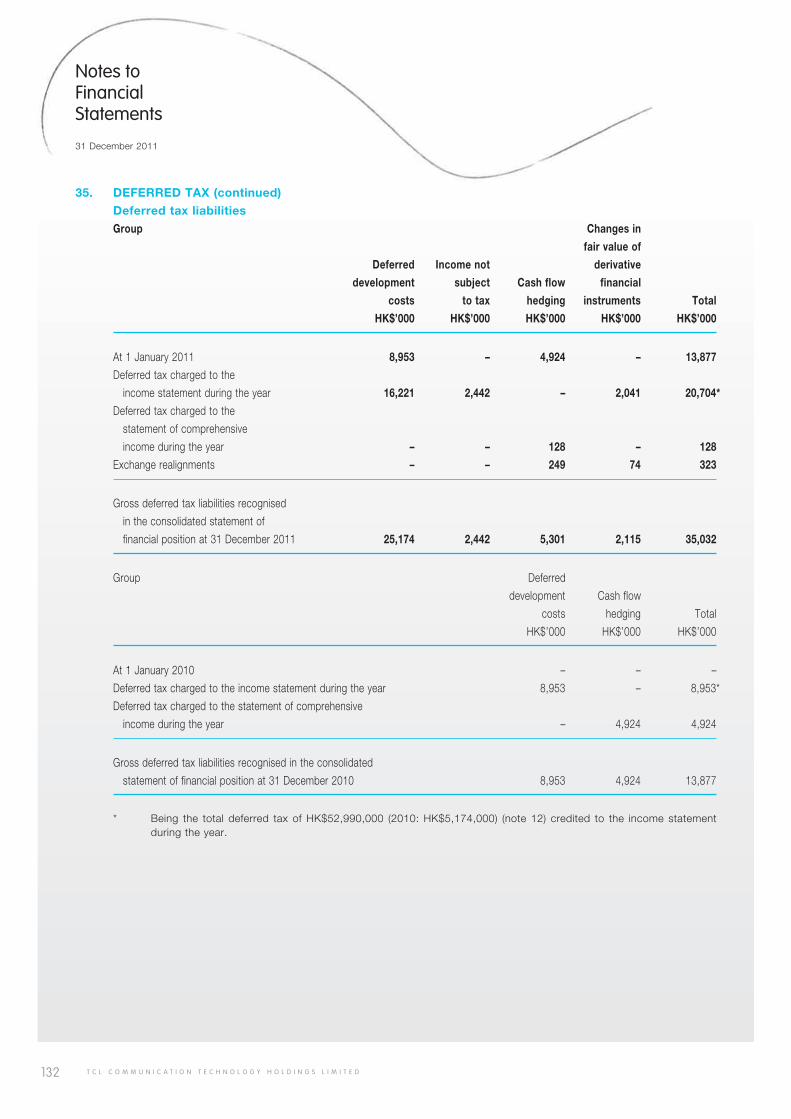
132 T C L C O M M U N I C A T I O N T E C H N O L O G Y H O L D I N G S L I M I T E D
Notes to Financial Statements
31 December 2011
35. DEFERRED TAX (continued)
Deferred tax liabilities
Group Changes in
fair value of
Deferred Income not derivative
development subject Cash flow financial
costs to tax hedging instruments Total
HK$’000 HK$’000 HK$’000 HK$’000 HK$’000
At 1 January 2011 8,953 – 4,924 – 13,877
Deferred tax charged to the
income statement during the year 16,221 2,442 – 2,041 20,704*
Deferred tax charged to the
statement of comprehensive
income during the year – – 128 – 128
Exchange realignments – – 249 74 323
Gross deferred tax liabilities recognised
in the consolidated statement of
financial position at 31 December 2011 25,174 2,442 5,301 2,115 35,032
Group Deferred
development Cash flow
costs hedging Total
HK$’000 HK$’000 HK$’000
At 1 January 2010 – – –
Deferred tax charged to the income statement during the year 8,953 – 8,953*
Deferred tax charged to the statement of comprehensive
income during the year – 4,924 4,924
Gross deferred tax liabilities recognised in the consolidated
statement of financial position at 31 December 2010 8,953 4,924 13,877
* Being the total deferred tax of HK$52,990,000 (2010: HK$5,174,000) (note 12) credited to the income statement during the year.
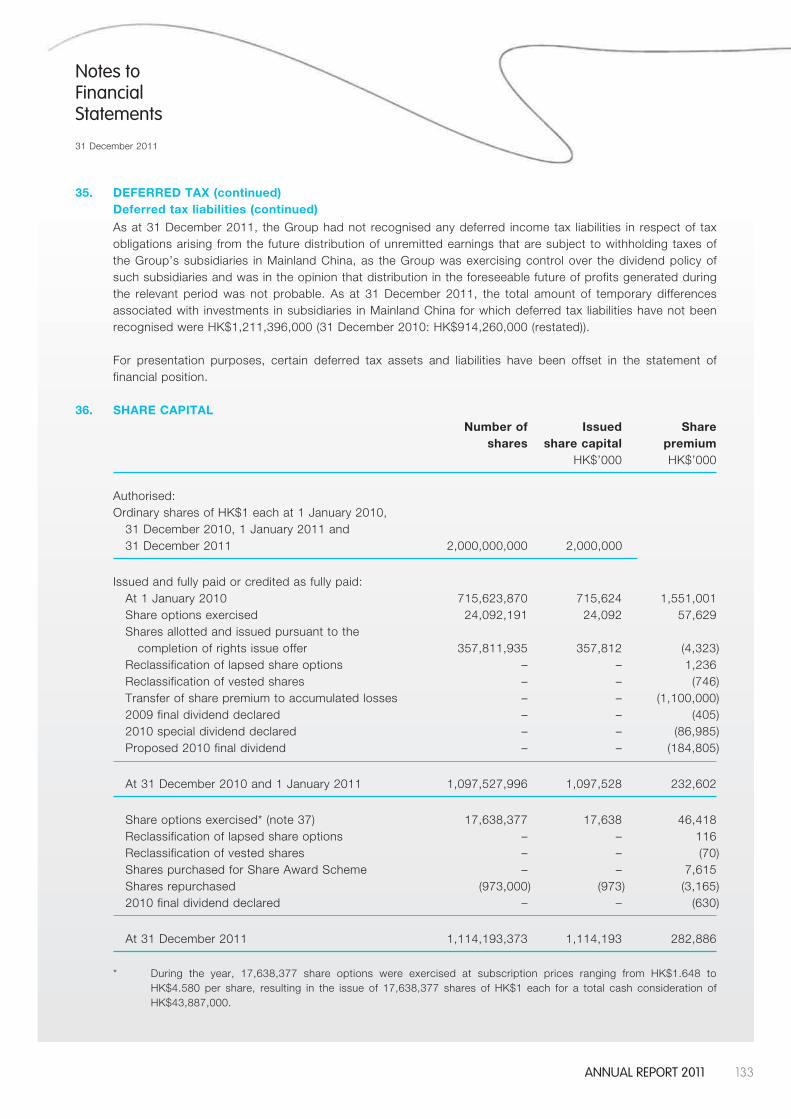
133AnnuAl report 2011
Notes to Financial Statements
31 December 2011
35. DEFERRED TAX (continued)Deferred tax liabilities (continued)
As at 31 December 2011, the Group had not recognised any deferred income tax liabilities in respect of tax obligations arising from the future distribution of unremitted earnings that are subject to withholding taxes of the Group’s subsidiaries in Mainland China, as the Group was exercising control over the dividend policy of such subsidiaries and was in the opinion that distribution in the foreseeable future of profits generated during the relevant period was not probable. As at 31 December 2011, the total amount of temporary differences associated with investments in subsidiaries in Mainland China for which deferred tax liabilities have not been recognised were HK$1,211,396,000 (31 December 2010: HK$914,260,000 (restated)).
For presentation purposes, certain deferred tax assets and liabilities have been offset in the statement of financial position.
36. SHARE CAPITAL Number of Issued Share shares share capital premium HK$’000 HK$’000
Authorised:Ordinary shares of HK$1 each at 1 January 2010, 31 December 2010, 1 January 2011 and 31 December 2011 2,000,000,000 2,000,000
Issued and fully paid or credited as fully paid: At 1 January 2010 715,623,870 715,624 1,551,001 Share options exercised 24,092,191 24,092 57,629 Shares allotted and issued pursuant to the completion of rights issue offer 357,811,935 357,812 (4,323) Reclassification of lapsed share options – – 1,236 Reclassification of vested shares – – (746) Transfer of share premium to accumulated losses – – (1,100,000) 2009 final dividend declared – – (405) 2010 special dividend declared – – (86,985) Proposed 2010 final dividend – – (184,805)
At 31 December 2010 and 1 January 2011 1,097,527,996 1,097,528 232,602
Share options exercised* (note 37) 17,638,377 17,638 46,418 Reclassification of lapsed share options – – 116 Reclassification of vested shares – – (70) Shares purchased for Share Award Scheme – – 7,615 Shares repurchased (973,000) (973) (3,165) 2010 final dividend declared – – (630)
At 31 December 2011 1,114,193,373 1,114,193 282,886
* During the year, 17,638,377 share options were exercised at subscription prices ranging from HK$1.648 to HK$4.580 per share, resulting in the issue of 17,638,377 shares of HK$1 each for a total cash consideration of HK$43,887,000.
134 T C L C O M M U N I C A T I O N T E C H N O L O G Y H O L D I N G S L I M I T E D
Notes to Financial Statements
31 December 2011
37. SHARE OPTION SCHEME
The Company has adopted a share option scheme for the purpose of providing incentives rewards for eligible
participants who contribute to the success of the Group’s operations. Eligible participants of the share option
scheme include employees (including executive directors, non-executive directors and independent non-
executive directors), advisers, consultants, agents, contractors, clients, suppliers and any other person(s)
whom the Board, in its sole discretion, considers has contributed or may contribute to the Group. The share
option scheme became effective on 13 September 2004 (the “Share Option Scheme”) and, unless otherwise
cancelled or amended, will remain in force for 10 years from that date. Apart from the Share Option Scheme,
the Company has no other share option scheme currently in force.
The maximum number of unexercised share options currently permitted to be granted under the Share Option
Scheme (as refreshed by shareholders’ approval in the AGM dated 10 May 2010) is an amount equivalent,
upon their exercise, to 10% of the shares of the Company in issue as at 10 May 2010 (i.e., up to 108,500,152
shares). The maximum number of shares issuable under share options to each eligible participant in the
Share Option Scheme within any 12-month period is limited to 1% of the shares of the Company in issue at
any time. Any further grant of share options in excess of this limit is subject to shareholders’ approval in a
general meeting.
Share options granted to a director, chief executive or substantial shareholder of the Company, or to any of
their respective associates, are subject to approval in advance by the independent non-executive directors.
In addition, any share options granted to a substantial shareholder or an independent non-executive director
of the Company, or to any of their respective associates, in excess of 0.1% of the shares of the Company in
issue at any time and with an aggregate value (based on the closing price of the Company’s shares at the
date of grant) in excess of HK$5 million, within any 12-month period, are subject to shareholders’ approval in
advance in a general meeting.
The exercise price of the share options is determinable by the directors, but may not be less than the highest
of (i) the Stock Exchange closing price of the Company’s shares on the date of grant of the share options,
(ii) the average Stock Exchange closing price of the Company’s shares for the five trading days immediately
preceding the date of grant, and (iii) the nominal value of a share.
Share options do not confer rights on the holders to dividends or to vote at shareholders’ meetings.
On 3 May 2011, a maximum of 50,500,000 share options under the Share Option Scheme were offered to
certain individuals respectively by the Company, among which a total of 12,000,000 options were accepted
by and granted to the grantees. Further details of the said granted share options were set out in the
announcements of the Company dated 3 May 2011 and 4 August 2011 respectively.
On 30 May 2011, the share options granted on 31 May 2005 were expired.
On 9 August 2011, the Company offered a total of 5,317,937 share options under the Share Option Scheme
to certain individuals wholly accepted by and granted to the grantees. Further details of the said granted
share options were set out in the announcement of the Company dated 9 August 2011.
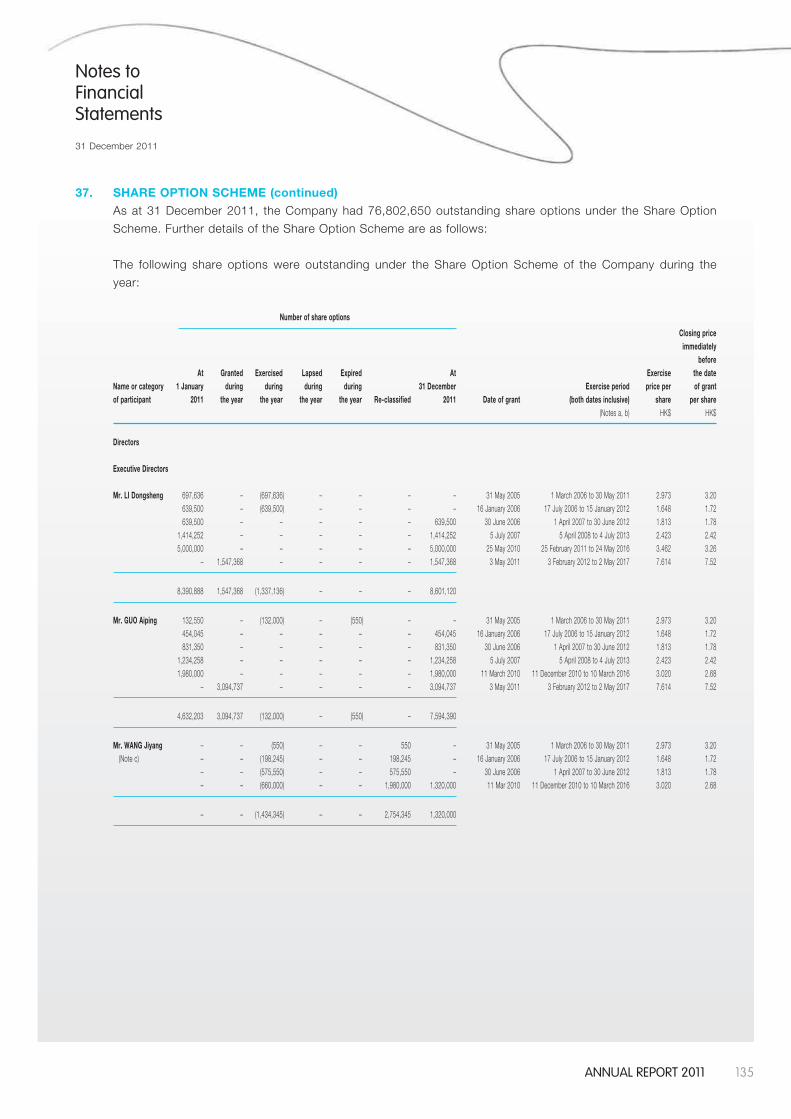
135AnnuAl report 2011
Notes to Financial Statements
31 December 2011
37. SHARE OPTION SCHEME (continued)
As at 31 December 2011, the Company had 76,802,650 outstanding share options under the Share Option
Scheme. Further details of the Share Option Scheme are as follows:
The following share options were outstanding under the Share Option Scheme of the Company during the
year:
Number of share options
Closing price immediately before At Granted Exercised Lapsed Expired At Exercise the dateName or category 1 January during during during during 31 December Exercise period price per of grantof participant 2011 the year the year the year the year Re-classified 2011 Date of grant (both dates inclusive) share per share (Notes a, b) HK$ HK$
Directors
Executive Directors
Mr. LI Dongsheng 697,636 – (697,636) – – – – 31 May 2005 1 March 2006 to 30 May 2011 2.973 3.20 639,500 – (639,500) – – – – 16 January 2006 17 July 2006 to 15 January 2012 1.648 1.72 639,500 – – – – – 639,500 30 June 2006 1 April 2007 to 30 June 2012 1.813 1.78 1,414,252 – – – – – 1,414,252 5 July 2007 5 April 2008 to 4 July 2013 2.423 2.42 5,000,000 – – – – – 5,000,000 25 May 2010 25 February 2011 to 24 May 2016 3.462 3.26 – 1,547,368 – – – – 1,547,368 3 May 2011 3 February 2012 to 2 May 2017 7.614 7.52
8,390,888 1,547,368 (1,337,136) – – – 8,601,120
Mr. GUO Aiping 132,550 – (132,000) – (550) – – 31 May 2005 1 March 2006 to 30 May 2011 2.973 3.20 454,045 – – – – – 454,045 16 January 2006 17 July 2006 to 15 January 2012 1.648 1.72 831,350 – – – – – 831,350 30 June 2006 1 April 2007 to 30 June 2012 1.813 1.78 1,234,258 – – – – – 1,234,258 5 July 2007 5 April 2008 to 4 July 2013 2.423 2.42 1,980,000 – – – – – 1,980,000 11 March 2010 11 December 2010 to 10 March 2016 3.020 2.68 – 3,094,737 – – – – 3,094,737 3 May 2011 3 February 2012 to 2 May 2017 7.614 7.52
4,632,203 3,094,737 (132,000) – (550) – 7,594,390
Mr. WANG Jiyang – – (550) – – 550 – 31 May 2005 1 March 2006 to 30 May 2011 2.973 3.20 (Note c) – – (198,245) – – 198,245 – 16 January 2006 17 July 2006 to 15 January 2012 1.648 1.72 – – (575,550) – – 575,550 – 30 June 2006 1 April 2007 to 30 June 2012 1.813 1.78 – – (660,000) – – 1,980,000 1,320,000 11 Mar 2010 11 December 2010 to 10 March 2016 3.020 2.68
– – (1,434,345) – – 2,754,345 1,320,000
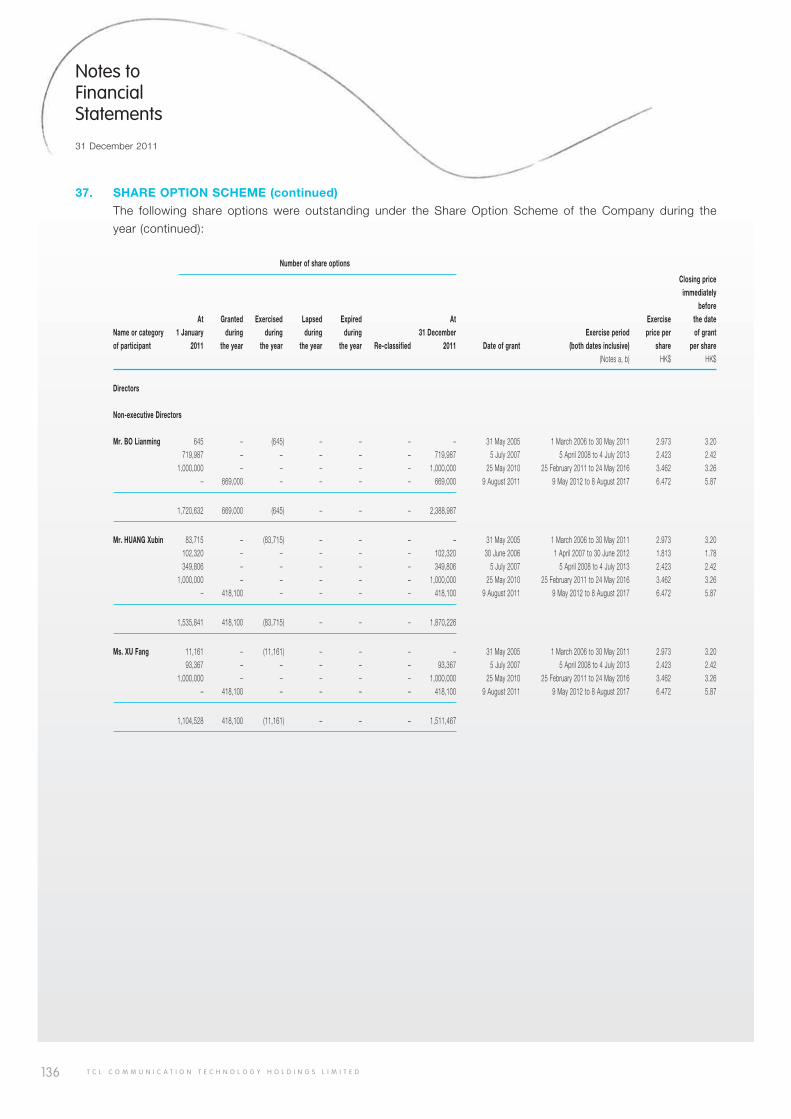
136 T C L C O M M U N I C A T I O N T E C H N O L O G Y H O L D I N G S L I M I T E D
Notes to Financial Statements
31 December 2011
37. SHARE OPTION SCHEME (continued)
The following share options were outstanding under the Share Option Scheme of the Company during the
year (continued):
Number of share options
Closing price immediately before At Granted Exercised Lapsed Expired At Exercise the dateName or category 1 January during during during during 31 December Exercise period price per of grantof participant 2011 the year the year the year the year Re-classified 2011 Date of grant (both dates inclusive) share per share (Notes a, b) HK$ HK$
Directors
Non-executive Directors
Mr. BO Lianming 645 – (645) – – – – 31 May 2005 1 March 2006 to 30 May 2011 2.973 3.20 719,987 – – – – – 719,987 5 July 2007 5 April 2008 to 4 July 2013 2.423 2.42 1,000,000 – – – – – 1,000,000 25 May 2010 25 February 2011 to 24 May 2016 3.462 3.26 – 669,000 – – – – 669,000 9 August 2011 9 May 2012 to 8 August 2017 6.472 5.87
1,720,632 669,000 (645) – – – 2,388,987
Mr. HUANG Xubin 83,715 – (83,715) – – – – 31 May 2005 1 March 2006 to 30 May 2011 2.973 3.20 102,320 – – – – – 102,320 30 June 2006 1 April 2007 to 30 June 2012 1.813 1.78 349,806 – – – – – 349,806 5 July 2007 5 April 2008 to 4 July 2013 2.423 2.42 1,000,000 – – – – – 1,000,000 25 May 2010 25 February 2011 to 24 May 2016 3.462 3.26 – 418,100 – – – – 418,100 9 August 2011 9 May 2012 to 8 August 2017 6.472 5.87
1,535,841 418,100 (83,715) – – – 1,870,226
Ms. XU Fang 11,161 – (11,161) – – – – 31 May 2005 1 March 2006 to 30 May 2011 2.973 3.20 93,367 – – – – – 93,367 5 July 2007 5 April 2008 to 4 July 2013 2.423 2.42 1,000,000 – – – – – 1,000,000 25 May 2010 25 February 2011 to 24 May 2016 3.462 3.26 – 418,100 – – – – 418,100 9 August 2011 9 May 2012 to 8 August 2017 6.472 5.87
1,104,528 418,100 (11,161) – – – 1,511,467
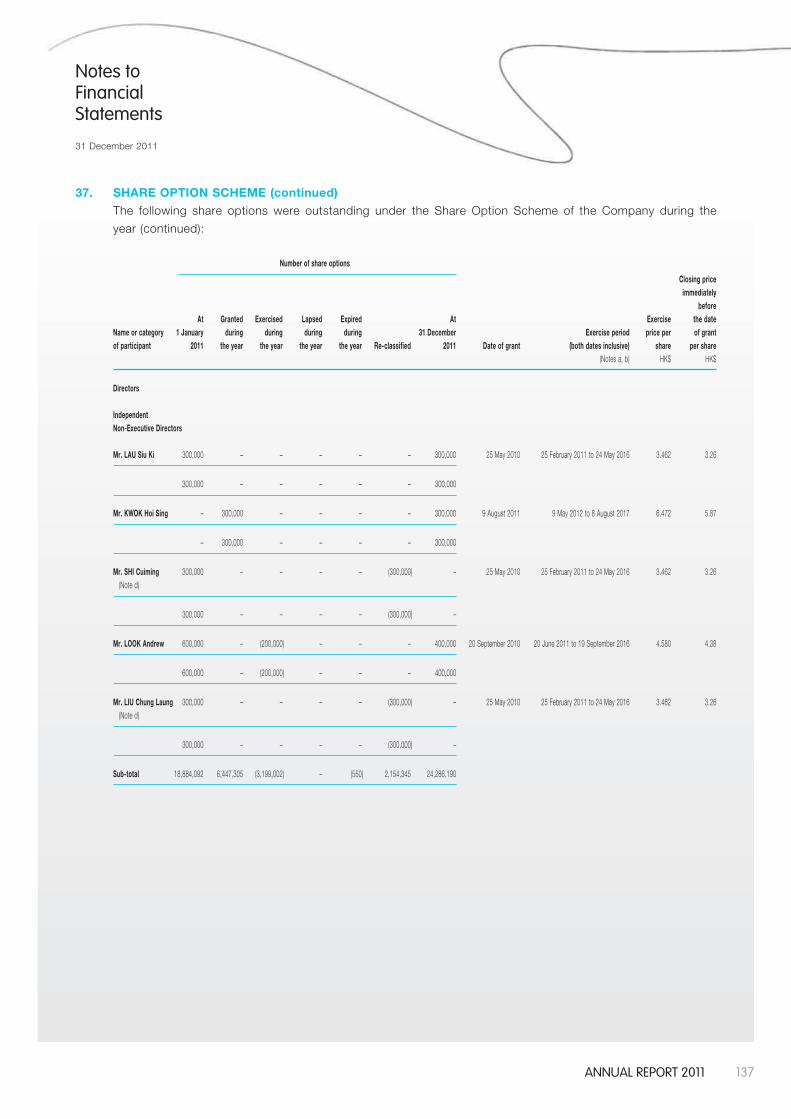
137AnnuAl report 2011
Notes to Financial Statements
31 December 2011
37. SHARE OPTION SCHEME (continued)
The following share options were outstanding under the Share Option Scheme of the Company during the
year (continued):
Number of share options
Closing price immediately before At Granted Exercised Lapsed Expired At Exercise the dateName or category 1 January during during during during 31 December Exercise period price per of grantof participant 2011 the year the year the year the year Re-classified 2011 Date of grant (both dates inclusive) share per share (Notes a, b) HK$ HK$
Directors
IndependentNon-Executive Directors
Mr. LAU Siu Ki 300,000 – – – – – 300,000 25 May 2010 25 February 2011 to 24 May 2016 3.462 3.26
300,000 – – – – – 300,000
Mr. KWOK Hoi Sing – 300,000 – – – – 300,000 9 August 2011 9 May 2012 to 8 August 2017 6.472 5.87
– 300,000 – – – – 300,000
Mr. SHI Cuiming 300,000 – – – – (300,000) – 25 May 2010 25 February 2011 to 24 May 2016 3.462 3.26 (Note d)
300,000 – – – – (300,000) –
Mr. LOOK Andrew 600,000 – (200,000) – – – 400,000 20 September 2010 20 June 2011 to 19 September 2016 4.580 4.38
600,000 – (200,000) – – – 400,000
Mr. LIU Chung Laung 300,000 – – – – (300,000) – 25 May 2010 25 February 2011 to 24 May 2016 3.462 3.26 (Note d)
300,000 – – – – (300,000) –
Sub-total 18,884,092 6,447,305 (3,199,002) – (550) 2,154,345 24,286,190
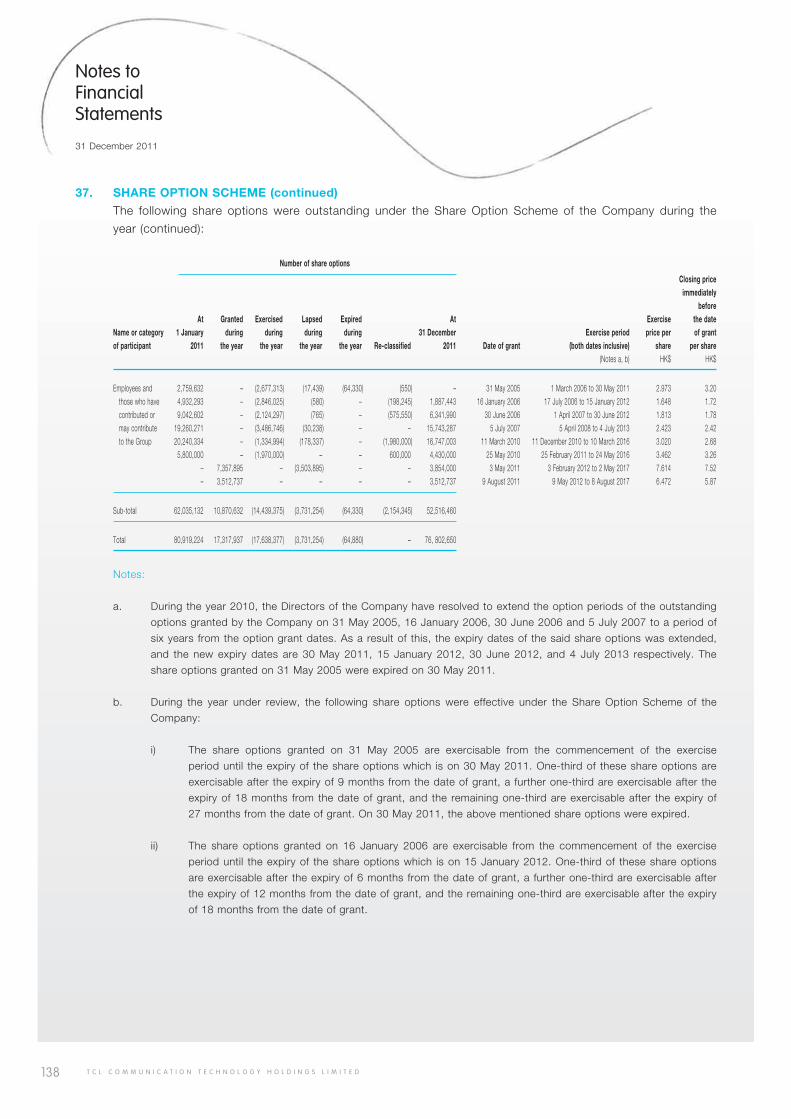
138 T C L C O M M U N I C A T I O N T E C H N O L O G Y H O L D I N G S L I M I T E D
Notes to Financial Statements
31 December 2011
37. SHARE OPTION SCHEME (continued)
The following share options were outstanding under the Share Option Scheme of the Company during the
year (continued):
Number of share options
Closing price immediately before At Granted Exercised Lapsed Expired At Exercise the dateName or category 1 January during during during during 31 December Exercise period price per of grantof participant 2011 the year the year the year the year Re-classified 2011 Date of grant (both dates inclusive) share per share (Notes a, b) HK$ HK$
Employees and 2,759,632 – (2,677,313) (17,439) (64,330) (550) – 31 May 2005 1 March 2006 to 30 May 2011 2.973 3.20 those who have 4,932,293 – (2,846,025) (580) – (198,245) 1,887,443 16 January 2006 17 July 2006 to 15 January 2012 1.648 1.72 contributed or 9,042,602 – (2,124,297) (765) – (575,550) 6,341,990 30 June 2006 1 April 2007 to 30 June 2012 1.813 1.78 may contribute 19,260,271 – (3,486,746) (30,238) – – 15,743,287 5 July 2007 5 April 2008 to 4 July 2013 2.423 2.42 to the Group 20,240,334 – (1,334,994) (178,337) – (1,980,000) 16,747,003 11 March 2010 11 December 2010 to 10 March 2016 3.020 2.68 5,800,000 – (1,970,000) – – 600,000 4,430,000 25 May 2010 25 February 2011 to 24 May 2016 3.462 3.26 – 7,357,895 – (3,503,895) – – 3,854,000 3 May 2011 3 February 2012 to 2 May 2017 7.614 7.52 – 3,512,737 – – – – 3,512,737 9 August 2011 9 May 2012 to 8 August 2017 6.472 5.87
Sub-total 62,035,132 10,870,632 (14,439,375) (3,731,254) (64,330) (2,154,345) 52,516,460
Total 80,919,224 17,317,937 (17,638,377) (3,731,254) (64,880) – 76, 802,650
Notes:
a. During the year 2010, the Directors of the Company have resolved to extend the option periods of the outstanding
options granted by the Company on 31 May 2005, 16 January 2006, 30 June 2006 and 5 July 2007 to a period of
six years from the option grant dates. As a result of this, the expiry dates of the said share options was extended,
and the new expiry dates are 30 May 2011, 15 January 2012, 30 June 2012, and 4 July 2013 respectively. The
share options granted on 31 May 2005 were expired on 30 May 2011.
b. During the year under review, the following share options were effective under the Share Option Scheme of the
Company:
i) The share options granted on 31 May 2005 are exercisable from the commencement of the exercise
period until the expiry of the share options which is on 30 May 2011. One-third of these share options are
exercisable after the expiry of 9 months from the date of grant, a further one-third are exercisable after the
expiry of 18 months from the date of grant, and the remaining one-third are exercisable after the expiry of
27 months from the date of grant. On 30 May 2011, the above mentioned share options were expired.
ii) The share options granted on 16 January 2006 are exercisable from the commencement of the exercise
period until the expiry of the share options which is on 15 January 2012. One-third of these share options
are exercisable after the expiry of 6 months from the date of grant, a further one-third are exercisable after
the expiry of 12 months from the date of grant, and the remaining one-third are exercisable after the expiry
of 18 months from the date of grant.
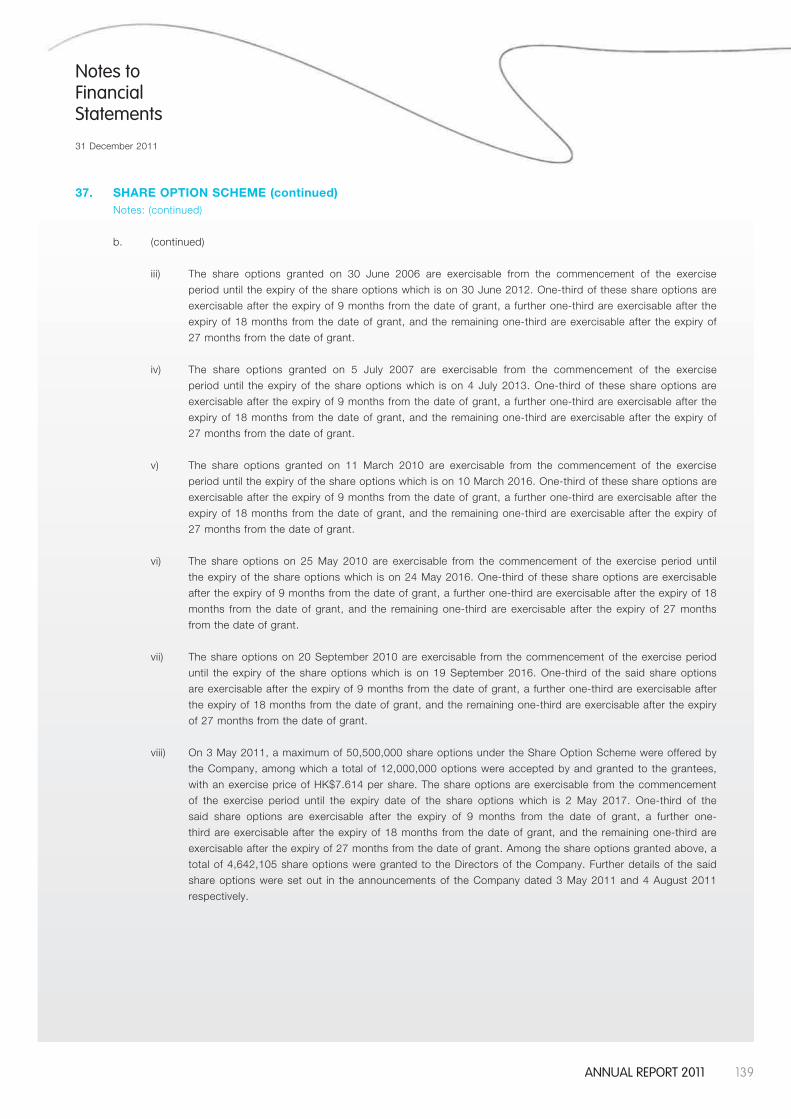
139AnnuAl report 2011
Notes to Financial Statements
31 December 2011
37. SHARE OPTION SCHEME (continued)Notes: (continued)
b. (continued)
iii) The share options granted on 30 June 2006 are exercisable from the commencement of the exercise
period until the expiry of the share options which is on 30 June 2012. One-third of these share options are
exercisable after the expiry of 9 months from the date of grant, a further one-third are exercisable after the
expiry of 18 months from the date of grant, and the remaining one-third are exercisable after the expiry of
27 months from the date of grant.
iv) The share options granted on 5 July 2007 are exercisable from the commencement of the exercise
period until the expiry of the share options which is on 4 July 2013. One-third of these share options are
exercisable after the expiry of 9 months from the date of grant, a further one-third are exercisable after the
expiry of 18 months from the date of grant, and the remaining one-third are exercisable after the expiry of
27 months from the date of grant.
v) The share options granted on 11 March 2010 are exercisable from the commencement of the exercise
period until the expiry of the share options which is on 10 March 2016. One-third of these share options are
exercisable after the expiry of 9 months from the date of grant, a further one-third are exercisable after the
expiry of 18 months from the date of grant, and the remaining one-third are exercisable after the expiry of
27 months from the date of grant.
vi) The share options on 25 May 2010 are exercisable from the commencement of the exercise period until
the expiry of the share options which is on 24 May 2016. One-third of these share options are exercisable
after the expiry of 9 months from the date of grant, a further one-third are exercisable after the expiry of 18
months from the date of grant, and the remaining one-third are exercisable after the expiry of 27 months
from the date of grant.
vii) The share options on 20 September 2010 are exercisable from the commencement of the exercise period
until the expiry of the share options which is on 19 September 2016. One-third of the said share options
are exercisable after the expiry of 9 months from the date of grant, a further one-third are exercisable after
the expiry of 18 months from the date of grant, and the remaining one-third are exercisable after the expiry
of 27 months from the date of grant.
viii) On 3 May 2011, a maximum of 50,500,000 share options under the Share Option Scheme were offered by
the Company, among which a total of 12,000,000 options were accepted by and granted to the grantees,
with an exercise price of HK$7.614 per share. The share options are exercisable from the commencement
of the exercise period until the expiry date of the share options which is 2 May 2017. One-third of the
said share options are exercisable after the expiry of 9 months from the date of grant, a further one-
third are exercisable after the expiry of 18 months from the date of grant, and the remaining one-third are
exercisable after the expiry of 27 months from the date of grant. Among the share options granted above, a
total of 4,642,105 share options were granted to the Directors of the Company. Further details of the said
share options were set out in the announcements of the Company dated 3 May 2011 and 4 August 2011
respectively.
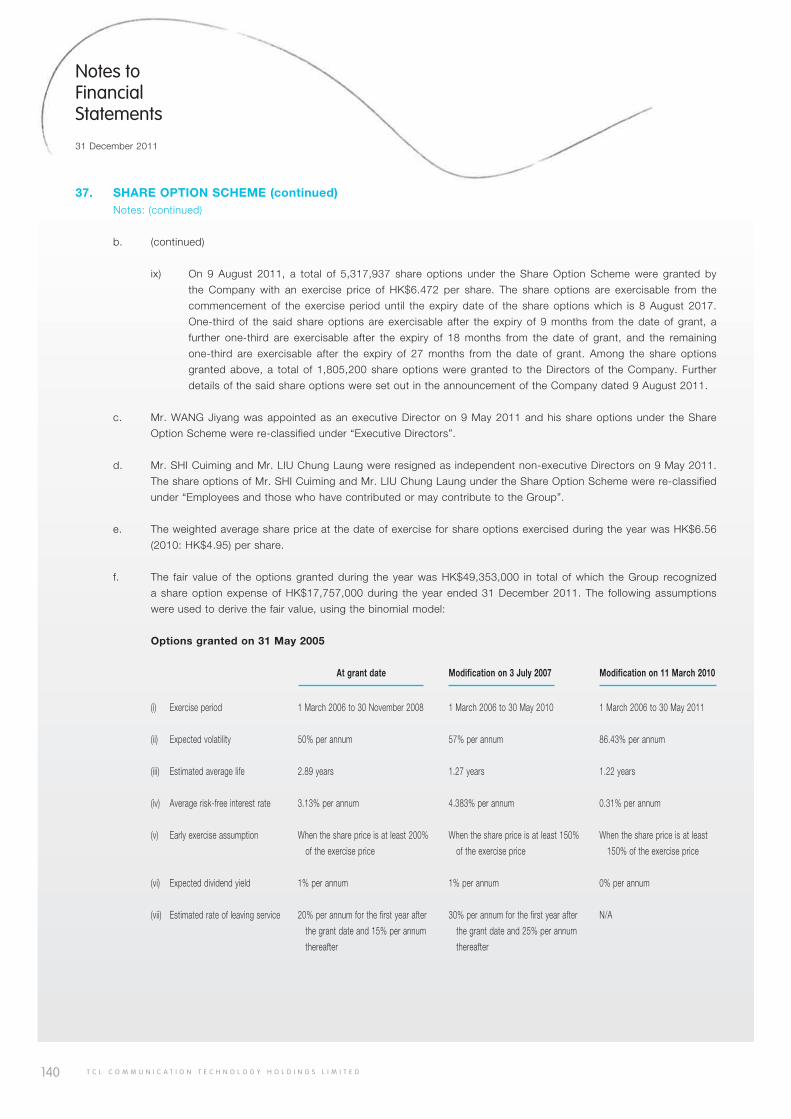
140 T C L C O M M U N I C A T I O N T E C H N O L O G Y H O L D I N G S L I M I T E D
Notes to Financial Statements
31 December 2011
37. SHARE OPTION SCHEME (continued)Notes: (continued)
b. (continued)
ix) On 9 August 2011, a total of 5,317,937 share options under the Share Option Scheme were granted by
the Company with an exercise price of HK$6.472 per share. The share options are exercisable from the
commencement of the exercise period until the expiry date of the share options which is 8 August 2017.
One-third of the said share options are exercisable after the expiry of 9 months from the date of grant, a
further one-third are exercisable after the expiry of 18 months from the date of grant, and the remaining
one-third are exercisable after the expiry of 27 months from the date of grant. Among the share options
granted above, a total of 1,805,200 share options were granted to the Directors of the Company. Further
details of the said share options were set out in the announcement of the Company dated 9 August 2011.
c. Mr. WANG Jiyang was appointed as an executive Director on 9 May 2011 and his share options under the Share
Option Scheme were re-classified under “Executive Directors”.
d. Mr. SHI Cuiming and Mr. LIU Chung Laung were resigned as independent non-executive Directors on 9 May 2011.
The share options of Mr. SHI Cuiming and Mr. LIU Chung Laung under the Share Option Scheme were re-classified
under “Employees and those who have contributed or may contribute to the Group”.
e. The weighted average share price at the date of exercise for share options exercised during the year was HK$6.56
(2010: HK$4.95) per share.
f. The fair value of the options granted during the year was HK$49,353,000 in total of which the Group recognized
a share option expense of HK$17,757,000 during the year ended 31 December 2011. The following assumptions
were used to derive the fair value, using the binomial model:
Options granted on 31 May 2005
At grant date Modification on 3 July 2007 Modification on 11 March 2010
(i) Exercise period 1 March 2006 to 30 November 2008 1 March 2006 to 30 May 2010 1 March 2006 to 30 May 2011
(ii) Expected volatility 50% per annum 57% per annum 86.43% per annum
(iii) Estimated average life 2.89 years 1.27 years 1.22 years
(iv) Average risk-free interest rate 3.13% per annum 4.383% per annum 0.31% per annum
(v) Early exercise assumption When the share price is at least 200% When the share price is at least 150% When the share price is at least
of the exercise price of the exercise price 150% of the exercise price
(vi) Expected dividend yield 1% per annum 1% per annum 0% per annum
(vii) Estimated rate of leaving service 20% per annum for the first year after 30% per annum for the first year after N/A
the grant date and 15% per annum the grant date and 25% per annum
thereafter thereafter
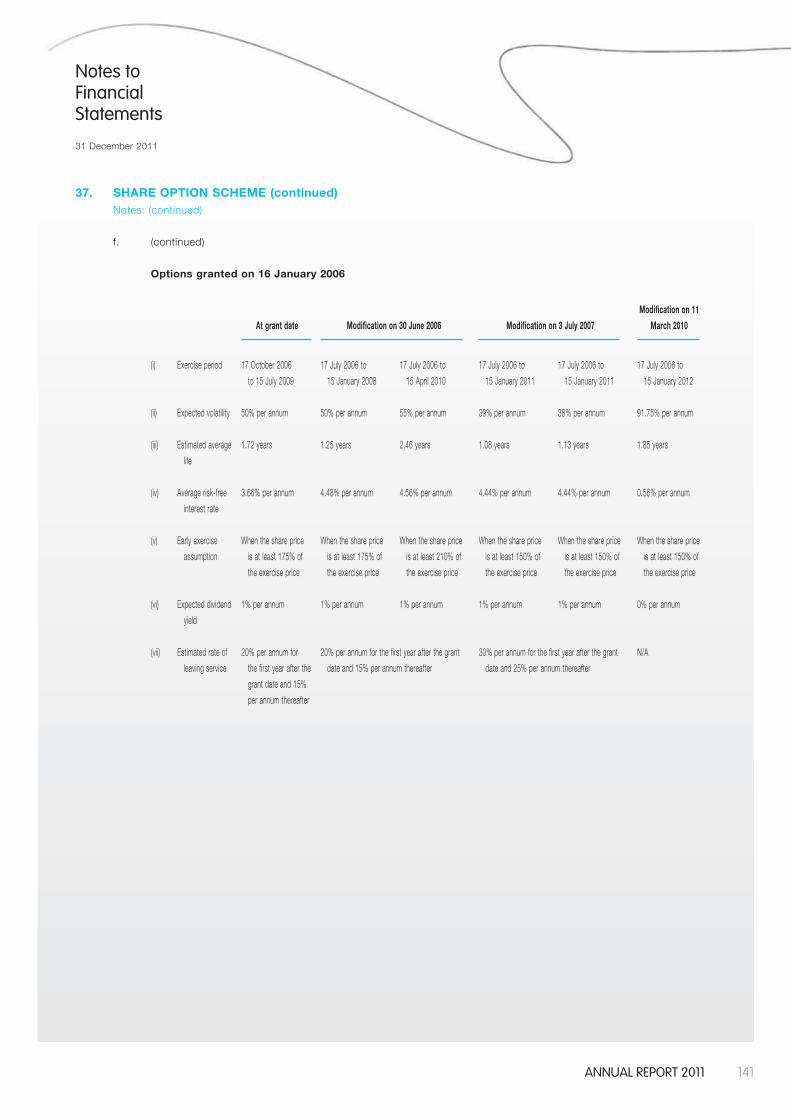
141AnnuAl report 2011
Notes to Financial Statements
31 December 2011
37. SHARE OPTION SCHEME (continued)Notes: (continued)
f. (continued)
Options granted on 16 January 2006
At grant date Modification on 30 June 2006 Modification on 3 July 2007
Modification on 11
March 2010
(i) Exercise period 17 October 2006
to 15 July 2009
17 July 2006 to
15 January 2008
17 July 2006 to
15 April 2010
17 July 2006 to
15 January 2011
17 July 2006 to
15 January 2011
17 July 2006 to
15 January 2012
(ii) Expected volatility 50% per annum 50% per annum 55% per annum 39% per annum 38% per annum 91.75% per annum
(iii) Estimated average
life
1.72 years 1.25 years 2.46 years 1.08 years 1.13 years 1.85 years
(iv) Average risk-free
interest rate
3.66% per annum 4.48% per annum 4.56% per annum 4.44% per annum 4.44% per annum 0.56% per annum
(v) Early exercise
assumption
When the share price
is at least 175% of
the exercise price
When the share price
is at least 175% of
the exercise price
When the share price
is at least 210% of
the exercise price
When the share price
is at least 150% of
the exercise price
When the share price
is at least 150% of
the exercise price
When the share price
is at least 150% of
the exercise price
(vi) Expected dividend
yield
1% per annum 1% per annum 1% per annum 1% per annum 1% per annum 0% per annum
(vii) Estimated rate of
leaving service
20% per annum for
the first year after the
grant date and 15%
per annum thereafter
20% per annum for the first year after the grant
date and 15% per annum thereafter
30% per annum for the first year after the grant
date and 25% per annum thereafter
N/A
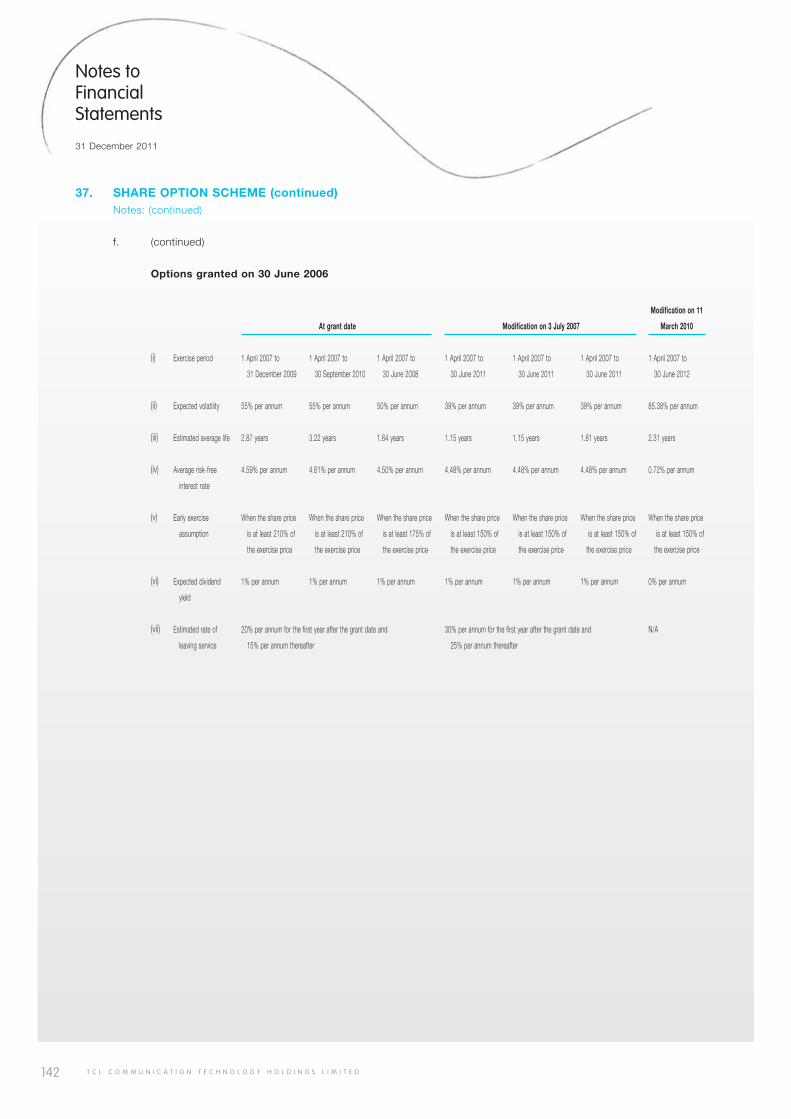
142 T C L C O M M U N I C A T I O N T E C H N O L O G Y H O L D I N G S L I M I T E D
Notes to Financial Statements
31 December 2011
37. SHARE OPTION SCHEME (continued)Notes: (continued)
f. (continued)
Options granted on 30 June 2006
At grant date Modification on 3 July 2007
Modification on 11
March 2010
(i) Exercise period 1 April 2007 to
31 December 2009
1 April 2007 to
30 September 2010
1 April 2007 to
30 June 2008
1 April 2007 to
30 June 2011
1 April 2007 to
30 June 2011
1 April 2007 to
30 June 2011
1 April 2007 to
30 June 2012
(ii) Expected volatility 55% per annum 55% per annum 50% per annum 39% per annum 39% per annum 39% per annum 85.38% per annum
(iii) Estimated average life 2.87 years 3.22 years 1.64 years 1.15 years 1.15 years 1.81 years 2.31 years
(iv) Average risk-free
interest rate
4.59% per annum 4.61% per annum 4.50% per annum 4.48% per annum 4.48% per annum 4.48% per annum 0.72% per annum
(v) Early exercise
assumption
When the share price
is at least 210% of
the exercise price
When the share price
is at least 210% of
the exercise price
When the share price
is at least 175% of
the exercise price
When the share price
is at least 150% of
the exercise price
When the share price
is at least 150% of
the exercise price
When the share price
is at least 150% of
the exercise price
When the share price
is at least 150% of
the exercise price
(vi) Expected dividend
yield
1% per annum 1% per annum 1% per annum 1% per annum 1% per annum 1% per annum 0% per annum
(vii) Estimated rate of
leaving service
20% per annum for the first year after the grant date and
15% per annum thereafter
30% per annum for the first year after the grant date and
25% per annum thereafter
N/A
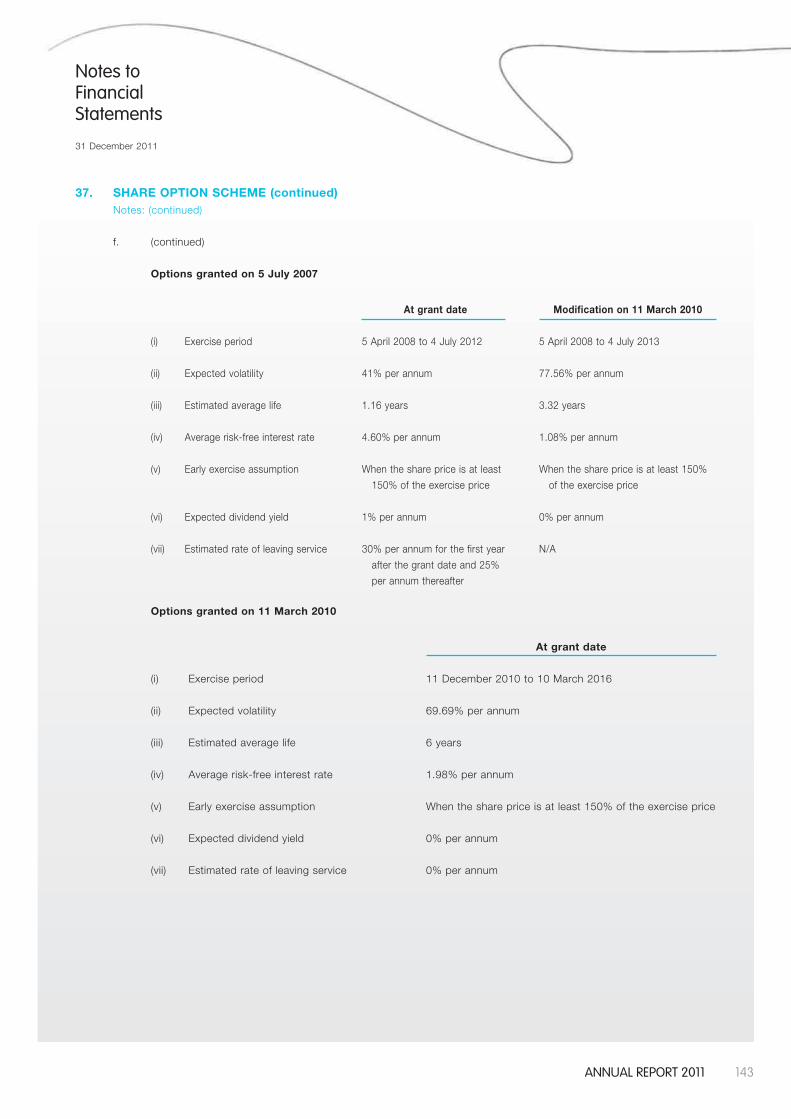
143AnnuAl report 2011
Notes to Financial Statements
31 December 2011
37. SHARE OPTION SCHEME (continued)Notes: (continued)
f. (continued)
Options granted on 5 July 2007
At grant date Modification on 11 March 2010
(i) Exercise period 5 April 2008 to 4 July 2012 5 April 2008 to 4 July 2013
(ii) Expected volatility 41% per annum 77.56% per annum
(iii) Estimated average life 1.16 years 3.32 years
(iv) Average risk-free interest rate 4.60% per annum 1.08% per annum
(v) Early exercise assumption When the share price is at least
150% of the exercise price
When the share price is at least 150%
of the exercise price
(vi) Expected dividend yield 1% per annum 0% per annum
(vii) Estimated rate of leaving service 30% per annum for the first year
after the grant date and 25%
per annum thereafter
N/A
Options granted on 11 March 2010
At grant date
(i) Exercise period 11 December 2010 to 10 March 2016
(ii) Expected volatility 69.69% per annum
(iii) Estimated average life 6 years
(iv) Average risk-free interest rate 1.98% per annum
(v) Early exercise assumption When the share price is at least 150% of the exercise price
(vi) Expected dividend yield 0% per annum
(vii) Estimated rate of leaving service 0% per annum
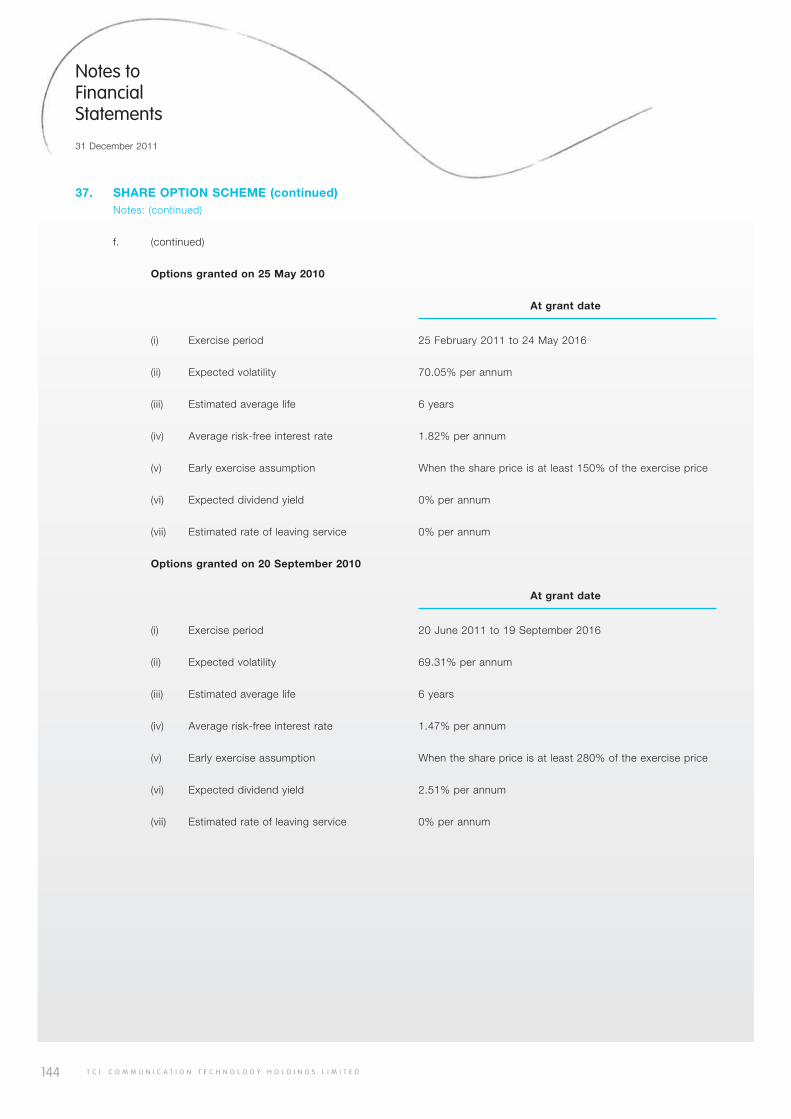
144 T C L C O M M U N I C A T I O N T E C H N O L O G Y H O L D I N G S L I M I T E D
Notes to Financial Statements
31 December 2011
37. SHARE OPTION SCHEME (continued)Notes: (continued)
f. (continued)
Options granted on 25 May 2010
At grant date
(i) Exercise period 25 February 2011 to 24 May 2016
(ii) Expected volatility 70.05% per annum
(iii) Estimated average life 6 years
(iv) Average risk-free interest rate 1.82% per annum
(v) Early exercise assumption When the share price is at least 150% of the exercise price
(vi) Expected dividend yield 0% per annum
(vii) Estimated rate of leaving service 0% per annum
Options granted on 20 September 2010
At grant date
(i) Exercise period 20 June 2011 to 19 September 2016
(ii) Expected volatility 69.31% per annum
(iii) Estimated average life 6 years
(iv) Average risk-free interest rate 1.47% per annum
(v) Early exercise assumption When the share price is at least 280% of the exercise price
(vi) Expected dividend yield 2.51% per annum
(vii) Estimated rate of leaving service 0% per annum
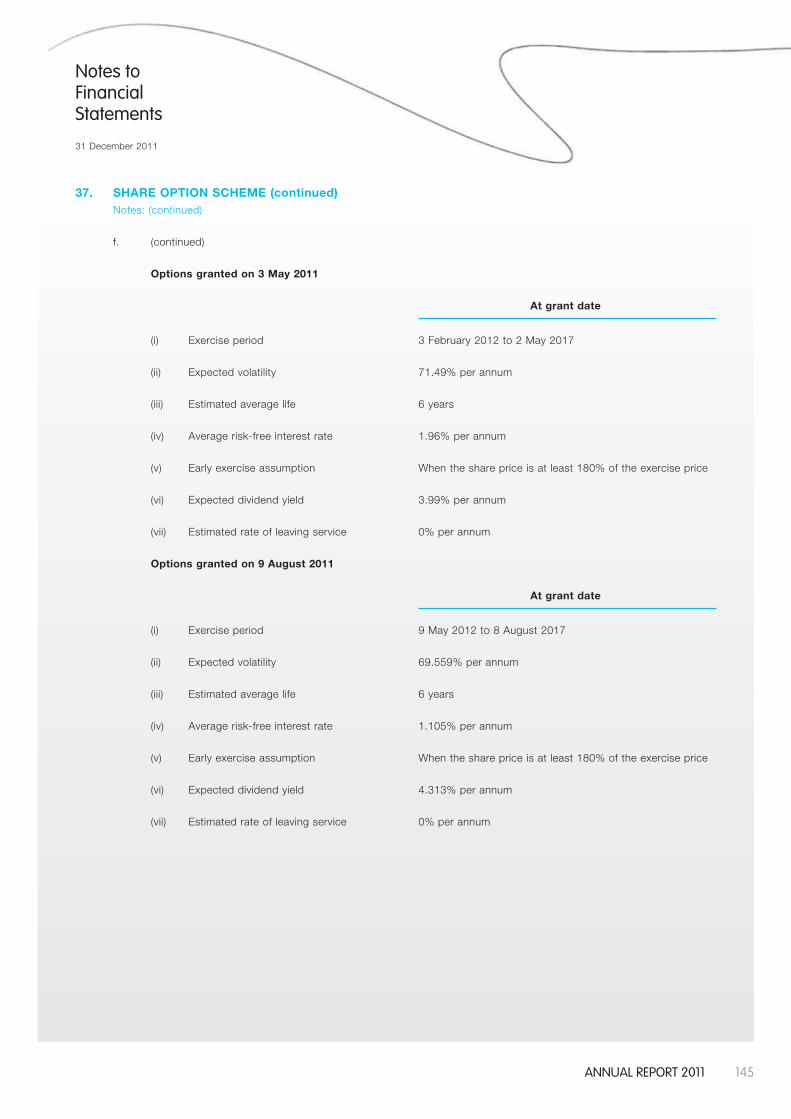
145AnnuAl report 2011
Notes to Financial Statements
31 December 2011
37. SHARE OPTION SCHEME (continued)Notes: (continued)
f. (continued)
Options granted on 3 May 2011
At grant date
(i) Exercise period 3 February 2012 to 2 May 2017
(ii) Expected volatility 71.49% per annum
(iii) Estimated average life 6 years
(iv) Average risk-free interest rate 1.96% per annum
(v) Early exercise assumption When the share price is at least 180% of the exercise price
(vi) Expected dividend yield 3.99% per annum
(vii) Estimated rate of leaving service 0% per annum
Options granted on 9 August 2011
At grant date
(i) Exercise period 9 May 2012 to 8 August 2017
(ii) Expected volatility 69.559% per annum
(iii) Estimated average life 6 years
(iv) Average risk-free interest rate 1.105% per annum
(v) Early exercise assumption When the share price is at least 180% of the exercise price
(vi) Expected dividend yield 4.313% per annum
(vii) Estimated rate of leaving service 0% per annum
146 T C L C O M M U N I C A T I O N T E C H N O L O G Y H O L D I N G S L I M I T E D
Notes to Financial Statements
31 December 2011
37. SHARE OPTION SCHEME (continued)Notes: (continued)
f. (continued)
The volatility rate of the share price of the Company was determined with reference to the historical volatilities of
the share prices of the Company as extracted from Bloomberg.
BMI Appraisals Limited has been appointed to perform the valuation on the two batches of share options newly
granted on 3 May 2011 and 9 August 2011 respectively.
At the end of the reporting year, the Company had 76,802,650 share options outstanding under the Share Option
Scheme. The exercise in full of the outstanding share options would, under the present capital structure of the
Company, result in the issue of 76,802,650 additional ordinary shares of the Company. Total funds raised from
exercise of the outstanding share options would be HK$271,143,000 which represents additional share capital of
HK$76,803,000 and share premium of HK$194,340,000 (before issue expenses).
38. SHARE AWARD SCHEMES
The Share Award Scheme A adopted by the Company on 3 July 2007 was terminated on 23 October 2009,
and the Board resolved to adopt another share award scheme, the Share Award Scheme B, on 11 March
2008. The Share Award Scheme B aims to provide incentives to employees and to retain and encourage
employees for the continual operation and development of the Group, pursuant to which existing shares will
be purchased by the trustee from the market out of cash contributed by the Group and be held in the Share
Award Scheme Trust for the relevant selected employees until such shares vest with the relevant selected
employees in accordance with the provisions of the Share Award Scheme B. On 17 March 2011, the Share
Award Scheme B was amended by the Group, pursuant to which, as an alternative to purchase of shares on
the market for any awards made under the Share Award Scheme B, the Board may allot and issue shares
as awarded shares and have the discretion to decide whether the awarded shares are to be purchased or
subscribed.
During the year ended 31 December 2008, the trustee purchased 105,898,000 shares of the Company at a
total cost (including related transaction costs) of HK$33,469,000.
On 11 March 2010, the Board approved the grant of 6,300,000 shares of the Company to be awarded to
designated employees under the Share Award Scheme B, which would be transferred to the employees by
the trustee at nil consideration upon vesting between 10 September 2010 and 31 December 2012.
On 3 May 2011, the Board offered a maximum of 11,500,000 shares of the Company to be awarded to
designated employees under the Share Award Scheme B, among which a total of 1,962,482 awarded shares
were accepted by the awardees. The awarded shares granted above would be transferred to the employees
by the trustee or through allotment and issuance of shares at nil consideration upon vesting between 3 May
2012 and 3 May 2014. One-third of the said awarded shares would be vested after the expiry of 1 year from
the date of grant, a further one-third would be vested after the expiry of 2 years from the date of grant, and
the remaining one-third would be vested after the expiry of 3 years from the date of grant. Further details
of the said awarded shares were set out in the announcements of the Company dated 3 May 2011 and 4
August 2011 respectively.
147AnnuAl report 2011
Notes to Financial Statements
31 December 2011
38. SHARE AWARD SCHEMES (continued)
On 9 August 2011, the Board approved the grant of 596,479 shares of the Company to be awarded to a
Director under the Share Award Scheme B which would be transferred to the employees by the trustee at
nil consideration upon vesting between 9 August 2012 and 9 August 2014. One-third of the said awarded
shares would be vested after the expiry of 1 year from the date of grant, a further one-third would be
vested after the expiry of 2 years from the date of grant, and the remaining one-third would be vested after
the expiry of 3 years from the date of grant. Further details of the said awarded shares were set out in the
announcement of the Company dated 9 August 2011.
On 29 August 2011, the Board approved the grant of 2,305,000 shares of the Company to be awarded to
designated employees under the Share Award Scheme B which would be transferred to the employees by
the trustee at nil consideration upon vesting between 29 August 2012 and 29 August 2014. One-third of the
said awarded shares would be vested after the expiry of 1 year from the date of grant, a further one-third
would be vested after the expiry of 2 years from the date of grant, and the remaining one-third would be
vested after the expiry of 3 years from the date of grant.
During the year under review, the trustee purchased 15,778,000 shares of the Company at a total cost
(including related transaction costs) of HK$71,256,000, and transferred a total of 500,000 shares to the
awardees upon vesting of those shares awarded under the Share Award Scheme B. The total cost of the
related vested shares was HK$1,580,000. As at 31 December 2011, the carrying amount of shares held for
Share Award Scheme was HK$80,708,000 (31 December 2010: HK$11,032,000).
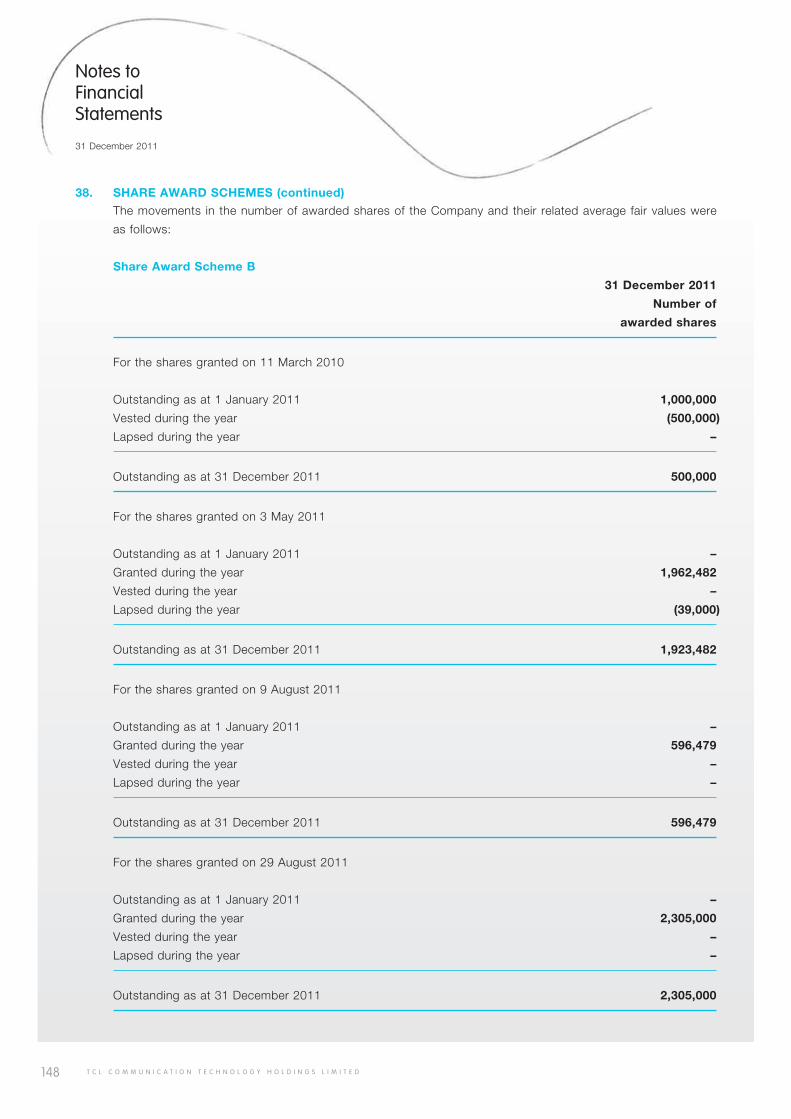
148 T C L C O M M U N I C A T I O N T E C H N O L O G Y H O L D I N G S L I M I T E D
Notes to Financial Statements
31 December 2011
38. SHARE AWARD SCHEMES (continued)
The movements in the number of awarded shares of the Company and their related average fair values were
as follows:
Share Award Scheme B
31 December 2011
Number of
awarded shares
For the shares granted on 11 March 2010
Outstanding as at 1 January 2011 1,000,000
Vested during the year (500,000)
Lapsed during the year –
Outstanding as at 31 December 2011 500,000
For the shares granted on 3 May 2011
Outstanding as at 1 January 2011 –
Granted during the year 1,962,482
Vested during the year –
Lapsed during the year (39,000)
Outstanding as at 31 December 2011 1,923,482
For the shares granted on 9 August 2011
Outstanding as at 1 January 2011 –
Granted during the year 596,479
Vested during the year –
Lapsed during the year –
Outstanding as at 31 December 2011 596,479
For the shares granted on 29 August 2011
Outstanding as at 1 January 2011 –
Granted during the year 2,305,000
Vested during the year –
Lapsed during the year –
Outstanding as at 31 December 2011 2,305,000
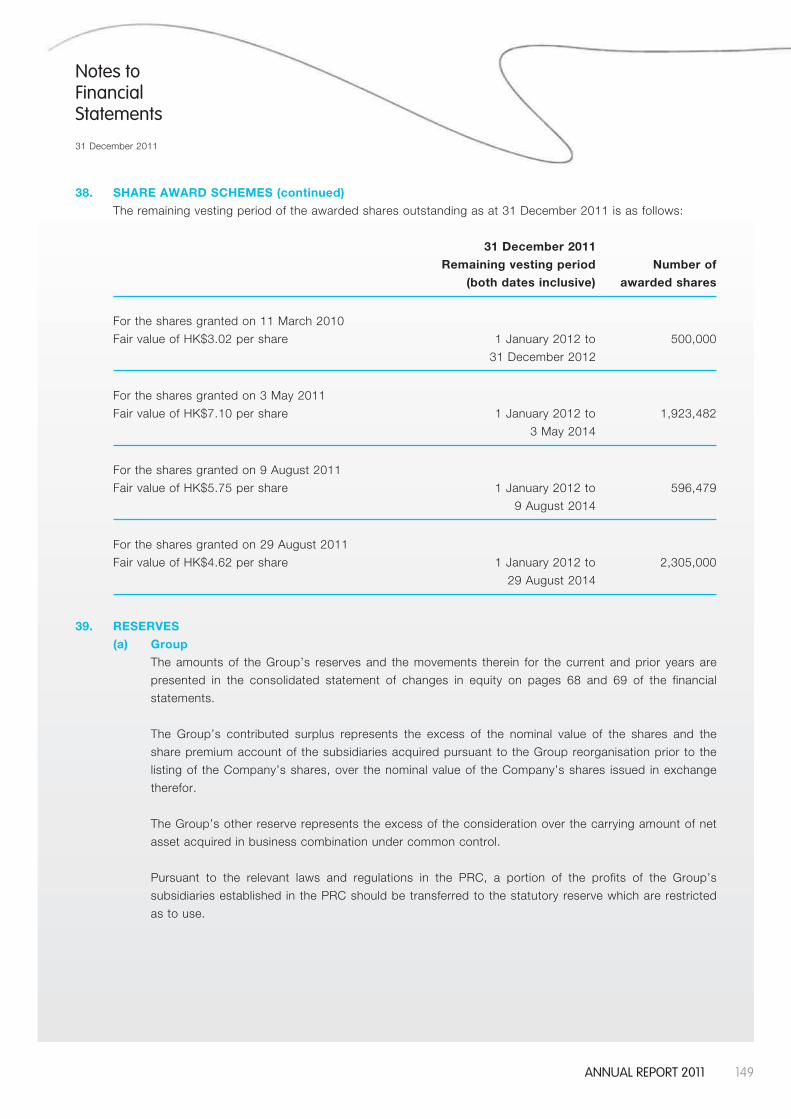
149AnnuAl report 2011
Notes to Financial Statements
31 December 2011
38. SHARE AWARD SCHEMES (continued)
The remaining vesting period of the awarded shares outstanding as at 31 December 2011 is as follows:
31 December 2011
Remaining vesting period Number of
(both dates inclusive) awarded shares
For the shares granted on 11 March 2010
Fair value of HK$3.02 per share 1 January 2012 to 500,000
31 December 2012
For the shares granted on 3 May 2011
Fair value of HK$7.10 per share 1 January 2012 to 1,923,482
3 May 2014
For the shares granted on 9 August 2011
Fair value of HK$5.75 per share 1 January 2012 to 596,479
9 August 2014
For the shares granted on 29 August 2011
Fair value of HK$4.62 per share 1 January 2012 to 2,305,000
29 August 2014
39. RESERVES
(a) Group
The amounts of the Group’s reserves and the movements therein for the current and prior years are
presented in the consolidated statement of changes in equity on pages 68 and 69 of the financial
statements.
The Group’s contributed surplus represents the excess of the nominal value of the shares and the
share premium account of the subsidiaries acquired pursuant to the Group reorganisation prior to the
listing of the Company’s shares, over the nominal value of the Company’s shares issued in exchange
therefor.
The Group’s other reserve represents the excess of the consideration over the carrying amount of net
asset acquired in business combination under common control.
Pursuant to the relevant laws and regulations in the PRC, a portion of the profits of the Group’s
subsidiaries established in the PRC should be transferred to the statutory reserve which are restricted
as to use.
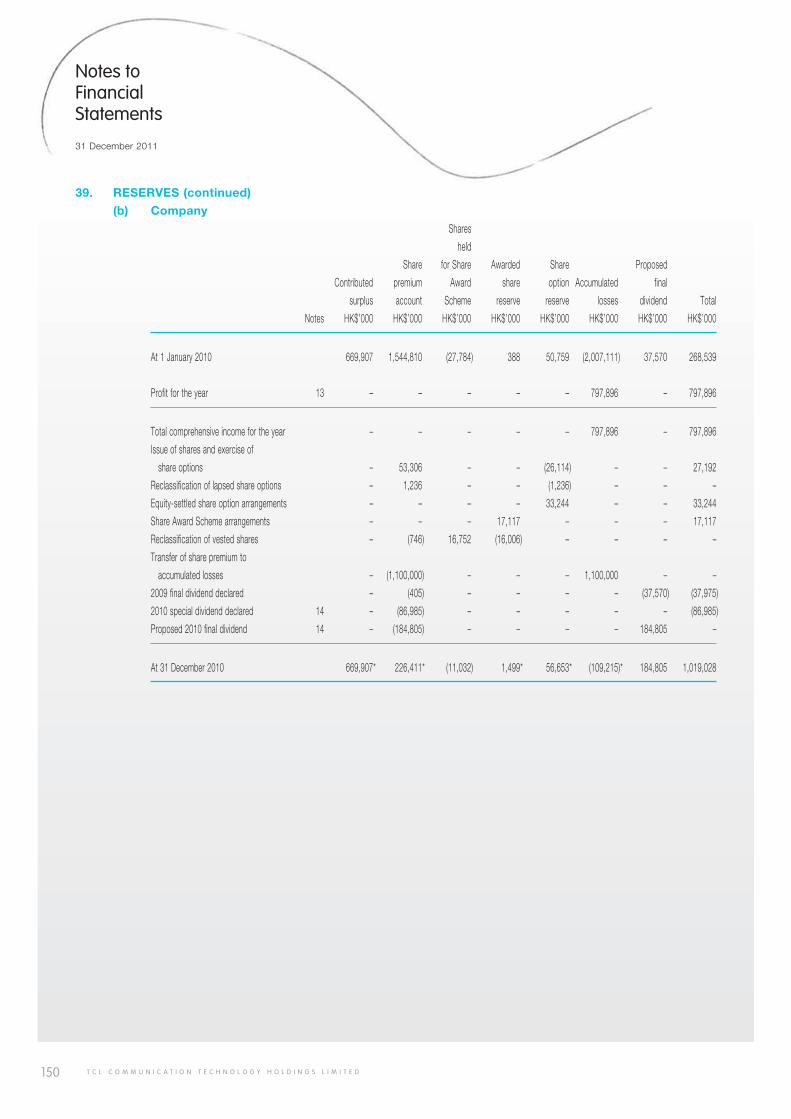
150 T C L C O M M U N I C A T I O N T E C H N O L O G Y H O L D I N G S L I M I T E D
Notes to Financial Statements
31 December 2011
39. RESERVES (continued)
(b) Company
Shares
held
Share for Share Awarded Share Proposed
Contributed premium Award share option Accumulated final
surplus account Scheme reserve reserve losses dividend Total
Notes HK$’000 HK$’000 HK$’000 HK$’000 HK$’000 HK$’000 HK$’000 HK$’000
At 1 January 2010 669,907 1,544,810 (27,784) 388 50,759 (2,007,111) 37,570 268,539
Profit for the year 13 – – – – – 797,896 – 797,896
Total comprehensive income for the year – – – – – 797,896 – 797,896
Issue of shares and exercise of
share options – 53,306 – – (26,114) – – 27,192
Reclassification of lapsed share options – 1,236 – – (1,236) – – –
Equity-settled share option arrangements – – – – 33,244 – – 33,244
Share Award Scheme arrangements – – – 17,117 – – – 17,117
Reclassification of vested shares – (746) 16,752 (16,006) – – – –
Transfer of share premium to
accumulated losses – (1,100,000) – – – 1,100,000 – –
2009 final dividend declared – (405) – – – – (37,570) (37,975)
2010 special dividend declared 14 – (86,985) – – – – – (86,985)
Proposed 2010 final dividend 14 – (184,805) – – – – 184,805 –
At 31 December 2010 669,907* 226,411* (11,032) 1,499* 56,653* (109,215)* 184,805 1,019,028
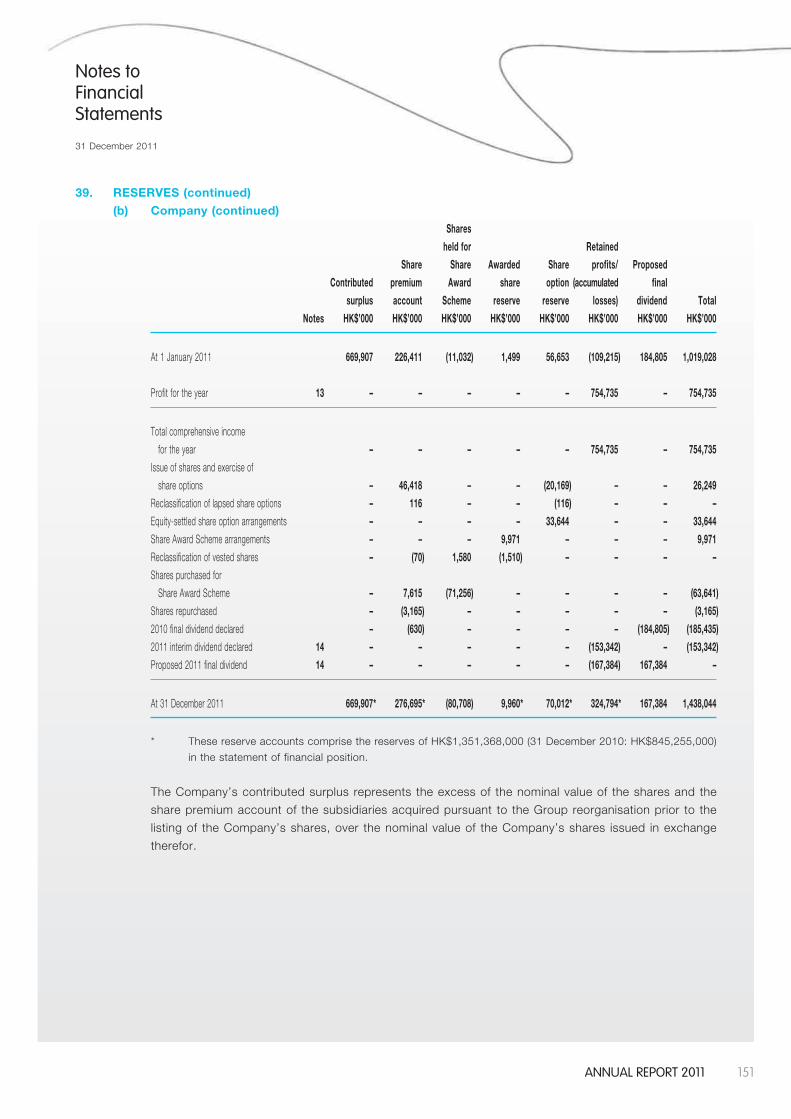
151AnnuAl report 2011
Notes to Financial Statements
31 December 2011
39. RESERVES (continued)
(b) Company (continued)
Shares
held for Retained
Share Share Awarded Share profits/ Proposed
Contributed premium Award share option (accumulated final
surplus account Scheme reserve reserve losses) dividend Total
Notes HK$’000 HK$’000 HK$’000 HK$’000 HK$’000 HK$’000 HK$’000 HK$’000
At 1 January 2011 669,907 226,411 (11,032) 1,499 56,653 (109,215) 184,805 1,019,028
Profit for the year 13 – – – – – 754,735 – 754,735
Total comprehensive income
for the year – – – – – 754,735 – 754,735
Issue of shares and exercise of
share options – 46,418 – – (20,169) – – 26,249
Reclassification of lapsed share options – 116 – – (116) – – –
Equity-settled share option arrangements – – – – 33,644 – – 33,644
Share Award Scheme arrangements – – – 9,971 – – – 9,971
Reclassification of vested shares – (70) 1,580 (1,510) – – – –
Shares purchased for
Share Award Scheme – 7,615 (71,256) – – – – (63,641)
Shares repurchased – (3,165) – – – – – (3,165)
2010 final dividend declared – (630) – – – – (184,805) (185,435)
2011 interim dividend declared 14 – – – – – (153,342) – (153,342)
Proposed 2011 final dividend 14 – – – – – (167,384) 167,384 –
At 31 December 2011 669,907* 276,695* (80,708) 9,960* 70,012* 324,794* 167,384 1,438,044
* These reserve accounts comprise the reserves of HK$1,351,368,000 (31 December 2010: HK$845,255,000)
in the statement of financial position.
The Company’s contributed surplus represents the excess of the nominal value of the shares and the
share premium account of the subsidiaries acquired pursuant to the Group reorganisation prior to the
listing of the Company’s shares, over the nominal value of the Company’s shares issued in exchange
therefor.
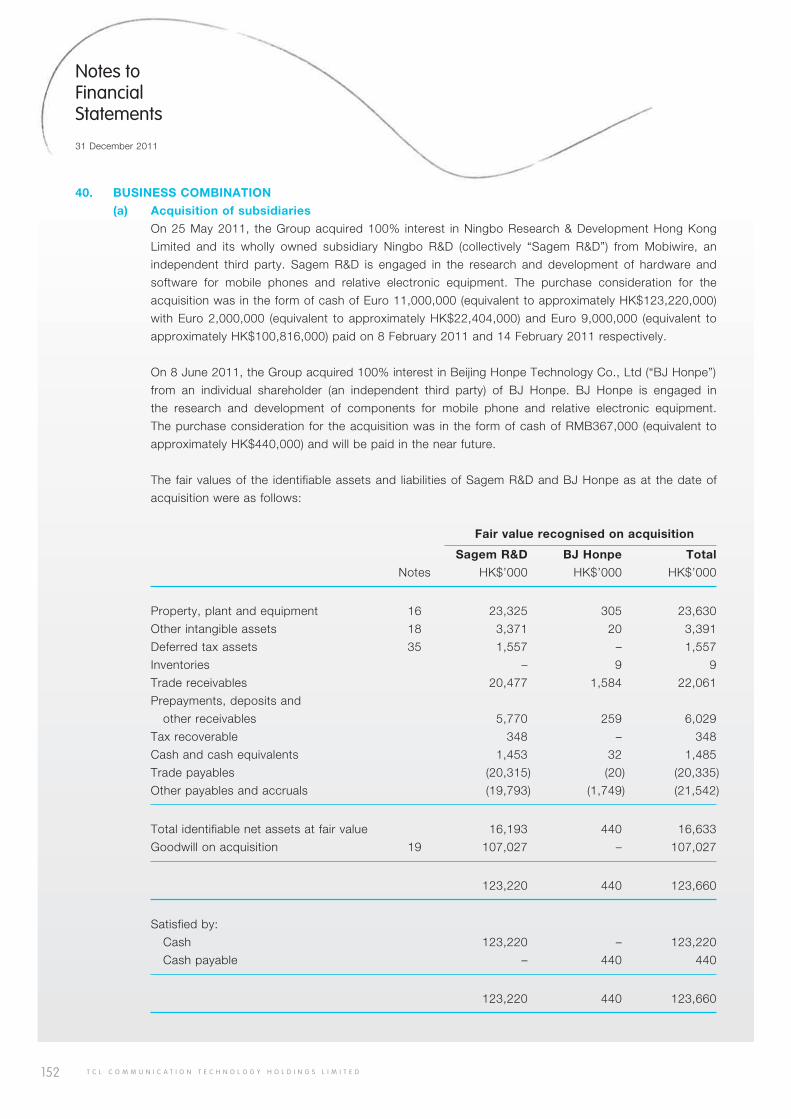
152 T C L C O M M U N I C A T I O N T E C H N O L O G Y H O L D I N G S L I M I T E D
Notes to Financial Statements
31 December 2011
40. BUSINESS COMBINATION
(a) Acquisition of subsidiaries
On 25 May 2011, the Group acquired 100% interest in Ningbo Research & Development Hong Kong
Limited and its wholly owned subsidiary Ningbo R&D (collectively “Sagem R&D”) from Mobiwire, an
independent third party. Sagem R&D is engaged in the research and development of hardware and
software for mobile phones and relative electronic equipment. The purchase consideration for the
acquisition was in the form of cash of Euro 11,000,000 (equivalent to approximately HK$123,220,000)
with Euro 2,000,000 (equivalent to approximately HK$22,404,000) and Euro 9,000,000 (equivalent to
approximately HK$100,816,000) paid on 8 February 2011 and 14 February 2011 respectively.
On 8 June 2011, the Group acquired 100% interest in Beijing Honpe Technology Co., Ltd (“BJ Honpe”)
from an individual shareholder (an independent third party) of BJ Honpe. BJ Honpe is engaged in
the research and development of components for mobile phone and relative electronic equipment.
The purchase consideration for the acquisition was in the form of cash of RMB367,000 (equivalent to
approximately HK$440,000) and will be paid in the near future.
The fair values of the identifiable assets and liabilities of Sagem R&D and BJ Honpe as at the date of
acquisition were as follows:
Fair value recognised on acquisition
Sagem R&D BJ Honpe Total
Notes HK$’000 HK$’000 HK$’000
Property, plant and equipment 16 23,325 305 23,630
Other intangible assets 18 3,371 20 3,391
Deferred tax assets 35 1,557 – 1,557
Inventories – 9 9
Trade receivables 20,477 1,584 22,061
Prepayments, deposits and
other receivables 5,770 259 6,029
Tax recoverable 348 – 348
Cash and cash equivalents 1,453 32 1,485
Trade payables (20,315) (20) (20,335)
Other payables and accruals (19,793) (1,749) (21,542)
Total identifiable net assets at fair value 16,193 440 16,633
Goodwill on acquisition 19 107,027 – 107,027
123,220 440 123,660
Satisfied by:
Cash 123,220 – 123,220
Cash payable – 440 440
123,220 440 123,660
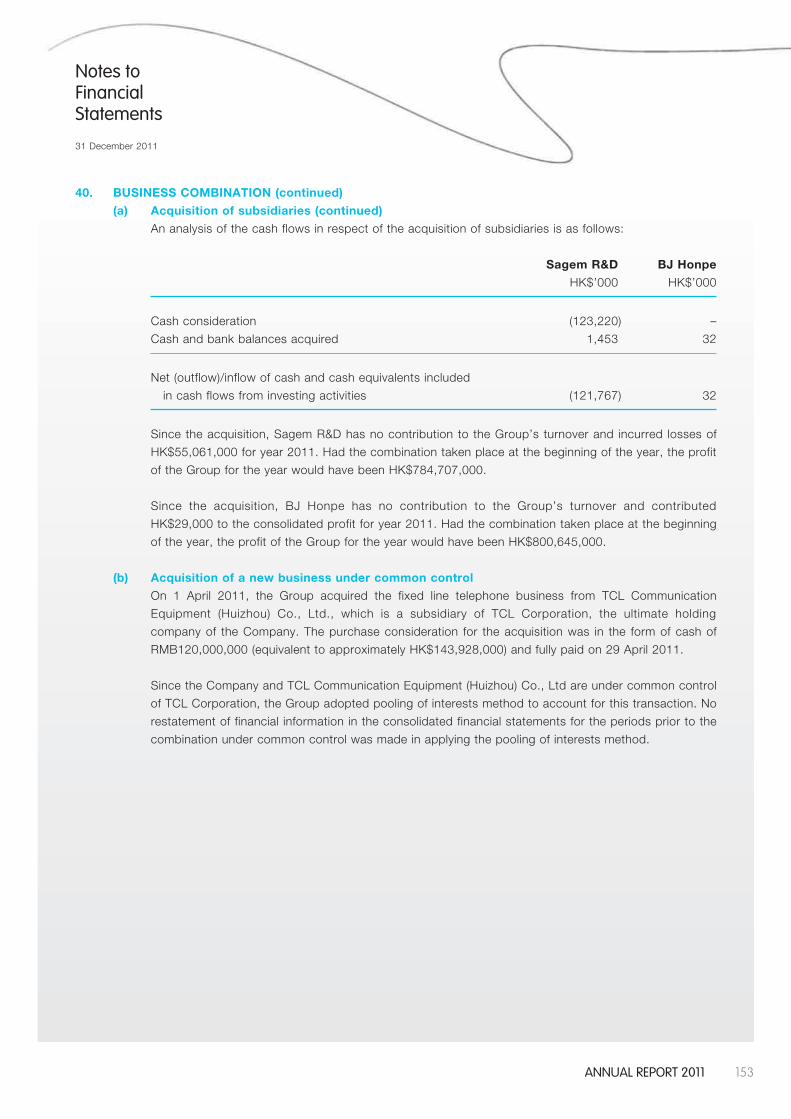
153AnnuAl report 2011
Notes to Financial Statements
31 December 2011
40. BUSINESS COMBINATION (continued)
(a) Acquisition of subsidiaries (continued)
An analysis of the cash flows in respect of the acquisition of subsidiaries is as follows:
Sagem R&D BJ Honpe
HK$’000 HK$’000
Cash consideration (123,220) –
Cash and bank balances acquired 1,453 32
Net (outflow)/inflow of cash and cash equivalents included
in cash flows from investing activities (121,767) 32
Since the acquisition, Sagem R&D has no contribution to the Group’s turnover and incurred losses of
HK$55,061,000 for year 2011. Had the combination taken place at the beginning of the year, the profit
of the Group for the year would have been HK$784,707,000.
Since the acquisition, BJ Honpe has no contribution to the Group’s turnover and contributed
HK$29,000 to the consolidated profit for year 2011. Had the combination taken place at the beginning
of the year, the profit of the Group for the year would have been HK$800,645,000.
(b) Acquisition of a new business under common control
On 1 April 2011, the Group acquired the fixed line telephone business from TCL Communication
Equipment (Huizhou) Co., Ltd., which is a subsidiary of TCL Corporation, the ultimate holding
company of the Company. The purchase consideration for the acquisition was in the form of cash of
RMB120,000,000 (equivalent to approximately HK$143,928,000) and fully paid on 29 April 2011.
Since the Company and TCL Communication Equipment (Huizhou) Co., Ltd are under common control
of TCL Corporation, the Group adopted pooling of interests method to account for this transaction. No
restatement of financial information in the consolidated financial statements for the periods prior to the
combination under common control was made in applying the pooling of interests method.
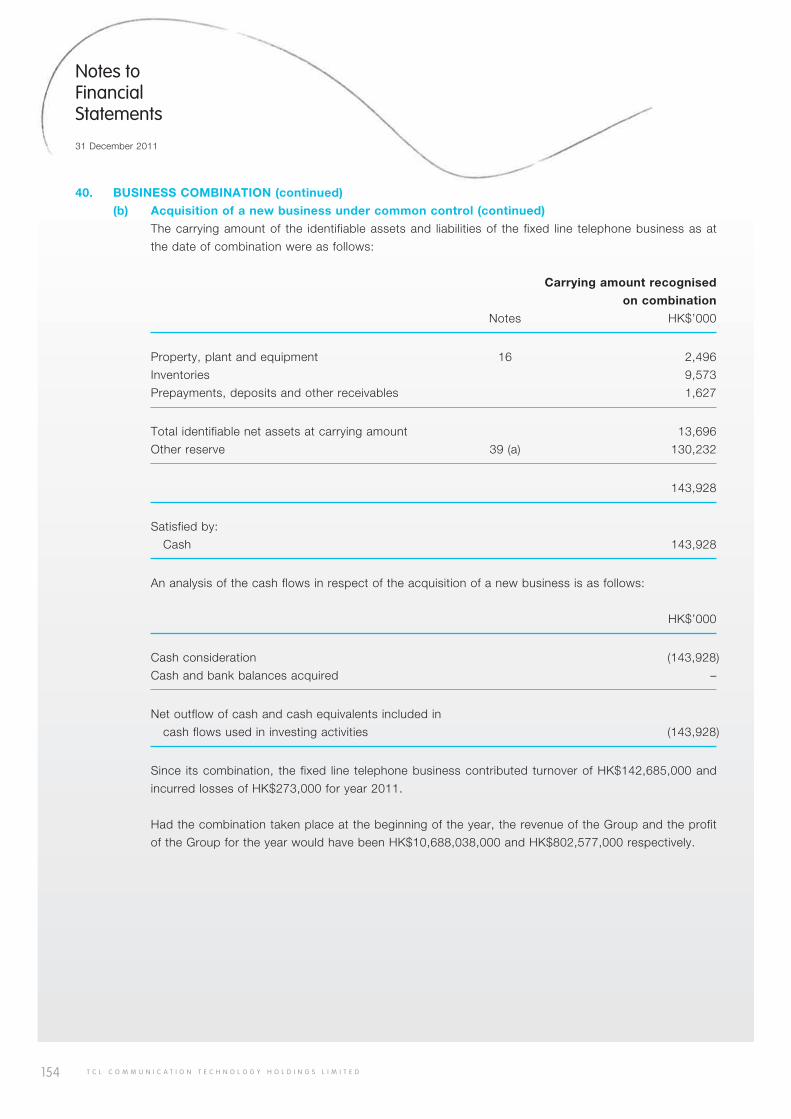
154 T C L C O M M U N I C A T I O N T E C H N O L O G Y H O L D I N G S L I M I T E D
Notes to Financial Statements
31 December 2011
40. BUSINESS COMBINATION (continued)
(b) Acquisition of a new business under common control (continued)
The carrying amount of the identifiable assets and liabilities of the fixed line telephone business as at
the date of combination were as follows:
Carrying amount recognised
on combination
Notes HK$’000
Property, plant and equipment 16 2,496
Inventories 9,573
Prepayments, deposits and other receivables 1,627
Total identifiable net assets at carrying amount 13,696
Other reserve 39 (a) 130,232
143,928
Satisfied by:
Cash 143,928
An analysis of the cash flows in respect of the acquisition of a new business is as follows:
HK$’000
Cash consideration (143,928)
Cash and bank balances acquired –
Net outflow of cash and cash equivalents included in
cash flows used in investing activities (143,928)
Since its combination, the fixed line telephone business contributed turnover of HK$142,685,000 and
incurred losses of HK$273,000 for year 2011.
Had the combination taken place at the beginning of the year, the revenue of the Group and the profit
of the Group for the year would have been HK$10,688,038,000 and HK$802,577,000 respectively.
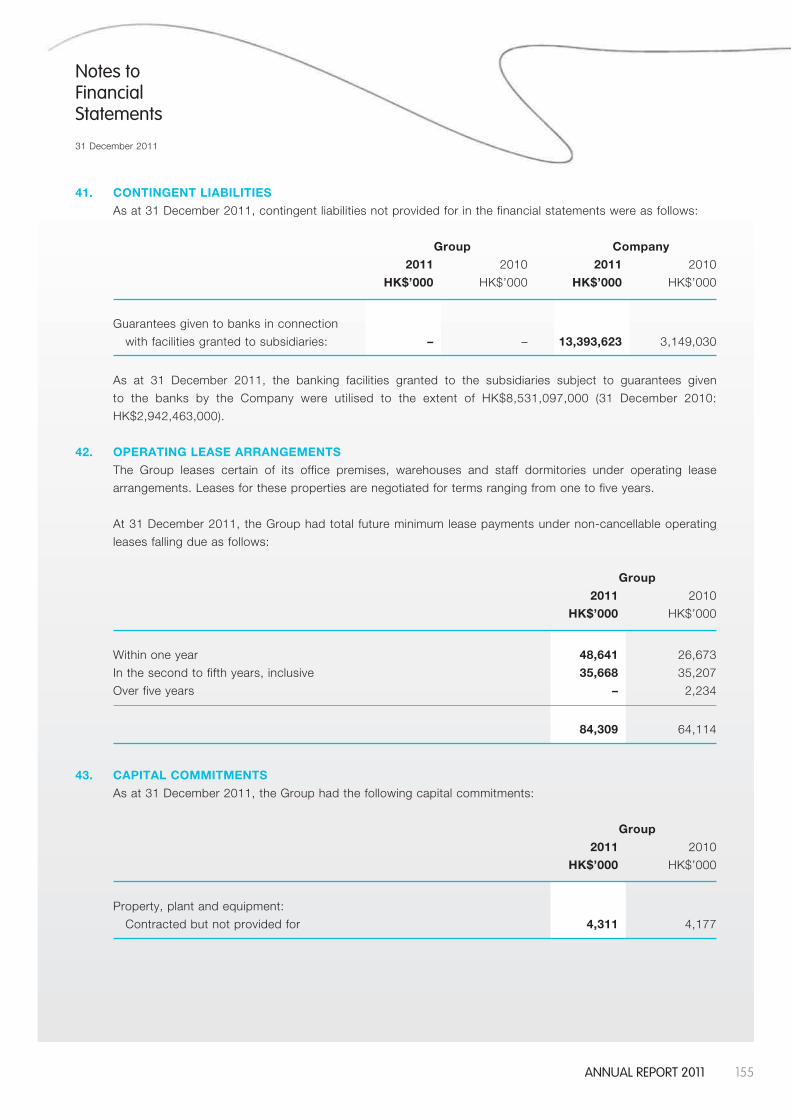
155AnnuAl report 2011
Notes to Financial Statements
31 December 2011
41. CONTINGENT LIABILITIES
As at 31 December 2011, contingent liabilities not provided for in the financial statements were as follows:
Group Company
2011 2010 2011 2010
HK$’000 HK$’000 HK$’000 HK$’000
Guarantees given to banks in connection
with facilities granted to subsidiaries: – – 13,393,623 3,149,030
As at 31 December 2011, the banking facilities granted to the subsidiaries subject to guarantees given
to the banks by the Company were utilised to the extent of HK$8,531,097,000 (31 December 2010:
HK$2,942,463,000).
42. OPERATING LEASE ARRANGEMENTS
The Group leases certain of its office premises, warehouses and staff dormitories under operating lease
arrangements. Leases for these properties are negotiated for terms ranging from one to five years.
At 31 December 2011, the Group had total future minimum lease payments under non-cancellable operating
leases falling due as follows:
Group
2011 2010
HK$’000 HK$’000
Within one year 48,641 26,673
In the second to fifth years, inclusive 35,668 35,207
Over five years – 2,234
84,309 64,114
43. CAPITAL COMMITMENTS
As at 31 December 2011, the Group had the following capital commitments:
Group
2011 2010
HK$’000 HK$’000
Property, plant and equipment:
Contracted but not provided for 4,311 4,177
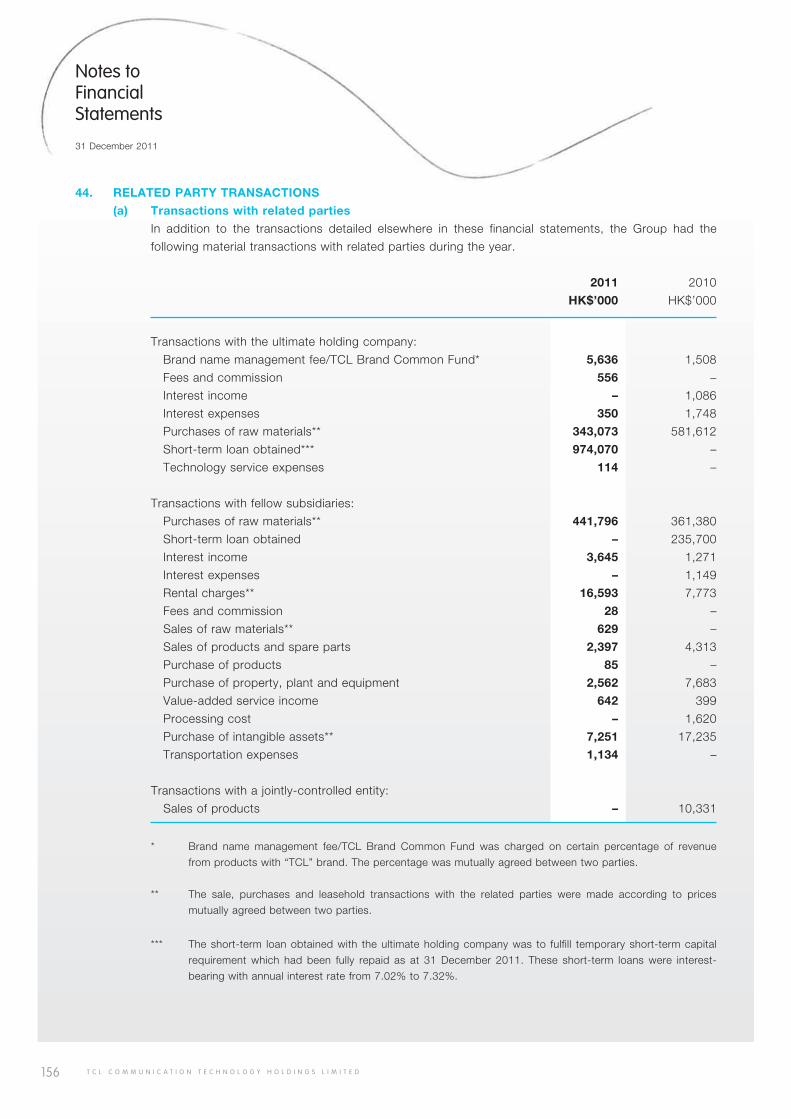
156 T C L C O M M U N I C A T I O N T E C H N O L O G Y H O L D I N G S L I M I T E D
Notes to Financial Statements
31 December 2011
44. RELATED PARTY TRANSACTIONS
(a) Transactions with related parties
In addition to the transactions detailed elsewhere in these financial statements, the Group had the
following material transactions with related parties during the year.
2011 2010
HK$’000 HK$’000
Transactions with the ultimate holding company:
Brand name management fee/TCL Brand Common Fund* 5,636 1,508
Fees and commission 556 –
Interest income – 1,086
Interest expenses 350 1,748
Purchases of raw materials** 343,073 581,612
Short-term loan obtained*** 974,070 –
Technology service expenses 114 –
Transactions with fellow subsidiaries:
Purchases of raw materials** 441,796 361,380
Short-term loan obtained – 235,700
Interest income 3,645 1,271
Interest expenses – 1,149
Rental charges** 16,593 7,773
Fees and commission 28 –
Sales of raw materials** 629 –
Sales of products and spare parts 2,397 4,313
Purchase of products 85 –
Purchase of property, plant and equipment 2,562 7,683
Value-added service income 642 399
Processing cost – 1,620
Purchase of intangible assets** 7,251 17,235
Transportation expenses 1,134 –
Transactions with a jointly-controlled entity:
Sales of products – 10,331
* Brand name management fee/TCL Brand Common Fund was charged on certain percentage of revenue
from products with “TCL” brand. The percentage was mutually agreed between two parties.
** The sale, purchases and leasehold transactions with the related parties were made according to prices
mutually agreed between two parties.
*** The short-term loan obtained with the ultimate holding company was to fulfill temporary short-term capital
requirement which had been fully repaid as at 31 December 2011. These short-term loans were interest-
bearing with annual interest rate from 7.02% to 7.32%.
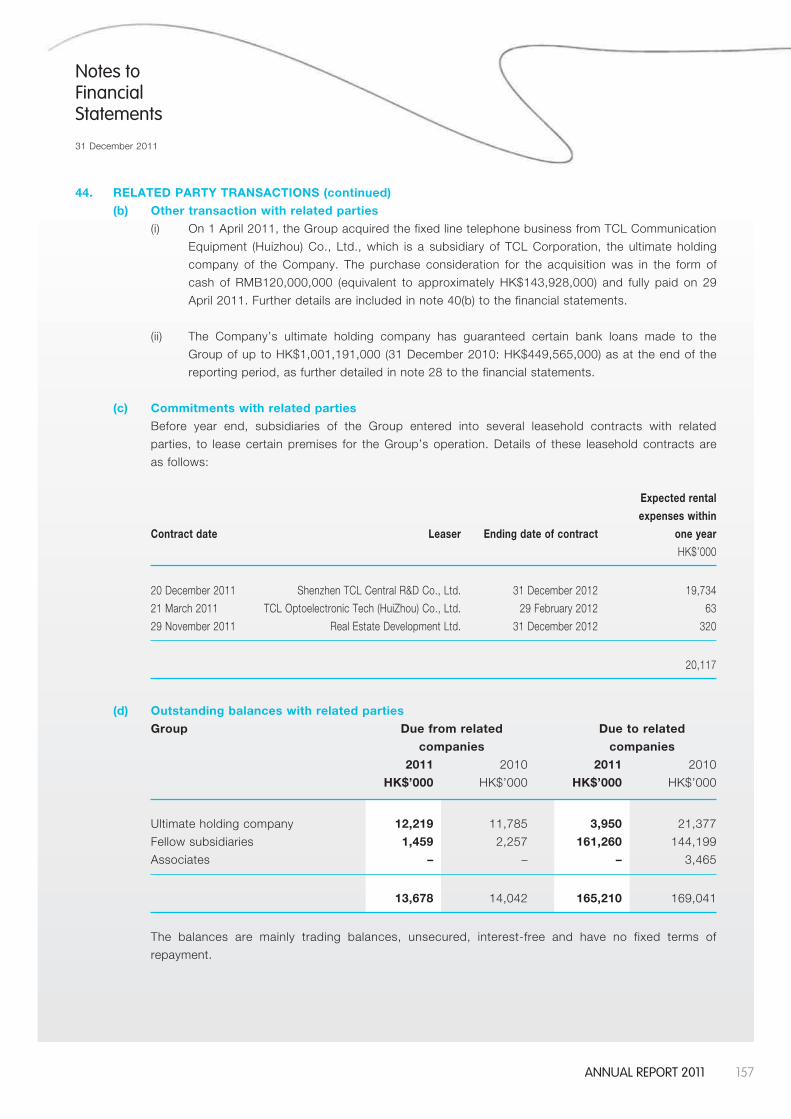
157AnnuAl report 2011
Notes to Financial Statements
31 December 2011
44. RELATED PARTY TRANSACTIONS (continued)
(b) Other transaction with related parties
(i) On 1 April 2011, the Group acquired the fixed line telephone business from TCL Communication
Equipment (Huizhou) Co., Ltd., which is a subsidiary of TCL Corporation, the ultimate holding
company of the Company. The purchase consideration for the acquisition was in the form of
cash of RMB120,000,000 (equivalent to approximately HK$143,928,000) and fully paid on 29
April 2011. Further details are included in note 40(b) to the financial statements.
(ii) The Company’s ultimate holding company has guaranteed certain bank loans made to the
Group of up to HK$1,001,191,000 (31 December 2010: HK$449,565,000) as at the end of the
reporting period, as further detailed in note 28 to the financial statements.
(c) Commitments with related parties
Before year end, subsidiaries of the Group entered into several leasehold contracts with related
parties, to lease certain premises for the Group’s operation. Details of these leasehold contracts are
as follows:
Expected rental
expenses within
Contract date Leaser Ending date of contract one year
HK$’000
20 December 2011 Shenzhen TCL Central R&D Co., Ltd. 31 December 2012 19,734
21 March 2011 TCL Optoelectronic Tech (HuiZhou) Co., Ltd. 29 February 2012 63
29 November 2011 Real Estate Development Ltd. 31 December 2012 320
20,117
(d) Outstanding balances with related parties
Group Due from related Due to related
companies companies
2011 2010 2011 2010
HK$’000 HK$’000 HK$’000 HK$’000
Ultimate holding company 12,219 11,785 3,950 21,377
Fellow subsidiaries 1,459 2,257 161,260 144,199
Associates – – – 3,465
13,678 14,042 165,210 169,041
The balances are mainly trading balances, unsecured, interest-free and have no fixed terms of
repayment.
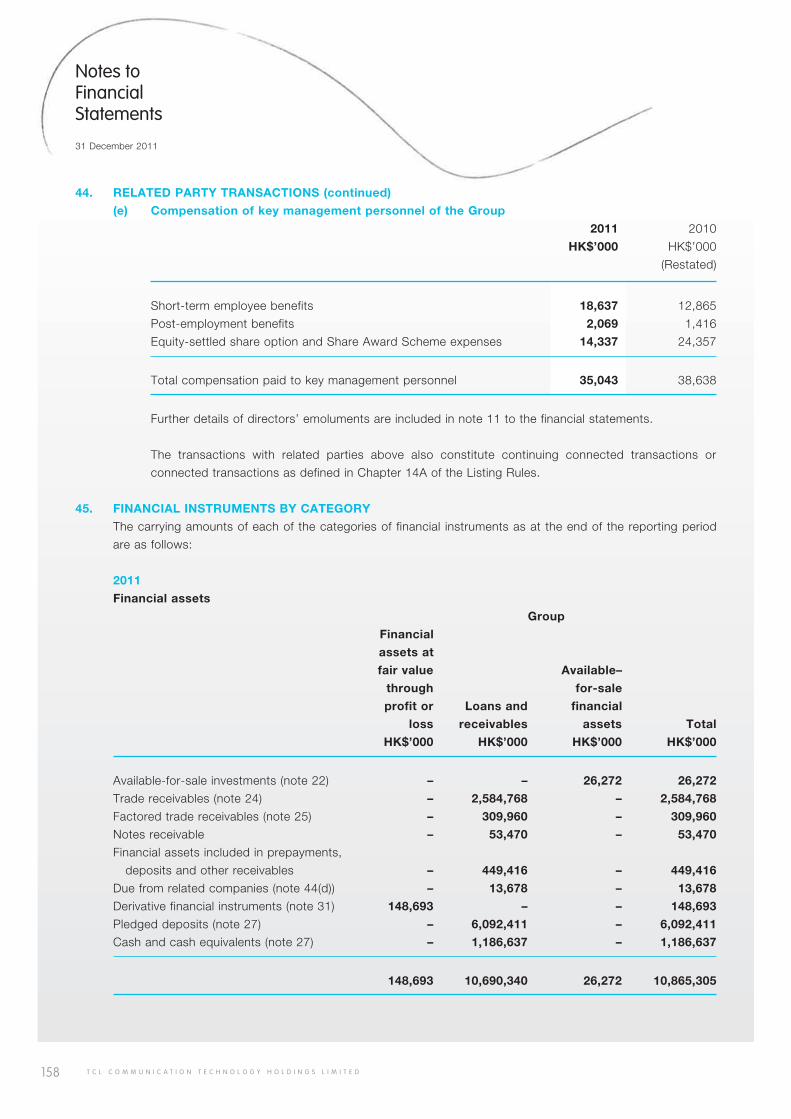
158 T C L C O M M U N I C A T I O N T E C H N O L O G Y H O L D I N G S L I M I T E D
Notes to Financial Statements
31 December 2011
44. RELATED PARTY TRANSACTIONS (continued)
(e) Compensation of key management personnel of the Group
2011 2010
HK$’000 HK$’000
(Restated)
Short-term employee benefits 18,637 12,865
Post-employment benefits 2,069 1,416
Equity-settled share option and Share Award Scheme expenses 14,337 24,357
Total compensation paid to key management personnel 35,043 38,638
Further details of directors’ emoluments are included in note 11 to the financial statements.
The transactions with related parties above also constitute continuing connected transactions or
connected transactions as defined in Chapter 14A of the Listing Rules.
45. FINANCIAL INSTRUMENTS BY CATEGORY
The carrying amounts of each of the categories of financial instruments as at the end of the reporting period
are as follows:
2011
Financial assets
Group
Financial
assets at
fair value Available–
through for-sale
profit or Loans and financial
loss receivables assets Total
HK$’000 HK$’000 HK$’000 HK$’000
Available-for-sale investments (note 22) – – 26,272 26,272
Trade receivables (note 24) – 2,584,768 – 2,584,768
Factored trade receivables (note 25) – 309,960 – 309,960
Notes receivable – 53,470 – 53,470
Financial assets included in prepayments,
deposits and other receivables – 449,416 – 449,416
Due from related companies (note 44(d)) – 13,678 – 13,678
Derivative financial instruments (note 31) 148,693 – – 148,693
Pledged deposits (note 27) – 6,092,411 – 6,092,411
Cash and cash equivalents (note 27) – 1,186,637 – 1,186,637
148,693 10,690,340 26,272 10,865,305
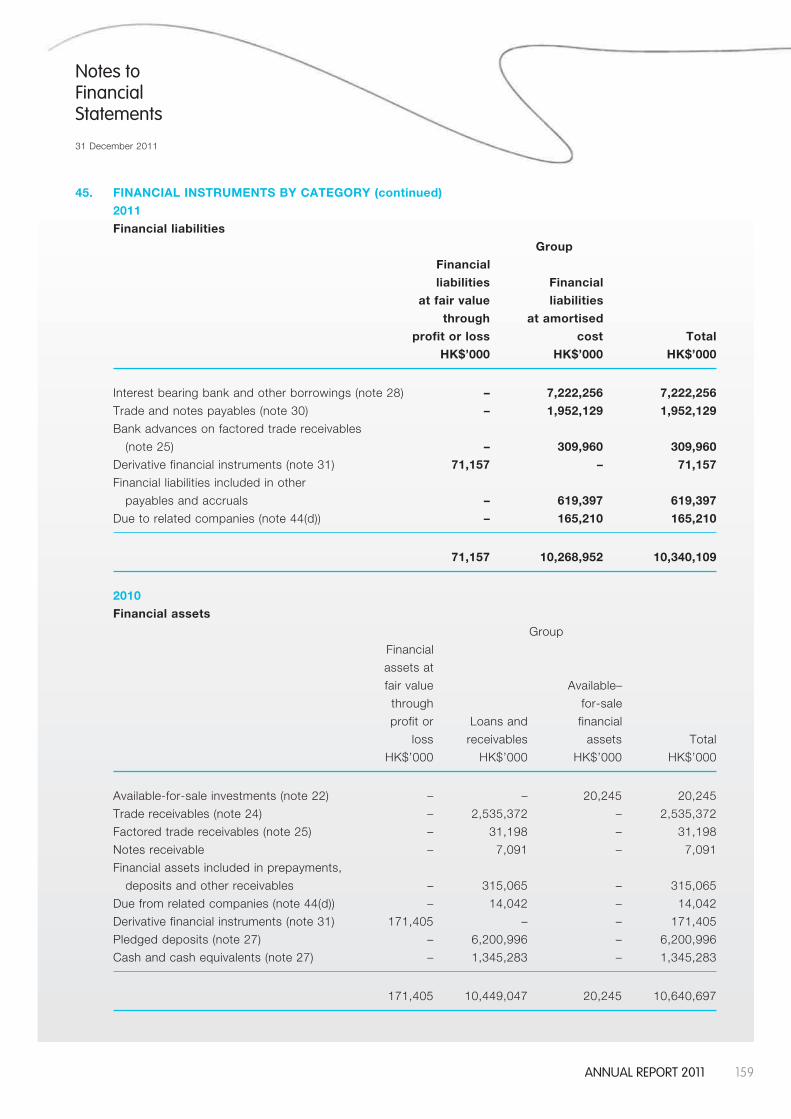
159AnnuAl report 2011
Notes to Financial Statements
31 December 2011
45. FINANCIAL INSTRUMENTS BY CATEGORY (continued)
2011
Financial liabilities
Group
Financial
liabilities Financial
at fair value liabilities
through at amortised
profit or loss cost Total
HK$’000 HK$’000 HK$’000
Interest bearing bank and other borrowings (note 28) – 7,222,256 7,222,256
Trade and notes payables (note 30) – 1,952,129 1,952,129
Bank advances on factored trade receivables
(note 25) – 309,960 309,960
Derivative financial instruments (note 31) 71,157 – 71,157
Financial liabilities included in other
payables and accruals – 619,397 619,397
Due to related companies (note 44(d)) – 165,210 165,210
71,157 10,268,952 10,340,109
2010
Financial assets
Group
Financial
assets at
fair value Available–
through for-sale
profit or Loans and financial
loss receivables assets Total
HK$’000 HK$’000 HK$’000 HK$’000
Available-for-sale investments (note 22) – – 20,245 20,245
Trade receivables (note 24) – 2,535,372 – 2,535,372
Factored trade receivables (note 25) – 31,198 – 31,198
Notes receivable – 7,091 – 7,091
Financial assets included in prepayments,
deposits and other receivables – 315,065 – 315,065
Due from related companies (note 44(d)) – 14,042 – 14,042
Derivative financial instruments (note 31) 171,405 – – 171,405
Pledged deposits (note 27) – 6,200,996 – 6,200,996
Cash and cash equivalents (note 27) – 1,345,283 – 1,345,283
171,405 10,449,047 20,245 10,640,697
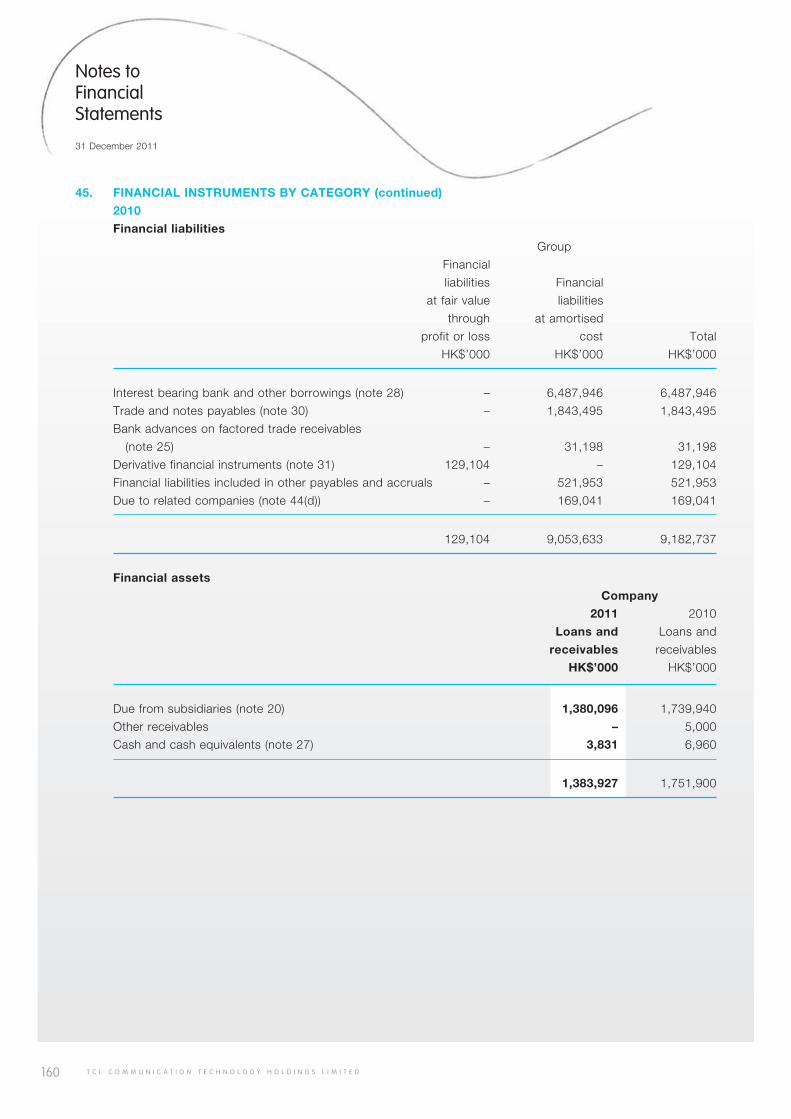
160 T C L C O M M U N I C A T I O N T E C H N O L O G Y H O L D I N G S L I M I T E D
Notes to Financial Statements
31 December 2011
45. FINANCIAL INSTRUMENTS BY CATEGORY (continued)
2010
Financial liabilities
Group
Financial
liabilities Financial
at fair value liabilities
through at amortised
profit or loss cost Total
HK$’000 HK$’000 HK$’000
Interest bearing bank and other borrowings (note 28) – 6,487,946 6,487,946
Trade and notes payables (note 30) – 1,843,495 1,843,495
Bank advances on factored trade receivables
(note 25) – 31,198 31,198
Derivative financial instruments (note 31) 129,104 – 129,104
Financial liabilities included in other payables and accruals – 521,953 521,953
Due to related companies (note 44(d)) – 169,041 169,041
129,104 9,053,633 9,182,737
Financial assets
Company
2011 2010
Loans and Loans and
receivables receivables
HK$’000 HK$’000
Due from subsidiaries (note 20) 1,380,096 1,739,940
Other receivables – 5,000
Cash and cash equivalents (note 27) 3,831 6,960
1,383,927 1,751,900
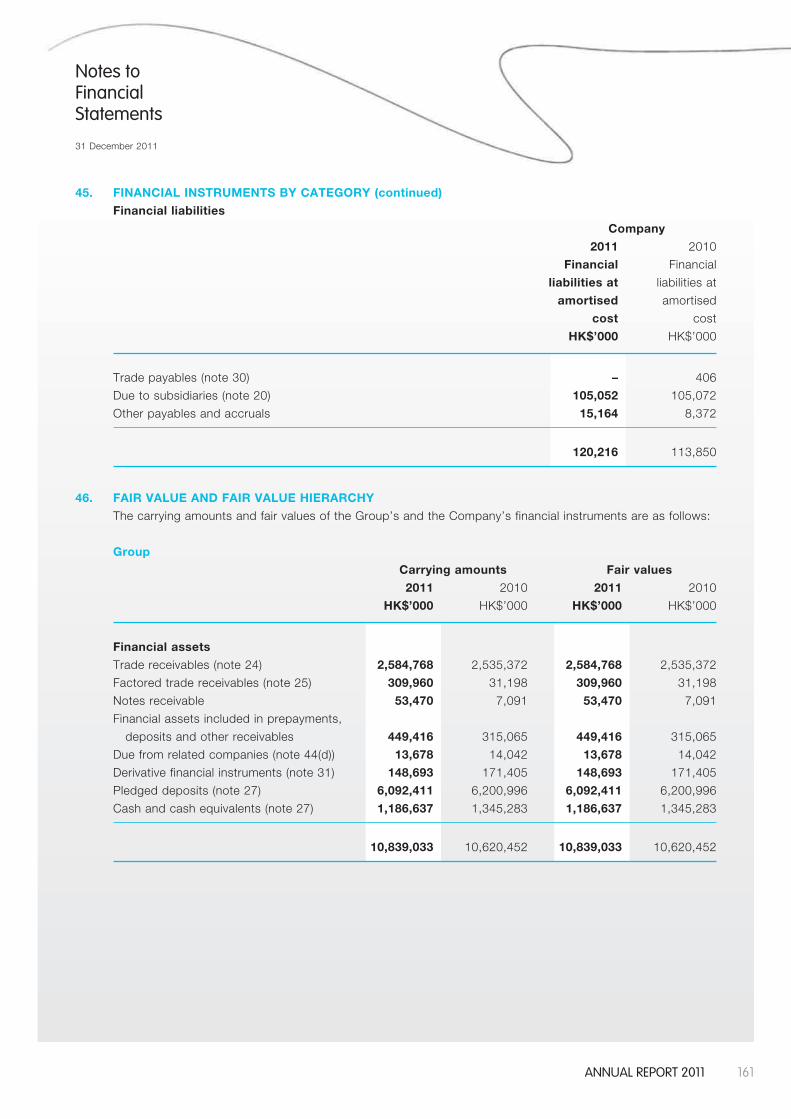
161AnnuAl report 2011
Notes to Financial Statements
31 December 2011
45. FINANCIAL INSTRUMENTS BY CATEGORY (continued)
Financial liabilities
Company
2011 2010
Financial Financial
liabilities at liabilities at
amortised amortised
cost cost
HK$’000 HK$’000
Trade payables (note 30) – 406
Due to subsidiaries (note 20) 105,052 105,072
Other payables and accruals 15,164 8,372
120,216 113,850
46. FAIR VALUE AND FAIR VALUE HIERARCHY
The carrying amounts and fair values of the Group’s and the Company’s financial instruments are as follows:
Group
Carrying amounts Fair values
2011 2010 2011 2010
HK$’000 HK$’000 HK$’000 HK$’000
Financial assets
Trade receivables (note 24) 2,584,768 2,535,372 2,584,768 2,535,372
Factored trade receivables (note 25) 309,960 31,198 309,960 31,198
Notes receivable 53,470 7,091 53,470 7,091
Financial assets included in prepayments,
deposits and other receivables 449,416 315,065 449,416 315,065
Due from related companies (note 44(d)) 13,678 14,042 13,678 14,042
Derivative financial instruments (note 31) 148,693 171,405 148,693 171,405
Pledged deposits (note 27) 6,092,411 6,200,996 6,092,411 6,200,996
Cash and cash equivalents (note 27) 1,186,637 1,345,283 1,186,637 1,345,283
10,839,033 10,620,452 10,839,033 10,620,452
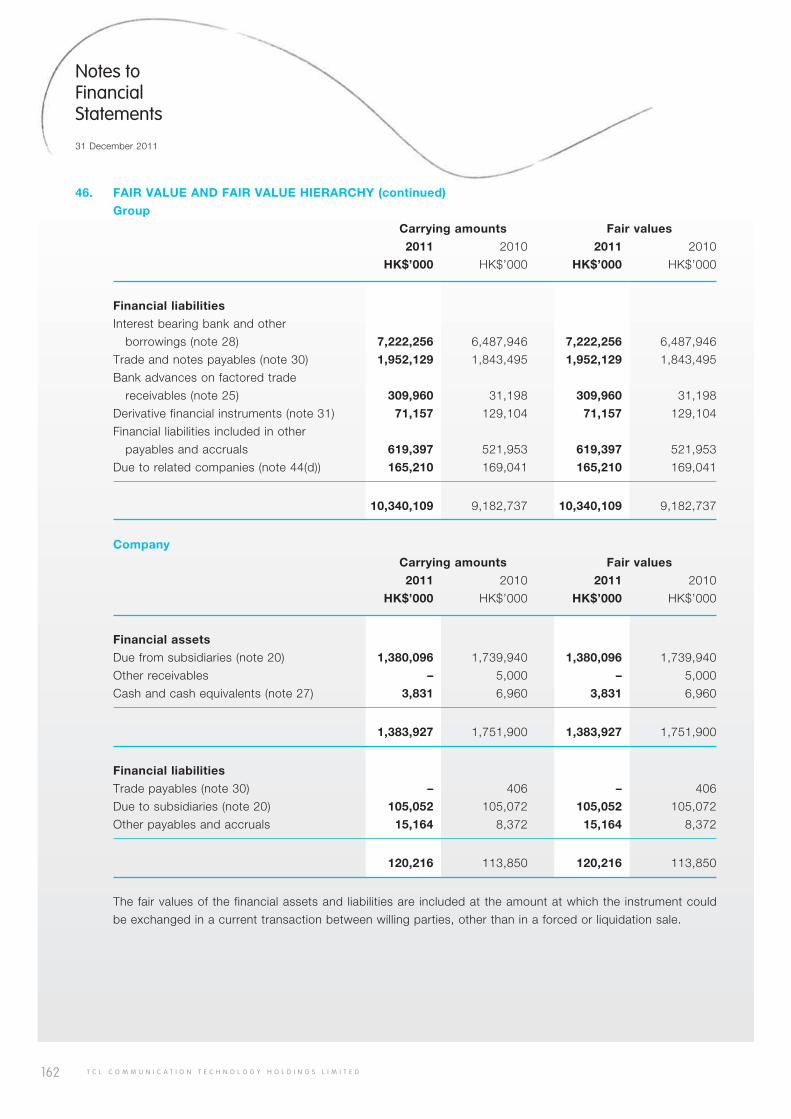
162 T C L C O M M U N I C A T I O N T E C H N O L O G Y H O L D I N G S L I M I T E D
Notes to Financial Statements
31 December 2011
46. FAIR VALUE AND FAIR VALUE HIERARCHY (continued)
Group
Carrying amounts Fair values
2011 2010 2011 2010
HK$’000 HK$’000 HK$’000 HK$’000
Financial liabilities
Interest bearing bank and other
borrowings (note 28) 7,222,256 6,487,946 7,222,256 6,487,946
Trade and notes payables (note 30) 1,952,129 1,843,495 1,952,129 1,843,495
Bank advances on factored trade
receivables (note 25) 309,960 31,198 309,960 31,198
Derivative financial instruments (note 31) 71,157 129,104 71,157 129,104
Financial liabilities included in other
payables and accruals 619,397 521,953 619,397 521,953
Due to related companies (note 44(d)) 165,210 169,041 165,210 169,041
10,340,109 9,182,737 10,340,109 9,182,737
Company
Carrying amounts Fair values
2011 2010 2011 2010
HK$’000 HK$’000 HK$’000 HK$’000
Financial assets
Due from subsidiaries (note 20) 1,380,096 1,739,940 1,380,096 1,739,940
Other receivables – 5,000 – 5,000
Cash and cash equivalents (note 27) 3,831 6,960 3,831 6,960
1,383,927 1,751,900 1,383,927 1,751,900
Financial liabilities
Trade payables (note 30) – 406 – 406
Due to subsidiaries (note 20) 105,052 105,072 105,052 105,072
Other payables and accruals 15,164 8,372 15,164 8,372
120,216 113,850 120,216 113,850
The fair values of the financial assets and liabilities are included at the amount at which the instrument could
be exchanged in a current transaction between willing parties, other than in a forced or liquidation sale.
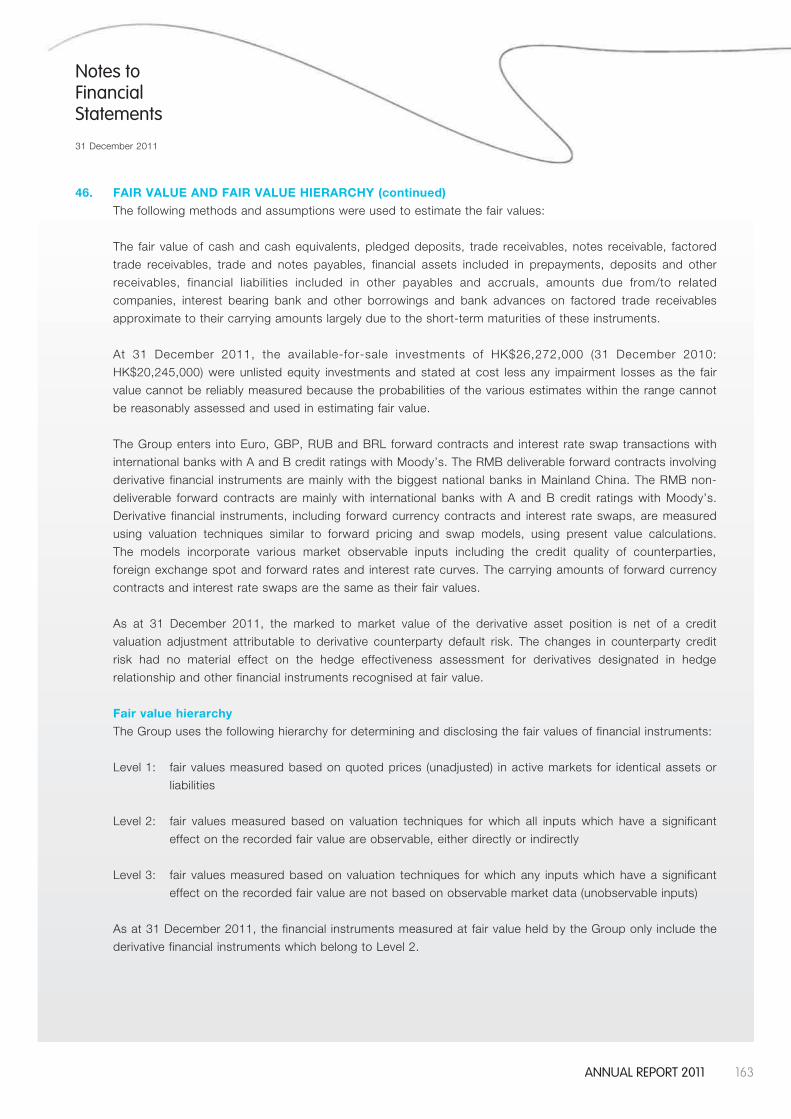
163AnnuAl report 2011
Notes to Financial Statements
31 December 2011
46. FAIR VALUE AND FAIR VALUE HIERARCHY (continued)
The following methods and assumptions were used to estimate the fair values:
The fair value of cash and cash equivalents, pledged deposits, trade receivables, notes receivable, factored
trade receivables, trade and notes payables, financial assets included in prepayments, deposits and other
receivables, financial liabilities included in other payables and accruals, amounts due from/to related
companies, interest bearing bank and other borrowings and bank advances on factored trade receivables
approximate to their carrying amounts largely due to the short-term maturities of these instruments.
At 31 December 2011, the available-for-sale investments of HK$26,272,000 (31 December 2010:
HK$20,245,000) were unlisted equity investments and stated at cost less any impairment losses as the fair
value cannot be reliably measured because the probabilities of the various estimates within the range cannot
be reasonably assessed and used in estimating fair value.
The Group enters into Euro, GBP, RUB and BRL forward contracts and interest rate swap transactions with
international banks with A and B credit ratings with Moody’s. The RMB deliverable forward contracts involving
derivative financial instruments are mainly with the biggest national banks in Mainland China. The RMB non-
deliverable forward contracts are mainly with international banks with A and B credit ratings with Moody’s.
Derivative financial instruments, including forward currency contracts and interest rate swaps, are measured
using valuation techniques similar to forward pricing and swap models, using present value calculations.
The models incorporate various market observable inputs including the credit quality of counterparties,
foreign exchange spot and forward rates and interest rate curves. The carrying amounts of forward currency
contracts and interest rate swaps are the same as their fair values.
As at 31 December 2011, the marked to market value of the derivative asset position is net of a credit
valuation adjustment attributable to derivative counterparty default risk. The changes in counterparty credit
risk had no material effect on the hedge effectiveness assessment for derivatives designated in hedge
relationship and other financial instruments recognised at fair value.
Fair value hierarchy
The Group uses the following hierarchy for determining and disclosing the fair values of financial instruments:
Level 1: fair values measured based on quoted prices (unadjusted) in active markets for identical assets or
liabilities
Level 2: fair values measured based on valuation techniques for which all inputs which have a significant
effect on the recorded fair value are observable, either directly or indirectly
Level 3: fair values measured based on valuation techniques for which any inputs which have a significant
effect on the recorded fair value are not based on observable market data (unobservable inputs)
As at 31 December 2011, the financial instruments measured at fair value held by the Group only include the
derivative financial instruments which belong to Level 2.
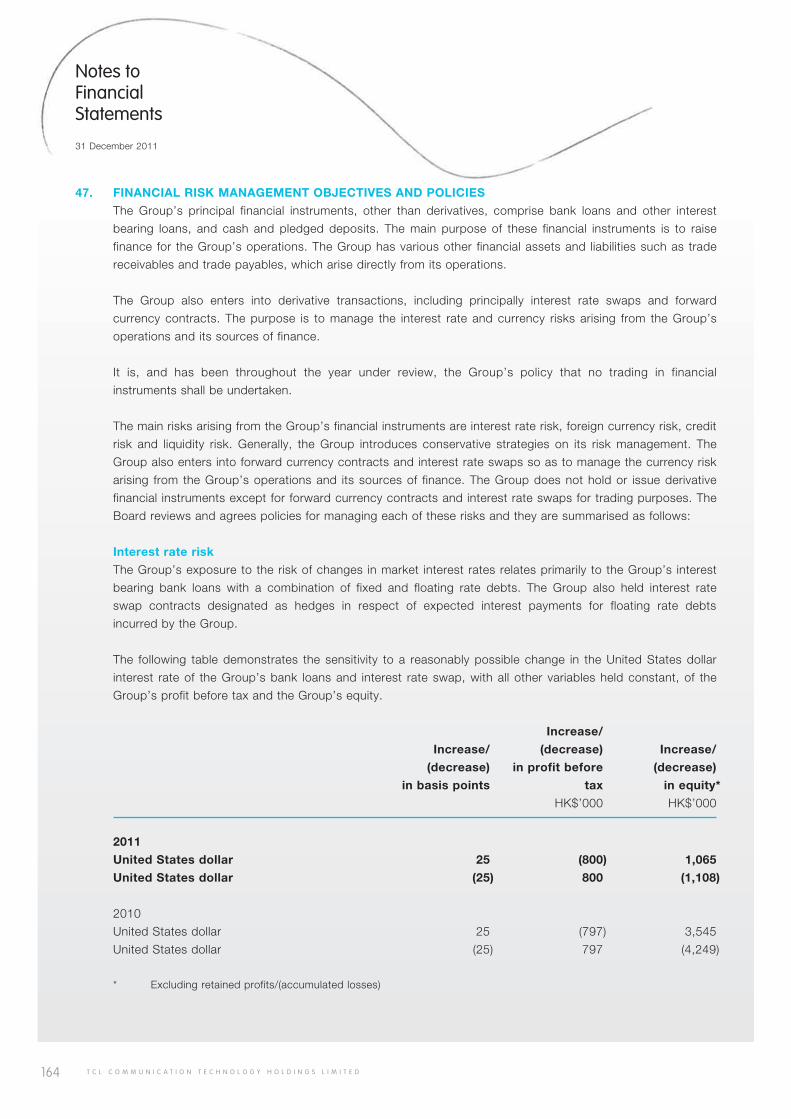
164 T C L C O M M U N I C A T I O N T E C H N O L O G Y H O L D I N G S L I M I T E D
Notes to Financial Statements
31 December 2011
47. FINANCIAL RISK MANAGEMENT OBJECTIVES AND POLICIES
The Group’s principal financial instruments, other than derivatives, comprise bank loans and other interest
bearing loans, and cash and pledged deposits. The main purpose of these financial instruments is to raise
finance for the Group’s operations. The Group has various other financial assets and liabilities such as trade
receivables and trade payables, which arise directly from its operations.
The Group also enters into derivative transactions, including principally interest rate swaps and forward
currency contracts. The purpose is to manage the interest rate and currency risks arising from the Group’s
operations and its sources of finance.
It is, and has been throughout the year under review, the Group’s policy that no trading in financial
instruments shall be undertaken.
The main risks arising from the Group’s financial instruments are interest rate risk, foreign currency risk, credit
risk and liquidity risk. Generally, the Group introduces conservative strategies on its risk management. The
Group also enters into forward currency contracts and interest rate swaps so as to manage the currency risk
arising from the Group’s operations and its sources of finance. The Group does not hold or issue derivative
financial instruments except for forward currency contracts and interest rate swaps for trading purposes. The
Board reviews and agrees policies for managing each of these risks and they are summarised as follows:
Interest rate risk
The Group’s exposure to the risk of changes in market interest rates relates primarily to the Group’s interest
bearing bank loans with a combination of fixed and floating rate debts. The Group also held interest rate
swap contracts designated as hedges in respect of expected interest payments for floating rate debts
incurred by the Group.
The following table demonstrates the sensitivity to a reasonably possible change in the United States dollar
interest rate of the Group’s bank loans and interest rate swap, with all other variables held constant, of the
Group’s profit before tax and the Group’s equity.
Increase/
Increase/ (decrease) Increase/
(decrease) in profit before (decrease)
in basis points tax in equity*
HK$’000 HK$’000
2011
United States dollar 25 (800) 1,065
United States dollar (25) 800 (1,108)
2010
United States dollar 25 (797) 3,545
United States dollar (25) 797 (4,249)
* Excluding retained profits/(accumulated losses)
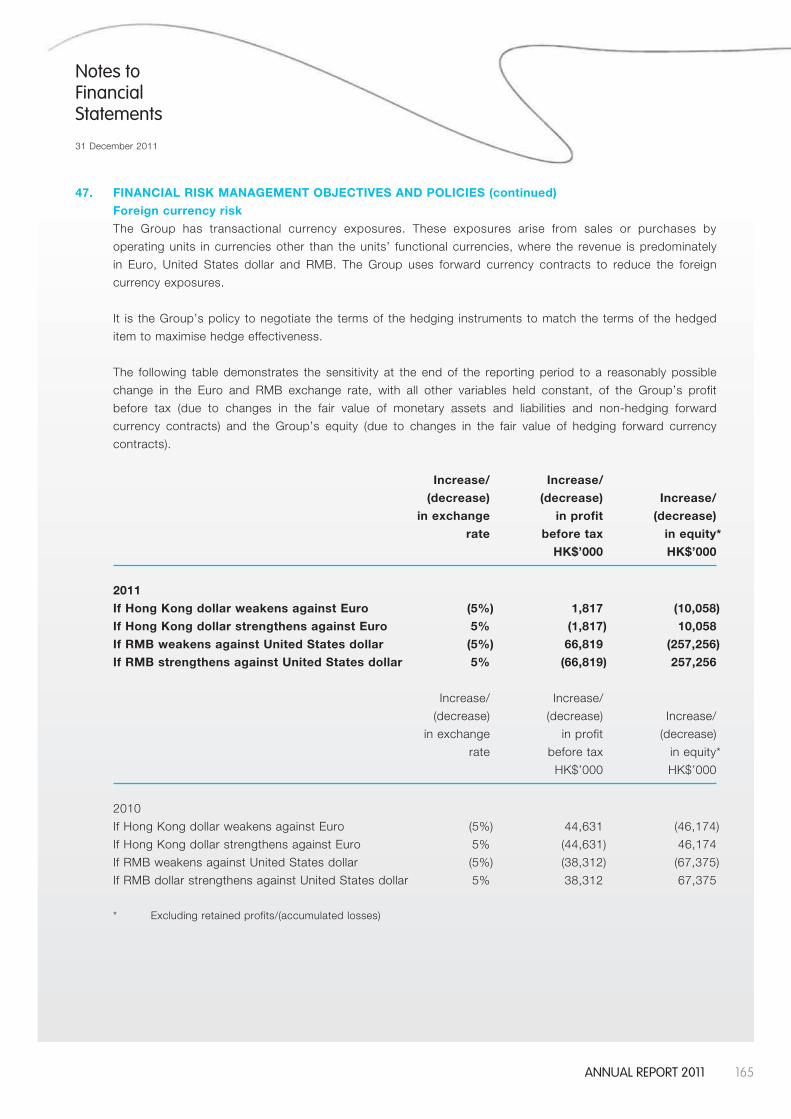
165AnnuAl report 2011
Notes to Financial Statements
31 December 2011
47. FINANCIAL RISK MANAGEMENT OBJECTIVES AND POLICIES (continued)
Foreign currency risk
The Group has transactional currency exposures. These exposures arise from sales or purchases by
operating units in currencies other than the units’ functional currencies, where the revenue is predominately
in Euro, United States dollar and RMB. The Group uses forward currency contracts to reduce the foreign
currency exposures.
It is the Group’s policy to negotiate the terms of the hedging instruments to match the terms of the hedged
item to maximise hedge effectiveness.
The following table demonstrates the sensitivity at the end of the reporting period to a reasonably possible
change in the Euro and RMB exchange rate, with all other variables held constant, of the Group’s profit
before tax (due to changes in the fair value of monetary assets and liabilities and non-hedging forward
currency contracts) and the Group’s equity (due to changes in the fair value of hedging forward currency
contracts).
Increase/ Increase/
(decrease) (decrease) Increase/
in exchange in profit (decrease)
rate before tax in equity*
HK$’000 HK$’000
2011
If Hong Kong dollar weakens against Euro (5%) 1,817 (10,058)
If Hong Kong dollar strengthens against Euro 5% (1,817) 10,058
If RMB weakens against United States dollar (5%) 66,819 (257,256)
If RMB strengthens against United States dollar 5% (66,819) 257,256
Increase/ Increase/
(decrease) (decrease) Increase/
in exchange in profit (decrease)
rate before tax in equity*
HK$’000 HK$’000
2010
If Hong Kong dollar weakens against Euro (5%) 44,631 (46,174)
If Hong Kong dollar strengthens against Euro 5% (44,631) 46,174
If RMB weakens against United States dollar (5%) (38,312) (67,375)
If RMB dollar strengthens against United States dollar 5% 38,312 67,375
* Excluding retained profits/(accumulated losses)
166 T C L C O M M U N I C A T I O N T E C H N O L O G Y H O L D I N G S L I M I T E D
Notes to Financial Statements
31 December 2011
47. FINANCIAL RISK MANAGEMENT OBJECTIVES AND POLICIES (continued)
Credit risk
The credit risk of the Group’s other financial assets, which comprise cash and cash equivalents, other
receivables, due from related parties, and trade receivables, arises from default of the counterparty, with a
maximum exposure equal to the carrying amounts of these instruments. The Company is also exposed to
credit risk through the granting of financial guarantees, further details of which are disclosed in note 41 to the
financial statements.
In order to minimise the credit risk, the management of the Group has delegated a team responsible for
determination of credit limits, credit approvals and other monitoring procedures to ensure that follow-up
action is taken to recover overdue debts. In addition, the Group reviews regularly the recoverable amount
of each individual trade receivable to ensure that adequate impairment losses are made for irrecoverable
amounts. Besides, the Group also utilises factoring facilities and credit insurance to minimise credit risk. In
this regard, the directors of the Company consider that the Group’s credit risk is minimal.
Concentration of credit risk is analysed by customer/counterparty and by geographical region. There is no
significant concentration of credit risk with the Group.
Liquidity risk
The Group monitors its risk to a shortage of funds using a recurring liquidity planning tool. This tool considers
the maturity of both its financial instruments and financial assets (e.g., trade receivables) and projected cash
flows from operations.
The Group’s objective is to maintain a balance between continuity of funding and flexibility through the use of
interest bearing bank and other loans. The maturity profiles of the Group’s borrowings are disclosed in notes
28, 29, and 31 to the financial statements.
As at 31 December 2011, other financial liabilities excluding interest bearing bank and other borrowings
and derivative financial instruments of HK$22,957,000 (31 December 2010: HK$14,835,000) and
HK$3,023,739,000 (31 December 2010: HK$2,550,852,000), would be on demand and matured within one
year respectively.
Capital management
The primary objectives of the Group’s capital management are to safeguard the Group’s ability to continue
as a going concern and to maintain healthy capital ratios in order to support its business and maximise
shareholders’ value.
The Group manages its capital structure and makes adjustments to it in light of changes in economic
conditions and the risk characteristics of the underlying assets. To maintain or adjust the capital structure,
the Group may adjust the dividend payment to shareholders, return capital to shareholders or issue new
shares. No changes were made in the objectives, policies or processes for managing capital during the years
ended 31 December 2011 and 2010.
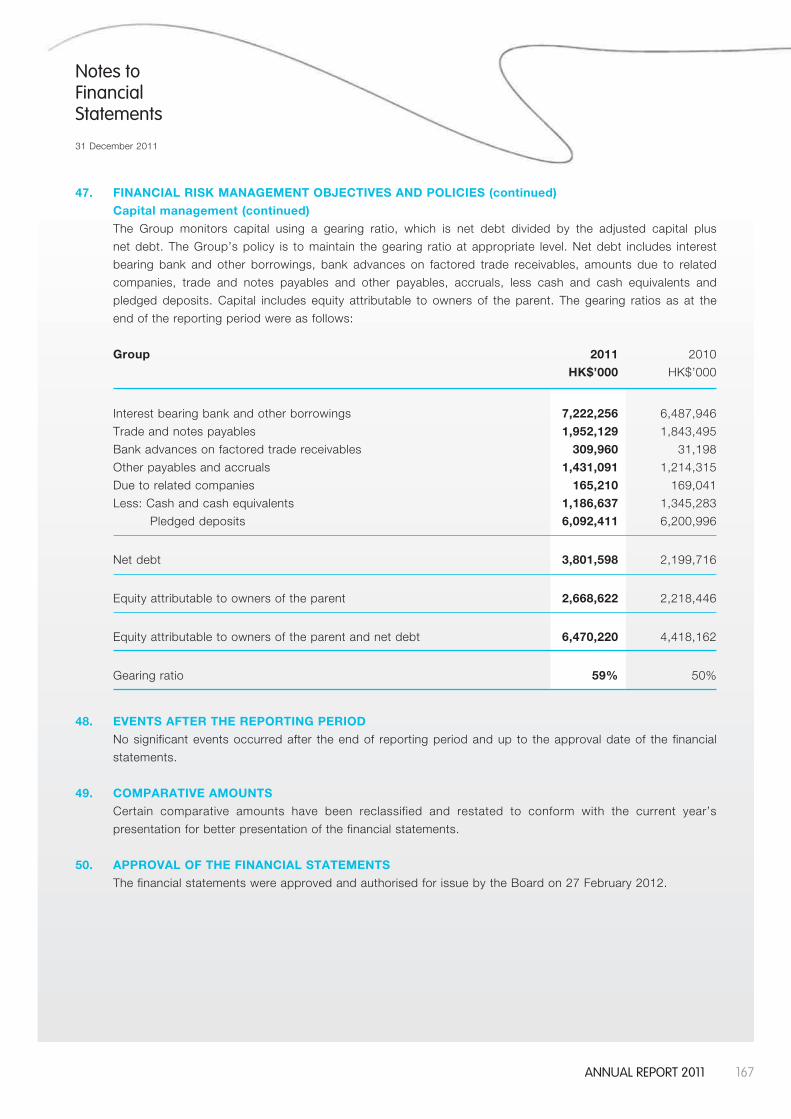
167AnnuAl report 2011
Notes to Financial Statements
31 December 2011
47. FINANCIAL RISK MANAGEMENT OBJECTIVES AND POLICIES (continued)
Capital management (continued)
The Group monitors capital using a gearing ratio, which is net debt divided by the adjusted capital plus
net debt. The Group’s policy is to maintain the gearing ratio at appropriate level. Net debt includes interest
bearing bank and other borrowings, bank advances on factored trade receivables, amounts due to related
companies, trade and notes payables and other payables, accruals, less cash and cash equivalents and
pledged deposits. Capital includes equity attributable to owners of the parent. The gearing ratios as at the
end of the reporting period were as follows:
Group 2011 2010
HK$’000 HK$’000
Interest bearing bank and other borrowings 7,222,256 6,487,946
Trade and notes payables 1,952,129 1,843,495
Bank advances on factored trade receivables 309,960 31,198
Other payables and accruals 1,431,091 1,214,315
Due to related companies 165,210 169,041
Less: Cash and cash equivalents 1,186,637 1,345,283
Pledged deposits 6,092,411 6,200,996
Net debt 3,801,598 2,199,716
Equity attributable to owners of the parent 2,668,622 2,218,446
Equity attributable to owners of the parent and net debt 6,470,220 4,418,162
Gearing ratio 59% 50%
48. EVENTS AFTER THE REPORTING PERIOD
No significant events occurred after the end of reporting period and up to the approval date of the financial
statements.
49. COMPARATIVE AMOUNTS
Certain comparative amounts have been reclassified and restated to conform with the current year’s
presentation for better presentation of the financial statements.
50. APPROVAL OF THE FINANCIAL STATEMENTS
The financial statements were approved and authorised for issue by the Board on 27 February 2012.
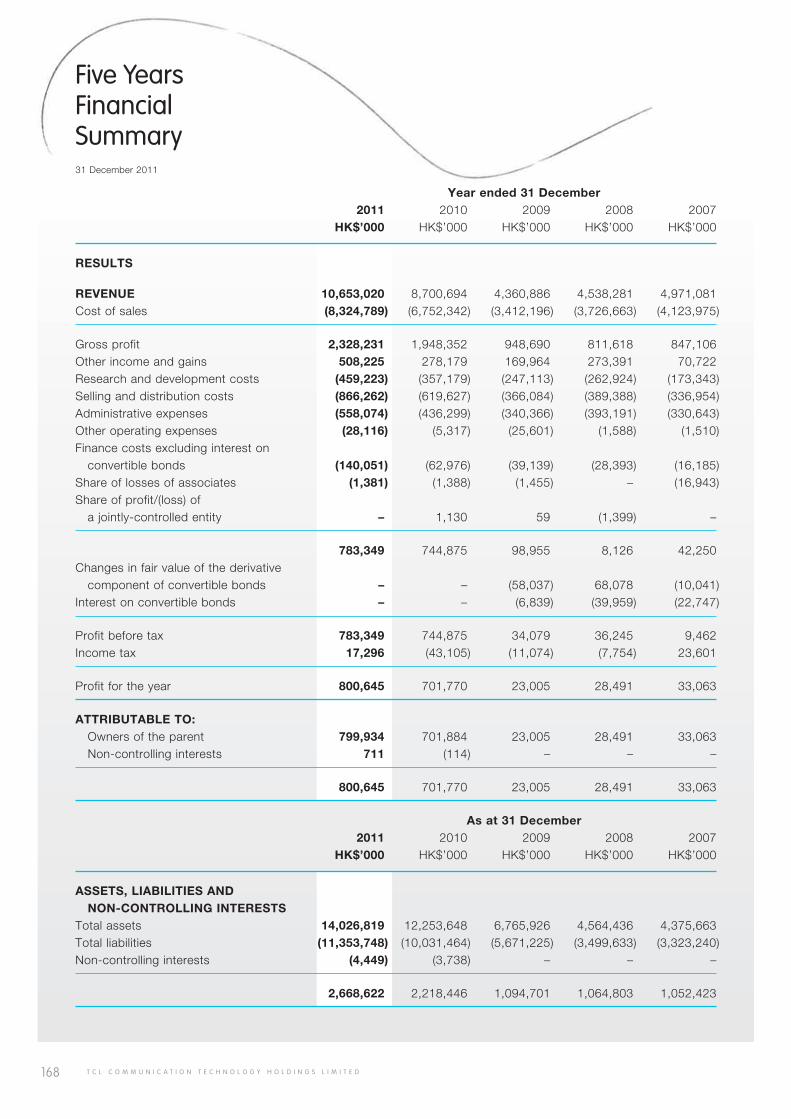
168 T C L C O M M U N I C A T I O N T E C H N O L O G Y H O L D I N G S L I M I T E D
Five YearsFinancialSummary31 December 2011
Year ended 31 December 2011 2010 2009 2008 2007 HK$’000 HK$’000 HK$’000 HK$’000 HK$’000
RESULTS
REVENUE 10,653,020 8,700,694 4,360,886 4,538,281 4,971,081Cost of sales (8,324,789) (6,752,342) (3,412,196) (3,726,663) (4,123,975)
Gross profit 2,328,231 1,948,352 948,690 811,618 847,106Other income and gains 508,225 278,179 169,964 273,391 70,722Research and development costs (459,223) (357,179) (247,113) (262,924) (173,343)Selling and distribution costs (866,262) (619,627) (366,084) (389,388) (336,954)Administrative expenses (558,074) (436,299) (340,366) (393,191) (330,643)Other operating expenses (28,116) (5,317) (25,601) (1,588) (1,510)Finance costs excluding interest on convertible bonds (140,051) (62,976) (39,139) (28,393) (16,185)Share of losses of associates (1,381) (1,388) (1,455) – (16,943)Share of profit/(loss) of a jointly-controlled entity – 1,130 59 (1,399) –
783,349 744,875 98,955 8,126 42,250Changes in fair value of the derivative component of convertible bonds – – (58,037) 68,078 (10,041)Interest on convertible bonds – – (6,839) (39,959) (22,747)
Profit before tax 783,349 744,875 34,079 36,245 9,462Income tax 17,296 (43,105) (11,074) (7,754) 23,601
Profit for the year 800,645 701,770 23,005 28,491 33,063
ATTRIBUTABLE TO: Owners of the parent 799,934 701,884 23,005 28,491 33,063 Non-controlling interests 711 (114) – – –
800,645 701,770 23,005 28,491 33,063
As at 31 December 2011 2010 2009 2008 2007 HK$’000 HK$’000 HK$’000 HK$’000 HK$’000
ASSETS, LIABILITIES AND NON-CONTROLLING INTERESTSTotal assets 14,026,819 12,253,648 6,765,926 4,564,436 4,375,663Total liabilities (11,353,748) (10,031,464) (5,671,225) (3,499,633) (3,323,240)Non-controlling interests (4,449) (3,738) – – –
2,668,622 2,218,446 1,094,701 1,064,803 1,052,423

TCL
Com
mun
icat
ion
Tech
nolo
gy H
oldi
ngs
Limite
d A
nnua
l Rep
ort 2
011
Annual Report 2011For more information, please visit the Group’s website:
http://tclcom.tcl.com
TCL Communication Technology Holdings LimitedStock Code: 02618