Embed Size (px)
Citation preview

AnnuAl RepoRt 2011TAG PACIFIC LIMITEDABN 73 009 485 625

1ANNUAL REPORT 2011
Contents
tAgpAc.com
contentsChairman’s report 4Directors’ report 12Consolidated statement of comprehensive income 22Consolidated statement of financial position 23Consolidated statement of changes in equity 24Consolidated statement of cash flows 25Notes to the financial statements 26Directors’ declaration 63Auditor’s independence declaration 64Independent auditor’s report 65Corporate governance statement 66Shareholder information 71Corporate directory 72

FinAnciAl summARy
TAG PACIFIC LIMITED2
Financial summary
2011 2010
Revenue1 $101.1 million $56.8 million
EBITDA2 $8.2 million $2.9 million
Profit/(loss) after tax3 $3.6 million ($3.3 million)
Earnings per share4 5.1 cents (4.7 cents)
NTA per share 30.6 cents 26.3 cents
Total Group cash $11.3 million $15.5 million
Total Group equity $32.4 million $26.1 million
Dividend per share (fully franked) 0.75 cents nil
1. From continuing operating activities.2. From continuing operating activities excluding fair value movements and before non-controlling interests.3. After non-controlling interests.4. From continuing and discontinued operating activities.

“ …the 2011 financial year was stellar from beginning to end and finished on a particularly high note ”
ANNUAL REPORT 2011 3
Financial summary
4 TAG PACIFIC LIMITED
Chairman’s report
I am pleased to report that the 2011 financial year was stellar from beginning to end and finished on a particularly high note. Not only did the scope and scale of our investments in power and technology consulting break all previous records, but we also witnessed the final chapter in what was a decade long roller coaster investment in health information technology.
I will report on health information technology first. The acquisition of iSOFT by the giant Computer Sciences Corporation shortly after balance date was at a lower than desirable figure from a shareholder perspective, but it was an elegant end to what had been a visionary investment – an investment which grew from small beginnings to become global in scale – and one which merited the delivery to us of a more satisfactory financial outcome. However, that era has now passed and it was pleasing that despite enormous instability, the final outcome had no materially detrimental effect on Tag’s profitability for the financial year.
The realisation of this investment, together with the earlier sale of our interior building products businesses, has freed up Tag’s balance sheet and delivered to us a new footing on which we are better able to focus our skills. We are transitioning from being a strategic investor with diversified investments to a strategic investor with focussed investments.
The resultsThe 2011 financial year delivered an outstanding result. Revenue touched just over $100 million for the first time, an increase of some 78% on the comparative base of $56.8 million. Almost all of the revenue is attributable to Tag’s MPower investment.
At the operational level, the Group delivered a very healthy EBITDA1 of $8.2 million, an increase of 183% on the comparative $2.9 million EBITDA in the 2010 year. The comparative EBITDA in the 2009 year was only $1.6 million, so the growth over a two year period can be clearly seen.
The Tag Group’s 2011 profit after tax and non-controlling interests was $3.6 million which translates to earnings per share of approximately 5.1 cents, a substantial improvement on the 2010 loss of $3.3 million.
The cash flow from operating activities was negative for the year, because as noted last year, cash gains through timing differences on projects were taken as benefits in the 2010 financial year with payments only being made in the 2011 financial year. In addition, there was a very large increase in the scale of operations in 2011 which required an increase in working capital. In context, the overall cash flows are considered to be robust.
chAiRmAn’s RepoRt
1. From continuing operating activities excluding fair value movements and before non-controlling interests.
ANNUAL REPORT 2011 5
Chairman’s report
The balance sheetThe growth in revenue and earnings obviously carries with it an increase in inventories and receivables, reflected on the consolidated balance sheet by a large increase in total assets from $48.7 million to $67.1 million during the period. At the same time, total equity has risen from $26.1 million to $32.4 million; and the Group cash balance has remained healthy at $11.3 million. In fact, with total Group borrowings of only $8.5 million, the Group had no net debt at balance date, a very desirable position which has been further enhanced by the receipt of $1.8 million from the realisation of Tag’s iSOFT investment post balance date.
The power journeyIt is fair to say that in 2011 all the stars aligned for MPower, which today houses all of the Group’s operating businesses in the power sector. These businesses have been aggregated over a long period of time in what has been a strategically planned journey. This culminated in 2011 with what can only be described as a spectacularly successful result – revenue of $100 million and EBITDA of $8.9 million.
The two main contributors to this result were the mushrooming growth of solar power and the major push into sophisticated power projects, ranging from green power solutions on the one hand to specialised power systems for the oil and gas sector on the other. In addition, the acquisition of Solaris Technology in November 2010 opened up new opportunities and delivered a commendable result in only a short period of time.
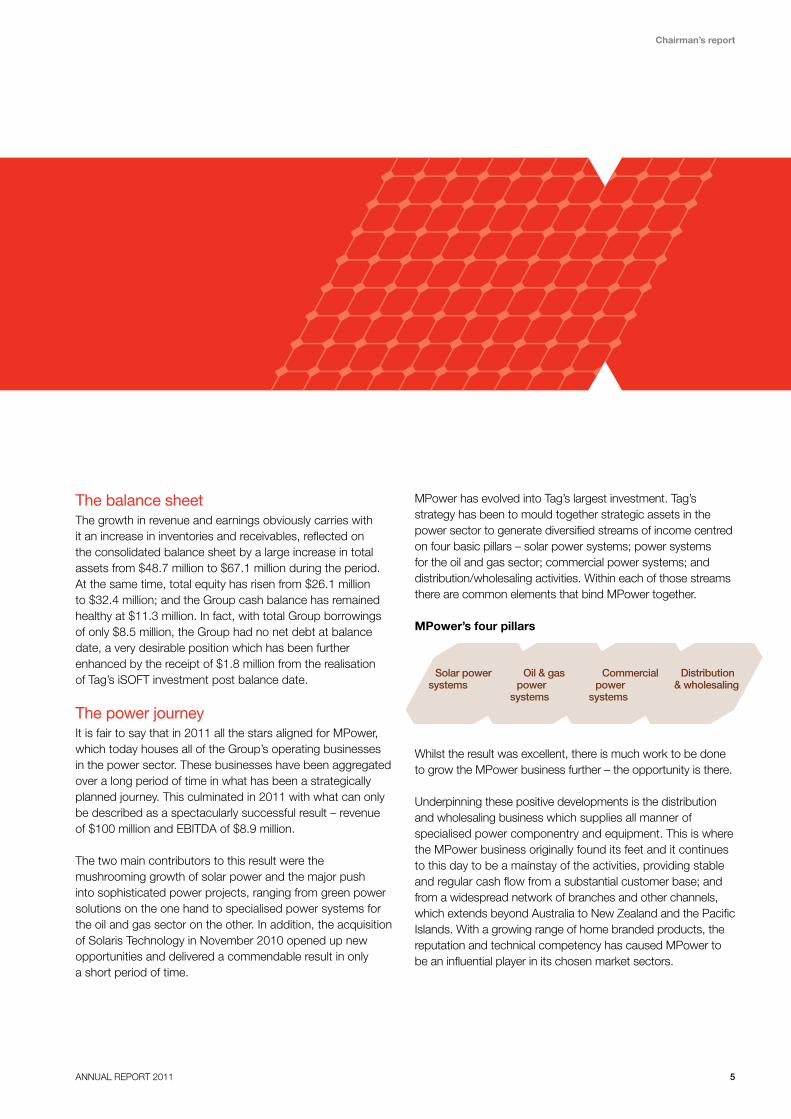
MPower has evolved into Tag’s largest investment. Tag’s strategy has been to mould together strategic assets in the power sector to generate diversified streams of income centred on four basic pillars – solar power systems; power systems for the oil and gas sector; commercial power systems; and distribution/wholesaling activities. Within each of those streams there are common elements that bind MPower together.
MPower’s four pillars
Whilst the result was excellent, there is much work to be done to grow the MPower business further – the opportunity is there.
Underpinning these positive developments is the distribution and wholesaling business which supplies all manner of specialised power componentry and equipment. This is where the MPower business originally found its feet and it continues to this day to be a mainstay of the activities, providing stable and regular cash flow from a substantial customer base; and from a widespread network of branches and other channels, which extends beyond Australia to New Zealand and the Pacific Islands. With a growing range of home branded products, the reputation and technical competency has caused MPower to be an influential player in its chosen market sectors.
Oil & gaspower
systems
Commercialpower
systems
Distribution& wholesaling
Solar powersystems

6 TAG PACIFIC LIMITED
Nikko Business
Equipment acquired
Santon Technology
merges with McKenzie +
Holland
Project Electronics
acquired
Control Systems
Consultants acquired
Early investment
in Santon Technology
Westpower Rectifiers
joins group
M+H Power becomes
head operating company
Bardic Emergency
Lighting acquired
First foray into power
generation
Advanced Power acquired
The solar power market has witnessed unprecedented growth and with the current uncertainties surrounding government policies, it is difficult to predict the level of short term demand with any degree of accuracy. There has been a noticeable slowdown since year end, but the level of activity is still ahead of previous comparative periods. What is certain is that renewable energy is part of Australia’s future; and within that environment MPower is exceptionally well placed. Unlike many new entrants, MPower has a broad base of skills, capabilities and technical sophistication – and a track record that is a rarity on this playing field.
In a similar vein, the high installed base of emergency power systems provides a solid platform for an increased push into environmentally friendly co- and tri-generation systems, which combine green credentials with reliability.
The oil and gas sector continues to hold significant promise of bigger and better things to come. The $32 million Gorgon project awarded to MPower in 2009 is nearing a successful conclusion and the pipeline of potential project work is many times larger than at any time in the past. Of course, by its very nature large scale and specialised project work is both long term in the design and tendering process and then in the construction and implementation phases, so results can only be truly measured in the fullness of time. However, there are strong indicators pointing to increased workload in the next few years, which is the main reason behind the recent establishment of large new modern facilities.
Tag is an active and participating owner of 59% of MPower, with the balance predominantly held by MPower management and staff.
Technology consultingTag’s involvement with the Unique World Group dates back over a decade and during that period we have witnessed its development which is typical of the journey so many other young companies have followed. The group has two distinct components – consultancy and software. In the 2011 financial year, Unique World Group’s revenue grew to $12.8 million from $7.6 million the year before and our 38% equity accounted interest in the Unique World Group delivered an after tax contribution of $0.6 million.
However, of greater interest was the Unique World consultancy business EBITDA which was $2.6 million in 2011. The prime driver for this was the pipeline of projects with top tier clients which the business has progressively developed. Unique World has enhanced its value by being successfully positioned as a key strategic adviser to its clients, with a focus on longer term value enhancing engagements.
RecordPoint’s proprietary software has made better than expected inroads into its niche records and information management market. Software activities are run independently of the consultancy business; and in common with other fledgling software enterprises the outlook and timing is not easy to forecast. However RecordPoint is approaching a crossover point as it moves progressively towards becoming a key player in the field of records management.
Chairman’s report
tAg’s poweR sectoR jouRney (so FAR)

ANNUAL REPORT 2011 7
Awarded $5M floodlight trailer
project for Australian Army
Green and Oil & Gas divisions
grow rapidly
Solaris Technology
acquired
M+H and Advanced
Power brought together to
create MPower
Awarded $32M Gorgon contract
Large new premises
established
$100M revenue achieved
Platform set for a
promising future
PropertyThe Tag Group has a majority interest in the Power Property Unit Trust which owns a commercial property in Melbourne leased to a Group company. The property was revalued during the year to reflect the current market value of $1.8 million. The positive movement of $0.8 million before non-controlling interests has been recognised in equity, but not through the income statement in accordance with the applicable accounting standards.
DividendIn view of the good result, the Directors have decided to reinstate the dividend policy and have declared a dividend of 0.75 cents per share. The dividend will be fully franked and will be paid on 5 October 2011.
Other mattersA variety of positive factors aligned to deliver a very satisfactory result for the 2011 financial year. General economic uncertainty, together with the challenges and opportunities in our chosen industry sectors, make it difficult to predict what the 2012 financial year will bring.
Notwithstanding this, the board recognises that based on its fundamentals, the company appears to be chronically undervalued by the investment market. Furthermore, constrained trading in the company’s shares makes Tag Pacific Limited less attractive to investors than it deserves to be. The delisting from the NZX on 15 July 2011 and the amalgamation of shareholders onto a single ASX share register is just one small step; and the possible utilisation of the recently refreshed on-market share buyback is another.
But more importantly, the board has taken a number of positive steps to transition the company from being a strategic investor with diversified investments to a strategic investor with focussed investments. In this way we hope that, over time, the inherent strengths and intrinsic value of the Tag Group will become more evident.
I would like to record appreciation to executives and staff at all levels in the wider organisation for their continued loyalty and good work.
For and on behalf of the board
Peter WiseChairman
29 August 2011
Chairman’s report
“ These businesses have been aggregated over a long period of time in what has been a strategically planned journey ”
i
h

8 TAG PACIFIC LIMITED
Chairman’s report
solAR poweR systems
“ What is certain is that renewable energy is part of Australia’s future; and within that environment MPower is exceptionally well placed ”
Project example: Australian Rail Track Corporation Railway Site Camp.
Location: Remote off grid site, WA.
Details: MPower designed, project managed and installed a 20kW solar power system on a remote off grid site for the Australian Rail Track Corporation.
Solar power is now expected to contribute up to 80% of the site’s energy needs, significantly reducing the reliance on diesel generation.

ANNUAL REPORT 2011 9
Chairman’s report
oil And gAs poweR
systems
Project example: Gorgon Temporary Power Station
Location: Barrow Island, WA.
Details: In 2009 MPower was awarded a contract to design and construct a $32 million temporary power station for the Gorgon LNG project.
The project comprises 12 generator sets which have to meet stringent environmental, quarantine, noise and technical specifications.

10
Chairman’s report
commeRciAl poweR systems
“ Unlike many new entrants, MPower has a broad base of skills, capabilities and technical sophistication – and a track record that is a rarity on this playing field ”
Project example: University of NSW Tyree Energy Technologies Building
Location: Kensington, NSW.
Details: The University of NSW Tyree Energy Technologies Building will form the hub of energy related research activities at UNSW. MPower has been awarded the contract to design and construct a carbon friendly trigeneration power system for the building.
TAG PACIFIC LIMITED
This image is intellectual property of Francis-Jones Morehen Thorp.

ANNUAL REPORT 2011 11
Chairman’s report
distRibution & wholesAling
MPower distributes a wide range of home branded and third party power related products, including industrial batteries, chargers, emergency lighting, portable generators and solar power panels and inverters.
MPower’s distribution network extends across 12 offices in Australia, New Zealand and the Pacific Islands and supplies over 500 distribution outlets.
12 TAG PACIFIC LIMITED
Directors’ report
diRectoRs’ RepoRt
The directors present their report on the company (Tag Parent) and its controlled entities (Tag Group) for the financial year ended 30 June 2011 in accordance with the provisions of the Corporations Act 2001 (Cth). The Chairman’s Report (pages 4 to 11) contains a review of the operations of the Tag Group during the financial year and the results of those operations and details of significant changes in the Tag Group. The Chairman’s Report is incorporated into and forms part of this Directors’ Report.
Principal activityThe Tag Group is a strategic investor.
Review of operationsThe operating result of the Tag Group for the financial year ended 30 June 2011 after eliminating non-controlling interests and providing for income tax was a profit of $3,628,282 (2010: loss of $3,267,189). Reference should be made to the Chairman’s Report for a more detailed review of operations.
Changes in the state of affairsNo significant changes in the state of affairs of the Tag Group occurred during the financial year other than the acquisition of Solaris Technology Pty Limited on 15 November 2010.
Subsequent eventsThere has not been any matter or circumstance occurring subsequent to the end of the financial year that has significantly affected, or may significantly affect, the operations of the Tag Group, the results of those operations, or the state of affairs of the Tag Group in future financial years other than those matters referred to in the Chairman’s Report.
Future developmentsDisclosure of information regarding likely developments in the activities of the Tag Group in future financial years and the expected results of those activities is likely to result in unreasonable prejudice to the Tag Group. Accordingly, this information has not been disclosed in this report.
ANNUAL REPORT 2011 13
Directors’ report
DividendsIn respect of the financial year ended 30 June 2011, a dividend of 0.75 cents per share (totalling $529,551) franked to 100% at the corporate income tax rate of 30% was declared on 29 August 2011 with a payment date of 5 October 2011 to the holders of fully paid ordinary shares.
The directors did not declare a dividend in respect of the financial year ended 30 June 2010.
Indemnification of officers and auditorDuring the financial year, the company paid a premium to insure each of the directors against liabilities for costs and expenses incurred by them in defending any legal proceedings arising out of their conduct while acting in the capacity of director of the company, other than conduct involving a wilful breach of duty in relation to the company.
The company has not otherwise, during or since the end of the financial year, except to the extent permitted by law, indemnified or agreed to indemnify an officer or auditor of the company or any related body corporate against a liability incurred as an officer or auditor.
Non-audit servicesDetails of amounts paid or payable to Deloitte Touche Tohmatsu for non-audit services provided during the year by the auditor are outlined in note 32 to the financial statements. The directors are satisfied that the provision of non-audit services during the year by the auditor is compatible with the general standard of independence for auditors imposed by the Corporations Act 2001 (Cth). The directors are of the opinion that the services as disclosed in note 32 to the financial statements do not compromise the external auditor’s independence, based on advice received from the audit committee, for the following reasons:
all non-audit services have been reviewed and approved JJto ensure that they do not impact the integrity and objectivity of the auditor; andnone of the services undermine the principles relating JJto auditor independence as set out in APES 110 Code of Ethics for Professional Accountants issued by the Accounting Professional and Ethical Standards Board, including reviewing or auditing the auditor’s own work, acting in a management or decision-making capacity for the company, acting as advocate for the company or jointly sharing economic risks or rewards.
14 TAG PACIFIC LIMITED
Directors’ report
Proceedings on behalf of the companyNo person has applied for leave of court to bring proceedings on behalf of the company or intervene in any proceedings to which the company is a party for the purpose of taking responsibility on behalf of the company for all or any part of those proceedings. The company was not a party to any such proceedings during the year.
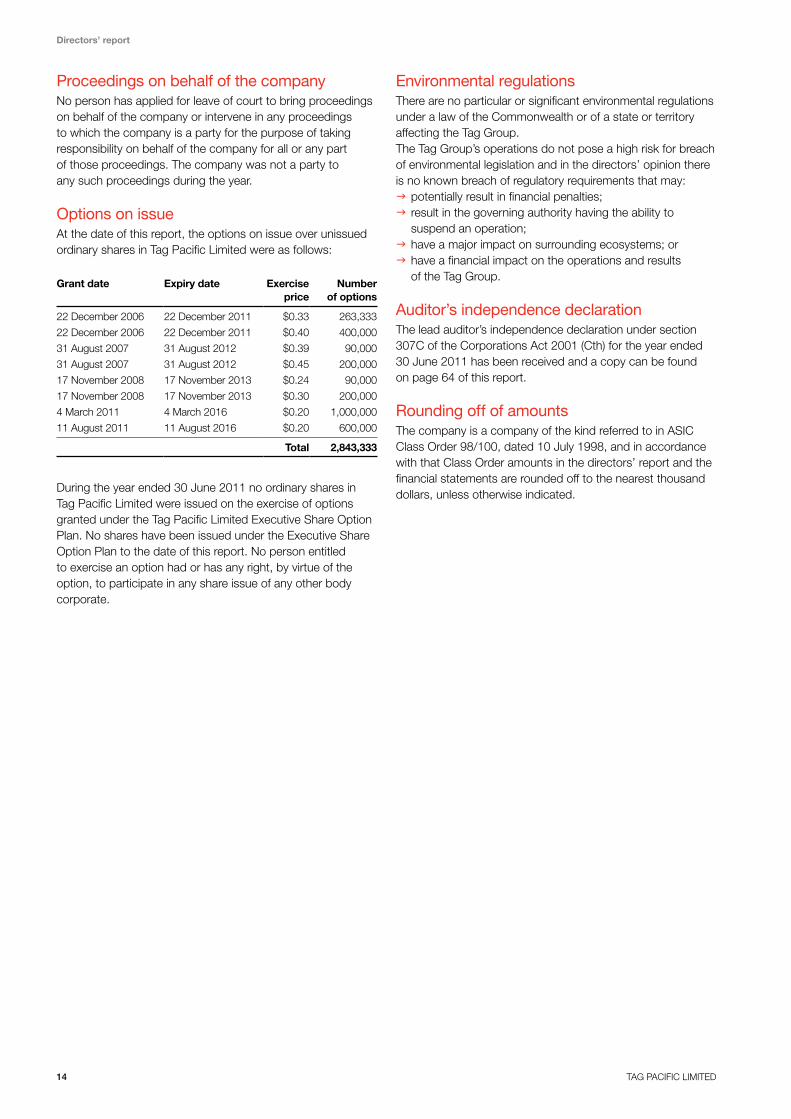
Options on issueAt the date of this report, the options on issue over unissued ordinary shares in Tag Pacific Limited were as follows:
Grant date Expiry date Exercise price
Number of options
22 December 2006 22 December 2011 $0.33 263,333
22 December 2006 22 December 2011 $0.40 400,000
31 August 2007 31 August 2012 $0.39 90,000
31 August 2007 31 August 2012 $0.45 200,000
17 November 2008 17 November 2013 $0.24 90,000
17 November 2008 17 November 2013 $0.30 200,000
4 March 2011 4 March 2016 $0.20 1,000,000
11 August 2011 11 August 2016 $0.20 600,000
Total 2,843,333
During the year ended 30 June 2011 no ordinary shares in Tag Pacific Limited were issued on the exercise of options granted under the Tag Pacific Limited Executive Share Option Plan. No shares have been issued under the Executive Share Option Plan to the date of this report. No person entitled to exercise an option had or has any right, by virtue of the option, to participate in any share issue of any other body corporate.
Environmental regulationsThere are no particular or significant environmental regulations under a law of the Commonwealth or of a state or territory affecting the Tag Group.The Tag Group’s operations do not pose a high risk for breach of environmental legislation and in the directors’ opinion there is no known breach of regulatory requirements that may:
potentially result in financial penalties;JJresult in the governing authority having the ability to JJsuspend an operation;have a major impact on surrounding ecosystems; orJJhave a financial impact on the operations and results JJof the Tag Group.
Auditor’s independence declarationThe lead auditor’s independence declaration under section 307C of the Corporations Act 2001 (Cth) for the year ended 30 June 2011 has been received and a copy can be found on page 64 of this report.
Rounding off of amountsThe company is a company of the kind referred to in ASIC Class Order 98/100, dated 10 July 1998, and in accordance with that Class Order amounts in the directors’ report and the financial statements are rounded off to the nearest thousand dollars, unless otherwise indicated.
ANNUAL REPORT 2011 15
Directors’ report
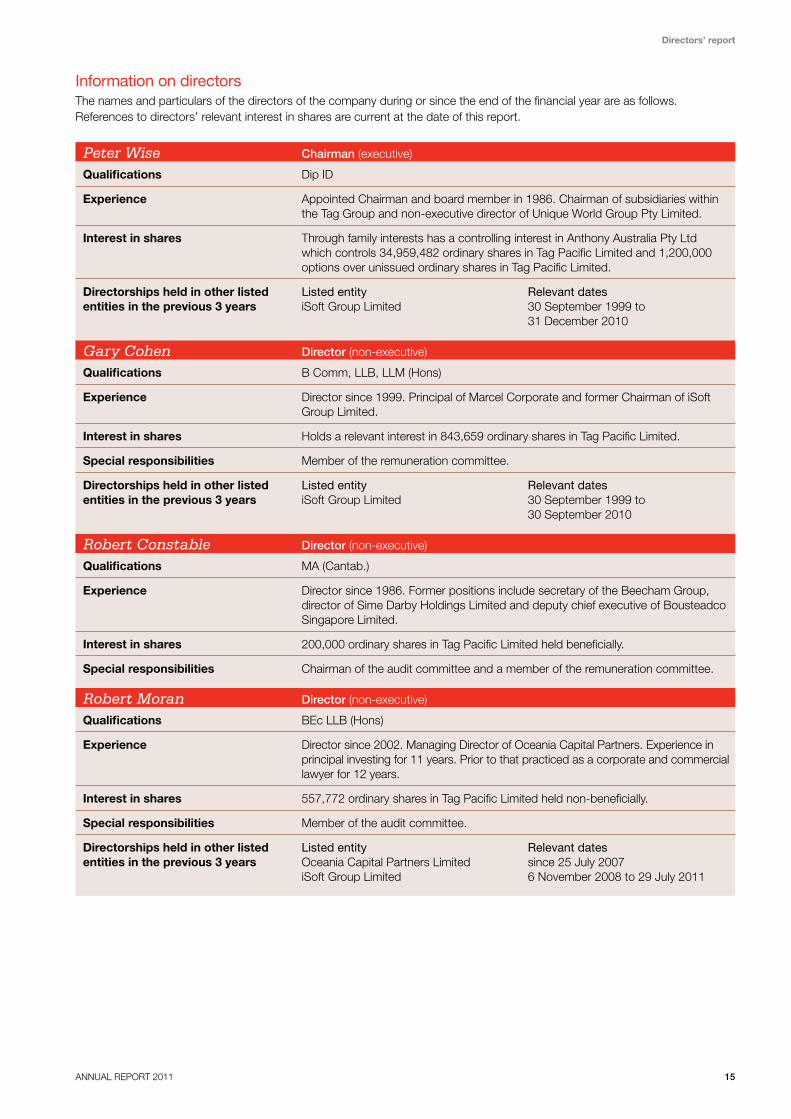
Information on directorsThe names and particulars of the directors of the company during or since the end of the financial year are as follows. References to directors’ relevant interest in shares are current at the date of this report.
peter wise Chairman (executive)
Qualifications Dip ID
Experience Appointed Chairman and board member in 1986. Chairman of subsidiaries within the Tag Group and non-executive director of Unique World Group Pty Limited.
Interest in shares Through family interests has a controlling interest in Anthony Australia Pty Ltd which controls 34,959,482 ordinary shares in Tag Pacific Limited and 1,200,000 options over unissued ordinary shares in Tag Pacific Limited.
Directorships held in other listed entities in the previous 3 years
Listed entity Relevant datesiSoft Group Limited 30 September 1999 to 31 December 2010
gary cohen Director (non-executive)
Qualifications B Comm, LLB, LLM (Hons)
Experience Director since 1999. Principal of Marcel Corporate and former Chairman of iSoft Group Limited.
Interest in shares Holds a relevant interest in 843,659 ordinary shares in Tag Pacific Limited.
Special responsibilities Member of the remuneration committee.
Directorships held in other listed entities in the previous 3 years
Listed entity Relevant datesiSoft Group Limited 30 September 1999 to 30 September 2010
Robert constable Director (non-executive)
Qualifications MA (Cantab.)
Experience Director since 1986. Former positions include secretary of the Beecham Group, director of Sime Darby Holdings Limited and deputy chief executive of Bousteadco Singapore Limited.
Interest in shares 200,000 ordinary shares in Tag Pacific Limited held beneficially.
Special responsibilities Chairman of the audit committee and a member of the remuneration committee.
Robert moran Director (non-executive)
Qualifications BEc LLB (Hons)
Experience Director since 2002. Managing Director of Oceania Capital Partners. Experience in principal investing for 11 years. Prior to that practiced as a corporate and commercial lawyer for 12 years.
Interest in shares 557,772 ordinary shares in Tag Pacific Limited held non-beneficially.
Special responsibilities Member of the audit committee.
Directorships held in other listed entities in the previous 3 years
Listed entity Relevant datesOceania Capital Partners Limited since 25 July 2007iSoft Group Limited 6 November 2008 to 29 July 2011
16 TAG PACIFIC LIMITED
Directors’ report
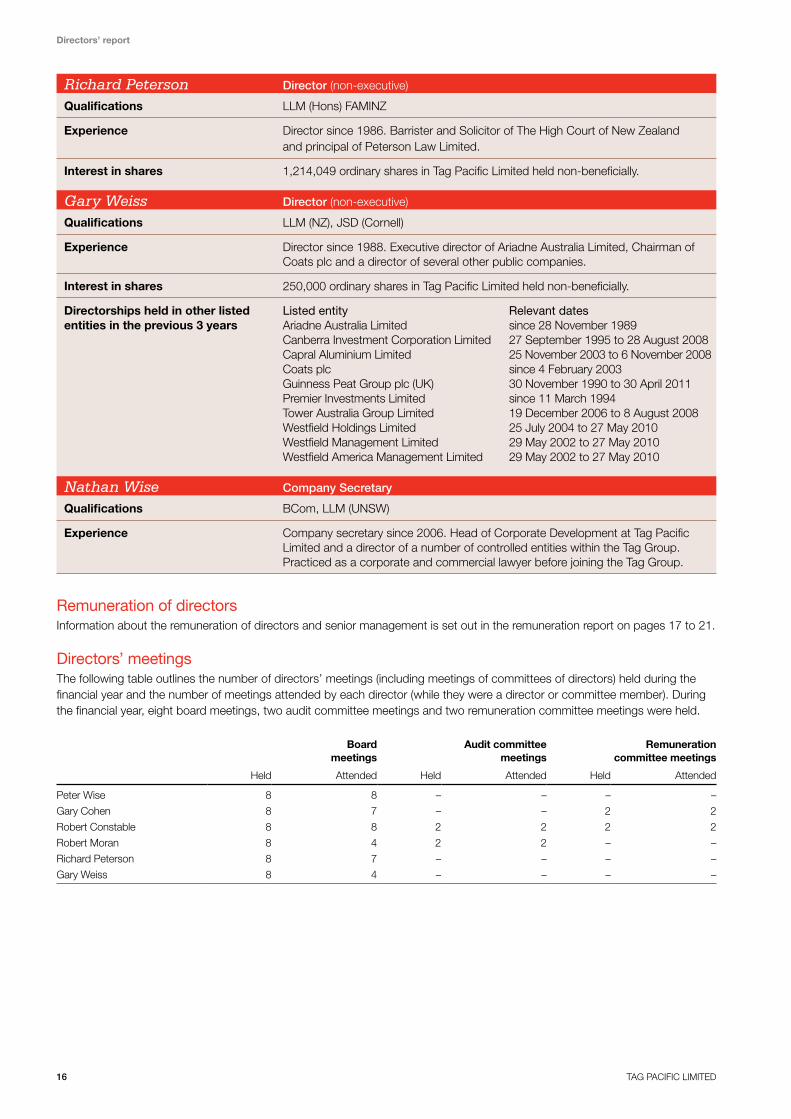
Richard peterson Director (non-executive)
Qualifications LLM (Hons) FAMINZ
Experience Director since 1986. Barrister and Solicitor of The High Court of New Zealand and principal of Peterson Law Limited.
Interest in shares 1,214,049 ordinary shares in Tag Pacific Limited held non-beneficially.
gary weiss Director (non-executive)
Qualifications LLM (NZ), JSD (Cornell)
Experience Director since 1988. Executive director of Ariadne Australia Limited, Chairman of Coats plc and a director of several other public companies.
Interest in shares 250,000 ordinary shares in Tag Pacific Limited held non-beneficially.
Directorships held in other listed entities in the previous 3 years
Listed entity Relevant datesAriadne Australia Limited since 28 November 1989Canberra Investment Corporation Limited 27 September 1995 to 28 August 2008Capral Aluminium Limited 25 November 2003 to 6 November 2008Coats plc since 4 February 2003Guinness Peat Group plc (UK) 30 November 1990 to 30 April 2011Premier Investments Limited since 11 March 1994Tower Australia Group Limited 19 December 2006 to 8 August 2008Westfield Holdings Limited 25 July 2004 to 27 May 2010Westfield Management Limited 29 May 2002 to 27 May 2010Westfield America Management Limited 29 May 2002 to 27 May 2010
nathan wise Company Secretary
Qualifications BCom, LLM (UNSW)
Experience Company secretary since 2006. Head of Corporate Development at Tag Pacific Limited and a director of a number of controlled entities within the Tag Group. Practiced as a corporate and commercial lawyer before joining the Tag Group.
Remuneration of directorsInformation about the remuneration of directors and senior management is set out in the remuneration report on pages 17 to 21.
Directors’ meetingsThe following table outlines the number of directors’ meetings (including meetings of committees of directors) held during the financial year and the number of meetings attended by each director (while they were a director or committee member). During the financial year, eight board meetings, two audit committee meetings and two remuneration committee meetings were held.
Board meetings
Audit committee meetings
Remuneration committee meetings
Held Attended Held Attended Held Attended
Peter Wise 8 8 – – – –
Gary Cohen 8 7 – – 2 2
Robert Constable 8 8 2 2 2 2
Robert Moran 8 4 2 2 – –
Richard Peterson 8 7 – – – –
Gary Weiss 8 4 – – – –
ANNUAL REPORT 2011 17
Directors’ report
Remuneration reportThis report details the remuneration arrangements in respect of each director of Tag Pacific Limited and the key management personnel.
Remuneration policyThe remuneration policy details set out below are relevant to Tag Pacific Limited (‘Tag’) only.
The board of each controlled entity in the Tag Group determines the remuneration policy for the senior managers of that controlled entity, the majority of which are not wholly owned by Tag. Accordingly, Tag’s remuneration policy does not extend to senior managers of controlled entities. Details of the remuneration of controlled entity senior managers have been included in this report where applicable for compliance reasons.
Tag’s remuneration policy has been designed to align director and senior manager objectives with shareholder and business objectives by providing a fixed remuneration component and, where applicable, offering specific short-term and long-term incentives based on key performance areas affecting Tag’s financial results. The board believes the remuneration policy to be appropriate and effective in its ability to attract and retain the best senior managers and directors to run and manage Tag, as well as create goal congruence between directors, senior managers and shareholders.
The board’s policy for determining the nature and amount of remuneration for executive board members and key management personnel of Tag is as follows:
The remuneration policy, setting the terms and conditions JJfor executive directors and other senior managers, was developed by the remuneration committee and approved by the board after seeking professional advice from independent external consultants where necessary.Senior managers may receive base remuneration JJ(which is based on factors such as length of service and experience), superannuation, fringe benefits, short-term incentives or long-term incentives.The remuneration committee reviews certain senior JJmanager packages annually by reference to Tag’s performance, senior manager performance and comparable information from industry sectors.
The performance of Tag’s senior managers is measured against criteria agreed regularly with each senior manager and is based predominantly on the forecast growth of the Tag Group’s profits and shareholder value. Short-term incentives, where applicable, are linked to predetermined performance indicators where possible. The board may exercise its discretion in relation to approving short-term and long-term incentives and can recommend changes to the committee’s recommendations. Any changes must be justified by reference to measurable performance indicators. The policy is designed to attract the highest calibre of senior managers and reward them for performance that results in long-term growth in shareholder wealth.
All remuneration paid to directors and senior managers is valued at the cost to the company and expensed. Options are valued using the Black-Scholes methodology.
The board’s policy is to remunerate non-executive directors for time, commitment and responsibilities. The remuneration committee determines payments to the non-executive directors based on market practice, duties and accountability. Independent external advice may be sought when required. The maximum aggregate amount of fees that can be paid to non-executive directors is subject to approval by shareholders. Fees for non-executive directors are not linked to Tag’s performance. However, to align directors’ interests with shareholders’ interests, the directors are encouraged to hold shares in the company.
Performance based remunerationTag has a policy which sets out the framework for awarding performance based remuneration to Tag senior managers. Performance based remuneration may comprise both a short-term incentive (‘STI’) and a long-term incentive (‘LTI’) component. The STI takes the form of a cash bonus and the LTI comprises the issue of options under the Tag Pacific Limited Executive Share Option Plan. The remuneration committee has the discretion to determine the STI and LTI for eligible senior managers.
Short-term incentivesThe remuneration package for an eligible senior manager may comprise a STI in the form of a performance based cash bonus. The maximum STI component of a remuneration package is expressed as a percentage of the relevant senior manager’s base remuneration. A senior manager may be awarded a STI depending on performance against a set of performance indicators. The performance indicators may differ for each senior manager and are determined by the remuneration committee from time to time. A weighting is given to each performance indicator at the time the performance indicators are set.
The performance criteria against which the STI’s are assessed are as follows:(a) Contribution to the profitability, future profitability or
potential profitability of the group.(b) Contribution to the enhancement of shareholder value,
future shareholder value or potential shareholder value.(c) Contribution to the strategic direction and growth of the
group.(d) Performance of the group compared to budget.(e) Group profitability in the relevant financial year relative to
shareholders’ funds.
In addition to the above, the remuneration committee has the discretion to award super cash bonus payments in excess of the above STI formula in the event of exceptional circumstances or performance by a senior manager.
18 TAG PACIFIC LIMITED
Directors’ report
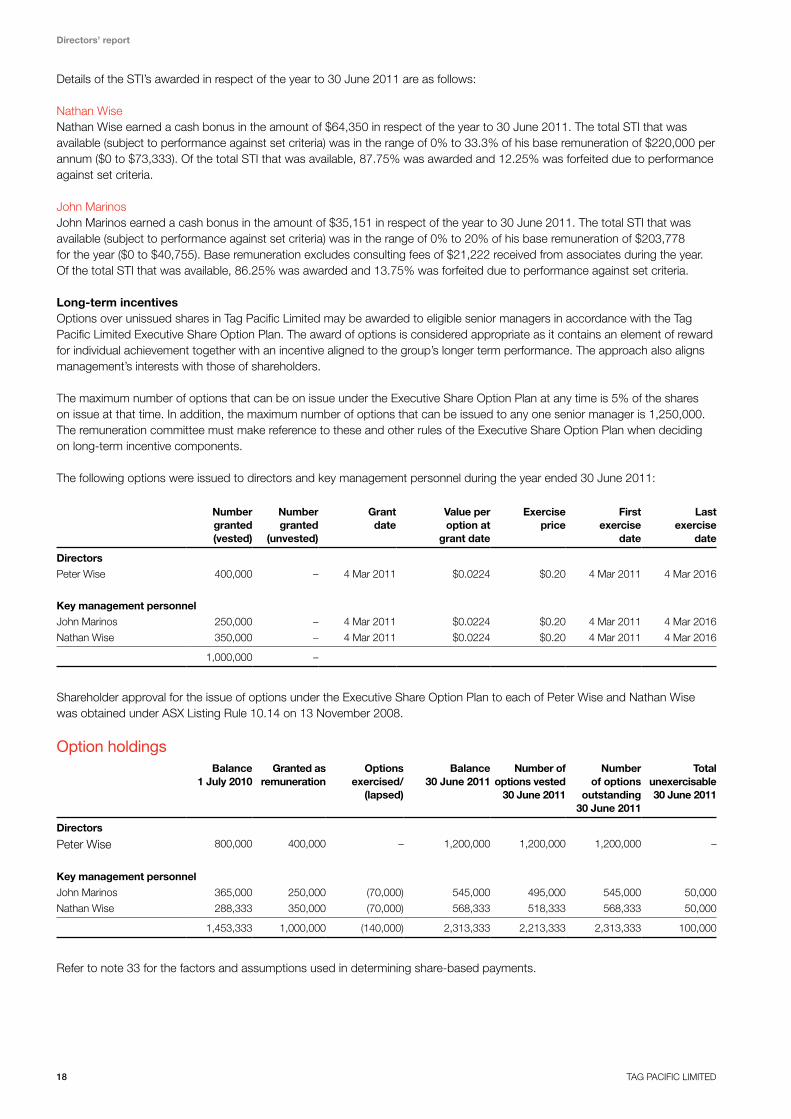
Details of the STI’s awarded in respect of the year to 30 June 2011 are as follows:
Nathan WiseNathan Wise earned a cash bonus in the amount of $64,350 in respect of the year to 30 June 2011. The total STI that was available (subject to performance against set criteria) was in the range of 0% to 33.3% of his base remuneration of $220,000 per annum ($0 to $73,333). Of the total STI that was available, 87.75% was awarded and 12.25% was forfeited due to performance against set criteria.
John MarinosJohn Marinos earned a cash bonus in the amount of $35,151 in respect of the year to 30 June 2011. The total STI that was available (subject to performance against set criteria) was in the range of 0% to 20% of his base remuneration of $203,778 for the year ($0 to $40,755). Base remuneration excludes consulting fees of $21,222 received from associates during the year. Of the total STI that was available, 86.25% was awarded and 13.75% was forfeited due to performance against set criteria.
Long-term incentivesOptions over unissued shares in Tag Pacific Limited may be awarded to eligible senior managers in accordance with the Tag Pacific Limited Executive Share Option Plan. The award of options is considered appropriate as it contains an element of reward for individual achievement together with an incentive aligned to the group’s longer term performance. The approach also aligns management’s interests with those of shareholders.
The maximum number of options that can be on issue under the Executive Share Option Plan at any time is 5% of the shares on issue at that time. In addition, the maximum number of options that can be issued to any one senior manager is 1,250,000. The remuneration committee must make reference to these and other rules of the Executive Share Option Plan when deciding on long-term incentive components.
The following options were issued to directors and key management personnel during the year ended 30 June 2011:
Number granted (vested)
Number granted
(unvested)
Grant date
Value per option at
grant date
Exercise price
First exercise
date
Last exercise
date
Directors
Peter Wise 400,000 – 4 Mar 2011 $0.0224 $0.20 4 Mar 2011 4 Mar 2016
Key management personnel
John Marinos 250,000 – 4 Mar 2011 $0.0224 $0.20 4 Mar 2011 4 Mar 2016
Nathan Wise 350,000 – 4 Mar 2011 $0.0224 $0.20 4 Mar 2011 4 Mar 2016
1,000,000 –
Shareholder approval for the issue of options under the Executive Share Option Plan to each of Peter Wise and Nathan Wise was obtained under ASX Listing Rule 10.14 on 13 November 2008.
Option holdingsBalance
1 July 2010
Granted as remuneration
Options exercised/
(lapsed)
Balance30 June 2011
Number of options vested
30 June 2011
Number of options
outstanding30 June 2011
Total unexercisable 30 June 2011
Directors
Peter Wise 800,000 400,000 – 1,200,000 1,200,000 1,200,000 –
Key management personnel
John Marinos 365,000 250,000 (70,000) 545,000 495,000 545,000 50,000
Nathan Wise 288,333 350,000 (70,000) 568,333 518,333 568,333 50,000
1,453,333 1,000,000 (140,000) 2,313,333 2,213,333 2,313,333 100,000
Refer to note 33 for the factors and assumptions used in determining share-based payments.
ANNUAL REPORT 2011 19
Directors’ report
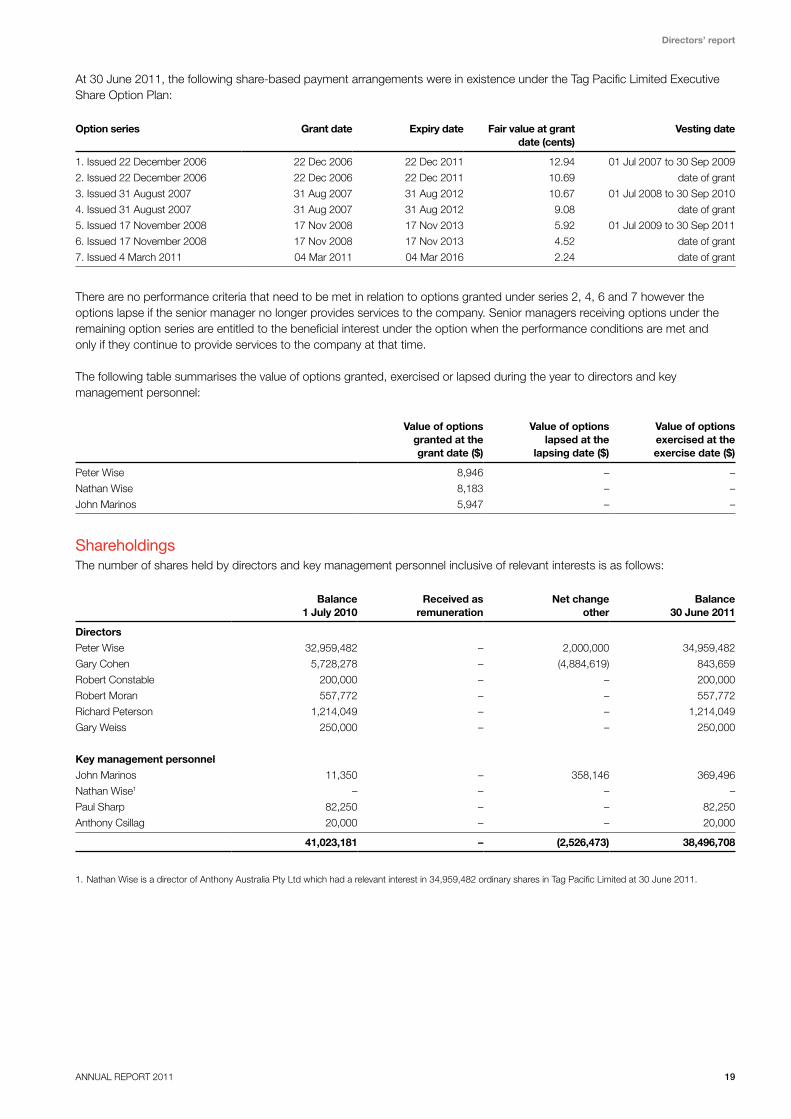
At 30 June 2011, the following share-based payment arrangements were in existence under the Tag Pacific Limited Executive Share Option Plan:
Option series Grant date Expiry date Fair value at grantdate (cents)
Vesting date
1. Issued 22 December 2006 22 Dec 2006 22 Dec 2011 12.94 01 Jul 2007 to 30 Sep 2009
2. Issued 22 December 2006 22 Dec 2006 22 Dec 2011 10.69 date of grant
3. Issued 31 August 2007 31 Aug 2007 31 Aug 2012 10.67 01 Jul 2008 to 30 Sep 2010
4. Issued 31 August 2007 31 Aug 2007 31 Aug 2012 9.08 date of grant
5. Issued 17 November 2008 17 Nov 2008 17 Nov 2013 5.92 01 Jul 2009 to 30 Sep 2011
6. Issued 17 November 2008 17 Nov 2008 17 Nov 2013 4.52 date of grant
7. Issued 4 March 2011 04 Mar 2011 04 Mar 2016 2.24 date of grant
There are no performance criteria that need to be met in relation to options granted under series 2, 4, 6 and 7 however the options lapse if the senior manager no longer provides services to the company. Senior managers receiving options under the remaining option series are entitled to the beneficial interest under the option when the performance conditions are met and only if they continue to provide services to the company at that time.
The following table summarises the value of options granted, exercised or lapsed during the year to directors and key management personnel:
Value of optionsgranted at thegrant date ($)
Value of optionslapsed at the
lapsing date ($)
Value of optionsexercised at theexercise date ($)
Peter Wise 8,946 – –
Nathan Wise 8,183 – –
John Marinos 5,947 – –
ShareholdingsThe number of shares held by directors and key management personnel inclusive of relevant interests is as follows:
Balance1 July 2010
Received as remuneration
Net change other
Balance30 June 2011
Directors
Peter Wise 32,959,482 – 2,000,000 34,959,482
Gary Cohen 5,728,278 – (4,884,619) 843,659
Robert Constable 200,000 – – 200,000
Robert Moran 557,772 – – 557,772
Richard Peterson 1,214,049 – – 1,214,049
Gary Weiss 250,000 – – 250,000
Key management personnel
John Marinos 11,350 – 358,146 369,496
Nathan Wise1 – – – –
Paul Sharp 82,250 – – 82,250
Anthony Csillag 20,000 – – 20,000
41,023,181 – (2,526,473) 38,496,708
1. Nathan Wise is a director of Anthony Australia Pty Ltd which had a relevant interest in 34,959,482 ordinary shares in Tag Pacific Limited at 30 June 2011.
20 TAG PACIFIC LIMITED
Directors’ report
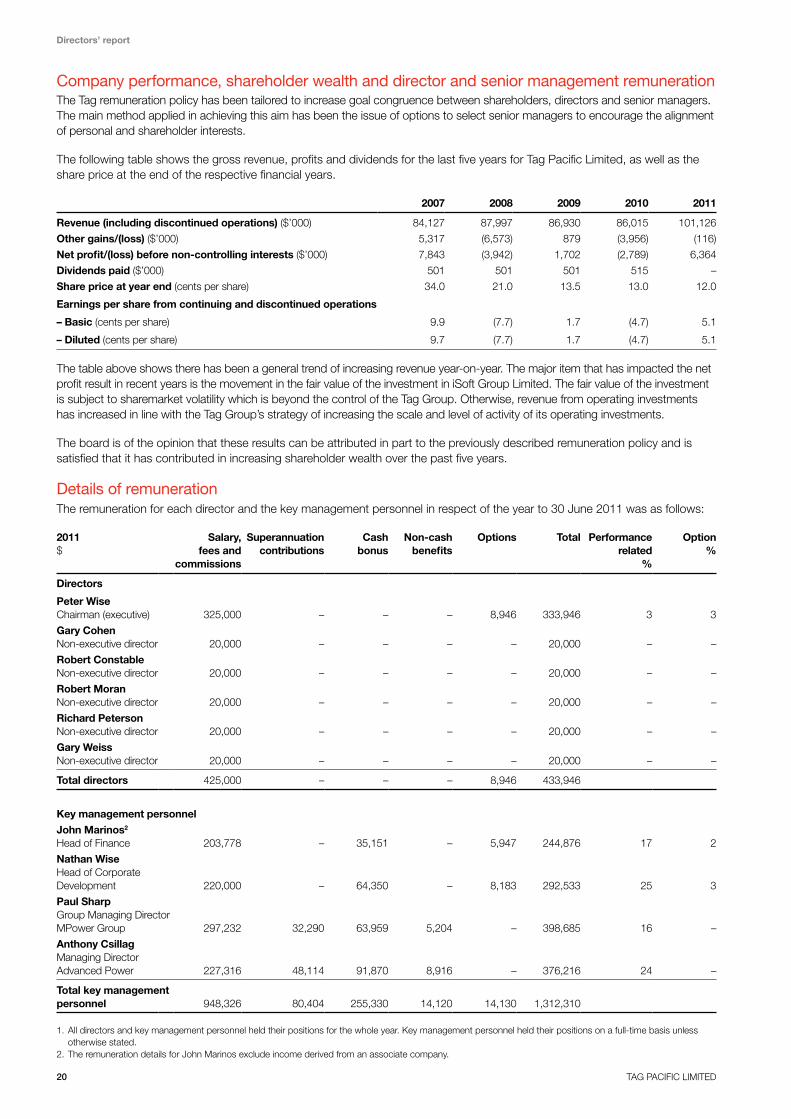
Company performance, shareholder wealth and director and senior management remunerationThe Tag remuneration policy has been tailored to increase goal congruence between shareholders, directors and senior managers. The main method applied in achieving this aim has been the issue of options to select senior managers to encourage the alignment of personal and shareholder interests.
The following table shows the gross revenue, profits and dividends for the last five years for Tag Pacific Limited, as well as the share price at the end of the respective financial years.
2007 2008 2009 2010 2011
Revenue (including discontinued operations) ($’000) 84,127 87,997 86,930 86,015 101,126
Other gains/(loss) ($’000) 5,317 (6,573) 879 (3,956) (116)
Net profit/(loss) before non-controlling interests ($’000) 7,843 (3,942) 1,702 (2,789) 6,364
Dividends paid ($’000) 501 501 501 515 –
Share price at year end (cents per share) 34.0 21.0 13.5 13.0 12.0
Earnings per share from continuing and discontinued operations
– Basic (cents per share) 9.9 (7.7) 1.7 (4.7) 5.1
– Diluted (cents per share) 9.7 (7.7) 1.7 (4.7) 5.1
The table above shows there has been a general trend of increasing revenue year-on-year. The major item that has impacted the net profit result in recent years is the movement in the fair value of the investment in iSoft Group Limited. The fair value of the investment is subject to sharemarket volatility which is beyond the control of the Tag Group. Otherwise, revenue from operating investments has increased in line with the Tag Group’s strategy of increasing the scale and level of activity of its operating investments.
The board is of the opinion that these results can be attributed in part to the previously described remuneration policy and is satisfied that it has contributed in increasing shareholder wealth over the past five years.
Details of remunerationThe remuneration for each director and the key management personnel in respect of the year to 30 June 2011 was as follows:
2011$
Salary, fees and
commissions
Superannuationcontributions
Cash bonus
Non-cash benefits
Options
Total
Performancerelated
%
Option%
Directors
Peter Wise Chairman (executive) 325,000 – – – 8,946 333,946 3 3
Gary Cohen Non-executive director 20,000 – – – – 20,000 – –
Robert Constable Non-executive director 20,000 – – – – 20,000 – –
Robert Moran Non-executive director 20,000 – – – – 20,000 – –
Richard Peterson Non-executive director 20,000 – – – – 20,000 – –
Gary Weiss Non-executive director 20,000 – – – – 20,000 – –
Total directors 425,000 – – – 8,946 433,946
Key management personnel
John Marinos2 Head of Finance 203,778 – 35,151 – 5,947 244,876 17 2
Nathan Wise Head of Corporate Development 220,000 – 64,350 – 8,183 292,533 25 3
Paul Sharp Group Managing Director MPower Group 297,232 32,290 63,959 5,204 – 398,685 16 –
Anthony Csillag Managing Director Advanced Power 227,316 48,114 91,870 8,916 – 376,216 24 –
Total key management personnel 948,326 80,404 255,330 14,120 14,130 1,312,310
1. All directors and key management personnel held their positions for the whole year. Key management personnel held their positions on a full-time basis unless otherwise stated.
2. The remuneration details for John Marinos exclude income derived from an associate company.
ANNUAL REPORT 2011 21
Directors’ report
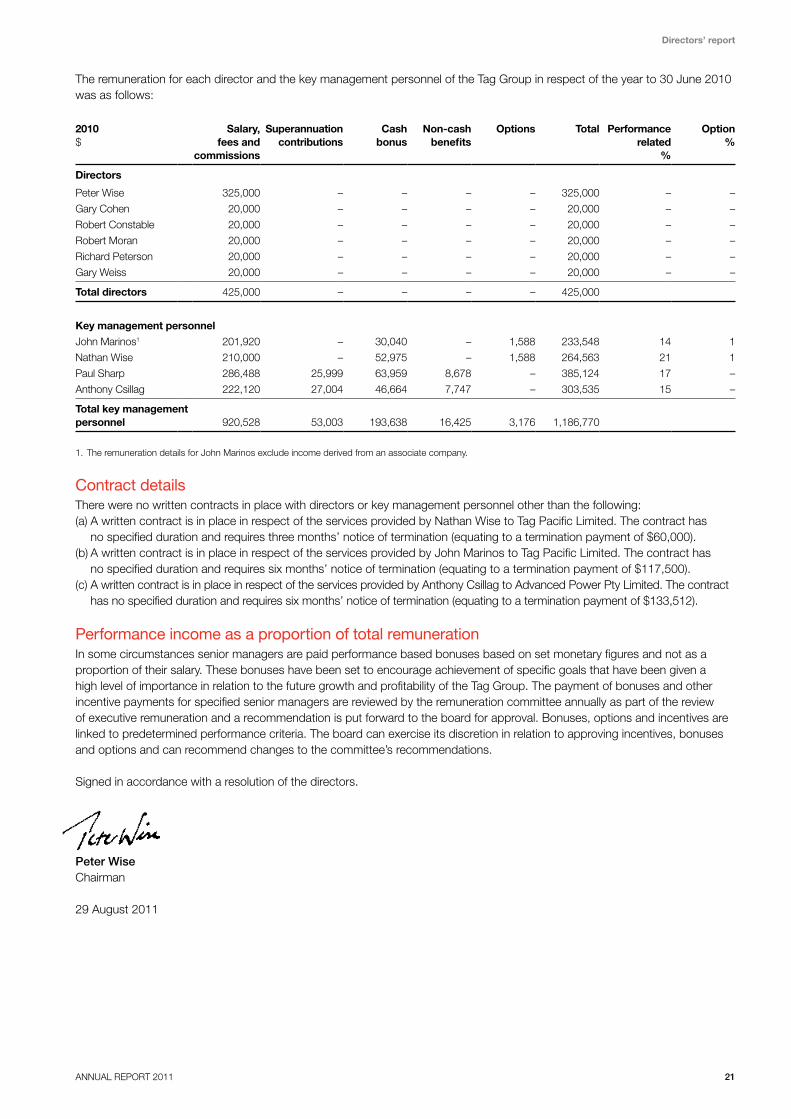
The remuneration for each director and the key management personnel of the Tag Group in respect of the year to 30 June 2010 was as follows:
2010$
Salary, fees and
commissions
Superannuationcontributions
Cash bonus
Non-cash benefits
Options
Total
Performancerelated
%
Option%
Directors
Peter Wise 325,000 – – – – 325,000 – –
Gary Cohen 20,000 – – – – 20,000 – –
Robert Constable 20,000 – – – – 20,000 – –
Robert Moran 20,000 – – – – 20,000 – –
Richard Peterson 20,000 – – – – 20,000 – –
Gary Weiss 20,000 – – – – 20,000 – –
Total directors 425,000 – – – – 425,000
Key management personnel
John Marinos1 201,920 – 30,040 – 1,588 233,548 14 1
Nathan Wise 210,000 – 52,975 – 1,588 264,563 21 1
Paul Sharp 286,488 25,999 63,959 8,678 – 385,124 17 –
Anthony Csillag 222,120 27,004 46,664 7,747 – 303,535 15 –
Total key management personnel 920,528 53,003 193,638 16,425 3,176 1,186,770
1. The remuneration details for John Marinos exclude income derived from an associate company.
Contract detailsThere were no written contracts in place with directors or key management personnel other than the following:(a) A written contract is in place in respect of the services provided by Nathan Wise to Tag Pacific Limited. The contract has
no specified duration and requires three months’ notice of termination (equating to a termination payment of $60,000).(b) A written contract is in place in respect of the services provided by John Marinos to Tag Pacific Limited. The contract has
no specified duration and requires six months’ notice of termination (equating to a termination payment of $117,500).(c) A written contract is in place in respect of the services provided by Anthony Csillag to Advanced Power Pty Limited. The contract
has no specified duration and requires six months’ notice of termination (equating to a termination payment of $133,512).
Performance income as a proportion of total remunerationIn some circumstances senior managers are paid performance based bonuses based on set monetary figures and not as a proportion of their salary. These bonuses have been set to encourage achievement of specific goals that have been given a high level of importance in relation to the future growth and profitability of the Tag Group. The payment of bonuses and other incentive payments for specified senior managers are reviewed by the remuneration committee annually as part of the review of executive remuneration and a recommendation is put forward to the board for approval. Bonuses, options and incentives are linked to predetermined performance criteria. The board can exercise its discretion in relation to approving incentives, bonuses and options and can recommend changes to the committee’s recommendations.
Signed in accordance with a resolution of the directors.
Peter WiseChairman
29 August 2011
22 TAG PACIFIC LIMITED
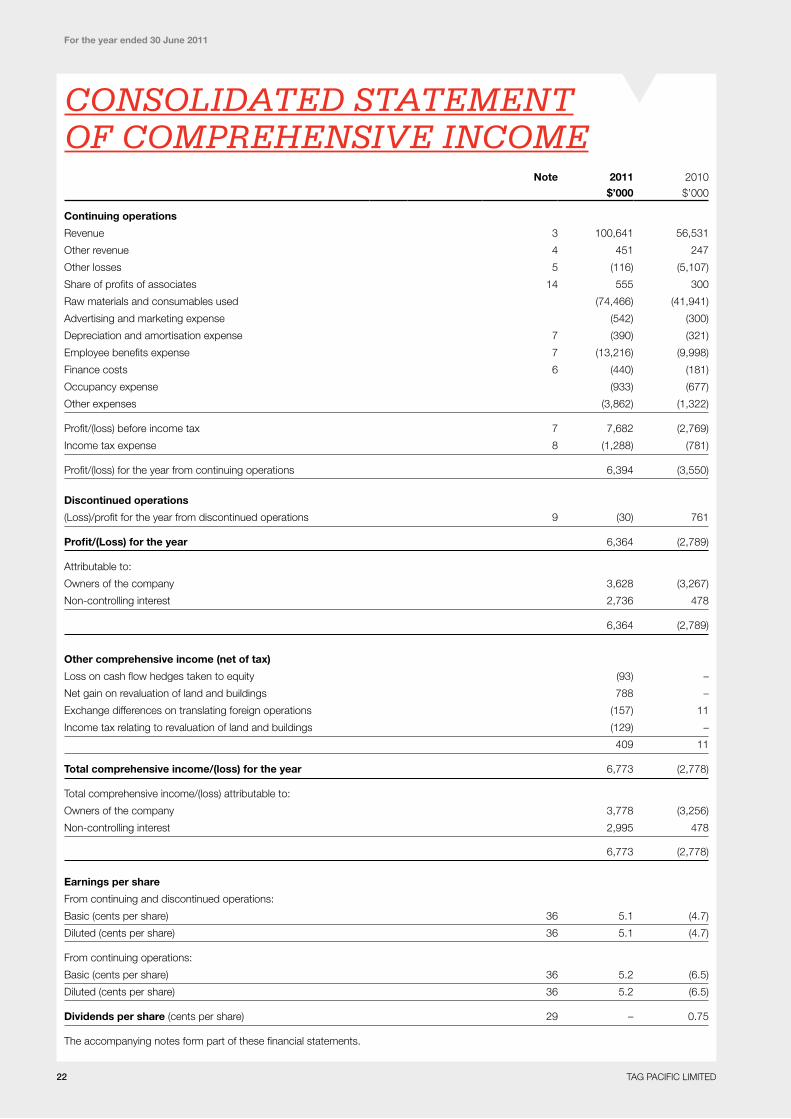
consolidAted stAtement oF compRehensive income
Note 2011 2010
$’000 $’000
Continuing operations
Revenue 3 100,641 56,531
Other revenue 4 451 247
Other losses 5 (116) (5,107)
Share of profits of associates 14 555 300
Raw materials and consumables used (74,466) (41,941)
Advertising and marketing expense (542) (300)
Depreciation and amortisation expense 7 (390) (321)
Employee benefits expense 7 (13,216) (9,998)
Finance costs 6 (440) (181)
Occupancy expense (933) (677)
Other expenses (3,862) (1,322)
Profit/(loss) before income tax 7 7,682 (2,769)
Income tax expense 8 (1,288) (781)
Profit/(loss) for the year from continuing operations 6,394 (3,550)
Discontinued operations
(Loss)/profit for the year from discontinued operations 9 (30) 761
Profit/(Loss) for the year 6,364 (2,789)
Attributable to:
Owners of the company 3,628 (3,267)
Non-controlling interest 2,736 478
6,364 (2,789)
Other comprehensive income (net of tax)
Loss on cash flow hedges taken to equity (93) –
Net gain on revaluation of land and buildings 788 –
Exchange differences on translating foreign operations (157) 11
Income tax relating to revaluation of land and buildings (129) –
409 11
Total comprehensive income/(loss) for the year 6,773 (2,778)
Total comprehensive income/(loss) attributable to:
Owners of the company 3,778 (3,256)
Non-controlling interest 2,995 478
6,773 (2,778)
Earnings per share
From continuing and discontinued operations:
Basic (cents per share) 36 5.1 (4.7)
Diluted (cents per share) 36 5.1 (4.7)
From continuing operations:
Basic (cents per share) 36 5.2 (6.5)
Diluted (cents per share) 36 5.2 (6.5)
Dividends per share (cents per share) 29 – 0.75
The accompanying notes form part of these financial statements.
For the year ended 30 June 2011

ANNUAL REPORT 2011 23
consolidAted stAtement oF FinAnciAl position
Note 30/06/2011 30/06/2010
$’000 $’000
AssetsCurrent assets
Cash and cash equivalents 10 11,346 15,479
Trade and other receivables 11 22,826 14,404
Inventories 12 16,021 7,148
Other assets 13 2,008 361
Total current assets 52,201 37,392
Non-current assets
Investments in associates 14 2,442 2,436
Other financial assets 16 1,748 1,873
Property, plant & equipment 17 3,404 2,063
Deferred tax assets 18 4,293 3,236
Intangible assets 19 2,998 1,717
Total non-current assets 14,885 11,325
Total assets 67,086 48,717
LiabilitiesCurrent liabilities
Trade and other payables 21 20,124 16,961
Borrowings 22 6,088 2,219
Current tax liabilities 23 1,950 650
Provisions 24 1,968 1,195
Other liabilities 25 1,461 1,220
Total current liabilities 31,591 22,245
Non-current liabilities
Borrowings 22 2,396 311
Provisions 24 197 61
Other liabilities 25 481 –
Total non-current liabilities 3,074 372
Total liabilities 34,665 22,617
Net assets 32,421 26,100
Equity
Issued capital 26 16,477 16,477
Reserves 27 745 572
Retained earnings 6,181 2,553
Equity attributable to owners of the company 23,403 19,602
Non-controlling interest 28 9,018 6,498
Total equity 32,421 26,100
The accompanying notes form part of these financial statements.
As at 30 June 2011
24 TAG PACIFIC LIMITED
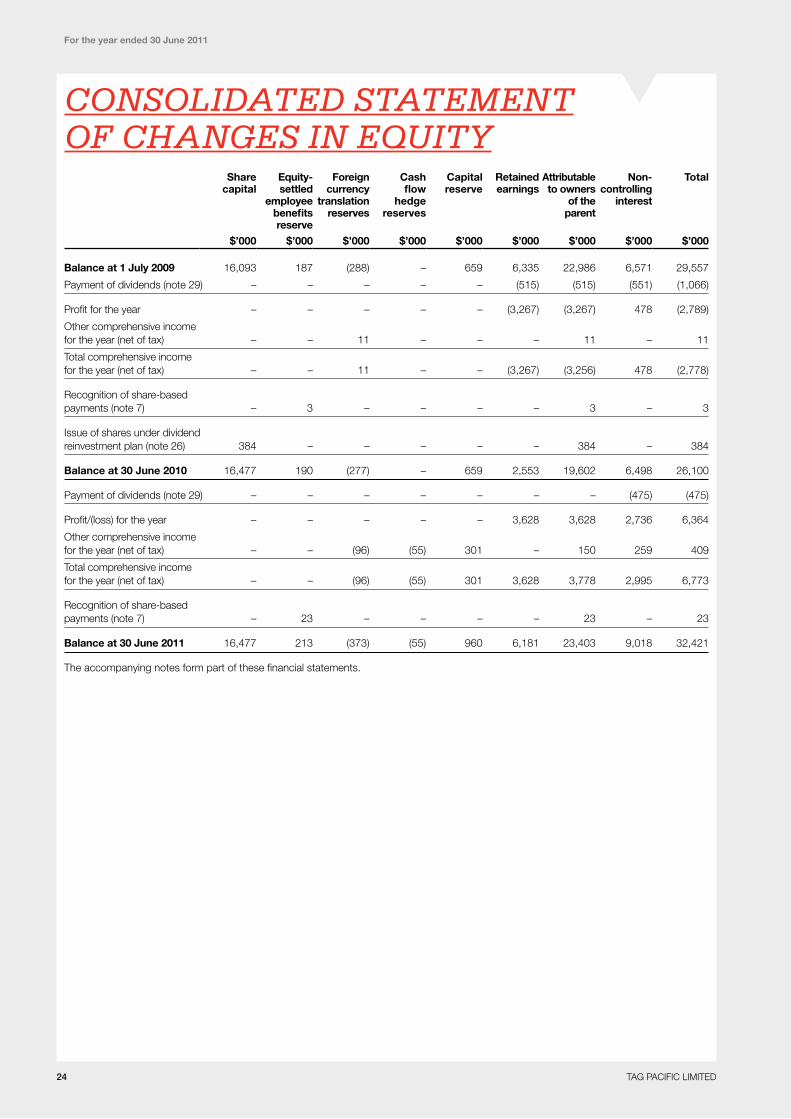
consolidAted stAtement oF chAnges in equity
Share capital
$’000
Equity-settled
employee benefits reserve
$’000
Foreign currency
translation reserves
$’000
Cashflow
hedge reserves
$’000
Capital reserve
$’000
Retained earnings
$’000
Attributable to owners
of the parent
$’000
Non-controlling
interest
$’000
Total
$’000
Balance at 1 July 2009 16,093 187 (288) – 659 6,335 22,986 6,571 29,557
Payment of dividends (note 29) – – – – – (515) (515) (551) (1,066)
Profit for the year – – – – – (3,267) (3,267) 478 (2,789)
Other comprehensive income for the year (net of tax) – – 11 – – – 11 – 11
Total comprehensive income for the year (net of tax) – – 11 – – (3,267) (3,256) 478 (2,778)
Recognition of share-based payments (note 7) – 3 – – – – 3 – 3
Issue of shares under dividend reinvestment plan (note 26) 384 – – – – – 384 – 384
Balance at 30 June 2010 16,477 190 (277) – 659 2,553 19,602 6,498 26,100
Payment of dividends (note 29) – – – – – – – (475) (475)
Profit/(loss) for the year – – – – – 3,628 3,628 2,736 6,364
Other comprehensive income for the year (net of tax) – – (96) (55) 301 – 150 259 409
Total comprehensive income for the year (net of tax) – – (96) (55) 301 3,628 3,778 2,995 6,773
Recognition of share-based payments (note 7) – 23 – – – – 23 – 23
Balance at 30 June 2011 16,477 213 (373) (55) 960 6,181 23,403 9,018 32,421
The accompanying notes form part of these financial statements.
For the year ended 30 June 2011
ANNUAL REPORT 2011 25
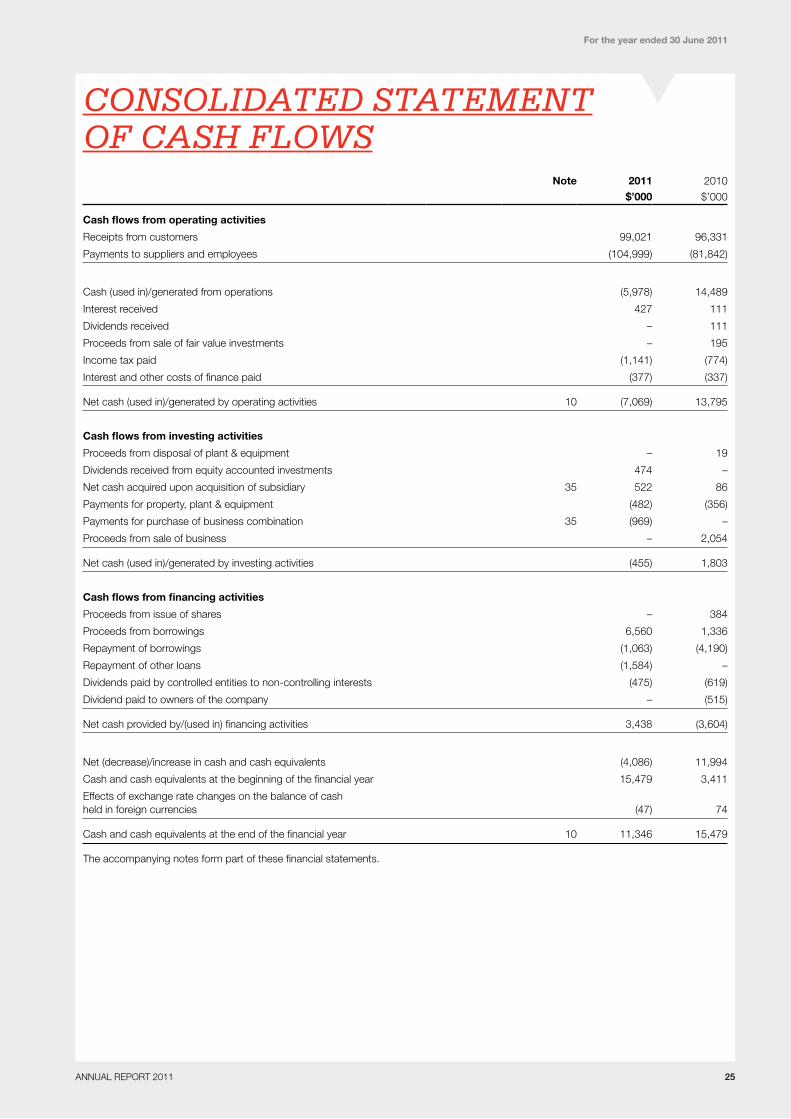
consolidAted stAtement oF cAsh Flows
Note 2011 2010
$’000 $’000
Cash flows from operating activities
Receipts from customers 99,021 96,331
Payments to suppliers and employees (104,999) (81,842)
Cash (used in)/generated from operations (5,978) 14,489
Interest received 427 111
Dividends received – 111
Proceeds from sale of fair value investments – 195
Income tax paid (1,141) (774)
Interest and other costs of finance paid (377) (337)
Net cash (used in)/generated by operating activities 10 (7,069) 13,795
Cash flows from investing activities
Proceeds from disposal of plant & equipment – 19
Dividends received from equity accounted investments 474 –
Net cash acquired upon acquisition of subsidiary 35 522 86
Payments for property, plant & equipment (482) (356)
Payments for purchase of business combination 35 (969) –
Proceeds from sale of business – 2,054
Net cash (used in)/generated by investing activities (455) 1,803
Cash flows from financing activities
Proceeds from issue of shares – 384
Proceeds from borrowings 6,560 1,336
Repayment of borrowings (1,063) (4,190)
Repayment of other loans (1,584) –
Dividends paid by controlled entities to non-controlling interests (475) (619)
Dividend paid to owners of the company – (515)
Net cash provided by/(used in) financing activities 3,438 (3,604)
Net (decrease)/increase in cash and cash equivalents (4,086) 11,994
Cash and cash equivalents at the beginning of the financial year 15,479 3,411
Effects of exchange rate changes on the balance of cash held in foreign currencies (47) 74
Cash and cash equivalents at the end of the financial year 10 11,346 15,479
The accompanying notes form part of these financial statements.
For the year ended 30 June 2011
26 TAG PACIFIC LIMITED
Notes to the financial statements for the financial year ended 30 June 20111. General information 2. Statement of significant accounting policies
1. General informationTag Pacific Limited is a strategic investor and is a listed public company, incorporated and domiciled in Australia. Tag Pacific Limited is also the ultimate parent of the Tag Group (Tag Pacific Limited and its controlled entities).
The registered office and principal place of business of the company is:Tag Pacific LimitedLevel 30, Piccadilly Tower133 Castlereagh StreetSydney NSW 2000Australia
2. Statement of significant accounting policiesStatement of complianceThe financial statements are general purpose financial statements which have been prepared in accordance with the Corporations Act 2001, Australian Accounting Standards, Australian Accounting Interpretations and other authoritative pronouncements of the Australian Accounting Standards Board.
Australian Accounting Standards set out accounting policies that the AASB has concluded would result in the financial statements containing relevant and reliable information about transactions, events and conditions to which they apply. Compliance with Australian Accounting Standards ensures that the financial statements and notes also comply with International Financial Reporting Standards.
The financial statements include the consolidated financial statements of the Tag Group. The financial statements were authorised for issue by the directors on 26 August 2011.
The following is a summary of the material accounting policies adopted by the Tag Group in the preparation of the financial statements. The accounting policies have been consistently applied, unless otherwise stated.
Basis of preparationThe accounting policies set out below have been consistently applied to all years presented.
The financial statements have been prepared on the basis of historical costs, except for the revaluation of financial instruments. Cost is based on the fair values of the consideration given in exchange for assets. All amounts are presented in Australian dollars, unless otherwise noted.
The Tag Parent has applied the relief available to it under ASIC Class Order 98/100. Accordingly, amounts in the financial statements are rounded off to the nearest thousand dollars, unless otherwise indicated.
Critical accounting judgments and key sources of estimation uncertaintyIn the application of the Tag Group’s accounting policies, management is required to make judgments, estimates and assumptions about carrying values of assets and liabilities that are not readily apparent from other sources.
The estimates and associated assumptions are based on historical experience and other factors that are considered to be relevant. Actual results may differ from these estimates. The estimates and underlying assumptions are reviewed on an ongoing basis. Revisions to accounting estimates are recognised in the period in which the estimate is revised if the revision affects only that period, or in the period of the revision and future periods if the revision affects both current and future periods.
Key estimates – ImpairmentThe Tag Group assesses impairment at each reporting date by evaluating conditions specific to the group that may lead to impairment of assets. Where an impairment trigger exists, the recoverable amount of the asset is determined. Value-in-use calculations performed in assessing recoverable amounts incorporate a number of key estimates. Should the projected turnover figures differ significantly from the budgeted figures incorporated in value-in-use calculations then an impairment loss would be recognised up to the maximum carrying value of intangibles at 30 June 2011. Goodwill and indefinite lived intangibles are tested annually for impairment and carried at cost less accumulated impairment losses.
No impairment has been recognised in respect of goodwill and indefinite lived intangibles for the year ended 30 June 2011.
Key estimates – Provision for impairment of receivablesAn estimate is made for doubtful debts when collection of the full amount of a receivable is no longer probable.
Key estimates – Construction contractsRevenue and expenses for power related projects are characterised as construction contracts under AASB 111 and recognised in the profit or loss by reference to the stage of completion of each identifiable component for construction contracts. A fundamental condition for being able to estimate percentage of completion profit recognition is that project revenues and project costs can be established reliably. This reliability is based on such factors as compliance with the Tag Group’s system for project control and that project management has the necessary skills. Project control also includes a number of estimates and assessments that depend on the experience and knowledge of project management in respect of project control, risk management and prior management of projects.
In determining revenues and expenses for construction contracts, management makes key assumptions regarding estimated revenues and expenses over the life of the contracts. Where variations are recognised in revenue, assumptions are made regarding the probability that customers will approve variations and the amount of revenue arising from variation. In respect of costs, key assumptions regarding costs to complete contracts may include estimation of labour, technical costs, impact of delays and productivity.
NoteS to the fiNaNcial StatemeNtS
ANNUAL REPORT 2011 27
Notes to the financial statements for the financial year ended 30 June 20112. Statement of significant accounting policies continued
Accounting policies(a) Basis of consolidationThe consolidated financial statements incorporate the financial statements of Tag Pacific Limited and entities controlled by Tag Pacific Limited (its subsidiaries). A list of subsidiaries is contained in note 15. All controlled entities have a 30 June financial year-end. Control is achieved where Tag Pacific Limited has the power to govern the financial and operating policies of an entity so as to obtain benefits from its activities.
The results of the subsidiaries acquired or disposed of during the year are included in consolidated statement of profit or loss from the effective date of acquisition or up to the effective date of disposal, as appropriate.
Where necessary, adjustments are made to the financial statements of subsidiaries to bring their accounting policies into line with those used by other members of the Tag Group.
All intra-group transactions, balances, income and expenses are eliminated in full on consolidation. In the parent entity disclosures in note 39 for Tag Pacific Limited, intra-group transactions (‘common controlled transactions’) are generally accounted for by reference to the existing (consolidated) book value of the items. Where the transaction value of common control transactions differ from their consolidated book value, the difference is recognised as a contribution by or distribution to equity participants by the transacting entities.
Non-controlling interests in the net assets (excluding goodwill) of consolidated subsidiaries are identified separately from the Tag Group’s equity therein. Non-controlling interests consist of the amount of those interests at the date of the original business combination and the non-controlling interests’ share of changes in equity since the date of the combination. Losses applicable to the non-controlling interests in excess of the non-controlling interests’ interest in the subsidiary’s equity are allocated against the non-controlling interests even if this results in the non-controlling interests having a deficit balance.
Acquisitions of businesses are accounted for using the acquisition method. The consideration transferred in a business combination is measured at fair value which is calculated as the sum of the acquisition-date fair values of assets transferred by the Group, liabilities incurred by the Group to the former owners of the acquiree and the equity instruments issued by the Group in exchange for control of the acquiree. Acquisition-related costs are recognised in profit or loss as incurred.
At the acquisition date, the identifiable assets acquired and the liabilities assumed are recognised at their fair value at the acquisition date, except that:gdeferred tax assets or liabilities and liabilities or assets related
to employee benefit arrangements are recognised and measured in accordance with AASB 112 ‘Income Taxes’ and AASB 119 ‘Employee Benefits’ respectively;
gliabilities or equity instruments related to share-based payment arrangements of the acquiree or share-based payments of the Group entered into to replace share-based payment arrangements of the acquiree are measured in accordance with AASB 2 ‘Share-based Payment’ at the acquisition date; and
gassets (or disposal groups) that are classified as held for sale in accordance with AASB 5 ‘Non-current Assets Held for Sale and Discontinued Operations’ are measured in accordance with that Standard.
Goodwill is measured as the excess of the sum of the consideration transferred, the amount of any non-controlling interests in the acquiree, and the fair value of the acquirer’s previously held equity interest in the acquiree (if any) over the net of the acquisition-date amounts of the identifiable assets acquired and the liabilities assumed. If, after reassessment, the net of the acquisition-date amounts of the identifiable assets acquired and liabilities assumed exceeds the sum of the consideration transferred, the amount of any non-controlling interests in the acquiree and the fair value of the acquirer’s previously held interest in the acquiree (if any), the excess is recognised immediately in profit or loss as a bargain purchase gain.
Non-controlling interests that are present ownership interests and entitle their holders to a proportionate share of the entity’s net assets in the event of liquidation may be initially measured either at fair value or at the non-controlling interests’ proportionate share of the recognised amounts of the acquiree’s identifiable net assets. The choice of measurement basis is made on a transaction-by-transaction basis. Other types of non-controlling interests are measured at fair value or, when applicable, on the basis specified in another Standard.
Where the consideration transferred by the Group in a business combination includes assets or liabilities resulting from a contingent consideration arrangement, the contingent consideration is measured at its acquisition-date fair value. Changes in the fair value of the contingent consideration that qualify as measurement period adjustments are adjusted retrospectively, with corresponding adjustments against goodwill. Measurement period adjustments are adjustments that arise from additional information obtained during the ‘measurement period’ (which cannot exceed one year from the acquisition date) about facts and circumstances that existed at the acquisition date The subsequent accounting for changes in the fair value of contingent consideration that do not qualify as measurement period adjustments depends on how the contingent consideration is classified.
Contingent consideration that is classified as equity is not remeasured at subsequent reporting dates and its subsequent settlement is accounted for within equity. Contingent consideration that is classified as an asset or liability is remeasured at subsequent reporting dates in accordance with AASB 139, or AASB 137 ‘Provisions, Contingent Liabilities and Contingent Assets’, as appropriate, with the corresponding gain or loss being recognised in profit or loss.
Where a business combination is achieved in stages, the Group’s previously held equity interest in the acquire is remeasured to fair value at the acquisition date (i.e. the date when the Group attains control) and the resulting gain or loss, if any, is recognised in profit or loss. Amounts arising from interests in the acquiree prior to the acquisition date that have previously been recognised in other comprehensive income are reclassified to profit or loss where such treatment would be appropriate if that interest were disposed of.
If the initial accounting for a business combination is incomplete by the end of the reporting period in which the combination occurs, the Group reports provisional amounts for the items for which the accounting is incomplete. Those provisional amounts are adjusted during the measurement period (see above), or additional assets or liabilities are recognised, to reflect new information obtained about facts and circumstances that existed as of the acquisition date that, if known, would have affected the amounts recognised as of that date.
Business combinations that took place prior to 1 July 2009 were accounted for in accordance with the previous version of AASB 3.
28 TAG PACIFIC LIMITED
Notes to the financial statements for the financial year ended 30 June 20112. Statement of significant accounting policies continued
(b) Income taxCurrent taxThe charge for current income tax expense is based on the profit for the year adjusted for any non-assessable or disallowed items. It is calculated using the tax rates that have been enacted or are substantively enacted by the balance date. Current tax for current and prior periods is recognised as a liability (or asset) to the extent that it is unpaid (or refundable).
Deferred taxDeferred tax is recognised on temporary differences between the tax bases of assets and liabilities and their carrying amounts in the financial statements. No deferred income tax will be recognised from the initial recognition of an asset or liability, excluding a business combination, where there is no effect on accounting or taxable profit or loss.
Deferred tax is calculated at the tax rates that are expected to apply to the period when the asset is realised or liability is settled. Deferred tax is credited in profit or loss except where it relates to items that may be credited directly to equity, in which case the deferred tax is adjusted directly against equity.
Deferred income tax assets are recognised to the extent that it is probable that future tax profits will be available against which deductible temporary differences can be utilised. Capitalised losses are only brought to account when it is probable they will be recouped through future taxable capital gains.
(c) InventoriesInventories are stated at the lower of cost and net realisable value. The cost of manufactured products includes direct materials, direct labour and an appropriate portion of variable and fixed overheads. Overheads are applied on the basis of normal operating capacity. Costs are assigned on the basis of weighted average costs. Refer to note 2(p) for the policy in relation to work in progress and construction contracts.
(d) Property, plant and equipmentEach class of property, plant and equipment is carried at cost less any accumulated depreciation and impairment.
Plant and equipmentPlant and equipment are measured on the cost basis. The carrying amount of plant and equipment is reviewed annually by directors to ensure it is not in excess of the recoverable amount from these assets. The recoverable amount is assessed on the basis of the expected net cash flows that will be received from the assets employment and subsequent disposal. The expected net cash flows have been discounted to their present values in determining recoverable amounts.
The cost of fixed assets constructed within the Tag Group includes the cost of materials, direct labour, borrowing costs and an appropriate proportion of fixed and variable overheads. Subsequent costs are included in the asset’s carrying amount or recognised as a separate asset, as appropriate, only when it is probable that future economic benefits associated with the item will flow to the Tag Group and the cost of the item can be measured reliably. All other repairs and maintenance are charged to the profit or loss during the financial period in which they are incurred.
Land and buildingsFreehold land and buildings are shown at their fair value being the amount for which an asset could be exchanged between knowledgeable willing parties in an arm’s length transaction, based on a valuation by external independent valuers, less subsequent depreciation for buildings. Increases in the carrying amount arising on revaluation of land and buildings are credited to a revaluation surplus in equity. Decreases that offset previous increases of the same asset are charged against fair value reserves directly in equity, all other decreases are charged to profit or loss. Any accumulated depreciation at the date of revaluation is eliminated against the gross carrying amount of the asset and the net amount is restated to the revalued amount of the asset.
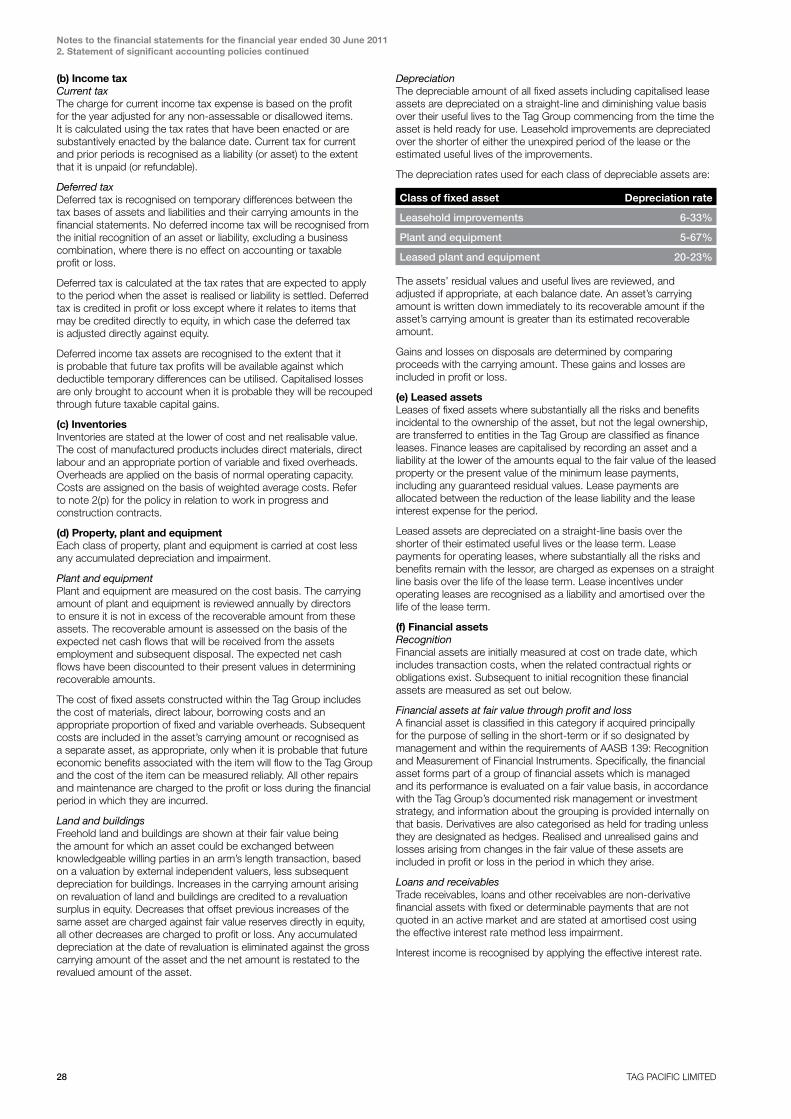
DepreciationThe depreciable amount of all fixed assets including capitalised lease assets are depreciated on a straight-line and diminishing value basis over their useful lives to the Tag Group commencing from the time the asset is held ready for use. Leasehold improvements are depreciated over the shorter of either the unexpired period of the lease or the estimated useful lives of the improvements.
The depreciation rates used for each class of depreciable assets are:
Class of fixed asset Depreciation rate
Leasehold improvements 6-33%
Plant and equipment 5-67%
Leased plant and equipment 20-23%
The assets’ residual values and useful lives are reviewed, and adjusted if appropriate, at each balance date. An asset’s carrying amount is written down immediately to its recoverable amount if the asset’s carrying amount is greater than its estimated recoverable amount.
Gains and losses on disposals are determined by comparing proceeds with the carrying amount. These gains and losses are included in profit or loss.
(e) Leased assetsLeases of fixed assets where substantially all the risks and benefits incidental to the ownership of the asset, but not the legal ownership, are transferred to entities in the Tag Group are classified as finance leases. Finance leases are capitalised by recording an asset and a liability at the lower of the amounts equal to the fair value of the leased property or the present value of the minimum lease payments, including any guaranteed residual values. Lease payments are allocated between the reduction of the lease liability and the lease interest expense for the period.
Leased assets are depreciated on a straight-line basis over the shorter of their estimated useful lives or the lease term. Lease payments for operating leases, where substantially all the risks and benefits remain with the lessor, are charged as expenses on a straight line basis over the life of the lease term. Lease incentives under operating leases are recognised as a liability and amortised over the life of the lease term.
(f) Financial assetsRecognitionFinancial assets are initially measured at cost on trade date, which includes transaction costs, when the related contractual rights or obligations exist. Subsequent to initial recognition these financial assets are measured as set out below.
Financial assets at fair value through profit and lossA financial asset is classified in this category if acquired principally for the purpose of selling in the short-term or if so designated by management and within the requirements of AASB 139: Recognition and Measurement of Financial Instruments. Specifically, the financial asset forms part of a group of financial assets which is managed and its performance is evaluated on a fair value basis, in accordance with the Tag Group’s documented risk management or investment strategy, and information about the grouping is provided internally on that basis. Derivatives are also categorised as held for trading unless they are designated as hedges. Realised and unrealised gains and losses arising from changes in the fair value of these assets are included in profit or loss in the period in which they arise.
Loans and receivablesTrade receivables, loans and other receivables are non-derivative financial assets with fixed or determinable payments that are not quoted in an active market and are stated at amortised cost using the effective interest rate method less impairment.
Interest income is recognised by applying the effective interest rate.

ANNUAL REPORT 2011 29
Notes to the financial statements for the financial year ended 30 June 20112. Statement of significant accounting policies continued
Fair valueFor all quoted investments fair value is determined by reference to observable prices of market transactions for identical assets at or near the measurement date whenever that information is available. Valuation techniques are applied to determine the fair value for all unlisted securities, including recent arm’s length transactions, reference to similar instruments and option pricing models.
Impairment of financial assetsFinancial assets, other than those at fair value through profit or loss, are assessed for indicators of impairment at each balance date. Financial assets are impaired where there is objective evidence that as a result of one or more events that occurred after the initial recognition of the financial asset the estimated future cash flows of the investment have been impacted.
For financial assets carried at amortised cost, the amount of the impairment is the difference between the asset’s carrying amount and the present value of estimated future cash flows, discounted at the original effective interest rate.
The carrying amount of financial assets including uncollectible trade receivables is reduced by the impairment loss through the use of an allowance account. Subsequent recoveries of amounts previously written off are credited against the allowance account. Changes in the carrying amount of the allowance account are recognised in profit or loss.
With the exception of available-for-sale equity instruments, if, in a subsequent period, the amount of the impairment loss decreases and the decrease can be related objectively to an event occurring after the impairment was recognised, the previously recognised impairment loss is reversed through profit or loss to the extent the carrying amount of the investment at the date the impairment is reversed does not exceed what the amortised cost would have been had the impairment not been recognised.
(g) Impairment of assetsAt each reporting date, the Tag Group reviews the carrying values of its tangible and intangible assets to determine whether there is any indication that those assets have been impaired. If such an indication exists, the recoverable amount of the asset, being the higher of the asset’s fair value less costs to sell and value in use, is compared to the asset’s carrying value. Any excess of the asset’s carrying value over its recoverable amount is expensed to profit or loss.
Impairment testing is performed annually for goodwill and intangible assets with indefinite lives.
Where it is not possible to estimate the recoverable amount of an individual asset, the Tag Group estimates the recoverable amount of the cash-generating unit to which the asset belongs.
(h) Investments in associatesAn associate is an entity over which the group has significant influence and that is neither a subsidiary nor an interest in a joint venture. Significant influence is the power to participate in the financial and operating policy decisions of the investee but is not control or joint control over those policies.
The results and assets and liabilities of associates are incorporated in these financial statements using the equity method of accounting, except when the investment is classified as held for sale, in which case it is accounted for in accordance with AASB 5 Non-current Assets Held for Sale and Discontinued Operations. Under the equity method, investments in associates are carried in the consolidated statement of financial position at cost as adjusted for post-acquisition changes in the group’s share of the net assets of the associate, less any impairment in the value of individual investments.
Losses of an associate in excess of the group’s interest in that associate (which includes any long-term interests that, in substance, form part of the group’s net investment in the associate) are recognised only to the extent that the group has incurred legal or constructive obligations or made payments on behalf of the associate.
Any excess of the cost of acquisition over the group’s share of the net fair value of the identifiable assets, liabilities and contingent liabilities of the associate recognised at the date of the acquisition is recognised as goodwill. The goodwill is included within the carrying amount of the investment and is assessed for impairment as part of that investment. Any excess of the group’s share of the net fair value of the identifiable assets, liabilities and contingent liabilities over the cost of the acquisition, after reassessment, is recognised immediately in profit or loss. Where a group transacts with an associate of the group, profits and losses are eliminated to the extent of the group’s interest in the relevant associate.
(i) Intangible assetsGoodwillGoodwill is initially recorded at the amount by which the purchase price for a business or for an ownership interest in a controlled entity exceeds the fair value attributed to its net assets at the date of acquisition. Goodwill on acquisition of controlled entities is included in intangible assets. Goodwill on acquisition of associates is included in investments in associates. Goodwill is tested annually for impairment and carried at cost less accumulated impairment losses. Goodwill is allocated to cash-generating units for the purposes of impairment testing (refer note 19).
If the recoverable amount of the cash-generating unit (or group of cash-generating units) is less than the carrying amount of the cash-generating unit (or groups of cash-generating units), the impairment loss is allocated first to reduce the carrying amount of any goodwill allocated to the cash-generating unit (or groups of cash-generating units) and then to reduce the other assets of the cash-generating units pro-rata on the basis of the carrying amount of each asset in the cash-generating unit (or groups of cash-generating units). An impairment loss recognised for goodwill is recognised immediately in profit or loss and is not reversed in a subsequent period. On disposal of an operation within a cash-generating unit, the attributable amount of goodwill is included in the determination of the profit or loss on disposal of the operation.
Patents and trademarksPatents and trademarks are recognised at cost of acquisition. Patents and trademarks have a finite life and are carried at cost less any accumulated amortisation and any impairment losses.
Research and developmentExpenditure during the research phase of a project is recognised as an expense as incurred. Development costs are capitalised only when technical feasibility studies identify that the project will deliver future economic benefits and these benefits can be measured reliably. Development costs are amortised on a straight line basis over the period during which the related benefits are expected to be realised, once commercial production has commenced.
(j) Foreign currency transactions and balancesFunctional and presentation currencyThe functional currency of each of the Tag Group’s entities is measured using the currency of the primary economic environment in which that entity operates. The consolidated financial statements are presented in Australian dollars which is the Tag Parent’s functional and presentation currency.
Transactions and balancesForeign currency transactions are translated into functional currency using the exchange rates prevailing at the date of the transaction. Foreign currency monetary items are translated at the year-end exchange rate. Non-monetary items measured at historical cost continue to be carried at the exchange rate at the date of the transaction. Non-monetary items measured at fair value are reported at the exchange rate at the date when fair values were determined.
Exchange differences arising on the translation of monetary items are recognised in profit or loss, except where deferred in equity as a qualifying cash flow hedge.
30 TAG PACIFIC LIMITED
Notes to the financial statements for the financial year ended 30 June 20112. Statement of significant accounting policies continued
Tag Group companiesThe financial results and position of foreign operations whose functional currency is different from the Tag Group’s presentation currency are translated as follows:gassets and liabilities are translated at year-end exchange rates
prevailing at that reporting date;gincome and expenses are translated at average exchange rates
for the period; andgretained earnings are translated at the historical exchange rates.
Exchange differences arising on translation of foreign operations are transferred directly to the Tag Group’s foreign currency translation reserve in the consolidated statement of financial position. These differences are recognised in the consolidated statement of comprehensive income in the period in which the operation is disposed.
(k) Employee benefitsA liability is recognised at balance date for benefits accruing to employees in respect of wages and salaries, annual leave and long service leave when it is probable that settlement will be required and they are capable of being measured reliably.
Employee benefits that are expected to be settled within one year have been measured at the amounts expected to be paid when the liability is settled, plus related on-costs.
Employee benefits payable later than one year have been measured at the present value of the estimated future cash outflows to be made for those benefits.
Contributions are made by the Tag Group to employee superannuation funds and are charged as an expense when employees have rendered service entitling them to the contributions.
(l) ProvisionsProvisions are recognised when the Tag Group has a present obligation (legal or constructive), as a result of a past event, for which it is probable that the Tag Group will be required to settle the obligation, and a reliable estimate can be made of the amount of the obligation.
The amount recognised as a provision is the best estimate of the consideration required to settle the present obligation at reporting date, taking into account the risks and uncertainties surrounding the obligation. Where a provision is measured using the cash flows estimated to settle the present obligation, its carrying amount is the present value of those cash flows. When some or all of the economic benefits required to settle a provision are expected to be recovered from a third party, the receivable is recognised as an asset if it is virtually certain that reimbursement will be received and the amount of the receivable can be measured reliably.
(m) Provision for warrantiesProvision is made in respect of the Tag Group’s estimated liability on all products and services under warranty at balance date. The provision is measured as the present value of future cash flows estimated to be required to settle the warranty obligation. The future cash flows have been estimated by reference to the Tag Group’s history of warranty claims.
(n) Cash and cash equivalentsCash and cash equivalents include cash on hand, deposits held at call with banks, other short-term highly liquid investments with original maturities of three months or less, and bank overdrafts. Bank overdrafts are shown within borrowings in current liabilities on the consolidated statement of financial position.
(o) RevenueRevenue is measured at the fair value of the consideration received or receivable. Revenue is reduced for estimated customer returns, stock rotation, price protection, rebates and other similar allowances.
Rendering of servicesRevenue from a contract to provide services is recognised by reference to the stage of completion of the contract. The stage of completion of the contract is determined as follows:ginstallation fees are recognised by reference to the stage of
completion of the installation, determined as the proportion of the total time expected to install that has elapsed at reporting date; and
grevenue from time and material contracts is recognised at the contractual rates as labour hours are delivered and direct expenses are incurred.
Revenue from construction contracts is recognised in accordance with the accounting policy set out in note 2(p).
Sale of goodsRevenue from sale of goods is recognised upon delivery of goods to customers.
Dividend, distribution and interest revenueDividend and distribution revenue from investments is recognised when the Tag Group’s right to receive payment has been established. Dividends received from associates are accounted for in accordance with the equity method of accounting.
Interest revenue is accrued on a time basis, by reference to the principal outstanding and at the effective interest rate applicable, which is the rate that exactly discounts estimated future cash receipts through the expected life of the financial asset to that asset’s net carrying amount.
All revenue is stated net of the amount of goods and services tax (GST).
(p) Construction contracts and work in progressWhere the outcome of a construction contract can be estimated reliably, revenue and costs are recognised by reference to the stage of completion of the contract activity at the balance date, as measured by the proportion that contract costs incurred for work performed to date bear to the estimated total contract costs or completion of a physical proportion of the contract work, except where this would not be representative of the stage of completion. Variations in contract work, claims and incentive payments are included to the extent that they have been agreed with the customer.
Where the outcome of a construction contract cannot be estimated reliably, contract revenue is recognised to the extent of contract costs incurred that it is probable will be recoverable. Contract costs are recognised as expenses in the period in which they are incurred. When it is probable that total contract costs will exceed total contract revenue, the expected loss is recognised as an expense immediately.
Construction work in progress is valued at cost, plus profit recognised to date less any provision for anticipated future losses. Cost includes both variable and fixed costs relating to specific contracts and those costs that are attributable to the contract activity in general and that can be allocated on a reasonable basis.
(q) Borrowing costsBorrowing costs directly attributable to the acquisition, construction or production of assets that necessarily take a substantial period of time to prepare for their intended use or sale, are added to the cost of those assets, until such time as the assets are substantially ready for their intended use or sale.
All other borrowing costs are recognised as an expense in the period in which they are incurred.
(r) Goods and services tax (GST)Revenues, expenses and assets are recognised net of the amount of goods and services tax (GST), except:gwhere the amount of GST incurred is not recoverable from the
taxation authority, it is recognised as part of the cost of acquisition of an asset or as part of an item of expense; or
gfor receivables and payables which are recognised inclusive of GST.
ANNUAL REPORT 2011 31
Notes to the financial statements for the financial year ended 30 June 20112. Statement of significant accounting policies continued
The net amount of GST recoverable from, or payable to, the taxation authority is included as part of receivables or payables.
Cash flows are included in the consolidated statement of cash flows on a gross basis. The GST component of cash flows arising from investing and financing activities which is recoverable from, or payable to, the taxation authority is classified within operating cash flows.
(s) Other financial liabilitiesOther financial liabilities, including borrowings, are initially measured at fair value, net of transaction costs.
Other financial liabilities are subsequently measured at amortised cost using the effective interest method, with interest expense recognised on an effective yield basis. The effective interest method is a method of calculating the amortised cost of a financial liability and of allocating interest expense over the relevant period. The effective interest rate is the rate that exactly discounts estimated future cash payments through the expected life of the financial liability, or, where appropriate, a shorter period, to the net carrying amount on initial recognition.
(t) Derivative financial instrumentsThe Tag Group enters into a variety of derivative financial instruments to manage its exposure to interest rate and foreign exchange rate risk, including foreign exchange forward contracts. Further details of derivative financial instruments are disclosed in note 38 to the financial statements.
Note 38 contains details of the fair values of the derivative instruments used for hedging purposes.
The Group enters into financial instruments to manage its exposure to foreign exchange risk, including foreign exchange forward contracts.
Derivatives are initially recognised at fair value at the date the derivative contract is entered into and are subsequently remeasured at their fair value at the end of each reporting period. The resulting gain or loss is recognised in profit or loss immediately unless the derivative is designated as effective as a hedging instrument, in which event the timing of the recognition in profit or loss depends on the nature of the hedging relationship. The Group designates certain derivatives as either hedges of the fair value of recognised assets or liabilities or firm commitments (fair value hedges), hedges of highly probable forecast transactions or hedges of foreign currency risk of firm commitments (cash flow hedges).
A derivative with a positive fair value is recognised as a financial asset; a derivative with a negative fair value is recognised as a financial liability.
A derivative is presented as a non-current asset or a non-current liability if the remaining maturity of the instrument is more than 12 months and it is not expected to be realised or settled within 12 months. Other derivatives are presented as current assets or current liabilities.
Hedge accountingThe Group designates certain hedging instruments, which include derivatives as either fair value hedges or cash flow hedges. Hedges of foreign exchange risk on firm commitments are accounted for as cash flow hedges.
At the inception of the hedge relationship, the entity documents the relationship between the hedging instrument and the hedged item, along with its risk management objectives and its strategy for undertaking various hedge transactions. Furthermore, at the inception of the hedge and on an ongoing basis, the Group documents whether the hedging instrument is highly effective in offsetting changes in fair values or cash flows of the hedged item.
Fair value hedgeChanges in the fair value of derivatives that are designated and qualify as fair value hedges are recognised in profit or loss immediately, together with any changes in the fair value of the hedged asset or liability that are attributable to the hedged risk. The change in the fair value of the hedging instrument and the change in the hedged item attributable to the hedged risk are recognised in the line of the statement of comprehensive income relating to the hedged item.
Hedge accounting is discontinued when the Group revokes the hedging relationship, when the hedging instrument expires or is sold, terminated or exercised, or when it no longer qualifies for hedge accounting. The fair value adjustment to the carrying amount of the hedged item arising from the hedged risk is amortised to profit or loss from that date.
Cash flow hedgesThe effective portion of changes in the fair value of derivatives that are designated and qualify as cash flow hedges is recognised in other comprehensive income. The gain or loss relating to the ineffective portion is recognised immediately in profit or loss, and is included in the ‘other gains or losses’ line item.
Amounts previously recognised in other comprehensive income and accumulated in equity are reclassified to profit or loss in the periods when the hedged item is recognised in profit or loss, in the same line of the statement of comprehensive income as the recognised hedged item. However, when the forecast transaction that is hedged results in the recognition of a non-financial asset or a non-financial liability, the gains and losses previously accumulated in equity are transferred from equity and included in the initial measurement of the cost of the non-financial asset or non-financial liability.
Hedge accounting is discontinued when the Group revokes the hedging relationship, when the hedging instrument expires or is sold, terminated or exercised, or when it no longer qualifies for hedge accounting. Any gain or loss accumulated in equity at that time remains in equity and is recognised when the forecast transaction is ultimately recognised in profit or loss. When a forecast transaction is no longer expected to occur, the gain or loss accumulated in equity is recognised immediately in profit or loss.
(u) Share-based paymentsShare-based payments with employees and others providing similar services are measured at the fair value of the equity instrument at the grant date. Fair value is measured by use of the Black-Scholes model. Further details on how the fair value of equity-settled share-based transactions has been determined can be found in note 33.
The fair value determined at the grant date of the equity-settled share-based payments is expensed on a straight line basis over the vesting period, based on the group’s estimate of equity instruments that will eventually vest.
At each reporting date, the group revises its estimate of the number of equity instruments expected to vest. The impact of the revision of the original estimates, if any, is recognised in profit or loss over the remaining vesting period, with corresponding adjustment to the equity-settled employee benefits reserve.
(v) Rounding of amountsThe Tag Parent has applied the relief available to it under ASIC Class Order 98/100 and accordingly, amounts in the financial statements and directors’ report have been rounded off to the nearest $1,000, unless otherwise indicated.
(w) Adoption of new and revised Accounting StandardsIn the current year, the Tag Group has adopted all of the new and revised Standards and Interpretations issued by the Australian Accounting Standards Board (the AASB) that are relevant to its operations and effective for the current annual reporting period.
Details of the impact of the adoption of these new accounting standards are set out in the individual accounting policy notes set out below.
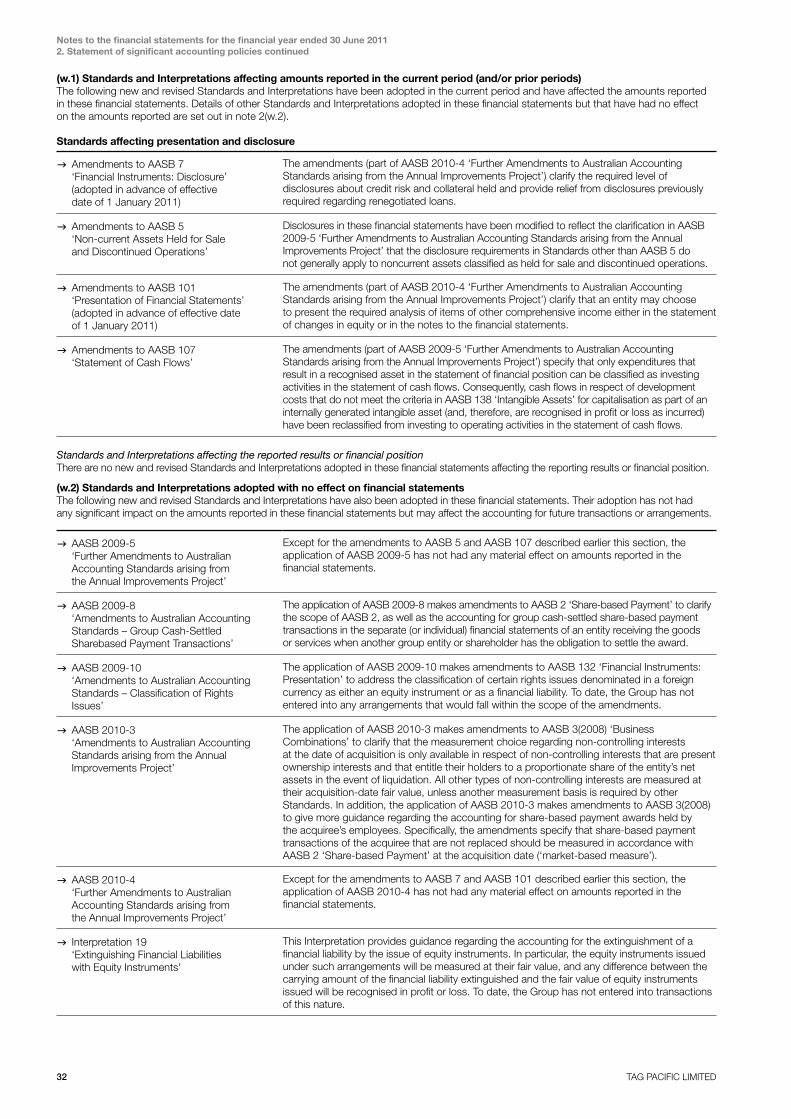
32 TAG PACIFIC LIMITED
Notes to the financial statements for the financial year ended 30 June 20112. Statement of significant accounting policies continued
(w.1) Standards and Interpretations affecting amounts reported in the current period (and/or prior periods)The following new and revised Standards and Interpretations have been adopted in the current period and have affected the amounts reported in these financial statements. Details of other Standards and Interpretations adopted in these financial statements but that have had no effect on the amounts reported are set out in note 2(w.2).
Standards affecting presentation and disclosure
gAmendments to AASB 7 ‘Financial Instruments: Disclosure’ (adopted in advance of effective date of 1 January 2011)
The amendments (part of AASB 2010-4 ‘Further Amendments to Australian Accounting Standards arising from the Annual Improvements Project’) clarify the required level of disclosures about credit risk and collateral held and provide relief from disclosures previously required regarding renegotiated loans.
gAmendments to AASB 5 ‘Non-current Assets Held for Sale and Discontinued Operations’
Disclosures in these financial statements have been modified to reflect the clarification in AASB 2009-5 ‘Further Amendments to Australian Accounting Standards arising from the Annual Improvements Project’ that the disclosure requirements in Standards other than AASB 5 do not generally apply to noncurrent assets classified as held for sale and discontinued operations.
gAmendments to AASB 101 ‘Presentation of Financial Statements’ (adopted in advance of effective date of 1 January 2011)
The amendments (part of AASB 2010-4 ‘Further Amendments to Australian Accounting Standards arising from the Annual Improvements Project’) clarify that an entity may choose to present the required analysis of items of other comprehensive income either in the statement of changes in equity or in the notes to the financial statements.
gAmendments to AASB 107 ‘Statement of Cash Flows’
The amendments (part of AASB 2009-5 ‘Further Amendments to Australian Accounting Standards arising from the Annual Improvements Project’) specify that only expenditures that result in a recognised asset in the statement of financial position can be classified as investing activities in the statement of cash flows. Consequently, cash flows in respect of development costs that do not meet the criteria in AASB 138 ‘Intangible Assets’ for capitalisation as part of an internally generated intangible asset (and, therefore, are recognised in profit or loss as incurred) have been reclassified from investing to operating activities in the statement of cash flows.
Standards and Interpretations affecting the reported results or financial position There are no new and revised Standards and Interpretations adopted in these financial statements affecting the reporting results or financial position.
(w.2) Standards and Interpretations adopted with no effect on financial statementsThe following new and revised Standards and Interpretations have also been adopted in these financial statements. Their adoption has not had any significant impact on the amounts reported in these financial statements but may affect the accounting for future transactions or arrangements.
gAASB 2009-5 ‘Further Amendments to Australian Accounting Standards arising from the Annual Improvements Project’
Except for the amendments to AASB 5 and AASB 107 described earlier this section, the application of AASB 2009-5 has not had any material effect on amounts reported in the financial statements.
gAASB 2009-8 ‘Amendments to Australian Accounting Standards – Group Cash-Settled Sharebased Payment Transactions’
The application of AASB 2009-8 makes amendments to AASB 2 ‘Share-based Payment’ to clarify the scope of AASB 2, as well as the accounting for group cash-settled share-based payment transactions in the separate (or individual) financial statements of an entity receiving the goods or services when another group entity or shareholder has the obligation to settle the award.
gAASB 2009-10 ‘Amendments to Australian Accounting Standards – Classification of Rights Issues’
The application of AASB 2009-10 makes amendments to AASB 132 ‘Financial Instruments: Presentation’ to address the classification of certain rights issues denominated in a foreign currency as either an equity instrument or as a financial liability. To date, the Group has not entered into any arrangements that would fall within the scope of the amendments.
gAASB 2010-3 ‘Amendments to Australian Accounting Standards arising from the Annual Improvements Project’
The application of AASB 2010-3 makes amendments to AASB 3(2008) ‘Business Combinations’ to clarify that the measurement choice regarding non-controlling interests at the date of acquisition is only available in respect of non-controlling interests that are present ownership interests and that entitle their holders to a proportionate share of the entity’s net assets in the event of liquidation. All other types of non-controlling interests are measured at their acquisition-date fair value, unless another measurement basis is required by other Standards. In addition, the application of AASB 2010-3 makes amendments to AASB 3(2008) to give more guidance regarding the accounting for share-based payment awards held by the acquiree’s employees. Specifically, the amendments specify that share-based payment transactions of the acquiree that are not replaced should be measured in accordance with AASB 2 ‘Share-based Payment’ at the acquisition date (‘market-based measure’).
gAASB 2010-4 ‘Further Amendments to Australian Accounting Standards arising from the Annual Improvements Project’
Except for the amendments to AASB 7 and AASB 101 described earlier this section, the application of AASB 2010-4 has not had any material effect on amounts reported in the financial statements.
gInterpretation 19 ‘Extinguishing Financial Liabilities with Equity Instruments’
This Interpretation provides guidance regarding the accounting for the extinguishment of a financial liability by the issue of equity instruments. In particular, the equity instruments issued under such arrangements will be measured at their fair value, and any difference between the carrying amount of the financial liability extinguished and the fair value of equity instruments issued will be recognised in profit or loss. To date, the Group has not entered into transactions of this nature.
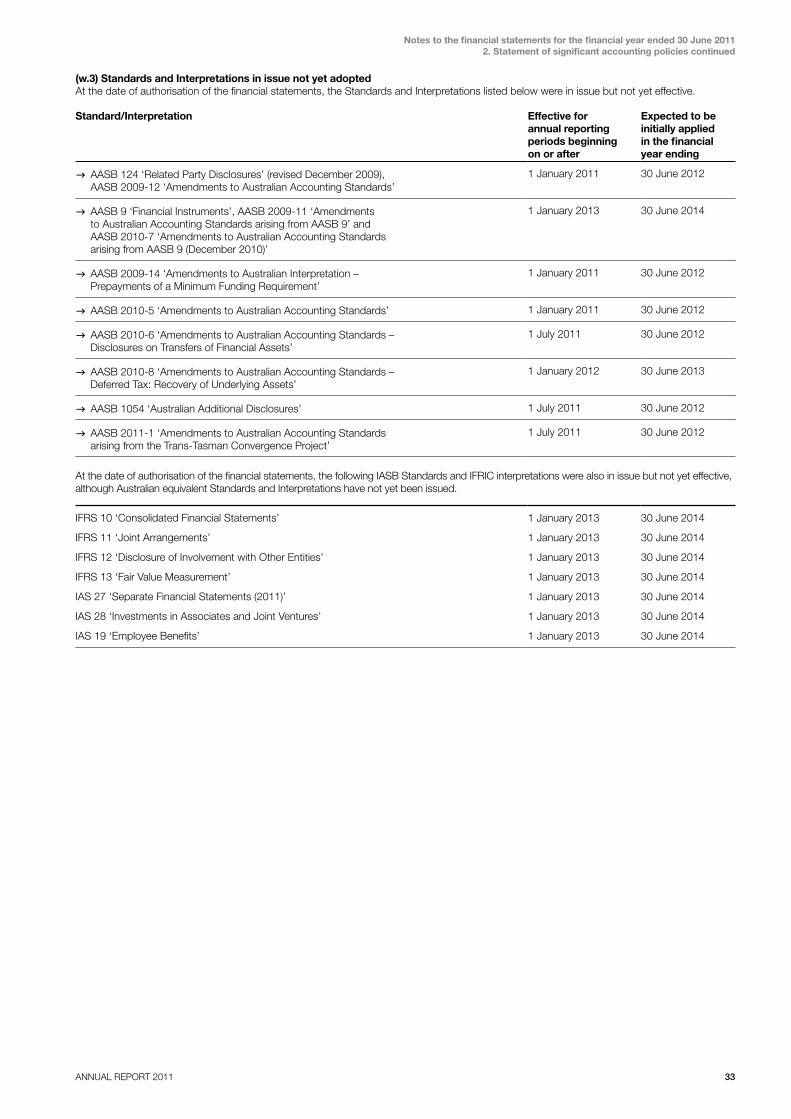
ANNUAL REPORT 2011 33
Notes to the financial statements for the financial year ended 30 June 20112. Statement of significant accounting policies continued
(w.3) Standards and Interpretations in issue not yet adopted At the date of authorisation of the financial statements, the Standards and Interpretations listed below were in issue but not yet effective.
Standard/Interpretation Effective for annual reporting periods beginning on or after
Expected to be initially applied in the financial year ending
gAASB 124 ‘Related Party Disclosures’ (revised December 2009), AASB 2009-12 ‘Amendments to Australian Accounting Standards’
1 January 2011 30 June 2012
gAASB 9 ‘Financial Instruments’, AASB 2009-11 ‘Amendments to Australian Accounting Standards arising from AASB 9’ and AASB 2010-7 ‘Amendments to Australian Accounting Standards arising from AASB 9 (December 2010)’
1 January 2013 30 June 2014
gAASB 2009-14 ‘Amendments to Australian Interpretation – Prepayments of a Minimum Funding Requirement’
1 January 2011 30 June 2012
gAASB 2010-5 ‘Amendments to Australian Accounting Standards’ 1 January 2011 30 June 2012
gAASB 2010-6 ‘Amendments to Australian Accounting Standards – Disclosures on Transfers of Financial Assets’
1 July 2011 30 June 2012
gAASB 2010-8 ‘Amendments to Australian Accounting Standards – Deferred Tax: Recovery of Underlying Assets’
1 January 2012 30 June 2013
gAASB 1054 ‘Australian Additional Disclosures’ 1 July 2011 30 June 2012
gAASB 2011-1 ‘Amendments to Australian Accounting Standards arising from the Trans-Tasman Convergence Project’
1 July 2011 30 June 2012
At the date of authorisation of the financial statements, the following IASB Standards and IFRIC interpretations were also in issue but not yet effective, although Australian equivalent Standards and Interpretations have not yet been issued.
IFRS 10 ‘Consolidated Financial Statements’ 1 January 2013 30 June 2014
IFRS 11 ‘Joint Arrangements’ 1 January 2013 30 June 2014
IFRS 12 ‘Disclosure of Involvement with Other Entities’ 1 January 2013 30 June 2014
IFRS 13 ‘Fair Value Measurement’ 1 January 2013 30 June 2014
IAS 27 ‘Separate Financial Statements (2011)’ 1 January 2013 30 June 2014
IAS 28 ‘Investments in Associates and Joint Ventures’ 1 January 2013 30 June 2014
IAS 19 ‘Employee Benefits’ 1 January 2013 30 June 2014
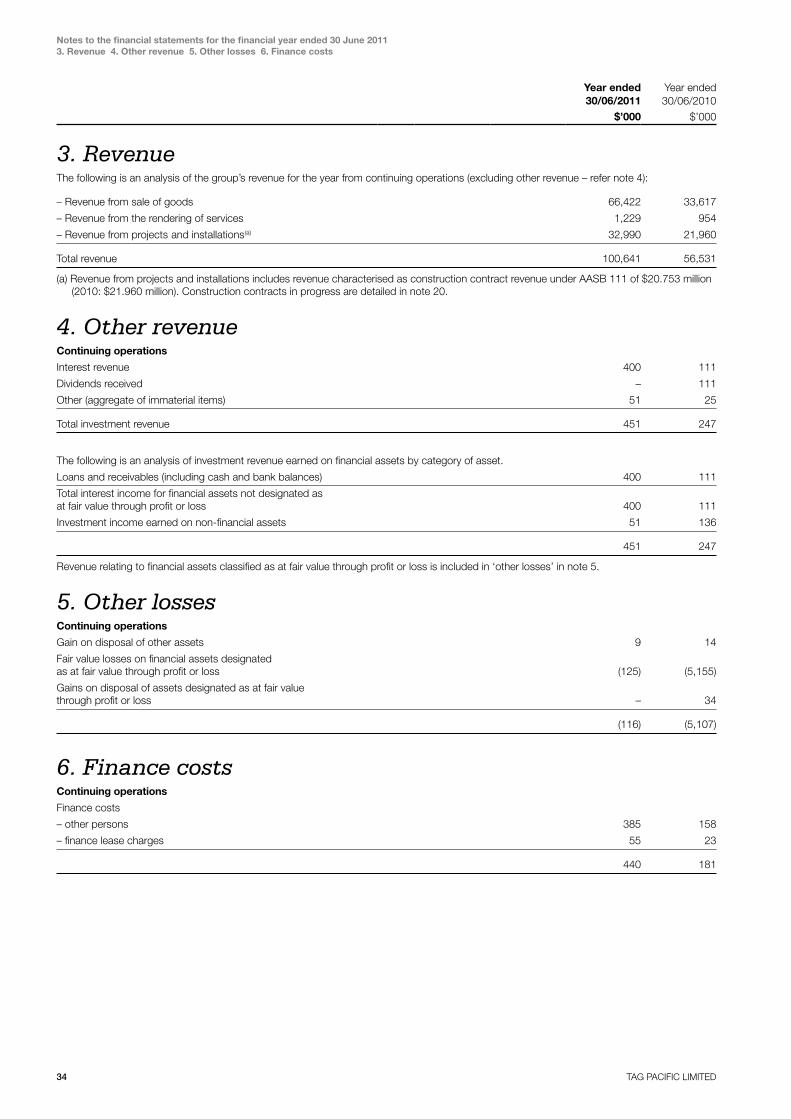
34 TAG PACIFIC LIMITED
Notes to the financial statements for the financial year ended 30 June 20113. Revenue 4. Other revenue 5. Other losses 6. Finance costs
Year ended30/06/2011
Year ended 30/06/2010
$’000 $’000
3. RevenueThe following is an analysis of the group’s revenue for the year from continuing operations (excluding other revenue – refer note 4):
– Revenue from sale of goods 66,422 33,617
– Revenue from the rendering of services 1,229 954
– Revenue from projects and installations(a) 32,990 21,960
Total revenue 100,641 56,531
(a) Revenue from projects and installations includes revenue characterised as construction contract revenue under AASB 111 of $20.753 million (2010: $21.960 million). Construction contracts in progress are detailed in note 20.
4. other revenueContinuing operations
Interest revenue 400 111
Dividends received – 111
Other (aggregate of immaterial items) 51 25
Total investment revenue 451 247
The following is an analysis of investment revenue earned on financial assets by category of asset.
Loans and receivables (including cash and bank balances) 400 111
Total interest income for financial assets not designated as at fair value through profit or loss 400 111
Investment income earned on non-financial assets 51 136
451 247
Revenue relating to financial assets classified as at fair value through profit or loss is included in ‘other losses’ in note 5.
5. other lossesContinuing operations
Gain on disposal of other assets 9 14
Fair value losses on financial assets designated as at fair value through profit or loss (125) (5,155)
Gains on disposal of assets designated as at fair value through profit or loss – 34
(116) (5,107)
6. finance costsContinuing operations
Finance costs
– other persons 385 158
– finance lease charges 55 23
440 181
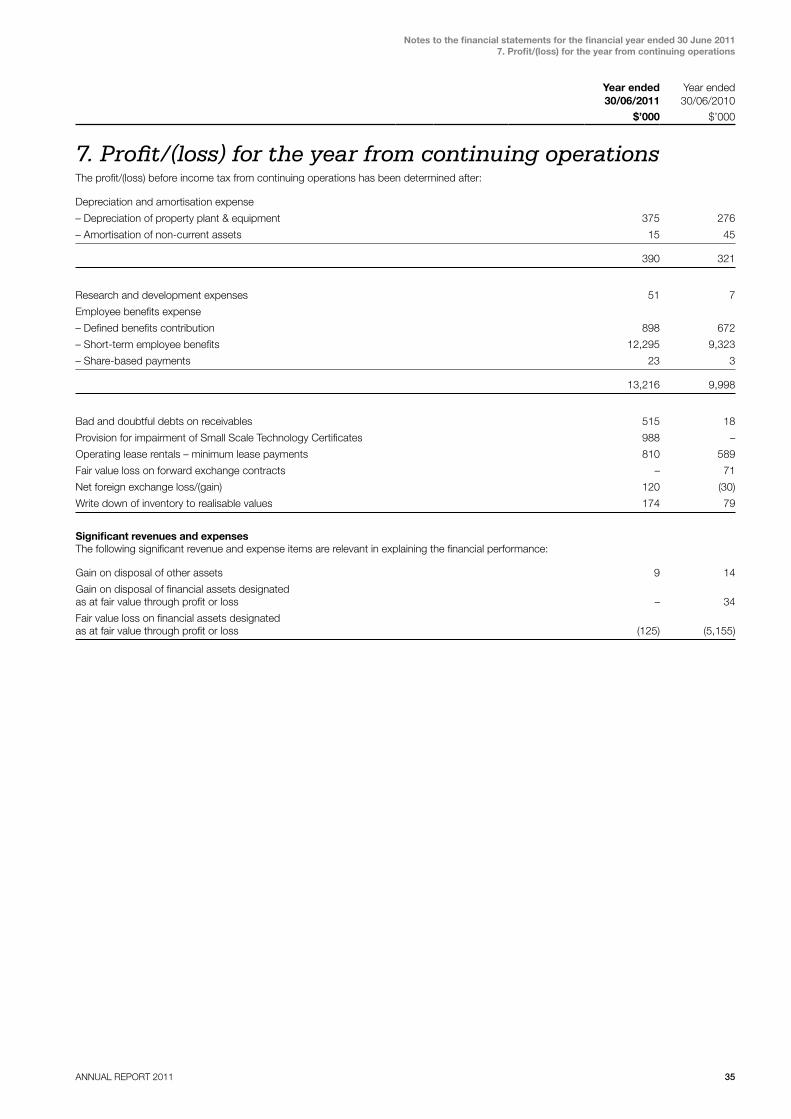
ANNUAL REPORT 2011 35
Notes to the financial statements for the financial year ended 30 June 20117. Profit/(loss) for the year from continuing operations
Year ended30/06/2011
Year ended 30/06/2010
$’000 $’000
7. Profit/(loss) for the year from continuing operationsThe profit/(loss) before income tax from continuing operations has been determined after:
Depreciation and amortisation expense
– Depreciation of property plant & equipment 375 276
– Amortisation of non-current assets 15 45
390 321
Research and development expenses 51 7
Employee benefits expense
– Defined benefits contribution 898 672
– Short-term employee benefits 12,295 9,323
– Share-based payments 23 3
13,216 9,998
Bad and doubtful debts on receivables 515 18
Provision for impairment of Small Scale Technology Certificates 988 –
Operating lease rentals – minimum lease payments 810 589
Fair value loss on forward exchange contracts – 71
Net foreign exchange loss/(gain) 120 (30)
Write down of inventory to realisable values 174 79
Significant revenues and expensesThe following significant revenue and expense items are relevant in explaining the financial performance:
Gain on disposal of other assets 9 14
Gain on disposal of financial assets designated as at fair value through profit or loss – 34
Fair value loss on financial assets designated as at fair value through profit or loss (125) (5,155)
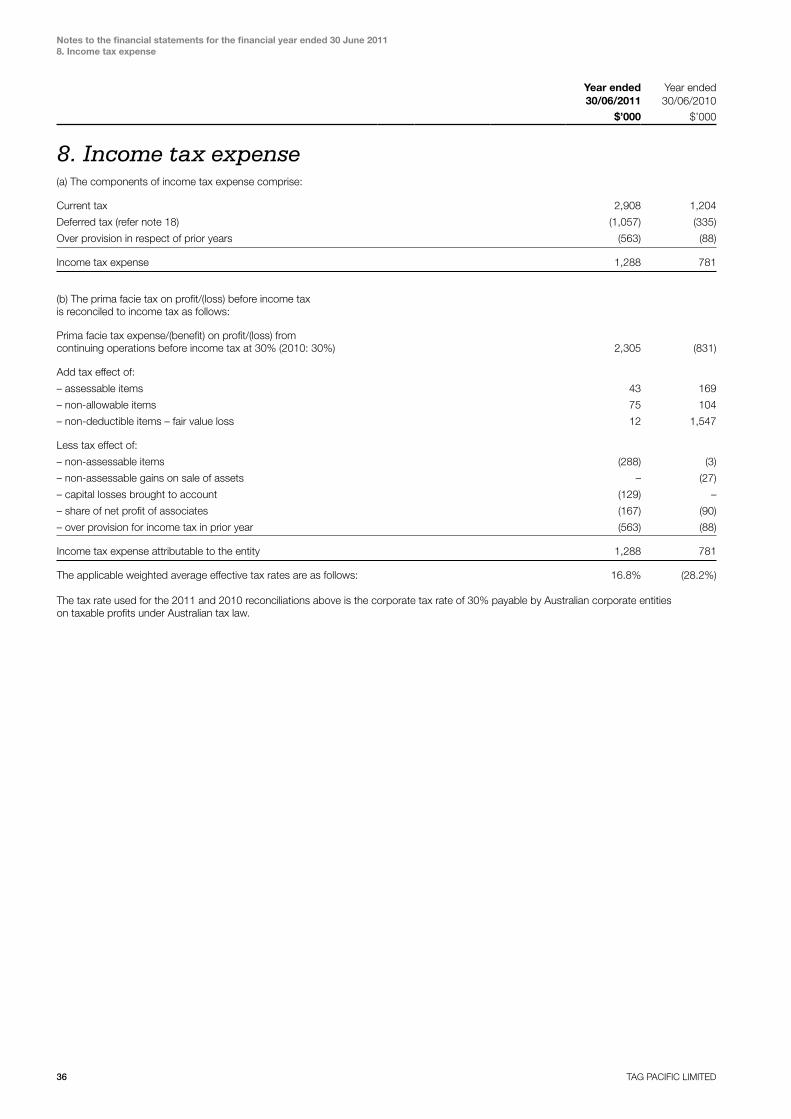
36 TAG PACIFIC LIMITED
Notes to the financial statements for the financial year ended 30 June 20118. Income tax expense
Year ended30/06/2011
Year ended 30/06/2010
$’000 $’000
8. income tax expense(a) The components of income tax expense comprise:
Current tax 2,908 1,204
Deferred tax (refer note 18) (1,057) (335)
Over provision in respect of prior years (563) (88)
Income tax expense 1,288 781
(b) The prima facie tax on profit/(loss) before income tax is reconciled to income tax as follows:
Prima facie tax expense/(benefit) on profit/(loss) from continuing operations before income tax at 30% (2010: 30%) 2,305 (831)
Add tax effect of:
– assessable items 43 169
– non-allowable items 75 104
– non-deductible items – fair value loss 12 1,547
Less tax effect of:
– non-assessable items (288) (3)
– non-assessable gains on sale of assets – (27)
– capital losses brought to account (129) –
– share of net profit of associates (167) (90)
– over provision for income tax in prior year (563) (88)
Income tax expense attributable to the entity 1,288 781
The applicable weighted average effective tax rates are as follows: 16.8% (28.2%)
The tax rate used for the 2011 and 2010 reconciliations above is the corporate tax rate of 30% payable by Australian corporate entities on taxable profits under Australian tax law.
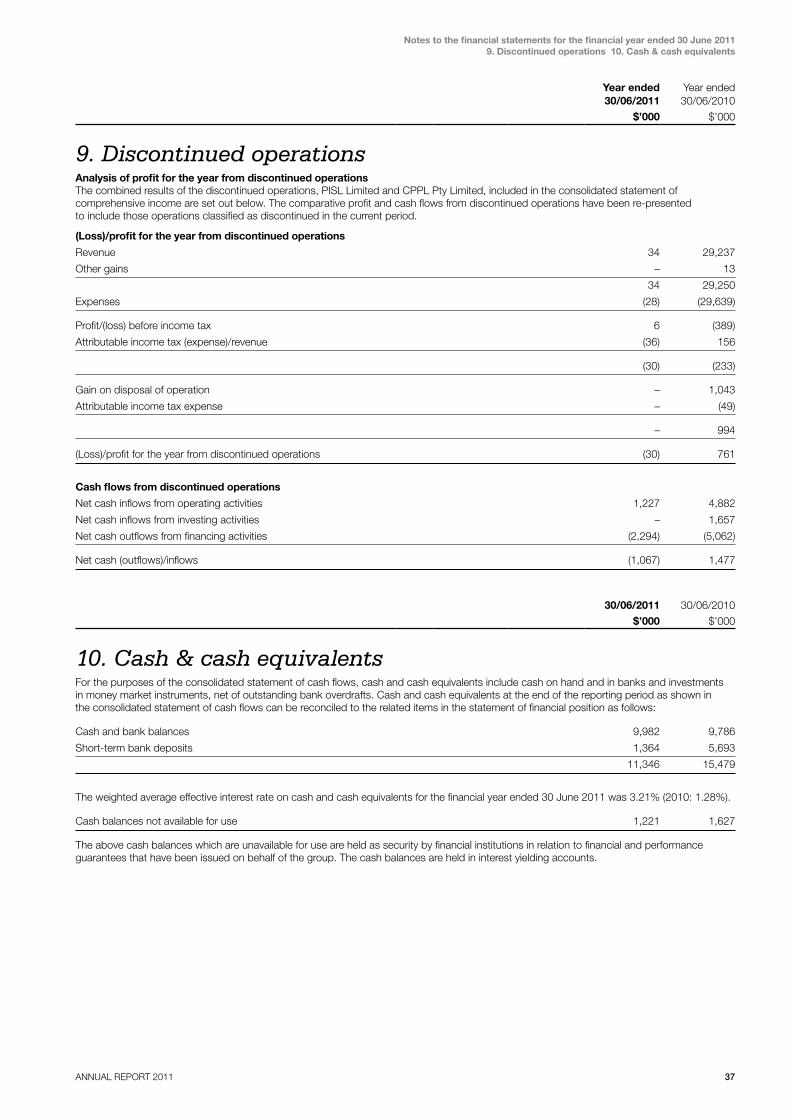
ANNUAL REPORT 2011 37
Notes to the financial statements for the financial year ended 30 June 20119. Discontinued operations 10. Cash & cash equivalents
Year ended30/06/2011
Year ended 30/06/2010
$’000 $’000
9. Discontinued operationsAnalysis of profit for the year from discontinued operationsThe combined results of the discontinued operations, PISL Limited and CPPL Pty Limited, included in the consolidated statement of comprehensive income are set out below. The comparative profit and cash flows from discontinued operations have been re-presented to include those operations classified as discontinued in the current period.
(Loss)/profit for the year from discontinued operations
Revenue 34 29,237
Other gains – 13
34 29,250
Expenses (28) (29,639)
Profit/(loss) before income tax 6 (389)
Attributable income tax (expense)/revenue (36) 156
(30) (233)
Gain on disposal of operation – 1,043
Attributable income tax expense – (49)
– 994
(Loss)/profit for the year from discontinued operations (30) 761
Cash flows from discontinued operations
Net cash inflows from operating activities 1,227 4,882
Net cash inflows from investing activities – 1,657
Net cash outflows from financing activities (2,294) (5,062)
Net cash (outflows)/inflows (1,067) 1,477
30/06/2011 30/06/2010
$’000 $’000
10. cash & cash equivalentsFor the purposes of the consolidated statement of cash flows, cash and cash equivalents include cash on hand and in banks and investments in money market instruments, net of outstanding bank overdrafts. Cash and cash equivalents at the end of the reporting period as shown in the consolidated statement of cash flows can be reconciled to the related items in the statement of financial position as follows:
Cash and bank balances 9,982 9,786
Short-term bank deposits 1,364 5,693
11,346 15,479
The weighted average effective interest rate on cash and cash equivalents for the financial year ended 30 June 2011 was 3.21% (2010: 1.28%).
Cash balances not available for use 1,221 1,627
The above cash balances which are unavailable for use are held as security by financial institutions in relation to financial and performance guarantees that have been issued on behalf of the group. The cash balances are held in interest yielding accounts.

38 TAG PACIFIC LIMITED
Notes to the financial statements for the financial year ended 30 June 201110. Cash & cash equivalents continued 11. Trade & other receivables
Year ended30/06/2011
Year ended 30/06/2010
$’000 $’000
Reconciliation of profit/(loss) for the period to net cash flow from operating activities
Profit/(loss) from operating activities after income tax 6,364 (2,789)
Non-cash flows
– amortisation 15 45
– depreciation (from continuing operations) 375 276
– depreciation (from discontinued operations) – 130
– changes to provisions 1,187 189
– share based payments 23 3
– share of associated companies operating profit after income tax (555) (300)
– write-down of assets (relocation) 187 –
– unrealised currency losses 120 –
Gain on sale of fair value assets – (34)
Dividends received – (111)
Gain on sale of property, plant and equipment (9) (1,070)
Net fair value losses on financial assets 125 5,155
Changes in assets and liabilities
– (increase)/decrease in receivables and prepayments (9,468) 1,340
– (increase)/decrease in inventories (9,133) 7,988
– increase in trade creditors & accruals 3,460 3,074
– increase/(decrease) in income tax balances 240 (101)
Cash flow (used in)/provided by operating activities (7,069) 13,795
Liquidity risk managementFinancing Facilities
Credit facilities 21,742 13,620
Amounts utilised (13,237) (8,732)
Unused credit facilities 8,505 4,888
Loan and non-financial facilitiesLoan and non-financial facilities are arranged with a number of Australian and New Zealand banks and insurers with the general terms and conditions being set and agreed to annually.
Interest rates are variable and subject to adjustment.
Non-cash financing and investment activitiesDuring the year the Tag Group acquired plant and equipment with an aggregate value of $207,629 (2010: $177,245) by means of finance leases and hire purchases. These acquisitions are not reflected in the consolidated statement of cash flows.
30/06/2011 30/06/2010
$’000 $’000
11. trade & other receivablesTrade receivables 18,148 8,110
Allowance for doubtful debts (529) (249)
17,619 7,861
Other debtors 659 32
Accrued revenue receivable 4,283 6,322
Amounts receivable from associates 265 189
5,207 6,543
22,826 14,404

ANNUAL REPORT 2011 39
Notes to the financial statements for the financial year ended 30 June 201111. Trade & other receivables continued
12. Inventories 13. Other assets
30/06/2011 30/06/2010
$’000 $’000
Ageing of past due but not impaired
60-90 days 726 476
90-120 days 662 928
Total 1,388 1,404
Average age (days) 54 46
Year ended30/06/2011
Year ended 30/06/2010
$’000 $’000
Movement in the allowance for doubtful debts
Balance at the beginning of the year 249 182
Impairment losses recognised on receivables 502 160
Amounts written off during the year as uncollectible (190) (87)
Amounts recovered during the year 49 –
Impairment losses reversed (81) (6)
Balance at the end of the year 529 249
Trade receivables increased substantially during the year due to a 78% increase in revenues from continuing operations.
The average credit period on sales of goods and rendering of services is 60 days. The Tag Group has provided for receivables over 60 days based on estimated unrecoverable amounts from sales of goods and rendering of services, determined by reference to the particular circumstances in relation to the debt and past default experience.
In determining the recoverability of a trade receivable, the Tag Group considers any change in the credit quality of the trade receivable from the date credit was initially granted up to the reporting date. The concentration of credit risk is limited due to the customer base being large and unrelated. Accordingly, the directors believe that there is no further credit provision required in excess of the allowance for doubtful debts. There is no security held in relation to these balances.
30/06/2011 30/06/2010
$’000 $’000
Ageing of impaired trade receivables
90-120 days 529 249
Total 529 249
12. inventoriesRaw materials 1,515 1,708
Work in progress – 87
Goods-in-transit 3,106 –
Finished goods 11,400 5,353
16,021 7,148
The cost of inventories recognised as an expense during the period in respect of continuing operations was $74.5 million (2010: $41.9 million).
13. other assetsCurrent
Small Scale Technology Certificates(a) 2,789 –
Less: Provision for impairment of certificates (988) –
1,801 –
Prepayments 207 361
Total 2,008 361
(a) Initiated by the Renewable Energy (Electricity) Act 2000, Small Scale Technology Certificates (STCs) are available when a client purchases a solar power system. One STC is equivalent to one megawatt of electricity generation. The STCs can be assigned or traded in exchange for a financial benefit. The Group initially recognises STCs at cost. At reporting date, the STCs are assessed for impairment and recognised at the lower of cost or net realisable value.
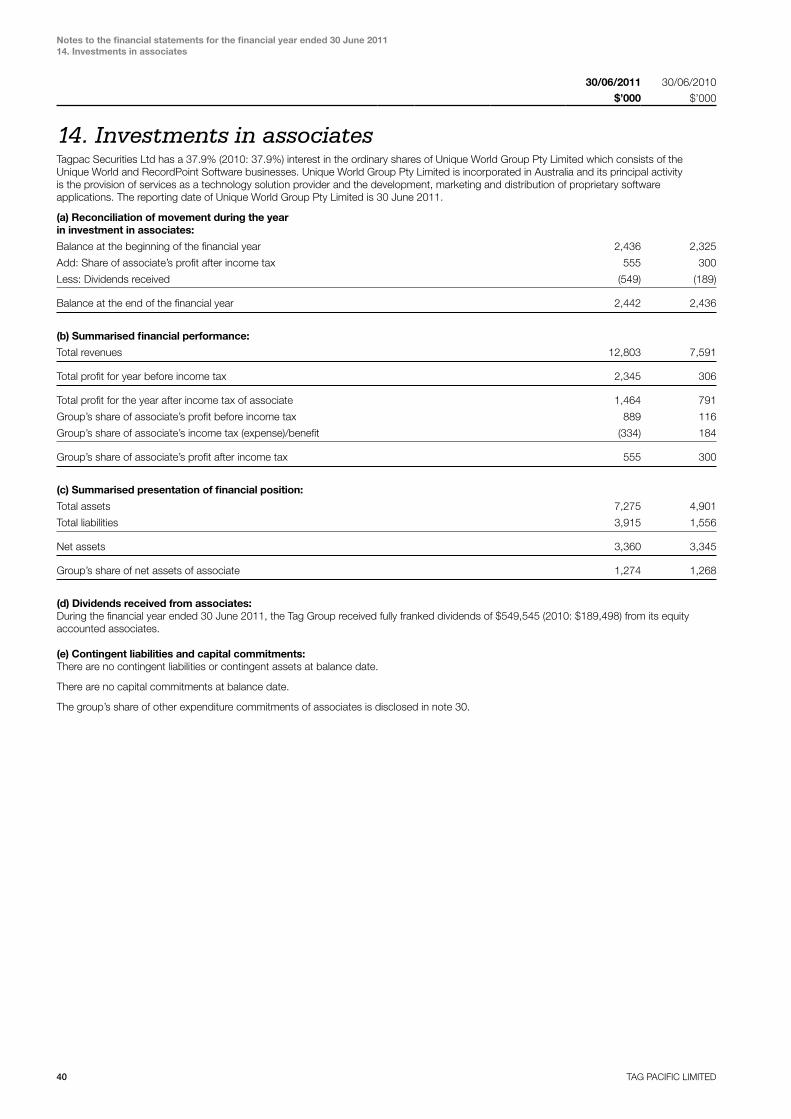
40 TAG PACIFIC LIMITED
Notes to the financial statements for the financial year ended 30 June 201114. Investments in associates
30/06/2011 30/06/2010
$’000 $’000
14. investments in associatesTagpac Securities Ltd has a 37.9% (2010: 37.9%) interest in the ordinary shares of Unique World Group Pty Limited which consists of the Unique World and RecordPoint Software businesses. Unique World Group Pty Limited is incorporated in Australia and its principal activity is the provision of services as a technology solution provider and the development, marketing and distribution of proprietary software applications. The reporting date of Unique World Group Pty Limited is 30 June 2011.
(a) Reconciliation of movement during the year in investment in associates:
Balance at the beginning of the financial year 2,436 2,325
Add: Share of associate’s profit after income tax 555 300
Less: Dividends received (549) (189)
Balance at the end of the financial year 2,442 2,436
(b) Summarised financial performance:
Total revenues 12,803 7,591
Total profit for year before income tax 2,345 306
Total profit for the year after income tax of associate 1,464 791
Group’s share of associate’s profit before income tax 889 116
Group’s share of associate’s income tax (expense)/benefit (334) 184
Group’s share of associate’s profit after income tax 555 300
(c) Summarised presentation of financial position:
Total assets 7,275 4,901
Total liabilities 3,915 1,556
Net assets 3,360 3,345
Group’s share of net assets of associate 1,274 1,268
(d) Dividends received from associates:During the financial year ended 30 June 2011, the Tag Group received fully franked dividends of $549,545 (2010: $189,498) from its equity accounted associates.
(e) Contingent liabilities and capital commitments:There are no contingent liabilities or contingent assets at balance date.
There are no capital commitments at balance date.
The group’s share of other expenditure commitments of associates is disclosed in note 30.
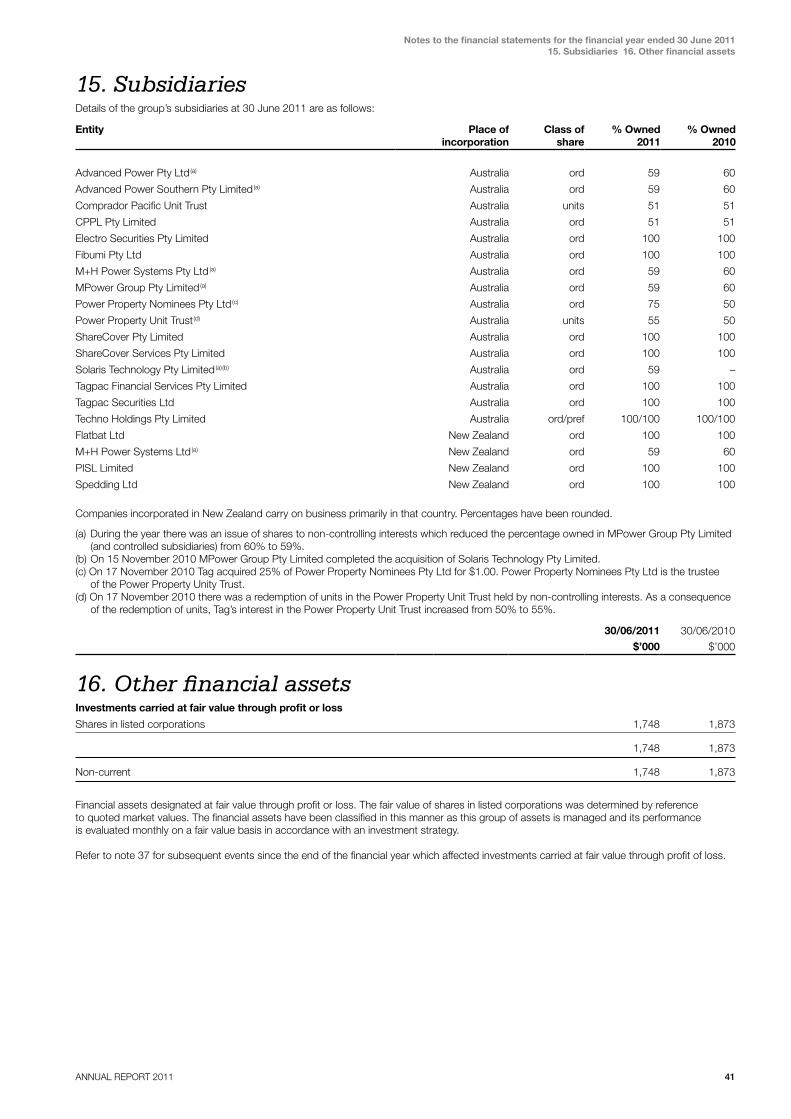
ANNUAL REPORT 2011 41
Notes to the financial statements for the financial year ended 30 June 201115. Subsidiaries 16. Other financial assets
15. SubsidiariesDetails of the group’s subsidiaries at 30 June 2011 are as follows:
Entity Place of incorporation
Class of share
% Owned 2011
% Owned 2010
Advanced Power Pty Ltd(a) Australia ord 59 60
Advanced Power Southern Pty Limited(a) Australia ord 59 60
Comprador Pacific Unit Trust Australia units 51 51
CPPL Pty Limited Australia ord 51 51
Electro Securities Pty Limited Australia ord 100 100
Fibumi Pty Ltd Australia ord 100 100
M+H Power Systems Pty Ltd (a) Australia ord 59 60
MPower Group Pty Limited(a) Australia ord 59 60
Power Property Nominees Pty Ltd(c) Australia ord 75 50
Power Property Unit Trust(d) Australia units 55 50
ShareCover Pty Limited Australia ord 100 100
ShareCover Services Pty Limited Australia ord 100 100
Solaris Technology Pty Limited(a)(b) Australia ord 59 –
Tagpac Financial Services Pty Limited Australia ord 100 100
Tagpac Securities Ltd Australia ord 100 100
Techno Holdings Pty Limited Australia ord/pref 100/100 100/100
Flatbat Ltd New Zealand ord 100 100
M+H Power Systems Ltd(a) New Zealand ord 59 60
PISL Limited New Zealand ord 100 100
Spedding Ltd New Zealand ord 100 100
Companies incorporated in New Zealand carry on business primarily in that country. Percentages have been rounded.
(a) During the year there was an issue of shares to non-controlling interests which reduced the percentage owned in MPower Group Pty Limited (and controlled subsidiaries) from 60% to 59%.
(b) On 15 November 2010 MPower Group Pty Limited completed the acquisition of Solaris Technology Pty Limited. (c) On 17 November 2010 Tag acquired 25% of Power Property Nominees Pty Ltd for $1.00. Power Property Nominees Pty Ltd is the trustee
of the Power Property Unity Trust.(d) On 17 November 2010 there was a redemption of units in the Power Property Unit Trust held by non-controlling interests. As a consequence
of the redemption of units, Tag’s interest in the Power Property Unit Trust increased from 50% to 55%.
30/06/2011 30/06/2010
$’000 $’000
16. other financial assetsInvestments carried at fair value through profit or loss
Shares in listed corporations 1,748 1,873
1,748 1,873
Non-current 1,748 1,873
Financial assets designated at fair value through profit or loss. The fair value of shares in listed corporations was determined by reference to quoted market values. The financial assets have been classified in this manner as this group of assets is managed and its performance is evaluated monthly on a fair value basis in accordance with an investment strategy.
Refer to note 37 for subsequent events since the end of the financial year which affected investments carried at fair value through profit of loss.
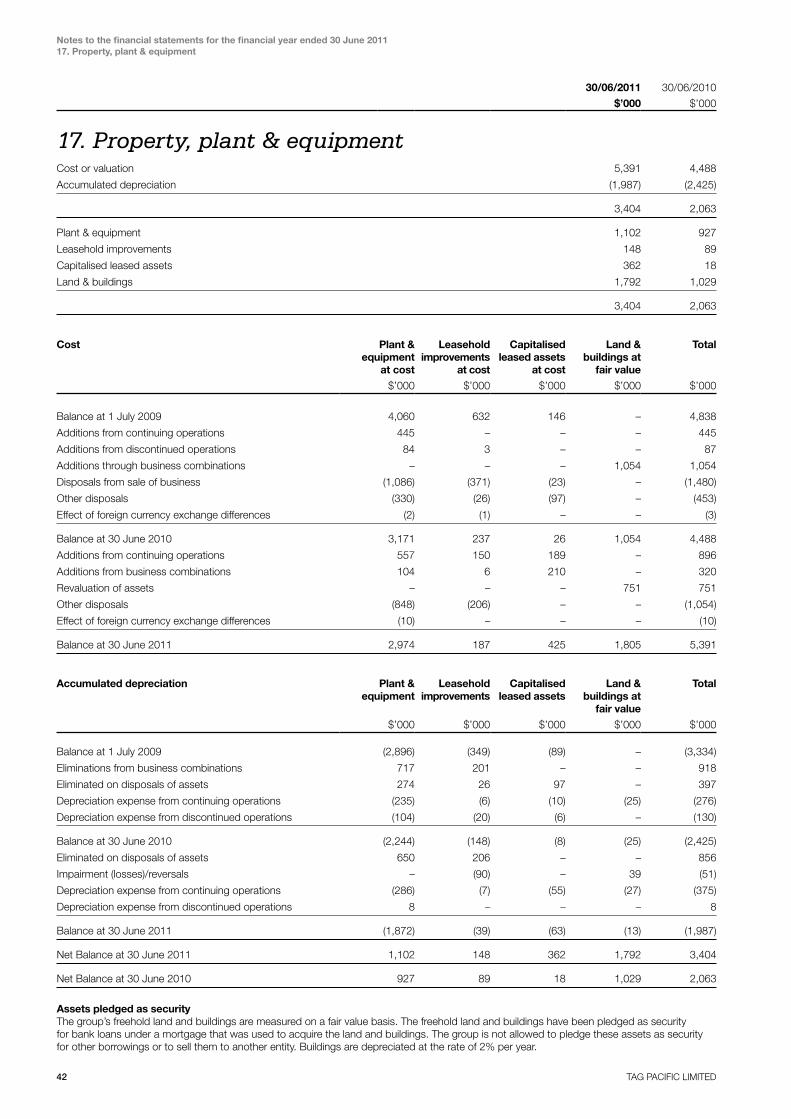
42 TAG PACIFIC LIMITED
Notes to the financial statements for the financial year ended 30 June 201117. Property, plant & equipment
30/06/2011 30/06/2010
$’000 $’000
17. Property, plant & equipmentCost or valuation 5,391 4,488
Accumulated depreciation (1,987) (2,425)
3,404 2,063
Plant & equipment 1,102 927
Leasehold improvements 148 89
Capitalised leased assets 362 18
Land & buildings 1,792 1,029
3,404 2,063
Cost Plant &equipment
at cost
Leasehold improvements
at cost
Capitalised leased assets
at cost
Land & buildings at
fair value
Total
$’000 $’000 $’000 $’000 $’000
Balance at 1 July 2009 4,060 632 146 – 4,838
Additions from continuing operations 445 – – – 445
Additions from discontinued operations 84 3 – – 87
Additions through business combinations – – – 1,054 1,054
Disposals from sale of business (1,086) (371) (23) – (1,480)
Other disposals (330) (26) (97) – (453)
Effect of foreign currency exchange differences (2) (1) – – (3)
Balance at 30 June 2010 3,171 237 26 1,054 4,488
Additions from continuing operations 557 150 189 – 896
Additions from business combinations 104 6 210 – 320
Revaluation of assets – – – 751 751
Other disposals (848) (206) – – (1,054)
Effect of foreign currency exchange differences (10) – – – (10)
Balance at 30 June 2011 2,974 187 425 1,805 5,391
Accumulated depreciation Plant &equipment
Leasehold improvements
Capitalised leased assets
Land & buildings at
fair value
Total
$’000 $’000 $’000 $’000 $’000
Balance at 1 July 2009 (2,896) (349) (89) – (3,334)
Eliminations from business combinations 717 201 – – 918
Eliminated on disposals of assets 274 26 97 – 397
Depreciation expense from continuing operations (235) (6) (10) (25) (276)
Depreciation expense from discontinued operations (104) (20) (6) – (130)
Balance at 30 June 2010 (2,244) (148) (8) (25) (2,425)
Eliminated on disposals of assets 650 206 – – 856
Impairment (losses)/reversals – (90) – 39 (51)
Depreciation expense from continuing operations (286) (7) (55) (27) (375)
Depreciation expense from discontinued operations 8 – – – 8
Balance at 30 June 2011 (1,872) (39) (63) (13) (1,987)
Net Balance at 30 June 2011 1,102 148 362 1,792 3,404
Net Balance at 30 June 2010 927 89 18 1,029 2,063
Assets pledged as securityThe group’s freehold land and buildings are measured on a fair value basis. The freehold land and buildings have been pledged as security for bank loans under a mortgage that was used to acquire the land and buildings. The group is not allowed to pledge these assets as security for other borrowings or to sell them to another entity. Buildings are depreciated at the rate of 2% per year.
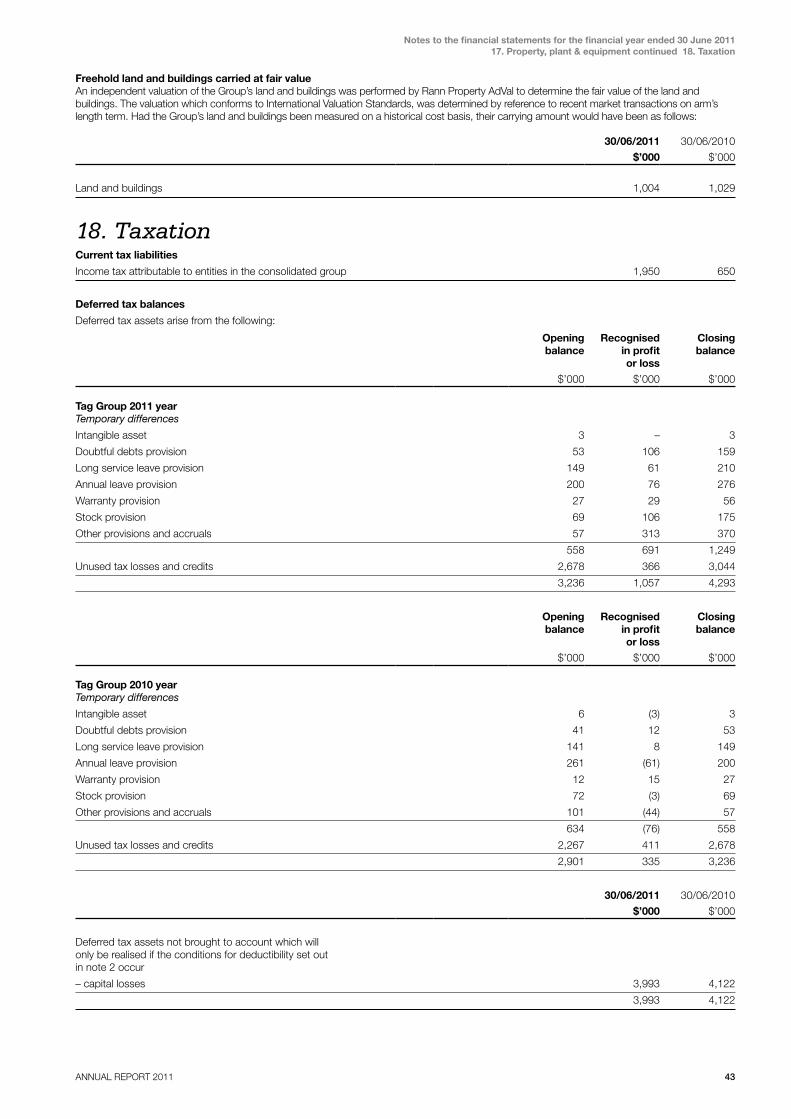
ANNUAL REPORT 2011 43
Notes to the financial statements for the financial year ended 30 June 201117. Property, plant & equipment continued 18. Taxation
Freehold land and buildings carried at fair valueAn independent valuation of the Group’s land and buildings was performed by Rann Property AdVal to determine the fair value of the land and buildings. The valuation which conforms to International Valuation Standards, was determined by reference to recent market transactions on arm’s length term. Had the Group’s land and buildings been measured on a historical cost basis, their carrying amount would have been as follows:
30/06/2011 30/06/2010
$’000 $’000
Land and buildings 1,004 1,029
18. taxationCurrent tax liabilities
Income tax attributable to entities in the consolidated group 1,950 650
Deferred tax balances
Deferred tax assets arise from the following:
Opening balance
Recognised in profit or loss
Closing balance
$’000 $’000 $’000
Tag Group 2011 year Temporary differences
Intangible asset 3 – 3
Doubtful debts provision 53 106 159
Long service leave provision 149 61 210
Annual leave provision 200 76 276
Warranty provision 27 29 56
Stock provision 69 106 175
Other provisions and accruals 57 313 370
558 691 1,249
Unused tax losses and credits 2,678 366 3,044
3,236 1,057 4,293
Opening balance
Recognised in profit or loss
Closing balance
$’000 $’000 $’000
Tag Group 2010 year Temporary differences
Intangible asset 6 (3) 3
Doubtful debts provision 41 12 53
Long service leave provision 141 8 149
Annual leave provision 261 (61) 200
Warranty provision 12 15 27
Stock provision 72 (3) 69
Other provisions and accruals 101 (44) 57
634 (76) 558
Unused tax losses and credits 2,267 411 2,678
2,901 335 3,236
30/06/2011 30/06/2010
$’000 $’000
Deferred tax assets not brought to account which will only be realised if the conditions for deductibility set out in note 2 occur
– capital losses 3,993 4,122
3,993 4,122
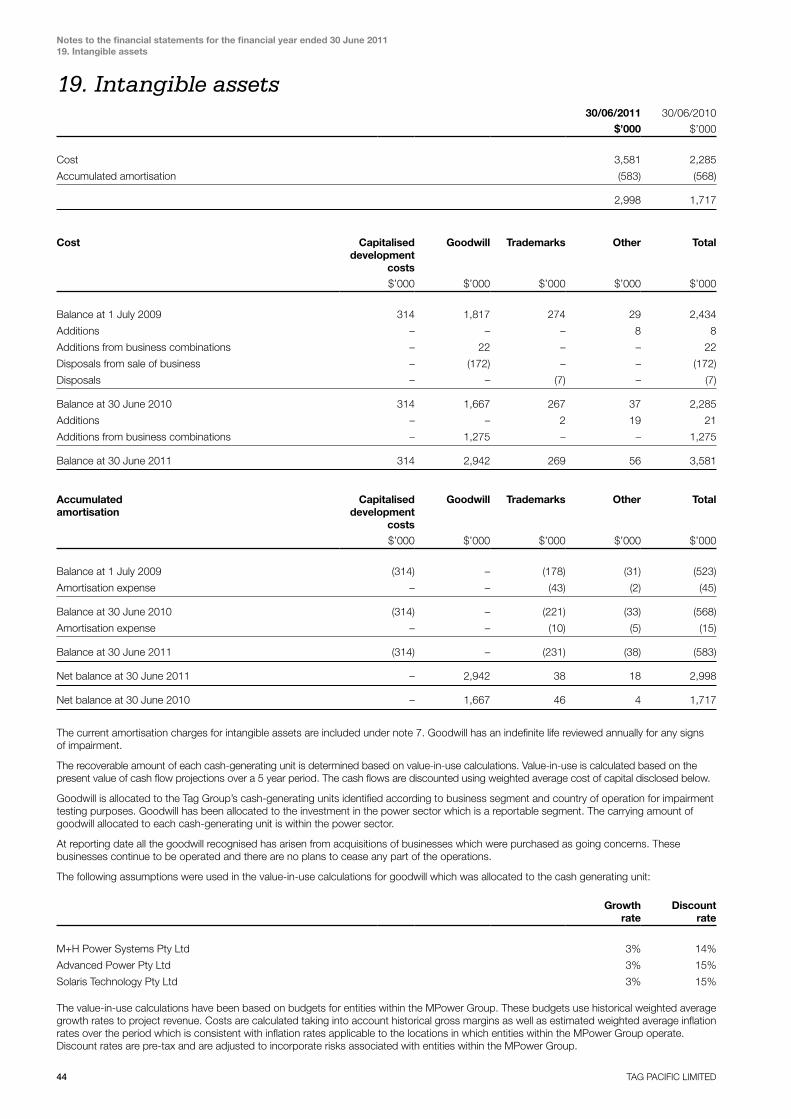
44 TAG PACIFIC LIMITED
Notes to the financial statements for the financial year ended 30 June 201119. Intangible assets
19. intangible assets30/06/2011 30/06/2010
$’000 $’000
Cost 3,581 2,285
Accumulated amortisation (583) (568)
2,998 1,717
Cost Capitalised development
costs
Goodwill Trademarks Other Total
$’000 $’000 $’000 $’000 $’000
Balance at 1 July 2009 314 1,817 274 29 2,434
Additions – – – 8 8
Additions from business combinations – 22 – – 22
Disposals from sale of business – (172) – – (172)
Disposals – – (7) – (7)
Balance at 30 June 2010 314 1,667 267 37 2,285
Additions – – 2 19 21
Additions from business combinations – 1,275 – – 1,275
Balance at 30 June 2011 314 2,942 269 56 3,581
Accumulated amortisation
Capitalised development
costs
Goodwill Trademarks Other Total
$’000 $’000 $’000 $’000 $’000
Balance at 1 July 2009 (314) – (178) (31) (523)
Amortisation expense – – (43) (2) (45)
Balance at 30 June 2010 (314) – (221) (33) (568)
Amortisation expense – – (10) (5) (15)
Balance at 30 June 2011 (314) – (231) (38) (583)
Net balance at 30 June 2011 – 2,942 38 18 2,998
Net balance at 30 June 2010 – 1,667 46 4 1,717
The current amortisation charges for intangible assets are included under note 7. Goodwill has an indefinite life reviewed annually for any signs of impairment.
The recoverable amount of each cash-generating unit is determined based on value-in-use calculations. Value-in-use is calculated based on the present value of cash flow projections over a 5 year period. The cash flows are discounted using weighted average cost of capital disclosed below.
Goodwill is allocated to the Tag Group’s cash-generating units identified according to business segment and country of operation for impairment testing purposes. Goodwill has been allocated to the investment in the power sector which is a reportable segment. The carrying amount of goodwill allocated to each cash-generating unit is within the power sector.
At reporting date all the goodwill recognised has arisen from acquisitions of businesses which were purchased as going concerns. These businesses continue to be operated and there are no plans to cease any part of the operations.
The following assumptions were used in the value-in-use calculations for goodwill which was allocated to the cash generating unit:
Growth rate
Discount rate
M+H Power Systems Pty Ltd 3% 14%
Advanced Power Pty Ltd 3% 15%
Solaris Technology Pty Ltd 3% 15%
The value-in-use calculations have been based on budgets for entities within the MPower Group. These budgets use historical weighted average growth rates to project revenue. Costs are calculated taking into account historical gross margins as well as estimated weighted average inflation rates over the period which is consistent with inflation rates applicable to the locations in which entities within the MPower Group operate. Discount rates are pre-tax and are adjusted to incorporate risks associated with entities within the MPower Group.
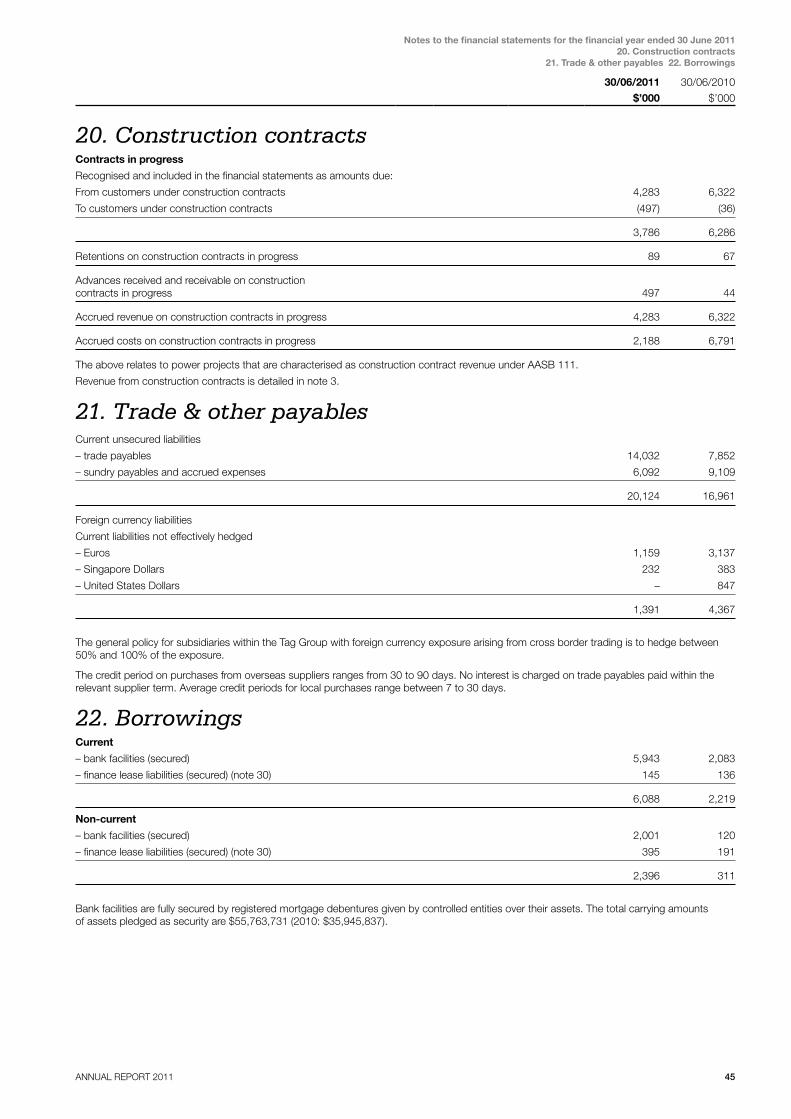
ANNUAL REPORT 2011 45
Notes to the financial statements for the financial year ended 30 June 201120. Construction contracts
21. Trade & other payables 22. Borrowings
30/06/2011 30/06/2010
$’000 $’000
20. construction contracts Contracts in progress
Recognised and included in the financial statements as amounts due:
From customers under construction contracts 4,283 6,322
To customers under construction contracts (497) (36)
3,786 6,286
Retentions on construction contracts in progress 89 67
Advances received and receivable on construction contracts in progress 497 44
Accrued revenue on construction contracts in progress 4,283 6,322
Accrued costs on construction contracts in progress 2,188 6,791
The above relates to power projects that are characterised as construction contract revenue under AASB 111.
Revenue from construction contracts is detailed in note 3.
21. trade & other payablesCurrent unsecured liabilities
– trade payables 14,032 7,852
– sundry payables and accrued expenses 6,092 9,109
20,124 16,961
Foreign currency liabilities
Current liabilities not effectively hedged
– Euros 1,159 3,137
– Singapore Dollars 232 383
– United States Dollars – 847
1,391 4,367
The general policy for subsidiaries within the Tag Group with foreign currency exposure arising from cross border trading is to hedge between 50% and 100% of the exposure.
The credit period on purchases from overseas suppliers ranges from 30 to 90 days. No interest is charged on trade payables paid within the relevant supplier term. Average credit periods for local purchases range between 7 to 30 days.
22. BorrowingsCurrent
– bank facilities (secured) 5,943 2,083
– finance lease liabilities (secured) (note 30) 145 136
6,088 2,219
Non-current
– bank facilities (secured) 2,001 120
– finance lease liabilities (secured) (note 30) 395 191
2,396 311
Bank facilities are fully secured by registered mortgage debentures given by controlled entities over their assets. The total carrying amounts of assets pledged as security are $55,763,731 (2010: $35,945,837).
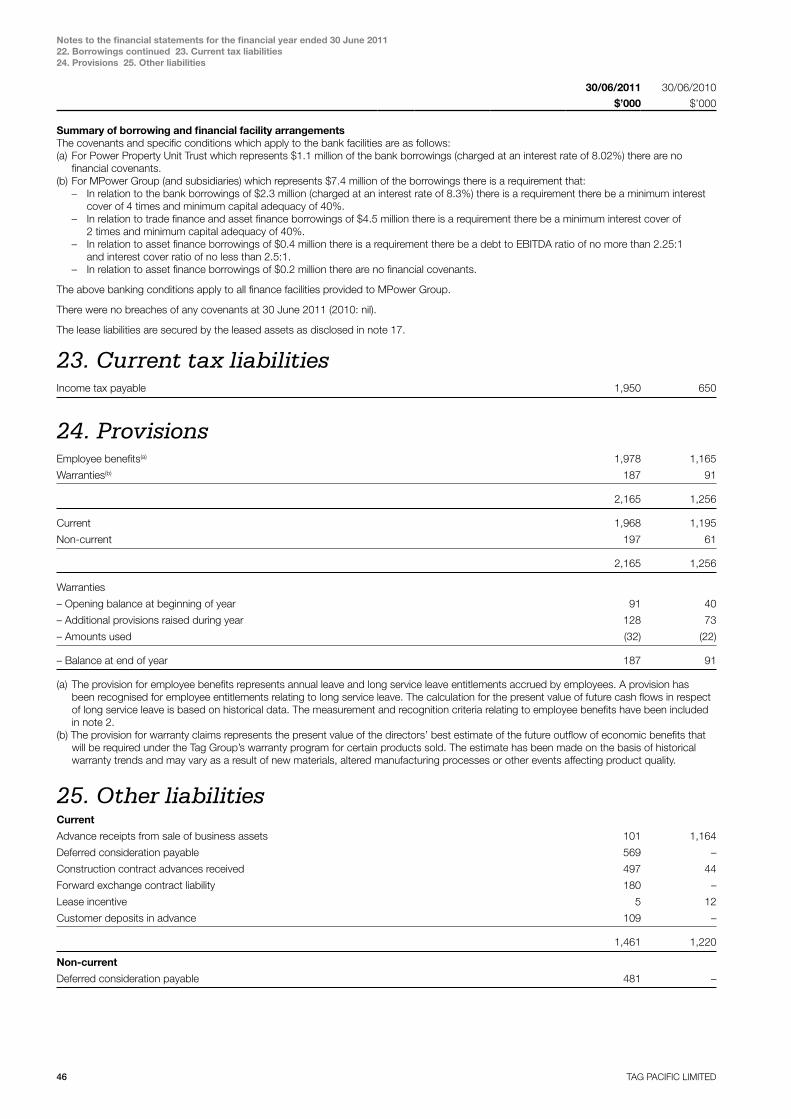
46 TAG PACIFIC LIMITED
Notes to the financial statements for the financial year ended 30 June 201122. Borrowings continued 23. Current tax liabilities 24. Provisions 25. Other liabilities
30/06/2011 30/06/2010
$’000 $’000
Summary of borrowing and financial facility arrangementsThe covenants and specific conditions which apply to the bank facilities are as follows:(a) For Power Property Unit Trust which represents $1.1 million of the bank borrowings (charged at an interest rate of 8.02%) there are no
financial covenants.(b) For MPower Group (and subsidiaries) which represents $7.4 million of the borrowings there is a requirement that:
– In relation to the bank borrowings of $2.3 million (charged at an interest rate of 8.3%) there is a requirement there be a minimum interest cover of 4 times and minimum capital adequacy of 40%.
– In relation to trade finance and asset finance borrowings of $4.5 million there is a requirement there be a minimum interest cover of 2 times and minimum capital adequacy of 40%.
– In relation to asset finance borrowings of $0.4 million there is a requirement there be a debt to EBITDA ratio of no more than 2.25:1 and interest cover ratio of no less than 2.5:1.
– In relation to asset finance borrowings of $0.2 million there are no financial covenants.
The above banking conditions apply to all finance facilities provided to MPower Group.
There were no breaches of any covenants at 30 June 2011 (2010: nil).
The lease liabilities are secured by the leased assets as disclosed in note 17.
23. current tax liabilitiesIncome tax payable 1,950 650
24. ProvisionsEmployee benefits(a) 1,978 1,165
Warranties(b) 187 91
2,165 1,256
Current 1,968 1,195
Non-current 197 61
2,165 1,256
Warranties
– Opening balance at beginning of year 91 40
– Additional provisions raised during year 128 73
– Amounts used (32) (22)
– Balance at end of year 187 91
(a) The provision for employee benefits represents annual leave and long service leave entitlements accrued by employees. A provision has been recognised for employee entitlements relating to long service leave. The calculation for the present value of future cash flows in respect of long service leave is based on historical data. The measurement and recognition criteria relating to employee benefits have been included in note 2.
(b) The provision for warranty claims represents the present value of the directors’ best estimate of the future outflow of economic benefits that will be required under the Tag Group’s warranty program for certain products sold. The estimate has been made on the basis of historical warranty trends and may vary as a result of new materials, altered manufacturing processes or other events affecting product quality.
25. other liabilitiesCurrent
Advance receipts from sale of business assets 101 1,164
Deferred consideration payable 569 –
Construction contract advances received 497 44
Forward exchange contract liability 180 –
Lease incentive 5 12
Customer deposits in advance 109 –
1,461 1,220
Non-current
Deferred consideration payable 481 –

ANNUAL REPORT 2011 47
Notes to the financial statements for the financial year ended 30 June 201126. Issued capital continued 27. Reserves
30/06/2011 30/06/2010
$’000 $’000
26. issued capital70,606,864 (2010: 70,606,864) fully paid ordinary shares 16,477 16,477
Number of shares
Share capital
’000 $’000
Balance at 1 July 2009 68,686 16,093
Shares issued during the year(a) 1,921 384
Balance at 30 June 2010 70,607 16,477
Shares issued during the year – –
Balance at 30 June 2011 70,607 16,477
Effective 1 July 1998, the Company Law Review Act abolished the concept of par value shares and the concept of authorised capital. Accordingly, the company does not have authorised capital or par value in respect of the issued shares.
Ordinary shares entitle the holder to participate in dividends and the proceeds on winding up of the company in proportion to the number of and amounts paid on the shares held. On a show of hands every holder of ordinary shares present at a meeting in person or by proxy is entitled to one vote, and upon a poll each is entitled to one vote for each share held.
(a) 1,920,902 fully paid ordinary shares were issued on 16 October 2009 pursuant to the company’s Dividend Reinvestment Plan with an issue price of $0.20 per ordinary share.
(b) During the financial year, an on-market share buy-back facility was in place. To date, no purchases have been made under the on-market share buy-back facility.
30/06/2011 30/06/2010
$’000 $’000
27. ReservesCapital reserve(a) 960 659
Share option reserve(b) 213 190
Foreign currency translation reserve(c) (373) (277)
Cash flow hedge reserve(d) (55) –
745 572
(a) Capital reserve
Balance at beginning of the year 659 659
Revaluation of capital assets during year 301 –
Balance at end of the year 960 659
The capital reserve records a capital profit from the realisation and revaluation of a non-current asset.
(b) Share option reserve
Balance at beginning of the year 190 187
Share based payments for the year 23 3
Balance at end of the year 213 190
The share option reserve records items recognised as expenses in relation to executive share options.
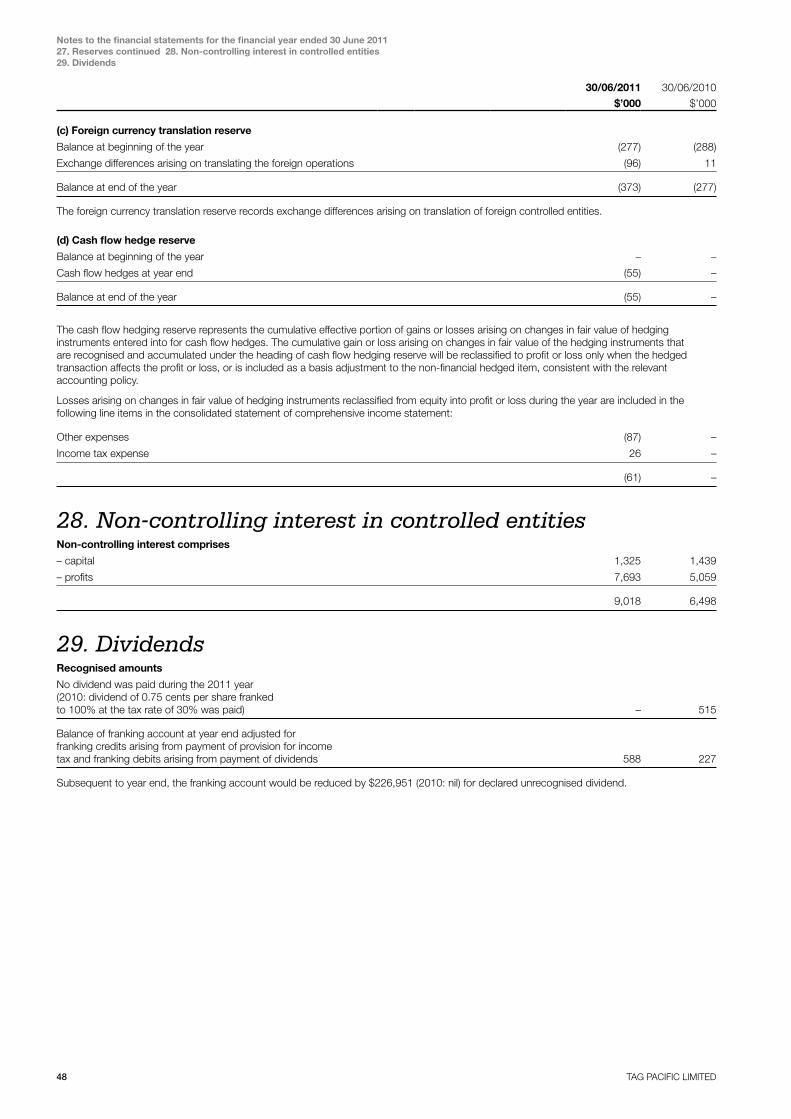
48 TAG PACIFIC LIMITED
Notes to the financial statements for the financial year ended 30 June 201127. Reserves continued 28. Non-controlling interest in controlled entities 29. Dividends
30/06/2011 30/06/2010
$’000 $’000
(c) Foreign currency translation reserve
Balance at beginning of the year (277) (288)
Exchange differences arising on translating the foreign operations (96) 11
Balance at end of the year (373) (277)
The foreign currency translation reserve records exchange differences arising on translation of foreign controlled entities.
(d) Cash flow hedge reserve
Balance at beginning of the year – –
Cash flow hedges at year end (55) –
Balance at end of the year (55) –
The cash flow hedging reserve represents the cumulative effective portion of gains or losses arising on changes in fair value of hedging instruments entered into for cash flow hedges. The cumulative gain or loss arising on changes in fair value of the hedging instruments that are recognised and accumulated under the heading of cash flow hedging reserve will be reclassified to profit or loss only when the hedged transaction affects the profit or loss, or is included as a basis adjustment to the non-financial hedged item, consistent with the relevant accounting policy.
Losses arising on changes in fair value of hedging instruments reclassified from equity into profit or loss during the year are included in the following line items in the consolidated statement of comprehensive income statement:
Other expenses (87) –
Income tax expense 26 –
(61) –
28. Non-controlling interest in controlled entitiesNon-controlling interest comprises
– capital 1,325 1,439
– profits 7,693 5,059
9,018 6,498
29. DividendsRecognised amounts
No dividend was paid during the 2011 year (2010: dividend of 0.75 cents per share franked to 100% at the tax rate of 30% was paid) – 515
Balance of franking account at year end adjusted for franking credits arising from payment of provision for income tax and franking debits arising from payment of dividends 588 227
Subsequent to year end, the franking account would be reduced by $226,951 (2010: nil) for declared unrecognised dividend.
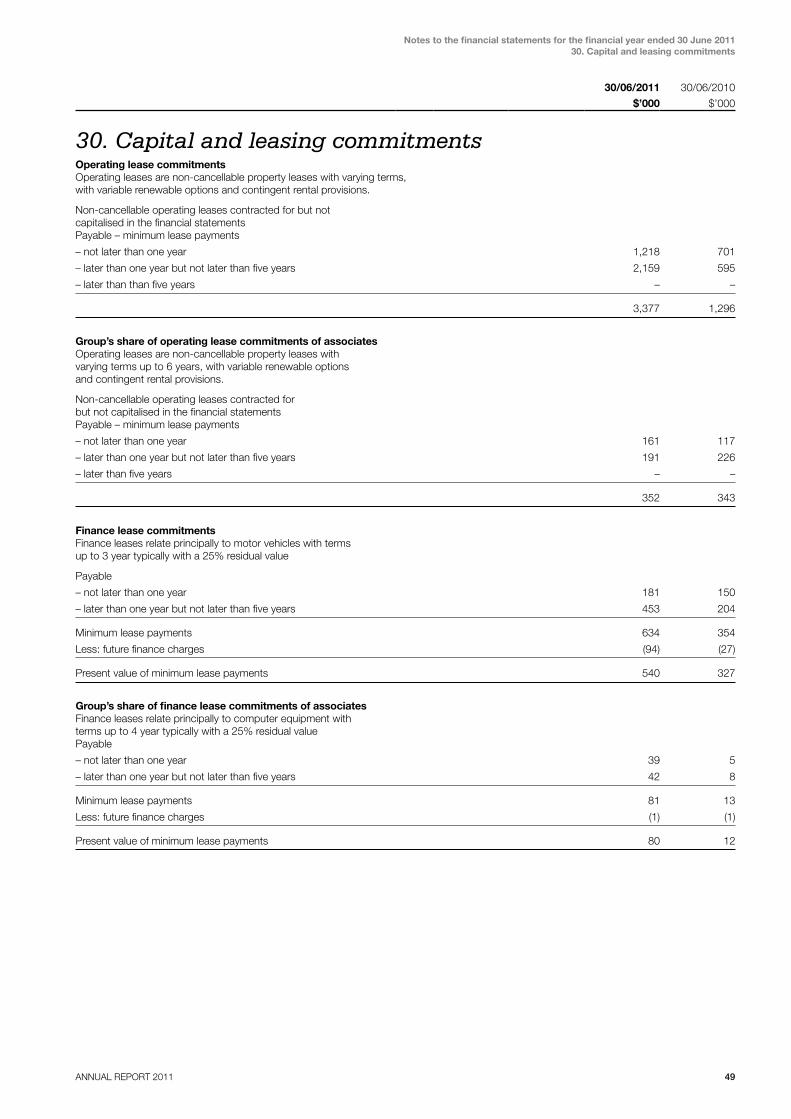
ANNUAL REPORT 2011 49
Notes to the financial statements for the financial year ended 30 June 201130. Capital and leasing commitments
30/06/2011 30/06/2010
$’000 $’000
30. capital and leasing commitmentsOperating lease commitmentsOperating leases are non-cancellable property leases with varying terms, with variable renewable options and contingent rental provisions.
Non-cancellable operating leases contracted for but not capitalised in the financial statementsPayable – minimum lease payments
– not later than one year 1,218 701
– later than one year but not later than five years 2,159 595
– later than than five years – –
3,377 1,296
Group’s share of operating lease commitments of associatesOperating leases are non-cancellable property leases with varying terms up to 6 years, with variable renewable options and contingent rental provisions.
Non-cancellable operating leases contracted for but not capitalised in the financial statementsPayable – minimum lease payments
– not later than one year 161 117
– later than one year but not later than five years 191 226
– later than five years – –
352 343
Finance lease commitmentsFinance leases relate principally to motor vehicles with terms up to 3 year typically with a 25% residual value
Payable
– not later than one year 181 150
– later than one year but not later than five years 453 204
Minimum lease payments 634 354
Less: future finance charges (94) (27)
Present value of minimum lease payments 540 327
Group’s share of finance lease commitments of associatesFinance leases relate principally to computer equipment with terms up to 4 year typically with a 25% residual valuePayable
– not later than one year 39 5
– later than one year but not later than five years 42 8
Minimum lease payments 81 13
Less: future finance charges (1) (1)
Present value of minimum lease payments 80 12
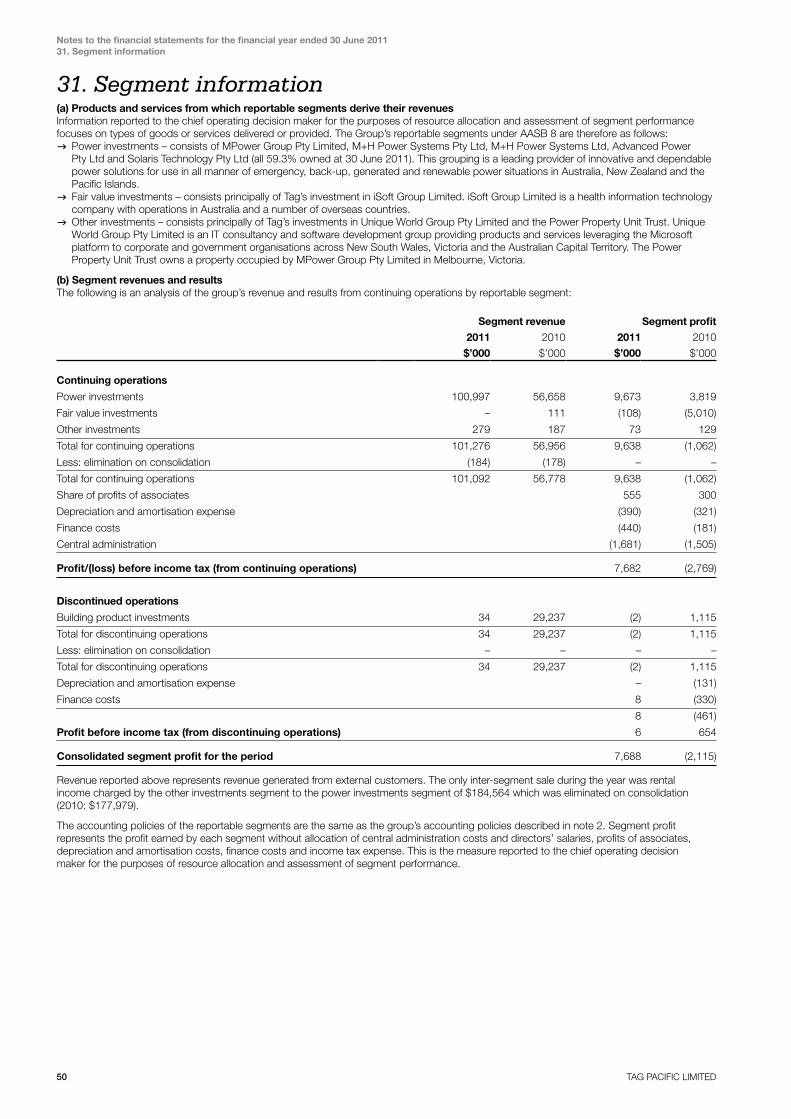
50 TAG PACIFIC LIMITED
Notes to the financial statements for the financial year ended 30 June 201131. Segment information
31. Segment information(a) Products and services from which reportable segments derive their revenuesInformation reported to the chief operating decision maker for the purposes of resource allocation and assessment of segment performance focuses on types of goods or services delivered or provided. The Group’s reportable segments under AASB 8 are therefore as follows:gPower investments – consists of MPower Group Pty Limited, M+H Power Systems Pty Ltd, M+H Power Systems Ltd, Advanced Power
Pty Ltd and Solaris Technology Pty Ltd (all 59.3% owned at 30 June 2011). This grouping is a leading provider of innovative and dependable power solutions for use in all manner of emergency, back-up, generated and renewable power situations in Australia, New Zealand and the Pacific Islands.
gFair value investments – consists principally of Tag’s investment in iSoft Group Limited. iSoft Group Limited is a health information technology company with operations in Australia and a number of overseas countries.
gOther investments – consists principally of Tag’s investments in Unique World Group Pty Limited and the Power Property Unit Trust. Unique World Group Pty Limited is an IT consultancy and software development group providing products and services leveraging the Microsoft platform to corporate and government organisations across New South Wales, Victoria and the Australian Capital Territory. The Power Property Unit Trust owns a property occupied by MPower Group Pty Limited in Melbourne, Victoria.
(b) Segment revenues and resultsThe following is an analysis of the group’s revenue and results from continuing operations by reportable segment:
Segment revenue Segment profit
2011 2010 2011 2010
$’000 $’000 $’000 $’000
Continuing operations
Power investments 100,997 56,658 9,673 3,819
Fair value investments – 111 (108) (5,010)
Other investments 279 187 73 129
Total for continuing operations 101,276 56,956 9,638 (1,062)
Less: elimination on consolidation (184) (178) – –
Total for continuing operations 101,092 56,778 9,638 (1,062)
Share of profits of associates 555 300
Depreciation and amortisation expense (390) (321)
Finance costs (440) (181)
Central administration (1,681) (1,505)
Profit/(loss) before income tax (from continuing operations) 7,682 (2,769)
Discontinued operations
Building product investments 34 29,237 (2) 1,115
Total for discontinuing operations 34 29,237 (2) 1,115
Less: elimination on consolidation – – – –
Total for discontinuing operations 34 29,237 (2) 1,115
Depreciation and amortisation expense – (131)
Finance costs 8 (330)
8 (461)
Profit before income tax (from discontinuing operations) 6 654
Consolidated segment profit for the period 7,688 (2,115)
Revenue reported above represents revenue generated from external customers. The only inter-segment sale during the year was rental income charged by the other investments segment to the power investments segment of $184,564 which was eliminated on consolidation (2010: $177,979).
The accounting policies of the reportable segments are the same as the group’s accounting policies described in note 2. Segment profit represents the profit earned by each segment without allocation of central administration costs and directors’ salaries, profits of associates, depreciation and amortisation costs, finance costs and income tax expense. This is the measure reported to the chief operating decision maker for the purposes of resource allocation and assessment of segment performance.

ANNUAL REPORT 2011 51
Notes to the financial statements for the financial year ended 30 June 201131. Segment information continued
30/06/2011 30/06/2010
$’000 $’000
(c) Segment assets and liabilitiesSegments Assets
Power investments 53,868 34,690
Fair value investments 1,731 1,873
Other investments 10,793 9,001
Total segment assets 66,392 45,564
Assets relating to interior building products investments (now discontinued) 694 3,153
Consolidated assets 67,086 48,717
All assets are allocated to reportable segments. There are no assets used jointly by reportable segments. During the half year reporting period, the Group acquired Solaris Technology Pty Ltd and this is included within the power investments segment.
Segments Liabilities
Power investments 32,948 19,534
Fair value investments – –
Other investments 1,607 1,632
Total segment liabilities 34,555 21,166
Liabilities relating to interior building products investments (now discontinued) 110 1,451
Consolidated liabilities 34,665 22,617
For the purposes of monitoring performance and allocating resources between segments:(a) All assets are allocated to reportable segments. There are no assets used jointly by reportable segments.(b) All liabilities are allocated to reportable segments. There are no liabilities for which reportable segments are jointly liable.
(d) Other segment information
Depreciation and amortisation
Additions to non-current assets
2011 2010 2011 2010
$’000 $’000 $’000 $’000
Power investments 347 279 2,506 437
Fair value Investments – – – –
Other investments 43 42 6 1,062
390 321 2,512 1,499
(e) Revenue from major products and servicesThe following is an analysis of the group’s revenue from continuing operations from its major products and services.
2011 2010
$’000 $’000
Power investments – project and installations revenue(a) 32,990 21,960
Power investments – other revenue(b) 68,007 34,698
100,997 56,658
(a) Project and installations revenue includes revenue characterised as construction contract revenue under AASB 111 of $20.753 million (2010: $21.960 million).
(b) Other revenue relates to the sale of goods and rendering of services.

52 TAG PACIFIC LIMITED
Notes to the financial statements for the financial year ended 30 June 201131. Segment information continued 32. Auditor’s remuneration 33. Employee benefits
(f) Geographical informationThe investment in the power sector has business segments located across Australia and New Zealand (incorporating the Pacific Islands). Specifically, geographical segments consist of branches across Australia in New South Wales, Victoria, Queensland, Western Australia, South Australia and Tasmania. The New Zealand segment includes branches in Auckland, Wellington and Christchurch.
There are only minor exports made to other countries.
The group’s revenue from continuing operations from external customers and information about its non-current assets by geographical location are detailed below.
Revenue from external customers
Non-current assets
2011 2010 2011 2010
$’000 $’000 $’000 $’000
Australia 94,808 50,384 14,786 11,212
New Zealand 6,284 6,394 99 113
101,092 56,778 14,885 11,325
(g) Information about major customersIncluded in revenues arising from power projects and installation revenue of $33.0 million are revenues of approximately $16.4 million which arose from sales to the group’s largest customer.
32. auditor’s remuneration2011 2010
$ $
Remuneration of the auditor of Tag Group:
Deloitte Touche Tohmatsu
– Auditing or reviewing financial statements 235,885 206,450
– Taxation and corporate advisory services 3,856 14,100
Total 239,741 220,550
33. employee benefitsExecutive Share Option PlanThe following share-based payment arrangement existed at 30 June 2011.
Under the Tag Pacific Limited Executive Share Option Plan, the remuneration committee may offer options to executives having regard to their length of service with the group, the contribution made to the Tag Group by the executive, the potential contribution of the executive and any other matters considered relevant.
The maximum number of options that can be on issue at any time is 5% of the shares on issue at that time. In addition, the maximum number of options that can be issued to any one executive is 1,250,000.
An option may be exercised, if vested, by the relevant participant lodging a Notice of Exercise of Option and Application for Shares, together with the exercise price for each share to be issued on exercise. Options may only be exercised by a participant at the times and in the numbers and subject to the satisfaction of any conditions set by the remuneration committee at the time of the offer of the options. The remuneration committee may stipulate that options may only be exercised if the company achieves stipulated performance benchmarks.
An option not exercised will lapse on the expiry of the exercise period or if the executive to whom the option was offered ceases to be engaged by the company due to resignation or retirement. Unless the remuneration committee determines otherwise, options may not be transferred.
There were 1,000,000 options granted under the Tag Pacific Limited Executive Share Option Plan in the year to 30 June 2011 (2010: nil options).
Tag Group Weighted average exercise price
2011 2010 2011 2010
No. No. $ $
Movement in the number of share options
held by executives are as follows:
Opening balance 1,453,333 2,695,000 0.35 0.34
Granted during the year 1,000,000 – 0.20 –
Lapsed during the year (140,000) (1,241,667) 0.32 0.33
Balance at end of the year 2,313,333 1,453,333

ANNUAL REPORT 2011 53
Notes to the financial statements for the financial year ended 30 June 201133. Employee benefits continued 34. Related parties
Details of the options on issue at year end were as follows:
Grant date
Expiry date
Exercise price
Fair value at grant date
Number of options
22 December 2006 22 December 2011 $0.33 $0.13 263,333
22 December 2006 22 December 2011 $0.40 $0.11 400,000
31 August 2007 31 August 2012 $0.39 $0.11 90,000
31 August 2007 31 August 2012 $0.45 $0.09 200,000
17 November 2008 17 November 2013 $0.24 $0.06 160,000
17 November 2008 17 November 2013 $0.30 $0.05 200,000
4 March 2011 4 March 2016 $0.20 $0.02 1,000,000
Total 2,313,333
During the year ended 30 June 2011 no ordinary shares in Tag Pacific Limited were issued on the exercise of options granted under the Tag Pacific Limited Executive Share Option Plan. No shares have been issued under the Executive Share Option Plan to the date of this report. No person entitled to exercise an option had or has any right by virtue of the option to participate in any share issue of any other body corporate.
During the year 140,000 share options lapsed.
The options outstanding at 30 June 2011 had a weighted average exercise price of $0.29 and a weighted average remaining contracted life of 2.01 years. Exercise prices range from $0.20 to $0.45 each in respect of options outstanding at 30 June 2011.
The weighted average fair value of the options granted during the year was $0.02 per option.
The fair value of options issued during the year was calculated by using a Black Scholes option pricing model applying the following inputs:
– Weighted average exercise price $0.20– Weighted average life of the option 5 years– Underlying share price at issue date $0.12– Expected share price volatility 32%– Risk free interest rate 6%
Historical volatility has been the basis for determining expected share price volatility as it assumed that this is indicative of future tender, which may not eventuate.
Included under employee benefits expense in the statement of comprehensive income is an expense of $23,076 (2010: $3,176) relating in full to equity-settled share-based payment transactions.
34.Related partiesParent entityThe parent entity and ultimate parent entity of the group is Tag Pacific Limited.
Controlled entitiesInformation relating to controlled entities is set out in note 15.
Director related entitiesPeter Wise has a controlling interest in Anthony Australia Pty Ltd through family interests. Anthony Australia Pty Ltd effected a net increase of 2,000,000 (2010: 1,191,308) ordinary shares in Tag Pacific Limited during the year under review. Anthony Australia Pty Ltd has received management fees for services rendered during the year. These fees are included in the remuneration of directors’ disclosures in the Directors’ Report. Anthony Australia Pty Ltd received 400,000 (2010: nil) share options during the year under the Tag Group’s Executive Share Option Plan.
DirectorsThe names of the directors of the Tag Group during the year under review are Peter Wise, Gary Cohen, Robert Constable, Robert Moran, Richard Peterson and Gary Weiss. Information on the remuneration of directors and their respective periods of service is set out in the Directors’ Report. Information on directors’ interests in shares is detailed in the Directors’ Report.
Richard Peterson is a principal of Peterson Law Limited. Peterson Law Limited received legal fees of $nil for the financial year (2010: $13,615) as the Tag Group’s solicitor in New Zealand. These services were provided on an arm’s length basis.
Transactions with related parties(a) Associated companiesAssociated companies paid directors fees of $10,000 to Tag Pacific Limited during the year (2010: $10,000). These services were provided on an arm’s length basis.
(b) Key management personnelThe names and positions held by key management personnel of the Tag Group who have held office during the financial year are:gPeter Wise – Chairman (executive)gGary Cohen – Non-executive DirectorgRobert Constable – Non-executive DirectorgRobert Moran – Non-executive DirectorgRichard Peterson – Non-executive DirectorgGary Weiss – Non-executive DirectorgNathan Wise – Head of Corporate Development and Company SecretarygJohn Marinos – Head of FinancegPaul Sharp – Group Managing Director, MPower GroupgAnthony Csillag – Managing Director, Advanced Power

54 TAG PACIFIC LIMITED
Notes to the financial statements for the financial year ended 30 June 201134. Related parties continued
The aggregate compensation made to directors and other key management personnel of the parent entity and consolidated group are set out below:
Tag Group
2011 2010
$ $
Short-term employee benefits 1,628,656 1,539,166
Post employment benefits 80,404 53,003
Other payments 14,120 16,425
Share based payments 23,076 3,176
1,746,256 1,611,770
Key management personnel remuneration has been included in the remuneration section of the Directors’ Report.
(c) Key management personnel equity holdings
Key management personnel and key management personnel-related entities hold directly, indirectly or beneficially as at the reporting date the following interests in Tag Pacific Limited:
2011 Balance at 1 July 2010 Net other change Balance at 30 June 2011No. No. No.
Peter Wise 32,959,482 2,000,000 34,959,482
Gary Cohen 5,728,278 (4,884,619) 843,659
Robert Constable 200,000 – 200,000
Robert Moran 557,772 – 557,772
Richard Peterson 1,214,049 – 1,214,049
Gary Weiss 250,000 – 250,000
Nathan Wise1 – – –
John Marinos 11,350 358,146 369,496
Paul Sharp 82,250 – 82,250
Anthony Csillag 20,000 – 20,000
41,023,181 (2,526,473) 38,496,708
2010 Balance at 1 July 2009 Net other change Balance at 30 June 2010No. No. No.
Peter Wise 31,768,174 1,191,308 32,959,482
Gary Cohen 5,523,970 204,308 5,728,278
Robert Constable 200,000 – 200,000
Robert Moran 537,611 20,161 557,772
Richard Peterson 1,170,167 43,882 1,214,049
Gary Weiss 250,000 – 250,000
Nathan Wise1 – – –
John Marinos 11,350 – 11,350
Paul Sharp 71,250 11,000 82,250
Anthony Csillag 20,000 – 20,000
39,552,522 1,470,659 41,023,181
1. Nathan Wise is a director of Anthony Australia Pty Ltd which had a relevant interest in 34,959,482 ordinary shares in Tag Pacific Limited at 30 June 2011.
(d) Share options in Tag Pacific Limited
2011 Balance at 1 July 2010
Granted as compensation
Lapsed Balance at 30 June 2011
Vested but not
exercisable
Vested and exercisable
No. No. No. No. No. No.
Peter Wise 800,000 400,000 – 1,200,000 – 1,200,000
Nathan Wise 288,333 350,000 (70,000) 568,333 – 518,333
John Marinos 365,000 250,000 (70,000) 545,000 – 495,000
1,453,333 1,000,000 (140,000) 2,313,333 – 2,213,333

ANNUAL REPORT 2011 55
Notes to the financial statements for the financial year ended 30 June 201134. Related parties continued 35. Business combinations
2010 Balance at 1 July 2009
Granted as compensation
Lapsed Balance at 30 June 2010
Vested but not
exercisable
Vested and exercisable
No. No. No. No. No. No.
Peter Wise 1,200,000 – (400,000) 800,000 – 800,000
Nathan Wise 655,000 – (366,667) 288,333 – 138,333
John Marinos 540,000 – (175,000) 365,000 – 215,000
2,395,000 – (941,667) 1,453,333 – 1,153,333
All share options issued to key management personnel were made in accordance with the provisions of the Executive Share Option Plan. Further details of the Tag Pacific Limited Executive Share Option Plan and of share options granted during the 2011 and 2010 financial years are included in note 33 to the financial statements.
35. Business combinations(a) Subsidiaries acquiredOn 15 November 2010 MPower Group completed the purchase of Solaris Technology Pty Limited. As a result, Solaris Technology Pty Limited is now consolidated by the Tag Group from 16 November 2010. Solaris Technology Pty Limited has extensive experience in the solar power sector through its specialisation in the design, construction and integration of solar power systems for both residential and commercial applications. The acquisition is part of the Group’s strategy for deeper involvement in renewable energy solutions. Through MPower Group acquiring 100% of the issued capital of Solaris Technology Pty Limited, the Tag Group has obtained control of the company.
Fair value of assets acquired and liabilities assumed at the date of acquisition
$’000
Current assets
Cash & cash equivalents 522
Trade and other receivables(i) 1,043
Other assets 14
Inventory 1,100
Total current assets 2,679
Non-current assets
Deferred tax asset 73
Plant & equipment 320
Total non-current assets 393
Total assets 3,072 Current liabilities
Trade & other payables(ii) (1,310)
Provisions(iii) (138)
Other liabilities(iv) (99)
Total current liabilities (1,547) Non-current liabilities
Provisions(iii) (79)
Other payables(v) (500)
Borrowings(vi) (203)
Total current liabilities (782)
Total liabilities (2,329)
Net assets assumed at the date of acquisition 743
(i) The directors believe the receivables are fully recoverable and no provision for impairment is required.(ii) Trade and other payables pertain predominantly to liabilities incurred in relation to trading activities conducted by the company.(iii) Provisions relate to annual leave and long service leave entitlements accrued by employees up to 15 November 2010.(iv) Other liabilities relate to customer deposits received in advance of the provision of services.(v) Other payables relates to loans payable to former shareholders of the company.(vi) Borrowings relate to loans payable to financial institutions in relation to finance used to acquire plant & equipment.
Goodwill arising on acquisition
$’000
Fair value of consideration paid and deferred consideration 2,018
Less: Fair value of identifiable net assets acquired (743)
Goodwill arising on acquisition 1,275

56 TAG PACIFIC LIMITED
Notes to the financial statements for the financial year ended 30 June 201135. Business combinations continued 36. Earnings per share
The consideration paid/to be paid for the combination effectively included amounts in relation to the benefit of expected synergies, revenue growth, future market development, design and implementation capability in the commercial and industrial solar market and the assembled workforce of Solaris Technology Pty Limited. These benefits are not recognised separately from goodwill because they do not meet the recognition criteria for identifiable intangible assets.
Part of the goodwill arising on this acquisition is expected to be deductible for tax purposes.
Net cash outflow/(inflow) arising on acquisition
$’000
Consideration paid in cash 969
Less: cash and cash equivalent balances acquired (522)
447
Impact of acquisition on the results of the groupIncluded in the profit for the year is a net profit before income tax and non-controlling interests of $926,465 attributable to Solaris Technology Pty Limited. Revenue for the year includes $13,257,747 in respect of Solaris Technology Pty Limited. Any inter-group transactions between the related parties from 16 November 2010 have been eliminated on consolidation.
Had Tag Pacific Limited taken control of Solaris Technology Pty Limited on 1 July 2010 the revenue for the year would have increased by $3,017,945 while the net profit for the year before non-controlling interest would have decreased by $103,357.
Consideration transferred
$’000
Consideration paid in cash 969
Deferred consideration payable(i) 1,049
Total 2,018
(i) Included in consideration transferred/to be transferred is deferred consideration payable by way of instalments over a 2.5 year period which has been valued on a discounted cash flow basis at $1.049M.
(ii) Acquisition-related costs amounting to $64,330 have been excluded from consideration transferred and have been recognised as an expense in the year, within the ‘other expenses’ line item in the consolidated statement of comprehensive income.
36. earnings per share2011 2010
cents per share
cents per share
Basic earnings per share
From continuing operations 5.2 (6.5)
From discontinued operations (0.1) 1.8
Total basic earnings per share 5.1 (4.7)
Diluted earnings per share
From continuing operations 5.2 (6.5)
From discontinued operations (0.1) 1.8
Total diluted earnings per share 5.1 (4.7)
2011 2010
$’000 $’000
Reconciliation of earnings to net profit/(loss)
Net (loss)/profit after income tax 6,364 (2,789)
Net profit attributable to non-controlling interests 2,736 478
Earnings used in the calculation of basic and diluted earnings per share 3,628 (3,267)
Weighted average number of shares used in the calculation of basic earnings per share 70,606,864 70,038,488
Weighted average number of shares used in the calculation of diluted earnings per share 70,606,864 70,038,488
No options were dilutive for the purposes of determining diluted EPS for the year ended 30 June 2011.
There were 2,313,333 options on issue at year end that have not been considered dilutive for the purposes of determining diluted EPS for the year ended 30 June 2011.

ANNUAL REPORT 2011 57
Notes to the financial statements for the financial year ended 30 June 201137. Subsequent events 38. Financial instruments
37. Subsequent eventsThere are no matters or circumstances have arisen since the end of the financial year which significantly affected or may significantly affect the operations of the Tag Group, the results of those operations, or the state of affairs of the Tag Group in future financial years with the exception of the following.
On 29 July 2011 iSOFT Group Limited was acquired by Computer Sciences Corporation by way of a scheme of arrangement for $0.17 per share. Accordingly, the investment held in iSOFT Group Limited was realised during the 30 June 2012 financial year for $1,838,875. The investment in iSOFT Group Limited was valued at $1,730,706 (being $0.16 per share) at 30 June 2011.
38. financial instruments(a) Capital risk managementThe Tag Group manages its capital to ensure that entities in the Tag Group will be able to continue as a going concern while maximising the return to stakeholders through the optimisation of the debt and equity balance. This strategy remains unchanged from 2010.
The capital structure of the Tag Group consists of cash and cash equivalents, debt (including the borrowings disclosed in note 22), and equity attributable to equity holders of the Tag Parent, comprising issued capital (disclosed in note 26), reserves (disclosed in note 27) and retained earnings. The Tag Group also utilises certain off-balance sheet bank financing arrangements, including documentary credit facilities, bank overdraft facilities and import trade finance facilities to facilitate the purchase of goods from overseas suppliers and the provision of performance guarantees to customers. The Tag Group operates internationally through subsidiary companies established in New Zealand. None of the Tag Group entities are subject to externally-imposed capital requirements other than those specific bank covenants and conditions referred to under note 22. Operating cash flows are used to maintain and expand the group’s manufacturing and distribution assets, as well as to make routine outflows of tax, dividends and repayment of maturing debt.
Gearing ratioThe Tag Group’s senior management reviews the capital structure on a semi-annual basis. As part of this review, senior management considers the cost of capital and the risks associated with each class of capital. The Tag Group has a target gearing ratio in line with the industry custom that is determined as a proportion of net debt to equity. The Tag Group balances its overall capital structure through the payment of dividends, new share issues and share buy-backs as well as the issue of new debt or the redemption of existing debt.
The gearing ratio at year-end was as follows:
2011 2010
$’000 $’000
Financial assets
Debt(i) 8,484 2,530
Cash and cash equivalents (11,346) (15,479)
Net (cash)/debt (2,862) (12,949)
Equity(ii) 32,421 26,100
Net (cash)/debt to equity ratio (8.8%) (49.6%)
(i) Debt is defined as long-term and short-term borrowings, as detailed in note 22.(ii) Equity includes all capital, reserves and non-controlling interests.
(b) Categories of financial instrumentsFinancial assets
Loans and receivables 22,826 14,404
Cash and cash equivalents 11,346 15,479
Fair value investments 1,748 1,873
Financial liabilities
Amortised cost 29,810 19,491
There were performance guarantee contracts and surety bonds in respect of construction contracts of $3,666,693 at the end of the financial year (2010: $6,060,948). The performance guarantees were provided in the ordinary course of business and at the end of the year it was not probable that the counterparty to any of the performance guarantee contracts will claim under the contract. As fair value was considered to be nil consequently, the amount included in the above table is nil.
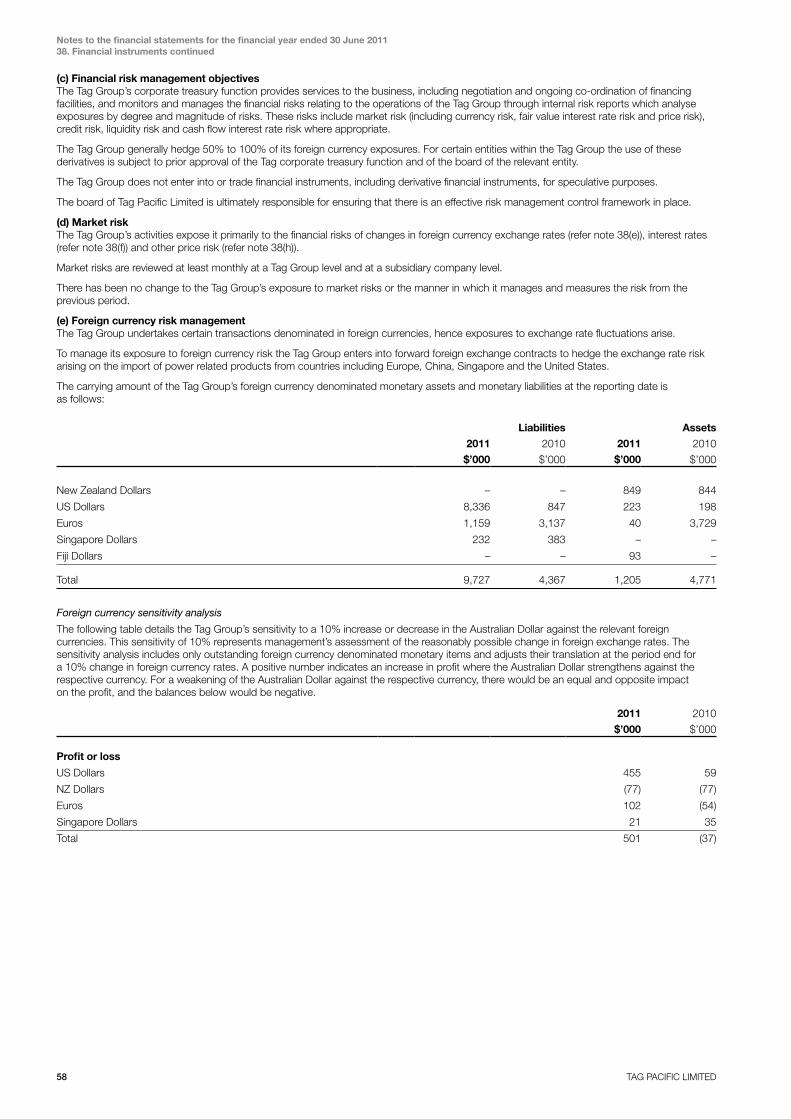
58 TAG PACIFIC LIMITED
Notes to the financial statements for the financial year ended 30 June 201138. Financial instruments continued
(c) Financial risk management objectivesThe Tag Group’s corporate treasury function provides services to the business, including negotiation and ongoing co-ordination of financing facilities, and monitors and manages the financial risks relating to the operations of the Tag Group through internal risk reports which analyse exposures by degree and magnitude of risks. These risks include market risk (including currency risk, fair value interest rate risk and price risk), credit risk, liquidity risk and cash flow interest rate risk where appropriate.
The Tag Group generally hedge 50% to 100% of its foreign currency exposures. For certain entities within the Tag Group the use of these derivatives is subject to prior approval of the Tag corporate treasury function and of the board of the relevant entity.
The Tag Group does not enter into or trade financial instruments, including derivative financial instruments, for speculative purposes.
The board of Tag Pacific Limited is ultimately responsible for ensuring that there is an effective risk management control framework in place.
(d) Market riskThe Tag Group’s activities expose it primarily to the financial risks of changes in foreign currency exchange rates (refer note 38(e)), interest rates (refer note 38(f)) and other price risk (refer note 38(h)).
Market risks are reviewed at least monthly at a Tag Group level and at a subsidiary company level.
There has been no change to the Tag Group’s exposure to market risks or the manner in which it manages and measures the risk from the previous period.
(e) Foreign currency risk managementThe Tag Group undertakes certain transactions denominated in foreign currencies, hence exposures to exchange rate fluctuations arise.
To manage its exposure to foreign currency risk the Tag Group enters into forward foreign exchange contracts to hedge the exchange rate risk arising on the import of power related products from countries including Europe, China, Singapore and the United States.
The carrying amount of the Tag Group’s foreign currency denominated monetary assets and monetary liabilities at the reporting date is as follows:
Liabilities Assets
2011 2010 2011 2010
$’000 $’000 $’000 $’000
New Zealand Dollars – – 849 844
US Dollars 8,336 847 223 198
Euros 1,159 3,137 40 3,729
Singapore Dollars 232 383 – –
Fiji Dollars – – 93 –
Total 9,727 4,367 1,205 4,771
Foreign currency sensitivity analysis
The following table details the Tag Group’s sensitivity to a 10% increase or decrease in the Australian Dollar against the relevant foreign currencies. This sensitivity of 10% represents management’s assessment of the reasonably possible change in foreign exchange rates. The sensitivity analysis includes only outstanding foreign currency denominated monetary items and adjusts their translation at the period end for a 10% change in foreign currency rates. A positive number indicates an increase in profit where the Australian Dollar strengthens against the respective currency. For a weakening of the Australian Dollar against the respective currency, there would be an equal and opposite impact on the profit, and the balances below would be negative.
2011 2010
$’000 $’000
Profit or loss
US Dollars 455 59
NZ Dollars (77) (77)
Euros 102 (54)
Singapore Dollars 21 35
Total 501 (37)

ANNUAL REPORT 2011 59
Notes to the financial statements for the financial year ended 30 June 201138. Financial instruments continued
Forward foreign exchange contractsThe Tag Group has entered into contracts to purchase power related products from suppliers in countries including the United States, China, Singapore and Europe. The relevant subsidiaries have entered into forward foreign exchange contracts for terms not exceeding 6 months to cover anticipated foreign currency payments within 50% to 100% of their respective exposures, which are designated into cash flow hedges.
At 30 June 2011, the aggregate amount of losses under forward foreign exchange contracts recognised in other comprehensive income and accumulated in the cash flow hedging reserve relating to these anticipated future purchase transactions is $87,487 (2010: nil). It is anticipated the purchases of products will take place during the first 6 months of the next financial year at which time the amount deferred in equity will be included in the carrying amount of inventory. It is anticipated the inventory will be sold within 6 months after purchase, at which time the amount deferred in equity will be reclassified to profit or loss.
The following table details the forward foreign currency contracts for the Tag Group outstanding as at reporting date:
Outstanding contracts Average Foreign currency Contract value Fair value exchange rate amount in A$ in A$
2011 2010 2011 2010 2011 2010 2011 2010
FC’000 FC’000 $’000 $’000 $’000 $’000
Consolidated
Buy US Dollars
Less than 3 months 1.045 0.810 10,081 903 9,650 1,116 180 31
3 to 6 months – – – – – – – –
Buy Euro
Less than 3 months – 0.641 – 300 – 468 – 30
Buy Singapore Dollars
Less than 3 months – 1.135 – 500 – 440 – 9
Buy Japanese Yen
Less than 3 months – – – – – – – –
10,081 1,703 9,650 2,024 180 70(f) Interest rate risk managementThe Tag Group is exposed to interest rate risk as entities in the Tag Group borrow funds at both fixed and floating interest rates. The risk is managed by the Tag Group by maintaining an appropriate mix between fixed and floating rate borrowings. The Tag Group does not enter into interest rate hedging activities.
Exposures to interest rates on the financial liabilities of the Tag Group are detailed in note 38(i) below.
Interest rate sensitivity analysisThe following analysis illustrates the Tag Group’s sensitivity to a 200 basis point (i.e. 2% p.a.) increase or decrease in nominal interest rates, based on exposures in existence at the reporting date. This represents management’s assessment of the reasonably possible change in interest rates as at that date.
At reporting date, if interest rates had been 200 basis points higher (or lower) and all other variables were held constant, the Tag Group’s net profit would decrease/(increase) on borrowings by $69,200 (2010: decrease/(increase) by $33,740). This is mainly attributable to the Tag Group’s exposure to interest rates on its variable rate borrowings.
The Tag Group’s sensitivity to interest rates has increased during the current period mainly due to the increase in variable rate debt instruments.
At reporting date, if interest rates had been 200 basis points higher (or lower) and all other variables were held constant, the Tag Group’s net profit would decrease/(increase) on deposits by $249,714 (2010: decrease/(increase) by $188,902). This is mainly attributable to the Tag Group’s exposure to interest rates on its cash and cash equivalents.
(g) Credit risk managementCredit risk refers to the risk that a counterparty will default on its contractual obligations resulting in financial loss to the Tag Group. The Tag Group has adopted a policy of only dealing with creditworthy counterparties and obtaining sufficient collateral where appropriate, as a means of mitigating the risk of financial loss from defaults. The Tag Group’s exposure and the credit ratings of its counterparties are continuously monitored and the aggregate value of transactions concluded is spread amongst approved counterparties. Credit exposure is controlled by counterparty limits that are reviewed and approved by the management of each operating subsidiary on a regular basis.
Trade receivables consist of a large number of customers, spread across diverse industries and geographical areas. Ongoing credit evaluation is performed on the financial condition of accounts receivable and, where appropriate, credit guarantee insurance is purchased.
The Tag Group does not have any significant credit risk exposure to any single counterparty or any group of counterparties having similar characteristics. The credit risk on liquid funds and derivative financial instruments is limited because the counterparties are banks with high credit-ratings assigned by international credit-rating agencies.

60 TAG PACIFIC LIMITED
Notes to the financial statements for the financial year ended 30 June 201138. Financial instruments continued
The following table sets out the carrying amount of financial assets recorded in the financial statements, net of any allowances for losses, representing the Tag Group’s maximum exposure to credit risk without taking account of the value of any collateral obtained:
Maximum risk
2011 2010
$’000 $’000
Tag Group
Trade and other receivables 22,826 14,404
Total 22,826 14,404
There has been no change in the Tag Group’s exposure to credit risk during the current period.
(h) Other price risksThe Tag Group is exposed to equity price risks in relation to its equity investments designated as at fair value through profit or loss upon initial recognition. This group of financial assets is managed on a fair value basis in accordance with the Tag Group’s documented risk management or investment strategy.
Equity price sensitivityThe sensitivity analyses below have been determined based on the exposure to equity price risks at the reporting date.
At reporting date, as the equity investments are designated as at fair value through profit or loss upon initial recognition, if the equity prices had been 10%p.a. higher or lower the net profit for the year ended 30 June 2011 would have increased/(decreased) by $174,771 (before non-controlling equity interest) (2010: $187,288).
The Tag Group’s sensitivity to equity prices has not changed significantly from the prior year.
(i) Liquidity risk managementLiquidity risk is the risk that the Tag Group will encounter difficulty in meeting its obligations associated with financial liabilities.
Ultimate responsibility for liquidity risk management rests with the Tag Parent board of directors, who have built an appropriate liquidity risk management framework for the management of the Tag Group’s short, medium and long-term funding and liquidity management requirements. The Tag Group manages liquidity risk by maintaining adequate reserves, banking facilities and reserve borrowing facilities by continuously monitoring forecast and actual cash flows and matching the maturity profiles of financial assets and liabilities. Included in note 10 is a listing of additional undrawn facilities that the Tag Group has at its disposal to further reduce liquidity risk.
Liquidity and interest risk tablesThe following tables detail the Tag Group’s remaining contractual maturity for its financial liabilities. The tables have been drawn up based on the undiscounted cash flows of financial liabilities based on the earliest date on which the Tag Group can be required to pay. The table includes both interest and principal cash flows.
Tag Group Weighted average effective interest rate
Less than 3 months
3 months to 1 year
1-5 years 5+ years
% $’000 $’000 $’000 $’000
2011
Non-interest bearing liability – 18,415 2,309 600 –
Finance lease liability 5.43 63 119 453 –
Variable interest rate instruments 8.30 365 1,094 1,860 141
Fixed interest rate instruments 8.60 4,486 – – –
Forward exchange contract liability – 180 – – –
23,509 3,522 2,913 141
2010
Non-interest bearing liability – 9,008 7,953 – –
Finance lease liability 5.77 54 96 204 –
Variable interest rate instruments 6.20 392 1,175 120 –
Fixed interest rate instruments 8.24 516 – – –
Forward exchange contract liability – 2,024 – – –
11,994 9,224 324 –
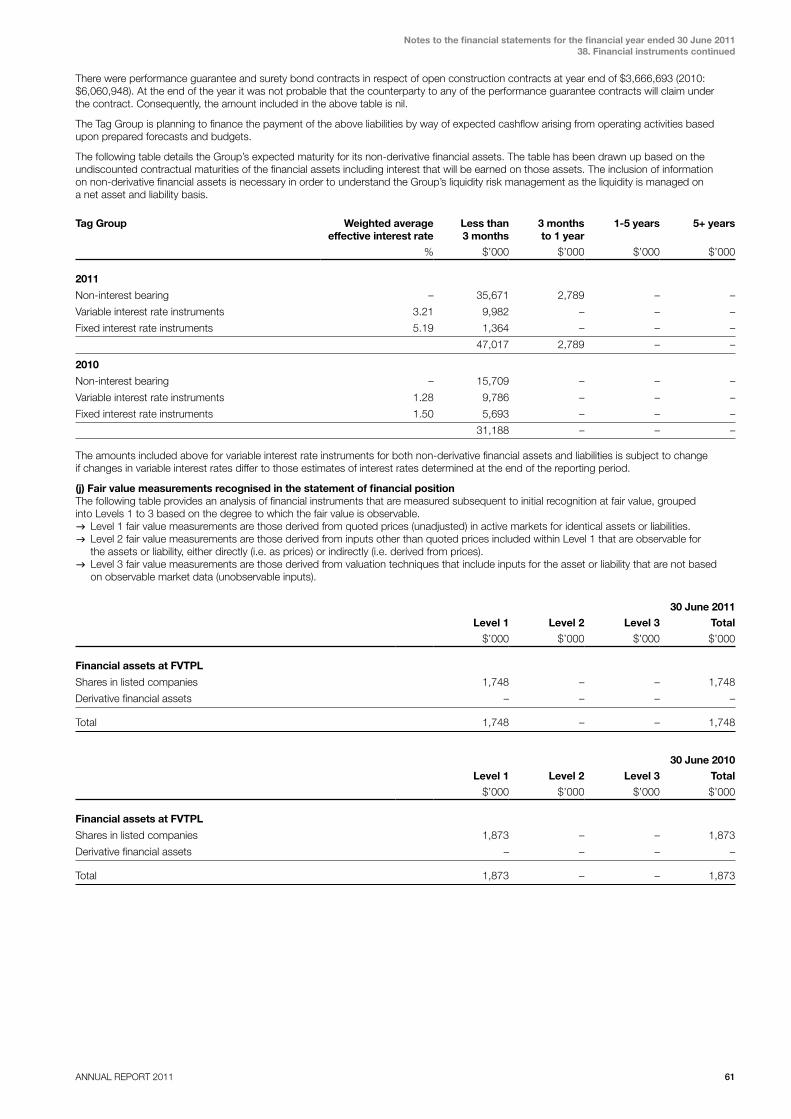
ANNUAL REPORT 2011 61
Notes to the financial statements for the financial year ended 30 June 201138. Financial instruments continued
There were performance guarantee and surety bond contracts in respect of open construction contracts at year end of $3,666,693 (2010: $6,060,948). At the end of the year it was not probable that the counterparty to any of the performance guarantee contracts will claim under the contract. Consequently, the amount included in the above table is nil.
The Tag Group is planning to finance the payment of the above liabilities by way of expected cashflow arising from operating activities based upon prepared forecasts and budgets.
The following table details the Group’s expected maturity for its non-derivative financial assets. The table has been drawn up based on the undiscounted contractual maturities of the financial assets including interest that will be earned on those assets. The inclusion of information on non-derivative financial assets is necessary in order to understand the Group’s liquidity risk management as the liquidity is managed on a net asset and liability basis.
Tag Group Weighted average effective interest rate
Less than 3 months
3 months to 1 year
1-5 years 5+ years
% $’000 $’000 $’000 $’000
2011
Non-interest bearing – 35,671 2,789 – –
Variable interest rate instruments 3.21 9,982 – – –
Fixed interest rate instruments 5.19 1,364 – – –
47,017 2,789 – –
2010
Non-interest bearing – 15,709 – – –
Variable interest rate instruments 1.28 9,786 – – –
Fixed interest rate instruments 1.50 5,693 – – –
31,188 – – –
The amounts included above for variable interest rate instruments for both non-derivative financial assets and liabilities is subject to change if changes in variable interest rates differ to those estimates of interest rates determined at the end of the reporting period.
(j) Fair value measurements recognised in the statement of financial positionThe following table provides an analysis of financial instruments that are measured subsequent to initial recognition at fair value, grouped into Levels 1 to 3 based on the degree to which the fair value is observable.gLevel 1 fair value measurements are those derived from quoted prices (unadjusted) in active markets for identical assets or liabilities.gLevel 2 fair value measurements are those derived from inputs other than quoted prices included within Level 1 that are observable for
the assets or liability, either directly (i.e. as prices) or indirectly (i.e. derived from prices).gLevel 3 fair value measurements are those derived from valuation techniques that include inputs for the asset or liability that are not based
on observable market data (unobservable inputs).
30 June 2011
Level 1 Level 2 Level 3 Total
$’000 $’000 $’000 $’000
Financial assets at FVTPL
Shares in listed companies 1,748 – – 1,748
Derivative financial assets – – – –
Total 1,748 – – 1,748
30 June 2010
Level 1 Level 2 Level 3 Total
$’000 $’000 $’000 $’000
Financial assets at FVTPL
Shares in listed companies 1,873 – – 1,873
Derivative financial assets – – – –
Total 1,873 – – 1,873

62 TAG PACIFIC LIMITED
Notes to the financial statements for the financial year ended 30 June 201139. Parent entity disclosures 40. Contingent liabilities and contingent assets
Tag Parent
30/06/2011 30/06/2010
$’000 $’000
39. Parent entity disclosures(i) Financial position
Assets
Current assets 4,829 7,219
Non-current assets 5,035 4,854
Total assets 9,864 12,073
Liabilities
Current liabilities 1,036 450
Non-current liabilities – –
Total liabilities 1,036 450
Equity
Issued capital 16,477 16,477
Retained earnings (7,862) (5,044)
Share option reserve 213 190
Total equity 8,828 11,623
Year ended 30/06/2011
Year ended 30/06/2010
$’000 $’000
(ii) Financial performance
Loss for the year (2,818) (4,808)
Other comprehensive income – –
Total comprehensive loss (2,818) (4,808)
(iii) Guarantees entered into by the parent entityTag Pacific Limited has not provided any guarantees in relation to any of its subsidiaries.
(iv) Contingent liabilities of the parent entityThere are no contingent liabilities for the parent entity.
(v) Commitments for the acquisition of property, plant and equipment by the parent entityThere are no commitments for the acquisition of property, plant and equipment by the parent entity.
40. contingent liabilities and contingent assetsThere are no contingent liabilities or contingent assets at balance date.

ANNUAL REPORT 2011 63
Directors’ declaration
DiRectoRS’ DeclaRatioN
The directors of Tag Pacific Limited declare that:
(a) in the directors’ opinion, there are reasonable grounds to believe that the company will be able to pay its debts as and when they become due and payable;
(b) the attached financial statements are in compliance with International Financial Reporting Standards, as stated in note 2 to the financial statements;
(c) in the director’s opinion, the attached financial statements and notes thereto are in accordance with the Corporations Act 2001, including compliance with accounting standards and giving a true and fair view of the financial position and performance of the consolidated entity; and
(d) the directors have been given the declarations required by section 295A of the Corporations Act 2001.
Signed in accordance with a resolution of the directors made pursuant to section 295(5) of the Corporations Act 2001.
On behalf of the directors
Peter WiseChairman
Sydney, 29 August 2011
TAG PACIFIC LIMITED64
Auditor’s independence declaration
auditor’s independence declaration
Deloitte Touche TohmatsuABN 74 490 121 060
Grosvenor Place225 George StreetSydney NSW 2000PO Box N250 Grosvenor PlaceSydney NSW 1220 Australia
DX: 10307SSETel: +61 (02) 9322 7000Fax: +61 (02) 9322 7001www.deloitte.com.au
The Board of DirectorsTag Pacific LimitedLevel 30, Piccadilly Tower133 Castlereagh StreetSydney NSW 2000
29 August 2011
Dear Board Members
Tag Pacific LimitedIn accordance with section 307C of the Corporations Act 2001, I am pleased to provide the following declaration of independence to the directors of Tag Pacific Limited.
As lead audit partner for the audit of the financial statements of Tag Pacific Limited for the financial year ended 30 June 2011, I declare that to the best of my knowledge and belief, there have been no contraventions of:(i) the auditor independence requirements of the Corporations Act 2001 in relation to the audit; and(ii) any applicable code of professional conduct in relation to the audit.
Yours sincerely
DELOITTE TOUCHE TOHMATSU
Bernard GildPartner Chartered Accountants
Liability limited by a scheme approved under Professional Standards Legislation
Member of Deloitte Touche Tohmatsu Limited
65ANNUAL REPORT 2011
Deloitte Touche TohmatsuABN 74 490 121 060
Grosvenor Place225 George StreetSydney NSW 2000PO Box N250 Grosvenor PlaceSydney NSW 1220 Australia
DX: 10307SSETel: +61 (02) 9322 7000Fax: +61 (02) 9322 7001www.deloitte.com.au
independent auditor’s reportto the Members of Tag Pacific Limited
Report on the Financial Report We have audited the accompanying financial report of Tag Pacific Limited, which comprises the statement of financial position as at 30 June 2011, the statement of comprehensive income, the statement of cash flows and the statement of changes in equity for the year ended on that date, notes comprising a summary of significant accounting policies and other explanatory information, and the directors’ declaration of the consolidated entity comprising the company and the entities it controlled at the year’s end or from time to time during the financial year as set out on pages 22 to 63.
Directors’ Responsibility for the Financial ReportThe directors of the company are responsible for the preparation of the financial report that gives a true and fair view in accordance with Australian Accounting Standards and the Corporations Act 2001 and for such internal control as the directors determine is necessary to enable the preparation of the financial report that is free from material misstatement, whether due to fraud or error. In Note 2, the directors also state, in accordance with Accounting Standard AASB 101 Presentation of Financial Statements, that the financial statements comply with International Financial Reporting Standards.
Auditor’s ResponsibilityOur responsibility is to express an opinion on the financial report based on our audit. We conducted our audit in accordance with Australian Auditing Standards. Those standards require that we comply with relevant ethical requirements relating to audit engagements and plan and perform the audit to obtain reasonable assurance whether the financial report is free from material misstatement.
An audit involves performing procedures to obtain audit evidence about the amounts and disclosures in the financial report. The procedures selected depend on the auditor’s judgement, including the assessment of the risks of material misstatement of the financial report, whether due to fraud or error. In making those risk assessments, the auditor considers internal control, relevant to the entity’s preparation of the financial report that gives a true and fair view, in order to design audit procedures that are appropriate in the circumstances, but not for the purpose of expressing an opinion on the effectiveness of the entity’s internal control. An audit also includes evaluating the appropriateness of accounting policies used and the reasonableness of accounting estimates made by the directors, as well as evaluating the overall presentation of the financial report.
We believe that the audit evidence we have obtained is sufficient and appropriate to provide a basis for our audit opinion.
Auditor’s Independence DeclarationIn conducting our audit, we have complied with the independence requirements of the Corporations Act 2001. We confirm that the independence declaration required by the Corporations Act 2001, which has been given to the directors of Tag Pacific Limited, would be in the same terms if given to the directors as at the time of this auditor’s report.
OpinionIn our opinion:(a) the financial report of Tag Pacific Limited is in accordance
with the Corporations Act 2001, including:(i) giving a true and fair view of the consolidated entity’s
financial position as at 30 June 2011 and of its performance for the year ended on that date; and
(ii) complying with Australian Accounting Standards and the Corporations Regulations 2001; and
(b) the consolidated financial statements also comply with International Financial Reporting Standards as disclosed in Note 2.
Report on the Remuneration Report We have audited the Remuneration Report included in pages 17 to 21 of the directors’ report for the year ended 30 June 2011. The directors of the company are responsible for the preparation and presentation of the Remuneration Report in accordance with section 300A of the Corporations Act 2001. Our responsibility is to express an opinion on the Remuneration Report, based on our audit conducted in accordance with Australian Auditing Standards.
OpinionIn our opinion the Remuneration Report of Tag Pacific Limited for the year ended 30 June 2011, complies with section 300A of the Corporations Act 2001.
DELOITTE TOUCHE TOHMATSU
Bernard GildPartner Chartered Accountants
Sydney, 29 August 2011
Independent auditor’s report
Liability limited by a scheme approved under Professional Standards Legislation
Member of Deloitte Touche Tohmatsu Limited
66 TAG PACIFIC LIMITED
Corporate governance statement
Approach to corporate governanceTag Pacific Limited is committed to achieving and demonstrating the highest standards of corporate governance, consistent with the size and nature of the company.
As a listed entity, the company must comply with the Corporations Act 2001, the Australian Securities Exchange Listing Rules (ASX Listing Rules) and other laws.
ASX Listing Rule 4.10.3 requires ASX listed companies to report on the extent to which they have followed the recommendations (“Recommendations”) set by the ASX Corporate Governance Council.
The Recommendations encourage the board to carefully consider the development and adoption of appropriate corporate governance policies and practices founded on the ASX Principles.
Compliance with ASX RecommendationsEach listed company is required to provide a statement in its annual report disclosing the extent to which it has followed the Recommendations during the reporting period.
A listed company must identify any Recommendation that has not been followed and give reasons for not following it. Where a Recommendation has been followed for only part of the period, the company must state the period during which it has been followed.
Except as noted below, and as detailed within this corporate governance statement, the company considers that its governance practices complied throughout the year ended 30 June 2011 with each of the Recommendations.
Information in respect of the company’s corporate governance practices can be found on the Tag website.
This statement outlines the company’s main corporate governance practices for the year ended 30 June 2011 in light of the eight core principles and twenty Recommendations set out by the ASX Corporate Governance Council.
ASX Principle 1: Lay solid foundations for management and oversightRecommendation 1.1Establish the functions reserved to the board and those delegated to senior executives and disclose those functions.
The board’s objective is to increase shareholder value within an appropriate framework that ensures the company’s affairs are properly managed and controlled and sets the strategic business direction to be followed.
The powers reserved to the board include the following:gestablishment and maintenance of appropriate governance
structures;gthe review and oversight of the company’s strategic plan, setting
goals and long-term objectives with a view to maximising shareholder value;
gadopting an annual budget and reviewing financial performance;gestablishment of the control environment to provide for meaningful
and timely information;
gproviding the basis for the review of the performance of the board and its members and the senior management and their remuneration;
gthe provision of a communication capability and the relevant procedures with all stakeholders in accordance with the continuous disclosure provisions and to comply with the relevant legal requirements;
greviewing and ratifying systems of risk management;gestablishing a basis for approvals of capital expenditure,
acquisitions and divestment; andgsetting high standards for ethical and corporate behaviour.
With the exception of matters reserved for the board, all other powers are delegated to senior management.
Senior managers who are not board members have formal contracts with the company which include details of their role and job descriptions.
Recommendation 1.2: Disclose the process for evaluating the performance of senior managers.
All senior managers, other than the Executive Chairman, are subject to a performance appraisal and remuneration review at least annually. As noted in Recommendation 8.1, such reviews are undertaken by the Remuneration Committee in accordance with the company’s performance based remuneration policy, details of which are set out in the Remuneration Report in the Directors’ Report.
Recommendation 1.3:Provide the information indicated in the Guide to reporting on Principle 1.
A performance evaluation for all senior managers other than the Executive Chairman took place during the reporting period. The Executive Chairman works closely with the board and senior executives and managers of the Tag Group. A performance evaluation for the Executive Chairman was not appropriate given the nature of the role and the structure of the company.
ASX Principle 2: Structure the board to add valueRecommendation 2.1:A majority of the board should be independent directors.
A Tag director is considered independent when he or she is independent of management (that is, non-executive), and free from any business or other relationship that could materially interfere with, or could be reasonably perceived to materially interfere with, the exercise of his or her unfettered and independent judgement.
Materiality is considered on a case by case basis by reference to the director’s individual circumstances rather than general materiality thresholds.
The Tag board has made its own assessment to determine the independence of each director on the board.
The Tag board comprises an executive chairman, Peter Wise, and five non-executive directors being Gary Cohen, Robert Constable, Robert Moran, Richard Peterson and Gary Weiss.
coRPoRate GoveRNaNce StatemeNt
ANNUAL REPORT 2011 67
Corporate governance statement
The composition of the board is based on the following factors:gsize of company;gnature and extent of head office operations;gtenure of directors; andglimited trading in the company’s securities.Notwithstanding the nature of the board composition, the board maintains protocols to ensure that any potential or actual conflicts of interest and duty are properly identified and managed, and to ensure directors act in accordance with their fiduciary responsibilities.
The criteria for board membership and the selection of appropriate members of the board are determined by the board itself. Election and rotation of directors is governed by the company’s constitution. Shareholder approval is sought where appropriate. In determining the appointment and retirement of non-executive directors, a cross section of skills and experience is sought.
The company’s constitution specifies that:gone third of the directors (with the exception of new appointees
who must retire under a different rule); andgany director, who would have held office for more than 3 years
at the time of the annual general meeting,
must retire from office at that general meeting but may stand for re-election.
Details of the directors who are considered independent appears under Recommendation 2.6. The company has adopted the recommendation for a majority of the board to be independent directors notwithstanding the nature and extent of the company’s operations and the fact that interests associated with directors hold a majority of the company’s issued securities.
Recommendation 2.2:The chairman should be an independent director.
Tag has not adopted this recommendation as interests associated with the chairman hold a significant percentage of the company’s issued securities. This recommendation is inappropriate to the company’s particular circumstances.
Recommendation 2.3: The roles of chairman and chief executive officer should not be exercised by the same individual.
Tag has not adopted this recommendation as interests associated with the chairman hold a significant percentage of the company’s issued securities. This recommendation is inappropriate to the company’s particular circumstances.
Recommendation 2.4:The board should establish a nomination committee.
Tag has not adopted this recommendation as the practices relating to the selection and appointment of directors, detailed within this statement, are an efficient means of meeting the needs of the company, having regard to the relative size of the company which is reflected in the board structure and composition.
The board consists of six directors, five of whom are considered independent, and it is considered that Tag has the capacity to consider director nomination practices within the duly constituted meetings of the board, and that the establishment of a formal committee structure would not add greater value to this process. The company has not adopted this recommendation as it is inappropriate to its particular circumstances.
Recommendation 2.5: Disclose the process for evaluating the performance of the board, its committees and individual directors.
The performance of the board, its committees and individual directors is considered on an informal, as needs basis, given that interests of directors have a beneficial or non-beneficial interest in a majority of the company’s issued securities.
All directors have direct access to the entire senior management team, including the company secretary, and are provided with information on a timely basis.
Recommendation 2.6:Provide the information indicated in the Guide to reporting on Principle 2.
Skills, experience and expertise of directorsInformation relevant to the position of each director in office at the date of this report is set out in the Directors’ Report.
Independent directorsRobert Constable, Robert Moran, Richard Peterson, Gary Cohen and Gary Weiss are considered “independent” in terms of the ASX recommendations, with each holding nominal numbers of shares as set out in the Directors’ Report. The board has not set a materiality threshold for determining “independence”.
No independent director has undertaken employment with a group entity, has acted as a principal of a material professional adviser or material consultant of a group entity, is a material supplier or customer of a group entity, or has a material contractual relationship with a group entity other than as a director.
Independent professional adviceDirectors are able to seek reasonable independent professional advice, as appropriate, in the furtherance of their duties. Any such advice may be at the company’s expense, subject to prior approval of the board.
Period of office held by each directorInformation in relation to the period of office held by each director can be found in the Directors’ Report.
Process for selection and appointment of directorsGiven the length of service of directors, the board does not consider it necessary to develop succession plans or procedures for the appointment and re-election of directors.
Performance evaluationA performance evaluation of the board, its committees and directors did not take place in the reporting period for the reasons given under Recommendation 2.5.
Departures from recommendations Any departure from Recommendations 2.1 to 2.6 is explained under the relevant Recommendation.
68 TAG PACIFIC LIMITED
Corporate governance statement
ASX Principle 3: Promote ethical and responsible decision-makingRecommendation 3.1: Establish a code of conduct and disclose the code or a summary of the code as to:gthe practices necessary to maintain confidence in the
company’s integrity;gthe practices necessary to take into account the company’s
legal obligations and the reasonable expectations of shareholders; and
gthe responsibility and accountability of individuals for reporting and investigating reports of unethical practices.
As part of the board’s commitment to the high standards of conduct, the company has established operating protocols to deal with various issues including:gconflicts of interest; gemployment practices;gfair trading;ghealth and safety; andgrelations with customers and suppliers.
These are designed to:gclarify the standards of ethical behaviour required of the board,
senior managers and employees and encourage compliance with those standards; and
gassist the company to comply with its legal obligations and have regard to the reasonable expectations of shareholders.
The recommendation to establish and publish a formal code has not been adopted in view of the nature and extent of company operations, the long-standing tenure of directors and the close relationship with the senior management team.
Recommendation 3.2: Establish a policy concerning trading in company securities by directors, senior executives and employees, and disclose the policy or a summary of that policy.
On 20 December 2010, the company adopted a formal trading policy for dealing in securities of the company or other entities by directors or senior managers. The trading policy was disclosed to the market on 20 December 2011.
Up until that time, the company had an informal policy to restrict directors and senior managers from acting on material information to trade in the company’s securities until such information has been released to the market and adequate time has passed for it to be reflected in the price of those securities.
Recommendation 3.3: Provide the information indicated in the Guide to reporting on Principle 3.
Any departure from Recommendations 3.1 to 3.3 is explained under the relevant recommendation.
ASX Principle 4: Safeguard integrity in financial reportingRecommendation 4.1:Establish an audit committee.
The board has established an audit committee to assist it to ensure the truthful and factual presentation of the company’s financial position.
Notwithstanding the existence of the audit committee, ultimate responsibility for the integrity of the company’s financial reporting rests with the full board.
Recommendation 4.2: The audit committee should be structured so that it:gconsists only of non-executive directors;gconsists of a majority of independent directors;gis chaired by an independent chair, who is not chair of the board;
andghas at least three members.
The audit committee comprises two of the five independent, non-executive directors and is chaired by Robert Constable who is not chairman of the board.
The board considers that the skills, experience and expertise of Messrs Constable and Moran are entirely suited to the effective discharge of the responsibilities of the committee.
The board has not adopted the recommendation for the committee to maintain at least three directors, given the nature and extent of company’s activities and the relative size of the board.
Recommendation 4.3: The audit committee should have a formal charter.
The role and responsibilities of the Tag audit committee are to: goversee the existence and maintenance of internal controls
and accounting systems;gensure the integrity of the financial reporting process;greview the annual and half-yearly financial statements;goversee the independence of the external auditor; andgensure the existence of a process for identification and
management of key business risks.
The committee has rights of access to management, rights to seek explanations and additional information, and access to external auditors without management being present.
The committee meets at least twice each year and reports to the board on all matters relevant to its role and responsibilities. Minutes of its meetings are made available to the full board.
The board has not adopted the recommendation to establish a committee charter in view of the nature and extent of company operations, the experience of each committee member, and close access to the executive team.
Recommendation 4.4: Provide the information indicated in the Guide to reporting on Principle 4.
The qualifications of committee members are listed in the Directors’ Report.
The number of committee meetings held during the reporting period and the attendance of each member at those meetings is set out in the Directors’ Report.
The board has not published a committee charter, or information on procedures for the selection and appointment of the external auditor, and for the rotation of external audit engagement partners as these matters are dealt with informally.
Any departure from Recommendations 4.1 to 4.4 is explained under the relevant Recommendation.
ANNUAL REPORT 2011 69
Corporate governance statement
ASX Principle 5: Make timely and balanced disclosureRecommendation 5.1: Establish written policies designed to ensure compliance with ASX Listing Rule disclosure requirements and to ensure accountability at a senior management level for that compliance and disclose those policies or a summary of those policies.
The company secretary has been nominated as the person responsible for communication with the Australian Securities Exchange (ASX). This role includes responsibility for ensuring compliance with the continuous disclosure requirement in the ASX listing rules and overseeing and co-ordinating information disclosure to the ASX and the public.
The company secretary and/or the executive chairman jointly ensure that any proposed announcement is drafted in a timely manner, is factual, expressed in a clear and consistent manner and does not omit material information.
Except for standard secretarial and procedural matters, all material announcements to the ASX are authorised by the board.
The recommendation to establish and publish written policies regarding compliance with ASX Listing Rule disclosure requirements has not been adopted in view of the nature and extent of company operations.
Recommendation 5.2:Provide the information indicated in the Guide to reporting on Principle 5.
Any departure from Recommendations 5.1 and 5.2 is explained under Recommendation 5.1 above.
ASX Principle 6: Respect the rights of shareholdersRecommendation 6.1: Design a communications policy for promoting effective communication with shareholders and encouraging their participation at general meetings and disclose the policy or a summary of that policy.
The recommendation to publish a communications policy has not been adopted in view of the nature and extent of company operations.
Recommendation 6.2: Provide the information indicated in the Guide to reporting on Principle 6.
The company aims to keep shareholders informed of its performance and all major developments in an ongoing manner. Copies of company announcements are made available on the company’s website.
Additionally, information is communicated to shareholders through:gthe annual report which is distributed to all shareholders;gthe half year report; andgother correspondence regarding matters impacting on
shareholders as required.
Any departure from Recommendations 6.1 and 6.2 is explained under Recommendation 6.1 above.
ASX Principle 7:Recognise and manage riskRecommendation 7.1: Establish policies for the oversight and management of material business risks and disclose a summary of those policies.
In view of the nature and extent of company operations, the tenure, experience and understanding of directors, the company has established informal policies for the oversight and management of material business risks. Formal policies would be inappropriate to the company’s particular circumstances.
Recommendation 7.2Require management to design and implement the risk management and internal control system to manage the company’s material business risks and report to it on whether those risks are being managed effectively. Disclose that management has reported to the board as to the effectiveness of the company’s management of its material business risks.
In view of the nature of the company’s investment activities, formal and informal policies for the oversight and management of the various business risks associated with the company’s specific investments are conducted at the relevant subsidiary board level.
A formal and documented risk management and internal control system has not been adopted as it is inappropriate to the company’s particular circumstances.
Recommendation 7.3: Disclose whether the board has received assurance from the chief executive (or equivalent) and the chief financial officer (or equivalent) that the declaration provided in accordance with section 295A of the Corporations Act is founded on a sound system of risk management and internal control and that the system is operating effectively in all material respects in relation to financial reporting risks.
The board has received the declaration in accordance with section 295A of the Corporations Act and has had an opportunity to question whether the declaration is founded on a system of risk management and internal control and that the system is operating effectively in all material respects in relation to financial reporting risks.
Recommendation 7.4: Provide the information included in the Guide to reporting on Principle 7.
Any departure from Recommendations 7.1 to 7.4 is explained under the relevant Recommendation.
70 TAG PACIFIC LIMITED
ASX Principle 8: Remunerate fairly and responsiblyRecommendation 8.1: Establish a remuneration committee.
The remuneration committee comprises two independent non-executive directors.
The role and responsibilities of the Tag remuneration committee are to: gmake recommendations to the board on an appropriate
remuneration policy for directors and senior managers;gundertake the performance reviews of senior managers; andgdetermine the remuneration and employment terms of senior
managers in accordance with the adopted remuneration policy.
Remuneration for non-executive directors is determined by the full board and is subject to shareholder approval.
The board considers that the skills, experience and expertise of Messrs Cohen and Constable are entirely suited to the effective discharge of the responsibilities of the committee.
The board has not established a committee charter in view of the nature and extent of company operations and the relative size of the board.
The committee meets at least once per annum.
The committee reports to the board on all matters relevant to its role and responsibilities. Minutes of its meetings are made available to the full board.
Recommendation 8.2: Clearly distinguish the structure of non-executive directors’ remuneration from that of directors and senior managers.
The company’s remuneration policy for senior managers and non-executive directors is set out in the Remuneration Report.
Recommendation 8.3: Provide the information indicated in the Guide to reporting on Principle 8.
The number of committee meetings held during the reporting period and the attendance of each member at those meetings is set out in the Directors’ Report.
There are no schemes for retirement benefits for non-executive directors.
The recommendation to publish information in relation to the role, rights, responsibilities and membership requirements for the remuneration committee has not been adopted in view of the nature and extent of company operations and the relative size of the board.
The company has not published a summary of the company’s policy on prohibiting entering into transactions in associated products which limit the economic risk of participating in unvested entitlements under any equity-based remuneration scheme as the directors consider that such a policy is inappropriate to the company’s particular circumstances.
Any departure from Recommendations 8.1 to 8.3 is explained under the relevant Recommendation.
Corporate governance statement
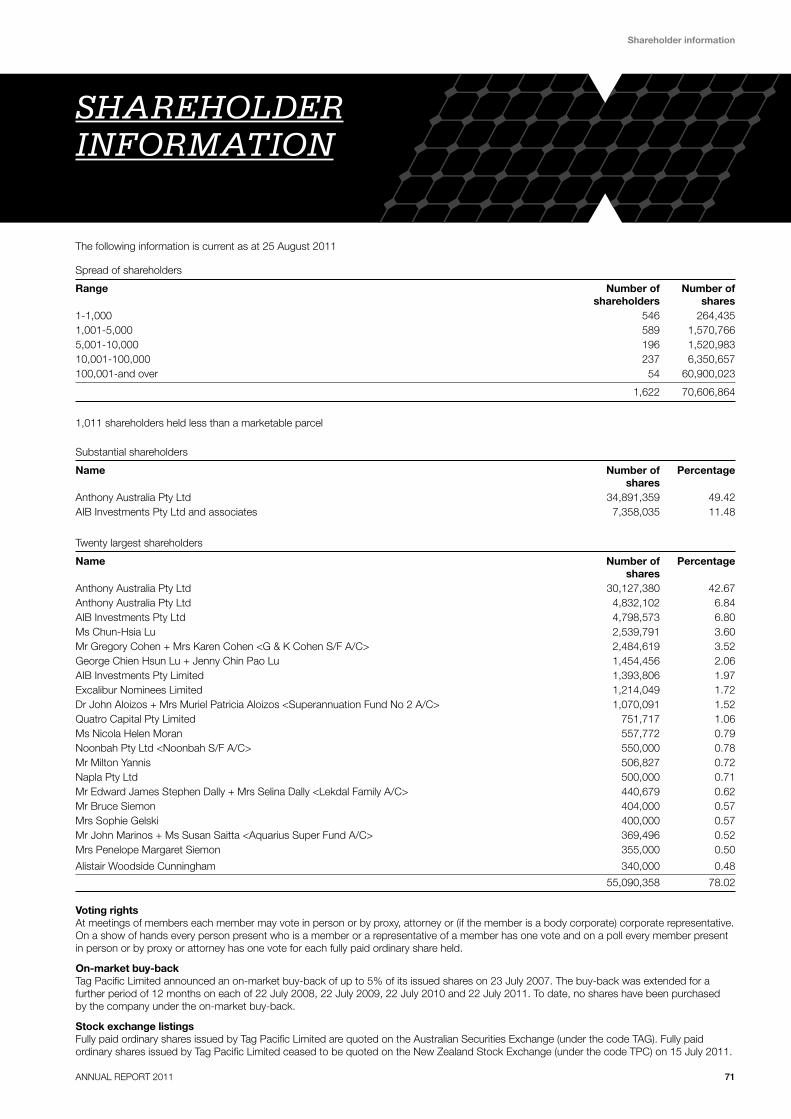
ANNUAL REPORT 2011 71
Shareholder information
The following information is current as at 25 August 2011
Spread of shareholders
Range Number of Number of shareholders shares1-1,000 546 264,4351,001-5,000 589 1,570,7665,001-10,000 196 1,520,98310,001-100,000 237 6,350,657100,001-and over 54 60,900,023
1,622 70,606,864
1,011 shareholders held less than a marketable parcel
Substantial shareholders
Name Number of Percentage sharesAnthony Australia Pty Ltd 34,891,359 49.42AIB Investments Pty Ltd and associates 7,358,035 11.48
Twenty largest shareholders
Name Number of Percentage sharesAnthony Australia Pty Ltd 30,127,380 42.67Anthony Australia Pty Ltd 4,832,102 6.84AIB Investments Pty Ltd 4,798,573 6.80Ms Chun-Hsia Lu 2,539,791 3.60Mr Gregory Cohen + Mrs Karen Cohen <G & K Cohen S/F A/C> 2,484,619 3.52George Chien Hsun Lu + Jenny Chin Pao Lu 1,454,456 2.06AIB Investments Pty Limited 1,393,806 1.97Excalibur Nominees Limited 1,214,049 1.72Dr John Aloizos + Mrs Muriel Patricia Aloizos <Superannuation Fund No 2 A/C> 1,070,091 1.52Quatro Capital Pty Limited 751,717 1.06Ms Nicola Helen Moran 557,772 0.79Noonbah Pty Ltd <Noonbah S/F A/C> 550,000 0.78Mr Milton Yannis 506,827 0.72Napla Pty Ltd 500,000 0.71Mr Edward James Stephen Dally + Mrs Selina Dally <Lekdal Family A/C> 440,679 0.62Mr Bruce Siemon 404,000 0.57Mrs Sophie Gelski 400,000 0.57Mr John Marinos + Ms Susan Saitta <Aquarius Super Fund A/C> 369,496 0.52Mrs Penelope Margaret Siemon 355,000 0.50
Alistair Woodside Cunningham 340,000 0.48
55,090,358 78.02
Voting rightsAt meetings of members each member may vote in person or by proxy, attorney or (if the member is a body corporate) corporate representative. On a show of hands every person present who is a member or a representative of a member has one vote and on a poll every member present in person or by proxy or attorney has one vote for each fully paid ordinary share held.
On-market buy-backTag Pacific Limited announced an on-market buy-back of up to 5% of its issued shares on 23 July 2007. The buy-back was extended for a further period of 12 months on each of 22 July 2008, 22 July 2009, 22 July 2010 and 22 July 2011. To date, no shares have been purchased by the company under the on-market buy-back.
Stock exchange listingsFully paid ordinary shares issued by Tag Pacific Limited are quoted on the Australian Securities Exchange (under the code TAG). Fully paid ordinary shares issued by Tag Pacific Limited ceased to be quoted on the New Zealand Stock Exchange (under the code TPC) on 15 July 2011.
ShaReholDeR iNfoRmatioN

72 TAG PACIFIC LIMITED
Corporate directory
coRPoRate DiRectoRy
DirectorsPeter Wise (Chairman)Gary CohenRobert Constable Robert MoranRichard PetersonGary Weiss
Company secretaryNathan Wise
Registered officeLevel 30 Piccadilly Tower133 Castlereagh StreetSydney NSW 2000AustraliaTelephone: +61 2 8275 6000Facsimile: +61 2 8275 6060
WebsitetaGPac.com
AuditorsDeloitte Touche TohmatsuGrosvenor Place225 George StreetSydney NSW 2000Australia
Share registryComputershare Investor Services Pty LimitedLevel 360 Carrington StreetSydney NSW 2000Telephone: 1300 85 05 05
Design: 3-DeGReeS.com.au


taGPac.com