Embed Size (px)
Citation preview

Annual Report 2010
. .
Autoscope ENCORE CitySync JetCam Fox HD RTMS G4
Image Sensing Systems, Inc.
enhance our management depth as well as our engineering and sales capabilities. Management positions that have either been recruited and/or are in transition include among, others:
• Senior VP of Sales and Marketing• Managing Director of ISS-Europe• Managing Director of Flow Traffic (Asia)
This reinvigoration of our core senior management base makes us even more bullish on our prospects going forward.
Financial Results
In 2010 the company experienced another strong year for revenues and operating profits. Year-on-year revenues were lifted and rose some 29%, but owing primarily to one time costs sustained in the acquisition of CitySync as well as intangible amortization, there was an attendant decline in GAAP income. However, on a non-GAAP basis, 2010 full-year net income showed an increase of 12%. We believe our emphasis on firm cost management coupled with continued full resourcing of our key development initiatives, especially those focused on manufacturing cost reduction, have positioned us well for the anticipated full recovery.
Revenue for fiscal year 2010 was $31.7 million compared to $24.6 million for fiscal 2009. Revenue from royalties was $12.5 million in fiscal year 2010 compared to $12.1 million in 2009. Product sales were $19.2 million for fiscal year 2010 compared to $12.5 million in 2009.
Net income for fiscal year 2010 was $3.0 million ($0.64 per diluted share) compared to $3.9 million ($0.95 per diluted share) for fiscal 2009. The
For ISS, 2010 was a year of challenges, due to the transitional state of the economy which seemingly continues a protracted and drawn-out improvement trend in fits and starts, and a year of excitement, with our market expansion activities, including the acquisition of CitySync, a capital raise and exceeding $30 million in revenues.
Beginning at the end of 2009 and continuing throughout 2010, there were ever more encouraging signs that the tentative economic recovery was gaining strength. Nonetheless, there remained an awareness of the fragility of the overall economy, and this acts as a central guide for our planning going forward. Despite the continuing uncertainties, our results demonstrate that Image Sensing Systems rose to the test in 2010. We have exited the year stronger, more profitable and more competitive.
In confirmation of our unshaken belief in the fundamentals of our core markets, we took the bold step at midyear of acquiring the European-based automatic license plate recognition (ANPR or ALPR) firm CitySync. This expansion of our detection portfolio brings both a step-function increase in revenues and profits and enhances our access to the adjacent security and surveillance markets as well. It also allows us to finally achieve critical mass in the key European market. To financially support the acquisition, we raised $8.8 million in a common stock offering in April 2010.
We also took the opportunity in 2010 to selectively
Dear Shareholders:*
*See “Information Regarding Forward-Looking Statements” on page 8 of 10-K.
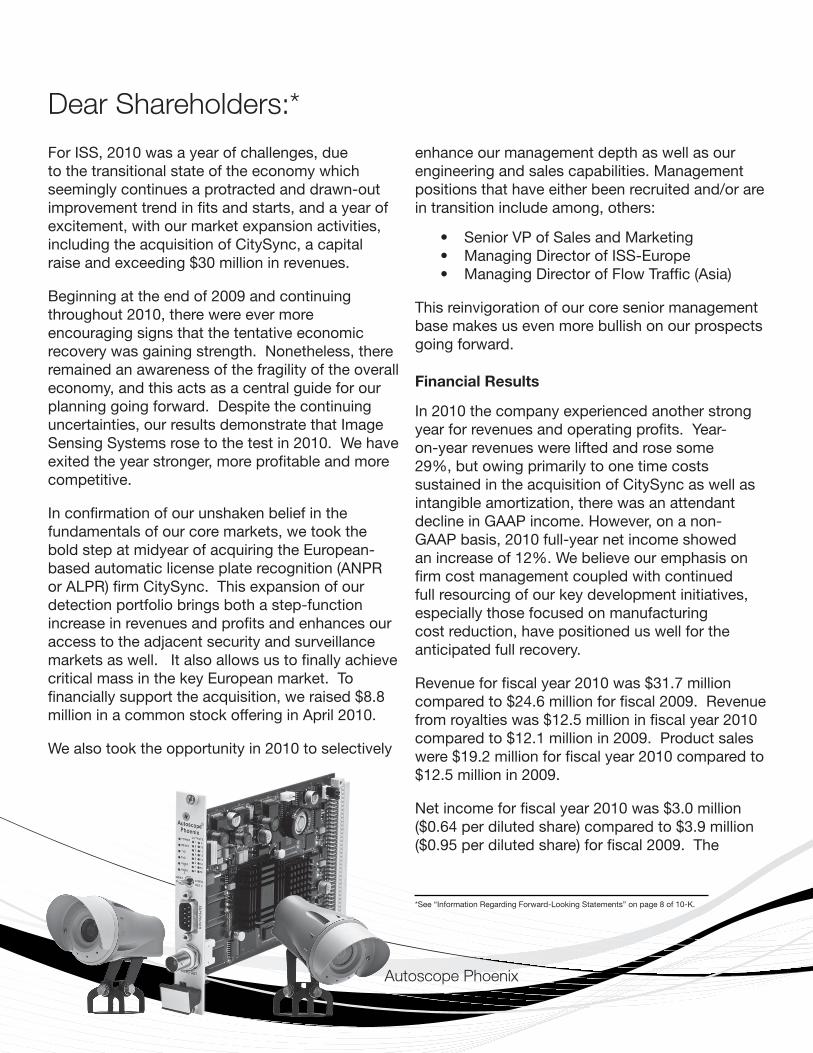
Autoscope Phoenix

results for 2010 include the impact of acquisition expenses incurred in conjunction with our June purchase of CitySync Limited as well as its operational activity post-acquisition, and the 2010 per share results are further impacted by the issuance of 798,000 shares of common stock in our stock offering.
On a non-GAAP basis, net income for the fiscal year 2010 was $4.6 million ($0.99 per diluted share) compared to $4.1 million ($1.01 per diluted share) for 2009. This is excluding intangible asset amortization net of tax and acquisition related expenses.
Our international business saw some recovery from 2009, with Asia experiencing more of a rebound from a percentage perspective than Europe. Our RTMS® (radar) activities were improved when viewed year-on-year, taking into account both domestic and international sales. Broadly, our Autoscope® (video) business was flat-to-improving in all sectors, including international and domestic.
Underlying Strategy
The following enumerates the strategic goals that were recently adopted by the Board of Directors of Image Sensing Systems Inc. They are:
• Enhance share value through focused organic revenue and profit growth;
• Redouble emphasis on operational execution;
• Timely achievement of key product launches, including hybrid products;
• Complete the integration of previous acquisitions;
• Expand selling capacity and sales distribution channels; and
• Broaden the pool of senior managers to better support the strategic goals.

In the background, most certainly growing network ubiquities, unabated cost compression and functionality/speed improvements of semiconductor components, underlying demographic shifts and a host of other macro trends are influences in ISS’ markets.
Overwhelmingly, though, in our opinion, one unremitting and incompressible driver is the mainstay influence. Stated simply, it is that for some decades now, the capacity of the world to manufacture cars and put them on the roads has greatly outstripped the civil infrastructure building rate willingness, and perhaps even capabilities, of the planet to construct new roads to cope with them.
The observably apparent net effect is that in both emerging and developed economies, roadways, especially in cities, are always in the process of being saturated by cars. The growth of traffic congestion only seems to expand year-on-year, and many credible predictions point to the high likelihood of the problem continuing to get worse.
In grappling with this problem, a civil infrastructure response alone is inadequate. The developed Western world (North America and Western Europe) has in effect filled its cities and countryside with asphalt and concrete roadways for the better part of the last century and beyond, yet many
These strategic goals will also guide us as we, among other areas, work towards bringing advanced hybrid technologies to market and reaching total integration of previous acquisitions. Our experience in conjunction with these strategy goals positions us to further enhance shareholder value, and as the recovery builds, we will continue to pursue these strategy goals aggressively.
Product Demand Drivers
We provide Computer Enabled Detection (CED) solutions which combine embedded software signal processing with sophisticated sensing technologies for use in ITS (intelligent transportation systems) and safety/security/surveillance management. CED is a group of technologies in which software rather than humans examines a field of view of complex sensors to extract selected information of interest. That information is then expressed as real-time data.
Our primary markets are ITS and safety/security/surveillance, which have a diverse set of drivers, one of which underpins all the others.
RTMS Echo

urban and interurban roadways remain stubbornly saturated to this day.
And the emerging economies of Asia and Eastern Europe arguably fare no better. The Chinese (PRC) are progressing an ambitious road building program at a pace unparalleled in human history, but in spite of their amazing efforts, traffic in Beijing and Shanghai and other major Chinese cities quickly became and remains intractable.
Confronted with the shortcomings of a civil infrastructure response, the viable alternative is a technological solution. At their heart, many demonstrably workable technological solutions have the need for real-time detection as their common denominator.
Coupled with the foregoing dominant theme, there are gathering worries as regards public security and safety. In conjunction with unabated cost compression pressures, ever more accurate CED products are the only viable response.
And at its core, that is what ISS does. The software based products that we provide directly respond to this problem.
In our view, above ground detection*, including our software based video and radar offerings, provides the best life-cycle-cost real-time detection for ITS, safety/security/surveillance and other nearly adjacent applications. We believe that we will strongly benefit from these trends.
Markets
As a primarily “B-to-G” (business-to-government) business, the vast majority of end-users of our offerings are government entities or providers of services to government entities (including cities, states, counties, etc.). We provide infrastructure productivity and safety/security improvements to these end-customers through a mix of tiered distribution and direct sales. Our offerings allow roadways, bridges, tunnels, intersections, parking lots, etc. to be more efficient and safer. The government entities are predominately funded through tax revenues, which tend to rise and fall
According to CCTV, Beijing’s traffic levels
have increased by 130 percent from 2009 to
2010. In 2009, the Beijing-Tibet expressway
traffic was estimated to carry roughly 6,000
cars per day; this figure has now risen to
14,000.
China’s Great Wall of Traffic Jamby Katherine Zhu
ABC News 03 Sep 2010
The cost of traffic congestion hit $87.2
billion in wasted fuel and lost production, or
$750 per traveler. By contrast, the cost of
congestion in 1982 was only $16.7 billion,
adjusted for inflation, or $290 per person.
America: Still Stuck in Traffic by Randy James
TIME 09 Jul 2009
Traffic congestion in the USA’s 100 biggest
metropolitan areas increased by 11% last year
and should only get worse as the economy
improves and more people get behind the
wheel to get to work.
Metro area’s traffic congestion up 11% in 2010by Larry Copeland
USA TODAY08 Mar 2011
CitySync JellyBean
*Note: “above ground detection” is what we do; “below ground detection” refers to legacy technologies in which a loop of wire or similar is embedded in the pavement to detect vehicles.

two-dimensional radar developments are being based.
Lastly, the developmental integration of our newly acquired CitySync business is now in full swing. Initially here, the emphasis will be on manufacturing cost reduction with an eye to margin improvement.
ISS’ RTMS radar products engineering activities additionally complement the development of hybrid technology detectors. Hybrid detectors are devices which combine two or more types of sensors (video and radar) into a single detector. Such devices will make it possible for the weaknesses of one detector to be offset by the strengths of the other and vice versa, which in turn will result in a detector able to perform better than either sensor type taken separately.
Conclusions
For over half a decade prior to 2009, ISS produced a consistent record of both revenue and profitability growth coupled with a steadily strengthening balance sheet. The unprecedented recession beginning in late 2008 and continuing for the better part of 2009 brought a pause to that profitability and revenue growth record. In contrast, 2010 was a year of return to both revenue and income growth.
Throughout the year, we placed strong emphasis on engineering and development activities which would result in substantive manufacturing cost reduction and those that would best position us for the anticipated recovery. Further, in confirmation of our unwavering belief in the fundamentals of our core markets, in midyear we made a substantial acquisition which brought both market as well as product portfolio expansion. We continue to focus on steadfastly pursuing our strategy.
Ken
in sync with the economy as a whole. Noting the slow climb out of global recession for the better part of 2010, many, if not all, local and state governments experienced unprecedented deficits which in turn have prompted infrastructure expenditure deferrals and cut-backs. We continue to feel the effects of this phenomenon and expect residual aspects to be a lingering aspect going forward, although on a diminishing basis.
Viewed geographically, North America continues to be our largest market. Even with the inclusion of our newly acquired ANPR product line, this will likely remain the case for some time to come. As in previous years, our Autoscope marketing focus for North America remains centered around a cooperative and symbiotic interaction in support of Econolite, whereas our RTMS and CitySync businesses are treated more independently. Although the markets in Europe, Asia, Latin America and the Middle East continue to be emerging markets, it is our expectation and strategic intent that the EMEA and Asian markets will grow at a faster rate than our core North American market across the breadth of our product portfolio offering.
Technology Developments and Engineering
The June acquisition of our new CitySync ANPR business saw a broadening of our product offering portfolio. Another analogous step to that end was the earlier acquisition of the RTMS product line via the EIS asset purchase. As a complementary pursuit, it is also our intention to broaden our portfolio offering by organic means as well. On that basis, we will continue the considered enhancement of our engineering capacity at a pace in sync with our revenue and income growth as it is experienced.
Specific to the Autoscope Terra product line, the platform remains our mainstream video product offering. New developments are primarily directed towards manufacturing cost reduction. There remains, as is typical, an undercurrent level of sustaining engineering.
For the radar segment, the RTMS G4 high resolution version continues as our main offering, having now virtually fully displacing the X3 generation. This is the platform on which ongoing

UNITED STATES SECURITIES AND EXCHANGE COMMISSION
WASHINGTON, D.C. 20549
FORM 10-K
ANNUAL REPORT PURSUANT TO SECTION 13 OR 15(d) OF THE SECURITIES EXCHANGE ACT OF 1934 For the fiscal year ended December 31, 2010
OR
TRANSITION REPORT PURSUANT TO SECTION 13 OR 15(d) OF THE SECURITIES EXCHANGE ACT OF 1934
For the transition period from ____________ to ____________
Commission file number: 0-26056
Image Sensing Systems, Inc. (Exact name of registrant as specified in its charter)
Minnesota 41-1519168 (State or other jurisdiction of incorporation or organization) (I.R.S. Employer Identification No.)
500 Spruce Tree Centre, 1600 University Avenue West, St. Paul, MN 55104
(Address of principal executive offices) (Zip Code)
(651) 603-7700 (Registrant’s telephone number, including area code)
Not applicable. (Former name, former address and former fiscal year, if changed since last report)
Securities registered pursuant to Section 12(b) of the Act:
Title of each class Name of each exchange on which registered Common Stock, $0.01 par value The NASDAQ Capital Market
Securities registered pursuant to Section 12(g) of the Act: None.
Indicate by check mark if the registrant is a well-known seasoned issuer, as defined in Rule 405 of the Securities Act. Yes No
Indicate by check mark if the registrant is not required to file reports pursuant to Section 13 or 15(d) of the Act. Yes No
Indicate by check mark whether the registrant (1) has filed all reports required to be filed by Section 13 or 15(d) of the Securities Exchange Act of 1934 during the preceding 12 months (or for such shorter period that the registrant was required to file such reports) and (2) has been subject to such filing requirements for the past 90 days. Yes No
Indicate by check mark whether the registrant has submitted electronically and posted on its corporate Web site, if any, every Interactive Data File required to be submitted and posted pursuant to Rule 405 of Regulation S-T during the preceding 12 months (or for such shorter period that the registrant was required to submit and post such files). Yes No
Indicate by check mark if disclosure of delinquent filers pursuant to Item 405 of Regulation S-K is not contained herein, and will not be contained, to the best of registrant’s knowledge, in definitive proxy or information statements incorporated by reference in Part III of this Form 10-K or any amendment to this Form 10-K. �
Indicate by check mark whether the registrant is a large accelerated filer, an accelerated filer, a non-accelerated filer or a smaller reporting company. See the definitions of “large accelerated filer,” “accelerated filer,” and “smaller reporting company” in Rule 12b-2 of the Exchange Act. (Check one):
Large accelerated filer Accelerated filer Non-accelerated filer
(Do not check if a smaller reporting company.) Smaller reporting company
Indicate by check mark whether the registrant is a shell company (as defined in Rule 12b-2 of the Act). Yes No
As of June 30, 2010, the aggregate market value of the registrant’s common stock held by non-affiliates of the registrant was $44,962,906 based on the closing sale price as reported on The NASDAQ Capital Market. The number of shares outstanding of the registrant’s $0.01 par value common stock as of February 28, 2011 was 4,880,619 shares.
DOCUMENTS INCORPORATED BY REFERENCE
Document Parts Into Which Incorporated
Proxy Statement for the 2011 Annual Meeting of Shareholders (Proxy Statement)
Part III

TABLE OF CONTENTS
PART I
Item 1. Business .................................................................................................................................................................................................... 1
Item 1A. Risk Factors ............................................................................................................................................................................................. 8
Item 1B. Unresolved Staff Comments ................................................................................................................................................................. 15
Item 2. Properties............................................................................................................................................................................................... 15
Item 3. Legal Proceedings ................................................................................................................................................................................. 15
Item 4. [Removed and Reserved] ...................................................................................................................................................................... 15
PART II
Item 5. Market for Registrant’s Common Equity, Related Stockholder Matters and Issuer Purchases of Equity Securities ................. 16
Item 6. Selected Financial Data ........................................................................................................................................................................ 18
Item 7. Management’s Discussion and Analysis of Financial Condition and Results of Operations .......................................................... 19
Item 7A. Quantitative and Qualitative Disclosures About Market Risks ........................................................................................................ 26
Item 8. Financial Statements and Supplementary Data ................................................................................................................................. 27
Item 9. Changes in and Disagreements with Accountants on Accounting and Financial Disclosure .......................................................... 43
Item 9A. Controls and Procedures ...................................................................................................................................................................... 43
Item 9B. Other Information ................................................................................................................................................................................ 43
PART III
Item 10. Directors, Executive Officers and Corporate Governance ................................................................................................................ 44
Item 11. Executive Compensation ...................................................................................................................................................................... 44
Item 12. Security Ownership of Certain Beneficial Owners and Management and Related Stockholder Matters ..................................... 44
Item 13. Certain Relationships and Related Transactions, and Director Independence ............................................................................... 44
Item 14. Principal Accounting Fees and Services .............................................................................................................................................. 44
PART IV
Item 15. Exhibits and Financial Statement Schedules ...................................................................................................................................... 45
Signatures ...................................................................................................................................................................................................................... 48

1
PART I
Item 1. Business
Business
Image Sensing Systems, Inc. (referred to in this report as “we,” “us,” “our” and the “Company”) develops and markets video and radar image processing products for use in traffic, security, police and parking applications such as intersection control, highway, bridge and tunnel traffic management, venue security, entry control, license plate recognition and traffic data collection.
We are a leading provider of software-based computer enabled detection, or CED, products and solutions for the intelligent transportation systems, or ITS, industry and adjacent security and law enforcement markets. Our family of products, which we market as Autoscope®, RTMS® and CitySync, provides end users with the tools needed to optimize traffic flow, enhance driver safety, regulate air quality and address security/surveillance concerns. Our technology analyzes signals from sophisticated sensors and transmits the information to management systems and controllers or directly to users.
CED is a process in which software rather than humans examines outputs from various types of sophisticated sensors to determine what is happening in a field of view. In the ITS industry, CED is a critical component of managing congestion and traffic flow. In many markets, it is not possible to build roads, bridges and highways quickly enough to accommodate increasing automobile ownership. For example, in 2007 there were approximately 3.0 million vehicles in Moscow, and the number of vehicles is expected to increase by 50% to 4.5 million vehicles by 2012. In China, 13.8 million vehicles were introduced in 2010, up from the 9.4 million vehicles introduced in 2008. This is expected to rise to 19.0 million in 2011. We believe this growing use of vehicles worldwide will make CED-based ITS solutions increasingly necessary to complement existing and new roadway infrastructure to manage traffic flow and optimize throughput.
We believe our CED solutions are technically superior to those of our competitors because they have a higher level of accuracy, limit the occurrence of false detection, are generally easier to install with lower costs of ownership, work effectively in a multitude of light and weather conditions, and provide end users the ability to manage inputs from a variety of sensors for a number of tasks. It is our view that the technical advantages of our products make our solutions well suited for use in ITS as well as adjacent security markets. We believe that the market for CED is increasingly favoring converged solutions that include ITS, security/surveillance and environmental management, which we expect to increase demand for CED products such as ours.
We believe the strength of our distribution channels positions us to increase the penetration of our technology-driven solutions in the marketplace. We market our Autoscope products in North America, the Caribbean and Latin America through an exclusive agreement with Econolite Control Products, Inc., or Econolite, which we believe is the leading distributor of ITS intersection control products in North America and the Caribbean. We market our Autoscope products outside of North America, the Caribbean and Latin America and our RTMS and CitySync products through a combination of distribution and direct sales channels, including our wholly-owned subsidiaries in Hong Kong, Poland and the United Kingdom. Our end users primarily include governmental agencies and municipalities, and, as of December 31, 2010, we had sold over 120,000 units in more than 60 countries.
In June 2010, we purchased all of the outstanding equity of CitySync Limited, or CitySync. CitySync was a privately-held, European-based developer and marketer of automatic number plate recognition, or ANPR, products and solutions. In December 2007, we completed our purchase of certain assets of EIS Electronic Integrated Systems, Inc., or EIS. EIS was a leading provider of radar-based detection solutions. In addition to the increased scale we gain through these transactions, the addition of EIS’ and CitySync’s products and operations expands our addressable markets and selling presence, enables us to provide a wider array of CED products to our end user, and supports the introduction of hybrid product offerings to help drive market demand.
Industry Overview
The Intelligent Transportation Systems Market. The market for ITS is large and growing. According to a September 2010 report by Global Industry Analysts, Inc., total ITS sales in the United States and Europe for 2009 were approximately $4.2 billion and $3.4 billion, respectively, and total global ITS sales were approximately $10.8 billion. Global Industry Analysts expects total global ITS sales to reach $18.6 billion by the end of 2015, representing a compound annual growth rate of 10.0% for the period from 2007 to 2015.
ITS encompasses a broad range of information processing and control electronics technologies that, when integrated into roadway infrastructure, help monitor and manage traffic flow, reduce congestion and enhance driver safety. The ITS market has been built around the detection of conditions that impact the proper operation of roadway infrastructure. ITS applications include a wide array of traffic management systems, such as traffic signal control, tolling and variable messaging signs. ITS technologies include

2
video vehicle detection, automatic number plate recognition, inductive loop detection, sensing technologies (such as radars), floating cellular data, computational technologies and wireless communications.
In traffic management applications, CED products are used for automated vehicle detection and are a primary data source upon which ITS solutions are built. Traditionally, automated vehicle detection is performed using inductive wire loops buried in the pavement. However, in-pavement loop detectors are costly to install, difficult to maintain, expensive to repair and not capable of wide-area vehicle detection without installations of multiple loops nor recognizing license plate numbers.
Above-ground CED solutions for ITS offer several advantages to in-pavement loop detectors. Above-ground CED solutions tend to have lower total cost of ownership than in-pavement loop detectors because above-ground CED solutions are non-destructive to road surfaces, do not require closing roadways to install or repair, and are capable of wide-area vehicle detection with a single device, thus enabling one input device to do the work of many in-pavement loops. Due to their location above ground, CED solutions have no exposure to the wear and tear associated with expanding and contracting pavement and generally less exposure to the vibration and compaction caused by traffic. Furthermore, in the event of malfunction or product failure, above-ground CED solutions can be serviced and repaired without shutting down the roadway. Each of these factors results in greater up-time and increased reliability of above-ground CED solutions compared to in-pavement loop detectors. Above-ground CED solutions also offer a broader set of detection capabilities and a wider field of view than in-pavement loop detectors. For example, unlike in-pavement loops, above-ground CED solutions can detect smoke and debris. In addition, a single unit video- or radar-based CED system can detect and measure a variety of parameters, including vehicle presence, counts, speed, length, time occupancy, headway and flow rate as well as environmental factors and obstructions to the roadway. An equivalent installation using loops would require many installations per lane.
We believe our Autoscope and RTMS products are competitive with and can take market share from in-pavement loop detectors. Based on our determination, the U.S. ITS above ground detection market sales in 2010 were approximately $160 million and were growing on average approximately 15% per year until the recession of 2009. We also have determined that the market in 2009 and 2010 was flat or slightly down from 2008 levels as governments in North America and Europe faced budgetary constraints. We believe that we are the leader in the U.S. above ground detection market in terms of unit sales, and we estimate that U.S. sales of the in-pavement loop detectors our Autoscope and RTMS products can supplant were approximately $300 million in 2010.
Our CitySync solutions add further to our offerings in ITS. In many ITS applications, such as tolling or journey time measurement, it is critical to ascertain the identity of the vehicle or to be able to uniquely identify a vehicle at a different time or location. ANPR is among the most widely used methods for these applications.
We believe that several trends are driving the growth in ITS and adjacent market segments:
Proliferation of Traffic. In many countries, there has been a surge in the number of vehicles on roadways. Due to the growth of emerging economies and elevated standards of living, more people desire and are able to afford automobiles. For example, in China, 13.8 million vehicles were introduced in 2010, up from the 9.4 million vehicles introduced in 2008. This is expected to rise to 19.0 million in 2011. The number of vehicles utilizing the world’s roadway infrastructure is growing at a quicker pace than new roads, bridges and highways are being constructed. The population of the United States has grown by about 30%, or 70 million, from 1982 to 2007, while highway miles have increased by approximately 5% in the same period. Between 1970 and 2005, the number of registered highway vehicles in the U.S. increased from 111 million to 247 million. Overall, the growth in roadway infrastructure is failing to match the surge in the number of vehicles using it. CED-based traffic management and control systems attempt to solve the problem by monitoring high traffic areas and analyzing data that can be used to mitigate traffic problems.
The Demographics of Urbanization. Accelerated worldwide urbanization drives the creation and expansion of middle classes and produces heightened demand for automobiles. Currently, there are over 400 cities in the world with over 1 million people. Since automobiles can be introduced to a metropolitan area faster than roadway infrastructure can be constructed, the result is continuously worsening traffic. Because expanding the roadway infrastructure is slow and costly to implement, and often environmentally undesirable, government agencies are increasingly turning to technology-based congestion solutions that optimize performance and throughput of existing and new roadway infrastructure. Detection is the requisite common denominator for any technology-based solution.
The Melding of Large City Service Domains. Large cities require a wide range of service domains, including traffic, security/surveillance and environmental protection. These cities are increasingly turning to centralized management of these service domains, employing a command and control model that requires sharing and integrating data across service domains to operate effectively – so called “Smart Cities” initiatives. For example, data collected for the traffic management service domain is relevant to all of the other service domains. This means that each CED sensor can supply information to multiple domain services. In turn, the sharing of detection information across service domains should increase the level of sophistication required to process and interpret that information.

3
Advances in Wireless Technology Create the Ubiquitous Network. Businesses and government entities, motivated by the need for improved productivity and functionality, are increasingly adopting pervasive, networked information systems. The internet and widely available broadband networks, including recent advances in wireless technologies such as mesh networks, have greatly reduced the deployment costs of adding broadly distributed CED solutions to existing information systems. The lower cost of deployment should increase demand for CED.
The Ascendancy of CED. Electronics of all sorts are becoming smaller and less costly to manufacture, while becoming more capable of performing certain complicated tasks than humans. CED solutions benefit from these trends. Of particular significance is the evolving concept of hybrid detection in which two or more sensing types such as radar and video are combined in a common CED device in which the weaknesses of each are synergistically offset by the strengths of the other. By leveraging a common digital signal processor and network interface, we believe the incremental cost of a hybrid device will be significantly lower than deploying multiple, single-sensor CED devices. This makes the concepts of “rich sensing” and “instrumenting the city” through CED solutions cost effective, which we believe will result in the extensive proliferation of sophisticated sensors and detection devices.
The non- ITS Automatic Number Plate Recognition Market. In addition to ITS, ANPR is widely used for applications in security, police and parking, among others. We believe the sum of these markets is significant and currently is in excess of $200 million for their ANPR components. We also believe the competitive landscape is fragmented, with no dominant market share for any one competitor.
Security. ANPR is used in security applications world-wide for border-crossings, airports and venues such as convention centers or sports arenas. Additionally, private industry uses ANPR to help control entrances at high value locations, such as power plants. Homeland security and counter-terrorism activities benefit from ANPR as part of the solution.
Police. Law enforcement has adopted ANPR for a variety of applications. Police may use ANPR to gather information on a stopped vehicle in a faster, automated fashion. ANPR can scan for vehicles of interest from a fixed position or from a moving police vehicle, looking for stolen cars or for automobiles of individuals with arrest warrants outstanding. Also, ANPR is regularly used as a component of red light, speed and bus lane enforcement systems.
Parking. Both public and private parking facilities have recently undergone a significant period of automation where human attendants have been replaced by machines that control access. ANPR is employed in numerous parking functions including automatic entrance/exit, open spot locator assistance, lost vehicle location, theft-avoidance and related security aspects.
Solutions for Adjacent Markets. We believe that the adjacent markets of ITS, security/surveillance and environmental management are converging, and that this convergence will accelerate as CED systems become more cost-effective when a single CED unit can be used for multiple purposes. Because the CED technologies involved are closely related, our CED technology can be adapted to or is already capable of addressing these adjacent markets.
We believe that environmental management systems will become a necessity, especially in large cities where the costs of air pollution are being increasingly borne by city residents. Long traffic delays result in idling vehicles that have adverse effects on urban areas. In conjunction with video detection for ITS, CED products can help governmental agencies reduce air pollution and energy consumption by controlling traffic flow and reducing travel time, accidents and delays. The convergence of traffic, security/surveillance and environmental management should drive significant continued CED demand growth.
Our Competitive Strengths
We are a leading provider of software-based CED products and solutions for the ITS industry and related security and law enforcement markets. We have the following competitive strengths that we expect will continue to enhance our leadership position:
Leading Proprietary Technologies. Over the last two decades, we have developed or acquired a proprietary portfolio of complex software algorithms and applications that we have continuously enhanced and refined. These algorithms, which include our advanced signal processing technologies, allow our video and radar detection products to capture and analyze objects in diverse weather and lighting conditions and to balance the accuracy of positive detection and the avoidance of false detections. Due to the strength of our proprietary technologies, we believe we command premium pricing. CED technologies similar to ours are also difficult to develop and refine in a commercially viable manner. We therefore should be well positioned to quickly introduce next-generation products to market.
Proven Ability to Develop, Enhance and Market New Products. We are continually developing and enhancing our product offerings. Over the last two decades, we have demonstrated our ability to lead the market with new products and product enhancements. For example, the Autoscope Solo system was the first fully integrated color camera, zoom lens and machine vision processor in the above ground detection market. EIS was one of the first companies to introduce radar-based technology solutions for
4
ITS applications, and it has continued to lead the market with technology enhancements and new products, such as RTMS. Additionally, the CitySync system was the first in the ANPR market to capture multiple license plates in the same lane with a standard configuration. We have successfully collaborated with our long-term channel partners to market these new products. We believe that developing, enhancing and marketing new products with our partners translates into strong organic revenue growth and high levels of profitability.
Leading Distribution Channel. We have maintained a relationship with Econolite for the distribution of our Autoscope products in North America and the Caribbean since 1991 and in Latin America since 2002. We believe that Econolite is the leading distributor of ITS control products in North America and the Caribbean. In our view, this relationship enhances our ability to commercialize and market new products and allows us to focus more resources on developing advanced signal processing software algorithms.
Broad Product Portfolio. Our product portfolio leverages our core software-based algorithms for CED to enable end users to detect and monitor objects in a designated field of view. We believe that our family of Autoscope, RTMS and CitySync products allows us to offer a broad product portfolio that meets the needs of our end users. Additionally, our intention is to use our broad product portfolio to offer hybrid products that satisfy traffic, security/surveillance and environmental management requirements.
Experienced Management Team and Engineering Staff. Our management team and engineering staff are highly experienced in the ITS and software industries. Additionally, the continuity of our engineering staff should allow us to continuously develop new or improved products.
Strong Financial Performance. Prior to the recession in 2009, we had profitably grown our revenue organically at an average double-digit compound annual growth rate over the six year period from 2003 through 2008. As of December 31, 2010, we had $46.0 million in shareholders’ equity. We believe our financial performance and strength gives us the ability to take advantage of favorable market trends without the restrictions that often handicap other technology companies similar to us in size.
Our Growth Strategy
As part of our growth strategy, we seek to:
Enhance and Extend Our Technology Leadership in ITS. We believe we have established ourselves as a leading provider of CED in the ITS market segment. We believe that we continue to have an opportunity to accelerate our growth. We plan to do this by improving the accuracy and functionality of our products and opportunistically expanding our product offering into adjacent markets, as well as expanding our portfolio and channels through licensing. We intend to develop and introduce hybrid CED products to take advantage of our technical leadership in ITS and further differentiate us from our competitors.
Expand Success in ANPR Markets. Prior to our acquisition of CitySync in June 2010, it had an annual revenue run rate in excess of $7.0 million and had 10 years of experience in ANPR. We believe that the ANPR market is poised for growth at a higher rate than the ITS market. Further, we believe that our financial strength, distribution channels and customer base will add to our ability to grow CitySync related revenue. We believe these synergies could lead to above average revenue growth.
Expand into Adjacent Markets. Our core skill is the implementation of software-based CED products and solutions. Over the past two decades, we have been developing and refining our complex signal processing software algorithms. We should be able to effectively utilize our core software skills more broadly as markets, including security/surveillance and environmental management systems, converge. We believe that a driver of this convergence is that CED systems will become more cost-effective when a single CED unit can be used for multiple purposes. As a result, our objective is to become the leading supplier of critical CED components to third party management systems, particularly those that exploit the convergence of traffic, security/surveillance and environmental management systems. To do this, we are integrating this concept into our long-range engineering development road-map and will evaluate the use of technology licensing and channel strategies that support this vision.
Increase the Scope of Our Distribution and Direct Sales. We have made substantial investments in product adjustments to tailor our solutions to the differing needs of our international end users and in new product acquisitions for both domestic and international markets. We have also invested in sales and marketing expansion, with a focus on our European and Asian subsidiaries. The addition of CitySync brought further critical mass to our European organization. Markets in Eastern Europe, the Asia/Pacific region, the Middle East, Africa and South America, which have historically lagged North America and Western Europe in their use of CED, have recently begun to increase the adoption of CED in their traffic, security/surveillance and environmental management systems. We intend to continue to refine our product offerings through engineering development and technology licensing to take advantage of the accelerated pace of the adoption of CED throughout the developing world.

5
Our Products and Solutions
Our vehicle and traffic detection products are critical components of many ITS and adjacent security and law enforcement applications. Our Autoscope video systems and RTMS radar systems convert sensory input collected by video cameras and radar units into vehicle detection and traffic data used to operate, monitor and improve the efficiency of roadway infrastructure. Our CitySync systems use video sensors in the visible and infrared spectrums to read license or number plates for tolling, traffic data, security, police and parking applications. At the core of each product line are proprietary digital signal processing algorithms and sophisticated embedded software that analyze sensory input and deliver actionable data to integrated applications. We invested approximately $3.6 million, $3.3 million and $2.9 million on research and development in 2010, 2009 and 2008, respectively, to develop and enhance our product technology. Our digital signal processing software algorithms represent a foundation on which support for additional sensory inputs such as acoustic, chemical, smoke, weather and vibration sensors may be added in the future. A diagram displaying our fundamental product architecture is shown below.
The Image Sensing Product Architecture
Autoscope. Our Autoscope system processes video input from a traffic scene in real time and extracts the required traffic data, including vehicle presence, counts, speed, length, time occupancy (percent of time the detection zone is occupied), average headway (time interval between vehicles) and flow rate (vehicles per hour per lane). Autoscope supports a variety of standard video cameras or can be purchased with an integrated video camera. For intersections, the system communicates with the intersection signal controller, which changes the traffic lights based on the data provided. In highway applications, the system gathers vehicle count and flow rates and detects anomalous incidents, such as stopped or wrong-way vehicles. In tunnel safety applications, Autoscope provides alerts to operators upon detecting stopped, wrong-way or slow moving vehicles and upon detecting pedestrians, debris or smoke. In any application, the data may also be transmitted to a traffic management center via the internet or other standard communication means and processed in real time to assist in traffic management and stored for later analysis for traffic planning purposes.
The Autoscope system runs on our Terra platform, which we introduced in April 2007. Enhancements to the Terra platform include the use of the Texas Instruments DaVinci dual core advanced RISCTM machine and digital signal processor, digital MPEG-4 video streaming, high speed Ethernet interface, web browser maintenance and data and video over power line communications.
The Terra platform comes in two varieties. Autoscope Solo Terra is our integrated color zoom camera and machine vision processing computer contained in one compact housing unit that is our leading Autoscope offering in the North American market. Autoscope RackVision is our card only machine vision processing computer that is located in an intersection signal controller, control hub, incident management center or traffic management center that receives video from a separate camera. The RackVision and its variants are our top selling Autoscope products in international markets.
RTMS. Our RTMS systems use radar to measure vehicle presence, volume, occupancy, speed and classification information for roadway monitoring applications. Data is transmitted to a central computer at a traffic management center via standard

6
communication means, including wireless. Data can be processed in real time to assist in traffic management and stored for later analysis for traffic planning purposes.
RTMS is an integrated radar transmitter/receiver and special purpose computer contained in a compact, self-contained unit. The unit is typically situated on roadway poles and side-fired, making it especially well suited for highway detection applications.
CitySync. Our CitySync systems process video information gathered from the visible and infrared spectrum to perform ANPR for ITS, security, police and parking applications. Data is transmitted to other integrated systems or stored in onboard vehicle systems for later processing. Data can be processed to assist in traffic and parking management, tolling applications, real-time law enforcement and traffic alerts and stored for later analysis for traffic, security and commercial purposes.
At the core of each CitySync system is the JetBase software suite which runs the ANPR algorithms and related processes including communications. JetBase operates with both non-proprietary and proprietary cameras. We offer a range of proprietary analog, high definition and intelligent cameras for both fixed and mobile systems.
Comparison of Detection Types. Video detection is best suited to applications in which the ability to act on complex and detailed information is desired. However, video can encounter difficulties in poorly-lit environments, in adverse weather conditions (such as fog or driving snow), in situations in which vehicles are obscured (for example, by other vehicles), or in extraordinarily dirty environments in which airborne particulates obscure the view. Also, despite the compensating factors of using high-quality color video, video can be susceptible to false detections due to shadows or reflections. Radar is less able to distinguish fine details than video but is considerably less affected by adverse environmental conditions and to some degree can see through certain kinds of obstructions. It also does not recognize shadows or visual reflections.
By combining video and radar sensors and algorithmically comparing their outputs, we believe we will be able to offer our end users products that provide superior accuracy. Hybrid CED detectors should be able to coalesce the strengths of each type of sensor to overcome the other’s limitations. The result will be improved overall performance in a broader range of circumstances.
Distribution, Sales and Marketing
We market and sell our products globally. As of December 31, 2010, we had supplied systems for more than 120,000 units in more than 60 countries. Together with our partners, we offer a combination of high-performance CED technology and experienced local support. Our end users primarily consist of federal, state, city and county departments of transportation, port, highway, tunnel, toll and other transportation authorities, law enforcement agencies and parking facility operators. The decision-makers within these entities typically are traffic planners and engineers, who in turn often rely on consulting firms that perform planning and feasibility studies. Our products sometimes are sold directly to system integrators or other suppliers of systems and services who are operating under subcontracts in connection with major road construction contracts.
Autoscope North American, Caribbean and Latin American Sales. We have granted Econolite an exclusive right to manufacture, market and distribute the Autoscope system in North America, the Caribbean and Latin America. The agreement with Econolite grants it a first refusal right that arises when we make a proposal to Econolite to extend the license to additional products in North America, the Caribbean and Latin America and a first negotiation right that arises when we make a proposal to Econolite to include rights corresponding to Econolite’s rights under our current agreement in countries not in these territories. Econolite provides the marketing and technical support needed for its sales in these territories. Econolite pays us a royalty on the revenue derived from its sales of the Autoscope system. We cooperate in marketing Autoscope products with Econolite for North America, the Caribbean and Latin America and provide second-tier technical support. We have the right to terminate our agreement with Econolite if it does not meet minimum annual sales levels or if Econolite fails to make payments as required by the agreement. In 2008, the term of the agreement was extended to 2028. The agreement can be terminated by either party upon three years’ notice.
RTMS and CitySync North American, Caribbean and Latin American Sales. We market the RTMS and CitySync systems to a network of distributors covering countries in North America, the Caribbean and Latin America. On a limited basis, we sell directly to the end-user. We provide technical support to these distributors from our various North American locations.
European and Asian Sales. We market Autoscope, RTMS and CitySync to a network of distributors covering countries in Europe, the Middle East, Africa and Asia through our wholly-owned subsidiaries that have offices in Hong Kong, Poland and the United Kingdom. On a limited a basis, we sell directly to the end-user. Technical support to these distributors is provided by our wholly-owned subsidiaries in Europe and Asia, with second-tier support provided by our engineering groups.
Competition
We compete with companies that develop, manufacture and sell traffic management devices using video and radar sensing technologies as well as other above-ground CED technologies based on laser, infrared and acoustic sensors. For ITS applications, we

7
also compete with providers of in-pavement loop detectors and estimate that more than 80% of the traffic management systems currently in use in the U.S. use in-pavement loop detectors. For competition with other above-ground CED products, we typically compete on performance and functionality, and to a lesser extent on price. When competing against providers of loop detectors, we compete principally on ease of installation and the total cost of ownership over a multi-year period, and to a lesser extent on functionality.
Among the companies that provide direct competition to Autoscope worldwide are Traficon N.V., Signal Group Inc. (Semex), Iteris, Inc. and Citilog S.A. Among the companies that provide direct competition to RTMS worldwide are Wavetronix, LLC, MS Sedco Inc. and Xtralis, LLC. Among the companies that provide direct competition to CitySync worldwide are Federal Signal Corporation (PIPS), Perceptics LLC, Genetec Inc., Elsag Datamat S.p.a. All of these companies have working installations of their video or radar systems in the U.S. and other parts of the world. To our knowledge, Autoscope and RTMS have the largest number of installations as compared to their direct competitors. In addition, there are smaller local companies providing direct competition in specific markets throughout the world. We are aware that these and other companies will continue to develop technologies for use in traffic management, security, police and parking applications. One or more of these technologies could in the future provide increased competition for our systems.
Other potential competitors of which we are aware include Siemens AG, Cognex Corp., Matsushita Electric Industrial Co., Ltd. (Panasonic), Sumitomo Corporation, Omron Electronics LLC and 3M Company. These companies have machine vision or radar capabilities and have substantially more financial, technological, marketing, personnel and research and development resources than we have.
Manufacturing
Autoscope products for sale under the Econolite license agreement are manufactured through agreements with Econolite and Wireless Technology, Inc. In 1991, we appointed Econolite as our exclusive licensee to manufacture and sell the Autoscope system and related technology and to sell the products in North America and the Caribbean. Econolite is responsible for setting warranty terms and must provide all service required under this warranty. In Europe and Asia, we engage contract manufacturers to manufacture the Autoscope family of products.
For RTMS products, we engage contract manufacturers to produce subassemblies based on our designs. These subassemblies are then shipped to our facilities in Toronto, where we perform final assembly, testing and calibration and packaging of finished units for shipment. We also perform warranty and post-warranty repairs of RTMS units in Toronto.
CitySync products are manufactured through contract manufacturers in the United Kingdom and the United States.
We typically provide a two-year warranty on our products.
Most of the hardware components used to manufacture our products are standard electronics components that are available from multiple sources. Although some of the components used in our products are obtained from single-source suppliers, we believe other component vendors are available should the necessity arise. To our knowledge, our contract manufacturing and component vendors in Europe and Asia comply with the European directive on RoHS, which is the restriction of the use of certain hazardous substances in electrical and electronic equipment.
Intellectual Property
To protect our rights to our proprietary know-how, technology and other intellectual property, it is our policy to require all employees and consultants to sign confidentiality agreements that prohibit the disclosure of confidential information to any third parties. These agreements also require disclosure and assignment to us of any discoveries and inventions made by employees and consultants while they are devoted to our business activities. We also rely on trade secret, copyright and trademark laws to protect our intellectual property.
We intend to protect our intellectual property assets and will actively seek, when appropriate, protection for owned or licensed products and proprietary information by means of U.S. and international copyrights, trademarks, patents and contractual arrangements. We have registered trademark rights to “Autoscope” and “RTMS” in the U.S. and in the European Union (E.U.). We have further registered “Autoscope” in Canada and 10 Asian-Pacific Rim countries, including China, while “RTMS” is pending registration in several additional countries. “CitySync” and “Jet” trademark designs are registered in the U.S. and E.U. We have other product trademarks that we have chosen not to register, but we aggressively monitor and protect their use in the market. Our patent portfolio includes six patents on RTMS technology which are registered in the U.S. and select E.U. countries, one CitySync ANPR patent registered in the U.K. and two CitySync patent applications pending in the U.S. and the E.U.

8
Employees
As of February 28, 2011, we had 123 employees, consisting of 73 employees in North America, 36 employees in Europe and 14 employees in Asia. None of our employees is represented by a union. We believe our employee relations are good.
Item 1A. Risk Factors
Information Regarding Forward-Looking Statements
This Annual Report on Form 10-K contains forward-looking statements within the meaning of Section 27A of the Securities Act of 1933, as amended, and Section 21E of the Securities Exchange of 1934, as amended. Forward-looking statements represent our expectations or beliefs concerning future events and can be identified by the use of forward-looking words such as “believes,” “may,” “will,” “should,” “intends,” “plans,” “estimates,” or “anticipates” or other comparable terminology. Forward-looking statements are subject to risks and uncertainties that may cause our actual results to differ materially from the results discussed in the forward-looking statements. Some factors that might cause these differences include the factors listed below. Although we have attempted to list these factors comprehensively, we wish to caution investors that other factors may prove to be important in the future and may affect our operating results. New factors may emerge from time to time, and it is not possible to predict all of these factors, nor can we assess the affect each factor or combination of factors may have on our business.
We further caution you not to unduly rely on any forward-looking statements, because they reflect our views only as of the date the statements were made. We undertake no obligation to publicly update or revise any forward-looking statements whether as a result of new information, future events or otherwise.
If governmental entities elect not to use our products due to budgetary constraints, project delays or other reasons, our revenue may fluctuate severely or be substantially diminished.
Our products are sold primarily to governmental entities. We expect that we will continue to rely substantially on revenue and royalties from sales of our systems to governmental entities. In addition to normal business risks, it often takes considerable time before governmental initiated projects are developed to the point at which a purchase of our systems would be made, and a purchase of our products also may be subject to a time-consuming approval process. Additionally, governmental budgets and plans may change without warning. Other risks of selling to governmental entities include dependence on appropriations and administrative allocation of funds, changes in governmental procurement legislation and regulations and other policies that may reflect political developments, significant changes in contract scheduling, competitive bidding and qualification requirements, performance bond requirements, intense competition for government business and termination of purchase decisions for the convenience of the governmental entity. Substantial delays in purchase decisions by governmental entities, or governmental budgetary constraints, could cause our revenue and income to drop substantially or to fluctuate significantly between fiscal periods.
A majority of our gross profit has been generated from sales of our Autoscope family of products, and if we do not maintain the market for these products, our business will be harmed.
Historically, a majority of our gross profit has been generated from sales of, or royalties from the sales of, Autoscope products. Gross profit from Autoscope sales accounted for approximately 63% of our gross profit in 2010, 73% in 2009 and 76% in 2008. We anticipate that gross profit from the sale of Autoscope systems will continue to account for a substantial portion of our gross profit for the foreseeable future. As such, any significant decline in sales of our Autoscope system would have a material adverse impact on our business, financial condition and results of operations.
If Econolite’s sales volume decreases or if it fails to pay royalties to us in a timely manner or at all, our financial results will suffer.
We have an agreement with Econolite under which Econolite is the exclusive distributor of the Autoscope system in North America, the Caribbean and Latin America. The agreement grants Econolite a first refusal right that arises when we make a proposal to Econolite to extend the license to additional products in North America, the Caribbean and Latin America. In addition, the agreement grants Econolite a first negotiation right that arises when we make a proposal to Econolite to include rights corresponding to Econolite’s rights under our current agreement in countries not in these territories. In exchange for its rights under the agreement, Econolite pays us royalties for sales of the Autoscope system. Since 2002, a substantial portion of our revenue has consisted of royalties resulting from sales made by Econolite, including 40% in 2010, 49% in 2009 and 50% in 2008. Econolite’s account receivable represented 25% of our accounts receivable at December 31, 2010 and 39% of our accounts receivable at December 31, 2009. We expect that Econolite will continue to account for a significant portion of our revenue for the foreseeable future. Any decrease in Econolite’s sales volume could significantly reduce our royalty revenue and adversely impact earnings. A failure by Econolite to make royalty payments to us in a timely manner or at all will harm our financial condition. In addition, we believe sales

9
of our products are a material part of Econolite’s business, and any significant decrease in Econolite’s sales of the other products it sells could harm Econolite, which could have a material adverse effect on our business and prospects.
The features and functions in our products have not been as widely utilized as traditional products offered by our competitors, and the failure of our end users to accept the features and functions in our products could adversely affect our business and growth prospects.
Video and radar technologies have not been utilized in the traffic management industry as extensively as other more traditional technologies, mainly in-pavement loop detectors. Our financial success and growth prospects depend on the continued development of the market for advanced technology solutions for traffic detection and management and the acceptance of our current Autoscope, RTMS and CitySync systems and also future systems we may develop as reliable, cost-effective alternatives to traditional vehicle detection systems. We cannot assure you that we will be able to utilize our technology profitably in other products or markets. If our end users do not continue to increase their acceptance of the features and functions provided by our current systems or hybrid or other systems we may develop in the future, our business and growth prospects could be adversely affected.
Existing and future laws, regulations and constitutional provisions protecting privacy rights could delay the acceptance and sale of our video and ANPR products and systems and have a negative effect on our financial condition and results of operations.
The use of video and ANPR products and systems has been challenged and limited under existing laws, regulations and constitutional provisions protecting privacy rights. For example, both Maine and New Hampshire have laws limiting the use of ANPR systems. In addition, laws, regulations and constitutional provisions may be adopted in the future to limit the use of video and ANPR products and systems. These existing and new laws, regulations and constitutional provisions could negatively affect the acceptance and sale of our video and ANPR products and systems and thus have a negative effect on our financial condition and results of operations.
Our operating costs tend to be fixed, while our revenue tends to be seasonal, thereby resulting in operating results that fluctuate from quarter to quarter.
Our expense levels are based in part on our product development efforts and our expectations regarding future revenues and, in the short-term, are generally fixed. Our quarterly revenues, however, have varied significantly in the past, with our first quarter historically being the weakest due to weather conditions in North America, Europe and northern Asia that make roadway construction more difficult. Additionally, our international revenues have a significant large project component, resulting in a varying revenue stream. We expect the seasonality of our revenue and the fixed nature of our operating costs to continue in the foreseeable future. Therefore, we may be unable to adjust our spending in a timely manner to compensate for any unexpected revenue shortfall. As a result, if anticipated revenues in any quarter do not occur or are delayed, our operating results for the quarter would be disproportionately affected. Operating results also may fluctuate due to factors such as the demand for our products; product life cycle; the development, introduction and acceptance of new products and product enhancements by us or our competitors; changes in the mix of distribution channels through which our products are offered; changes in the level of operating expenses; end user order deferrals in anticipation of new products; competitive conditions in the industry; and economic conditions generally. No assurance can be given that we will be able to achieve or maintain profitability on a quarterly or annual basis in the future.
Increased competition may make it difficult for us to acquire and retain end users. If we are unsuccessful in developing new applications and product enhancements, our products may become noncompetitive or obsolete.
Competition in the area of ITS, security and parking management is continuing to grow. Some of the companies that may compete with us in the business of developing and implementing traffic control and related security systems have substantially more financial, technological, marketing, personnel and research and development resources than we have. Therefore, they may be able to respond more quickly than we can to new or changing opportunities, technologies, standards or end user requirements. If we are unable to compete successfully with these companies, the market share for our products will decrease, and competitive pressures may seriously harm our business.
Additionally, the market for vehicle detection and ANPR is continuously seeking more advanced technological solutions to problems. Technologies such as embedded loop detectors, pressure plates, pneumatic tubes, radars, lasers, magnetometers, acoustics and microwaves that have been used as traffic sensing devices in the past are being enhanced for use in the traffic management industry, and new technologies may be developed. We are aware of several companies that are developing traffic management devices using machine vision technology or other advanced technology. Floating vehicle and/or radio frequency identification (RFID) tagged license plate initiatives are under consideration and may be implemented. We expect to face increasingly competitive product developments, applications and enhancements. New technologies or applications in traffic control systems from other companies may provide our end users with alternatives to our products and could render our solutions noncompetitive or obsolete. If we are unable to

10
increase the number of our applications and develop and commercialize product enhancements and applications in a timely manner that respond to changing technology and satisfy the needs of our end users, our business and financial results will suffer.
Our dependence on third parties for manufacturing and marketing our products may prevent us from meeting customers’ needs in a timely manner.
We do not have, and do not intend to develop in the near future, internal capabilities to manufacture our products. We have entered into agreements with Econolite and Wireless Technology, Inc., or WTI, to manufacture the Autoscope system and related products for sales in North America, the Caribbean and Latin America. We work with suppliers, most of whom are overseas, to manufacture the rest of our products. We also need to comply with the European Union’s regulatory RoHS directive on the restriction of the use of certain hazardous substances in electrical and electronic equipment. If Econolite, WTI or our other suppliers are unable to manufacture our products in the future, we may be unable to identify other manufacturers able to meet product and quality demands in a timely manner or at all. Our inability to find suitable manufacturers for our products could result in delays or reductions in product shipments, which in turn may harm our business reputation and results of operations. In addition, we have granted Econolite the exclusive right to market the Autoscope system and related products in North America, the Caribbean and Latin America. Consequently, our revenue depends to a significant extent on Econolite’s marketing efforts. Econolite’s inability to effectively market the Autoscope system, or the disruption or termination of that relationship, could result in reduced revenue and market share for our products.
We and our third party manufacturers obtain some of the components of our products from a single source, and an interruption in the supply of those components may prevent us from meeting customers’ needs in a timely manner and could therefore reduce our sales.
Although substantially all of the hardware components incorporated into our products are standard electronics components that are available from multiple sources, we and our third party manufacturers obtain some of the components from a single source. The loss or interruption of any of these supply sources could force us or our manufacturers to identify new suppliers, which could increase our costs, reduce our sales and profitability, or harm our customer relations by delaying product deliveries.
Some of our products are covered by our warranties, and, if the cost of fulfilling these warranties exceeds our warranty allowance, it could adversely affect our financial condition and results of operations.
Unanticipated warranty and other costs for defective products could adversely affect our financial condition and results of operations and our reputation. We generally provide a two-year warranty on our product sales. These warranties require us to repair or replace faulty products, among other customary warranty provisions. Although we monitor our warranty claims and provide an allowance for estimated warranty costs, unanticipated claims in excess of the allowance could have a material adverse impact on our financial condition and results of operations. In addition, the need to repair or replace products with design or manufacturing defects could adversely affect our reputation.
We may face increased competition if we fail to adequately protect our intellectual property rights, and any efforts to protect our intellectual property rights may result in costly litigation.
Our success depends in large measure on the protection of our proprietary technology rights. We rely on trade secret, copyright and trademark laws, and confidentiality agreements with employees and third parties, all of which offer only limited protection. We have six patents related to RTMS technology and one patent related to CitySync technology. However, we cannot assure you that the scope of these or any future patents relating to our products will exclude competitors or provide competitive advantages to us. We also cannot assure you that we will become aware of all instances in which others develop similar products, duplicate any of our products, or reverse engineer or misappropriate our proprietary technology. If our proprietary technology is misappropriated, our business and financial results could be adversely affected. Litigation may be necessary in the future to enforce our intellectual property rights, to protect our trade secrets or to determine the validity and scope of the proprietary rights of others. In addition, we may be the subject of lawsuits by others who claim we violate their intellectual property rights. Even if the result is favorable, litigation could result in substantial costs and the diversion of management resources, either of which could harm our business.
We have not applied for patent protection in all countries in which we market and sell our products. Consequently, our proprietary rights in the technology underlying the Autoscope, RTMS and CitySync systems in countries other than the U.S. will be protected only to the extent that trade secret, copyright or other non-patent protection is available and to the extent we are able to enforce our rights. The laws of other countries in which we market our products may afford little or no effective protection of our proprietary technology, which could harm our business.
11
We plan to continue introducing new products and technologies and may not realize the degree or timing of benefits we initially anticipated, which could adversely affect our business and results of operations.
We regularly invest substantial amounts in research and development efforts that pursue advancements in a range of technologies, products and services. Our ability to realize the anticipated benefits of these advancements depends on a variety of factors, including meeting development, production, certification and regulatory approval schedules; the execution of internal and external performance plans; the availability of supplier-produced parts and materials; the performance of suppliers and vendors; achieving cost efficiencies; the validation of innovative technologies; and the level of end user interest in new technologies and products. These factors involve significant risks and uncertainties. We may encounter difficulties in developing and producing these new products and may not realize the degree or timing of benefits initially anticipated. In particular, we cannot predict with certainty whether, when or in what quantities our current or potential end users will have a demand for products currently in development or pending release. Moreover, as new products are announced, sales of current products may decrease as end users delay making purchases until such new products are available. Any of the foregoing could adversely affect our business and results of operations.
We price certain of our products at a premium compared to other technologies. As such, we may not be able to quickly respond to emerging low-cost competitors, and our inability to do so could adversely affect revenue and profitability.
We price certain of our products at a premium as compared to products using less sophisticated technologies. As the technological sophistication of our competitors and the size of the market increase, competing low-cost developers of machine vision products for traffic are likely to emerge and grow stronger. If end users prefer low-cost alternatives over our products, our revenue and profitability could be adversely affected.
Our revenue could be adversely affected by the emergence of local competitors and local biases in international markets.
Our experience indicates that local officials that purchase traffic management products in the international markets we serve favor products that are developed and manufactured locally. As local competitors to our products emerge, local biases could erode our revenue in Europe and Asia and adversely affect our sales and revenue in those markets.
Our failure to predict technological convergence could harm our business and could reduce our sales.
Within our product families, we currently utilize only certain detection technologies available in the ITS field. If we fail to predict convergence of technology preferences in the market for ITS, or fail to identify and acquire complementary businesses or products that broaden our current product offerings, we may not capture certain segments of the market, which could harm our business and reduce our sales.
We sell our products internationally and are subject to various risks relating to such international activities, which could harm our international sales and profitability.
During 2010, 2009 and 2008, 37%, 25% and 28% of our total revenue, respectively, was attributable to international sales. By doing business in international markets, we are exposed to risks separate and distinct from those we face in our U.S. operations. Our international business may be adversely affected by changing economic conditions in foreign countries. Additionally fluctuations in currency exchange rates could affect demand for our products or otherwise negatively affect profitability. Engaging in international business inherently involves a number of other difficulties and risks, including:
• export restrictions and controls relating to technology;
• pricing pressure that we may experience internationally;
• required compliance with existing and new foreign regulatory requirements and laws;
• laws and business practices favoring local companies;
• longer payment cycles;
• difficulties in enforcing agreements and collecting receivables through foreign legal systems;
• political and economic instability;
• potentially adverse tax consequences, tariffs and other trade barriers;

12
• international terrorism and anti-American sentiment;
• difficulties and costs of staffing and managing foreign operations; and
• difficulties in enforcing intellectual property rights.
Our exposure to each of these risks may increase our costs, lengthen our sales cycle and require significant management attention. One or more of these factors may harm our business.
Our inability to comply with European and Asian regulatory restrictions over hazardous substances and electronic waste could restrict product sales in those markets and reduce profitability in the future.
The European Union has finalized the Waste Electrical and Electronic Equipment, or WEEE, directive, which makes producers of electrical goods financially responsible for specified collection, recycling, treatment and disposal of past and future covered products. This directive must now be enacted and implemented by individual European Union governments, and certain producers will be financially responsible under the WEEE legislation. This may impose requirements on us, which, if we are unable to meet them, could adversely affect our ability to market our products in European Union countries, and sales revenues and profitability would suffer as a consequence. In addition, the European Parliament has enacted a directive for the restriction of the use of certain hazardous substances in electrical and electronic equipment, or RoHS. This legislation restricts the use of such substances as mercury, lead, cadmium and hexavalent cadmium. If we are unable to have our products manufactured in compliance with the RoHS directive, we would be unable to market our products in European Union countries, and our revenues and profitability would suffer. In addition, various Asian governments could adopt their own versions of environment-friendly electronic regulations similar to the European directives, RoHS and WEEE. This could require new and unanticipated manufacturing changes, product testing and certification requirements, thereby increasing cost, delaying sales and lowering revenue and profitability.
Our inability to manage growth effectively could seriously harm our business.
Growth and expansion of our business could significantly strain our capital resources as well as the time and abilities of our management personnel. Our ability to manage growth effectively will require continued improvement of our operational, financial and management systems and the successful training, motivation and management of our employees. If we are unable to manage growth successfully, our business and operating results will suffer.
Our business operations will be severely disrupted if we lose key personnel or if we fail to attract and retain qualified personnel.
Our technology depends upon the knowledge, experience and skills of our key management and scientific and technical personnel. Additionally, our ability to continue technological developments and to market our products, and thereby develop a competitive edge in the marketplace, depends in large part on our ability to attract and retain qualified scientific and technical personnel. Competition for qualified personnel is intense, and we cannot assure you that we will be able to attract and retain the individuals we need, especially if our business expands and requires us to employ additional personnel. In addition, the loss of personnel or our failure to hire additional personnel could materially and adversely affect our business, operating results and ability to expand. The loss of key personnel, including Kenneth R. Aubrey, our President and Chief Executive Officer, or our inability to hire and retain qualified personnel, would harm our business.
Our stock is thinly traded and our stock price is volatile.
Our common stock is thinly traded, with 3,468,301 shares of our 4,880,619 outstanding shares held by non-affiliates as of February 28, 2011. Based on the trading history of our common stock and the nature of the market for publicly traded securities of companies in evolving high-tech industries, we believe there are several factors that have caused and are likely to continue to cause the market price of our common stock to fluctuate substantially. The fluctuations may occur on a day-to-day basis or over a longer period of time. Factors that may cause fluctuations in our stock price include announcements of large orders obtained by us or our competitors, substantial cutbacks in government funding of highway projects or of the potential availability of alternative technologies for use in traffic control and safety, quarterly fluctuations in our financial results or the financial results of our competitors, consolidation among our competitors, fluctuations in stock market prices and volumes, and the volatility of the stock market.
We may not be successful in integrating acquired companies into our business which could materially and adversely affect our financial condition and operating results.
Part of our business strategy has been to acquire or invest in companies, products or technologies that complement our current products, enhance our market coverage or technical capabilities or offer growth opportunities. As part of this strategy, in December 2007, we completed the EIS asset purchase and in June 2010, we acquired CitySync Limited. For any acquisition, a

13
significant amount of management’s time and financial resources may be required to complete the acquisition and integrate the acquired business into our existing operations. Even with this investment of management time and financial resources, an acquisition may not produce the revenue, earnings or business synergies anticipated. Acquisitions involve numerous other risks, including the assumption of unanticipated operating problems or legal liabilities; problems integrating the purchased operations, technologies or products; the diversion of management’s attention from our core businesses; restrictions on the manner in which we may use purchased companies or assets imposed by acquisition agreements; adverse effects on existing business relationships with suppliers and customers; incorrect estimates made in the accounting for acquisitions and amortization of acquired intangible assets that would reduce future reported earnings (such as goodwill impairments); ensuring acquired companies’ compliance with the requirements of the Sarbanes-Oxley Act; and the potential loss of customers or key employees of acquired businesses. We cannot assure you that any acquisitions, investments, strategic alliances or joint ventures will be completed or integrated in a timely manner or achieve anticipated synergies, will be structured or financed in a way that will enhance our business or creditworthiness, or will meet our strategic objectives or otherwise be successful.
Amounts recorded for goodwill could be adversely impacted by current market conditions.
Our recorded goodwill of approximately $14.7 million at December 31, 2010 relates to our Hong Kong-based subsidiary, Flow Traffic Ltd., the EIS asset purchase and the CitySync acquisition. Each year, we perform an impairment test of goodwill in October for the EIS assets and in December for Flow Traffic or whenever an impairment indicator arises, and we test our long-lived assets for impairment when indicators of impairment are present. We plan to test CitySync annually beginning with April 2011. The impairment test requires us to estimate the fair value of our reporting units and then compare it to the carrying value of the reporting units. If the carrying value exceeds the fair value, further analysis is performed to determine if there is an impairment charge. We estimate the fair value primarily by using a combination of income and market approaches, where fair value under the income approach is dependent on the present value of future economic benefits to be derived from the reporting units and fair value under the market approach considers recently completed transactions within our industry sectors, comparable trading values and other market conditions. The future economic benefits are significantly dependent on future revenue growth. If the reporting units do not provide the future economic benefits we project, the fair value of these assets may become impaired, and we would need to record an impairment loss. Fair market valuation requires assumptions and estimates of many critical factors, including revenue and market growth, operating cash flows, market multiples and discount rates. As general market conditions have deteriorated, our reporting units could experience a decline in fair market value, which could adversely affect the results of the impairment testing that we perform in the future and could potentially lead to a future impairment charge of some or all of our goodwill at one or all of our reporting units. In addition, ongoing financial market turmoil could impact common stock trading prices for many companies, including ours. If our market capitalization falls below our shareholders’ equity, it could trigger an impairment of goodwill in the future.
Difficult and volatile conditions in the capital, credit and commodities markets and in the overall economy could continue to adversely affect our financial position, results of operations and cash flows, and we do not know if these conditions will improve in the near future.
Our financial position, results of operations and cash flows could continue to be adversely affected by difficult conditions and significant volatility in the capital, credit and commodities markets and in the overall worldwide economy. These factors, combined with declining business and consumer confidence and increased unemployment, have precipitated a worldwide economic slowdown and recession in the United States and other parts of the world. The continuing impact that these factors might have on us and our business is uncertain and cannot be estimated at this time. Current economic conditions have accentuated each of these risks and magnified their potential effect on us and our business. The difficult conditions in these markets and the overall economy affect our business in a number of ways. For example:
• Although we believe we have sufficient liquidity under our financing arrangement with Associated Bank, National Association, to run our business, under extreme market conditions, there can be no assurance that such funds would be available or sufficient, and, in such a case, we may not be able to successfully obtain additional financing on favorable terms, or at all.
• Recent market volatility has exerted downward pressure on our stock price, which may make it more difficult or unfavorable for us to raise additional capital in the future.
• Economic conditions could result in customers in our markets continuing to experience financial difficulties or electing to limit spending because of the economy which may result, for example, in declining tax revenue for our customers that are governmental entities, which in turn could result in decreased sales and earnings for us.
We do not know if market conditions or the state of the overall economy will improve in the near future, when improvement will occur or if any improvement will benefit our market segment.

14
Our directors and executive officers have substantial influence over us and could limit the ability of our other shareholders to affect the outcome of key transactions, including changes of control.
Our executive officers and directors and entities affiliated with them, in the aggregate, beneficially owned 11% of our outstanding common stock as of March 24, 2011, assuming the exercise by them of all of their options that were currently exercisable or that vest within 60 days of March 24, 2011. Our executive officers and directors and their affiliated entities, if acting together, thus are able to influence significantly all matters requiring approval by our shareholders, including the election of directors and the approval of mergers or other significant corporate transactions. These shareholders may have interests that differ from other shareholders, and they may vote in a way with which other shareholders disagree and that may be adverse to other shareholders’ interests. The concentration of ownership of our common stock may have the effect of delaying, preventing or deterring a change of control of our company, could deprive our shareholders of an opportunity to receive a premium for their common stock as part of a sale of our company, and may affect the market price of our common stock. This concentration of ownership of our common stock may also have the effect of influencing the completion of a change in control that may not necessarily be in the best interests of all of our shareholders.
Our articles of incorporation and bylaws and Minnesota law may inhibit a takeover that shareholders consider favorable.
Provisions of our articles of incorporation and bylaws and applicable provisions of Minnesota law may delay or discourage transactions involving an actual or potential change in our control or change in our management, including transactions in which shareholders might otherwise receive a premium for their shares or transactions that our shareholders might otherwise deem to be in their best interests. These provisions:
• permit our board of directors to issue up to 5,000,000 shares of preferred stock with any rights, preferences and privileges as it may designate, including the right to approve an acquisition or other change in our control;
• provide that the authorized number of directors may be changed by resolution of the board of directors;
• provide that all vacancies, including newly-created directorships, may, except as otherwise required by law, be filled by the affirmative vote of a majority of directors then in office, even if less than a quorum; and
• eliminate cumulative voting rights, therefore allowing the holders of a majority of the shares of common stock entitled to vote in any election of directors to elect all of the directors standing for election, if they should so choose.
In addition, Section 302A.671 of the Minnesota Business Corporation Act, or MBCA, generally limits the voting rights of a shareholder acquiring a substantial percentage of our voting shares in an attempted takeover or otherwise becoming a substantial shareholder of our company unless holders of a majority of the voting power of the disinterested shares approve full voting rights for the substantial shareholder. Section 302A.673 of the MBCA generally limits our ability to engage in any business combination with certain persons who own 10% or more of our outstanding voting stock or any of our associates or affiliates who at any time in the past four years have owned 10% or more of our outstanding voting stock. These provisions of the MBCA may have the effect of entrenching our management team and may deprive shareholders of the opportunity to sell their shares to potential acquirers at a premium over prevailing prices. This potential inability to obtain a control premium could reduce the price of our common stock.
We can issue shares of preferred stock without shareholder approval, which could adversely affect the rights of common shareholders.
Our articles of incorporation permit our board of directors to establish the rights, privileges, preferences and restrictions, including voting rights, of future series of our preferred stock and to issue such stock without approval from our shareholders. The rights of holders of our common stock may suffer as a result of the rights granted to holders of preferred stock that may be issued in the future. In addition, we could issue preferred stock to prevent a change in control of our company, depriving common shareholders of an opportunity to sell their stock at a price in excess of the prevailing market price.
We do not intend to declare dividends on our stock in the foreseeable future.
We currently intend to retain all future earnings for the operation and expansion of our business and, therefore, do not anticipate declaring or paying cash dividends on our common stock in the foreseeable future. Any payment of cash dividends on our common stock will be at the discretion of our board of directors and will depend upon our operating results, earnings, current and anticipated cash needs, capital requirements, financial condition, future prospects, any contractual restrictions and any other factors deemed relevant by our board of directors. Therefore, shareholders should not expect to receive dividend income from shares of our common stock.

15
Item 1B. Unresolved Staff Comments
None.
Item 2. Properties
We currently lease and occupy approximately 20,000 square feet in St. Paul, Minnesota for our headquarters. This lease expires in May 2014, and we have the right to renew the lease for two additional three-year terms. Our office in suburban north London, United Kingdom consists of 17,000 square feet of space, and our lease for this space expires at our option in January 2015. We also lease smaller facilities in Canada, Hong Kong, China and Poland. We believe that our facilities are adequate to meet our current and expected needs.
We believe that our current space is generally adequate in the United States, Asia and Europe, and we do not intend to lease significantly more space in 2011.
Item 3. Legal Proceedings
We are involved in legal actions and claims relating to various matters. Although we are unable to predict the ultimate outcome of these legal actions and claims, it is the opinion of management that the disposition of these matters, taken as a whole, will not have a material adverse effect on our consolidated financial statements.
Item 4. [Removed and Reserved]

16
PART II
Item 5. Market for Registrant’s Common Equity, Related Stockholder Matters and Issuer Purchases of Equity Securities
Market Information
Our common stock is traded on The NASDAQ Capital Market under the symbol “ISNS.” The quarterly high and low sales prices for our common stock for our last two fiscal years are set forth below.
2010 2009 Quarter High Low High Low
First $ 15.53 $ 11.50 $ 10.51 $ 6.69 Second 14.47 12.20 10.25 8.19 Third 13.50 10.10 13.11 8.61 Fourth 13.50 11.10 14.10 11.40
Shareholders
As of February 28, 2011, there were 25 holders of record of our common stock. The number of holders of record is based upon the actual number of holders registered at such date and does not include holders of shares in “street names” or persons, partnerships, associates, corporations, or other entities identified in security position listings maintained by depositories.
Dividends
We have never declared or paid a cash dividend on our common stock. We currently intend to retain earnings for use in the operation and expansion of our business, and, consequently, we do not anticipate paying any dividends in the foreseeable future.

17
Comparative Stock Performance Graph
The graph below compares the five-year cumulative total stockholder return on our common stock with the cumulative total stockholder return of (i) the Dow Jones Wilshire 5000 Index and (ii) the Dow Jones Wilshire Electronic Equipment Index, assuming an investment of $100 on December 31, 2005, including reinvestment of dividends.
Notwithstanding anything to the contrary set forth in any of our previous or future filings under the Securities Act of 1933 or the Securities Exchange Act of 1934 that might incorporate future filings by reference, including this Annual Report on Form 10-K, in whole or in part, the following performance graph and accompanying data shall not be deemed to be incorporated by reference into any such filings and shall not otherwise be deemed filed under such Acts.
12/05 12/06 12/07 12/08 12/09 12/10 Image Sensing Systems, Inc 100.00 107.35 130.28 47.75 85.46 97.53 Wilshire 5000 100.00 115.77 122.27 76.75 98.47 115.37 Dow Jones US Electrical Components & Equipment TSM 100.00 113.96 135.86 72.41 111.44 139.51

18
Item 6. Selected Financial Data
The following table sets forth selected consolidated financial data for each of the five fiscal years ended December 31, 2010. The statement of income and balance sheet data for the years ended and as of December 31, 2010, 2009, 2008, 2007 and 2006 are derived from our audited consolidated financial statements. The following information should be read in conjunction with “Management’s Discussion and Analysis of Financial Condition and Results of Operations” and with our consolidated financial statements and the related notes thereto included elsewhere in this report.
Fiscal Years Ended December 31,
2010 2009 2008 2007 2006
(in thousands, except per share data)
Consolidated Statement of Income Data: Revenue:
Product sales $ 19,162 $ 12,483 $ 13,144 $ 4,336 $ 2,980Royalties 12,519 12,110 13,321 10,747 10,136
Total revenue 31,681 24,593 26,465 15,083 13,116Cost of revenue:
Product sales 7,799 4,297 4,912 1,987 1,501Royalties — — — — 220
Total cost of revenue 7,799 4,297 4,912 1,987 1,721Gross profit 23,882 20,296 21,553 13,096 11,395Operating expenses:
Selling, marketing and product support 9,807 7,201 6,680 3,463 2,850General and administrative 4,372 3,779 4,069 2,653 2,383Research and development 3,630 3,336 2,908 2,299 2,639Amortization of intangible assets 1,218 768 768 51 —Acquisition related expenses 817 — — — —In-process research and development — — — 4,500 —
19,844 15,084 14,425 12,966 7,871Income from operations 4,038 5,212 7,128 130 3,524Other income (expense), net (123) 7 43 543 523Income before income taxes 3,915 5,219 7,171 673 4,047Income tax expense (benefit) 910 1,354 2,207) (199) 942Net income $ 3,005 $ 3,865 $ 4,964 $ 872 $ 3,105 Net income per share:
Basic $ 0.66 $ 0.97 $ 1.26 $ 0.23 $ 0.83Diluted 0.64 0.95 1.24 0.22 0.80
Weighted average number of common shares outstanding:
Basic 4,555 3,985 3,943 3,789 3,725Diluted 4,667 4,081 4,001 3,881 3,891
At December 31,
2010 2009 2008 2007 2006
(in thousands)
Consolidated Balance Sheet Data: Total assets $ 54,356 $ 41,150 $ 36,108 $ 30,388 $ 21,224Bank debt — 4,000 3,750 5,000 —Total shareholders’ equity 46,021 32,713 28,530 23,225 19,333

19
Item 7. Management’s Discussion and Analysis of Financial Condition and Results of Operations
The following discussion and analysis of our financial condition and results of operations should be read in conjunction with the Selected Financial Data and our financial statements and the accompanying notes included elsewhere in this Annual Report. Our actual results could differ materially from those anticipated in the forward-looking statements included in this discussion as a result of certain factors, including, but not limited to, those discussed in “Risk Factors” and “Information Regarding Forward-Looking Statements” included elsewhere in this Annual Report.
General. We provide software based computer enabled detection, or CED, products and solutions that use advanced signal processing software algorithms to detect and monitor objects in a designated field of view. Our technology analyzes the signal from a sophisticated sensor and passes the information along to management systems, controllers or directly to users. Our core products, the Autoscope® Video Vehicle Detection System, RTMS® Radar Detection System and CitySync Automatic Number Plate Recognition (ANPR) System, operate using our proprietary application software in conjunction with video cameras or radar and commonly available electronic components. Our systems are used by traffic managers primarily to improve the flow of vehicle traffic and to enhance safety at intersections, main thoroughfares, freeways and tunnels and by parking and toll managers and law enforcement officials to read license plates for various safety, security, access and enforcement ANPR applications. Autoscope systems are sold to distributors and end users of traffic management products in North America, the Caribbean and Latin America by Econolite Control Products, Inc., or Econolite, our exclusive licensee in these regions. We sell RTMS and CitySync systems to distributors and end users in North America. We sell all of our systems to distributors and end users in Europe and Asia through our European and Hong Kong subsidiaries, respectively. The majority of our sales are to end users that are funded by government agencies responsible for traffic management or traffic law enforcement. CitySync Acquisition. In June 2010, we purchased all of the outstanding equity of CitySync Limited through which we own its principal product line, the CitySync ANPR system. We believe the CitySync acquisition expands our addressable market, strengthens our selling presence in Europe and extends our opportunities for hybrid product developments. In its fiscal year ended January 31, 2010, CitySync had revenue of $7.4 million, substantially all of which related to ANPR system sales. EIS Asset Purchase. In 2007, we purchased certain assets from EIS Electronic Integrated Systems Inc., or EIS, including its principal product line, the RTMS system. In its fiscal year ended September 30, 2007, EIS had revenue of $8.7 million, substantially all of which related to RTMS sales. Trends and Challenges in Our Business
We believe the growth in our business can be attributed primarily to the following global trends:
• worsening traffic caused by increased numbers of vehicles in metropolitan areas without corresponding expansions of road infrastructure and the need to automate safety, security and access applications for automobiles and trucks, which has increased demand for our products;
• advances in information technology, which have made our products easier to market and implement;
• the continued funding allocations for centralized traffic management services and automated enforcement schemes, which has increased the ability of our primary end users to implement our products; and
• general increases in the cost-effectiveness of electronics, which make our products more affordable for end users.
We believe our continued growth primarily depends upon:
• continued adoption and governmental funding of intelligent transportation systems, or ITS, and other automated applications for traffic control, safety and enforcement in developed countries;
• a propensity by traffic engineers to implement lower cost technology-based solutions rather than civil engineering solutions such as widening roadways;
• countries in the developing world adopting above-ground detection technology, such as video or radar, instead of in-pavement loop technology to manage traffic;

20
• the use of CED to provide solutions to security/surveillance and environmental issues associated with increasing automobile use in metropolitan areas; and
• our ability to develop new products, such as hybrid CED devices incorporating, for example, radar and video technologies, that provide increasingly accurate information and enhance the end users’ ability to cost-effectively manage traffic, security/surveillance and environmental issues.
Because the majority of our end users are governmental entities, we are faced with challenges related to potential delays in purchase decisions by those entities and changes in budgetary constraints. These contingencies could result in significant fluctuations in our revenue between periods. The slow rate at which the worldwide recession is ending is further adding to the unpredictability of purchase decisions, creating more delays than usual and decreasing governmental budgets, and it is likely to continue to negatively affect our revenue. We believe we will continue to be a beneficiary of the federal stimulus bills enacted in 2009 and 2010, but it is difficult to determine the level of impact it has on our operations.
Key Financial Terms and Metrics
Revenue. We derive revenue from two sources: (1) royalties received from Econolite for sales of the Autoscope system in North America, the Caribbean and Latin America and (2) revenue received from the direct sales of our RTMS and CitySync systems in North America, the Caribbean and Latin America and all of our systems in Europe and Asia. We calculate the royalties using a profit sharing model where we split with Econolite the gross profit on sales of Autoscope product made through Econolite. This royalty arrangement has the benefit of decreasing our cost of revenues and our selling, marketing and product support expenses because these costs and expenses are borne primarily by Econolite. Although this royalty model has a positive impact on our gross margin, it also negatively impacts our total revenue, which would be higher if all the sales made by Econolite were made directly by us. The royalty arrangement is exclusive under a long-term agreement.
Cost of Revenue. There is no cost of revenue related to royalties, as virtually all manufacturing, warranty and related costs are incurred by Econolite. Cost of revenue related to product sales consists primarily of the amount charged by our third party contractors to manufacture hardware platforms, which is influenced mainly by the cost of electronic components. The cost of revenue also includes logistics costs and estimated expenses for product warranties and inventory reserves. The key metric that we follow is achieving certain gross margin percentages by geographic region and to a lesser extent by product line.
Operating Expenses. Our operating expenses fall into three categories: (1) selling, marketing and product support; (2) general and administrative; and (3) research and development. Selling, marketing and product support expenses consist of various costs related to sales and support of our products, including salaries, benefits and commissions paid to our personnel; commissions paid to third parties; travel, trade show and advertising costs; second-tier technical support for Econolite; and general product support, where applicable. General and administrative expenses consist of certain corporate and administrative functions that support the development and sales of our products and provide an infrastructure to support future growth. General and administrative expenses reflect management, supervisory and staff salaries and benefits, legal and auditing fees, travel, rent and costs associated with being a public company, such as board of director fees, Sarbanes-Oxley compliance, listing fees and annual reporting expenses. Research and development expenses consist mainly of salaries and benefits for our engineers and third party costs for consulting and prototyping. We measure all operating expenses against our annually approved budget, which is developed with achieving a certain operating margin as a key focus. Also included in operating expenses are acquisition related expenses and non-cash expense for intangible asset amortization.
Non-GAAP Operating Measure. We use non-GAAP net income, which excludes the impact, net of tax, of amortizing the intangible assets from the 2007 EIS asset acquisition and the CitySync acquisition and expenses related to these acquisitions, including earn-out adjustments and other unusual items, to analyze our business. Management believes that this non-GAAP operating measure, when shown in conjunction with GAAP measures, facilitates the comparison of our current operating results to historical operating results. We use this non-GAAP information to evaluate short-term and long-term operating trends in our core operations. Further, we believe that this non-GAAP measure improves management’s and investors’ ability to compare our financial performance with other companies in the technology industry. Non-GAAP information is not prepared in accordance with GAAP and should not be considered a substitute for or an alternative to GAAP financial measures and may not be computed the same as similarly titled measures used by other companies.

21
Reconciliations of GAAP net income to non-GAAP net income are as follows (dollars in thousands, except per share amounts):
Years ended December 31 2010 2009 2008 GAAP net income $ 3,005 $ 3,865 $ 4,964 Adjustments to reconcile to non-GAAP net income
Amortization of intangible assets 1,218 768 768 Acquisition related expenses 817 — — Non-recurring foreign tax benefit — (236) — Withdrawn offering expenses — — 221 Impact on income tax expense of amortization and acquisition expenses (414) (261) (336)
Non-GAAP net income $ 4,626 $ 4,136 $ 5,617 GAAP diluted earnings per share $ 0.64 $ 0.95 $ 1.24 Non-GAAP diluted earnings per share 0.99 1.01 1.40
Seasonality. Our quarterly revenues and operating results have varied significantly in the past due to the seasonality of our business. Our first quarter generally is the weakest due to weather conditions that make roadway construction more difficult in North America, Europe and northern Asia. We expect such seasonality to continue for the foreseeable future. Additionally, our international revenues have a significant large project component, resulting in a varying revenue stream. Accordingly, we believe that quarter-to-quarter comparisons of our financial results should not be relied upon as an indication of our future performance. No assurance can be given that we will be able to achieve or maintain profitability on a quarterly or annual basis in the future.
History. We were incorporated in the state of Minnesota in December 1984 and began operations by pioneering the commercial application of wide-area video vehicle detection for traffic management. The technology underlying our products was initially developed at the University of Minnesota. In 1989, the University was awarded a patent for that technology, which it exclusively licensed to us. In 1991, we sub-licensed this technology to Econolite, a leading manufacturer and seller of traffic control products in North America and the Caribbean, to manufacture and distribute products incorporating the technology.
Segments. We currently operate in three reportable segments: Autoscope, RTMS and CitySync. Autoscope is our machine-vision product line, and revenue consists of royalties (all of which are received from Econolite), as well as a portion of international sales. RTMS is our radar product line acquired in the EIS asset purchase in December 2007. CitySync is our ANPR product line acquired in the CitySync purchase in June 2010. All segment revenues are derived from external customers.
Due to the CitySync acquisition and related changes in how we manage our business, we may reevaluate our segment definitions in the future.
The following tables set forth selected unaudited financial information for each of the Company’s reportable segments (in thousands):
For the year ended December 31, 2010 Autoscope RTMS CitySync Total
Revenue $ 16,659 $ 9,819 $ 5,203 $ 31,681Depreciation 293 173 32 498Amortization of intangible assets — 768 450 1,218Income (loss) before income taxes 2,618 1,823 (526) 3,915Capital expenditures 325 77 14 416Total assets 26,915 13,202 14,239 54,356
For the year ended December 31, 2009 Autoscope RTMS Total
Revenue $ 16,240 $ 8,353 $ 24,593Depreciation 292 132 424Amortization of intangible assets — 768 768Income before income taxes 3,807 1,412 5,219Capital expenditures 555 139 694Total assets 29,752 11,398 41,150
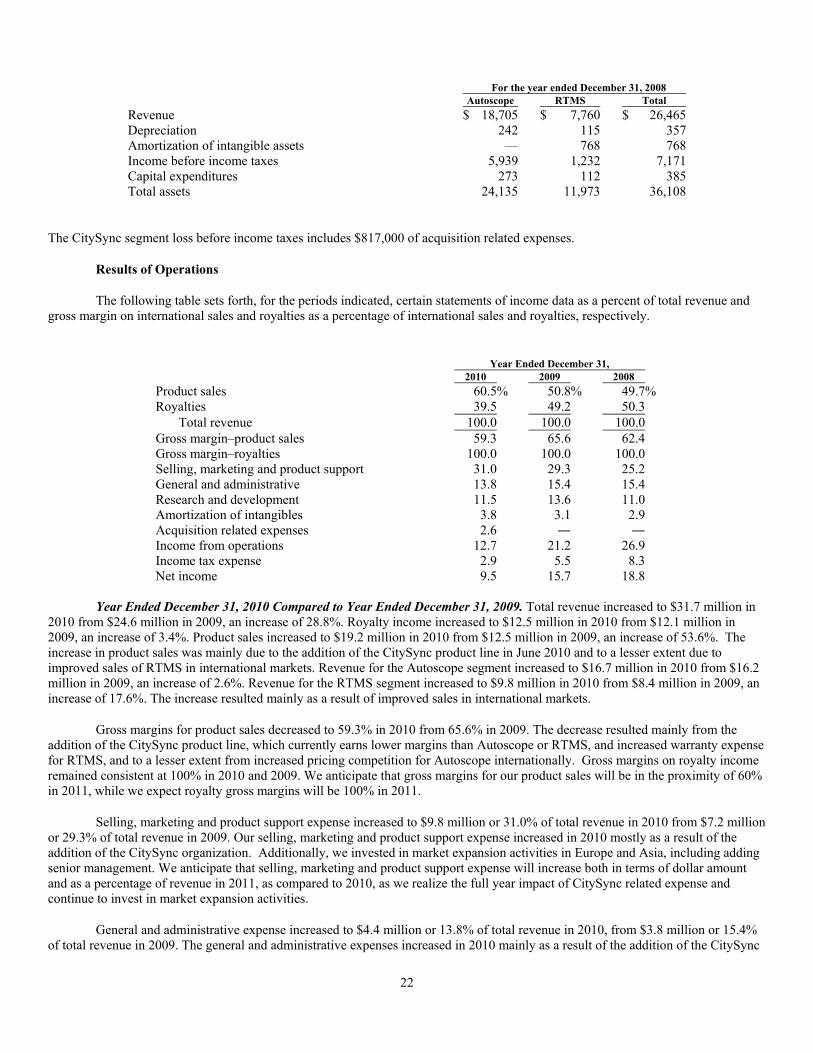
22
For the year ended December 31, 2008 Autoscope RTMS Total
Revenue $ 18,705 $ 7,760 $ 26,465Depreciation 242 115 357Amortization of intangible assets — 768 768Income before income taxes 5,939 1,232 7,171Capital expenditures 273 112 385Total assets 24,135 11,973 36,108
The CitySync segment loss before income taxes includes $817,000 of acquisition related expenses.
Results of Operations
The following table sets forth, for the periods indicated, certain statements of income data as a percent of total revenue and gross margin on international sales and royalties as a percentage of international sales and royalties, respectively.
Year Ended December 31,
2010 2009 2008
Product sales 60.5% 50.8% 49.7%Royalties 39.5 49.2 50.3
Total revenue 100.0 100.0 100.0 Gross margin–product sales 59.3 65.6 62.4 Gross margin–royalties 100.0 100.0 100.0 Selling, marketing and product support 31.0 29.3 25.2 General and administrative 13.8 15.4 15.4 Research and development 11.5 13.6 11.0 Amortization of intangibles 3.8 3.1 2.9 Acquisition related expenses 2.6 ― ― Income from operations 12.7 21.2 26.9 Income tax expense 2.9 5.5 8.3 Net income 9.5 15.7 18.8
Year Ended December 31, 2010 Compared to Year Ended December 31, 2009. Total revenue increased to $31.7 million in
2010 from $24.6 million in 2009, an increase of 28.8%. Royalty income increased to $12.5 million in 2010 from $12.1 million in 2009, an increase of 3.4%. Product sales increased to $19.2 million in 2010 from $12.5 million in 2009, an increase of 53.6%. The increase in product sales was mainly due to the addition of the CitySync product line in June 2010 and to a lesser extent due to improved sales of RTMS in international markets. Revenue for the Autoscope segment increased to $16.7 million in 2010 from $16.2 million in 2009, an increase of 2.6%. Revenue for the RTMS segment increased to $9.8 million in 2010 from $8.4 million in 2009, an increase of 17.6%. The increase resulted mainly as a result of improved sales in international markets.
Gross margins for product sales decreased to 59.3% in 2010 from 65.6% in 2009. The decrease resulted mainly from the addition of the CitySync product line, which currently earns lower margins than Autoscope or RTMS, and increased warranty expense for RTMS, and to a lesser extent from increased pricing competition for Autoscope internationally. Gross margins on royalty income remained consistent at 100% in 2010 and 2009. We anticipate that gross margins for our product sales will be in the proximity of 60% in 2011, while we expect royalty gross margins will be 100% in 2011.
Selling, marketing and product support expense increased to $9.8 million or 31.0% of total revenue in 2010 from $7.2 million or 29.3% of total revenue in 2009. Our selling, marketing and product support expense increased in 2010 mostly as a result of the addition of the CitySync organization. Additionally, we invested in market expansion activities in Europe and Asia, including adding senior management. We anticipate that selling, marketing and product support expense will increase both in terms of dollar amount and as a percentage of revenue in 2011, as compared to 2010, as we realize the full year impact of CitySync related expense and continue to invest in market expansion activities.
General and administrative expense increased to $4.4 million or 13.8% of total revenue in 2010, from $3.8 million or 15.4% of total revenue in 2009. The general and administrative expenses increased in 2010 mainly as a result of the addition of the CitySync

23
organization and to a lesser extent due to increased compensation and benefits. We anticipate that general and administrative expense will increase in terms of dollar amount in 2011 as compared to 2010.
Research and development expense increased to $3.6 million or 11.5% of total revenue in 2010, up from $3.3 million or 13.6% of total revenue in 2009. The increase was mainly related to the addition of the CitySync engineering organization. We anticipate that research and development expense will increase in terms of dollar amount in 2011 as compared to 2010.
Amortization of intangibles expense was $1.2 million in 2010 and reflects the amortization of intangible assets acquired in both the EIS asset purchase and the CitySync acquisition. Assuming there are no changes to our intangible assets, we anticipate amortization expense will be approximately $1.6 million in 2011.
Other income (expense) was an expense of $123,000 in 2010, primarily consisting of interest expense, as opposed to income of $7,000 in 2009 mainly due to higher debt balances in 2010 including a portion related to CitySync.
Income before income taxes for the Autoscope segment decreased to $2.6 million in 2010 from $3.8 million in 2009, a decrease of 31.6%. The decrease was mainly due to increased competition. Income before income taxes for the RTMS segment increased to $1.8 million in 2010 from $1.4 million in 2009, an increase of 29.1%. The increase was due to higher revenues in the segment, which were partially offset by increased warranty expense.
Our income tax effective rate was 23.2% in 2010 compared to 25.9% in 2009. The 2010 effective rate was positively impacted by increased tax credits for research and development activities. We expect the effective rate in 2011 to be below 30%.
Year Ended December 31, 2009 Compared to Year Ended December 31, 2008. Total revenue decreased to $24.6 million in 2009 from $26.5 million in 2008, a decrease of 7.1%. Royalty income decreased to $12.1 million in 2009 from $13.3 million in 2008, a decrease of 9.1%. We attribute the decrease in royalties to the economic recession in North America and its negative impact on state and federal spending. Product sales decreased to $12.5 million in 2009 from $13.1 million in 2008, a decrease of 5.0%. The decrease was mainly due to weakness in the Asian market in the first half of 2009. Revenue for the Autoscope segment decreased to $16.2 million in 2009 from $18.7 million in 2008, a decrease of 13.2%. The decrease related to lower royalties and weakness in Asia as discussed above. Revenue for the RTMS segment increased to $8.4 million in 2009 from $7.8 million in 2008, an increase of 7.6%. The increase resulted mainly as a result of improved sales in North America.
Gross margins for product sales increased to 65.6% in 2009 from 62.4% in 2008. The increase resulted mainly from the increase in RTMS revenue, which typically earns higher margins than Autoscope, and to a lesser extent from fewer lower of cost or market adjustments to inventory in 2009 as compared to 2008. Gross margins on royalty income remained consistent at 100% in 2009 and 2008.
Selling, marketing and product support expense increased to $7.2 million or 29.3% of total revenue in 2009 from $6.7 million or 25.2% of total revenue in 2008. The selling, marketing and product support expense increased in 2009 as we invested in market expansion activities in Europe and Asia and realized the impact of headcount additions made late in 2008.
General and administrative expense decreased to $3.8 million or 15.4% of total revenue in 2009, down from $4.1 million or 15.4% of total revenue in 2008. The general and administrative expenses decrease in 2009 resulted mainly from lower incentive pay expense and higher foreign currency transaction gains, which were partially offset by increased professional services expense.
Research and development expense increased to $3.3 million or 13.6% of total revenue in 2009, up from $2.9 million or 11.0% of total revenue in 2008. The increase was directly related to our investment in video/radar hybrid solutions and tailored international offerings, development projects to reduce manufacturing costs, and the realization of the impact of headcount additions made late in 2008.
Amortization of intangibles expense was $768,000 in 2009 and reflects the amortization of intangible assets acquired in the EIS asset purchase.
Other income decreased to $7,000 in 2009 from $43,000 in 2008 mainly due to lower interest rates. In 2008, other income fell due to lower cash and investment balances, lower interest rates and interest expense on debt incurred for the EIS asset purchase.
Income before income taxes for the Autoscope segment decreased to $3.8 million in 2009 from $5.9 million in 2008, a decrease of 35.9%. The decrease was mainly due to lower gross margins and higher investments in market expansion activities in the segment. Income before income taxes for the RTMS segment increased to $1.4 million in 2009 from $1.2 million in 2008, an increase of 14.6%. The increase was due to higher revenues in the segment, which were partially offset by increased expenses, a majority of which were caused by the U.S. Dollar weakening over the course of 2009 against the Canadian Dollar.

24
Our income tax effective rate was 25.9% in 2009 compared to 30.8% in 2008. The 2009 effective rate was positively impacted by the realization of $236,000 in foreign tax credits whose status was uncertain prior to 2009.
Liquidity and Capital Resources
At December 31, 2010, we had $8.0 million in cash and cash equivalents and $4.0 million in short-term investments, compared to $14.1 million in cash and cash equivalents and $3.9 million in short-term investments at December 31, 2009.
Net cash provided by operating activities was $33,000 in 2010, compared to $5.4 million and $5.2 million in 2009 and 2008, respectively. In 2010, as compared to 2009, we had increased accounts and other receivables outstanding, the majority of which related to CitySync activity. The primary reasons for the 2009 change compared to 2008 were lower net income and increased inventory balances that were offset by decreased accounts receivable outstanding. In 2010, investment balances were similar to those of 2009. We anticipate that average receivable collection days in 2011 will be similar to 2010 and that it will not have a material impact on our liquidity. Our planned additions of property and equipment are discretionary, and we do not expect them to exceed historical levels in 2011. We used $8.3 million of cash in 2010 to acquire CitySync including repaying seller loans. This was mostly offset by our 2010 secondary offering which provided $8.8 million in cash, net of offering expenses.
In December 2009, we entered into a term loan agreement for $4.0 million with Associated Bank, National Association, or Associated Bank, which we fully repaid in September 2010. We previously had a separate $4.0 million term note with Associated Bank that originated in May 2008 and was fully repaid in February 2009.
We also have a revolving line of credit agreement with Associated Bank. The revolving line of credit provides for up to $5.0 million at an annual interest rate equal to the greater of 4.5% or LIBOR plus 2.75%, as reset from time to time by the bank. Advances on the line of credit cannot exceed a borrowing base determined under a formula, which is a percentage of the amounts of eligible receivables. The line of credit currently has no borrowings outstanding and matures on May 1, 2012. We believe that on an ongoing basis, we will have regular availability to draw a minimum of $3.0 million on our line of credit based on our qualifying assets.
In conjunction with our acquisition of CitySync, the sellers have an earn-out arrangement over approximately 18 months from the June 2010 date of purchase. The earn-out is based on achieving certain revenue and minimum gross margins from the sale of CitySync ANPR systems and it is calculated in two separate periods, each ending on December 31. In each period there are two tiers and superior performance could lead to a total earn-out of $2 million or higher, as the earn-out is not capped. Earn-out payments are due within three months of the end of an earn-out period. Based on the 2010 results, the sellers are entitled to receive a $696,000 earn-out for the first period which ran from the June acquisition date to December 31, 2010. The payment is expected to be made in March 2011, and a liability has been recorded on our balance sheet as of December 31, 2010. As part of the recognition of the liability, we recorded an additional $205,000 in expense as the earn-out exceeded our initial estimate.
In conjunction with our EIS asset purchase, the sellers had an earn-out arrangement over approximately three years from the December 2007 date of purchase. The earn-out ended as of December 31, 2010. The earn-out was based on earnings before taxes from RTMS sales less related cost of revenue and operating expenses, excluding depreciation, amortization and interest expenses, and was calculated annually. For the first two earn-out periods, the sellers of the EIS assets received a total of $2.7 million in earn-out payments. Based on the 2010 results, the sellers are entitled to receive a $1.7 million earn-out for the third and final period. The payment is expected to be made in March 2011, and a liability has been recorded on our balance sheet as of December 31, 2010.
We believe that cash and cash equivalents on hand at December 31, 2010, along with the availability of funds under our $5.0
million revolving line of credit and cash provided by operating activities, will satisfy our projected working capital needs, payments under the EIS and CitySync earn-outs, investing activities, and other cash requirements for the foreseeable future.
Off-Balance Sheet Arrangements
We do not participate in transactions or have relationships or other arrangements with an unconsolidated entity, including special purpose and similar entities or other off-balance sheet arrangements.
Critical Accounting Policies
Goodwill and Intangible Assets. Goodwill is not amortized but is tested for impairment annually or whenever an impairment indicator arises. Our goodwill related to our Flow Traffic subsidiary is tested for impairment on December 31 of each year. EIS asset purchase (RTMS) related goodwill is tested on October 1 of each year. CitySync goodwill will be tested beginning in April 2011.
On an annual basis, we reconcile our market value to the estimated combined fair value of our business segments and reporting units as a separate measure to determine whether goodwill is impaired.

25
For Flow Traffic, we estimate the fair value by using a combination of the income approach, where fair value is dependent on the present value of future economic benefits to be derived from ownership of Flow Traffic, and the comparable market transactions method. The future economic benefits are significantly dependent on sustaining revenue levels for all product lines. For the RTMS reporting units, we estimate fair value by using a combination of the income approach, where fair value is dependent on the present value of future economic benefits to be derived from the RTMS product line, and the market valuation approach, where the business was compared to guideline public company price-earning multiples with a significant weighting to companies in the traffic detection business. The future economic benefits are mainly dependent on future revenue growth of the RTMS product line. No impairment of goodwill was recorded as of December 31, 2010, 2009 and 2008. If Flow Traffic and/or the RTMS reporting units do not provide the future economic benefits we project, the fair value of these assets may become impaired, and we would need to record an impairment loss.
Intangible assets are stated at their estimated value at the time of acquisition. Amortization is computed by the straight-line method over a three- to nine-year period for financial reporting purposes based on their estimated useful lives.
Earn-outs related to the EIS asset purchase are recorded as additional goodwill in the year earned. Intangible assets related to the EIS asset purchase are for trade names and technology. Earn-outs for the CitySync acquisition were estimated at the time of the acquisition, based on projected sales and gross margins during the earn-out period, and recorded on our balance sheet as a liability with an offsetting increase in goodwill. Actual earn-outs that vary from the initial estimated liability result in operating expense or income in the applicable year. Intangible assets related to the CitySync acquisition are for customer relationships, trade names and technology.
Revenue Recognition. Royalty income is recognized based upon a monthly royalty report provided to us by Econolite. This report is prepared by Econolite based on its sales of products we developed and is based on sales shipped or delivered to its customers. We recognize revenue from North American and international sales at the time of shipment or delivery; the selling price is fixed or determinable; and collectability is reasonably assured. We record provisions against revenue for estimated returns and allowances in the period when the related revenue is recorded based upon historical sales returns and changes in end user demands. The allowance for doubtful accounts is estimated based on specific identification of delinquent receivables.
Income Taxes. Income taxes are accounted for under the liability method. Deferred income taxes reflect the effects of temporary differences between the carrying amounts of assets and liabilities for financial reporting purposes and amounts used for income tax purposes. Deferred tax assets are offset by a valuation allowance as deemed necessary based on our estimate of our future sources of taxable income and the expected timing of temporary difference reversals. Uncertain tax positions are recognized if the tax position is more likely than not of being sustained on audit based on the technical merits of the position.
Inventories. Inventories are stated at the lower of cost (first-in, first-out method) or market and allowances have been made for obsolete, excess or unmarketable inventories based on estimated future usage or actual or anticipated product line changes.
Warranties. We generally provide a standard two-year warranty on product sales. Reserves to honor warranty claims are estimated and recorded at the time of sale based on historical claim information and are analyzed and adjusted periodically based on claim trends.
New and Recently Adopted Accounting Pronouncements
In January 2010, the FASB issued Accounting Standards Update (“ASU”) No. 2010-06, Improving Disclosures about Fair Value Measurements (“ASU 2010-06”). ASU 2010-06 requires new disclosures regarding transfers in and out of Levels 1 and 2 and activity in Level 3 fair value measurements. It also clarifies existing disclosure requirements regarding the level of disaggregation in certain disclosures, inputs, and valuation techniques used in ASC 820, Fair Value Measurements and Disclosures. We adopted all of the requirements of this update on January 1, 2010, its effective date, except for the new requirement regarding activity in Level 3 fair value measurements which has a later effective date under the provisions of ASU 2010-6 and will become effective on January 1, 2011. Adoption of this pronouncement has not had, and is not expected to have, a significant effect on our consolidated financial statements disclosures.
In September 2010, the FASB issued ASU No. 2010-20, Disclosures about the Credit Quality of Financing Receivables and
the Allowance for Credit Losses, to enhance the disclosures required for financing receivables (for example, loans, trade accounts receivable, notes receivable, and receivables relating to a lessor’s leveraged, direct financing, and sales-type leases) and allowances for credit losses. The amended disclosures are designed to provide more information to financial statement users regarding the credit quality of a creditor’s financing receivables and the adequacy of its allowance for credit losses. We adopted all of the requirements of the amended guidance on December 31, 2010, its effective date, except for the disclosures regarding the activity during a reporting period which will become effective January 1, 2011. Adoption of the pronouncement has not had, and is not expected to have, a significant effect on our consolidated financial statement disclosures.

26
Item 7A. Quantitative and Qualitative Disclosures About Market Risks
Our foreign sales and results of operations are subject to the impact of foreign currency fluctuations. From time to time, we enter into currency hedges to attempt to lower our exposure to translation gains and losses as well as to limit the impact of foreign currency translation upon the consolidation of our foreign subsidiaries. A 10% adverse change in foreign currency rates, if we have not hedged, could have a material effect on our results of operations or financial position. Our current greatest exposure for a negative material impact to our operations is a rising Canadian Dollar versus the U.S. Dollar.

27
Item 8. Financial Statements and Supplementary Data
IMAGE SENSING SYSTEMS, INC. CONSOLIDATED BALANCE SHEETS
(in thousands, except share data) December 31 2010 2009 ASSETS Current assets:
Cash and cash equivalents $ 8,021 $ 14,084 Investments 3,954 3,935 Accounts receivable, net of allowance for returns and doubtful accounts of $328 ($90 in 2009) 10,137 5,660 Inventories 4,649 2,734 Prepaid expenses and other receivables 2,017 588 Deferred income taxes 230 137
Total current assets 29,008 27,138 Property and equipment:
Furniture and fixtures 380 274 Leasehold improvements 158 92 Equipment 2,714 2,288
3,252 2,654 Accumulated depreciation 2,130 1,656
1,122 998 Deferred income taxes — 1,676 Intangible assets 9,513 3,714 Goodwill 14,713 7,624 TOTAL ASSETS $ 54,356 $ 41,150 LIABILITIES AND SHAREHOLDERS’ EQUITY Current liabilities:
Accounts payable $ 2,094 $ 953 Bank debt — 4,000 Accrued compensation 1,364 858 Accrued warranty and other 1,467 643 Earn-outs payable 2,928 1,541 Income taxes payable 17 234
Total current liabilities 7,870 8,229 Deferred income taxes 290 — Income taxes payable 175 208 Shareholders’ equity:
Preferred stock, $.01 par value; 5,000,000 shares authorized, none issued or outstanding — — Common stock, $.01 par value; 20,000,000 shares authorized, 4,878,519 issued and outstanding
(3,985,819 in 2009) 49 40 Additional paid-in capital 22,065 11,994 Accumulated other comprehensive income (loss) 52 (171)Retained earnings 23,855 20,850
Total shareholders’ equity 46,021 32,713 TOTAL LIABILITIES AND SHAREHOLDERS’ EQUITY $ 54,356 $ 41,150
See accompanying notes to the consolidated financial statements.

28
IMAGE SENSING SYSTEMS, INC. CONSOLIDATED STATEMENTS OF INCOME
(in thousands, except share data) Years ended December 31 2010 2009 2008 Revenue:
Product sales $ 19,162 $ 12,483 $ 13,144 Royalties 12,519 12,110 13,321
31,681 24,593 26,465 Cost of revenue (exclusive of amortization shown below):
Product sales 7,799 4,297 4,912 Gross profit 23,882 20,296 21,553 Operating expenses:
Selling, marketing and product support 9,807 7,201 6,680 General and administrative 4,372 3,779 4,069 Research and development 3,630 3,336 2,908 Amortization of intangible assets 1,218 768 768 Acquisition related expenses 817 — —
19,844 15,084 14,425 Income from operations 4,038 5,212 7,128 Other income (expense), net (123) 7 43 Income before income taxes 3,915 5,219 7,171 Income tax expense 910 1,354 2,207 Net income $ 3,005 $ 3,865 $ 4,964 Net income per share:
Basic $ 0.66 $ 0.97 $ 1.26 Diluted 0.64 0.95 1.24
Weighted average number of common shares outstanding: Basic 4,555 3,985 3,943 Diluted 4,667 4,081 4,001
See accompanying notes to the consolidated financial statements.

29
IMAGE SENSING SYSTEMS, INC.
CONSOLIDATED STATEMENTS OF CASH FLOW (in thousands)
Years ended December 31 2010 2009 2008 Operating activities: Net income $ 3,005 $ 3,865 $ 4,964 Adjustments to reconcile net income to net cash provided by operating activities:
Depreciation 498 424 357 Amortization 1,218 768 768 Tax benefit from disqualifying disposition 72 — 137 Stock option expense 342 341 339 Deferred income taxes 174 138 (133)Changes in operating assets and liabilities, net of acquisition:
Accounts receivable (3,711) 960 (1,623)Inventories (1,309) (1,126) (29)Prepaid expenses and other receivables (1,229) (212) (148)Accounts payable 391 702 (565)Accrued liabilities 832 (384) 671 Income taxes payable (250) (87) 445
Net cash provided by operating activities 33 5,389 5,183 Investing activities:
Cash paid to sellers of CitySync equity (7,871) — — Repayment of CitySync seller loans (445) — — EIS earn-out payment (1,541) (1,192) — Purchase of short-term investments (8,882) (6,640) (7,400)Sale of short-term investments 8,863 6,705 3,400 Purchases of property and equipment (380) (694) (385)
Net cash used in investing activities (10,256) (1,821) (4,385) Financing activities: Net proceeds from common stock offering 8,818 — —
Proceeds from exercise of stock options 121 1 173 Proceeds from bank debt — 4,000 — Repayment of bank debt (4,556) (3,750) (1,250)Cash released from restriction on bank debt — — 5,263
Net cash provided by financing activities 4,383 251 4,186 Effect of exchange rate changes on cash (223) 24 (308)Increase (decrease) in cash and cash equivalents (6,063) 3,795 4,676 Cash and cash equivalents at beginning of year 14,084 10,289 5,613 Cash and cash equivalents at end of year $ 8,021 $ 14,084 $ 10,289 Supplemental disclosure:
Income taxes paid $ 1,571 $ 1,488 $ 1,680 Interest expense paid $ 155 $ 33 $ 278
Supplemental non-cash disclosure:
Common stock issued in connection with CitySync acquisition $ 727 $ — $ — EIS earn-out payable recorded as additional goodwill $ 1,665 $ 1,541 $ 1,164
See accompanying notes to the consolidated financial statements.

30
IMAGE SENSING SYSTEMS, INC. CONSOLIDATED STATEMENTS OF SHAREHOLDERS’ EQUITY AND COMPREHENSIVE INCOME
(in thousands, except share data)
Shares Issued
Common Stock
Additional Paid-In Capital
Accumulated Other
Comprehensive Income (Loss)
Retained Earnings Total
Balance at December 31, 2007 3,927,806 $ 39 $ 11,004 $ 161 $ 12,021 $ 23,225 Tax benefit from disqualifying disposition — — 137 — — 137 Common stock issued for options exercised 59,000 1 194 — — 195 Common stock retired (1,587) — (22) — — (22) Stock option expense — — 339 — — 339 Foreign currency translation adjustment — — — (308) — (308) Net income — — — — 4,964 4,964 Comprehensive income — — — — — 4,656 Balance at December 31, 2008 3,985,219 40 11,652 (147) 16,985 28,530 Common stock issued for options exercised 600 — 1 — — 1 Stock option expense — — 341 — — 341 Foreign currency translation adjustment — — — (24) — (24) Net income — — — — 3,865 3,865 Comprehensive income — — — — — 3,841 Balance at December 31, 2009 3,985,819 40 11,994 (171) 20,850 32,713 Tax benefit from disqualifying disposition — — 72 — — 72 Common stock issued for options exercised 37,700 — 121 — — 121 Common stock issued in secondary offering, net 798,000 8 8,810 — — 8,818 Common stock issued in CitySync acquisition 57,000 1 726 — — 727 Stock option expense — — 342 — — 342 Foreign currency translation adjustment — — — 223 — 223 Net income — — — — 3,005 3,005 Comprehensive income — — — — — 3,228 Balance at December 31, 2010 4,878,519 $ 49 $ 22,065 $ 52 $ 23,855 $ 46,021
See accompanying notes to the consolidated financial statements.

31
Notes to Consolidated Financial Statements
December 31, 2010
1. DESCRIPTION OF BUSINESS AND SIGNIFICANT ACCOUNTING POLICIES
DESCRIPTION OF BUSINESS
Image Sensing Systems, Inc. (referred to herein as “we,” the “Company,” “us” and “our”) develops and markets software-based computer enabled detection products for use in traffic, security, police and parking applications. We sell our products primarily to distributors and also receive royalties under a license agreement with a manufacturer/distributor for one of our product lines. Our products are used primarily by governmental entities.
PRINCIPLES OF CONSOLIDATION
The consolidated financial statements include the accounts of Image Sensing Systems, Inc. and its wholly-owned subsidiaries: Flow Traffic Ltd. (Flow Traffic) located in Hong Kong; Image Sensing Systems Holdings Limited (ISS/Holdings) and Image Sensing Systems Europe Ltd. (ISS/Europe), both located in the United Kingdom; Image Sensing Systems Europe Limited SP.Z.O.O. (ISS/Poland), located in Poland; ISS Image Sensing Systems Canada Ltd (ISS/Canada) and ISS Canada Sales Corp. (Canada Sales Corp.), both located in Ontario, Canada; and CitySync Limited (CitySync), located in the United Kingdom. All significant inter-company transactions and accounts have been eliminated in consolidation.
REVENUE RECOGNITION
Royalty income is recognized based upon a monthly royalty report provided to us by Econolite Control Products, Inc. (Econolite), a licensee that sells one of our products in North America, the Caribbean and Latin America. The royalty is calculated using a profit sharing model where we split evenly the gross profit on sales of our Autoscope product made by Econolite. The royalty report is prepared by Econolite based on its sales of licensed products shipped or delivered to its customers.
We recognize revenue from product sales at the time of shipment or delivery, the selling price is fixed or determinable and collection of payment is reasonably assured. We record provisions against sales revenue for estimated returns and allowances in the period when the related revenue is recorded based on historical sales returns and changes in end user demand.
CASH AND CASH EQUIVALENTS
We consider all highly liquid investments with an original maturity of three months or less to be cash equivalents. Cash equivalents consist of money market funds. Cash located in foreign banks was $3.3 million and $3.6 million at December 31, 2010 and 2009, respectively. We hold our cash and cash equivalents with financial institutions and, at times, the amounts of our balances may be in excess of insurance limits.
INVESTMENTS
Investments and marketable securities held at December 31, 2010 and 2009 that do not qualify as cash equivalents have been designated as “available for sale”.
ACCOUNTS RECEIVABLE
We grant credit to customers in the normal course of business and generally do not require collateral. Management performs on-going credit evaluations of customers. We have fixed payment terms with each of our customers that vary in length. Accounts receivable that are outstanding longer than the fixed payment term are considered past due. We determine an allowance for doubtful accounts by considering a number of factors, including any on-going technical problems with product in the field, the length of time trade accounts receivable are past due, our previous loss history with the customer and the customer’s current ability to pay. We write off accounts receivable when they become uncollectible, and payments subsequently received on such receivables are credited to the allowance for doubtful accounts.

32
INVENTORIES
Inventories are primarily electronic components and finished goods and are valued at the lower of cost or market on the first-in, first-out (FIFO) method. Adjustments to record inventory at the lower of cost or market are charged to cost of revenue in the period incurred and totaled $23,000, $6,000 and $211,000 for the years ended December 31, 2010, 2009 and 2008, respectively.
PROPERTY AND EQUIPMENT
Property and equipment are stated at cost. Depreciation is computed by the straight-line method over a three- to seven-year period for financial reporting purposes and by accelerated methods for income tax purposes.
INCOME TAXES
Income taxes are accounted for under the liability method. Deferred income taxes are provided for temporary differences between the carrying amounts of assets and liabilities for financial reporting purposes and amounts used for income tax purposes. Deferred taxes are reduced by a valuation allowance when, in the opinion of management, it is more likely than not that some portion or the entire deferred tax asset will not be realized. Deferred tax assets and liabilities are adjusted for the effects of changes in tax laws and rates on the date of the enactment. We recognize tax benefits when we believe the benefit is more likely than not to be sustained upon review from the relevant authorities. We recognize penalties and interest expense related to unrecognized tax benefits in income tax expense.
FAIR VALUE MEASUREMENTS
Fair value is determined on the exchange price that would be received for an asset or paid to transfer a liability (an exit price) in the principal or most advantageous market for the asset or liability in an orderly transaction between market participants. Each major asset and liability category is measured at fair value on either a recurring or nonrecurring basis using a three-tier fair value hierarchy which prioritizes the inputs used in fair value measurements. The three-tier hierarchy for inputs used in measuring fair value is as follows:
Level 1. Observable inputs such as quoted prices in active markets;
Level 2. Inputs, other than the quoted prices in active markets, that are observable either directly or indirectly; and
Level 3. Unobservable inputs in which there is little or no market data, which require the reporting entity to develop its own assumptions.
INTANGIBLE ASSETS
Intangible assets are stated at their estimated value at the time of acquisition. Amortization is computed by the straight-line method over a three- to nine-year period for financial reporting purposes based on their estimated useful lives.
GOODWILL
Goodwill is not amortized but is tested for impairment annually or whenever an impairment indicator arises. Our goodwill related to our Flow Traffic subsidiary is tested for impairment on December 31 of each year. EIS asset purchase related goodwill is tested on October 1 of each year. CitySync goodwill will be tested beginning in April 2011. There is a two-step process for impairment testing of goodwill. The first step, used to identify potential impairment, compares the fair value of a reporting unit with its carrying amount, including goodwill. The second step, if necessary, measures the amount of the impairment by comparing the estimated fair value of the goodwill and intangible assets to their respective carrying values. If an impairment is identified, the carrying value of the asset is adjusted to estimated fair value.
During our annual impairment testing, we reconcile our market value, based on the value of our common stock, to the estimated combined fair value of our reporting units, to ensure that goodwill is not impaired. For Flow Traffic, we estimate the fair value by using a combination of the income approach, where fair value is dependent on the present value of future economic benefits to be derived from ownership of Flow Traffic, and the comparable market transactions method. The future economic benefits are significantly dependent on sustaining revenue levels for all product lines. For the RTMS reporting unit, we estimate fair value by using a combination of the income approach, where fair value is dependent on the present value of future economic benefits to be derived from the RTMS product line, and the market valuation approach, where the business was compared to guideline public company price-earning multiples with a significant weighting to companies in the traffic detection business. The future economic

33
benefits are mainly dependent on future revenue growth of the RTMS product line. At December 31, 2008, we performed a reconciliation, as our market capitalization was similar to our consolidated shareholders’ equity. We determined that no goodwill impairment existed at December 31, 2010, 2009 and 2008, as the fair value of each reporting unit exceeded its carrying value.
IMPAIRMENT OF LONG-LIVED ASSETS
Long-lived assets are reviewed for impairment when indicators of impairment are present. Impairment is recognized when the undiscounted cash flows estimated to be generated by those assets are less than the assets’ carrying amount. No such losses were recorded during the years ended December 31, 2010, 2009 or 2008.
USE OF ESTIMATES
Preparing financial statements in conformity with accounting principles generally accepted in the United States of America requires management to make estimates and assumptions that affect the reported amounts of assets and liabilities and disclosure of contingent assets and liabilities at the date of the consolidated financial statements and reported amounts of revenues and expenses during the reporting periods. Actual results could differ from the estimates.
RESEARCH AND DEVELOPMENT
Research and development costs are charged to operations in the period incurred.
WARRANTIES
We generally provide a standard two-year warranty on product sales. Reserves to honor warranty claims are estimated and recorded at the time of sale based on historical claim information and are analyzed and adjusted periodically based on claim trends.
ADVERTISING
Advertising costs are charged to operations in the period incurred and totaled $153,000, $151,000 and $196,000 for the years ended December 31, 2010, 2009 and 2008, respectively.
FOREIGN CURRENCY
All assets and liabilities of Flow Traffic, ISS/Europe, ISS/Holdings, ISS/Poland, ISS/Canada, Canada Sales Corp. and CitySync are translated from their respective functional currency to United States dollars at period-end rates of exchange, while the statement of income is translated at the average exchange rates during the period. Accumulated translation adjustments are shown in equity under “Accumulated other comprehensive income (loss).”
NET INCOME PER SHARE
Our basic net income per share amounts have been computed by dividing net income by the weighted average number of outstanding common shares. Diluted net income per share amounts have been computed by dividing net income by the weighted average number of outstanding common shares and common share equivalents relating to stock options, when dilutive.
For the years ended December 31, 2010, 2009 and 2008, respectively, 112,000, 96,000 and 58,000 common share equivalents were included in the computation of diluted net income per share.
At December 31, 2010, 2009 and 2008, the exercise prices of 133,000, 36,000 and 253,500 outstanding options, respectively, were greater than the average market price of the common shares during the period and were excluded from the calculation of diluted net income per share.
STOCK OPTIONS
We recognize compensation expense for share-based awards using the fair value of the option at the time of the grant and amortizing the fair value over the estimated service period on the straight-line attribute method. Unrecognized compensation costs were $761,000 at December 31, 2010, with a weighted average remaining life of 2.4 years.

34
NEW ACCOUNTING PRONOUNCEMENTS
In January 2010, the FASB issued Accounting Standards Update (“ASU”) No. 2010-06, Improving Disclosures about Fair Value Measurements (“ASU 2010-06”). ASU 2010-06 requires new disclosures regarding transfers in and out of Levels 1 and 2 and activity in Level 3 fair value measurements. It also clarifies existing disclosure requirements regarding the level of disaggregation in certain disclosures, inputs, and valuation techniques used in ASC 820, Fair Value Measurements and Disclosures. We adopted all of the requirements of this update on January 1, 2010, its effective date, except for the new requirement regarding activity in Level 3 fair value measurements which has a later effective date under the provisions of ASU 2010-6 and will become effective on January 1, 2011. Adoption of this pronouncement has not had, and is not expected to have, a significant effect on our consolidated financial statements disclosures.
In September 2010, the FASB issued ASU No. 2010-20, Disclosures about the Credit Quality of Financing Receivables and
the Allowance for Credit Losses, to enhance the disclosures required for financing receivables (for example, loans, trade accounts receivable, notes receivable, and receivables relating to a lessor’s leveraged, direct financing, and sales-type leases) and allowances for credit losses. The amended disclosures are designed to provide more information to financial statement users regarding the credit quality of a creditor’s financing receivables and the adequacy of its allowance for credit losses. We adopted all of the requirements of the amended guidance on December 31, 2010, its effective date, except for the disclosures regarding the activity during a reporting period which will become effective January 1, 2011. Adoption of the pronouncement has not had, and is not expected to have, a significant effect on our consolidated financial statement disclosures.
RECLASSIFICATIONS
Certain prior year amounts have been reclassified to conform to the current year presentation.
2. INVESTMENTS
Investments and marketable securities held at December 31, 2010 and 2009 that do not qualify as cash equivalents have been designated as “available for sale”. The estimated fair value of the investments held at December 31, 2010 and 2009 was determined using Level 1 measurements.
Our current portfolio is composed of high-grade municipal bonds, federal notes and commercial paper. The maximum term to maturity or time to next reset is six months.
Investments consisted of the following (in thousands):
December 31, 2010 2009
Federal notes $ 422 $ — Municipal bonds 2,217 3,935 Commercial paper 1,315 — Total $ 3,954 $ 3,935
Proceeds from maturities and sales of investments totaled $8.9 million, $6.7 million and $3.4 million for the years ended December 31, 2010, 2009 and 2008, respectively. Realized gains or losses related to sales during the years ended December 31, 2010 and 2009 were immaterial and are included in interest income.
3. INVENTORIES
Inventories, net of reserves, consisted of the following (in thousands):
December 31, 2010 2009
Electronic components $ 2,114 $ 1,733 Finished goods 2,535 1,001 Total $ 4,649 $ 2,734

35
4. ACQUISITIONS
On June 21, 2010, we purchased all of the outstanding equity of CitySync Limited, a privately-held developer and marketer of automatic number plate recognition (ANPR) products. We believe the CitySync acquisition expands our addressable market, strengthens our selling presence in Europe and extends the opportunities for hybrid product developments. The purchase price was $7.9 million in cash plus 57,000 shares of our common stock, valued using the closing price on the day before the acquisition, totaling approximately $727,000. In conjunction with the purchase, we repaid seller loans, including accrued interest, of $601,000. Following the acquisition, CitySync became a wholly-owned subsidiary of ISS/Europe.
As part of the purchase agreement, the sellers are eligible to receive an earn-out based on the performance of the business for
the next 18 months. Earn-outs will be calculated as of each calendar year end and paid within 90 days thereof. The earn-out is based on achieving certain revenue and minimum gross margins from the sale of CitySync ANPR systems, and it is calculated in two separate periods, each ending on December 31. In each period there are two tiers, and superior performance could lead to a total earn-out of $2 million or higher, as the earn-out is not capped. The 2010 earn-out achieved was $696,000. We had initially determined the fair value of the 2010 earn-out to be $491,000 as of June 30, 2010, and therefore we incurred an additional $205,000 that is recognized in the consolidated statements of income under the caption “Acquisition related expenses.” The estimate of the 2011 earn-out fair value of $519,000 is unchanged.
At June 30, 2010, we preliminarily estimated the value of goodwill from the CitySync acquisition at $3.3 million and revised
our estimate to $5.3 million as of September 30, 2010. This estimate did not change as of December 31, 2010, and management has determined the goodwill is no longer subject to look-back adjustments.
The purchase price was allocated on the basis of estimated fair value at the date of the purchase. The final purchase price allocation is as follows (in thousands):
In conjunction with the acquisition, all of the shares of common stock issued in connection with the transaction were placed
in escrow to secure potential indemnification obligations. Any shares remaining in escrow on December 31, 2012 will be released to the sellers.
The results of CitySync operations are included in the accompanying financial statements since the date of the acquisition.
The following pro forma summary presents the results of operations as if the acquisition had occurred on January 1, 2009. The table below includes our results for the periods as shown and for CitySync based on a January fiscal year. The pro forma results are not necessarily indicative of the results that would have been achieved had the CitySync acquisition taken place on that date (in thousands, except per share amounts):
Consideration transferred: Cash $ 7,871 Fair value of common stock 727 Estimated fair value of earn-out 1,010
Total purchase price 9,608 Allocation:
Net tangible current assets (1,684) Property and equipment (242) Liabilities 2,450 Deferred income taxes 1,876 Developed technology (3,300) Trade names (1,900) Other intangibles (1,500) Goodwill $ 5,308

36
Year Ended
December 31,
2010 2009
Total revenue $34,088 $32,034
Net income
2,508
2,937
Net income per share: Basic $ 0.55 $ 0.73 Diluted $ 0.53 $ 0.71
In 2007, we purchased certain assets of EIS Electronic Integrated Systems, Inc. (EIS), including its RTMS radar product line.
As part of the purchase agreement, the sellers are eligible to receive an earn-out based on the performance of the EIS assets purchased for approximately three years after the December 2007 purchase date. Earn-outs were calculated annually for 2008, 2009 and 2010. Earn-out payments related to the EIS asset purchase were recorded as additional goodwill when earned. In 2009, the sellers were entitled to a $1.5 million earn-out for the second earn-out period, which was paid in March 2010. For 2010, the final earn-out period, the sellers are entitled to a $1.7 million earn-out, which is expected to be paid in March 2011.
5. GOODWILL AND INTANGIBLE ASSETS
Goodwill consists of $1.1 million related to our acquisition of Flow Traffic (Autoscope segment), $8.2 million related to the EIS asset purchase (RTMS segment) and $5.4 million related to our acquisition of CitySync (CitySync segment). Because the goodwill and intangible assets related to the CitySync acquisition are accounted for in Great Britain Pounds, they are impacted by period-end rates of exchange to United States Dollars and therefore may vary in different reporting periods.
Intangible assets consisted of the following (dollars in thousands):
December 31, 2010 2009
Developed technology (8 to 9 year life) $ 7,364 $ 3,900 Trade names (5 to 8 year life) 3,193 1,200 Other intangibles (3 to 8 year life) 1,774 200
Less: Accumulated amortization (2,818) (1,586) Total identifiable intangible assets, net $ 9,513 $ 3,714
We expect to recognize amortization expense for the intangible assets in the above table in each of our years ending
December 31 of $1.6 million in each of 2011 and 2012, and $1.3 million in each of 2013, 2014 and 2015. The weighted average amortization period remaining for intangible assets is 6.5 years. Goodwill and intangible assets related to the EIS asset purchase are deductible for tax purposes over 15 years.
6. CREDIT FACILITIES
We have a revolving line of credit and had term loans with our bank. These credit agreements were initially entered into on May 1, 2008 and replaced all prior bank agreements, including the repayment of loans under the previous agreements.
The revolving line of credit agreement with Associated Bank, National Association, or Associated Bank, provides up to $5.0 million in short-term borrowings at the bank’s prime rate expiring May 1, 2012. Any loans are secured by inventories, accounts receivable and equipment, and Associated Bank has the right of setoff against our checking, savings and other accounts. There was no outstanding balance under the line at December 31, 2010 and 2009.
In December 2009, we entered into a term loan agreement for $4.0 million with Associated Bank, which was fully repaid in September 2010. We previously had a separate $4.0 million term note with Associated Bank that originated in May 2008 and was fully repaid in February 2009.

37
7. WARRANTIES
Warranty liability and related activity consisted of the following (in thousands):
Years Ended December 31, 2010 2009 2008
Warranty liability at beginning of year $ 289 $ 217 $ 157 Provisions for estimated future warranty obligations 484 175 153 Costs incurred for warranties honored (149) (103) (93)Warranty liability at end of year $ 624 $ 289 $ 217
8. LEASE COMMITMENTS
We rent office space and equipment under operating lease agreements expiring at various dates through January 2015. Our leases currently provide for monthly payments of $90,000, which is inclusive of our proportionate share of operating expenses that exceed a base rent. Rent expense for office facilities was $777,000 in 2010, $585,000 in 2009 and $555,000 in 2008.
Future minimum annual lease payments under noncancelable operating leases for the years ending December 31, 2011, 2012, 2013, 2014 and 2015 are $556,000, $376,000, $353,000, $261,000 and $16,000, respectively.
9. INCOME TAXES
Our deferred tax assets (liabilities) are as follows (in thousands):
December 31, 2010 2009
Current deferred tax assets (liabilities): Accrued compensation $ 55 $ 47 Prepaid expenses (67) (48) Bad debt reserves 75 27 Warranty reserves 143 45 Other 24 66 Foreign net operating loss carryforwards — 55 Less valuation allowance — (55)
230 137 Non-current deferred tax assets (liabilities):
Intangible asset amortization - EIS 1,369 1,525 Intangible asset amortization - CitySync (1,840) — Stock option expense (non-qualified) 164 131 Other 17 20
(290) 1,676 Net deferred tax assets (liabilities) $ (60) $ 1,813
Deferred tax assets have been offset by a valuation allowance as deemed necessary based on our estimates of future sources
of taxable income and the expected timing of temporary difference reversals.
There were $4.4 million, $3.3 million and $2.0 million in undistributed earnings of our wholly-owned foreign subsidiaries at December 31, 2010, 2009 and 2008, respectively. We have not provided any additional federal or state income taxes or foreign withholding taxes on the undistributed earnings, as such earnings have been indefinitely reinvested in the business.
We realize an income tax benefit from the exercise or early disposition of certain stock options. This benefit results in a decrease in current income taxes payable and an increase in additional paid-in capital.

38
The components of income tax expense are as follows (in thousands):
Years Ended December 31, 2010 2009 2008
Current: Federal $ 983 $ 1,222 $ 1,738 State (65) 23 38 Foreign 25 (29) 564
943 1,216 2,340 Deferred:
Federal (32) 82 (59)State (1) 5 (23)Foreign — 51 (51)
(33) 138 (133)Total income tax expense $ 910 $ 1,354 $ 2,207
Income before taxes for the foreign operations was $1.1 million, $1.3 million and $1.7 million for the years ended
December 31, 2010, 2009 and 2008.
A reconciliation of income taxes to the statutory federal rate is as follows (in thousands):
Years Ended December 31, 2010 2009 2008
Federal tax statutory rate $ 1,331 $ 1,774 $ 2,438 State taxes, net of federal benefit (47) 18 10 Research and development tax credits (454) (301) (120)Non-deductible acquisition expenses and earn-out 238 — — Domestic production activity deduction (111) (62) (83)Effect of lower rates on foreign income (43) (58) (125)Reduction in valuation allowance (55) — (77)Stock option expense 75 74 66 Adjustment of prior year tax credits and refunds (64) (77) (50)Uncertain tax positions (33) (38) 96 Other 73 (46) 52 $ 910 $ 1,354 $ 2,207
A reconciliation of the beginning and ending amount of the tax liability for uncertain tax benefits is as follows (in thousands):
Balance at January 1, 2009 $ 246 Additions for current year tax positions — Reductions as a result of lapses in statute of limitations (38) Balance at December 31, 2009 208 Additions for current year tax positions — Reductions as a result of lapses in statute of limitations (33) Balance at December 31, 2010 $ 175
We are subject to income taxes in the U.S. federal jurisdiction and various state and foreign jurisdictions. Tax regulations within each jurisdiction are subject to the interpretation of the related tax laws and require significant judgment to apply. Generally, we are subject to U.S. federal, state, local and foreign tax examinations by taxing authorities for years after the fiscal year ended December 31, 2006.
10. LICENSING
We have sublicensed the exclusive right to manufacture and market the Autoscope technology in North America, the Caribbean and Latin America to Econolite Control Products, Inc. (Econolite) and receive royalties from Econolite on sales of the Autoscope system in those territories as well as in non-exclusive territories as allowed from time to time. We may terminate our agreement with Econolite if a minimum annual sales level is not met or Econolite fails to make royalty payments as required by the agreement. The agreement’s term runs to 2028, unless terminated by either party upon three years’ notice.

39
We recognized royalty income from this agreement of $12.5 million, $12.1 million and $13.3 million in 2010, 2009 and 2008, respectively.
11. REVENUE BY GEOGRAPHY
We derived the following percentages of our net revenues from the following geographic regions:
2010 2009 2008
Asia Pacific 11% 10% 12% Europe 26% 15% 16% North America 63% 75% 72% No country other than the United States had revenue in excess of 10% of our total revenue. The aggregate net book value of
long-lived assets held outside of the United States, not including goodwill and intangible assets, was $401,000 and $288,000 at December 31, 2010 and 2009, respectively.
12. SIGNIFICANT CUSTOMERS AND CONCENTRATION OF CREDIT RISK
Royalty income from Econolite comprised 40%, 49% and 50% of revenue in the years ended December 31, 2010, 2009 and 2008, respectively. Accounts receivable from Econolite were $2.6 million and $2.2 million at December 31, 2010 and 2009, respectively. Major disruptions in the manufacturing and distribution of our products by Econolite or the inability of Econolite to make payments on their accounts receivable with us could have a material adverse effect on our business, financial condition and results of operations. Not including Econolite, one international customer comprised 15% of accounts receivable at December 31, 2010 and a separate international customer comprised 10% of accounts receivable at December 31, 2009.
13. RETIREMENT PLANS
Substantially all of our employees in the United States are eligible to participate in a qualified defined contribution 401(k) plan in which participants may elect to have a specified portion of their salary contributed to the plan and we may make discretionary contributions to the plan. Flow Traffic and CitySync are obligated to contribute to certain employee pension plans. We made contributions totaling $131,000, $98,000 and $97,000 to the plans for 2010, 2009 and 2008, respectively.
14. EQUITY AND STOCK OPTIONS
In April 2010, we sold 798,000 shares of our common stock to investors at $12.25 per share under a registration statement on Form S-3 declared effective by the Securities and Exchange Commission in December 2009. Net of underwriting fees and other offering expenses, we received $8.8 million in cash from the stock sale.
In February 1995 and April 2005, we adopted the 1995 Long-Term Incentive and Stock Option Plan (the 1995 Plan) and the 2005 Stock Incentive Plan (the 2005 Plan), respectively, which provide for the granting of incentive (ISO) and non-qualified (NQO) stock options, stock appreciation rights, restricted stock awards and performance awards to our officers, directors, employees, consultants and independent contractors. The 1995 Plan terminated in February 2005, although the options granted under the 1995 Plan remain outstanding according to their terms. Options granted under the Plans generally vest over three to five years based on service, and have a contractual term of six to ten years and are amortized to expense on a straight-line basis. The following table summarizes stock option activity for 2010, 2009 and 2008:

40
Plan Options
Available For Grant
Plan Options Outstanding
Non-Plan Options
Outstanding
Weighted Average
Exercise PricePer Share
ISO NQO Balance at December 31, 2007 122,200 119,615 175,618 42,000 $ 8.47
Granted (95,500) 48,130 47,370 — 13.58Exercised — (13,000) (10,000) (36,000) 3.31Plan addition 138,800 — — —
Balance at December 31, 2008 165,500 154,745 212,988 6,000 $ 10.59Granted (68,000) 19,000 49,000 — 8.62Exercised — (600) — — 1.30Plan addition 10,000 (10,000) — — 9.22
Balance at December 31, 2009 107,500 163,145 261,988 6,000 $ 8.10Granted (85,000) 40,300 44,700 — 12.33Exercised — (20,200) (11,500) (6,000) 3.31Plan addition 135,000 — — — —Forfeited 15,000 (7,000) (8,000) — 6.69
Balance at December 31, 2010 172,500 176,245 287,188 — $ 9.11
The following table summarizes information about the stock options outstanding at December 31, 2010:
Options Outstanding Options Exercisable
Range of Exercise Price
Number Outstanding
Weighted Average
Remaining Contractual
Life
Weighted Average Exercise
Price
Aggregate Intrinsic
ValueNumber
Exercisable
WeightedAverage Exercise
Price
Aggregate Intrinsic
Value
$1.30-1.99 46,000 1.5 years $ 1.36 $ 497,147 46,000 $ 1.36 $ 497,1473.00-3.99 38,933 1.8 years 3.15 351,080 38,933 3.15 351,0808.00-8.99 48,000 5.9 years 8.63 169,755 13,500 8.58 48,4009.00-9.99 172,500 4.4 years 9.20 511,371 55,125 9.16 165,811
11.00-11.99 15,000 5.8 years 11.19 — — — —12.00-12.99 115,000 4.9 years 12.53 — 31,500 12.51 —15.00-15.99 28,000 1.0 years 15.30 — 28,000 15.30 —
463,433 4.0 years $ 9.11 $ 1,529,353 213,058 $ 7.64 $ 1,062,438 The fair value of the 85,000, 68,000 and 95,500 options granted during 2010, 2009 and 2008, respectively, was $348,000,
$279,000 and $388,000.
The total intrinsic value of options exercised during 2010, 2009 and 2008 was $352,000, $7,000 and $292,000, respectively. The total fair value of option shares vested during 2010, 2009 and 2008 was $716,000, $578,000 and $807,000, respectively. The fair value of each option granted is estimated on the date of grant using the Black-Scholes option-pricing model with the following weighted-average assumptions used during 2010, 2009 and 2008, respectively: zero dividend yield; expected volatility of 78%, 45% and 41%; risk-free interest rate of 2.84%, 3.19% and 3.68%; and expected life of 3.68, 3.0 and 3.5 years. The expected life of the options is based on evaluations of historical and expected future exercise behavior. The risk-free interest rate is based on the U.S. Treasury rates at the date of grant, with maturity dates approximately equal to the expected life at the grant date. Volatility is based on historical volatility of our stock over the past three years. We have not historically paid any dividends and do not expect to in the foreseeable future. We recognized stock option expense of $342,000, $341,000 and $339,000 in the years ended December 31, 2010, 2009 and 2008, respectively, and the expense is included within general and administrative expense on the consolidated statements of income.
There were 213,058, 181,383 and 183,633 options exercisable at December 31, 2010, 2009 and 2008, respectively. The weighted average exercise price of these options was $7.64, $6.39 and $2.94 at December 31, 2010, 2009 and 2008, respectively.

41
15. SEGMENT INFORMATION
We currently operate in three reportable segments: Autoscope, RTMS and CitySync. Autoscope is our machine-vision product line, and revenue consists of royalties (all of which are received from Econolite), as well as a portion of international sales. RTMS is our radar product line acquired in the EIS asset purchase in December 2007. CitySync is our ANPR product line acquired in the CitySync purchase in June 2010. All segment revenues are derived from external customers.
Due to the CitySync acquisition and related changes in how we manage our business, we may reevaluate our segment definitions in the future.
The following tables set forth selected unaudited financial information for each of the Company’s reportable segments (in thousands):
For the year ended December 31, 2010 Autoscope RTMS CitySync Total
Revenue $ 16,659 $ 9,819 $ 5,203 $ 31,681Depreciation 293 173 32 498Amortization of intangible assets — 768 450 1,218Income (loss) before income taxes 2,618 1,823 (526) 3,915Capital expenditures 325 77 14 416Total assets 26,915 13,202 14,239 54,356
For the year ended December 31, 2009 Autoscope RTMS Total
Revenue $ 16,240 $ 8,353 $ 24,593Depreciation 292 132 424Amortization of intangible assets — 768 768Income before income taxes 3,807 1,412 5,219Capital expenditures 555 139 694Total assets 29,752 11,398 41,150
For the year ended December 31, 2008 Autoscope RTMS Total
Revenue $ 18,705 $ 7,760 $ 26,465Depreciation 242 115 357Amortization of intangible assets — 768 768Income before income taxes 5,939 1,232 7,171Capital expenditures 273 112 385Total assets 24,135 11,973 36,108
The CitySync segment loss before income taxes includes $817,000 of acquisition related expenses.
16. RELATED PARTY TRANSACTIONS
Dan Manor, who was a named executive officer in 2010, is a beneficiary of the earn-out for the EIS asset purchase as further described in Note 4.

42
Report of Independent Registered Public Accounting Firm
Board of Directors and Shareholders Image Sensing Systems, Inc.
We have audited the accompanying consolidated balance sheets of Image Sensing Systems, Inc. (a Minnesota Corporation) and subsidiaries (the Company) as of December 31, 2010 and 2009, and the related consolidated statements of income, shareholders’ equity and comprehensive income, and cash flows for each of the three years in the period ended December 31, 2010. These consolidated financial statements are the responsibility of the Company’s management. Our responsibility is to express an opinion on these financial statements based on our audits.
We conducted our audits in accordance with the standards of the Public Company Accounting Oversight Board (United States). Those standards require that we plan and perform the audit to obtain reasonable assurance about whether the financial statements are free of material misstatement. The Company is not required to have, nor were we engaged to perform an audit of its internal control over financial reporting. Our audit included consideration of internal control over financial reporting as a basis for designing audit procedures that are appropriate in the circumstances, but not for the purpose of expressing an opinion on the effectiveness of the Company’s internal control over financial reporting. Accordingly, we express no such opinion. An audit also includes examining, on a test basis, evidence supporting the amounts and disclosures in the financial statements, assessing the accounting principles used and significant estimates made by management, as well as evaluating the overall financial statement presentation. We believe that our audits provide a reasonable basis for our opinion.
In our opinion, the consolidated financial statements referred to above present fairly, in all material respects, the financial position of Image Sensing Systems, Inc. and subsidiaries as of December 31, 2010 and 2009, and the results of their operations and their cash flows for each of the three years in the period ended December 31, 2010 in conformity with accounting principles generally accepted in the United States of America.
/s/ GRANT THORNTON LLP
Minneapolis, Minnesota March 24, 2011
43
Item 9. Changes in and Disagreements with Accountants on Accounting and Financial Disclosure
None.
Item 9A. Controls and Procedures
Evaluation of disclosure controls and procedures
We maintain disclosure controls and procedures (as defined in Rules 13a-15(e) and 15d-15(e) under the Securities Exchange Act of 1934, as amended (Exchange Act)), that are designed to reasonably ensure that information required to be disclosed by us in the reports we file or submit under the Exchange Act is recorded, processed, summarized and reported within the time periods specified in the SEC’s rules and forms and that such information is accumulated and communicated to our management, including our principal executive officer and principal financial officer, or persons performing similar functions, as appropriate to allow timely decisions regarding required disclosure. Under the supervision and with the participation of our management, including our Chief Executive Officer and Chief Financial Officer, we evaluated the effectiveness of the design and operation of our disclosure controls and procedures. Based upon that evaluation, the Chief Executive Officer and Chief Financial Officer concluded that, as of the end of the period covered by this report, our disclosure controls and procedures were effective.
Management’s report on internal control over financial reporting
Our management is responsible for establishing and maintaining adequate internal control over financial reporting. Our internal control over financial reporting is a process designed to provide reasonable assurance regarding the reliability of financial reporting and the preparation of financial statements for external purposes in accordance with generally accepted accounting principles in the United States of America. Our internal control over financial reporting includes those policies and procedures that (i) pertain to the maintenance of records that, in reasonable detail, accurately and fairly reflect our transactions and dispositions of our assets; (ii) provide reasonable assurance that transactions are recorded as necessary to permit preparation of the financial statements in accordance with generally accepted accounting principles in the United States of America, and that our receipts and expenditures are being made only in accordance with authorizations of our management and directors; and (iii) provide reasonable assurance regarding prevention or timely detection of unauthorized acquisition, use or disposition of our assets that could have a material effect on the financial statements.
Internal control over financial reporting cannot provide absolute assurance of achieving financial reporting objectives because of its inherent limitations. Internal control over financial reporting is a process that involves human diligence and is subject to lapses in judgment or breakdowns resulting from human failures. Internal control over financial reporting also can be circumvented by collusion or improper management override. Because of such limitations, there is a risk that material misstatements may not be prevented or detected on a timely basis by internal control over financial reporting. However, these inherent limitations are known features of the financial reporting process. Therefore, it is possible to design into the process safeguards to reduce, though not eliminate, this risk.
Because of its inherent limitations, internal control over financial reporting may not prevent or detect all misstatements. Further, projections of any evaluation of effectiveness to future periods are subject to the risk that controls may become inadequate because of changes in conditions, or that the degree of compliance with the policies or procedures may deteriorate.
Management assessed the effectiveness of our internal control over financial reporting as of December 31, 2010. In making this assessment, management used the criteria set forth by the Committee of Sponsoring Organizations of the Treadway Commission (COSO) in “Internal Control—Integrated Framework”. Based on this assessment, management has concluded that our internal control over financial reporting was effective as of December 31, 2010.
Changes in internal control over financial reporting
During the most recent fiscal quarter covered by this report, there has been no change in our internal control over financial reporting (as defined in Rule 13a-15(f) and 15d-15(f) under the Exchange Act) that has materially affected, or is reasonably likely to materially affect, our internal control over financial reporting.
Item 9B. Other Information
None.

44
PART III
Item 10. Directors, Executive Officers and Corporate Governance
We have adopted a Code of Ethics which applies to our principal executive, accounting and financial officers. The Code of Ethics is published on our website at www.imagesensing.com. Any amendments to the Code of Ethics and waivers of the Code of Ethics for our principal executive, accounting and financial officers will be published on our website.
The sections entitled “Proposal I - Election of Directors,” “Audit Committee” and “Section 16(a) Beneficial Ownership Reporting Compliance” in our definitive proxy statement for our 2011 annual meeting of shareholders are incorporated into this Annual Report on Form 10-K by reference.
Item 11. Executive Compensation
The sections entitled “Executive Compensation” and “Compensation of Directors” in our definitive proxy statement for the 2011 annual meeting of shareholders are incorporated into this Annual Report on Form 10-K by reference.
Item 12. Security Ownership of Certain Beneficial Owners and Management and Related Stockholder Matters
Equity Compensation Plan Information
The following table provides information as of December 31, 2010 about our shares of common stock subject to outstanding awards or available for future awards under our equity compensation plans and arrangements.
Plan Category
Number of securities tobe issued upon exerciseof outstanding options,
warrants and rights
Weighted-average exerciseprice of outstanding
options, warrants and rights
Number of securities remaining available for future issuance
under equity compensation plans(excluding securities reflected in
the first column)(2) Equity compensation plans approved by
shareholders(1) 463,433 $ 9.11 172,500
(1) Includes shares underlying stock options granted under the Image Sensing Systems, Inc. 1995 Long-Term Incentive and Stock Option Plan (1995 Plan) and non-qualified stock options granted outside the 1995 Plan between 1996 and 2000 to current and former members of the Board of Directors.
(2) The 172,500 shares available for grant under the 2005 Stock Incentive Plan may become the subject of future awards in the form of stock options, stock appreciation rights, restricted stock, performance awards or other stock-based awards.
The section entitled “Security Ownership of Certain Beneficial Owners and Management” in our definitive proxy statement for the 2011 annual meeting of shareholders is incorporated into this Form Annual Report on 10-K by reference.
Item 13. Certain Relationships and Related Transactions, and Director Independence
The section entitled “Certain Relationships and Related Transactions” in our definitive proxy statement for the 2011 annual meeting of shareholders is incorporated into this Annual Report on Form 10-K by reference.
Item 14. Principal Accounting Fees and Services
The sections entitled “Audit Fees,” “Audit-Related Fees,” “Tax Fees,” “All Other Fees” and “Policy on Audit Committee Pre-Approval of Audit and Permissible Non-Audit Services Provided by Our Independent Registered Public Accounting Firm” in our definitive proxy statement for our 2011 annual meeting of shareholders are incorporated into this Annual Report on Form 10-K by reference.
45
PART IV
Item 15. Exhibits and Financial Statement Schedules
(a) Documents filed as part of this report:
1. Financial statements
The following consolidated financial statements are included in Part II, Item 8. “Financial Statements and Supplementary Data”:
Consolidated Balance Sheets as of December 31, 2010 and 2009 Consolidated Statements of Income for the years ended December 31, 2010, 2009 and 2008 Consolidated Statements of Cash Flow for the years ended December 31, 2010, 2009 and 2008 Consolidated Statements of Shareholders’ Equity and Comprehensive Income for the years ended December 31, 2010, 2009 and 2008 Notes to Consolidated Financial Statements Report of Independent Registered Public Accounting Firm
2. Financial Statement Schedules:
All financial statement schedules have been omitted because they are not required or not applicable, or the information is included in the Consolidated Financial Statements or Notes.
3. The following documents are filed as exhibits to this report:
Exhibit No. Description 1.1 Underwriting Agreement by and among ISS, Wedbush Securities Inc. and Craig-Hallum Capital Group Inc. dated
April 15, 2010, incorporated by reference to Exhibit 1.1 to ISS’ Current Report on Form 8-K dated April 15, 2010.
2.1* Asset Purchase Agreement dated December 6, 2007 by and among Image Sensing Systems, Inc. (ISS), EIS
Electronic Integrated Systems Inc., Dan Manor and the other parties named therein, incorporated by reference to Exhibit 2.1 to ISS’ Annual Report on Form 10-K for the year ended December 31, 2007 (2007 Form 10-K). (Schedules to this Agreement have not been filed in reliance on Item 601(b)(2) of Regulation S-K of the Securities and Exchange Commission (SEC). ISS will furnish supplementally copies of such schedules to the SEC upon its request.)
2.2 Share Purchase Agreement dated June 21, 2010 by and among ISS, Image Sensing Systems Europe Limited,
CitySync Limited and three shareholders of CitySync Limited, incorporated by reference to Exhibit 2.1 to ISS’ Quarterly Report on Form 10-Q for the quarter ended June 30, 2010.
3.1 Restated Articles of Incorporation of ISS, incorporated by reference to Exhibit 3.1 to ISS’ Registration Statement
on Form SB-2 (Registration No. 33-90298C) filed on March 14, 1995, as amended (Registration Statement). 3.2 Articles of Amendment to Articles of Incorporation of ISS, incorporated by reference to Exhibit 3.2 to ISS’
Quarterly Report on Form 10-QSB for the quarter ended June 30, 2001. 3.3 Bylaws of ISS, incorporated by reference to Exhibit 3.3 to ISS’ Registration Statement. 4.1 Specimen form of ISS’ common stock certificate, incorporated by reference to Exhibit 4.1 to ISS’ Registration
Statement. 10.1 Form of Distributor Agreement, incorporated by reference to Exhibit 10.1 to ISS’ Registration Statement. 10.2** 1995 Long-Term Incentive and Stock Option Plan, amended and restated through May 17, 2001, incorporated by
reference to Exhibit 10.10 to ISS’ Annual Report on Form 10-KSB for the year ended December 31, 2001.

46
10.3** Employment Agreement between ISS and Kenneth R. Aubrey, dated December 12, 2006, effective on or about January 15, 2007 (in capacity as President) and effective on or about June 1, 2007 (in capacity of President and Chief Executive Officer), incorporated by reference to Exhibit 10.1 to ISS’ Current Report on Form 8-K dated December 14, 2006.
10.4** Employment Agreement between ISS and Gregory R. L. Smith, dated December 8, 2006, incorporated by
reference to Exhibit 10.1 to ISS’ Current Report on Form 8-K dated December 8, 2006. 10.5 Amendment VII to Office Lease Agreement dated April 26, 2007 by and between ISS and Spruce Tree Centre
L.L.P., incorporated by reference to Exhibit 10.11 to ISS’ Annual Report on Form 10-K for the year ended December 31, 2007 (2007 Form 10-K).
10.6 Modification to Manufacturing, Distributing and Technology License Agreement dated September 1, 2000 by and
between ISS and Econolite Control Products, Inc. (Econolite), incorporated by reference to Exhibit 10.12 to ISS’ 2007 Form 10-K.
10.7** Image Sensing Systems, Inc. 2005 Stock Incentive Plan, incorporated by reference to Appendix A to ISS’ proxy
statement filed with the SEC on April 19, 2005. 10.8 Manufacturing, Distributing and Technology License Agreement dated June 11, 1991 by and between ISS and
Econolite Control Products, Inc. (Econolite), incorporated by reference to Exhibit 10.1 to the Registration Statement.
10.09 Extension and Second Modification to License Agreement dated July 13, 2001 by and between ISS and Econolite,
incorporated by reference to Exhibit 10.12 to ISS’ Annual Report on Form 10-KSB for the year ended December 31, 2001.
10.10 Office Lease Agreement dated November 24, 1998 by and between ISS and Spruce Tree Centre L.L.P.,
incorporated by reference to Exhibit 10.18 to ISS’ Annual Report on Form 10-KSB for the year ended December 31, 1998.
10.11 Production Agreement dated February 14, 2002 by and among ISS, Wireless Technology, Inc. and Econolite,
incorporated by reference to Exhibit 10.20 to ISS’ Annual Report on Form 10-KSB for the year ended December 31, 2001.
10.12 Extension and Third Modification to Manufacturing Distributing and Technology License Agreement dated
July 3, 2008 by and between ISS and Econolite, incorporated by reference to Exhibit 10.1 to ISS’ Current Report on Form 8-K dated July 3, 2008.
10.13** Employment Agreement dated December 6, 2007 by and between ISS Image Sensing Systems Canada Ltd. and
Dan Manor, incorporated by reference to Exhibit 99.1 to ISS’ 2007 Form 10-K. 10.14 Loan Agreement dated May 1, 2008 by and between ISS and Associated Bank, National Association (Associated
Bank), incorporated by reference to Exhibit 10.19 to ISS’ Registration Statement on Form S-1 filed on May 12, 2008 (Form S-1).
10.15 Security Agreement dated May 1, 2008 by and between ISS and Associated Bank, incorporated by reference to
Exhibit 10.20 to ISS’ Form S-1. 10.16 Promissory Note (Line of Credit) dated May 1, 2008 in the original principal amount of $5,000,000 issued by ISS
to Associated Bank, incorporated by reference to Exhibit 10.21 to ISS’ Form S-1. 10.17 Promissory Note (Loan) dated May 1, 2008 in the original principal amount of $3,000,000 issued by ISS to
Associated Bank, incorporated by reference to Exhibit 10.22 to ISS’ Form S-1. 10.18 Modification Agreement dated December 28, 2009 by and between ISS and Associated Bank under which ISS
and Associated Bank amended the Loan Agreement dated as of May 1, 2008 by and between ISS and Associated Bank, incorporated by reference to Exhibit 10.18 to ISS’ Annual Report on Form 10-K for the year ended December 31, 2009 (2009 Form 10-K).

47
10.19 Promissory Note (Loan) dated December 28, 2009 in the original principal amount of $4,000,000 issued by ISS to Associated Bank, incorporated by reference to Exhibit 10.19 to the 2009 Form 10-K.
10.20 Lease dated February 1, 2010 between CitySync Limited and Nortrust Nominees Limited, incorporated by
reference to Exhibit 10.1 to ISS’ Quarterly Report on Form 10-Q for the quarter ended June 30, 2010. 10.21 Third Modification Agreement dated December 28, 2010 by and between ISS and Associated Bank under which
ISS and Associated Bank amended the Loan Agreement dated as of May 1, 2008 by and between ISS and Associated Bank (filed herewith).
21 List of Subsidiaries of ISS. 23.1 Consent of Independent Registered Public Accounting Firm. 24 Power of Attorney (included on signature page). 31.1 Certification of Chief Executive Officer Pursuant to Section 302 of the Sarbanes-Oxley Act of 2002. 31.2 Certification of Chief Financial Officer Pursuant to Section 302 of the Sarbanes-Oxley Act of 2002. 32.1 Certification of Chief Executive Officer Pursuant to Section 906 of the Sarbanes-Oxley Act of 2002. 32.2 Certification of Chief Financial Officer Pursuant to Section 906 of the Sarbanes-Oxley Act of 2002. 99.1 Extension of Modification to Manufacturing, Distributing and Technology License Agreement dated May 31,
2002 by and between ISS and Econolite, incorporated by reference to Exhibit 99.2 to ISS’ 2007 Form 10-K. 99.2 Letter agreement dated June 19, 1997 by and between ISS and Econolite, incorporated by reference to Exhibit
99.3 to ISS’ 2007 Form 10-K.
* Portions of this exhibit are treated as confidential pursuant to a request for confidential treatment filed by ISS with the SEC.
** Management contract or compensatory plan or arrangement.
Copies of all exhibits not attached will be furnished without charge upon written request to the Company at the address set forth on the inside back cover page of this Annual Report.

48
Signatures
Pursuant to the requirements of Section 13 or 15(d) of the Securities Exchange Act of 1934, the registrant has duly caused this report to be signed on its behalf by the undersigned, thereunto duly authorized.
Image Sensing Systems, Inc. /s/ Kenneth R. Aubrey Date: March 24, 2011 Kenneth R. Aubrey President and Chief Executive Officer (Principal Executive Officer)
Each person whose signature to this Annual Report on Form 10-K appears below hereby constitutes and appoints Kenneth R. Aubrey and Gregory R. L. Smith, and each of them, as his or her true and lawful attorney-in-fact and agent, with full power of substitution, to sign on his or her behalf individually and in the capacity stated below and to perform any acts necessary to be done in order to file all amendments to this Annual Report on Form 10-K, and any and all instruments or documents filed as part of or in connection with this Annual Report on Form 10-K or any amendments hereto, and each of the undersigned does hereby ratify and confirm all that said attorney-in-fact and agent, or his substitutes, shall do or cause to be done by virtue hereof.
In accordance with the Exchange Act, this report has been signed below by the following persons on behalf of the registrant and in the capacities and on the dates indicated:
/s/ Kenneth R. Aubrey Date: March 24, 2011 Kenneth R. Aubrey President and Chief Executive Officer (Principal Executive Officer) /s/ Gregory R. L. Smith Date: March 24, 2011 Gregory R. L. Smith Chief Financial Officer (Principal Financial and Principal Accounting Officer) /s/ James Murdakes Date: March 24, 2011 James Murdakes Chairman of the Board of Directors /s/ James W. Bracke Date: March 24, 2011 James W. Bracke Director /s/ Michael G. Eleftheriou Date: March 24, 2011 Michael G. Eleftheriou Director /s/ Panos G. Michalopoulos Date: March 24, 2011 Panos G. Michalopoulos Director /s/ Sven A. Wehrwein Date: March 24, 2011 Sven A. Wehrwein Director

49
Exhibit 21
List of Subsidiaries of Image Sensing Systems, Inc.
Name of Subsidiaries Jurisdiction of Incorporation or Organization
Flow Traffic Ltd. Hong Kong Special Administrative Region of the People’s Republic of China
Image Sensing Systems Europe Limited United Kingdom Image Sensing Systems Holdings Limited United Kingdom CitySync Limited United Kingdom
Image Sensing Systems Europe Limited SP.Z.O.O. Poland
ISS Image Sensing Systems Canada Ltd. British Columbia, Canada
ISS Canada Sales Corp. British Columbia, Canada

50
Exhibit 23.1
Consent of Independent Registered Public Accounting Firm
We have issued our report dated March 24, 2011 with respect to the consolidated financial statements included in the Annual Report of Image Sensing Systems, Inc. on Form 10-K for the year ended December 31, 2010. We hereby consent to the incorporation by reference of said report in the Registration Statements of Image Sensing Systems, Inc. on Forms S-3 (File No. 333-162810, effective November 18, 2009; File No. 333-41706, effective July 19, 2000) and on Forms S-8 (File No. 333-167496, effective June 14, 2010; File No. 333-165303, effective March 8, 2010; File No. 333-152117, effective July 3, 2008; File No. 333-142449, effective April 30, 2007; File No. 333-82546, effective February 11, 2002; File No. 333-86169, effective August 30, 1999; and File No. 333-09289, effective July 31, 1996). /s/ GRANT THORNTON LLP Minneapolis, Minnesota March 24, 2011

51
Exhibit 31.1
CERTIFICATION PURSUANT TO SECTION 302 OF THE SARBANES-OXLEY ACT OF 2002
I, Kenneth R. Aubrey, certify that:
1. I have reviewed this annual report on Form 10-K of Image Sensing Systems, Inc.;
2. Based on my knowledge, this report does not contain any untrue statement of a material fact or omit to state a material fact necessary to make the statements made, in light of the circumstances under which such statements were made, not misleading with respect to the period covered by this report;
3. Based on my knowledge, the financial statements, and other financial information included in this report, fairly present in all material respects the financial condition, results of operations and cash flows of the registrant as of, and for, the periods presented in this report;
4. The registrant’s other certifying officer and I are responsible for establishing and maintaining disclosure controls and procedures (as defined in Exchange Act Rules 13a-15(e) and 15d-15(e)) and internal control over financial reporting (as defined in Exchange Act Rules 13a-15(f) and 15d-15(f)) for the registrant and have:
(a) Designed such disclosure controls and procedures, or caused such disclosure controls and procedures to be designed under our supervision, to ensure that material information relating to the registrant, including its consolidated subsidiaries, is made known to us by others within those entities, particularly during the period in which this report is being prepared;
(b) Designed such internal control over financial reporting, or caused such internal control over financial reporting to be designed under our supervision, to provide reasonable assurance regarding the reliability of financial reporting and the preparation of financial statements for external purposes in accordance with generally accepted accounting principles;
(c) Evaluated the effectiveness of the registrant’s disclosure controls and procedures and presented in this report our conclusions about the effectiveness of the disclosure controls and procedures, as of the end of the period covered by this report based on such evaluation; and
(d) Disclosed in this report any change in the registrant’s internal control over financial reporting that occurred during the registrant’s most recent fiscal quarter (the registrant’s fourth fiscal quarter in the case of an annual report) that has materially affected, or is reasonably likely to materially affect, the registrant’s internal control over financial reporting; and
5. The registrant’s other certifying officer and I have disclosed, based on our most recent evaluation of internal control over financial reporting, to the registrant’s auditors and the audit committee of the registrant’s board of directors (or persons performing the equivalent functions):
(a) All significant deficiencies and material weaknesses in the design or operation of internal control over financial reporting which are reasonably likely to adversely affect the registrant’s ability to record, process, summarize and report financial information; and
(b) Any fraud, whether or not material, that involves management or other employees who have a significant role in the registrant’s internal control over financial reporting.
Date: March 24, 2011
/s/ Kenneth R. Aubrey Name: Kenneth R. Aubrey Title: President and Chief Executive Officer

52
Exhibit 31.2
CERTIFICATION PURSUANT TO SECTION 302 OF THE SARBANES-OXLEY ACT OF 2002
I, Gregory R. L. Smith, certify that:
1. I have reviewed this annual report on Form 10-K of Image Sensing Systems, Inc.;
2. Based on my knowledge, this report does not contain any untrue statement of a material fact or omit to state a material fact necessary to make the statements made, in light of the circumstances under which such statements were made, not misleading with respect to the period covered by this report;
3. Based on my knowledge, the financial statements, and other financial information included in this report, fairly present in all material respects the financial condition, results of operations and cash flows of the registrant as of, and for, the periods presented in this report;
4. The registrant’s other certifying officer and I are responsible for establishing and maintaining disclosure controls and procedures (as defined in Exchange Act Rules 13a-15(e) and 15d-15(e)) and internal control over financial reporting (as defined in Exchange Act Rules 13a-15(f) and 15d-15(f)) for the registrant and have:
(a) Designed such disclosure controls and procedures, or caused such disclosure controls and procedures to be designed under our supervision, to ensure that material information relating to the registrant, including its consolidated subsidiaries, is made known to us by others within those entities, particularly during the period in which this report is being prepared;
(b) Designed such internal control over financial reporting, or caused such internal control over financial reporting to be designed under our supervision, to provide reasonable assurance regarding the reliability of financial reporting and the preparation of financial statements for external purposes in accordance with generally accepted accounting principles;
(c) Evaluated the effectiveness of the registrant’s disclosure controls and procedures and presented in this report our conclusions about the effectiveness of the disclosure controls and procedures, as of the end of the period covered by this report based on such evaluation; and
(d) Disclosed in this report any change in the registrant’s internal control over financial reporting that occurred during the registrant’s most recent fiscal quarter (the registrant’s fourth fiscal quarter in the case of an annual report) that has materially affected, or is reasonably likely to materially affect, the registrant’s internal control over financial reporting; and
5. The registrant’s other certifying officer and I have disclosed, based on our most recent evaluation of internal control over financial reporting, to the registrant’s auditors and the audit committee of the registrant’s board of directors (or persons performing the equivalent functions):
(a) All significant deficiencies and material weaknesses in the design or operation of internal control over financial reporting which are reasonably likely to adversely affect the registrant’s ability to record, process, summarize and report financial information; and
(b) Any fraud, whether or not material, that involves management or other employees who have a significant role in the registrant’s internal control over financial reporting.
Date: March 24, 2011
/s/ Gregory R. L. Smith Name: Gregory R. L. Smith Title: Chief Financial Officer
53
Exhibit 32.1
CERTIFICATION PURSUANT TO 18 U.S.C. §1350,
AS ADOPTED PURSUANT TO SECTION 906 OF THE SARBANES-OXLEY ACT OF 2002
In connection with the Annual Report on Form 10-K of Image Sensing System, Inc. (the “Company”) for the fiscal year ended December 31, 2010, as filed with the Securities and Exchange Commission (the “Report”), I, Kenneth R. Aubrey, President and Chief Executive Officer of the Company, certify, pursuant to 18 U.S.C. §1350, as adopted pursuant to Section 906 of the Sarbanes-Oxley Act of 2002, that:
1. The Report fully complies with the requirements of Section 13(a) or 15(d) of the Securities Exchange Act of 1934; and
2. The information contained in the Report fairly presents, in all material respects, the financial condition and results of operations of the Company.
/s/ Kenneth R. Aubrey Kenneth R. Aubrey President and Chief Executive Officer March 24, 2011

54
Exhibit 32.2
CERTIFICATION PURSUANT TO 18 U.S.C. §1350,
AS ADOPTED PURSUANT TO SECTION 906 OF THE SARBANES-OXLEY ACT OF 2002
In connection with the Annual Report on Form 10-K of Image Sensing System, Inc. (the “Company”) for the fiscal year ended December 31, 2010, as filed with the Securities and Exchange Commission (the “Report”), I, Gregory R. L. Smith, Chief Financial Officer of the Company, certify, pursuant to 18 U.S.C. §1350, as adopted pursuant to Section 906 of the Sarbanes-Oxley Act of 2002, that:
1. The Report fully complies with the requirements of Section 13(a) or 15(d) of the Securities Exchange Act of 1934; and
2. The information contained in the Report fairly presents, in all material respects, the financial condition and results of operations of the Company.
/s/ Gregory R. L. Smith Gregory R. L. Smith Chief Financial Officer March 24, 2011

2010 2009Quarter High Low High LowFirst $ 15.53 $ 11.50 $ 10.51 $ 6.69
Second 14.47 12.20 10.25 8.19Third 13.50 10.10 13.11 8.61Fourth 13.50 11.10 14.10 11.40
Price Range for Common Stock
The Company’s common stock trades on The Nasdaq Capital Market tier of The Nasdaq Stock Market under the symbol ISNS. The table below presents the price range of the high and low trading prices for the Company’s common stock for each period indicated as reported by Nasdaq.
Corporate Information
Directors and Officers
James MurdakesChairman of the Board
James W. Bracke* ‡Director
Michael C. DoyleDirector
Michael G. Eleftheriou*†Director
Panos G. Michalopoulos†‡Director
Sven A. Wehrwein*† ‡Director
Kenneth R. AubreyDirector, President and Chief Executive Officer
Daniel W. SkitesVice President of Sales and Marketing
Gregory R.L. SmithChief Financial Officer, Treasurer and Secretary
*Member of audit committee† Member of compensation and stock option comittee‡ Member of nominating and corporate governence committee
Annual Shareholders’ MeetingThe annual meeting of the shareholders will be held on May 25, 2011, at 3:30 pm CDT at the Embassy Suites, 175 East 10th Street, Saint Paul, Minnesota, 55101.
Legal CounselWinthrop & Weinstine, P.A.
Independent Registered Public Accounting FirmGrant Thornton LLP
Stock Transfer AgentContinental Stock Transfer & Trust Company
LocationCorporate Headquarters500 Spruce Tree Centre1600 Univeristy Avenue WestSt. Paul, Minnesota 55104-3825
A copy of the Company’s Form 10-K, filed with the Securities and Exchange Commission, may be obtained without charge upon written request to the Company.
A copy of this 2010 Annual Report to Shareholders can be obtained from our Web site: imagesensing.com

Image Sensing Systems, Inc. 1600 University Avenue West, Suite 500, St. Paul, Minnesota 55104Phone +1.651.603.7700 Fax +1.651.305.6402 imagesensing.com