Embed Size (px)
Citation preview
Annual Report 2010
Henkel_GB_2010_E_18.02.2011_15.42.39
At
a g
lan
ce
Henkel_GB_2010_E_18.02.2011_15.42.39
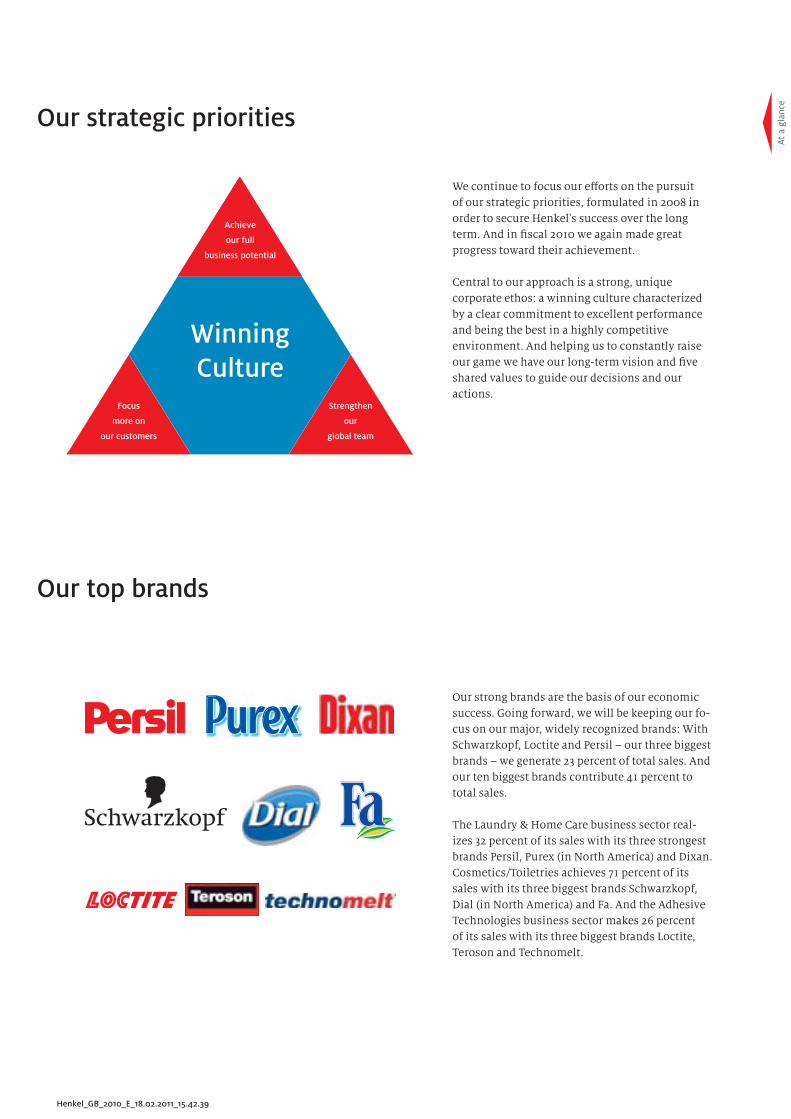
We continue to focus our eff orts on the pursuit
of our strategic priorities, formulated in 2008 in
order to secure Henkel's success over the long
term. And in fi scal 2010 we again made great
progress toward their achievement.
Central to our approach is a strong, unique
corporate ethos: a winning culture characterized
by a clear commitment to excellent performance
and being the best in a highly competitive
environment. And helping us to constantly raise
our game we have our long-term vision and fi ve
shared values to guide our decisions and our
actions.
Our top brands
Our strong brands are the basis of our economic
success. Going forward, we will be keeping our fo-
cus on our major, widely recognized brands: With
Schwarzkopf, Loctite and Persil – our three biggest
brands – we generate 23 percent of total sales. And
our ten biggest brands contribute 41 percent to
total sales.
The Laundry & Home Care business sector real-
izes 32 percent of its sales with its three strongest
brands Persil, Purex (in North America) and Dixan.
Cosmetics/Toiletries achieves 71 percent of its
sales with its three biggest brands Schwarzkopf,
Dial (in North America) and Fa. And the Adhesive
Technologies business sector makes 26 percent
of its sales with its three biggest brands Loctite,
Teroson and Technomelt.
Our strategic priorities
Achieve
our full
business potential
Winning Culture
Strengthen
our
global team
Focus
more on
our customers
Henkel_GB_2010_E_18.02.2011_15.42.39
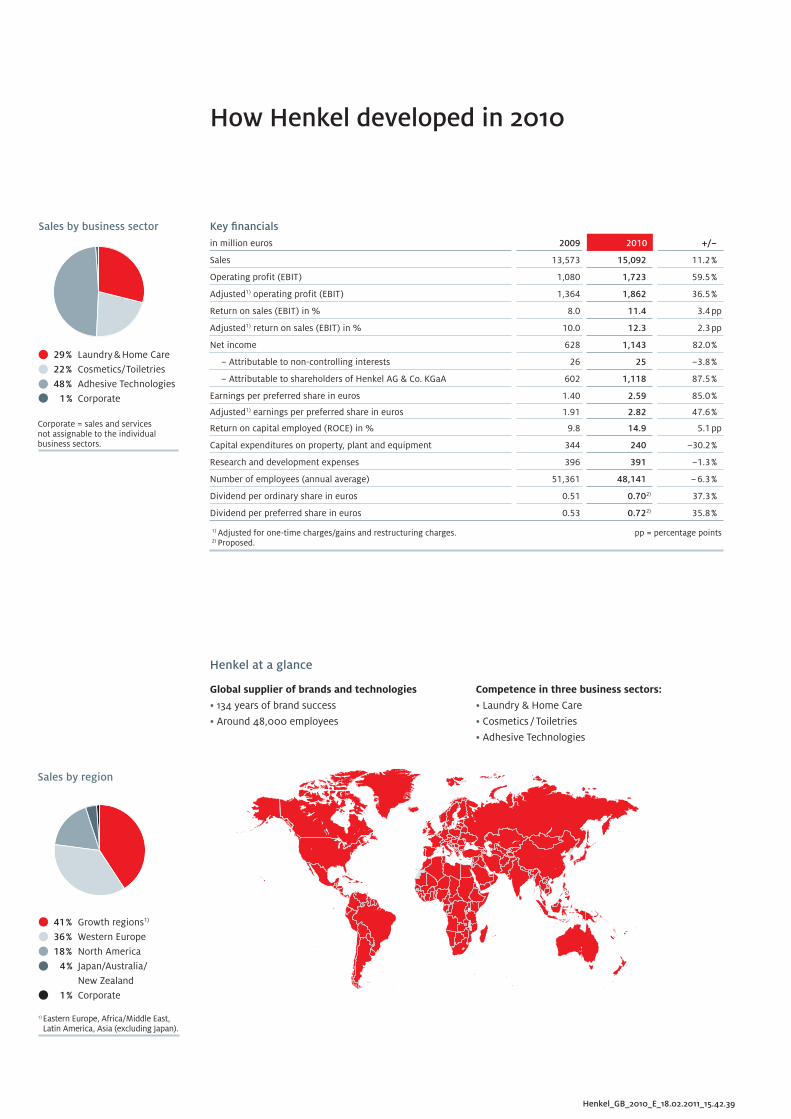
How Henkel developed in 2010
Global supplier of brands and technologies
• 134 years of brand success
• Around 48,000 employees
Competence in three business sectors:
• Laundry & Home Care
• Cosmetics / Toiletries
• Adhesive Technologies
Key fi nancials
in million euros 2009 2010 +/–
Sales 13,573 15,092 11.2 %
Operating profit (EBIT) 1,080 1,723 59.5 %
Adjusted1) operating profit (EBIT) 1,364 1,862 36.5 %
Return on sales (EBIT) in % 8.0 11.4 3.4 pp
Adjusted1) return on sales (EBIT) in % 10.0 12.3 2.3 pp
Net income 628 1,143 82.0 %
– Attributable to non-controlling interests 26 25 –3.8 %
– Attributable to shareholders of Henkel AG & Co. KGaA 602 1,118 87.5 %
Earnings per preferred share in euros 1.40 2.59 85.0 %
Adjusted1) earnings per preferred share in euros 1.91 2.82 47.6 %
Return on capital employed (ROCE) in % 9.8 14.9 5.1 pp
Capital expenditures on property, plant and equipment 344 240 –30.2 %
Research and development expenses 396 391 –1.3 %
Number of employees (annual average) 51,361 48,141 – 6.3 %
Dividend per ordinary share in euros 0.51 0.702) 37.3 %
Dividend per preferred share in euros 0.53 0.722) 35.8 %
1) Adjusted for one-time charges/gains and restructuring charges. 2) Proposed.
pp = percentage points
Henkel at a glance
Sales by region
1) Eastern Europe, Africa/Middle East, Latin America, Asia (excluding Japan).
41 % Growth regions1)
36 % Western Europe
18 % North America
4 % Japan/Australia/
New Zealand
1 % Corporate
Corporate = sales and services not assignable to the individual business sectors.
Sales by business sector
29 % Laundry & Home Care
22 % Cosmetics/Toiletries
48 % Adhesive Technologies
1 % Corporate
At
a g
lan
ce
Henkel_GB_2010_E_18.02.2011_15.42.39
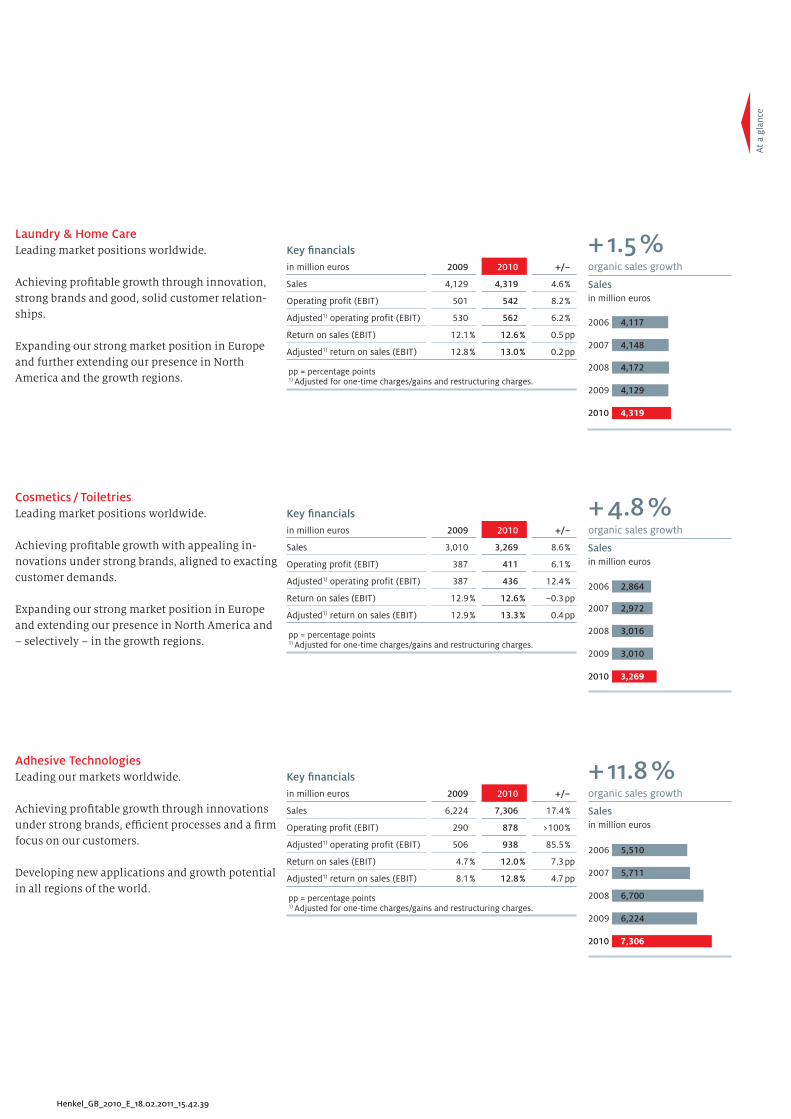
Salesin million euros
2006
2007
2008
2009
2010
4,117
4,148
4,172
4,129
4,319
Salesin million euros
2006
2007
2008
2009
2010
2,864
2,972
3,016
3,010
3,269
Salesin million euros
2006
2007
2008
2009
2010
5,510
5,711
6,700
6,224
7,306
Laundry & Home Care
Leading market positions worldwide.
Achieving profi table growth through innovation,
strong brands and good, solid customer relation-
ships.
Expanding our strong market position in Europe
and further extending our presence in North
America and the growth regions.
Cosmetics / Toiletries
Leading market positions worldwide.
Achieving profi table growth with appealing in-
novations under strong brands, aligned to exacting
customer demands.
Expanding our strong market position in Europe
and extending our presence in North America and
– selectively – in the growth regions.
Adhesive Technologies
Leading our markets worldwide.
Achieving profi table growth through innovations
under strong brands, effi cient processes and a fi rm
focus on our customers.
Developing new applications and growth potential
in all regions of the world.
+ 1.5 %organic sales growth
+ 4.8 %organic sales growth
+ 11.8 %organic sales growth
Key fi nancials
in million euros 2009 2010 +/–
Sales 4,129 4,319 4.6 %
Operating profit (EBIT) 501 542 8.2 %
Adjusted1) operating profit (EBIT) 530 562 6.2 %
Return on sales (EBIT) 12.1 % 12.6 % 0.5 pp
Adjusted1) return on sales (EBIT) 12.8 % 13.0 % 0.2 pp
pp = percentage points1) Adjusted for one-time charges/gains and restructuring charges.
Key fi nancials
in million euros 2009 2010 +/–
Sales 3,010 3,269 8.6 %
Operating profit (EBIT) 387 411 6.1 %
Adjusted1) operating profit (EBIT) 387 436 12.4 %
Return on sales (EBIT) 12.9 % 12.6 % –0.3 pp
Adjusted1) return on sales (EBIT) 12.9 % 13.3 % 0.4 pp
pp = percentage points1) Adjusted for one-time charges/gains and restructuring charges.
Key fi nancials
in million euros 2009 2010 +/–
Sales 6,224 7,306 17.4 %
Operating profit (EBIT) 290 878 >100 %
Adjusted1) operating profit (EBIT) 506 938 85.5 %
Return on sales (EBIT) 4.7 % 12.0 % 7.3 pp
Adjusted1) return on sales (EBIT) 8.1 % 12.8 % 4.7 pp
pp = percentage points1) Adjusted for one-time charges/gains and restructuring charges.
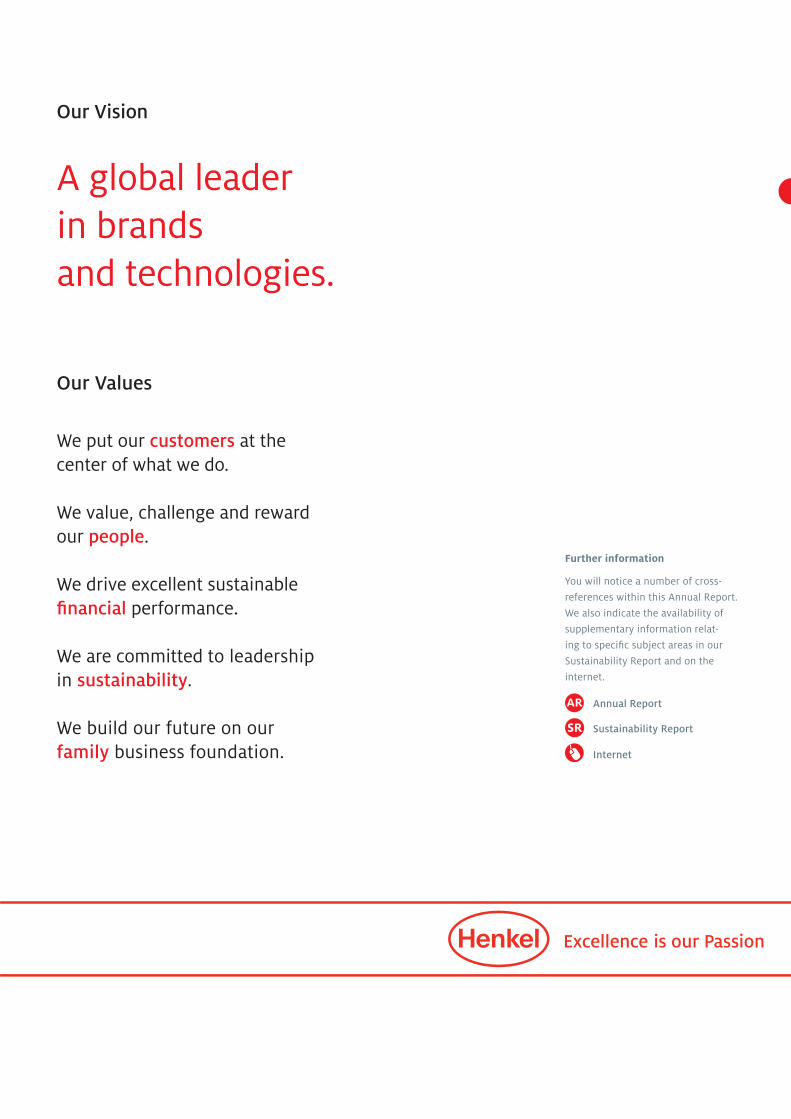
Our Vision
A global leader
in brands
and technologies.
Our Values
We put our customers at the
center of what we do.
We value, challenge and reward
our people.
We drive excellent sustainable
fi nancial performance.
We are committed to leadership
in sustainability.
We build our future on our
family business foundation.
Further information
You will notice a number of cross-
references within this Annual Report.
We also indicate the availability of
supplementary information relat-
ing to specifi c subject areas in our
Sustainability Report and on the
internet.
Internet
Annual Report
Sustainability Report
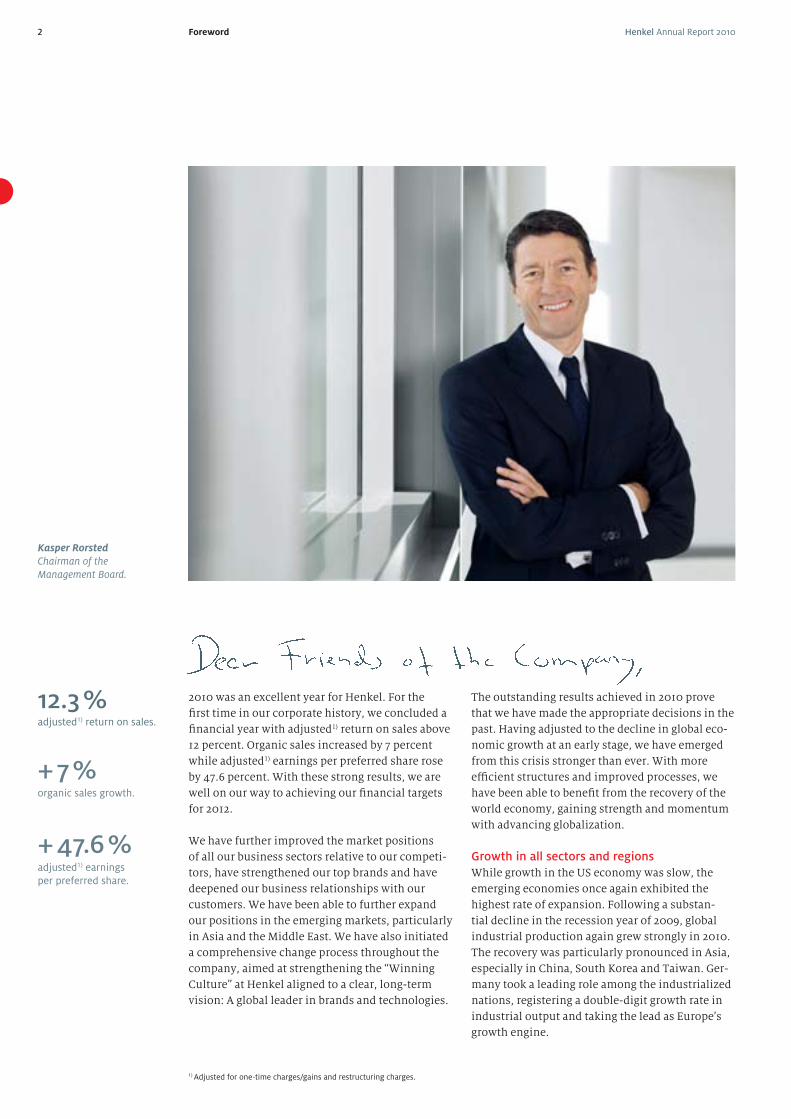
Henkel Annual Report 20102 Foreword
Kasper RorstedChairman of the Management Board.
2010 was an excellent year for Henkel. For the
fi rst time in our corporate history, we concluded a
fi nancial year with adjusted1) return on sales above
12 percent. Organic sales increased by 7 percent
while adjusted1) earnings per preferred share rose
by 47.6 percent. With these strong results, we are
well on our way to achieving our fi nancial targets
for 2012.
We have further improved the market positions
of all our business sectors relative to our competi-
tors, have strengthened our top brands and have
deepened our business relationships with our
customers. We have been able to further expand
our positions in the emerging markets, particularly
in Asia and the Middle East. We have also initiated
a comprehensive change process throughout the
company, aimed at strengthening the “Winning
Culture” at Henkel aligned to a clear, long-term
vision: A global leader in brands and technologies.
The outstanding results achieved in 2010 prove
that we have made the appropriate decisions in the
past. Having adjusted to the decline in global eco-
nomic growth at an early stage, we have emerged
from this crisis stronger than ever. With more
effi cient structures and improved processes, we
have been able to benefi t from the recovery of the
world economy, gaining strength and momentum
with advancing globalization.
Growth in all sectors and regions
While growth in the US economy was slow, the
emerging economies once again exhibited the
highest rate of expansion. Following a substan-
tial decline in the recession year of 2009, global
industrial production again grew strongly in 2010.
The recovery was particularly pronounced in Asia,
especially in China, South Korea and Taiwan. Ger-
many took a leading role among the industrialized
nations, registering a double-digit growth rate in
industrial output and taking the lead as Europe’s
growth engine.
12.3 %adjusted1) return on sales.
+ 7 %organic sales growth.
+ 47.6 %adjusted1) earnings per preferred share.
1) Adjusted for one-time charges/gains and restructuring charges.
Henkel Annual Report 2010 3Foreword
An analysis of the individual sectors shows that
manufacturing – after substantial declines in the
previous year – became a growth driver, with the
automotive, metals and electronics industries
all returning to growth. By contrast, growth in
private consumption – having suff ered only a
comparatively minor decline in 2009 – was moder-
ate.
In an improved yet, in some markets, still diffi cult
environment, all our business sectors and regions
were able to make major contributions to our busi-
ness success. This was due not just to the general
economic recovery but also, and particularly, to
our continued strong focus on our strategic priori-
ties:
• Achieve our full business potential
• Focus more on our customers
• Strengthen our global team
Everyone at Henkel has made important contribu-
tions to our success in 2010. I would like, on behalf
of the entire Management Board, to express our
sincere thanks for their commitment and hard
work!
Ongoing adaptation of our structures
The volatile business environment in recent years
has shown how important it is to respond quickly,
fl exibly and decisively to change. Even though the
economic situation has stabilized in most markets,
the necessity remains to continuously adapt and
optimize existing structures so we can stay ahead
of our international competition. In 2010, we were
able to make further progress in a number of areas.
For example, we successfully concluded the inte-
gration process of the National Starch businesses,
the largest acquisition in our corporate history.
Through further improvements in purchasing, hu-
man resources and our supply chain, and through
the expansion of our shared service centers in
Bratislava (Slovakia) and Manila (Philippines), we
have succeeded in simplifying our processes and
further increasing effi ciency. The ongoing optimi-
zation of our production sites around the world has
also had a positive eff ect on our cost effi ciency.
A major factor for success is and will remain
expansion in the emerging markets: once again,
we were able to generate double-digit growth in
2010. We currently realize 41 percent of our total
sales within these emerging economies, and
53 percent of our employees are now working in
those markets.
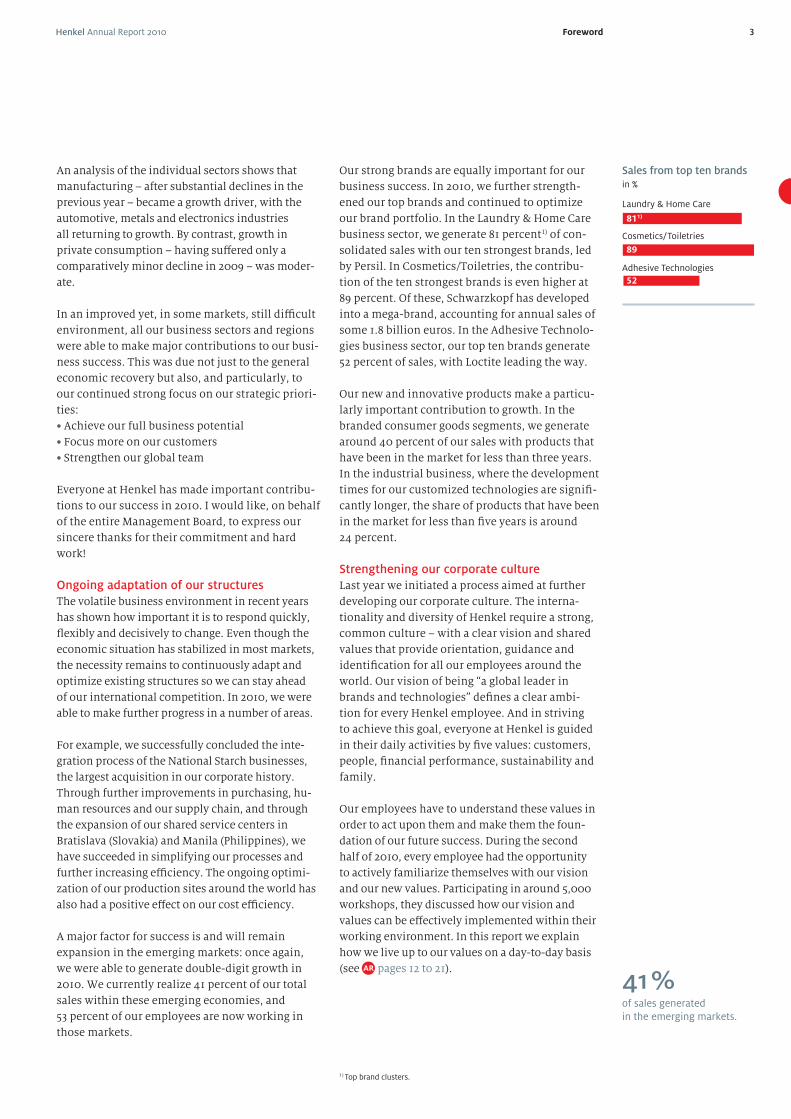
Our strong brands are equally important for our
business success. In 2010, we further strength-
ened our top brands and continued to optimize
our brand portfolio. In the Laundry & Home Care
business sector, we generate 81 percent1) of con-
solidated sales with our ten strongest brands, led
by Persil. In Cosmetics/Toiletries, the contribu-
tion of the ten strongest brands is even higher at
89 percent. Of these, Schwarzkopf has developed
into a mega-brand, accounting for annual sales of
some 1.8 billion euros. In the Adhesive Technolo-
gies business sector, our top ten brands generate
52 percent of sales, with Loctite leading the way.
Our new and innovative products make a particu-
larly important contribution to growth. In the
branded consumer goods segments, we generate
around 40 percent of our sales with products that
have been in the market for less than three years.
In the industrial business, where the development
times for our customized technologies are signifi -
cantly longer, the share of products that have been
in the market for less than fi ve years is around
24 percent.
Strengthening our corporate culture
Last year we initiated a process aimed at further
developing our corporate culture. The interna-
tionality and diversity of Henkel require a strong,
common culture – with a clear vision and shared
values that provide orientation, guidance and
identifi cation for all our employees around the
world. Our vision of being “a global leader in
brands and technologies” defi nes a clear ambi-
tion for every Henkel employee. And in striving
to achieve this goal, everyone at Henkel is guided
in their daily activities by fi ve values: customers,
people, fi nancial performance, sustainability and
family.
Our employees have to understand these values in
order to act upon them and make them the foun-
dation of our future success. During the second
half of 2010, every employee had the opportunity
to actively familiarize themselves with our vision
and our new values. Participating in around 5,000
workshops, they discussed how our vision and
values can be eff ectively implemented within their
working environment. In this report we explain
how we live up to our values on a day-to-day basis
(see pages 12 to 21).
1) Top brand clusters.
41 %of sales generated in the emerging markets.
> 80
> 90
~ 50
Sales from top ten brands in %
Laundry & Home Care
Cosmetics/Toiletries
Adhesive Technologies
811)
89
52
Henkel Annual Report 20104 Foreword
We have also aligned our global system for em-
ployee assessment directly to our fi ve values. By
the end of 2010, the performance and development
potential of around 9,000 mana gerial staff had
been evaluated on the basis of these internation-
ally standardized criteria. With this approach, we
ensure that the decisions and the performance of
our managers are fully aligned to our values.
Together, our vision and values defi ne our credo
as a company: “One Henkel.” In order to com-
municate and strengthen the Henkel brand both
internally and externally, we are introducing a
new claim in combination with a revised corporate
identity. Our claim captures what we stand for:
What do we expect for 2011? In order to achieve
our full business potential, we intend to further
optimize our portfolio by divesting marginal busi-
nesses and non-strategic local brands. In addi-
tion, continued focus on costs, adaptation of our
structures in mature markets and further measures
aimed at effi ciency enhancement throughout the
company will contribute to achieving our targets.
Major elements in this process include the further
expansion of our shared service center organiza-
tion and increased utilization of standardized pro-
cesses in all our business sectors and functions.
We want to further enhance our strong customer
focus with targeted projects in all our business
sectors. It is becoming increasingly important for
many of our customers and consumers to un-
derstand how we integrate sustainability in our
business activities. Henkel has already assumed
a leading position in sustainability performance,
as confi rmed numerous times by external ratings.
Based on this strong position, we will be further
developing our long-term sustainability strategy
in 2011.
We are intro ducing a new compensation system
off ering higher incentives for outperformance, and
we will also increase our focus on talent develop-
ment in 2011. We particularly want to increase the
number of women in our management. By the end
of 2010, the share of female managers had already
climbed to around 29 percent.
Outlook for 2011
We expect further growth in the world economy
in 2011. Following the substantial expansion in
many of our customer industries, especially at the
beginning of 2010, growth in the industrial sector
is likely to normalize, with private consumption
showing moderate growth.
We are confi dent of generating organic sales
growth (i.e. sales adjusted for foreign exchange
and acquisitions/divestments) in the range of 3 to
5 percent in 2011. We anticipate achieving an in-
crease to around 13 percent in adjusted1) return on
sales (EBIT) and an increase in adjusted1) earnings
per preferred share of around 10 percent.
Our Supervisory Board and Shareholders’ Com-
mittee also made an important contribution to
Henkel’s business success in 2010. On behalf of
the Management Board, I would like to take this
opportunity to thank them for their strong support
and advice throughout the year.
And on behalf of the entire company, I would also
like to express our gratitude to our shareholders for
their confi dence and support. We are also grateful
to our customers for their continuing trust in our
company, our brands and our technologies.
Henkel is well positioned for the future. We have
a solid fi nancial base, hold strong positions in our
international markets, and have highly motivated
employees, successful brands and a strong pres-
ence in the growth regions. We intend to continue
our transformation process in 2011 and to create
a strong foundation for the future success of our
company.
Düsseldorf, January 28, 2011
Kasper Rorsted
Chairman of the Management Board
1) Adjusted for one-time charges/gains and restructuring charges.
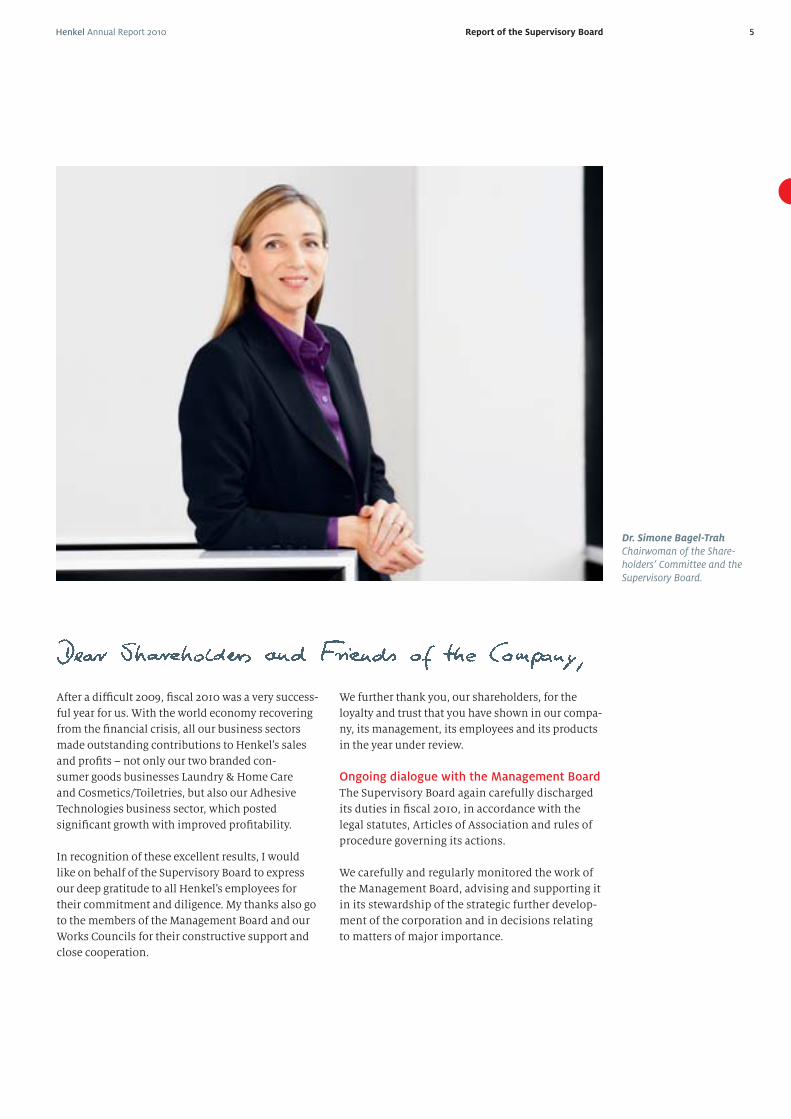
Henkel Annual Report 2010 5Report of the Supervisory Board
After a diffi cult 2009, fi scal 2010 was a very success-
ful year for us. With the world economy recovering
from the fi nancial crisis, all our business sectors
made outstanding contributions to Henkel’s sales
and profi ts – not only our two branded con-
sumer goods businesses Laundry & Home Care
and Cosmetics/Toiletries, but also our Adhesive
Technologies business sector, which posted
signifi cant growth with improved profi tability.
In recognition of these excellent results, I would
like on behalf of the Supervisory Board to express
our deep gratitude to all Henkel’s employees for
their commitment and diligence. My thanks also go
to the members of the Management Board and our
Works Councils for their constructive support and
close cooperation.
We further thank you, our shareholders, for the
loyalty and trust that you have shown in our compa-
ny, its management, its employees and its products
in the year under review.
Ongoing dialogue with the Management Board
The Supervisory Board again carefully discharged
its duties in fi scal 2010, in accordance with the
legal statutes, Articles of Association and rules of
procedure governing its actions.
We carefully and regularly monitored the work of
the Management Board, advising and supporting it
in its stewardship of the strategic further develop-
ment of the corporation and in decisions relating
to matters of major importance.
Dr. Simone Bagel-TrahChairwoman of the Share-holders’ Committee and the Supervisory Board.
Henkel Annual Report 20106 Report of the Supervisory Board
Throughout the year, the Management Board and
the Supervisory Board remained in close communi-
cation, exchanging information with mutual trust
and confi dence. The Management Board complied
with its reporting duties punctually and in full,
informing us regularly and in detail through both
written and verbal communications of major issues
aff ecting the corporation and our Group compa-
nies. In particular, the Management Board provided
extensive explanations of the business situation
and development of the corporation, business
policy, the profi tability of our operations, and our
short-term and long-term corporate, fi nancial and
personnel planning, as well as capital expenditures
and organizational measures.
In the course of preparing the quarterly reports,
details were provided of the sales and profi ts of
Henkel as a whole, with further analysis by business
sector and region. Outside Supervisory Board meet-
ings, I as Chairwoman remained in regular contact
with the Chairman of the Management Board; this
ensured that the Supervisory Board constantly
remained in touch with current business develop-
ments and events.
Major issues discussed at
Supervisory Board meetings
The Supervisory Board met a total of four times
in fi scal 2010. At these meetings, we examined in
detail the reports of the Management Board and
conferred with its members on the development of
the corporation and on specifi c strategic issues.
In all our meetings, we discussed the general eco-
nomic climate and how it was infl uencing business
performance at Henkel.
The main item of the agenda for our meeting held
on February 23, 2010 was the annual and consoli-
dated fi nancial statements for 2009, including the
risk report and our corporate governance report. At
this meeting, we also approved the Annual Report
and fi nalized our proposals for resolution to be put
before the Annual General Meeting. We likewise
dealt with organizational issues relating to the
Adhesive Technologies business sector and the cus-
tomer alignment of its fi ve strategic business units.
The meeting held on April 19, 2010 dealt with the
recent business development of the Henkel Group
and the further elaboration of the compensation
concept devised for our managerial staff .
One of the main issues discussed at our meeting of
October 5, 2010 related to purchasing. We discussed
in detail the global management and control of
our worldwide sourcing activities, and particularly
action required to secure supply continuity and op-
timize the value chain. The movement in raw mate-
rial prices was likewise considered in some detail.
We further deliberated on R&D strategy, organiza-
tion and cross-divisional cooperation and the use
of external and globally available R&D resources.
Balance-sheet and fi nancial planning, including
items on the income statement and the projects
and budgets of our business sectors were the
source of extensive discussion during our meeting
of December 14, 2010. We also heard a presentation
from an external management consultant dealing
in detail with the legal principles underlying our
Supervisory Board activities, focusing especially on
more recent developments in this domain.
Attendance at the Supervisory Board meetings dur-
ing the year under review averaged 92 percent. No
member of the Supervisory Board took part in fewer
than half the meetings. There were no incidents of
confl icts of interest involving Management Board
or Supervisory Board members. Where such exist,
they are notifi able to the Supervisory Board, which
is then required to report to the Annual General
Meeting on their treatment.
Committee activities
In order to effi ciently comply with the duties in-
cumbent upon us according to legal statute and our
Articles of Association, we have assigned certain
activities to two separate committees: an Audit
Committee comprised of three shareholder-repre-
sentative members and three employee-representa-
tive members, and a Nominations Committee made
up of three shareholder-representative members.
The memberships of the committees are shown in
the table on pages 138 and 139.
Henkel Annual Report 2010 7Report of the Supervisory Board
The Audit Committee, which has special responsi-
bility for preparing the proceedings and proposals
of the Supervisory Board and for approving the
annual and consolidated fi nancial statements, met
four times during the year under review. The Chair
of the Committee informed the plenary Supervi-
sory Board of the content and results of each of the
Committee meetings punctually and in full.
The focus in all our meetings was on the annual
and consolidated fi nancial statements and also the
interim fi nancial reports, which were extensively
discussed with the Management Board. The meet-
ings at which the half-year fi nancial report and
also the report on the third quarter were discussed
and approved were also attended by the auditor.
The latter reported on the results of the respective
reviews and on all the main issues and occurrences
relevant to the work of the Audit Committee. No
objections were raised.
We also dealt in detail with the development and
implementation of the accounting process and
with the effi cacy and further development of the
internal Group-wide control and risk management
system. The Committee further received the status
reports of the Chief Compliance Offi cer and the
Head of Internal Audit, and approved the audit
plan put forward by Internal Audit. These activities
also involved examining the functional effi ciency
and effi cacy of the Internal Control System and our
compliance organization.
The Audit Committee mandated the external audi-
tor, pursuant to the latter’s appointment by the
2010 Annual General Meeting, to audit the annual
consolidated fi nancial statements for fi scal 2010,
at the same time defi ning the main areas on which
the audit was to concentrate. The audit fee was also
established. The Audit Committee likewise man-
dated the external auditor to review the half-year
fi nancial report and the report on the third quarter
of 2010, and obtained necessary validation of audi-
tor independence.
At the meeting of February 21, 2011, the Audit
Committee discussed together with the external
auditor the annual and consolidated fi nancial
statements for fi scal 2010, the associated pro-
posal for the appropriation of profi ts, and the risk
report, and submitted to the Supervisory Board
corresponding proposals for resolution by the
Annual General Meeting. The Committee also
made recommendations to the Supervisory Board
regarding its proposal for the appointment by the
Annual General Meeting of the external auditor for
the subsequent fi nancial year. A declaration from
the auditor relating to its independence was again
duly received; the auditor likewise provided details
of the non-audit services rendered in fi scal 2010
and those envisaged for fi scal 2011. There was no
evidence of any bias or partiality on the part of the
auditor. Other members of the Supervisory Board
also took part as guests in this specifi cally audit-
related meeting of the Audit Committee.
Each meeting of the Audit Committee was attended
by all its members in the year under review.
The Nominations Committee made appropriate
recommendations in preparation for the resolu-
tions to be formulated by the Supervisory Board
and placed before the 2011 Annual General Meeting
with respect to the upcoming supplementary elec-
tions to the Supervisory Board.
Corporate governance and
declaration of compliance
Again in 2010, we consulted on issues relating to
corporate governance and amendments to the Ger-
man Corporate Governance Code.
At the meeting of December 14, 2010, we discussed
the objectives and composition of our Supervisory
Board. Taking into account the company’s specifi c
situation, we established criteria for the election
of new Supervisory Board members, on the basis
of which the Nominations Committee would be
required to recommend candidates to the plenary
Supervisory Board in preparation for election by the
Annual General Meeting. For further details on this
and the corporate governance of the company, please
refer to the report on pages 26 to 31, with which
we fully acquiesce.
Henkel Annual Report 20108 Report of the Supervisory Board
At the meeting of February 22, 2011, we discussed
and approved the joint Declaration of Compli-
ance of the Management Board, the Shareholders’
Committee and the Supervisory Board with respect
to the German Corporate Governance Code for
2011. The full wording of the current and previous
declarations of compliance can be found on the
company website.
Annual and consolidated
fi nancial statements/Audit
The annual fi nancial statements of Henkel AG &
Co. KGaA and the management report have been
prepared by the Management Board in accordance
with the provisions of the German Commercial
Code [HGB]. The consolidated fi nancial statements
and the Group management report have been pre-
pared by the Management Board in accordance with
International Financial Reporting Standards (IFRS)
as endorsed by the European Union, supplemented
by the provisions under commercial law applicable
pursuant to Section 315a (1) HGB.
The auditor appointed for 2010 by the last Annual
General Meeting – KPMG AG Wirtschaftsprüfungs-
gesellschaft (KPMG), Berlin – has examined the
2010 annual fi nancial statements of Henkel AG &
Co. KGaA and the 2010 consolidated annual fi nan-
cial statements, including the management reports,
in compliance with the generally accepted stan-
dards for the audit of fi nancial statements promul-
gated by the Institut der Wirtschaftsprüfer (IDW)
and – in the case of the consolidated fi nancial
statements – in supplementary compliance with
International Standards on Auditing (ISA), and has
issued them with an unqualifi ed opinion.
KPMG reports that the annual fi nancial statements
give a true and fair view of the net assets, fi nancial
position and results of operations of Henkel AG &
Co. KGaA in accordance with generally accepted
German accounting principles, and that the consoli-
dated fi nancial statements give a true and fair view
of the net assets, fi nancial position, results of opera-
tions and cash fl ows of the Group, in compliance
with International Financial Reporting Standards,
for the year under review. KPMG further confi rms
that the consolidated fi nancial statements and
Group management report for the year under review
meet the requirements of Section 315a (1) HGB.
The annual fi nancial statements and management
report, consolidated fi nancial statements and
Group management report, the audit reports of
KPMG and the recommendations by the Personally
Liable Partner for the appropriation of the profi t
made by Henkel AG & Co. KGaA were duly laid
before all members of the Supervisory Board. We
examined these documents and discussed them
at our meeting of February 22, 2011. This was at-
tended by the auditor, which reported on its main
audit fi ndings. We received the audit reports and
voiced our acquiescence therewith. The Chair of
the Audit Committee provided the plenary session
of the Supervisory Board with a detailed account of
the treatment of the annual and the consolidated
fi nancial statements by the Audit Committee.
Having received the fi nal results of the review con-
ducted by the Audit Committee and concluded our
own examination, we see no reason for objection to
the aforementioned documents. The assessment by
the Personally Liable Partner of the position of the
company and the Group coincides with our own
appraisal. At our meeting of February 22, 2011, we
concurred with the recommendations of the Audit
Committee and therefore approved the annual
fi nancial statements, the consolidated fi nancial
statements and the management reports as pre-
pared by the Personally Liable Partner.
Taking into account the fi nancial position and re-
sults of operations of the corporation, its medium-
term fi nancial and investment planning and the
interests of the shareholders, we discussed and
approved the proposal of the Personally Liable
Partner to pay out of the unappropriated profi t of
Henkel AG & Co. KGaA a dividend of 0.70 euros
per ordinary share and of 0.72 euros per preferred
share, and to allocate the remaining amount to
other retained earnings and – together with the
amount attributable to the treasury shares held
by the company at the time of the Annual General
Meeting – retained earnings carried forward to the
following year. We consider the proposed dividends
to be reasonable and appropriate. At this meeting,
we also ratifi ed our proposals, based on the recom-
mendations of the Audit Committee, for resolution
to be presented before the Annual General Meeting
relating to the appointment of the external auditor
for the next fi nancial year, and discussed the focal
points and costs of the audit of the fi nancial state-
ments.
Henkel Annual Report 2010 9Report of the Supervisory Board
Risk management
Risk management issues were examined not only
by the Audit Committee but also in the plenary ses-
sions of the Supervisory Board. The emphasis was
on the risk management system in place at Henkel
and any major individual risks of which we needed
to be notifi ed. There were no identifi able risks that
might jeopardize the continued existence of the
corporation as a going concern. The structure and
function of the risk management system were also
integral to the audit performed by KPMG, which
found no cause for reservation. It is our considered
opinion that the risk management system cor-
responds to the statutory requirements and is fi t
for the purpose of early identifi cation of develop-
ments that could endanger the continuation of the
corporation as a going concern.
Changes in the Supervisory Board
and the Management Board
Having taken retirement, Mr. Fritz Franke and Mr.
Bernd Hinz resigned from the Supervisory Board
eff ective December 31, 2009 and July 31, 2010 re-
spectively. They were succeeded by new members
Mr. Mayc Nienhaus as of January 1, 2010 and Mr.
Edgar Topsch as of August 1, 2010. Mr. Konstantin
von Unger resigned from the Supervisory Board as
of the end of the 2010 Annual General Meeting. We
expressed our unreserved gratitude to all the de-
parting members for their committed involvement
in the Supervisory Board’s work.
Dr. Kaspar Freiherr von Braun was newly elected
to the Supervisory Board. In addition, Dipl.-Kfm.
Johann-Christoph Frey, who replaced Dipl.-Ing.
Albrecht Woeste on the Supervisory Board in 2009
and whose mandate, in compliance with the provi-
sions of the German Corporate Governance Code,
was limited to the end of the 2010 Annual General
Meeting, was re-elected. We elected Mr. Frey as a
member of the Nominations Committee.
Mr. Thomas Geitner resigned from the Manage-
ment Board eff ective December 31, 2010. At our
meeting of December 14, we thanked Mr. Geitner
for the successful completion of the integration of
the National Starch activities within the adhesives
business of Henkel, providing us with exceptional
global positions as world market leader in this
industry. Newly appointed to the Management
Board, Mr. Jan-Dirk Auris took over as Executive
Vice President responsible for the Adhesive
Technologies business sector as of January 1, 2011.
At our meeting of February 22, 2011, we said good-
bye to Dr. Friedrich Stara, who retires as of March 1,
2011. We expressed our thanks to Dr. Stara – who
joined Henkel in 1976 and, since July 2005, has
fi lled the role of Executive Vice President respon-
sible for the Laundry & Home Care business sector
– for his many years of commitment and highly
successful contribution to the Henkel Group.
Worthy of particular mention in this respect is the
development of our businesses in Eastern Europe,
which Dr. Stara oversaw with exceptional success
as President of Henkel Central and Eastern Europe
from 1998 to 2005.
Eff ective January 1, 2011, Mr. Bruno Piacenza joined
the Management Board and, as of March 1, 2011,
will take over from Dr. Stara as Executive Vice
President responsible for the Laundry & Home
Care business sector.
We wish Mr. Auris and Mr. Piacenza every success
in their new roles.
Düsseldorf, February 22, 2011
On behalf of the Supervisory Board
Dr. Simone Bagel-Trah
(Chairwoman)
Henkel Annual Report 201022 Shares and bonds
Shares and bonds
• Henkel share prices outpace overall market to reach new historic highs
• Weighting of the Henkel preferred share within the DAX 30 increased
• International, widely diversifi ed shareholder structure
• Ongoing and extensive capital market communications
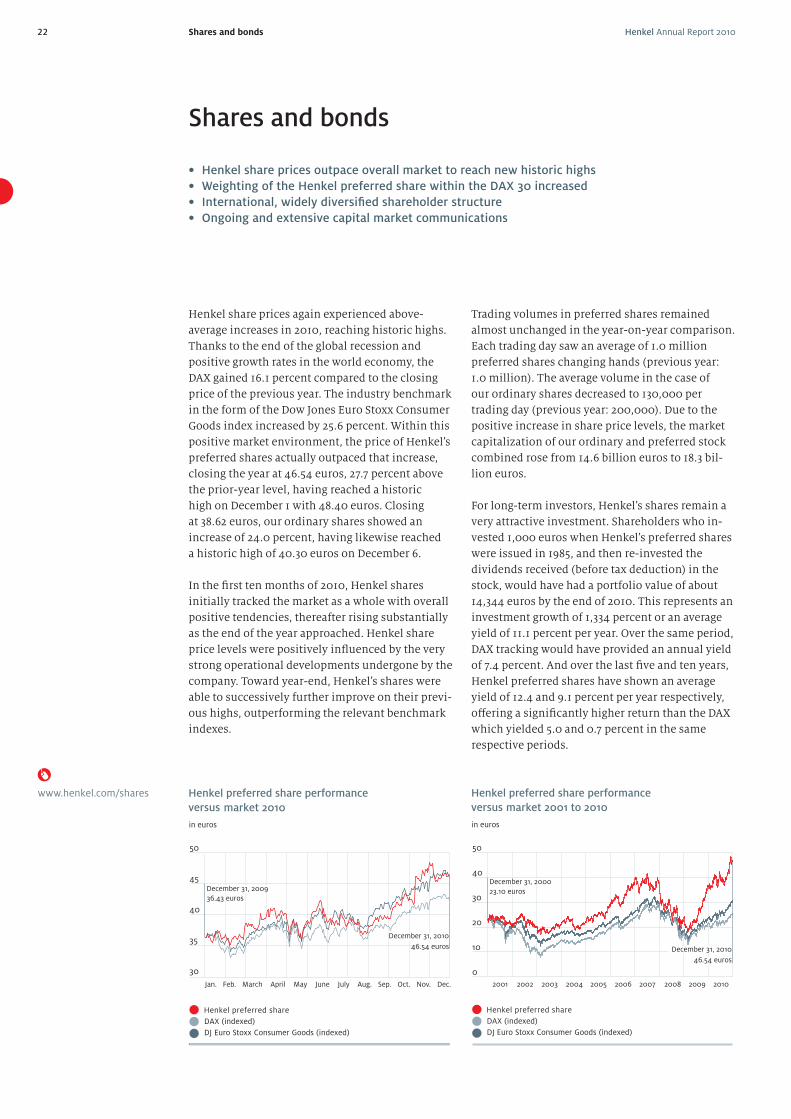
Henkel share prices again experienced above-
average increases in 2010, reaching historic highs.
Thanks to the end of the global recession and
positive growth rates in the world economy, the
DAX gained 16.1 percent compared to the closing
price of the previous year. The industry benchmark
in the form of the Dow Jones Euro Stoxx Consumer
Goods index increased by 25.6 percent. Within this
positive market environment, the price of Henkel’s
preferred shares actually outpaced that increase,
closing the year at 46.54 euros, 27.7 percent above
the prior-year level, having reached a historic
high on December 1 with 48.40 euros. Closing
at 38.62 euros, our ordinary shares showed an
increase of 24.0 percent, having likewise reached
a historic high of 40.30 euros on December 6.
In the fi rst ten months of 2010, Henkel shares
initially tracked the market as a whole with overall
positive tendencies, thereafter rising substantially
as the end of the year approached. Henkel share
price levels were positively infl uenced by the very
strong operational developments undergone by the
company. Toward year-end, Henkel’s shares were
able to successively further improve on their previ-
ous highs, outperforming the relevant benchmark
indexes.
Trading volumes in preferred shares remained
almost unchanged in the year-on-year comparison .
Each trading day saw an average of 1.0 million
preferred shares changing hands (previous year:
1.0 million). The average volume in the case of
our ordinary shares decreased to 130,000 per
trading day (previous year: 200,000). Due to the
positive increase in share price levels, the market
capitalization of our ordinary and preferred stock
combined rose from 14.6 billion euros to 18.3 bil-
lion euros.
For long-term investors, Henkel’s shares remain a
very attractive investment. Shareholders who in-
vested 1,000 euros when Henkel’s preferred shares
were issued in 1985, and then re-invested the
dividends received (before tax deduction) in the
stock, would have had a portfolio value of about
14,344 euros by the end of 2010. This represents an
investment growth of 1,334 percent or an average
yield of 11.1 percent per year. Over the same period,
DAX tracking would have provided an annual yield
of 7.4 percent. And over the last fi ve and ten years,
Henkel preferred shares have shown an average
yield of 12.4 and 9.1 percent per year respectively,
off ering a signifi cantly higher return than the DAX
which yielded 5.0 and 0.7 percent in the same
respective periods.
www.henkel.com/shares
50
40
30
20
10
0
2003 20042001 2002 2005 2006 2009 20102007 2008
December 31, 2010
December 31, 2000
Henkel preferred share performance
versus market 2001 to 2010
46.54 euros
23.10 euros
DAX (indexed)
Henkel preferred share
DJ Euro Stoxx Consumer Goods (indexed)
in euros
50
45
40
35
30
Henkel preferred share performance
versus market 2010
December 31, 2009
36.43 euros
December 31, 2010
46.54 euros
April MayFeb.Jan. March June July Oct. Nov.Aug. Sep. Dec.
DAX (indexed)
Henkel preferred share
DJ Euro Stoxx Consumer Goods (indexed)
in euros
Henkel Annual Report 2010 23Shares and bonds
for the capital markets and as benchmarks for fund
managers. Particularly noteworthy in this respect
are the MSCI World, the Dow Jones Euro Stoxx,
and the FTSE World Europe indexes. Henkel is
also listed in the Dow Jones Titans 30 Personal &
Household Goods Index, confi rming our position
as one of the 30 most important listed corporations
operating in the personal and household goods
sectors worldwide. And as a DAX stock, Henkel
counts as one of the 30 most important listed com-
panies in Germany.
As of year-end 2010, the market capitalization of
the DAX-relevant preferred shares was 8.3 billion
euros, placing Henkel 21st among the DAX com-
panies (2009: 20th). In terms of trading volumes,
Henkel was ranked 26th on the list (2009: 28th).
Our DAX weighting rose to 1.32 percent (2009:
1.22 percent).
International shareholder structure
The ownership structure of our preferred shares
– the signifi cantly more liquid class of stock –
shows a free fl oat of 100 percent. A large majority
of these shares are owned by institutional inves-
tors with globally distributed shareholdings.
According to notices of disclosure received by
the company, members of the Henkel family own
a majority of the ordinary shares amounting to
53.21 percent. We have received no further notices
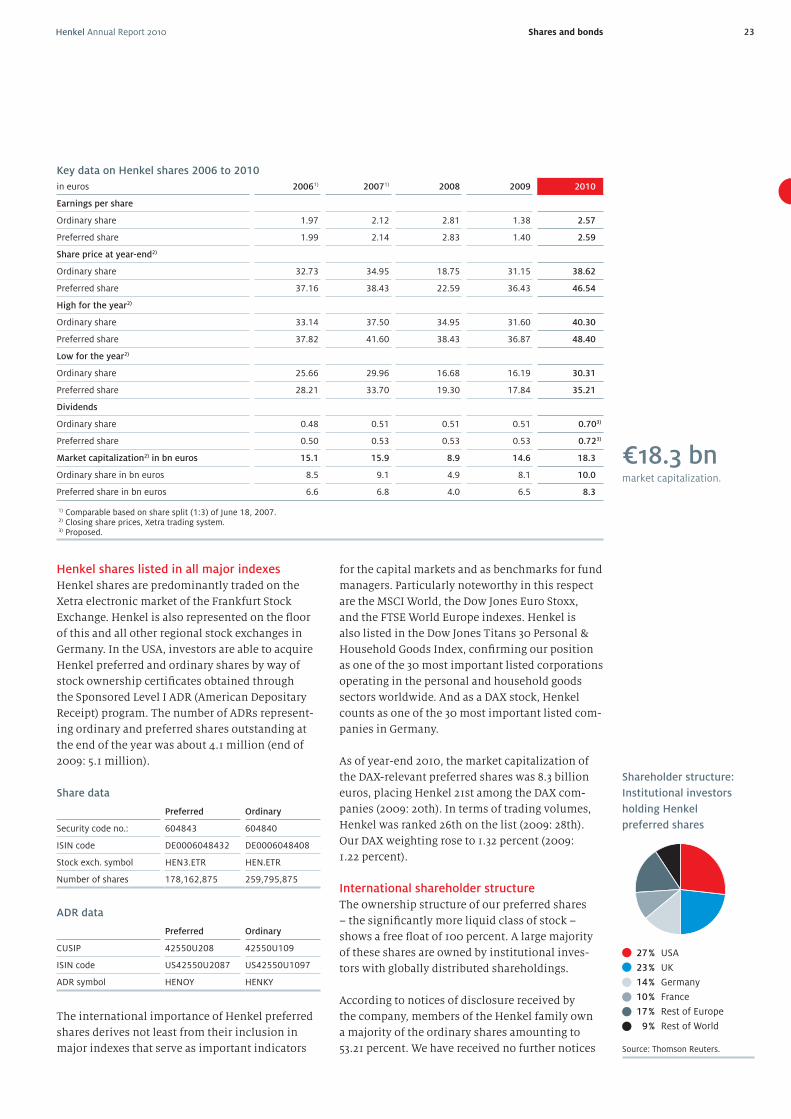
Key data on Henkel shares 2006 to 2010
in euros 20061) 20071) 2008 2009 2010
Earnings per share
Ordinary share 1.97 2.12 2.81 1.38 2.57
Preferred share 1.99 2.14 2.83 1.40 2.59
Share price at year-end2)
Ordinary share 32.73 34.95 18.75 31.15 38.62
Preferred share 37.16 38.43 22.59 36.43 46.54
High for the year2)
Ordinary share 33.14 37.50 34.95 31.60 40.30
Preferred share 37.82 41.60 38.43 36.87 48.40
Low for the year2)
Ordinary share 25.66 29.96 16.68 16.19 30.31
Preferred share 28.21 33.70 19.30 17.84 35.21
Dividends
Ordinary share 0.48 0.51 0.51 0.51 0.703)
Preferred share 0.50 0.53 0.53 0.53 0.723)
Market capitalization2) in bn euros 15.1 15.9 8.9 14.6 18.3
Ordinary share in bn euros 8.5 9.1 4.9 8.1 10.0
Preferred share in bn euros 6.6 6.8 4.0 6.5 8.3
1) Comparable based on share split (1:3) of June 18, 2007. 2) Closing share prices, Xetra trading system. 3) Proposed.
Henkel shares listed in all major indexes
Henkel shares are predominantly traded on the
Xetra electronic market of the Frankfurt Stock
Exchange. Henkel is also represented on the fl oor
of this and all other regional stock exchanges in
Germany. In the USA, investors are able to acquire
Henkel preferred and ordinary shares by way of
stock ownership certifi cates obtained through
the Sponsored Level I ADR (American Depositary
Receipt) program. The number of ADRs represent-
ing ordinary and preferred shares outstanding at
the end of the year was about 4.1 million (end of
2009: 5.1 million).
Share data
Preferred Ordinary
Security code no.: 604843 604840
ISIN code DE0006048432 DE0006048408
Stock exch. symbol HEN3.ETR HEN.ETR
Number of shares 178,162,875 259,795,875
ADR data
Preferred Ordinary
CUSIP 42550U208 42550U109
ISIN code US42550U2087 US42550U1097
ADR symbol HENOY HENKY
The international importance of Henkel preferred
shares derives not least from their inclusion in
major indexes that serve as important indicators
€18.3 bnmarket capitalization.
Shareholder structure:
Institutional investors
holding Henkel
preferred shares
Source: Thomson Reuters.
27 % USA
23 % UK
14 % Germany
10 % France
17 % Rest of Europe
9 % Rest of World
Henkel Annual Report 201024 Shares and bonds
of disclosure from other shareholders indicating
a shareholding in excess of 3 percent of the voting
shares (notifi able ownership).
In the period up to 2007, Henkel repurchased
around 7.5 million preferred shares to fund the
Stock Incentive Plan operated for our senior
executive personnel. As of December 31, 2010, this
treasury stock amounted to 4.0 million preferred
shares.
Employee share program
Since 2001, Henkel has been operating an employ-
ee share program (ESP). For each euro invested by
an employee (limited to 4 percent of salary up to a
maximum of 5,000 euros per year), Henkel added
an additional 33 cents in 2010. The number of sub-
scribers increased by 12 percent in the year under
review compared to the previous year, with around
10,500 employees in 57 countries buying Henkel
shares within the framework of this program. At
year-end, around 14,000 employees held a total
of some 3.6 million shares within the ESP, repre-
senting roughly 2.0 percent of the total preferred
shares outstanding. The vesting period for newly
acquired ESP shares is three years.
Henkel bonds
Henkel is represented in the international bonds
markets by three bonds with a total nominal vol-
ume of 3.3 billion euros:
Bond data
Senior bond Senior bond Hybrid bond
Due date June 10, 2013 March 19, 2014 Nov. 25, 21041)
Volume 1.0 billion euros 1.0 billion euros 1.3 billion euros
Nominal
coupon 4.25 % 4.625 % 5.375 %
Coupon
payment
date June 10 March 19 Nov. 25
Listing Frankfurt Luxembourg Luxembourg
Security
code no. 664196 A0AD9Q A0JBUR
ISIN code DE0006641962 XS0418268198 XS0234434222
1) First call option for Henkel on November 25, 2015.
Further detailed information regarding these
bonds, current developments in their respective
prices and the associated risk premium (credit
margin) can be found on our website www.
henkel.com/bonds
Pro-active capital market communication
Henkel is covered by numerous fi nancial ana-
lysts, primarily in the UK, Germany and the USA.
Over 35 equity and debt analysts regularly publish
reports and commentaries on the performance of
the company.
Henkel places great importance on meaningful
dialogue with both investors and analysts. In 2010,
institutional investors and fi nancial analysts were
aff orded the opportunity to talk directly with our
top management in more than 30 capital market
conferences and road shows held in Europe, North
America and Asia. The two highlights of the year
were our Analyst and Investor Conference held in
Düsseldorf on February 25, 2010, and our Inves-
tor Day for the Adhesive Technologies business
sector, which took place on September 16, 2010.
At this latter conference, the Adhesive Technolo-
gies management team presented the strategy and
new developments of the business sector to some
70 investors and analysts from around the world.
In addition, we held numerous telephone confer-
ences and one-on-one meetings – amounting to
more than 500 events in all.
Private investors are able to receive all relevant
information through telephone enquiry or via the
Investor Relations website www.henkel.com/ir.
This also serves as the medium for the live broad-
cast of telephone and analyst conferences as well
as the transmission of the Annual General Meet-
ing. The AGM off ers all shareholders the possibility
of obtaining extensive information directly from
Henkel’s management.
The quality of our capital market communications
was evaluated in 2010 by various independent
rankings. Once more, our Investor Relations team
garnered a number of top positions in various
comparisons with European corporations in the
home & personal care category, as well as with
other DAX companies – taking, for example, the
number-one position in both the ThomsonExtel
and the IR Magazine rankings for European home
& personal care companies.
You will fi nd a fi nancial calendar with all our
important publishing and announcement dates on
the inside back cover of this Annual Report.
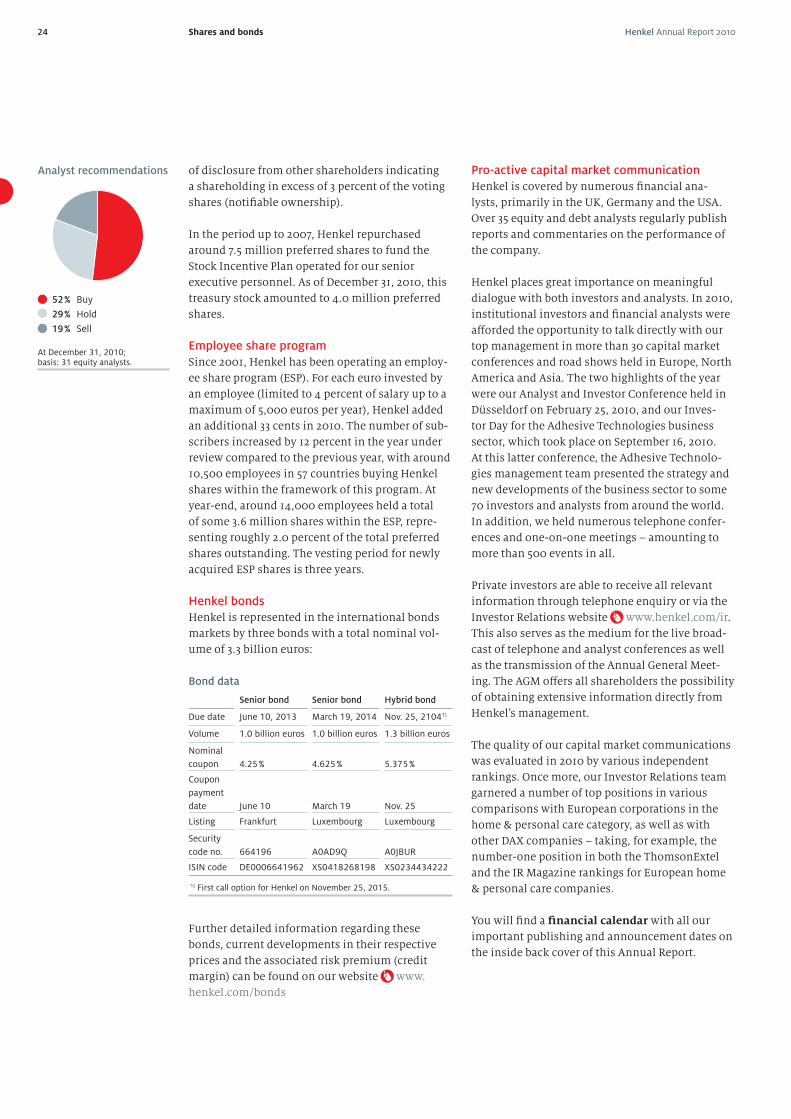
Analyst recommendations
At December 31, 2010; basis: 31 equity analysts.
52 % Buy
29 % Hold
19 % Sell
Henkel Annual Report 201010 Management Board
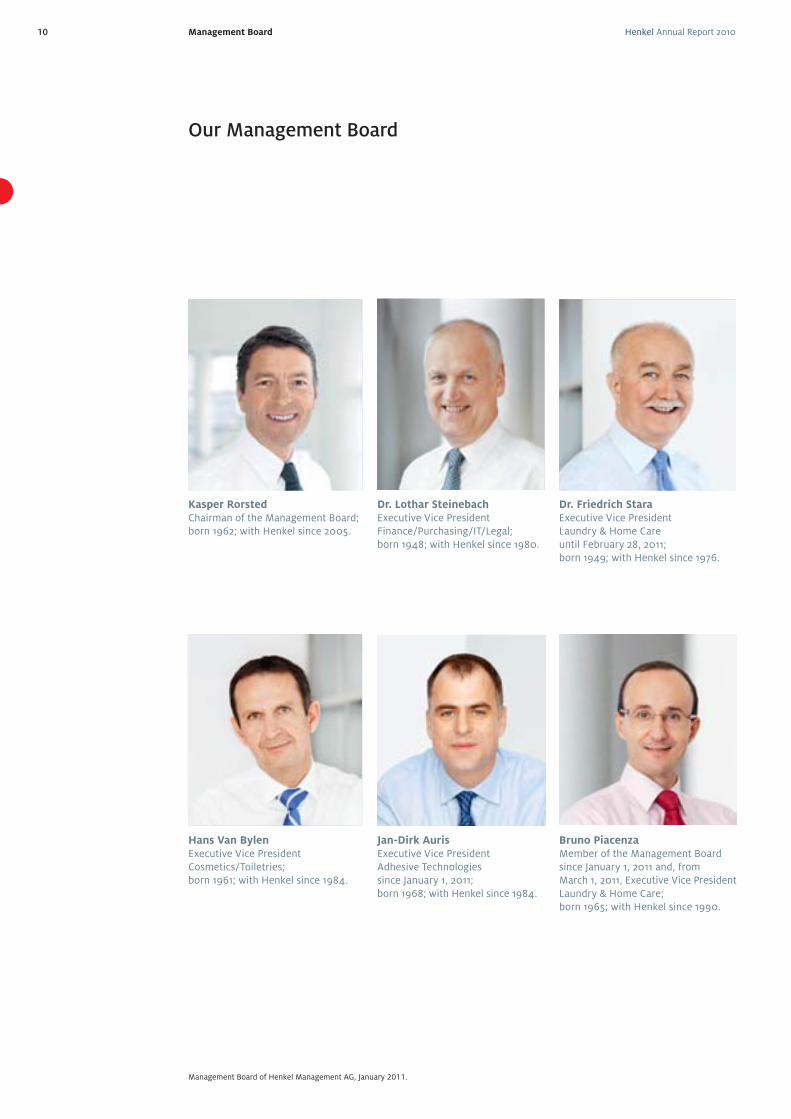
Our Management Board
Kasper RorstedChairman of the Management Board;born 1962; with Henkel since 2005.
Jan-Dirk AurisExecutive Vice PresidentAdhesive Technologiessince January 1, 2011;born 1968; with Henkel since 1984.
Dr. Lothar SteinebachExecutive Vice President Finance/Purchasing/IT/Legal; born 1948; with Henkel since 1980.
Hans Van BylenExecutive Vice President Cosmetics/Toiletries;born 1961; with Henkel since 1984.
Bruno PiacenzaMember of the Management Board since January 1, 2011 and, from March 1, 2011, Executive Vice President Laundry & Home Care;born 1965; with Henkel since 1990.
Dr. Friedrich StaraExecutive Vice President Laundry & Home Care until February 28, 2011;born 1949; with Henkel since 1976.
Management Board of Henkel Management AG, January 2011.
Henkel Annual Report 2010 11Vision and Values
We hold our customers in the high-
est regard and place them at the
center of all that we do. This is the
only way we can off er them added
value. The “customer” value is
vital to our success, and since not
all Henkel employees are in direct
contact with our customers, it is
all the more important for us to
understand what this value means
for Henkel. In order to off er the
best products, the highest quality
and outstanding service, we need
to understand our customers and
consumers better than our com-
petitors do. If we succeed in this,
we can look forward to successful
growth in all our markets.
People always make the diff er-
ence. Through their creativity and
knowledge, good ideas become
great business successes. They are
our interface with our custom-
ers, make innovation possible,
develop successful strategies and
give our company its unique iden-
tity. Only by valuing, challenging
and rewarding our employees will
we establish a “Winning Culture”
within Henkel. It is up to each of
us to set a good example: in the
way we lead our teams and in the
way we take personal responsibil-
ity for our development. Together
we will make Henkel a global
leader in brands and technologies.
We are pursuing our strategic
priorities in order to achieve our
fi nancial targets and make Henkel
even more successful. Excellent
and sustainable fi nancial perfor-
mance allows us to act more fl exi-
bly in the future. It enables healthy
growth over the long term, and will
benefi t not only our shareholders
but also our employees. This value
infl uences our decisions on invest-
ments, personnel, strategies, our
teamwork and many other aspects
of our daily business.
A strong commitment to sustain-
ability has always been a major
driver of our performance. We
take a long-term, entrepreneurial
approach toward all elements of
sustainability, aiming not just to
comply with existing standards but
also to set new ones. Henkel has
always strived to create a balance
between people, planet and profi t.
This approach brings us a clear
competitive advantage and helps
us achieve our full business poten-
tial – and it will provide us with
a signifi cant edge in the future
competition for new talent.
The “family” value makes us
unique. We build our future on a
solid foundation. Since 1876, the
year Henkel was founded, the
Henkel family has shown a strong
commitment to the company. The
family provides us the opportunity
to operate in the long term. It also
supports us when we have to make
diffi cult strategic decisions. We are
committed to leading Henkel with
an entrepreneurial spirit, which
has been a strong characteristic
since our foundation, and that is
what ultimately makes the diff er-
ence in the marketplace.
We put our customers at the
center of what we do.
We value, challenge and reward
our people.
We are committed to leadership
in sustainability.
We build our future on our
family business foundation.
Our Values
Our Vision
A global leader in brandsand technologies.
We drive excellent sustainable
financial performance.
12 Henkel Annual Report 2010Our Values
We put our customers at the center of what we do.
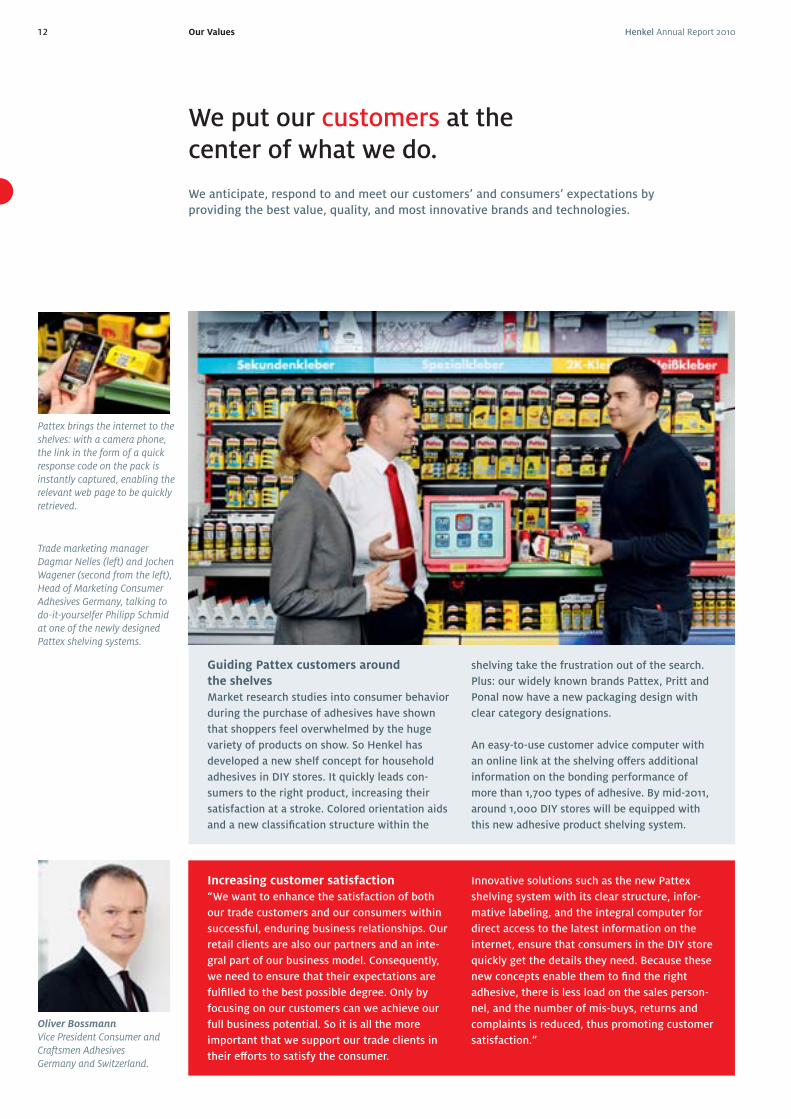
Trade marketing manager Dagmar Nelles (left) and Jochen Wagener (second from the left), Head of Marketing Consumer Adhesives Germany, talking to do-it-yourselfer Philipp Schmid at one of the newly designed Pattex shelving systems.
Pattex brings the internet to the shelves: with a camera phone, the link in the form of a quick response code on the pack is instantly captured, enabling the relevant web page to be quickly retrieved.
Guiding Pattex customers around
the shelves
Market research studies into consumer behavior
during the purchase of adhesives have shown
that shoppers feel overwhelmed by the huge
variety of products on show. So Henkel has
developed a new shelf concept for household
adhesives in DIY stores. It quickly leads con-
sumers to the right product, increasing their
satisfaction at a stroke. Colored orientation aids
and a new classifi cation structure within the
shelving take the frustration out of the search.
Plus: our widely known brands Pattex, Pritt and
Ponal now have a new packaging design with
clear category designations.
An easy-to-use customer advice computer with
an online link at the shelving off ers additional
information on the bonding performance of
more than 1,700 types of adhesive. By mid-2011,
around 1,000 DIY stores will be equipped with
this new adhesive product shelving system.
We anticipate, respond to and meet our customers’ and consumers’ expectations by
providing the best value, quality, and most innovative brands and technologies.
Oliver BossmannVice President Consumer and Craftsmen Adhesives Germany and Switzerland.
Increasing customer satisfaction
“We want to enhance the satisfaction of both
our trade customers and our consumers within
successful, enduring business relationships. Our
retail clients are also our partners and an inte-
gral part of our business model. Consequently,
we need to ensure that their expectations are
fulfi lled to the best possible degree. Only by
focusing on our customers can we achieve our
full business potential. So it is all the more
important that we support our trade clients in
their eff orts to satisfy the consumer.
Innovative solutions such as the new Pattex
shelving system with its clear structure, infor-
mative labeling, and the integral computer for
direct access to the latest information on the
internet, ensure that consumers in the DIY store
quickly get the details they need. Because these
new concepts enable them to fi nd the right
adhesive, there is less load on the sales person-
nel, and the number of mis-buys, returns and
complaints is reduced, thus promoting customer
satisfaction.”
Henkel Annual Report 2010 13Our Values
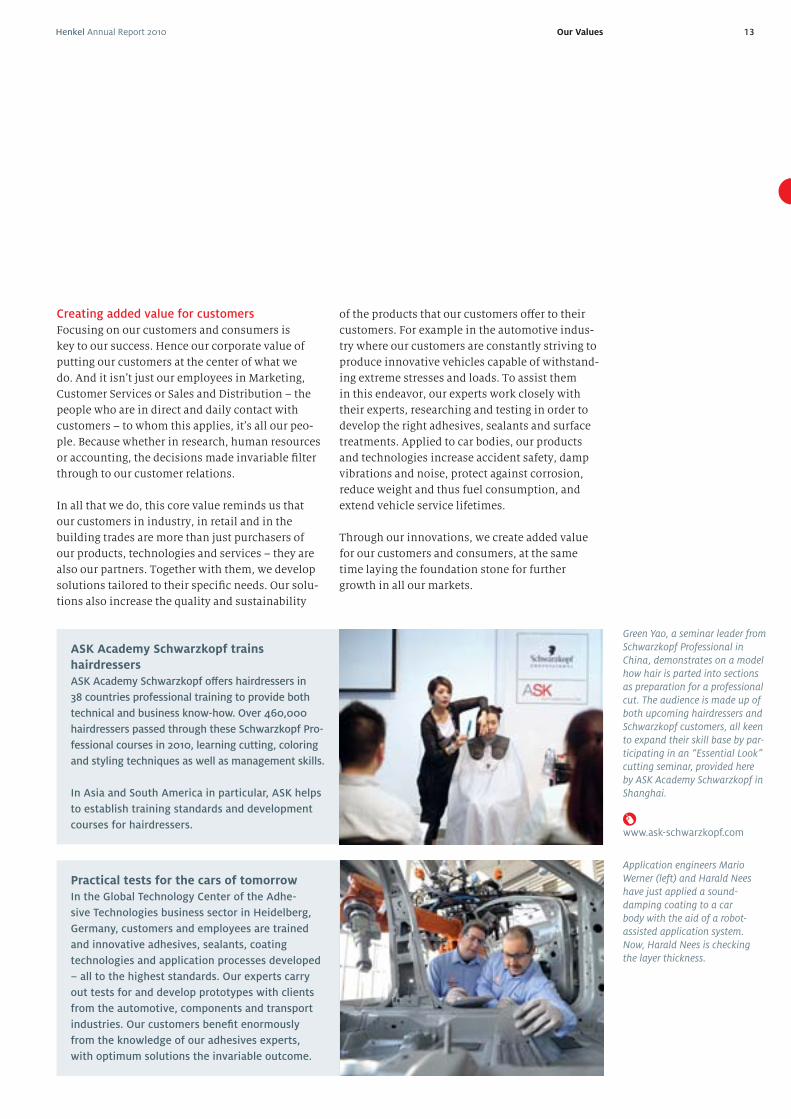
ASK Academy Schwarzkopf trains
hairdressers
ASK Academy Schwarzkopf off ers hairdressers in
38 countries professional training to provide both
technical and business know-how. Over 460,000
hairdressers passed through these Schwarzkopf Pro-
fessional courses in 2010, learning cutting, coloring
and styling techniques as well as management skills.
In Asia and South America in particular, ASK helps
to establish training standards and development
courses for hairdressers.
Green Yao, a seminar leader from Schwarzkopf Professional in China, demonstrates on a model how hair is parted into sections as preparation for a professional cut. The audience is made up of both upcoming hairdressers and Schwarzkopf customers, all keen to expand their skill base by par-ticipating in an “Essential Look” cutting seminar, provided here by ASK Academy Schwarzkopf in Shanghai.
Application engineers Mario Werner (left) and Harald Nees have just applied a sound-damping coating to a car body with the aid of a robot-assisted application system. Now, Harald Nees is checking the layer thickness.
Practical tests for the cars of tomorrow
In the Global Technology Center of the Adhe-
sive Technologies business sector in Heidelberg,
Germany, customers and employees are trained
and innovative adhesives, sealants, coating
technologies and application processes developed
– all to the highest standards. Our experts carry
out tests for and develop prototypes with clients
from the automotive, components and transport
industries. Our customers benefi t enormously
from the knowledge of our adhesives experts,
with optimum solutions the invariable outcome.
www.ask-schwarzkopf.com
Creating added value for customers
Focusing on our customers and consumers is
key to our success. Hence our corporate value of
putting our customers at the center of what we
do. And it isn’t just our employees in Marketing,
Customer Services or Sales and Distribution – the
people who are in direct and daily contact with
customers – to whom this applies, it’s all our peo-
ple. Because whether in research, human resources
or accounting, the decisions made invariable fi lter
through to our customer relations.
In all that we do, this core value reminds us that
our customers in industry, in retail and in the
building trades are more than just purchasers of
our products, technologies and services – they are
also our partners. Together with them, we develop
solutions tailored to their specifi c needs. Our solu-
tions also increase the quality and sustainability
of the products that our customers off er to their
customers. For example in the automotive indus-
try where our customers are constantly striving to
produce innovative vehicles capable of withstand-
ing extreme stresses and loads. To assist them
in this endeavor, our experts work closely with
their experts, researching and testing in order to
develop the right adhesives, sealants and surface
treatments. Applied to car bodies, our products
and technologies increase accident safety, damp
vibrations and noise, protect against corrosion,
reduce weight and thus fuel consumption, and
extend vehicle service lifetimes.
Through our innovations, we create added value
for our customers and consumers, at the same
time laying the foundation stone for further
growth in all our markets.
Henkel Annual Report 201014 Our Values
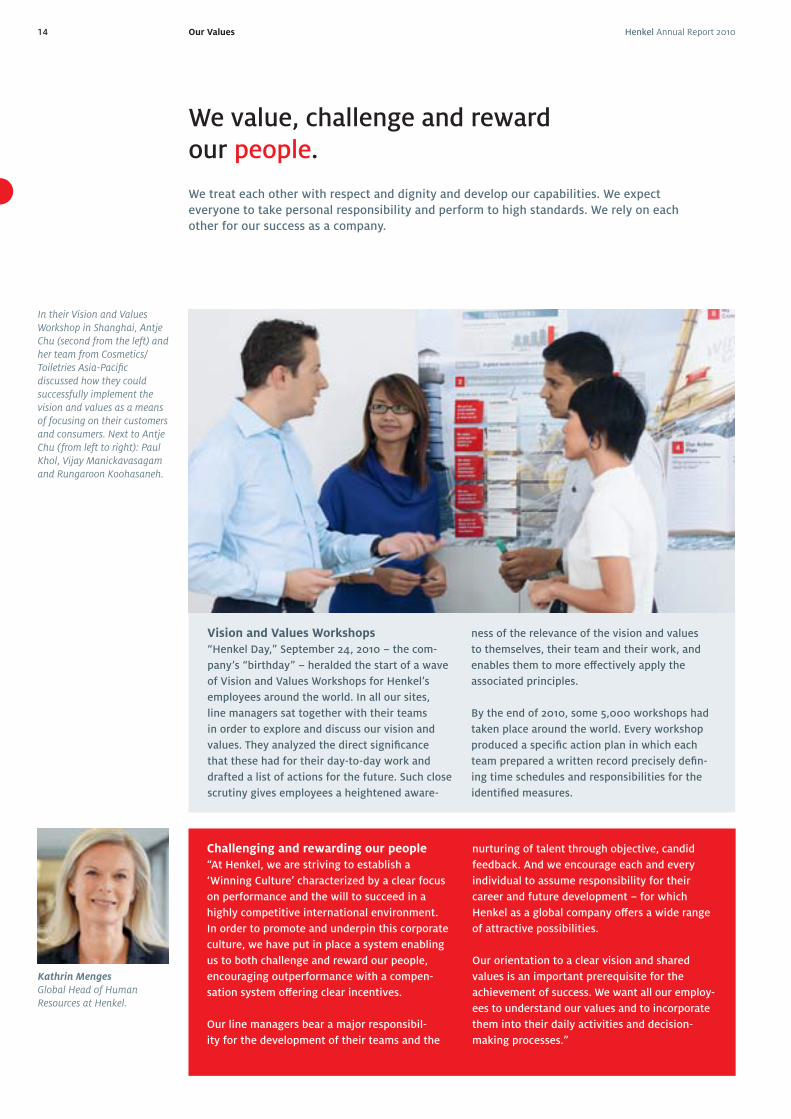
In their Vision and Values Workshop in Shanghai, Antje Chu (second from the left) and her team from Cosmetics/Toiletries Asia-Pacifi c discussed how they could successfully implement the vision and values as a means of focusing on their customers and consumers. Next to Antje Chu (from left to right): Paul Khol, Vijay Manickavasagam and Rungaroon Koohasaneh.
We value, challenge and reward our people.
We treat each other with respect and dignity and develop our capabilities. We expect
everyone to take personal responsibility and perform to high standards. We rely on each
other for our success as a company.
Vision and Values Workshops
“Henkel Day,” September 24, 2010 – the com-
pany’s “birthday” – heralded the start of a wave
of Vision and Values Workshops for Henkel’s
employees around the world. In all our sites,
line managers sat together with their teams
in order to explore and discuss our vision and
values. They analyzed the direct signifi cance
that these had for their day-to-day work and
drafted a list of actions for the future. Such close
scrutiny gives employees a heightened aware-
ness of the relevance of the vision and values
to themselves, their team and their work, and
enables them to more eff ectively apply the
associated principles.
By the end of 2010, some 5,000 workshops had
taken place around the world. Every workshop
produced a specifi c action plan in which each
team prepared a written record precisely defi n-
ing time schedules and responsibilities for the
identifi ed measures.
Challenging and rewarding our people
“At Henkel, we are striving to establish a
‘Winning Culture’ characterized by a clear focus
on performance and the will to succeed in a
highly competitive international environment.
In order to promote and underpin this corporate
culture, we have put in place a system enabling
us to both challenge and reward our people,
encouraging outperformance with a compen-
sation system off ering clear incentives.
Our line managers bear a major responsibil-
ity for the development of their teams and the
Kathrin MengesGlobal Head of Human Resources at Henkel.
nurturing of talent through objective, candid
feedback . And we encourage each and every
individual to assume responsibility for their
career and future development – for which
Henkel as a global company off ers a wide range
of attractive possibilities.
Our orientation to a clear vision and shared
values is an important prerequisite for the
achievement of success. We want all our employ-
ees to understand our values and to incorporate
them into their daily activities and decision-
making processes.”
Henkel Annual Report 2010 15Our Values
Pages 55 to 57.
Sustainability Report, pages 30 to 37.
Employees as vital factors for success
Henkel is a globally active corporation with
around 48,000 employees of whom 80 percent
work outside Germany. Collaborating with our
customers, they develop innovations, successfully
implement strategies and provide the company
with its unique identity. Our employees are a vital
factor for success in the competitive international
environment in which we operate.
Our new vision and the revised values have been
introduced in order to contribute to establish-
ing a sustainable “Winning Culture” within the
company. A shared vision and actively promoted
values generate a feeling of unity and off er us guid-
“It is important for a
company to have a vision
and values for employees
to follow. They reinforce
what our organization is
striving for and the goals
we are trying to attain.
They give us guidance on
doing what’s best for our
business.”
“The ‘people’ value
supports a fundamental
human need for respect,
to be appreciated and
rewarded for excellent
performance, to be sup-
ported by our colleagues
and to be part of a suc-
cessful team.”
“Henkel performs within
a family-business atmo-
sphere, with belief and
trust in its people and a
willingness to take risks
with them. Proof of this
can be found in the emerg-
ing markets where Henkel
started as a small player
and is now a competitive,
strategic company for its
customers.”
Around 32 %of our employees are women.
Around 29 %of our managerial staffare women.
Crystal Frazier, Chemist, Product Development Adhesive Technologies, USA.
Olga Gadetskaya, Human Resources Director Henkel Russia.
Eduardo Díaz Cortazar, Laundry & Home Care Walmart Team Leader, Mexico.
Emmanuelle Manier, Key Account Lawyer, Legal Department, France.
“Our vision and values
are authentic. Abiding by
these values in our daily
life will definitely help
us establish a ʻwinning
cultureʼ and differentiate
us from our competitors
– by reminding us never
to let the consumer down
and to be compliant in
all circumstances.”
ance in the performance of our everyday work.
They encourage us to develop innovative and
sustainable products, technologies and services for
our customers, and to devise eff ective marketing,
selling and distribution concepts.
Around the world, our corporate culture serves as
a bond, enabling us to utilize the full potential of
our internationality and diversity. Our employees
have a key role to play in our future success: by be-
ing open, by adopting a positive approach to new
developments and challenges, by helping to shape
events, by adopting an entrepreneurial attitude
and through their willingness to assume and ac-
cept responsibility.
Henkel Annual Report 201016 Our Values
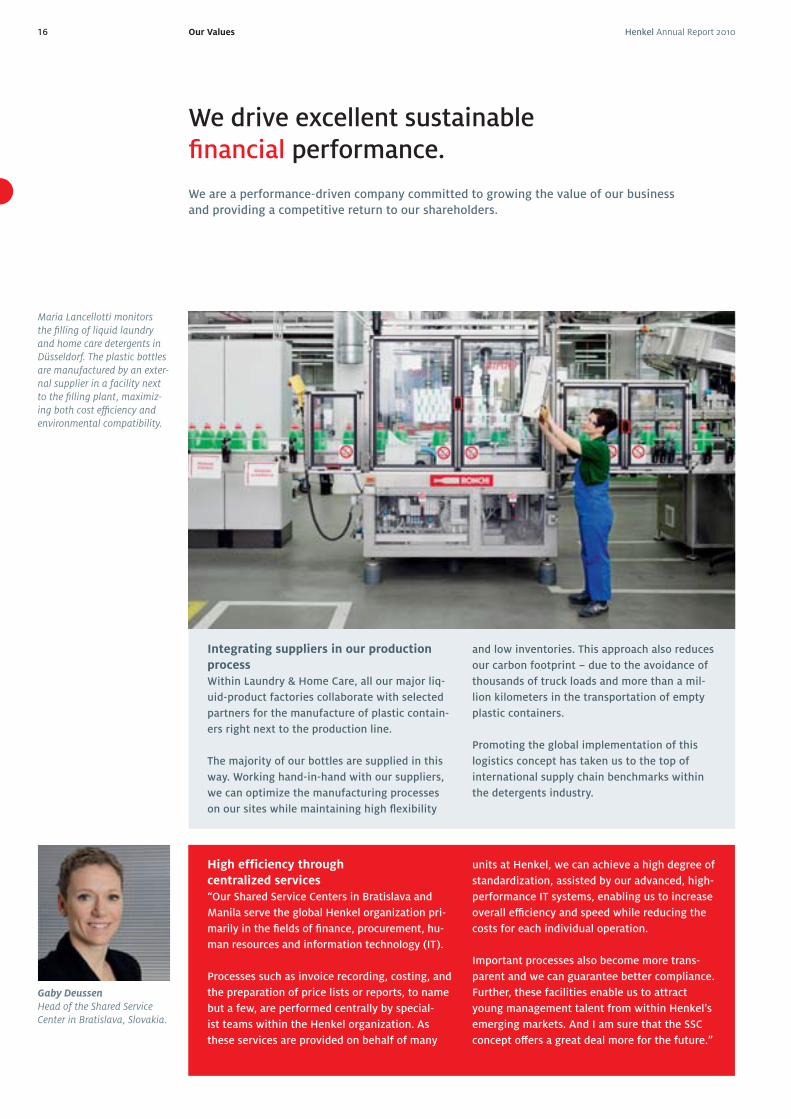
Integrating suppliers in our production
process
Within Laundry & Home Care, all our major liq-
uid-product factories collaborate with selected
partners for the manufacture of plastic contain-
ers right next to the production line.
The majority of our bottles are supplied in this
way. Working hand-in-hand with our suppliers,
we can optimize the manufacturing processes
on our sites while maintaining high fl exibility
We drive excellent sustainable fi nancial performance.
We are a performance-driven company committed to growing the value of our business
and providing a competitive return to our shareholders.
Maria Lancellotti monitors the fi lling of liquid laundry and home care detergents in Düsseldorf. The plastic bottles are manufactured by an exter-nal supplier in a facility next to the fi lling plant, maximiz-ing both cost effi ciency and environmental compatibility.
and low inventories. This approach also reduces
our carbon footprint – due to the avoidance of
thousands of truck loads and more than a mil-
lion kilometers in the transportation of empty
plastic containers.
Promoting the global implementation of this
logistics concept has taken us to the top of
international supply chain benchmarks within
the detergents industry.
High efficiency through
centralized services
“Our Shared Service Centers in Bratislava and
Manila serve the global Henkel organization pri-
marily in the fi elds of fi nance, procurement, hu-
man resources and information technology (IT).
Processes such as invoice recording, costing, and
the preparation of price lists or reports, to name
but a few, are performed centrally by special-
ist teams within the Henkel organization. As
these services are provided on behalf of many
units at Henkel, we can achieve a high degree of
standardization, assisted by our advanced, high-
performance IT systems, enabling us to increase
overall effi ciency and speed while reducing the
costs for each individual operation.
Important processes also become more trans-
parent and we can guarantee better compliance.
Further, these facilities enable us to attract
young management talent from within Henkel’s
emerging markets. And I am sure that the SSC
concept off ers a great deal more for the future.”
Gaby Deussen Head of the Shared Service Center in Bratislava, Slovakia.
Henkel Annual Report 2010 17Our Values
Profi table growth
Effi cient processes and eff ective development
are the cornerstones of our economic success. For
us as a performance-driven company, progress
in these domains is key if we are to maintain and
constantly strengthen our long-term competitive-
ness. We intend, through innovation, to grow
faster than our peers in our highly competitive
markets, and to develop new markets wherever
we can.
Increasing profi tability is not an end in itself. On
the other hand, we can only spend money that we
earn. The more we earn, the more we can invest
in research and innovations, and in our markets.
Communication with the capital market
The Investor Relations team from Henkel had
more than 500 meetings and events involving
investors and analysts last year. One of the main
highlights happened on September 16, 2010 in
Düsseldorf: top management from Adhesive
Technologies provided around 70 international
investors and analysts with a comprehensive
insight into our adhesives markets, innovative
portfolio and growth drivers. Aside from presen-
tations, Henkel employees held an exhibition to
show investors and analysts more of the great
potential that Adhesive Technologies has to off er.
The success of the Schwarzkopf brand
Our hair cosmetics brand Schwarzkopf is the
biggest and fastest growing within the Henkel
portfolio. Indeed, it is one of the most impor-
tant hair cosmetics brands in the world. Its sales
have grown from 500 million euros in 1995 to
1.8 billion euros in 2010. For the last 113 years, the
name Schwarzkopf has been synonymous with
hair competence, and values such as modernity,
high quality and innovative strength. This makes
Schwarzkopf an ideal umbrella for a clearly
diff erentiated brands portfolio serving both our
consumer segment and our international hair
salon business, Schwarzkopf Professional.
20quarters of profitable growth in a row posted by our Cosmetics/Toiletries business sector.
This basic understanding guides the approach
adopted by our three business sectors and our
corporate functions, each of which endeavors to
optimize its processes and fi nd synergies within
the value chain – in close alliance with our
strategic suppliers and our partners in research,
development, production and logistics.
A high level of profi tability guarantees us
greater fi nancial scope, gives us more fl exibility
and enhances our development possibilities.
And the better we manage our business, the
better are the conditions under which we can
obtain funds for investment from the fi nancial
markets.
Peter Rushe presents to the audience of investors and ana-lysts some of our new products for consumers and craftsmen: Pattex Power PU Foam and the Pritt Ecomfort Roller.
Henkel Annual Report 201018 Our Values
The sustainability challenge
“Companies are facing a very signifi cant and
growing challenge; that is, regulators, suppliers,
employees and customers increasingly expect
them to act thoughtfully regarding their use of
energy and natural resources, their impact on
the environments in which they operate and the
well-being of the people and communities they
serve.
At the same time, companies must make profi ts
commensurate with their investments and
shareholders’ expectations. In 2011 and beyond,
determining strategies and taking actions that
create sustainable outcomes will be the key to
industry leadership.
Henkel was among the fi rst global companies to
make a profound commitment to sustainability
as a core value. It has done a remarkable and
commendable job of achieving balance among
quality products, profi tability and sustainabil-
ity, something that other companies should
emulate.”
Dr. Rob MelnickExecutive Dean, Global Institute of Sustainability, Presidential Professor of Practice, School of Sustainability at the Arizona State University, USA.
We are committed to leadership in sustainability.
We provide products, technologies and processes that meet the highest standards.
We are committed to the safety and health of our employees, the protection of the
environment and the quality of life in the communities in which we operate.
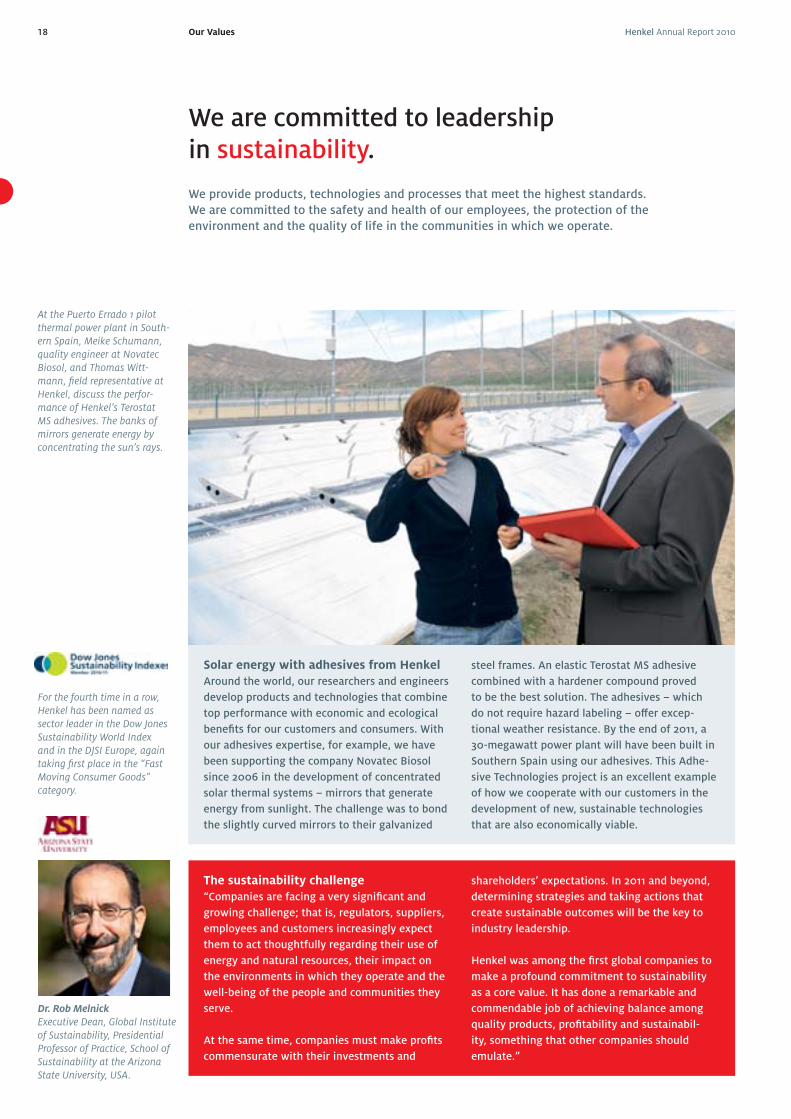
Solar energy with adhesives from Henkel
Around the world, our researchers and engineers
develop products and technologies that combine
top performance with economic and ecological
benefi ts for our customers and consumers. With
our adhesives expertise, for example, we have
been supporting the company Novatec Biosol
since 2006 in the development of concentrated
solar thermal systems – mirrors that generate
energy from sunlight. The challenge was to bond
the slightly curved mirrors to their galvanized
steel frames. An elastic Terostat MS adhesive
combined with a hardener compound proved
to be the best solution. The adhesives – which
do not require hazard labeling – off er excep-
tional weather resistance. By the end of 2011, a
30-megawatt power plant will have been built in
Southern Spain using our adhesives. This Adhe-
sive Technologies project is an excellent example
of how we cooperate with our customers in the
development of new, sustainable technologies
that are also economically viable.
At the Puerto Errado 1 pilot thermal power plant in South-ern Spain, Meike Schumann, quality engineer at Novatec Biosol, and Thomas Witt-mann, fi eld representative at Henkel, discuss the perfor-mance of Henkel’s Terostat MS adhesives. The banks of mirrors generate energy by concentrating the sun’s rays.
For the fourth time in a row, Henkel has been named as sector leader in the Dow Jones Sustainability World Index and in the DJSI Europe, again taking fi rst place in the “Fast Moving Consumer Goods” category.
Henkel Annual Report 2010 19Our Values
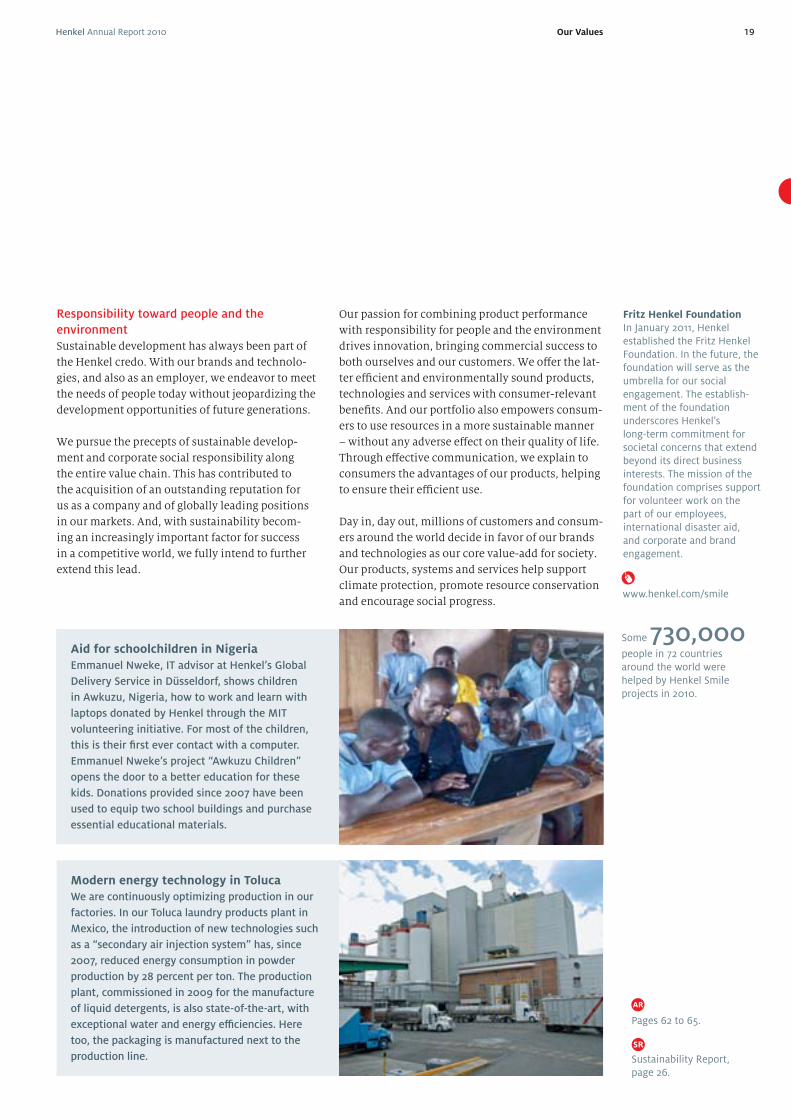
Responsibility toward people and the
environment
Sustainable development has always been part of
the Henkel credo. With our brands and technolo-
gies, and also as an employer, we endeavor to meet
the needs of people today without jeopardizing the
development opportunities of future generations.
We pursue the precepts of sustainable develop-
ment and corporate social responsibility along
the entire value chain. This has contributed to
the acquisition of an outstanding reputation for
us as a company and of globally leading positions
in our markets. And, with sustainability becom-
ing an increasingly important factor for success
in a competitive world, we fully intend to further
extend this lead.
Aid for schoolchildren in Nigeria
Emmanuel Nweke, IT advisor at Henkel’s Global
Delivery Service in Düsseldorf, shows children
in Awkuzu, Nigeria, how to work and learn with
laptops donated by Henkel through the MIT
volunteering initiative. For most of the children,
this is their fi rst ever contact with a computer.
Emmanuel Nweke’s project “Awkuzu Children”
opens the door to a better education for these
kids. Donations provided since 2007 have been
used to equip two school buildings and purchase
essential educational materials.
Fritz Henkel FoundationIn January 2011, Henkel established the Fritz Henkel Foundation. In the future, the foundation will serve as the umbrella for our social engagement. The establish-ment of the foundation underscores Henkel’s long-term commitment for societal concerns that extend beyond its direct business interests. The mission of the foundation comprises support for volunteer work on the part of our employees, international disaster aid, and corporate and brand engagement.
Modern energy technology in Toluca
We are continuously optimizing production in our
factories. In our Toluca laundry products plant in
Mexico, the introduction of new technologies such
as a “secondary air injection system” has, since
2007, reduced energy consumption in powder
production by 28 percent per ton. The production
plant, commissioned in 2009 for the manufacture
of liquid detergents, is also state-of-the-art, with
exceptional water and energy effi ciencies. Here
too, the packaging is manufactured next to the
production line.
Some 730,000people in 72 countries around the world were helped by Henkel Smile projects in 2010.
www.henkel.com/smile
Pages 62 to 65.
Sustainability Report, page 26.
Our passion for combining product performance
with responsibility for people and the environment
drives innovation, bringing commercial success to
both ourselves and our customers. We off er the lat-
ter effi cient and environmentally sound products,
technologies and services with consumer-relevant
benefi ts. And our portfolio also empowers consum-
ers to use resources in a more sustainable manner
– without any adverse eff ect on their quality of life.
Through eff ective communication, we explain to
consumers the advantages of our products, helping
to ensure their effi cient use.
Day in, day out, millions of customers and consum-
ers around the world decide in favor of our brands
and technologies as our core value-add for society.
Our products, systems and services help support
climate protection, promote resource conservation
and encourage social progress.
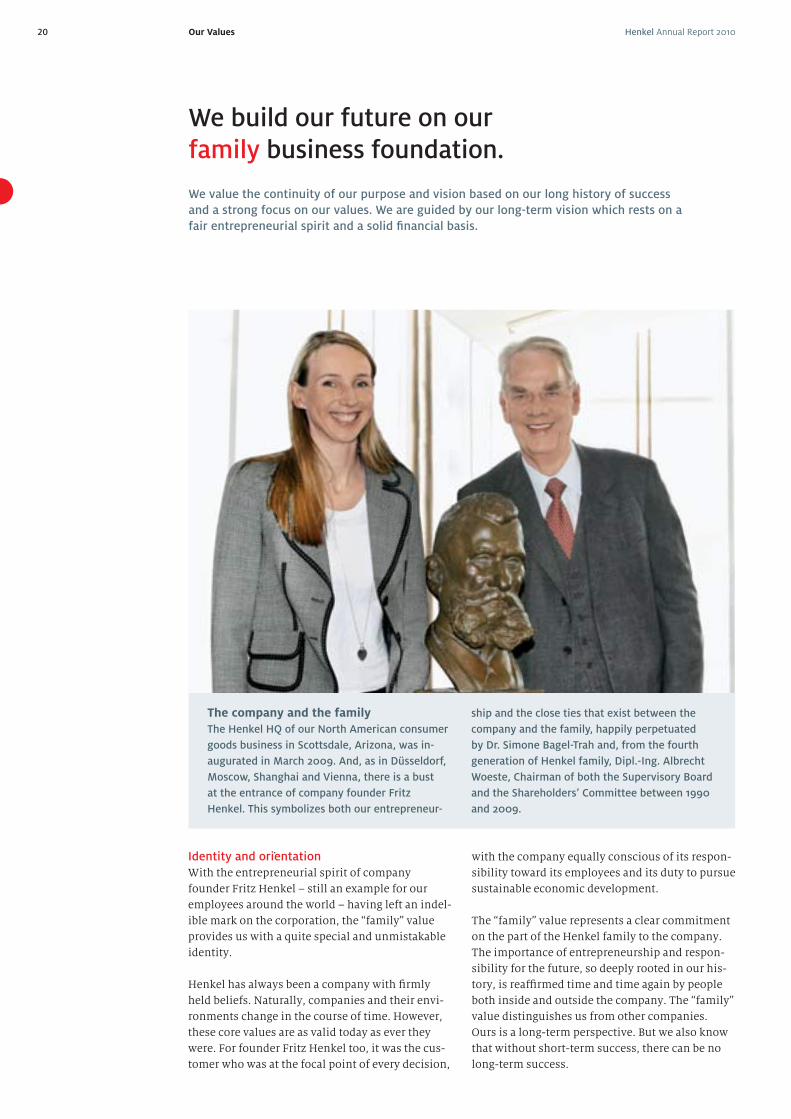
Henkel Annual Report 201020 Our Values
The company and the family
The Henkel HQ of our North American consumer
goods business in Scottsdale, Arizona, was in-
augurated in March 2009. And, as in Düsseldorf ,
Moscow, Shanghai and Vienna, there is a bust
at the entrance of company founder Fritz
Henkel. This symbolizes both our entrepreneur-
ship and the close ties that exist between the
company and the family, happily perpetuated
by Dr. Simone Bagel-Trah and, from the fourth
generation of Henkel family, Dipl.-Ing. Albrecht
Woeste, Chairman of both the Supervisory Board
and the Shareholders’ Committee between 1990
and 2009.
We build our future on our family business foundation.
We value the continuity of our purpose and vision based on our long history of success
and a strong focus on our values. We are guided by our long-term vision which rests on a
fair entrepreneurial spirit and a solid fi nancial basis.
Identity and orientation
With the entrepreneurial spirit of company
founder Fritz Henkel – still an example for our
employees around the world – having left an indel-
ible mark on the corporation, the “family” value
provides us with a quite special and unmistakable
identity.
Henkel has always been a company with fi rmly
held beliefs. Naturally, companies and their envi-
ronments change in the course of time. However,
these core values are as valid today as ever they
were. For founder Fritz Henkel too, it was the cus-
tomer who was at the focal point of every decision,
with the company equally conscious of its respon-
sibility toward its employees and its duty to pursue
sustainable economic development.
The “family” value represents a clear commitment
on the part of the Henkel family to the company.
The importance of entrepreneurship and respon-
sibility for the future, so deeply rooted in our his-
tory, is reaffi rmed time and time again by people
both inside and outside the company. The “family”
value distinguishes us from other companies.
Ours is a long-term perspective. But we also know
that without short-term success, there can be no
long-term success.
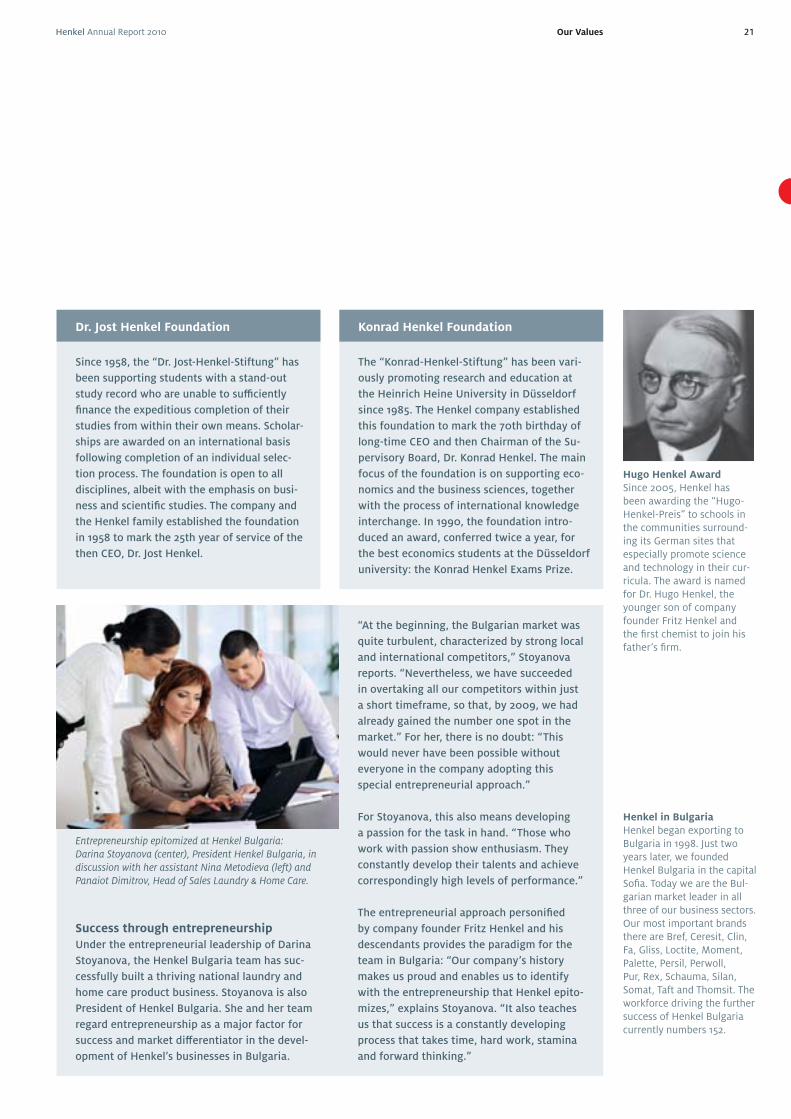
Henkel Annual Report 2010 21Our Values
Entrepreneurship epitomized at Henkel Bulgaria: Darina Stoyanova (center), President Henkel Bulgaria, in discussion with her assistant Nina Metodieva (left) and Panaiot Dimitrov, Head of Sales Laundry & Home Care.
Hugo Henkel AwardSince 2005, Henkel has been awarding the “Hugo-Henkel-Preis” to schools in the communities surround-ing its German sites that especially promote science and technology in their cur-ricula. The award is named for Dr. Hugo Henkel, the younger son of company founder Fritz Henkel and the fi rst chemist to join his father’s fi rm.
Henkel in BulgariaHenkel began exporting to Bulgaria in 1998. Just two years later, we founded Henkel Bulgaria in the capital Sofi a. Today we are the Bul-garian market leader in all three of our business sectors. Our most important brands there are Bref, Ceresit, Clin, Fa, Gliss, Loctite, Moment, Palette, Persil, Perwoll, Pur, Rex, Schauma, Silan, Somat, Taft and Thomsit. The workforce driving the further success of Henkel Bulgaria currently numbers 152.
“At the beginning, the Bulgarian market was
quite turbulent, characterized by strong local
and international competitors,” Stoyanova
reports. “Nevertheless, we have succeeded
in overtaking all our competitors within just
a short timeframe, so that, by 2009, we had
already gained the number one spot in the
market.” For her, there is no doubt: “This
would never have been possible without
everyone in the company adopting this
special entrepreneurial approach.”
For Stoyanova, this also means developing
a passion for the task in hand. “Those who
work with passion show enthusiasm. They
constantly develop their talents and achieve
correspondingly high levels of performance.”
The entrepreneurial approach personifi ed
by company founder Fritz Henkel and his
descendants provides the paradigm for the
team in Bulgaria: “Our company’s history
makes us proud and enables us to identify
with the entrepreneurship that Henkel epito-
mizes,” explains Stoyanova. “It also teaches
us that success is a constantly developing
process that takes time, hard work, stamina
and forward thinking.”
Success through entrepreneurship
Under the entrepreneurial leadership of Darina
Stoyanova, the Henkel Bulgaria team has suc-
cessfully built a thriving national laundry and
home care product business. Stoyanova is also
President of Henkel Bulgaria. She and her team
regard entrepreneurship as a major factor for
success and market diff erentiator in the devel-
opment of Henkel’s businesses in Bulgaria.
Dr. Jost Henkel Foundation Konrad Henkel Foundation
Since 1958, the “Dr. Jost-Henkel-Stiftung” has
been supporting students with a stand-out
study record who are unable to suffi ciently
fi nance the expeditious completion of their
studies from within their own means. Scholar-
ships are awarded on an international basis
following completion of an individual selec-
tion process. The foundation is open to all
disciplines, albeit with the emphasis on busi-
ness and scientifi c studies. The company and
the Henkel family established the foundation
in 1958 to mark the 25th year of service of the
then CEO, Dr. Jost Henkel.
The “Konrad-Henkel-Stiftung” has been vari-
ously promoting research and education at
the Heinrich Heine University in Düsseldorf
since 1985. The Henkel company established
this foundation to mark the 70th birthday of
long-time CEO and then Chairman of the Su-
pervisory Board, Dr. Konrad Henkel. The main
focus of the foundation is on supporting eco-
nomics and the business sciences, together
with the process of international knowledge
interchange. In 1990, the foundation intro-
duced an award, conferred twice a year, for
the best economics students at the Düsseldorf
university: the Konrad Henkel Exams Prize.
Henkel Annual Report 2010 25Group management report
Subindex
26 Corporate governance
26 I. Corporate governance/
Corporate management report
31 II. Remuneration report
40 Operational activities
40 Overview
40 Organization and business sectors
40 Strategy and fi nancial targets for 2012
41 Strategic priorities and progress in fi scal 2010
42 Progress in fi scal 2010
42 Financial targets for 2012
43 Value-based management and control system
44 EVA® and ROCE
44 Statutory and regulatory situation
45 Business performance
45 World economy
47 Management Board review of business
performance
47 Sales and profi ts
49 Comparison between actual and forecast
business performance
50 National Starch businesses:
Integration in Adhesive Technologies
successfully completed
50 Expense items
51 Other operating income and charges
51 Financial result
51 Net income
51 Dividends
51 Earnings per share (EPS)
52 Assets and fi nancial analysis
52 Acquisitions and divestments
52 Capital expenditures
52 Net assets
53 Financing
54 Financial position
54 Key fi nancial ratios
55 Employees
57 Procurement
58 Production
59 Research and development
61 Marketing and distribution
62 Sustainability
63 Alignment and focus
63 Objectives and progress achieved
64 Organization
65 Stakeholder dialogue
66 Business sector performance
66 Laundry & Home Care
70 Cosmetics/Toiletries
74 Adhesive Technologies
78 Risk report
78 Risk management system
79 Disclosure of major individual risks
82 Overall risk – Management Board appraisal
83 Forecast
83 General economic development
83 Sector development
84 Opportunities: growth regions and
innovative products with plenty of potential
84 Outlook for the Henkel Group in 2011
85 Sales and profi ts forecast 2012
86 Subsequent events
Group management report subindex
Henkel Annual Report 201026 Group management report
Corporate governance
Group management report
Corporate governance at
Henkel AG & Co. KGaA
Corporate governance in the sense of responsible ,
transparent management and control of the corpo-
ration aligned to a long-term increase in share-
holder value has long been an integral component
of our corporate culture, and will remain so into
the future.
Consequently, the Management Board, Sharehold-
ers’ Committee and Supervisory Board have com-
mitted to the following three principles:
• Value creation as the foundation of our man-
agement approach.
• Sustainability achieved through the application
of socially responsible management principles.
• Transparency supported by an active and open
information policy.
I. Corporate governance/
Corporate management report
This corporate governance report describes the prin-
ciples of the management and control structure,
corporate stewardship and also the essential rights
of shareholders of Henkel AG & Co. KGaA; in addi-
tion, it explains the special features that arise from
our particular legal form and our Articles of Associa-
tion as compared to a joint stock corporation (AG in
Germany). It takes into account the recommenda-
tions of the German Corporate Governance Code
and contains all the information required according
to Section 289 (4), Section 289 (a) and Section 315 (4)
of the German Commercial Code [HGB].
Legal form/Special statutory features of
Henkel AG & Co. KGaA
Henkel is a “Kommanditgesellschaft auf Aktien”
(KGaA). A KGaA is a company with its own legal
personality (i.e. it is a legal person) in which at
least one partner assumes unlimited liability in
respect of the company’s creditors (personally
liable partner). The other partners participate in
the capital stock, which is split into shares, and
their liability is limited by these shares; they are
thus not liable for the company’s debts (limited
partners per Section 278 (1) German Stock Corpora-
tion Act [AktG]).
The following major diff erences exist compared to
an AG:
• At Henkel AG & Co. KGaA, the executive role is
assigned to Henkel Management AG – acting
through its Management Board – as the sole
Personally Liable Partner (Section 278 (2), Sec-
tion 283 AktG in conjunction with Article 11 of
the Articles of Association [Corporate Bylaws]).
• The rights and duties of the supervisory board
of a KGaA are more limited compared to those of
the supervisory board of an AG. In particular, the
supervisory board is not authorized to appoint
personally liable partners, to preside over the
associated contractual arrangements, to impose
procedural rules on the management board or
to rule on business transactions. A KGaA is not
required to appoint a director of labor aff airs,
even if, like Henkel, the company is bound to
abide by Germany’s Codetermination Act of 1976.
• The general meeting of a KGaA essentially has
the same rights as the shareholders’ meeting of
an AG. In addition, it votes on the adoption of
the annual fi nancial statements of the corpora-
tion; it further formally approves the actions of
the personally liable partner(s). In the case of
Henkel, it also elects and approves the actions
of the members of the Shareholders’ Committee.
Resolutions passed in general meeting require
the approval of the personally liable partner
where they involve matters which, in the case of
a partnership, require the authorization of the
personally liable partners and also that of the
limited partners (Section 285 (2) AktG) or relate
to the adoption of annual fi nancial statements
(Section 286 (1) AktG).
According to our Articles of Association, in addi-
tion to the Supervisory Board, Henkel also has a
standing Shareholders’ Committee comprising a
minimum of fi ve and a maximum of ten members,
all of whom are elected by the Annual General
Meeting [AGM] (Article 27 of the Articles of Asso-
ciation). The Shareholders’ Committee is required
in particular to perform the following functions:
• It acts in place of the AGM in guiding the busi-
ness activities of the corporation.
• It decides on the appointment and dismissal of
the personally liable partner(s).
• It holds both the power of representation and
executive powers over the legal relationships
prevailing between the corporation and Henkel
Management AG, the Personally Liable Partner.
• It exercises the voting rights of the corporation in
the General Meeting of Henkel Management AG.
• It issues rules of procedure incumbent upon
Henkel Management AG (Section 278 (2) AktG) in
conjunction with Sections 114 and 161 HGB and
Articles 8, 9 and 26 of the Articles of Association.
Capital stock denominations/Shareholder rights
The capital stock of the corporation amounts
to 437,958,750 euros. It is divided into a total of
437,958,750 bearer shares of no par value, of which
259,795,875 are ordinary bearer shares (proportion
www.corporate-governance-code.com
Henkel Annual Report 2010 27Group management report
Corporate governance
authorized, subject to the approval of the Supervi-
sory Board and of the Shareholders’ Committee, to
increase the capital stock of the corporation in one
or several acts until April 18, 2015, by up to a total of
25,600,000 euros through the issue for cash of new
preferred shares with no voting rights. All share-
holders are essentially assigned pre-emptive rights.
However, these may be set aside in three cases:
(1) in order to dispose of fractional amounts; (2) to
grant to creditors/holders of bonds with warrants
or conversion rights or a conversion obligation
issued by the corporation or one of the companies
dependent upon it, pre-emptive rights correspond-
ing to those that would accrue to such creditors/
bondholders following exercise of their warrant or
conversion rights or on fulfi llment of their conver-
sion obligations; or (3) if the issue price of the new
shares is not signifi cantly below the quoted market
price at the time of issue price fi xing.
In addition, the Personally Liable Partner is autho-
rized to purchase ordinary and/or preferred shares
of the corporation at any time up to April 18, 2015.
This authorization can be exercised for any legal
purpose. To the exclusion of the pre-emptive rights
of existing shareholders, treasury shares may be
used to operate the Stock Incentive Plan of the
Henkel Group or transferred to third parties for
the purpose of acquiring companies or investing
in companies. Treasury stock may also be sold to
third parties against payment in cash, provided
that the selling price is not signifi cantly below the
quoted market price at the time of share disposal.
The shares may likewise be used to satisfy war-
rants or conversion rights granted by the corpora-
tion. The personally liable partner has also been
authorized – with the approval of the Sharehold-
ers’ Committee and of the Supervisory Board – to
cancel treasury stock without further resolution in
General Meeting being required.
Inasmuch as shares may be issued or used to the
exclusion of pre-emptive rights, the proportion of
capital stock represented by such shares shall not
exceed 10 percent.
Major shareholders
According to notifi cations received by the com-
pany on October 21, 2010, a total of 53.21 percent of
the voting rights are held by parties to the Henkel
family’s share-pooling agreement. This agreement
was concluded between members of the families of
the descendants of company founder Fritz Henkel;
it contains restrictions with respect to transfers of
the ordinary shares covered (Art. 7 of the Articles of
Association).
of capital stock: 259,795,875 euros or 59.3 percent)
and 178,162,875 are preferred shares (proportion of
capital stock: 178,162,875 euros or 40.7 percent). All
the shares are fully paid up.
Each ordinary share grants to its holder one vote.
The preferred shares accord to their holder all
shareholder rights apart from the right to vote.
Unless otherwise resolved in General Meeting, the
profi t attributable to shareholders of Henkel AG &
Co. KGaA is distributed as follows: First, the hold-
ers of preferred shares receive a preferred dividend
in the amount of 0.04 euros per preferred share.
The holders of ordinary shares then receive a
dividend of 0.02 euros per ordinary share, with the
residual amount being distributed to the holders of
ordinary and preferred shares in accordance with
the proportion of the capital stock attributable to
them (Art. 35 (2) of the Articles of Association).
If the preferred dividend is not paid out either in
part or in whole in a year, and the arrears are not
paid off in the following year together with the full
preferred share dividend for that second year, the
holders of preferred shares are accorded voting
rights until such arrears are paid (Section 140 (2)
AktG). Cancellation or limitation of this preferred
dividend requires the consent of the holders of
preferred shares (Section 141 (1) AktG).
There are no shares bearing cumulative/plural vot-
ing rights, preferential voting rights or maximum
voting rights (voting restrictions).
The shareholders exercise their rights in General
Meeting as per the relevant statutory provisions
and the Articles of Association of Henkel AG & Co.
KGaA. In particular, they may vote (as per entitle-
ment), speak on agenda items, ask relevant ques-
tions and propose motions.
Unless otherwise required by mandatory provi-
sions of statute or the Articles of Association, the
resolutions of the General Meeting are adopted by
simple majority of the votes cast and, inasmuch
as a majority of shares is required by statute, by
simple majority of the voting stock represented
(Art. 24 of the Articles of Association). This also
applies to changes in the Articles of Associa-
tion. However, modifi cations to the object of the
company require a three-quarters’ majority (Sec-
tion 179 (2) AktG).
Authorized capital/Share buy-back
According to Art. 6 (5) of the Articles of Associa-
tion, there is an authorized capital limit. Acting
within this limit, the Personally Liable Partner is
Henkel Annual Report 201028 Group management report
Corporate governance
Interaction between Management Board,
Supervisory Board, Shareholders’ Committee
and other committees
The Management Board of Henkel Management AG,
which is responsible for the corporation’s operating
business, the Supervisory Board and the Sharehold-
ers’ Committee of the corporation cooperate closely
for the benefi t of the organization.
The Management Board agrees with the Share-
holders’ Committee the strategic alignment of the
corporation and discusses with the Shareholders’
Committee at regular intervals the status of imple-
mentation of said strategy.
In keeping with good corporate management
practice, the Management Board informs the
Supervisory Board and the Shareholders’ Commit-
tee regularly, and in a timely and comprehensive
fashion, of all issues of relevance to the corporation
concerning business policy, corporate planning,
profi tability, the business development of the
corporation and of major Group companies, and
also matters relating to risk exposure and risk
management.
For transactions of fundamental signifi cance, the
Shareholders’ Committee has established a right of
veto in the procedural rules governing the actions
of Henkel Management AG in its function as sole
Personally Liable Partner (Article 26 of the Articles
of Association). This covers, in particular, deci-
sions or measures that materially change the net
assets, fi nancial position or results of operations of
the corporation. The Management Board complies
with these rights of consent of the Shareholders’
Committee and also duly submits to the spheres of
authority of the corporation’s General Meeting.
The Shareholders’ Committee passes its resolutions
on the basis of a simple majority of the votes cast.
It has established a Finance Subcommittee and a
Human Resources Subcommittee, each of which
comprises fi ve members of the Shareholders’ Com-
mittee. The Finance Subcommittee deals princi-
pally with the fi nancial matters, accounting issues
including external auditing, taxation planning and
accounting policies, and the internal auditing and
risk management of the corporation. It also carries
out the necessary preparatory work for decisions
to be taken by the Shareholders’ Committee in
such aff airs. The Human Resources Subcommittee
principally discusses personnel matters relating
to the members of the Management Board, human
resources strategy, and remuneration. It is further
concerned with succession planning and identify-
ing management potential within the individual
business sectors, taking into account relevant
diversity aspects.
The Supervisory Board passes its resolutions by
a simple majority of the votes cast. In the event
of a tie, the Chairperson has the casting vote. The
Supervisory Board has established an Audit Com-
mittee and a Nominations Committee. The Audit
Committee is made up of three shareholder- and
three employee-representative members of the
Supervisory Board, each elected by the Super-
visory Board based on proposals of their fellow
shareholder or fellow employee representatives
on the Supervisory Board. The Chairperson of the
Audit Committee is elected by the shareholder-
representative members on the Supervisory Board.
It is a statutory requirement that the Audit Com-
mittee includes an independent member of the
Supervisory Board with expertise in the fi elds of
accounting and auditing. The Chairperson of the
Audit Committee, Dr. h.c. Bernhard Walter, who is
not the Chairperson of the Supervisory Board or a
former member of the Management Board, satisfi es
these requirements. The Audit Committee prepares
the proceedings and resolutions of the Supervisory
Board relating to adoption of the annual fi nancial
statements and the consolidated fi nancial state-
ments, and also the auditor appointment proposal
to be made to the Annual General Meeting. It is also
concerned with monitoring the accounting process,
the eff ectiveness of the internal control system, the
risk management system and the internal audit-
ing and review system, as well as with compliance
issues. It further discusses with the Management
Board, with the external auditors also in atten-
dance, the quarterly reports and the fi nancial report
for the half-year prior to publication, issues audit
mandates to the auditors and defi nes the focal
areas of the audit or review.
The Nominations Committee comprises the Chair-
person of the Supervisory Board and two further
shareholder representatives elected by the share-
holder representatives on the Supervisory Board;
the Chairperson of the Supervisory Board is also
Chairperson of the Nominations Committee. The
Nominations Committee prepares the proposals to
be submitted by the Supervisory Board to the An-
nual General Meeting for the election of members
to the Supervisory Board (shareholder representa-
tives).
At regular intervals, the Supervisory Board and
the Shareholders’ Committee carry out an internal
review to determine the effi ciency with which they
and their committees/subcommittees carry out
their duties. This self-assessment is performed on
Henkel Annual Report 2010 29Group management report
Corporate governance
the basis of a checklist which also contains points
relating to corporate governance and improve-
ment indicators. Pursuant to the German Corporate
Governance Code, confl icts of interest must be dis-
closed in an appropriate manner to the Supervisory
Board or Shareholders’ Committee, particularly
those that may arise as the result of a consultancy
or committee function performed in the service
of customers, suppliers, lenders or other business
partners. Members encountering material confl icts
of interest that are more than just temporary are
required to resign their mandate.
The members of the Management Board are respon-
sible for managing Henkel’s business operations in
their entirety. To this end, the individual Manage-
ment Board members are assigned – in accor-
dance with a business distribution plan – areas of
competence for which they bear lead responsibility.
The members of the Management Board cooperate
closely as colleagues, informing one another of all
major occurrences within their areas of compe-
tence and conferring on all actions that may aff ect
several such areas. Further details relating to coop-
eration and the division of operational responsibil-
ities are regulated by rules of procedure issued by
the Supervisory Board of Henkel Management AG.
The Management Board reaches its decisions by a
simple majority of the votes cast. In the event of a
tie, the Chairperson has the casting vote.
Some members of the Supervisory Board and of the
Shareholders’ Committee are or were in past years
holders of senior managerial positions in other
companies. Inasmuch as Henkel pursues business
activities with these companies, the same arm’s
length principles apply as those applicable to trans-
actions with and between unrelated third parties.
For more details on the composition of the
Management Board, the Supervisory Board and
the Shareholders’ Committee, the committees
established within the Supervisory Board and the
subcommittees of the Shareholders’ Committee,
please refer to pages 137 to 141. Details of com-
pensation can be found in the remuneration report
on pages 31 to 39.
For further details with respect to corporate gov-
ernance in general, please go to our website at
www.henkel.com/ir
Principles of corporate stewardship/Compliance
For our company to be successful, it is essential
that we share a common approach to entrepre-
neurship. The company’s vision provides its ma-
nagement and employees worldwide with both
direction and a primary objective. It reaffi rms our
commitment to be the best and meet the highest
standards in everything that we do.
Our vision:
• A global leader in brands and technologies.
Our vision provides the foundation for building
a company with a common ethic: “One Henkel.”
The company’s values guide its employees in all
the day-to-day decisions they make, providing a
compass for their conduct and actions.
Our values:
• We put our customers at the center of what we do.
• We value, challenge and reward our people.
• We drive excellent sustainable fi nancial perfor-
mance.
• We are committed to leadership in sustainability.
• We build our future on our family business
foundation.
Henkel is committed to ensuring that all busi-
ness transactions are conducted in an ethically
irreproachable, legal fashion. Consequently,
Henkel expects all its employees to respect not
only the company’s internal rules and all relevant
laws, but also to avoid confl icts of interest, to
protect Henkel’s assets and to respect the customs,
traditions and social values of the countries and
cultural environments in which the company does
business. The Management Board has therefore
issued a series of Group-wide codes, standards and
guidelines with binding precepts of professional
conduct and behavior. These regulatory instru-
ments are regularly reviewed and amended as ap-
propriate, evolving in step with the changing legal
and commercial conditions that aff ect Henkel as a
globally active corporation. Our Code of Conduct
supports our employees in dealing with ethical
and legal issues; our Code of Teamwork and Lead-
ership defi nes the approach, actions and attitudes
to be adopted by management and employees
in their interpersonal dealings; and the Code of
Corporate Sustainability describes the principles
that underlie our approach to sustainable, socially
responsible development. These codes also enable
Henkel to meet the commitments derived from the
Global Compact of the United Nations.
Ensuring compliance in the sense of obeying
laws and adhering to regulations is an integral
component of our business processes. Henkel has
established a Group-wide compliance organization
with locally and regionally responsible compli-
ance offi cers led by a globally responsible Chief
Compliance Offi cer. The CCO manages and con-
Henkel Annual Report 201030 Group management report
Corporate governance
trols compliance-related activities undertaken at
the corporate level, coordinates training courses,
oversees fulfi llment of both internal and external
regulations, and supports the corporation in the
further development and implementation of the
associated standards. He is assisted in this capacity
by Internal Audit, and also by a Compliance Com-
mittee of interdisciplinary composition.
The remit of the local and regional compliance
offi cers includes organizing and overseeing the
training activities and implementation measures
tailored to the specifi c requirements of their loca-
tions. They report through the locally or regionally
responsible presidents to the Chief Compliance
Offi cer. The CCO and the head of Internal Audit
report regularly to the Management Board and also
the Audit Committee of the Supervisory Board on
identifi ed compliance violations.
The issue of compliance is also a permanent item
in the target agreements signed by all managerial
staff in the Group. Because of their seniority, it is
particularly incumbent on them to set the right
example for their subordinates, to eff ectively com-
municate the compliance rules and to ensure that
these are obeyed through the implementation of
suitable organizational measures.
The procedures to be adopted in the event of com-
plaints or suspicion of malpractice also constitute
an important element of the compliance regime. In
addition to our internal reporting system and com-
plaint registration channels, employees may also,
for the purpose of reporting serious violations to
the CCO, anonymously use a Compliance Hotline
operated by an external service-provider. The CCO
is mandated to initiate the necessary follow-up
procedures.
Our corporate compliance activities are focused on
the fi elds of safety, health and the environment,
antitrust law and the fi ght against corruption. A
further compliance-relevant area relates to capital
market law. Supplementing the legal provisions,
internal codes of conduct have been put in place to
regulate the treatment of information that has the
potential to aff ect share prices. The company has
an Ad-hoc Committee comprising representatives
of various departments. In order to ensure that all
insider information is handled as required by law,
this reviews developments and events for their
possible eff ect on share prices, determining the
need to issue reports to the capital markets on an
ad-hoc basis. There are also rules that go beyond
the legal requirements, governing the behavior of
the members of the Board of Management, the Su-
pervisory Board and the Shareholders’ Committee,
and also employees of the corporation who, due
to their function or involvement in projects, have
access to insider information. An insider register is
kept, listing the people involved.
For further information relating to the principles
guiding our corporate stewardship, please go to our
website www.henkel.com/ir
Application of the German Corporate
Governance Code
Taking into account the special features arising
from our legal form and Articles of Association,
Henkel AG & Co. KGaA complies with the recom-
mendations (“shall” provisions) of the German
Corporate Governance Code, with two exceptions:
(1) The executive contracts concluded in 2008 with
respect to those members of the Management
Board appointed in conjunction with the establish-
ment of Henkel Management AG as the Personally
Liable Partner in 2008, contain no severance pay
cap in the event of premature termination of their
tenure as executives of the corporation without
good cause or reason, i.e. severance payouts may
exceed the formal maximum of two years’ emolu-
ments. Newly concluded post-2008 executive
contracts and executive contracts extended for a
period of more than two years do contain a sever-
ance pay cap. (2) In order to protect the legitimate
interests and private spheres of the members of
the corporate management bodies who are also
members of the Henkel family, their individual
shareholdings are not disclosed unless required by
law. The Code requires disclosure of shareholdings
in excess of 1 percent.
Henkel also complies with all the suggestions
(“may/should” provisions) of the Code in keeping
with our legal form and the special statutory fea-
tures anchored in our Articles of Association. The
corresponding declarations of compliance together
with the reasons for deviations from recommen-
dations can be found on our website at www.
henkel.com/ir
In accordance with the Declaration on the German
Corporate Governance Code, the following details
have been disclosed in relation to notifi able share-
holdings: The aggregate holdings of the members
of the Supervisory Board and of the members of
the Shareholders’ Committee exceed in each case
1 percent of the shares issued by the company.
The members of the Management Board together
hold less than 1 percent of the shares issued by the
company.
Henkel Annual Report 2010 31Group management report
Corporate governance
In fi scal 2010, a total of 19 transactions were
notifi ed in compliance with Section 15a Securi-
ties Trading Act [WpHG], “Directors’ Dealings.”
One member of the Shareholders’ Committee sold
a total of 360,000 ordinary shares and entered
into 16 put or call option transactions involving
1,430,000 preferred shares and 311,000 ordinary
shares. For further details in this regard, please go
to our website www.henkel.com/ir
Objectives regarding Supervisory Board
composition
The recently amended German Corporate Gover-
nance Code has newly introduced recommenda-
tions that the Supervisory Board shall specify
concrete objectives regarding its composition. At
its meeting on December 14, 2010, the Supervisory
Board therefore reviewed the prevailing criteria
for approving candidates for election and, giving
due consideration to the specifi cs of Henkel and
taking into account the international activities
of the company, passed a resolution detailing the
following objectives for its composition. These
objectives, to be reviewed at regular intervals, will
be taken into account by the Supervisory Board in
proposing election candidates to the Annual Gen-
eral Meeting with respect to all re-electable and
replacement Supervisory Board positions.
• The members of the Supervisory Board should,
generally speaking, off er the knowledge, skills
and relevant experience necessary in order
to properly perform their duties. Particularly
required are experience and expertise in one or
several of the fi elds of corporate management,
book-keeping and accountancy, fi nancial con-
trol/risk management, corporate governance/
compliance, research and development, produc-
tion/technology, and marketing/sales/distribu-
tion, as is knowledge of the industrial or con-
sumer business in the primary markets in which
Henkel is active. Members of the Supervisory
Board should also have suffi cient time at their
disposal in order to carry out their mandate.
• The international activities of the corporation
should be appropriately refl ected in the compo-
sition of the Supervisory Board. Consequently,
eff orts will be made to retain those current
members with an international background.
The mix of candidates proposed for election
should also contain an appropriate number of
women. The current share of 25 percent is gener-
ally regarded as adequate. Eff orts will therefore
be made to maintain or, if possible, increase
this proportion for upcoming new and ad-hoc
replacement elections.
• In addition, the Supervisory Board should have
a suffi cient number of independent members.
In future, therefore, the Supervisory Board is to
contain not more than two former members of
the Management Board, no persons who perform
board or committee functions or act as consul-
tants for major competitors, and no persons
whose relationship with the corporation or mem-
bers of the Management Board could give rise to
confl icts of interest. Further, no persons shall be
proposed for election who, at the time of the elec-
tion, have already reached their 70th birthday.
II. Remuneration report
This remuneration report provides an outline of the
compensation system for the Management Board,
Henkel Management AG as the Personally Liable
Partner, the Supervisory Board and the Sharehold-
ers’ Committee of Henkel AG & Co. KGaA, and the
Supervisory Board of Henkel Management AG; it
also explains the level and structure of the remu-
neration paid.
This remuneration report takes into account
the recommendations of the German Corporate
Governance Code and contains all the informa-
tion required pursuant to Section 285 sentence 1
no. 9, Section 289 (2) no. 5, Section 314 (1) no. 6 and
Section 315 (2) no. 4 of the German Commercial
Code [HGB]. The associated information has not
therefore been additionally disclosed in the notes
to the consolidated fi nancial statements at the back
of this Annual Report.
1. Remuneration of the Management Board
In compliance with the object of the Act on the
Appropriateness of Management Board Remunera-
tion [VorstAG] to structure the remuneration of the
Management Board in keeping with the need for a
sustainable form of corporate development aligned
to the long term, in 2010 the Supervisory Board of
Henkel Management AG modifi ed the compen-
sation system and further reinforced its already
pronounced long-term orientation.
The compensation system described in the following
was presented to the 2010 AGM of Henkel AG & Co.
KGaA and approved by it with a large majority. Eff ec-
tive fi scal 2010, it is to be applied uniformly to the
remuneration of all Management Board members,
irrespective of the expiry dates of their executive
contracts and any diff ering legacy arrangements.
Regulation, structure and amounts
The compensation for members of the Manage-
ment Board of Henkel Management AG is regulated
by the Supervisory Board of Henkel Management
AG in consultation with the Human Resources
Subcommittee of the Shareholders’ Committee.
25 %Supervisory Board membership female.
Henkel Annual Report 201032 Group management report
Corporate governance
The Supervisory Board of Henkel Management AG
is comprised of three members of the Shareholders’
Committee.
The structure and amounts of the emoluments
accruing to the Management Board are aligned to the
size and international activities of the corporation,
its economic and fi nancial position, its performance
and future prospects, the normal levels of remune-
ration encountered in comparable companies and
also the general compensation structure within the
Henkel organization. The compensation package
is further determined on the basis of the functions,
responsibilities and performance of the individual
executives and the performance of the Management
Board as a whole. The variable annual remuneration
components have been devised such that they take
into account both positive and negative develop-
ments. The overall remuneration mix is designed to
be internationally competitive while also providing
an incentive for ongoing business development and
a sustainable increase in shareholder value within
a dynamic operating environment. The Supervisory
Board of Henkel Man agement AG regularly reviews
the compensation arrangements applied to the
Management Board.
The remuneration of the members of the Manage-
ment Board is based on a so-called target compen-
sation amount (total remunerations excluding other
ancillary emoluments and pension entitlements)
which accrues to a member of the Management
Board in the event of 100 percent achievement of
the underlying performance targets, this “at-target”
amount coming in at around 2.1 million euros in
total per fi nancial year. Of this target compensation,
around 30 percent is in fi xed salary, some 35 percent
is performance-related over the short term and
about 35 percent is performance-related over the
long term.
Compensation structure
Fixed salary:
30 percent
Short-term
components:
35 percent
Long-term
components:
35 percent
35 percentage
points in variable
annual remunera-
tion (cash compo-
nent)
25 percentage
points in variable
annual remunera-
tion (own invest-
ment in Henkel
preferred shares)
10 percentage
points in long-term
incentive
This target compensation amount is supplemented
by other emoluments and pension benefi ts. The
components in detail:
Fixed salary
The annual non-performance-related fi xed sal-
ary accounts for around 30 percent of the target
compensation amount. It is paid on a monthly
basis. The amount paid refl ects both the function
and responsibilities of the position and relevant
market conditions.
Variable annual remuneration
Overall, the variable annual remuneration accounts
for around 60 percent of the target compensation
amount. The variable annual remuneration is made
up of annual performance-related components
which account for around 35 percent of the target
compensation amount, and a long-term variable in-
centive which accounts for around 25 percent of the
target compensation amount and takes the form of
an investment by the recipient (own investment) in
Henkel preferred shares with a minimum vesting
period of three years.
Determination of variable annual remuneration
The performance criteria governing the variable
annual remuneration are primarily return on capital
employed (ROCE) and earnings per preferred share
(EPS) in the relevant fi scal year, adjusted in each
case by exceptional items. The further factors used
in establishing the variable annual remuneration
payable to the Management Board members are: the
Group results and the results of the relevant busi-
ness sector or corporate function, and the quality of
management demonstrated in those functions and
the individual contribution made by the Manage-
ment Board member concerned.
The target amount is adjusted on the basis of a
performance factor related to the degree of target
achievement. In determining the variable annual
remuneration, the Supervisory Board of Henkel
Management AG also takes into due account the
apparent sustainability of the economic success and
the performance levels of the Management Board
members.
Variable annual remuneration is also subject to an
overall cap, with the result that the amount paid may
only range between 0 percent and 250 percent of the
target amount.
Short-term and long-term components of the
variable annual remuneration
The variable annual remuneration is paid an-
nually in arrears once the corporation’s annual
fi nancial statements have been approved by the
Annual General Meeting. Of the variable annual
remuneration, around 60 percent is paid in cash,
which in turn corresponds to a proportion of the
Henkel Annual Report 2010 33Group management report
Corporate governance
target compensation of around 35 percent. For
the remaining 40 percent – corresponding to 25
percent of the target compensation – the members
of the Management Board acquire Henkel preferred
shares (own investment) at the price prevailing at
the time of acquisition. These shares are placed in a
blocked custody account with a three-year draw-
ing restriction. This own investment ensures that
the members of the Management Board participate
through a portion of their compensation in the
long-term performance of the corporation.
Therefore, around 35 percent of the target compen-
sation amount is short-term performance-related
and – due to the own investment portion and the
long-term incentive described below – a further
35 percent is aligned to components of a long-term
performance-related nature.
Long-term incentive (LTI)
The long-term incentive, which accounts for
10 percent of the target compensation amount, is
a variable cash payment based on the long-term
performance of the corporation, the amount pay-
able being dependent on the future increase reg-
istered in earnings per preferred share (EPS) over
three consecutive years (the performance period).
Together with the recipient’s own investment from
the variable annual remuneration, performance-
related components aligned to the long term make
up 35 percent of the target compensation amount.
On completion of the performance period, the
degree of target achievement is ascertained by
the Supervisory Board of Henkel Management AG
on the basis of the increase in EPS achieved. The
amounts included in the calculation of the in-
crease, are in each case, the earnings per preferred
share adjusted for exceptional items, as disclosed
in the consolidated fi nancial statements of the
relevant fi nancial years.
Depending on the level of target achievement
ascertained by the Supervisory Board of Henkel
Management AG, the target amount is adjusted by
a performance multiplier. The long-term incentive
is also subject to an overall cap, with the result that
the amount paid may only range between 0 percent
and 250 percent of the target amount.
Pension benefi ts
The retirement pension for members joining the
Management Board of the former Henkel KGaA be-
fore January 1, 2005 amounts to a certain percent-
age of the last paid fi xed salary (defi ned benefi t).
For these Management Board members, the amount
payable is set at 60 percent of the fi nal fi xed salary
in the event of retirement on attainment of their
62nd birthday. The actual percentage individu-
ally determined for each executive is made up of
two components: (1) the so-called base percentage
rate derived from the vested pension entitlement
earned prior to entry into the former or latter
Management Board, and (2) an incremental annual
increase of the base percentage rate for each year
of the executive’s membership of the Management
Board.
Eff ective January 1, 2005, we changed the pension
entitlement for new members of the Management
Board to a defi ned contribution scheme. Once a
covered event occurs, the benefi ciaries receive a su-
perannuation lump-sum payment combined with
a continuing basic annuity. The superannuation
lump-sum payment comprises the total of annual
contributions calculated on the basis of a certain
percentage of the target compensation amount,
this percentage being the same for all members of
the Management Board. The annual contributions
depend to a certain degree on developments in the
annual total cash compensation paid in the fi nan-
cial year in question. Any vested pension rights
earned within the corporation prior to the execu-
tive’s joining the Management Board are taken into
account as start-up units. The defi ned contribution
pension system ensures appropriate retirement
and welfare benefi ts while also incorporating a
performance-related element.
In the event that a member of the Management
Board (executive) receives no pension benefi ts
prior to their death, the superannuation lump sum
accumulated up to time of death is paid out to the
surviving spouse or surviving children. In addition,
the executive’s surviving spouse receives pension
payments amounting to 60 percent and each
dependant child benefi t payments amounting to
15 percent – up to a maximum of 100 percent for all
benefi ciaries – of the executive’s pension entitle-
ment. The surviving child’s benefi t is generally paid
until the child’s 18th birthday or, if longer, until
completion of their professional training, but only
up to their 27th birthday.
Other emoluments
The members of the Management Board also
receive other emoluments in the form of benefi ts
arising out of standard commercial insurance poli-
cies and the provision of a company car.
Other regulatory provisions
In the event of retirement being taken by mem-
bers of the Management Board whose contracts of
employment were concluded before 2009, they are
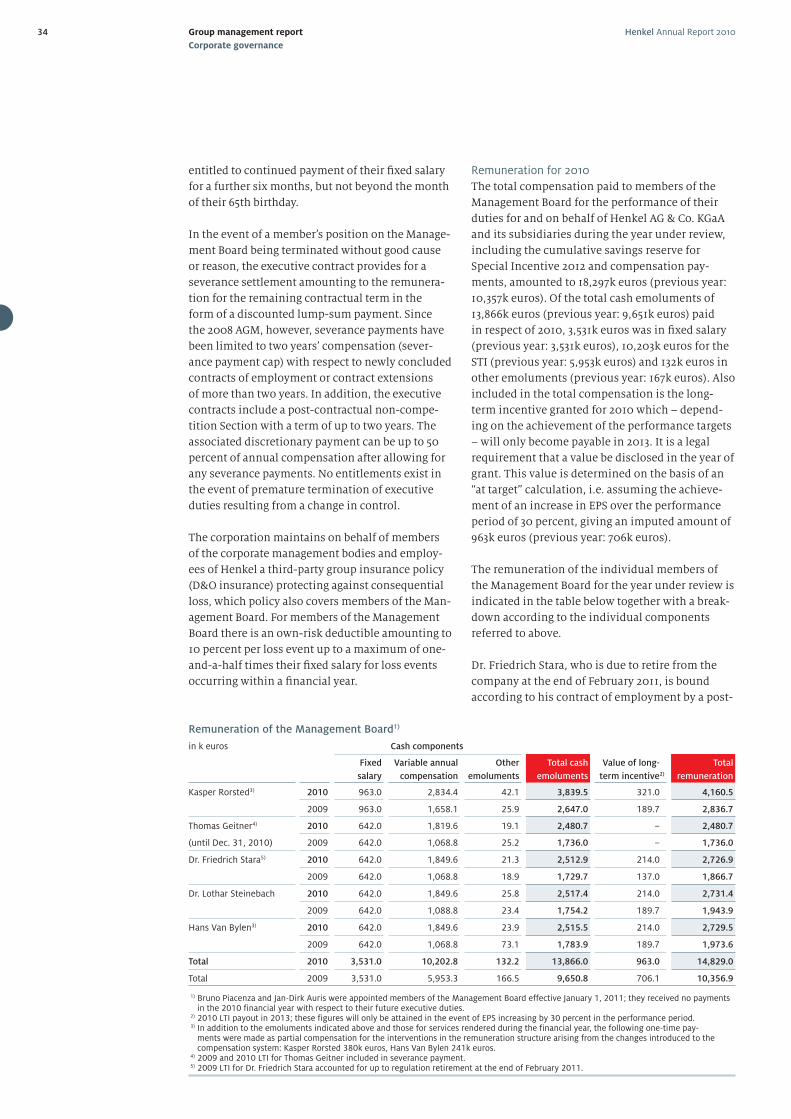
Henkel Annual Report 201034 Group management report
Corporate governance
entitled to continued payment of their fi xed salary
for a further six months, but not beyond the month
of their 65th birthday.
In the event of a member’s position on the Manage-
ment Board being terminated without good cause
or reason, the executive contract provides for a
severance settlement amounting to the remunera-
tion for the remaining contractual term in the
form of a discounted lump-sum payment. Since
the 2008 AGM, however, severance payments have
been limited to two years’ compensation (sever-
ance payment cap) with respect to newly concluded
contracts of employment or contract extensions
of more than two years. In addition, the executive
contracts include a post-contractual non-compe-
tition Section with a term of up to two years. The
associated discretionary payment can be up to 50
percent of annual compensation after allowing for
any severance payments. No entitlements exist in
the event of premature termination of executive
duties resulting from a change in control.
The corporation maintains on behalf of members
of the corporate management bodies and employ-
ees of Henkel a third-party group insurance policy
(D&O insurance) protecting against consequential
loss, which policy also covers members of the Man-
agement Board. For members of the Management
Board there is an own-risk deductible amounting to
10 percent per loss event up to a maximum of one-
and-a-half times their fi xed salary for loss events
occurring within a fi nancial year.
Remuneration for 2010
The total compensation paid to members of the
Management Board for the performance of their
duties for and on behalf of Henkel AG & Co. KGaA
and its subsidiaries during the year under review,
including the cumulative savings reserve for
Special Incentive 2012 and compensation pay-
ments, amounted to 18,297k euros (previous year:
10,357k euros). Of the total cash emoluments of
13,866k euros (previous year: 9,651k euros) paid
in respect of 2010, 3,531k euros was in fi xed salary
(previous year: 3,531k euros), 10,203k euros for the
STI (previous year: 5,953k euros) and 132k euros in
other emoluments (previous year: 167k euros). Also
included in the total compensation is the long-
term incentive granted for 2010 which – depend-
ing on the achievement of the performance targets
– will only become payable in 2013. It is a legal
requirement that a value be disclosed in the year of
grant. This value is determined on the basis of an
“at target” calculation, i.e. assuming the achieve-
ment of an increase in EPS over the performance
period of 30 percent, giving an imputed amount of
963k euros (previous year: 706k euros).
The remuneration of the individual members of
the Management Board for the year under review is
indicated in the table below together with a break-
down according to the individual components
referred to above.
Dr. Friedrich Stara, who is due to retire from the
company at the end of February 2011, is bound
according to his contract of employment by a post-
Remuneration of the Management Board1)
in k euros Cash components
Fixed
salary
Variable annual
compensation
Other
emoluments
Total cash
emoluments
Value of long-
term incentive2)
Total
remuneration
Kasper Rorsted3) 2010 963.0 2,834.4 42.1 3,839.5 321.0 4,160.5
2009 963.0 1,658.1 25.9 2,647.0 189.7 2,836.7
Thomas Geitner4) 2010 642.0 1,819.6 19.1 2,480.7 – 2,480.7
(until Dec. 31, 2010) 2009 642.0 1,068.8 25.2 1,736.0 – 1,736.0
Dr. Friedrich Stara5) 2010 642.0 1,849.6 21.3 2,512.9 214.0 2,726.9
2009 642.0 1,068.8 18.9 1,729.7 137.0 1,866.7
Dr. Lothar Steinebach 2010 642.0 1,849.6 25.8 2,517.4 214.0 2,731.4
2009 642.0 1,088.8 23.4 1,754.2 189.7 1,943.9
Hans Van Bylen3) 2010 642.0 1,849.6 23.9 2,515.5 214.0 2,729.5
2009 642.0 1,068.8 73.1 1,783.9 189.7 1,973.6
Total 2010 3,531.0 10,202.8 132.2 13,866.0 963.0 14,829.0
Total 2009 3,531.0 5,953.3 166.5 9,650.8 706.1 10,356.9
1) Bruno Piacenza and Jan-Dirk Auris were appointed members of the Management Board effective January 1, 2011; they received no payments in the 2010 financial year with respect to their future executive duties.
2) 2010 LTI payout in 2013; these figures will only be attained in the event of EPS increasing by 30 percent in the performance period. 3) In addition to the emoluments indicated above and those for services rendered during the financial year, the following one-time pay-
ments were made as partial compensation for the interventions in the remuneration structure arising from the changes introduced to the compensation system: Kasper Rorsted 380k euros, Hans Van Bylen 241k euros.
4) 2009 and 2010 LTI for Thomas Geitner included in severance payment. 5) 2009 LTI for Dr. Friedrich Stara accounted for up to regulation retirement at the end of February 2011.
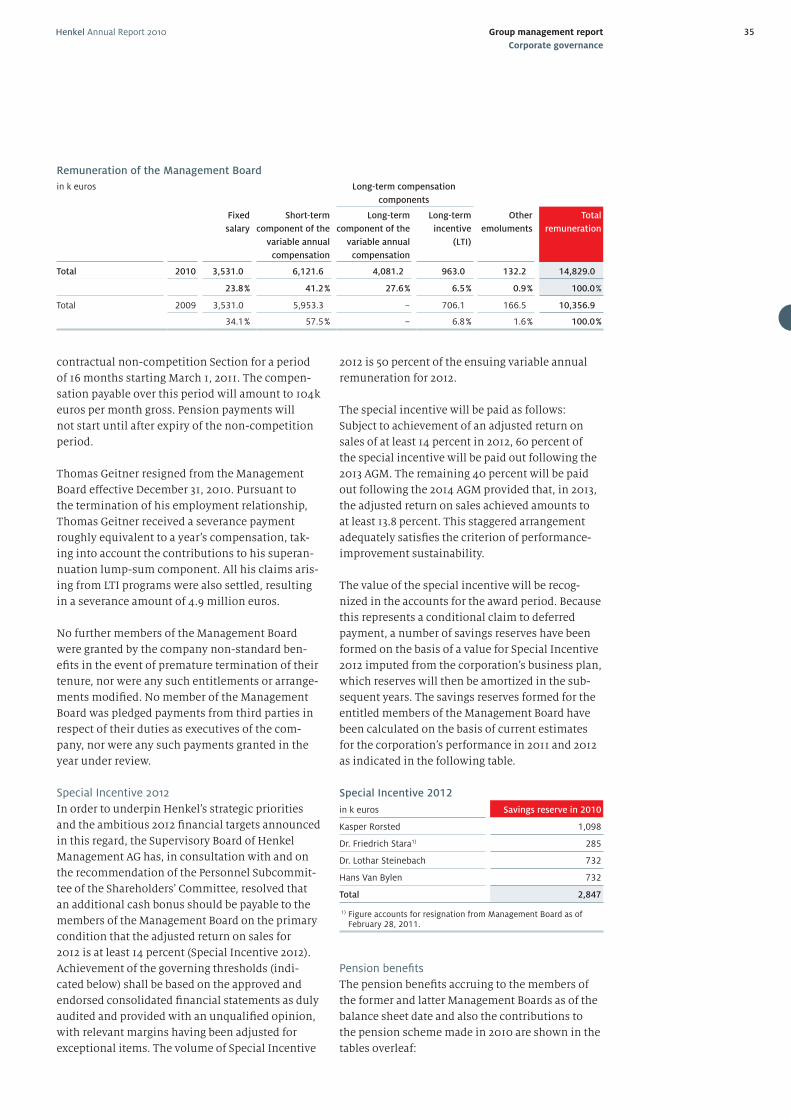
Henkel Annual Report 2010 35Group management report
Corporate governance
contractual non-competition Section for a period
of 16 months starting March 1, 2011. The compen-
sation payable over this period will amount to 104k
euros per month gross. Pension payments will
not start until after expiry of the non-competition
period.
Thomas Geitner resigned from the Management
Board eff ective December 31, 2010. Pursuant to
the termination of his employment relationship,
Thomas Geitner received a severance payment
roughly equivalent to a year’s compensation, tak-
ing into account the contributions to his superan-
nuation lump-sum component. All his claims aris-
ing from LTI programs were also settled, resulting
in a severance amount of 4.9 million euros.
No further members of the Management Board
were granted by the company non-standard ben-
efi ts in the event of premature termination of their
tenure, nor were any such entitlements or arrange-
ments modifi ed. No member of the Management
Board was pledged payments from third parties in
respect of their duties as executives of the com-
pany, nor were any such payments granted in the
year under review.
Special Incentive 2012
In order to underpin Henkel’s strategic priorities
and the ambitious 2012 fi nancial targets announced
in this regard, the Supervisory Board of Henkel
Management AG has, in consultation with and on
the recommendation of the Personnel Subcommit-
tee of the Shareholders’ Committee, resolved that
an additional cash bonus should be payable to the
members of the Management Board on the primary
condition that the adjusted return on sales for
2012 is at least 14 percent (Special Incentive 2012).
Achievement of the governing thresholds (indi-
cated below) shall be based on the approved and
endorsed consolidated fi nancial statements as duly
audited and provided with an unqualifi ed opinion,
with relevant margins having been adjusted for
exceptional items. The volume of Special Incentive
2012 is 50 percent of the ensuing variable annual
remuneration for 2012.
The special incentive will be paid as follows:
Subject to achievement of an adjusted return on
sales of at least 14 percent in 2012, 60 percent of
the special incentive will be paid out following the
2013 AGM. The remaining 40 percent will be paid
out following the 2014 AGM provided that, in 2013,
the adjusted return on sales achieved amounts to
at least 13.8 percent. This staggered arrangement
adequately satisfi es the criterion of performance-
improvement sustainability.
The value of the special incentive will be recog-
nized in the accounts for the award period. Because
this represents a conditional claim to deferred
payment, a number of savings reserves have been
formed on the basis of a value for Special Incentive
2012 imputed from the corporation’s business plan,
which reserves will then be amortized in the sub-
sequent years. The savings reserves formed for the
entitled members of the Management Board have
been calculated on the basis of current estimates
for the corporation’s performance in 2011 and 2012
as indicated in the following table.
Special Incentive 2012
in k euros Savings reserve in 2010
Kasper Rorsted 1,098
Dr. Friedrich Stara1) 285
Dr. Lothar Steinebach 732
Hans Van Bylen 732
Total 2,847
1) Figure accounts for resignation from Management Board as of February 28, 2011.
Pension benefi ts
The pension benefi ts accruing to the members of
the former and latter Management Boards as of the
balance sheet date and also the contributions to
the pension scheme made in 2010 are shown in the
tables overleaf:
Remuneration of the Management Board
in k euros Long-term compensation
components
Fixed
salary
Short-term
component of the
variable annual
compensation
Long-term
component of the
variable annual
compensation
Long-term
incentive
(LTI)
Other
emoluments
Total
remuneration
Total 2010 3,531.0 6,121.6 4,081.2 963.0 132.2 14,829.0
23.8 % 41.2 % 27.6 % 6.5 % 0.9 % 100.0 %
Total 2009 3,531.0 5,953.3 – 706.1 166.5 10,356.9
34.1 % 57.5 % – 6.8 % 1.6 % 100.0 %
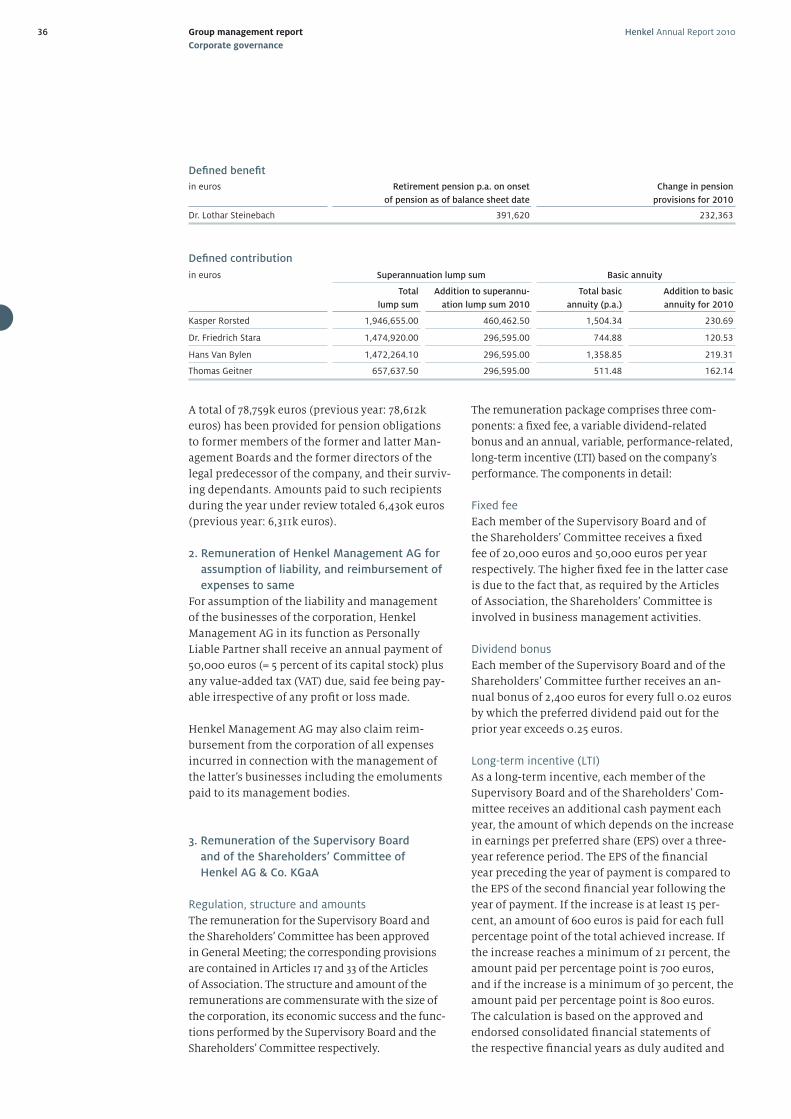
Henkel Annual Report 201036 Group management report
Corporate governance
A total of 78,759k euros (previous year: 78,612k
euros) has been provided for pension obligations
to former members of the former and latter Man-
agement Boards and the former directors of the
legal predecessor of the company, and their surviv-
ing dependants. Amounts paid to such recipients
during the year under review totaled 6,430k euros
(previous year: 6,311k euros).
2. Remuneration of Henkel Management AG for
assumption of liability, and reimbursement of
expenses to same
For assumption of the liability and management
of the businesses of the corporation, Henkel
Manage ment AG in its function as Personally
Liable Partner shall receive an annual payment of
50,000 euros (= 5 percent of its capital stock) plus
any value-added tax (VAT) due, said fee being pay-
able irrespective of any profi t or loss made.
Henkel Management AG may also claim reim-
bursement from the corporation of all expenses
incurred in connection with the management of
the latter’s businesses including the emoluments
paid to its management bodies.
3. Remuneration of the Supervisory Board
and of the Shareholders’ Committee of
Henkel AG & Co. KGaA
Regulation, structure and amounts
The remuneration for the Supervisory Board and
the Shareholders’ Committee has been approved
in General Meeting; the corresponding provisions
are contained in Articles 17 and 33 of the Articles
of Association. The structure and amount of the
remunerations are commensurate with the size of
the corporation, its economic success and the func-
tions performed by the Supervisory Board and the
Shareholders’ Committee respectively.
The remuneration package comprises three com-
ponents: a fi xed fee, a variable dividend-related
bonus and an annual, variable, performance-related,
long-term incentive (LTI) based on the company’s
performance. The components in detail:
Fixed fee
Each member of the Supervisory Board and of
the Shareholders’ Committee receives a fi xed
fee of 20,000 euros and 50,000 euros per year
respectively. The higher fi xed fee in the latter case
is due to the fact that, as required by the Articles
of Association, the Shareholders’ Committee is
involved in business management activities.
Dividend bonus
Each member of the Supervisory Board and of the
Shareholders’ Committee further receives an an-
nual bonus of 2,400 euros for every full 0.02 euros
by which the preferred dividend paid out for the
prior year exceeds 0.25 euros.
Long-term incentive (LTI)
As a long-term incentive, each member of the
Supervisory Board and of the Shareholders’ Com-
mittee receives an additional cash payment each
year, the amount of which depends on the increase
in earnings per preferred share (EPS) over a three-
year reference period. The EPS of the fi nancial
year preceding the year of payment is compared to
the EPS of the second fi nancial year following the
year of payment. If the increase is at least 15 per-
cent, an amount of 600 euros is paid for each full
percentage point of the total achieved increase. If
the increase reaches a minimum of 21 percent, the
amount paid per percentage point is 700 euros,
and if the increase is a minimum of 30 percent, the
amount paid per percentage point is 800 euros.
The calculation is based on the approved and
endorsed consolidated fi nancial statements of
the respective fi nancial years as duly audited and
Defi ned benefi t
in euros Retirement pension p.a. on onset
of pension as of balance sheet date
Change in pension
provisions for 2010
Dr. Lothar Steinebach 391,620 232,363
Defi ned contribution
in euros Superannuation lump sum Basic annuity
Total
lump sum
Addition to superannu-
ation lump sum 2010
Total basic
annuity (p.a.)
Addition to basic
annuity for 2010
Kasper Rorsted 1,946,655.00 460,462.50 1,504.34 230.69
Dr. Friedrich Stara 1,474,920.00 296,595.00 744.88 120.53
Hans Van Bylen 1,472,264.10 296,595.00 1,358.85 219.31
Thomas Geitner 657,637.50 296,595.00 511.48 162.14
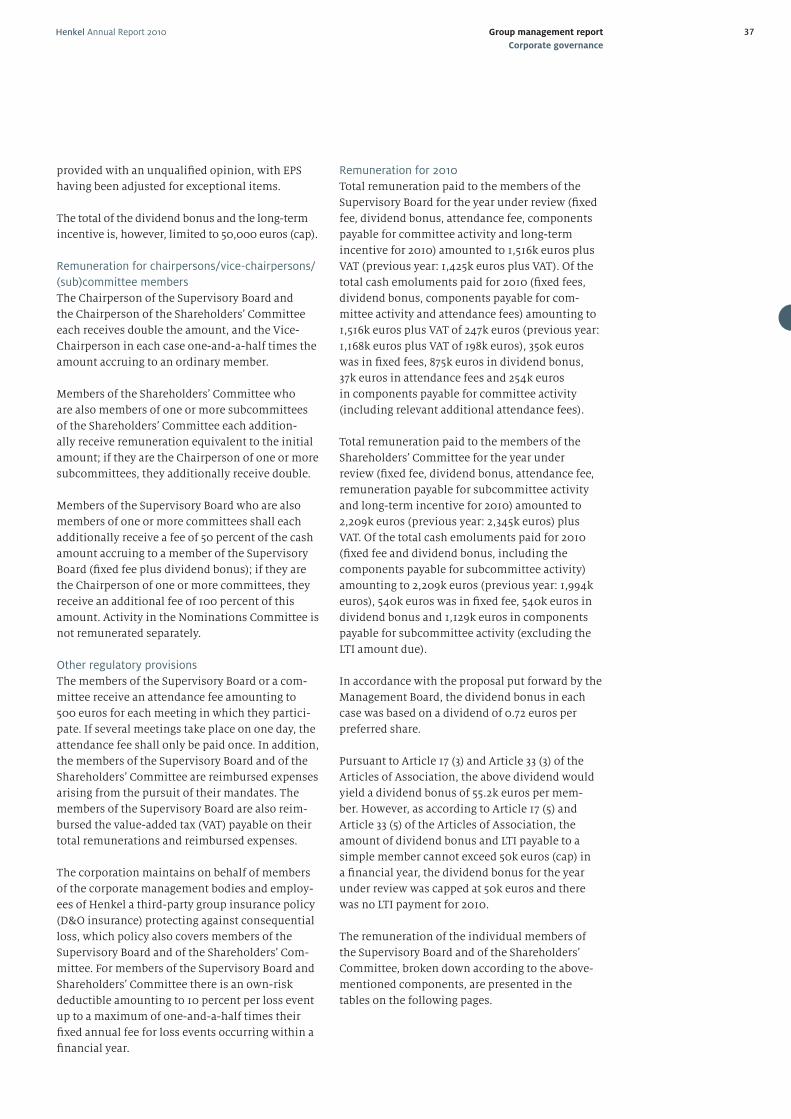
Henkel Annual Report 2010 37Group management report
Corporate governance
provided with an unqualifi ed opinion, with EPS
having been adjusted for exceptional items.
The total of the dividend bonus and the long-term
incentive is, however, limited to 50,000 euros (cap).
Remuneration for chairpersons/vice-chairpersons/
(sub)committee members
The Chairperson of the Supervisory Board and
the Chairperson of the Shareholders’ Committee
each receives double the amount, and the Vice-
Chairperson in each case one-and-a-half times the
amount accruing to an ordinary member.
Members of the Shareholders’ Committee who
are also members of one or more subcommittees
of the Shareholders’ Committee each addition-
ally receive remuneration equivalent to the initial
amount; if they are the Chairperson of one or more
subcommittees, they additionally receive double.
Members of the Supervisory Board who are also
members of one or more committees shall each
additionally receive a fee of 50 percent of the cash
amount accruing to a member of the Supervisory
Board (fi xed fee plus dividend bonus); if they are
the Chairperson of one or more committees, they
receive an additional fee of 100 percent of this
amount. Activity in the Nominations Committee is
not remunerated separately.
Other regulatory provisions
The members of the Supervisory Board or a com-
mittee receive an attendance fee amounting to
500 euros for each meeting in which they partici-
pate. If several meetings take place on one day, the
attendance fee shall only be paid once. In addition,
the members of the Supervisory Board and of the
Shareholders’ Committee are reimbursed expenses
arising from the pursuit of their mandates. The
members of the Supervisory Board are also reim-
bursed the value-added tax (VAT) payable on their
total remunerations and reimbursed expenses.
The corporation maintains on behalf of members
of the corporate management bodies and employ-
ees of Henkel a third-party group insurance policy
(D&O insurance) protecting against consequential
loss, which policy also covers members of the
Supervisory Board and of the Shareholders’ Com-
mittee. For members of the Supervisory Board and
Shareholders’ Committee there is an own-risk
deductible amounting to 10 percent per loss event
up to a maximum of one-and-a-half times their
fi xed annual fee for loss events occurring within a
fi nancial year.
Remuneration for 2010
Total remuneration paid to the members of the
Supervisory Board for the year under review (fi xed
fee, dividend bonus, attendance fee, components
payable for committee activity and long-term
incentive for 2010) amounted to 1,516k euros plus
VAT (previous year: 1,425k euros plus VAT). Of the
total cash emoluments paid for 2010 (fi xed fees,
dividend bonus, components payable for com-
mittee activity and attendance fees) amounting to
1,516k euros plus VAT of 247k euros (previous year:
1,168k euros plus VAT of 198k euros), 350k euros
was in fi xed fees, 875k euros in dividend bonus,
37k euros in attendance fees and 254k euros
in components payable for committee activity
(including relevant additional attendance fees).
Total remuneration paid to the members of the
Shareholders’ Committee for the year under
review (fi xed fee, dividend bonus, attendance fee,
remuneration payable for subcommittee activity
and long-term incentive for 2010) amounted to
2,209k euros (previous year: 2,345k euros) plus
VAT. Of the total cash emoluments paid for 2010
(fi xed fee and dividend bonus, including the
components payable for subcommittee activity)
amounting to 2,209k euros (previous year: 1,994k
euros), 540k euros was in fi xed fee, 540k euros in
dividend bonus and 1,129k euros in components
payable for subcommittee activity (excluding the
LTI amount due).
In accordance with the proposal put forward by the
Management Board, the dividend bonus in each
case was based on a dividend of 0.72 euros per
preferred share.
Pursuant to Article 17 (3) and Article 33 (3) of the
Articles of Association, the above dividend would
yield a dividend bonus of 55.2k euros per mem-
ber. However, as according to Article 17 (5) and
Article 33 (5) of the Articles of Association, the
amount of dividend bonus and LTI payable to a
simple member cannot exceed 50k euros (cap) in
a fi nancial year, the dividend bonus for the year
under review was capped at 50k euros and there
was no LTI payment for 2010.
The remuneration of the individual members of
the Supervisory Board and of the Shareholders’
Committee, broken down according to the above-
mentioned components, are presented in the
tables on the following pages.
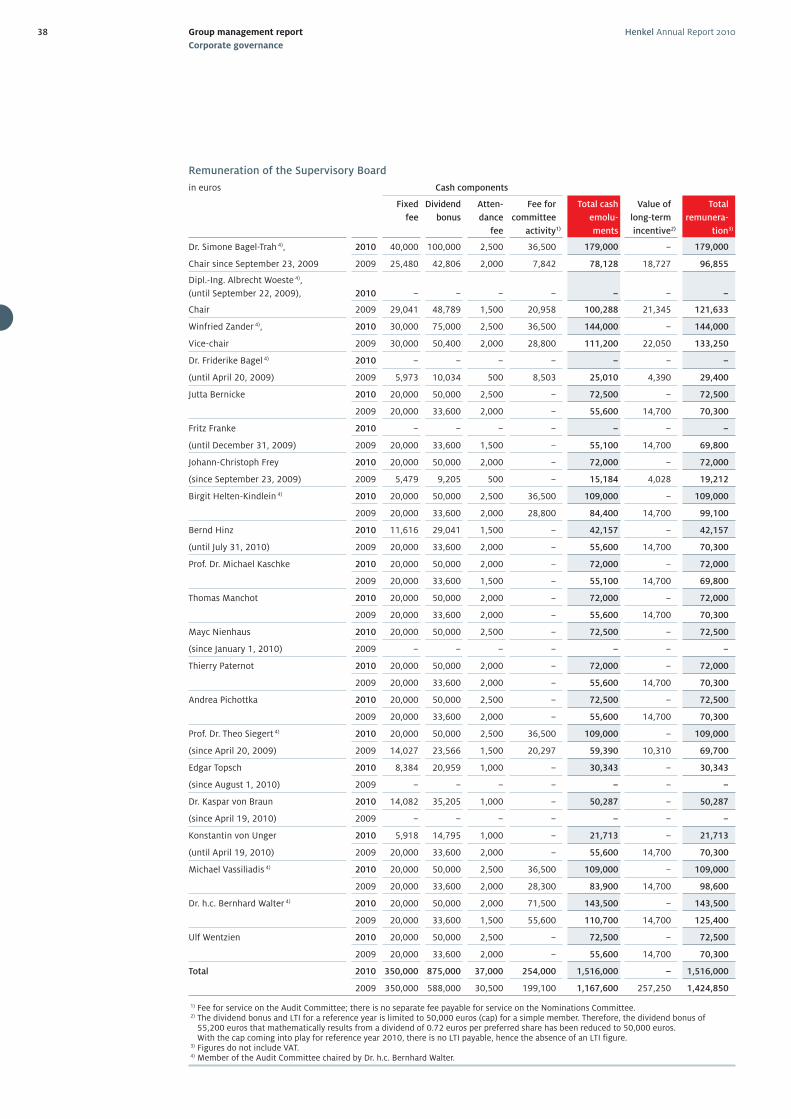
Henkel Annual Report 201038 Group management report
Corporate governance
Remuneration of the Supervisory Board
in euros Cash components
Fixed
fee
Dividend
bonus
Atten-
dance
fee
Fee for
committee
activity1)
Total cash
emolu-
ments
Value of
long-term
incentive2)
Total
remunera-
tion3)
Dr. Simone Bagel-Trah 4), 2010 40,000 100,000 2,500 36,500 179,000 – 179,000
Chair since September 23, 2009 2009 25,480 42,806 2,000 7,842 78,128 18,727 96,855
Dipl.-Ing. Albrecht Woeste 4),
(until September 22, 2009), 2010 – – – – – – –
Chair 2009 29,041 48,789 1,500 20,958 100,288 21,345 121,633
Winfried Zander 4), 2010 30,000 75,000 2,500 36,500 144,000 – 144,000
Vice-chair 2009 30,000 50,400 2,000 28,800 111,200 22,050 133,250
Dr. Friderike Bagel 4) 2010 – – – – – – –
(until April 20, 2009) 2009 5,973 10,034 500 8,503 25,010 4,390 29,400
Jutta Bernicke 2010 20,000 50,000 2,500 – 72,500 – 72,500
2009 20,000 33,600 2,000 – 55,600 14,700 70,300
Fritz Franke 2010 – – – – – – –
(until December 31, 2009) 2009 20,000 33,600 1,500 – 55,100 14,700 69,800
Johann-Christoph Frey 2010 20,000 50,000 2,000 – 72,000 – 72,000
(since September 23, 2009) 2009 5,479 9,205 500 – 15,184 4,028 19,212
Birgit Helten-Kindlein 4) 2010 20,000 50,000 2,500 36,500 109,000 – 109,000
2009 20,000 33,600 2,000 28,800 84,400 14,700 99,100
Bernd Hinz 2010 11,616 29,041 1,500 – 42,157 – 42,157
(until July 31, 2010) 2009 20,000 33,600 2,000 – 55,600 14,700 70,300
Prof. Dr. Michael Kaschke 2010 20,000 50,000 2,000 – 72,000 – 72,000
2009 20,000 33,600 1,500 – 55,100 14,700 69,800
Thomas Manchot 2010 20,000 50,000 2,000 – 72,000 – 72,000
2009 20,000 33,600 2,000 – 55,600 14,700 70,300
Mayc Nienhaus 2010 20,000 50,000 2,500 – 72,500 – 72,500
(since January 1, 2010) 2009 – – – – – – –
Thierry Paternot 2010 20,000 50,000 2,000 – 72,000 – 72,000
2009 20,000 33,600 2,000 – 55,600 14,700 70,300
Andrea Pichottka 2010 20,000 50,000 2,500 – 72,500 – 72,500
2009 20,000 33,600 2,000 – 55,600 14,700 70,300
Prof. Dr. Theo Siegert 4) 2010 20,000 50,000 2,500 36,500 109,000 – 109,000
(since April 20, 2009) 2009 14,027 23,566 1,500 20,297 59,390 10,310 69,700
Edgar Topsch 2010 8,384 20,959 1,000 – 30,343 – 30,343
(since August 1, 2010) 2009 – – – – – – –
Dr. Kaspar von Braun 2010 14,082 35,205 1,000 – 50,287 – 50,287
(since April 19, 2010) 2009 – – – – – – –
Konstantin von Unger 2010 5,918 14,795 1,000 – 21,713 – 21,713
(until April 19, 2010) 2009 20,000 33,600 2,000 – 55,600 14,700 70,300
Michael Vassiliadis 4) 2010 20,000 50,000 2,500 36,500 109,000 – 109,000
2009 20,000 33,600 2,000 28,300 83,900 14,700 98,600
Dr. h.c. Bernhard Walter 4) 2010 20,000 50,000 2,000 71,500 143,500 – 143,500
2009 20,000 33,600 1,500 55,600 110,700 14,700 125,400
Ulf Wentzien 2010 20,000 50,000 2,500 – 72,500 – 72,500
2009 20,000 33,600 2,000 – 55,600 14,700 70,300
Total 2010 350,000 875,000 37,000 254,000 1,516,000 – 1,516,000
2009 350,000 588,000 30,500 199,100 1,167,600 257,250 1,424,850
1) Fee for service on the Audit Committee; there is no separate fee payable for service on the Nominations Committee. 2) The dividend bonus and LTI for a reference year is limited to 50,000 euros (cap) for a simple member. Therefore, the dividend bonus of
55,200 euros that mathematically results from a dividend of 0.72 euros per preferred share has been reduced to 50,000 euros. With the cap coming into play for reference year 2010, there is no LTI payable, hence the absence of an LTI figure.
3) Figures do not include VAT. 4) Member of the Audit Committee chaired by Dr. h.c. Bernhard Walter.
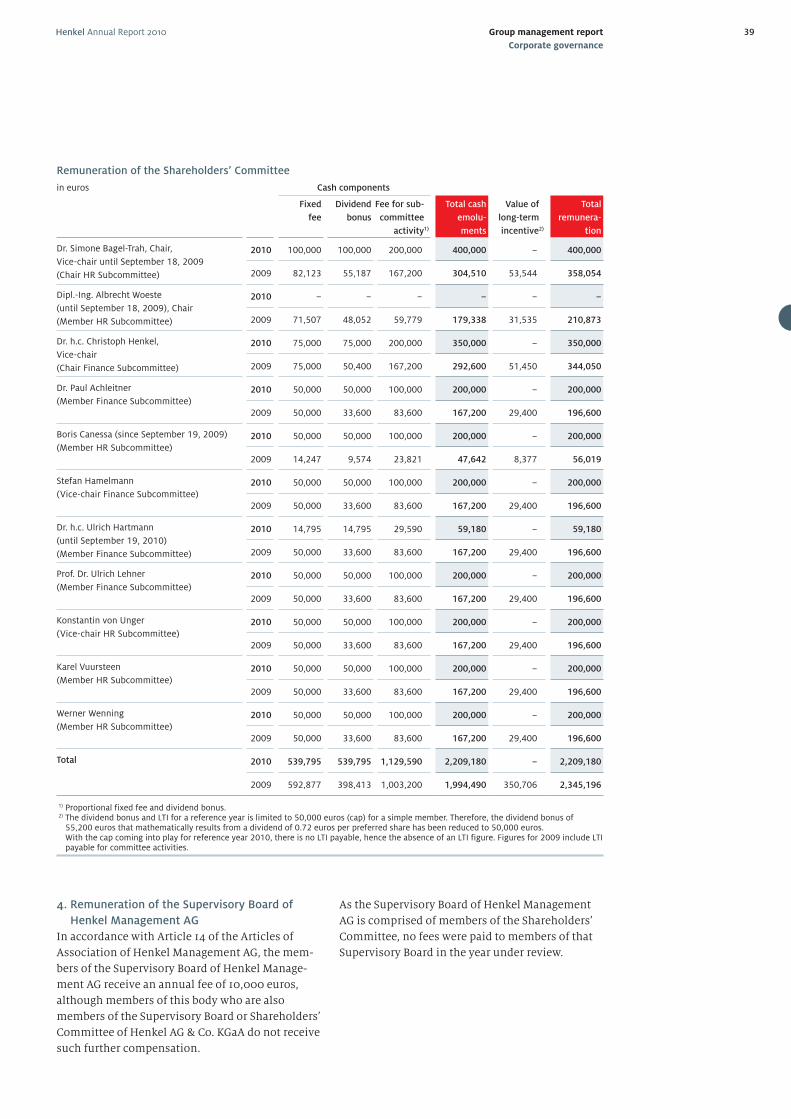
Henkel Annual Report 2010 39Group management report
Corporate governance
Remuneration of the Shareholders’ Committee
in euros Cash components
Fixed
fee
Dividend
bonus
Fee for sub-
committee
activity1)
Total cash
emolu-
ments
Value of
long-term
incentive2)
Total
remunera-
tion
Dr. Simone Bagel-Trah, Chair,
Vice-chair until September 18, 2009
(Chair HR Subcommittee)
2010 100,000 100,000 200,000 400,000 – 400,000
2009 82,123 55,187 167,200 304,510 53,544 358,054
Dipl.-Ing. Albrecht Woeste
(until September 18, 2009), Chair
(Member HR Subcommittee)
2010 – – – – – –
2009 71,507 48,052 59,779 179,338 31,535 210,873
Dr. h.c. Christoph Henkel,
Vice-chair
(Chair Finance Subcommittee)
2010 75,000 75,000 200,000 350,000 – 350,000
2009 75,000 50,400 167,200 292,600 51,450 344,050
Dr. Paul Achleitner
(Member Finance Subcommittee)2010 50,000 50,000 100,000 200,000 – 200,000
2009 50,000 33,600 83,600 167,200 29,400 196,600
Boris Canessa (since September 19, 2009)
(Member HR Subcommittee)2010 50,000 50,000 100,000 200,000 – 200,000
2009 14,247 9,574 23,821 47,642 8,377 56,019
Stefan Hamelmann
(Vice-chair Finance Subcommittee)2010 50,000 50,000 100,000 200,000 – 200,000
2009 50,000 33,600 83,600 167,200 29,400 196,600
Dr. h.c. Ulrich Hartmann
(until September 19, 2010)
(Member Finance Subcommittee)
2010 14,795 14,795 29,590 59,180 – 59,180
2009 50,000 33,600 83,600 167,200 29,400 196,600
Prof. Dr. Ulrich Lehner
(Member Finance Subcommittee)2010 50,000 50,000 100,000 200,000 – 200,000
2009 50,000 33,600 83,600 167,200 29,400 196,600
Konstantin von Unger
(Vice-chair HR Subcommittee)2010 50,000 50,000 100,000 200,000 – 200,000
2009 50,000 33,600 83,600 167,200 29,400 196,600
Karel Vuursteen
(Member HR Subcommittee)2010 50,000 50,000 100,000 200,000 – 200,000
2009 50,000 33,600 83,600 167,200 29,400 196,600
Werner Wenning
(Member HR Subcommittee)2010 50,000 50,000 100,000 200,000 – 200,000
2009 50,000 33,600 83,600 167,200 29,400 196,600
Total 2010 539,795 539,795 1,129,590 2,209,180 – 2,209,180
2009 592,877 398,413 1,003,200 1,994,490 350,706 2,345,196
1) Proportional fixed fee and dividend bonus. 2) The dividend bonus and LTI for a reference year is limited to 50,000 euros (cap) for a simple member. Therefore, the dividend bonus of
55,200 euros that mathematically results from a dividend of 0.72 euros per preferred share has been reduced to 50,000 euros. With the cap coming into play for reference year 2010, there is no LTI payable, hence the absence of an LTI figure. Figures for 2009 include LTI payable for committee activities.
4. Remuneration of the Supervisory Board of
Henkel Management AG
In accordance with Article 14 of the Articles of
Association of Henkel Management AG, the mem-
bers of the Supervisory Board of Henkel Manage-
ment AG receive an annual fee of 10,000 euros,
although members of this body who are also
members of the Supervisory Board or Shareholders’
Committee of Henkel AG & Co. KGaA do not receive
such further compensation.
As the Supervisory Board of Henkel Management
AG is comprised of members of the Shareholders’
Committee, no fees were paid to members of that
Supervisory Board in the year under review.
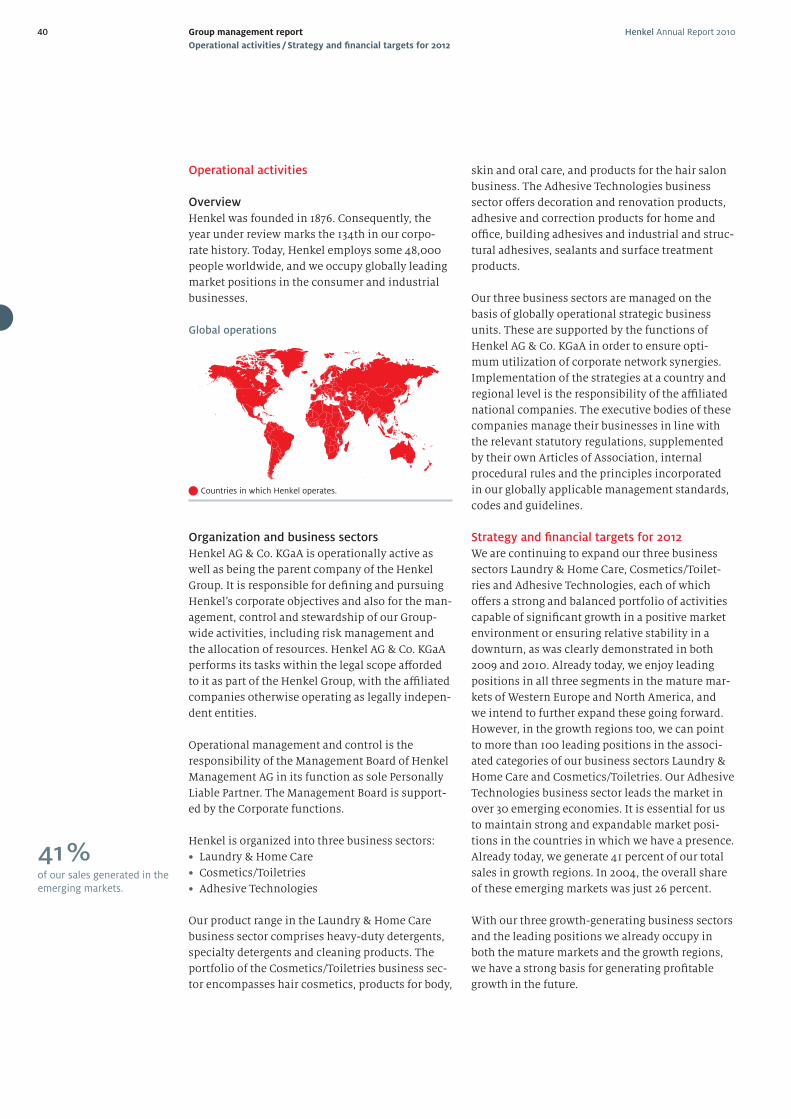
Henkel Annual Report 201040 Group management report
Operational activities / Strategy and fi nancial targets for 2012
Operational activities
Overview
Henkel was founded in 1876. Consequently, the
year under review marks the 134th in our corpo-
rate history. Today, Henkel employs some 48,000
people worldwide, and we occupy globally leading
market positions in the consumer and industrial
businesses.
Global operations
Organization and business sectors
Henkel AG & Co. KGaA is operationally active as
well as being the parent company of the Henkel
Group. It is responsible for defi ning and pursuing
Henkel’s corporate objectives and also for the man-
agement, control and stewardship of our Group-
wide activities, including risk management and
the allocation of resources. Henkel AG & Co. KGaA
performs its tasks within the legal scope aff orded
to it as part of the Henkel Group, with the affi liated
companies otherwise operating as legally indepen-
dent entities.
Operational management and control is the
responsibility of the Management Board of Henkel
Management AG in its function as sole Personally
Liable Partner. The Management Board is support-
ed by the Corporate functions.
Henkel is organized into three business sectors:
• Laundry & Home Care
• Cosmetics/Toiletries
• Adhesive Technologies
Our product range in the Laundry & Home Care
business sector comprises heavy-duty detergents,
specialty detergents and cleaning products. The
portfolio of the Cosmetics/Toiletries business sec-
tor encompasses hair cosmetics, products for body,
skin and oral care, and products for the hair salon
business. The Adhesive Technologies business
sector off ers decoration and renovation products,
adhesive and correction products for home and
offi ce, building adhesives and industrial and struc-
tural adhesives, sealants and surface treatment
products.
Our three business sectors are managed on the
basis of globally operational strategic business
units. These are supported by the functions of
Henkel AG & Co. KGaA in order to ensure opti-
mum utilization of corporate network synergies.
Implementation of the strategies at a country and
regional level is the responsibility of the affi liated
national companies. The executive bodies of these
companies manage their businesses in line with
the relevant statutory regulations, supplemented
by their own Articles of Association, internal
procedural rules and the principles incorporated
in our globally applicable management standards,
codes and guidelines.
Strategy and fi nancial targets for 2012
We are continuing to expand our three business
sectors Laundry & Home Care, Cosmetics/Toilet-
ries and Adhesive Technologies, each of which
off ers a strong and balanced portfolio of activities
capable of signifi cant growth in a positive market
environment or ensuring relative stability in a
downturn, as was clearly demonstrated in both
2009 and 2010. Already today, we enjoy leading
positions in all three segments in the mature mar-
kets of Western Europe and North America, and
we intend to further expand these going forward.
However, in the growth regions too, we can point
to more than 100 leading positions in the associ-
ated categories of our business sectors Laundry &
Home Care and Cosmetics/Toiletries. Our Adhesive
Technologies business sector leads the market in
over 30 emerging economies. It is essential for us
to maintain strong and expandable market posi-
tions in the countries in which we have a presence.
Already today, we generate 41 percent of our total
sales in growth regions. In 2004, the overall share
of these emerging markets was just 26 percent.
With our three growth-generating business sectors
and the leading positions we already occupy in
both the mature markets and the growth regions,
we have a strong basis for generating profi table
growth in the future.
Countries in which Henkel operates.
41 %of our sales generated in the emerging markets.
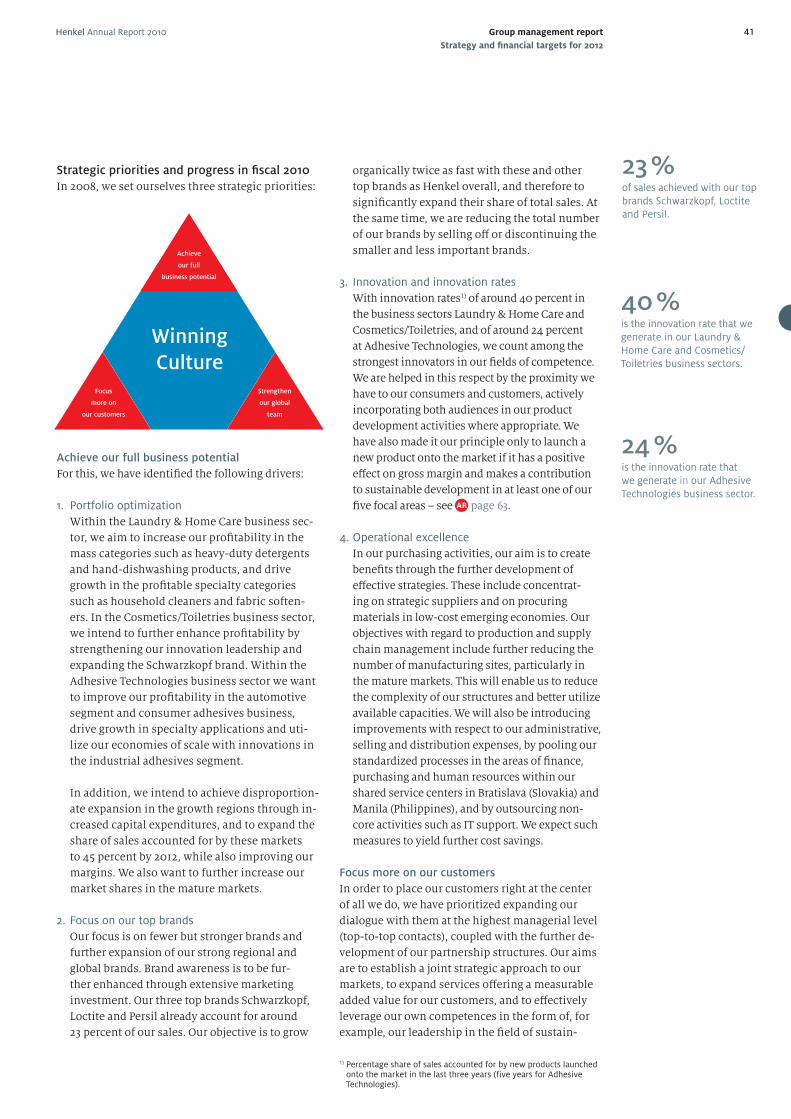
Henkel Annual Report 2010 41Group management report
Strategy and fi nancial targets for 2012
organically twice as fast with these and other
top brands as Henkel overall, and therefore to
signifi cantly expand their share of total sales. At
the same time, we are reducing the total number
of our brands by selling off or discontinuing the
smaller and less important brands.
3. Innovation and innovation rates
With innovation rates1) of around 40 percent in
the business sectors Laundry & Home Care and
Cosmetics/Toiletries, and of around 24 percent
at Adhesive Technologies, we count among the
strongest innovators in our fi elds of competence.
We are helped in this respect by the proximity we
have to our consumers and customers, actively
incorporating both audiences in our product
development activities where appropriate. We
have also made it our principle only to launch a
new product onto the market if it has a positive
eff ect on gross margin and makes a contribution
to sustainable development in at least one of our
fi ve focal areas – see page 63.
4. Operational excellence
In our purchasing activities, our aim is to create
benefi ts through the further development of
eff ective strategies. These include concentrat-
ing on strategic suppliers and on procuring
materials in low-cost emerging economies. Our
objectives with regard to production and supply
chain management include further reducing the
number of manufacturing sites, particularly in
the mature markets. This will enable us to reduce
the complexity of our structures and better utilize
available capacities. We will also be introducing
improvements with respect to our administrative,
selling and distribution expenses, by pooling our
standardized processes in the areas of fi nance,
purchasing and human resources within our
shared service centers in Bratislava (Slovakia) and
Manila (Philippines), and by outsourcing non-
core activities such as IT support. We expect such
measures to yield further cost savings.
Focus more on our customers
In order to place our customers right at the center
of all we do, we have prioritized expanding our
dialogue with them at the highest managerial level
(top-to-top contacts), coupled with the further de-
velopment of our partnership structures. Our aims
are to establish a joint strategic approach to our
markets, to expand services off ering a measurable
added value for our customers, and to eff ectively
leverage our own competences in the form of, for
example, our leadership in the fi eld of sustain-
Strategic priorities and progress in fi scal 2010
In 2008, we set ourselves three strategic priorities:
Achieve our full business potential
For this, we have identifi ed the following drivers:
1. Portfolio optimization
Within the Laundry & Home Care business sec-
tor, we aim to increase our profi tability in the
mass categories such as heavy-duty detergents
and hand-dishwashing products, and drive
growth in the profi table specialty categories
such as household cleaners and fabric soften-
ers. In the Cosmetics/Toiletries business sector,
we intend to further enhance profi tability by
strengthening our innovation leadership and
expanding the Schwarzkopf brand. Within the
Adhesive Technologies business sector we want
to improve our profi tability in the automotive
segment and consumer adhesives business,
drive growth in specialty applications and uti-
lize our economies of scale with innovations in
the industrial adhesives segment.
In addition, we intend to achieve disproportion-
ate expansion in the growth regions through in-
creased capital expenditures, and to expand the
share of sales accounted for by these markets
to 45 percent by 2012, while also improving our
margins. We also want to further increase our
market shares in the mature markets.
2. Focus on our top brands
Our focus is on fewer but stronger brands and
further expansion of our strong regional and
global brands. Brand awareness is to be fur-
ther enhanced through extensive marketing
invest ment. Our three top brands Schwarzkopf,
Loctite and Persil already account for around
23 percent of our sales. Our objective is to grow
1) Percentage share of sales accounted for by new products launched onto the market in the last three years (five years for Adhesive Technologies).
23 %of sales achieved with our top brands Schwarzkopf, Loctite and Persil.
40 %is the innovation rate that we generate in our Laundry & Home Care and Cosmetics/Toiletries business sectors.
24 %is the innovation rate that we generate in our Adhesive Technologies business sector.
Achieve
our full
business potential
Winning Culture
Strengthen
our global
team
Focus
more on
our customers
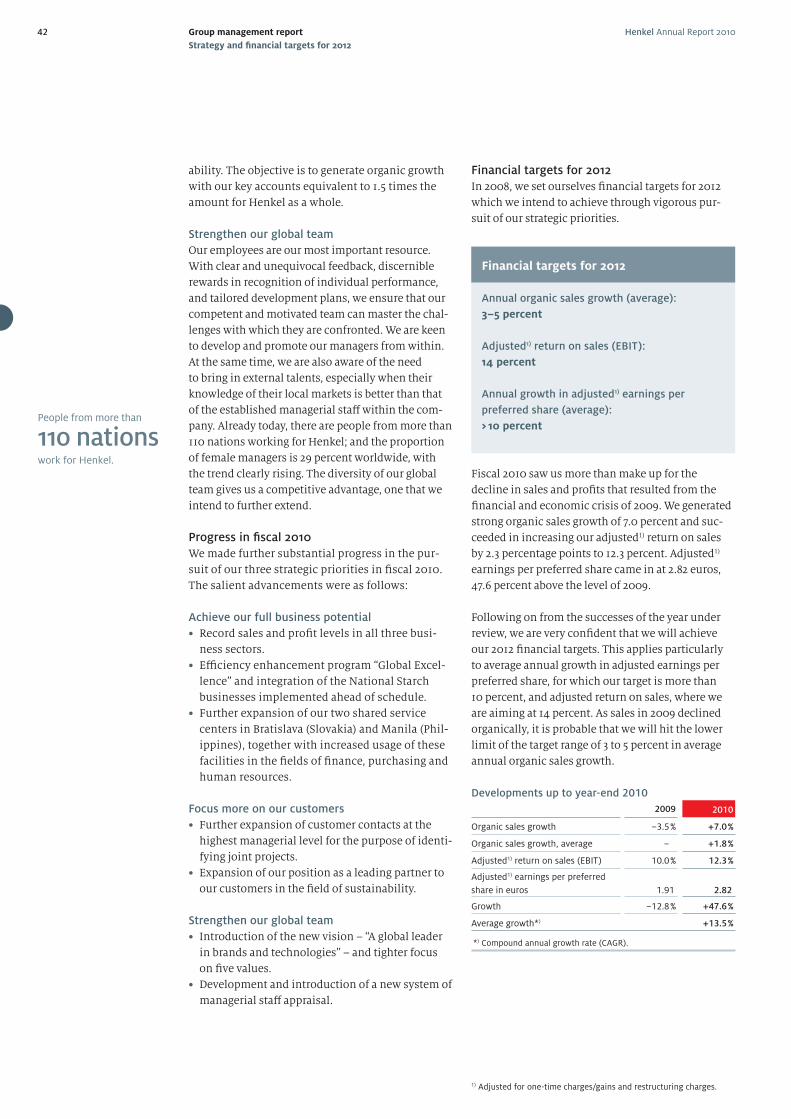
Henkel Annual Report 201042 Group management report
Strategy and fi nancial targets for 2012
ability. The objective is to generate organic growth
with our key accounts equivalent to 1.5 times the
amount for Henkel as a whole.
Strengthen our global team
Our employees are our most important resource.
With clear and unequivocal feedback, discernible
rewards in recognition of individual performance,
and tailored development plans, we ensure that our
competent and motivated team can master the chal-
lenges with which they are confronted. We are keen
to develop and promote our managers from within.
At the same time, we are also aware of the need
to bring in external talents, especially when their
knowledge of their local markets is better than that
of the established managerial staff within the com-
pany. Already today, there are people from more than
110 nations working for Henkel; and the proportion
of female managers is 29 percent worldwide, with
the trend clearly rising. The diversity of our global
team gives us a competitive advantage, one that we
intend to further extend.
Progress in fi scal 2010
We made further substantial progress in the pur-
suit of our three strategic priorities in fi scal 2010.
The salient advancements were as follows:
Achieve our full business potential
• Record sales and profi t levels in all three busi-
ness sectors.
• Effi ciency enhancement program “Global Excel-
lence” and integration of the National Starch
businesses implemented ahead of schedule.
• Further expansion of our two shared service
centers in Bratislava (Slovakia) and Manila (Phil-
ippines), together with increased usage of these
facilities in the fi elds of fi nance, purchasing and
human resources.
Focus more on our customers
• Further expansion of customer contacts at the
highest managerial level for the purpose of identi-
fying joint projects.
• Expansion of our position as a leading partner to
our customers in the fi eld of sustainability.
Strengthen our global team
• Introduction of the new vision – “A global leader
in brands and technologies” – and tighter focus
on fi ve values.
• Development and introduction of a new system of
managerial staff appraisal.
Financial targets for 2012
In 2008, we set ourselves fi nancial targets for 2012
which we intend to achieve through vigorous pur-
suit of our strategic priorities.
Fiscal 2010 saw us more than make up for the
decline in sales and profi ts that resulted from the
fi nancial and economic crisis of 2009. We generated
strong organic sales growth of 7.0 percent and suc-
ceeded in increasing our adjusted1) return on sales
by 2.3 percentage points to 12.3 percent. Adjusted1)
earnings per preferred share came in at 2.82 euros,
47.6 percent above the level of 2009.
Following on from the successes of the year under
review, we are very confi dent that we will achieve
our 2012 fi nancial targets. This applies particularly
to average annual growth in adjusted earnings per
preferred share, for which our target is more than
10 percent, and adjusted return on sales, where we
are aiming at 14 percent. As sales in 2009 declined
organically, it is probable that we will hit the lower
limit of the target range of 3 to 5 percent in average
annual organic sales growth.
Developments up to year-end 2010
2009 2010
Organic sales growth –3.5 % + 7.0 %
Organic sales growth, average – + 1.8 %
Adjusted1) return on sales (EBIT) 10.0 % 12.3 %
Adjusted1) earnings per preferred
share in euros 1.91 2.82
Growth –12.8 % + 47.6 %
Average growth*) + 13.5 %
*) Compound annual growth rate (CAGR).
Financial targets for 2012
Annual organic sales growth (average):
3–5 percent
Adjusted1) return on sales (EBIT):
14 percent
Annual growth in adjusted1) earnings per
preferred share (average):
> 10 percent
1) Adjusted for one-time charges/gains and restructuring charges.
People from more than
11o nationswork for Henkel.
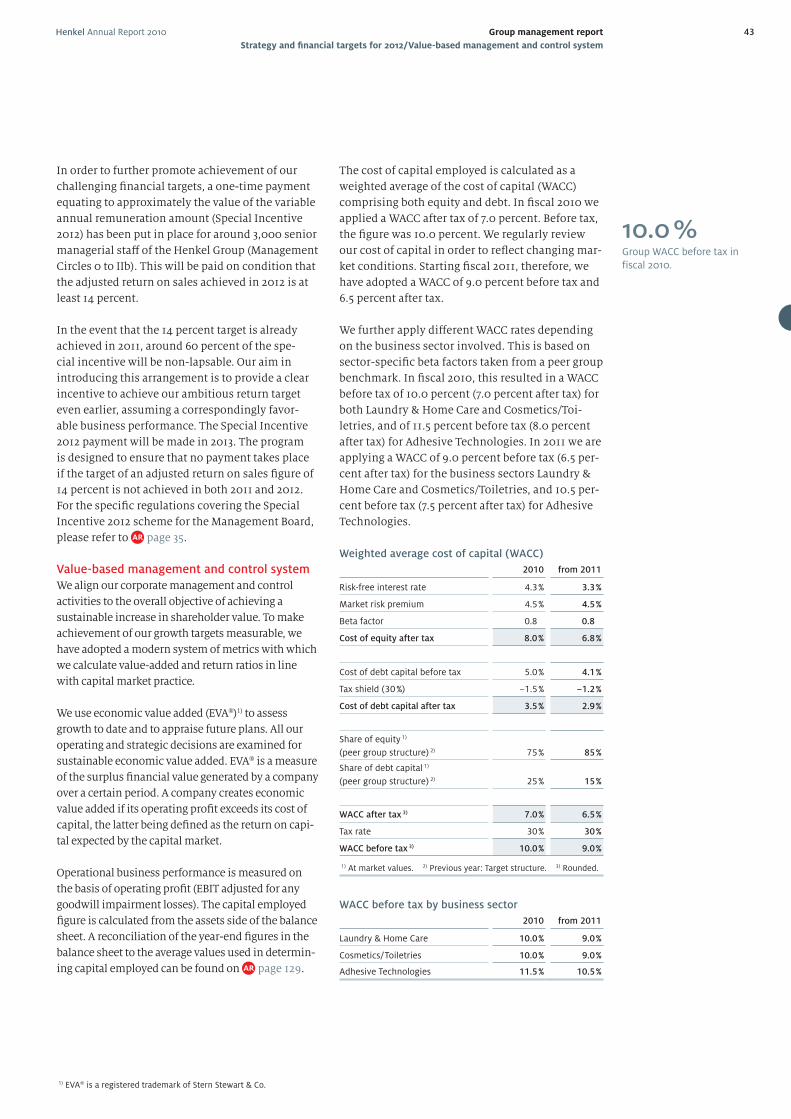
Henkel Annual Report 2010 43Group management report
Strategy and fi nancial targets for 2012/Value-based management and control system
1) EVA® is a registered trademark of Stern Stewart & Co.
The cost of capital employed is calculated as a
weighted average of the cost of capital (WACC)
comprising both equity and debt. In fi scal 2010 we
applied a WACC after tax of 7.0 percent. Before tax,
the fi gure was 10.0 percent. We regularly review
our cost of capital in order to refl ect changing mar-
ket conditions. Starting fi scal 2011, therefore, we
have adopted a WACC of 9.0 percent before tax and
6.5 percent after tax.
We further apply diff erent WACC rates depending
on the business sector involved. This is based on
sector-specifi c beta factors taken from a peer group
benchmark. In fi scal 2010, this resulted in a WACC
before tax of 10.0 percent (7.0 percent after tax) for
both Laundry & Home Care and Cosmetics/Toi-
letries, and of 11.5 percent before tax (8.0 percent
after tax) for Adhesive Technologies. In 2011 we are
applying a WACC of 9.0 percent before tax (6.5 per-
cent after tax) for the business sectors Laundry &
Home Care and Cosmetics/Toiletries, and 10.5 per-
cent before tax (7.5 percent after tax) for Adhesive
Technologies.
Weighted average cost of capital (WACC)
2010 from 2011
Risk-free interest rate 4.3 % 3.3 %
Market risk premium 4.5 % 4.5 %
Beta factor 0.8 0.8
Cost of equity after tax 8.0 % 6.8 %
Cost of debt capital before tax 5.0 % 4.1 %
Tax shield (30 %) –1.5 % –1.2 %
Cost of debt capital after tax 3.5 % 2.9 %
Share of equity 1)
(peer group structure) 2) 75 % 85 %
Share of debt capital 1)
(peer group structure) 2) 25 % 15 %
WACC after tax 3) 7.0 % 6.5 %
Tax rate 30 % 30 %
WACC before tax 3) 10.0 % 9.0 %
1) At market values. 2) Previous year: Target structure. 3) Rounded.
WACC before tax by business sector
2010 from 2011
Laundry & Home Care 10.0 % 9.0 %
Cosmetics/Toiletries 10.0 % 9.0 %
Adhesive Technologies 11.5 % 10.5 %
10.0 %Group WACC before tax in fiscal 2010.
Value-based management and control system
We align our corporate management and control
activities to the overall objective of achieving a
sustainable increase in shareholder value. To make
achievement of our growth targets measurable, we
have adopted a modern system of metrics with which
we calculate value-added and return ratios in line
with capital market practice.
We use economic value added (EVA®)1) to assess
growth to date and to appraise future plans. All our
operating and strategic decisions are examined for
sustainable economic value added. EVA® is a measure
of the surplus fi nancial value generated by a company
over a certain period. A company creates economic
value added if its operating profi t exceeds its cost of
capital, the latter being defi ned as the return on capi-
tal expected by the capital market.
Operational business performance is measured on
the basis of operating profi t (EBIT adjusted for any
goodwill impairment losses). The capital employed
fi gure is calculated from the assets side of the balance
sheet. A reconciliation of the year-end fi gures in the
balance sheet to the average values used in determin-
ing capital employed can be found on page 129.
In order to further promote achievement of our
challenging fi nancial targets, a one-time payment
equating to approximately the value of the variable
annual remuneration amount (Special Incentive
2012) has been put in place for around 3,000 senior
managerial staff of the Henkel Group (Management
Circles 0 to IIb). This will be paid on condition that
the adjusted return on sales achieved in 2012 is at
least 14 percent.
In the event that the 14 percent target is already
achieved in 2011, around 60 percent of the spe-
cial incentive will be non-lapsable. Our aim in
introducing this arrangement is to provide a clear
incentive to achieve our ambitious return target
even earlier, assuming a correspondingly favor-
able business performance. The Special Incentive
2012 payment will be made in 2013. The program
is designed to ensure that no payment takes place
if the target of an adjusted return on sales fi gure of
14 percent is not achieved in both 2011 and 2012.
For the specifi c regulations covering the Special
Incentive 2012 scheme for the Management Board,
please refer to page 35.
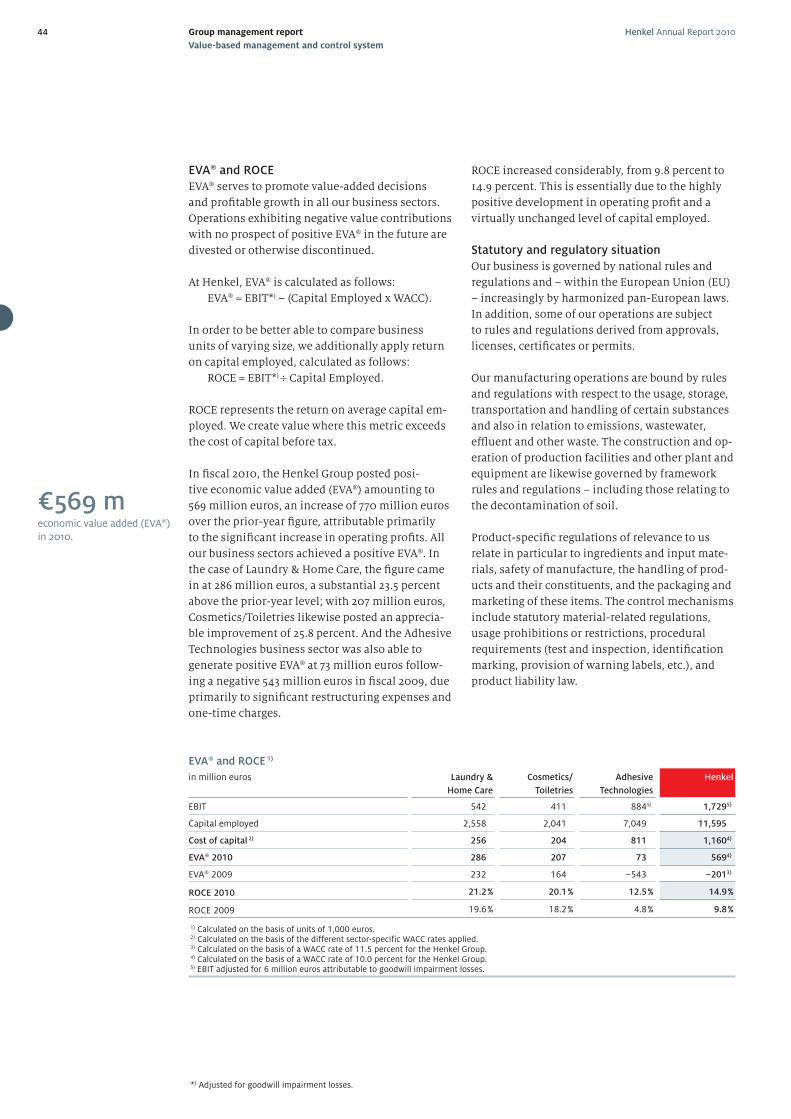
Henkel Annual Report 201044 Group management report
Value-based management and control system
EVA® and ROCE
EVA® serves to promote value-added decisions
and profi table growth in all our business sectors.
Operations exhibiting negative value contributions
with no prospect of positive EVA® in the future are
divested or otherwise discontinued.
At Henkel, EVA® is calculated as follows:
EVA® = EBIT*) – (Capital Employed x WACC).
In order to be better able to compare business
units of varying size, we additionally apply return
on capital employed, calculated as follows:
ROCE = EBIT*) ÷ Capital Employed.
ROCE represents the return on average capital em-
ployed. We create value where this metric exceeds
the cost of capital before tax.
In fi scal 2010, the Henkel Group posted posi-
tive economic value added (EVA®) amounting to
569 million euros, an increase of 770 million euros
over the prior-year fi gure, attributable primarily
to the signifi cant increase in operating profi ts. All
our business sectors achieved a positive EVA®. In
the case of Laundry & Home Care, the fi gure came
in at 286 million euros, a substantial 23.5 percent
above the prior-year level; with 207 million euros,
Cosmetics/Toiletries likewise posted an apprecia-
ble improvement of 25.8 percent. And the Adhesive
Technologies business sector was also able to
generate positive EVA® at 73 million euros follow-
ing a negative 543 million euros in fi scal 2009, due
primarily to signifi cant restructuring expenses and
one-time charges.
*) Adjusted for goodwill impairment losses.
ROCE increased considerably, from 9.8 percent to
14.9 percent. This is essentially due to the highly
positive development in operating profi t and a
virtually unchanged level of capital employed.
Statutory and regulatory situation
Our business is governed by national rules and
regulations and – within the European Union (EU)
– increasingly by harmonized pan-European laws.
In addition, some of our operations are subject
to rules and regulations derived from approvals,
licenses, certifi cates or permits.
Our manufacturing operations are bound by rules
and regulations with respect to the usage, storage,
transportation and handling of certain substances
and also in relation to emissions, wastewater,
effl uent and other waste. The construction and op-
eration of production facilities and other plant and
equipment are likewise governed by framework
rules and regulations – including those relating to
the decontamination of soil.
Product-specifi c regulations of relevance to us
relate in particular to ingredients and input mate-
rials, safety of manufacture, the handling of prod-
ucts and their constituents, and the packaging and
marketing of these items. The control mechanisms
include statutory material-related regulations,
usage prohibitions or restrictions, procedural
requirements (test and inspection, identifi cation
marking, provision of warning labels, etc.), and
product liability law.
EVA® and ROCE 1)
in million euros Laundry &
Home Care
Cosmetics/
Toiletries
Adhesive
Technologies
Henkel
EBIT 542 411 8845) 1,7295)
Capital employed 2,558 2,041 7,049 11,595
Cost of capital 2) 256 204 811 1,1604)
EVA® 2010 286 207 73 5694)
EVA® 2009 232 164 –543 –2013)
ROCE 2010 21.2 % 20.1 % 12.5 % 14.9 %
ROCE 2009 19.6 % 18.2 % 4.8 % 9.8 %
1) Calculated on the basis of units of 1,000 euros.2) Calculated on the basis of the different sector-specific WACC rates applied.3) Calculated on the basis of a WACC rate of 11.5 percent for the Henkel Group.4) Calculated on the basis of a WACC rate of 10.0 percent for the Henkel Group.5) EBIT adjusted for 6 million euros attributable to goodwill impairment losses.
€569 meconomic value added (EVA®) in 2010.
Henkel Annual Report 2010 45Group management report
Value-based management and control system / Business performance
Our internal standards are geared to ensuring com-
pliance with statutory regulations and the safety
of our manufacturing facilities and products. The
associated requirements have been incorporated
within, and implemented through, our manage-
ment systems, and are subject to a regular audit
and review regime. This includes monitoring
and evaluating relevant statutory and regulatory
requirements and changes.
One important statutory instrument aff ecting us is
the European regulation on the registration, evalu-
ation, authorization and restriction of chemicals
– Regulation (EC) No. 1907/2006, abbreviation:
REACH. This regulation primarily aff ects Henkel
as a user of chemical materials; however, it also
aff ects us as an importer and manufacturer. In
order to ensure the effi cient implementation of
the associated requirements, we have established a
central REACH management team for handling and
controlling the main REACH processes.
Business performance
World economy
Overview:
Robust recovery after heavy recession
The world economy recovered from the heavy
recession more quickly and more strongly in 2010
than was initially expected. Around the world, gross
domestic product underwent strong growth of
4 percent. While the emerging economies regis-
tered an increase of around 7 percent, the industrial
countries exceeded the prior-year level by about
2.5 percent. Economic output has thus already
returned to the pre-crisis level, and in some cases
actually exceeded it. A major growth driver was the
very expansive money and fi scal policies adopted by
individual countries. Interest rates reached historic
lows and the fi nancial packages introduced in order
to stabilize and stimulate the economy have served
their purpose, leading to increasing demand. In
addition, consumer confi dence in the economy has
recovered surprisingly quickly.
Developments in 2010:
Strong fi rst half-year
Running counter to economic development in
2009, which exhibited a substantial decline during
the fi rst half of the year, the recovery in 2010 was
characterized by a high rate of growth in the fi rst
six months, with declining dynamics in the second
half-year, although economic output in the second
half of 2010 still increased substantially compared
to the prior-year period.
Industry and consumption:
Double-digit growth in the industrial sector
With a plus in excess of 10 percent, the indus-
trial sector participated considerably more in the
economic recovery than did private consumption,
which increased by some 2.5 percent. The export-
dependent industries registered particularly strong
growth in the intermediaries and capital goods
segments. This discrepancy between a dynamic
industrial sector and subdued consumer activity
is a mirror image of the pattern of the preceding
downturn in which industry was heavily recessive
while consumption remained relatively stable.
Regions:
Mature markets sluggish,
growth regions buoyant
In Western Europe, the upturn was relatively
slow with an increase in gross domestic product
of around 2 percent. Here, Germany assumed a
special role, recording a high rate of growth in
excess of 3.5 percent. Improved price competitive-
ness stimulated German exports, and a robust labor
market boosted domestic demand. Although the US
economy recovered with a good 2.5 percent growth
in gross domestic product, the high unemployment
numbers and a substantial state defi cit, combined
with the fear of a double-dip recession, prevented
developments from becoming more dynamic.
Economic output in Japan increased by more
than 4 percent, primarily due to a rapidly expand-
ing industrial sector. The growth regions of Asia
(excluding Japan), Latin America and Africa/Middle
East registered strong, in some cases double-digit
economic growth. This applies particularly to Chi-
na, India and Brazil. While India and Brazil grew,
primarily due to brisk domestic demand, China
posted strong growth both in the export sector and
in domestic demand. Eastern Europe lagged behind
somewhat by comparison, with Russia – having
also benefi ted from increasing raw material prices
– counting among the more dynamic economies
within the region with a plus of around 3.5 percent.
Raw material prices:
Rapid increase with some supply shortages
The economic recovery also resulted in an increase
in demand for raw materials. In some cases, uptake
was so high that supply shortages occurred. Conse-
quently, the prices of important raw materials such
as crude oil, ethylene, propylene, palm kernel oil,
metals and paper increased further in the course
of the year. At around 80 US dollars per barrel, the
average price for crude oil for the year was almost
20 dollars above the prior-year level.
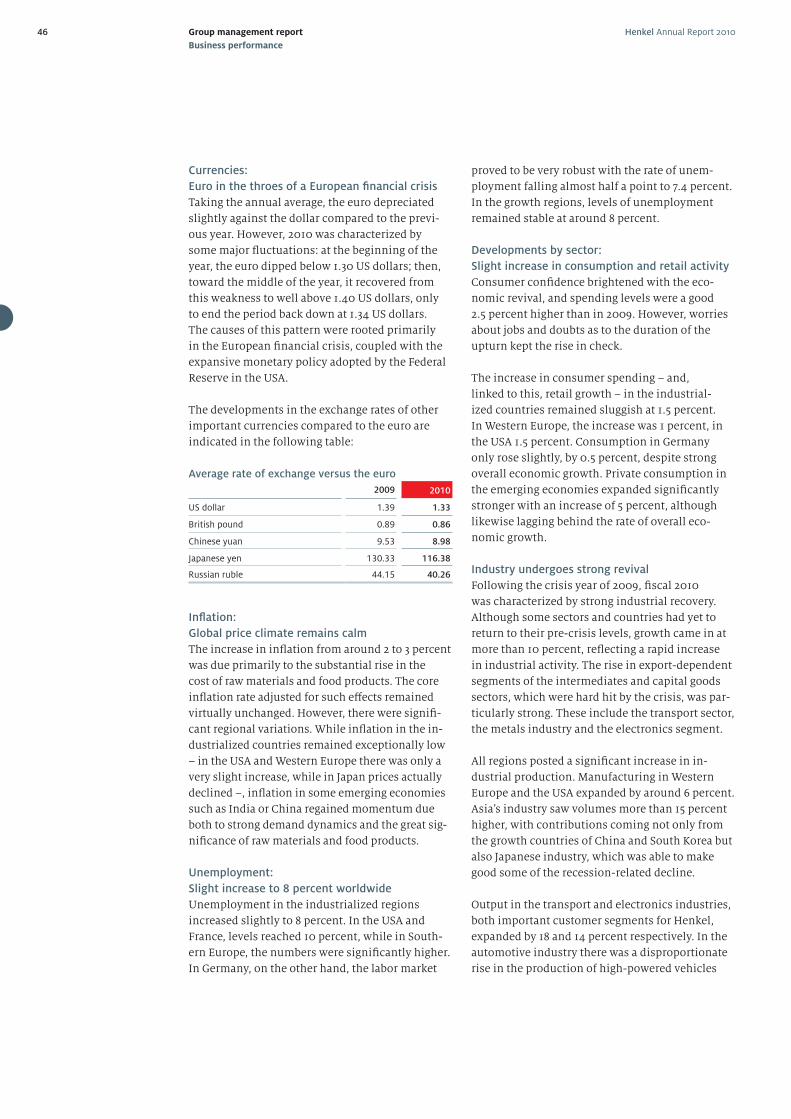
Henkel Annual Report 201046 Group management report
Business performance
Currencies:
Euro in the throes of a European fi nancial crisis
Taking the annual average, the euro depreciated
slightly against the dollar compared to the previ-
ous year. However, 2010 was characterized by
some major fl uctuations: at the beginning of the
year, the euro dipped below 1.30 US dollars; then,
toward the middle of the year, it recovered from
this weakness to well above 1.40 US dollars, only
to end the period back down at 1.34 US dollars.
The causes of this pattern were rooted primarily
in the European fi nancial crisis, coupled with the
expansive monetary policy adopted by the Federal
Reserve in the USA.
The developments in the exchange rates of other
important currencies compared to the euro are
indicated in the following table:
Average rate of exchange versus the euro
2009 2010
US dollar 1.39 1.33
British pound 0.89 0.86
Chinese yuan 9.53 8.98
Japanese yen 130.33 116.38
Russian ruble 44.15 40.26
Infl ation:
Global price climate remains calm
The increase in infl ation from around 2 to 3 percent
was due primarily to the substantial rise in the
cost of raw materials and food products. The core
infl ation rate adjusted for such eff ects remained
virtually unchanged. However, there were signifi -
cant regional variations. While infl ation in the in-
dustrialized countries remained exceptionally low
– in the USA and Western Europe there was only a
very slight increase, while in Japan prices actually
declined –, infl ation in some emerging economies
such as India or China regained momentum due
both to strong demand dynamics and the great sig-
nifi cance of raw materials and food products.
Unemployment:
Slight increase to 8 percent worldwide
Unemployment in the industrialized regions
increased slightly to 8 percent. In the USA and
France, levels reached 10 percent, while in South-
ern Europe, the numbers were signifi cantly higher.
In Germany, on the other hand, the labor market
proved to be very robust with the rate of unem-
ployment falling almost half a point to 7.4 percent.
In the growth regions, levels of unemployment
remained stable at around 8 percent.
Developments by sector:
Slight increase in consumption and retail activity
Consumer confi dence brightened with the eco-
nomic revival, and spending levels were a good
2.5 percent higher than in 2009. However, worries
about jobs and doubts as to the duration of the
upturn kept the rise in check.
The increase in consumer spending – and,
linked to this, retail growth – in the industrial-
ized countries remained sluggish at 1.5 percent.
In Western Europe, the increase was 1 percent, in
the USA 1.5 percent. Consumption in Germany
only rose slightly, by 0.5 percent, despite strong
overall economic growth. Private consumption in
the emerging economies expanded signifi cantly
stronger with an increase of 5 percent, although
likewise lagging behind the rate of overall eco-
nomic growth.
Industry undergoes strong revival
Following the crisis year of 2009, fi scal 2010
was characterized by strong industrial recovery.
Although some sectors and countries had yet to
return to their pre-crisis levels, growth came in at
more than 10 percent, refl ecting a rapid increase
in industrial activity. The rise in export-dependent
segments of the intermediates and capital goods
sectors, which were hard hit by the crisis, was par-
ticularly strong. These include the transport sector,
the metals industry and the electronics segment.
All regions posted a signifi cant increase in in-
dustrial production. Manufacturing in Western
Europe and the USA expanded by around 6 percent.
Asia’s industry saw volumes more than 15 percent
higher, with contributions coming not only from
the growth countries of China and South Korea but
also Japanese industry, which was able to make
good some of the recession-related decline.
Output in the transport and electronics industries,
both important customer segments for Henkel,
expanded by 18 and 14 percent respectively. In the
automotive industry there was a disproportionate
rise in the production of high-powered vehicles
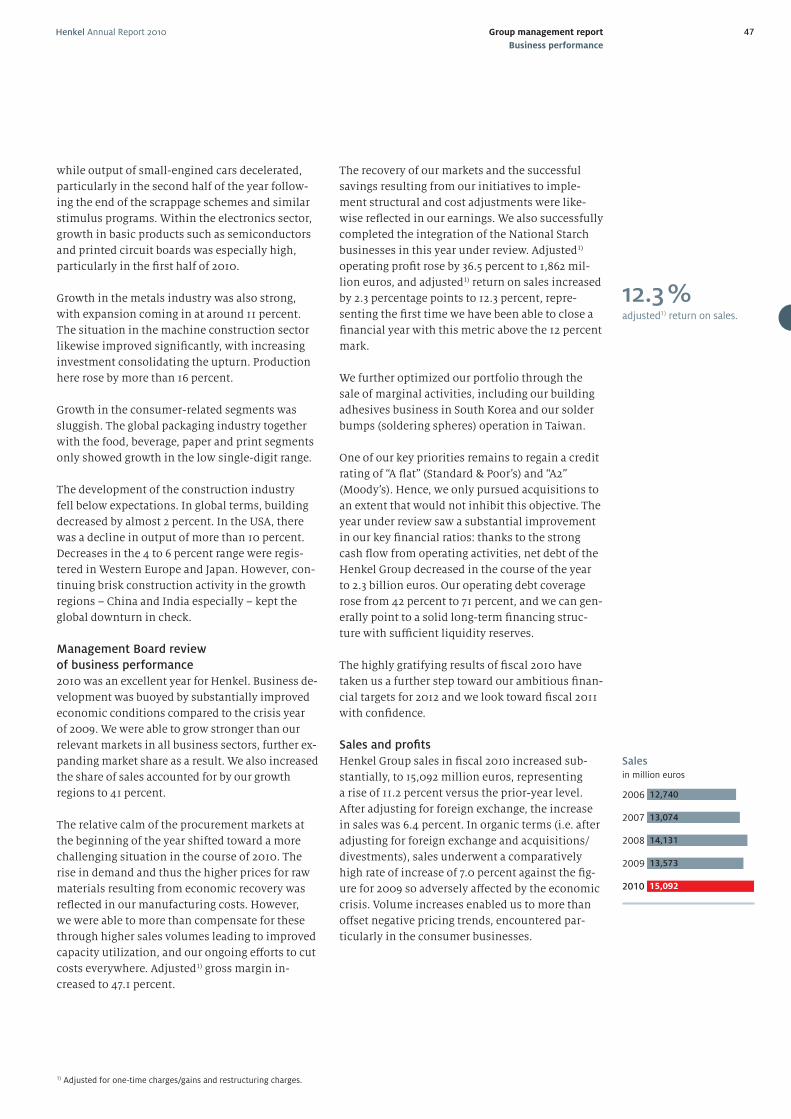
Henkel Annual Report 2010 47Group management report
Business performance
while output of small-engined cars decelerated,
particularly in the second half of the year follow-
ing the end of the scrappage schemes and similar
stimulus programs. Within the electronics sector,
growth in basic products such as semiconductors
and printed circuit boards was especially high,
particularly in the fi rst half of 2010.
Growth in the metals industry was also strong,
with expansion coming in at around 11 percent.
The situation in the machine construction sector
likewise improved signifi cantly, with increasing
investment consolidating the upturn. Production
here rose by more than 16 percent.
Growth in the consumer-related segments was
sluggish. The global packaging industry together
with the food, beverage, paper and print segments
only showed growth in the low single-digit range.
The development of the construction industry
fell below expectations. In global terms, building
decreased by almost 2 percent. In the USA, there
was a decline in output of more than 10 percent.
Decreases in the 4 to 6 percent range were regis-
tered in Western Europe and Japan. However, con-
tinuing brisk construction activity in the growth
regions – China and India especially – kept the
global downturn in check.
Management Board review
of business performance
2010 was an excellent year for Henkel. Business de-
velopment was buoyed by substantially improved
economic conditions compared to the crisis year
of 2009. We were able to grow stronger than our
relevant markets in all business sectors, further ex-
panding market share as a result. We also increased
the share of sales accounted for by our growth
regions to 41 percent.
The relative calm of the procurement markets at
the beginning of the year shifted toward a more
challenging situation in the course of 2010. The
rise in demand and thus the higher prices for raw
materials resulting from economic recovery was
refl ected in our manufacturing costs. However,
we were able to more than compensate for these
through higher sales volumes leading to improved
capacity utilization, and our ongoing eff orts to cut
costs everywhere. Adjusted1) gross margin in-
creased to 47.1 percent.
The recovery of our markets and the successful
savings resulting from our initiatives to imple-
ment structural and cost adjustments were like-
wise refl ected in our earnings. We also successfully
completed the integration of the National Starch
businesses in this year under review. Adjusted1)
operating profi t rose by 36.5 percent to 1,862 mil-
lion euros, and adjusted1) return on sales increased
by 2.3 percentage points to 12.3 percent, repre-
senting the fi rst time we have been able to close a
fi nancial year with this metric above the 12 percent
mark.
We further optimized our portfolio through the
sale of marginal activities, including our building
adhesives business in South Korea and our solder
bumps (soldering spheres) operation in Taiwan.
One of our key priorities remains to regain a credit
rating of “A fl at” (Standard & Poor’s) and “A2”
(Moody’s). Hence, we only pursued acquisitions to
an extent that would not inhibit this objective. The
year under review saw a substantial improvement
in our key fi nancial ratios: thanks to the strong
cash fl ow from operating activities, net debt of the
Henkel Group decreased in the course of the year
to 2.3 billion euros. Our operating debt coverage
rose from 42 percent to 71 percent, and we can gen-
erally point to a solid long-term fi nancing struc-
ture with suffi cient liquidity reserves.
The highly gratifying results of fi scal 2010 have
taken us a further step toward our ambitious fi nan-
cial targets for 2012 and we look toward fi scal 2011
with confi dence.
Sales and profi ts
Henkel Group sales in fi scal 2010 increased sub-
stantially, to 15,092 million euros, representing
a rise of 11.2 percent versus the prior-year level.
After adjusting for foreign exchange, the increase
in sales was 6.4 percent. In organic terms (i.e. after
adjusting for foreign exchange and acquisitions/
divestments), sales underwent a comparatively
high rate of increase of 7.0 percent against the fi g-
ure for 2009 so adversely aff ected by the economic
crisis. Volume increases enabled us to more than
off set negative pricing trends, encountered par-
ticularly in the consumer businesses.
12.3 %adjusted1) return on sales.
1) Adjusted for one-time charges/gains and restructuring charges.
Salesin million euros
2006
2007
2008
2009
2010
12,740
13,074
14,131
13,573
15,092
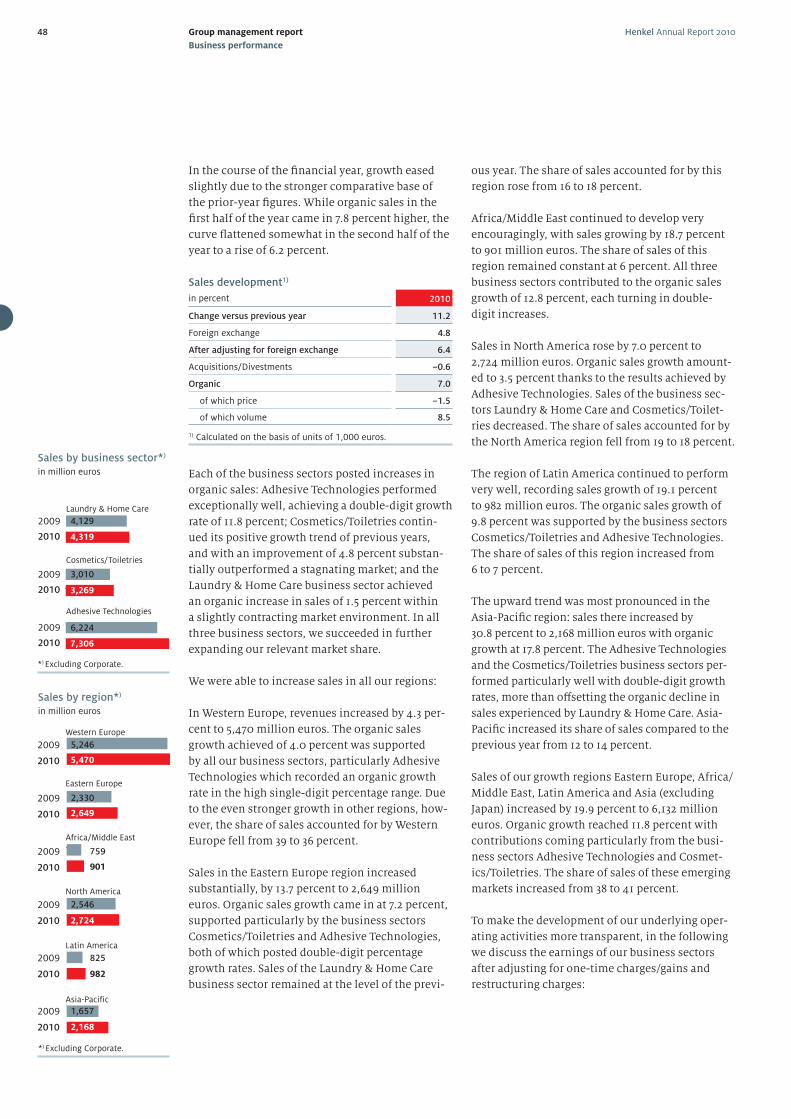
Henkel Annual Report 201048 Group management report
Business performance
In the course of the fi nancial year, growth eased
slightly due to the stronger comparative base of
the prior-year fi gures. While organic sales in the
fi rst half of the year came in 7.8 percent higher, the
curve fl attened somewhat in the second half of the
year to a rise of 6.2 percent.
Sales development1)
in percent 2010
Change versus previous year 11.2
Foreign exchange 4.8
After adjusting for foreign exchange 6.4
Acquisitions/Divestments –0.6
Organic 7.0
of which price –1.5
of which volume 8.5
1) Calculated on the basis of units of 1,000 euros.
Each of the business sectors posted increases in
organic sales: Adhesive Technologies performed
exceptionally well, achieving a double-digit growth
rate of 11.8 percent; Cosmetics/Toiletries contin-
ued its positive growth trend of previous years,
and with an improvement of 4.8 percent substan-
tially outperformed a stagnating market; and the
Laundry & Home Care business sector achieved
an organic increase in sales of 1.5 percent within
a slightly contracting market environment. In all
three business sectors, we succeeded in further
expanding our relevant market share.
We were able to increase sales in all our regions:
In Western Europe, revenues increased by 4.3 per-
cent to 5,470 million euros. The organic sales
growth achieved of 4.0 percent was supported
by all our business sectors, particularly Adhesive
Technologies which recorded an organic growth
rate in the high single-digit percentage range. Due
to the even stronger growth in other regions, how-
ever, the share of sales accounted for by Western
Europe fell from 39 to 36 percent.
Sales in the Eastern Europe region increased
substantially, by 13.7 percent to 2,649 million
euros. Organic sales growth came in at 7.2 percent,
supported particularly by the business sectors
Cosmetics/Toiletries and Adhesive Technologies,
both of which posted double-digit percentage
growth rates. Sales of the Laundry & Home Care
business sector remained at the level of the previ-
ous year. The share of sales accounted for by this
region rose from 16 to 18 percent.
Africa/Middle East continued to develop very
encouragingly, with sales growing by 18.7 percent
to 901 million euros. The share of sales of this
region remained constant at 6 percent. All three
business sectors contributed to the organic sales
growth of 12.8 percent, each turning in double-
digit increases.
Sales in North America rose by 7.0 percent to
2,724 million euros. Organic sales growth amount-
ed to 3.5 percent thanks to the results achieved by
Adhesive Technologies. Sales of the business sec-
tors Laundry & Home Care and Cosmetics/Toilet-
ries decreased. The share of sales accounted for by
the North America region fell from 19 to 18 percent.
The region of Latin America continued to perform
very well, recording sales growth of 19.1 percent
to 982 million euros. The organic sales growth of
9.8 percent was supported by the business sectors
Cosmetics/Toiletries and Adhesive Technologies.
The share of sales of this region increased from
6 to 7 percent.
The upward trend was most pronounced in the
Asia-Pacifi c region: sales there increased by
30.8 percent to 2,168 million euros with organic
growth at 17.8 percent. The Adhesive Technologies
and the Cosmetics/Toiletries business sectors per-
formed particularly well with double-digit growth
rates, more than off setting the organic decline in
sales experienced by Laundry & Home Care. Asia-
Pacifi c increased its share of sales compared to the
previous year from 12 to 14 percent.
Sales of our growth regions Eastern Europe, Africa/
Middle East, Latin America and Asia (excluding
Japan) increased by 19.9 percent to 6,132 million
euros. Organic growth reached 11.8 percent with
contributions coming particularly from the busi-
ness sectors Adhesive Technologies and Cosmet-
ics/Toiletries. The share of sales of these emerging
markets increased from 38 to 41 percent.
To make the development of our underlying oper-
ating activities more transparent, in the following
we discuss the earnings of our business sectors
after adjusting for one-time charges/gains and
restructuring charges:
Sales by business sector*)
in million euros
2009
2010
2009
2010
2009
2010
Laundry & Home Care
Cosmetics/Toiletries
Adhesive Technologies
*) Excluding Corporate.
4,129
4,319
3,010
3,269
6,224
7,306
2009
2010
2009
2010
2009
2010
2009
2010
2009
2010
2009
2010
5,246
5,470
2,330
2,649
Western Europe
Eastern Europe
Africa/Middle East
North America
Latin America
Asia-Pacific
759
901
2,546
2,724
825
982
1,657
2,168
Sales by region*)
in million euros
*) Excluding Corporate.
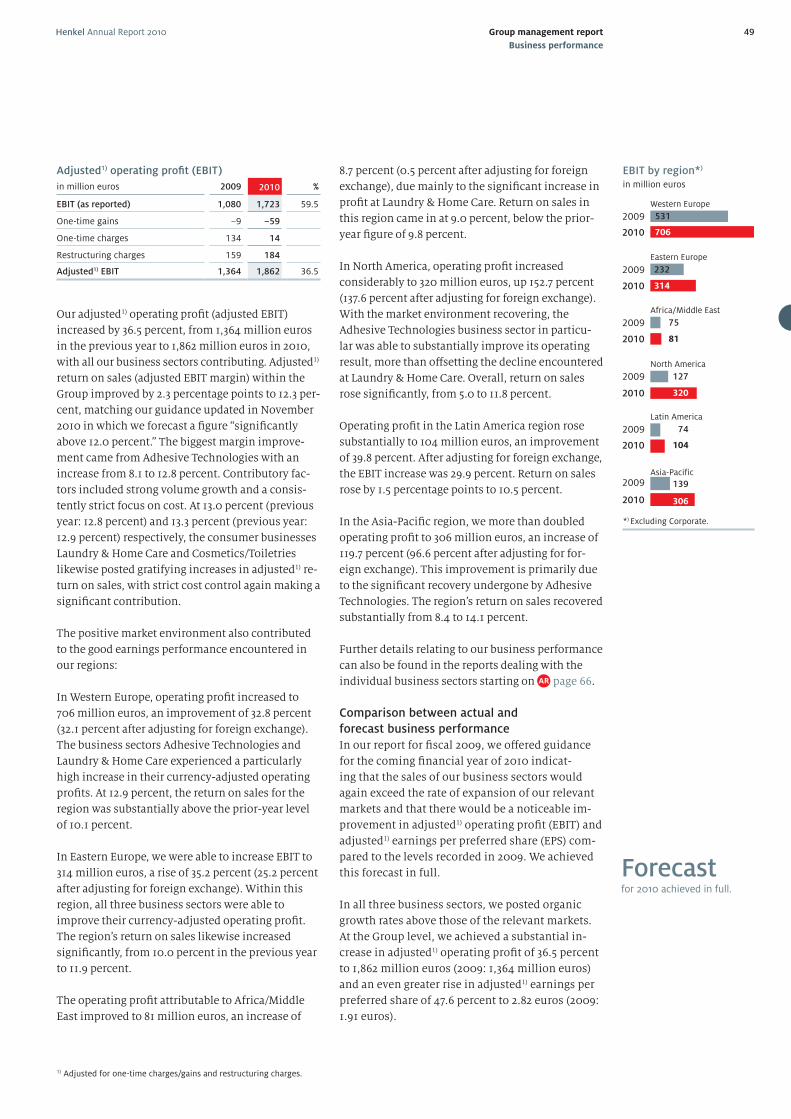
Henkel Annual Report 2010 49Group management report
Business performance
Adjusted1) operating profi t (EBIT)
in million euros 2009 2010 %
EBIT (as reported) 1,080 1,723 59.5
One-time gains –9 –59
One-time charges 134 14
Restructuring charges 159 184
Adjusted1) EBIT 1,364 1,862 36.5
Our adjusted1) operating profi t (adjusted EBIT)
increased by 36.5 percent, from 1,364 million euros
in the previous year to 1,862 million euros in 2010,
with all our business sectors contributing. Adjusted1)
return on sales (adjusted EBIT margin) within the
Group improved by 2.3 percentage points to 12.3 per-
cent, matching our guidance updated in November
2010 in which we forecast a fi gure “signifi cantly
above 12.0 percent.” The biggest margin improve-
ment came from Adhesive Technologies with an
increase from 8.1 to 12.8 percent. Contributory fac-
tors included strong volume growth and a consis-
tently strict focus on cost. At 13.0 percent (previous
year: 12.8 percent) and 13.3 percent (previous year:
12.9 percent) respectively, the consumer businesses
Laundry & Home Care and Cosmetics/Toiletries
likewise posted gratifying increases in adjusted1) re-
turn on sales, with strict cost control again making a
signifi cant contribution.
The positive market environment also contributed
to the good earnings performance encountered in
our regions:
In Western Europe, operating profi t increased to
706 million euros, an improvement of 32.8 percent
(32.1 percent after adjusting for foreign exchange).
The business sectors Adhesive Technologies and
Laundry & Home Care experienced a particularly
high increase in their currency-adjusted operating
profi ts. At 12.9 percent, the return on sales for the
region was substantially above the prior-year level
of 10.1 percent.
In Eastern Europe, we were able to increase EBIT to
314 million euros, a rise of 35.2 percent (25.2 percent
after adjusting for foreign exchange). Within this
region, all three business sectors were able to
improve their currency-adjusted operating profi t.
The region’s return on sales likewise increased
signifi cantly, from 10.0 percent in the previous year
to 11.9 percent.
The operating profi t attributable to Africa/Middle
East improved to 81 million euros, an increase of
8.7 percent (0.5 percent after adjusting for foreign
exchange), due mainly to the signifi cant increase in
profi t at Laundry & Home Care. Return on sales in
this region came in at 9.0 percent, below the prior-
year fi gure of 9.8 percent.
In North America, operating profi t increased
considerably to 320 million euros, up 152.7 percent
(137.6 percent after adjusting for foreign exchange).
With the market environment recovering, the
Adhesive Technologies business sector in particu-
lar was able to substantially improve its operating
result, more than off setting the decline encountered
at Laundry & Home Care. Overall, return on sales
rose signifi cantly, from 5.0 to 11.8 percent.
Operating profi t in the Latin America region rose
substantially to 104 million euros, an improvement
of 39.8 percent. After adjusting for foreign exchange,
the EBIT increase was 29.9 percent. Return on sales
rose by 1.5 percentage points to 10.5 percent.
In the Asia-Pacifi c region, we more than doubled
operating profi t to 306 million euros, an increase of
119.7 percent (96.6 percent after adjusting for for-
eign exchange). This improvement is primarily due
to the signifi cant recovery undergone by Adhesive
Technologies. The region’s return on sales recovered
substantially from 8.4 to 14.1 percent.
Further details relating to our business performance
can also be found in the reports dealing with the
individual business sectors starting on page 66.
Comparison between actual and
forecast business performance
In our report for fi scal 2009, we off ered guidance
for the coming fi nancial year of 2010 indicat-
ing that the sales of our business sectors would
again exceed the rate of expansion of our relevant
markets and that there would be a noticeable im-
provement in adjusted1) operating profi t (EBIT) and
adjusted1) earnings per preferred share (EPS) com-
pared to the levels recorded in 2009. We achieved
this forecast in full.
In all three business sectors, we posted organic
growth rates above those of the relevant markets.
At the Group level, we achieved a substantial in-
crease in adjusted1) operating profi t of 36.5 percent
to 1,862 million euros (2009: 1,364 million euros)
and an even greater rise in adjusted1) earnings per
preferred share of 47.6 percent to 2.82 euros (2009:
1.91 euros).
1) Adjusted for one-time charges/gains and restructuring charges.
2009
2010
2009
2010
2009
2010
2009
2010
2009
2010
2009
2010
531
706
232
314
Western Europe
Eastern Europe
Africa/Middle East
North America
Latin America
Asia-Pacific
75
81
127
320
74
104
139
306
EBIT by region*)
in million euros
*) Excluding Corporate.
Forecastfor 2010 achieved in full.
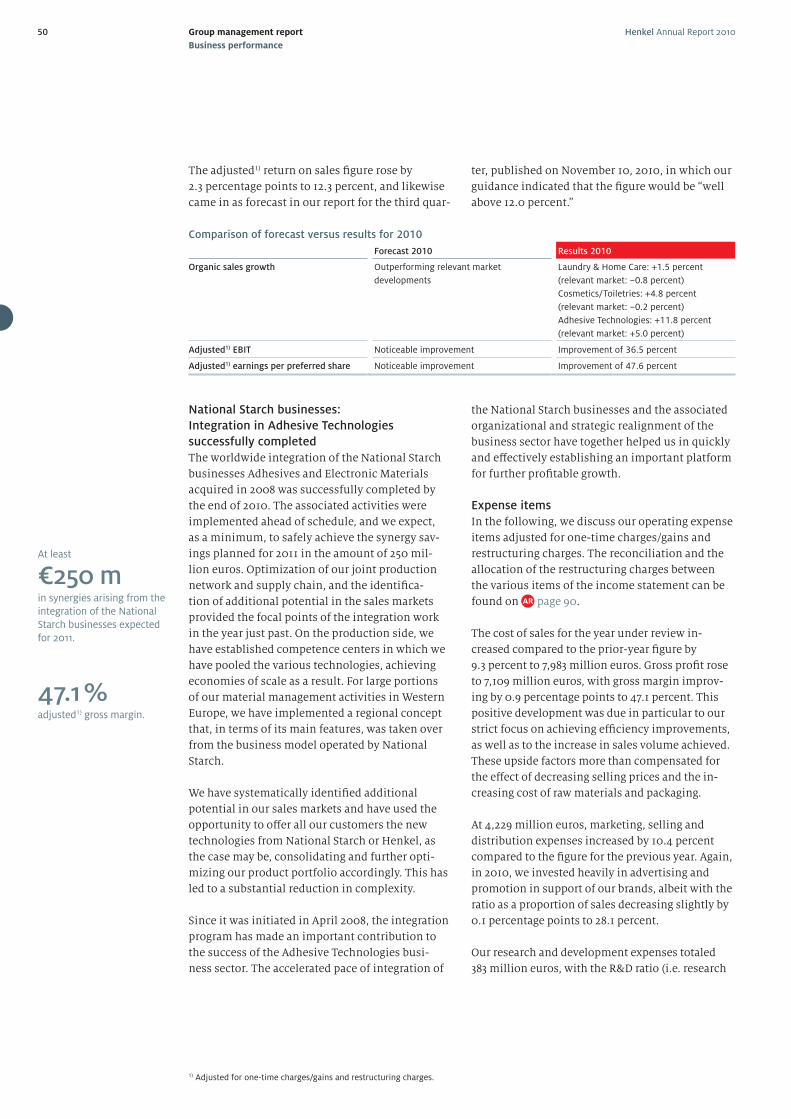
Henkel Annual Report 201050 Group management report
Business performance
The adjusted1) return on sales fi gure rose by
2.3 percentage points to 12.3 percent, and likewise
came in as forecast in our report for the third quar-
ter, published on November 10, 2010, in which our
guidance indicated that the fi gure would be “well
above 12.0 percent.”
Comparison of forecast versus results for 2010
Forecast 2010 Results 2010
Organic sales growth Outperforming relevant market
developments
Laundry & Home Care: +1.5 percent
(relevant market: –0.8 percent)
Cosmetics/Toiletries: +4.8 percent
(relevant market: –0.2 percent)
Adhesive Technologies: +11.8 percent
(relevant market: +5.0 percent)
Adjusted1) EBIT Noticeable improvement Improvement of 36.5 percent
Adjusted1) earnings per preferred share Noticeable improvement Improvement of 47.6 percent
At least
€250 m in synergies arising from the integration of the National Starch businesses expected for 2011.
National Starch businesses:
Integration in Adhesive Technologies
successfully completed
The worldwide integration of the National Starch
businesses Adhesives and Electronic Materials
acquired in 2008 was successfully completed by
the end of 2010. The associated activities were
implemented ahead of schedule, and we expect,
as a minimum, to safely achieve the synergy sav-
ings planned for 2011 in the amount of 250 mil-
lion euros. Optimization of our joint production
network and supply chain, and the identifi ca-
tion of additional potential in the sales markets
provided the focal points of the integration work
in the year just past. On the production side, we
have established competence centers in which we
have pooled the various technologies, achieving
economies of scale as a result. For large portions
of our material management activities in Western
Europe, we have implemented a regional concept
that, in terms of its main features, was taken over
from the business model operated by National
Starch.
We have systematically identifi ed additional
potential in our sales markets and have used the
opportunity to off er all our customers the new
technologies from National Starch or Henkel, as
the case may be, consolidating and further opti-
mizing our product portfolio accordingly. This has
led to a substantial reduction in complexity.
Since it was initiated in April 2008, the integration
program has made an important contribution to
the success of the Adhesive Technologies busi-
ness sector. The accelerated pace of integration of
1) Adjusted for one-time charges/gains and restructuring charges.
47.1 %adjusted1) gross margin.
the National Starch businesses and the associated
organizational and strategic realignment of the
business sector have together helped us in quickly
and eff ectively establishing an important platform
for further profi table growth.
Expense items
In the following, we discuss our operating expense
items adjusted for one-time charges/gains and
restructuring charges. The reconciliation and the
allocation of the restructuring charges between
the various items of the income statement can be
found on page 90.
The cost of sales for the year under review in-
creased compared to the prior-year fi gure by
9.3 percent to 7,983 million euros. Gross profi t rose
to 7,109 million euros, with gross margin improv-
ing by 0.9 percentage points to 47.1 percent. This
positive development was due in particular to our
strict focus on achieving effi ciency improvements,
as well as to the increase in sales volume achieved.
These upside factors more than compensated for
the eff ect of decreasing selling prices and the in-
creasing cost of raw materials and packaging.
At 4,229 million euros, marketing, selling and
distribution expenses increased by 10.4 percent
compared to the fi gure for the previous year. Again,
in 2010, we invested heavily in advertising and
promotion in support of our brands, albeit with the
ratio as a proportion of sales decreasing slightly by
0.1 percentage points to 28.1 percent.
Our research and development expenses totaled
383 million euros, with the R&D ratio (i.e. research
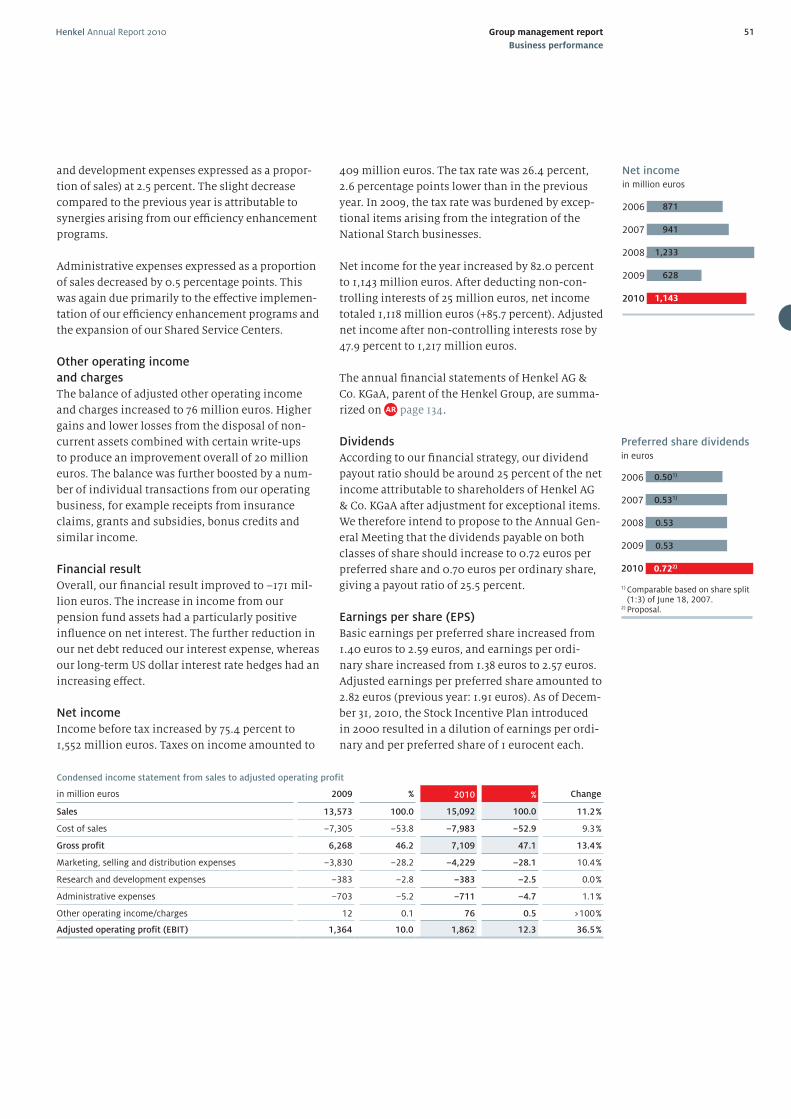
Henkel Annual Report 2010 51Group management report
Business performance
and development expenses expressed as a propor-
tion of sales) at 2.5 percent. The slight decrease
compared to the previous year is attributable to
synergies arising from our effi ciency enhancement
programs.
Administrative expenses expressed as a proportion
of sales decreased by 0.5 percentage points. This
was again due primarily to the eff ective implemen-
tation of our effi ciency enhancement programs and
the expansion of our Shared Service Centers.
Other operating income
and charges
The balance of adjusted other operating income
and charges increased to 76 million euros. Higher
gains and lower losses from the disposal of non-
current assets combined with certain write-ups
to produce an improvement overall of 20 million
euros. The balance was further boosted by a num-
ber of individual transactions from our operating
business, for example receipts from insurance
claims, grants and subsidies, bonus credits and
similar income.
Financial result
Overall, our fi nancial result improved to –171 mil-
lion euros. The increase in income from our
pension fund assets had a particularly positive
infl uence on net interest. The further reduction in
our net debt reduced our interest expense, whereas
our long-term US dollar interest rate hedges had an
increasing eff ect.
Net income
Income before tax increased by 75.4 percent to
1,552 million euros. Taxes on income amounted to
409 million euros. The tax rate was 26.4 percent,
2.6 percentage points lower than in the previous
year. In 2009, the tax rate was burdened by excep-
tional items arising from the integration of the
National Starch businesses.
Net income for the year increased by 82.0 percent
to 1,143 million euros. After deducting non-con-
trolling interests of 25 million euros, net income
totaled 1,118 million euros (+85.7 percent). Adjusted
net income after non-controlling interests rose by
47.9 percent to 1,217 million euros.
The annual fi nancial statements of Henkel AG &
Co. KGaA, parent of the Henkel Group, are summa-
rized on page 134.
Dividends
According to our fi nancial strategy, our dividend
payout ratio should be around 25 percent of the net
income attributable to shareholders of Henkel AG
& Co. KGaA after adjustment for exceptional items.
We therefore intend to propose to the Annual Gen-
eral Meeting that the dividends payable on both
classes of share should increase to 0.72 euros per
preferred share and 0.70 euros per ordinary share,
giving a payout ratio of 25.5 percent.
Earnings per share (EPS)
Basic earnings per preferred share increased from
1.40 euros to 2.59 euros, and earnings per ordi-
nary share increased from 1.38 euros to 2.57 euros.
Adjusted earnings per preferred share amounted to
2.82 euros (previous year: 1.91 euros). As of Decem-
ber 31, 2010, the Stock Incentive Plan introduced
in 2000 resulted in a dilution of earnings per ordi-
nary and per preferred share of 1 eurocent each.
Preferred share dividendsin euros
2006
2007
2008
2009
2010
0.501)
0.531)
0.53
0.53
0.722)
1) Comparable based on share split (1:3) of June 18, 2007.
2) Proposal.
Condensed income statement from sales to adjusted operating profit
in million euros 2009 % 2010 % Change
Sales 13,573 100.0 15,092 100.0 11.2 %
Cost of sales –7,305 –53.8 –7,983 –52.9 9.3 %
Gross profit 6,268 46.2 7,109 47.1 13.4 %
Marketing, selling and distribution expenses –3,830 –28.2 –4,229 –28.1 10.4 %
Research and development expenses –383 –2.8 –383 –2.5 0.0 %
Administrative expenses –703 –5.2 –711 –4.7 1.1 %
Other operating income/charges 12 0.1 76 0.5 >100 %
Adjusted operating profit (EBIT) 1,364 10.0 1,862 12.3 36.5 %
Net incomein million euros
871
941
1,233
628
1,143
2006
2007
2008
2009
2010
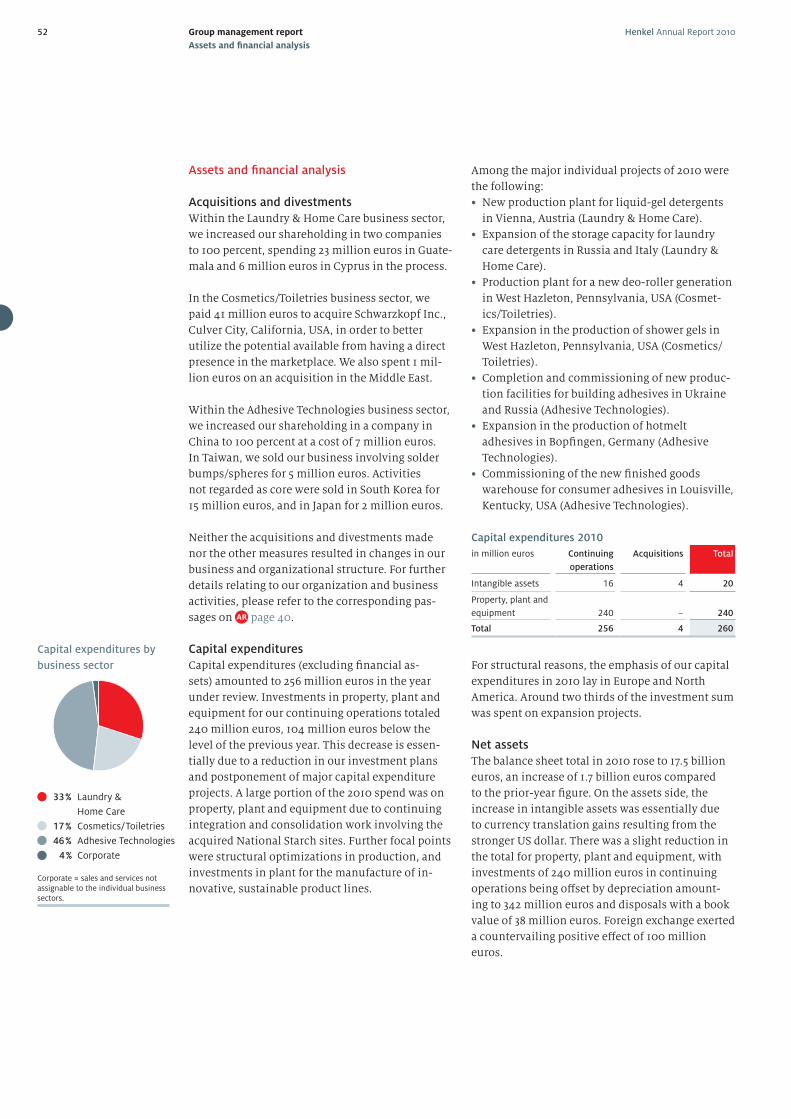
Henkel Annual Report 201052 Group management report
Assets and fi nancial analysis
Assets and fi nancial analysis
Acquisitions and divestments
Within the Laundry & Home Care business sector,
we increased our shareholding in two companies
to 100 percent, spending 23 million euros in Guate-
mala and 6 million euros in Cyprus in the process.
In the Cosmetics/Toiletries business sector, we
paid 41 million euros to acquire Schwarzkopf Inc.,
Culver City, California, USA, in order to better
utilize the potential available from having a direct
presence in the marketplace. We also spent 1 mil-
lion euros on an acquisition in the Middle East.
Within the Adhesive Technologies business sector,
we increased our shareholding in a company in
China to 100 percent at a cost of 7 million euros.
In Taiwan, we sold our business involving solder
bumps/spheres for 5 million euros. Activities
not regarded as core were sold in South Korea for
15 million euros, and in Japan for 2 million euros.
Neither the acquisitions and divestments made
nor the other measures resulted in changes in our
business and organizational structure. For further
details relating to our organization and business
activities, please refer to the corresponding pas-
sages on page 40.
Capital expenditures
Capital expenditures (excluding fi nancial as-
sets) amounted to 256 million euros in the year
under review. Investments in property, plant and
equipment for our continuing operations totaled
240 million euros, 104 million euros below the
level of the previous year. This decrease is essen-
tially due to a reduction in our investment plans
and postponement of major capital expenditure
projects. A large portion of the 2010 spend was on
property, plant and equipment due to continuing
integration and consolidation work involving the
acquired National Starch sites. Further focal points
were structural optimizations in production, and
investments in plant for the manufacture of in-
novative, sustainable product lines.Corporate = sales and services not assignable to the individual business sectors.
Capital expenditures by
business sector
33 % Laundry &
Home Care
17 % Cosmetics/Toiletries
46 % Adhesive Technologies
4 % Corporate
Among the major individual projects of 2010 were
the following:
• New production plant for liquid-gel detergents
in Vienna, Austria (Laundry & Home Care).
• Expansion of the storage capacity for laundry
care detergents in Russia and Italy (Laundry &
Home Care).
• Production plant for a new deo-roller generation
in West Hazleton, Pennsylvania, USA (Cosmet-
ics/Toiletries).
• Expansion in the production of shower gels in
West Hazleton, Pennsylvania, USA (Cosmetics/
Toiletries).
• Completion and commissioning of new produc-
tion facilities for building adhesives in Ukraine
and Russia (Adhesive Technologies).
• Expansion in the production of hotmelt
adhesives in Bopfi ngen, Germany (Adhesive
Technologies).
• Commissioning of the new fi nished goods
warehouse for consumer adhesives in Louisville,
Kentucky, USA (Adhesive Technologies).
Capital expenditures 2010
in million euros Continuing
operations
Acquisitions Total
Intangible assets 16 4 20
Property, plant and
equipment 240 – 240
Total 256 4 260
For structural reasons, the emphasis of our capital
expenditures in 2010 lay in Europe and North
America. Around two thirds of the investment sum
was spent on expansion projects.
Net assets
The balance sheet total in 2010 rose to 17.5 billion
euros, an increase of 1.7 billion euros compared
to the prior-year fi gure. On the assets side, the
increase in intangible assets was essentially due
to currency translation gains resulting from the
stronger US dollar. There was a slight reduction in
the total for property, plant and equipment, with
investments of 240 million euros in continuing
operations being off set by depreciation amount-
ing to 342 million euros and disposals with a book
value of 38 million euros. Foreign exchange exerted
a countervailing positive eff ect of 100 million
euros.
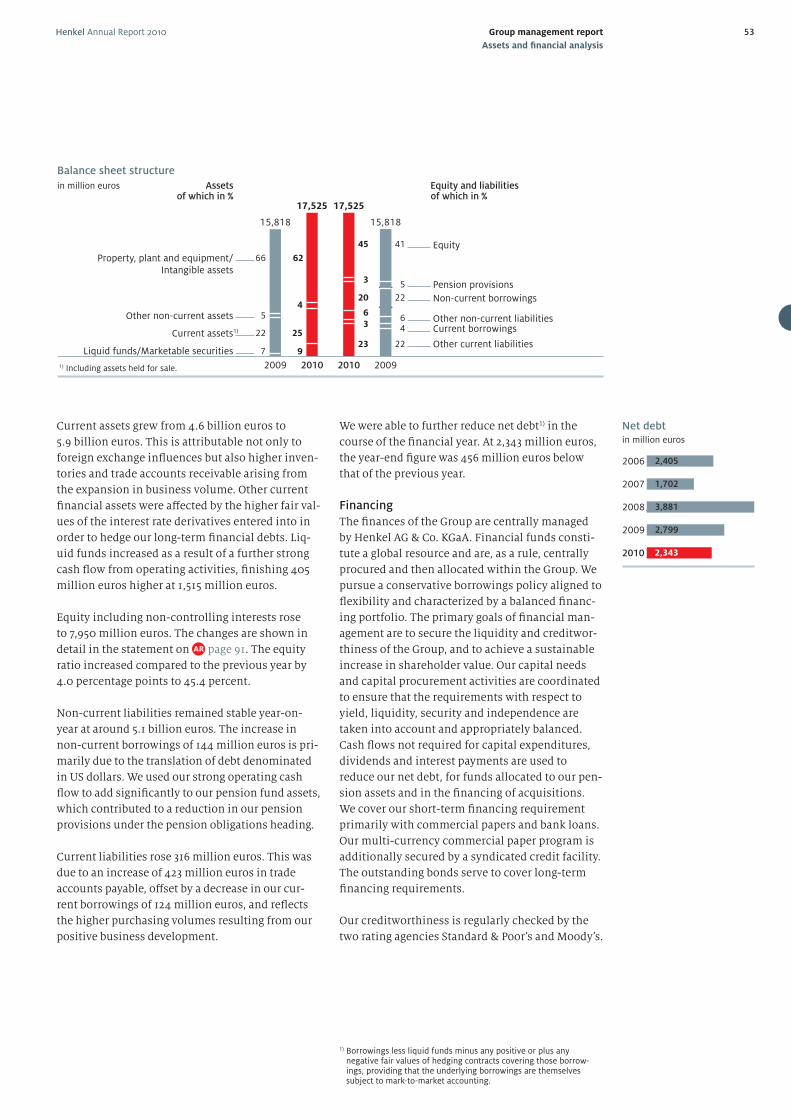
Henkel Annual Report 2010 53Group management report
Assets and fi nancial analysis
Current assets grew from 4.6 billion euros to
5.9 billion euros. This is attributable not only to
foreign exchange infl uences but also higher inven-
tories and trade accounts receivable arising from
the expansion in business volume. Other current
fi nancial assets were aff ected by the higher fair val-
ues of the interest rate derivatives entered into in
order to hedge our long-term fi nancial debts. Liq-
uid funds increased as a result of a further strong
cash fl ow from operating activities, fi nishing 405
million euros higher at 1,515 million euros.
Equity including non-controlling interests rose
to 7,950 million euros. The changes are shown in
detail in the statement on page 91. The equity
ratio increased compared to the previous year by
4.0 percentage points to 45.4 percent.
Non-current liabilities remained stable year-on-
year at around 5.1 billion euros. The increase in
non-current borrowings of 144 million euros is pri-
marily due to the translation of debt denominated
in US dollars. We used our strong operating cash
fl ow to add signifi cantly to our pension fund assets,
which contributed to a reduction in our pension
provisions under the pension obligations heading.
Current liabilities rose 316 million euros. This was
due to an increase of 423 million euros in trade
accounts payable, off set by a decrease in our cur-
rent borrowings of 124 million euros, and refl ects
the higher purchasing volumes resulting from our
positive business development.
We were able to further reduce net debt1) in the
course of the fi nancial year. At 2,343 million euros,
the year-end fi gure was 456 million euros below
that of the previous year.
Financing
The fi nances of the Group are centrally managed
by Henkel AG & Co. KGaA. Financial funds consti-
tute a global resource and are, as a rule, centrally
procured and then allocated within the Group. We
pursue a conservative borrowings policy aligned to
fl exibility and characterized by a balanced fi nanc-
ing portfolio. The primary goals of fi nancial man-
agement are to secure the liquidity and creditwor-
thiness of the Group, and to achieve a sustainable
increase in shareholder value. Our capital needs
and capital procurement activities are coordinated
to ensure that the requirements with respect to
yield, liquidity, security and independence are
taken into account and appropriately balanced.
Cash fl ows not required for capital expenditures,
dividends and interest payments are used to
reduce our net debt, for funds allocated to our pen-
sion assets and in the fi nancing of acquisitions.
We cover our short-term fi nancing requirement
primarily with commercial papers and bank loans.
Our multi-currency commercial paper program is
additionally secured by a syndicated credit facility.
The outstanding bonds serve to cover long-term
fi nancing requirements.
Our creditworthiness is regularly checked by the
two rating agencies Standard & Poor’s and Moody’s.
1) Borrowings less liquid funds minus any positive or plus any negative fair values of hedging contracts covering those borrow-ings, providing that the underlying borrowings are themselves subject to mark-to-market accounting.
Net debtin million euros
2,405
1,702
3,881
2,799
2,343
2006
2007
2008
2009
2010
Property, plant and equipment/Intangible assets
Other non-current assets
Liquid funds/Marketable securities
Equity
of which in % of which in %
Pension provisions
Other non-current liabilitiesCurrent borrowings
Other current liabilities
1) Including assets held for sale. 2009 2010 2010 2009
Balance sheet structure
in million euros Assets Equity and liabilities
17,525
15,818
17,525
15,818
Current assets1)
Non-current borrowings
6266
45
3
45
20
2522
6
97
3
23
41
5
22
64
22
Henkel Annual Report 201054 Group management report
Assets and fi nancial analysis
Both currently place Henkel in the highest catego-
ry, the Investment Grade Segment, with “A–/A–2”
(S&P) and “A3/P2” (Moody’s). We are endeavoring to
achieve a long-term credit rating one notch higher
at “A fl at” (Standard & Poor’s) and “A2” (Moody’s).
Credit ratings
Standard & Poor’s Moody’s
Long-term A– A3
Outlook Stable Stable
Short-term A–2 P2
At December 31, 2010.
At December 31, 2010, our non-current borrowings
amounted to 3,570 million euros. Included in this
fi gure are the hybrid bond issued in November
2005 with a nominal value of 1.3 billion euros,
and the fi xed-interest bonds issued in May 2003
and March 2009, each with a volume of 1.0 billion
euros. Our current borrowings – i.e. those with
maturities of less than 12 months – amounted
to 536 million euros as of the balance sheet date.
These essentially comprise interest-bearing loans
and overdrafts from banks.
We used the cash fl ow from operating activities to
redeem current borrowings and to build up our liq-
uid funds. As a result, we have reduced our overall
net debt. The hybrid bond is treated by Standard
& Poor’s as 50 percent equity, and – following a
change in its evaluation method – also as 50 per-
cent equity by Moody’s. This reduces the rating-
specifi c debt ratios of the Group (see key fi nancial
ratios table on page 55).
For further information on our fi nancial steward-
ship and our fi nancial instruments, please refer to
Notes 30 and 31 on pages 115 to 121.
Henkel’s fi nancial risk management activities are
explained in the risk report on pages 78 to 82.
Financial position
Cash fl ow from operating activities in 2010
amounted to 1,851 million euros, close to the level
of the previous year. The cash infl ow was boosted
by the substantial increase in operating profi ts.
Low tax payments in respect of previous years and
the utilization of losses carried forward meant that
the outgoings for taxes on income rose at a lower
rate than operating profi ts. Despite the substantial
revival in business, cash fl ow from net working
capital was extensively neutral. In the previous
year, optimization measures had led to a substan-
tial reduction in net working capital.
Cash fl ow from investing activities/acquisitions
was positively aff ected by a lower level of invest-
ment in intangible assets and property, plant and
equipment compared to the previous year. Con-
versely, following the sale of the North American
consumer adhesives brands in 2009, proceeds
from the sale of individual activities were lower in
the year under review.
Cash fl ow from operating activities was also used
in the year under review to increase the allocations
made to pension fund assets. The resultant rise in
pension funding increased the associated cover-
age ratio to the targeted level of around 90 percent.
These additional investments and the reduction in
borrowings led to an increase in cash outfl ow from
fi nancing activities of 291 million euros compared
to the previous year.
Liquid funds/marketable securities increased as a
result of the higher cash fl ow from operating ac-
tivities, by 405 million euros to 1,515 million euros.
At 1,508 million euros, free cash fl ow came in
46 million euros higher than the comparable
prior-year level, due primarily to developments
in cash fl ow from operating activities, with lower
investment volumes in the year under review also
contributing.
Key fi nancial ratios
The interest coverage ratio, i.e. EBITDA divided by
our net interest expense, benefi ted both from a
reduction in the latter and a higher EBITDA level.
The reduction in net debt in 2010 has had a favor-
able eff ect on operating debt coverage. And the
increase in the equity ratio refl ects the Group’s im-
proved fi nancial strength in the year under review.
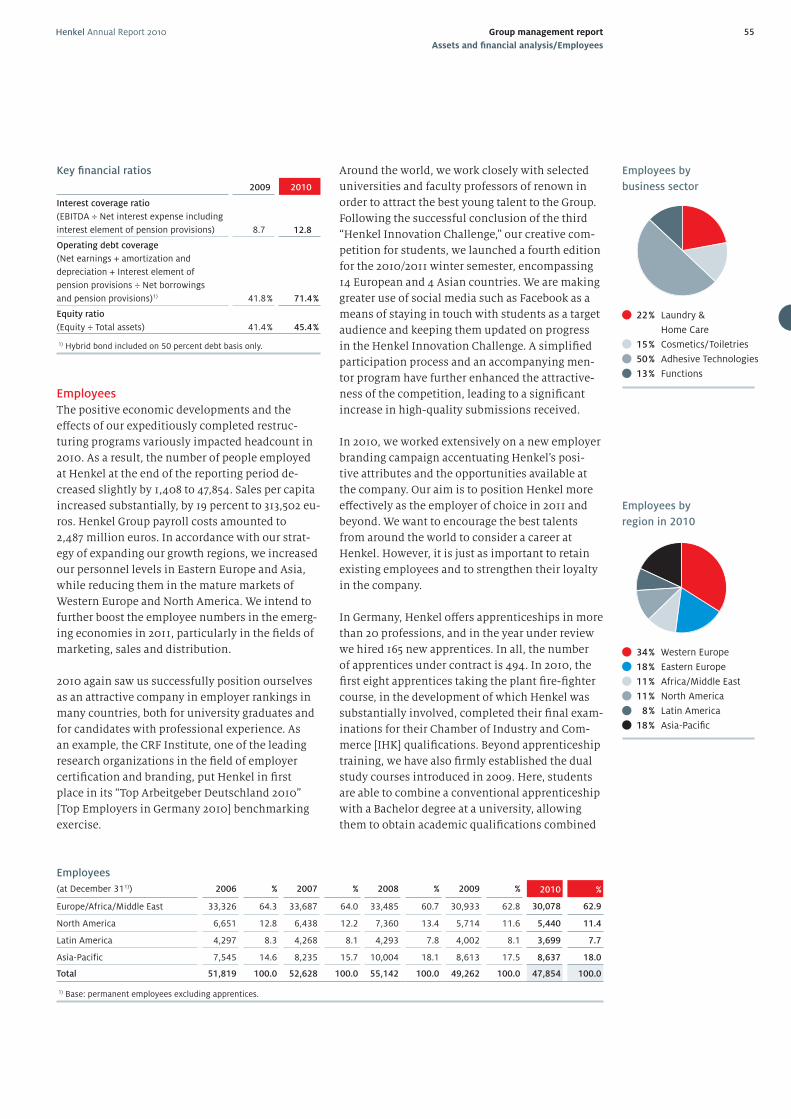
Henkel Annual Report 2010 55Group management report
Assets and fi nancial analysis/Employees
Key fi nancial ratios
2009 2010
Interest coverage ratio
(EBITDA ÷ Net interest expense including
interest element of pension provisions) 8.7 12.8
Operating debt coverage
(Net earnings + amortization and
depreciation + Interest element of
pension provisions ÷ Net borrowings
and pension provisions)1) 41.8 % 71.4 %
Equity ratio
(Equity ÷ Total assets) 41.4 % 45.4 %
1) Hybrid bond included on 50 percent debt basis only.
Employees
The positive economic developments and the
eff ects of our expeditiously completed restruc-
turing programs variously impacted headcount in
2010. As a result, the number of people employed
at Henkel at the end of the reporting period de-
creased slightly by 1,408 to 47,854. Sales per capita
increased substantially, by 19 percent to 313,502 eu-
ros. Henkel Group payroll costs amounted to
2,487 million euros. In accordance with our strat-
egy of expanding our growth regions, we increased
our personnel levels in Eastern Europe and Asia,
while reducing them in the mature markets of
Western Europe and North America. We intend to
further boost the employee numbers in the emerg-
ing economies in 2011, particularly in the fi elds of
marketing, sales and distribution.
2010 again saw us successfully position ourselves
as an attractive company in employer rankings in
many countries, both for university graduates and
for candidates with professional experience. As
an example, the CRF Institute, one of the leading
research organizations in the fi eld of employer
certifi cation and branding, put Henkel in fi rst
place in its “Top Arbeitgeber Deutschland 2010”
[Top Employers in Germany 2010] benchmarking
exercise.
Around the world, we work closely with selected
universities and faculty professors of renown in
order to attract the best young talent to the Group.
Following the successful conclusion of the third
“Henkel Innovation Challenge,” our creative com-
petition for students, we launched a fourth edition
for the 2010/2011 winter semester, encompassing
14 European and 4 Asian countries. We are making
greater use of social media such as Facebook as a
means of staying in touch with students as a target
audience and keeping them updated on progress
in the Henkel Innovation Challenge. A simplifi ed
participation process and an accompanying men-
tor program have further enhanced the attractive-
ness of the competition, leading to a signifi cant
increase in high-quality submissions received.
In 2010, we worked extensively on a new employer
branding campaign accentuating Henkel’s posi-
tive attributes and the opportunities available at
the company. Our aim is to position Henkel more
eff ec tively as the employer of choice in 2011 and
beyond. We want to encourage the best talents
from around the world to consider a career at
Henkel. However, it is just as important to retain
existing employees and to strengthen their loyalty
in the company.
In Germany, Henkel off ers apprenticeships in more
than 20 professions, and in the year under review
we hired 165 new apprentices. In all, the number
of apprentices under contract is 494. In 2010, the
fi rst eight apprentices taking the plant fi re-fi ghter
course, in the development of which Henkel was
substantially involved, completed their fi nal exam-
inations for their Chamber of Industry and Com-
merce [IHK] qualifi cations. Beyond apprenticeship
training, we have also fi rmly established the dual
study courses introduced in 2009. Here, students
are able to combine a conventional apprenticeship
with a Bachelor degree at a university, allowing
them to obtain academic qualifi cations combined
Employees by
business sector
22 % Laundry &
Home Care
15 % Cosmetics/Toiletries
50 % Adhesive Technologies
13 % Functions
Employees by
region in 2010
34 % Western Europe
18 % Eastern Europe
11 % Africa/Middle East
11 % North America
8 % Latin America
18 % Asia-Pacifi c
Employees
(at December 311)) 2006 % 2007 % 2008 % 2009 % 2010 %
Europe/Africa/Middle East 33,326 64.3 33,687 64.0 33,485 60.7 30,933 62.8 30,078 62.9
North America 6,651 12.8 6,438 12.2 7,360 13.4 5,714 11.6 5,440 11.4
Latin America 4,297 8.3 4,268 8.1 4,293 7.8 4,002 8.1 3,699 7.7
Asia-Pacific 7,545 14.6 8,235 15.7 10,004 18.1 8,613 17.5 8,637 18.0
Total 51,819 100.0 52,628 100.0 55,142 100.0 49,262 100.0 47,854 100.0
1) Base: permanent employees excluding apprentices.
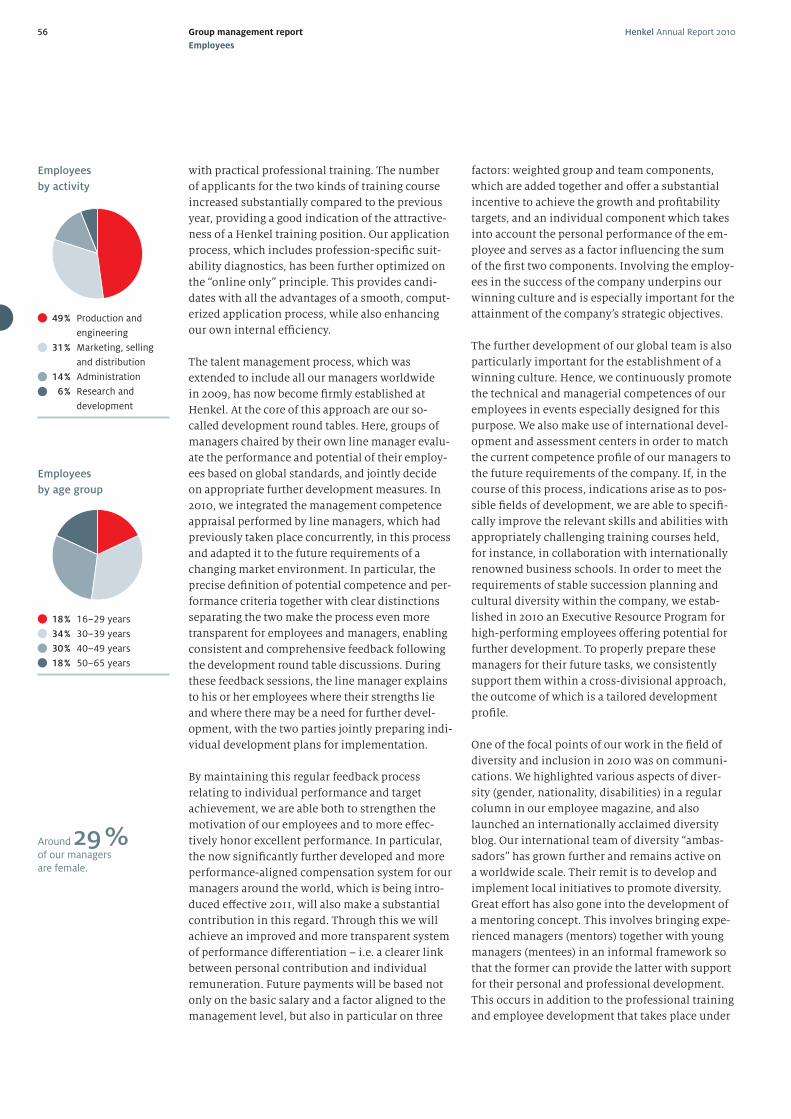
Henkel Annual Report 201056 Group management report
Employees
with practical professional training. The number
of applicants for the two kinds of training course
increased substantially compared to the previous
year, providing a good indication of the attractive-
ness of a Henkel training position. Our application
process, which includes profession-specifi c suit-
ability diagnostics, has been further optimized on
the “online only” principle. This provides candi-
dates with all the advantages of a smooth, comput-
erized application process, while also enhancing
our own internal effi ciency.
The talent management process, which was
extended to include all our managers worldwide
in 2009, has now become fi rmly established at
Henkel. At the core of this approach are our so-
called development round tables. Here, groups of
managers chaired by their own line manager evalu-
ate the performance and potential of their employ-
ees based on global standards, and jointly decide
on appropriate further development measures. In
2010, we integrated the management competence
appraisal performed by line managers, which had
previously taken place concurrently, in this process
and adapted it to the future requirements of a
changing market environment. In particular, the
precise defi nition of potential competence and per-
formance criteria together with clear distinctions
separating the two make the process even more
transparent for employees and managers, enabling
consistent and comprehensive feedback following
the development round table discussions. During
these feedback sessions, the line manager explains
to his or her employees where their strengths lie
and where there may be a need for further devel-
opment, with the two parties jointly preparing indi-
vidual development plans for implementation.
By maintaining this regular feedback process
relating to individual performance and target
achievement, we are able both to strengthen the
motivation of our employees and to more eff ec-
tively honor excellent performance. In particular,
the now signifi cantly further developed and more
performance-aligned compensation system for our
managers around the world, which is being intro-
duced eff ective 2011, will also make a substantial
contribution in this regard. Through this we will
achieve an improved and more transparent system
of performance diff erentiation – i.e. a clearer link
between personal contribution and individual
remuneration. Future payments will be based not
only on the basic salary and a factor aligned to the
management level, but also in particular on three
factors: weighted group and team components,
which are added together and off er a substantial
incentive to achieve the growth and profi tability
targets, and an individual component which takes
into account the personal performance of the em-
ployee and serves as a factor infl uencing the sum
of the fi rst two components. Involving the employ-
ees in the success of the company underpins our
winning culture and is especially important for the
attainment of the company’s strategic objectives.
The further development of our global team is also
particularly important for the establishment of a
winning culture. Hence, we continuously promote
the technical and managerial competences of our
employees in events especially designed for this
purpose. We also make use of international devel-
opment and assessment centers in order to match
the current competence profi le of our managers to
the future requirements of the company. If, in the
course of this process, indications arise as to pos-
sible fi elds of development, we are able to specifi -
cally improve the relevant skills and abilities with
appropriately challenging training courses held,
for instance, in collaboration with internationally
renowned business schools. In order to meet the
requirements of stable succession planning and
cultural diversity within the company, we estab-
lished in 2010 an Executive Resource Program for
high-performing employees off ering potential for
further development. To properly prepare these
managers for their future tasks, we consistently
support them within a cross-divisional approach,
the outcome of which is a tailored development
profi le.
One of the focal points of our work in the fi eld of
diversity and inclusion in 2010 was on communi-
cations. We highlighted various aspects of diver-
sity (gender, nationality, disabilities) in a regular
column in our employee magazine, and also
launched an internationally acclaimed diversity
blog. Our international team of diversity “ambas-
sadors” has grown further and remains active on
a worldwide scale. Their remit is to develop and
implement local initiatives to promote diversity.
Great eff ort has also gone into the development of
a mentoring concept. This involves bringing expe-
rienced managers (mentors) together with young
managers (mentees) in an informal framework so
that the former can provide the latter with support
for their personal and professional development.
This occurs in addition to the professional training
and employee development that takes place under
Employees
by age group
18 % 16–29 years
34 % 30–39 years
30 % 40–49 years
18 % 50–65 years
Around 29 % of our managers are female.
Employees
by activity
49 % Production and
engineering
31 % Marketing, selling
and distribution
14 % Administration
6 % Research and
development
04 Geschaftstatigkeit bis Nachhaltigkeit_E.indd 56 22.02.11 16:13
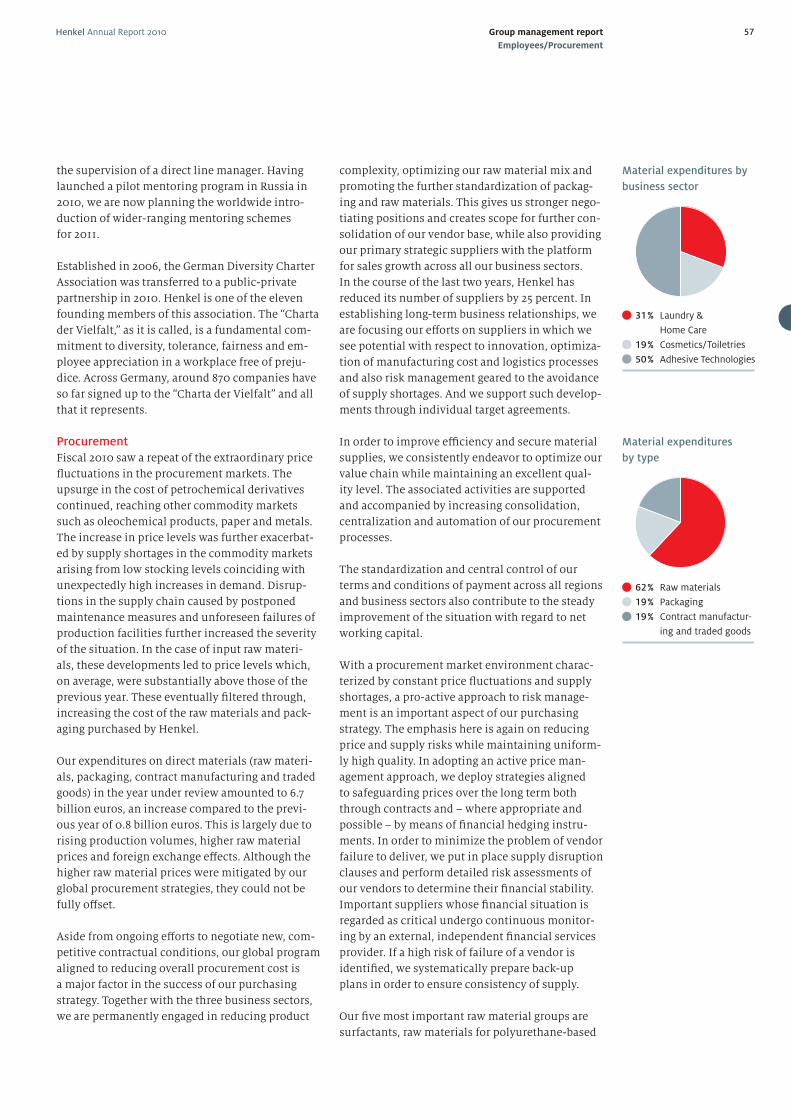
Henkel Annual Report 2010 57Group management report
Employees/Procurement
the supervision of a direct line manager. Having
launched a pilot mentoring program in Russia in
2010, we are now planning the worldwide intro-
duction of wider-ranging mentoring schemes
for 2011.
Established in 2006, the German Diversity Charter
Association was transferred to a public-private
partnership in 2010. Henkel is one of the eleven
founding members of this association. The “Charta
der Vielfalt,” as it is called, is a fundamental com-
mitment to diversity, tolerance, fairness and em-
ployee appreciation in a workplace free of preju-
dice. Across Germany, around 870 companies have
so far signed up to the “Charta der Vielfalt” and all
that it represents.
Procurement
Fiscal 2010 saw a repeat of the extraordinary price
fl uctuations in the procurement markets. The
upsurge in the cost of petrochemical derivatives
continued, reaching other commodity markets
such as oleochemical products, paper and metals.
The increase in price levels was further exacerbat-
ed by supply shortages in the commodity markets
arising from low stocking levels coinciding with
unexpectedly high increases in demand. Disrup-
tions in the supply chain caused by postponed
maintenance measures and unforeseen failures of
production facilities further increased the severity
of the situation. In the case of input raw materi-
als, these developments led to price levels which,
on average, were substantially above those of the
previous year. These eventually fi ltered through,
increasing the cost of the raw materials and pack-
aging purchased by Henkel.
Our expenditures on direct materials (raw materi-
als, packaging, contract manufacturing and traded
goods) in the year under review amounted to 6.7
billion euros, an increase compared to the previ-
ous year of 0.8 billion euros. This is largely due to
rising production volumes, higher raw material
prices and foreign exchange eff ects. Although the
higher raw material prices were mitigated by our
global procurement strategies, they could not be
fully off set.
Aside from ongoing eff orts to negotiate new, com-
petitive contractual conditions, our global program
aligned to reducing overall procurement cost is
a major factor in the success of our purchasing
strategy. Together with the three business sectors,
we are permanently engaged in reducing product
complexity, optimizing our raw material mix and
promoting the further standardization of packag-
ing and raw materials. This gives us stronger nego-
tiating positions and creates scope for further con-
solidation of our vendor base, while also providing
our primary strategic suppliers with the platform
for sales growth across all our business sectors.
In the course of the last two years, Henkel has
reduced its number of suppliers by 25 percent. In
establishing long-term business relationships, we
are focusing our eff orts on suppliers in which we
see potential with respect to innovation, optimiza-
tion of manufacturing cost and logistics processes
and also risk management geared to the avoidance
of supply shortages. And we support such develop-
ments through individual target agreements.
In order to improve effi ciency and secure material
supplies, we consistently endeavor to optimize our
value chain while maintaining an excellent qual-
ity level. The associated activities are supported
and accompanied by increasing consolidation,
centralization and automation of our procurement
processes.
The standardization and central control of our
terms and conditions of payment across all regions
and business sectors also contribute to the steady
improvement of the situation with regard to net
working capital.
With a procurement market environment charac-
terized by constant price fl uctuations and supply
shortages, a pro-active approach to risk manage-
ment is an important aspect of our purchasing
strategy. The emphasis here is again on reducing
price and supply risks while maintaining uniform-
ly high quality. In adopting an active price man-
agement approach, we deploy strategies aligned
to safeguarding prices over the long term both
through contracts and – where appropriate and
possible – by means of fi nancial hedging instru-
ments. In order to minimize the problem of vendor
failure to deliver, we put in place supply disruption
clauses and perform detailed risk assessments of
our vendors to determine their fi nancial stability.
Important suppliers whose fi nancial situation is
regarded as critical undergo continuous monitor-
ing by an external, independent fi nancial services
provider. If a high risk of failure of a vendor is
identifi ed, we systematically prepare back-up
plans in order to ensure consistency of supply.
Our fi ve most important raw material groups are
surfactants, raw materials for polyurethane-based
Material expenditures by
business sector
31 % Laundry &
Home Care
19 % Cosmetics/Toiletries
50 % Adhesive Technologies
Material expenditures
by type
62 % Raw materials
19 % Packaging
19 % Contract manufactur-
ing and traded goods
Henkel Annual Report 201058 Group management report
Procurement/Production
adhesives, raw materials for water-based adhesive
systems, raw materials for use in hotmelt adhe-
sives, and inorganic raw materials for use e.g. in
detergents and surface treatment products. These
account for around 31 percent of our total direct
material expenditures. Our fi ve largest suppliers
account for around 13 percent of our direct mate-
rial cost.
Because of the substantial improvement in
business in the course of the year under review,
demand for indirect materials and services also
increased, as did that for logistics services. At the
same time, we were able to reduce the purchase
prices paid compared to the previous year in all
categories through savings achieved at both the re-
gional and global level resulting from the sourcing
strategies implemented throughout the corpora-
tion. Expenditures increased overall by 0.5 billion
euros to 3.9 billion euros.
Production
Fiscal 2010 saw us further optimize our production
sites. Henkel operates 188 facilities in 57 countries.
Our largest production center is in Düsseldorf,
Germany. Here we manufacture not only deter-
gents and household cleaners but also adhesives
for consumers and craftsmen, and products for our
industrial customers.
Our Düsseldorf facility is also the largest produc-
tion site of the Laundry & Home Care business sec-
tor. Here we predominantly manufacture powder
and liquid detergents, fabric softeners and liquid
cleaning products. Overall, we have upgraded our
German-based production activities within our
European manufacturing concept. Consequently,
the Düsseldorf site has seen the commission-
ing of a new plant for the manufacture of liquid
laundry and home care products for the markets
of Germany, Benelux and Switzerland. In the year
under review, we further reduced the number of
production sites around the world from 33 to 31. By
concentrating our laundry and home care product
manufacturing activities on fewer, high-perfor-
mance factories close to our customers, we have
been able to achieve a number of signifi cant cost
and sustainability advantages.
Our biggest production plant serving the Cosmet-
ics/Toiletries business sector is located in Wasser-
trüdingen, Germany. In addition to body and hair
care products for consumers, we also manufacture
products for the salon business here. With eight
facilities worldwide, we have an effi cient manufac-
turing network serving our Cosmetics/Toiletries
business sector.
The two largest sites for Adhesive Technologies are
likewise located in Germany: in Düsseldorf – with
a portfolio of high-quality specialty adhesives
for industry and consumers – and in Heidelberg,
where we manufacture a broad range of adhesives
and sealants. As part of the program to optimize
our global production activities, we continued the
process of consolidating our production network
in 2010, reducing the number of factories by 13
to 149. We also intend to further streamline our
production network in accordance with regional
requirements in 2011 in order to further reduce
our manufacturing costs. At the same time, we are
expanding our capacities in the growth regions: in
2010, we took the decision to construct a plant in
China destined to be our largest facility worldwide.
We have improved our production network
throughout the Group within the framework of the
effi ciency enhancement programs implemented,
part of which involved further reducing the
number of manufacturing sites in the developed
markets. We have also cut complexity within the
overall value chain with respect to both production
and logistics, and specifi cally in product manu-
facturing and our vendor selection process. As a
result, we have been able to substantially increase
effi ciency and reduce cost.
Our optimization activities are also aligned to
making our manufacturing operations ever more
environmentally compatible. Measures to reduce
energy consumption and water usage make a direct
contribution to improving the climate compatibil-
ity of our manufacturing processes. New storage
concepts and the manufacture of packaging mate-
rials at the point of fi ll also reduce transportation,
likewise contributing to climate protection. For
further details relating to our environmental per-
formance, please refer to the sustainability report
on page 64.
The current and planned measures are expected to
contribute in equal measure to both cost optimiza-
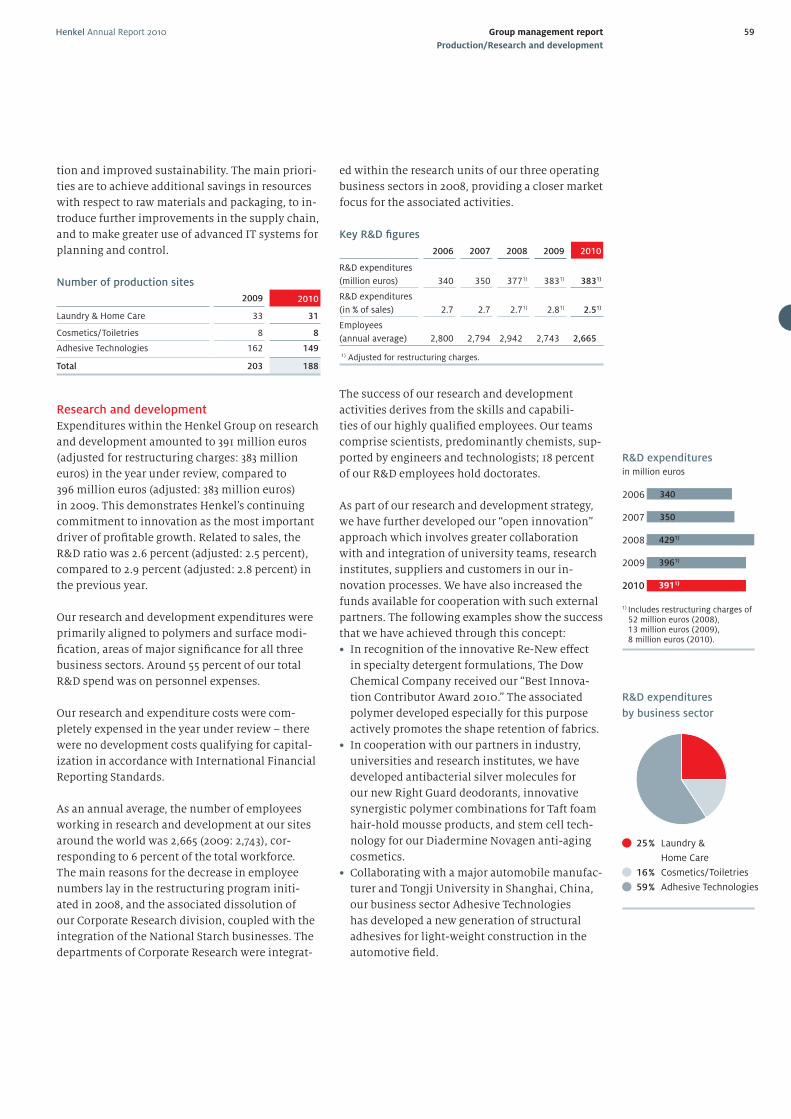
Henkel Annual Report 2010 59Group management report
Production/Research and development
tion and improved sustainability. The main priori-
ties are to achieve additional savings in resources
with respect to raw materials and packaging, to in-
troduce further improvements in the supply chain,
and to make greater use of advanced IT systems for
planning and control.
Number of production sites
2009 2010
Laundry & Home Care 33 31
Cosmetics/Toiletries 8 8
Adhesive Technologies 162 149
Total 203 188
Research and development
Expenditures within the Henkel Group on research
and development amounted to 391 million euros
(adjusted for restructuring charges: 383 million
euros) in the year under review, compared to
396 million euros (adjusted: 383 million euros)
in 2009. This demonstrates Henkel’s continuing
commitment to innovation as the most important
driver of profi table growth. Related to sales, the
R&D ratio was 2.6 percent (adjusted: 2.5 percent),
compared to 2.9 percent (adjusted: 2.8 percent) in
the previous year.
Our research and development expenditures were
primarily aligned to polymers and surface modi-
fi cation, areas of major signifi cance for all three
business sectors. Around 55 percent of our total
R&D spend was on personnel expenses.
Our research and expenditure costs were com-
pletely expensed in the year under review – there
were no development costs qualifying for capital-
ization in accordance with International Financial
Reporting Standards.
As an annual average, the number of employees
working in research and development at our sites
around the world was 2,665 (2009: 2,743), cor-
responding to 6 percent of the total workforce.
The main reasons for the decrease in employee
numbers lay in the restructuring program initi-
ated in 2008, and the associated dissolution of
our Corporate Research division, coupled with the
integration of the National Starch businesses. The
departments of Corporate Research were integrat-
ed within the research units of our three operating
business sectors in 2008, providing a closer market
focus for the associated activities.
Key R&D fi gures
2006 2007 2008 2009 2010
R&D expenditures
(million euros) 340 350 3771) 3831) 3831)
R&D expenditures
(in % of sales) 2.7 2.7 2.71) 2.81) 2.51)
Employees
(annual average) 2,800 2,794 2,942 2,743 2,665
1) Adjusted for restructuring charges.
The success of our research and development
activities derives from the skills and capabili-
ties of our highly qualifi ed employees. Our teams
comprise scientists, predominantly chemists, sup-
ported by engineers and technologists; 18 percent
of our R&D employees hold doctorates.
As part of our research and development strategy,
we have further developed our “open innovation”
approach which involves greater collaboration
with and integration of university teams, research
institutes, suppliers and customers in our in-
novation processes. We have also increased the
funds available for cooperation with such external
partners. The following examples show the success
that we have achieved through this concept:
• In recognition of the innovative Re-New eff ect
in specialty detergent formulations, The Dow
Chemical Company received our “Best Innova-
tion Contributor Award 2010.” The associated
polymer developed especially for this purpose
actively promotes the shape retention of fabrics.
• In cooperation with our partners in industry,
universities and research institutes, we have
developed antibacterial silver molecules for
our new Right Guard deodorants, innovative
synergistic polymer combinations for Taft foam
hair-hold mousse products, and stem cell tech-
nology for our Diadermine Novagen anti-aging
cosmetics.
• Collaborating with a major automobile manufac-
turer and Tongji University in Shanghai, China,
our business sector Adhesive Technologies
has developed a new generation of structural
adhesives for light-weight construction in the
automotive fi eld.
R&D expendituresin million euros
2006
2007
2008
2009
2010
340
350
4291)
3961)
3911)
1) Includes restructuring charges of 52 million euros (2008), 13 million euros (2009), 8 million euros (2010).
R&D expenditures
by business sector
25 % Laundry &
Home Care
16 % Cosmetics/Toiletries
59 % Adhesive Technologies
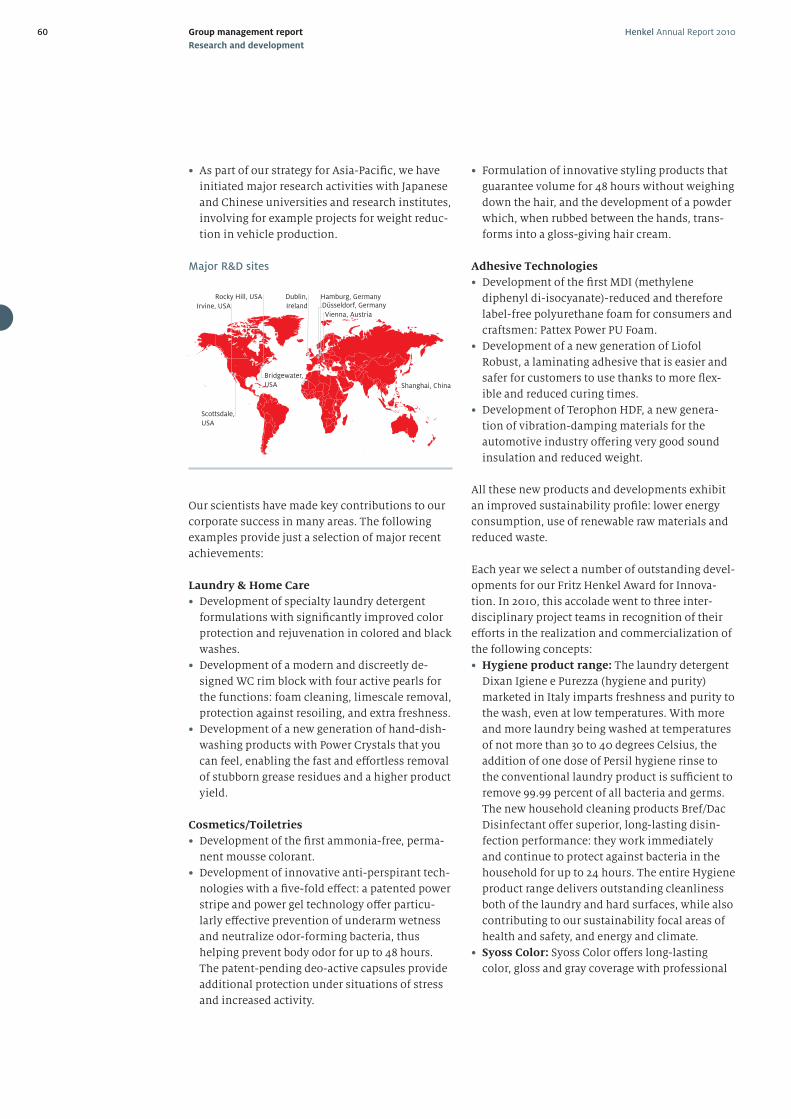
Henkel Annual Report 201060 Group management report
Research and development
• As part of our strategy for Asia-Pacifi c, we have
initiated major research activities with Japanese
and Chinese universities and research institutes,
involving for example projects for weight reduc-
tion in vehicle production.
Our scientists have made key contributions to our
corporate success in many areas. The following
examples provide just a selection of major recent
achievements:
Laundry & Home Care
• Development of specialty laundry detergent
formulations with signifi cantly improved color
protection and rejuvenation in colored and black
washes.
• Development of a modern and discreetly de-
signed WC rim block with four active pearls for
the functions: foam cleaning, limescale removal,
protection against resoiling, and extra freshness.
• Development of a new generation of hand-dish-
washing products with Power Crystals that you
can feel, enabling the fast and eff ortless removal
of stubborn grease residues and a higher product
yield.
Cosmetics/Toiletries
• Development of the fi rst ammonia-free, perma-
nent mousse colorant.
• Development of innovative anti-perspirant tech-
nologies with a fi ve-fold eff ect: a patented power
stripe and power gel technology off er particu-
larly eff ective prevention of underarm wetness
and neutralize odor-forming bacteria, thus
helping prevent body odor for up to 48 hours.
The patent-pending deo-active capsules provide
additional protection under situations of stress
and increased activity.
• Formulation of innovative styling products that
guarantee volume for 48 hours without weighing
down the hair, and the development of a powder
which, when rubbed between the hands, trans-
forms into a gloss-giving hair cream.
Adhesive Technologies
• Development of the fi rst MDI (methylene
diphenyl di-isocyanate)-reduced and therefore
label-free polyurethane foam for consumers and
craftsmen: Pattex Power PU Foam.
• Development of a new generation of Liofol
Robust, a laminating adhesive that is easier and
safer for customers to use thanks to more fl ex-
ible and reduced curing times.
• Development of Terophon HDF, a new genera-
tion of vibration-damping materials for the
automotive industry off ering very good sound
insulation and reduced weight.
All these new products and developments exhibit
an improved sustainability profi le: lower energy
consumption, use of renewable raw materials and
reduced waste.
Each year we select a number of outstanding devel-
opments for our Fritz Henkel Award for Innova-
tion. In 2010, this accolade went to three inter-
disciplinary project teams in recognition of their
eff orts in the realization and commercialization of
the following concepts:
• Hygiene product range: The laundry detergent
Dixan Igiene e Purezza (hygiene and purity)
marketed in Italy imparts freshness and purity to
the wash, even at low temperatures. With more
and more laundry being washed at temperatures
of not more than 30 to 40 degrees Celsius, the
addition of one dose of Persil hygiene rinse to
the conventional laundry product is suffi cient to
remove 99.99 percent of all bacteria and germs.
The new household cleaning products Bref/Dac
Disinfectant off er superior, long-lasting disin-
fection performance: they work immediately
and continue to protect against bacteria in the
household for up to 24 hours. The entire Hygiene
product range delivers outstanding cleanliness
both of the laundry and hard surfaces, while also
contributing to our sustainability focal areas of
health and safety, and energy and climate.
• Syoss Color: Syoss Color off ers long-lasting
color, gloss and gray coverage with professional
Düsseldorf, GermanyDublin,
Ireland
Scottsdale,
USA
Rocky Hill, USA
Shanghai, China
Hamburg, Germany
Irvine, USAVienna, Austria
Bridgewater,
USA
Major R&D sites
Henkel Annual Report 2010 61Group management report
Research and development/Marketing and distribution
quality at an aff ordable price for at-home ap-
plications. The permanent colorant contains a
high-performance formula with a color-inten-
sive pigment blend, delivering a true, intensive
and lustrous look. Syoss Color ensures that the
pigment blend is sealed deep into the hair, to
produce long-lasting, intensive colors. The color
sealing conditioner with Nutri-Care Complex
structures the hair after coloration from the
inside out, generating a scintillating shine.
• Loctite HF: Our halogen-free structural adhe-
sives are used by the most innovative manu-
facturers of portable electronic devices. These
unique adhesives create particularly strong, fast-
curing and resistant bonds between a variety of
materials. In addition to the patented halogen-
free curing system, the fl ow behavior and
reaction speed can also be tailored to individual
requirements, ensuring reliable dosage applica-
tion and curing even in the case of extremely
thin adhesive fi lms of 0.3 millimeters or less.
We currently hold some 7,500 patents as protection
for our technologies around the world. We also
have around 5,000 patent applications pending,
and own approximately 2,000 registered designs
safeguarding our intellectual property.
Further information on our research and devel-
opment activities can be found on our website
www.henkel.com/innovation
Marketing and distribution
Our customers are at the center of what we do.
Consequently, we align our marketing and distri-
bution activities in each of our business sectors to
the respective requirements of our various target
groups.
At Laundry & Home Care, our marketing activities
are controlled from headquarters and regional
competence centers. Our approach is to prioritize
product categories in order to target investments
in the brands and market segments of greatest
importance for us with a view to generating
disproportionate growth in those areas. Our sales
and distribution activities, on the other hand, are
planned on a country-specifi c basis and coordi-
nated at the regional level. Our primary direct
customer grouping is the grocery retail trade with
distribution channels in the form of supermarkets,
mass merchandizers/hypermarkets and discount
stores. In Europe, drug stores are also extremely
important, while in the markets outside Europe
and North America, a large proportion of sales
continues to be channeled via wholesalers and
distributors. Our Sales unit provides a full range
of competences in serving our trade customers. In
marketing, however, we focus on the requirements
of the end consumer. Our Marketing unit initi-
ates innovation processes, applying knowledge
acquired from market research and analysis. In
order to address consumers directly, our market-
ing teams also develop and implement especially
targeted media strategies and advertising formats.
At the Cosmetics/Toiletries business sector, our
marketing strategies are globally developed and lo-
cally implemented in the case of both our branded
consumer goods and our professional hair salon
business. Here too, our sales activities are con-
trolled on a national level while being increasingly
internationally coordinated. We communicate
with consumers primarily through media advertis-
ing and point-of-sale measures. Our communica-
tion and advertising activities involving the new
web-based media have recently been intensifi ed.
Consumers purchase our products from retailers,
primarily in the form of drug stores, grocery stores,
supermarkets and department stores. We ad-
dress our customers in the salon business directly
through the activities of our sales force. Field sales
representatives support the salons at a local level
with, for example, product demonstrations and
technical advice. As an additional service, we also
off er specialist seminars and training courses in
our globally established Schwarzkopf academies.
Our Adhesive Technologies business sector serves
a wide range of clientèle from large, international-
ly active corporations to small and medium-sized
industrial businesses, craftsmen, do-it-yourselfers
and private home consumers, all with specifi c
needs and applications.
For the most part, our customers are addressed
by our own sales personnel. Our direct custom-
ers are industrial clients and retail companies;
these latter are able to meet demand from private
users, craftsmen and small industrial customers
more effi ciently than is possible through direct
sales. While the grocery retailers, DIY stores and
Henkel Annual Report 201062 Group management report
Marketing and distribution/Sustainability
specialist retailers are of great importance for the
private user, craftsmen purchase our products
primarily from specialist wholesalers. Due to our
unique global position, we are able to support in-
ternationally active customers such as automobile
manufacturers or large retail chains eff ectively and
comprehensively with key account management
teams. As many of our products are characterized
by their high technical complexity, our Technical
Customer Services and the training of users also
have an important role to play. The staff at Techni-
cal Customer Services possess detailed knowledge
both of the properties of our products and of their
customer-specifi c application, and can therefore
assist our clients in everything from the choice of
the right product to optimization of their manufac-
turing processes.
The close contact maintained by our employees
with our customers and users is also an important
source of input for innovation, enabling us to
meet existing requirements even more eff ectively
and to fi nd new applications for our adhesives.
We develop our marketing strategies at both the
global and regional level. We then implement the
measures derived at the local level. In the case of
the private consumer, we mainly use classic media
advertising with complementary promotional and
support activities at the point of sale. We serve
professional craftsmen and industrial customers
primarily through our Sales organization. This of-
fers technical advice, product demonstrations and
training courses and also organizes appearances at
industrial fairs. Much of our marketing activity is
aligned to our strong, internationally established
brands as key components in our service off ering.
Sustainability
Maintaining a balance between economic success,
protection of the environment, and social respon-
sibility has been fundamental to our corporate
culture for decades, and this is refl ected in our cor-
porate values. Our pursuit of sustainability is both
long-term and entrepreneurial in nature, covering
all of our activities throughout the value chain.
Having invested many years of focused eff ort in
the cause of sustainable development, we have
built up an excellent reputation as a company with
globally leading positions in this arena. And we are
determined to remain in the vanguard of sustain-
ability. The foundation for this is provided by our
48,000 employees around the world, in whose
minds the principles of sustainable development
are fi rmly anchored, guiding their attitudes and
actions. Our corporate values play a key role in
this regard. They provide orientation for our daily
decision-making and are therefore the basis for
long-term corporate success rooted in clear value
concepts.
We are convinced that sustainable business prac-
tices will contribute to the successful pursuit of
our strategic priorities and thus to the long-term
growth of our company. Our insistence that each
new product must combine high quality with
responsibility toward people and the environment
results in more effi cient products and improved
technical solutions. Sustainability is therefore a
key innovation driver, encouraging us to achieve
our full business potential. With our decades of ex-
perience in sustainable development, we are able
to off er our customers and consumers solutions
that are fi t for the future and to position ourselves
as a leading partner in the areas of competence
within which we operate. Internally, responsible
and sustainable business practices strengthen
both the identifi cation of our employees with the
company and their motivation. Our sustainability
credentials are also bound to become increasingly
important in the competition for new talent in the
recruitment market.
Once again in 2010, our progress and performance
with respect to sustainable development im-
pressed a range of external experts, as refl ected in
various global and national sustainability ratings.
For example, we are present in the Dow Jones
Sustainability World and in the Dow Jones Sustain-
ability Europe indexes, again being named Sustain-
ability Leader and the only company present in the
Nondurable Household Products market sector.
Our inclusion in the FTSE4Good index was also
Recipient of the Walmart Sustainability Award for a second year running.
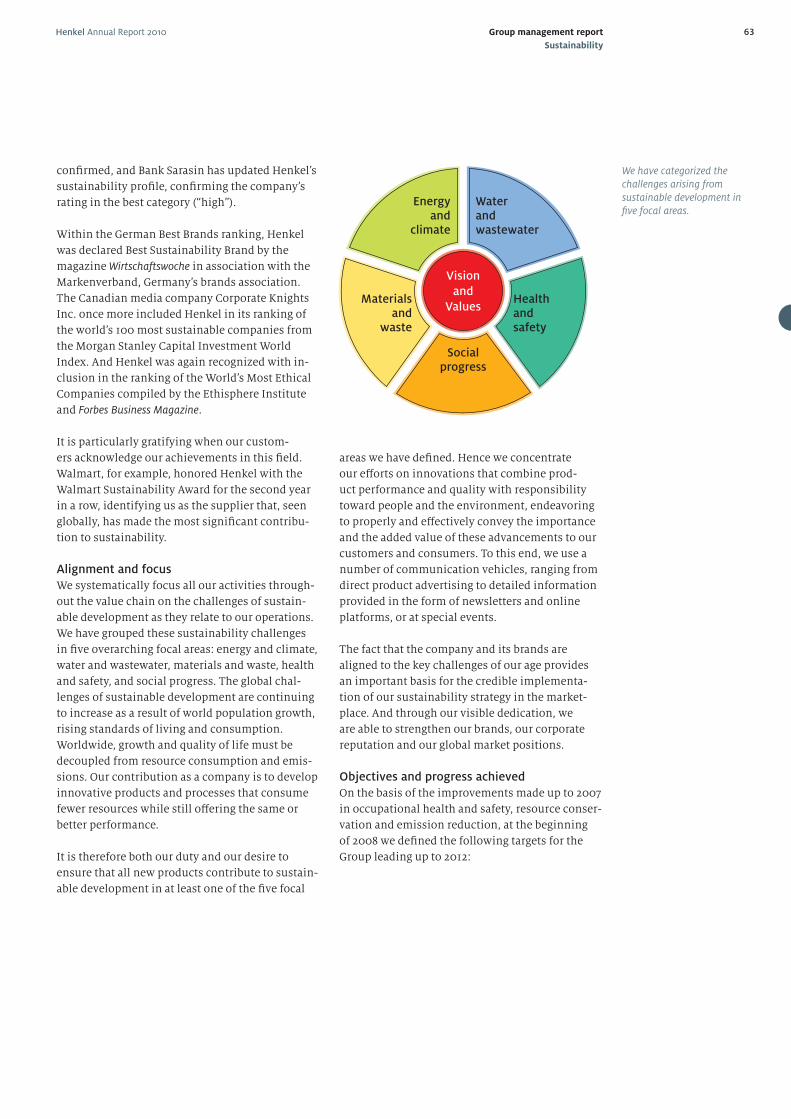
Henkel Annual Report 2010 63Group management report
Sustainability
confi rmed, and Bank Sarasin has updated Henkel’s
sustainability profi le, confi rming the company’s
rating in the best category (“high”).
Within the German Best Brands ranking, Henkel
was declared Best Sustainability Brand by the
magazine Wirtschaftswoche in association with the
Markenverband, Germany’s brands association.
The Canadian media company Corporate Knights
Inc. once more included Henkel in its ranking of
the world’s 100 most sustainable companies from
the Morgan Stanley Capital Investment World
Index. And Henkel was again recognized with in-
clusion in the ranking of the World’s Most Ethical
Companies compiled by the Ethisphere Institute
and Forbes Business Magazine.
It is particularly gratifying when our custom-
ers acknowledge our achievements in this fi eld.
Walmart, for example, honored Henkel with the
Walmart Sustainability Award for the second year
in a row, identifying us as the supplier that, seen
globally, has made the most signifi cant contribu-
tion to sustainability.
Alignment and focus
We systematically focus all our activities through-
out the value chain on the challenges of sustain-
able development as they relate to our operations.
We have grouped these sustainability challenges
in fi ve overarching focal areas: energy and climate,
water and wastewater, materials and waste, health
and safety, and social progress. The global chal-
lenges of sustainable development are continuing
to increase as a result of world population growth,
rising standards of living and consumption.
Worldwide, growth and quality of life must be
decoupled from resource consumption and emis-
sions. Our contribution as a company is to develop
innovative products and processes that consume
fewer resources while still off ering the same or
better performance.
It is therefore both our duty and our desire to
ensure that all new products contribute to sustain-
able development in at least one of the fi ve focal
areas we have defi ned. Hence we concentrate
our eff orts on innovations that combine prod-
uct performance and quality with responsibility
toward people and the environment, endeavoring
to properly and eff ectively convey the importance
and the added value of these advancements to our
customers and consumers. To this end, we use a
number of communication vehicles, ranging from
direct product advertising to detailed information
provided in the form of newsletters and online
platforms, or at special events.
The fact that the company and its brands are
aligned to the key challenges of our age provides
an important basis for the credible implementa-
tion of our sustainability strategy in the market-
place. And through our visible dedication, we
are able to strengthen our brands, our corporate
reputation and our global market positions.
Objectives and progress achieved
On the basis of the improvements made up to 2007
in occupational health and safety, resource conser-
vation and emission reduction, at the beginning
of 2008 we defi ned the following targets for the
Group leading up to 2012:
We have categorized the challenges arising from sustainable development in fi ve focal areas.
Energyand
climate
Materialsand
waste
Waterandwastewater
Healthandsafety
Socialprogress
Visionand
Values
Henkel Annual Report 201064 Group management report
Sustainability
Organization
The Henkel Management Board bears overall
responsibility for our sustainability strategy and
objectives, and hence the pursuit thereof within
the corporation. A Sustainability Council steers
our global sustainability activities in collaboration
with the individual business sectors and functions,
and our regional and national affi liated companies.
By joining the United Nations Global Compact
in July 2003, we also publicly underscored our
commitment to respect human rights and funda-
mental labor standards, to promote environmental
protection and to work against all forms of corrup-
tion. Our understanding of socially responsible
behavior has been specifi ed and communicated
to our employees throughout the entire Group
in our Code of Corporate Sustainability and our
Code of Conduct. From these codes are derived our
more detailed internal standards governing safety,
health and environmental protection, our social
standards and our Group purchasing standards.
Compliance with these rules and requirements
is regularly monitored throughout the Group by
internal audits performed at our production and
administration sites, and also – increasingly – au-
dits at our toll manufacturers and logistics centers.
In addition, Henkel companies have their manage-
ment systems externally certifi ed. As of the end
of 2010, 71 percent of our production volume was
generated at sites which have obtained certifi ca-
tion to international environmental management
standard ISO 14001.
As a responsible corporate citizen, Henkel provides
fi nancial aid for numerous projects aligned to
social needs, the environment, education, science,
health, sport, art and culture. In 2010, the total
allocation was 2.9 million euros. Forty percent of
this sum was entrusted to our MIT initiative (Make
an Impact on Tomorrow), through which we have
been supporting the volunteering activities of our
employees and retirees since 1998. In 2010, we pro-
vided aid to MIT projects in 72 diff erent countries.
In addition to cash donations, we also support
projects with in-kind and product donations, as
well as granting the volunteers paid time off from
work.
We participated in the “Product Carbon Footprint” pilot project in Germany with products from all three of our business sectors.
• To reduce energy consumption per ton of output
by a further 15 percent.
• To reduce water consumption per ton of output
by a further 10 percent.
• To reduce waste per ton of output by a further
10 percent.
• To reduce occupational accidents per million
hours worked by a further 20 percent.
Thanks to the high level of commitment of our em-
ployees, we were already able to achieve the targets
for our production sites by 2010. We are convinced
that the advances in both resource effi ciency and
cost eff ectiveness will also make an important
contribution toward achieving our 2012 fi nancial
targets. We have initiated the process of defi ning
new sustainability targets for the coming years.
Sustainability performance 2007 to 2010
Environmental indicators per ton of output
Energy consumption –21 %
Water consumption –26 %
Waste footprint –24 %
Occupational accidents1) –29 %
1) Per million hours worked.
By optimizing our own production processes and
our value chains, we – together with our partners
– make relevant contributions to climate protec-
tion. For example, many of our products help our
customers and consumers to save energy. These
include adhesives and sealants, and also laundry
and home care products that are able to unleash
their cleaning power at low temperatures. With
high-quality sealants, it is possible to save up to
1,000 times more in emissions over the lifetime of
a window than originally caused by the manufac-
ture of those sealants.
Appropriate metrics need to be developed in order
to communicate these contributions in a persua-
sive and credible manner. Keen to drive progress in
this arena, we were involved in the Product Carbon
Footprint pilot project with products from all three
of our business sectors, and are participating fully
in the related national and international discus-
sions.
04 Geschaftstatigkeit bis Nachhaltigkeit_E.indd 64 22.02.11 16:13
Henkel Annual Report 2010 65Group management report
Sustainability
Stakeholder dialogue
Viable solutions promoting sustainability can
only be developed in dialogue with all the rel-
evant social groups. These include our employees,
shareholders, customers, suppliers, civil authori-
ties, politicians, associations, governmental and
non-governmental organizations, academia and
the public at large. We view the dialogue with our
stakeholders as an opportunity to identify the
needs of our diff erent markets at an early stage and
to defi ne the directions which our activities should
take. Our dialogue with various stakeholders
enables us to access new ideas for our company,
which fl ow continuously into our strategy develop-
ment and reporting.
We deploy a wide range of communication instru-
ments in order to meet the specifi c information
requirements of our stakeholders. More details and
background reading on the subject of sustainabil-
ity can be found in our Sustainability Report.
With this, we document the high priority assigned
to the pursuit of sustainable development by our
company, at the same time satisfying the reporting
obligations laid down in the United Nations Global
Compact.
We regard the promotion of sustainable con-
sumption as a key responsibility in the coming
years. This requires not just the development of
appropriate products, but also political support
and collaboration with consumers. We therefore
strive continuously to raise awareness of this issue
among actors at all levels through our involvement
in associations, working groups and at confer-
ences, by engaging in a dialogue with politicians
and non-governmental organizations, and through
product communication.
In addition, we participate in national and in-
ternational initiatives, for example in the World
Business Council for Sustainable Development
(WBCSD) and in the Consumer Goods Forum
founded in 2009. Thanks to our many years of
experience in sustainable business, we fi nd we are
much valued as partners in such collaborations.
Further information, reports, background details
and the latest news on sustainable development at
Henkel can be found on our website:
www.henkel.com/sustainability
Sustainability Report 2010
Detailed information and back-ground reading on the subject of sustainability can be found in our Sustainability Report which is available in both printed and online form.
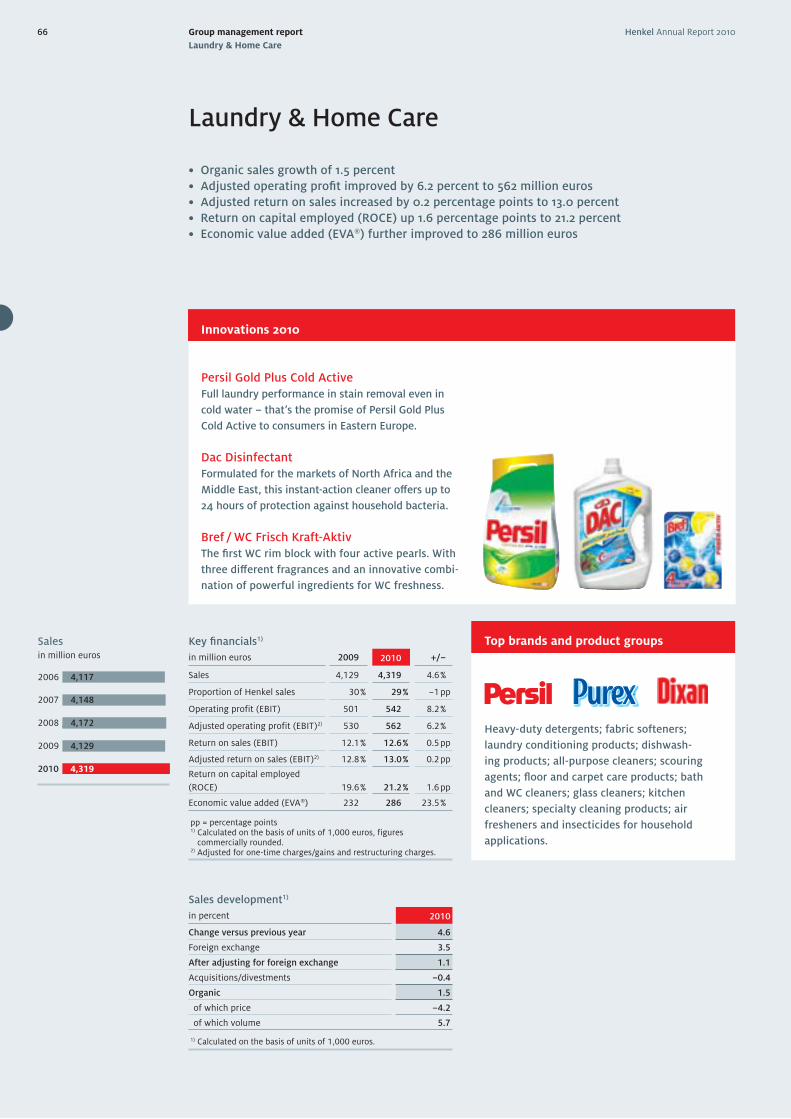
Henkel Annual Report 201066 Group management report
Laundry & Home Care
Laundry & Home Care
• Organic sales growth of 1.5 percent
• Adjusted operating profi t improved by 6.2 percent to 562 million euros
• Adjusted return on sales increased by 0.2 percentage points to 13.0 percent
• Return on capital employed (ROCE) up 1.6 percentage points to 21.2 percent
• Economic value added (EVA®) further improved to 286 million euros
Bref / WC Frisch Kraft-Aktiv
The fi rst WC rim block with four active pearls. With
three diff erent fragrances and an innovative combi-
nation of powerful ingredients for WC freshness.
Innovations 2010
Heavy-duty detergents; fabric softeners;
laundry conditioning products; dishwash-
ing products; all-purpose cleaners; scouring
agents; fl oor and carpet care products; bath
and WC cleaners; glass cleaners; kitchen
cleaners; specialty cleaning products; air
fresheners and insecticides for household
applications.
Top brands and product groups Key fi nancials1)
in million euros 2009 2010 +/–
Sales 4,129 4,319 4.6 %
Proportion of Henkel sales 30 % 29 % –1 pp
Operating profit (EBIT) 501 542 8.2 %
Adjusted operating profit (EBIT)2) 530 562 6.2 %
Return on sales (EBIT) 12.1 % 12.6 % 0.5 pp
Adjusted return on sales (EBIT)2) 12.8 % 13.0 % 0.2 pp
Return on capital employed
(ROCE) 19.6 % 21.2 % 1.6 pp
Economic value added (EVA®) 232 286 23.5 %
pp = percentage points 1) Calculated on the basis of units of 1,000 euros, figures
commercially rounded. 2) Adjusted for one-time charges/gains and restructuring charges.
Salesin million euros
2006
2007
2008
2009
2010
4,117
4,148
4,172
4,129
4,319
Sales development1)
in percent 2010
Change versus previous year 4.6
Foreign exchange 3.5
After adjusting for foreign exchange 1.1
Acquisitions/divestments –0.4
Organic 1.5
of which price –4.2
of which volume 5.7
1) Calculated on the basis of units of 1,000 euros.
Persil Gold Plus Cold Active
Full laundry performance in stain removal even in
cold water – that’s the promise of Persil Gold Plus
Cold Active to consumers in Eastern Europe.
Dac Disinfectant
Formulated for the markets of North Africa and the
Middle East, this instant-action cleaner off ers up to
24 hours of protection against household bacteria.
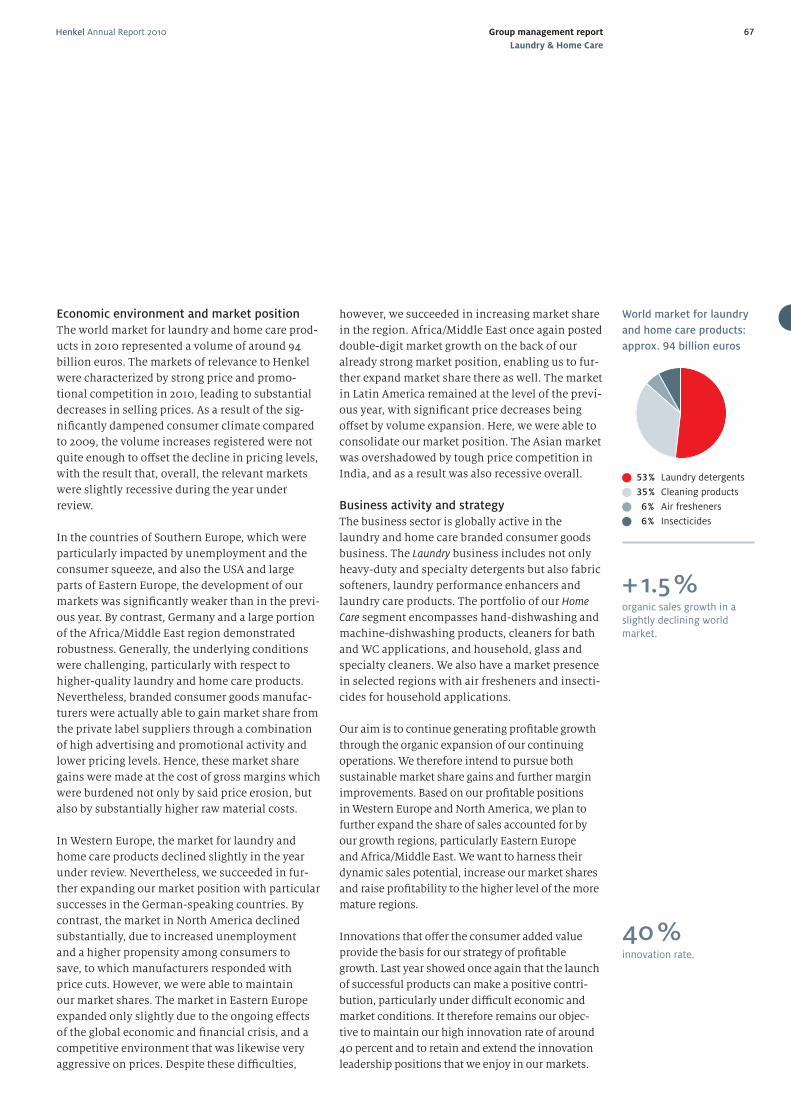
Henkel Annual Report 2010 67Group management report
Laundry & Home Care
however, we succeeded in increasing market share
in the region. Africa/Middle East once again posted
double-digit market growth on the back of our
already strong market position, enabling us to fur-
ther expand market share there as well. The market
in Latin America remained at the level of the previ-
ous year, with signifi cant price decreases being
off set by volume expansion. Here, we were able to
consolidate our market position. The Asian market
was overshadowed by tough price competition in
India, and as a result was also recessive overall.
Business activity and strategy
The business sector is globally active in the
laundry and home care branded consumer goods
business. The Laundry business includes not only
heavy-duty and specialty detergents but also fabric
softeners, laundry performance enhancers and
laundry care products. The portfolio of our Home
Care segment encompasses hand-dishwashing and
machine-dishwashing products, cleaners for bath
and WC applications, and household, glass and
specialty cleaners. We also have a market presence
in selected regions with air fresheners and insecti-
cides for household applications.
Our aim is to continue generating profi table growth
through the organic expansion of our continuing
operations. We therefore intend to pursue both
sustainable market share gains and further margin
improvements. Based on our profi table positions
in Western Europe and North America, we plan to
further expand the share of sales accounted for by
our growth regions, particularly Eastern Europe
and Africa/Middle East. We want to harness their
dynamic sales potential, increase our market shares
and raise profi tability to the higher level of the more
mature regions.
Innovations that off er the consumer added value
provide the basis for our strategy of profi table
growth. Last year showed once again that the launch
of successful products can make a positive contri-
bution, particularly under diffi cult economic and
market conditions. It therefore remains our objec-
tive to maintain our high innovation rate of around
40 percent and to retain and extend the innovation
leadership positions that we enjoy in our markets.
Economic environment and market position
The world market for laundry and home care prod-
ucts in 2010 represented a volume of around 94
billion euros. The markets of relevance to Henkel
were characterized by strong price and promo-
tional competition in 2010, leading to substantial
decreases in selling prices. As a result of the sig-
nifi cantly dampened consumer climate compared
to 2009, the volume increases registered were not
quite enough to off set the decline in pricing levels,
with the result that, overall, the relevant markets
were slightly recessive during the year under
review.
In the countries of Southern Europe, which were
particularly impacted by unemployment and the
consumer squeeze, and also the USA and large
parts of Eastern Europe, the development of our
markets was signifi cantly weaker than in the previ-
ous year. By contrast, Germany and a large portion
of the Africa/Middle East region demonstrated
robustness. Generally, the underlying conditions
were challenging, particularly with respect to
higher-quality laundry and home care products.
Nevertheless, branded consumer goods manufac-
turers were actually able to gain market share from
the private label suppliers through a combination
of high advertising and promotional activity and
lower pricing levels. Hence, these market share
gains were made at the cost of gross margins which
were burdened not only by said price erosion, but
also by substantially higher raw material costs.
In Western Europe, the market for laundry and
home care products declined slightly in the year
under review. Nevertheless, we succeeded in fur-
ther expanding our market position with particular
successes in the German-speaking countries. By
contrast, the market in North America declined
substantially, due to increased unemployment
and a higher propensity among consumers to
save, to which manufacturers responded with
price cuts. However, we were able to maintain
our market shares. The market in Eastern Europe
expanded only slightly due to the ongoing eff ects
of the global economic and fi nancial crisis, and a
competitive environment that was likewise very
aggressive on prices. Despite these diffi culties,
World market for laundry
and home care products:
approx. 94 billion euros
53 % Laundry detergents
35 % Cleaning products
6 % Air fresheners
6 % Insecticides
+ 1.5 %organic sales growth in aslightly declining world market.
40 %innovation rate.
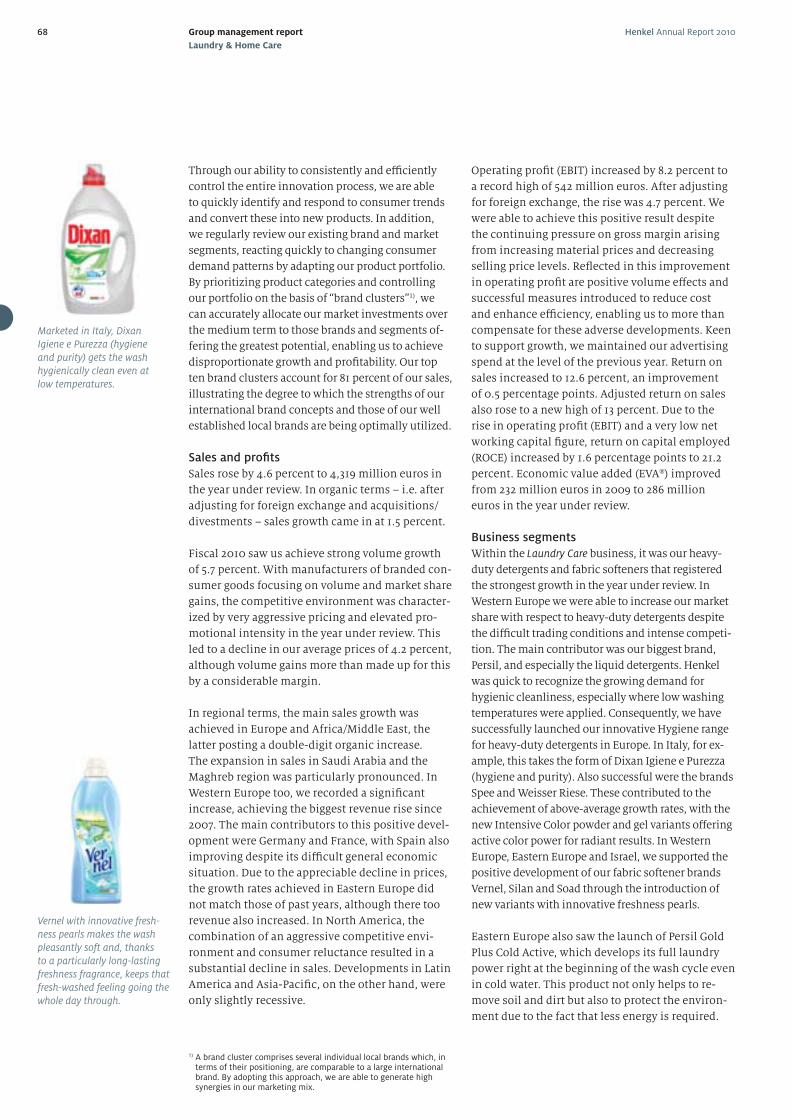
68 Henkel Annual Report 2010Group management report
Laundry & Home Care
Through our ability to consistently and effi ciently
control the entire innovation process, we are able
to quickly identify and respond to consumer trends
and convert these into new products. In addition,
we regularly review our existing brand and market
segments, reacting quickly to changing consumer
demand patterns by adapting our product portfolio.
By prioritizing product categories and controlling
our portfolio on the basis of “brand clusters”1), we
can accurately allocate our market investments over
the medium term to those brands and segments of-
fering the greatest potential, enabling us to achieve
disproportionate growth and profi tability. Our top
ten brand clusters account for 81 percent of our sales,
illustrating the degree to which the strengths of our
international brand concepts and those of our well
established local brands are being optimally utilized.
Sales and profi ts
Sales rose by 4.6 percent to 4,319 million euros in
the year under review. In organic terms – i.e. after
adjusting for foreign exchange and acquisitions/
divestments – sales growth came in at 1.5 percent.
Fiscal 2010 saw us achieve strong volume growth
of 5.7 percent. With manufacturers of branded con-
sumer goods focusing on volume and market share
gains, the competitive environment was character-
ized by very aggressive pricing and elevated pro-
motional intensity in the year under review. This
led to a decline in our average prices of 4.2 percent,
although volume gains more than made up for this
by a considerable margin.
In regional terms, the main sales growth was
achieved in Europe and Africa/Middle East, the
latter posting a double-digit organic increase.
The expansion in sales in Saudi Arabia and the
Maghreb region was particularly pronounced. In
Western Europe too, we recorded a signifi cant
increase, achieving the biggest revenue rise since
2007. The main contributors to this positive devel-
opment were Germany and France, with Spain also
improving despite its diffi cult general economic
situation. Due to the appreciable decline in prices,
the growth rates achieved in Eastern Europe did
not match those of past years, although there too
revenue also increased. In North America, the
combination of an aggressive competitive envi-
ronment and consumer reluctance resulted in a
substantial decline in sales. Developments in Latin
America and Asia-Pacifi c, on the other hand, were
only slightly recessive.
Operating profi t (EBIT) increased by 8.2 percent to
a record high of 542 million euros. After adjusting
for foreign exchange, the rise was 4.7 percent. We
were able to achieve this positive result despite
the continuing pressure on gross margin arising
from increasing material prices and decreasing
selling price levels. Refl ected in this improvement
in operating profi t are positive volume eff ects and
successful measures introduced to reduce cost
and enhance effi ciency, enabling us to more than
compensate for these adverse developments. Keen
to support growth, we maintained our advertising
spend at the level of the previous year. Return on
sales increased to 12.6 percent, an improvement
of 0.5 percentage points. Adjusted return on sales
also rose to a new high of 13 percent. Due to the
rise in operating profi t (EBIT) and a very low net
working capital fi gure, return on capital employed
(ROCE) increased by 1.6 percentage points to 21.2
percent. Economic value added (EVA®) improved
from 232 million euros in 2009 to 286 million
euros in the year under review.
Business segments
Within the Laundry Care business, it was our heavy-
duty detergents and fabric softeners that registered
the strongest growth in the year under review. In
Western Europe we were able to increase our market
share with respect to heavy-duty detergents despite
the diffi cult trading conditions and intense competi-
tion. The main contributor was our biggest brand,
Persil, and especially the liquid detergents. Henkel
was quick to recognize the growing demand for
hygienic cleanliness, especially where low washing
temperatures were applied. Consequently, we have
successfully launched our innovative Hygiene range
for heavy-duty detergents in Europe. In Italy, for ex-
ample, this takes the form of Dixan Igiene e Purezza
(hygiene and purity). Also successful were the brands
Spee and Weisser Riese. These contributed to the
achievement of above-average growth rates, with the
new Intensive Color powder and gel variants off ering
active color power for radiant results. In Western
Europe, Eastern Europe and Israel, we supported the
positive development of our fabric softener brands
Vernel, Silan and Soad through the introduction of
new variants with innovative freshness pearls.
Eastern Europe also saw the launch of Persil Gold
Plus Cold Active, which develops its full laundry
power right at the beginning of the wash cycle even
in cold water. This product not only helps to re-
move soil and dirt but also to protect the environ-
ment due to the fact that less energy is required.
Vernel with innovative fresh-ness pearls makes the wash pleasantly soft and, thanks to a particularly long-lasting freshness fragrance, keeps that fresh-washed feeling going the whole day through.
Marketed in Italy, Dixan Igiene e Purezza (hygiene and purity) gets the wash hygienically clean even at low temperatures.
1) A brand cluster comprises several individual local brands which, in terms of their positioning, are comparable to a large international brand. By adopting this approach, we are able to generate high synergies in our marketing mix.
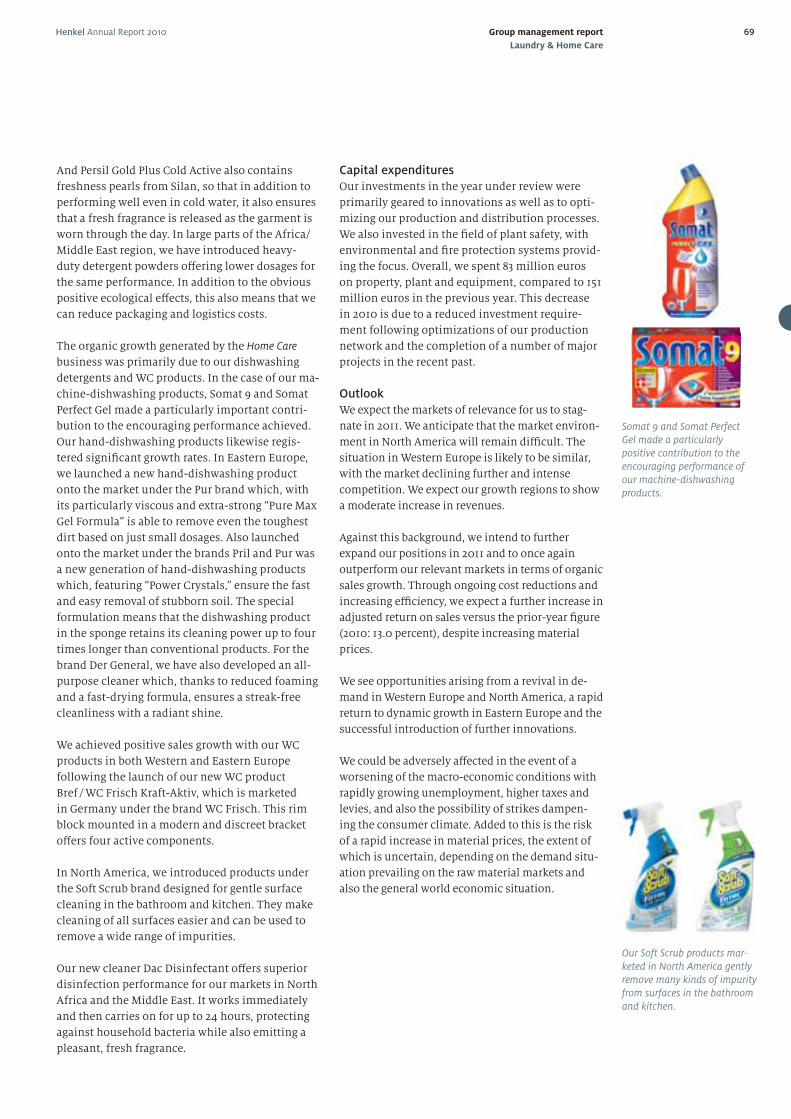
Henkel Annual Report 2010 69Group management report
Laundry & Home Care
Capital expenditures
Our investments in the year under review were
primarily geared to innovations as well as to opti-
mizing our production and distribution processes.
We also invested in the fi eld of plant safety, with
environmental and fi re protection systems provid-
ing the focus. Overall, we spent 83 million euros
on property, plant and equipment, compared to 151
million euros in the previous year. This decrease
in 2010 is due to a reduced investment require-
ment following optimizations of our production
network and the completion of a number of major
projects in the recent past.
Outlook
We expect the markets of relevance for us to stag-
nate in 2011. We anticipate that the market environ-
ment in North America will remain diffi cult. The
situation in Western Europe is likely to be similar,
with the market declining further and intense
competition. We expect our growth regions to show
a moderate increase in revenues.
Against this background, we intend to further
expand our positions in 2011 and to once again
outperform our relevant markets in terms of organic
sales growth. Through ongoing cost reductions and
increasing effi ciency, we expect a further increase in
adjusted return on sales versus the prior-year fi gure
(2010: 13.0 percent), despite increasing material
prices.
We see opportunities arising from a revival in de-
mand in Western Europe and North America, a rapid
return to dynamic growth in Eastern Europe and the
successful introduction of further innovations.
We could be adversely aff ected in the event of a
worsening of the macro-economic conditions with
rapidly growing unemployment, higher taxes and
levies, and also the possibility of strikes dampen-
ing the consumer climate. Added to this is the risk
of a rapid increase in material prices, the extent of
which is uncertain, depending on the demand situ-
ation prevailing on the raw material markets and
also the general world economic situation.
And Persil Gold Plus Cold Active also contains
freshness pearls from Silan, so that in addition to
performing well even in cold water, it also ensures
that a fresh fragrance is released as the garment is
worn through the day. In large parts of the Africa/
Middle East region, we have introduced heavy-
duty detergent powders off ering lower dosages for
the same performance. In addition to the obvious
positive ecological eff ects, this also means that we
can reduce packaging and logistics costs.
The organic growth generated by the Home Care
business was primarily due to our dishwashing
detergents and WC products. In the case of our ma-
chine-dishwashing products, Somat 9 and Somat
Perfect Gel made a particularly important contri-
bution to the encouraging performance achieved.
Our hand-dishwashing products likewise regis-
tered signifi cant growth rates. In Eastern Europe,
we launched a new hand-dishwashing product
onto the market under the Pur brand which, with
its particularly viscous and extra-strong “Pure Max
Gel Formula” is able to remove even the toughest
dirt based on just small dosages. Also launched
onto the market under the brands Pril and Pur was
a new generation of hand-dishwashing products
which, featuring “Power Crystals,” ensure the fast
and easy removal of stubborn soil. The special
formulation means that the dishwashing product
in the sponge retains its cleaning power up to four
times longer than conventional products. For the
brand Der General, we have also developed an all-
purpose cleaner which, thanks to reduced foaming
and a fast-drying formula, ensures a streak-free
cleanliness with a radiant shine.
We achieved positive sales growth with our WC
products in both Western and Eastern Europe
following the launch of our new WC product
Bref / WC Frisch Kraft-Aktiv, which is marketed
in Germany under the brand WC Frisch. This rim
block mounted in a modern and discreet bracket
off ers four active components.
In North America, we introduced products under
the Soft Scrub brand designed for gentle surface
cleaning in the bathroom and kitchen. They make
cleaning of all surfaces easier and can be used to
remove a wide range of impurities.
Our new cleaner Dac Disinfectant off ers superior
disinfection performance for our markets in North
Africa and the Middle East. It works immediately
and then carries on for up to 24 hours, protecting
against household bacteria while also emitting a
pleasant, fresh fragrance.
Somat 9 and Somat Perfect Gel made a particularly positive contribution to the encouraging performance of our machine-dishwashing products.
Our Soft Scrub products mar-keted in North America gently remove many kinds of impurity from surfaces in the bathroom and kitchen.
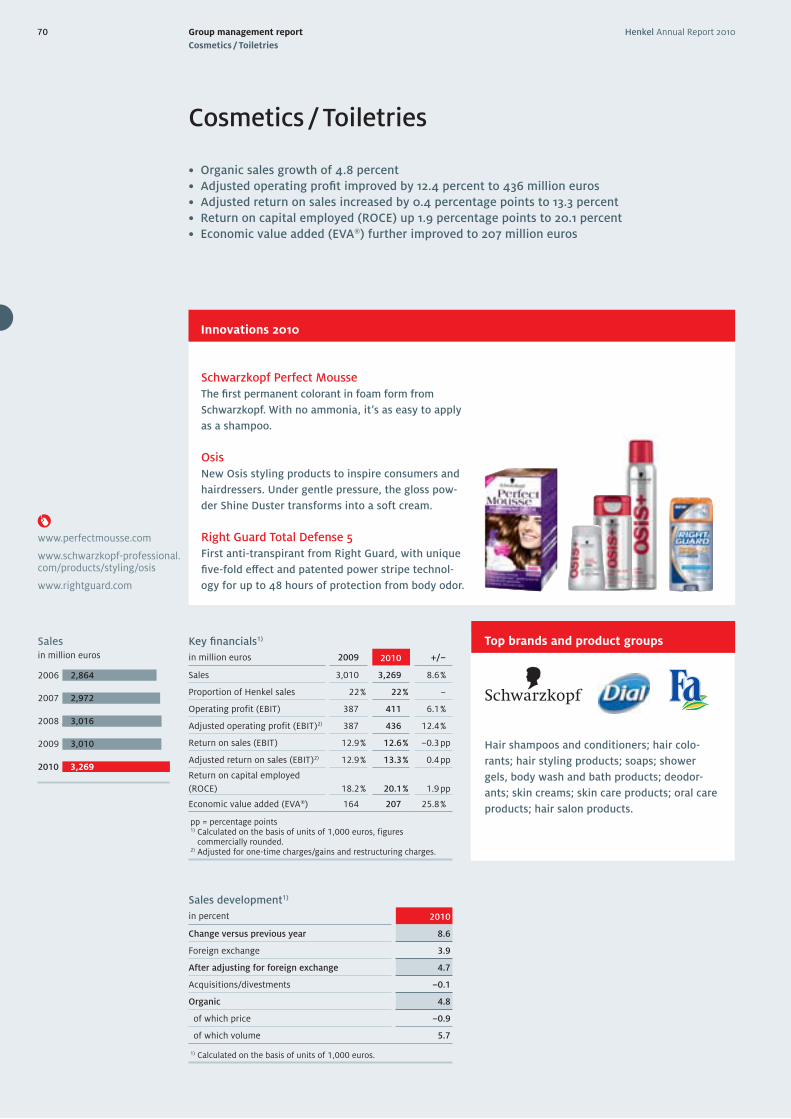
Group management report
Cosmetics / Toiletries
Henkel Annual Report 201070
Cosmetics / Toiletries
• Organic sales growth of 4.8 percent
• Adjusted operating profi t improved by 12.4 percent to 436 million euros
• Adjusted return on sales increased by 0.4 percentage points to 13.3 percent
• Return on capital employed (ROCE) up 1.9 percentage points to 20.1 percent
• Economic value added (EVA®) further improved to 207 million euros
Innovations 2010
Hair shampoos and conditioners; hair colo-
rants; hair styling products; soaps; shower
gels, body wash and bath products; deodor-
ants; skin creams; skin care products; oral care
products; hair salon products.
Top brands and product groupsKey fi nancials1)
in million euros 2009 2010 +/–
Sales 3,010 3,269 8.6 %
Proportion of Henkel sales 22 % 22 % –
Operating profit (EBIT) 387 411 6.1 %
Adjusted operating profit (EBIT)2) 387 436 12.4 %
Return on sales (EBIT) 12.9 % 12.6 % –0.3 pp
Adjusted return on sales (EBIT)2) 12.9 % 13.3 % 0.4 pp
Return on capital employed
(ROCE) 18.2 % 20.1 % 1.9 pp
Economic value added (EVA®) 164 207 25.8 %
pp = percentage points 1) Calculated on the basis of units of 1,000 euros, figures
commercially rounded.2) Adjusted for one-time charges/gains and restructuring charges.
Salesin million euros
2006
2007
2008
2009
2010
2,864
2,972
3,016
3,010
3,269
Right Guard Total Defense 5
First anti-transpirant from Right Guard, with unique
fi ve-fold eff ect and patented power stripe technol-
ogy for up to 48 hours of protection from body odor.
Sales development1)
in percent 2010
Change versus previous year 8.6
Foreign exchange 3.9
After adjusting for foreign exchange 4.7
Acquisitions/divestments –0.1
Organic 4.8
of which price –0.9
of which volume 5.7
1) Calculated on the basis of units of 1,000 euros.
Schwarzkopf Perfect Mousse
The fi rst permanent colorant in foam form from
Schwarzkopf. With no ammonia, it’s as easy to apply
as a shampoo.
Osis
New Osis styling products to inspire consumers and
hairdressers. Under gentle pressure, the gloss pow-
der Shine Duster transforms into a soft cream.
www.perfectmousse.com
www.schwarzkopf-professional.com/products/styling/osis
www.rightguard.com
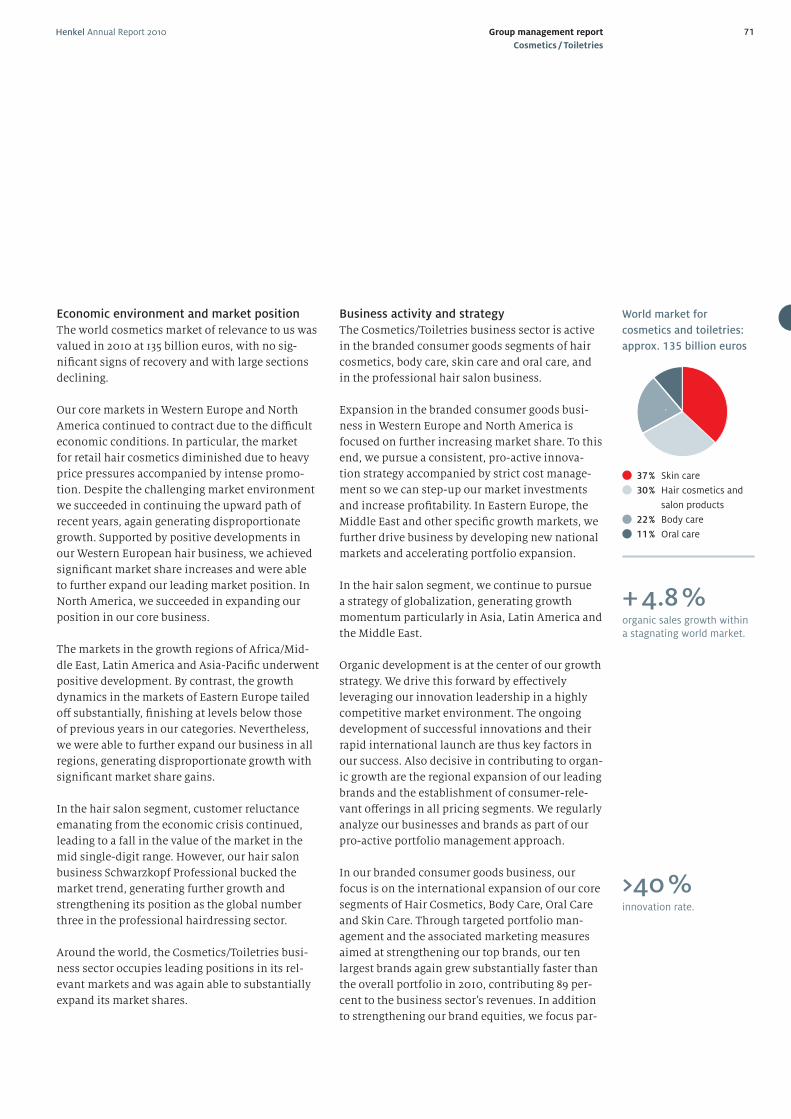
71Henkel Annual Report 2010 Group management report
Cosmetics / Toiletries
Business activity and strategy
The Cosmetics/Toiletries business sector is active
in the branded consumer goods segments of hair
cosmetics, body care, skin care and oral care, and
in the professional hair salon business.
Expansion in the branded consumer goods busi-
ness in Western Europe and North America is
focused on further increasing market share. To this
end, we pursue a consistent, pro-active innova-
tion strategy accompanied by strict cost manage-
ment so we can step-up our market investments
and increase profi tability. In Eastern Europe, the
Middle East and other specifi c growth markets, we
further drive business by developing new national
markets and accelerating portfolio expansion.
In the hair salon segment, we continue to pursue
a strategy of globalization, generating growth
momentum particularly in Asia, Latin America and
the Middle East.
Organic development is at the center of our growth
strategy. We drive this forward by eff ectively
leveraging our innovation leadership in a highly
competitive market environment. The ongoing
development of successful innovations and their
rapid international launch are thus key factors in
our success. Also decisive in contributing to organ-
ic growth are the regional expansion of our leading
brands and the establishment of consumer-rele-
vant off erings in all pricing segments. We regularly
analyze our businesses and brands as part of our
pro-active portfolio management approach.
In our branded consumer goods business, our
focus is on the international expansion of our core
segments of Hair Cosmetics, Body Care, Oral Care
and Skin Care. Through targeted portfolio man-
agement and the associated marketing measures
aimed at strengthening our top brands, our ten
largest brands again grew substantially faster than
the overall portfolio in 2010, contributing 89 per-
cent to the business sector’s revenues. In addition
to strengthening our brand equities, we focus par-
Economic environment and market position
The world cosmetics market of relevance to us was
valued in 2010 at 135 billion euros, with no sig-
nifi cant signs of recovery and with large sections
declining.
Our core markets in Western Europe and North
America continued to contract due to the diffi cult
economic conditions. In particular, the market
for retail hair cosmetics diminished due to heavy
price pressures accompanied by intense promo-
tion. Despite the challenging market environment
we succeeded in continuing the upward path of
recent years, again generating disproportionate
growth. Supported by positive developments in
our Western European hair business, we achieved
signifi cant market share increases and were able
to further expand our leading market position. In
North America, we succeeded in expanding our
position in our core business.
The markets in the growth regions of Africa/Mid-
dle East, Latin America and Asia-Pacifi c underwent
positive development. By contrast, the growth
dynamics in the markets of Eastern Europe tailed
off substantially, fi nishing at levels below those
of previous years in our categories. Nevertheless,
we were able to further expand our business in all
regions, generating disproportionate growth with
signifi cant market share gains.
In the hair salon segment, customer reluctance
emanating from the economic crisis continued,
leading to a fall in the value of the market in the
mid single-digit range. However, our hair salon
business Schwarzkopf Professional bucked the
market trend, generating further growth and
strengthening its position as the global number
three in the professional hairdressing sector.
Around the world, the Cosmetics/Toiletries busi-
ness sector occupies leading positions in its rel-
evant markets and was again able to substantially
expand its market shares.
World market for
cosmetics and toiletries:
approx. 135 billion euros
37 % Skin care
30 % Hair cosmetics and
salon products
22 % Body care
11 % Oral care
+ 4.8 %organic sales growth within a stagnating world market.
>40 %innovation rate.
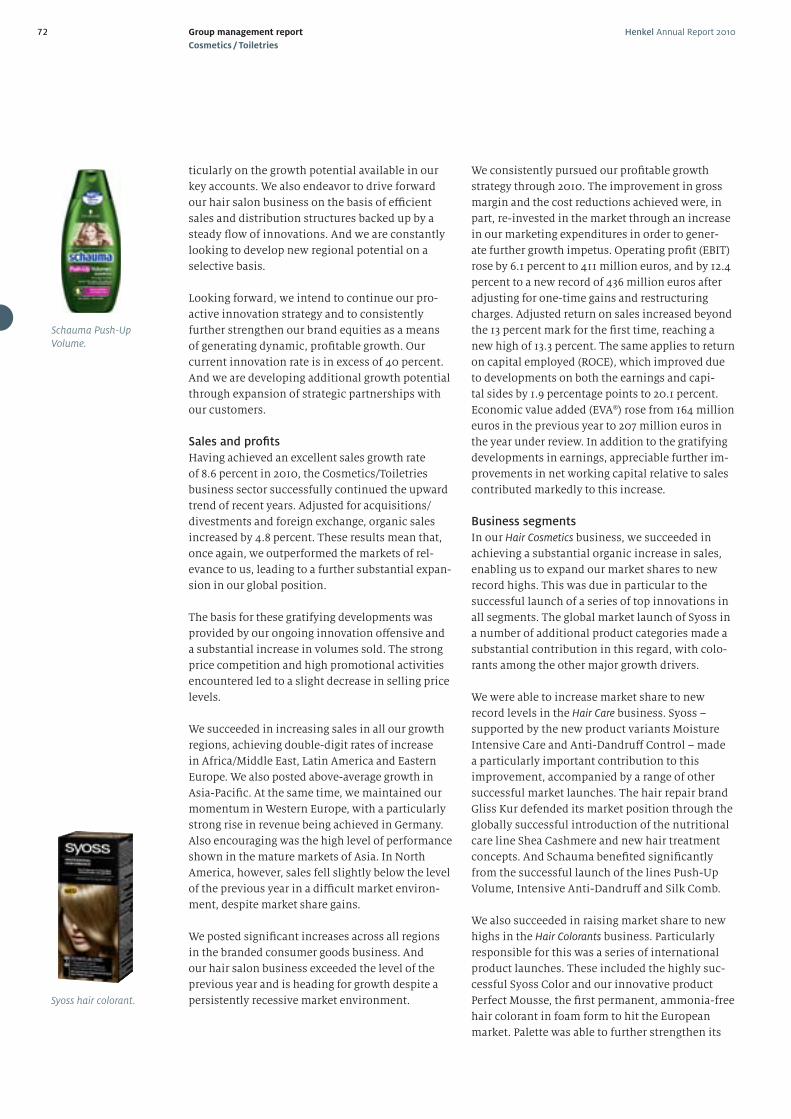
72 Henkel Annual Report 2010Group management report
Cosmetics / Toiletries
ticularly on the growth potential available in our
key accounts. We also endeavor to drive forward
our hair salon business on the basis of effi cient
sales and distribution structures backed up by a
steady fl ow of innovations. And we are constantly
looking to develop new regional potential on a
selective basis.
Looking forward, we intend to continue our pro-
active innovation strategy and to consistently
further strengthen our brand equities as a means
of generating dynamic, profi table growth. Our
current innovation rate is in excess of 40 percent.
And we are developing additional growth potential
through expansion of strategic partnerships with
our customers.
Sales and profi ts
Having achieved an excellent sales growth rate
of 8.6 percent in 2010, the Cosmetics/Toiletries
business sector successfully continued the upward
trend of recent years. Adjusted for acquisitions/
divestments and foreign exchange, organic sales
increased by 4.8 percent. These results mean that,
once again, we outperformed the markets of rel-
evance to us, leading to a further substantial expan-
sion in our global position.
The basis for these gratifying developments was
provided by our ongoing innovation off ensive and
a substantial increase in volumes sold. The strong
price competition and high promotional activities
encountered led to a slight decrease in selling price
levels.
We succeeded in increasing sales in all our growth
regions, achieving double-digit rates of increase
in Africa/Middle East, Latin America and Eastern
Europe. We also posted above-average growth in
Asia-Pacifi c. At the same time, we maintained our
momentum in Western Europe, with a particularly
strong rise in revenue being achieved in Germany.
Also encouraging was the high level of performance
shown in the mature markets of Asia. In North
America, however, sales fell slightly below the level
of the previous year in a diffi cult market environ-
ment, despite market share gains.
We posted signifi cant increases across all regions
in the branded consumer goods business. And
our hair salon business exceeded the level of the
previous year and is heading for growth despite a
persistently recessive market environment.
We consistently pursued our profi table growth
strategy through 2010. The improvement in gross
margin and the cost reductions achieved were, in
part, re-invested in the market through an increase
in our marketing expenditures in order to gener-
ate further growth impetus. Operating profi t (EBIT)
rose by 6.1 percent to 411 million euros, and by 12.4
percent to a new record of 436 million euros after
adjusting for one-time gains and restructuring
charges. Adjusted return on sales increased beyond
the 13 percent mark for the fi rst time, reaching a
new high of 13.3 percent. The same applies to return
on capital employed (ROCE), which improved due
to developments on both the earnings and capi-
tal sides by 1.9 percentage points to 20.1 percent.
Economic value added (EVA®) rose from 164 million
euros in the previous year to 207 million euros in
the year under review. In addition to the gratifying
developments in earnings, appreciable further im-
provements in net working capital relative to sales
contributed markedly to this increase.
Business segments
In our Hair Cosmetics business, we succeeded in
achieving a substantial organic increase in sales,
enabling us to expand our market shares to new
record highs. This was due in particular to the
successful launch of a series of top innovations in
all segments. The global market launch of Syoss in
a number of additional product categories made a
substantial contribution in this regard, with colo-
rants among the other major growth drivers.
We were able to increase market share to new
record levels in the Hair Care business. Syoss –
supported by the new product variants Moisture
Intensive Care and Anti-Dandruff Control – made
a particularly important contribution to this
improvement, accompanied by a range of other
successful market launches. The hair repair brand
Gliss Kur defended its market position through the
globally successful introduction of the nutritional
care line Shea Cashmere and new hair treatment
concepts. And Schauma benefi ted signifi cantly
from the successful launch of the lines Push-Up
Volume, Intensive Anti-Dandruff and Silk Comb.
We also succeeded in raising market share to new
highs in the Hair Colorants business. Particularly
responsible for this was a series of international
product launches. These included the highly suc-
cessful Syoss Color and our innovative product
Perfect Mousse, the fi rst permanent, ammonia-free
hair colorant in foam form to hit the European
market. Palette was able to further strengthen its
Syoss hair colorant.
Schauma Push-Up Volume.
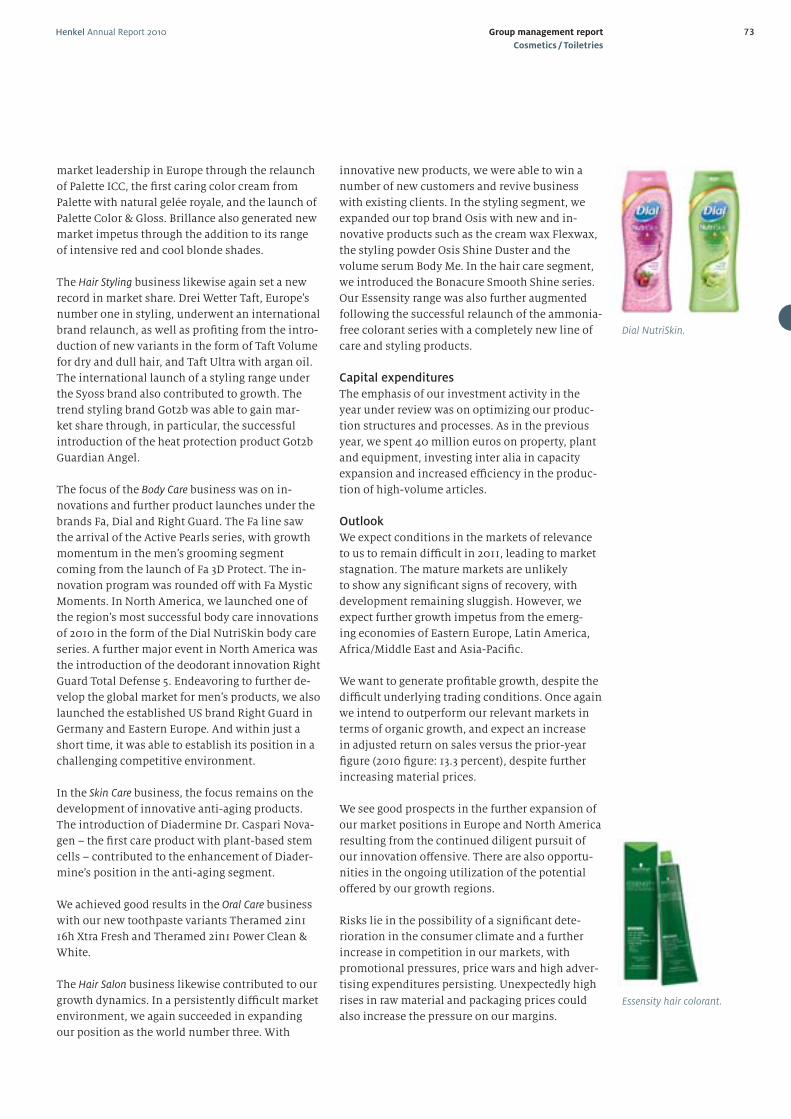
Henkel Annual Report 2010 73Group management report
Cosmetics / Toiletries
innovative new products, we were able to win a
number of new customers and revive business
with existing clients. In the styling segment, we
expanded our top brand Osis with new and in-
novative products such as the cream wax Flexwax,
the styling powder Osis Shine Duster and the
volume serum Body Me. In the hair care segment,
we introduced the Bonacure Smooth Shine series.
Our Essensity range was also further augmented
following the successful relaunch of the ammonia-
free colorant series with a completely new line of
care and styling products.
Capital expenditures
The emphasis of our investment activity in the
year under review was on optimizing our produc-
tion structures and processes. As in the previous
year, we spent 40 million euros on property, plant
and equipment, investing inter alia in capacity
expansion and increased effi ciency in the produc-
tion of high-volume articles.
Outlook
We expect conditions in the markets of relevance
to us to remain diffi cult in 2011, leading to market
stagnation. The mature markets are unlikely
to show any signifi cant signs of recovery, with
development remaining sluggish. However, we
expect further growth impetus from the emerg-
ing economies of Eastern Europe, Latin America,
Africa/Middle East and Asia-Pacifi c.
We want to generate profi table growth, despite the
diffi cult underlying trading conditions. Once again
we intend to outperform our relevant markets in
terms of organic growth, and expect an increase
in adjusted return on sales versus the prior-year
fi gure (2010 fi gure: 13.3 percent), despite further
increasing material prices.
We see good prospects in the further expansion of
our market positions in Europe and North America
resulting from the continued diligent pursuit of
our innovation off ensive. There are also opportu-
nities in the ongoing utilization of the potential
off ered by our growth regions.
Risks lie in the possibility of a signifi cant dete-
rioration in the consumer climate and a further
increase in competition in our markets, with
promotional pressures, price wars and high adver-
tising expenditures persisting. Unexpectedly high
rises in raw material and packaging prices could
also increase the pressure on our margins.
market leadership in Europe through the relaunch
of Palette ICC, the fi rst caring color cream from
Palette with natural gelée royale, and the launch of
Palette Color & Gloss. Brillance also generated new
market impetus through the addition to its range
of intensive red and cool blonde shades.
The Hair Styling business likewise again set a new
record in market share. Drei Wetter Taft, Europe’s
number one in styling, underwent an international
brand relaunch, as well as profi ting from the intro-
duction of new variants in the form of Taft Volume
for dry and dull hair, and Taft Ultra with argan oil.
The international launch of a styling range under
the Syoss brand also contributed to growth. The
trend styling brand Got2b was able to gain mar-
ket share through, in particular, the successful
introduction of the heat protection product Got2b
Guardian Angel.
The focus of the Body Care business was on in-
novations and further product launches under the
brands Fa, Dial and Right Guard. The Fa line saw
the arrival of the Active Pearls series, with growth
momentum in the men’s grooming segment
coming from the launch of Fa 3D Protect. The in-
novation program was rounded off with Fa Mystic
Moments. In North America, we launched one of
the region’s most successful body care innovations
of 2010 in the form of the Dial NutriSkin body care
series. A further major event in North America was
the introduction of the deodorant innovation Right
Guard Total Defense 5. Endeavoring to further de-
velop the global market for men’s products, we also
launched the established US brand Right Guard in
Germany and Eastern Europe. And within just a
short time, it was able to establish its position in a
challenging competitive environment.
In the Skin Care business, the focus remains on the
development of innovative anti-aging products.
The introduction of Diadermine Dr. Caspari Nova-
gen – the fi rst care product with plant-based stem
cells – contributed to the enhancement of Diader-
mine’s position in the anti-aging segment.
We achieved good results in the Oral Care business
with our new toothpaste variants Theramed 2in1
16h Xtra Fresh and Theramed 2in1 Power Clean &
White.
The Hair Salon business likewise contributed to our
growth dynamics. In a persistently diffi cult market
environment, we again succeeded in expanding
our position as the world number three. With
Essensity hair colorant.
Dial NutriSkin.
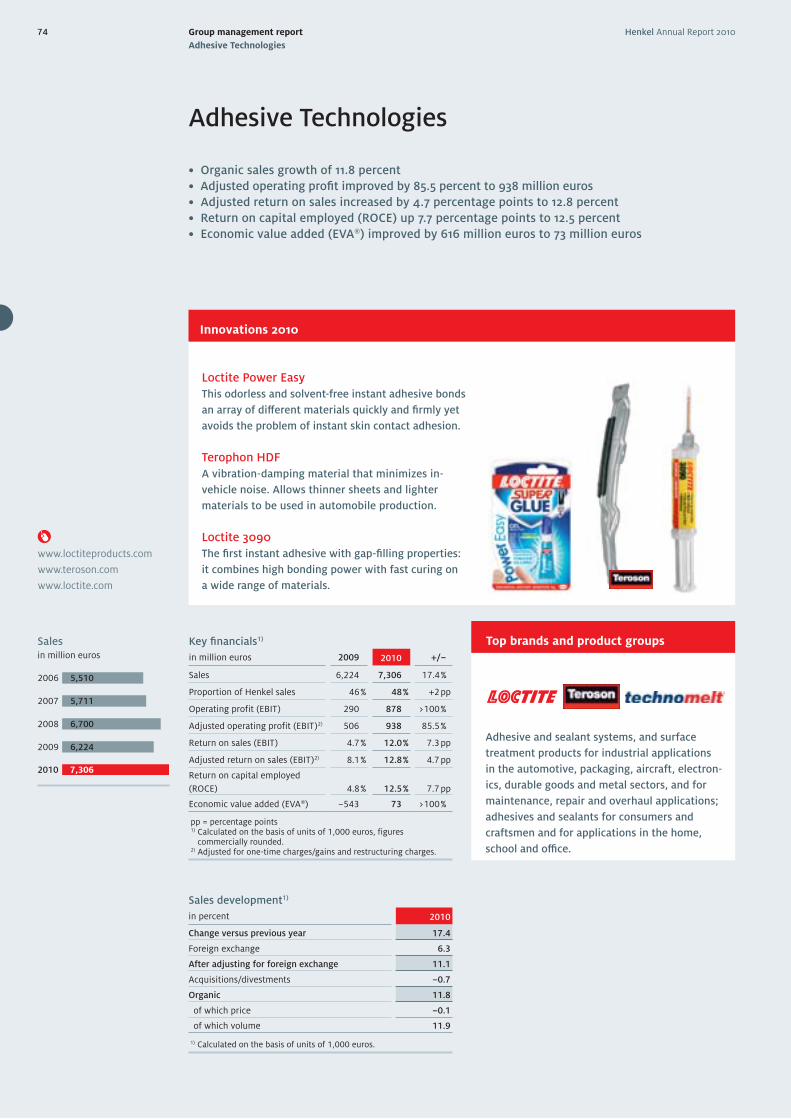
74 Group management report
Adhesive Technologies
Henkel Annual Report 2010
• Organic sales growth of 11.8 percent
• Adjusted operating profi t improved by 85.5 percent to 938 million euros
• Adjusted return on sales increased by 4.7 percentage points to 12.8 percent
• Return on capital employed (ROCE) up 7.7 percentage points to 12.5 percent
• Economic value added (EVA®) improved by 616 million euros to 73 million euros
Adhesive Technologies
Adhesive and sealant systems, and surface
treatment products for industrial applications
in the automotive, packaging, aircraft, electron-
ics, durable goods and metal sectors, and for
maintenance, repair and overhaul applications;
adhesives and sealants for consumers and
craftsmen and for applications in the home,
school and offi ce.
Top brands and product groups
Sales development1)
in percent 2010
Change versus previous year 17.4
Foreign exchange 6.3
After adjusting for foreign exchange 11.1
Acquisitions/divestments –0.7
Organic 11.8
of which price –0.1
of which volume 11.9
1) Calculated on the basis of units of 1,000 euros.
Key fi nancials1)
in million euros 2009 2010 +/–
Sales 6,224 7,306 17.4 %
Proportion of Henkel sales 46 % 48 % +2 pp
Operating profit (EBIT) 290 878 >100 %
Adjusted operating profit (EBIT)2) 506 938 85.5 %
Return on sales (EBIT) 4.7 % 12.0 % 7.3 pp
Adjusted return on sales (EBIT)2) 8.1 % 12.8 % 4.7 pp
Return on capital employed
(ROCE) 4.8 % 12.5 % 7.7 pp
Economic value added (EVA®) –543 73 >100 %
pp = percentage points 1) Calculated on the basis of units of 1,000 euros, figures
commercially rounded.2) Adjusted for one-time charges/gains and restructuring charges.
Loctite Power Easy
This odorless and solvent-free instant adhesive bonds
an array of diff erent materials quickly and fi rmly yet
avoids the problem of instant skin contact adhesion.
Terophon HDF
A vibration-damping material that minimizes in-
vehicle noise. Allows thinner sheets and lighter
materials to be used in automobile production.
Loctite 3090
The fi rst instant adhesive with gap-fi lling properties:
it combines high bonding power with fast curing on
a wide range of materials.
Sales in million euros
2006
2007
2008
2009
2010
5,510
5,711
6,700
6,224
7,306
Innovations 2010
www.loctiteproducts.com
www.teroson.com
www.loctite.com
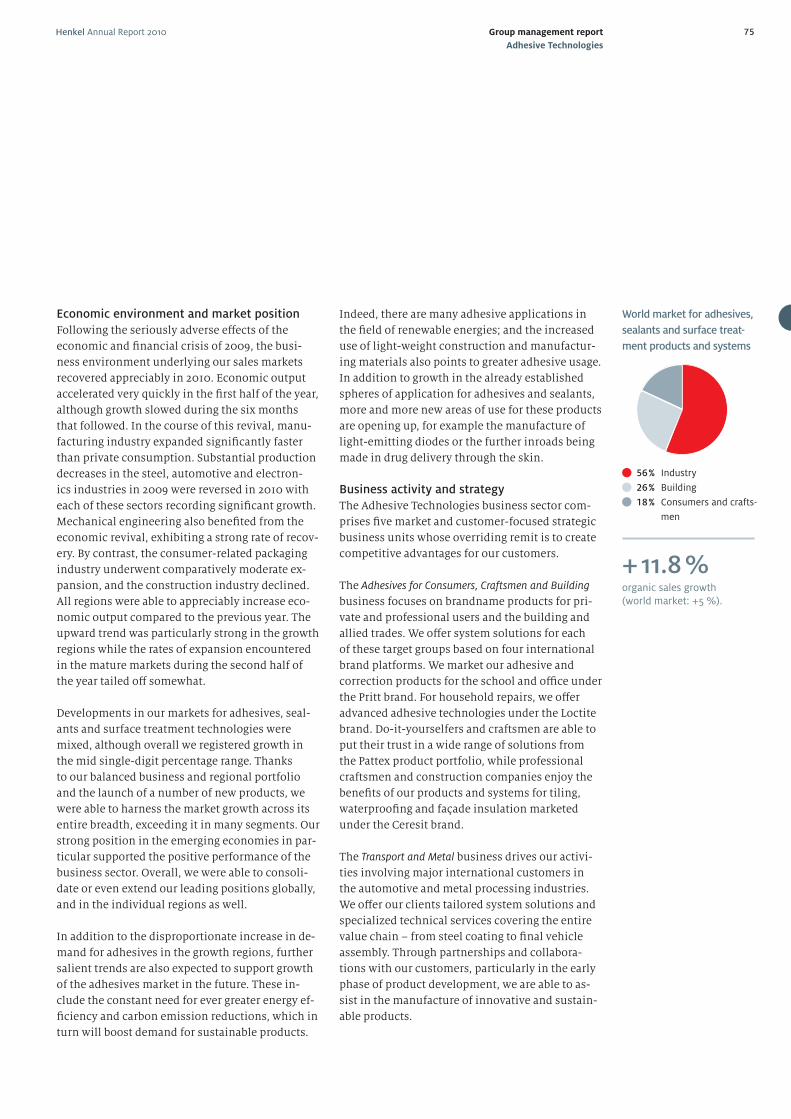
Henkel Annual Report 2010 75Group management report
Adhesive Technologies
Indeed, there are many adhesive applications in
the fi eld of renewable energies; and the increased
use of light-weight construction and manufactur-
ing materials also points to greater adhesive usage.
In addition to growth in the already established
spheres of application for adhesives and sealants,
more and more new areas of use for these products
are opening up, for example the manufacture of
light-emitting diodes or the further inroads being
made in drug delivery through the skin.
Business activity and strategy
The Adhesive Technologies business sector com-
prises fi ve market and customer-focused strategic
business units whose overriding remit is to create
competitive advantages for our customers.
The Adhesives for Consumers, Craftsmen and Building
business focuses on brandname products for pri-
vate and professional users and the building and
allied trades. We off er system solutions for each
of these target groups based on four international
brand platforms. We market our adhesive and
correction products for the school and offi ce under
the Pritt brand. For household repairs, we off er
advanced adhesive technologies under the Loctite
brand. Do-it-yourselfers and craftsmen are able to
put their trust in a wide range of solutions from
the Pattex product portfolio, while professional
craftsmen and construction companies enjoy the
benefi ts of our products and systems for tiling,
waterproofi ng and façade insulation marketed
under the Ceresit brand.
The Transport and Metal business drives our activi-
ties involving major international customers in
the automotive and metal processing industries.
We off er our clients tailored system solutions and
specialized technical services covering the entire
value chain – from steel coating to fi nal vehicle
assembly. Through partnerships and collabora-
tions with our customers, particularly in the early
phase of product development, we are able to as-
sist in the manufacture of innovative and sustain-
able products.
Economic environment and market position
Following the seriously adverse eff ects of the
economic and fi nancial crisis of 2009, the busi-
ness environment underlying our sales markets
recovered appreciably in 2010. Economic output
accelerated very quickly in the fi rst half of the year,
although growth slowed during the six months
that followed. In the course of this revival, manu-
facturing industry expanded signifi cantly faster
than private consumption. Substantial production
decreases in the steel, automotive and electron-
ics industries in 2009 were reversed in 2010 with
each of these sectors recording signifi cant growth.
Mechanical engineering also benefi ted from the
economic revival, exhibiting a strong rate of recov-
ery. By contrast, the consumer-related packaging
industry underwent comparatively moderate ex-
pansion, and the construction industry declined.
All regions were able to appreciably increase eco-
nomic output compared to the previous year. The
upward trend was particularly strong in the growth
regions while the rates of expansion encountered
in the mature markets during the second half of
the year tailed off somewhat.
Developments in our markets for adhesives, seal-
ants and surface treatment technologies were
mixed, although overall we registered growth in
the mid single-digit percentage range. Thanks
to our balanced business and regional portfolio
and the launch of a number of new products, we
were able to harness the market growth across its
entire breadth, exceeding it in many segments. Our
strong position in the emerging economies in par-
ticular supported the positive performance of the
business sector. Overall, we were able to consoli-
date or even extend our leading positions globally,
and in the individual regions as well.
In addition to the disproportionate increase in de-
mand for adhesives in the growth regions, further
salient trends are also expected to support growth
of the adhesives market in the future. These in-
clude the constant need for ever greater energy ef-
fi ciency and carbon emission reductions, which in
turn will boost demand for sustainable products.
World market for adhesives,
sealants and surface treat-
ment products and systems
56 % Industry
26 % Building
18 % Consumers and crafts-
men
+ 11.8 %organic sales growth (world market: +5 %).
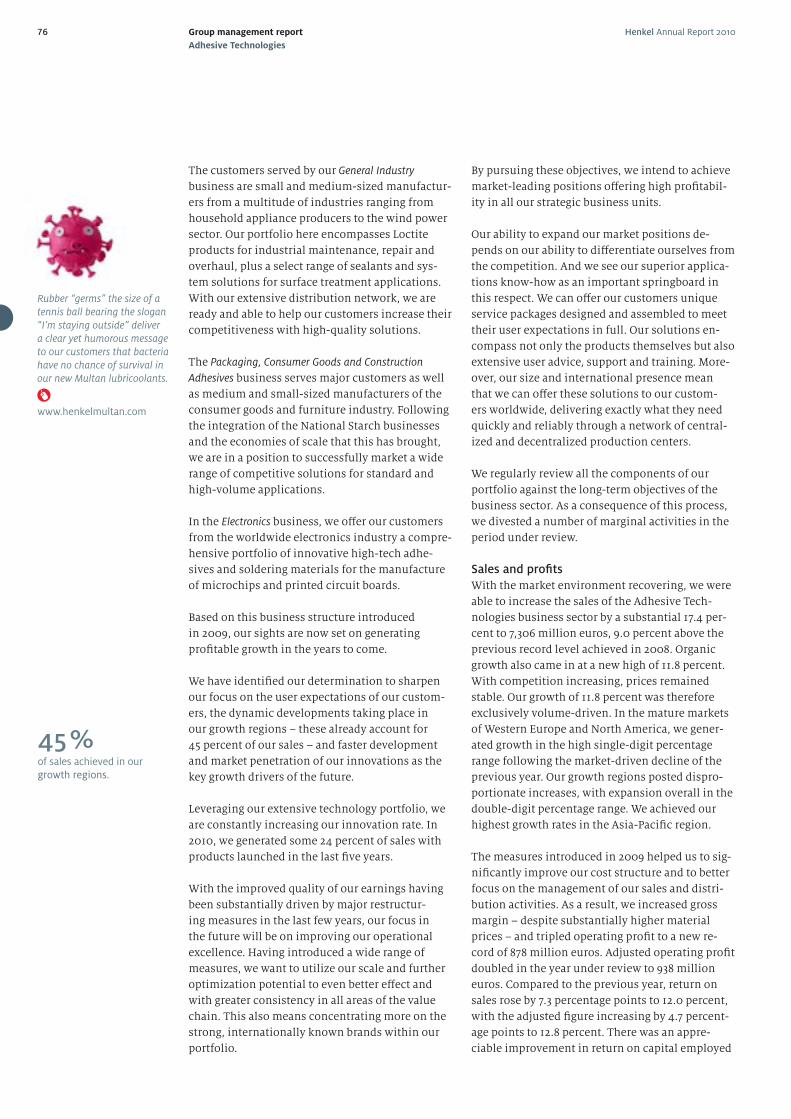
76 Henkel Annual Report 2010Group management report
Adhesive Technologies
The customers served by our General Industry
business are small and medium-sized manufactur-
ers from a multitude of industries ranging from
household appliance producers to the wind power
sector. Our portfolio here encompasses Loctite
products for industrial maintenance, repair and
overhaul, plus a select range of sealants and sys-
tem solutions for surface treatment applications.
With our extensive distribution network, we are
ready and able to help our customers increase their
competitiveness with high-quality solutions.
The Packaging, Consumer Goods and Construction
Adhesives business serves major customers as well
as medium and small-sized manufacturers of the
consumer goods and furniture industry. Following
the integration of the National Starch businesses
and the economies of scale that this has brought,
we are in a position to successfully market a wide
range of competitive solutions for standard and
high-volume applications.
In the Electronics business, we off er our customers
from the worldwide electronics industry a compre-
hensive portfolio of innovative high-tech adhe-
sives and soldering materials for the manufacture
of microchips and printed circuit boards.
Based on this business structure introduced
in 2009, our sights are now set on generating
profi table growth in the years to come.
We have identifi ed our determination to sharpen
our focus on the user expectations of our custom-
ers, the dynamic developments taking place in
our growth regions – these already account for
45 percent of our sales – and faster development
and market penetration of our innovations as the
key growth drivers of the future.
Leveraging our extensive technology portfolio, we
are constantly increasing our innovation rate. In
2010, we generated some 24 percent of sales with
products launched in the last fi ve years.
With the improved quality of our earnings having
been substantially driven by major restructur-
ing measures in the last few years, our focus in
the future will be on improving our operational
excellence. Having introduced a wide range of
measures, we want to utilize our scale and further
optimization potential to even better eff ect and
with greater consistency in all areas of the value
chain. This also means concentrating more on the
strong, internationally known brands within our
portfolio.
By pursuing these objectives, we intend to achieve
market-leading positions off ering high profi tabil-
ity in all our strategic business units.
Our ability to expand our market positions de-
pends on our ability to diff erentiate ourselves from
the competition. And we see our superior applica-
tions know-how as an important springboard in
this respect. We can off er our customers unique
service packages designed and assembled to meet
their user expectations in full. Our solutions en-
compass not only the products themselves but also
extensive user advice, support and training. More-
over, our size and international presence mean
that we can off er these solutions to our custom-
ers worldwide, delivering exactly what they need
quickly and reliably through a network of central-
ized and decentralized production centers.
We regularly review all the components of our
portfolio against the long-term objectives of the
business sector. As a consequence of this process,
we divested a number of marginal activities in the
period under review.
Sales and profi ts
With the market environment recovering, we were
able to increase the sales of the Adhesive Tech-
nologies business sector by a substantial 17.4 per-
cent to 7,306 million euros, 9.0 percent above the
previous record level achieved in 2008. Organic
growth also came in at a new high of 11.8 percent.
With competition increasing, prices remained
stable. Our growth of 11.8 percent was therefore
exclusively volume-driven. In the mature markets
of Western Europe and North America, we gener-
ated growth in the high single-digit percentage
range following the market-driven decline of the
previous year. Our growth regions posted dispro-
portionate increases, with expansion overall in the
double-digit percentage range. We achieved our
highest growth rates in the Asia-Pacifi c region.
The measures introduced in 2009 helped us to sig-
nifi cantly improve our cost structure and to better
focus on the management of our sales and distri-
bution activities. As a result, we increased gross
margin – despite substantially higher material
prices – and tripled operating profi t to a new re-
cord of 878 million euros. Adjusted operating profi t
doubled in the year under review to 938 million
euros. Compared to the previous year, return on
sales rose by 7.3 percentage points to 12.0 percent,
with the adjusted fi gure increasing by 4.7 percent-
age points to 12.8 percent. There was an appre-
ciable improvement in return on capital employed
Rubber “germs” the size of a tennis ball bearing the slogan “I’m staying outside” deliver a clear yet humorous message to our customers that bacteria have no chance of survival in our new Multan lubricoolants.
www.henkelmultan.com
45 %of sales achieved in our growth regions.
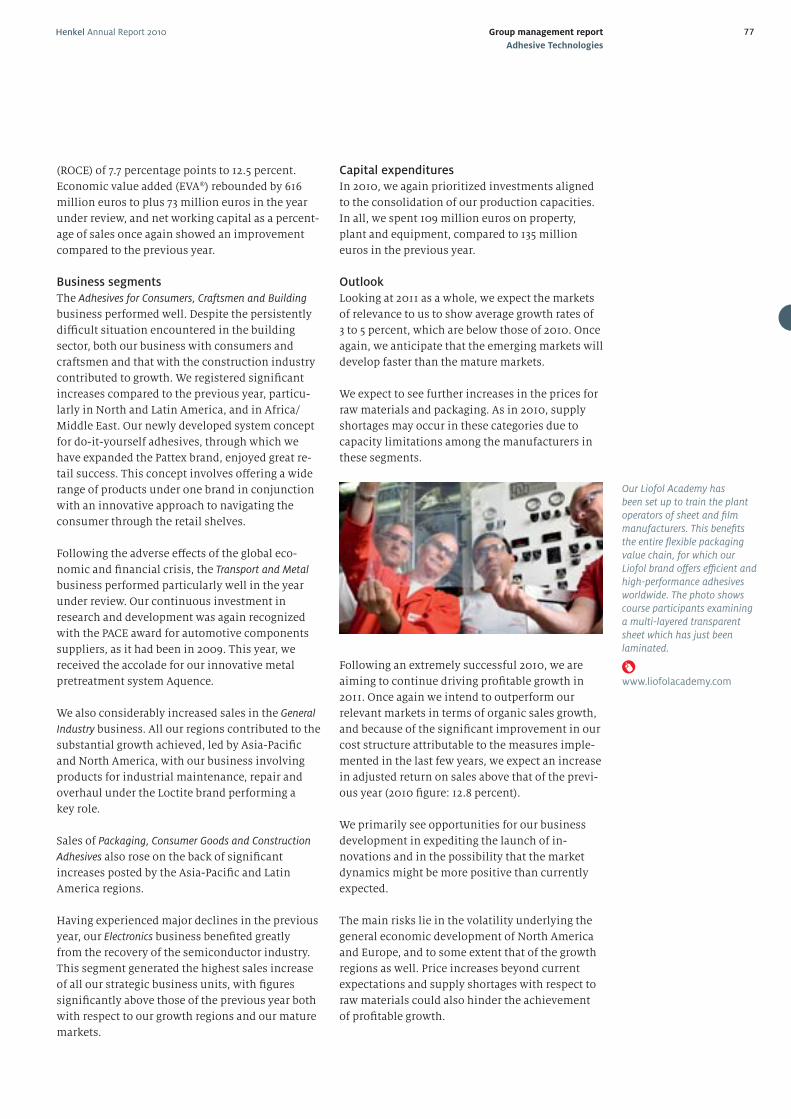
Henkel Annual Report 2010 77Group management report
Adhesive Technologies
Capital expenditures
In 2010, we again prioritized investments aligned
to the consolidation of our production capacities.
In all, we spent 109 million euros on property,
plant and equipment, compared to 135 million
euros in the previous year.
Outlook
Looking at 2011 as a whole, we expect the markets
of relevance to us to show average growth rates of
3 to 5 percent, which are below those of 2010. Once
again, we anticipate that the emerging markets will
develop faster than the mature markets.
We expect to see further increases in the prices for
raw materials and packaging. As in 2010, supply
shortages may occur in these categories due to
capacity limitations among the manufacturers in
these segments.
Following an extremely successful 2010, we are
aiming to continue driving profi table growth in
2011. Once again we intend to outperform our
relevant markets in terms of organic sales growth,
and because of the signifi cant improvement in our
cost structure attributable to the measures imple-
mented in the last few years, we expect an increase
in adjusted return on sales above that of the previ-
ous year (2010 fi gure: 12.8 percent).
We primarily see opportunities for our business
development in expediting the launch of in-
novations and in the possibility that the market
dynamics might be more positive than currently
expected.
The main risks lie in the volatility underlying the
general economic development of North America
and Europe, and to some extent that of the growth
regions as well. Price increases beyond current
expectations and supply shortages with respect to
raw materials could also hinder the achievement
of profi table growth.
(ROCE) of 7.7 percentage points to 12.5 percent.
Economic value added (EVA®) rebounded by 616
million euros to plus 73 million euros in the year
under review, and net working capital as a percent-
age of sales once again showed an improvement
compared to the previous year.
Business segments
The Adhesives for Consumers, Craftsmen and Building
business performed well. Despite the persistently
diffi cult situation encountered in the building
sector, both our business with consumers and
craftsmen and that with the construction industry
contributed to growth. We registered signifi cant
increases compared to the previous year, particu-
larly in North and Latin America, and in Africa/
Middle East. Our newly developed system concept
for do-it-yourself adhesives, through which we
have expanded the Pattex brand, enjoyed great re-
tail success. This concept involves off ering a wide
range of products under one brand in conjunction
with an innovative approach to navigating the
consumer through the retail shelves.
Following the adverse eff ects of the global eco-
nomic and fi nancial crisis, the Transport and Metal
business performed particularly well in the year
under review. Our continuous investment in
research and development was again recognized
with the PACE award for automotive components
suppliers, as it had been in 2009. This year, we
received the accolade for our innovative metal
pretreatment system Aquence.
We also considerably increased sales in the General
Industry business. All our regions contributed to the
substantial growth achieved, led by Asia-Pacifi c
and North America, with our business involving
products for industrial maintenance, repair and
overhaul under the Loctite brand performing a
key role.
Sales of Packaging, Consumer Goods and Construction
Adhesives also rose on the back of signifi cant
increases posted by the Asia-Pacifi c and Latin
America regions.
Having experienced major declines in the previous
year, our Electronics business benefi ted greatly
from the recovery of the semiconductor industry.
This segment generated the highest sales increase
of all our strategic business units, with fi gures
signifi cantly above those of the previous year both
with respect to our growth regions and our mature
markets.
Our Liofol Academy has been set up to train the plant operators of sheet and fi lm manufacturers. This benefi ts the entire fl exible packaging value chain, for which our Liofol brand off ers effi cient and high-performance adhesives worldwide. The photo shows course participants examining a multi-layered transparent sheet which has just been laminated.
www.liofolacademy.com
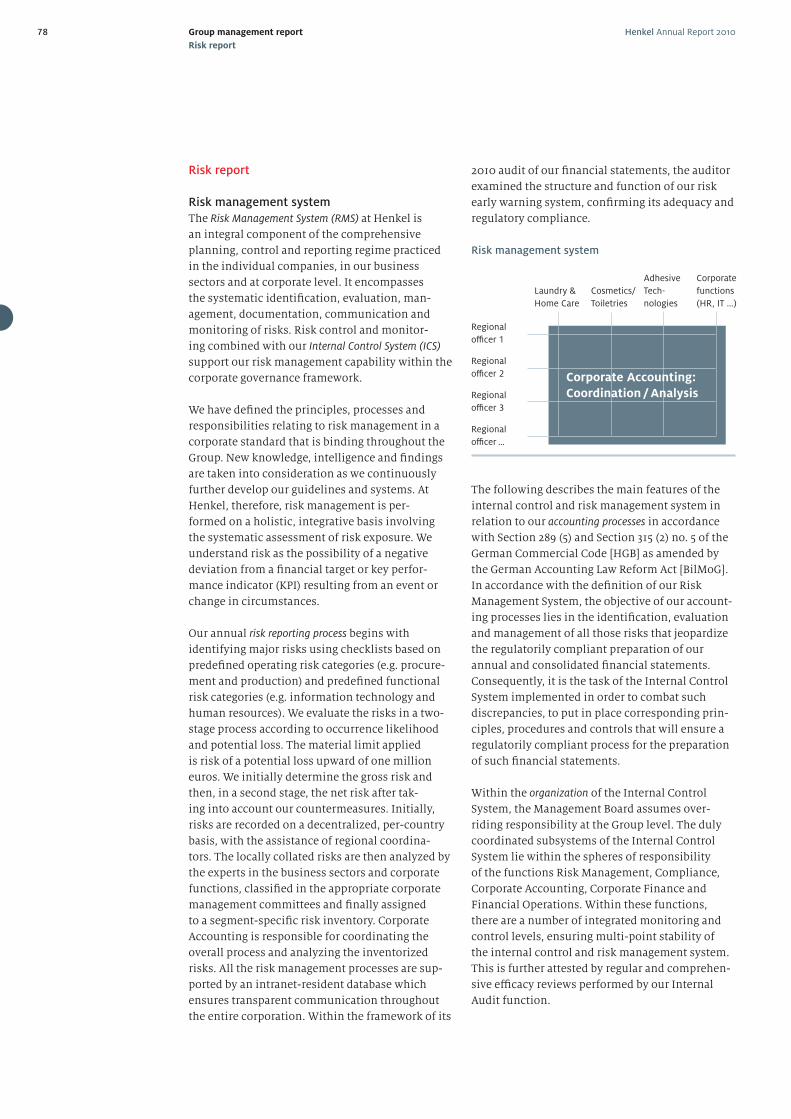
Henkel Annual Report 201078 Group management report
Risk report
Risk report
Risk management system
The Risk Management System (RMS) at Henkel is
an integral component of the comprehensive
planning, control and reporting regime practiced
in the individual companies, in our business
sectors and at corporate level. It encompasses
the systematic identifi cation, evaluation, man-
agement, documentation, communication and
monitoring of risks. Risk control and monitor-
ing combined with our Internal Control System (ICS)
support our risk management capability within the
corporate governance framework.
We have defi ned the principles, processes and
responsibilities relating to risk management in a
corporate standard that is binding throughout the
Group. New knowledge, intelligence and fi ndings
are taken into consideration as we continuously
further develop our guidelines and systems. At
Henkel, therefore, risk management is per-
formed on a holistic, integrative basis involving
the systematic assessment of risk exposure. We
understand risk as the possibility of a negative
deviation from a fi nancial target or key perfor-
mance indicator (KPI) resulting from an event or
change in circumstances.
Our annual risk reporting process begins with
identifying major risks using checklists based on
predefi ned operating risk categories (e.g. procure-
ment and production) and predefi ned functional
risk categories (e.g. information technology and
human resources). We evaluate the risks in a two-
stage process according to occurrence likelihood
and potential loss. The material limit applied
is risk of a potential loss upward of one million
euros. We initially determine the gross risk and
then, in a second stage, the net risk after tak-
ing into account our countermeasures. Initially,
risks are recorded on a decentralized, per-country
basis, with the assistance of regional coordina-
tors. The locally collated risks are then analyzed by
the experts in the business sectors and corporate
functions, classifi ed in the appropriate corporate
management committees and fi nally assigned
to a segment-specifi c risk inventory. Corporate
Accounting is responsible for coordinating the
overall process and analyzing the inventorized
risks. All the risk management processes are sup-
ported by an intranet-resident database which
ensures transparent communication throughout
the entire corporation. Within the framework of its
2010 audit of our fi nancial statements, the auditor
examined the structure and function of our risk
early warning system, confi rming its adequacy and
regulatory compliance.
The following describes the main features of the
internal control and risk management system in
relation to our accounting processes in accordance
with Section 289 (5) and Section 315 (2) no. 5 of the
German Commercial Code [HGB] as amended by
the German Accounting Law Reform Act [BilMoG].
In accordance with the defi nition of our Risk
Management System, the objective of our account-
ing processes lies in the identifi cation, evaluation
and management of all those risks that jeopardize
the regulatorily compliant preparation of our
annual and consolidated fi nancial statements.
Consequently, it is the task of the Internal Control
System implemented in order to combat such
discrepancies, to put in place corresponding prin-
ciples, procedures and controls that will ensure a
regulatorily compliant process for the preparation
of such fi nancial statements.
Within the organization of the Internal Control
System, the Management Board assumes over-
riding responsibility at the Group level. The duly
coordinated subsystems of the Internal Control
System lie within the spheres of responsibility
of the functions Risk Management, Compliance,
Corporate Accounting, Corporate Finance and
Financial Operations. Within these functions,
there are a number of integrated monitoring and
control levels, ensuring multi-point stability of
the internal control and risk management system.
This is further attested by regular and comprehen-
sive effi cacy reviews performed by our Internal
Audit function.
Risk management system
Regional
offi cer 1
Regional
offi cer 3
Regional
offi cer 2
Regional
offi cer ...
Adhesive
Tech-
nologies
Cosmetics/
Toiletries
Corporate
functions
(HR, IT ...)
Laundry &
Home Care
Corporate Accounting:
Coordination / Analysis
Henkel Annual Report 2010 79Group management report
Risk report
Of the many and varied control processes incorpo-
rated into the accounting regime, some are
worthy of particular mention. The basis for all our
account ing processes is provided by our “Account-
ing” corporate standard, which contains detailed
accounting instructions covering all major activi-
ties and material eventualities. It specifi es, for
example, the procedure to be adopted in inventory
valuation, and how the transfer prices applicable
for intra-group transactions are to be determined.
This corporate standard is binding on the entire
Group and is regularly reviewed and re-released
by the CFO. Further globally binding procedural
instructions aff ecting our accounting practice are
contained in our corporate standards “Treasury”
and “Investments.”
With appropriate organizational measures in
conjunction with restrictive control of access to
our information systems, we ensure the eff ective
separation of responsibilities in our accounting
systems between transaction entry on the one
hand and checking/auditing and approval on the
other. Documentation relating to the operational
accounting and closure processes ensures that
important tasks – such as the reconciliation of
receivables and payables on the basis of balance
statements and confi rmations – are clearly as-
signed. Strict authorization regulations also exist
governing the approval of contracts, credit notes
and similar, and we practice the double-check se-
curity principle right across the board. This is also
stipulated in our Group-wide corporate standards.
We consider the established systems to be fi t for
purpose and functionally effi cient. They are regu-
larly reviewed in order to determine their potential
for further development and optimization. Once
identifi ed, such potential is duly utilized.
Disclosure of major individual risks
Economic and sector-specifi c risks: Despite the eco-
nomic recovery, we remain exposed to risks arising
from the economic and market environment. The
industrial sector particularly harbors risks that
could lead to a decline in sales volumes. In the
consumer goods sector, there is the risk of weaken-
ing market growth in conjunction with increasing
competition. Here we are currently observing an
ongoing process of consolidation within the retail
trade, resulting in increased pressure with respect
to both prices and terms of business due to the
advent of the trade’s own private label brands. Our
focus therefore is on achieving a steady increase in
our brand equities and developing further innova-
tions. We see innovative products as enabling us to
diff erentiate ourselves from the competition, this
being a signifi cant prerequisite for the success of
our company.
Procurement market risks: We expect the prices for
important raw materials and packaging to rise
further on our procurement markets. These price
increases are being caused by the upward trend in
input raw materials caused by accelerating world
economic output and the growing occurrence of
supply shortages. We combat price and supply
risks by adopting a comprehensive risk manage-
ment approach. This involves the pro-active man-
agement of our vendor portfolio and utilization
of our globally engaged, cross-divisional sourcing
capability together with strategies aimed at secur-
ing both price and volume through the conclusion
of contracts. Where appropriate and possible,
we also make prudent use of eff ectively tailored
fi nancial safeguards and hedging instruments. We
also work within interdisciplinary teams (Research
and Development, Supply Chain Management and
Purchasing) on devising alternative formulations
and diff erent forms of packaging that will enable
us to respond fl exibly to unforeseen fl uctuations
in raw material prices. We also avoid becoming
dependent on individual vendors so as to better
secure the constant supply of the goods and ser-
vices that we require. Close collaboration with our
strategic suppliers plays an exceptionally impor-
tant role in our risk management regime. We deal
in detail with the assessment of vendor risk with
respect to their fi nancial stability in the section on
“Procurement” on pages 57 and 58. The basis for
our successful risk management approach in this
domain is a comprehensive procurement informa-
tion system that ensures permanent transparency
with respect to our purchasing volumes.
Production risks: Risks in the fi eld of production
arise in the Henkel case not only from low capacity
utilization due to volume decreases but also in the
possibility of operational interruptions, especially
at our so-called single-source sites. The negative
eff ects of possible production outages can be off set
through fl exible production control and appro-
priate insurance policies where economically
viable. Generally, risks in the fi eld of production
are minimized by ensuring a high level of em-
ployee qualifi cation, establishing clearly defi ned
safety standards and carrying out regular plant
and equipment maintenance. Decisions relating
Henkel Annual Report 201080 Group management report
Risk report
linked to performance-related compensation
arrangements. You will fi nd further information
relating to our employees on pages 55 to 57.
Financial risks: We mitigate credit risk within the
framework of our global credit policy through
standardized procedures, a pro-active credit
management regime and the use of guarantees and
payment default insurance policies. Aside from
meticulous local vigilance, we also monitor our
key customer relationships at the global level.
Default and credit risks also arise in the case of
fi nancial investments such as cash at bank and the
positive fair value of derivatives. However, such
exposure is limited by our Corporate Treasury spe-
cialists through selection of banks of good reputa-
tion with at least an A rating, and restriction of
the amounts allocated to individual investments.
We also ensure the wide diversifi cation of our fi -
nancial investments both with respect to diff erent
counterparties and diff erent fi nancial assets. More
detailed information with respect to our credit risk
can be found on Note 31 on pages 115 to 121.
Risks from pension obligations relate to changes in
interest rates, infl ation rates, trends in wages and
salaries, and changes in the statistical life expec-
tancies of pension benefi ciaries. To minimize
exposure and improve risk management, the
pension obligations arising in the most important
countries are therefore fully funded and managed
on the basis of a two-track portfolio approach: The
main portion of the portfolio is invested in fund
assets exhibiting the same maturity structure and
similar interest and infl ation sensitivities as the
pension obligations (liability-driven investments),
reducing the interest rate and infl ation risk. In or-
der to cover the risks arising from trends in wages,
salaries and life expectancies, and to close the
potential defi cit between fund assets and pension
obligations over the long term, additional invest-
ments are made in a return-enhancing portfolio as
an add-on instrument that contains assets such as
equities, private equity investments, hedge funds,
real estate and commodity investments.
The pension fund can be adversely aff ected in the
event of a downturn in the capital markets. We
mitigate this risk by investing in widely diversifi ed
classes of assets and diff erent instruments within
each asset class. The risks inherent in the pen-
sion fund assets are continuously monitored and
controlled on the basis of risk and return criteria.
Risks in this respect are quantifi ed using sensitiv-
to capital expenditures on property, plant and
equipment are made in accordance with defi ned,
diff erentiated responsibility matrices and approval
procedures in order to mitigate concomitant risk.
The procedures implemented incorporate all the
relevant specialist functions and are regulated in
an internal corporate guideline requiring that such
investments be analyzed in advance on the basis
of a detailed risk appraisal. Further auditing and
analytical procedures accompanying projects at
the appraisal and implementation stage provide
the foundation for successful project management
and eff ective risk reduction.
Information technology risks: The risks associated
with our IT operations relate primarily to the
potential for unauthorized access and data loss.
Appropriate approval procedures, authorization
profi les and defensive technologies are deployed
in order to guard against such eventualities.
Daily data back-up runs are conducted to shadow
all critical databases, and the resultant fi les are
transferred to another site. We also carry out
regular restore tests. External attacks that took
place in 2010 – for example in the form of hack-
ing, spamming or viruses – were successfully
repelled by the security measures implemented
and therefore had no disruptive eff ect on our busi-
ness processes. Moreover, Henkel has put in place
a globally binding internal IT guideline to which
our external service-providers are also bound.
Major components of this code include measures
for avoiding risk, and descriptions of escalation
processes and best-practice technologies. Correct
implementation is continuously monitored by our
globally active Internal Audit function. In addition,
our safeguards are examined for their effi cacy and
effi ciency by external specialists.
Personnel risks: The future economic development
of Henkel is essentially dependent upon the com-
mitment and capabilities of our employees. We
respond to the increasing competition for well
qualifi ed technical and managerial staff by main-
taining close contacts with selected universities
and by conducting special recruitment campaigns.
Our new employer branding campaign is serving
to position us more eff ectively as an employer of
choice. We combat the risk of failing to retain valu-
able employees over the long term through specifi -
cally aligned personnel development programs.
The basis for these is provided by regular potential
and performance analyses leading to attractive
qualifi cation and further training opportunities
Henkel Annual Report 2010 81Group management report
Risk report
ity analyses. Major pension funds are administered
by external fund managers in Germany, the USA,
the UK, Ireland and the Netherlands. All these
countries follow the above-described standard in-
vestment strategy and are centrally monitored. The
funds covering our pension obligations are invest-
ed on the basis of asset-liability studies aligned to
the expected cash fl ows arising from the country-
specifi c pension obligations. Further information
on the development of our pension obligations can
be found in Note 17 on pages 106 to 110.
Given the global alignment of our businesses, we
are exposed to two types of currency risk. Trans-
action risks arise from possible exchange rate
fl uctuations causing changes in the value of future
foreign currency cash fl ows. Transaction risks
arising from our operating business are partially
avoided by the fact that we largely manufacture our
products in those countries where they are sold.
Residual transaction risks on the operating side are
pro-actively managed by Corporate Treasury. Its
remit includes the ongoing assessment of specifi c
currency risk and the development of appropriate
hedging strategies. Because we limit our potential
losses, any negative impact on profi ts is restricted.
The transaction risks arising from major fi nancial
receivables and fi nancial liabilities are invari-
ably hedged in full. The risks are predominantly
mitigated by forward exchange contracts and cur-
rency swaps. Translation risks, on the other hand,
emanate from changes caused by foreign exchange
fl uctuations to items on the balance sheet and
income statement of a subsidiary, and the eff ect
these changes have on the translation of individual
company fi nancial statements into Group cur-
rency. The risks arising from the translation of the
earnings results of subsidiaries in foreign curren-
cies and from net investments in foreign entities
are only hedged in exceptional cases.
The interest rate risk encompasses those potentially
positive or negative infl uences on profi ts, share-
holders’ equity or cash fl ow in current or future
reporting periods arising from changes in interest
rates. The deployment of interest-bearing fi nancial
instruments with the objective of optimizing the
net interest result for the Henkel Group consti-
tutes an essential component of our fi nancial
policy. The maturity structure is controlled both
by choosing appropriate fi xed-interest periods
for the underlying fi nancial assets and fi nancial
liabilities aff ecting liquidity, and by using interest
rate derivatives. We changed the coupon of the two
euro-denominated bonds issued by the company
from fi xed to fl oating with the aid of interest rate
swaps. As the bonds and interest rate swaps are in
a formally documented hedge accounting rela-
tionship, the measurement of the bonds and the
measurement of the interest rate swaps match in
practical terms (fair value hedge accounting). We
have converted a major portion of the fi nancing of
Henkel of America, Inc. in US dollars from fl oat-
ing to fi xed interest rates, again through interest
rate swaps. When using interest rate swaps to fi x
an interest rate, the net result arising from the
transaction is accrued in equity (cash fl ow hedge
accounting). Depending on interest rate expecta-
tions, Henkel also protects itself against short-
term increases by negotiating additional interest
rate caps and concluding forward rate agreements.
As a result, the net interest item derives from a
mixed fi xed and fl oating interest rate structure.
The liquidity risk describes the risk of a company
failing to meet its fi nancial obligations at any
given time. We combat this risk by deploying
long-term fi nancing instruments and additional
liquidity reserves in the form of permanently
assured credit lines. The basis of our currency,
interest rate and liquidity risk control capability is
provided by the treasury guidelines introduced by
the Management Board, which are binding on the
entire corporation. Defi ned in these are the targets,
principles, accountability and competences of
Corporate Treasury. They describe the fi elds of re-
sponsibility and establish the distribution of these
responsibilities between the Corporate Treasury
department and our subsidiaries. The Management
Board is regularly and comprehensively informed
of all major risks and of all relevant hedging trans-
actions and arrangements.
Additional information on risk management with
respect to fi nancial instruments can be found in
Note 31 on pages 115 to 121.
Legal risks: As a globally active corporation, we are
also exposed in the course of our ordinary busi-
ness activities to a range of risks relating to litiga-
tions and other proceedings or actions, including
those brought by governmental agencies, in which
we are currently involved or may become involved
in the future. These include, in particular, risks
arising from the fi elds of product liability, product
defi ciency, laws relating to competition and mo-
nopolies, the infringement of proprietary rights,
patent law and tax law, and environmental protec-
Henkel Annual Report 201082 Group management report
Risk report
tion and land contamination issues. The possibil-
ity cannot be discounted that the fi nal decisions
taken in some of these litigations and proceedings
will go against us.
We counteract legal risks by issuing correspond-
ing binding guidelines and codes of conduct and
by instituting appropriate training measures. We
address current actions and potential litigation
risk by maintaining constant contacts between the
corporate legal department and local attorneys,
and also through our separate reporting system.
For certain legal risks, we have concluded insur-
ance policies that are standard for the industry and
that we consider to be fi t for purpose. We form pro-
visions for litigations to the extent that it is likely
in our estimation that obligations may arise which
are either excluded from or not fully covered by
our insurance policies and where a reasonably
accurate estimate of the potential loss is possible.
However, predicting the results of actions is beset
with considerable diffi culties, especially in cases
in which the claimant is seeking substantial or
unspecifi ed damages. Given these imponderables,
we are unable to predict what obligations may
arise from such litigations. Consequently, major
losses can arise from litigations and proceedings
that are not covered by our insurance policies or
our provisions.
We do not currently foresee risks arising from
litigations or proceedings either pending or
threatened that could have a material infl uence
on our net assets, fi nancial position or results of
operations.
Business strategy risks can arise from the expecta-
tions that we have invested in internal projects,
acquisitions and strategic alliances failing to
materialize in part or in full. This may, in turn,
mean that we are unable to recoup the associated
capital expenditures. Individual projects could
also be delayed by unforeseen risks.
Our strategy of standardizing our processes on
a global scale and concentrating our production
facilities may give rise, for example, to strained re-
lationships with employees and vendors. Logistics
processes likewise have to be harmonized in the
course of integrating acquirees. We limit exposure
through early risk analyses performed by expe-
rienced specialist units, supported by external
consultants where appropriate.
Overall risk – Management Board appraisal
At the time of writing this report, there are no
identifi able risks relating to future developments
that could endanger the existence either of Henkel
AG & Co. KGaA or of the Group as a going concern.
As we have no special-purpose entities or invest-
ment vehicles, there is no risk that might ema-
nate from such a source. Aggregation of the most
signifi cant individual risks is not appropriate due
to the unlikelihood that such risks would occur
simultaneously. Our risk analysis indicates that
our exposure to risk does not represent any lasting
endangerment to the net assets, fi nancial position
and results of operations either of Henkel AG & Co.
KGaA or of the Group. The overall picture shows no
underlying change to the risk situation compared
to the previous year. The system of risk categoriza-
tion undertaken by Henkel continues to indicate
that the most signifi cant exposure currently relates
to the impact of economic and sector uncertainty
and fi nancial risk, to which we are responding
with the countermeasures described.
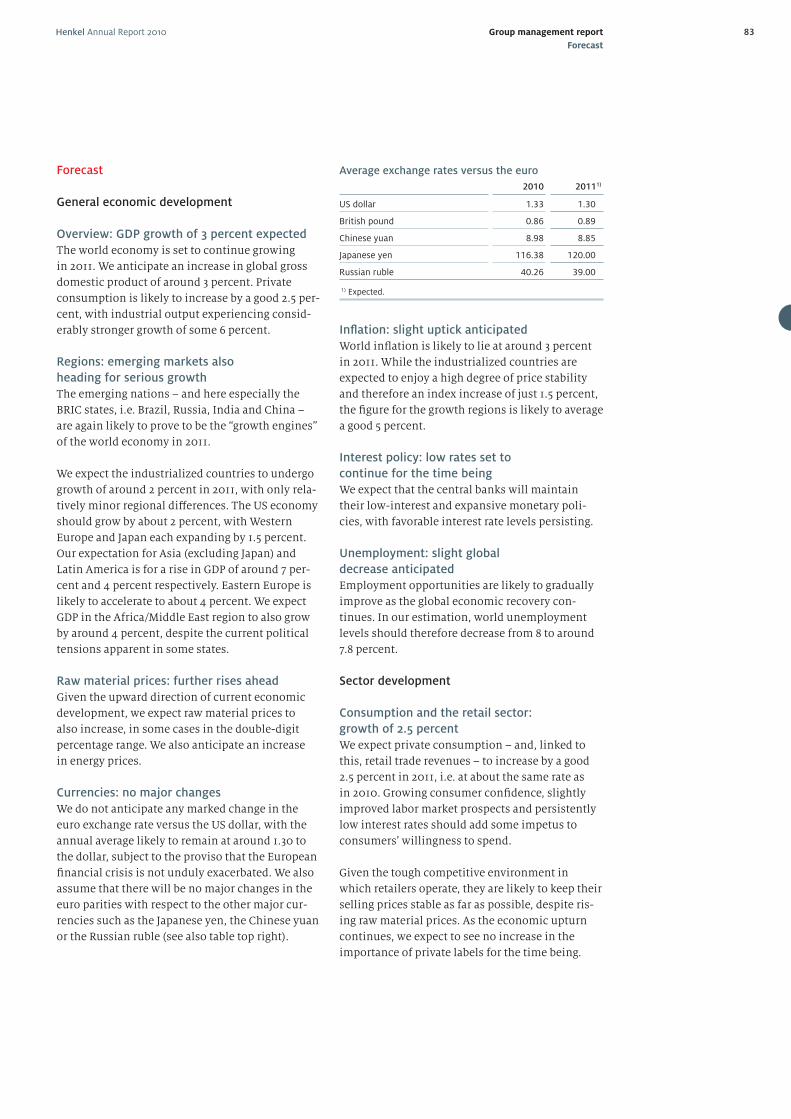
Henkel Annual Report 2010 83Group management report
Forecast
Forecast
General economic development
Overview: GDP growth of 3 percent expected
The world economy is set to continue growing
in 2011. We anticipate an increase in global gross
domestic product of around 3 percent. Private
consumption is likely to increase by a good 2.5 per-
cent, with industrial output experiencing consid-
erably stronger growth of some 6 percent.
Regions: emerging markets also
heading for serious growth
The emerging nations – and here especially the
BRIC states, i.e. Brazil, Russia, India and China –
are again likely to prove to be the “growth engines”
of the world economy in 2011.
We expect the industrialized countries to undergo
growth of around 2 percent in 2011, with only rela-
tively minor regional diff erences. The US economy
should grow by about 2 percent, with Western
Europe and Japan each expanding by 1.5 percent.
Our expectation for Asia (excluding Japan) and
Latin America is for a rise in GDP of around 7 per-
cent and 4 percent respectively. Eastern Europe is
likely to accelerate to about 4 percent. We expect
GDP in the Africa/Middle East region to also grow
by around 4 percent, despite the current political
tensions apparent in some states.
Raw material prices: further rises ahead
Given the upward direction of current economic
development, we expect raw material prices to
also increase, in some cases in the double-digit
percentage range. We also anticipate an in crease
in energy prices.
Currencies: no major changes
We do not anticipate any marked change in the
euro exchange rate versus the US dollar, with the
annual average likely to remain at around 1.30 to
the dollar, subject to the proviso that the European
fi nancial crisis is not unduly exacerbated. We also
assume that there will be no major changes in the
euro parities with respect to the other major cur-
rencies such as the Japanese yen, the Chinese yuan
or the Russian ruble (see also table top right).
Average exchange rates versus the euro
2010 20111)
US dollar 1.33 1.30
British pound 0.86 0.89
Chinese yuan 8.98 8.85
Japanese yen 116.38 120.00
Russian ruble 40.26 39.00
1) Expected.
Infl ation: slight uptick anticipated
World infl ation is likely to lie at around 3 percent
in 2011. While the industrialized countries are
expected to enjoy a high degree of price stability
and therefore an index increase of just 1.5 percent,
the fi gure for the growth regions is likely to average
a good 5 percent.
Interest policy: low rates set to
continue for the time being
We expect that the central banks will maintain
their low-interest and expansive monetary poli-
cies, with favorable interest rate levels persisting.
Unemployment: slight global
decrease anticipated
Employment opportunities are likely to gradually
improve as the global economic recovery con-
tinues. In our estimation, world unemployment
levels should therefore decrease from 8 to around
7.8 percent.
Sector development
Consumption and the retail sector:
growth of 2.5 percent
We expect private consumption – and, linked to
this, retail trade revenues – to increase by a good
2.5 percent in 2011, i.e. at about the same rate as
in 2010. Growing consumer confi dence, slightly
improved labor market prospects and persistently
low interest rates should add some impetus to
consumers’ willingness to spend.
Given the tough competitive environment in
which retailers operate, they are likely to keep their
selling prices stable as far as possible, despite ris-
ing raw material prices. As the economic upturn
continues, we expect to see no increase in the
importance of private labels for the time being.
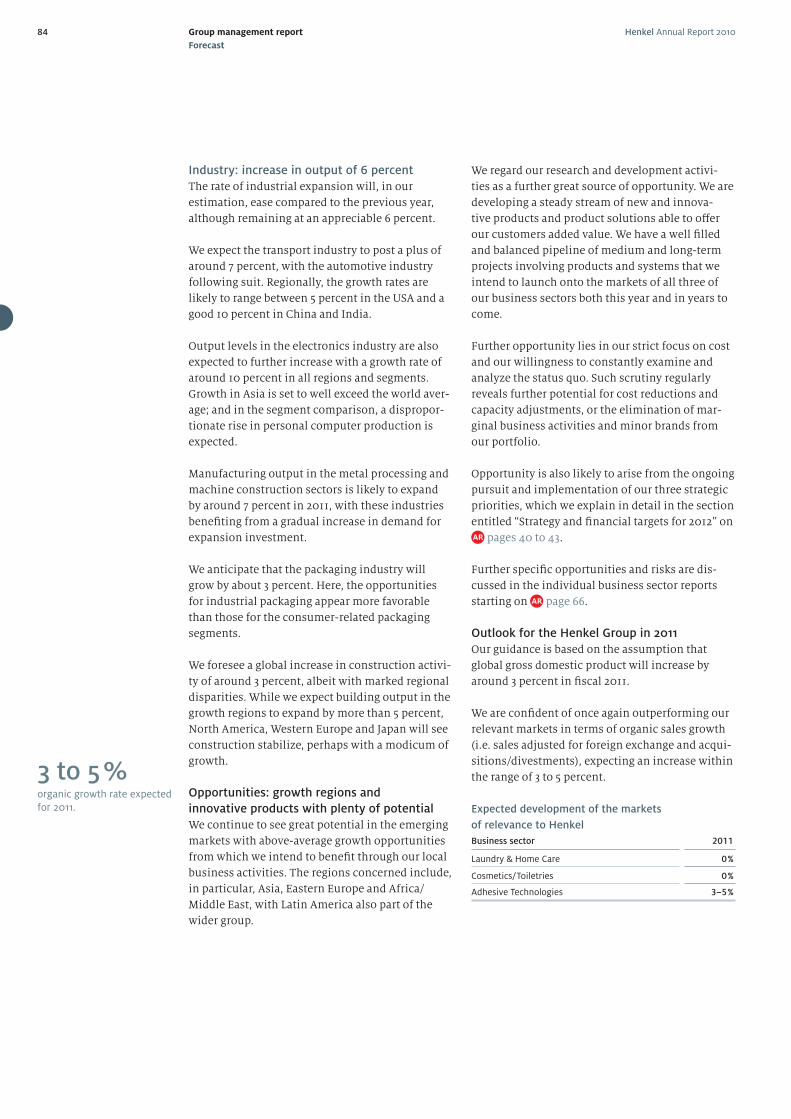
Henkel Annual Report 201084 Group management report
Forecast
We regard our research and development activi-
ties as a further great source of opportunity. We are
developing a steady stream of new and innova-
tive products and product solutions able to off er
our customers added value. We have a well fi lled
and balanced pipeline of medium and long-term
projects involving products and systems that we
intend to launch onto the markets of all three of
our business sectors both this year and in years to
come.
Further opportunity lies in our strict focus on cost
and our willingness to constantly examine and
analyze the status quo. Such scrutiny regularly
reveals further potential for cost reductions and
capacity adjustments, or the elimination of mar-
ginal business activities and minor brands from
our portfolio.
Opportunity is also likely to arise from the ongoing
pursuit and implementation of our three strategic
priorities, which we explain in detail in the section
entitled “Strategy and fi nancial targets for 2012” on
pages 40 to 43.
Further specifi c opportunities and risks are dis-
cussed in the individual business sector reports
starting on page 66.
Outlook for the Henkel Group in 2011
Our guidance is based on the assumption that
global gross domestic product will increase by
around 3 percent in fi scal 2011.
We are confi dent of once again outperforming our
relevant markets in terms of organic sales growth
(i.e. sales adjusted for foreign exchange and acqui-
sitions/divestments), expecting an increase within
the range of 3 to 5 percent.
Expected development of the markets
of relevance to Henkel
Business sector 2011
Laundry & Home Care 0 %
Cosmetics/Toiletries 0 %
Adhesive Technologies 3–5 %
Industry: increase in output of 6 percent
The rate of industrial expansion will, in our
estimation, ease compared to the previous year,
although remaining at an appreciable 6 percent.
We expect the transport industry to post a plus of
around 7 percent, with the automotive industry
following suit. Regionally, the growth rates are
likely to range between 5 percent in the USA and a
good 10 percent in China and India.
Output levels in the electronics industry are also
expected to further increase with a growth rate of
around 10 percent in all regions and segments.
Growth in Asia is set to well exceed the world aver-
age; and in the segment comparison, a dispropor-
tionate rise in personal computer production is
expected.
Manufacturing output in the metal processing and
machine construction sectors is likely to expand
by around 7 percent in 2011, with these industries
benefi ting from a gradual increase in demand for
expansion investment.
We anticipate that the packaging industry will
grow by about 3 percent. Here, the opportunities
for industrial packaging appear more favorable
than those for the consumer-related packaging
segments.
We foresee a global increase in construction activi-
ty of around 3 percent, albeit with marked regional
disparities. While we expect building output in the
growth regions to expand by more than 5 percent,
North America, Western Europe and Japan will see
construction stabilize, perhaps with a modicum of
growth.
Opportunities: growth regions and
innovative products with plenty of potential
We continue to see great potential in the emerging
markets with above-average growth opportunities
from which we intend to benefi t through our local
business activities. The regions concerned include,
in particular, Asia, Eastern Europe and Africa/
Middle East, with Latin America also part of the
wider group.
3 to 5 %organic growth rate expected for 2011.
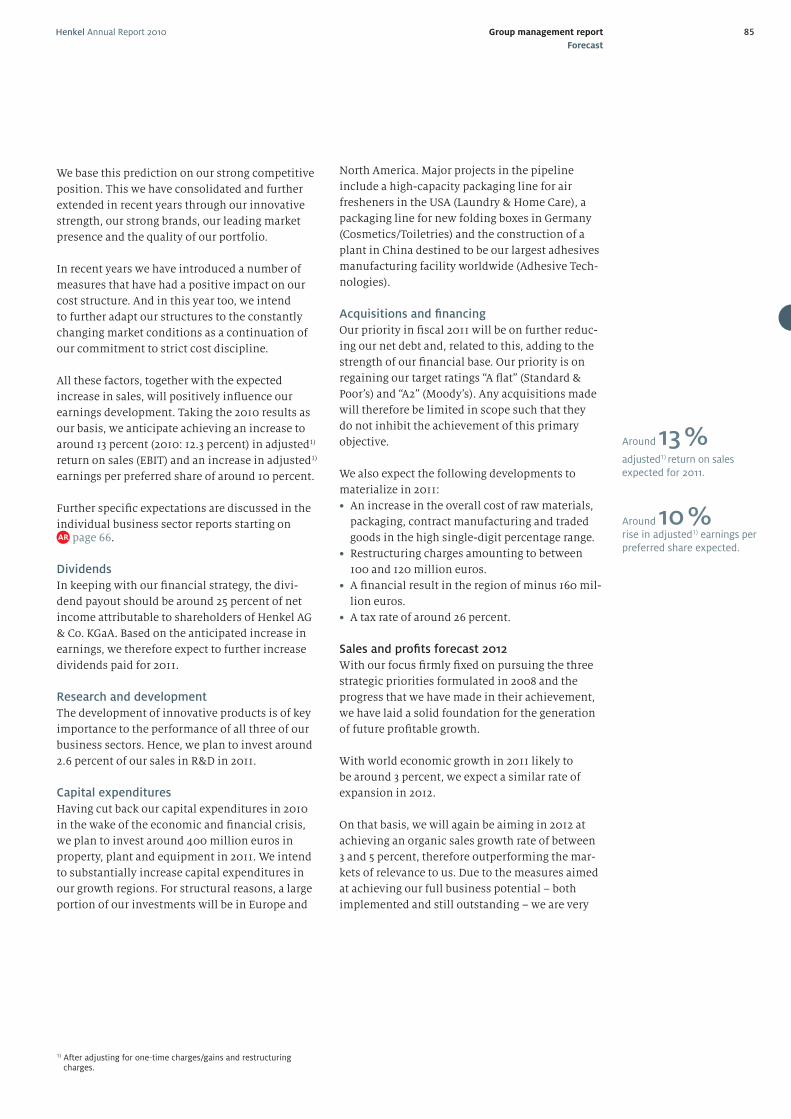
Henkel Annual Report 2010 85Group management report
Forecast
We base this prediction on our strong competitive
position. This we have consolidated and further
extended in recent years through our innovative
strength, our strong brands, our leading market
presence and the quality of our portfolio.
In recent years we have introduced a number of
measures that have had a positive impact on our
cost structure. And in this year too, we intend
to further adapt our structures to the constantly
changing market conditions as a continuation of
our commitment to strict cost discipline.
All these factors, together with the expected
increase in sales, will positively infl uence our
earnings development. Taking the 2010 results as
our basis, we anticipate achieving an increase to
around 13 percent (2010: 12.3 percent) in adjusted1)
return on sales (EBIT) and an increase in adjusted1)
earnings per preferred share of around 10 percent.
Further specifi c expectations are discussed in the
individual business sector reports starting on page 66.
Dividends
In keeping with our fi nancial strategy, the divi-
dend payout should be around 25 percent of net
income attributable to shareholders of Henkel AG
& Co. KGaA. Based on the anticipated increase in
earnings, we therefore expect to further increase
dividends paid for 2011.
Research and development
The development of innovative products is of key
importance to the performance of all three of our
business sectors. Hence, we plan to invest around
2.6 percent of our sales in R&D in 2011.
Capital expenditures
Having cut back our capital expenditures in 2010
in the wake of the economic and fi nancial crisis,
we plan to invest around 400 million euros in
property, plant and equipment in 2011. We intend
to substantially increase capital expenditures in
our growth regions. For structural reasons, a large
portion of our investments will be in Europe and
North America. Major projects in the pipeline
include a high-capacity packaging line for air
fresheners in the USA (Laundry & Home Care), a
packaging line for new folding boxes in Germany
(Cosmetics/Toiletries) and the construction of a
plant in China destined to be our largest adhesives
manufacturing facility worldwide (Adhesive Tech-
nologies).
Acquisitions and fi nancing
Our priority in fi scal 2011 will be on further reduc-
ing our net debt and, related to this, adding to the
strength of our fi nancial base. Our priority is on
regaining our target ratings “A fl at” (Standard &
Poor’s) and “A2” (Moody’s). Any acquisitions made
will therefore be limited in scope such that they
do not inhibit the achievement of this primary
objective.
We also expect the following developments to
materialize in 2011:
• An increase in the overall cost of raw materials,
packaging, contract manufacturing and traded
goods in the high single-digit percentage range.
• Restructuring charges amounting to between
100 and 120 million euros.
• A fi nancial result in the region of minus 160 mil-
lion euros.
• A tax rate of around 26 percent.
Sales and profi ts forecast 2012
With our focus fi rmly fi xed on pursuing the three
strategic priorities formulated in 2008 and the
progress that we have made in their achievement,
we have laid a solid foundation for the generation
of future profi table growth.
With world economic growth in 2011 likely to
be around 3 percent, we expect a similar rate of
expansion in 2012.
On that basis, we will again be aiming in 2012 at
achieving an organic sales growth rate of between
3 and 5 percent, therefore outperforming the mar-
kets of relevance to us. Due to the measures aimed
at achieving our full business potential – both
implemented and still outstanding – we are very
1) After adjusting for one-time charges/gains and restructuring charges.
Around 13 %adjusted1) return on salesexpected for 2011.
Around 10 %rise in adjusted1) earnings per preferred share expected.
Henkel Annual Report 201086 Group management report
Forecast/Subsequent events
Subsequent events
With economic eff ect as of January 1, 2011, we
acquired 100 percent of the shares in Schwarzkopf
Inc., Culver City, California, USA and have included
it within our scope of consolidation from that
date. Until the end of 2010 we operated our hair
salon business in the USA using the well known
Schwarz kopf Professional brands on the basis of a
license agreement.
Eff ective January 11, 2011, we completed the dis-
posal of a non-core portion of our building adhe-
sives business in South Korea. The assets recog-
nized as held for sale at the time of the divestment
have been transferred to the purchaser.
Together with our cooperation partner Sandoz, we
have decided, as of the end of 2012, to end our joint
venture Biozym in Kundl, Austria, founded in 1984,
and to close down our enzyme manufacturing
operations there. This action is in line with chang-
ing market conditions relating to both quality and
price. The employees aff ected were informed of
this decision on January 17, 2011.
We have decided to transfer detergent tablet
production for machine-dishwashing applica-
tions back to our plant in Düsseldorf-Holthausen,
Germany, and have therefore given notice of
termination of the associated toll manufacturing
contract. We intend to invest around 25 million
euros between now and February 2012 in order
to establish the required tablet manufacturing
capability for machine-dishwashing products at
our Düsseldorf-Holthausen site. We informed the
appropriate works committees of this decision in
mid-January 2011.
At the end of January 2011, we ended our own pro-
duction of the bleach activator TAED in Cork, Ire-
land, selling the associated business to an investor.
TAED (tetra acetyl ethylene diamine) is a laundry
detergent additive designed to boost bleaching
performance. The investor taking over the plant
will continue supplying Henkel with TAED.
confi dent of reaching our 2012 targets of 14 percent
in adjusted1) return on sales (EBIT) and an increase
of more than 10 percent in adjusted1) earnings per
preferred share (EPS).
Financial targets for 2012
Annual organic sales growth (average):
3–5 percent
Adjusted1) return on sales (EBIT):
14 percent
Annual growth in adjusted1) earnings per
preferred share (average):
> 10 percent
1) After adjusting for one-time charges/gains and restructuring charges.
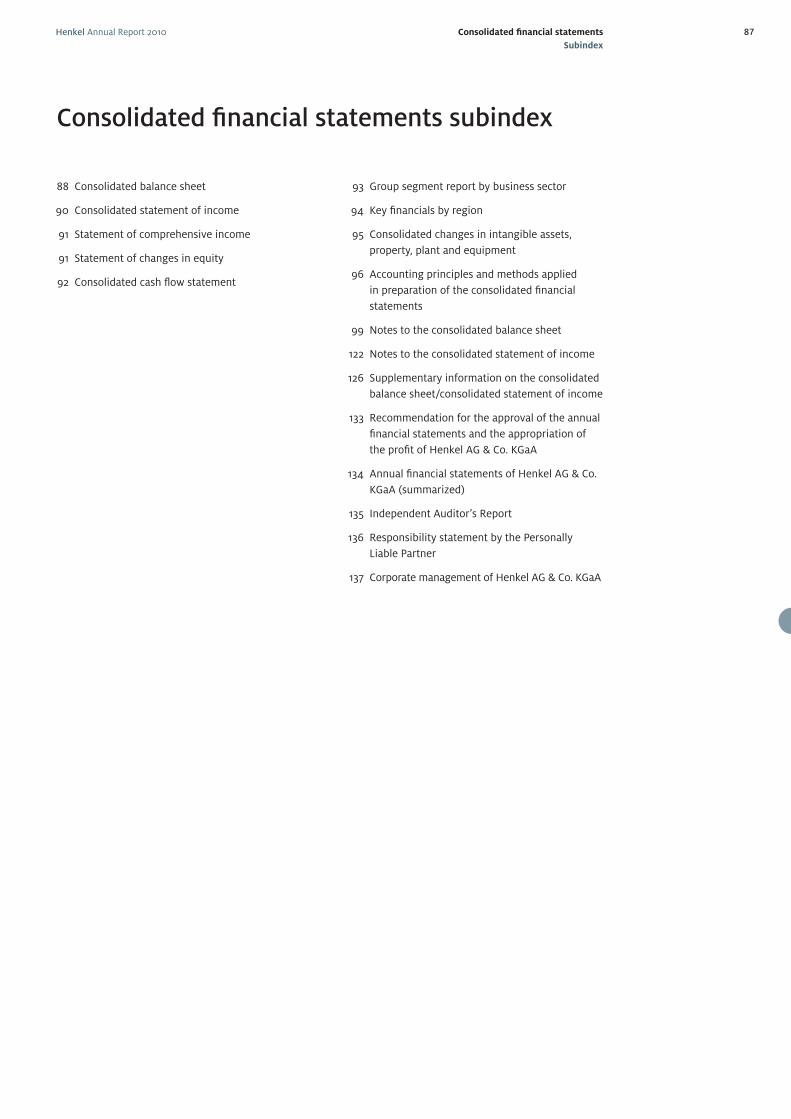
Henkel Annual Report 2010 87Consolidated fi nancial statements
Subindex
Consolidated fi nancial statements subindex
88 Consolidated balance sheet
90 Consolidated statement of income
91 Statement of comprehensive income
91 Statement of changes in equity
92 Consolidated cash fl ow statement
93 Group segment report by business sector
94 Key fi nancials by region
95 Consolidated changes in intangible assets,
property, plant and equipment
96 Accounting principles and methods applied
in preparation of the consolidated fi nancial
statements
99 Notes to the consolidated balance sheet
122 Notes to the consolidated statement of income
126 Supplementary information on the consolidated
balance sheet/consolidated statement of income
133 Recommendation for the approval of the annual
fi nancial statements and the appropriation of
the profi t of Henkel AG & Co. KGaA
134 Annual fi nancial statements of Henkel AG & Co.
KGaA (summarized)
135 Independent Auditor’s Report
136 Responsibility statement by the Personally
Liable Partner
137 Corporate management of Henkel AG & Co. KGaA
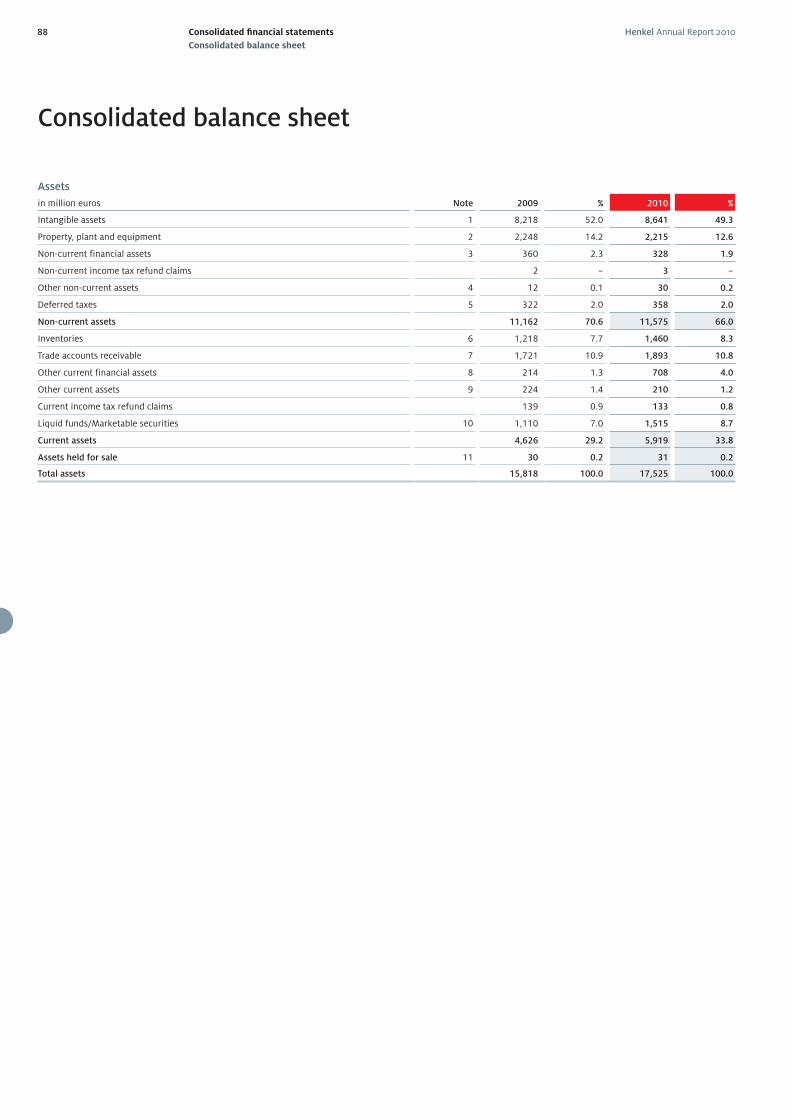
Henkel Annual Report 201088 Consolidated fi nancial statements
Consolidated balance sheet
Consolidated balance sheet
Assets
in million euros Note 2009 % 2010 %
Intangible assets 1 8,218 52.0 8,641 49.3
Property, plant and equipment 2 2,248 14.2 2,215 12.6
Non-current financial assets 3 360 2.3 328 1.9
Non-current income tax refund claims 2 – 3 –
Other non-current assets 4 12 0.1 30 0.2
Deferred taxes 5 322 2.0 358 2.0
Non-current assets 11,162 70.6 11,575 66.0
Inventories 6 1,218 7.7 1,460 8.3
Trade accounts receivable 7 1,721 10.9 1,893 10.8
Other current financial assets 8 214 1.3 708 4.0
Other current assets 9 224 1.4 210 1.2
Current income tax refund claims 139 0.9 133 0.8
Liquid funds/Marketable securities 10 1,110 7.0 1,515 8.7
Current assets 4,626 29.2 5,919 33.8
Assets held for sale 11 30 0.2 31 0.2
Total assets 15,818 100.0 17,525 100.0
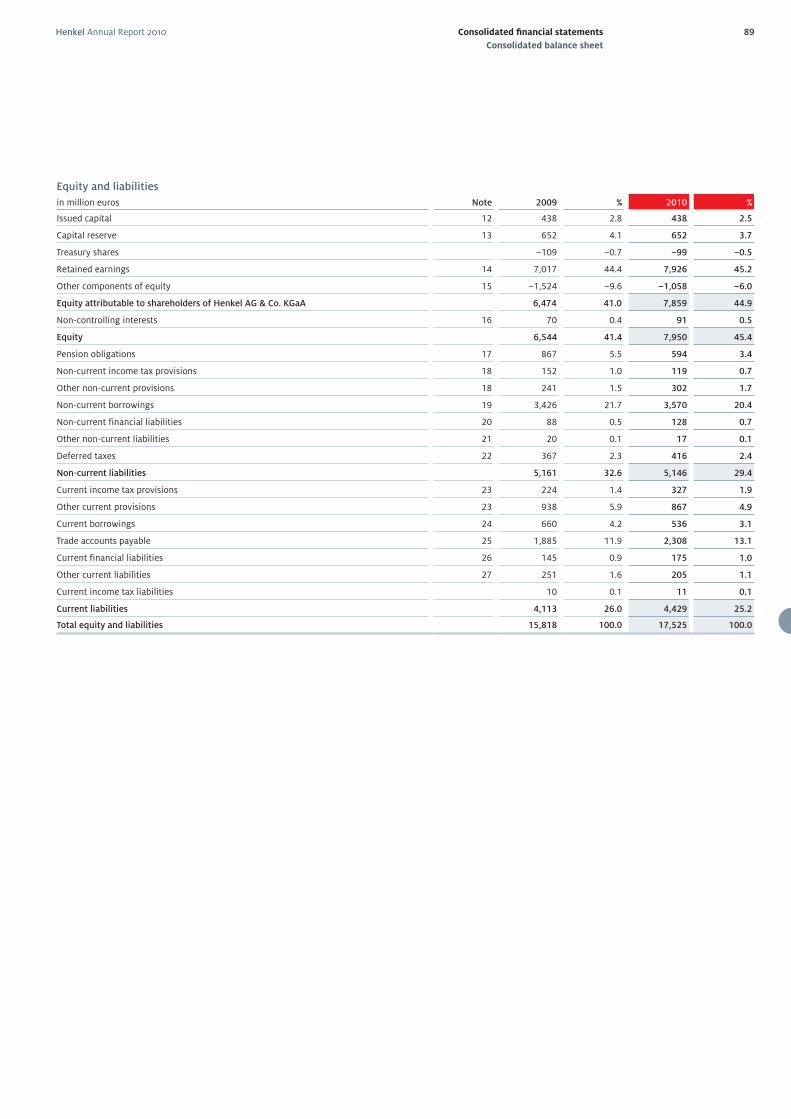
Henkel Annual Report 2010 89Consolidated fi nancial statements
Consolidated balance sheet
Equity and liabilities
in million euros Note 2009 % 2010 %
Issued capital 12 438 2.8 438 2.5
Capital reserve 13 652 4.1 652 3.7
Treasury shares –109 –0.7 –99 –0.5
Retained earnings 14 7,017 44.4 7,926 45.2
Other components of equity 15 –1,524 –9.6 –1,058 –6.0
Equity attributable to shareholders of Henkel AG & Co. KGaA 6,474 41.0 7,859 44.9
Non-controlling interests 16 70 0.4 91 0.5
Equity 6,544 41.4 7,950 45.4
Pension obligations 17 867 5.5 594 3.4
Non-current income tax provisions 18 152 1.0 119 0.7
Other non-current provisions 18 241 1.5 302 1.7
Non-current borrowings 19 3,426 21.7 3,570 20.4
Non-current financial liabilities 20 88 0.5 128 0.7
Other non-current liabilities 21 20 0.1 17 0.1
Deferred taxes 22 367 2.3 416 2.4
Non-current liabilities 5,161 32.6 5,146 29.4
Current income tax provisions 23 224 1.4 327 1.9
Other current provisions 23 938 5.9 867 4.9
Current borrowings 24 660 4.2 536 3.1
Trade accounts payable 25 1,885 11.9 2,308 13.1
Current financial liabilities 26 145 0.9 175 1.0
Other current liabilities 27 251 1.6 205 1.1
Current income tax liabilities 10 0.1 11 0.1
Current liabilities 4,113 26.0 4,429 25.2
Total equity and liabilities 15,818 100.0 17,525 100.0
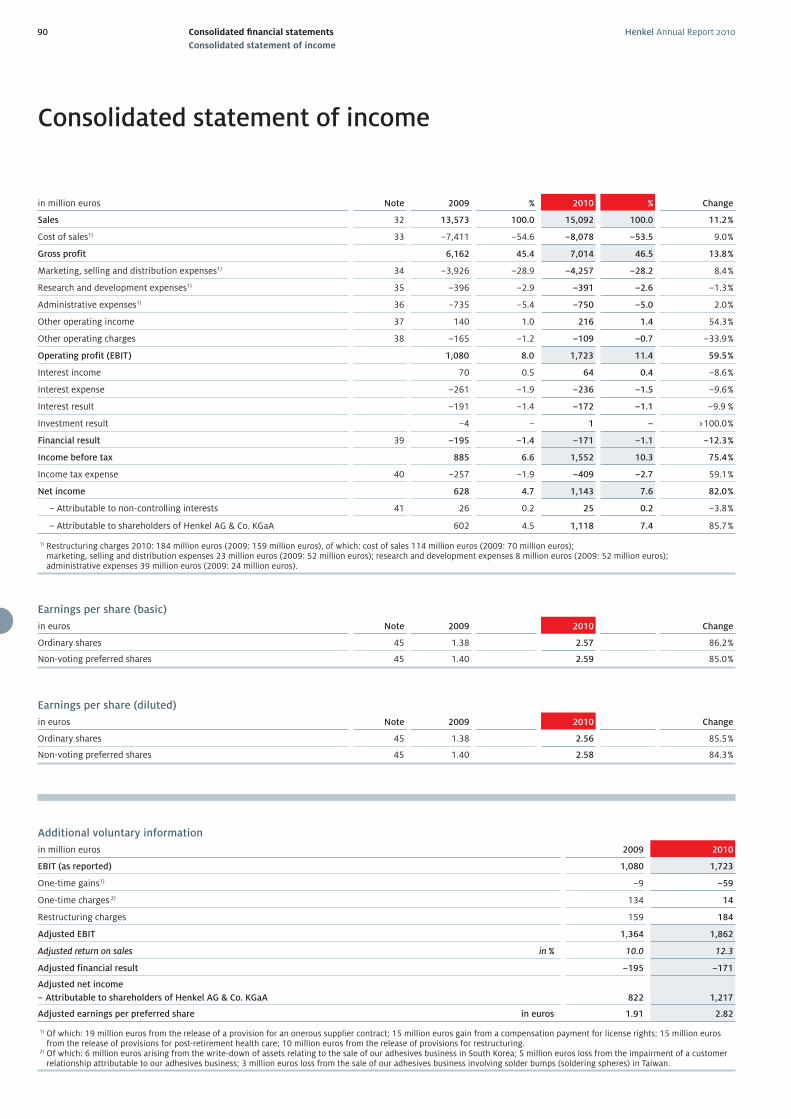
Henkel Annual Report 201090 Consolidated fi nancial statements
Consolidated statement of income
Consolidated statement of income
in million euros Note 2009 % 2010 % Change
Sales 32 13,573 100.0 15,092 100.0 11.2 %
Cost of sales1) 33 –7,411 –54.6 –8,078 –53.5 9.0 %
Gross profit 6,162 45.4 7,014 46.5 13.8 %
Marketing, selling and distribution expenses1) 34 –3,926 –28.9 –4,257 –28.2 8.4 %
Research and development expenses1) 35 –396 –2.9 –391 –2.6 –1.3 %
Administrative expenses1) 36 –735 –5.4 –750 –5.0 2.0 %
Other operating income 37 140 1.0 216 1.4 54.3 %
Other operating charges 38 –165 –1.2 –109 –0.7 –33.9 %
Operating profit (EBIT) 1,080 8.0 1,723 11.4 59.5 %
Interest income 70 0.5 64 0.4 –8.6 %
Interest expense –261 –1.9 –236 –1.5 –9.6 %
Interest result –191 –1.4 –172 –1.1 –9.9 %
Investment result –4 – 1 – >100.0 %
Financial result 39 –195 –1.4 –171 –1.1 –12.3 %
Income before tax 885 6.6 1,552 10.3 75.4 %
Income tax expense 40 –257 –1.9 –409 –2.7 59.1 %
Net income 628 4.7 1,143 7.6 82.0 %
– Attributable to non-controlling interests 41 26 0.2 25 0.2 –3.8 %
– Attributable to shareholders of Henkel AG & Co. KGaA 602 4.5 1,118 7.4 85.7 %
1) Restructuring charges 2010: 184 million euros (2009: 159 million euros), of which: cost of sales 114 million euros (2009: 70 million euros); marketing, selling and distribution expenses 23 million euros (2009: 52 million euros); research and development expenses 8 million euros (2009: 52 million euros); administrative expenses 39 million euros (2009: 24 million euros).
Earnings per share (basic)
in euros Note 2009 2010 Change
Ordinary shares 45 1.38 2.57 86.2 %
Non-voting preferred shares 45 1.40 2.59 85.0 %
Earnings per share (diluted)
in euros Note 2009 2010 Change
Ordinary shares 45 1.38 2.56 85.5 %
Non-voting preferred shares 45 1.40 2.58 84.3 %
Additional voluntary information
in million euros 2009 2010
EBIT (as reported) 1,080 1,723
One-time gains1) –9 –59
One-time charges 2) 134 14
Restructuring charges 159 184
Adjusted EBIT 1,364 1,862
Adjusted return on sales in % 10.0 12.3
Adjusted financial result –195 –171
Adjusted net income
– Attributable to shareholders of Henkel AG & Co. KGaA 822 1,217
Adjusted earnings per preferred share in euros 1.91 2.82
1) Of which: 19 million euros from the release of a provision for an onerous supplier contract; 15 million euros gain from a compensation payment for license rights; 15 million euros from the release of provisions for post-retirement health care; 10 million euros from the release of provisions for restructuring.
2) Of which: 6 million euros arising from the write-down of assets relating to the sale of our adhesives business in South Korea; 5 million euros loss from the impairment of a customerrelationship attributable to our adhesives business; 3 million euros loss from the sale of our adhesives business involving solder bumps (soldering spheres) in Taiwan.
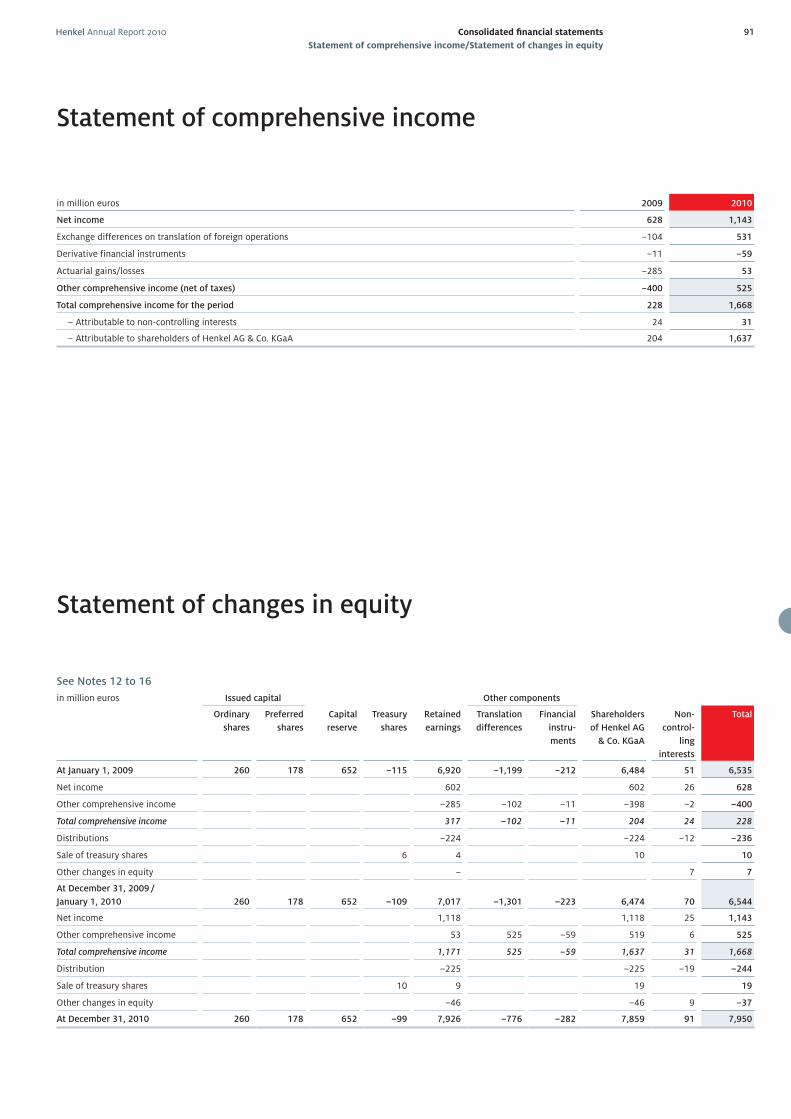
Henkel Annual Report 2010 91Consolidated fi nancial statements
Statement of comprehensive income/Statement of changes in equity
in million euros 2009 2010
Net income 628 1,143
Exchange differences on translation of foreign operations –104 531
Derivative financial instruments –11 –59
Actuarial gains/losses –285 53
Other comprehensive income (net of taxes) –400 525
Total comprehensive income for the period 228 1,668
– Attributable to non-controlling interests 24 31
– Attributable to shareholders of Henkel AG & Co. KGaA 204 1,637
Statement of comprehensive income
Statement of changes in equity
See Notes 12 to 16
in million euros Issued capital Other components
Ordinary
shares
Preferred
shares
Capital
reserve
Treasury
shares
Retained
earnings
Translation
differences
Financial
instru-
ments
Shareholders
of Henkel AG
& Co. KGaA
Non-
control-
ling
interests
Total
At January 1, 2009 260 178 652 –115 6,920 –1,199 –212 6,484 51 6,535
Net income 602 602 26 628
Other comprehensive income –285 –102 –11 –398 –2 –400
Total comprehensive income 317 –102 –11 204 24 228
Distributions –224 –224 –12 –236
Sale of treasury shares 6 4 10 10
Other changes in equity – 7 7
At December 31, 2009 /
January 1, 2010 260 178 652 –109 7,017 –1,301 –223 6,474 70 6,544
Net income 1,118 1,118 25 1,143
Other comprehensive income 53 525 –59 519 6 525
Total comprehensive income 1,171 525 –59 1,637 31 1,668
Distribution –225 –225 –19 –244
Sale of treasury shares 10 9 19 19
Other changes in equity –46 –46 9 –37
At December 31, 2010 260 178 652 –99 7,926 –776 –282 7,859 91 7,950
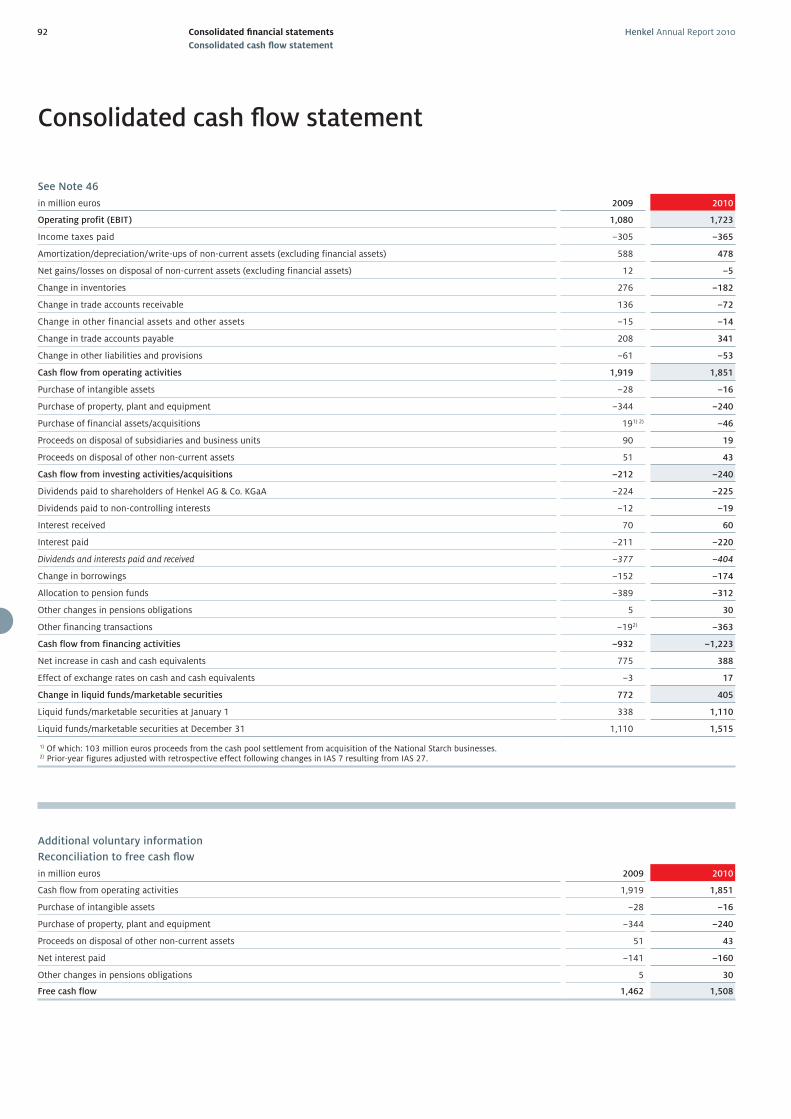
Henkel Annual Report 201092 Consolidated fi nancial statements
Consolidated cash fl ow statement
See Note 46
in million euros 2009 2010
Operating profit (EBIT) 1,080 1,723
Income taxes paid –305 –365
Amortization/depreciation/write-ups of non-current assets (excluding financial assets) 588 478
Net gains/losses on disposal of non-current assets (excluding financial assets) 12 –5
Change in inventories 276 –182
Change in trade accounts receivable 136 –72
Change in other financial assets and other assets –15 –14
Change in trade accounts payable 208 341
Change in other liabilities and provisions –61 –53
Cash flow from operating activities 1,919 1,851
Purchase of intangible assets –28 –16
Purchase of property, plant and equipment –344 –240
Purchase of financial assets/acquisitions 191) 2) –46
Proceeds on disposal of subsidiaries and business units 90 19
Proceeds on disposal of other non-current assets 51 43
Cash flow from investing activities/acquisitions –212 –240
Dividends paid to shareholders of Henkel AG & Co. KGaA –224 –225
Dividends paid to non-controlling interests –12 –19
Interest received 70 60
Interest paid –211 –220
Dividends and interests paid and received –377 –404
Change in borrowings –152 –174
Allocation to pension funds –389 –312
Other changes in pensions obligations 5 30
Other financing transactions –192) –363
Cash flow from financing activities –932 –1,223
Net increase in cash and cash equivalents 775 388
Effect of exchange rates on cash and cash equivalents –3 17
Change in liquid funds/marketable securities 772 405
Liquid funds/marketable securities at January 1 338 1,110
Liquid funds/marketable securities at December 31 1,110 1,515
1) Of which: 103 million euros proceeds from the cash pool settlement from acquisition of the National Starch businesses.2) Prior-year figures adjusted with retrospective effect following changes in IAS 7 resulting from IAS 27.
Additional voluntary information
Reconciliation to free cash fl ow
in million euros 2009 2010
Cash flow from operating activities 1,919 1,851
Purchase of intangible assets –28 –16
Purchase of property, plant and equipment –344 –240
Proceeds on disposal of other non-current assets 51 43
Net interest paid –141 –160
Other changes in pensions obligations 5 30
Free cash flow 1,462 1,508
Consolidated cash fl ow statement
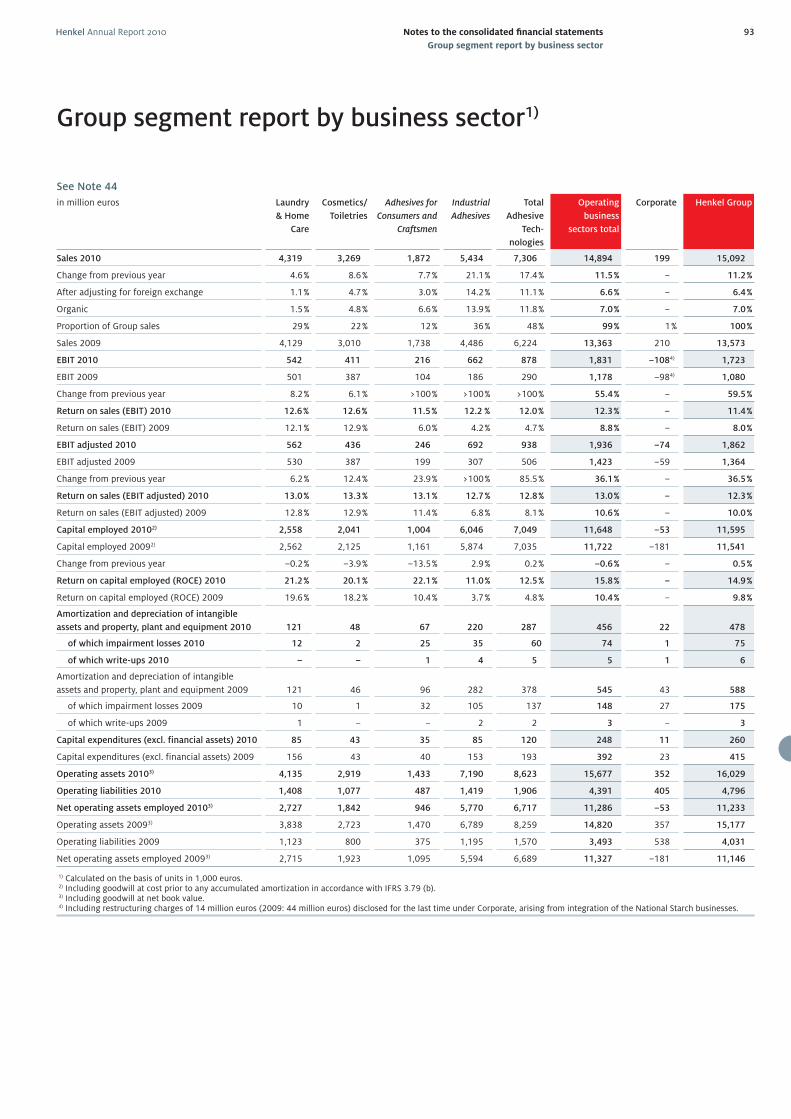
Henkel Annual Report 2010 93Notes to the consolidated fi nancial statements
Group segment report by business sector
See Note 44
in million euros Laundry
& Home
Care
Cosmetics/
Toiletries
Adhesives for
Consumers and
Craftsmen
Industrial
Adhesives
Total
Adhesive
Tech-
nologies
Operating
business
sectors total
Corporate Henkel Group
Sales 2010 4,319 3,269 1,872 5,434 7,306 14,894 199 15,092
Change from previous year 4.6 % 8.6 % 7.7 % 21.1 % 17.4 % 11.5 % – 11.2 %
After adjusting for foreign exchange 1.1 % 4.7 % 3.0 % 14.2 % 11.1 % 6.6 % – 6.4 %
Organic 1.5 % 4.8 % 6.6 % 13.9 % 11.8 % 7.0 % – 7.0 %
Proportion of Group sales 29 % 22 % 12 % 36 % 48 % 99 % 1 % 100 %
Sales 2009 4,129 3,010 1,738 4,486 6,224 13,363 210 13,573
EBIT 2010 542 411 216 662 878 1,831 –1084) 1,723
EBIT 2009 501 387 104 186 290 1,178 –984) 1,080
Change from previous year 8.2 % 6.1 % >100 % >100 % >100 % 55.4 % – 59.5 %
Return on sales (EBIT) 2010 12.6 % 12.6 % 11.5 % 12.2 % 12.0 % 12.3 % – 11.4 %
Return on sales (EBIT) 2009 12.1 % 12.9 % 6.0 % 4.2 % 4.7 % 8.8 % – 8.0 %
EBIT adjusted 2010 562 436 246 692 938 1,936 –74 1,862
EBIT adjusted 2009 530 387 199 307 506 1,423 –59 1,364
Change from previous year 6.2 % 12.4 % 23.9 % >100 % 85.5 % 36.1 % – 36.5 %
Return on sales (EBIT adjusted) 2010 13.0 % 13.3 % 13.1 % 12.7 % 12.8 % 13.0 % – 12.3 %
Return on sales (EBIT adjusted) 2009 12.8 % 12.9 % 11.4 % 6.8 % 8.1 % 10.6 % – 10.0 %
Capital employed 20102) 2,558 2,041 1,004 6,046 7,049 11,648 –53 11,595
Capital employed 20092) 2,562 2,125 1,161 5,874 7,035 11,722 –181 11,541
Change from previous year –0.2 % –3.9 % –13.5 % 2.9 % 0.2 % –0.6 % – 0.5 %
Return on capital employed (ROCE) 2010 21.2 % 20.1 % 22.1 % 11.0 % 12.5 % 15.8 % – 14.9 %
Return on capital employed (ROCE) 2009 19.6 % 18.2 % 10.4 % 3.7 % 4.8 % 10.4 % – 9.8 %
Amortization and depreciation of intangible
assets and property, plant and equipment 2010 121 48 67 220 287 456 22 478
of which impairment losses 2010 12 2 25 35 60 74 1 75
of which write-ups 2010 – – 1 4 5 5 1 6
Amortization and depreciation of intangible
assets and property, plant and equipment 2009 121 46 96 282 378 545 43 588
of which impairment losses 2009 10 1 32 105 137 148 27 175
of which write-ups 2009 1 – – 2 2 3 – 3
Capital expenditures (excl. financial assets) 2010 85 43 35 85 120 248 11 260
Capital expenditures (excl. financial assets) 2009 156 43 40 153 193 392 23 415
Operating assets 20103) 4,135 2,919 1,433 7,190 8,623 15,677 352 16,029
Operating liabilities 2010 1,408 1,077 487 1,419 1,906 4,391 405 4,796
Net operating assets employed 20103) 2,727 1,842 946 5,770 6,717 11,286 –53 11,233
Operating assets 20093) 3,838 2,723 1,470 6,789 8,259 14,820 357 15,177
Operating liabilities 2009 1,123 800 375 1,195 1,570 3,493 538 4,031
Net operating assets employed 20093) 2,715 1,923 1,095 5,594 6,689 11,327 –181 11,146
1) Calculated on the basis of units in 1,000 euros.2) Including goodwill at cost prior to any accumulated amortization in accordance with IFRS 3.79 (b).3) Including goodwill at net book value.4) Including restructuring charges of 14 million euros (2009: 44 million euros) disclosed for the last time under Corporate, arising from integration of the National Starch businesses.
Group segment report by business sector1)
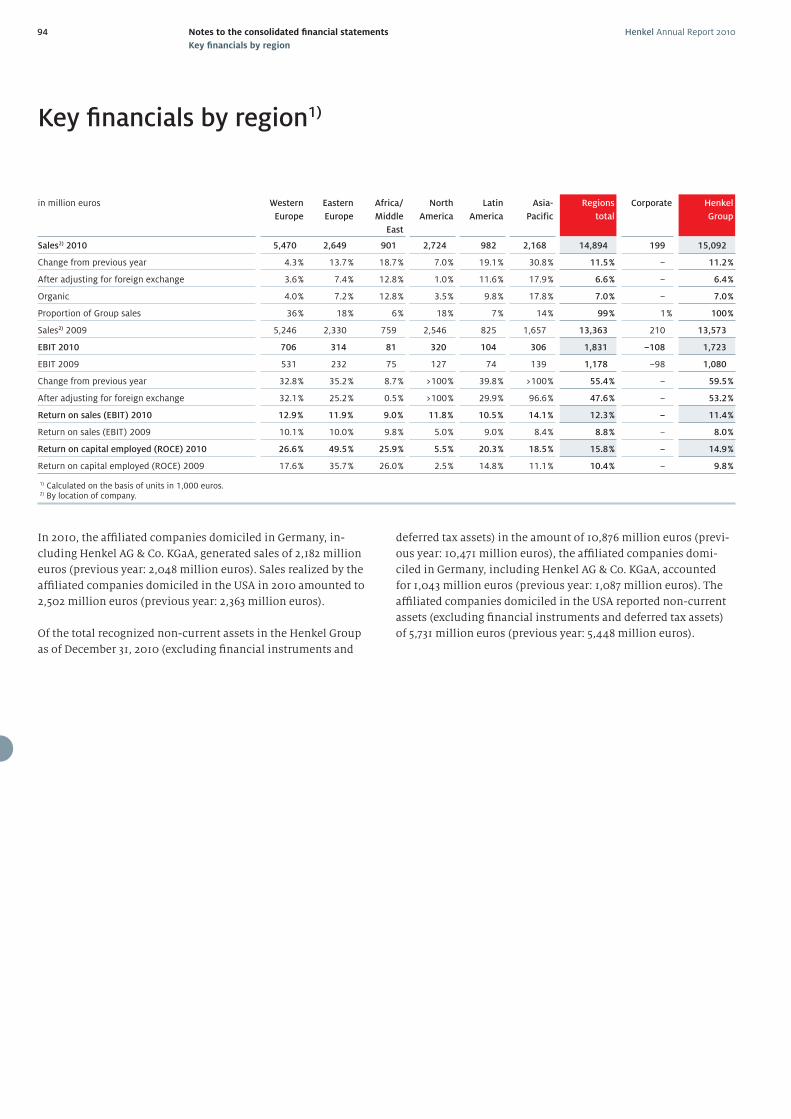
Henkel Annual Report 201094 Notes to the consolidated fi nancial statements
Key fi nancials by region
Key fi nancials by region1)
In 2010, the affi liated companies domiciled in Germany, in-
cluding Henkel AG & Co. KGaA, generated sales of 2,182 million
euros (previous year: 2,048 million euros). Sales realized by the
affi liated companies domiciled in the USA in 2010 amounted to
2,502 million euros (previous year: 2,363 million euros).
Of the total recognized non-current assets in the Henkel Group
as of December 31, 2010 (excluding fi nancial instruments and
deferred tax assets) in the amount of 10,876 million euros (previ-
ous year: 10,471 million euros), the affi liated companies domi-
ciled in Germany, including Henkel AG & Co. KGaA, accounted
for 1,043 million euros (previous year: 1,087 million euros). The
affi liated companies domiciled in the USA reported non-current
assets (excluding fi nancial instruments and deferred tax assets)
of 5,731 million euros (previous year: 5,448 million euros).
in million euros Western
Europe
Eastern
Europe
Africa/
Middle
East
North
America
Latin
America
Asia-
Pacific
Regions
total
Corporate Henkel
Group
Sales2) 2010 5,470 2,649 901 2,724 982 2,168 14,894 199 15,092
Change from previous year 4.3 % 13.7 % 18.7 % 7.0 % 19.1 % 30.8 % 11.5 % – 11.2 %
After adjusting for foreign exchange 3.6 % 7.4 % 12.8 % 1.0 % 11.6 % 17.9 % 6.6 % – 6.4 %
Organic 4.0 % 7.2 % 12.8 % 3.5 % 9.8 % 17.8 % 7.0 % – 7.0 %
Proportion of Group sales 36 % 18 % 6 % 18 % 7 % 14 % 99 % 1 % 100 %
Sales2) 2009 5,246 2,330 759 2,546 825 1,657 13,363 210 13,573
EBIT 2010 706 314 81 320 104 306 1,831 –108 1,723
EBIT 2009 531 232 75 127 74 139 1,178 –98 1,080
Change from previous year 32.8 % 35.2 % 8.7 % >100 % 39.8 % >100 % 55.4 % – 59.5 %
After adjusting for foreign exchange 32.1 % 25.2 % 0.5 % >100 % 29.9 % 96.6 % 47.6 % – 53.2 %
Return on sales (EBIT) 2010 12.9 % 11.9 % 9.0 % 11.8 % 10.5 % 14.1 % 12.3 % – 11.4 %
Return on sales (EBIT) 2009 10.1 % 10.0 % 9.8 % 5.0 % 9.0 % 8.4 % 8.8 % – 8.0 %
Return on capital employed (ROCE) 2010 26.6 % 49.5 % 25.9 % 5.5 % 20.3 % 18.5 % 15.8 % – 14.9 %
Return on capital employed (ROCE) 2009 17.6 % 35.7 % 26.0 % 2.5 % 14.8 % 11.1 % 10.4 % – 9.8 %
1) Calculated on the basis of units in 1,000 euros.2) By location of company.
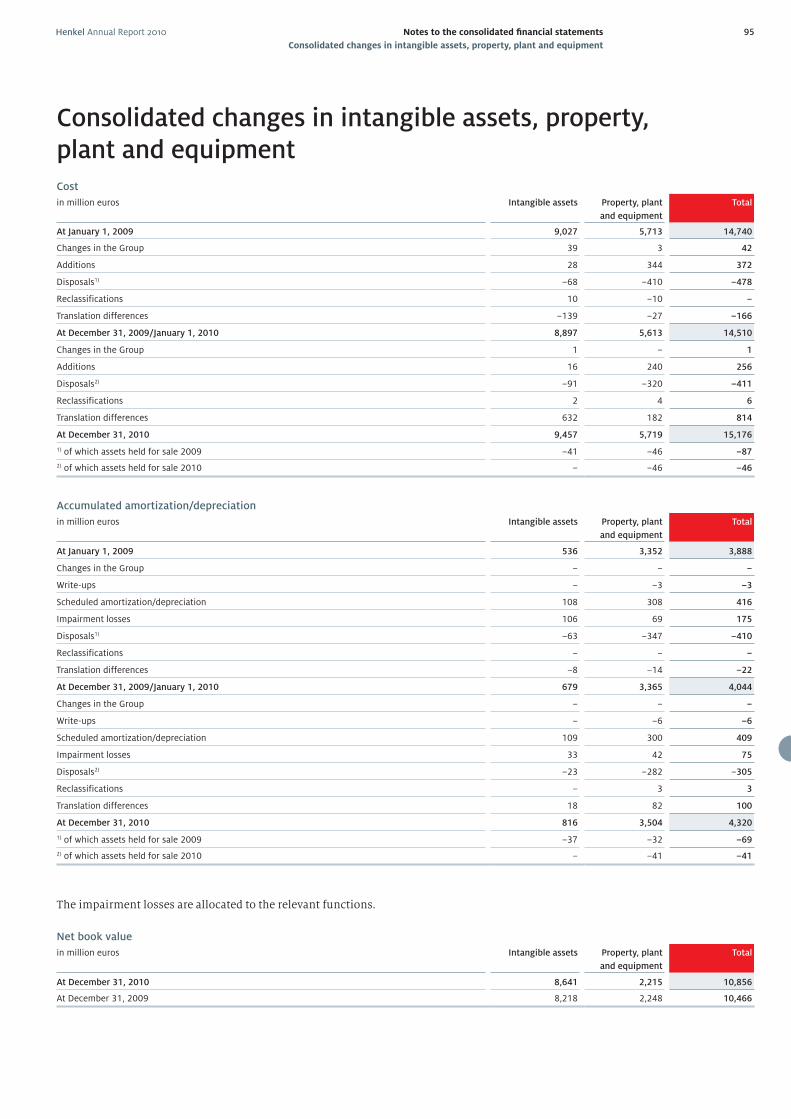
Henkel Annual Report 2010 95Notes to the consolidated fi nancial statements
Consolidated changes in intangible assets, property, plant and equipment
Cost
in million euros Intangible assets Property, plant
and equipment
Total
At January 1, 2009 9,027 5,713 14,740
Changes in the Group 39 3 42
Additions 28 344 372
Disposals1) –68 –410 –478
Reclassifications 10 –10 –
Translation differences –139 –27 –166
At December 31, 2009/January 1, 2010 8,897 5,613 14,510
Changes in the Group 1 – 1
Additions 16 240 256
Disposals2) –91 –320 –411
Reclassifications 2 4 6
Translation differences 632 182 814
At December 31, 2010 9,457 5,719 15,176
1) of which assets held for sale 2009 –41 –46 –87
2) of which assets held for sale 2010 – –46 –46
Accumulated amortization/depreciation
in million euros Intangible assets Property, plant
and equipment
Total
At January 1, 2009 536 3,352 3,888
Changes in the Group – – –
Write-ups – –3 –3
Scheduled amortization/depreciation 108 308 416
Impairment losses 106 69 175
Disposals1) –63 –347 –410
Reclassifications – – –
Translation differences –8 –14 –22
At December 31, 2009/January 1, 2010 679 3,365 4,044
Changes in the Group – – –
Write-ups – –6 –6
Scheduled amortization/depreciation 109 300 409
Impairment losses 33 42 75
Disposals2) –23 –282 –305
Reclassifications – 3 3
Translation differences 18 82 100
At December 31, 2010 816 3,504 4,320
1) of which assets held for sale 2009 –37 –32 –69
2) of which assets held for sale 2010 – –41 –41
The impairment losses are allocated to the relevant functions.
Net book value
in million euros Intangible assets Property, plant
and equipment
Total
At December 31, 2010 8,641 2,215 10,856
At December 31, 2009 8,218 2,248 10,466
Consolidated changes in intangible assets, property, plant and equipment
Henkel Annual Report 201096 Notes to the consolidated fi nancial statements
Accounting principles and methods applied in preparation
of the consolidated fi nancial statements
Accounting principles and methods applied in preparation of the consolidated fi nancial statementsGeneral information
The consolidated fi nancial statements of Henkel AG & Co. KGaA
have been prepared in accordance with International Financial
Reporting Standards (IFRS) as adopted by the European Union
and in compliance with Section 315a of the German Commercial
Code [HGB].
The individual fi nancial statements of the companies included in
the consolidation are drawn up on the same accounting date as
those of Henkel AG & Co. KGaA.
Members of the KPMG organization or other independent fi rms of
auditors instructed accordingly have either audited the fi nancial
statements of companies included in the consolidation or, in ex-
ceptional cases, conducted a review of those fi nancial statements.
On January 28, 2011, the Management Board of Henkel Manage-
ment AG – which is the Personally Liable Partner of Henkel AG
& Co. KGaA – approved the release of the consolidated fi nancial
statements to the Supervisory Board. The Supervisory Board is
responsible for reviewing the consolidated fi nancial statements
and declaring whether it approves them.
The consolidated fi nancial statements are based on the principle
of historical cost with the exception that certain fi nancial instru-
ments are accounted for at their fair values. The Group currency
is the euro. Unless otherwise indicated, all amounts are shown
in million euros. In order to improve the clarity and informative
value of the consolidated fi nancial statements, certain items are
combined in the consolidated balance sheet, the consolidated
statement of income and the statement of comprehensive in-
come, and then shown separately in the Notes.
Scope of consolidation
In addition to Henkel AG & Co. KGaA as the ultimate parent com-
pany, the consolidated fi nancial statements at December 31, 2010
include nine German and 182 non-German companies in which
Henkel AG & Co. KGaA has the power to govern fi nancial and op-
erating policy, based on the concept of control. This is generally
the case where Henkel AG & Co. KGaA holds, directly or indirectly,
a majority of the voting rights. Companies in which not more
than half of the shares are held, are fully consolidated if Henkel
AG & Co. KGaA has the power, directly or indirectly, to govern
their fi nancial and operating policies.
Compared to December 31, 2009, three new companies have been
included in the scope of consolidation, seven companies have
been merged, and a further sixteen companies have ceased to be
subsidiaries and have therefore left the scope of consolidation.
No companies are included in the scope of consolidation on a
proportionate basis. The changes in the scope of consolidation
have not had any material eff ect on the main items of the consoli-
dated fi nancial statements.
Acquisitions and divestments
In April 2010, we spent 7 million euros on acquisition of the
remaining non-controlling interests in Henkel Huawei Electron-
ics Co. Ltd., Lianyungang, China. Our shareholding in Henkel
Huawei Electronics Co. Ltd. now stands at 95 percent. In August
2010, we made an acquisition in the Middle East attributable to
the Cosmetics/Toiletries business sector at a cost of 1 million
euros. In addition, we increased to 100 percent our shareholdings
in subsidiaries in Guatemala (at a cost of 23 million euros) and
on Cyprus (for 6 million euros). In December 2010, we acquired
Schwarzkopf Inc., Culver City, California, USA. The purchase price
was 41 million euros.
In June 2010, we sold our Taiwanese business involving solder
bumps/spheres for 5 million euros.
We also divested non-core activities in Japan in March 2010, and
in South Korea in December 2010. The proceeds from the sale in
Japan amounted to 2 million euros, while the disposal in South
Korea generated 15 million euros
As a result of amendments to IFRS 3 coming into force as of
January 1, 2010, (ancillary) transaction costs arising from the
acquisition of participating interests/business combinations
are no longer included in the measurement of the consideration
transferred or the assets acquired. Instead, they are expensed as
of the period when incurred.
The acquisitions and divestments made in fi scal 2010 had no
material eff ect on the business and organizational structure of
Henkel, nor on our net assets, fi nancial position or results of
operations.
Consolidation methods
The purchase method is used for the consolidation of capital.
This method stipulates that, for business combinations, all hid-
den reserves and hidden charges in the company acquired must
be fully refl ected at fair value and all identifi able intangible assets
must be separately disclosed. Any diff erence arising between the
fair value of the net assets and the purchase price is recognized as
goodwill. Companies acquired are included in the consolidation
for the fi rst time as subsidiaries by off setting the carrying amount
of the Henkel AG & Co. KGaA investment in them against their
assets and liabilities. In subsequent years, the carrying amount of
the Henkel AG & Co. KGaA investment in the subsidiary compa-
nies is eliminated against the current equity of the subsidiary
companies.
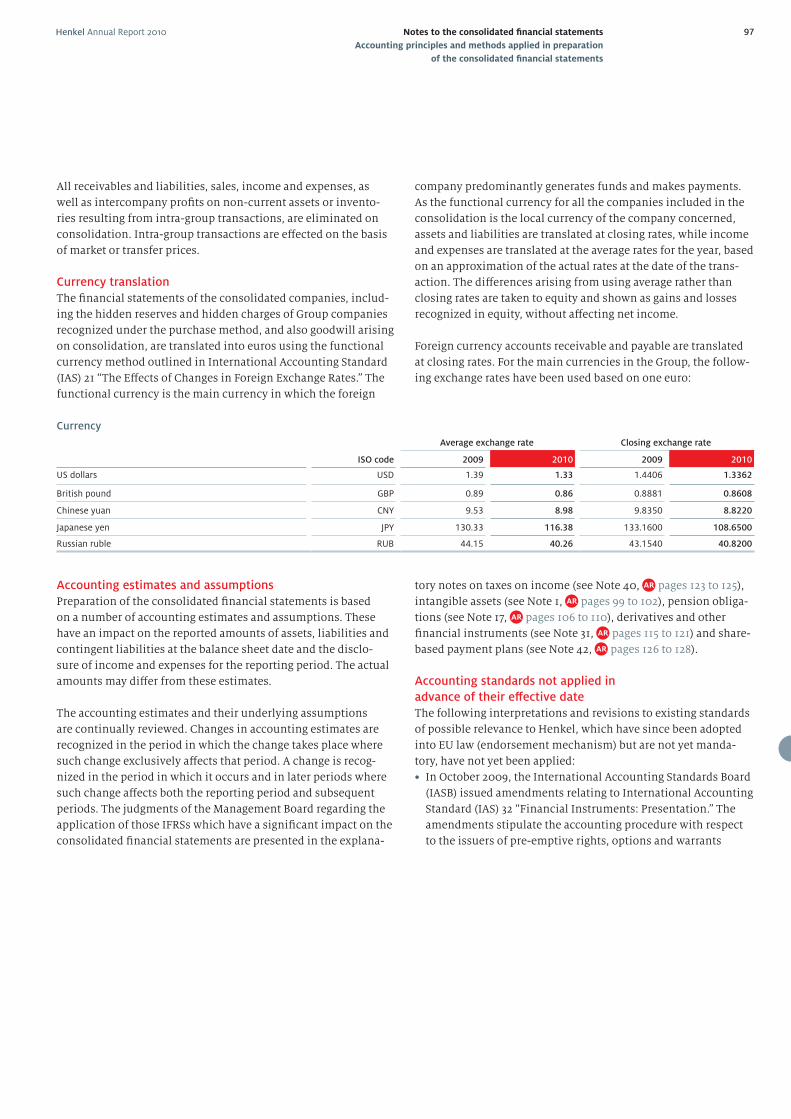
Henkel Annual Report 2010 97Notes to the consolidated fi nancial statements
Accounting principles and methods applied in preparation
of the consolidated fi nancial statements
All receivables and liabilities, sales, income and expenses, as
well as intercompany profi ts on non-current assets or invento-
ries resulting from intra-group transactions, are eliminated on
consolidation. Intra-group transactions are eff ected on the basis
of market or transfer prices.
Currency translation
The fi nancial statements of the consolidated companies, includ-
ing the hidden reserves and hidden charges of Group companies
recognized under the purchase method, and also goodwill arising
on consolidation, are translated into euros using the functional
currency method outlined in International Accounting Standard
(IAS) 21 “The Eff ects of Changes in Foreign Exchange Rates.” The
functional currency is the main currency in which the foreign
company predominantly generates funds and makes payments.
As the functional currency for all the companies included in the
consolidation is the local currency of the company concerned,
assets and liabilities are translated at closing rates, while income
and expenses are translated at the average rates for the year, based
on an approximation of the actual rates at the date of the trans-
action. The diff erences arising from using average rather than
closing rates are taken to equity and shown as gains and losses
recognized in equity, without aff ecting net income.
Foreign currency accounts receivable and payable are translated
at closing rates. For the main currencies in the Group, the follow-
ing exchange rates have been used based on one euro:
tory notes on taxes on income (see Note 40, pages 123 to 125),
intangible assets (see Note 1, pages 99 to 102), pension obliga-
tions (see Note 17, pages 106 to 110), derivatives and other
fi nancial instruments (see Note 31, pages 115 to 121) and share-
based payment plans (see Note 42, pages 126 to 128).
Accounting standards not applied in
advance of their eff ective date
The following interpretations and revisions to existing standards
of possible relevance to Henkel, which have since been adopted
into EU law (endorsement mechanism) but are not yet manda-
tory, have not yet been applied:
• In October 2009, the International Accounting Standards Board
(IASB) issued amendments relating to International Accounting
Standard (IAS) 32 “Financial Instruments: Presentation.” The
amendments stipulate the accounting procedure with respect
to the issuers of pre-emptive rights, options and warrants
Currency
Average exchange rate Closing exchange rate
ISO code 2009 2010 2009 2010
US dollars USD 1.39 1.33 1.4406 1.3362
British pound GBP 0.89 0.86 0.8881 0.8608
Chinese yuan CNY 9.53 8.98 9.8350 8.8220
Japanese yen JPY 130.33 116.38 133.1600 108.6500
Russian ruble RUB 44.15 40.26 43.1540 40.8200
Accounting estimates and assumptions
Preparation of the consolidated fi nancial statements is based
on a number of accounting estimates and assumptions. These
have an impact on the reported amounts of assets, liabilities and
contingent liabilities at the balance sheet date and the disclo-
sure of income and expenses for the reporting period. The actual
amounts may diff er from these estimates.
The accounting estimates and their underlying assumptions
are continually reviewed. Changes in accounting estimates are
recognized in the period in which the change takes place where
such change exclusively aff ects that period. A change is recog-
nized in the period in which it occurs and in later periods where
such change aff ects both the reporting period and subsequent
periods. The judgments of the Management Board regarding the
application of those IFRSs which have a signifi cant impact on the
consolidated fi nancial statements are presented in the explana-
Henkel Annual Report 201098 Notes to the consolidated fi nancial statements
Accounting principles and methods applied in preparation
of the consolidated fi nancial statements
for acquiring a fi xed number of equity instruments that are
denominated in a currency other than that of the issuer. Such
cases were hitherto reported as derivative liabilities. Pre-emp-
tive rights that are issued pro-rata at a fi xed currency amount
to the existing shareholders of a company are in future to be
classifi ed as equity. The currency in which the exercise price is
stated is irrelevant. The amendments are applicable for fi nan-
cial years beginning on or after February 1, 2010, with earlier
application permitted.
• In November 2009, the International Accounting Standards
Board (IASB) issued a revised version of IAS 24 “Related Party
Disclosures.” The revised standard clarifi es the defi nition of
a related party and simplifi es the disclosure requirements for
government-related entities. The amendments are applicable
for fi nancial years beginning after December 31, 2010, with
earlier application permitted.
• International Financial Reporting Interpretations Committee
(IFRIC) 14 “IAS 19 – The Limit on a Defi ned Benefi t Asset, Mini-
mum Funding Requirements and their Interaction” deals with
the accounting treatment of voluntary prepaid contributions
made by a company in order to meet existing minimum fund-
ing requirements. The amendment allows a company to rec-
ognize the benefi t arising from such a prepayment as an asset.
The interpretation is applicable for fi nancial years beginning
after December 31, 2010, with earlier application permitted.
• IFRIC 19 “Extinguishing Financial Liabilities with Equity
Instruments” states in particular that if a debtor issues equity
instruments to a creditor to extinguish all or part of a fi nancial
liability, those equity instruments are “consideration paid”
in accordance with IAS 39.41. The debtor should measure the
equity instruments issued to the creditor at fair value. The
debtor recognizes in profi t or loss the diff erence between the
carrying amount of the fi nancial liability (or part) extinguished
and the measurement of the equity instruments issued. The
interpretation is applicable for fi nancial years beginning after
June 30, 2010, with earlier application permitted.
All these standards and interpretations will be applied by Henkel
from fi scal 2011 or later. We expect the future application of
amendments to IAS 24 and IAS 32, and of IFRIC 14 and 19 not to
have a signifi cant impact on the presentation of the fi nancial
statements.
In fi scal 2010, the IASB issued the following standards or in-
terpretations of and amendments to standards of relevance to
Henkel which still have to be adopted in EU law (endorsement
mechanism) before they become applicable:
• Amendments to IFRS 7 “Financial Instruments: Disclosures.”
• IFRS 9 “Financial Instruments.”
• Collective standard “Improvements to IFRSs.”
These interpretations and standards will be applied by Henkel
from fi scal 2011 or later. We expect the future application of the
aforementioned standards and interpretations not to have a sig-
nifi cant impact on the presentation of the fi nancial statements.
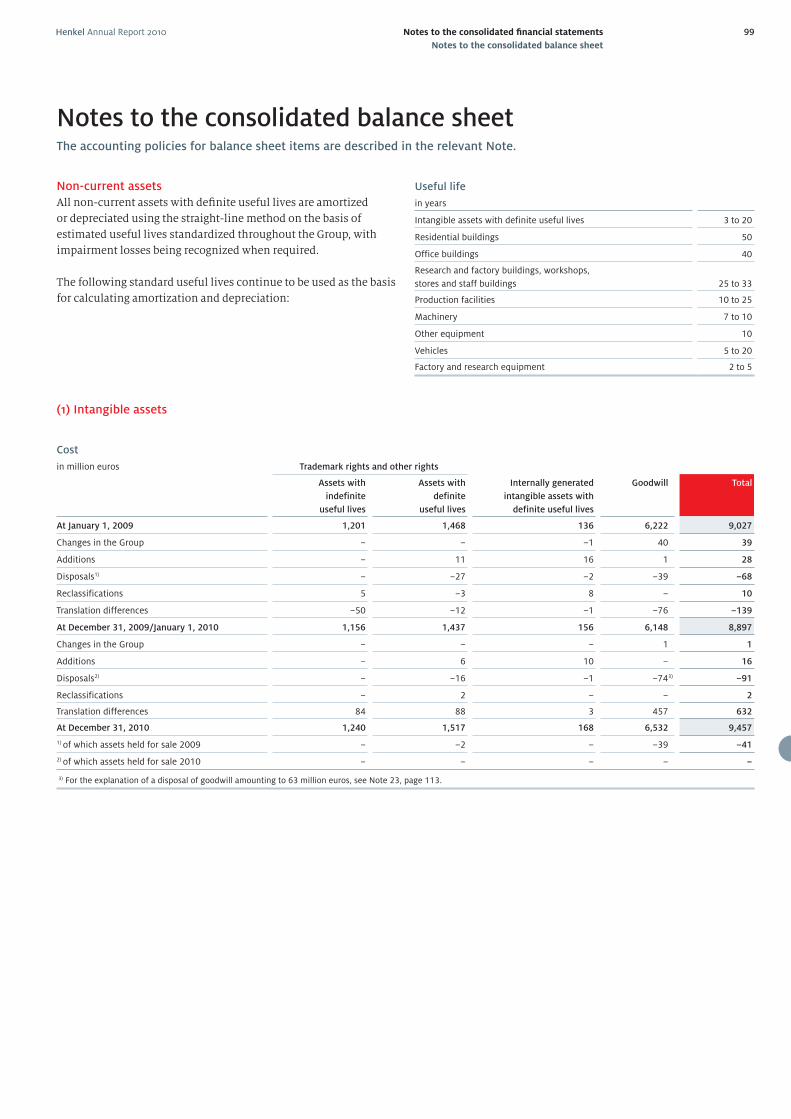
Henkel Annual Report 2010 99Notes to the consolidated fi nancial statements
Notes to the consolidated balance sheet
Non-current assets
All non-current assets with defi nite useful lives are amortized
or depreciated using the straight-line method on the basis of
estimated useful lives standardized throughout the Group, with
impairment losses being recognized when required.
The following standard useful lives continue to be used as the basis
for calculating amortization and depreciation:
Useful life
in years
Intangible assets with definite useful lives 3 to 20
Residential buildings 50
Office buildings 40
Research and factory buildings, workshops,
stores and staff buildings 25 to 33
Production facilities 10 to 25
Machinery 7 to 10
Other equipment 10
Vehicles 5 to 20
Factory and research equipment 2 to 5
Notes to the consolidated balance sheetThe accounting policies for balance sheet items are described in the relevant Note.
(1) Intangible assets
Cost
in million euros Trademark rights and other rights
Assets with
indefinite
useful lives
Assets with
definite
useful lives
Internally generated
intangible assets with
definite useful lives
Goodwill Total
At January 1, 2009 1,201 1,468 136 6,222 9,027
Changes in the Group – – –1 40 39
Additions – 11 16 1 28
Disposals1) – –27 –2 –39 –68
Reclassifications 5 –3 8 – 10
Translation differences –50 –12 –1 –76 –139
At December 31, 2009/January 1, 2010 1,156 1,437 156 6,148 8,897
Changes in the Group – – – 1 1
Additions – 6 10 – 16
Disposals2) – –16 –1 –743) –91
Reclassifications – 2 – – 2
Translation differences 84 88 3 457 632
At December 31, 2010 1,240 1,517 168 6,532 9,457
1) of which assets held for sale 2009 – –2 – –39 –41
2) of which assets held for sale 2010 – – – – –
3) For the explanation of a disposal of goodwill amounting to 63 million euros, see Note 23, page 113.
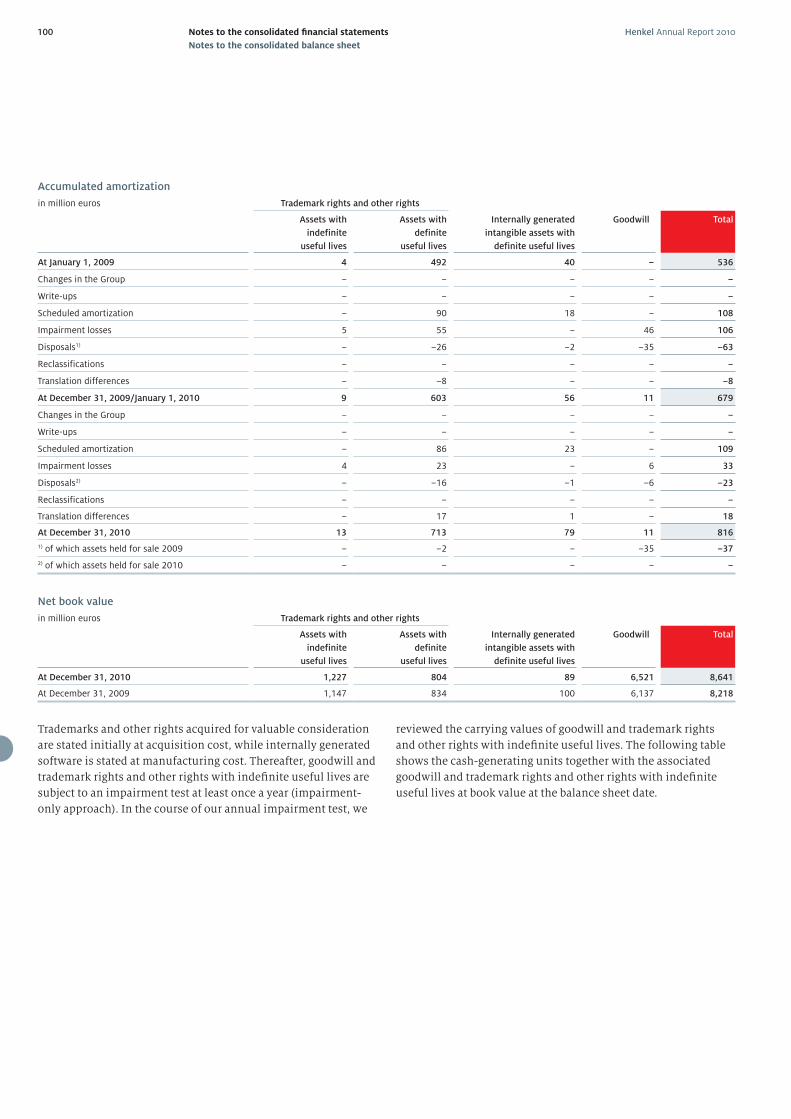
Henkel Annual Report 2010100 Notes to the consolidated fi nancial statements
Notes to the consolidated balance sheet
Accumulated amortization
in million euros Trademark rights and other rights
Assets with
indefinite
useful lives
Assets with
definite
useful lives
Internally generated
intangible assets with
definite useful lives
Goodwill Total
At January 1, 2009 4 492 40 – 536
Changes in the Group – – – – –
Write-ups – – – – –
Scheduled amortization – 90 18 – 108
Impairment losses 5 55 – 46 106
Disposals1) – –26 –2 –35 –63
Reclassifications – – – – –
Translation differences – –8 – – –8
At December 31, 2009/January 1, 2010 9 603 56 11 679
Changes in the Group – – – – –
Write-ups – – – – –
Scheduled amortization – 86 23 – 109
Impairment losses 4 23 – 6 33
Disposals2) – –16 –1 –6 –23
Reclassifications – – – – –
Translation differences – 17 1 – 18
At December 31, 2010 13 713 79 11 816
1) of which assets held for sale 2009 – –2 – –35 –37
2) of which assets held for sale 2010 – – – – –
Net book value
in million euros Trademark rights and other rights
Assets with
indefinite
useful lives
Assets with
definite
useful lives
Internally generated
intangible assets with
definite useful lives
Goodwill Total
At December 31, 2010 1,227 804 89 6,521 8,641
At December 31, 2009 1,147 834 100 6,137 8,218
Trademarks and other rights acquired for valuable consideration
are stated initially at acquisition cost, while internally generated
software is stated at manufacturing cost. Thereafter, goodwill and
trademark rights and other rights with indefi nite useful lives are
subject to an impairment test at least once a year (impairment-
only approach). In the course of our annual impairment test, we
reviewed the carrying values of goodwill and trademark rights
and other rights with indefi nite useful lives. The following table
shows the cash-generating units together with the associated
goodwill and trademark rights and other rights with indefi nite
useful lives at book value at the balance sheet date.
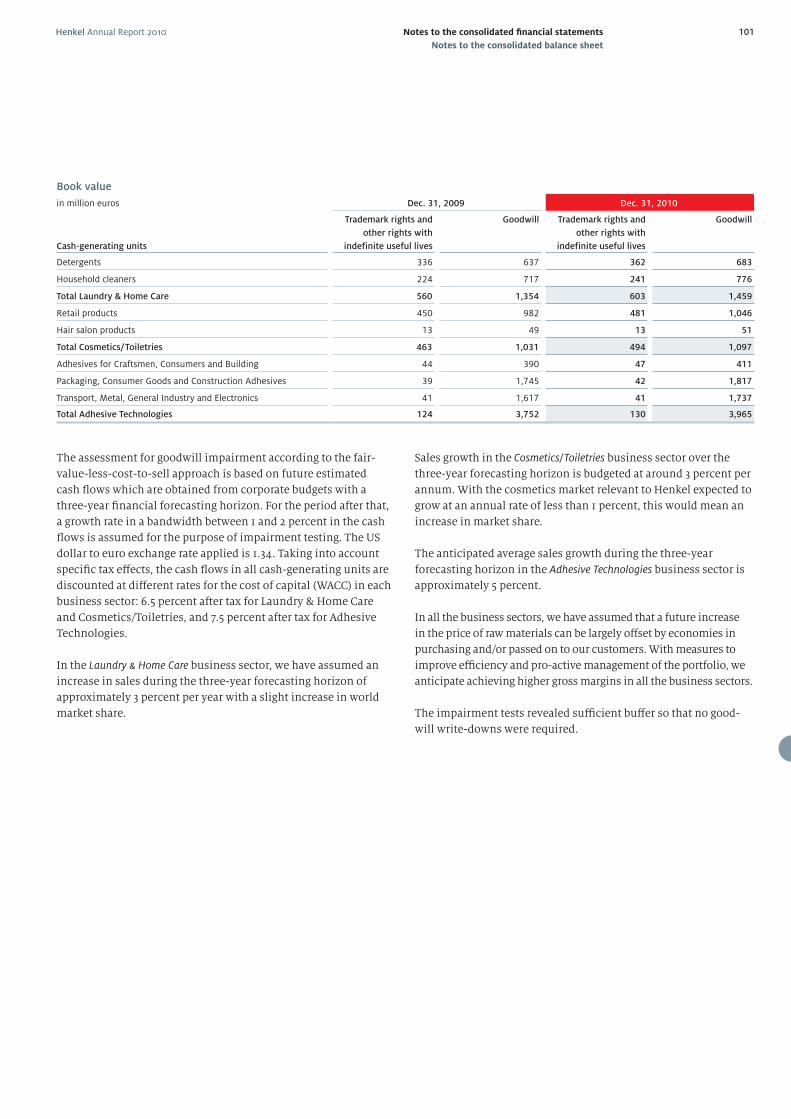
Henkel Annual Report 2010 101Notes to the consolidated fi nancial statements
Notes to the consolidated balance sheet
Book value
in million euros Dec. 31, 2009 Dec. 31, 2010
Cash-generating units
Trademark rights and
other rights with
indefinite useful lives
Goodwill Trademark rights and
other rights with
indefinite useful lives
Goodwill
Detergents 336 637 362 683
Household cleaners 224 717 241 776
Total Laundry & Home Care 560 1,354 603 1,459
Retail products 450 982 481 1,046
Hair salon products 13 49 13 51
Total Cosmetics/Toiletries 463 1,031 494 1,097
Adhesives for Craftsmen, Consumers and Building 44 390 47 411
Packaging, Consumer Goods and Construction Adhesives 39 1,745 42 1,817
Transport, Metal, General Industry and Electronics 41 1,617 41 1,737
Total Adhesive Technologies 124 3,752 130 3,965
The assessment for goodwill impairment according to the fair-
value-less-cost-to-sell approach is based on future estimated
cash fl ows which are obtained from corporate budgets with a
three-year fi nancial forecasting horizon. For the period after that,
a growth rate in a bandwidth between 1 and 2 percent in the cash
fl ows is assumed for the purpose of impairment testing. The US
dollar to euro exchange rate applied is 1.34. Taking into account
specifi c tax eff ects, the cash fl ows in all cash-generating units are
discounted at diff erent rates for the cost of capital (WACC) in each
business sector: 6.5 percent after tax for Laundry & Home Care
and Cosmetics/Toiletries, and 7.5 percent after tax for Adhesive
Technologies.
In the Laundry & Home Care business sector, we have assumed an
increase in sales during the three-year forecasting horizon of
approximately 3 percent per year with a slight increase in world
market share.
Sales growth in the Cosmetics/Toiletries business sector over the
three-year forecasting horizon is budgeted at around 3 percent per
annum. With the cosmetics market relevant to Henkel expected to
grow at an annual rate of less than 1 percent, this would mean an
increase in market share.
The anticipated average sales growth during the three-year
forecasting horizon in the Adhesive Technologies business sector is
approximately 5 percent.
In all the business sectors, we have assumed that a future increase
in the price of raw materials can be largely off set by economies in
purchasing and/or passed on to our customers. With measures to
improve effi ciency and pro-active management of the portfolio, we
anticipate achieving higher gross margins in all the business sectors.
The impairment tests revealed suffi cient buff er so that no good-
will write-downs were required.
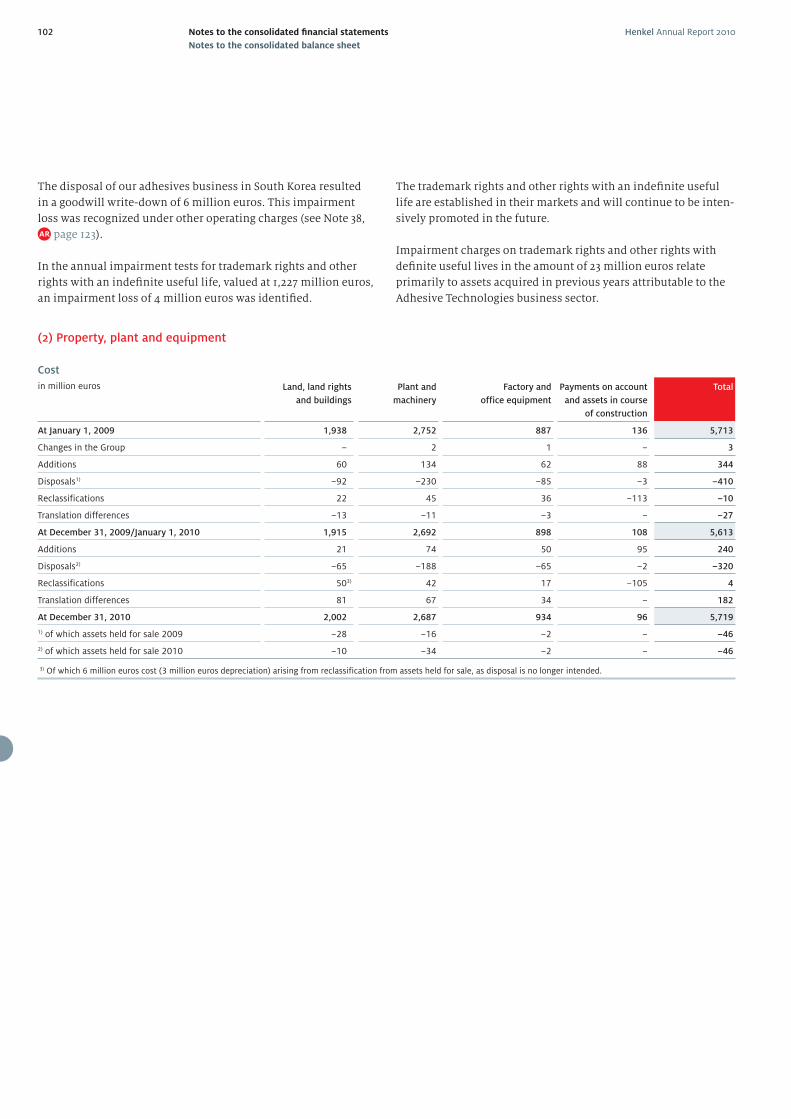
Henkel Annual Report 2010102 Notes to the consolidated fi nancial statements
Notes to the consolidated balance sheet
(2) Property, plant and equipment
Cost
in million euros Land, land rights
and buildings
Plant and
machinery
Factory and
office equipment
Payments on account
and assets in course
of construction
Total
At January 1, 2009 1,938 2,752 887 136 5,713
Changes in the Group – 2 1 – 3
Additions 60 134 62 88 344
Disposals1) –92 –230 –85 –3 –410
Reclassifications 22 45 36 –113 –10
Translation differences –13 –11 –3 – –27
At December 31, 2009/January 1, 2010 1,915 2,692 898 108 5,613
Additions 21 74 50 95 240
Disposals2) –65 –188 –65 –2 –320
Reclassifications 503) 42 17 –105 4
Translation differences 81 67 34 – 182
At December 31, 2010 2,002 2,687 934 96 5,719
1) of which assets held for sale 2009 –28 –16 –2 – –46
2) of which assets held for sale 2010 –10 –34 –2 – –46
3) Of which 6 million euros cost (3 million euros depreciation) arising from reclassification from assets held for sale, as disposal is no longer intended.
The disposal of our adhesives business in South Korea resulted
in a goodwill write-down of 6 million euros. This impairment
loss was recognized under other operating charges (see Note 38,
page 123).
In the annual impairment tests for trademark rights and other
rights with an indefi nite useful life, valued at 1,227 million euros,
an impairment loss of 4 million euros was identifi ed.
The trademark rights and other rights with an indefi nite useful
life are established in their markets and will continue to be inten-
sively promoted in the future.
Impairment charges on trademark rights and other rights with
defi nite useful lives in the amount of 23 million euros relate
primarily to assets acquired in previous years attributable to the
Adhesive Technologies business sector.
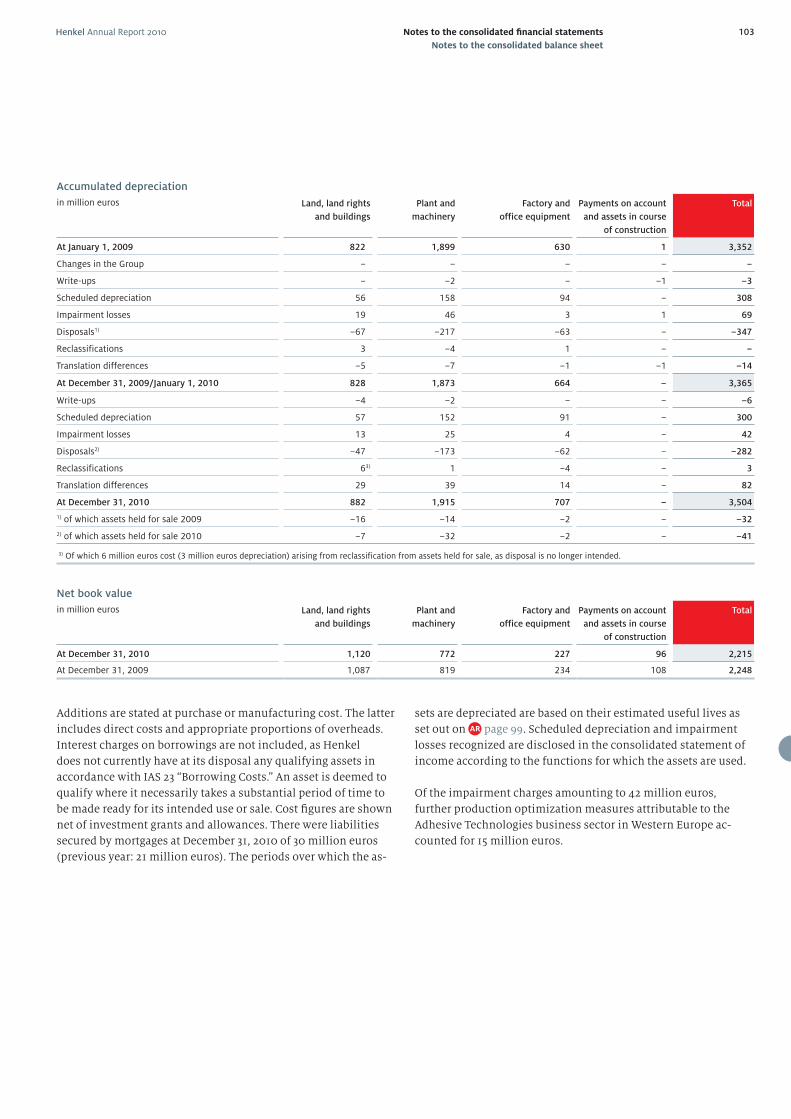
Henkel Annual Report 2010 103Notes to the consolidated fi nancial statements
Notes to the consolidated balance sheet
Accumulated depreciation
in million euros Land, land rights
and buildings
Plant and
machinery
Factory and
office equipment
Payments on account
and assets in course
of construction
Total
At January 1, 2009 822 1,899 630 1 3,352
Changes in the Group – – – – –
Write-ups – –2 – –1 –3
Scheduled depreciation 56 158 94 – 308
Impairment losses 19 46 3 1 69
Disposals1) –67 –217 –63 – –347
Reclassifications 3 –4 1 – –
Translation differences –5 –7 –1 –1 –14
At December 31, 2009/January 1, 2010 828 1,873 664 – 3,365
Write-ups –4 –2 – – –6
Scheduled depreciation 57 152 91 – 300
Impairment losses 13 25 4 – 42
Disposals2) –47 –173 –62 – –282
Reclassifications 63) 1 –4 – 3
Translation differences 29 39 14 – 82
At December 31, 2010 882 1,915 707 – 3,504
1) of which assets held for sale 2009 –16 –14 –2 – –32
2) of which assets held for sale 2010 –7 –32 –2 – –41
3) Of which 6 million euros cost (3 million euros depreciation) arising from reclassification from assets held for sale, as disposal is no longer intended.
Net book value
in million euros Land, land rights
and buildings
Plant and
machinery
Factory and
office equipment
Payments on account
and assets in course
of construction
Total
At December 31, 2010 1,120 772 227 96 2,215
At December 31, 2009 1,087 819 234 108 2,248
Additions are stated at purchase or manufacturing cost. The latter
includes direct costs and appropriate proportions of overheads.
Interest charges on borrowings are not included, as Henkel
does not currently have at its disposal any qualifying assets in
accordance with IAS 23 “Borrowing Costs.” An asset is deemed to
qualify where it necessarily takes a substantial period of time to
be made ready for its intended use or sale. Cost fi gures are shown
net of investment grants and allowances. There were liabilities
secured by mortgages at December 31, 2010 of 30 million euros
(previous year: 21 million euros). The periods over which the as-
sets are depreciated are based on their estimated useful lives as
set out on page 99. Scheduled depreciation and impairment
losses recognized are disclosed in the consolidated statement of
income according to the functions for which the assets are used.
Of the impairment charges amounting to 42 million euros,
further production optimization measures attributable to the
Adhesive Technologies business sector in Western Europe ac-
counted for 15 million euros.
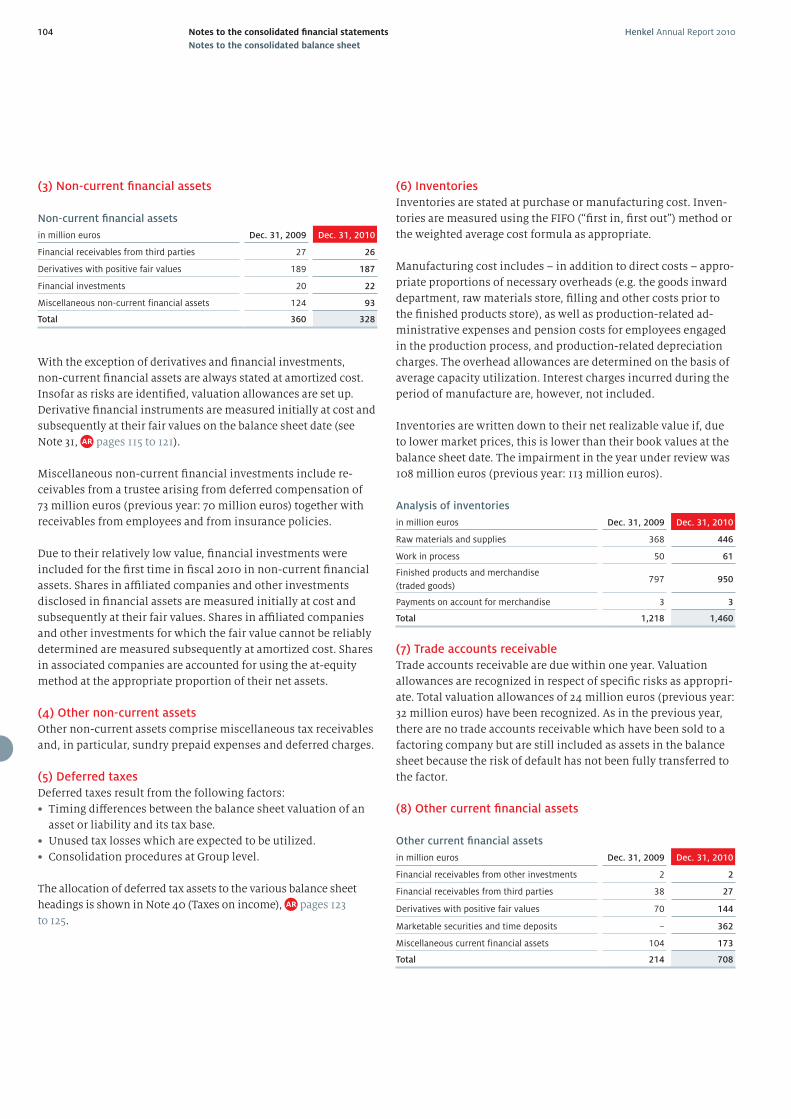
Henkel Annual Report 2010104 Notes to the consolidated fi nancial statements
Notes to the consolidated balance sheet
(7) Trade accounts receivable
Trade accounts receivable are due within one year. Valuation
allowances are recognized in respect of specifi c risks as appropri-
ate. Total valuation allowances of 24 million euros (previous year:
32 million euros) have been recognized. As in the previous year,
there are no trade accounts receivable which have been sold to a
factoring company but are still included as assets in the balance
sheet because the risk of default has not been fully transferred to
the factor.
(8) Other current fi nancial assets
Other current fi nancial assets
in million euros Dec. 31, 2009 Dec. 31, 2010
Financial receivables from other investments 2 2
Financial receivables from third parties 38 27
Derivatives with positive fair values 70 144
Marketable securities and time deposits – 362
Miscellaneous current financial assets 104 173
Total 214 708
(5) Deferred taxes
Deferred taxes result from the following factors:
• Timing diff erences between the balance sheet valuation of an
asset or liability and its tax base.
• Unused tax losses which are expected to be utilized.
• Consolidation procedures at Group level.
The allocation of deferred tax assets to the various balance sheet
headings is shown in Note 40 (Taxes on income), pages 123
to 125.
(6) Inventories
Inventories are stated at purchase or manufacturing cost. Inven-
tories are measured using the FIFO (“fi rst in, fi rst out”) method or
the weighted average cost formula as appropriate.
Manufacturing cost includes – in addition to direct costs – appro-
priate proportions of necessary overheads (e.g. the goods inward
department, raw materials store, fi lling and other costs prior to
the fi nished products store), as well as production-related ad-
ministrative expenses and pension costs for employees engaged
in the production process, and production-related depreciation
charges. The overhead allowances are determined on the basis of
average capacity utilization. Interest charges incurred during the
period of manufacture are, however, not included.
Inventories are written down to their net realizable value if, due
to lower market prices, this is lower than their book values at the
balance sheet date. The impairment in the year under review was
108 million euros (previous year: 113 million euros).
Analysis of inventories
in million euros Dec. 31, 2009 Dec. 31, 2010
Raw materials and supplies 368 446
Work in process 50 61
Finished products and merchandise
(traded goods)797 950
Payments on account for merchandise 3 3
Total 1,218 1,460
(3) Non-current fi nancial assets
Non-current fi nancial assets
in million euros Dec. 31, 2009 Dec. 31, 2010
Financial receivables from third parties 27 26
Derivatives with positive fair values 189 187
Financial investments 20 22
Miscellaneous non-current financial assets 124 93
Total 360 328
With the exception of derivatives and fi nancial investments,
non-current fi nancial assets are always stated at amortized cost.
Insofar as risks are identifi ed, valuation allowances are set up.
Derivative fi nancial instruments are measured initially at cost and
subsequently at their fair values on the balance sheet date (see
Note 31, pages 115 to 121).
Miscellaneous non-current fi nancial investments include re-
ceivables from a trustee arising from deferred compensation of
73 million euros (previous year: 70 million euros) together with
receivables from employees and from insurance policies.
Due to their relatively low value, fi nancial investments were
included for the fi rst time in fi scal 2010 in non-current fi nancial
assets. Shares in affi liated companies and other investments
disclosed in fi nancial assets are measured initially at cost and
subsequently at their fair values. Shares in affi liated companies
and other investments for which the fair value cannot be reliably
determined are measured subsequently at amortized cost. Shares
in associated companies are accounted for using the at-equity
method at the appropriate proportion of their net assets.
(4) Other non-current assets
Other non-current assets comprise miscellaneous tax receivables
and, in particular, sundry prepaid expenses and deferred charges.
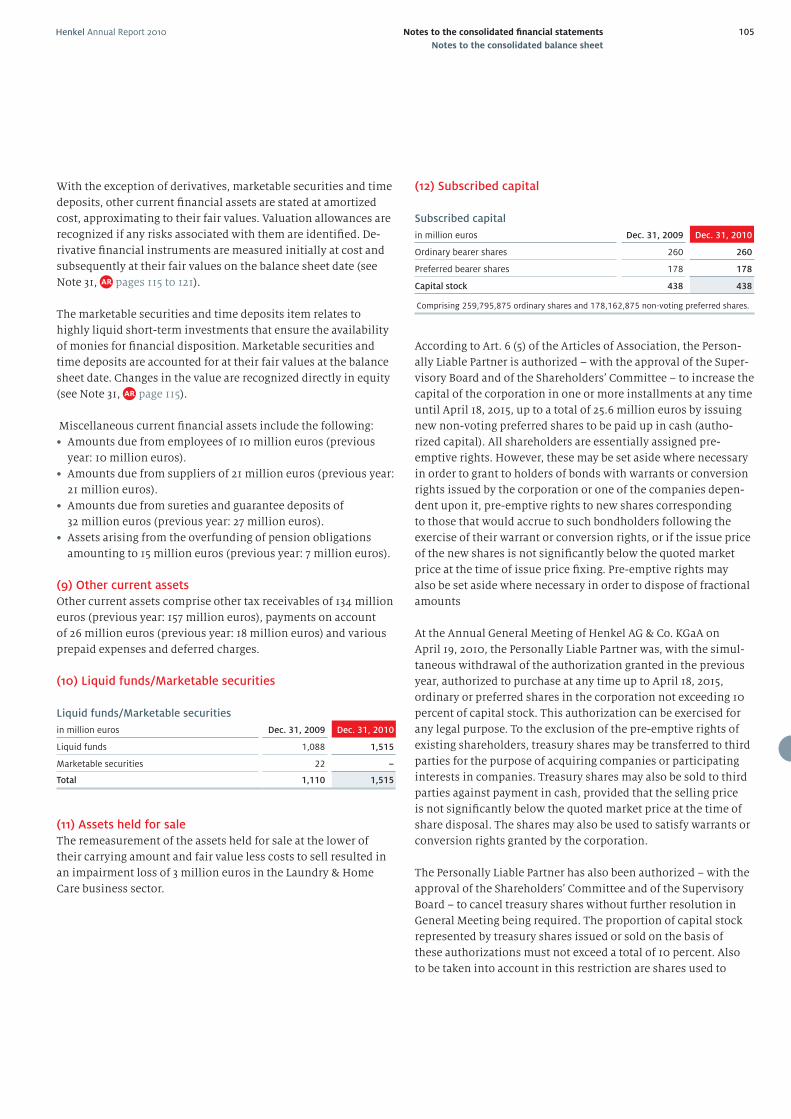
Henkel Annual Report 2010 105Notes to the consolidated fi nancial statements
Notes to the consolidated balance sheet
(12) Subscribed capital
Subscribed capital
in million euros Dec. 31, 2009 Dec. 31, 2010
Ordinary bearer shares 260 260
Preferred bearer shares 178 178
Capital stock 438 438
Comprising 259,795,875 ordinary shares and 178,162,875 non-voting preferred shares.
According to Art. 6 (5) of the Articles of Association, the Person-
ally Liable Partner is authorized – with the approval of the Super-
visory Board and of the Shareholders’ Committee – to increase the
capital of the corporation in one or more installments at any time
until April 18, 2015, up to a total of 25.6 million euros by issuing
new non-voting preferred shares to be paid up in cash (autho-
rized capital). All shareholders are essentially assigned pre-
emptive rights. However, these may be set aside where necessary
in order to grant to holders of bonds with warrants or conversion
rights issued by the corporation or one of the companies depen-
dent upon it, pre-emptive rights to new shares corresponding
to those that would accrue to such bondholders following the
exercise of their warrant or conversion rights, or if the issue price
of the new shares is not signifi cantly below the quoted market
price at the time of issue price fi xing. Pre-emptive rights may
also be set aside where necessary in order to dispose of fractional
amounts
At the Annual General Meeting of Henkel AG & Co. KGaA on
April 19, 2010, the Personally Liable Partner was, with the simul-
taneous withdrawal of the authorization granted in the previous
year, authorized to purchase at any time up to April 18, 2015,
ordinary or preferred shares in the corporation not exceeding 10
percent of capital stock. This authorization can be exercised for
any legal purpose. To the exclusion of the pre-emptive rights of
existing shareholders, treasury shares may be transferred to third
parties for the purpose of acquiring companies or participating
interests in companies. Treasury shares may also be sold to third
parties against payment in cash, provided that the selling price
is not signifi cantly below the quoted market price at the time of
share disposal. The shares may also be used to satisfy warrants or
conversion rights granted by the corporation.
The Personally Liable Partner has also been authorized – with the
approval of the Shareholders’ Committee and of the Supervisory
Board – to cancel treasury shares without further resolution in
General Meeting being required. The proportion of capital stock
represented by treasury shares issued or sold on the basis of
these authorizations must not exceed a total of 10 percent. Also
to be taken into account in this restriction are shares used to
(11) Assets held for sale
The remeasurement of the assets held for sale at the lower of
their carrying amount and fair value less costs to sell resulted in
an impairment loss of 3 million euros in the Laundry & Home
Care business sector.
With the exception of derivatives, marketable securities and time
deposits, other current fi nancial assets are stated at amortized
cost, approximating to their fair values. Valuation allowances are
recognized if any risks associated with them are identifi ed. De-
rivative fi nancial instruments are measured initially at cost and
subsequently at their fair values on the balance sheet date (see
Note 31, pages 115 to 121).
The marketable securities and time deposits item relates to
highly liquid short-term investments that ensure the availability
of monies for fi nancial disposition. Marketable securities and
time deposits are accounted for at their fair values at the balance
sheet date. Changes in the value are recognized directly in equity
(see Note 31, page 115).
Miscellaneous current fi nancial assets include the following:
• Amounts due from employees of 10 million euros (previous
year: 10 million euros).
• Amounts due from suppliers of 21 million euros (previous year:
21 million euros).
• Amounts due from sureties and guarantee deposits of
32 million euros (previous year: 27 million euros).
• Assets arising from the overfunding of pension obligations
amounting to 15 million euros (previous year: 7 million euros).
(9) Other current assets
Other current assets comprise other tax receivables of 134 million
euros (previous year: 157 million euros), payments on account
of 26 million euros (previous year: 18 million euros) and various
prepaid expenses and deferred charges.
(10) Liquid funds/Marketable securities
Liquid funds/Marketable securities
in million euros Dec. 31, 2009 Dec. 31, 2010
Liquid funds 1,088 1,515
Marketable securities 22 –
Total 1,110 1,515
Henkel Annual Report 2010106 Notes to the consolidated fi nancial statements
Notes to the consolidated balance sheet
(17) Pension obligations
Employees in companies included in the consolidated fi nancial
statements have entitlements under company pension plans
which are either defi ned contribution or defi ned benefi t plans.
These take diff erent forms depending on the legal, fi nancial
and tax regime in each country. The level of benefi ts provided
is based, as a rule, on the length of service and earnings of the
person entitled.
The defi ned contribution plans are structured in such a way that
the corporation pays contributions to public or private sector
institutions on the basis of statutory or contractual terms or on
a voluntary basis and has no further obligations regarding the
payment of benefi ts to employees. The contributions for defi ned
contribution plans for the year under review amounted to 91 mil-
lion euros (previous year: 111 million euros). In 2010, payments to
public sector institutions totaled 46 million euros (previous year:
57 million euros) and payments to private sector institutions
totaled 45 million euros (previous year: 54 million euros).
In defi ned benefi t plans, the liability for pensions and other post-
employment benefi ts is calculated at the present value of the
future obligations (projected unit credit method). This actuarial
method of calculation takes future trends in wages, salaries and
retirement benefi ts into account.
To provide protection under civil law of the pension entitle-
ments of future and current pensioners of Henkel AG & Co. KGaA
against insolvency, we have allocated proceeds of the bond issued
in 2005 and certain other assets to Henkel Trust e.V. The trustee
invests the cash with which it has been entrusted in the capital
market in accordance with investment policies laid down in the
trust agreement.
service bonds with warrants or conversion rights or a conversion
obligation, issued by the corporation or one of the companies
dependent upon it, where these bonds were or are issued with the
pre-emptive rights of existing shareholders excluded.
Treasury stock held by the corporation at December 31, 2010
amounted to 4,026,565 preferred shares. This represents 0.92 per-
cent of capital stock and a proportional nominal value of 4.0 mil-
lion euros. Originally, 992,680 shares were purchased in the year
2000, an amount of 808,120 shares was purchased in 2001 and
694,900 shares were purchased in 2002. This corresponds to a to-
tal of 2,495,700 shares or, following the share split implemented
in 2007 (at a ratio of 1:3), 7,487,100 shares. Options were exercised
for the fi rst time under the Stock Incentive Plan in 2004. Since
2004, taking the share split into account, the exercise of options
has led to a reduction of 3,460,535 in treasury shares held, with
a proportional nominal value of 3.5 million euros (0.79 percent
of capital stock). In 2010, the exercise of options led to a reduc-
tion of 515,305 in treasury shares held. The proportional nominal
value of the capital stock amounted to 0.5 million euros (0.12 per-
cent). The selling prices were based on the stock market prices
prevailing at the time of disposal. The total proceeds on disposal
of 18.8 million euros were recognized directly in equity.
(13) Capital reserve
The capital reserve comprises the amounts received in previous
years in excess of the nominal value of preferred shares and con-
vertible warrant bonds issued by Henkel AG & Co. KGaA.
(14) Retained earnings
Included in the retained earnings are the following:
• Amounts allocated in the fi nancial statements of Henkel AG &
Co. KGaA in previous years.
• Amounts allocated from the consolidated net income less those
amounts attributable to non-controlling interests.
• Buy-back of treasury shares by Henkel AG & Co. KGaA at cost
and the proceeds from their disposal.
• Actuarial gains and losses recognized in equity.
(15) Gains and losses recognized in equity
The items under this heading represent the diff erences on trans-
lation of the fi nancial statements of foreign subsidiary com-
panies and the eff ects of the revaluation of derivative fi nancial
instruments and available-for-sale fi nancial assets recognized
in equity. The derivative fi nancial instruments take the form of
either cash fl ow hedges or hedges of a net investment in a foreign
entity.
Due in particular to the increase in the US dollar exchange rate
versus the euro, the negative diff erence from currency translation
attributable to shareholders of Henkel AG & Co. KGaA decreased by
525 million euros compared to the fi gure as of December 31, 2009.
(16) Non-controlling interests
Non-controlling interests comprise the shares of third parties in the
equity of a number of companies included in the consolidation.
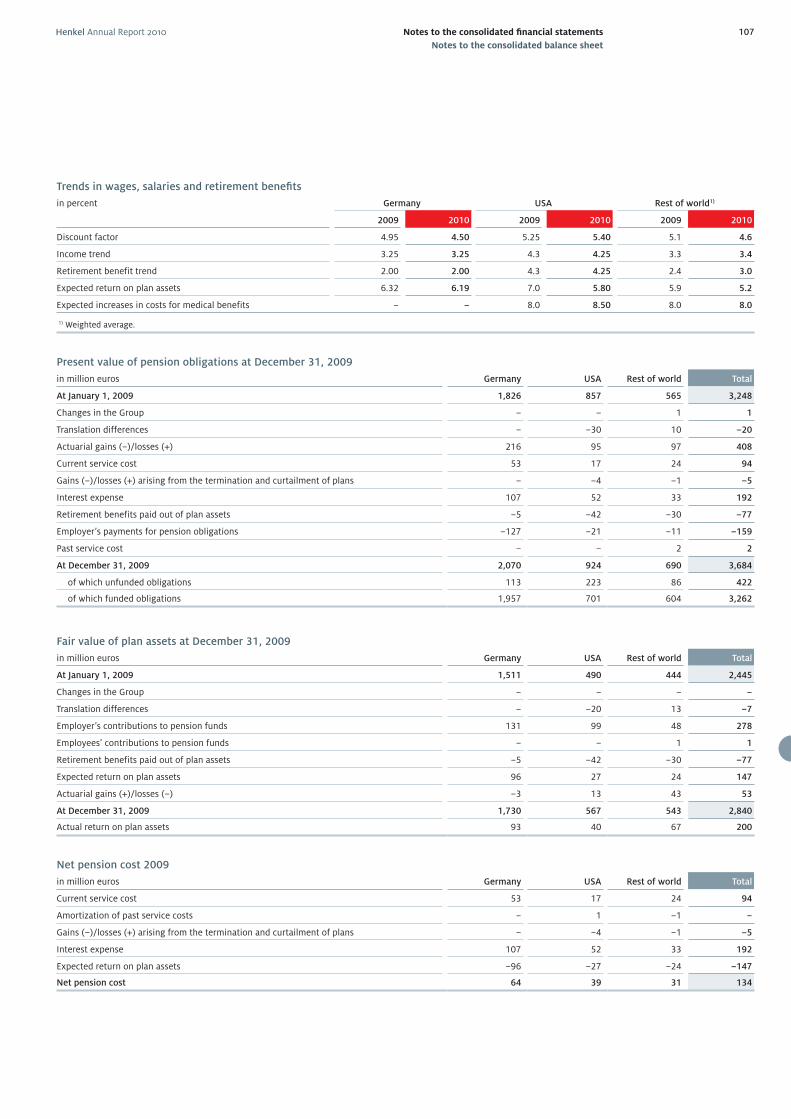
Henkel Annual Report 2010 107Notes to the consolidated fi nancial statements
Notes to the consolidated balance sheet
Trends in wages, salaries and retirement benefi ts
in percent Germany USA Rest of world1)
2009 2010 2009 2010 2009 2010
Discount factor 4.95 4.50 5.25 5.40 5.1 4.6
Income trend 3.25 3.25 4.3 4.25 3.3 3.4
Retirement benefit trend 2.00 2.00 4.3 4.25 2.4 3.0
Expected return on plan assets 6.32 6.19 7.0 5.80 5.9 5.2
Expected increases in costs for medical benefits – – 8.0 8.50 8.0 8.0
1) Weighted average.
Present value of pension obligations at December 31, 2009
in million euros Germany USA Rest of world Total
At January 1, 2009 1,826 857 565 3,248
Changes in the Group – – 1 1
Translation differences – –30 10 –20
Actuarial gains (–)/losses (+) 216 95 97 408
Current service cost 53 17 24 94
Gains (–)/losses (+) arising from the termination and curtailment of plans – –4 –1 –5
Interest expense 107 52 33 192
Retirement benefits paid out of plan assets –5 –42 –30 –77
Employer’s payments for pension obligations –127 –21 –11 –159
Past service cost – – 2 2
At December 31, 2009 2,070 924 690 3,684
of which unfunded obligations 113 223 86 422
of which funded obligations 1,957 701 604 3,262
Fair value of plan assets at December 31, 2009
in million euros Germany USA Rest of world Total
At January 1, 2009 1,511 490 444 2,445
Changes in the Group – – – –
Translation differences – –20 13 –7
Employer’s contributions to pension funds 131 99 48 278
Employees’ contributions to pension funds – – 1 1
Retirement benefits paid out of plan assets –5 –42 –30 –77
Expected return on plan assets 96 27 24 147
Actuarial gains (+)/losses (–) –3 13 43 53
At December 31, 2009 1,730 567 543 2,840
Actual return on plan assets 93 40 67 200
Net pension cost 2009
in million euros Germany USA Rest of world Total
Current service cost 53 17 24 94
Amortization of past service costs – 1 –1 –
Gains (–)/losses (+) arising from the termination and curtailment of plans – –4 –1 –5
Interest expense 107 52 33 192
Expected return on plan assets –96 –27 –24 –147
Net pension cost 64 39 31 134
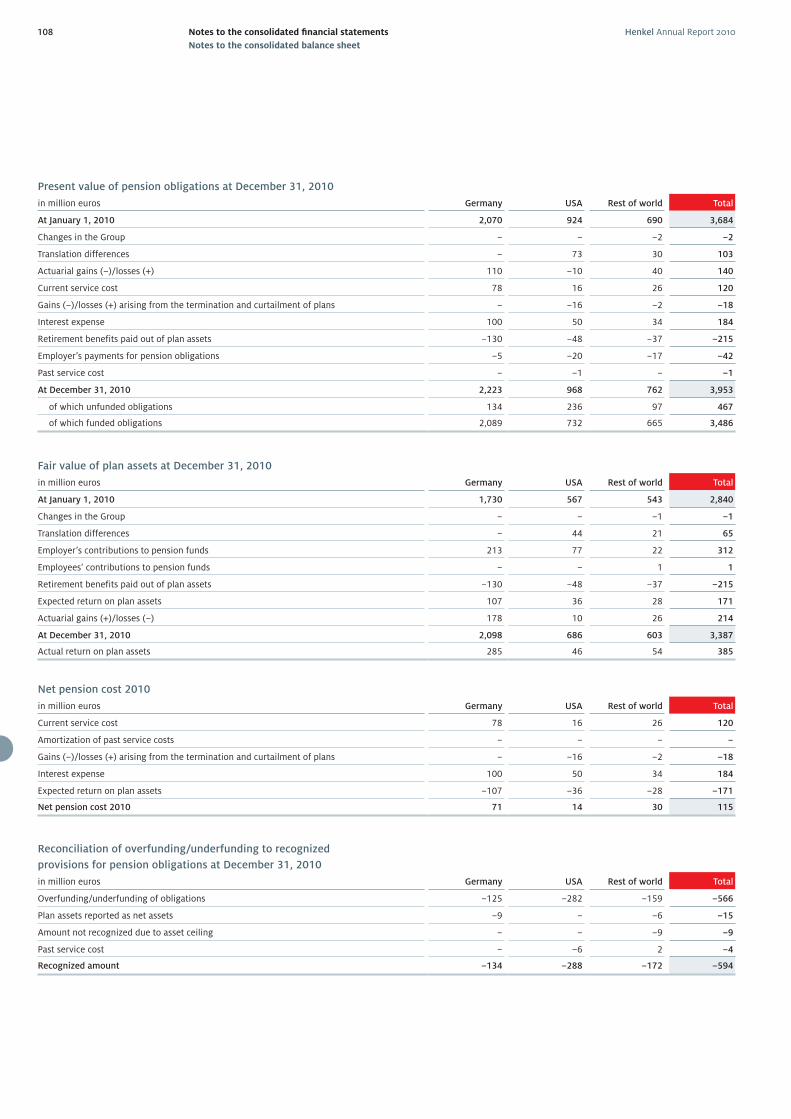
Henkel Annual Report 2010108 Notes to the consolidated fi nancial statements
Notes to the consolidated balance sheet
Present value of pension obligations at December 31, 2010
in million euros Germany USA Rest of world Total
At January 1, 2010 2,070 924 690 3,684
Changes in the Group – – –2 –2
Translation differences – 73 30 103
Actuarial gains (–)/losses (+) 110 –10 40 140
Current service cost 78 16 26 120
Gains (–)/losses (+) arising from the termination and curtailment of plans – –16 –2 –18
Interest expense 100 50 34 184
Retirement benefits paid out of plan assets –130 –48 –37 –215
Employer’s payments for pension obligations –5 –20 –17 –42
Past service cost – –1 – –1
At December 31, 2010 2,223 968 762 3,953
of which unfunded obligations 134 236 97 467
of which funded obligations 2,089 732 665 3,486
Fair value of plan assets at December 31, 2010
in million euros Germany USA Rest of world Total
At January 1, 2010 1,730 567 543 2,840
Changes in the Group – – –1 –1
Translation differences – 44 21 65
Employer’s contributions to pension funds 213 77 22 312
Employees’ contributions to pension funds – – 1 1
Retirement benefits paid out of plan assets –130 –48 –37 –215
Expected return on plan assets 107 36 28 171
Actuarial gains (+)/losses (–) 178 10 26 214
At December 31, 2010 2,098 686 603 3,387
Actual return on plan assets 285 46 54 385
Net pension cost 2010
in million euros Germany USA Rest of world Total
Current service cost 78 16 26 120
Amortization of past service costs – – – –
Gains (–)/losses (+) arising from the termination and curtailment of plans – –16 –2 –18
Interest expense 100 50 34 184
Expected return on plan assets –107 –36 –28 –171
Net pension cost 2010 71 14 30 115
Reconciliation of overfunding/underfunding to recognized
provisions for pension obligations at December 31, 2010
in million euros Germany USA Rest of world Total
Overfunding/underfunding of obligations –125 –282 –159 –566
Plan assets reported as net assets –9 – –6 –15
Amount not recognized due to asset ceiling – – –9 –9
Past service cost – –6 2 –4
Recognized amount –134 –288 –172 –594
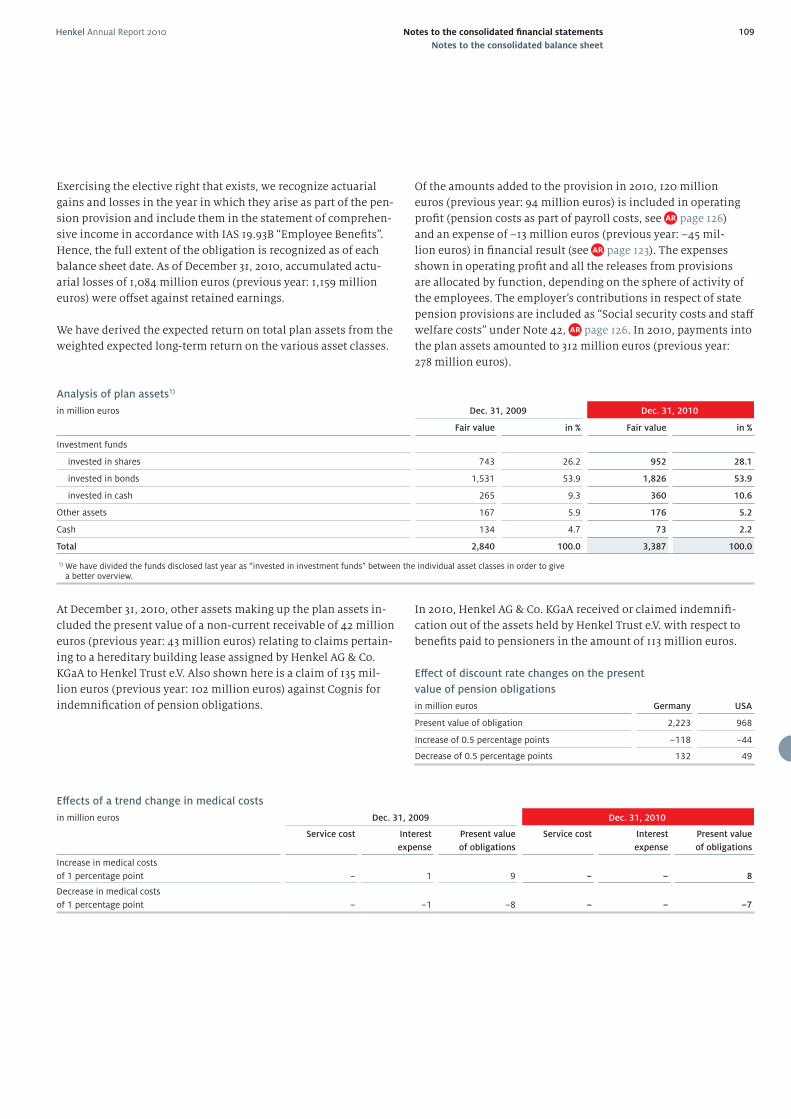
Henkel Annual Report 2010 109Notes to the consolidated fi nancial statements
Notes to the consolidated balance sheet
Analysis of plan assets1)
in million euros Dec. 31, 2009 Dec. 31, 2010
Fair value in % Fair value in %
Investment funds
invested in shares 743 26.2 952 28.1
invested in bonds 1,531 53.9 1,826 53.9
invested in cash 265 9.3 360 10.6
Other assets 167 5.9 176 5.2
Cash 134 4.7 73 2.2
Total 2,840 100.0 3,387 100.0
1) We have divided the funds disclosed last year as “invested in investment funds” between the individual asset classes in order to give a better overview.
At December 31, 2010, other assets making up the plan assets in-
cluded the present value of a non-current receivable of 42 million
euros (previous year: 43 million euros) relating to claims pertain-
ing to a hereditary building lease assigned by Henkel AG & Co.
KGaA to Henkel Trust e.V. Also shown here is a claim of 135 mil-
lion euros (previous year: 102 million euros) against Cognis for
indemnifi cation of pension obligations.
Of the amounts added to the provision in 2010, 120 million
euros (previous year: 94 million euros) is included in operating
profi t (pension costs as part of payroll costs, see page 126)
and an expense of –13 million euros (previous year: –45 mil-
lion euros) in fi nancial result (see page 123). The expenses
shown in operating profi t and all the releases from provisions
are allocated by function, depending on the sphere of activity of
the employees. The employer’s contributions in respect of state
pension provisions are included as “Social security costs and staff
welfare costs” under Note 42, page 126. In 2010, payments into
the plan assets amounted to 312 million euros (previous year:
278 million euros).
Exercising the elective right that exists, we recognize actuarial
gains and losses in the year in which they arise as part of the pen-
sion provision and include them in the statement of comprehen-
sive income in accordance with IAS 19.93B “Employee Benefi ts”.
Hence, the full extent of the obligation is recognized as of each
balance sheet date. As of December 31, 2010, accumulated actu-
arial losses of 1,084 million euros (previous year: 1,159 million
euros) were off set against retained earnings.
We have derived the expected return on total plan assets from the
weighted expected long-term return on the various asset classes.
In 2010, Henkel AG & Co. KGaA received or claimed indemnifi -
cation out of the assets held by Henkel Trust e.V. with respect to
benefi ts paid to pensioners in the amount of 113 million euros.
Eff ect of discount rate changes on the present
value of pension obligations
in million euros Germany USA
Present value of obligation 2,223 968
Increase of 0.5 percentage points –118 –44
Decrease of 0.5 percentage points 132 49
Eff ects of a trend change in medical costs
in million euros Dec. 31, 2009 Dec. 31, 2010
Service cost Interest
expense
Present value
of obligations
Service cost Interest
expense
Present value
of obligations
Increase in medical costs
of 1 percentage point – 1 9 – – 8
Decrease in medical costs
of 1 percentage point – –1 –8 – – –7
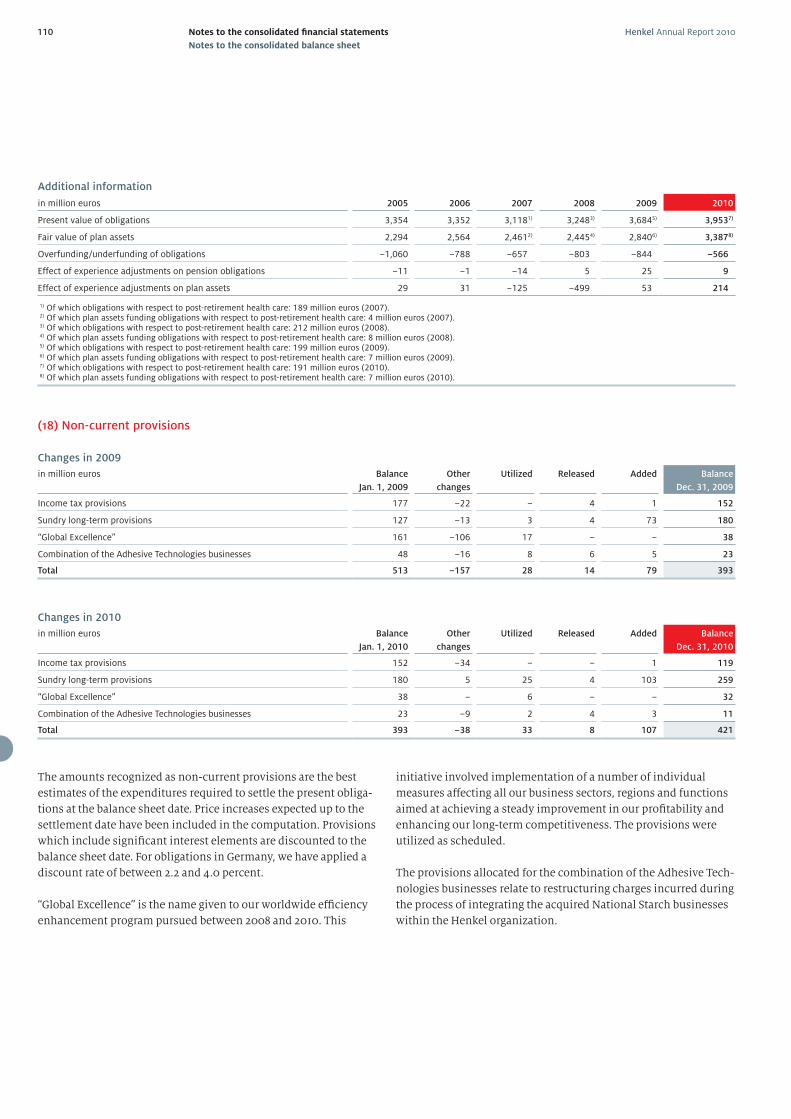
Henkel Annual Report 2010110 Notes to the consolidated fi nancial statements
Notes to the consolidated balance sheet
Additional information
in million euros 2005 2006 2007 2008 2009 2010
Present value of obligations 3,354 3,352 3,1181) 3,2483) 3,6845) 3,9537)
Fair value of plan assets 2,294 2,564 2,4612) 2,4454) 2,8406) 3,3878)
Overfunding/underfunding of obligations –1,060 –788 –657 –803 –844 –566
Effect of experience adjustments on pension obligations –11 –1 –14 5 25 9
Effect of experience adjustments on plan assets 29 31 –125 –499 53 214
1) Of which obligations with respect to post-retirement health care: 189 million euros (2007). 2) Of which plan assets funding obligations with respect to post-retirement health care: 4 million euros (2007).3) Of which obligations with respect to post-retirement health care: 212 million euros (2008).4) Of which plan assets funding obligations with respect to post-retirement health care: 8 million euros (2008).5) Of which obligations with respect to post-retirement health care: 199 million euros (2009). 6) Of which plan assets funding obligations with respect to post-retirement health care: 7 million euros (2009).7) Of which obligations with respect to post-retirement health care: 191 million euros (2010). 8) Of which plan assets funding obligations with respect to post-retirement health care: 7 million euros (2010).
(18) Non-current provisions
Changes in 2009
in million euros Balance
Jan. 1, 2009
Other
changes
Utilized Released Added Balance
Dec. 31, 2009
Income tax provisions 177 –22 – 4 1 152
Sundry long-term provisions 127 –13 3 4 73 180
“Global Excellence” 161 –106 17 – – 38
Combination of the Adhesive Technologies businesses 48 –16 8 6 5 23
Total 513 –157 28 14 79 393
Changes in 2010
in million euros Balance
Jan. 1, 2010
Other
changes
Utilized Released Added Balance
Dec. 31, 2010
Income tax provisions 152 –34 – – 1 119
Sundry long-term provisions 180 5 25 4 103 259
“Global Excellence” 38 – 6 – – 32
Combination of the Adhesive Technologies businesses 23 –9 2 4 3 11
Total 393 –38 33 8 107 421
The amounts recognized as non-current provisions are the best
estimates of the expenditures required to settle the present obliga-
tions at the balance sheet date. Price increases expected up to the
settlement date have been included in the computation. Provisions
which include signifi cant interest elements are discounted to the
balance sheet date. For obligations in Germany, we have applied a
discount rate of between 2.2 and 4.0 percent.
“Global Excellence” is the name given to our worldwide effi ciency
enhancement program pursued between 2008 and 2010. This
initiative involved implementation of a number of individual
measures aff ecting all our business sectors, regions and functions
aimed at achieving a steady improvement in our profi tability and
enhancing our long-term competitiveness. The provisions were
utilized as scheduled.
The provisions allocated for the combination of the Adhesive Tech-
nologies businesses relate to restructuring charges incurred during
the process of integrating the acquired National Starch businesses
within the Henkel organization.
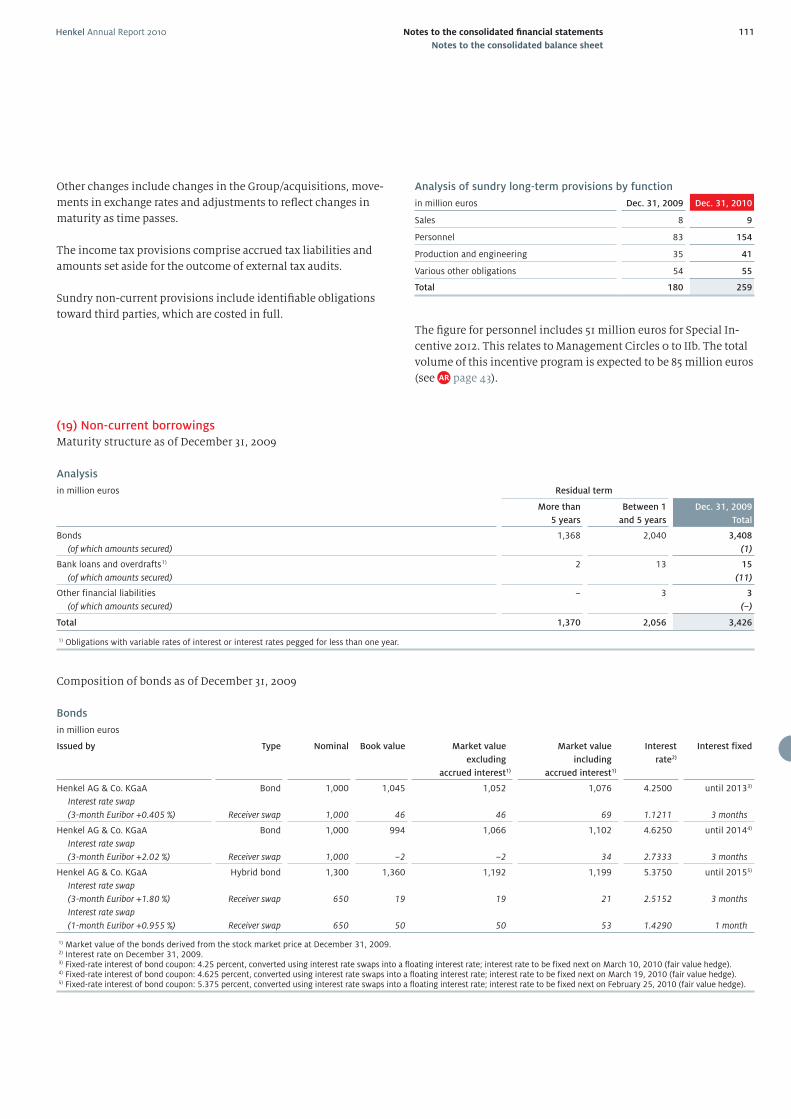
Henkel Annual Report 2010 111Notes to the consolidated fi nancial statements
Notes to the consolidated balance sheet
(19) Non-current borrowings
Maturity structure as of December 31, 2009
Analysis
in million euros Residual term
More than
5 years
Between 1
and 5 years
Dec. 31, 2009
Total
Bonds
(of which amounts secured)
1,368 2,040 3,408
(1)
Bank loans and overdrafts 1)
(of which amounts secured)
2 13 15
(11)
Other financial liabilities
(of which amounts secured)
– 3 3
(–)
Total 1,370 2,056 3,426
1) Obligations with variable rates of interest or interest rates pegged for less than one year.
Composition of bonds as of December 31, 2009
Bonds
in million euros
Issued by Type Nominal Book value Market value
excluding
accrued interest1)
Market value
including
accrued interest1)
Interest
rate2)
Interest fixed
Henkel AG & Co. KGaA
Interest rate swap
(3-month Euribor +0.405 %)
Bond
Receiver swap
1,000
1,000
1,045
46
1,052
46
1,076
69
4.2500
1.1211
until 20133)
3 months
Henkel AG & Co. KGaA
Interest rate swap
(3-month Euribor +2.02 %)
Bond
Receiver swap
1,000
1,000
994
–2
1,066
–2
1,102
34
4.6250
2.7333
until 20144)
3 months
Henkel AG & Co. KGaA
Interest rate swap
(3-month Euribor +1.80 %)
Interest rate swap
(1-month Euribor +0.955 %)
Hybrid bond
Receiver swap
Receiver swap
1,300
650
650
1,360
19
50
1,192
19
50
1,199
21
53
5.3750
2.5152
1.4290
until 20155)
3 months
1 month
1) Market value of the bonds derived from the stock market price at December 31, 2009. 2) Interest rate on December 31, 2009. 3) Fixed-rate interest of bond coupon: 4.25 percent, converted using interest rate swaps into a floating interest rate; interest rate to be fixed next on March 10, 2010 (fair value hedge). 4) Fixed-rate interest of bond coupon: 4.625 percent, converted using interest rate swaps into a floating interest rate; interest rate to be fixed next on March 19, 2010 (fair value hedge). 5) Fixed-rate interest of bond coupon: 5.375 percent, converted using interest rate swaps into a floating interest rate; interest rate to be fixed next on February 25, 2010 (fair value hedge).
Other changes include changes in the Group/acquisitions, move-
ments in exchange rates and adjustments to refl ect changes in
maturity as time passes.
The income tax provisions comprise accrued tax liabilities and
amounts set aside for the outcome of external tax audits.
Sundry non-current provisions include identifi able obligations
toward third parties, which are costed in full.
Analysis of sundry long-term provisions by function
in million euros Dec. 31, 2009 Dec. 31, 2010
Sales 8 9
Personnel 83 154
Production and engineering 35 41
Various other obligations 54 55
Total 180 259
The fi gure for personnel includes 51 million euros for Special In-
centive 2012. This relates to Management Circles 0 to IIb. The total
volume of this incentive program is expected to be 85 million euros
(see page 43).
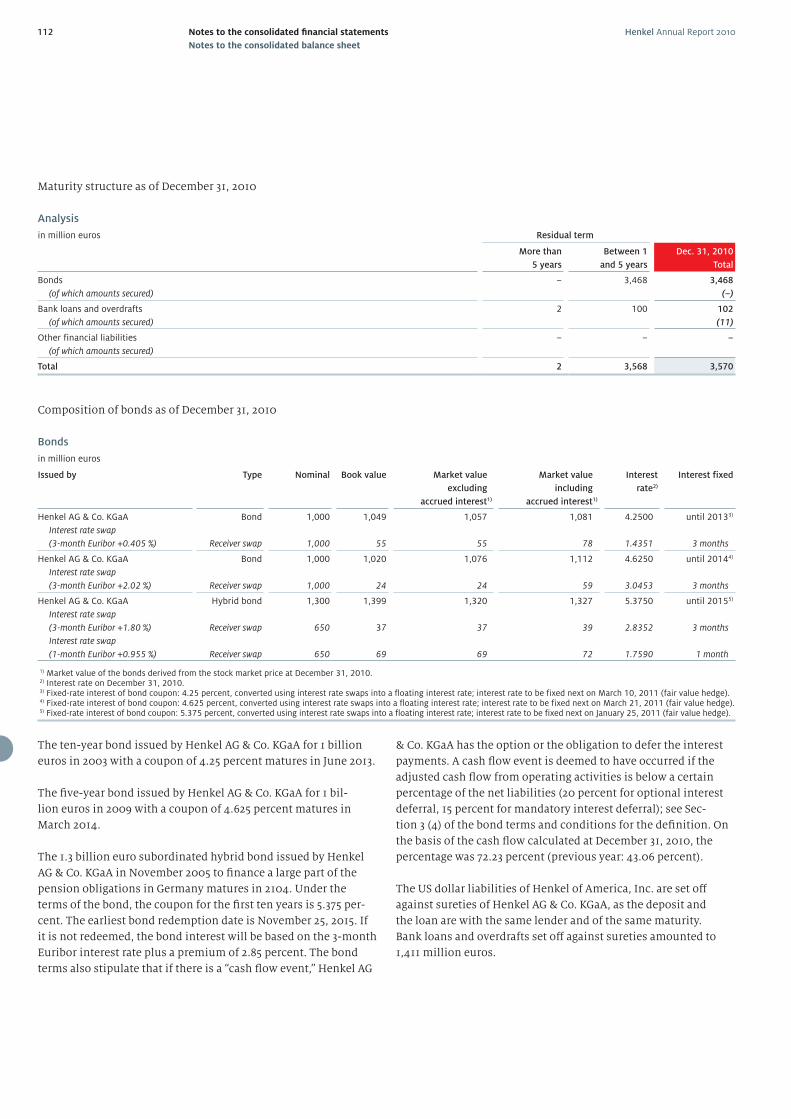
Henkel Annual Report 2010112 Notes to the consolidated fi nancial statements
Notes to the consolidated balance sheet
Maturity structure as of December 31, 2010
Analysis
in million euros Residual term
More than
5 years
Between 1
and 5 years
Dec. 31, 2010
Total
Bonds
(of which amounts secured)
– 3,468 3,468
(–)
Bank loans and overdrafts
(of which amounts secured)
2 100 102
(11)
Other financial liabilities
(of which amounts secured)
– – –
Total 2 3,568 3,570
Composition of bonds as of December 31, 2010
Bonds
in million euros
Issued by Type Nominal Book value Market value
excluding
accrued interest1)
Market value
including
accrued interest1)
Interest
rate2)
Interest fixed
Henkel AG & Co. KGaA
Interest rate swap
(3-month Euribor +0.405 %)
Bond
Receiver swap
1,000
1,000
1,049
55
1,057
55
1,081
78
4.2500
1.4351
until 20133)
3 months
Henkel AG & Co. KGaA
Interest rate swap
(3-month Euribor +2.02 %)
Bond
Receiver swap
1,000
1,000
1,020
24
1,076
24
1,112
59
4.6250
3.0453
until 20144)
3 months
Henkel AG & Co. KGaA
Interest rate swap
(3-month Euribor +1.80 %)
Interest rate swap
(1-month Euribor +0.955 %)
Hybrid bond
Receiver swap
Receiver swap
1,300
650
650
1,399
37
69
1,320
37
69
1,327
39
72
5.3750
2.8352
1.7590
until 20155)
3 months
1 month
1) Market value of the bonds derived from the stock market price at December 31, 2010. 2) Interest rate on December 31, 2010. 3) Fixed-rate interest of bond coupon: 4.25 percent, converted using interest rate swaps into a floating interest rate; interest rate to be fixed next on March 10, 2011 (fair value hedge). 4) Fixed-rate interest of bond coupon: 4.625 percent, converted using interest rate swaps into a floating interest rate; interest rate to be fixed next on March 21, 2011 (fair value hedge). 5) Fixed-rate interest of bond coupon: 5.375 percent, converted using interest rate swaps into a floating interest rate; interest rate to be fixed next on January 25, 2011 (fair value hedge).
The ten-year bond issued by Henkel AG & Co. KGaA for 1 billion
euros in 2003 with a coupon of 4.25 percent matures in June 2013.
The fi ve-year bond issued by Henkel AG & Co. KGaA for 1 bil-
lion euros in 2009 with a coupon of 4.625 percent matures in
March 2014.
The 1.3 billion euro subordinated hybrid bond issued by Henkel
AG & Co. KGaA in November 2005 to fi nance a large part of the
pension obligations in Germany matures in 2104. Under the
terms of the bond, the coupon for the fi rst ten years is 5.375 per-
cent. The earliest bond redemption date is November 25, 2015. If
it is not redeemed, the bond interest will be based on the 3-month
Euribor interest rate plus a premium of 2.85 percent. The bond
terms also stipulate that if there is a “cash fl ow event,” Henkel AG
& Co. KGaA has the option or the obligation to defer the interest
payments. A cash fl ow event is deemed to have occurred if the
adjusted cash fl ow from operating activities is below a certain
percentage of the net liabilities (20 percent for optional interest
deferral, 15 percent for mandatory interest deferral); see Sec-
tion 3 (4) of the bond terms and conditions for the defi nition. On
the basis of the cash fl ow calculated at December 31, 2010, the
percentage was 72.23 percent (previous year: 43.06 percent).
The US dollar liabilities of Henkel of America, Inc. are set off
against sureties of Henkel AG & Co. KGaA, as the deposit and
the loan are with the same lender and of the same maturity.
Bank loans and overdrafts set off against sureties amounted to
1,411 million euros.
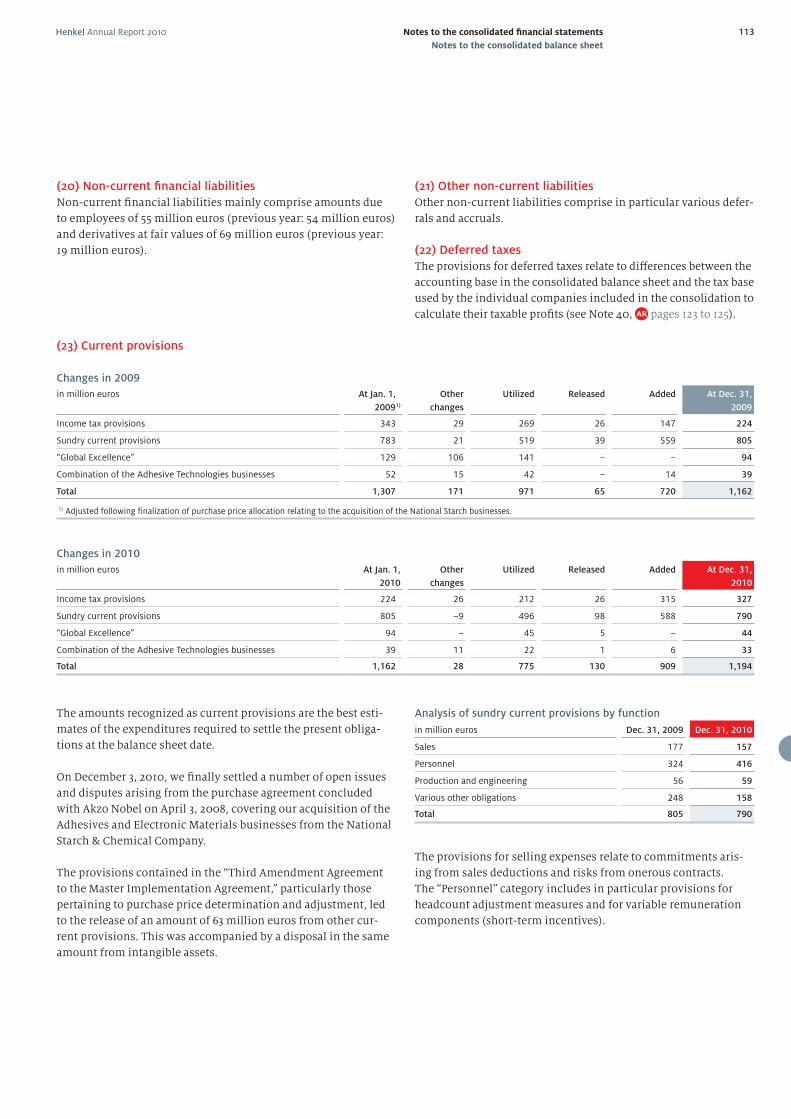
Henkel Annual Report 2010 113Notes to the consolidated fi nancial statements
Notes to the consolidated balance sheet
(22) Deferred taxes
The provisions for deferred taxes relate to diff erences between the
accounting base in the consolidated balance sheet and the tax base
used by the individual companies included in the consolidation to
calculate their taxable profi ts (see Note 40, pages 123 to 125).
Changes in 2009
in million euros At Jan. 1,
20091)
Other
changes
Utilized Released Added At Dec. 31,
2009
Income tax provisions 343 29 269 26 147 224
Sundry current provisions 783 21 519 39 559 805
“Global Excellence” 129 106 141 – – 94
Combination of the Adhesive Technologies businesses 52 15 42 – 14 39
Total 1,307 171 971 65 720 1,162
1) Adjusted following finalization of purchase price allocation relating to the acquisition of the National Starch businesses.
Changes in 2010
in million euros At Jan. 1,
2010
Other
changes
Utilized Released Added At Dec. 31,
2010
Income tax provisions 224 26 212 26 315 327
Sundry current provisions 805 –9 496 98 588 790
“Global Excellence” 94 – 45 5 – 44
Combination of the Adhesive Technologies businesses 39 11 22 1 6 33
Total 1,162 28 775 130 909 1,194
Analysis of sundry current provisions by function
in million euros Dec. 31, 2009 Dec. 31, 2010
Sales 177 157
Personnel 324 416
Production and engineering 56 59
Various other obligations 248 158
Total 805 790
The provisions for selling expenses relate to commitments aris-
ing from sales deductions and risks from onerous contracts.
The “Personnel” category includes in particular provisions for
headcount adjustment measures and for variable remuneration
components (short-term incentives).
The amounts recognized as current provisions are the best esti-
mates of the expenditures required to settle the present obliga-
tions at the balance sheet date.
On December 3, 2010, we fi nally settled a number of open issues
and disputes arising from the purchase agreement concluded
with Akzo Nobel on April 3, 2008, covering our acquisition of the
Adhesives and Electronic Materials businesses from the National
Starch & Chemical Company.
The provisions contained in the “Third Amendment Agreement
to the Master Implementation Agreement,” particularly those
pertaining to purchase price determination and adjustment, led
to the release of an amount of 63 million euros from other cur-
rent provisions. This was accompanied by a disposal in the same
amount from intangible assets.
(23) Current provisions
(20) Non-current fi nancial liabilities
Non-current fi nancial liabilities mainly comprise amounts due
to employees of 55 million euros (previous year: 54 million euros)
and derivatives at fair values of 69 million euros (previous year:
19 million euros).
(21) Other non-current liabilities
Other non-current liabilities comprise in particular various defer-
rals and accruals.
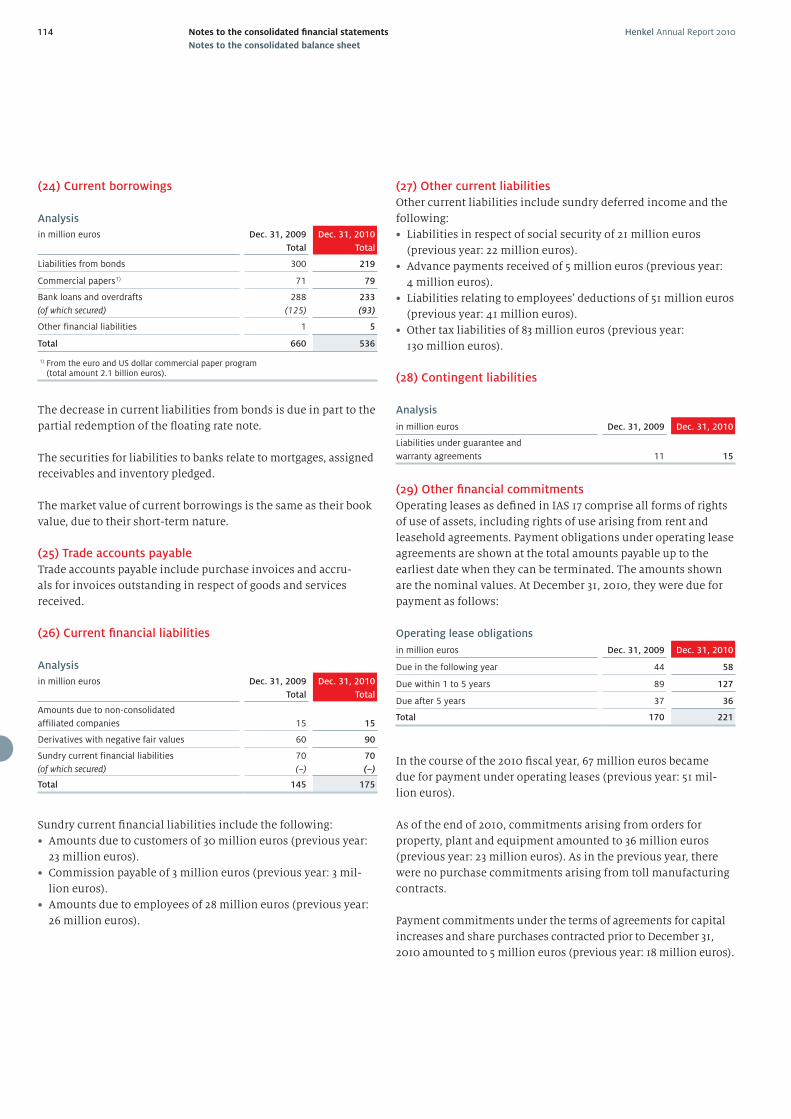
Henkel Annual Report 2010114 Notes to the consolidated fi nancial statements
Notes to the consolidated balance sheet
(28) Contingent liabilities
Analysis
in million euros Dec. 31, 2009 Dec. 31, 2010
Liabilities under guarantee and
warranty agreements 11 15
(29) Other fi nancial commitments
Operating leases as defi ned in IAS 17 comprise all forms of rights
of use of assets, including rights of use arising from rent and
leasehold agreements. Payment obligations under operating lease
agreements are shown at the total amounts payable up to the
earliest date when they can be terminated. The amounts shown
are the nominal values. At December 31, 2010, they were due for
payment as follows:
Operating lease obligations
in million euros Dec. 31, 2009 Dec. 31, 2010
Due in the following year 44 58
Due within 1 to 5 years 89 127
Due after 5 years 37 36
Total 170 221
In the course of the 2010 fi scal year, 67 million euros became
due for payment under operating leases (previous year: 51 mil-
lion euros).
As of the end of 2010, commitments arising from orders for
property, plant and equipment amounted to 36 million euros
(previous year: 23 million euros). As in the previous year, there
were no purchase commitments arising from toll manufacturing
contracts.
Payment commitments under the terms of agreements for capital
increases and share purchases contracted prior to December 31,
2010 amounted to 5 million euros (previous year: 18 million euros).
(27) Other current liabilities
Other current liabilities include sundry deferred income and the
following:
• Liabilities in respect of social security of 21 million euros
(previous year: 22 million euros).
• Advance payments received of 5 million euros (previous year:
4 million euros).
• Liabilities relating to employees’ deductions of 51 million euros
(previous year: 41 million euros).
• Other tax liabilities of 83 million euros (previous year:
130 million euros).
(24) Current borrowings
Analysis
in million euros Dec. 31, 2009
Total
Dec. 31, 2010
Total
Liabilities from bonds 300 219
Commercial papers 1) 71 79
Bank loans and overdrafts
(of which secured)
288
(125)
233
(93)
Other financial liabilities 1 5
Total 660 536
1) From the euro and US dollar commercial paper program (total amount 2.1 billion euros).
The decrease in current liabilities from bonds is due in part to the
partial redemption of the fl oating rate note.
The securities for liabilities to banks relate to mortgages, assigned
receivables and inventory pledged.
The market value of current borrowings is the same as their book
value, due to their short-term nature.
(25) Trade accounts payable
Trade accounts payable include purchase invoices and accru-
als for invoices outstanding in respect of goods and services
received.
(26) Current fi nancial liabilities
Analysis
in million euros Dec. 31, 2009
Total
Dec. 31, 2010
Total
Amounts due to non-consolidated
affiliated companies 15 15
Derivatives with negative fair values 60 90
Sundry current financial liabilities
(of which secured)
70
(–)
70
(–)
Total 145 175
Sundry current fi nancial liabilities include the following:
• Amounts due to customers of 30 million euros (previous year:
23 million euros).
• Commission payable of 3 million euros (previous year: 3 mil-
lion euros).
• Amounts due to employees of 28 million euros (previous year:
26 million euros).
Henkel Annual Report 2010 115Notes to the consolidated fi nancial statements
Notes to the consolidated balance sheet
(30) Capital management
The aims of capital management are derived from the fi nancial
strategy of the Group. These include ensuring liquidity and access
to the capital market at all times.
To achieve the capital management targets, the Group seeks to op-
timize its capital structure, manage its dividend policy, take equity
measures, make acquisitions and divestments and reduce debt.
In the past fi nancial year, the dividend paid for ordinary and
preferred shares was unchanged compared to the previous year.
The free cash fl ow not used for dividend payments (see page
92) was essentially used to reduce net debt and for allocations to
pension funds. Short-term fi nancing requirements were met by
commercial papers and bank loans. The bonds outstanding serve
to cover long-term fi nancing requirements.
Our fi nancial management is based on the key performance
indicators set out in our fi nancial strategy. In 2010 the interest
coverage ratio was 12.8 (previous year: 8.7), while operating debt
coverage was 71.4 percent (previous year: 41.8 percent). The equity
ratio was 45.4 percent (previous year: 41.4 percent). For further
details, see the fi nancial ratios section in the Group management
report on pages 54 and 55. Due to the international nature of
its business, the Group is required to comply with diff erent legal
and regulatory provisions in diff erent regions. The status of these
regulations and any developments are monitored at the local
level as well as centrally, with changes being taken into account
for the purpose of capital management.
(31) Derivatives and other fi nancial instruments
Treasury guidelines and systems
The Corporate Treasury department manages currency exposure
and interest rates centrally for the Group and is therefore respon-
sible for all transactions with fi nancial derivatives and other
fi nancial instruments. Trading, treasury control and settlement
(front, middle and back offi ces) are separated both physically and
in terms of organization. The parties to the contracts are German
and international banks which Henkel monitors regularly, in
accordance with Corporate Treasury guidelines, for creditworthi-
ness and the quality of their quotations. Financial derivatives
are used to manage currency exposure and interest rate risks in
connection with operating activities and the resultant fi nancing
requirements, again in accordance with the Treasury guidelines.
Financial derivatives are entered into exclusively for hedging
purposes.
The currency and interest rate risk management of the Group
is supported by an integrated treasury system which is used to
identify, measure and analyze the Group’s currency exposure and
interest rate risks. In this context, “integrated” means that the en-
tire process from the initial recording of fi nancial transactions to
their entry in the accounts is covered. Much of the currency trad-
ing takes place on internet-based, multi-bank dealing platforms.
These foreign currency transactions are automatically transferred
into the treasury system. The currency exposure and interest rate
risks reported by all subsidiaries under standardized report-
ing procedures are integrated into the treasury system by data
transfer. As a result, it is possible to retrieve and measure at any
time all currency and interest rate risks across the Group and all
derivatives entered into to hedge the exposure to these risks. The
treasury system supports the use of various risk concepts so that
the risk positions and the success of the risk management in each
company, country and group of countries is regularly determined
on a mark-to-market basis and compared to a benchmark.
Recognition and measurement of fi nancial instruments
Financial instruments are initially recorded at cost on the day
of trading. The marketable securities and time deposits are
classifi ed as available for sale and measured at fair value as of
the reporting date, based without exception on quoted market
prices (level 1 of the fair value hierarchy). Consequently, the fair
values adopted correspond to the book values as of December 31,
2010. Changes in value are recognized in equity unless there is a
cause for impairment, in which case the impairment losses are
recognized under profi t or loss. Other investments/shares in af-
fi liated companies that are also classifi ed as available for sale are
measured at amortized cost, as their fair value cannot be reliably
determined.
Specifi c fi nancial instruments by category
in million euros Dec. 31, 2009 Dec. 31, 2010
Marketable securities and time deposits 22 362
– at fair value through profit or loss – –
– at fair value recognized in equity 22 362
Other investments/Shares in
affiliated companies 19 21
– at fair value through profit or loss – –
– at amortized cost 19 21
We have no fi nancial assets under the “held to maturity” category.
Like all other fi nancial assets, long-term loans are designated as
loans and receivables, and stated at amortized cost.
Henkel Annual Report 2010116 Notes to the consolidated fi nancial statements
Notes to the consolidated balance sheet
The carrying amount of trade accounts receivable, other current
fi nancial assets and liquid funds corresponds to their fair value
due to their short-term nature. Financial liabilities with a fi xed
maturity are measured at amortized cost using the eff ective inter-
est method. Financial liabilities in respect of which a hedging
transaction has been entered into, and which meet the conditions
set out in IAS 39 regarding a hedging relationship, are measured
under hedge accounting rules. The fair value of trade accounts
payable and other current liabilities corresponds to their book
value.
All derivative fi nancial instruments entered into by the Group
are recorded initially at cost and subsequently at their fair values
on the balance sheet date. The accounting treatment of gains and
losses on derivative fi nancial instruments on remeasurement to
fair value depends on whether the conditions set out in IAS 39
with respect to hedge accounting have been met.
Hedge accounting is not used for the majority of derivative fi nan-
cial instruments. The changes in the fair value of those deriva-
tives which, from an economic point of view, represent eff ective
hedges in line with corporate strategy, are recognized in profi t or
loss. These are virtually matched by changes in the fair value of
the hedged underlying transactions.
Under hedge accounting, derivative fi nancial instruments are
designated either as a hedge of the exposure to changes in the fair
value of an underlying transaction (fair value hedge), as a hedge
of the exposure to variability in future cash fl ows (cash fl ow
hedge) or as a hedge of a net investment in a foreign entity.
Fair value hedges: The gain or loss from remeasuring derivative
fi nancial instruments used to hedge the exposure to changes in
fair value is recognized in the fi nancial result, together with the
gain or loss on the hedged item. The receiver interest rate swaps,
referred to under Note 19 on pages 111 and 112, hedging the in-
terest rate risk of bonds issued by Henkel AG & Co. KGaA, are the
only derivatives designated as fair value hedges. To determine the
change in fair value of the bonds (see Note 19, pages 111 and
112), only that portion of the bond which relates to the interest
rate risk is taken into account.
Interest rate hedging instruments at the balance sheet date had
positive fair values of 185 million euros (previous year: 113 million
euros) excluding accrued interest. The changes in fair value of the
receiver interest rate swaps arising from market interest rate risks
amounted to 72 million euros (previous year: 48 million euros).
The corresponding changes in fair value of the hedged bonds
amounted to –69 million euros (previous year: –47 million euros).
Cash fl ow hedges: Changes in the fair value of derivatives used
to hedge the exposure to variability in cash fl ows are recognized
directly in equity. The portion of the gain or loss on the derivative
that is determined to be ineff ective in respect of the risk being
hedged is reported directly in the consolidated statement of in-
come. If a fi rm commitment or an expected and highly probable
future transaction results in the recognition of an asset or a liabil-
ity, the accumulated gains or losses on the hedging instrument
that were recognized directly in equity are included in the initial
measurement of the asset or liability. Otherwise, the amounts
recognized directly in equity are included in the statement of
income in those reporting periods in which the hedged transac-
tion impacts earnings.
Cash fl ow hedges
(after tax)
in million euros At
January 1
Additions
(taken
to equity)
Disposals
(taken to profit
or loss)
At
December 31
2010 –276 –75 – –351
2009 –265 –11 – –276
The opening balance relates to unsettled interest rate hedges of
the US dollar liabilities of Henkel of America, Inc., and forward
exchange transactions entered into and settled in previous years.
The addition of –75 million euros is due in part to –46 million
euros arising from the acquisition of the National Starch busi-
nesses. The interest rate hedge of the US dollar liabilities of
Henkel of America, Inc. accounts for an addition of –29 mil-
lion euros after taxes on income. The fair value of the interest
rate hedges of the US dollar liabilities of Henkel of America,
Inc. amount to –69 million euros. The amount attributable to
ineff ec tiveness in the year under review of 0.4 million euros was
expensed under fi nancial result. The cash fl ows from the transac-
tions hedged at December 31, 2010 are expected in June 2013 and
March 2014.
Henkel Annual Report 2010 117Notes to the consolidated fi nancial statements
Notes to the consolidated balance sheet
Hedge of a net investment in a foreign entity: The account-
ing treatment of hedges of a net investment in a foreign entity
is similar to that applied to cash fl ow hedges. Hedges of a net in-
vestment in a foreign entity apply to forward exchange contracts
that are used to hedge the exposure to currency translation risks
in foreign entities.
The items recognized in equity relate to translation risks arising
from net investments in Swiss francs (CHF) and US dollars (USD)
for which the associated hedges were entered into and settled in
previous years.
In the past fi nancial year, no hedges of a net investment in a
foreign entity were entered into. The addition of 16 million euros
relates to the acquisition of the National Starch businesses. No
amounts were transferred in the course of the year from equity
to profi t or loss and no ineff ective portions were included in the
consolidated statement of income.
Due to the complexities involved, fi nancial derivatives entered
into as hedges of commodity price risks are primarily measured
on the basis of bank-developed simulation models, which are
derived from market quotations. Regular plausibility checks are
performed in order to safeguard valuation correctness.
In measuring derivative fi nancial instruments, the credit risk of
the counterparty is taken into account in the form of a lump-sum
adjustment to the fair values, determined on the basis of credit
risk premiums. The adjustment relating to fi scal 2010 amounts to
0.8 million euros.
Derivative fi nancial instruments with a positive fair value at the
balance sheet date are included in fi nancial assets and those with
a negative fair value are included in fi nancial liabilities, depend-
ing on their fair value and their maturity on the reporting date.
Most of the forward exchange contracts and currency options
serve to hedge risks arising from trade accounts receivable and
Group fi nancing in US dollars.
Hedges of a net investment in a foreign entity
(after tax)
in million euros At
January 1
Additions
(taken
to equity)
Disposals
(taken to profit
or loss)
At
December 31
2010 53 16 – 69
2009 53 – – 53
Fair values of derivative fi nancial instruments
The fair values of derivative fi nancial instruments are based on
observable market data (level 2 of the fair value hierarchy). The
fair value of forward exchange contracts is determined on the
basis of the quoted reference exchange rates of the European Cen-
tral Bank as of the balance sheet date after allowing for forward
premiums and discounts on the contracted exchange rate for the
remaining term of the contract. Currency options are measured
using market quotations or recognized option pricing models.
The interest rate hedging instruments are measured on the basis
of the discounted future cash fl ows expected based on market
interest rates applicable to the remaining term of the contracts.
These are shown in the table below for the four most important
currencies. In each case, these are the interest rates quoted on the
inter-bank market at December 31.
Interest rates in percent per annum
At December 31 EUR USD JPY GBP
Maturities 2009 2010 2009 2010 2009 2010 2009 2010
3 months 0.50 0.96 0.47 0.48 0.45 0.11 0.71 0.82
6 months 0.93 1.23 0.68 0.40 0.30 0.44 0.93 1.27
1 year 1.21 1.51 1.12 0.88 0.47 0.71 1.58 1.52
2 years 1.84 1.53 1.38 0.82 0.48 0.38 2.01 1.51
5 years 2.80 2.50 2.99 2.23 0.70 0.57 3.45 2.67
10 years 3.65 3.35 4.07 3.56 1.44 1.19 4.21 3.65
Henkel Annual Report 2010118 Notes to the consolidated fi nancial statements
Notes to the consolidated balance sheet
The following positions were held at the balance sheet date:
Derivative fi nancial instruments
At December 31 Nominal value Positive fair value3) Negative fair value3)
in million euros 2009 2010 2009 2010 2009 2010
Forward exchange contracts 1) 2,450 2,396 70 77 –60 –89
(of which for hedging loans within the Group) (2,091) (1,848) (68) (75) (–56) (–83)
Interest rate swaps 4,688 4,797 177 248 –19 –70
(of which: designated as fair value hedge) (3,300) (3,300) (177) (248) (–) (–)
(of which: designated as cash flow hedge) (1,388) (1,497) (–) (–) (–19) (–70)
Other interest rate hedging instruments 1,000 500 11 2 – –
(of which designated for hedge accounting) (–) (–) (–) (–) (–) (–)
Commodity futures2) 16 44 1 4 – –
(of which designated for hedge accounting) (–) (–) (–) (–) (–) (–)
Total derivative financial instruments 8,154 7,737 259 331 –79 –159
1) Maturity shorter than 1 year. 2) Maturity shorter than 1 year in 2010; maturity longer than 1 year in 2009. 3) Fair values including accrued interest.
Risks arising from fi nancial instruments
As a globally active corporation, Henkel is exposed in the course
of its ordinary business operations to credit risks, liquidity risks
and market risks (currency translation, interest rate and commod-
ity price risks). The purpose of fi nancial risk management is to
restrict the exposure arising from operating activities through the
use of selective derivative and non-derivative hedges. There were
no major risk clusters in the year under review. For more details
on the management of fi nancial risks, please refer to the risk
report on pages 78 to 82.
Credit risk
In the course of its business activities with third parties, the
Henkel Group is exposed to global credit risk in various lines of
business. The risk arises if a contracting party fails to meet its
obligations. The maximum credit risk is represented by the book
value of the fi nancial assets recognized in the balance sheet. In
principle, Henkel is confronted by progressive concentration and
consolidation on the customer side, refl ected in the receivables
from individual customers.
A credit risk management system operating on the basis of a glob-
ally applied credit policy ensures that credit risks are constantly
monitored and bad debts minimized. This policy, which applies
to both new and existing customers, governs the allocation of
credit limits and compliance with those limits, individual analy-
ses of customers’ creditworthiness employing both internal and
external fi nancial information, risk classifi cation and continu-
ous monitoring of the risk of bad debts at the local level. Our key
customer relationships are also monitored at the regional and
global level. In addition, hedging measures, for instance payment
default insurance policies, are implemented on a selective basis
for particular countries and customers.
In fi nancial investments and derivatives trading with German
and international banks, we only enter into transactions with
counterparties of the highest fi nancial standing. Financial invest-
ments are generally undertaken for periods of less than one year.
To minimize the credit risk, netting arrangements are agreed with
counterparties and investment limits are set. These limits are
based on the credit rating of the counterparty and are regularly
monitored and adjusted. Besides relevant ratings, certain other
indicators such as the pricing of credit default swaps (CDS) by the
banks are applied in determining the limits. We additionally en-
ter into collateral agreements with selected banks, on the basis of
which reciprocal sureties are established to hedge the fair values
of contracted derivatives.
Collateral and other safeguards include country-specifi c and
customer-specifi c protection aff orded by credit insurance, con-
fi rmed and unconfi rmed letters of credit in the export business,
as well as warranties, guarantees and cover notes.
As in the previous year, the book value of receivables and loans
which were overdue or impaired and for which new due dates
have been negotiated was less than 1 million euros.
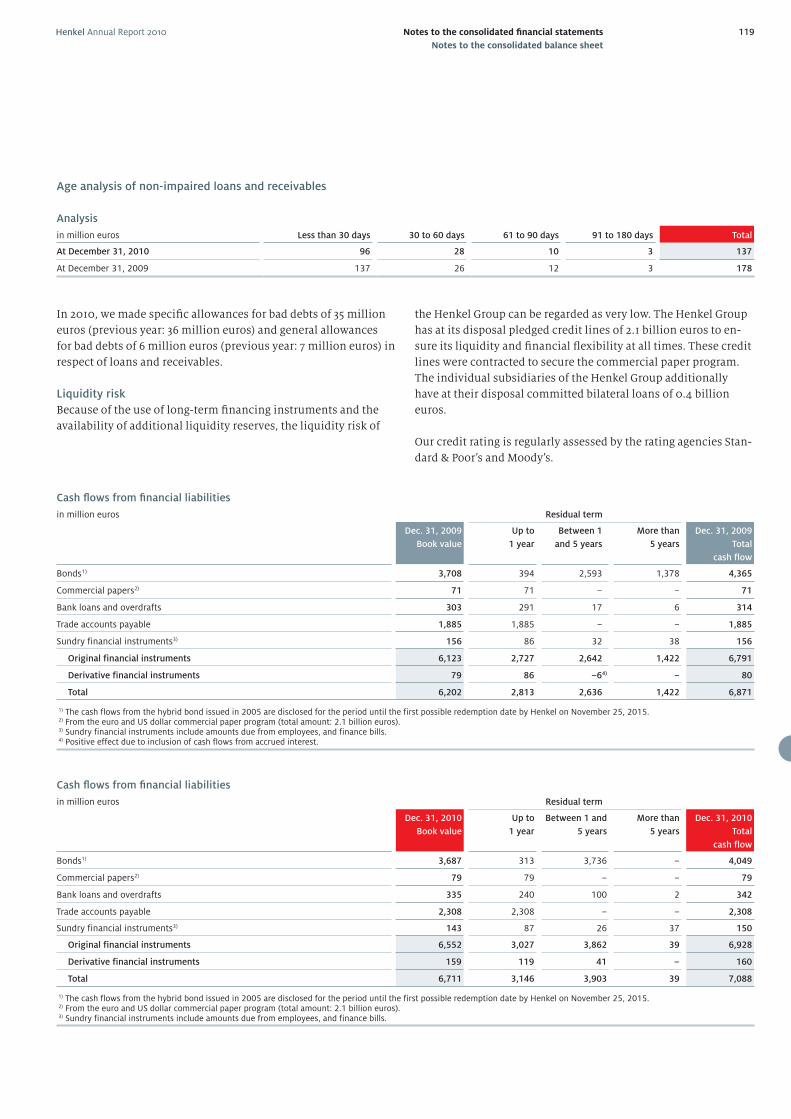
Henkel Annual Report 2010 119Notes to the consolidated fi nancial statements
Notes to the consolidated balance sheet
Age analysis of non-impaired loans and receivables
Analysis
in million euros Less than 30 days 30 to 60 days 61 to 90 days 91 to 180 days Total
At December 31, 2010 96 28 10 3 137
At December 31, 2009 137 26 12 3 178
In 2010, we made specifi c allowances for bad debts of 35 million
euros (previous year: 36 million euros) and general allowances
for bad debts of 6 million euros (previous year: 7 million euros) in
respect of loans and receivables.
Liquidity risk
Because of the use of long-term fi nancing instruments and the
availability of additional liquidity reserves, the liquidity risk of
the Henkel Group can be regarded as very low. The Henkel Group
has at its disposal pledged credit lines of 2.1 billion euros to en-
sure its liquidity and fi nancial fl exibility at all times. These credit
lines were contracted to secure the commercial paper program.
The individual subsidiaries of the Henkel Group additionally
have at their disposal committed bilateral loans of 0.4 billion
euros.
Our credit rating is regularly assessed by the rating agencies Stan-
dard & Poor’s and Moody’s.
Cash fl ows from fi nancial liabilities
in million euros Residual term
Dec. 31, 2009
Book value
Up to
1 year
Between 1
and 5 years
More than
5 years
Dec. 31, 2009
Total
cash flow
Bonds 1) 3,708 394 2,593 1,378 4,365
Commercial papers2) 71 71 – – 71
Bank loans and overdrafts 303 291 17 6 314
Trade accounts payable 1,885 1,885 – – 1,885
Sundry financial instruments3) 156 86 32 38 156
Original financial instruments 6,123 2,727 2,642 1,422 6,791
Derivative financial instruments 79 86 –64) – 80
Total 6,202 2,813 2,636 1,422 6,871
1) The cash flows from the hybrid bond issued in 2005 are disclosed for the period until the first possible redemption date by Henkel on November 25, 2015. 2) From the euro and US dollar commercial paper program (total amount: 2.1 billion euros). 3) Sundry financial instruments include amounts due from employees, and finance bills.4) Positive effect due to inclusion of cash flows from accrued interest.
Cash fl ows from fi nancial liabilities
in million euros Residual term
Dec. 31, 2010
Book value
Up to
1 year
Between 1 and
5 years
More than
5 years
Dec. 31, 2010
Total
cash flow
Bonds1) 3,687 313 3,736 – 4,049
Commercial papers2) 79 79 – – 79
Bank loans and overdrafts 335 240 100 2 342
Trade accounts payable 2,308 2,308 – – 2,308
Sundry financial instruments3) 143 87 26 37 150
Original financial instruments 6,552 3,027 3,862 39 6,928
Derivative financial instruments 159 119 41 – 160
Total 6,711 3,146 3,903 39 7,088
1) The cash flows from the hybrid bond issued in 2005 are disclosed for the period until the first possible redemption date by Henkel on November 25, 2015. 2) From the euro and US dollar commercial paper program (total amount: 2.1 billion euros). 3) Sundry financial instruments include amounts due from employees, and finance bills.
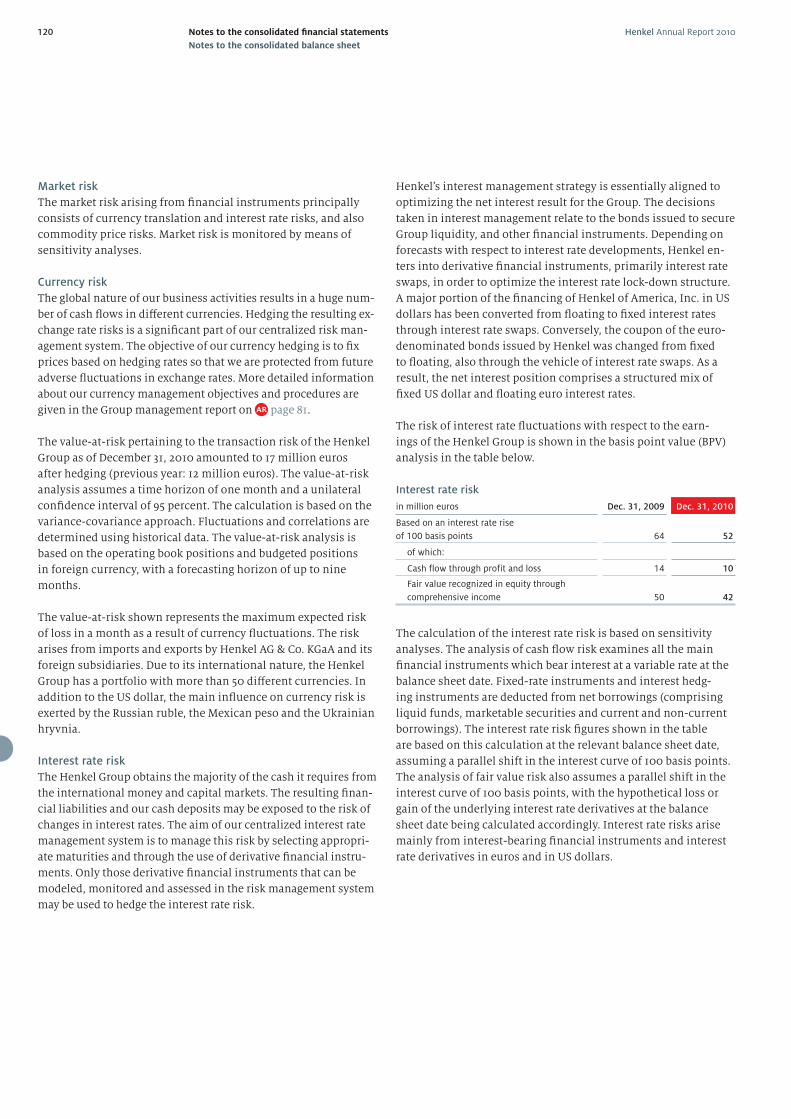
Henkel Annual Report 2010120 Notes to the consolidated fi nancial statements
Notes to the consolidated balance sheet
Market risk
The market risk arising from fi nancial instruments principally
consists of currency translation and interest rate risks, and also
commodity price risks. Market risk is monitored by means of
sensitivity analyses.
Currency risk
The global nature of our business activities results in a huge num-
ber of cash fl ows in diff erent currencies. Hedging the resulting ex-
change rate risks is a signifi cant part of our centralized risk man-
agement system. The objective of our currency hedging is to fi x
prices based on hedging rates so that we are protected from future
adverse fl uctuations in exchange rates. More detailed information
about our currency management objectives and procedures are
given in the Group management report on page 81.
The value-at-risk pertaining to the transaction risk of the Henkel
Group as of December 31, 2010 amounted to 17 million euros
after hedging (previous year: 12 million euros). The value-at-risk
analysis assumes a time horizon of one month and a unilateral
confi dence interval of 95 percent. The calculation is based on the
variance-covariance approach. Fluctuations and correlations are
determined using historical data. The value-at-risk analysis is
based on the operating book positions and budgeted positions
in foreign currency, with a forecasting horizon of up to nine
months.
The value-at-risk shown represents the maximum expected risk
of loss in a month as a result of currency fl uctuations. The risk
arises from imports and exports by Henkel AG & Co. KGaA and its
foreign subsidiaries. Due to its international nature, the Henkel
Group has a portfolio with more than 50 diff erent currencies. In
addition to the US dollar, the main infl uence on currency risk is
exerted by the Russian ruble, the Mexican peso and the Ukrainian
hryvnia.
Interest rate risk
The Henkel Group obtains the majority of the cash it requires from
the international money and capital markets. The resulting fi nan-
cial liabilities and our cash deposits may be exposed to the risk of
changes in interest rates. The aim of our centralized interest rate
management system is to manage this risk by selecting appropri-
ate maturities and through the use of derivative fi nancial instru-
ments. Only those derivative fi nancial instruments that can be
modeled, monitored and assessed in the risk management system
may be used to hedge the interest rate risk.
Henkel’s interest management strategy is essentially aligned to
optimizing the net interest result for the Group. The decisions
taken in interest management relate to the bonds issued to secure
Group liquidity, and other fi nancial instruments. Depending on
forecasts with respect to interest rate developments, Henkel en-
ters into derivative fi nancial instruments, primarily interest rate
swaps, in order to optimize the interest rate lock-down structure.
A major portion of the fi nancing of Henkel of America, Inc. in US
dollars has been converted from fl oating to fi xed interest rates
through interest rate swaps. Conversely, the coupon of the euro-
denominated bonds issued by Henkel was changed from fi xed
to fl oating, also through the vehicle of interest rate swaps. As a
result, the net interest position comprises a structured mix of
fi xed US dollar and fl oating euro interest rates.
The risk of interest rate fl uctuations with respect to the earn-
ings of the Henkel Group is shown in the basis point value (BPV)
analysis in the table below.
Interest rate risk
in million euros Dec. 31, 2009 Dec. 31, 2010
Based on an interest rate rise
of 100 basis points 64 52
of which:
Cash flow through profit and loss 14 10
Fair value recognized in equity through
comprehensive income 50 42
The calculation of the interest rate risk is based on sensitivity
analyses. The analysis of cash fl ow risk examines all the main
fi nancial instruments which bear interest at a variable rate at the
balance sheet date. Fixed-rate instruments and interest hedg-
ing instruments are deducted from net borrowings (comprising
liquid funds, marketable securities and current and non-current
borrowings). The interest rate risk fi gures shown in the table
are based on this calculation at the relevant balance sheet date,
assuming a parallel shift in the interest curve of 100 basis points.
The analysis of fair value risk also assumes a parallel shift in the
interest curve of 100 basis points, with the hypothetical loss or
gain of the underlying interest rate derivatives at the balance
sheet date being calculated accordingly. Interest rate risks arise
mainly from interest-bearing fi nancial instruments and interest
rate derivatives in euros and in US dollars.
Henkel Annual Report 2010 121Notes to the consolidated fi nancial statements
Notes to the consolidated balance sheet
Commodity price risk
The volatility of raw material prices impacts Group business.
Depending on the market situation, the fl uctuations in purchase
prices for raw materials can be substantial and so aff ect the fi nan-
cial position and results of operations of the corporation. The risk
management strategy put in place by the Group management for
coping with and safeguarding against the raw material price risk
is described in more detail in the risk management report on
page 79.
As a small part of the risk management strategy, cash-settled
commodity futures are entered into on the basis of forecast
purchasing requirements in order to hedge commodity price
fl uctuations. Cash-settled commodity derivatives are only used at
Henkel where there is a direct relationship between the hedging
derivative and the physical underlying. Henkel does not practice
hedge accounting and is therefore exposed to temporary price
risks when holding commodity derivatives. Such price risks arise
due to the fact that the commodity derivatives are measured at
fair value whereas the purchasing requirement, as a pending
transaction, is not recognized. This can lead to losses recognized
in profi t or loss. Developments in fair values and the resultant
risks are continuously monitored.
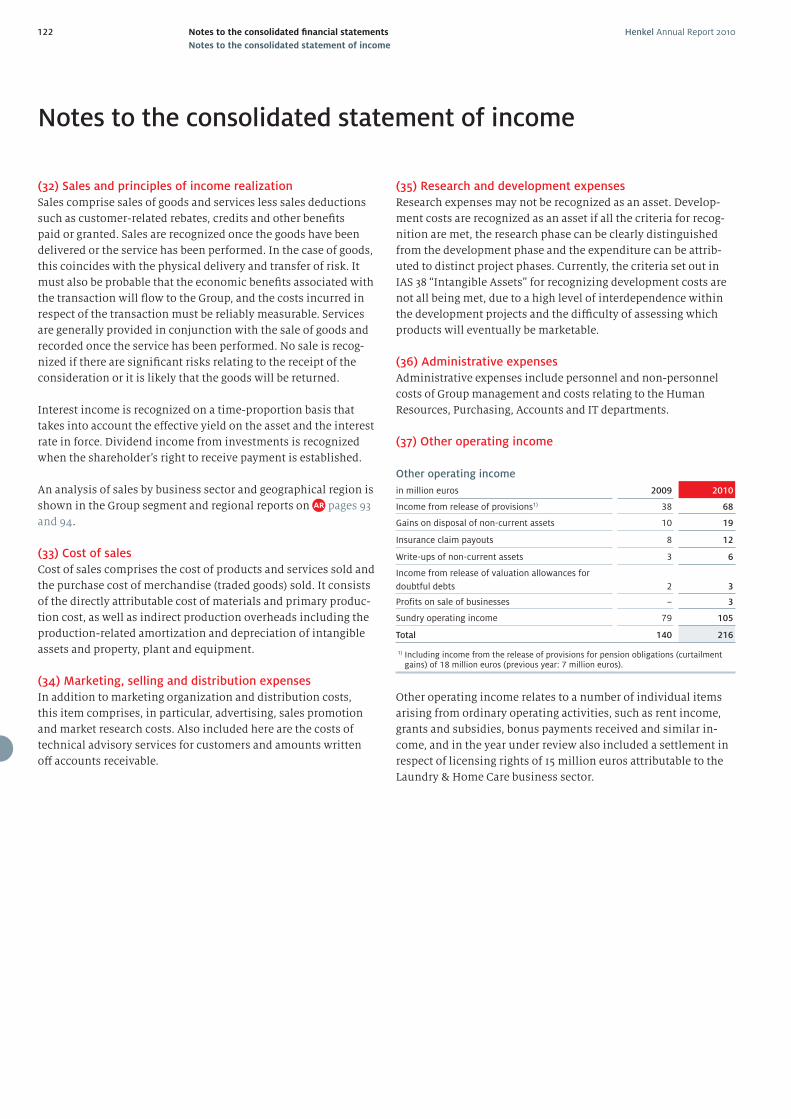
Henkel Annual Report 2010122 Notes to the consolidated fi nancial statements
Notes to the consolidated statement of income
(37) Other operating income
Other operating income
in million euros 2009 2010
Income from release of provisions1) 38 68
Gains on disposal of non-current assets 10 19
Insurance claim payouts 8 12
Write-ups of non-current assets 3 6
Income from release of valuation allowances for
doubtful debts 2 3
Profits on sale of businesses – 3
Sundry operating income 79 105
Total 140 216
1) Including income from the release of provisions for pension obligations (curtailment gains) of 18 million euros (previous year: 7 million euros).
Other operating income relates to a number of individual items
arising from ordinary operating activities, such as rent income,
grants and subsidies, bonus payments received and similar in-
come, and in the year under review also included a settlement in
respect of licensing rights of 15 million euros attributable to the
Laundry & Home Care business sector.
(32) Sales and principles of income realization
Sales comprise sales of goods and services less sales deductions
such as customer-related rebates, credits and other benefi ts
paid or granted. Sales are recognized once the goods have been
delivered or the service has been performed. In the case of goods,
this coincides with the physical delivery and transfer of risk. It
must also be probable that the economic benefi ts associated with
the transaction will fl ow to the Group, and the costs incurred in
respect of the transaction must be reliably measurable. Services
are generally provided in conjunction with the sale of goods and
recorded once the service has been performed. No sale is recog-
nized if there are signifi cant risks relating to the receipt of the
consideration or it is likely that the goods will be returned.
Interest income is recognized on a time-proportion basis that
takes into account the eff ective yield on the asset and the interest
rate in force. Dividend income from investments is recognized
when the shareholder’s right to receive payment is established.
An analysis of sales by business sector and geographical region is
shown in the Group segment and regional reports on pages 93
and 94.
(33) Cost of sales
Cost of sales comprises the cost of products and services sold and
the purchase cost of merchandise (traded goods) sold. It consists
of the directly attributable cost of materials and primary produc-
tion cost, as well as indirect production overheads including the
production-related amortization and depreciation of intangible
assets and property, plant and equipment.
(34) Marketing, selling and distribution expenses
In addition to marketing organization and distribution costs,
this item comprises, in particular, advertising, sales promotion
and market research costs. Also included here are the costs of
technical advisory services for customers and amounts written
off accounts receivable.
(35) Research and development expenses
Research expenses may not be recognized as an asset. Develop-
ment costs are recognized as an asset if all the criteria for recog-
nition are met, the research phase can be clearly distinguished
from the development phase and the expenditure can be attrib-
uted to distinct project phases. Currently, the criteria set out in
IAS 38 “Intangible Assets” for recognizing development costs are
not all being met, due to a high level of interdependence within
the development projects and the diffi culty of assessing which
products will eventually be marketable.
(36) Administrative expenses
Administrative expenses include personnel and non-personnel
costs of Group management and costs relating to the Human
Resources, Purchasing, Accounts and IT departments.
Notes to the consolidated statement of income
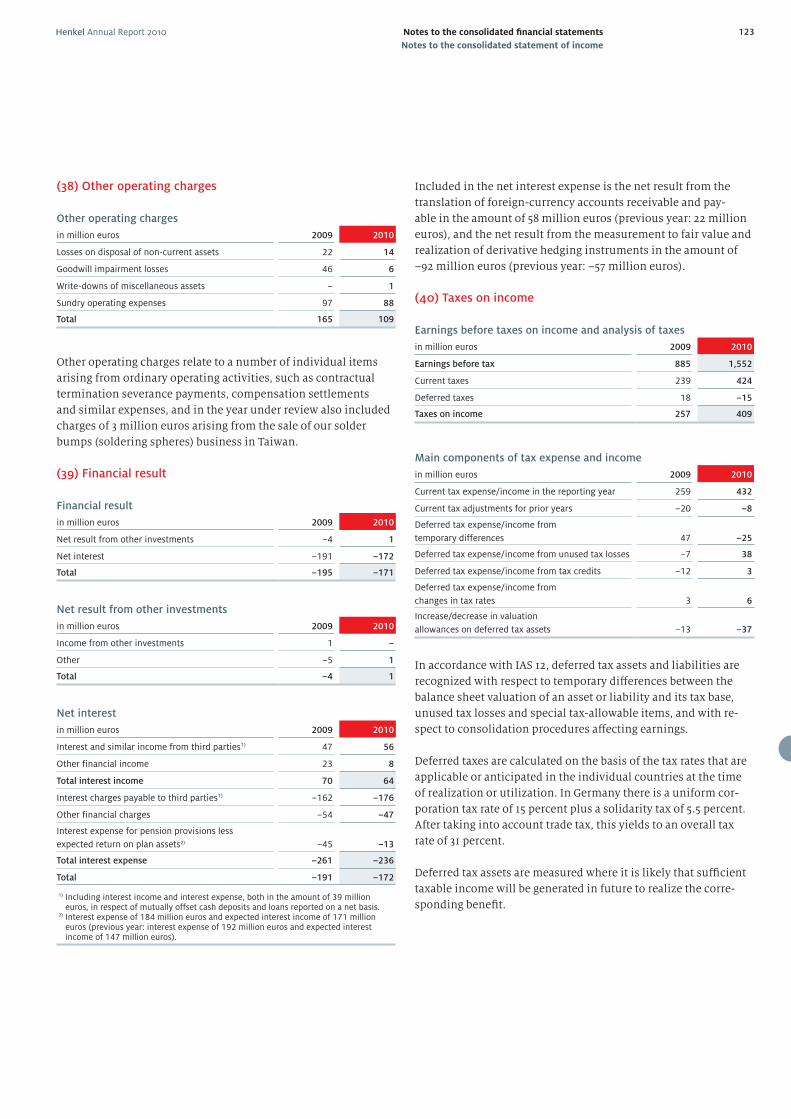
Henkel Annual Report 2010 123Notes to the consolidated fi nancial statements
Notes to the consolidated statement of income
Included in the net interest expense is the net result from the
translation of foreign-currency accounts receivable and pay-
able in the amount of 58 million euros (previous year: 22 million
euros), and the net result from the measurement to fair value and
realization of derivative hedging instruments in the amount of
–92 million euros (previous year: –57 million euros).
(40) Taxes on income
Earnings before taxes on income and analysis of taxes
in million euros 2009 2010
Earnings before tax 885 1,552
Current taxes 239 424
Deferred taxes 18 –15
Taxes on income 257 409
Main components of tax expense and income
in million euros 2009 2010
Current tax expense/income in the reporting year 259 432
Current tax adjustments for prior years –20 –8
Deferred tax expense/income from
temporary differences 47 –25
Deferred tax expense/income from unused tax losses –7 38
Deferred tax expense/income from tax credits –12 3
Deferred tax expense/income from
changes in tax rates 3 6
Increase/decrease in valuation
allowances on deferred tax assets –13 –37
In accordance with IAS 12, deferred tax assets and liabilities are
recognized with respect to temporary diff erences between the
balance sheet valuation of an asset or liability and its tax base,
unused tax losses and special tax-allowable items, and with re-
spect to consolidation procedures aff ecting earnings.
Deferred taxes are calculated on the basis of the tax rates that are
applicable or anticipated in the individual countries at the time
of realization or utilization. In Germany there is a uniform cor-
poration tax rate of 15 percent plus a solidarity tax of 5.5 percent.
After taking into account trade tax, this yields to an overall tax
rate of 31 percent.
Deferred tax assets are measured where it is likely that suffi cient
taxable income will be generated in future to realize the corre-
sponding benefi t.
(38) Other operating charges
Other operating charges
in million euros 2009 2010
Losses on disposal of non-current assets 22 14
Goodwill impairment losses 46 6
Write-downs of miscellaneous assets – 1
Sundry operating expenses 97 88
Total 165 109
Other operating charges relate to a number of individual items
arising from ordinary operating activities, such as contractual
termination severance payments, compensation settlements
and similar expenses, and in the year under review also included
charges of 3 million euros arising from the sale of our solder
bumps (soldering spheres) business in Taiwan.
(39) Financial result
Financial result
in million euros 2009 2010
Net result from other investments –4 1
Net interest –191 –172
Total –195 –171
Net result from other investments
in million euros 2009 2010
Income from other investments 1 –
Other –5 1
Total –4 1
Net interest
in million euros 2009 2010
Interest and similar income from third parties1) 47 56
Other financial income 23 8
Total interest income 70 64
Interest charges payable to third parties1) –162 –176
Other financial charges –54 –47
Interest expense for pension provisions less
expected return on plan assets2) –45 –13
Total interest expense –261 –236
Total –191 –172
1) Including interest income and interest expense, both in the amount of 39 million euros, in respect of mutually offset cash deposits and loans reported on a net basis.
2) Interest expense of 184 million euros and expected interest income of 171 million euros (previous year: interest expense of 192 million euros and expected interest income of 147 million euros).
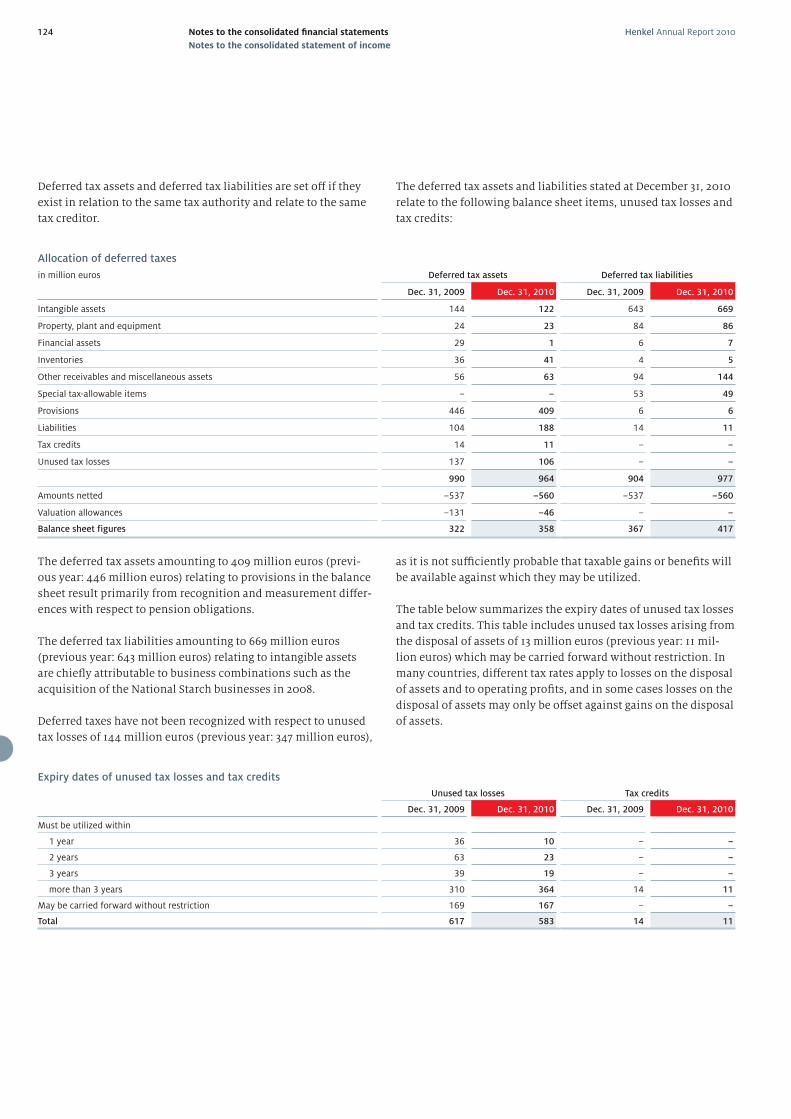
Henkel Annual Report 2010124 Notes to the consolidated fi nancial statements
Notes to the consolidated statement of income
Deferred tax assets and deferred tax liabilities are set off if they
exist in relation to the same tax authority and relate to the same
tax creditor.
Allocation of deferred taxes
in million euros Deferred tax assets Deferred tax liabilities
Dec. 31, 2009 Dec. 31, 2010 Dec. 31, 2009 Dec. 31, 2010
Intangible assets 144 122 643 669
Property, plant and equipment 24 23 84 86
Financial assets 29 1 6 7
Inventories 36 41 4 5
Other receivables and miscellaneous assets 56 63 94 144
Special tax-allowable items – – 53 49
Provisions 446 409 6 6
Liabilities 104 188 14 11
Tax credits 14 11 – –
Unused tax losses 137 106 – –
990 964 904 977
Amounts netted –537 –560 –537 –560
Valuation allowances –131 –46 – –
Balance sheet figures 322 358 367 417
The deferred tax assets amounting to 409 million euros (previ-
ous year: 446 million euros) relating to provisions in the balance
sheet result primarily from recognition and measurement diff er-
ences with respect to pension obligations.
The deferred tax liabilities amounting to 669 million euros
(previous year: 643 million euros) relating to intangible assets
are chiefl y attributable to business combinations such as the
acquisition of the National Starch businesses in 2008.
Deferred taxes have not been recognized with respect to unused
tax losses of 144 million euros (previous year: 347 million euros),
The deferred tax assets and liabilities stated at December 31, 2010
relate to the following balance sheet items, unused tax losses and
tax credits:
as it is not suffi ciently probable that taxable gains or benefi ts will
be available against which they may be utilized.
The table below summarizes the expiry dates of unused tax losses
and tax credits. This table includes unused tax losses arising from
the disposal of assets of 13 million euros (previous year: 11 mil-
lion euros) which may be carried forward without restriction. In
many countries, diff erent tax rates apply to losses on the disposal
of assets and to operating profi ts, and in some cases losses on the
disposal of assets may only be off set against gains on the disposal
of assets.
Expiry dates of unused tax losses and tax credits)
Unused tax losses Tax credits
Dec. 31, 2009 Dec. 31, 2010 Dec. 31, 2009 Dec. 31, 2010
Must be utilized within
1 year 36 10 – –
2 years 63 23 – –
3 years 39 19 – –
more than 3 years 310 364 14 11
May be carried forward without restriction 169 167 – –
Total 617 583 14 11
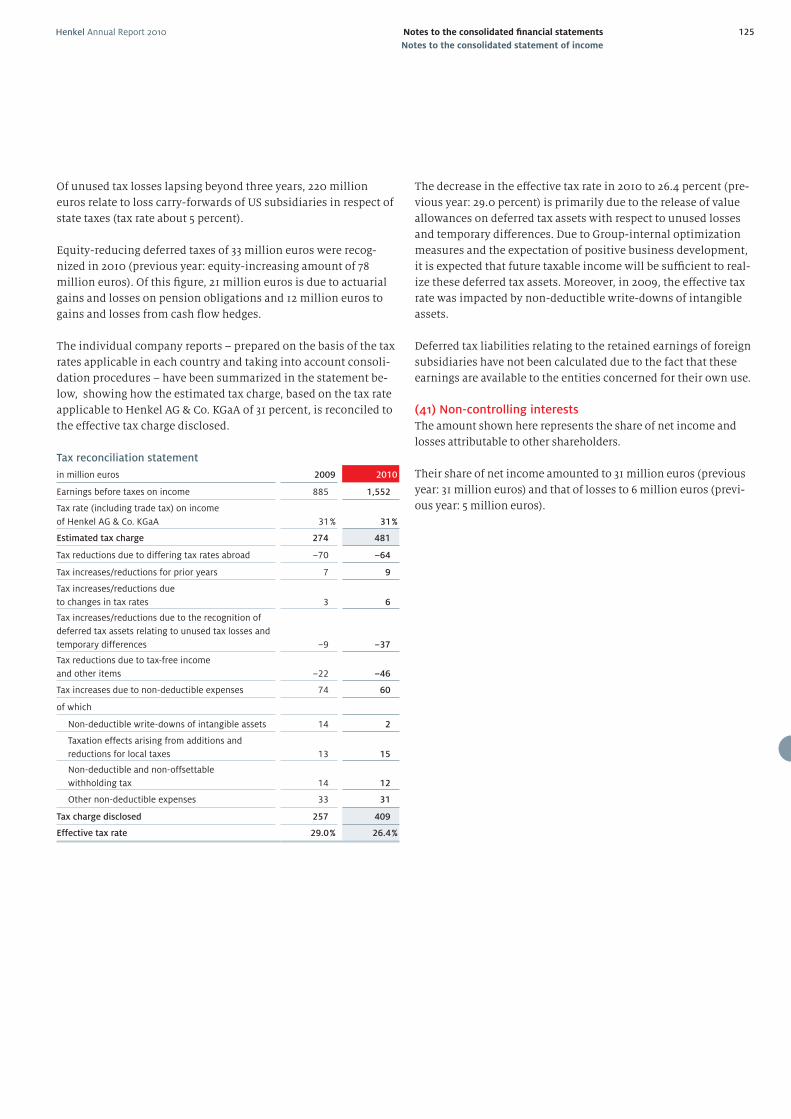
Henkel Annual Report 2010 125Notes to the consolidated fi nancial statements
Notes to the consolidated statement of income
Of unused tax losses lapsing beyond three years, 220 million
euros relate to loss carry-forwards of US subsidiaries in respect of
state taxes (tax rate about 5 percent).
Equity-reducing deferred taxes of 33 million euros were recog-
nized in 2010 (previous year: equity-increasing amount of 78
million euros). Of this fi gure, 21 million euros is due to actuarial
gains and losses on pension obligations and 12 million euros to
gains and losses from cash fl ow hedges.
The individual company reports – prepared on the basis of the tax
rates applicable in each country and taking into account consoli-
dation procedures – have been summarized in the statement be-
low, showing how the estimated tax charge, based on the tax rate
applicable to Henkel AG & Co. KGaA of 31 percent, is reconciled to
the eff ective tax charge disclosed.
Tax reconciliation statement
in million euros 2009 2010
Earnings before taxes on income 885 1,552
Tax rate (including trade tax) on income
of Henkel AG & Co. KGaA 31 % 31 %
Estimated tax charge 274 481
Tax reductions due to differing tax rates abroad –70 –64
Tax increases/reductions for prior years 7 9
Tax increases/reductions due
to changes in tax rates 3 6
Tax increases/reductions due to the recognition of
deferred tax assets relating to unused tax losses and
temporary differences –9 –37
Tax reductions due to tax-free income
and other items –22 –46
Tax increases due to non-deductible expenses 74 60
of which
Non-deductible write-downs of intangible assets 14 2
Taxation effects arising from additions and
reductions for local taxes 13 15
Non-deductible and non-offsettable
withholding tax 14 12
Other non-deductible expenses 33 31
Tax charge disclosed 257 409
Effective tax rate 29.0 % 26.4 %
The decrease in the eff ective tax rate in 2010 to 26.4 percent (pre-
vious year: 29.0 percent) is primarily due to the release of value
allowances on deferred tax assets with respect to unused losses
and temporary diff erences. Due to Group-internal optimization
measures and the expectation of positive business development,
it is expected that future taxable income will be suffi cient to real-
ize these deferred tax assets. Moreover, in 2009, the eff ective tax
rate was impacted by non-deductible write-downs of intangible
assets.
Deferred tax liabilities relating to the retained earnings of foreign
subsidiaries have not been calculated due to the fact that these
earnings are available to the entities concerned for their own use.
(41) Non-controlling interests
The amount shown here represents the share of net income and
losses attributable to other shareholders.
Their share of net income amounted to 31 million euros (previous
year: 31 million euros) and that of losses to 6 million euros (previ-
ous year: 5 million euros).
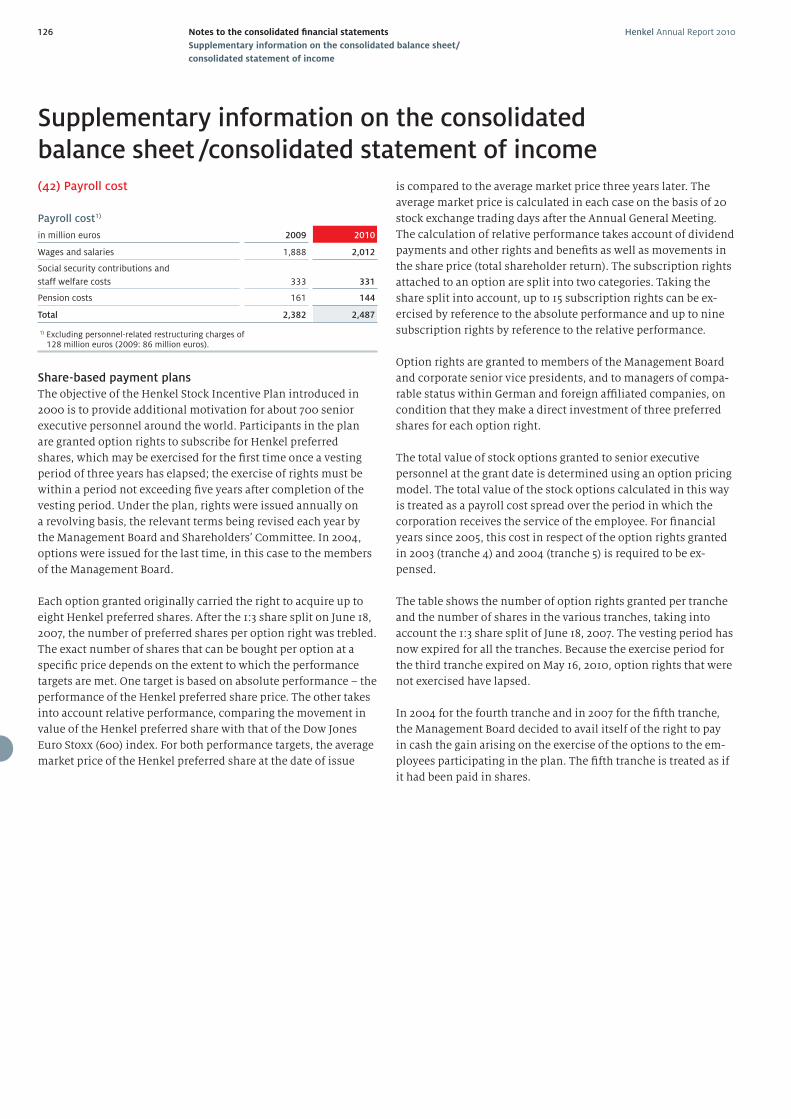
Henkel Annual Report 2010126 Notes to the consolidated fi nancial statements
Supplementary information on the consolidated balance sheet/
consolidated statement of income
(42) Payroll cost
Payroll cost1)
in million euros 2009 2010
Wages and salaries 1,888 2,012
Social security contributions and
staff welfare costs 333 331
Pension costs 161 144
Total 2,382 2,487
1) Excluding personnel-related restructuring charges of 128 million euros (2009: 86 million euros).
Share-based payment plans
The objective of the Henkel Stock Incentive Plan introduced in
2000 is to provide additional motivation for about 700 senior
executive personnel around the world. Participants in the plan
are granted option rights to subscribe for Henkel preferred
shares, which may be exercised for the fi rst time once a vesting
period of three years has elapsed; the exercise of rights must be
within a period not exceeding fi ve years after completion of the
vesting period. Under the plan, rights were issued annually on
a revolving basis, the relevant terms being revised each year by
the Management Board and Shareholders’ Committee. In 2004,
options were issued for the last time, in this case to the members
of the Management Board.
Each option granted originally carried the right to acquire up to
eight Henkel preferred shares. After the 1:3 share split on June 18,
2007, the number of preferred shares per option right was trebled.
The exact number of shares that can be bought per option at a
specifi c price depends on the extent to which the performance
targets are met. One target is based on absolute performance – the
performance of the Henkel preferred share price. The other takes
into account relative performance, comparing the movement in
value of the Henkel preferred share with that of the Dow Jones
Euro Stoxx (600) index. For both performance targets, the average
market price of the Henkel preferred share at the date of issue
is compared to the average market price three years later. The
average market price is calculated in each case on the basis of 20
stock exchange trading days after the Annual General Meeting.
The calculation of relative performance takes account of dividend
payments and other rights and benefi ts as well as movements in
the share price (total shareholder return). The subscription rights
attached to an option are split into two categories. Taking the
share split into account, up to 15 subscription rights can be ex-
ercised by reference to the absolute performance and up to nine
subscription rights by reference to the relative performance.
Option rights are granted to members of the Management Board
and corporate senior vice presidents, and to managers of compa-
rable status within German and foreign affi liated companies, on
condition that they make a direct investment of three preferred
shares for each option right.
The total value of stock options granted to senior executive
personnel at the grant date is determined using an option pricing
model. The total value of the stock options calculated in this way
is treated as a payroll cost spread over the period in which the
corporation receives the service of the employee. For fi nancial
years since 2005, this cost in respect of the option rights granted
in 2003 (tranche 4) and 2004 (tranche 5) is required to be ex-
pensed.
The table shows the number of option rights granted per tranche
and the number of shares in the various tranches, taking into
account the 1:3 share split of June 18, 2007. The vesting period has
now expired for all the tranches. Because the exercise period for
the third tranche expired on May 16, 2010, option rights that were
not exercised have lapsed.
In 2004 for the fourth tranche and in 2007 for the fi fth tranche,
the Management Board decided to avail itself of the right to pay
in cash the gain arising on the exercise of the options to the em-
ployees participating in the plan. The fi fth tranche is treated as if
it had been paid in shares.
Supplementary information on the consolidated balance sheet /consolidated statement of income
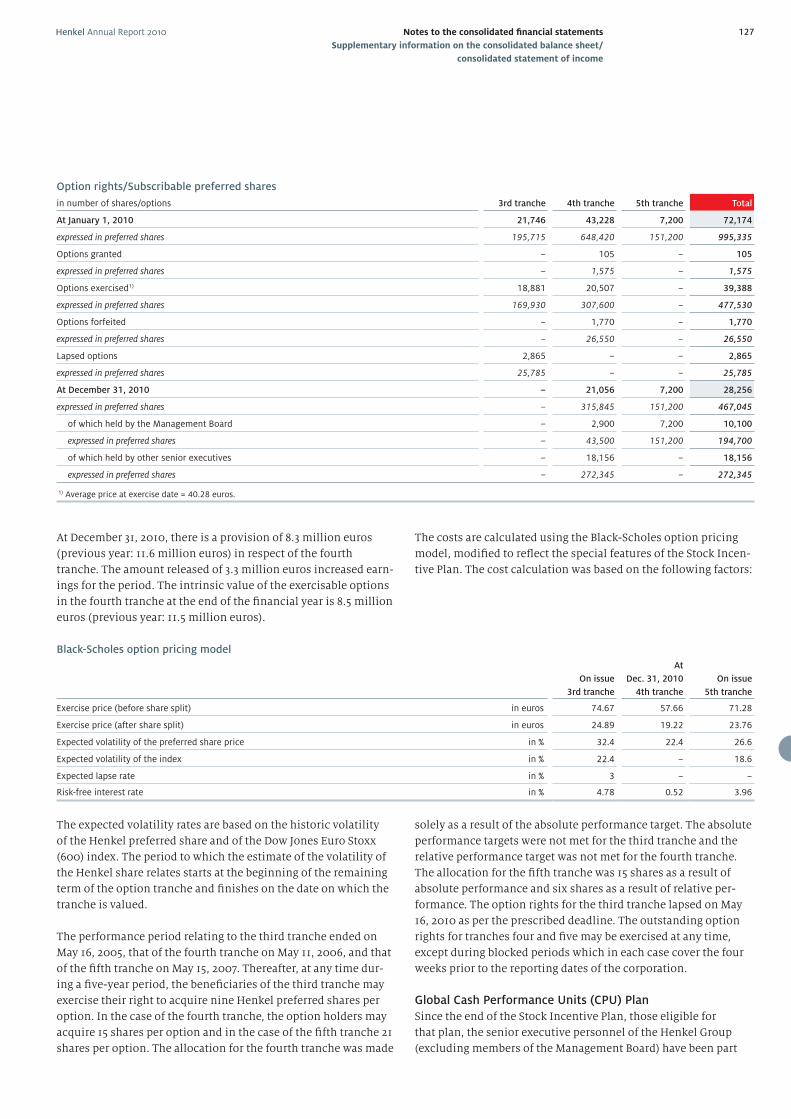
Henkel Annual Report 2010 127Notes to the consolidated fi nancial statements
Supplementary information on the consolidated balance sheet/
consolidated statement of income
Option rights/Subscribable preferred shares
in number of shares/options 3rd tranche 4th tranche 5th tranche Total
At January 1, 2010 21,746 43,228 7,200 72,174
expressed in preferred shares 195,715 648,420 151,200 995,335
Options granted – 105 – 105
expressed in preferred shares – 1,575 – 1,575
Options exercised1) 18,881 20,507 – 39,388
expressed in preferred shares 169,930 307,600 – 477,530
Options forfeited – 1,770 – 1,770
expressed in preferred shares – 26,550 – 26,550
Lapsed options 2,865 – – 2,865
expressed in preferred shares 25,785 – – 25,785
At December 31, 2010 – 21,056 7,200 28,256
expressed in preferred shares – 315,845 151,200 467,045
of which held by the Management Board – 2,900 7,200 10,100
expressed in preferred shares – 43,500 151,200 194,700
of which held by other senior executives – 18,156 – 18,156
expressed in preferred shares – 272,345 – 272,345
1) Average price at exercise date = 40.28 euros.
At December 31, 2010, there is a provision of 8.3 million euros
(previous year: 11.6 million euros) in respect of the fourth
tranche. The amount released of 3.3 million euros increased earn-
ings for the period. The intrinsic value of the exercisable options
in the fourth tranche at the end of the fi nancial year is 8.5 million
euros (previous year: 11.5 million euros).
The costs are calculated using the Black-Scholes option pricing
model, modifi ed to refl ect the special features of the Stock Incen-
tive Plan. The cost calculation was based on the following factors:
solely as a result of the absolute performance target. The absolute
performance targets were not met for the third tranche and the
relative performance target was not met for the fourth tranche.
The allocation for the fi fth tranche was 15 shares as a result of
absolute performance and six shares as a result of relative per-
formance. The option rights for the third tranche lapsed on May
16, 2010 as per the prescribed deadline. The outstanding option
rights for tranches four and fi ve may be exercised at any time,
except during blocked periods which in each case cover the four
weeks prior to the reporting dates of the corporation.
Global Cash Performance Units (CPU) Plan
Since the end of the Stock Incentive Plan, those eligible for
that plan, the senior executive personnel of the Henkel Group
(excluding members of the Management Board) have been part
Black-Scholes option pricing model
On issue
3rd tranche
At
Dec. 31, 2010
4th tranche
On issue
5th tranche
Exercise price (before share split) in euros 74.67 57.66 71.28
Exercise price (after share split) in euros 24.89 19.22 23.76
Expected volatility of the preferred share price in % 32.4 22.4 26.6
Expected volatility of the index in % 22.4 – 18.6
Expected lapse rate in % 3 – –
Risk-free interest rate in % 4.78 0.52 3.96
The expected volatility rates are based on the historic volatility
of the Henkel preferred share and of the Dow Jones Euro Stoxx
(600) index. The period to which the estimate of the volatility of
the Henkel share relates starts at the beginning of the remaining
term of the option tranche and fi nishes on the date on which the
tranche is valued.
The performance period relating to the third tranche ended on
May 16, 2005, that of the fourth tranche on May 11, 2006, and that
of the fi fth tranche on May 15, 2007. Thereafter, at any time dur-
ing a fi ve-year period, the benefi ciaries of the third tranche may
exercise their right to acquire nine Henkel preferred shares per
option. In the case of the fourth tranche, the option holders may
acquire 15 shares per option and in the case of the fi fth tranche 21
shares per option. The allocation for the fourth tranche was made
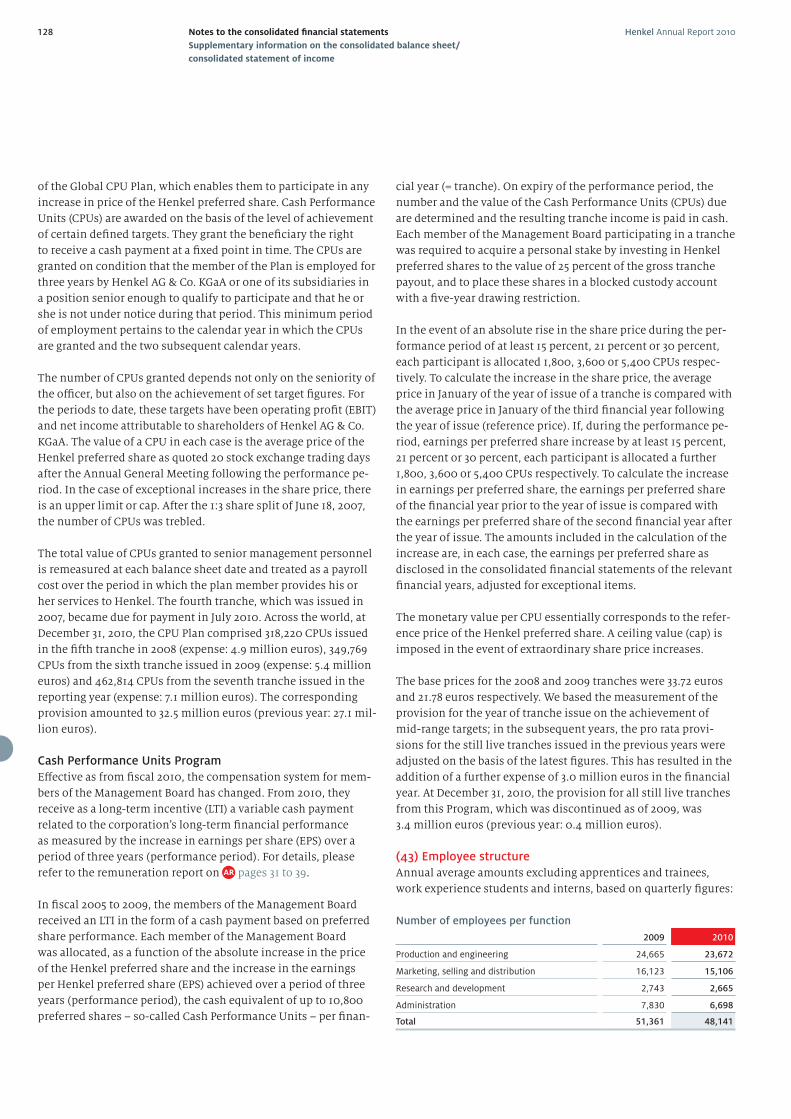
Henkel Annual Report 2010128 Notes to the consolidated fi nancial statements
Supplementary information on the consolidated balance sheet/
consolidated statement of income
of the Global CPU Plan, which enables them to participate in any
increase in price of the Henkel preferred share. Cash Performance
Units (CPUs) are awarded on the basis of the level of achievement
of certain defi ned targets. They grant the benefi ciary the right
to receive a cash payment at a fi xed point in time. The CPUs are
granted on condition that the member of the Plan is employed for
three years by Henkel AG & Co. KGaA or one of its subsidiaries in
a position senior enough to qualify to participate and that he or
she is not under notice during that period. This minimum period
of employment pertains to the calendar year in which the CPUs
are granted and the two subsequent calendar years.
The number of CPUs granted depends not only on the seniority of
the offi cer, but also on the achievement of set target fi gures. For
the periods to date, these targets have been operating profi t (EBIT)
and net income attributable to shareholders of Henkel AG & Co.
KGaA. The value of a CPU in each case is the average price of the
Henkel preferred share as quoted 20 stock exchange trading days
after the Annual General Meeting following the performance pe-
riod. In the case of exceptional increases in the share price, there
is an upper limit or cap. After the 1:3 share split of June 18, 2007,
the number of CPUs was trebled.
The total value of CPUs granted to senior management personnel
is remeasured at each balance sheet date and treated as a payroll
cost over the period in which the plan member provides his or
her services to Henkel. The fourth tranche, which was issued in
2007, became due for payment in July 2010. Across the world, at
December 31, 2010, the CPU Plan comprised 318,220 CPUs issued
in the fi fth tranche in 2008 (expense: 4.9 million euros), 349,769
CPUs from the sixth tranche issued in 2009 (expense: 5.4 million
euros) and 462,814 CPUs from the seventh tranche issued in the
reporting year (expense: 7.1 million euros). The corresponding
provision amounted to 32.5 million euros (previous year: 27.1 mil-
lion euros).
Cash Performance Units Program
Eff ective as from fi scal 2010, the compensation system for mem-
bers of the Management Board has changed. From 2010, they
receive as a long-term incentive (LTI) a variable cash payment
related to the corporation’s long-term fi nancial performance
as measured by the increase in earnings per share (EPS) over a
period of three years (performance period). For details, please
refer to the remuneration report on pages 31 to 39.
In fi scal 2005 to 2009, the members of the Management Board
received an LTI in the form of a cash payment based on preferred
share performance. Each member of the Management Board
was allocated, as a function of the absolute increase in the price
of the Henkel preferred share and the increase in the earnings
per Henkel preferred share (EPS) achieved over a period of three
years (performance period), the cash equivalent of up to 10,800
preferred shares – so-called Cash Performance Units – per fi nan-
cial year (= tranche). On expiry of the performance period, the
number and the value of the Cash Performance Units (CPUs) due
are determined and the resulting tranche income is paid in cash.
Each member of the Management Board participating in a tranche
was required to acquire a personal stake by investing in Henkel
preferred shares to the value of 25 percent of the gross tranche
payout, and to place these shares in a blocked custody account
with a fi ve-year drawing restriction.
In the event of an absolute rise in the share price during the per-
formance period of at least 15 percent, 21 percent or 30 percent,
each participant is allocated 1,800, 3,600 or 5,400 CPUs respec-
tively. To calculate the increase in the share price, the average
price in January of the year of issue of a tranche is compared with
the average price in January of the third fi nancial year following
the year of issue (reference price). If, during the performance pe-
riod, earnings per preferred share increase by at least 15 percent,
21 percent or 30 percent, each participant is allocated a further
1,800, 3,600 or 5,400 CPUs respectively. To calculate the increase
in earnings per preferred share, the earnings per preferred share
of the fi nancial year prior to the year of issue is compared with
the earnings per preferred share of the second fi nancial year after
the year of issue. The amounts included in the calculation of the
increase are, in each case, the earnings per preferred share as
disclosed in the consolidated fi nancial statements of the relevant
fi nancial years, adjusted for exceptional items.
The monetary value per CPU essentially corresponds to the refer-
ence price of the Henkel preferred share. A ceiling value (cap) is
imposed in the event of extraordinary share price increases.
The base prices for the 2008 and 2009 tranches were 33.72 euros
and 21.78 euros respectively. We based the measurement of the
provision for the year of tranche issue on the achievement of
mid-range targets; in the subsequent years, the pro rata provi-
sions for the still live tranches issued in the previous years were
adjusted on the basis of the latest fi gures. This has resulted in the
addition of a further expense of 3.0 million euros in the fi nancial
year. At December 31, 2010, the provision for all still live tranches
from this Program, which was discontinued as of 2009, was
3.4 million euros (previous year: 0.4 million euros).
(43) Employee structure
Annual average amounts excluding apprentices and trainees,
work experience students and interns, based on quarterly fi gures:
Number of employees per function
2009 2010
Production and engineering 24,665 23,672
Marketing, selling and distribution 16,123 15,106
Research and development 2,743 2,665
Administration 7,830 6,698
Total 51,361 48,141
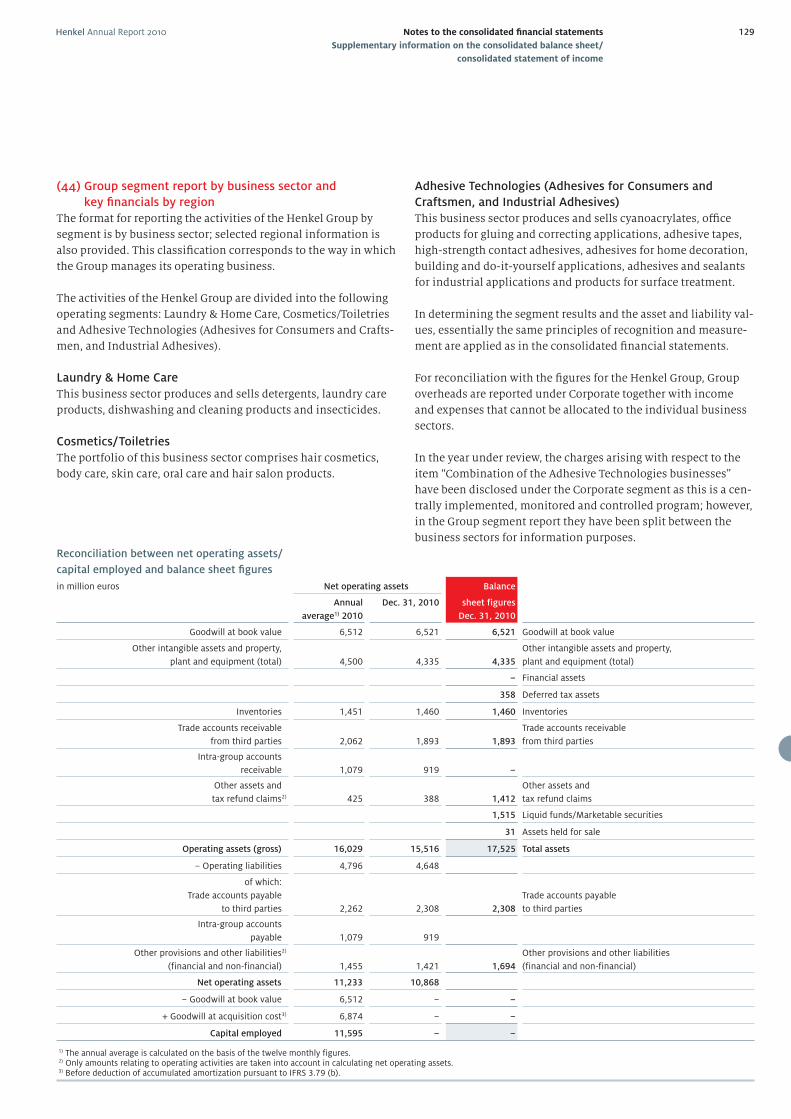
Henkel Annual Report 2010 129Notes to the consolidated fi nancial statements
Supplementary information on the consolidated balance sheet/
consolidated statement of income
(44) Group segment report by business sector and
key fi nancials by region
The format for reporting the activities of the Henkel Group by
segment is by business sector; selected regional information is
also provided. This classifi cation corresponds to the way in which
the Group manages its operating business.
The activities of the Henkel Group are divided into the following
operating segments: Laundry & Home Care, Cosmetics/Toiletries
and Adhesive Technologies (Adhesives for Consumers and Crafts-
men, and Industrial Adhesives).
Laundry & Home Care
This business sector produces and sells detergents, laundry care
products, dishwashing and cleaning products and insecticides.
Cosmetics/Toiletries
The portfolio of this business sector comprises hair cosmetics,
body care, skin care, oral care and hair salon products.
Adhesive Technologies (Adhesives for Consumers and
Craftsmen, and Industrial Adhesives)
This business sector produces and sells cyanoacrylates, offi ce
products for gluing and correcting applications, adhesive tapes,
high-strength contact adhesives, adhesives for home decoration,
building and do-it-yourself applications, adhesives and sealants
for industrial applications and products for surface treatment.
In determining the segment results and the asset and liability val-
ues, essentially the same principles of recognition and measure-
ment are applied as in the consolidated fi nancial statements.
For reconciliation with the fi gures for the Henkel Group, Group
overheads are reported under Corporate together with income
and expenses that cannot be allocated to the individual business
sectors.
In the year under review, the charges arising with respect to the
item “Combination of the Adhesive Technologies businesses”
have been disclosed under the Corporate segment as this is a cen-
trally implemented, monitored and controlled program; however,
in the Group segment report they have been split between the
business sectors for information purposes.
Reconciliation between net operating assets/
capital employed and balance sheet fi gures
in million euros Net operating assets Balance
Annual
average1) 2010
Dec. 31, 2010 sheet figures
Dec. 31, 2010
Goodwill at book value 6,512 6,521 6,521 Goodwill at book value
Other intangible assets and property,
plant and equipment (total) 4,500 4,335 4,335
Other intangible assets and property,
plant and equipment (total)
– Financial assets
358 Deferred tax assets
Inventories 1,451 1,460 1,460 Inventories
Trade accounts receivable
from third parties 2,062 1,893 1,893
Trade accounts receivable
from third parties
Intra-group accounts
receivable 1,079 919 –
Other assets and
tax refund claims2) 425 388 1,412
Other assets and
tax refund claims
1,515 Liquid funds/Marketable securities
31 Assets held for sale
Operating assets (gross) 16,029 15,516 17,525 Total assets
– Operating liabilities 4,796 4,648
of which:
Trade accounts payable
to third parties 2,262 2,308 2,308
Trade accounts payable
to third parties
Intra-group accounts
payable 1,079 919
Other provisions and other liabilities2)
(financial and non-financial) 1,455 1,421 1,694
Other provisions and other liabilities
(financial and non-financial)
Net operating assets 11,233 10,868
– Goodwill at book value 6,512 – –
+ Goodwill at acquisition cost3) 6,874 – –
Capital employed 11,595 – –
1) The annual average is calculated on the basis of the twelve monthly figures. 2) Only amounts relating to operating activities are taken into account in calculating net operating assets.3) Before deduction of accumulated amortization pursuant to IFRS 3.79 (b).
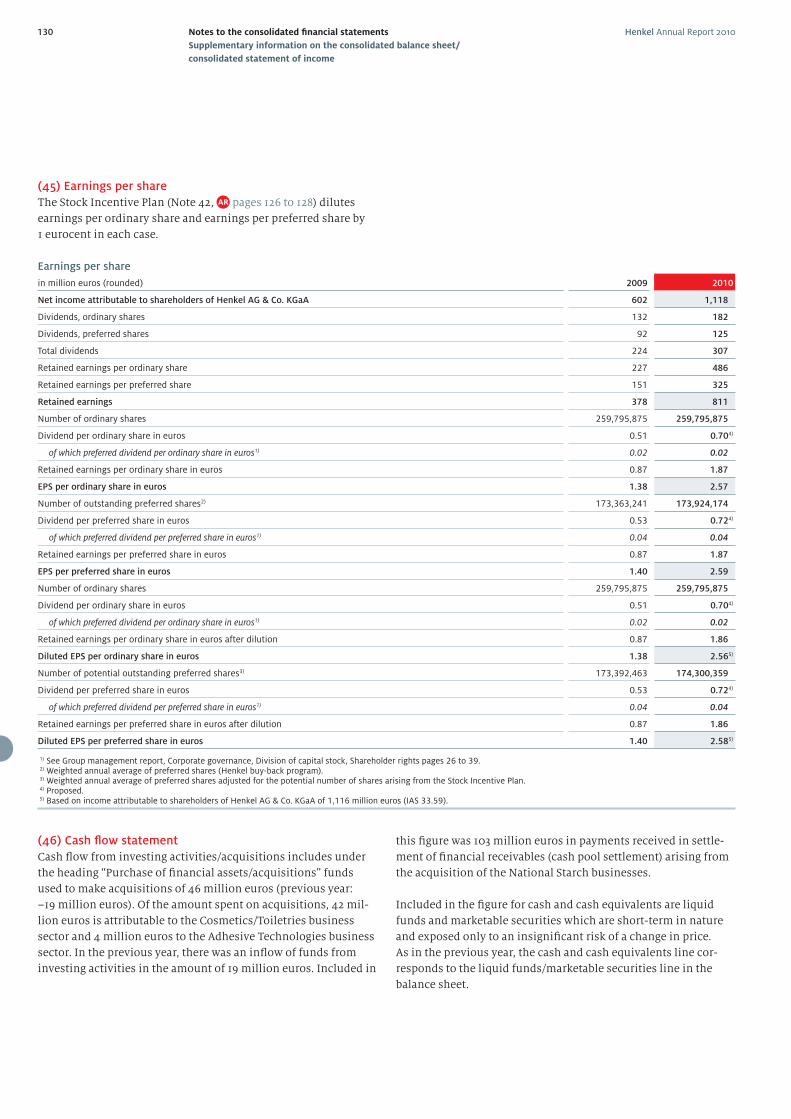
Henkel Annual Report 2010130 Notes to the consolidated fi nancial statements
Supplementary information on the consolidated balance sheet/
consolidated statement of income
(46) Cash fl ow statement
Cash fl ow from investing activities/acquisitions includes under
the heading “Purchase of fi nancial assets/acquisitions” funds
used to make acquisitions of 46 million euros (previous year:
–19 million euros). Of the amount spent on acquisitions, 42 mil-
lion euros is attributable to the Cosmetics/Toiletries business
sector and 4 million euros to the Adhesive Technologies business
sector. In the previous year, there was an infl ow of funds from
investing activities in the amount of 19 million euros. Included in
this fi gure was 103 million euros in payments received in settle-
ment of fi nancial receivables (cash pool settlement) arising from
the acquisition of the National Starch businesses.
Included in the fi gure for cash and cash equivalents are liquid
funds and marketable securities which are short-term in nature
and exposed only to an insignifi cant risk of a change in price.
As in the previous year, the cash and cash equivalents line cor-
responds to the liquid funds/marketable securities line in the
balance sheet.
(45) Earnings per share
The Stock Incentive Plan (Note 42, pages 126 to 128) dilutes
earnings per ordinary share and earnings per preferred share by
1 eurocent in each case.
Earnings per share
in million euros (rounded) 2009 2010
Net income attributable to shareholders of Henkel AG & Co. KGaA 602 1,118
Dividends, ordinary shares 132 182
Dividends, preferred shares 92 125
Total dividends 224 307
Retained earnings per ordinary share 227 486
Retained earnings per preferred share 151 325
Retained earnings 378 811
Number of ordinary shares 259,795,875 259,795,875
Dividend per ordinary share in euros 0.51 0.704)
of which preferred dividend per ordinary share in euros1) 0.02 0.02
Retained earnings per ordinary share in euros 0.87 1.87
EPS per ordinary share in euros 1.38 2.57
Number of outstanding preferred shares2) 173,363,241 173,924,174
Dividend per preferred share in euros 0.53 0.724)
of which preferred dividend per preferred share in euros1) 0.04 0.04
Retained earnings per preferred share in euros 0.87 1.87
EPS per preferred share in euros 1.40 2.59
Number of ordinary shares 259,795,875 259,795,875
Dividend per ordinary share in euros 0.51 0.704)
of which preferred dividend per ordinary share in euros1) 0.02 0.02
Retained earnings per ordinary share in euros after dilution 0.87 1.86
Diluted EPS per ordinary share in euros 1.38 2.565)
Number of potential outstanding preferred shares3) 173,392,463 174,300,359
Dividend per preferred share in euros 0.53 0.724)
of which preferred dividend per preferred share in euros1) 0.04 0.04
Retained earnings per preferred share in euros after dilution 0.87 1.86
Diluted EPS per preferred share in euros 1.40 2.585)
1) See Group management report, Corporate governance, Division of capital stock, Shareholder rights pages 26 to 39. 2) Weighted annual average of preferred shares (Henkel buy-back program). 3) Weighted annual average of preferred shares adjusted for the potential number of shares arising from the Stock Incentive Plan. 4) Proposed.5) Based on income attributable to shareholders of Henkel AG & Co. KGaA of 1,116 million euros (IAS 33.59).
Henkel Annual Report 2010 131Notes to the consolidated fi nancial statements
Supplementary information on the consolidated balance sheet/
consolidated statement of income
(50) Subsidiaries and other investments
Details relating to the investments held by Henkel AG & Co.
KGaA and the Henkel Group are provided in a separate schedule
appended to these notes to the consolidated fi nancial statements
but not included in the printed form of the Annual Report. Said
schedule is included in the accounting record submitted for
publication in the Electronic Federal Gazette and can be viewed
there and at the Annual General Meeting. The schedule is also in-
cluded in the online version of the Annual Report on our website:
www.henkel.com/ir
(47) Information on voting rights/Related party transactions
Information required by Section 160 (1) no. 8 of the German Stock
Corporation Act [AktG]:
The company has been notifi ed that the share of voting rights
of the parties to the Henkel share-pooling agreement at Octo-
ber 21, 2010 represents in total 53.21 percent of the voting rights
(138,240,804 votes) in Henkel AG & Co. KGaA and is held by
• 111 members of the families of the descendants of Fritz Henkel,
the company’s founder,
• four foundations set up by members of those families,
• one civil-law partnership set up by members of those families,
and
• eight private limited companies set up by members of those
families, seven limited partnerships with a limited company
as a general partner (GmbH & Co. KG) and one limited partner-
ship (KG)
under the terms of a share-pooling agreement (agreement restrict-
ing the transfer of shares) pursuant to Section 22 (2) of the German
Securities Trading Act [WpHG], whereby the shares held by the
eight private limited companies, the seven limited partnerships
with a limited company as a general partner and the one limited
partnership representing a total of 14.02 percent (36,419,097 vot-
ing rights) are attributed (pursuant to Section 22 (1) no. 1 WpHG) to
the family members who control those companies.
Dr. Christoph Henkel, London, has exceeded the 5 percent thresh-
old of voting rights in Henkel AG & Co. KGaA with 14,172,457
voting ordinary shares in Henkel AG & Co. KGaA, representing
a rounded percentage of 5.46 percent. Even after adding voting
rights expressly granted under the terms of usufruct agreements,
no other party to the share-pooling agreement has a notifi cation
obligation triggered by their reaching or exceeding the threshold
of 3 percent or more of the total voting rights in Henkel AG & Co.
KGaA.
The authorized representative of the parties to the Henkel share-
pooling agreement is Dr. Simone Bagel-Trah, Düsseldorf.
(48) Remuneration of the corporate management
The total remuneration of the members of the Supervisory Board
and of the Shareholders’ Committee of Henkel AG & Co. KGaA
amounted to 1,516k euros plus VAT (previous year: 1,425k euros)
and 2,209k euros (previous year: 2,345k euros) respectively. The
total remuneration (Section 285 no. 9 German Commercial Code
[HGB]) of the Management Board and members of the Manage-
ment Board of Henkel Management AG amounted to 18,297k
euros (previous year: 11,084k euros). For further details regarding
the emoluments of the corporate management, please refer to the
remuneration report on pages 31 to 39.
(49) Declaration of compliance with the
Corporate Governance Code
In February 2010, the Management Board of Henkel Manage-
ment AG and the Supervisory Board and Shareholders’ Com-
mittee of Henkel AG & Co. KGaA approved a joint declaration of
compliance with the recommendations of the German Corporate
Governance Code in accordance with Section 161 of the German
Stock Corporation Act [AktG]. The declaration has been made
permanently available to shareholders on the company website:
www.henkel.com/ir
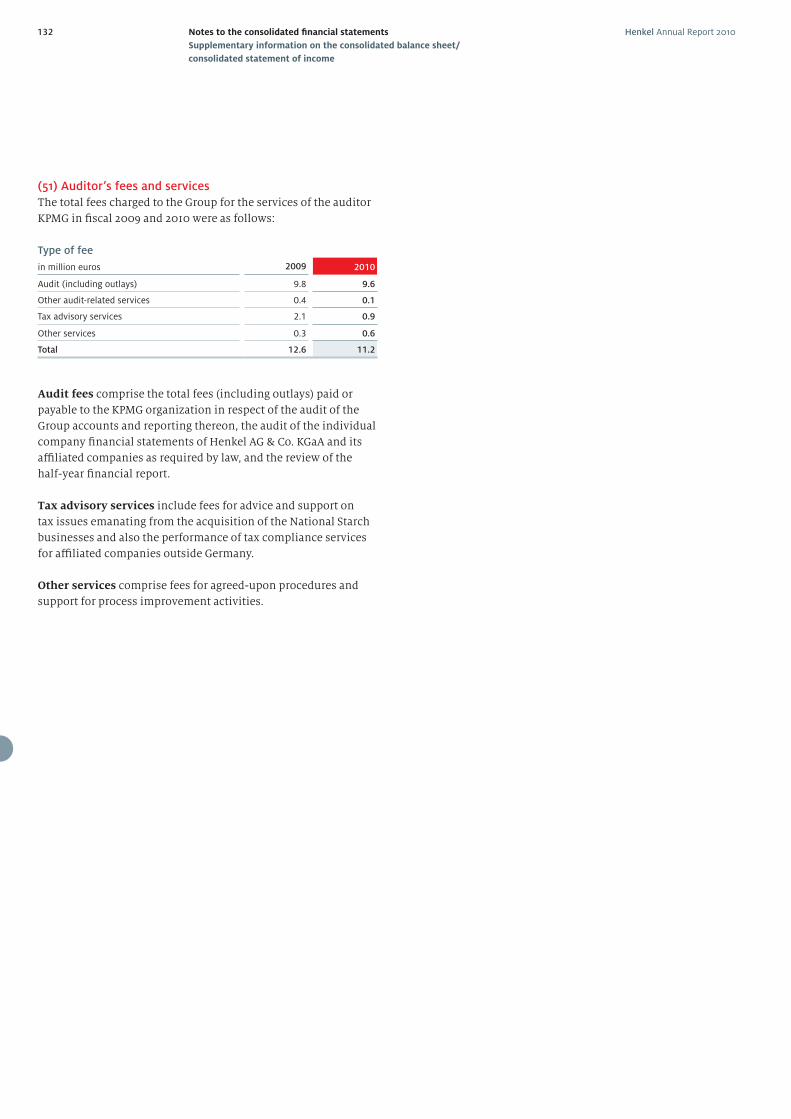
Henkel Annual Report 2010132 Notes to the consolidated fi nancial statements
Supplementary information on the consolidated balance sheet/
consolidated statement of income
(51) Auditor’s fees and services
The total fees charged to the Group for the services of the auditor
KPMG in fi scal 2009 and 2010 were as follows:
Type of fee
in million euros 2009 2010
Audit (including outlays) 9.8 9.6
Other audit-related services 0.4 0.1
Tax advisory services 2.1 0.9
Other services 0.3 0.6
Total 12.6 11.2
Audit fees comprise the total fees (including outlays) paid or
payable to the KPMG organization in respect of the audit of the
Group accounts and reporting thereon, the audit of the individual
company fi nancial statements of Henkel AG & Co. KGaA and its
affi liated companies as required by law, and the review of the
half-year fi nancial report.
Tax advisory services include fees for advice and support on
tax issues emanating from the acquisition of the National Starch
businesses and also the performance of tax compliance services
for affi liated companies outside Germany.
Other services comprise fees for agreed-upon procedures and
support for process improvement activities.
Henkel Annual Report 2010 133Notes to the consolidated fi nancial statements
It is proposed that the annual fi nancial statements of Henkel AG
& Co. KGaA be approved as presented and that the unappropriated
profi t of 861,527,712.35 euros for the year ended December 31, 2010
be applied as follows:
a) Payment of a dividend of 0.70 euros per ordinary share
(259,795,875 shares) = 181,857,112.50 euros
b) Payment of a dividend of 0.72 euros per preferred share
(178,162,875 shares) = 128,277,270.00 euros
c) Allocation to other retained earnings
= 250,000,000.00 euros
d) Carry-forward of the remaining
amount of 301,393,329.85 euros
to the following year (retained earnings)
861,527,712.35 euros
According to Section 71 German Stock Corporation Act [AktG],
treasury shares do not qualify for a dividend. The amount in
unappropriated profi t which relates to the shares held by the
corporation (treasury stock) at the date of the Annual General
Meeting will be carried forward as retained earnings. As the
Annual General Meeting can change the number of such treasury
shares, an appropriately adapted proposal for the appropria-
tion of profi t will be submitted to it, providing for an unchanged
payout of 0.70 euros per ordinary share qualifying for a dividend
and 0.72 euros per preferred share qualifying for dividend, with
corresponding adjustment of the other retained earnings and
retained earnings carried forward to the following year.
Düsseldorf, January 28, 2011
Henkel Management AG
(Personally Liable Partner
of Henkel AG & Co. KGaA)
Management Board
Recommendation for the approval of the annual fi nancial statements and the appropriation of the profi t of Henkel AG & Co. KGaA
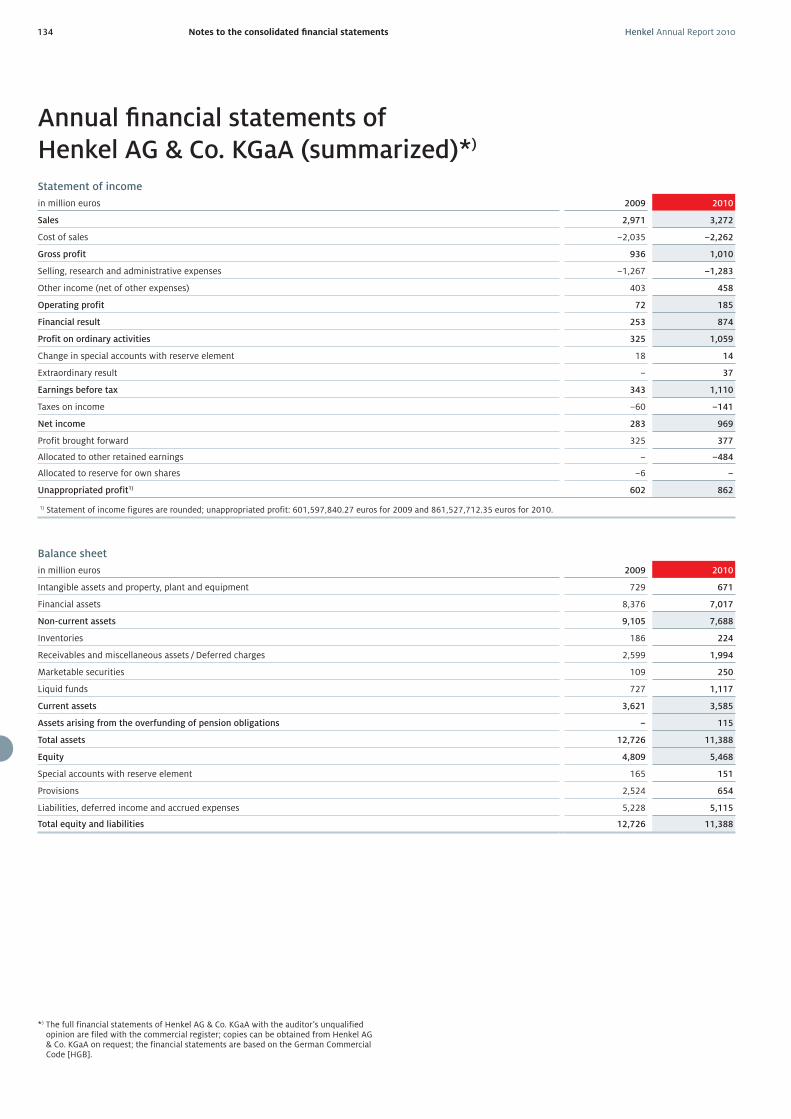
Henkel Annual Report 2010134 Notes to the consolidated fi nancial statements
Statement of income
in million euros 2009 2010
Sales 2,971 3,272
Cost of sales –2,035 –2,262
Gross profit 936 1,010
Selling, research and administrative expenses –1,267 –1,283
Other income (net of other expenses) 403 458
Operating profit 72 185
Financial result 253 874
Profit on ordinary activities 325 1,059
Change in special accounts with reserve element 18 14
Extraordinary result – 37
Earnings before tax 343 1,110
Taxes on income –60 –141
Net income 283 969
Profit brought forward 325 377
Allocated to other retained earnings – –484
Allocated to reserve for own shares –6 –
Unappropriated profit1) 602 862
1) Statement of income figures are rounded; unappropriated profit: 601,597,840.27 euros for 2009 and 861,527,712.35 euros for 2010.
Balance sheet
in million euros 2009 2010
Intangible assets and property, plant and equipment 729 671
Financial assets 8,376 7,017
Non-current assets 9,105 7,688
Inventories 186 224
Receivables and miscellaneous assets / Deferred charges 2,599 1,994
Marketable securities 109 250
Liquid funds 727 1,117
Current assets 3,621 3,585
Assets arising from the overfunding of pension obligations – 115
Total assets 12,726 11,388
Equity 4,809 5,468
Special accounts with reserve element 165 151
Provisions 2,524 654
Liabilities, deferred income and accrued expenses 5,228 5,115
Total equity and liabilities 12,726 11,388
Annual fi nancial statements of Henkel AG & Co. KGaA (summarized)*)
*) The full financial statements of Henkel AG & Co. KGaA with the auditor’s unqualified opinion are filed with the commercial register; copies can be obtained from Henkel AG & Co. KGaA on request; the financial statements are based on the German Commercial Code [HGB].
Henkel Annual Report 2010 135
We have issued the following unqualifi ed auditor’s report:
“Independent Auditor’s Report
To Henkel AG & Co. KGaA, Düsseldorf
Report on the Consolidated Financial Statements
We have audited the accompanying consolidated fi nancial statements
of Henkel AG & Co. KGaA, Düsseldorf, and its subsidiaries, which
comprise the consolidated balance sheet as at December 31, 2010, and
the consolidated statement of income, the statement of comprehen-
sive income, the statement of changes in equity, the consolidated cash
fl ow statement for the fi nancial year then ended, and the notes to the
consolidated fi nancial statements.
Responsibility of the Personally Liable Partner of the
Company for the Consolidated Financial Statements
The personally liable partner of Henkel AG & Co. KGaA is responsible
for the preparation of these consolidated fi nancial statements. This re-
sponsibility includes preparing these consolidated fi nancial statements
in accordance with International Financial Reporting Standards as
adopted by the European Union and the supplementary requirements of
German law pursuant to Section 315a (1) German Commercial Code, to
give a true and fair view of the net assets, fi nancial position and results
of operations of the Group in accordance with these requirements. The
personally liable partner of the company is also responsible for the
internal controls that it determines are necessary to enable the prepara-
tion of consolidated fi nancial statements that are free from material
misstatement, whether due to fraud or error.
Auditor’s Responsibility
Our responsibility is to express an opinion on these consolidated fi nan-
cial statements based on our audit. We conducted our audit in accor-
dance with Section 317 German Commercial Code and German generally
accepted standards for the audit of fi nancial statements promulgated
by the Institut der Wirtschaftsprüfer (Institute of Public Auditors in
Germany) as well as in supplementary compliance with International
Standards on Auditing (ISA). Those standards require that we comply
with professional requirements and plan and perform the audit to
obtain reasonable assurance about whether the consolidated fi nancial
statements are free from material misstatement.
An audit involves performing audit procedures to obtain audit evi-
dence about the amounts and disclosures in the consolidated fi nancial
statements. The selection of audit procedures depends on the auditor’s
professional judgment. This includes the assessment of the risks of ma-
terial misstatement of the consolidated fi nancial statements, whether
due to fraud or error. In assessing those risks, the auditor considers
the system of internal control relevant to the entity’s preparation of
the consolidated fi nancial statements that give a true and fair view in
accordance with International Financial Reporting Standards as adopted
by the European Union and the supplementary requirements of German
law pursuant to Section 315a (1) German Commercial Code. The aim of
this is to plan and perform audit procedures that are appropriate in the
given circumstances, but not for the purpose of expressing an opinion
on the eff ectiveness of the Group’s system of internal control. An audit
also includes evaluating the appropriateness of accounting policies used
and the reasonableness of accounting estimates made by the person-
ally liable partner of the company, as well as evaluating the overall
presentation of the consolidated fi nancial statements.
We believe that the audit evidence we have obtained is suffi cient and
appropriate to provide a basis for our audit opinion.
Audit Opinion
Pursuant to Section 322 (3) 1 German Commercial Code, we state that
our audit of the consolidated fi nancial statements has not led to any
reservations.
In our opinion, based on the fi ndings of our audit, the consolidated
fi nancial statements comply in all material respects with International
Financial Reporting Standards as adopted by the European Union and
the supplementary requirements of German law pursuant to Section
315a (1) German Commercial Code and give a true and fair view of the
net assets and fi nancial position of the Henkel Group as at December
31, 2010, as well as the results of operations for the fi nancial year then
ended, in accordance with these requirements.
Report on the Group management report
We have audited the accompanying Group management report of
Henkel AG & Co. KGaA. The personally liable partner of Henkel AG &
Co. KGaA is responsible for the preparation of the Group management
report in compliance with the applicable requirements of German law
pursuant to Section 315a (1) German Commercial Code. We conducted
our audit in accordance with Section 317 (2) German Commercial Code
and German generally accepted standards for the audit of the Group
management reports promulgated by the Institut der Wirtschaftsprüfer
(Institute of Public Auditors in Germany). Those standards require that
we plan and perform the audit of the Group management report to
obtain reasonable assurance about whether the Group management
report is consistent with the consolidated fi nancial statements and with
the fi ndings of our audit, and as a whole provides a suitable view of the
Group’s position and suitably presents the opportunities and risks of
future development.
Pursuant to Section 322 (3) 1 German Commercial Code, we state that
our audit of the Group management report has not led to any reserva-
tions.
In our opinion, based on the fi ndings of our audit of the consolidated
fi nancial statements and of the Group management report, the Group
management report is consistent with the consolidated fi nancial
statements and as a whole provides a suitable view of the Group’s
position and suitably presents the opportunities and risks of future
development.
Düsseldorf, January 28, 2011
KPMG AG
Wirtschaftsprüfungsgesellschaft
Thomas Sauter Michael Gewehr
Wirtschaftsprüfer Wirtschaftsprüfer
(German Public Auditor) (German Public Auditor)”
Independent Auditor’s Report
Henkel Annual Report 2010136
To the best of our knowledge, and in accordance with the appli-
cable accounting principles for fi nancial reporting, the consoli-
dated fi nancial statements give a true and fair view of the net
assets, fi nancial position and results of operations of the Group,
and the management report of the Group includes a fair review
of the development, performance and results of the business
and the position of the Group, together with a cogent descrip-
tion of the principal opportunities and risks associated with the
expected development of the Group.
Düsseldorf, January 28, 2011
Henkel Management AG
Management Board
Kasper Rorsted,
Jan-Dirk Auris, Bruno Piacenza, Dr. Friedrich Stara,
Dr. Lothar Steinebach, Hans Van Bylen
Responsibility statement by the Personally Liable Partner
Henkel Annual Report 2010 137Notes to the consolidated fi nancial statements
Corporate management of Henkel AG & Co. KGaA
Supervisory Board of Henkel AG & Co. KGaA
Members of the Supervisory Board of
Henkel AG & Co. KGaA
Membership in statutory supervisory
and administrative boards in Germany
Membership of comparable
supervisory boards
Dr. Simone Bagel-Trah
Chairwoman,
Private Investor, Düsseldorf
Born: 1969
Member since April 14, 2008
Henkel Management AG (Chairwoman) Henkel AG & Co. KGaA
(Shareholders’ Committee, Chairwoman)
Winfried Zander1)
Vice-chairman,
Chairman of the General Works Council of
Henkel AG & Co. KGaA and Chairman of the Works Council
of Henkel AG & Co. KGaA, Düsseldorf site
Born: 1954
Member since May 17, 1993
Jutta Bernicke1)
Member of the Works Council of Henkel AG & Co. KGaA,
Düsseldorf site
Born: 1962
Member since April 14, 2008
Dr. rer. nat. Kaspar von Braun
(since April 19, 2010)
Astrophysicist, Pasadena
Born: 1971
Member since April 19, 2010
Johann-Christoph Frey
Commercial Executive, Klosters
Born: 1955
Member since September 23, 2009
Birgit Helten-Kindlein1)
Member of the Works Council of Henkel AG & Co. KGaA,
Düsseldorf site
Born: 1964
Member since April 14, 2008
Bernd Hinz1)
(until July 31, 2010)
Member of the General Works Council of
Henkel AG & Co. KGaA and Vice-chairman
of the Works Council of Henkel AG & Co. KGaA,
Düsseldorf site
Born: 1951
Member since May 4, 1998
Prof. Dr. sc. nat. Michael Kaschke
Chairman of the Executive Board of
Carl Zeiss AG, Oberkochen
Born: 1957
Member since April 14, 2008
Carl Zeiss Group mandates:
Carl Zeiss MicroImaging GmbH (Chairman),
Carl Zeiss SMT GmbH (Chairman)
Carl Zeiss Group mandates:
Carl Zeiss Japan Co. Ltd. (Chairman),
Carl Zeiss Far East (Chairman),
Carl Zeiss India Pte. Ltd. (Chairman)
Thomas Manchot
Private Investor, Düsseldorf
Born: 1965
Member since April 10, 2006
Mayc Nienhaus1)
(since January 1, 2010)
Member of the General Works Council of
Henkel AG & Co. KGaA and Chairman of the
Works Council of Henkel AG & Co. KGaA,
Unna site
Born: 1961
Member since January 1, 2010
1) Employee representative.
Corporate management of Henkel AG & Co. KGaA Boards/Memberships as defi ned by Section 125 (1) sentence 5 of the German Stock Corporation Act [AktG]
as at January 2011
Dipl.-Ing. Albrecht Woeste Honorary Chairman of the Henkel Group
Henkel Annual Report 2010138 Notes to the consolidated fi nancial statements
Corporate management of Henkel AG & Co. KGaA
Supervisory Board of Henkel AG & Co. KGaA
Members of the Supervisory Board of
Henkel AG & Co. KGaA
Membership in statutory supervisory
and administrative boards in Germany
Membership of comparable
supervisory boards
Thierry Paternot
Operating Partner, Duke Street Capital, Paris
Born: 1948
Member since April 14, 2008
Eckes AG Bio DS SAS, France,
Freedom-FullSix SAS (Chairman), France,
Oeneo SA, France
Andrea Pichottka1)
Executive Assistant to the Executive Board
Member Section 3, Members/Target Groups/Education
IG Bergbau, Chemie, Energie, Hannover
Born: 1959
Member since October 26, 2004
Siltronic AG
Prof. Dr. Theo Siegert
Managing Partner of
de Haen-Carstanjen & Söhne, Düsseldorf
Born: 1947
Member since April 20, 2009
Deutsche Bank AG,
E.ON AG,
Merck KGaA
DKSH Holding Ltd., Switzerland,
E. Merck OHG
Edgar Topsch1)
(since August 1, 2010)
Member of the General Works Council of
Henkel AG & Co. KGaA and Vice-chairman
of the Works Council of Henkel AG & Co. KGaA,
Düsseldorf site
Born: 1960
Member since August 1, 2010
Konstantin von Unger
(until April 19, 2010)
Founding Partner Blue Corporate Finance, London
Born: 1966
Member since April 10, 2006
Henkel AG & Co. KGaA
(Shareholders’ Committee),
Ten Lifestyle Management Ltd.,
Great Britain
Michael Vassiliadis1)
Chairman of the Executive
Committee of IG Bergbau,
Chemie, Energie, Hannover
Born: 1964
Member since May 4, 1998
BASF SE,
K + S AG (Vice-chairman),
Evonik Steag GmbH (Vice-chairman)
Dr. h.c. Bernhard Walter
Former Chairman of the Executive Board of
Dresdner Bank AG, Frankfurt am Main
Born: 1942
Member since May 4, 1998
Bilfinger Berger AG (Chairman),
Daimler AG,
Deutsche Telekom AG
Ulf Wentzien1)
Commercial Executive, Düsseldorf
Representative of the Senior Staff of
Henkel AG & Co. KGaA
Born: 1963
Member since April 14, 2008
1) Employee representative.
Committees of the Supervisory Board
Functions Members
Nominations Committee The Nominations Committee prepares the resolutions
of the Supervisory Board on election proposals to
be presented to the Annual General Meeting for the
election of members of the Supervisory Board (share-
holder representatives).
Dr. Simone Bagel-Trah, Chairwoman
Dr. h.c. Bernhard Walter
Johann-Christoph Frey (since April 19, 2010)
Konstantin von Unger (until April 19, 2010)
Audit Committee The Audit Committee prepares resolutions of the
Supervisory Board on the approval of the annual
financial statements and the consolidated financial
statements, and for ratification of the proposal to be
put before the Annual General Meeting regarding
appointment of the auditor and also deals with ac-
countancy, risk management and compliance issues.
Dr. h.c. Bernhard Walter, Chairman
Prof. Dr. Theo Siegert, Vice-chairman
Dr. Simone Bagel-Trah
Birgit Helten-Kindlein
Michael Vassiliadis
Winfried Zander
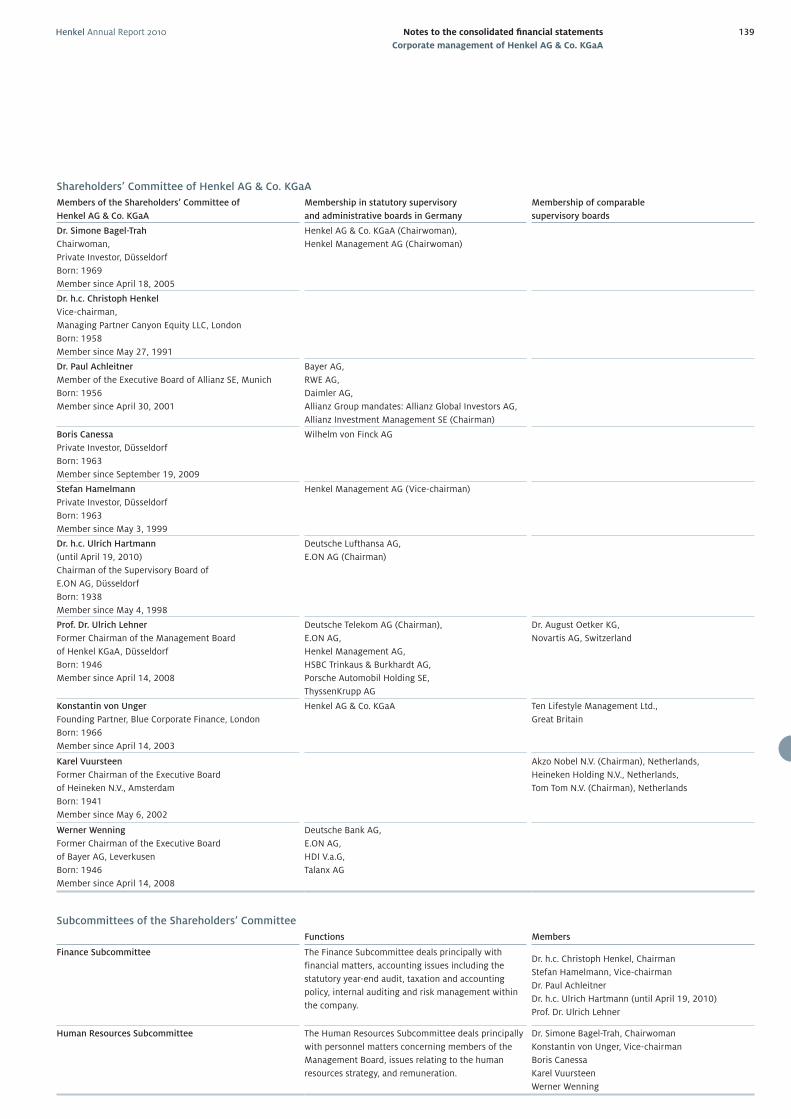
Henkel Annual Report 2010 139Notes to the consolidated fi nancial statements
Corporate management of Henkel AG & Co. KGaA
Shareholders’ Committee of Henkel AG & Co. KGaA
Members of the Shareholders’ Committee of
Henkel AG & Co. KGaA
Membership in statutory supervisory
and administrative boards in Germany
Membership of comparable
supervisory boards
Dr. Simone Bagel-Trah
Chairwoman,
Private Investor, Düsseldorf
Born: 1969
Member since April 18, 2005
Henkel AG & Co. KGaA (Chairwoman),
Henkel Management AG (Chairwoman)
Dr. h.c. Christoph Henkel
Vice-chairman,
Managing Partner Canyon Equity LLC, London
Born: 1958
Member since May 27, 1991
Dr. Paul Achleitner
Member of the Executive Board of Allianz SE, Munich
Born: 1956
Member since April 30, 2001
Bayer AG,
RWE AG,
Daimler AG,
Allianz Group mandates: Allianz Global Investors AG,
Allianz Investment Management SE (Chairman)
Boris Canessa
Private Investor, Düsseldorf
Born: 1963
Member since September 19, 2009
Wilhelm von Finck AG
Stefan Hamelmann
Private Investor, Düsseldorf
Born: 1963
Member since May 3, 1999
Henkel Management AG (Vice-chairman)
Dr. h.c. Ulrich Hartmann
(until April 19, 2010)
Chairman of the Supervisory Board of
E.ON AG, Düsseldorf
Born: 1938
Member since May 4, 1998
Deutsche Lufthansa AG,
E.ON AG (Chairman)
Prof. Dr. Ulrich Lehner
Former Chairman of the Management Board
of Henkel KGaA, Düsseldorf
Born: 1946
Member since April 14, 2008
Deutsche Telekom AG (Chairman),
E.ON AG,
Henkel Management AG,
HSBC Trinkaus & Burkhardt AG,
Porsche Automobil Holding SE,
ThyssenKrupp AG
Dr. August Oetker KG,
Novartis AG, Switzerland
Konstantin von Unger
Founding Partner, Blue Corporate Finance, London
Born: 1966
Member since April 14, 2003
Henkel AG & Co. KGaA Ten Lifestyle Management Ltd.,
Great Britain
Karel Vuursteen
Former Chairman of the Executive Board
of Heineken N.V., Amsterdam
Born: 1941
Member since May 6, 2002
Akzo Nobel N.V. (Chairman), Netherlands,
Heineken Holding N.V., Netherlands,
Tom Tom N.V. (Chairman), Netherlands
Werner Wenning
Former Chairman of the Executive Board
of Bayer AG, Leverkusen
Born: 1946
Member since April 14, 2008
Deutsche Bank AG,
E.ON AG,
HDI V.a.G,
Talanx AG
Subcommittees of the Shareholders’ Committee
Functions Members
Finance Subcommittee The Finance Subcommittee deals principally with
financial matters, accounting issues including the
statutory year-end audit, taxation and accounting
policy, internal auditing and risk management within
the company.
Dr. h.c. Christoph Henkel, Chairman
Stefan Hamelmann, Vice-chairman
Dr. Paul Achleitner
Dr. h.c. Ulrich Hartmann (until April 19, 2010)
Prof. Dr. Ulrich Lehner
Human Resources Subcommittee The Human Resources Subcommittee deals principally
with personnel matters concerning members of the
Management Board, issues relating to the human
resources strategy, and remuneration.
Dr. Simone Bagel-Trah, Chairwoman
Konstantin von Unger, Vice-chairman
Boris Canessa
Karel Vuursteen
Werner Wenning
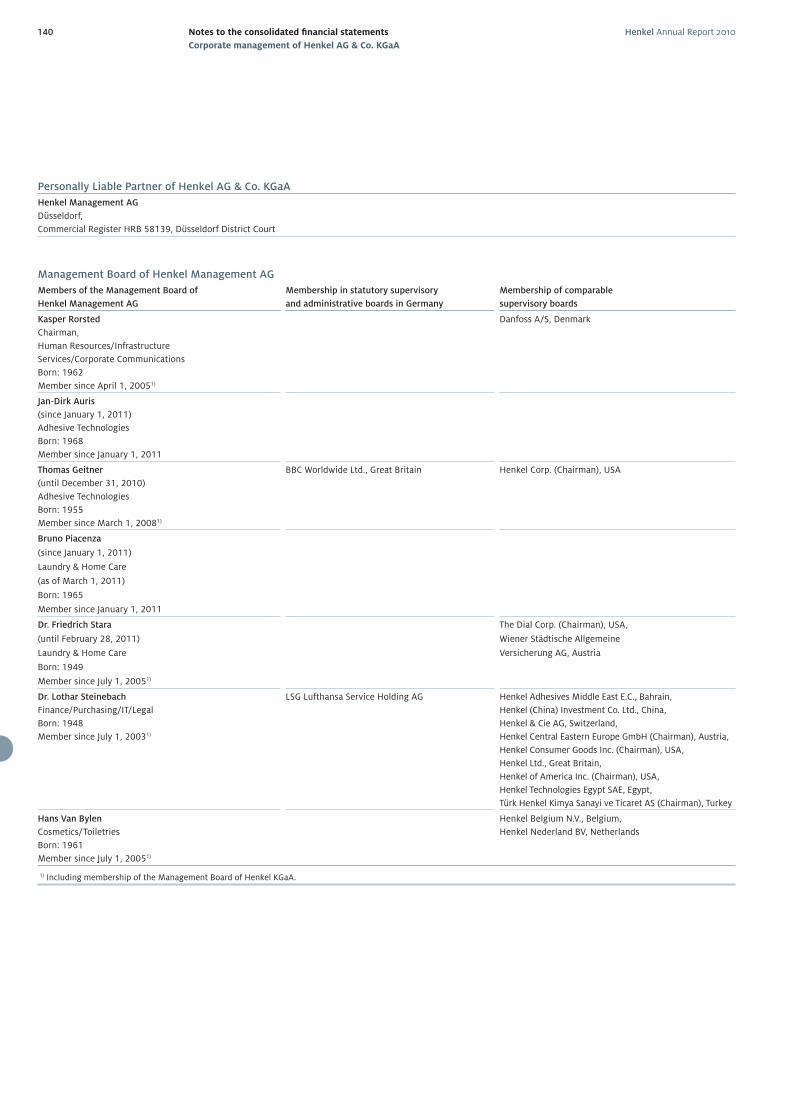
Henkel Annual Report 2010140 Notes to the consolidated fi nancial statements
Corporate management of Henkel AG & Co. KGaA
Personally Liable Partner of Henkel AG & Co. KGaA
Henkel Management AG
Düsseldorf,
Commercial Register HRB 58139, Düsseldorf District Court
Management Board of Henkel Management AG
Members of the Management Board of
Henkel Management AG
Membership in statutory supervisory
and administrative boards in Germany
Membership of comparable
supervisory boards
Kasper Rorsted
Chairman,
Human Resources/Infrastructure
Services/Corporate Communications
Born: 1962
Member since April 1, 20051)
Danfoss A/S, Denmark
Jan-Dirk Auris
(since January 1, 2011)
Adhesive Technologies
Born: 1968
Member since January 1, 2011
Thomas Geitner
(until December 31, 2010)
Adhesive Technologies
Born: 1955
Member since March 1, 20081)
BBC Worldwide Ltd., Great Britain Henkel Corp. (Chairman), USA
Bruno Piacenza
(since January 1, 2011)
Laundry & Home Care
(as of March 1, 2011)
Born: 1965
Member since January 1, 2011
Dr. Friedrich Stara
(until February 28, 2011)
Laundry & Home Care
Born: 1949
Member since July 1, 20051 )
The Dial Corp. (Chairman), USA,
Wiener Städtische Allgemeine
Versicherung AG, Austria
Dr. Lothar Steinebach
Finance/Purchasing/IT/Legal
Born: 1948
Member since July 1, 20031)
LSG Lufthansa Service Holding AG Henkel Adhesives Middle East E.C., Bahrain,
Henkel (China) Investment Co. Ltd., China,
Henkel & Cie AG, Switzerland,
Henkel Central Eastern Europe GmbH (Chairman), Austria,
Henkel Consumer Goods Inc. (Chairman), USA,
Henkel Ltd., Great Britain,
Henkel of America Inc. (Chairman), USA,
Henkel Technologies Egypt SAE, Egypt,
Türk Henkel Kimya Sanayi ve Ticaret AS (Chairman), Turkey
Hans Van Bylen
Cosmetics/Toiletries
Born: 1961
Member since July 1, 20051)
Henkel Belgium N.V., Belgium,
Henkel Nederland BV, Netherlands
1) Including membership of the Management Board of Henkel KGaA.
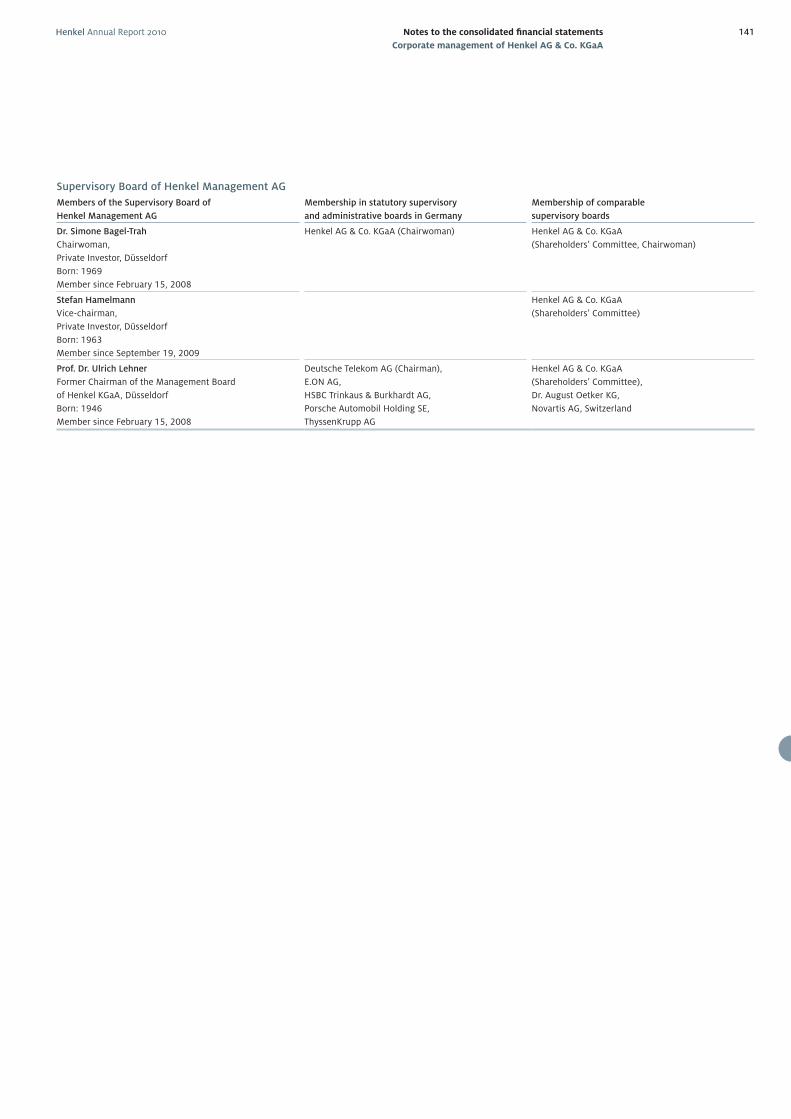
Henkel Annual Report 2010 141Notes to the consolidated fi nancial statements
Corporate management of Henkel AG & Co. KGaA
Supervisory Board of Henkel Management AG
Members of the Supervisory Board of
Henkel Management AG
Membership in statutory supervisory
and administrative boards in Germany
Membership of comparable
supervisory boards
Dr. Simone Bagel-Trah
Chairwoman,
Private Investor, Düsseldorf
Born: 1969
Member since February 15, 2008
Henkel AG & Co. KGaA (Chairwoman) Henkel AG & Co. KGaA
(Shareholders’ Committee, Chairwoman)
Stefan Hamelmann
Vice-chairman,
Private Investor, Düsseldorf
Born: 1963
Member since September 19, 2009
Henkel AG & Co. KGaA
(Shareholders’ Committee)
Prof. Dr. Ulrich Lehner
Former Chairman of the Management Board
of Henkel KGaA, Düsseldorf
Born: 1946
Member since February 15, 2008
Deutsche Telekom AG (Chairman),
E.ON AG,
HSBC Trinkaus & Burkhardt AG,
Porsche Automobil Holding SE,
ThyssenKrupp AG
Henkel AG & Co. KGaA
(Shareholders’ Committee),
Dr. August Oetker KG,
Novartis AG, Switzerland
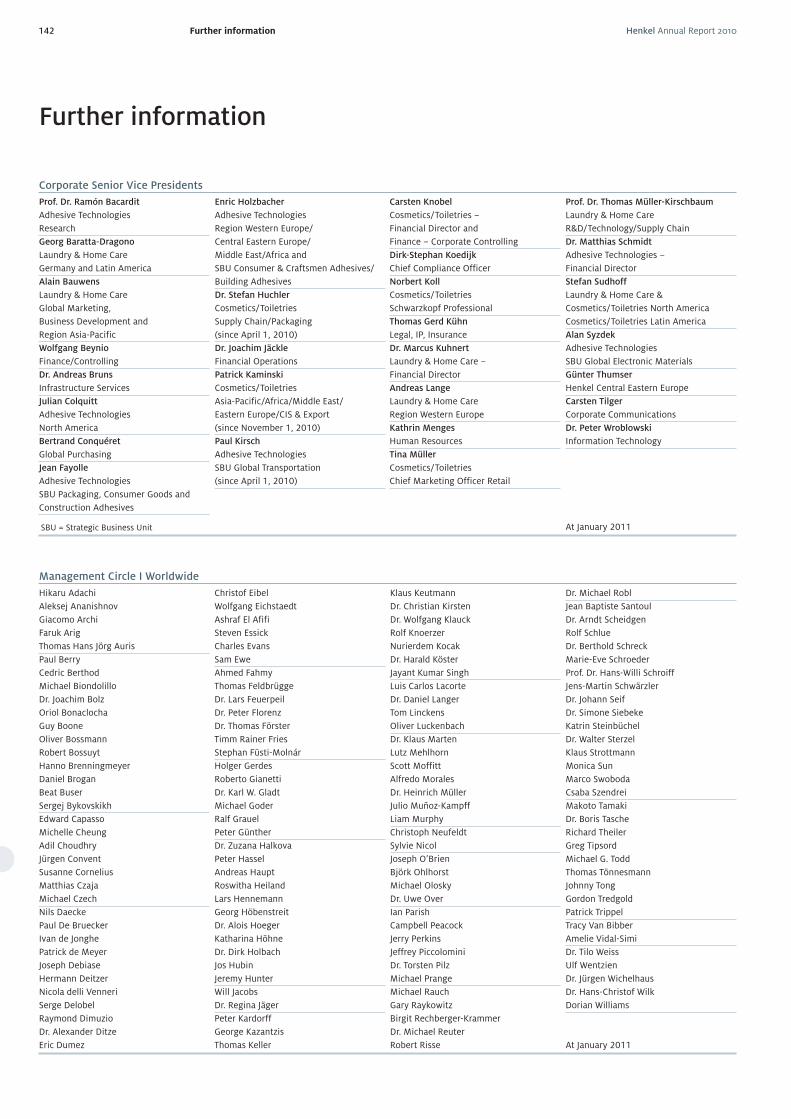
Henkel Annual Report 2010142 Further information
Further information
Corporate Senior Vice PresidentsProf. Dr. Ramón Bacardit Adhesive Technologies ResearchGeorg Baratta-Dragono Laundry & Home Care Germany and Latin AmericaAlain Bauwens Laundry & Home Care Global Marketing, Business Development and Region Asia-PacificWolfgang Beynio Finance/ControllingDr. Andreas Bruns Infrastructure ServicesJulian Colquitt Adhesive Technologies North AmericaBertrand Conquéret Global PurchasingJean Fayolle Adhesive Technologies SBU Packaging, Consumer Goods and Construction Adhesives
Enric Holzbacher Adhesive Technologies Region Western Europe/ Central Eastern Europe/ Middle East/Africa and SBU Consumer & Craftsmen Adhesives/Building AdhesivesDr. Stefan Huchler Cosmetics/Toiletries Supply Chain/Packaging (since April 1, 2010)Dr. Joachim Jäckle Financial OperationsPatrick Kaminski Cosmetics/Toiletries Asia-Pacific/Africa/Middle East/ Eastern Europe/CIS & Export (since November 1, 2010)Paul Kirsch Adhesive Technologies SBU Global Transportation (since April 1, 2010)
Carsten Knobel Cosmetics/Toiletries – Financial Director and Finance – Corporate ControllingDirk-Stephan Koedijk Chief Compliance OfficerNorbert Koll Cosmetics/Toiletries Schwarzkopf ProfessionalThomas Gerd Kühn Legal, IP, InsuranceDr. Marcus Kuhnert Laundry & Home Care – Financial DirectorAndreas Lange Laundry & Home Care Region Western EuropeKathrin Menges Human ResourcesTina Müller Cosmetics/Toiletries Chief Marketing Officer Retail
Prof. Dr. Thomas Müller-Kirschbaum Laundry & Home Care R&D/Technology/Supply ChainDr. Matthias Schmidt Adhesive Technologies – Financial DirectorStefan Sudhoff Laundry & Home Care & Cosmetics/Toiletries North America Cosmetics/Toiletries Latin AmericaAlan Syzdek Adhesive Technologies SBU Global Electronic Materials Günter Thumser Henkel Central Eastern EuropeCarsten Tilger Corporate CommunicationsDr. Peter Wroblowski Information Technology
At January 2011SBU = Strategic Business Unit
Management Circle I WorldwideHikaru Adachi Aleksej Ananishnov Giacomo Archi Faruk Arig Thomas Hans Jörg AurisPaul Berry Cedric Berthod Michael Biondolillo Dr. Joachim Bolz Oriol Bonaclocha Guy Boone Oliver Bossmann Robert Bossuyt Hanno Brenningmeyer Daniel Brogan Beat Buser Sergej BykovskikhEdward Capasso Michelle Cheung Adil Choudhry Jürgen Convent Susanne Cornelius Matthias Czaja Michael CzechNils Daecke Paul De Bruecker Ivan de Jonghe Patrick de Meyer Joseph Debiase Hermann Deitzer Nicola delli Venneri Serge Delobel Raymond DimuzioDr. Alexander Ditze Eric Dumez
Christof Eibel Wolfgang Eichstaedt Ashraf El Afifi Steven Essick Charles Evans Sam EweAhmed Fahmy Thomas Feldbrügge Dr. Lars Feuerpeil Dr. Peter Florenz Dr. Thomas Förster Timm Rainer Fries Stephan Füsti-MolnárHolger Gerdes Roberto Gianetti Dr. Karl W. Gladt Michael Goder Ralf Grauel Peter GüntherDr. Zuzana Halkova Peter Hassel Andreas Haupt Roswitha Heiland Lars Hennemann Georg Höbenstreit Dr. Alois Hoeger Katharina Höhne Dr. Dirk Holbach Jos Hubin Jeremy HunterWill Jacobs Dr. Regina JägerPeter Kardorff Georg Kazantzis Thomas Keller
Klaus Keutmann Dr. Christian Kirsten Dr. Wolfgang Klauck Rolf Knoerzer Nurierdem Kocak Dr. Harald Köster Jayant Kumar SinghLuis Carlos Lacorte Dr. Daniel Langer Tom Linckens Oliver LuckenbachDr. Klaus Marten Lutz Mehlhorn Scott Moffitt Alfredo Morales Dr. Heinrich Müller Julio Muñoz-Kampff Liam MurphyChristoph Neufeldt Sylvie NicolJoseph O’Brien Björk Ohlhorst Michael Olosky Dr. Uwe OverIan Parish Campbell Peacock Jerry Perkins Jeffrey Piccolomini Dr. Torsten Pilz Michael PrangeMichael Rauch Gary Raykowitz Birgit Rechberger-Krammer Dr. Michael Reuter Robert Risse
Dr. Michael RoblJean Baptiste Santoul Dr. Arndt Scheidgen Rolf Schlue Dr. Berthold Schreck Marie-Eve Schroeder Prof. Dr. Hans-Willi Schroiff Jens-Martin Schwärzler Dr. Johann Seif Dr. Simone Siebeke Katrin Steinbüchel Dr. Walter Sterzel Klaus Strottmann Monica Sun Marco Swoboda Csaba SzendreiMakoto Tamaki Dr. Boris Tasche Richard Theiler Greg Tipsord Michael G. Todd Thomas Tönnesmann Johnny Tong Gordon Tredgold Patrick TrippelTracy Van Bibber Amelie Vidal-SimiDr. Tilo Weiss Ulf Wentzien Dr. Jürgen Wichelhaus Dr. Hans-Christof Wilk Dorian Williams At January 2011
e
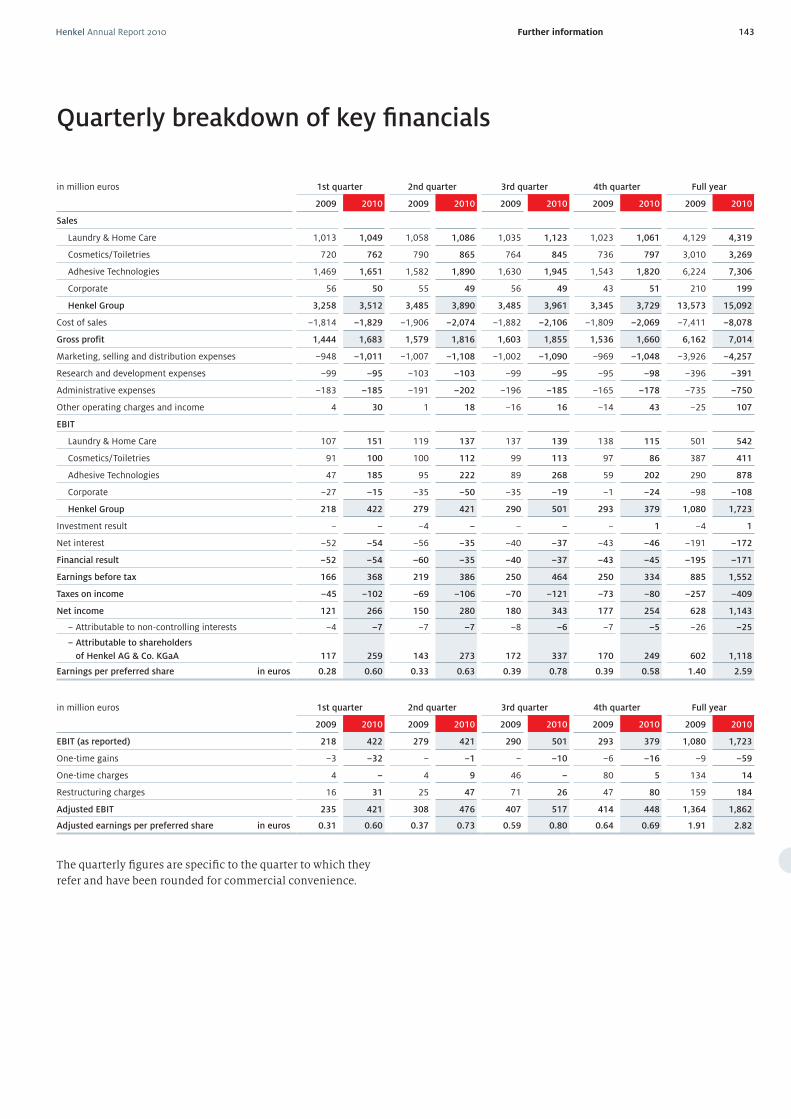
Henkel Annual Report 2010 143Further information
in million euros 1st quarter 2nd quarter 3rd quarter 4th quarter Full year
2009 2010 2009 2010 2009 2010 2009 2010 2009 2010
Sales
Laundry & Home Care 1,013 1,049 1,058 1,086 1,035 1,123 1,023 1,061 4,129 4,319
Cosmetics/Toiletries 720 762 790 865 764 845 736 797 3,010 3,269
Adhesive Technologies 1,469 1,651 1,582 1,890 1,630 1,945 1,543 1,820 6,224 7,306
Corporate 56 50 55 49 56 49 43 51 210 199
Henkel Group 3,258 3,512 3,485 3,890 3,485 3,961 3,345 3,729 13,573 15,092
Cost of sales –1,814 –1,829 –1,906 –2,074 –1,882 –2,106 –1,809 –2,069 –7,411 –8,078
Gross profit 1,444 1,683 1,579 1,816 1,603 1,855 1,536 1,660 6,162 7,014
Marketing, selling and distribution expenses –948 –1,011 –1,007 –1,108 –1,002 –1,090 –969 –1,048 –3,926 –4,257
Research and development expenses –99 –95 –103 –103 –99 –95 –95 –98 –396 –391
Administrative expenses –183 –185 –191 –202 –196 –185 –165 –178 –735 –750
Other operating charges and income 4 30 1 18 –16 16 –14 43 –25 107
EBIT
Laundry & Home Care 107 151 119 137 137 139 138 115 501 542
Cosmetics/Toiletries 91 100 100 112 99 113 97 86 387 411
Adhesive Technologies 47 185 95 222 89 268 59 202 290 878
Corporate –27 –15 –35 –50 –35 –19 –1 –24 –98 –108
Henkel Group 218 422 279 421 290 501 293 379 1,080 1,723
Investment result – – –4 – – – – 1 –4 1
Net interest –52 –54 –56 –35 –40 –37 –43 –46 –191 –172
Financial result –52 –54 –60 –35 –40 –37 –43 –45 –195 –171
Earnings before tax 166 368 219 386 250 464 250 334 885 1,552
Taxes on income –45 –102 –69 –106 –70 –121 –73 –80 –257 –409
Net income 121 266 150 280 180 343 177 254 628 1,143
– Attributable to non-controlling interests –4 –7 –7 –7 –8 –6 –7 –5 –26 –25
– Attributable to shareholders
of Henkel AG & Co. KGaA 117 259 143 273 172 337 170 249 602 1,118
Earnings per preferred share in euros 0.28 0.60 0.33 0.63 0.39 0.78 0.39 0.58 1.40 2.59
in million euros 1st quarter 2nd quarter 3rd quarter 4th quarter Full year
2009 2010 2009 2010 2009 2010 2009 2010 2009 2010
EBIT (as reported) 218 422 279 421 290 501 293 379 1,080 1,723
One-time gains –3 –32 – –1 – –10 –6 –16 –9 –59
One-time charges 4 – 4 9 46 – 80 5 134 14
Restructuring charges 16 31 25 47 71 26 47 80 159 184
Adjusted EBIT 235 421 308 476 407 517 414 448 1,364 1,862
Adjusted earnings per preferred share in euros 0.31 0.60 0.37 0.73 0.59 0.80 0.64 0.69 1.91 2.82
The quarterly fi gures are specifi c to the quarter to which they
refer and have been rounded for commercial convenience.
Quarterly breakdown of key fi nancials
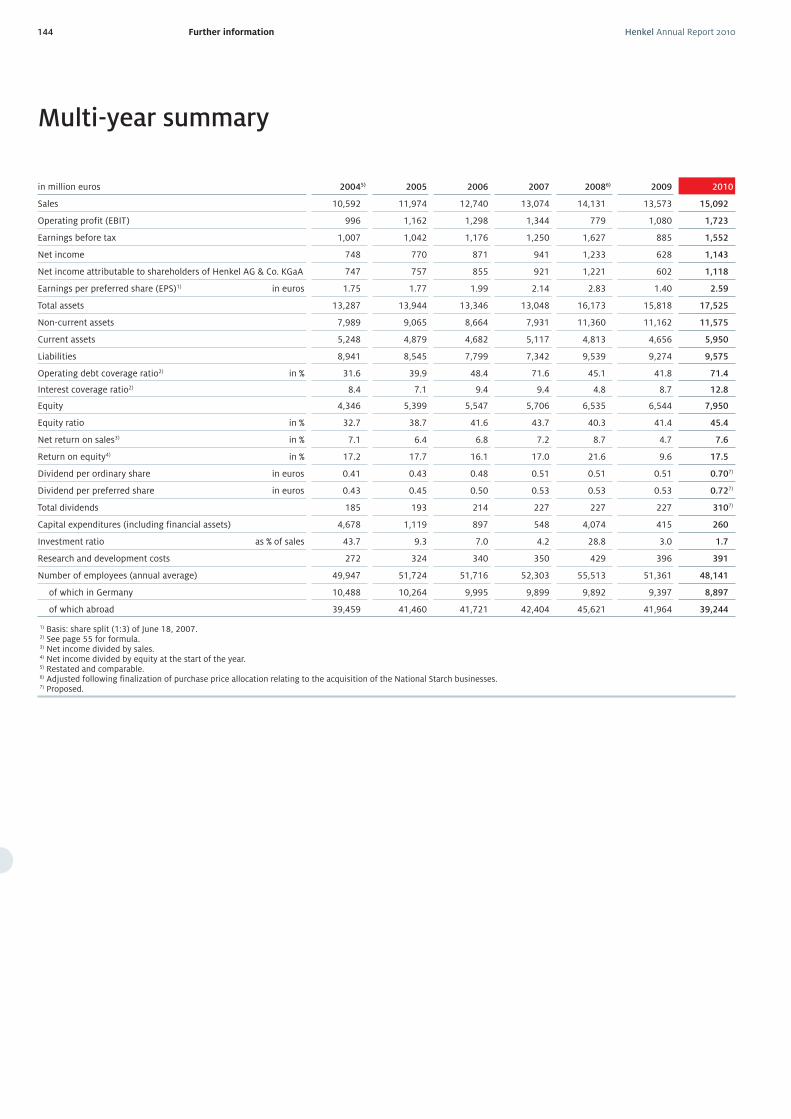
Henkel Annual Report 2010144 Further information
in million euros 20045) 2005 2006 2007 20086) 2009 2010
Sales 10,592 11,974 12,740 13,074 14,131 13,573 15,092
Operating profit (EBIT) 996 1,162 1,298 1,344 779 1,080 1,723
Earnings before tax 1,007 1,042 1,176 1,250 1,627 885 1,552
Net income 748 770 871 941 1,233 628 1,143
Net income attributable to shareholders of Henkel AG & Co. KGaA 747 757 855 921 1,221 602 1,118
Earnings per preferred share (EPS)1) in euros 1.75 1.77 1.99 2.14 2.83 1.40 2.59
Total assets 13,287 13,944 13,346 13,048 16,173 15,818 17,525
Non-current assets 7,989 9,065 8,664 7,931 11,360 11,162 11,575
Current assets 5,248 4,879 4,682 5,117 4,813 4,656 5,950
Liabilities 8,941 8,545 7,799 7,342 9,539 9,274 9,575
Operating debt coverage ratio2) in % 31.6 39.9 48.4 71.6 45.1 41.8 71.4
Interest coverage ratio2) 8.4 7.1 9.4 9.4 4.8 8.7 12.8
Equity 4,346 5,399 5,547 5,706 6,535 6,544 7,950
Equity ratio in % 32.7 38.7 41.6 43.7 40.3 41.4 45.4
Net return on sales3) in % 7.1 6.4 6.8 7.2 8.7 4.7 7.6
Return on equity4) in % 17.2 17.7 16.1 17.0 21.6 9.6 17.5
Dividend per ordinary share in euros 0.41 0.43 0.48 0.51 0.51 0.51 0.707)
Dividend per preferred share in euros 0.43 0.45 0.50 0.53 0.53 0.53 0.727)
Total dividends 185 193 214 227 227 227 3107)
Capital expenditures (including financial assets) 4,678 1,119 897 548 4,074 415 260
Investment ratio as % of sales 43.7 9.3 7.0 4.2 28.8 3.0 1.7
Research and development costs 272 324 340 350 429 396 391
Number of employees (annual average) 49,947 51,724 51,716 52,303 55,513 51,361 48,141
of which in Germany 10,488 10,264 9,995 9,899 9,892 9,397 8,897
of which abroad 39,459 41,460 41,721 42,404 45,621 41,964 39,244
1) Basis: share split (1:3) of June 18, 2007.2) See page 55 for formula. 3) Net income divided by sales. 4) Net income divided by equity at the start of the year. 5) Restated and comparable.6) Adjusted following finalization of purchase price allocation relating to the acquisition of the National Starch businesses.7) Proposed.
Multi-year summary
Henkel_GB_2010_E_18.02.2011_15.42.39
Published by:
Henkel AG & Co. KGaA
40191 Düsseldorf, Germany
Phone: +49 (0)211-797-0
© 2011 Henkel AG & Co. KGaA
Edited by:
Corporate Communications, Investor Relations,
Corporate Accounting and Reporting
Coordination: Oliver Luckenbach,
Jens Bruno Wilhelm, Wolfgang Zengerling
English translation: Paul Knighton
Concept and design: Kirchhoff Consult AG, Hamburg
Photographs: Brian Ambrose, Thomas Bauer, Tobias Ebert,
Andreas Fechner, Michael Hetzmannseder, Xu Jian,
Claudia Kempf, Dmitry Livshits, Dilian Markov, Alain Pérus,
Mark Susan, Alberto Venegas; Henkel
Produced by: Druckpartner Schotte, Essen/Krefeld
Date of publication of this report:
February 24, 2011
Corporate Communications
Phone: + 49 (0)211-797-2606
Fax: + 49 (0)211-798-2484
E-mail: [email protected]
Investor Relations
Phone: + 49 (0)211-797-3937
Fax: + 49 (0)211-798-2863
E-mail: [email protected]
PR No. 02 11 8,000
ISSN: 0724-4738
ISBN: 978-3-941517-22-6
Credits
This document contains forward-looking statements which are based
on the current estimates and assumptions made by the executiv man-
agement of Henkel AG & Co. KGaA. Forward-looking statements are
characterized by the use of words such as expect, intend, plan, predict,
assume, believe, estimate, anticipate and similar formulations. Such
statements are not to be understood as in any way guaranteeing that
those expectations will turn out to be accurate. Future performance and
the results actually achieved by Henkel AG & Co. KGaA and its affiliated
companies depend on a number of risks and uncertainties and may
therefore differ materially from the forward-looking statements. Many
of these factors are outside Henkel’s control and cannot be accurately
estimated in advance, such as the future economic environment and the
actions of competitors and others involved in the marketplace. Henkel
neither plans nor undertakes to update forward-looking statements.
Annual General Meeting
Henkel AG & Co. KGaA 2011:
Monday, April 11, 2011
Publication of Report
for the First Quarter 2011:
Wednesday, May 4, 2011
Publication of Report
for the Second Quarter / Half Year 2011:
Wednesday, August 10, 2011
Publication of Report
for the Third Quarter / Nine Months 2011:
Wednesday, November 9, 2011
Publication of Report
for Fiscal 2011:
Thursday, March 8, 2012
Annual General Meeting
Henkel AG & Co. KGaA 2012:
Monday, April 16, 2012
Up-to-date facts and fi gures on Henkel also
available on the internet:
Financial calendar
www.henkel.com
The Annual Report is printed on PROFIsilkFSC from Sappi. The paper is made from
pulp bleached without chlorine. It consists of wood fi bers originating from sustain-
ably managed forests and certifi ed according to the rules of the Forest Stewardship
Council (FSC). The printing inks contain no heavy metals. This publication was
cover-fi nished and bound with these Henkel products: MiraFoil metallic eff ect, Soft-
touch cellophaning with Adhesin laminating adhesive, UV spot coating with Mira-
Cure UV coating, bound so as to be suitable for recycling, using Purmelt MicroEmis-
sion and Technomelt Ultra for the highest occupational health and safety standards.
All product names are registered trademarks of Henkel AG & Co. KGaA, Düsseldorf, or
its affi liated companies.
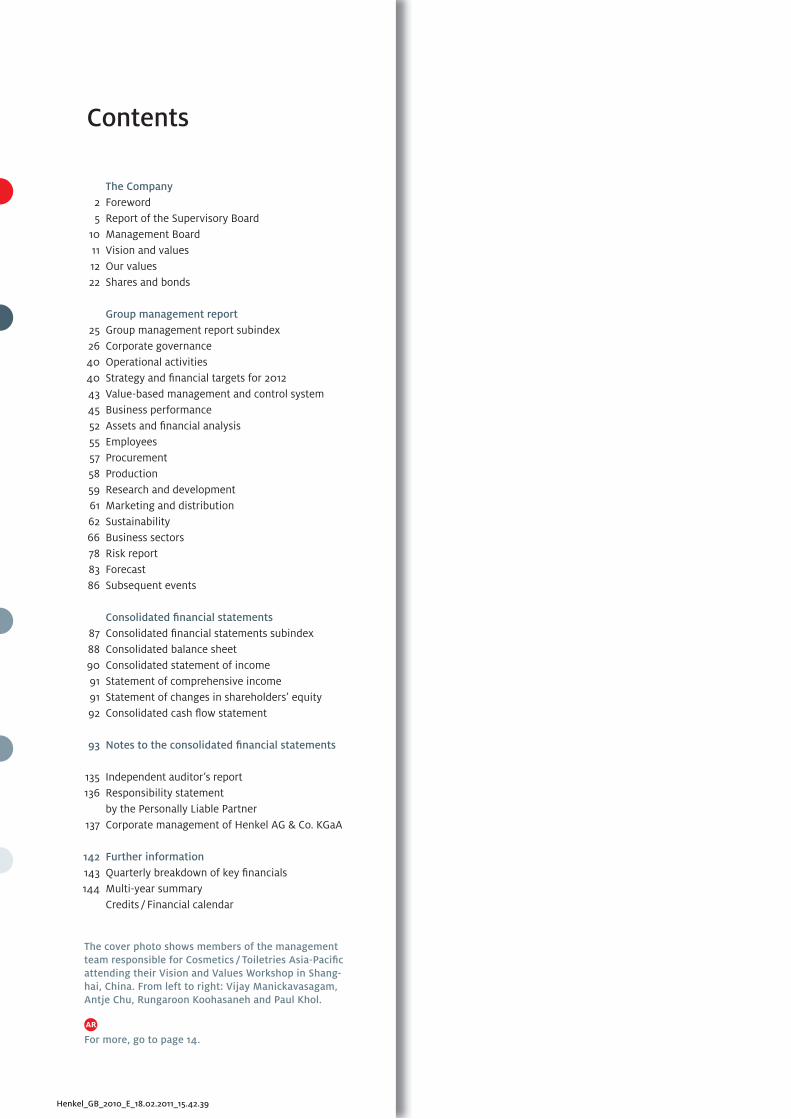
Henkel_GB_2010_E_18.02.2011_15.42.39
Contents
The Company
2 Foreword
5 Report of the Supervisory Board
10 Management Board
11 Vision and values
12 Our values
22 Shares and bonds
Group management report
25 Group management report subindex
26 Corporate governance
40 Operational activities
40 Strategy and fi nancial targets for 2012
43 Value-based management and control system
45 Business performance
52 Assets and fi nancial analysis
55 Employees
57 Procurement
58 Production
59 Research and development
61 Marketing and distribution
62 Sustainability
66 Business sectors
78 Risk report
83 Forecast
86 Subsequent events
Consolidated fi nancial statements
87 Consolidated fi nancial statements subindex
88 Consolidated balance sheet
90 Consolidated statement of income
91 Statement of comprehensive income
91 Statement of changes in shareholders’ equity
92 Consolidated cash fl ow statement
93 Notes to the consolidated fi nancial statements
135 Independent auditor’s report
136 Responsibility statement
by the Personally Liable Partner
137 Corporate management of Henkel AG & Co. KGaA
142 Further information
143 Quarterly breakdown of key fi nancials
144 Multi-year summary
Credits / Financial calendar
The cover photo shows members of the management team responsible for Cosmetics / Toiletries Asia-Pacifi c attending their Vision and Values Workshop in Shang-hai, China. From left to right: Vijay Manickavasagam, Antje Chu, Rungaroon Koohasaneh and Paul Khol.
For more, go to page 14.
Henkel_GB_2010_E_18.02.2011_15.42.39
Henkel AG & Co. KGaA
40191 Düsseldorf, Germany
Phone: + 49 (0)211-797-0
www.henkel.com
www.henkel.com/annualreport