Embed Size (px)
Citation preview

ANNUAL REPORT 2010For the Year Ended March 31, 2010
NOHMI BOSAI LTD.

sProfi le
Nohmi Bosai Ltd., established in 1944 and listed on the First Section of the Tokyo Stock Exchange in 1991, is a leading Japanese manufacturer of fi re alarm and fi re extinguishing systems. In fi scal 2010, ended March 31, 2010, the Company realized consolidated net sales of ¥84.2 billion. Nohmi Bosai is responsible for the development, marketing, installation and maintenance of a wide variety of state-of-the-art fi re protection systems. In addition to our strong domestic presence, we are also active in China, other parts of Asia and the United States.
sContents
Cautionary Statement with Respect to Forward-Looking Statements
Statements made in this annual report with respect to Nohmi Bosai’s plans, strategies and beliefs, and other statements that are not historical facts are forward-looking statements about the future performance of Nohmi Bosai, which are based on management’s assumptions and beliefs in light of the information currently available to it, and involve risks and uncertainties. Potential risks and uncertainties include, without limitation, general economic conditions in Nohmi Bosai’s markets, industrial market conditions and Nohmi Bosai’s ability to continue to win acceptance of its products and services, which are offered in highly competitive markets characterized by continual new product introductions, rapid developments in technology and changing customer preferences.
Consolidated Financial Highlights 1
A Message from the President 2
Nohmi Bosai at a Glance 4
Review of Operations 5
Corporate Governance 7
An Integrated Fire Protection Service 8
Management’s Discussion and Analysis 9
Consolidated Balance Sheets 11
Consolidated Statements of Income 13
Consolidated Statements of Changes in Net Assets 14
Consolidated Statements of Cash Flows 15
Notes to the Consolidated Financial Statements 16
Independent Auditors’ Report 28
Board of Directors and Corporate Auditors 29
Investor Information 29

Percentage Thousands of Millions of Yen Change U.S. Dollars
2008 2009 2010 2010/2009 2010
For the year: New orders ....................................................................... ¥ 85,077 ¥ 92,516 ¥ 77,799 (15.9).% $ 836,189 Net sales ........................................................................... 84,947 89,580 84,150 (6.1) 904,450 Cost of sales ..................................................................... 60,770 63,462 59,612 (6.1) 640,714 Operating income ............................................................. 4,829 5,579 4,338 (22.2) 46,625 Net income ...................................................................... 2,854 3,202 2,334 (27.1) 25,086
At year-end: Total assets ....................................................................... ¥ 81,249 ¥ 81,875 ¥ 80,266 (2.0).% $ 862,704 Total net assets ................................................................. 49,319 50,981 52,633 3.2 565,703 Backlog of orders ............................................................. 32,418 35,354 29,003 (18.0) 311,726 Number of employees ........................................................ 2,068 2,150 2,214 3.0 —
Per share (in yen and U.S. dollars): Net income —primary ........................................................ ¥ 47.26 ¥ 53.04 ¥ 38.66 (27.1).% $ 0.42
Net assets ......................................................................... 798.86 828.72 854.26 3.1 9.18 Cash dividends .................................................................. 13.00 15.00 15.00 — 0.16
Notes: 1. Per share amounts are based on the weighted average number of shares outstanding during each period. 2. All dollar fi gures herein refer to U.S. currency unless otherwise specifi ed. The dollar amounts in this report represent the translation of yen, for convenience only, at the rate of ¥93.04=US$1, using the prevailing exchange rate at March 31, 2010. 3. All amounts are in millions of yen or thousands of U.S. dollars, except number of employees and per share amounts.
Total Assets(Billions of Yen)
Net Income(Billions of Yen)
100
80
60
40
20
0
Net Sales(Billions of Yen)
FY2010 Net Sales Breakdown
’06 ’07 ’08 ’09 ’10 ’06 ’07 ’08 ’09 ’10 ’06 ’07 ’08 ’09 ’10
100
80
60
40
20
0
4.0
3.0
2.0
1.0
0
Fire ExtinguishingSystems
31.4%
Fire ExtinguishingSystems
31.4%
Fire Alarm Systems35.9%
Fire Alarm Systems35.9%
MaintenanceServices
27.2%
MaintenanceServices
27.2%
Others5.5%
Others5.5%
FY2010 Operating Income Breakdown
Fire ExtinguishingSystems18.8%
Fire ExtinguishingSystems18.8%
Fire Alarm Systems26.0%
Fire Alarm Systems26.0%
MaintenanceServices
50.5%
MaintenanceServices
50.5%
Others4.7%
Others4.7%
Consolidated Financial HighlightsNohmi Bosai Ltd. and its SubsidiariesFor the years ended March 31, 2008, 2009 and 2010
2
plan covering the three years from fi scal 2011 aimed at overcoming adversity in the business environment, which remains unclear. The times have changed from the pursuit of wealth to a focus on safety and security. As such, we need to fulfi ll our responsibility of contributing to safety through system development and sales promotion. Although uncertainty remains with regard to economic trends and the market environment, the Nohmi Bosai Group intends to continue taking on challenges and exerting its full power amid strong headwinds in making reforms. To realize our management philosophy underpinned by the concept of valuing people and safety, we will continue pursuing challenges with a bright, energetic and positive spirit.
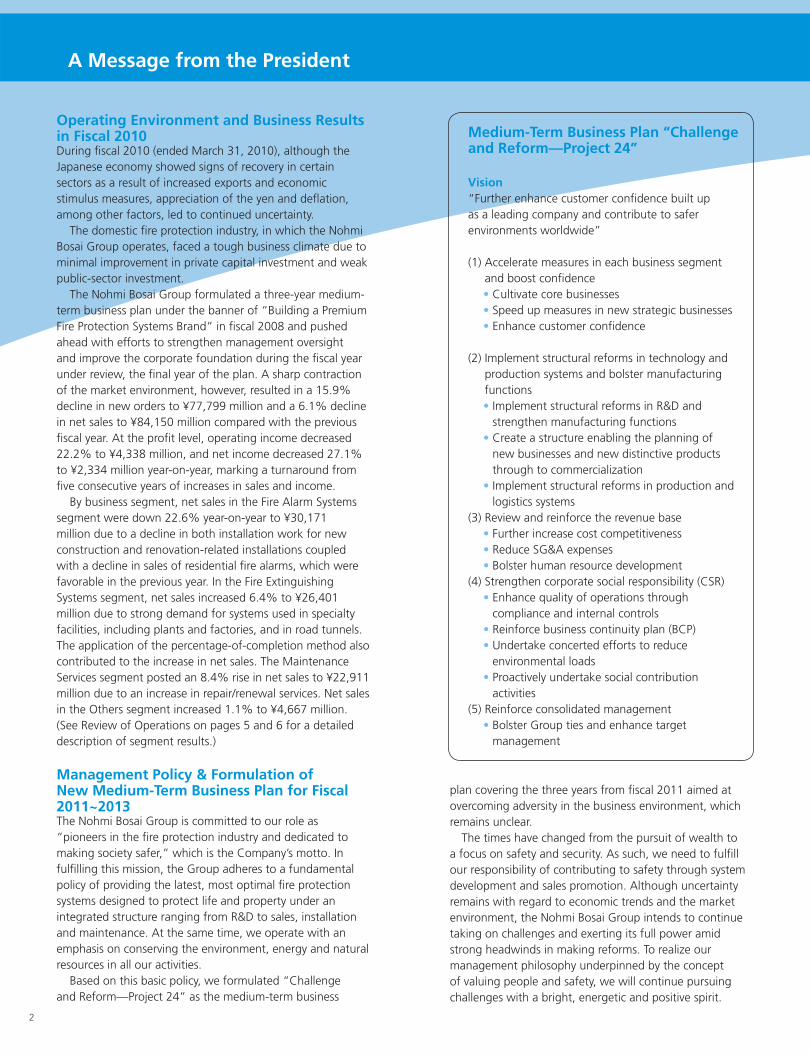
Operating Environment and Business Results in Fiscal 2010During fi scal 2010 (ended March 31, 2010), although the Japanese economy showed signs of recovery in certain sectors as a result of increased exports and economic stimulus measures, appreciation of the yen and defl ation, among other factors, led to continued uncertainty. The domestic fi re protection industry, in which the Nohmi Bosai Group operates, faced a tough business climate due to minimal improvement in private capital investment and weak public-sector investment. The Nohmi Bosai Group formulated a three-year medium-term business plan under the banner of “Building a Premium Fire Protection Systems Brand” in fi scal 2008 and pushed ahead with efforts to strengthen management oversight and improve the corporate foundation during the fi scal year under review, the fi nal year of the plan. A sharp contraction of the market environment, however, resulted in a 15.9% decline in new orders to ¥77,799 million and a 6.1% decline in net sales to ¥84,150 million compared with the previous fi scal year. At the profi t level, operating income decreased 22.2% to ¥4,338 million, and net income decreased 27.1% to ¥2,334 million year-on-year, marking a turnaround from fi ve consecutive years of increases in sales and income. By business segment, net sales in the Fire Alarm Systems segment were down 22.6% year-on-year to ¥30,171 million due to a decline in both installation work for new construction and renovation-related installations coupled with a decline in sales of residential fi re alarms, which were favorable in the previous year. In the Fire Extinguishing Systems segment, net sales increased 6.4% to ¥26,401 million due to strong demand for systems used in specialty facilities, including plants and factories, and in road tunnels. The application of the percentage-of-completion method also contributed to the increase in net sales. The Maintenance Services segment posted an 8.4% rise in net sales to ¥22,911 million due to an increase in repair/renewal services. Net sales in the Others segment increased 1.1% to ¥4,667 million. (See Review of Operations on pages 5 and 6 for a detailed description of segment results.)
Management Policy & Formulation of New Medium-Term Business Plan for Fiscal 2011~2013The Nohmi Bosai Group is committed to our role as “pioneers in the fi re protection industry and dedicated to making society safer,” which is the Company’s motto. In fulfi lling this mission, the Group adheres to a fundamental policy of providing the latest, most optimal fi re protection systems designed to protect life and property under an integrated structure ranging from R&D to sales, installation and maintenance. At the same time, we operate with an emphasis on conserving the environment, energy and natural resources in all our activities. Based on this basic policy, we formulated “Challenge and Reform—Project 24” as the medium-term business
Medium-Term Business Plan “Challenge and Reform—Project 24”
Vision“Further enhance customer confi dence built up as a leading company and contribute to safer environments worldwide”
(1) Accelerate measures in each business segment and boost confi dence• Cultivate core businesses• Speed up measures in new strategic businesses• Enhance customer confi dence
(2) Implement structural reforms in technology and production systems and bolster manufacturing functions• Implement structural reforms in R&D and
strengthen manufacturing functions• Create a structure enabling the planning of
new businesses and new distinctive products through to commercialization
• Implement structural reforms in production and logistics systems
(3) Review and reinforce the revenue base• Further increase cost competitiveness• Reduce SG&A expenses• Bolster human resource development
(4) Strengthen corporate social responsibility (CSR)• Enhance quality of operations through
compliance and internal controls• Reinforce business continuity plan (BCP)• Undertake concerted efforts to reduce
environmental loads• Proactively undertake social contribution
activities(5) Reinforce consolidated management
• Bolster Group ties and enhance target management
A Message from the President

3
While working to strengthen the corporate foundation and profi t structure, the starting point of reforms will be to focus on customer sites and actual circumstances, ensure speedy decision-making and execution and become an innovator in safety-related areas.
Initiatives for Transparent ManagementThe Nohmi Bosai Group has been undertaking a variety of initiatives to strengthen our corporate governance structure with the aim of maximizing corporate value, ensuring transparency in corporate management and enabling a quick decision-making process. We emphasize accountability to such key stakeholders as our shareholders and investors by disclosing information in a timely and appropriate manner. Moreover, by building an internal control system, we are carrying out compliance-based management that ensures strict Group-wide adherence to our code of conduct and internal rules and thereby preventing any kinds of misconduct.
Shareholder ReturnFor the fi scal year ended March 31, 2010, the Company paid total cash dividends per share of ¥15.00, which includes a year-end cash dividend per share of ¥7.50 and interim dividend of ¥7.50 per share. With an emphasis on returning profi ts to shareholders, we pay dividends based on a comprehensive evaluation of such fi nancial indicators as our payout ratio while considering the need for internal reserves to strengthen our corporate structure in preparation for future business development.
Outlook for Fiscal 2011The fi re protection industry is projected to be sluggish in fi scal 2011 with no expectations of drastic improvement in the market environment. In addition, fi re protection for existing buildings is becoming a mature market. Faced with these realities, the Nohmi Bosai Group has set as a priority management issue, the enhancement of business foundations, including strengthening sales in the residential fi re protection sector where new laws and regulations have been introduced along with cultivating other markets related to fi re protection and overseas markets, in order to drive ongoing growth. The initiatives outlined in the new medium-term business plan aim to strengthen our corporate foundation and profi t structure. Through these measures, we are projecting consolidated net sales of ¥84,500 million, operating income of ¥4,350 million and net income of ¥2,350 million. In closing, I would like to ask all our stakeholders, including shareholders, for their continued understanding and support in the coming year.
July 2010
Takeshi HashizumePresident
Takeshi HashizumePresident
Further Enhance Customer Confi dence Built Up as a Leading Company and Contribute to Safer Environments Worldwide
4
Nohmi Bosai at a Glance
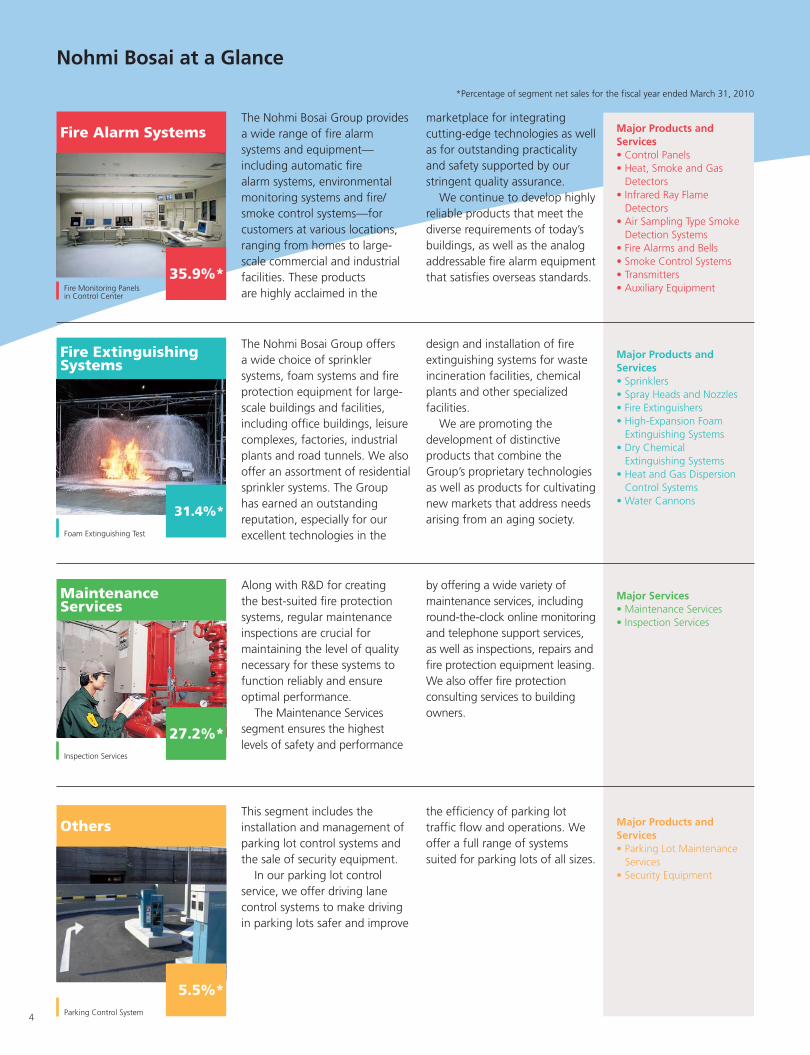
The Nohmi Bosai Group provides a wide range of fi re alarm systems and equipment—including automatic fi re alarm systems, environmental monitoring systems and fi re/smoke control systems—for customers at various locations, ranging from homes to large-scale commercial and industrial facilities. These products are highly acclaimed in the
marketplace for integrating cutting-edge technologies as well as for outstanding practicality and safety supported by our stringent quality assurance. We continue to develop highly reliable products that meet the diverse requirements of today’s buildings, as well as the analog addressable fi re alarm equipment that satisfi es overseas standards.
Fire Alarm Systems Major Products and Services• Control Panels• Heat, Smoke and Gas
Detectors• Infrared Ray Flame
Detectors• Air Sampling Type Smoke
Detection Systems• Fire Alarms and Bells• Smoke Control Systems• Transmitters• Auxiliary Equipment
The Nohmi Bosai Group offers a wide choice of sprinkler systems, foam systems and fi re protection equipment for large-scale buildings and facilities, including offi ce buildings, leisure complexes, factories, industrial plants and road tunnels. We also offer an assortment of residential sprinkler systems. The Group has earned an outstanding reputation, especially for our excellent technologies in the
design and installation of fi re extinguishing systems for waste incineration facilities, chemical plants and other specialized facilities. We are promoting the development of distinctive products that combine the Group’s proprietary technologies as well as products for cultivating new markets that address needs arising from an aging society.
Major Products and Services• Sprinklers• Spray Heads and Nozzles• Fire Extinguishers• High-Expansion Foam
Extinguishing Systems• Dry Chemical
Extinguishing Systems• Heat and Gas Dispersion
Control Systems• Water Cannons
Along with R&D for creating the best-suited fi re protection systems, regular maintenance inspections are crucial for maintaining the level of quality necessary for these systems to function reliably and ensure optimal performance. The Maintenance Services segment ensures the highest levels of safety and performance
by offering a wide variety of maintenance services, including round-the-clock online monitoring and telephone support services, as well as inspections, repairs and fi re protection equipment leasing. We also offer fi re protection consulting services to building owners.
Major Services• Maintenance Services• Inspection Services
This segment includes the installation and management of parking lot control systems and the sale of security equipment. In our parking lot control service, we offer driving lane control systems to make driving in parking lots safer and improve
the effi ciency of parking lot traffi c fl ow and operations. We offer a full range of systems suited for parking lots of all sizes.
Major Products and Services• Parking Lot Maintenance
Services• Security Equipment
*Percentage of segment net sales for the fi scal year ended March 31, 2010
Fire Monitoring Panels in Control Center
35.9%*
Fire Extinguishing Systems
Maintenance Services
Others
Foam Extinguishing Test
Inspection Services
Parking Control System
31.4%*
27.2%*
5.5%*
5
60Net Sales Operating Income
40
20
0
6
4
2
0
Net Sales/Operating Income of Fire Alarm Systems
Net Sales Operating Income
’06 ’07 ’08 ’09 ’10
(Billions of Yen) (Billions of Yen) 30Net Sales Operating Income
20
10
0
3
2
1
0
Net Sales/Operating Income of Fire Extinguishing Systems
Net Sales Operating Income
’06 ’07 ’08 ’09 ’10
(Billions of Yen) (Billions of Yen)
Review of Operations
Fire Alarm Systems Fire Extinguishing Systems
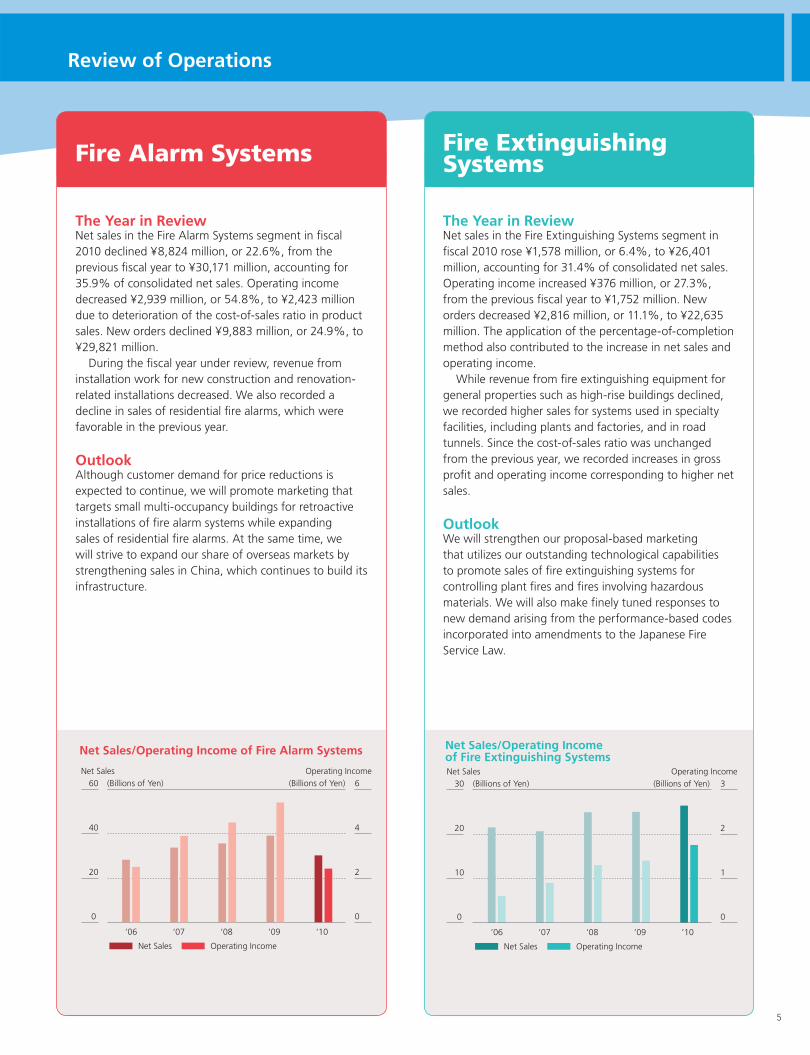
The Year in ReviewNet sales in the Fire Alarm Systems segment in fi scal 2010 declined ¥8,824 million, or 22.6%, from the previous fi scal year to ¥30,171 million, accounting for 35.9% of consolidated net sales. Operating income decreased ¥2,939 million, or 54.8%, to ¥2,423 million due to deterioration of the cost-of-sales ratio in product sales. New orders declined ¥9,883 million, or 24.9%, to ¥29,821 million. During the fi scal year under review, revenue from installation work for new construction and renovation-related installations decreased. We also recorded a decline in sales of residential fi re alarms, which were favorable in the previous year.
OutlookAlthough customer demand for price reductions is expected to continue, we will promote marketing that targets small multi-occupancy buildings for retroactive installations of fi re alarm systems while expanding sales of residential fi re alarms. At the same time, we will strive to expand our share of overseas markets by strengthening sales in China, which continues to build its infrastructure.
The Year in ReviewNet sales in the Fire Extinguishing Systems segment in fi scal 2010 rose ¥1,578 million, or 6.4%, to ¥26,401 million, accounting for 31.4% of consolidated net sales. Operating income increased ¥376 million, or 27.3%, from the previous fi scal year to ¥1,752 million. New orders decreased ¥2,816 million, or 11.1%, to ¥22,635 million. The application of the percentage-of-completion method also contributed to the increase in net sales and operating income. While revenue from fi re extinguishing equipment for general properties such as high-rise buildings declined, we recorded higher sales for systems used in specialty facilities, including plants and factories, and in road tunnels. Since the cost-of-sales ratio was unchanged from the previous year, we recorded increases in gross profi t and operating income corresponding to higher net sales.
OutlookWe will strengthen our proposal-based marketing that utilizes our outstanding technological capabilities to promote sales of fi re extinguishing systems for controlling plant fi res and fi res involving hazardous materials. We will also make fi nely tuned responses to new demand arising from the performance-based codes incorporated into amendments to the Japanese Fire Service Law.
6
50
30
20
10
0
5
2
1
0
Net Sales/Operating Income of Maintenance Services
Net Sales Operating Income
40
3
4
’06 ’07 ’08 ’09 ’10
Net Sales Operating Income(Billions of Yen) (Billions of Yen) 6
4
2
0
0.6
0.4
0.2
0
Net Sales/Operating Income of Others
Net Sales Operating Income
’06 ’07 ’08 ’09 ’10
Net Sales Operating Income(Billions of Yen) (Billions of Yen)
Review of Operations
Maintenance Services Others
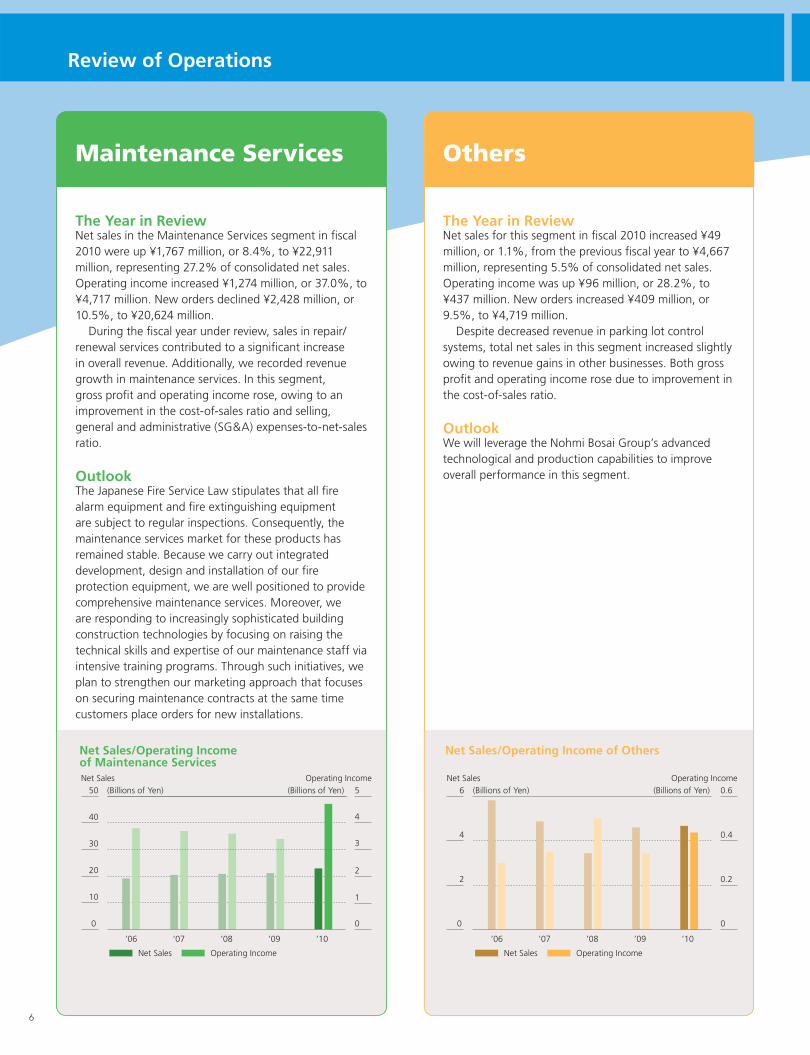
The Year in ReviewNet sales in the Maintenance Services segment in fi scal 2010 were up ¥1,767 million, or 8.4%, to ¥22,911 million, representing 27.2% of consolidated net sales. Operating income increased ¥1,274 million, or 37.0%, to ¥4,717 million. New orders declined ¥2,428 million, or 10.5%, to ¥20,624 million. During the fi scal year under review, sales in repair/renewal services contributed to a signifi cant increase in overall revenue. Additionally, we recorded revenue growth in maintenance services. In this segment, gross profi t and operating income rose, owing to an improvement in the cost-of-sales ratio and selling, general and administrative (SG&A) expenses-to-net-sales ratio.
OutlookThe Japanese Fire Service Law stipulates that all fi re alarm equipment and fi re extinguishing equipment are subject to regular inspections. Consequently, the maintenance services market for these products has remained stable. Because we carry out integrated development, design and installation of our fi re protection equipment, we are well positioned to provide comprehensive maintenance services. Moreover, we are responding to increasingly sophisticated building construction technologies by focusing on raising the technical skills and expertise of our maintenance staff via intensive training programs. Through such initiatives, we plan to strengthen our marketing approach that focuses on securing maintenance contracts at the same time customers place orders for new installations.
The Year in ReviewNet sales for this segment in fi scal 2010 increased ¥49 million, or 1.1%, from the previous fi scal year to ¥4,667 million, representing 5.5% of consolidated net sales. Operating income was up ¥96 million, or 28.2%, to ¥437 million. New orders increased ¥409 million, or 9.5%, to ¥4,719 million. Despite decreased revenue in parking lot control systems, total net sales in this segment increased slightly owing to revenue gains in other businesses. Both gross profi t and operating income rose due to improvement in the cost-of-sales ratio.
OutlookWe will leverage the Nohmi Bosai Group’s advanced technological and production capabilities to improve overall performance in this segment.
7
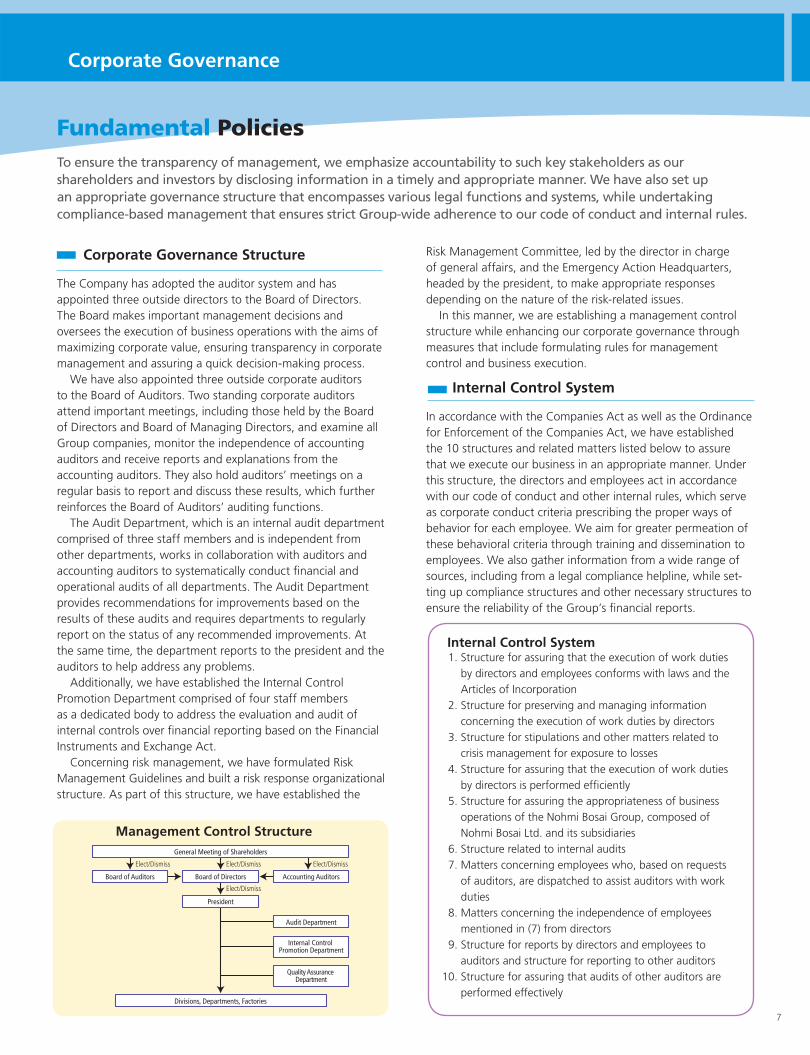
Corporate Governance Structure
Internal Control System
The Company has adopted the auditor system and has appointed three outside directors to the Board of Directors. The Board makes important management decisions and oversees the execution of business operations with the aims of maximizing corporate value, ensuring transparency in corporate management and assuring a quick decision-making process. We have also appointed three outside corporate auditors to the Board of Auditors. Two standing corporate auditors attend important meetings, including those held by the Board of Directors and Board of Managing Directors, and examine all Group companies, monitor the independence of accounting auditors and receive reports and explanations from the accounting auditors. They also hold auditors’ meetings on a regular basis to report and discuss these results, which further reinforces the Board of Auditors’ auditing functions. The Audit Department, which is an internal audit department comprised of three staff members and is independent from other departments, works in collaboration with auditors and accounting auditors to systematically conduct fi nancial and operational audits of all departments. The Audit Department provides recommendations for improvements based on the results of these audits and requires departments to regularly report on the status of any recommended improvements. At the same time, the department reports to the president and the auditors to help address any problems. Additionally, we have established the Internal Control Promotion Department comprised of four staff members as a dedicated body to address the evaluation and audit of internal controls over fi nancial reporting based on the Financial Instruments and Exchange Act. Concerning risk management, we have formulated Risk Management Guidelines and built a risk response organizational structure. As part of this structure, we have established the
Risk Management Committee, led by the director in charge of general affairs, and the Emergency Action Headquarters, headed by the president, to make appropriate responses depending on the nature of the risk-related issues. In this manner, we are establishing a management control structure while enhancing our corporate governance through measures that include formulating rules for management control and business execution.
In accordance with the Companies Act as well as the Ordinance for Enforcement of the Companies Act, we have established the 10 structures and related matters listed below to assure that we execute our business in an appropriate manner. Under this structure, the directors and employees act in accordance with our code of conduct and other internal rules, which serve as corporate conduct criteria prescribing the proper ways of behavior for each employee. We aim for greater permeation of these behavioral criteria through training and dissemination to employees. We also gather information from a wide range of sources, including from a legal compliance helpline, while set-ting up compliance structures and other necessary structures to ensure the reliability of the Group’s fi nancial reports.
To ensure the transparency of management, we emphasize accountability to such key stakeholders as our shareholders and investors by disclosing information in a timely and appropriate manner. We have also set up an appropriate governance structure that encompasses various legal functions and systems, while undertaking compliance-based management that ensures strict Group-wide adherence to our code of conduct and internal rules.
Fundamental Policies
General Meeting of Shareholders
Divisions, Departments, Factories
Board of Auditors Board of Directors
President
Accounting Auditors
Audit Department
Internal Control Promotion Department
Quality Assurance Department
Elect/Dismiss Elect/Dismiss
Elect/Dismiss
Elect/Dismiss
Management Control Structure
Internal Control System 1. Structure for assuring that the execution of work duties
by directors and employees conforms with laws and the Articles of Incorporation
2. Structure for preserving and managing information concerning the execution of work duties by directors
3. Structure for stipulations and other matters related to crisis management for exposure to losses
4. Structure for assuring that the execution of work duties by directors is performed effi ciently
5. Structure for assuring the appropriateness of business operations of the Nohmi Bosai Group, composed of Nohmi Bosai Ltd. and its subsidiaries
6. Structure related to internal audits 7. Matters concerning employees who, based on requests
of auditors, are dispatched to assist auditors with work duties
8. Matters concerning the independence of employees mentioned in (7) from directors
9. Structure for reports by directors and employees to auditors and structure for reporting to other auditors
10. Structure for assuring that audits of other auditors are performed effectively
Corporate Governance
8
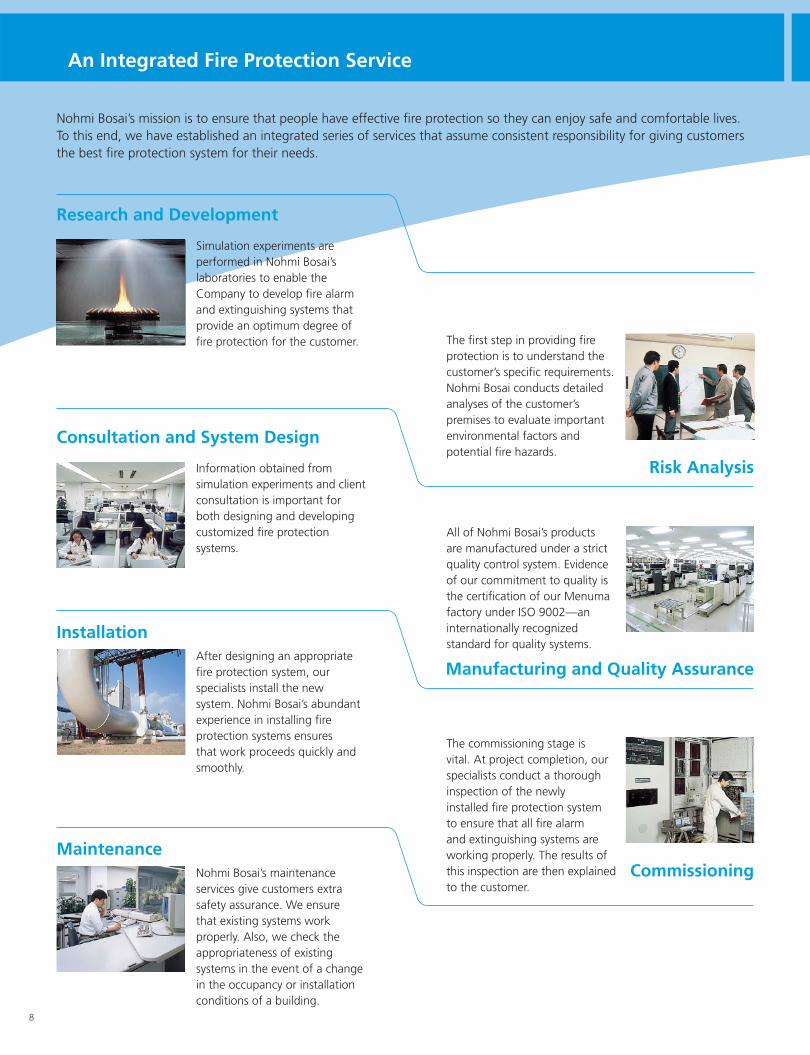
Nohmi Bosai’s mission is to ensure that people have effective fi re protection so they can enjoy safe and comfortable lives. To this end, we have established an integrated series of services that assume consistent responsibility for giving customers the best fi re protection system for their needs.
Information obtained from simulation experiments and client consultation is important for both designing and developing customized fi re protection systems.
Consultation and System Design
Simulation experiments are performed in Nohmi Bosai’s laboratories to enable the Company to develop fi re alarm and extinguishing systems that provide an optimum degree of fi re protection for the customer.
Research and Development
After designing an appropriate fi re protection system, our specialists install the new system. Nohmi Bosai’s abundant experience in installing fi re protection systems ensures that work proceeds quickly and smoothly.
Installation
Nohmi Bosai’s maintenance services give customers extra safety assurance. We ensure that existing systems work properly. Also, we check the appropriateness of existing systems in the event of a change in the occupancy or installation conditions of a building.
Maintenance
An Integrated Fire Protection Service
The fi rst step in providing fi re protection is to understand the customer’s specifi c requirements. Nohmi Bosai conducts detailed analyses of the customer’s premises to evaluate important environmental factors and potential fi re hazards.
Risk Analysis
All of Nohmi Bosai’s products are manufactured under a strict quality control system. Evidence of our commitment to quality is the certifi cation of our Menuma factory under ISO 9002—an internationally recognized standard for quality systems.
Manufacturing and Quality Assurance
The commissioning stage is vital. At project completion, our specialists conduct a thorough inspection of the newly installed fi re protection system to ensure that all fi re alarm and extinguishing systems are working properly. The results of this inspection are then explained to the customer.
Commissioning

9
Performance AnalysisThe Nohmi Bosai Group’s consolidated fi nancial statements are prepared in accordance with generally accepted accounting principles in Japan (Japanese GAAP). An analysis of our fi nancial condition and business results for fi scal 2010 is shown below. With regard to the Nohmi Bosai Group’s business results for the fi scal year under review, both revenue and profi ts declined due to a rapid cooling of the market environment surrounding the fi re protection industry. Under such conditions, the Nohmi Bosai Group’s business results by segment were as follows. Net sales in the Fire Alarm Systems segment were down ¥8,824 million, or 22.6%, year-on-year to ¥30,171 million due to a decline in both installation work for new construction and renovation-related installations coupled with a decline in sales of residential fi re alarms, which were favorable in the previous year. In the Fire Extinguishing Systems segment, net sales increased ¥1,578 million, or 6.4%, to ¥26,401 million. Despite a decline in revenue from fi re extinguishing equipment for such general properties as high-rise buildings, we posted higher sales for systems used in specialty facilities, including plants and factories, and in road tunnels. The application of the percentage-of-completion method also contributed to the increase in net sales. Net sales in the Maintenance Services segment rose ¥1,767 million, or 8.4%, to ¥22,911 million. We recorded increased sales in both maintenance and repair/renewal services. In the Others segment, which includes all other businesses, despite a decrease in revenue of parking lot control systems, net sales edged up ¥49 million, or 1.1%, to ¥4,667 million owing to an increase in sales of security equipment. Consequently, net sales decreased ¥5,430 million, or 6.1%, from the previous fi scal year to ¥84,150 million. As a result of efforts to reduce costs amid harsh circumstances, the cost-of-sales ratio was unchanged from the
previous fi scal year at 70.8%. Gross profi t fell 6.0% to ¥24,538 million, and the gross profi t margin remained the same at 29.2%. Although selling, general and administrative (SG&A) expenses decreased ¥339 million, the SG&A expenses-to-net-sales ratio increased 1.1 percentage points from the previous fi scal year to 24.0%. As a result of these factors, operating income declined 22.2% to ¥4,338 million. Net income fell 27.1% from the previous fi scal year to ¥2,334 million, and net income per share was ¥38.66.
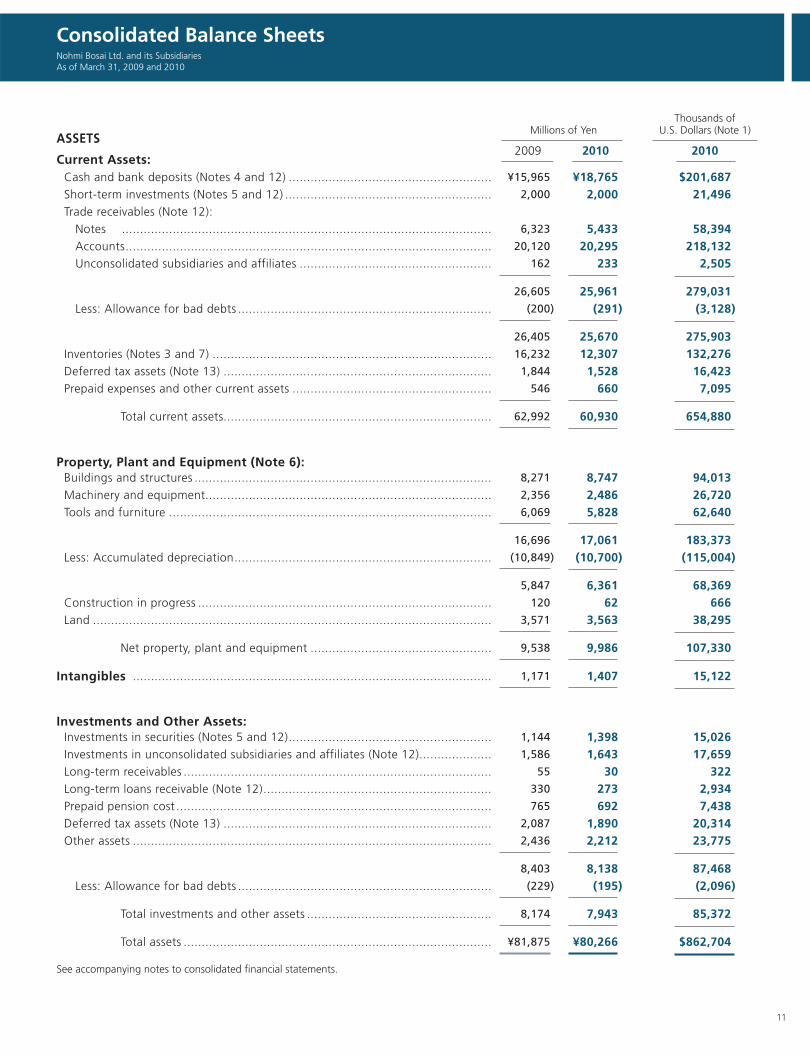
Assets, Liabilities and Net AssetsTotal assets at the end of fi scal 2010 amounted to ¥80,266 million, down ¥1,609 million, or 2.0%, from the previous fi scal year-end. Total current assets decreased ¥2,062 million, or 3.3%, from the previous fi scal year-end to ¥60,930 million. Property, plant and equipment rose ¥448 million, or 4.7%, to ¥9,986 million due to an increase in buildings and structures in the amount of ¥476 million. Investments and other assets decreased ¥231 million, or 2.8%, to ¥7,943 million due to a decrease in deferred tax assets in the amount of ¥197 million. Total current liabilities and long-term liabilities declined ¥3,261 million, or 10.6%, from the previous fi scal year-end to ¥27,633 million. Interest-bearing debt totaled ¥34 million as short-term debt remained at the same level as the previous fi scal year-end. Total net assets increased ¥1,652 million, or 3.2%, from the end of the previous fi scal year to ¥52,633 million. The equity ratio was 64.2%, up 3.1 percentage points from 61.1% at the end of the previous fi scal year. Net assets per share rose to ¥854.26 from ¥828.72 per share in fi scal 2009.
Net Income/Return on Sales(Billions of Yen) (%)
Total Assets/Equity Ratio(Billions of Yen) (%)
Total Net Assets/Return on Equity(Billions of Yen) (%)
100
80
60
40
20
0
100
80
60
40
20
0
100
80
60
40
20
0
10.0
8.0
6.0
4.0
2.0
0
4
3
2
1
0
4.0
3.0
2.0
1.0
0’06 ’07 ’08 ’09 ’10 ’06 ’07 ’08 ’09 ’10 ’06 ’07 ’08 ’09 ’10
Management’s Discussion and Analysis

10
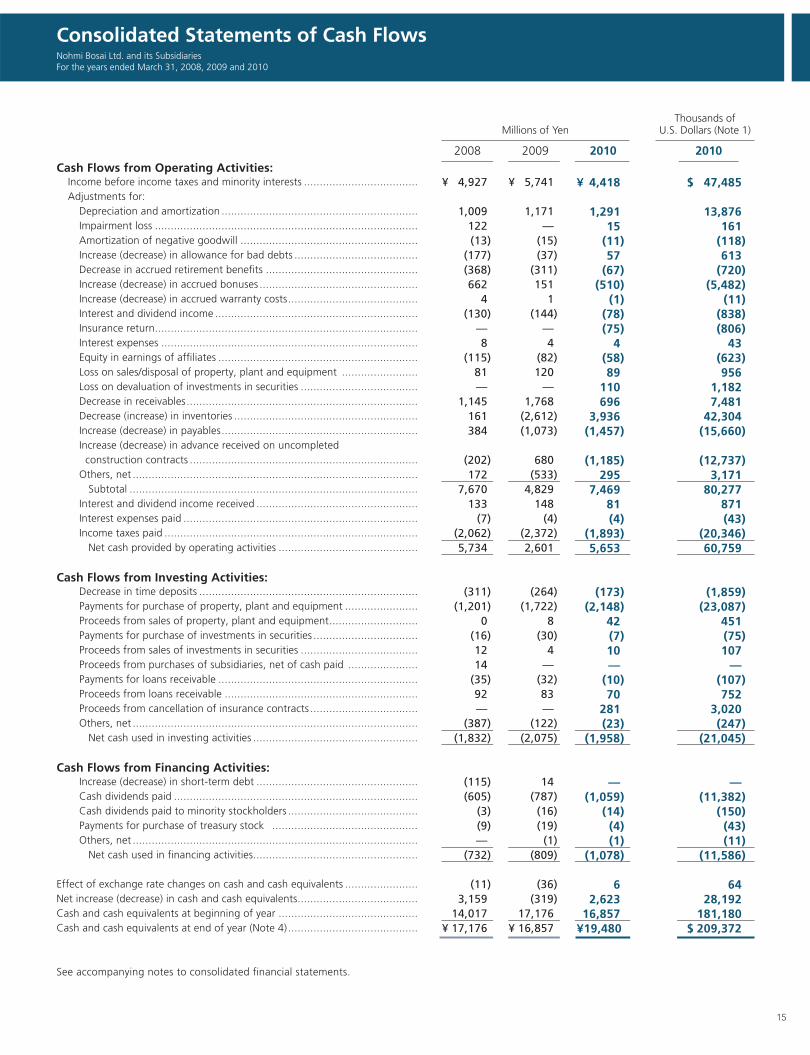
Cash FlowNet cash provided by operating activities amounted to ¥5,653 million compared with ¥2,601 million in the previous fi scal year due primarily to ¥4,418 million in income before income taxes, ¥1,291 million in depreciation and amortization, a decrease in inventories of ¥3,936 million, a decrease in payables of ¥1,457 million and a decrease in advance received on uncompleted construction contracts of ¥1,185 million. Net cash used in investing activities amounted to ¥1,958 million compared with ¥2,075 million in the previous fi scal year, consisting mainly of payments for purchase of property, plant and equipment. Net cash used in fi nancing activities amounted to ¥1,078 million compared with ¥809 million in the previous fi scal year due mainly to cash dividends paid. As a result, net increase in cash and cash equivalents was ¥2,623 million. Therefore, cash and cash equivalents at end of year totaled ¥19,480 million. This amount has been temporarily allocated for bank deposits and securities in preparation for future investments.
Outlook for Fiscal 2011Given the current situation, a rapid improvement in the market environment in the fi re protection industry is not anticipated, and economic conditions are expected to remain sluggish during fi scal 2011 as well. In order to address such circumstances, the Nohmi Bosai Group has formulated “Challenge and Reform—Project 24,” a new three-year medium-term business plan starting from fi scal 2011. Under this plan, we aim to secure revenues and profi ts by strengthening the corporate foundation and profi t structure through the implementation of principle measures. These include accelerating measures in each business segment and boosting confi dence; implementing structural reforms in technology and production systems and bolstering manufacturing functions; reviewing and reinforcing the revenue base; strengthening CSR; and reinforcing consolidated management.
For fi scal 2011, ending March 31, 2011, we are forecasting consolidated net sales of ¥84,500 million and net income of ¥2,350 million. Although we foresee a diffi cult environment for new orders, we are aiming for a ¥350 million increase in net sales by obtaining new orders, including strategic businesses such as residential fi re alarms, sprinklers and wireless detectors for group homes for cognitively impaired elderly persons and fi re alarm systems for overseas markets. At the same time, the cost-of-sales ratio is expected to deteriorate slightly although we have set the target of maintaining the ratio at the current level. To this end, we will strive to secure profi ts through intensive cost-reduction measures and improving the SG&A expenses-to-net-sales ratio. We will aim for increases in operating income and net income, albeit slightly. Accordingly, we plan to pay annual cash dividends per share of ¥15.00, which will include an interim cash dividend per share of ¥7.50 and a year-end cash dividend per share of ¥7.50.
Risk Information(1) Business EnvironmentThe Nohmi Bosai Group’s businesses are closely associated with the construction industry and public works projects. Accordingly, business trends in these sectors could have an adverse impact on the Nohmi Bosai Group’s fi nancial condition and business results.
(2) Laws and RegulationsThe dominant portion of the Nohmi Bosai Group’s businesses is conducted in conformance with the Japanese Fire Service Law. Accordingly, changes in the law could have an adverse impact on the Nohmi Bosai Group’s fi nancial condition and business results.
(3) Seasonal Variation in Business ResultsBusiness results of the Nohmi Bosai Group greatly fl uctuate by season, whereby there is a tendency for sales to amass in the fourth quarter of the fi scal year.
11
ASSETS
Current Assets: Cash and bank deposits (Notes 4 and 12) ........................................................ ¥15,965 ¥18,765 $201,687 Short-term investments (Notes 5 and 12) ......................................................... 2,000 2,000 21,496 Trade receivables (Note 12): Notes ...................................................................................................... 6,323 5,433 58,394 Accounts ..................................................................................................... 20,120 20,295 218,132 Unconsolidated subsidiaries and affiliates ..................................................... 162 233 2,505 26,605 25,961 279,031 Less: Allowance for bad debts ...................................................................... (200) (291) (3,128) 26,405 25,670 275,903 Inventories (Notes 3 and 7) ............................................................................. 16,232 12,307 132,276 Deferred tax assets (Note 13) .......................................................................... 1,844 1,528 16,423 Prepaid expenses and other current assets ....................................................... 546 660 7,095 Total current assets.......................................................................... 62,992 60,930 654,880
Property, Plant and Equipment (Note 6): Buildings and structures .................................................................................. 8,271 8,747 94,013 Machinery and equipment............................................................................... 2,356 2,486 26,720 Tools and furniture ......................................................................................... 6,069 5,828 62,640 16,696 17,061 183,373 Less: Accumulated depreciation ....................................................................... (10,849) (10,700) (115,004) 5,847 6,361 68,369 Construction in progress ................................................................................. 120 62 666 Land .............................................................................................................. 3,571 3,563 38,295 Net property, plant and equipment .................................................. 9,538 9,986 107,330 Intangibles ................................................................................................... 1,171 1,407 15,122
Investments and Other Assets: Investments in securities (Notes 5 and 12) ........................................................ 1,144 1,398 15,026 Investments in unconsolidated subsidiaries and affiliates (Note 12) .................... 1,586 1,643 17,659 Long-term receivables ..................................................................................... 55 30 322 Long-term loans receivable (Note 12) ............................................................... 330 273 2,934 Prepaid pension cost ....................................................................................... 765 692 7,438 Deferred tax assets (Note 13) .......................................................................... 2,087 1,890 20,314 Other assets ................................................................................................... 2,436 2,212 23,775 8,403 8,138 87,468 Less: Allowance for bad debts ...................................................................... (229) (195) (2,096) Total investments and other assets ................................................... 8,174 7,943 85,372 Total assets ..................................................................................... ¥81,875 ¥80,266 $862,704 See accompanying notes to consolidated fi nancial statements.
Thousands of Millions of Yen U.S. Dollars (Note 1)
2009 2010 2010
Consolidated Balance SheetsNohmi Bosai Ltd. and its SubsidiariesAs of March 31, 2009 and 2010

12
LIABILITIES AND NET ASSETS
Current Liabilities: Short-term debt (Notes 8 and 12) .................................................................... ¥ 34 ¥ 34 $ 365 Trade payables (Note 12): Notes ...................................................................................................... 1,823 1,643 17,659 Accounts ..................................................................................................... 6,013 4,288 46,088 Unconsolidated subsidiaries and affiliates ..................................................... 1,621 2,052 22,055
9,457 7,983 85,802 Non-trade accounts payable (Note 12) ............................................................. 4,756 4,839 52,010 Advances received on uncompleted construction contracts ............................... 3,781 2,596 27,902 Accrued bonuses to employees........................................................................ 3,090 2,580 27,730 Accrued warranty costs ................................................................................... 58 58 623 Income taxes payable (Notes 12 and 13) .......................................................... 1,649 1,310 14,080 Allowance for losses on construction contracts ................................................ 241 145 1,558 Other current liabilities .................................................................................... 1,237 1,575 16,929
Total current liabilities ..................................................................... 24,303 21,120 226,999
Long-term Liabilities: Long-term debt (Note 8) ................................................................................. 366 364 3,912 Accrued retirement benefits (Note 9) ............................................................... 5,578 5,433 58,394 Directors’ and corporate auditors’ retirement benefits ...................................... 594 671 7,212 Other long-term liabilities ............................................................................... 26 28 301 Negative goodwill ........................................................................................... 27 17 183
Total long-term liabilities ................................................................. 6,591 6,513 70,002
Contingent liabilities (Note 14)
Net Assets (Note 15)Shareholders’ Equity: Common stock; Authorized: 160,000,000 shares at March 31, 2009 and 2010 Issued: 60,832,771 shares at March 31, 2009 and 2010 ................................ 13,302 13,302 142,971 Capital surplus ............................................................................................... 12,745 12,745 136,984 Retained earnings ........................................................................................... 24,277 25,552 274,635 Less: Treasury stock, at cost 470,747 shares and 477,721 shares at March 31, 2009 and 2010 ................. (234) (238) (2,558)
Valuation and Translation Adjustments: Unrealized gains (losses) on securities, net of taxes .......................................... (68) 181 1,945 Foreign currency translation adjustments ......................................................... 1 17 183 Minority interests ............................................................................................ 958 1,074 11,543
Total net assets ............................................................................... 50,981 52,633 565,703
¥81,875 ¥80,266 $862,704
See accompanying notes to consolidated financial statements.
Thousands of Millions of Yen U.S. Dollars (Note 1)
2009 2010 2010

13
Consolidated Statements of IncomeNohmi Bosai Ltd. and its SubsidiariesFor the years ended March 31, 2008, 2009 and 2010
Thousands of Millions of Yen U.S. Dollars (Note 1)
2008 2009 2010 2010
Net Sales ........................................................................................... ¥84,947 ¥89,580 ¥84,150 $904,450Cost of Sales .......................................................................................... 60,770 63,462 59,612 640,714 Gross profi t .......................................................................... 24,177 26,118 24,538 263,736 Selling, General and Administrative Expenses ...................................... 19,348 20,539 20,200 217,111 Operating income ................................................................. 4,829 5,579 4,338 46,625Other Income (Expenses):
Interest income ...................................................................................... 94 106 52 559 Interest expense ..................................................................................... (8) (4) (4) (43) Dividend income .................................................................................... 37 39 26 279 Dividend on insurance policies ................................................................. 25 31 34 365 Insurance return ..................................................................................... — — 75 806 Rental revenue ....................................................................................... 77 76 71 763 Rental expense ........................................................................................... (60) (72) (62) (666) Foreign exchange loss ................................................................................. (63) (13) (28) (301) Commitment fee ........................................................................................ (7) (7) (32) (344) Loss on sale/disposal of property and equipment ........................................ (81) (120) (89) (957) Loss on devaluation of investments in securities .......................................... — (66) (110) (1,182)
Amortization of negative goodwill .............................................................. 13 15 11 118 Equity in earnings of affi liates ..................................................................... 115 82 58 623 Impairment loss on fi xed assets (Note 6) ..................................................... (122) — (15) (161) Others, net ................................................................................................ 78 95 93 1,001 98 162 80 860 Income before income taxes and minority interests ................... 4,927 5,741 4,418 47,485Income Taxes:
Current (Note 13) ....................................................................................... 2,075 2,079 1,562 16,789 Deferred (Note 13) ..................................................................................... (23) 402 392 4,213 2,052 2,481 1,954 21,002
Minority Interests in Net Income of Consolidated Subsidiaries ....................... (21) (58) (130) (1,397) Net income ............................................................................... ¥ 2,854 ¥ 3,202 ¥ 2,334 $ 25,086
Per Share (Note 2):
Net income—primary ................................................................................. ¥ 47.26 ¥ 53.04 ¥ 38.66 $ 0.42 Net assets ................................................................................................ 798.86 828.72 854.26 9.18 Cash dividends ........................................................................................... 13.00 15.00 15.00 0.16Weighted Average Number of Shares Issued (in thousands) ................... 60,390 60,374 60,359 —
See accompanying notes to consolidated fi nancial statements.
Yen U.S. Dollars (Note 1)

14
Consolidated Statements of Changes in Net AssetsNohmi Bosai Ltd. and its SubsidiariesFor the years ended March 31, 2008, 2009 and 2010
Thousands Millions of Yen Unrealized Foreign Number of gains (losses) currency shares of Common Capital Retained Treasury on securities, translation Minority common stock stock surplus earnings stock net of taxes adjustments interests Total
Net assets at April 1, 2007 60,832 ¥13,302 ¥12,744 ¥19,634 ¥ (204) ¥ 845 ¥ 181 ¥ 144 ¥46,646 Net income 2,854 2,854 Cash dividends paid (605) (605) Acquisition of treasury stock (11) (11) Gain on sales of treasury stock 1 1 2 Net changes during the year (524) 22 935 433
Balance at March 31, 2008 60,832 ¥13,302 ¥12,745 ¥21,883 ¥ (214) ¥ 321 ¥ 203 ¥1,079 ¥49,319 Effect of application of the Practical Issues
(21) (21) Task Force No. 18 (Note 3 (1)) Net income 3,202 3,202 Cash dividends paid (787) (787) Acquisition of treasury stock (21) (21) Gain on sales of treasury stock 0 1 1 Net changes during the year (389) (202) (121) (712)
Balance at March 31, 2009 60,832 ¥13,302 ¥12,745 ¥24,277 ¥ (234) ¥ (68) ¥ 1 ¥ 958 ¥50,981 Net income 2,334 2,334 Cash dividends paid (1,059) (1,059) Acquisition of treasury stock (4) (4) Net changes during the year 249 16 116 381Balance at March 31, 2010 60,832 ¥13,302 ¥12,745 ¥25,552 ¥ (238) ¥ 181 ¥ 17 ¥1,074 ¥52,633
Thousands of U.S. Dollars (Note 1) Unrealized Foreign gains (losses) currency Common Capital Retained Treasury on securities, translation Minority stock surplus earnings stock net of taxes adjustments interests Total
Balance at March 31, 2009 $142,971 $136,984 $260,931 $(2,515) $ (731) $ 11 $10,296 $547,947 Net income 25,086 25,086 Cash dividends paid (11,382) (11,382) Acquisition of treasury stock (43) (43) Net changes during the year 2,676 172 1,247 4,095Balance at March 31, 2010 $142,971 $136,984 $274,635 $(2,558) $ 1,945 $ 183 $11,543 $565,703
See accompanying notes to consolidated fi nancial statements.
15
Consolidated Statements of Cash FlowsNohmi Bosai Ltd. and its SubsidiariesFor the years ended March 31, 2008, 2009 and 2010
Thousands of Millions of Yen U.S. Dollars (Note 1)
2008 2009 2010 2010Cash Flows from Operating Activities: Income before income taxes and minority interests .................................... Adjustments for: Depreciation and amortization .............................................................. Impairment loss ................................................................................... Amortization of negative goodwill ........................................................ Increase (decrease) in allowance for bad debts ....................................... Decrease in accrued retirement benefi ts ................................................ Increase (decrease) in accrued bonuses .................................................. Increase (decrease) in accrued warranty costs ......................................... Interest and dividend income ................................................................ Insurance return ................................................................................... Interest expenses ................................................................................. Equity in earnings of affi liates ............................................................... Loss on sales/disposal of property, plant and equipment ........................ Loss on devaluation of investments in securities ..................................... Decrease in receivables ......................................................................... Decrease (increase) in inventories .......................................................... Increase (decrease) in payables .............................................................. Increase (decrease) in advance received on uncompleted construction contracts ........................................................................ Others, net .......................................................................................... Subtotal ........................................................................................... Interest and dividend income received ................................................... Interest expenses paid .......................................................................... Income taxes paid ................................................................................ Net cash provided by operating activities ............................................
Cash Flows from Investing Activities: Decrease in time deposits ..................................................................... Payments for purchase of property, plant and equipment ....................... Proceeds from sales of property, plant and equipment ............................ Payments for purchase of investments in securities ................................. Proceeds from sales of investments in securities ..................................... Proceeds from purchases of subsidiaries, net of cash paid ...................... Payments for loans receivable ............................................................... Proceeds from loans receivable ............................................................. Proceeds from cancellation of insurance contracts .................................. Others, net .......................................................................................... Net cash used in investing activities ....................................................
Cash Flows from Financing Activities: Increase (decrease) in short-term debt ................................................... Cash dividends paid ............................................................................. Cash dividends paid to minority stockholders ......................................... Payments for purchase of treasury stock .............................................. Others, net .......................................................................................... Net cash used in fi nancing activities ....................................................
Effect of exchange rate changes on cash and cash equivalents ....................... Net increase (decrease) in cash and cash equivalents ...................................... Cash and cash equivalents at beginning of year ............................................ Cash and cash equivalents at end of year (Note 4) .........................................
¥ 4,927 1,009 122 (13) (177) (368) 662 4 (130) — 8 (115) 81 — 1,145 161 384 (202) 172 7,670 133 (7) (2,062) 5,734 (311) (1,201) 0 (16) 12 14 (35) 92 — (387) (1,832) (115) (605) (3) (9) — (732) (11) 3,159 14,017 ¥ 17,176
¥ 5,741 1,171 — (15) (37) (311) 151 1 (144) — 4 (82) 120 — 1,768 (2,612) (1,073) 680 (533) 4,829 148 (4) (2,372) 2,601 (264) (1,722) 8 (30) 4 — (32) 83 — (122) (2,075) 14 (787) (16) (19) (1) (809) (36) (319) 17,176 ¥ 16,857
¥ 4,418 1,291 15 (11) 57 (67) (510) (1) (78) (75) 4 (58) 89 110 696 3,936 (1,457) (1,185) 295 7,469 81 (4) (1,893) 5,653 (173) (2,148) 42 (7) 10 — (10) 70 281 (23) (1,958) — (1,059) (14) (4) (1) (1,078) 6 2,623 16,857 ¥ 19,480
$ 47,485 13,876 161 (118) 613 (720) (5,482) (11) (838) (806) 43 (623) 956 1,182 7,481 42,304 (15,660) (12,737) 3,171 80,277 871 (43) (20,346) 60,759 (1,859) (23,087) 451 (75) 107 — (107) 752 3,020 (247) (21,045) — (11,382) (150) (43) (11) (11,586) 64 28,192 181,180 $ 209,372
See accompanying notes to consolidated fi nancial statements.
16
1. Basis of Presenting the Consolidated Financial Statements
The accompanying consolidated fi nancial statements of Nohmi Bosai Ltd.
(the “Company”) and its consolidated subsidiaries (the “Companies”) have
been prepared in accordance with the provisions set forth in the Financial
Instruments and Exchange Law and its related accounting regulations,
and in conformity with accounting principles generally accepted in
Japan (“Japanese GAAP”), which are different in certain respects as
to application and disclosure requirements from International Financial
Reporting Standards.
Prior to the year ended March 31, 2009, the accounts of consolidated
overseas subsidiaries were based on their accounting records maintained in
conformity with generally accepted accounting principles prevailing in the
respective countries of domicile. As discussed in Note 3 (1), the accounts of
consolidated overseas subsidiaries for the year ended March 31, 2009 are
prepared in accordance with International Financial Reporting Standards
with adjustments for the specifi ed six items as applicable.
The accompanying consolidated fi nancial statements have been
restructured and translated into English from the consolidated fi nancial
statements of the Company prepared in accordance with Japanese GAAP
and fi led with the appropriate Local Finance Bureau of the Ministry of
Finance as required by the Financial Instruments and Exchange Law.
Certain supplementary information included in the statutory Japanese
language consolidated fi nancial statements, but not required for fair
presentation, is not presented in the accompanying consolidated fi nancial
statements.
The translation of the Japanese yen amounts into U.S. dollars is included
solely for the convenience of readers outside Japan, using the prevailing
exchange rate at March 31, 2010, which was ¥93.04 to U.S.$1. The
convenience translation should not be construed as representation that the
Japanese yen amounts have been, could have been, or could in the future
be, converted into U.S. dollars at this or any other rate of exchange.
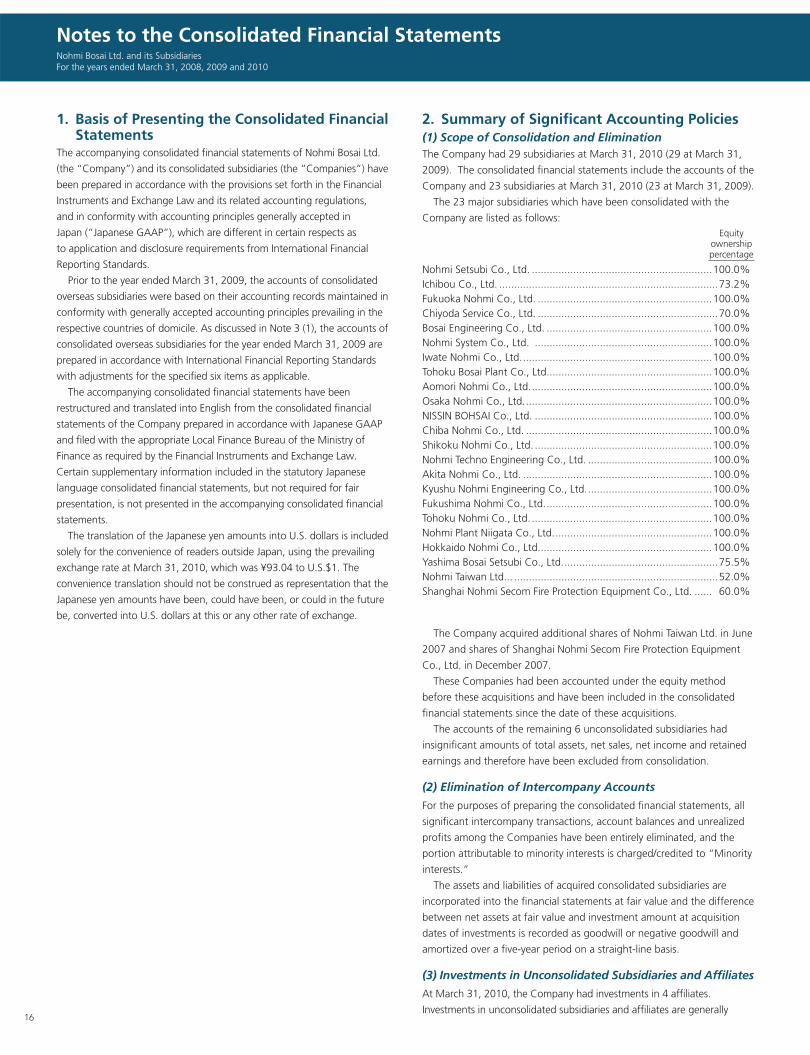
2. Summary of Signifi cant Accounting Policies(1) Scope of Consolidation and EliminationThe Company had 29 subsidiaries at March 31, 2010 (29 at March 31,
2009). The consolidated fi nancial statements include the accounts of the
Company and 23 subsidiaries at March 31, 2010 (23 at March 31, 2009).
The 23 major subsidiaries which have been consolidated with the
Company are listed as follows: Equity ownership percentage
Nohmi Setsubi Co., Ltd. .............................................................100.0%Ichibou Co., Ltd. ..........................................................................73.2%Fukuoka Nohmi Co., Ltd. ...........................................................100.0%Chiyoda Service Co., Ltd. .............................................................70.0%Bosai Engineering Co., Ltd. ........................................................100.0%Nohmi System Co., Ltd. ............................................................100.0%Iwate Nohmi Co., Ltd. ................................................................100.0%Tohoku Bosai Plant Co., Ltd. .......................................................100.0%Aomori Nohmi Co., Ltd. .............................................................100.0%Osaka Nohmi Co., Ltd. ...............................................................100.0%NISSIN BOHSAI Co., Ltd. ............................................................100.0%Chiba Nohmi Co., Ltd. ...............................................................100.0%Shikoku Nohmi Co., Ltd. ............................................................100.0%Nohmi Techno Engineering Co., Ltd. ..........................................100.0%Akita Nohmi Co., Ltd. ................................................................100.0%Kyushu Nohmi Engineering Co., Ltd. ..........................................100.0%Fukushima Nohmi Co., Ltd. ........................................................100.0%Tohoku Nohmi Co., Ltd. .............................................................100.0%Nohmi Plant Niigata Co., Ltd. .....................................................100.0%Hokkaido Nohmi Co., Ltd. ..........................................................100.0%Yashima Bosai Setsubi Co., Ltd. ....................................................75.5%Nohmi Taiwan Ltd... .....................................................................52.0%Shanghai Nohmi Secom Fire Protection Equipment Co., Ltd. ...... 60.0%
The Company acquired additional shares of Nohmi Taiwan Ltd. in June
2007 and shares of Shanghai Nohmi Secom Fire Protection Equipment
Co., Ltd. in December 2007.
These Companies had been accounted under the equity method
before these acquisitions and have been included in the consolidated
fi nancial statements since the date of these acquisitions.
The accounts of the remaining 6 unconsolidated subsidiaries had
insignifi cant amounts of total assets, net sales, net income and retained
earnings and therefore have been excluded from consolidation.
(2) Elimination of Intercompany Accounts
For the purposes of preparing the consolidated fi nancial statements, all
signifi cant intercompany transactions, account balances and unrealized
profi ts among the Companies have been entirely eliminated, and the
portion attributable to minority interests is charged/credited to “Minority
interests.”
The assets and liabilities of acquired consolidated subsidiaries are
incorporated into the fi nancial statements at fair value and the difference
between net assets at fair value and investment amount at acquisition
dates of investments is recorded as goodwill or negative goodwill and
amortized over a fi ve-year period on a straight-line basis.
(3) Investments in Unconsolidated Subsidiaries and Affi liates
At March 31, 2010, the Company had investments in 4 affi liates.
Investments in unconsolidated subsidiaries and affi liates are generally
Notes to the Consolidated Financial StatementsNohmi Bosai Ltd. and its SubsidiariesFor the years ended March 31, 2008, 2009 and 2010

17
accounted for under the equity method. Consolidated income includes the
Company’s current equity in the net income of affi liates, after elimination
of intercompany profi ts.
The equity method is applied to the investments in 1 affi liate out of 4
affi liates in the consolidated fi nancial statements.
However, the remaining 6 unconsolidated subsidiaries and 3 affi liates do
not have a material effect on “Net income (loss)” or “Retained earnings”
in the consolidated fi nancial statements. Accordingly, the investments in
the 6 unconsolidated subsidiaries and 3 affi liates are carried at cost.
(4) Cash and Cash Equivalents
Cash and cash equivalents in the consolidated statements of cash fl ows
are composed of cash in hand, bank deposits able to be withdrawn on
demand and short-term investments with an original maturity of three
months or less and which represent minor risk of fl uctuations in value.
(5) Inventories
Prior to April 1, 2008, inventories of the Company and consolidated
domestic subsidiaries are stated at cost determined by the following
methods according to inventory item:
Products and raw materials…….Weighted-average cost method
Work in progress and cost of construction contracts in progress
…….Individually identifi ed cost method
As discussed in Note 3 (2), effective April 1, 2008, the Company and its
consolidated domestic subsidiaries adopted a new accounting standard
for the measurement of inventories and stated the inventories at the
lower of weighted-average cost or net realizable value at March 31, 2009.
Inventories of consolidated foreign subsidiaries are stated at the lower of
weighted-average cost or market.
(6) Financial Instruments
Securities
In accordance with Japanese GAAP, securities held by the Company and
its subsidiaries are classifi ed into four categories as follows.
Trading securities, which are held for the purpose of generating profi ts
on short-term differences in prices, are stated at fair value, with changes in
fair value included in net profi t or loss for the period in which they arise.
Held-to-maturity debt securities, that the Company and its subsidiaries
intend to hold to maturity, are stated at cost after accounting for premium
or discount on acquisition, which is amortized over the period to maturity.
Investments of the Company in equity securities issued by
unconsolidated subsidiaries and affi liates are accounted for under the
equity method.
Other securities, for which market quotations are available, are stated
at fair value. The differences between the book value and market prices of
other securities, net of applicable income taxes, are presented in net assets
as a component of valuation and translation adjustments. If fair value is
not available, other securities are stated at moving average cost.
(7) Property, Plant and Equipment
Property, plant and equipment are stated at cost.
Depreciation is computed using the straight-line method over the
estimated useful lives of the assets.
Effective from the year ended March 31, 2009, the Company and its
consolidated domestic subsidiaries changed the useful lives of machinery
and equipment from 10 years to 8 years based on a reassessment of the
useful lives in light of the change in the Corporation Tax Code of Japan.
The effect on net income of this change was not material.
Effective from the year ended March 31, 2008, the Company and its
domestic consolidated subsidiaries changed their depreciation method for
tangible fi xed assets acquired on or after April 1, 2007 in accordance with
the revision of the Japanese Corporate Tax Law (Partial Revision of Income
Tax Law, Law No. 6 of March 30, 2007; Partial Revision of Income Tax Law
Enforcement Ordinance, Cabinet Order No. 83 of March 30, 2007). The
effect of this change on consolidated operating income and income before
income taxes for the year ended March 31, 2008 was immaterial.
Pursuant to an amendment to the Japanese Corporate Tax Law,
effective from the year ended March 31, 2008, the Company and its
domestic consolidated subsidiaries depreciate the difference between the
original residual value of 5% of acquisition cost of assets acquired before
April 1, 2007 and the new residual value of 1 yen (memorandum value)
by the straight-line method over 5 years commencing from the fi scal
year following the year in which the asset becomes fully depreciated to
the original residual value. As a result of this change, operating income
decreased ¥60 million, and income before income taxes decreased ¥61
million for the year ended March 31, 2008.
The Companies assessed impairment of each group of assets, which are
grouped on the basis of managerial accounting and investment decision-
making purposes.
(8) Amortization
With respect to intangible fi xed assets, amortization of software is
computed using the straight-line method over the expected useful life of
the software (5 years).
Amortization of intangible fi xed assets and deferred charges other than
software is computed using the straight-line method.
Goodwill or negative goodwill are amortized over a fi ve-year period on
a straight-line basis.
(9) Allowance for Bad Debts
In accordance with Japanese GAAP, future credit losses on receivables are
estimated by the following classifi cation of receivables:
Receivables from debtors who are not in serious fi nancial diffi culty
are called “normal receivables.” The allowance for doubtful accounts
against normal receivables is estimated by applying the historical credit loss
rates, on an appropriate aggregated basis, or on a disaggregated basis by
category of similar receivables.
Receivables from debtors who have not gone into bankruptcy, but
who are or probably would be in serious fi nancial diffi culty if they had to
repay debts are called “doubtful receivables.” The allowance for doubtful
accounts against these doubtful receivables is estimated by fi rst deducting
future cash infl ows to be generated from foreclosure or guarantors
from the recorded receivable amount, and then considering the debtor’s
fi nancial condition and operating results to determine the remaining
amount.
Receivables from debtors who have either gone into bankruptcy or are
substantially insolvent are called “failed receivables.” The allowance for
doubtful accounts against failed receivables and other similar receivables
is estimated as the recorded receivables amount less cash infl ows from
foreclosures or guarantors.
(10) Accrued Warranty Costs
Accrued warranty costs have been provided by the Companies for the
cost of warranties on completed construction contracts estimated to
be incurred subsequent to year-end dates. Accrued warranty costs are
provided based on past experience.

18
(18) Foreign Currency Translation
Receivables and payables denominated in foreign currencies are translated
into Japanese yen at the exchange rate prevailing on the respective
balance sheet dates, and resulting exchange gains or losses are included
in net income or loss for the period.
The balance sheet accounts of foreign subsidiaries are translated into
Japanese yen at the rates of exchange in effect at the balance sheet date,
except for shareholders’ equity accounts, which are translated at the
historical rates. Revenue and expense accounts of foreign subsidiaries are
translated at average rates of exchange in effect during the year. Resulting
translation adjustments are presented in net assets as a component
of valuation and translation adjustments and minority interests in the
consolidated fi nancial statements.
(19) Net Income and Dividends per Share
Net income per share of common stock is based upon the weighted
average number of shares of common stock outstanding during each
year. There are no equity instruments issued that have a dilutive effect on
earnings per share. Cash dividends per share shown for each period in
the accompanying consolidated statements of income represent dividends
declared as applicable to the respective periods.
(20) Reclassifi cationCertain reclassifi cations of previously reported data have been made to
conform with current classifi cations.
3. Changes in Accounting Policies(1) Unifi cation of Accounting Policies Applied to Foreign
Subsidiaries for Consolidated Financial Statements Effective from April 1, 2008, the Companies adopted “Practical Solution
on Unifi cation of Accounting Policies Applied to Foreign Subsidiaries for
Consolidated Financial Statements” (Practical Issues Task Force No. 18
(“PITF No. 18”) issued by the Accounting Standards Board of Japan). PITF
No. 18 requires that accounting policies and procedures applied by the
Companies to similar transactions and events under similar circumstances
should, in principle, be unifi ed for the preparation of the consolidated
fi nancial statements. PITF No. 18, however, as a tentative measure,
allows a parent company to prepare consolidated fi nancial statements
using foreign subsidiaries’ fi nancial statements prepared in accordance
with either International Financial Reporting Standards or U.S. generally
accepted accounting principles. In this case, adjustments for the following
six items are required in the consolidation process so that their impact on
net income is accounted for in accordance with Japanese GAAP unless the
impact is not material.
(a) Goodwill not subject to amortization
(b) Actuarial gains and losses of defi ned-benefi t retirement plans
recognized outside profi t or loss
(c) Capitalized expenditures for research and development activities
(d) Fair value measurement of investment properties, and revaluation of
property, plant and equipment and intangible assets
(e) Retrospective treatment of a change in accounting policies
(f) Accounting for net income attributable to minority interests
There were no material effects as a result of the adoption of PITF No. 18
on the consolidated fi nancial statements.
(11) Allowance for Losses on Construction Contracts
Allowance for losses on construction contracts is provided at the
estimated amount for future losses on construction backlog if those
losses are judged to be inevitable at the balance sheet date and
reasonable estimation of the amounts of such losses is possible.
(12) Accounting for Leases
The Company and its consolidated domestic subsidiaries account for
fi nance leases commencing prior to April 1, 2008 which do not transfer
the ownership of the leased property to the lessee as operating leases
with disclosures of certain “as if capitalized” information. As discussed
in Note 3 (3), the Company and its consolidated domestic subsidiaries
adopted a new accounting standard and capitalized fi nance leases which
commenced on or after April 1, 2008, except for certain immaterial or
short-term fi nance leases, which are accounted for as operating leases.
As permitted, fi nance leases which commenced prior to April 1,
2008 and have been accounted for as operating leases, continue to
be accounted for as operating leases with disclosure of certain “as if
capitalized” information.
(13) Revenue Recognition
As discussed in Note 3 (5), effective from April 1, 2009, the Companies
adopted a new accounting standard for recognition of revenues.
The Company applies the percentage-of-completion method to
construction contracts, commencing on or after April 1, 2009, whose
outcomes are deemed certain for progress until the end of the current
fi scal year, and applies the completed-contract method to other
construction contracts. The percentage of costs incurred to the estimated
total cost is used for estimating the percentage of completion.
(14) Income Taxes
Income taxes consist of corporation, enterprise and inhabitant taxes.
In accordance with Japanese GAAP for deferred taxes, the Company
and its consolidated subsidiaries adopted the deferred tax assets and
liability approach, which is used to recognize deferred tax assets.
(15) Accrued Retirement Benefi ts
In accordance with Japanese Accounting Standard for Accrued Retirement
Benefi ts, accrued retirement benefi ts represent the estimated present value
of projected benefi t obligations in excess of fair value of the plan assets.
Any unrecognized actuarial differences are amortized on a straight-line
basis over the period of 10 years from the next year in which they arise.
As discussed in Note 3 (4), the Companies adopted a new accounting
standard.
(16) Directors’ and Corporate Auditors’ Retirement Benefi ts
Retirement benefi ts for directors and corporate auditors are provided for
at an amount based upon internal rules at the balance sheet date.
(17) Research and Development Expenses
Research and development expenses are charged to income as incurred.
19
(2) New Accounting Standard for InventoriesEffective from April 1, 2008, the Company and its consolidated domestic
subsidiaries adopted “Accounting Standard for Measurement of
Inventories” (Statement No. 9 issued by the Accounting Standards Board
of Japan). As permitted under the superseded accounting standard, the
Company and its consolidated domestic subsidiaries previously stated
inventories at cost. The new accounting standard requires that inventories
held for sale in the ordinary course of business be measured at the lower
of cost or net realizable value. Replacement cost may be used in lieu of the
net realizable value, if appropriate.
The adoption of the new accounting standard had no material effects on
the consolidated fi nancial statements.
(3) New Accounting Standard for Lease Transactions as Lessee
Prior to the year ended March 31, 2009, the Company and its consolidated
domestic subsidiaries accounted for fi nance leases, which do not transfer
ownership of the leased property to the lessee, as operating leases with
disclosure of certain “as if capitalized” information in the notes to the
consolidated fi nancial statements.
On March 31, 2007, the Accounting Standards Board of Japan issued
Statement No. 13, “Accounting Standard for Lease Transactions” and
Guidance No. 16, “Guidance on Accounting Standard for Lease Transactions.”
The new accounting standards require that all fi nance lease transactions be
treated as capital leases.
Effective from the year ended March 31, 2009, the Company and its
consolidated domestic subsidiaries adopted the new accounting standard for
fi nance leases commencing on or after April 1, 2008 and capitalized assets
used under such leases, except for certain immaterial or short-term fi nance
leases, which are accounted for as operating leases. As permitted, fi nance
leases which commenced prior to April 1, 2008 and have been accounted
for as operating leases, continue to be accounted for as operating leases with
disclosure of certain “as if capitalized” information.
The adoption of the new accounting standard had no material effects on
the consolidated fi nancial statements.
(4) New Accounting Standard for Retirement Benefi ts
Effective from April 1, 2009, the Company and its consolidated domestic
subsidiaries adopted the “Partial Amendments to Accounting Standard
for Retirement Benefi ts (Part 3)” (Accounting Standards Board of
Japan Statement No. 19 issued on July 31, 2008). The new accounting
standard requires domestic companies to use the rate of return on long-
term government or gilt-edged bonds as of the end of the fi scal year for
calculating the projected benefi t obligation of a defi ned-benefi t plan.
Previously, domestic companies were allowed to use a discount rate
determined by taking into consideration fl uctuations in the yield of long-
term government or gilt-edged bonds over a certain period. This change had
no material impact on the consolidated fi nancial statements.
(5) New Accounting Standard for Construction Contracts
The “Accounting Standards for Construction Contracts” (the Accounting
Standards Board of Japan Statement No. 15 dated December 27, 2007) and
the “Guidance on Accounting Standard for Construction Contracts” (the
Accounting Standards Board of Japan Guidance No. 18 dated December
27, 2007) have been adopted in recognition of the sales effective in the
fi scal year ended March 31, 2010.
The Company applies the percentage-of-completion method to
construction contracts, commencing on or after April 1, 2009, whose
outcomes are deemed certain for progress until the end of the current
fi scal year, and applies the completed-contract method to other
construction contracts. The percentage of costs incurred to the estimated
total cost is used for estimating the percentage of completion.
By having adopted the new accounting standards, net sales increased
¥903 million ($9,706 thousand), and gross profi t, operating income and
income before income taxes increased ¥136 million ($1,462 thousand),
respectively, for the year ended March 31, 2010.
4. Cash and Cash EquivalentsCash and cash equivalents consisted of the following: Thousands of Millions of Yen U.S. Dollars
2008 2009 2010 2010 Cash and bank deposits .................... ¥16,078 ¥15,965 ¥18,765 $201,687Short-term investments 2,000 2,000 2,000 21,496 Total.......................... 18,078 17,965 20,765 223,183Time deposits with deposit terms of over three months ..... (902) (1,108) (1,285) (13,811) Cash and cash equivalents................ ¥17,176 ¥16,857 ¥19,480 $209,372
5. SecuritiesThe following tables summarize the acquisition costs, book values and fair
values of securities with available fair values as of March 31, 2009 and 2010.
Available-for-sale securities
Securities with book value exceeding acquisition costs
Millions of Yen 2009 Acquisition Book Cost Value Difference Equity securities ............................. ¥ 382 ¥ 493 ¥ 111 Millions of Yen 2010 Acquisition Book Cost Value Difference Equity securities ............................. ¥ 660 ¥ 950 ¥ 290 Thousands of U.S. Dollars 2010 Acquisition Book Cost Value Difference Equity securities ............................. $ 7,094 $10,211 $ 3,117

20
Securities with book value not exceeding acquisition cost Millions of Yen 2009 Acquisition Book Cost Value Difference Equity securities ............................. ¥ 775 ¥ 528 ¥ (247) Millions of Yen 2010 Acquisition Book Cost Value Difference Equity securities ............................. ¥ 393 ¥ 335 ¥ (58) Thousands of U.S. Dollars 2010 Acquisition Book Cost Value Difference Equity securities ............................. $ 4,224 $ 3,601 $ (623)
The following tables summarize book value of securities with no available
fair market values as of March 31, 2009 and 2010.
Available-for-sale securities Thousands of Millions of Yen U.S. Dollars 2009 2010 2010 Non-listed equity securities ............ ¥ 123 ¥ 113 $ 1,215Negotiable certifi cate of deposit .... 2,000 2,000 21,496 ¥ 2,123 ¥ 2,113 $ 22,711
Available-for-sale securities with maturities and held-to-maturity debt
securities are as follows: Millions of Yen 2009 Over 1 year but Within 1 year within 5 years Negotiable certifi cate of deposit .................. ¥ 2,000 ¥ —
Millions of Yen 2010 Over 1 year but Within 1 year within 5 years Negotiable certifi cate of deposit .................. ¥ 2,000 ¥ —
Thousands of U.S. Dollars 2010 Over 1 year but Within 1 year within 5 years Negotiable certifi cate of deposit .................. $21,496 $ —
6. Impairment Loss on Fixed AssetsThe Companies have recognized impairment loss of ¥122 million for the
following group of assets as of March 31, 2008.
Location Use CategoryMenuma factory (Kumagaya City, Saitama Prefecture)
For business Buildings and structures, Other
Kobe City, Hyogo Prefecture
For lease Land, Buildings and structures, Other
The Company recognized impairment losses amounting to ¥107 million on
the assets for businesses as the Company planned to dispose of a part of
existing equipments in accordance with the production base restructuring
plan of the factory, which is to maintain the quality of products and
competitiveness with regard to productivity. Items included in the amount
of impairment losses on buildings amounted to ¥106 million and others
amounted to ¥1 million. The collectible amount is measured by net sale
value and calculated on the disposable value.
The Company recognized impairment losses amounting to ¥15 million
on the assets for rentals because of the continuous decreases of land
prices. Impairment losses on buildings amounted to ¥9 million and land
amounted to ¥6 million. The collectible amount is measured based on the
usable value and calculated based on the discounted future cash fl ow by
5.6%.
The Companies have recognized impairment loss of ¥15 million ($161
thousand) for the following group of assets as of March 31, 2010.
Location Use CategoryInternational division (Chiyoda Ward, Tokyo Metropolis)
For business Tools and furniture
The Company recognized impairment losses amounting to ¥15 million
($161 thousand) on the assets for businesses due to its low profi tability
caused by fi erce competition outside of Japan. The collectible amount is
measured by net sale value and calculated on the disposable value.
7. InventoriesInventories consisted of the following: Thousands of Millions of Yen U.S. Dollars 2009 2010 2010 Products ....................................... ¥ 2,357 ¥ 2,584 $ 27,773Raw materials ............................... 3,648 3,753 40,337Work in progress ........................... 940 813 8,738Cost of construction contracts in progress ................... 9,287 5,157 55,428 ¥ 16,232 ¥ 12,307 $132,276
8. Short-term Debt and Long-term DebtShort-term debt at March 31, 2010 bore interest at annual rates ranging
from 1.875% to 3.4% and was represented generally by bank overdrafts
and short-term notes maturing at various dates within one year.
It is the normal business custom in Japan for short-term borrowings to be
rolled over each year.
Long-term debt at March 31, 2009 and 2010 comprised the following: Thousands of Millions of Yen U.S. Dollars 2009 2010 2010 Guarantee deposits received ........ ¥ 366 ¥ 364 $ 3,912
Total long-term debt .................... ¥ 366 ¥ 364 $ 3,912
The average interest rate uses the weighted-average rate applicable to the
year-end balance.
Since there are no annual maturities of guarantee deposits received, the
annual maturities and the aggregate annual maturities are not presented.

21
9. Accrued Retirement Benefi ts and Pension PlanThe composition of amounts recognized in the consolidated balance
sheets at March 31, 2009 and 2010 were as follows:
Thousands of Millions of Yen U.S. Dollars 2009 2010 2010 Benefi t obligations at end of year .. ¥(10,778) ¥(11,053) $(118,798)Fair value of plan assets at end of year 4,459 5,389 57,921 Funded status ............................... (6,319) (5,664) (60,877)Unrecognized actuarial losses ........ 1,506 923 9,920 Net amount recognized ............... (4,813) (4,741) (50,957)Prepaid pension costs .................... 765 692 7,437 Accrued retirement benefi ts .......... ¥ (5,578) ¥ (5,433) $ (58,394)
The components of net pension and employees’ severance costs for the
years ended March 31, 2008, 2009 and 2010 were as follows: Thousands of Millions of Yen U.S. Dollars 2008 2009 2010 2010 Service costs ................................ ¥649 ¥591 ¥540 $5,804Interest costs ................................ 272 260 251 2,698Expected return on plan assets ..... (109) (109) (102) (1,096)Recognized actuarial loss ............. 97 138 222 2,386Extra severance costs ................... 16 19 10 107 Net periodic benefi t costs ............. ¥925 ¥899 ¥921 $9,899
Assumptions used as of March 31, 2008, 2009 and 2010 were as follows.
2008 2009 2010Discount rate 2.5% 2.5% 2.5%
Expected rate of return on plan assets
2.5% 2.5% 2.5%
Method of attributing the projected benefi ts to periods of services
Straight-line basis
Straight-line basis
Straight-line basis
Amortization of unrecognized prior service cost
10 years 10 years 10 years
Amortization of unrecognized actuarial differences
10 years 10 years 10 years
10. Research and Development ExpensesResearch and development expenses included in selling, general and
administrative expenses for the years ended March 31, 2008, 2009 and
2010 were ¥1,648 million, ¥1,691 million and ¥1,673 million ($17,982
thousand), respectively.
11. Accounting for LeasesThe Companies have various lease agreements whereby the Companies
act as both lessee and lessor. The Companies’ fi nance lease contracts are
not deemed to transfer the ownership of the leased assets. As permitted,
fi nance leases which commenced prior to April 1, 2008 and have been
accounted for as operating leases, continue to be accounted for as
operating leases with disclosure of certain “as if capitalized” information.
Certain key information on such lease contracts of the Companies for
the years ended March 31, 2009 and 2010 was as follows:
As lessee:
Assumed data as to acquisition cost, accumulated depreciation, net
book value and depreciation expense of the leased assets, including the
portion of interest thereon, were summarized as follows: Thousands of Millions of Yen U.S. Dollars 2009 2010 2010 Machinery and equipment ............ ¥ 13 ¥ 13 $ 140Tools and furniture ......................... 77 37 397Intangibles ..................................... 16 16 172 106 66 709Less: Accumulated depreciation .... (79) (56) (602) Net book value .............................. ¥ 27 ¥ 10 $ 107 Depreciation .................................. ¥ 22 ¥ 16 $ 172
Depreciation is based on the straight-line method over the lease term of
the leased assets assuming no residual value.
The scheduled maturities of future minimum lease payments on such
lease contracts as of March 31, 2009 and 2010 were as follows:
Thousands of Millions of Yen U.S. Dollars 2009 2010 2010 Due within one year ................... ¥ 17 ¥ 6 $ 64 Due over one year ...................... 10 4 43 ¥ 27 ¥ 10 $ 107 Minimum lease payments expensed for the year ................ ¥ 22 ¥ 16 $ 172
As lessor: Thousands of Millions of Yen U.S. Dollars 2009 2010 2010 Leased tools and furniture: Purchase cost ............................. ¥ 109 ¥ 29 $ 312 Accumulated depreciation .......... (95) (22) (237) Net book value........................... ¥ 14 ¥ 7 $ 75
The scheduled maturities of future minimum lease payments to be received
on such lease contracts as of March 31, 2009 and 2010 were as follows:
Thousands of Millions of Yen U.S. Dollars 2009 2010 2010 Due within one year ................... ¥0 27 ¥ 16 $ 172 Due over one year ...................... 65 34 365 ¥ 92 ¥ 50 $ 537 Revenue on minimum lease payments to be received for the year ............................. ¥ 0 31 ¥ 25 $ 269 Depreciation for the year ............ ¥0 03 ¥ 2 $ 21
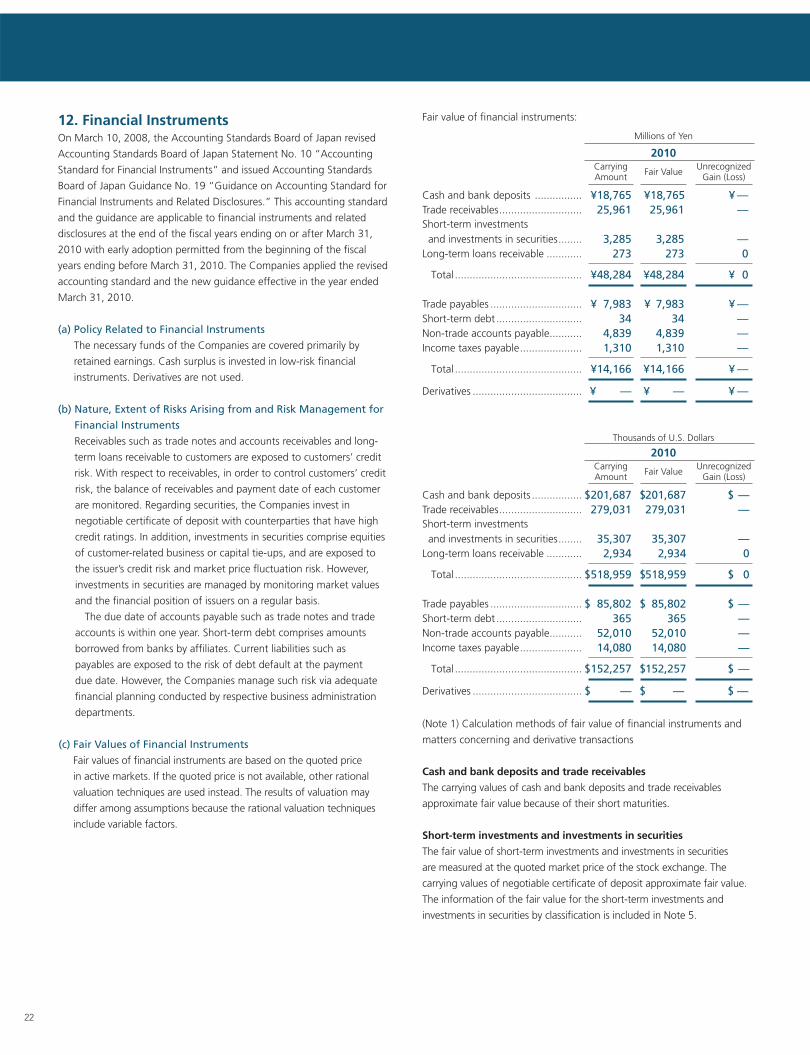
22
12. Financial InstrumentsOn March 10, 2008, the Accounting Standards Board of Japan revised
Accounting Standards Board of Japan Statement No. 10 “Accounting
Standard for Financial Instruments” and issued Accounting Standards
Board of Japan Guidance No. 19 “Guidance on Accounting Standard for
Financial Instruments and Related Disclosures.” This accounting standard
and the guidance are applicable to fi nancial instruments and related
disclosures at the end of the fi scal years ending on or after March 31,
2010 with early adoption permitted from the beginning of the fi scal
years ending before March 31, 2010. The Companies applied the revised
accounting standard and the new guidance effective in the year ended
March 31, 2010.
(a) Policy Related to Financial Instruments
The necessary funds of the Companies are covered primarily by
retained earnings. Cash surplus is invested in low-risk fi nancial
instruments. Derivatives are not used.
(b) Nature, Extent of Risks Arising from and Risk Management for
Financial Instruments
Receivables such as trade notes and accounts receivables and long-
term loans receivable to customers are exposed to customers’ credit
risk. With respect to receivables, in order to control customers’ credit
risk, the balance of receivables and payment date of each customer
are monitored. Regarding securities, the Companies invest in
negotiable certifi cate of deposit with counterparties that have high
credit ratings. In addition, investments in securities comprise equities
of customer-related business or capital tie-ups, and are exposed to
the issuer’s credit risk and market price fl uctuation risk. However,
investments in securities are managed by monitoring market values
and the fi nancial position of issuers on a regular basis.
The due date of accounts payable such as trade notes and trade
accounts is within one year. Short-term debt comprises amounts
borrowed from banks by affi liates. Current liabilities such as
payables are exposed to the risk of debt default at the payment
due date. However, the Companies manage such risk via adequate
fi nancial planning conducted by respective business administration
departments.
(c) Fair Values of Financial Instruments
Fair values of fi nancial instruments are based on the quoted price
in active markets. If the quoted price is not available, other rational
valuation techniques are used instead. The results of valuation may
differ among assumptions because the rational valuation techniques
include variable factors.
Fair value of fi nancial instruments:
Millions of Yen
2010 Carrying Unrecognized Amount Fair Value Gain (Loss)
Cash and bank deposits ................ ¥18,765 ¥18,765 ¥ —Trade receivables ............................ 25,961 25,961 —Short-term investments and investments in securities ........ 3,285 3,285 —Long-term loans receivable ............ 273 273 0
Total ........................................... ¥48,284 ¥48,284 ¥ 0
Trade payables ............................... ¥ 7,983 ¥ 7,983 ¥ —Short-term debt ............................. 34 34 —Non-trade accounts payable ........... 4,839 4,839 —Income taxes payable ..................... 1,310 1,310 —
Total ........................................... ¥14,166 ¥14,166 ¥ —
Derivatives ..................................... ¥ — ¥ — ¥ —
Thousands of U.S. Dollars
2010 Carrying Unrecognized Amount Fair Value Gain (Loss)
Cash and bank deposits ................. $201,687 $201,687 $ —Trade receivables ............................ 279,031 279,031 —Short-term investments and investments in securities ........ 35,307 35,307 —Long-term loans receivable ............ 2,934 2,934 0
Total ........................................... $518,959 $518,959 $ 0
Trade payables ............................... $ 85,802 $ 85,802 $ —Short-term debt ............................. 365 365 —Non-trade accounts payable ........... 52,010 52,010 —Income taxes payable ..................... 14,080 14,080 —
Total ........................................... $152,257 $152,257 $ —
Derivatives ..................................... $ — $ — $ —
(Note 1) Calculation methods of fair value of fi nancial instruments and
matters concerning and derivative transactions
Cash and bank deposits and trade receivables
The carrying values of cash and bank deposits and trade receivables
approximate fair value because of their short maturities.
Short-term investments and investments in securities
The fair value of short-term investments and investments in securities
are measured at the quoted market price of the stock exchange. The
carrying values of negotiable certifi cate of deposit approximate fair value.
The information of the fair value for the short-term investments and
investments in securities by classifi cation is included in Note 5.
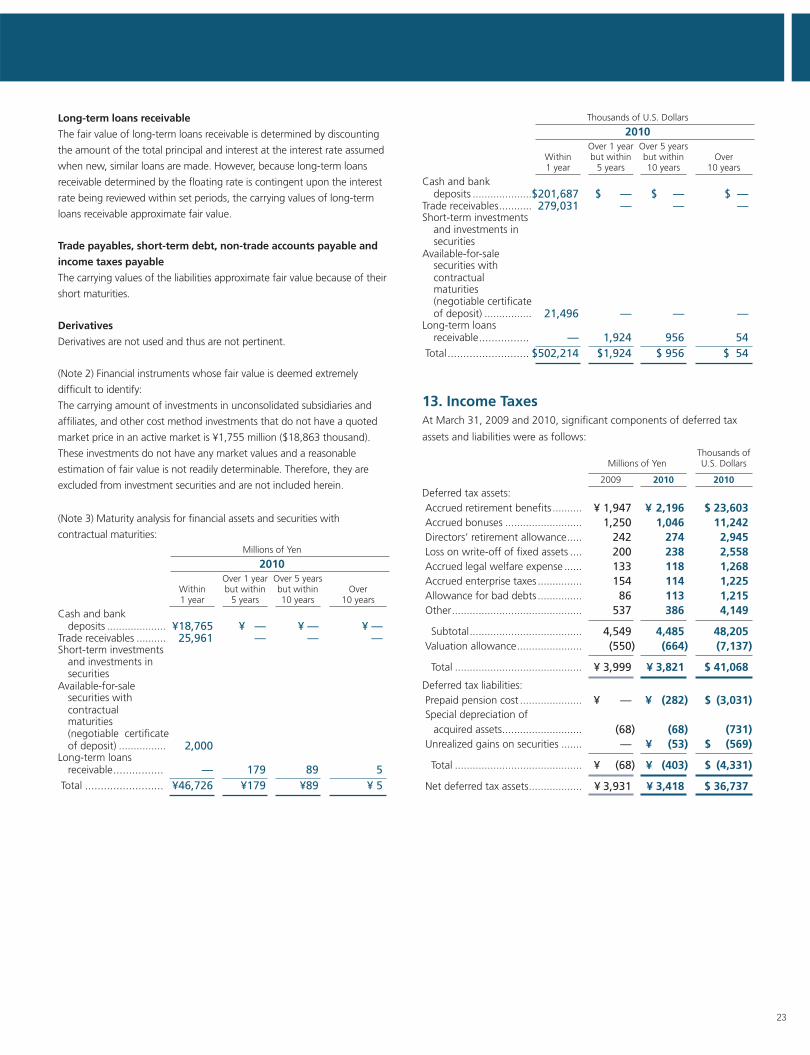
23
Long-term loans receivable
The fair value of long-term loans receivable is determined by discounting
the amount of the total principal and interest at the interest rate assumed
when new, similar loans are made. However, because long-term loans
receivable determined by the fl oating rate is contingent upon the interest
rate being reviewed within set periods, the carrying values of long-term
loans receivable approximate fair value.
Trade payables, short-term debt, non-trade accounts payable and
income taxes payable
The carrying values of the liabilities approximate fair value because of their
short maturities.
Derivatives
Derivatives are not used and thus are not pertinent.
(Note 2) Financial instruments whose fair value is deemed extremely
diffi cult to identify:
The carrying amount of investments in unconsolidated subsidiaries and
affi liates, and other cost method investments that do not have a quoted
market price in an active market is ¥1,755 million ($18,863 thousand).
These investments do not have any market values and a reasonable
estimation of fair value is not readily determinable. Therefore, they are
excluded from investment securities and are not included herein.
(Note 3) Maturity analysis for fi nancial assets and securities with
contractual maturities: Millions of Yen
2010 Over 1 year Over 5 years Within but within but within Over 1 year 5 years 10 years 10 years Cash and bank deposits .................... ¥18,765 ¥ — ¥ — ¥ —Trade receivables .......... 25,961 — — —Short-term investments and investments in securities Available-for-sale securities with contractual maturities (negotiable certifi cate of deposit) ................ 2,000 Long-term loans receivable ................ — 179 89 5 Total ......................... ¥46,726 ¥179 ¥89 ¥ 5
Thousands of U.S. Dollars
2010 Over 1 year Over 5 years Within but within but within Over 1 year 5 years 10 years 10 years Cash and bank deposits ....................$201,687 $ — $ — $ —Trade receivables ........... 279,031 — — —Short-term investments and investments in securities Available-for-sale securities with contractual maturities (negotiable certifi cate of deposit) ................ 21,496 — — —Long-term loans receivable ................ — 1,924 956 54 Total .......................... $502,214 $1,924 $ 956 $ 54
13. Income TaxesAt March 31, 2009 and 2010, signifi cant components of deferred tax
assets and liabilities were as follows:
Thousands of Millions of Yen U.S. Dollars 2009 2010 2010 Deferred tax assets: Accrued retirement benefi ts .......... ¥ 1,947 ¥ 2,196 $ 23,603 Accrued bonuses .......................... 1,250 1,046 11,242 Directors’ retirement allowance ..... 242 274 2,945 Loss on write-off of fi xed assets .... 200 238 2,558 Accrued legal welfare expense ...... 133 118 1,268 Accrued enterprise taxes ............... 154 114 1,225 Allowance for bad debts ............... 86 113 1,215 Other ............................................ 537 386 4,149
Subtotal ...................................... 4,549 4,485 48,205 Valuation allowance ...................... (550) (664) (7,137)
Total ........................................... ¥ 3,999 ¥ 3,821 $ 41,068 Deferred tax liabilities: Prepaid pension cost ..................... ¥ — ¥ (282) $ (3,031) Special depreciation of acquired assets ........................... (68) (68) (731) Unrealized gains on securities ....... — ¥ (53) $ (569)
Total ........................................... ¥ (68) ¥ (403) $ (4,331)
Net deferred tax assets .................. ¥ 3,931 ¥ 3,418 $ 36,737
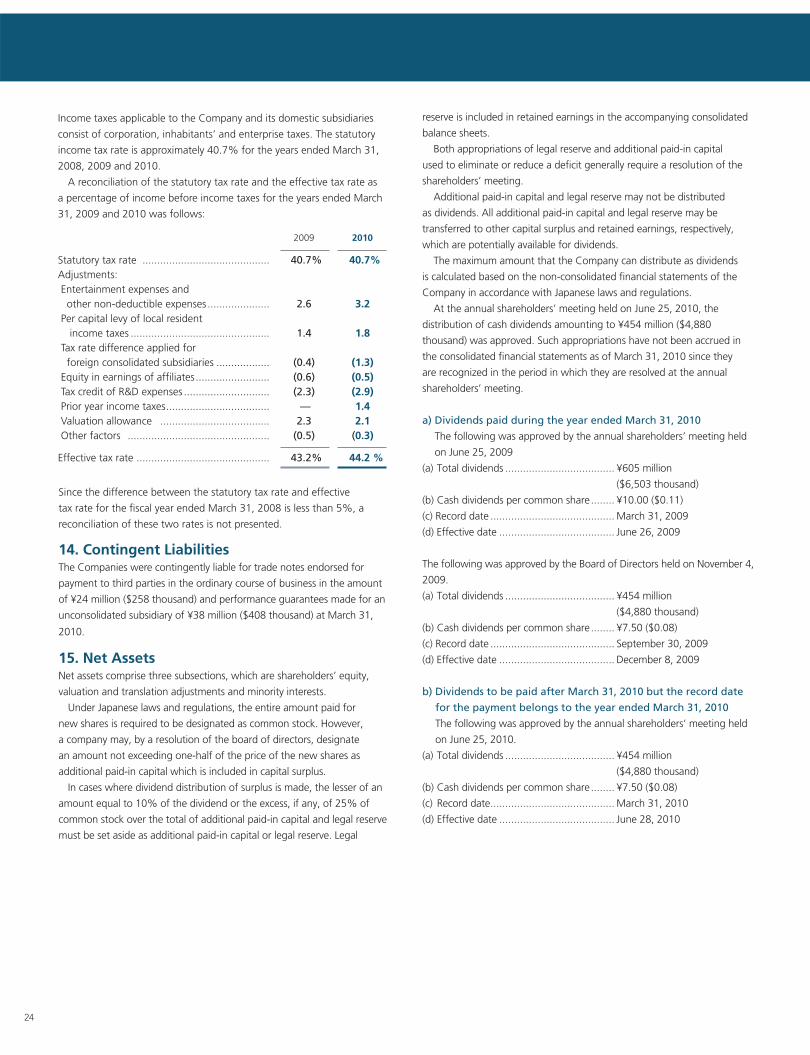
24
Income taxes applicable to the Company and its domestic subsidiaries
consist of corporation, inhabitants’ and enterprise taxes. The statutory
income tax rate is approximately 40.7% for the years ended March 31,
2008, 2009 and 2010.
A reconciliation of the statutory tax rate and the effective tax rate as
a percentage of income before income taxes for the years ended March
31, 2009 and 2010 was follows:
2009 2010 Statutory tax rate ........................................... 40.7% 40.7% Adjustments: Entertainment expenses and other non-deductible expenses ..................... 2.6 3.2 Per capital levy of local resident income taxes ............................................... 1.4 1.8 Tax rate difference applied for foreign consolidated subsidiaries .................. (0.4) (1.3) Equity in earnings of affi liates ......................... (0.6) (0.5) Tax credit of R&D expenses ............................. (2.3) (2.9) Prior year income taxes ................................... — 1.4 Valuation allowance ..................................... 2.3 2.1 Other factors ................................................ (0.5) (0.3) Effective tax rate ............................................. 43.2% 44.2 %
Since the difference between the statutory tax rate and effective
tax rate for the fi scal year ended March 31, 2008 is less than 5%, a
reconciliation of these two rates is not presented.
14. Contingent LiabilitiesThe Companies were contingently liable for trade notes endorsed for
payment to third parties in the ordinary course of business in the amount
of ¥24 million ($258 thousand) and performance guarantees made for an
unconsolidated subsidiary of ¥38 million ($408 thousand) at March 31,
2010.
15. Net AssetsNet assets comprise three subsections, which are shareholders’ equity,
valuation and translation adjustments and minority interests.
Under Japanese laws and regulations, the entire amount paid for
new shares is required to be designated as common stock. However,
a company may, by a resolution of the board of directors, designate
an amount not exceeding one-half of the price of the new shares as
additional paid-in capital which is included in capital surplus.
In cases where dividend distribution of surplus is made, the lesser of an
amount equal to 10% of the dividend or the excess, if any, of 25% of
common stock over the total of additional paid-in capital and legal reserve
must be set aside as additional paid-in capital or legal reserve. Legal
reserve is included in retained earnings in the accompanying consolidated
balance sheets.
Both appropriations of legal reserve and additional paid-in capital
used to eliminate or reduce a defi cit generally require a resolution of the
shareholders’ meeting.
Additional paid-in capital and legal reserve may not be distributed
as dividends. All additional paid-in capital and legal reserve may be
transferred to other capital surplus and retained earnings, respectively,
which are potentially available for dividends.
The maximum amount that the Company can distribute as dividends
is calculated based on the non-consolidated fi nancial statements of the
Company in accordance with Japanese laws and regulations.
At the annual shareholders’ meeting held on June 25, 2010, the
distribution of cash dividends amounting to ¥454 million ($4,880
thousand) was approved. Such appropriations have not been accrued in
the consolidated fi nancial statements as of March 31, 2010 since they
are recognized in the period in which they are resolved at the annual
shareholders’ meeting.
a) Dividends paid during the year ended March 31, 2010
The following was approved by the annual shareholders’ meeting held
on June 25, 2009
(a) Total dividends ..................................... ¥605 million
($6,503 thousand)
(b) Cash dividends per common share ........ ¥10.00 ($0.11)
(c) Record date .......................................... March 31, 2009
(d) Effective date ....................................... June 26, 2009
The following was approved by the Board of Directors held on November 4,
2009.
(a) Total dividends ..................................... ¥454 million
($4,880 thousand)
(b) Cash dividends per common share ........ ¥7.50 ($0.08)
(c) Record date .......................................... September 30, 2009
(d) Effective date ....................................... December 8, 2009
b) Dividends to be paid after March 31, 2010 but the record date
for the payment belongs to the year ended March 31, 2010
The following was approved by the annual shareholders’ meeting held
on June 25, 2010.
(a) Total dividends ..................................... ¥454 million
($4,880 thousand)
(b) Cash dividends per common share ........ ¥7.50 ($0.08)
(c) Record date .......................................... March 31, 2010
(d) Effective date ....................................... June 28, 2010
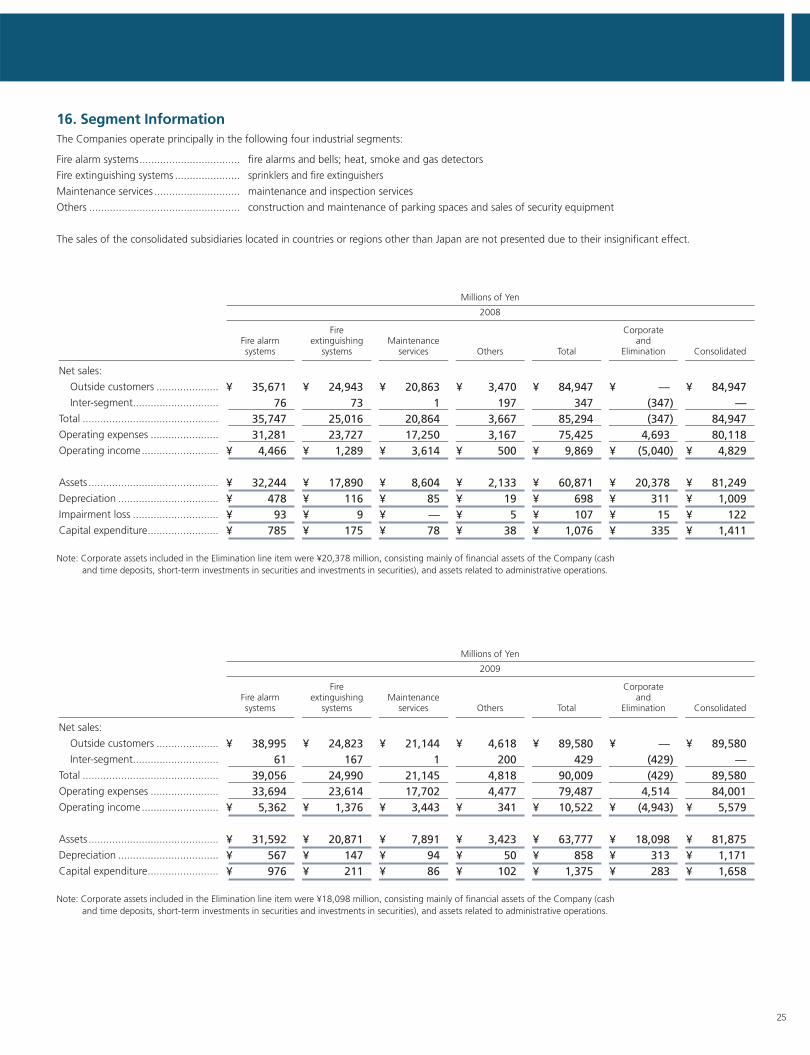
25
16. Segment InformationThe Companies operate principally in the following four industrial segments:
Fire alarm systems .................................. fi re alarms and bells; heat, smoke and gas detectors
Fire extinguishing systems ...................... sprinklers and fi re extinguishers
Maintenance services ............................. maintenance and inspection services
Others ................................................... construction and maintenance of parking spaces and sales of security equipment
The sales of the consolidated subsidiaries located in countries or regions other than Japan are not presented due to their insignifi cant effect.
Net sales:
Outside customers .....................
Inter-segment.............................
Total ..............................................
Operating expenses .......................
Operating income ..........................
Assets ............................................
Depreciation ..................................
Impairment loss .............................
Capital expenditure ........................
Fire alarmsystems
Fire extinguishing
systemsMaintenance
services Others Total
Corporate and
Elimination Consolidated
¥ 35,671 76 35,747 31,281¥ 4,466
¥ 32,244¥ 478¥ 93¥ 785
¥ 24,943 73 25,016 23,727¥ 1,289
¥ 17,890¥ 116¥ 9¥ 175
¥ 20,863 1 20,864 17,250¥ 3,614
¥ 8,604¥ 85¥ —¥ 78
¥ 3,470 197 3,667 3,167¥ 500
¥ 2,133¥ 19¥ 5¥ 38
¥ 84,947 347 85,294 75,425¥ 9,869
¥ 60,871¥ 698¥ 107¥ 1,076
¥ — (347) (347) 4,693¥ (5,040)
¥ 20,378¥ 311¥ 15¥ 335
¥ 84,947 — 84,947 80,118¥ 4,829
¥ 81,249¥ 1,009¥ 122¥ 1,411
Millions of Yen
2008
Note: Corporate assets included in the Elimination line item were ¥20,378 million, consisting mainly of fi nancial assets of the Company (cash and time deposits, short-term investments in securities and investments in securities), and assets related to administrative operations.
Net sales:
Outside customers .....................
Inter-segment.............................
Total ..............................................
Operating expenses .......................
Operating income ..........................
Assets ............................................
Depreciation ..................................
Capital expenditure ........................
Fire alarmsystems
Fire extinguishing
systemsMaintenance
services Others Total
Corporate and
Elimination Consolidated
¥ 38,995 61 39,056 33,694¥ 5,362
¥ 31,592¥ 567¥ 976
¥ 24,823 167 24,990 23,614¥ 1,376
¥ 20,871¥ 147¥ 211
¥ 21,144 1 21,145 17,702¥ 3,443
¥ 7,891¥ 94¥ 86
¥ 4,618 200 4,818 4,477¥ 341
¥ 3,423¥ 50¥ 102
¥ 89,580 429 90,009 79,487¥ 10,522
¥ 63,777¥ 858¥ 1,375
¥ — (429) (429) 4,514¥ (4,943)
¥ 18,098¥ 313¥ 283
¥ 89,580 — 89,580 84,001¥ 5,579
¥ 81,875¥ 1,171¥ 1,658
Millions of Yen
2009
Note: Corporate assets included in the Elimination line item were ¥18,098 million, consisting mainly of fi nancial assets of the Company (cash and time deposits, short-term investments in securities and investments in securities), and assets related to administrative operations.

26
Net sales:
Outside customers .....................
Inter-segment.............................
Total ..............................................
Operating expenses .......................
Operating income ..........................
Assets ............................................
Depreciation ..................................
Capital expenditure ........................
Fire alarmsystems
Fire extinguishing
systemsMaintenance
services Others Total
Corporate and
Elimination Consolidated
¥ 30,171 65 30,236 27,813¥ 2,423
¥ 29,959¥ 639¥ 1,250
¥ 26,401 62 26,463 24,711¥ 1,752
¥ 18,433¥ 156¥ 245
¥ 22,911 1 22,912 18,195¥ 4,717
¥ 9,014¥ 109¥ 198
¥ 4,667 196 4,863 4,426¥ 437
¥ 3,699¥ 58¥ 125
¥ 84,150 324 84,474 75,145¥ 9,329
¥ 61,105¥ 962¥ 1,818
¥ — (324) (324) 4,667¥ (4,991)
¥ 19,161¥ 329¥ 414
¥ 84,150 — 84,150 79,812¥ 4,338
¥ 80,266¥ 1,291¥ 2,232
Millions of Yen
2010
Note 1: Corporate assets included in the Elimination line item were ¥19,161 million, consisting mainly of fi nancial assets of the Company (cash and time deposits, short-term investments in securities and investments in securities), and assets related to administrative operations.
Note 2: As discussed in Note 3 (5), effective from April 1, 2009, the Companies adopted a new accounting standard for recognition of revenues. By having adopted the new accounting standards, net sales increased ¥903 million and operating income increased ¥136 million in the Fire Extinguishing Systems segment.
Net sales:
Outside customers .....................
Inter-segment.............................
Total ..............................................
Operating expenses .......................
Operating income ..........................
Assets ............................................
Depreciation ..................................
Capital expenditure ........................
Fire alarmsystems
Fire extinguishing
systemsMaintenance
services Others Total
Corporate and
Elimination Consolidated
$ 324,280 699 324,979 298,936$ 26,043
$ 322,001$ 6,868$ 13,435
$ 283,760 666 284,426 265,595$ 18,831
$ 198,119$ 1,677$ 2,633
$ 246,249 11 246,260 195,561$ 50,699
$ 96,883$ 1,172$ 2,128
$ 50,161 2,107 52,268 47,571$ 4,697
$ 39,757$ 623$ 1,344
$ 904,450 3,483 907,933 807,663$ 100,270
$ 656,760$ 10,340$ 19,540
$ — (3,483) (3,483) 50,162$ (53,645)
$ 205,944$ 3,536$ 4,450
$ 904,450 — 904,450 857,825$ 46,625
$ 862,704$ 13,876$ 23,990
Thousands of U.S. Dollars
2010
Note 1: Corporate assets included in the Elimination line item were $205,944 thousand, consisting mainly of fi nancial assets of the Company (cash and time deposits, short-term investments in securities and investments in securities), and assets related to administrative operations.
Note 2: As discussed in Note 3 (5), effective from April 1, 2009, the Companies adopted a new accounting standard for recognition of revenues. By having adopted the new accounting standards, net sales increased $9,706 thousand and operating income increased $1,462 thousand in the Fire Extinguishing Systems segment.
Geographical segmentsAs net sales and total assets of the overseas operations constituted less than 10% of the consolidated totals for the years ended March 31, 2008, 2009 and 2010, the disclosure of geographical segment information has been omitted.
Overseas salesAs overseas sales constituted less than 10% of the consolidated net sales for the years ended March 31, 2008, 2009 and 2010, the disclosure of overseas sales information was omitted.
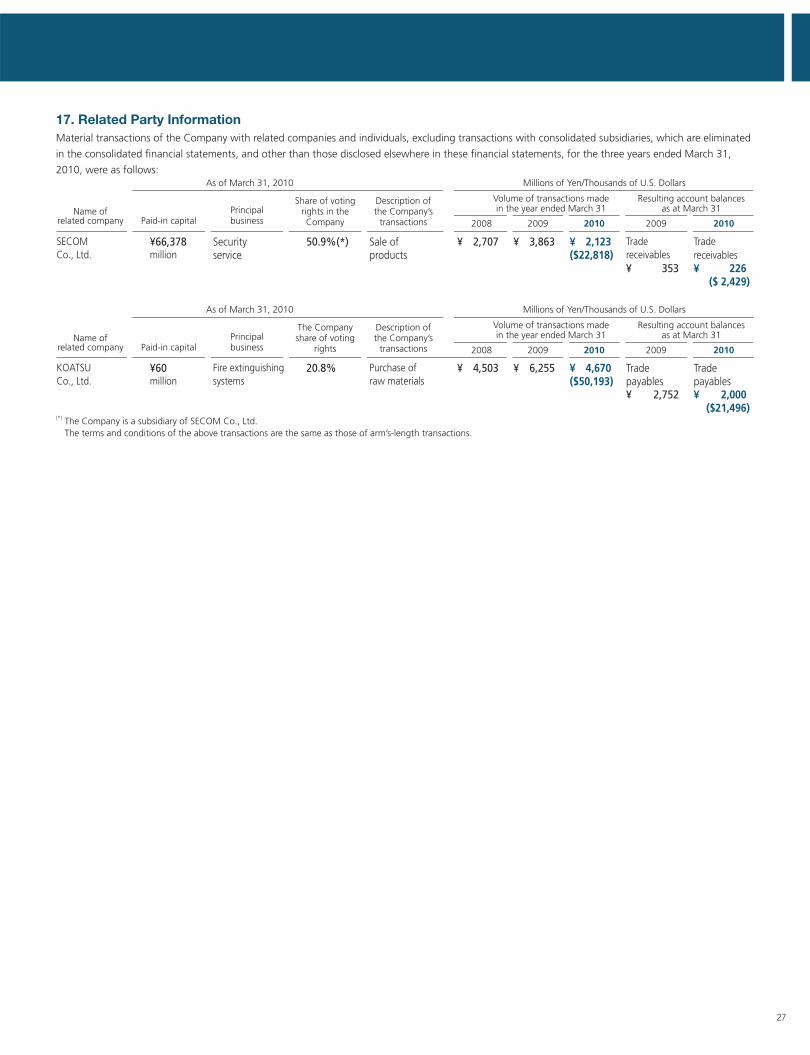
27
17. Related Party InformationMaterial transactions of the Company with related companies and individuals, excluding transactions with consolidated subsidiaries, which are eliminated
in the consolidated fi nancial statements, and other than those disclosed elsewhere in these fi nancial statements, for the three years ended March 31,
2010, were as follows:
Name ofrelated company
Name ofrelated company
Paid-in capital
Paid-in capital
2008
2008
2009
2009
2009
2009
2010
2010
2010
2010
Volume of transactions madein the year ended March 31
Volume of transactions madein the year ended March 31
Resulting account balancesas at March 31
Resulting account balancesas at March 31
¥ 2,707 ¥ 3,863 ¥ 2,123($22,818)
Tradereceivables¥ 353
Tradereceivables¥ 226 ($ 2,429)
SECOMCo., Ltd.
¥66,378million
Principal business
Principal business
Securityservice
Share of votingrights in the Company
The Company share of voting
rights
50.9%(*)
Description ofthe Company’s
transactions
Description ofthe Company’s
transactions
Sale ofproducts
As of March 31, 2010
As of March 31, 2010
Millions of Yen/Thousands of U.S. Dollars
Millions of Yen/Thousands of U.S. Dollars
(*) The Company is a subsidiary of SECOM Co., Ltd. The terms and conditions of the above transactions are the same as those of arm’s-length transactions.
¥ 4,503 ¥ 6,255 ¥ 4,670 ($50,193)
Tradepayables¥ 2,752
Tradepayables¥ 2,000 ($21,496)
KOATSUCo., Ltd.
Fire extinguishingsystems
20.8% Purchase ofraw materials
¥60million

28
Independent Auditors’ Report
To the Board of Directors of NOHMI BOSAI Ltd.:
We have audited the accompanying consolidated balance sheets of NOHMI BOSAI Ltd. and consolidated subsidiaries as of March 31, 2010 and 2009, and the related consolidated statements of income, changes in net assets and cash fl ows for each of the years in the three-year period ended March 31, 2010, expressed in Japanese yen. These consolidated fi nancial statements are the responsibility of the Company’s management. Our responsibility is to independently express an opinion on these consolidated fi nancial statements based on our audits.
We conducted our audits in accordance with auditing standards generally accepted in Japan. Those standards require that we plan and perform the audit to obtain reasonable assurance about whether the fi nancial statements are free of material misstatement. An audit includes examining, on a test basis, evidence supporting the amounts and disclosures in the fi nancial statements. An audit also includes assessing the accounting principles used and signifi cant estimates made by management, as well as evaluating the overall fi nancial statement presentation. We believe that our audits provide a reasonable basis for our opinion.
In our opinion, the consolidated fi nancial statements referred to above present fairly, in all material respects, the fi nancial position of NOHMI BOSAI Ltd. and subsidiaries as of March 31, 2010 and 2009, and the results of their operations and their cash fl ows for each of the years in the three-year period ended March 31, 2010, in conformity with accounting principles generally accepted in Japan.
The U.S. dollar amounts in the accompanying consolidated fi nancial statements with respect to the year ended March 31, 2010 are presented solely for convenience. Our audit also included the translation of yen amounts into U.S. dollar amounts and, in our opinion, such translation has been made on the basis described in Note 1 to the consolidated fi nancial statements.
Tokyo, JapanJune 25, 2010

ChairmanTadashi Tanoue*
PresidentTakeshi Hashizume*
Senior Managing DirectorYushi Tayama
Managing DirectorsYukimasa TachibanaJun UchiyamaKazuo KajitaToshiyuki Mori
DirectorsKoukei Higuchi†
Koichi Sato†
Hideo Morishita†
Makoto SawanoHajime AraiKiyotaka FujiiYoshinori SodaAkira IgarashiHiroaki IshiiTatsunori ItoKeiji Kageyama
Standing Corporate AuditorsHiroshi ShiinaShojiro Nohmi
Corporate AuditorsTakashi YamashitaTojiro IshiiHiroshi Nishigaki
*Representative Director†External
Fiscal YearEnding March 31
Annual Stockholders’ MeetingThe annual meeting of the Company’s stockholders is normally held in June of each year in Tokyo, Japan.
Stock Exchange ListingFirst Section, Tokyo Stock Exchange
Transfer AgentSumitomo Trust & Banking Co., Ltd.5-33, Kitahama 4-chome,Chuo-ku, Osaka 541-0041, Japan
Paid-in Capital¥13,302,282,161
Number of Shares Issued60,832,771
Distribution of Stockholders and Shares
Japanese national and regional governmental bodies ................. 0 0 0.00Japanese fi nancial institutions ................... 40 9,234 15.26Japanese securities companies .................. 38 478 0.79Other Japanese corporations ..................... 205 35,467 58.61Japanese individuals and others ................ 3,164 13,619 22.51Foreign institutions and individuals ............ 66 1,353 2.24Treasury stocks .......................................... 1 354 0.59
Total ......................................................... 3,514 60,505 100.0
Major Stockholders
SECOM Co., Ltd. 30,598 50.3 Shareholding Commission of Nohmi Bosai Distributors 1,761 2.9 Shareholding Commission of Nohmi Bosai Partners 1,591 2.6 Shareholding Commission of Nohmi Bosai Employees 1,206 2.0 The Bank of Tokyo-Mitsubishi UFJ , Ltd. 1,140 1.9 The Master Trust Bank of Japan, Ltd. (Trust Account) 997 1.6 Fuji Electric Holdings Co., Ltd. 855 1.4 Sumitomo Mitsui Banking Corporation 765 1.3 Tokio Marine & Nichido Fire Insurance Co., Ltd. 745 1.2 Shareholding Commission of Nohmi Bosai Safety and Health Cooperation Forum 717 1.2
Number of Stockholders
Number of Shares Held (Thousands)
Number ofShares Held(Thousands)
Percentage of Total Shares in
Issue (%)
Percentage ofTotal Shares in
Issue (%)
s Board of Directors and Corporate Auditors(As of June 25, 2010)
s Investor Information(As of June 25, 2010)
Printed in Japan
• HEAD OFFICE: 7-3, Kudan-Minami 4-chome, Chiyoda-ku, Tokyo 102-8277, Japan• TEL: 81-3-3265-0211 FAX: 81-3-3263-4948• URL: http://www.nohmi.co.jp