Embed Size (px)
Citation preview

Powered by Our People
Annual Report 2010

At home all over the world.
Over 50 countries, 5 continents, 4 emerging markets and still counting.
Letter to shareholders 9
Our product lineup 12
Review of operations 14
Management’s discussion and analysis 17
Consolidated financial statements 31
Corporate information 51
C o v e r p h o t o : G u e l p h , o n ta r i o , C a n a d a o p e r at i o n .

Strength in numbers. 367%
5 yeAR gROwth in bOOk vALue PeR ShARe
8%PRe-tAx PROfit
12%inCReASe in bOOkingS
$18.1Mnet CASh POSitiOn
$15.1MCASh PROvided by OPeRAtiOnS
84¢bASiC eARningS
PeR ShARe
Andrew Pys Position: MAintenAnCe MeChAniCWith hPs since: 2005
“for over 90 years, hammond has built relationships of mutual trust and respect not only with our customers, but with each other. we all share the same core values and goals – trust, integrity and we constantly challenge ourselves as well as evolve. we believe in our ability to be the best. we believe in each other.”
Robin hardy Position: PROjeCt MAnAgeRWith hPs since: 2005
“if a customer were to see how we operate day-to-day, they wouldn’t be able to tell the CeO from anyone else. Position – title – isn’t the most important thing at hammond. Respect, honesty, and superior work are. Status quo is not good enough for us. that’s why we’re able to offer the quality of product we do. that’s why were successful. that’s why i love my job.”
A company powered by people, energized by results.
At hammond, we value honesty
and integrity as much as we
value profits. And we know
our worth as a company not
only lies in our share price,
but in our offices and
warehouses. where our
people relentlessly pursue to
improve our process and our
company. where they make
timely decisions based on facts,
experience and knowledge.
we value their innovation
and expertise. because without
it, we wouldn’t be who we
are today – a company that
succeeds when world markets
do not. A company that offers
stability when others cannot.
A company that is a true
powerhouse of people.
together, we produce
power and results.
together, we are stronger.
2 H a m m o n d P o w e r S o l u t i o n S | a n n u a l r e P o r t 3

when the economy is weak, we stay strong.
190,
604
0
131,
978
160,
606
226,
358
195,
437
5
10
15
20
25
Consolidated Sales(in thousands of dollars)
2006 2007 2008 2009 2010
50,1
31
2006
36,9
54
47,0
58
65,1
91
63,6
20
Gross Margin(in thousands of dollars)
2007 2008 2009 2010
35
40
45
50
55
60
65
70
30
14,9
77
18,9
43Earnings From Operations
(in thousands of dollars)
0
5
10
15
20
25
30
26,5
58
19,5
75
14,0
67
2006 2007 2008 2009 2010
7.39
0
2.78
3.87
5.95
6.67
1
2
3
4
5
6
7
8
Book Value Per Share ($)
2006 2007 2008 2009 2010
7,66
1
7,61
1
6,25
4
26,4
18
Cash Provided By Operations(in thousands of dollars)
0
5
10
15
20
25
30
2006 2007 2008 2009 2010
15,0
48
18,0
89
-4
(180
)
4,39
5
(4,1
00)
10,0
24
-2
-6
0
2
4
6
8
10
12
16
18
2006 2007 2008 2009 2010
Total (Bank Indebtedness)/Cash Position(in thousands of dollars)
14
(in thousands of dollars, except earnings per share) 2010 2009
Sales $ 190,604 $ 195,437
earnings from operations 14, 977 18,943
net earnings 9,710 9,631
Cash provided by operations 15,048 26,418
Overall cash (bank indebtedness) 18,089 10,024
basic earnings per share $ 0.84 $ 0.82
4 H a m m o n d P o w e r S o l u t i o n S | a n n u a l r e P o r t 5

dale Sidey Position: diReCtOR Of uS SALeSWith hPs since: 1984
“Leadership is key to the future of our company. but it’s the combined strength of leadership and employees that makes us the best in the electrical industry, now and for years to come. the teamwork and passion that we all share makes being part of this successful organization just awesome. Passion is our single greatest strength.”
Margo yakimchick Position: ReCePtiOniStWith hPs since: 2005
“At hammond, we are progressive in the way we do business. we strive to offer the best products and service, and then we strive to better the best each and every day. however, we are traditional in our values and the way people are treated. we value honesty and integrity as much as innovation and continuous improvement.”
H a m m o n d P o w e r S o l u t i o n S | a n n u a l r e P o r t 76

At hPS we believe our people are the real source of our competitive advantage. to successfully execute our strategic initiatives we are dependent on their talent, skills and their passion. their commitment and determination are the power behind our success.
William G. HammondChairman of the Board & Chief exeCutive offiCer
22%Return on net assets
$18Mnet cash position
fellow Shareholders,we are only two years removed from the worst global financial collapse since the great depression. the world economy and many of its markets have yet to fully recover from the recession and fears that gripped us collectively. but there is hope and there is growth for companies that have the vision and capabilities to take advantage of them and we believe that hammond Power Solutions inc. (“hPS”) is one of those companies.
Over the last four years, hPS has been implementing a strategy of growth through market and channel diversification. these strategies not only propelled our sales and profits while the economy expanded, they also limited their decline in the worst recession seen in more than 60 years. Although not reflected in our financial performance, which was also affected by the rising Canadian dollar, we held or increased our share of key strategic markets over the last two very tough and highly competitive years. Our dominance in certain sectors, as well as strengthening commodities, benefitted from renewed growth in Asia, which enhanced our financial results when other north American sectors were still struggling.
the worst appears to be over and most, though not all, markets we serve are coming to life. we are seeing increased activity levels across north America and a renewal of confidence that bodes well for the next
two years. we expect that our larger footprint in the distributor channel and the product line expansions, either in place or under development, will accelerate our growth rate even more.
we have also been working on a number of activities to control and reduce our costs in these competitive times; expanding the production of products in more cost competitive plants in Mexico, more aggressive sourcing of materials and components from China, and the improvement of processes to increase productivity.
we are continuing with our efforts to enlarge our business footprint outside of Canada and the united States through acquisition, partnerships and commercial relationships in Mexico, europe, and Asia. this strategy will not only give hPS access to markets that are quickly expanding, it provides geographical diversification which will lessen our dependence on the north American economy. we believe that such diversification is prudent given the current state of the housing and commercial construction markets in the united States, as well as the potential impact of decisions that will have to be made at some point to deal with the enormous levels of government debt.
finally, at hPS we believe our people are the real source of our competitive advantage. to successfully execute our strategic initiatives we are dependent on their talent, skills and their passion. their commitment and determination are the power behind our success. U
8 H a m m o n d P o w e r S o l u t i o n S | a n n u a l r e P o r t 9L e t t e r t o s h a r e h o L d e r s

Maria Perez Cowan Position: COSt ACCOuntAntWith hPs since: 2002
“Our greatest strength is our people. And that’s definitely a sentiment everyone feels. i know my work is important to the company – that it, and i, make a difference. we each know the important role we play, and we know that no matter what that role is, it’s respected and recognized. we stay strong because we not only satisfy customers, we proactively plan and effectively execute strategy.”
dhiru Patel Position: diReCtOR Of engineeRingWith hPs since: 1983
“we are a great team because everyone is respected. everyone’s input is sought, especially in the areas where employees can make a difference. the vision of the company is never short; we believe in long-term strategic planning and the effective execution of these plans. great team, great plan – that’s what makes us strong.”
10 H a m m o n d P o w e r S o l u t i o n S | a n n u a l r e P o r t 11

Our people not only supply power,
control transformer
A variety of HPS control transformers
are the source of power to pizza ovens
manufactured by the world’s largest
producer. HPS control transformers keep
things cooking at Pizza Hut, Domino’s
Pizza, Tim Hortons and Wendy’s
restaurants across Canada and the U.S.
Distribution transformer
Distribution transformers account
for more than 50% of HPS sales.
These transformers step higher voltage
levels on the utility grid down to lower
voltage levels that power lights,
equipment and other systems used in
commercial, institutional and industrial
buildings. Growth in the global power
quality market is a large part of HPS’
future business.
shovel Duty transformer
Moving the highest possible payload
per hour while minimizing operating costs
is key. Shovel duty transformers are part
of a new wave of power regulation that
ensures uninterrupted operation while
improving dynamic machine performance.
Drive isolation transformer
HPS drive isolation transformers
are engineered to regulate power to
conveyors, robotics, machine tools
and other production line equipment.
Power transformer
HPS manufactures transformers to withstand some of the harshest outdoor environments.
HPS power transformers can be found on one of the largest and deepest oil-drilling
platforms of its kind in the world. Power transformers are cost effective and dependable
solutions for indoor commercial, as well as industrial and manufacturing processes.
they supply knowledge.
12 H a m m o n d P o w e r S o l u t i o n S | a n n u a l r e P o r t 13O U R P R O D U C T L I N E U P

we look back at 2010 not only as the end of a decade but also as
the end of a great recession. this significant economic downturn
didn’t really hit hPS until 2009, much later than many other
electrical manufacturers.
A company powered by people, energized by results.
eventually help give us the capacity to build over $300 million of transformers for the north American market, is the expansion of our guelph, Ontario facility. this addition will allow us to expand the size of power transformers we are able to build, improve our service, and create a test lab dedicated to the research and development of unique and industry leading transformer designs.
due to the escalating growth rate through our u.S. distributor network we increased our production of smaller products sold through this channel. Most of this capacity expansion occurred in our walkerton, Ontario facility, but we also initiated a number of projects to increase the production of products from our contract manufacturers in China as well as in one of our Monterrey, Mexico facilities. these expansions will continue in 2011 as our market share is expected to grow even more in north America in the years ahead.
in addition to all of this, we continued our efforts to improve productivity across our organization. the rising value of the Canadian dollar as well as increasing material costs has intensified the pressure for us to reduce our input costs through material procurement activities and cost competitive designs. i am pleased to report that our productivity targets were met or exceeded at all of our established facilities in 2010, a credit to the work of all involved in our ongoing efforts to become a leaner company with higher levels of engagement from our employees. these efforts will improve various processes throughout the organization, which will also help us reduce our lead times as well as work-in-process inventories, and improve our ship on time performance. Strategically the Company initiated a project to research a new eRP software engine that would upgrade our information and management systems to meet the needs of a growing multi-plant, geographically diverse, multi-channel, custom and standard design manufacturing and distribution company. the selection and initial implementation of this new system is not expected until Quarter 3 of 2011.
Many of our accomplishments, not only in 2010 but also in previous years, are the collective results of one of hPS’ greatest strengths – our employees. we have many strengths; broad product capabilities, engineering experience, reputation for quality, and our diverse market penetration but none of these would be possible without the loyalty, hard work and passion of our employees. this has been a core strength of our family company for more than 90 years, and it is an attribute that continues to set us apart from our multi-national competitors.
this recession began to wane by the middle of 2010. Our total sales were down marginally compared with the previous year, despite the impact of a stronger Canadian dollar which ended the fiscal period ten percent higher in value than in 2010 relative to the u.S. dollar. Overall we feel that our financial performance was very respectable given the slow pace of recovery in the u.S. economy, a highly competitive marketplace, and the affects of the rising Canadian currency.
Some of our major markets, such as commercial construction, were indeed ravaged by this recession, especially in the united States. the geographic and market diversity of our business was an advantage to the Company during this downturn and positions us well for the recovery currently underway.
the outlook for commercial and retail construction in the u.S. did not improve in 2010, and this impacted on our sales to customers and distributors serving this market. its growth rate for several years to come will be hobbled by a slow recovery in certain regions of the u.S. due to the current excess capacity of u.S. commercial real estate.
the construction market in Canada, although slower than in 2009, was not hit as hard as in the u.S. the ongoing construction of condominiums in toronto and vancouver, in addition to the construction of new hospitals, university, and government buildings across the country helped lessen the drop in this market during this economic downturn.
Our market diversification also helped to start our rebound in 2010, lead by OeM customers who are benefiting from the more robust economic growth in Asia and increasing consumption and prices for commodities like copper, coal, and oil.
At the same time we continued to expand our penetration of major u.S. distributor organizations with the conversion of more than 100 new distributor locations, even in a tough economy. this conversion rate of new distributor organizations accelerated in the second half of 2010, creating an expanded footprint which will help hPS grow faster as the u.S. economy recovers.
during 2010, we also put considerable time into our vision of becoming a global transformer company. these efforts were focused in europe as well as india with the objective of finding transformer companies involved in similar markets to hPS. Our goal is to find companies that will not only serve as platforms to grow our sales in other continents but also to find products and technology that hPS can bring back to our markets in north America or wherever we sell our transformers today and in the future. unfortunately our time and efforts did not culminate in any successful transactions to date however we do feel that this work will be rewarded by at least one positive conclusion in 2011.
it was a very busy year for building and improving our operations in north America. work continued on expanding our large product capabilities in our second Mexican plant in Monterrey, which opened in late 2008 just six months before the economic downturn hit hPS. Our production plans for this plant were scaled back with the drop in bookings in 2009, but as our markets gradually came back to life last year we started to expand our workforce and build more products in this lower cost facility.
Another important element of our operational plan, which will
during 2010, we also put considerable time into our vision of becoming a global transformer company.
14 H a m m o n d P o w e r S o l u t i o n S | a n n u a l r e P o r t 15R e v i e w o f o p e R at i o n s

this strength, along with our other advantages including our size and financial health, makes hPS a formidable transformer company compared to our much smaller competitors. during 2010, we improved our collective talent and resources with the recruitment of more electrical designers, manufacturing engineers, sales managers, as well as it staff in particular. hammond has recognized from its beginnings that people can make the difference, and we’re working hard to build on this and keep it sustainable.
Another positive development for hPS in 2010 was the launch of an ongoing regular annual dividend program for its shareholders. we have recognized for some time the attractiveness of an annual dividend and that hPS has the consistent and strong generation of cash flow that will support paying out a dividend in addition to funding the continued growth of our business. given our conservative manner, we wanted to wait until the Company was through this past recession before we embarked on a
program of annual and growing dividends, which we hope will reward the patient investors of an expanding global transformer company.
going forward, we remain mindful of the challenging and uncertain times around us as the world recovers from the worst economic downturn in more than 60 years. we believe that north America and europe should experience positive but restrained growth for the next two years. however at this time, we are cautious about what may happen after the u.S. Presidential election in late 2012, in addition to the potential adverse impacts of rising inflation, higher interest rates, currency volatility, and unexpected geopolitical shocks. we firmly believe that our Company strengths, our global growth plans into markets that have decades of potential, our conservative management style and our strong financial position will allow hammond Power Solutions to navigate these interesting times and grow at a pace when many other Canadian electrical companies will not.
dollars in thousands unless otherwise stated
Chris huether Position: Chief finAnCiAL OffiCeR &
CORPORAte SeCRetARyWith hPs since: 1985
dollars in thousands unless otherwise stated
2010 Management’s discussion and Analysis
hammond Power Solutions inc. (“hPS” or the “Company”) is a north American leader in the design and manufacture of custom electrical engineered magnetics, as well as a leading manufacturer of standard electrical dry-type transformers. Advanced engineering capabilities, high quality products and fast responsive service to customers’ needs have established the Company as a technical and innovative leader in the electrical and electronic industries. the Company has manufacturing plants in Canada, the united States and Mexico.the following is Management’s discussion and Analysis (“Md&A”) of the Company’s consolidated operating results for the years ended december 31, 2010 and 2009, and should be read in conjunction with the accompanying Consolidated financial Statements of the Company as at december 31, 2010 and 2009, which have been prepared in accordance with Canadian generally accepted accounting principles (“gAAP”). this information is based on Management’s knowledge as at March 30, 2011. All amounts in this report are expressed in thousands of Canadian dollars unless otherwise noted. Additional information relating to the Company may be found on SedAR’s website at www.sedar.com or on the Company’s website at www.hammondpowersolutions.com.
forward-looking informationOur Md&A contains forward-looking information that reflects the current expectations of Management about the future results, performance, achievements, prospects or opportunities for hPS and the transformer business. these statements can generally be identified by the use of forward looking words such as “may”, “will”, “expect”, “estimate”, “anticipate”, “believe”, “project”, “should” or “continue” or the negative thereof or similar variations. forward-looking statements are based upon a number of assumptions and are subject to a number of known and unknown risks and uncertainties, many of which are beyond Company control that could cause actual results to differ materially from those that are disclosed in or implied by such forward-looking statements.
we do not have an intention to update any forward-looking information, except as required by applicable securities laws. Any forward-looking information contained in our Md&A represents our views as of the date of this document and such information should not be relied upon as representing our views as of any date subsequent to the date of this document. there can be no assurance that any forward-looking information will prove to be accurate, as actual results and future events could differ materially from those expected or estimated in such statements. Accordingly, readers should not place undue reliance on any such forward-looking information. for a list of factors that could affect hPS, see “risk factors” highlighted in materials filed with the securities regulatory authorities in Canada from time to time.
non-gAAP measuresthis document uses the terms “earnings from operations” which represents earnings before other income and expenses and income taxes (“ebitdA”). ebitdA is also used and is defined as earnings before interest, taxes, depreciation and amortization. Operating earnings and ebitdA are some of the measures the Company uses to evaluate the operational profitability. the Company presents ebitdA to show its performance before interest, taxes and depreciation and amortization. Management believes that hPS shareholders and potential investors in hPS use non-gAAP financial measures, such as operating earnings and ebitdA, in making investment decisions about the Company and to measure its operational results. A reconciliation of ebitdA to earnings from operations for the years ending december 31, 2010 and 2009 is contained in the Md&A. ebitdA should not be construed as a substitute for net income determined in accordance with gAAP. “Order bookings” represent confirmed purchase orders for goods or services received from our customers. “backlog” represents all unshipped customer orders. “book value per share” is the total shareholders’ equity divided by the average outstanding shares. the terms “earnings from operations” “ebitdA”, “adjusted ebitdA”, “order bookings”, “backlog” and “book value per share” do not have any standardized meaning prescribed within gAAP and therefore may not be comparable to similar measures presented by other companies.
Overviewthe Company continues to be an industry leader as evidenced by our solid sales performance, steady gross margin rates, company profitability and consistent balance Sheet liquidity. in 2010 the Company delivered solid sales revenues, reliable profit performance and a strengthened balance Sheet through a combination of short-term operational initiatives and longer-term
16 H a m m o n d P o w e r S o l u t i o n S | a n n u a l r e P o r t 17R e v i e w o f o p e R at i o n s

strategic projects. the Company’s focus on expanded market penetration, gross margin achievement and operational effectiveness were the key success areas and are the foundation to driving industry leading financial performance. hPS remains well positioned for electrical industry market share growth in the u.S. and Canada, as well as in offshore markets.
the Company realized a product sales volume increase in 2010 despite the weakened economy and soft electrical market conditions. from a revenue point of view, consolidated sales dollars were down slightly due to a lower u.S. exchange rate relative to the Canadian dollar, which results in lower u.S. dollar sales stated, in Canadian dollars. however, the Company continues to be a leader in markets served. the Company is very mindful of the softer u.S. and Canadian economies, the impact of more stringent banking policies, particularly in the u.S., the unpredictability and lack of certainty of the u.S. dollar, fluctuating resource based commodity costs and the absence of a sustained global economic recovery.
the Company’s 2010 financial performance was unwavering despite the unfavourable exchange environment the Canadian dollar had on our u.S. margins for the majority of the year, volatile and unpredictable raw material costs and ongoing competitor selling price pressures. we combated these negative economic challenges by additional market share expansion, market specific selling price increases and competitive manufacturing cycle times. the Company also utilized forward contracts to hedge against the negative impact of a stronger Canadian dollar and fluctuating copper commodity costs.
the Company is not unaffected by the business and profitability pressures it must endure from these influences but is confident that the business fundamentals that it has built and its strategic vision will sustain and breed growth opportunities as hPS moves forward. Our focus on continuous improvement enhanced our cost savings, productivity and efficiency gains and overall cost effectiveness. we expect that combined organic and new customer sales expansion, real capacity expansion, improved manufacturing agility and our multinational operations capabilities will provide new market opportunities going forward and deliver improved revenue and profitability trends. in addition, we continue to see signs of moderate market condition improvement. the Company believes that this remains a time to be cautious but not complacent and to be very calculating in the risks and opportunities of its strategies.
we expect continued sales growth in some of our market segments but will see decline in others, and a portion of our sales will come from major customer projects for which the exact timing is hard to predict, thus influencing quarterly sales fluctuations.
notwithstanding these challenges, hPS’ sales and booking rates were industry-leading due to diligent focus in our strategic target markets. this focus continues to deliver additional market share penetration, new account development and organic sales increases. hPS realized significant growth in the u.S. and Canadian electrical markets. this is evidenced by our elevated booking rates, market share growth, increased backlog and overall financial performance. the Company’s market diversity is demonstrated by the
growth in many of its markets, specifically, the north American electrical distributor (nAed), power conditioning, excitation, specialty, oil and gas pumping, catalog, MRO and utility markets in both Canada and the u.S., which resulted in increased sales in 2010.
this broad market participation provides a natural business hedge, as the Company is not single market or industry dependent. As a result, the Company’s 2010 sales momentum continued to outpace the electrical industry average.
the Company has continued to deliver consistent and solid profit performance as further evidenced in our 2010 Annual Report, and the Company is well positioned for continued success going forward. we continue to build a company that can be relied upon in all we do, for the goals we set, and in the commitments we undertake. despite the continuation of the poor global economies the Company has benefitted from the implementation of its strategic initiatives in the areas of market share expansion, realized cost reductions, productivity improvements and increased manufacturing throughput and the Company continues to build on its strategies to increase its sales and manufacturing capacities. the Company remains attentive to its strategies to grow its market share and will continue to capitalize on sales opportunities and distributor market share.
the Company has a strong balance Sheet, is well capitalized, has a net cash position and has a long-term committed credit facility available to implement these strategies.
the Company is unwavering in its quest to expand market share through channel growth initiatives in strategic market segments in the u.S., Canada and globally. hPS’ focus on custom product design capabilities, competitive lead-times, product breadth and uncompromised quality should continue to generate market share growth. in addition, organic and new customer sales, flexible manufacturing capacity and our multi-national operations capabilities, should lead to sales opportunities and overall market growth. these strategies, combined with our distributor channel expansion and our multinational manufacturing capabilities, will provide sales opportunities for our existing customer base and new customer opportunities that we expect will contribute to our positive revenue and profitability trends.
the Company is determined to deliver industry leading financial results. hPS will be steadfast in its pursuit of continuous productivity improvement, organic sales growth, new product development, geographic diversification, manufacturing cycle time reductions and market share expansion. Management is committed to the execution of its operational and strategic initiatives.
hPS will continue to develop and expand its market share growth through both our u.S. and Canadian distributor channels, by developing supplier relationships with new Original equipment Manufacturer (“OeM”) customers and by seeking new markets and expanding our sales of custom engineered transformers to alternative energy systems, mining equipment and drives equipment manufacturers.
dollars in thousands unless otherwise stated
SalesSales in 2010 totaled $190,604 versus sales of $195,437 in 2009, a decrease of $4,833 or 2.5%. Consolidated sales are negatively impacted by u.S. foreign exchange. the average u.S. to Canadian exchange rate for 2010 was $1.030 versus $1.145 in 2009, a decline of 10%. Our 2010 consolidated sales after restating our u.S. dollar sales using 2009 u.S. to Canadian foreign exchange rates were $203,684, an $8,247 or 4.2% increase over the prior year. in addition, a significant difference when comparing 2010 to the prior year is the impact of the higher backlog carryover from 2008 into 2009, which resulted in the abnormally large first quarter in 2009, and the economic recession, which was just starting to impact the industry.
the Company’s sales momentum continues to outpace the electrical industry average.
the Company’s market diversification strategies provide a business hedge, as the Company is not single market or industry dependent. Specifically, the nAed, specialty, capital equipment, power conditioning, mining, oil and gas pumping and utility markets in both Canada and the u.S. resulted in increased sales in 2010.
u.S. sales when stated in u.S. dollars actually increased year over year by $7,922 from $105,822 in 2009 to $113,744 in 2010, an increase of 7.5%. in 2010, sales to the u.S. market of $118,926 (stated in Canadian dollars) decreased by $2,598 or 2.1% compared to 2009 sales of $121,524. this decline was mostly as a result of the decrease in the u.S. dollar exchange rate throughout 2010 when compared to 2009.
Canadian sales were $71,678, a decrease of $2,235 or 3.0% as compared to sales of $73,913 in 2009. Although the Canadian electrical industry markets were softer in 2010, the utility, nAed, and power markets all realized sales growth.
the Company continues to expand sales by focusing on strategic target markets, assisted by the improvement in market conditions in the electrical industry in the u.S. and Canada. we expect our focus on custom and competitive product design and uncompromised quality will fuel growth.
Stated by geographic segment, u.S. sales were 62.4% of our total sales in 2010 versus 61.8% in 2009, while 37.6% of the segment sales in 2010 were derived in Canada as compared to 38.2% last year.
the Company is unwavering in its implementation of channel growth initiatives in strategic market segments in the u.S. and Canada. the Company is adamant that it produces premium quality transformers, competitive custom engineered designs and offers a broad and evolving product range. we expect that this, combined with our capabilities in custom product design, manufacturing agility, competitive lead-times, product breadth, uncompromised quality, and our multi-national operations capabilities will garner further growth in organic and new customer sales.
Order bookings and backlogOur sales growth strategies, along with slightly improved market conditions, have produced healthy booking rates in 2010. these factors were essential in our success in delivering a 12.2% increase in bookings year over year. by channel, booking levels were 3.1% higher on a direct basis and grew 9.1% through our distributor channel, as compared to 2009. Although the company had higher capacity and achieved productivity improvements, order backlog increased by 7.0% from the prior year.
Our sales development initiatives supported better than industry booking rates during the year. the impact of a modest improvement in general world economies and improving electrical market condition is now evidenced with increased quotation activity and new order bookings, as many of our customers have started to see a moderate pickup in their business activity and are replenishing their inventory stocking levels. the Company is also seeing a longer booking horizon, as many of our customers are feeling more positive about market trends.
As a result, we anticipate seeing an upward lift of new order bookings going forward.
gross marginsthe Company is very pleased with its gross margin rates considering pricing margin pressures, lower sales volumes and the negative impact that a stronger Canadian dollar has on margins. gross margin rates finished at 25.9% versus 27.0% in 2009, a decrease of 1.1%. this also resulted in decreased gross margin dollar contribution of 6.5% compared to 2009.
2010 gross margin rates were hampered by an 11.2% stronger Canadian dollar as compared to last year. this negatively impacts gross margin rates on Canadian manufactured products sold in the u.S. the Company continues to experience negative selling price pressures from many of our competitors due to the available excess capacity in the industry. however, margins were positively impacted through internally driven design and material procurement cost reductions and effective factory expense management, contributing approximately 0.8% to margin rates. Product mix and our ability to obtain market specific selling price increases also positively impacted gross margin rates. despite the moderate economic climate, the Company has implemented several capacity expansion projects during the past year. in the short-term, the additional fixed costs associated with the expansion are dilutive to our net margin rates. however, as sales grow the favourable impact that higher manufacturing throughput will have on absorption of our factory overheads will positively affect margin rates. this will better match manufacturing capacity requirements to anticipated future booking rates. the Company is focused on productivity improvements, cost reductions and lead-time improvements throughout the organization.
these actions will help advance margin rates.
18 H a m m o n d P o w e r S o l u t i o n S | a n n u a l r e P o r t 19M a n a g e M e n t ’ s D i s c u s s i o n a n D a n a ly s i s

Selling, general and administrative expensetotal selling, general and administrative (“Sg&A”) expenses amounted to $34,341 in 2010 versus $33,784 in 2009, an increase of $557 or 1.6%. during 2010, as a result of fiscally prudent accounts receivable management and the solid credit policy execution, there was only $85 of bad debt expense. in 2009, Sg&A expenses were positively impacted by an abnormal $671 reversal in allowance for doubtful accounts. there was also an increase of $233 in stock option expense in 2010 as compared to $140 in 2009 resulting from increased compensation expenses due to a higher underlying stock value attributed to stock options granted in the year.
the effect of fixed Sg&A expenses on lower sales resulted in the percentage of sales increasing from 17.3% in 2009 to 18.0% in 2010.
in 2010, the company continued with its people resource investment, specifically in the areas of information services and engineering, which resulted in increased costs of $429 in 2010.
the Company is very mindful of managing and containing selling and administration expenses through strong Sg&A expense management and cost control.
interest expensethe interest expense for the year ended december 31, 2010, finished at $103 as compared to $178 in 2009, a decrease of $75 or 42.1%. the reduction of interest expense for the year was as a result of low operating debt levels and further interest rate reductions. interest expense includes all bank fees.
gain/loss on foreign exchangethe effectiveness of the Company’s hedging strategy essentially eliminated its u.S. dollar balance Sheet translation exposure.
the foreign exchange loss in fiscal 2010 was only $14 compared to a foreign exchange loss of $2,370 in 2009, a reduction of $2,356 or 99.4%. the Company had forward foreign exchange contracts in place throughout 2010, which significantly reduced its exposure to changes in currency rates, which affect the translation of the foreign operations balance Sheets. the majority of the foreign exchange gains and losses were a result of realized and unrealized gains and losses from foreign balance Sheet translation and the Company’s u.S. dollar hedge contracts. the balance Sheet translational loss was $1,136 in 2010 compared to a $4,194 loss in 2009. the 2010 loss was mitigated by the gain on forward foreign exchange contracts of $1,078.
income taxesAs a result of the decrease in income before income tax expense, 2010 income tax expense was $5,057 as compared to $6,441 in 2009. the consolidated effective tax rate for 2010 decreased to 34.2% versus 40.1% last year, mostly as a result of the effect of u.S. dollar balance Sheet conversion foreign exchange currency losses. the tax rate on earnings before income taxes is distorted by the impact of balance Sheet translation losses of $1,136 in 2010 and $4,194 in 2009, which are not deductible from earnings for tax purposes. Adjusting for this, the consolidated tax rate would approximate 31.7% for 2010 and 32.0% for 2009.
the current future tax assets and liabilities are related to temporary differences on current assets and liabilities, which are not deductible against current year earnings and consist mainly of reserves and allowances. the long-term future tax assets and liabilities relate to temporary differences resulting from intangible assets and the difference between the net book value and undepreciated capital cost of property, plant and equipment. Our income tax provision is explained further in note 9 in the notes to Consolidated financial Statements.
net earningsearnings from operations in 2010 totaled $14,977 compared to $18,943 in 2009, a decrease of $3,966 or 20.9%, as a result of lower margin rates and lower u.S. dollar exchange and higher unabsorbed overheard due to capacity expansion fixed costs. the income before income taxes decreased to $14,767 for 2010, compared to $16,072 in 2009, down $1,305 or 8.1%.
Our 2010 net earnings finished at $9,710 as compared to $9,631 in 2009, an increase of $79 or 0.8%. After tax earnings were higher in 2010 as tax expenses were lower due to reduced corporate income tax rates in Canada and the Province of Ontario and lower non-deductible foreign balance Sheet translation losses of $3,058 when compared to 2009.
earnings from operations is calculated as outlined in the following table:
2010 2009net earnings for the year $ 9,710 $ 9,631Add:income tax expense 5,057 6,441Other (income) expenses 210 2,871earnings from operations $ 14,977 $ 18,943
dollars in thousands unless otherwise stated
ebitdAebitdA was $18,719 for 2010 versus $19,816 in 2009, a decrease of $1,097 or 5.5%.
ebitdA is calculated as outlined in the following table: 2010 2009net earnings for the year $ 9,710 $ 9,631Add:income tax expense 5,057 6,441interest expense 103 178depreciation and amortization 3,849 3,566ebitdA $ 18,719 $ 19,816
normalizing ebitdA to exclude foreign exchange gains or losses will provide a better indication of the fundamental business operating condition.
Adjusted ebitdA is calculated as outlined in the following table: 2010 2009ebitdA $ 18,719 $ 19,816Reverse: (gain)/Loss on foreign exchange 14 2,370Adjusted ebitdA $ 18,733 $ 22,186
Adjusted ebitdA was $18,733 for 2010 versus $22,186 in 2009, a decrease of $3,453 or 15.5%.
Summary of quarterly financial information (unaudited)
Fiscal 2010 Quarters Q1 Q2 Q3 Q4 total
Sales $ 44,273 $ 50,820 $ 47,903 $ 47,608 $ 190,604
net income $ 2,224 $ 2,401 $ 1,497 $ 3,588 $ 9,710
net income per share – basic $ 0.19 $ 0.21 $ 0.13 $ 0.31 $ 0.84
Average u.S. to Canadian exchange rate $ 1.041 $ 1.028 $ 1.039 $ 1.013 $ 1.030
Fiscal 2009 Quarters Q1 Q2 Q3 Q4 total
Sales $ 54,845 $ 48,203 $ 43,768 $ 48,621 $ 195,437
net income $ 4,242 $ 472 $ 57 $ 4,860 $ 9,631
net income per share – basic $ 0.36 $ 0.04 $ 0.01 $ 0.41 $ 0.82
Average u.S. to Canadian exchange rate $ 1.245 $ 1.175 $ 1.103 $ 1.058 $ 1.145
historically the first quarter of the company’s fiscal year has lower revenues due to a general decline in activity in the construction industry and overall electrical markets at the start of year as many projects are just getting underway. there was an exception in Quarter 1, 2009, as the Company ended a very robust 2008, and there was an unusually high order backlog just prior to the collapse of the electrical markets in north America.
the sales decline can be noted starting in Quarter 2, 2009. the year-to-year quarterly fluctuations in both sales and income are affected by the changes in the u.S. to Canadian foreign exchange rates, changing economic conditions, and competitive pricing pressures.
20 H a m m o n d P o w e r S o l u t i o n S | a n n u a l r e P o r t 21M a n a g e M e n t ’ s D i s c u s s i o n a n D a n a ly s i s

Sales for the quarter ended december 31, 2010, were $47,608, down $1,013 or 2.1% from the comparative quarter last year which is reflective of the impact of the softer economy, foreign exchange rates, lower selling prices in several market segments and product mix.
Quarter 4, 2010 gross margin dollars decreased by 5.6% compared to Quarter 4, 2009. gross margin rates finished at 28.3% this quarter versus 29.3% in Quarter 4, 2009. Quarter 4, 2010 gross margin dollars decreased as a result of lower sales levels due to the softer market conditions particularly in Canada, lower capacity utilization and the negative margin rate impact of 0.7% due to a stronger Canadian dollar.
total Sg&A expenses amounted to $7,935 in Quarter 4, 2010 versus $7,557 in Quarter 4, 2009, an increase of $378 or 5.0%. the higher expense in the quarter was from higher freight, commission and engineering costs in Quarter 4, 2010 totaling $690 versus Quarter 4, 2009. these higher costs were partially offset by lower bad debt expense in the quarter of $205 when compared to the same quarter of 2009.
the foreign exchange loss in Quarter 4, 2010 was $180 compared to a foreign exchange gain of $214 in Quarter 4, 2009 and there was a foreign exchange loss of $14 in 2010 compared to a loss of $2,370 in 2009. foreign exchange hedges helped offset the majority of Quarter 4 balance Sheet translation losses. the majority of the Quarter 4, 2010 foreign exchange gains and losses are as a result of realized and unrealized gains and losses from u.S. balance Sheet translation and the Company’s settled u.S. dollar foreign exchange contracts.
earnings from operations for the quarter were negatively impacted by reduced sales and lower gross margin rates which suffered as a result of the stronger Canadian dollar. Quarter 4, 2010 earnings from operations were down $1,171 or 17.5% from the same quarter last year, finishing at $5,516 in the quarter as compared to $6,687 in Quarter 4, 2009.
Quarter 4, 2010 income tax expense was $1,736 as compared to $1,766 in Quarter 4, 2009, a decrease of $30 and was $5,057 versus $6,441 last year, a decrease of $1,384.the percentage of tax booked
on earnings before income taxes is distorted by the impact of balance Sheet translation losses of $644 for Quarter 4, 2010 versus a $871 loss in Quarter 4, 2009 which are not tax effected.
net earnings for Quarter 4, 2010 were lower by $1,272 or 26.2%, concluding at $3,588 compared to $4,860 in Quarter 4, 2009. net earnings for the quarter were impaired by lower sales, margin rates, higher Sg&A expenses and the loss on foreign exchange as noted above.
Cash provided by operations for Quarter 4, 2010 was $4,349 versus $11,059 in Quarter 4, 2009, a decrease of $6,418. the major difference in cash from operations is due to an increase in usage of working capital as a result of higher accounts receivable and inventories balances related to higher late quarter shipments and increased inventory levels to support business growth.
Cash, net of overall bank operating lines of credit balance was an $18,089 cash balance as at december 31 2010, an increase of $8,065 as compared to a balance of $10,024 as at december 31, 2009.
Capital resources and liquidityin 2010 the Company continued to focus on generating cash from operations, debt management and liquidity.
Cash provided by operations during 2010 was $15,048 versus $26,418 in 2009, a decrease in cash generated from operations of $11,370. due to the improving business activity and working capital investment requirement supporting the business, there was a natural increase in working capital due to higher accounts receivable caused by increased late Quarter 4, 2010 sales and a build of inventory required for improvements in business activity and customer service. Accounts payable also increased year-to-year, offsetting much of the working capital usage. Accounts receivable finished the year at $32,201 as compared to $27,820 as at december 31, 2009, an increase of $4,381. Most of the year over year increase in the accounts receivable can be attributed to an increase in outstanding receivables as a result of higher sales to American distributor
dollars in thousands unless otherwise stated
Quarter 4, 2010 financial resultsDecember 31, 2010 December 31, 2009 change
Sales $ 47,608 $ 48,621 $ (1,013)
earnings from operations $ 5,516 $ 6,687 $ (1,171)
exchange gain/(loss) $ (180) $ 214 $ (394)
net earnings $ 3,588 $ 4,860 $ (1,272)
earnings per share – basic 0.31 0.41 (0.10)
earnings per share – diluted 0.31 0.41 (0.10)
Cash provided by operations $ 4,349 $ 11,059 $ (6,710)
buying groups who typically have longer credit terms and extended OeM payment terms. As a result of effective credit policies and tightly managed accounts receivable administration, our year-end average accounts receivable collection velocity improved 6% over 2010. inventories finished the year at $26,535 as at december 31, 2010, versus $25,722 as at december 31, 2009. this increase can be attributed to a planned increase in levels of standard products due to the ongoing improvement in customer demand as a result of improvements in the general economy. Accounts payable and accrued liabilities increased by $4,367 finishing at $27,870 as at december 31, 2010, compared to $23,503 at the end of 2009 due to higher purchases to support inventory level increases. net income taxes recoverable were $1,970 (income taxes recoverable of $2,188 less income taxes payable of $218) as at december 31, 2010, versus net income taxes recoverable of $2,921 (income taxes recoverable of $3,006 less income taxes payable of $85) as at december 31, 2009. Cash used in financing activities was $4,216 in 2010, compared to cash used of $4,500 in 2009. this change was due to a lower share repurchase of $331, offset by higher bank advances of $130, principal advance of long term debt of $395 and an increased dividend payout of $331.
the Company’s long-term debt of $395 is a result of funding it received from the Southern Ontario development Program (SOdP) for the expansion of its operations including a state-of-the-art research and development test laboratory to increase larger power transformer manufacturing capacity. this is an interest free line that will be repaid over 5 years. the maximum line available to the company under this program is $1,495 of which the Company has drawn $395 as at december 31, 2011. this is explained further in note 8 in the notes to Consolidated financial Statements.
there was a decrease in capital spending of $4,237 over the prior year, totaling $4,105 in 2010, compared to $8,342 for 2009, a decrease of 50.8%. the majority of the capital dollars spent in 2010 was for increased capacity and expanded testing capabilities at our guelph, Ontario plant, investment in machinery and equipment to support demand at our in our granby, Quebec and Monterrey, Mexico facilities, and information services architecture. there were also “normal” maintenance capital invested at all facilities, manufacturing product mandate projects and productivity improvement projects.
bank operating lines of credit finished the year at $1,447 as at december 31, 2010, compared to $4,025 as at december 31, 2009, resulting in a decrease of $2,578 in the year.
Overall cash balances net of bank indebtedness resulted in a net cash position of $18,089 as at december 31, 2010, versus a net cash position of $10,024 as at december 31, 2009.
All bank covenants were met as at december 31, 2010, and were in compliance throughout the year.
the Company’s growth strategy includes the pursuit of strategic acquisitions which would be primarily funded by cash from operations and our existing available credit facility of $40,000 u.S., against which the Company has currently drawn $1,447, supplemented by debt
financing as required. the Company’s financial objective is to ensure that the Company has sufficient cash and debt capacity to fund its operating activities, investments and growth. the Company has several alternatives to fund future capital requirements, including its existing cash position, credit facility, future operating cash flows and debt or equity financing. the Company continually evaluates these options to ensure the appropriate mix of capital resources is maintained to best meet our needs. the Company has capital expenditure commitments of $147 required for the completion of its plant capacity expansion projects for planned growth from future business development.
Additional details of our change in non-cash working capital can be found in note 14 in the notes to Consolidated financial Statements.
Contractual obligationsthe following table outlines payments due for each of the next 5 years and thereafter related to debt, lease, purchase and other long-term obligations.
2011 2012 2013 2014 2015 thereafter total
Accounts payable and liabilities
$ 27,217 – – – – – $ 27,217
Operating leases 1,445 923 783 455 118 – 3,724
Capital expenditures
147 – – – – – 147
Long-term debt 59 79 79 79 79 20 395
total $ 28,868 $ 1,002 $ 862 $ 534 $ 197 $ 20 $ 31,483
Contingent liabilitiesAs described in note 17 in the notes to Consolidated financial Statements, we have two properties for which there are contingent liabilities.
Moloney Properties (1159714 Ontario Inc.)
the Sterling Road property was sold on October 13, 2009, to 2111289 Ontario inc. As a term of condition of the sale the purchaser assumed all the remediation and environmental liability of the property.
Glen Ewing Properties
On August 15, 2009, the Company announced that a settlement of statements of claim was reached between the adjoining industrial property owner, hPS and hammond Manufacturing Company Limited.
All claims with regard to glen ewing properties have been settled by agreement between the parties and include the undertaking of a joint remediation plan.
Management is not aware of any other contingent liabilities.
22 H a m m o n d P o w e r S o l u t i o n S | a n n u a l r e P o r t 23M a n a g e M e n t ’ s D i s c u s s i o n a n D a n a ly s i s

normal course issuer bidOn March 9, 2009, the board of directors authorized the repurchase of up to 400,000 of its Class A Subordinate voting Shares (“Class A Shares”), representing 4.47% of the 8,948,000 Class A Shares outstanding as of july 14, 2009, by way of a normal course issuer bid (“nCib”) through the facilities of the toronto Stock exchange (“tSx”). daily purchases were limited to 2,582 Class A shares, other than block purchase exceptions, which is 25% of the average daily trading volume of 10,327 Class A shares of hPS on the tSx in the preceding six calendar months.
Per the terms of the normal course issuer bid, the Class A Shares repurchase program was terminated as at july 20, 2010.
the Company purchased a total of 108,174 Class A Shares at a cost of $915 in 2009 and purchased 51,202 Class A Shares at a cost of $584 in 2010 for a cumulative total of 159,376 Class A shares at a cost of $1,499 under the plan.
decisions regarding the timing of repurchases were based on market conditions, share price and other factors. Class A Shares repurchased under the bid were cancelled.
the board of directors of hPS authorized the nCib, as it believed market conditions provided opportunities for hPS to acquire Class A Shares at attractive prices and were an appropriate use of hPS funds enhancing shareholder value.
Regular dividend declaredOn October 26, 2010, the board of directors declared a regular annual cash dividend of $0.13 per Class A Subordinate voting Share and $0.13 per Class b Common Share, which was paid on december 10, 2010, to shareholders of record at the close of business on november 19, 2010. the ex-dividend date is november 17, 2010. the regular dividend was declared in recognition of the Company’s financial performance in 2010 and demonstrates confidence in hPS’ business strategies going forward.
disclosure controls and proceduresAs at december 31, 2010, we conducted an evaluation, under the supervision and with the participation of the Chief executive Officer and the Chief financial Officer, of the effectiveness of the design and operation of our disclosure controls and procedures. based on this evaluation, our Chief executive Officer and Chief financial Officer have concluded that as of december 31, 2010 such disclosure controls and procedures were operating effectively.
internal controls over financial reportingthe Management of our company is responsible for establishing and maintaining adequate internal controls over financial reporting. Our internal control system was designed to provide reasonable assurance to
dollars in thousands unless otherwise stated
our Management and board of directors regarding the preparation and fair presentation of published financial statements in accordance with generally accepted accounting principles. All internal control systems, no matter how well designed, have inherent limitations. therefore, even those systems determined to be effective can provide only reasonable assurance with respect to financial statement preparation and presentation.
Canadian Securities Administrators require that companies certify the effectiveness of internal controls over financial reporting. it also requires a company to use a control framework such as the internal Control – integrated framework (COSO framework) to design internal controls over financial reporting. As well, the threshold for reporting a weakness of internal controls over financial reporting should be of a “material weakness” rather than “reportable deficiency.” hPS has designed its internal controls in accordance with the COSO framework and has carried out retesting in 2010, which was completed in the fourth quarter.
As of december 31, 2010, Management, with the supervision and participation of the Chief executive Officer and Chief financial Officer, assessed the effectiveness of the Company’s internal control over financial reporting. based on that assessment, the Chief executive Officer and Chief financial Officer have concluded that the internal controls are effective and that there were no material weaknesses in the Company’s internal control over financial reporting as of december 31, 2010.
Changes in internal control over financial reporting and disclosure controls and proceduresduring 2010 there were no material changes identified in hPS’ internal controls over financial reporting that had materially affected, or were reasonably likely to materially affect, hPS’ internal control over financial reporting. hPS does carry out ongoing improvements to its internal controls over financial reporting but nothing considered at a material level.
international financial reporting standardsthe following information is provided solely for the purpose of allowing investors and others to obtain a better understanding of the Company’s international financial reporting standards (“ifRS”) changeover plan and the resulting expected effects on the Company’s financial statements. Readers are cautioned that it may not be appropriate to use such information for any other purpose. the accounting policy differences identified in this Md&A should not be considered as complete or final as further changes, or other effects and other policy differences may be identified. in addition, the information provided reflects the Company’s current assumptions, estimates and expectations, all of which are subject to change. Circumstances
may arise, including changes in ifRS, regulations or economic conditions, which could change these assumptions, estimates or expectations or the information provided.
in february 2008, the Accounting Standards board of the Canadian institute of Chartered Accountants (“CiCA”) affirmed its intention to replace Canadian gAAP with ifRS. Although ifRS uses a conceptual framework similar to Canadian gAAP, differences in accounting policies and additional required disclosures will need to be addressed. the Company will adopt ifRS commencing the first quarter reporting of 2011 with comparative data from 2010.
the project was completed in 3 phases; Phase One – Scoping and diagnostics, Phase two – Analysis and development and Phase three – implementation and Review.
Phase one – scoping and Diagnosticsthis phase consisted of a high-level assessment to identify key areas of Canadian gAAP and ifRS differences that were most likely to impact the Company. this assessment was completed by Management and external advisers in the third quarter of 2009 and was integral in prioritizing subsequent steps.
Phase two – Analysis and Developmentthis phase involves the detailed assessment, from an accounting, reporting and business perspective, of the changes that will be caused by the conversion to ifRS. during this phase any applicable accounting policy choices permissible under ifRS will be assessed for the most appropriate application. Areas identified in Phase One are analyzed in detail to assess if any changes to policies are required and what, if any, impact this will have. during this phase our key finance staff will be trained on ifRS. Management and Audit Committee members will be educated regarding ifRS implications.
this phase is underway and is scheduled for completion early in 2011. in this regard the Company has considered the following aspects of the transitional provisions to be effective on january 1, 2010. this is not an exhaustive list and relates only to those areas where Management considers the likely impact to be more significant.
▶ Property, plant and equipment: the Company intends to utilize the ifRS 1 election to recognize certain parcels of land at fair value at january 1, 2010. All other property, plant and equipment will retain its historical cost on transition and will reflect the application of componentization, which is expected to have an insignificant impact on the opening financial position at january 1, 2010. the Company has finalized fair value assessments for its properties and the resulting adjustment will be an increase to property of $2,270, and a $2,006 increase to retained earnings at january 1, 2010, net of future tax implications.
24 H a m m o n d P o w e r S o l u t i o n S | a n n u a l r e P o r t 25M a n a g e M e n t ’ s D i s c u s s i o n a n D a n a ly s i s

▶ employee future benefits: the Company plans to utilize the ifRS 1 election and recognize all unamortized actuarial gains and losses through equity. this will result in an increase in an accrued benefit obligation of $245 and a corresponding decrease in retained earnings at january 1, 2010, net of any related future tax implications.
▶ functional currency: the Company has performed an analysis of the functional currency of each of its operations located in Canada, the u.S. and Mexico, in accordance with the requirements of iAS 21 – the effects of Changes in foreign exchange Rates. under Canadian gAAP it had previously been concluded that the functional currency of all the Company’s operations was the Canadian dollar. under iAS 21 it has been concluded that the operations in Canada have the Canadian dollar as their functional currency, the operations in the u.S. have the u.S. dollar as their functional currency and that the operations in Mexico have the Mexican peso as their functional currency.
▶ balance Sheet translation: the impact of adapting balance Sheet spot rate currency translation as at january 1, 2010, resulted in a in a decrease in retained earnings of $625. going forward, translation adjustments related to the operations in the u.S. and Mexico will be recognized in shareholders’ equity rather than through the statement of earnings, as is currently the case under Canadian gAAP.
▶ business combinations: the impact of adapting business combinations ifRS accounting at january 1, 2010, resulted in a decrease in retained earnings of $26.
the Company expects that the net impact of the above items and any related future tax implications to result in a small increase in shareholders’ equity at january 1, 2011, with such increase not expected to exceed $1,110.
Phase three – implementation and Reviewthis phase involves executing the work completed in Phase two by making changes to business and accounting processes and supporting information systems. it will also include the review of all internal controls that may have been impacted by any of the changes. 2010 comparative data will be collected for comparative disclosure starting in the first quarter of 2011.
the Company’s ifRS transition and implementation project is on schedule and will meet the Quarter 1, 2011 reporting deadline.
Subsequent eventsPurchase of euroelettro s.p.A.the Company announced on March 21, 2011, that the acquisition of euroelettro S.p.A. was completed. the company will operate as euroelettro S.p.A. (“ee”), a wholly-owned subsidiary of hammond Power Solutions inc.
with more than 20 years’ of experience, ee has its corporate office and manufacturing plant in Meledo di Sarego, italy. ee’s business involves the design and manufacture of cast coil, standard and custom dry-type distribution and power transformers with annual sales revenues of approximately $15 million. ee has a reputation in the industry for its custom design capabilities, product reliability and quality.
the cost of the acquisition was approximately $13,700 (stated in Canadian dollars) and the total purchase consideration was a combination of approximately $7,990 (stated in Canadian dollars) in cash and $5,710 (stated in Canadian dollars) in assumed debt.
the purchase of ee expands hPS’ global presence, provides a platform for expansion into the european market and increases its product breadth offering with design and manufacturing capabilities in cast coil transformer technology. the addition of cast coil product with hPS’ already broad dry transformer product offering will support hPS’ growth in north America as well as in other global markets.
the acquisition of ee further strengthens hPS’ transformer brands, supports north American and european market share expansion, provides increased manufacturing capacity and advances the Company’s business hedging strategies.
Risks and uncertaintiesAs with most businesses, hPS is subject to a number of marketplace, industry and economic related business risks, which could have some material impact on our operating results. these risks include:
▶ the cyclical effects, unpredictability and volatility of market costs and supply pressures for commodities such as copper, insulation and electrical grain oriented steel;
▶ A significant, unexpected change in the global demand for resources;
▶ the extreme variability of the Canadian dollar versus the u.S. dollar;▶ global economic recession;▶ interest rates;▶ government protectionism;▶ Competition;▶ Credit risk; and▶ global political unrest.
the Company is very cognizant of these risks and continually assesses the current and potential impacts that they have on the business. hPS continuously works to lessen the negative impact of these risks through diversification of its core business, market channel expansion, breadth of product offering, geographic diversity of its operations and business hedging strategies.
there are, however, several risks that deserve particular attention:
dollars in thousands unless otherwise stated
commodity pricesAn area that has had a definite impact on the Company’s costs and earnings is the cyclical effects and unprecedented market cost pressures of copper commodity and steel pricing in the global market. due to this unpredictability, particularly with copper pricing, hPS implemented a future contracts hedging strategy. Strategic supply line agreements and alliances are in place with our major steel suppliers to ensure adequate supply and competitive market pricing.
the Company had forward commodity contracts in place for 2010 and has entered into contracts to the end of the year 2011.the details of the forward commodity contracts outstanding as at december 31, 2010, are discussed in note 16 in the notes to Consolidated financial Statements.
Foreign exchangehPS operating results are reported in Canadian dollars. nonetheless, the majority of our sales and material purchases are denominated in u.S. dollars. while there is a natural hedge, as sales denominated in u.S. dollars are partially offset by the cost of raw materials purchased from the u.S. and commodities tied to u.S. dollar pricing, a change in the value of the Canadian dollar against the u.S. dollar will impact earnings. in general, a lower value for the Canadian dollar compared to the u.S. dollar will have a beneficial impact on the Company’s results. inversely, a higher value for the Canadian dollar compared to the u.S. dollar will have a corresponding negative impact on the Company’s profitability.
the Company also has a u.S. operating subsidiary and u.S. dollar assets. the exchange rate between the Canadian and u.S. dollar can vary significantly from year to year. there is a corresponding positive or negative impact to the Company’s Statement of earnings solely related to the foreign exchange translation of its u.S. balance Sheet.
we have partially reduced the impact of foreign exchange fluctuations through increasing our u.S. dollar driven manufacturing output and have further enhanced our geographic manufacturing hedge through the acquisition of delta transformers inc. this operation is a buyer of raw materials priced in u.S. dollars and essentially has all of its sales in Canada.
the Company also lessened its balance Sheet translation exchange rate risk by entering into forward foreign exchange contracts.
finally, hPS periodically institutes price increases to help offset the negative impact of changes in foreign exchange and product cost increases.
interest ratesthe Company has structured its debt financing to take advantage of the current lower interest rates, but is cognizant that a rise in interest rates will negatively impact the financial results of the Company. the Company continuously reviews its interest rate strategy and with current lower short-term interest rates has not entered into any long-term contracts. As part of hedging this risk, the Company may enter into fixed long-term rates on part of its total debt. the Company believes that a
more significant impact of a rise in interest rates would apply to our customers’ investment decisions and financing capabilities.
creditA substantial portion of the Company’s accounts receivable are with customers in manufacturing sectors and are subject to credit risks normal to those industries. Although the Company has historically incurred very low bad debt expense, the current economic conditions increase this exposure.
Global/north American economygiven the negative economic environment, particularly in north America, we are focusing our efforts over the next twelve months on projects that will increase our cost competitiveness, capacity and improve our manufacturing flexibility. the Company believes that being agile as an organization will become even more important in order to respond quickly to both unexpected opportunities and challenges. we also believe that through our OeM and distributor channels, our growing access to a variety of global and domestic markets will help hPS expand market share during this economic slowdown.
Off-balance sheet arrangementsthe Company has no off-balance sheet arrangements, other than operating leases disclosed in the notes to the Consolidated financial Statements as at the end of the of the 2010 fiscal year.
transactions with related partiesthe Company had no transactions with related parties in 2010.
Proposed transactionswhile the Company continues to evaluate potential business expansion initiatives, it has no firm proposed transactions as at december 31, 2010.
financial instruments the Company utilized foreign exchange forward contracts, which resulted in a gain of $1,078 in the year, to hedge the risk associated with currency fluctuations as a result of foreign balance Sheet translation. the Company does not enter into foreign exchange forwards for speculative purposes. Realized and unrealized losses and gains associated with foreign exchange forward contracts are included in “foreign exchange loss/gain” in the consolidated financial statements.
there were no forward foreign exchange contracts in place as at december 31, 2010.
26 H a m m o n d P o w e r S o l u t i o n S | a n n u a l r e P o r t 27M a n a g e M e n t ’ s D i s c u s s i o n a n D a n a ly s i s

Critical accounting estimates the preparation of the Company’s consolidated financial statements requires Management to make estimates and assumptions that affect the reported amounts of assets, liabilities, revenues and expenses and the disclosure of contingent assets and liabilities. these estimates are based upon Management’s historical experience and various other assumptions that are believed by Management to be reasonable under the circumstances. Such assumptions and estimates are evaluated on an ongoing basis and form the basis for making judgments about the carrying values of assets and liabilities that are not readily apparent from other sources. Actual results could differ from these estimates. the Company assesses the carrying value of its property, plant and equipment, intangible assets and goodwill every year, or more often if necessary, if it is determined that we cannot recover the carrying value of an asset or goodwill, the unrecoverable amount is written off against current earnings. the Company bases its assessment of recoverability on assumptions and judgments about future prices, demand and manufacturing costs. A material change in any of these assumptions could have a significant impact on the potential impairment and/or useful lives of these assets.
Outstanding share datadetails of the Company’s outstanding share data as of March 30, 2011, are as follows:
8,804,624 Class A Shares
2,778,300 Class b Common Shares
11,582,924 total Class A and b Shares
Strategic direction and outlookAs evidenced in the 2010 Annual Report, hPS continues to expand in both Canada and the u.S. Although their economies and the electrical market were soft for most of this year, the Company is very aware of the general global economic decline particularly in north America, the potential negative impact of a stronger and unpredictable Canadian dollar and the variability of raw material commodity costs. the Company continues to deal with these deterrents in a deliberate and forthright manner through its operational projects and strategic initiatives.
dollars in thousands unless otherwise stated
the Company is not immune to the challenges it faces from these negative influences but is confident that the business fundamentals that it has built will sustain and grow the Company in the future. the Company believes that this is a time to be cautious but not complacent, conservative but progressive. it will be unwavering in its pursuit of improved productivity gains, sales growth from new product development, geographic diversification, capacity expansion and escalation of market share.
the Company is proud of our past achievements and is aware of the cloak of economic pessimism, but we are optimistic about our future opportunities. we are stronger and more capable of enduring economic uncertainty.
hPS showed strong performance across all financial and operational metrics and it is noteworthy that last year’s solid financial performance was realized during a global economic decline.
we will continue to focus our efforts on sustaining profit rates through selling price increases, sales growth, geographic manufacturing dispersion, productivity gains, new product development and market share penetration.
we expect sales growth will be realized in several of our market segments but will remain at a lower level in others. A portion of our sales will come from major customer projects for which the exact timing is hard to predict, thus influencing quarterly sales fluctuations.
hPS is positioned to meet the evolving needs of our traditional markets while becoming a central player in a growing number of emerging markets. Our success lies in our ability to bring together decades of experience, engineering expertise, solid supplier relationships, as well as a unique business perspective gained through our diverse products, customers and markets.
we define success during these periods of economic disruption as the ability to deliver sound financial results while maintaining the level of investment required keeping our Company at a strategic advantage going forward.
we remain attentive in continuing our disciplined cost management initiatives and in bringing quality and value to all stakeholders of the Company. we will deliver solid financial performance, provide a sustainable return to our shareholders and maintain the balance Sheet strength of the Company.
28 H a m m o n d P o w e r S o l u t i o n S | a n n u a l r e P o r t 29M a n a g e M e n t ’ s D i s c u s s i o n a n D a n a ly s i s

Management’s Responsibility for financial Statementsthe Consolidated financial Statements are the responsibility of the management of hammond Power Solutions inc. these statements have been prepared in accordance with Canadian generally accepted accounting principles, using management’s best estimates and judgments where appropriate.
Management is responsible for the reliability and integrity of the Consolidated financial Statements, the notes to Consolidated financial Statements and other financial information contained in the report. in the preparation of these statements, estimates were sometimes necessary because a precise determination of certain assets and liabilities is dependent on future events. Management believes such estimates have been based on careful judgment and have been properly reflected in the accompanying Consolidated financial Statements. Management is responsible for the maintenance of a system of internal controls designed to provide reasonable assurances that the assets are safeguarded and that accounting systems provide timely, accurate and reliable financial information.
the board of directors is responsible for ensuring that management fulfills its responsibilities through the Audit Committee of the board, which is composed of all of the directors, of whom five are non-management directors. the Audit Committee meets periodically with management and the auditors to satisfy itself that management’s responsibilities are properly discharged, to review the Consolidated financial Statements and to recommend approval of the Consolidated financial Statements to the board of directors.
kPMg LLP, the independent auditors appointed by the shareholders, has audited the Company’s Consolidated financial Statements in accordance with Canadian generally accepted auditing standards, and their report follows. the independent auditors have full and unrestricted access to the Audit Committee to discuss their audit and related findings as to the integrity of the financial reporting process.
William G. hammondChairman & Chief executive Officer
christopher R. huetherCorporate Secretary and Chief financial Officer
to the Shareholders of hammond Power Solutions inc.we have audited the accompanying consolidated financial statements of hammond Power Solutions inc. (“the entity”), which comprise the balance sheets as at december 31, 2010 and december 31, 2009 and the statements of earnings and comprehensive earnings, statements of shareholders’ equity, and statements of cash flows for the years then ended, and notes, comprising a summary of significant accounting policies and other explanatory information.
Management’s Responsibility for the Financial statementsManagement is responsible for the preparation and fair presentation of these consolidated financial statements in accordance with Canadian generally accepted accounting principles, and for such internal control as Management determines is necessary to enable the preparation of financial statements that are free from material misstatement, whether due to fraud or error.
Auditors’ ResponsibilityOur responsibility is to express an opinion on these consolidated financial statements based on our audits. we conducted our audits in accordance with Canadian generally accepted auditing standards. those standards require that we comply with ethical requirements and plan and perform the audit to obtain reasonable assurance about whether the consolidated financial statements are free from material misstatement.
An audit involves performing procedures to obtain audit evidence about the amounts and disclosures in the financial statements. the procedures selected depend on our judgment, including the assessment of the risks of material misstatement of the financial statements, whether due to fraud or error. in making those risk assessments, we consider internal control relevant to the entity’s preparation and fair presentation of the financial statements in order to design audit procedures that are appropriate in the circumstances, but not for the purpose of expressing an opinion on the effectiveness of the entity’s internal control. An audit also includes evaluating the appropriateness of accounting policies used and the reasonableness of accounting estimates made by Management, as well as evaluating the overall presentation of the financial statements.
we believe that the audit evidence we have obtained in our audits is sufficient and appropriate to provide a basis for our audit opinions.
opinionin our opinion, the consolidated financial statements present fairly, in all material respects, the financial position of hammond Power Solutions inc. as at december 31, 2010 and december 31, 2009, and the results of its operations and its cash flows for the years then ended in accordance with Canadian generally accepted accounting principles.
Chartered Accountants, Licensed Public Accountants March 30, 2011 waterloo, Canada
2010 independent Auditors’ Reportdollars in thousands unless otherwise stated
Consolidated balance Sheetsyears ended december 31, 2010 and 2009 (tabular amounts in thousands of dollars)
2010 2009
AssetsCurrent assets:
Cash $ 19,536 $ 14,049
Accounts receivable 32,201 27,820
income taxes recoverable 2,188 3,006
inventories (note 3) 26,535 25,722
Prepaid expenses 921 514
future income taxes (note 9) 574 643
81,955 71,754
Property, plant and equipment (note 4) 27,292 26,452
investment in properties (note 5) 1,044 1,044
Accrued pension benefit asset (note 12) 4 –
future income taxes (note 9) 12 42
intangible assets (note 6) 4,905 5,125
goodwill 2,180 2,180
$ 117,392 $ 106,597
Liabilities and Shareholders’ EquityCurrent liabilities:
bank operating lines of credit (note 7) $ 1,447 $ 4,025
Accounts payable and accrued liabilities 27,870 23,503
income taxes payable 218 85
future income taxes (note 9) 326 180
29,861 27,793
Long term debt (note 8) 395 –
Accrued pension benefit obligation (note 12) – 5
environmental reserve, net of current portion (note 17(b)) 118 139
future income taxes (note 9) 1,465 1,157
Shareholders’ equity:
Share capital (note 10) 12,968 12,959
Contributed surplus 968 626
Retained earnings 71,617 63,918
85,553 77,503
Commitments (note 17)
Contingent liabilities (note 18)
Subsequent event (note 19)
$ 117,392 $ 106,597
See accompanying notes to Consolidated financial Statements.
william g. hammondChairman & Chief executive Officer
douglas v. baldwindirector
On behalf of the board:
30 H a m m o n d P o w e r S o l u t i o n S | a n n u a l r e P o r t 31I N D E P E N D E N T A U D I T o r s ’ r E P o r T

Consolidated Statements of earnings and Comprehensive earningsyears ended december 31, 2010 and 2009 (tabular amounts in thousands of dollars except earnings per share)
2010 2009
Sales $ 190,604 $ 195,437
Costs of sales 141,286 142,710
49,318 52,727
Selling, general and administrative 34,341 33,784
earnings before the undernoted 14,977 18,943
Other expenses:
interest expense 103 178
foreign exchange loss 14 2,370
Loss on disposal of equipment 6 –
Co-tenancy expense 84 175
Loss – rental property investment 3 148
210 2,871
income before income taxes 14,767 16,072
income tax expense: (note 9)
Current 4,520 5,679
future 537 762
5,057 6,441
net earnings and comprehensive earnings $ 9,710 $ 9,631
earnings per share: (note 11)
basic $ 0.84 $ 0.82
diluted $ 0.83 $ 0.82
See accompanying notes to Consolidated financial Statements.
Consolidated Statements of Shareholders’ equityyears ended december 31, 2010 and 2009 (tabular amounts in thousands of dollars)
ShARe CAPitAL
COntRibuted SuRPLuS
RetAined eARningS
totAl shAReholDeRs’
eQuity
balance, as at january 1, 2009 $ 13,061 $ 512 $ 56,211 $ 69,784
Cash consideration on exercise of stock options 36 – – 36
Ascribed value credited to share capital on exercise of stock options 20 (20) –
Stock based compensation expense – 140 – 140
Share repurchase and cancellation (158) (6) (751) (915)
net earnings – – 9,631 9,631
dividends – – (1,173) (1,173)
balance as at december 31, 2009 $ 12,959 $ 626 $ 63,918 $ 77,503
Cash consideration on exercise of stock options 55 – – 55
Ascribed value credited to share capital on exercise of stock options 28 (28) – –
Stock based compensation expense – 373 – 373
Share repurchase and cancellation (74) (3) (507) (584)
net earnings – – 9,710 9,710
dividends – – (1,504) (1,504)
balance as at december 31, 2010 $ 12,968 $ 968 $ 71,617 $ 85,553
See accompanying notes to Consolidated financial Statements.
32 H a m m o n d P o w e r S o l u t i o n S | a n n u a l r e P o r t 33C O N S O L I D AT E D F I N A N C I A L S TAT E M E N T S

notes to Consolidated financial Statementsyears ended december 31, 2010 and 2009 (tabular amounts in thousands of dollars)
Consolidated Statements of Cash flowsyears ended december 31, 2010 and 2009 (tabular amounts in thousands of dollars)
2010 2009
Cash provided by (used in):
Operations:
net earnings $ 9,710 $ 9,631
Add (deduct) items not involving cash:
Amortization of property, plant and equipment 3,257 3,013
Amortization of intangible assets 592 553
Accrued pension benefit obligation (9) (24)
future income taxes 537 762
foreign exchange 886 1,248
environmental reserve (40) (85)
Stock based compensation expense 373 140
Loss on disposal of equipment 6 –
15,312 15,238
Change in non-cash operating working capital (note 14) (264) 11,180
Cash provided by operations 15,048 26,418
financing:
Repayments of bank operating lines of credit (2,578) (2,448)
issuance of common shares 55 36
Share repurchase and cancellation (584) (915)
dividends paid (1,504) (1,173)
Proceeds from long-term debt 395 –
Cash used in financing activities (4,216) (4,500)
investments:
Proceeds on disposal of equipment 2 –
Purchase of intangible assets (372) (207)
Purchase of property, plant and equipment (4,105) (8,342)
Cash used in investment activities (4,475) (8,549)
foreign exchange loss on cash held in foreign currency (870) (1,162)
increase in cash 5,487 12,207
Cash, beginning of year 14,049 1,842
Cash, end of year $ 19,536 $ 14,049
See note 13 for supplemental cash flow information.See accompanying notes to Consolidated financial Statements.
hammond Power Solutions inc. (“hPS” or the “Company”) is a public company, traded on the toronto Stock exchange (“hPS.A”) and is incorporated under the Ontario business Corporations Act. hPS designs and manufactures custom electrical engineered magnetics and standard electrical dry-type transformers, serving the electrical and electronic industries. the Company has manufacturing plants in Canada, the united States and Mexico.
1. Summary of significant accounting policies:
the consolidated financial statements have been prepared in accordance with Canadian generally accepted accounting principles (“gAAP”) and reflect the following policies:
(a) Principles of consolidation:the consolidated financial statements include the accounts of hammond Power Solutions inc. and its wholly owned subsidiaries, hammond Power Solutions, inc., hammond Power Solutions, S.A. de C.v., and delta transformers inc. All significant inter-company transactions and balances have been eliminated.
(b) translation of foreign currencies:the Company’s subsidiary operations, located in the u.S. and Mexico are deemed to be integrated foreign operations and, therefore, their financial statements are translated using the temporal method. under this method, all asset, liability, revenue and expense items are translated at the exchange rate in effect at the transaction date. At the balance Sheet dates, monetary assets and liabilities are adjusted to reflect the year-end exchange rate. the gain or loss resulting from translation is included in the determination of income for the current period.
(c) Revenue recognition: the Company recognizes revenue when products are shipped and the customer takes ownership and assumes risk of loss, collection of the relevant receivable is probable, persuasive evidence of an arrangement exists and the sales price is fixed or determinable.
Service revenue is recognized when the service is performed, or, in the case of maintenance contracts, is recognized as costs are incurred to fulfill the contract.
A provision for potential warranty claims is provided for at the same time of sale, based on warranty terms and prior claims experience.
(d) inventoriesinventories are valued at the lower of cost, determined on a first-in, first-out basis, and net realizable value. when circumstances, which previously caused inventories to be written down no longer, exists the previous impairment is reversed.
(e) Property, plant and equipment:Property, plant and equipment are stated at cost less accumulated amortization. Property, plant and equipment under capital leases are initially recorded at the present value of the minimum lease payments at the inception of the lease.Amortization is provided using the following method and annual rates:
Asset basis Ratesbuildings Straight-line 3.3 – 7.1%Leaseholds Straight-line 20%Machinery and equipment Straight-line 10 – 25%Office equipment Straight-line 10 – 25%
(f) long-term investments:the investments in the co-tenancy of glen ewing Properties (50%) and in 1159714 Ontario inc. (50%), the rental property investment, are accounted for using the proportionate consolidation method whereby the Company’s proportionate share of the assets, liabilities and the related revenues and expenses of the co-tenancy and rental property is included in the consolidated financial statements.
(g) Financial instruments: the Company has classified its financial instruments as follows:• Cash is classified as held-for-trading; • Accounts receivable and note receivable are classified as loans and receivables;
34 H a m m o n d P o w e r S o l u t i o n S | a n n u a l r e P o r t 35C O N S O L I D AT E D F I N A N C I A L S TAT E M E N T S

notes to Consolidated financial Statementsyears ended december 31, 2010 and 2009 (tabular amounts in thousands of dollars)
notes to Consolidated financial Statementsyears ended december 31, 2010 and 2009 (tabular amounts in thousands of dollars)
• Bank operating lines of credit are classified as held-for-trading;• Account payable and accrued liabilities and long-term debt are classified as other liabilities; and• Derivative financial instruments are classified as held-for-trading.
All financial assets and financial liabilities are initially recognized at fair value. Subsequent measurement is dependent on their initial classification, as follows:• Financial assets and financial liabilities classified as held-for-trading are measured at fair value with changes in fair value recorded in the
consolidated statements of earnings and comprehensive earnings; and • Financial assets classified as loans and receivables and financial liabilities classified as other liabilities are measured at amortized cost using the
effective interest method.
the Company is party to derivative financial instruments in the form of forward foreign exchange contracts used to manage foreign currency exposures and forward copper contracts used to manage commodity price exposures. the Company records all of its forward contracts at fair value, with changes in fair value of foreign exchange contracts recognized through earnings as foreign exchange gains or losses and changes in fair value of copper contracts recognized through earnings as costs of sales. the carrying amount of the Company’s forward contracts is included in accounts receivable in the case of contracts in a gain position and in accounts payable and accrued liabilities in the case of contracts in a loss position.
the Company capitalizes transaction costs related to financial instruments classified as other than held-for-trading.the Company uses trade date accounting for regular-way purchases and sales of financial assets.the fair value of a financial instrument is the amount of consideration that would be agreed upon in an arm’s length transaction between
knowledgeable, willing parties who are under no compulsion to act. the fair value of a financial instrument on initial recognition is the transaction price, which is the fair value of the consideration given or received. Subsequent to initial recognition, the fair values of financial instruments that are quoted in active markets are based on bid prices for financial assets held and offer prices for financial liabilities. when independent prices are not available, fair values are determined by using valuation techniques that refer to observable market data.
(h) intangible assets:intangible assets acquired individually or as part of a group of other assets are initially recognized and measured at cost and are amortized over their useful lives. the amortization methods and estimated useful lives of intangible assets, which are reviewed annually, are as follows:
Asset basis RatesCustomer relationships Straight-line over 15 yearsSoftware and other Straight-line over 4 years
(i) Goodwill:goodwill is the residual amount that results when the purchase price of an acquired business exceeds the sum of the amounts allocated to the assets acquired, less liabilities assumed based on their fair values. goodwill is allocated as of the date of the business combination to the Company’s reporting units that are expected to benefit from the synergies of the business combination. the amount recognized as goodwill would include acquired intangible assets that do not qualify for recognition as separate assets in accordance with generally accepted accounting principles.
goodwill is not amortized and is tested for impairment annually or more frequently if events or changes in circumstance indicate that the asset might be impaired.
(j) Accrued pension benefit obligation:the Company has a defined benefit pension plan covering the former hourly employees at the Company’s baraboo, wisconsin facility. As at december 31, 2010, there are no active employees under the plan (2009 – no active employees).
the Company accrues the cost of the defined benefit plan as determined by an independent actuary based on assumptions determined by the Company and in that regard has adopted the following policies:• The pension benefit obligation is actuarially determined using the projected benefit method pro-rated on service and Management’s best estimate
of expected plan investment performance, salary escalation and retirement ages.• For the purpose of calculating expected return on plan assets, those assets are valued at fair value.• Past service costs from plan amendments are amortized on a straight-line basis over the average remaining service period of employees active
at the date of the amendment.• The excess of the net actuarial gain or loss over 10% of the greater of the benefit obligation and the fair value of plan assets is amortized over
the average remaining life expectancy of the former employees, which is 21.75 years (2009 – 20.63).• When a restructuring of a benefit plan gives rise to both a curtailment and a settlement of obligations, the curtailment is accounted for prior to
the settlement.
(k) income taxes:the Company provides for income taxes under the asset and liability method. under the asset and liability method, future tax assets and liabilities are recognized for the future tax consequences attributable to differences between the financial statement carrying value of existing assets and liabilities and their respective tax bases. future tax assets and liabilities are measured using enacted or substantively enacted tax rates expected to apply to taxable income in the years in which those temporary differences are expected to be recovered or settled. the effect on future tax assets and liabilities of a change in tax rates is recognized in income in the period that includes the date of enactment or substantive enactment.
(l) stock-based compensation:the Company has a stock-based compensation plan, which is described in note 10(c). the Company accounts for all stock-based payments using the fair value based method.
under the fair value based method, compensation cost for stock options and direct awards of stock is measured at fair value at the grant date. Compensation cost is recognized in earnings on a straight-line basis over the relevant vesting period. the counterpart is recognized in contributed surplus. upon exercise of a stock option, share capital is recorded at the sum of the proceeds received and the related amount of contributed surplus.
(m) earnings per share:basic earnings per share are computed by dividing net earnings by the weighted average shares outstanding during the reporting period. the Company uses the treasury stock method for calculating diluted earnings per share. diluted earnings per share are computed similar to basic earnings per share except that the weighted average shares outstanding are increased to include additional shares from the assumed exercise of warrants or stock options, if dilutive. the number of additional shares is calculated by assuming that outstanding warrants and stock options were exercised and that the proceeds from such exercises were used to acquire shares of common stock at the average market price during the reporting period.
(n) impairment of long-lived assets:Long-lived assets, including property, plant and equipment and intangible assets are amortized over their useful lives. the Company periodically reviews the useful lives and the carrying values of its long-lived assets for continued appropriateness. the Company reviews for impairment of long-lived assets, or asset groups, held and used whenever events or changes in circumstances indicate that the carrying amount of the assets may not be recoverable. if the sum of the undiscounted expected future cash flows expected to result from the use and eventual disposition of an asset is less than its carrying amount, it is considered to be impaired. An impairment loss is measured at the amount by which the carrying amount of the asset exceeds its fair value. when quoted market prices are not available, the Company uses the expected future cash flows discounted at a rate corresponding with the risks associated with the recovery of the asset as an estimate of fair value.
(o) use of estimates:the preparation of the consolidated financial statements in conformity with Canadian gAAP requires Management to make estimates and assumptions that affect the reported amounts of assets and liabilities and disclosure of contingent assets and liabilities at the dates of the consolidated financial statements and the reported amounts of revenues and expenses during the reporting periods. Significant estimates and assumptions are used when accounting for items such as the determination of estimated useful lives of intangible assets and property, plant and equipment, stock-based compensation costs and valuation of goodwill. Actual results could differ from those estimates.
2. Future accounting changes:
international Financial Reporting standardsthe Company will adopt international financial Reporting Standards effective january 1, 2011.
N O T E S T O C O N S O L I D AT E D F I N A N C I A L S TAT E M E N T S36 H a m m o n d P o w e r S o l u t i o n S | a n n u a l r e P o r t 37

notes to Consolidated financial Statementsyears ended december 31, 2010 and 2009 (tabular amounts in thousands of dollars)
notes to Consolidated financial Statementsyears ended december 31, 2010 and 2009 (tabular amounts in thousands of dollars)
3. Inventories:
2010 2009
Raw materials and work-in-process $ 15,006 $ 13,815
finished goods 11,529 11,907
$ 26,535 $ 25,722
the Company recognized $141,254,000 of inventory as an expense, which is included in cost of sales during the year (2009 – $142,719,000). during the year an expense of $32,000 was recorded in cost of sales for an increase in provision to the lower of cost or net realizable value (2009 – reversal of $9,000).
4. Property, plant and equipment:
2010
CostAccumulated amortization
net book value
Land $ 1,491 – $ 1,491
buildings 14,222 3,238 10,984
Leaseholds 2,468 1,767 701
Machinery and equipment 32,784 20,911 11,873
Office equipment 7,506 5,914 1,592
Construction in progress 651 – 651
$ 59,122 $ 31,830 $ 27,292
2009
CostAccumulated amortization
net book value
Land $ 1,491 – $ 1,491
buildings 13,000 3,275 9,725
Leaseholds 1,852 817 1,035
Machinery and equipment 29,643 19,043 10,600
Office equipment 6,927 5,441 1,486
Construction in progress 2,115 – 2,115
$ 55,028 $ 28,576 $ 26,452
Amortization expense for the year is $3,257,000 (2009 – $3,013,000) of which $3,129,000, $104,000, and $24,000 (2009 – $2,913,000, $94,000, and $6,000) was contributed to cost of sales, selling, general and administrative, and other expenses respectively.
5. Investment in properties:
the Company’s proportionate share (50%) of the revenue, expenses, assets and liabilities of the co-tenancy called glen ewing Properties is as the Company’s proportionate share (50%) of the assets, liabilities and cash flows of the co-tenancy called glen ewing Properties is as follows:
2010 2009
Assets:
Cash $ 4 $ 46
investment in properties 1,044 1,044
equipment, net of depreciation 90 114
$ 1,138 $ 1,204
Liabilities and shareholders’ equity:
Accounts payable and accrued liabilities $ (144) $ (159)
environmental reserve, net of current portion (118) (139)
Shareholders’ equity (876) (906)
$ (1,138) $ (1,204)
Cash provided by (used in):
Operations $ (102) $ (399)
financing 60 435
total increase in cash $ (42) $ 36
the investment in properties is stated at the lower of carrying amount and estimated net realizable value.
6. Intangible assets:
2010
CostAccumulated amortization
net book value
Customer relationships $ 5,250 $ 1,050 $ 4,200
Software and other 1,400 695 705
$ 6,650 $ 1,745 $ 4,905
2009
CostAccumulated amortization
net book value
Customer relationships $ 5,250 $ 700 $ 4,550
Software and other 1,028 453 575
$ 6,278 $ 1,153 $ 5,125
none of the intangible assets recognized by the Company are internally developed. Amortization expense for the year is $592,000 (2009 – $553,000), of which $112,000, $471,000, and $9,000 (2009 – $119,000, $434,000, and $nil) was contributed to cost of sales, selling, general & administrative and other expenses respectively.
N O T E S T O C O N S O L I D AT E D F I N A N C I A L S TAT E M E N T S38 H a m m o n d P o w e r S o l u t i o n S | a n n u a l r e P o r t 39

notes to Consolidated financial Statementsyears ended december 31, 2010 and 2009 (tabular amounts in thousands of dollars)
notes to Consolidated financial Statementsyears ended december 31, 2010 and 2009 (tabular amounts in thousands of dollars)
7. Bank operating lines of credit:
the Company has a u.S. $40,000,000 revolving credit facility that expires on September 30, 2012, consisting of a u.S. $25,000,000 (or Canadian dollar equivalent) revolving credit line, and a u.S. $15,000,000 (or Canadian dollar equivalent) delayed draw revolving credit line facility, which are both unsecured. interest on the revolving credit lines is dependent on certain financial ratios and ranges from Canadian bank prime rate minus 0.50% to Canadian bank prime rate for the Canadian dollar denominated revolving credit lines or, if designated, the bank’s CdOR rate plus 1.25% to 1.75% and from u.S. base rate minus 1.00% to u.S. base rate minus 1.50% for the u.S. dollar denominated revolving credit lines or, if designated, the bank’s LibOR rate plus 1.25% to 1.75%. As at december 31, 2010, the Canadian dollar equivalent outstanding under the Canadian revolving credit line and the u.S. revolving credit line was $1,034,000 and $413,000 respectively (2009 – $393,000 and $3,632,000).
under the terms of the facility, the Company pays an unused line fee at rates ranging from 0.15% to 0.25% calculated monthly in arrears, on the average daily un-borrowed portion of the credit facility.
8. Long-term debt:
during the year the Company was awarded an unsecured, non-interest bearing credit facility of up to $1,495,000 from the Canadian federal economic development Agency for Southern Ontario for the expansion of the guelph manufacturing facility. As at december 31, 2010, $395,000 had been advanced to hPS, which is payable over 5 years in equal monthly installments commencing March 1, 2011.
9. Income taxes:
the Company’s provision for income tax is comprised of the following:
2010 2009
income taxes based on a combined Canadian federal and provincial income tax rate of 41.00% (2009 – 42.00%) $ 6,054 $ 6,750
increase (decrease) in income taxes resulting from:
Reduced rate for active business and manufacturing and processing (1,180) (963)
Lower income tax rate on income of foreign subsidiaries (345) (785)
foreign exchange translation loss (gain) 466 1,762
Permanent tax differences 118 91
Others (56) (414)
income tax expense $ 5,057 $ 6,441
the tax effect of temporary differences that give rise to significant portions of the future tax assets and future tax liabilities at december 31 are presented below:
2010 2009
Current future tax asset:
inventory provisions $ 278 $ 265
Accounts receivable, allowance for doubtful accounts 23 86
investment tax credits (1) (3)
Accounts payable and accrued liabilities not currently deductible 27 295
$ 574 $ 643
2010 2009
Current future tax liability:
deductible subsequent pension contributions $ 120 $ 104
inventory provision (66) (61)
investment tax credits 44 19
unrealized gains on forward contracts 287 133
Accounts receivable, allowance for doubtful accounts – (15)
Accounts payable and accrued liabilities not currently deductible (59) –
$ 326 $ 180
Long-term future tax asset:
Property, plant and equipment – differences in net book value and undepreciated capital cost $ 12 $ 42
Long-term future tax liability:
Property, plant and equipment – differences in net book value and undepreciated capital cost $ 1,461 $ 1,157
intangible assets – differences in net book value and undepreciated capital cost 77 86
Accrued liabilities and environmental reserve not currently deductible (73) (86)
$ 1,465 $ 1,157
10. Share capital:
(a) Authorized:unlimited number of special shares, discretionary dividends, non-voting, redeemable and retractable;
unlimited number of Class A subordinate voting shares;unlimited number of Class b common shares with four votes per share, convertible into Class A subordinate voting shares on a one-for-one
basis. Annual dividends on the Class b common shares may not exceed the annual dividends on the Class A subordinate voting shares.
(b) issued:2010 2009
8,804,624 Class A subordinate voting shares (2009 – 8,839,826) $ 12,961 $ 12,952
2,778,300 Class b common shares (2009 – 2,778,300) 7 7
11,582,924 total Class A and b shares $ 12,968 $ 12,959
during the year, 16,000 (2009 – 6,000) Class A subordinate voting shares were issued upon exercise of stock options, resulting in cash proceeds of $55,000 (2009 – $36,000) and a transfer of $28,000 (2009 – $20,000) from contributed surplus. Additionally, the Company purchased and cancelled 51,202 (2009 – 108,174) Class A shares under a normal course issuer bid at a cost of $584,000 (2009 – $915,000) of which $74,000, $3,000, and $507,000 (2009 – $158,000, $6,000 and $751,000) was applied against share capital, contributed surplus and retained earnings respectively. the normal course issuer authorized the repurchase of up to 400,000 Class A shares. Shares acquired under the normal course issuer bid were cancelled upon purchase. the normal course issuer bid expired on july 20, 2010.
(c) stock option plan:the Company uses a stock option plan to attract and retain key employees, officers and directors. the shareholders have approved a maximum of 800,000 Class A subordinate voting shares for issuance under the Stock Option Plan, with the maximum reserved for issuance to any one person at 5% of the Class A shares outstanding calculated immediately prior to the time of the grant. As per the Stock Option Plan, the board of directors may, at its sole discretion, determine the time during which the Options shall vest and the method of vesting, or that no vesting restriction shall exist. the stock option exercise price is the price of the Company’s common shares on the toronto Stock exchange at closing for the day prior to the
N O T E S T O C O N S O L I D AT E D F I N A N C I A L S TAT E M E N T S40 H a m m o n d P o w e r S o l u t i o n S | a n n u a l r e P o r t 41

notes to Consolidated financial Statementsyears ended december 31, 2010 and 2009 (tabular amounts in thousands of dollars)
notes to Consolidated financial Statementsyears ended december 31, 2010 and 2009 (tabular amounts in thousands of dollars)
grant date on which the Class A shares traded. the period during which an option will be outstanding shall be 7 years, or such other time fixed by the board of directors, subject to earlier termination upon the optionee ceasing to be a director, officer or employee of the Company. Options issued under the plan are non-transferable unless specifically provided in the Stock Option plan. Any option granted, which is cancelled or terminated for any reason prior to exercise, shall become available for future stock option grants.
during the year the Company granted 100,000 options, of which 60,000 vested immediately and the remaining 40,000 vest equally in 2011 and 2012. Stock-based compensation recognized and the amount credited to contributed surplus during the year is $373,000 and relates to 2010 options granted and to options granted in prior years that vested during the year. in 2009, 60,000 options were granted, of which 33,334 vested immediately, 13,333 vest in 2010 and 13,333 in 2011. the stock-based compensation expense recognized and amount credited to contributed surplus in 2009 amounted to $140,000. the weighted average fair value of options granted in 2010 is $4.13 (2009 – $2.47) and is calculated based on the following assumptions:
2010 2009
expected volatility 50.39% 53.2%
Risk free interest rate 2.08% 1.8%
expected life in years 3.8 years 3.8 years
expected dividend yield 1.2% 0.0%
Summary of the Plan as at december 31, 2010 and 2009:
2010 2009
number of options
Weighted average
exercise pricenumber of
options
weighted average
exercise price
Outstanding, beginning of year 269,500 $ 5.90 224,500 $ 6.07
granted 100,000 10.55 60,000 5.91
exercised (16,000) 3.46 (6,000) 6.00
Cancelled – – (9,000) 10.24
Outstanding, end of year 353,500 $ 7.32 269,500 $ 5.90
exercisable, end of year 300,167 $ 6.96 229,834 $ 5.89
Options outstanding and exercisable at december 31, 2010:
Options outstanding Options exercisable
exercise price
number of options
outstanding
weighted average remaining
contractual life (years)
weighted average
exercise price
number of options
exercisable
weighted average
exercise price
$ 1.93 94,000 1.6 $ 1.93 94,000 $ 1.93
6.00 47,000 2.9 6.00 47,000 6.00
13.64 52,500 4.2 13.64 52,500 13.64
5.91 60,000 5.2 5.91 46,667 5.91
10.55 100,000 6.2 10.55 60,000 10.55
353,500 4.1 $ 7.32 300,167 $ 6.96
11. Earnings per share:
the computations for basic and diluted earnings per share are as follows:
2010 2009
net earnings $ 9,710 $ 9,631
weighted average number of common shares outstanding during the year 11,597,831 11,702,990
incremental shares issued from assumed exercise of stock options 117,755 91,982
11,715,586 11,794,972
earnings per share:
basic $ 0.84 $ 0.82
diluted $ 0.83 $ 0.82
for the year ended december 31, 2010, stock options to purchase 52,500 (2009 – 52,500) Class A subordinate voting shares are excluded from the weighted average number of common shares outstanding in the calculation of the diluted earnings per share as they are anti-dilutive.
12. Pension plans:
(a) Defined contribution plan:the Company has defined contribution pension plans that are available to virtually all of its employees with eligible employee contributions based on 2-5.75% of annual earnings. the Company’s contribution of $ 991,000 (2009 – $922,000) matches the employee contribution.
(b) Defined benefit plan:the Company maintains a contributory defined pension plan covering all of its former hourly employees in baraboo, wisconsin. the Company measures its accrued pension benefit obligations and the fair value of plan assets for accounting purposes as at december 31 of each year. the most recent actuarial valuation of the pension plan for funding purposes was as of August 1, 2010 and the next required valuation is August 1, 2011.information about the Company’s defined benefit plan is as follows:
2010 2009
Accrued benefit obligation:
balance, beginning of year $ (975) $ (1,052)
interest cost (51) (59)
benefits paid 71 50
Actuarial gain (47) (92)
foreign exchange 49 178
balance, end of year $ (953) $ (975)
Plan assets:
fair value, beginning of year $ 725 $ 824
Actual return on plan assets 51 45
employer contributions 32 10
benefits paid (71) (50)
foreign exchange (36) (104)
fair value, end of year $ 701 $ 725
unfunded status deficit $ (252) $ (250)
unamortized net actuarial loss 256 245
Accrued pension benefit (obligation) asset $ 4 $ (5)
N O T E S T O C O N S O L I D AT E D F I N A N C I A L S TAT E M E N T S42 H a m m o n d P o w e r S o l u t i o n S | a n n u a l r e P o r t 43
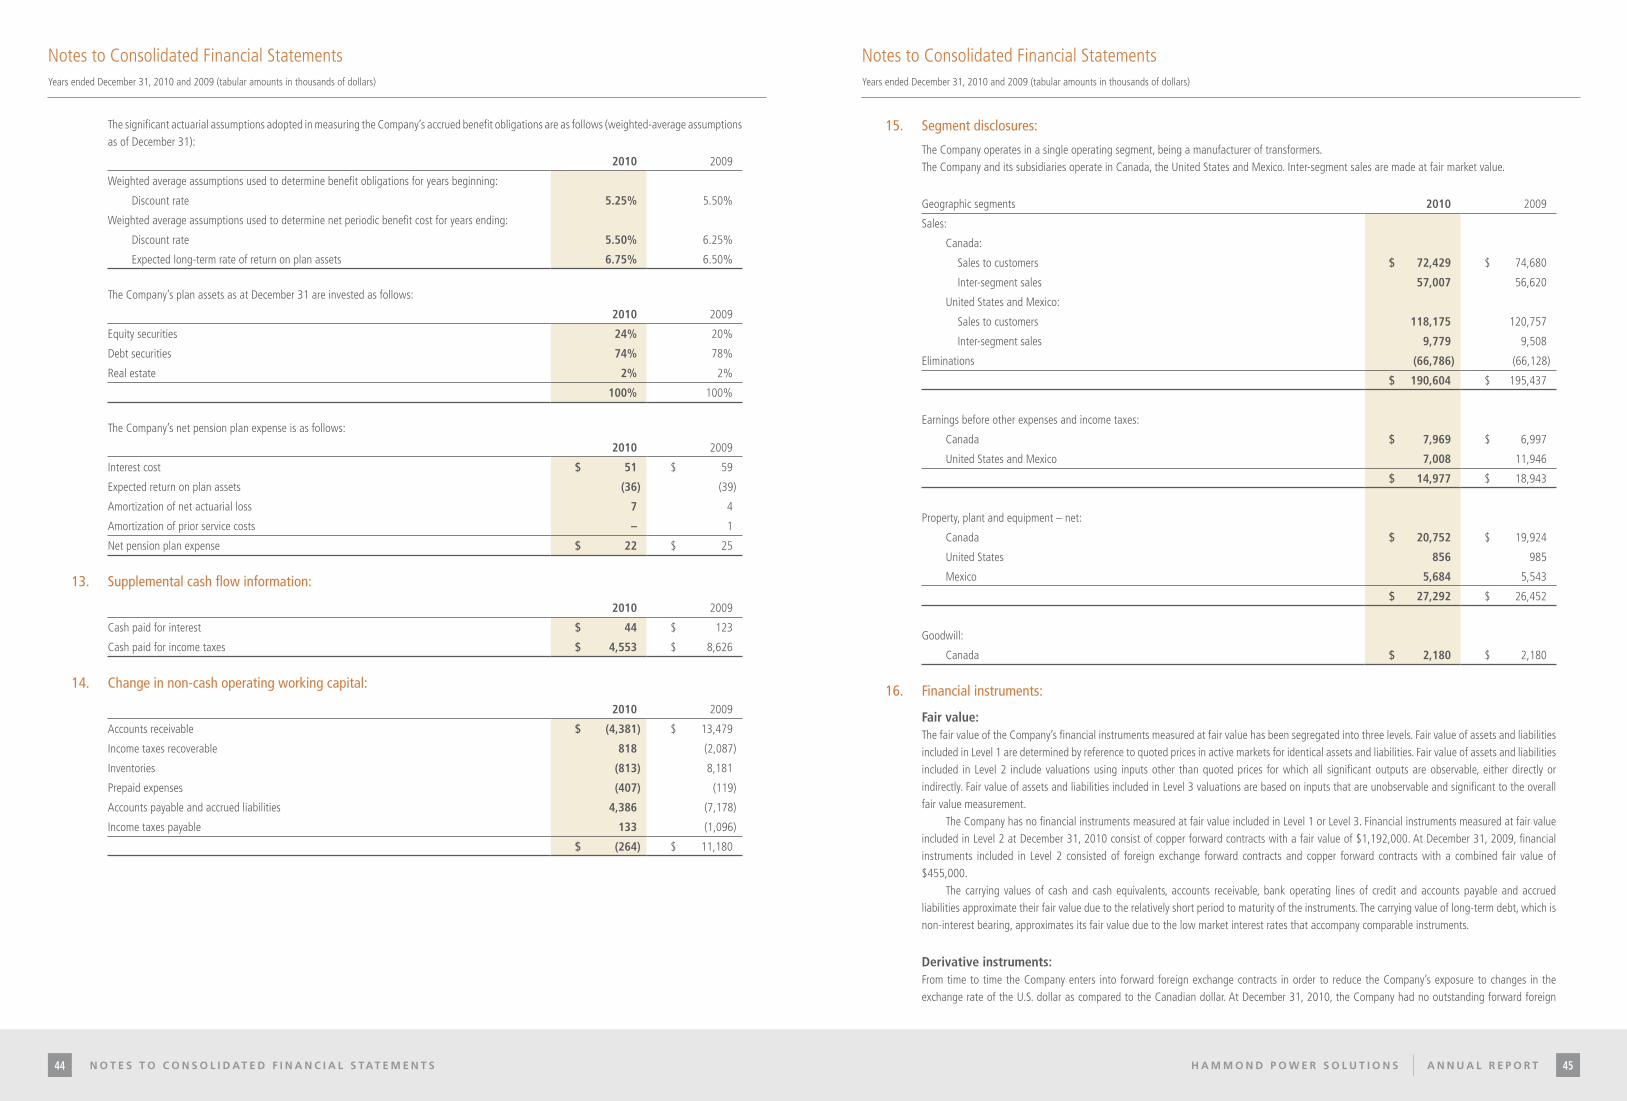
notes to Consolidated financial Statementsyears ended december 31, 2010 and 2009 (tabular amounts in thousands of dollars)
notes to Consolidated financial Statementsyears ended december 31, 2010 and 2009 (tabular amounts in thousands of dollars)
the significant actuarial assumptions adopted in measuring the Company’s accrued benefit obligations are as follows (weighted-average assumptions as of december 31):
2010 2009
weighted average assumptions used to determine benefit obligations for years beginning:
discount rate 5.25% 5.50%
weighted average assumptions used to determine net periodic benefit cost for years ending:
discount rate 5.50% 6.25%
expected long-term rate of return on plan assets 6.75% 6.50%
the Company’s plan assets as at december 31 are invested as follows:
2010 2009
equity securities 24% 20%
debt securities 74% 78%
Real estate 2% 2%
100% 100%
the Company’s net pension plan expense is as follows:
2010 2009
interest cost $ 51 $ 59
expected return on plan assets (36) (39)
Amortization of net actuarial loss 7 4
Amortization of prior service costs – 1
net pension plan expense $ 22 $ 25
13. Supplemental cash flow information:
2010 2009
Cash paid for interest $ 44 $ 123
Cash paid for income taxes $ 4,553 $ 8,626
14. Change in non-cash operating working capital:
2010 2009
Accounts receivable $ (4,381) $ 13,479
income taxes recoverable 818 (2,087)
inventories (813) 8,181
Prepaid expenses (407) (119)
Accounts payable and accrued liabilities 4,386 (7,178)
income taxes payable 133 (1,096)
$ (264) $ 11,180
15. Segment disclosures:
the Company operates in a single operating segment, being a manufacturer of transformers.the Company and its subsidiaries operate in Canada, the united States and Mexico. inter-segment sales are made at fair market value.
geographic segments 2010 2009
Sales:
Canada:
Sales to customers $ 72,429 $ 74,680
inter-segment sales 57,007 56,620
united States and Mexico:
Sales to customers 118,175 120,757
inter-segment sales 9,779 9,508
eliminations (66,786) (66,128)
$ 190,604 $ 195,437
earnings before other expenses and income taxes:
Canada $ 7,969 $ 6,997
united States and Mexico 7,008 11,946
$ 14,977 $ 18,943
Property, plant and equipment – net:
Canada $ 20,752 $ 19,924
united States 856 985
Mexico 5,684 5,543
$ 27,292 $ 26,452
goodwill:
Canada $ 2,180 $ 2,180
16. Financial instruments:
Fair value:the fair value of the Company’s financial instruments measured at fair value has been segregated into three levels. fair value of assets and liabilities included in Level 1 are determined by reference to quoted prices in active markets for identical assets and liabilities. fair value of assets and liabilities included in Level 2 include valuations using inputs other than quoted prices for which all significant outputs are observable, either directly or indirectly. fair value of assets and liabilities included in Level 3 valuations are based on inputs that are unobservable and significant to the overall fair value measurement.
the Company has no financial instruments measured at fair value included in Level 1 or Level 3. financial instruments measured at fair value included in Level 2 at december 31, 2010 consist of copper forward contracts with a fair value of $1,192,000. At december 31, 2009, financial instruments included in Level 2 consisted of foreign exchange forward contracts and copper forward contracts with a combined fair value of $455,000.
the carrying values of cash and cash equivalents, accounts receivable, bank operating lines of credit and accounts payable and accrued liabilities approximate their fair value due to the relatively short period to maturity of the instruments. the carrying value of long-term debt, which is non-interest bearing, approximates its fair value due to the low market interest rates that accompany comparable instruments.
Derivative instruments:from time to time the Company enters into forward foreign exchange contracts in order to reduce the Company’s exposure to changes in the exchange rate of the u.S. dollar as compared to the Canadian dollar. At december 31, 2010, the Company had no outstanding forward foreign
N O T E S T O C O N S O L I D AT E D F I N A N C I A L S TAT E M E N T S44 H a m m o n d P o w e r S o l u t i o n S | a n n u a l r e P o r t 45

notes to Consolidated financial Statementsyears ended december 31, 2010 and 2009 (tabular amounts in thousands of dollars)
notes to Consolidated financial Statementsyears ended december 31, 2010 and 2009 (tabular amounts in thousands of dollars)
exchange contracts. As at december 31, 2009, the Company had outstanding forward foreign exchange contracts in the amount of u.S. $23,000,000 at rates ranging from 1.0476 to 1.0726 with maturity dates ranging from january to May of 2010. As at december 31, 2009 the Company had recognized an unrealized gain of $197,000, representing the fair value of these forward foreign exchange contracts.
the Company has also entered into forward copper contracts in order to reduce the Company’s exposure to changes in the price of copper. At december 31, 2010, the Company had outstanding forward copper contracts for the purchase of a notional 2,300,000 pounds (2009 – 750,000) of copper at a fixed price ranging from $3.66 uS to $4.06 uS (2009 – $2.74 uS to $3.17 uS) per pound with maturity dates ranging from january 2011 to february 2012. As at december 31, 2010 the Company has recognized an unrealized gain of $1,192,000 (2009 – $258,000) representing the fair value of these forward copper contracts
Financial risk management:the Company is exposed to a variety of financial risks by virtue of its activities: market risk (including currency risk, credit risk and interest rate risk) and liquidity risk. the overall risk management program focuses on the unpredictability of financial markets and seeks to minimize potential adverse effects on financial performance.
Risk management is carried out by the finance department under guidance by the board of directors. this department identifies and evaluates financial risks in close cooperation with Management. the finance department is charged with the responsibility of establishing controls and procedures to ensure that financial risks are mitigated.
currency risk:the Company operates internationally and is exposed to foreign exchange risk from various currencies, primarily u.S. dollars and Mexican pesos. foreign exchange risk arises from purchases and Canada/u.S. cross border sales transactions as well as recognized financial assets and liabilities denominated in foreign currencies. the Company manages its foreign exchange risk by having geographically diverse manufacturing facilities and purchasing u.S. dollar raw materials in Canada. the Company also monitors forecasted cash flows in foreign currencies and attempts to mitigate the risk by entering into forward foreign exchange contracts. forward foreign exchange contracts are only entered into for the purposes of managing foreign exchange risk and not for speculative purposes.
As at december 31, 2010, the Company had cash denominated in u.S. dollars of $19,377,000 (2009 – $11,132,000) and in Mexican pesos of 401,000 (2009 – 218,000) and the u.S. revolving credit line has an outstanding balance of u.S. $411,000 (2009 – u.S. $3,463,000) As at december 31, 2010 accounts receivable include u.S. $ 16,793,000 (2009 – u.S. $15,179,000) and Mexican Pesos 21,557,000 (2009 – 10,226,000) and accounts payable include u.S. $ 16,140,000 (2009 – u.S. $12,341,000) and Mexican Pesos 13,602,000 (2009 – 7,933,000).
A one cent decline in the Canadian dollar against the u.S dollar as at december 31, 2010 would have increased shareholders’ equity due to balance sheet translation by $162,000 (2009 – $142,000) and increased net earnings by $162,000 (2009 – $152,000). this analysis assumes that all other variables, in particular interest rates, remain constant. inversely, a one cent increase in of the Canadian dollar against the u.S. dollar as at december 31, 2010, would have had an equal but opposite effect.
fluctuations in the u.S. dollar exchange rate could have a potentially significant impact on the Company’s results from operations. however, they would not impair or enhance the ability of the Company to pay its foreign currency-denominated expenses as such items would be similarly affected.
credit risk:Credit risk arises from the possibility that the Company’s customers may experience financial difficulty and be unable to fulfill their contractual obligations. the Company manages this risk by applying credit procedures whereby analyses are performed to control the granting of credit to its customer based on their credit rating. As at december 31, 2010, the Company’s accounts receivable are not subject to significant concentrations of credit risk. the Company’s maximum exposure to credit risk associated with the Company’s financial instruments is limited to their carrying amount.
A decrease in the allowance for doubtful trade accounts receivables of $ 85,000 (2009 – decrease of $586,000) was recognized in selling, general and administrative expenses. the aging of trade receivables at december 31, 2010 was as follows:
Gross2010
Allowance gross2009
Allowance
not past due $ 17,982 $ – $ 17,990 $ –
Past due 0-30 days 9,589 – 7,924 –
Past due 31-120 days 2,165 355 3,030 550
More than one year – – – –
total $ 29,736 $ 355 $ 28,944 $ 550
interest rate risk:interest rate risk is the risk that the future cash flows of a financial instrument will fluctuate because of changes in market interest rates. financial assets and financial liabilities with variable interest rates expose the Company to cash flow interest rate risk. Changes in market interest rates also directly affect cash flows associated with the Company’s bank operating lines of credit.
the Company manages its interest rate risk by maximizing the interest income earned on excess funds while maintaining the liquidity necessary to conduct operations on a day-to-day basis. fluctuations in market rates of interest do not have a significant impact on the Company’s results of operations due to the low level of bank indebtedness. A 1% increase or decrease in interest rates as at december 31, 2010 would increase or decrease net earnings by approximately $179,000 (2009 – $98,000) respectively.
the Company’s long-term debt is non-interest bearing and accordingly is not subject to interest rate risk.
liquidity risk:Liquidity risk is the risk that the Company will not be able to meet its obligations as they become due.
the Company manages its liquidity risk by forecasting cash flows from operations and anticipated investing and financing activities. Senior Management is also actively involved in the review and approval of planned expenditures.
the following are the contractual maturities of the Company’s financial liabilities:
2011 2012 2013 2014 2015 thereafter
Accounts payable and accrued liabilities $ 27,217 $ – $ – $ – $ – $ –
Long-term debt 59 79 79 79 79 20
total $ 27,276 $ 79 $ 79 $ 79 $ 79 $ 20
17. Commitments:
the Company has entered into various non-cancelable operating leases and binding equipment purchase orders. the future minimum lease payments for each of five years subsequent to december 31, 2010, as well as the maturity profile of the committed equipment purchases are as follows:
2011 2012 2013 2014 2015 total
Operating leases $ 1,445 $ 923 $ 783 $ 455 $ 118 $ 3,724
Capital expenditure purchase commitments $ 147 – – – – $ 147
total $ 1,592 $ 923 $ 783 $ 455 $ 118 $ 3,871
18. Contingent liabilities:
(a) Moloney Properties (1159714 ontario inc.):the Sterling Road property was sold on October 13, 2009, to 2111289 Ontario inc. As a term of condition of the sale the purchaser assumed all the remediation and environmental liability of the property.
(b) Glen ewing Properties:On August 15, 2009, the Company announced that a settlement of statements of claim was reached between the adjoining industrial property owner, hPS and hammond Manufacturing Company Limited.
All claims with regard to glen ewing properties have been settled by agreement between the parties and include the undertaking of a joint remediation plan. the Company has recorded a liability for its estimated portion of the joint remediation.
hPS’ share of ongoing legal and consulting costs pertaining to the glen Road site incurred during the year was $84,000 (2009 – $175,000).
N O T E S T O C O N S O L I D AT E D F I N A N C I A L S TAT E M E N T S46 H a m m o n d P o w e r S o l u t i o n S | a n n u a l r e P o r t 47

notes to Consolidated financial Statementsyears ended december 31, 2010 and 2009 (tabular amounts in thousands of dollars)
19. Subsequent event:
the Company announced on March 21, 2011 that the acquisition of euroelettro S.p.A. was completed. the Company will operate as euroelettro S.p.A. (“ee”), a wholly-owned subsidiary of hammond Power Solutions inc.
ee has its corporate office and manufacturing plant in Meledo di Sarego, italy. ee’s business involves the design and manufacture of cast coil, standard and custom dry-type distribution and power transformers.
the cost of the acquisition was $13,697 and the total purchase consideration was a combination of approximately $7,990 in cash and $5,707 in assumed debt.
20. Capital risk management:
the Company’s objective is to maintain a strong capital base so as to maintain investor, creditor and market confidence and to sustain future business development. the Company includes cash, debt and equity, compromising of issued common and subordinate voting shares, contributed surplus and retained earnings in the definition of capital. the Company is not subject to externally imposed capital requirements and there has been no change with respect to the overall capital risk management strategy during the year ended december 31, 2010.
21. Recast of comparative figures:
Certain of the 2009 comparative figures have been reclassified to conform with the current year financial statement presentation.
Selected Annual and Quarterly information(tabular amounts in thousands of dollars)
Annual Information**2006 2007 2008 2009 2010
Sales 131,978 160,606 226,358 195,437 190,604
earnings from operations 14,067 19,575 26,558** 18,943 14,977
ebitdA 16,190 22,704 34,742 19,816 18,719
net earnings (loss) for the year 8,674 12,403 22,829 9,631 9,710
total assets 57,688 70,264 110,891 106,597 117,392
total liabilities 25,907 25,784 41,107 29,094 31,839
total cash (debt) (180) 4,395 (4,100) 10,024 17,694
Cash provided from operations 7,661 7,611 6,254 26,418 15,048
basic earnings (loss) per share 0.76 1.08 1.95 0.82 0.84
diluted earnings (loss) per share 0.75 1.06 1.93 0.82 0.83
dividends declared and paid – – – 1,173 1,504
Average exchange Rate (uSd$ = CAn$) 1.134 1.075 1.064 1.145 1.030
book value per share 2.78 3.87 5.95 6.67 7.39
Quarterly Information**2009 2010
Q1 Q2 Q3 Q4 Q1 Q2 Q3 Q4
Sales 54,845 48,203 43,768 48,621 44,273 50,820 47,903 47,608
earnings from operations 6,072 3,966 2,218 6,687 3,580 3,420 2,461 5,516
ebitdA 7,777 2,900 2,125 7,014 4,984 4,319 3,749 5,667
net earnings 4,242 472 57 4,860 2,224 2,401 1,497 3,588
total assets 107,200 107,446 105,302 106,597 105,339 107,450 110,083 117,392
total liabilities 33,087 33,981 30,965 29,094 25,582 25,359 26,678 31,839
total cash (debt) (4,527) 970 1,326 10,024 10,464 10,415 16,030 17,694
Cash provided (used) by operations 2,012 8,006 5,341 11,059 1,645 1,852 7,202 4,349
basic earnings per share 0.36 0.04 0.01 0.41 0.19 0.21 0.13 0.31
diluted earnings per share 0.36 0.04 0.01 0.41 0.19 0.20 0.13 0.31
dividends declared and paid – – 1,173 – – – – 1,504
Average exchange rate (uSd$ = CAn$) 1.245 1.175 1.103 1.058 1.041 1.028 1.039 1.013
book value per share 6.32 6.27 6.30 6.67 6.86 7.08 7.21 7.39
** exchange gain/loss of the 2008 comparative figures has been reclassified to conform with the current period financial statement presentation
N O T E S T O C O N S O L I D AT E D F I N A N C I A L S TAT E M E N T S48 H a m m o n d P o w e r S o l u t i o n S | a n n u a l r e P o r t 49

the hammond Museum of Radio is one of north America’s premiere wireless museums. it is home to thousands of receivers and transmitters dating back to the turn of the century. the museum is open regular business hours Monday to friday; evenings and weekends by special appointment. tours can be arranged by calling: 519-822-2441 x 590.
hammond Power Solutions inc.Canadacorporate head office595 Southgate driveguelph, Ontario n1g 3w6Phone: (519) 822-2441
15 industrial Roadwalkerton, Ontario n0g 2v0Phone: (519) 881-3552
Distribution centre10 tawse Placeguelph, Ontario n1h 6h9
Delta transformers inc.795 industriel boul.granby, Quebec j2g 9A1Phone (450) 378-3617
1311 A Ampereboucherville, Quebec j4b 5Z5
hammond Power Solutions, inc.united States1100 Lake Streetbaraboo, wisconsin 53913Phone (608) 356-3921
17715 Susana RoadCompton, California 90224Phone (310) 537-4690
hammond Power Solutions S.A. de C.v.MexicoAve. Avante #810Parque industrial guadalupeguadalupe, nuevo Leon, C.P. 67190Monterrey, Mexico(011) 52-81-8479-7115
Ave. Avante #900Parque industrial guadalupeguadalupe, nuevo Leon, C.P. 67190Monterrey, Mexico
Corporate Officers and directors
William G. Hammond *Chairman and Chief executive Officer
Chris R. HuetherCorporate Secretary and
Chief financial Officer
Donald H. MacAdam *+
director
Zoltan D. Simo *+
director
Douglas V. Baldwin *+
director
Grant C. Robinson *+
director
David J. FitzGibbon *+
director
* Corporate governance Committee + Audit and Compensation Committee
Corporate head Office
595 Southgate driveguelph, Ontario n1g 3w6
Stock exchange Listing
toronto Stock exchange (tSx)trading Symbol: hPS.A
Registrar and transfer Agent
Computershare investor Share Services inc.100 university Avenuetoronto, Ontario M5j 2y1
Auditors
kPMg, LLP 115 king Street Southwaterloo, Ontario n2j 5A3
investor Relations
Contact: dawn henderson, Manager investor Relationstelephone: 519.822.2441email: [email protected]
Annual general Meeting
Shareholders are cordially invited to attend the Annual general meeting held at:
the toronto Stock exchange(the gallery)130 king Street westtoronto, Ontario M5x 1j2
wednesday, May 25, 2011 at 3:00 p.m.
50 H a m m o n d P o w e r S o l u t i o n S | a n n u a l r e P o r t 51C o r p o r at e I n f o r m at I o n

hammondpowersolutions.com