Embed Size (px)
Citation preview
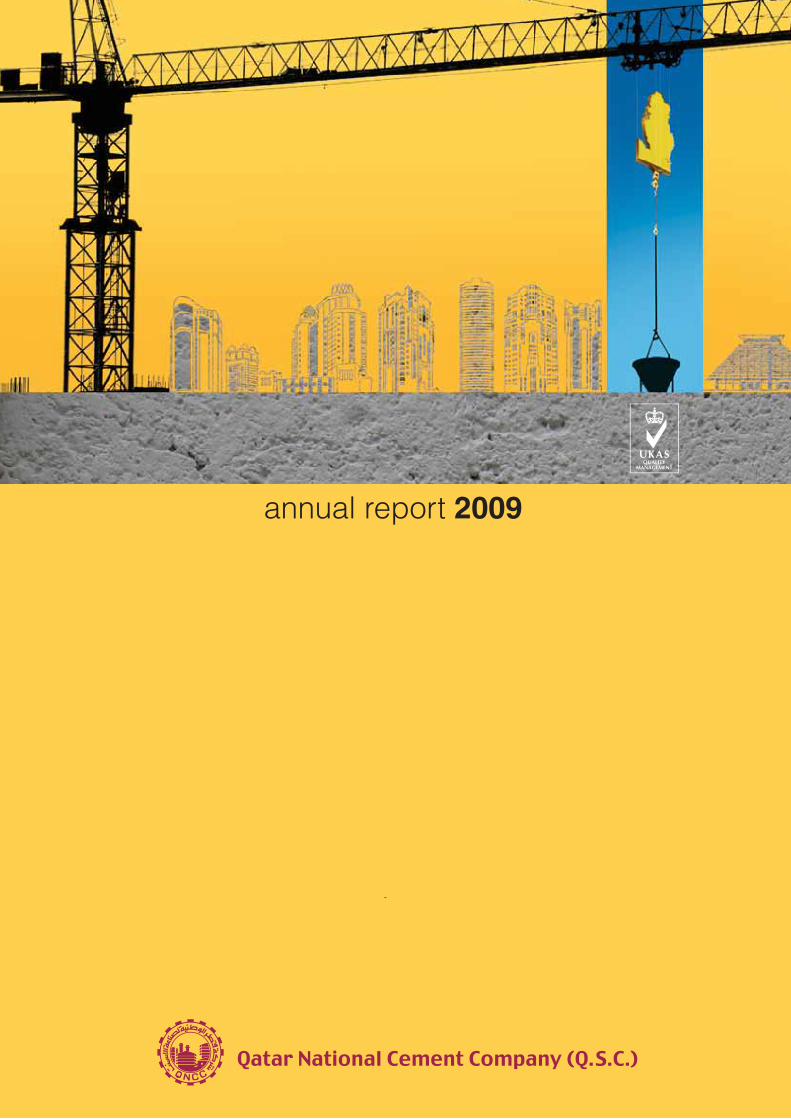
annual report 2009

2 1
Qatar National Cement Co. (Q.S.C.) P.O. Box 1333, Doha, Qatar Head Office Tel. +974 4693800, 4694354/5/6/7 Factory Tel. +974 4711811 (5 lines), 4712880 Fax +974 4693900, 4694517 C.R. No. 25 [email protected] www.qatarcement.com
In the Name of Allah,the Most Gracious, the Most Merciful
His HighnessSheikh Hamad Bin Khalifa Al-Thani
Emir of the State of Qatar
His HighnessSheikh Tamim Bin Hamad Bin Khalifa Al-Thani
The Heir Apparent
ContentsBoard of Directors 3
Board of Directors’ Report 4-5
Financial Highlights 9
Independent Auditors’ Report 11
Statement of Financial Position 12
Statement of Income 13
Statement of Comprehensive Income 14
Statement of Changes in Equity 15-16
Statement of Cash Flows 17
Notes to the Financial Statements 18-40

2
Board ofDirectors
buildingthe nation
Qatar National Cement Co. is a major producer of Ordinary Portland Cement, Sulphate Resistant Cement, Hydrated Lime, Calcined Lime and Washed Sand in the State of Qatar.
3
Salem Bin Butti Al-NaimiChairman & Managing Director
Sulaiman Khalid Al ManaDeputy Chairman
Mohammad Ali AlSulaity
General Manager
Khalil Ibrahim Radwani Member
Hassan Al JufairiMember
Sh. Abdulaziz Bin Jassim Al-Thani
Member
Najib Al SadaMember
Abdel Latif Al Mohanadi Member
Badr Ahmed QayedMember
Dear Shareholders,
Al-Salamu Alaikum
I have the pleasure, personally and on behalf of the Board of Directors, to welcome you to this meeting and to present to you the Board of Directors’ Report No. 44 on the Company’s performance and its financial position as at 31st December 2009, and our future plans for the year 2010.
Production, Sales & Profit of 2009 During 2009, the Company’s production in both categories of cement – OPC & SRC – increased to 4.1 million tons compared to 3.8 million tons during the previous year; the production of washed sand increased to 7.5 million tons compared to 6.5 million tons during 2008; and lime production in both categories – Calcined & Hydrated – amounted to 22,200 tons compared to 25,300 tons recorded during the previous year.
Sales of all types of cement (OPC, SRC, Slag Blended Cement & Fly Ash Blended Cement) increased to 5.2 million tons during 2009 compared to 4.8 million tons achieved during 2008 (+8%). On the other hand, the sales of washed sand amounted to 6.6 million tons, the same quantity as the year before. Sales of lime in both the categories stood at 20,700 tons at the end of 2009 compared to 24,200 tons achieved in 2008.
During 2009 the total value of sales revenue increased toQR 1.5 billion from QR 1.4 billion in 2008, an increase ofQR 106 million (+7.5%).
Net profit increased to QR 417 million during 2009 from QR 414 million in the previous year, despite the adverse impact of the global financial crisis on the economy of Qatar.
Our company successfully met the local market’s demand for all types of cement – washed sand and lime – at high quality standards and competitive prices. This stands testimony to the vital role the Company is playing in supporting the developmental projects in this country.
Financial Position and Profit DistributionDuring 2009 the financial position of the Company became further stronger. The shareholders’ equity increased to QR 1.9 billion as at 31st December 2009 compared to QR 1.6 billion at the end of the previous year, an increase of QR 280 million (+17%).
Accordingly, the Company’s Board of Directors have recommended to the respected general assembly meeting to approve the distribution of 60% cash dividend to the shareholders, for the year 2009.
Significant Achievements during 2009 Cement Plant-4, which was fully completed in May 2009, has added around 5,000 tons of clinker and around 5,500 tons of cement per day to the Company’s production capacity. The Company’s daily production capacity has now increased to around 12,000 tons of clinker and around 15,500 tons of cement and the Company’s total annual production capacity has reached 4.7 million tons of cement.
In order to cater to the local demand for blended cement the Company has increased its sales of slag cement, fly ash cement and micro silica.
During 2009 the Company successfully maintained its sales from washed sand and kept sufficient stock at site. The Company’s production capacity at the end of 2008 was around 40,000 tons of washed sand per day.
The Company entered into a contract with Qatar Electricity and Water Company to supply them with calcium carbonate for 25 years. This is expected to have a positive impact on the Company’s revenue and its financial position in the future. Presently QNCC is in the process of constructing a production unit for this purpose. The construction will be completed during the coming year.
The Company has also initiated the preliminary steps to establish a limited liability company in partnership with Shuaiba Company of Kuwait and other partners in order to construct a packaging plant in Qatar to produce paper bags and other products.
With a view towards showcasing the Company’s integral role in the local, regional and global industry, QNCC successfully organised the eighth International Cement Conference (Intercem) in Doha from 27 to 28 January 2009 in association with Arab Cement Union.
Future Plans • TheCompanywillcontinuetosupportthedevelopment
plans of Qatar by meeting the local market’s demand for different kinds of cement, washed sand and both kinds of lime.
• TheCompanyislookingatdiverseinvestmentopportunities in order to achieve its objectives and enhance its financial position.
• TheCompanywillcontinuetoplayavitalroleinprotectingthe environment and the natural resources by adopting the highest environmental standards.
• TheCompanywillcontinuetoencourageQatarinationalsto join the Company, in line with the State’s Qatarization policy.
• TheCompanyaimstoconstantlyimprovetheconditionsand welfare of its employees working at different sites.
• TheCompanywillcontinuetosupportallthenationalprojects and programmes that are aimed at the general welfare of the community.
Board ofDirectors’ Report
Finally I have the pleasure to extend our most profound gratitude to His Highness Sheikh Hamad Bin Khalifa Al-Thani, Emir of the State of Qatar and to His Highness Sheikh Tamim Bin Hamad Bin Khalifa Al-Thani, the Heir Apparent, for their continuous and generous support to our ongoing progress and development.
I would also like to thank His Excellency Sheikh Hamad Bin Jassim Bin Jabor Al-Thani, the Prime Minister and Minister of Foreign Affairs; His Excellency Abdullah Bin Hamad Al Attiyah, the Deputy Premier, Minister of Energy and Industry and Chairman of Qatar Petroleum; all Ministries, government departments, establishments and institutions; as well as all Qatari and foreign companies who are co-operating with our company. My sincere thanks are also extended to our
esteemed customers for their continuous co-operation & encouragement.
I would like to take this opportunity to express my sincere thanks to our employees for their hard work and diligence in executing their duties and responsibilities for the benefit and development of the Company, and to our respected shareholders for entrusting us with the management of this leading industrial company. We hereby reiterate our commitment to take all the necessary actions to further develop this company.
I pray to Almighty Allah to give us the strength to achieve our targeted objectives for the development and welfare of the State of Qatar.
Salem Bin Butti Al-Naimi Chairman & Managing Director
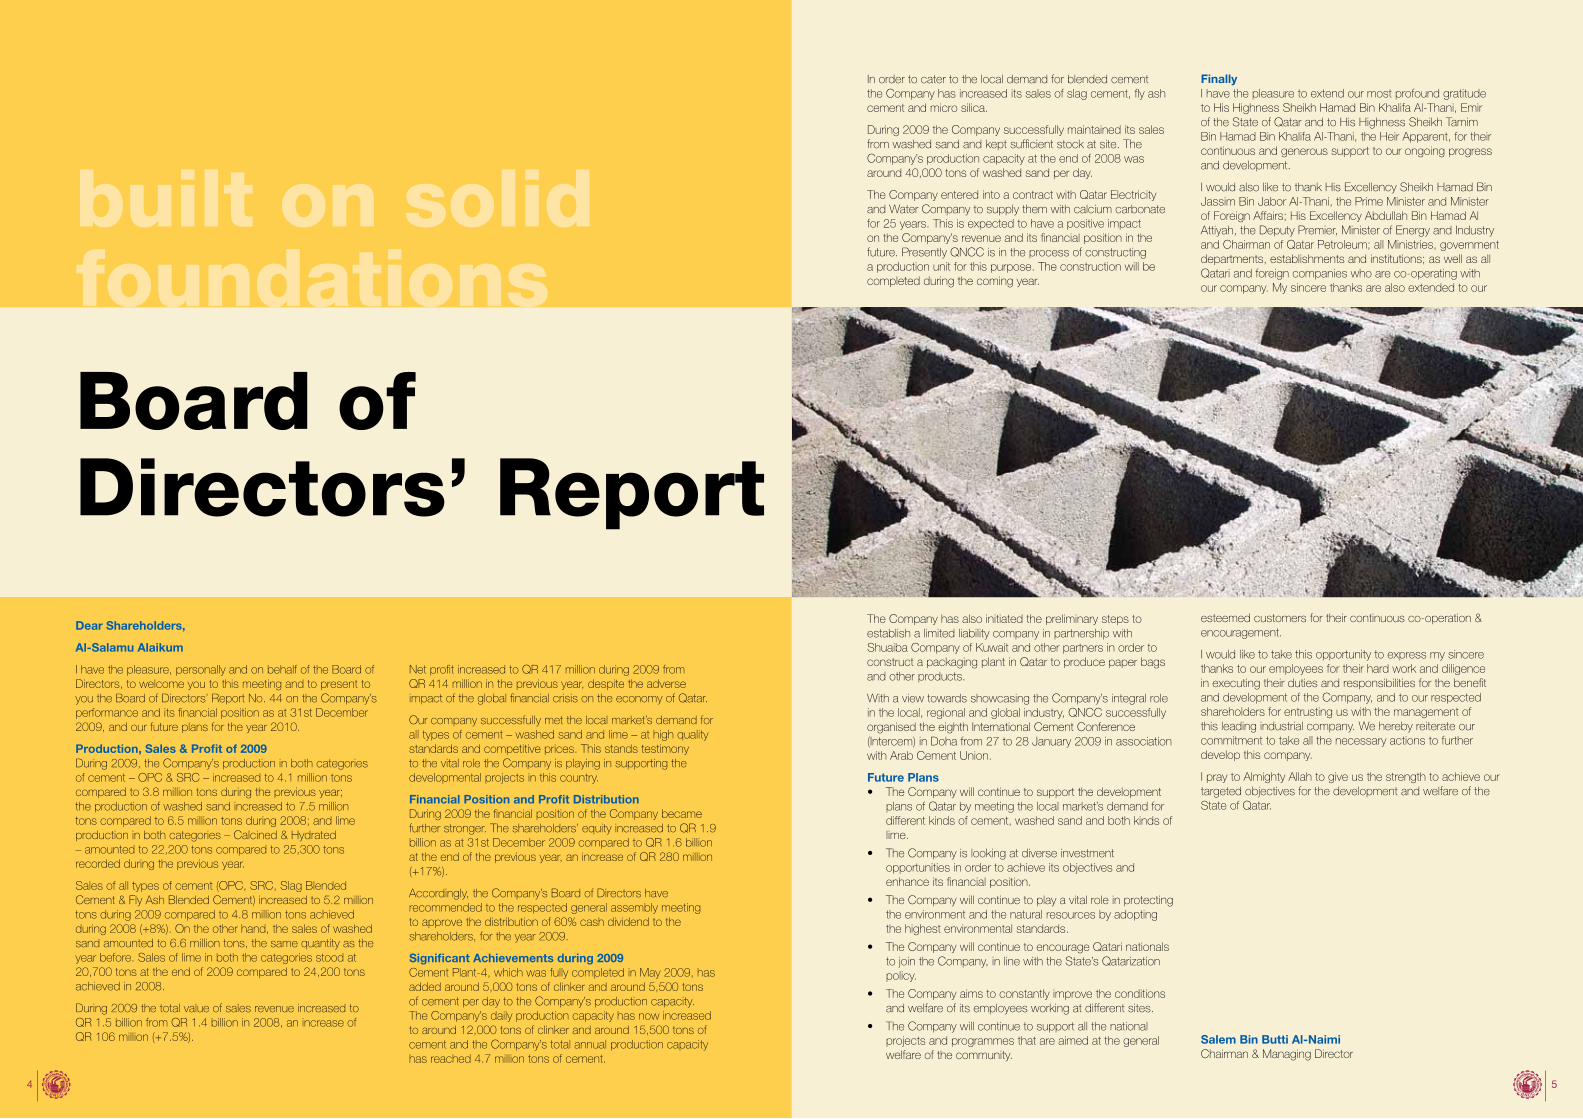
built on solidfoundations
54
6 7
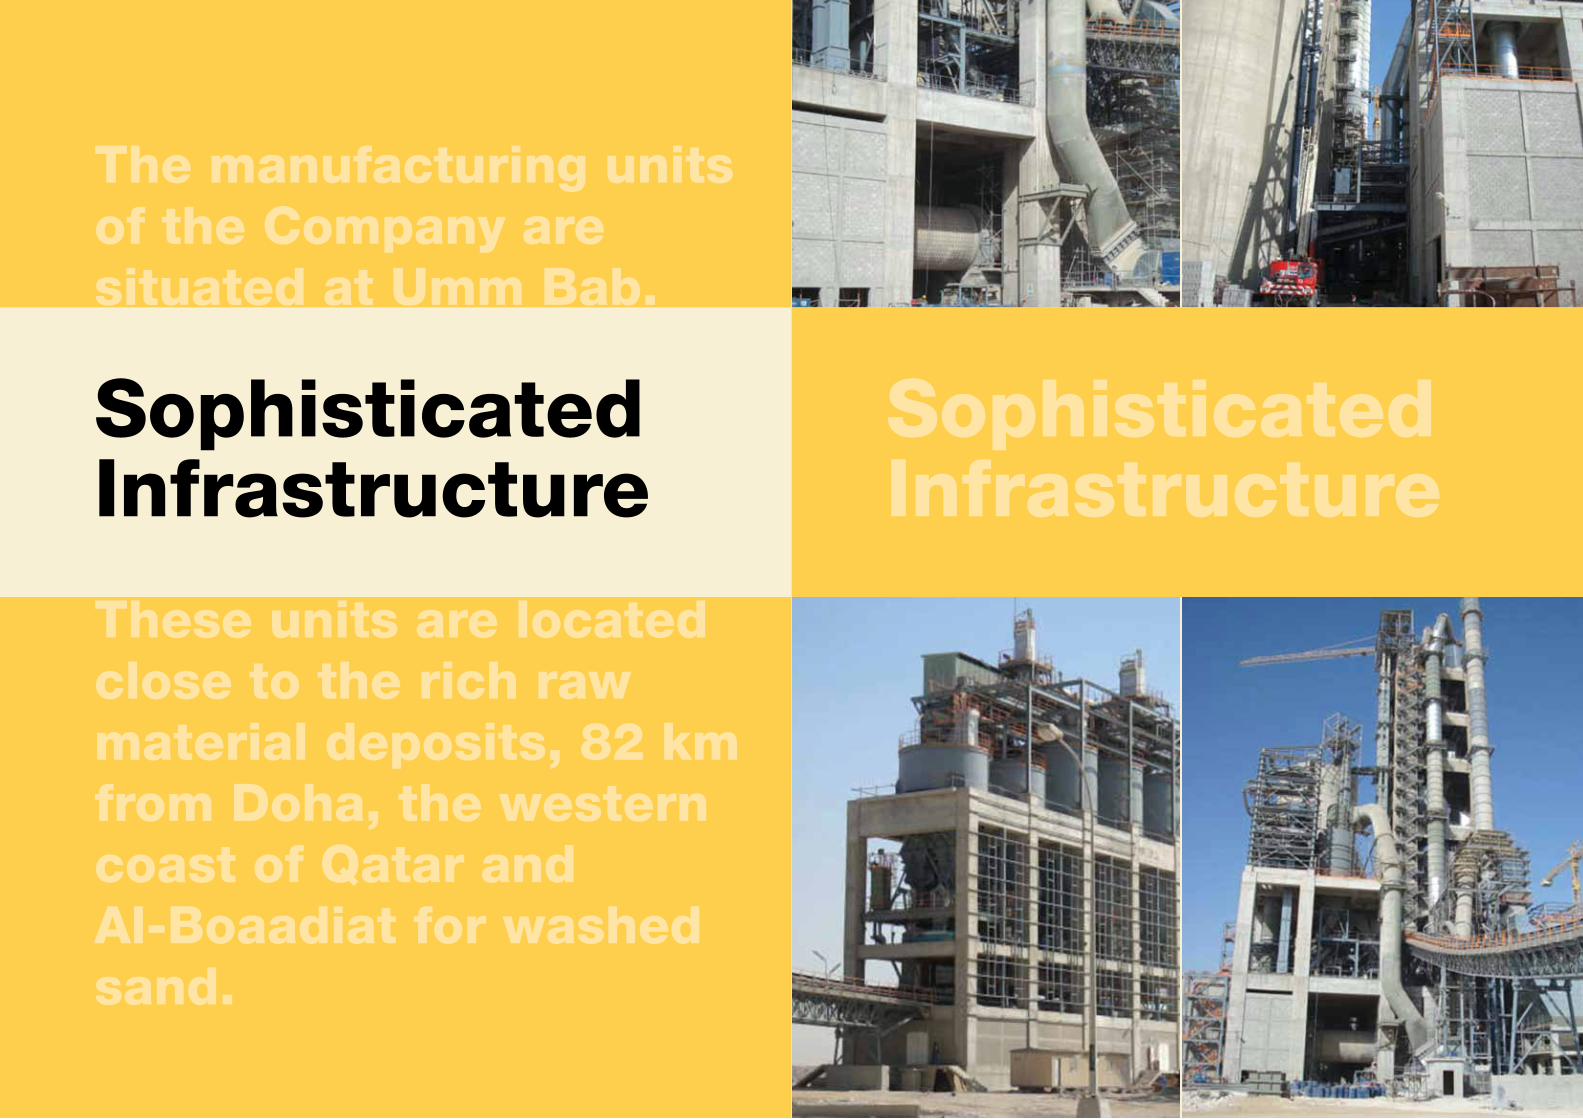
SophisticatedInfrastructure
SophisticatedInfrastructure
These units are located close to the rich raw material deposits, 82 km from Doha, the western coast of Qatar and Al-Boaadiat for washed sand.
The manufacturing units of the Company are situated at Umm Bab.
8 98
FinancialHighlights
NET PROFIT (in QR Million)
0
50
150
250
350
300
200
100
450
400
0
400
200
800
600
1,000
1,200
1,400
1,600
SALES (in QR Million)
2009 2008 2007 2006 2005 2004 2003 2002
2009 2008 2007 2006 2005 2004 2003 2002
DISTRIBUTIONS (%)
2009 2008 2007 2006 2005 2004 2003 2002 0%
40%
20%
60%
80%
100%
120%
0
EARNINGS PER SHARE (in QR)
2009 2008 2007 2006 2005 2004 2003 2002
4.00
6.00
10.00
14.00
2.00
8.00
12.00
16.00
0
NET WORTH (in QR)
2009 2008 2007 2006 2005 2004 2003 2002
500,000,000
1,000,000,000
1,500,000,000
2,000,000,000
2,500,000,000
0
SHARE CAPITAL (in QR)
2009 2008 2007 2006 2005 2004 2003 2002
100,000,000
200,000,000
300,000,000
400,000,000
500,000,000
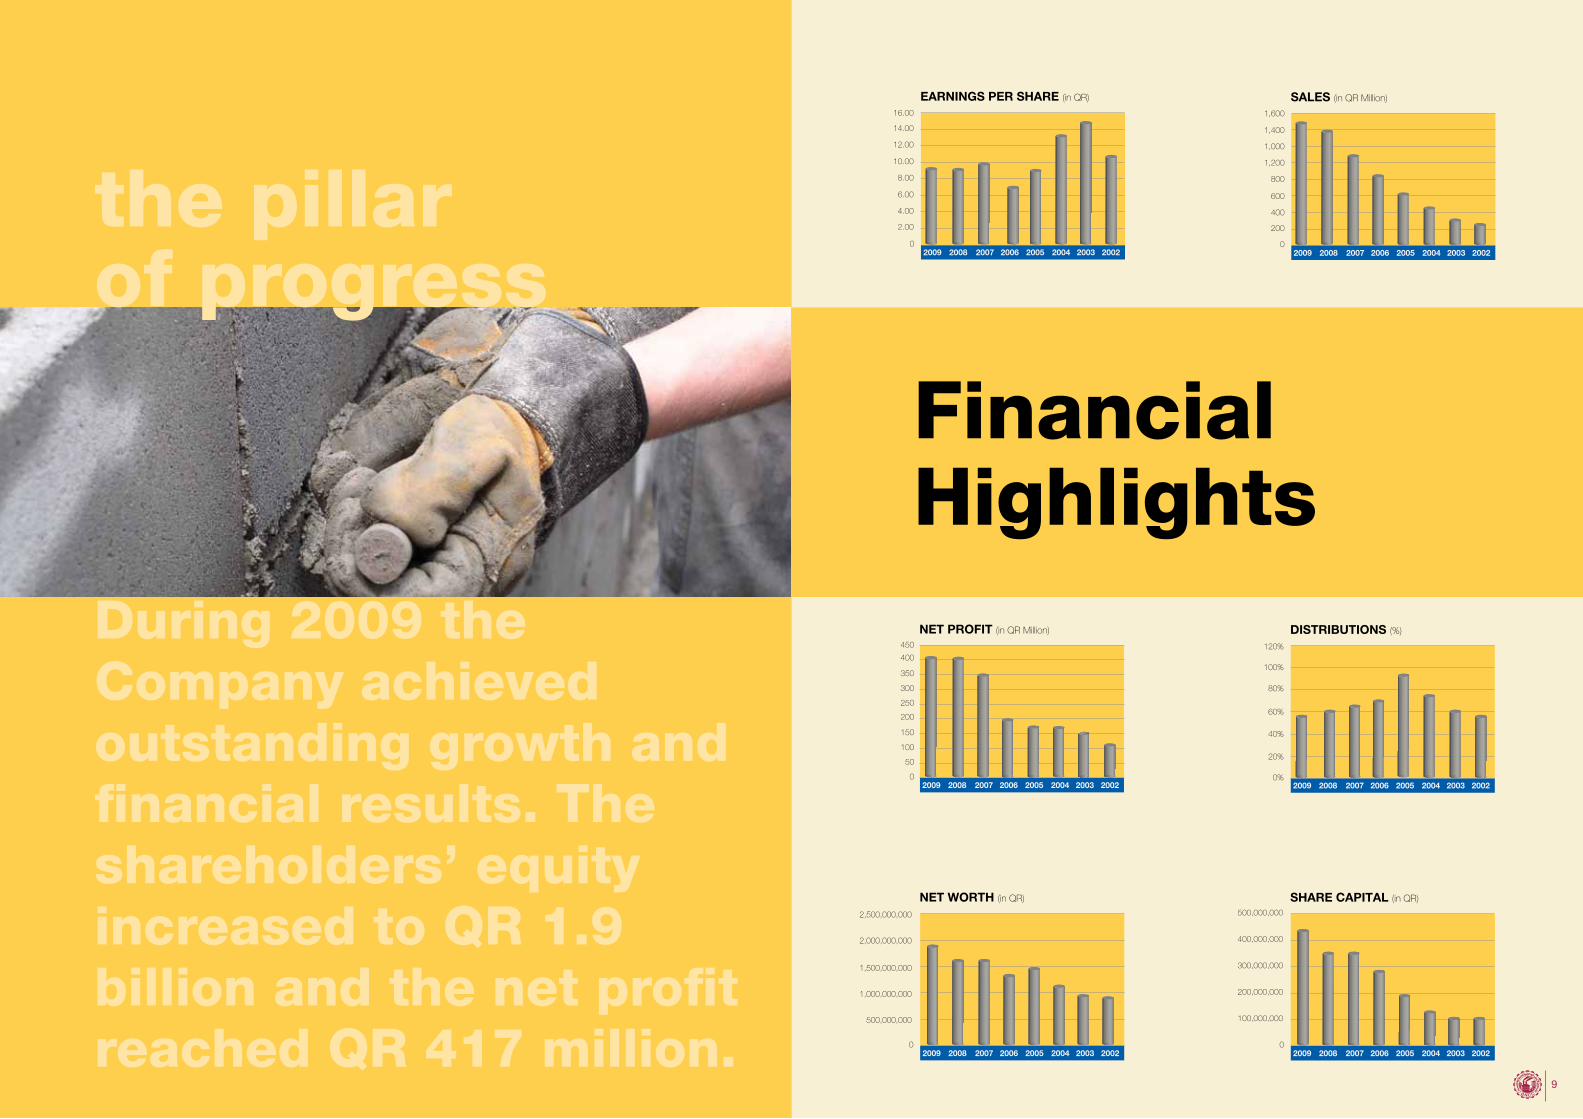
During 2009 the Company achieved outstanding growth and financial results. The shareholders’ equity increased to QR 1.9 billion and the net profit reached QR 417 million.
the pillarof progress
1010
ToThe shareholdersQatar National Cement Company Q.S.C.Doha, State of Qatar
Report on the financial statementsWe have audited the accompanying financial statements of Qatar National Cement Company Q.S.C (the “Company”) which comprise the statement of financial position as at 31 December 2009 and the statements of income, comprehensive income, changes in equity and cash flows for the year then ended, and a summary of significant accounting policies and other explanatory notes.
The comparative financial statements of the Company for the year ended 31 December 2008 were audited by another auditor, whose audit report dated 10 February 2009 expressed an unqualified opinion.
Responsibility of the directors for the financial statementsThe directors of the Company are responsible for the preparation and fair presentation of these financial statements in accordance with International Financial Reporting Standards. This responsibility includes: designing, implementing and maintaining internal control relevant to the preparation and fair presentation of the financial statements that are free from material misstatement, whether due to fraud or error; selecting and applying appropriate accounting policies; and making accounting estimates that are reasonable in the circumstances.
Auditors’ responsibilityOur responsibility is to express an opinion on these financial statements based on our audit. We conducted our audit in accordance with International Standards on Auditing. Those standards require that we comply with relevant ethical requirements and plan and perform the audit to obtain reasonable assurance whether the financial statements are free from material misstatement.
An audit involves performing procedures to obtain audit evidence about the amounts and disclosures in the financial statements. The procedures selected depend on the auditors’ judgement, including the assessment of the risks of material misstatement of the financial statements, whether due to fraud or error. In making those risk assessments, the auditor consider internal control relevant to the entity’s preparation and fair presentation of the financial statements
in order to design audit procedures that are appropriate for the circumstances, but not for the purpose of expressing an opinion on the effectiveness of the entity’s internal control.
An audit also includes evaluating the appropriateness of accounting policies used and the reasonableness of accounting estimates, as well as evaluating the overall presentation of the financial statements.
We believe that the audit evidence we have obtained is sufficient and appropriate to provide a basis for our audit opinion.
Opinion In our opinion, the financial statements present fairly, in all material respects, the financial position of the Company as at 31 December 2009, and of its financial performance and its cash flows for the year then ended in accordance with International Financial Reporting Standards.
Report on other legal and regulatory requirementsIn addition, in our opinion, the Company has maintained proper accounting records and the financial statements are in agreement therewith, and we confirm that a physical count for the inventory was carried out at year end as per the established principles. We have reviewed the report of the Board of Directors and confirm that the information contained thereon is in agreement with the books and records of the Company. We are not aware of any violations of the provisions of Qatar Commercial Companies Law No. 5 of 2002 or the terms of Articles of Association having occurred during the year which might have had a material effect on the business of the Company or its financial position as at 31 December 2009. Satisfactory explanations and information have been provided to us by the management in response to all our requests.
Gopal BalasubramaniamKPMG 8 February 2010Qatar Auditor;s Registry Number 251 Doha, State of Qatar
Independent Auditors’ Report
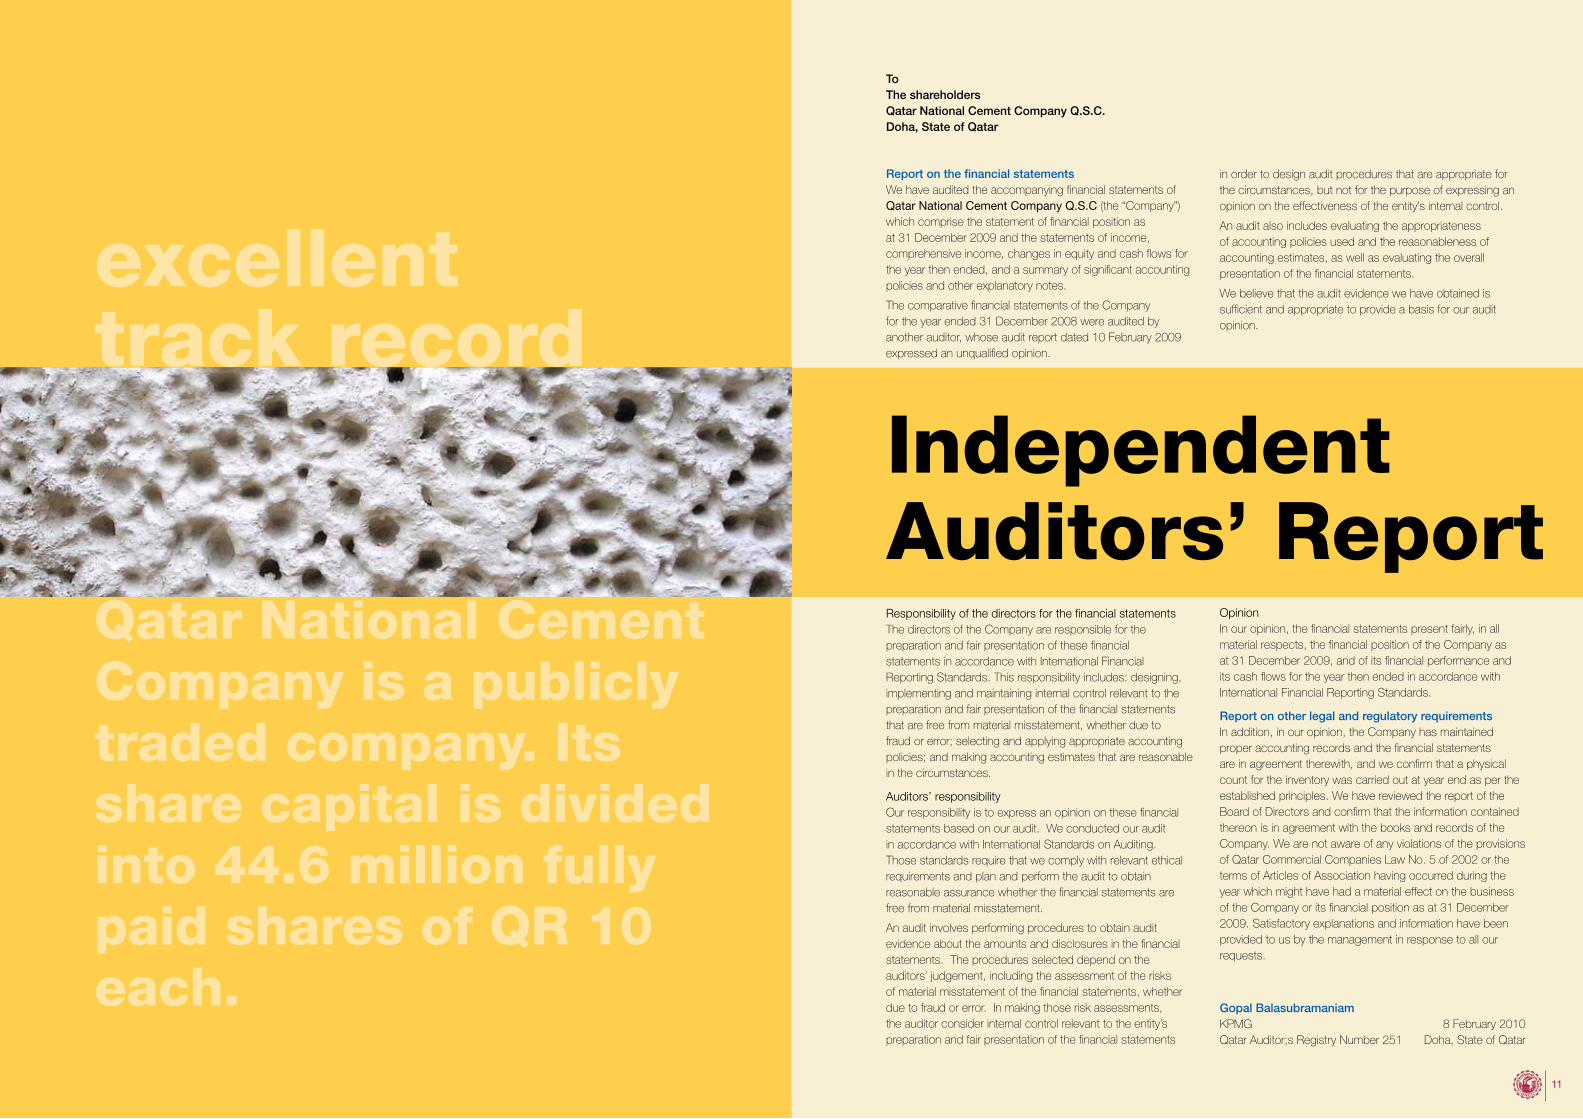
excellenttrack record
Qatar National Cement Company is a publicly traded company. Its share capital is divided into 44.6 million fully paid shares of QR 10 each.
11
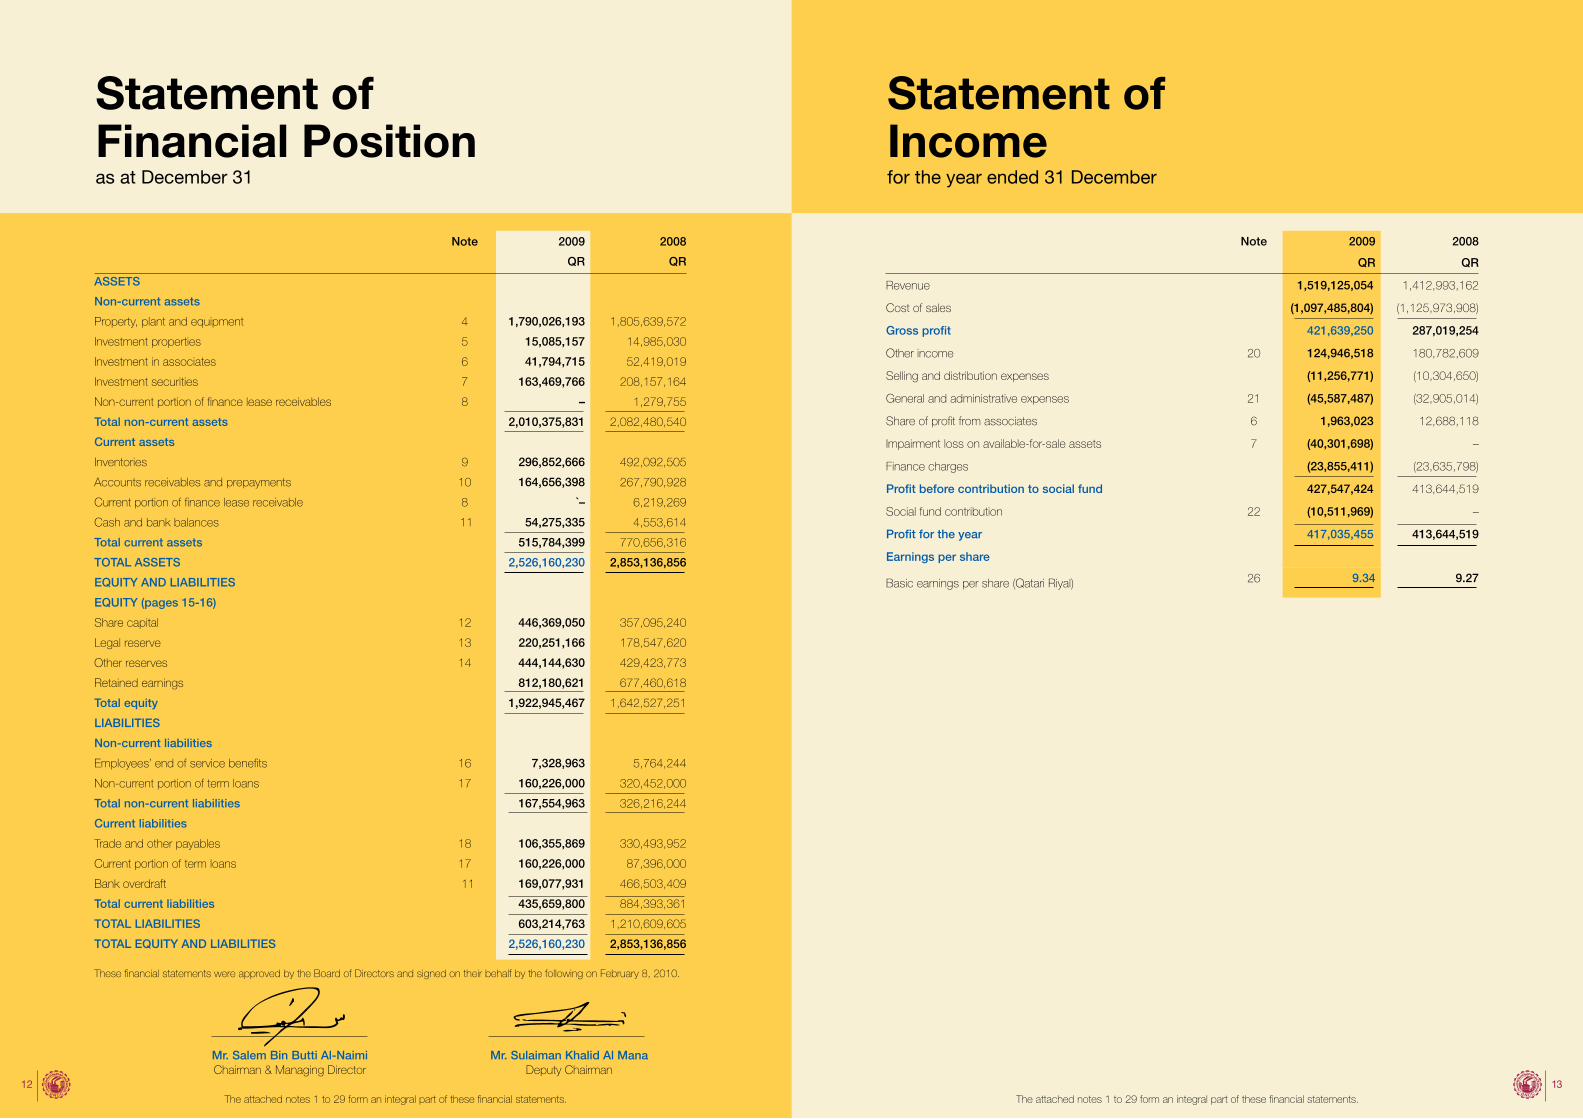
Statement ofFinancial Positionas at December 31
Mr. Salem Bin Butti Al-Naimi Mr. Sulaiman Khalid Al Mana Chairman & Managing Director Deputy Chairman
Statement ofIncomefor the year ended 31 December
Note 2009 2008
QR QR
ASSETS
Non-current assets
Property, plant and equipment 4 1,790,026,193 1,805,639,572
Investment properties 5 15,085,157 14,985,030
Investment in associates 6 41,794,715 52,419,019
Investment securities 7 163,469,766 208,157,164
Non-current portion of finance lease receivables 8 – 1,279,755
Total non-current assets 2,010,375,831 2,082,480,540
Current assets
Inventories 9 296,852,666 492,092,505
Accounts receivables and prepayments 10 164,656,398 267,790,928
Current portion of finance lease receivable 8 `– 6,219,269
Cash and bank balances 11 54,275,335 4,553,614
Total current assets 515,784,399 770,656,316
TOTAL ASSETS 2,526,160,230 2,853,136,856
EQUITY AND LIABILITIES
EQUITY (pages 15-16)
Share capital 12 446,369,050 357,095,240
Legal reserve 13 220,251,166 178,547,620
Other reserves 14 444,144,630 429,423,773
Retained earnings 812,180,621 677,460,618
Total equity 1,922,945,467 1,642,527,251
LIABILITIES
Non-current liabilities
Employees’ end of service benefits 16 7,328,963 5,764,244
Non-current portion of term loans 17 160,226,000 320,452,000
Total non-current liabilities 167,554,963 326,216,244
Current liabilities
Trade and other payables 18 106,355,869 330,493,952
Current portion of term loans 17 160,226,000 87,396,000
Bank overdraft 11 169,077,931 466,503,409
Total current liabilities 435,659,800 884,393,361
TOTAL LIABILITIES 603,214,763 1,210,609,605
TOTAL EQUITY AND LIABILITIES 2,526,160,230 2,853,136,856
These financial statements were approved by the Board of Directors and signed on their behalf by the following on February 8, 2010.
Note 2009 2008
QR QR
Revenue 1,519,125,054 1,412,993,162
Cost of sales (1,097,485,804) (1,125,973,908)
Gross profit 421,639,250 287,019,254
Other income 20 124,946,518 180,782,609
Selling and distribution expenses (11,256,771) (10,304,650)
General and administrative expenses 21 (45,587,487) (32,905,014)
Share of profit from associates 6 1,963,023 12,688,118
Impairment loss on available-for-sale assets 7 (40,301,698) –
Finance charges (23,855,411) (23,635,798)
Profit before contribution to social fund 427,547,424 413,644,519
Social fund contribution 22 (10,511,969) –
Profit for the year 417,035,455 413,644,519
Earnings per share
Basic earnings per share (Qatari Riyal) 26 9.34 9.27
The attached notes 1 to 29 form an integral part of these financial statements. The attached notes 1 to 29 form an integral part of these financial statements.1312
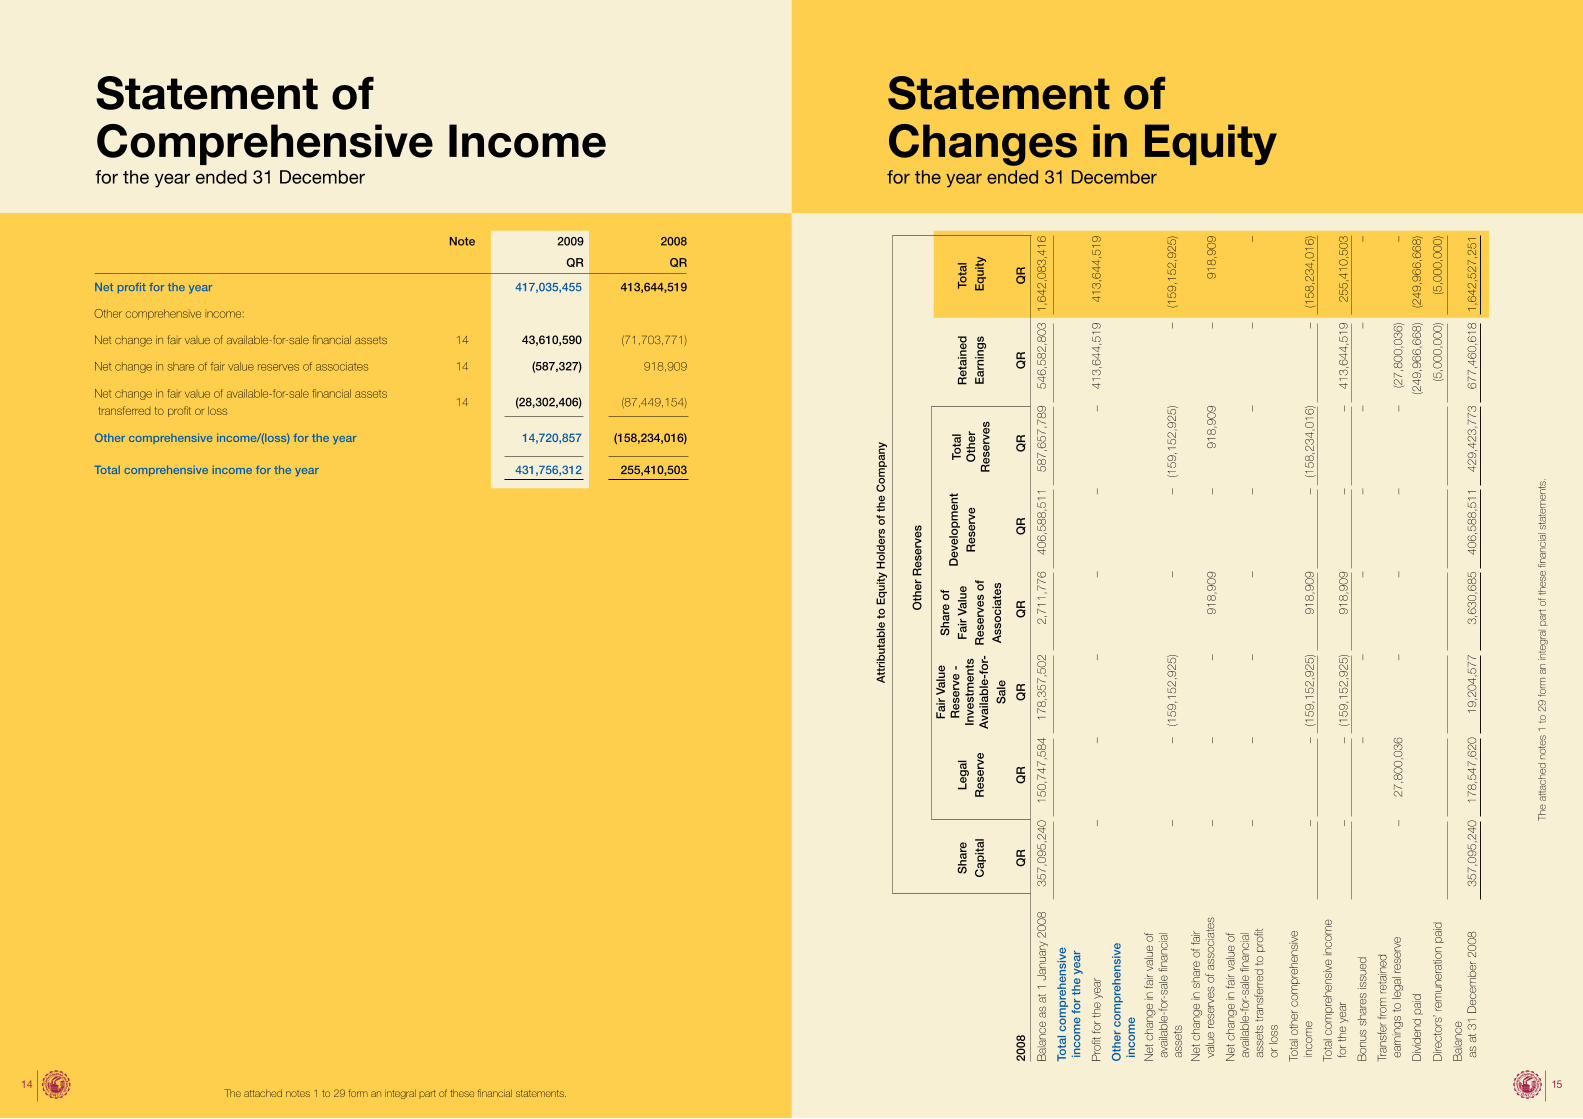
Statement of Comprehensive Incomefor the year ended 31 December
Statement ofChanges in Equityfor the year ended 31 December
Note 2009 2008
QR QR
Net profit for the year 417,035,455 413,644,519
Other comprehensive income:
Net change in fair value of available-for-sale financial assets 14 43,610,590 (71,703,771)
Net change in share of fair value reserves of associates 14 (587,327) 918,909
Net change in fair value of available-for-sale financial assets
transferred to profit or loss14 (28,302,406) (87,449,154)
Other comprehensive income/(loss) for the year 14,720,857 (158,234,016)
Total comprehensive income for the year 431,756,312 255,410,503
Oth
er R
eser
ves
Sha
re
Cap
ital
Leg
al
Res
erve
Fai
r Va
lue
Res
erve
-
Inve
stm
ents
A
vaila
ble
-fo
r-S
ale
Sha
re o
f F
air
Valu
e R
eser
ves
of
Ass
oci
ates
Dev
elo
pm
ent
Res
erve
Tota
lO
ther
R
eser
ves
Ret
aine
d
Ear
ning
sTo
tal
Eq
uity
2008
QR
QR
QR
QR
QR
QR
QR
QR
Bal
ance
as
at 1
Jan
uary
200
8 35
7,09
5,24
015
0,74
7,58
417
8,35
7,50
22,
711,
776
406,
588,
511
587,
657,
789
546,
582,
803
1,64
2,08
3,41
6
Tota
l co
mp
rehe
nsiv
ein
com
e fo
r th
e ye
ar
Pro
fit fo
r the
yea
r–
––
––
–41
3,64
4,51
941
3,64
4,51
9
Oth
er c
om
pre
hens
ive
inco
me
Net
cha
nge
in fa
ir va
lue
ofav
aila
ble-
for-
sale
fina
ncia
l as
sets
–
–(1
59,1
52,9
25)
––
(159
,152
,925
)–
(159
,152
,925
)
Net
cha
nge
in s
hare
of f
air
valu
e re
serv
es o
f ass
ocia
tes
––
–91
8,90
9–
918,
909
–91
8,90
9
Net
cha
nge
in fa
ir va
lue
ofav
aila
ble-
for-
sale
fina
ncia
l as
sets
tran
sfer
red
to p
rofit
or
loss
––
––
––
––
Tota
l oth
er c
ompr
ehen
sive
inco
me
––
(159
,152
,925
)91
8,90
9–
(158
,234
,016
)–
(158
,234
,016
)
Tota
l com
preh
ensi
ve in
com
efo
r the
yea
r–
–(1
59,1
52,9
25)
918,
909
––
413,
644,
519
255,
410,
503
Bon
us s
hare
s is
sued
––
––
––
–
Tran
sfer
from
reta
ined
earn
ings
to le
gal r
eser
ve–
27,8
00,0
36–
––
–(2
7,80
0,03
6)–
Div
iden
d pa
id(2
49,9
66,6
68)
(249
,966
,668
)
Dire
ctor
s’ re
mun
erat
ion
paid
(5,0
00,0
00)
(5,0
00,0
00)
Bal
ance
as a
t 31
Dec
embe
r 200
8 35
7,09
5,24
017
8,54
7,62
019
,204
,577
3,63
0,68
540
6,58
8,51
142
9,42
3,77
367
7,46
0,61
81,
642,
527,
251
The attached notes 1 to 29 form an integral part of these financial statements.
Att
rib
utab
le t
o E
qui
ty H
old
ers
of
the
Co
mp
any
The
atta
ched
not
es 1
to 2
9 fo
rm a
n in
tegr
al p
art o
f the
se fi
nanc
ial s
tate
men
ts.
1514
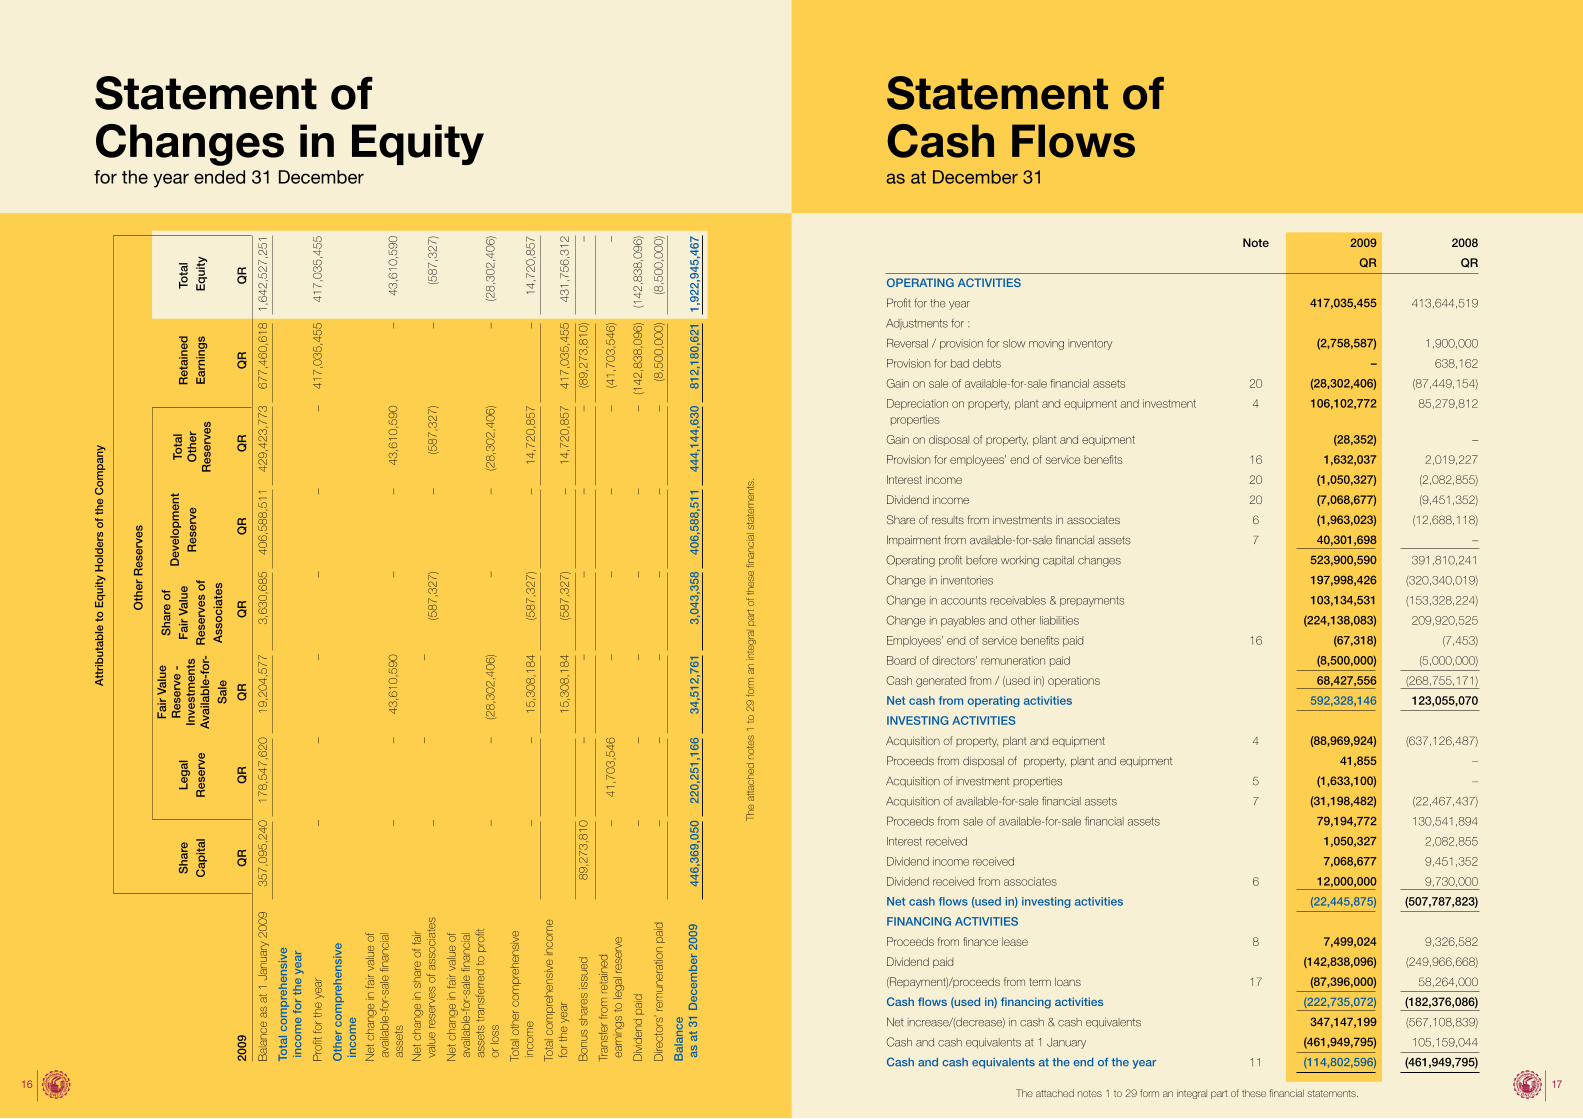
Note 2009 2008
QR QR
OPERATING ACTIVITIES
Profit for the year 417,035,455 413,644,519
Adjustments for :
Reversal / provision for slow moving inventory (2,758,587) 1,900,000
Provision for bad debts – 638,162
Gain on sale of available-for-sale financial assets 20 (28,302,406) (87,449,154)
Depreciation on property, plant and equipment and investmentproperties
4 106,102,772 85,279,812
Gain on disposal of property, plant and equipment (28,352) –
Provision for employees’ end of service benefits 16 1,632,037 2,019,227
Interest income 20 (1,050,327) (2,082,855)
Dividend income 20 (7,068,677) (9,451,352)
Share of results from investments in associates 6 (1,963,023) (12,688,118)
Impairment from available-for-sale financial assets 7 40,301,698 –
Operating profit before working capital changes 523,900,590 391,810,241
Change in inventories 197,998,426 (320,340,019)
Change in accounts receivables & prepayments 103,134,531 (153,328,224)
Change in payables and other liabilities (224,138,083) 209,920,525
Employees’ end of service benefits paid 16 (67,318) (7,453)
Board of directors’ remuneration paid (8,500,000) (5,000,000)
Cash generated from / (used in) operations 68,427,556 (268,755,171)
Net cash from operating activities 592,328,146 123,055,070
INVESTING ACTIVITIES
Acquisition of property, plant and equipment 4 (88,969,924) (637,126,487)
Proceeds from disposal of property, plant and equipment 41,855 –
Acquisition of investment properties 5 (1,633,100) –
Acquisition of available-for-sale financial assets 7 (31,198,482) (22,467,437)
Proceeds from sale of available-for-sale financial assets 79,194,772 130,541,894
Interest received 1,050,327 2,082,855
Dividend income received 7,068,677 9,451,352
Dividend received from associates 6 12,000,000 9,730,000
Net cash flows (used in) investing activities (22,445,875) (507,787,823)
FINANCING ACTIVITIES
Proceeds from finance lease 8 7,499,024 9,326,582
Dividend paid (142,838,096) (249,966,668)
(Repayment)/proceeds from term loans 17 (87,396,000) 58,264,000
Cash flows (used in) financing activities (222,735,072) (182,376,086)
Net increase/(decrease) in cash & cash equivalents 347,147,199 (567,108,839)
Cash and cash equivalents at 1 January (461,949,795) 105,159,044
Cash and cash equivalents at the end of the year 11 (114,802,596) (461,949,795)
The attached notes 1 to 29 form an integral part of these financial statements.
Statement ofChanges in Equityfor the year ended 31 December
Statement ofCash Flowsas at December 31
Att
rib
utab
le t
o E
qui
ty H
old
ers
of
the
Co
mp
any
Oth
er R
eser
ves
Sha
re
Cap
ital
Leg
al
Res
erve
Fai
r Va
lue
Res
erve
-
Inve
stm
ents
A
vaila
ble
-fo
r-S
ale
Sha
re o
f F
air
Valu
e R
eser
ves
of
Ass
oci
ates
Dev
elo
pm
ent
Res
erve
Tota
lO
ther
R
eser
ves
Ret
aine
d
Ear
ning
sTo
tal
Eq
uity
2009
QR
QR
QR
QR
QR
QR
QR
QR
Bal
ance
as
at 1
Jan
uary
200
9 35
7,09
5,24
017
8,54
7,62
019
,204
,577
3,63
0,68
540
6,58
8,51
142
9,42
3,77
367
7,46
0,61
81,
642,
527,
251
Tota
l co
mp
rehe
nsiv
ein
com
e fo
r th
e ye
ar
Pro
fit fo
r the
yea
r–
––
––
–41
7,03
5,45
541
7,03
5,45
5
Oth
er c
om
pre
hens
ive
inco
me
Net
cha
nge
in fa
ir va
lue
ofav
aila
ble-
for-
sale
fina
ncia
l as
sets
–
–43
,610
,590
––
43,6
10,5
90–
43,6
10,5
90
Net
cha
nge
in s
hare
of f
air
valu
e re
serv
es o
f ass
ocia
tes
––
–(5
87,3
27)
–(5
87,3
27)
–(5
87,3
27)
Net
cha
nge
in fa
ir va
lue
ofav
aila
ble-
for-
sale
fina
ncia
l as
sets
tran
sfer
red
to p
rofit
or
loss
––
(28,
302,
406)
––
(28,
302,
406)
–(2
8,30
2,40
6)
Tota
l oth
er c
ompr
ehen
sive
inco
me
––
15,3
08,1
84(5
87,3
27)
–14
,720
,857
–14
,720
,857
Tota
l com
preh
ensi
ve in
com
efo
r the
yea
r15
,308
,184
(587
,327
)–
14,7
20,8
5741
7,03
5,45
5
431,
756,
312
Bon
us s
hare
s is
sued
89,2
73,8
10–
––
––
(89,
273,
810)
–
Tran
sfer
from
reta
ined
earn
ings
to le
gal r
eser
ve–
41,7
03,5
46–
––
–(4
1,70
3,54
6)–
Div
iden
d pa
id–
––
––
–(1
42,8
38,0
96)
(142
,838
,096
)
Dire
ctor
s’ re
mun
erat
ion
paid
––
––
––
(8,5
00,0
00)
(8,5
00,0
00)
Bal
ance
as a
t 31
Dec
emb
er 2
009
446
,369
,050
220,
251,
166
34,5
12,7
613,
043,
358
406,
588,
511
444,
144,
630
812,
180,
621
1,92
2,94
5,46
7
The
atta
ched
not
es 1
to 2
9 fo
rm a
n in
tegr
al p
art o
f the
se fi
nanc
ial s
tate
men
ts.
1716
18 19
Notes to theFinancial Statementsfor the year ended 31 December 2009
Notes to theFinancial Statementsfor the year ended 31 December 2009
2) BASIS OF PREPARATION (continued)e) Standards, amendments and interpretations issued (continued)
iii) Improvements to IFRS (issued in May 2008) Improvements to IFRS issued in May 2008 contained numerous amendments to IFRS that the IASB considers
non-urgent but necessary. ‘Improvements to IFRS’ comprise amendments that result in accounting changes to presentation, recognition or measurement purposes, as well as terminology or editorial amendments related to a variety of individual IFRS standards. The amendments effective for annual periods beginning on or after 1 January 2009 have been adopted by the Company and no material changes to accounting policies arose as a result of these amendments.
iv) Amendment to IFRS 7 Financial Instruments: Disclosures The amendment to the standard requires an entity to provide a quantitative and qualitative analysis of those
instruments recognised at fair value based on a three-level measurement hierarchy. Furthermore, for those instruments which have significant unobservable inputs (classified as Level 3), the amendment requires disclosures on the transfers into and out of Level 3, a reconciliation of the opening and closing balances, total gains and losses for the period split between those recognised in other comprehensive income, purchases, sales issues and settlements, and sensitivity analysis of reasonably possible changes in assumptions. In addition, disclosure is required of the movements between different levels of the fair value hierarchy and the reason for those movements. Finally, the standard amends the previous liquidity risk disclosures as required under IFRS 7 for non-derivative and derivative financial liabilities.
Entities are required to apply this amendment for annual periods beginning on or after 1 January 2009, with no requirement to provide comparatives on transition. Since the change in accounting policy only impacts presentation and disclosure aspects, there is no impact on earnings per share.
Standards, amendments and interpretations issued but not yet effectiveA number of new standards, amendments to standards and interpretations are not yet effective for the year ended 31 December 2009, and have not been applied in preparing these financial statements. None of these are expected to have a material effect on the financial statements of the Company, with the exception of:
i) IFRS 9 Financial Instruments IFRS 9 Financial Instruments, published on 12 November 2009 as part of phase I of the IASB’s comprehensive
project to replace lAS 39, deals with classification and measurement of financial assets. The requirements of this standard represent a significant change from the existing requirements in lAS 39 in respect of financial assets. The standard contains two primary measurement categories for financial assets: amortised cost and fair value. A financial asset would be measured at amortised cost if it is held within a business model whose objective is to hold assets in order to collect contractual cash flows, and the asset’s contractual terms give rise on specified dates to cash flows that are solely payments of principal and interest on the principal outstanding. All other financial assets would be measured at fair value.
The standard eliminates the existing lAS 39 categories of held to maturity, available for sale and loans and receivables. For an investment in an equity instrument which is not held for trading, the standard permits an irrevocable election, on initial recognition, on an individual share-by-share basis, to present all fair value changes from the investment in other comprehensive income. No amount recognised in other comprehensive income would ever be reclassified to profit or loss at a later date. However, dividends on such investments are recognised in profit or loss, rather than other comprehensive income unless they clearly represent a partial recovery of the cost of the investment. Investments in equity instruments in respect of which an entity does not elect to present fair value changes in other comprehensive income would be measured at fair value with changes in fair value recognised in profit or loss.
The standard requires that derivatives embedded in contracts with a host that is a financial asset within the scope of the standard are not separated: instead the hybrid financial instrument is assessed in its entirety as to whether it should be measured at amortised cost or fair value.
The standard is effective for annual periods beginning on or after 1 January 2013. Earlier application is permitted. The Company is currently in the process of evaluating the potential effect of this standard.
1) STATUS AND OPERATIONSQatar National Cement Company Q.S.C. (the “Company”) was incorporated in the State of Qatar as a Qatari Shareholding Company, under the Emiri Decree No. 7 of 1965 with a Commercial Registration No. of 25. The Company’s head office is situated in Doha.
The Company is primarily engaged in the production and sale of cement, washed sand and lime at its plants located in Ummbab, Qatar.
2) BASIS OF PREPARATIONa) Statement of compliance The accompanying financial statements have been prepared in accordance with International Financial Reporting
Standards (IFRSs) issued by International Accounting Standards Board (IASB) and the applicable provisions of the Qatar Commercial Companies Law no 5 of 2002.
b) Basis of measurement These financial statements have been prepared on the historical cost basis except for certain investment securities
which are carried at fair value.
c) Functional and presentation currency The financial statements are presented in Qatari Riyals, which is the Company’s functional currency and all values
are rounded to the nearest Qatari Riyal except when otherwise indicated.
d) Use of estimates and judgements The preparation of financial statements requires management to make judgements, estimates and assumptions that
affect the application of accounting policies and the reported amounts of assets, liabilities, income and expenses. Actual results may differ from these estimates.
Estimates underlying assumptions are reviewed on an ongoing basis. Revisions to accounting estimates are recognised in the period in which the estimate is revised and in any future periods affected.
In particular, information about significant areas of estimation uncertainty and critical judgments in applying accounting policies that have the most significant effect on the amount recognised in the financial statements are described in the note 28.
e) Standards, amendments and interpretations issued Standards, amendments and interpretations issued and effective on or after 1 January 2009
The following standards, amendments and interpretations have been issued and are effective for financial years beginning on or after 1 January 2009 and therefore, these have been adopted and applied in the preparation if these financial statements:
i) Determination and presentation of operating segments As of 1 January 2009 the Company determines and presents operating segments based on the information that
internally is provided to the Managing Director (“MD”), who is the Company’s Chief Operating Decision Maker. This change in accounting policy is due to the adoption of IFRS 8 Operating Segments. Previously operating segments were determined and presented in accordance with IAS 14 Segment Reporting. The new accounting policy in respect of segment operating disclosures is presented as follows.
An operating segment is a component of the Company that engages in business activities from which it may earn revenues and incur expenses, including revenues and expenses that relate to transactions with any of the Company’s other components. An operating segment’s operating results are reviewed regularly by the MD to make decisions about resources to be allocated to the segment and assess its performance, and for which discrete financial information is available.
ii) Presentation of financial statements The Company applies revised IAS 1 Presentation of Financial Statements (2007), which became effective as of
1 January 2009. As a result, the Company presents in the statement of changes in equity all owner changes in equity, whereas all non-owner changes in equity are presented in the statement of comprehensive income. This presentation has been applied in these financial statements as at and for the year ended 31 December 2009. Comparative information has been re-presented so that it also is in conformity with the revised standard. Since the change in accounting policy only impacts presentation aspects, there is no impact on earnings per share.
20 21
Notes to theFinancial Statementsfor the year ended 31 December 2009
Notes to theFinancial Statementsfor the year ended 31 December 2009
3) SIGNIFICANT IN ACCOUNTING POLICIES (continued)e) Financial instruments Financial instruments represent the Company’s financial assets and liabilities. Financial assets and financial
liabilities are recognized on the Company’s statement of financial position when the Company becomes a party to the contractual provisions of the instrument. Financial instruments also include commitments not recognized but adequately disclosed in the respective notes to the financial statements.
Financial assets include trade receivables, available-for-sale financial assets, cash and bank balances and certain other assets. Financial liabilities include term loans, bank overdraft, trade and certain other liabilities.
Available-for-sale financial assets Available-for-sale financial assets are non-derivative financial assets that are designated as available-for-sale
and are not classified as an investment at fair value through the statement of income or held to maturity or loans or receivables. Available-for-sale financial assets are initially recognised at cost being the fair value of the consideration given. Subsequent to initial recognition, they are measured at fair value and changes therein, other than impairment losses and foreign currency differences on available-for-sale equity instruments are recognized in other comprehensive income and presented within equity in a fair value reserve. When an investment is derecognized, cumulative gains and losses in other comprehensive income are transferred to the statement of income.
Accounts receivables Accounts receivables are stated at cost being the fair value, net of provisions for amounts estimated to be non-
collectable. An estimate for doubtful accounts is made when collection of the full amount is no longer probable. Bad debts are written off as incurred.
Cash and cash equivalents Cash and cash equivalents comprise of cash in hand, balances under current and call accounts with the banks
and deposits having a maturity of less than ninety days. For the purpose of the statement of cash flow, cash and cash equivalents consists of bank balances and cash, net of bank overdrafts.
Trade payables Liabilities are recognised for amounts to be paid in the future for goods or services received, whether billed by
the supplier or not.
Term loans Term loans are recognised initially at fair value. Subsequent to initial recognition these are measured at amortised
cost using the effective interest method.
f) Inventories Inventories are stated at the lower of cost and net realisable value after providing for any obsolescence and
damages determined by the management. Costs are those expenses incurred in bringing each product to its present location and condition which are computed as follows:
• Rawmaterials,sparepartsandconsumables:Purchasescostsonweightedaveragebasis.
• Workinprogressandfinishedgoods:Costofdirectmaterials,directlabourandotherdirectcostplusattributable overheads based on normal level of activity.
Net realisable value is based on estimated selling price less any further costs expected to be incurred on completion and disposal.
g) Employees’ end of service benefits Expatriate employees For the expatriate employees, the Company provides for employees’ end of service benefits determined in
accordance with the requirements of Qatar Labour laws pertaining to retirement and pensions, wherever required. These unfunded charges are made by the Company on the basis of employees’ salaries and the number of years of service at the statement of financial position date. Applicable benefits are paid to employees on termination of employment with the Company.
2) BASIS OF PREPARATION (continued)e) Standards, amendments and interpretations issued (continued)
ii) Improvements to IFRS (issued in April 2009) Improvements to IFRS issued in April 2009 contained numerous amendments to IFRS that the IASB considers
non-urgent but necessary. ‘Improvements to IFRS’ comprise amendments that result in accounting changes to presentation, recognition or measurement purposes, as well as terminology or editorial amendments related to a variety of individual IFRS standards. The amendments are effective for annual periods beginning on or after 1 January 2010 with earlier adoption permitted. No material changes to accounting policies are expected as a result of these amendments.
3) SIGNIFICANT IN ACCOUNTING POLICIESThe following significant accounting policies have been applied in the preparation of these financial statements:
a) Property, plant and equipment Items of property, plant and equipment are measured at cost less accumulated depreciation and accumulated
impairment losses. Cost includes expenditures that are directly attributable to the acquisition of the asset. The cost of self-constructed assets includes the cost of materials and direct labour, any other costs directly attributable to bringing the assets to a working condition for their intended use, including the capitalised borrowing. Purchased software that is integral to the functionality of the related equipment is capitalised as part of that equipment.
Estimated useful lives of property, plant and equipment are as follows:
Buildings 5-30 years
Plant, equipment and tools 1-20 years
Motor vehicles 5-10 years
Furniture and fixtures 10 years
b) Capital work in progress Capital work in progress is stated at cost. Cost includes all expenditure incurred on capital projects that have not
been completed. When the projects are completed they are transferred to property, plant and equipment and depreciated thereafter. Advances paid for capital payments are included in capital work in progress.
c) Investment property Investment property is property held either to earn rentals or for capital appreciation or both, but not for sale
in ordinary course of business, use in production in the production or supply of goods or services or for administrative purpose. Investment property is stated at cost less accumulated depreciation and impairment losses, if any. Investment properties, other than land, are depreciated on a straight-line basis over their estimated useful lives of 20-30 years.
d) Investments in associates Associates are those entities in which the Company has significant influence, but not control, over the financial
and operating policies. Significant influence is presumed to exist when the Company holds between 20 and 50 percent of the voting power of another entity. It is neither a subsidiary nor an interest in joint venture.
Investments in associates are accounted for using the equity method (equity accounted investees) and are recognised initially at cost. The Company’s investment includes goodwill identified on acquisition, net of any accumulated impairment losses. These financial statements include the Company’s share of the income and expenses and equity movements of equity accounted investees, after adjustments to align the accounting policies with that of the Company, from the date that significant influence or joint control commences until the date that significant influence or joint control ceases.
When the Company’s share of losses exceeds its interest in an equity accounted investee, the carrying amount of that interest, including any long-term investments, is reduced to nil, and the recognition of further losses is discontinued except to the extent that the Company has an obligation or has made payments on behalf of the investee.
Notes to theFinancial Statementsfor the year ended 31 December 2009
22 23
Notes to theFinancial Statementsfor the year ended 31 December 2009
Notes to theFinancial Statementsfor the year ended 31 December 2009
3) SIGNIFICANT IN ACCOUNTING POLICIES (continued)j) Borrowing costs (continued) The Company begins capitalizing borrowing costs as part of the cost of a qualifying asset on the commencement
date. The commencement date for capitalization is the date when the Company first meets all of the following conditions:
(a) incurs expenditures for the asset;
(b) incurs borrowing costs; and
(c) undertakes activities that are necessary to prepare the asset for its intended use or sale.
To the extent that the Company borrows funds specifically for the purpose of obtaining a qualifying asset, the Company determines the amount of borrowing costs eligible for capitalization as the actual borrowing costs incurred on that borrowing during the period less any investment income on the temporary investment of those borrowings, if any.
The borrowing costs applicable to the borrowings of the Company that are outstanding during the period, other than those specific borrowings mentioned above as made specifically for the purpose of obtaining a qualified asset, are capitalized by applying a capitalization rate to the expenditures on that asset. The amount of borrowing costs that the Company capitalizes during the year is not to exceed the amount of borrowing costs it incurred during that year.
The Company suspends capitalization of borrowing costs during extended periods in which it suspends active development of a qualifying asset, and ceases capitalizing borrowing costs when substantially all the activities necessary to prepare the qualifying asset for its intended use or sale are complete.
k) Foreign currency transactions Foreign currency transactions are translated into the functional currency using the exchange rates prevailing
at the dates of the transactions. Foreign exchange gains and losses resulting from the settlement of such transactions and from the translation at year-end exchange rates of monetary assets and liabilities denominated in foreign currencies are recognized in the statement of income.
l) Dividend distribution Dividend distribution to the Company’s shareholders is recognized as a liability in the Company’s financial
statements in the period in which the dividend is approved by the Company’s shareholders.
m) Impairment Financial assets A financial asset is assessed at each reporting date to determine whether there is any objective evidence that it
is impaired. A financial asset is considered to be impaired if objective evidence indicates that one or more events have had a negative effect on the estimated future cash flows of that asset.
All impairment losses are recognized in the statement of income. Any cumulative loss in respect of an available-for-sale financial asset recognized previously in other comprehensive income is transferred to the statement of income.
• Forassetscarriedatfairvalue,impairmentisthedifferencebetweencostandfairvalue,lessanyimpairmentloss previously recognised in the statement of income;
• Forassetscarriedatcost,impairmentisthedifferencebetweencarryingvalueandthepresentvalueoffuturecash flows discounted at the current market rate of return for a similar financial asset;
• Forassetscarriedatamortisedcost,impairmentisthedifferencebetweencarryingamountandthepresentvalue of the estimated future cash flows discounted at the original effective finance cost rate.
• Significantfinancialassetsaretestedforimpairmentonanindividualbasis.
• Theremainingfinancialassetsareassessedcollectivelyingroupsthatsharesimilarcreditriskcharacteristics.
For shares classified as available-for-sale, a significant or prolonged decline in the fair value of the security below its cost is considered to be objective evidence of impairment. For all other financial assets, objective evidence of impairment could include:
3) SIGNIFICANT IN ACCOUNTING POLICIES (continued)g) Employees’ end of service benefits (continued) Qatari employees With respect to its Qatari employees, the Company makes contributions to the General Pension Fund Authority
calculated as a percentage of the employees’ salaries in accordance with the requirements of Law No. 24 of 2002 pertaining to Retirement and Pensions. The Company’s obligations are limited to these contributions, which are expensed when due.
h) Provision A provision is recognized if, as a result of a past event, the Company has a present legal or constructive
obligation that can be estimated reliably, and it is probable that an outflow of economic benefits will be required to settle the obligation. Provisions are determined by discounting the expected future cash flows that reflects current market assessments of the time value of money and the risks specific to the liability.
i) Revenue recognition Revenue is measured at fair value of the consideration received or receivable. Revenue is reduced for estimated
customer returns, rebates and other similar allowances. The following specific recognition criteria must also be met before revenue is recognised:
Sale of goods Revenue from the sale of goods in the course of ordinary activities is measured at the fair value of the
consideration received or receivable, net of returns. Revenue is recognised when persuasive evidence exists, usually in the form of an executed sales agreement, that the significant risks and rewards of ownership have been transferred to the buyer, recovery of the consideration is probable, the associated costs and possible return of goods can be estimated reliably, there is no continuing management involvement with the goods, and the amount of revenue can be measured reliably. If it is probable that discounts will be granted and the amount can be measured reliably, then the discount is recognised as a reduction of revenue as the sales are recognised.
Finance lease income Finance lease income is recognized based on a pattern reflecting constant periodic rate of return on the lessor’s
net investment outstanding in respect of the finance lease.
Dividend and interest income Dividends from investments are recognised when the shareholder’s right to receive payment has been
established.
Interest is accrued on a time proportion basis, by reference to the principal outstanding and at the effective interest rate applicable, which is the rate that exactly discounts estimated future cash receipts through the expected life of the financial asset to that asset’s net carrying amount.
Profit on sale of investments Profit on the sale of quoted investments is recognized when the sale is confirmed by the broker.
Rental income Rental income from investment property is recognised in the statement of income on a straight-line basis over the
term of the lease.
Other income Other income is recognized on an accrual basis.
j) Borrowing costs Borrowing costs are finance and other costs that the Company incurs in connection with the borrowing of funds.
A qualifying asset for finance cost capitalization is an asset that necessarily takes a substantial period of time to get ready for its intended use or sale. The Company capitalizes borrowing costs that are directly attributable to the acquisition, construction or production of a qualifying asset as part of the cost of that asset. The Company recognizes other borrowing costs as an expense in the period in which it incurs them.
24 25
Notes to theFinancial Statementsfor the year ended 31 December 2009
Notes to theFinancial Statementsfor the year ended 31 December 2009
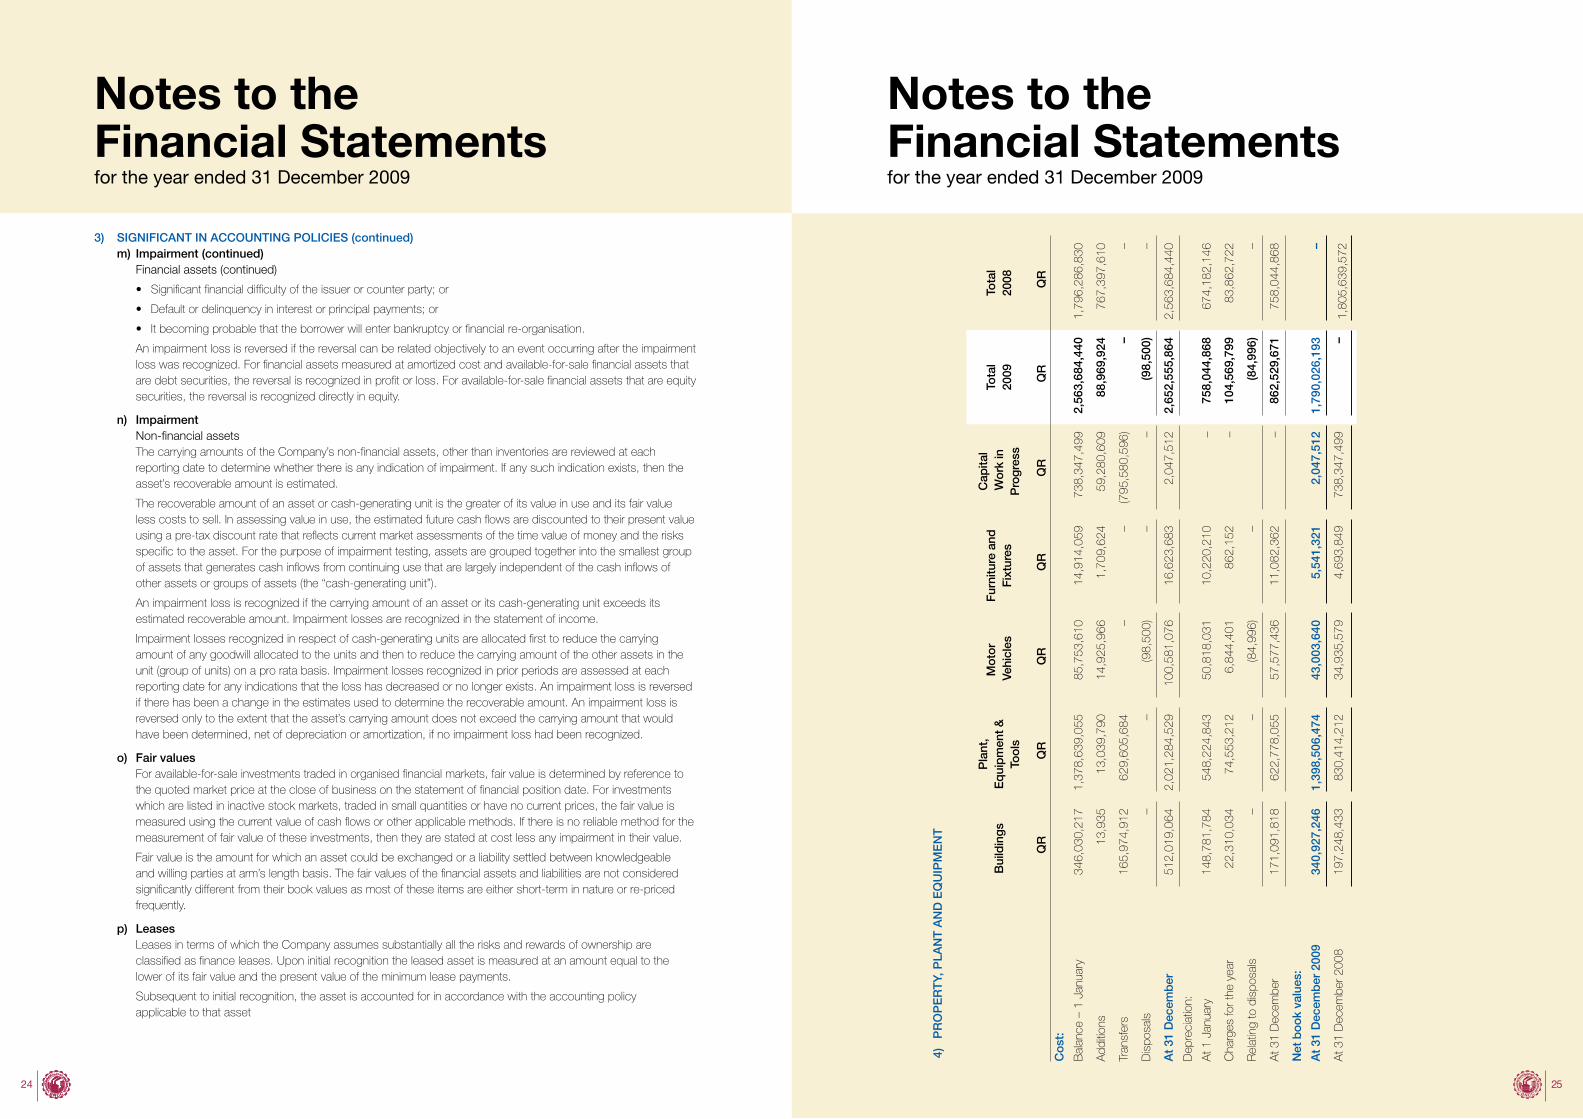
4)
PR
OP
ER
TY,
PLA
NT
AN
D E
QU
IPM
EN
T
3) SIGNIFICANT IN ACCOUNTING POLICIES (continued)m) Impairment (continued) Financial assets (continued)
• Significantfinancialdifficultyoftheissuerorcounterparty;or
• Defaultordelinquencyininterestorprincipalpayments;or
• Itbecomingprobablethattheborrowerwillenterbankruptcyorfinancialre-organisation.
An impairment loss is reversed if the reversal can be related objectively to an event occurring after the impairment loss was recognized. For financial assets measured at amortized cost and available-for-sale financial assets that are debt securities, the reversal is recognized in profit or loss. For available-for-sale financial assets that are equity securities, the reversal is recognized directly in equity.
n) Impairment Non-financial assets The carrying amounts of the Company’s non-financial assets, other than inventories are reviewed at each
reporting date to determine whether there is any indication of impairment. If any such indication exists, then the asset’s recoverable amount is estimated.
The recoverable amount of an asset or cash-generating unit is the greater of its value in use and its fair value less costs to sell. In assessing value in use, the estimated future cash flows are discounted to their present value using a pre-tax discount rate that reflects current market assessments of the time value of money and the risks specific to the asset. For the purpose of impairment testing, assets are grouped together into the smallest group of assets that generates cash inflows from continuing use that are largely independent of the cash inflows of other assets or groups of assets (the “cash-generating unit”).
An impairment loss is recognized if the carrying amount of an asset or its cash-generating unit exceeds its estimated recoverable amount. Impairment losses are recognized in the statement of income.
Impairment losses recognized in respect of cash-generating units are allocated first to reduce the carrying amount of any goodwill allocated to the units and then to reduce the carrying amount of the other assets in the unit (group of units) on a pro rata basis. Impairment losses recognized in prior periods are assessed at each reporting date for any indications that the loss has decreased or no longer exists. An impairment loss is reversed if there has been a change in the estimates used to determine the recoverable amount. An impairment loss is reversed only to the extent that the asset’s carrying amount does not exceed the carrying amount that would have been determined, net of depreciation or amortization, if no impairment loss had been recognized.
o) Fair values For available-for-sale investments traded in organised financial markets, fair value is determined by reference to
the quoted market price at the close of business on the statement of financial position date. For investments which are listed in inactive stock markets, traded in small quantities or have no current prices, the fair value is measured using the current value of cash flows or other applicable methods. If there is no reliable method for the measurement of fair value of these investments, then they are stated at cost less any impairment in their value.
Fair value is the amount for which an asset could be exchanged or a liability settled between knowledgeable and willing parties at arm’s length basis. The fair values of the financial assets and liabilities are not considered significantly different from their book values as most of these items are either short-term in nature or re-priced frequently.
p) Leases Leases in terms of which the Company assumes substantially all the risks and rewards of ownership are
classified as finance leases. Upon initial recognition the leased asset is measured at an amount equal to the lower of its fair value and the present value of the minimum lease payments.
Subsequent to initial recognition, the asset is accounted for in accordance with the accounting policy applicable to that asset
Bui
ldin
gs
Pla
nt,
Eq
uip
men
t &
To
ols
Mot
or V
ehic
les
Furn
iture
and
Fi
xtur
es
Cap
ital
Wor
k in
P
rogr
ess
Tota
l 20
09To
tal
2008
QR
QR
QR
QR
QR
QR
QR
Cos
t:
Bal
ance
– 1
Jan
uary
34
6,03
0,21
71,
378,
639,
055
85,7
53,6
10
14,9
14,0
59
7
38,3
47,4
992,
563,
684,
440
1,79
6,28
6,83
0
Add
ition
s 13
,935
13,0
39,7
9014
,925
,966
1,70
9,62
459
,280
,609
88,9
69,9
2476
7,39
7,61
0
Tran
sfer
s16
5,97
4,91
262
9,60
5,68
4–
–(7
95,5
80,5
96)
––
Dis
posa
ls
––
(98,
500)
––
(98,
500)
–
At
31 D
ecem
ber
51
2,01
9,06
42,
021,
284,
529
100,
581,
076
16,6
23,6
832,
047,
512
2,65
2,55
5,86
42,
563,
684,
440
Dep
reci
atio
n:
At 1
Jan
uary
14
8,78
1,78
454
8,22
4,84
350
,818
,031
10,2
20,2
10–
758,
044,
868
674,
182,
146
Cha
rges
for t
he y
ear
22,3
10,0
3474
,553
,212
6,84
4,40
186
2,15
2–
104,
569,
799
83,8
62,7
22
Rel
atin
g to
dis
posa
ls–
–(8
4,99
6)–
(84,
996)
–
At 3
1 D
ecem
ber
171,
091,
818
622,
778,
055
57,5
77,4
3611
,082
,362
–86
2,52
9,67
175
8,04
4,86
8
Net
boo
k va
lues
:
At
31 D
ecem
ber
200
9
340,
927,
246
1,39
8,50
6,47
4
43,0
03,6
40
5,5
41,3
21
2
,047
,512
1,79
0,02
6,19
3–
At 3
1 D
ecem
ber 2
008
19
7,24
8,43
383
0,41
4,21
2
34,9
35,5
79
4,6
93,8
49
738
,347
,499
–1,
805,
639,
572
26 27
Notes to theFinancial Statementsfor the year ended 31 December 2009
Notes to theFinancial Statementsfor the year ended 31 December 2009
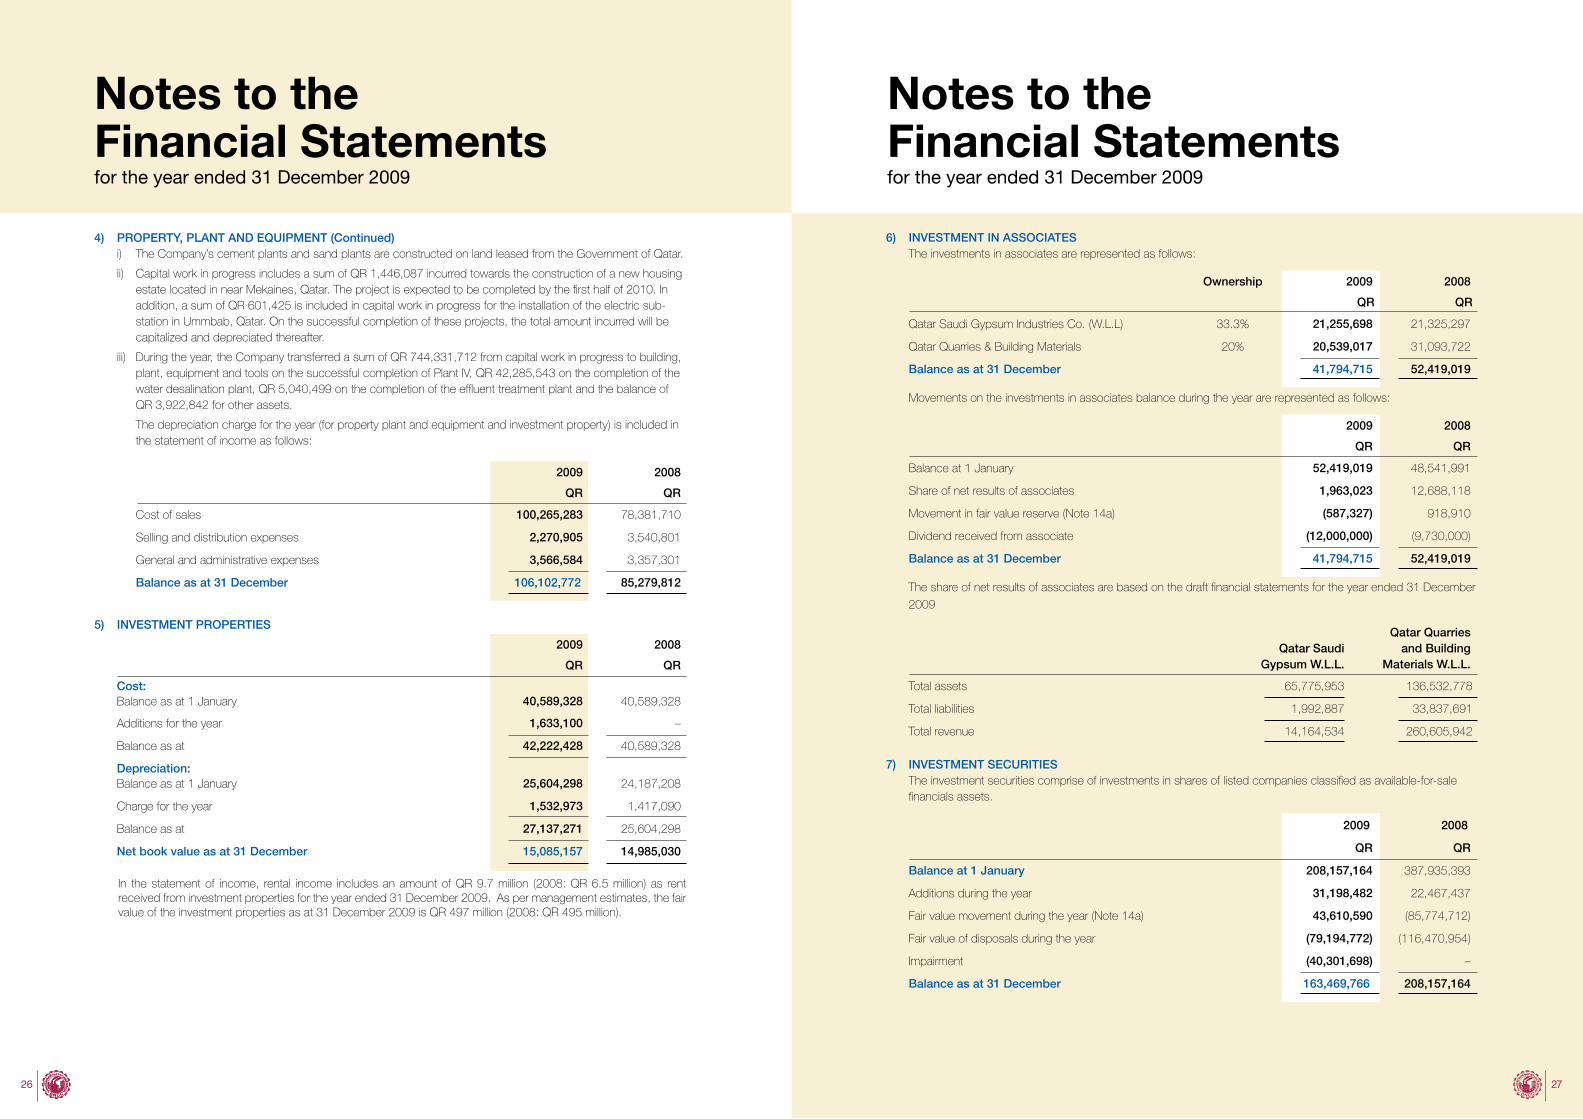
6) INVESTMENT IN ASSOCIATESThe investments in associates are represented as follows:
Ownership 2009 2008
QR QR
Qatar Saudi Gypsum Industries Co. (W.L.L) 33.3% 21,255,698 21,325,297
Qatar Quarries & Building Materials 20% 20,539,017 31,093,722
Balance as at 31 December 41,794,715 52,419,019
Movements on the investments in associates balance during the year are represented as follows:
2009 2008
QR QR
Balance at 1 January 52,419,019 48,541,991
Share of net results of associates 1,963,023 12,688,118
Movement in fair value reserve (Note 14a) (587,327) 918,910
Dividend received from associate (12,000,000) (9,730,000)
Balance as at 31 December 41,794,715 52,419,019
The share of net results of associates are based on the draft financial statements for the year ended 31 December
2009
Qatar SaudiGypsum W.L.L.
Qatar Quarriesand Building
Materials W.L.L.
Total assets 65,775,953 136,532,778
Total liabilities 1,992,887 33,837,691
Total revenue 14,164,534 260,605,942
7) INVESTMENT SECURITIESThe investment securities comprise of investments in shares of listed companies classified as available-for-sale financials assets.
2009 2008
QR QR
Balance at 1 January 208,157,164 387,935,393
Additions during the year 31,198,482 22,467,437
Fair value movement during the year (Note 14a) 43,610,590 (85,774,712)
Fair value of disposals during the year (79,194,772) (116,470,954)
Impairment (40,301,698) –
Balance as at 31 December 163,469,766 208,157,164
4) PROPERTY, PLANT AND EQUIPMENT (Continued)i) The Company’s cement plants and sand plants are constructed on land leased from the Government of Qatar.
ii) Capital work in progress includes a sum of QR 1,446,087 incurred towards the construction of a new housing estate located in near Mekaines, Qatar. The project is expected to be completed by the first half of 2010. In addition, a sum of QR 601,425 is included in capital work in progress for the installation of the electric sub-station in Ummbab, Qatar. On the successful completion of these projects, the total amount incurred will be capitalized and depreciated thereafter.
iii) During the year, the Company transferred a sum of QR 744,331,712 from capital work in progress to building, plant, equipment and tools on the successful completion of Plant IV, QR 42,285,543 on the completion of the water desalination plant, QR 5,040,499 on the completion of the effluent treatment plant and the balance of QR 3,922,842 for other assets.
The depreciation charge for the year (for property plant and equipment and investment property) is included in the statement of income as follows:
2009 2008
QR QR
Cost of sales 100,265,283 78,381,710
Selling and distribution expenses 2,270,905 3,540,801
General and administrative expenses 3,566,584 3,357,301
Balance as at 31 December 106,102,772 85,279,812
5) INVESTMENT PROPERTIES
2009 2008
QR QR
Cost:Balance as at 1 January 40,589,328 40,589,328
Additions for the year 1,633,100 –
Balance as at 42,222,428 40,589,328
Depreciation:Balance as at 1 January 25,604,298 24,187,208
Charge for the year 1,532,973 1,417,090
Balance as at 27,137,271 25,604,298
Net book value as at 31 December 15,085,157 14,985,030
In the statement of income, rental income includes an amount of QR 9.7 million (2008: QR 6.5 million) as rent received from investment properties for the year ended 31 December 2009. As per management estimates, the fair value of the investment properties as at 31 December 2009 is QR 497 million (2008: QR 495 million).
28 29
Notes to theFinancial Statementsfor the year ended 31 December 2009
Notes to theFinancial Statementsfor the year ended 31 December 2009
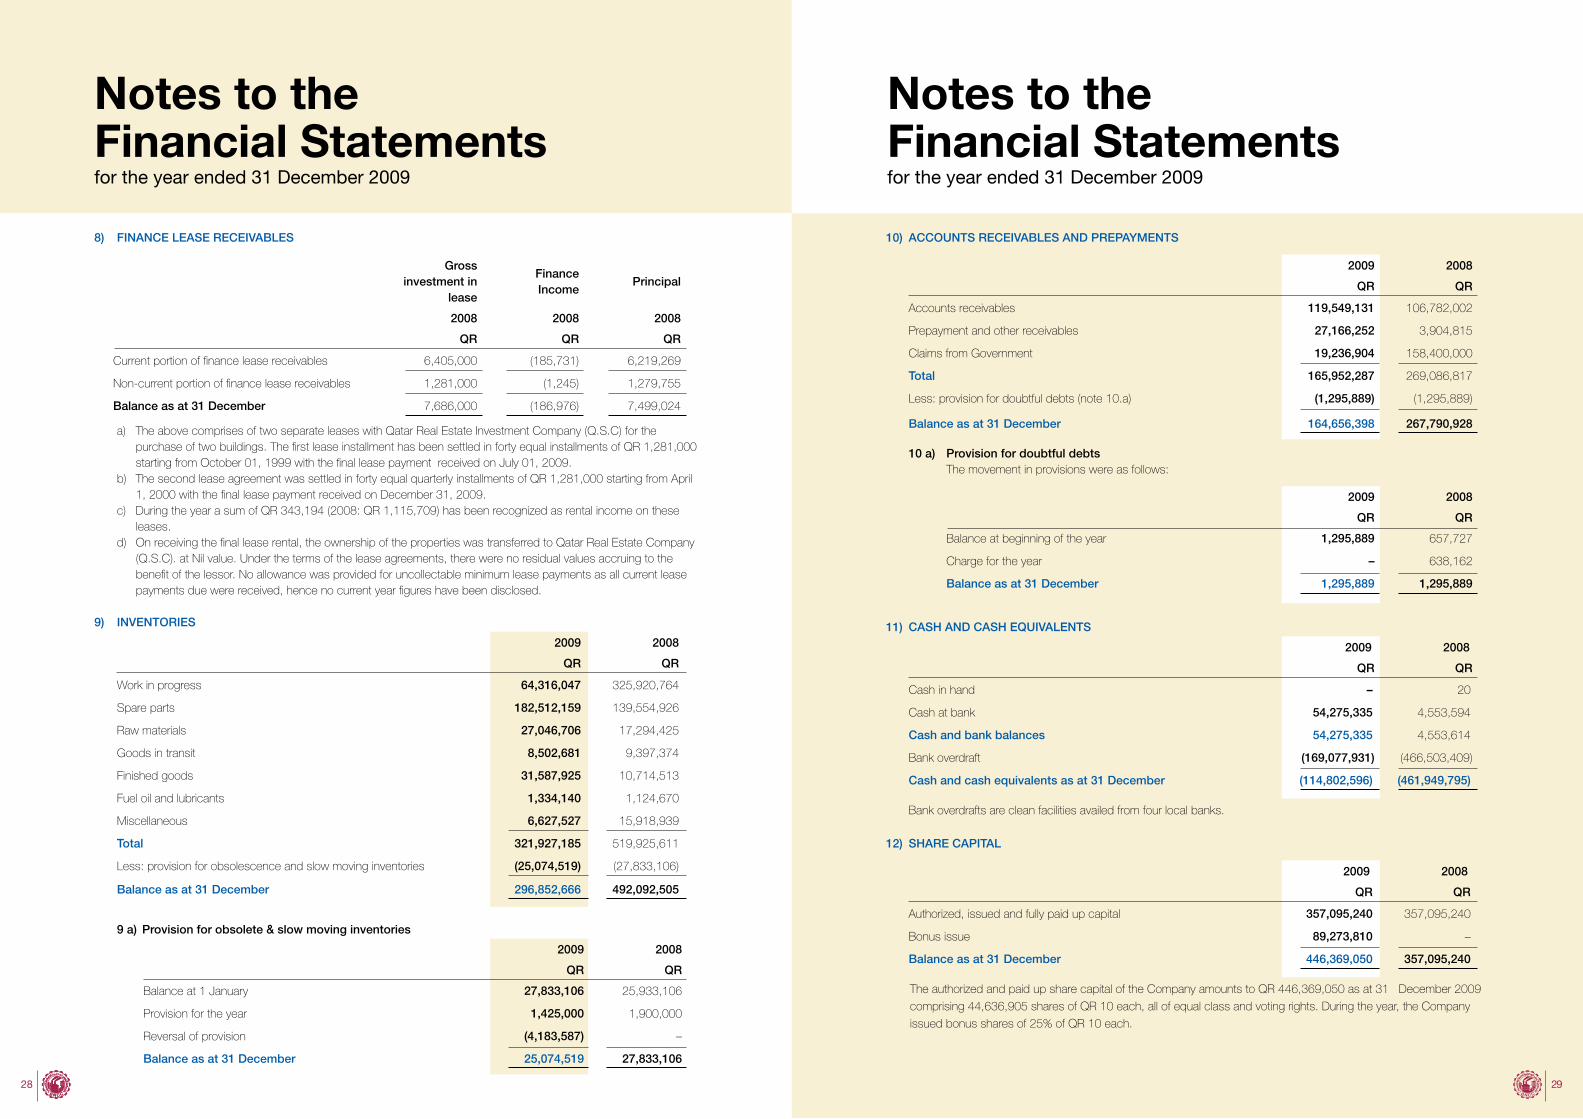
10) ACCOUNTS RECEIVABLES AND PREPAYMENTS
2009 2008
QR QR
Accounts receivables 119,549,131 106,782,002
Prepayment and other receivables 27,166,252 3,904,815
Claims from Government 19,236,904 158,400,000
Total 165,952,287 269,086,817
Less: provision for doubtful debts (note 10.a) (1,295,889) (1,295,889)
Balance as at 31 December 164,656,398 267,790,928
10 a) Provision for doubtful debtsThe movement in provisions were as follows:
2009 2008
QR QR
Balance at beginning of the year 1,295,889 657,727
Charge for the year – 638,162
Balance as at 31 December 1,295,889 1,295,889
11) CASH AND CASH EQUIVALENTS
2009 2008
QR QR
Cash in hand – 20
Cash at bank 54,275,335 4,553,594
Cash and bank balances 54,275,335 4,553,614
Bank overdraft (169,077,931) (466,503,409)
Cash and cash equivalents as at 31 December (114,802,596) (461,949,795)
Bank overdrafts are clean facilities availed from four local banks.
12) SHARE CAPITAL
2009 2008
QR QR
Authorized, issued and fully paid up capital 357,095,240 357,095,240
Bonus issue 89,273,810 –
Balance as at 31 December 446,369,050 357,095,240
The authorized and paid up share capital of the Company amounts to QR 446,369,050 as at 31 December 2009
comprising 44,636,905 shares of QR 10 each, all of equal class and voting rights. During the year, the Company
issued bonus shares of 25% of QR 10 each.
8) FINANCE LEASE RECEIVABLES
Gross investment in
lease
FinanceIncome
Principal
2008 2008 2008
QR QR QR
Current portion of finance lease receivables 6,405,000 (185,731) 6,219,269
Non-current portion of finance lease receivables 1,281,000 (1,245) 1,279,755
Balance as at 31 December 7,686,000 (186,976) 7,499,024
a) The above comprises of two separate leases with Qatar Real Estate Investment Company (Q.S.C) for the purchase of two buildings. The first lease installment has been settled in forty equal installments of QR 1,281,000 starting from October 01, 1999 with the final lease payment received on July 01, 2009.
b) The second lease agreement was settled in forty equal quarterly installments of QR 1,281,000 starting from April 1, 2000 with the final lease payment received on December 31, 2009.
c) During the year a sum of QR 343,194 (2008: QR 1,115,709) has been recognized as rental income on these leases.
d) On receiving the final lease rental, the ownership of the properties was transferred to Qatar Real Estate Company (Q.S.C). at Nil value. Under the terms of the lease agreements, there were no residual values accruing to the benefit of the lessor. No allowance was provided for uncollectable minimum lease payments as all current lease payments due were received, hence no current year figures have been disclosed.
9) INVENTORIES
2009 2008
QR QR
Work in progress 64,316,047 325,920,764
Spare parts 182,512,159 139,554,926
Raw materials 27,046,706 17,294,425
Goods in transit 8,502,681 9,397,374
Finished goods 31,587,925 10,714,513
Fuel oil and lubricants 1,334,140 1,124,670
Miscellaneous 6,627,527 15,918,939
Total 321,927,185 519,925,611
Less: provision for obsolescence and slow moving inventories (25,074,519) (27,833,106)
Balance as at 31 December 296,852,666 492,092,505
9 a) Provision for obsolete & slow moving inventories
2009 2008
QR QR
Balance at 1 January 27,833,106 25,933,106
Provision for the year 1,425,000 1,900,000
Reversal of provision (4,183,587) –
Balance as at 31 December 25,074,519 27,833,106
30 31
Notes to theFinancial Statementsfor the year ended 31 December 2009
Notes to theFinancial Statementsfor the year ended 31 December 2009
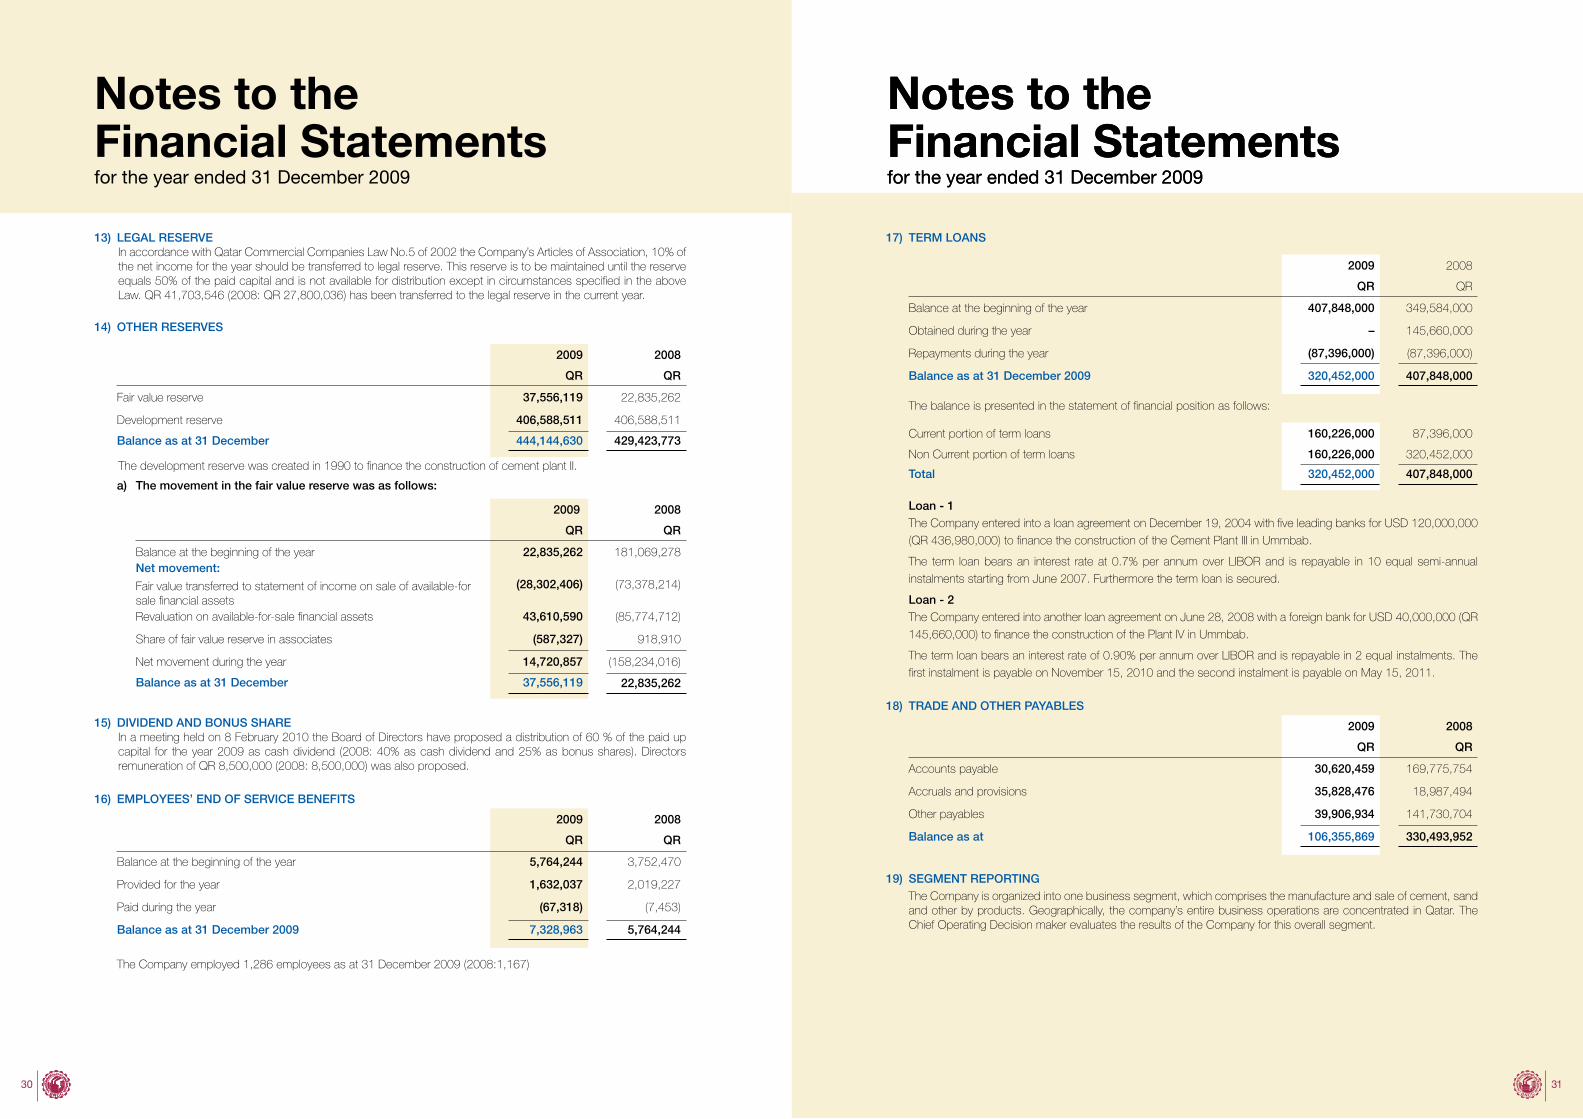
17) TERM LOANS
2009 2008
QR QR
Balance at the beginning of the year 407,848,000 349,584,000
Obtained during the year – 145,660,000
Repayments during the year (87,396,000) (87,396,000)
Balance as at 31 December 2009 320,452,000 407,848,000
The balance is presented in the statement of financial position as follows:
Current portion of term loans 160,226,000 87,396,000
Non Current portion of term loans 160,226,000 320,452,000
Total 320,452,000 407,848,000
Loan - 1The Company entered into a loan agreement on December 19, 2004 with five leading banks for USD 120,000,000
(QR 436,980,000) to finance the construction of the Cement Plant III in Ummbab.
The term loan bears an interest rate at 0.7% per annum over LIBOR and is repayable in 10 equal semi-annual
instalments starting from June 2007. Furthermore the term loan is secured.
Loan - 2The Company entered into another loan agreement on June 28, 2008 with a foreign bank for USD 40,000,000 (QR
145,660,000) to finance the construction of the Plant IV in Ummbab.
The term loan bears an interest rate of 0.90% per annum over LIBOR and is repayable in 2 equal instalments. The
first instalment is payable on November 15, 2010 and the second instalment is payable on May 15, 2011.
18) TRADE AND OTHER PAYABLES
2009 2008
QR QR
Accounts payable 30,620,459 169,775,754
Accruals and provisions 35,828,476 18,987,494
Other payables 39,906,934 141,730,704
Balance as at 106,355,869 330,493,952
19) SEGMENT REPORTINGThe Company is organized into one business segment, which comprises the manufacture and sale of cement, sand and other by products. Geographically, the company’s entire business operations are concentrated in Qatar. The Chief Operating Decision maker evaluates the results of the Company for this overall segment.
13) LEGAL RESERVEIn accordance with Qatar Commercial Companies Law No.5 of 2002 the Company’s Articles of Association, 10% of the net income for the year should be transferred to legal reserve. This reserve is to be maintained until the reserve equals 50% of the paid capital and is not available for distribution except in circumstances specified in the above Law. QR 41,703,546 (2008: QR 27,800,036) has been transferred to the legal reserve in the current year.
14) OTHER RESERVES
2009 2008
QR QR
Fair value reserve 37,556,119 22,835,262
Development reserve 406,588,511 406,588,511
Balance as at 31 December 444,144,630 429,423,773
The development reserve was created in 1990 to finance the construction of cement plant II.
a) The movement in the fair value reserve was as follows:
2009 2008
QR QR
Balance at the beginning of the year 22,835,262 181,069,278Net movement:
Fair value transferred to statement of income on sale of available-for sale financial assets
(28,302,406) (73,378,214)
Revaluation on available-for-sale financial assets 43,610,590 (85,774,712)
Share of fair value reserve in associates (587,327) 918,910
Net movement during the year 14,720,857 (158,234,016)
Balance as at 31 December 37,556,119 22,835,262
15) DIVIDEND AND BONUS SHAREIn a meeting held on 8 February 2010 the Board of Directors have proposed a distribution of 60 % of the paid up capital for the year 2009 as cash dividend (2008: 40% as cash dividend and 25% as bonus shares). Directors remuneration of QR 8,500,000 (2008: 8,500,000) was also proposed.
16) EMPLOYEES’ END OF SERVICE BENEFITS
2009 2008
QR QR
Balance at the beginning of the year 5,764,244 3,752,470
Provided for the year 1,632,037 2,019,227
Paid during the year (67,318) (7,453)
Balance as at 31 December 2009 7,328,963 5,764,244
The Company employed 1,286 employees as at 31 December 2009 (2008:1,167)
Notes to theFinancial Statementsfor the year ended 31 December 2009
32 33
Notes to theFinancial Statementsfor the year ended 31 December 2009
Notes to theFinancial Statementsfor the year ended 31 December 2009
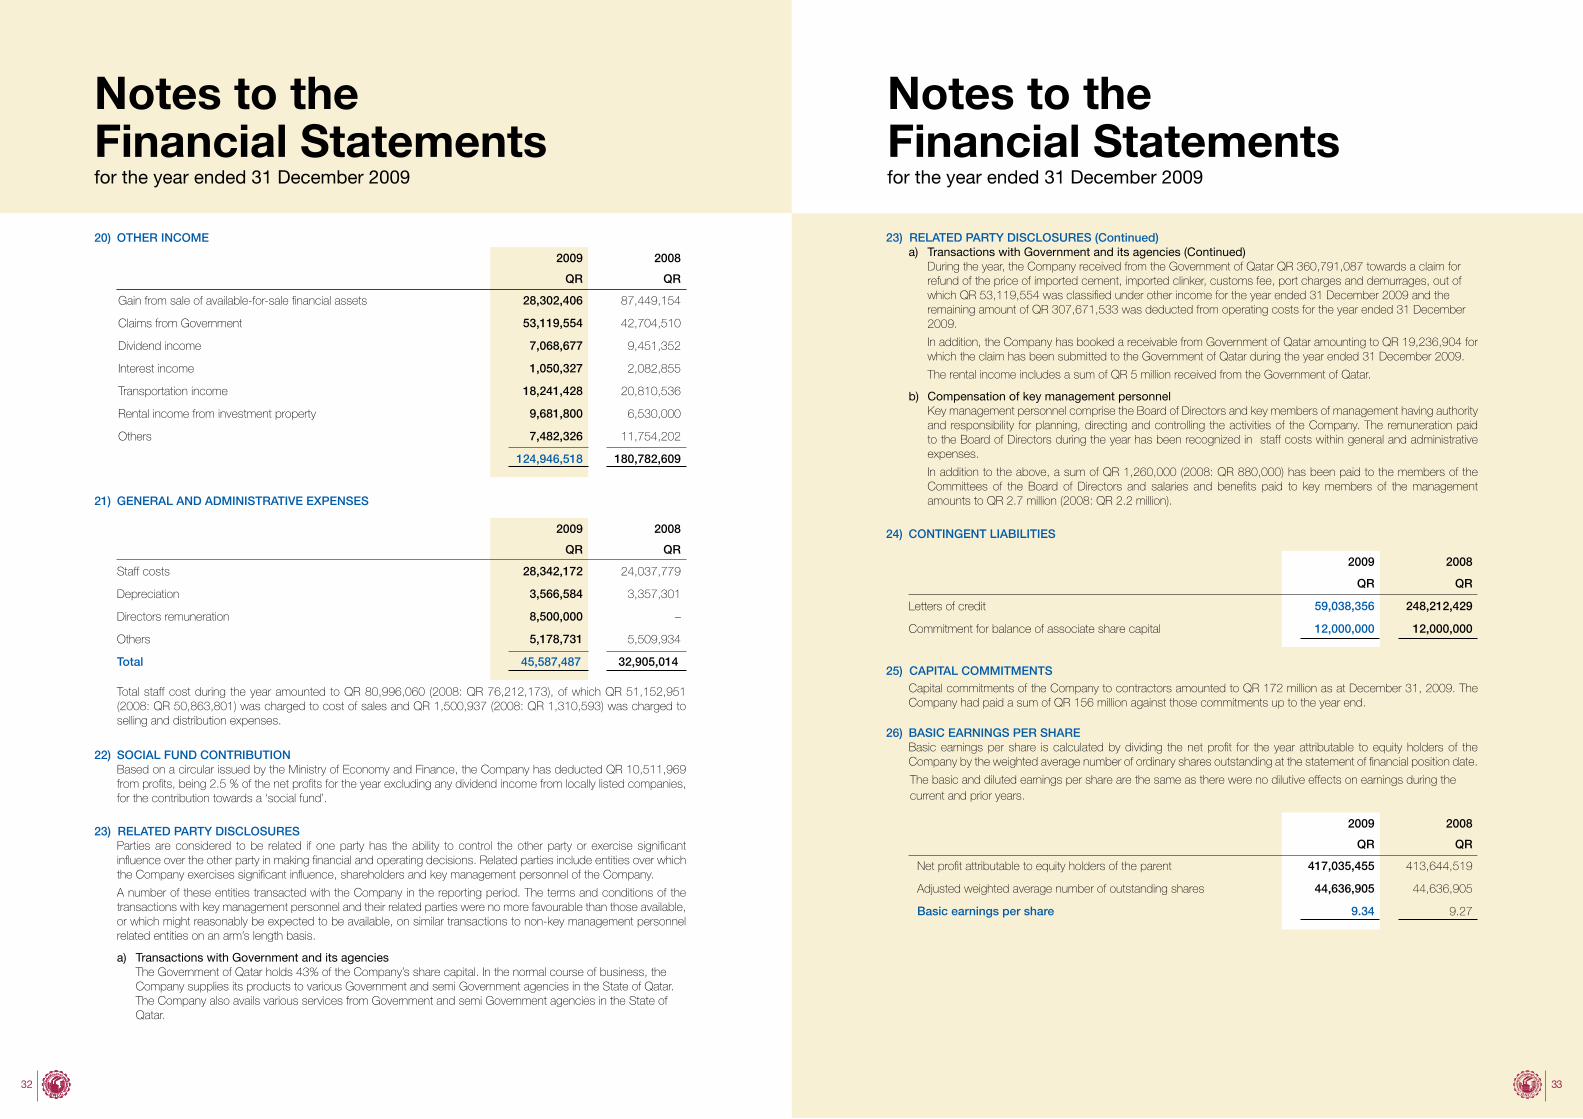
23) RELATED PARTY DISCLOSURES (Continued)a) Transactions with Government and its agencies (Continued) During the year, the Company received from the Government of Qatar QR 360,791,087 towards a claim for
refund of the price of imported cement, imported clinker, customs fee, port charges and demurrages, out of which QR 53,119,554 was classified under other income for the year ended 31 December 2009 and the remaining amount of QR 307,671,533 was deducted from operating costs for the year ended 31 December 2009.
In addition, the Company has booked a receivable from Government of Qatar amounting to QR 19,236,904 for which the claim has been submitted to the Government of Qatar during the year ended 31 December 2009.
The rental income includes a sum of QR 5 million received from the Government of Qatar.
b) Compensation of key management personnel Key management personnel comprise the Board of Directors and key members of management having authority
and responsibility for planning, directing and controlling the activities of the Company. The remuneration paid to the Board of Directors during the year has been recognized in staff costs within general and administrative expenses.
In addition to the above, a sum of QR 1,260,000 (2008: QR 880,000) has been paid to the members of the Committees of the Board of Directors and salaries and benefits paid to key members of the management amounts to QR 2.7 million (2008: QR 2.2 million).
24) CONTINGENT LIABILITIES
2009 2008
QR QR
Letters of credit 59,038,356 248,212,429
Commitment for balance of associate share capital 12,000,000 12,000,000
25) CAPITAL COMMITMENTSCapital commitments of the Company to contractors amounted to QR 172 million as at December 31, 2009. The Company had paid a sum of QR 156 million against those commitments up to the year end.
26) BASIC EARNINGS PER SHAREBasic earnings per share is calculated by dividing the net profit for the year attributable to equity holders of the Company by the weighted average number of ordinary shares outstanding at the statement of financial position date.
The basic and diluted earnings per share are the same as there were no dilutive effects on earnings during the current and prior years.
2009 2008
QR QR
Net profit attributable to equity holders of the parent 417,035,455 413,644,519
Adjusted weighted average number of outstanding shares 44,636,905 44,636,905
Basic earnings per share 9.34 9.27
20) OTHER INCOME
2009 2008
QR QR
Gain from sale of available-for-sale financial assets 28,302,406 87,449,154
Claims from Government 53,119,554 42,704,510
Dividend income 7,068,677 9,451,352
Interest income 1,050,327 2,082,855
Transportation income 18,241,428 20,810,536
Rental income from investment property 9,681,800 6,530,000
Others 7,482,326 11,754,202
124,946,518 180,782,609
21) GENERAL AND ADMINISTRATIVE EXPENSES
2009 2008
QR QR
Staff costs 28,342,172 24,037,779
Depreciation 3,566,584 3,357,301
Directors remuneration 8,500,000 –
Others 5,178,731 5,509,934
Total 45,587,487 32,905,014
Total staff cost during the year amounted to QR 80,996,060 (2008: QR 76,212,173), of which QR 51,152,951 (2008: QR 50,863,801) was charged to cost of sales and QR 1,500,937 (2008: QR 1,310,593) was charged to selling and distribution expenses.
22) SOCIAL FUND CONTRIBUTIONBased on a circular issued by the Ministry of Economy and Finance, the Company has deducted QR 10,511,969 from profits, being 2.5 % of the net profits for the year excluding any dividend income from locally listed companies, for the contribution towards a ‘social fund’.
23) RELATED PARTY DISCLOSURESParties are considered to be related if one party has the ability to control the other party or exercise significant influence over the other party in making financial and operating decisions. Related parties include entities over which the Company exercises significant influence, shareholders and key management personnel of the Company.
A number of these entities transacted with the Company in the reporting period. The terms and conditions of the transactions with key management personnel and their related parties were no more favourable than those available, or which might reasonably be expected to be available, on similar transactions to non-key management personnel related entities on an arm’s length basis.
a) Transactions with Government and its agencies The Government of Qatar holds 43% of the Company’s share capital. In the normal course of business, the
Company supplies its products to various Government and semi Government agencies in the State of Qatar. The Company also avails various services from Government and semi Government agencies in the State of Qatar.
34 35
Notes to theFinancial Statementsfor the year ended 31 December 2009
Notes to theFinancial Statementsfor the year ended 31 December 2009
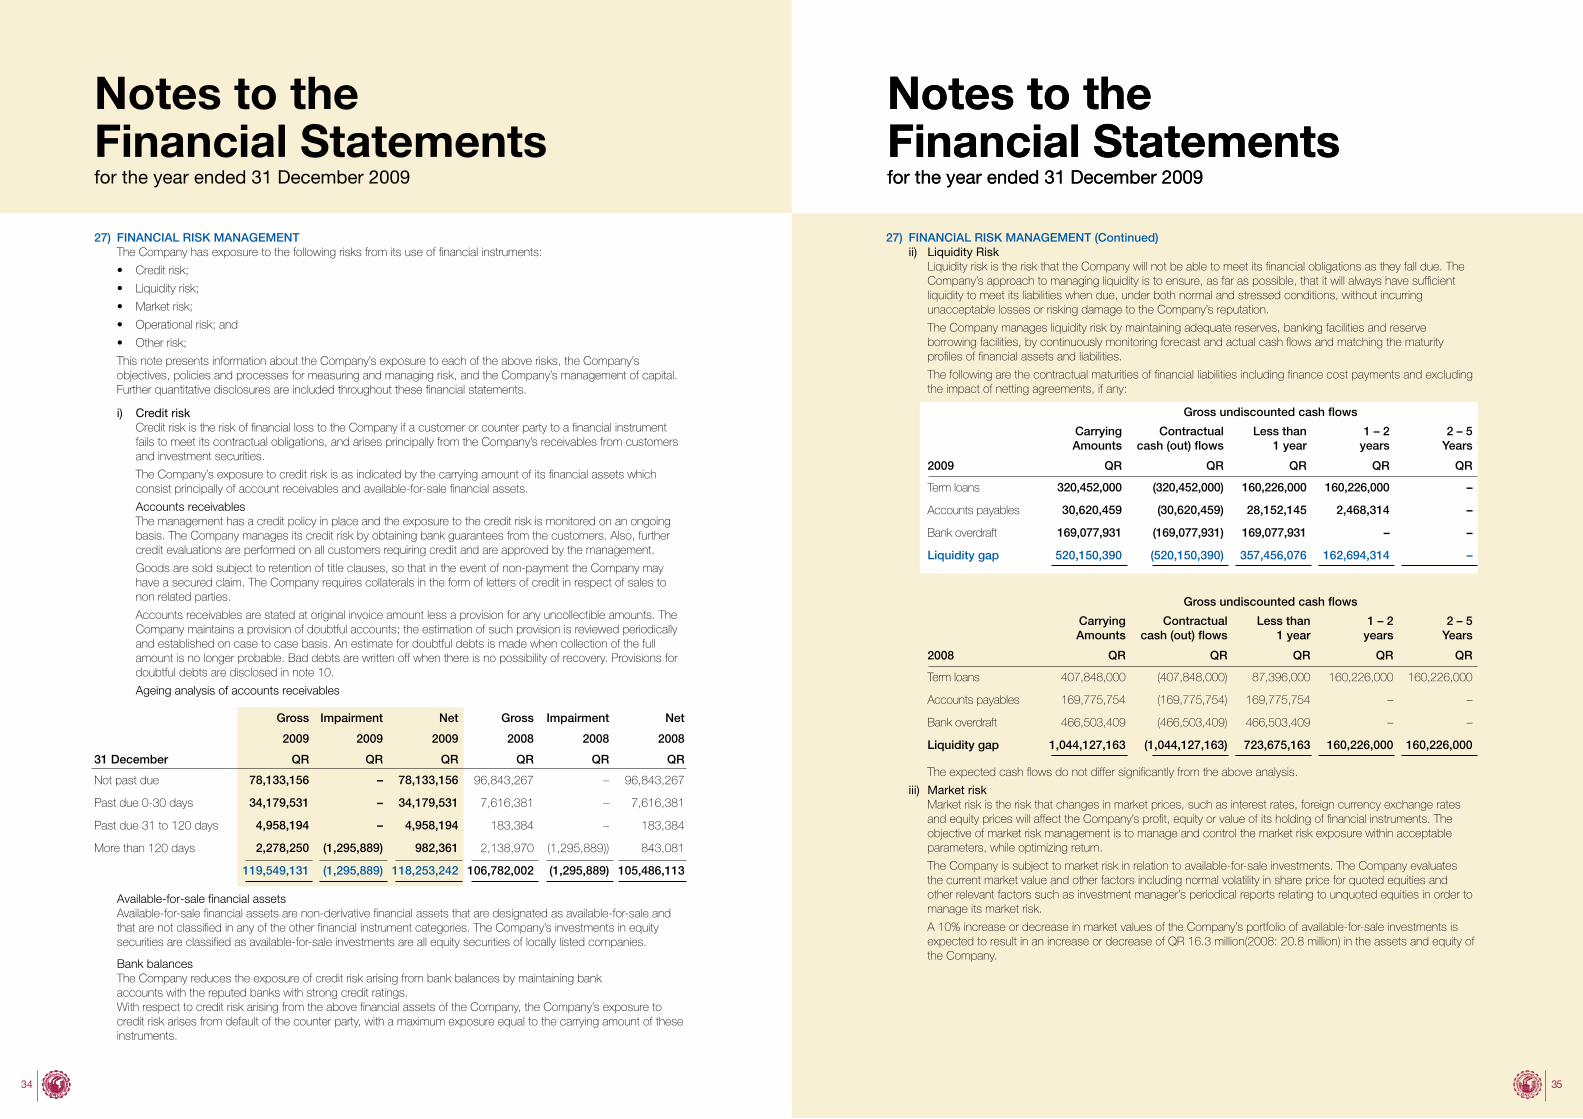
27) FINANCIAL RISK MANAGEMENT (Continued)ii) Liquidity Risk Liquidity risk is the risk that the Company will not be able to meet its financial obligations as they fall due. The
Company’s approach to managing liquidity is to ensure, as far as possible, that it will always have sufficient liquidity to meet its liabilities when due, under both normal and stressed conditions, without incurring unacceptable losses or risking damage to the Company’s reputation.
The Company manages liquidity risk by maintaining adequate reserves, banking facilities and reserve borrowing facilities, by continuously monitoring forecast and actual cash flows and matching the maturity profiles of financial assets and liabilities.
The following are the contractual maturities of financial liabilities including finance cost payments and excluding the impact of netting agreements, if any:
Gross undiscounted cash flows
Carrying Amounts
Contractual cash (out) flows
Less than1 year
1 – 2years
2 – 5Years
2009 QR QR QR QR QR
Term loans 320,452,000 (320,452,000) 160,226,000 160,226,000 –
Accounts payables 30,620,459 (30,620,459) 28,152,145 2,468,314 –
Bank overdraft 169,077,931 (169,077,931) 169,077,931 – –
Liquidity gap 520,150,390 (520,150,390) 357,456,076 162,694,314 –
Gross undiscounted cash flows
Carrying Amounts
Contractual cash (out) flows
Less than 1 year
1 – 2 years
2 – 5Years
2008 QR QR QR QR QR
Term loans 407,848,000 (407,848,000) 87,396,000 160,226,000 160,226,000
Accounts payables 169,775,754 (169,775,754) 169,775,754 – –
Bank overdraft 466,503,409 (466,503,409) 466,503,409 – –
Liquidity gap 1,044,127,163 (1,044,127,163) 723,675,163 160,226,000 160,226,000
The expected cash flows do not differ significantly from the above analysis.
iii) Market risk Market risk is the risk that changes in market prices, such as interest rates, foreign currency exchange rates and equity prices will affect the Company’s profit, equity or value of its holding of financial instruments. The objective of market risk management is to manage and control the market risk exposure within acceptable parameters, while optimizing return.
The Company is subject to market risk in relation to available-for-sale investments. The Company evaluates the current market value and other factors including normal volatility in share price for quoted equities and other relevant factors such as investment manager’s periodical reports relating to unquoted equities in order to manage its market risk.
A 10% increase or decrease in market values of the Company’s portfolio of available-for-sale investments is expected to result in an increase or decrease of QR 16.3 million(2008: 20.8 million) in the assets and equity of the Company.
27) FINANCIAL RISK MANAGEMENTThe Company has exposure to the following risks from its use of financial instruments:
• Creditrisk;
• Liquidityrisk;
• Marketrisk;
• Operationalrisk;and
• Otherrisk;
This note presents information about the Company’s exposure to each of the above risks, the Company’s objectives, policies and processes for measuring and managing risk, and the Company’s management of capital. Further quantitative disclosures are included throughout these financial statements.
i) Credit risk Credit risk is the risk of financial loss to the Company if a customer or counter party to a financial instrument
fails to meet its contractual obligations, and arises principally from the Company’s receivables from customers and investment securities.
The Company’s exposure to credit risk is as indicated by the carrying amount of its financial assets which consist principally of account receivables and available-for-sale financial assets.
Accounts receivables The management has a credit policy in place and the exposure to the credit risk is monitored on an ongoing
basis. The Company manages its credit risk by obtaining bank guarantees from the customers. Also, further credit evaluations are performed on all customers requiring credit and are approved by the management.
Goods are sold subject to retention of title clauses, so that in the event of non-payment the Company may have a secured claim. The Company requires collaterals in the form of letters of credit in respect of sales to non related parties.
Accounts receivables are stated at original invoice amount less a provision for any uncollectible amounts. The Company maintains a provision of doubtful accounts; the estimation of such provision is reviewed periodically and established on case to case basis. An estimate for doubtful debts is made when collection of the full amount is no longer probable. Bad debts are written off when there is no possibility of recovery. Provisions for doubtful debts are disclosed in note 10.
Ageing analysis of accounts receivables
Gross Impairment Net Gross Impairment Net
2009 2009 2009 2008 2008 2008
31 December QR QR QR QR QR QR
Not past due 78,133,156 – 78,133,156 96,843,267 – 96,843,267
Past due 0-30 days 34,179,531 – 34,179,531 7,616,381 – 7,616,381
Past due 31 to 120 days 4,958,194 – 4,958,194 183,384 – 183,384
More than 120 days 2,278,250 (1,295,889) 982,361 2,138,970 (1,295,889)) 843,081
119,549,131 (1,295,889) 118,253,242 106,782,002 (1,295,889) 105,486,113
Available-for-sale financial assetsAvailable-for-sale financial assets are non-derivative financial assets that are designated as available-for-sale and that are not classified in any of the other financial instrument categories. The Company’s investments in equity securities are classified as available-for-sale investments are all equity securities of locally listed companies.
Bank balancesThe Company reduces the exposure of credit risk arising from bank balances by maintaining bankaccounts with the reputed banks with strong credit ratings.With respect to credit risk arising from the above financial assets of the Company, the Company’s exposure to credit risk arises from default of the counter party, with a maximum exposure equal to the carrying amount of these instruments.
Notes to theFinancial Statementsfor the year ended 31 December 2009
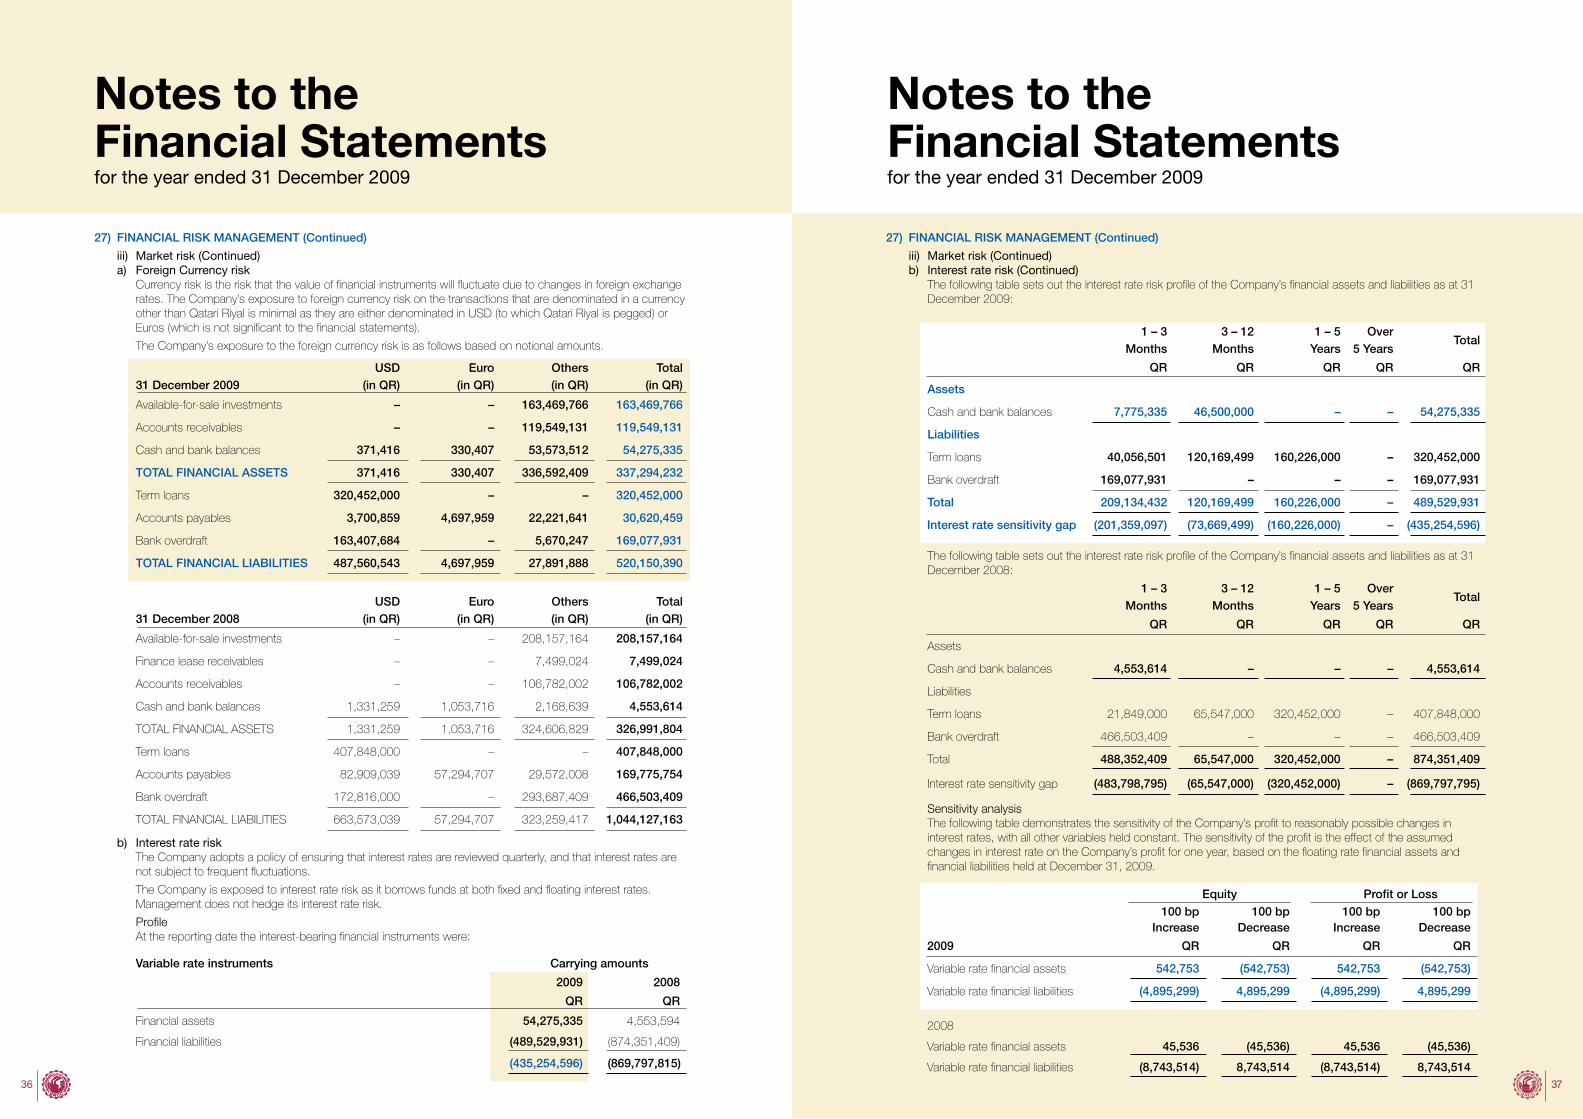
36 37
Notes to theFinancial Statementsfor the year ended 31 December 2009
Notes to theFinancial Statementsfor the year ended 31 December 2009
27) FINANCIAL RISK MANAGEMENT (Continued)
iii) Market risk (Continued) b) Interest rate risk (Continued)
The following table sets out the interest rate risk profile of the Company’s financial assets and liabilities as at 31 December 2009:
1 – 3Months
3 – 12Months
1 – 5Years
Over5 Years
Total
QR QR QR QR QR
Assets
Cash and bank balances 7,775,335 46,500,000 – – 54,275,335
Liabilities
Term loans 40,056,501 120,169,499 160,226,000 – 320,452,000
Bank overdraft 169,077,931 – – – 169,077,931
Total 209,134,432 120,169,499 160,226,000 – 489,529,931
Interest rate sensitivity gap (201,359,097) (73,669,499) (160,226,000) – (435,254,596)
The following table sets out the interest rate risk profile of the Company’s financial assets and liabilities as at 31 December 2008:
1 – 3Months
3 – 12Months
1 – 5Years
Over5 Years
Total
QR QR QR QR QR
Assets
Cash and bank balances 4,553,614 – – – 4,553,614
Liabilities
Term loans 21,849,000 65,547,000 320,452,000 – 407,848,000
Bank overdraft 466,503,409 – – – 466,503,409
Total 488,352,409 65,547,000 320,452,000 – 874,351,409
Interest rate sensitivity gap (483,798,795) (65,547,000) (320,452,000) – (869,797,795)
Sensitivity analysisThe following table demonstrates the sensitivity of the Company’s profit to reasonably possible changes in interest rates, with all other variables held constant. The sensitivity of the profit is the effect of the assumed changes in interest rate on the Company’s profit for one year, based on the floating rate financial assets and financial liabilities held at December 31, 2009.
Equity Profit or Loss100 bp
Increase100 bp
Decrease100 bp
Increase100 bp
Decrease
2009 QR QR QR QR
Variable rate financial assets 542,753 (542,753) 542,753 (542,753)
Variable rate financial liabilities (4,895,299) 4,895,299 (4,895,299) 4,895,299
2008
Variable rate financial assets 45,536 (45,536) 45,536 (45,536)
Variable rate financial liabilities (8,743,514) 8,743,514 (8,743,514) 8,743,514
27) FINANCIAL RISK MANAGEMENT (Continued)
iii) Market risk (Continued) a) Foreign Currency risk
Currency risk is the risk that the value of financial instruments will fluctuate due to changes in foreign exchange rates. The Company’s exposure to foreign currency risk on the transactions that are denominated in a currency other than Qatari Riyal is minimal as they are either denominated in USD (to which Qatari Riyal is pegged) or Euros (which is not significant to the financial statements).
The Company’s exposure to the foreign currency risk is as follows based on notional amounts.
31 December 2009USD
(in QR)Euro
(in QR)Others(in QR)
Total(in QR)
Available-for-sale investments – – 163,469,766 163,469,766
Accounts receivables – – 119,549,131 119,549,131
Cash and bank balances 371,416 330,407 53,573,512 54,275,335
TOTAL FINANCIAL ASSETS 371,416 330,407 336,592,409 337,294,232
Term loans 320,452,000 – – 320,452,000
Accounts payables 3,700,859 4,697,959 22,221,641 30,620,459
Bank overdraft 163,407,684 – 5,670,247 169,077,931
TOTAL FINANCIAL LIABILITIES 487,560,543 4,697,959 27,891,888 520,150,390
31 December 2008USD
(in QR)Euro
(in QR)Others(in QR)
Total(in QR)
Available-for-sale investments – – 208,157,164 208,157,164
Finance lease receivables – – 7,499,024 7,499,024
Accounts receivables – – 106,782,002 106,782,002
Cash and bank balances 1,331,259 1,053,716 2,168,639 4,553,614
TOTAL FINANCIAL ASSETS 1,331,259 1,053,716 324,606,829 326,991,804
Term loans 407,848,000 – – 407,848,000
Accounts payables 82,909,039 57,294,707 29,572,008 169,775,754
Bank overdraft 172,816,000 – 293,687,409 466,503,409
TOTAL FINANCIAL LIABILITIES 663,573,039 57,294,707 323,259,417 1,044,127,163
b) Interest rate riskThe Company adopts a policy of ensuring that interest rates are reviewed quarterly, and that interest rates are not subject to frequent fluctuations.
The Company is exposed to interest rate risk as it borrows funds at both fixed and floating interest rates. Management does not hedge its interest rate risk.
Profile At the reporting date the interest-bearing financial instruments were:
Variable rate instruments Carrying amounts
2009 2008
QR QR
Financial assets 54,275,335 4,553,594
Financial liabilities (489,529,931) (874,351,409)
(435,254,596) (869,797,815)
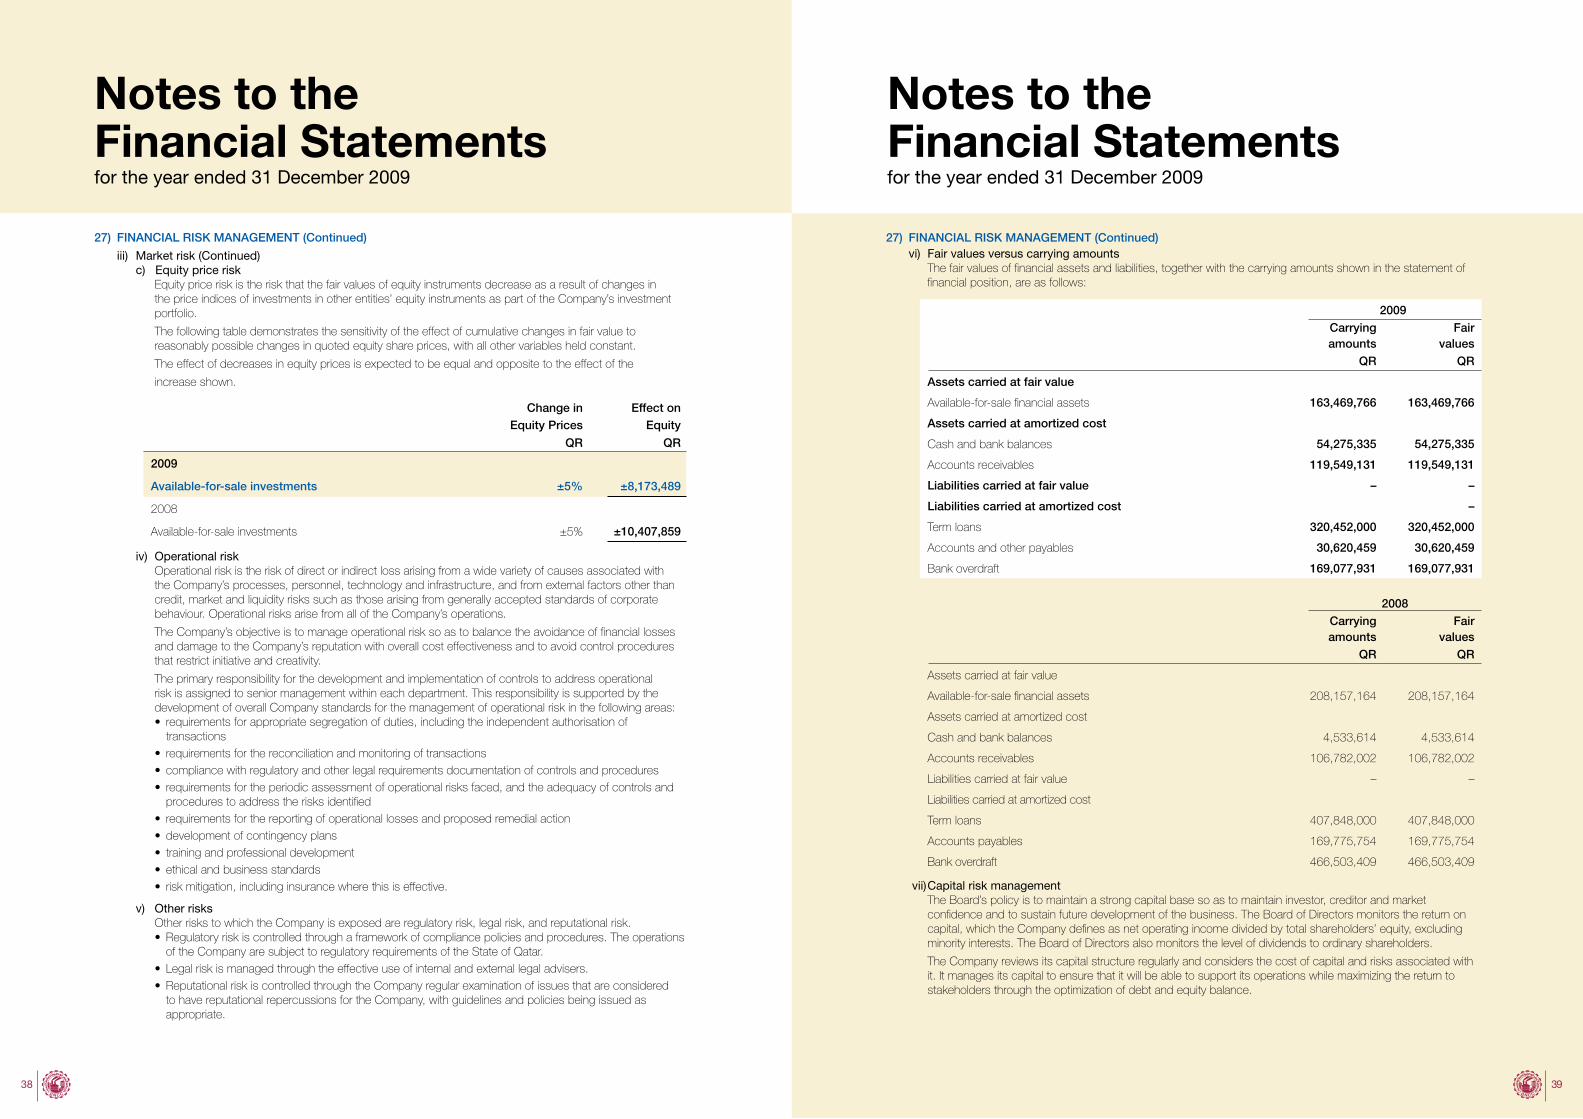
38 39
Notes to theFinancial Statementsfor the year ended 31 December 2009
Notes to theFinancial Statementsfor the year ended 31 December 2009
27) FINANCIAL RISK MANAGEMENT (Continued)vi) Fair values versus carrying amounts The fair values of financial assets and liabilities, together with the carrying amounts shown in the statement of
financial position, are as follows:
2009Carrying amounts
Fairvalues
QR QR
Assets carried at fair value
Available-for-sale financial assets 163,469,766 163,469,766
Assets carried at amortized cost
Cash and bank balances 54,275,335 54,275,335
Accounts receivables 119,549,131 119,549,131
Liabilities carried at fair value – –
Liabilities carried at amortized cost –
Term loans 320,452,000 320,452,000
Accounts and other payables 30,620,459 30,620,459
Bank overdraft 169,077,931 169,077,931
2008Carrying amounts
Fairvalues
QR QR
Assets carried at fair value
Available-for-sale financial assets 208,157,164 208,157,164
Assets carried at amortized cost
Cash and bank balances 4,533,614 4,533,614
Accounts receivables 106,782,002 106,782,002
Liabilities carried at fair value – –
Liabilities carried at amortized cost
Term loans 407,848,000 407,848,000
Accounts payables 169,775,754 169,775,754
Bank overdraft 466,503,409 466,503,409
vii) Capital risk management The Board’s policy is to maintain a strong capital base so as to maintain investor, creditor and market confidence and to sustain future development of the business. The Board of Directors monitors the return on capital, which the Company defines as net operating income divided by total shareholders’ equity, excluding minority interests. The Board of Directors also monitors the level of dividends to ordinary shareholders.
The Company reviews its capital structure regularly and considers the cost of capital and risks associated with it. It manages its capital to ensure that it will be able to support its operations while maximizing the return to stakeholders through the optimization of debt and equity balance.
27) FINANCIAL RISK MANAGEMENT (Continued)
iii) Market risk (Continued) c) Equity price risk
Equity price risk is the risk that the fair values of equity instruments decrease as a result of changes in the price indices of investments in other entities’ equity instruments as part of the Company’s investment portfolio.
The following table demonstrates the sensitivity of the effect of cumulative changes in fair value to reasonably possible changes in quoted equity share prices, with all other variables held constant.
The effect of decreases in equity prices is expected to be equal and opposite to the effect of the
increase shown.
Change in Equity Prices
Effect onEquity
QR QR
2009
Available-for-sale investments ±5% ±8,173,489
2008
Available-for-sale investments ±5% ±10,407,859
iv) Operational riskOperational risk is the risk of direct or indirect loss arising from a wide variety of causes associated with the Company’s processes, personnel, technology and infrastructure, and from external factors other than credit, market and liquidity risks such as those arising from generally accepted standards of corporate behaviour. Operational risks arise from all of the Company’s operations.
The Company’s objective is to manage operational risk so as to balance the avoidance of financial losses and damage to the Company’s reputation with overall cost effectiveness and to avoid control procedures that restrict initiative and creativity.
The primary responsibility for the development and implementation of controls to address operational risk is assigned to senior management within each department. This responsibility is supported by the development of overall Company standards for the management of operational risk in the following areas:• requirementsforappropriatesegregationofduties,includingtheindependentauthorisationof
transactions• requirementsforthereconciliationandmonitoringoftransactions• compliancewithregulatoryandotherlegalrequirementsdocumentationofcontrolsandprocedures• requirementsfortheperiodicassessmentofoperationalrisksfaced,andtheadequacyofcontrolsand
procedures to address the risks identified• requirementsforthereportingofoperationallossesandproposedremedialaction• developmentofcontingencyplans• trainingandprofessionaldevelopment• ethicalandbusinessstandards• riskmitigation,includinginsurancewherethisiseffective.
v) Other risksOther risks to which the Company is exposed are regulatory risk, legal risk, and reputational risk. • Regulatoryriskiscontrolledthroughaframeworkofcompliancepoliciesandprocedures.Theoperations
of the Company are subject to regulatory requirements of the State of Qatar.• Legalriskismanagedthroughtheeffectiveuseofinternalandexternallegaladvisers.• ReputationalriskiscontrolledthroughtheCompanyregularexaminationofissuesthatareconsidered
to have reputational repercussions for the Company, with guidelines and policies being issued as appropriate.
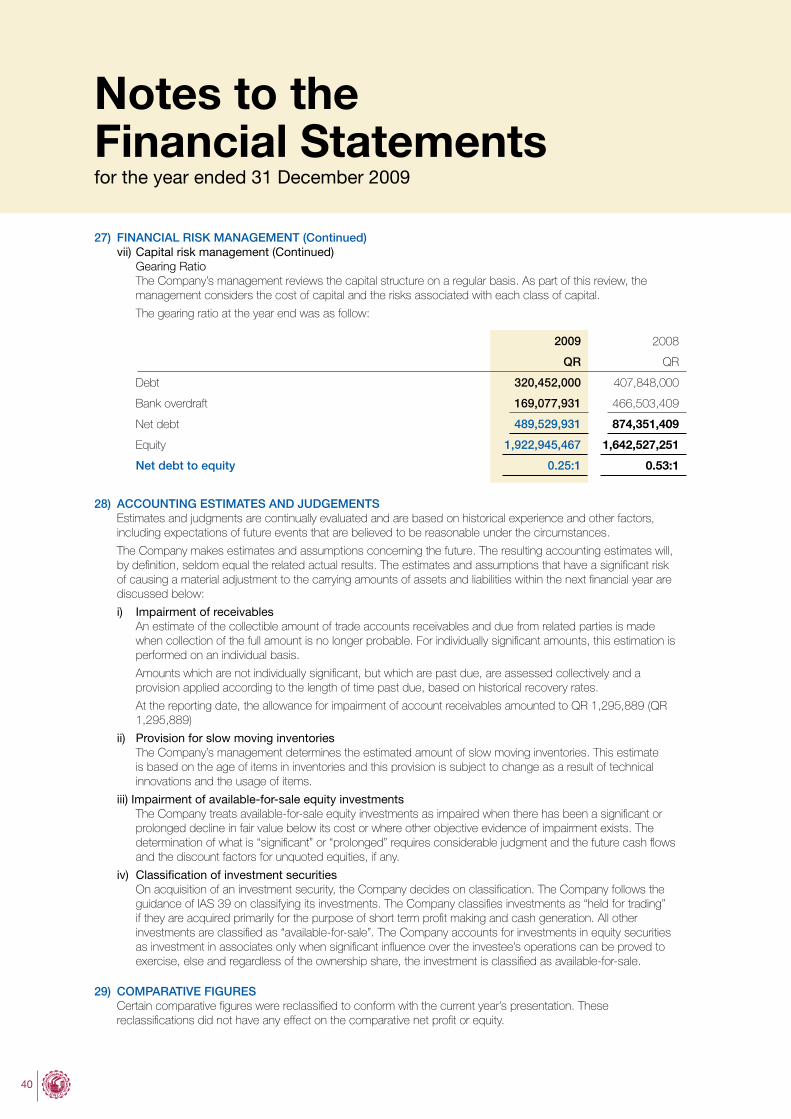
40
27) FINANCIAL RISK MANAGEMENT (Continued)vii) Capital risk management (Continued)
Gearing RatioThe Company’s management reviews the capital structure on a regular basis. As part of this review, the management considers the cost of capital and the risks associated with each class of capital.
The gearing ratio at the year end was as follow:
2009 2008
QR QR
Debt 320,452,000 407,848,000
Bank overdraft 169,077,931 466,503,409
Net debt 489,529,931 874,351,409
Equity 1,922,945,467 1,642,527,251
Net debt to equity 0.25:1 0.53:1
28) ACCOUNTING ESTIMATES AND JUDGEMENTSEstimates and judgments are continually evaluated and are based on historical experience and other factors, including expectations of future events that are believed to be reasonable under the circumstances.
The Company makes estimates and assumptions concerning the future. The resulting accounting estimates will, by definition, seldom equal the related actual results. The estimates and assumptions that have a significant risk of causing a material adjustment to the carrying amounts of assets and liabilities within the next financial year are discussed below:
i) Impairment of receivablesAn estimate of the collectible amount of trade accounts receivables and due from related parties is made when collection of the full amount is no longer probable. For individually significant amounts, this estimation is performed on an individual basis.
Amounts which are not individually significant, but which are past due, are assessed collectively and a provision applied according to the length of time past due, based on historical recovery rates.
At the reporting date, the allowance for impairment of account receivables amounted to QR 1,295,889 (QR 1,295,889)
ii) Provision for slow moving inventoriesThe Company’s management determines the estimated amount of slow moving inventories. This estimate is based on the age of items in inventories and this provision is subject to change as a result of technical innovations and the usage of items.
iii) Impairment of available-for-sale equity investmentsThe Company treats available-for-sale equity investments as impaired when there has been a significant or prolonged decline in fair value below its cost or where other objective evidence of impairment exists. The determination of what is “significant” or “prolonged” requires considerable judgment and the future cash flows and the discount factors for unquoted equities, if any.
iv) Classification of investment securitiesOn acquisition of an investment security, the Company decides on classification. The Company follows the guidance of IAS 39 on classifying its investments. The Company classifies investments as “held for trading” if they are acquired primarily for the purpose of short term profit making and cash generation. All other investments are classified as “available-for-sale”. The Company accounts for investments in equity securities as investment in associates only when significant influence over the investee’s operations can be proved to exercise, else and regardless of the ownership share, the investment is classified as available-for-sale.
29) COMPARATIVE FIGURESCertain comparative figures were reclassified to conform with the current year’s presentation. These reclassifications did not have any effect on the comparative net profit or equity.
Notes to theFinancial Statementsfor the year ended 31 December 2009