Embed Size (px)
Citation preview

Annual Report 2009
Overcoming Challenges
Annual Report 2009
Overcoming Challenges
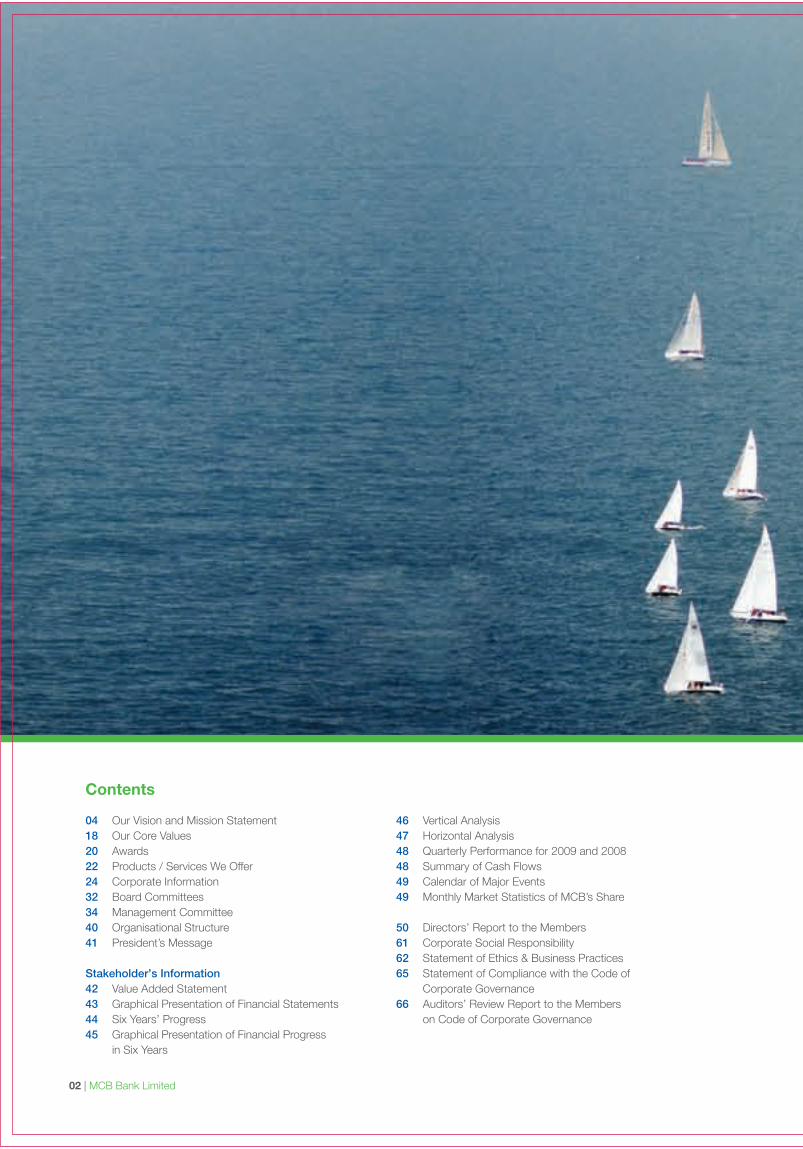
Contents
04 Our Vision and Mission Statement18 Our Core Values20 Awards22 Products / Services We Offer24 Corporate Information32 Board Committees34 Management Committee40 Organisational Structure41 President’s Message
Stakeholder’s Information42 Value Added Statement43 Graphical Presentation of Financial Statements44 Six Years’ Progress45 Graphical Presentation of Financial Progress
in Six Years
46 Vertical Analysis47 Horizontal Analysis48 Quarterly Performance for 2009 and 200848 Summary of Cash Flows49 Calendar of Major Events49 Monthly Market Statistics of MCB’s Share
50 Directors’ Report to the Members61 Corporate Social Responsibility62 Statement of Ethics & Business Practices65 Statement of Compliance with the Code of
Corporate Governance66 Auditors’ Review Report to the Members
on Code of Corporate Governance
02 | MCB Bank Limited
Annual Report 2009 | 03
Standalone Financial Statements 67 Auditors’ Report to the Members 68 Balance Sheet 69 Profit and Loss Account 70 Cash Flow Statement 71 Statement of Changes in Equity 72 Statement of Comprehensive Income 73 Notes to the Financial Statements134 Annexures
Consolidated Financial Statements154 Directors’ Report on Consolidated Financial Statements155 Auditors’ Report to the Members156 Consolidated Balance Sheet157 Consolidated Profit and Loss Account
158 Consolidated Cash Flow Statement159 Consolidated Statement of Changes in Equity160 Consolidated Statement of Comprehensive Income161 Notes to the Consolidated Financial Statements223 Annexures
241 Branch Network243 Pattern of Shareholdings246 Categories of Shareholders247 Notice of 62nd Annual General Meeting249 Form of Proxy

Vision
To be the leading financial services provider, partnering with our customers for a more prosperous and secure future.
04 | MCB Bank Limited

We are a team of committed professionals, providing innovative and efficient financial solutions to create and nurturelong-term relationships with our customers. In doing so, we ensure that our shareholders can invest with confidence in us.
Mission
Annual Report 2009 | 05

Overcoming challenges with optimism.
Adapting to change can be a huge challenge. At MCB, our positive approach to life and business enables us to anticipateand welcome change. During these financially trying times, our enthusiasm and confidence helps us to shape a future fullof prospects and opportunities.
06 | MCB Bank Limited

Annual Report 2009 | 07
Overcoming challenges with courage.
At MCB, we dare to brave the unchartered. By spearheading relief efforts in refugee settlements, we continued toserve in a territory others were hesitant to enter. After all, only by facing challenges can one appraise life with courage,strength and belief.
08 | MCB Bank Limited

Annual Report 2009 | 09

Overcoming challenges with teamwork.
We believe that cultivating team spirit is critical to foster personal and organizational growth.At MCB, this signature approach to teamwork proves how collective progress helps achieve continuous growth.
10 | MCB Bank Limited

Annual Report 2009 | 11

Overcoming challenges with conviction.
At MCB, we are driven to deliver the best. Under the most demanding circumstances, we are committed to achievingour vision of growth and prosperity through innovation. It is this brand of conviction that culminates in greater success.
12 | MCB Bank Limited

Annual Report 2009 | 13

The vision of a secure and prosperous future requires insight. A combination of foresight and hindsight that has enabledMCB to withstand new and demanding challenges — and emerge as one of the forebearers of stability.
Overcoming challenges with focus.
14 | MCB Bank Limited

Annual Report 2009 | 15

Overcoming challenges with persistence.
Success comes with perseverance, endurance and a commitment to tenacity. Which is why, our dedication to excelling inall areas manifests itself through an ever-expanding portfolio of products and services; not to mention, a consistently growingbranch network.
16 | MCB Bank Limited

Annual Report 2009 | 17

Values
IntegrityWe are the trustees of public funds and serve our community with integrity. We believe in being the best at always doing theright thing. We deliver on our responsibilities and commitments to our customers as well as our colleagues.
InnovationWe encourage and reward people who challenge the status quo and think beyond the boundaries of the conventional.Our teams work together for the smooth and efficient implementation of ideas and initiatives.
ExcellenceWe take personal responsibility for our role as leaders in pursuit of excellence.We are a performance driven, result oriented organization where merit is the only criterion for reward.
18 | MCB Bank Limited

Annual Report 2009 | 19
Customer CentricityOur customers are at the heart of everything we do. We thrive on the challenge of understanding their needs and aspirations,both realized and unrealized. We make every effort to exceed customer expectations through superior services and solutions.
RespectWe respect our customers’ values, beliefs, culture and history. We value the equality of gender and diversity of experienceand education that our employees bring with them. We create an environment where each individual is enabled to succeed.

20 | MCB Bank Limited
Awards
2009 Asiamoney: Best Domestic Bank in Pakistan2009 The Asset: Best Domestic Bank in Pakistan2008 Euromoney: Best Bank in Asia2008 Euromoney: Best Bank in Pakistan
2008 Asiamoney: Best Domestic Bank in Pakistan2006 Asiamoney: Best Domestic Bank in Pakistan2006 Euromoney: Best Bank in Pakistan2005 Asiamoney: Best Domestic Bank in Pakistan

Annual Report 2009 | 21
2005 Euromoney: Best Bank in Pakistan2004 Euromoney: Best Bank in Pakistan2004 Asiamoney: Best Domestic Bank in Pakistan2003 Euromoney: Best Bank in Pakistan
2001 Euromoney: Best Bank in Pakistan2000 Euromoney: Best Bank in Pakistan
Products and Services
MCB Online BankingMCB has a fast growing network of over 1,100 onlinebranches in the country providing customers real time onlinetransaction facilities.
MCB MNETMNET is an electronic inter-bank connectivity platform foronline transactions on ATM and other remote banking channels.It offers other Value Added Services that include a portfolioof e-banking and payment system products as well asmanagement and day-to-day operations of the same. Membersinclude 10 local and foreign financial institutions enjoying ATMsharing and Value Added Services.
MCB Cash ManagementCash Management provides a wide range of value addedservices to large corporations through its vast network ofonline branches. Our structured and customized productsenable our customers to realize their sales proceeds swiftlyfrom all over the country, supported by real-time MIS.
MCB Channel FinancingMCB Channel Financing provides working capital facilities todealers and vendors of selected companies under a structuredproduct program. This product enables our customer's dealersto leverage themselves and increase their business capacitywith their respective business partners.
MCB Local Rupee Drawing ArrangementTransaction Banking Department at MCB, provides LocalRupee Drawing Arrangement, a product for small banks andfinancial institutions to use our vast branch network platformto make payments in areas where their own branch networkdoes not exist, thus extending their reach countrywide.
MCB Home RemittanceMCB Home Remittance provides a seamless inflow offoreign remittances credited in the beneficiary’s accountwithin minutes. Cash payments can also be made at ourdesignated branches on behalf of Xpressmoney, Samba(SpeedcashNow) and Moneygram, along with cash paymentsfrom other correspondents all over the world.
MCB Corporate FinancingMCB Corporate Financing provides access to diversifiedfinancing options, including working capital loans, term loans,trade finance services and investment banking.
MCB Project & Structured FinanceInvolves financing complex projects, usually in an SPV structure,where the loan is tightly structured around the cash flows,risks are allocated amongst various stakeholders, and thereis limited or no recourse to the sponsors.
MCB Syndicated Loans And Debt Capital MarketsIt involves arrangement, underwriting and placement servicesfor significant financing requirements by large corporate andinstitutional clients to other financial institutions or throughthe debt capital markets.
MCB Quasi Equity/Hybrid InstrumentsIt structures and places a category of debt that has somecharacteristics of equity such as being unsecured, subordinatedor with a potential equity upside.
MCB Equity Capital RaisingEquity Services relate to raising capital for our clients byoffering common or preferred equity to public or privateinvestors, through initial public offers, offers for sale, rightsissues and private equity placements.
MCB Advisory ServicesFinancial and Capital Raising Advisory provides our clientswith financial advisory services, commercial structuringsupport and access to capital resources to help companiessuccessfully finance their business/project.
MCB Islamic BankingWith the help of Shariah specialists, lawyers andprofessional commercial bankers, MCB Islamic Bankingprovides Riba Free and Shariah Compliant solutions to variouscustomer segments in a growing number of cities.
MCB Agri ProductsMCB has been providing finance to the agriculture sectorsince 1973. With the help of our vast branch network,specialized staff posted in the branches, multiple and diversifiedproduct range, we cater to the financing requirements of thefarming community spread throughout the country and facilitatein achieving increased productivity.
MCB PrivilegeA first from a local bank, MCB Privilege through its dedicated,world class Privilege Centers offers a higher level of personalizedservices, more rewarding in-branch experiences and a widearray of deposit and investment products that are tailored tomeet the financial expectations of our affluent clientele. Asmembers of MCB Privilege, customers experience unparalleledadvantages that put them ahead of others. MCB’s dedicatedPrivilege Centers await to welcome you in Karachi, Lahore,Islamabad and Multan, with plans to expand to more locations.
Current AccountMCB Bank offers a variety of current accounts to cater tothe everyday transactional needs of various customers.These accounts ensure ease and freedom to bank from anyof the 1,100 branches across the country. The differentaccounts include: the basic account that has no minimumbalance; Business Account offering free online transactions,Demand Drafts, Pay Orders and lots more to meet the dayto day business requirements; Current Life Account whichoffers the security of life insurance free of cost; and for allthe others the conventional Current Account.
Savings AccountIt offers a wide array of savings products that suit short termgrowth & transactional needs. Our savings accounts offerattractive profit rates as well as flexibility to transact. SavingsXtra is targeted for customers having Rs. 5 million + deposit,365 Gold offers profit rate on daily balance while PLS savingshas a lower minimum balance requirement. In addition, aunique product: Smart Savings is an account run solely viaa debit cart, offering a very competitive rate to small savers.
22 | MCB Bank Limited
Annual Report 2009 | 23
Terms DepositMCB Term Deposits offer attractive short to mid-terminvestment options with flexibility, convenience and security.With various tenor options available customers can chooseone that suits their needs. This is combined with differentprofit payout options and the added facility of being able toavail credit facility against their deposits.
MCB Salary ClubA payroll solution designed to make life easy; it simplifies allthe monthly payroll related banking needs of employers andopens the door to a world of special offers for employees.Salary Club provides the convenience of having an extensiverange of financial services available to employees at theirplace of work.
MCB Investment ServicesMake the most of your wealth with investment opportunitiesthat match your unique financial aspirations. MCB InvestmentServices offer distribution of mutual funds managed by theleading fund managers of Pakistan. We can suggest theproducts most suited for your needs, or work with you tocreate a personalized solution completely focused on yourexpectations of the capital markets.
MCB Visa Credit CardMCB offers a complete suite of Classic, Gold and PlatinumVisa Credit Cards focusing on providing, superior service,travel privileges & shopping pleasure. It also offerscomprehensive insurance & installment plans, reward pointsand SMS alerts that give a different feel to the world of CreditCards. These unique features include i-revolve, which makesvariable mark-up rate available to customers allowing themto repay at affordable rates.
MCB Car4UMCB Car4U not only gets you a car of your own choice butis also affordable with competitive mark-up, flexible conditions,easy processing and above all, no hidden costs.
MCB Instant FinanceWith MCB instant Finance get a loan instantly at any MCBbranch against liquid collateral at competitive pricing.
MCB Smart CardMCB Smart Card is the key that enables access to convenientbanking services.Smart Card allows you to manage your account, withdrawcash, transfer funds, pay utility and mobile bills, rechargeprepaid connections, register for mobile and internet bankingservices and much more.
MCB Rupee Travelers ChequeIt is a safe and secure way to make payments nationwide.MCB Rupee Travelers Cheque, being the market leader, isthe most widely accepted way to pay cash for travel-relatedpurposes.
MCB ATMsMCB has one of the nation's largest ATM networks with over450 ATMs and still growing. MCB ATMs give you 24-hoursconvenience of cash withdrawal, mini-statement, utility billpayment, funds transfer services and much more.
MCB Mobile ATMWith MCB Mobile ATM not only do we provide you withworld class banking service but we also provide convenience.Our innovative mobile ATMs ensure that you are given serviceclose to you.
MCB LockersMCB Lockers are the best protection for your valuables.Lockers of different capacities are available nationwide.
MCB SMS BankingBanking at your finger tips: SMS anytime to get informationregarding balance, mini statements and credit card relatedinformation once your card is linked.
MCB Full Day BankingEnjoy the convenience of extended banking hours form9am to 5pm, including Saturdays at MCB FULL Day Bankingbranches across the country.
MCB BancassuranceCombining the best of banking and insurance solutions,MCB Bancassurance has created a one-stop shop for allyour financial and insurance needs. Whether you want tosave for your child’s education or marriage, for the securityof dignity after retirement or gaining maximum return onsavings, MCB Bancassurance has a plan just for you.
MCB Call CenterThere’s no easier way to bank than the new enhanced24/7 MCB Call Center, which blends innovation andconvenience to provide Banking Services that go beyondexpectations. With MCB Call Centre you can maintain yourVISA credit & ATM/Debit cards, check your account balances,confirm last 5 transactions, pay utility & mobile phone bills,top-up your mobile, pay MCB Visa Credit Card bill from yourMCB account, transfer money within your own accounts inMCB and register complaints.
MCB MobileMCB Mobile is a quick easy and secure way to rechargemobile phones, transfer money, pay bills and do much more.No need to visit a branch or an ATM anymore, login towww.mcbmobile.com using your mobile phone andstart transacting.
MCB Virtual BankingMCB provides the convenience of banking via internet, whetherat home, office or on travel, log on to www.mcb.com.pk andenjoy 24 hour access to all your accounts at MCB for a greatnumber of services such as Funds Transfer, Utility Bill Payments,Mobile Top-ups and much more.

Corporate Information
24 | MCB Bank Limited
Board of Directors
Mian Mohammad ManshaChairman (Non-Executive Director)
S.M. MuneerVice Chairman (Non-Executive Director)
Tariq Rafi (Non-Executive Director)
Shahzad Saleem (Non-Executive Director)
Sarmad Amin (Non-Executive Director)
Dr. Muhammad Yaqub (Non-Executive Director)
Mian Raza Mansha (Non-Executive Director)
Mian Umer Mansha (Non-Executive Director)
Dato’ Mohammed Hussein (Non-Executive Director)
Abdul Farid Bin Alias (Non-Executive Director)
Aftab Ahmad Khan (Non-Executive Director)
Muhammad Ali Zeb (Non-Executive Director)
Atif BajwaPresident & Chief Executive Officer (Executive Director)
Audit Committee
Tariq Rafi – Chairman (Non-Executive Director)
Dr. Muhammad Yaqub (Non-Executive Director)
Dato’ Mohammed Hussein (Non-Executive Director)
Aftab Ahmad Khan (Non-Executive Director)
Muhammad Ali Zeb (Non-Executive Director)
Malik Abdul Waheed (Advisor to the Chairman)

Annual Report 2009 | 25
Registered Office
MCB Building, F-6/G-6, Jinnah Avenue, Islamabad.
Principal Office
MCB 15 Main Gulberg, Lahore.UAN: (042) 111-000-111PABX: (042) 36041998-9Website: www.mcb.com.pkEmail: [email protected]
Shares RegistrarM/s. THK Associates (Pvt.) Ltd., State Life Building No.3,Dr. Ziauddin Ahmed Road, Karachi.
Chief Financial Officer
Salman Zafar Siddiqi
Company Secretary
Abdus S. Sami
AuditorsKPMG Taseer Hadi & Co.Chartered Accountants
Legal Advisors
Khalid Anwer & Co.Advocates & Legal Consultants
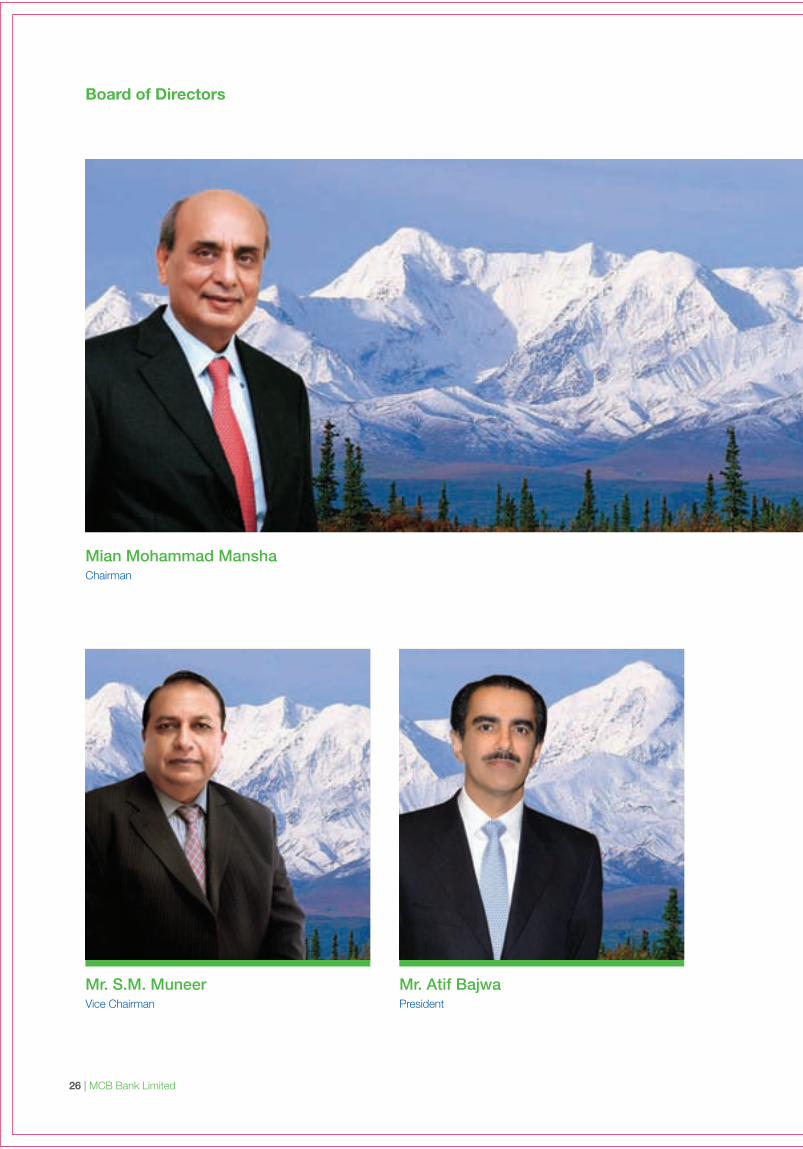
Mian Mohammad ManshaChairman
Mr. S.M. MuneerVice Chairman
Mr. Atif BajwaPresident
Board of Directors
26 | MCB Bank Limited
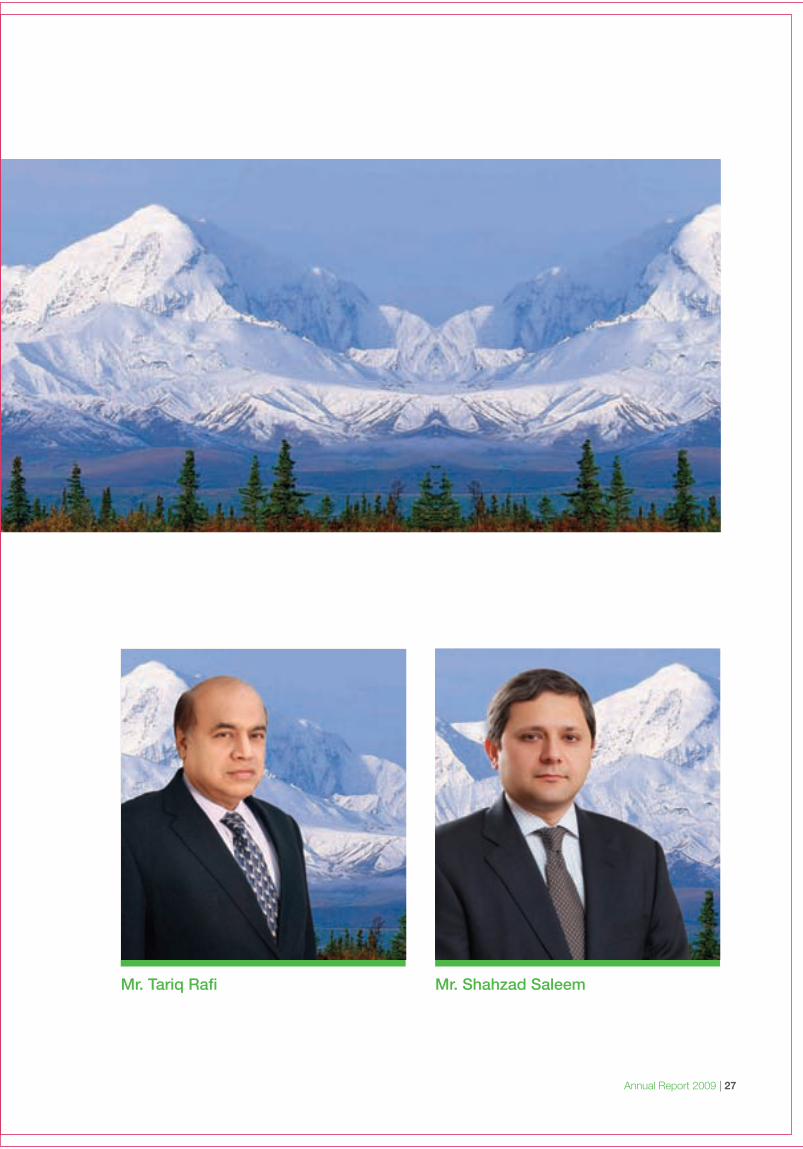
Mr. Tariq Rafi Mr. Shahzad Saleem
Annual Report 2009 | 27

Dr. Muhammad YaqubMr. Sarmad Amin
Dato’ Mohammed Hussein Mian Raza Mansha
28 | MCB Bank Limited

Mr. Abdul Farid Bin Alias
Mr. Muhammad Ali ZebMian Umer Mansha
Mr. Aftab Ahmad Khan
Annual Report 2009 | 29
Profile of the Board
Mian Mohammad Mansha
ChairmanMr. Mansha has served as the Chairman of MCB since its privatization in 1991. In 2004, he was presented with Pakistan'shighest civil award the Sitara-e-Imtiaz, for his contributions to industrial development. He is a member of the InternationalAdvisory Board at Babson College in the USA. He is also on the Board of Engineering Management Foundation (FASAT),Board of Investment (Govt. of Pakistan), Civil Aviation Authority (Govt. Nominee), Shalamar Medical & Dental College and alsoserves as the Honorary Director of Punjab Board of Investment & Trade (PBIT). In addition, he is the Chairman on the Boardof Punjab Coal Mining Company.
Mr. S.M. Muneer
Vice ChairmanWith experience in sectors ranging from tanneries, textiles and leather garments, Mr. Muneer is a consummate industrialist.He has been awarded with The Best Export Performance trophy by the Federation of Pakistan Chamber of Commerce &Industry (FPCCI), the Gold Medallion Award from the International Export Association, UK and Best Businessman of the YearAward from FPCCI. In addition, he has received the Sitara-e-Isaar and the Sitara-e-Imtiaz in 2006 and 2007 respectively.His contributions and achievements go beyond the economic sphere into the education sector as well. He was awarded anHonorary PhD degree by the Governor of Sindh and is also a member of the Board of Directors of CBM and GreenwichCollege, Karachi.
Mr. Atif Bajwa
PresidentMr. Bajwa has 28 years of diverse national and international experience in corporate and consumer banking. He began hiscareer at Citibank Pakistan as a corporate banker in 1982 and went on to become a senior member of the Corporate Banking& Finance Unit for the Gulf Markets. From 1993 - 2001, he was part of ABN AMRO Bank where, among other significantroles, he served as Country Head, Pakistan and later Consumer Banking Head, Asia Pacific. Mr. Bajwa re-joined Citibank in2001 as Regional Head for Central and Eastern Europe covering corporate and consumer banking and then in 2005, movedto Dubai with Mashreqbank to lead their Retail and Small Business Group. In June 2007, he joined MCB Bank and has broughtalong with him the vision and leadership to lead the bank to new horizons.
Mr. Tariq Rafi
Mr. Rafi is a recipient of the coveted civil award Sitara-e-Imtiaz and the Best Businessman of the Decade. At MCB, he is theChairman of the Audit Committee, Member of the Risk Management & Portfolio Review Committee, Member of the Committeeon Physical Planning, IT System & Contingency Arrangements.
Mr. Shahzad Saleem
Mr. Shahzad Saleem is an active member of the Risk Management & Portfolio Review Committee at MCB. Along with thathe is serving as the Chief Executive of Nishat Chunian Ltd and Chairman of Nishat Chunian Power Ltd.
Mr. Sarmad Amin
Mr. Amin has 30 years of business experience in the fields of Construction, Electrical Manufacturing and Textiles. He servesas a Director for various companies. At MCB, he is the Chairman of the Committee on Physical Planning, IT Systems &Contingency Arrangements and a member of the Risk Management & Portfolio Review Committee.
Dr. Muhammad Yaqub
Former Governor of SBP (1993-1999), Dr. Yaqub has held various offices for the Government of Pakistan and the IMF.Appointed to the MCB Board in April 2006 he is a member of the Audit Committee, the Business Strategy & DevelopmentCommittee and the Human Resource Committee.
Dato’ Mohammed Hussein
Dato' Mohammed Hussein, joined the MCB Board as an Independent Non-Executive Director in August 2008. He is currentlya member of the Audit Committee and the Business Strategy & Development Committee. His years of experience in thefinancial sector include 31 years with the Maybank Group where he held various senior management positions includingDeputy President and Chief Financial Officer until he retired in 2008. Presently he also sits on the board of a number of
30 | MCB Bank Limited
Annual Report 2009 | 31
Profile of the Board
companies listed on the Stock Exchange in Malaysia and Singapore, several government-linked institutions in Malaysia andthe Exim Bank of Malaysia.
Mian Raza Mansha
Mr. Raza Mansha, is a member of the Committee for Business Strategy & Development, Human Resource, Risk Management& Portfolio Review, Physical Planning, IT Systems & Contingency Arrangements at MCB. In addition, he is a board memberfor various other businesses.
Mr. Aftab Ahmad Khan
Mr. Aftab Ahmad Khan is the Group Director, Finance and Accounts at Nishat Group of Companies, which involves financialplanning, strategic decision making and investment appraisals for the group. He is also a fellow Chartered Accountant of theInstitute of Chartered Accountants of Pakistan. Mr. Aftab Ahmad Khan has over 47 years of diversified professional experiencein various sectors. Presently he serves on the board of Commercial Banking, Textile, Paper, Energy, Hotel and Tourism sectors.He has also served on the Punjab Industrial Development Board and in Public sector organizations such as Ghee, Sugar andRice mills. At MCB he is a member of the Audit Committee.
Mr. Abdul Farid Bin Alias
Mr. Farid is the Head of International at Maybank, Malaysia. He has held senior positions at a number of Malaysian and globalfinancial institutions primarily in the area of Investment Banking. From April 2009 to May 2009 he served as a member of theCommittee on Physical Planning, IT System & Contingency Arrangements at MCB.
Mian Umer Mansha
Mr. Umer Mansha was elected as a Director to the MCB Board in November 1997 and served till September 2007. He wasre-elected as a Director at MCB in the 61st AGM held on March 27, 2009. Presently he is the Chairman of the Risk Management& Portfolio Review Committee and is a member of the Business Strategy & Development Committee at MCB. In addition,he is a Director on the Board of Adamjee Insurance Company and Pakistan Business Council.
Mr. Muhammad Ali Zeb
Mr. Muhammad Ali Zeb is currently the CEO of Adamjee Insurance and has more than 15 years of professional experiencein Finance, Insurance & Manufacturing sectors. He was elected as a Director at MCB in the 61st AGM held in March 2009.At MCB, he is a member of the Audit Committee.
Board Committees
32 | MCB Bank Limited
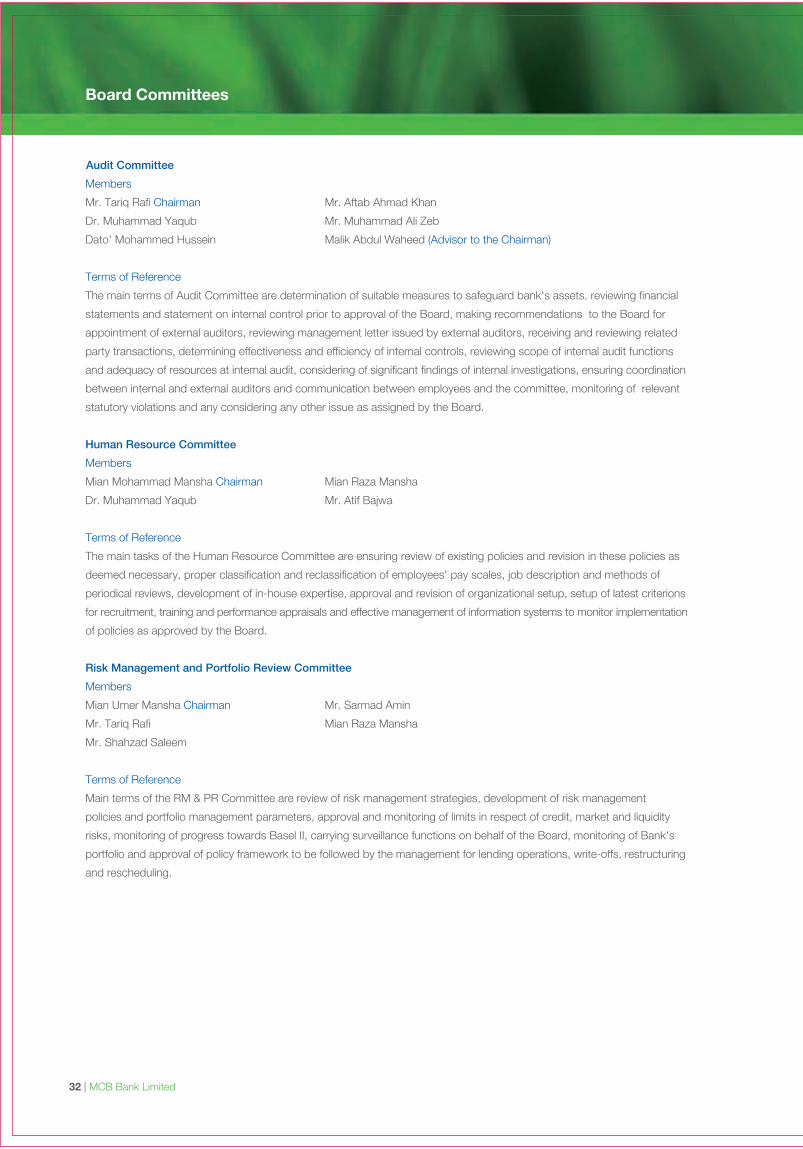
Audit Committee
Members
Mr. Tariq Rafi Chairman Mr. Aftab Ahmad Khan
Dr. Muhammad Yaqub Mr. Muhammad Ali Zeb
Dato' Mohammed Hussein Malik Abdul Waheed (Advisor to the Chairman)
Terms of Reference
The main terms of Audit Committee are determination of suitable measures to safeguard bank's assets, reviewing financial
statements and statement on internal control prior to approval of the Board, making recommendations to the Board for
appointment of external auditors, reviewing management letter issued by external auditors, receiving and reviewing related
party transactions, determining effectiveness and efficiency of internal controls, reviewing scope of internal audit functions
and adequacy of resources at internal audit, considering of significant findings of internal investigations, ensuring coordination
between internal and external auditors and communication between employees and the committee, monitoring of relevant
statutory violations and any considering any other issue as assigned by the Board.
Human Resource Committee
Members
Mian Mohammad Mansha Chairman Mian Raza Mansha
Dr. Muhammad Yaqub Mr. Atif Bajwa
Terms of Reference
The main tasks of the Human Resource Committee are ensuring review of existing policies and revision in these policies as
deemed necessary, proper classification and reclassification of employees' pay scales, job description and methods of
periodical reviews, development of in-house expertise, approval and revision of organizational setup, setup of latest criterions
for recruitment, training and performance appraisals and effective management of information systems to monitor implementation
of policies as approved by the Board.
Risk Management and Portfolio Review Committee
Members
Mian Umer Mansha Chairman Mr. Sarmad Amin
Mr. Tariq Rafi Mian Raza Mansha
Mr. Shahzad Saleem
Terms of Reference
Main terms of the RM & PR Committee are review of risk management strategies, development of risk management
policies and portfolio management parameters, approval and monitoring of limits in respect of credit, market and liquidity
risks, monitoring of progress towards Basel II, carrying surveillance functions on behalf of the Board, monitoring of Bank's
portfolio and approval of policy framework to be followed by the management for lending operations, write-offs, restructuring
and rescheduling.
Annual Report 2009 | 33
Board Committees
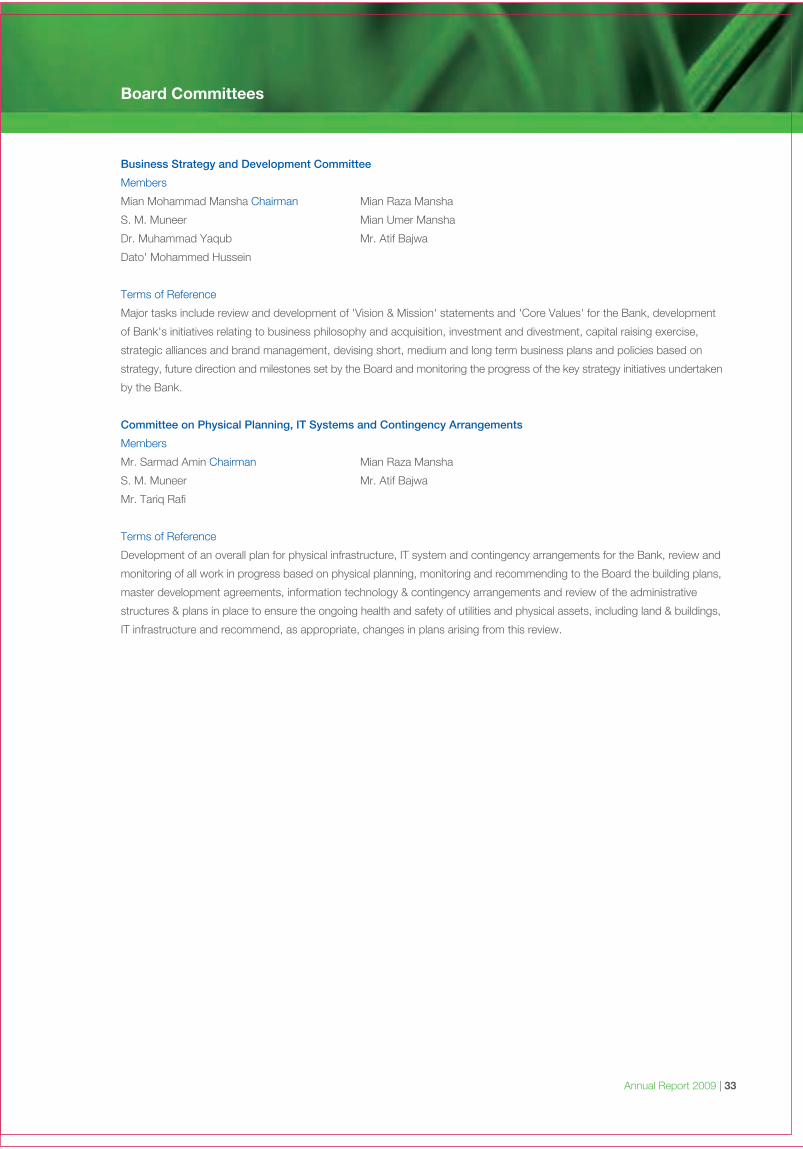
Business Strategy and Development Committee
Members
Mian Mohammad Mansha Chairman Mian Raza Mansha
S. M. Muneer Mian Umer Mansha
Dr. Muhammad Yaqub Mr. Atif Bajwa
Dato' Mohammed Hussein
Terms of Reference
Major tasks include review and development of 'Vision & Mission' statements and 'Core Values' for the Bank, development
of Bank's initiatives relating to business philosophy and acquisition, investment and divestment, capital raising exercise,
strategic alliances and brand management, devising short, medium and long term business plans and policies based on
strategy, future direction and milestones set by the Board and monitoring the progress of the key strategy initiatives undertaken
by the Bank.
Committee on Physical Planning, IT Systems and Contingency Arrangements
Members
Mr. Sarmad Amin Chairman Mian Raza Mansha
S. M. Muneer Mr. Atif Bajwa
Mr. Tariq Rafi
Terms of Reference
Development of an overall plan for physical infrastructure, IT system and contingency arrangements for the Bank, review and
monitoring of all work in progress based on physical planning, monitoring and recommending to the Board the building plans,
master development agreements, information technology & contingency arrangements and review of the administrative
structures & plans in place to ensure the ongoing health and safety of utilities and physical assets, including land & buildings,
IT infrastructure and recommend, as appropriate, changes in plans arising from this review.
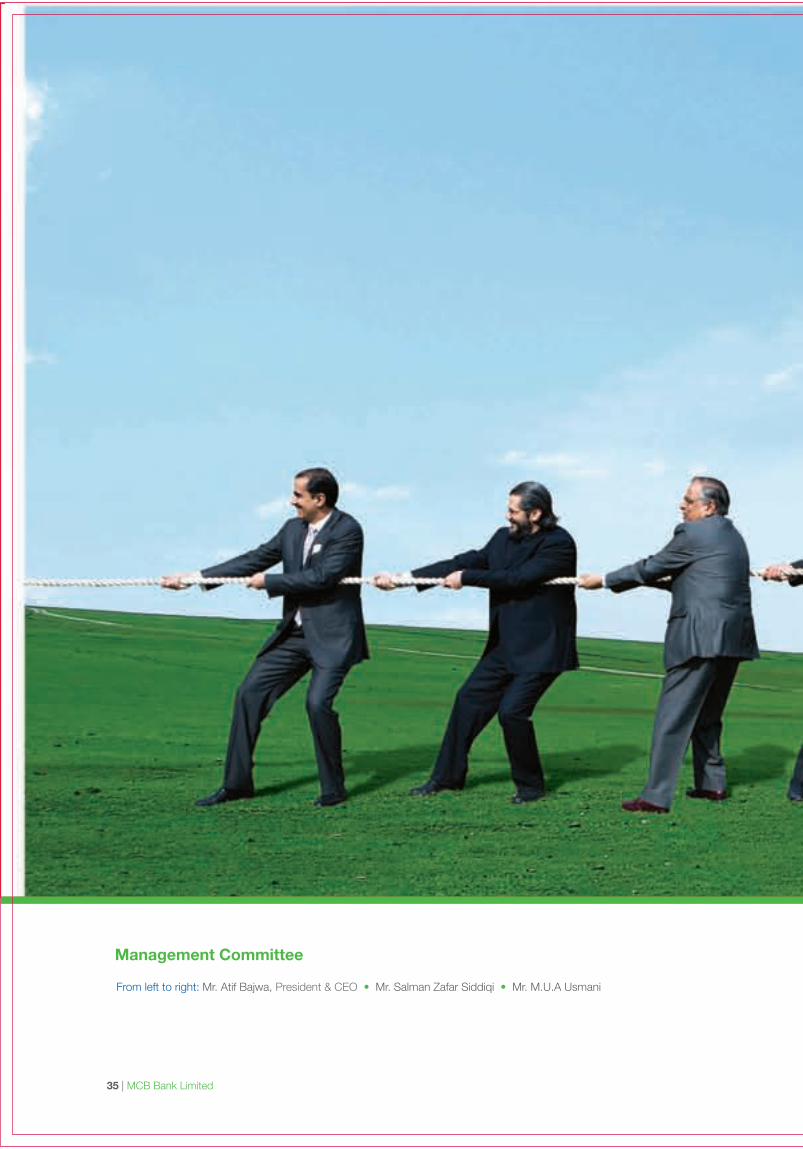
Management Committee
From left to right: Mr. Atif Bajwa, President & CEO • Mr. Salman Zafar Siddiqi • Mr. M.U.A Usmani
35 | MCB Bank Limited
• Mr. Laqa Sarwar • Mr. Ali Munir • Mr. Kamran Zaffar Muggo • Mr. Muhtashim Ashai
• Mr. Faisal Farooq Khan • Mr. Imran Maqbool • Mr. Azfar Alam Nomani • Ms. Mehreen Ahmed
Annual Report 2009 | 37
• Mr. Mohammad Nauman Chughtai • Ms. Romana Abdullah • Mr. Usman Hassan • Mr. Agha Saeed Khan
“Coming together is a beginning. Keeping together is progress. Working together is success.”–Henry Ford
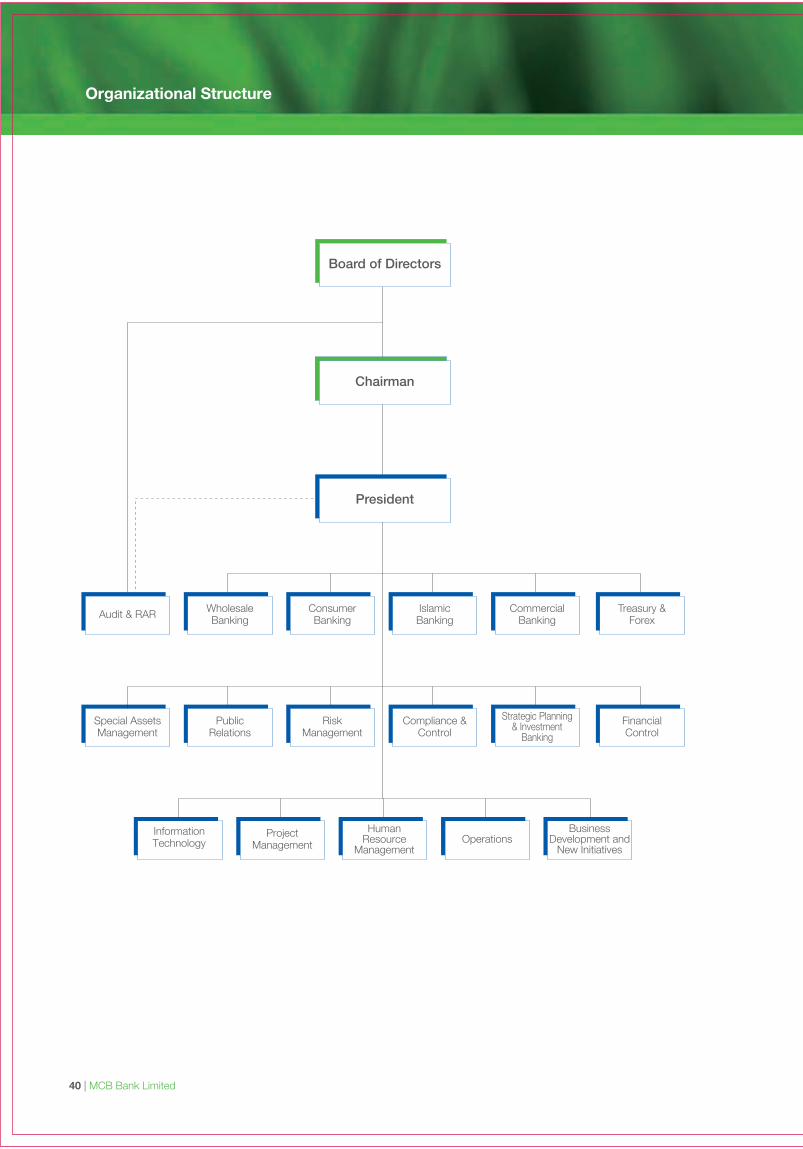
Organizational Structure
40 | MCB Bank Limited
Audit & RAR WholesaleBanking
ConsumerBanking
President
Chairman
Board of Directors
IslamicBanking
CommercialBanking
Treasury &Forex
PublicRelations
RiskManagement
Compliance &Control
Strategic Planning& Investment
Banking
FinancialControl
Special AssetsManagement
InformationTechnology
ProjectManagement
HumanResource
ManagementOperations
BusinessDevelopment and
New Initiatives
To our owners,
I am pleased to announce that MCB Bank Ltd in 2009
delivered a profit before tax of Rs. 23.2 Billion registering a
growth of 6% over last year. This growth is directly attributable
to an increase of 14% in our CASA deposits, 21% in revenues
and a tight control on our expense base enabling us to retain
our position as one of the most profitable banks in the country.
In 2009, we also delivered a superior return on equity of
27.4% and our assets crossed the Rs. 500 Billion mark. This
performance is all the more remarkable keeping in view the
economic & political challenges faced by the country during
this past year and miscreant created issues that MCB
specifically grappled with for a large part of the year.
Our fundamental belief is that a financial services company
can only succeed if it meets it’s customers’ needs. If we can
understand our customer’s financial objectives and offer them
the right products and services so that they can be financially
successful, then MCB Bank will continue to build on it’s
leadership position and provide requisite returns to it’s
shareholders. During 2009, we took several initiatives that
brought us even closer to our customers. With the launch of
MCB Privilege, we became the first local bank to offer a
dedicated proposition for the affluent segment; to meet the
growth and protection needs of our customers, we introduced
Bancassurance and Investment Products in many of our
branches; to enhance transactional convenience for our
customers, we became the first Pakistani bank to launch
mobile banking. These coupled with several other initiatives
enabled us to continue on the path of growing our customer
base and profitability. Last year, to expand our reach and
customer proposition, we also reached an agreement with
RBS Pakistan to acquire their business. Unfortunately, the
deal did not go through but we continue to invest organically
to further strengthen our businesses.
For MCB, this is just the beginning and we are committed to
taking the Bank to the next levels of success. Key features
of our multi-pronged plan are as follows:
• We want to be viewed as the leader in transactional
convenience. To get top market share, we will continue
to invest in our alternate channel payment capabilities
and services as well as getting a larger share of
transaction driven businesses like remittances, cash
management, payroll and trade.
• We will continue to invest in our branches to make
them more sales and service oriented. Through
introduction of our new sales and service model,
strengthened transaction processing and leading
financial products menu, we aspire to achieve this
ambition.
• In addition to our core focus on mass, mid market
and corporate segments, we will continue down the
path of further segmenting our customer needs and
developing focused customer propositions, particularly
in Privilege, Islamic & SME.
• No organization can deliver without investing in its
employees. In order to deliver our growth targets, we
will further strengthen our reserve of talent and
leadership powered by a strong performance culture
and training.
• Finally, for us as an organization, controls and efficiency
is central to our existence. We will build stronger
controls, develop a unit cost culture and generally be
on top of our game.
MCB’s strengths in terms of its franchise, balance sheet and
reputation are unparalleled. My task and that of the entire
team is to ensure that we continue to go from strength to
strength. Bank’s performance in 2009 is an attestation of the
commitment & passion that the team brings to MCB and the
strong support of the shareholders. We look forward to an
even better 2010.
With best regards,
Atif BajwaPresident and CEO
Annual Report 2009 | 41
President’s Message
42 | MCB Bank Limited
toemployees
5%
togovernment
28%
toprovidersof capital
32%
toexpansion
andgrowth35%
2008
toemployees
11%
toexpansionand growth
30%
toprovidersof capital
30%
togovernment
29%
2009
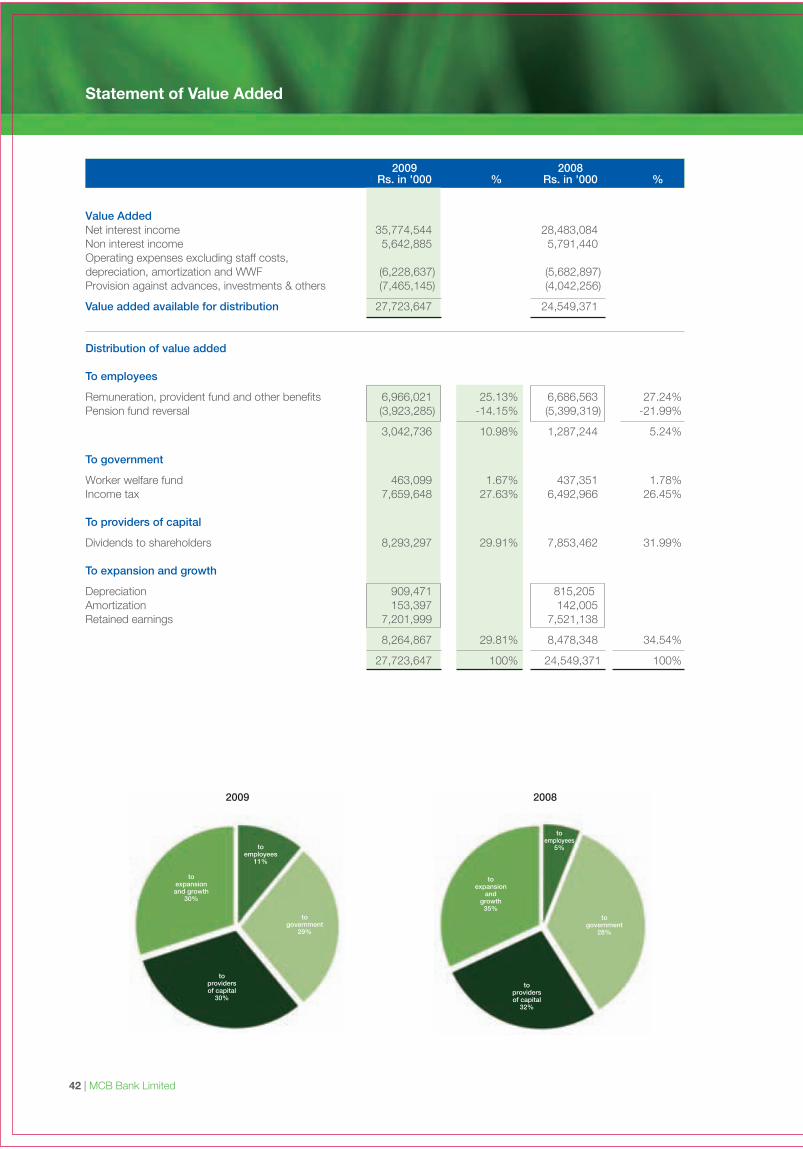
2009 2008Rs. in '000 % Rs. in '000 %
Value AddedNet interest income 35,774,544 28,483,084Non interest income 5,642,885 5,791,440Operating expenses excluding staff costs,depreciation, amortization and WWF (6,228,637) (5,682,897)Provision against advances, investments & others (7,465,145) (4,042,256)
Value added available for distribution 27,723,647 24,549,371
Distribution of value added
To employees
Remuneration, provident fund and other benefits 6,966,021 25.13% 6,686,563 27.24%Pension fund reversal (3,923,285) -14.15% (5,399,319) -21.99%
3,042,736 10.98% 1,287,244 5.24%
To government
Worker welfare fund 463,099 1.67% 437,351 1.78%Income tax 7,659,648 27.63% 6,492,966 26.45%
To providers of capital
Dividends to shareholders 8,293,297 29.91% 7,853,462 31.99%
To expansion and growth
Depreciation 909,471 815,205Amortization 153,397 142,005 Retained earnings 7,201,999 7,521,138
8,264,867 29.81% 8,478,348 34.54%
27,723,647 100% 24,549,371 100%
Statement of Value Added
Annual Report 2009 | 43
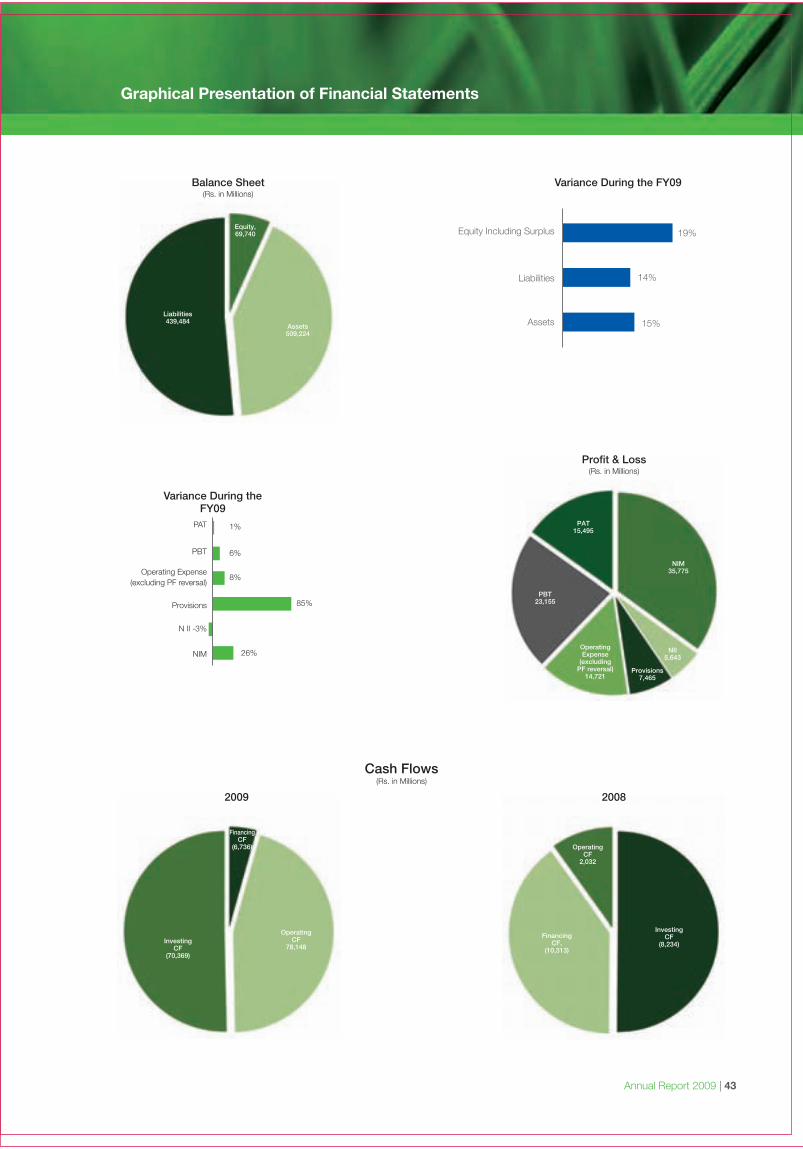
Graphical Presentation of Financial Statements
Equity Including Surplus
Liabilities
Assets 15%
14%
19%
Variance During the FY09
Liabilities439,484
Equity,69,740
Assets509,224
Balance Sheet(Rs. in Millions)
PAT15,495
NIM35,775
NII5,643
Provisions7,465
PBT23,155
OperatingExpense
(excludingPF reversal)
14,721
Profit & Loss(Rs. in Millions)
FinancingCF,
(10,313)
OperatingCF
2,032
InvestingCF
(8,234)
2008
InvestingCF
(70,369)
OperatingCF
78,148
FinancingCF
(6,736)
2009
Cash Flows(Rs. in Millions)
Variance During theFY09
PAT
PBT
Operating Expense(excluding PF reversal)
Provisions
N II -3%
NIM
1%
6%
8%
85%
26%
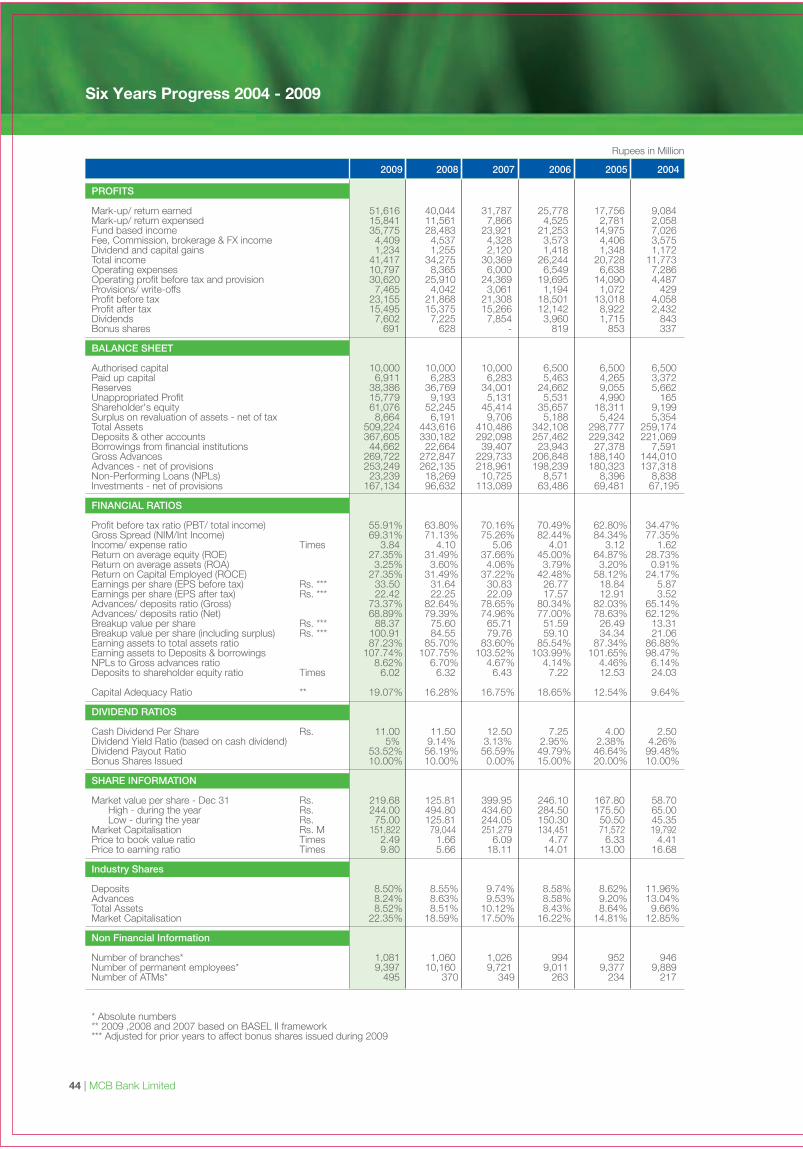
Six Years Progress 2004 - 2009
44 | MCB Bank Limited
2009 2008 2007 2006 2005 2004
PROFITS
Mark-up/ return earned 51,616 40,044 31,787 25,778 17,756 9,084Mark-up/ return expensed 15,841 11,561 7,866 4,525 2,781 2,058Fund based income 35,775 28,483 23,921 21,253 14,975 7,026Fee, Commission, brokerage & FX income 4,409 4,537 4,328 3,573 4,406 3,575Dividend and capital gains 1,234 1,255 2,120 1,418 1,348 1,172Total income 41,417 34,275 30,369 26,244 20,728 11,773Operating expenses 10,797 8,365 6,000 6,549 6,638 7,286Operating profit before tax and provision 30,620 25,910 24,369 19,695 14,090 4,487Provisions/ write-offs 7,465 4,042 3,061 1,194 1,072 429Profit before tax 23,155 21,868 21,308 18,501 13,018 4,058Profit after tax 15,495 15,375 15,266 12,142 8,922 2,432Dividends 7,602 7,225 7,854 3,960 1,715 843Bonus shares 691 628 - 819 853 337
BALANCE SHEET
Authorised capital 10,000 10,000 10,000 6,500 6,500 6,500Paid up capital 6,911 6,283 6,283 5,463 4,265 3,372Reserves 38,386 36,769 34,001 24,662 9,055 5,662Unappropriated Profit 15,779 9,193 5,131 5,531 4,990 165Shareholder's equity 61,076 52,245 45,414 35,657 18,311 9,199Surplus on revaluation of assets - net of tax 8,664 6,191 9,706 5,188 5,424 5,354Total Assets 509,224 443,616 410,486 342,108 298,777 259,174Deposits & other accounts 367,605 330,182 292,098 257,462 229,342 221,069Borrowings from financial institutions 44,662 22,664 39,407 23,943 27,378 7,591Gross Advances 269,722 272,847 229,733 206,848 188,140 144,010Advances - net of provisions 253,249 262,135 218,961 198,239 180,323 137,318Non-Performing Loans (NPLs) 23,239 18,269 10,725 8,571 8,396 8,838Investments - net of provisions 167,134 96,632 113,089 63,486 69,481 67,195
FINANCIAL RATIOS
Profit before tax ratio (PBT/ total income) 55.91% 63.80% 70.16% 70.49% 62.80% 34.47%Gross Spread (NIM/Int Income) 69.31% 71.13% 75.26% 82.44% 84.34% 77.35%Income/ expense ratio Times 3.84 4.10 5.06 4.01 3.12 1.62Return on average equity (ROE) 27.35% 31.49% 37.66% 45.00% 64.87% 28.73%Return on average assets (ROA) 3.25% 3.60% 4.06% 3.79% 3.20% 0.91%Return on Capital Employed (ROCE) 27.35% 31.49% 37.22% 42.48% 58.12% 24.17%Earnings per share (EPS before tax) Rs. *** 33.50 31.64 30.83 26.77 18.84 5.87Earnings per share (EPS after tax) Rs. *** 22.42 22.25 22.09 17.57 12.91 3.52Advances/ deposits ratio (Gross) 73.37% 82.64% 78.65% 80.34% 82.03% 65.14%Advances/ deposits ratio (Net) 68.89% 79.39% 74.96% 77.00% 78.63% 62.12%Breakup value per share Rs. *** 88.37 75.60 65.71 51.59 26.49 13.31Breakup value per share (including surplus) Rs. *** 100.91 84.55 79.76 59.10 34.34 21.06Earning assets to total assets ratio 87.23% 85.70% 83.60% 85.54% 87.34% 86.88%Earning assets to Deposits & borrowings 107.74% 107.75% 103.52% 103.99% 101.65% 98.47%NPLs to Gross advances ratio 8.62% 6.70% 4.67% 4.14% 4.46% 6.14%Deposits to shareholder equity ratio Times 6.02 6.32 6.43 7.22 12.53 24.03
Capital Adequacy Ratio ** 19.07% 16.28% 16.75% 18.65% 12.54% 9.64%
DIVIDEND RATIOS
Cash Dividend Per Share Rs. 11.00 11.50 12.50 7.25 4.00 2.50Dividend Yield Ratio (based on cash dividend) 5% 9.14% 3.13% 2.95% 2.38% 4.26%Dividend Payout Ratio 53.52% 56.19% 56.59% 49.79% 46.64% 99.48%Bonus Shares Issued 10.00% 10.00% 0.00% 15.00% 20.00% 10.00%
SHARE INFORMATION
Market value per share - Dec 31 Rs. 219.68 125.81 399.95 246.10 167.80 58.70 High - during the year Rs. 244.00 494.80 434.60 284.50 175.50 65.00 Low - during the year Rs. 75.00 125.81 244.05 150.30 50.50 45.35Market Capitalisation Rs. M 151,822 79,044 251,279 134,451 71,572 19,792Price to book value ratio Times 2.49 1.66 6.09 4.77 6.33 4.41Price to earning ratio Times 9.80 5.66 18.11 14.01 13.00 16.68
Industry Shares
Deposits 8.50% 8.55% 9.74% 8.58% 8.62% 11.96%Advances 8.24% 8.63% 9.53% 8.58% 9.20% 13.04%Total Assets 8.52% 8.51% 10.12% 8.43% 8.64% 9.66%Market Capitalisation 22.35% 18.59% 17.50% 16.22% 14.81% 12.85%
Non Financial Information
Number of branches* 1,081 1,060 1,026 994 952 946Number of permanent employees* 9,397 10,160 9,721 9,011 9,377 9,889Number of ATMs* 495 370 349 263 234 217
* Absolute numbers** 2009 ,2008 and 2007 based on BASEL II framework*** Adjusted for prior years to affect bonus shares issued during 2009
Rupees in Million
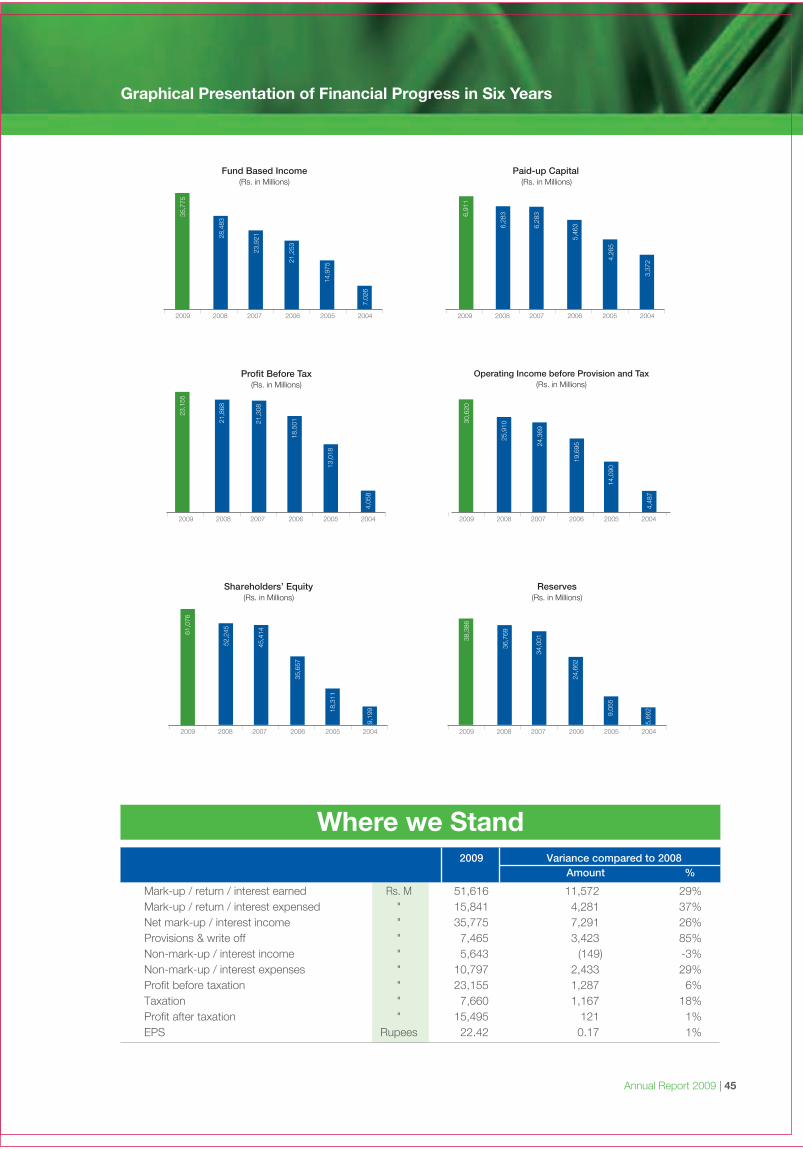
Graphical Presentation of Financial Progress in Six Years
Annual Report 2009 | 45
Where we Stand2009 Variance compared to 2008
Amount %
Mark-up / return / interest earned Rs. M 51,616 11,572 29%Mark-up / return / interest expensed " 15,841 4,281 37%Net mark-up / interest income " 35,775 7,291 26%Provisions & write off " 7,465 3,423 85%Non-mark-up / interest income " 5,643 (149) -3%Non-mark-up / interest expenses " 10,797 2,433 29%Profit before taxation " 23,155 1,287 6%Taxation " 7,660 1,167 18%Profit after taxation " 15,495 121 1%EPS Rupees 22.42 0.17 1%
35,7
75
28,4
83
23,9
21
2009 2008 2007 2006 2005 2004
Fund Based Income(Rs. in Millions)
21,2
53
14,9
75
7,02
6
6,91
1
6,28
3
6,28
3
2009 2008 2007 2006 2005 2004
Paid-up Capital(Rs. in Millions)
5,46
3
4,26
5
3,37
2
61,0
76
52,2
45
45,4
14
2009 2008 2007 2006 2005 2004
Shareholders’ Equity
35,6
57
18,3
11
9,19
9
38,3
86
36,7
69
34,0
01
2009 2008 2007 2006 2005 2004
Reserves(Rs. in Millions)
24,6
62
9,05
5
5,66
2
23,1
55
21,8
68
21,3
08
2009 2008 2007 2006 2005 2004
18,5
01
13,0
18
4,05
8Profit Before Tax
(Rs. in Millions)
30,6
20
25,9
10
24,3
69
2009 2008 2007 2006 2005 2004
19,6
95
14,0
90
4,48
7
Operating Income before Provision and Tax(Rs. in Millions)
(Rs. in Millions)
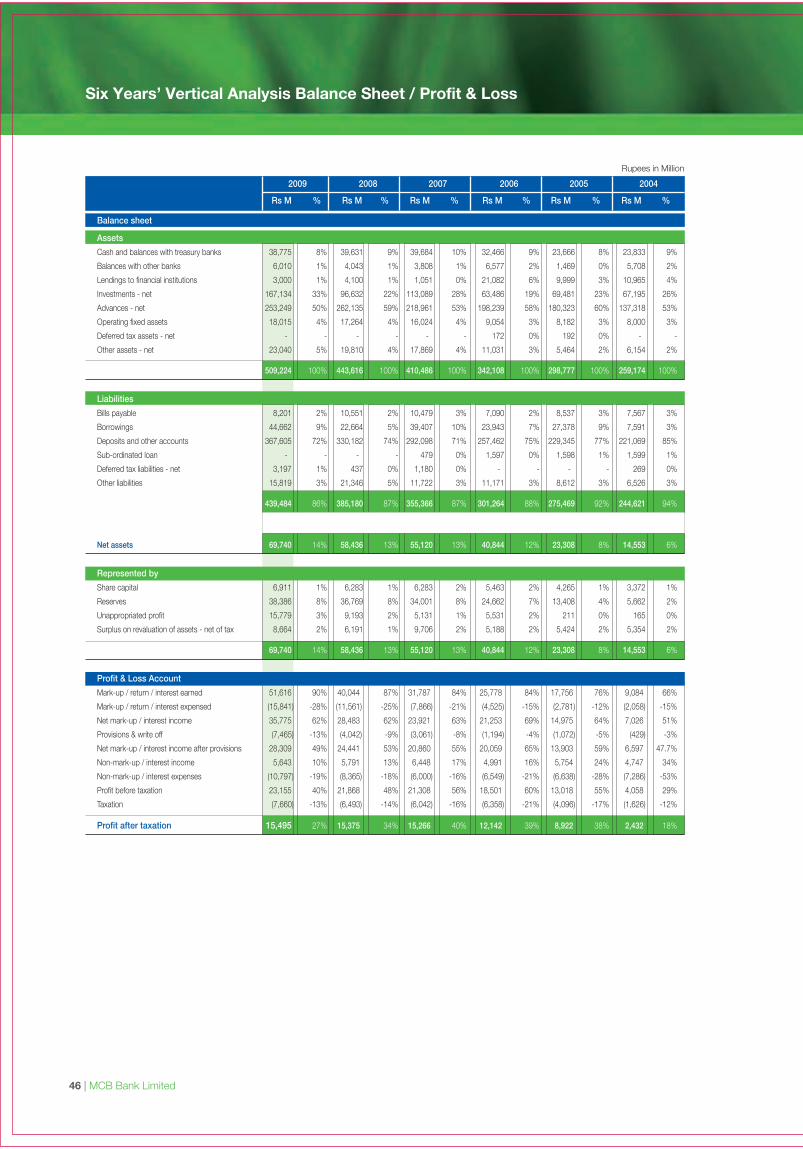
Six Years’ Vertical Analysis Balance Sheet / Profit & Loss
46 | MCB Bank Limited
Rupees in Million
2009 2008 2007 2006 2005 2004
Rs M % Rs M % Rs M % Rs M % Rs M % Rs M %
Balance sheet
Assets
Cash and balances with treasury banks 38,775 8% 39,631 9% 39,684 10% 32,466 9% 23,666 8% 23,833 9%
Balances with other banks 6,010 1% 4,043 1% 3,808 1% 6,577 2% 1,469 0% 5,708 2%
Lendings to financial institutions 3,000 1% 4,100 1% 1,051 0% 21,082 6% 9,999 3% 10,965 4%
Investments - net 167,134 33% 96,632 22% 113,089 28% 63,486 19% 69,481 23% 67,195 26%
Advances - net 253,249 50% 262,135 59% 218,961 53% 198,239 58% 180,323 60% 137,318 53%
Operating fixed assets 18,015 4% 17,264 4% 16,024 4% 9,054 3% 8,182 3% 8,000 3%
Deferred tax assets - net - - - - - - 172 0% 192 0% - -
Other assets - net 23,040 5% 19,810 4% 17,869 4% 11,031 3% 5,464 2% 6,154 2%
509,224 100% 443,616 100% 410,486 100% 342,108 100% 298,777 100% 259,174 100%
Liabilities
Bills payable 8,201 2% 10,551 2% 10,479 3% 7,090 2% 8,537 3% 7,567 3%
Borrowings 44,662 9% 22,664 5% 39,407 10% 23,943 7% 27,378 9% 7,591 3%
Deposits and other accounts 367,605 72% 330,182 74% 292,098 71% 257,462 75% 229,345 77% 221,069 85%
Sub-ordinated loan - - - - 479 0% 1,597 0% 1,598 1% 1,599 1%
Deferred tax liabilities - net 3,197 1% 437 0% 1,180 0% - - - - 269 0%
Other liabilities 15,819 3% 21,346 5% 11,722 3% 11,171 3% 8,612 3% 6,526 3%
439,484 86% 385,180 87% 355,366 87% 301,264 88% 275,469 92% 244,621 94%
Net assets 69,740 14% 58,436 13% 55,120 13% 40,844 12% 23,308 8% 14,553 6%
Represented by
Share capital 6,911 1% 6,283 1% 6,283 2% 5,463 2% 4,265 1% 3,372 1%
Reserves 38,386 8% 36,769 8% 34,001 8% 24,662 7% 13,408 4% 5,662 2%
Unappropriated profit 15,779 3% 9,193 2% 5,131 1% 5,531 2% 211 0% 165 0%
Surplus on revaluation of assets - net of tax 8,664 2% 6,191 1% 9,706 2% 5,188 2% 5,424 2% 5,354 2%
69,740 14% 58,436 13% 55,120 13% 40,844 12% 23,308 8% 14,553 6%
Profit & Loss Account
Mark-up / return / interest earned 51,616 90% 40,044 87% 31,787 84% 25,778 84% 17,756 76% 9,084 66%
Mark-up / return / interest expensed (15,841) -28% (11,561) -25% (7,866) -21% (4,525) -15% (2,781) -12% (2,058) -15%
Net mark-up / interest income 35,775 62% 28,483 62% 23,921 63% 21,253 69% 14,975 64% 7,026 51%
Provisions & write off (7,465) -13% (4,042) -9% (3,061) -8% (1,194) -4% (1,072) -5% (429) -3%
Net mark-up / interest income after provisions 28,309 49% 24,441 53% 20,860 55% 20,059 65% 13,903 59% 6,597 47.7%
Non-mark-up / interest income 5,643 10% 5,791 13% 6,448 17% 4,991 16% 5,754 24% 4,747 34%
Non-mark-up / interest expenses (10,797) -19% (8,365) -18% (6,000) -16% (6,549) -21% (6,638) -28% (7,286) -53%
Profit before taxation 23,155 40% 21,868 48% 21,308 56% 18,501 60% 13,018 55% 4,058 29%
Taxation (7,660) -13% (6,493) -14% (6,042) -16% (6,358) -21% (4,096) -17% (1,626) -12%
Profit after taxation 15,495 27% 15,375 34% 15,266 40% 12,142 39% 8,922 38% 2,432 18%
Annual Report 2009 | 47
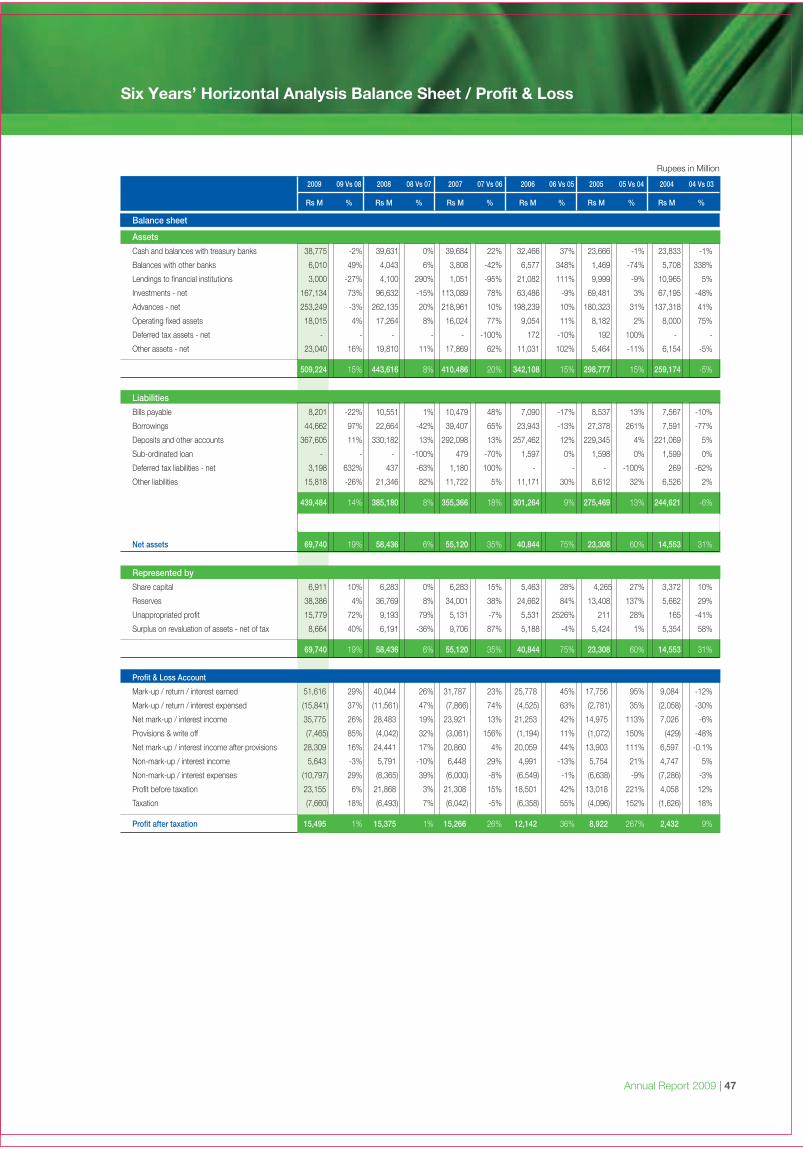
Six Years’ Horizontal Analysis Balance Sheet / Profit & Loss
Rupees in Million
2009 09 Vs 08 2008 08 Vs 07 2007 07 Vs 06 2006 06 Vs 05 2005 05 Vs 04 2004 04 Vs 03
Rs M % Rs M % Rs M % Rs M % Rs M % Rs M %
Balance sheet
Assets
Cash and balances with treasury banks 38,775 -2% 39,631 0% 39,684 22% 32,466 37% 23,666 -1% 23,833 -1%
Balances with other banks 6,010 49% 4,043 6% 3,808 -42% 6,577 348% 1,469 -74% 5,708 338%
Lendings to financial institutions 3,000 -27% 4,100 290% 1,051 -95% 21,082 111% 9,999 -9% 10,965 5%
Investments - net 167,134 73% 96,632 -15% 113,089 78% 63,486 -9% 69,481 3% 67,195 -48%
Advances - net 253,249 -3% 262,135 20% 218,961 10% 198,239 10% 180,323 31% 137,318 41%
Operating fixed assets 18,015 4% 17,264 8% 16,024 77% 9,054 11% 8,182 2% 8,000 75%
Deferred tax assets - net - - - - - -100% 172 -10% 192 100% - -
Other assets - net 23,040 16% 19,810 11% 17,869 62% 11,031 102% 5,464 -11% 6,154 -5%
509,224 15% 443,616 8% 410,486 20% 342,108 15% 298,777 15% 259,174 -5%
Liabilities
Bills payable 8,201 -22% 10,551 1% 10,479 48% 7,090 -17% 8,537 13% 7,567 -10%
Borrowings 44,662 97% 22,664 -42% 39,407 65% 23,943 -13% 27,378 261% 7,591 -77%
Deposits and other accounts 367,605 11% 330,182 13% 292,098 13% 257,462 12% 229,345 4% 221,069 5%
Sub-ordinated loan - - - -100% 479 -70% 1,597 0% 1,598 0% 1,599 0%
Deferred tax liabilities - net 3,198 632% 437 -63% 1,180 100% - - - -100% 269 -62%
Other liabilities 15,818 -26% 21,346 82% 11,722 5% 11,171 30% 8,612 32% 6,526 2%
439,484 14% 385,180 8% 355,366 18% 301,264 9% 275,469 13% 244,621 -6%
Net assets 69,740 19% 58,436 6% 55,120 35% 40,844 75% 23,308 60% 14,553 31%
Represented by
Share capital 6,911 10% 6,283 0% 6,283 15% 5,463 28% 4,265 27% 3,372 10%
Reserves 38,386 4% 36,769 8% 34,001 38% 24,662 84% 13,408 137% 5,662 29%
Unappropriated profit 15,779 72% 9,193 79% 5,131 -7% 5,531 2526% 211 28% 165 -41%
Surplus on revaluation of assets - net of tax 8,664 40% 6,191 -36% 9,706 87% 5,188 -4% 5,424 1% 5,354 58%
69,740 19% 58,436 6% 55,120 35% 40,844 75% 23,308 60% 14,553 31%
Profit & Loss Account
Mark-up / return / interest earned 51,616 29% 40,044 26% 31,787 23% 25,778 45% 17,756 95% 9,084 -12%
Mark-up / return / interest expensed (15,841) 37% (11,561) 47% (7,866) 74% (4,525) 63% (2,781) 35% (2,058) -30%
Net mark-up / interest income 35,775 26% 28,483 19% 23,921 13% 21,253 42% 14,975 113% 7,026 -6%
Provisions & write off (7,465) 85% (4,042) 32% (3,061) 156% (1,194) 11% (1,072) 150% (429) -48%
Net mark-up / interest income after provisions 28,309 16% 24,441 17% 20,860 4% 20,059 44% 13,903 111% 6,597 -0.1%
Non-mark-up / interest income 5,643 -3% 5,791 -10% 6,448 29% 4,991 -13% 5,754 21% 4,747 5%
Non-mark-up / interest expenses (10,797) 29% (8,365) 39% (6,000) -8% (6,549) -1% (6,638) -9% (7,286) -3%
Profit before taxation 23,155 6% 21,868 3% 21,308 15% 18,501 42% 13,018 221% 4,058 12%
Taxation (7,660) 18% (6,493) 7% (6,042) -5% (6,358) 55% (4,096) 152% (1,626) 18%
Profit after taxation 15,495 1% 15,375 1% 15,266 26% 12,142 36% 8,922 267% 2,432 9%
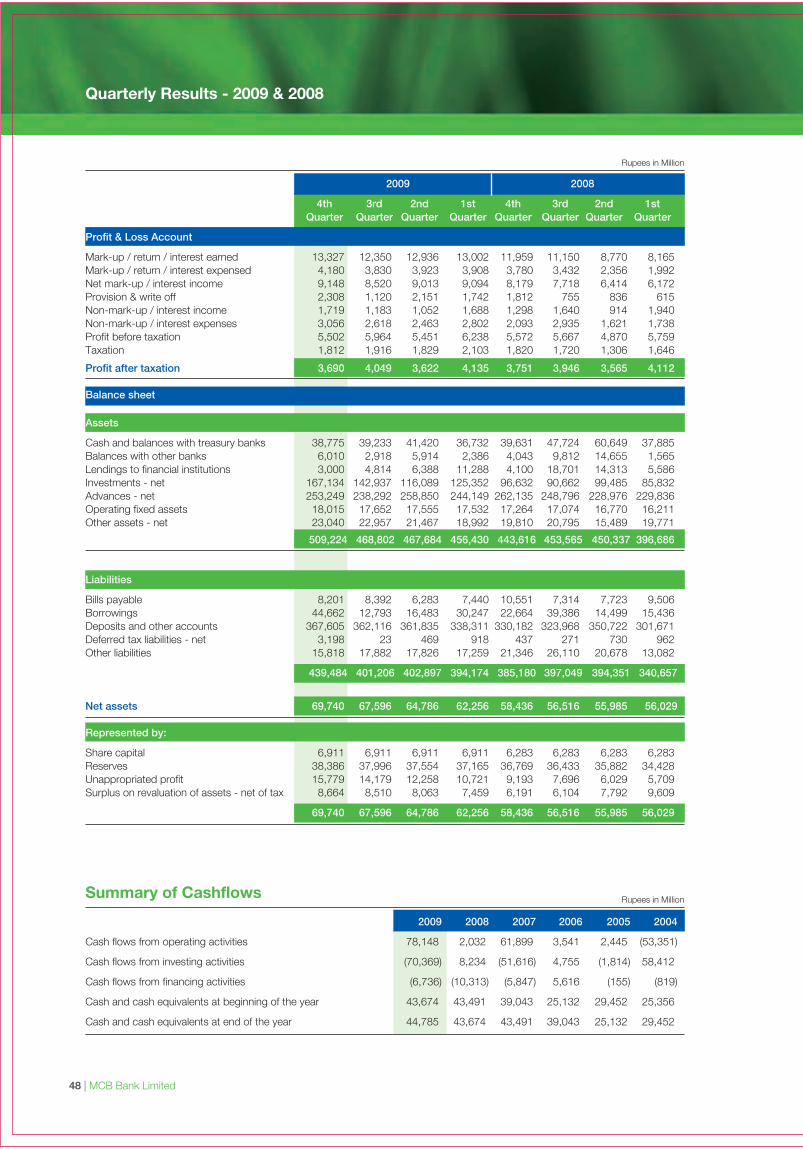
Quarterly Results - 2009 & 2008
48 | MCB Bank Limited
Rupees in Million
Summary of Cashflows
2009 2008 2007 2006 2005 2004
Cash flows from operating activities 78,148 2,032 61,899 3,541 2,445 (53,351)
Cash flows from investing activities (70,369) 8,234 (51,616) 4,755 (1,814) 58,412
Cash flows from financing activities (6,736) (10,313) (5,847) 5,616 (155) (819)
Cash and cash equivalents at beginning of the year 43,674 43,491 39,043 25,132 29,452 25,356
Cash and cash equivalents at end of the year 44,785 43,674 43,491 39,043 25,132 29,452
Rupees in Million
2009 2008
4th 3rd 2nd 1st 4th 3rd 2nd 1stQuarter Quarter Quarter Quarter Quarter Quarter Quarter Quarter
Profit & Loss Account
Mark-up / return / interest earned 13,327 12,350 12,936 13,002 11,959 11,150 8,770 8,165Mark-up / return / interest expensed 4,180 3,830 3,923 3,908 3,780 3,432 2,356 1,992Net mark-up / interest income 9,148 8,520 9,013 9,094 8,179 7,718 6,414 6,172Provision & write off 2,308 1,120 2,151 1,742 1,812 755 836 615Non-mark-up / interest income 1,719 1,183 1,052 1,688 1,298 1,640 914 1,940Non-mark-up / interest expenses 3,056 2,618 2,463 2,802 2,093 2,935 1,621 1,738Profit before taxation 5,502 5,964 5,451 6,238 5,572 5,667 4,870 5,759Taxation 1,812 1,916 1,829 2,103 1,820 1,720 1,306 1,646
Profit after taxation 3,690 4,049 3,622 4,135 3,751 3,946 3,565 4,112
Balance sheet
Assets
Cash and balances with treasury banks 38,775 39,233 41,420 36,732 39,631 47,724 60,649 37,885Balances with other banks 6,010 2,918 5,914 2,386 4,043 9,812 14,655 1,565Lendings to financial institutions 3,000 4,814 6,388 11,288 4,100 18,701 14,313 5,586Investments - net 167,134 142,937 116,089 125,352 96,632 90,662 99,485 85,832Advances - net 253,249 238,292 258,850 244,149 262,135 248,796 228,976 229,836Operating fixed assets 18,015 17,652 17,555 17,532 17,264 17,074 16,770 16,211Other assets - net 23,040 22,957 21,467 18,992 19,810 20,795 15,489 19,771
509,224 468,802 467,684 456,430 443,616 453,565 450,337 396,686
Liabilities
Bills payable 8,201 8,392 6,283 7,440 10,551 7,314 7,723 9,506Borrowings 44,662 12,793 16,483 30,247 22,664 39,386 14,499 15,436Deposits and other accounts 367,605 362,116 361,835 338,311 330,182 323,968 350,722 301,671Deferred tax liabilities - net 3,198 23 469 918 437 271 730 962Other liabilities 15,818 17,882 17,826 17,259 21,346 26,110 20,678 13,082
439,484 401,206 402,897 394,174 385,180 397,049 394,351 340,657
Net assets 69,740 67,596 64,786 62,256 58,436 56,516 55,985 56,029
Represented by:
Share capital 6,911 6,911 6,911 6,911 6,283 6,283 6,283 6,283Reserves 38,386 37,996 37,554 37,165 36,769 36,433 35,882 34,428Unappropriated profit 15,779 14,179 12,258 10,721 9,193 7,696 6,029 5,709Surplus on revaluation of assets - net of tax 8,664 8,510 8,063 7,459 6,191 6,104 7,792 9,609
69,740 67,596 64,786 62,256 58,436 56,516 55,985 56,029
Annual Report 2009 | 49
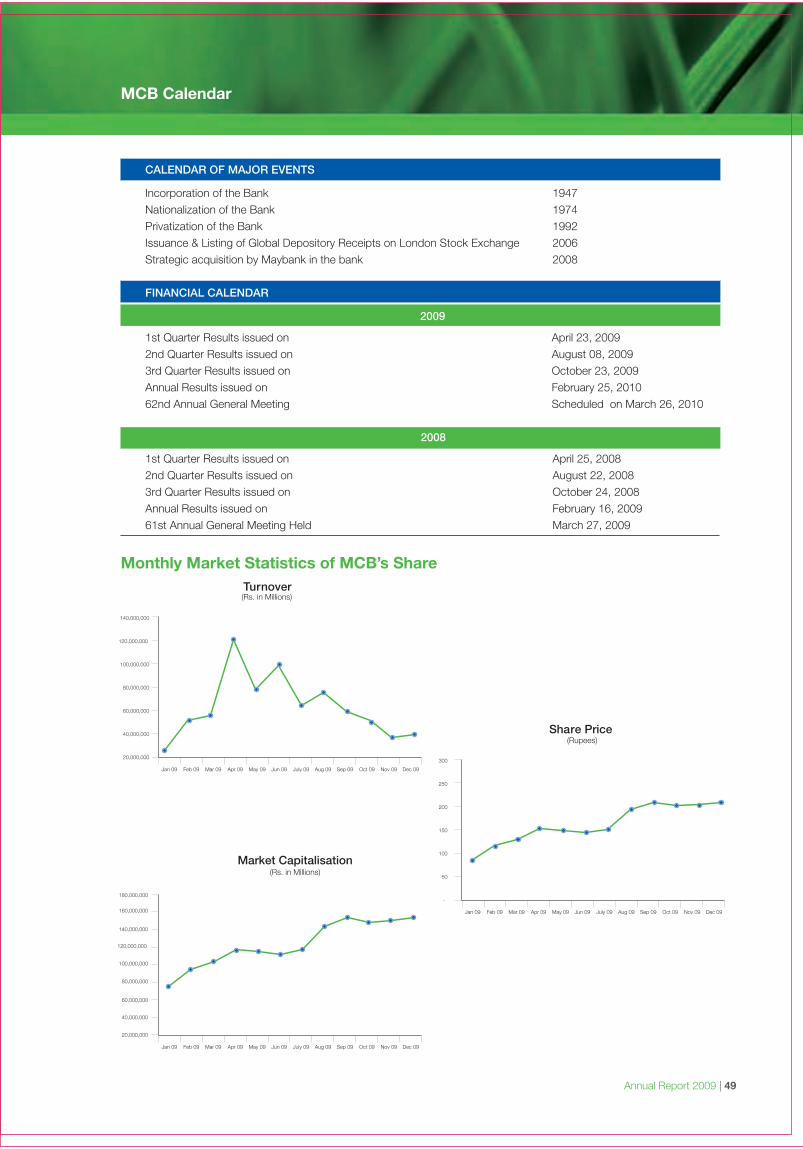
MCB Calendar
Share Price
Jan 09 Feb 09 Mar 09 Apr 09 May 09 Jun 09 July 09 Aug 09 Sep 09 Oct 09 Nov 09 Dec 09
300
250
50
100
150
200
-
Market Capitalisation(Rs. in Millions)
Jan 09 Feb 09 Mar 09 Apr 09 May 09 Jun 09 July 09 Aug 09 Sep 09 Oct 09 Nov 09 Dec 09
140,000,000
160,000,000
180,000,000
120,000,000
40,000,000
60,000,000
80,000,000
100,000,000
20,000,000
Turnover
Jan 09 Feb 09 Mar 09 Apr 09 May 09 Jun 09 July 09 Aug 09 Sep 09 Oct 09 Nov 09 Dec 09
140,000,000
120,000,000
40,000,000
60,000,000
80,000,000
100,000,000
20,000,000
Monthly Market Statistics of MCB’s Share
(Rs. in Millions)
(Rupees)
Directors’ Report to Members
50 | MCB Bank Limited
I am pleased to place before you, on behalf of the Board ofDirectors, the 62nd annual report of your Bank for the yearended December 31, 2009.
Economic Review
The country continued to face difficulties and the governmenttook some stabilized measures under a stand-by arrangementwith the IMF. However, the road to sustainable economicrecovery remained slow with the power sector capacityshortfall reducing the productive capacity of the economy,the pass-through of utility subsidies to the consumer placingupward pressure on inflation reinforced by excessivegovernment borrowings from the banking system andincreasing level of external debt. It is imperative for thegovernment to formulate a long-term strategy to resolve thestructural issues in the power sector, budget and balance ofpayments, as this is of key importance in placing the countryon a sustainable growth path within the framework of relativeprice stability and external sector validity. Political uncertaintyand the law and order situation also hampered thedevelopment of a positive investment and growth climate.
The external account benefited from robust remittances fromforeign workers and an improved trade balance due todemand management and the global recovery. However,the external account remains susceptible to pressure fromglobal commodity prices and weaker inflows from multi-national agencies and FoDP.
A key structural challenge for the government is the need toincrease the tax/GDP ratio in the country to finance currentbudgetary expenditure and promote savings to meet thedevelopment needs of the economy. Reliance on the bankingsystem to finance the deficit, combined with indirect fundingof subsidies by the banking sector through the build-up ofcircular debt to the power sector, led to the crowding out ofthe private sector and tight liquidity in the banking sector.
The banking system, as a whole, remains healthy despitethe economy going through a period of economic difficulty. The banking sector absorbed the build-up of non-performingloans in the system while maintaining profitability and robustbalance sheets. Much of the credit for this must go to theSBP for the policies it has pursued over the last decade toensure that banks are adequately capitalized and adhere toprudent risk management.
Bank's Performance in 2009
The objectives were targeted towards our customers,improved management policies, strong policy framework,improved governance structure, strategic investment initiativesand implementation of cost effective measure across bank.The group structure of the bank individually worked hard in
achieving the milestones under continuous monitoring andsupervision of the senior management and Board.
Group Performance
Business Groups
Corporate Banking Group
Corporate Banking Group's scope of work was expandedwith the inclusion of International Division and InvestmentBanking, which were absorbed to create better control andsynergy. The group reported a revenue growth of 41% onthe back of 18% asset build-up, 12% fee income increaseand improved spreads. The group managed to maintain thequality of their risk assets and derived comfort from the factthat corporate non-performing loans constituted only 1% ofthe total corporate portfolio as compared to industrypercentage of 4%. Information technology led changes inTransaction Banking (TB) related Products led to a quantumjump in volumes and income, as a result of automation ofour payments and collections systems. The group embarkson 2010 with cautious optimism with strategic thrust beingon building fee based income and trade business by crossselling to the existing customer base.
Commercial Banking Group
With its large network of branches, Commercial BankingGroup posted robust growth in 2009 by increasing theirdeposit volume by Rs.28 billion (10.12 %). This bolsteredrevenue and consequently the profitability in 2009. The Groupenhanced their sales model through the introduction of adirect sales force team and personnel bankers in manybranches while continuing to strengthen their customerservices quality. The year witnessed a successful restructuringof the SME & Mid market segment with continued optimismof the benefit accruing in the upcoming times. Going forward,the Group focuses on revenue growth and profitability whilethrough cross sell and optimization of branch banking platform.
Consumer Banking Group
The Consumer Banking Group continued on its path ofexpanding the product suite and customer base. MCB Mobile,the first of its kind, mobile payment solution was launchedenabling customers to access their accounts and makepayments using their mobile phones. With the launch of MCBPrivilege, MCB also became the first local bank in Pakistanto start a dedicated offering for the affluent segment throughthree dedicated Privilege Centers in Karachi, Lahore &Islamabad. A specialized Investment Services Unit wasestablished to develop and distribute specialized investmentproducts catering to the growth needs of affluent/mass-affluent segments. There was increased focus on enhancingcross sell to deposit customers by expanding the footprint
Annual Report 2009 | 51
of Bancassurance. Functionality, reach, as well as, penetrationof Alternate Delivery Channels was enhanced. A significantmilestone in 2009 was the transformation of the call centrefrom a service centre to a transactional phone banking facility.
Given the high interest rate environment and tight economicconditions, 2009 remained a cautious year for the consumerfinancing business. Only selective lending was carried out insegments that have performed well historically. With closemonitoring of NPLs, the focus remained on collection &recovery and portfolio management during the year.The strategic focus of the Group in 2010 will be to enhancecross sell, strengthen customer propositions and improvecustomer service. Emphasis will be on rapid expansion ofthe new initiatives such as MCB Privilege, Bancassurance,Investment Services and Alternate Distribution Channels. Inparallel, the Group will remain committed to productdevelopment & refinement of processes for continuous growthof deposits & customer base.
MCB Islamic Banking
MCB Islamic Banking managed to maintain its profitabilitywhile ensuring quality of its earning assets despite toughmarket conditions & deterioration in assets quality of bankingindustry. Islamic Banking further strengthened its marketoutreach by increasing its deposit base and equity. Duringthe year 2010, MCB-IB plans to improve its assets & liabilityproduct range. Strategic initiative for further increase indedicated branches and capitalizing on existing out reach ofMCB Bank has been undertaken for capturing Islamic bankingbusiness.
Treasury and Forex Group
Treasury & FX remained focused on its customer orientationand enhanced its coverage to a broader customer base. Theportfolio of customers grew not only through the TreasuryMarketing Unit's own efforts but also as a result of a bettercross-sell platform fully supported by the Wholesale,Commercial, Consumer and Financial Institutions businesses.Fixed Income sales showed substantial improvement overthe past year's performance and remained an area of focus.The Treasury Money Market business worked towardsgradually enhancing the investment portfolio's duration overthe course of the year. This effort was granted greaterbuoyancy by the stable deposit growth shown by the bankduring the year and the portfolio was almost entirely fundedthrough the bank's own sources and decreased whateverlittle dependence there was on the inter-bank money market.The enhanced duration of the portfolio ensured that thedeposit-taking areas of the bank were able to pay superiorrates of return to customers and was a key support factorin the overall growth of the bank's balance sheet. The ForeignExchange business continued to grow over the course of
the year in spite of substantial volatility in the inter-bankmarkets owing to the turbulent economic situation facing thecountry. Overall the Treasury & FX Group turned in a verystrong performance and ensured its continued support forthe rest of the bank's businesses. The Treasury followedthrough on the vision of the Bank's management and deployeda Treasury Marketing Unit in Lahore which supports thebank's client base in key centres such as Islamabad,Rawalpindi, Lahore, Faisalabad etc. Further efforts in thisregard are continuing and in the coming year Treasury willadd at least one more marketing desk in a major citybroadening its coverage even further.
Support Functions / Services
Special Assets Management Group
Owing to prolonged dismal economic milieu, Bank's SpecialAsset Recovery outfit (SAMG) role gained further prominence.SAMG during 2009, for the second consecutive year, postedcash recovery in excess of Rs. 1 Billion. It is foreseen thatthe asset remedial management function would continue toplay a visibly pronounced role at least in the medium termscenario.
Audit & RAR Group
Audit Group has performed consultative role in addition tothe assurance services that it is geared to provide. The Grouphas strengthened itself to cater to the requirements of Bank'sWhistleblowing Program. Training & Quality AssuranceDepartment, developed within the Group, ensures that theaudit assignments qualify the high standards that have beendefined for the Group. Audit Group is now equipped both interms of human resource and methodology, and is committedtowards optimization of its operations.
Operations Group
Significant progress was made during the year in these areasthrough centralization, strengthening of the Bank's processesthrough compliance with the COSO based Internal ControlFramework, Business Continuity Management and StaffTraining & Development. Strong operational support wasprovided to the businesses to ensure the launch of newproducts, channels and services including Bancassurance,Privilege Banking, Mobile Banking, Phone Banking, TradeProducts & Cash Management as well as in the migration ofcore banking application across all branches in the country.
Human Resource Group
The Human Resources Group has worked towards instillingsystematic processes to build a performance-based culturebased on internal equity. Alongside aligning the bank withbest practices, this is surely to bring about an efficient and
Directors’ Report to Members
52 | MCB Bank Limited
motivated workforce. For 2010, the Group will be furtherdeveloping staff through a focus on career development andtraining to truly brand MCB as an employee-focusedorganization.
Business Development and New Initiatives
In 2009, the Group, in close coordination with the Board andsenior management, led the bank-wide strategic planningexercise to refine and revalidate MCB's 2012 strategy. Inaddition, Program Alpha, an initiative tasked with transformingbranches into efficient sales and service centers was veryactive in 2009. The Group also set-up a bank-wide CentralBusiness Intelligence Unit responsible for supporting the retailbank in its sales and performance MIS needs. In 2010, BDNIwill continue to ramp up on Program Alpha and BIU coverageand will work closely with all bank groups to ensure strategydelivery.
Information Technology Group
In 2009, the major focus was on the completion of the roll-out of the Core Banking System (Symbols) which heralds anew era for the bank. Apart from the roll-out, the Groupfocused on up gradation of network technology, revision ofsecurity framework and provision of disaster recovery for thecritical business applications, deployment of a new Paymentsand Collection system moving MCB to the 3rd market position(from 7th) and launched its Mobile Banking platform fullyintegrated with MCB systems. Information Technologygovernance model has been introduced to ensure qualityselection, monitoring and delivery of all high value projects.
Compliance Group
Focus for the financial year 2009 remained on pro-activelyidentifying and resolving any regulatory gaps, particularlyrelated to Know Your Customer (KYC) and Anti-MoneyLaundering (AML). To create awareness across the bankregarding KYC & AML regulations, over eighty training sessionswere conducted by the group in 39 cities / regions trainingapproximately 2,600 staff. Other initiatives were undertakenin the shape of “Compliance News Letter” and “Regulatory& Legal update”.. The Bank is now moving towards a solutionbased monitoring and has already acquired “Name filtering”solution while an AML solution is in the process of beingfinalized for implementation in 2010 which will better equipthe bank in curbing any unscrupulous transaction.
Risk Management Group
Prudent and effective risk management is and has alwaysbeen a significant success factor in steering the Bank's marchtowards strong profitability and market leadership. The Bankemploys the function of risk management as an importanttool in implementation of its long term vision. MCB has
successfully created a culture based on modern techniquesthat allows risk management and business units to createmore shareholder value through a better understanding ofour Bank and our customers.
The Risk Management framework combines core policies,by procedures and process design with oversight and issupported by risk monitoring across the bank. Elements ofrisk management framework are reviewed and updated inorder to align our long-term strategy in the field with lessonslearned through the Bank's own experiences and internationalbest practices also kept compliant with the local regulationsand selected international best practices, particularly thoserelating to implementation of Basel-II.
The group controls the review and administration of lendingsolutions offered to our clients through a dedicated team ofexperienced professionals. Specific functions of the groupensuring particular risk management are;
• Credit Review and Credit Risk Control ensure that ourlending decisions are in line with the Bank's strategy,our lending is prudently given, and that our recoveriesare actively monitored;
• Credit Risk Management identifies our target marketsthrough economic research and data analysis, defineshow the Bank lends to its customers through detailedpolicies and procedural product manuals and coordinateswith business units to ensure that targeted lendingactivity is in line with the Bank's overall risk appetite andstrategy;
• Market Risk Management ensures that the Bank'sexposures in financial markets are actively managedwithin reasonable limits;
• Operational Risk Management helps the Bankunderstand our risks and improve our mitigating controlsso as to minimize operational risks that are inherent inalmost all areas of the Bank;
• Basel II Projects monitors the implementation of variousprojects in the areas of credit, market and operationalrisk that have been initiated to allow the Bank to adhereto, and adopt, the internationally accepted best practicesof Basel II;
• In addition to the internal Compliance unit within theRisk Management Group, the Risk Management &Portfolio Review Committee provides oversight anddirection to the activities of the Group.
These elements of risk management within MCB Bankcollectively ensure that the Bank's risk profile is activelymonitored and adjusted according to the Bank's strategyand the operating environment in a manner which ensuresprotection to the depositor and value to the shareholder.
Bank’s Financial Performance
Annual Report 2009 | 53
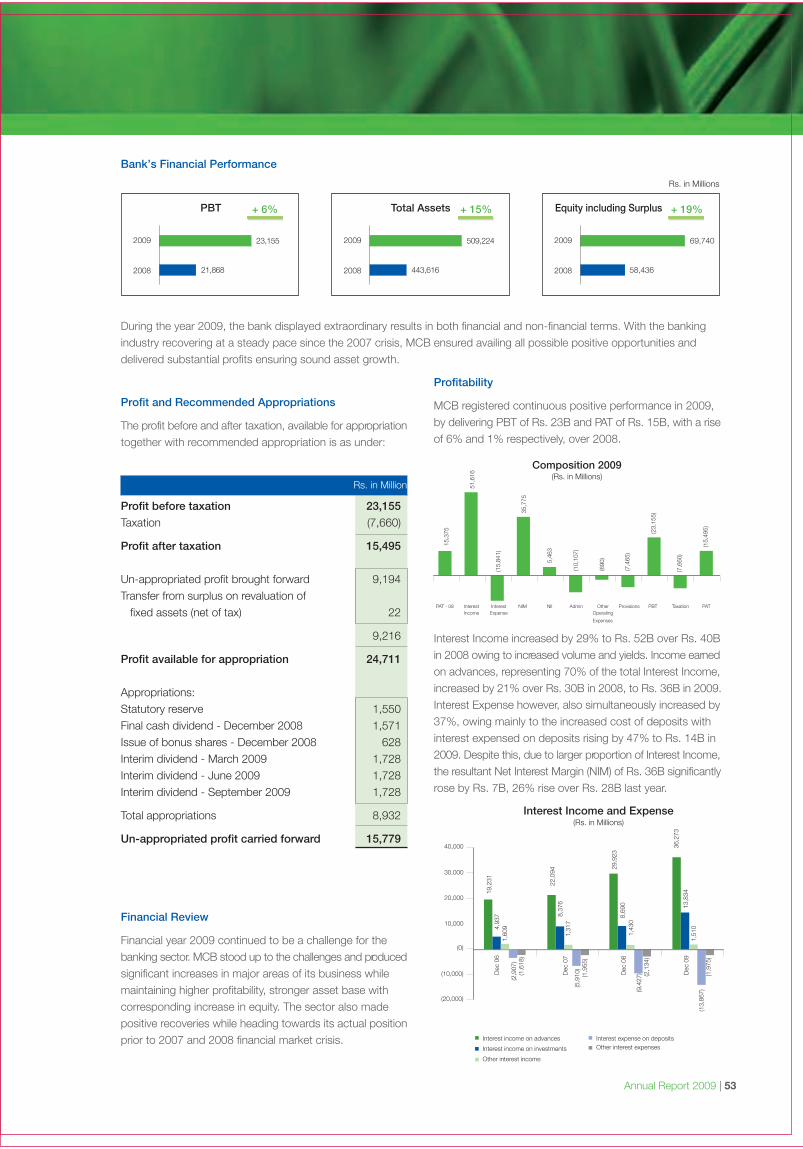
During the year 2009, the bank displayed extraordinary results in both financial and non-financial terms. With the bankingindustry recovering at a steady pace since the 2007 crisis, MCB ensured availing all possible positive opportunities anddelivered substantial profits ensuring sound asset growth.
Profit and Recommended Appropriations
The profit before and after taxation, available for appropriationtogether with recommended appropriation is as under:
Rs. in Million
Profit before taxation 23,155
Taxation (7,660)
Profit after taxation 15,495
Un-appropriated profit brought forward 9,194Transfer from surplus on revaluation of fixed assets (net of tax) 22
9,216
Profit available for appropriation 24,711
Appropriations:Statutory reserve 1,550Final cash dividend - December 2008 1,571Issue of bonus shares - December 2008 628Interim dividend - March 2009 1,728Interim dividend - June 2009 1,728Interim dividend - September 2009 1,728
Total appropriations 8,932
Un-appropriated profit carried forward 15,779
Financial Review
Financial year 2009 continued to be a challenge for thebanking sector. MCB stood up to the challenges and producedsignificant increases in major areas of its business whilemaintaining higher profitability, stronger asset base withcorresponding increase in equity. The sector also madepositive recoveries while heading towards its actual positionprior to 2007 and 2008 financial market crisis.
Profitability
MCB registered continuous positive performance in 2009,by delivering PBT of Rs. 23B and PAT of Rs. 15B, with a riseof 6% and 1% respectively, over 2008.
Interest Income increased by 29% to Rs. 52B over Rs. 40Bin 2008 owing to increased volume and yields. Income earnedon advances, representing 70% of the total Interest Income,increased by 21% over Rs. 30B in 2008, to Rs. 36B in 2009.Interest Expense however, also simultaneously increased by37%, owing mainly to the increased cost of deposits withinterest expensed on deposits rising by 47% to Rs. 14B in2009. Despite this, due to larger proportion of Interest Income,the resultant Net Interest Margin (NIM) of Rs. 36B significantlyrose by Rs. 7B, 26% rise over Rs. 28B last year.
2009
2008
23,155
21,868
+ 6%PBT Total Assets
2009
2008
509,224
443,616
+ 15% Equity including Surplus
2009
2008
69,740
58,436
+ 19%
Expenses
Composition 2009(Rs. in Millions)
PAT - 08 NIM NII Admin
15,3
75
51,6
16
35,7
75
5,46
3
(10,
107)
(690
)
(7,4
65)
(23,
155)
(15,
495)
(7,6
60)
(15,
841)
OtherOperating
Provisions PBT Taxation PATInterestIncome
InterestExpense
Interest Income and Expense(Rs. in Millions)
Dec
06
Dec
07
19,2
31
22,0
94
29,9
23
36,2
73
4,93
7 8,37
6
8,69
0 13,8
34
1,60
9
1,31
7
1,43
0
1,51
0
(2,9
07)
(5,9
10)
(9,4
27)
(13,
867)
(1,6
18)
(1,9
55)
(2,1
34)
(1,9
75)
Dec
08
Dec
09
40,000
30,000
20,000
10,000
(10,000)
(20,000)
Interest income on advances
Other interest income
Interest expense on depositsOther interest expensesInterest income on investments
(0)
Directors’ Report to Members
54 | MCB Bank Limited
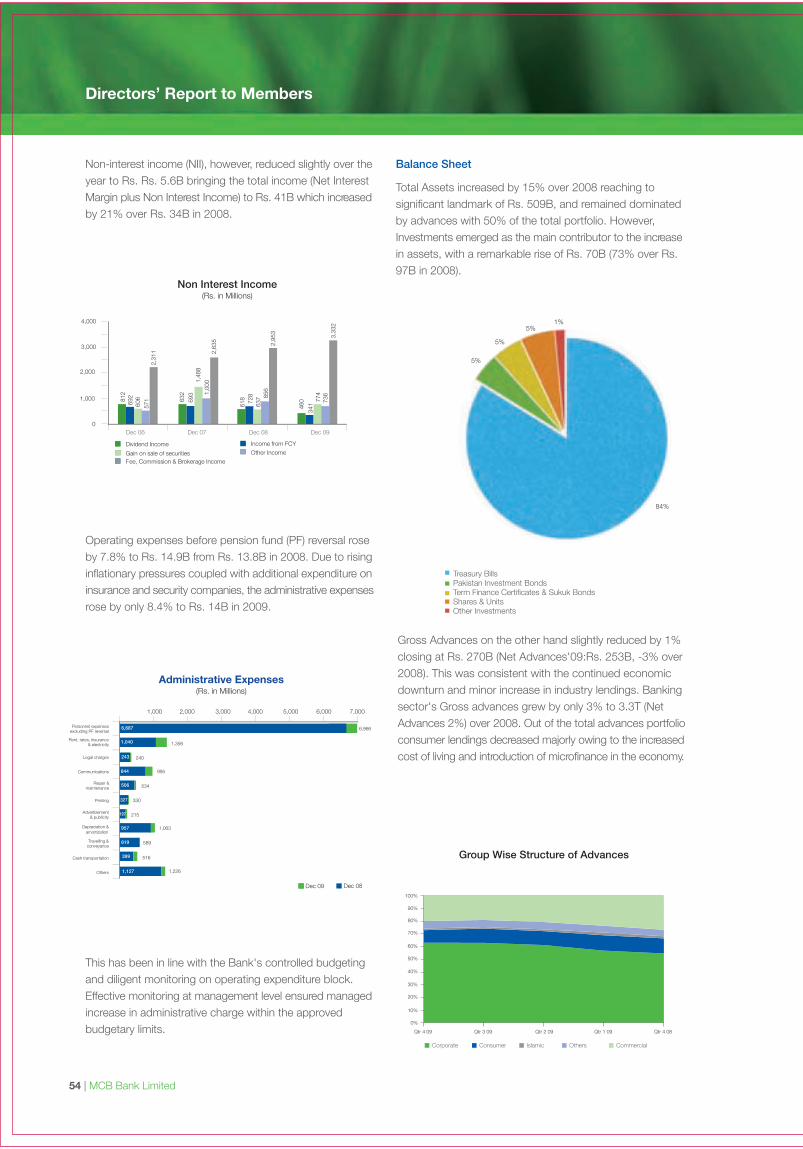
Non-interest income (NII), however, reduced slightly over theyear to Rs. Rs. 5.6B bringing the total income (Net InterestMargin plus Non Interest Income) to Rs. 41B which increasedby 21% over Rs. 34B in 2008.
Operating expenses before pension fund (PF) reversal roseby 7.8% to Rs. 14.9B from Rs. 13.8B in 2008. Due to risinginflationary pressures coupled with additional expenditure oninsurance and security companies, the administrative expensesrose by only 8.4% to Rs. 14B in 2009.
This has been in line with the Bank's controlled budgetingand diligent monitoring on operating expenditure block.Effective monitoring at management level ensured managedincrease in administrative charge within the approvedbudgetary limits.
Balance Sheet
Total Assets increased by 15% over 2008 reaching tosignificant landmark of Rs. 509B, and remained dominatedby advances with 50% of the total portfolio. However,Investments emerged as the main contributor to the increasein assets, with a remarkable rise of Rs. 70B (73% over Rs.97B in 2008).
Gross Advances on the other hand slightly reduced by 1%closing at Rs. 270B (Net Advances'09:Rs. 253B, -3% over2008). This was consistent with the continued economicdownturn and minor increase in industry lendings. Bankingsector's Gross advances grew by only 3% to 3.3T (NetAdvances 2%) over 2008. Out of the total advances portfolioconsumer lendings decreased majorly owing to the increasedcost of living and introduction of microfinance in the economy.
Administrative Expenses(Rs. in Millions)
Rent, rates, insurance& electricity
Personnel expensesexcluding PF reversal
Legal charges
Communications
Repair &maintenance
Printing
Advertisement& publicity
Depreciation &amortization
Travelling &conveyance
Cash transportation
Others
844
1,000
1,040
506
957
619
399
1,127
327
197
243
6,687 6,966
1,356
240
995
534
330
215
1,063
589
516
1,226
2,000 3,000 4,000 5,000 6,000 7,000
Dec 09 Dec 08
100%
Corporate
Group Wise Structure of Advances
90%
80%
70%
60%
50%
40%
30%
20%
10%
0%
Qtr 4 09 Qtr 3 09 Qtr 2 09 Qtr 1 09 Qtr 4 08
Consumer Islamic Others Commercial
Dec 06 Dec 07
812
632
618
46069
2
693
728
34160
6
1,48
8
637 77
4
571
1,00
0
856
736
2,31
1 2,63
5 2,95
3
3,33
2
Dec 09Dec 08
4,000
3,000
2,000
1,000
0
Dividend Income
Gain on sale of securitiesFee, Commission & Brokerage Income
Income from FCY
Other Income
Non Interest Income(Rs. in Millions)
Treasury BillsPakistan Investment BondsTerm Finance Certificates & Sukuk BondsShares & UnitsOther Investments
84%
5%
5%
5%1%
Annual Report 2009 | 55
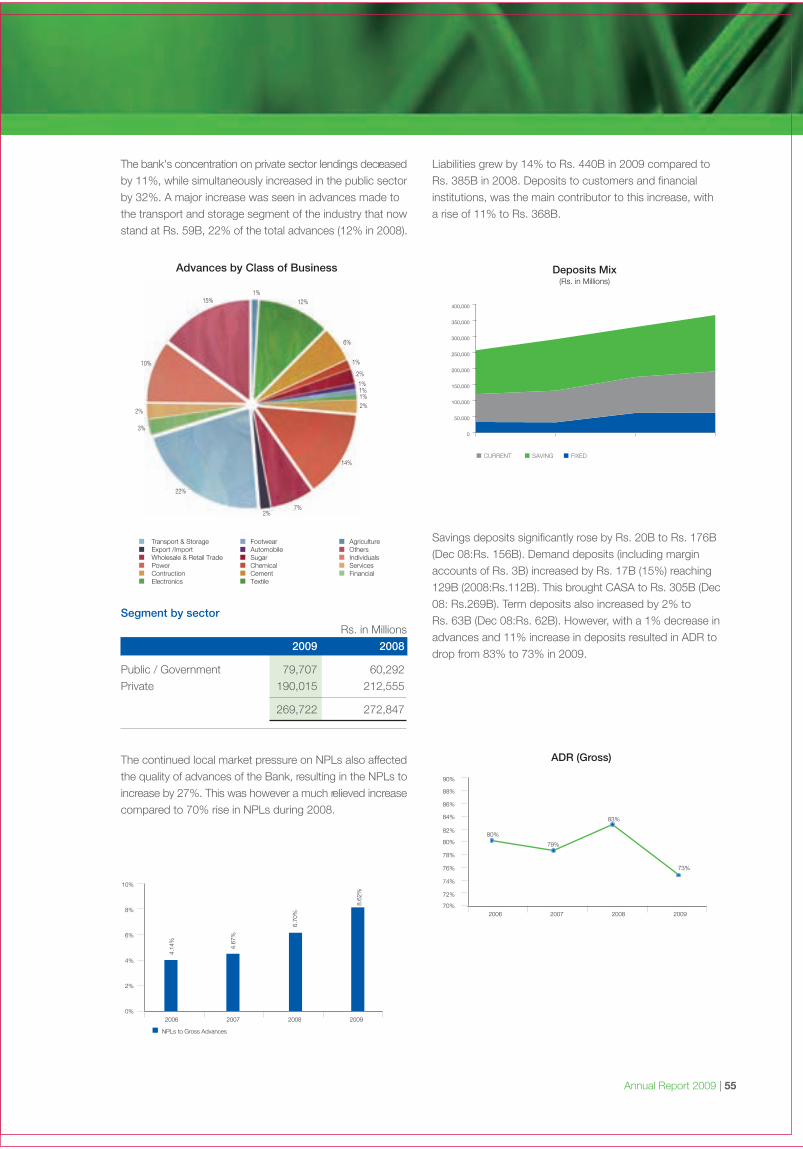
The bank's concentration on private sector lendings decreasedby 11%, while simultaneously increased in the public sectorby 32%. A major increase was seen in advances made tothe transport and storage segment of the industry that nowstand at Rs. 59B, 22% of the total advances (12% in 2008).
The continued local market pressure on NPLs also affectedthe quality of advances of the Bank, resulting in the NPLs toincrease by 27%. This was however a much relieved increasecompared to 70% rise in NPLs during 2008.
Liabilities grew by 14% to Rs. 440B in 2009 compared toRs. 385B in 2008. Deposits to customers and financialinstitutions, was the main contributor to this increase, witha rise of 11% to Rs. 368B.
Savings deposits significantly rose by Rs. 20B to Rs. 176B(Dec 08:Rs. 156B). Demand deposits (including marginaccounts of Rs. 3B) increased by Rs. 17B (15%) reaching129B (2008:Rs.112B). This brought CASA to Rs. 305B (Dec08: Rs.269B). Term deposits also increased by 2% toRs. 63B (Dec 08:Rs. 62B). However, with a 1% decrease inadvances and 11% increase in deposits resulted in ADR todrop from 83% to 73% in 2009.
2006 2007
4.14
%
4.67
%
6.70
%
8.62
%
20092008
10%
6%
4%
2%
0%
NPLs to Gross Advances
2006 2007 20092008
80%
79%
83%
73%
90%
88%
86%
80%
82%
84%
72%
74%
76%
78%
70%
ADR (Gross)
Advances by Class of Business
0
50,000
100,000
150,000
200,000
250,000
300,000
350,000
400,000
CURRENT SAVING FIXED
Deposits Mix(Rs. in Millions)
Transport & StorageExport /ImportWholesale & Retail TradePowerContructionElectronics
FootwearAutomobileSugarChemicalCementTextile
AgricultureOthersIndividualsServicesFinancial
22%
2%7%
14%
2%1%1%1%
2%
1%
6%
12%1%
15%
10%
2%
3%
8%
56 | MCB Bank Limited
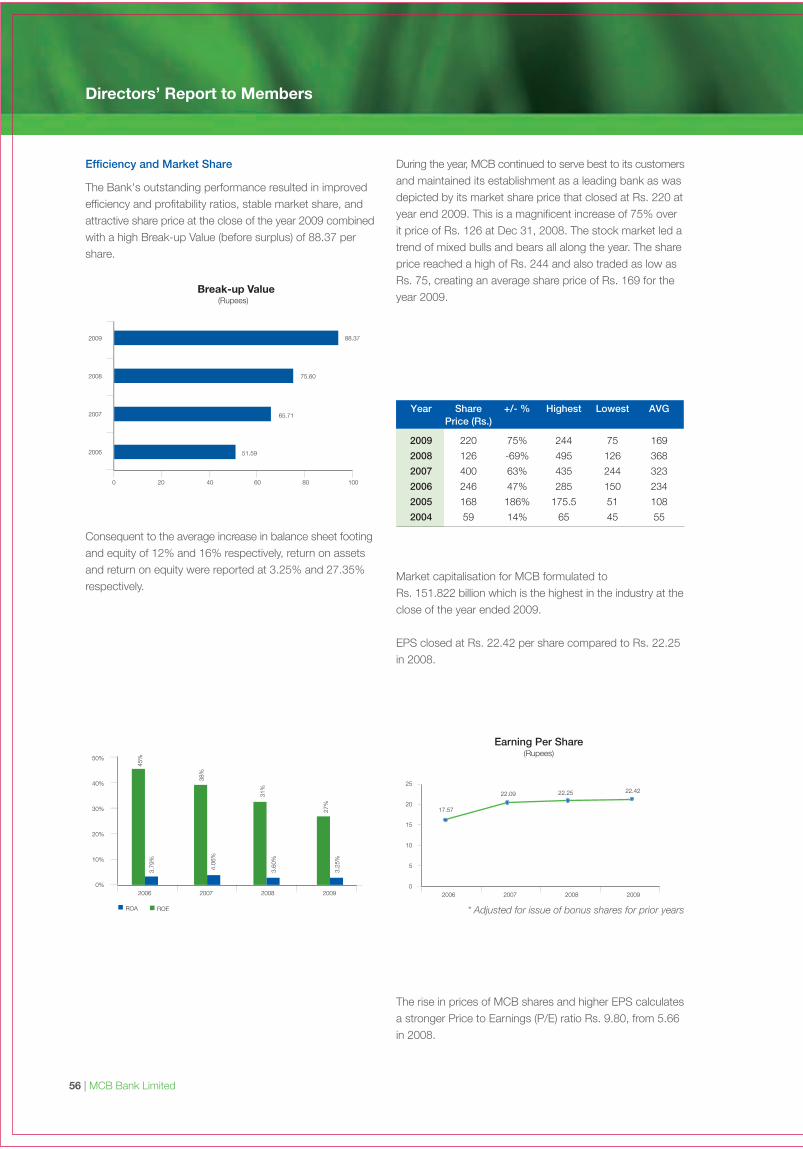
Efficiency and Market Share
The Bank's outstanding performance resulted in improvedefficiency and profitability ratios, stable market share, andattractive share price at the close of the year 2009 combinedwith a high Break-up Value (before surplus) of 88.37 pershare.
Consequent to the average increase in balance sheet footingand equity of 12% and 16% respectively, return on assetsand return on equity were reported at 3.25% and 27.35%respectively.
During the year, MCB continued to serve best to its customersand maintained its establishment as a leading bank as wasdepicted by its market share price that closed at Rs. 220 atyear end 2009. This is a magnificent increase of 75% overit price of Rs. 126 at Dec 31, 2008. The stock market led atrend of mixed bulls and bears all along the year. The shareprice reached a high of Rs. 244 and also traded as low asRs. 75, creating an average share price of Rs. 169 for theyear 2009.
Year Share +/- % Highest Lowest AVGPrice (Rs.)
2009 220 75% 244 75 169
2008 126 -69% 495 126 368
2007 400 63% 435 244 323
2006 246 47% 285 150 234
2005 168 186% 175.5 51 108
2004 59 14% 65 45 55
Market capitalisation for MCB formulated toRs. 151.822 billion which is the highest in the industry at theclose of the year ended 2009.
EPS closed at Rs. 22.42 per share compared to Rs. 22.25in 2008.
The rise in prices of MCB shares and higher EPS calculatesa stronger Price to Earnings (P/E) ratio Rs. 9.80, from 5.66in 2008.
2006 2007
45%
3.79
%
4.06
%
3.60
%
3.25
%
38%
31%
27%
20092008
50%
30%
20%
10%
0%
ROA ROE
Earning Per Share(Rupees)
2006 2007 20092008
17.57
22.09 22.25 22.42
* Adjusted for issue of bonus shares for prior years
Break-up Value
2009 88.37
75.60
65.71
51.59
2008
2007
2006
Directors’ Report to Members
0 20 40 60 80 100
40%
0
5
10
15
20
25
(Rupees)
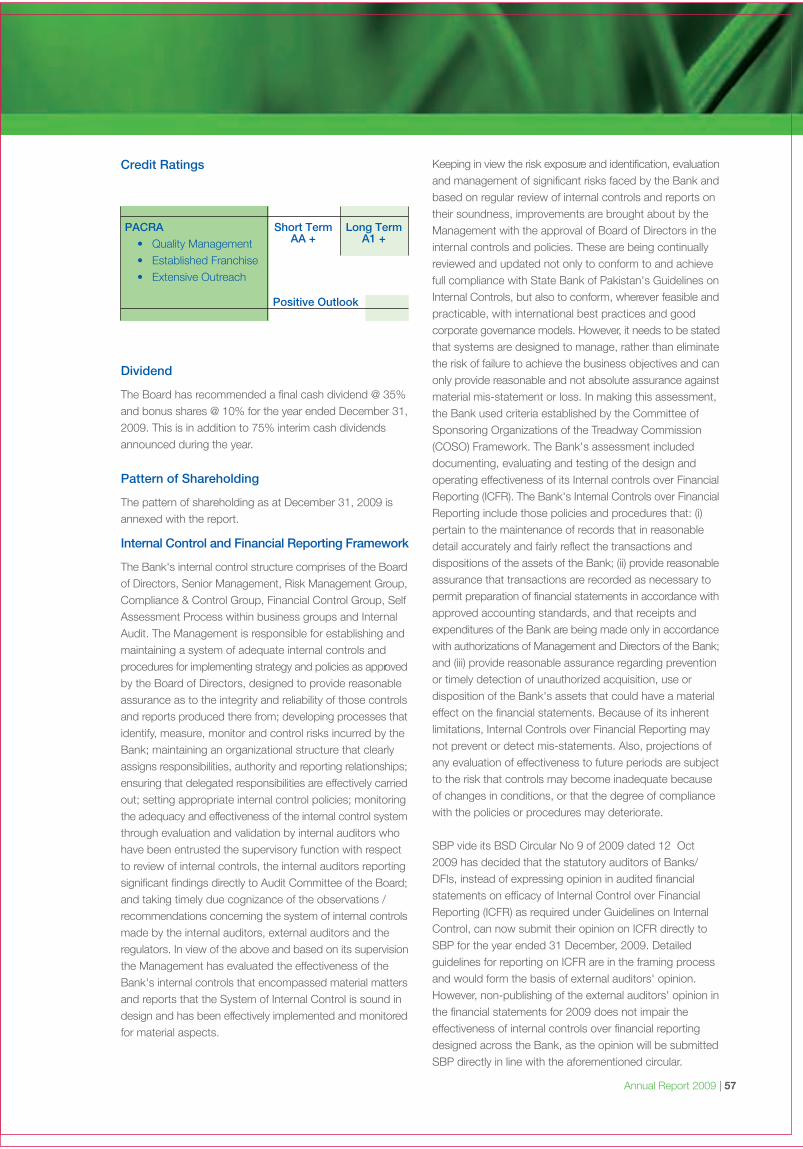
Annual Report 2009 | 57
Credit Ratings
Dividend
The Board has recommended a final cash dividend @ 35%and bonus shares @ 10% for the year ended December 31,2009. This is in addition to 75% interim cash dividendsannounced during the year.
Pattern of Shareholding
The pattern of shareholding as at December 31, 2009 isannexed with the report.
Internal Control and Financial Reporting Framework
The Bank's internal control structure comprises of the Boardof Directors, Senior Management, Risk Management Group,Compliance & Control Group, Financial Control Group, SelfAssessment Process within business groups and InternalAudit. The Management is responsible for establishing andmaintaining a system of adequate internal controls andprocedures for implementing strategy and policies as approvedby the Board of Directors, designed to provide reasonableassurance as to the integrity and reliability of those controlsand reports produced there from; developing processes thatidentify, measure, monitor and control risks incurred by theBank; maintaining an organizational structure that clearlyassigns responsibilities, authority and reporting relationships;ensuring that delegated responsibilities are effectively carriedout; setting appropriate internal control policies; monitoringthe adequacy and effectiveness of the internal control systemthrough evaluation and validation by internal auditors whohave been entrusted the supervisory function with respectto review of internal controls, the internal auditors reportingsignificant findings directly to Audit Committee of the Board;and taking timely due cognizance of the observations /recommendations concerning the system of internal controlsmade by the internal auditors, external auditors and theregulators. In view of the above and based on its supervisionthe Management has evaluated the effectiveness of theBank's internal controls that encompassed material mattersand reports that the System of Internal Control is sound indesign and has been effectively implemented and monitoredfor material aspects.
Keeping in view the risk exposure and identification, evaluationand management of significant risks faced by the Bank andbased on regular review of internal controls and reports ontheir soundness, improvements are brought about by theManagement with the approval of Board of Directors in theinternal controls and policies. These are being continuallyreviewed and updated not only to conform to and achievefull compliance with State Bank of Pakistan's Guidelines onInternal Controls, but also to conform, wherever feasible andpracticable, with international best practices and goodcorporate governance models. However, it needs to be statedthat systems are designed to manage, rather than eliminatethe risk of failure to achieve the business objectives and canonly provide reasonable and not absolute assurance againstmaterial mis-statement or loss. In making this assessment,the Bank used criteria established by the Committee ofSponsoring Organizations of the Treadway Commission(COSO) Framework. The Bank's assessment includeddocumenting, evaluating and testing of the design andoperating effectiveness of its Internal controls over FinancialReporting (ICFR). The Bank's Internal Controls over FinancialReporting include those policies and procedures that: (i)pertain to the maintenance of records that in reasonabledetail accurately and fairly reflect the transactions anddispositions of the assets of the Bank; (ii) provide reasonableassurance that transactions are recorded as necessary topermit preparation of financial statements in accordance withapproved accounting standards, and that receipts andexpenditures of the Bank are being made only in accordancewith authorizations of Management and Directors of the Bank;and (iii) provide reasonable assurance regarding preventionor timely detection of unauthorized acquisition, use ordisposition of the Bank's assets that could have a materialeffect on the financial statements. Because of its inherentlimitations, Internal Controls over Financial Reporting maynot prevent or detect mis-statements. Also, projections ofany evaluation of effectiveness to future periods are subjectto the risk that controls may become inadequate becauseof changes in conditions, or that the degree of compliancewith the policies or procedures may deteriorate.
SBP vide its BSD Circular No 9 of 2009 dated 12 Oct2009 has decided that the statutory auditors of Banks/DFIs, instead of expressing opinion in audited financialstatements on efficacy of Internal Control over FinancialReporting (ICFR) as required under Guidelines on InternalControl, can now submit their opinion on ICFR directly toSBP for the year ended 31 December, 2009. Detailedguidelines for reporting on ICFR are in the framing processand would form the basis of external auditors' opinion.However, non-publishing of the external auditors' opinion inthe financial statements for 2009 does not impair theeffectiveness of internal controls over financial reportingdesigned across the Bank, as the opinion will be submittedSBP directly in line with the aforementioned circular.
PACRA
• Quality Management• Established Franchise• Extensive Outreach
Short TermAA +
Long TermA1 +
Positive Outlook
Directors’ Report to Members
58 | MCB Bank Limited
A separate Issues, Tracking and Monitoring (ITAM) Committeewas formed in 2007 with all the Group Heads as part of it.Periodic ITAM meetings are being held with the goal tostrengthen internal control processes and proactively identifyand resolve identified issues.
The Board of Directors has responsibility for ensuring thatManagement maintains an effective System of Internal Controlsand for reviewing its effectiveness. The Bank has a Systemof Internal Controls which provides reasonable assurance inall material respects of efficient and effective operation ofcontrols. Processes are in place for identifying, evaluatingand managing the significant risks facing the Bank inaccordance with the Risk Management Policy and InternalControl System and Audit Policy, as approved by the Board.The Board regularly reviews these processes through relevantBoard Committees.
In line with improvement in other areas, particular emphasishas been laid on strengthening internal controls and revampinginternal audit functions. The staff and professional strengthof Internal Audit Group has been improved, its audit activitiesexpanded and its autonomy enhanced. Audit Group hasbeen revamped in terms of quality of staff and auditmethodology. With the application of risk centric auditmethodology through professional staff, the Audit Departmentwill pave its way for the much desired strategic stature in theorganization. The Audit Group is geared to meet the challengeof carrying out its role in Basel II implementation. It is furthercommitted to continuous improvement through qualityassurance, strengthen its IT Audit Capabilities and leveragetechnology for optimizing audit operations. The Audit Groupnow functionally reports to the Audit Committee andadministratively to the Chairman of the Board. The Boardintends to strengthen further the role of the Audit Group toact as eyes and ears of the Board to ensure integrity of theoperations of the Bank.
The Directors are pleased to give following statement inrespect of Code of Corporate Governance:
• The financial statements, together with the notes thereonhave been drawn up in conformity with the CompaniesOrdinance, 1984. These statements present fairly theCompany's state of affairs, result of its operations, cashflow and change in equity
• Proper books of accounts of the Company have beenmaintained
• Appropriate accounting policies have been consistentlyapplied
• The International Financial Reporting Standards, asapplicable in Pakistan have been followed in preparationof financial statements and any departure having materialimpact there from has been adequately disclosed
• The system of internal control is sound in design andhas been effectively implemented and monitored
• There is no doubt upon the company's ability to continueas a going concern
• There has been no material departure from the bestpractices of corporate governance, as detailed in thelisting regulations
• Key operating and financial data are made available inthe Annual Report
• All the statutory liabilities, if any, have been adequatelydisclosed in the financial statements
• The Board met on 4 occasions and its meetings wereattended by directors as under:
Name Meetings attended
Mian Mohammad Mansha 4S. M. Muneer 4Tariq Rafi 4Shahzad Saleem 3Sarmad Amin 4Dr. Muhammad Yaqub 3Mian Raza Mansha 3Mian Umer Mansha * 3Dato' Mohammed Hussein 4Abdul Farid Bin Alias * 2Aftab Ahmad Khan 4Muhammad Ali Zeb * 2Atif Bajwa 4
* Mian Umer Mansha, Abdul Farid Bin Alias & Muhammad Ali Zeb havebeen elected as director in AGM held on March 27, 2009. After theirelection/appointment three Board Meetings were held during 2009.
• Value of investment including accrued income ofprovident and pension fund as at 30.06.2009 on thebasis of audited accounts is:
Provident Fund Pak Staff Rs. 11,065.51 millionPension Fund Pak Staff Rs. 14,805.23 million
Annual Report 2009 | 59
• The aggregate shares held by associated and related parties as at December 31, 2009, are as follows:
a) Associated Companies, undertakings & related parties No. of shares
1 Siddiqsons Denim Mills 31,553,5892 Din Leather (Pvt) Ltd 4,306,9193 Adamjee Insurance Co. Ltd 21,148,5264 MCB Employees Pension Fund 10,611,0065 MCB Provident Fund Pakistan Staff 21,354,5176 Nishat Mills Limited 47,810,2427 Mayban International Trust (Labuan) Berhad 138,220,905
b) National Investment Trust Limited 5,159
c) Investment Corp. of Pakistan 676
d) Directors Self Spouse & TotalChildren
1 Mian Mohammad Mansha 4,866 3,988,836 3,993,7022 S. M. Muneer 1,280 - 1,2803 Tariq Rafi 2,717,420 73,077 2,790,4974 Shahzad Saleem 562 - 5625 Sarmad Amin 1,772 - 1,7726 Dr. Muhammad Yaqub 632 - 6327 Mian Raza Mansha 7,861,916 17,672,270 25,534,1868 Mian Umer Mansha 19,861,026 - 19,861,0269 Dato' Mohammed Hussein 5,550 - 5,55010 Abdul Farid Bin Alias - -11 Aftab Ahmad Khan 570 - 57012 Muhammad Ali Zeb 1,100 - 1,10013 Atif Bajwa - - -
e) Other Executives 21,181 - 21,181
All the trade in shares carried out by Directors, CEO, CFO, Secretary, their spouses and minor children is reported as under:
Name Purchase
Dato' Mohammed Hussein 5,000Abdus S. Sami, Company Secretary 2,500
Directors’ Report to Members
60 | MCB Bank Limited
Auditors
The retiring auditor M/S KMPG Taseer Hadi CharteredAccountants and Company, being eligible for the next termhave offered themselves for reappointment. The Board onsuggestions of the Audit Committee, recommended themfor appointment till the conclusion of next Annual GeneralMeeting.
Acknowledgments
In the end, we would like to applaud the State Bank ofPakistan, the Security and Exchange Commission of Pakistanand the Ministry of Finance for their effort to strengthen thebanking and financial system of the country and to improveregulatory, policy and governance framework for them. Wealso wish to extend our sincere thanks to all our employeesfor their significant contributions to the continued growth andsuccess of our Bank. Lastly, we are most grateful to all ourclients and shareholders for their constant trust in our abilityto provide best possible services.
The Board of Directors, Management and the staff of theBank remain committed to continuously strive to take newinitiatives, introduce new products, improve service qualityand work efficiency, and strengthen the institutional andcontrol framework to enable MCB to continue to remain aleading and well governed Bank of the country.
On behalf of Directors
Mian Mohammad ManshaFebruary 25, 2010 Chairman
Annual Report 2009 | 61
Corporate Social Responsibility
In 2009 MCB Bank Limited continued to engage with itsstakeholders and the community, demonstrating the priorityplaced on corporate responsibility. Our vision to become aleading financial services provider along with our values, actas a guide for our corporate responsibility efforts.
GOVERNANCE
The Bank advocates a culture of excellence, high degree ofgood governance, transparency, integrity and accountabilityas well as ensuring the highest level of professionalism.Controls and Compliance is an integral internal function andcare is taken to ensure that all activities are carried out inaccordance with prevailing regulations so that the interestsof all our stakeholders are protected. Code of Ethics andConduct signed by all employees acts as a guide for themin discharging their duties and sets out the standards of goodbanking practice.
CORPORATE RESPONSIBILITY IN BUSINESSOPERATIONS
As the leading financial services provide, MCB Bank has animportant role in the development of the nation as well as inthe community it serves. Being a responsible corporate citizenMCB continues to support national development in the areaof public interest. Its branch operations span urban and ruralareas pan Pakistan including remote locations. Currently weserve 155,662 basic banking customers who enjoy bankingservices, free of services charges as per SBP mandate. Boldlyfacing the challenges, our branches and staff continued toperform their duties and ensured that the Bank and itscustomers get the requisite services under extremely tryingconditions in effected Northern Areas of Pakistan.
In line with our goal to facilitate consumers in making theirbanking experience more convenient, significant investmentshave been made to develop alternate distribution channels.We are the 1st bank in Pakistan to offer a comprehensivemobile banking solution allows them to perform a host ofbasic banking transactions around the clock at theirconvenience. In addition to this we also serve our as wellother bank's customers with over 450 ATMs installednationwide. Our 24/7 call center and Virtual Banking enablethe customers to access their account whenever & whereverthey choose.
MCB bank undertakes its lending function responsibly ensuringcustomer's financial well being. Our extensive deposit productsuite encourages savings in the society at large.Bancassurance products not only provide financial protectionto our customers to face any unforeseen incident but providethem a means to save for their long term financial needs.
CSR COMMITMENT
MCB has always been at forefront in terms of its contributionto society at large especially in the times of need. MCB'svast branch network of over 1,000 online branches anddelivery channels such as ATMs, internet banking & mobilebanking lend continuous support to several NGO's,humanitarian causes and other public interest fund raisingcampaigns.
During 2009, MCB showed complete solidarity with InternallyDisplaced People (IDPs) and contributed PKR25 milliontowards their relief and rehabilitation efforts. Besides thefinancial contribution, all the channels including branches,internet banking, mobile banking and ATMs were activatedto collect donations from public at large for the Prime MinisterRelief Fund (PMRF) as well as several other NGOs. Alongwith this dedicated help desks were also set up in the IDPcamps to facilitate people.
With objective to promote emerging talent, healthy activitiesand social development, the bank supports various activitiesin the spheres of sports, culture, education and health.These activities include sponsoring national level events likeUnder 19 Hockey Championship, Thar Desert & Jhal MagsiCar Rallies, educational seminars, health workshops andseveral other initiatives.
EMPLOYEE ENGAGEMENT
The Bank recognizes the importance of its human capitaland invests in their growth and development.
The Bank introduced a relief scheme for MCB employees inSWAT and Malakand Division. The scheme incorporates cashcompensation for the staff in the above mentioned affectedareas of Pakistan. A total of 103 permanent and 52 outsourcedstaff members have been provided cash compensation. Acumulatively over PKR 9.5 million was disbursed in 2009. Inaddition to this a one year moratorium has also been givento the regular employees in the affected areas, availing theHouse Building Finance, Car Finance and Motorcycle Financethrough HR Loans, whereby no principal amount will berecovered from them.
There is a strong emphasis on on-going employee educationand training. In 2009, over PKR 47 million were invested intraining of employees. With its vision to make training &development a core activity, the bank has also recentlyrevamped the training centre in Karachi.
The Bank has also conducted an Employee SatisfactionSurvey (ESS) to gauge employees' satisfaction at MCB andto strategize its business as well as human resource policies.
62 | MCB Bank Limited
In line with “Statement of Ethics and Business Practices”prepared in 2002, the Employees of the bank shall;
ABIDANCE OF LAWS / RULES
• Conform to and abide by the Bank rules andpolicies and obey all lawful orders and directiveswhich may from time to time be given by anyperson or persons under whose jurisdiction,superintendence or control, the persona will, forthe time being, be placed. To undertake at all timescompliance with and observation of all applicablelaws, regulations and Bank's policies, whereverthe bank operates.
INTEGRITY
• Conduct the highest standards of ethics,professional integrity and dignity in all dealings withthe public, customers, investors, employees, andgovernment officials, State Bank of Pakistan andfellow bankers and non-engagement in actsdiscreditable to the Bank, profession and nation.
• In case of awareness of any breaches of laws andregulations, frauds and other criminal activities orother similar serious incidents that might affect theinterests of the Bank, the same shall be informedto the senior management immediately, includingany issue, which may pose a reputational risk.
• Not use this policy to raise grievances or act inbad faith against colleagues.
PROFESSIONALISM
• Serve the Bank honestly and faithfully and strictlyserve the Bank's affairs and the affairs of itsconstituents.
• Use utmost endeavour to promote the interest andgoodwill of the Bank and show courtesy andattention in all transactions/correspondence withofficers of Government, State Bank of Pakistan,other Banks & Financial Institutions, otherestablishments dealing with the Bank, the Bank'sconstituents and the public.
• Disclose and assign to MCB all interest in anyinvention, improvement, discovery or work ofauthorship that may be made or conceived andwhich may arise out of the employment with MCB.
• In case the employment is terminated, all rights toproperty and information generated or obtainedas part of employment relationship will remain theexclusive property of MCB.
• Comply with the laws and regulations on moneylaundering and fraud prevention and immediatereporting of all suspicions of money laundering asper the guidelines provided in KYC & AMLProcedures Handbook for Management and Staff.
• Not to engage in any act of violation of KYC & AMLguidelines given by State Bank of Pakistan andexercising of extreme vigilance in protecting MCB
from being misused by anyone to launder moneyby violating these guidelines.
• Ensure that all customer complaints are resolvedquickly, fairly and recorded appropriately.
CONFLICT OF INTEREST
• Avoid all such circumstances in which there ispersonal interest conflict, or may appear to be inconflict, with the interest of the Bank or itscustomers.
• In case of potential conflict of interest, the sameshould be declared immediately to seniormanagement, action is taken to resolve and manageit in open manner and resolving the conflict ofinterest on their own would be avoided.
• Report to the Company Secretary about any saleand purchase of MCB shares (own or spouse) incase the annual basic salary exceeds Rs.500,000/-.
Political Participation
• Stand firmly against supporting the activities of anyGroup or individual that unlawfully threatens publicorder and safety.
• Not obtain membership of any political party, ortake part in, subscribing in aid of, or assist in anyway, any political movement in or outside of Pakistanor relating to the affairs of Pakistan.
• Not express views detrimental to the ideology,sovereignty or integrity of Pakistan.
• Not canvass or otherwise interfere or use influencein connection with or take part in any election asa candidate to a legislative/local body or issue anaddress to the electorate or in any mannerannounce or allowed to be announced publicly asa candidate or prospective candidate whether inPakistan or elsewhere. However, the right to votecan be exercised.
• Not bring or attempt to bring political or otherpressure/influence directly or indirectly to bear onthe authorities/superior officers or indulge inderogatory pamphleteering, contribute, or writeletters to the newspapers, anonymously or in ownname with an intent to induce the authority/superiorofficers to act in a manner inconsistent with rules,in respect of any matter relating to appointment,promotion, transfer, punishment, retirement or forany other conditions of service of employment.
Financial Interest
Not indulge in any of the following activities:• Borrow money from or in any way place myself
under pecuniary obligation to a broker ormoneylender or any firm or person having dealingswith the Bank.
• Buy or sell stock, shares or securities of anydescription without funds to meet the full cost inthe case of purchase or scripts for delivery in thecase of sale.
Statement of Ethics and Business Practices
Annual Report 2009 | 63
• However, a bona-fide investment of own funds insuch stocks, shares and securities as wished canbe made.
• Lend money in private capacity to a constituent ofthe Bank or have personal dealings with aconstituent in the purchase or sale of bills ofexchange, Government paper or any othersecurities.
• Act as agent for an insurance company otherwisethan as agent for or on behalf of the Bank.
• Be connected with the formation or managementof a joint stock company.
• Engage in any other commercial business or pursuit,either on own account or as agent for another orothers.
• Accept or seek any outside employment or officewhether stipendiary or honorary.
• Undertake part-time work for a private or publicbody or private person, or accept fee thereof.
Gift, Favors Etc.
• Not use the employment status to seek personalgain from those doing business or seeking to dobusiness with MCB, nor accept such gain if offered.
• Not accept any gift, favors, entertainment or otherbenefit the size or frequency of which exceedsnormal business contacts from a constituent or asubordinate employee of the Bank or from personslikely to have dealings with the Bank and candidatesfor employment in the Bank.
• Not accept any benefit from the estate of, or atrust created by a customer, or from an estate ortrust of which a Bank's Company or business unitis an executor, administrator or trustee.
• Not give or accept bribes or engage in any formof corruption.
CONFIDENTIALITY
• Maintain the privacy and confidentiality (during thecourse of employment and after its termination forwhatever reason), of all the information acquiredduring the course of professional activities andrefrain from disclosing the same unless otherwiserequired by statutory authorities / law. All suchinformation will remain as a trust and will only beused for the purpose for which it is intended andwill not be used for the personal benefit of anyindividual(s).
• Not use for self gain, or for that of others eitherdirectly or indirectly, all inside information aboutBank's customers / affairs including customer data,product manuals, confidential research work,technical processes, operating manuals, marketingplans and strategies and other confidential financialand business information of the Bank etc.
• Not trade in relevant investments or indulge ingiving tips to another person or dealing on behalfof relatives, friends or any other third parties, whilstin possession of non-public price sensitiveinformation.
• Not disclose that a suspicious transaction or relatedinformation is being reported for investigation tothe customer or any irrelevant quarter.
Data Security
• Only access or update the system and dataaccording to the authority given by the bank. Anyunauthorized access or updation will hold theperson liable for a penal action by the bank inaccordance with HR policies.
• Not compromise access to system bycommunicating my identification and /or passwordsto others.
Communication/ Contact with Media
• Be truthful in all advertisings and promotional effortsand to publish only accurate information about theBank's operations under valid authority.
• Not give any interview in the print/electronic mediaor have the photograph displayed or an act intelevision/stage plays or in cinema without havingpermission from the competent authority.
BUSINESS / WORK ETHICS
• Respect fellow colleagues and work as a team. Tobe, at all times, courteous and to not let anypersonal differences affect work.
• Treat every customer of the Bank with respect andcourtesy.
Personal Responsibility
• Demonstrate commitment to the code throughwords and actions.
• Be responsible for data relating to officialresponsibilities and to not alter / modify / amendBank's record so as to obtain any personal benefits,attempt which in doing so shall hold the personliable to disciplinary action as per Bank's policy.
• Safeguard as a personal responsibility, both thetangible and intangible assets of MCB and itscustomer(s) that are under personal control andto not use Bank's assets for personal benefitsexcept where permitted by MCB.
• Not use any Bank facilities including a car ortelephone to promote trade union activities, orcarry weapons into Bank premises unless soauthorized by the management, or to carry ontrade union activities during office hours, or subjectBank officials to physical harassment or abuse.
Statement of Ethics and Business Practices
64 | MCB Bank Limited
• Not indulge in any kind of harassment or intimidationwhether committed by or against any senior/ junior,co-worker, customer, vendor or visitor.
• Not use language, written or spoken in intra-officeor communication(s) with individual(s) outside theoffice that may contain any statement or materialthat is offensive to others.
• Not engage in any discrimination against anindividual's race, colour, religion, gender, age,marital status, sexual orientation or disability.
Punctuality
• Ensure good attendance and punctuality anddemonstrate a consistently good record in thisarea.
• Obtain, for any absence during working hours,written permission of the immediate supervisor.
• Not absent oneself from assigned duties, nor leavestation over night, without having first obtained thepermission of the competent authority. In case ofemergency, if it is not possible to obtain priorpermission, necessary permission / confirmationto be obtained from the competent authority within24 hours.
Dress Code
• Maintain a standard of personal hygiene and dressappropriate for attendance at work. The appearancemust inspire confidence and convey a sense ofprofessionalism.
WORK ENVIRONMENT
• Help in maintaining a healthy and productive workenvironment to meet the responsibilities to fellowemployees, customers and investors, and to notget engaged in the selling, manufacturing,distributing, using any illegal substance or gettingunder the influence of illegal drugs while on thejob.
• Ensure strict adherence to all health and safetypolicies as may be implemented from time to timeby the Bank.
USAGE OF COMMUNICATION TOOLS
• Ensure strict adherence to the use of internet,emails and telephone provided by the Bank forprofessional use only.
• Never use the Bank's system to transmit or receiveelectronic images or text containing ethnic slurs,social epithets or any thing that might be construedas harassing, offensive or insulting to others.
• Never utilize Bank's system to disseminate anymaterial detrimental to the ideology, sovereigntyor integrity of Pakistan.
• Never utilize the Bank's system for supporting anyterrorist activity within and/or outside Pakistan.
REPORTING AND ACCOUNTABILITY
• Maintain all books, data, information and recordswith scrupulous integrity, reflecting in an accurateand timely manner and to ensure that all businesstransactions are reported and documented correctlyaccording to the business practices.
Ensure facts are not misinterpreted pertaining to:
• Issuing an incorrect account statement / any otherinformation for any customer or staff member.
• Placing a fake claim for reimbursement of anyexpenses.
• Unrecorded funds or assets of Bank in custodyfor any reason.
• Posting of false, artificial or misleading entries inthe books or record of the Bank.
• Intimate Human Resources Management of anychanges in the personal circumstances relating toemployment or benefits.
Statement of Ethics and Business Practices
Annual Report 2009 | 65
Statement of Compliance with the Best Practices of Code of Corporate Governancefor the Year Ended December 31, 2009
This statement is being presented to comply with the Codeof Corporate Governance (the Code) contained in theRegulation No. 37, chapter XIII and XI of listing regulationsof Karachi, Lahore & Islamabad Stock Exchanges (Guarantee)Limited respectively, for the purpose of establishing aframework of good governance, whereby a listed companyis in compliance with the best practices of corporategovernance.
1. The Bank encourages representation of non-executivedirectors on its Board of Directors. At present all thedirectors on the Board are non-executive except forPresident and CEO Mr. Atif Bajwa.
2. The directors have confirmed that none of them isserving as a director in more than ten listed companies,including this Bank.
3. All the resident directors of the Bank are registeredtaxpayers and none of them has defaulted in paymentof any loan to a banking company, a DFI or an NBFI or,being a member of a stock exchange, has been declaredas a defaulter by that stock exchange.
4. No casual vacancy occurred in the Board of MCB BankLimited during the year 2009.
5. The Bank in year 2002 prepared “Statement of Ethicsand Business Practices” for directors and employees.It has been signed by the directors and employees.During the year the same has been circulated as requiredunder the code.
6. The Board has developed a vision / mission statement,overall corporate strategy and significant policies of theBank. A complete record of particulars of significantpolicies along with the dates on which these wereapproved or amended has been maintained.
7. All the powers of the Board have been duly exercisedand decision on material transactions, includingappointment and determination of remuneration andterms and conditions of employment of the ChiefExecutive Officer have been taken by the Board.
8. The meetings of the Board were presided over by theChairman. The Board met at least once in every quarter.Written notices of the Board meeting, along with agendaand working papers, were circulated at least seven daysbefore the meetings. The minutes of the meeting wereappropriately recorded and circulated. The CompanySecretary and Chief Financial Officer attended themeetings of the Board of Directors.
9. During the year Mr. Salman Zafar Siddiqi has beenappointed as Chief Financial Officer replacing Mr. AliMunir, Acting CFO and Mr. Kamran Zaffar Muggo hasbeen appointed as Head Internal Audit in place of Mr.Salman Zafar Siddiqi. Both the appointments includingtheir remuneration and terms & conditions ofemployment, as determined by CEO have been approvedby the Board.
10. The Board arranged orientation courses for its directorsto apprise them of their duties and responsibilities.
11. The directors' report for this year has been prepared incompliance with the requirements of the Code and fullydescribes the salient matters required to be disclosed.
12. The financial statements of the Bank were duly endorsedby the Chief Executive Officer and Chief Financial Officerbefore approval of the Board.
13. The directors, Chief Executive Officer and executivesdo not hold any interest in the shares of the Bank otherthan those disclosed in the annual report.
14. The Bank has complied with all the corporate andfinancial reporting requirements.
15. The Board has formed an audit committee. It comprisesof five members, all of them are non-executive directorsincluding the Chairman of the Committee.
16. The meetings of the audit committee are held at leastonce every quarter prior to approval of interim and finalresults of the Bank, as required by the Code. The termsof reference of the committee have been formulatedand advised to the committee for compliance.
17. The Board has set up an effective internal audit function.Personnel of Internal Audit Department are suitablyqualified and are involved in the internal audit functionon full time basis.
18. The statutory auditors of the Bank have confirmed thatthey have been given a satisfactory rating under theQuality Control Review Program of The Institute ofChartered Accountants of Pakistan, that they or any ofthe partners of the firm, their spouses and minor childrendo not hold shares of the Bank and that the firm and allits partners are in compliance with International Federationof Accountants (IFAC) guidelines on Code of Ethics asadopted by the Institute of Chartered Accountants ofPakistan.
19. The statutory auditors or the persons associated withthem have not been appointed to provide services otherthan approved services and the auditors have confirmedthat they have observed IFAC guidelines in this regard.
20. All related party transactions entered during the yearwere at arm's length basis and these have been placedbefore the Audit Committee and Board of Directors.These transactions are duly reviewed and approved byAudit Committee and Board of Directors.
21. We confirm that all other material principles containedin the Code have been complied with.
On behalf of Directors
Mian Mohammad Mansha ChairmanDated: February 25, 2010
66 | MCB Bank Limited
We have reviewed the Statement of Compliance with the
best practices contained in the Code of Corporate Governance
prepared by the Board of Directors of MCB Bank Limited
(“the Bank”) for the year ended 31 December 2009, to comply
with the Listing Regulations of the respective Stock Exchanges,
where the Bank is listed.
The responsibility for compliance with the Code of Corporate
Governance is that of the Board of Directors of the Bank.
Our responsibility is to review, to the extent where such
compliance can be objectively verified, whether the Statement
of Compliance reflects the status of the Bank's compliance
with the provisions of the Code of Corporate Governance
and report if it does not. A review is limited primarily to inquiries
of the Bank personnel and review of various documents
prepared by the Bank to comply with the Code.
Further, Sub-Regulation (xiii a) of Listing Regulation 35
(previously Regulation No. 37) notified by the Karachi Stock
Exchange (Guarantee) Limited vide circular KSE/ N-269 dated
January 19, 2009 requires the Bank to place before the
Board of Director for their consideration and approval related
party transactions, distinguishing between transactions carried
out on terms equivalent to those that prevail in arm's length
transactions and transactions which are not executed at
arm's length price recording proper justification for using
such alternative pricing mechanism. Further, all such
transactions are also required to be separately placed before
the Audit Committee.
We are only required and have ensured compliance of
requirement to the extent of approval of related party
transactions by the Board of Directors and placement of
such transactions before the Audit Committee. We have not
carried out any procedure to determine whether the related
party transactions were undertaken at arm's length price.
As part of our audit of financial statements, we are required
to obtain an understanding of the accounting and internal
control systems sufficient to plan the audit and develop an
effective audit approach. We have not carried out any special
review of the internal control system to enable us to express
an opinion as to whether the Board's statement on internal
control covers all controls and the effectiveness of such
internal controls.
Based on our review, nothing has come to our attention
which causes us to believe that the Statement of Compliance
does not appropriately reflect the Bank's compliance, in all
material respects, with the best practices contained in the
Code of Corporate Governance as applicable to the Bank
for the year ended 31 December 2009.
KPMG TASEER HADI & CO.Lahore Chartered AccountantsDated: February 25, 2010 (Farid Uddin Ahmed)
Review Report to the Members on Statement of Compliance with Best Practicesof Code of Corporate Governance
Annual Report 2009 I 67
We have audited the annexed balance sheet of MCB Bank Limited (“the Bank”) as at 31 December 2009 and the related profit and loss account, statement of comprehensive income, cash flow statement and statement of changes in equity, together with the notes forming part thereof (hereinafter referred to as the ‘financial statements’) for the year then ended, in which are incorporated the unaudited certified returns from the branches except for sixty branches which have been audited by us and seven branches audited by auditors abroad and we state that we have obtained all the information and explanations which, to the best of our knowledge and belief, were necessary for the purposes of our audit.
It is the responsibility of the Bank’s Board of Directors to establish and maintain a system of internal control and prepare and present the financial statements in conformity with approved accounting standards and the requirements of the Banking Companies Ordinance, 1962 (LVII of 1962) and the Companies Ordinance, 1984 (XLVII of 1984). Our responsibility is to express an opinion on these statements based on our audit.
We conducted our audit in accordance with the International Standards on Auditing as applicable in Pakistan. These standards require that we plan and perform the audit to obtain reasonable assurance about whether the financial statements are free of any material misstatement. An audit includes examining, on a test basis, evidence supporting the amounts and disclosures in the financial statements. An audit also includes assessing the accounting policies and significant estimates made by management, as well as, evaluating the overall presentation of the financial statements. We believe that our audit provides a reasonable basis for our opinion and after due verification, which in case of loans and advances covered more than sixty per cent of the total domestic loans and advances of the Bank, we report that:
a) in our opinion, proper books of account have been kept by the Bank as required by the Companies Ordinance, 1984 (XLVII of 1984) and the returns referred to above received from the branches have been found adequate for the purposes of our audit;
b) in our opinion:
i) the balance sheet and profit and loss account together with the notes thereon have been drawn up in conformity with the Banking Companies Ordinance, 1962 (LVII of 1962) and the Companies Ordinance, 1984 (XLVII of 1984), and are in agreement with the books of account and are further in accordance with accounting policies consistently applied, except for the changes referred to in note 5.1, with which we concur;
ii) the expenditure incurred during the year was for the purpose of the Bank’s business; and
iii) the business conducted, investments made and the expenditure incurred during the year were in accordance with the objects of the Bank and the transactions of the Bank which have come to our notice have been within the powers of the Bank;
c) in our opinion and to the best of our information and according to the explanations given to us the balance sheet, profit and loss account, statement of comprehensive income, cash flow statement and statement of changes in equity, together with the notes forming part thereof conform with the approved accounting standards as applicable in Pakistan and give the information required by the Banking Companies Ordinance, 1962 (LVII of 1962), and the Companies Ordinance, 1984 (XLVII of 1984), in the manner so required and give a true and fair view of the state of the Bank’s affairs as at 31 December 2009 and its true balance of the profit, its comprehensive income, its cash flows and changes in equity for the year then ended; and
d) in our opinion Zakat deductible at source under the Zakat and Ushr Ordinance, 1980 (XVIII of 1980), was deducted by the Bank and deposited in the Central Zakat Fund established under section 7 of that Ordinance.
Lahore KPMG Taseer Hadi & Co. Chartered AccountantsFebruary 25, 2010 Farid ud Din Ahmed
Auditors’ Report to the Members
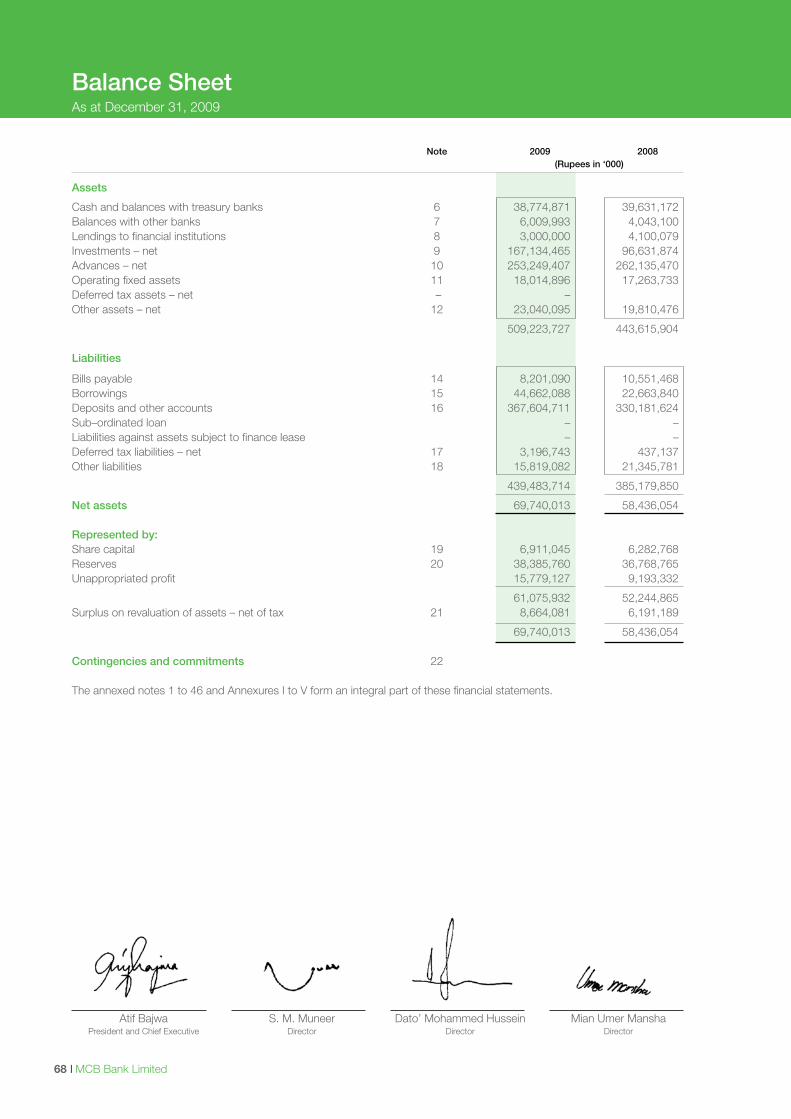
I MCB Bank Limited68
Note 2009 2008 (Rupees in ‘000)
Assets
Cash and balances with treasury banks 6 38,774,871 39,631,172 Balances with other banks 7 6,009,993 4,043,100 Lendings to financial institutions 8 3,000,000 4,100,079 Investments – net 9 167,134,465 96,631,874 Advances – net 10 253,249,407 262,135,470 Operating fixed assets 11 18,014,896 17,263,733 Deferred tax assets – net – – Other assets – net 12 23,040,095 19,810,476
509,223,727 443,615,904
Liabilities
Bills payable 14 8,201,090 10,551,468 Borrowings 15 44,662,088 22,663,840 Deposits and other accounts 16 367,604,711 330,181,624 Sub–ordinated loan – – Liabilities against assets subject to finance lease – – Deferred tax liabilities – net 17 3,196,743 437,137 Other liabilities 18 15,819,082 21,345,781
439,483,714 385,179,850
Net assets 69,740,013 58,436,054 Represented by: Share capital 19 6,911,045 6,282,768 Reserves 20 38,385,760 36,768,765 Unappropriated profit 15,779,127 9,193,332
61,075,932 52,244,865 Surplus on revaluation of assets – net of tax 21 8,664,081 6,191,189
69,740,013 58,436,054 Contingencies and commitments 22
The annexed notes 1 to 46 and Annexures I to V form an integral part of these financial statements.
Balance SheetAs at December 31, 2009
Atif Bajwa S. M. Muneer Dato’ Mohammed Hussein Mian Umer Mansha President and Chief Executive Director Director Director
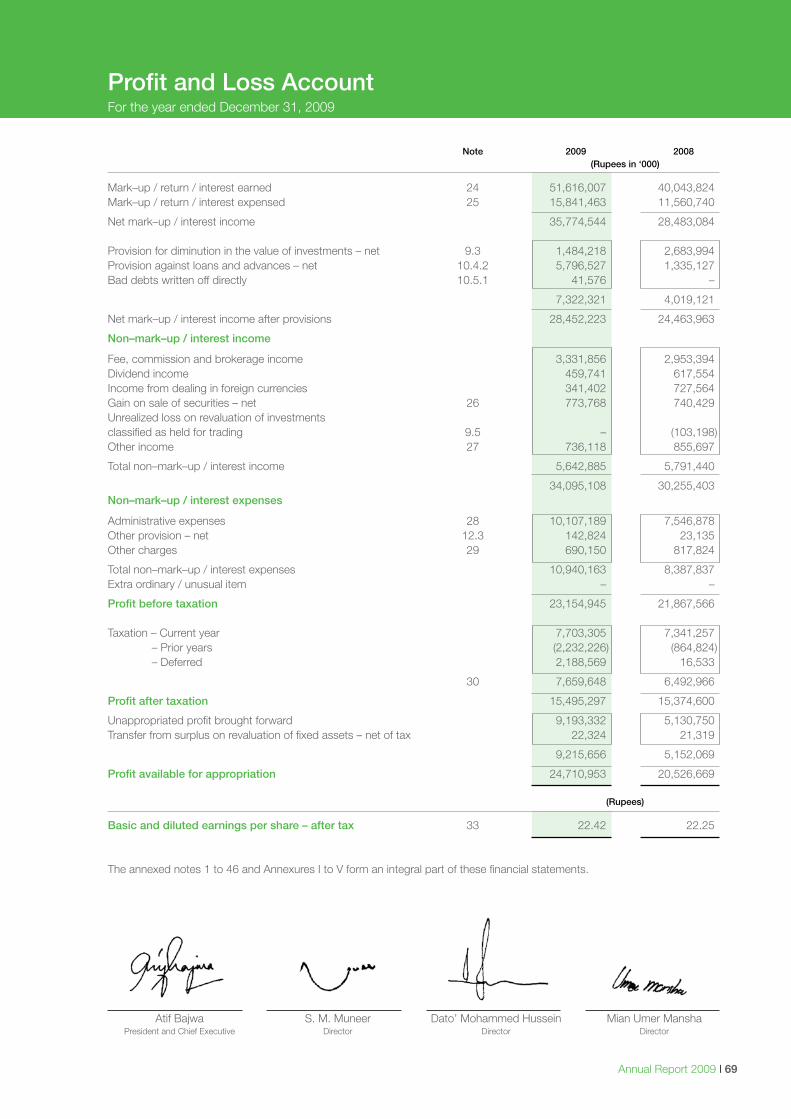
Annual Report 2009 I 69
Note 2009 2008 (Rupees in ‘000)
Mark–up / return / interest earned 24 51,616,007 40,043,824 Mark–up / return / interest expensed 25 15,841,463 11,560,740
Net mark–up / interest income 35,774,544 28,483,084 Provision for diminution in the value of investments – net 9.3 1,484,218 2,683,994 Provision against loans and advances – net 10.4.2 5,796,527 1,335,127 Bad debts written off directly 10.5.1 41,576 –
7,322,321 4,019,121
Net mark–up / interest income after provisions 28,452,223 24,463,963
Non–mark–up / interest income
Fee, commission and brokerage income 3,331,856 2,953,394 Dividend income 459,741 617,554 Income from dealing in foreign currencies 341,402 727,564 Gain on sale of securities – net 26 773,768 740,429 Unrealized loss on revaluation of investments classified as held for trading 9.5 – (103,198)Other income 27 736,118 855,697
Total non–mark–up / interest income 5,642,885 5,791,440
34,095,108 30,255,403 Non–mark–up / interest expenses
Administrative expenses 28 10,107,189 7,546,878 Other provision – net 12.3 142,824 23,135 Other charges 29 690,150 817,824
Total non–mark–up / interest expenses 10,940,163 8,387,837 Extra ordinary / unusual item – –
Profit before taxation 23,154,945 21,867,566 Taxation – Current year 7,703,305 7,341,257 – Prior years (2,232,226) (864,824) – Deferred 2,188,569 16,533
30 7,659,648 6,492,966
Profit after taxation 15,495,297 15,374,600
Unappropriated profit brought forward 9,193,332 5,130,750 Transfer from surplus on revaluation of fixed assets – net of tax 22,324 21,319
9,215,656 5,152,069
Profit available for appropriation 24,710,953 20,526,669
(Rupees)
Basic and diluted earnings per share – after tax 33 22.42 22.25
The annexed notes 1 to 46 and Annexures I to V form an integral part of these financial statements.
Profit and Loss AccountFor the year ended December 31, 2009
Atif Bajwa S. M. Muneer Dato’ Mohammed Hussein Mian Umer Mansha President and Chief Executive Director Director Director
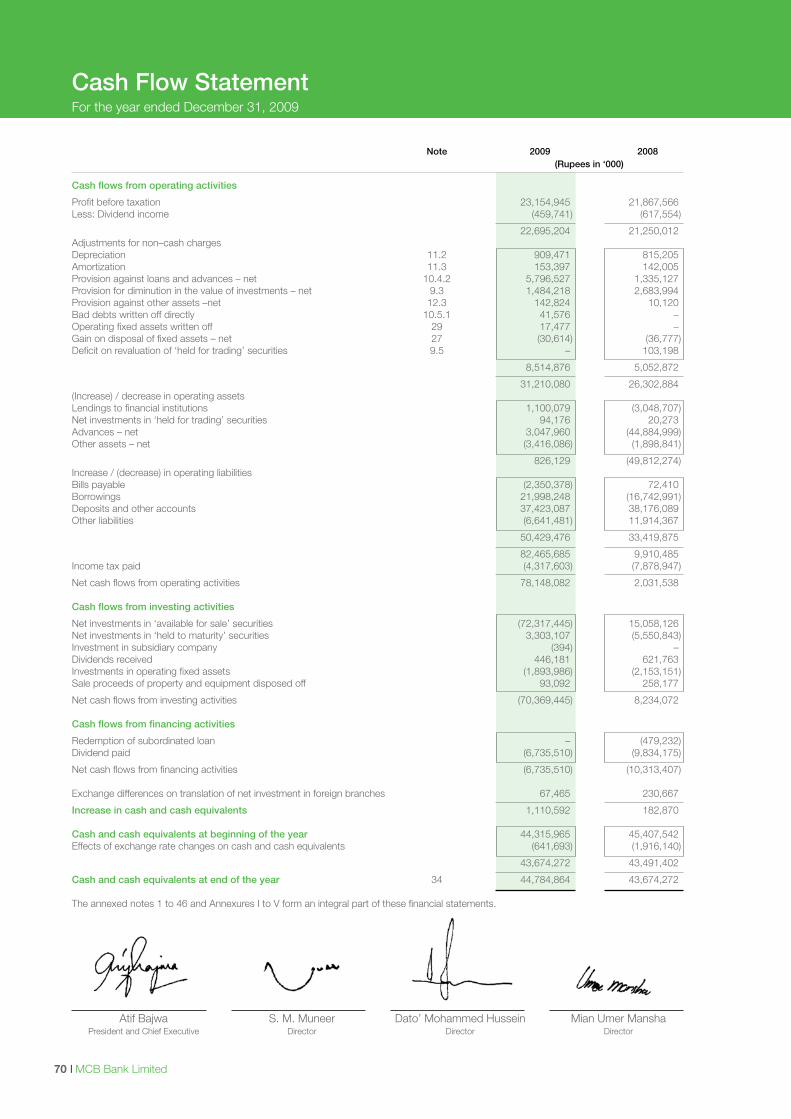
I MCB Bank Limited70
Cash Flow StatementFor the year ended December 31, 2009
Note 2009 2008 (Rupees in ‘000)
Cash flows from operating activities
Profit before taxation 23,154,945 21,867,566 Less: Dividend income (459,741) (617,554)
22,695,204 21,250,012 Adjustments for non–cash charges Depreciation 11.2 909,471 815,205 Amortization 11.3 153,397 142,005 Provision against loans and advances – net 10.4.2 5,796,527 1,335,127 Provision for diminution in the value of investments – net 9.3 1,484,218 2,683,994 Provision against other assets –net 12.3 142,824 10,120 Bad debts written off directly 10.5.1 41,576 – Operating fixed assets written off 29 17,477 – Gain on disposal of fixed assets – net 27 (30,614) (36,777)Deficit on revaluation of ‘held for trading’ securities 9.5 – 103,198
8,514,876 5,052,872
31,210,080 26,302,884 (Increase) / decrease in operating assets Lendings to financial institutions 1,100,079 (3,048,707)Net investments in ‘held for trading’ securities 94,176 20,273 Advances – net 3,047,960 (44,884,999)Other assets – net (3,416,086) (1,898,841)
826,129 (49,812,274)Increase / (decrease) in operating liabilities Bills payable (2,350,378) 72,410 Borrowings 21,998,248 (16,742,991)Deposits and other accounts 37,423,087 38,176,089 Other liabilities (6,641,481) 11,914,367
50,429,476 33,419,875
82,465,685 9,910,485 Income tax paid (4,317,603) (7,878,947)
Net cash flows from operating activities 78,148,082 2,031,538 Cash flows from investing activities
Net investments in ‘available for sale’ securities (72,317,445) 15,058,126 Net investments in ‘held to maturity’ securities 3,303,107 (5,550,843)Investment in subsidiary company (394) – Dividends received 446,181 621,763 Investments in operating fixed assets (1,893,986) (2,153,151)Sale proceeds of property and equipment disposed off 93,092 258,177
Net cash flows from investing activities (70,369,445) 8,234,072 Cash flows from financing activities
Redemption of subordinated loan – (479,232)Dividend paid (6,735,510) (9,834,175)
Net cash flows from financing activities (6,735,510) (10,313,407) Exchange differences on translation of net investment in foreign branches 67,465 230,667
Increase in cash and cash equivalents 1,110,592 182,870 Cash and cash equivalents at beginning of the year 44,315,965 45,407,542 Effects of exchange rate changes on cash and cash equivalents (641,693) (1,916,140)
43,674,272 43,491,402
Cash and cash equivalents at end of the year 34 44,784,864 43,674,272 The annexed notes 1 to 46 and Annexures I to V form an integral part of these financial statements.
Atif Bajwa S. M. Muneer Dato’ Mohammed Hussein Mian Umer Mansha President and Chief Executive Director Director Director
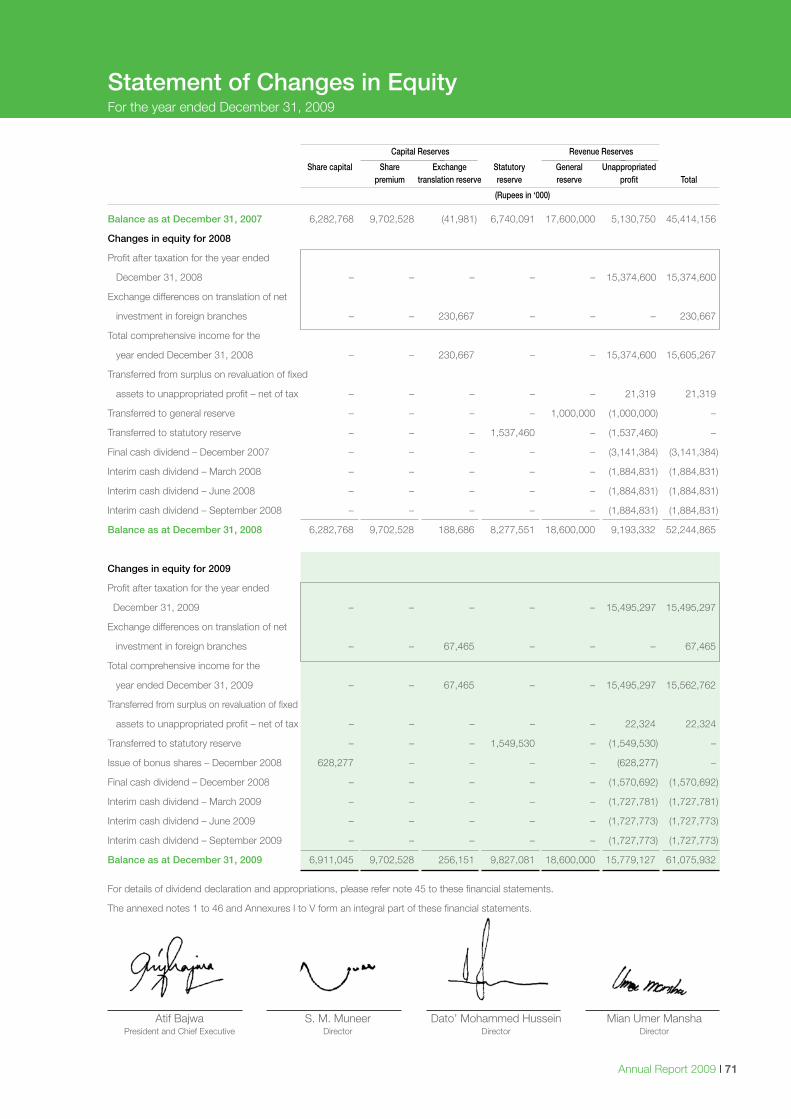
Annual Report 2009 I 71
Atif Bajwa S. M. Muneer Dato’ Mohammed Hussein Mian Umer Mansha President and Chief Executive Director Director Director
Statement of Changes in EquityFor the year ended December 31, 2009
Capital Reserves Revenue Reserves
Share capital Share Exchange Statutory General Unappropriated premium translation reserve reserve reserve profit Total
(Rupees in ‘000)
Balance as at December 31, 2007 6,282,768 9,702,528 (41,981) 6,740,091 17,600,000 5,130,750 45,414,156
Changes in equity for 2008
Profit after taxation for the year ended
December 31, 2008 – – – – – 15,374,600 15,374,600
Exchange differences on translation of net
investment in foreign branches – – 230,667 – – – 230,667
Total comprehensive income for the
year ended December 31, 2008 – – 230,667 – – 15,374,600 15,605,267
Transferred from surplus on revaluation of fixed
assets to unappropriated profit – net of tax – – – – – 21,319 21,319
Transferred to general reserve – – – – 1,000,000 (1,000,000) –
Transferred to statutory reserve – – – 1,537,460 – (1,537,460) –
Final cash dividend – December 2007 – – – – – (3,141,384) (3,141,384)
Interim cash dividend – March 2008 – – – – – (1,884,831) (1,884,831)
Interim cash dividend – June 2008 – – – – – (1,884,831) (1,884,831)
Interim cash dividend – September 2008 – – – – – (1,884,831) (1,884,831)
Balance as at December 31, 2008 6,282,768 9,702,528 188,686 8,277,551 18,600,000 9,193,332 52,244,865
Changes in equity for 2009
Profit after taxation for the year ended
December 31, 2009 – – – – – 15,495,297 15,495,297
Exchange differences on translation of net
investment in foreign branches – – 67,465 – – – 67,465
Total comprehensive income for the
year ended December 31, 2009 – – 67,465 – – 15,495,297 15,562,762
Transferred from surplus on revaluation of fixed
assets to unappropriated profit – net of tax – – – – – 22,324 22,324
Transferred to statutory reserve – – – 1,549,530 – (1,549,530) –
Issue of bonus shares – December 2008 628,277 – – – – (628,277) –
Final cash dividend – December 2008 – – – – – (1,570,692) (1,570,692)
Interim cash dividend – March 2009 – – – – – (1,727,781) (1,727,781)
Interim cash dividend – June 2009 – – – – – (1,727,773) (1,727,773)
Interim cash dividend – September 2009 – – – – – (1,727,773) (1,727,773)
Balance as at December 31, 2009 6,911,045 9,702,528 256,151 9,827,081 18,600,000 15,779,127 61,075,932
For details of dividend declaration and appropriations, please refer note 45 to these financial statements.
The annexed notes 1 to 46 and Annexures I to V form an integral part of these financial statements.
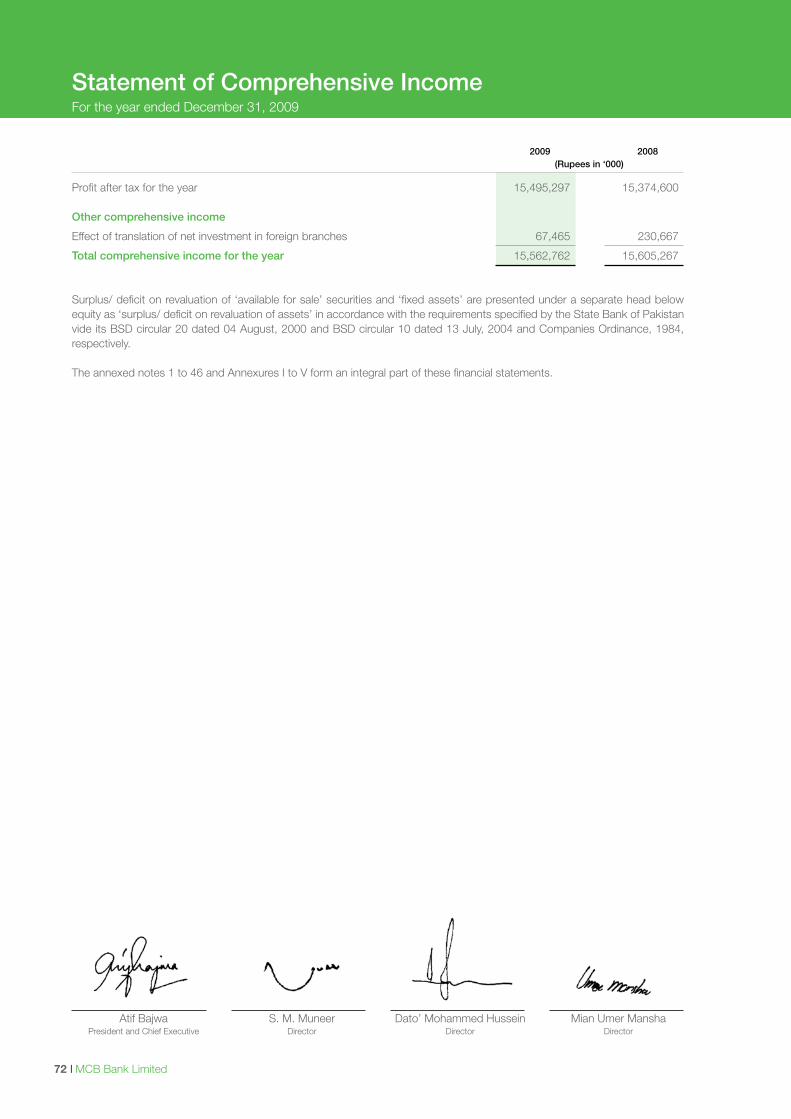
I MCB Bank Limited72
2009 2008 (Rupees in ‘000)
Profit after tax for the year 15,495,297 15,374,600
Other comprehensive income
Effect of translation of net investment in foreign branches 67,465 230,667
Total comprehensive income for the year 15,562,762 15,605,267 Surplus/ deficit on revaluation of ‘available for sale’ securities and ‘fixed assets’ are presented under a separate head below equity as ‘surplus/ deficit on revaluation of assets’ in accordance with the requirements specified by the State Bank of Pakistan vide its BSD circular 20 dated 04 August, 2000 and BSD circular 10 dated 13 July, 2004 and Companies Ordinance, 1984, respectively.
The annexed notes 1 to 46 and Annexures I to V form an integral part of these financial statements.
Statement of Comprehensive IncomeFor the year ended December 31, 2009
Atif Bajwa S. M. Muneer Dato’ Mohammed Hussein Mian Umer Mansha President and Chief Executive Director Director Director
Annual Report 2009 I 73
1. STATUS AND NATURE OF BUSINESS
MCB Bank Limited (the ‘Bank’) is a banking company incorporated in Pakistan and is engaged in commercial banking and related services. The Bank’s ordinary shares are listed on all the stock exchanges in Pakistan whereas its Global Depository Receipts (GDRs) representing two ordinary shares (2008: two ordinary shares) are traded on the International Order Book (IOB) system of the London Stock Exchange. The Bank’s Registered Office and Principal Office are situated at MCB Building, Jinnah Avenue, Islamabad and MCB –15 Main Gulberg, Lahore, respectively. The Bank operates 1,074 branches including 11 Islamic banking branches (2008: 1,040 branches including 11 Islamic banking branches) within Pakistan and 7 branches (2008: 7 branches) outside the country (including the Karachi Export Processing Zone branch).
2. BASIS OF PRESENTATION
2.1 These financial statements represent separate financial statements of MCB Bank Limited. The consolidated financial statements of the Group are being issued separately.
2.2 In accordance with the directives of the Federal Government regarding the shifting of the banking system to Islamic modes, the State Bank of Pakistan has issued various circulars from time to time. Permissible forms of trade–related modes of financing include purchase of goods by banks from their customers and immediate resale to them at appropriate mark–up in price on deferred payment basis. The purchases and sales arising under these arrangements are not reflected in these financial statements as such but are restricted to the amount of facility actually utilized and the appropriate portion of mark–up thereon.
2.3 The financial results of the Islamic Banking branches have been consolidated in these financial statements for reporting purposes, after eliminating material inter–branch transactions / balances. Key financial figures of the Islamic Banking branches are disclosed in Annexure II to these financial statements.
2.4 For the purpose of translation, rates of Rs. 84.2416
per US Dollar (2008: Rs. 79.0985) and Rs. 0.7364 per SLR (2008: Rs.0.700) have been used.
3. STATEMENT OF COMPLIANCE
3.1 These financial statements have been prepared in accordance with the approved accounting standards as applicable in Pakistan. Approved Accounting Standards comprise of such International Financial Reporting Standards (IFRS) issued by the International Accounting Standards Board as are notified under the Companies Ordinance, 1984, provisions of and directives issued under the Companies Ordinance, 1984 and Banking Companies Ordinance, 1962. In case requirements differ, the provisions and directives given in Companies Ordinance, 1984 and Banking Companies Ordinance, 1962 shall prevail.
The State Bank of Pakistan has deferred the applicability of International Accounting Standard (IAS) 39, ‘Financial Instruments: Recognition and Measurement’ and International Accounting Standard (IAS) 40, ‘Investment Property’ for Banking Companies through BSD Circular No. 10 dated August 26, 2002. The Securities Exchange Commission of Pakistan (SECP) has deferred applicability of IFRS–7 “Financial Instruments: Disclosures” on banks through S.R.O 411(1) /2008 dated April 28, 2008. Accordingly, the requirements of these standards have not been considered in the preparation of these financial statements. However, investments have been classified and valued in accordance with the requirements prescribed by the State Bank of Pakistan through various circulars.
3.2 Standards, amendments and interpretations to published approved accounting standards that are not relevant and not yet effective
The following standards, amendments and interpretations of approved accounting standards will be effective for accounting periods beginning on or after January 01, 2010. These standards are either not relevant to the Bank’s operations or are not expected to have a significant impact on the Bank’s financial statements other then increase in disclosures in certain cases:
– Revised IFRS 3 – Business Combinations (applicable for annual periods beginning on or after July 01, 2009) broadens among other things the definition of business resulting in more acquisitions being treated as business combinations, contingent consideration to be measured at fair value, transaction costs other than share and debt issue costs to be expensed, any pre-existing interest in an acquiree to be measured at fair value, with the related gain or loss recognised in profit or loss and any non-controlling (minority) interest to be measured at either fair value, or at its proportionate interest in the identifiable assets and liabilities of an acquiree, on a transaction-by-transaction basis.
– Amended IAS 27 – Consolidated and Separate Financial Statements (effective for annual periods beginning on or after July 01, 2009) requires accounting for changes in ownership interest by the group in a subsidiary, while maintaining control, to be recognized as an equity transaction. When the group loses control of subsidiary, any interest retained in the former subsidiary will be measured at fair value with the gain or loss recognized in the profit or loss.
– IFRIC 15 – Agreement for the Construction of Real Estate (effective for annual periods beginning on or after October 01, 2009) clarifies the recognition of revenue by real estate developers for sale of units, such as apartments or houses, ‘off-plan’, that is, before construction is complete.
Notes to the Financial StatementsFor the year ended December 31, 2009
I MCB Bank Limited74
– Amendments to IAS 39 – Financial Instruments: Recognition and Measurement – Eligible hedged Items (effective for annual periods beginning on or after July 01, 2009) clarifies the application of existing principles that determine whether specific risks or portions of cash flows are eligible for designation in a hedging relationship.
– IFRIC – 17 – Distributions of Non–cash Assets to Owners (effective for annual periods beginning on or after July 01, 2009) states that when a Bank distributes non cash assets to its shareholders as dividend, the liability for the dividend is measured at fair value. If there are subsequent changes in the fair value before the liability is discharged, this is recognised in equity. When the non–cash asset is distributed, the difference between the carrying amount and fair value is recognised in the income statement.
The International Accounting Standards Board made certain amendments to existing standards as part of its second annual improvements project. The effective dates for these amendments vary by standard and most will be applicable to the Bank’s 2010 financial statements.
– Amendment to IFRS 2 – Share–based Payment – Group Cash–settled Share–based Payment Transactions (effective for annual periods beginning on or after January 01, 2010). Currently effective IFRSs require attribution of group share–based payment transactions only if they are equity–settled. The amendments resolve diversity in practice regarding attribution of cash–settled share–based payment transactions and require an entity receiving goods or services in either an equity–settled or a cash–settled payment transaction to account for the transaction in its separate or individual financial statements.
– Amendment to IAS 32 – Financial Instruments: Presentation – Classification of Rights Issues (effective for annual periods beginning on or after February 01, 2010). The IASB amended IAS 32 to allow rights, options or warrants to acquire a fixed number of the entity’s own equity instruments for a fixed amount of any currency to be classified as equity instruments provided the entity offers the rights, options or warrants pro rata to all of its existing owners of the same class of its own non–derivative equity instruments.
– IFRIC 19 – Extinguishing Financial Liabilities with Equity Instruments (effective for annual periods beginning on or after July 01, 2010). This interpretation provides guidance on the accounting for debt for equity swaps.
– IAS 24 – Related Party Disclosures (revised 2009) – effective for annual periods beginning on
or after January 01, 2011. The revision amends the definition of a related party and modifies certain related party disclosure requirements for government–related entities. The amendment would result in certain changes in disclosures.
– Amendments to IFRIC 14 IAS 19 – The Limit on a Defined Benefit Assets, Minimum Funding Requirements and their Interaction (effective for annual periods beginning on or after January 01, 2011). These amendments remove unintended consequences arising from the treatment of prepayments where there is a minimum funding requirement. These amendments result in prepayments of contributions in certain circumstances being recognised as an asset rather than an expense. This amendment is not likely to have any impact on Bank’s financial statements.
– Amendments to IFRS 5 – Non–current Assets Held for Sale and Discontinued Operations – (effective for annual periods beginning on or after July 01, 2009). The amendments specify that if an entity is committed to a plan to sell a subsidiary, then it would classify all of that subsidiary’s assets and liabilities as held for sale when the held for sale criteria in IFRS 5 are met. This applies regardless of the entity retaining an interest (other than control) in the subsidiary; and disclosures for discontinued operations are required by the parent when a subsidiary meets the definition of a discontinued operation. This amendment is not likely to have any impact on Bank’s financial statements.
4. BASIS OF MEASUREMENT
4.1 These financial statements have been prepared under the historical cost convention except that certain fixed assets are stated at revalued amounts and certain investments, commitments in respect of certain forward exchange contracts and derivative financial instruments have been marked to market and are carried at fair value.
4.2 The financial statements are presented in Pak Rupees, which is the Bank’s functional and presentation currency. The amounts are rounded off to the nearest thousand.
4.3 Critical accounting estimates and judgments
The preparation of financial statements in conformity with the approved accounting standards requires the use of certain critical accounting estimates. It also requires the management to exercise its judgment in the process of applying the Bank’s accounting policies. Estimates and judgments are continually evaluated and are based on historical experiences, including expectations of future events that are believed to be reasonable under the circumstances.
Notes to the Financial StatementsFor the year ended December 31, 2009
Annual Report 2009 I 75
The areas where various assumptions and estimates are significant to the Bank’s financial statements or where judgment was exercised in the application of accounting policies are as follows: a) Classification of investments
– In classifying investments as ‘held for trading’, the Bank has determined securities which are acquired with an intention to trade by taking advantage of short term market / interest rate movements and are to be sold within 90 days.
– In classifying investments as ‘held to maturity’, the Bank follows the guidance provided in SBP circulars on classifying non-derivative financial assets with fixed or determinable payments and fixed maturity. In making this judgment, the Bank evaluates its intention and ability to hold such investment to maturity.
– The investments which are not classified as ‘held for trading’ or ‘held to maturity’ are classified as ‘available for sale’.
b) Provision against advances
The Bank reviews its loan portfolio to assess the amount of non-performing advances and provision required there against on regular basis. While assessing this requirement various factors including the delinquency in the account, financial position of the borrowers and the requirements of the Prudential Regulations are considered.
The amount of general provision is determined in accordance with the relevant regulations and management’s judgment as explained in notes 10.4.3 and 10.4.4.
c) Impairment of ‘available for sale’ equity investments
The Bank determines that ‘available for sale’ equity investments are impaired when there has been a significant or prolonged decline in the fair value below its cost. The determination of what is significant or prolonged requires judgment. In making this judgment, the Bank evaluates among other factors, the normal volatility in share price. In addition, the impairment may be appropriate when there is an evidence of deterioration in the financial health of the invested industry and sector performance, changes in technology and operational/financial cash flows.
d) Taxation
In making the estimates for income taxes currently payable by the Bank, the management considers the current income tax laws and the decisions of appellate authorities on certain issues in the past.
e) Fair value of derivatives
The fair values of derivatives which are not quoted in active markets are determined by using valuation techniques. The valuation techniques
take into account the relevant interest rates at the balance sheet date and the rates contracted.
f) Depreciation, amortization and revaluation of operating fixed assets
In making estimates of the depreciation / amortization method, the management uses the method which reflects the pattern in which economic benefits are expected to be consumed by the Bank. The method applied is reviewed at each financial year end and if there is a change in the expected pattern of consumption of the future economic benefits embodied in the assets, the method is changed to reflect the changed pattern. Such change is accounted for as change in accounting estimates in accordance with International Accounting Standard (IAS) 8 “Accounting Policies, Changes in Accounting Estimates and Errors”. Further, the Bank estimates the revalued amount of land and buildings on a regular basis. The estimates are based on valuations carried out by independent professional valuers under the market conditions.
g) Staff retirement benefits
Certain actuarial assumptions have been adopted as disclosed in these financial statements (note 36) for the actuarial valuation of staff retirement benefit plans. Actuarial assumptions are entity’s best estimates of the variables that will determine the ultimate cost of providing post employment benefits. Changes in these assumptions in future years may affect the liability / asset under these plans in those years.
5. SUMMARY OF SIGNIFICANT ACCOUNTING POLICIES
5.1 Change in accounting policies
Starting January 01, 2009, the Bank has changed its accounting policies in respect of ‘Presentation of financial statements’ and ‘Ijarah’.
5.1.1 The Bank has applied Revised IAS 1 Presentation of Financial Statements (2007) which became effective as of January 01, 2009. As a result, the Bank presents in the statement of changes in equity all owner changes in equity, whereas all non–owner changes in equity are presented in statement of comprehensive income. This presentation has been applied in these financial statements as of and for the year ended on December 31, 2009.
Comparative information has been re-presented so that it is also in conformity with the revised standard. Since the change in accounting policy only impacts presentation aspects, there is no impact on earning per share.
5.1.2 The State Bank of Pakistan has notified for adoption of Islamic Financial Accounting Standard – IFAS 2 “Ijarah” which is applicable for accounting periods beginning on or after January 01, 2009. IFAS 2 requires assets underlying ijarah financing to be recorded as operating fixed assets separately from the assets in Bank’s own use. These assets are carried at cost less accumulated depreciation and impairment, if any.
Notes to the Financial StatementsFor the year ended December 31, 2009
I MCB Bank Limited76
5.2 Investments
The Bank classifies its investments as follows:
a) Held for trading
These are securities, which are either acquired for generating profit from short-term fluctuations in market prices, interest rate movements, dealers margin or are securities included in a portfolio in which a pattern of short-term profit taking exists.
b) Held to maturity
These are securities with fixed or determinable payments and fixed maturity in respect of which the Bank has the positive intent and ability to hold to maturity.
c) Available for sale
These are investments, other than those in subsidiaries and associates, that do not fall under the ‘held for trading’ or ‘held to maturity’ categories.
Investments are initially recognized at cost which in case of investments other than ‘held for trading’ include transaction costs associated with the investment.
All purchases and sales of investments that require delivery within the time frame established by regulation or market convention are recognized at the trade date. Trade date is the date on which the Bank commits to purchase or sell the investment.
In accordance with the requirements of the State Bank of Pakistan, quoted securities, other than those classified as ‘held to maturity’, investments in subsidiaries and investments in associates are subsequently re–measured to market value. Surplus / (deficit) arising on revaluation of quoted securities which are classified as ‘available for sale’, is taken to a separate account which is shown in the balance sheet below equity. Surplus / (deficit) arising on revaluation of quoted securities which are classified as ‘held for trading’, is taken to the profit and loss account currently.
Unquoted equity securities (excluding investments in subsidiaries and associates) are valued at the lower of cost and break–up value. Break–up value of equity securities is calculated with reference to the net assets of the investee company as per the latest available audited financial statements. Investments classified as ‘held to maturity’ are carried at amortized cost. Investments in subsidiaries and investments in associates are carried at cost.
Provision for impairment in the values of securities (except debentures, participation term certificates and term finance certificates) is made currently.
Provisions for impairment in value of debentures, participation term certificates and term finance certificates are made as per the requirements of the Prudential Regulations issued by the State Bank of Pakistan.
5.3 Sale and repurchase agreements
Securities sold subject to a repurchase agreement (repo) are retained in the financial statements as investments and the counter party liability is included in borrowings. Securities purchased under an agreement to resell (reverse repo) are not recognized in the financial statements as investments and the amount extended to the counter party is included in lendings to financial institutions. The difference between the purchase / sale and re-sale / re-purchase price is recognized as mark-up income / expense on a time proportion basis, as the case may be.
5.4 Advances
Advances are stated net of specific and general provisions. Specific provision is determined on the basis of the Prudential Regulations and other directives issued by the State Bank of Pakistan (SBP) and charged to the profit and loss account. Provisions are held against identified as well as unidentified losses. Provisions against unidentified losses include general provision against consumer loans made in accordance with the requirements of the Prudential Regulations issued by SBP and provision based on historical loss experience on advances. Advances are written off when there is no realistic prospect of recovery.
Leases where the Bank transfers substantially all the risks and rewards incidental to ownership of an asset to the lessee are classified as financial leases. A receivable is recognized at an amount equal to the present value of the lease payments including any guaranteed residual value. Finance lease receivables are included in advances to the customers.
5.5 Operating fixed assets and depreciation
Property and equipment, other than land carrying value of which is not amortized, are stated at cost or revalued amount less accumulated depreciation and accumulated impairment losses (if any). Land is carried at revalued amount. Capital work-in-progress is stated at cost. Cost of property and equipment of foreign operations includes exchange differences arising on currency translation at year-end rates.
Depreciation on all operating fixed assets is charged using the diminishing balance method except for vehicles, computers, carpets and buildings which are depreciated using the straight line method in accordance with the rates specified in note 11.2 to these financial statements and after taking into account residual value, if any. The residual values, useful lives and depreciation methods are reviewed and adjusted, if appropriate, at each balance sheet date.
Notes to the Financial StatementsFor the year ended December 31, 2009
Annual Report 2009 I 77
Depreciation on additions is charged from the month the assets are available for use while no depreciation is charged in the month in which the assets are disposed off.
Surplus on revaluation of land and buildings is credited
to the surplus on revaluation account. Revaluation is carried out with sufficient regularity to ensure that the carrying amount of assets does not differ materially from the fair value. To the extent of the incremental depreciation charged on the revalued assets, the related surplus on revaluation of land and buildings (net of deferred taxation) is transferred directly to unappropriated profit.
Gains / losses on sale of property and equipment are credited / charged to the profit and loss account currently, except that the related surplus on revaluation of land and buildings (net of deferred taxation) is transferred directly to unappropriated profit.
Subsequent costs are included in the asset’s carrying amount or are recognized as a separate asset, as appropriate, only when it is probable that future economic benefits associated with the item will flow to the Bank and the cost of the item can be measured reliably. All other repairs and maintenance are charged to the profit and loss account.
5.5.1 Intangible assets
Intangible assets are stated at cost less accumulated amortization and accumulated impairment losses, if any. Intangible assets are amortized from the month when these assets are available for use, using the straight line method, whereby the cost of the intangible assets are amortized over its estimated useful lives over which economic benefits are expected to flow to the Bank. The useful lives are reviewed and adjusted, if appropriate, at each balance sheet date.
5.5.2 Leased (Ijarah)
Assets leased out under ‘Ijarah’ are stated at cost less accumulated depreciation and accumulated impairment losses, if any. Assets under Ijarah are depreciated over the period of lease term. However, in the event the asset is expected to be available for re-ijarah, depreciation is charged over the economic life of the asset using straight line basis.
Ijarah income is recognized on an accrual basis as and when the rental becomes due.
5.6 Impairment
The carrying amount of assets are reviewed at each balance sheet date for impairment whenever events or changes in circumstances indicate that the carrying amounts of the assets may not be recoverable. If such indication exists, and where the carrying value exceeds the estimated recoverable amount, assets are written down to their recoverable amounts. Recoverable amount is the greater of net selling price and value in use. The resulting impairment loss is taken to the profit and loss account except for impairment loss on revalued assets, which is adjusted against the related
revaluation surplus to the extent that the impairment loss does not exceed the surplus on revaluation of that asset.
5.7 Staff retirement benefits
The Bank operates the following staff retirement benefits for its employees:
a) For clerical / non–clerical staff who did not opt for the new scheme, the Bank operates the following:
– an approved contributory provident fund;
– an approved gratuity scheme; and
– a contributory benevolent scheme
b) For clerical / non–clerical staff who joined the Bank after the introduction of the new scheme and for others who opted for the new scheme introduced in 1975, the Bank operates the following:
– an approved non–contributory provident fund introduced in lieu of the contributory provident fund;
– an approved pension fund; and
– contributory benevolent scheme
c) For officers who joined the Bank after the introduction of the new scheme and for others who opted for the new scheme introduced in 1977, the Bank operates the following:
– an approved non–contributory provident fund introduced in lieu of the contributory provident fund; and
– an approved pension fund.
However, the management has replaced the pension benefits for employees in the officer category with a contributory provident fund for services rendered after December 31, 2003.
d) For executives and officers who joined the Bank on or after January 01, 2000 the Bank operates an approved contributory provident fund.
e) Post retirement medical benefits to entitled employees.
Annual contributions towards the defined benefit plans and schemes are made on the basis of actuarial advice using the projected unit credit method. The above benefits are payable to staff at the time of separation from the Bank’s services subject to the completion of qualifying period of service. The net cumulative actuarial gains / losses at each balance sheet date are recognized equally over a period of three years or the expected remaining average working lives of employees, whichever is lower.
Notes to the Financial StatementsFor the year ended December 31, 2009
I MCB Bank Limited78
Past service cost resulting from changes to defined benefit plans to the extent the benefits are already vested is recognized immediately and the remaining unrecognized past service cost is recognized as an expense on a straight line basis over the average period until the benefits become vested.
5.8 Employees’ compensated absences
Liability in respect of employees’ compensated absences is accounted for in the year in which these are earned on the basis of actuarial valuation carried out using the Projected Unit Credit Method. Actuarial gains or losses if any, are recognized immediately.
5.9 Taxation
Current
Provision for current taxation is based on taxable income at the current rates of taxation after taking into consideration available tax credits and rebates. The charge for current tax also includes adjustments where considered necessary, relating to prior years which arise from assessments framed / finalized during the year.
Deferred
Deferred tax is recognised using the balance sheet liability method on all major temporary differences between the amounts attributed to assets and liabilities for financial reporting purposes and amounts used for taxation purposes. The Bank records deferred tax assets / liabilities using the tax rates, enacted or substantively enacted by the balance sheet date expected to be applicable at the time of its reversal. Deferred tax asset is recognised only to the extent that it is probable that future taxable profits will be available against which the asset can be utilised. Deferred tax assets are reduced to the extent that it is no longer probable that the related tax benefit will be realised. The Bank also recognises deferred tax asset / liability on deficit / surplus on revaluation of securities and deferred tax liability on surplus on revaluation of fixed assets which is adjusted against the related deficit / surplus in accordance with the requirements of International Accounting Standard (IAS) 12, ‘Income Taxes’.
Deferred tax liability is not recognized in respect of taxable temporary differences associated with exchange translation reserves of foreign operations, where the timing of the reversal of the temporary difference can be controlled and it is probable that the temporary differences will not reverse in the foreseeable future.
5.10 Provisions
Provisions are recognized when the Bank has a legal or constructive obligation as a result of past events and it is probable that an outflow of resources will be required to settle the obligation and a reliable estimate of the amount can be made. Provisions are reviewed at each balance sheet date and are adjusted to reflect the current best estimates.
5.11 Foreign currencies
5.11.1 Foreign currency transactions
Transactions in foreign currencies (other than the results of foreign operations discussed in note 5.11.2) are translated to Rupees at the foreign exchange rates ruling on the transaction date. Monetary assets and liabilities in foreign currencies are expressed in Rupee terms at the rates of exchange prevailing at the balance sheet date. Foreign bills purchased and forward foreign exchange contracts other than those relating to foreign currency deposits are valued at the rates applicable to their respective maturities.
5.11.2 Foreign operations
The assets and liabilities of foreign branches are translated to Rupees at exchange rates prevailing at the balance sheet date. The results of foreign operations are translated to Rupees at the average rate of exchange for the year.
5.11.3 Translation gains and losses
Translation gains and losses are included in the profit and loss account, except those arising on the translation of the Bank’s net investment in foreign branches, which are taken to the capital reserve (exchange translation reserve).
5.11.4 Commitments
Commitments for outstanding forward foreign exchange contracts are disclosed in these financial statements at committed amounts. Contingent liabilities / commitments for letters of credit and letters of guarantee denominated in foreign currencies are expressed in Rupee terms at the rates of exchange ruling on the balance sheet date.
5.12 Revenue recognition
– Mark–up / interest on advances and returns on investments are recognized on a time proportion basis using the effective interest method except that mark–up / interest on non–performing advances and investments is recognized on a receipt basis, in accordance with the requirements of the Prudential Regulations issued by the State Bank of Pakistan (SBP) or as permitted by the regulations of the overseas regulatory authorities of the countries where the branches operate.
– Financing method is used in accounting for income from lease financing. Under this method, the unearned lease income (excess of the sum of total lease rentals and estimated residual value over the cost of leased assets) is deferred and taken to income over the term of the lease period so as to produce a constant periodic rate of return on the outstanding net investment in lease. Gains / losses on termination of lease contracts are recognized as income when these are realized.
Notes to the Financial StatementsFor the year ended December 31, 2009
Annual Report 2009 I 79
– Unrealized lease income is held in suspense account, where necessary, in accordance with the requirements of SBP or overseas regulatory authorities of the country where the foreign branches of the Bank operate.
– Commission income is recognized on a time proportion basis.
– Dividend income is recognized when the Bank’s right to receive dividend is established.
– Gain / loss on sale of investments is credited / charged to profit and loss account currently.
5.13 Operating leases
Operating lease rentals are recorded in profit and loss account on a time proportion basis over the term of the lease arrangements.
5.14 Cash and cash equivalents
Cash and cash equivalents include cash and balances with treasury banks and balances with other banks in current and deposit accounts.
5.15 Financial instruments
5.15.1 Financial assets and financial liabilities
Financial instruments carried on the balance sheet include cash and balances with treasury banks, balances with other banks, lendings to financial institutions, investments (excluding investment in associates and subsidiaries), advances, other assets, bills payable, borrowings, deposits and other liabilities. The particular recognition methods adopted for significant financial assets and financial liabilities are disclosed in the individual policy statements associated with these assets and liabilities.
5.15.2 Derivative financial instruments
Derivative financial instruments are initially recognized at fair value on the date on which a derivative contract is entered into and are subsequently remeasured at their fair value using valuation techniques. All the derivative financial instruments are carried as an asset when the fair value is positive and liability when the fair value is negative. Any change in the fair value of derivative financial instruments is taken to the profit and loss account currently.
5.15.3 Off setting
Financial assets and financial liabilities are set off and the net amount is reported in the financial statements when there is a legally enforceable right to set off and the Bank intends either to settle on a net basis, or to realize the assets and settle the liabilities, simultaneously.
5.16 Share issuance cost
Share issuance cost directly attributable to issuance of shares, is recognized as deduction from the share premium account.
5.17 Segment reporting
A segment is a distinguishable component of the Bank that is engaged in providing products or services (business segment) or in providing products or services within a particular economic environment (geographical segment), which is subject to risks and rewards that are different from those of other segments. The Bank’s primary format of reporting is based on business segments.
5.17.1 Business segments
Corporate Finance
Corporate Finance includes underwriting, securitization, investment banking, syndications, IPO related activities (excluding investments) and secondary private placements.
Trading and Sales
It includes fixed income, equity, foreign exchange commodities, lendings to financial institutions and brokerage debt.
Retail and Consumer Banking
It includes retail lending and deposits, banking services, private lending and deposits, banking services and retail offered to its retail customers and small and medium enterprises.
Commercial Banking
It includes project finance, export finance, trade finance, leasing, lending, guarantees and bills of exchange relating to its corporate customers.
5.17.2 Geographical segments
The Bank operates in three geographic regions being:
– Pakistan
– Asia Pacific (including South Asia)
– Middle East
5.18 Dividend distribution and appropriation
Dividends (including bonus dividend) and other appropriations (except appropriations which are required by law) are recognized in the period in which these are approved.
Notes to the Financial StatementsFor the year ended December 31, 2009
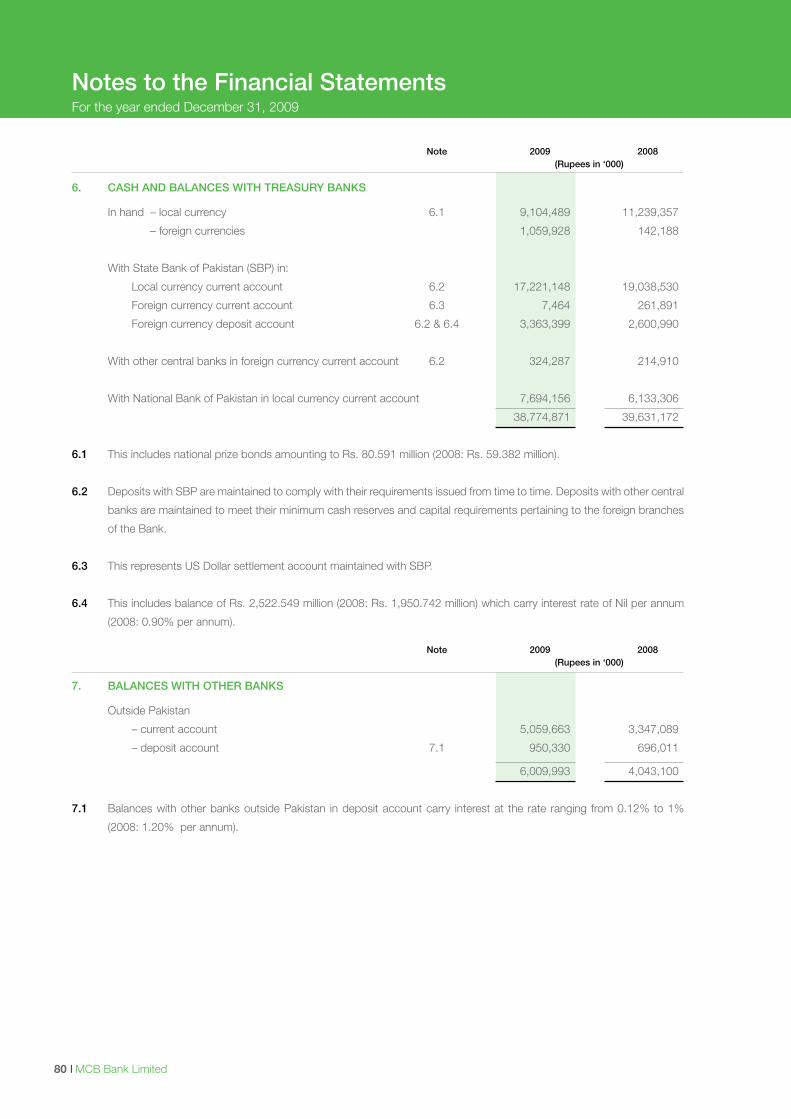
I MCB Bank Limited80
Notes to the Financial StatementsFor the year ended December 31, 2009
Note 2009 2008 (Rupees in ‘000)
6. CASH AND BALANCES WITH TREASURY BANKS
In hand – local currency 6.1 9,104,489 11,239,357
– foreign currencies 1,059,928 142,188
With State Bank of Pakistan (SBP) in:
Local currency current account 6.2 17,221,148 19,038,530
Foreign currency current account 6.3 7,464 261,891
Foreign currency deposit account 6.2 & 6.4 3,363,399 2,600,990
With other central banks in foreign currency current account 6.2 324,287 214,910
With National Bank of Pakistan in local currency current account 7,694,156 6,133,306
38,774,871 39,631,172
6.1 This includes national prize bonds amounting to Rs. 80.591 million (2008: Rs. 59.382 million).
6.2 Deposits with SBP are maintained to comply with their requirements issued from time to time. Deposits with other central
banks are maintained to meet their minimum cash reserves and capital requirements pertaining to the foreign branches
of the Bank.
6.3 This represents US Dollar settlement account maintained with SBP.
6.4 This includes balance of Rs. 2,522.549 million (2008: Rs. 1,950.742 million) which carry interest rate of Nil per annum
(2008: 0.90% per annum). Note 2009 2008 (Rupees in ‘000)
7. BALANCES WITH OTHER BANKS
Outside Pakistan
– current account 5,059,663 3,347,089
– deposit account 7.1 950,330 696,011
6,009,993 4,043,100
7.1 Balances with other banks outside Pakistan in deposit account carry interest at the rate ranging from 0.12% to 1%
(2008: 1.20% per annum).
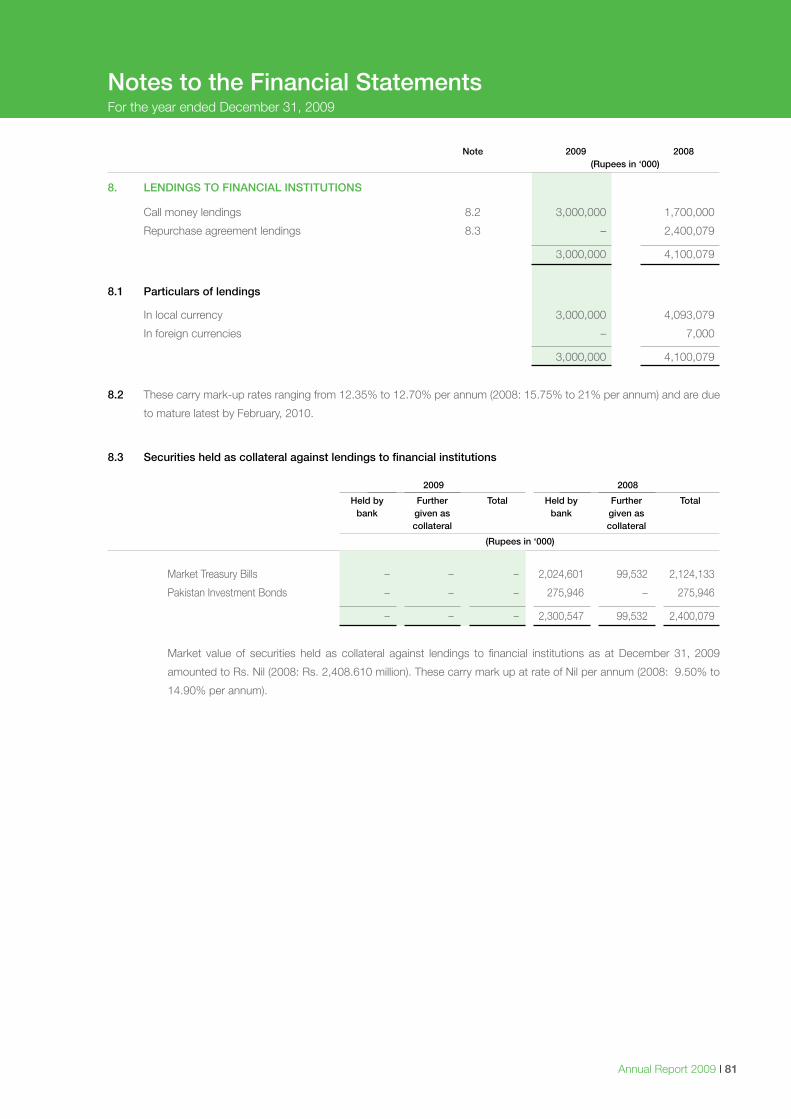
Annual Report 2009 I 81
Notes to the Financial StatementsFor the year ended December 31, 2009
Note 2009 2008 (Rupees in ‘000)
8. LENDINGS TO FINANCIAL INSTITUTIONS
Call money lendings 8.2 3,000,000 1,700,000
Repurchase agreement lendings 8.3 – 2,400,079
3,000,000 4,100,079
8.1 Particulars of lendings
In local currency 3,000,000 4,093,079
In foreign currencies – 7,000
3,000,000 4,100,079
8.2 These carry mark-up rates ranging from 12.35% to 12.70% per annum (2008: 15.75% to 21% per annum) and are due
to mature latest by February, 2010.
8.3 Securities held as collateral against lendings to financial institutions 2009 2008
Held by Further Total Held by Further Total bank given as bank given as collateral collateral
(Rupees in ‘000)
Market Treasury Bills – – – 2,024,601 99,532 2,124,133
Pakistan Investment Bonds – – – 275,946 – 275,946
– – – 2,300,547 99,532 2,400,079
Market value of securities held as collateral against lendings to financial institutions as at December 31, 2009
amounted to Rs. Nil (2008: Rs. 2,408.610 million). These carry mark up at rate of Nil per annum (2008: 9.50% to
14.90% per annum).
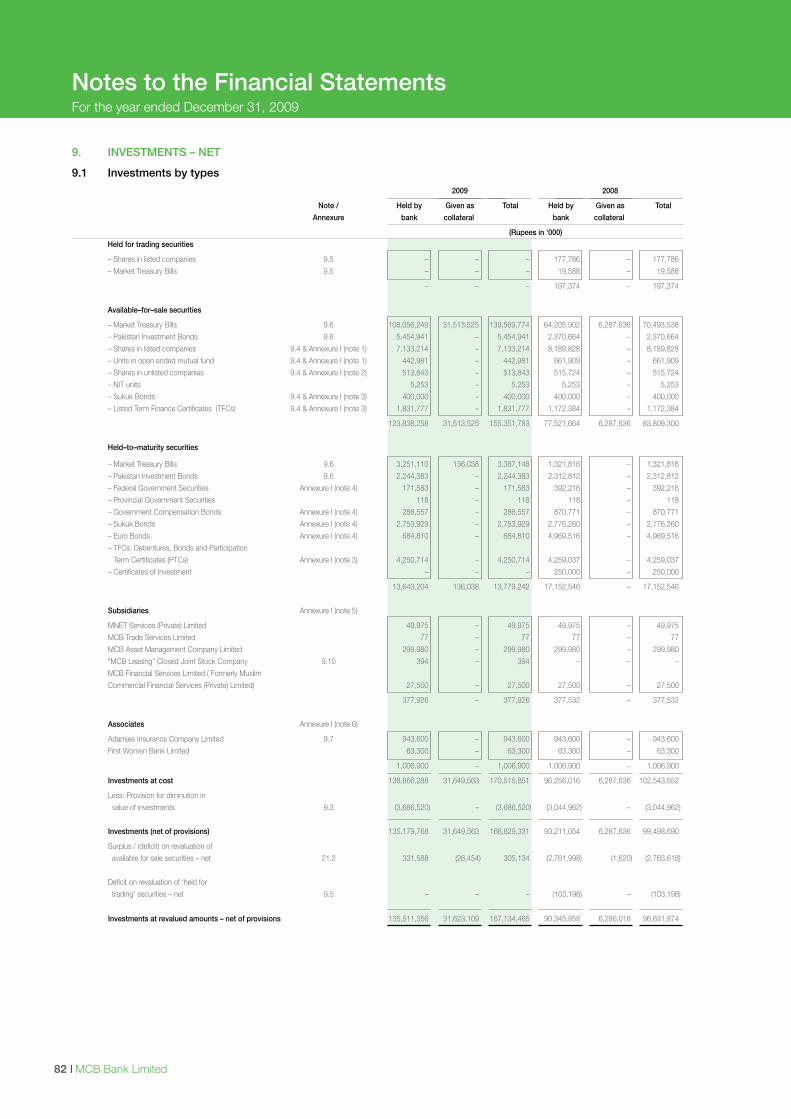
I MCB Bank Limited82
9. INVESTMENTS – NET
9.1 Investments by types
2009 2008
Note / Held by Given as Total Held by Given as Total
Annexure bank collateral bank collateral
(Rupees in ‘000)
Held for trading securities
– Shares in listed companies 9.5 – – – 177,786 – 177,786
– Market Treasury Bills 9.5 – – – 19,588 – 19,588
– – – 197,374 – 197,374
Available–for–sale securities
– Market Treasury Bills 9.6 108,056,249 31,513,525 139,569,774 64,205,902 6,287,636 70,493,538
– Pakistan Investment Bonds 9.6 5,454,941 – 5,454,941 2,370,664 – 2,370,664
– Shares in listed companies 9.4 & Annexure I (note 1) 7,133,214 – 7,133,214 8,189,828 – 8,189,828
– Units in open ended mutual fund 9.4 & Annexure I (note 1) 442,981 – 442,981 661,909 – 661,909
– Shares in unlisted companies 9.4 & Annexure I (note 2) 513,843 – 513,843 515,724 – 515,724
– NIT units 5,253 – 5,253 5,253 – 5,253
– Sukuk Bonds 9.4 & Annexure I (note 3) 400,000 – 400,000 400,000 – 400,000
– Listed Term Finance Certificates (TFCs) 9.4 & Annexure I (note 3) 1,831,777 – 1,831,777 1,172,384 – 1,172,384
123,838,258 31,513,525 155,351,783 77,521,664 6,287,636 83,809,300
Held–to–maturity securities
– Market Treasury Bills 9.6 3,251,110 136,038 3,387,148 1,321,816 – 1,321,816
– Pakistan Investment Bonds 9.6 2,244,383 – 2,244,383 2,312,812 – 2,312,812
– Federal Government Securities Annexure I (note 4) 171,583 – 171,583 392,216 – 392,216
– Provincial Government Securities 118 – 118 118 – 118
– Government Compensation Bonds Annexure I (note 4) 286,557 – 286,557 870,771 – 870,771
– Sukuk Bonds Annexure I (note 4) 2,753,929 – 2,753,929 2,776,260 – 2,776,260
– Euro Bonds Annexure I (note 4) 684,810 – 684,810 4,969,516 – 4,969,516
– TFCs, Debentures, Bonds and Participation
Term Certificates (PTCs) Annexure I (note 3) 4,250,714 – 4,250,714 4,259,037 – 4,259,037
– Certificates of Investment – – – 250,000 – 250,000
13,643,204 136,038 13,779,242 17,152,546 – 17,152,546
Subsidiaries Annexure I (note 5)
MNET Services (Private) Limited 49,975 – 49,975 49,975 – 49,975
MCB Trade Services Limited 77 – 77 77 – 77
MCB Asset Management Company Limited 299,980 – 299,980 299,980 – 299,980
“MCB Leasing” Closed Joint Stock Company 9.10 394 – 394 – – –
MCB Financial Services Limited ( Formerly Muslim
Commercial Financial Services (Private) Limited) 27,500 – 27,500 27,500 – 27,500
377,926 – 377,926 377,532 – 377,532
Associates Annexure I (note 6)
Adamjee Insurance Company Limited 9.7 943,600 – 943,600 943,600 – 943,600
First Women Bank Limited 63,300 – 63,300 63,300 – 63,300
1,006,900 – 1,006,900 1,006,900 – 1,006,900
Investments at cost 138,866,288 31,649,563 170,515,851 96,256,016 6,287,636 102,543,652
Less: Provision for diminution in
value of investments 9.3 (3,686,520) – (3,686,520) (3,044,962) – (3,044,962)
Investments (net of provisions) 135,179,768 31,649,563 166,829,331 93,211,054 6,287,636 99,498,690
Surplus / (deficit) on revaluation of
available for sale securities – net 21.2 331,588 (26,454) 305,134 (2,761,998) (1,620) (2,763,618)
Deficit on revaluation of ‘held for
trading’ securities – net 9.5 – – – (103,198) – (103,198)
Investments at revalued amounts – net of provisions 135,511,356 31,623,109 167,134,465 90,345,858 6,286,016 96,631,874
Notes to the Financial StatementsFor the year ended December 31, 2009
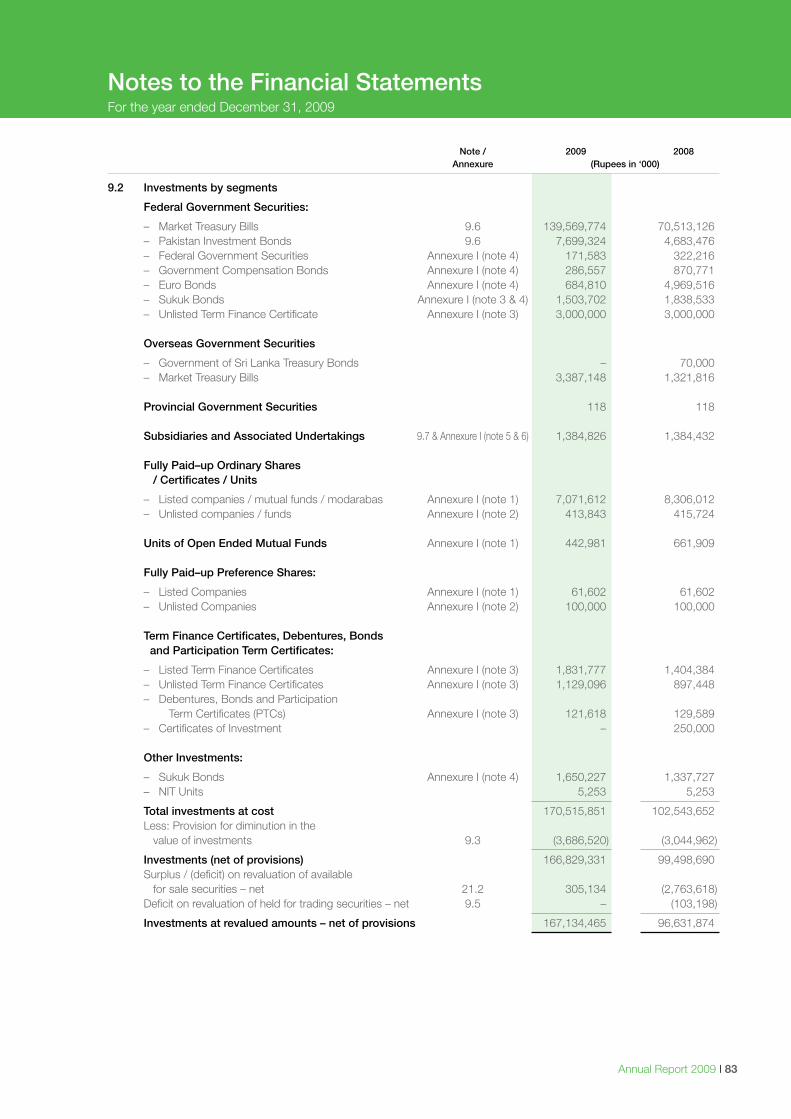
Annual Report 2009 I 83
Notes to the Financial StatementsFor the year ended December 31, 2009
Note / 2009 2008 Annexure (Rupees in ‘000)
9.2 Investments by segments
Federal Government Securities:
– Market Treasury Bills 9.6 139,569,774 70,513,126 – Pakistan Investment Bonds 9.6 7,699,324 4,683,476 – Federal Government Securities Annexure I (note 4) 171,583 322,216 – Government Compensation Bonds Annexure I (note 4) 286,557 870,771 – Euro Bonds Annexure I (note 4) 684,810 4,969,516 – Sukuk Bonds Annexure I (note 3 & 4) 1,503,702 1,838,533 – Unlisted Term Finance Certificate Annexure I (note 3) 3,000,000 3,000,000 Overseas Government Securities
– Government of Sri Lanka Treasury Bonds – 70,000 – Market Treasury Bills 3,387,148 1,321,816 Provincial Government Securities 118 118 Subsidiaries and Associated Undertakings 9.7 & Annexure I (note 5 & 6) 1,384,826 1,384,432 Fully Paid–up Ordinary Shares / Certificates / Units
– Listed companies / mutual funds / modarabas Annexure I (note 1) 7,071,612 8,306,012 – Unlisted companies / funds Annexure I (note 2) 413,843 415,724 Units of Open Ended Mutual Funds Annexure I (note 1) 442,981 661,909 Fully Paid–up Preference Shares:
– Listed Companies Annexure I (note 1) 61,602 61,602 – Unlisted Companies Annexure I (note 2) 100,000 100,000
Term Finance Certificates, Debentures, Bonds and Participation Term Certificates:
– Listed Term Finance Certificates Annexure I (note 3) 1,831,777 1,404,384 – Unlisted Term Finance Certificates Annexure I (note 3) 1,129,096 897,448 – Debentures, Bonds and Participation Term Certificates (PTCs) Annexure I (note 3) 121,618 129,589 – Certificates of Investment – 250,000 Other Investments:
– Sukuk Bonds Annexure I (note 4) 1,650,227 1,337,727 – NIT Units 5,253 5,253
Total investments at cost 170,515,851 102,543,652 Less: Provision for diminution in the value of investments 9.3 (3,686,520) (3,044,962)
Investments (net of provisions) 166,829,331 99,498,690 Surplus / (deficit) on revaluation of available for sale securities – net 21.2 305,134 (2,763,618) Deficit on revaluation of held for trading securities – net 9.5 – (103,198)
Investments at revalued amounts – net of provisions 167,134,465 96,631,874
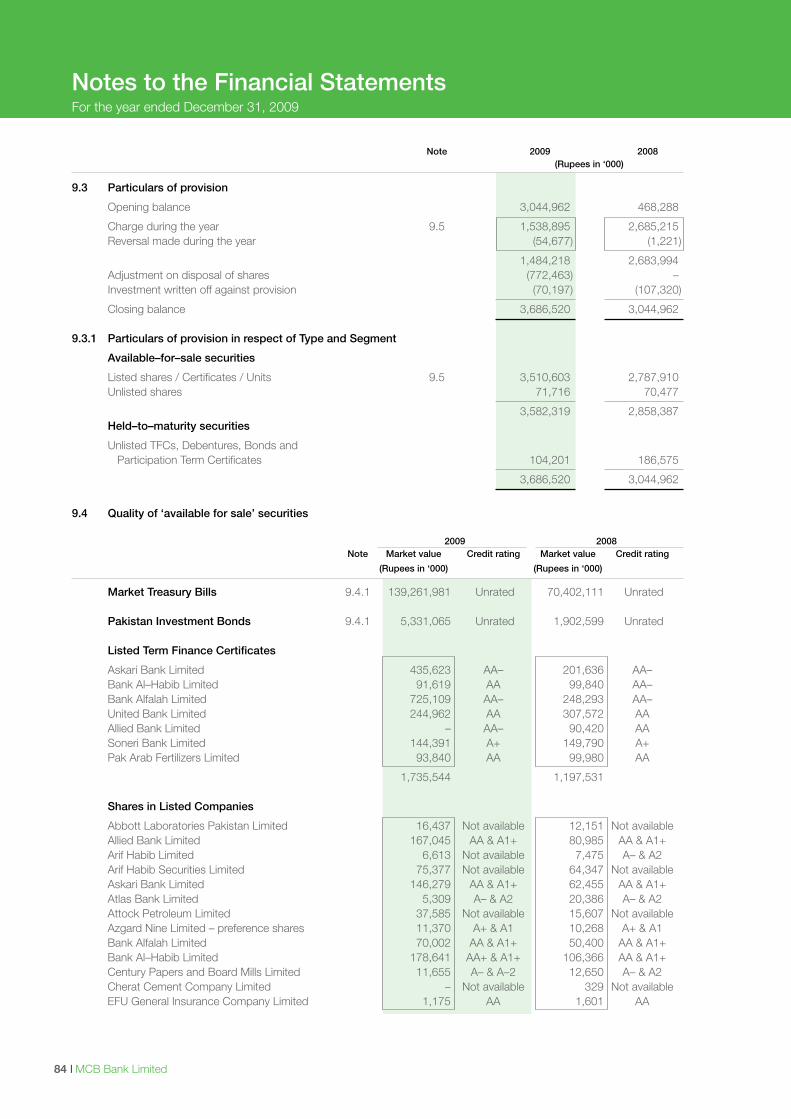
I MCB Bank Limited84
Note 2009 2008 (Rupees in ‘000)
9.3 Particulars of provision
Opening balance 3,044,962 468,288
Charge during the year 9.5 1,538,895 2,685,215 Reversal made during the year (54,677) (1,221)
1,484,218 2,683,994 Adjustment on disposal of shares (772,463) – Investment written off against provision (70,197) (107,320)
Closing balance 3,686,520 3,044,962 9.3.1 Particulars of provision in respect of Type and Segment
Available–for–sale securities
Listed shares / Certificates / Units 9.5 3,510,603 2,787,910 Unlisted shares 71,716 70,477
3,582,319 2,858,387 Held–to–maturity securities
Unlisted TFCs, Debentures, Bonds and Participation Term Certificates 104,201 186,575
3,686,520 3,044,962
9.4 Quality of ‘available for sale’ securities 2009 2008 Note Market value Credit rating Market value Credit rating
(Rupees in ‘000) (Rupees in ‘000)
Market Treasury Bills 9.4.1 139,261,981 Unrated 70,402,111 Unrated Pakistan Investment Bonds 9.4.1 5,331,065 Unrated 1,902,599 Unrated Listed Term Finance Certificates
Askari Bank Limited 435,623 AA– 201,636 AA– Bank Al–Habib Limited 91,619 AA 99,840 AA– Bank Alfalah Limited 725,109 AA– 248,293 AA– United Bank Limited 244,962 AA 307,572 AA Allied Bank Limited – AA– 90,420 AA Soneri Bank Limited 144,391 A+ 149,790 A+ Pak Arab Fertilizers Limited 93,840 AA 99,980 AA
1,735,544 1,197,531 Shares in Listed Companies
Abbott Laboratories Pakistan Limited 16,437 Not available 12,151 Not available Allied Bank Limited 167,045 AA & A1+ 80,985 AA & A1+ Arif Habib Limited 6,613 Not available 7,475 A– & A2 Arif Habib Securities Limited 75,377 Not available 64,347 Not available Askari Bank Limited 146,279 AA & A1+ 62,455 AA & A1+ Atlas Bank Limited 5,309 A– & A2 20,386 A– & A2 Attock Petroleum Limited 37,585 Not available 15,607 Not available Azgard Nine Limited – preference shares 11,370 A+ & A1 10,268 A+ & A1 Bank Alfalah Limited 70,002 AA & A1+ 50,400 AA & A1+ Bank Al–Habib Limited 178,641 AA+ & A1+ 106,366 AA & A1+ Century Papers and Board Mills Limited 11,655 A– & A–2 12,650 A– & A2 Cherat Cement Company Limited – Not available 329 Not available EFU General Insurance Company Limited 1,175 AA 1,601 AA
Notes to the Financial StatementsFor the year ended December 31, 2009
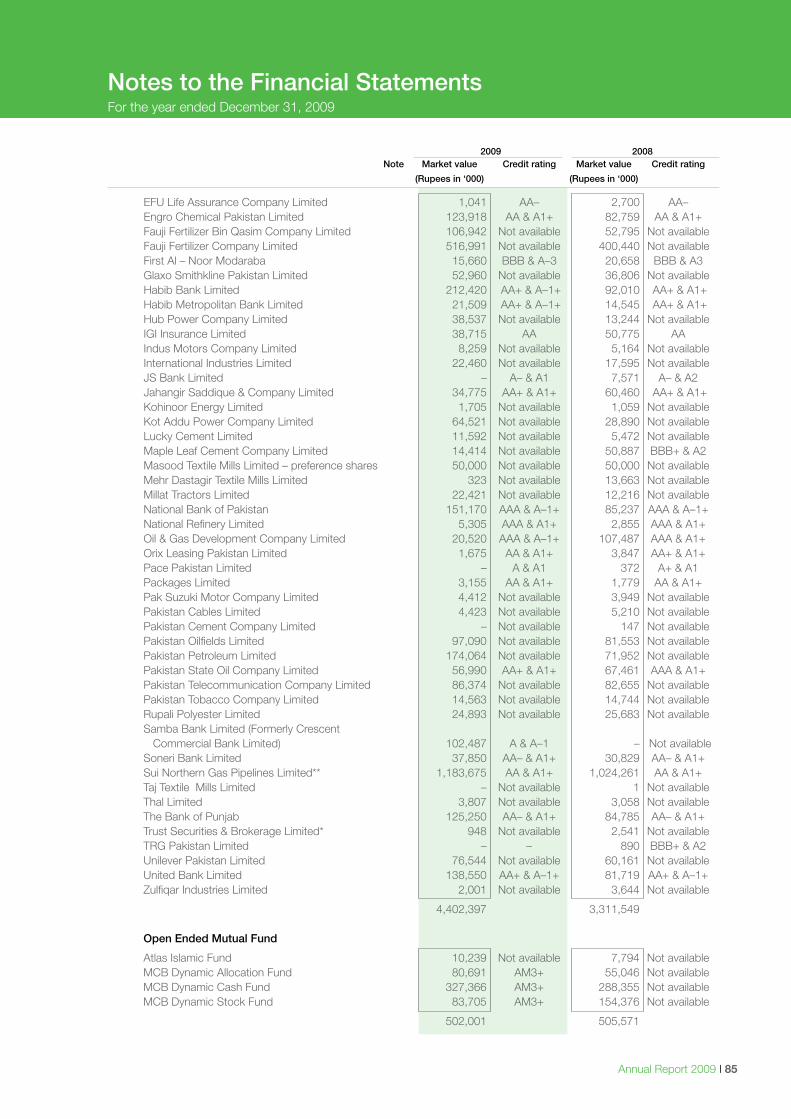
Annual Report 2009 I 85
Notes to the Financial StatementsFor the year ended December 31, 2009
2009 2008 Note Market value Credit rating Market value Credit rating
(Rupees in ‘000) (Rupees in ‘000)
EFU Life Assurance Company Limited 1,041 AA– 2,700 AA– Engro Chemical Pakistan Limited 123,918 AA & A1+ 82,759 AA & A1+ Fauji Fertilizer Bin Qasim Company Limited 106,942 Not available 52,795 Not available Fauji Fertilizer Company Limited 516,991 Not available 400,440 Not available First Al – Noor Modaraba 15,660 BBB & A–3 20,658 BBB & A3 Glaxo Smithkline Pakistan Limited 52,960 Not available 36,806 Not available Habib Bank Limited 212,420 AA+ & A–1+ 92,010 AA+ & A1+ Habib Metropolitan Bank Limited 21,509 AA+ & A–1+ 14,545 AA+ & A1+ Hub Power Company Limited 38,537 Not available 13,244 Not available IGI Insurance Limited 38,715 AA 50,775 AA Indus Motors Company Limited 8,259 Not available 5,164 Not available International Industries Limited 22,460 Not available 17,595 Not available JS Bank Limited – A– & A1 7,571 A– & A2 Jahangir Saddique & Company Limited 34,775 AA+ & A1+ 60,460 AA+ & A1+ Kohinoor Energy Limited 1,705 Not available 1,059 Not available Kot Addu Power Company Limited 64,521 Not available 28,890 Not available Lucky Cement Limited 11,592 Not available 5,472 Not available Maple Leaf Cement Company Limited 14,414 Not available 50,887 BBB+ & A2 Masood Textile Mills Limited – preference shares 50,000 Not available 50,000 Not available Mehr Dastagir Textile Mills Limited 323 Not available 13,663 Not available Millat Tractors Limited 22,421 Not available 12,216 Not available National Bank of Pakistan 151,170 AAA & A–1+ 85,237 AAA & A–1+ National Refinery Limited 5,305 AAA & A1+ 2,855 AAA & A1+ Oil & Gas Development Company Limited 20,520 AAA & A–1+ 107,487 AAA & A1+ Orix Leasing Pakistan Limited 1,675 AA & A1+ 3,847 AA+ & A1+ Pace Pakistan Limited – A & A1 372 A+ & A1 Packages Limited 3,155 AA & A1+ 1,779 AA & A1+ Pak Suzuki Motor Company Limited 4,412 Not available 3,949 Not available Pakistan Cables Limited 4,423 Not available 5,210 Not available Pakistan Cement Company Limited – Not available 147 Not available Pakistan Oilfields Limited 97,090 Not available 81,553 Not available Pakistan Petroleum Limited 174,064 Not available 71,952 Not available Pakistan State Oil Company Limited 56,990 AA+ & A1+ 67,461 AAA & A1+ Pakistan Telecommunication Company Limited 86,374 Not available 82,655 Not available Pakistan Tobacco Company Limited 14,563 Not available 14,744 Not available Rupali Polyester Limited 24,893 Not available 25,683 Not available Samba Bank Limited (Formerly Crescent Commercial Bank Limited) 102,487 A & A–1 – Not available Soneri Bank Limited 37,850 AA– & A1+ 30,829 AA– & A1+ Sui Northern Gas Pipelines Limited** 1,183,675 AA & A1+ 1,024,261 AA & A1+ Taj Textile Mills Limited – Not available 1 Not available Thal Limited 3,807 Not available 3,058 Not available The Bank of Punjab 125,250 AA– & A1+ 84,785 AA– & A1+ Trust Securities & Brokerage Limited* 948 Not available 2,541 Not available TRG Pakistan Limited – – 890 BBB+ & A2 Unilever Pakistan Limited 76,544 Not available 60,161 Not available United Bank Limited 138,550 AA+ & A–1+ 81,719 AA+ & A–1+ Zulfiqar Industries Limited 2,001 Not available 3,644 Not available
4,402,397 3,311,549 Open Ended Mutual Fund
Atlas Islamic Fund 10,239 Not available 7,794 Not available MCB Dynamic Allocation Fund 80,691 AM3+ 55,046 Not available MCB Dynamic Cash Fund 327,366 AM3+ 288,355 Not available MCB Dynamic Stock Fund 83,705 AM3+ 154,376 Not available
502,001 505,571
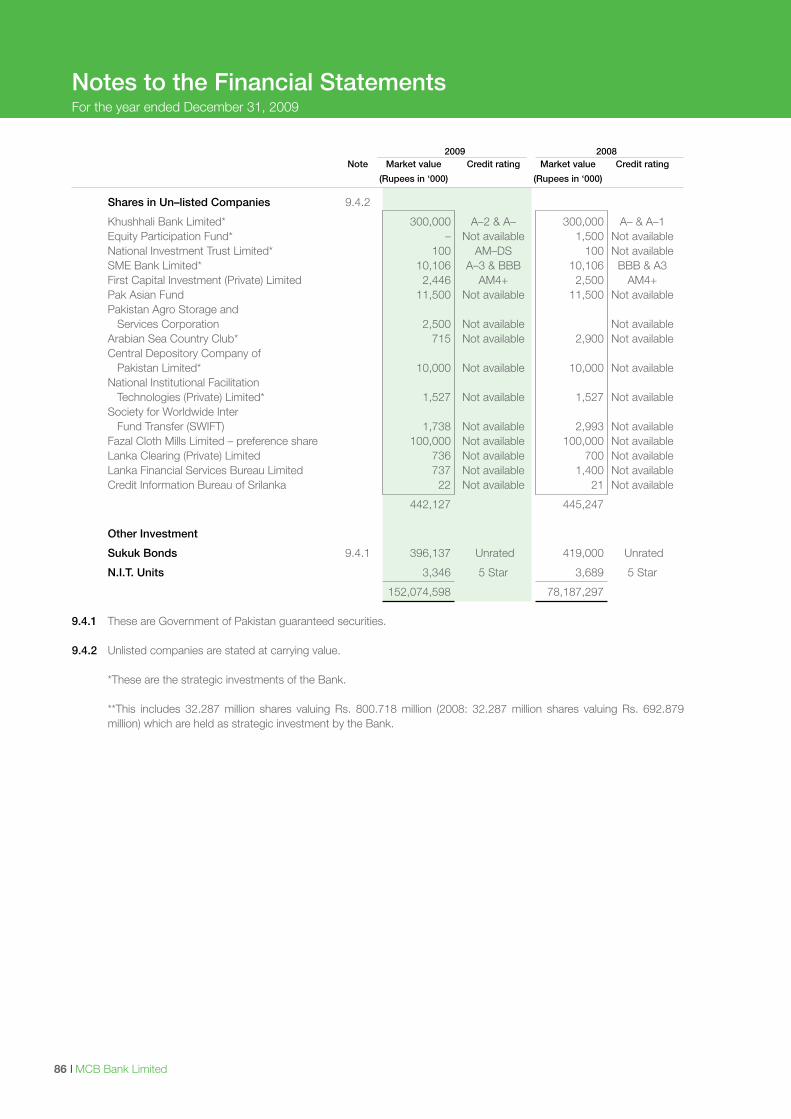
I MCB Bank Limited86
2009 2008 Note Market value Credit rating Market value Credit rating
(Rupees in ‘000) (Rupees in ‘000)
Shares in Un–listed Companies 9.4.2
Khushhali Bank Limited* 300,000 A–2 & A– 300,000 A– & A–1 Equity Participation Fund* – Not available 1,500 Not available National Investment Trust Limited* 100 AM–DS 100 Not available SME Bank Limited* 10,106 A–3 & BBB 10,106 BBB & A3 First Capital Investment (Private) Limited 2,446 AM4+ 2,500 AM4+ Pak Asian Fund 11,500 Not available 11,500 Not available Pakistan Agro Storage and Services Corporation 2,500 Not available Not available Arabian Sea Country Club* 715 Not available 2,900 Not available Central Depository Company of Pakistan Limited* 10,000 Not available 10,000 Not available National Institutional Facilitation Technologies (Private) Limited* 1,527 Not available 1,527 Not available Society for Worldwide Inter Fund Transfer (SWIFT) 1,738 Not available 2,993 Not available Fazal Cloth Mills Limited – preference share 100,000 Not available 100,000 Not available Lanka Clearing (Private) Limited 736 Not available 700 Not available Lanka Financial Services Bureau Limited 737 Not available 1,400 Not available Credit Information Bureau of Srilanka 22 Not available 21 Not available
442,127 445,247 Other Investment
Sukuk Bonds 9.4.1 396,137 Unrated 419,000 Unrated
N.I.T. Units 3,346 5 Star 3,689 5 Star
152,074,598 78,187,297 9.4.1 These are Government of Pakistan guaranteed securities.
9.4.2 Unlisted companies are stated at carrying value. *These are the strategic investments of the Bank. **This includes 32.287 million shares valuing Rs. 800.718 million (2008: 32.287 million shares valuing Rs. 692.879
million) which are held as strategic investment by the Bank.
Notes to the Financial StatementsFor the year ended December 31, 2009
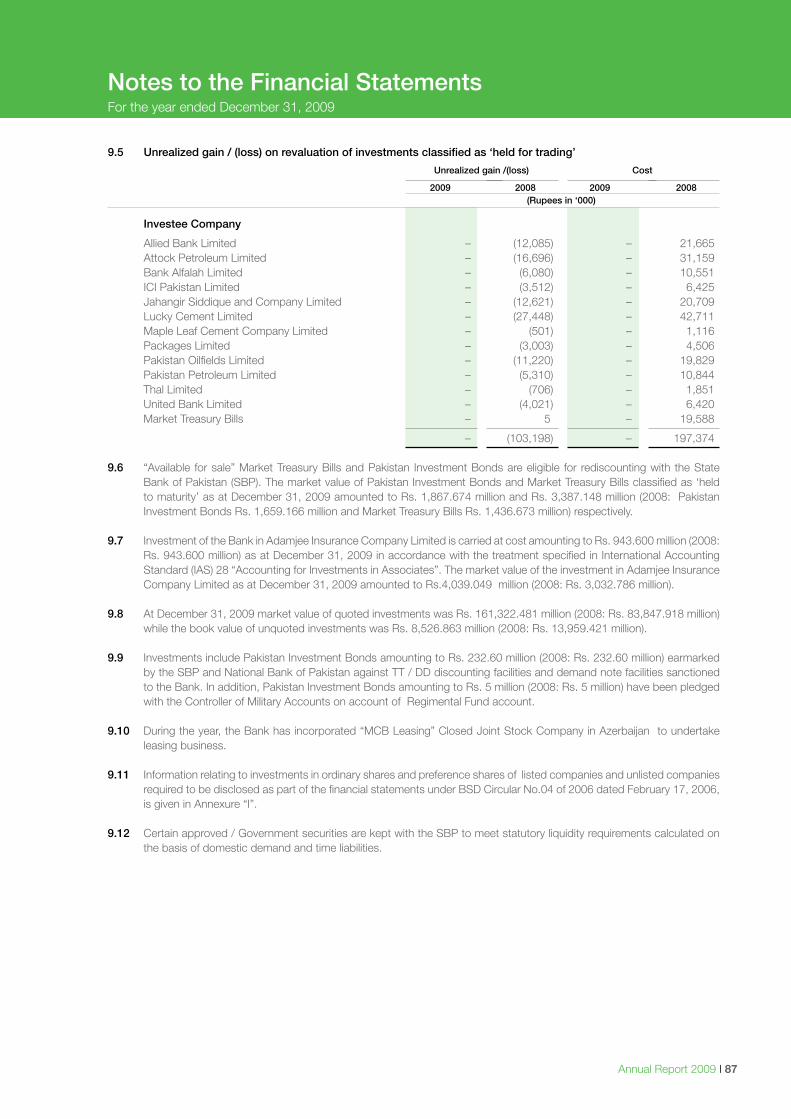
Annual Report 2009 I 87
9.5 Unrealized gain / (loss) on revaluation of investments classified as ‘held for trading’
Unrealized gain /(loss) Cost
2009 2008 2009 2008 (Rupees in ‘000)
Investee Company
Allied Bank Limited – (12,085) – 21,665 Attock Petroleum Limited – (16,696) – 31,159 Bank Alfalah Limited – (6,080) – 10,551 ICI Pakistan Limited – (3,512) – 6,425 Jahangir Siddique and Company Limited – (12,621) – 20,709 Lucky Cement Limited – (27,448) – 42,711 Maple Leaf Cement Company Limited – (501) – 1,116 Packages Limited – (3,003) – 4,506 Pakistan Oilfields Limited – (11,220) – 19,829 Pakistan Petroleum Limited – (5,310) – 10,844 Thal Limited – (706) – 1,851 United Bank Limited – (4,021) – 6,420 Market Treasury Bills – 5 – 19,588
– (103,198) – 197,374 9.6 “Available for sale” Market Treasury Bills and Pakistan Investment Bonds are eligible for rediscounting with the State
Bank of Pakistan (SBP). The market value of Pakistan Investment Bonds and Market Treasury Bills classified as ‘held to maturity’ as at December 31, 2009 amounted to Rs. 1,867.674 million and Rs. 3,387.148 million (2008: Pakistan Investment Bonds Rs. 1,659.166 million and Market Treasury Bills Rs. 1,436.673 million) respectively.
9.7 Investment of the Bank in Adamjee Insurance Company Limited is carried at cost amounting to Rs. 943.600 million (2008: Rs. 943.600 million) as at December 31, 2009 in accordance with the treatment specified in International Accounting Standard (IAS) 28 “Accounting for Investments in Associates”. The market value of the investment in Adamjee Insurance Company Limited as at December 31, 2009 amounted to Rs.4,039.049 million (2008: Rs. 3,032.786 million).
9.8 At December 31, 2009 market value of quoted investments was Rs. 161,322.481 million (2008: Rs. 83,847.918 million) while the book value of unquoted investments was Rs. 8,526.863 million (2008: Rs. 13,959.421 million).
9.9 Investments include Pakistan Investment Bonds amounting to Rs. 232.60 million (2008: Rs. 232.60 million) earmarked
by the SBP and National Bank of Pakistan against TT / DD discounting facilities and demand note facilities sanctioned to the Bank. In addition, Pakistan Investment Bonds amounting to Rs. 5 million (2008: Rs. 5 million) have been pledged with the Controller of Military Accounts on account of Regimental Fund account.
9.10 During the year, the Bank has incorporated “MCB Leasing” Closed Joint Stock Company in Azerbaijan to undertake
leasing business. 9.11 Information relating to investments in ordinary shares and preference shares of listed companies and unlisted companies
required to be disclosed as part of the financial statements under BSD Circular No.04 of 2006 dated February 17, 2006, is given in Annexure “I”.
9.12 Certain approved / Government securities are kept with the SBP to meet statutory liquidity requirements calculated on
the basis of domestic demand and time liabilities.
Notes to the Financial StatementsFor the year ended December 31, 2009
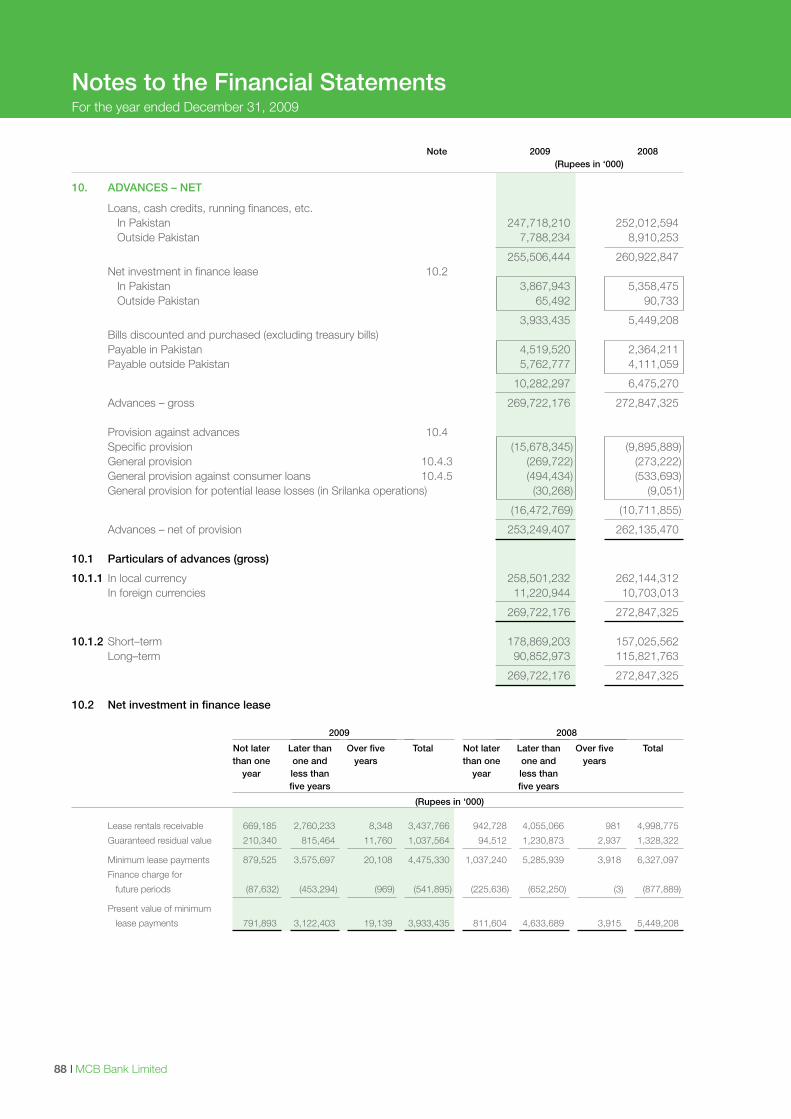
I MCB Bank Limited88
Notes to the Financial StatementsFor the year ended December 31, 2009
Note 2009 2008 (Rupees in ‘000)
10. ADVANCES – NET
Loans, cash credits, running finances, etc. In Pakistan 247,718,210 252,012,594 Outside Pakistan 7,788,234 8,910,253
255,506,444 260,922,847 Net investment in finance lease 10.2 In Pakistan 3,867,943 5,358,475 Outside Pakistan 65,492 90,733
3,933,435 5,449,208 Bills discounted and purchased (excluding treasury bills) Payable in Pakistan 4,519,520 2,364,211 Payable outside Pakistan 5,762,777 4,111,059
10,282,297 6,475,270
Advances – gross 269,722,176 272,847,325 Provision against advances 10.4 Specific provision (15,678,345) (9,895,889) General provision 10.4.3 (269,722) (273,222) General provision against consumer loans 10.4.5 (494,434) (533,693) General provision for potential lease losses (in Srilanka operations) (30,268) (9,051)
(16,472,769) (10,711,855)
Advances – net of provision 253,249,407 262,135,470 10.1 Particulars of advances (gross)
10.1.1 In local currency 258,501,232 262,144,312 In foreign currencies 11,220,944 10,703,013
269,722,176 272,847,325 10.1.2 Short–term 178,869,203 157,025,562 Long–term 90,852,973 115,821,763
269,722,176 272,847,325 10.2 Net investment in finance lease 2009 2008
Not later Later than Over five Total Not later Later than Over five Total than one one and years than one one and years year less than year less than five years five years
(Rupees in ‘000)
Lease rentals receivable 669,185 2,760,233 8,348 3,437,766 942,728 4,055,066 981 4,998,775
Guaranteed residual value 210,340 815,464 11,760 1,037,564 94,512 1,230,873 2,937 1,328,322
Minimum lease payments 879,525 3,575,697 20,108 4,475,330 1,037,240 5,285,939 3,918 6,327,097
Finance charge for
future periods (87,632) (453,294) (969) (541,895) (225,636) (652,250) (3) (877,889)
Present value of minimum
lease payments 791,893 3,122,403 19,139 3,933,435 811,604 4,633,689 3,915 5,449,208
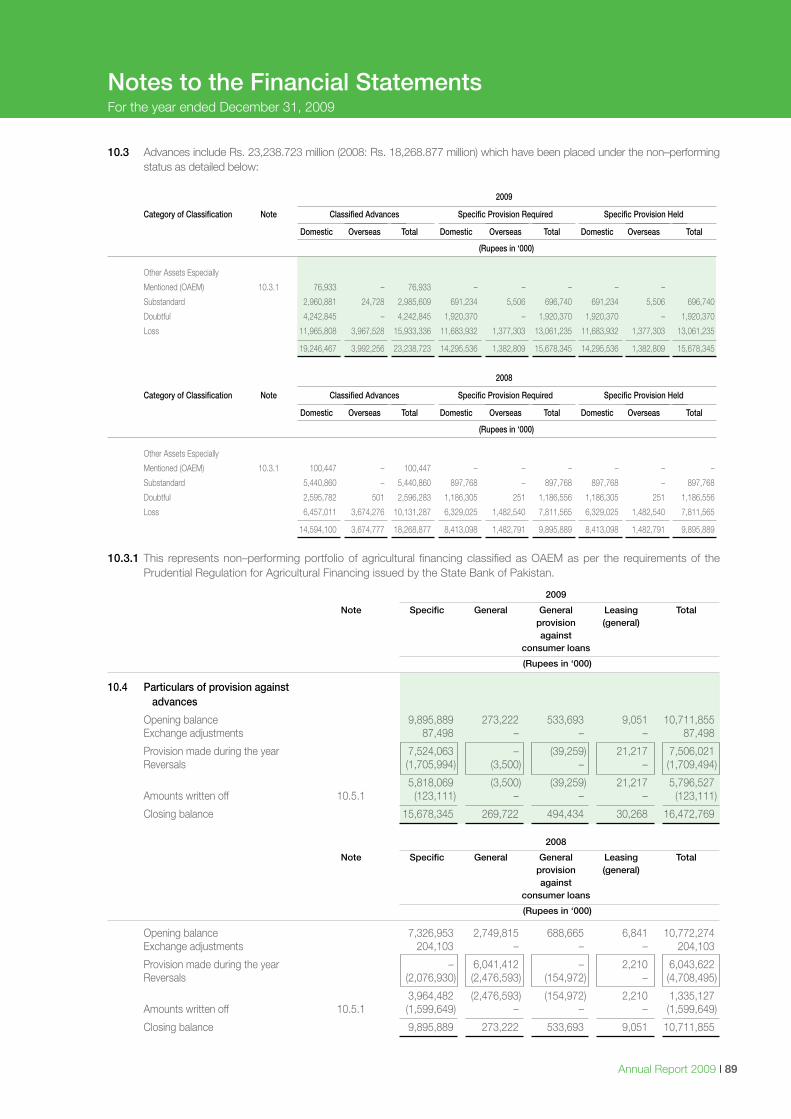
Annual Report 2009 I 89
10.3 Advances include Rs. 23,238.723 million (2008: Rs. 18,268.877 million) which have been placed under the non–performing status as detailed below:
2009
Category of Classification Note Classified Advances Specific Provision Required Specific Provision Held
Domestic Overseas Total Domestic Overseas Total Domestic Overseas Total
(Rupees in ‘000)
Other Assets Especially
Mentioned (OAEM) 10.3.1 76,933 – 76,933 – – – – –
Substandard 2,960,881 24,728 2,985,609 691,234 5,506 696,740 691,234 5,506 696,740
Doubtful 4,242,845 – 4,242,845 1,920,370 – 1,920,370 1,920,370 – 1,920,370
Loss 11,965,808 3,967,528 15,933,336 11,683,932 1,377,303 13,061,235 11,683,932 1,377,303 13,061,235
19,246,467 3,992,256 23,238,723 14,295,536 1,382,809 15,678,345 14,295,536 1,382,809 15,678,345
2008
Category of Classification Note Classified Advances Specific Provision Required Specific Provision Held
Domestic Overseas Total Domestic Overseas Total Domestic Overseas Total
(Rupees in ‘000)
Other Assets Especially
Mentioned (OAEM) 10.3.1 100,447 – 100,447 – – – – – –
Substandard 5,440,860 – 5,440,860 897,768 – 897,768 897,768 – 897,768
Doubtful 2,595,782 501 2,596,283 1,186,305 251 1,186,556 1,186,305 251 1,186,556
Loss 6,457,011 3,674,276 10,131,287 6,329,025 1,482,540 7,811,565 6,329,025 1,482,540 7,811,565
14,594,100 3,674,777 18,268,877 8,413,098 1,482,791 9,895,889 8,413,098 1,482,791 9,895,889
10.3.1 This represents non–performing portfolio of agricultural financing classified as OAEM as per the requirements of the
Prudential Regulation for Agricultural Financing issued by the State Bank of Pakistan.
2009
Note Specific General General Leasing Total provision (general) against consumer loans
(Rupees in ‘000)
10.4 Particulars of provision against advances
Opening balance 9,895,889 273,222 533,693 9,051 10,711,855 Exchange adjustments 87,498 – – – 87,498
Provision made during the year 7,524,063 – (39,259) 21,217 7,506,021 Reversals (1,705,994) (3,500) – – (1,709,494)
5,818,069 (3,500) (39,259) 21,217 5,796,527 Amounts written off 10.5.1 (123,111) – – – (123,111)
Closing balance 15,678,345 269,722 494,434 30,268 16,472,769
2008
Note Specific General General Leasing Total provision (general) against consumer loans
(Rupees in ‘000)
Opening balance 7,326,953 2,749,815 688,665 6,841 10,772,274 Exchange adjustments 204,103 – – – 204,103
Provision made during the year – 6,041,412 – 2,210 6,043,622 Reversals (2,076,930) (2,476,593) (154,972) – (4,708,495)
3,964,482 (2,476,593) (154,972) 2,210 1,335,127 Amounts written off 10.5.1 (1,599,649) – – – (1,599,649)
Closing balance 9,895,889 273,222 533,693 9,051 10,711,855
Notes to the Financial StatementsFor the year ended December 31, 2009
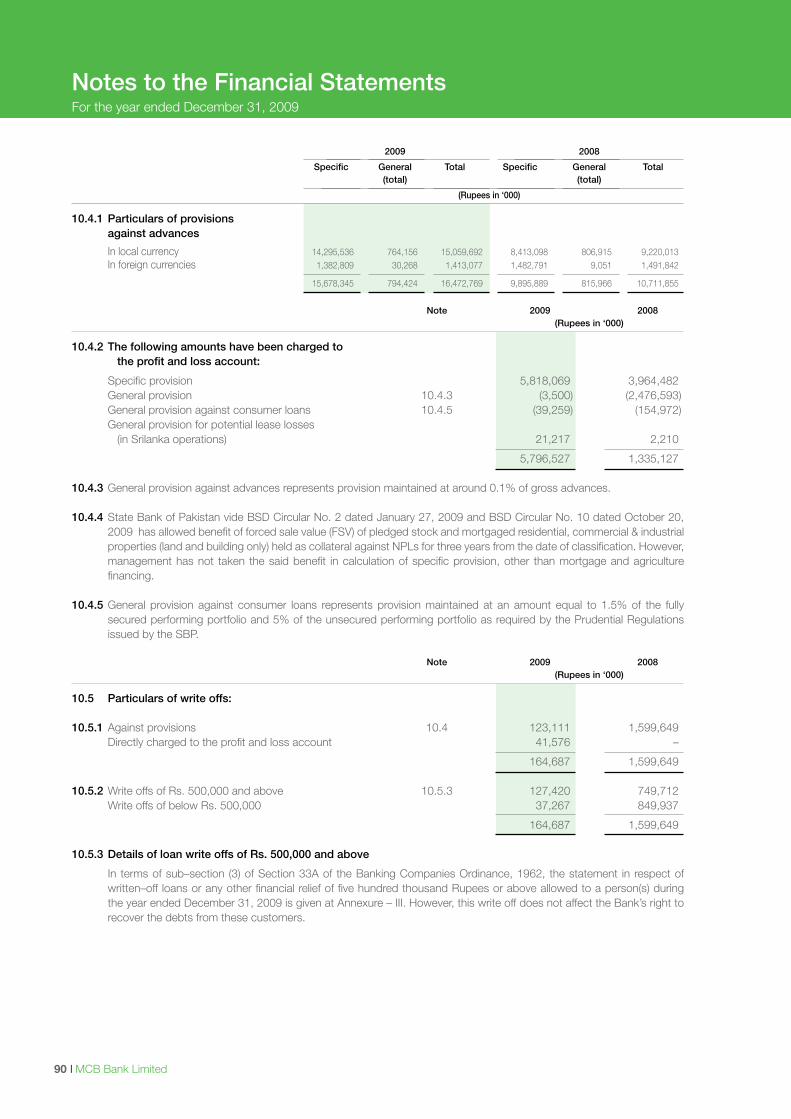
I MCB Bank Limited90
Notes to the Financial StatementsFor the year ended December 31, 2009
2009 2008
Specific General Total Specific General Total (total) (total)
(Rupees in ‘000)
10.4.1 Particulars of provisions against advances
In local currency 14,295,536 764,156 15,059,692 8,413,098 806,915 9,220,013 In foreign currencies 1,382,809 30,268 1,413,077 1,482,791 9,051 1,491,842
15,678,345 794,424 16,472,769 9,895,889 815,966 10,711,855
Note 2009 2008 (Rupees in ‘000)
10.4.2 The following amounts have been charged to the profit and loss account:
Specific provision 5,818,069 3,964,482 General provision 10.4.3 (3,500) (2,476,593) General provision against consumer loans 10.4.5 (39,259) (154,972) General provision for potential lease losses (in Srilanka operations) 21,217 2,210
5,796,527 1,335,127 10.4.3 General provision against advances represents provision maintained at around 0.1% of gross advances.
10.4.4 State Bank of Pakistan vide BSD Circular No. 2 dated January 27, 2009 and BSD Circular No. 10 dated October 20, 2009 has allowed benefit of forced sale value (FSV) of pledged stock and mortgaged residential, commercial & industrial properties (land and building only) held as collateral against NPLs for three years from the date of classification. However, management has not taken the said benefit in calculation of specific provision, other than mortgage and agriculture financing.
10.4.5 General provision against consumer loans represents provision maintained at an amount equal to 1.5% of the fully secured performing portfolio and 5% of the unsecured performing portfolio as required by the Prudential Regulations issued by the SBP.
Note 2009 2008 (Rupees in ‘000)
10.5 Particulars of write offs: 10.5.1 Against provisions 10.4 123,111 1,599,649 Directly charged to the profit and loss account 41,576 –
164,687 1,599,649 10.5.2 Write offs of Rs. 500,000 and above 10.5.3 127,420 749,712 Write offs of below Rs. 500,000 37,267 849,937
164,687 1,599,649 10.5.3 Details of loan write offs of Rs. 500,000 and above
In terms of sub–section (3) of Section 33A of the Banking Companies Ordinance, 1962, the statement in respect of written–off loans or any other financial relief of five hundred thousand Rupees or above allowed to a person(s) during the year ended December 31, 2009 is given at Annexure – III. However, this write off does not affect the Bank’s right to recover the debts from these customers.
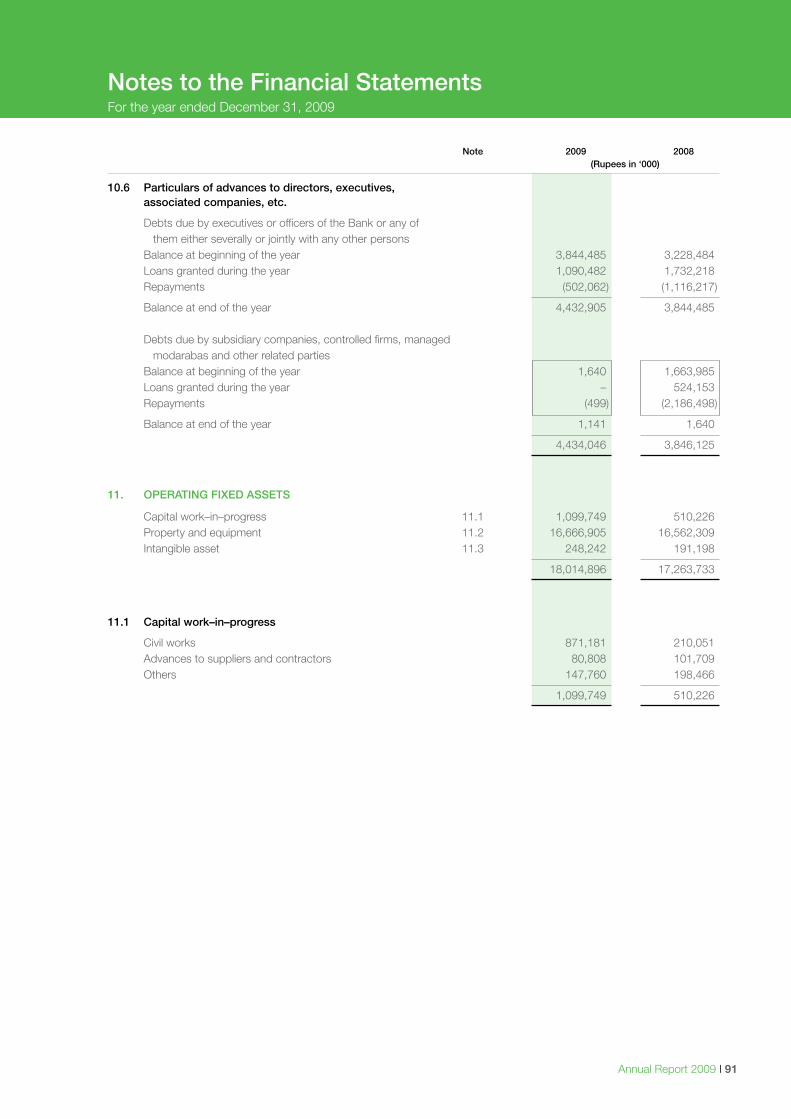
Annual Report 2009 I 91
Note 2009 2008 (Rupees in ‘000)
10.6 Particulars of advances to directors, executives, associated companies, etc.
Debts due by executives or officers of the Bank or any of them either severally or jointly with any other persons Balance at beginning of the year 3,844,485 3,228,484 Loans granted during the year 1,090,482 1,732,218 Repayments (502,062) (1,116,217)
Balance at end of the year 4,432,905 3,844,485 Debts due by subsidiary companies, controlled firms, managed modarabas and other related parties Balance at beginning of the year 1,640 1,663,985 Loans granted during the year – 524,153 Repayments (499) (2,186,498)
Balance at end of the year 1,141 1,640
4,434,046 3,846,125
11. OPERATING FIXED ASSETS
Capital work–in–progress 11.1 1,099,749 510,226 Property and equipment 11.2 16,666,905 16,562,309 Intangible asset 11.3 248,242 191,198
18,014,896 17,263,733
11.1 Capital work–in–progress
Civil works 871,181 210,051 Advances to suppliers and contractors 80,808 101,709 Others 147,760 198,466
1,099,749 510,226
Notes to the Financial StatementsFor the year ended December 31, 2009
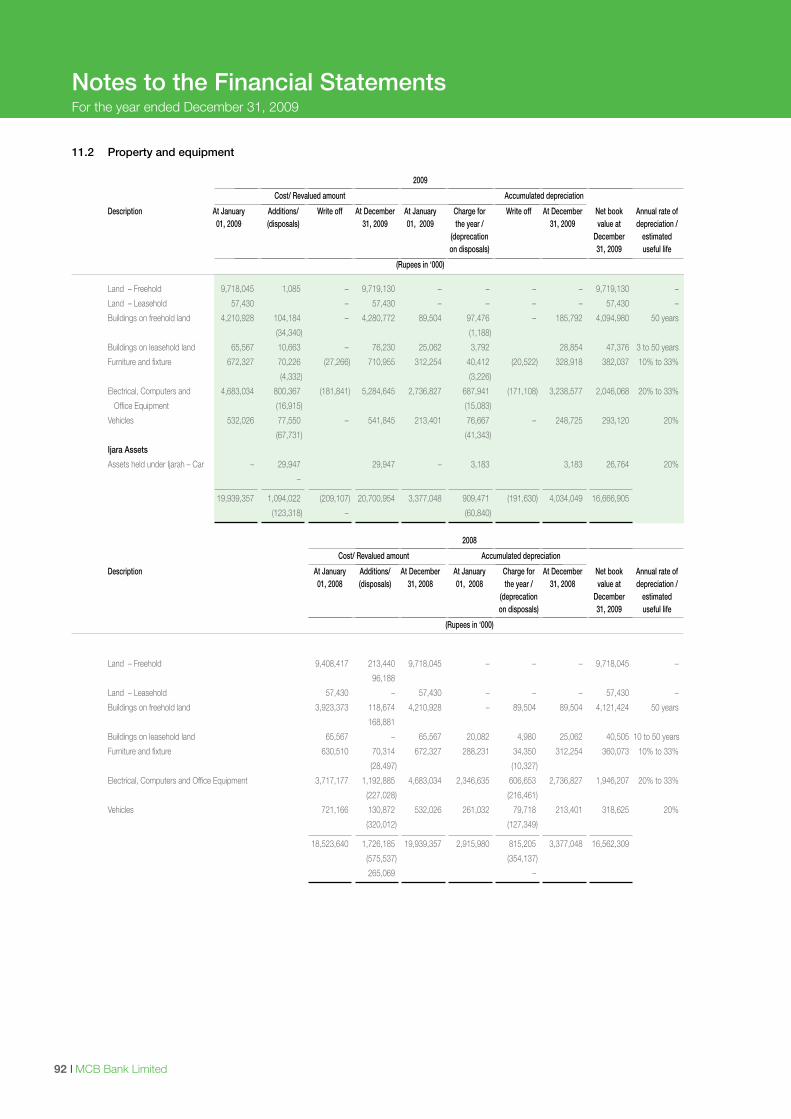
I MCB Bank Limited92
Notes to the Financial StatementsFor the year ended December 31, 2009
11.2 Property and equipment 2009
Cost/ Revalued amount Accumulated depreciation
Description At January Additions/ Write off At December At January Charge for Write off At December Net book Annual rate of 01, 2009 (disposals) 31, 2009 01, 2009 the year / 31, 2009 value at depreciation / (deprecation December estimated on disposals) 31, 2009 useful life
(Rupees in ‘000)
Land – Freehold 9,718,045 1,085 – 9,719,130 – – – – 9,719,130 –
Land – Leasehold 57,430 – 57,430 – – – – 57,430 –
Buildings on freehold land 4,210,928 104,184 – 4,280,772 89,504 97,476 – 185,792 4,094,980 50 years
(34,340) (1,188)
Buildings on leasehold land 65,567 10,663 – 76,230 25,062 3,792 28,854 47,376 3 to 50 years
Furniture and fixture 672,327 70,226 (27,266) 710,955 312,254 40,412 (20,522) 328,918 382,037 10% to 33%
(4,332) (3,226)
Electrical, Computers and 4,683,034 800,367 (181,841) 5,284,645 2,736,827 687,941 (171,108) 3,238,577 2,046,068 20% to 33%
Office Equipment (16,915) (15,083)
Vehicles 532,026 77,550 – 541,845 213,401 76,667 – 248,725 293,120 20%
(67,731) (41,343)
Ijara Assets
Assets held under Ijarah – Car – 29,947 29,947 – 3,183 3,183 26,764 20%
–
19,939,357 1,094,022 (209,107) 20,700,954 3,377,048 909,471 (191,630) 4,034,049 16,666,905
(123,318) – (60,840)
2008
Cost/ Revalued amount Accumulated depreciation
Description At January Additions/ At December At January Charge for At December Net book Annual rate of 01, 2008 (disposals) 31, 2008 01, 2008 the year / 31, 2008 value at depreciation / (deprecation December estimated on disposals) 31, 2009 useful life
(Rupees in ‘000)
Land – Freehold 9,408,417 213,440 9,718,045 – – – 9,718,045 –
96,188
Land – Leasehold 57,430 – 57,430 – – – 57,430 –
Buildings on freehold land 3,923,373 118,674 4,210,928 – 89,504 89,504 4,121,424 50 years
168,881
Buildings on leasehold land 65,567 – 65,567 20,082 4,980 25,062 40,505 10 to 50 years
Furniture and fixture 630,510 70,314 672,327 288,231 34,350 312,254 360,073 10% to 33%
(28,497) (10,327)
Electrical, Computers and Office Equipment 3,717,177 1,192,885 4,683,034 2,346,635 606,653 2,736,827 1,946,207 20% to 33%
(227,028) (216,461)
Vehicles 721,166 130,872 532,026 261,032 79,718 213,401 318,625 20%
(320,012) (127,349)
18,523,640 1,726,185 19,939,357 2,915,980 815,205 3,377,048 16,562,309
(575,537) (354,137)
265,069 –
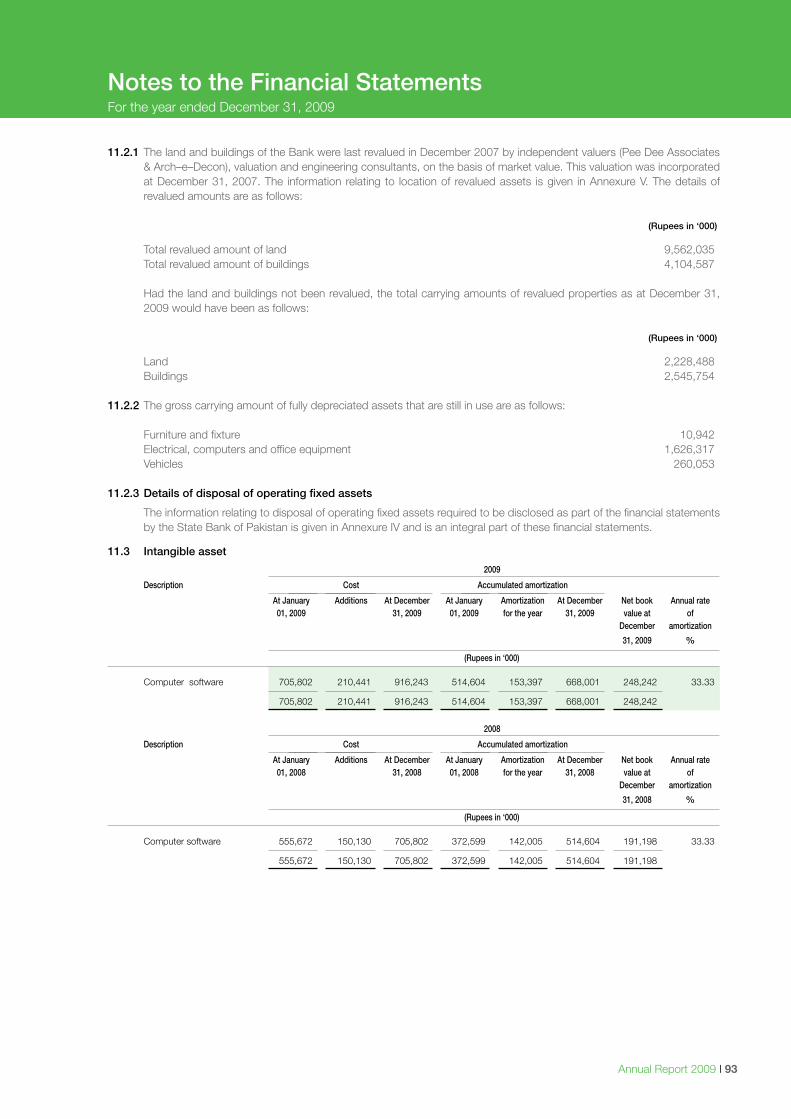
Annual Report 2009 I 93
11.2.1 The land and buildings of the Bank were last revalued in December 2007 by independent valuers (Pee Dee Associates & Arch–e–Decon), valuation and engineering consultants, on the basis of market value. This valuation was incorporated at December 31, 2007. The information relating to location of revalued assets is given in Annexure V. The details of revalued amounts are as follows:
(Rupees in ‘000)
Total revalued amount of land 9,562,035 Total revalued amount of buildings 4,104,587
Had the land and buildings not been revalued, the total carrying amounts of revalued properties as at December 31, 2009 would have been as follows:
(Rupees in ‘000)
Land 2,228,488 Buildings 2,545,754
11.2.2 The gross carrying amount of fully depreciated assets that are still in use are as follows:
Furniture and fixture 10,942 Electrical, computers and office equipment 1,626,317 Vehicles 260,053
11.2.3 Details of disposal of operating fixed assets
The information relating to disposal of operating fixed assets required to be disclosed as part of the financial statements by the State Bank of Pakistan is given in Annexure IV and is an integral part of these financial statements.
11.3 Intangible asset
2009
Description Cost Accumulated amortization
At January Additions At December At January Amortization At December Net book Annual rate 01, 2009 31, 2009 01, 2009 for the year 31, 2009 value at of December amortization
31, 2009 %
(Rupees in ‘000)
Computer software 705,802 210,441 916,243 514,604 153,397 668,001 248,242 33.33
705,802 210,441 916,243 514,604 153,397 668,001 248,242
2008
Description Cost Accumulated amortization
At January Additions At December At January Amortization At December Net book Annual rate 01, 2008 31, 2008 01, 2008 for the year 31, 2008 value at of December amortization
31, 2008 %
(Rupees in ‘000)
Computer software 555,672 150,130 705,802 372,599 142,005 514,604 191,198 33.33
555,672 150,130 705,802 372,599 142,005 514,604 191,198
Notes to the Financial StatementsFor the year ended December 31, 2009
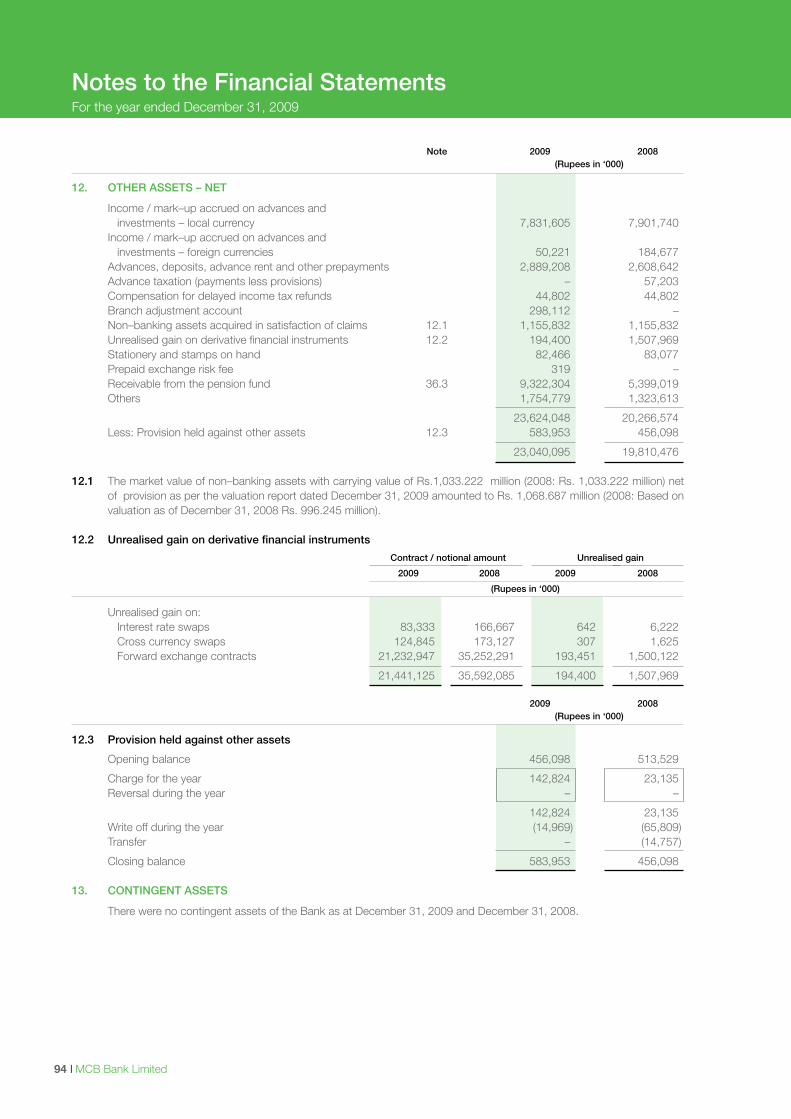
I MCB Bank Limited94
Notes to the Financial StatementsFor the year ended December 31, 2009
Note 2009 2008 (Rupees in ‘000)
12. OTHER ASSETS – NET
Income / mark–up accrued on advances and investments – local currency 7,831,605 7,901,740 Income / mark–up accrued on advances and investments – foreign currencies 50,221 184,677 Advances, deposits, advance rent and other prepayments 2,889,208 2,608,642 Advance taxation (payments less provisions) – 57,203 Compensation for delayed income tax refunds 44,802 44,802 Branch adjustment account 298,112 – Non–banking assets acquired in satisfaction of claims 12.1 1,155,832 1,155,832 Unrealised gain on derivative financial instruments 12.2 194,400 1,507,969 Stationery and stamps on hand 82,466 83,077 Prepaid exchange risk fee 319 – Receivable from the pension fund 36.3 9,322,304 5,399,019 Others 1,754,779 1,323,613
23,624,048 20,266,574 Less: Provision held against other assets 12.3 583,953 456,098
23,040,095 19,810,476 12.1 The market value of non–banking assets with carrying value of Rs.1,033.222 million (2008: Rs. 1,033.222 million) net
of provision as per the valuation report dated December 31, 2009 amounted to Rs. 1,068.687 million (2008: Based on valuation as of December 31, 2008 Rs. 996.245 million).
12.2 Unrealised gain on derivative financial instruments
Contract / notional amount Unrealised gain
2009 2008 2009 2008
(Rupees in ‘000)
Unrealised gain on: Interest rate swaps 83,333 166,667 642 6,222 Cross currency swaps 124,845 173,127 307 1,625 Forward exchange contracts 21,232,947 35,252,291 193,451 1,500,122
21,441,125 35,592,085 194,400 1,507,969 2009 2008 (Rupees in ‘000)
12.3 Provision held against other assets
Opening balance 456,098 513,529
Charge for the year 142,824 23,135 Reversal during the year – –
142,824 23,135 Write off during the year (14,969) (65,809) Transfer – (14,757)
Closing balance 583,953 456,098 13. CONTINGENT ASSETS
There were no contingent assets of the Bank as at December 31, 2009 and December 31, 2008.
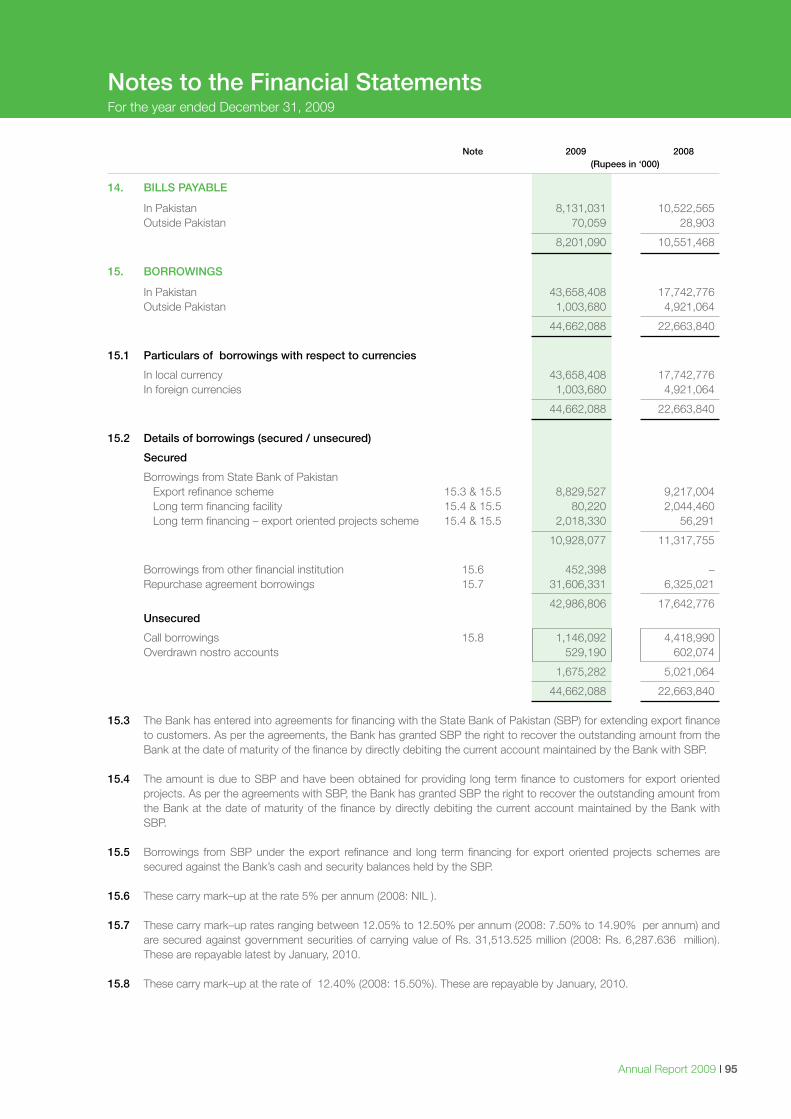
Annual Report 2009 I 95
Note 2009 2008 (Rupees in ‘000)
14. BILLS PAYABLE
In Pakistan 8,131,031 10,522,565 Outside Pakistan 70,059 28,903
8,201,090 10,551,468 15. BORROWINGS
In Pakistan 43,658,408 17,742,776 Outside Pakistan 1,003,680 4,921,064
44,662,088 22,663,840 15.1 Particulars of borrowings with respect to currencies
In local currency 43,658,408 17,742,776 In foreign currencies 1,003,680 4,921,064
44,662,088 22,663,840 15.2 Details of borrowings (secured / unsecured)
Secured
Borrowings from State Bank of Pakistan Export refinance scheme 15.3 & 15.5 8,829,527 9,217,004 Long term financing facility 15.4 & 15.5 80,220 2,044,460 Long term financing – export oriented projects scheme 15.4 & 15.5 2,018,330 56,291
10,928,077 11,317,755 Borrowings from other financial institution 15.6 452,398 – Repurchase agreement borrowings 15.7 31,606,331 6,325,021
42,986,806 17,642,776 Unsecured
Call borrowings 15.8 1,146,092 4,418,990 Overdrawn nostro accounts 529,190 602,074
1,675,282 5,021,064
44,662,088 22,663,840 15.3 The Bank has entered into agreements for financing with the State Bank of Pakistan (SBP) for extending export finance
to customers. As per the agreements, the Bank has granted SBP the right to recover the outstanding amount from the Bank at the date of maturity of the finance by directly debiting the current account maintained by the Bank with SBP.
15.4 The amount is due to SBP and have been obtained for providing long term finance to customers for export oriented
projects. As per the agreements with SBP, the Bank has granted SBP the right to recover the outstanding amount from the Bank at the date of maturity of the finance by directly debiting the current account maintained by the Bank with SBP.
15.5 Borrowings from SBP under the export refinance and long term financing for export oriented projects schemes are
secured against the Bank’s cash and security balances held by the SBP. 15.6 These carry mark–up at the rate 5% per annum (2008: NIL ).
15.7 These carry mark–up rates ranging between 12.05% to 12.50% per annum (2008: 7.50% to 14.90% per annum) and are secured against government securities of carrying value of Rs. 31,513.525 million (2008: Rs. 6,287.636 million). These are repayable latest by January, 2010.
15.8 These carry mark–up at the rate of 12.40% (2008: 15.50%). These are repayable by January, 2010.
Notes to the Financial StatementsFor the year ended December 31, 2009
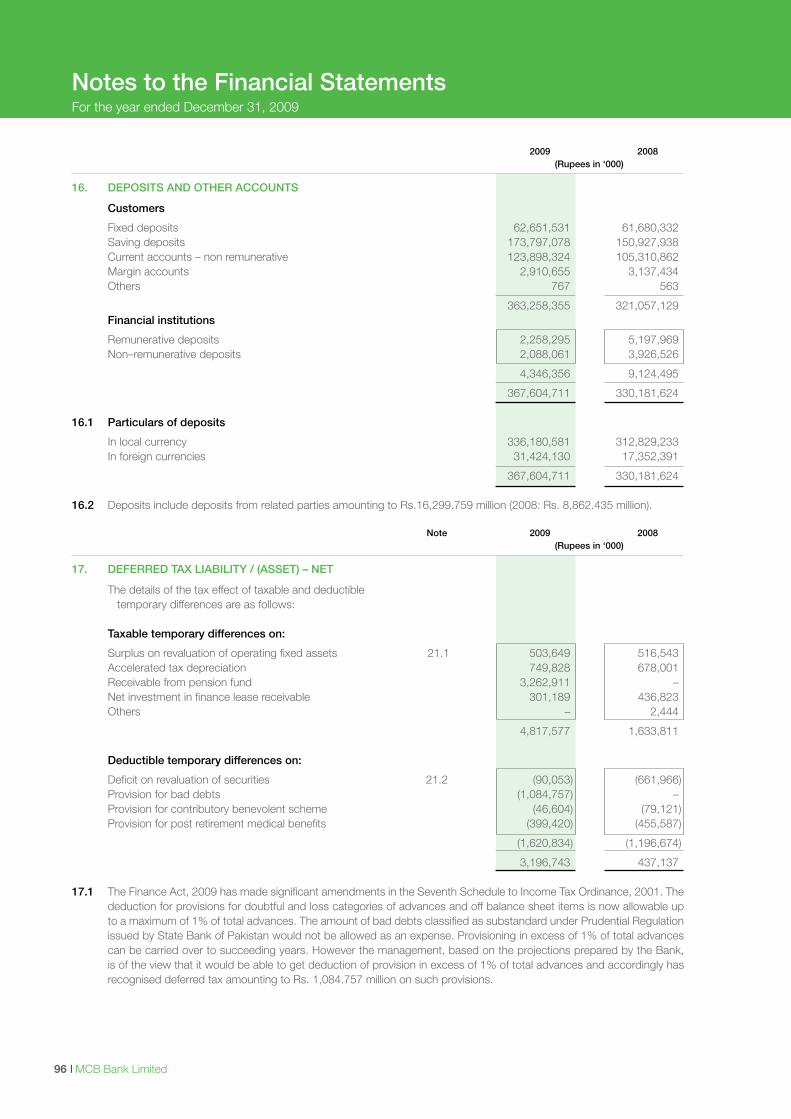
I MCB Bank Limited96
Notes to the Financial StatementsFor the year ended December 31, 2009
2009 2008 (Rupees in ‘000)
16. DEPOSITS AND OTHER ACCOUNTS
Customers
Fixed deposits 62,651,531 61,680,332 Saving deposits 173,797,078 150,927,938 Current accounts – non remunerative 123,898,324 105,310,862 Margin accounts 2,910,655 3,137,434 Others 767 563
363,258,355 321,057,129 Financial institutions
Remunerative deposits 2,258,295 5,197,969 Non–remunerative deposits 2,088,061 3,926,526
4,346,356 9,124,495
367,604,711 330,181,624
16.1 Particulars of deposits
In local currency 336,180,581 312,829,233 In foreign currencies 31,424,130 17,352,391
367,604,711 330,181,624 16.2 Deposits include deposits from related parties amounting to Rs.16,299.759 million (2008: Rs. 8,862.435 million). Note 2009 2008 (Rupees in ‘000)
17. DEFERRED TAX LIABILITY / (ASSET) – NET
The details of the tax effect of taxable and deductible temporary differences are as follows:
Taxable temporary differences on:
Surplus on revaluation of operating fixed assets 21.1 503,649 516,543 Accelerated tax depreciation 749,828 678,001 Receivable from pension fund 3,262,911 – Net investment in finance lease receivable 301,189 436,823 Others – 2,444
4,817,577 1,633,811 Deductible temporary differences on:
Deficit on revaluation of securities 21.2 (90,053) (661,966) Provision for bad debts (1,084,757) – Provision for contributory benevolent scheme (46,604) (79,121) Provision for post retirement medical benefits (399,420) (455,587)
(1,620,834) (1,196,674)
3,196,743 437,137 17.1 The Finance Act, 2009 has made significant amendments in the Seventh Schedule to Income Tax Ordinance, 2001. The
deduction for provisions for doubtful and loss categories of advances and off balance sheet items is now allowable up to a maximum of 1% of total advances. The amount of bad debts classified as substandard under Prudential Regulation issued by State Bank of Pakistan would not be allowed as an expense. Provisioning in excess of 1% of total advances can be carried over to succeeding years. However the management, based on the projections prepared by the Bank, is of the view that it would be able to get deduction of provision in excess of 1% of total advances and accordingly has recognised deferred tax amounting to Rs. 1,084.757 million on such provisions.
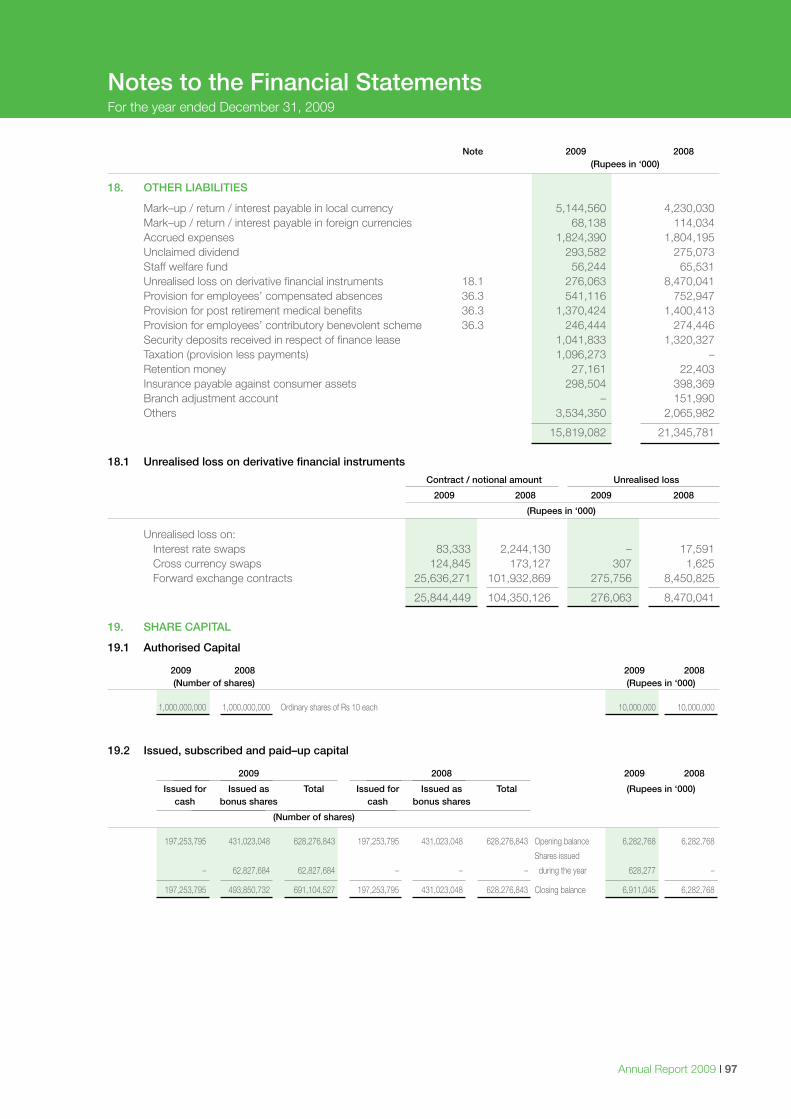
Annual Report 2009 I 97
Note 2009 2008 (Rupees in ‘000)
18. OTHER LIABILITIES
Mark–up / return / interest payable in local currency 5,144,560 4,230,030 Mark–up / return / interest payable in foreign currencies 68,138 114,034 Accrued expenses 1,824,390 1,804,195 Unclaimed dividend 293,582 275,073 Staff welfare fund 56,244 65,531 Unrealised loss on derivative financial instruments 18.1 276,063 8,470,041 Provision for employees’ compensated absences 36.3 541,116 752,947 Provision for post retirement medical benefits 36.3 1,370,424 1,400,413 Provision for employees’ contributory benevolent scheme 36.3 246,444 274,446 Security deposits received in respect of finance lease 1,041,833 1,320,327 Taxation (provision less payments) 1,096,273 – Retention money 27,161 22,403 Insurance payable against consumer assets 298,504 398,369 Branch adjustment account – 151,990 Others 3,534,350 2,065,982
15,819,082 21,345,781 18.1 Unrealised loss on derivative financial instruments
Contract / notional amount Unrealised loss
2009 2008 2009 2008
(Rupees in ‘000)
Unrealised loss on: Interest rate swaps 83,333 2,244,130 – 17,591 Cross currency swaps 124,845 173,127 307 1,625 Forward exchange contracts 25,636,271 101,932,869 275,756 8,450,825
25,844,449 104,350,126 276,063 8,470,041 19. SHARE CAPITAL
19.1 Authorised Capital
2009 2008 2009 2008 (Number of shares) (Rupees in ‘000)
1,000,000,000 1,000,000,000 Ordinary shares of Rs 10 each 10,000,000 10,000,000
19.2 Issued, subscribed and paid–up capital
2009 2008 2009 2008
Issued for Issued as Total Issued for Issued as Total (Rupees in ‘000) cash bonus shares cash bonus shares
(Number of shares)
197,253,795 431,023,048 628,276,843 197,253,795 431,023,048 628,276,843 Opening balance 6,282,768 6,282,768
Shares issued
– 62,827,684 62,827,684 – – – during the year 628,277 –
197,253,795 493,850,732 691,104,527 197,253,795 431,023,048 628,276,843 Closing balance 6,911,045 6,282,768
Notes to the Financial StatementsFor the year ended December 31, 2009
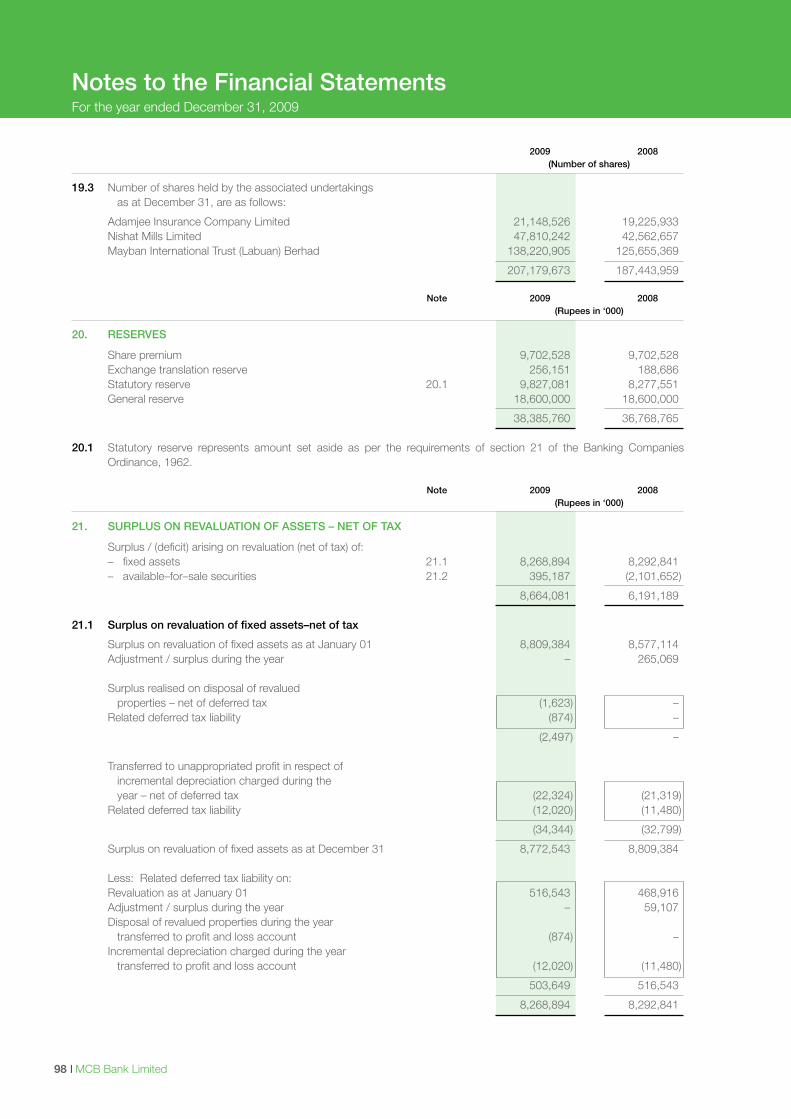
I MCB Bank Limited98
Notes to the Financial StatementsFor the year ended December 31, 2009
2009 2008 (Number of shares)
19.3 Number of shares held by the associated undertakings as at December 31, are as follows:
Adamjee Insurance Company Limited 21,148,526 19,225,933 Nishat Mills Limited 47,810,242 42,562,657 Mayban International Trust (Labuan) Berhad 138,220,905 125,655,369
207,179,673 187,443,959 Note 2009 2008 (Rupees in ‘000)
20. RESERVES
Share premium 9,702,528 9,702,528 Exchange translation reserve 256,151 188,686 Statutory reserve 20.1 9,827,081 8,277,551 General reserve 18,600,000 18,600,000
38,385,760 36,768,765
20.1 Statutory reserve represents amount set aside as per the requirements of section 21 of the Banking Companies Ordinance, 1962.
Note 2009 2008 (Rupees in ‘000)
21. SURPLUS ON REVALUATION OF ASSETS – NET OF TAX
Surplus / (deficit) arising on revaluation (net of tax) of: – fixed assets 21.1 8,268,894 8,292,841 – available–for–sale securities 21.2 395,187 (2,101,652)
8,664,081 6,191,189 21.1 Surplus on revaluation of fixed assets–net of tax
Surplus on revaluation of fixed assets as at January 01 8,809,384 8,577,114 Adjustment / surplus during the year – 265,069 Surplus realised on disposal of revalued properties – net of deferred tax (1,623) – Related deferred tax liability (874) –
(2,497) – Transferred to unappropriated profit in respect of incremental depreciation charged during the year – net of deferred tax (22,324) (21,319) Related deferred tax liability (12,020) (11,480)
(34,344) (32,799)
Surplus on revaluation of fixed assets as at December 31 8,772,543 8,809,384 Less: Related deferred tax liability on: Revaluation as at January 01 516,543 468,916 Adjustment / surplus during the year – 59,107 Disposal of revalued properties during the year transferred to profit and loss account (874) – Incremental depreciation charged during the year transferred to profit and loss account (12,020) (11,480)
503,649 516,543
8,268,894 8,292,841
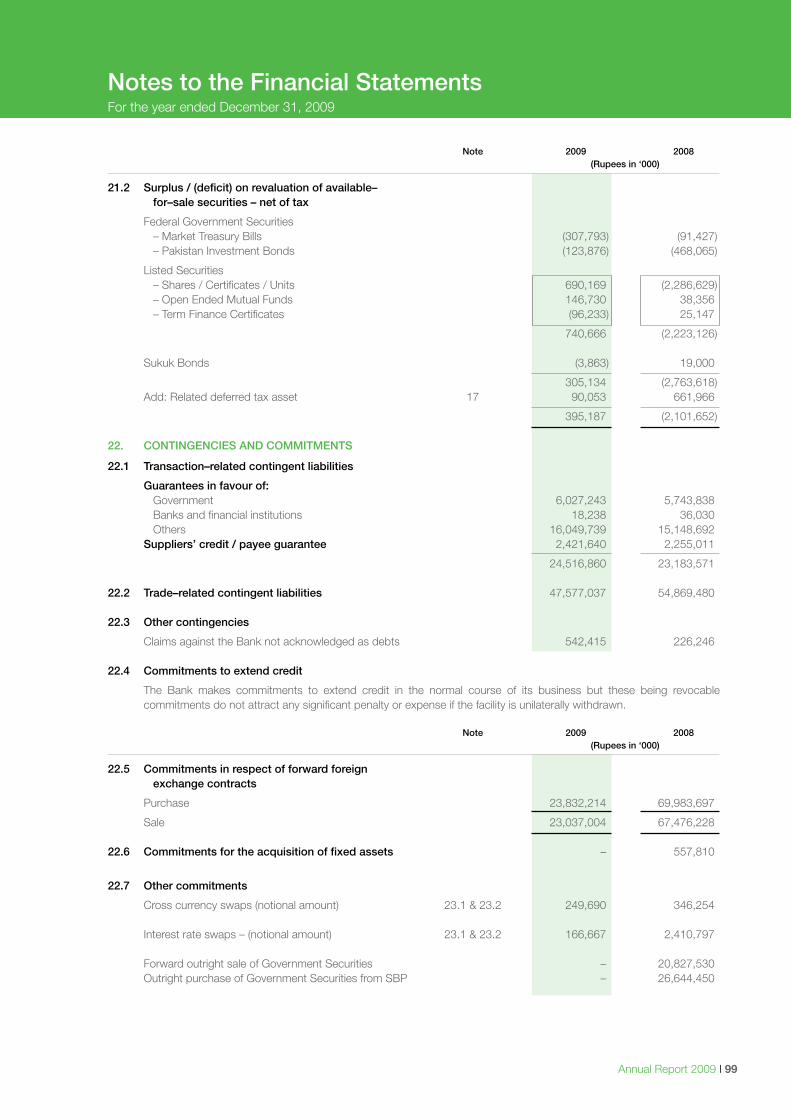
Annual Report 2009 I 99
Note 2009 2008 (Rupees in ‘000)
21.2 Surplus / (deficit) on revaluation of available– for–sale securities – net of tax
Federal Government Securities – Market Treasury Bills (307,793) (91,427) – Pakistan Investment Bonds (123,876) (468,065)
Listed Securities – Shares / Certificates / Units 690,169 (2,286,629) – Open Ended Mutual Funds 146,730 38,356 – Term Finance Certificates (96,233) 25,147
740,666 (2,223,126) Sukuk Bonds (3,863) 19,000
305,134 (2,763,618) Add: Related deferred tax asset 17 90,053 661,966
395,187 (2,101,652)
22. CONTINGENCIES AND COMMITMENTS
22.1 Transaction–related contingent liabilities
Guarantees in favour of: Government 6,027,243 5,743,838 Banks and financial institutions 18,238 36,030 Others 16,049,739 15,148,692 Suppliers’ credit / payee guarantee 2,421,640 2,255,011
24,516,860 23,183,571 22.2 Trade–related contingent liabilities 47,577,037 54,869,480 22.3 Other contingencies
Claims against the Bank not acknowledged as debts 542,415 226,246 22.4 Commitments to extend credit
The Bank makes commitments to extend credit in the normal course of its business but these being revocable commitments do not attract any significant penalty or expense if the facility is unilaterally withdrawn.
Note 2009 2008 (Rupees in ‘000)
22.5 Commitments in respect of forward foreign exchange contracts
Purchase 23,832,214 69,983,697
Sale 23,037,004 67,476,228
22.6 Commitments for the acquisition of fixed assets – 557,810
22.7 Other commitments
Cross currency swaps (notional amount) 23.1 & 23.2 249,690 346,254
Interest rate swaps – (notional amount) 23.1 & 23.2 166,667 2,410,797
Forward outright sale of Government Securities – 20,827,530 Outright purchase of Government Securities from SBP – 26,644,450
Notes to the Financial StatementsFor the year ended December 31, 2009
I MCB Bank Limited100
Notes to the Financial StatementsFor the year ended December 31, 2009
22.8 Taxation
The income tax assessments of the Bank have been finalised upto and including the Tax Year 2009. For the Tax Years 2003 to 2008, the department has amended the assessments on certain issues against which the Bank has filed appeal before the Commissioner of Income Tax (Appeals). In respect of the Tax Year 2003 to 2006, the Commissioner of Income Tax (Appeals) vide his orders has decided the matter in favour of the Bank against which the department has filed appeal before the Income Tax Appellate Tribunal (ITAT). The management and the Bank’s legal counsel are of the view that the issues will be decided in the Bank’s favour as and when these are taken up by the appellate authorities. For Tax Year 2007, the department has amended the assessment on similar issues resulting in additional tax liability of Rs. 716.713 million against which the legal/appellate course from the Bank has reached ITAT level.
Total disallowances for the assessment years 1994–95 to 1997–98 on account of interest in suspense amounted to Rs.
722.682 million out of which an amount of Rs. 317.289 million has been allowed in the assessment years 1998–1999 to 2000–2001. It is expected that the pending appeals in this regard in the Honourable Sindh High Court shall be decided in favour of the Bank as allowed in assessment years 1992–1993 and 1993–1994. Subsequent to the favourable order of the Honourable Sindh High Court, the management considers that provision is not necessary for the remaining balance of Rs.405.393 million resulting in tax liability for interest in suspense for Rs. 244.781 million as the Bank has been subjected to tax far exceeding its normal tax liability and is hopeful of favourable decisions in appeals. Accordingly, no provision has been made in these financial statements for the above amount.
23. DERIVATIVE INSTRUMENTS
Most corporates (counter parties) have either interest rate exposures arising from debt financing or excess liquidity or currency exposures arising out of commercial and business transactions. In the event of a shift in interest or foreign exchange (FX) rates, these corporates may incur higher borrowing costs or higher cash outflows that will adversely affect profitability.
The Bank is providing solutions to this conundrum through derivatives. Through this, counterparties will be hedging
exposure to adverse price movements in a security, typically when the counterparty has a concentrated position in the security and is acutely exposed to movements in the underlying risk factors. The Bank is in a better position to hedge that risk, and is thus able to provide cost efficient hedging solutions to the counterparties enabling them to concentrate on their business risk.
Other Objectives include:
– contribution to the development of Pakistani financial markets. – provision of financial solutions to the counterparties. In light of the above the Bank is actively marketing interest rate risk and FX risk management tools, including:
– Interest Rate Swaps – Currency Swaps. Risk management is performed at:
a) Strategic level: By senior management Assets and Liabilities Management Committee (ALCO), Risk Management Committee (RMC) and the Board of Directors to institute a risk management framework and to ensure provision of all resources and support required for effective risk management on Bank–wide basis.
b) Macro Level: By Financial Institution Public Sector (FIPS) & Market Risk Management (MRM) Division, responsible for policy formulation, procedure development & implementation, monitoring and reporting.
c) Micro Level: Treasury Derivatives & Structured Product Desk and Treasury Operations, where risks are actually created.
FIPS & MRM Division is responsible for coordinating for risk management of derivatives. The risk management system generates marked to market risk numbers (i.e. VaR PVBP, duration, etc.) of Interest rate
derivative portfolio. These numbers are reported to senior management on a daily basis.
As per the State Bank of Pakistan’s (SBP) regulations, currency options are hedged back to back and thus the risks associated with such transactions are minimal.
Risk Limits
Before initiating any new derivative transaction, Treasury Division requests the FIPS & MRM Division for risk limits. Limit requests are approved by the appropriate level of authority. Presently the Bank has notional limits (both for the portfolio and the counterparty).
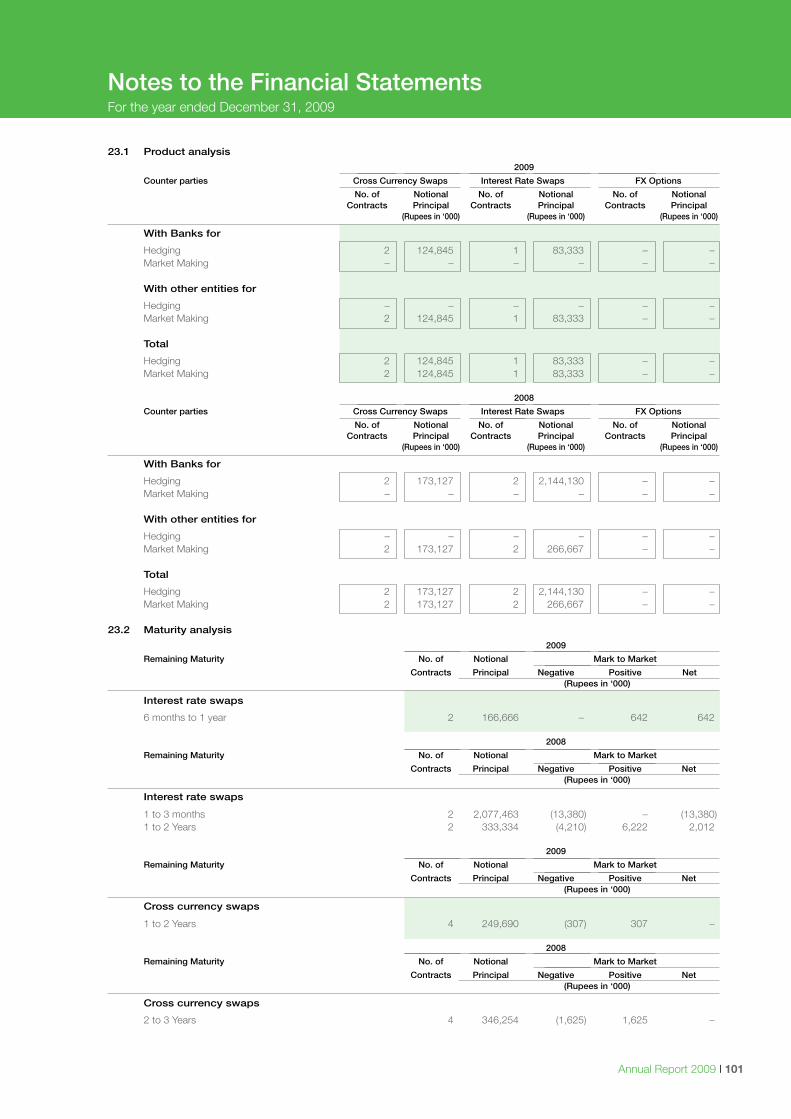
Annual Report 2009 I 101
Notes to the Financial StatementsFor the year ended December 31, 2009
23.1 Product analysis
2009
Counter parties Cross Currency Swaps Interest Rate Swaps FX Options
No. of Notional No. of Notional No. of Notional Contracts Principal Contracts Principal Contracts Principal (Rupees in ‘000) (Rupees in ‘000) (Rupees in ‘000)
With Banks for
Hedging 2 124,845 1 83,333 – – Market Making – – – – – – With other entities for
Hedging – – – – – – Market Making 2 124,845 1 83,333 – – Total
Hedging 2 124,845 1 83,333 – – Market Making 2 124,845 1 83,333 – – 2008
Counter parties Cross Currency Swaps Interest Rate Swaps FX Options
No. of Notional No. of Notional No. of Notional Contracts Principal Contracts Principal Contracts Principal (Rupees in ‘000) (Rupees in ‘000) (Rupees in ‘000)
With Banks for
Hedging 2 173,127 2 2,144,130 – – Market Making – – – – – – With other entities for
Hedging – – – – – – Market Making 2 173,127 2 266,667 – – Total
Hedging 2 173,127 2 2,144,130 – – Market Making 2 173,127 2 266,667 – –
23.2 Maturity analysis
2009
Remaining Maturity No. of Notional Mark to Market
Contracts Principal Negative Positive Net (Rupees in ‘000)
Interest rate swaps
6 months to 1 year 2 166,666 – 642 642
2008
Remaining Maturity No. of Notional Mark to Market
Contracts Principal Negative Positive Net (Rupees in ‘000)
Interest rate swaps
1 to 3 months 2 2,077,463 (13,380) – (13,380) 1 to 2 Years 2 333,334 (4,210) 6,222 2,012
2009
Remaining Maturity No. of Notional Mark to Market
Contracts Principal Negative Positive Net (Rupees in ‘000)
Cross currency swaps
1 to 2 Years 4 249,690 (307) 307 –
2008
Remaining Maturity No. of Notional Mark to Market
Contracts Principal Negative Positive Net (Rupees in ‘000)
Cross currency swaps
2 to 3 Years 4 346,254 (1,625) 1,625 –
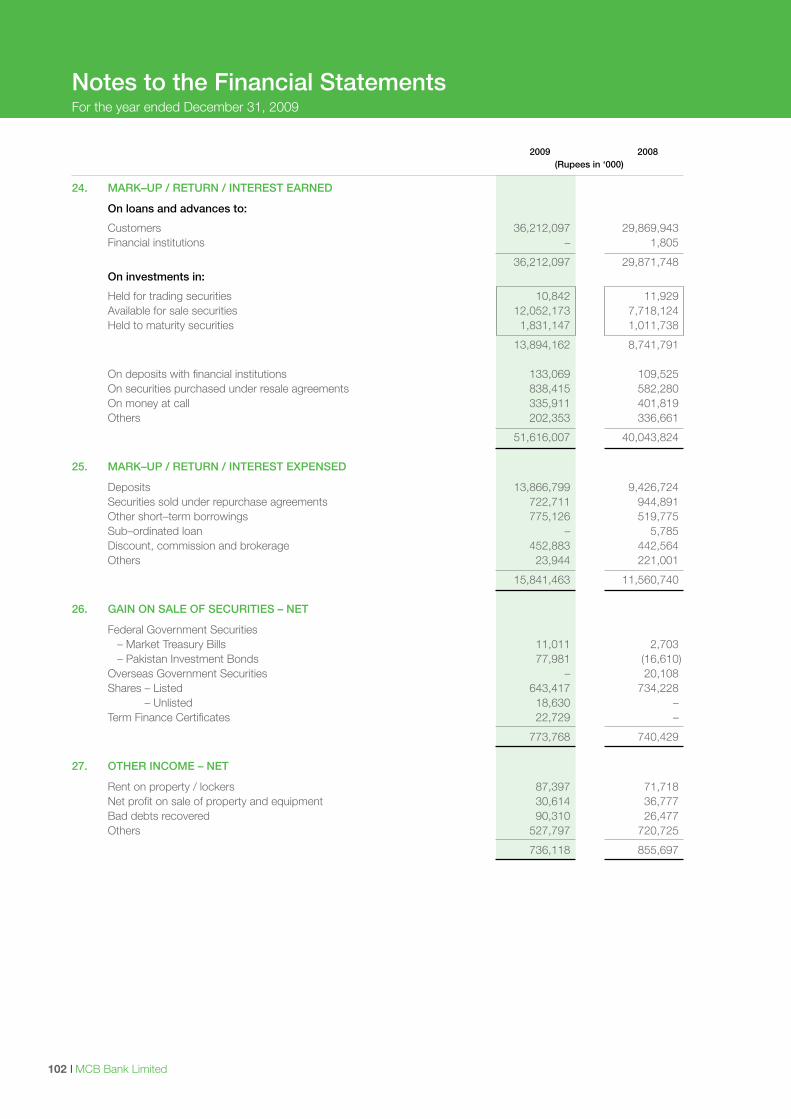
I MCB Bank Limited102
2009 2008 (Rupees in ‘000)
24. MARK–UP / RETURN / INTEREST EARNED
On loans and advances to:
Customers 36,212,097 29,869,943 Financial institutions – 1,805
36,212,097 29,871,748 On investments in:
Held for trading securities 10,842 11,929 Available for sale securities 12,052,173 7,718,124 Held to maturity securities 1,831,147 1,011,738
13,894,162 8,741,791 On deposits with financial institutions 133,069 109,525 On securities purchased under resale agreements 838,415 582,280 On money at call 335,911 401,819 Others 202,353 336,661
51,616,007 40,043,824 25. MARK–UP / RETURN / INTEREST EXPENSED
Deposits 13,866,799 9,426,724 Securities sold under repurchase agreements 722,711 944,891 Other short–term borrowings 775,126 519,775 Sub–ordinated loan – 5,785 Discount, commission and brokerage 452,883 442,564 Others 23,944 221,001
15,841,463 11,560,740 26. GAIN ON SALE OF SECURITIES – NET
Federal Government Securities – Market Treasury Bills 11,011 2,703 – Pakistan Investment Bonds 77,981 (16,610) Overseas Government Securities – 20,108 Shares – Listed 643,417 734,228 – Unlisted 18,630 – Term Finance Certificates 22,729 –
773,768 740,429 27. OTHER INCOME – NET
Rent on property / lockers 87,397 71,718 Net profit on sale of property and equipment 30,614 36,777 Bad debts recovered 90,310 26,477 Others 527,797 720,725
736,118 855,697
Notes to the Financial StatementsFor the year ended December 31, 2009
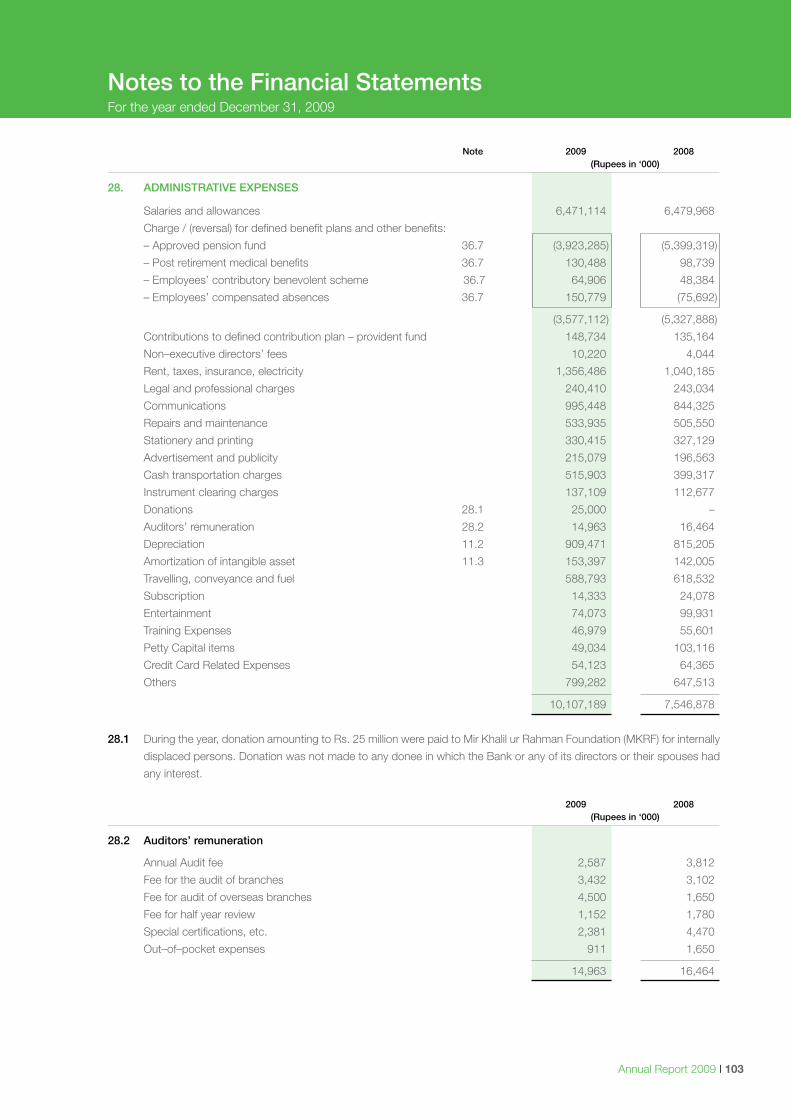
Annual Report 2009 I 103
Note 2009 2008 (Rupees in ‘000)
28. ADMINISTRATIVE EXPENSES
Salaries and allowances 6,471,114 6,479,968
Charge / (reversal) for defined benefit plans and other benefits:
– Approved pension fund 36.7 (3,923,285) (5,399,319)
– Post retirement medical benefits 36.7 130,488 98,739
– Employees’ contributory benevolent scheme 36.7 64,906 48,384
– Employees’ compensated absences 36.7 150,779 (75,692)
(3,577,112) (5,327,888)
Contributions to defined contribution plan – provident fund 148,734 135,164
Non–executive directors’ fees 10,220 4,044
Rent, taxes, insurance, electricity 1,356,486 1,040,185
Legal and professional charges 240,410 243,034
Communications 995,448 844,325
Repairs and maintenance 533,935 505,550
Stationery and printing 330,415 327,129
Advertisement and publicity 215,079 196,563
Cash transportation charges 515,903 399,317
Instrument clearing charges 137,109 112,677
Donations 28.1 25,000 –
Auditors’ remuneration 28.2 14,963 16,464
Depreciation 11.2 909,471 815,205
Amortization of intangible asset 11.3 153,397 142,005
Travelling, conveyance and fuel 588,793 618,532
Subscription 14,333 24,078
Entertainment 74,073 99,931
Training Expenses 46,979 55,601
Petty Capital items 49,034 103,116
Credit Card Related Expenses 54,123 64,365
Others 799,282 647,513
10,107,189 7,546,878
28.1 During the year, donation amounting to Rs. 25 million were paid to Mir Khalil ur Rahman Foundation (MKRF) for internally
displaced persons. Donation was not made to any donee in which the Bank or any of its directors or their spouses had
any interest.
2009 2008 (Rupees in ‘000)
28.2 Auditors’ remuneration
Annual Audit fee 2,587 3,812
Fee for the audit of branches 3,432 3,102
Fee for audit of overseas branches 4,500 1,650
Fee for half year review 1,152 1,780
Special certifications, etc. 2,381 4,470
Out–of–pocket expenses 911 1,650
14,963 16,464
Notes to the Financial StatementsFor the year ended December 31, 2009

I MCB Bank Limited104
2009 2008 (Rupees in ‘000)
29. OTHER CHARGES
Fixed assets written off 17,477 –
Penalties of State Bank of Pakistan 30,000 300,000
Workers welfare fund 463,099 437,351
VAT Sri Lanka 103,707 80,473
Others 75,867 –
690,150 817,824
30. TAXATION
For the year
Current 7,703,305 7,341,257
Deferred 298,807 16,533
8,002,112 7,357,790
Prior years
Current (2,232,226) (864,824)
Deferred 1,889,762 –
(342,464) (864,824)
7,659,648 6,492,966
30.1 Relationship between tax expense and accounting profit
Accounting profit for the year 23,154,945 21,867,566
Tax rate 35% 35%
Tax on income 8,104,231 7,653,648
Tax effect on separate block of income (taxable at reduced rate) (114,935) (234,934)
Tax effect of permanent differences 24,836 (49,444)
Tax effect of prior years provisions / reversals (342,464) (864,824)
Reversal of deferred tax liability on incremental depreciation (12,020) (11,480)
Tax charge for the year 7,659,648 6,492,966
31. CREDIT RATING
PACRA through its notification in June 2009, has assigned long term credit rating of AA+ [double A plus] and short–term
credit rating of A1+ [A one plus] to the Bank (2008: AA+ [Double A plus] for long term and A1+ [A one plus] for short term
rating).
Notes to the Financial StatementsFor the year ended December 31, 2009
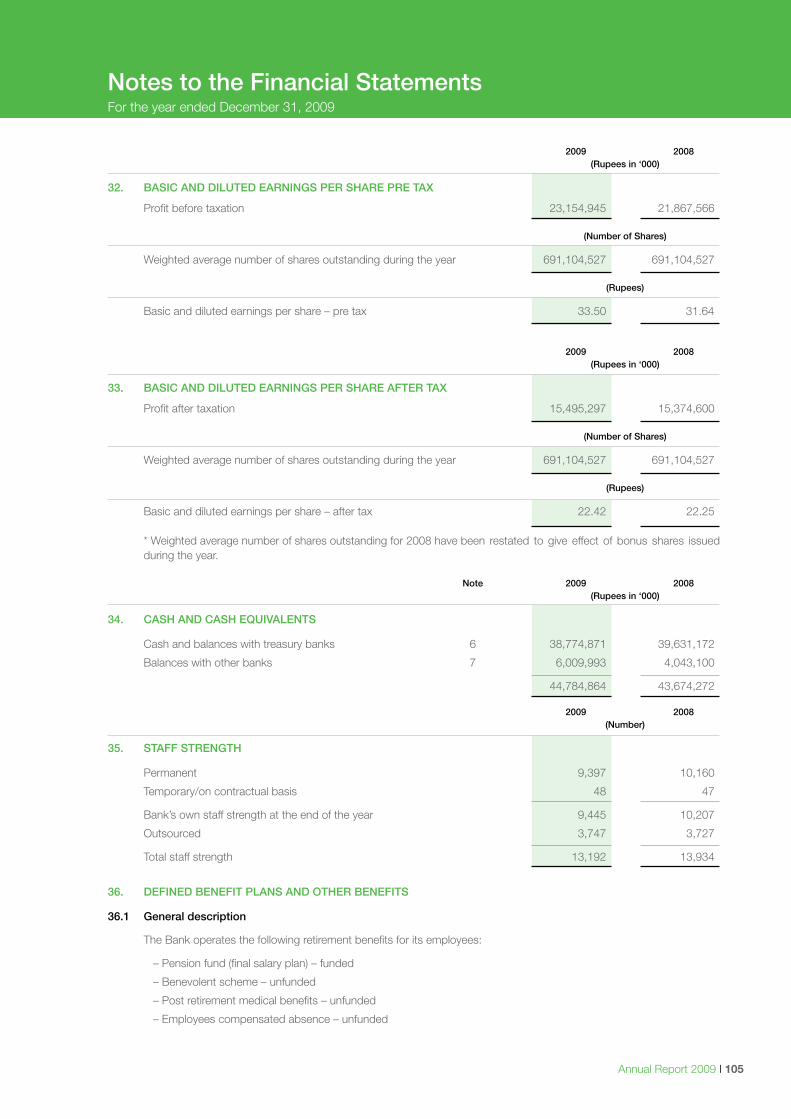
Annual Report 2009 I 105
2009 2008 (Rupees in ‘000)
32. BASIC AND DILUTED EARNINGS PER SHARE PRE TAX
Profit before taxation 23,154,945 21,867,566 (Number of Shares)
Weighted average number of shares outstanding during the year 691,104,527 691,104,527 (Rupees)
Basic and diluted earnings per share – pre tax 33.50 31.64
2009 2008 (Rupees in ‘000)
33. BASIC AND DILUTED EARNINGS PER SHARE AFTER TAX
Profit after taxation 15,495,297 15,374,600 (Number of Shares)
Weighted average number of shares outstanding during the year 691,104,527 691,104,527 (Rupees)
Basic and diluted earnings per share – after tax 22.42 22.25
* Weighted average number of shares outstanding for 2008 have been restated to give effect of bonus shares issued during the year.
Note 2009 2008 (Rupees in ‘000)
34. CASH AND CASH EQUIVALENTS
Cash and balances with treasury banks 6 38,774,871 39,631,172
Balances with other banks 7 6,009,993 4,043,100
44,784,864 43,674,272
2009 2008 (Number)
35. STAFF STRENGTH
Permanent 9,397 10,160
Temporary/on contractual basis 48 47
Bank’s own staff strength at the end of the year 9,445 10,207
Outsourced 3,747 3,727
Total staff strength 13,192 13,934
36. DEFINED BENEFIT PLANS AND OTHER BENEFITS
36.1 General description
The Bank operates the following retirement benefits for its employees:
– Pension fund (final salary plan) – funded
– Benevolent scheme – unfunded
– Post retirement medical benefits – unfunded
– Employees compensated absence – unfunded
Notes to the Financial StatementsFor the year ended December 31, 2009
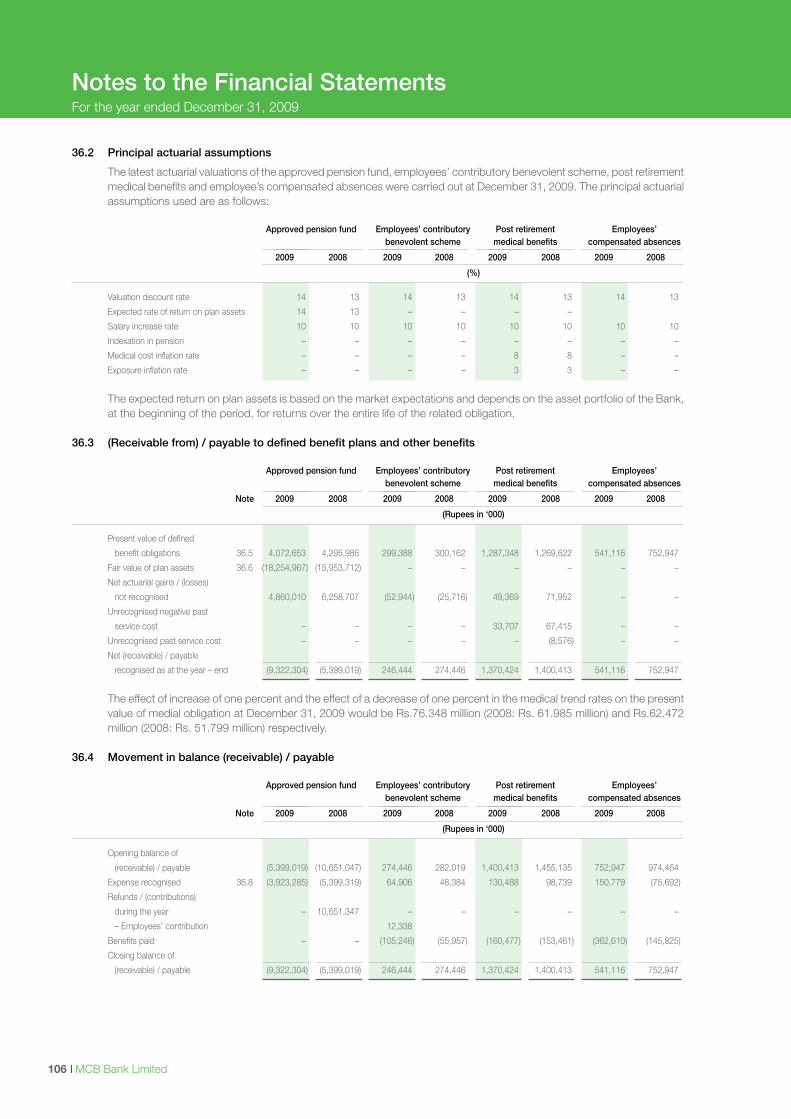
I MCB Bank Limited106
36.2 Principal actuarial assumptions
The latest actuarial valuations of the approved pension fund, employees’ contributory benevolent scheme, post retirement medical benefits and employee’s compensated absences were carried out at December 31, 2009. The principal actuarial assumptions used are as follows:
Approved pension fund Employees’ contributory Post retirement Employees’ benevolent scheme medical benefits compensated absences
2009 2008 2009 2008 2009 2008 2009 2008
(%)
Valuation discount rate 14 13 14 13 14 13 14 13
Expected rate of return on plan assets 14 13 – – – –
Salary increase rate 10 10 10 10 10 10 10 10
Indexation in pension – – – – – – – –
Medical cost inflation rate – – – – 8 8 – –
Exposure inflation rate – – – – 3 3 – –
The expected return on plan assets is based on the market expectations and depends on the asset portfolio of the Bank,
at the beginning of the period, for returns over the entire life of the related obligation. 36.3 (Receivable from) / payable to defined benefit plans and other benefits Approved pension fund Employees’ contributory Post retirement Employees’ benevolent scheme medical benefits compensated absences
Note 2009 2008 2009 2008 2009 2008 2009 2008
(Rupees in ‘000)
Present value of defined
benefit obligations 36.5 4,072,653 4,295,986 299,388 300,162 1,287,348 1,269,622 541,116 752,947
Fair value of plan assets 36.6 (18,254,967) (15,953,712) – – – – – –
Net actuarial gains / (losses)
not recognised 4,860,010 6,258,707 (52,944) (25,716) 49,369 71,952 – –
Unrecognised negative past
service cost – – – – 33,707 67,415 – –
Unrecognised past service cost – – – – – (8,576) – –
Net (receivable) / payable
recognised as at the year – end (9,322,304) (5,399,019) 246,444 274,446 1,370,424 1,400,413 541,116 752,947
The effect of increase of one percent and the effect of a decrease of one percent in the medical trend rates on the present
value of medial obligation at December 31, 2009 would be Rs.76.348 million (2008: Rs. 61.985 million) and Rs.62.472 million (2008: Rs. 51.799 million) respectively.
36.4 Movement in balance (receivable) / payable
Approved pension fund Employees’ contributory Post retirement Employees’ benevolent scheme medical benefits compensated absences
Note 2009 2008 2009 2008 2009 2008 2009 2008
(Rupees in ‘000)
Opening balance of
(receivable) / payable (5,399,019) (10,651,047) 274,446 282,019 1,400,413 1,455,135 752,947 974,464
Expense recognised 36.8 (3,923,285) (5,399,319) 64,906 48,384 130,488 98,739 150,779 (75,692)
Refunds / (contributions)
during the year – 10,651,347 – – – – – –
– Employees’ contribution 12,338
Benefits paid – – (105,246) (55,957) (160,477) (153,461) (362,610) (145,825)
Closing balance of
(receivable) / payable (9,322,304) (5,399,019) 246,444 274,446 1,370,424 1,400,413 541,116 752,947
Notes to the Financial StatementsFor the year ended December 31, 2009
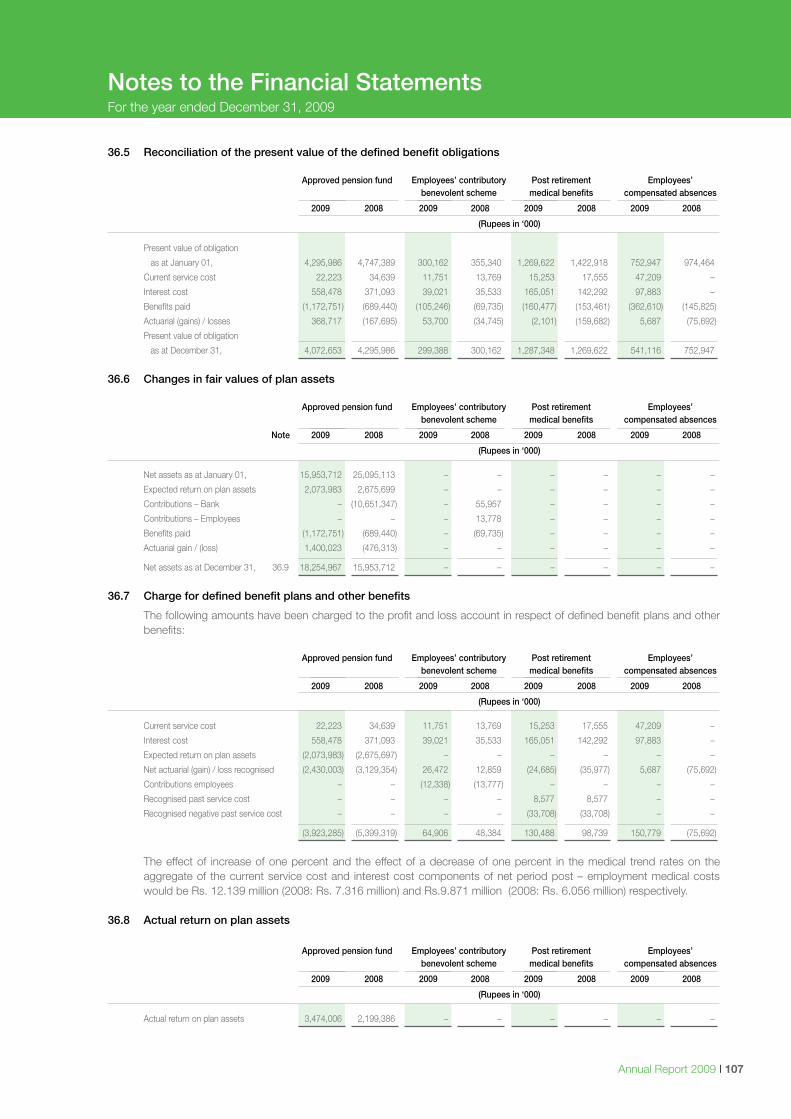
Annual Report 2009 I 107
36.5 Reconciliation of the present value of the defined benefit obligations Approved pension fund Employees’ contributory Post retirement Employees’ benevolent scheme medical benefits compensated absences
2009 2008 2009 2008 2009 2008 2009 2008
(Rupees in ‘000)
Present value of obligation
as at January 01, 4,295,986 4,747,389 300,162 355,340 1,269,622 1,422,918 752,947 974,464
Current service cost 22,223 34,639 11,751 13,769 15,253 17,555 47,209 –
Interest cost 558,478 371,093 39,021 35,533 165,051 142,292 97,883 –
Benefits paid (1,172,751) (689,440) (105,246) (69,735) (160,477) (153,461) (362,610) (145,825)
Actuarial (gains) / losses 368,717 (167,695) 53,700 (34,745) (2,101) (159,682) 5,687 (75,692)
Present value of obligation
as at December 31, 4,072,653 4,295,986 299,388 300,162 1,287,348 1,269,622 541,116 752,947
36.6 Changes in fair values of plan assets
Approved pension fund Employees’ contributory Post retirement Employees’ benevolent scheme medical benefits compensated absences
Note 2009 2008 2009 2008 2009 2008 2009 2008
(Rupees in ‘000)
Net assets as at January 01, 15,953,712 25,095,113 – – – – – –
Expected return on plan assets 2,073,983 2,675,699 – – – – – –
Contributions – Bank – (10,651,347) – 55,957 – – – –
Contributions – Employees – – – 13,778 – – – –
Benefits paid (1,172,751) (689,440) – (69,735) – – – –
Actuarial gain / (loss) 1,400,023 (476,313) – – – – – –
Net assets as at December 31, 36.9 18,254,967 15,953,712 – – – – – –
36.7 Charge for defined benefit plans and other benefits
The following amounts have been charged to the profit and loss account in respect of defined benefit plans and other benefits:
Approved pension fund Employees’ contributory Post retirement Employees’ benevolent scheme medical benefits compensated absences
2009 2008 2009 2008 2009 2008 2009 2008
(Rupees in ‘000)
Current service cost 22,223 34,639 11,751 13,769 15,253 17,555 47,209 –
Interest cost 558,478 371,093 39,021 35,533 165,051 142,292 97,883 –
Expected return on plan assets (2,073,983) (2,675,697) – – – – – –
Net actuarial (gain) / loss recognised (2,430,003) (3,129,354) 26,472 12,859 (24,685) (35,977) 5,687 (75,692)
Contributions employees – – (12,338) (13,777) – – – –
Recognised past service cost – – – – 8,577 8,577 – –
Recognised negative past service cost – – – – (33,708) (33,708) – –
(3,923,285) (5,399,319) 64,906 48,384 130,488 98,739 150,779 (75,692)
The effect of increase of one percent and the effect of a decrease of one percent in the medical trend rates on the
aggregate of the current service cost and interest cost components of net period post – employment medical costs would be Rs. 12.139 million (2008: Rs. 7.316 million) and Rs.9.871 million (2008: Rs. 6.056 million) respectively.
36.8 Actual return on plan assets
Approved pension fund Employees’ contributory Post retirement Employees’ benevolent scheme medical benefits compensated absences
2009 2008 2009 2008 2009 2008 2009 2008
(Rupees in ‘000)
Actual return on plan assets 3,474,006 2,199,386 – – – – – –
Notes to the Financial StatementsFor the year ended December 31, 2009
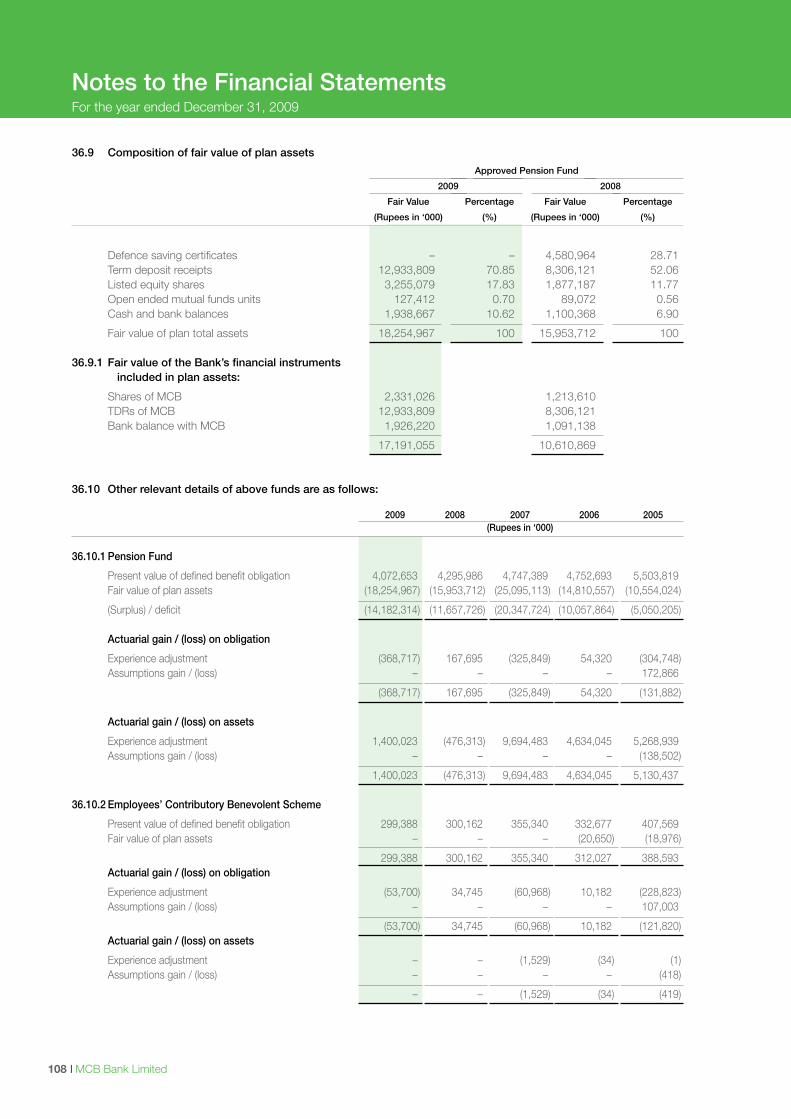
I MCB Bank Limited108
36.9 Composition of fair value of plan assets
Approved Pension Fund
2009 2008
Fair Value Percentage Fair Value Percentage
(Rupees in ‘000) (%) (Rupees in ‘000) (%)
Defence saving certificates – – 4,580,964 28.71 Term deposit receipts 12,933,809 70.85 8,306,121 52.06 Listed equity shares 3,255,079 17.83 1,877,187 11.77 Open ended mutual funds units 127,412 0.70 89,072 0.56 Cash and bank balances 1,938,667 10.62 1,100,368 6.90
Fair value of plan total assets 18,254,967 100 15,953,712 100 36.9.1 Fair value of the Bank’s financial instruments included in plan assets:
Shares of MCB 2,331,026 1,213,610 TDRs of MCB 12,933,809 8,306,121 Bank balance with MCB 1,926,220 1,091,138
17,191,055 10,610,869
36.10 Other relevant details of above funds are as follows:
2009 2008 2007 2006 2005 (Rupees in ‘000)
36.10.1 Pension Fund
Present value of defined benefit obligation 4,072,653 4,295,986 4,747,389 4,752,693 5,503,819 Fair value of plan assets (18,254,967) (15,953,712) (25,095,113) (14,810,557) (10,554,024)
(Surplus) / deficit (14,182,314) (11,657,726) (20,347,724) (10,057,864) (5,050,205) Actuarial gain / (loss) on obligation
Experience adjustment (368,717) 167,695 (325,849) 54,320 (304,748) Assumptions gain / (loss) – – – – 172,866
(368,717) 167,695 (325,849) 54,320 (131,882) Actuarial gain / (loss) on assets
Experience adjustment 1,400,023 (476,313) 9,694,483 4,634,045 5,268,939 Assumptions gain / (loss) – – – – (138,502)
1,400,023 (476,313) 9,694,483 4,634,045 5,130,437 36.10.2 Employees’ Contributory Benevolent Scheme
Present value of defined benefit obligation 299,388 300,162 355,340 332,677 407,569 Fair value of plan assets – – – (20,650) (18,976)
299,388 300,162 355,340 312,027 388,593 Actuarial gain / (loss) on obligation
Experience adjustment (53,700) 34,745 (60,968) 10,182 (228,823) Assumptions gain / (loss) – – – – 107,003
(53,700) 34,745 (60,968) 10,182 (121,820) Actuarial gain / (loss) on assets
Experience adjustment – – (1,529) (34) (1) Assumptions gain / (loss) – – – – (418)
– – (1,529) (34) (419)
Notes to the Financial StatementsFor the year ended December 31, 2009
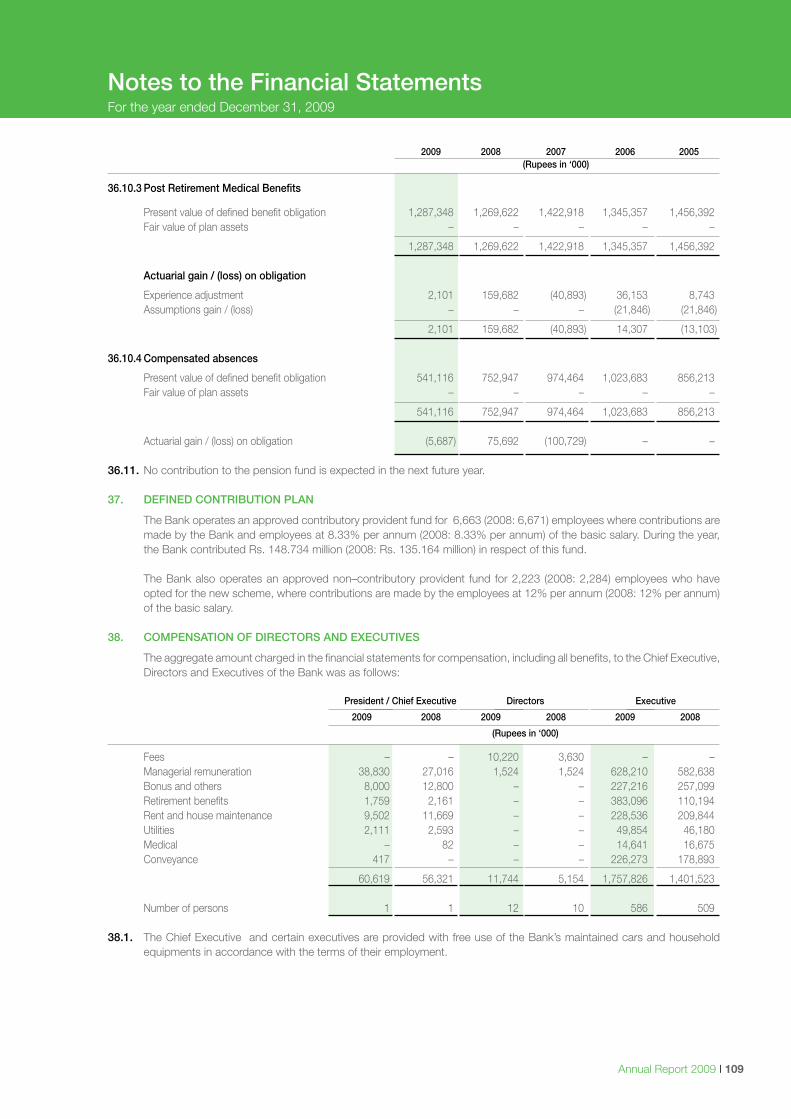
Annual Report 2009 I 109
2009 2008 2007 2006 2005 (Rupees in ‘000)
36.10.3 Post Retirement Medical Benefits
Present value of defined benefit obligation 1,287,348 1,269,622 1,422,918 1,345,357 1,456,392 Fair value of plan assets – – – – –
1,287,348 1,269,622 1,422,918 1,345,357 1,456,392 Actuarial gain / (loss) on obligation
Experience adjustment 2,101 159,682 (40,893) 36,153 8,743 Assumptions gain / (loss) – – – (21,846) (21,846)
2,101 159,682 (40,893) 14,307 (13,103) 36.10.4 Compensated absences
Present value of defined benefit obligation 541,116 752,947 974,464 1,023,683 856,213 Fair value of plan assets – – – – –
541,116 752,947 974,464 1,023,683 856,213
Actuarial gain / (loss) on obligation (5,687) 75,692 (100,729) – – 36.11. No contribution to the pension fund is expected in the next future year. 37. DEFINED CONTRIBUTION PLAN
The Bank operates an approved contributory provident fund for 6,663 (2008: 6,671) employees where contributions are made by the Bank and employees at 8.33% per annum (2008: 8.33% per annum) of the basic salary. During the year, the Bank contributed Rs. 148.734 million (2008: Rs. 135.164 million) in respect of this fund.
The Bank also operates an approved non–contributory provident fund for 2,223 (2008: 2,284) employees who have opted for the new scheme, where contributions are made by the employees at 12% per annum (2008: 12% per annum) of the basic salary.
38. COMPENSATION OF DIRECTORS AND EXECUTIVES
The aggregate amount charged in the financial statements for compensation, including all benefits, to the Chief Executive, Directors and Executives of the Bank was as follows:
President / Chief Executive Directors Executive
2009 2008 2009 2008 2009 2008
(Rupees in ‘000)
Fees – – 10,220 3,630 – – Managerial remuneration 38,830 27,016 1,524 1,524 628,210 582,638 Bonus and others 8,000 12,800 – – 227,216 257,099 Retirement benefits 1,759 2,161 – – 383,096 110,194 Rent and house maintenance 9,502 11,669 – – 228,536 209,844 Utilities 2,111 2,593 – – 49,854 46,180 Medical – 82 – – 14,641 16,675 Conveyance 417 – – – 226,273 178,893
60,619 56,321 11,744 5,154 1,757,826 1,401,523 Number of persons 1 1 12 10 586 509
38.1. The Chief Executive and certain executives are provided with free use of the Bank’s maintained cars and household
equipments in accordance with the terms of their employment.
Notes to the Financial StatementsFor the year ended December 31, 2009
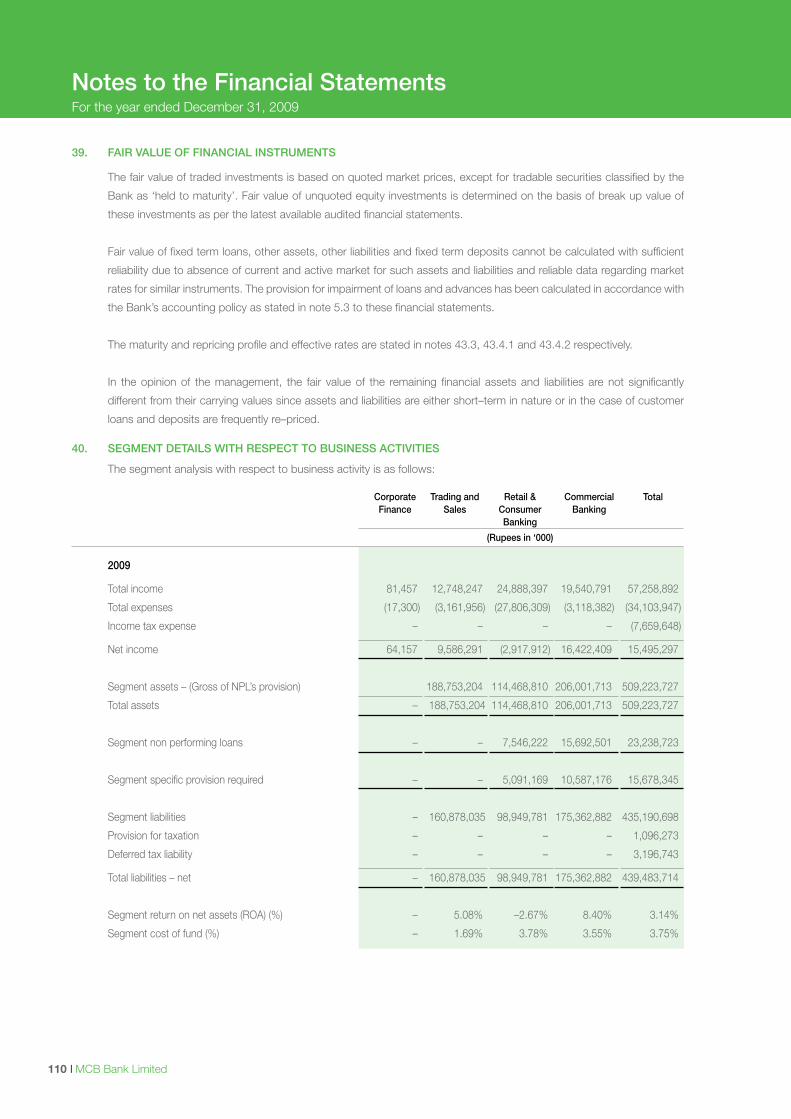
I MCB Bank Limited110
39. FAIR VALUE OF FINANCIAL INSTRUMENTS
The fair value of traded investments is based on quoted market prices, except for tradable securities classified by the
Bank as ‘held to maturity’. Fair value of unquoted equity investments is determined on the basis of break up value of
these investments as per the latest available audited financial statements.
Fair value of fixed term loans, other assets, other liabilities and fixed term deposits cannot be calculated with sufficient
reliability due to absence of current and active market for such assets and liabilities and reliable data regarding market
rates for similar instruments. The provision for impairment of loans and advances has been calculated in accordance with
the Bank’s accounting policy as stated in note 5.3 to these financial statements.
The maturity and repricing profile and effective rates are stated in notes 43.3, 43.4.1 and 43.4.2 respectively.
In the opinion of the management, the fair value of the remaining financial assets and liabilities are not significantly
different from their carrying values since assets and liabilities are either short–term in nature or in the case of customer
loans and deposits are frequently re–priced. 40. SEGMENT DETAILS WITH RESPECT TO BUSINESS ACTIVITIES
The segment analysis with respect to business activity is as follows: Corporate Trading and Retail & Commercial Total Finance Sales Consumer Banking Banking
(Rupees in ‘000)
2009
Total income 81,457 12,748,247 24,888,397 19,540,791 57,258,892
Total expenses (17,300) (3,161,956) (27,806,309) (3,118,382) (34,103,947)
Income tax expense – – – – (7,659,648)
Net income 64,157 9,586,291 (2,917,912) 16,422,409 15,495,297
Segment assets – (Gross of NPL’s provision) 188,753,204 114,468,810 206,001,713 509,223,727
Total assets – 188,753,204 114,468,810 206,001,713 509,223,727
Segment non performing loans – – 7,546,222 15,692,501 23,238,723
Segment specific provision required – – 5,091,169 10,587,176 15,678,345
Segment liabilities – 160,878,035 98,949,781 175,362,882 435,190,698
Provision for taxation – – – – 1,096,273
Deferred tax liability – – – – 3,196,743
Total liabilities – net – 160,878,035 98,949,781 175,362,882 439,483,714
Segment return on net assets (ROA) (%) – 5.08% –2.67% 8.40% 3.14%
Segment cost of fund (%) – 1.69% 3.78% 3.55% 3.75%
Notes to the Financial StatementsFor the year ended December 31, 2009
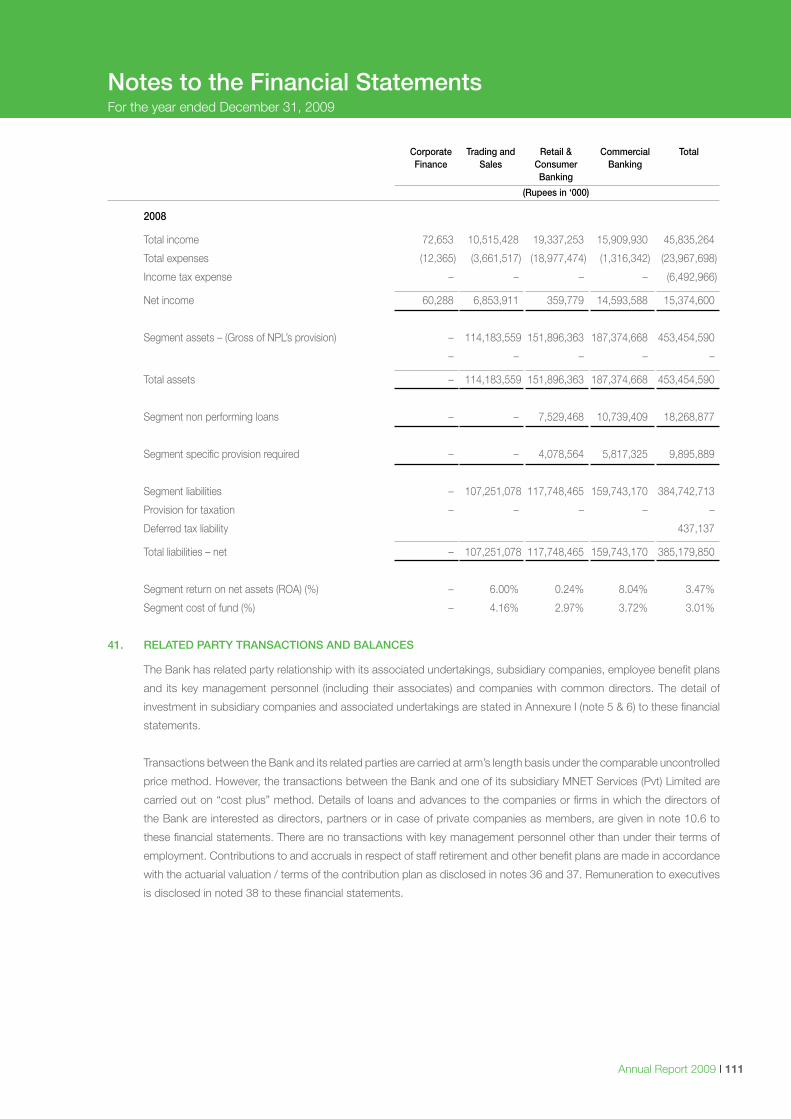
Annual Report 2009 I 111
Corporate Trading and Retail & Commercial Total Finance Sales Consumer Banking Banking
(Rupees in ‘000)
2008
Total income 72,653 10,515,428 19,337,253 15,909,930 45,835,264
Total expenses (12,365) (3,661,517) (18,977,474) (1,316,342) (23,967,698)
Income tax expense – – – – (6,492,966)
Net income 60,288 6,853,911 359,779 14,593,588 15,374,600
Segment assets – (Gross of NPL’s provision) – 114,183,559 151,896,363 187,374,668 453,454,590
– – – – –
Total assets – 114,183,559 151,896,363 187,374,668 453,454,590
Segment non performing loans – – 7,529,468 10,739,409 18,268,877
Segment specific provision required – – 4,078,564 5,817,325 9,895,889
Segment liabilities – 107,251,078 117,748,465 159,743,170 384,742,713
Provision for taxation – – – – –
Deferred tax liability 437,137
Total liabilities – net – 107,251,078 117,748,465 159,743,170 385,179,850
Segment return on net assets (ROA) (%) – 6.00% 0.24% 8.04% 3.47%
Segment cost of fund (%) – 4.16% 2.97% 3.72% 3.01%
41. RELATED PARTY TRANSACTIONS AND BALANCES
The Bank has related party relationship with its associated undertakings, subsidiary companies, employee benefit plans
and its key management personnel (including their associates) and companies with common directors. The detail of
investment in subsidiary companies and associated undertakings are stated in Annexure I (note 5 & 6) to these financial
statements.
Transactions between the Bank and its related parties are carried at arm’s length basis under the comparable uncontrolled
price method. However, the transactions between the Bank and one of its subsidiary MNET Services (Pvt) Limited are
carried out on “cost plus” method. Details of loans and advances to the companies or firms in which the directors of
the Bank are interested as directors, partners or in case of private companies as members, are given in note 10.6 to
these financial statements. There are no transactions with key management personnel other than under their terms of
employment. Contributions to and accruals in respect of staff retirement and other benefit plans are made in accordance
with the actuarial valuation / terms of the contribution plan as disclosed in notes 36 and 37. Remuneration to executives
is disclosed in noted 38 to these financial statements.
Notes to the Financial StatementsFor the year ended December 31, 2009
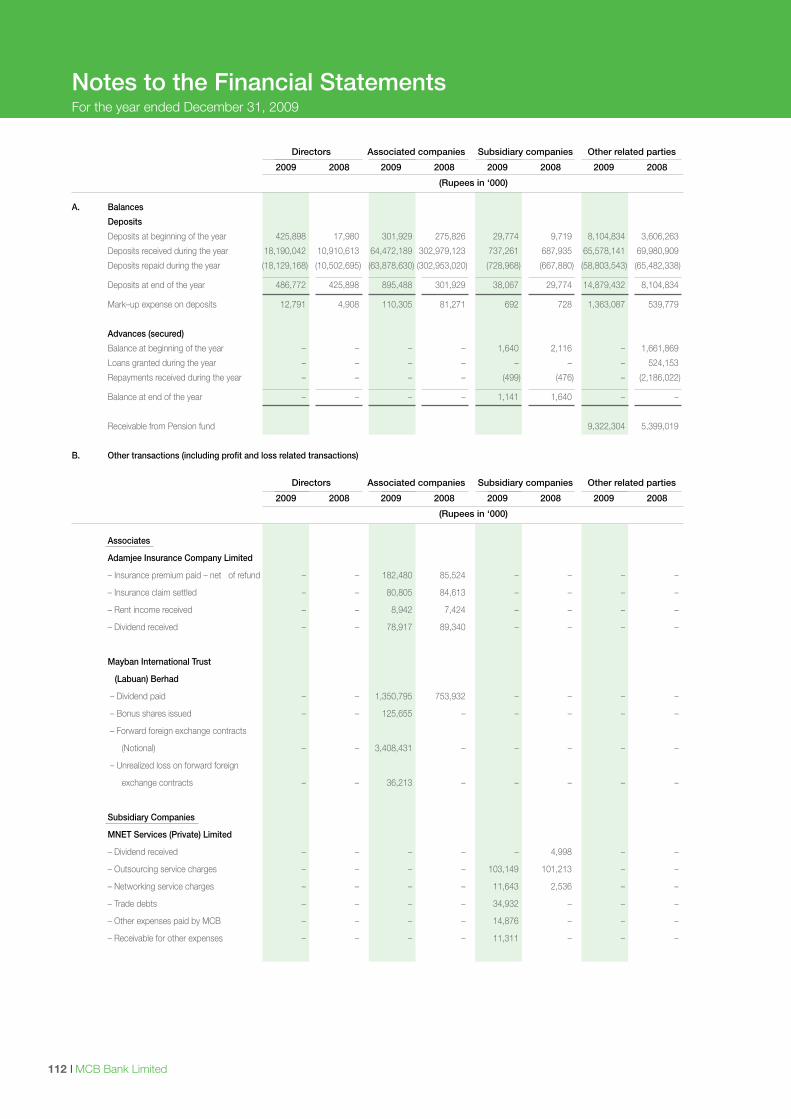
I MCB Bank Limited112
Directors Associated companies Subsidiary companies Other related parties
2009 2008 2009 2008 2009 2008 2009 2008
(Rupees in ‘000)
A. Balances
Deposits
Deposits at beginning of the year 425,898 17,980 301,929 275,826 29,774 9,719 8,104,834 3,606,263
Deposits received during the year 18,190,042 10,910,613 64,472,189 302,979,123 737,261 687,935 65,578,141 69,980,909
Deposits repaid during the year (18,129,168) (10,502,695) (63,878,630) (302,953,020) (728,968) (667,880) (58,803,543) (65,482,338)
Deposits at end of the year 486,772 425,898 895,488 301,929 38,067 29,774 14,879,432 8,104,834
Mark–up expense on deposits 12,791 4,908 110,305 81,271 692 728 1,363,087 539,779
Advances (secured)
Balance at beginning of the year – – – – 1,640 2,116 – 1,661,869
Loans granted during the year – – – – – – – 524,153
Repayments received during the year – – – – (499) (476) – (2,186,022)
Balance at end of the year – – – – 1,141 1,640 – –
Receivable from Pension fund 9,322,304 5,399,019
B. Other transactions (including profit and loss related transactions)
Directors Associated companies Subsidiary companies Other related parties
2009 2008 2009 2008 2009 2008 2009 2008
(Rupees in ‘000)
Associates
Adamjee Insurance Company Limited
– Insurance premium paid – net of refund – – 182,480 85,524 – – – –
– Insurance claim settled – – 80,805 84,613 – – – –
– Rent income received – – 8,942 7,424 – – – –
– Dividend received – – 78,917 89,340 – – – –
Mayban International Trust
(Labuan) Berhad
– Dividend paid – – 1,350,795 753,932 – – – –
– Bonus shares issued – – 125,655 – – – – –
– Forward foreign exchange contracts
(Notional) – – 3,408,431 – – – – –
– Unrealized loss on forward foreign
exchange contracts – – 36,213 – – – – –
Subsidiary Companies
MNET Services (Private) Limited
– Dividend received – – – – – 4,998 – –
– Outsourcing service charges – – – – 103,149 101,213 – –
– Networking service charges – – – – 11,643 2,536 – –
– Trade debts – – – – 34,932 – – –
– Other expenses paid by MCB – – – – 14,876 – – –
– Receivable for other expenses – – – – 11,311 – – –
Notes to the Financial StatementsFor the year ended December 31, 2009
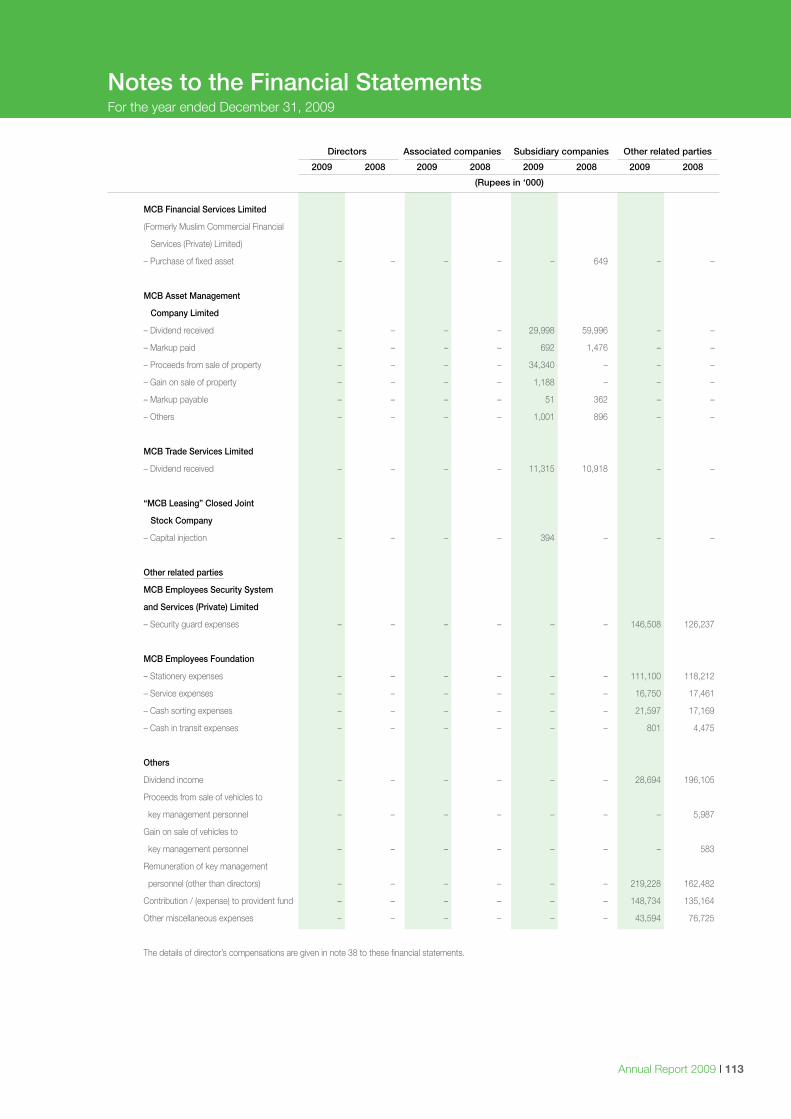
Annual Report 2009 I 113
Directors Associated companies Subsidiary companies Other related parties
2009 2008 2009 2008 2009 2008 2009 2008
(Rupees in ‘000)
MCB Financial Services Limited
(Formerly Muslim Commercial Financial
Services (Private) Limited)
– Purchase of fixed asset – – – – – 649 – –
MCB Asset Management
Company Limited
– Dividend received – – – – 29,998 59,996 – –
– Markup paid – – – – 692 1,476 – –
– Proceeds from sale of property – – – – 34,340 – – –
– Gain on sale of property – – – – 1,188 – – –
– Markup payable – – – – 51 362 – –
– Others – – – – 1,001 896 – –
MCB Trade Services Limited
– Dividend received – – – – 11,315 10,918 – –
“MCB Leasing” Closed Joint
Stock Company
– Capital injection – – – – 394 – – –
Other related parties
MCB Employees Security System
and Services (Private) Limited
– Security guard expenses – – – – – – 146,508 126,237
MCB Employees Foundation
– Stationery expenses – – – – – – 111,100 118,212
– Service expenses – – – – – – 16,750 17,461
– Cash sorting expenses – – – – – – 21,597 17,169
– Cash in transit expenses – – – – – – 801 4,475
Others
Dividend income – – – – – – 28,694 196,105
Proceeds from sale of vehicles to
key management personnel – – – – – – – 5,987
Gain on sale of vehicles to
key management personnel – – – – – – – 583
Remuneration of key management
personnel (other than directors) – – – – – – 219,228 162,482
Contribution / (expense) to provident fund – – – – – – 148,734 135,164
Other miscellaneous expenses – – – – – – 43,594 76,725
The details of director’s compensations are given in note 38 to these financial statements.
Notes to the Financial StatementsFor the year ended December 31, 2009
I MCB Bank Limited114
42. CAPITAL ASSESSMENT AND ADEQUACY
42.1 Scope of Applications
The Basel II Framework is applicable to the bank both at the consolidated level (comprising of wholly/partially owned
subsidiaries & associates undertaking) and also on a stand alone basis. Subsidiaries are included while calculating
Consolidated Capital Adequacy for the Bank using full consolidation method whereas associates in which the bank has
significant influence on equity method. Standardized Approach is used for calculating the Capital Adequacy for Credit
and Market risk, whereas, Basic Indicator Approach (BIA) is used for Operational Risk Capital Adequacy purposes.
42.2 Capital Management
Objectives and goals of managing capital
The objectives and goals of managing capital of the Bank are as follows:
– to be an appropriately capitalized institution, as defined by regulatory authorities and comparable to the peers;
– maintain strong ratings and to protect the Bank against unexpected events;
– availability of adequate capital (including the quantum) at a reasonable cost so as to enable the Bank to expand; and
– achieve low overall cost of capital with appropriate mix of capital elements.
Statutory minimum capital requirement and management of capital
The State Bank of Pakistan through its BSD Circular No.07 of 2009 dated April 15, 2009 requires the minimum paid up
capital (net of losses) for all locally incorporated banks to be raised to Rs. 10 billion by the year ending on December 31,
2013. The raise is to be achieved in a phased manner requiring Rs. 6 billion paid up capital (net of losses) by the end of
the financial year 2009. The paid up capital of the Bank for the year ended December 31, 2009 stands at Rs. 6.9 billion
and is in compliance with the SBP requirement for the said year. In addition the banks are also required to maintain a
minimum capital adequacy ratio (CAR) of 10 % of the risk weighted exposure. The Bank’s CAR as at December 31, 2009
was 19.07 % of its risk weighted exposure.
Bank’s regulatory capital is analysed into two tiers.
– Tier 1 capital, which includes fully paid up capital (including the bonus shares), balance in share premium account,
general reserves as per the financial statements and net unappropriated profits, etc after deductions for deficit
on revaluation of available for sale investments and 50% deduction for investments in the equity of subsidiary
companies and significant minority investments in entities engaged in banking and financial activities.
– Tier 2 capital, which includes general provisions for loan losses (up to a maximum of 1.25 % of risk weighted assets),
reserves on revaluation of fixed assets and equity investments up to a maximum of 45 % of the balance, foreign
exchange translation reserves, etc after 50% deduction for investments in the equity of subsidiary companies and
significant minority investments in entities engaged in banking and financial activities.
Tier 3 capital has also been prescribed by the State Bank of Pakistan. However, the Bank currently does not have any
Tier III capital.
The Capital of the Bank is managed keeping in view the minimum “Capital Adequacy Ratio” required by SBP through
BSD Circular No. 30 dated November 25, 2008 and BSD Circular No.07 of 2009 dated April 15, 2009 . The adequacy
of the capital is tested with reference to the risk–weighted assets of the Bank.
Notes to the Financial StatementsFor the year ended December 31, 2009
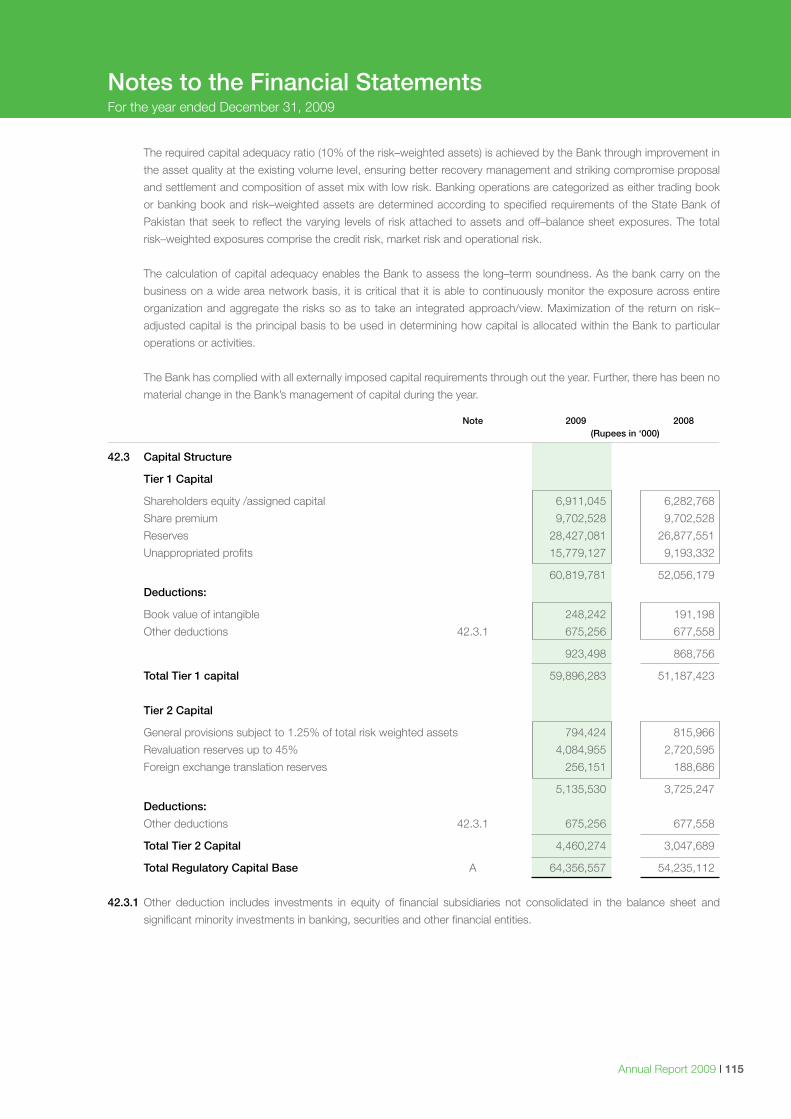
Annual Report 2009 I 115
The required capital adequacy ratio (10% of the risk–weighted assets) is achieved by the Bank through improvement in
the asset quality at the existing volume level, ensuring better recovery management and striking compromise proposal
and settlement and composition of asset mix with low risk. Banking operations are categorized as either trading book
or banking book and risk–weighted assets are determined according to specified requirements of the State Bank of
Pakistan that seek to reflect the varying levels of risk attached to assets and off–balance sheet exposures. The total
risk–weighted exposures comprise the credit risk, market risk and operational risk.
The calculation of capital adequacy enables the Bank to assess the long–term soundness. As the bank carry on the
business on a wide area network basis, it is critical that it is able to continuously monitor the exposure across entire
organization and aggregate the risks so as to take an integrated approach/view. Maximization of the return on risk–
adjusted capital is the principal basis to be used in determining how capital is allocated within the Bank to particular
operations or activities.
The Bank has complied with all externally imposed capital requirements through out the year. Further, there has been no
material change in the Bank’s management of capital during the year.
Notes to the Financial StatementsFor the year ended December 31, 2009
Note 2009 2008 (Rupees in ‘000)
42.3 Capital Structure
Tier 1 Capital
Shareholders equity /assigned capital 6,911,045 6,282,768
Share premium 9,702,528 9,702,528
Reserves 28,427,081 26,877,551
Unappropriated profits 15,779,127 9,193,332
60,819,781 52,056,179
Deductions:
Book value of intangible 248,242 191,198
Other deductions 42.3.1 675,256 677,558
923,498 868,756
Total Tier 1 capital 59,896,283 51,187,423
Tier 2 Capital
General provisions subject to 1.25% of total risk weighted assets 794,424 815,966
Revaluation reserves up to 45% 4,084,955 2,720,595
Foreign exchange translation reserves 256,151 188,686
5,135,530 3,725,247
Deductions:
Other deductions 42.3.1 675,256 677,558
Total Tier 2 Capital 4,460,274 3,047,689
Total Regulatory Capital Base A 64,356,557 54,235,112
42.3.1 Other deduction includes investments in equity of financial subsidiaries not consolidated in the balance sheet and
significant minority investments in banking, securities and other financial entities.
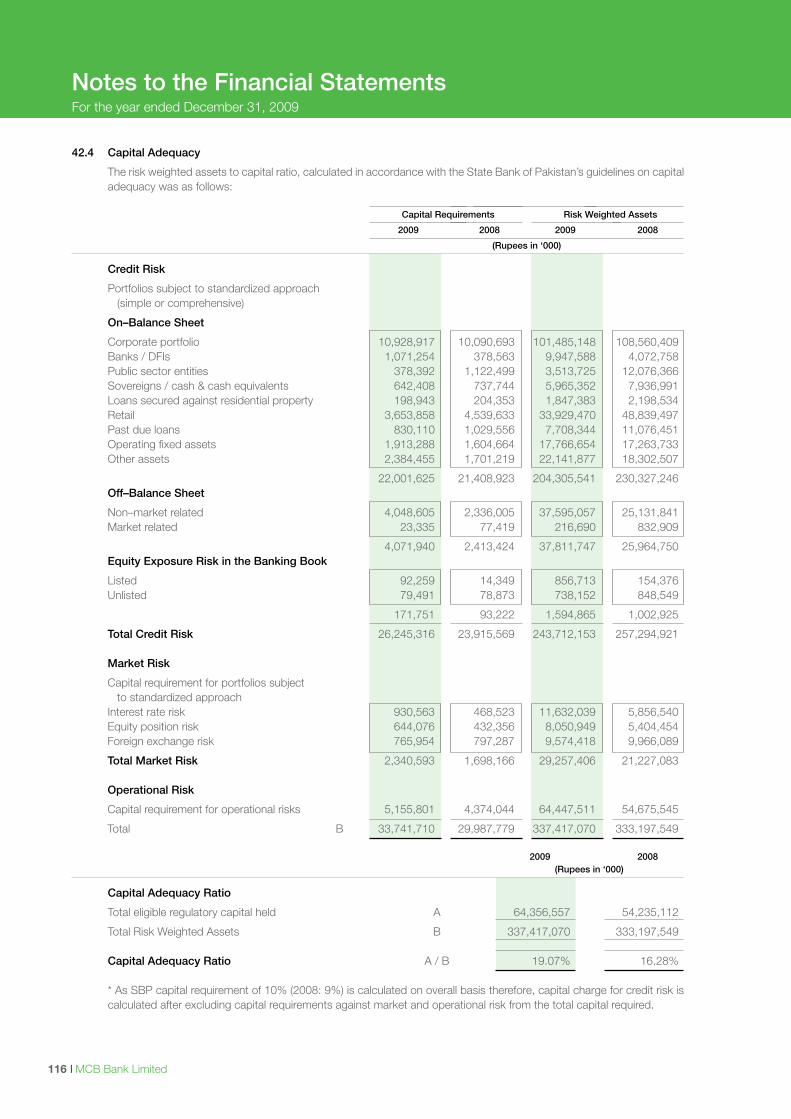
I MCB Bank Limited116
42.4 Capital Adequacy
The risk weighted assets to capital ratio, calculated in accordance with the State Bank of Pakistan’s guidelines on capital adequacy was as follows:
Capital Requirements Risk Weighted Assets
2009 2008 2009 2008
(Rupees in ‘000)
Credit Risk
Portfolios subject to standardized approach (simple or comprehensive)
On–Balance Sheet
Corporate portfolio 10,928,917 10,090,693 101,485,148 108,560,409 Banks / DFIs 1,071,254 378,563 9,947,588 4,072,758 Public sector entities 378,392 1,122,499 3,513,725 12,076,366 Sovereigns / cash & cash equivalents 642,408 737,744 5,965,352 7,936,991 Loans secured against residential property 198,943 204,353 1,847,383 2,198,534 Retail 3,653,858 4,539,633 33,929,470 48,839,497 Past due loans 830,110 1,029,556 7,708,344 11,076,451 Operating fixed assets 1,913,288 1,604,664 17,766,654 17,263,733 Other assets 2,384,455 1,701,219 22,141,877 18,302,507
22,001,625 21,408,923 204,305,541 230,327,246 Off–Balance Sheet
Non–market related 4,048,605 2,336,005 37,595,057 25,131,841 Market related 23,335 77,419 216,690 832,909
4,071,940 2,413,424 37,811,747 25,964,750 Equity Exposure Risk in the Banking Book
Listed 92,259 14,349 856,713 154,376 Unlisted 79,491 78,873 738,152 848,549
171,751 93,222 1,594,865 1,002,925
Total Credit Risk 26,245,316 23,915,569 243,712,153 257,294,921 Market Risk
Capital requirement for portfolios subject to standardized approach Interest rate risk 930,563 468,523 11,632,039 5,856,540 Equity position risk 644,076 432,356 8,050,949 5,404,454 Foreign exchange risk 765,954 797,287 9,574,418 9,966,089
Total Market Risk 2,340,593 1,698,166 29,257,406 21,227,083 Operational Risk
Capital requirement for operational risks 5,155,801 4,374,044 64,447,511 54,675,545
Total B 33,741,710 29,987,779 337,417,070 333,197,549 2009 2008 (Rupees in ‘000)
Capital Adequacy Ratio
Total eligible regulatory capital held A 64,356,557 54,235,112
Total Risk Weighted Assets B 337,417,070 333,197,549
Capital Adequacy Ratio A / B 19.07% 16.28% * As SBP capital requirement of 10% (2008: 9%) is calculated on overall basis therefore, capital charge for credit risk is
calculated after excluding capital requirements against market and operational risk from the total capital required.
Notes to the Financial StatementsFor the year ended December 31, 2009
Annual Report 2009 I 117
Notes to the Financial StatementsFor the year ended December 31, 2009
43 RISK MANAGEMENT
MCB defines risk as any deviation from an anticipated outcome that may affect the value, capital or earnings of the Bank. Identifying and managing exposure to risk is an integral part of strategic and operational activities of risk management. Bank’s risk management policy is aimed at setting the best course of action under uncertainty by identifying, prioritizing, mitigating and monitoring risk issues. With the goal of enhancing shareholders’ value, following are the five guiding principles of robust risk management structure:
• Optimizingrisk/returninacontrolledmanner • Establishingclearresponsibilityandaccountability • Establishingindependentandproperlyresourcedriskmanagementfunction. • Promotingopenriskculture • Adoptinginternationalbestpracticesinriskmanagement Keeping in view dynamics of internal and external environment, the Bank regularly reviews and updates policy manuals
/ frameworks and procedures in accordance with domestic regulatory environment and international standards. The Bank executes its risk strategy and undertakes controlled risk–taking activities within its risk management framework.
This framework combines core policies, procedures and process design with broad oversight and is supported by risk monitoring across the bank. The Board of Directors and its relevant committee, i.e. the Risk Management & Portfolio Review Committee (RM&PRC) and the senior management and its relevant committees, i.e. the Management Committee (MC), Asset Liability Committee (ALCO), etc., are responsible to ensure formulation and implementation of comprehensive Risk Management Framework. This framework is based on prudent risk identification, measurement, management and monitoring process which are closely aligned with the activities of the Bank so as to ensure that risks are kept within an acceptable level.
As part of risk assessment process, the Bank ensures that not only the relevant risks are identified but their implications
are considered and basis provided for managing and measuring the risks. Through Internal Control units, the Bank ensures that effective controls are in place to mitigate each of the identified risk.
Independent from business groups, Head of Risk Management reports functionally to the Risk Management & Portfolio
Review Committee (RM&PRC) and administratively to the President; the RM & PRC convenes regularly to evaluate Bank’s risk and portfolio concentrations. The Risk Management Group performs the following critical functions:
• CreditRiskManagement • CreditReview • CreditRiskControl • MarketRiskManagement • OperationalRiskManagement In line with regulatory guidelines, the Bank has initiated Internal Capital Adequacy Assessment Process (ICAAP). 43.1 Credit Risk
Credit risk arises from our dealings with individuals, corporate, financial institutions, sovereigns etc. The Bank is exposed to credit risk through its lending and investment activities. It also stems from activities both on and off–balance sheet activities. Credit risk makes up the largest part of the Bank’s exposure. Purpose of credit risk function is to identify measure, manage, monitor and mitigate credit risk. Organizational structure of this function ensures pre and post–facto management of credit risk. While, Credit Review function provides pre–fact evaluation of counterparties, the Credit Risk Control (CRC) performs post–fact evaluation of financing facilities and review clients’ performance as an ongoing process.
The Bank has adopted standardized approach to measure Credit risk regulatory charge in compliance with Basel–II
requirements. The approach is reliant upon the assessment of external credit rating agencies. In line with SBP guidelines on Internal Credit Ratings Systems, Bank has developed a system and all its corporate borrowers are internally rated. Bank is in the process of continuously improving the system and bringing it inline with the Basel framework requirements
In order to manage bank’s credit risk, the Bank has the following policies and procedures in place: • IndividualswhotakeormanagerisksclearlyunderstandtheminordertoprotecttheBankfromavoidablerisks; • Theapprovalofcreditlimitstocounterpartiesaresubjecttopre–factreview; • Extensionincreditfacilityormaterialchangetothecreditfacilityissubjecttocreditreview; • ApprovalandreviewprocessisreviewedbyRM&PRCandinternalaudit; • Managementperiodicallyreviewsthepowersofcreditapprovingandcreditreviewingauthorities.
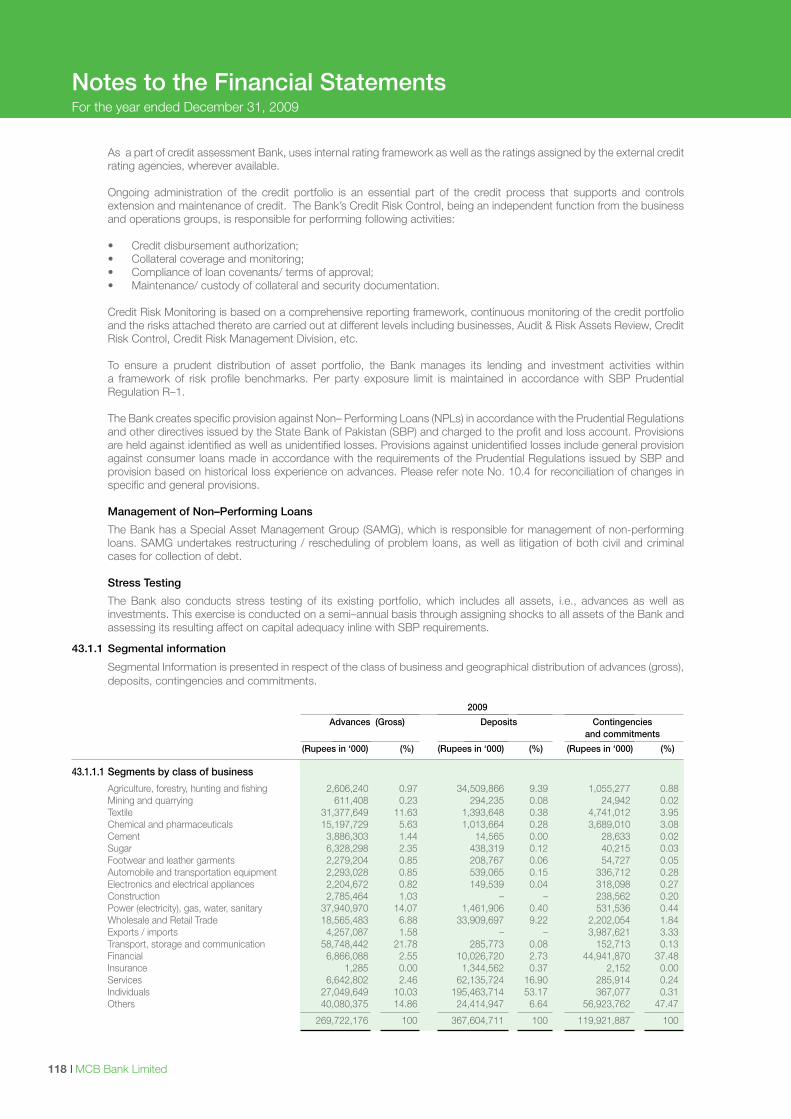
I MCB Bank Limited118
As a part of credit assessment Bank, uses internal rating framework as well as the ratings assigned by the external credit rating agencies, wherever available.
Ongoing administration of the credit portfolio is an essential part of the credit process that supports and controls
extension and maintenance of credit. The Bank’s Credit Risk Control, being an independent function from the business and operations groups, is responsible for performing following activities:
• Creditdisbursementauthorization; • Collateralcoverageandmonitoring; • Complianceofloancovenants/termsofapproval; • Maintenance/custodyofcollateralandsecuritydocumentation.
Credit Risk Monitoring is based on a comprehensive reporting framework, continuous monitoring of the credit portfolio and the risks attached thereto are carried out at different levels including businesses, Audit & Risk Assets Review, Credit Risk Control, Credit Risk Management Division, etc.
To ensure a prudent distribution of asset portfolio, the Bank manages its lending and investment activities within
a framework of risk profile benchmarks. Per party exposure limit is maintained in accordance with SBP Prudential Regulation R–1.
The Bank creates specific provision against Non– Performing Loans (NPLs) in accordance with the Prudential Regulations
and other directives issued by the State Bank of Pakistan (SBP) and charged to the profit and loss account. Provisions are held against identified as well as unidentified losses. Provisions against unidentified losses include general provision against consumer loans made in accordance with the requirements of the Prudential Regulations issued by SBP and provision based on historical loss experience on advances. Please refer note No. 10.4 for reconciliation of changes in specific and general provisions.
Management of Non–Performing Loans
The Bank has a Special Asset Management Group (SAMG), which is responsible for management of non-performing loans. SAMG undertakes restructuring / rescheduling of problem loans, as well as litigation of both civil and criminal cases for collection of debt.
Stress Testing
The Bank also conducts stress testing of its existing portfolio, which includes all assets, i.e., advances as well as investments. This exercise is conducted on a semi–annual basis through assigning shocks to all assets of the Bank and assessing its resulting affect on capital adequacy inline with SBP requirements.
Notes to the Financial StatementsFor the year ended December 31, 2009
43.1.1 Segmental information
Segmental Information is presented in respect of the class of business and geographical distribution of advances (gross), deposits, contingencies and commitments.
2009
Advances (Gross) Deposits Contingencies and commitments
(Rupees in ‘000) (%) (Rupees in ‘000) (%) (Rupees in ‘000) (%)
43.1.1.1 Segments by class of business
Agriculture, forestry, hunting and fishing 2,606,240 0.97 34,509,866 9.39 1,055,277 0.88 Mining and quarrying 611,408 0.23 294,235 0.08 24,942 0.02 Textile 31,377,649 11.63 1,393,648 0.38 4,741,012 3.95 Chemical and pharmaceuticals 15,197,729 5.63 1,013,664 0.28 3,689,010 3.08 Cement 3,886,303 1.44 14,565 0.00 28,633 0.02 Sugar 6,328,298 2.35 438,319 0.12 40,215 0.03 Footwear and leather garments 2,279,204 0.85 208,767 0.06 54,727 0.05 Automobile and transportation equipment 2,293,028 0.85 539,065 0.15 336,712 0.28 Electronics and electrical appliances 2,204,672 0.82 149,539 0.04 318,098 0.27 Construction 2,785,464 1.03 – – 238,562 0.20 Power (electricity), gas, water, sanitary 37,940,970 14.07 1,461,906 0.40 531,536 0.44 Wholesale and Retail Trade 18,565,483 6.88 33,909,697 9.22 2,202,054 1.84 Exports / imports 4,257,087 1.58 – – 3,987,621 3.33 Transport, storage and communication 58,748,442 21.78 285,773 0.08 152,713 0.13 Financial 6,866,088 2.55 10,026,720 2.73 44,941,870 37.48 Insurance 1,285 0.00 1,344,562 0.37 2,152 0.00 Services 6,642,802 2.46 62,135,724 16.90 285,914 0.24 Individuals 27,049,649 10.03 195,463,714 53.17 367,077 0.31 Others 40,080,375 14.86 24,414,947 6.64 56,923,762 47.47
269,722,176 100 367,604,711 100 119,921,887 100
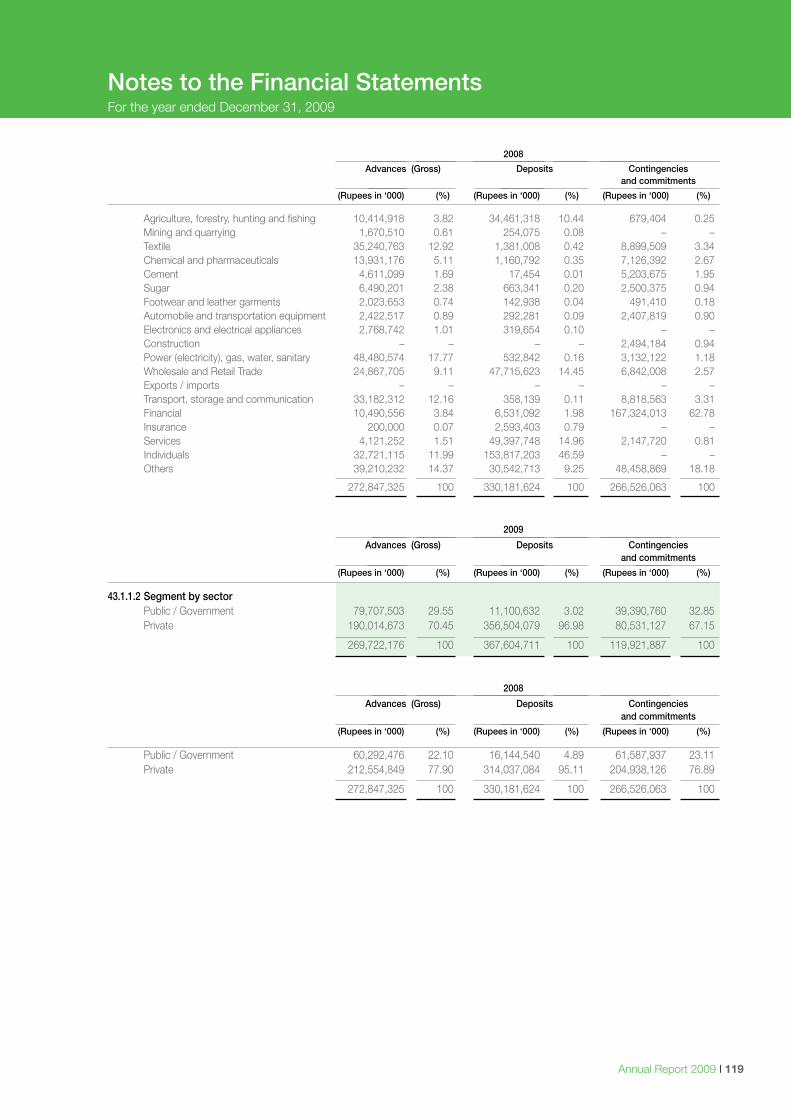
Annual Report 2009 I 119
Notes to the Financial StatementsFor the year ended December 31, 2009
2008
Advances (Gross) Deposits Contingencies and commitments
(Rupees in ‘000) (%) (Rupees in ‘000) (%) (Rupees in ‘000) (%)
Agriculture, forestry, hunting and fishing 10,414,918 3.82 34,461,318 10.44 679,404 0.25 Mining and quarrying 1,670,510 0.61 254,075 0.08 – – Textile 35,240,763 12.92 1,381,008 0.42 8,899,509 3.34 Chemical and pharmaceuticals 13,931,176 5.11 1,160,792 0.35 7,126,392 2.67 Cement 4,611,099 1.69 17,454 0.01 5,203,675 1.95 Sugar 6,490,201 2.38 663,341 0.20 2,500,375 0.94 Footwear and leather garments 2,023,653 0.74 142,938 0.04 491,410 0.18 Automobile and transportation equipment 2,422,517 0.89 292,281 0.09 2,407,819 0.90 Electronics and electrical appliances 2,768,742 1.01 319,654 0.10 – – Construction – – – – 2,494,184 0.94 Power (electricity), gas, water, sanitary 48,480,574 17.77 532,842 0.16 3,132,122 1.18 Wholesale and Retail Trade 24,867,705 9.11 47,715,623 14.45 6,842,008 2.57 Exports / imports – – – – – – Transport, storage and communication 33,182,312 12.16 358,139 0.11 8,818,563 3.31 Financial 10,490,556 3.84 6,531,092 1.98 167,324,013 62.78 Insurance 200,000 0.07 2,593,403 0.79 – – Services 4,121,252 1.51 49,397,748 14.96 2,147,720 0.81 Individuals 32,721,115 11.99 153,817,203 46.59 – – Others 39,210,232 14.37 30,542,713 9.25 48,458,869 18.18
272,847,325 100 330,181,624 100 266,526,063 100
2009
Advances (Gross) Deposits Contingencies and commitments
(Rupees in ‘000) (%) (Rupees in ‘000) (%) (Rupees in ‘000) (%)
43.1.1.2 Segment by sector Public / Government 79,707,503 29.55 11,100,632 3.02 39,390,760 32.85 Private 190,014,673 70.45 356,504,079 96.98 80,531,127 67.15
269,722,176 100 367,604,711 100 119,921,887 100
2008
Advances (Gross) Deposits Contingencies and commitments
(Rupees in ‘000) (%) (Rupees in ‘000) (%) (Rupees in ‘000) (%)
Public / Government 60,292,476 22.10 16,144,540 4.89 61,587,937 23.11 Private 212,554,849 77.90 314,037,084 95.11 204,938,126 76.89
272,847,325 100 330,181,624 100 266,526,063 100
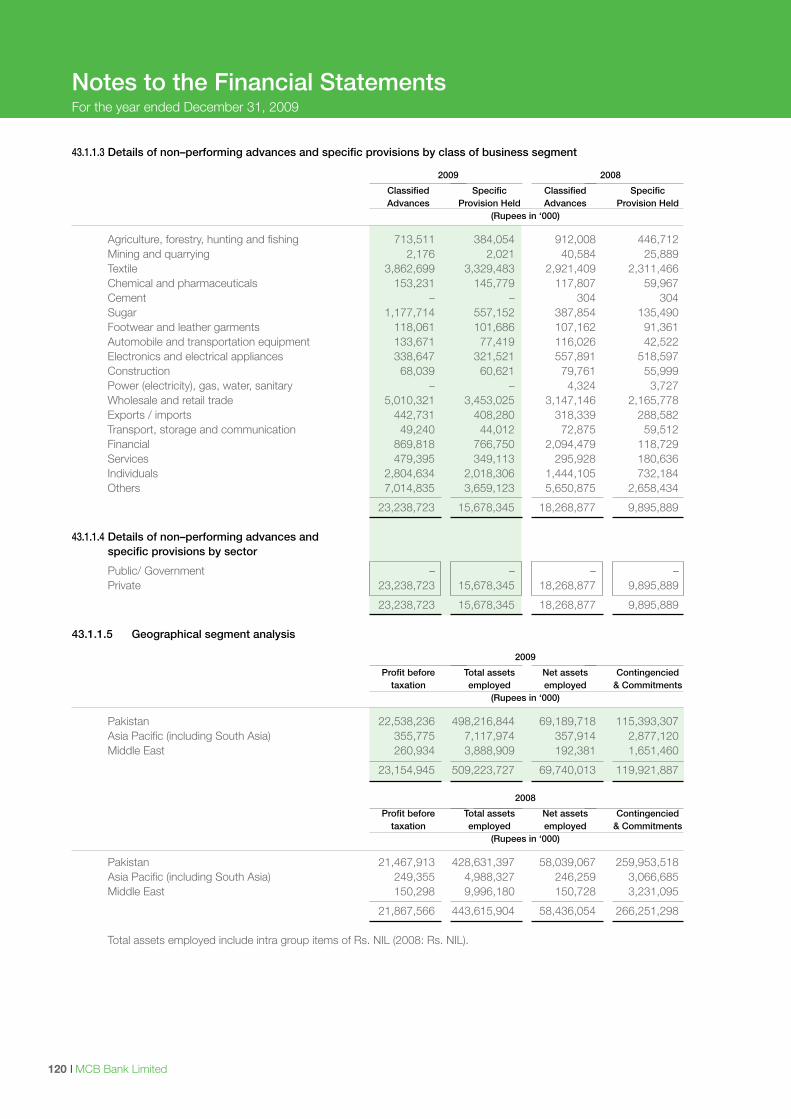
I MCB Bank Limited120
43.1.1.3 Details of non–performing advances and specific provisions by class of business segment
2009 2008
Classified Specific Classified Specific Advances Provision Held Advances Provision Held (Rupees in ‘000)
Agriculture, forestry, hunting and fishing 713,511 384,054 912,008 446,712 Mining and quarrying 2,176 2,021 40,584 25,889 Textile 3,862,699 3,329,483 2,921,409 2,311,466 Chemical and pharmaceuticals 153,231 145,779 117,807 59,967 Cement – – 304 304 Sugar 1,177,714 557,152 387,854 135,490 Footwear and leather garments 118,061 101,686 107,162 91,361 Automobile and transportation equipment 133,671 77,419 116,026 42,522 Electronics and electrical appliances 338,647 321,521 557,891 518,597 Construction 68,039 60,621 79,761 55,999 Power (electricity), gas, water, sanitary – – 4,324 3,727 Wholesale and retail trade 5,010,321 3,453,025 3,147,146 2,165,778 Exports / imports 442,731 408,280 318,339 288,582 Transport, storage and communication 49,240 44,012 72,875 59,512 Financial 869,818 766,750 2,094,479 118,729 Services 479,395 349,113 295,928 180,636 Individuals 2,804,634 2,018,306 1,444,105 732,184 Others 7,014,835 3,659,123 5,650,875 2,658,434
23,238,723 15,678,345 18,268,877 9,895,889 43.1.1.4 Details of non–performing advances and specific provisions by sector
Public/ Government – – – – Private 23,238,723 15,678,345 18,268,877 9,895,889
23,238,723 15,678,345 18,268,877 9,895,889 43.1.1.5 Geographical segment analysis
2009
Profit before Total assets Net assets Contingencied taxation employed employed & Commitments (Rupees in ‘000)
Pakistan 22,538,236 498,216,844 69,189,718 115,393,307 Asia Pacific (including South Asia) 355,775 7,117,974 357,914 2,877,120 Middle East 260,934 3,888,909 192,381 1,651,460
23,154,945 509,223,727 69,740,013 119,921,887 2008
Profit before Total assets Net assets Contingencied taxation employed employed & Commitments (Rupees in ‘000)
Pakistan 21,467,913 428,631,397 58,039,067 259,953,518 Asia Pacific (including South Asia) 249,355 4,988,327 246,259 3,066,685 Middle East 150,298 9,996,180 150,728 3,231,095
21,867,566 443,615,904 58,436,054 266,251,298 Total assets employed include intra group items of Rs. NIL (2008: Rs. NIL).
Notes to the Financial StatementsFor the year ended December 31, 2009
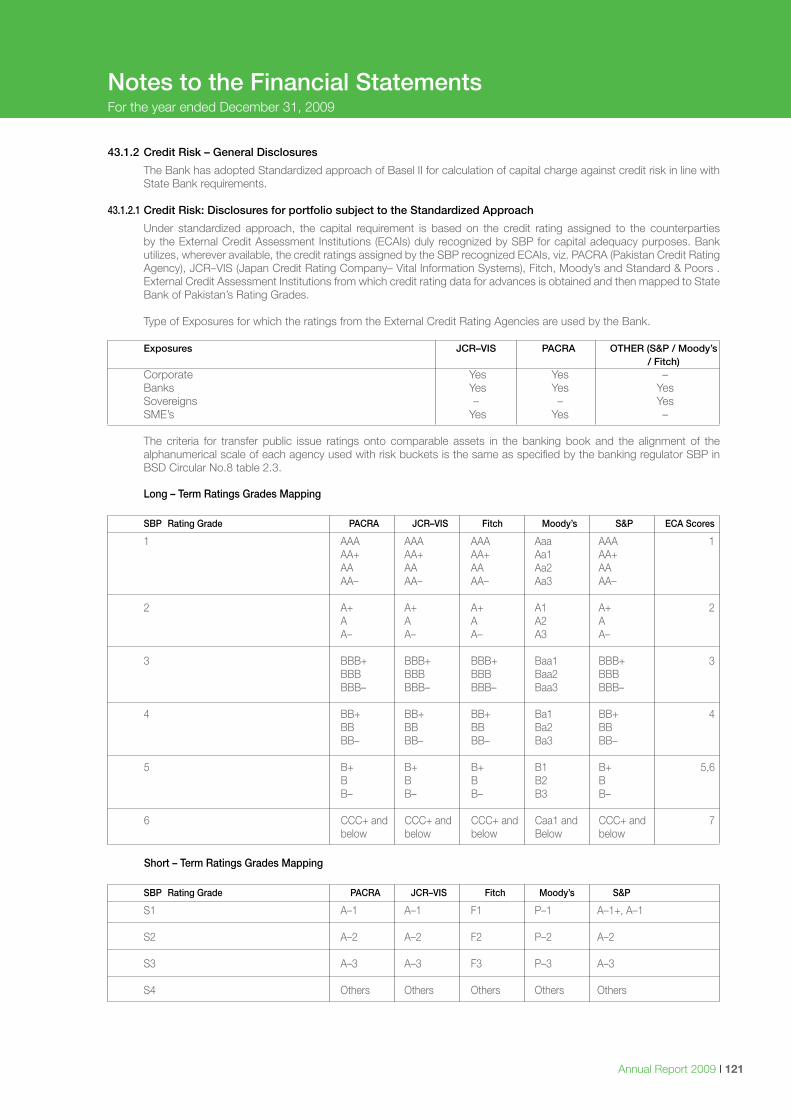
Annual Report 2009 I 121
43.1.2 Credit Risk – General Disclosures
The Bank has adopted Standardized approach of Basel II for calculation of capital charge against credit risk in line with State Bank requirements.
43.1.2.1 Credit Risk: Disclosures for portfolio subject to the Standardized Approach
Under standardized approach, the capital requirement is based on the credit rating assigned to the counterparties by the External Credit Assessment Institutions (ECAIs) duly recognized by SBP for capital adequacy purposes. Bank utilizes, wherever available, the credit ratings assigned by the SBP recognized ECAIs, viz. PACRA (Pakistan Credit Rating Agency), JCR–VIS (Japan Credit Rating Company– Vital Information Systems), Fitch, Moody’s and Standard & Poors . External Credit Assessment Institutions from which credit rating data for advances is obtained and then mapped to State Bank of Pakistan’s Rating Grades.
Type of Exposures for which the ratings from the External Credit Rating Agencies are used by the Bank.
Exposures JCR–VIS PACRA OTHER (S&P / Moody’s / Fitch) Corporate Yes Yes – Banks Yes Yes Yes Sovereigns – – Yes SME’s Yes Yes –
The criteria for transfer public issue ratings onto comparable assets in the banking book and the alignment of the alphanumerical scale of each agency used with risk buckets is the same as specified by the banking regulator SBP in BSD Circular No.8 table 2.3.
Notes to the Financial StatementsFor the year ended December 31, 2009
Long – Term Ratings Grades Mapping SBP Rating Grade PACRA JCR–VIS Fitch Moody’s S&P ECA Scores
1 AAA AAA AAA Aaa AAA 1 AA+ AA+ AA+ Aa1 AA+ AA AA AA Aa2 AA AA– AA– AA– Aa3 AA–
2 A+ A+ A+ A1 A+ 2 A A A A2 A A– A– A– A3 A–
3 BBB+ BBB+ BBB+ Baa1 BBB+ 3 BBB BBB BBB Baa2 BBB BBB– BBB– BBB– Baa3 BBB–
4 BB+ BB+ BB+ Ba1 BB+ 4 BB BB BB Ba2 BB BB– BB– BB– Ba3 BB–
5 B+ B+ B+ B1 B+ 5,6 B B B B2 B B– B– B– B3 B–
6 CCC+ and CCC+ and CCC+ and Caa1 and CCC+ and 7 below below below Below below
Short – Term Ratings Grades Mapping SBP Rating Grade PACRA JCR–VIS Fitch Moody’s S&P
S1 A–1 A–1 F1 P–1 A–1+, A–1
S2 A–2 A–2 F2 P–2 A–2
S3 A–3 A–3 F3 P–3 A–3
S4 Others Others Others Others Others
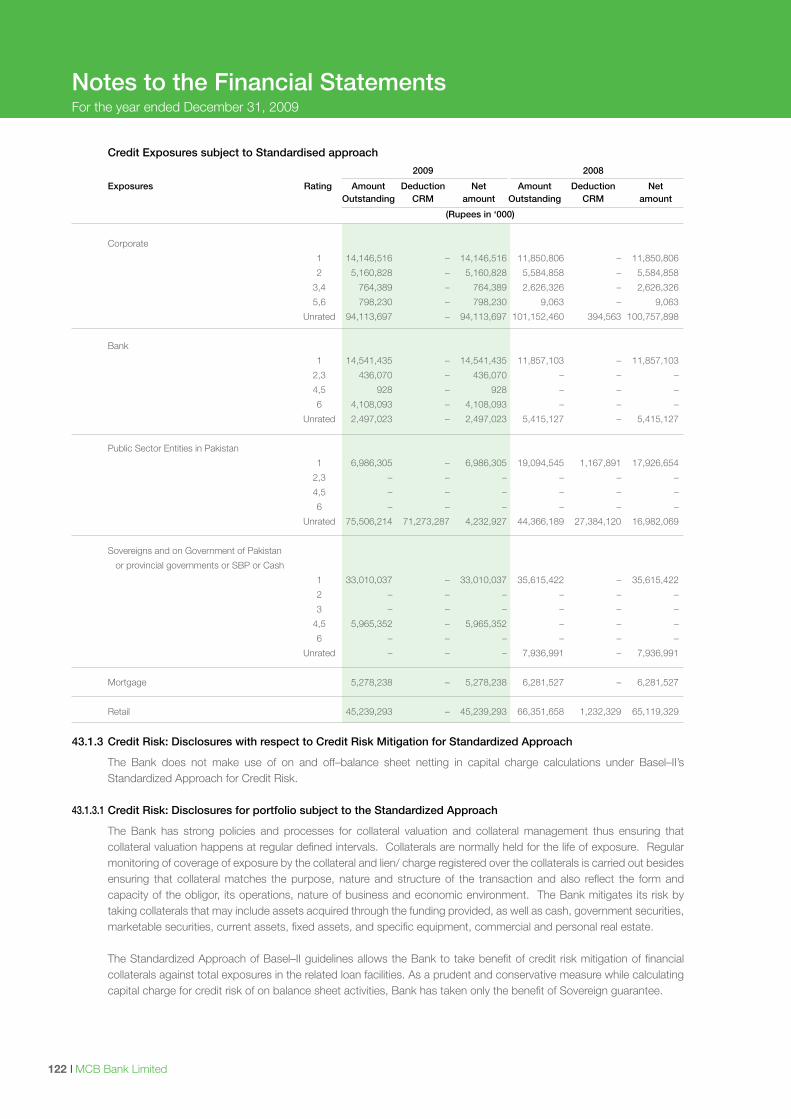
I MCB Bank Limited122
Notes to the Financial StatementsFor the year ended December 31, 2009
Credit Exposures subject to Standardised approach
2009 2008
Exposures Rating Amount Deduction Net Amount Deduction Net Outstanding CRM amount Outstanding CRM amount
(Rupees in ‘000)
Corporate
1 14,146,516 – 14,146,516 11,850,806 – 11,850,806
2 5,160,828 – 5,160,828 5,584,858 – 5,584,858
3,4 764,389 – 764,389 2,626,326 – 2,626,326
5,6 798,230 – 798,230 9,063 – 9,063
Unrated 94,113,697 – 94,113,697 101,152,460 394,563 100,757,898
Bank
1 14,541,435 – 14,541,435 11,857,103 – 11,857,103
2,3 436,070 – 436,070 – – –
4,5 928 – 928 – – –
6 4,108,093 – 4,108,093 – – –
Unrated 2,497,023 – 2,497,023 5,415,127 – 5,415,127
Public Sector Entities in Pakistan
1 6,986,305 – 6,986,305 19,094,545 1,167,891 17,926,654
2,3 – – – – – –
4,5 – – – – – –
6 – – – – – –
Unrated 75,506,214 71,273,287 4,232,927 44,366,189 27,384,120 16,982,069
Sovereigns and on Government of Pakistan
or provincial governments or SBP or Cash
1 33,010,037 – 33,010,037 35,615,422 – 35,615,422
2 – – – – – –
3 – – – – – –
4,5 5,965,352 – 5,965,352 – – –
6 – – – – – –
Unrated – – – 7,936,991 – 7,936,991
Mortgage 5,278,238 – 5,278,238 6,281,527 – 6,281,527
Retail 45,239,293 – 45,239,293 66,351,658 1,232,329 65,119,329
43.1.3 Credit Risk: Disclosures with respect to Credit Risk Mitigation for Standardized Approach
The Bank does not make use of on and off–balance sheet netting in capital charge calculations under Basel–II’s Standardized Approach for Credit Risk.
43.1.3.1 Credit Risk: Disclosures for portfolio subject to the Standardized Approach
The Bank has strong policies and processes for collateral valuation and collateral management thus ensuring that collateral valuation happens at regular defined intervals. Collaterals are normally held for the life of exposure. Regular monitoring of coverage of exposure by the collateral and lien/ charge registered over the collaterals is carried out besides ensuring that collateral matches the purpose, nature and structure of the transaction and also reflect the form and capacity of the obligor, its operations, nature of business and economic environment. The Bank mitigates its risk by taking collaterals that may include assets acquired through the funding provided, as well as cash, government securities, marketable securities, current assets, fixed assets, and specific equipment, commercial and personal real estate.
The Standardized Approach of Basel–II guidelines allows the Bank to take benefit of credit risk mitigation of financial
collaterals against total exposures in the related loan facilities. As a prudent and conservative measure while calculating capital charge for credit risk of on balance sheet activities, Bank has taken only the benefit of Sovereign guarantee.
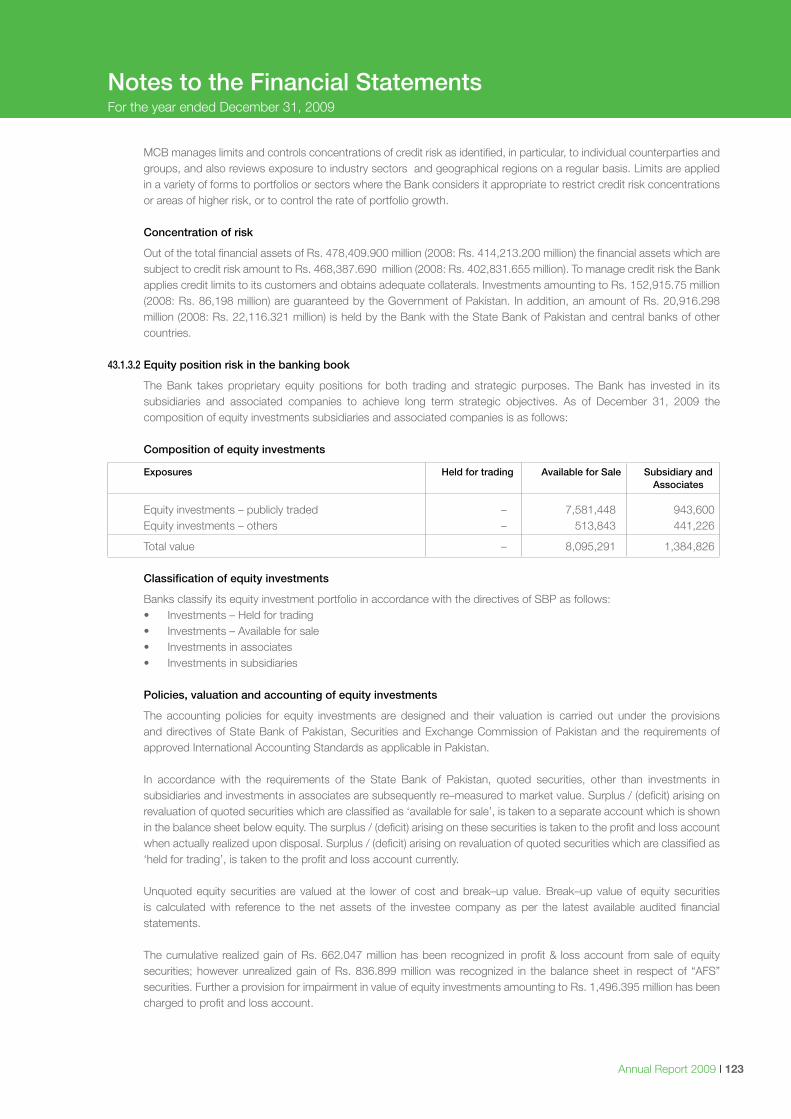
Annual Report 2009 I 123
MCB manages limits and controls concentrations of credit risk as identified, in particular, to individual counterparties and groups, and also reviews exposure to industry sectors and geographical regions on a regular basis. Limits are applied in a variety of forms to portfolios or sectors where the Bank considers it appropriate to restrict credit risk concentrations or areas of higher risk, or to control the rate of portfolio growth.
Concentration of risk
Out of the total financial assets of Rs. 478,409.900 million (2008: Rs. 414,213.200 million) the financial assets which are subject to credit risk amount to Rs. 468,387.690 million (2008: Rs. 402,831.655 million). To manage credit risk the Bank applies credit limits to its customers and obtains adequate collaterals. Investments amounting to Rs. 152,915.75 million (2008: Rs. 86,198 million) are guaranteed by the Government of Pakistan. In addition, an amount of Rs. 20,916.298 million (2008: Rs. 22,116.321 million) is held by the Bank with the State Bank of Pakistan and central banks of other countries.
43.1.3.2 Equity position risk in the banking book
The Bank takes proprietary equity positions for both trading and strategic purposes. The Bank has invested in its subsidiaries and associated companies to achieve long term strategic objectives. As of December 31, 2009 the composition of equity investments subsidiaries and associated companies is as follows:
Composition of equity investments
Exposures Held for trading Available for Sale Subsidiary and Associates
Equity investments – publicly traded – 7,581,448 943,600 Equity investments – others – 513,843 441,226
Total value – 8,095,291 1,384,826 Classification of equity investments
Banks classify its equity investment portfolio in accordance with the directives of SBP as follows: • Investments–Heldfortrading • Investments–Availableforsale • Investmentsinassociates • Investmentsinsubsidiaries Policies, valuation and accounting of equity investments
The accounting policies for equity investments are designed and their valuation is carried out under the provisions and directives of State Bank of Pakistan, Securities and Exchange Commission of Pakistan and the requirements of approved International Accounting Standards as applicable in Pakistan.
In accordance with the requirements of the State Bank of Pakistan, quoted securities, other than investments in
subsidiaries and investments in associates are subsequently re–measured to market value. Surplus / (deficit) arising on revaluation of quoted securities which are classified as ‘available for sale’, is taken to a separate account which is shown in the balance sheet below equity. The surplus / (deficit) arising on these securities is taken to the profit and loss account when actually realized upon disposal. Surplus / (deficit) arising on revaluation of quoted securities which are classified as ‘held for trading’, is taken to the profit and loss account currently.
Unquoted equity securities are valued at the lower of cost and break–up value. Break–up value of equity securities is calculated with reference to the net assets of the investee company as per the latest available audited financial statements.
The cumulative realized gain of Rs. 662.047 million has been recognized in profit & loss account from sale of equity
securities; however unrealized gain of Rs. 836.899 million was recognized in the balance sheet in respect of “AFS” securities. Further a provision for impairment in value of equity investments amounting to Rs. 1,496.395 million has been charged to profit and loss account.
Notes to the Financial StatementsFor the year ended December 31, 2009
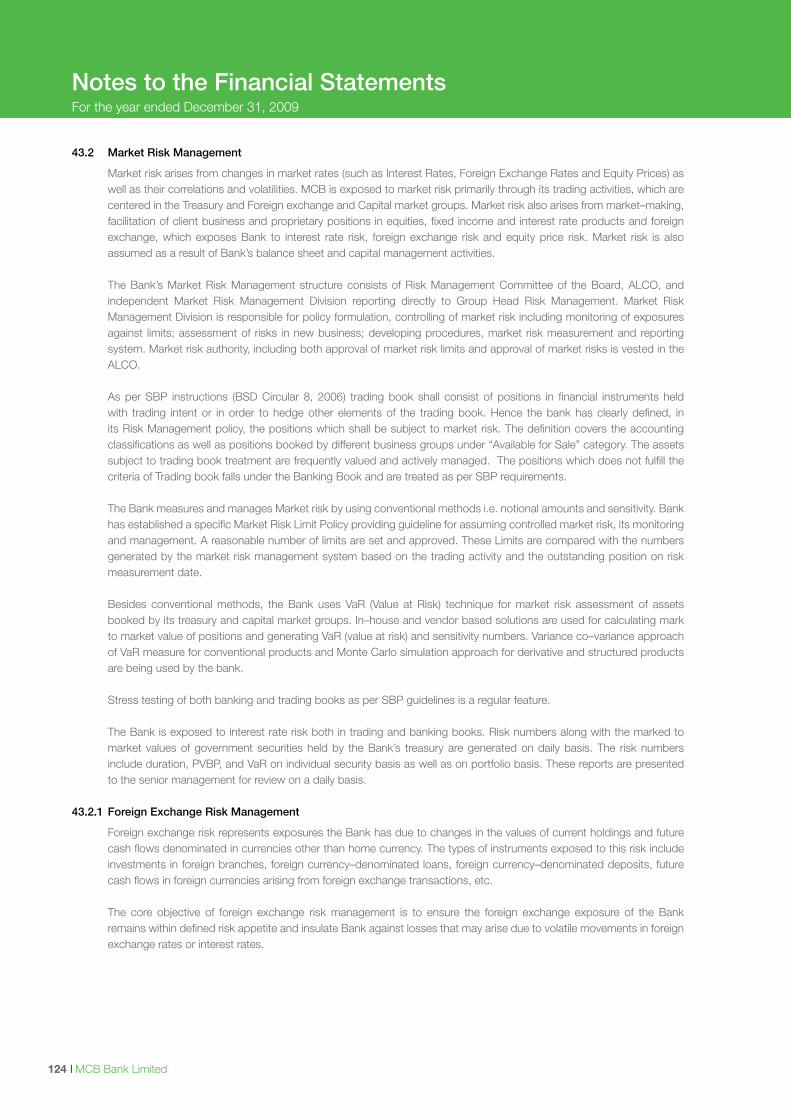
I MCB Bank Limited124
Notes to the Financial StatementsFor the year ended December 31, 2009
43.2 Market Risk Management
Market risk arises from changes in market rates (such as Interest Rates, Foreign Exchange Rates and Equity Prices) as well as their correlations and volatilities. MCB is exposed to market risk primarily through its trading activities, which are centered in the Treasury and Foreign exchange and Capital market groups. Market risk also arises from market–making, facilitation of client business and proprietary positions in equities, fixed income and interest rate products and foreign exchange, which exposes Bank to interest rate risk, foreign exchange risk and equity price risk. Market risk is also assumed as a result of Bank’s balance sheet and capital management activities.
The Bank’s Market Risk Management structure consists of Risk Management Committee of the Board, ALCO, and
independent Market Risk Management Division reporting directly to Group Head Risk Management. Market Risk Management Division is responsible for policy formulation, controlling of market risk including monitoring of exposures against limits; assessment of risks in new business; developing procedures, market risk measurement and reporting system. Market risk authority, including both approval of market risk limits and approval of market risks is vested in the ALCO.
As per SBP instructions (BSD Circular 8, 2006) trading book shall consist of positions in financial instruments held
with trading intent or in order to hedge other elements of the trading book. Hence the bank has clearly defined, in its Risk Management policy, the positions which shall be subject to market risk. The definition covers the accounting classifications as well as positions booked by different business groups under “Available for Sale” category. The assets subject to trading book treatment are frequently valued and actively managed. The positions which does not fulfill the criteria of Trading book falls under the Banking Book and are treated as per SBP requirements.
The Bank measures and manages Market risk by using conventional methods i.e. notional amounts and sensitivity. Bank
has established a specific Market Risk Limit Policy providing guideline for assuming controlled market risk, its monitoring and management. A reasonable number of limits are set and approved. These Limits are compared with the numbers generated by the market risk management system based on the trading activity and the outstanding position on risk measurement date.
Besides conventional methods, the Bank uses VaR (Value at Risk) technique for market risk assessment of assets
booked by its treasury and capital market groups. In–house and vendor based solutions are used for calculating mark to market value of positions and generating VaR (value at risk) and sensitivity numbers. Variance co–variance approach of VaR measure for conventional products and Monte Carlo simulation approach for derivative and structured products are being used by the bank.
Stress testing of both banking and trading books as per SBP guidelines is a regular feature. The Bank is exposed to interest rate risk both in trading and banking books. Risk numbers along with the marked to
market values of government securities held by the Bank’s treasury are generated on daily basis. The risk numbers include duration, PVBP, and VaR on individual security basis as well as on portfolio basis. These reports are presented to the senior management for review on a daily basis.
43.2.1 Foreign Exchange Risk Management
Foreign exchange risk represents exposures the Bank has due to changes in the values of current holdings and future cash flows denominated in currencies other than home currency. The types of instruments exposed to this risk include investments in foreign branches, foreign currency–denominated loans, foreign currency–denominated deposits, future cash flows in foreign currencies arising from foreign exchange transactions, etc.
The core objective of foreign exchange risk management is to ensure the foreign exchange exposure of the Bank
remains within defined risk appetite and insulate Bank against losses that may arise due to volatile movements in foreign exchange rates or interest rates.
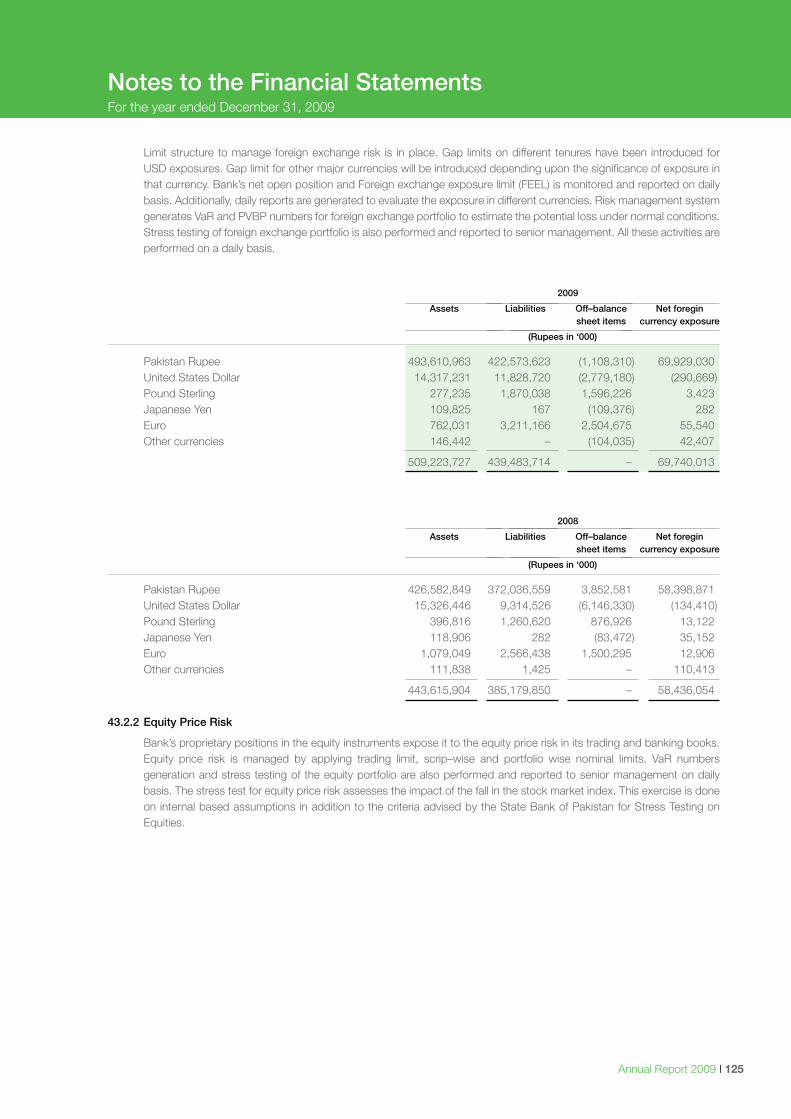
Annual Report 2009 I 125
Notes to the Financial StatementsFor the year ended December 31, 2009
Limit structure to manage foreign exchange risk is in place. Gap limits on different tenures have been introduced for USD exposures. Gap limit for other major currencies will be introduced depending upon the significance of exposure in that currency. Bank’s net open position and Foreign exchange exposure limit (FEEL) is monitored and reported on daily basis. Additionally, daily reports are generated to evaluate the exposure in different currencies. Risk management system generates VaR and PVBP numbers for foreign exchange portfolio to estimate the potential loss under normal conditions. Stress testing of foreign exchange portfolio is also performed and reported to senior management. All these activities are performed on a daily basis.
2009
Assets Liabilities Off–balance Net foregin sheet items currency exposure
(Rupees in ‘000)
Pakistan Rupee 493,610,963 422,573,623 (1,108,310) 69,929,030 United States Dollar 14,317,231 11,828,720 (2,779,180) (290,669) Pound Sterling 277,235 1,870,038 1,596,226 3,423 Japanese Yen 109,825 167 (109,376) 282 Euro 762,031 3,211,166 2,504,675 55,540 Other currencies 146,442 – (104,035) 42,407
509,223,727 439,483,714 – 69,740,013
2008
Assets Liabilities Off–balance Net foregin sheet items currency exposure
(Rupees in ‘000)
Pakistan Rupee 426,582,849 372,036,559 3,852,581 58,398,871 United States Dollar 15,326,446 9,314,526 (6,146,330) (134,410) Pound Sterling 396,816 1,260,620 876,926 13,122 Japanese Yen 118,906 282 (83,472) 35,152 Euro 1,079,049 2,566,438 1,500,295 12,906 Other currencies 111,838 1,425 – 110,413
443,615,904 385,179,850 – 58,436,054 43.2.2 Equity Price Risk
Bank’s proprietary positions in the equity instruments expose it to the equity price risk in its trading and banking books. Equity price risk is managed by applying trading limit, scrip–wise and portfolio wise nominal limits. VaR numbers generation and stress testing of the equity portfolio are also performed and reported to senior management on daily basis. The stress test for equity price risk assesses the impact of the fall in the stock market index. This exercise is done on internal based assumptions in addition to the criteria advised by the State Bank of Pakistan for Stress Testing on Equities.
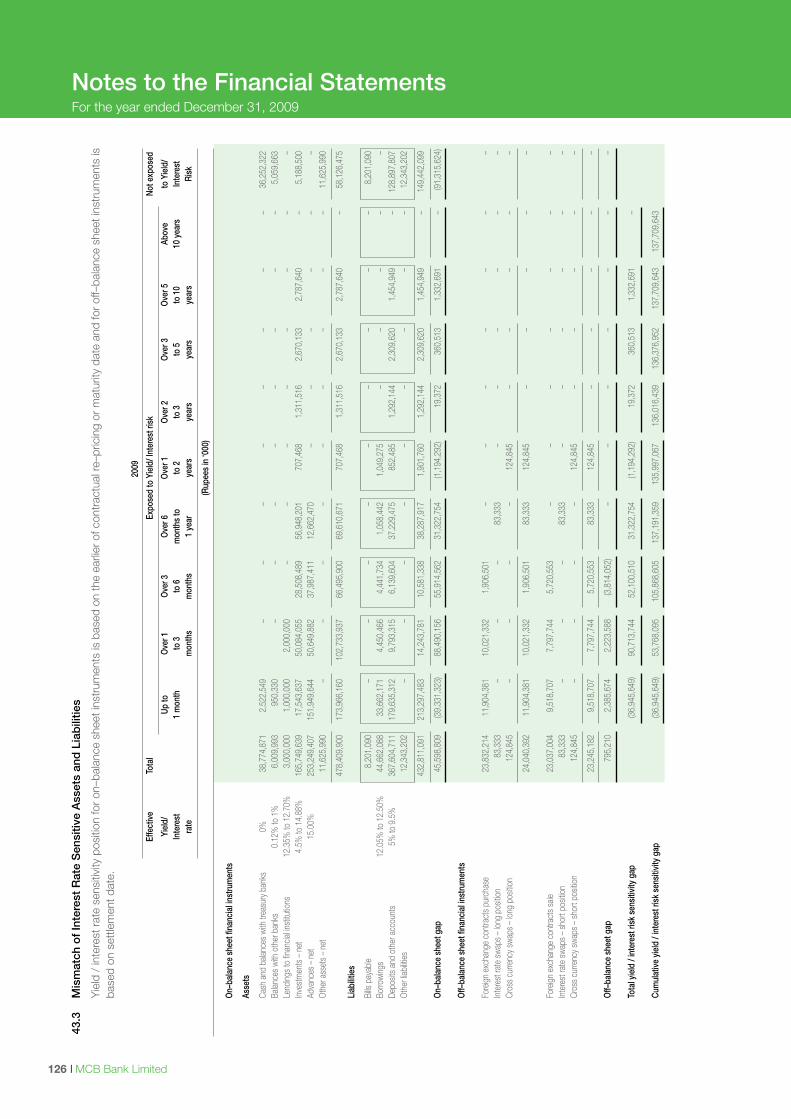
I MCB Bank Limited126 Annual Report 2009 I 127
Notes to the Financial StatementsFor the year ended December 31, 2009
43.3
M
ism
atch
of
Inte
rest
Rat
e S
ensi
tive
Ass
ets
and
Lia
bili
ties
Y
ield
/ in
tere
st ra
te s
ensi
tivity
pos
ition
for o
n–ba
lanc
e sh
eet i
nstr
umen
ts is
bas
ed o
n th
e ea
rlier
of c
ontr
actu
al re
–pric
ing
or m
atur
ity d
ate
and
for o
ff–ba
lanc
e sh
eet i
nstr
umen
ts is
ba
sed
on s
ettle
men
t dat
e.
20
09
Ef
fect
ive
Tot
al
Exp
osed
to Y
ield
/ Int
eres
t ris
k
N
ot e
xpos
ed
Yi
eld/
Up
to
Ove
r 1
Ove
r 3
Ove
r 6
Ove
r 1
Ove
r 2
Ove
r 3
Ove
r 5
Abo
ve
to Y
ield
/
Inte
rest
1 m
onth
to
3
to 6
m
onth
s to
to
2
to 3
to
5
to 1
0
10
year
s
Inte
rest
rate
m
onth
s
mon
ths
1
yea
r y
ears
y
ears
y
ears
y
ears
Ris
k
(R
upee
s in
‘000
)
O
n–ba
lanc
e sh
eet f
inan
cial
inst
rum
ents
As
sets
Ca
sh a
nd b
alanc
es w
ith tr
easu
ry b
anks
0%
3
8,77
4,87
1
2,5
22,5
49
–
–
–
–
–
–
–
–
36,
252,
322
Ba
lance
s w
ith o
ther
ban
ks
0.12
% to
1%
6
,009
,993
9
50,3
30
–
–
–
–
–
–
–
–
5,0
59,6
63
Le
nding
s to
finan
cial in
stitu
tions
12
.35%
to 1
2.70
%
3,0
00,0
00
1,0
00,0
00
2,0
00,0
00
–
–
–
–
–
–
–
–
Inve
stm
ents
– n
et
4.5%
to 1
4.88
%
165
,749
,639
1
7,54
3,63
7
50,
084,
055
2
8,50
8,48
9
56,
948,
201
7
07,4
68
1,3
11,5
16
2,6
70,1
33
2,7
87,6
40
–
5
,188
,500
Adva
nces
– n
et
15.0
0%
253
,249
,407
1
51,9
49,6
44
50,
649,
882
3
7,98
7,41
1
12,
662,
470
–
–
–
–
–
–
O
ther
ass
ets
– ne
t
11,
625,
990
–
–
–
–
–
–
–
–
–
11,
625,
990
478
,409
,900
1
73,9
66,1
60
102
,733
,937
6
6,49
5,90
0
69,
610,
671
7
07,4
68
1,3
11,5
16
2,6
70,1
33
2,7
87,6
40
–
5
8,12
6,47
5
Liab
ilitie
s
Bi
lls p
ayab
le
8,2
01,0
90
–
–
–
–
–
–
–
–
–
8
,201
,090
Borro
wing
s 12
.05%
to 1
2.50
%
44,
662,
088
3
3,66
2,17
1
4,4
50,4
66
4,4
41,7
34
1,0
58,4
42
1,0
49,2
75
–
–
–
–
–
De
posit
s an
d ot
her a
ccou
nts
5% to
9.5
%
367
,604
,711
1
79,6
35,3
12
9,7
93,3
15
6,1
39,6
04
37,
229,
475
8
52,4
85
1,2
92,1
44
2,3
09,6
20
1,4
54,9
49
–
1
28,8
97,8
07
O
ther
liabi
lities
12,
343,
202
–
–
–
–
–
–
–
–
–
12,
343,
202
432
,811
,091
2
13,2
97,4
83
14,
243,
781
1
0,58
1,33
8
38,
287,
917
1
,901
,760
1
,292
,144
2
,309
,620
1
,454
,949
–
149
,442
,099
O
n–ba
lanc
e sh
eet g
ap
4
5,59
8,80
9
(39,
331,
323)
8
8,49
0,15
6
55,
914,
562
3
1,32
2,75
4
(1,1
94,2
92)
19,
372
3
60,5
13
1,3
32,6
91
–
(9
1,31
5,62
4)
Off–
bala
nce
shee
t fin
anci
al in
stru
men
ts
Fo
reig
n ex
chan
ge c
ontra
cts
purc
hase
23,
832,
214
1
1,90
4,38
1
10,
021,
332
1
,906
,501
–
–
–
–
–
–
–
Inte
rest
rate
sw
aps
– lo
ng p
ositio
n
83,
333
–
–
–
83,
333
–
–
–
–
–
–
Cr
oss
curre
ncy
swap
s –
long
pos
ition
1
24,8
45
–
–
–
–
124
,845
–
–
–
–
–
24,
040,
392
1
1,90
4,38
1
10,
021,
332
1
,906
,501
8
3,33
3
124
,845
–
–
–
–
–
Fore
ign
exch
ange
con
tract
s sa
le
23,
037,
004
9
,518
,707
7
,797
,744
5
,720
,553
–
–
–
–
–
–
–
Inte
rest
rate
sw
aps
– sh
ort p
ositio
n
83,
333
–
–
–
83,
333
–
–
–
–
–
–
Cr
oss
curre
ncy
swap
s –
shor
t pos
ition
1
24,8
45
–
–
–
–
124
,845
–
–
–
–
–
23,
245,
182
9
,518
,707
7
,797
,744
5
,720
,553
8
3,33
3
124
,845
–
–
–
–
–
O
ff–ba
lanc
e sh
eet g
ap
7
95,2
10
2,3
85,6
74
2,2
23,5
88
(3,8
14,0
52)
–
–
–
–
–
–
–
To
tal y
ield
/ in
tere
st ri
sk s
ensi
tivity
gap
(3
6,94
5,64
9)
90,
713,
744
5
2,10
0,51
0
31,
322,
754
(1
,194
,292
) 1
9,37
2
360
,513
1
,332
,691
–
Cu
mul
ativ
e yi
eld
/ int
eres
t ris
k se
nsiti
vity
gap
(3
6,94
5,64
9)
53,
768,
095
1
05,8
68,6
05
137
,191
,359
1
35,9
97,0
67
136
,016
,439
1
36,3
76,9
52
137
,709
,643
1
37,7
09,6
43
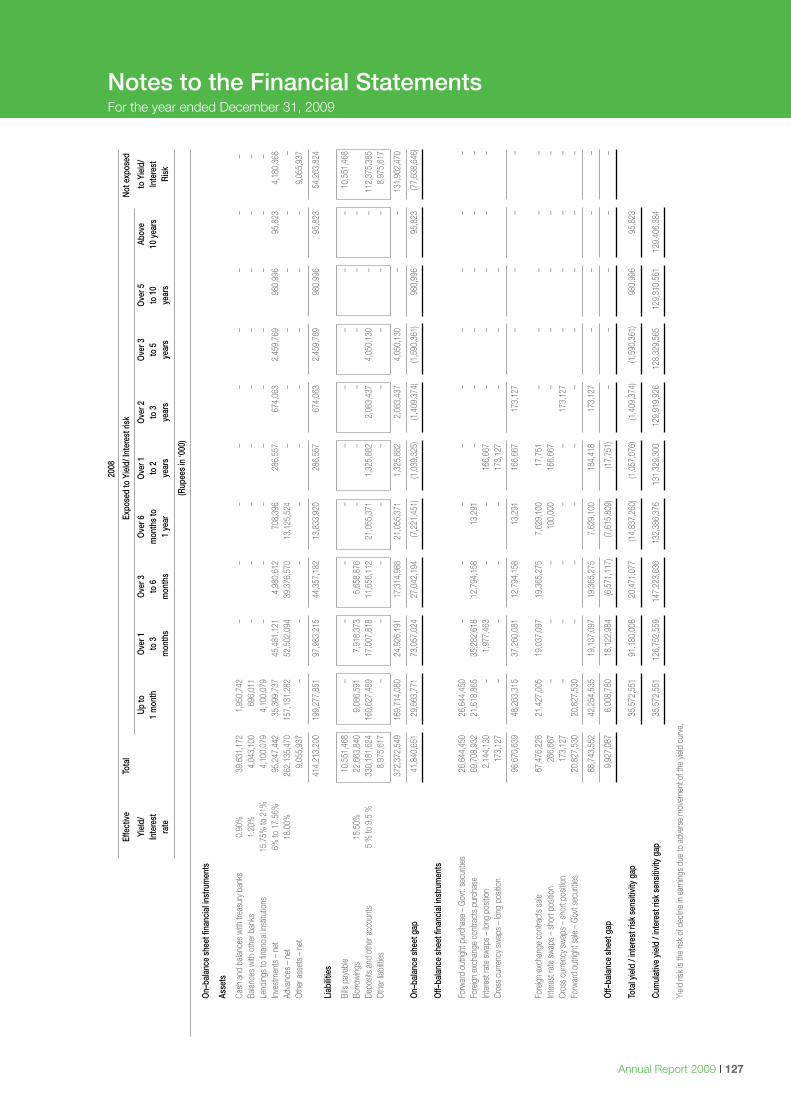
I MCB Bank Limited126 Annual Report 2009 I 127
Notes to the Financial StatementsFor the year ended December 31, 2009
20
08
Ef
fect
ive
Tot
al
Exp
osed
to Y
ield
/ Int
eres
t ris
k
No
t exp
osed
Yi
eld/
Up
to
Ove
r 1
Ove
r 3
Ove
r 6
Ove
r 1
Ove
r 2
Ove
r 3
Ove
r 5
Abo
ve
to Y
ield
/
Inte
rest
1 m
onth
to
3
to 6
m
onth
s to
to
2
to 3
to
5
to 1
0
10
year
s
Inte
rest
rate
m
onth
s
mon
ths
1
yea
r y
ears
y
ears
y
ears
y
ears
Ris
k
(R
upee
s in
‘000
)
O
n–ba
lanc
e sh
eet f
inan
cial
inst
rum
ents
As
sets
Ca
sh a
nd b
alanc
es w
ith tr
easu
ry b
anks
0.
90%
3
9,63
1,17
2
1,9
50,7
42
–
–
–
–
–
–
–
–
– Ba
lance
s w
ith o
ther
ban
ks
1.20
%
4,0
43,1
00
696
,011
–
–
–
–
–
–
–
–
–
Lend
ings
to fin
ancia
l inst
itutio
ns
15.7
5% to
21%
4
,100
,079
4
,100
,079
–
–
–
–
–
–
–
–
–
Inve
stm
ents
– n
et
6% to
17.
56%
9
5,24
7,44
2
35,
399,
737
4
5,48
1,12
1
4,9
80,6
12
708
,396
2
86,5
57
674
,063
2
,459
,769
9
80,9
96
95,
823
4
,180
,368
Adva
nces
– n
et
18.0
0%
262
,135
,470
1
57,1
31,2
82
52,
502,
094
3
9,37
6,57
0
13,
125,
524
–
–
–
–
–
–
O
ther
ass
ets
– ne
t
9,0
55,9
37
–
–
–
–
–
–
–
–
–
9
,055
,937
414
,213
,200
1
99,2
77,8
51
97,
983,
215
4
4,35
7,18
2
13,
833,
920
2
86,5
57
674
,063
2
,459
,769
9
80,9
96
95,
823
5
4,26
3,82
4
Liab
ilitie
s
Bi
lls p
ayab
le
10,
551,
468
–
–
–
–
–
–
–
–
–
10,
551,
468
Bo
rrow
ings
15.5
0%
22,
663,
840
9
,086
,591
7
,918
,373
5
,658
,876
–
–
–
–
–
–
De
posit
s an
d ot
her a
ccou
nts
5 %
to 9
.5 %
3
30,1
81,6
24
160
,627
,489
1
7,00
7,81
8
11,
656,
112
2
1,05
5,37
1
1,3
25,8
82
2,0
83,4
37
4,0
50,1
30
–
–
112
,375
,385
Oth
er lia
biliti
es
8
,975
,617
–
–
–
–
–
–
–
–
–
8,9
75,6
17
372
,372
,549
1
69,7
14,0
80
24,
926,
191
1
7,31
4,98
8
21,
055,
371
1
,325
,882
2
,083
,437
4
,050
,130
–
–
1
31,9
02,4
70
O
n–ba
lanc
e sh
eet g
ap
41
,840
,651
2
9,56
3,77
1
73,
057,
024
2
7,04
2,19
4
(7,2
21,4
51)
(1,0
39,3
25)
(1,4
09,3
74)
(1,5
90,3
61)
980
,996
9
5,82
3
(77,
638,
646)
O
ff–ba
lanc
e sh
eet f
inan
cial
inst
rum
ents
Forw
ard
outri
ght p
urch
ase
– G
ovt.
secu
rities
26,6
44,4
50
26,
644,
450
–
–
–
–
–
–
–
–
–
Fore
ign
exch
ange
con
tract
s pu
rcha
se
6
9,70
8,93
2
21,
618,
865
3
5,28
2,61
8
12,
794,
158
1
3,29
1
–
–
–
–
–
–
Inte
rest
rate
sw
aps
– lo
ng p
ositio
n
2,1
44,1
30
–
1
,977
,463
–
–
1
66,6
67
–
–
–
–
–
Cr
oss
curre
ncy
swap
s –
long
pos
ition
1
73,1
27
–
–
–
–
173
,127
–
–
–
98,
670,
639
4
8,26
3,31
5
37,
260,
081
1
2,79
4,15
8
13,
291
1
66,6
67
173
,127
–
–
–
–
Fo
reig
n ex
chan
ge c
ontra
cts
sale
6
7,47
6,22
8
21,
427,
005
1
9,03
7,09
7
19,
365,
275
7
,629
,100
1
7,75
1
–
–
–
–
–
In
tere
st ra
te s
wap
s –
shor
t pos
ition
2
66,6
67
– –
– 1
00,0
00
166
,667
–
– –
– –
Cr
oss
curre
ncy
swap
s –
shor
t pos
ition
1
73,1
27
– –
– –
– 1
73,1
27
– –
– –
Fo
rwar
d ou
trigh
t sale
– G
ovt s
ecur
ities
2
0,82
7,53
0
20,
827,
530
–
– –
– –
– –
– –
88,
743,
552
4
2,25
4,53
5
19,
137,
097
1
9,36
5,27
5
7,6
29,1
00
184
,418
1
73,1
27
–
–
–
–
O
ff–ba
lanc
e sh
eet g
ap
9
,927
,087
6
,008
,780
1
8,12
2,98
4
(6,5
71,1
17)
(7,6
15,8
09)
(17,
751)
–
–
–
–
–
Tota
l yie
ld /
inte
rest
risk
sen
sitiv
ity g
ap
35,
572,
551
9
1,18
0,00
8
20,
471,
077
(1
4,83
7,26
0)
(1,0
57,0
76)
(1,4
09,3
74)
(1,5
90,3
61)
980
,996
9
5,82
3
Cu
mul
ativ
e yi
eld
/ int
eres
t ris
k se
nsiti
vity
gap
3
5,57
2,55
1
126
,752
,559
1
47,2
23,6
36
132
,386
,376
1
31,3
29,3
00
129
,919
,926
1
28,3
29,5
65
129
,310
,561
1
29,4
06,3
84
Yi
eld ri
sk is
the
risk
of d
eclin
e in
earn
ings
due
to a
dver
se m
ovem
ent o
f the
yiel
d cu
rve.
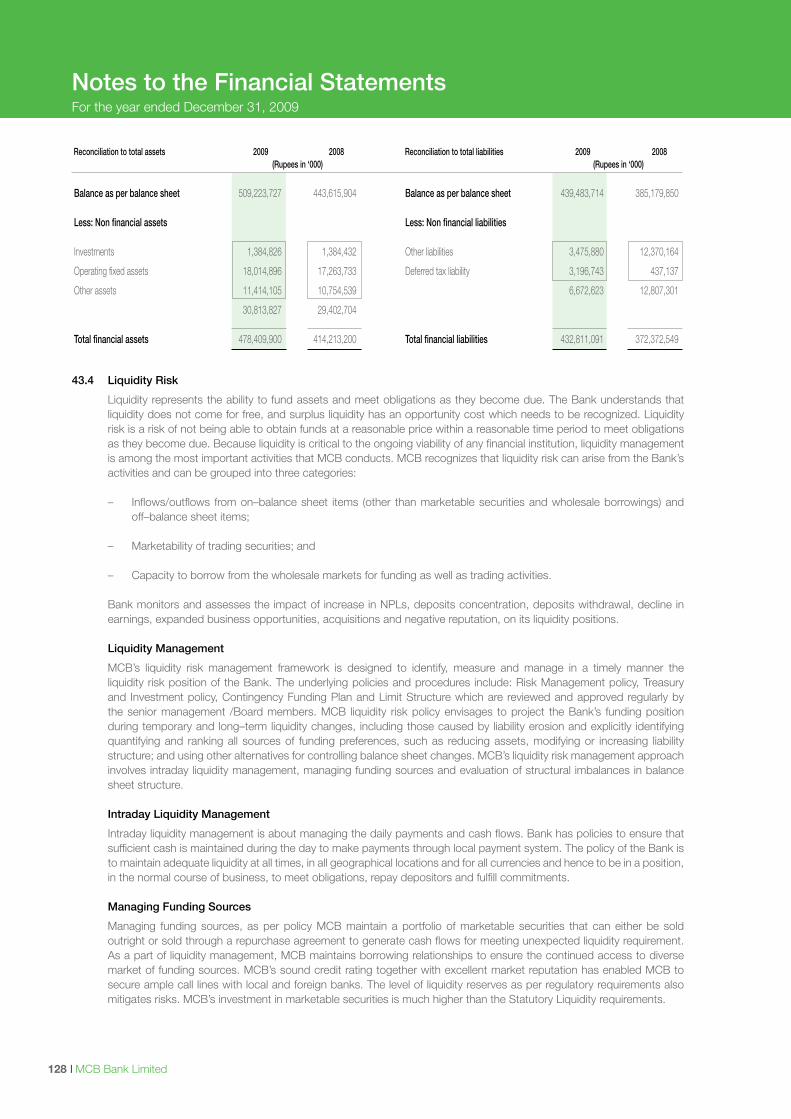
I MCB Bank Limited128
Notes to the Financial StatementsFor the year ended December 31, 2009
Reconciliation to total assets 2009 2008 Reconciliation to total liabilities 2009 2008 (Rupees in ‘000) (Rupees in ‘000)
Balance as per balance sheet 509,223,727 443,615,904 Balance as per balance sheet 439,483,714 385,179,850 Less: Non financial assets Less: Non financial liabilities Investments 1,384,826 1,384,432 Other liabilities 3,475,880 12,370,164
Operating fixed assets 18,014,896 17,263,733 Deferred tax liability 3,196,743 437,137
Other assets 11,414,105 10,754,539 6,672,623 12,807,301
30,813,827 29,402,704 Total financial assets 478,409,900 414,213,200 Total financial liabilities 432,811,091 372,372,549
43.4 Liquidity Risk
Liquidity represents the ability to fund assets and meet obligations as they become due. The Bank understands that liquidity does not come for free, and surplus liquidity has an opportunity cost which needs to be recognized. Liquidity risk is a risk of not being able to obtain funds at a reasonable price within a reasonable time period to meet obligations as they become due. Because liquidity is critical to the ongoing viability of any financial institution, liquidity management is among the most important activities that MCB conducts. MCB recognizes that liquidity risk can arise from the Bank’s activities and can be grouped into three categories:
– Inflows/outflows from on–balance sheet items (other than marketable securities and wholesale borrowings) and
off–balance sheet items;
– Marketability of trading securities; and
– Capacity to borrow from the wholesale markets for funding as well as trading activities.
Bank monitors and assesses the impact of increase in NPLs, deposits concentration, deposits withdrawal, decline in earnings, expanded business opportunities, acquisitions and negative reputation, on its liquidity positions.
Liquidity Management
MCB’s liquidity risk management framework is designed to identify, measure and manage in a timely manner the liquidity risk position of the Bank. The underlying policies and procedures include: Risk Management policy, Treasury and Investment policy, Contingency Funding Plan and Limit Structure which are reviewed and approved regularly by the senior management /Board members. MCB liquidity risk policy envisages to project the Bank’s funding position during temporary and long–term liquidity changes, including those caused by liability erosion and explicitly identifying quantifying and ranking all sources of funding preferences, such as reducing assets, modifying or increasing liability structure; and using other alternatives for controlling balance sheet changes. MCB’s liquidity risk management approach involves intraday liquidity management, managing funding sources and evaluation of structural imbalances in balance sheet structure.
Intraday Liquidity Management
Intraday liquidity management is about managing the daily payments and cash flows. Bank has policies to ensure that sufficient cash is maintained during the day to make payments through local payment system. The policy of the Bank is to maintain adequate liquidity at all times, in all geographical locations and for all currencies and hence to be in a position, in the normal course of business, to meet obligations, repay depositors and fulfill commitments.
Managing Funding Sources
Managing funding sources, as per policy MCB maintain a portfolio of marketable securities that can either be sold outright or sold through a repurchase agreement to generate cash flows for meeting unexpected liquidity requirement. As a part of liquidity management, MCB maintains borrowing relationships to ensure the continued access to diverse market of funding sources. MCB’s sound credit rating together with excellent market reputation has enabled MCB to secure ample call lines with local and foreign banks. The level of liquidity reserves as per regulatory requirements also mitigates risks. MCB’s investment in marketable securities is much higher than the Statutory Liquidity requirements.
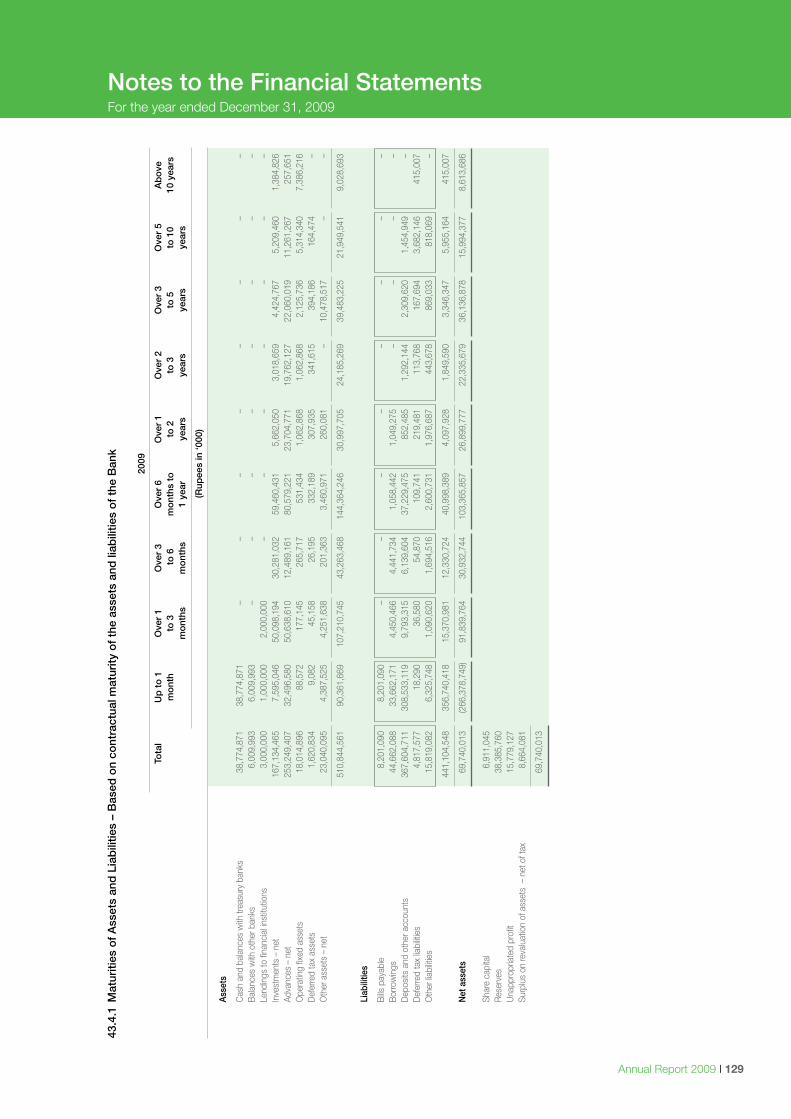
Annual Report 2009 I 129
Notes to the Financial StatementsFor the year ended December 31, 2009
43.4
.1 M
atur
ities
of
Ass
ets
and
Lia
bili
ties
– B
ased
on
cont
ract
ual m
atur
ity o
f th
e as
sets
and
liab
ilitie
s o
f th
e B
ank
20
09
To
tal
Up
to
1
Ove
r 1
O
ver
3
Ove
r 6
O
ver
1
Ove
r 2
O
ver
3
Ove
r 5
A
bo
ve
mo
nth
t
o 3
t
o 6
m
ont
hs t
o
to
2
to
3
to
5
to
10
1
0 ye
ars
m
ont
hs
mo
nths
1
yea
r
yea
rs
yea
rs
yea
rs
yea
rs
(R
upee
s in
‘000
)
A
sset
s
C
ash
and
bala
nces
with
trea
sury
ban
ks
38,
774,
871
3
8,77
4,87
1
–
–
–
–
–
–
–
–
Bal
ance
s w
ith o
ther
ban
ks
6,0
09,9
93
6,0
09,9
93
–
–
–
–
–
–
–
–
Lend
ings
to fi
nanc
ial in
stitu
tions
3
,000
,000
1
,000
,000
2
,000
,000
–
–
–
–
–
–
–
Inve
stm
ents
– n
et
167
,134
,465
7
,595
,046
5
0,09
8,19
4
30,
281,
032
5
9,46
0,43
1
5,6
62,0
50
3,0
18,6
59
4,4
24,7
67
5,2
09,4
60
1,3
84,8
26
Ad
vanc
es –
net
2
53,2
49,4
07
32,
496,
580
5
0,63
8,61
0
12,
489,
161
8
0,57
9,22
1
23,
704,
771
1
9,76
2,12
7
22,
060,
019
1
1,26
1,26
7
257
,651
Ope
ratin
g fix
ed a
sset
s 1
8,01
4,89
6
88,
572
1
77,1
45
265
,717
5
31,4
34
1,0
62,8
68
1,0
62,8
68
2,1
25,7
36
5,3
14,3
40
7,3
86,2
16
D
efer
red
tax
asse
ts
1,6
20,8
34
9,0
82
45,
158
2
6,19
5
332
,189
3
07,9
35
341
,615
3
94,1
86
164
,474
–
Oth
er a
sset
s –
net
23,
040,
095
4
,387
,525
4
,251
,638
2
01,3
63
3,4
60,9
71
260
,081
–
10,
478,
517
–
–
5
10,8
44,5
61
90,
361,
669
1
07,2
10,7
45
43,
263,
468
1
44,3
64,2
46
30,
997,
705
2
4,18
5,26
9
39,
483,
225
2
1,94
9,54
1
9,0
28,6
93
Li
abili
ties
B
ills p
ayab
le
8,2
01,0
90
8,2
01,0
90
–
–
–
–
–
–
–
–
Bor
row
ings
4
4,66
2,08
8
33,
662,
171
4
,450
,466
4
,441
,734
1
,058
,442
1
,049
,275
–
–
–
–
D
epos
its a
nd o
ther
acc
ount
s 3
67,6
04,7
11
308
,533
,119
9
,793
,315
6
,139
,604
3
7,22
9,47
5
852
,485
1
,292
,144
2
,309
,620
1
,454
,949
–
Def
erre
d ta
x lia
bilit
ies
4
,817
,577
1
8,29
0
36,
580
5
4,87
0
109
,741
2
19,4
81
113
,768
1
67,6
94
3,6
82,1
46
415
,007
Oth
er lia
bilit
ies
15,
819,
082
6
,325
,748
1
,090
,620
1
,694
,516
2
,600
,731
1
,976
,687
4
43,6
78
869
,033
8
18,0
69
–
4
41,1
04,5
48
356
,740
,418
1
5,37
0,98
1
12,
330,
724
4
0,99
8,38
9
4,0
97,9
28
1,8
49,5
90
3,3
46,3
47
5,9
55,1
64
415
,007
N
et a
sset
s 6
9,74
0,01
3
(266
,378
,749
) 9
1,83
9,76
4
30,
932,
744
1
03,3
65,8
57
26,
899,
777
2
2,33
5,67
9
36,
136,
878
1
5,99
4,37
7
8,6
13,6
86
Sh
are
capi
tal
6,9
11,0
45
R
eser
ves
38,
385,
760
Una
ppro
pria
ted
prof
it 1
5,77
9,12
7
Su
rplu
s on
reva
luat
ion
of a
sset
s –
net
of t
ax
8,6
64,0
81
6
9,74
0,01
3
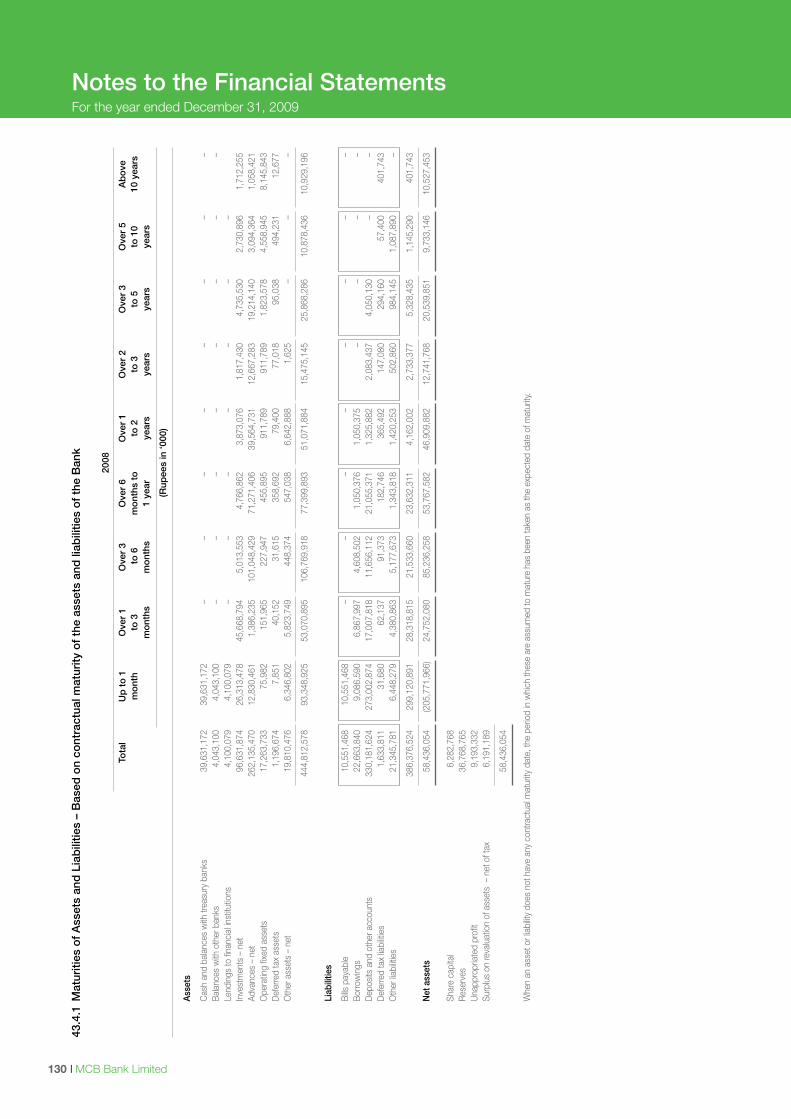
I MCB Bank Limited130
Notes to the Financial StatementsFor the year ended December 31, 2009
43.4
.1 M
atur
ities
of
Ass
ets
and
Lia
bili
ties
– B
ased
on
cont
ract
ual m
atur
ity o
f th
e as
sets
and
liab
ilitie
s o
f th
e B
ank
20
08
To
tal
Up
to
1
Ove
r 1
O
ver
3
Ove
r 6
O
ver
1
Ove
r 2
O
ver
3
Ove
r 5
A
bo
ve
mo
nth
t
o 3
t
o 6
m
ont
hs t
o
to
2
to
3
to
5
to
10
1
0 ye
ars
m
ont
hs
mo
nths
1
yea
r
yea
rs
yea
rs
yea
rs
yea
rs
(R
upee
s in
‘000
)
A
sset
s
C
ash
and
bala
nces
with
trea
sury
ban
ks
39,
631,
172
3
9,63
1,17
2
–
–
–
–
–
–
–
–
Bal
ance
s w
ith o
ther
ban
ks
4,0
43,1
00
4,0
43,1
00
–
–
–
–
–
–
–
–
Lend
ings
to fi
nanc
ial in
stitu
tions
4
,100
,079
4
,100
,079
–
–
–
–
–
–
–
Inve
stm
ents
– n
et
96,
631,
874
2
6,31
3,47
8
45,
668,
794
5
,013
,553
4
,766
,862
3
,873
,076
1
,817
,430
4
,735
,530
2
,730
,896
1
,712
,255
Adva
nces
– n
et
262
,135
,470
1
2,83
0,46
1
1,3
86,2
35
101
,048
,429
7
1,27
1,40
6
39,
564,
731
1
2,66
7,28
3
19,
214,
140
3
,094
,364
1
,058
,421
Ope
ratin
g fix
ed a
sset
s 1
7,26
3,73
3
75,
982
1
51,9
65
227
,947
4
55,8
95
911
,789
9
11,7
89
1,8
23,5
78
4,5
58,9
45
8,1
45,8
43
D
efer
red
tax
asse
ts
1,1
96,6
74
7,8
51
40,
152
3
1,61
5
358
,692
7
9,40
0
77,
018
9
5,03
8
494
,231
1
2,67
7
Oth
er a
sset
s –
net
19,
810,
476
6
,346
,802
5
,823
,749
4
48,3
74
547
,038
6
,642
,888
1
,625
–
–
–
4
44,8
12,5
78
93,
348,
925
5
3,07
0,89
5
106
,769
,918
7
7,39
9,89
3
51,
071,
884
1
5,47
5,14
5
25,
868,
286
1
0,87
8,43
6
10,
929,
196
Li
abili
ties
B
ills p
ayab
le
10,
551,
468
1
0,55
1,46
8
–
–
–
–
–
–
–
–
Bor
row
ings
2
2,66
3,84
0
9,0
86,5
90
6,8
67,9
97
4,6
08,5
02
1,0
50,3
76
1,0
50,3
75
–
–
–
–
Dep
osits
and
oth
er a
ccou
nts
330
,181
,624
2
73,0
02,8
74
17,
007,
818
1
1,65
6,11
2
21,
055,
371
1
,325
,882
2
,083
,437
4
,050
,130
–
–
D
efer
red
tax
liabi
litie
s
1,6
33,8
11
31,
680
6
2,13
7
91,
373
1
82,7
46
365
,492
1
47,0
80
294
,160
5
7,40
0
401
,743
Oth
er lia
bilit
ies
21,
345,
781
6
,448
,279
4
,380
,863
5
,177
,673
1
,343
,818
1
,420
,253
5
02,8
60
984
,145
1
,087
,890
–
3
86,3
76,5
24
299
,120
,891
2
8,31
8,81
5
21,
533,
660
2
3,63
2,31
1
4,1
62,0
02
2,7
33,3
77
5,3
28,4
35
1,1
45,2
90
401
,743
N
et a
sset
s 5
8,43
6,05
4
(205
,771
,966
) 2
4,75
2,08
0
85,
236,
258
5
3,76
7,58
2
46,
909,
882
1
2,74
1,76
8
20,
539,
851
9
,733
,146
1
0,52
7,45
3
Shar
e ca
pita
l 6
,282
,768
Res
erve
s 3
6,76
8,76
5
U
napp
ropr
iate
d pr
ofit
9,1
93,3
32
Su
rplu
s on
reva
luat
ion
of a
sset
s –
net
of t
ax
6,1
91,1
89
5
8,43
6,05
4
W
hen
an a
sset
or l
iabi
lity
does
not
hav
e an
y co
ntra
ctua
l mat
urity
dat
e, th
e pe
riod
in w
hich
thes
e ar
e as
sum
ed to
mat
ure
has
been
take
n as
the
expe
cted
dat
e of
mat
urity
.
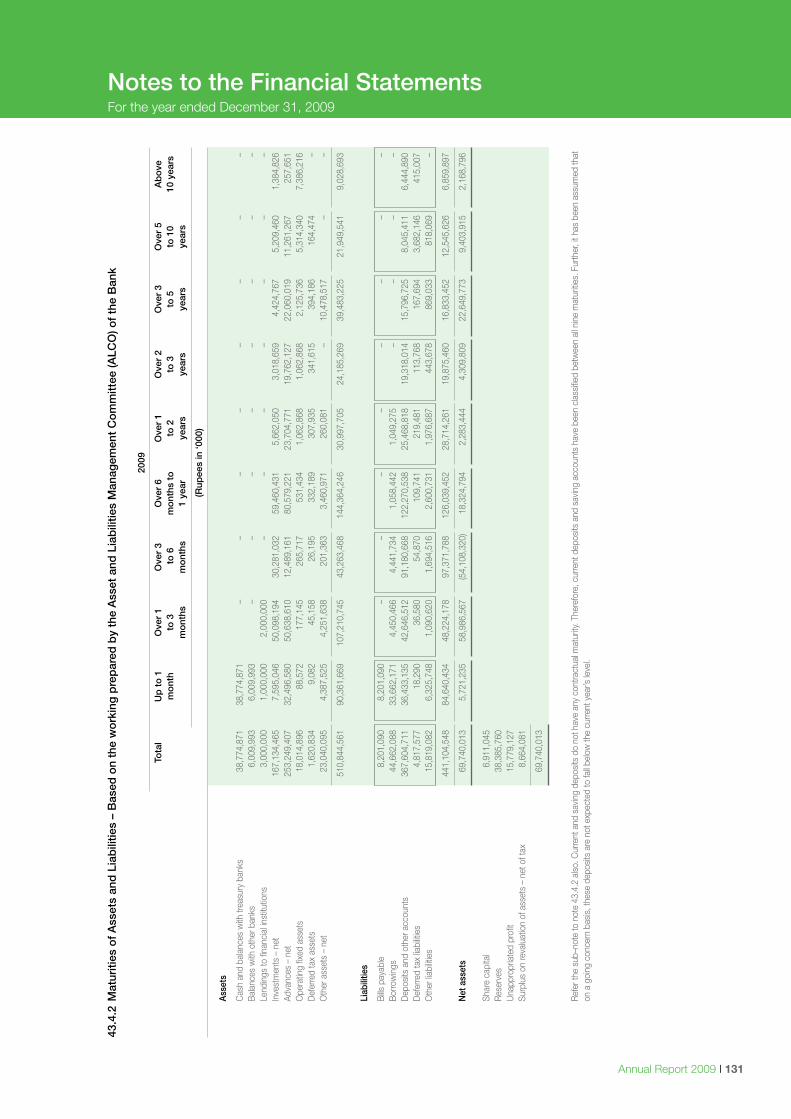
Annual Report 2009 I 131
Notes to the Financial StatementsFor the year ended December 31, 2009
43.4
.2 M
atur
ities
of
Ass
ets
and
Lia
bili
ties
– B
ased
on
the
wo
rkin
g p
rep
ared
by
the
Ass
et a
nd L
iab
ilitie
s M
anag
emen
t C
om
mitt
ee (A
LCO
) of
the
Ban
k
20
09
To
tal
Up
to
1
Ove
r 1
O
ver
3
Ove
r 6
O
ver
1
Ove
r 2
O
ver
3
Ove
r 5
A
bo
ve
mo
nth
t
o 3
t
o 6
m
ont
hs t
o
to
2
to
3
to
5
to
10
1
0 ye
ars
m
ont
hs
mo
nths
1
yea
r
yea
rs
yea
rs
yea
rs
yea
rs
(R
upee
s in
‘000
)
A
sset
s
C
ash
and
bala
nces
with
trea
sury
ban
ks
38,
774,
871
3
8,77
4,87
1
–
–
–
–
–
–
–
–
Bal
ance
s w
ith o
ther
ban
ks
6,0
09,9
93
6,0
09,9
93
–
–
–
–
–
–
–
–
Lend
ings
to fi
nanc
ial in
stitu
tions
3
,000
,000
1
,000
,000
2
,000
,000
–
–
–
–
–
–
–
Inve
stm
ents
– n
et
167
,134
,465
7
,595
,046
5
0,09
8,19
4
30,
281,
032
5
9,46
0,43
1
5,6
62,0
50
3,0
18,6
59
4,4
24,7
67
5,2
09,4
60
1,3
84,8
26
Ad
vanc
es –
net
2
53,2
49,4
07
32,
496,
580
5
0,63
8,61
0
12,
489,
161
8
0,57
9,22
1
23,
704,
771
1
9,76
2,12
7
22,
060,
019
1
1,26
1,26
7
257
,651
Ope
ratin
g fix
ed a
sset
s 1
8,01
4,89
6
88,
572
1
77,1
45
265
,717
5
31,4
34
1,0
62,8
68
1,0
62,8
68
2,1
25,7
36
5,3
14,3
40
7,3
86,2
16
D
efer
red
tax
asse
ts
1,6
20,8
34
9,0
82
45,
158
2
6,19
5
332
,189
3
07,9
35
341
,615
3
94,1
86
164
,474
–
Oth
er a
sset
s –
net
23,
040,
095
4
,387
,525
4
,251
,638
2
01,3
63
3,4
60,9
71
260
,081
–
10,
478,
517
–
–
5
10,8
44,5
61
90,
361,
669
1
07,2
10,7
45
43,
263,
468
1
44,3
64,2
46
30,
997,
705
2
4,18
5,26
9
39,
483,
225
2
1,94
9,54
1
9,0
28,6
93
Li
abili
ties
B
ills p
ayab
le
8,2
01,0
90
8,2
01,0
90
–
–
–
–
–
–
–
–
Bor
row
ings
4
4,66
2,08
8
33,
662,
171
4
,450
,466
4
,441
,734
1
,058
,442
1
,049
,275
–
–
–
–
D
epos
its a
nd o
ther
acc
ount
s 3
67,6
04,7
11
36,
433,
135
4
2,64
6,51
2
91,
180,
668
1
22,2
70,5
38
25,
468,
818
1
9,31
8,01
4
15,
796,
725
8
,045
,411
6
,444
,890
Def
erre
d ta
x lia
bilit
ies
4
,817
,577
1
8,29
0
36,
580
5
4,87
0
109
,741
2
19,4
81
113
,768
1
67,6
94
3,6
82,1
46
415
,007
Oth
er lia
bilit
ies
15,
819,
082
6
,325
,748
1
,090
,620
1
,694
,516
2
,600
,731
1
,976
,687
4
43,6
78
869
,033
8
18,0
69
–
4
41,1
04,5
48
84,
640,
434
4
8,22
4,17
8
97,
371,
788
1
26,0
39,4
52
28,
714,
261
1
9,87
5,46
0
16,
833,
452
1
2,54
5,62
6
6,8
59,8
97
N
et a
sset
s 6
9,74
0,01
3
5,7
21,2
35
58,
986,
567
(5
4,10
8,32
0)
18,
324,
794
2
,283
,444
4
,309
,809
2
2,64
9,77
3
9,4
03,9
15
2,1
68,7
96
Sh
are
capi
tal
6,9
11,0
45
R
eser
ves
38,
385,
760
Una
ppro
pria
ted
prof
it 1
5,77
9,12
7
Su
rplu
s on
reva
luat
ion
of a
sset
s –
net o
f tax
8
,664
,081
6
9,74
0,01
3
R
efer
the
sub–
note
to n
ote
43.4
.2 a
lso.
Cur
rent
and
sav
ing
depo
sits
do
not h
ave
any
cont
ract
ual m
atur
ity. T
here
fore
, cur
rent
dep
osits
and
sav
ing
acco
unts
hav
e be
en c
lass
ified
betw
een
all n
ine
mat
uriti
es. F
urth
er, i
t has
bee
n as
sum
ed th
at
on a
goi
ng c
once
rn b
asis
, the
se d
epos
its a
re n
ot e
xpec
ted
to fa
ll bel
ow th
e cu
rrent
yea
r’s le
vel.
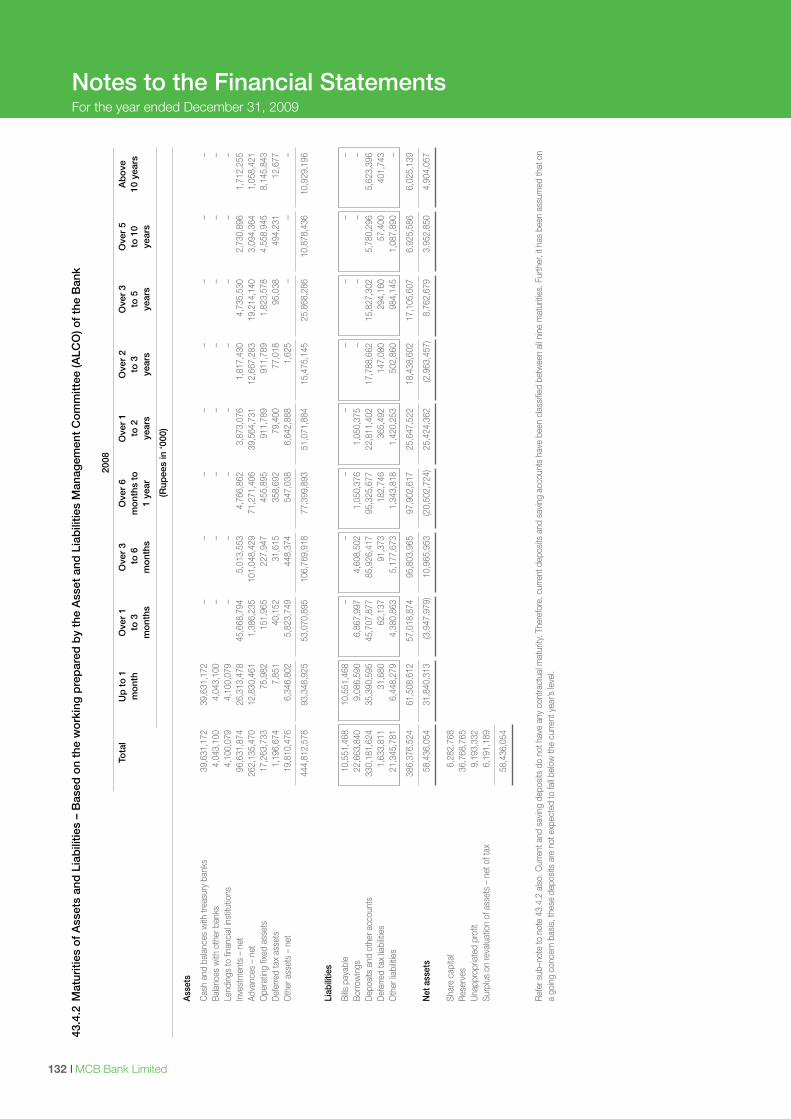
I MCB Bank Limited132
Notes to the Financial StatementsFor the year ended December 31, 2009
43.4
.2 M
atur
ities
of
Ass
ets
and
Lia
bili
ties
– B
ased
on
the
wo
rkin
g p
rep
ared
by
the
Ass
et a
nd L
iab
ilitie
s M
anag
emen
t C
om
mitt
ee (A
LCO
) of
the
Ban
k
20
08
To
tal
Up
to
1
Ove
r 1
O
ver
3
Ove
r 6
O
ver
1
Ove
r 2
O
ver
3
Ove
r 5
A
bo
ve
mo
nth
t
o 3
t
o 6
m
ont
hs t
o
to
2
to
3
to
5
to
10
1
0 ye
ars
m
ont
hs
mo
nths
1
yea
r
yea
rs
yea
rs
yea
rs
yea
rs
(R
upee
s in
‘000
)
A
sset
s
C
ash
and
bala
nces
with
trea
sury
ban
ks
39,
631,
172
3
9,63
1,17
2
–
–
–
–
–
–
–
–
Bal
ance
s w
ith o
ther
ban
ks
4,0
43,1
00
4,0
43,1
00
–
–
–
–
–
–
–
–
Lend
ings
to fi
nanc
ial in
stitu
tions
4
,100
,079
4
,100
,079
–
–
–
–
–
–
–
–
In
vest
men
ts –
net
9
6,63
1,87
4
26,
313,
478
4
5,66
8,79
4
5,0
13,5
53
4,7
66,8
62
3,8
73,0
76
1,8
17,4
30
4,7
35,5
30
2,7
30,8
96
1,7
12,2
55
Ad
vanc
es –
net
2
62,1
35,4
70
12,
830,
461
1
,386
,235
1
01,0
48,4
29
71,
271,
406
3
9,56
4,73
1
12,
667,
283
1
9,21
4,14
0
3,0
94,3
64
1,0
58,4
21
O
pera
ting
fixed
ass
ets
17,
263,
733
7
5,98
2
151
,965
2
27,9
47
455
,895
9
11,7
89
911
,789
1
,823
,578
4
,558
,945
8
,145
,843
Def
erre
d ta
x as
sets
1
,196
,674
7
,851
4
0,15
2
31,
615
3
58,6
92
79,
400
7
7,01
8
95,
038
4
94,2
31
12,
677
O
ther
ass
ets
– ne
t 1
9,81
0,47
6
6,3
46,8
02
5,8
23,7
49
448
,374
5
47,0
38
6,6
42,8
88
1,6
25
–
–
–
4
44,8
12,5
78
93,
348,
925
5
3,07
0,89
5
106
,769
,918
7
7,39
9,89
3
51,
071,
884
1
5,47
5,14
5
25,
868,
286
1
0,87
8,43
6
10,
929,
196
Li
abili
ties
B
ills p
ayab
le
10,
551,
468
1
0,55
1,46
8
–
–
–
–
–
–
–
–
Bor
row
ings
2
2,66
3,84
0
9,0
86,5
90
6,8
67,9
97
4,6
08,5
02
1,0
50,3
76
1,0
50,3
75
–
–
–
–
Dep
osits
and
oth
er a
ccou
nts
330
,181
,624
3
5,39
0,59
5
45,
707,
877
8
5,92
6,41
7
95,
325,
677
2
2,81
1,40
2
17,
788,
662
1
5,82
7,30
2
5,7
80,2
96
5,6
23,3
96
D
efer
red
tax
liabi
litie
s
1,6
33,8
11
31,
680
6
2,13
7
91,
373
1
82,7
46
365
,492
1
47,0
80
294
,160
5
7,40
0
401
,743
Oth
er lia
bilit
ies
21,
345,
781
6
,448
,279
4
,380
,863
5
,177
,673
1
,343
,818
1
,420
,253
5
02,8
60
984
,145
1
,087
,890
–
3
86,3
76,5
24
61,
508,
612
5
7,01
8,87
4
95,
803,
965
9
7,90
2,61
7
25,
647,
522
1
8,43
8,60
2
17,
105,
607
6
,925
,586
6
,025
,139
N
et a
sset
s 5
8,43
6,05
4
31,
840,
313
(3
,947
,979
) 1
0,96
5,95
3
(20,
502,
724)
2
5,42
4,36
2
(2,9
63,4
57)
8,7
62,6
79
3,9
52,8
50
4,9
04,0
57
Sh
are
capi
tal
6,2
82,7
68
R
eser
ves
36,
768,
765
Una
ppro
pria
ted
prof
it 9
,193
,332
Surp
lus
on re
valu
atio
n of
ass
ets
– ne
t of t
ax
6,1
91,1
89
5
8,43
6,05
4
R
efer
sub
–not
e to
not
e 43
.4.2
als
o. C
urre
nt a
nd s
avin
g de
posi
ts d
o no
t hav
e an
y co
ntra
ctua
l mat
urity
. The
refo
re, c
urre
nt d
epos
its a
nd s
avin
g ac
coun
ts h
ave
been
cla
ssifie
d be
twee
n al
l nin
e m
atur
ities
. Fur
ther
, it h
as b
een
assu
med
that
on
a go
ing
conc
ern
basi
s, th
ese
depo
sits
are
not
exp
ecte
d to
fall b
elow
the
curre
nt y
ear’s
leve
l.
Annual Report 2009 I 133
Notes to the Financial StatementsFor the year ended December 31, 2009
43.5 Operational Risk
Operational Risk is risk of loss resulting from an inadequacy or a failure ascribable to people, processes, technology or external events. This definition includes legal risk, but excludes strategic and reputational risk.
Operational Risk Management Division (ORMD) within Risk Management Group (RMG) is primarily responsible for oversight of bank–wide operational risk management. ORMD is independent of revenue generating functions. Although, respective business and support functions are the risk takers / owners, ORMD provides assistance and guidance for proactive operational risk management. The Risk Management Policy and bank–wide Operational Risk Management Framework (ORMF) have been developed in line with international best practices. The policy and framework are reviewed periodically so as to incorporate the current changes.
Major processes for operational risk management include, but not limited to Risk and Control Self Assessment, loss
database management, enhancing operational risk awareness through workshops and sessions. ORMD has active coordination with audit and compliance for information sharing on Key Risk Indicators (KRIs) with respect to management of various operational risk aspects within the bank.
43.5.1 Operational Risk–Disclosures Basel II Specific
Currently, the Bank is reporting operational risk capital charge under Basic Indicator Approach (BIA). However, a number of initiatives are underway for adoption of The Standardized Approach (TSA) / Alternative Standardized Approach (ASA) like business line mapping, risk and control self assessment exercises.
ORMD initiated the process of collecting loss data on key risk events in the year 2007. Based on periodical analysis of loss data, ORMD generates reports for senior management and Risk Management and Portfolio Review Committee (RM&PRC) of the Board. The report covers the significant risk events, impact analysis and recommendations for improvement in control / risk mitigation.
44. GENERAL
Comparative information has been reclassified and rearranged in these financial statements for the purpose of comparison. No significant reclassification has been made except for as follows:
Reclassified Description Amount From To
(Rs. in 000)
Exchange income on import / export bills purchased / negotiated 86,665 Other income Fee, commission and brokerage income
Key Deposits Account and collection of Zakat Account 92,531 Deposits and Other Liabilities other accounts
Islamic Sukuk Certificates of Maple Leaf Cement Factory Limited 375,000 Advances Investments
Contractual security guard cost 216,244 Salaries and allowances Others (Administrative expenses) 45. NON–ADJUSTING EVENT
The Board of Directors in its meeting held on February 25, 2010 has announced a final cash dividend in respect of the year ended December 31, 2009 of Rs. 3.5 per share (2008: Rs. 2.5 per share) and bonus shares issue of 10% (2008: 10%). These financial statements for the year ended December 31, 2009 do not include the effect of these appropriations which will be accounted for subsequent to the year end.
46. DATE OF AUTHORIZATION FOR ISSUE
These financial statements were authorized for issue by the Board of Directors of the Bank in their meeting held on February 25, 2010.
Atif Bajwa S. M. Muneer Dato’ Mohammed Hussein Mian Umer Mansha President and Chief Executive Director Director Director
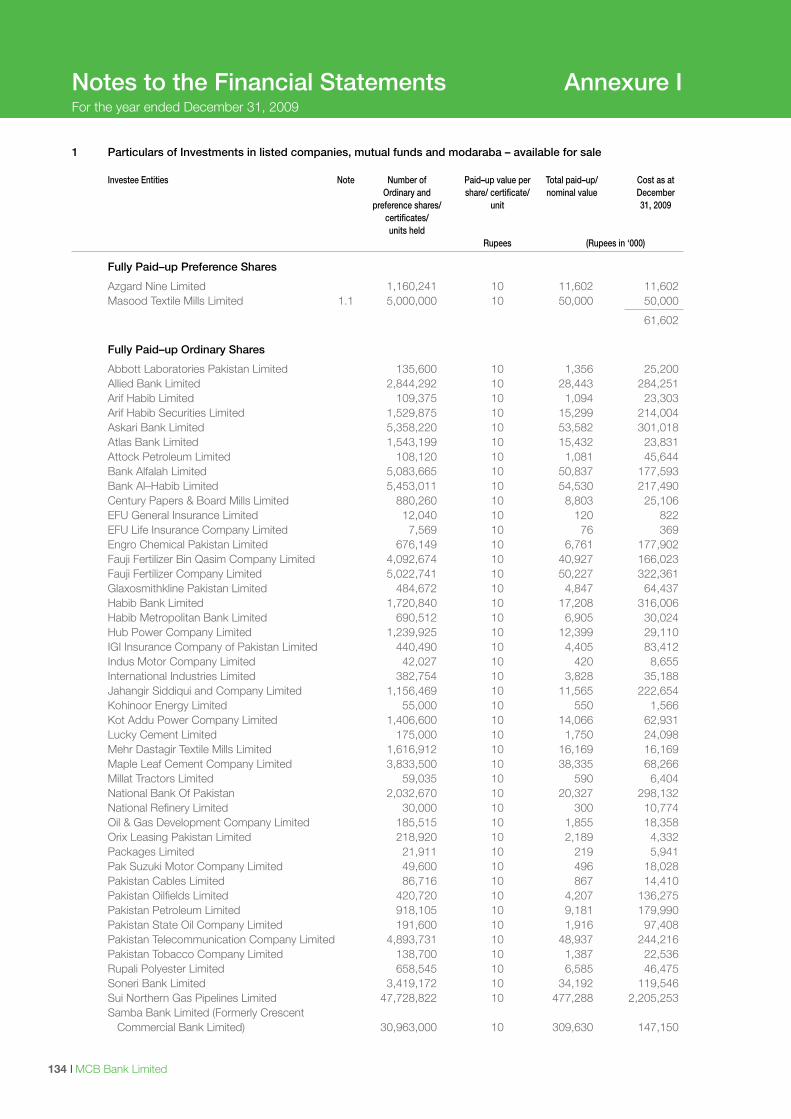
I MCB Bank Limited134
Notes to the Financial Statements Annexure IFor the year ended December 31, 2009
1 Particulars of Investments in listed companies, mutual funds and modaraba – available for sale Investee Entities Note Number of Paid–up value per Total paid–up/ Cost as at Ordinary and share/ certificate/ nominal value December preference shares/ unit 31, 2009 certificates/ units held Rupees (Rupees in ‘000)
Fully Paid–up Preference Shares
Azgard Nine Limited 1,160,241 10 11,602 11,602 Masood Textile Mills Limited 1.1 5,000,000 10 50,000 50,000
61,602 Fully Paid–up Ordinary Shares
Abbott Laboratories Pakistan Limited 135,600 10 1,356 25,200 Allied Bank Limited 2,844,292 10 28,443 284,251 Arif Habib Limited 109,375 10 1,094 23,303 Arif Habib Securities Limited 1,529,875 10 15,299 214,004 Askari Bank Limited 5,358,220 10 53,582 301,018 Atlas Bank Limited 1,543,199 10 15,432 23,831 Attock Petroleum Limited 108,120 10 1,081 45,644 Bank Alfalah Limited 5,083,665 10 50,837 177,593 Bank Al–Habib Limited 5,453,011 10 54,530 217,490 Century Papers & Board Mills Limited 880,260 10 8,803 25,106 EFU General Insurance Limited 12,040 10 120 822 EFU Life Insurance Company Limited 7,569 10 76 369 Engro Chemical Pakistan Limited 676,149 10 6,761 177,902 Fauji Fertilizer Bin Qasim Company Limited 4,092,674 10 40,927 166,023 Fauji Fertilizer Company Limited 5,022,741 10 50,227 322,361 Glaxosmithkline Pakistan Limited 484,672 10 4,847 64,437 Habib Bank Limited 1,720,840 10 17,208 316,006 Habib Metropolitan Bank Limited 690,512 10 6,905 30,024 Hub Power Company Limited 1,239,925 10 12,399 29,110 IGI Insurance Company of Pakistan Limited 440,490 10 4,405 83,412 Indus Motor Company Limited 42,027 10 420 8,655 International Industries Limited 382,754 10 3,828 35,188 Jahangir Siddiqui and Company Limited 1,156,469 10 11,565 222,654 Kohinoor Energy Limited 55,000 10 550 1,566 Kot Addu Power Company Limited 1,406,600 10 14,066 62,931 Lucky Cement Limited 175,000 10 1,750 24,098 Mehr Dastagir Textile Mills Limited 1,616,912 10 16,169 16,169 Maple Leaf Cement Company Limited 3,833,500 10 38,335 68,266 Millat Tractors Limited 59,035 10 590 6,404 National Bank Of Pakistan 2,032,670 10 20,327 298,132 National Refinery Limited 30,000 10 300 10,774 Oil & Gas Development Company Limited 185,515 10 1,855 18,358 Orix Leasing Pakistan Limited 218,920 10 2,189 4,332 Packages Limited 21,911 10 219 5,941 Pak Suzuki Motor Company Limited 49,600 10 496 18,028 Pakistan Cables Limited 86,716 10 867 14,410 Pakistan Oilfields Limited 420,720 10 4,207 136,275 Pakistan Petroleum Limited 918,105 10 9,181 179,990 Pakistan State Oil Company Limited 191,600 10 1,916 97,408 Pakistan Telecommunication Company Limited 4,893,731 10 48,937 244,216 Pakistan Tobacco Company Limited 138,700 10 1,387 22,536 Rupali Polyester Limited 658,545 10 6,585 46,475 Soneri Bank Limited 3,419,172 10 34,192 119,546 Sui Northern Gas Pipelines Limited 47,728,822 10 477,288 2,205,253 Samba Bank Limited (Formerly Crescent Commercial Bank Limited) 30,963,000 10 309,630 147,150
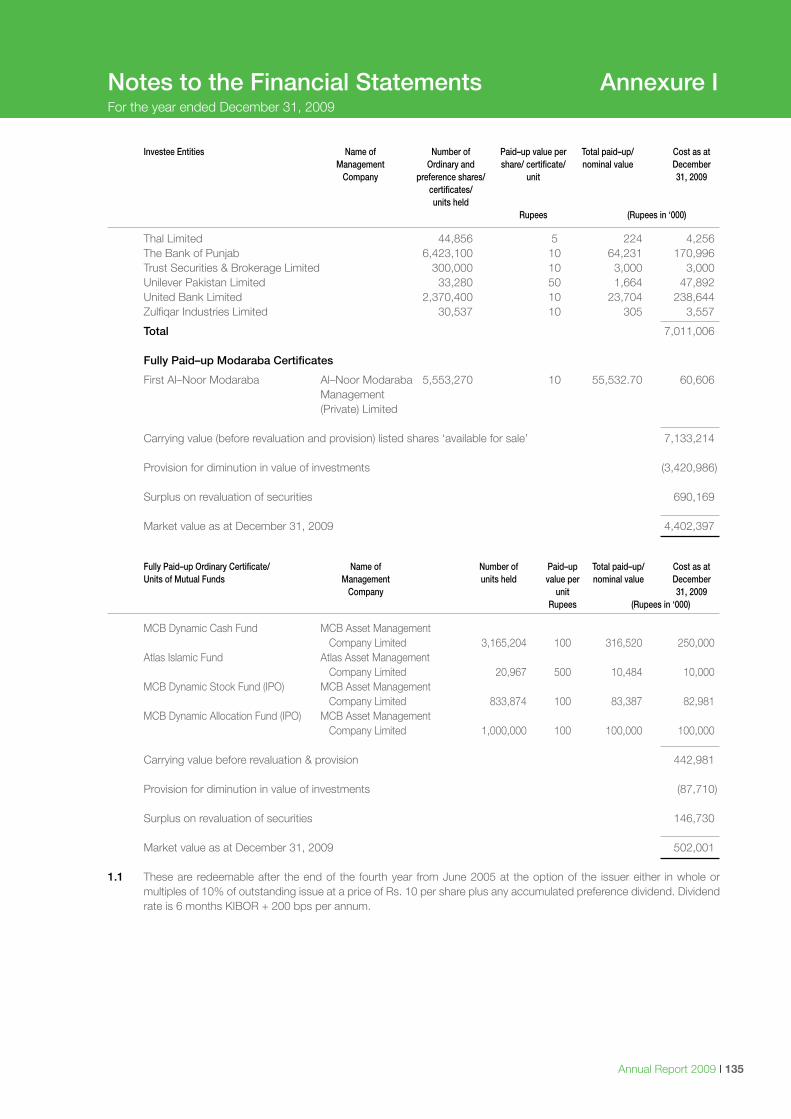
Annual Report 2009 I 135
Notes to the Financial Statements Annexure IFor the year ended December 31, 2009
Investee Entities Name of Number of Paid–up value per Total paid–up/ Cost as at Management Ordinary and share/ certificate/ nominal value December Company preference shares/ unit 31, 2009 certificates/ units held Rupees (Rupees in ‘000)
Thal Limited 44,856 5 224 4,256 The Bank of Punjab 6,423,100 10 64,231 170,996 Trust Securities & Brokerage Limited 300,000 10 3,000 3,000 Unilever Pakistan Limited 33,280 50 1,664 47,892 United Bank Limited 2,370,400 10 23,704 238,644 Zulfiqar Industries Limited 30,537 10 305 3,557
Total 7,011,006 Fully Paid–up Modaraba Certificates
First Al–Noor Modaraba Al–Noor Modaraba 5,553,270 10 55,532.70 60,606 Management (Private) Limited Carrying value (before revaluation and provision) listed shares ‘available for sale’ 7,133,214 Provision for diminution in value of investments (3,420,986) Surplus on revaluation of securities 690,169 Market value as at December 31, 2009 4,402,397
Fully Paid–up Ordinary Certificate/ Name of Number of Paid–up Total paid–up/ Cost as at Units of Mutual Funds Management units held value per nominal value December Company unit 31, 2009 Rupees (Rupees in ‘000)
MCB Dynamic Cash Fund MCB Asset Management Company Limited 3,165,204 100 316,520 250,000 Atlas Islamic Fund Atlas Asset Management Company Limited 20,967 500 10,484 10,000 MCB Dynamic Stock Fund (IPO) MCB Asset Management Company Limited 833,874 100 83,387 82,981 MCB Dynamic Allocation Fund (IPO) MCB Asset Management Company Limited 1,000,000 100 100,000 100,000
Carrying value before revaluation & provision 442,981 Provision for diminution in value of investments (87,710) Surplus on revaluation of securities 146,730 Market value as at December 31, 2009 502,001 1.1 These are redeemable after the end of the fourth year from June 2005 at the option of the issuer either in whole or
multiples of 10% of outstanding issue at a price of Rs. 10 per share plus any accumulated preference dividend. Dividend rate is 6 months KIBOR + 200 bps per annum.
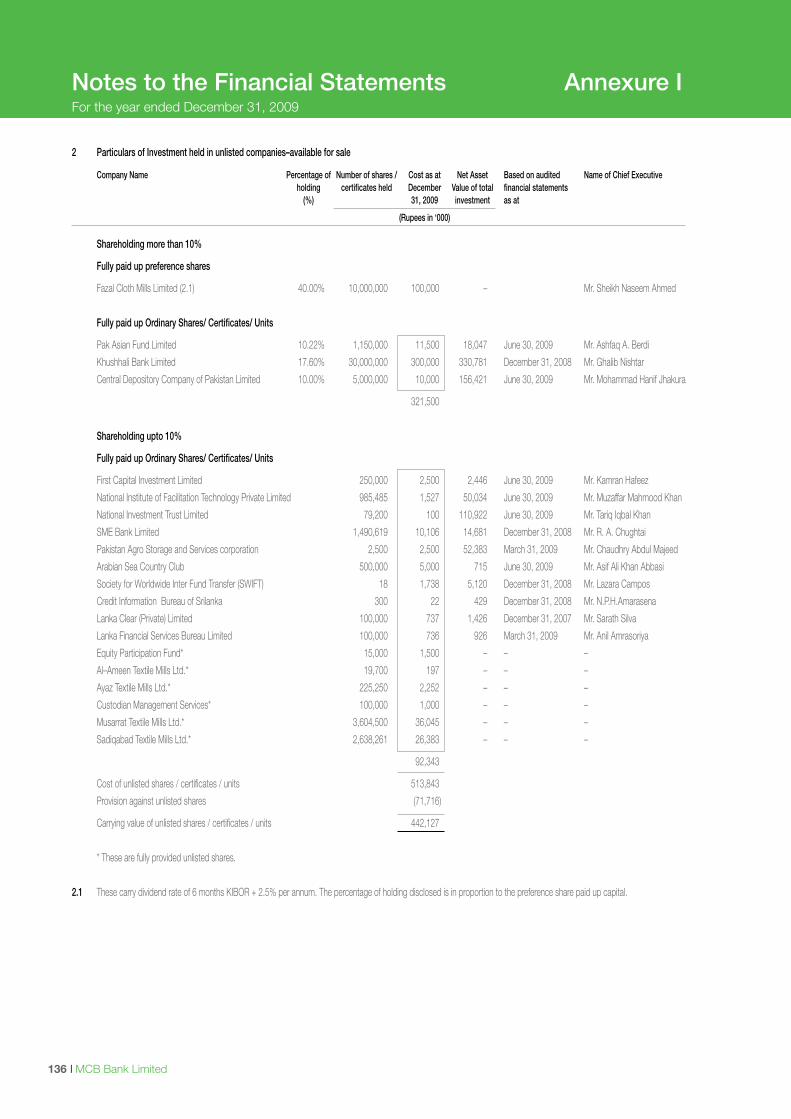
I MCB Bank Limited136
Notes to the Financial Statements Annexure IFor the year ended December 31, 2009
2 Particulars of Investment held in unlisted companies–available for sale
Company Name Percentage of Number of shares / Cost as at Net Asset Based on audited Name of Chief Executive holding certificates held December Value of total financial statements (%) 31, 2009 investment as at
(Rupees in ‘000)
Shareholding more than 10%
Fully paid up preference shares
Fazal Cloth Mills Limited (2.1) 40.00% 10,000,000 100,000 – Mr. Sheikh Naseem Ahmed
Fully paid up Ordinary Shares/ Certificates/ Units
Pak Asian Fund Limited 10.22% 1,150,000 11,500 18,047 June 30, 2009 Mr. Ashfaq A. Berdi
Khushhali Bank Limited 17.60% 30,000,000 300,000 330,781 December 31, 2008 Mr. Ghalib Nishtar
Central Depository Company of Pakistan Limited 10.00% 5,000,000 10,000 156,421 June 30, 2009 Mr. Mohammad Hanif Jhakura
321,500
Shareholding upto 10%
Fully paid up Ordinary Shares/ Certificates/ Units
First Capital Investment Limited 250,000 2,500 2,446 June 30, 2009 Mr. Kamran Hafeez
National Institute of Facilitation Technology Private Limited 985,485 1,527 50,034 June 30, 2009 Mr. Muzaffar Mahmood Khan
National Investment Trust Limited 79,200 100 110,922 June 30, 2009 Mr. Tariq Iqbal Khan
SME Bank Limited 1,490,619 10,106 14,681 December 31, 2008 Mr. R. A. Chughtai
Pakistan Agro Storage and Services corporation 2,500 2,500 52,383 March 31, 2009 Mr. Chaudhry Abdul Majeed
Arabian Sea Country Club 500,000 5,000 715 June 30, 2009 Mr. Asif Ali Khan Abbasi
Society for Worldwide Inter Fund Transfer (SWIFT) 18 1,738 5,120 December 31, 2008 Mr. Lazara Campos
Credit Information Bureau of Srilanka 300 22 429 December 31, 2008 Mr. N.P.H.Amarasena
Lanka Clear (Private) Limited 100,000 737 1,426 December 31, 2007 Mr. Sarath Silva
Lanka Financial Services Bureau Limited 100,000 736 926 March 31, 2009 Mr. Anil Amrasoriya
Equity Participation Fund* 15,000 1,500 – – –
Al–Ameen Textile Mills Ltd.* 19,700 197 – – –
Ayaz Textile Mills Ltd.* 225,250 2,252 – – –
Custodian Management Services* 100,000 1,000 – – –
Musarrat Textile Mills Ltd.* 3,604,500 36,045 – – –
Sadiqabad Textile Mills Ltd.* 2,638,261 26,383 – – –
92,343
Cost of unlisted shares / certificates / units 513,843
Provision against unlisted shares (71,716)
Carrying value of unlisted shares / certificates / units 442,127
* These are fully provided unlisted shares.
2.1 These carry dividend rate of 6 months KIBOR + 2.5% per annum. The percentage of holding disclosed is in proportion to the preference share paid up capital.
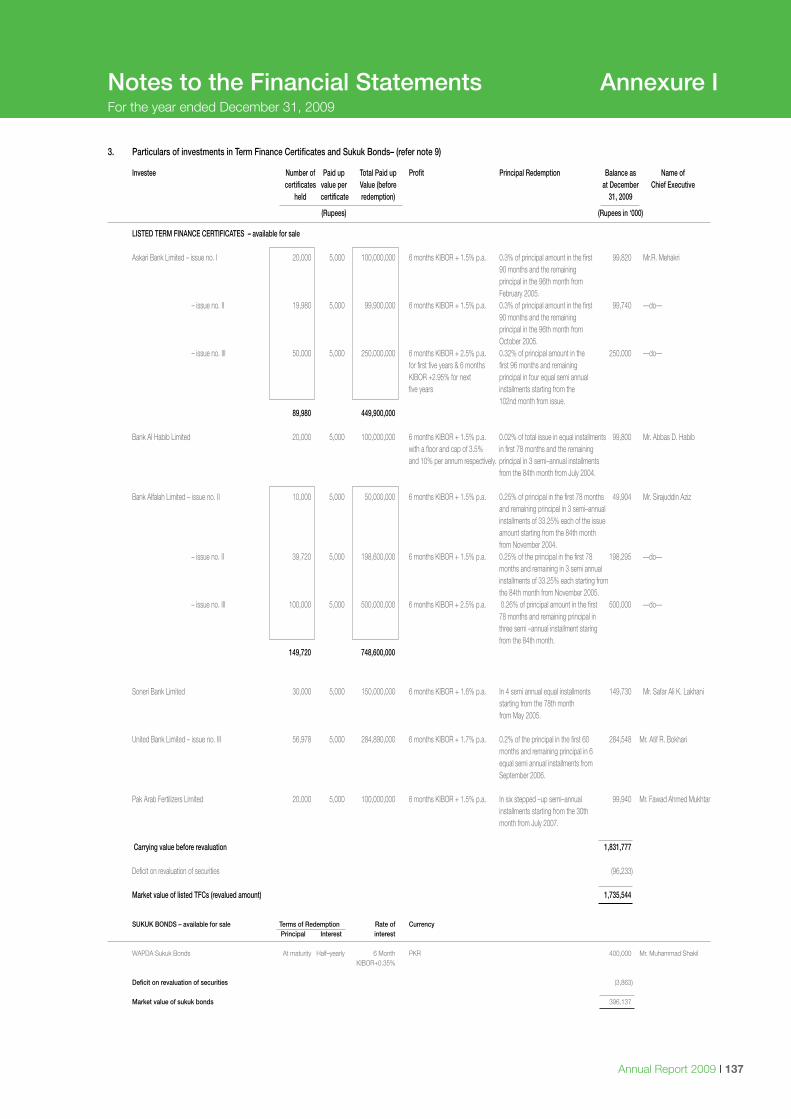
Annual Report 2009 I 137
Notes to the Financial Statements Annexure IFor the year ended December 31, 2009
3. Particulars of investments in Term Finance Certificates and Sukuk Bonds– (refer note 9)
Investee Number of Paid up Total Paid up Profit Principal Redemption Balance as Name of certificates value per Value (before at December Chief Executive held certificate redemption) 31, 2009
(Rupees) (Rupees in ‘000)
LISTED TERM FINANCE CERTIFICATES – available for sale
Askari Bank Limited – issue no. I 20,000 5,000 100,000,000 6 months KIBOR + 1.5% p.a. 0.3% of principal amount in the first 99,820 Mr.R. Mehakri 90 months and the remaining principal in the 96th month from February 2005. – issue no. II 19,980 5,000 99,900,000 6 months KIBOR + 1.5% p.a. 0.3% of principal amount in the first 99,740 ––do–– 90 months and the remaining principal in the 96th month from October 2005. – issue no. III 50,000 5,000 250,000,000 6 months KIBOR + 2.5% p.a. 0.32% of principal amount in the 250,000 ––do–– for first five years & 6 months first 96 months and remaining KIBOR +2.95% for next principal in four equal semi annual five years installments starting from the 102nd month from issue. 89,980 449,900,000 Bank Al Habib Limited 20,000 5,000 100,000,000 6 months KIBOR + 1.5% p.a. 0.02% of total issue in equal installments 99,800 Mr. Abbas D. Habib with a floor and cap of 3.5% in first 78 months and the remaining and 10% per annum respectively. principal in 3 semi–annual installments from the 84th month from July 2004.
Bank Alfalah Limited – issue no. II 10,000 5,000 50,000,000 6 months KIBOR + 1.5% p.a. 0.25% of principal in the first 78 months 49,904 Mr. Sirajuddin Aziz and remaining principal in 3 semi–annual installments of 33.25% each of the issue amount starting from the 84th month from November 2004. – issue no. II 39,720 5,000 198,600,000 6 months KIBOR + 1.5% p.a. 0.25% of the principal in the first 78 198,295 ––do–– months and remaining in 3 semi annual installments of 33.25% each starting from the 84th month from November 2005. – issue no. III 100,000 5,000 500,000,000 6 months KIBOR + 2.5% p.a. 0.26% of principal amount in the first 500,000 ––do–– 78 months and remaining principal in three semi –annual installment staring from the 84th month. 149,720 748,600,000
Soneri Bank Limited 30,000 5,000 150,000,000 6 months KIBOR + 1.6% p.a. In 4 semi annual equal installments 149,730 Mr. Safar Ali K. Lakhani starting from the 78th month from May 2005. United Bank Limited – issue no. III 56,978 5,000 284,890,000 6 months KIBOR + 1.7% p.a. 0.2% of the principal in the first 60 284,548 Mr. Atif R. Bokhari months and remaining principal in 6 equal semi annual installments from September 2006. Pak Arab Fertilizers Limited 20,000 5,000 100,000,000 6 months KIBOR + 1.5% p.a. In six stepped –up semi–annual 99,940 Mr. Fawad Ahmed Mukhtar installments starting from the 30th month from July 2007. Carrying value before revaluation 1,831,777 Deficit on revaluation of securities (96,233) Market value of listed TFCs (revalued amount) 1,735,544
SUKUK BONDS – available for sale Terms of Redemption Rate of Currency Principal Interest interest WAPDA Sukuk Bonds At maturity Half–yearly 6 Month PKR 400,000 Mr. Muhammad Shakil KIBOR+0.35%
Deficit on revaluation of securities (3,863) Market value of sukuk bonds 396,137
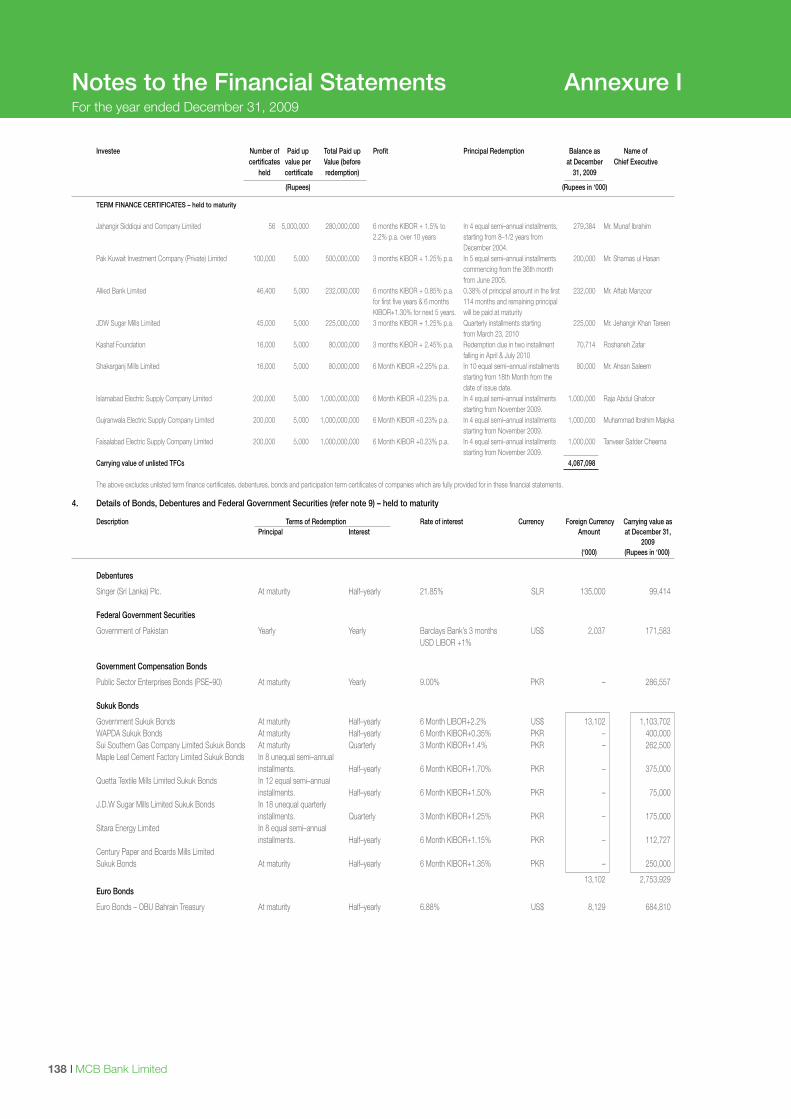
I MCB Bank Limited138
Notes to the Financial Statements Annexure IFor the year ended December 31, 2009
Investee Number of Paid up Total Paid up Profit Principal Redemption Balance as Name of certificates value per Value (before at December Chief Executive held certificate redemption) 31, 2009
(Rupees) (Rupees in ‘000)
TERM FINANCE CERTIFICATES – held to maturity
Jahangir Siddiqui and Company Limited 56 5,000,000 280,000,000 6 months KIBOR + 1.5% to In 4 equal semi–annual installments, 279,384 Mr. Munaf Ibrahim 2.2% p.a. over 10 years starting from 8–1/2 years from December 2004. Pak Kuwait Investment Company (Private) Limited 100,000 5,000 500,000,000 3 months KIBOR + 1.25% p.a. In 5 equal semi–annual installments 200,000 Mr. Shamas ul Hasan commencing from the 36th month from June 2005. Allied Bank Limited 46,400 5,000 232,000,000 6 months KIBOR + 0.85% p.a. 0.38% of principal amount in the first 232,000 Mr. Aftab Manzoor for first five years & 6 months 114 months and remaining principal KIBOR+1.30% for next 5 years. will be paid at maturity JDW Sugar Mills Limited 45,000 5,000 225,000,000 3 months KIBOR + 1.25% p.a. Quarterly installments starting 225,000 Mr. Jehangir Khan Tareen from March 23, 2010 Kashaf Foundation 16,000 5,000 80,000,000 3 months KIBOR + 2.45% p.a. Redemption due in two installment 70,714 Roshaneh Zafar falling in April & July 2010 Shakarganj Mills Limited 16,000 5,000 80,000,000 6 Month KIBOR +2.25% p.a. In 10 equal semi–annual installments 80,000 Mr. Ahsan Saleem starting from 18th Month from the date of issue date. Islamabad Electric Supply Company Limited 200,000 5,000 1,000,000,000 6 Month KIBOR +0.23% p.a. In 4 equal semi–annual installments 1,000,000 Raja Abdul Ghafoor starting from November 2009. Gujranwala Electric Supply Company Limited 200,000 5,000 1,000,000,000 6 Month KIBOR +0.23% p.a. In 4 equal semi–annual installments 1,000,000 Muhammad Ibrahim Majoka starting from November 2009. Faisalabad Electric Supply Company Limited 200,000 5,000 1,000,000,000 6 Month KIBOR +0.23% p.a. In 4 equal semi–annual installments 1,000,000 Tanveer Safder Cheema starting from November 2009. Carrying value of unlisted TFCs 4,087,098 The above excludes unlisted term finance certificates, debentures, bonds and participation term certificates of companies which are fully provided for in these financial statements.
4. Details of Bonds, Debentures and Federal Government Securities (refer note 9) – held to maturity
Description Terms of Redemption Rate of interest Currency Foreign Currency Carrying value as Principal Interest Amount at December 31, 2009 (‘000) (Rupees in ‘000)
Debentures
Singer (Sri Lanka) Plc. At maturity Half–yearly 21.85% SLR 135,000 99,414
Federal Government Securities
Government of Pakistan Yearly Yearly Barclays Bank’s 3 months US$ 2,037 171,583 USD LIBOR +1%
Government Compensation Bonds
Public Sector Enterprises Bonds (PSE–90) At maturity Yearly 9.00% PKR – 286,557 Sukuk Bonds
Government Sukuk Bonds At maturity Half–yearly 6 Month LIBOR+2.2% US$ 13,102 1,103,702 WAPDA Sukuk Bonds At maturity Half–yearly 6 Month KIBOR+0.35% PKR – 400,000 Sui Southern Gas Company Limited Sukuk Bonds At maturity Quarterly 3 Month KIBOR+1.4% PKR – 262,500 Maple Leaf Cement Factory Limited Sukuk Bonds In 8 unequal semi–annual installments. Half–yearly 6 Month KIBOR+1.70% PKR – 375,000 Quetta Textile Mills Limited Sukuk Bonds In 12 equal semi–annual installments. Half–yearly 6 Month KIBOR+1.50% PKR – 75,000 J.D.W Sugar Mills Limited Sukuk Bonds In 18 unequal quarterly installments. Quarterly 3 Month KIBOR+1.25% PKR – 175,000 Sitara Energy Limited In 8 equal semi–annual installments. Half–yearly 6 Month KIBOR+1.15% PKR – 112,727 Century Paper and Boards Mills Limited Sukuk Bonds At maturity Half–yearly 6 Month KIBOR+1.35% PKR – 250,000
13,102 2,753,929 Euro Bonds
Euro Bonds – OBU Bahrain Treasury At maturity Half–yearly 6.88% US$ 8,129 684,810
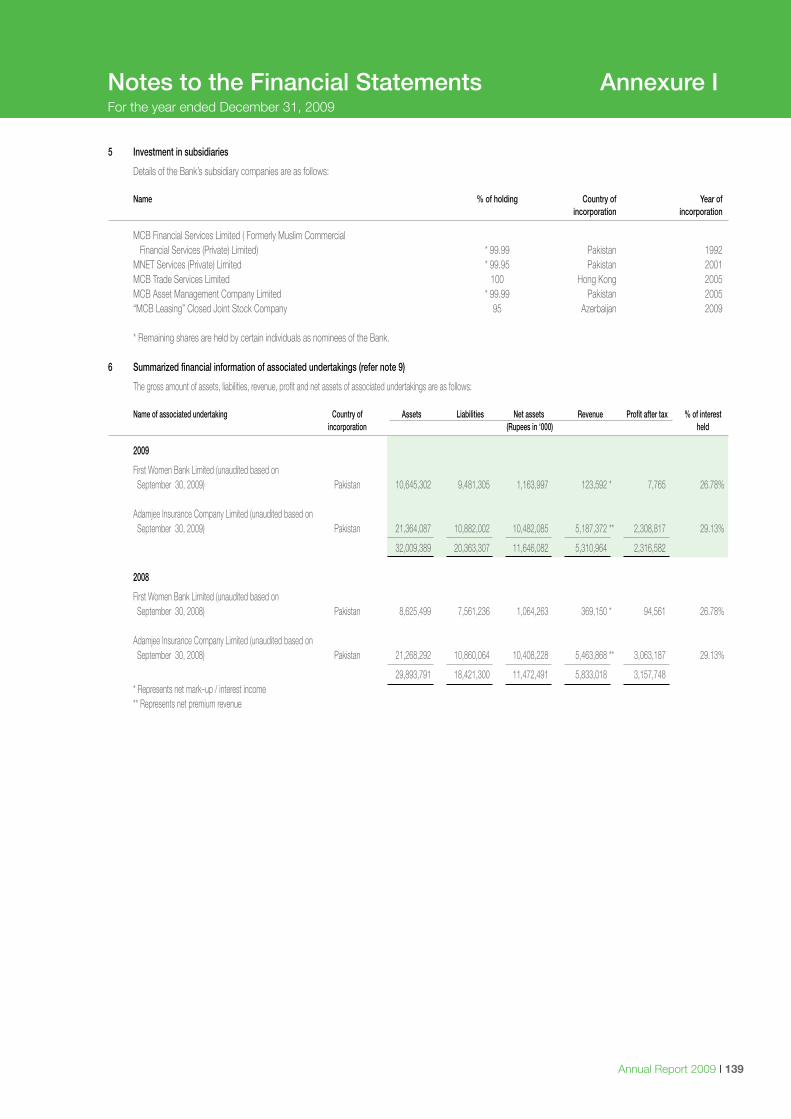
Annual Report 2009 I 139
Notes to the Financial Statements Annexure IFor the year ended December 31, 2009
5 Investment in subsidiaries
Details of the Bank’s subsidiary companies are as follows: Name % of holding Country of Year of incorporation incorporation
MCB Financial Services Limited ( Formerly Muslim Commercial Financial Services (Private) Limited) * 99.99 Pakistan 1992 MNET Services (Private) Limited * 99.95 Pakistan 2001 MCB Trade Services Limited 100 Hong Kong 2005 MCB Asset Management Company Limited * 99.99 Pakistan 2005 “MCB Leasing” Closed Joint Stock Company 95 Azerbaijan 2009 * Remaining shares are held by certain individuals as nominees of the Bank.
6 Summarized financial information of associated undertakings (refer note 9)
The gross amount of assets, liabilities, revenue, profit and net assets of associated undertakings are as follows: Name of associated undertaking Country of Assets Liabilities Net assets Revenue Profit after tax % of interest incorporation (Rupees in ‘000) held
2009
First Women Bank Limited (unaudited based on September 30, 2009) Pakistan 10,645,302 9,481,305 1,163,997 123,592 * 7,765 26.78% Adamjee Insurance Company Limited (unaudited based on September 30, 2009) Pakistan 21,364,087 10,882,002 10,482,085 5,187,372 ** 2,308,817 29.13%
32,009,389 20,363,307 11,646,082 5,310,964 2,316,582
2008
First Women Bank Limited (unaudited based on September 30, 2008) Pakistan 8,625,499 7,561,236 1,064,263 369,150 * 94,561 26.78% Adamjee Insurance Company Limited (unaudited based on September 30, 2008) Pakistan 21,268,292 10,860,064 10,408,228 5,463,868 ** 3,063,187 29.13%
29,893,791 18,421,300 11,472,491 5,833,018 3,157,748 * Represents net mark–up / interest income ** Represents net premium revenue
I MCB Bank Limited140
Based on review conducted in terms of Para B (2) of Annexure–I of SBP–IBD Circular No. 02 of 2008, it is reported that;
i) I have examined, on test check basis, each class of transaction, the relevant documentation and procedures adopted
by MCB Islamic Banking Division;
ii) Affairs of MCB–Islamic Banking Division have been carried out in accordance with rules and principles of Shariah, SBP
regulations and guidelines related to Shariah compliance and other rules as well as with specific fatawa and rulings
issued by me from time to time;
iii) Allocation of funds, weight–ages, profit sharing ratios, profits and charging of losses (if any) relating to PLS accounts
conform to the basis vetted by me in accordance with Shariah rules and principles;
iv) Earnings realized from sources or by means prohibited by Shariah rules and principles have been credited to charity
account.
Dated: February 25, 2010 Muhammad Zubair Usmani Sharia Advisor MCB– Islamic Banking Division
Notes to the Financial Statements Annexure IIFor the year ended December 31, 2009
Islamic Banking Business
Report of Shariah Advisor
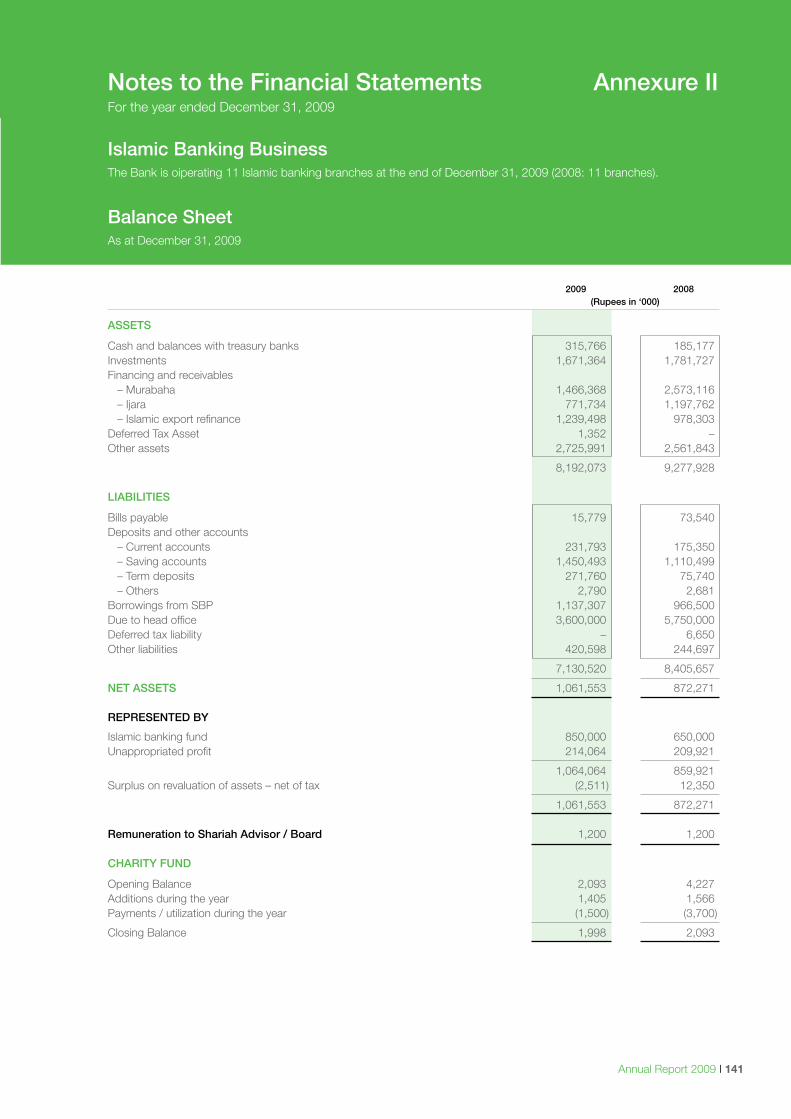
Annual Report 2009 I 141
Notes to the Financial Statements Annexure IIFor the year ended December 31, 2009
Islamic Banking BusinessThe Bank is oiperating 11 Islamic banking branches at the end of December 31, 2009 (2008: 11 branches).
Balance SheetAs at December 31, 2009
2009 2008 (Rupees in ‘000)
ASSETS
Cash and balances with treasury banks 315,766 185,177 Investments 1,671,364 1,781,727 Financing and receivables – Murabaha 1,466,368 2,573,116 – Ijara 771,734 1,197,762 – Islamic export refinance 1,239,498 978,303 Deferred Tax Asset 1,352 – Other assets 2,725,991 2,561,843
8,192,073 9,277,928
LIABILITIES
Bills payable 15,779 73,540 Deposits and other accounts – Current accounts 231,793 175,350 – Saving accounts 1,450,493 1,110,499 – Term deposits 271,760 75,740 – Others 2,790 2,681 Borrowings from SBP 1,137,307 966,500 Due to head office 3,600,000 5,750,000 Deferred tax liability – 6,650 Other liabilities 420,598 244,697
7,130,520 8,405,657
NET ASSETS 1,061,553 872,271
REPRESENTED BY
Islamic banking fund 850,000 650,000 Unappropriated profit 214,064 209,921
1,064,064 859,921 Surplus on revaluation of assets – net of tax (2,511) 12,350
1,061,553 872,271 Remuneration to Shariah Advisor / Board 1,200 1,200 CHARITY FUND
Opening Balance 2,093 4,227 Additions during the year 1,405 1,566 Payments / utilization during the year (1,500) (3,700)
Closing Balance 1,998 2,093
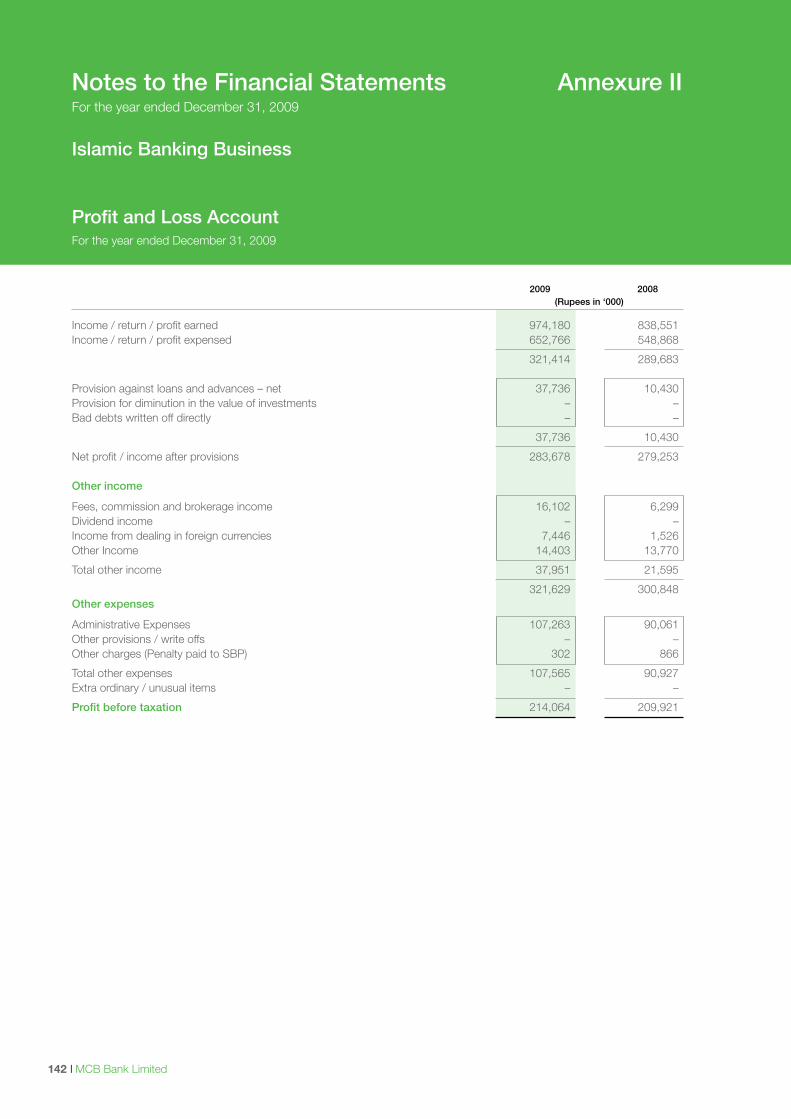
I MCB Bank Limited142
Islamic Banking Business
Profit and Loss AccountFor the year ended December 31, 2009
Notes to the Financial Statements Annexure IIFor the year ended December 31, 2009
2009 2008 (Rupees in ‘000)
Income / return / profit earned 974,180 838,551 Income / return / profit expensed 652,766 548,868
321,414 289,683
Provision against loans and advances – net 37,736 10,430 Provision for diminution in the value of investments – – Bad debts written off directly – –
37,736 10,430
Net profit / income after provisions 283,678 279,253 Other income
Fees, commission and brokerage income 16,102 6,299 Dividend income – – Income from dealing in foreign currencies 7,446 1,526 Other Income 14,403 13,770
Total other income 37,951 21,595
321,629 300,848 Other expenses
Administrative Expenses 107,263 90,061 Other provisions / write offs – – Other charges (Penalty paid to SBP) 302 866
Total other expenses 107,565 90,927 Extra ordinary / unusual items – –
Profit before taxation 214,064 209,921
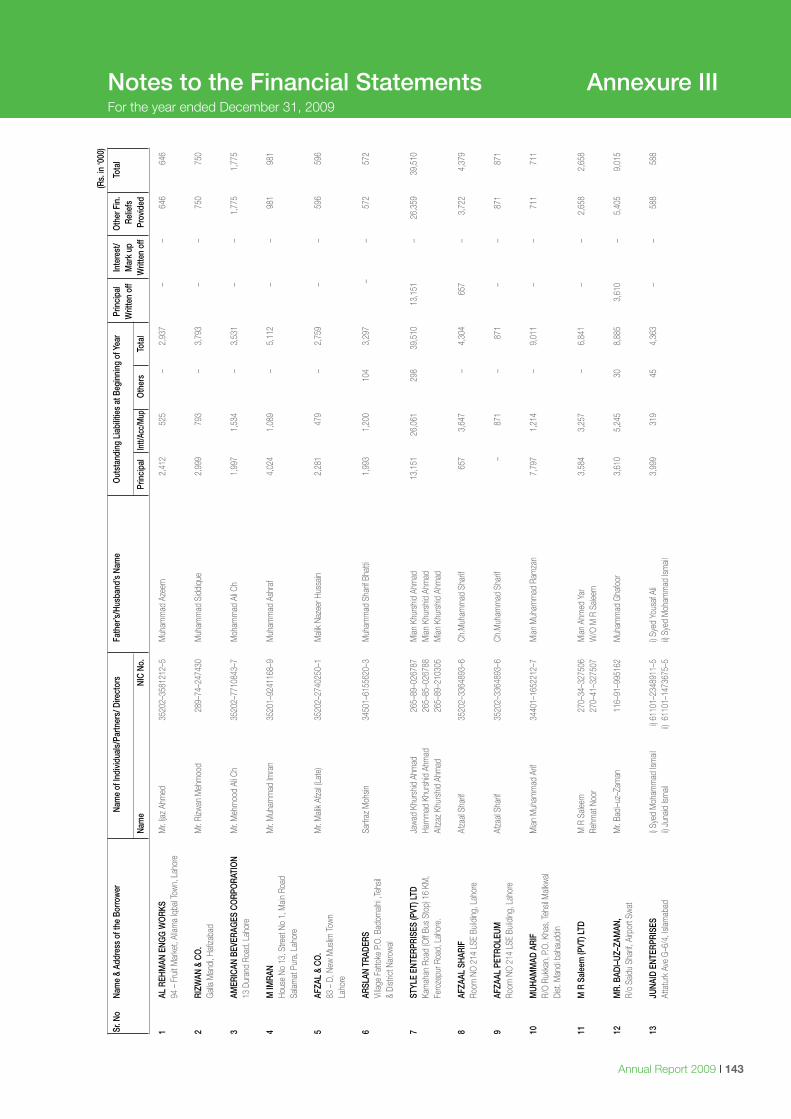
Annual Report 2009 I 143
Notes to the Financial Statements Annexure IIIFor the year ended December 31, 2009
1 AL
REH
MAN
ENG
G W
ORK
S M
r. Ija
z Ah
med
35
202–
3581
212–
5 M
uham
mad
Aze
em
2,4
12
525
–
2,9
37
– –
646
6
46
94
– F
ruit
Mar
ket,
Allam
a Iq
bal T
own,
Lah
ore
2 RI
ZWAN
& C
O.
Mr.
Rizw
an M
ehm
ood
289–
74–2
4743
0 M
uham
mad
Sid
diqu
e 2
,999
7
93
– 3
,793
–
– 7
50
750
Gall
a M
andi
, Haf
izaba
d
3 AM
ERIC
AN B
EVER
AGES
CO
RPO
RATI
ON
Mr.
Meh
moo
d Al
i Ch
3520
2–77
1084
3–7
Moh
amm
ad A
li Ch
1,9
97
1,5
34
– 3
,531
–
– 1
,775
1
,775
13 D
uran
d Ro
ad, L
ahor
e
4 M
IMRA
N M
r. M
uham
mad
Imra
n 35
201–
9241
168–
9 M
uham
mad
Ash
raf
4,0
24
1,0
89
– 5
,112
–
– 9
81
981
Hous
e No
13,
Stre
et N
o 1,
Main
Roa
d
Salam
at P
ura,
Lah
ore
5 AF
ZAL
& CO
. M
r. M
alik
Afza
l (Lat
e)
3520
2–27
4025
0–1
Mali
k Na
zeer
Hus
sain
2,2
81
479
–
2,7
59
– –
596
5
96
83
– D
, New
Mus
lim To
wn
La
hore
6 AR
SLAN
TRA
DERS
Sa
rfraz
Moh
sin
3450
1–61
5562
0–3
Muh
amm
ad S
harif
Bha
tti
1,99
3 1,
200
104
3,2
97
– –
572
572
Vi
llage
Fat
toke
P.O
. Bad
omalh
i ,Te
hsil
&
Dist
rict N
arow
al
7 ST
YLE
ENTE
RPRI
SES
(PVT
) LTD
Ja
wad
Khu
rshid
Ahm
ad
265–
89–0
2678
7 M
ian K
hurs
hid A
hmad
13
,151
26
,061
29
8 39
,510
13
,151
–
26,3
59
39,5
10
Kam
ahan
Roa
d (O
ff Bu
s St
op) 1
6 KM
, Ha
mm
ad K
hurs
hid A
hmad
26
5–85
–026
788
Mian
Khu
rshid
Ahm
ad
Fe
roze
pur R
oad,
Lah
ore.
Ai
tzaz
Khu
rshid
Ahm
ad
265–
89–2
1030
5 M
ian K
hurs
hid A
hmad
8 AF
ZAAL
SHA
RIF
Afza
al Sh
arif
3520
2–33
6489
3–6
Ch.M
uham
mad
Sha
rif
657
3
,647
–
4,
304
6
57
–
3,72
2
4,3
79
Ro
om N
O 2
14 L
SE B
uildi
ng, L
ahor
e
9 AF
ZAAL
PET
ROLE
UM
Afza
al Sh
arif
3520
2–33
6489
3–6
Ch.M
uham
mad
Sha
rif
–
8
71
–
8
71
–
–
87
1
871
Room
NO
214
LSE
Buil
ding
, Lah
ore
10
MUH
AMM
AD A
RIF
Mian
Muh
amm
ad A
rif
3440
1–16
5221
2–7
Mian
Muh
amm
ad R
amza
n 7
,797
1
,214
–
9,0
11
–
–
711
7
11
R/
O R
ukka
n, P
.O. K
has,
Tehs
il Malk
wal
Di
st. M
andi
bah
audd
in
11
M R
Sal
eem
(PVT
) LTD
M
R S
aleem
27
0–34
–327
506
Mian
Ahm
ed Y
ar
3,58
4
3,25
7
–
6,
841
–
–
2,65
8
2,65
8
Re
hmat
Noo
r 27
0–41
–327
507
W/O
M R
Sale
em
12
MR.
BAD
I–UZ
–ZAM
AN,
Mr.
Badi
–uz–
Zam
an
116–
91–9
9516
2 M
uham
mad
Gha
foor
3,
610
5,24
5 30
8,
885
3,61
0 –
5,40
5 9,
015
R/
o Sa
idu
Shar
if, Ai
rpor
t Sw
at
13
JUNA
ID E
NTER
PRIS
ES
i) Sye
d M
oham
mad
Ism
ail
i) 611
01–2
3489
11–5
i) S
yed
Yous
af A
li 3,
999
319
45
4,36
3 –
– 58
8 58
8
Atta
turk
Ave
G–6
/4, I
slam
abad
ii)
Juna
id Is
ii)
611
01–1
4736
75–5
ii)
Syed
Moh
amm
ad Is
Sr.
No
Nam
e &
Addr
ess
of th
e Bo
rrow
er
Nam
e of
Indi
vidu
als/
Partn
ers/
Dire
ctor
s
Fath
er’s/
Husb
and’
s Na
me
Out
stan
ding
Lia
bilit
ies
at B
egin
ning
of Y
ear
Prin
cipa
l In
tere
st/
Oth
er F
in.
Tota
l
Writ
ten
off
Mar
k up
Re
liefs
Nam
e NI
C No
.
Prin
cipa
l In
tt/Ac
c/M
up
Oth
ers
Tota
l
Writ
ten
off
Prov
ided
(Rs.
in ‘0
00)
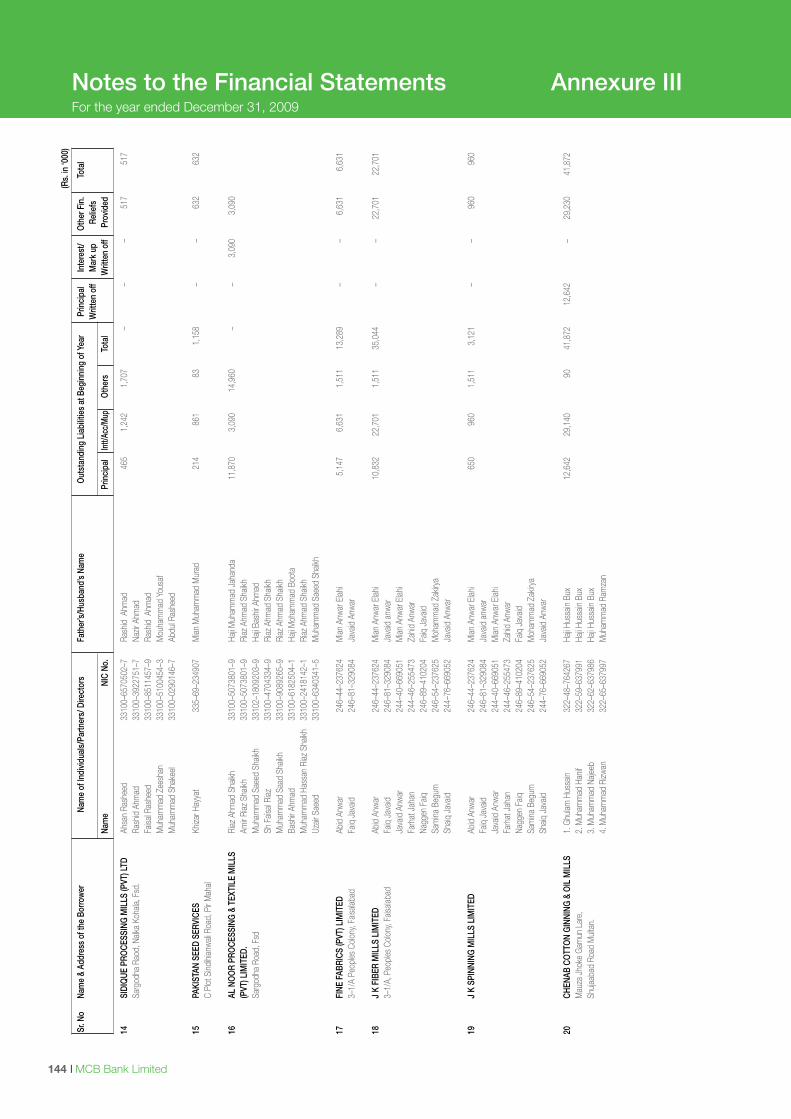
I MCB Bank Limited144 Annual Report 2009 I 145
Notes to the Financial Statements Annexure IIIFor the year ended December 31, 2009
14
SIDI
QUE
PRO
CESS
ING
MIL
LS (P
VT) L
TD
Ahsa
n Ra
shee
d 33
100–
6570
502–
7 Ra
shid
Ahm
ad
465
1,24
2 1,
707
– –
– 51
7 51
7
Sarg
odha
Rao
d, N
alka
Koha
la, F
sd.
Rash
id A
hmad
33
100–
3922
751–
7 Na
zir A
hmad
Fa
isal R
ashe
ed
3310
0–85
1145
7–9
Rash
id A
hmad
M
uham
mad
Zee
shan
33
100–
5100
454–
3 M
ouha
mm
ad Y
ousa
f
M
uham
mad
Sha
keel
3310
0–02
9014
6–7
Abdu
l Ras
heed
15
PAKI
STAN
SEE
D SE
RVIC
ES
Khiza
r Hay
yat
335–
69–2
3490
7 M
ian M
uham
mad
Mur
ad
214
861
83
1,15
8 –
– 63
2 63
2
C Pl
ot S
indihi
anw
ali R
oad,
Pir
Mah
al
16
AL N
OO
R PR
OCE
SSIN
G &
TEX
TILE
MIL
LS
Riaz
Ahm
ad S
haikh
33
100–
5073
801–
9 Ha
ji Muh
amm
ad J
ahan
da
11,8
70
3,09
0 14
,960
–
– 3,
090
3,09
0
(PVT
) LIM
ITED
. Am
ir Ri
az S
haikh
33
100–
5073
801–
9 Ri
az A
hmad
Sha
ikh
Sa
rgod
ha R
oad,
Fsd
M
uham
mad
Sae
ed S
haikh
33
102–
1809
203–
9 Ha
ji Bas
hir A
hmad
Sh
Fais
al Ri
az
3310
0–47
0433
4–9
Riaz
Ahm
ad S
haikh
M
uham
mad
Saa
d Sh
aikh
3310
0–90
8926
5–9
Riaz
Ahm
ad S
haikh
Ba
shir
Ahm
ad
3310
0–61
8250
4–1
Haji M
oham
mad
Boo
ta
Muh
amm
ad H
assa
n Ri
az S
haikh
33
100–
2418
142–
1 Ri
az A
hmad
Sha
ikh
Uzair
Sae
ed
3310
0–63
4034
1–5
Muh
amm
ad S
aeed
Sha
ikh
17
FINE
FAB
RICS
(PVT
) LIM
ITED
Ab
id A
nwar
24
6–44
–237
624
Mian
Anw
ar E
lahi
5,14
7 6,
631
1,51
1 13
,289
–
– 6,
631
6,63
1
3–1/
A Pe
oples
Col
ony,
Faisa
labad
Fa
iq J
avaid
24
6–81
–329
084
Java
id A
nwar
18
J K
FIBE
R M
ILLS
LIM
ITED
Ab
id A
nwar
24
6–44
–237
624
Mian
Anw
ar E
lahi
10,8
32
22,7
01
1,51
1 35
,044
–
– 22
,701
22
,701
3–
1/A,
Peo
ples
Col
ony,
Faisa
labad
Fa
iq J
avaid
24
6–81
–329
084
Java
id a
nwar
Ja
vaid
Anw
ar
244–
40–6
6905
1 M
ian A
nwar
Elah
i
Fa
rhat
Jah
an
244–
46–2
5547
3 Za
hid A
nwar
Na
ggen
Faiq
24
6–89
–410
204
Faiq
Jav
aid
Sam
ina B
egum
24
6–54
–237
625
Moh
amm
ad Z
akiry
a
Shaiq
Jav
aid
244–
76–6
6905
2 Ja
vaid
Anw
ar
19
J K
SPIN
NING
MIL
LS L
IMIT
ED
Abid
Anw
ar
246–
44–2
3762
4 M
ian A
nwar
Elah
i 65
0 96
0 1,
511
3,12
1 –
– 96
0 96
0
Fa
iq J
avaid
24
6–81
–329
084
Java
id a
nwar
Ja
vaid
Anw
ar
244–
40–6
6905
1 M
ian A
nwar
Elah
i
Fa
rhat
Jah
an
244–
46–2
5547
3 Za
hid A
nwar
Na
ggen
Faiq
24
6–89
–410
204
Faiq
Jav
aid
Sam
ina B
egum
24
6–54
–237
625
Moh
amm
ad Z
akiry
a
Shaiq
Jav
aid
244–
76–6
6905
2 Ja
vaid
Anw
ar
20
CHEN
AB C
OTT
ON
GIN
NING
& O
IL M
ILLS
1.
Ghu
lam H
ussa
in
322–
48–7
6426
7 Ha
ji Hus
sain
Bux
12,6
42
29,1
40
90
41,8
72
12,6
42
– 29
,230
41
,872
M
auza
Jho
ke G
amun
Lar
e,
2. M
uham
mad
Han
if 32
2–59
–637
991
Haji H
ussa
in Bu
x
Shuja
abad
Roa
d M
ultan
. 3.
Muh
amm
ad N
ajeeb
32
2–62
–637
986
Haji H
ussa
in Bu
x
4.
Muh
amm
ad R
izwan
32
2–65
–637
997
Muh
amm
ad R
amza
n
Sr.
No
Nam
e &
Addr
ess
of th
e Bo
rrow
er
Nam
e of
Indi
vidu
als/
Partn
ers/
Dire
ctor
s
Fath
er’s/
Husb
and’
s Na
me
Out
stan
ding
Lia
bilit
ies
at B
egin
ning
of Y
ear
Prin
cipa
l In
tere
st/
Oth
er F
in.
Tota
l
Writ
ten
off
Mar
k up
Re
liefs
Nam
e NI
C No
.
Prin
cipa
l In
tt/Ac
c/M
up
Oth
ers
Tota
l
Writ
ten
off
Prov
ided
(Rs.
in ‘0
00)
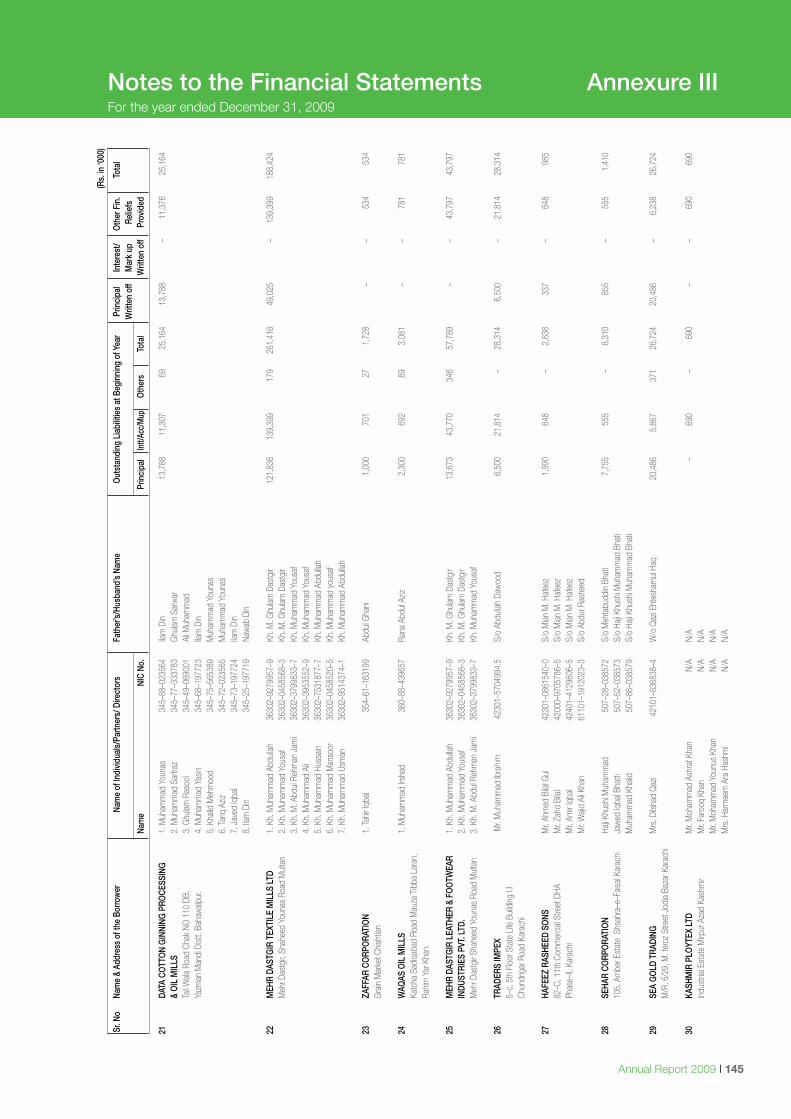
I MCB Bank Limited144 Annual Report 2009 I 145
Notes to the Financial Statements Annexure IIIFor the year ended December 31, 2009
21
DATA
CO
TTO
N G
INNI
NG P
ROCE
SSIN
G
1. M
uham
mad
You
nas
34
5–88
–023
564
Ilam
Din
13,7
88
11,3
07
69
25,1
64
13,7
88
– 11
,376
25
,164
&
OIL
MIL
LS
2. M
uham
mad
Sar
fraz
345–
77–3
3378
3 G
hulam
Sar
war
Tail W
ala R
oad
Chak
NO
110
DB,
3.
Ghu
lam R
asoo
l 34
5–49
–069
001
Ali M
uham
mad
Yazm
an M
andi
Dist
t. Ba
haw
alpur
. 4.
Muh
amm
ad Y
asin
345–
68–1
9772
3 Ila
m D
in
5.
Kha
lid M
ehm
ood
345–
75–5
6538
9 M
uham
mad
You
nas
6. Ta
riq A
ziz
345–
72–0
2356
5 M
uham
mad
You
nas
7. J
aved
Iqba
l 34
5–73
–197
724
Ilam
Din
8. Ila
m D
in 34
5–25
–197
719
Naw
ab D
in
22
MEH
R DA
STG
IR T
EXTI
LE M
ILLS
LTD
1.
Kh.
Muh
amm
ad A
bdull
ah
3630
2–92
7995
7–9
Kh. M
. Ghu
lam D
astg
ir
121,
838
139,
399
179
261,
416
49,0
25
– 13
9,39
9 18
8,42
4
Meh
r Das
tgir,
Shah
eed
Youn
as R
oad
Mult
an
2. K
h. M
uham
mad
You
saf
3630
2–04
5856
8–3
Kh. M
. Ghu
lam D
astg
ir
3.
Kh.
M. A
bdul
Rehm
an J
ami
3630
2–37
9983
3–7
Kh. M
uham
mad
You
saf
4. K
h. M
uham
mad
Ali
3630
2–39
5355
2–9
Kh. M
uham
mad
You
saf
5. K
h. M
uham
mad
Hus
sain
36
302–
7531
877–
7 Kh
. Muh
amm
ad A
bdull
ah
6. K
h. M
uham
mad
Man
soor
36
302–
0458
520–
5 Kh
. Muh
amm
ad y
ousa
f
7.
Kh.
Muh
amm
ad U
sman
36
302–
9514
374–
1 Kh
. Muh
amm
ad A
bdull
ah
23
ZAFF
AR C
ORP
ORA
TIO
N
1. Ta
hir Iq
bal
354–
61–1
6319
9 Ab
dul G
hani
1,
000
701
27
1,72
8 –
– 53
4 53
4
Gra
in M
arke
t Chis
htian
24
WAQ
AS O
IL M
ILLS
1.
Muh
amm
ad Ir
shad
36
0–88
–439
657
Rana
Abd
ul Az
iz 2,
300
692
89
3,08
1 –
– 78
1 78
1
Katc
ha S
adiq
abad
Roa
d M
auza
Tib
ba L
aran
,
Rahim
Yar
Kha
n.
25
MEH
R DA
STG
IR L
EATH
ER &
FO
OTW
EAR
1.
Kh.
Muh
amm
ad A
bdull
ah
3630
2–92
7995
7–9
Kh. M
. Ghu
lam D
astg
ir
13,6
73
43,7
70
346
57,7
89
– –
43,7
97
43,7
97
INDU
STRI
ES P
VT. L
TD.
2. K
h. M
uham
mad
You
saf
3630
2–04
5856
8–3
Kh. M
. Ghu
lam D
astg
ir
Meh
r Das
tgir
Shah
eed
Youn
as R
oad
Mult
an
3. K
h. M
. Abd
ul Re
hman
Jam
i 36
302–
3799
833–
7 Kh
. Muh
amm
ad Y
ousa
f 26
TR
ADER
S IM
PEX
Mr.
Muh
amm
ad Ib
rahim
42
301–
5704
994.
5 S/
o Ab
dulla
h Da
woo
d 6,
500
21,8
14
– 28
,314
6,
500
– 21
,814
28
,314
5–
c, 5
th F
loor
Sta
te L
ife B
uildi
ng I.
I
Chun
drig
ar R
oad
Kara
chi
27
HAFE
EZ R
ASHE
ED S
ONS
M
r. Ah
med
Bila
l Gul
4230
1–08
6154
0–0
S/o
Mian
M. H
afee
z 1,
990
648
– 2,
638
337
– 64
8 98
5
82–C
, 11t
h Co
mm
ercia
l Stre
et D
HA
Mr.
Zahd
Bila
l 42
000–
9705
786–
5 S/
o M
ian M
. Haf
eez
Ph
ase–
II, Ka
rach
i M
r. Am
ir Iq
bal
4240
1–41
2960
6–5
S/o
Mian
M. H
afee
z
M
r. W
ajid
Ali K
han
6110
1–19
1202
3–3
S/o
Abdu
r Ras
heed
28
SE
HAR
CORP
ORA
TIO
N Ha
ji Khu
shi M
uham
mad
50
7–28
–038
572
S/o
Meh
tabu
ddin
Bhat
i 7,
755
555
– 8,
310
855
– 55
5 1,
410
10
5, A
mbe
r Est
ate
Shs
ahra
–e–F
aisal
Kara
chi
Jaw
ed Iq
bal B
hatti
50
7–52
–038
573
S/o
Haji K
hush
i Muh
amm
ad B
hati
Muh
amm
ad K
halid
50
7–86
–038
579
S/o
Haji K
hush
i Muh
amm
ad B
hati
29
SEA
GO
LD T
RADI
NG
Mrs
. Dils
had
Qaz
i 42
101–
8368
38–4
W
/o Q
azi E
htes
ham
ul Ha
q 20
,486
5,
867
371
26,7
24
20,4
86
– 6,
238
26,7
24
M/R
, 6/2
9, M
. fer
oz S
treet
Jod
ia Ba
zar K
arac
hi 30
KA
SHM
IR P
LOYT
EX L
TD
Mr.
Moh
amm
ad A
shra
f Kha
n N/
A N/
A –
690
– 69
0 –
– 69
0 69
0
Indu
stria
l Est
ate
Mirp
ur A
zad
Kash
mir
Mr.
Faro
oq K
han
N/A
N/A
Mr.
Moh
amm
ad Y
ounu
s Kh
an
N/A
N/A
Mrs
. Har
mee
m A
ra H
ashm
i N/
A N/
A S
r. No
Na
me
& Ad
dres
s of
the
Borro
wer
Na
me
of In
divi
dual
s/Pa
rtner
s/ D
irect
ors
Fa
ther
’s/Hu
sban
d’s
Nam
e O
utst
andi
ng L
iabi
litie
s at
Beg
inni
ng o
f Yea
r Pr
inci
pal
Inte
rest
/ O
ther
Fin
. To
tal
W
ritte
n of
f M
ark
up
Relie
fs
Na
me
NIC
No.
Pr
inci
pal
Intt/
Acc/
Mup
O
ther
s To
tal
W
ritte
n of
f Pr
ovid
ed
(Rs.
in ‘0
00)
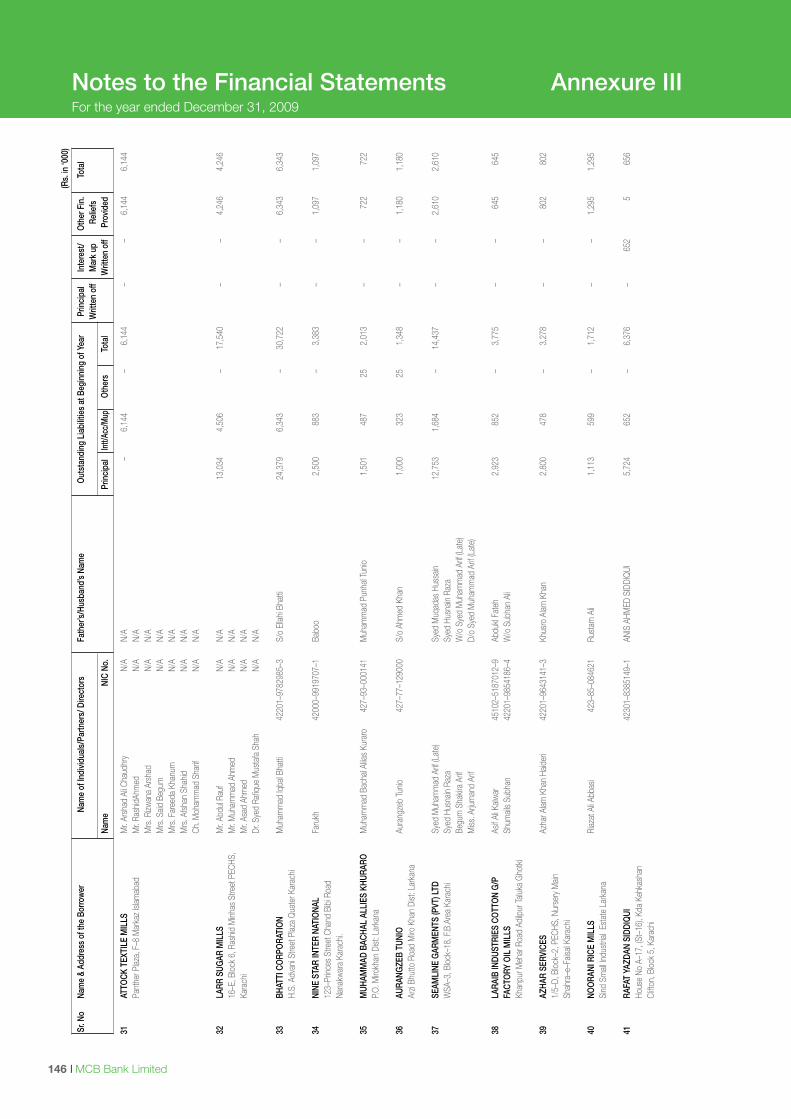
I MCB Bank Limited146 Annual Report 2009 I 147
Notes to the Financial Statements Annexure IIIFor the year ended December 31, 2009
31
ATTO
CK T
EXTI
LE M
ILLS
M
r. Ar
shad
Ali C
haud
hry
N/A
N/A
– 6,
144
– 6,
144
– –
6,14
4 6,
144
Pa
nthe
r Plaz
a, F
–8 M
arka
z Isl
amab
ad
Mr.
Rash
idAh
med
N/
A N/
A
M
rs. R
izwan
a Ar
shad
N/
A N/
A
M
rs. S
aid B
egum
N/
A N/
A
M
rs. F
aree
da K
hanu
m
N/A
N/A
Mrs
. Afs
han
Shah
id
N/A
N/A
Ch. M
oham
mad
Sha
rif
N/A
N/A
32
LARR
SUG
AR M
ILLS
M
r. Ab
dul R
auf
N/A
N/A
13,
034
4
,506
–
17,
540
–
–
4
,246
4
,246
16–E
, Blo
ck 6
, Ras
hid M
inhas
Stre
et P
ECHS
, M
r. M
uham
mad
Ahm
ed
N/A
N/A
Ka
rach
i M
r. As
ad A
hmed
N/
A N/
A
Dr
. Sye
d Ra
fique
Mus
tafa
Sha
h N/
A N/
A 33
BH
ATTI
CO
RPO
RATI
ON
Muh
amm
ad Iq
bal B
hatti
42
201–
9782
985–
3 S/
o El
lahi B
hatti
2
4,37
9
6,3
43
–
3
0,72
2
–
–
6,3
43
6,3
43
H.
S. A
dvan
i Stre
et P
laza
Qua
ter K
arac
hi 34
NI
NE S
TAR
INTE
R NA
TIO
NAL
Faru
kh
4200
0–99
1970
7–1
Babo
o 2,
500
883
– 3,
383
– –
1,09
7 1,
097
12
3–Pr
inces
Stre
et C
hand
Bib
i Roa
d
Nana
kwar
a Ka
rach
i. 35
M
UHAM
MAD
BAC
HAL
ALLI
ES K
HURA
RO
Muh
amm
ad B
acha
l Aliia
s Ku
raro
42
7–93
–000
141
Muh
amm
ad P
unha
l Tun
io
1,50
1 48
7 25
2,
013
– –
722
722
P.
O. M
irokh
an D
ist: L
arka
na
36
AURA
NGZE
B TU
NIO
Au
rang
zeb
Tunio
42
7–77
–129
000
S/o
Ahm
ed K
han
1,00
0 32
3 25
1,
348
– –
1,18
0 1,
180
Ar
zi Bh
utto
Roa
d M
iro K
han
Dist
: Lar
kana
37
SE
AMLI
NE G
ARM
ENTS
(PVT
) LTD
Sy
ed M
uham
mad
Arif
(Lat
e)
Sy
ed M
uqad
as H
ussa
in 12
,753
1,
684
– 14
,437
–
– 2,
610
2,61
0
WSA
–3, B
lock
–18,
F.B.
Area
Kar
achi
Syed
Hus
nain
Raza
Syed
Hus
nain
Raza
Be
gum
Sha
kira
Arif
W
/o S
yed
Muh
amm
ad A
rif (L
ate)
M
iss. A
rjum
and
Arif
D/
o Sy
ed M
uham
mad
Arif
(Lat
e)
38
LARA
IB IN
DUST
RIES
CO
TTO
N G
/P
Asif A
li Kalw
ar
4510
2–51
8701
2–9
Abdu
kl Fa
teh
2,92
3 85
2 –
3,77
5 –
– 64
5 64
5
FACT
ORY
OIL
MIL
LS
Shum
ails
Subh
an
4220
1–98
5418
6–4
W/o
Sub
han
Ali
Kh
anpu
r Meh
ar R
oad
Adilp
ur Ta
luka
Gho
tki
39
AZHA
R SE
RVIC
ES
Azha
r Alam
Kha
n Ha
ider
i 42
201–
9643
141–
3 Kh
usro
Alam
Kha
n 2,
800
478
– 3,
278
– –
802
802
1/
5–D,
Blo
ck–2
, PEC
HS, N
urse
ry M
ain
Sh
ahra
–e–F
aisal
Kara
chi
40
NOO
RANI
RIC
E M
ILLS
Ri
azat
Ali A
bbas
i 42
3–85
–084
621
Rust
am A
li 1,
113
599
– 1,
712
– –
1,29
5 1,
295
Si
nd S
mall
Indu
stria
l Es
tate
Lar
kana
41
RA
FAT
YAZD
AN S
IDDI
QUI
4230
1–83
8514
9–1
ANIS
AHM
ED S
IDDI
QUI
5
,724
6
52
–
6
,376
–
652
5
6
56
Ho
use
No A
–17,
(St–
16),
Kda
Kehk
asha
n
Clift
on, B
lock
5, K
arac
hi
Sr.
No
Nam
e &
Addr
ess
of th
e Bo
rrow
er
Nam
e of
Indi
vidu
als/
Partn
ers/
Dire
ctor
s
Fath
er’s/
Husb
and’
s Na
me
Out
stan
ding
Lia
bilit
ies
at B
egin
ning
of Y
ear
Prin
cipa
l In
tere
st/
Oth
er F
in.
Tota
l
Writ
ten
off
Mar
k up
Re
liefs
Nam
e NI
C No
.
Prin
cipa
l In
tt/Ac
c/M
up
Oth
ers
Tota
l
Writ
ten
off
Prov
ided
(Rs.
in ‘0
00)
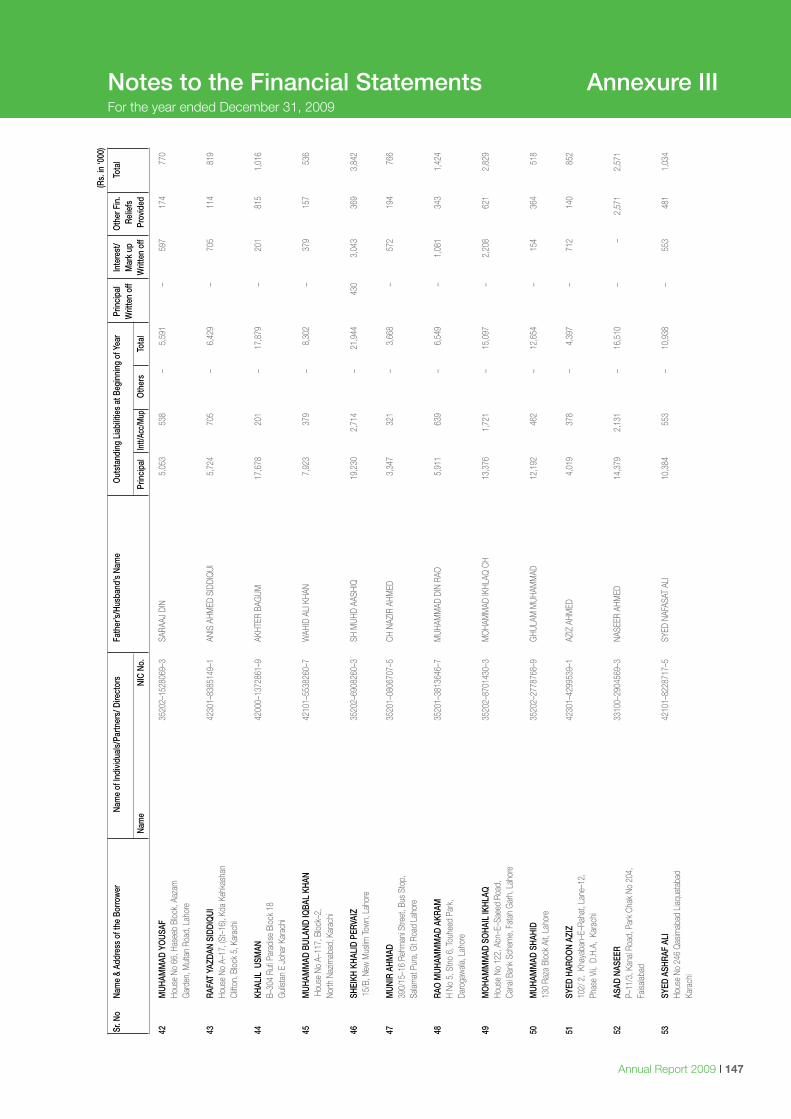
I MCB Bank Limited146 Annual Report 2009 I 147
Notes to the Financial Statements Annexure IIIFor the year ended December 31, 2009
42
MUH
AMM
AD Y
OUS
AF
35
202–
1528
069–
3 SA
RAAJ
DIN
5
,053
5
38
–
5
,591
–
597
1
74
770
Hous
e No
66,
Has
eeb
Bloc
k, A
azam
Gar
den,
Mult
an R
oad,
Lah
ore
43
RAFA
T YA
ZDAN
SID
DIQ
UI
42
301–
8385
149–
1 AN
IS A
HMED
SID
DIQ
UI
5,7
24
705
–
6,4
29
–
7
05
114
8
19
Ho
use
No A
–17,
(St–
16),
Kda
Kehk
asha
n
Clift
on, B
lock
5, K
arac
hi 44
KH
ALIL
USM
AN
42
000–
1372
861–
9 AK
HTER
BAG
UM
17,
678
2
01
–
1
7,87
9
–
2
01
815
1
,016
B–30
4 Ru
fi Par
adise
Blo
ck 1
8
Guli
stan
E J
ohar
Kar
achi
45
MUH
AMM
AD B
ULAN
D IQ
BAL
KHAN
4210
1–55
3826
0–7
WAH
ID A
LI K
HAN
7,9
23
379
–
8,3
02
–
3
79
157
5
36
H
ouse
No
A–11
7, B
lock
–2,
No
rth N
azim
abad
, Kar
achi
46
SHEI
KH K
HALI
D PE
RVAI
Z
3520
2–69
0826
0–3
SH M
UHD
AASH
IQ
19,
230
2
,714
–
21,
944
4
30
3,0
43
369
3
,842
15/
B, N
ew M
uslim
Tow
n, L
ahor
e 47
M
UNIR
AHM
AD
35
201–
0806
707–
5 CH
NAZ
IR A
HMED
3
,347
3
21
–
3
,668
–
572
1
94
766
390/
15–1
6 Re
hman
i Stre
et, B
us S
top,
Salam
at P
ura,
Gt R
oad
Laho
re
48
RAO
MUH
AMM
MAD
AKR
AM
35
201–
3813
646–
7 M
UHAM
MAD
DIN
RAO
5
,911
6
39
–
6
,549
–
1,0
81
343
1
,424
H No
5, S
tno
6, To
uhee
d Pa
rk,
Da
roga
wala
, Lah
ore
49
MO
HAM
MM
AD S
OHA
IL IK
HLAQ
3520
2–87
0143
0–3
MO
HAM
MAD
IKHL
AQ C
H 1
3,37
6
1,7
21
–
1
5,09
7
–
2
,208
6
21
2,8
29
Ho
use
No 1
22, A
bn–E
–Sae
ed R
oad,
Cana
l Ban
k Sc
hem
e, F
atah
Gar
h, L
ahor
e 50
M
UHAM
MAD
SHA
HID
35
202–
2778
768–
9 G
HULA
M M
UHAM
MAD
1
2,19
2
462
–
12,
654
–
154
3
64
518
130
Raza
Blo
ck A
it, L
ahor
e 51
SY
ED H
ARO
ON
AZIZ
4230
1–42
9953
9–1
AZIZ
AHM
ED
4,0
19
378
–
4,3
97
–
7
12
140
8
52
10
2/ 2
, Kh
ayab
an–E
–Rah
at, L
ane–
12,
Ph
ase
Vii,
D.H
.A,
Kara
chi
52
ASAD
NAS
EER
3310
0–29
0456
9–3
NASE
ER A
HMED
1
4,37
9
2,1
31
–
1
6,51
0
–
–
2,5
71
2,5
71
P–
11/3
, Kan
al Ro
ad, P
ark
Chak
No
204,
Faisa
labad
53
SY
ED A
SHRA
F AL
I
4210
1–82
2871
7–5
SYED
NAF
ASAT
ALI
1
0,38
4
553
–
10,
938
–
553
4
81
1,0
34
Ho
use
No 2
46 Q
asim
abad
Liaq
uata
bad
Ka
rach
i S
r. No
Na
me
& Ad
dres
s of
the
Borro
wer
Na
me
of In
divi
dual
s/Pa
rtner
s/ D
irect
ors
Fa
ther
’s/Hu
sban
d’s
Nam
e O
utst
andi
ng L
iabi
litie
s at
Beg
inni
ng o
f Yea
r Pr
inci
pal
Inte
rest
/ O
ther
Fin
. To
tal
W
ritte
n of
f M
ark
up
Relie
fs
Na
me
NIC
No.
Pr
inci
pal
Intt/
Acc/
Mup
O
ther
s To
tal
W
ritte
n of
f Pr
ovid
ed
(Rs.
in ‘0
00)
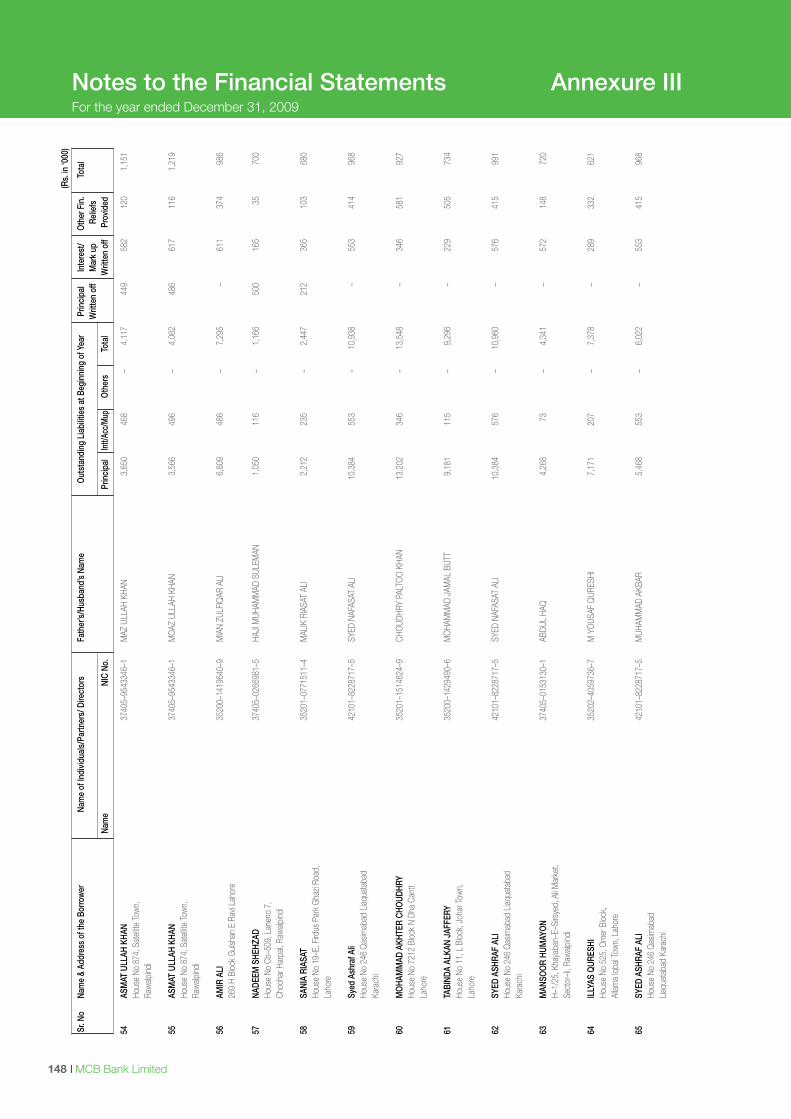
I MCB Bank Limited148 Annual Report 2009 I 149
Notes to the Financial Statements Annexure IIIFor the year ended December 31, 2009
54
ASM
AT U
LLAH
KHA
N
3740
5–95
4334
6–1
MAZ
ULL
AH K
HAN
3,6
50
468
–
4,1
17
449
5
82
120
1
,151
Hous
e No
874
, Sat
ellite
Tow
n,
Ra
walp
indi
55
ASM
AT U
LLAH
KHA
N
3740
5–95
4334
6–1
MO
AZ U
LLAH
KHA
N 3
,566
4
96
–
4
,062
4
86
617
1
16
1,2
19
Ho
use
No 8
74, S
atell
ite To
wn,
Raw
alpind
i 56
AM
IR A
LI
35
200–
1419
640–
9 M
IAN
ZULF
IQAR
ALI
6
,809
4
86
–
7
,295
–
611
3
74
986
269
H Bl
ock
Guls
han
E Ra
vi La
hore
57
NA
DEEM
SHE
HZAD
3740
5–02
6698
1–5
HAJI
MUH
AMM
AD S
ULEM
AN
1,0
50
116
–
1,1
66
500
1
65
35
7
00
Ho
use
No C
b–50
9, L
anen
o 7,
Choo
har H
arpa
l, Ra
walp
indi
58
SANI
A RI
ASAT
3520
1–07
7151
1–4
MAL
IK R
IASA
T AL
I 2
,212
2
35
–
2
,447
2
12
365
1
03
680
Hous
e No
19–
E, F
irdus
Par
k G
hazi
Road
,
Laho
re
59
Syed
Ash
raf A
li
42
101–
8228
717–
5 SY
ED N
AFAS
AT A
LI
10,
384
5
53
–
1
0,93
8
–
5
53
414
9
68
Ho
use
No 2
46 Q
asim
abad
Liaq
uata
bad
Ka
rach
i 60
M
OHA
MM
AD A
KHTE
R CH
OUD
HRY
35
201–
1514
624–
9 CH
OUD
HRY
PALT
OO
KHA
N 1
3,20
2
346
–
13,
548
–
346
5
81
927
Hous
e No
721
2 Bl
ock
N Dh
a Ca
ntt
La
hore
61
TA
BIND
A AL
KAN
JAFF
ERY
3520
0–14
2949
0–6
MO
HAM
MAD
JAM
AL B
UTT
9,1
81
115
–
9,2
96
–
2
29
505
7
34
Ho
use
No 1
1, L
Blo
ck, J
ohar
Tow
n,
Laho
re
62
SYED
ASH
RAF
ALI
42
101–
8228
717–
5 SY
ED N
AFAS
AT A
LI
10,
384
5
76
–
1
0,96
0
–
5
76
415
9
91
Ho
use
No 2
46 Q
asim
abad
Liaq
uata
bad
Ka
rach
i 63
M
ANSO
OR
HUM
AYO
N
37
405–
0153
130–
1 AB
DUL
HAQ
4
,268
7
3
–
4
,341
–
572
1
48
720
H–1/
25, K
haya
ban–
E–Si
rsye
d, A
li Mar
ket,
Se
ctor
–Ii, R
awalp
indi
64
ILLY
AS Q
URES
HI
35
202–
4059
736–
7 M
YO
USAF
QUR
ESHI
7
,171
2
07
–
7
,378
–
289
3
32
621
Hous
e No
525
, Om
er B
lock
,
Allam
a Iq
bal T
own,
Lah
ore
65
SYED
ASH
RAF
ALI
42
101–
8228
717–
5 M
UHAM
MAD
AKB
AR
5,4
68
553
–
6,0
22
–
5
53
415
9
68
Ho
use
No 2
46 Q
asim
abad
Liaqu
atab
ad K
arac
hi S
r. No
Na
me
& Ad
dres
s of
the
Borro
wer
Na
me
of In
divi
dual
s/Pa
rtner
s/ D
irect
ors
Fa
ther
’s/Hu
sban
d’s
Nam
e O
utst
andi
ng L
iabi
litie
s at
Beg
inni
ng o
f Yea
r Pr
inci
pal
Inte
rest
/ O
ther
Fin
. To
tal
W
ritte
n of
f M
ark
up
Relie
fs
Na
me
NIC
No.
Pr
inci
pal
Intt/
Acc/
Mup
O
ther
s To
tal
W
ritte
n of
f Pr
ovid
ed
(Rs.
in ‘0
00)
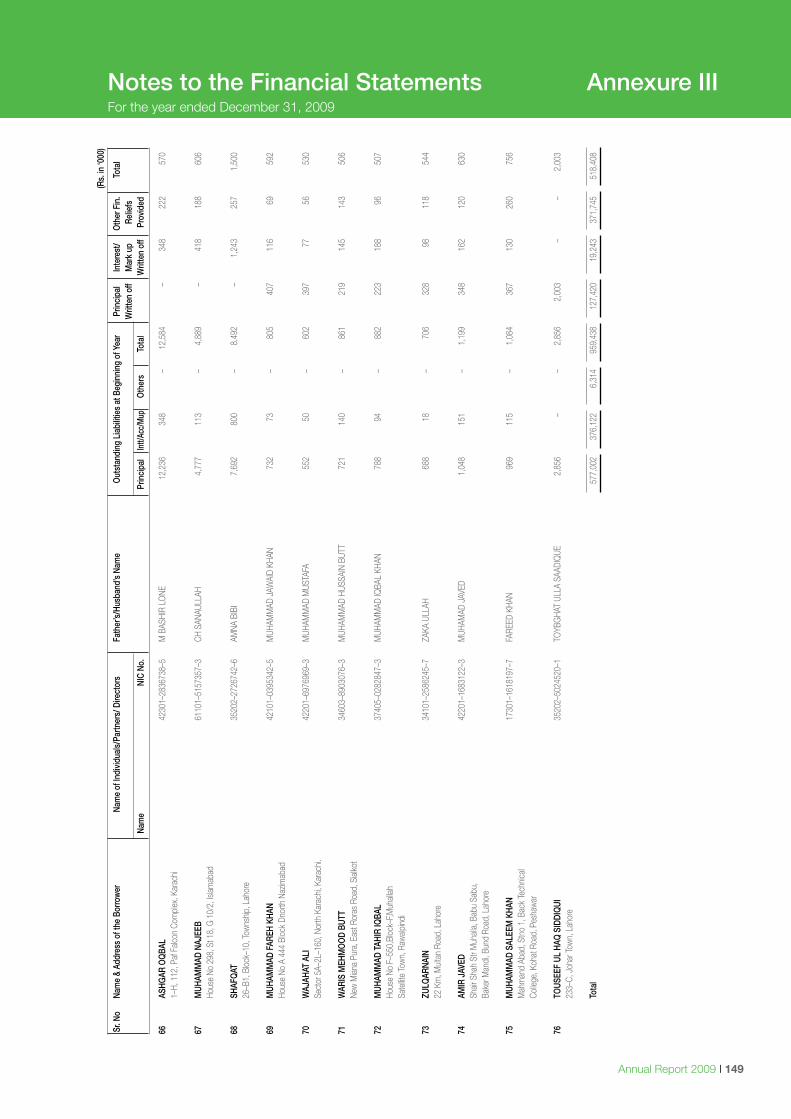
I MCB Bank Limited148 Annual Report 2009 I 149
Notes to the Financial Statements Annexure IIIFor the year ended December 31, 2009
66
ASHG
AR O
QBA
L
42
301–
2836
738–
5 M
BAS
HIR
LONE
1
2,23
6
348
–
12,
584
–
348
2
22
570
1–H,
112
, Paf
Falc
on C
ompl
ex, K
arac
hi 67
M
UHAM
MAD
NAJ
EEB
6110
1–51
5735
7–3
CH S
ANAU
LLAH
4
,777
1
13
–
4
,889
–
418
1
88
606
Hous
e No
298
, St 1
8, G
10/
2, Is
lamab
ad
68
SHAF
QAT
3520
2–27
2674
2–6
AMNA
BIB
I 7
,692
8
00
–
8
,492
–
1,2
43
257
1
,500
26–B
1, B
lock
–10,
Tow
nship
, Lah
ore
69
MUH
AMM
AD F
AREH
KHA
N
42
101–
0395
342–
5 M
UHAM
MAD
JAW
AID
KHAN
7
32
73
–
805
4
07
116
6
9
592
Hous
e No
A 4
44 B
lock
Dno
rth N
azim
abad
70
W
AJAH
AT A
LI
42
201–
6976
969–
3 M
UHAM
MAD
MUS
TAFA
5
52
50
–
602
3
97
77
5
6
530
Sect
or 5
A–2L
–160
, Nor
th K
arac
hi, K
arac
hi.
71
WAR
IS M
EHM
OO
D BU
TT
34
603–
8903
076–
3 M
UHAM
MAD
HUS
SAIN
BUT
T 7
21
140
–
861
2
19
145
1
43
506
New
Mian
a Pu
ra, E
ast R
oras
Roa
d, S
ialko
t 72
M
UHAM
MAD
TAH
IR IQ
BAL
3740
5–02
8284
7–3
MUH
AMM
AD IQ
BAL
KHAN
7
88
94
–
882
2
23
188
9
6
507
Hous
e No
F–5
50,B
lock
–F,M
uhall
ah
Sa
tellit
e To
wn,
Raw
alpind
i 73
ZU
LQAR
NAIN
3410
1–25
8624
5–7
ZAKA
ULL
AH
688
1
8
–
7
06
328
9
8
118
5
44
22
Km
, Mult
an R
oad,
Lah
ore
74
AMIR
JAV
ED
42
201–
1683
122–
3 M
UHAM
AD J
AVED
1
,048
1
51
–
1
,199
3
48
162
1
20
630
Shair
Sha
h St
r Muh
alla,
Bab
u Sa
bu,
Ba
ker M
andi
, Bun
d Ro
ad, L
ahor
e 75
M
UHAM
MAD
SAL
EEM
KHA
N
17
301–
1618
197–
7 FA
REED
KHA
N 9
69
115
–
1,0
84
367
1
30
260
7
56
M
ahm
and
Abad
, Stn
o 1,
Bac
k Te
chnic
al
Colle
ge, K
ohat
Roa
d, P
esha
war
76
TO
USEE
F UL
HAQ
SID
DIQ
UI
35
202–
5024
520–
1 TO
YBG
HAT
ULLA
SAA
DIQ
UE
2,8
56
–
–
2,8
56
2,0
03
–
–
2,0
03
23
3–C,
Joh
ar To
wn,
Lah
ore
To
tal
5
77,0
02
376
,122
6
,314
9
59,4
38
127
,420
1
9,24
3
371
,745
5
18,4
08
Sr.
No
Nam
e &
Addr
ess
of th
e Bo
rrow
er
Nam
e of
Indi
vidu
als/
Partn
ers/
Dire
ctor
s
Fath
er’s/
Husb
and’
s Na
me
Out
stan
ding
Lia
bilit
ies
at B
egin
ning
of Y
ear
Prin
cipa
l In
tere
st/
Oth
er F
in.
Tota
l
Writ
ten
off
Mar
k up
Re
liefs
Nam
e NI
C No
.
Prin
cipa
l In
tt/Ac
c/M
up
Oth
ers
Tota
l
Writ
ten
off
Prov
ided
(Rs.
in ‘0
00)
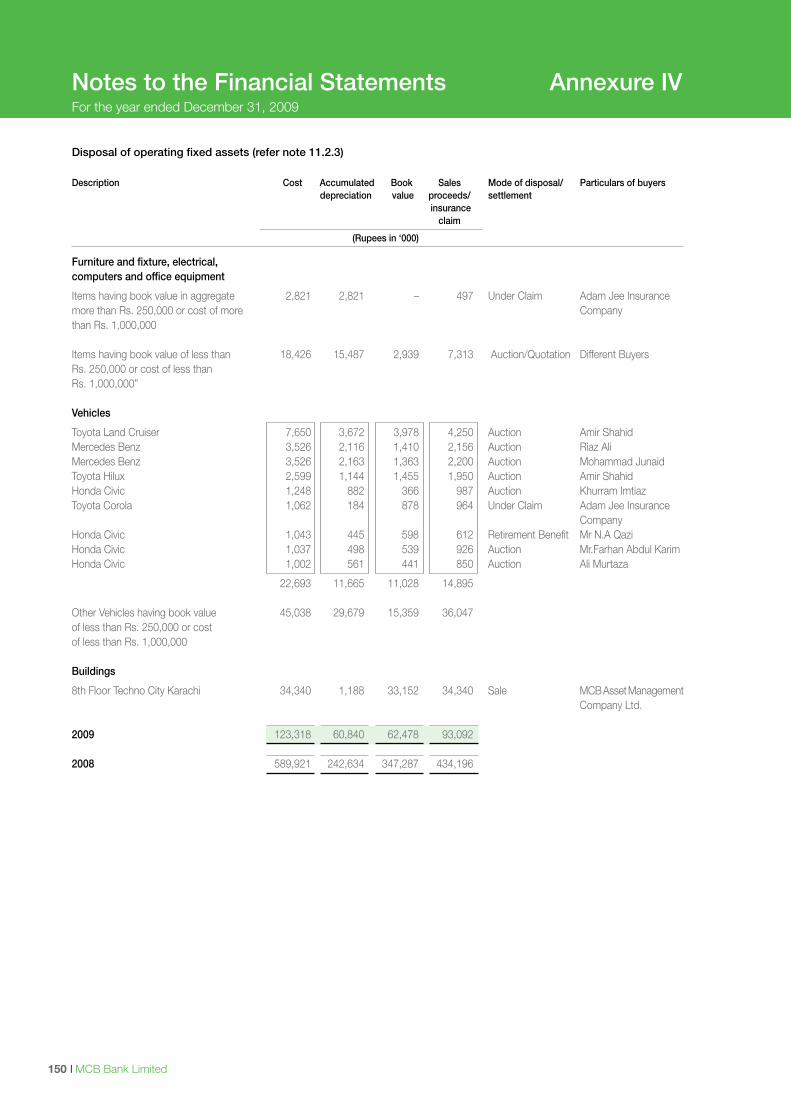
I MCB Bank Limited150
Notes to the Financial Statements Annexure IVFor the year ended December 31, 2009
Disposal of operating fixed assets (refer note 11.2.3)
Description Cost Accumulated Book Sales Mode of disposal/ Particulars of buyers depreciation value proceeds/ settlement insurance claim
(Rupees in ‘000)
Furniture and fixture, electrical, computers and office equipment
Items having book value in aggregate 2,821 2,821 – 497 Under Claim Adam Jee Insurancemore than Rs. 250,000 or cost of more Companythan Rs. 1,000,000
Items having book value of less than 18,426 15,487 2,939 7,313 Auction/Quotation Different BuyersRs. 250,000 or cost of less than Rs. 1,000,000” Vehicles
Toyota Land Cruiser 7,650 3,672 3,978 4,250 Auction Amir ShahidMercedes Benz 3,526 2,116 1,410 2,156 Auction Riaz AliMercedes Benz 3,526 2,163 1,363 2,200 Auction Mohammad JunaidToyota Hilux 2,599 1,144 1,455 1,950 Auction Amir ShahidHonda Civic 1,248 882 366 987 Auction Khurram ImtiazToyota Corola 1,062 184 878 964 Under Claim Adam Jee Insurance CompanyHonda Civic 1,043 445 598 612 Retirement Benefit Mr N.A QaziHonda Civic 1,037 498 539 926 Auction Mr.Farhan Abdul KarimHonda Civic 1,002 561 441 850 Auction Ali Murtaza
22,693 11,665 11,028 14,895 Other Vehicles having book value 45,038 29,679 15,359 36,047 of less than Rs. 250,000 or cost of less than Rs. 1,000,000 Buildings
8th Floor Techno City Karachi 34,340 1,188 33,152 34,340 Sale MCB Asset Management Company Ltd. 2009 123,318 60,840 62,478 93,092
2008 589,921 242,634 347,287 434,196
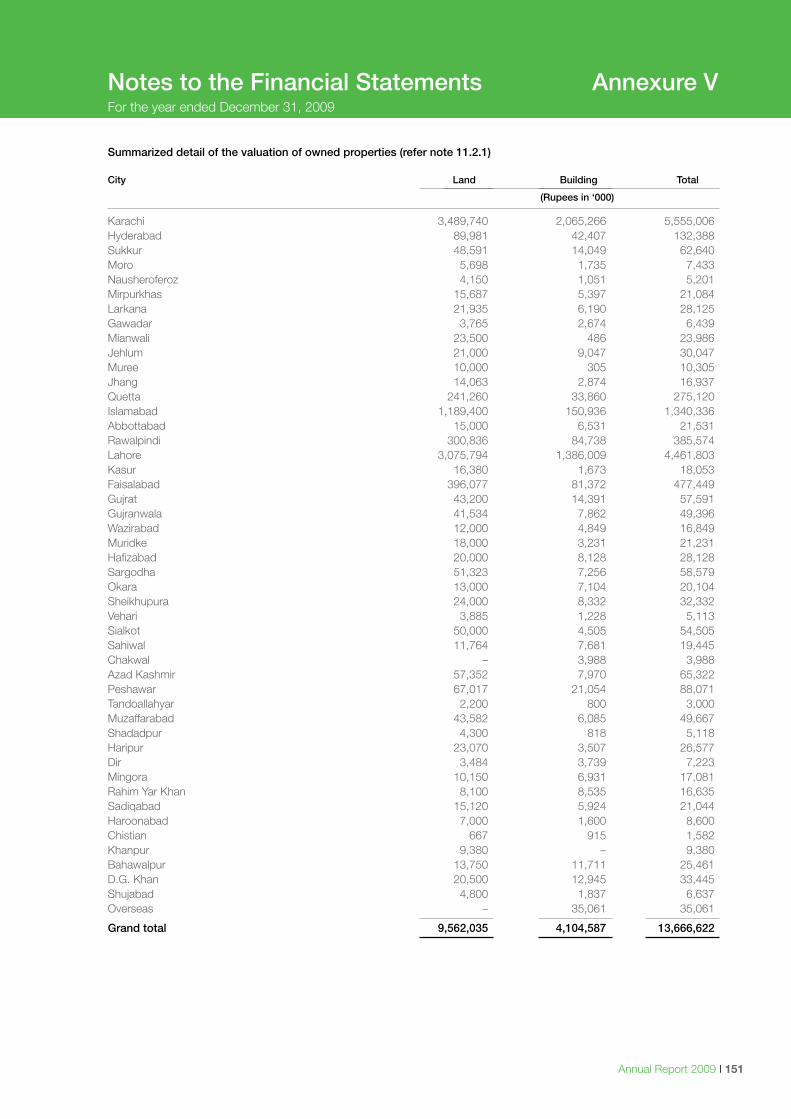
Annual Report 2009 I 151
Notes to the Financial Statements Annexure VFor the year ended December 31, 2009
Summarized detail of the valuation of owned properties (refer note 11.2.1) City Land Building Total
(Rupees in ‘000)
Karachi 3,489,740 2,065,266 5,555,006 Hyderabad 89,981 42,407 132,388 Sukkur 48,591 14,049 62,640 Moro 5,698 1,735 7,433 Nausheroferoz 4,150 1,051 5,201 Mirpurkhas 15,687 5,397 21,084 Larkana 21,935 6,190 28,125 Gawadar 3,765 2,674 6,439 Mianwali 23,500 486 23,986 Jehlum 21,000 9,047 30,047 Muree 10,000 305 10,305 Jhang 14,063 2,874 16,937 Quetta 241,260 33,860 275,120 Islamabad 1,189,400 150,936 1,340,336 Abbottabad 15,000 6,531 21,531 Rawalpindi 300,836 84,738 385,574 Lahore 3,075,794 1,386,009 4,461,803 Kasur 16,380 1,673 18,053 Faisalabad 396,077 81,372 477,449 Gujrat 43,200 14,391 57,591 Gujranwala 41,534 7,862 49,396 Wazirabad 12,000 4,849 16,849 Muridke 18,000 3,231 21,231 Hafizabad 20,000 8,128 28,128 Sargodha 51,323 7,256 58,579 Okara 13,000 7,104 20,104 Sheikhupura 24,000 8,332 32,332 Vehari 3,885 1,228 5,113 Sialkot 50,000 4,505 54,505 Sahiwal 11,764 7,681 19,445 Chakwal – 3,988 3,988 Azad Kashmir 57,352 7,970 65,322 Peshawar 67,017 21,054 88,071 Tandoallahyar 2,200 800 3,000 Muzaffarabad 43,582 6,085 49,667 Shadadpur 4,300 818 5,118 Haripur 23,070 3,507 26,577 Dir 3,484 3,739 7,223 Mingora 10,150 6,931 17,081 Rahim Yar Khan 8,100 8,535 16,635 Sadiqabad 15,120 5,924 21,044 Haroonabad 7,000 1,600 8,600 Chistian 667 915 1,582 Khanpur 9,380 – 9,380 Bahawalpur 13,750 11,711 25,461 D.G. Khan 20,500 12,945 33,445 Shujabad 4,800 1,837 6,637 Overseas – 35,061 35,061
Grand total 9,562,035 4,104,587 13,666,622

I MCB Bank Limited152
Notes

MCB Bank Limited and Subsidiary CompaniesConsolidated Financial Statements
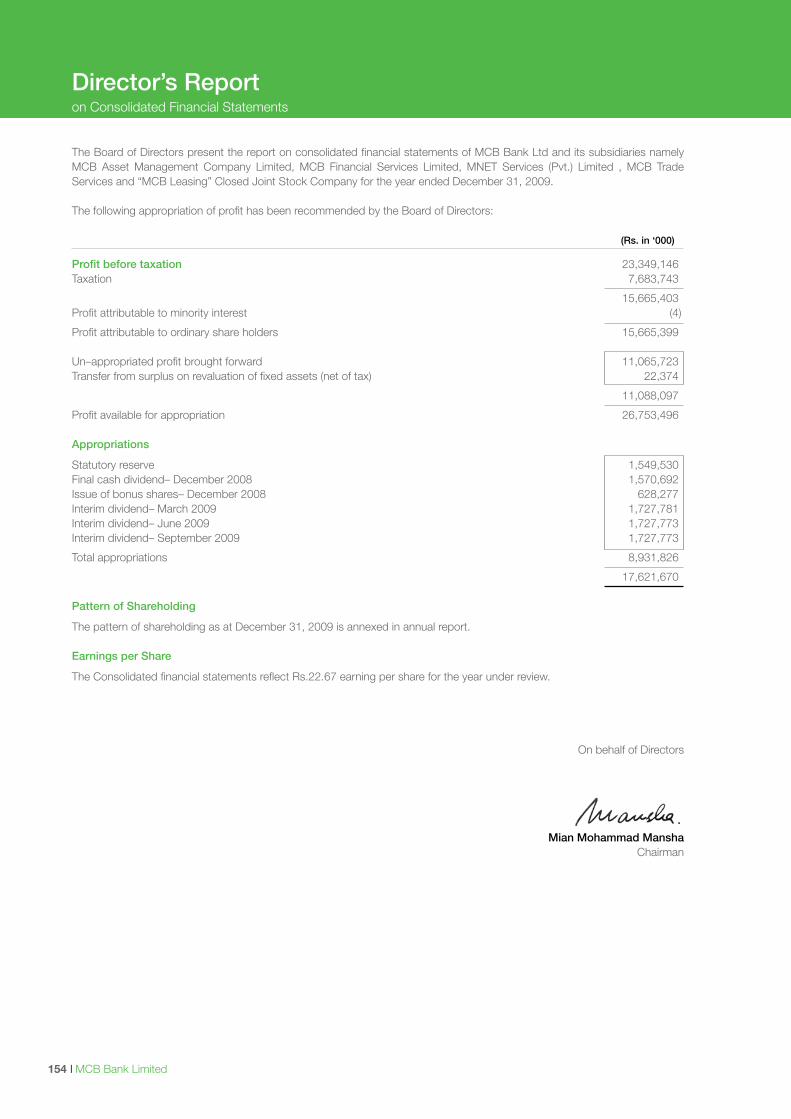
I MCB Bank Limited154
The Board of Directors present the report on consolidated financial statements of MCB Bank Ltd and its subsidiaries namely MCB Asset Management Company Limited, MCB Financial Services Limited, MNET Services (Pvt.) Limited , MCB Trade Services and “MCB Leasing” Closed Joint Stock Company for the year ended December 31, 2009.
The following appropriation of profit has been recommended by the Board of Directors:
(Rs. in ‘000)
Profit before taxation 23,349,146Taxation 7,683,743
15,665,403Profit attributable to minority interest (4)
Profit attributable to ordinary share holders 15,665,399
Un–appropriated profit brought forward 11,065,723Transfer from surplus on revaluation of fixed assets (net of tax) 22,374
11,088,097
Profit available for appropriation 26,753,496
Appropriations
Statutory reserve 1,549,530Final cash dividend– December 2008 1,570,692Issue of bonus shares– December 2008 628,277Interim dividend– March 2009 1,727,781Interim dividend– June 2009 1,727,773Interim dividend– September 2009 1,727,773
Total appropriations 8,931,826
17,621,670
Pattern of Shareholding
The pattern of shareholding as at December 31, 2009 is annexed in annual report.
Earnings per Share
The Consolidated financial statements reflect Rs.22.67 earning per share for the year under review.
On behalf of Directors
Mian Mohammad Mansha Chairman
Director’s Reporton Consolidated Financial Statements
Annual Report 2009 I 155
We have audited the annexed consolidated financial statements comprising consolidated balance sheet of MCB Bank Limited
(“the Bank”) and its subsidiary companies as at December 31, 2009 and the related consolidated profit and loss account,
consolidated statement of comprehensive income, consolidated cash flow statement and consolidated statement of changes
in equity together with the notes forming part thereof, for the year then ended. These consolidated financial statements include
unaudited certified returns from the branches except for sixty branches which have been audited by us and seven branches
audited by auditors abroad. We have also expressed separate opinions on the financial statements of MCB Bank Limited and
MNET Services (Private) Limited. The financial statements of subsidiary companies MCB Financial Services Limited, MCB Asset
Management Company Limited and MCB Trade Services Limited were audited by another firm of auditors, whose report has
been furnished to us and our opinion, in so far as it relates to the amounts included for such companies, is based solely on the
report of such other auditors.
These consolidated financial statements are responsibility of the Bank’s management. Our responsibility is to express our
opinion on these consolidated financial statements based on our audit.
We conducted our audit in accordance with the auditing standards as applicable in Pakistan. These standards require that we
plan and perform the audit to obtain reasonable assurance about whether the above said statements are free of any material
misstatement. An audit includes examining, on a test basis, evidence supporting the amounts and disclosures in the above said
statements. An audit also includes assessing the accounting policies and significant estimates made by management, as well
as, evaluating the overall presentation of the above said statements. We believe that our audit provides a reasonable basis for
our opinion.
In our opinion the consolidated financial statements present fairly the financial position of MCB Bank Limited as at December
31, 2009 and the results of its operations, its cash flows and changes in equity for the year then ended in accordance with the
approved accounting standards as applicable in Pakistan.
Lahore KPMG Taseer Hadi & Co. Chartered AccountantsFebruary 25, 2010 Farid ud Din Ahmed
Auditors’ Report to the Members
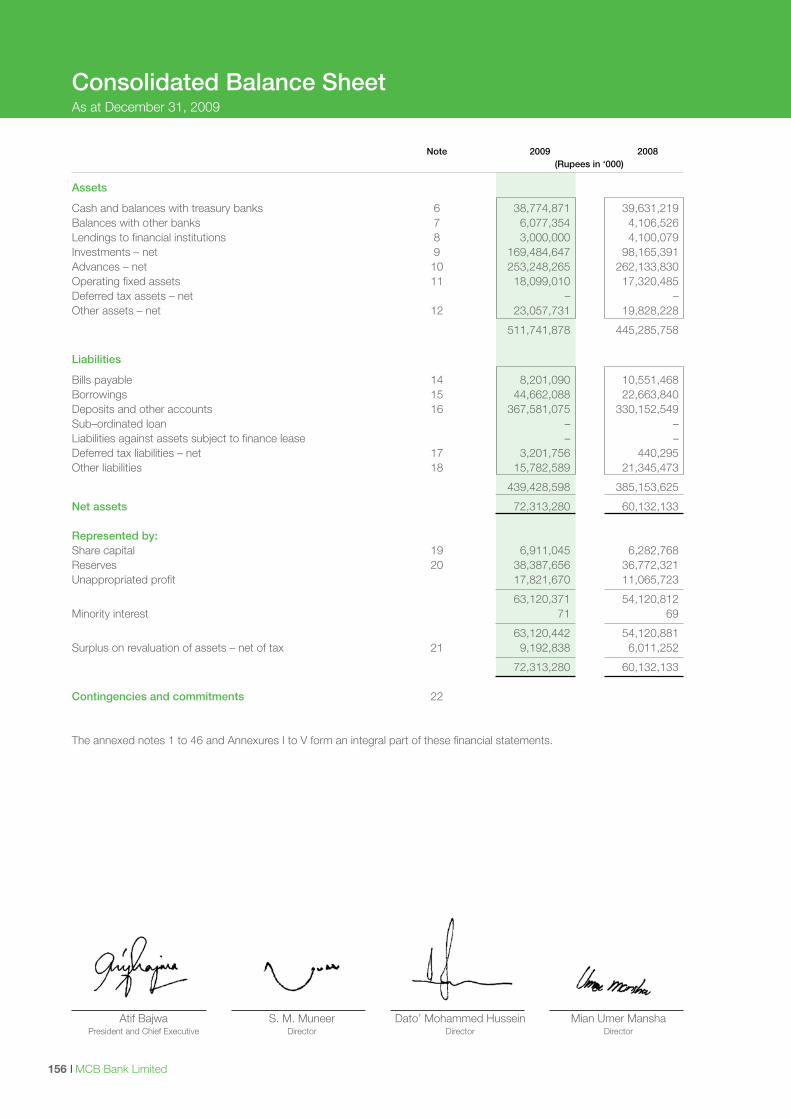
I MCB Bank Limited156
Note 2009 2008 (Rupees in ‘000)
Assets
Cash and balances with treasury banks 6 38,774,871 39,631,219 Balances with other banks 7 6,077,354 4,106,526 Lendings to financial institutions 8 3,000,000 4,100,079 Investments – net 9 169,484,647 98,165,391 Advances – net 10 253,248,265 262,133,830 Operating fixed assets 11 18,099,010 17,320,485 Deferred tax assets – net – – Other assets – net 12 23,057,731 19,828,228
511,741,878 445,285,758
Liabilities
Bills payable 14 8,201,090 10,551,468 Borrowings 15 44,662,088 22,663,840 Deposits and other accounts 16 367,581,075 330,152,549 Sub–ordinated loan – – Liabilities against assets subject to finance lease – – Deferred tax liabilities – net 17 3,201,756 440,295 Other liabilities 18 15,782,589 21,345,473
439,428,598 385,153,625
Net assets 72,313,280 60,132,133 Represented by: Share capital 19 6,911,045 6,282,768 Reserves 20 38,387,656 36,772,321 Unappropriated profit 17,821,670 11,065,723
63,120,371 54,120,812 Minority interest 71 69
63,120,442 54,120,881 Surplus on revaluation of assets – net of tax 21 9,192,838 6,011,252
72,313,280 60,132,133 Contingencies and commitments 22 The annexed notes 1 to 46 and Annexures I to V form an integral part of these financial statements.
Consolidated Balance SheetAs at December 31, 2009
Atif Bajwa S. M. Muneer Dato’ Mohammed Hussein Mian Umer Mansha President and Chief Executive Director Director Director
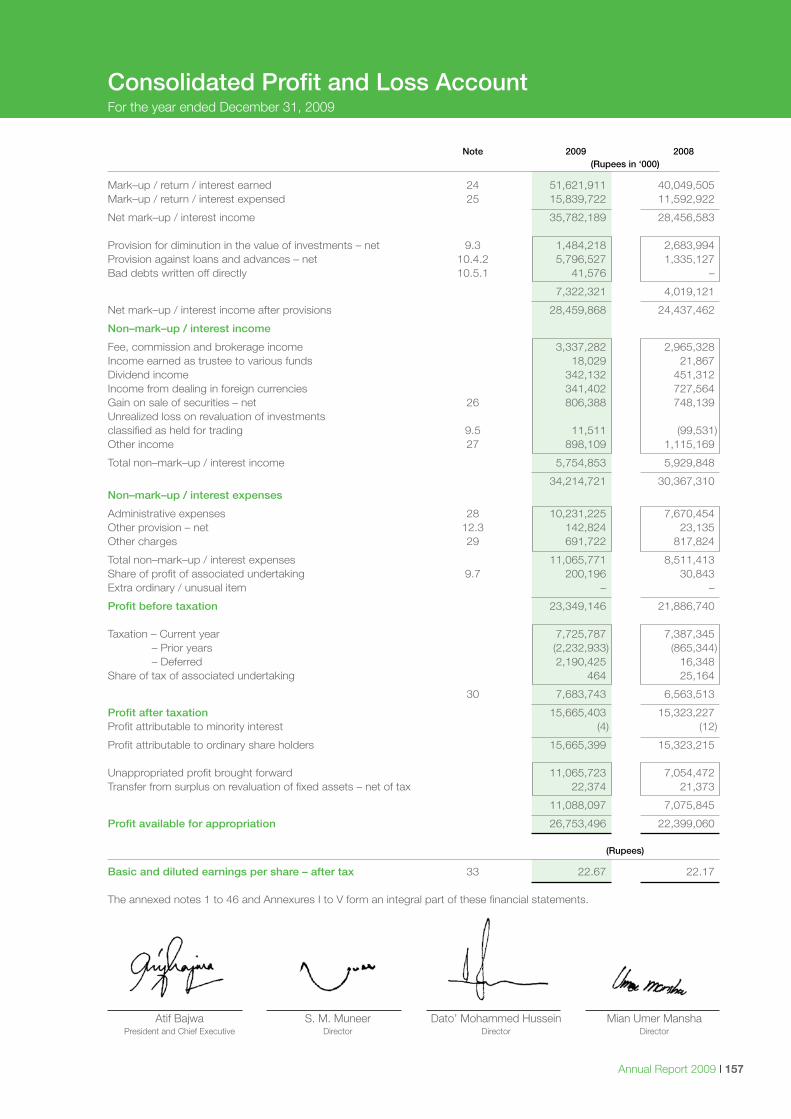
Annual Report 2009 I 157
Atif Bajwa S. M. Muneer Dato’ Mohammed Hussein Mian Umer Mansha President and Chief Executive Director Director Director
Consolidated Profit and Loss AccountFor the year ended December 31, 2009
Note 2009 2008 (Rupees in ‘000)
Mark–up / return / interest earned 24 51,621,911 40,049,505 Mark–up / return / interest expensed 25 15,839,722 11,592,922
Net mark–up / interest income 35,782,189 28,456,583 Provision for diminution in the value of investments – net 9.3 1,484,218 2,683,994 Provision against loans and advances – net 10.4.2 5,796,527 1,335,127 Bad debts written off directly 10.5.1 41,576 –
7,322,321 4,019,121
Net mark–up / interest income after provisions 28,459,868 24,437,462
Non–mark–up / interest income
Fee, commission and brokerage income 3,337,282 2,965,328 Income earned as trustee to various funds 18,029 21,867 Dividend income 342,132 451,312 Income from dealing in foreign currencies 341,402 727,564 Gain on sale of securities – net 26 806,388 748,139 Unrealized loss on revaluation of investments classified as held for trading 9.5 11,511 (99,531)Other income 27 898,109 1,115,169
Total non–mark–up / interest income 5,754,853 5,929,848
34,214,721 30,367,310 Non–mark–up / interest expenses
Administrative expenses 28 10,231,225 7,670,454 Other provision – net 12.3 142,824 23,135 Other charges 29 691,722 817,824
Total non–mark–up / interest expenses 11,065,771 8,511,413 Share of profit of associated undertaking 9.7 200,196 30,843 Extra ordinary / unusual item – –
Profit before taxation 23,349,146 21,886,740 Taxation – Current year 7,725,787 7,387,345 – Prior years (2,232,933) (865,344) – Deferred 2,190,425 16,348 Share of tax of associated undertaking 464 25,164
30 7,683,743 6,563,513
Profit after taxation 15,665,403 15,323,227 Profit attributable to minority interest (4) (12)
Profit attributable to ordinary share holders 15,665,399 15,323,215 Unappropriated profit brought forward 11,065,723 7,054,472 Transfer from surplus on revaluation of fixed assets – net of tax 22,374 21,373
11,088,097 7,075,845
Profit available for appropriation 26,753,496 22,399,060
(Rupees)
Basic and diluted earnings per share – after tax 33 22.67 22.17 The annexed notes 1 to 46 and Annexures I to V form an integral part of these financial statements.
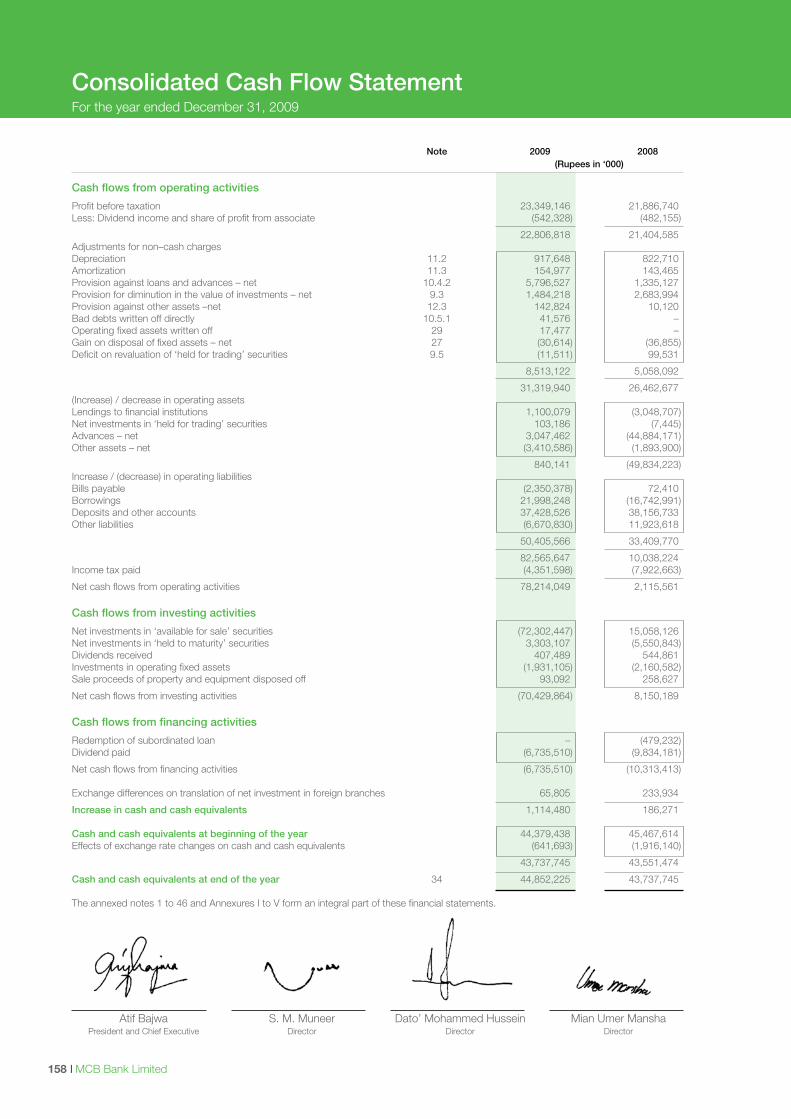
I MCB Bank Limited158
Consolidated Cash Flow StatementFor the year ended December 31, 2009
Note 2009 2008 (Rupees in ‘000)
Cash flows from operating activities
Profit before taxation 23,349,146 21,886,740 Less: Dividend income and share of profit from associate (542,328) (482,155)
22,806,818 21,404,585 Adjustments for non–cash charges Depreciation 11.2 917,648 822,710 Amortization 11.3 154,977 143,465 Provision against loans and advances – net 10.4.2 5,796,527 1,335,127 Provision for diminution in the value of investments – net 9.3 1,484,218 2,683,994 Provision against other assets –net 12.3 142,824 10,120 Bad debts written off directly 10.5.1 41,576 – Operating fixed assets written off 29 17,477 – Gain on disposal of fixed assets – net 27 (30,614) (36,855)Deficit on revaluation of ‘held for trading’ securities 9.5 (11,511) 99,531
8,513,122 5,058,092
31,319,940 26,462,677 (Increase) / decrease in operating assets Lendings to financial institutions 1,100,079 (3,048,707)Net investments in ‘held for trading’ securities 103,186 (7,445)Advances – net 3,047,462 (44,884,171)Other assets – net (3,410,586) (1,893,900)
840,141 (49,834,223)Increase / (decrease) in operating liabilities Bills payable (2,350,378) 72,410 Borrowings 21,998,248 (16,742,991)Deposits and other accounts 37,428,526 38,156,733 Other liabilities (6,670,830) 11,923,618
50,405,566 33,409,770
82,565,647 10,038,224 Income tax paid (4,351,598) (7,922,663)
Net cash flows from operating activities 78,214,049 2,115,561 Cash flows from investing activities
Net investments in ‘available for sale’ securities (72,302,447) 15,058,126 Net investments in ‘held to maturity’ securities 3,303,107 (5,550,843)Dividends received 407,489 544,861 Investments in operating fixed assets (1,931,105) (2,160,582)Sale proceeds of property and equipment disposed off 93,092 258,627
Net cash flows from investing activities (70,429,864) 8,150,189 Cash flows from financing activities
Redemption of subordinated loan – (479,232)Dividend paid (6,735,510) (9,834,181)
Net cash flows from financing activities (6,735,510) (10,313,413) Exchange differences on translation of net investment in foreign branches 65,805 233,934
Increase in cash and cash equivalents 1,114,480 186,271 Cash and cash equivalents at beginning of the year 44,379,438 45,467,614 Effects of exchange rate changes on cash and cash equivalents (641,693) (1,916,140)
43,737,745 43,551,474
Cash and cash equivalents at end of the year 34 44,852,225 43,737,745 The annexed notes 1 to 46 and Annexures I to V form an integral part of these financial statements.
Atif Bajwa S. M. Muneer Dato’ Mohammed Hussein Mian Umer Mansha President and Chief Executive Director Director Director
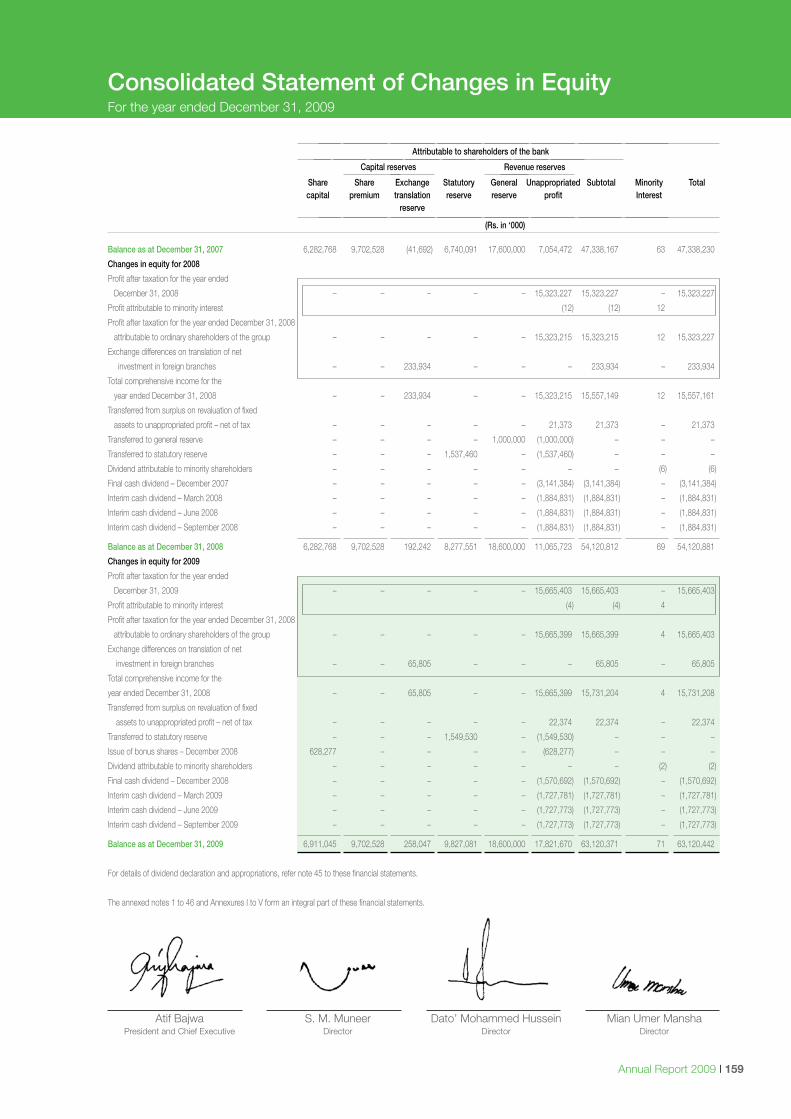
Annual Report 2009 I 159
Consolidated Statement of Changes in EquityFor the year ended December 31, 2009
Attributable to shareholders of the bank
Capital reserves Revenue reserves
Share Share Exchange Statutory General Unappropriated Subtotal Minority Total capital premium translation reserve reserve profit Interest reserve
(Rs. in ‘000)
Balance as at December 31, 2007 6,282,768 9,702,528 (41,692) 6,740,091 17,600,000 7,054,472 47,338,167 63 47,338,230
Changes in equity for 2008
Profit after taxation for the year ended
December 31, 2008 – – – – – 15,323,227 15,323,227 – 15,323,227
Profit attributable to minority interest (12) (12) 12
Profit after taxation for the year ended December 31, 2008
attributable to ordinary shareholders of the group – – – – – 15,323,215 15,323,215 12 15,323,227
Exchange differences on translation of net
investment in foreign branches – – 233,934 – – – 233,934 – 233,934
Total comprehensive income for the
year ended December 31, 2008 – – 233,934 – – 15,323,215 15,557,149 12 15,557,161
Transferred from surplus on revaluation of fixed
assets to unappropriated profit – net of tax – – – – – 21,373 21,373 – 21,373
Transferred to general reserve – – – – 1,000,000 (1,000,000) – – –
Transferred to statutory reserve – – – 1,537,460 – (1,537,460) – – –
Dividend attributable to minority shareholders – – – – – – – (6) (6)
Final cash dividend – December 2007 – – – – – (3,141,384) (3,141,384) – (3,141,384)
Interim cash dividend – March 2008 – – – – – (1,884,831) (1,884,831) – (1,884,831)
Interim cash dividend – June 2008 – – – – – (1,884,831) (1,884,831) – (1,884,831)
Interim cash dividend – September 2008 – – – – – (1,884,831) (1,884,831) – (1,884,831)
Balance as at December 31, 2008 6,282,768 9,702,528 192,242 8,277,551 18,600,000 11,065,723 54,120,812 69 54,120,881
Changes in equity for 2009
Profit after taxation for the year ended
December 31, 2009 – – – – – 15,665,403 15,665,403 – 15,665,403
Profit attributable to minority interest (4) (4) 4
Profit after taxation for the year ended December 31, 2008
attributable to ordinary shareholders of the group – – – – – 15,665,399 15,665,399 4 15,665,403
Exchange differences on translation of net
investment in foreign branches – – 65,805 – – – 65,805 – 65,805
Total comprehensive income for the
year ended December 31, 2008 – – 65,805 – – 15,665,399 15,731,204 4 15,731,208
Transferred from surplus on revaluation of fixed
assets to unappropriated profit – net of tax – – – – – 22,374 22,374 – 22,374
Transferred to statutory reserve – – – 1,549,530 – (1,549,530) – – –
Issue of bonus shares – December 2008 628,277 – – – – (628,277) – – –
Dividend attributable to minority shareholders – – – – – – – (2) (2)
Final cash dividend – December 2008 – – – – – (1,570,692) (1,570,692) – (1,570,692)
Interim cash dividend – March 2009 – – – – – (1,727,781) (1,727,781) – (1,727,781)
Interim cash dividend – June 2009 – – – – – (1,727,773) (1,727,773) – (1,727,773)
Interim cash dividend – September 2009 – – – – – (1,727,773) (1,727,773) – (1,727,773)
Balance as at December 31, 2009 6,911,045 9,702,528 258,047 9,827,081 18,600,000 17,821,670 63,120,371 71 63,120,442
For details of dividend declaration and appropriations, refer note 45 to these financial statements.
The annexed notes 1 to 46 and Annexures I to V form an integral part of these financial statements.
Atif Bajwa S. M. Muneer Dato’ Mohammed Hussein Mian Umer Mansha President and Chief Executive Director Director Director
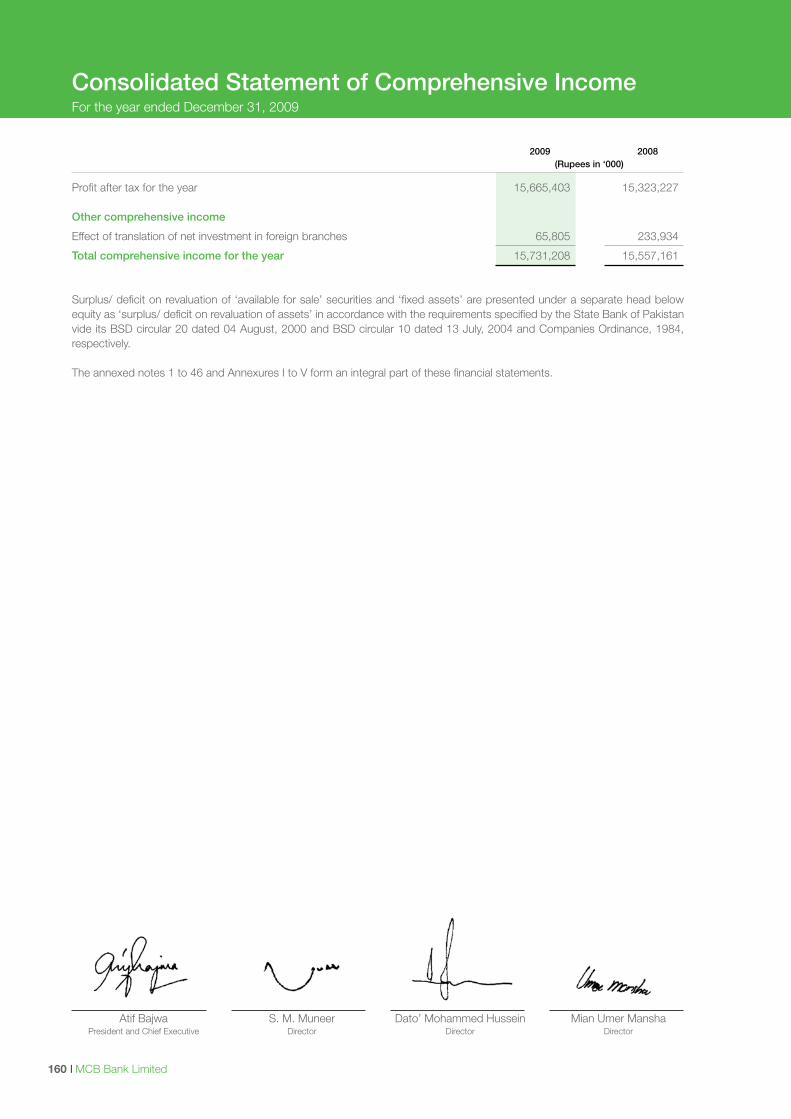
I MCB Bank Limited160
2009 2008 (Rupees in ‘000)
Profit after tax for the year 15,665,403 15,323,227
Other comprehensive income
Effect of translation of net investment in foreign branches 65,805 233,934
Total comprehensive income for the year 15,731,208 15,557,161 Surplus/ deficit on revaluation of ‘available for sale’ securities and ‘fixed assets’ are presented under a separate head below equity as ‘surplus/ deficit on revaluation of assets’ in accordance with the requirements specified by the State Bank of Pakistan vide its BSD circular 20 dated 04 August, 2000 and BSD circular 10 dated 13 July, 2004 and Companies Ordinance, 1984, respectively.
The annexed notes 1 to 46 and Annexures I to V form an integral part of these financial statements.
Consolidated Statement of Comprehensive IncomeFor the year ended December 31, 2009
Atif Bajwa S. M. Muneer Dato’ Mohammed Hussein Mian Umer Mansha President and Chief Executive Director Director Director
Annual Report 2009 I 161
1. THE GROUP AND ITS OPERATIONS
The “Group” consists of:
Holding company
– MCB Bank Limited
Subsidiary companies Percentage holding of MCB Bank Limited %
– MCB Financial Services Limited 99.999 (formerly Muslim Commercial Financial Services (Private) Limited) – MNET Services (Private) Limited 99.950 – MCB Trade Services Limited 100.000 – MCB Asset Management Company Limited 99.990 – “MCB Leasing” Closed Joint Stock Company 95.000
MCB Bank Limited (holding company)
MCB Bank Limited (the ‘Bank’) is a banking company incorporated in Pakistan and is engaged in commercial banking and related services. The Bank’s ordinary shares are listed on all the stock exchanges in Pakistan whereas its Global Depository Receipts (GDRs) representing two ordinary shares (2008: two ordinary shares) are traded on the International Order Book (IOB) system of the London Stock Exchange. The Bank’s Registered Office and Principal Office are situated at MCB Building, Jinnah Avenue, Islamabad and MCB –15 Main Gulberg, Lahore, respectively. The Bank operates 1,074 branches including 11 Islamic banking branches (2008: 1,040 branches including 11 Islamic banking branches) within Pakistan and 7 branches (2008: 7 branches) outside the country (including the Karachi Export Processing Zone branch).
MCB Financial Services Limited (subsidiary company) (formerly Muslim Commercial Financial Services (Private) Limited)
The company was incorporated on February 12, 1992 under the Companies Ordinance, 1984 as a private limited company. The principal object of the company is to float, administer and manage modaraba funds and modarabas under Modaraba Companies & Modaraba (Floatation and Control) Ordinance 1980. The company’s registered office is situated at 16th Floor, MCB Tower, I.I. Chundrigar Road, Karachi.
The company also acts as a trustee of certain mutual funds.
MNET Services (Private) Limited (subsidiary company)
MNET Services (Private) Limited is a private limited company incorporated in Pakistan under the Companies Ordinance, 1984 on September 7, 2001. The company’s registered office and principal place of business are situated at MCB Building, F–6 / G–6, Jinnah Avenue, Islamabad and Sheikh Sultan Trust
Building, Beaumount Road, Karachi respectively. The core objective of the company is to provide services in Information Technology and to develop computer software and other data processing equipment for planning, designing, management and execution of all types of financial, personal, organizational and institutional activities.
MCB Trade Services Limited (subsidiary company)
The company was incorporated under the laws of Hong Kong on February 25, 2005. The registered office of the company is located at 28 / F, BEA Harbour View Centre 56 Gloucester Road, Wan Chai, Hong Kong.
The principal activity of the company is to provide agency services.
MCB Asset Management Company Limited (subsidiary company)
The company was incorporated in Pakistan under the Companies Ordinance 1984 on September 14, 2005 as a public limited company. The registered office and principal place of business of the company is located at 8th Floor, Technocity, Corporate Tower, Hasrat Mohani Road, Karachi.
The company is registered as an asset management company under the Non–Banking Finance Companies (Establishment and Regulation) Rules, 2003 to carry on the business of an asset management company under the said rules.
The principal activity of the company includes asset management, investment advisory, portfolio management, equity research and underwriting.
“MCB Leasing” Closed Joint Stock Company (subsidiary company)
The Bank incorporated a Closed Joint Stock Company under the laws of Azerbaijan on October 15, 2009 with 95% holding. The registered office of the company is located at AZ 1001, Baku, Sabil District, 11 Jafarov Shlari, Baku, Azerbaijan.
The principal activity of the company is to undertake
leasing business.
2. BASIS OF PRESENTATION
2.1 The consolidated financial statements include the financial statements of MCB Bank Limited and its subsidiary companies and associates.
2.2 In accordance with the directives of the Federal Government regarding the shifting of the banking system to Islamic modes, the State Bank of Pakistan has issued various circulars from time to time. Permissible forms of trade–related modes of financing include purchase of goods by banks from
Notes to the Consolidated Financial StatementsFor the year ended December 31, 2009
I MCB Bank Limited162
their customers and immediate resale to them at appropriate mark–up in price on deferred payment basis. The purchases and sales arising under these arrangements are not reflected in these financial statements as such but are restricted to the amount of facility actually utilized and the appropriate portion of mark–up thereon.
2.3 The financial results of the Islamic Banking branches have been consolidated in these financial statements for reporting purposes, after eliminating material inter–branch transactions / balances. Key financial figures of the Islamic Banking branches are disclosed in Annexure II to these financial statements.
2.4 For the purpose of translation, rates of Rs. 84.2416 per US Dollar (2008: Rs. 79.0985) and Rs. 0.7364 per SLR (2008: Rs.0.70) have been used.
3. STATEMENT OF COMPLIANCE
3.1 These financial statements have been prepared in accordance with the approved accounting standards as applicable in Pakistan. Approved Accounting Standards comprise of such International Financial Reporting Standards (IFRS) issued by the International Accounting Standards Board as are notified under the Companies Ordinance, 1984, provisions of and directives issued under the Companies Ordinance, 1984 and Banking Companies Ordinance, 1962. In case requirements differ, the provisions and directives given in Companies Ordinance, 1984 and Banking Companies Ordinance, 1962 shall prevail.
The State Bank of Pakistan has deferred the applicability of International Accounting Standard (IAS) 39, ‘Financial Instruments: Recognition and Measurement’ and International Accounting Standard (IAS) 40, ‘Investment Property’ for Banking Companies through BSD Circular No. 10 dated August 26, 2002. The Securities Exchange Commission of Pakistan (SECP) has deferred applicability of IFRS–7 “Financial Instruments: Disclosures” on banks through S.R.O 411(1) /2008 dated April 28, 2008. Accordingly, the requirements of these standards have not been considered in the preparation of these financial statements. However, investments have been classified and valued in accordance with the requirements prescribed by the State Bank of Pakistan through various circulars.
3.2 Standards, amendments and interpretations to published approved accounting standards that are not relevant and not yet effective
The following standards, amendments and interpretations of approved accounting standards will be effective for accounting periods beginning on or after January 01, 2010. These standards are either not relevant to the Group operations or are not expected to have a significant impact on the Group financial statements other than increase in disclosures in certain cases:
– Revised IFRS 3 – Business Combinations (applicable for annual periods beginning on or after July 01, 2009) broadens among other things the definition of business resulting in more acquisitions being treated as business combinations, contingent consideration to be measured at fair value, transaction costs other than share and debt issue costs to be expensed, any pre–existing interest in an acquiree to be measured at fair value, with the related gain or loss recognised in profit or loss and any non–controlling (minority) interest to be measured at either fair value, or at its proportionate interest in the identifiable assets and liabilities of an acquiree, on a transaction–by–transaction basis.
– Amended IAS 27 – Consolidated and Separate Financial Statements (effective for annual periods beginning on or after July 01, 2009) requires accounting for changes in ownership interest by the group in a subsidiary, while maintaining control, to be recognized as an equity transaction. When the group loses control of subsidiary, any interest retained in the former subsidiary will be measured at fair value with the gain or loss recognized in the profit or loss.
– IFRIC 15 – Agreement for the Construction of Real Estate (effective for annual periods beginning on or after October 01, 2009) clarifies the recognition of revenue by real estate developers for sale of units, such as apartments or houses, ‘off–plan’, that is, before construction is complete.
– Amendments to IAS 39 – Financial Instruments: Recognition and Measurement – Eligible hedged Items (effective for annual periods beginning on or after July 01, 2009) clarifies the application of existing principles that determine whether specific risks or portions of cash flows are eligible for designation in a hedging relationship.
– IFRIC – 17 – Distributions of Non–cash Assets to Owners (effective for annual periods beginning on or after July 01, 2009) states that when a bank distributes non cash assets to its shareholders as dividend, the liability for the dividend is measured at fair value. If there are subsequent changes in the fair value before the liability is discharged, this is recognised in equity. When the non–cash asset is distributed, the difference between the carrying amount and fair value is recognised in the income statement.
The International Accounting Standards Board made certain amendments to existing standards as part of its second annual improvements project. The effective dates for these amendments vary by standard and most will be applicable to the Bank’s 2010 financial statements.
Notes to the Consolidated Financial StatementsFor the year ended December 31, 2009
Annual Report 2009 I 163
– Amendment to IFRS 2 – Share–based Payment – Group Cash–settled Share–based Payment Transactions (effective for annual periods beginning on or after January 01, 2010). Currently effective IFRSs require attribution of group share–based payment transactions only if they are equity–settled. The amendments resolve diversity in practice regarding attribution of cash–settled share–based payment transactions and require an entity receiving goods or services in either an equity–settled or a cash–settled payment transaction to account for the transaction in its separate or individual financial statements.
– Amendment to IAS 32 – Financial Instruments: Presentation – Classification of Rights Issues (effective for annual periods beginning on or after February 01, 2010). The IASB amended IAS 32 to allow rights, options or warrants to acquire a fixed number of the entity’s own equity instruments for a fixed amount of any currency to be classified as equity instruments provided the entity offers the rights, options or warrants pro rata to all of its existing owners of the same class of its own non–derivative equity instruments.
– IFRIC 19 – Extinguishing Financial Liabilities with Equity Instruments (effective for annual periods beginning on or after July 01, 2010). This interpretation provides guidance on the accounting for debt for equity swaps.
– IAS 24 – Related Party Disclosures (revised 2009) – effective for annual periods beginning on or after January 01, 2011. The revision amends the definition of a related party and modifies certain related party disclosure requirements for government–related entities. The amendment would result in certain changes in disclosures.
– Amendments to IFRIC 14 IAS 19 – The Limit on a Defined Benefit Assets, Minimum Funding Requirements and their Interaction (effective for annual periods beginning on or after January 01, 2011). These amendments remove unintended consequences arising from the treatment of prepayments where there is a minimum funding requirement. These amendments result in prepayments of contributions in certain circumstances being recognised as an asset rather than an expense. This amendment is not likely to have any impact on Bank’s financial statements.
– Amendments to IFRS 5 – Non–current Assets Held for Sale and Discontinued Operations – (effective for annual periods beginning on or after July 01, 2009). The amendments specify that if an entity is committed to a plan to sell a subsidiary, then it would classify all of that
subsidiary’s assets and liabilities as held for sale when the held for sale criteria in IFRS 5 are met. This applies regardless of the entity retaining an interest (other than control) in the subsidiary; and disclosures for discontinued operations are required by the parent when a subsidiary meets the definition of a discontinued operation. This amendment is not likely to have any impact on Bank’s financial statements.
4. BASIS OF MEASUREMENT
4.1 These financial statements have been prepared under the historical cost convention except that certain fixed assets are stated at revalued amounts and certain investments, commitments in respect of certain forward exchange contracts and derivative financial instruments have been marked to market and are carried at fair value.
4.2 The financial statements are presented in Pak Rupees, which is the Group’s functional and presentation currency. The amounts are rounded off to the nearest thousand.
4.3 Critical accounting estimates and judgments
The preparation of financial statements in conformity with the approved accounting standards requires the use of certain critical accounting estimates. It also requires the management to exercise its judgment in the process of applying the Bank’s accounting policies. Estimates and judgments are continually evaluated and are based on historical experiences, including expectations of future events that are believed to be reasonable under the circumstances. The areas where various assumptions and estimates are significant to the Bank’s financial statements or where judgment was exercised in the application of accounting policies are as follows:
a) Classification of investments
– In classifying investments as ‘held for trading’, the Group has determined securities which are acquired with an intention to trade by taking advantage of short term market / interest rate movements and are to be sold within 90 days.
– In classifying investments as ‘held to maturity’, the Group follows the guidance provided in SBP circulars on classifying non–derivative financial assets with fixed or determinable payments and fixed maturity. In making this judgment, the Group evaluates its intention and ability to hold such investment to maturity.
– The investments which are not classified as ‘held for trading’ or ‘held to maturity’ are classified as ‘available for sale’.
Notes to the Consolidated Financial StatementsFor the year ended December 31, 2009
I MCB Bank Limited164
b) Provision against advances
The Group reviews its loan portfolio to assess amount of non–performing advances and provision required there against on regular basis. While assessing this requirement various factors including the delinquency in the account, financial position of the borrowers and the requirements of the Prudential Regulations are considered.
The amount of general provision is determined in accordance with the relevant regulations and management’s judgment as explained in notes 10.4.3 and 10.4.4.
c) Impairment of ‘available for sale’ equity investments
The Group determines that ‘available for sale’ equity investments are impaired when there has been a significant or prolonged decline in the fair value below its cost. The determination of what is significant or prolonged requires judgment. In making this judgment, the Group evaluates among other factors, the normal volatility in share price. In addition, the impairment may be appropriate when there is an evidence of deterioration in the financial health of the invested industry and sector performance, changes in technology and operational/financial cash flows.
d) Taxation
In making the estimates for income taxes currently payable by the Group, the management considers the current income tax laws and the decisions of appellate authorities on certain issues in the past.
e) Fair value of derivatives
The fair values of derivatives which are not quoted in active markets are determined by using valuation techniques. The valuation techniques take into account the relevant interest rates at the balance sheet date and the rates contracted.
f) Depreciation, amortization and revaluation of operating fixed assets
In making estimates of the depreciation / amortization method, the management uses the method which reflects the pattern in which economic benefits are expected to be consumed by the Group. The method applied is reviewed at each financial year end and if there is a change in the expected pattern of consumption of the future economic benefits embodied in the assets, the method is changed to reflect the changed pattern. Such change is accounted for as change in accounting estimates in accordance with International Accounting Standard (IAS) 8 “Accounting Policies, Changes in Accounting Estimates and Errors”. Further, the Group
estimates the revalued amount of land and buildings on a regular basis. The estimates are based on valuations carried out by independent professional valuers under the market conditions.
g) Staff retirement benefits
Certain actuarial assumptions have been adopted as disclosed in these financial statements (note 36) for the actuarial valuation of staff retirement benefit plans. Actuarial assumptions are entity’s best estimates of the variables that will determine the ultimate cost of providing post employment benefits. Changes in these assumptions in future years may affect the liability / asset under these plans in those years.
5. SUMMARY OF SIGNIFICANT ACCOUNTING POLICIES
5.1 Change in accounting policies
Starting January 01, 2009, the Bank has changed its accounting policies in respect of ‘Presentation of financial statements’ and ‘Ijarah’.
5.1.1 The Bank has applied Revised IAS 1 Presentation of Financial Statements (2007) which became effective as of January 01, 2009. As a result, the Bank presents in the statement of changes in equity all owner changes in equity, whereas all non–owner changes in equity are presented in statement of comprehensive income. This presentation has been applied in these financial statements as of and for the year ended on December 31, 2009.
Comparative information has been re–presented so that it is also in conformity with the revised standard. Since the change in accounting policy only impacts presentation aspects, there is no impact on earning per share.
5.1.2 The State Bank of Pakistan has notified for adoption of Islamic Financial Accounting Standard – IFAS 2 “Ijarah” which is applicable for accounting periods beginning on or after January 01, 2009. IFAS 2 requires assets underlying ijarah financing to be recorded as operating fixed assets separately from the assets in Bank’s own use. These assets are carried at cost less accumulated depreciation and impairment, if any.
5.2 Basis of consolidation
a) The consolidated financial statements include the financial statements of MCB Bank Limited and its subsidiary companies and share of the profit / reserves of an associate accounted for under the equity basis of accounting.
Notes to the Consolidated Financial StatementsFor the year ended December 31, 2009
Annual Report 2009 I 165
b) Subsidiaries are all entities over which the Group has the power to govern the financial and operating policies accompanying a shareholding of more than one half of the voting rights. The existence and effect of potential voting rights that are currently exercisable are considered when assessing whether the Group controls another entity. Subsidiaries are fully consolidated from the date on which control is transferred to the Group. They are de–consolidated from the date when control ceases / the subsidiaries disposed off. The assets and liabilities of subsidiary companies have been consolidated on a line by line basis based on the financial statements as at December 31, 2008 and the carrying value of investments held by the Bank is eliminated against the subsidiaries’ shareholders’ equity in these consolidated financial statements. Material intra–Group balances and transactions have been eliminated.
c) Associates are all entities over which the Group has significant influence but not control. Investments in associates are accounted for by the equity method of accounting and are initially recognised at cost, thereafter for the post–acquisition change in the Group’s share of net assets of the associate, the cumulative post–acquisition movements are adjusted in the carrying amount of the investment. Accounting policies of the associate have been changed where necessary to ensure consistency with the policies adopted by the Group. The Group’s share in an associate has been accounted for on the basis of the financial statements for the year ended December 31, 2009.
d) Minority interest is that part of the net results of operations and of net assets of subsidiary companies attributable to interests which are not owned by the Group.
5.3 Investments
The Group classifies its investments as follows:
a) Held for trading
These are securities, which are either acquired for generating profit from short–term fluctuations in market prices, interest rate movements, dealers margin or are securities included in a portfolio in which a pattern of short–term profit taking exists.
b) Held to maturity
These are securities with fixed or determinable payments and fixed maturity in respect of which the Group has the positive intent and ability to hold to maturity.
c) Available for sale
These are investments, other than those in subsidiaries and associates, that do not fall under the ‘held for trading’ or ‘held to maturity’ categories.
Investments are initially recognized at cost which in case of investments other than ‘held for trading’ include transaction costs associated with the investment.
All purchases and sales of investments that
require delivery within the time frame established by regulation or market convention are recognized at the trade date. Trade date is the date on which the Group commits to purchase or sell the investment.
In accordance with the requirements of the State Bank of Pakistan, quoted securities, other than those classified as ‘held to maturity’, investments in subsidiaries and investments in associates are subsequently re–measured to market value. Surplus / (deficit) arising on revaluation of quoted securities which are classified as ‘available for sale’, is taken to a separate account which is shown in the balance sheet below equity. Surplus / (deficit) arising on revaluation of quoted securities which are classified as ‘held for trading’, is taken to the profit and loss account currently.
Unquoted equity securities (excluding investments in subsidiaries and associates) are valued at the lower of cost and break–up value. Break–up value of equity securities is calculated with reference to the net assets of the investee company as per the latest available audited financial statements. Investments classified as ‘held to maturity’ are carried at amortized cost. Investments in subsidiaries and investments in associates are carried at cost.
Provision for impairment in the values of securities (except debentures, participation term certificates and term finance certificates) is made currently. Provisions for impairment in value of debentures, participation term certificates and term finance certificates are made as per the requirements of the Prudential Regulations issued by the State Bank of Pakistan.
Goodwill represents the excess of the cost of an acquisition over the fair value of the Group’s share of the net identifiable assets of the acquired associate at the date of acquisition. Goodwill on acquisitions of associates is included in ‘investments in associates’. Goodwill is tested annually for impairment and carried at cost less accumulated impairment losses. Gains and losses on the disposal of an associate include the carrying amount of goodwill relating to the associate sold.
Notes to the Consolidated Financial StatementsFor the year ended December 31, 2009
I MCB Bank Limited166
5.4 Sale and repurchase agreements
Securities sold subject to a repurchase agreement (repo) are retained in the financial statements as investments and the counter party liability is included in borrowings. Securities purchased under an agreement to resell (reverse repo) are not recognized in the financial statements as investments and the amount extended to the counter party is included in lendings to financial institutions. The difference between the purchase / sale and re–sale / re–purchase price is recognized as mark–up income / expense on a time proportion basis, as the case may be.
5.5 Advances
Advances are stated net of specific and general provisions. Specific provision is determined on the basis of the Prudential Regulations and other directives issued by the State Bank of Pakistan (SBP) and charged to the profit and loss account. Provisions are held against identified as well as unidentified losses. Provisions against unidentified losses include general provision against consumer loans made in accordance with the requirements of the Prudential Regulations issued by SBP and provision based on historical loss experience on advances. Advances are written off when there is no realistic prospect of recovery.
Leases where the Bank transfers substantially all the risks and rewards incidental to ownership of an asset to the lessee are classified as financial leases. A receivable is recognized at an amount equal to the present value of the lease payments including any guaranteed residual value. Finance lease receivables are included in advances to the customers.
5.6 Operating fixed assets and depreciation
Property and equipment, other than land carrying value of which is not amortized, are stated at cost or revalued amount less accumulated depreciation and accumulated impairment losses (if any). Land is carried at revalued amount. Capital work–in–progress is stated at cost. Cost of property and equipment of foreign operations includes exchange differences arising on currency translation at year–end rates.
Depreciation on all operating fixed assets is charged using the diminishing balance method except for vehicles, computers, carpets and buildings which are depreciated using the straight line method in accordance with the rates specified in note 11.2 to these financial statements and after taking into account residual value, if any. The residual values, useful lives and depreciation methods are reviewed and adjusted, if appropriate, at each balance sheet date.
Depreciation on additions is charged from the month
the assets are available for use while no depreciation is charged in the month in which the assets are disposed off.
Surplus on revaluation of land and buildings is credited to the surplus on revaluation account. Revaluation is carried out with sufficient regularity to ensure that the carrying amount of assets does not differ materially from the fair value. To the extent of the incremental depreciation charged on the revalued assets, the related surplus on revaluation of land and buildings (net of deferred taxation) is transferred directly to unappropriated profit.
Gains / losses on sale of property and equipment
are credited / charged to the profit and loss account currently, except that the related surplus on revaluation of land and buildings (net of deferred taxation) is transferred directly to unappropriated profit.
Subsequent costs are included in the asset’s carrying
amount or are recognized as a separate asset, as appropriate, only when it is probable that future economic benefits associated with the item will flow to the Bank and the cost of the item can be measured reliably. All other repairs and maintenance are charged to the profit and loss account.
5.6.1 Intangible assets
Intangible assets are stated at cost less accumulated amortization and accumulated impairment losses, if any. Intangible assets are amortized from the month when these assets are available for use, using the straight line method, whereby the cost of the intangible assets are amortized over its estimated useful lives over which economic benefits are expected to flow to the Bank. The useful lives are reviewed and adjusted, if appropriate, at each balance sheet date.
5.6.2 Leased (Ijarah)
Assets leased out under ‘Ijarah’ are stated at cost less accumulated depreciation and accumulated impairment losses, if any. Assets under Ijarah are depreciated over the period of lease term. However, in the event the asset is expected to be available for re–ijarah, depreciation is charged over the economic life of the asset using straight line basis.
Ijarah income is recognized on an accrual basis as and when the rental becomes due.
5.7 Impairment
The carrying amount of assets are reviewed at each balance sheet date for impairment whenever events or changes in circumstances indicate that the carrying amounts of the assets may not be recoverable. If such indication exists, and where the carrying value exceeds the estimated recoverable amount, assets are written down to their recoverable amounts. Recoverable amount is the greater of net selling price and value in use. The resulting impairment loss is taken to the profit and loss account except for impairment loss on revalued assets, which is adjusted against the related revaluation surplus to the extent that the impairment loss does not exceed the surplus on revaluation of that asset.
Notes to the Consolidated Financial StatementsFor the year ended December 31, 2009
Annual Report 2009 I 167
5.8 Staff retirement benefits
MCB Bank Limited (holding company) The Bank operates the following staff retirement
benefits for its employees:
a) For clerical / non–clerical staff who did not opt for the new scheme, the Bank operates the following:
– an approved contributory provident fund; – an approved gratuity scheme; and– a contributory benevolent scheme
b) For clerical / non–clerical staff who joined the Group after the introduction of the new scheme and for others who opted for the new scheme introduced in 1975, the Bank operates the following:
– an approved non–contributory provident fund introduced in lieu of the contributory provident fund;
– an approved pension fund; and– contributory benevolent scheme
c) For officers who joined the Group after the introduction of the new scheme and for others who opted for the new scheme introduced in 1977, the Bank operates the following:
– an approved non–contributory provident fund introduced in lieu of the contributory provident fund; and
– an approved pension fund.
However, the management has replaced the pension benefits for employees in the officer category with a contributory provident fund for services rendered after December 31, 2003.
d) For executives and officers who joined the Group on or after January 01, 2000 the Group operates an approved contributory provident fund.
e) Post retirement medical benefits to entitled employees.
Annual contributions towards the defined benefit plans and schemes are made on the basis of actuarial advice using the projected unit credit method. The above benefits are payable to staff at the time of separation from the Bank’s services subject to the completion of qualifying period of service. The net cumulative actuarial gains / losses at each balance sheet date are recognized equally over a period of three years or the expected remaining average working lives of employees, whichever is lower.
Past service cost resulting from changes to defined benefit plans to the extent the benefits are already vested is recognized immediately and the remaining unrecognized past service cost is recognized as an expense on a straight line basis over the average period until the benefits become vested.
MNET Services (Private) Limited (subsidiary company)
The company operates an unfunded gratuity scheme for its eligible employees. Minimum qualifying period for entitlement to gratuity is five years continuous service with the Company. Accrual of charge for the year is made on the basis of actuarial valuations carried out under the projected unit credit method. Actuarial gains and losses are amortized over the expected future service of employees to the extent of the greater of ten percent of the present value of the defined benefit obligations at that date.
5.9 Employees’ compensated absences
MCB Bank Limited (holding company)
Liability in respect of employees’ compensated absences is accounted for in the year in which these are earned on the basis of actuarial valuation carried out using the Projected Unit Credit Method. Actuarial gains or losses if any, are recognized immediately.
5.10 Taxation
Current
Provision for current taxation is based on taxable income at the current rates of taxation after taking into consideration available tax credits and rebates. The charge for current tax also includes adjustments where considered necessary, relating to prior years which arise from assessments framed / finalized during the year.
Deferred
Deferred tax is recognised using the balance sheet liability method on all major temporary differences between the amounts attributed to assets and liabilities for financial reporting purposes and amounts used for taxation purposes. The Group records deferred tax assets / liabilities using the tax rates, enacted or substantively enacted by the balance sheet date expected to be applicable at the time of its reversal. Deferred tax asset is recognised only to the extent that it is probable that future taxable profits will be available against which the asset can be utilised. Deferred tax assets are reduced to the extent that it is no longer probable that the related tax benefit will be realised. The Group also recognises deferred tax asset / liability on deficit / surplus on revaluation of securities and deferred tax liability on surplus on revaluation of fixed assets which is adjusted against the related deficit / surplus in accordance with the requirements of International Accounting Standard (IAS) 12, ‘Income Taxes’.
Notes to the Consolidated Financial StatementsFor the year ended December 31, 2009
I MCB Bank Limited168
Deferred tax liability is not recognized in respect of taxable temporary differences associated with exchange translation reserves of foreign operations, where the timing of the reversal of the temporary difference can be controlled and it is probable that the temporary differences will not reverse in the foreseeable future.
5.11 Provisions
Provisions are recognized when the Group has a legal or constructive obligation as a result of past events and it is probable that an outflow of resources will be required to settle the obligation and a reliable estimate of the amount can be made. Provisions are reviewed at each balance sheet date and are adjusted to reflect the current best estimates.
5.12 Foreign currencies
5.12.1 Foreign currency transactions
Transactions in foreign currencies (other than the results of foreign operations discussed in note 5.12.2) are translated to Rupees at the foreign exchange rates ruling on the transaction date. Monetary assets and liabilities in foreign currencies are expressed in Rupee terms at the rates of exchange prevailing at the balance sheet date. Foreign bills purchased and forward foreign exchange contracts other than those relating to foreign currency deposits are valued at the rates applicable to their respective maturities.
5.12.2 Foreign operations
The assets and liabilities of foreign branches are translated to Rupees at exchange rates prevailing at the balance sheet date. The results of foreign operations are translated to Rupees at the average rate of exchange for the year.
5.12.3 Translation gains and losses
Translation gains and losses are included in the profit and loss account, except those arising on the translation of the Bank’s net investment in foreign branches, which are taken to the capital reserve (exchange translation reserve).
5.12.4 Commitments
Commitments for outstanding forward foreign exchange contracts are disclosed in these financial statements at committed amounts. Contingent liabilities / commitments for letters of credit and letters of guarantee denominated in foreign currencies are expressed in Rupee terms at the rates of exchange ruling on the balance sheet date.
5.13 Revenue recognition
– Mark–up / interest on advances and returns on investments are recognized on a time proportion basis using the effective interest method except that mark–up / interest on non–performing advances and investments is recognized on a receipt basis, in accordance with the requirements of the Prudential Regulations issued by the State Bank of Pakistan (SBP) or as permitted by the regulations of the overseas regulatory authorities of the countries where the branches operate.
– Financing method is used in accounting for income from lease financing. Under this method, the unearned lease income (excess of the sum of total lease rentals and estimated residual value over the cost of leased assets) is deferred and taken to income over the term of the lease period so as to produce a constant periodic rate of return on the outstanding net investment in lease. Gains / losses on termination of lease contracts are recognized as income when these are realized.
– Unrealized lease income is held in suspense account, where necessary, in accordance with the requirements of SBP or overseas regulatory authorities of the country where the foreign branches of the Bank operate.
– Premium on foreign currency options and commission income is recognized on a time proportion basis.
– Dividend income is recognized when the Group’s right to receive dividend is established.
– Gain / loss on sale of investments is credited / charged to profit and loss account currently.
– Outsourcing and networking service revenue is recognized on an accrual basis.
– Revenue for acting as trustee is recognized on net asset value (NAV) of respective funds.
– Commission income is recognized at the time of sale of units by the Asset Management Company.
5.14 Operating leases
Operating lease rentals are recorded in profit and loss account on a time proportion basis over the term of the lease arrangements.
Notes to the Consolidated Financial StatementsFor the year ended December 31, 2009
Annual Report 2009 I 169
5.15 Cash and cash equivalents
Cash and cash equivalents include cash and balances with treasury banks and balances with other banks in current and deposit accounts.
5.16 Financial instruments
5.16.1 Financial assets and financial liabilities
Financial instruments carried on the balance sheet include cash and balances with treasury banks, balances with other banks, lendings to financial institutions, investments (excluding investment in associates and subsidiaries), advances, other assets, bills payable, borrowings, deposits and other liabilities. The particular recognition methods adopted for significant financial assets and financial liabilities are disclosed in the individual policy statements associated with these assets and liabilities.
5.16.2 Derivative financial instruments
Derivative financial instruments are initially recognized at fair value on the date on which a derivative contract is entered into and are subsequently remeasured at their fair value using valuation techniques. All the derivative financial instruments are carried as an asset when the fair value is positive and liability when the fair value is negative. Any change in the fair value of derivative financial instruments is taken to the profit and loss account currently.
5.16.3 Off setting
Financial assets and financial liabilities are set off and the net amount is reported in the financial statements when there is a legally enforceable right to set off and the Group intends either to settle on a net basis, or to realize the assets and settle the liabilities, simultaneously.
5.17 Share issuance cost
Share issuance cost directly attributable to issuance of shares, is recognized as deduction from the share premium account.
5.18 Segment reporting
A segment is a distinguishable component of the Group that is engaged in providing products or services (business segment) or in providing products or services within a particular economic environment (geographical segment), which is subject to risks and rewards that are different from those of other segments. The Group’s primary format of reporting is based on business segments.
5.18.1 Business segments
Corporate Finance
Corporate Finance includes underwriting, securitization, investment banking, syndications, IPO related activities (excluding investments) and secondary private placements.
Trading and Sales
It includes fixed income, equity, foreign exchange commodities, lendings to financial institutions and brokerage debt.
Retail and Consumer Banking
It includes retail lending and deposits, banking services, private lending and deposits, banking services and retail offered to its retail customers and small and medium enterprises.
Commercial Banking
It includes project finance, export finance, trade finance, leasing, lending, guarantees and bills of exchange relating to its corporate customers.
5.18.2 Geographical segments
The Group operates in three geographic regions being:
– Pakistan – Asia Pacific (including South Asia)
– Middle East 5.19 Dividend distribution and appropriation
Dividends (including bonus dividend) and other appropriations (except appropriations which are required by law) are recognized in the period in which these are approved.
Notes to the Consolidated Financial StatementsFor the year ended December 31, 2009
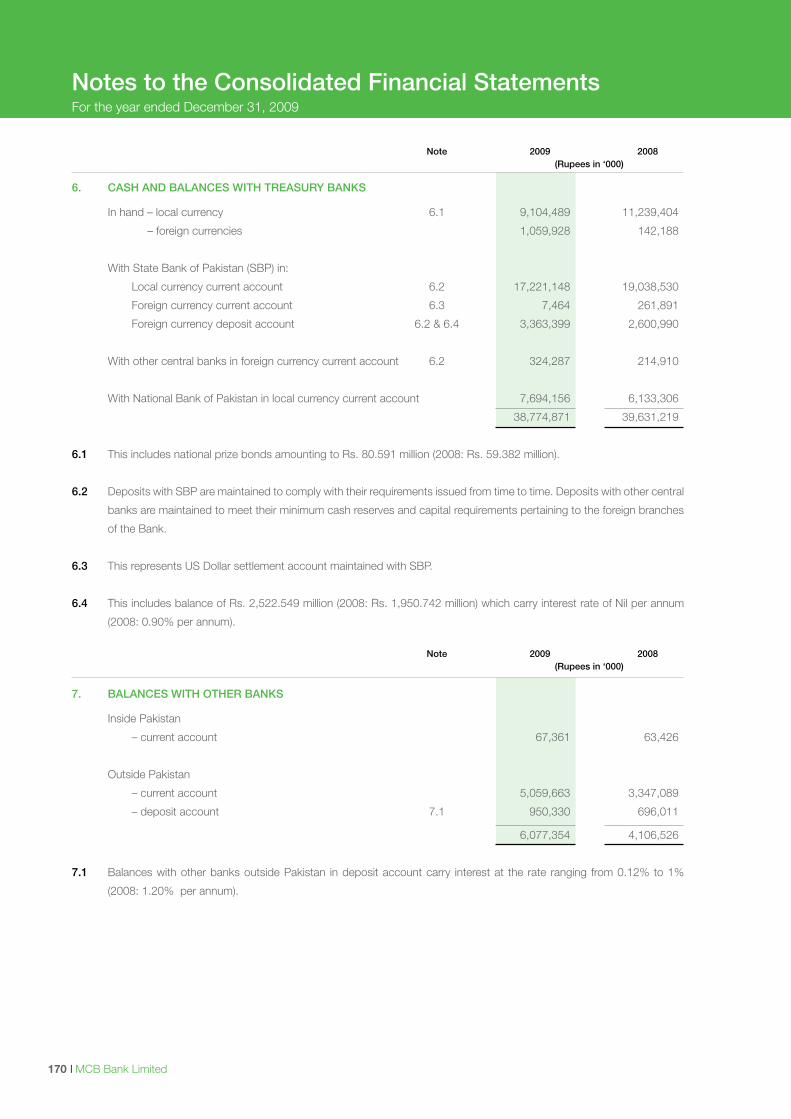
I MCB Bank Limited170
Notes to the Consolidated Financial StatementsFor the year ended December 31, 2009
Note 2009 2008 (Rupees in ‘000)
6. CASH AND BALANCES WITH TREASURY BANKS
In hand – local currency 6.1 9,104,489 11,239,404
– foreign currencies 1,059,928 142,188
With State Bank of Pakistan (SBP) in:
Local currency current account 6.2 17,221,148 19,038,530
Foreign currency current account 6.3 7,464 261,891
Foreign currency deposit account 6.2 & 6.4 3,363,399 2,600,990
With other central banks in foreign currency current account 6.2 324,287 214,910
With National Bank of Pakistan in local currency current account 7,694,156 6,133,306
38,774,871 39,631,219
6.1 This includes national prize bonds amounting to Rs. 80.591 million (2008: Rs. 59.382 million).
6.2 Deposits with SBP are maintained to comply with their requirements issued from time to time. Deposits with other central
banks are maintained to meet their minimum cash reserves and capital requirements pertaining to the foreign branches
of the Bank.
6.3 This represents US Dollar settlement account maintained with SBP.
6.4 This includes balance of Rs. 2,522.549 million (2008: Rs. 1,950.742 million) which carry interest rate of Nil per annum
(2008: 0.90% per annum).
Note 2009 2008 (Rupees in ‘000)
7. BALANCES WITH OTHER BANKS
Inside Pakistan
– current account 67,361 63,426
Outside Pakistan
– current account 5,059,663 3,347,089
– deposit account 7.1 950,330 696,011
6,077,354 4,106,526
7.1 Balances with other banks outside Pakistan in deposit account carry interest at the rate ranging from 0.12% to 1%
(2008: 1.20% per annum).
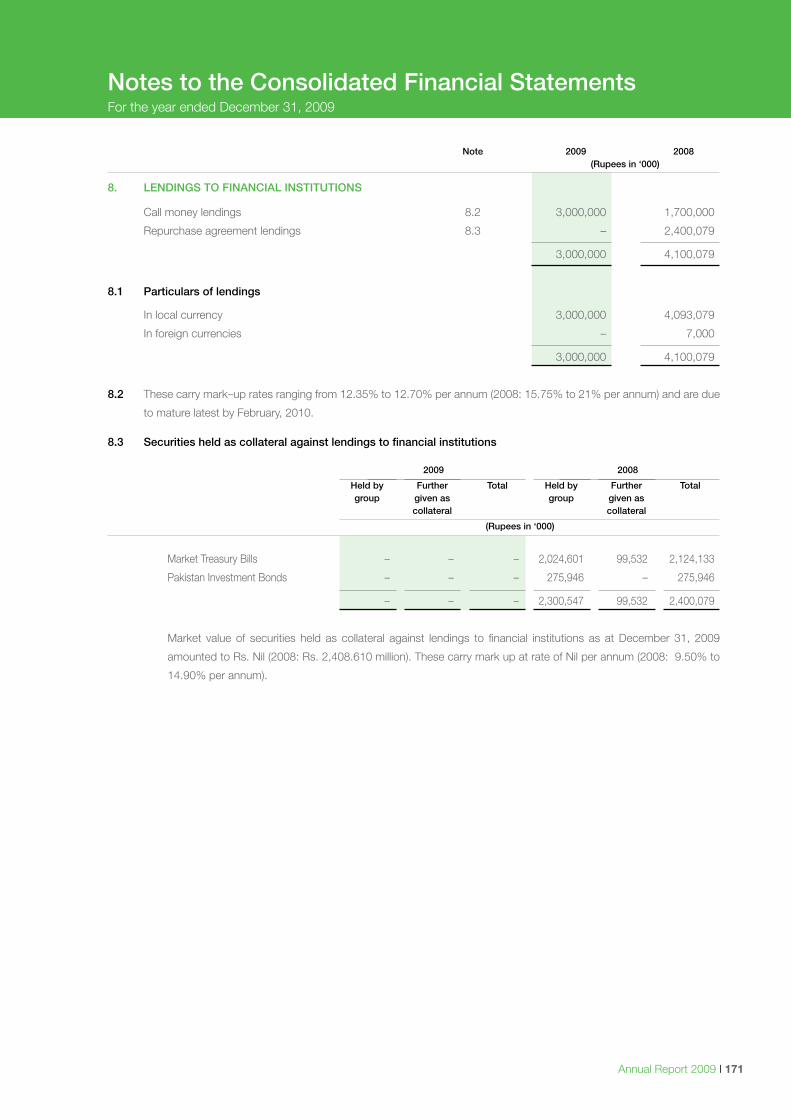
Annual Report 2009 I 171
Notes to the Consolidated Financial StatementsFor the year ended December 31, 2009
Note 2009 2008 (Rupees in ‘000)
8. LENDINGS TO FINANCIAL INSTITUTIONS
Call money lendings 8.2 3,000,000 1,700,000
Repurchase agreement lendings 8.3 – 2,400,079
3,000,000 4,100,079
8.1 Particulars of lendings
In local currency 3,000,000 4,093,079
In foreign currencies – 7,000
3,000,000 4,100,079
8.2 These carry mark–up rates ranging from 12.35% to 12.70% per annum (2008: 15.75% to 21% per annum) and are due
to mature latest by February, 2010. 8.3 Securities held as collateral against lendings to financial institutions
2009 2008
Held by Further Total Held by Further Total group given as group given as collateral collateral
(Rupees in ‘000)
Market Treasury Bills – – – 2,024,601 99,532 2,124,133
Pakistan Investment Bonds – – – 275,946 – 275,946
– – – 2,300,547 99,532 2,400,079
Market value of securities held as collateral against lendings to financial institutions as at December 31, 2009
amounted to Rs. Nil (2008: Rs. 2,408.610 million). These carry mark up at rate of Nil per annum (2008: 9.50% to
14.90% per annum).
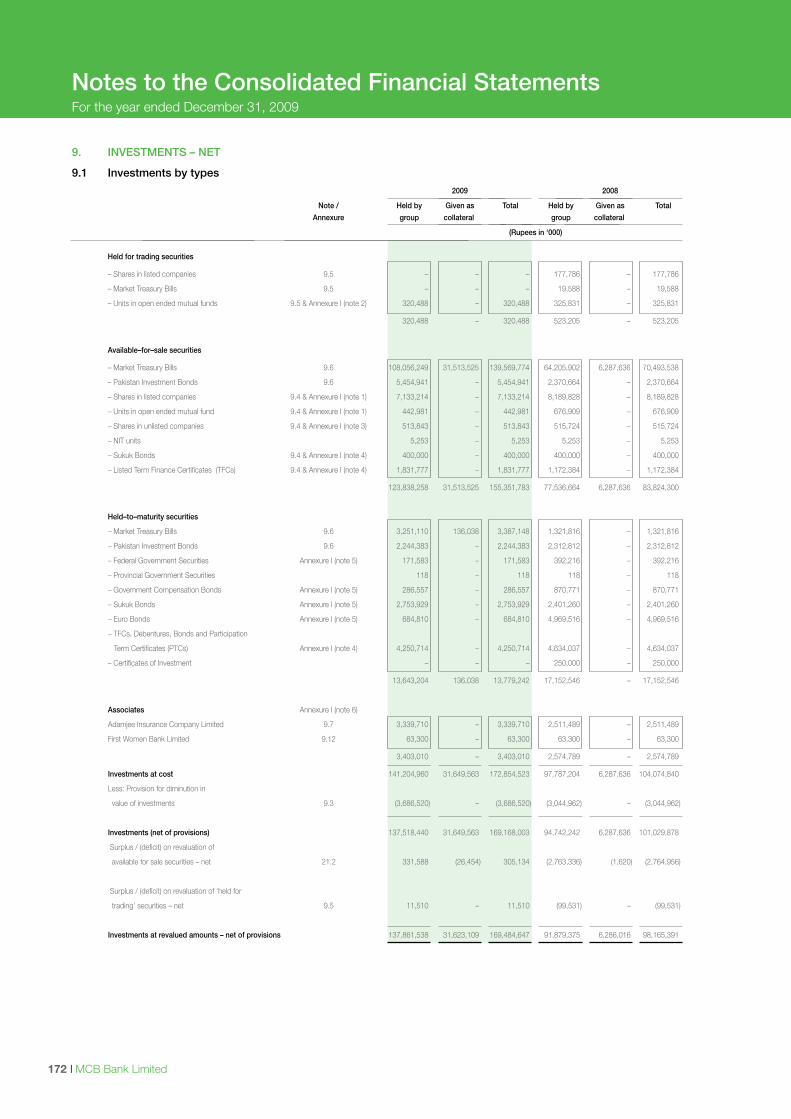
I MCB Bank Limited172
9. INVESTMENTS – NET
9.1 Investments by types
2009 2008
Note / Held by Given as Total Held by Given as Total
Annexure group collateral group collateral
(Rupees in ‘000)
Held for trading securities
– Shares in listed companies 9.5 – – – 177,786 – 177,786
– Market Treasury Bills 9.5 – – – 19,588 – 19,588
– Units in open ended mutual funds 9.5 & Annexure I (note 2) 320,488 – 320,488 325,831 – 325,831
320,488 – 320,488 523,205 – 523,205
Available–for–sale securities
– Market Treasury Bills 9.6 108,056,249 31,513,525 139,569,774 64,205,902 6,287,636 70,493,538
– Pakistan Investment Bonds 9.6 5,454,941 – 5,454,941 2,370,664 – 2,370,664
– Shares in listed companies 9.4 & Annexure I (note 1) 7,133,214 – 7,133,214 8,189,828 – 8,189,828
– Units in open ended mutual fund 9.4 & Annexure I (note 1) 442,981 – 442,981 676,909 – 676,909
– Shares in unlisted companies 9.4 & Annexure I (note 3) 513,843 – 513,843 515,724 – 515,724
– NIT units 5,253 – 5,253 5,253 – 5,253
– Sukuk Bonds 9.4 & Annexure I (note 4) 400,000 – 400,000 400,000 – 400,000
– Listed Term Finance Certificates (TFCs) 9.4 & Annexure I (note 4) 1,831,777 – 1,831,777 1,172,384 – 1,172,384
123,838,258 31,513,525 155,351,783 77,536,664 6,287,636 83,824,300
Held–to–maturity securities
– Market Treasury Bills 9.6 3,251,110 136,038 3,387,148 1,321,816 – 1,321,816
– Pakistan Investment Bonds 9.6 2,244,383 – 2,244,383 2,312,812 – 2,312,812
– Federal Government Securities Annexure I (note 5) 171,583 – 171,583 392,216 – 392,216
– Provincial Government Securities 118 – 118 118 – 118
– Government Compensation Bonds Annexure I (note 5) 286,557 – 286,557 870,771 – 870,771
– Sukuk Bonds Annexure I (note 5) 2,753,929 – 2,753,929 2,401,260 – 2,401,260
– Euro Bonds Annexure I (note 5) 684,810 – 684,810 4,969,516 – 4,969,516
– TFCs, Debentures, Bonds and Participation
Term Certificates (PTCs) Annexure I (note 4) 4,250,714 – 4,250,714 4,634,037 – 4,634,037
– Certificates of Investment – – – 250,000 – 250,000
13,643,204 136,038 13,779,242 17,152,546 – 17,152,546
Associates Annexure I (note 6)
Adamjee Insurance Company Limited 9.7 3,339,710 – 3,339,710 2,511,489 – 2,511,489
First Women Bank Limited 9.12 63,300 – 63,300 63,300 – 63,300
3,403,010 – 3,403,010 2,574,789 – 2,574,789
Investments at cost 141,204,960 31,649,563 172,854,523 97,787,204 6,287,636 104,074,840
Less: Provision for diminution in
value of investments 9.3 (3,686,520) – (3,686,520) (3,044,962) – (3,044,962)
Investments (net of provisions) 137,518,440 31,649,563 169,168,003 94,742,242 6,287,636 101,029,878
Surplus / (deficit) on revaluation of
available for sale securities – net 21.2 331,588 (26,454) 305,134 (2,763,336) (1,620) (2,764,956)
Surplus / (deficit) on revaluation of ‘held for
trading’ securities – net 9.5 11,510 – 11,510 (99,531) – (99,531)
Investments at revalued amounts – net of provisions 137,861,538 31,623,109 169,484,647 91,879,375 6,286,016 98,165,391
Notes to the Consolidated Financial StatementsFor the year ended December 31, 2009
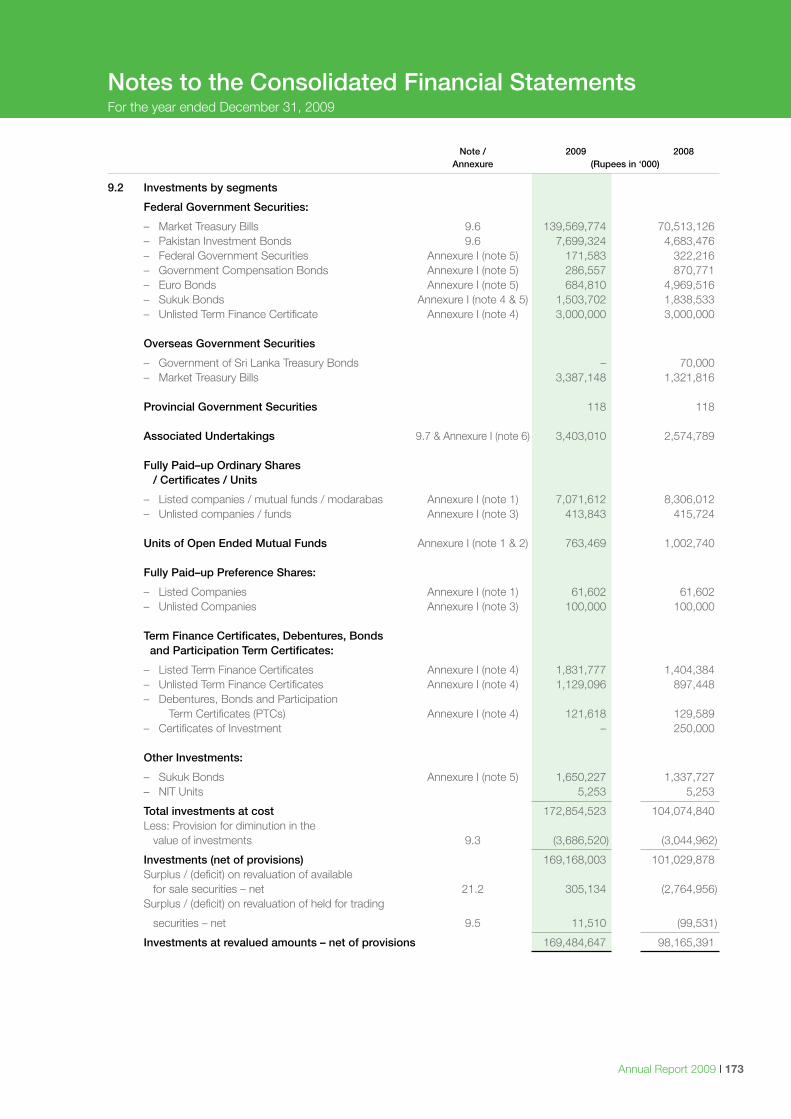
Annual Report 2009 I 173
Notes to the Consolidated Financial StatementsFor the year ended December 31, 2009
Note / 2009 2008 Annexure (Rupees in ‘000)
9.2 Investments by segments
Federal Government Securities:
– Market Treasury Bills 9.6 139,569,774 70,513,126 – Pakistan Investment Bonds 9.6 7,699,324 4,683,476 – Federal Government Securities Annexure I (note 5) 171,583 322,216 – Government Compensation Bonds Annexure I (note 5) 286,557 870,771 – Euro Bonds Annexure I (note 5) 684,810 4,969,516 – Sukuk Bonds Annexure I (note 4 & 5) 1,503,702 1,838,533 – Unlisted Term Finance Certificate Annexure I (note 4) 3,000,000 3,000,000 Overseas Government Securities
– Government of Sri Lanka Treasury Bonds – 70,000 – Market Treasury Bills 3,387,148 1,321,816 Provincial Government Securities 118 118 Associated Undertakings 9.7 & Annexure I (note 6) 3,403,010 2,574,789 Fully Paid–up Ordinary Shares / Certificates / Units
– Listed companies / mutual funds / modarabas Annexure I (note 1) 7,071,612 8,306,012 – Unlisted companies / funds Annexure I (note 3) 413,843 415,724 Units of Open Ended Mutual Funds Annexure I (note 1 & 2) 763,469 1,002,740 Fully Paid–up Preference Shares:
– Listed Companies Annexure I (note 1) 61,602 61,602 – Unlisted Companies Annexure I (note 3) 100,000 100,000
Term Finance Certificates, Debentures, Bonds and Participation Term Certificates:
– Listed Term Finance Certificates Annexure I (note 4) 1,831,777 1,404,384 – Unlisted Term Finance Certificates Annexure I (note 4) 1,129,096 897,448 – Debentures, Bonds and Participation Term Certificates (PTCs) Annexure I (note 4) 121,618 129,589 – Certificates of Investment – 250,000 Other Investments:
– Sukuk Bonds Annexure I (note 5) 1,650,227 1,337,727 – NIT Units 5,253 5,253
Total investments at cost 172,854,523 104,074,840 Less: Provision for diminution in the value of investments 9.3 (3,686,520) (3,044,962)
Investments (net of provisions) 169,168,003 101,029,878 Surplus / (deficit) on revaluation of available for sale securities – net 21.2 305,134 (2,764,956) Surplus / (deficit) on revaluation of held for trading
securities – net 9.5 11,510 (99,531)
Investments at revalued amounts – net of provisions 169,484,647 98,165,391
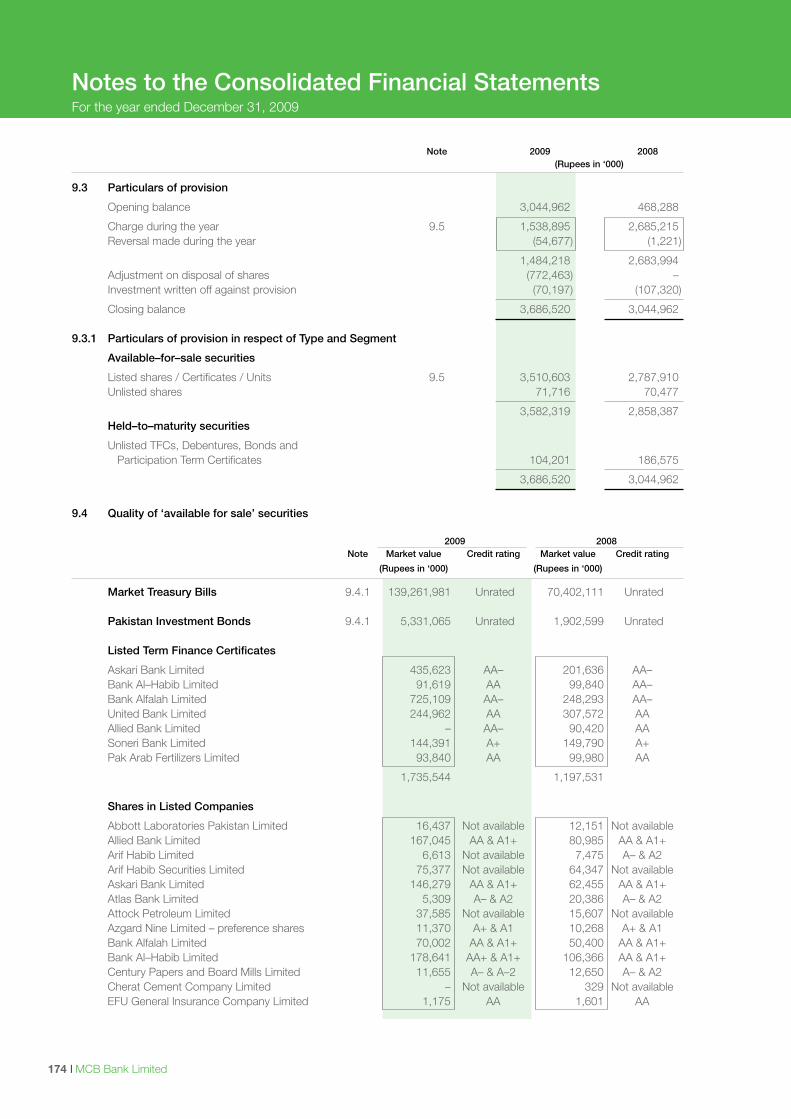
I MCB Bank Limited174
Note 2009 2008 (Rupees in ‘000)
9.3 Particulars of provision
Opening balance 3,044,962 468,288
Charge during the year 9.5 1,538,895 2,685,215 Reversal made during the year (54,677) (1,221)
1,484,218 2,683,994 Adjustment on disposal of shares (772,463) – Investment written off against provision (70,197) (107,320)
Closing balance 3,686,520 3,044,962 9.3.1 Particulars of provision in respect of Type and Segment
Available–for–sale securities
Listed shares / Certificates / Units 9.5 3,510,603 2,787,910 Unlisted shares 71,716 70,477
3,582,319 2,858,387 Held–to–maturity securities
Unlisted TFCs, Debentures, Bonds and Participation Term Certificates 104,201 186,575
3,686,520 3,044,962
9.4 Quality of ‘available for sale’ securities 2009 2008 Note Market value Credit rating Market value Credit rating
(Rupees in ‘000) (Rupees in ‘000)
Market Treasury Bills 9.4.1 139,261,981 Unrated 70,402,111 Unrated Pakistan Investment Bonds 9.4.1 5,331,065 Unrated 1,902,599 Unrated Listed Term Finance Certificates
Askari Bank Limited 435,623 AA– 201,636 AA– Bank Al–Habib Limited 91,619 AA 99,840 AA– Bank Alfalah Limited 725,109 AA– 248,293 AA– United Bank Limited 244,962 AA 307,572 AA Allied Bank Limited – AA– 90,420 AA Soneri Bank Limited 144,391 A+ 149,790 A+ Pak Arab Fertilizers Limited 93,840 AA 99,980 AA
1,735,544 1,197,531 Shares in Listed Companies
Abbott Laboratories Pakistan Limited 16,437 Not available 12,151 Not available Allied Bank Limited 167,045 AA & A1+ 80,985 AA & A1+ Arif Habib Limited 6,613 Not available 7,475 A– & A2 Arif Habib Securities Limited 75,377 Not available 64,347 Not available Askari Bank Limited 146,279 AA & A1+ 62,455 AA & A1+ Atlas Bank Limited 5,309 A– & A2 20,386 A– & A2 Attock Petroleum Limited 37,585 Not available 15,607 Not available Azgard Nine Limited – preference shares 11,370 A+ & A1 10,268 A+ & A1 Bank Alfalah Limited 70,002 AA & A1+ 50,400 AA & A1+ Bank Al–Habib Limited 178,641 AA+ & A1+ 106,366 AA & A1+ Century Papers and Board Mills Limited 11,655 A– & A–2 12,650 A– & A2 Cherat Cement Company Limited – Not available 329 Not available EFU General Insurance Company Limited 1,175 AA 1,601 AA
Notes to the Consolidated Financial StatementsFor the year ended December 31, 2009
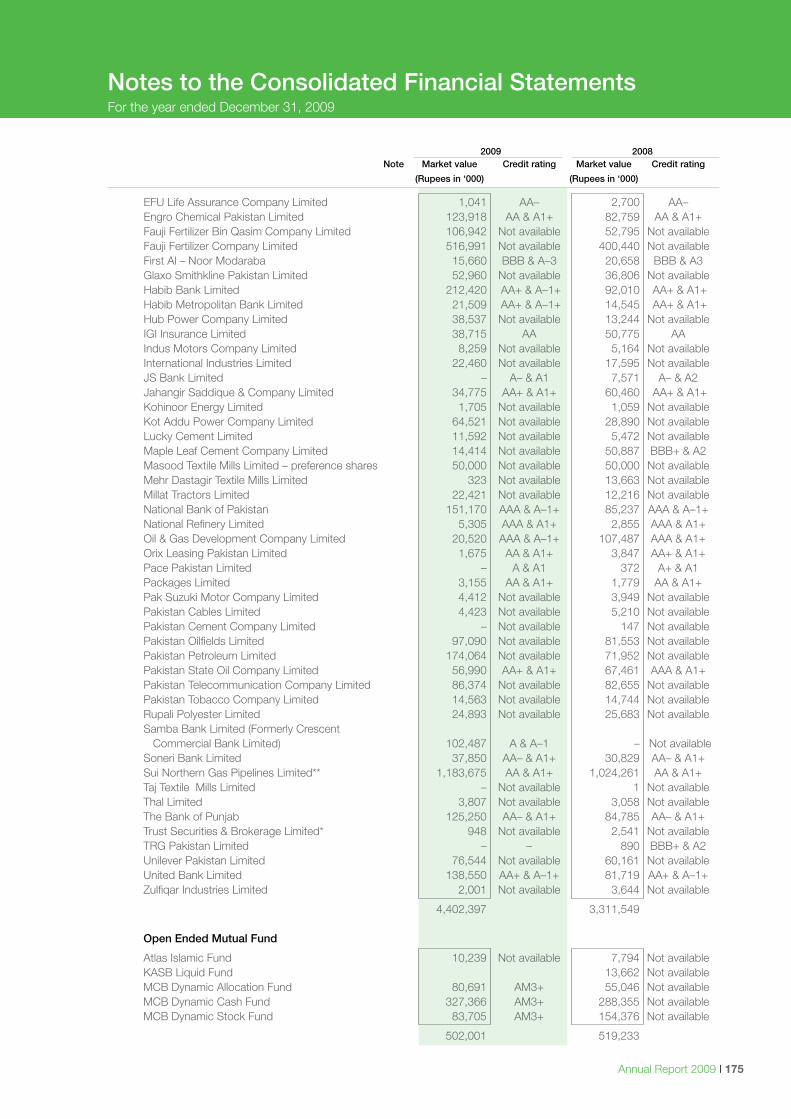
Annual Report 2009 I 175
Notes to the Consolidated Financial StatementsFor the year ended December 31, 2009
2009 2008 Note Market value Credit rating Market value Credit rating
(Rupees in ‘000) (Rupees in ‘000)
EFU Life Assurance Company Limited 1,041 AA– 2,700 AA– Engro Chemical Pakistan Limited 123,918 AA & A1+ 82,759 AA & A1+ Fauji Fertilizer Bin Qasim Company Limited 106,942 Not available 52,795 Not available Fauji Fertilizer Company Limited 516,991 Not available 400,440 Not available First Al – Noor Modaraba 15,660 BBB & A–3 20,658 BBB & A3 Glaxo Smithkline Pakistan Limited 52,960 Not available 36,806 Not available Habib Bank Limited 212,420 AA+ & A–1+ 92,010 AA+ & A1+ Habib Metropolitan Bank Limited 21,509 AA+ & A–1+ 14,545 AA+ & A1+ Hub Power Company Limited 38,537 Not available 13,244 Not available IGI Insurance Limited 38,715 AA 50,775 AA Indus Motors Company Limited 8,259 Not available 5,164 Not available International Industries Limited 22,460 Not available 17,595 Not available JS Bank Limited – A– & A1 7,571 A– & A2 Jahangir Saddique & Company Limited 34,775 AA+ & A1+ 60,460 AA+ & A1+ Kohinoor Energy Limited 1,705 Not available 1,059 Not available Kot Addu Power Company Limited 64,521 Not available 28,890 Not available Lucky Cement Limited 11,592 Not available 5,472 Not available Maple Leaf Cement Company Limited 14,414 Not available 50,887 BBB+ & A2 Masood Textile Mills Limited – preference shares 50,000 Not available 50,000 Not available Mehr Dastagir Textile Mills Limited 323 Not available 13,663 Not available Millat Tractors Limited 22,421 Not available 12,216 Not available National Bank of Pakistan 151,170 AAA & A–1+ 85,237 AAA & A–1+ National Refinery Limited 5,305 AAA & A1+ 2,855 AAA & A1+ Oil & Gas Development Company Limited 20,520 AAA & A–1+ 107,487 AAA & A1+ Orix Leasing Pakistan Limited 1,675 AA & A1+ 3,847 AA+ & A1+ Pace Pakistan Limited – A & A1 372 A+ & A1 Packages Limited 3,155 AA & A1+ 1,779 AA & A1+ Pak Suzuki Motor Company Limited 4,412 Not available 3,949 Not available Pakistan Cables Limited 4,423 Not available 5,210 Not available Pakistan Cement Company Limited – Not available 147 Not available Pakistan Oilfields Limited 97,090 Not available 81,553 Not available Pakistan Petroleum Limited 174,064 Not available 71,952 Not available Pakistan State Oil Company Limited 56,990 AA+ & A1+ 67,461 AAA & A1+ Pakistan Telecommunication Company Limited 86,374 Not available 82,655 Not available Pakistan Tobacco Company Limited 14,563 Not available 14,744 Not available Rupali Polyester Limited 24,893 Not available 25,683 Not available Samba Bank Limited (Formerly Crescent Commercial Bank Limited) 102,487 A & A–1 – Not available Soneri Bank Limited 37,850 AA– & A1+ 30,829 AA– & A1+ Sui Northern Gas Pipelines Limited** 1,183,675 AA & A1+ 1,024,261 AA & A1+ Taj Textile Mills Limited – Not available 1 Not available Thal Limited 3,807 Not available 3,058 Not available The Bank of Punjab 125,250 AA– & A1+ 84,785 AA– & A1+ Trust Securities & Brokerage Limited* 948 Not available 2,541 Not available TRG Pakistan Limited – – 890 BBB+ & A2 Unilever Pakistan Limited 76,544 Not available 60,161 Not available United Bank Limited 138,550 AA+ & A–1+ 81,719 AA+ & A–1+ Zulfiqar Industries Limited 2,001 Not available 3,644 Not available
4,402,397 3,311,549 Open Ended Mutual Fund
Atlas Islamic Fund 10,239 Not available 7,794 Not available KASB Liquid Fund 13,662 Not available MCB Dynamic Allocation Fund 80,691 AM3+ 55,046 Not available MCB Dynamic Cash Fund 327,366 AM3+ 288,355 Not available MCB Dynamic Stock Fund 83,705 AM3+ 154,376 Not available
502,001 519,233
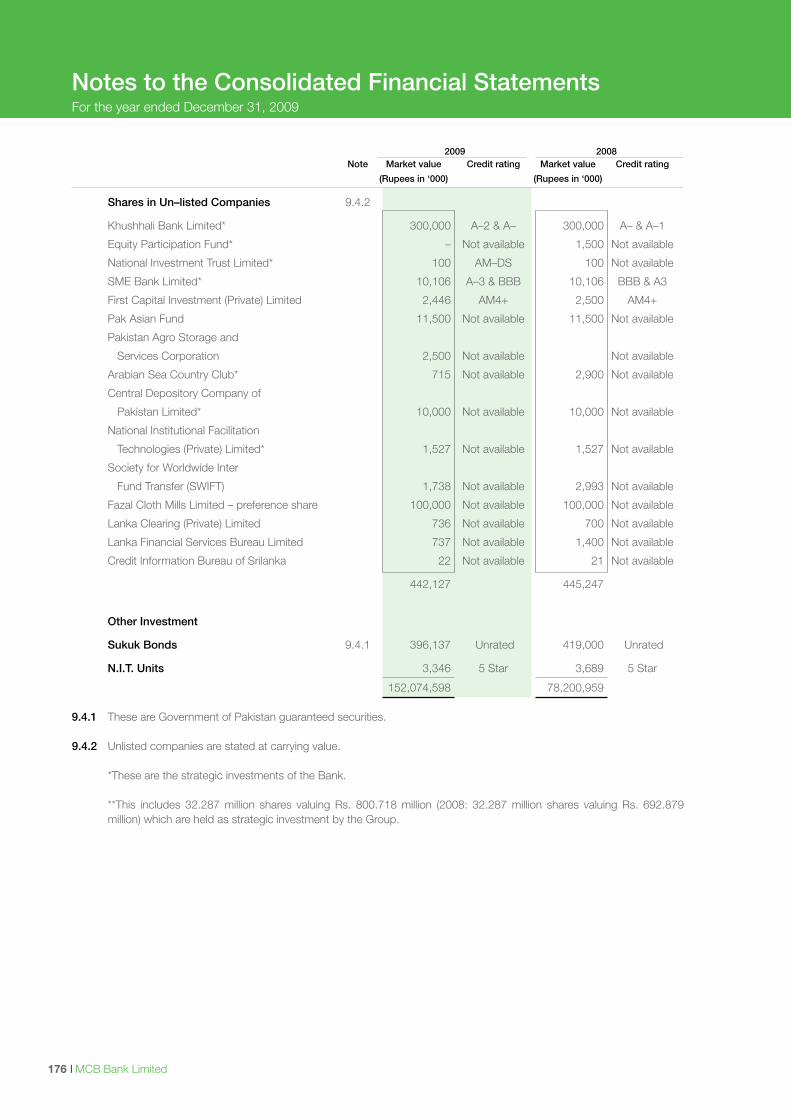
I MCB Bank Limited176
2009 2008 Note Market value Credit rating Market value Credit rating
(Rupees in ‘000) (Rupees in ‘000)
Shares in Un–listed Companies 9.4.2
Khushhali Bank Limited* 300,000 A–2 & A– 300,000 A– & A–1
Equity Participation Fund* – Not available 1,500 Not available
National Investment Trust Limited* 100 AM–DS 100 Not available
SME Bank Limited* 10,106 A–3 & BBB 10,106 BBB & A3
First Capital Investment (Private) Limited 2,446 AM4+ 2,500 AM4+
Pak Asian Fund 11,500 Not available 11,500 Not available
Pakistan Agro Storage and
Services Corporation 2,500 Not available Not available
Arabian Sea Country Club* 715 Not available 2,900 Not available
Central Depository Company of
Pakistan Limited* 10,000 Not available 10,000 Not available
National Institutional Facilitation
Technologies (Private) Limited* 1,527 Not available 1,527 Not available
Society for Worldwide Inter
Fund Transfer (SWIFT) 1,738 Not available 2,993 Not available
Fazal Cloth Mills Limited – preference share 100,000 Not available 100,000 Not available
Lanka Clearing (Private) Limited 736 Not available 700 Not available
Lanka Financial Services Bureau Limited 737 Not available 1,400 Not available
Credit Information Bureau of Srilanka 22 Not available 21 Not available
442,127 445,247
Other Investment
Sukuk Bonds 9.4.1 396,137 Unrated 419,000 Unrated
N.I.T. Units 3,346 5 Star 3,689 5 Star
152,074,598 78,200,959 9.4.1 These are Government of Pakistan guaranteed securities.
9.4.2 Unlisted companies are stated at carrying value. *These are the strategic investments of the Bank. **This includes 32.287 million shares valuing Rs. 800.718 million (2008: 32.287 million shares valuing Rs. 692.879
million) which are held as strategic investment by the Group.
Notes to the Consolidated Financial StatementsFor the year ended December 31, 2009
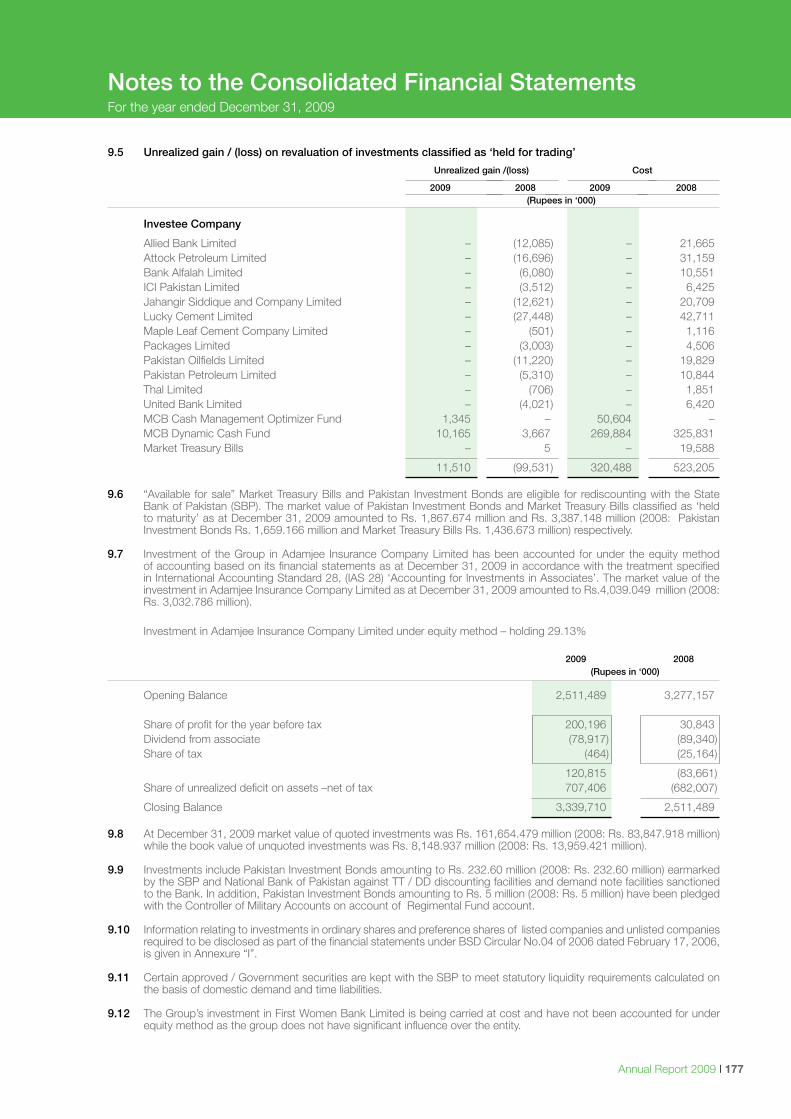
Annual Report 2009 I 177
9.5 Unrealized gain / (loss) on revaluation of investments classified as ‘held for trading’
Unrealized gain /(loss) Cost
2009 2008 2009 2008 (Rupees in ‘000)
Investee Company
Allied Bank Limited – (12,085) – 21,665 Attock Petroleum Limited – (16,696) – 31,159 Bank Alfalah Limited – (6,080) – 10,551 ICI Pakistan Limited – (3,512) – 6,425 Jahangir Siddique and Company Limited – (12,621) – 20,709 Lucky Cement Limited – (27,448) – 42,711 Maple Leaf Cement Company Limited – (501) – 1,116 Packages Limited – (3,003) – 4,506 Pakistan Oilfields Limited – (11,220) – 19,829 Pakistan Petroleum Limited – (5,310) – 10,844 Thal Limited – (706) – 1,851 United Bank Limited – (4,021) – 6,420 MCB Cash Management Optimizer Fund 1,345 – 50,604 – MCB Dynamic Cash Fund 10,165 3,667 269,884 325,831 Market Treasury Bills – 5 – 19,588
11,510 (99,531) 320,488 523,205 9.6 “Available for sale” Market Treasury Bills and Pakistan Investment Bonds are eligible for rediscounting with the State
Bank of Pakistan (SBP). The market value of Pakistan Investment Bonds and Market Treasury Bills classified as ‘held to maturity’ as at December 31, 2009 amounted to Rs. 1,867.674 million and Rs. 3,387.148 million (2008: Pakistan Investment Bonds Rs. 1,659.166 million and Market Treasury Bills Rs. 1,436.673 million) respectively.
9.7 Investment of the Group in Adamjee Insurance Company Limited has been accounted for under the equity method of accounting based on its financial statements as at December 31, 2009 in accordance with the treatment specified in International Accounting Standard 28, (IAS 28) ‘Accounting for Investments in Associates’. The market value of the investment in Adamjee Insurance Company Limited as at December 31, 2009 amounted to Rs.4,039.049 million (2008: Rs. 3,032.786 million).
Investment in Adamjee Insurance Company Limited under equity method – holding 29.13%
2009 2008 (Rupees in ‘000)
Opening Balance 2,511,489 3,277,157 Share of profit for the year before tax 200,196 30,843 Dividend from associate (78,917) (89,340) Share of tax (464) (25,164)
120,815 (83,661) Share of unrealized deficit on assets –net of tax 707,406 (682,007)
Closing Balance 3,339,710 2,511,489 9.8 At December 31, 2009 market value of quoted investments was Rs. 161,654.479 million (2008: Rs. 83,847.918 million)
while the book value of unquoted investments was Rs. 8,148.937 million (2008: Rs. 13,959.421 million). 9.9 Investments include Pakistan Investment Bonds amounting to Rs. 232.60 million (2008: Rs. 232.60 million) earmarked
by the SBP and National Bank of Pakistan against TT / DD discounting facilities and demand note facilities sanctioned to the Bank. In addition, Pakistan Investment Bonds amounting to Rs. 5 million (2008: Rs. 5 million) have been pledged with the Controller of Military Accounts on account of Regimental Fund account.
9.10 Information relating to investments in ordinary shares and preference shares of listed companies and unlisted companies
required to be disclosed as part of the financial statements under BSD Circular No.04 of 2006 dated February 17, 2006, is given in Annexure “I”.
9.11 Certain approved / Government securities are kept with the SBP to meet statutory liquidity requirements calculated on the basis of domestic demand and time liabilities.
9.12 The Group’s investment in First Women Bank Limited is being carried at cost and have not been accounted for under
equity method as the group does not have significant influence over the entity.
Notes to the Consolidated Financial StatementsFor the year ended December 31, 2009
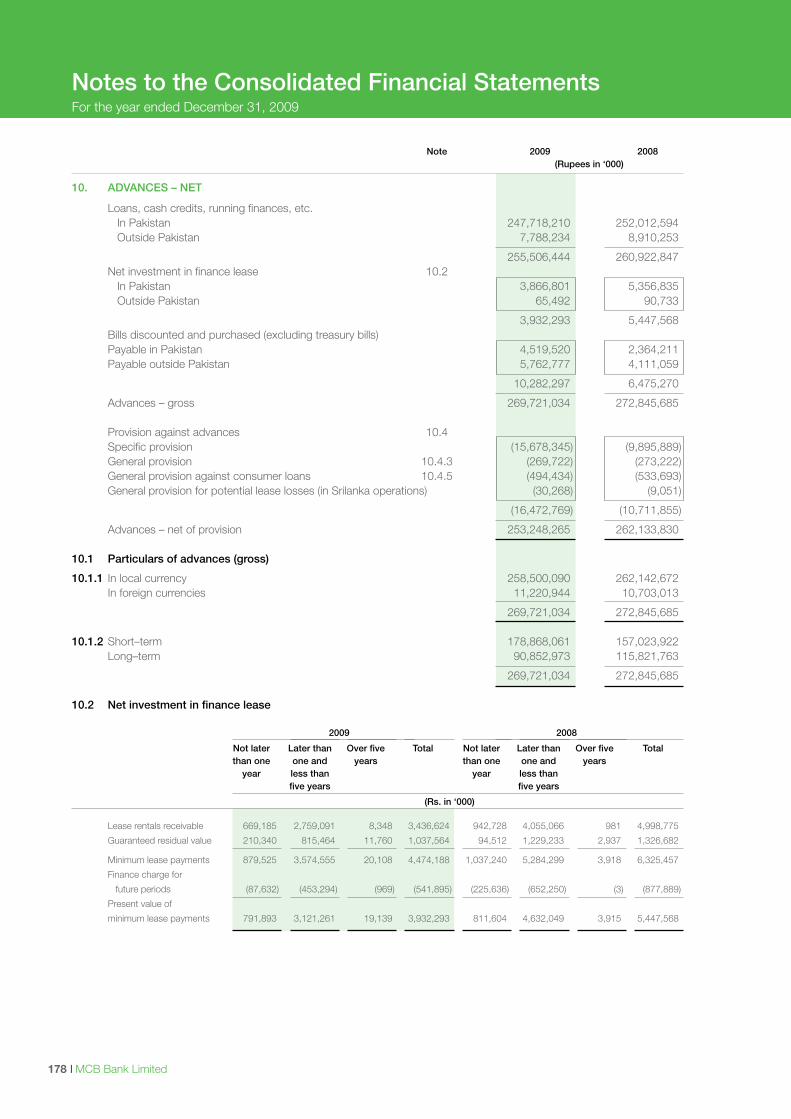
I MCB Bank Limited178
Notes to the Consolidated Financial StatementsFor the year ended December 31, 2009
Note 2009 2008 (Rupees in ‘000)
10. ADVANCES – NET
Loans, cash credits, running finances, etc. In Pakistan 247,718,210 252,012,594 Outside Pakistan 7,788,234 8,910,253
255,506,444 260,922,847 Net investment in finance lease 10.2 In Pakistan 3,866,801 5,356,835 Outside Pakistan 65,492 90,733
3,932,293 5,447,568 Bills discounted and purchased (excluding treasury bills) Payable in Pakistan 4,519,520 2,364,211 Payable outside Pakistan 5,762,777 4,111,059
10,282,297 6,475,270
Advances – gross 269,721,034 272,845,685 Provision against advances 10.4 Specific provision (15,678,345) (9,895,889) General provision 10.4.3 (269,722) (273,222) General provision against consumer loans 10.4.5 (494,434) (533,693) General provision for potential lease losses (in Srilanka operations) (30,268) (9,051)
(16,472,769) (10,711,855)
Advances – net of provision 253,248,265 262,133,830 10.1 Particulars of advances (gross)
10.1.1 In local currency 258,500,090 262,142,672 In foreign currencies 11,220,944 10,703,013
269,721,034 272,845,685 10.1.2 Short–term 178,868,061 157,023,922 Long–term 90,852,973 115,821,763
269,721,034 272,845,685 10.2 Net investment in finance lease 2009 2008
Not later Later than Over five Total Not later Later than Over five Total than one one and years than one one and years year less than year less than five years five years
(Rs. in ‘000)
Lease rentals receivable 669,185 2,759,091 8,348 3,436,624 942,728 4,055,066 981 4,998,775
Guaranteed residual value 210,340 815,464 11,760 1,037,564 94,512 1,229,233 2,937 1,326,682
Minimum lease payments 879,525 3,574,555 20,108 4,474,188 1,037,240 5,284,299 3,918 6,325,457
Finance charge for
future periods (87,632) (453,294) (969) (541,895) (225,636) (652,250) (3) (877,889)
Present value of
minimum lease payments 791,893 3,121,261 19,139 3,932,293 811,604 4,632,049 3,915 5,447,568
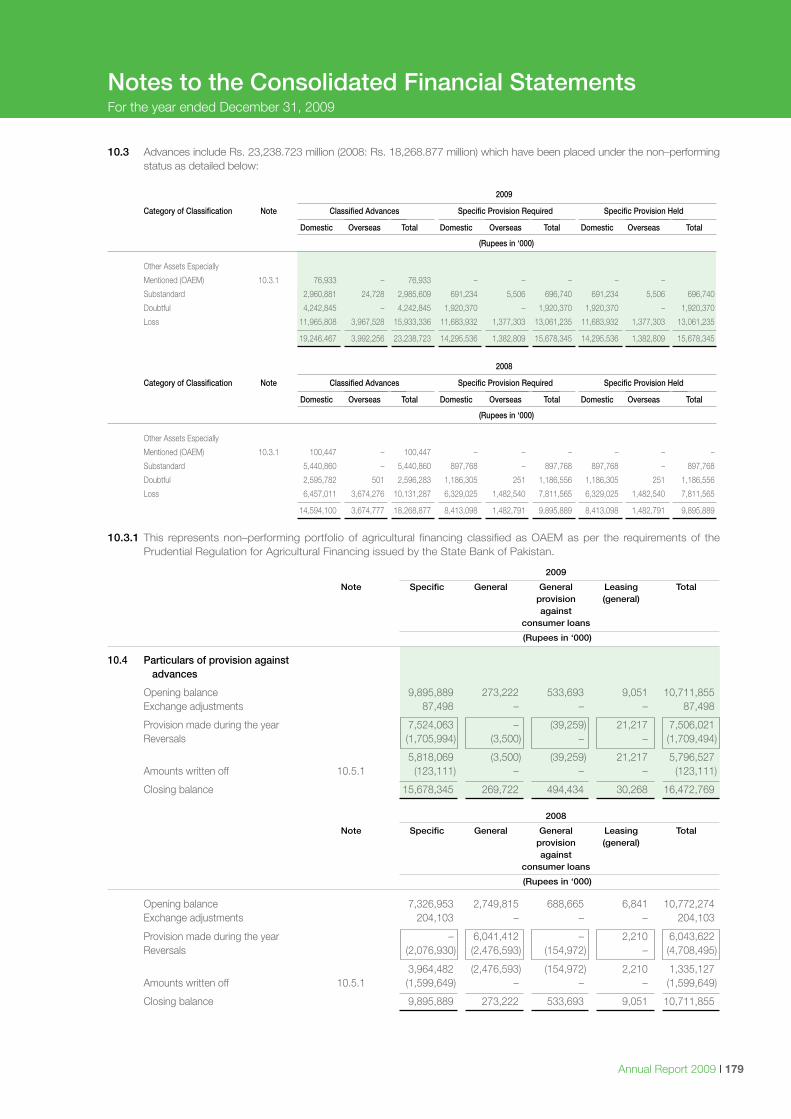
Annual Report 2009 I 179
Notes to the Consolidated Financial StatementsFor the year ended December 31, 2009
10.3 Advances include Rs. 23,238.723 million (2008: Rs. 18,268.877 million) which have been placed under the non–performing status as detailed below:
2009
Category of Classification Note Classified Advances Specific Provision Required Specific Provision Held
Domestic Overseas Total Domestic Overseas Total Domestic Overseas Total
(Rupees in ‘000)
Other Assets Especially
Mentioned (OAEM) 10.3.1 76,933 – 76,933 – – – – –
Substandard 2,960,881 24,728 2,985,609 691,234 5,506 696,740 691,234 5,506 696,740
Doubtful 4,242,845 – 4,242,845 1,920,370 – 1,920,370 1,920,370 – 1,920,370
Loss 11,965,808 3,967,528 15,933,336 11,683,932 1,377,303 13,061,235 11,683,932 1,377,303 13,061,235
19,246,467 3,992,256 23,238,723 14,295,536 1,382,809 15,678,345 14,295,536 1,382,809 15,678,345
2008
Category of Classification Note Classified Advances Specific Provision Required Specific Provision Held
Domestic Overseas Total Domestic Overseas Total Domestic Overseas Total
(Rupees in ‘000)
Other Assets Especially
Mentioned (OAEM) 10.3.1 100,447 – 100,447 – – – – – –
Substandard 5,440,860 – 5,440,860 897,768 – 897,768 897,768 – 897,768
Doubtful 2,595,782 501 2,596,283 1,186,305 251 1,186,556 1,186,305 251 1,186,556
Loss 6,457,011 3,674,276 10,131,287 6,329,025 1,482,540 7,811,565 6,329,025 1,482,540 7,811,565
14,594,100 3,674,777 18,268,877 8,413,098 1,482,791 9,895,889 8,413,098 1,482,791 9,895,889
10.3.1 This represents non–performing portfolio of agricultural financing classified as OAEM as per the requirements of the
Prudential Regulation for Agricultural Financing issued by the State Bank of Pakistan.
2009
Note Specific General General Leasing Total provision (general) against consumer loans
(Rupees in ‘000)
10.4 Particulars of provision against advances
Opening balance 9,895,889 273,222 533,693 9,051 10,711,855 Exchange adjustments 87,498 – – – 87,498
Provision made during the year 7,524,063 – (39,259) 21,217 7,506,021 Reversals (1,705,994) (3,500) – – (1,709,494)
5,818,069 (3,500) (39,259) 21,217 5,796,527 Amounts written off 10.5.1 (123,111) – – – (123,111)
Closing balance 15,678,345 269,722 494,434 30,268 16,472,769
2008
Note Specific General General Leasing Total provision (general) against consumer loans
(Rupees in ‘000)
Opening balance 7,326,953 2,749,815 688,665 6,841 10,772,274 Exchange adjustments 204,103 – – – 204,103
Provision made during the year – 6,041,412 – 2,210 6,043,622 Reversals (2,076,930) (2,476,593) (154,972) – (4,708,495)
3,964,482 (2,476,593) (154,972) 2,210 1,335,127 Amounts written off 10.5.1 (1,599,649) – – – (1,599,649)
Closing balance 9,895,889 273,222 533,693 9,051 10,711,855
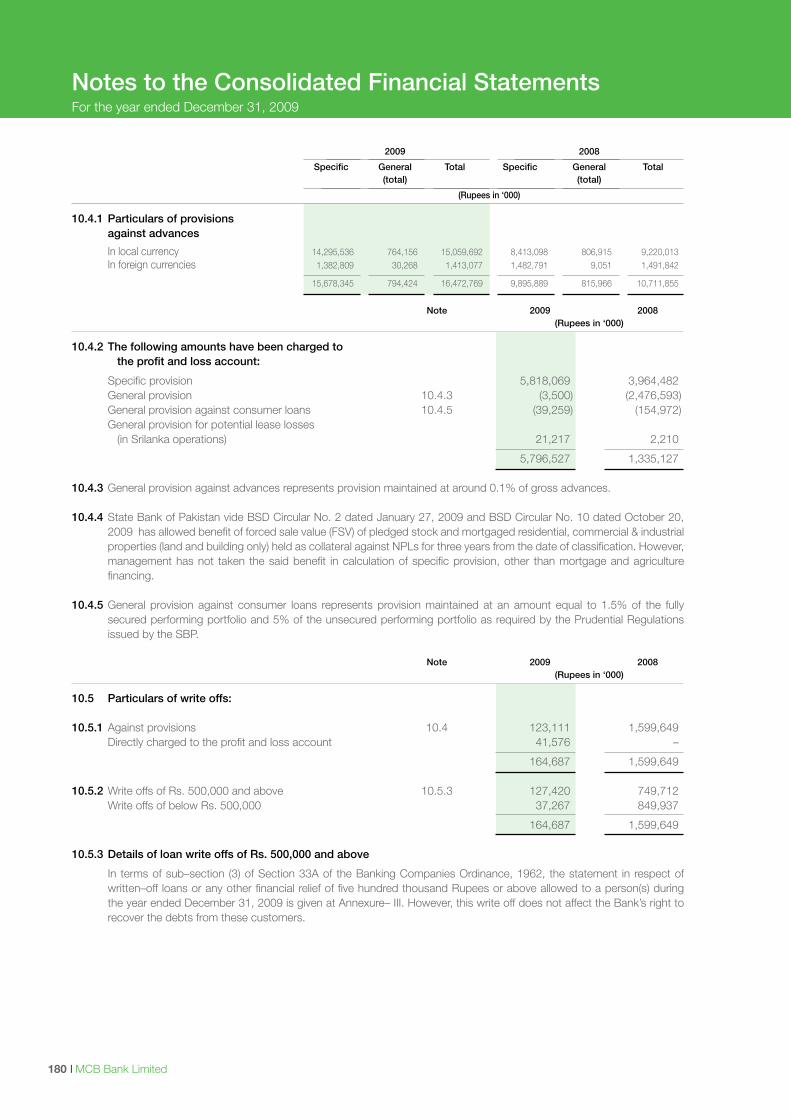
I MCB Bank Limited180
Notes to the Consolidated Financial StatementsFor the year ended December 31, 2009
2009 2008
Specific General Total Specific General Total (total) (total)
(Rupees in ‘000)
10.4.1 Particulars of provisions against advances
In local currency 14,295,536 764,156 15,059,692 8,413,098 806,915 9,220,013 In foreign currencies 1,382,809 30,268 1,413,077 1,482,791 9,051 1,491,842
15,678,345 794,424 16,472,769 9,895,889 815,966 10,711,855
Note 2009 2008 (Rupees in ‘000)
10.4.2 The following amounts have been charged to the profit and loss account:
Specific provision 5,818,069 3,964,482 General provision 10.4.3 (3,500) (2,476,593) General provision against consumer loans 10.4.5 (39,259) (154,972) General provision for potential lease losses (in Srilanka operations) 21,217 2,210
5,796,527 1,335,127 10.4.3 General provision against advances represents provision maintained at around 0.1% of gross advances.
10.4.4 State Bank of Pakistan vide BSD Circular No. 2 dated January 27, 2009 and BSD Circular No. 10 dated October 20, 2009 has allowed benefit of forced sale value (FSV) of pledged stock and mortgaged residential, commercial & industrial properties (land and building only) held as collateral against NPLs for three years from the date of classification. However, management has not taken the said benefit in calculation of specific provision, other than mortgage and agriculture financing.
10.4.5 General provision against consumer loans represents provision maintained at an amount equal to 1.5% of the fully secured performing portfolio and 5% of the unsecured performing portfolio as required by the Prudential Regulations issued by the SBP.
Note 2009 2008 (Rupees in ‘000)
10.5 Particulars of write offs: 10.5.1 Against provisions 10.4 123,111 1,599,649 Directly charged to the profit and loss account 41,576 –
164,687 1,599,649 10.5.2 Write offs of Rs. 500,000 and above 10.5.3 127,420 749,712 Write offs of below Rs. 500,000 37,267 849,937
164,687 1,599,649 10.5.3 Details of loan write offs of Rs. 500,000 and above
In terms of sub–section (3) of Section 33A of the Banking Companies Ordinance, 1962, the statement in respect of written–off loans or any other financial relief of five hundred thousand Rupees or above allowed to a person(s) during the year ended December 31, 2009 is given at Annexure– III. However, this write off does not affect the Bank’s right to recover the debts from these customers.
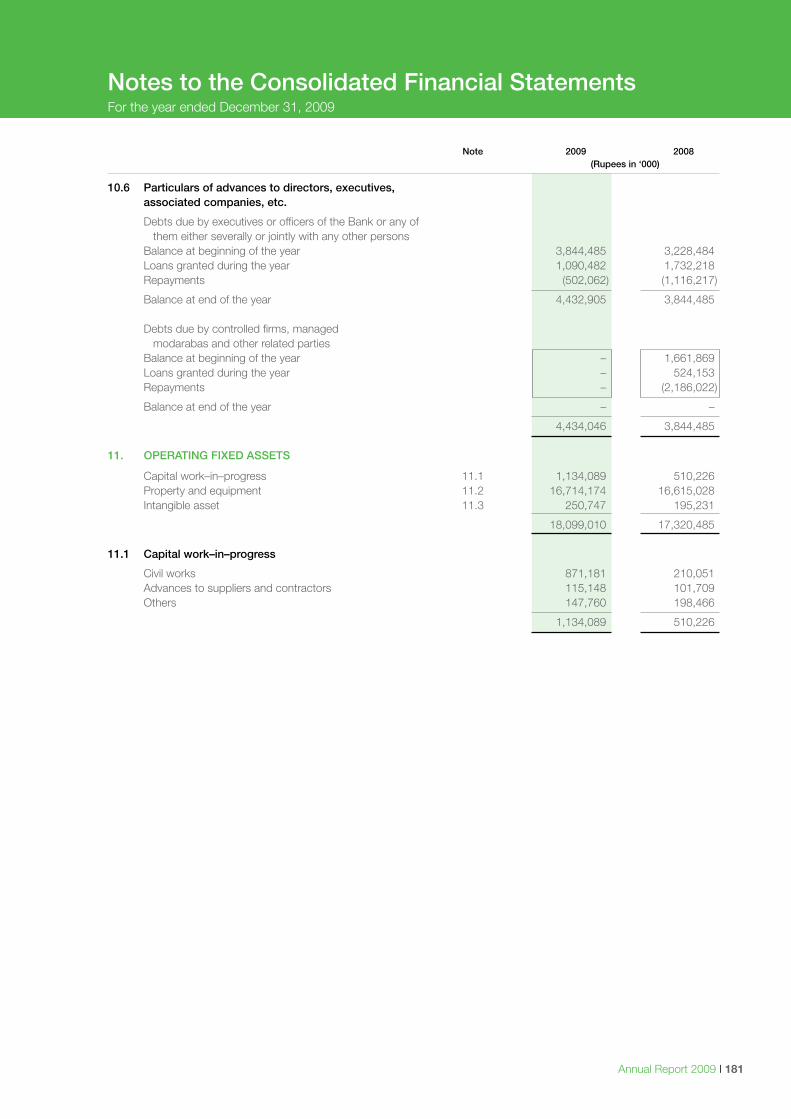
Annual Report 2009 I 181
Note 2009 2008 (Rupees in ‘000)
10.6 Particulars of advances to directors, executives, associated companies, etc.
Debts due by executives or officers of the Bank or any of them either severally or jointly with any other persons Balance at beginning of the year 3,844,485 3,228,484 Loans granted during the year 1,090,482 1,732,218 Repayments (502,062) (1,116,217)
Balance at end of the year 4,432,905 3,844,485 Debts due by controlled firms, managed modarabas and other related parties Balance at beginning of the year – 1,661,869 Loans granted during the year – 524,153 Repayments – (2,186,022)
Balance at end of the year – –
4,434,046 3,844,485 11. OPERATING FIXED ASSETS
Capital work–in–progress 11.1 1,134,089 510,226 Property and equipment 11.2 16,714,174 16,615,028 Intangible asset 11.3 250,747 195,231
18,099,010 17,320,485 11.1 Capital work–in–progress
Civil works 871,181 210,051 Advances to suppliers and contractors 115,148 101,709 Others 147,760 198,466
1,134,089 510,226
Notes to the Consolidated Financial StatementsFor the year ended December 31, 2009
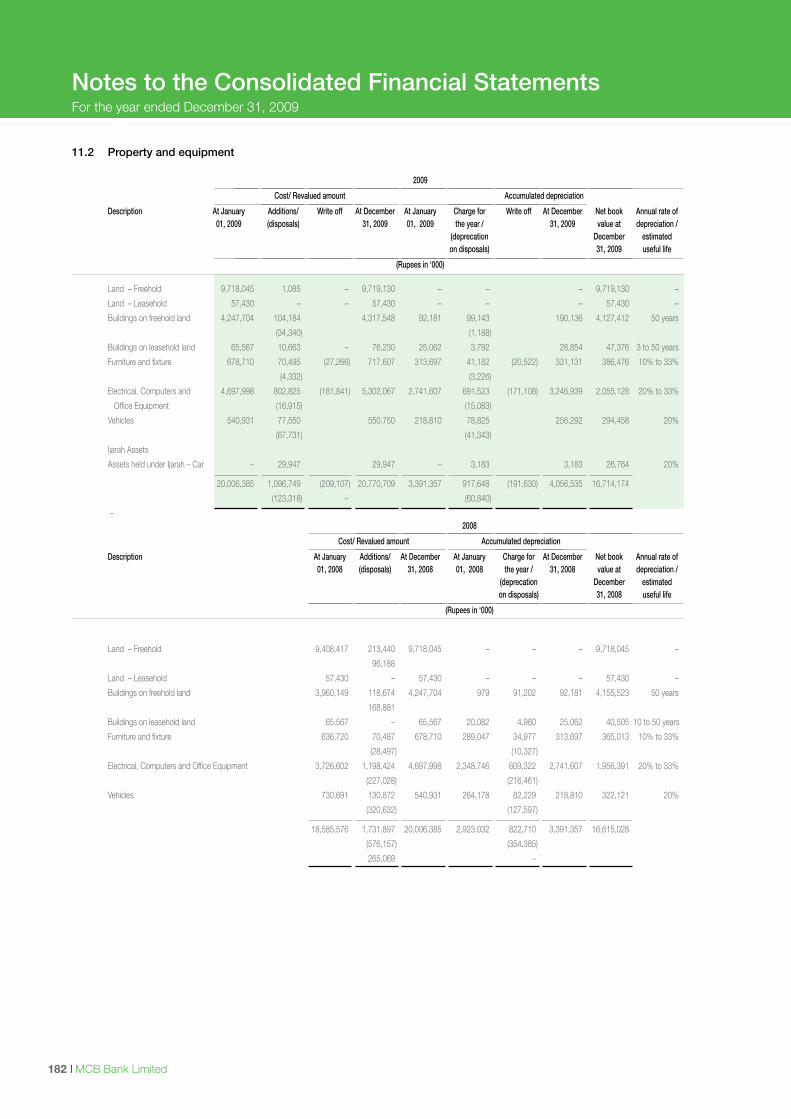
I MCB Bank Limited182
Notes to the Consolidated Financial StatementsFor the year ended December 31, 2009
11.2 Property and equipment 2009
Cost/ Revalued amount Accumulated depreciation
Description At January Additions/ Write off At December At January Charge for Write off At December Net book Annual rate of 01, 2009 (disposals) 31, 2009 01, 2009 the year / 31, 2009 value at depreciation / (deprecation December estimated on disposals) 31, 2009 useful life
(Rupees in ‘000)
Land – Freehold 9,718,045 1,085 – 9,719,130 – – – 9,719,130 –
Land – Leasehold 57,430 – – 57,430 – – – 57,430 –
Buildings on freehold land 4,247,704 104,184 4,317,548 92,181 99,143 190,136 4,127,412 50 years
(34,340) (1,188)
Buildings on leasehold land 65,567 10,663 – 76,230 25,062 3,792 28,854 47,376 3 to 50 years
Furniture and fixture 678,710 70,495 (27,266) 717,607 313,697 41,182 (20,522) 331,131 386,476 10% to 33%
(4,332) (3,226)
Electrical, Computers and 4,697,998 802,825 (181,841) 5,302,067 2,741,607 691,523 (171,108) 3,246,939 2,055,128 20% to 33%
Office Equipment (16,915) (15,083)
Vehicles 540,931 77,550 550,750 218,810 78,825 256,292 294,458 20%
(67,731) (41,343)
Ijarah Assets
Assets held under Ijarah – Car – 29,947 29,947 – 3,183 3,183 26,764 20%
20,006,385 1,096,749 (209,107) 20,770,709 3,391,357 917,648 (191,630) 4,056,535 16,714,174
(123,318) – (60,840)
– 2008
Cost/ Revalued amount Accumulated depreciation
Description At January Additions/ At December At January Charge for At December Net book Annual rate of 01, 2008 (disposals) 31, 2008 01, 2008 the year / 31, 2008 value at depreciation / (deprecation December estimated on disposals) 31, 2008 useful life
(Rupees in ‘000)
Land – Freehold 9,408,417 213,440 9,718,045 – – – 9,718,045 –
96,188
Land – Leasehold 57,430 – 57,430 – – – 57,430 –
Buildings on freehold land 3,960,149 118,674 4,247,704 979 91,202 92,181 4,155,523 50 years
168,881
Buildings on leasehold land 65,567 – 65,567 20,082 4,980 25,062 40,505 10 to 50 years
Furniture and fixture 636,720 70,487 678,710 289,047 34,977 313,697 365,013 10% to 33%
(28,497) (10,327)
Electrical, Computers and Office Equipment 3,726,602 1,198,424 4,697,998 2,348,746 609,322 2,741,607 1,956,391 20% to 33%
(227,028) (216,461)
Vehicles 730,691 130,872 540,931 264,178 82,229 218,810 322,121 20%
(320,632) (127,597)
18,585,576 1,731,897 20,006,385 2,923,032 822,710 3,391,357 16,615,028
(576,157) (354,385)
265,069 –
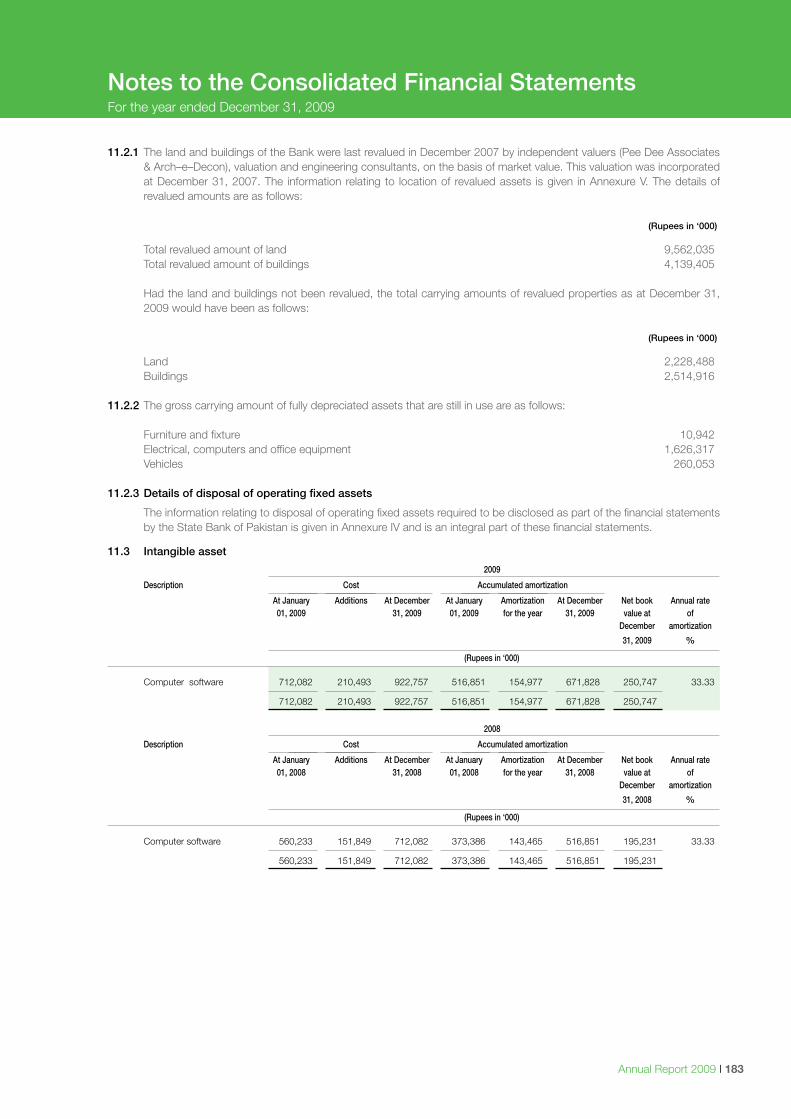
Annual Report 2009 I 183
11.2.1 The land and buildings of the Bank were last revalued in December 2007 by independent valuers (Pee Dee Associates & Arch–e–Decon), valuation and engineering consultants, on the basis of market value. This valuation was incorporated at December 31, 2007. The information relating to location of revalued assets is given in Annexure V. The details of revalued amounts are as follows:
(Rupees in ‘000)
Total revalued amount of land 9,562,035 Total revalued amount of buildings 4,139,405
Had the land and buildings not been revalued, the total carrying amounts of revalued properties as at December 31, 2009 would have been as follows:
(Rupees in ‘000)
Land 2,228,488 Buildings 2,514,916
11.2.2 The gross carrying amount of fully depreciated assets that are still in use are as follows:
Furniture and fixture 10,942 Electrical, computers and office equipment 1,626,317 Vehicles 260,053
11.2.3 Details of disposal of operating fixed assets
The information relating to disposal of operating fixed assets required to be disclosed as part of the financial statements by the State Bank of Pakistan is given in Annexure IV and is an integral part of these financial statements.
11.3 Intangible asset
2009
Description Cost Accumulated amortization
At January Additions At December At January Amortization At December Net book Annual rate 01, 2009 31, 2009 01, 2009 for the year 31, 2009 value at of December amortization
31, 2009 %
(Rupees in ‘000)
Computer software 712,082 210,493 922,757 516,851 154,977 671,828 250,747 33.33
712,082 210,493 922,757 516,851 154,977 671,828 250,747
2008
Description Cost Accumulated amortization
At January Additions At December At January Amortization At December Net book Annual rate 01, 2008 31, 2008 01, 2008 for the year 31, 2008 value at of December amortization
31, 2008 %
(Rupees in ‘000)
Computer software 560,233 151,849 712,082 373,386 143,465 516,851 195,231 33.33
560,233 151,849 712,082 373,386 143,465 516,851 195,231
Notes to the Consolidated Financial StatementsFor the year ended December 31, 2009
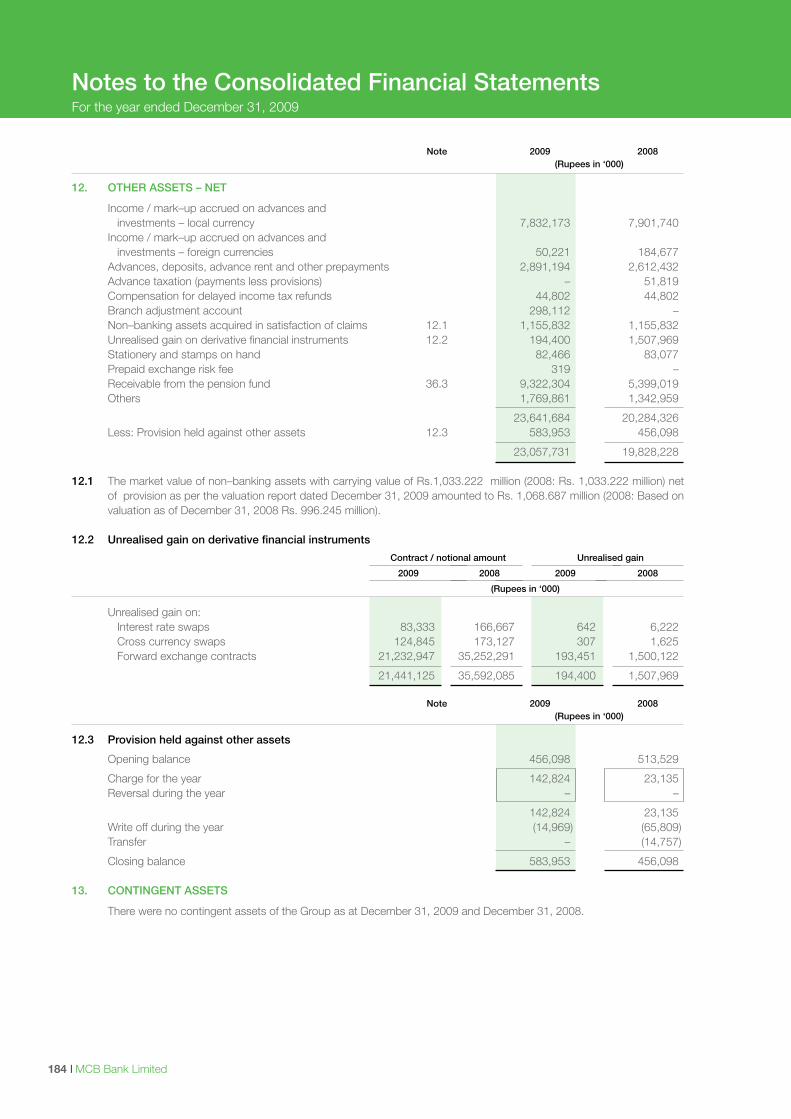
I MCB Bank Limited184
Notes to the Consolidated Financial StatementsFor the year ended December 31, 2009
Note 2009 2008 (Rupees in ‘000)
12. OTHER ASSETS – NET
Income / mark–up accrued on advances and investments – local currency 7,832,173 7,901,740 Income / mark–up accrued on advances and investments – foreign currencies 50,221 184,677 Advances, deposits, advance rent and other prepayments 2,891,194 2,612,432 Advance taxation (payments less provisions) – 51,819 Compensation for delayed income tax refunds 44,802 44,802 Branch adjustment account 298,112 – Non–banking assets acquired in satisfaction of claims 12.1 1,155,832 1,155,832 Unrealised gain on derivative financial instruments 12.2 194,400 1,507,969 Stationery and stamps on hand 82,466 83,077 Prepaid exchange risk fee 319 – Receivable from the pension fund 36.3 9,322,304 5,399,019 Others 1,769,861 1,342,959
23,641,684 20,284,326 Less: Provision held against other assets 12.3 583,953 456,098
23,057,731 19,828,228 12.1 The market value of non–banking assets with carrying value of Rs.1,033.222 million (2008: Rs. 1,033.222 million) net
of provision as per the valuation report dated December 31, 2009 amounted to Rs. 1,068.687 million (2008: Based on valuation as of December 31, 2008 Rs. 996.245 million).
12.2 Unrealised gain on derivative financial instruments
Contract / notional amount Unrealised gain
2009 2008 2009 2008
(Rupees in ‘000)
Unrealised gain on: Interest rate swaps 83,333 166,667 642 6,222 Cross currency swaps 124,845 173,127 307 1,625 Forward exchange contracts 21,232,947 35,252,291 193,451 1,500,122
21,441,125 35,592,085 194,400 1,507,969 Note 2009 2008 (Rupees in ‘000)
12.3 Provision held against other assets
Opening balance 456,098 513,529
Charge for the year 142,824 23,135 Reversal during the year – –
142,824 23,135 Write off during the year (14,969) (65,809) Transfer – (14,757)
Closing balance 583,953 456,098 13. CONTINGENT ASSETS
There were no contingent assets of the Group as at December 31, 2009 and December 31, 2008.
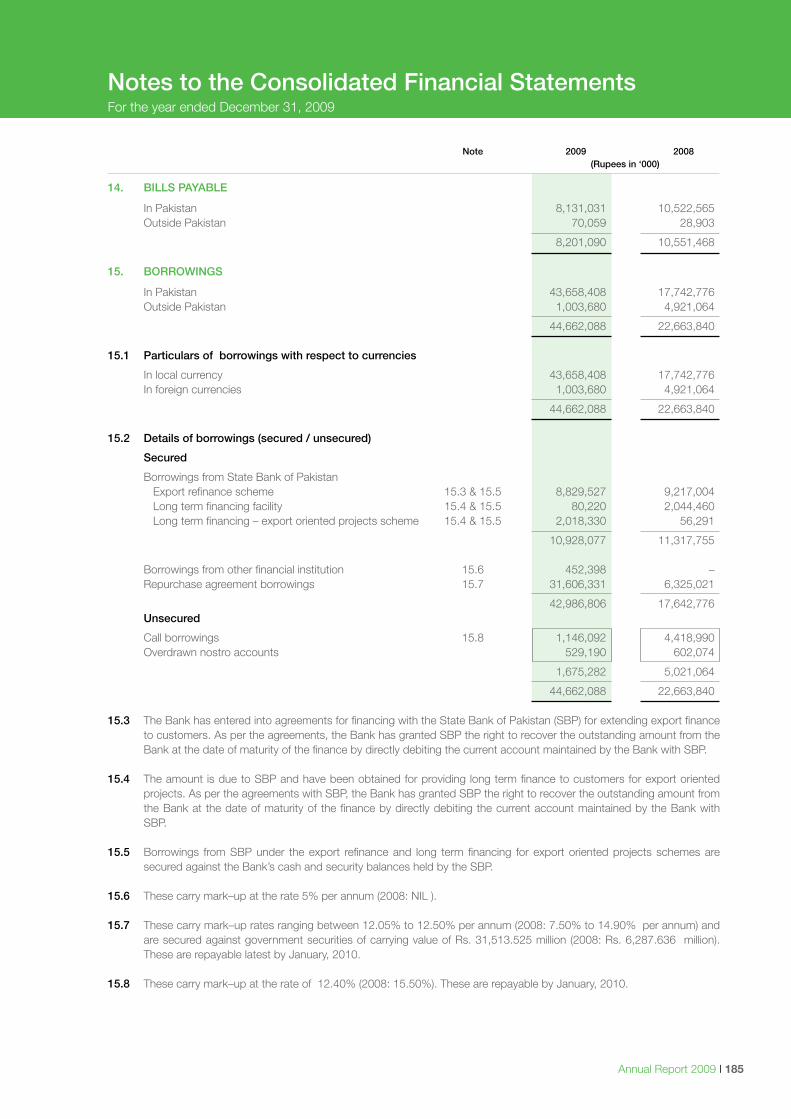
Annual Report 2009 I 185
Note 2009 2008 (Rupees in ‘000)
14. BILLS PAYABLE
In Pakistan 8,131,031 10,522,565 Outside Pakistan 70,059 28,903
8,201,090 10,551,468 15. BORROWINGS
In Pakistan 43,658,408 17,742,776 Outside Pakistan 1,003,680 4,921,064
44,662,088 22,663,840 15.1 Particulars of borrowings with respect to currencies
In local currency 43,658,408 17,742,776 In foreign currencies 1,003,680 4,921,064
44,662,088 22,663,840 15.2 Details of borrowings (secured / unsecured)
Secured
Borrowings from State Bank of Pakistan Export refinance scheme 15.3 & 15.5 8,829,527 9,217,004 Long term financing facility 15.4 & 15.5 80,220 2,044,460 Long term financing – export oriented projects scheme 15.4 & 15.5 2,018,330 56,291
10,928,077 11,317,755 Borrowings from other financial institution 15.6 452,398 – Repurchase agreement borrowings 15.7 31,606,331 6,325,021
42,986,806 17,642,776 Unsecured
Call borrowings 15.8 1,146,092 4,418,990 Overdrawn nostro accounts 529,190 602,074
1,675,282 5,021,064
44,662,088 22,663,840 15.3 The Bank has entered into agreements for financing with the State Bank of Pakistan (SBP) for extending export finance
to customers. As per the agreements, the Bank has granted SBP the right to recover the outstanding amount from the Bank at the date of maturity of the finance by directly debiting the current account maintained by the Bank with SBP.
15.4 The amount is due to SBP and have been obtained for providing long term finance to customers for export oriented
projects. As per the agreements with SBP, the Bank has granted SBP the right to recover the outstanding amount from the Bank at the date of maturity of the finance by directly debiting the current account maintained by the Bank with SBP.
15.5 Borrowings from SBP under the export refinance and long term financing for export oriented projects schemes are
secured against the Bank’s cash and security balances held by the SBP. 15.6 These carry mark–up at the rate 5% per annum (2008: NIL ).
15.7 These carry mark–up rates ranging between 12.05% to 12.50% per annum (2008: 7.50% to 14.90% per annum) and are secured against government securities of carrying value of Rs. 31,513.525 million (2008: Rs. 6,287.636 million). These are repayable latest by January, 2010.
15.8 These carry mark–up at the rate of 12.40% (2008: 15.50%). These are repayable by January, 2010.
Notes to the Consolidated Financial StatementsFor the year ended December 31, 2009
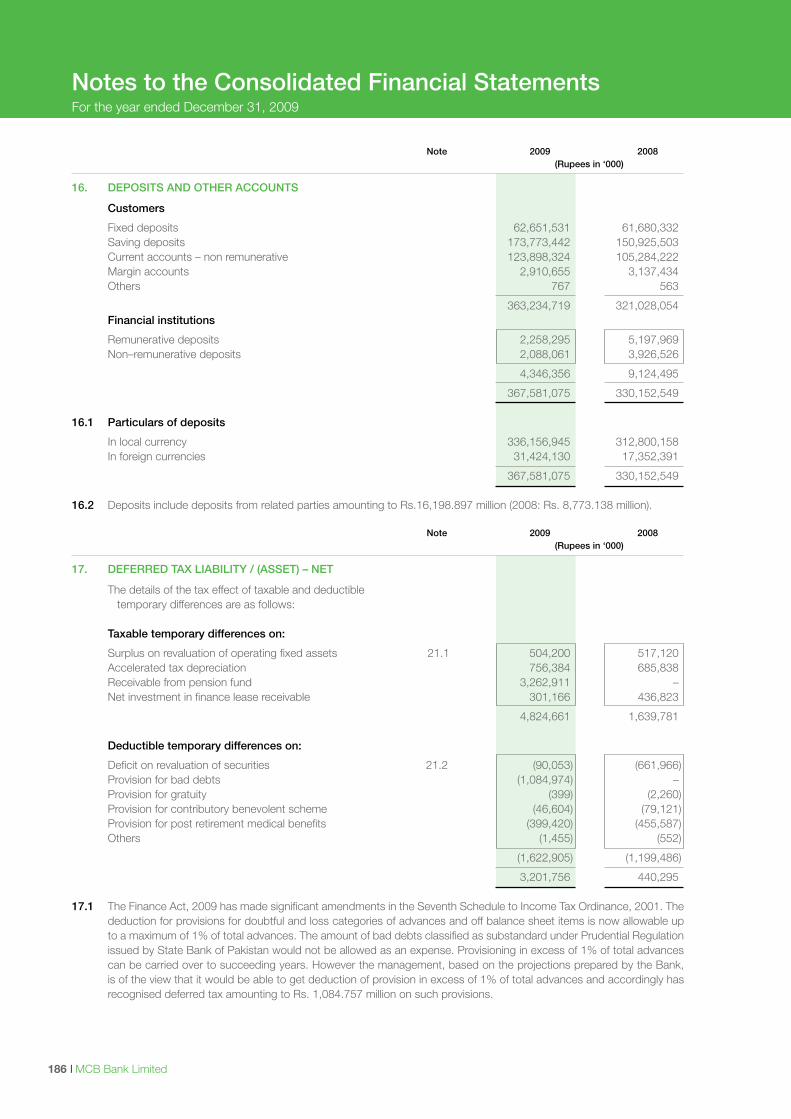
I MCB Bank Limited186
Notes to the Consolidated Financial StatementsFor the year ended December 31, 2009
Note 2009 2008 (Rupees in ‘000)
16. DEPOSITS AND OTHER ACCOUNTS
Customers
Fixed deposits 62,651,531 61,680,332 Saving deposits 173,773,442 150,925,503 Current accounts – non remunerative 123,898,324 105,284,222 Margin accounts 2,910,655 3,137,434 Others 767 563
363,234,719 321,028,054 Financial institutions
Remunerative deposits 2,258,295 5,197,969 Non–remunerative deposits 2,088,061 3,926,526
4,346,356 9,124,495
367,581,075 330,152,549
16.1 Particulars of deposits
In local currency 336,156,945 312,800,158 In foreign currencies 31,424,130 17,352,391
367,581,075 330,152,549 16.2 Deposits include deposits from related parties amounting to Rs.16,198.897 million (2008: Rs. 8,773.138 million). Note 2009 2008 (Rupees in ‘000)
17. DEFERRED TAX LIABILITY / (ASSET) – NET
The details of the tax effect of taxable and deductible temporary differences are as follows:
Taxable temporary differences on:
Surplus on revaluation of operating fixed assets 21.1 504,200 517,120 Accelerated tax depreciation 756,384 685,838 Receivable from pension fund 3,262,911 – Net investment in finance lease receivable 301,166 436,823
4,824,661 1,639,781 Deductible temporary differences on:
Deficit on revaluation of securities 21.2 (90,053) (661,966) Provision for bad debts (1,084,974) – Provision for gratuity (399) (2,260) Provision for contributory benevolent scheme (46,604) (79,121) Provision for post retirement medical benefits (399,420) (455,587) Others (1,455) (552)
(1,622,905) (1,199,486)
3,201,756 440,295 17.1 The Finance Act, 2009 has made significant amendments in the Seventh Schedule to Income Tax Ordinance, 2001. The
deduction for provisions for doubtful and loss categories of advances and off balance sheet items is now allowable up to a maximum of 1% of total advances. The amount of bad debts classified as substandard under Prudential Regulation issued by State Bank of Pakistan would not be allowed as an expense. Provisioning in excess of 1% of total advances can be carried over to succeeding years. However the management, based on the projections prepared by the Bank, is of the view that it would be able to get deduction of provision in excess of 1% of total advances and accordingly has recognised deferred tax amounting to Rs. 1,084.757 million on such provisions.
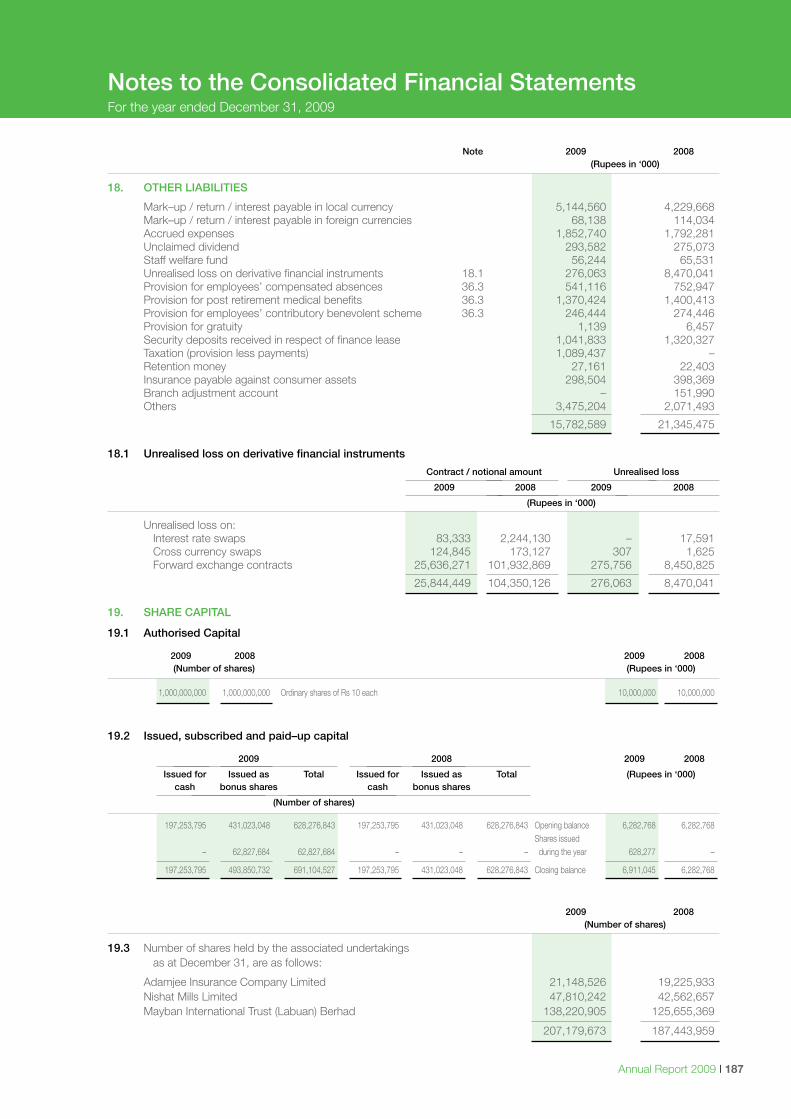
Annual Report 2009 I 187
Note 2009 2008 (Rupees in ‘000)
18. OTHER LIABILITIES
Mark–up / return / interest payable in local currency 5,144,560 4,229,668 Mark–up / return / interest payable in foreign currencies 68,138 114,034 Accrued expenses 1,852,740 1,792,281 Unclaimed dividend 293,582 275,073 Staff welfare fund 56,244 65,531 Unrealised loss on derivative financial instruments 18.1 276,063 8,470,041 Provision for employees’ compensated absences 36.3 541,116 752,947 Provision for post retirement medical benefits 36.3 1,370,424 1,400,413 Provision for employees’ contributory benevolent scheme 36.3 246,444 274,446 Provision for gratuity 1,139 6,457 Security deposits received in respect of finance lease 1,041,833 1,320,327 Taxation (provision less payments) 1,089,437 – Retention money 27,161 22,403 Insurance payable against consumer assets 298,504 398,369 Branch adjustment account – 151,990 Others 3,475,204 2,071,493
15,782,589 21,345,475 18.1 Unrealised loss on derivative financial instruments
Contract / notional amount Unrealised loss
2009 2008 2009 2008
(Rupees in ‘000)
Unrealised loss on: Interest rate swaps 83,333 2,244,130 – 17,591 Cross currency swaps 124,845 173,127 307 1,625 Forward exchange contracts 25,636,271 101,932,869 275,756 8,450,825
25,844,449 104,350,126 276,063 8,470,041 19. SHARE CAPITAL
19.1 Authorised Capital
2009 2008 2009 2008 (Number of shares) (Rupees in ‘000)
1,000,000,000 1,000,000,000 Ordinary shares of Rs 10 each 10,000,000 10,000,000
19.2 Issued, subscribed and paid–up capital
2009 2008 2009 2008
Issued for Issued as Total Issued for Issued as Total (Rupees in ‘000) cash bonus shares cash bonus shares
(Number of shares)
197,253,795 431,023,048 628,276,843 197,253,795 431,023,048 628,276,843 Opening balance 6,282,768 6,282,768 Shares issued – 62,827,684 62,827,684 – – – during the year 628,277 –
197,253,795 493,850,732 691,104,527 197,253,795 431,023,048 628,276,843 Closing balance 6,911,045 6,282,768
2009 2008 (Number of shares)
19.3 Number of shares held by the associated undertakings as at December 31, are as follows:
Adamjee Insurance Company Limited 21,148,526 19,225,933 Nishat Mills Limited 47,810,242 42,562,657 Mayban International Trust (Labuan) Berhad 138,220,905 125,655,369
207,179,673 187,443,959
Notes to the Consolidated Financial StatementsFor the year ended December 31, 2009
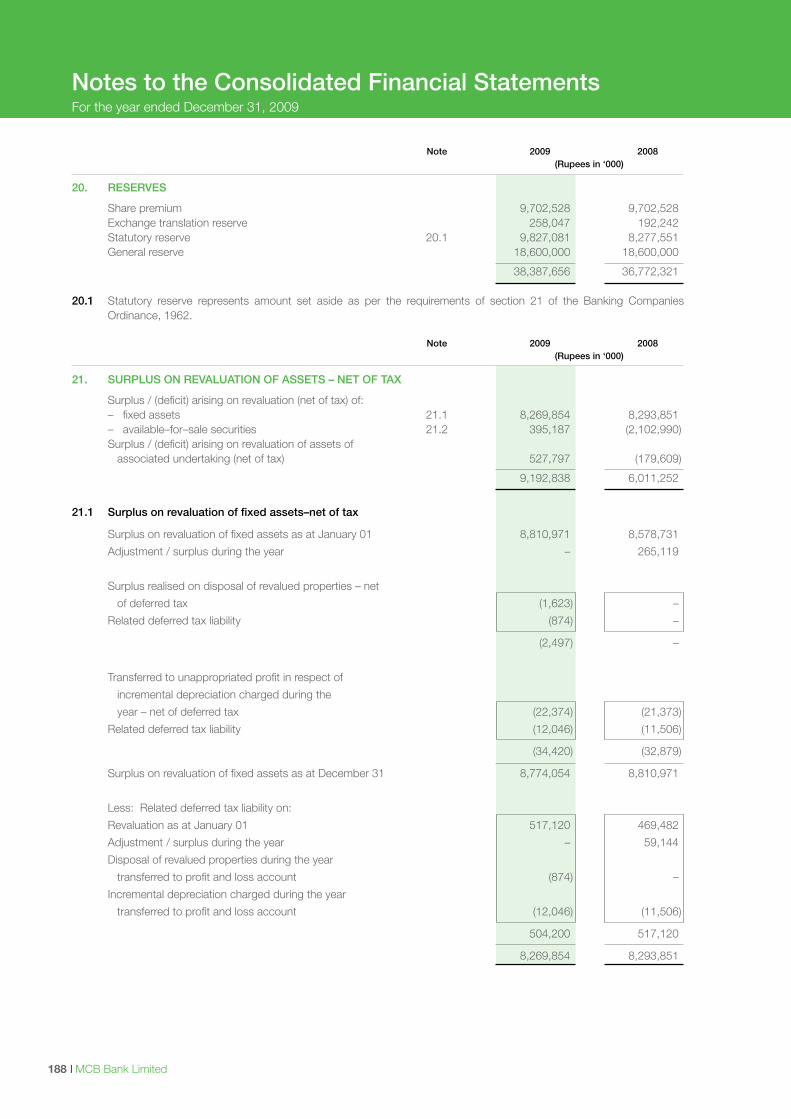
I MCB Bank Limited188
Notes to the Consolidated Financial StatementsFor the year ended December 31, 2009
Note 2009 2008 (Rupees in ‘000)
20. RESERVES
Share premium 9,702,528 9,702,528 Exchange translation reserve 258,047 192,242 Statutory reserve 20.1 9,827,081 8,277,551 General reserve 18,600,000 18,600,000
38,387,656 36,772,321
20.1 Statutory reserve represents amount set aside as per the requirements of section 21 of the Banking Companies Ordinance, 1962.
Note 2009 2008 (Rupees in ‘000)
21. SURPLUS ON REVALUATION OF ASSETS – NET OF TAX
Surplus / (deficit) arising on revaluation (net of tax) of: – fixed assets 21.1 8,269,854 8,293,851 – available–for–sale securities 21.2 395,187 (2,102,990) Surplus / (deficit) arising on revaluation of assets of associated undertaking (net of tax) 527,797 (179,609)
9,192,838 6,011,252
21.1 Surplus on revaluation of fixed assets–net of tax
Surplus on revaluation of fixed assets as at January 01 8,810,971 8,578,731
Adjustment / surplus during the year – 265,119
Surplus realised on disposal of revalued properties – net
of deferred tax (1,623) –
Related deferred tax liability (874) –
(2,497) –
Transferred to unappropriated profit in respect of
incremental depreciation charged during the
year – net of deferred tax (22,374) (21,373)
Related deferred tax liability (12,046) (11,506)
(34,420) (32,879)
Surplus on revaluation of fixed assets as at December 31 8,774,054 8,810,971
Less: Related deferred tax liability on:
Revaluation as at January 01 517,120 469,482
Adjustment / surplus during the year – 59,144
Disposal of revalued properties during the year
transferred to profit and loss account (874) –
Incremental depreciation charged during the year
transferred to profit and loss account (12,046) (11,506)
504,200 517,120
8,269,854 8,293,851
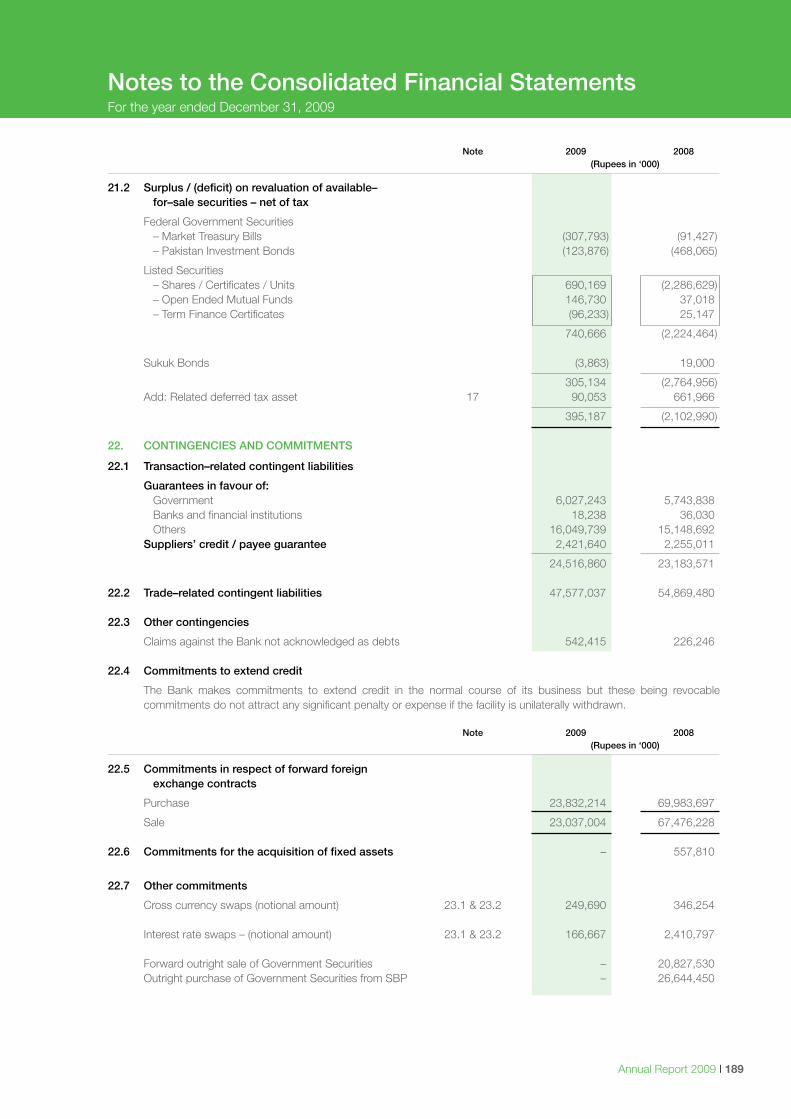
Annual Report 2009 I 189
Note 2009 2008 (Rupees in ‘000)
21.2 Surplus / (deficit) on revaluation of available– for–sale securities – net of tax
Federal Government Securities – Market Treasury Bills (307,793) (91,427) – Pakistan Investment Bonds (123,876) (468,065)
Listed Securities – Shares / Certificates / Units 690,169 (2,286,629) – Open Ended Mutual Funds 146,730 37,018 – Term Finance Certificates (96,233) 25,147
740,666 (2,224,464) Sukuk Bonds (3,863) 19,000
305,134 (2,764,956) Add: Related deferred tax asset 17 90,053 661,966
395,187 (2,102,990)
22. CONTINGENCIES AND COMMITMENTS
22.1 Transaction–related contingent liabilities
Guarantees in favour of: Government 6,027,243 5,743,838 Banks and financial institutions 18,238 36,030 Others 16,049,739 15,148,692 Suppliers’ credit / payee guarantee 2,421,640 2,255,011
24,516,860 23,183,571 22.2 Trade–related contingent liabilities 47,577,037 54,869,480 22.3 Other contingencies
Claims against the Bank not acknowledged as debts 542,415 226,246 22.4 Commitments to extend credit
The Bank makes commitments to extend credit in the normal course of its business but these being revocable commitments do not attract any significant penalty or expense if the facility is unilaterally withdrawn.
Note 2009 2008 (Rupees in ‘000)
22.5 Commitments in respect of forward foreign exchange contracts
Purchase 23,832,214 69,983,697
Sale 23,037,004 67,476,228
22.6 Commitments for the acquisition of fixed assets – 557,810
22.7 Other commitments
Cross currency swaps (notional amount) 23.1 & 23.2 249,690 346,254
Interest rate swaps – (notional amount) 23.1 & 23.2 166,667 2,410,797
Forward outright sale of Government Securities – 20,827,530 Outright purchase of Government Securities from SBP – 26,644,450
Notes to the Consolidated Financial StatementsFor the year ended December 31, 2009
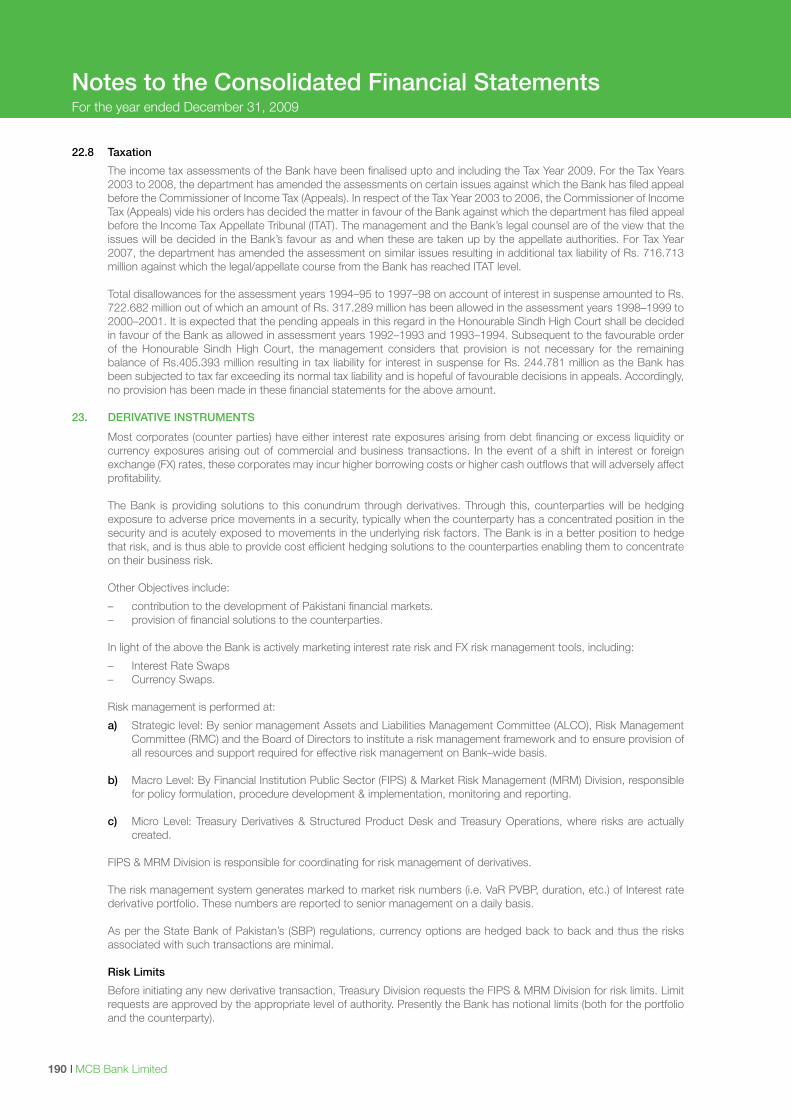
I MCB Bank Limited190
Notes to the Consolidated Financial StatementsFor the year ended December 31, 2009
22.8 Taxation
The income tax assessments of the Bank have been finalised upto and including the Tax Year 2009. For the Tax Years 2003 to 2008, the department has amended the assessments on certain issues against which the Bank has filed appeal before the Commissioner of Income Tax (Appeals). In respect of the Tax Year 2003 to 2006, the Commissioner of Income Tax (Appeals) vide his orders has decided the matter in favour of the Bank against which the department has filed appeal before the Income Tax Appellate Tribunal (ITAT). The management and the Bank’s legal counsel are of the view that the issues will be decided in the Bank’s favour as and when these are taken up by the appellate authorities. For Tax Year 2007, the department has amended the assessment on similar issues resulting in additional tax liability of Rs. 716.713 million against which the legal/appellate course from the Bank has reached ITAT level.
Total disallowances for the assessment years 1994–95 to 1997–98 on account of interest in suspense amounted to Rs.
722.682 million out of which an amount of Rs. 317.289 million has been allowed in the assessment years 1998–1999 to 2000–2001. It is expected that the pending appeals in this regard in the Honourable Sindh High Court shall be decided in favour of the Bank as allowed in assessment years 1992–1993 and 1993–1994. Subsequent to the favourable order of the Honourable Sindh High Court, the management considers that provision is not necessary for the remaining balance of Rs.405.393 million resulting in tax liability for interest in suspense for Rs. 244.781 million as the Bank has been subjected to tax far exceeding its normal tax liability and is hopeful of favourable decisions in appeals. Accordingly, no provision has been made in these financial statements for the above amount.
23. DERIVATIVE INSTRUMENTS
Most corporates (counter parties) have either interest rate exposures arising from debt financing or excess liquidity or currency exposures arising out of commercial and business transactions. In the event of a shift in interest or foreign exchange (FX) rates, these corporates may incur higher borrowing costs or higher cash outflows that will adversely affect profitability.
The Bank is providing solutions to this conundrum through derivatives. Through this, counterparties will be hedging
exposure to adverse price movements in a security, typically when the counterparty has a concentrated position in the security and is acutely exposed to movements in the underlying risk factors. The Bank is in a better position to hedge that risk, and is thus able to provide cost efficient hedging solutions to the counterparties enabling them to concentrate on their business risk.
Other Objectives include:
– contribution to the development of Pakistani financial markets. – provision of financial solutions to the counterparties. In light of the above the Bank is actively marketing interest rate risk and FX risk management tools, including:
– Interest Rate Swaps – Currency Swaps. Risk management is performed at:
a) Strategic level: By senior management Assets and Liabilities Management Committee (ALCO), Risk Management Committee (RMC) and the Board of Directors to institute a risk management framework and to ensure provision of all resources and support required for effective risk management on Bank–wide basis.
b) Macro Level: By Financial Institution Public Sector (FIPS) & Market Risk Management (MRM) Division, responsible for policy formulation, procedure development & implementation, monitoring and reporting.
c) Micro Level: Treasury Derivatives & Structured Product Desk and Treasury Operations, where risks are actually created.
FIPS & MRM Division is responsible for coordinating for risk management of derivatives. The risk management system generates marked to market risk numbers (i.e. VaR PVBP, duration, etc.) of Interest rate
derivative portfolio. These numbers are reported to senior management on a daily basis.
As per the State Bank of Pakistan’s (SBP) regulations, currency options are hedged back to back and thus the risks associated with such transactions are minimal.
Risk Limits
Before initiating any new derivative transaction, Treasury Division requests the FIPS & MRM Division for risk limits. Limit requests are approved by the appropriate level of authority. Presently the Bank has notional limits (both for the portfolio and the counterparty).
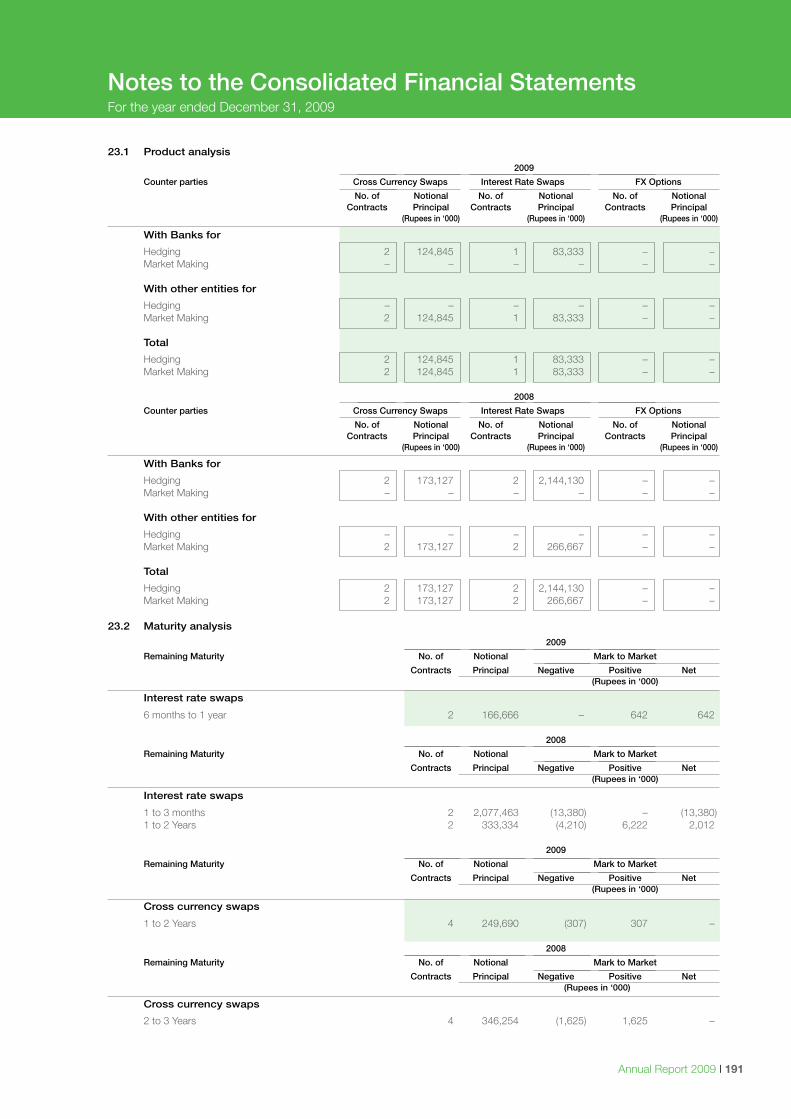
Annual Report 2009 I 191
Notes to the Consolidated Financial StatementsFor the year ended December 31, 2009
23.1 Product analysis
2009
Counter parties Cross Currency Swaps Interest Rate Swaps FX Options
No. of Notional No. of Notional No. of Notional Contracts Principal Contracts Principal Contracts Principal (Rupees in ‘000) (Rupees in ‘000) (Rupees in ‘000)
With Banks for
Hedging 2 124,845 1 83,333 – – Market Making – – – – – – With other entities for
Hedging – – – – – – Market Making 2 124,845 1 83,333 – – Total
Hedging 2 124,845 1 83,333 – – Market Making 2 124,845 1 83,333 – – 2008
Counter parties Cross Currency Swaps Interest Rate Swaps FX Options
No. of Notional No. of Notional No. of Notional Contracts Principal Contracts Principal Contracts Principal (Rupees in ‘000) (Rupees in ‘000) (Rupees in ‘000)
With Banks for
Hedging 2 173,127 2 2,144,130 – – Market Making – – – – – – With other entities for
Hedging – – – – – – Market Making 2 173,127 2 266,667 – – Total
Hedging 2 173,127 2 2,144,130 – – Market Making 2 173,127 2 266,667 – –
23.2 Maturity analysis
2009
Remaining Maturity No. of Notional Mark to Market
Contracts Principal Negative Positive Net (Rupees in ‘000)
Interest rate swaps
6 months to 1 year 2 166,666 – 642 642
2008
Remaining Maturity No. of Notional Mark to Market
Contracts Principal Negative Positive Net (Rupees in ‘000)
Interest rate swaps
1 to 3 months 2 2,077,463 (13,380) – (13,380) 1 to 2 Years 2 333,334 (4,210) 6,222 2,012
2009
Remaining Maturity No. of Notional Mark to Market
Contracts Principal Negative Positive Net (Rupees in ‘000)
Cross currency swaps
1 to 2 Years 4 249,690 (307) 307 –
2008
Remaining Maturity No. of Notional Mark to Market
Contracts Principal Negative Positive Net (Rupees in ‘000)
Cross currency swaps
2 to 3 Years 4 346,254 (1,625) 1,625 –
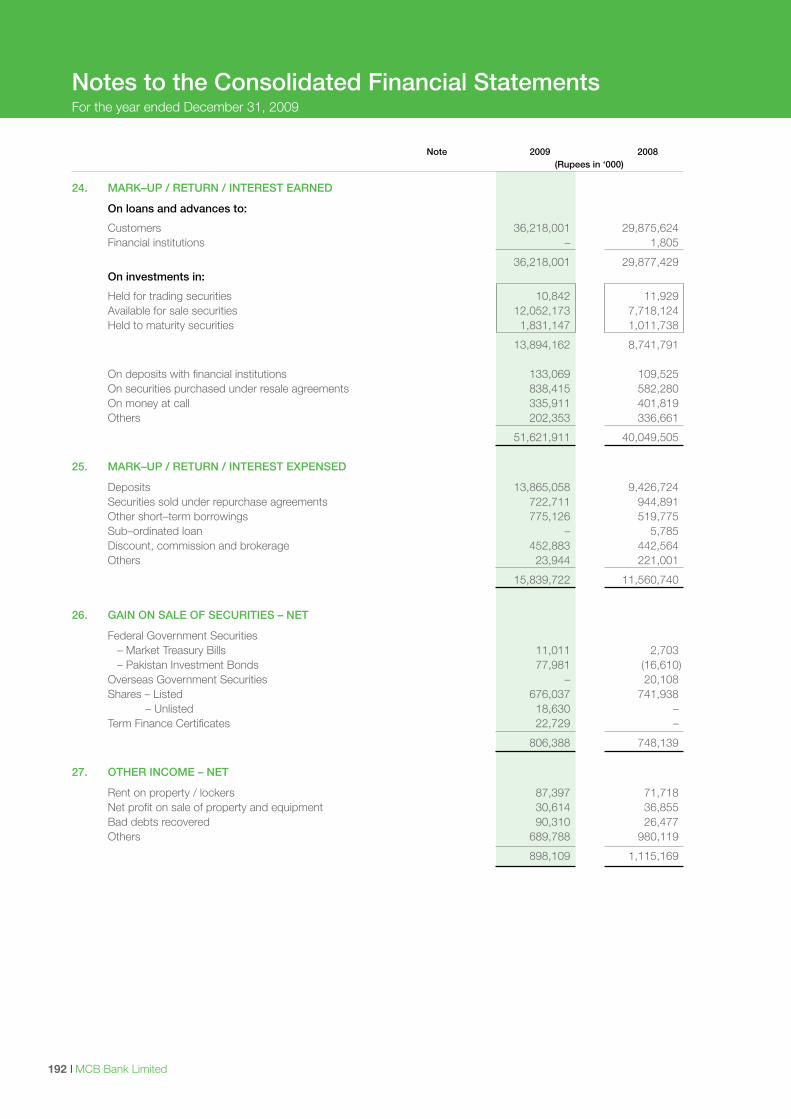
I MCB Bank Limited192
Note 2009 2008 (Rupees in ‘000)
24. MARK–UP / RETURN / INTEREST EARNED
On loans and advances to:
Customers 36,218,001 29,875,624 Financial institutions – 1,805
36,218,001 29,877,429 On investments in:
Held for trading securities 10,842 11,929 Available for sale securities 12,052,173 7,718,124 Held to maturity securities 1,831,147 1,011,738
13,894,162 8,741,791 On deposits with financial institutions 133,069 109,525 On securities purchased under resale agreements 838,415 582,280 On money at call 335,911 401,819 Others 202,353 336,661
51,621,911 40,049,505 25. MARK–UP / RETURN / INTEREST EXPENSED
Deposits 13,865,058 9,426,724 Securities sold under repurchase agreements 722,711 944,891 Other short–term borrowings 775,126 519,775 Sub–ordinated loan – 5,785 Discount, commission and brokerage 452,883 442,564 Others 23,944 221,001
15,839,722 11,560,740
26. GAIN ON SALE OF SECURITIES – NET
Federal Government Securities – Market Treasury Bills 11,011 2,703 – Pakistan Investment Bonds 77,981 (16,610) Overseas Government Securities – 20,108 Shares – Listed 676,037 741,938 – Unlisted 18,630 – Term Finance Certificates 22,729 –
806,388 748,139
27. OTHER INCOME – NET
Rent on property / lockers 87,397 71,718 Net profit on sale of property and equipment 30,614 36,855 Bad debts recovered 90,310 26,477 Others 689,788 980,119
898,109 1,115,169
Notes to the Consolidated Financial StatementsFor the year ended December 31, 2009
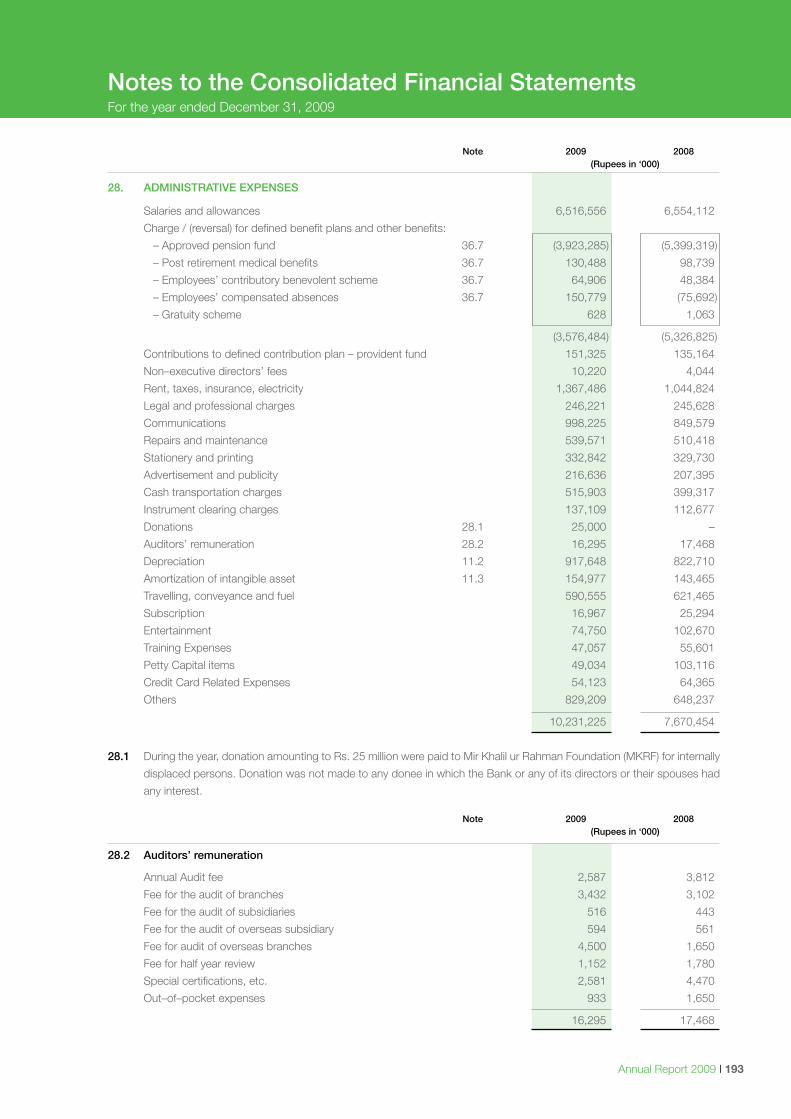
Annual Report 2009 I 193
Note 2009 2008 (Rupees in ‘000)
28. ADMINISTRATIVE EXPENSES
Salaries and allowances 6,516,556 6,554,112
Charge / (reversal) for defined benefit plans and other benefits:
– Approved pension fund 36.7 (3,923,285) (5,399,319)
– Post retirement medical benefits 36.7 130,488 98,739
– Employees’ contributory benevolent scheme 36.7 64,906 48,384
– Employees’ compensated absences 36.7 150,779 (75,692)
– Gratuity scheme 628 1,063
(3,576,484) (5,326,825)
Contributions to defined contribution plan – provident fund 151,325 135,164
Non–executive directors’ fees 10,220 4,044
Rent, taxes, insurance, electricity 1,367,486 1,044,824
Legal and professional charges 246,221 245,628
Communications 998,225 849,579
Repairs and maintenance 539,571 510,418
Stationery and printing 332,842 329,730
Advertisement and publicity 216,636 207,395
Cash transportation charges 515,903 399,317
Instrument clearing charges 137,109 112,677
Donations 28.1 25,000 –
Auditors’ remuneration 28.2 16,295 17,468
Depreciation 11.2 917,648 822,710
Amortization of intangible asset 11.3 154,977 143,465
Travelling, conveyance and fuel 590,555 621,465
Subscription 16,967 25,294
Entertainment 74,750 102,670
Training Expenses 47,057 55,601
Petty Capital items 49,034 103,116
Credit Card Related Expenses 54,123 64,365
Others 829,209 648,237
10,231,225 7,670,454
28.1 During the year, donation amounting to Rs. 25 million were paid to Mir Khalil ur Rahman Foundation (MKRF) for internally
displaced persons. Donation was not made to any donee in which the Bank or any of its directors or their spouses had
any interest.
Note 2009 2008 (Rupees in ‘000)
28.2 Auditors’ remuneration
Annual Audit fee 2,587 3,812
Fee for the audit of branches 3,432 3,102
Fee for the audit of subsidiaries 516 443
Fee for the audit of overseas subsidiary 594 561
Fee for audit of overseas branches 4,500 1,650
Fee for half year review 1,152 1,780
Special certifications, etc. 2,581 4,470
Out–of–pocket expenses 933 1,650
16,295 17,468
Notes to the Consolidated Financial StatementsFor the year ended December 31, 2009
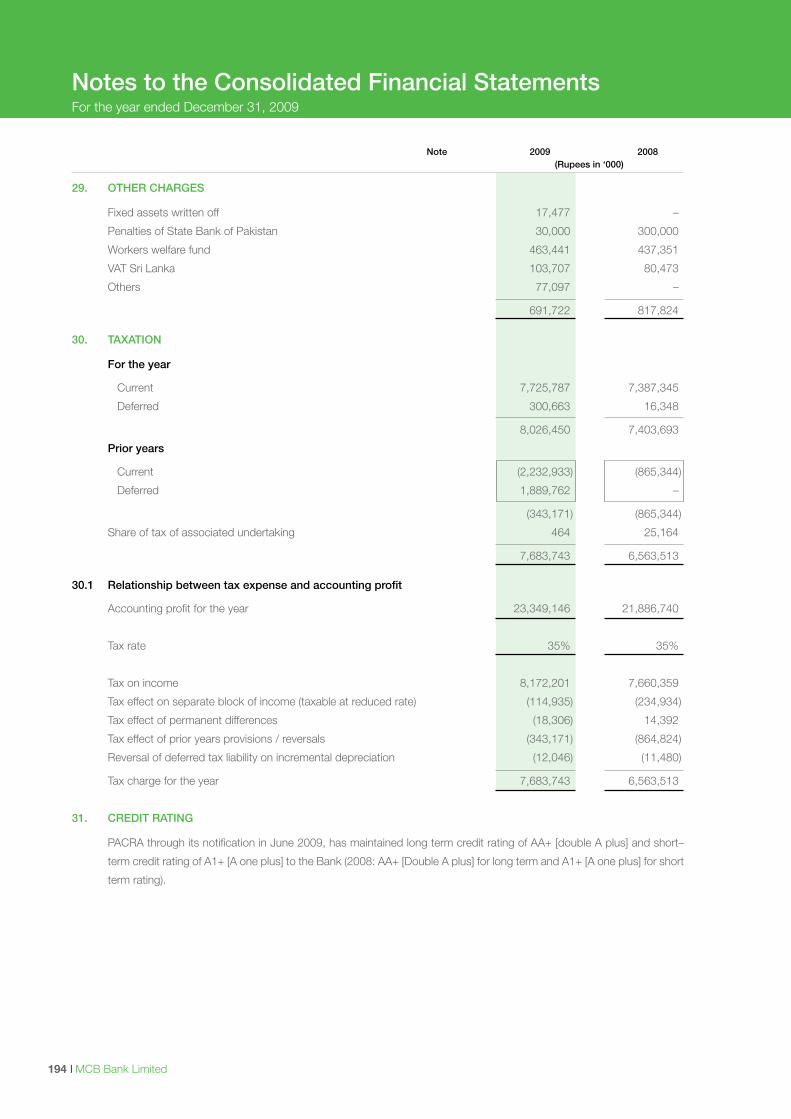
I MCB Bank Limited194
Note 2009 2008 (Rupees in ‘000)
29. OTHER CHARGES
Fixed assets written off 17,477 –
Penalties of State Bank of Pakistan 30,000 300,000
Workers welfare fund 463,441 437,351
VAT Sri Lanka 103,707 80,473
Others 77,097 –
691,722 817,824
30. TAXATION
For the year
Current 7,725,787 7,387,345
Deferred 300,663 16,348
8,026,450 7,403,693
Prior years
Current (2,232,933) (865,344)
Deferred 1,889,762 –
(343,171) (865,344)
Share of tax of associated undertaking 464 25,164
7,683,743 6,563,513 30.1 Relationship between tax expense and accounting profit
Accounting profit for the year 23,349,146 21,886,740
Tax rate 35% 35%
Tax on income 8,172,201 7,660,359
Tax effect on separate block of income (taxable at reduced rate) (114,935) (234,934)
Tax effect of permanent differences (18,306) 14,392
Tax effect of prior years provisions / reversals (343,171) (864,824)
Reversal of deferred tax liability on incremental depreciation (12,046) (11,480)
Tax charge for the year 7,683,743 6,563,513
31. CREDIT RATING
PACRA through its notification in June 2009, has maintained long term credit rating of AA+ [double A plus] and short–
term credit rating of A1+ [A one plus] to the Bank (2008: AA+ [Double A plus] for long term and A1+ [A one plus] for short
term rating).
Notes to the Consolidated Financial StatementsFor the year ended December 31, 2009
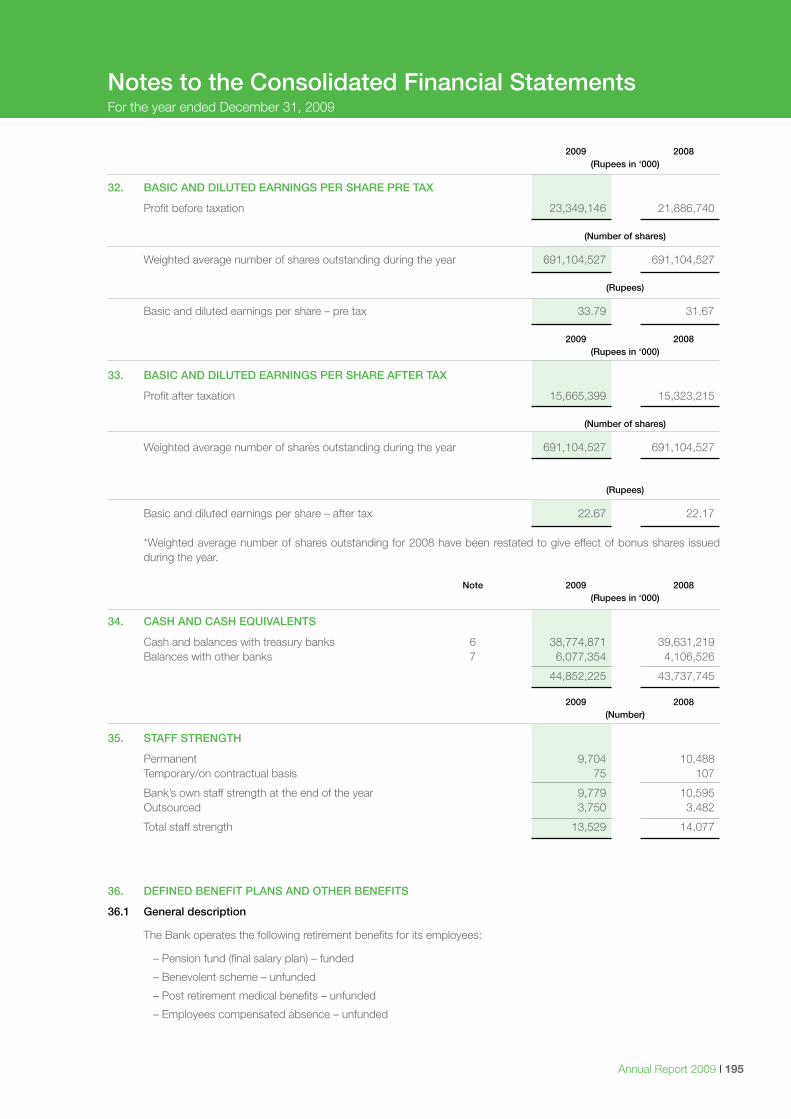
Annual Report 2009 I 195
2009 2008 (Rupees in ‘000)
32. BASIC AND DILUTED EARNINGS PER SHARE PRE TAX
Profit before taxation 23,349,146 21,886,740 (Number of shares)
Weighted average number of shares outstanding during the year 691,104,527 691,104,527 (Rupees)
Basic and diluted earnings per share – pre tax 33.79 31.67 2009 2008 (Rupees in ‘000)
33. BASIC AND DILUTED EARNINGS PER SHARE AFTER TAX
Profit after taxation 15,665,399 15,323,215 (Number of shares)
Weighted average number of shares outstanding during the year 691,104,527 691,104,527 (Rupees)
Basic and diluted earnings per share – after tax 22.67 22.17
*Weighted average number of shares outstanding for 2008 have been restated to give effect of bonus shares issued during the year.
Note 2009 2008 (Rupees in ‘000)
34. CASH AND CASH EQUIVALENTS
Cash and balances with treasury banks 6 38,774,871 39,631,219 Balances with other banks 7 6,077,354 4,106,526
44,852,225 43,737,745
2009 2008 (Number)
35. STAFF STRENGTH
Permanent 9,704 10,488 Temporary/on contractual basis 75 107
Bank’s own staff strength at the end of the year 9,779 10,595 Outsourced 3,750 3,482
Total staff strength 13,529 14,077
36. DEFINED BENEFIT PLANS AND OTHER BENEFITS
36.1 General description
The Bank operates the following retirement benefits for its employees:
– Pension fund (final salary plan) – funded
– Benevolent scheme – unfunded
– Post retirement medical benefits – unfunded
– Employees compensated absence – unfunded
Notes to the Consolidated Financial StatementsFor the year ended December 31, 2009
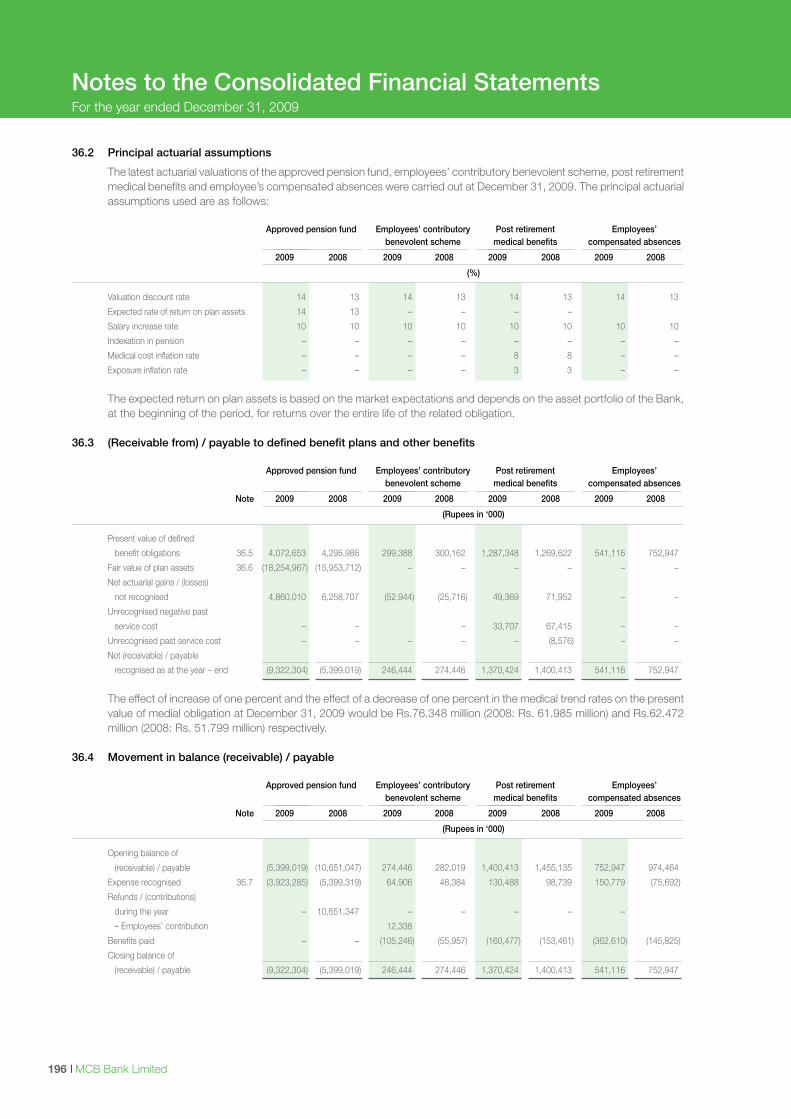
I MCB Bank Limited196
36.2 Principal actuarial assumptions
The latest actuarial valuations of the approved pension fund, employees’ contributory benevolent scheme, post retirement medical benefits and employee’s compensated absences were carried out at December 31, 2009. The principal actuarial assumptions used are as follows:
Approved pension fund Employees’ contributory Post retirement Employees’ benevolent scheme medical benefits compensated absences
2009 2008 2009 2008 2009 2008 2009 2008
(%)
Valuation discount rate 14 13 14 13 14 13 14 13
Expected rate of return on plan assets 14 13 – – – –
Salary increase rate 10 10 10 10 10 10 10 10
Indexation in pension – – – – – – – –
Medical cost inflation rate – – – – 8 8 – –
Exposure inflation rate – – – – 3 3 – –
The expected return on plan assets is based on the market expectations and depends on the asset portfolio of the Bank,
at the beginning of the period, for returns over the entire life of the related obligation. 36.3 (Receivable from) / payable to defined benefit plans and other benefits Approved pension fund Employees’ contributory Post retirement Employees’ benevolent scheme medical benefits compensated absences
Note 2009 2008 2009 2008 2009 2008 2009 2008
(Rupees in ‘000)
Present value of defined
benefit obligations 36.5 4,072,653 4,295,986 299,388 300,162 1,287,348 1,269,622 541,116 752,947
Fair value of plan assets 36.6 (18,254,967) (15,953,712) – – – – – –
Net actuarial gains / (losses)
not recognised 4,860,010 6,258,707 (52,944) (25,716) 49,369 71,952 – –
Unrecognised negative past
service cost – – – 33,707 67,415 – –
Unrecognised past service cost – – – – – (8,576) – –
Net (receivable) / payable
recognised as at the year – end (9,322,304) (5,399,019) 246,444 274,446 1,370,424 1,400,413 541,116 752,947
The effect of increase of one percent and the effect of a decrease of one percent in the medical trend rates on the present
value of medial obligation at December 31, 2009 would be Rs.76.348 million (2008: Rs. 61.985 million) and Rs.62.472 million (2008: Rs. 51.799 million) respectively.
36.4 Movement in balance (receivable) / payable
Approved pension fund Employees’ contributory Post retirement Employees’ benevolent scheme medical benefits compensated absences
Note 2009 2008 2009 2008 2009 2008 2009 2008
(Rupees in ‘000)
Opening balance of
(receivable) / payable (5,399,019) (10,651,047) 274,446 282,019 1,400,413 1,455,135 752,947 974,464
Expense recognised 36.7 (3,923,285) (5,399,319) 64,906 48,384 130,488 98,739 150,779 (75,692)
Refunds / (contributions)
during the year – 10,651,347 – – – – –
– Employees’ contribution 12,338
Benefits paid – – (105,246) (55,957) (160,477) (153,461) (362,610) (145,825)
Closing balance of
(receivable) / payable (9,322,304) (5,399,019) 246,444 274,446 1,370,424 1,400,413 541,116 752,947
Notes to the Consolidated Financial StatementsFor the year ended December 31, 2009
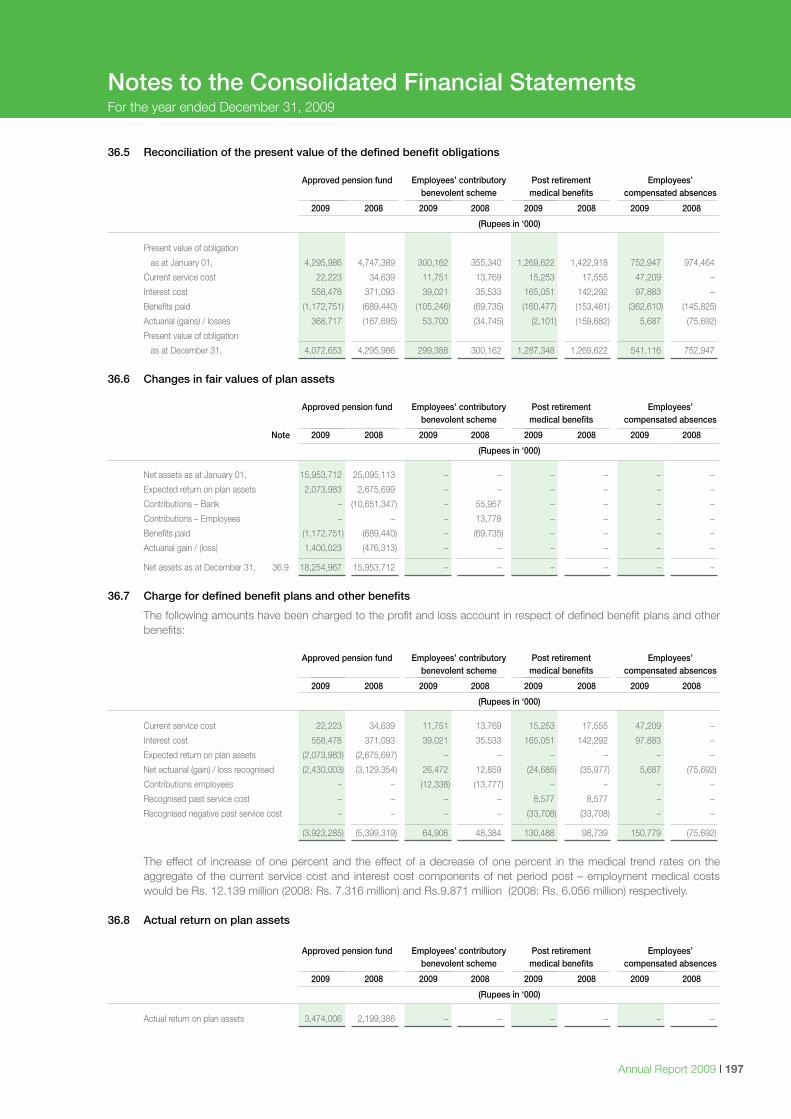
Annual Report 2009 I 197
36.5 Reconciliation of the present value of the defined benefit obligations Approved pension fund Employees’ contributory Post retirement Employees’ benevolent scheme medical benefits compensated absences
2009 2008 2009 2008 2009 2008 2009 2008
(Rupees in ‘000)
Present value of obligation
as at January 01, 4,295,986 4,747,389 300,162 355,340 1,269,622 1,422,918 752,947 974,464
Current service cost 22,223 34,639 11,751 13,769 15,253 17,555 47,209 –
Interest cost 558,478 371,093 39,021 35,533 165,051 142,292 97,883 –
Benefits paid (1,172,751) (689,440) (105,246) (69,735) (160,477) (153,461) (362,610) (145,825)
Actuarial (gains) / losses 368,717 (167,695) 53,700 (34,745) (2,101) (159,682) 5,687 (75,692)
Present value of obligation
as at December 31, 4,072,653 4,295,986 299,388 300,162 1,287,348 1,269,622 541,116 752,947
36.6 Changes in fair values of plan assets
Approved pension fund Employees’ contributory Post retirement Employees’ benevolent scheme medical benefits compensated absences
Note 2009 2008 2009 2008 2009 2008 2009 2008
(Rupees in ‘000)
Net assets as at January 01, 15,953,712 25,095,113 – – – – – –
Expected return on plan assets 2,073,983 2,675,699 – – – – – –
Contributions – Bank – (10,651,347) – 55,957 – – – –
Contributions – Employees – – – 13,778 – – – –
Benefits paid (1,172,751) (689,440) – (69,735) – – – –
Actuarial gain / (loss) 1,400,023 (476,313) – – – – – –
Net assets as at December 31, 36.9 18,254,967 15,953,712 – – – – – –
36.7 Charge for defined benefit plans and other benefits
The following amounts have been charged to the profit and loss account in respect of defined benefit plans and other benefits:
Approved pension fund Employees’ contributory Post retirement Employees’ benevolent scheme medical benefits compensated absences
2009 2008 2009 2008 2009 2008 2009 2008
(Rupees in ‘000)
Current service cost 22,223 34,639 11,751 13,769 15,253 17,555 47,209 –
Interest cost 558,478 371,093 39,021 35,533 165,051 142,292 97,883 –
Expected return on plan assets (2,073,983) (2,675,697) – – – – – –
Net actuarial (gain) / loss recognised (2,430,003) (3,129,354) 26,472 12,859 (24,685) (35,977) 5,687 (75,692)
Contributions employees – – (12,338) (13,777) – – – –
Recognised past service cost – – – – 8,577 8,577 – –
Recognised negative past service cost – – – – (33,708) (33,708) – –
(3,923,285) (5,399,319) 64,906 48,384 130,488 98,739 150,779 (75,692)
The effect of increase of one percent and the effect of a decrease of one percent in the medical trend rates on the
aggregate of the current service cost and interest cost components of net period post – employment medical costs would be Rs. 12.139 million (2008: Rs. 7.316 million) and Rs.9.871 million (2008: Rs. 6.056 million) respectively.
36.8 Actual return on plan assets
Approved pension fund Employees’ contributory Post retirement Employees’ benevolent scheme medical benefits compensated absences
2009 2008 2009 2008 2009 2008 2009 2008
(Rupees in ‘000)
Actual return on plan assets 3,474,006 2,199,386 – – – – – –
Notes to the Consolidated Financial StatementsFor the year ended December 31, 2009
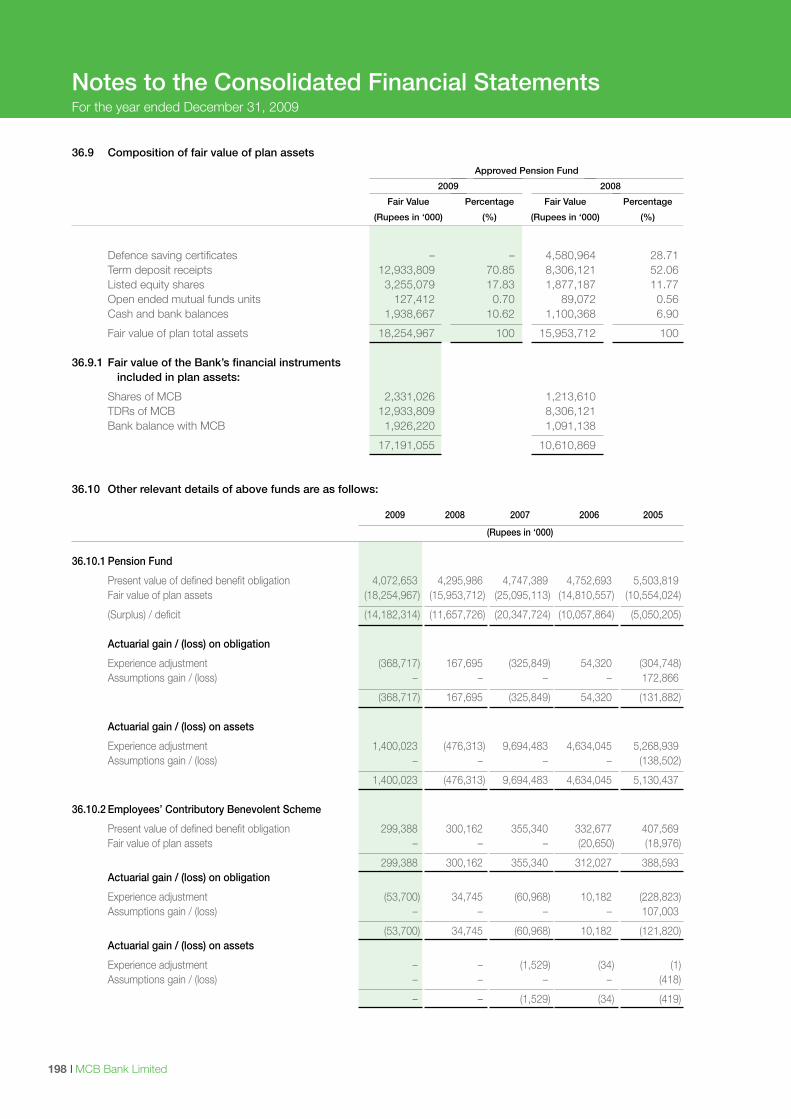
I MCB Bank Limited198
36.9 Composition of fair value of plan assets
Approved Pension Fund
2009 2008
Fair Value Percentage Fair Value Percentage
(Rupees in ‘000) (%) (Rupees in ‘000) (%)
Defence saving certificates – – 4,580,964 28.71 Term deposit receipts 12,933,809 70.85 8,306,121 52.06 Listed equity shares 3,255,079 17.83 1,877,187 11.77 Open ended mutual funds units 127,412 0.70 89,072 0.56 Cash and bank balances 1,938,667 10.62 1,100,368 6.90
Fair value of plan total assets 18,254,967 100 15,953,712 100 36.9.1 Fair value of the Bank’s financial instruments included in plan assets:
Shares of MCB 2,331,026 1,213,610 TDRs of MCB 12,933,809 8,306,121 Bank balance with MCB 1,926,220 1,091,138
17,191,055 10,610,869
36.10 Other relevant details of above funds are as follows:
2009 2008 2007 2006 2005
(Rupees in ‘000)
36.10.1 Pension Fund
Present value of defined benefit obligation 4,072,653 4,295,986 4,747,389 4,752,693 5,503,819 Fair value of plan assets (18,254,967) (15,953,712) (25,095,113) (14,810,557) (10,554,024)
(Surplus) / deficit (14,182,314) (11,657,726) (20,347,724) (10,057,864) (5,050,205) Actuarial gain / (loss) on obligation
Experience adjustment (368,717) 167,695 (325,849) 54,320 (304,748) Assumptions gain / (loss) – – – – 172,866
(368,717) 167,695 (325,849) 54,320 (131,882) Actuarial gain / (loss) on assets
Experience adjustment 1,400,023 (476,313) 9,694,483 4,634,045 5,268,939 Assumptions gain / (loss) – – – – (138,502)
1,400,023 (476,313) 9,694,483 4,634,045 5,130,437 36.10.2 Employees’ Contributory Benevolent Scheme
Present value of defined benefit obligation 299,388 300,162 355,340 332,677 407,569 Fair value of plan assets – – – (20,650) (18,976)
299,388 300,162 355,340 312,027 388,593 Actuarial gain / (loss) on obligation
Experience adjustment (53,700) 34,745 (60,968) 10,182 (228,823) Assumptions gain / (loss) – – – – 107,003
(53,700) 34,745 (60,968) 10,182 (121,820) Actuarial gain / (loss) on assets
Experience adjustment – – (1,529) (34) (1) Assumptions gain / (loss) – – – – (418)
– – (1,529) (34) (419)
Notes to the Consolidated Financial StatementsFor the year ended December 31, 2009
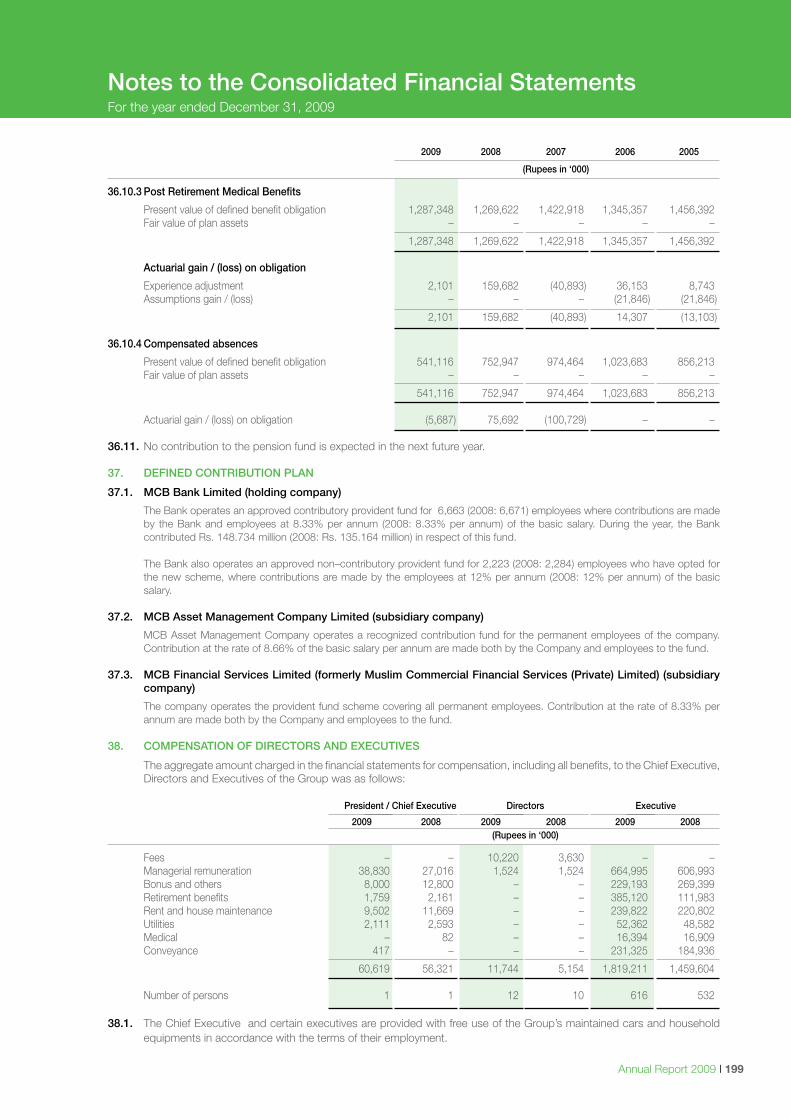
Annual Report 2009 I 199
2009 2008 2007 2006 2005
(Rupees in ‘000)
36.10.3 Post Retirement Medical Benefits
Present value of defined benefit obligation 1,287,348 1,269,622 1,422,918 1,345,357 1,456,392 Fair value of plan assets – – – – –
1,287,348 1,269,622 1,422,918 1,345,357 1,456,392 Actuarial gain / (loss) on obligation
Experience adjustment 2,101 159,682 (40,893) 36,153 8,743 Assumptions gain / (loss) – – – (21,846) (21,846)
2,101 159,682 (40,893) 14,307 (13,103) 36.10.4 Compensated absences
Present value of defined benefit obligation 541,116 752,947 974,464 1,023,683 856,213 Fair value of plan assets – – – – –
541,116 752,947 974,464 1,023,683 856,213
Actuarial gain / (loss) on obligation (5,687) 75,692 (100,729) – – 36.11. No contribution to the pension fund is expected in the next future year. 37. DEFINED CONTRIBUTION PLAN
37.1. MCB Bank Limited (holding company)
The Bank operates an approved contributory provident fund for 6,663 (2008: 6,671) employees where contributions are made by the Bank and employees at 8.33% per annum (2008: 8.33% per annum) of the basic salary. During the year, the Bank contributed Rs. 148.734 million (2008: Rs. 135.164 million) in respect of this fund.
The Bank also operates an approved non–contributory provident fund for 2,223 (2008: 2,284) employees who have opted for the new scheme, where contributions are made by the employees at 12% per annum (2008: 12% per annum) of the basic salary.
37.2. MCB Asset Management Company Limited (subsidiary company)
MCB Asset Management Company operates a recognized contribution fund for the permanent employees of the company. Contribution at the rate of 8.66% of the basic salary per annum are made both by the Company and employees to the fund.
37.3. MCB Financial Services Limited (formerly Muslim Commercial Financial Services (Private) Limited) (subsidiary company)
The company operates the provident fund scheme covering all permanent employees. Contribution at the rate of 8.33% per annum are made both by the Company and employees to the fund.
38. COMPENSATION OF DIRECTORS AND EXECUTIVES
The aggregate amount charged in the financial statements for compensation, including all benefits, to the Chief Executive, Directors and Executives of the Group was as follows:
President / Chief Executive Directors Executive
2009 2008 2009 2008 2009 2008 (Rupees in ‘000)
Fees – – 10,220 3,630 – – Managerial remuneration 38,830 27,016 1,524 1,524 664,995 606,993 Bonus and others 8,000 12,800 – – 229,193 269,399 Retirement benefits 1,759 2,161 – – 385,120 111,983 Rent and house maintenance 9,502 11,669 – – 239,822 220,802 Utilities 2,111 2,593 – – 52,362 48,582 Medical – 82 – – 16,394 16,909 Conveyance 417 – – – 231,325 184,936
60,619 56,321 11,744 5,154 1,819,211 1,459,604 Number of persons 1 1 12 10 616 532
38.1. The Chief Executive and certain executives are provided with free use of the Group’s maintained cars and household equipments in accordance with the terms of their employment.
Notes to the Consolidated Financial StatementsFor the year ended December 31, 2009
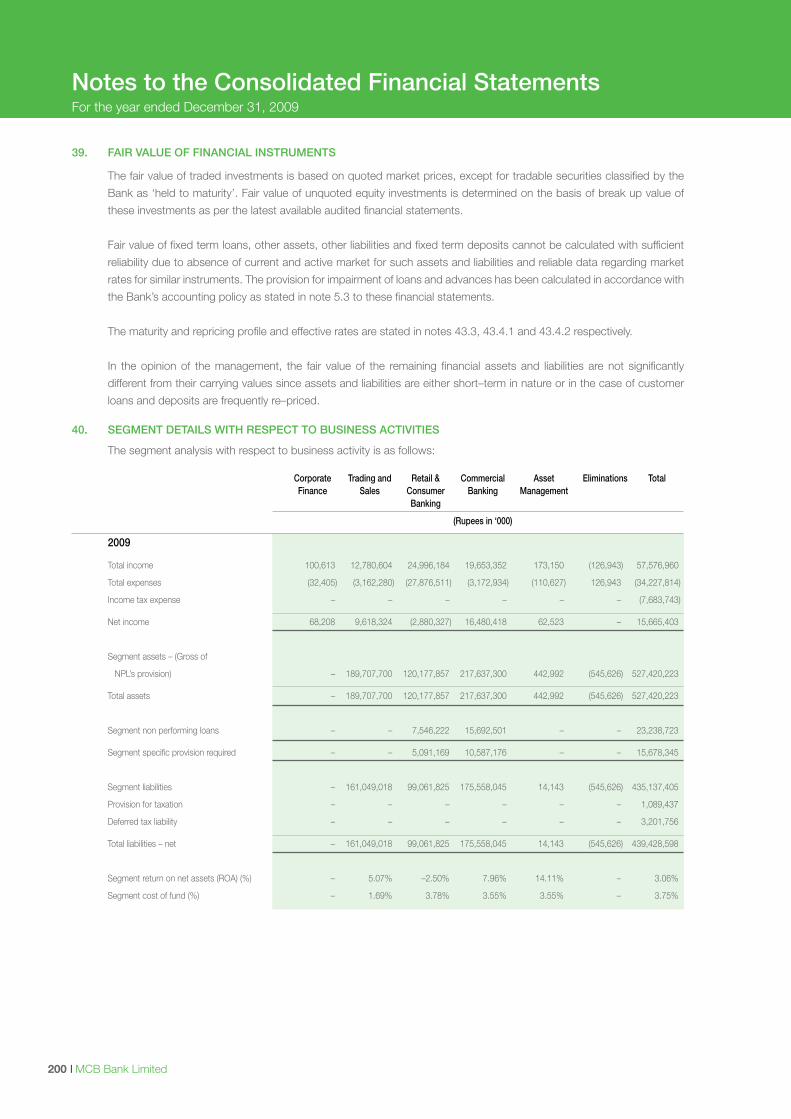
I MCB Bank Limited200
39. FAIR VALUE OF FINANCIAL INSTRUMENTS
The fair value of traded investments is based on quoted market prices, except for tradable securities classified by the
Bank as ‘held to maturity’. Fair value of unquoted equity investments is determined on the basis of break up value of
these investments as per the latest available audited financial statements.
Fair value of fixed term loans, other assets, other liabilities and fixed term deposits cannot be calculated with sufficient
reliability due to absence of current and active market for such assets and liabilities and reliable data regarding market
rates for similar instruments. The provision for impairment of loans and advances has been calculated in accordance with
the Bank’s accounting policy as stated in note 5.3 to these financial statements.
The maturity and repricing profile and effective rates are stated in notes 43.3, 43.4.1 and 43.4.2 respectively.
In the opinion of the management, the fair value of the remaining financial assets and liabilities are not significantly
different from their carrying values since assets and liabilities are either short–term in nature or in the case of customer
loans and deposits are frequently re–priced. 40. SEGMENT DETAILS WITH RESPECT TO BUSINESS ACTIVITIES
The segment analysis with respect to business activity is as follows: Corporate Trading and Retail & Commercial Asset Eliminations Total Finance Sales Consumer Banking Management Banking
(Rupees in ‘000)
2009
Total income 100,613 12,780,604 24,996,184 19,653,352 173,150 (126,943) 57,576,960
Total expenses (32,405) (3,162,280) (27,876,511) (3,172,934) (110,627) 126,943 (34,227,814)
Income tax expense – – – – – – (7,683,743)
Net income 68,208 9,618,324 (2,880,327) 16,480,418 62,523 – 15,665,403
Segment assets – (Gross of
NPL’s provision) – 189,707,700 120,177,857 217,637,300 442,992 (545,626) 527,420,223
Total assets – 189,707,700 120,177,857 217,637,300 442,992 (545,626) 527,420,223
Segment non performing loans – – 7,546,222 15,692,501 – – 23,238,723
Segment specific provision required – – 5,091,169 10,587,176 – – 15,678,345
Segment liabilities – 161,049,018 99,061,825 175,558,045 14,143 (545,626) 435,137,405
Provision for taxation – – – – – – 1,089,437
Deferred tax liability – – – – – – 3,201,756
Total liabilities – net – 161,049,018 99,061,825 175,558,045 14,143 (545,626) 439,428,598
Segment return on net assets (ROA) (%) – 5.07% –2.50% 7.96% 14.11% – 3.06%
Segment cost of fund (%) – 1.69% 3.78% 3.55% 3.55% – 3.75%
Notes to the Consolidated Financial StatementsFor the year ended December 31, 2009
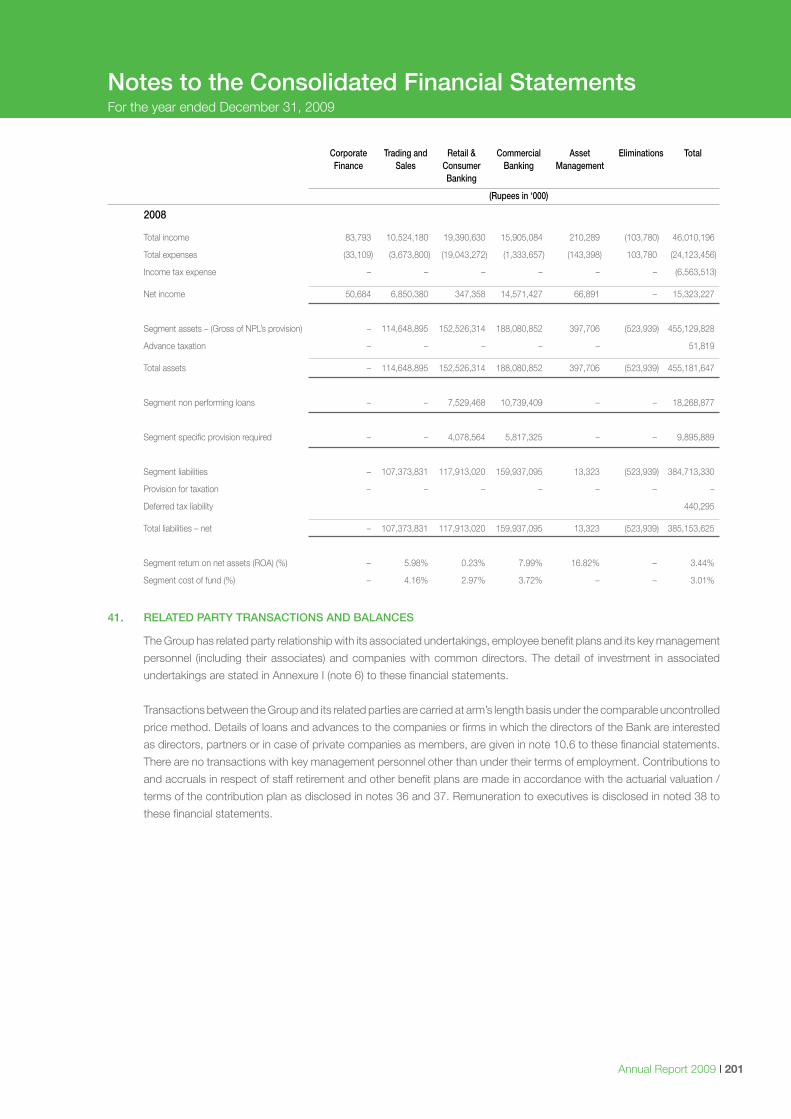
Annual Report 2009 I 201
Corporate Trading and Retail & Commercial Asset Eliminations Total Finance Sales Consumer Banking Management Banking
(Rupees in ‘000)
2008
Total income 83,793 10,524,180 19,390,630 15,905,084 210,289 (103,780) 46,010,196
Total expenses (33,109) (3,673,800) (19,043,272) (1,333,657) (143,398) 103,780 (24,123,456)
Income tax expense – – – – – – (6,563,513)
Net income 50,684 6,850,380 347,358 14,571,427 66,891 – 15,323,227
Segment assets – (Gross of NPL’s provision) – 114,648,895 152,526,314 188,080,852 397,706 (523,939) 455,129,828
Advance taxation – – – – – 51,819
Total assets – 114,648,895 152,526,314 188,080,852 397,706 (523,939) 455,181,647
Segment non performing loans – – 7,529,468 10,739,409 – – 18,268,877
Segment specific provision required – – 4,078,564 5,817,325 – – 9,895,889
Segment liabilities – 107,373,831 117,913,020 159,937,095 13,323 (523,939) 384,713,330
Provision for taxation – – – – – – –
Deferred tax liability 440,295
Total liabilities – net – 107,373,831 117,913,020 159,937,095 13,323 (523,939) 385,153,625
Segment return on net assets (ROA) (%) – 5.98% 0.23% 7.99% 16.82% – 3.44%
Segment cost of fund (%) – 4.16% 2.97% 3.72% – – 3.01%
41. RELATED PARTY TRANSACTIONS AND BALANCES
The Group has related party relationship with its associated undertakings, employee benefit plans and its key management
personnel (including their associates) and companies with common directors. The detail of investment in associated
undertakings are stated in Annexure I (note 6) to these financial statements.
Transactions between the Group and its related parties are carried at arm’s length basis under the comparable uncontrolled
price method. Details of loans and advances to the companies or firms in which the directors of the Bank are interested
as directors, partners or in case of private companies as members, are given in note 10.6 to these financial statements.
There are no transactions with key management personnel other than under their terms of employment. Contributions to
and accruals in respect of staff retirement and other benefit plans are made in accordance with the actuarial valuation /
terms of the contribution plan as disclosed in notes 36 and 37. Remuneration to executives is disclosed in noted 38 to
these financial statements.
Notes to the Consolidated Financial StatementsFor the year ended December 31, 2009
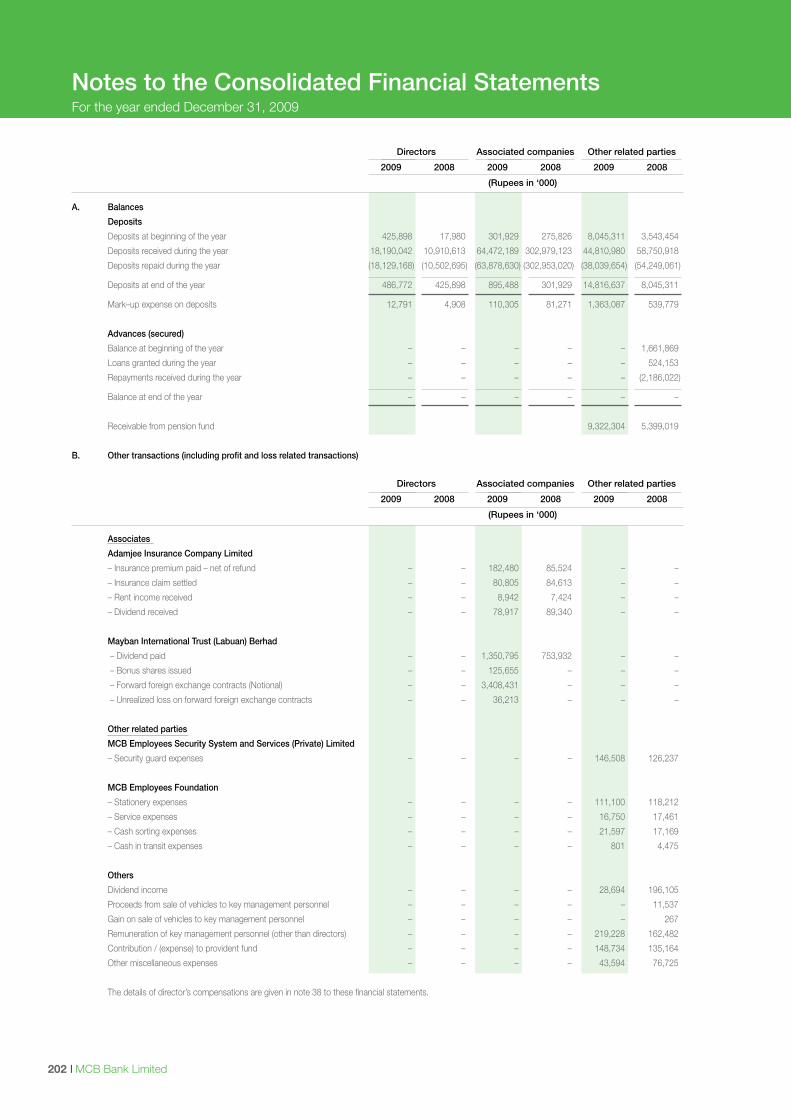
I MCB Bank Limited202
Directors Associated companies Other related parties
2009 2008 2009 2008 2009 2008
(Rupees in ‘000)
A. Balances
Deposits
Deposits at beginning of the year 425,898 17,980 301,929 275,826 8,045,311 3,543,454
Deposits received during the year 18,190,042 10,910,613 64,472,189 302,979,123 44,810,980 58,750,918
Deposits repaid during the year (18,129,168) (10,502,695) (63,878,630) (302,953,020) (38,039,654) (54,249,061)
Deposits at end of the year 486,772 425,898 895,488 301,929 14,816,637 8,045,311
Mark–up expense on deposits 12,791 4,908 110,305 81,271 1,363,087 539,779
Advances (secured)
Balance at beginning of the year – – – – – 1,661,869
Loans granted during the year – – – – – 524,153
Repayments received during the year – – – – – (2,186,022)
Balance at end of the year – – – – – –
Receivable from pension fund 9,322,304 5,399,019
B. Other transactions (including profit and loss related transactions)
Directors Associated companies Other related parties
2009 2008 2009 2008 2009 2008
(Rupees in ‘000)
Associates
Adamjee Insurance Company Limited
– Insurance premium paid – net of refund – – 182,480 85,524 – –
– Insurance claim settled – – 80,805 84,613 – –
– Rent income received – – 8,942 7,424 – –
– Dividend received – – 78,917 89,340 – –
Mayban International Trust (Labuan) Berhad
– Dividend paid – – 1,350,795 753,932 – –
– Bonus shares issued – – 125,655 – – –
– Forward foreign exchange contracts (Notional) – – 3,408,431 – – –
– Unrealized loss on forward foreign exchange contracts – – 36,213 – – –
Other related parties
MCB Employees Security System and Services (Private) Limited
– Security guard expenses – – – – 146,508 126,237
MCB Employees Foundation
– Stationery expenses – – – – 111,100 118,212
– Service expenses – – – – 16,750 17,461
– Cash sorting expenses – – – – 21,597 17,169
– Cash in transit expenses – – – – 801 4,475
Others
Dividend income – – – – 28,694 196,105
Proceeds from sale of vehicles to key management personnel – – – – – 11,537
Gain on sale of vehicles to key management personnel – – – – – 267
Remuneration of key management personnel (other than directors) – – – – 219,228 162,482
Contribution / (expense) to provident fund – – – – 148,734 135,164
Other miscellaneous expenses – – – – 43,594 76,725
The details of director’s compensations are given in note 38 to these financial statements.
Notes to the Consolidated Financial StatementsFor the year ended December 31, 2009
Annual Report 2009 I 203
42. CAPITAL ASSESSMENT AND ADEQUACY
42.1 Scope of Applications
The Basel II Framework is applicable to the bank both at the consolidated level (comprising of wholly/partially owned
subsidiaries & associates undertaking) and also on a stand alone basis. Subsidiaries are included while calculating
Consolidated Capital Adequacy for the Bank using full consolidation method whereas associates in which the bank has
significant influence on equity method. Standardized Approach is used for calculating the Capital Adequacy for Credit
and Market risk, whereas, Basic Indicator Approach (BIA) is used for Operational Risk Capital Adequacy purposes.
42.2 Capital Management
Objectives and goals of managing capital
The objectives and goals of managing capital of the Bank are as follows:
– to be an appropriately capitalized institution, as defined by regulatory authorities and comparable to the peers;
– maintain strong ratings and to protect the Bank against unexpected events;
– availability of adequate capital (including the quantum) at a reasonable cost so as to enable the Bank to expand; and
– achieve low overall cost of capital with appropriate mix of capital elements.
Statutory minimum capital requirement and management of capital
The State Bank of Pakistan through its BSD Circular No.07 of 2009 dated April 15, 2009 requires the minimum paid up
capital (net of losses) for all locally incorporated banks to be raised to Rs. 10 billion by the year ending on December 31,
2013. The raise is to be achieved in a phased manner requiring Rs. 6 billion paid up capital (net of losses) by the end of
the financial year 2009. The paid up capital of the Bank for the year ended December 31, 2009 stands at Rs. 6.9 billion
and is in compliance with the SBP requirement for the said year. In addition the banks are also required to maintain a
minimum capital adequacy ratio (CAR) of 10 % of the risk weighted exposure. The Bank’s CAR as at December 31, 2009
was 19.10% of its risk weighted exposure.
Bank’s regulatory capital is analysed into two tiers.
– Tier 1 capital, which includes fully paid up capital (including the bonus shares), balance in share premium account,
general reserves as per the financial statements and net unappropriated profits, etc after deductions for deficit
on revaluation of available for sale investments and 50% deduction for investments in the equity of subsidiary
companies and significant minority investments in entities engaged in banking and financial activities.
– Tier 2 capital, which includes general provisions for loan losses (up to a maximum of 1.25 % of risk weighted assets),
reserves on revaluation of fixed assets and equity investments up to a maximum of 45 % the balance, foreign
exchange translation reserves, etc after 50% deduction for investments in the equity of subsidiary companies and
significant minority investments in entities engaged in banking and financial activities.
Tier 3 capital has also been prescribed by the State Bank of Pakistan. However, The bank currently does not have any
Tier III capital.
The Capital of the Bank is managed keeping in view the minimum “Capital Adequacy Ratio” required by SBP through
BSD Circular No. 30 dated November 25, 2008 and BSD Circular No.07 of 2009 dated April 15, 2009 . The adequacy
of the capital is tested with reference to the risk–weighted assets of the Bank.
Notes to the Consolidated Financial StatementsFor the year ended December 31, 2009
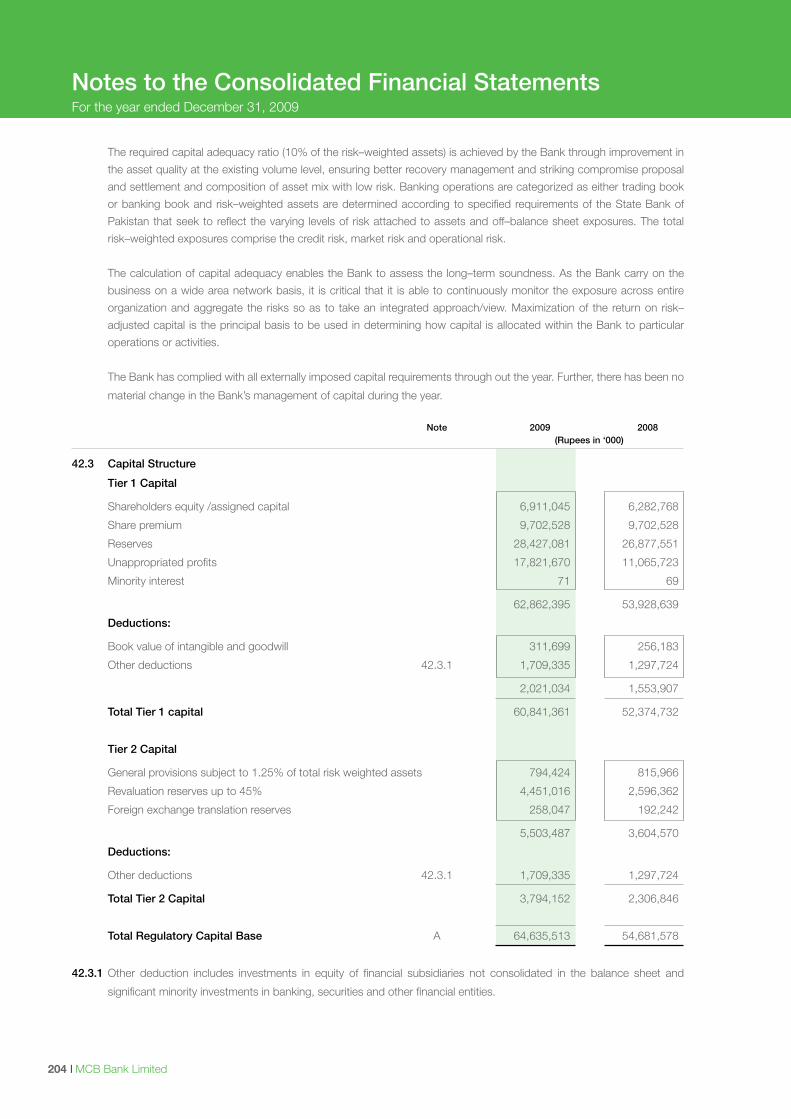
I MCB Bank Limited204
Notes to the Consolidated Financial StatementsFor the year ended December 31, 2009
The required capital adequacy ratio (10% of the risk–weighted assets) is achieved by the Bank through improvement in
the asset quality at the existing volume level, ensuring better recovery management and striking compromise proposal
and settlement and composition of asset mix with low risk. Banking operations are categorized as either trading book
or banking book and risk–weighted assets are determined according to specified requirements of the State Bank of
Pakistan that seek to reflect the varying levels of risk attached to assets and off–balance sheet exposures. The total
risk–weighted exposures comprise the credit risk, market risk and operational risk.
The calculation of capital adequacy enables the Bank to assess the long–term soundness. As the Bank carry on the
business on a wide area network basis, it is critical that it is able to continuously monitor the exposure across entire
organization and aggregate the risks so as to take an integrated approach/view. Maximization of the return on risk–
adjusted capital is the principal basis to be used in determining how capital is allocated within the Bank to particular
operations or activities.
The Bank has complied with all externally imposed capital requirements through out the year. Further, there has been no
material change in the Bank’s management of capital during the year.
Note 2009 2008 (Rupees in ‘000)
42.3 Capital Structure
Tier 1 Capital
Shareholders equity /assigned capital 6,911,045 6,282,768
Share premium 9,702,528 9,702,528
Reserves 28,427,081 26,877,551
Unappropriated profits 17,821,670 11,065,723
Minority interest 71 69
62,862,395 53,928,639
Deductions:
Book value of intangible and goodwill 311,699 256,183
Other deductions 42.3.1 1,709,335 1,297,724
2,021,034 1,553,907
Total Tier 1 capital 60,841,361 52,374,732
Tier 2 Capital
General provisions subject to 1.25% of total risk weighted assets 794,424 815,966
Revaluation reserves up to 45% 4,451,016 2,596,362
Foreign exchange translation reserves 258,047 192,242
5,503,487 3,604,570
Deductions:
Other deductions 42.3.1 1,709,335 1,297,724
Total Tier 2 Capital 3,794,152 2,306,846
Total Regulatory Capital Base A 64,635,513 54,681,578
42.3.1 Other deduction includes investments in equity of financial subsidiaries not consolidated in the balance sheet and
significant minority investments in banking, securities and other financial entities.
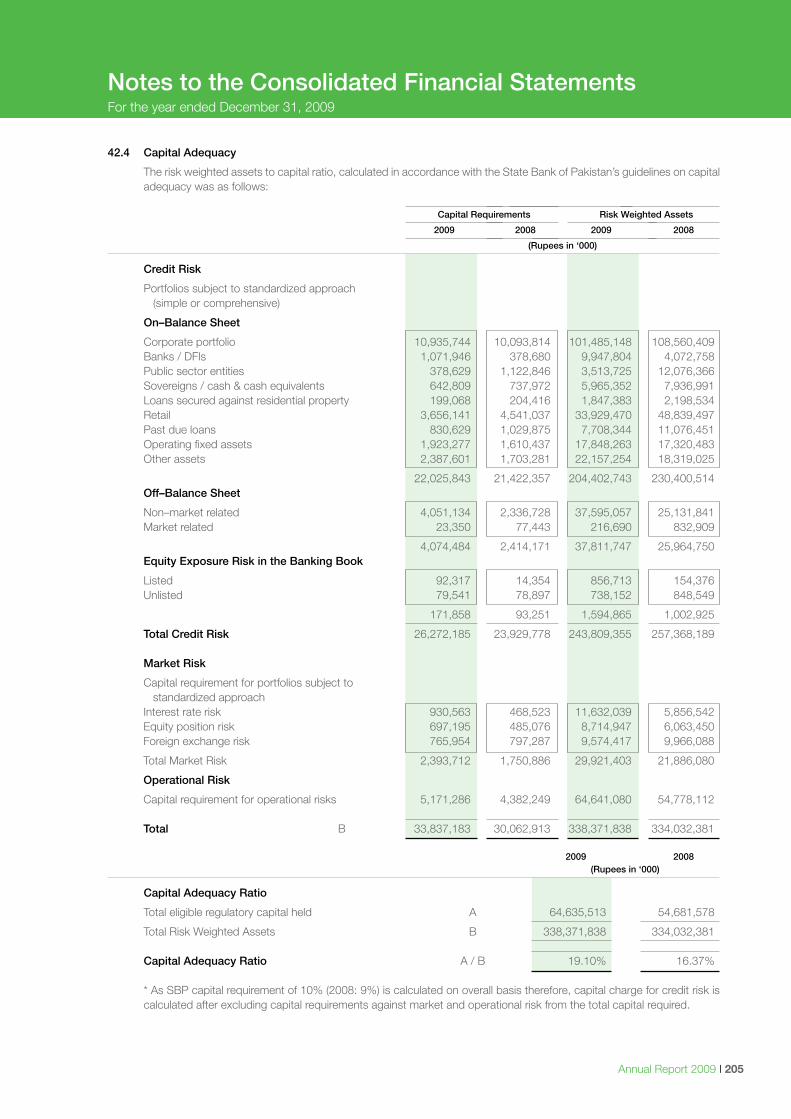
Annual Report 2009 I 205
42.4 Capital Adequacy
The risk weighted assets to capital ratio, calculated in accordance with the State Bank of Pakistan’s guidelines on capital adequacy was as follows:
Capital Requirements Risk Weighted Assets
2009 2008 2009 2008
(Rupees in ‘000)
Credit Risk
Portfolios subject to standardized approach (simple or comprehensive)
On–Balance Sheet
Corporate portfolio 10,935,744 10,093,814 101,485,148 108,560,409 Banks / DFIs 1,071,946 378,680 9,947,804 4,072,758 Public sector entities 378,629 1,122,846 3,513,725 12,076,366 Sovereigns / cash & cash equivalents 642,809 737,972 5,965,352 7,936,991 Loans secured against residential property 199,068 204,416 1,847,383 2,198,534 Retail 3,656,141 4,541,037 33,929,470 48,839,497 Past due loans 830,629 1,029,875 7,708,344 11,076,451 Operating fixed assets 1,923,277 1,610,437 17,848,263 17,320,483 Other assets 2,387,601 1,703,281 22,157,254 18,319,025
22,025,843 21,422,357 204,402,743 230,400,514 Off–Balance Sheet
Non–market related 4,051,134 2,336,728 37,595,057 25,131,841 Market related 23,350 77,443 216,690 832,909
4,074,484 2,414,171 37,811,747 25,964,750 Equity Exposure Risk in the Banking Book
Listed 92,317 14,354 856,713 154,376 Unlisted 79,541 78,897 738,152 848,549
171,858 93,251 1,594,865 1,002,925
Total Credit Risk 26,272,185 23,929,778 243,809,355 257,368,189 Market Risk
Capital requirement for portfolios subject to standardized approach Interest rate risk 930,563 468,523 11,632,039 5,856,542 Equity position risk 697,195 485,076 8,714,947 6,063,450 Foreign exchange risk 765,954 797,287 9,574,417 9,966,088
Total Market Risk 2,393,712 1,750,886 29,921,403 21,886,080
Operational Risk
Capital requirement for operational risks 5,171,286 4,382,249 64,641,080 54,778,112 Total B 33,837,183 30,062,913 338,371,838 334,032,381 2009 2008 (Rupees in ‘000)
Capital Adequacy Ratio
Total eligible regulatory capital held A 64,635,513 54,681,578
Total Risk Weighted Assets B 338,371,838 334,032,381
Capital Adequacy Ratio A / B 19.10% 16.37% * As SBP capital requirement of 10% (2008: 9%) is calculated on overall basis therefore, capital charge for credit risk is
calculated after excluding capital requirements against market and operational risk from the total capital required.
Notes to the Consolidated Financial StatementsFor the year ended December 31, 2009
I MCB Bank Limited206
Notes to the Consolidated Financial StatementsFor the year ended December 31, 2009
43 RISK MANAGEMENT
MCB defines risk as any deviation from an anticipated outcome that may affect the value, capital or earnings of the Bank. Identifying and managing exposure to risk is an integral part of strategic and operational activities of risk management. Bank’s risk management policy is aimed at setting the best course of action under uncertainty by identifying, prioritizing, mitigating and monitoring risk issues. With the goal of enhancing shareholders’ value, following are the five guiding principles of robust risk management structure:
• Optimizingrisk/returninacontrolledmanner • Establishingclearresponsibilityandaccountability • Establishingindependentandproperlyresourcedriskmanagementfunction. • Promotingopenriskculture • Adoptinginternationalbestpracticesinriskmanagement Keeping in view dynamics of internal and external environment, the Bank regularly reviews and updates policy manuals
/ frameworks and procedures in accordance with domestic regulatory environment and international standards. The Bank executes its risk strategy and undertakes controlled risk–taking activities within its risk management framework.
This framework combines core policies, procedures and process design with broad oversight and is supported by risk monitoring across the bank. The Board of Directors and its relevant committee, i.e. the Risk Management & Portfolio Review Committee (RM&PRC) and the senior management and its relevant committees, i.e. the Management Committee (MC), Asset Liability Committee (ALCO), etc., are responsible to ensure formulation and implementation of comprehensive Risk Management Framework. This framework is based on prudent risk identification, measurement, management and monitoring process which are closely aligned with the activities of the Bank so as to ensure that risks are kept within an acceptable level.
As part of risk assessment process, the Bank ensures that not only the relevant risks are identified but their implications
are considered and basis provided for managing and measuring the risks. Through Internal Control units, the Bank ensures that effective controls are in place to mitigate each of the identified risk.
Independent from business groups, Head of Risk Management reports functionally to the Risk Management & Portfolio
Review Committee (RM&PRC) and administratively to the President; the RM & PRC convenes regularly to evaluate Bank’s risk and portfolio concentrations. The Risk Management Group performs the following critical functions:
• CreditRiskManagement • CreditReview • CreditRiskControl • MarketRiskManagement • OperationalRiskManagement In line with regulatory guidelines, the Bank has initiated Internal Capital Adequacy Assessment Process (ICAAP). 43.1 Credit Risk
Credit risk arises from our dealings with individuals, corporate, financial institutions, sovereigns etc. The Bank is exposed to credit risk through its lending and investment activities. It also stems from activities both on and off–balance sheet activities. Credit risk makes up the largest part of the Bank’s exposure. Purpose of credit risk function is to identify measure, manage, monitor and mitigate credit risk. Organizational structure of this function ensures pre and post–facto management of credit risk. While, Credit Review function provides pre–fact evaluation of counterparties, the Credit Risk Control (CRC) performs post–fact evaluation of financing facilities and review clients’ performance as an ongoing process.
The Bank has adopted standardized approach to measure Credit risk regulatory charge in compliance with Basel–II
requirements. The approach is reliant upon the assessment of external credit rating agencies. In line with SBP guidelines on Internal Credit Ratings Systems, Bank has developed a system and all its corporate borrowers are internally rated. Bank is in the process of continuously improving the system and bringing it inline with the Basel framework requirements
In order to manage bank’s credit risk, the Bank has the following policies and procedures in place: • IndividualswhotakeormanagerisksclearlyunderstandtheminordertoprotecttheBankfromavoidablerisks; • Theapprovalofcreditlimitstocounterpartiesaresubjecttopre–factreview; • Extensionincreditfacilityormaterialchangetothecreditfacilityissubjecttocreditreview; • ApprovalandreviewprocessisreviewedbyRM&PRCandinternalaudit; • Managementperiodicallyreviewsthepowersofcreditapprovingandcreditreviewingauthorities.
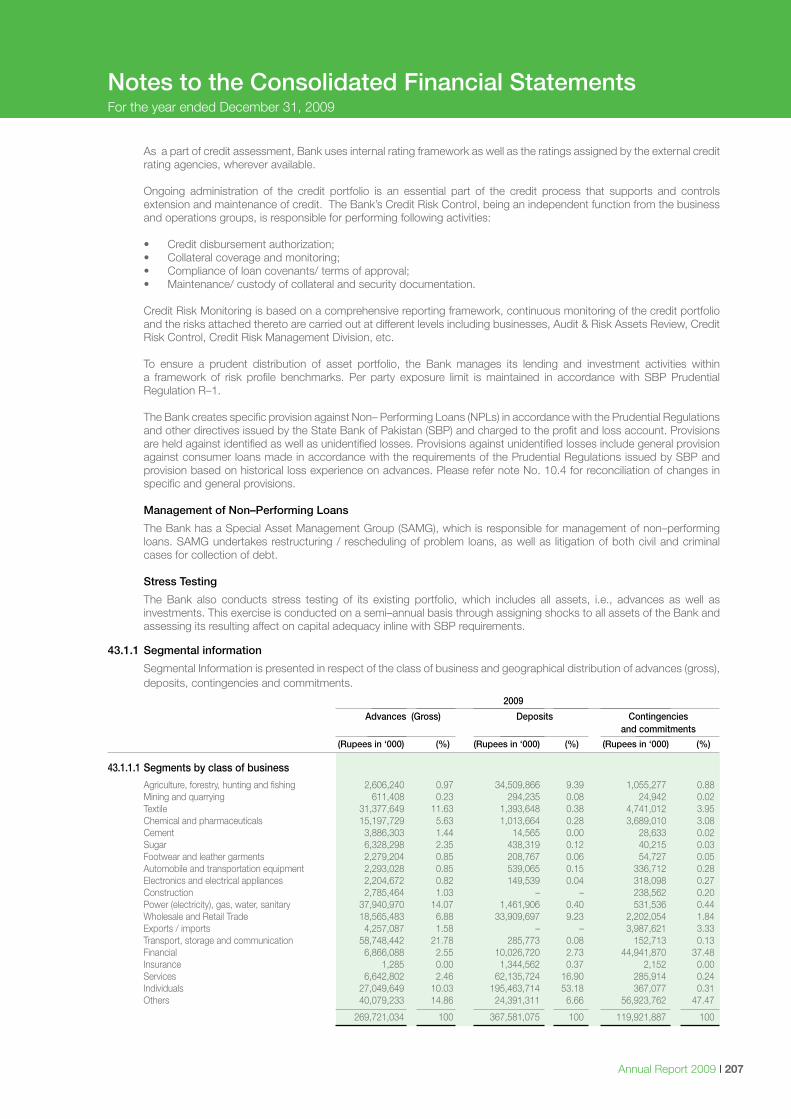
Annual Report 2009 I 207
Notes to the Consolidated Financial StatementsFor the year ended December 31, 2009
As a part of credit assessment, Bank uses internal rating framework as well as the ratings assigned by the external credit rating agencies, wherever available.
Ongoing administration of the credit portfolio is an essential part of the credit process that supports and controls
extension and maintenance of credit. The Bank’s Credit Risk Control, being an independent function from the business and operations groups, is responsible for performing following activities:
• Creditdisbursementauthorization; • Collateralcoverageandmonitoring; • Complianceofloancovenants/termsofapproval; • Maintenance/custodyofcollateralandsecuritydocumentation.
Credit Risk Monitoring is based on a comprehensive reporting framework, continuous monitoring of the credit portfolio and the risks attached thereto are carried out at different levels including businesses, Audit & Risk Assets Review, Credit Risk Control, Credit Risk Management Division, etc.
To ensure a prudent distribution of asset portfolio, the Bank manages its lending and investment activities within
a framework of risk profile benchmarks. Per party exposure limit is maintained in accordance with SBP Prudential Regulation R–1.
The Bank creates specific provision against Non– Performing Loans (NPLs) in accordance with the Prudential Regulations
and other directives issued by the State Bank of Pakistan (SBP) and charged to the profit and loss account. Provisions are held against identified as well as unidentified losses. Provisions against unidentified losses include general provision against consumer loans made in accordance with the requirements of the Prudential Regulations issued by SBP and provision based on historical loss experience on advances. Please refer note No. 10.4 for reconciliation of changes in specific and general provisions.
Management of Non–Performing Loans
The Bank has a Special Asset Management Group (SAMG), which is responsible for management of non–performing loans. SAMG undertakes restructuring / rescheduling of problem loans, as well as litigation of both civil and criminal cases for collection of debt.
Stress Testing
The Bank also conducts stress testing of its existing portfolio, which includes all assets, i.e., advances as well as investments. This exercise is conducted on a semi–annual basis through assigning shocks to all assets of the Bank and assessing its resulting affect on capital adequacy inline with SBP requirements.
43.1.1 Segmental information
Segmental Information is presented in respect of the class of business and geographical distribution of advances (gross), deposits, contingencies and commitments.
2009
Advances (Gross) Deposits Contingencies and commitments
(Rupees in ‘000) (%) (Rupees in ‘000) (%) (Rupees in ‘000) (%)
43.1.1.1 Segments by class of business
Agriculture, forestry, hunting and fishing 2,606,240 0.97 34,509,866 9.39 1,055,277 0.88 Mining and quarrying 611,408 0.23 294,235 0.08 24,942 0.02 Textile 31,377,649 11.63 1,393,648 0.38 4,741,012 3.95 Chemical and pharmaceuticals 15,197,729 5.63 1,013,664 0.28 3,689,010 3.08 Cement 3,886,303 1.44 14,565 0.00 28,633 0.02 Sugar 6,328,298 2.35 438,319 0.12 40,215 0.03 Footwear and leather garments 2,279,204 0.85 208,767 0.06 54,727 0.05 Automobile and transportation equipment 2,293,028 0.85 539,065 0.15 336,712 0.28 Electronics and electrical appliances 2,204,672 0.82 149,539 0.04 318,098 0.27 Construction 2,785,464 1.03 – – 238,562 0.20 Power (electricity), gas, water, sanitary 37,940,970 14.07 1,461,906 0.40 531,536 0.44 Wholesale and Retail Trade 18,565,483 6.88 33,909,697 9.23 2,202,054 1.84 Exports / imports 4,257,087 1.58 – – 3,987,621 3.33 Transport, storage and communication 58,748,442 21.78 285,773 0.08 152,713 0.13 Financial 6,866,088 2.55 10,026,720 2.73 44,941,870 37.48 Insurance 1,285 0.00 1,344,562 0.37 2,152 0.00 Services 6,642,802 2.46 62,135,724 16.90 285,914 0.24 Individuals 27,049,649 10.03 195,463,714 53.18 367,077 0.31 Others 40,079,233 14.86 24,391,311 6.66 56,923,762 47.47
269,721,034 100 367,581,075 100 119,921,887 100
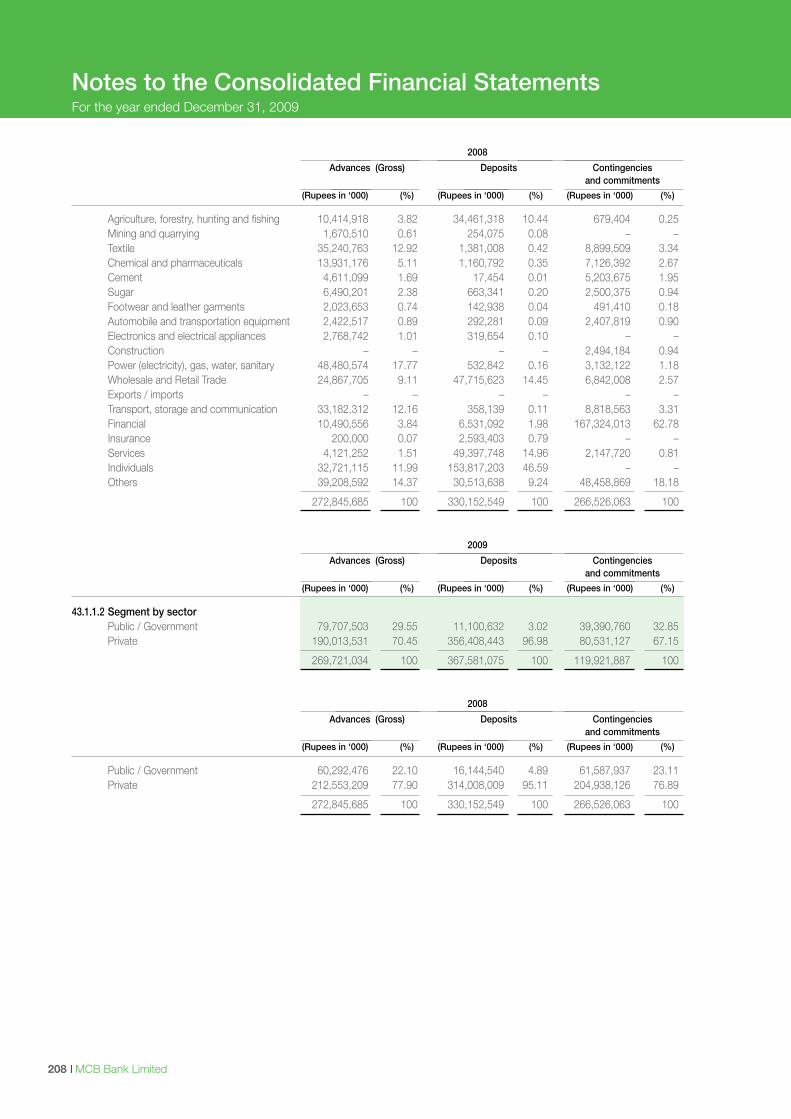
I MCB Bank Limited208
2008
Advances (Gross) Deposits Contingencies and commitments
(Rupees in ‘000) (%) (Rupees in ‘000) (%) (Rupees in ‘000) (%)
Agriculture, forestry, hunting and fishing 10,414,918 3.82 34,461,318 10.44 679,404 0.25 Mining and quarrying 1,670,510 0.61 254,075 0.08 – – Textile 35,240,763 12.92 1,381,008 0.42 8,899,509 3.34 Chemical and pharmaceuticals 13,931,176 5.11 1,160,792 0.35 7,126,392 2.67 Cement 4,611,099 1.69 17,454 0.01 5,203,675 1.95 Sugar 6,490,201 2.38 663,341 0.20 2,500,375 0.94 Footwear and leather garments 2,023,653 0.74 142,938 0.04 491,410 0.18 Automobile and transportation equipment 2,422,517 0.89 292,281 0.09 2,407,819 0.90 Electronics and electrical appliances 2,768,742 1.01 319,654 0.10 – – Construction – – – – 2,494,184 0.94 Power (electricity), gas, water, sanitary 48,480,574 17.77 532,842 0.16 3,132,122 1.18 Wholesale and Retail Trade 24,867,705 9.11 47,715,623 14.45 6,842,008 2.57 Exports / imports – – – – – – Transport, storage and communication 33,182,312 12.16 358,139 0.11 8,818,563 3.31 Financial 10,490,556 3.84 6,531,092 1.98 167,324,013 62.78 Insurance 200,000 0.07 2,593,403 0.79 – – Services 4,121,252 1.51 49,397,748 14.96 2,147,720 0.81 Individuals 32,721,115 11.99 153,817,203 46.59 – – Others 39,208,592 14.37 30,513,638 9.24 48,458,869 18.18
272,845,685 100 330,152,549 100 266,526,063 100
2009
Advances (Gross) Deposits Contingencies and commitments
(Rupees in ‘000) (%) (Rupees in ‘000) (%) (Rupees in ‘000) (%)
43.1.1.2 Segment by sector Public / Government 79,707,503 29.55 11,100,632 3.02 39,390,760 32.85 Private 190,013,531 70.45 356,408,443 96.98 80,531,127 67.15
269,721,034 100 367,581,075 100 119,921,887 100
2008
Advances (Gross) Deposits Contingencies and commitments
(Rupees in ‘000) (%) (Rupees in ‘000) (%) (Rupees in ‘000) (%)
Public / Government 60,292,476 22.10 16,144,540 4.89 61,587,937 23.11 Private 212,553,209 77.90 314,008,009 95.11 204,938,126 76.89
272,845,685 100 330,152,549 100 266,526,063 100
Notes to the Consolidated Financial StatementsFor the year ended December 31, 2009
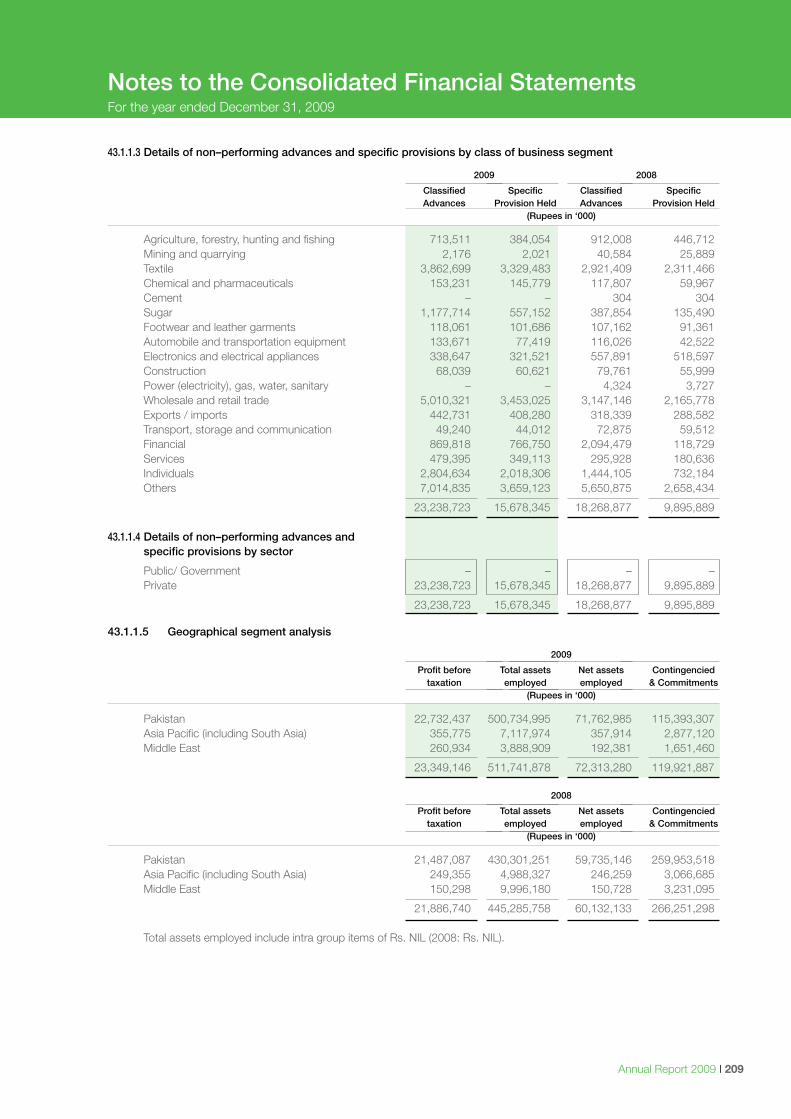
Annual Report 2009 I 209
43.1.1.3 Details of non–performing advances and specific provisions by class of business segment
2009 2008
Classified Specific Classified Specific Advances Provision Held Advances Provision Held (Rupees in ‘000)
Agriculture, forestry, hunting and fishing 713,511 384,054 912,008 446,712 Mining and quarrying 2,176 2,021 40,584 25,889 Textile 3,862,699 3,329,483 2,921,409 2,311,466 Chemical and pharmaceuticals 153,231 145,779 117,807 59,967 Cement – – 304 304 Sugar 1,177,714 557,152 387,854 135,490 Footwear and leather garments 118,061 101,686 107,162 91,361 Automobile and transportation equipment 133,671 77,419 116,026 42,522 Electronics and electrical appliances 338,647 321,521 557,891 518,597 Construction 68,039 60,621 79,761 55,999 Power (electricity), gas, water, sanitary – – 4,324 3,727 Wholesale and retail trade 5,010,321 3,453,025 3,147,146 2,165,778 Exports / imports 442,731 408,280 318,339 288,582 Transport, storage and communication 49,240 44,012 72,875 59,512 Financial 869,818 766,750 2,094,479 118,729 Services 479,395 349,113 295,928 180,636 Individuals 2,804,634 2,018,306 1,444,105 732,184 Others 7,014,835 3,659,123 5,650,875 2,658,434
23,238,723 15,678,345 18,268,877 9,895,889 43.1.1.4 Details of non–performing advances and specific provisions by sector
Public/ Government – – – – Private 23,238,723 15,678,345 18,268,877 9,895,889
23,238,723 15,678,345 18,268,877 9,895,889
Notes to the Consolidated Financial StatementsFor the year ended December 31, 2009
43.1.1.5 Geographical segment analysis
2009
Profit before Total assets Net assets Contingencied taxation employed employed & Commitments (Rupees in ‘000)
Pakistan 22,732,437 500,734,995 71,762,985 115,393,307 Asia Pacific (including South Asia) 355,775 7,117,974 357,914 2,877,120 Middle East 260,934 3,888,909 192,381 1,651,460
23,349,146 511,741,878 72,313,280 119,921,887 2008
Profit before Total assets Net assets Contingencied taxation employed employed & Commitments (Rupees in ‘000)
Pakistan 21,487,087 430,301,251 59,735,146 259,953,518 Asia Pacific (including South Asia) 249,355 4,988,327 246,259 3,066,685 Middle East 150,298 9,996,180 150,728 3,231,095
21,886,740 445,285,758 60,132,133 266,251,298 Total assets employed include intra group items of Rs. NIL (2008: Rs. NIL).
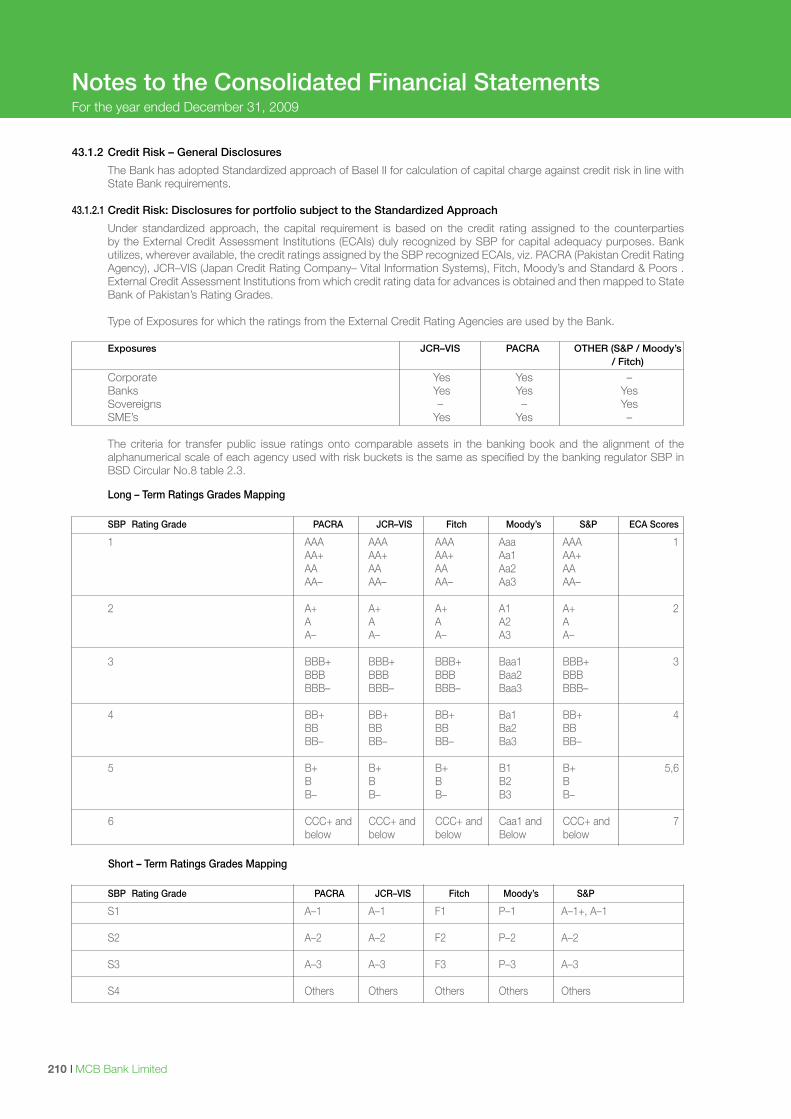
I MCB Bank Limited210
Long – Term Ratings Grades Mapping SBP Rating Grade PACRA JCR–VIS Fitch Moody’s S&P ECA Scores
1 AAA AAA AAA Aaa AAA 1 AA+ AA+ AA+ Aa1 AA+ AA AA AA Aa2 AA AA– AA– AA– Aa3 AA–
2 A+ A+ A+ A1 A+ 2 A A A A2 A A– A– A– A3 A–
3 BBB+ BBB+ BBB+ Baa1 BBB+ 3 BBB BBB BBB Baa2 BBB BBB– BBB– BBB– Baa3 BBB–
4 BB+ BB+ BB+ Ba1 BB+ 4 BB BB BB Ba2 BB BB– BB– BB– Ba3 BB–
5 B+ B+ B+ B1 B+ 5,6 B B B B2 B B– B– B– B3 B–
6 CCC+ and CCC+ and CCC+ and Caa1 and CCC+ and 7 below below below Below below
Short – Term Ratings Grades Mapping SBP Rating Grade PACRA JCR–VIS Fitch Moody’s S&P
S1 A–1 A–1 F1 P–1 A–1+, A–1
S2 A–2 A–2 F2 P–2 A–2
S3 A–3 A–3 F3 P–3 A–3
S4 Others Others Others Others Others
Notes to the Consolidated Financial StatementsFor the year ended December 31, 2009
43.1.2 Credit Risk – General Disclosures
The Bank has adopted Standardized approach of Basel II for calculation of capital charge against credit risk in line with State Bank requirements.
43.1.2.1 Credit Risk: Disclosures for portfolio subject to the Standardized Approach
Under standardized approach, the capital requirement is based on the credit rating assigned to the counterparties by the External Credit Assessment Institutions (ECAIs) duly recognized by SBP for capital adequacy purposes. Bank utilizes, wherever available, the credit ratings assigned by the SBP recognized ECAIs, viz. PACRA (Pakistan Credit Rating Agency), JCR–VIS (Japan Credit Rating Company– Vital Information Systems), Fitch, Moody’s and Standard & Poors . External Credit Assessment Institutions from which credit rating data for advances is obtained and then mapped to State Bank of Pakistan’s Rating Grades.
Type of Exposures for which the ratings from the External Credit Rating Agencies are used by the Bank.
Exposures JCR–VIS PACRA OTHER (S&P / Moody’s / Fitch)
Corporate Yes Yes – Banks Yes Yes Yes Sovereigns – – Yes SME’s Yes Yes –
The criteria for transfer public issue ratings onto comparable assets in the banking book and the alignment of the alphanumerical scale of each agency used with risk buckets is the same as specified by the banking regulator SBP in BSD Circular No.8 table 2.3.
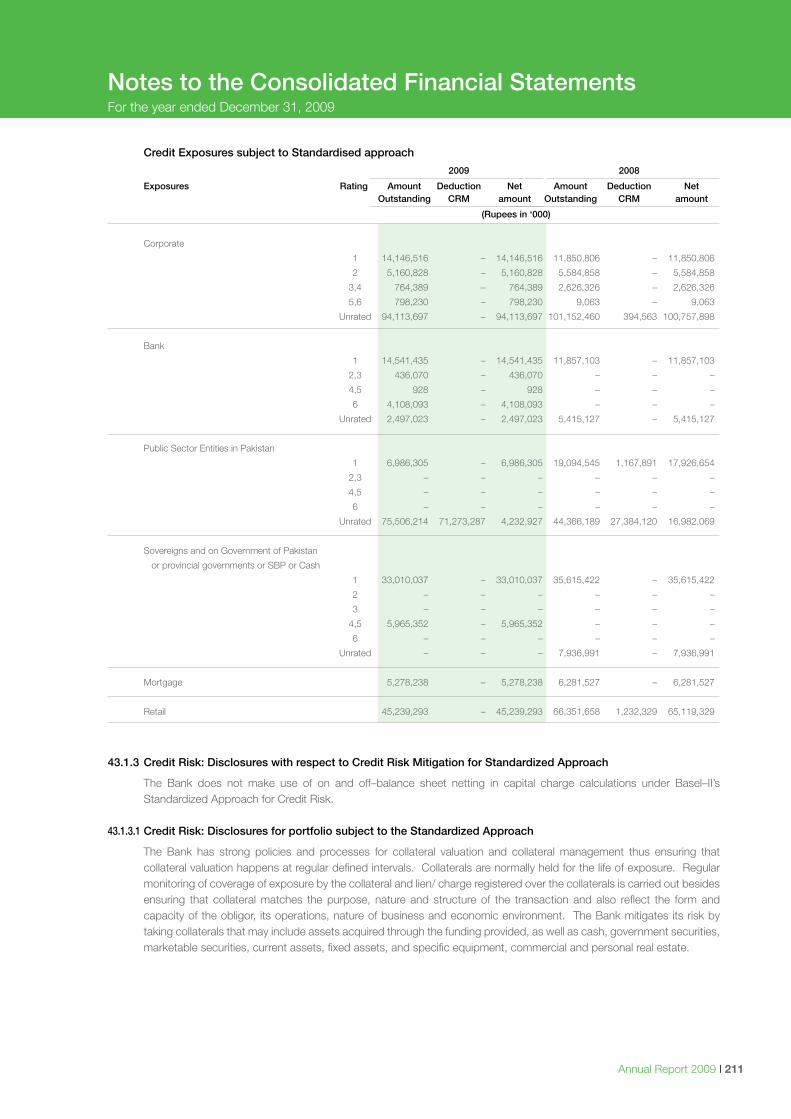
Annual Report 2009 I 211
Notes to the Consolidated Financial StatementsFor the year ended December 31, 2009
Credit Exposures subject to Standardised approach
2009 2008
Exposures Rating Amount Deduction Net Amount Deduction Net Outstanding CRM amount Outstanding CRM amount
(Rupees in ‘000)
Corporate
1 14,146,516 – 14,146,516 11,850,806 – 11,850,806
2 5,160,828 – 5,160,828 5,584,858 – 5,584,858
3,4 764,389 – 764,389 2,626,326 – 2,626,326
5,6 798,230 – 798,230 9,063 – 9,063
Unrated 94,113,697 – 94,113,697 101,152,460 394,563 100,757,898
Bank
1 14,541,435 – 14,541,435 11,857,103 – 11,857,103
2,3 436,070 – 436,070 – – –
4,5 928 – 928 – – –
6 4,108,093 – 4,108,093 – – –
Unrated 2,497,023 – 2,497,023 5,415,127 – 5,415,127
Public Sector Entities in Pakistan
1 6,986,305 – 6,986,305 19,094,545 1,167,891 17,926,654
2,3 – – – – – –
4,5 – – – – – –
6 – – – – – –
Unrated 75,506,214 71,273,287 4,232,927 44,366,189 27,384,120 16,982,069
Sovereigns and on Government of Pakistan
or provincial governments or SBP or Cash
1 33,010,037 – 33,010,037 35,615,422 – 35,615,422
2 – – – – – –
3 – – – – – –
4,5 5,965,352 – 5,965,352 – – –
6 – – – – – –
Unrated – – – 7,936,991 – 7,936,991
Mortgage 5,278,238 – 5,278,238 6,281,527 – 6,281,527
Retail 45,239,293 – 45,239,293 66,351,658 1,232,329 65,119,329
43.1.3 Credit Risk: Disclosures with respect to Credit Risk Mitigation for Standardized Approach
The Bank does not make use of on and off–balance sheet netting in capital charge calculations under Basel–II’s Standardized Approach for Credit Risk.
43.1.3.1 Credit Risk: Disclosures for portfolio subject to the Standardized Approach
The Bank has strong policies and processes for collateral valuation and collateral management thus ensuring that collateral valuation happens at regular defined intervals. Collaterals are normally held for the life of exposure. Regular monitoring of coverage of exposure by the collateral and lien/ charge registered over the collaterals is carried out besides ensuring that collateral matches the purpose, nature and structure of the transaction and also reflect the form and capacity of the obligor, its operations, nature of business and economic environment. The Bank mitigates its risk by taking collaterals that may include assets acquired through the funding provided, as well as cash, government securities, marketable securities, current assets, fixed assets, and specific equipment, commercial and personal real estate.
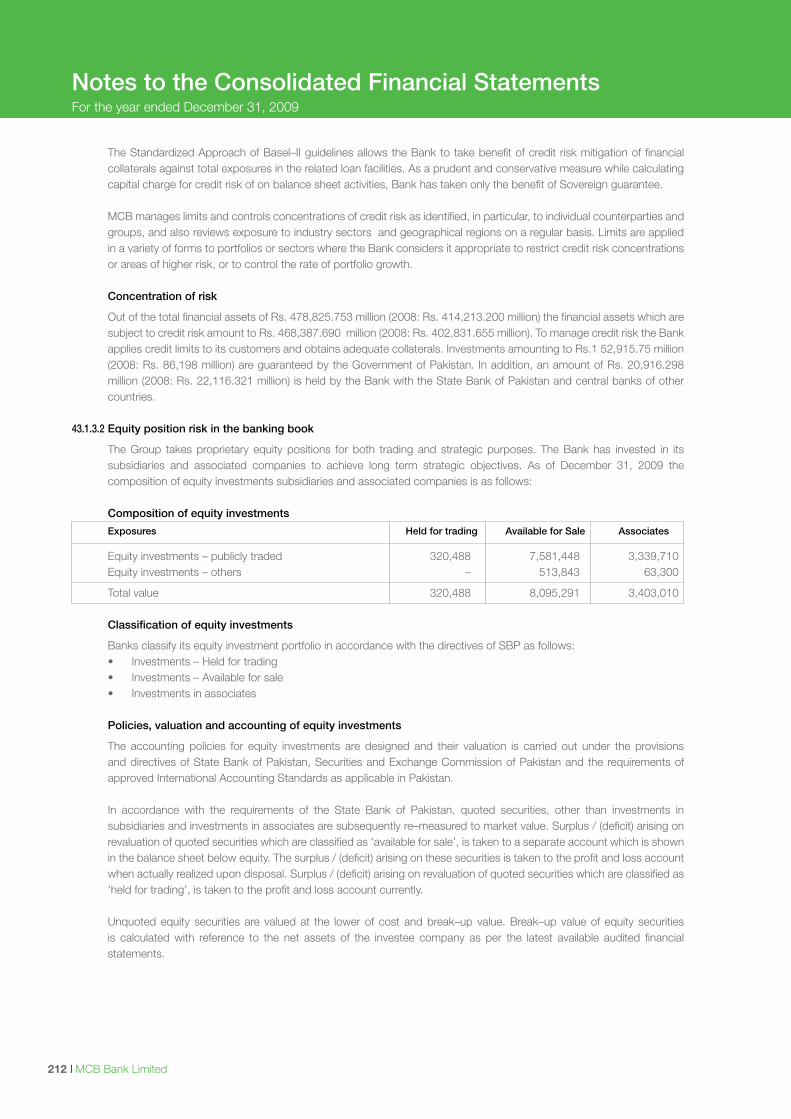
I MCB Bank Limited212
The Standardized Approach of Basel–II guidelines allows the Bank to take benefit of credit risk mitigation of financial collaterals against total exposures in the related loan facilities. As a prudent and conservative measure while calculating capital charge for credit risk of on balance sheet activities, Bank has taken only the benefit of Sovereign guarantee.
MCB manages limits and controls concentrations of credit risk as identified, in particular, to individual counterparties and groups, and also reviews exposure to industry sectors and geographical regions on a regular basis. Limits are applied in a variety of forms to portfolios or sectors where the Bank considers it appropriate to restrict credit risk concentrations or areas of higher risk, or to control the rate of portfolio growth.
Concentration of risk
Out of the total financial assets of Rs. 478,825.753 million (2008: Rs. 414,213.200 million) the financial assets which are subject to credit risk amount to Rs. 468,387.690 million (2008: Rs. 402,831.655 million). To manage credit risk the Bank applies credit limits to its customers and obtains adequate collaterals. Investments amounting to Rs.1 52,915.75 million (2008: Rs. 86,198 million) are guaranteed by the Government of Pakistan. In addition, an amount of Rs. 20,916.298 million (2008: Rs. 22,116.321 million) is held by the Bank with the State Bank of Pakistan and central banks of other countries.
43.1.3.2 Equity position risk in the banking book
The Group takes proprietary equity positions for both trading and strategic purposes. The Bank has invested in its subsidiaries and associated companies to achieve long term strategic objectives. As of December 31, 2009 the composition of equity investments subsidiaries and associated companies is as follows:
Composition of equity investments
Exposures Held for trading Available for Sale Associates
Equity investments – publicly traded 320,488 7,581,448 3,339,710 Equity investments – others – 513,843 63,300
Total value 320,488 8,095,291 3,403,010 Classification of equity investments
Banks classify its equity investment portfolio in accordance with the directives of SBP as follows: • Investments–Heldfortrading • Investments–Availableforsale • Investmentsinassociates Policies, valuation and accounting of equity investments
The accounting policies for equity investments are designed and their valuation is carried out under the provisions and directives of State Bank of Pakistan, Securities and Exchange Commission of Pakistan and the requirements of approved International Accounting Standards as applicable in Pakistan.
In accordance with the requirements of the State Bank of Pakistan, quoted securities, other than investments in
subsidiaries and investments in associates are subsequently re–measured to market value. Surplus / (deficit) arising on revaluation of quoted securities which are classified as ‘available for sale’, is taken to a separate account which is shown in the balance sheet below equity. The surplus / (deficit) arising on these securities is taken to the profit and loss account when actually realized upon disposal. Surplus / (deficit) arising on revaluation of quoted securities which are classified as ‘held for trading’, is taken to the profit and loss account currently.
Unquoted equity securities are valued at the lower of cost and break–up value. Break–up value of equity securities is calculated with reference to the net assets of the investee company as per the latest available audited financial statements.
Notes to the Consolidated Financial StatementsFor the year ended December 31, 2009
Annual Report 2009 I 213
Notes to the Consolidated Financial StatementsFor the year ended December 31, 2009
The cumulative realized gain of Rs. 694.667 million has been recognized in profit & loss account from sale of equity securities; however unrealized gain of Rs. 836.899 million was recognized in the balance sheet in respect of “AFS” securities. Further a provision for impairment in value of equity investments amounting to Rs. 1,496.395 million has been charged to profit and loss account.
43.2 Market Risk Management
Market risk arises from changes in market rates (such as Interest Rates, Foreign Exchange Rates and Equity Prices) as well as their correlations and volatilities. MCB is exposed to market risk primarily through its trading activities, which are centered in the Treasury and Foreign exchange and Capital market groups. Market risk also arises from market–making, facilitation of client business and proprietary positions in equities, fixed income and interest rate products and foreign exchange, which exposes Bank to interest rate risk, foreign exchange risk and equity price risk. Market risk is also assumed as a result of Bank’s balance sheet and capital management activities.
The Bank’s Market Risk Management structure consists of Risk Management Committee of the Board, ALCO, and
independent Market Risk Management Division reporting directly to Group Head Risk Management. Market Risk Management Division is responsible for policy formulation, controlling of market risk including monitoring of exposures against limits; assessment of risks in new business; developing procedures, market risk measurement and reporting system. Market risk authority, including both approval of market risk limits and approval of market risks is vested in the ALCO.
As per SBP instructions (BSD Circular 8, 2006) trading book shall consist of positions in financial instruments held
with trading intent or in order to hedge other elements of the trading book. Hence the bank has clearly defined, in its Risk Management policy, the positions which shall be subject to market risk. The definition covers the accounting classifications as well as positions booked by different business groups under “Available for Sale” category. The assets subject to trading book treatment are frequently valued and actively managed. The positions which does not fulfill the criteria of Trading book falls under the Banking Book and are treated as per SBP requirements.
The Bank measures and manages Market risk by using conventional methods i.e. notional amounts and sensitivity. Bank
has established a specific Market Risk Limit Policy providing guideline for assuming controlled market risk, its monitoring and management. A reasonable number of limits are set and approved. These Limits are compared with the numbers generated by the market risk management system based on the trading activity and the outstanding position on risk measurement date.
Besides conventional methods, the Bank uses VaR (Value at Risk) technique for market risk assessment of assets
booked by its treasury and capital market groups. In–house and vendor based solutions are used for calculating mark to market value of positions and generating VaR (value at risk) and sensitivity numbers. Variance co–variance approach of VaR measure for conventional products and Monte Carlo simulation approach for derivative and structured products are being used by the bank.
Stress testing of both banking and trading books as per SBP guidelines is a regular feature. The Bank is exposed to interest rate risk both in trading and banking books. Risk numbers along with the marked to
market values of government securities held by the Bank’s treasury are generated on daily basis. The risk numbers include duration, PVBP, and VaR on individual security basis as well as on portfolio basis. These reports are presented to the senior management for review on a daily basis.
43.2.1 Foreign Exchange Risk Management
Foreign exchange risk represents exposures the Bank has due to changes in the values of current holdings and future cash flows denominated in currencies other than home currency. The types of instruments exposed to this risk include investments in foreign branches, foreign currency–denominated loans, foreign currency–denominated deposits, future cash flows in foreign currencies arising from foreign exchange transactions, etc.
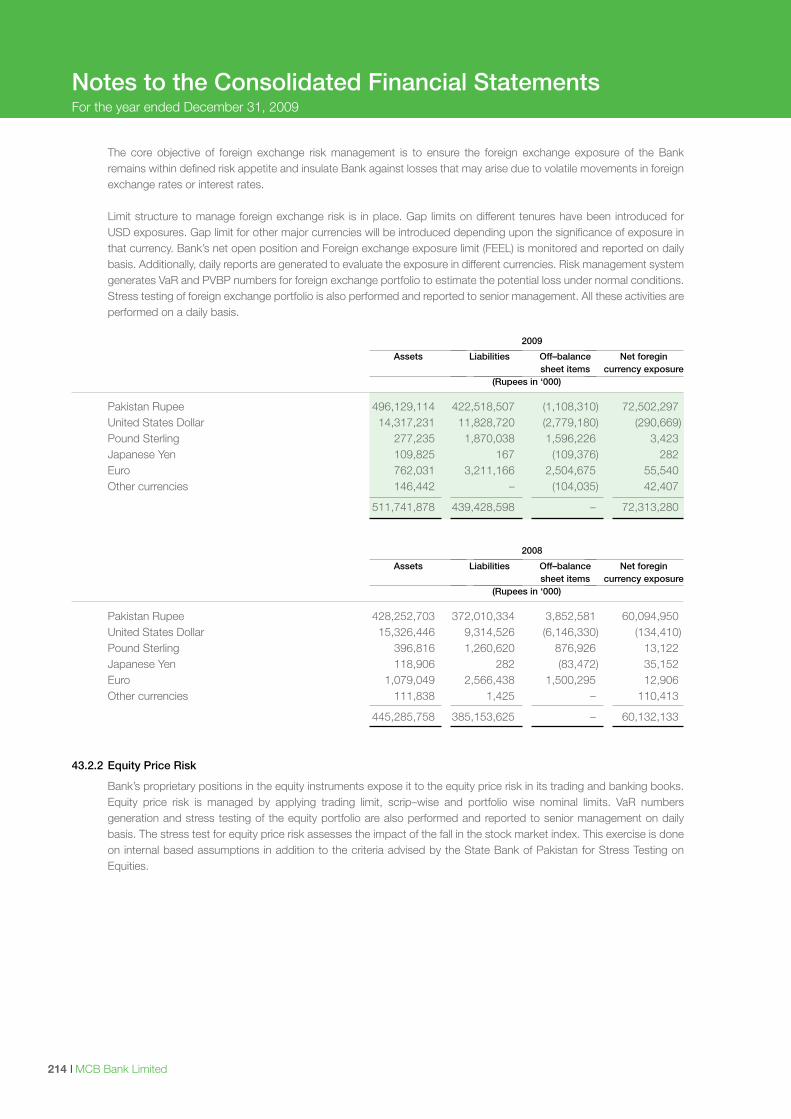
I MCB Bank Limited214
Notes to the Consolidated Financial StatementsFor the year ended December 31, 2009
The core objective of foreign exchange risk management is to ensure the foreign exchange exposure of the Bank remains within defined risk appetite and insulate Bank against losses that may arise due to volatile movements in foreign exchange rates or interest rates.
Limit structure to manage foreign exchange risk is in place. Gap limits on different tenures have been introduced for USD exposures. Gap limit for other major currencies will be introduced depending upon the significance of exposure in that currency. Bank’s net open position and Foreign exchange exposure limit (FEEL) is monitored and reported on daily basis. Additionally, daily reports are generated to evaluate the exposure in different currencies. Risk management system generates VaR and PVBP numbers for foreign exchange portfolio to estimate the potential loss under normal conditions. Stress testing of foreign exchange portfolio is also performed and reported to senior management. All these activities are performed on a daily basis.
2009
Assets Liabilities Off–balance Net foregin sheet items currency exposure (Rupees in ‘000)
Pakistan Rupee 496,129,114 422,518,507 (1,108,310) 72,502,297 United States Dollar 14,317,231 11,828,720 (2,779,180) (290,669) Pound Sterling 277,235 1,870,038 1,596,226 3,423 Japanese Yen 109,825 167 (109,376) 282 Euro 762,031 3,211,166 2,504,675 55,540 Other currencies 146,442 – (104,035) 42,407
511,741,878 439,428,598 – 72,313,280
2008
Assets Liabilities Off–balance Net foregin sheet items currency exposure (Rupees in ‘000)
Pakistan Rupee 428,252,703 372,010,334 3,852,581 60,094,950 United States Dollar 15,326,446 9,314,526 (6,146,330) (134,410) Pound Sterling 396,816 1,260,620 876,926 13,122 Japanese Yen 118,906 282 (83,472) 35,152 Euro 1,079,049 2,566,438 1,500,295 12,906 Other currencies 111,838 1,425 – 110,413
445,285,758 385,153,625 – 60,132,133
43.2.2 Equity Price Risk
Bank’s proprietary positions in the equity instruments expose it to the equity price risk in its trading and banking books. Equity price risk is managed by applying trading limit, scrip–wise and portfolio wise nominal limits. VaR numbers generation and stress testing of the equity portfolio are also performed and reported to senior management on daily basis. The stress test for equity price risk assesses the impact of the fall in the stock market index. This exercise is done on internal based assumptions in addition to the criteria advised by the State Bank of Pakistan for Stress Testing on Equities.
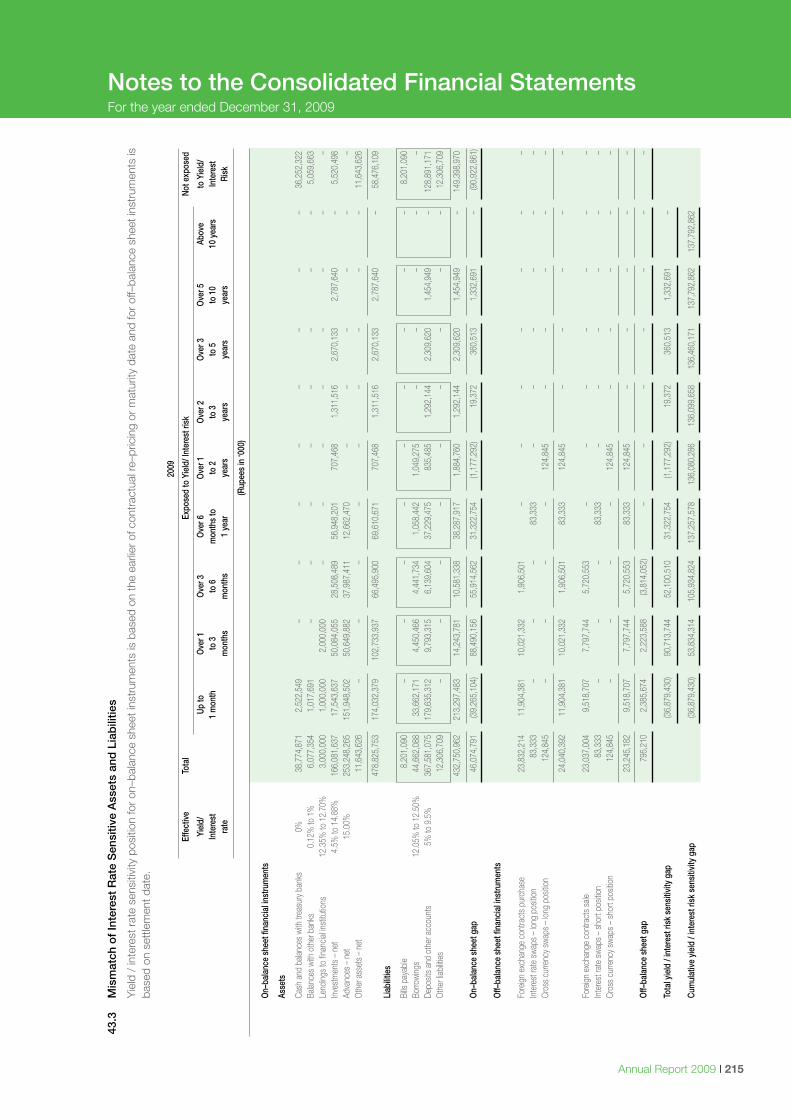
Annual Report 2009 I 215
Notes to the Consolidated Financial StatementsFor the year ended December 31, 2009
43.3
M
ism
atch
of
Inte
rest
Rat
e S
ensi
tive
Ass
ets
and
Lia
bili
ties
Y
ield
/ in
tere
st ra
te s
ensi
tivity
pos
ition
for o
n–ba
lanc
e sh
eet i
nstr
umen
ts is
bas
ed o
n th
e ea
rlier
of c
ontr
actu
al re
–pric
ing
or m
atur
ity d
ate
and
for o
ff–ba
lanc
e sh
eet i
nstr
umen
ts is
ba
sed
on s
ettle
men
t dat
e.
20
09
Ef
fect
ive
Tot
al
Exp
osed
to Y
ield
/ Int
eres
t ris
k
N
ot e
xpos
ed
Yi
eld/
Up
to
Ove
r 1
Ove
r 3
Ove
r 6
Ove
r 1
Ove
r 2
Ove
r 3
Ove
r 5
Abo
ve
to Y
ield
/
Inte
rest
1 m
onth
to
3
to 6
m
onth
s to
to
2
to 3
to
5
to 1
0
10
year
s
Inte
rest
rate
m
onth
s
mon
ths
1
yea
r y
ears
y
ears
y
ears
y
ears
Ris
k
(R
upee
s in
‘000
)
O
n–ba
lanc
e sh
eet f
inan
cial
inst
rum
ents
As
sets
Ca
sh a
nd b
alanc
es w
ith tr
easu
ry b
anks
0%
3
8,77
4,87
1
2,5
22,5
49
–
–
–
–
–
–
–
–
36,
252,
322
Ba
lance
s w
ith o
ther
ban
ks
0.12
% to
1%
6
,077
,354
1
,017
,691
–
–
–
–
–
–
–
–
5
,059
,663
Lend
ings
to fin
ancia
l inst
itutio
ns
12.3
5% to
12.
70%
3
,000
,000
1
,000
,000
2
,000
,000
–
–
–
–
–
–
–
–
In
vest
men
ts –
net
4.
5% to
14.
88%
1
66,0
81,6
37
17,
543,
637
5
0,08
4,05
5
28,
508,
489
5
6,94
8,20
1
707
,468
1
,311
,516
2
,670
,133
2
,787
,640
–
5,5
20,4
98
Ad
vanc
es –
net
15
.00%
2
53,2
48,2
65
151
,948
,502
5
0,64
9,88
2
37,
987,
411
1
2,66
2,47
0
–
–
–
–
–
–
Oth
er a
sset
s –
net
1
1,64
3,62
6
–
–
–
–
–
–
–
–
–
1
1,64
3,62
6
478
,825
,753
1
74,0
32,3
79
102
,733
,937
6
6,49
5,90
0
69,
610,
671
7
07,4
68
1,3
11,5
16
2,6
70,1
33
2,7
87,6
40
–
5
8,47
6,10
9
Liab
ilitie
s
Bi
lls p
ayab
le
8,2
01,0
90
–
–
–
–
–
–
–
–
–
8
,201
,090
Borro
wing
s 12
.05%
to 1
2.50
%
44,
662,
088
3
3,66
2,17
1
4,4
50,4
66
4,4
41,7
34
1,0
58,4
42
1,0
49,2
75
–
–
–
–
–
De
posit
s an
d ot
her a
ccou
nts
5% to
9.5
%
367
,581
,075
1
79,6
35,3
12
9,7
93,3
15
6,1
39,6
04
37,
229,
475
8
35,4
85
1,2
92,1
44
2,3
09,6
20
1,4
54,9
49
–
1
28,8
91,1
71
O
ther
liabi
lities
12,
306,
709
–
–
–
–
–
–
–
–
–
12,
306,
709
432
,750
,962
2
13,2
97,4
83
14,
243,
781
1
0,58
1,33
8
38,
287,
917
1
,884
,760
1
,292
,144
2
,309
,620
1
,454
,949
–
149
,398
,970
O
n–ba
lanc
e sh
eet g
ap
4
6,07
4,79
1
(39,
265,
104)
8
8,49
0,15
6
55,
914,
562
3
1,32
2,75
4
(1,1
77,2
92)
19,
372
3
60,5
13
1,3
32,6
91
–
(9
0,92
2,86
1)
Off–
bala
nce
shee
t fin
anci
al in
stru
men
ts
Fo
reig
n ex
chan
ge c
ontra
cts
purc
hase
23,
832,
214
1
1,90
4,38
1
10,
021,
332
1
,906
,501
–
–
–
–
–
–
–
Inte
rest
rate
sw
aps
– lo
ng p
ositio
n
83,
333
–
–
–
83,
333
–
–
–
–
–
–
Cr
oss
curre
ncy
swap
s –
long
pos
ition
1
24,8
45
–
–
–
–
124
,845
–
–
–
–
–
24,
040,
392
1
1,90
4,38
1
10,
021,
332
1
,906
,501
8
3,33
3
124
,845
–
–
–
–
–
Fore
ign
exch
ange
con
tract
s sa
le
23,
037,
004
9
,518
,707
7
,797
,744
5
,720
,553
–
–
–
–
–
–
–
Inte
rest
rate
sw
aps
– sh
ort p
ositio
n
83,
333
–
–
–
83,
333
–
–
–
–
–
–
Cr
oss
curre
ncy
swap
s –
shor
t pos
ition
1
24,8
45
–
–
–
–
124
,845
–
–
–
–
–
23,
245,
182
9
,518
,707
7
,797
,744
5
,720
,553
8
3,33
3
124
,845
–
–
–
–
–
O
ff–ba
lanc
e sh
eet g
ap
7
95,2
10
2,3
85,6
74
2,2
23,5
88
(3,8
14,0
52)
–
–
–
–
–
–
–
To
tal y
ield
/ in
tere
st ri
sk s
ensi
tivity
gap
(3
6,87
9,43
0)
90,
713,
744
5
2,10
0,51
0
31,
322,
754
(1
,177
,292
) 1
9,37
2
360
,513
1
,332
,691
–
Cu
mul
ativ
e yi
eld
/ int
eres
t ris
k se
nsiti
vity
gap
(3
6,87
9,43
0)
53,
834,
314
1
05,9
34,8
24
137
,257
,578
1
36,0
80,2
86
136
,099
,658
1
36,4
60,1
71
137
,792
,862
1
37,7
92,8
62
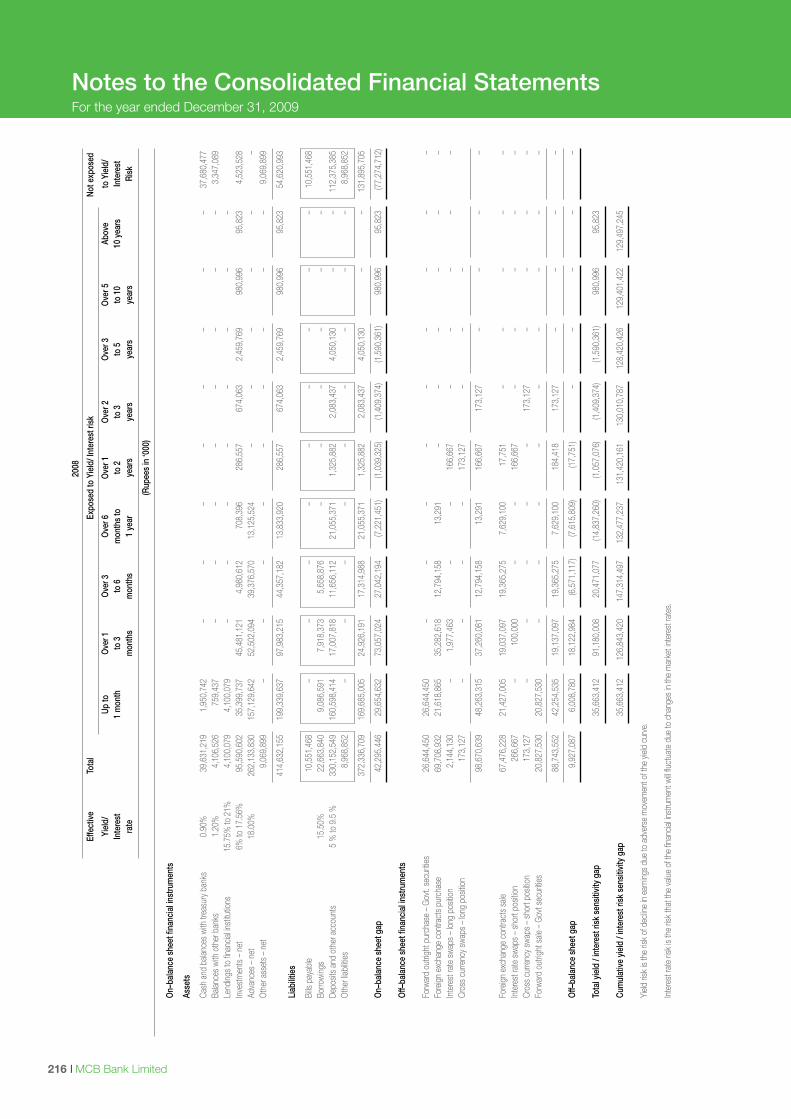
I MCB Bank Limited216
Notes to the Consolidated Financial StatementsFor the year ended December 31, 2009
20
08
Ef
fect
ive
Tot
al
Exp
osed
to Y
ield
/ Int
eres
t ris
k
No
t exp
osed
Yi
eld/
Up
to
Ove
r 1
Ove
r 3
Ove
r 6
Ove
r 1
Ove
r 2
Ove
r 3
Ove
r 5
Abo
ve
to Y
ield
/
Inte
rest
1 m
onth
to
3
to 6
m
onth
s to
to
2
to 3
to
5
to 1
0
10
year
s
Inte
rest
rate
m
onth
s
mon
ths
1
yea
r y
ears
y
ears
y
ears
y
ears
Ris
k
(R
upee
s in
‘000
)
O
n–ba
lanc
e sh
eet f
inan
cial
inst
rum
ents
As
sets
Ca
sh a
nd b
alanc
es w
ith tr
easu
ry b
anks
0.
90%
3
9,63
1,21
9
1,9
50,7
42
–
–
–
–
–
–
–
–
37,
680,
477
Ba
lance
s w
ith o
ther
ban
ks
1.20
%
4,1
06,5
26
759
,437
–
–
–
–
–
–
–
–
3
,347
,089
Lend
ings
to fin
ancia
l inst
itutio
ns
15.7
5% to
21%
4
,100
,079
4
,100
,079
–
–
–
–
–
–
–
–
In
vest
men
ts –
net
6%
to 1
7.56
%
95,
590,
602
3
5,39
9,73
7
45,
481,
121
4
,980
,612
7
08,3
96
286
,557
6
74,0
63
2,4
59,7
69
980
,996
9
5,82
3
4,5
23,5
28
Ad
vanc
es –
net
18
.00%
2
62,1
33,8
30
157
,129
,642
5
2,50
2,09
4
39,
376,
570
1
3,12
5,52
4
–
–
–
–
–
–
Oth
er a
sset
s –
net
9
,069
,899
–
–
–
–
–
–
–
–
–
9,0
69,8
99
414
,632
,155
1
99,3
39,6
37
97,
983,
215
4
4,35
7,18
2
13,
833,
920
2
86,5
57
674
,063
2
,459
,769
9
80,9
96
95,
823
5
4,62
0,99
3
Liab
ilitie
s
Bi
lls p
ayab
le
10,
551,
468
–
–
–
–
–
–
–
–
–
10,
551,
468
Bo
rrow
ings
15.5
0%
22,
663,
840
9
,086
,591
7
,918
,373
5
,658
,876
–
–
–
–
–
–
De
posit
s an
d ot
her a
ccou
nts
5 %
to 9
.5 %
3
30,1
52,5
49
160
,598
,414
1
7,00
7,81
8
11,
656,
112
2
1,05
5,37
1
1,3
25,8
82
2,0
83,4
37
4,0
50,1
30
–
–
11
2,37
5,38
5
Oth
er lia
biliti
es
8
,968
,852
–
–
–
–
–
–
–
–
–
8,9
68,8
52
372
,336
,709
1
69,6
85,0
05
24,
926,
191
1
7,31
4,98
8
21,
055,
371
1
,325
,882
2
,083
,437
4
,050
,130
–
–
1
31,8
95,7
05
O
n–ba
lanc
e sh
eet g
ap
4
2,29
5,44
6
29,
654,
632
7
3,05
7,02
4
27,
042,
194
(7
,221
,451
) (1
,039
,325
) (1
,409
,374
) (1
,590
,361
) 9
80,9
96
95,
823
(7
7,27
4,71
2)
Off–
bala
nce
shee
t fin
anci
al in
stru
men
ts
Fo
rwar
d ou
trigh
t pur
chas
e –
Gov
t. se
curit
ies
2
6,64
4,45
0
26,
644,
450
–
–
–
–
–
–
–
–
–
Fore
ign
exch
ange
con
tract
s pu
rcha
se
6
9,70
8,93
2
21,
618,
865
3
5,28
2,61
8
12,
794,
158
1
3,29
1
–
–
–
–
–
–
Inte
rest
rate
sw
aps
– lo
ng p
ositio
n
2,1
44,1
30
–
1
,977
,463
–
–
1
66,6
67
–
–
–
–
–
Cr
oss
curre
ncy
swap
s –
long
pos
ition
1
73,1
27
–
–
–
–
173
,127
–
–
–
98,
670,
639
4
8,26
3,31
5
37,
260,
081
1
2,79
4,15
8
13,
291
1
66,6
67
173
,127
–
–
–
–
Fo
reig
n ex
chan
ge c
ontra
cts
sale
6
7,47
6,22
8
21,
427,
005
1
9,03
7,09
7
19,
365,
275
7
,629
,100
1
7,75
1
–
–
–
–
–
In
tere
st ra
te s
wap
s –
shor
t pos
ition
2
66,6
67
– 1
00,0
00
– –
166
,667
–
– –
– –
Cr
oss
curre
ncy
swap
s –
shor
t pos
ition
1
73,1
27
– –
– –
– 1
73,1
27
– –
– –
Fo
rwar
d ou
trigh
t sale
– G
ovt s
ecur
ities
2
0,82
7,53
0
20,
827,
530
–
– –
– –
– –
– –
88,
743,
552
4
2,25
4,53
5
19,
137,
097
1
9,36
5,27
5
7,6
29,1
00
184
,418
1
73,1
27
–
–
–
–
O
ff–ba
lanc
e sh
eet g
ap
9
,927
,087
6
,008
,780
1
8,12
2,98
4
(6,5
71,1
17)
(7,6
15,8
09)
(17,
751)
–
–
–
–
–
Tota
l yie
ld /
inte
rest
risk
sen
sitiv
ity g
ap
35,
663,
412
9
1,18
0,00
8
20,
471,
077
(1
4,83
7,26
0)
(1,0
57,0
76)
(1,4
09,3
74)
(1,5
90,3
61)
980
,996
9
5,82
3
Cu
mul
ativ
e yi
eld
/ int
eres
t ris
k se
nsiti
vity
gap
3
5,66
3,41
2
126
,843
,420
1
47,3
14,4
97
132
,477
,237
1
31,4
20,1
61
130
,010
,787
1
28,4
20,4
26
129
,401
,422
1
29,4
97,2
45
Yi
eld ri
sk is
the
risk
of d
eclin
e in
earn
ings
due
to a
dver
se m
ovem
ent o
f the
yiel
d cu
rve.
Inte
rest
rate
risk
is th
e ris
k th
at th
e va
lue o
f the
finan
cial in
stru
men
t will
fluct
uate
due
to c
hang
es in
the
mar
ket i
nter
est r
ates
.
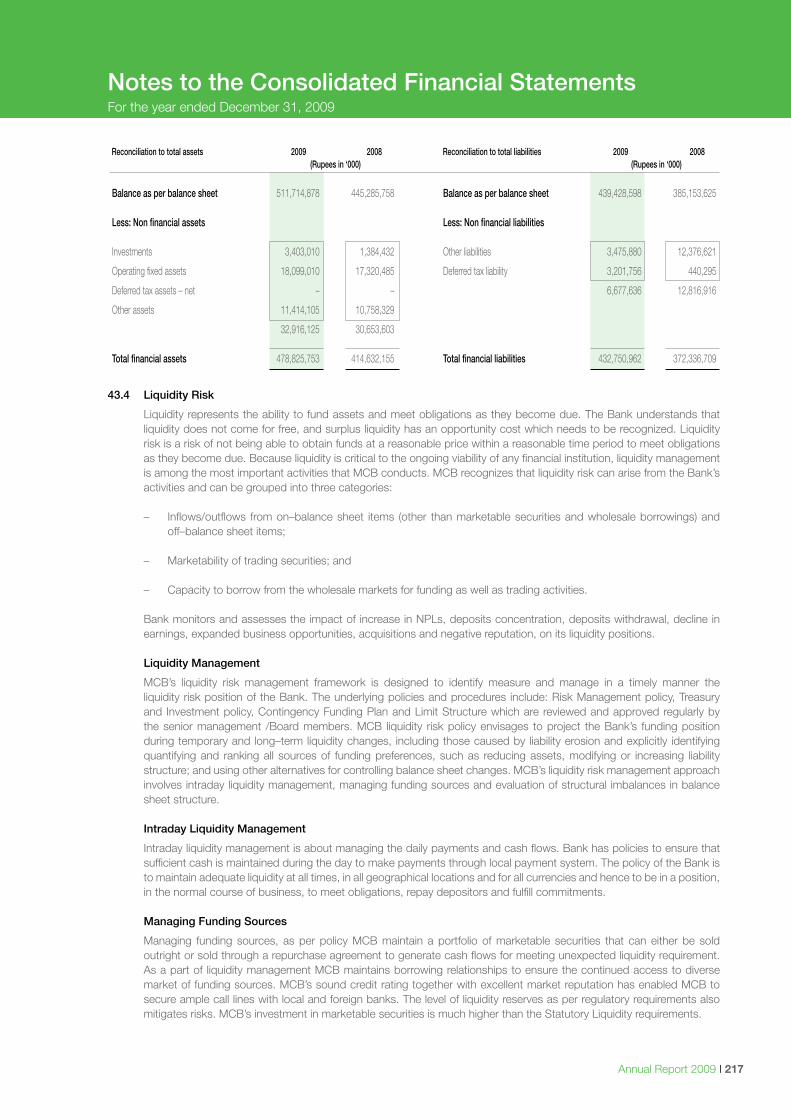
Annual Report 2009 I 217
Notes to the Consolidated Financial StatementsFor the year ended December 31, 2009
Reconciliation to total assets 2009 2008 Reconciliation to total liabilities 2009 2008 (Rupees in ‘000) (Rupees in ‘000)
Balance as per balance sheet 511,714,878 445,285,758 Balance as per balance sheet 439,428,598 385,153,625 Less: Non financial assets Less: Non financial liabilities Investments 3,403,010 1,384,432 Other liabilities 3,475,880 12,376,621
Operating fixed assets 18,099,010 17,320,485 Deferred tax liability 3,201,756 440,295
Deferred tax assets – net – – 6,677,636 12,816,916
Other assets 11,414,105 10,758,329
32,916,125 30,653,603 Total financial assets 478,825,753 414,632,155 Total financial liabilities 432,750,962 372,336,709
43.4 Liquidity Risk
Liquidity represents the ability to fund assets and meet obligations as they become due. The Bank understands that liquidity does not come for free, and surplus liquidity has an opportunity cost which needs to be recognized. Liquidity risk is a risk of not being able to obtain funds at a reasonable price within a reasonable time period to meet obligations as they become due. Because liquidity is critical to the ongoing viability of any financial institution, liquidity management is among the most important activities that MCB conducts. MCB recognizes that liquidity risk can arise from the Bank’s activities and can be grouped into three categories:
– Inflows/outflows from on–balance sheet items (other than marketable securities and wholesale borrowings) and
off–balance sheet items;
– Marketability of trading securities; and
– Capacity to borrow from the wholesale markets for funding as well as trading activities.
Bank monitors and assesses the impact of increase in NPLs, deposits concentration, deposits withdrawal, decline in earnings, expanded business opportunities, acquisitions and negative reputation, on its liquidity positions.
Liquidity Management
MCB’s liquidity risk management framework is designed to identify measure and manage in a timely manner the liquidity risk position of the Bank. The underlying policies and procedures include: Risk Management policy, Treasury and Investment policy, Contingency Funding Plan and Limit Structure which are reviewed and approved regularly by the senior management /Board members. MCB liquidity risk policy envisages to project the Bank’s funding position during temporary and long–term liquidity changes, including those caused by liability erosion and explicitly identifying quantifying and ranking all sources of funding preferences, such as reducing assets, modifying or increasing liability structure; and using other alternatives for controlling balance sheet changes. MCB’s liquidity risk management approach involves intraday liquidity management, managing funding sources and evaluation of structural imbalances in balance sheet structure.
Intraday Liquidity Management
Intraday liquidity management is about managing the daily payments and cash flows. Bank has policies to ensure that sufficient cash is maintained during the day to make payments through local payment system. The policy of the Bank is to maintain adequate liquidity at all times, in all geographical locations and for all currencies and hence to be in a position, in the normal course of business, to meet obligations, repay depositors and fulfill commitments.
Managing Funding Sources
Managing funding sources, as per policy MCB maintain a portfolio of marketable securities that can either be sold outright or sold through a repurchase agreement to generate cash flows for meeting unexpected liquidity requirement. As a part of liquidity management MCB maintains borrowing relationships to ensure the continued access to diverse market of funding sources. MCB’s sound credit rating together with excellent market reputation has enabled MCB to secure ample call lines with local and foreign banks. The level of liquidity reserves as per regulatory requirements also mitigates risks. MCB’s investment in marketable securities is much higher than the Statutory Liquidity requirements.
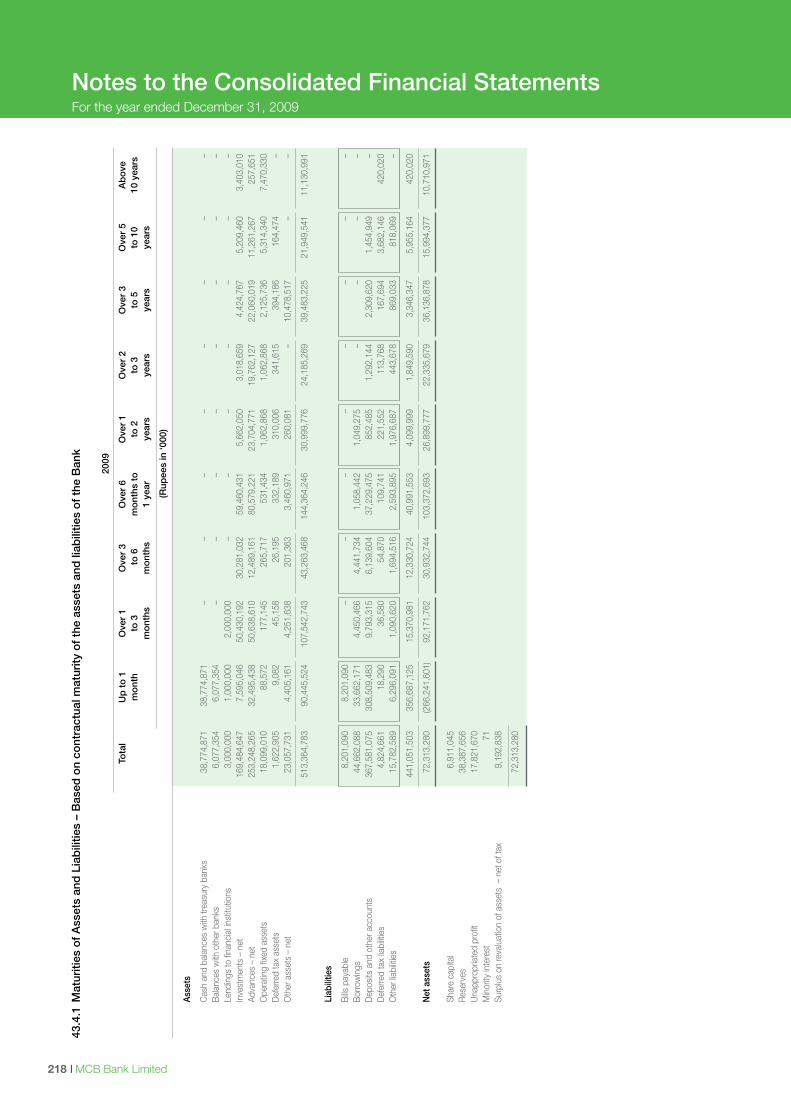
I MCB Bank Limited218
Notes to the Consolidated Financial StatementsFor the year ended December 31, 2009
43.4
.1 M
atur
ities
of
Ass
ets
and
Lia
bili
ties
– B
ased
on
cont
ract
ual m
atur
ity o
f th
e as
sets
and
liab
ilitie
s o
f th
e B
ank
20
09
To
tal
Up
to
1
Ove
r 1
O
ver
3
Ove
r 6
O
ver
1
Ove
r 2
O
ver
3
Ove
r 5
A
bo
ve
mo
nth
t
o 3
t
o 6
m
ont
hs t
o
to
2
to
3
to
5
to
10
1
0 ye
ars
m
ont
hs
mo
nths
1
yea
r
yea
rs
yea
rs
yea
rs
yea
rs
(R
upee
s in
‘000
)
A
sset
s
C
ash
and
bala
nces
with
trea
sury
ban
ks
38,
774,
871
3
8,77
4,87
1
–
–
–
–
–
–
–
–
Bal
ance
s w
ith o
ther
ban
ks
6,0
77,3
54
6,0
77,3
54
–
–
–
–
–
–
–
–
Lend
ings
to fi
nanc
ial in
stitu
tions
3
,000
,000
1
,000
,000
2
,000
,000
–
–
–
–
–
–
–
Inve
stm
ents
– n
et
169
,484
,647
7
,595
,046
5
0,43
0,19
2
30,
281,
032
5
9,46
0,43
1
5,6
62,0
50
3,0
18,6
59
4,4
24,7
67
5,2
09,4
60
3,4
03,0
10
Ad
vanc
es –
net
2
53,2
48,2
65
32,
495,
438
5
0,63
8,61
0
12,
489,
161
8
0,57
9,22
1
23,
704,
771
1
9,76
2,12
7
22,
060,
019
1
1,26
1,26
7
257
,651
Ope
ratin
g fix
ed a
sset
s 1
8,09
9,01
0
88,
572
1
77,1
45
265
,717
5
31,4
34
1,0
62,8
68
1,0
62,8
68
2,1
25,7
36
5,3
14,3
40
7,4
70,3
30
D
efer
red
tax
asse
ts
1,6
22,9
05
9,0
82
45,
158
2
6,19
5
332
,189
3
10,0
06
341
,615
3
94,1
86
164
,474
–
Oth
er a
sset
s –
net
23,
057,
731
4
,405
,161
4
,251
,638
2
01,3
63
3,4
60,9
71
260
,081
–
10,
478,
517
–
–
5
13,3
64,7
83
90,
445,
524
1
07,5
42,7
43
43,
263,
468
1
44,3
64,2
46
30,
999,
776
2
4,18
5,26
9
39,
483,
225
2
1,94
9,54
1
11,
130,
991
Li
abili
ties
B
ills p
ayab
le
8,2
01,0
90
8,2
01,0
90
–
–
–
–
–
–
–
–
Bor
row
ings
4
4,66
2,08
8
33,
662,
171
4
,450
,466
4
,441
,734
1
,058
,442
1
,049
,275
–
–
–
–
D
epos
its a
nd o
ther
acc
ount
s 3
67,5
81,0
75
308
,509
,483
9
,793
,315
6
,139
,604
3
7,22
9,47
5
852
,485
1
,292
,144
2
,309
,620
1
,454
,949
–
Def
erre
d ta
x lia
bilit
ies
4
,824
,661
1
8,29
0
36,
580
5
4,87
0
109
,741
2
21,5
52
113
,768
1
67,6
94
3,6
82,1
46
420
,020
Oth
er lia
bilit
ies
15,
782,
589
6
,296
,091
1
,090
,620
1
,694
,516
2
,593
,895
1
,976
,687
4
43,6
78
869
,033
8
18,0
69
–
4
41,0
51,5
03
356
,687
,125
1
5,37
0,98
1
12,
330,
724
4
0,99
1,55
3
4,0
99,9
99
1,8
49,5
90
3,3
46,3
47
5,9
55,1
64
420
,020
N
et a
sset
s 7
2,31
3,28
0
(266
,241
,601
) 9
2,17
1,76
2
30,
932,
744
1
03,3
72,6
93
26,
899,
777
2
2,33
5,67
9
36,
136,
878
1
5,99
4,37
7
10,
710,
971
Sh
are
capi
tal
6,9
11,0
45
R
eser
ves
38,
387,
656
Una
ppro
pria
ted
prof
it 1
7,82
1,67
0
M
inor
ity in
tere
st
71
Surp
lus
on re
valu
atio
n of
ass
ets
– n
et o
f tax
9
,192
,838
7
2,31
3,28
0
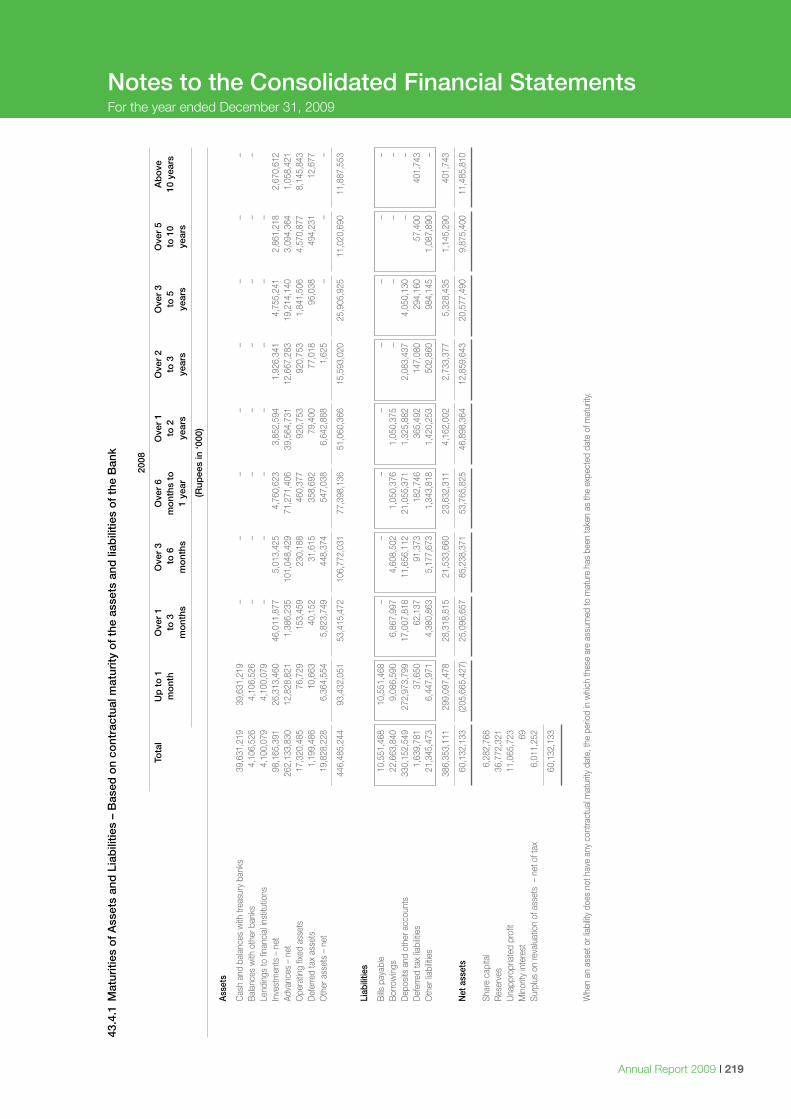
Annual Report 2009 I 219
Notes to the Consolidated Financial StatementsFor the year ended December 31, 2009
43.4
.1 M
atur
ities
of
Ass
ets
and
Lia
bili
ties
– B
ased
on
cont
ract
ual m
atur
ity o
f th
e as
sets
and
liab
ilitie
s o
f th
e B
ank
20
08
To
tal
Up
to
1
Ove
r 1
O
ver
3
Ove
r 6
O
ver
1
Ove
r 2
O
ver
3
Ove
r 5
A
bo
ve
mo
nth
t
o 3
t
o 6
m
ont
hs t
o
to
2
to
3
to
5
to
10
1
0 ye
ars
m
ont
hs
mo
nths
1
yea
r
yea
rs
yea
rs
yea
rs
yea
rs
(R
upee
s in
‘000
)
A
sset
s
C
ash
and
bala
nces
with
trea
sury
ban
ks
39,
631,
219
3
9,63
1,21
9
–
–
–
–
–
–
–
–
Bal
ance
s w
ith o
ther
ban
ks
4,1
06,5
26
4,1
06,5
26
–
–
–
–
–
–
–
–
Lend
ings
to fi
nanc
ial in
stitu
tions
4
,100
,079
4
,100
,079
–
–
–
–
–
–
–
Inve
stm
ents
– n
et
98,
165,
391
2
6,31
3,46
0
46,
011,
877
5
,013
,425
4
,760
,623
3
,852
,594
1
,926
,341
4
,755
,241
2
,861
,218
2
,670
,612
Adva
nces
– n
et
262
,133
,830
1
2,82
8,82
1
1,3
86,2
35
101
,048
,429
7
1,27
1,40
6
39,
564,
731
1
2,66
7,28
3
19,
214,
140
3
,094
,364
1
,058
,421
Ope
ratin
g fix
ed a
sset
s 1
7,32
0,48
5
76,
729
1
53,4
59
230
,188
4
60,3
77
920
,753
9
20,7
53
1,8
41,5
06
4,5
70,8
77
8,1
45,8
43
D
efer
red
tax
asse
ts
1,1
99,4
86
10,
663
4
0,15
2
31,
615
3
58,6
92
79,
400
7
7,01
8
95,
038
4
94,2
31
12,
677
O
ther
ass
ets
– ne
t 1
9,82
8,22
8
6,3
64,5
54
5,8
23,7
49
448
,374
5
47,0
38
6,6
42,8
88
1,6
25
–
–
–
4
46,4
85,2
44
93,
432,
051
5
3,41
5,47
2
106
,772
,031
7
7,39
8,13
6
51,
060,
366
1
5,59
3,02
0
25,
905,
925
1
1,02
0,69
0
11,
887,
553
Li
abili
ties
B
ills p
ayab
le
10,
551,
468
1
0,55
1,46
8
–
–
–
–
–
–
–
–
Bor
row
ings
2
2,66
3,84
0
9,0
86,5
90
6,8
67,9
97
4,6
08,5
02
1,0
50,3
76
1,0
50,3
75
–
–
–
–
Dep
osits
and
oth
er a
ccou
nts
330
,152
,549
2
72,9
73,7
99
17,
007,
818
1
1,65
6,11
2
21,
055,
371
1
,325
,882
2
,083
,437
4
,050
,130
–
–
D
efer
red
tax
liabi
litie
s
1,6
39,7
81
37,
650
6
2,13
7
91,
373
1
82,7
46
365
,492
1
47,0
80
294
,160
5
7,40
0
401
,743
Oth
er lia
bilit
ies
21,
345,
473
6
,447
,971
4
,380
,863
5
,177
,673
1
,343
,818
1
,420
,253
5
02,8
60
984
,145
1
,087
,890
–
3
86,3
53,1
11
299
,097
,478
2
8,31
8,81
5
21,
533,
660
2
3,63
2,31
1
4,1
62,0
02
2,7
33,3
77
5,3
28,4
35
1,1
45,2
90
401
,743
N
et a
sset
s 6
0,13
2,13
3
(205
,665
,427
) 2
5,09
6,65
7
85,
238,
371
5
3,76
5,82
5
46,
898,
364
1
2,85
9,64
3
20,
577,
490
9
,875
,400
1
1,48
5,81
0
Shar
e ca
pita
l 6
,282
,768
Res
erve
s 3
6,77
2,32
1
U
napp
ropr
iate
d pr
ofit
11,
065,
723
Min
ority
inte
rest
6
9
Su
rplu
s on
reva
luat
ion
of a
sset
s –
net
of t
ax
6,0
11,2
52
6
0,13
2,13
3
W
hen
an a
sset
or l
iabi
lity
does
not
hav
e an
y co
ntra
ctua
l mat
urity
dat
e, th
e pe
riod
in w
hich
thes
e ar
e as
sum
ed to
mat
ure
has
been
take
n as
the
expe
cted
dat
e of
mat
urity
.
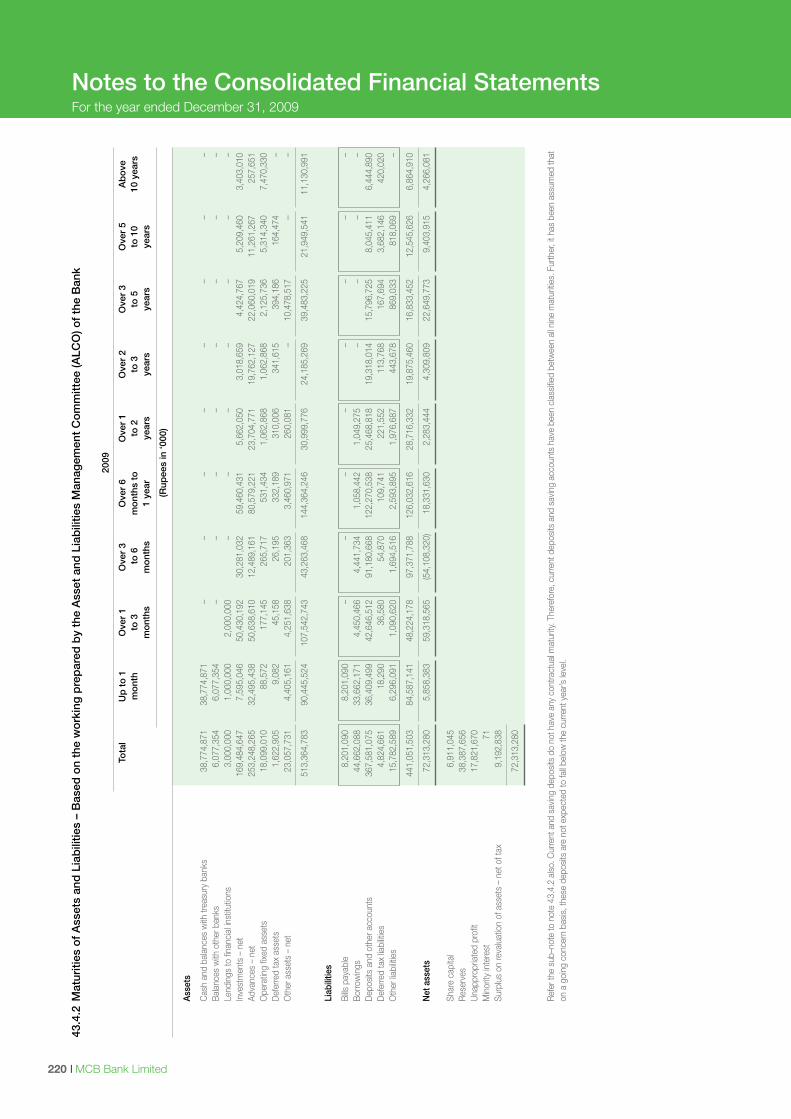
I MCB Bank Limited220
Notes to the Consolidated Financial StatementsFor the year ended December 31, 2009
43.4
.2 M
atur
ities
of
Ass
ets
and
Lia
bili
ties
– B
ased
on
the
wo
rkin
g p
rep
ared
by
the
Ass
et a
nd L
iab
ilitie
s M
anag
emen
t C
om
mitt
ee (A
LCO
) of
the
Ban
k
20
09
To
tal
Up
to
1
Ove
r 1
O
ver
3
Ove
r 6
O
ver
1
Ove
r 2
O
ver
3
Ove
r 5
A
bo
ve
mo
nth
t
o 3
t
o 6
m
ont
hs t
o
to
2
to
3
to
5
to
10
1
0 ye
ars
m
ont
hs
mo
nths
1
yea
r
yea
rs
yea
rs
yea
rs
yea
rs
(R
upee
s in
‘000
)
A
sset
s
C
ash
and
bala
nces
with
trea
sury
ban
ks
38,
774,
871
3
8,77
4,87
1
–
–
–
–
–
–
–
–
Bal
ance
s w
ith o
ther
ban
ks
6,0
77,3
54
6,0
77,3
54
–
–
–
–
–
–
–
–
Lend
ings
to fi
nanc
ial in
stitu
tions
3
,000
,000
1
,000
,000
2
,000
,000
–
–
–
–
–
–
–
Inve
stm
ents
– n
et
169
,484
,647
7
,595
,046
5
0,43
0,19
2
30,
281,
032
5
9,46
0,43
1
5,6
62,0
50
3,0
18,6
59
4,4
24,7
67
5,2
09,4
60
3,4
03,0
10
Ad
vanc
es –
net
2
53,2
48,2
65
32,
495,
438
5
0,63
8,61
0
12,
489,
161
8
0,57
9,22
1
23,
704,
771
1
9,76
2,12
7
22,
060,
019
1
1,26
1,26
7
257
,651
Ope
ratin
g fix
ed a
sset
s 1
8,09
9,01
0
88,
572
1
77,1
45
265
,717
5
31,4
34
1,0
62,8
68
1,0
62,8
68
2,1
25,7
36
5,3
14,3
40
7,4
70,3
30
D
efer
red
tax
asse
ts
1,6
22,9
05
9,0
82
45,
158
2
6,19
5
332
,189
3
10,0
06
341
,615
3
94,1
86
164
,474
–
Oth
er a
sset
s –
net
23,
057,
731
4
,405
,161
4
,251
,638
2
01,3
63
3,4
60,9
71
260
,081
–
10,
478,
517
–
–
5
13,3
64,7
83
90,
445,
524
1
07,5
42,7
43
43,
263,
468
1
44,3
64,2
46
30,
999,
776
2
4,18
5,26
9
39,
483,
225
2
1,94
9,54
1
11,
130,
991
Li
abili
ties
B
ills p
ayab
le
8,2
01,0
90
8,2
01,0
90
–
–
–
–
–
–
–
–
Bor
row
ings
4
4,66
2,08
8
33,
662,
171
4
,450
,466
4
,441
,734
1
,058
,442
1
,049
,275
–
–
–
–
D
epos
its a
nd o
ther
acc
ount
s 3
67,5
81,0
75
36,
409,
499
4
2,64
6,51
2
91,
180,
668
1
22,2
70,5
38
25,
468,
818
1
9,31
8,01
4
15,
796,
725
8
,045
,411
6
,444
,890
Def
erre
d ta
x lia
bilit
ies
4
,824
,661
1
8,29
0
36,
580
5
4,87
0
109
,741
2
21,5
52
113
,768
1
67,6
94
3,6
82,1
46
420
,020
Oth
er lia
bilit
ies
15,
782,
589
6
,296
,091
1
,090
,620
1
,694
,516
2
,593
,895
1
,976
,687
4
43,6
78
869
,033
8
18,0
69
–
4
41,0
51,5
03
84,
587,
141
4
8,22
4,17
8
97,
371,
788
1
26,0
32,6
16
28,
716,
332
1
9,87
5,46
0
16,
833,
452
1
2,54
5,62
6
6,8
64,9
10
N
et a
sset
s 7
2,31
3,28
0
5,8
58,3
83
59,
318,
565
(5
4,10
8,32
0)
18,
331,
630
2
,283
,444
4
,309
,809
2
2,64
9,77
3
9,4
03,9
15
4,2
66,0
81
Sh
are
capi
tal
6,9
11,0
45
R
eser
ves
38,
387,
656
Una
ppro
pria
ted
prof
it 1
7,82
1,67
0
M
inor
ity in
tere
st
71
Surp
lus
on re
valu
atio
n of
ass
ets
– ne
t of t
ax
9,1
92,8
38
7
2,31
3,28
0
R
efer
the
sub–
note
to n
ote
43.4
.2 a
lso.
Cur
rent
and
sav
ing
depo
sits
do
not h
ave
any
cont
ract
ual m
atur
ity. T
here
fore
, cur
rent
dep
osits
and
sav
ing
acco
unts
hav
e be
en c
lass
ified
betw
een
all n
ine
mat
uriti
es. F
urth
er, i
t has
bee
n as
sum
ed th
at
on a
goi
ng c
once
rn b
asis
, the
se d
epos
its a
re n
ot e
xpec
ted
to fa
ll bel
ow th
e cu
rrent
yea
r’s le
vel.
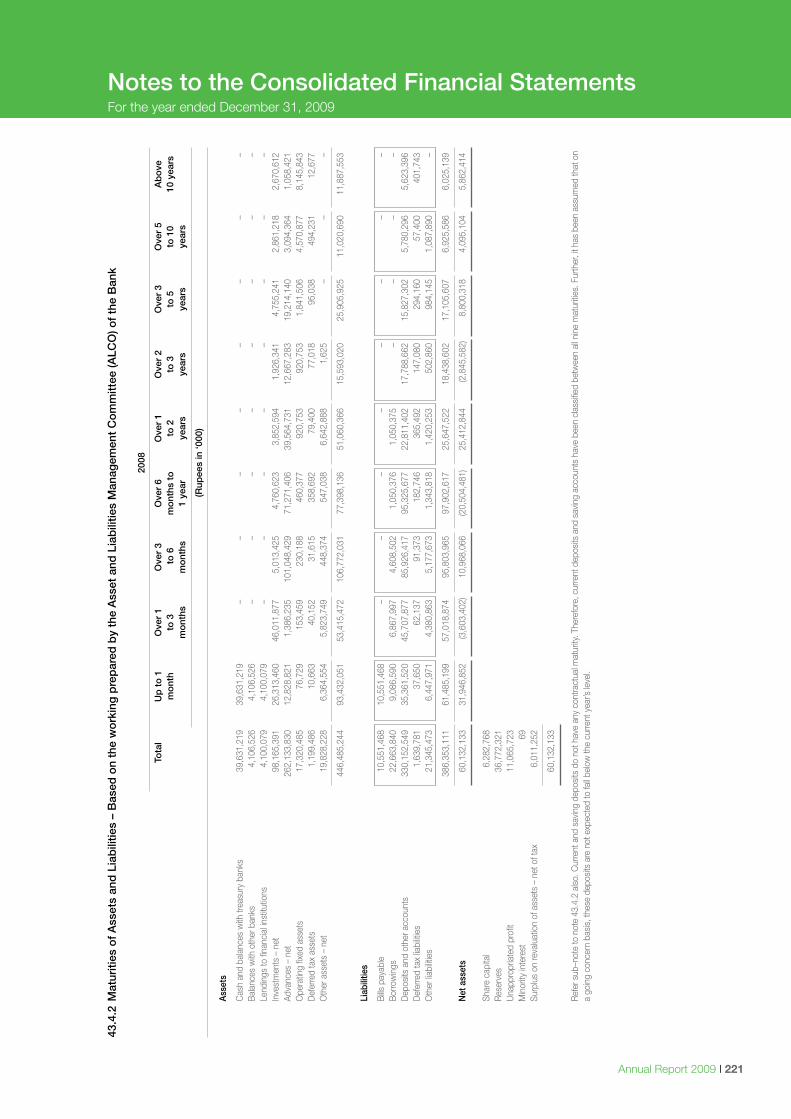
Annual Report 2009 I 221
Notes to the Consolidated Financial StatementsFor the year ended December 31, 2009
43.4
.2 M
atur
ities
of
Ass
ets
and
Lia
bili
ties
– B
ased
on
the
wo
rkin
g p
rep
ared
by
the
Ass
et a
nd L
iab
ilitie
s M
anag
emen
t C
om
mitt
ee (A
LCO
) of
the
Ban
k
20
08
To
tal
Up
to
1
Ove
r 1
O
ver
3
Ove
r 6
O
ver
1
Ove
r 2
O
ver
3
Ove
r 5
A
bo
ve
mo
nth
t
o 3
t
o 6
m
ont
hs t
o
to
2
to
3
to
5
to
10
1
0 ye
ars
m
ont
hs
mo
nths
1
yea
r
yea
rs
yea
rs
yea
rs
yea
rs
(R
upee
s in
‘000
)
A
sset
s
C
ash
and
bala
nces
with
trea
sury
ban
ks
39,
631,
219
3
9,63
1,21
9
–
–
–
–
–
–
–
–
Bal
ance
s w
ith o
ther
ban
ks
4,1
06,5
26
4,1
06,5
26
–
–
–
–
–
–
–
–
Lend
ings
to fi
nanc
ial in
stitu
tions
4
,100
,079
4
,100
,079
–
–
–
–
–
–
–
–
In
vest
men
ts –
net
9
8,16
5,39
1
26,
313,
460
4
6,01
1,87
7
5,0
13,4
25
4,7
60,6
23
3,8
52,5
94
1,9
26,3
41
4,7
55,2
41
2,8
61,2
18
2,6
70,6
12
Ad
vanc
es –
net
2
62,1
33,8
30
12,
828,
821
1
,386
,235
1
01,0
48,4
29
71,
271,
406
3
9,56
4,73
1
12,
667,
283
1
9,21
4,14
0
3,0
94,3
64
1,0
58,4
21
O
pera
ting
fixed
ass
ets
17,
320,
485
7
6,72
9
153
,459
2
30,1
88
460
,377
9
20,7
53
920
,753
1
,841
,506
4
,570
,877
8
,145
,843
Def
erre
d ta
x as
sets
1
,199
,486
1
0,66
3
40,
152
3
1,61
5
358
,692
7
9,40
0
77,
018
9
5,03
8
494
,231
1
2,67
7
Oth
er a
sset
s –
net
19,
828,
228
6
,364
,554
5
,823
,749
4
48,3
74
547
,038
6
,642
,888
1
,625
–
–
–
4
46,4
85,2
44
93,
432,
051
5
3,41
5,47
2
106
,772
,031
7
7,39
8,13
6
51,
060,
366
1
5,59
3,02
0
25,
905,
925
1
1,02
0,69
0
11,
887,
553
Li
abili
ties
B
ills p
ayab
le
10,
551,
468
1
0,55
1,46
8
–
–
–
–
–
–
–
–
Bor
row
ings
2
2,66
3,84
0
9,0
86,5
90
6,8
67,9
97
4,6
08,5
02
1,0
50,3
76
1,0
50,3
75
–
–
–
–
Dep
osits
and
oth
er a
ccou
nts
330
,152
,549
3
5,36
1,52
0
45,
707,
877
8
5,92
6,41
7
95,
325,
677
2
2,81
1,40
2
17,
788,
662
1
5,82
7,30
2
5,7
80,2
96
5,6
23,3
96
D
efer
red
tax
liabi
litie
s
1,6
39,7
81
37,
650
6
2,13
7
91,
373
1
82,7
46
365
,492
1
47,0
80
294
,160
5
7,40
0
401
,743
Oth
er lia
bilit
ies
21,
345,
473
6
,447
,971
4
,380
,863
5
,177
,673
1
,343
,818
1
,420
,253
5
02,8
60
984
,145
1
,087
,890
–
3
86,3
53,1
11
61,
485,
199
5
7,01
8,87
4
95,
803,
965
9
7,90
2,61
7
25,
647,
522
1
8,43
8,60
2
17,
105,
607
6
,925
,586
6
,025
,139
N
et a
sset
s 6
0,13
2,13
3
31,
946,
852
(3
,603
,402
) 1
0,96
8,06
6
(20,
504,
481)
2
5,41
2,84
4
(2,8
45,5
82)
8,8
00,3
18
4,0
95,1
04
5,8
62,4
14
Sh
are
capi
tal
6,2
82,7
68
R
eser
ves
36,
772,
321
Una
ppro
pria
ted
prof
it 1
1,06
5,72
3
M
inor
ity in
tere
st
69
Su
rplu
s on
reva
luat
ion
of a
sset
s –
net o
f tax
6
,011
,252
6
0,13
2,13
3
R
efer
sub
–not
e to
not
e 43
.4.2
als
o. C
urre
nt a
nd s
avin
g de
posi
ts d
o no
t hav
e an
y co
ntra
ctua
l mat
urity
. The
refo
re, c
urre
nt d
epos
its a
nd s
avin
g ac
coun
ts h
ave
been
cla
ssifie
d be
twee
n al
l nin
e m
atur
ities
. Fur
ther
, it h
as b
een
assu
med
that
on
a go
ing
conc
ern
basi
s, th
ese
depo
sits
are
not
exp
ecte
d to
fall b
elow
the
curre
nt y
ear’s
leve
l.
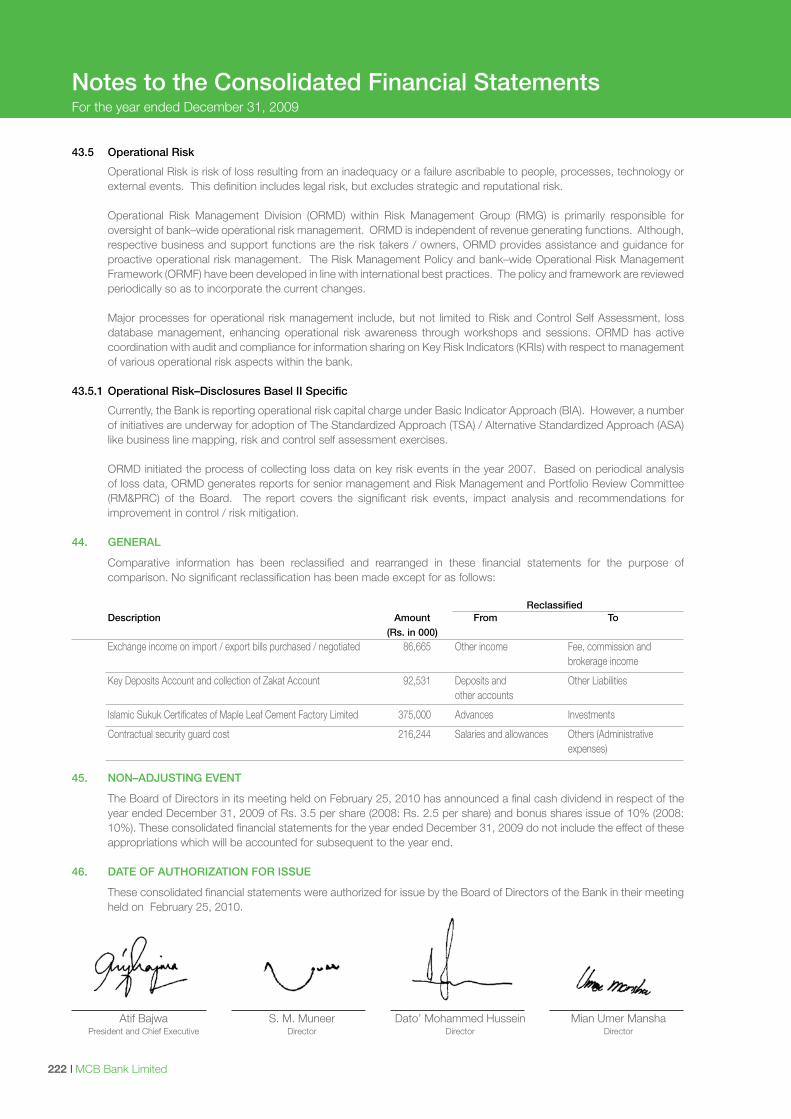
I MCB Bank Limited222
Notes to the Consolidated Financial StatementsFor the year ended December 31, 2009
43.5 Operational Risk
Operational Risk is risk of loss resulting from an inadequacy or a failure ascribable to people, processes, technology or external events. This definition includes legal risk, but excludes strategic and reputational risk.
Operational Risk Management Division (ORMD) within Risk Management Group (RMG) is primarily responsible for oversight of bank–wide operational risk management. ORMD is independent of revenue generating functions. Although, respective business and support functions are the risk takers / owners, ORMD provides assistance and guidance for proactive operational risk management. The Risk Management Policy and bank–wide Operational Risk Management Framework (ORMF) have been developed in line with international best practices. The policy and framework are reviewed periodically so as to incorporate the current changes.
Major processes for operational risk management include, but not limited to Risk and Control Self Assessment, loss
database management, enhancing operational risk awareness through workshops and sessions. ORMD has active coordination with audit and compliance for information sharing on Key Risk Indicators (KRIs) with respect to management of various operational risk aspects within the bank.
43.5.1 Operational Risk–Disclosures Basel II Specific
Currently, the Bank is reporting operational risk capital charge under Basic Indicator Approach (BIA). However, a number of initiatives are underway for adoption of The Standardized Approach (TSA) / Alternative Standardized Approach (ASA) like business line mapping, risk and control self assessment exercises.
ORMD initiated the process of collecting loss data on key risk events in the year 2007. Based on periodical analysis of loss data, ORMD generates reports for senior management and Risk Management and Portfolio Review Committee (RM&PRC) of the Board. The report covers the significant risk events, impact analysis and recommendations for improvement in control / risk mitigation.
44. GENERAL
Comparative information has been reclassified and rearranged in these financial statements for the purpose of comparison. No significant reclassification has been made except for as follows:
Reclassified Description Amount From To
(Rs. in 000) Exchange income on import / export bills purchased / negotiated 86,665 Other income Fee, commission and brokerage income
Key Deposits Account and collection of Zakat Account 92,531 Deposits and Other Liabilities other accounts
Islamic Sukuk Certificates of Maple Leaf Cement Factory Limited 375,000 Advances Investments
Contractual security guard cost 216,244 Salaries and allowances Others (Administrative expenses) 45. NON–ADJUSTING EVENT
The Board of Directors in its meeting held on February 25, 2010 has announced a final cash dividend in respect of the year ended December 31, 2009 of Rs. 3.5 per share (2008: Rs. 2.5 per share) and bonus shares issue of 10% (2008: 10%). These consolidated financial statements for the year ended December 31, 2009 do not include the effect of these appropriations which will be accounted for subsequent to the year end.
46. DATE OF AUTHORIZATION FOR ISSUE
These consolidated financial statements were authorized for issue by the Board of Directors of the Bank in their meeting held on February 25, 2010.
Atif Bajwa S. M. Muneer Dato’ Mohammed Hussein Mian Umer Mansha President and Chief Executive Director Director Director
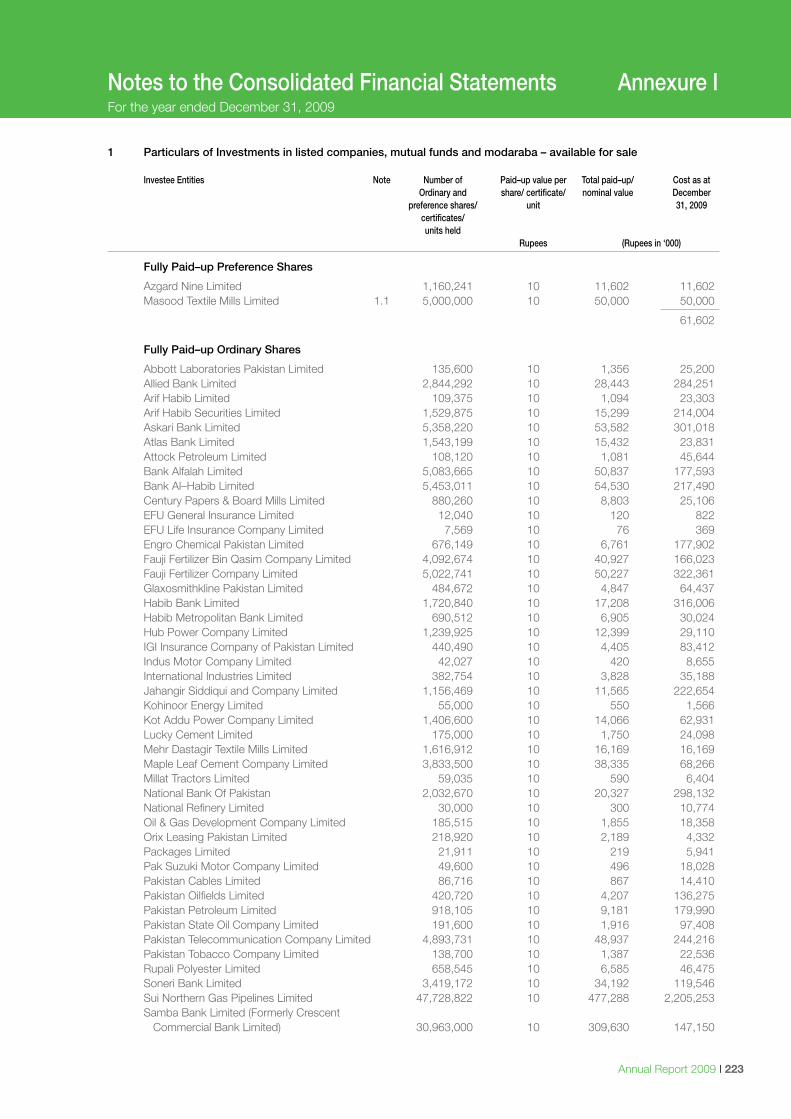
Annual Report 2009 I 223
Notes to the Consolidated Financial Statements Annexure IFor the year ended December 31, 2009
1 Particulars of Investments in listed companies, mutual funds and modaraba – available for sale Investee Entities Note Number of Paid–up value per Total paid–up/ Cost as at Ordinary and share/ certificate/ nominal value December preference shares/ unit 31, 2009 certificates/ units held Rupees (Rupees in ‘000)
Fully Paid–up Preference Shares
Azgard Nine Limited 1,160,241 10 11,602 11,602 Masood Textile Mills Limited 1.1 5,000,000 10 50,000 50,000
61,602 Fully Paid–up Ordinary Shares
Abbott Laboratories Pakistan Limited 135,600 10 1,356 25,200 Allied Bank Limited 2,844,292 10 28,443 284,251 Arif Habib Limited 109,375 10 1,094 23,303 Arif Habib Securities Limited 1,529,875 10 15,299 214,004 Askari Bank Limited 5,358,220 10 53,582 301,018 Atlas Bank Limited 1,543,199 10 15,432 23,831 Attock Petroleum Limited 108,120 10 1,081 45,644 Bank Alfalah Limited 5,083,665 10 50,837 177,593 Bank Al–Habib Limited 5,453,011 10 54,530 217,490 Century Papers & Board Mills Limited 880,260 10 8,803 25,106 EFU General Insurance Limited 12,040 10 120 822 EFU Life Insurance Company Limited 7,569 10 76 369 Engro Chemical Pakistan Limited 676,149 10 6,761 177,902 Fauji Fertilizer Bin Qasim Company Limited 4,092,674 10 40,927 166,023 Fauji Fertilizer Company Limited 5,022,741 10 50,227 322,361 Glaxosmithkline Pakistan Limited 484,672 10 4,847 64,437 Habib Bank Limited 1,720,840 10 17,208 316,006 Habib Metropolitan Bank Limited 690,512 10 6,905 30,024 Hub Power Company Limited 1,239,925 10 12,399 29,110 IGI Insurance Company of Pakistan Limited 440,490 10 4,405 83,412 Indus Motor Company Limited 42,027 10 420 8,655 International Industries Limited 382,754 10 3,828 35,188 Jahangir Siddiqui and Company Limited 1,156,469 10 11,565 222,654 Kohinoor Energy Limited 55,000 10 550 1,566 Kot Addu Power Company Limited 1,406,600 10 14,066 62,931 Lucky Cement Limited 175,000 10 1,750 24,098 Mehr Dastagir Textile Mills Limited 1,616,912 10 16,169 16,169 Maple Leaf Cement Company Limited 3,833,500 10 38,335 68,266 Millat Tractors Limited 59,035 10 590 6,404 National Bank Of Pakistan 2,032,670 10 20,327 298,132 National Refinery Limited 30,000 10 300 10,774 Oil & Gas Development Company Limited 185,515 10 1,855 18,358 Orix Leasing Pakistan Limited 218,920 10 2,189 4,332 Packages Limited 21,911 10 219 5,941 Pak Suzuki Motor Company Limited 49,600 10 496 18,028 Pakistan Cables Limited 86,716 10 867 14,410 Pakistan Oilfields Limited 420,720 10 4,207 136,275 Pakistan Petroleum Limited 918,105 10 9,181 179,990 Pakistan State Oil Company Limited 191,600 10 1,916 97,408 Pakistan Telecommunication Company Limited 4,893,731 10 48,937 244,216 Pakistan Tobacco Company Limited 138,700 10 1,387 22,536 Rupali Polyester Limited 658,545 10 6,585 46,475 Soneri Bank Limited 3,419,172 10 34,192 119,546 Sui Northern Gas Pipelines Limited 47,728,822 10 477,288 2,205,253 Samba Bank Limited (Formerly Crescent Commercial Bank Limited) 30,963,000 10 309,630 147,150
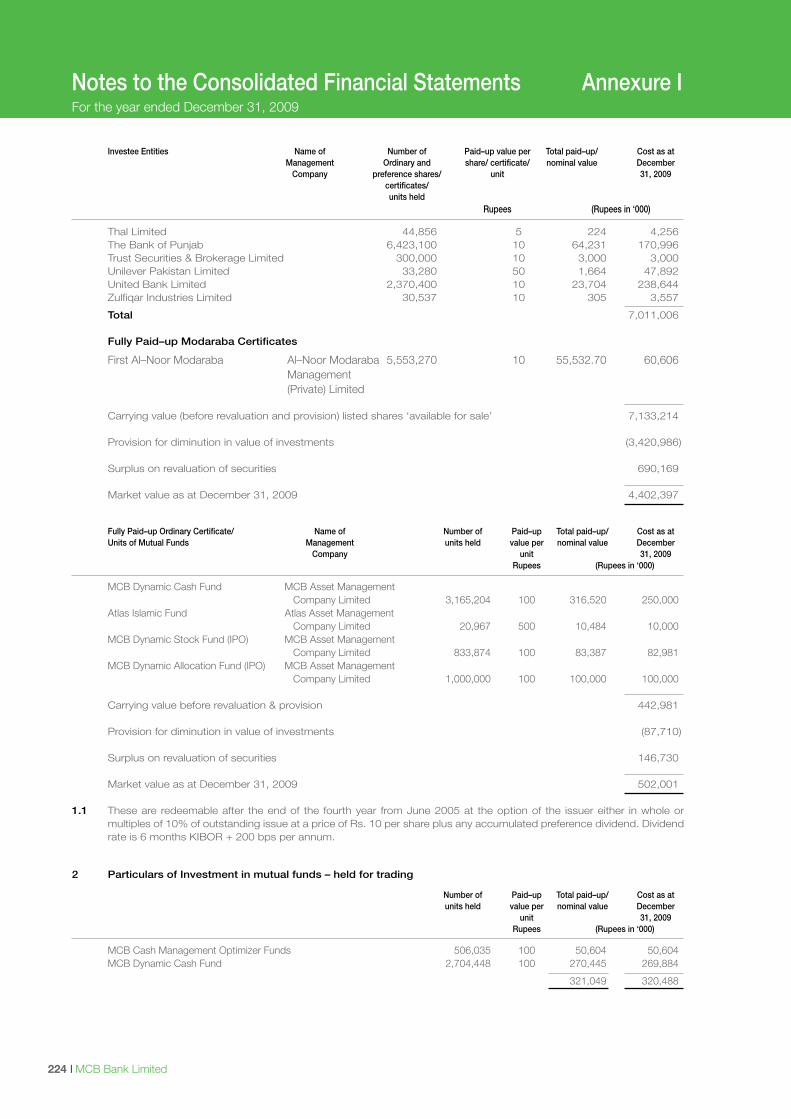
I MCB Bank Limited224
Notes to the Consolidated Financial Statements Annexure IFor the year ended December 31, 2009
Investee Entities Name of Number of Paid–up value per Total paid–up/ Cost as at Management Ordinary and share/ certificate/ nominal value December Company preference shares/ unit 31, 2009 certificates/ units held Rupees (Rupees in ‘000)
Thal Limited 44,856 5 224 4,256 The Bank of Punjab 6,423,100 10 64,231 170,996 Trust Securities & Brokerage Limited 300,000 10 3,000 3,000 Unilever Pakistan Limited 33,280 50 1,664 47,892 United Bank Limited 2,370,400 10 23,704 238,644 Zulfiqar Industries Limited 30,537 10 305 3,557
Total 7,011,006 Fully Paid–up Modaraba Certificates
First Al–Noor Modaraba Al–Noor Modaraba 5,553,270 10 55,532.70 60,606 Management (Private) Limited Carrying value (before revaluation and provision) listed shares ‘available for sale’ 7,133,214 Provision for diminution in value of investments (3,420,986) Surplus on revaluation of securities 690,169 Market value as at December 31, 2009 4,402,397
Fully Paid–up Ordinary Certificate/ Name of Number of Paid–up Total paid–up/ Cost as at Units of Mutual Funds Management units held value per nominal value December Company unit 31, 2009 Rupees (Rupees in ‘000)
MCB Dynamic Cash Fund MCB Asset Management Company Limited 3,165,204 100 316,520 250,000 Atlas Islamic Fund Atlas Asset Management Company Limited 20,967 500 10,484 10,000 MCB Dynamic Stock Fund (IPO) MCB Asset Management Company Limited 833,874 100 83,387 82,981 MCB Dynamic Allocation Fund (IPO) MCB Asset Management Company Limited 1,000,000 100 100,000 100,000
Carrying value before revaluation & provision 442,981 Provision for diminution in value of investments (87,710) Surplus on revaluation of securities 146,730 Market value as at December 31, 2009 502,001 1.1 These are redeemable after the end of the fourth year from June 2005 at the option of the issuer either in whole or
multiples of 10% of outstanding issue at a price of Rs. 10 per share plus any accumulated preference dividend. Dividend rate is 6 months KIBOR + 200 bps per annum.
2 Particulars of Investment in mutual funds – held for trading
Number of Paid–up Total paid–up/ Cost as at units held value per nominal value December unit 31, 2009 Rupees (Rupees in ‘000)
MCB Cash Management Optimizer Funds 506,035 100 50,604 50,604 MCB Dynamic Cash Fund 2,704,448 100 270,445 269,884
321,049 320,488
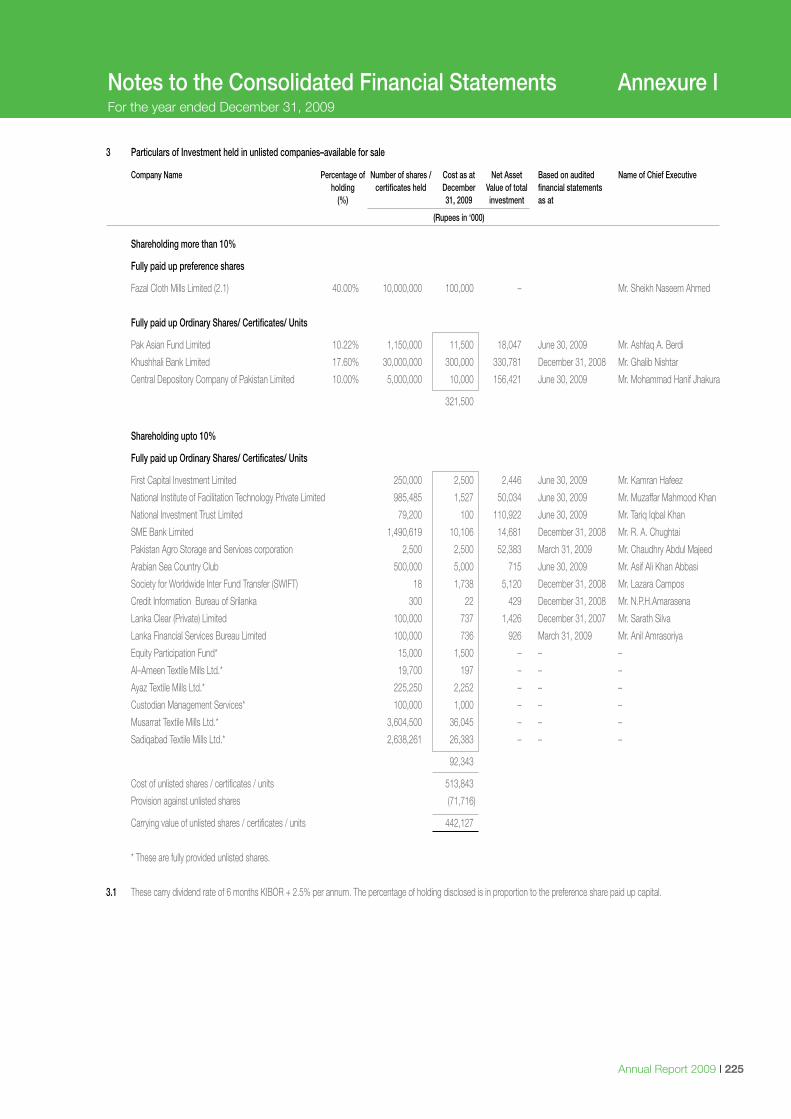
Annual Report 2009 I 225
Notes to the Consolidated Financial Statements Annexure IFor the year ended December 31, 2009
3 Particulars of Investment held in unlisted companies–available for sale
Company Name Percentage of Number of shares / Cost as at Net Asset Based on audited Name of Chief Executive holding certificates held December Value of total financial statements (%) 31, 2009 investment as at
(Rupees in ‘000)
Shareholding more than 10%
Fully paid up preference shares
Fazal Cloth Mills Limited (2.1) 40.00% 10,000,000 100,000 – Mr. Sheikh Naseem Ahmed
Fully paid up Ordinary Shares/ Certificates/ Units
Pak Asian Fund Limited 10.22% 1,150,000 11,500 18,047 June 30, 2009 Mr. Ashfaq A. Berdi
Khushhali Bank Limited 17.60% 30,000,000 300,000 330,781 December 31, 2008 Mr. Ghalib Nishtar
Central Depository Company of Pakistan Limited 10.00% 5,000,000 10,000 156,421 June 30, 2009 Mr. Mohammad Hanif Jhakura
321,500
Shareholding upto 10%
Fully paid up Ordinary Shares/ Certificates/ Units
First Capital Investment Limited 250,000 2,500 2,446 June 30, 2009 Mr. Kamran Hafeez
National Institute of Facilitation Technology Private Limited 985,485 1,527 50,034 June 30, 2009 Mr. Muzaffar Mahmood Khan
National Investment Trust Limited 79,200 100 110,922 June 30, 2009 Mr. Tariq Iqbal Khan
SME Bank Limited 1,490,619 10,106 14,681 December 31, 2008 Mr. R. A. Chughtai
Pakistan Agro Storage and Services corporation 2,500 2,500 52,383 March 31, 2009 Mr. Chaudhry Abdul Majeed
Arabian Sea Country Club 500,000 5,000 715 June 30, 2009 Mr. Asif Ali Khan Abbasi
Society for Worldwide Inter Fund Transfer (SWIFT) 18 1,738 5,120 December 31, 2008 Mr. Lazara Campos
Credit Information Bureau of Srilanka 300 22 429 December 31, 2008 Mr. N.P.H.Amarasena
Lanka Clear (Private) Limited 100,000 737 1,426 December 31, 2007 Mr. Sarath Silva
Lanka Financial Services Bureau Limited 100,000 736 926 March 31, 2009 Mr. Anil Amrasoriya
Equity Participation Fund* 15,000 1,500 – – –
Al–Ameen Textile Mills Ltd.* 19,700 197 – – –
Ayaz Textile Mills Ltd.* 225,250 2,252 – – –
Custodian Management Services* 100,000 1,000 – – –
Musarrat Textile Mills Ltd.* 3,604,500 36,045 – – –
Sadiqabad Textile Mills Ltd.* 2,638,261 26,383 – – –
92,343
Cost of unlisted shares / certificates / units 513,843
Provision against unlisted shares (71,716)
Carrying value of unlisted shares / certificates / units 442,127
* These are fully provided unlisted shares.
3.1 These carry dividend rate of 6 months KIBOR + 2.5% per annum. The percentage of holding disclosed is in proportion to the preference share paid up capital.
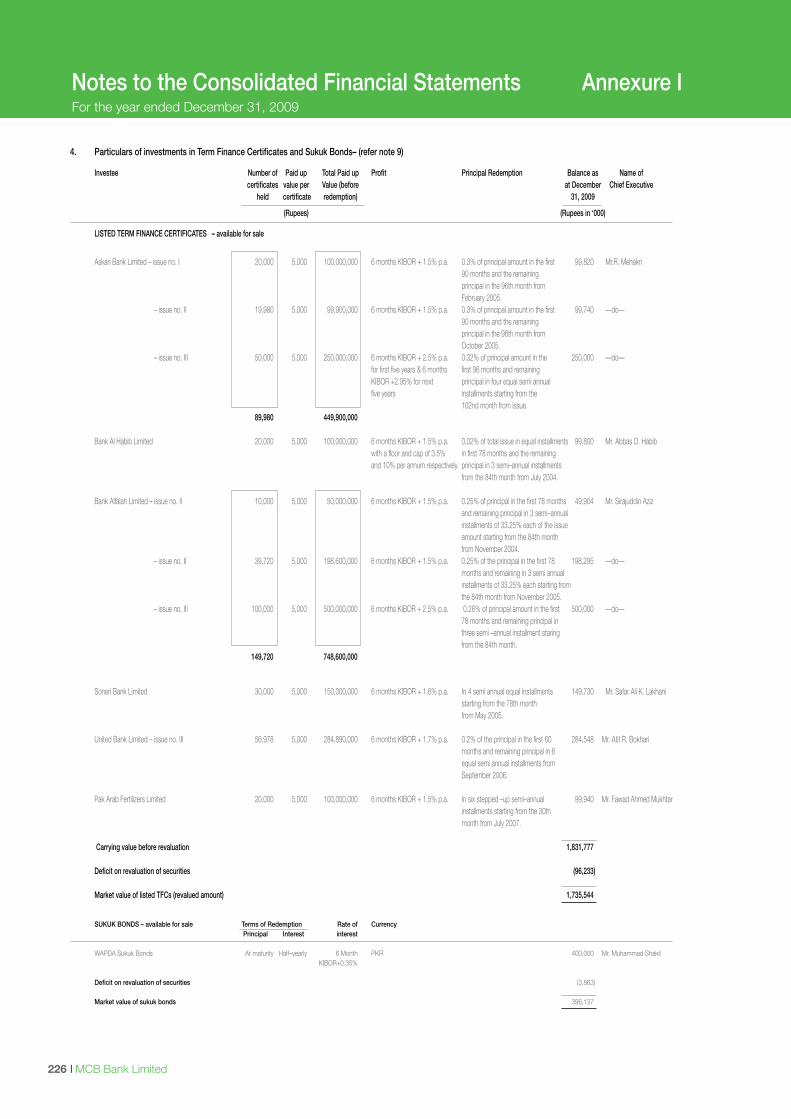
I MCB Bank Limited226
Notes to the Consolidated Financial Statements Annexure IFor the year ended December 31, 2009
4. Particulars of investments in Term Finance Certificates and Sukuk Bonds– (refer note 9)
Investee Number of Paid up Total Paid up Profit Principal Redemption Balance as Name of certificates value per Value (before at December Chief Executive held certificate redemption) 31, 2009
(Rupees) (Rupees in ‘000)
LISTED TERM FINANCE CERTIFICATES – available for sale
Askari Bank Limited – issue no. I 20,000 5,000 100,000,000 6 months KIBOR + 1.5% p.a. 0.3% of principal amount in the first 99,820 Mr.R. Mehakri 90 months and the remaining principal in the 96th month from February 2005. – issue no. II 19,980 5,000 99,900,000 6 months KIBOR + 1.5% p.a. 0.3% of principal amount in the first 99,740 ––do–– 90 months and the remaining principal in the 96th month from October 2005. – issue no. III 50,000 5,000 250,000,000 6 months KIBOR + 2.5% p.a. 0.32% of principal amount in the 250,000 ––do–– for first five years & 6 months first 96 months and remaining KIBOR +2.95% for next principal in four equal semi annual five years installments starting from the 102nd month from issue. 89,980 449,900,000 Bank Al Habib Limited 20,000 5,000 100,000,000 6 months KIBOR + 1.5% p.a. 0.02% of total issue in equal installments 99,800 Mr. Abbas D. Habib with a floor and cap of 3.5% in first 78 months and the remaining and 10% per annum respectively. principal in 3 semi–annual installments from the 84th month from July 2004.
Bank Alfalah Limited – issue no. II 10,000 5,000 50,000,000 6 months KIBOR + 1.5% p.a. 0.25% of principal in the first 78 months 49,904 Mr. Sirajuddin Aziz and remaining principal in 3 semi–annual installments of 33.25% each of the issue amount starting from the 84th month from November 2004. – issue no. II 39,720 5,000 198,600,000 6 months KIBOR + 1.5% p.a. 0.25% of the principal in the first 78 198,295 ––do–– months and remaining in 3 semi annual installments of 33.25% each starting from the 84th month from November 2005. – issue no. III 100,000 5,000 500,000,000 6 months KIBOR + 2.5% p.a. 0.26% of principal amount in the first 500,000 ––do–– 78 months and remaining principal in three semi –annual installment staring from the 84th month. 149,720 748,600,000
Soneri Bank Limited 30,000 5,000 150,000,000 6 months KIBOR + 1.6% p.a. In 4 semi annual equal installments 149,730 Mr. Safar Ali K. Lakhani starting from the 78th month from May 2005. United Bank Limited – issue no. III 56,978 5,000 284,890,000 6 months KIBOR + 1.7% p.a. 0.2% of the principal in the first 60 284,548 Mr. Atif R. Bokhari months and remaining principal in 6 equal semi annual installments from September 2006. Pak Arab Fertilizers Limited 20,000 5,000 100,000,000 6 months KIBOR + 1.5% p.a. In six stepped –up semi–annual 99,940 Mr. Fawad Ahmed Mukhtar installments starting from the 30th month from July 2007. Carrying value before revaluation 1,831,777 Deficit on revaluation of securities (96,233) Market value of listed TFCs (revalued amount) 1,735,544
SUKUK BONDS – available for sale Terms of Redemption Rate of Currency Principal Interest interest WAPDA Sukuk Bonds At maturity Half–yearly 6 Month PKR 400,000 Mr. Muhammad Shakil KIBOR+0.35%
Deficit on revaluation of securities (3,863) Market value of sukuk bonds 396,137
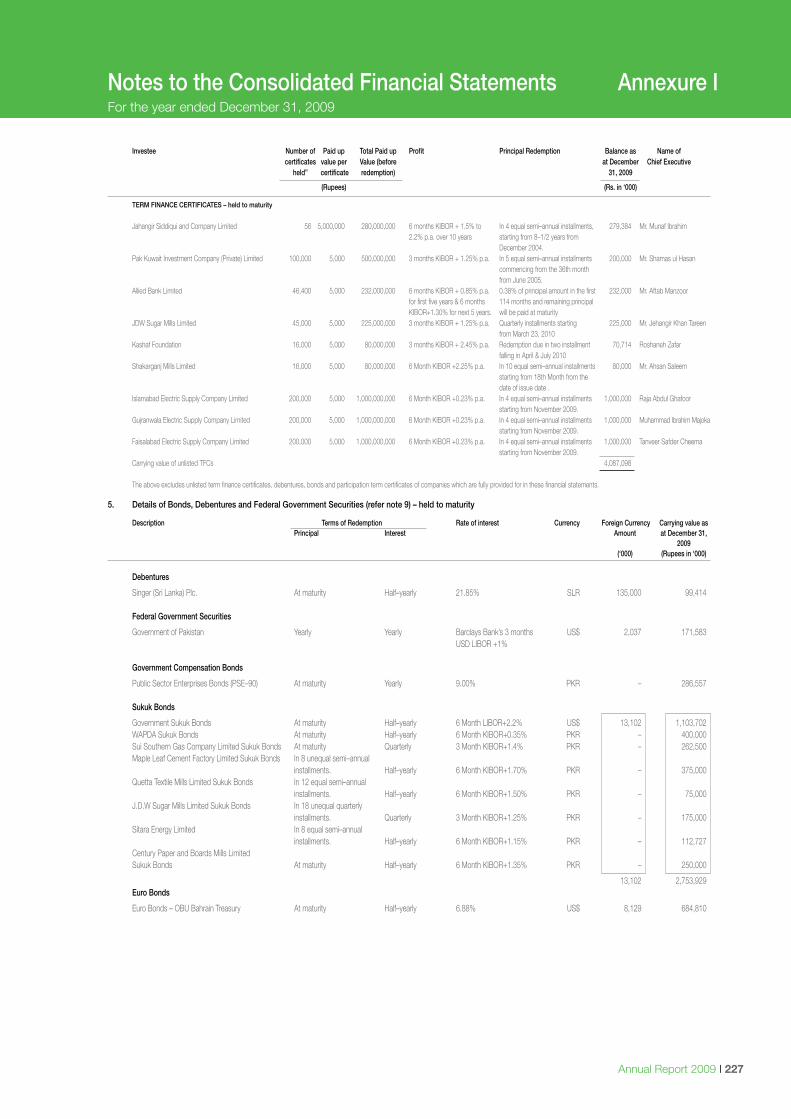
Annual Report 2009 I 227
Notes to the Consolidated Financial Statements Annexure IFor the year ended December 31, 2009
Investee Number of Paid up Total Paid up Profit Principal Redemption Balance as Name of certificates value per Value (before at December Chief Executive held” certificate redemption) 31, 2009
(Rupees) (Rs. in ‘000)
TERM FINANCE CERTIFICATES – held to maturity
Jahangir Siddiqui and Company Limited 56 5,000,000 280,000,000 6 months KIBOR + 1.5% to In 4 equal semi–annual installments, 279,384 Mr. Munaf Ibrahim 2.2% p.a. over 10 years starting from 8–1/2 years from December 2004. Pak Kuwait Investment Company (Private) Limited 100,000 5,000 500,000,000 3 months KIBOR + 1.25% p.a. In 5 equal semi–annual installments 200,000 Mr. Shamas ul Hasan commencing from the 36th month from June 2005. Allied Bank Limited 46,400 5,000 232,000,000 6 months KIBOR + 0.85% p.a. 0.38% of principal amount in the first 232,000 Mr. Aftab Manzoor for first five years & 6 months 114 months and remaining principal KIBOR+1.30% for next 5 years. will be paid at maturity JDW Sugar Mills Limited 45,000 5,000 225,000,000 3 months KIBOR + 1.25% p.a. Quarterly installments starting 225,000 Mr. Jehangir Khan Tareen from March 23, 2010 Kashaf Foundation 16,000 5,000 80,000,000 3 months KIBOR + 2.45% p.a. Redemption due in two installment 70,714 Roshaneh Zafar falling in April & July 2010 Shakarganj Mills Limited 16,000 5,000 80,000,000 6 Month KIBOR +2.25% p.a. In 10 equal semi–annual installments 80,000 Mr. Ahsan Saleem starting from 18th Month from the date of issue date . Islamabad Electric Supply Company Limited 200,000 5,000 1,000,000,000 6 Month KIBOR +0.23% p.a. In 4 equal semi–annual installments 1,000,000 Raja Abdul Ghafoor starting from November 2009. Gujranwala Electric Supply Company Limited 200,000 5,000 1,000,000,000 6 Month KIBOR +0.23% p.a. In 4 equal semi–annual installments 1,000,000 Muhammad Ibrahim Majoka starting from November 2009. Faisalabad Electric Supply Company Limited 200,000 5,000 1,000,000,000 6 Month KIBOR +0.23% p.a. In 4 equal semi–annual installments 1,000,000 Tanveer Safder Cheema starting from November 2009. Carrying value of unlisted TFCs 4,087,098 The above excludes unlisted term finance certificates, debentures, bonds and participation term certificates of companies which are fully provided for in these financial statements.
5. Details of Bonds, Debentures and Federal Government Securities (refer note 9) – held to maturity
Description Terms of Redemption Rate of interest Currency Foreign Currency Carrying value as Principal Interest Amount at December 31, 2009 (‘000) (Rupees in ‘000)
Debentures
Singer (Sri Lanka) Plc. At maturity Half–yearly 21.85% SLR 135,000 99,414
Federal Government Securities
Government of Pakistan Yearly Yearly Barclays Bank’s 3 months US$ 2,037 171,583 USD LIBOR +1%
Government Compensation Bonds
Public Sector Enterprises Bonds (PSE–90) At maturity Yearly 9.00% PKR – 286,557 Sukuk Bonds
Government Sukuk Bonds At maturity Half–yearly 6 Month LIBOR+2.2% US$ 13,102 1,103,702 WAPDA Sukuk Bonds At maturity Half–yearly 6 Month KIBOR+0.35% PKR – 400,000 Sui Southern Gas Company Limited Sukuk Bonds At maturity Quarterly 3 Month KIBOR+1.4% PKR – 262,500 Maple Leaf Cement Factory Limited Sukuk Bonds In 8 unequal semi–annual installments. Half–yearly 6 Month KIBOR+1.70% PKR – 375,000 Quetta Textile Mills Limited Sukuk Bonds In 12 equal semi–annual installments. Half–yearly 6 Month KIBOR+1.50% PKR – 75,000 J.D.W Sugar Mills Limited Sukuk Bonds In 18 unequal quarterly installments. Quarterly 3 Month KIBOR+1.25% PKR – 175,000 Sitara Energy Limited In 8 equal semi–annual installments. Half–yearly 6 Month KIBOR+1.15% PKR – 112,727 Century Paper and Boards Mills Limited Sukuk Bonds At maturity Half–yearly 6 Month KIBOR+1.35% PKR – 250,000
13,102 2,753,929 Euro Bonds
Euro Bonds – OBU Bahrain Treasury At maturity Half–yearly 6.88% US$ 8,129 684,810
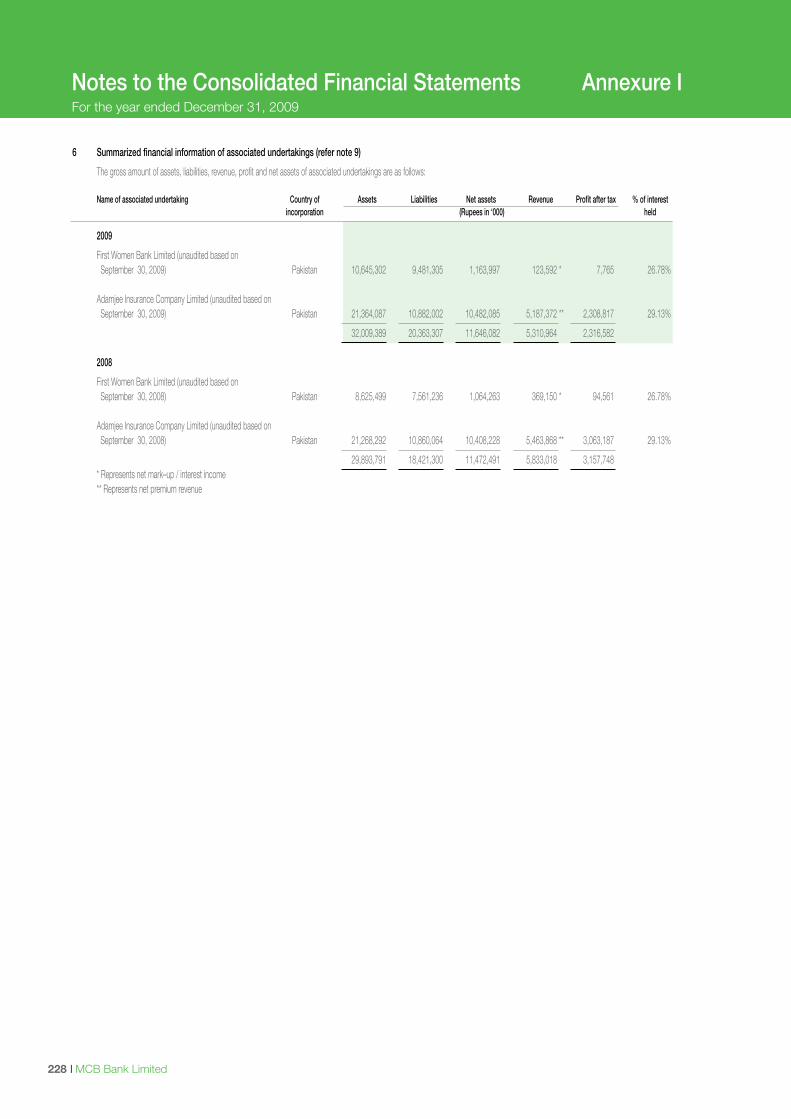
I MCB Bank Limited228
Notes to the Consolidated Financial Statements Annexure IFor the year ended December 31, 2009
6 Summarized financial information of associated undertakings (refer note 9)
The gross amount of assets, liabilities, revenue, profit and net assets of associated undertakings are as follows: Name of associated undertaking Country of Assets Liabilities Net assets Revenue Profit after tax % of interest incorporation (Rupees in ‘000) held
2009
First Women Bank Limited (unaudited based on September 30, 2009) Pakistan 10,645,302 9,481,305 1,163,997 123,592 * 7,765 26.78% Adamjee Insurance Company Limited (unaudited based on September 30, 2009) Pakistan 21,364,087 10,882,002 10,482,085 5,187,372 ** 2,308,817 29.13%
32,009,389 20,363,307 11,646,082 5,310,964 2,316,582
2008
First Women Bank Limited (unaudited based on September 30, 2008) Pakistan 8,625,499 7,561,236 1,064,263 369,150 * 94,561 26.78% Adamjee Insurance Company Limited (unaudited based on September 30, 2008) Pakistan 21,268,292 10,860,064 10,408,228 5,463,868 ** 3,063,187 29.13%
29,893,791 18,421,300 11,472,491 5,833,018 3,157,748 * Represents net mark–up / interest income ** Represents net premium revenue
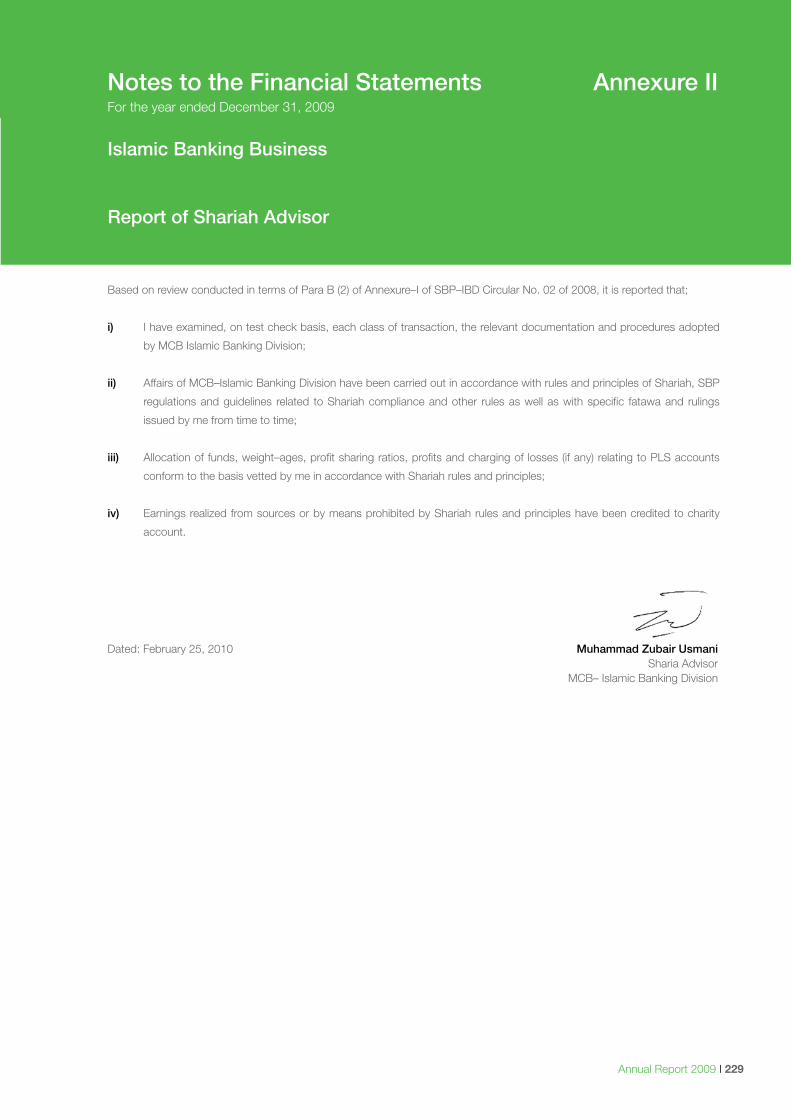
Annual Report 2009 I 229
Notes to the Financial Statements Annexure IIFor the year ended December 31, 2009
Islamic Banking Business
Report of Shariah Advisor
Based on review conducted in terms of Para B (2) of Annexure–I of SBP–IBD Circular No. 02 of 2008, it is reported that;
i) I have examined, on test check basis, each class of transaction, the relevant documentation and procedures adopted
by MCB Islamic Banking Division;
ii) Affairs of MCB–Islamic Banking Division have been carried out in accordance with rules and principles of Shariah, SBP
regulations and guidelines related to Shariah compliance and other rules as well as with specific fatawa and rulings
issued by me from time to time;
iii) Allocation of funds, weight–ages, profit sharing ratios, profits and charging of losses (if any) relating to PLS accounts
conform to the basis vetted by me in accordance with Shariah rules and principles;
iv) Earnings realized from sources or by means prohibited by Shariah rules and principles have been credited to charity
account.
Dated: February 25, 2010 Muhammad Zubair Usmani Sharia Advisor MCB– Islamic Banking Division
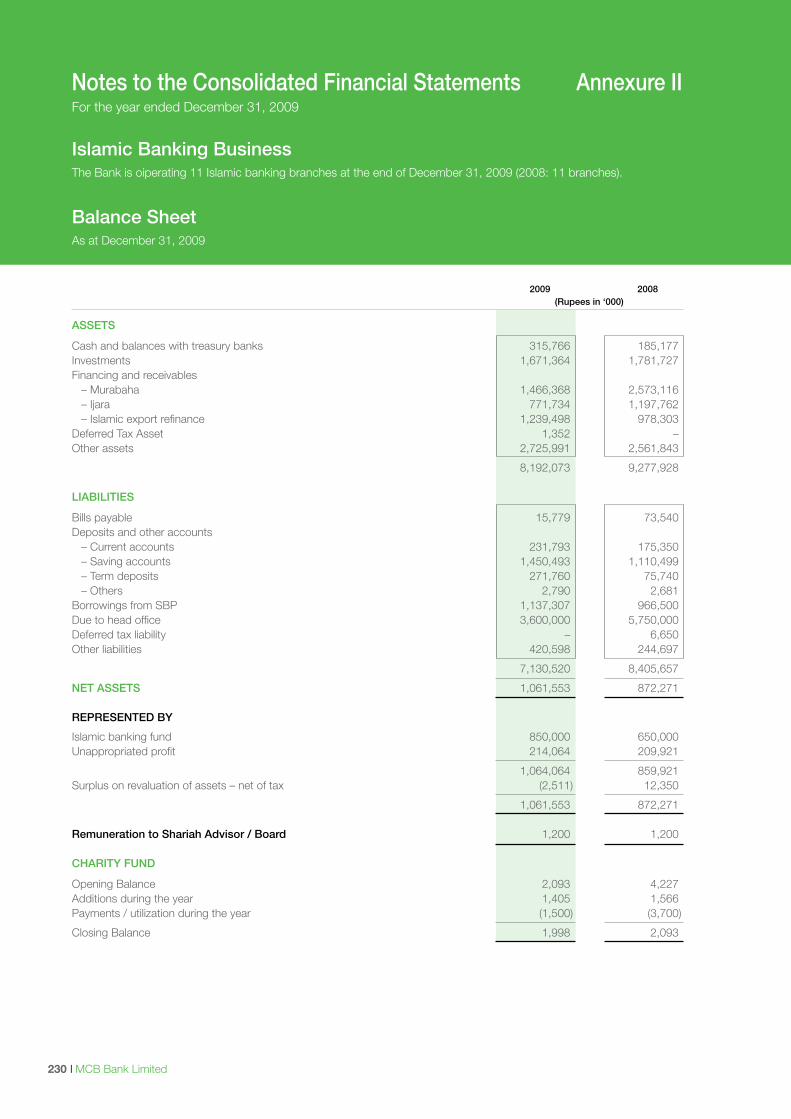
I MCB Bank Limited230
Balance SheetAs at December 31, 2009
Notes to the Consolidated Financial Statements Annexure IIFor the year ended December 31, 2009
Islamic Banking BusinessThe Bank is oiperating 11 Islamic banking branches at the end of December 31, 2009 (2008: 11 branches).
2009 2008 (Rupees in ‘000)
ASSETS
Cash and balances with treasury banks 315,766 185,177 Investments 1,671,364 1,781,727 Financing and receivables – Murabaha 1,466,368 2,573,116 – Ijara 771,734 1,197,762 – Islamic export refinance 1,239,498 978,303 Deferred Tax Asset 1,352 – Other assets 2,725,991 2,561,843
8,192,073 9,277,928
LIABILITIES
Bills payable 15,779 73,540 Deposits and other accounts – Current accounts 231,793 175,350 – Saving accounts 1,450,493 1,110,499 – Term deposits 271,760 75,740 – Others 2,790 2,681 Borrowings from SBP 1,137,307 966,500 Due to head office 3,600,000 5,750,000 Deferred tax liability – 6,650 Other liabilities 420,598 244,697
7,130,520 8,405,657
NET ASSETS 1,061,553 872,271
REPRESENTED BY
Islamic banking fund 850,000 650,000 Unappropriated profit 214,064 209,921
1,064,064 859,921 Surplus on revaluation of assets – net of tax (2,511) 12,350
1,061,553 872,271 Remuneration to Shariah Advisor / Board 1,200 1,200 CHARITY FUND
Opening Balance 2,093 4,227 Additions during the year 1,405 1,566 Payments / utilization during the year (1,500) (3,700)
Closing Balance 1,998 2,093
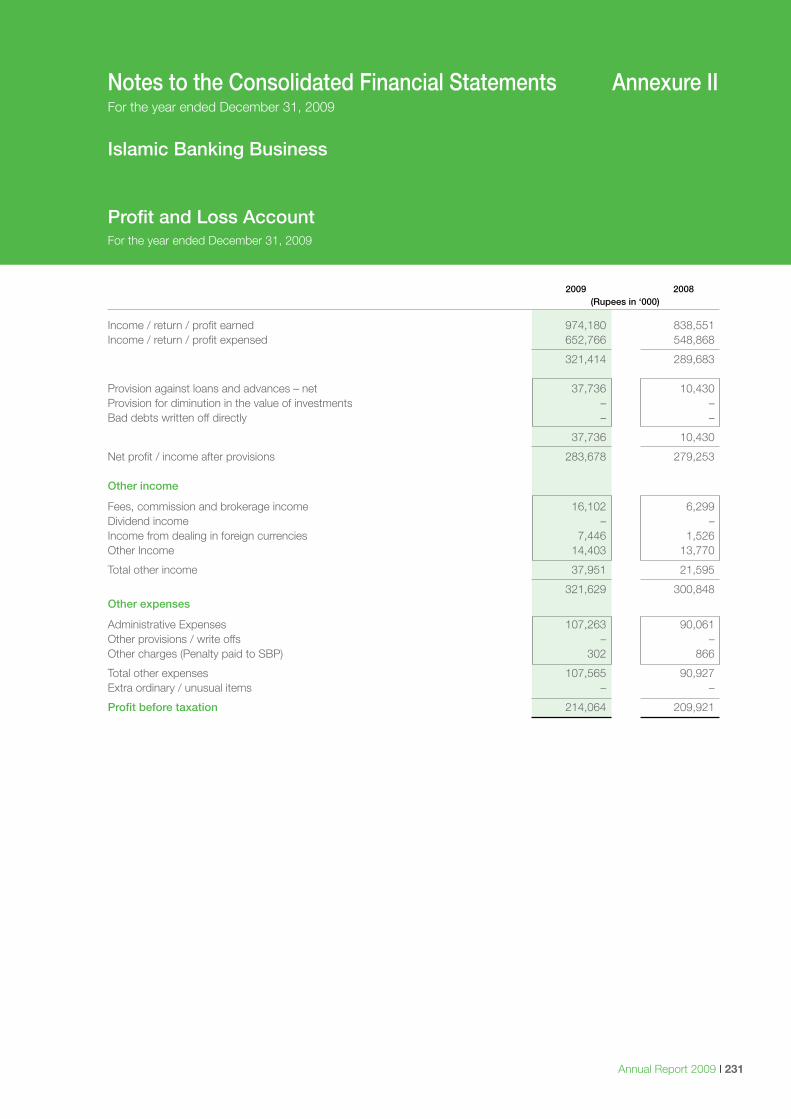
Annual Report 2009 I 231
2009 2008 (Rupees in ‘000)
Income / return / profit earned 974,180 838,551 Income / return / profit expensed 652,766 548,868
321,414 289,683
Provision against loans and advances – net 37,736 10,430 Provision for diminution in the value of investments – – Bad debts written off directly – –
37,736 10,430
Net profit / income after provisions 283,678 279,253 Other income
Fees, commission and brokerage income 16,102 6,299 Dividend income – – Income from dealing in foreign currencies 7,446 1,526 Other Income 14,403 13,770
Total other income 37,951 21,595
321,629 300,848 Other expenses
Administrative Expenses 107,263 90,061 Other provisions / write offs – – Other charges (Penalty paid to SBP) 302 866
Total other expenses 107,565 90,927 Extra ordinary / unusual items – –
Profit before taxation 214,064 209,921
Islamic Banking Business
Profit and Loss AccountFor the year ended December 31, 2009
Notes to the Consolidated Financial Statements Annexure IIFor the year ended December 31, 2009
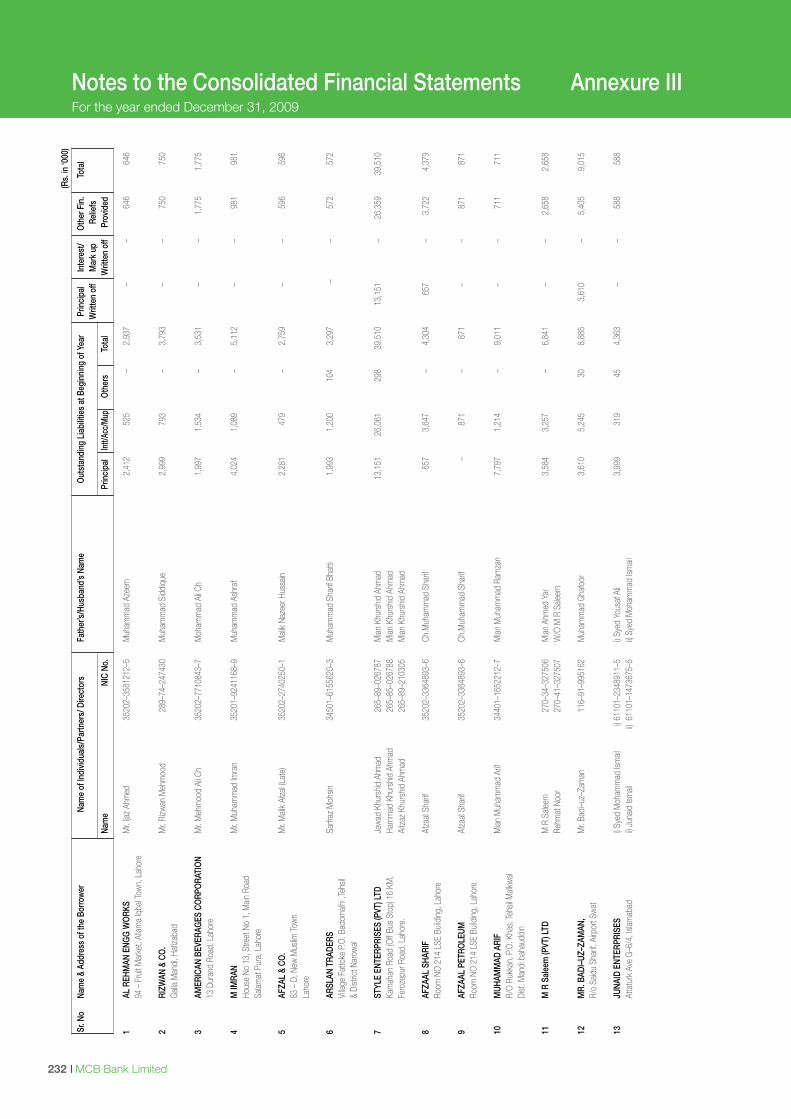
I MCB Bank Limited232 Annual Report 2009 I 233
Notes to the Consolidated Financial Statements Annexure IIIFor the year ended December 31, 2009
1 AL
REH
MAN
ENG
G W
ORK
S M
r. Ija
z Ah
med
35
202–
3581
212–
5 M
uham
mad
Aze
em
2,4
12
525
–
2,9
37
– –
646
6
46
94
– F
ruit
Mar
ket,
Allam
a Iq
bal T
own,
Lah
ore
2 RI
ZWAN
& C
O.
Mr.
Rizw
an M
ehm
ood
289–
74–2
4743
0 M
uham
mad
Sid
diqu
e 2
,999
7
93
– 3
,793
–
– 7
50
750
Gall
a M
andi
, Haf
izaba
d
3 AM
ERIC
AN B
EVER
AGES
CO
RPO
RATI
ON
Mr.
Meh
moo
d Al
i Ch
3520
2–77
1084
3–7
Moh
amm
ad A
li Ch
1,9
97
1,5
34
– 3
,531
–
– 1
,775
1
,775
13 D
uran
d Ro
ad, L
ahor
e
4 M
IMRA
N M
r. M
uham
mad
Imra
n 35
201–
9241
168–
9 M
uham
mad
Ash
raf
4,0
24
1,0
89
– 5
,112
–
– 9
81
981
Hous
e No
13,
Stre
et N
o 1,
Main
Roa
d
Salam
at P
ura,
Lah
ore
5 AF
ZAL
& CO
. M
r. M
alik
Afza
l (Lat
e)
3520
2–27
4025
0–1
Mali
k Na
zeer
Hus
sain
2,2
81
479
–
2,7
59
– –
596
5
96
83
– D
, New
Mus
lim To
wn
La
hore
6 AR
SLAN
TRA
DERS
Sa
rfraz
Moh
sin
3450
1–61
5562
0–3
Muh
amm
ad S
harif
Bha
tti
1,99
3 1,
200
104
3,2
97
– –
572
572
Vi
llage
Fat
toke
P.O
. Bad
omalh
i ,Te
hsil
&
Dist
rict N
arow
al
7 ST
YLE
ENTE
RPRI
SES
(PVT
) LTD
Ja
wad
Khu
rshid
Ahm
ad
265–
89–0
2678
7 M
ian K
hurs
hid A
hmad
13
,151
26
,061
29
8 39
,510
13
,151
–
26,3
59
39,5
10
Kam
ahan
Roa
d (O
ff Bu
s St
op) 1
6 KM
, Ha
mm
ad K
hurs
hid A
hmad
26
5–85
–026
788
Mian
Khu
rshid
Ahm
ad
Fe
roze
pur R
oad,
Lah
ore.
Ai
tzaz
Khu
rshid
Ahm
ad
265–
89–2
1030
5 M
ian K
hurs
hid A
hmad
8 AF
ZAAL
SHA
RIF
Afza
al Sh
arif
3520
2–33
6489
3–6
Ch.M
uham
mad
Sha
rif
657
3
,647
–
4,
304
6
57
–
3,72
2
4,3
79
Ro
om N
O 2
14 L
SE B
uildi
ng, L
ahor
e
9 AF
ZAAL
PET
ROLE
UM
Afza
al Sh
arif
3520
2–33
6489
3–6
Ch.M
uham
mad
Sha
rif
–
8
71
–
8
71
–
–
87
1
871
Room
NO
214
LSE
Buil
ding
, Lah
ore
10
MUH
AMM
AD A
RIF
Mian
Muh
amm
ad A
rif
3440
1–16
5221
2–7
Mian
Muh
amm
ad R
amza
n 7
,797
1
,214
–
9,0
11
–
–
711
7
11
R/
O R
ukka
n, P
.O. K
has,
Tehs
il Malk
wal
Di
st. M
andi
bah
audd
in
11
M R
Sal
eem
(PVT
) LTD
M
R S
aleem
27
0–34
–327
506
Mian
Ahm
ed Y
ar
3,58
4
3,25
7
–
6,
841
–
–
2,65
8
2,65
8
Re
hmat
Noo
r 27
0–41
–327
507
W/O
M R
Sale
em
12
MR.
BAD
I–UZ
–ZAM
AN,
Mr.
Badi
–uz–
Zam
an
116–
91–9
9516
2 M
uham
mad
Gha
foor
3,
610
5,24
5 30
8,
885
3,61
0 –
5,40
5 9,
015
R/
o Sa
idu
Shar
if, Ai
rpor
t Sw
at
13
JUNA
ID E
NTER
PRIS
ES
i) Sye
d M
oham
mad
Ism
ail
i) 611
01–2
3489
11–5
i) S
yed
Yous
af A
li 3,
999
319
45
4,36
3 –
– 58
8 58
8
Atta
turk
Ave
G–6
/4, I
slam
abad
ii)
Juna
id Is
ii)
611
01–1
4736
75–5
ii)
Syed
Moh
amm
ad Is
Sr.
No
Nam
e &
Addr
ess
of th
e Bo
rrow
er
Nam
e of
Indi
vidu
als/
Partn
ers/
Dire
ctor
s
Fath
er’s/
Husb
and’
s Na
me
Out
stan
ding
Lia
bilit
ies
at B
egin
ning
of Y
ear
Prin
cipa
l In
tere
st/
Oth
er F
in.
Tota
l
Writ
ten
off
Mar
k up
Re
liefs
Nam
e NI
C No
.
Prin
cipa
l In
tt/Ac
c/M
up
Oth
ers
Tota
l
Writ
ten
off
Prov
ided
(Rs.
in ‘0
00)
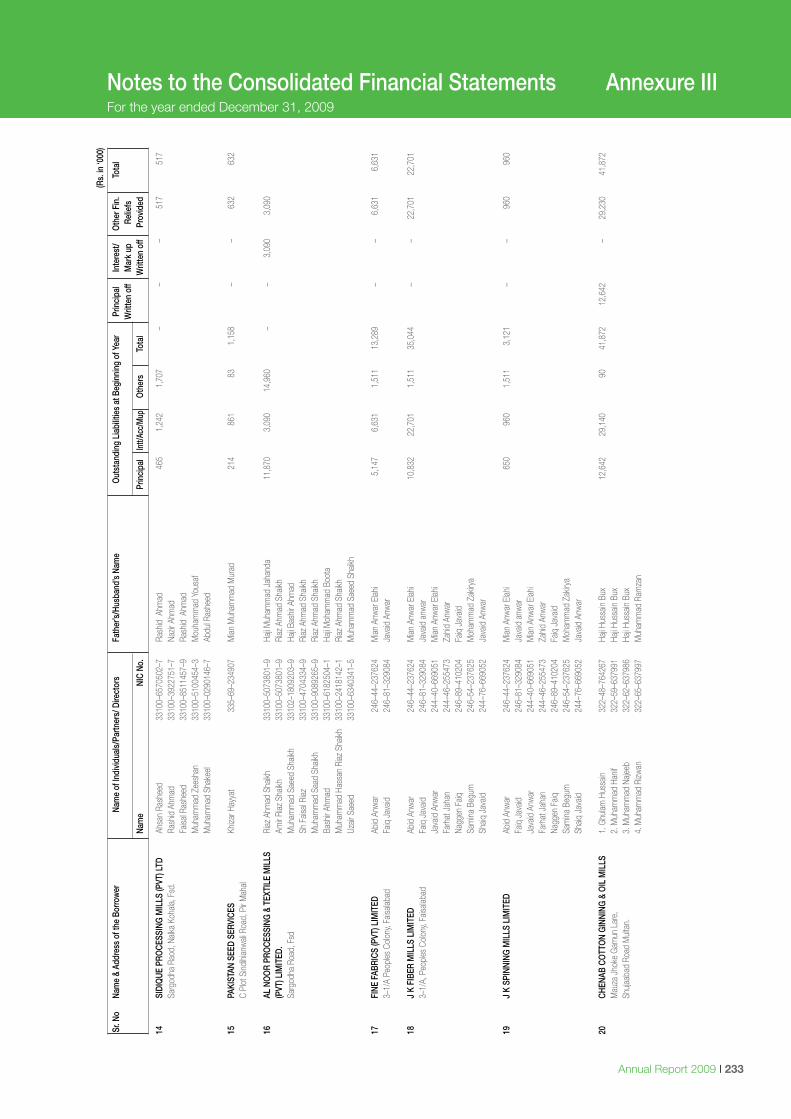
I MCB Bank Limited232 Annual Report 2009 I 233
Notes to the Consolidated Financial Statements Annexure IIIFor the year ended December 31, 2009
14
SIDI
QUE
PRO
CESS
ING
MIL
LS (P
VT) L
TD
Ahsa
n Ra
shee
d 33
100–
6570
502–
7 Ra
shid
Ahm
ad
465
1,24
2 1,
707
– –
– 51
7 51
7
Sarg
odha
Rao
d, N
alka
Koha
la, F
sd.
Rash
id A
hmad
33
100–
3922
751–
7 Na
zir A
hmad
Fa
isal R
ashe
ed
3310
0–85
1145
7–9
Rash
id A
hmad
M
uham
mad
Zee
shan
33
100–
5100
454–
3 M
ouha
mm
ad Y
ousa
f
M
uham
mad
Sha
keel
3310
0–02
9014
6–7
Abdu
l Ras
heed
15
PAKI
STAN
SEE
D SE
RVIC
ES
Khiza
r Hay
yat
335–
69–2
3490
7 M
ian M
uham
mad
Mur
ad
214
861
83
1,15
8 –
– 63
2 63
2
C Pl
ot S
indihi
anw
ali R
oad,
Pir
Mah
al
16
AL N
OO
R PR
OCE
SSIN
G &
TEX
TILE
MIL
LS
Riaz
Ahm
ad S
haikh
33
100–
5073
801–
9 Ha
ji Muh
amm
ad J
ahan
da
11,8
70
3,09
0 14
,960
–
– 3,
090
3,09
0
(PVT
) LIM
ITED
. Am
ir Ri
az S
haikh
33
100–
5073
801–
9 Ri
az A
hmad
Sha
ikh
Sa
rgod
ha R
oad,
Fsd
M
uham
mad
Sae
ed S
haikh
33
102–
1809
203–
9 Ha
ji Bas
hir A
hmad
Sh
Fais
al Ri
az
3310
0–47
0433
4–9
Riaz
Ahm
ad S
haikh
M
uham
mad
Saa
d Sh
aikh
3310
0–90
8926
5–9
Riaz
Ahm
ad S
haikh
Ba
shir
Ahm
ad
3310
0–61
8250
4–1
Haji M
oham
mad
Boo
ta
Muh
amm
ad H
assa
n Ri
az S
haikh
33
100–
2418
142–
1 Ri
az A
hmad
Sha
ikh
Uzair
Sae
ed
3310
0–63
4034
1–5
Muh
amm
ad S
aeed
Sha
ikh
17
FINE
FAB
RICS
(PVT
) LIM
ITED
Ab
id A
nwar
24
6–44
–237
624
Mian
Anw
ar E
lahi
5,14
7 6,
631
1,51
1 13
,289
–
– 6,
631
6,63
1
3–1/
A Pe
oples
Col
ony,
Faisa
labad
Fa
iq J
avaid
24
6–81
–329
084
Java
id A
nwar
18
J K
FIBE
R M
ILLS
LIM
ITED
Ab
id A
nwar
24
6–44
–237
624
Mian
Anw
ar E
lahi
10,8
32
22,7
01
1,51
1 35
,044
–
– 22
,701
22
,701
3–
1/A,
Peo
ples
Col
ony,
Faisa
labad
Fa
iq J
avaid
24
6–81
–329
084
Java
id a
nwar
Ja
vaid
Anw
ar
244–
40–6
6905
1 M
ian A
nwar
Elah
i
Fa
rhat
Jah
an
244–
46–2
5547
3 Za
hid A
nwar
Na
ggen
Faiq
24
6–89
–410
204
Faiq
Jav
aid
Sam
ina B
egum
24
6–54
–237
625
Moh
amm
ad Z
akiry
a
Shaiq
Jav
aid
244–
76–6
6905
2 Ja
vaid
Anw
ar
19
J K
SPIN
NING
MIL
LS L
IMIT
ED
Abid
Anw
ar
246–
44–2
3762
4 M
ian A
nwar
Elah
i 65
0 96
0 1,
511
3,12
1 –
– 96
0 96
0
Fa
iq J
avaid
24
6–81
–329
084
Java
id a
nwar
Ja
vaid
Anw
ar
244–
40–6
6905
1 M
ian A
nwar
Elah
i
Fa
rhat
Jah
an
244–
46–2
5547
3 Za
hid A
nwar
Na
ggen
Faiq
24
6–89
–410
204
Faiq
Jav
aid
Sam
ina B
egum
24
6–54
–237
625
Moh
amm
ad Z
akiry
a
Shaiq
Jav
aid
244–
76–6
6905
2 Ja
vaid
Anw
ar
20
CHEN
AB C
OTT
ON
GIN
NING
& O
IL M
ILLS
1.
Ghu
lam H
ussa
in
322–
48–7
6426
7 Ha
ji Hus
sain
Bux
12,6
42
29,1
40
90
41,8
72
12,6
42
– 29
,230
41
,872
M
auza
Jho
ke G
amun
Lar
e,
2. M
uham
mad
Han
if 32
2–59
–637
991
Haji H
ussa
in Bu
x
Shuja
abad
Roa
d M
ultan
. 3.
Muh
amm
ad N
ajeeb
32
2–62
–637
986
Haji H
ussa
in Bu
x
4.
Muh
amm
ad R
izwan
32
2–65
–637
997
Muh
amm
ad R
amza
n
Sr.
No
Nam
e &
Addr
ess
of th
e Bo
rrow
er
Nam
e of
Indi
vidu
als/
Partn
ers/
Dire
ctor
s
Fath
er’s/
Husb
and’
s Na
me
Out
stan
ding
Lia
bilit
ies
at B
egin
ning
of Y
ear
Prin
cipa
l In
tere
st/
Oth
er F
in.
Tota
l
Writ
ten
off
Mar
k up
Re
liefs
Nam
e NI
C No
.
Prin
cipa
l In
tt/Ac
c/M
up
Oth
ers
Tota
l
Writ
ten
off
Prov
ided
(Rs.
in ‘0
00)
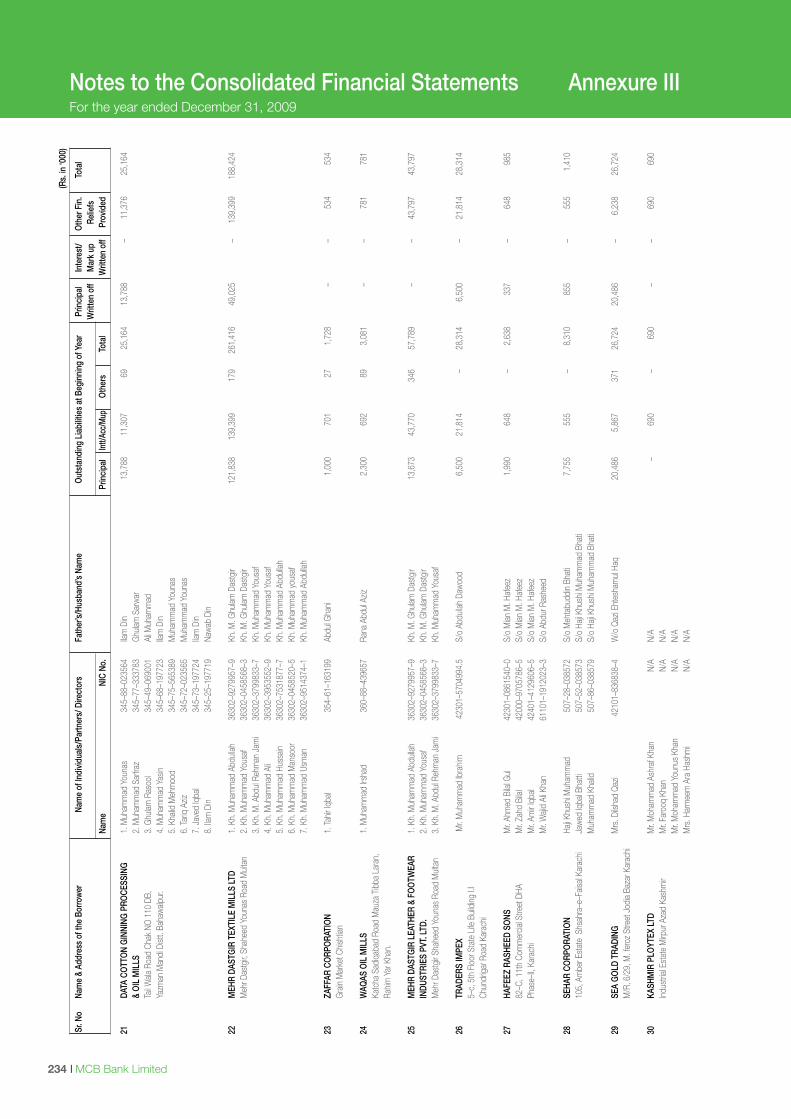
I MCB Bank Limited234 Annual Report 2009 I 235
Notes to the Consolidated Financial Statements Annexure IIIFor the year ended December 31, 2009
21
DATA
CO
TTO
N G
INNI
NG P
ROCE
SSIN
G
1. M
uham
mad
You
nas
34
5–88
–023
564
Ilam
Din
13,7
88
11,3
07
69
25,1
64
13,7
88
– 11
,376
25
,164
&
OIL
MIL
LS
2. M
uham
mad
Sar
fraz
345–
77–3
3378
3 G
hulam
Sar
war
Tail W
ala R
oad
Chak
NO
110
DB,
3.
Ghu
lam R
asoo
l 34
5–49
–069
001
Ali M
uham
mad
Yazm
an M
andi
Dist
t. Ba
haw
alpur
. 4.
Muh
amm
ad Y
asin
345–
68–1
9772
3 Ila
m D
in
5.
Kha
lid M
ehm
ood
345–
75–5
6538
9 M
uham
mad
You
nas
6. Ta
riq A
ziz
345–
72–0
2356
5 M
uham
mad
You
nas
7. J
aved
Iqba
l 34
5–73
–197
724
Ilam
Din
8. Ila
m D
in 34
5–25
–197
719
Naw
ab D
in
22
MEH
R DA
STG
IR T
EXTI
LE M
ILLS
LTD
1.
Kh.
Muh
amm
ad A
bdull
ah
3630
2–92
7995
7–9
Kh. M
. Ghu
lam D
astg
ir
121,
838
139,
399
179
261,
416
49,0
25
– 13
9,39
9 18
8,42
4
Meh
r Das
tgir,
Shah
eed
Youn
as R
oad
Mult
an
2. K
h. M
uham
mad
You
saf
3630
2–04
5856
8–3
Kh. M
. Ghu
lam D
astg
ir
3.
Kh.
M. A
bdul
Rehm
an J
ami
3630
2–37
9983
3–7
Kh. M
uham
mad
You
saf
4. K
h. M
uham
mad
Ali
3630
2–39
5355
2–9
Kh. M
uham
mad
You
saf
5. K
h. M
uham
mad
Hus
sain
36
302–
7531
877–
7 Kh
. Muh
amm
ad A
bdull
ah
6. K
h. M
uham
mad
Man
soor
36
302–
0458
520–
5 Kh
. Muh
amm
ad y
ousa
f
7.
Kh.
Muh
amm
ad U
sman
36
302–
9514
374–
1 Kh
. Muh
amm
ad A
bdull
ah
23
ZAFF
AR C
ORP
ORA
TIO
N
1. Ta
hir Iq
bal
354–
61–1
6319
9 Ab
dul G
hani
1,
000
701
27
1,72
8 –
– 53
4 53
4
Gra
in M
arke
t Chis
htian
24
WAQ
AS O
IL M
ILLS
1.
Muh
amm
ad Ir
shad
36
0–88
–439
657
Rana
Abd
ul Az
iz 2,
300
692
89
3,08
1 –
– 78
1 78
1
Katc
ha S
adiq
abad
Roa
d M
auza
Tib
ba L
aran
,
Rahim
Yar
Kha
n.
25
MEH
R DA
STG
IR L
EATH
ER &
FO
OTW
EAR
1.
Kh.
Muh
amm
ad A
bdull
ah
3630
2–92
7995
7–9
Kh. M
. Ghu
lam D
astg
ir
13,6
73
43,7
70
346
57,7
89
– –
43,7
97
43,7
97
INDU
STRI
ES P
VT. L
TD.
2. K
h. M
uham
mad
You
saf
3630
2–04
5856
8–3
Kh. M
. Ghu
lam D
astg
ir
Meh
r Das
tgir
Shah
eed
Youn
as R
oad
Mult
an
3. K
h. M
. Abd
ul Re
hman
Jam
i 36
302–
3799
833–
7 Kh
. Muh
amm
ad Y
ousa
f 26
TR
ADER
S IM
PEX
Mr.
Muh
amm
ad Ib
rahim
42
301–
5704
994.
5 S/
o Ab
dulla
h Da
woo
d 6,
500
21,8
14
– 28
,314
6,
500
– 21
,814
28
,314
5–
c, 5
th F
loor
Sta
te L
ife B
uildi
ng I.
I
Chun
drig
ar R
oad
Kara
chi
27
HAFE
EZ R
ASHE
ED S
ONS
M
r. Ah
med
Bila
l Gul
4230
1–08
6154
0–0
S/o
Mian
M. H
afee
z 1,
990
648
– 2,
638
337
– 64
8 98
5
82–C
, 11t
h Co
mm
ercia
l Stre
et D
HA
Mr.
Zahd
Bila
l 42
000–
9705
786–
5 S/
o M
ian M
. Haf
eez
Ph
ase–
II, Ka
rach
i M
r. Am
ir Iq
bal
4240
1–41
2960
6–5
S/o
Mian
M. H
afee
z
M
r. W
ajid
Ali K
han
6110
1–19
1202
3–3
S/o
Abdu
r Ras
heed
28
SE
HAR
CORP
ORA
TIO
N Ha
ji Khu
shi M
uham
mad
50
7–28
–038
572
S/o
Meh
tabu
ddin
Bhat
i 7,
755
555
– 8,
310
855
– 55
5 1,
410
10
5, A
mbe
r Est
ate
Shs
ahra
–e–F
aisal
Kara
chi
Jaw
ed Iq
bal B
hatti
50
7–52
–038
573
S/o
Haji K
hush
i Muh
amm
ad B
hati
Muh
amm
ad K
halid
50
7–86
–038
579
S/o
Haji K
hush
i Muh
amm
ad B
hati
29
SEA
GO
LD T
RADI
NG
Mrs
. Dils
had
Qaz
i 42
101–
8368
38–4
W
/o Q
azi E
htes
ham
ul Ha
q 20
,486
5,
867
371
26,7
24
20,4
86
– 6,
238
26,7
24
M/R
, 6/2
9, M
. fer
oz S
treet
Jod
ia Ba
zar K
arac
hi 30
KA
SHM
IR P
LOYT
EX L
TD
Mr.
Moh
amm
ad A
shra
f Kha
n N/
A N/
A –
690
– 69
0 –
– 69
0 69
0
Indu
stria
l Est
ate
Mirp
ur A
zad
Kash
mir
Mr.
Faro
oq K
han
N/A
N/A
Mr.
Moh
amm
ad Y
ounu
s Kh
an
N/A
N/A
Mrs
. Har
mee
m A
ra H
ashm
i N/
A N/
A S
r. No
Na
me
& Ad
dres
s of
the
Borro
wer
Na
me
of In
divi
dual
s/Pa
rtner
s/ D
irect
ors
Fa
ther
’s/Hu
sban
d’s
Nam
e O
utst
andi
ng L
iabi
litie
s at
Beg
inni
ng o
f Yea
r Pr
inci
pal
Inte
rest
/ O
ther
Fin
. To
tal
W
ritte
n of
f M
ark
up
Relie
fs
Na
me
NIC
No.
Pr
inci
pal
Intt/
Acc/
Mup
O
ther
s To
tal
W
ritte
n of
f Pr
ovid
ed
(Rs.
in ‘0
00)
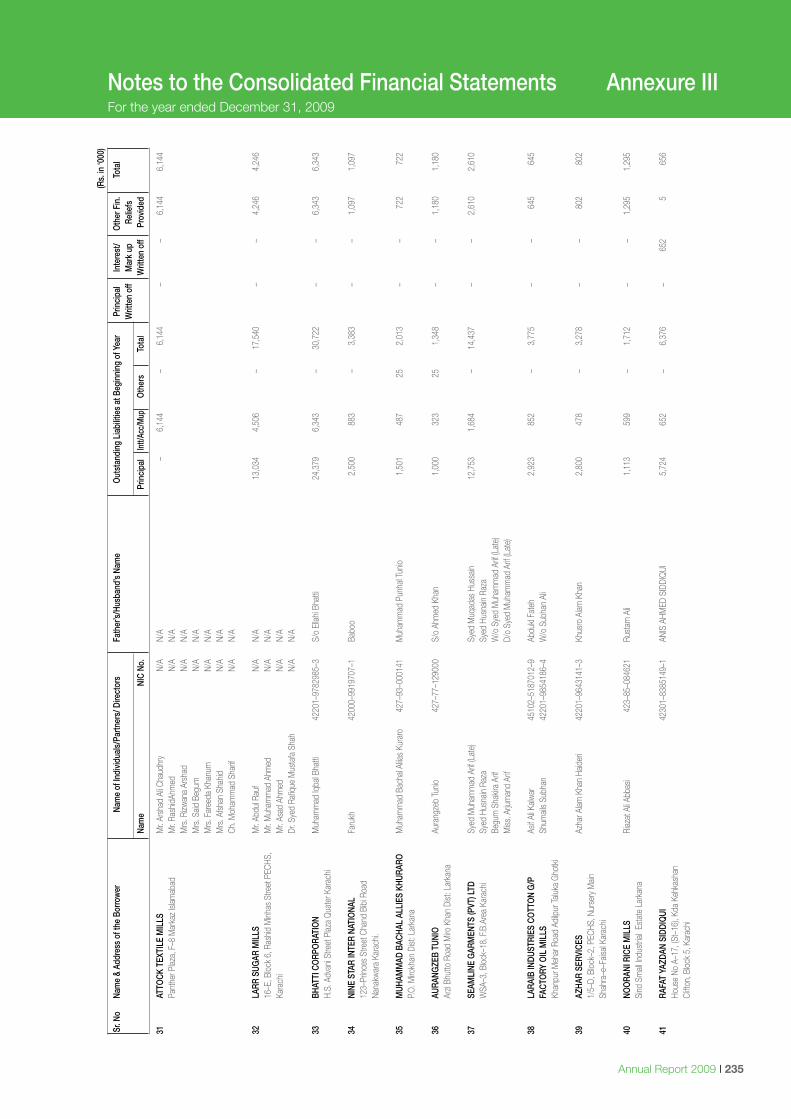
I MCB Bank Limited234 Annual Report 2009 I 235
Notes to the Consolidated Financial Statements Annexure IIIFor the year ended December 31, 2009
31
ATTO
CK T
EXTI
LE M
ILLS
M
r. Ar
shad
Ali C
haud
hry
N/A
N/A
– 6,
144
– 6,
144
– –
6,14
4 6,
144
Pa
nthe
r Plaz
a, F
–8 M
arka
z Isl
amab
ad
Mr.
Rash
idAh
med
N/
A N/
A
M
rs. R
izwan
a Ar
shad
N/
A N/
A
M
rs. S
aid B
egum
N/
A N/
A
M
rs. F
aree
da K
hanu
m
N/A
N/A
Mrs
. Afs
han
Shah
id
N/A
N/A
Ch. M
oham
mad
Sha
rif
N/A
N/A
32
LARR
SUG
AR M
ILLS
M
r. Ab
dul R
auf
N/A
N/A
13,
034
4
,506
–
17,
540
–
–
4
,246
4
,246
16–E
, Blo
ck 6
, Ras
hid M
inhas
Stre
et P
ECHS
, M
r. M
uham
mad
Ahm
ed
N/A
N/A
Ka
rach
i M
r. As
ad A
hmed
N/
A N/
A
Dr
. Sye
d Ra
fique
Mus
tafa
Sha
h N/
A N/
A 33
BH
ATTI
CO
RPO
RATI
ON
Muh
amm
ad Iq
bal B
hatti
42
201–
9782
985–
3 S/
o El
lahi B
hatti
2
4,37
9
6,3
43
–
3
0,72
2
–
–
6,3
43
6,3
43
H.
S. A
dvan
i Stre
et P
laza
Qua
ter K
arac
hi 34
NI
NE S
TAR
INTE
R NA
TIO
NAL
Faru
kh
4200
0–99
1970
7–1
Babo
o 2,
500
883
– 3,
383
– –
1,09
7 1,
097
12
3–Pr
inces
Stre
et C
hand
Bib
i Roa
d
Nana
kwar
a Ka
rach
i. 35
M
UHAM
MAD
BAC
HAL
ALLI
ES K
HURA
RO
Muh
amm
ad B
acha
l Aliia
s Ku
raro
42
7–93
–000
141
Muh
amm
ad P
unha
l Tun
io
1,50
1 48
7 25
2,
013
– –
722
722
P.
O. M
irokh
an D
ist: L
arka
na
36
AURA
NGZE
B TU
NIO
Au
rang
zeb
Tunio
42
7–77
–129
000
S/o
Ahm
ed K
han
1,00
0 32
3 25
1,
348
– –
1,18
0 1,
180
Ar
zi Bh
utto
Roa
d M
iro K
han
Dist
: Lar
kana
37
SE
AMLI
NE G
ARM
ENTS
(PVT
) LTD
Sy
ed M
uham
mad
Arif
(Lat
e)
Sy
ed M
uqad
as H
ussa
in 12
,753
1,
684
– 14
,437
–
– 2,
610
2,61
0
WSA
–3, B
lock
–18,
F.B.
Area
Kar
achi
Syed
Hus
nain
Raza
Syed
Hus
nain
Raza
Be
gum
Sha
kira
Arif
W
/o S
yed
Muh
amm
ad A
rif (L
ate)
M
iss. A
rjum
and
Arif
D/
o Sy
ed M
uham
mad
Arif
(Lat
e)
38
LARA
IB IN
DUST
RIES
CO
TTO
N G
/P
Asif A
li Kalw
ar
4510
2–51
8701
2–9
Abdu
kl Fa
teh
2,92
3 85
2 –
3,77
5 –
– 64
5 64
5
FACT
ORY
OIL
MIL
LS
Shum
ails
Subh
an
4220
1–98
5418
6–4
W/o
Sub
han
Ali
Kh
anpu
r Meh
ar R
oad
Adilp
ur Ta
luka
Gho
tki
39
AZHA
R SE
RVIC
ES
Azha
r Alam
Kha
n Ha
ider
i 42
201–
9643
141–
3 Kh
usro
Alam
Kha
n 2,
800
478
– 3,
278
– –
802
802
1/
5–D,
Blo
ck–2
, PEC
HS, N
urse
ry M
ain
Sh
ahra
–e–F
aisal
Kara
chi
40
NOO
RANI
RIC
E M
ILLS
Ri
azat
Ali A
bbas
i 42
3–85
–084
621
Rust
am A
li 1,
113
599
– 1,
712
– –
1,29
5 1,
295
Si
nd S
mall
Indu
stria
l Es
tate
Lar
kana
41
RA
FAT
YAZD
AN S
IDDI
QUI
4230
1–83
8514
9–1
ANIS
AHM
ED S
IDDI
QUI
5
,724
6
52
–
6
,376
–
652
5
6
56
Ho
use
No A
–17,
(St–
16),
Kda
Kehk
asha
n
Clift
on, B
lock
5, K
arac
hi
Sr.
No
Nam
e &
Addr
ess
of th
e Bo
rrow
er
Nam
e of
Indi
vidu
als/
Partn
ers/
Dire
ctor
s
Fath
er’s/
Husb
and’
s Na
me
Out
stan
ding
Lia
bilit
ies
at B
egin
ning
of Y
ear
Prin
cipa
l In
tere
st/
Oth
er F
in.
Tota
l
Writ
ten
off
Mar
k up
Re
liefs
Nam
e NI
C No
.
Prin
cipa
l In
tt/Ac
c/M
up
Oth
ers
Tota
l
Writ
ten
off
Prov
ided
(Rs.
in ‘0
00)
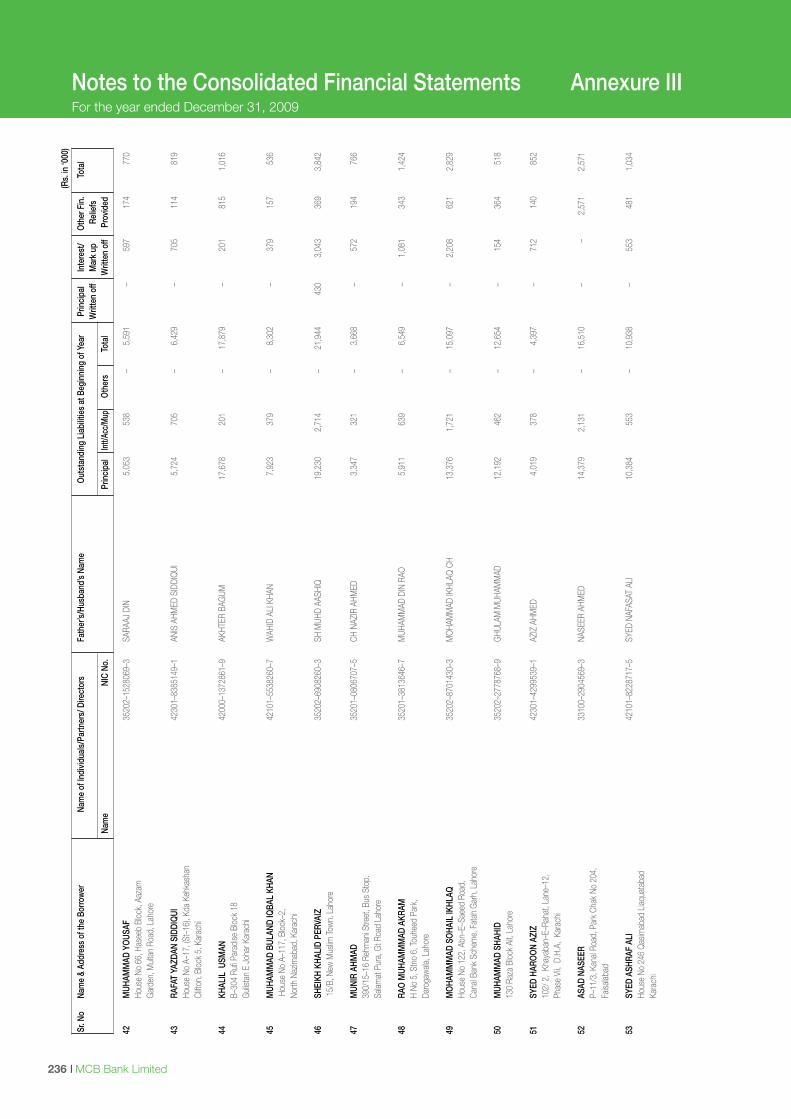
I MCB Bank Limited236 Annual Report 2009 I 237
Notes to the Consolidated Financial Statements Annexure IIIFor the year ended December 31, 2009
42
MUH
AMM
AD Y
OUS
AF
35
202–
1528
069–
3 SA
RAAJ
DIN
5
,053
5
38
–
5
,591
–
597
1
74
770
Hous
e No
66,
Has
eeb
Bloc
k, A
azam
Gar
den,
Mult
an R
oad,
Lah
ore
43
RAFA
T YA
ZDAN
SID
DIQ
UI
42
301–
8385
149–
1 AN
IS A
HMED
SID
DIQ
UI
5,7
24
705
–
6,4
29
–
7
05
114
8
19
Ho
use
No A
–17,
(St–
16),
Kda
Kehk
asha
n
Clift
on, B
lock
5, K
arac
hi 44
KH
ALIL
USM
AN
42
000–
1372
861–
9 AK
HTER
BAG
UM
17,
678
2
01
–
1
7,87
9
–
2
01
815
1
,016
B–30
4 Ru
fi Par
adise
Blo
ck 1
8
Guli
stan
E J
ohar
Kar
achi
45
MUH
AMM
AD B
ULAN
D IQ
BAL
KHAN
4210
1–55
3826
0–7
WAH
ID A
LI K
HAN
7,9
23
379
–
8,3
02
–
3
79
157
5
36
H
ouse
No
A–11
7, B
lock
–2,
No
rth N
azim
abad
, Kar
achi
46
SHEI
KH K
HALI
D PE
RVAI
Z
3520
2–69
0826
0–3
SH M
UHD
AASH
IQ
19,
230
2
,714
–
21,
944
4
30
3,0
43
369
3
,842
15/
B, N
ew M
uslim
Tow
n, L
ahor
e 47
M
UNIR
AHM
AD
35
201–
0806
707–
5 CH
NAZ
IR A
HMED
3
,347
3
21
–
3
,668
–
572
1
94
766
390/
15–1
6 Re
hman
i Stre
et, B
us S
top,
Salam
at P
ura,
Gt R
oad
Laho
re
48
RAO
MUH
AMM
MAD
AKR
AM
35
201–
3813
646–
7 M
UHAM
MAD
DIN
RAO
5
,911
6
39
–
6
,549
–
1,0
81
343
1
,424
H No
5, S
tno
6, To
uhee
d Pa
rk,
Da
roga
wala
, Lah
ore
49
MO
HAM
MM
AD S
OHA
IL IK
HLAQ
3520
2–87
0143
0–3
MO
HAM
MAD
IKHL
AQ C
H 1
3,37
6
1,7
21
–
1
5,09
7
–
2
,208
6
21
2,8
29
Ho
use
No 1
22, A
bn–E
–Sae
ed R
oad,
Cana
l Ban
k Sc
hem
e, F
atah
Gar
h, L
ahor
e 50
M
UHAM
MAD
SHA
HID
35
202–
2778
768–
9 G
HULA
M M
UHAM
MAD
1
2,19
2
462
–
12,
654
–
154
3
64
518
130
Raza
Blo
ck A
it, L
ahor
e 51
SY
ED H
ARO
ON
AZIZ
4230
1–42
9953
9–1
AZIZ
AHM
ED
4,0
19
378
–
4,3
97
–
7
12
140
8
52
10
2/ 2
, Kh
ayab
an–E
–Rah
at, L
ane–
12,
Ph
ase
Vii,
D.H
.A,
Kara
chi
52
ASAD
NAS
EER
3310
0–29
0456
9–3
NASE
ER A
HMED
1
4,37
9
2,1
31
–
1
6,51
0
–
–
2,5
71
2,5
71
P–
11/3
, Kan
al Ro
ad, P
ark
Chak
No
204,
Faisa
labad
53
SY
ED A
SHRA
F AL
I
4210
1–82
2871
7–5
SYED
NAF
ASAT
ALI
1
0,38
4
553
–
10,
938
–
553
4
81
1,0
34
Ho
use
No 2
46 Q
asim
abad
Liaq
uata
bad
Ka
rach
i S
r. No
Na
me
& Ad
dres
s of
the
Borro
wer
Na
me
of In
divi
dual
s/Pa
rtner
s/ D
irect
ors
Fa
ther
’s/Hu
sban
d’s
Nam
e O
utst
andi
ng L
iabi
litie
s at
Beg
inni
ng o
f Yea
r Pr
inci
pal
Inte
rest
/ O
ther
Fin
. To
tal
W
ritte
n of
f M
ark
up
Relie
fs
Na
me
NIC
No.
Pr
inci
pal
Intt/
Acc/
Mup
O
ther
s To
tal
W
ritte
n of
f Pr
ovid
ed
(Rs.
in ‘0
00)
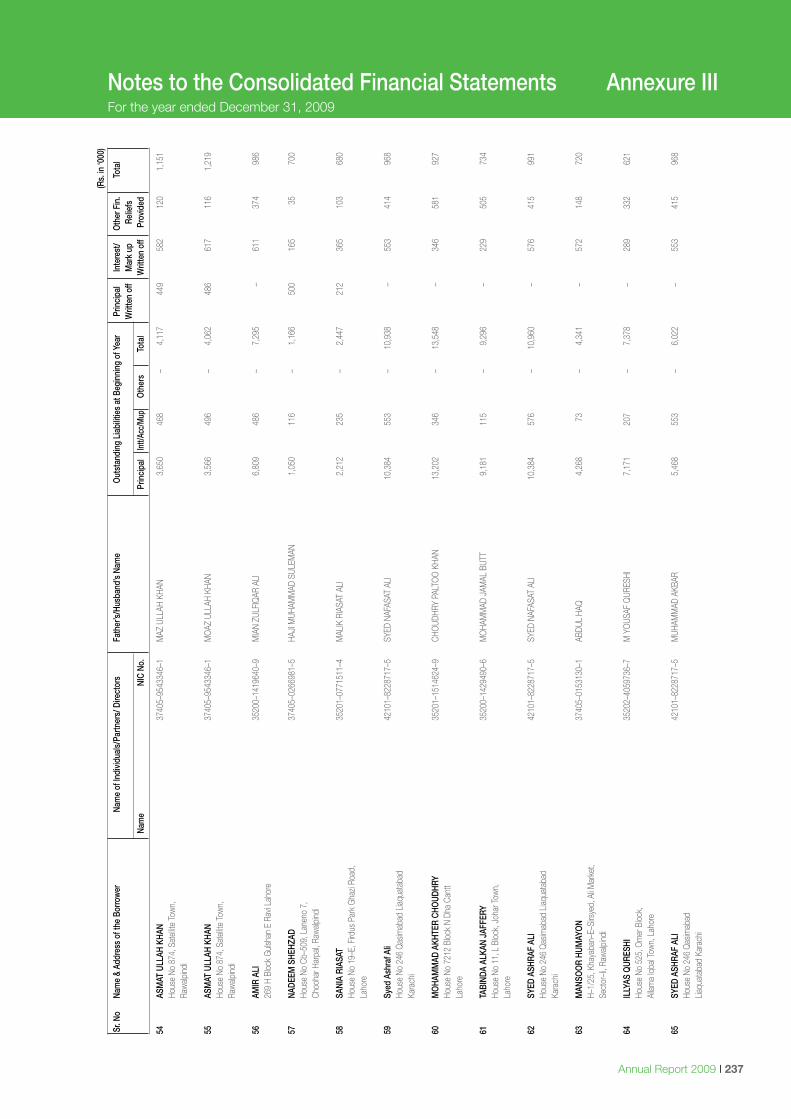
I MCB Bank Limited236 Annual Report 2009 I 237
Notes to the Consolidated Financial Statements Annexure IIIFor the year ended December 31, 2009
54
ASM
AT U
LLAH
KHA
N
3740
5–95
4334
6–1
MAZ
ULL
AH K
HAN
3,6
50
468
–
4,1
17
449
5
82
120
1
,151
Hous
e No
874
, Sat
ellite
Tow
n,
Ra
walp
indi
55
ASM
AT U
LLAH
KHA
N
3740
5–95
4334
6–1
MO
AZ U
LLAH
KHA
N 3
,566
4
96
–
4
,062
4
86
617
1
16
1,2
19
Ho
use
No 8
74, S
atell
ite To
wn,
Raw
alpind
i 56
AM
IR A
LI
35
200–
1419
640–
9 M
IAN
ZULF
IQAR
ALI
6
,809
4
86
–
7
,295
–
611
3
74
986
269
H Bl
ock
Guls
han
E Ra
vi La
hore
57
NA
DEEM
SHE
HZAD
3740
5–02
6698
1–5
HAJI
MUH
AMM
AD S
ULEM
AN
1,0
50
116
–
1,1
66
500
1
65
35
7
00
Ho
use
No C
b–50
9, L
anen
o 7,
Choo
har H
arpa
l, Ra
walp
indi
58
SANI
A RI
ASAT
3520
1–07
7151
1–4
MAL
IK R
IASA
T AL
I 2
,212
2
35
–
2
,447
2
12
365
1
03
680
Hous
e No
19–
E, F
irdus
Par
k G
hazi
Road
,
Laho
re
59
Syed
Ash
raf A
li
42
101–
8228
717–
5 SY
ED N
AFAS
AT A
LI
10,
384
5
53
–
1
0,93
8
–
5
53
414
9
68
Ho
use
No 2
46 Q
asim
abad
Liaq
uata
bad
Ka
rach
i 60
M
OHA
MM
AD A
KHTE
R CH
OUD
HRY
35
201–
1514
624–
9 CH
OUD
HRY
PALT
OO
KHA
N 1
3,20
2
346
–
13,
548
–
346
5
81
927
Hous
e No
721
2 Bl
ock
N Dh
a Ca
ntt
La
hore
61
TA
BIND
A AL
KAN
JAFF
ERY
3520
0–14
2949
0–6
MO
HAM
MAD
JAM
AL B
UTT
9,1
81
115
–
9,2
96
–
2
29
505
7
34
Ho
use
No 1
1, L
Blo
ck, J
ohar
Tow
n,
Laho
re
62
SYED
ASH
RAF
ALI
42
101–
8228
717–
5 SY
ED N
AFAS
AT A
LI
10,
384
5
76
–
1
0,96
0
–
5
76
415
9
91
Ho
use
No 2
46 Q
asim
abad
Liaq
uata
bad
Ka
rach
i 63
M
ANSO
OR
HUM
AYO
N
37
405–
0153
130–
1 AB
DUL
HAQ
4
,268
7
3
–
4
,341
–
572
1
48
720
H–1/
25, K
haya
ban–
E–Si
rsye
d, A
li Mar
ket,
Se
ctor
–Ii, R
awalp
indi
64
ILLY
AS Q
URES
HI
35
202–
4059
736–
7 M
YO
USAF
QUR
ESHI
7
,171
2
07
–
7
,378
–
289
3
32
621
Hous
e No
525
, Om
er B
lock
,
Allam
a Iq
bal T
own,
Lah
ore
65
SYED
ASH
RAF
ALI
42
101–
8228
717–
5 M
UHAM
MAD
AKB
AR
5,4
68
553
–
6,0
22
–
5
53
415
9
68
Ho
use
No 2
46 Q
asim
abad
Liaqu
atab
ad K
arac
hi S
r. No
Na
me
& Ad
dres
s of
the
Borro
wer
Na
me
of In
divi
dual
s/Pa
rtner
s/ D
irect
ors
Fa
ther
’s/Hu
sban
d’s
Nam
e O
utst
andi
ng L
iabi
litie
s at
Beg
inni
ng o
f Yea
r Pr
inci
pal
Inte
rest
/ O
ther
Fin
. To
tal
W
ritte
n of
f M
ark
up
Relie
fs
Na
me
NIC
No.
Pr
inci
pal
Intt/
Acc/
Mup
O
ther
s To
tal
W
ritte
n of
f Pr
ovid
ed
(Rs.
in ‘0
00)
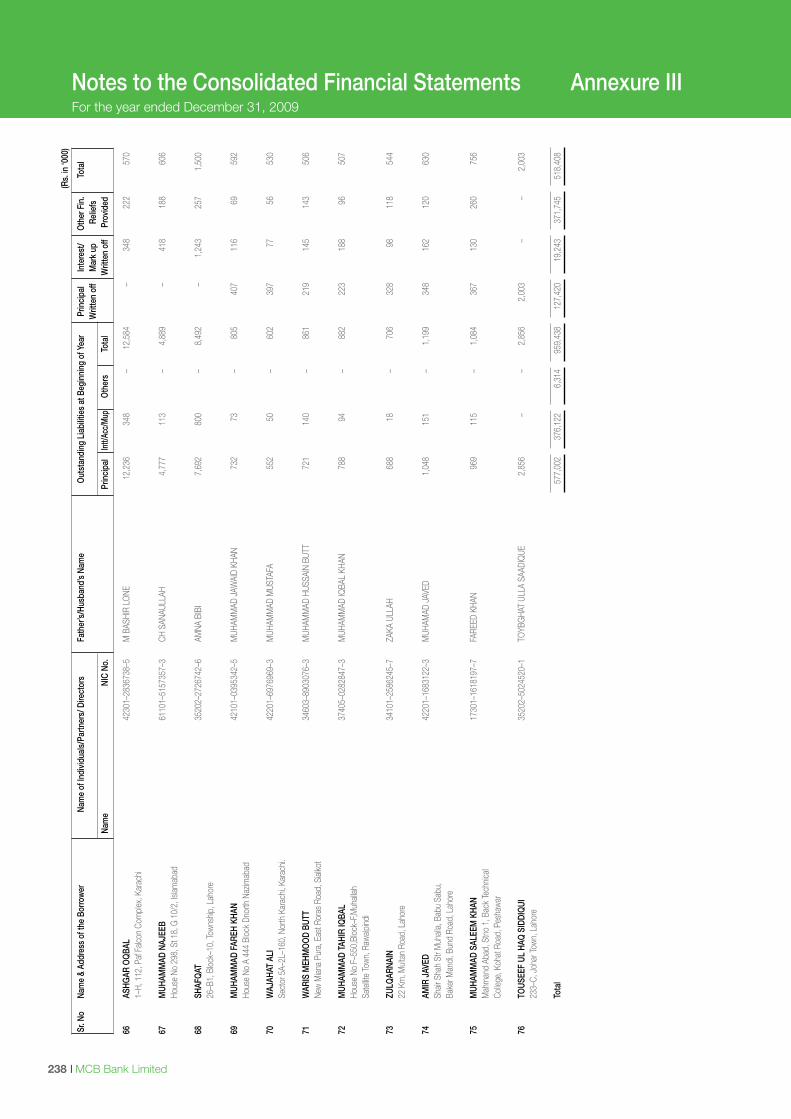
I MCB Bank Limited238 Annual Report 2009 I 239
Notes to the Consolidated Financial Statements Annexure IIIFor the year ended December 31, 2009
66
ASHG
AR O
QBA
L
42
301–
2836
738–
5 M
BAS
HIR
LONE
1
2,23
6
348
–
12,
584
–
348
2
22
570
1–H,
112
, Paf
Falc
on C
ompl
ex, K
arac
hi 67
M
UHAM
MAD
NAJ
EEB
6110
1–51
5735
7–3
CH S
ANAU
LLAH
4
,777
1
13
–
4
,889
–
418
1
88
606
Hous
e No
298
, St 1
8, G
10/
2, Is
lamab
ad
68
SHAF
QAT
3520
2–27
2674
2–6
AMNA
BIB
I 7
,692
8
00
–
8
,492
–
1,2
43
257
1
,500
26–B
1, B
lock
–10,
Tow
nship
, Lah
ore
69
MUH
AMM
AD F
AREH
KHA
N
42
101–
0395
342–
5 M
UHAM
MAD
JAW
AID
KHAN
7
32
73
–
805
4
07
116
6
9
592
Hous
e No
A 4
44 B
lock
Dno
rth N
azim
abad
70
W
AJAH
AT A
LI
42
201–
6976
969–
3 M
UHAM
MAD
MUS
TAFA
5
52
50
–
602
3
97
77
5
6
530
Sect
or 5
A–2L
–160
, Nor
th K
arac
hi, K
arac
hi.
71
WAR
IS M
EHM
OO
D BU
TT
34
603–
8903
076–
3 M
UHAM
MAD
HUS
SAIN
BUT
T 7
21
140
–
861
2
19
145
1
43
506
New
Mian
a Pu
ra, E
ast R
oras
Roa
d, S
ialko
t 72
M
UHAM
MAD
TAH
IR IQ
BAL
3740
5–02
8284
7–3
MUH
AMM
AD IQ
BAL
KHAN
7
88
94
–
882
2
23
188
9
6
507
Hous
e No
F–5
50,B
lock
–F,M
uhall
ah
Sa
tellit
e To
wn,
Raw
alpind
i 73
ZU
LQAR
NAIN
3410
1–25
8624
5–7
ZAKA
ULL
AH
688
1
8
–
7
06
328
9
8
118
5
44
22
Km
, Mult
an R
oad,
Lah
ore
74
AMIR
JAV
ED
42
201–
1683
122–
3 M
UHAM
AD J
AVED
1
,048
1
51
–
1
,199
3
48
162
1
20
630
Shair
Sha
h St
r Muh
alla,
Bab
u Sa
bu,
Ba
ker M
andi
, Bun
d Ro
ad, L
ahor
e 75
M
UHAM
MAD
SAL
EEM
KHA
N
17
301–
1618
197–
7 FA
REED
KHA
N 9
69
115
–
1,0
84
367
1
30
260
7
56
M
ahm
and
Abad
, Stn
o 1,
Bac
k Te
chnic
al
Colle
ge, K
ohat
Roa
d, P
esha
war
76
TO
USEE
F UL
HAQ
SID
DIQ
UI
35
202–
5024
520–
1 TO
YBG
HAT
ULLA
SAA
DIQ
UE
2,8
56
–
–
2,8
56
2,0
03
–
–
2,0
03
23
3–C,
Joh
ar To
wn,
Lah
ore
To
tal
5
77,0
02
376
,122
6
,314
9
59,4
38
127
,420
1
9,24
3
371
,745
5
18,4
08
Sr.
No
Nam
e &
Addr
ess
of th
e Bo
rrow
er
Nam
e of
Indi
vidu
als/
Partn
ers/
Dire
ctor
s
Fath
er’s/
Husb
and’
s Na
me
Out
stan
ding
Lia
bilit
ies
at B
egin
ning
of Y
ear
Prin
cipa
l In
tere
st/
Oth
er F
in.
Tota
l
Writ
ten
off
Mar
k up
Re
liefs
Nam
e NI
C No
.
Prin
cipa
l In
tt/Ac
c/M
up
Oth
ers
Tota
l
Writ
ten
off
Prov
ided
(Rs.
in ‘0
00)
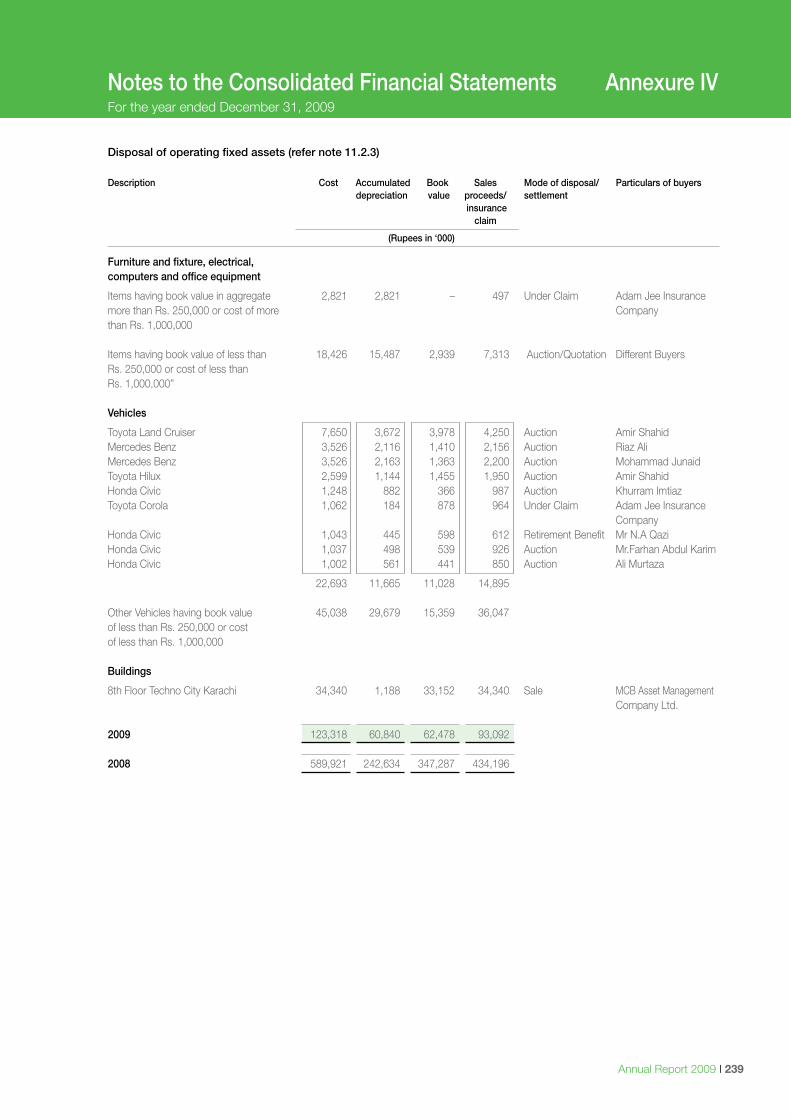
I MCB Bank Limited238 Annual Report 2009 I 239
Notes to the Consolidated Financial Statements Annexure IVFor the year ended December 31, 2009
Disposal of operating fixed assets (refer note 11.2.3)
Description Cost Accumulated Book Sales Mode of disposal/ Particulars of buyers depreciation value proceeds/ settlement insurance claim
(Rupees in ‘000)
Furniture and fixture, electrical, computers and office equipment
Items having book value in aggregate 2,821 2,821 – 497 Under Claim Adam Jee Insurancemore than Rs. 250,000 or cost of more Companythan Rs. 1,000,000
Items having book value of less than 18,426 15,487 2,939 7,313 Auction/Quotation Different BuyersRs. 250,000 or cost of less than Rs. 1,000,000” Vehicles
Toyota Land Cruiser 7,650 3,672 3,978 4,250 Auction Amir ShahidMercedes Benz 3,526 2,116 1,410 2,156 Auction Riaz AliMercedes Benz 3,526 2,163 1,363 2,200 Auction Mohammad JunaidToyota Hilux 2,599 1,144 1,455 1,950 Auction Amir ShahidHonda Civic 1,248 882 366 987 Auction Khurram ImtiazToyota Corola 1,062 184 878 964 Under Claim Adam Jee Insurance CompanyHonda Civic 1,043 445 598 612 Retirement Benefit Mr N.A QaziHonda Civic 1,037 498 539 926 Auction Mr.Farhan Abdul KarimHonda Civic 1,002 561 441 850 Auction Ali Murtaza
22,693 11,665 11,028 14,895 Other Vehicles having book value 45,038 29,679 15,359 36,047 of less than Rs. 250,000 or cost of less than Rs. 1,000,000 Buildings
8th Floor Techno City Karachi 34,340 1,188 33,152 34,340 Sale MCB Asset Management Company Ltd. 2009 123,318 60,840 62,478 93,092
2008 589,921 242,634 347,287 434,196
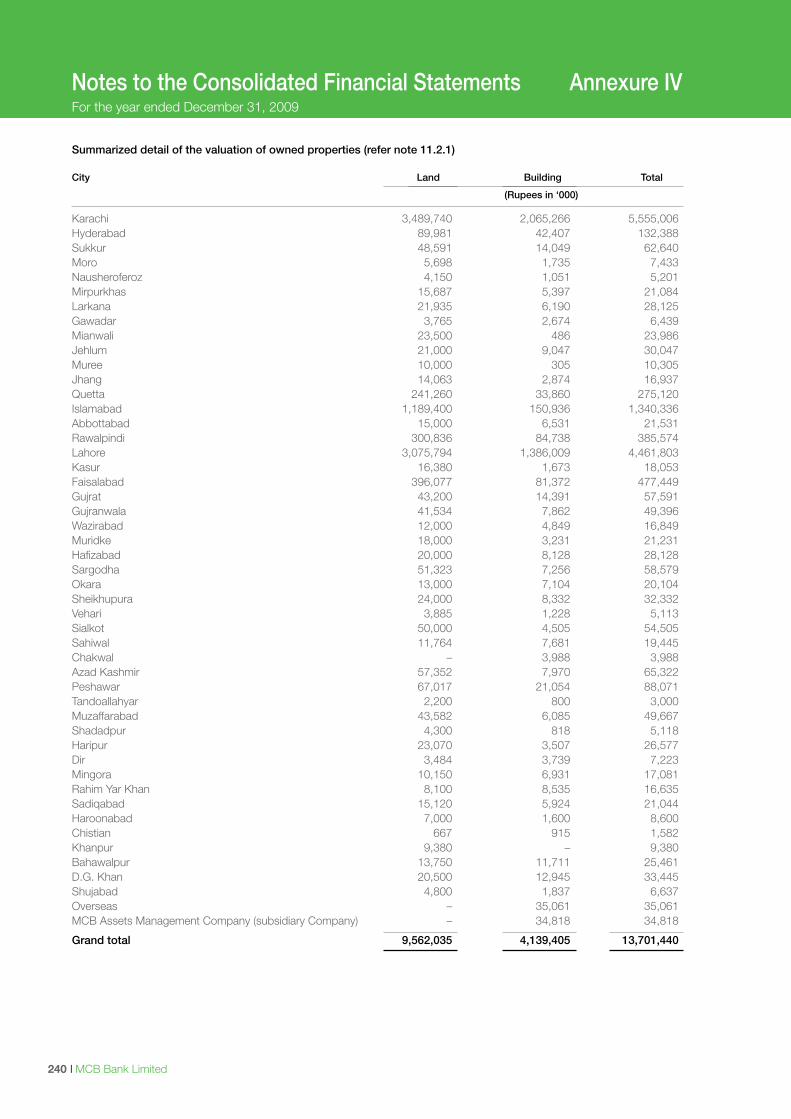
I MCB Bank Limited240
Notes to the Consolidated Financial Statements Annexure IVFor the year ended December 31, 2009
Summarized detail of the valuation of owned properties (refer note 11.2.1) City Land Building Total
(Rupees in ‘000)
Karachi 3,489,740 2,065,266 5,555,006 Hyderabad 89,981 42,407 132,388 Sukkur 48,591 14,049 62,640 Moro 5,698 1,735 7,433 Nausheroferoz 4,150 1,051 5,201 Mirpurkhas 15,687 5,397 21,084 Larkana 21,935 6,190 28,125 Gawadar 3,765 2,674 6,439 Mianwali 23,500 486 23,986 Jehlum 21,000 9,047 30,047 Muree 10,000 305 10,305 Jhang 14,063 2,874 16,937 Quetta 241,260 33,860 275,120 Islamabad 1,189,400 150,936 1,340,336 Abbottabad 15,000 6,531 21,531 Rawalpindi 300,836 84,738 385,574 Lahore 3,075,794 1,386,009 4,461,803 Kasur 16,380 1,673 18,053 Faisalabad 396,077 81,372 477,449 Gujrat 43,200 14,391 57,591 Gujranwala 41,534 7,862 49,396 Wazirabad 12,000 4,849 16,849 Muridke 18,000 3,231 21,231 Hafizabad 20,000 8,128 28,128 Sargodha 51,323 7,256 58,579 Okara 13,000 7,104 20,104 Sheikhupura 24,000 8,332 32,332 Vehari 3,885 1,228 5,113 Sialkot 50,000 4,505 54,505 Sahiwal 11,764 7,681 19,445 Chakwal – 3,988 3,988 Azad Kashmir 57,352 7,970 65,322 Peshawar 67,017 21,054 88,071 Tandoallahyar 2,200 800 3,000 Muzaffarabad 43,582 6,085 49,667 Shadadpur 4,300 818 5,118 Haripur 23,070 3,507 26,577 Dir 3,484 3,739 7,223 Mingora 10,150 6,931 17,081 Rahim Yar Khan 8,100 8,535 16,635 Sadiqabad 15,120 5,924 21,044 Haroonabad 7,000 1,600 8,600 Chistian 667 915 1,582 Khanpur 9,380 – 9,380 Bahawalpur 13,750 11,711 25,461 D.G. Khan 20,500 12,945 33,445 Shujabad 4,800 1,837 6,637 Overseas – 35,061 35,061 MCB Assets Management Company (subsidiary Company) – 34,818 34,818
Grand total 9,562,035 4,139,405 13,701,440
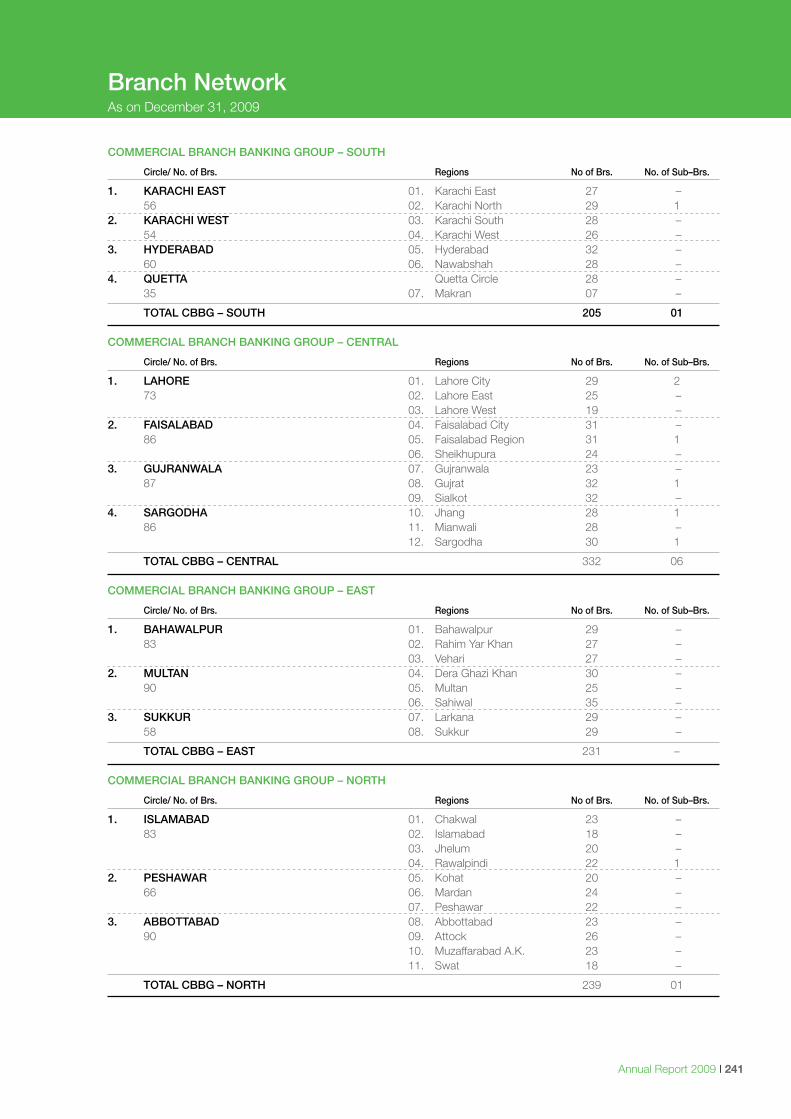
Annual Report 2009 I 241
Branch NetworkAs on December 31, 2009
COMMERCIAL BRANCH BANKING GROUP – SOUTH
Circle/ No. of Brs. Regions No of Brs. No. of Sub–Brs.
1. KARACHI EAST 01. Karachi East 27 – 56 02. Karachi North 29 12. KARACHI WEST 03. Karachi South 28 – 54 04. Karachi West 26 – 3. HYDERABAD 05. Hyderabad 32 – 60 06. Nawabshah 28 – 4. QUETTA Quetta Circle 28 – 35 07. Makran 07 –
TOTAL CBBG – SOUTH 205 01
COMMERCIAL BRANCH BANKING GROUP – CENTRAL
Circle/ No. of Brs. Regions No of Brs. No. of Sub–Brs.
1. LAHORE 01. Lahore City 29 2 73 02. Lahore East 25 – 03. Lahore West 19 – 2. FAISALABAD 04. Faisalabad City 31 – 86 05. Faisalabad Region 31 1 06. Sheikhupura 24 – 3. GUJRANWALA 07. Gujranwala 23 – 87 08. Gujrat 32 1 09. Sialkot 32 – 4. SARGODHA 10. Jhang 28 1 86 11. Mianwali 28 – 12. Sargodha 30 1
TOTAL CBBG – CENTRAL 332 06
COMMERCIAL BRANCH BANKING GROUP – EAST
Circle/ No. of Brs. Regions No of Brs. No. of Sub–Brs.
1. BAHAWALPUR 01. Bahawalpur 29 – 83 02. Rahim Yar Khan 27 – 03. Vehari 27 – 2. MULTAN 04. Dera Ghazi Khan 30 – 90 05. Multan 25 – 06. Sahiwal 35 – 3. SUKKUR 07. Larkana 29 – 58 08. Sukkur 29 –
TOTAL CBBG – EAST 231 –
COMMERCIAL BRANCH BANKING GROUP – NORTH
Circle/ No. of Brs. Regions No of Brs. No. of Sub–Brs.
1. ISLAMABAD 01. Chakwal 23 – 83 02. Islamabad 18 – 03. Jhelum 20 – 04. Rawalpindi 22 12. PESHAWAR 05. Kohat 20 – 66 06. Mardan 24 – 07. Peshawar 22 – 3. ABBOTTABAD 08. Abbottabad 23 – 90 09. Attock 26 – 10. Muzaffarabad A.K. 23 – 11. Swat 18 –
TOTAL CBBG – NORTH 239 01
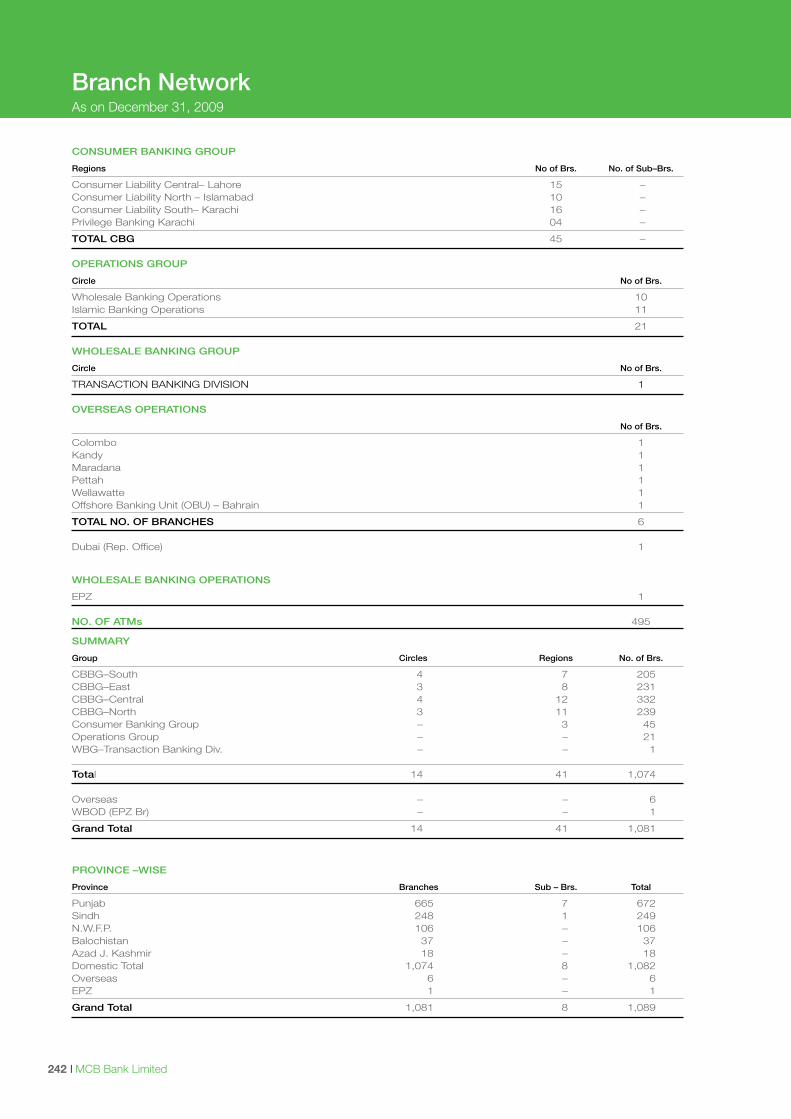
I MCB Bank Limited242
Branch NetworkAs on December 31, 2009
CONSUMER BANKING GROUP
Regions No of Brs. No. of Sub–Brs.
Consumer Liability Central– Lahore 15 – Consumer Liability North – Islamabad 10 – Consumer Liability South– Karachi 16 – Privilege Banking Karachi 04 –
TOTAL CBG 45 –
OPERATIONS GROUP
Circle No of Brs.
Wholesale Banking Operations 10Islamic Banking Operations 11
TOTAL 21
WHOLESALE BANKING GROUP
Circle No of Brs.
TRANSACTION BANKING DIVISION 1
OVERSEAS OPERATIONS
No of Brs.
Colombo 1Kandy 1Maradana 1Pettah 1Wellawatte 1Offshore Banking Unit (OBU) – Bahrain 1
TOTAL NO. OF BRANCHES 6
Dubai (Rep. Office) 1
WHOLESALE BANKING OPERATIONS
EPZ 1
NO. OF ATMs 495
SUMMARY
Group Circles Regions No. of Brs.
CBBG–South 4 7 205 CBBG–East 3 8 231 CBBG–Central 4 12 332 CBBG–North 3 11 239 Consumer Banking Group – 3 45 Operations Group – – 21 WBG–Transaction Banking Div. – – 1
Total 14 41 1,074
Overseas – – 6 WBOD (EPZ Br) – – 1
Grand Total 14 41 1,081
PROVINCE –WISE
Province Branches Sub – Brs. Total
Punjab 665 7 672 Sindh 248 1 249 N.W.F.P. 106 – 106 Balochistan 37 – 37 Azad J. Kashmir 18 – 18 Domestic Total 1,074 8 1,082 Overseas 6 – 6 EPZ 1 – 1
Grand Total 1,081 8 1,089
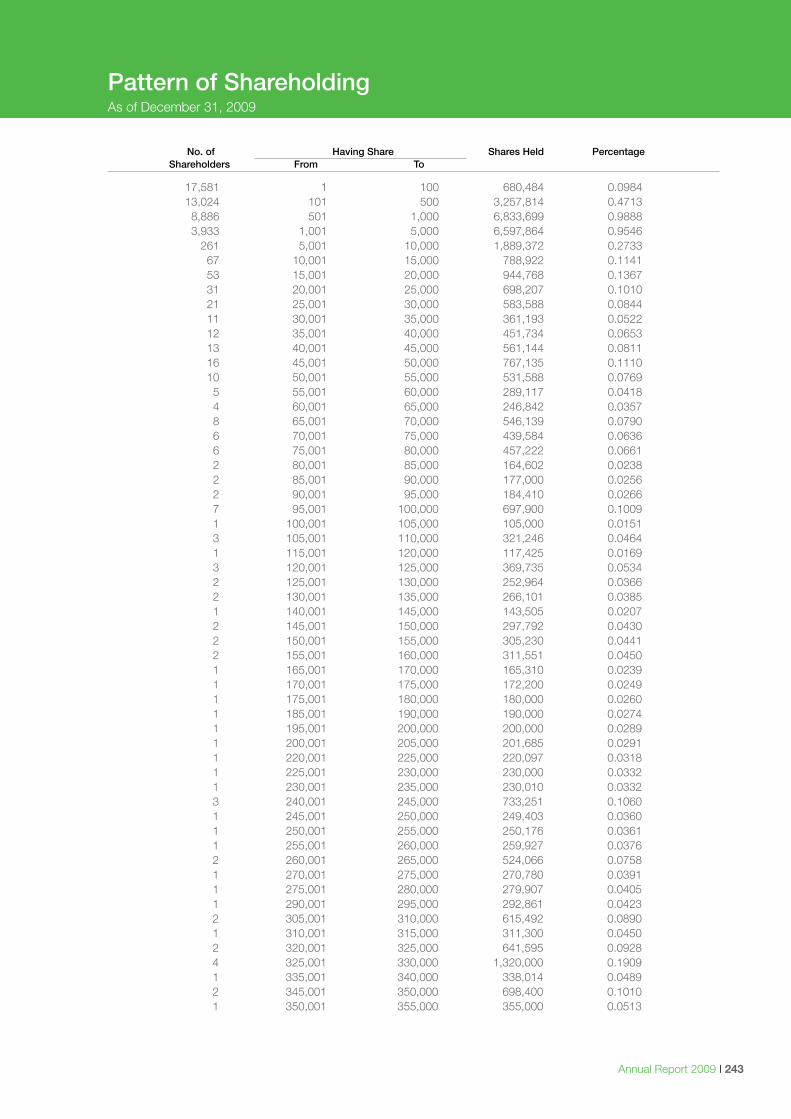
Annual Report 2009 I 243
Pattern of ShareholdingAs of December 31, 2009
17,581 1 100 680,484 0.0984 13,024 101 500 3,257,814 0.4713 8,886 501 1,000 6,833,699 0.9888 3,933 1,001 5,000 6,597,864 0.9546 261 5,001 10,000 1,889,372 0.2733 67 10,001 15,000 788,922 0.1141 53 15,001 20,000 944,768 0.1367 31 20,001 25,000 698,207 0.1010 21 25,001 30,000 583,588 0.0844 11 30,001 35,000 361,193 0.0522 12 35,001 40,000 451,734 0.0653 13 40,001 45,000 561,144 0.0811 16 45,001 50,000 767,135 0.1110 10 50,001 55,000 531,588 0.0769 5 55,001 60,000 289,117 0.0418 4 60,001 65,000 246,842 0.0357 8 65,001 70,000 546,139 0.0790 6 70,001 75,000 439,584 0.0636 6 75,001 80,000 457,222 0.0661 2 80,001 85,000 164,602 0.0238 2 85,001 90,000 177,000 0.0256 2 90,001 95,000 184,410 0.0266 7 95,001 100,000 697,900 0.1009 1 100,001 105,000 105,000 0.0151 3 105,001 110,000 321,246 0.0464 1 115,001 120,000 117,425 0.0169 3 120,001 125,000 369,735 0.0534 2 125,001 130,000 252,964 0.0366 2 130,001 135,000 266,101 0.0385 1 140,001 145,000 143,505 0.0207 2 145,001 150,000 297,792 0.0430 2 150,001 155,000 305,230 0.0441 2 155,001 160,000 311,551 0.0450 1 165,001 170,000 165,310 0.0239 1 170,001 175,000 172,200 0.0249 1 175,001 180,000 180,000 0.0260 1 185,001 190,000 190,000 0.0274 1 195,001 200,000 200,000 0.0289 1 200,001 205,000 201,685 0.0291 1 220,001 225,000 220,097 0.0318 1 225,001 230,000 230,000 0.0332 1 230,001 235,000 230,010 0.0332 3 240,001 245,000 733,251 0.1060 1 245,001 250,000 249,403 0.0360 1 250,001 255,000 250,176 0.0361 1 255,001 260,000 259,927 0.0376 2 260,001 265,000 524,066 0.0758 1 270,001 275,000 270,780 0.0391 1 275,001 280,000 279,907 0.0405 1 290,001 295,000 292,861 0.0423 2 305,001 310,000 615,492 0.0890 1 310,001 315,000 311,300 0.0450 2 320,001 325,000 641,595 0.0928 4 325,001 330,000 1,320,000 0.1909 1 335,001 340,000 338,014 0.0489 2 345,001 350,000 698,400 0.1010 1 350,001 355,000 355,000 0.0513
No. of Having Share Shares Held Percentage Shareholders From To
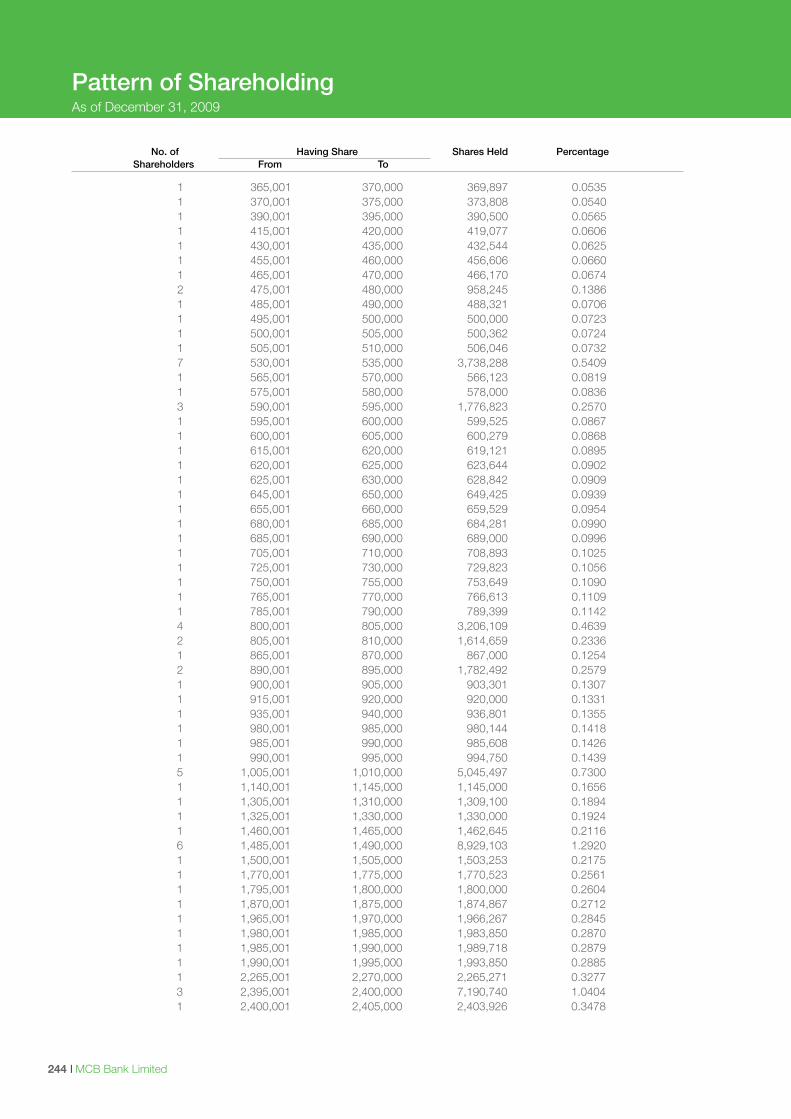
I MCB Bank Limited244
Pattern of ShareholdingAs of December 31, 2009
1 365,001 370,000 369,897 0.0535 1 370,001 375,000 373,808 0.0540 1 390,001 395,000 390,500 0.0565 1 415,001 420,000 419,077 0.0606 1 430,001 435,000 432,544 0.0625 1 455,001 460,000 456,606 0.0660 1 465,001 470,000 466,170 0.0674 2 475,001 480,000 958,245 0.1386 1 485,001 490,000 488,321 0.0706 1 495,001 500,000 500,000 0.0723 1 500,001 505,000 500,362 0.0724 1 505,001 510,000 506,046 0.0732 7 530,001 535,000 3,738,288 0.5409 1 565,001 570,000 566,123 0.0819 1 575,001 580,000 578,000 0.0836 3 590,001 595,000 1,776,823 0.2570 1 595,001 600,000 599,525 0.0867 1 600,001 605,000 600,279 0.0868 1 615,001 620,000 619,121 0.0895 1 620,001 625,000 623,644 0.0902 1 625,001 630,000 628,842 0.0909 1 645,001 650,000 649,425 0.0939 1 655,001 660,000 659,529 0.0954 1 680,001 685,000 684,281 0.0990 1 685,001 690,000 689,000 0.0996 1 705,001 710,000 708,893 0.1025 1 725,001 730,000 729,823 0.1056 1 750,001 755,000 753,649 0.1090 1 765,001 770,000 766,613 0.1109 1 785,001 790,000 789,399 0.1142 4 800,001 805,000 3,206,109 0.4639 2 805,001 810,000 1,614,659 0.2336 1 865,001 870,000 867,000 0.1254 2 890,001 895,000 1,782,492 0.2579 1 900,001 905,000 903,301 0.1307 1 915,001 920,000 920,000 0.1331 1 935,001 940,000 936,801 0.1355 1 980,001 985,000 980,144 0.1418 1 985,001 990,000 985,608 0.1426 1 990,001 995,000 994,750 0.1439 5 1,005,001 1,010,000 5,045,497 0.7300 1 1,140,001 1,145,000 1,145,000 0.1656 1 1,305,001 1,310,000 1,309,100 0.1894 1 1,325,001 1,330,000 1,330,000 0.1924 1 1,460,001 1,465,000 1,462,645 0.2116 6 1,485,001 1,490,000 8,929,103 1.2920 1 1,500,001 1,505,000 1,503,253 0.2175 1 1,770,001 1,775,000 1,770,523 0.2561 1 1,795,001 1,800,000 1,800,000 0.2604 1 1,870,001 1,875,000 1,874,867 0.2712 1 1,965,001 1,970,000 1,966,267 0.2845 1 1,980,001 1,985,000 1,983,850 0.2870 1 1,985,001 1,990,000 1,989,718 0.2879 1 1,990,001 1,995,000 1,993,850 0.2885 1 2,265,001 2,270,000 2,265,271 0.3277 3 2,395,001 2,400,000 7,190,740 1.0404 1 2,400,001 2,405,000 2,403,926 0.3478
No. of Having Share Shares Held Percentage Shareholders From To
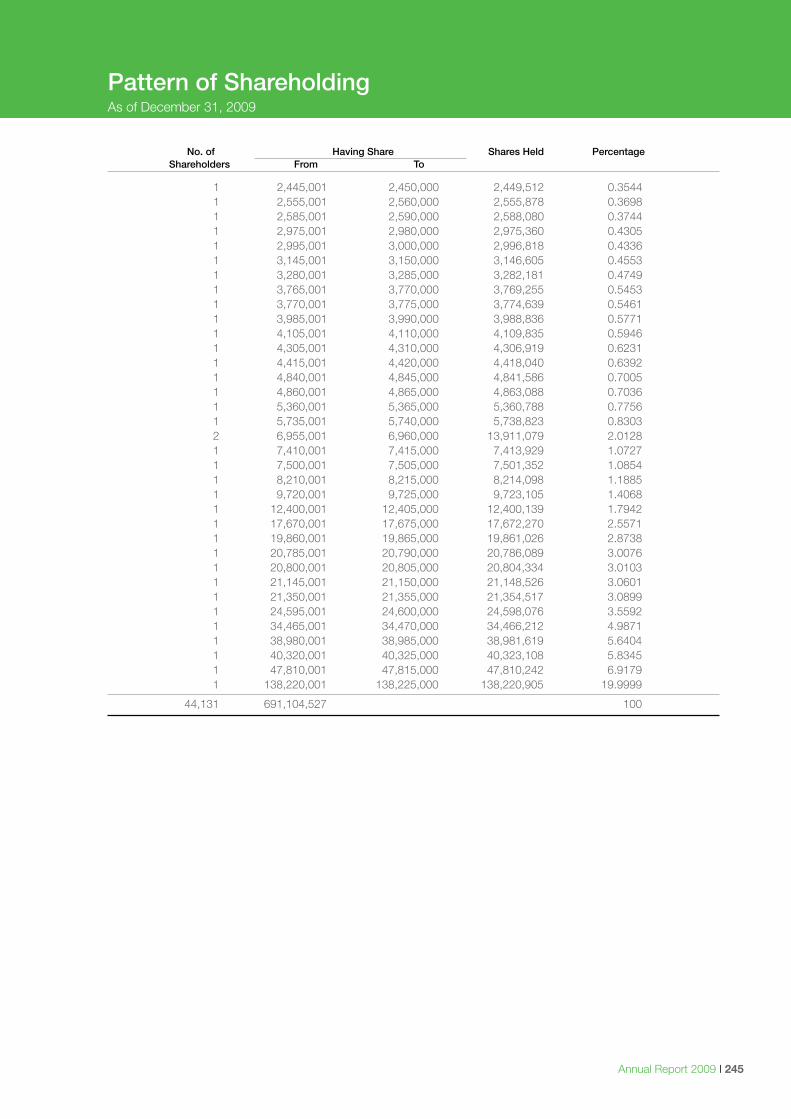
Annual Report 2009 I 245
Pattern of ShareholdingAs of December 31, 2009
1 2,445,001 2,450,000 2,449,512 0.3544 1 2,555,001 2,560,000 2,555,878 0.3698 1 2,585,001 2,590,000 2,588,080 0.3744 1 2,975,001 2,980,000 2,975,360 0.4305 1 2,995,001 3,000,000 2,996,818 0.4336 1 3,145,001 3,150,000 3,146,605 0.4553 1 3,280,001 3,285,000 3,282,181 0.4749 1 3,765,001 3,770,000 3,769,255 0.5453 1 3,770,001 3,775,000 3,774,639 0.5461 1 3,985,001 3,990,000 3,988,836 0.5771 1 4,105,001 4,110,000 4,109,835 0.5946 1 4,305,001 4,310,000 4,306,919 0.6231 1 4,415,001 4,420,000 4,418,040 0.6392 1 4,840,001 4,845,000 4,841,586 0.7005 1 4,860,001 4,865,000 4,863,088 0.7036 1 5,360,001 5,365,000 5,360,788 0.7756 1 5,735,001 5,740,000 5,738,823 0.8303 2 6,955,001 6,960,000 13,911,079 2.0128 1 7,410,001 7,415,000 7,413,929 1.0727 1 7,500,001 7,505,000 7,501,352 1.0854 1 8,210,001 8,215,000 8,214,098 1.1885 1 9,720,001 9,725,000 9,723,105 1.4068 1 12,400,001 12,405,000 12,400,139 1.7942 1 17,670,001 17,675,000 17,672,270 2.5571 1 19,860,001 19,865,000 19,861,026 2.8738 1 20,785,001 20,790,000 20,786,089 3.0076 1 20,800,001 20,805,000 20,804,334 3.0103 1 21,145,001 21,150,000 21,148,526 3.0601 1 21,350,001 21,355,000 21,354,517 3.0899 1 24,595,001 24,600,000 24,598,076 3.5592 1 34,465,001 34,470,000 34,466,212 4.9871 1 38,980,001 38,985,000 38,981,619 5.6404 1 40,320,001 40,325,000 40,323,108 5.8345 1 47,810,001 47,815,000 47,810,242 6.9179 1 138,220,001 138,225,000 138,220,905 19.9999
44,131 691,104,527 100
No. of Having Share Shares Held Percentage Shareholders From To
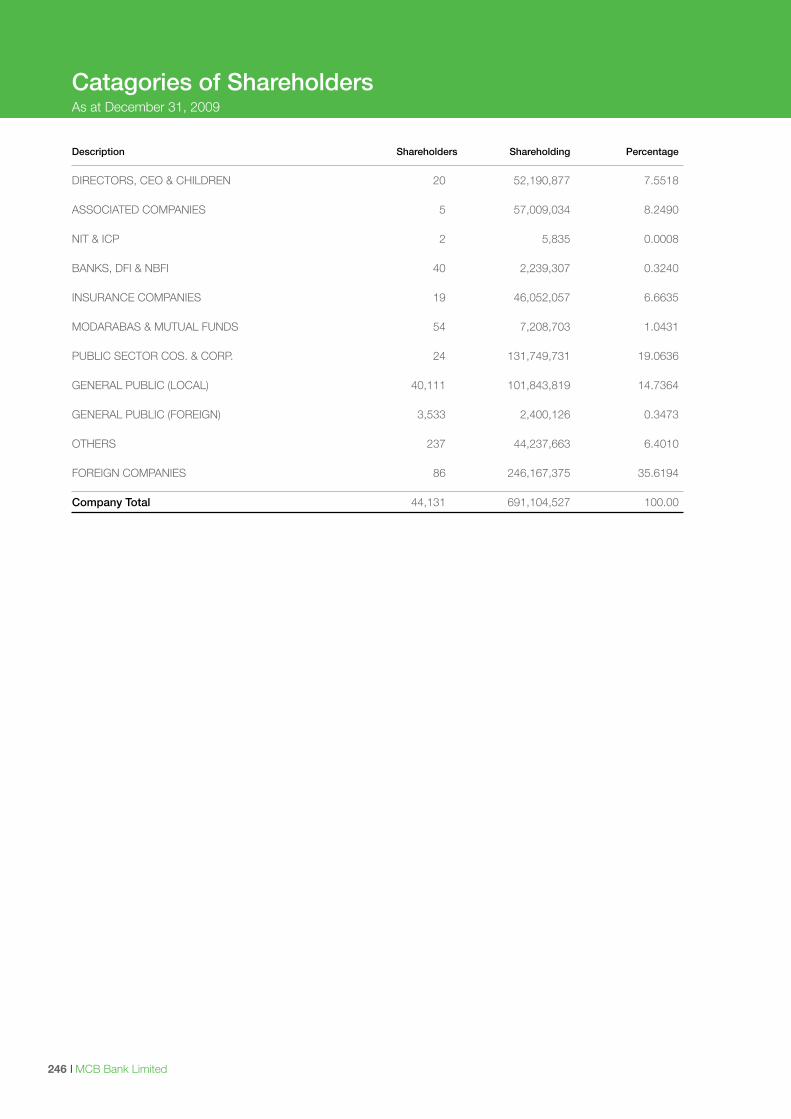
I MCB Bank Limited246
Catagories of ShareholdersAs at December 31, 2009
Description Shareholders Shareholding Percentage
DIRECTORS, CEO & CHILDREN 20 52,190,877 7.5518
ASSOCIATED COMPANIES 5 57,009,034 8.2490
NIT & ICP 2 5,835 0.0008
BANKS, DFI & NBFI 40 2,239,307 0.3240
INSURANCE COMPANIES 19 46,052,057 6.6635
MODARABAS & MUTUAL FUNDS 54 7,208,703 1.0431
PUBLIC SECTOR COS. & CORP. 24 131,749,731 19.0636
GENERAL PUBLIC (LOCAL) 40,111 101,843,819 14.7364
GENERAL PUBLIC (FOREIGN) 3,533 2,400,126 0.3473
OTHERS 237 44,237,663 6.4010
FOREIGN COMPANIES 86 246,167,375 35.6194
Company Total 44,131 691,104,527 100.00
Annual Report 2009 I 247
Notice of Annual General Meeting
Notice is hereby given that 62nd Annual General Meeting of the members of MCB BANK LIMITED will be held at Islamabad Hotel (Holiday Inn), G-6, Civic Centre, Islamabad on Friday, March 26, 2010 at 3:00 p.m. to transact the following business:
Ordinary Business
1. To confirm the minutes of last Annual General Meeting held on March 27, 2009.
2. To receive, consider and adopt the audited accounts of MCB Bank Ltd. & consolidated accounts of MCB Bank Ltd. and its subsidiaries for the year ended 31st December 2009 together with the Directors’ and Auditors’ reports thereon including post facto approval of (a) donations of Rs.25 million to aid IDPs of Swat; (b) Rs 1.524 million remuneration to the Chairman; reported at notes 28 & 38 of annual report respectively, as required under SBP Prudential Regulations.
3. To approve as recommended by directors dividend @10 % in the form of bonus shares and final cash dividend @ 35 % i.e. Rs 3.5 per share, in addition to 75% (25% each 1st, 2nd & 3rd quarters) interim cash dividends already paid.
4. To approve that in the event of any member holding shares which were not an exact multiple of his/her entitlement, the Company Secretary be authorized to sell such entitlements in the Stock Market and to pay the proceeds of sale when realized to any recognized charitable institution.
5. To appoint auditors for 2010 and fix their remuneration. The retiring auditors namely M/s. KPMG Taseer Hadi
& Co., Chartered Accountants being eligible have offered themselves for re-appointment.
Special Business
6. To consider and, if deemed fit, pass the following special resolutions:
a) “RESOLVED that the existing fees and facilities provided to the members of the Board for attending the Board and Board Committee meetings shall remain unchanged until those are reviewed and revised subsequently. However, the Board Chairman shall be paid a fixed annual remuneration of Rs 25 million with effect from January 2010 as per the amendment by the State Bank of Pakistan in its Prudential Regulations G-1 vide BPRD Circular 14 dated August 07, 2009.”
“ALSO RESOLVED that the chartered plane round trips (domestic and/or International) by the Chairman for Bank business will be limited to four in a calendar year starting January 2010 and any additional such trips may be paid by the Chairman out of his annual compensation. However, travel expenses on chartered planes already undertaken during 2006-2009, and paid by the Bank, are approved herewith as “Remuneration paid to the Chairman.”
“FURTHER RESOLVED that the details of the four chartered plane round trips (domestic and/or International) by the Chairman, allowed by the Board on annual basis and approved by AGM, be placed before the Board for its information and record.”
b) “RESOLVED that the Directors residing abroad may be allowed reimbursement of traveling expenses for the spouses while accompanying for attending the board meetings subject to a maximum limit of twice in a financial year, in addition to the cost of boarding & lodging payments/reimbursements to the board members in connection with attending the meetings with effect from January 2007.”
Statement required under section 160(1)(b) of Companies Ordinance, 1984 is attached with this notice.
7. Any other business with the permission of the Chair.
By order of the Board
ABDUS S. SAMIIslamabad: February 25, 2010. Secretary Notes:
1. The share transfer books of the Bank will remain closed from March 19, 2010 to March 26, 2010 (both days inclusive) for entitlement of cash dividend/bonus shares to those members whose name appear on the register of members as at the close of business on March 18, 2010.
2. Any member entitled to attend and vote at the Annual General Meeting is entitled to appoint another member as a proxy to attend and vote on his/her behalf. A corporation being a member may appoint as its proxy any of its official or any other person whether a member of the bank or not.
I MCB Bank Limited248
3. Members whose shares are deposited with Central Depository Company of Pakistan Limited are requested to bring their original Computerized National Identity Cards (C.N.I.C.) along with the participant’s I.D. Number and their account numbers in Central Depository Company of Pakistan Limited to facilitate identification at the time of Annual General Meeting. In case of proxy, an attested copy of proxy’s Identity Card (C.N.I.C.), Account & Participant’s ID number be enclosed. In case of corporate entity, the Board of Directors’ resolution/power of attorney with specimen signature of the nominee shall be produced at the time of the meeting (unless it has been provided earlier).
Proxies, in order to be valid, must be deposited at the office of Share Registrar, THK Associates (Pvt.) Ltd., Ground Floor, State Life Building No.3, Dr.Ziauddin Ahmed Road, Karachi not less than 48 hours before the time of meeting.
4. Members are requested to promptly notify Bank’s Registrar M/s. THK Associates (Pvt.) Limited of any change in their addresses to ensure delivery of mail.
Statement under Section 160(1)(b) of Companies Ordinance,1984:
For Item 6 (a)
The remuneration to the Chairman needs to be revised in line with the amendments made by the State Bank of Pakistan in its Prudential Regulations G-1 through BPRD Circular No 14 of August 07, 2009, and prevalent national and international practices of compensating the members of the Board.
For Item 6 (b)
The Non-resident Board members required to stay in Pakistan longer period of time to attend Board of Directors’ and Board Committees Meetings and, at times, spouses accompany them. Since Non-resident Board members are arriving from abroad, on bank’s official business and required to stay longer period of time, it is obligatory on the bank to reimburse the cost of spouse ticket as well with a maximum limit of twice in a financial year in terms of State Bank of Pakistan BPRD Circular No 14 of August 07, 2009.
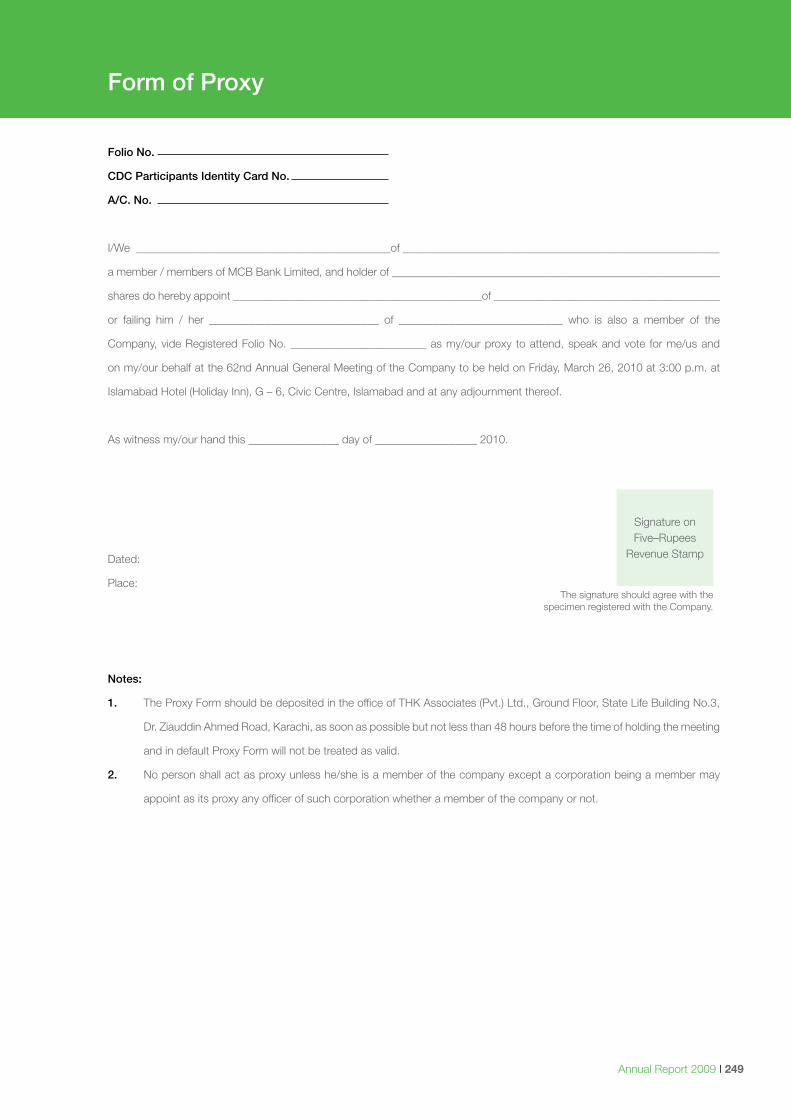
Annual Report 2009 I 249
Folio No.
CDC Participants Identity Card No.
A/C. No.
I/We _____________________________________________of ________________________________________________________
a member / members of MCB Bank Limited, and holder of __________________________________________________________
shares do hereby appoint ____________________________________________of ________________________________________
or failing him / her ______________________________ of _____________________________ who is also a member of the
Company, vide Registered Folio No. ________________________ as my/our proxy to attend, speak and vote for me/us and
on my/our behalf at the 62nd Annual General Meeting of the Company to be held on Friday, March 26, 2010 at 3:00 p.m. at
Islamabad Hotel (Holiday Inn), G – 6, Civic Centre, Islamabad and at any adjournment thereof.
As witness my/our hand this ________________ day of __________________ 2010.
Dated:
Place:
Notes:
1. The Proxy Form should be deposited in the office of THK Associates (Pvt.) Ltd., Ground Floor, State Life Building No.3,
Dr. Ziauddin Ahmed Road, Karachi, as soon as possible but not less than 48 hours before the time of holding the meeting
and in default Proxy Form will not be treated as valid.
2. No person shall act as proxy unless he/she is a member of the company except a corporation being a member may
appoint as its proxy any officer of such corporation whether a member of the company or not.
Form of Proxy
Signature onFive–Rupees
Revenue Stamp
The signature should agree with thespecimen registered with the Company.

Principal OfficeMCB 15-Main Gulberg, LahoreUAN: (042) 111-000-111PABX: (042) 36041998-9
www.mcb.com.pk
Printed by: www. pakistan.com