Embed Size (px)
Citation preview
Hügli Holding AG, Steinach
Annual Report 2008
Contents
Annual General Meeting of ShareholdersWe d n e s d a y , 1 3 M a y 2 0 0 9
4 . 3 0 p m
S e e p a r k s a a l , 9 3 2 0 A r b o n , S w i t z e r l a n d
T h e H ü g l i G r o u p 2-3
B o a r d o f D i r e c t o r s , G r o u p M a n a g e m e n t & A u d i t o r o f H ü g l i H o l d i n g A G 4
K e y f i g u r e s i n b r i e f 5
R e p o r t o f t h e B o a r d o f D i r e c t o r s 6-8
D e v e l o p m e n t a n d S e g m e n t s o f S a l e s 2 0 0 4 – 2 0 0 8 9
S e g m e n t R e p o r t s 10-12
D i v i s i o n R e p o r t s 13-16
C o r p o r a t e G o v e r n a n c e 17-25
B a l a n c e S h e e t o f H ü g l i H o l d i n g A G 26
I n c o m e S t a t e m e n t o f H ü g l i H o l d i n g A G 27
P r o p o s e d A p p r o p r i a t i o n o f t h e Av a i l a b l e E a r n i n g s 28
N o t e s t o t h e F i n a n c i a l S t a t e m e n t s o f t h e H ü g l i H o l d i n g A G 29-30
R e p o r t o f t h e S t a t u t o r y A u d i t o r o n t h e F i n a n c i a l S t a t e m e n t s 31
C o n s o l i d a t e d B a l a n c e S h e e t 32
S t a t e m e n t o f C h a n g e s i n E q u i t y 33
C o n s o l i d a t e d I n c o m e S t a t e m e n t 34
C o n s o l i d a t e d C a s h F l o w S t a t e m e n t 35
S e g m e n t I n f o r m a t i o n 36
N o t e s t o t h e C o n s o l i d a t e d F i n a n c i a l S t a t e m e n t s 37-58
R e p o r t o f t h e S t a t u t o r y A u d i t o r o n t h e C o n s o l i d a t e d F i n a n c i a l S t a t e m e n t s 59
C o m m e n t t o t h e C o n s o l i d a t e d F i n a n c i a l S t a t e m e n t s 60-61
K e y F i g u r e s 5 - Ye a r S u m m a r y 62
G r o u p C o m p a n i e s 63
Translation: The original of this Annual Report is written in German. In the case of inconsistencies between theGerman original and this English translation, the German version shall prevail.
2
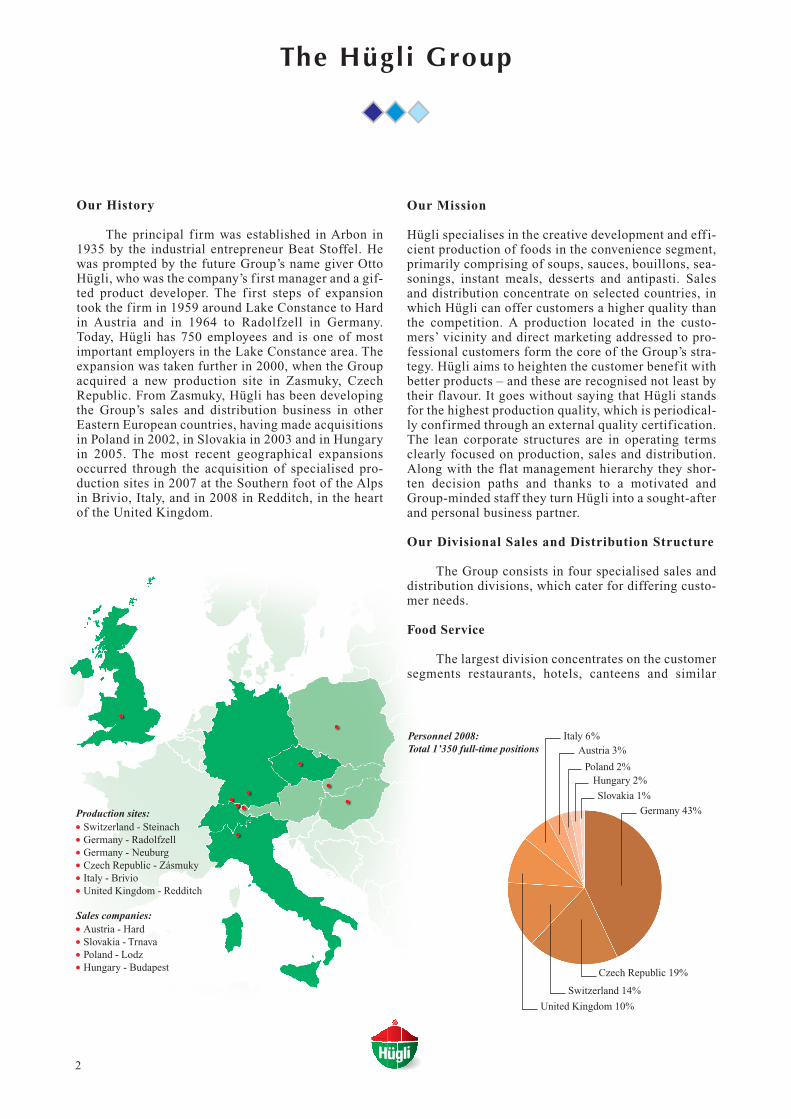
Production sites:� Switzerland - Steinach� Germany - Radolfzell� Germany - Neuburg � Czech Republic - Zásmuky� Italy - Brivio� United Kingdom - Redditch
Sales companies:� Austria - Hard� Slovakia - Trnava� Poland - Lodz� Hungary - Budapest
Our Mission
Hügli specialises in the creative development and eff i-cient production of foods in the convenience segment,primarily comprising of soups, sauces, bouillons, sea-sonings, instant meals, desserts and antipasti. Salesand distribution concentrate on selected countries, inwhich Hügli can offer customers a higher quality thanthe competition. A production located in the custo-mers’ vicinity and direct marketing addressed to pro-fessional customers form the core of the Group’s stra-tegy. Hügli aims to heighten the customer benefit withbetter products – and these are recognised not least bytheir flavour. It goes without saying that Hügli standsfor the highest production quality, which is periodical-ly confirmed through an external quality certif ication.The lean corporate structures are in operating termsclearly focused on production, sales and distribution.Along with the flat management hierarchy they shor-ten decision paths and thanks to a motivated andGroup-minded staff they turn Hügli into a sought-afterand personal business partner.
Our Divisional Sales and Distribution Structure
The Group consists in four specialised sales anddistribution divisions, which cater for differing custo-mer needs.
Food Service
The largest division concentrates on the customersegments restaurants, hotels, canteens and similar
Our History
The principal f irm was established in Arbon in1935 by the industrial entrepreneur Beat Stoffel. Hewas prompted by the future Group’s name giver OttoHügli, who was the company’s f irst manager and a gif-ted product developer. The f irst steps of expansiontook the f irm in 1959 around Lake Constance to Hardin Austria and in 1964 to Radolfzell in Germany.Today, Hügli has 750 employees and is one of mostimportant employers in the Lake Constance area. Theexpansion was taken further in 2000, when the Groupacquired a new production site in Zasmuky, CzechRepublic. From Zasmuky, Hügli has been developingthe Group’s sales and distribution business in otherEastern European countries, having made acquisitionsin Poland in 2002, in Slovakia in 2003 and in Hungaryin 2005. The most recent geographical expansionsoccurred through the acquisition of specialised pro-duction sites in 2007 at the Southern foot of the Alpsin Brivio, Italy, and in 2008 in Redditch, in the heartof the United Kingdom.
The Hügli Group
Personnel 2008:Total 1’350 full-time positions
Czech Republic 19%
Switzerland 14%
United Kingdom 10%
Germany 43%
Slovakia 1%
Hungary 2%Poland 2%
Austria 3%Italy 6%
3
institutions. Sales and distribution are effectedthrough Hügli’s sales off ices. In this segment, Hügli isthe third biggest supplies, after Maggi (Nestlé) andKnorr (Unilever). A comprehensive sales organisationwith over 250 vendors in 8 countries reaches morethan 35’000 customers directly. Outstanding own pro-ducts are combined with selected trade specialities,with which Hügli can supply customers with a well-balanced product line for a high standard cuisine.
Private Label LEH
The Hügli Group is one of the biggest PrivateLabel producers of dry blended meals in Europe. Hüg-li manufactures own brands of several leading busin-esses in the retail food industry. The market share ofthese products has in the past years been consistentlyincreasing, thanks to a very good price-performance-ratio.
Industrial Foods
Hügli has been manufacturing semi-finished pro-ducts for the food industry for more than 30 years.Innovation and full concentration on customer needsare the requisites of this success, which is reflected inthe prospering of Hügli’s technically demanding pro-ducts in this customer segment. The focus is on salesand distribution of flavouring and functional ingre-dients that are developed in close cooperation with thecustomers.
Health and Natural Food
Hügli is one of the largest manufacturers ofsoups, bouillons and sauces for the European organicproducts market. This division supplies the specialisedtrade – predominantly the health food stores, naturalfood and drug stores – exclusively with biologicallycontrolled products, from Hügli’s own production, aswell as with further organic specialities. The Group’spresence in the market is based on own brands such asHeirler, Cenovis, Natur Compagnie and Erntesegen.The trend towards healthy nutrition has in the recentyears led to an over-proportional increase of organicproducts.
Our Objectives
Hügli’s strategy is long-term orientated and aimsat sustained growth. The Group wants to grow over-proportionally and achieve an organic sales increase ofmore than 5% on a long-term basis. Potential acquisi-tions are periodically taken into consideration as theyround off the product assortment as well as the pro-duction technology and serve the market developmentin a new country. The sales and distribution of own pro-ducts are a main objective; the product line, however,is supplemented with selected trade goods according tocustomer needs.
Growth is supported by all sales and distributiondivisions. The Hügli Group is committed to its econo-mic and social responsibility towards its stakeholders– employees, business partners, shareholders and inve-stors – and strives to achieve an adequate return on theinvested capital through sustained growth, continuousimprovement of processes and consistent cost mana-gement. This is the best foundation for a continuallyand solidly growing Group that is locally rooted and inits business active all across Europe.
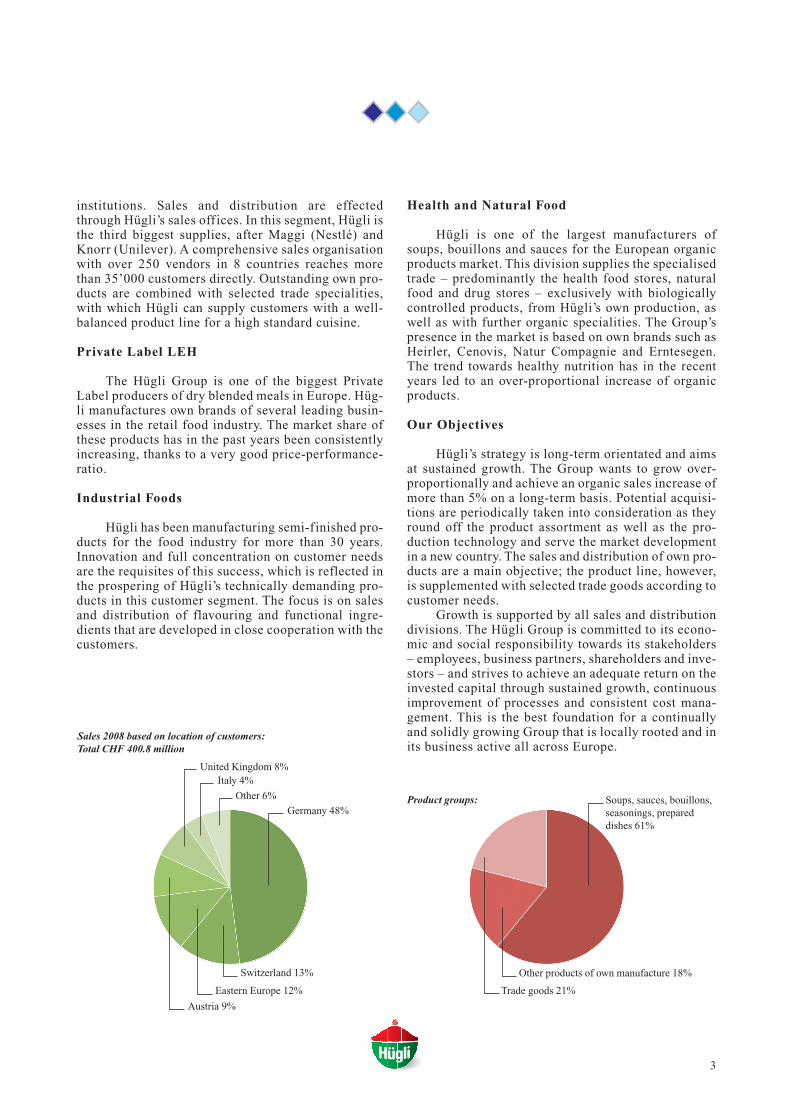
Sales 2008 based on location of customers:Total CHF 400.8 million
Product groups:
Switzerland 13%
Eastern Europe 12%
Austria 9%
Germany 48%
Other 6%
Italy 4%United Kingdom 8%
Other products of own manufacture 18%
Trade goods 21%
Soups, sauces, bouillons,seasonings, prepared dishes 61%
4
Hügli Holding AG
B O A R D O F D I R E C T O R S
D r . A l e x a n d e r S t o f f e l , Chairman Arbon
R e t o C o n s o n i , Representative of bearer shareholders Horn
F r i t z H ö c h n e r Romanshorn
D r . C h r i s t o p h L e c h n e r Hettlingen
D r . E r n s t L i e n h a r d Glarus
D r . J e a n G é r a r d V i l l o t , Vice President and Delegate Rorschacherberg
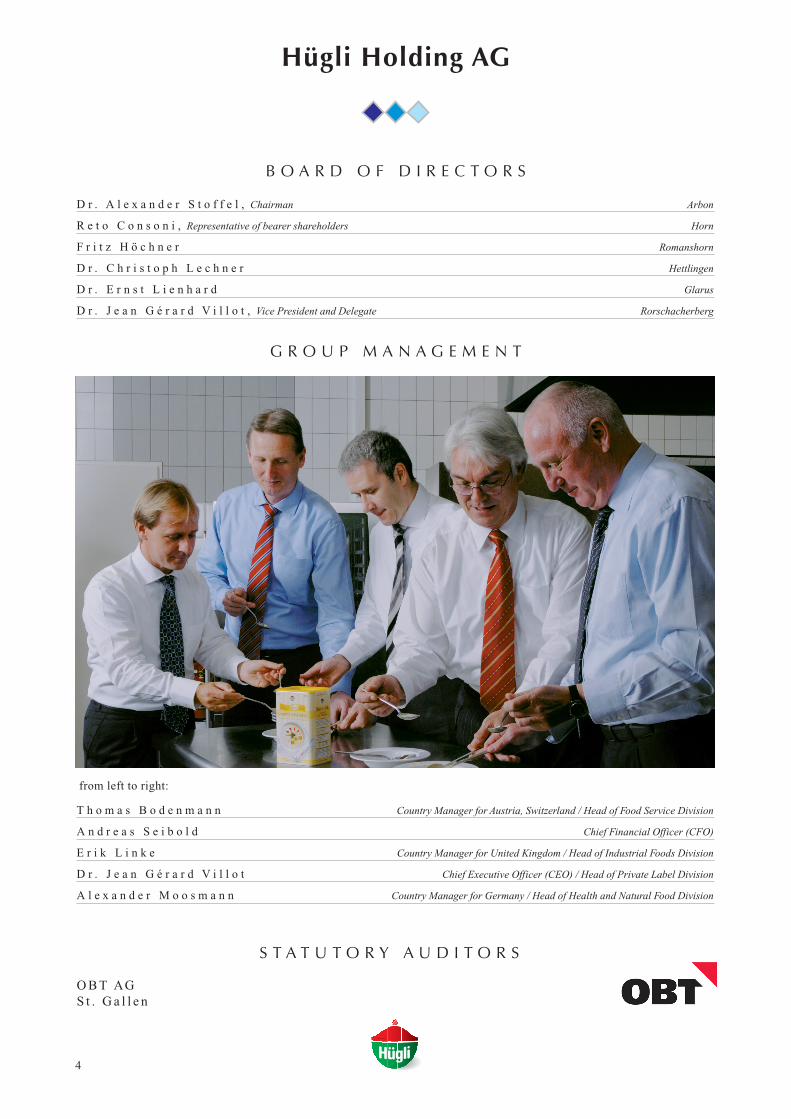
T h o m a s B o d e n m a n n Country Manager for Austria, Switzerland / Head of Food Service Division
A n d r e a s S e i b o l d Chief Financial Officer (CFO)
E r i k L i n k e Country Manager for United Kingdom / Head of Industrial Foods Division
D r . J e a n G é r a r d V i l l o t Chief Executive Officer (CEO) / Head of Private Label Division
A l e x a n d e r M o o s m a n n Country Manager for Germany / Head of Health and Natural Food Division
from left to right:
Dr. Alexander StoffelGesamtleitung
G R O U P M A N A G E M E N T
S T A T U T O R Y A U D I T O R S
O B T AGS t . G a l l e n
5
Key f igures in brief
Variance inKey figures of geographical segments 2008 CHF local currency 2007
m i l l i o n C H F
Variance inKey figures of the group 2008 CHF local currency 2007
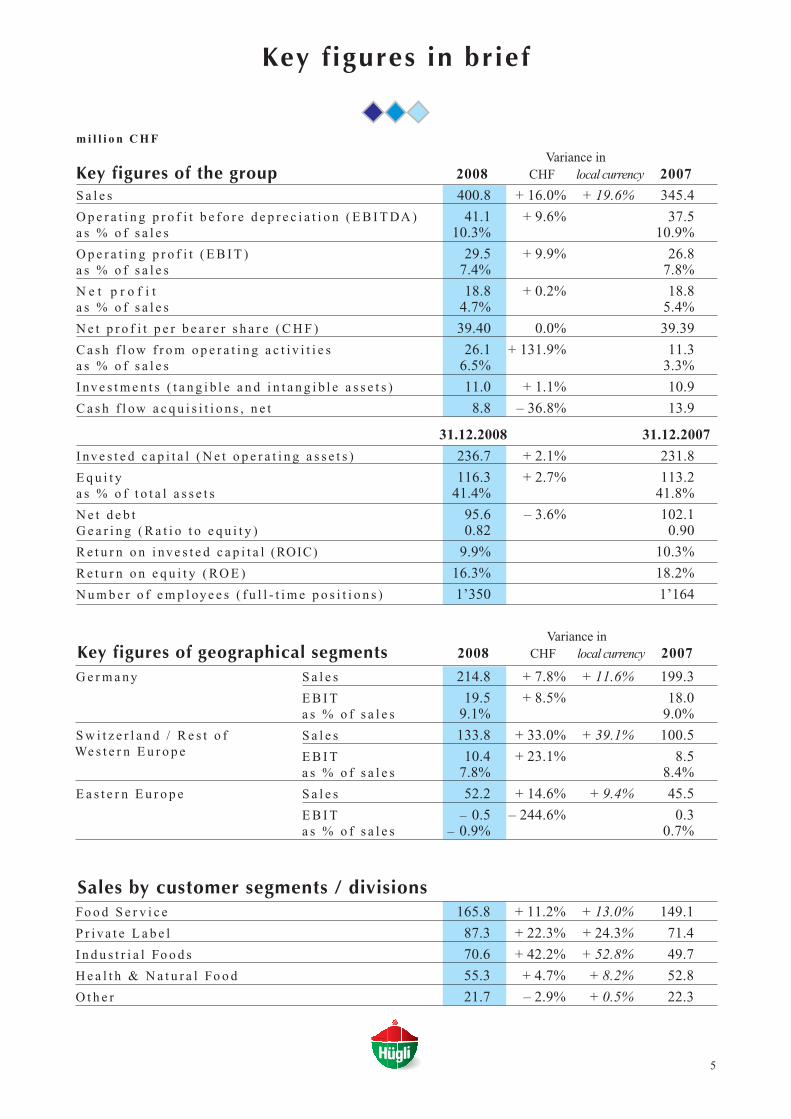
S a l e s 400.8 + 16.0% + 19.6% 345.4
O p e r a t i n g p r o f i t b e f o r e d e p r e c i a t i o n ( E B I T DA ) 41.1 + 9.6% 37.5a s % o f s a l e s 10.3% 10.9%
O p e r a t i n g p r o f i t ( E B I T ) 29.5 + 9.9% 26.8a s % o f s a l e s 7.4% 7.8%
N e t p r o f i t 18.8 + 0.2% 18.8a s % o f s a l e s 4.7% 5.4%
N e t p r o f i t p e r b e a r e r s h a r e ( C H F ) 39.40 0.0% 39.39
C a s h f l ow f r o m o p e r a t i n g a c t i v i t i e s 26.1 + 131.9% 11.3a s % o f s a l e s 6.5% 3.3%
I nv e s t m e n t s ( t a n g i b l e a n d i n t a n g i b l e a s s e t s ) 11.0 + 1.1% 10.9
C a s h f l ow a c q u i s i t i o n s , n e t 8.8 – 36.8% 13.9
31.12.2008 31.12.2007
I nv e s t e d c a p i t a l ( N e t o p e r a t i n g a s s e t s ) 236.7 + 2.1% 231.8
E q u i t y 116.3 + 2.7% 113.2a s % o f t o t a l a s s e t s 41.4% 41.8%
N e t d e b t 95.6 – 3.6% 102.1G e a r i n g ( R a t i o t o e q u i t y ) 0.82 0.90
R e t u r n o n i nv e s t e d c a p i t a l (ROIC) 9.9% 10.3%
R e t u r n o n e q u i t y ( RO E ) 16.3% 18.2%
N u m b e r o f e m p l oy e e s ( f u l l - t i m e p o s i t i o n s ) 1’350 1’164
Fo o d S e r v i c e 165.8 + 11.2% + 13.0% 149.1
P r i v a t e L a b e l 87.3 + 22.3% + 24.3% 71.4
I n d u s t r i a l Fo o d s 70.6 + 42.2% + 52.8% 49.7
H e a l t h & N a t u r a l Fo o d 55.3 + 4.7% + 8.2% 52.8
O t h e r 21.7 – 2.9% + 0.5% 22.3
G e r m a n y S a l e s 214.8 + 7.8% + 11.6% 199.3
E B I T 19.5 + 8.5% 18.0a s % o f s a l e s 9.1% 9.0%
S w i t z e r l a n d / R e s t o f S a l e s 133.8 + 33.0% + 39.1% 100.5
E B I T 10.4 + 23.1% 8.5a s % o f s a l e s 7.8% 8.4%
E a s t e r n E u r o p e S a l e s 52.2 + 14.6% + 9.4% 45.5
E B I T – 0.5 – 244.6% 0.3a s % o f s a l e s – 0.9% 0.7%
Sales by customer segments / divisions
We s t e r n E u r o p e
6
Report of the Board of Directors
remarkably successful.
Within the geographical segments, Germanyachieved an organic sales growth of 11.6% and anincrease of EBIT by CHF 1.5 million to 9.1% of salesand thereby accomplished an outstanding result towhich all sales divisions as well as a stringent con-trol of operating and administrative costs had contri-buted.
In the segment Switzerland and Rest of WesternEurope, organic sales also grew by favourable11.1%. Rendered in Swiss Francs and showing anincrease of 33.0%, sales amounted to CHF 133.8 mil-lion, whereof CHF 25.9 million were acquisition-related. The integration of the Italian company Ali-Big in the Hügli Group, which was acquired during2007, has progressed very well. The antipasti produ-ced by Ali-Big are successfully being sold in all ofthe countries in which our Food Service divisions arepositioned; and Ali-Big’s liquid sauces have esta-blished an additional well-equipped product pipeli-ne. The EBIT of the segment Switzerland and Rest ofWestern Europe rose by CHF 1.9 million thanks tovery good results in Switzerland and Austria. In com-parison with sales, however, we had to register adecrease from 8.4% to 7.8%; the main reason beingthe value loss of the British currency that by the endof 2008 had fallen by approximately 1/3 as comparedto the Swiss Franc. This development signif icantlyaffected the prof itability of our important exports toEngland. On the other hand, it indicates that our
Sustained strong organic sales growthCurrency effects slow down profitsdevelopment
In the business year 2008, the Hügli Group hasagain given proof of its good strategic positioningand operative strength based on solid organic salesgrowth in the Group’s established markets and thedevelopment of new growth areas. With regard torevenue growth – of operating results (EBIT) andprof its – we have not fully reached our objectives inspite of a factually sound operative development dueto substantial losses caused by negative currencyeffects. Let us now consider the details in the indi-vidual sectors:
Group sales reached CHF 400.8 million corres-ponding to an increase of 16.0% despite 3.6% nega-tive currency effects. We especially value theGroup’s organic growth of 11.1% with a gain of7.0% of sales volume. This also stands for a conti-nued strengthening of Hügli’s market position in allof the segments in which we are active. It is a cen-tral point in Hügli’s strategy to work only in thosemarket areas – customer segments, product domainsand geographical markets –, in which we can eff i-ciently implement our specif ic strengths and excel inmeeting our customer’s needs. The average organicgrowth of 7.7% per year – without currency fluctua-tions and acquisitions – that we have attained in thepast f ive years conf irms that our strategy has been
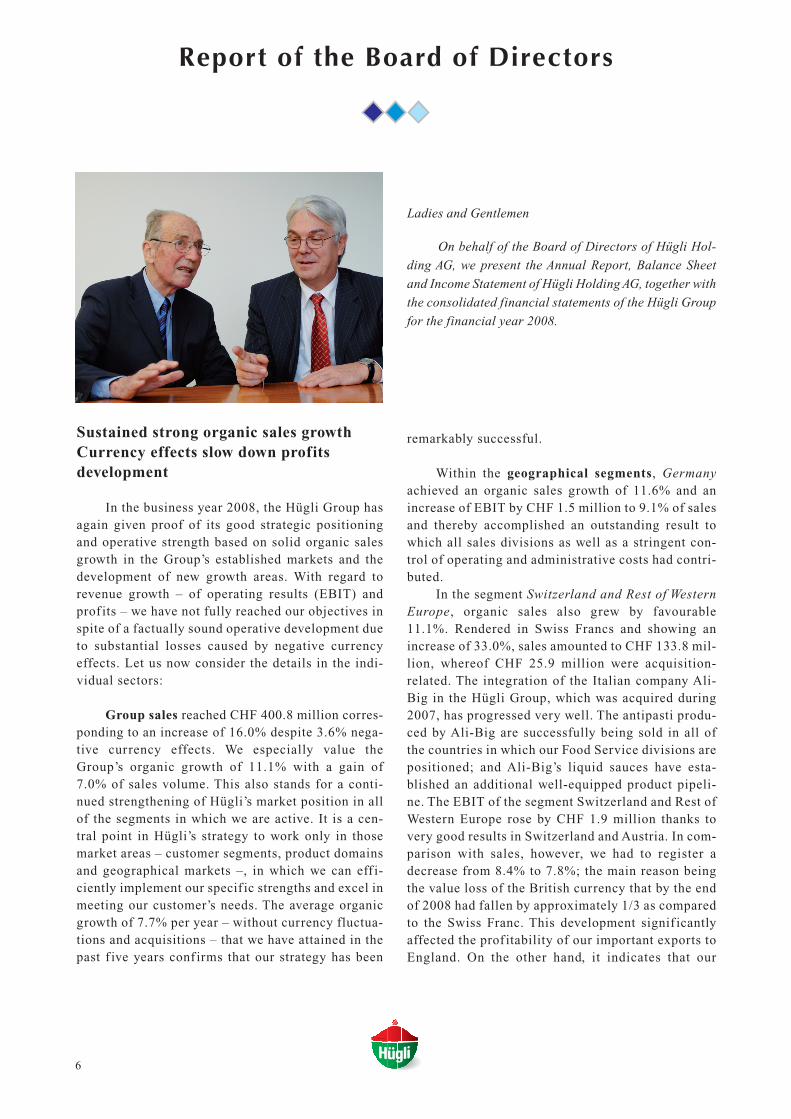
Ladies and Gentlemen
On behalf of the Board of Directors of Hügli Hol-
ding AG, we present the Annual Report, Balance Sheet
and Income Statement of Hügli Holding AG, together with
the consolidated financial statements of the Hügli Group
for the financial year 2008.
7
A still solid outcome is imparted by our conso-lidated balance sheet. The slight increase of thebalance sheet total by CHF 10.2 million can be attri-buted to the acquisition of Contract Foods in the UK,and – in current assets – to strong sales growth andincreased liquidity. All balance sheet positions, onthe other hand, decreased owing to the decline of allcurrencies relevant for Hügli as compared to theSwiss Franc. Our net debt has favourably fallen by6.3% and led to an improvement of the gearing – theratio of equity to net debt – from 0.9 to 0.8. Equitygrew only by CHF 3.1 million to CHF 116.3 millionbecause the weak foreign currencies induced negati-ve translation adjustments of CHF 10.7 million. Wecan nevertheless still report a solid equity base with41.4% of total assets, as compared to 41.8% in theprevious year.
Hügli observes a principle for distribution ofprofits based on achieved earnings with a payoutratio of 25% – 30% of prof its to shareholders. At theGeneral Meeting, the Board of Directors will requestan unchanged dividend of CHF 11.00, which relatesto 28% of prof its per share. The payout will be effec-tuated by a last reduction in par value of bearer sha-res from CHF 9.50 to 1.00 and a dividend payment ofCHF 2.50. The corresponding change of the articlesof incorporation will be requested at the GeneralMeeting of Shareholders on 13 May 2009.
In this year, we remain cautious in our conside-rations of the further outlook. Let us f irst considerthe positive perspectives of the current macroecono-mic conditions: Inflation is at a remarkable low andit is, from a medium-term view, expected to remainlow, although – when perceived from a long-termstandpoint – it is diff icult to discern how the indivi-dual countries will be able to reduce the now addi-tionally accumulated horrendous national debtswithout active inflating. Interests are similarly lowand anticipated to remain so. Thus, no signif icantcost increases caused by inflation-related salary rai-ses are to be expected. Raw material prices – a pro-nounced concern in 2007 and in the f irst semester of2008 – have stabilised on a high level. These are allrelevant positive factors. Yet, a strongly negative
acquisition of the British company Contract Foodson 31.01.2008 may in future assume an importantrole for the Hügli Group.
The country segment Eastern Europe looksback at a diff icult year. The restructuring of crucialmanagement positions that was carried out at thebeginning of 2008 has proven itself as the right deci-sion, and starting from the second semester we havebeen seeing operative progress. Negative currencyeffects nevertheless also considerably impeded thef inancial result in Eastern Europe. We supply oursales companies in Slovakia, Poland and Hungaryfrom the Czech Republic. Since September 2008, theHungarian Forint and Polish Zloty have massivelyfallen in value compared to the Czech crown. Thishas caused signif icant export losses in the CzechRepublic and led to the depreciation of our receiva-bles in Poland and Hungary. The organic sales gro-wth of Hügli Eastern Europe still amounted to 9.4%,but EBIT fell by CHF 0.8 million.
On pages 10-16 of this report, you will f inddetailed comments of the country segment and divi-sion heads on the development in their areas of res-ponsibility.
The consolidated income statement, with astrong sales growth of 16.0%, displays an increase ofoperating result (EBIT) by 9.9%, corresponding CHF2.7 million to CHF 29.5 million respectively. We con-sider the EBIT growth still favourable against a back-ground of negative currency effects that we assess tocome to approximately CHF 4 million. In absolutenumbers, this is Hügli’s best result. Rendered in per-centages of sales, the EBIT, however, decreased from7.8% to 7.4%. We nonetheless still target a medium-term rate of 8% – 9%. The netted financial expensesslightly increased because of marginally higher inte-rest rates, the partial shift from short-term to long-term f inancing and particularly due to the eliminati-on of an extraordinary f inancial income of the pre-vious year of around CHF 2 million by CHF 2.7 mil-lion. With taxes remaining unchanged, we cantherefore report – as anticipated in our half-yearreport – profits of CHF 18.8 million that are unchan-ged when compared to the previous year.
8
products to the food industry –, negative external andpositive internal potentials are more or less balanced.The Division Private Label – sales to big retail tradecompanies, mainly discounters under their own“labels” – may, assuming a generally low income,even prof it from the crisis due to the very good price-performance-ratio of its products. We thereforeexpect the currency rate shifting to bear the highestrisks for our sales and prof its development, not leastbecause its effects are extremely diff icult to predict.Notwithstanding our efforts to provide compensationand protection to our production sites that are loca-ted in different currency zones, exports are suffe-ring. Anyway, price adjustments are only possiblewith a certain time lag if one does not want to losethe market. The translation of prof its achieved byour foreign subsidiaries to Swiss Francs also resultsin lower values owing to the strength of our nationalcurrency.
Overall, we aim at an organic sales growth of3% – 5% per year and a slightly higher increase ofprof its that we want to attain on average in the nexttwo to three years – assuming that it may take theeconomy this long to overcome the global crisis. Wecan conf irm our long-term strategic objectives ofsales growth that amount to at least 5% in local cur-rencies.
Finally, we thank all who in the past years havebeen contributing to the prospering of Hügli, especi-ally our staff and you, our shareholders. We look for-ward to continue collaborating on building Hügli’ssuccessful future even in these diff icult times.
impact evidently emanates from the economic reces-sion that is being affected by the crisis in the ban-king sector to a still not fully clarif ied extent.Moreover, the f inancial and banking crises have ledto abrupt changes in the currency structure and theyimpede attempts to achieve a new balance. Theimpending danger is that, as with all abrupt correc-tions, these attempts may swing to the other extreme.
What do these only briefly sketched economicconditions mean for Hügli? In general, we can f irst-ly establish that our outlook is certainly cautious butdef initely conf ident. Even in the current diff iculttimes of an economic situation, we may fully trust inthe sustainability of our corporate strategy. We can– and that is crucially important – rely on an outs-tanding seasoned staff, particularly in leading mana-gement positions. Aware of the fact that we cannotcompletely avoid the consequences of a decrease intotal demand, we can depend on a certain risk balan-ce between the individual divisions operating in themarkets. Our Food Service Division – catering forall out-of-home food businesses – may encounter adecline in areas related to tourism and corporatecanteens. Nonetheless, it owns considerable additio-nal potential owing to new products and several onlypartially developed markets. The Division Healthand Natural Food – sales of biological and organicproducts to the specialised trade – is expected toexperience slower growth because it operates in ahigher price segment; it is benef iting from a positivegeneral trend nevertheless. As for the Division Indu-strial Foods – supply of f inished and semi-f inished
Steinach, March 2009
Dr. Alexander Stoffel Dr. Jean Gérard VillotChairman of the Board of Directors CEO, Vice President of the Board of Directors
9
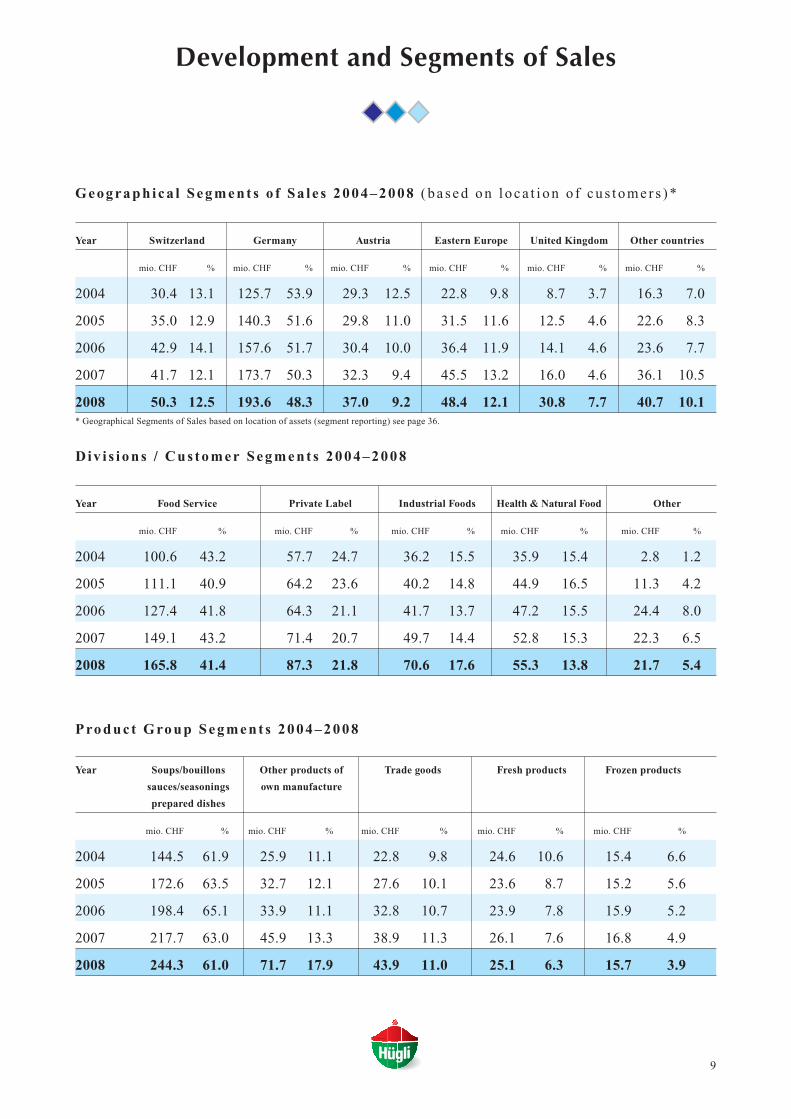
Div i s ions / Cus tomer Segment s 2004–2008
Year Food Service Private Label Industrial Foods Health & Natural Food Other
mio. CHF % mio. CHF % mio. CHF % mio. CHF % mio. CHF %
2004 100.6 43.2 57.7 24.7 36.2 15.5 35.9 15.4 2.8 1.2
2005 111.1 40.9 64.2 23.6 40.2 14.8 44.9 16.5 11.3 4.2
2006 127.4 41.8 64.3 21.1 41.7 13.7 47.2 15.5 24.4 8.0
2007 149.1 43.2 71.4 20.7 49.7 14.4 52.8 15.3 22.3 6.5
2008 165.8 41.4 87.3 21.8 70.6 17.6 55.3 13.8 21.7 5.4
Development and Segments of Sales
Produc t Group Segment s 2004–2008
Year Soups/bouillons Other products of Trade goods Fresh products Frozen products
sauces/seasonings own manufacture
prepared dishes
mio. CHF % mio. CHF % mio. CHF % mio. CHF % mio. CHF %
2004 144.5 61.9 25.9 11.1 22.8 9.8 24.6 10.6 15.4 6.6
2005 172.6 63.5 32.7 12.1 27.6 10.1 23.6 8.7 15.2 5.6
2006 198.4 65.1 33.9 11.1 32.8 10.7 23.9 7.8 15.9 5.2
2007 217.7 63.0 45.9 13.3 38.9 11.3 26.1 7.6 16.8 4.9
2008 244.3 61.0 71.7 17.9 43.9 11.0 25.1 6.3 15.7 3.9
Geograph ica l Segment s o f Sa l e s 2004–2008 (ba sed on l oca t i on o f cu s tomer s )*
Year Switzerland Germany Austria Eastern Europe United Kingdom Other countries
mio. CHF % mio. CHF % mio. CHF % mio. CHF % mio. CHF % mio. CHF %
2004 30.4 13.1 125.7 53.9 29.3 12.5 22.8 9.8 8.7 3.7 16.3 7.0
2005 35.0 12.9 140.3 51.6 29.8 11.0 31.5 11.6 12.5 4.6 22.6 8.3
2006 42.9 14.1 157.6 51.7 30.4 10.0 36.4 11.9 14.1 4.6 23.6 7.7
2007 41.7 12.1 173.7 50.3 32.3 9.4 45.5 13.2 16.0 4.6 36.1 10.5
2008 50.3 12.5 193.6 48.3 37.0 9.2 48.4 12.1 30.8 7.7 40.7 10.1* Geographical Segments of Sales based on location of assets (segment reporting) see page 36.
10
527 employees as per the end of 2008. New staff was pri-marily hired for production. The workforce in Neuburgan der Kammel comprises of 55 employees.
The steep price increases that spread widely acrossthe raw materials and agricultural markets have in thebusiness year generated lower gross profits, althoughprices could be augmented in stages and the improvedproduct mix, containing a larger share of own highervalue products, showed a positive impact. It was onlydue to an efficient utilisation of capacity, further opti-misation of processes and a consistent cost managementthat corporate expenses rose under-proportionally by7.9%. The EBIT increased by 8.5%, or CHF 1.5 million,respectively, to CHF 19.5 million. This results in anEBIT margin of sales of 9.1% as compared to 9.0% inthe previous year.
Apart from the usual investments in regular equip-ment replacement and various efforts of rationalisation,Hügli invested in the qualitative optimisation of theplants. The total investments amounted to CHF 4.8 mil-lion (CHF 4.7 million in the previous year). The depre-ciation totalling CHF 4.6 million along with the amorti-sation of acquired brands approximated the level rea-ched in the previous year.
O u t l o o k f o r 2 0 0 9
The portfolio optimisation of the Private LabelDivision on the one hand, as well as a moderate growthof the other divisions on the other hand, are expected toyield sales comparable to the level achieved in the pre-vious year. The focus is clearly on maintaining and as faras possible increasing the earning power of the HügliGroup’s sites in Germany.
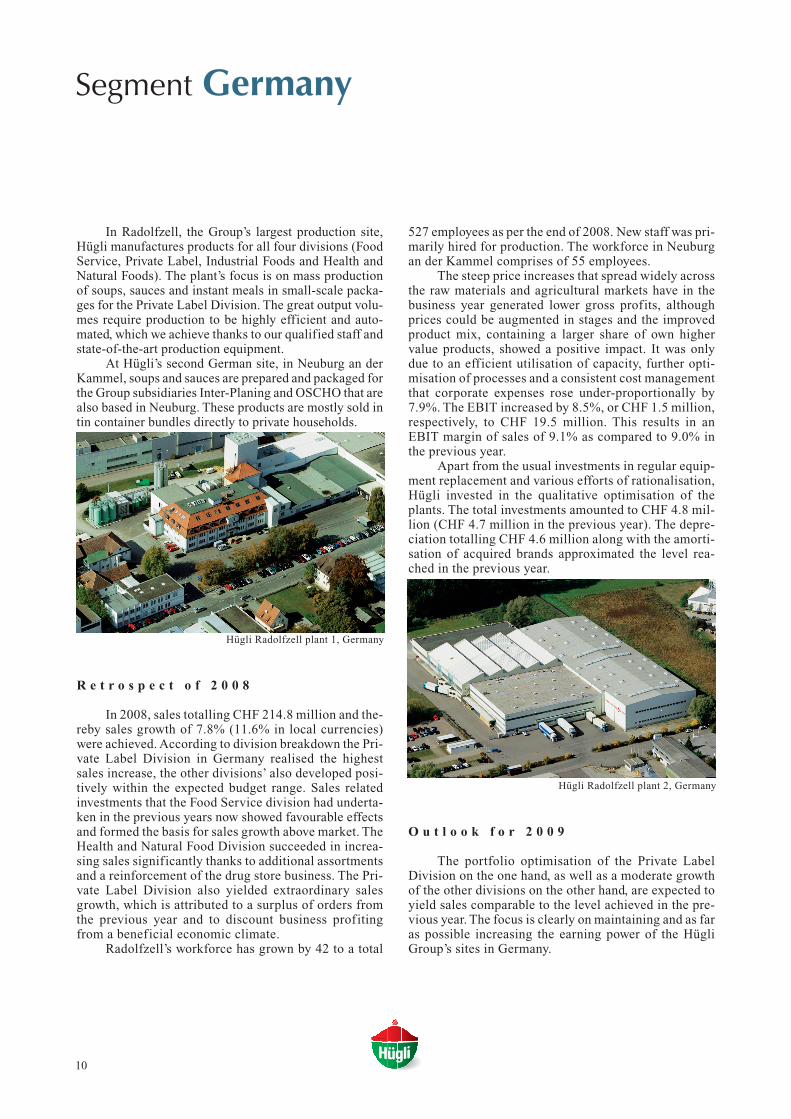
In Radolfzell, the Group’s largest production site,Hügli manufactures products for all four divisions (FoodService, Private Label, Industrial Foods and Health andNatural Foods). The plant’s focus is on mass productionof soups, sauces and instant meals in small-scale packa-ges for the Private Label Division. The great output volu-mes require production to be highly efficient and auto-mated, which we achieve thanks to our qualified staff andstate-of-the-art production equipment.
At Hügli’s second German site, in Neuburg an derKammel, soups and sauces are prepared and packaged forthe Group subsidiaries Inter-Planing and OSCHO that arealso based in Neuburg. These products are mostly sold intin container bundles directly to private households.
R e t r o s p e c t o f 2 0 0 8
In 2008, sales totalling CHF 214.8 million and the-reby sales growth of 7.8% (11.6% in local currencies)were achieved. According to division breakdown the Pri-vate Label Division in Germany realised the highestsales increase, the other divisions’ also developed posi-tively within the expected budget range. Sales relatedinvestments that the Food Service division had underta-ken in the previous years now showed favourable effectsand formed the basis for sales growth above market. TheHealth and Natural Food Division succeeded in increa-sing sales significantly thanks to additional assortmentsand a reinforcement of the drug store business. The Pri-vate Label Division also yielded extraordinary salesgrowth, which is attributed to a surplus of orders fromthe previous year and to discount business profitingfrom a beneficial economic climate.
Radolfzell’s workforce has grown by 42 to a total
Hügli Radolfzell plant 1, Germany
Hügli Radolfzell plant 2, Germany
Segment Germany
11
Segment Switzerland / Rest of Western Europe
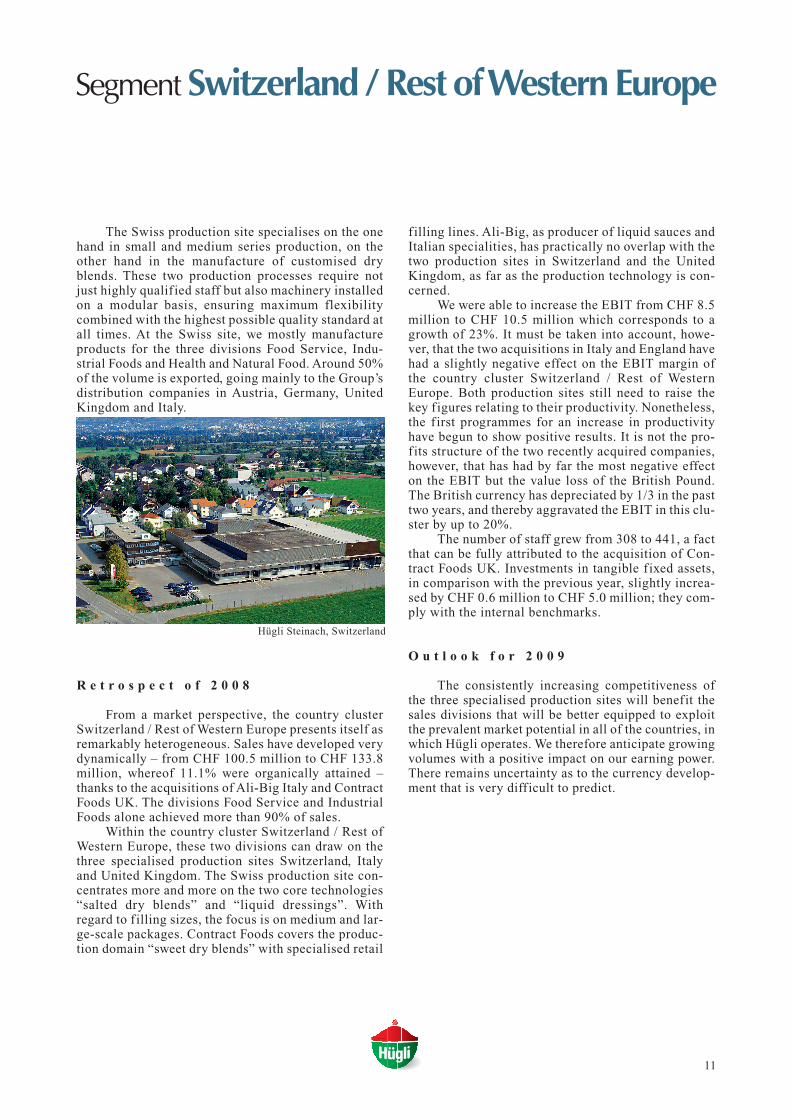
f illing lines. Ali-Big, as producer of liquid sauces andItalian specialities, has practically no overlap with thetwo production sites in Switzerland and the UnitedKingdom, as far as the production technology is con-cerned.
We were able to increase the EBIT from CHF 8.5million to CHF 10.5 million which corresponds to agrowth of 23%. It must be taken into account, howe-ver, that the two acquisitions in Italy and England havehad a slightly negative effect on the EBIT margin ofthe country cluster Switzerland / Rest of WesternEurope. Both production sites still need to raise thekey f igures relating to their productivity. Nonetheless,the f irst programmes for an increase in productivityhave begun to show positive results. It is not the pro-fits structure of the two recently acquired companies,however, that has had by far the most negative effecton the EBIT but the value loss of the British Pound.The British currency has depreciated by 1/3 in the pasttwo years, and thereby aggravated the EBIT in this clu-ster by up to 20%.
The number of staff grew from 308 to 441, a factthat can be fully attributed to the acquisition of Con-tract Foods UK. Investments in tangible f ixed assets,in comparison with the previous year, slightly increa-sed by CHF 0.6 million to CHF 5.0 million; they com-ply with the internal benchmarks.
O u t l o o k f o r 2 0 0 9
The consistently increasing competitiveness ofthe three specialised production sites will benefit thesales divisions that will be better equipped to exploitthe prevalent market potential in all of the countries, inwhich Hügli operates. We therefore anticipate growingvolumes with a positive impact on our earning power.There remains uncertainty as to the currency develop-ment that is very difficult to predict.
The Swiss production site specialises on the onehand in small and medium series production, on theother hand in the manufacture of customised dryblends. These two production processes require notjust highly qualif ied staff but also machinery installedon a modular basis, ensuring maximum flexibilitycombined with the highest possible quality standard atall times. At the Swiss site, we mostly manufactureproducts for the three divisions Food Service, Indu-strial Foods and Health and Natural Food. Around 50%of the volume is exported, going mainly to the Group’sdistribution companies in Austria, Germany, UnitedKingdom and Italy.
R e t r o s p e c t o f 2 0 0 8
From a market perspective, the country clusterSwitzerland / Rest of Western Europe presents itself asremarkably heterogeneous. Sales have developed verydynamically – from CHF 100.5 million to CHF 133.8million, whereof 11.1% were organically attained –thanks to the acquisitions of Ali-Big Italy and ContractFoods UK. The divisions Food Service and IndustrialFoods alone achieved more than 90% of sales.
Within the country cluster Switzerland / Rest ofWestern Europe, these two divisions can draw on thethree specialised production sites Switzerland, Italyand United Kingdom. The Swiss production site con-centrates more and more on the two core technologies“salted dry blends” and “liquid dressings”. Withregard to f illing sizes, the focus is on medium and lar-ge-scale packages. Contract Foods covers the produc-tion domain “sweet dry blends” with specialised retail
Hügli Steinach, Switzerland
Segment Eastern Europe
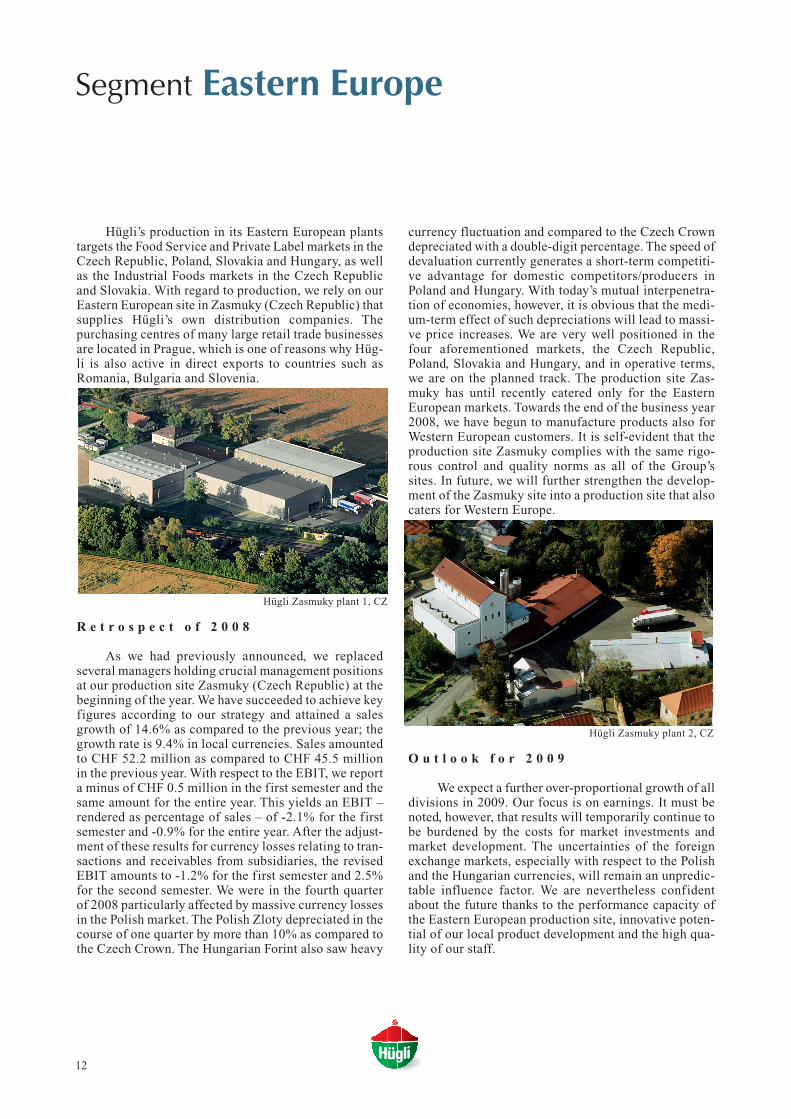
currency fluctuation and compared to the Czech Crowndepreciated with a double-digit percentage. The speed ofdevaluation currently generates a short-term competiti-ve advantage for domestic competitors/producers inPoland and Hungary. With today’s mutual interpenetra-tion of economies, however, it is obvious that the medi-um-term effect of such depreciations will lead to massi-ve price increases. We are very well positioned in thefour aforementioned markets, the Czech Republic,Poland, Slovakia and Hungary, and in operative terms,we are on the planned track. The production site Zas-muky has until recently catered only for the EasternEuropean markets. Towards the end of the business year2008, we have begun to manufacture products also forWestern European customers. It is self-evident that theproduction site Zasmuky complies with the same rigo-rous control and quality norms as all of the Group’ssites. In future, we will further strengthen the develop-ment of the Zasmuky site into a production site that alsocaters for Western Europe.
O u t l o o k f o r 2 0 0 9
We expect a further over-proportional growth of alldivisions in 2009. Our focus is on earnings. It must benoted, however, that results will temporarily continue tobe burdened by the costs for market investments andmarket development. The uncertainties of the foreignexchange markets, especially with respect to the Polishand the Hungarian currencies, will remain an unpredic-table influence factor. We are nevertheless confidentabout the future thanks to the performance capacity ofthe Eastern European production site, innovative poten-tial of our local product development and the high qua-lity of our staff.
Hügli’s production in its Eastern European plantstargets the Food Service and Private Label markets in theCzech Republic, Poland, Slovakia and Hungary, as wellas the Industrial Foods markets in the Czech Republicand Slovakia. With regard to production, we rely on ourEastern European site in Zasmuky (Czech Republic) thatsupplies Hügli’s own distribution companies. Thepurchasing centres of many large retail trade businessesare located in Prague, which is one of reasons why Hüg-li is also active in direct exports to countries such asRomania, Bulgaria and Slovenia.
R e t r o s p e c t o f 2 0 0 8
As we had previously announced, we replacedseveral managers holding crucial management positionsat our production site Zasmuky (Czech Republic) at thebeginning of the year. We have succeeded to achieve keyfigures according to our strategy and attained a salesgrowth of 14.6% as compared to the previous year; thegrowth rate is 9.4% in local currencies. Sales amountedto CHF 52.2 million as compared to CHF 45.5 millionin the previous year. With respect to the EBIT, we reporta minus of CHF 0.5 million in the first semester and thesame amount for the entire year. This yields an EBIT –rendered as percentage of sales – of -2.1% for the firstsemester and -0.9% for the entire year. After the adjust-ment of these results for currency losses relating to tran-sactions and receivables from subsidiaries, the revisedEBIT amounts to -1.2% for the first semester and 2.5%for the second semester. We were in the fourth quarterof 2008 particularly affected by massive currency lossesin the Polish market. The Polish Zloty depreciated in thecourse of one quarter by more than 10% as compared tothe Czech Crown. The Hungarian Forint also saw heavy
Hügli Zasmuky plant 1, CZ
Hügli Zasmuky plant 2, CZ
12
13
DivisionFood Service
O u t l o o k f o r 2 0 0 9
As all businesses, we are directly and indirectlyaffected by the economic decline. In comparison toother companies, we own the advantage to work in anon-cyclical industry and in addition to rely on strongsales teams on site. We are on the other hand also awa-re of the fact that closed-down canteens cannot servemeals and that our customers in the catering tradeclearly depend on their clients’ disposition to consu-me. Our institutional customers (hospitals, retirementhomes, armed forces, etc.) are notwithstanding veryresistant to economic trends. Weighing the pluses andminuses, we assume that we are well situated with ourmarket position, strategy, our structures and proces-ses, and that we shall emerge strengthened from thiseconomic crisis. Overall, we are therefore cautiouslyoptimistic and anticipate the greatest challenges to befound on the currency front.
Thomas BodenmannHead of Food Service Division
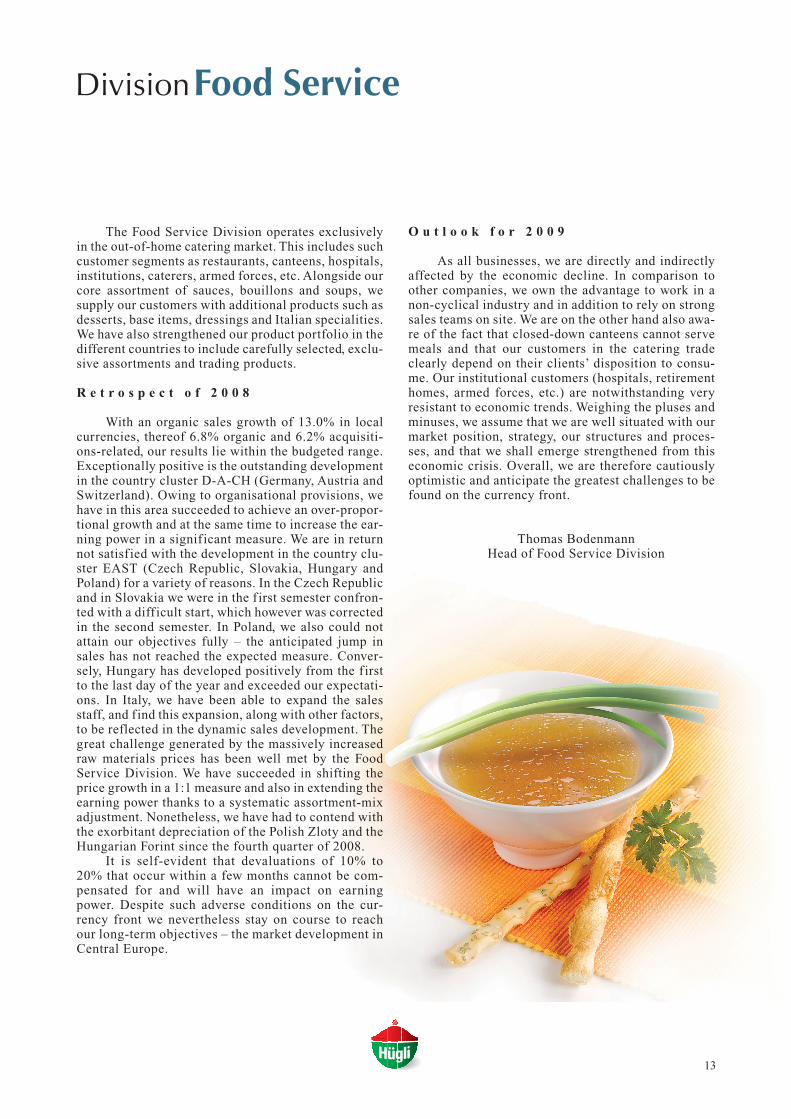
The Food Service Division operates exclusivelyin the out-of-home catering market. This includes suchcustomer segments as restaurants, canteens, hospitals,institutions, caterers, armed forces, etc. Alongside ourcore assortment of sauces, bouillons and soups, wesupply our customers with additional products such asdesserts, base items, dressings and Italian specialities.We have also strengthened our product portfolio in thedifferent countries to include carefully selected, exclu-sive assortments and trading products.
R e t r o s p e c t o f 2 0 0 8
With an organic sales growth of 13.0% in localcurrencies, thereof 6.8% organic and 6.2% acquisiti-ons-related, our results lie within the budgeted range.Exceptionally positive is the outstanding developmentin the country cluster D-A-CH (Germany, Austria andSwitzerland). Owing to organisational provisions, wehave in this area succeeded to achieve an over-propor-tional growth and at the same time to increase the ear-ning power in a signif icant measure. We are in returnnot satisf ied with the development in the country clu-ster EAST (Czech Republic, Slovakia, Hungary andPoland) for a variety of reasons. In the Czech Republicand in Slovakia we were in the f irst semester confron-ted with a diff icult start, which however was correctedin the second semester. In Poland, we also could notattain our objectives fully – the anticipated jump insales has not reached the expected measure. Conver-sely, Hungary has developed positively from the f irstto the last day of the year and exceeded our expectati-ons. In Italy, we have been able to expand the salesstaff, and find this expansion, along with other factors,to be reflected in the dynamic sales development. Thegreat challenge generated by the massively increasedraw materials prices has been well met by the FoodService Division. We have succeeded in shifting theprice growth in a 1:1 measure and also in extending theearning power thanks to a systematic assortment-mixadjustment. Nonetheless, we have had to contend withthe exorbitant depreciation of the Polish Zloty and theHungarian Forint since the fourth quarter of 2008.
It is self-evident that devaluations of 10% to20% that occur within a few months cannot be com-pensated for and will have an impact on earningpower. Despite such adverse conditions on the cur-rency front we nevertheless stay on course to reachour long-term objectives – the market development inCentral Europe.
14
DivisionPrivate Label LEH
O u t l o o k f o r 2 0 0 9
After the tempestuous unfolding of the businessyear 2008, we expect a consolidation for the comingyear. We clearly anticipate an increase in Eastern Euro-pe within the double-digit percentage range. WesternEurope may see a decline in growth when compared tothe extraordinarily successful previous year. Wenevertheless expect to be well positioned thanks to ourassortments. It is conceivable that the Private LabelDivision could profit from the financial crisis and theaccompanying recession, should they persist. We relyon products with an outstanding price-performanceformula.
Dr. Jean Gérard VillotHead of Private Label Division
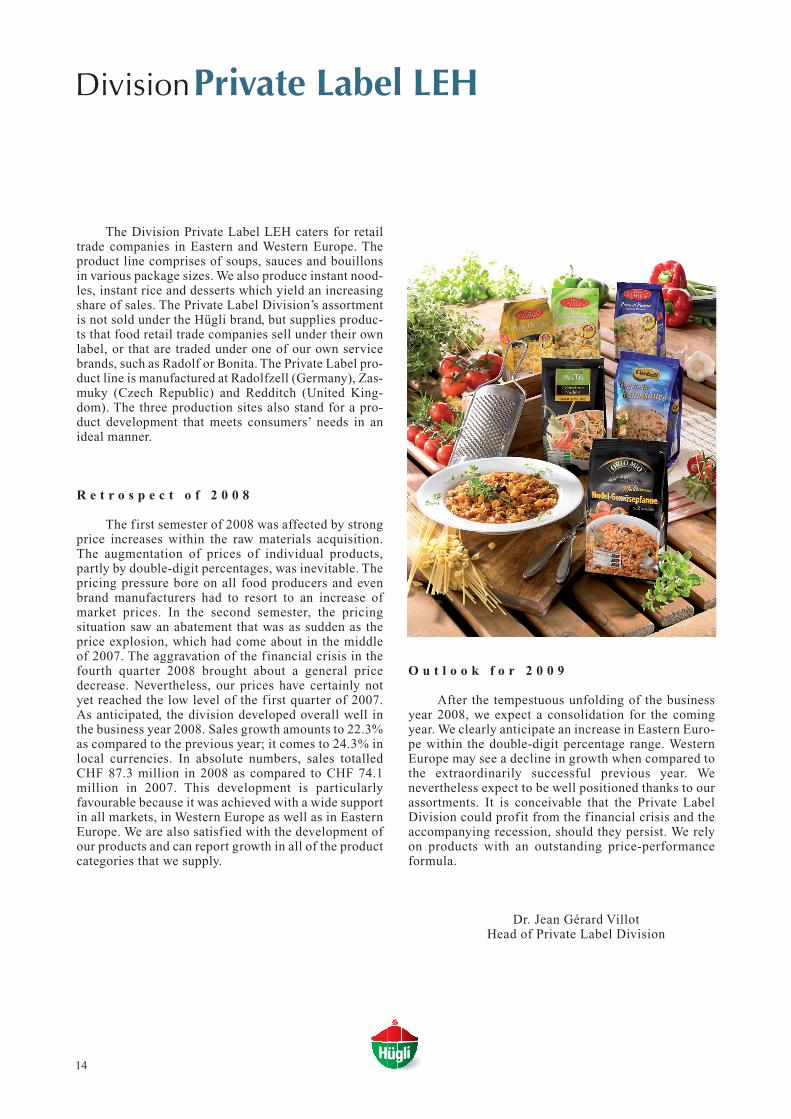
The Division Private Label LEH caters for retailtrade companies in Eastern and Western Europe. Theproduct line comprises of soups, sauces and bouillonsin various package sizes. We also produce instant nood-les, instant rice and desserts which yield an increasingshare of sales. The Private Label Division’s assortmentis not sold under the Hügli brand, but supplies produc-ts that food retail trade companies sell under their ownlabel, or that are traded under one of our own servicebrands, such as Radolf or Bonita. The Private Label pro-duct line is manufactured at Radolfzell (Germany), Zas-muky (Czech Republic) and Redditch (United King-dom). The three production sites also stand for a pro-duct development that meets consumers’ needs in anideal manner.
R e t r o s p e c t o f 2 0 0 8
The first semester of 2008 was affected by strongprice increases within the raw materials acquisition.The augmentation of prices of individual products,partly by double-digit percentages, was inevitable. Thepricing pressure bore on all food producers and evenbrand manufacturers had to resort to an increase ofmarket prices. In the second semester, the pricingsituation saw an abatement that was as sudden as theprice explosion, which had come about in the middleof 2007. The aggravation of the financial crisis in thefourth quarter 2008 brought about a general pricedecrease. Nevertheless, our prices have certainly notyet reached the low level of the first quarter of 2007.As anticipated, the division developed overall well inthe business year 2008. Sales growth amounts to 22.3%as compared to the previous year; it comes to 24.3% inlocal currencies. In absolute numbers, sales totalledCHF 87.3 million in 2008 as compared to CHF 74.1million in 2007. This development is particularlyfavourable because it was achieved with a wide supportin all markets, in Western Europe as well as in EasternEurope. We are also satisfied with the development ofour products and can report growth in all of the productcategories that we supply.
15
DivisionIndustrial Foods
The successfully completed integration of ContractFoods in the established organisation of Huegli UK was legal-ly settled on 2 March 2009. Most of the preparatory measu-res, however, were implement in the course of 2008 and con-stituted a core task for the division.
From the perspective of regional importance, Switzer-land has now been again overtaken by the United Kingdom.Organic sales growth of the Swiss companies turned out tobe extraordinarily strong nevertheless, and Switzerlandremains our market with the highest market shares. Outstan-ding work is being performed in Switzerland. The situationis more difficult in the traditional export business of foodingredients. Because of the increasing amount of technicaland declaratory requirements in Europe, exports are limitedand only feasible with carefully selected and efficient part-ners.
O u t l o o k f o r 2 0 0 9Against the background of the crisis of the global eco-
nomy, formulating an outlook has rarely been as difficult asfor the year 2009. Hügli Industrial Foods clearly expects fur-ther growth. Contrary to the previous years, we shall use theexisting and partially just implemented structures (e.g. Con-tract Foods) to generate a profitable increase, rather thanmaking further major investments in new structural develop-ment.
The outlook for this strategy is very promising. Thanksto the new site in England and its portfolio, which is new tothe division, we expect new opportunities of supplying thedivision’s existing customers with products from other sites.Ali-Big in Italy lends itself especially well to such an enhan-cement of the product assortment.
As a matter of course, we further promote the develop-ment of the successful “flavour systems” range. Substituteproducts for glutamate and seasonings – which form part ofthis product line – may be given less priority for cost reaso-ns. Aromas – the remaining part of the product line – areexpected to benefit from the crisis.
We anticipate the previously mentioned partial slow-down of the raw materials markets to have a positive effect.It will encourage customers and suppliers to re-enter long-term contracts, and this will free their capacities for valuecreating activities.
Overall, we are still very optimistic about the develop-ment of the division. If there is no catastrophic macroecono-mic influence on our markets, we expect that the growthtrend of the previous years will continue unbroken in 2009.
Erik LinkeHead of Industrial Foods Division
The products of the Industrial Foods Division serve asbasic ingredients, for example in soups, sauces, instant foodand snacks. These are flavouring blends, which also carryadditional functional characteristics.
With the acquisition of Contract Foods in United King-dom in 2008, the division has taken an important step. Onthe one hand, it has given us the status of a “local player”. Onthe other hand, we can now utilise the product pipeline andthe know-how of the meanwhile renamed company HuegliUK. With the acquisition, we have developed a general newmarket potential in the areas of slimming, sports and func-tional foods. These segments are growing all over Europeand the British market, occupying the role of a forerunner,indicates the volumes that can be traded in these domains.
M a r k e t E nv i ro n m e n tThe food ingredients market is self-evidently also
affected by the worldwide economic crisis. Nonetheless, theeffects vary in their characteristics and some may even emer-ge to be positive for a part of the market participants. Werecognize a trend towards less expensive recipes with flavourenhancers, aromas and food dyes especially in countries,which had, against the background of a booming economy,shifted towards expensive clean recipes. Based on the seg-mentation of the market into budget, standard and luxuryproducts mainly in countries such as the UK, Holland andSwitzerland, brand leaders as well as retail traders can main-tain several “clean” products at high prices in the market.However, this appears to be a fig leaf. The volume productshave been migrated to less expensive recipes and this processwill continue in future. The forerunner is, as so often, Uni-ted Kingdom.
The impact of these market trends on Hügli IndustrialFoods should be neutral. On the one hand, we can again selldry blends to customers that have used only fresh productsuntil now. Organic semi-finished products, one of our mainsegments, are on the other hand expected to be affected bythe economic situation.
The explosion of raw materials prices, which we repor-ted in the previous year, has in the meantime partially aba-ted. As several raw materials categories keep on being extre-mely volatile, a continued very active price policy along witha detailed cost control are still one of the main tasks withinour daily business.
R e t ro s p e c t o f 2 0 0 8Hügli Industrial Foods has again grown faster than the
food ingredients market, with organic 13.5%. We are alsostill one of the Hügli Group’s “growth divisions”.
16
DivisionHealth and Natural Food
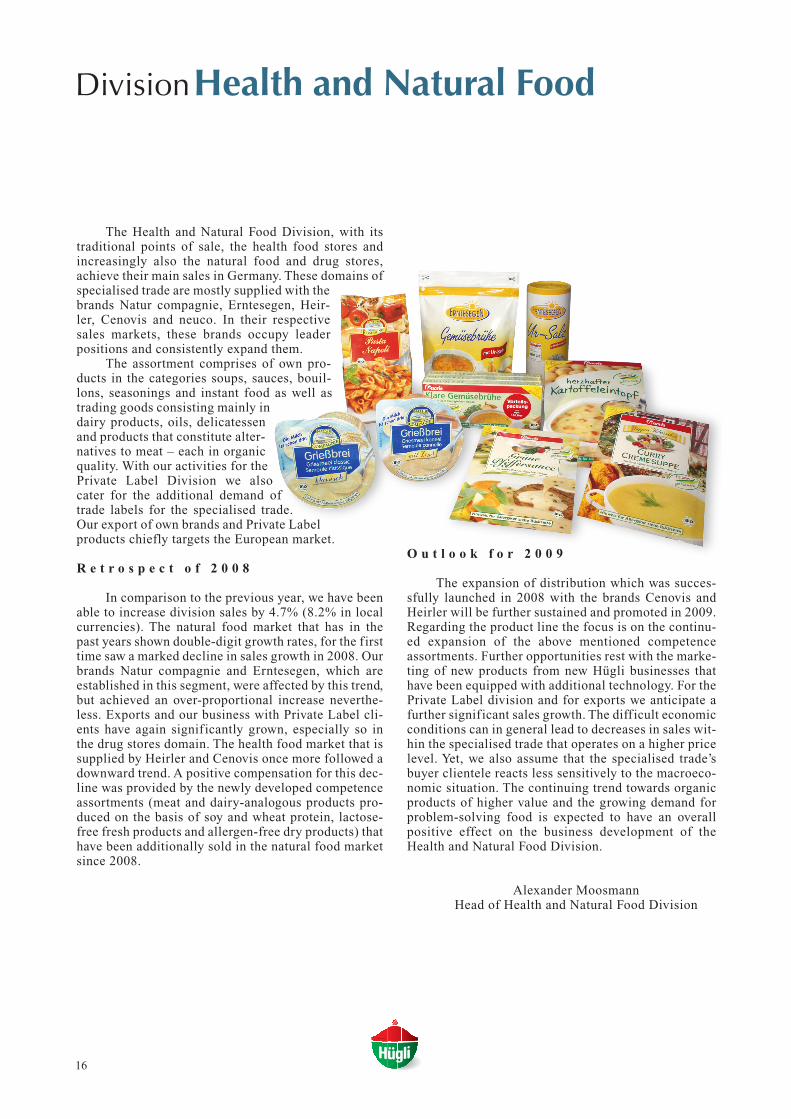
The Health and Natural Food Division, with itstraditional points of sale, the health food stores andincreasingly also the natural food and drug stores,achieve their main sales in Germany. These domains ofspecialised trade are mostly supplied with thebrands Natur compagnie, Erntesegen, Heir-ler, Cenovis and neuco. In their respectivesales markets, these brands occupy leaderpositions and consistently expand them.
The assortment comprises of own pro-ducts in the categories soups, sauces, bouil-lons, seasonings and instant food as well astrading goods consisting mainly indairy products, oils, delicatessenand products that constitute alter-natives to meat – each in organicquality. With our activities for thePrivate Label Division we alsocater for the additional demand oftrade labels for the specialised trade.Our export of own brands and Private Labelproducts chiefly targets the European market.
R e t r o s p e c t o f 2 0 0 8
In comparison to the previous year, we have beenable to increase division sales by 4.7% (8.2% in localcurrencies). The natural food market that has in thepast years shown double-digit growth rates, for the firsttime saw a marked decline in sales growth in 2008. Ourbrands Natur compagnie and Erntesegen, which areestablished in this segment, were affected by this trend,but achieved an over-proportional increase neverthe-less. Exports and our business with Private Label cli-ents have again significantly grown, especially so inthe drug stores domain. The health food market that issupplied by Heirler and Cenovis once more followed adownward trend. A positive compensation for this dec-line was provided by the newly developed competenceassortments (meat and dairy-analogous products pro-duced on the basis of soy and wheat protein, lactose-free fresh products and allergen-free dry products) thathave been additionally sold in the natural food marketsince 2008.
O u t l o o k f o r 2 0 0 9
The expansion of distribution which was succes-sfully launched in 2008 with the brands Cenovis andHeirler will be further sustained and promoted in 2009.Regarding the product line the focus is on the continu-ed expansion of the above mentioned competenceassortments. Further opportunities rest with the marke-ting of new products from new Hügli businesses thathave been equipped with additional technology. For thePrivate Label division and for exports we anticipate afurther significant sales growth. The difficult economicconditions can in general lead to decreases in sales wit-hin the specialised trade that operates on a higher pricelevel. Yet, we also assume that the specialised trade’sbuyer clientele reacts less sensitively to the macroeco-nomic situation. The continuing trend towards organicproducts of higher value and the growing demand forproblem-solving food is expected to have an overallpositive effect on the business development of theHealth and Natural Food Division.
Alexander MoosmannHead of Health and Natural Food Division
17
Corporate Governance
Corporate Governance
Hügli Group. These Divisions mainly focus on custo-mer needs and are responsible for sales development aswell as the design of Marketing and Sales. In this areaHügli is organized as a matrix. The Food Service Divi-sion covers the “Out of Home Market” with sales tohotels, restaurants, institutions such as company cater-ers, hospitals, residential homes and other caterers. TheHealth and Natural Food Division is responsible forthe sale of organic products to the European specialisttrade, i.e. natural food outlets, health food stores and insome cases also drugstores and chemists. The PrivateLabel Division supplies big European retail trade orga-nisations, primarily discounters and mass retailers, withproducts sold under their own labels. The IndustrialFoods Division specialises in the sale of semi-finishedand finished products to the European food industry
A detailed segment reporting is found on page 36.
The only listed company in the scope of consoli-dation is Hügli Holding AG, 9323 Steinach, Switzer-land. Its bearer shares are quoted on the SIX SwissExchange in Zurich (security no. 464795). On 31December 2008, the closing price for the Hügli bearershare was CHF 460, corresponding to a market capita-lisation of CHF 223 million. Of this total, CHF 129 mil-lion are represented by the stock capitalisation of thelisted bearer shares and CHF 94 million by unlistedregistered shares.
Major Shareholders
- Dr. A. Stoffel Holding AG / Dr. A. Stoffel, 9320 Arb-on, Switzerland:37’930 bearer shares with a par value of CHF 9.50each (13.5% of bearer share capital)410’000 registered shares with a par value of CHF4.75 each (100% of the registered share capital)64.9% of the voting rights, equivalent to 50.1% ofthe share capital
- Hügli Holding AG, 9323 Steinach, Switzerland (ownshares):7’132 bearer shares with a par value of CHF 9.50each (2.5% of bearer share capital)
Hügli attaches great value to maintai-ning a good and responsible corporategovernance. The Group acknowledges itseconomic and social responsibility. Hightransparency contributes to strengtheningthe trust in the company and its manage-ment and it ensures that stakeholders –shareholders, investors, staff and businesspartners – can exercise their interests andrights. Our corporate governance rests onclearly laid out structures, precisely allo-cated areas of responsibility, efficient deci-sion processes and appropriate controlroutines.
The following report is in line with the Corpora-te Governance Guideline of the SIX Swiss Exchange.If not mentioned differently, the information reflectsthe situation on 31 December 2008.
1. Group Structure and Shareholders
Group Structure
The Hügli Company consists of one single busin-ess unit with the business operating area to develop,produce and distribute dry blended food products. Thesegmentation is based on the geographic responsibili-ties of the production sites and their associated distri-bution companies. The segment Germany covers allassociated German companies, the segment Switzer-land / Rest of Western Europe the companies in Swit-zerland, Austria, United Kingdom and Italy, the seg-ment Eastern Europe the companies in Czech Repu-blic, Slovakia, Poland and Hungary. Detailed informa-tion of the Group companies can be seen on page 63.
In addition four cross-national Divisions havebeen created reflecting the customer segments of the
18 Corporate Governance
in CHF 31.12.2007 Change 2007Share capital 9’942’500 – 5’092’500Reserves 36’479’626 4’969’642Profit carried forward 21’169’035 5’413’333Total equity 67’591’161 5’290’475
in CHF 31.12.2006 Change 2006Share capital 15’035’000 – 5’092’500Reserves 31’509’984 19’952’963Profit carried forward 15’755’702 – 13’532’562Total equity 62’300’686 1’327’901
3. Board of Directors
Members of the Board of Directors
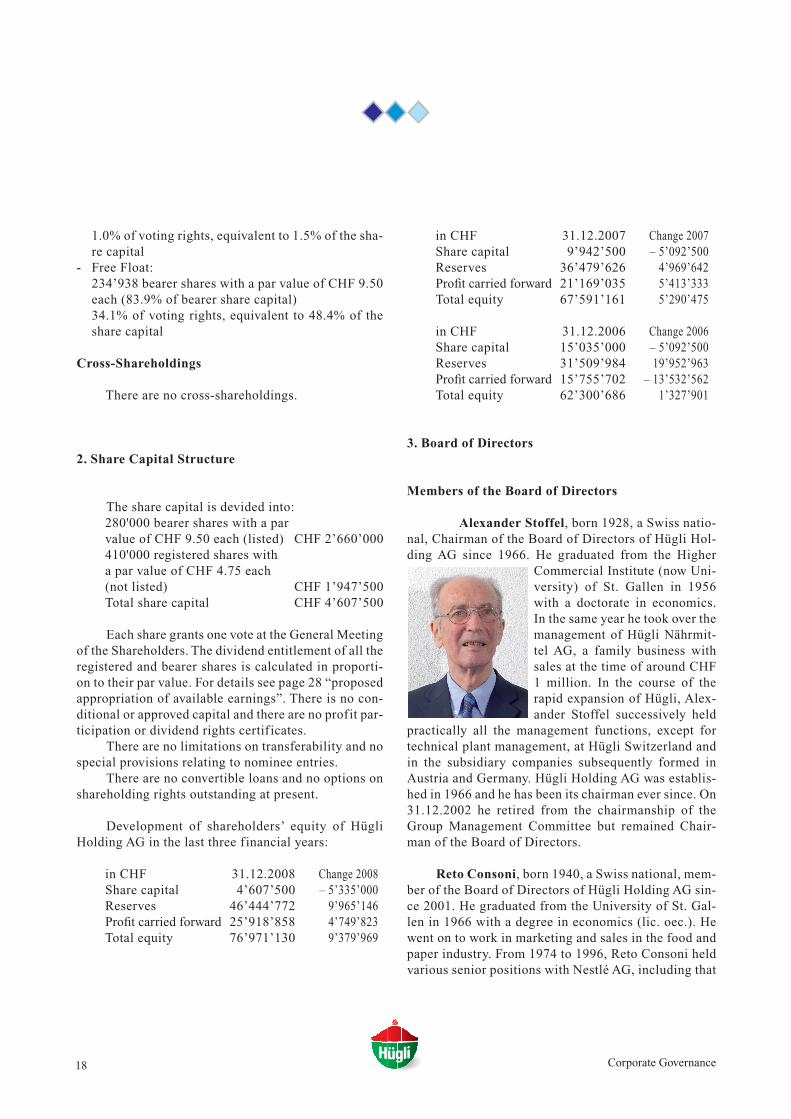
Alexander Stoffel, born 1928, a Swiss natio-nal, Chairman of the Board of Directors of Hügli Hol-ding AG since 1966. He graduated from the Higher
Commercial Institute (now Uni-versity) of St. Gallen in 1956with a doctorate in economics.In the same year he took over themanagement of Hügli Nährmit-tel AG, a family business withsales at the time of around CHF1 million. In the course of therapid expansion of Hügli, Alex-ander Stoffel successively held
practically all the management functions, except fortechnical plant management, at Hügli Switzerland andin the subsidiary companies subsequently formed inAustria and Germany. Hügli Holding AG was establis-hed in 1966 and he has been its chairman ever since. On31.12.2002 he retired from the chairmanship of theGroup Management Committee but remained Chair-man of the Board of Directors.
Reto Consoni, born 1940, a Swiss national, mem-ber of the Board of Directors of Hügli Holding AG sin-ce 2001. He graduated from the University of St. Gal-len in 1966 with a degree in economics (lic. oec.). Hewent on to work in marketing and sales in the food andpaper industry. From 1974 to 1996, Reto Consoni heldvarious senior positions with Nestlé AG, including that
1.0% of voting rights, equivalent to 1.5% of the sha-re capital
- Free Float:234’938 bearer shares with a par value of CHF 9.50each (83.9% of bearer share capital)34.1% of voting rights, equivalent to 48.4% of theshare capital
Cross-Shareholdings
There are no cross-shareholdings.
2. Share Capital Structure
The share capital is devided into:280'000 bearer shares with a par value of CHF 9.50 each (listed) CHF 2’660’000410'000 registered shares witha par value of CHF 4.75 each(not listed) CHF 1’947’500Total share capital CHF 4’607’500
Each share grants one vote at the General Meetingof the Shareholders. The dividend entitlement of all theregistered and bearer shares is calculated in proporti-on to their par value. For details see page 28 “proposedappropriation of available earnings”. There is no con-ditional or approved capital and there are no profit par-ticipation or dividend rights certif icates.
There are no limitations on transferability and nospecial provisions relating to nominee entries.
There are no convertible loans and no options onshareholding rights outstanding at present.
Development of shareholders’ equity of HügliHolding AG in the last three financial years:
in CHF 31.12.2008 Change 2008Share capital 4’607’500 – 5’335’000Reserves 46’444’772 9’965’146Profit carried forward 25’918’858 4’749’823Total equity 76’971’130 9’379’969
19Corporate Governance
te of Business Administration (IfB). He is member ofthe Board of Directors of Helvetia Holding AG.
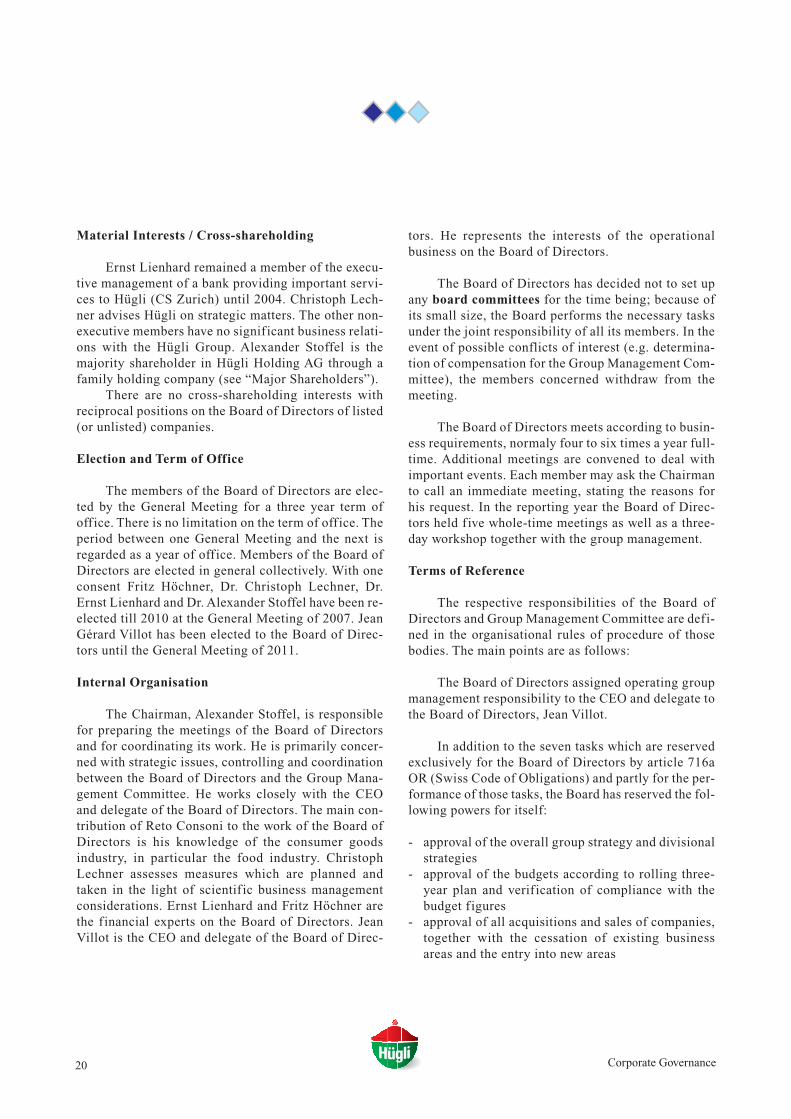
Ernst Lienhard, born 1946, a Swiss national,member of the Board of Directors for Hügli HoldingAG since 2001. He completed his studies at the Uni-versity of St. Gallen in 1976 with a doctorate in econo-mics. Ernst Lienhard joined Credit Suisse Zurich in
1972. After serving abroad inParis, Peru, New York and theBahamas, he was appointed headof commerce in Zurich and beca-me Managing Director SwissCorporates in 1997. Ernst Lien-hard retired in 2004. He is mem-ber of the Board of Directors ofDätwyler Holding AG as well asof other Swiss family-owned
companies and group companies.
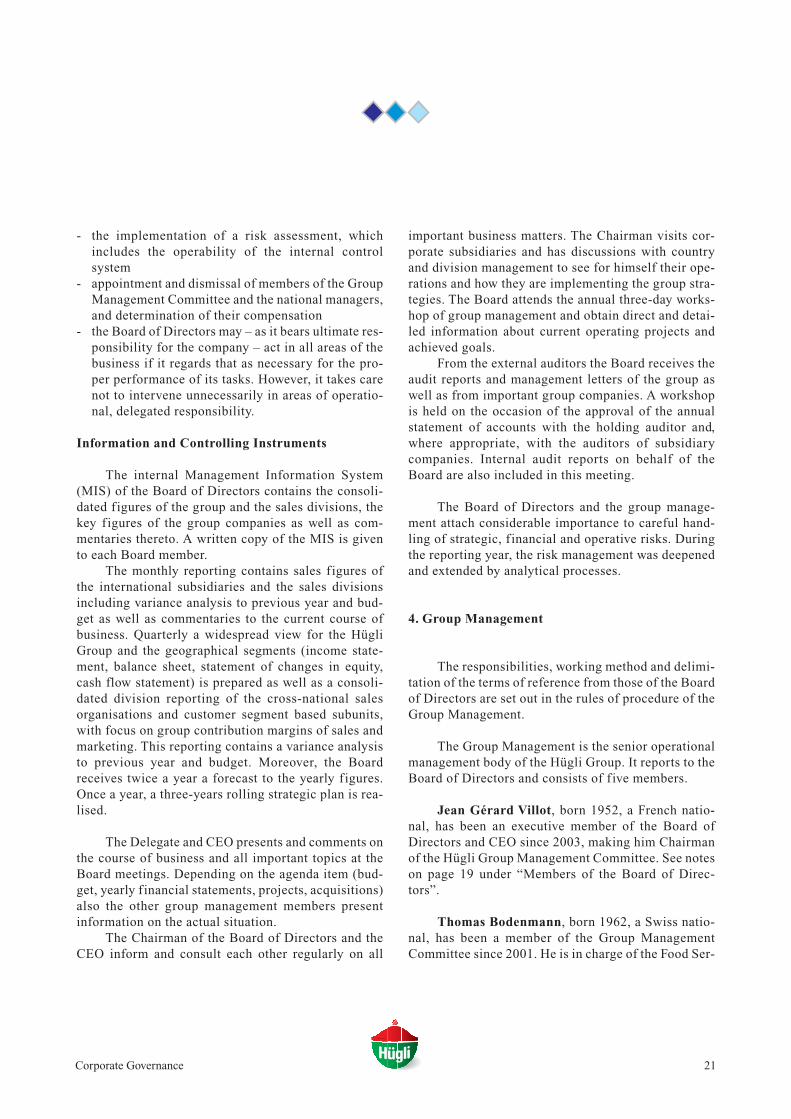
Jean Gérard Villot, born 1952, a French national,member of the Board since 2002, Chief Executive Offi-cer since 2003 and Vice President of the Board ofDirectors of Hügli Holding AG since 2007. He com-pleted a doctorate at Strasbourg University and, after
holding various positions inindustry, worked as a manage-ment consultant, most recentlyas director of management con-sultancy and member of theManagement Committee of Pro-gnos AG Basel. He joined Hügliin 1990 and was in charge ofHügli Switzerland until 1996,after which he was responsible
for Hügli Germany until the end of 2002. At the Gene-ral Meeting in May 2002 he was elected to the Board ofDirectors of Hügli Holding AG. In addition to his dutiesas CEO, Mr Villot represents the interests of the Priva-te Label Division on the Group Management Commit-tee and is responsible for coordination of production,quality assurance and materials management activitieswithin the Hügli Group.
All the members of the Board of Directors, withthe exception of Jean Gérard Villot, are non-executive.
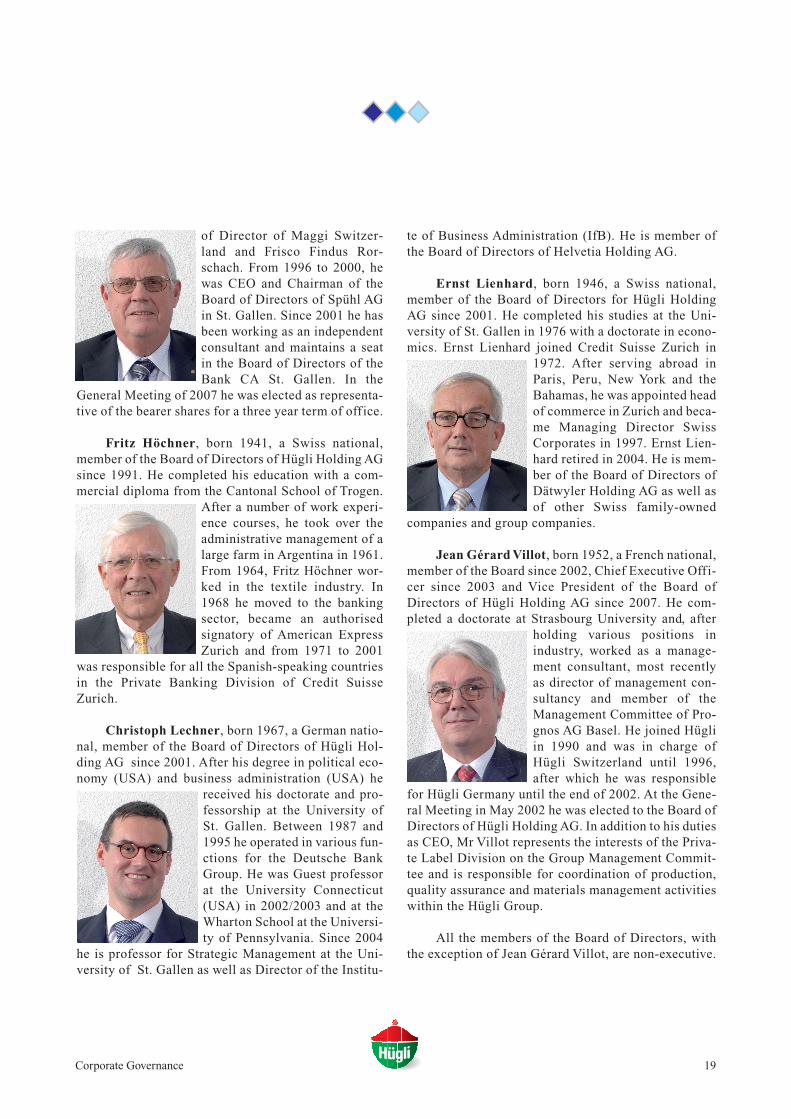
of Director of Maggi Switzer-land and Frisco Findus Ror-schach. From 1996 to 2000, hewas CEO and Chairman of theBoard of Directors of Spühl AGin St. Gallen. Since 2001 he hasbeen working as an independentconsultant and maintains a seatin the Board of Directors of theBank CA St. Gallen. In the
General Meeting of 2007 he was elected as representa-tive of the bearer shares for a three year term of office.
Fritz Höchner, born 1941, a Swiss national,member of the Board of Directors of Hügli Holding AGsince 1991. He completed his education with a com-mercial diploma from the Cantonal School of Trogen.
After a number of work experi-ence courses, he took over theadministrative management of alarge farm in Argentina in 1961.From 1964, Fritz Höchner wor-ked in the textile industry. In1968 he moved to the bankingsector, became an authorisedsignatory of American ExpressZurich and from 1971 to 2001
was responsible for all the Spanish-speaking countriesin the Private Banking Division of Credit SuisseZurich.
Christoph Lechner, born 1967, a German natio-nal, member of the Board of Directors of Hügli Hol-ding AG since 2001. After his degree in political eco-nomy (USA) and business administration (USA) he
received his doctorate and pro-fessorship at the University ofSt. Gallen. Between 1987 and1995 he operated in various fun-ctions for the Deutsche BankGroup. He was Guest professorat the University Connecticut(USA) in 2002/2003 and at theWharton School at the Universi-ty of Pennsylvania. Since 2004
he is professor for Strategic Management at the Uni-versity of St. Gallen as well as Director of the Institu-
20 Corporate Governance
Material Interests / Cross-shareholding
Ernst Lienhard remained a member of the execu-tive management of a bank providing important servi-ces to Hügli (CS Zurich) until 2004. Christoph Lech-ner advises Hügli on strategic matters. The other non-executive members have no significant business relati-ons with the Hügli Group. Alexander Stoffel is themajority shareholder in Hügli Holding AG through afamily holding company (see “Major Shareholders”).
There are no cross-shareholding interests withreciprocal positions on the Board of Directors of listed(or unlisted) companies.
Election and Term of Office
The members of the Board of Directors are elec-ted by the General Meeting for a three year term ofoffice. There is no limitation on the term of office. Theperiod between one General Meeting and the next isregarded as a year of office. Members of the Board ofDirectors are elected in general collectively. With oneconsent Fritz Höchner, Dr. Christoph Lechner, Dr.Ernst Lienhard and Dr. Alexander Stoffel have been re-elected till 2010 at the General Meeting of 2007. JeanGérard Villot has been elected to the Board of Direc-tors until the General Meeting of 2011.
Internal Organisation
The Chairman, Alexander Stoffel, is responsiblefor preparing the meetings of the Board of Directorsand for coordinating its work. He is primarily concer-ned with strategic issues, controlling and coordinationbetween the Board of Directors and the Group Mana-gement Committee. He works closely with the CEOand delegate of the Board of Directors. The main con-tribution of Reto Consoni to the work of the Board ofDirectors is his knowledge of the consumer goodsindustry, in particular the food industry. ChristophLechner assesses measures which are planned andtaken in the light of scientific business managementconsiderations. Ernst Lienhard and Fritz Höchner arethe financial experts on the Board of Directors. JeanVillot is the CEO and delegate of the Board of Direc-
tors. He represents the interests of the operationalbusiness on the Board of Directors.
The Board of Directors has decided not to set upany board committees for the time being; because ofits small size, the Board performs the necessary tasksunder the joint responsibility of all its members. In theevent of possible conflicts of interest (e.g. determina-tion of compensation for the Group Management Com-mittee), the members concerned withdraw from themeeting.
The Board of Directors meets according to busin-ess requirements, normaly four to six times a year full-time. Additional meetings are convened to deal withimportant events. Each member may ask the Chairmanto call an immediate meeting, stating the reasons forhis request. In the reporting year the Board of Direc-tors held five whole-time meetings as well as a three-day workshop together with the group management.
Terms of Reference
The respective responsibilities of the Board ofDirectors and Group Management Committee are defi-ned in the organisational rules of procedure of thosebodies. The main points are as follows:
The Board of Directors assigned operating groupmanagement responsibility to the CEO and delegate tothe Board of Directors, Jean Villot.
In addition to the seven tasks which are reservedexclusively for the Board of Directors by article 716aOR (Swiss Code of Obligations) and partly for the per-formance of those tasks, the Board has reserved the fol-lowing powers for itself:
- approval of the overall group strategy and divisionalstrategies
- approval of the budgets according to rolling three-year plan and verification of compliance with thebudget figures
- approval of all acquisitions and sales of companies,together with the cessation of existing businessareas and the entry into new areas
21Corporate Governance
- the implementation of a risk assessment, whichincludes the operability of the internal controlsystem
- appointment and dismissal of members of the GroupManagement Committee and the national managers,and determination of their compensation
- the Board of Directors may – as it bears ultimate res-ponsibility for the company – act in all areas of thebusiness if it regards that as necessary for the pro-per performance of its tasks. However, it takes carenot to intervene unnecessarily in areas of operatio-nal, delegated responsibility.
Information and Controlling Instruments
The internal Management Information System(MIS) of the Board of Directors contains the consoli-dated figures of the group and the sales divisions, thekey figures of the group companies as well as com-mentaries thereto. A written copy of the MIS is givento each Board member.
The monthly reporting contains sales figures ofthe international subsidiaries and the sales divisionsincluding variance analysis to previous year and bud-get as well as commentaries to the current course ofbusiness. Quarterly a widespread view for the HügliGroup and the geographical segments (income state-ment, balance sheet, statement of changes in equity,cash flow statement) is prepared as well as a consoli-dated division reporting of the cross-national salesorganisations and customer segment based subunits,with focus on group contribution margins of sales andmarketing. This reporting contains a variance analysisto previous year and budget. Moreover, the Boardreceives twice a year a forecast to the yearly figures.Once a year, a three-years rolling strategic plan is rea-lised.
The Delegate and CEO presents and comments onthe course of business and all important topics at theBoard meetings. Depending on the agenda item (bud-get, yearly financial statements, projects, acquisitions)also the other group management members presentinformation on the actual situation.
The Chairman of the Board of Directors and theCEO inform and consult each other regularly on all
important business matters. The Chairman visits cor-porate subsidiaries and has discussions with countryand division management to see for himself their ope-rations and how they are implementing the group stra-tegies. The Board attends the annual three-day works-hop of group management and obtain direct and detai-led information about current operating projects andachieved goals.
From the external auditors the Board receives theaudit reports and management letters of the group aswell as from important group companies. A workshopis held on the occasion of the approval of the annualstatement of accounts with the holding auditor and,where appropriate, with the auditors of subsidiarycompanies. Internal audit reports on behalf of theBoard are also included in this meeting.
The Board of Directors and the group manage-ment attach considerable importance to careful hand-ling of strategic, f inancial and operative risks. Duringthe reporting year, the risk management was deepenedand extended by analytical processes.
4. Group Management
The responsibilities, working method and delimi-tation of the terms of reference from those of the Boardof Directors are set out in the rules of procedure of theGroup Management.
The Group Management is the senior operationalmanagement body of the Hügli Group. It reports to theBoard of Directors and consists of five members.
Jean Gérard Villot, born 1952, a French natio-nal, has been an executive member of the Board ofDirectors and CEO since 2003, making him Chairmanof the Hügli Group Management Committee. See noteson page 19 under “Members of the Board of Direc-tors”.
Thomas Bodenmann, born 1962, a Swiss natio-nal, has been a member of the Group ManagementCommittee since 2001. He is in charge of the Food Ser-
22 Corporate Governance
vice Division. Following basic commercial training,Thomas Bodenmann graduated from the St. GallenUniversity of Applied Sciences with a degree in mana-gement and went on to take various courses of furthertraining at the University of St. Gallen and at HarvardBusiness School, Boston, USA. After holding variouspositions in industry, he became Swiss sales managerat Benckiser (Schweiz) AG, Winterthur, a positionwhich he held until 1995. Thomas Bodenmann joinedHügli Switzerland in 1995 as export manager andmember of the Management Committee. In 1997, hebecame Managing Director of Hügli Switzerland, towhich the position of Managing Director of Hügli Aus-tria was added in 1999. In addition to his duties as amember of the Group Management Committee andHead of the Food Service Division, he remains Mana-ging Director of Hügli Switzerland and Hügli Austria.
Erik Linke, born 1966, a German national, hasbeen a member of the Group Management Committeesince 2001. He is in charge of the Industrial FoodsDivision and has been Managing Director of the BritishHügli companies, Contract Foods Ltd. and Huegli UKLtd., since 2008. Erik Linke graduated in commercefrom the University of Erlangen-Nürnberg. Beforeworking for Hügli he held various posts with Lidl Ger-many, one of the leading German discounters, and mostrecently a senior position with Lidl UK. In 1997 hemoved to Hügli Switzerland as export manager.
Alexander Moosmann, born 1950, a Germannational, has been a member of the Group ManagementCommittee since 2001. He is in charge of the Healthand Natural Food Division. After taking his universityentrance examinations, Alexander Moosmann studiedeconomics, management and law at the University ofGiessen (without graduating). He held various positi-ons in industry before becoming marketing and distri-bution manager at Hellma Gastronomie Service inHemmingen, near Stuttgart, Germany. In 1988, he joi-ned Hügli as Head of Food Service Germany and wasalso appointed Head of Health and Natural Food Ger-many in 1996. In addition to his duties as member ofthe Group Management Committee and Head of theHealth & Natural Food Division, Alexander Moosmannis also the General Manager of Hügli Germany.
Andreas Seibold, born 1964, a Swiss national,became Chief Financial Officer and member of theGroup Management Committee in March 2004. Afterthe swiss certif icate in business administration, heacquired the high-school diploma and studied econo-mic sciences at Zurich University (lic. oec. publ.). Hewent on to qualify as a chartered accountant at theSwiss Institute of Certified Accountants while conti-nuing his professional employment. After working formany years as an auditor with KPMG Zurich he chan-ged to Sefar AG, Rüschlikon, as Head of Finance andTreasury and then to Sefar Holding AG as Head ofGroup Controlling. In addition to his function as CFOhe is responsible for Investor Relations.
No member of the Group Management Commit-tee has any other important activities or material inte-rests. Hügli Holding AG and its subsidiary companieshave not concluded any management agreements withthird parties.
5. Compensations, Shareholding Interests andLoans
Content and Procedure for Fixing Compensationand Shareholding Programmes
The principles of the compensation policy aredesigned to provide simple and clearly structuredsalary systems that ensure fair remuneration and aretransparent for the corporation’s employees. Individu-al compensation is determined by the specifications ofthe position (complexity, responsibility, technical andpersonal requirements), competencies, performanceand the corporation’s business success. The amountand the elements of the compensation are also tailoredto the respective sector and labour market. The fixedbase salary is determined primarily by the manager’stasks, responsibility, skills and experience. The perfor-mance related bonus depends on the business successof the corporation and is measured by two financialdrivers: results of the segments in charge and group netprofit of the year. The bonus of the segment depends onthe results of the year compared to the results achieved
23Corporate Governance
in the past. The bonus of the group net profit is derivedfrom the reported group net profit exceeding a definedbottom threshold. The objectives are set by the Boardof Directors and clearly focus on the group net profitcovering 60 to 100 percent of the performance relatedbonus. Both components have no ceiling. If the thres-hold for the criterion in question is not reached nobonus will apply. The bonus should be under normalconditions in the range of 30 to 60 percent of the totalcompensation.
The non-executive members of the Board ofDirectors receive a fixed salary; in addition, the Chair-man also receives a profit share. The members of theGroup Management Committee receive a fixed salaryand a profit share which is linked to the overall resultsof the group and the results of the respective segments.They also have the possibility of using a limited part oftheir bonus to buy shares of the company with a reten-tion period of 3 years at a preferential price, which is25% below the market price.
The Swiss members of the Group ManagementCommittee are insured in the pension fund with theirwages covered by the AHV; in addition and in accor-dance to the general valid rules the employer-savingspremiums are covered. There are no additional regula-tions for the pension fund. Moreover, every member ofthe Group Management is provided with a companycar. Furthermore, no other significant non-cash bene-fits are made.
Former members of the Board of Directors andGroup Management Committee do not receive anyremuneration.
All compensation figures are decided annually bythe Board of Directors; members directly concerned(Chairman, Delegate) leave the meeting during thesedeliberations.
Compensation for Serving Members of the Corpo-rate Bodies
Total compensation of CHF 2.990 million waspaid to the executive member of the Board of Directorsand to the members of the Group Management (5 per-sons in all) in the financial year 2008. This consists of
fixed components of CHF 2.031 million (salary, lump-sum allowances, pension plan, company car) as well asof variable elements of CHF 0.959 million (variablecompensation, stock ownership program).
A total of CHF 0.791 million was paid to non-exe-cutive members of the Board of Directors (5 persons)in the financial year 2008. For the Chairman of theBoard the total compensation was CHF 0.518 million,thereof CHF 0.264 million fixed components and CHF0.254 million variable compensation.
Further details for compensation and sharehol-dings of the Board of Directors and the Group Mana-gement according to Swiss law articles 663b to CO(Swiss Code of Obligations) can be found on page 30.
No separate severance compensation was paid.
Compensation for Former Members of CorporateBodies
No compensation was paid to former members ofcorporate bodies.
Allocation of Shares in the Year Under Review
In the year under review, the executive member ofthe Board of Directors and the members of the GroupManagement Committee purchased a total of 637 bea-rer shares on the stated preferential terms (CHF 468.00per bearer share). No allocations were made to any per-sons having a close relationship to these members. Noshares were allocated to non-executive members of theBoard of Directors or to persons close to them.
Share Ownership
Together all the executive members of the Boardof Directors and the members of the Group Manage-ment Committee and persons close to them hold 3’199bearer shares.
All the non-executive members of the Board ofDirectors and persons close to them together own40’121 bearer shares and 410’000 registered shares.This f igure includes the 37’930 bearer shares and410’000 registered shares which are owned by the Dr.A. Stoffel Holding AG / Dr. A. Stoffel (see section 1,
24 Corporate Governance
Major Shareholders).
Options
No options have ever been issued on shareholdingrights in Hügli Holding AG, either to executive or tonon- executive members of the Board of Directors or tomembers of the Group Management Committee.
Additional Fees and Remuneration
In the fiscal year no additional fees were paid tomembers of the Board of Directors or the Group Mana-gement Committee.
Loans to Members of Corporate Bodies
There are no loans, advances or credits outstan-ding with respect to members of the Board of Directorsor the Group Management Committee, or to personsclose to them.
Maximum Total Compensation
The maximum total compensation paid to a mem-ber of the Board of Directors in the financial year 2008was CHF 0.840 million.
6. Shareholders’ Rights of Participation
There are no limitations on voting rights.
There are no statutory quorum requirements,apart from the statutory provisions of articles 703 and704 CO (Swiss Code of Obligations).
There are no rules deviating from statutory provi-sions in respect of the convening of the General Mee-ting.
There are no rules deviating from articles 699 and700 CO relating to the placing of items for discussi-on on the agenda and time limits.
Entry in the share register: Pursuant to article 8,paragraph 4, of the articles of incorporation of thecompany, changes in the ownership of registered sha-res are no longer taken into account after invitationshave been issued to attend the General Meeting.
7. Change of Control and Safeguard Measures
Obligation to Offer for Purchase
Under article 5 of the articles of incorporation, abidder is only required to make a public purchase offeras specified in article 32 of BEHG (Swiss federal lawon share trading and the stock exchange) if he holdsmore than 49% of the voting rights in the company(opting-up).
Change of Control Clauses
No such agreements exist with the members of theBoard of Directors, the Group Management Commit-tee or other executive staff.
8. Statutory Auditors
Duration of Mandate and Term of Office of theAuditor in Charge
OBT AG, St. Gallen, Switzerland is the statutoryauditor for Hügli Holding AG. This firm was appoin-ted for the first time in 1962 as the statutory auditingcompany to Hügli Nährmittel AG and then as auditingcompany to Hügli Holding AG following its incorpo-ration in 1966. The audit mandate runs for one year
25Corporate Governance
with the possibility of reappointment under article 19of the articles of incorporation.
The auditor in charge, Mr. Christian Siegfried,has held his position since the financial year 2007.
Audit Fees
In 2008 OBT AG, St. Gallen, invoiced the sum ofCHF 0.102 million to Hügli Holding AG and its Swisssubsidiary companies for services provided in connec-tion with the audit of the annual statement of accountsand consolidated accounts.
No additional fees were paid to OBT AG or to per-sons or companies affiliated to it.
Information Instruments in Relation to the externalAudit
The Board of Directors examines the audit reportsof Hügli Holding AG, the group audit and the manage-ment letters of the main subsidiary companies. Aworkshop is held on the occasion of the approval of theannual statement of accounts with the group auditorsand, where appropriate, with the auditors of individualsubsidiary companies. At this meeting the commentaryreports and important issues of the management letterswere discussed in detail as well as the audit focusesexplained.
9. Information Policy
The Hügli Group cares for open and regular com-munication with shareholders, the capital market andthe public. The CEO and the CFO are available for allissues concerning external communication.
Hügli informs twice a year with the annual andthe half-year report about the course of business andthe f inancial situation. Important businesses andevents which may have an impact on share price arepublished routinely (ad hoc publicity).
Key dates in 2009:
- Sales report: 27 January 2009- Media- and analyst conference
(annual report 2008, report for first quarter 2009): 15 April 2009
- General Meeting of Shareholders: 13 May 2009- Reduction in par value / Dividend: 7 August 2009- Half-year report 2009: 14 August 2009
Further dates, reports and media releases can be foundat www. huegli.com under Investor Relations.The responsible person for investor relations is:Andreas Seibold, CFOTel. +41 71 447 22 50, Fax. +41 71 447 22 [email protected]
26 Financial Statements Holding
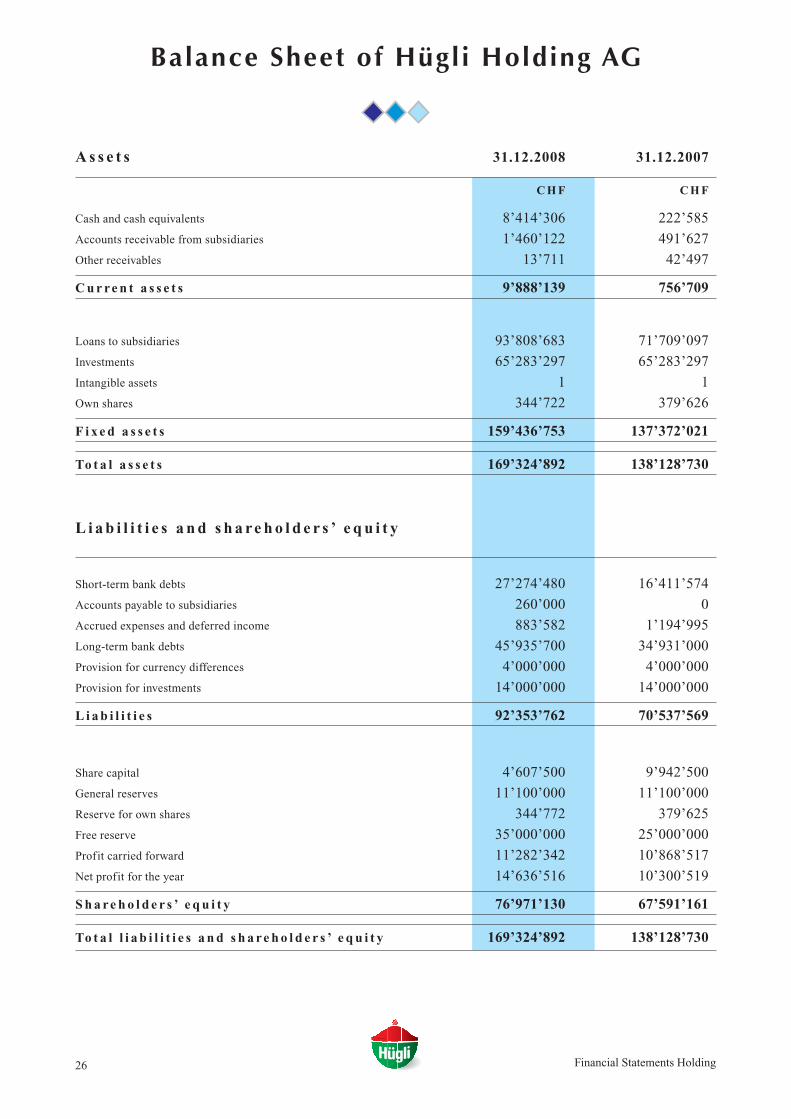
Balance Sheet of Hügli Holding AG
A s s e t s 31.12.2008 31.12.2007
C H F C H F
Cash and cash equivalents 8’414’306 222’585
Accounts receivable from subsidiaries 1’460’122 491’627
Other receivables 13’711 42’497
C u r re n t a s s e t s 9’888’139 756’709
Loans to subsidiaries 93’808’683 71’709’097
Investments 65’283’297 65’283’297
Intangible assets 1 1
Own shares 344’722 379’626
F i x e d a s s e t s 159’436’753 137’372’021
To t a l a s s e t s 169’324’892 138’128’730
L i a b i l i t i e s a n d s h a re h o l d e r s ’ e q u i t y
Short-term bank debts 27’274’480 16’411’574
Accounts payable to subsidiaries 260’000 0
Accrued expenses and deferred income 883’582 1’194’995
Long-term bank debts 45’935’700 34’931’000
Provision for currency differences 4’000’000 4’000’000
Provision for investments 14’000’000 14’000’000
L i a b i l i t i e s 92’353’762 70’537’569
Share capital 4’607’500 9’942’500
General reserves 11’100’000 11’100’000
Reserve for own shares 344’772 379’625
Free reserve 35’000’000 25’000’000
Profit carried forward 11’282’342 10’868’517
Net profit for the year 14’636’516 10’300’519
S h a re h o l d e r s ’ e q u i t y 76’971’130 67’591’161
To t a l l i a b i l i t i e s a n d s h a re h o l d e r s ’ e q u i t y 169’324’892 138’128’730
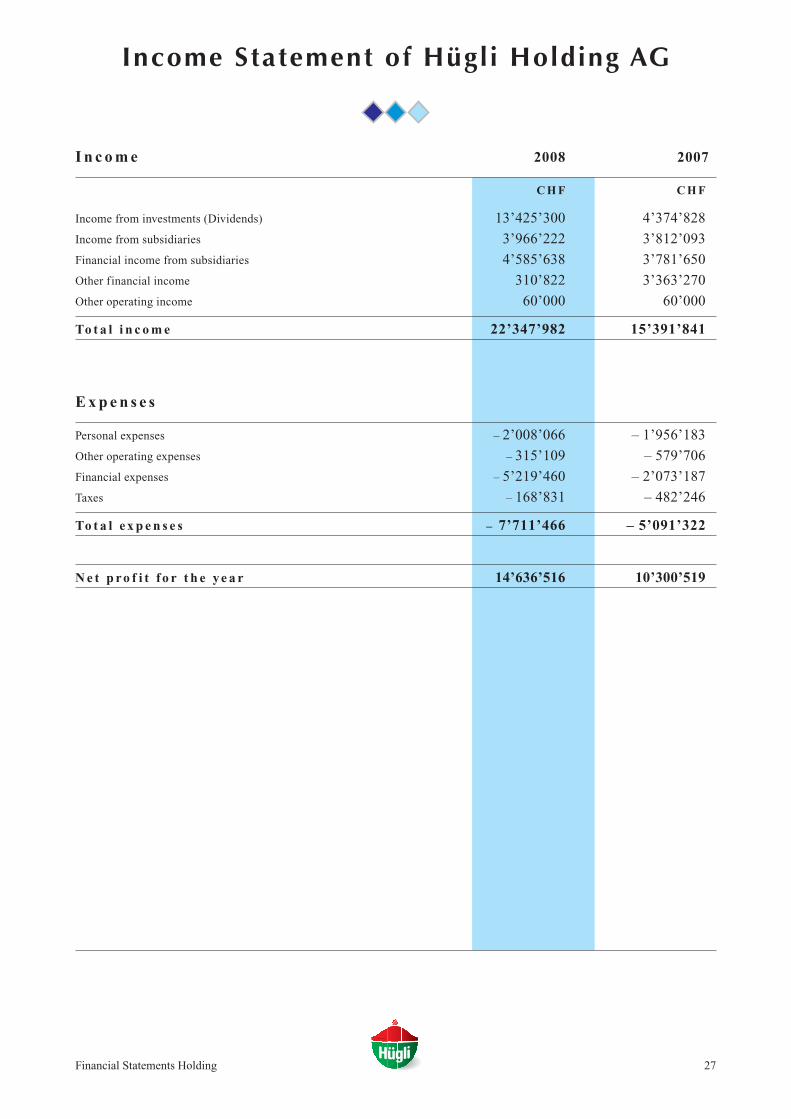
27Financial Statements Holding
Income Statement of Hügli Holding AG
I n c o m e 2008 2007
C H F C H F
Income from investments (Dividends) 13’425’300 4’374’828
Income from subsidiaries 3’966’222 3’812’093
Financial income from subsidiaries 4’585’638 3’781’650
Other financial income 310’822 3’363’270
Other operating income 60’000 60’000
To t a l i n c o m e 22’347’982 15’391’841
E x p e n s e s
Personal expenses – 2’008’066 – 1’956’183
Other operating expenses – 315’109 – 579’706
Financial expenses – 5’219’460 – 2’073’187
Taxes – 168’831 – 482’246
To t a l e x p e n s e s – 7’711’466 – 5’091’322
N e t p ro f i t f o r t h e y e a r 14’636’516 10’300’519
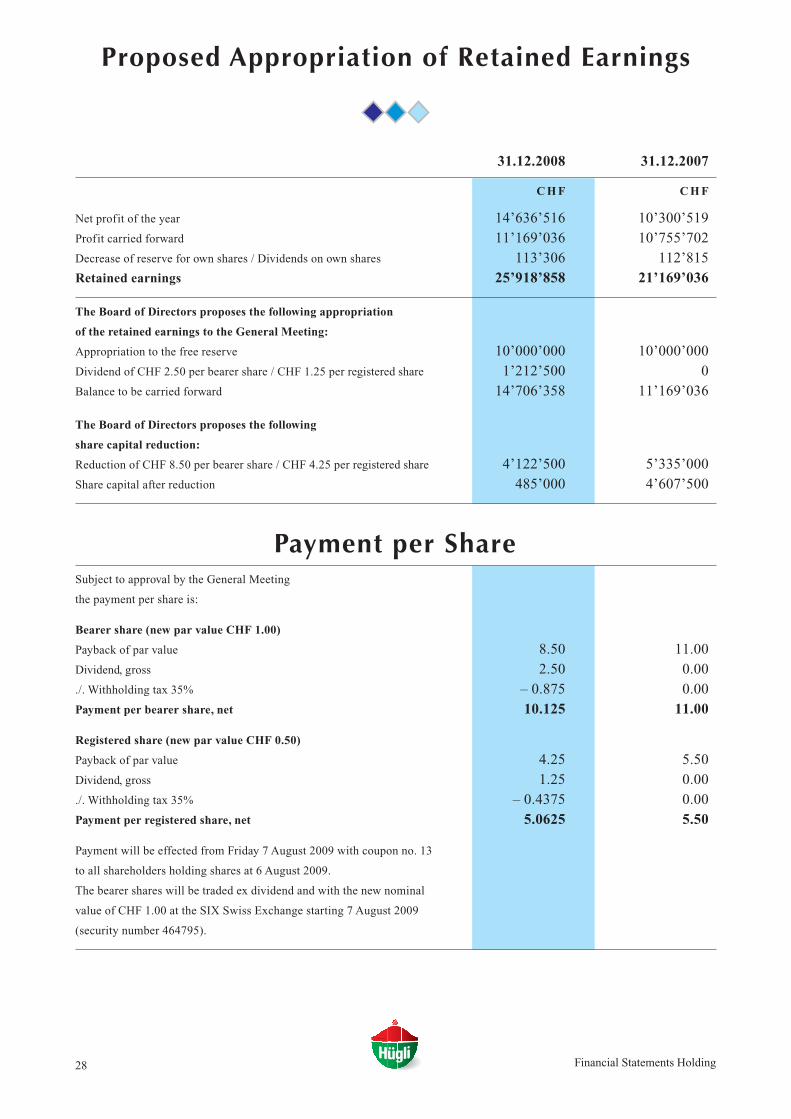
28 Financial Statements Holding
Proposed Appropriation of Retained Earnings
31.12.2008 31.12.2007
C H F C H F
Net profit of the year 14’636’516 10’300’519Profit carried forward 11’169’036 10’755’702Decrease of reserve for own shares / Dividends on own shares 113’306 112’815Retained earnings 25’918’858 21’169’036
The Board of Directors proposes the following appropriation
of the retained earnings to the General Meeting:
Appropriation to the free reserve 10’000’000 10’000’000Dividend of CHF 2.50 per bearer share / CHF 1.25 per registered share 1’212’500 0Balance to be carried forward 14’706’358 11’169’036
The Board of Directors proposes the following
share capital reduction:
Reduction of CHF 8.50 per bearer share / CHF 4.25 per registered share 4’122’500 5’335’000Share capital after reduction 485’000 4’607’500
Payment per ShareSubject to approval by the General Meeting
the payment per share is:
Bearer share (new par value CHF 1.00)
Payback of par value 8.50 11.00Dividend, gross 2.50 0.00./. Withholding tax 35% – 0.875 0.00Payment per bearer share, net 10.125 11.00
Registered share (new par value CHF 0.50)
Payback of par value 4.25 5.50Dividend, gross 1.25 0.00./. Withholding tax 35% – 0.4375 0.00Payment per registered share, net 5.0625 5.50
Payment will be effected from Friday 7 August 2009 with coupon no. 13
to all shareholders holding shares at 6 August 2009.
The bearer shares will be traded ex dividend and with the new nominal
value of CHF 1.00 at the SIX Swiss Exchange starting 7 August 2009
(security number 464795).

29Financial Statements Holding
Notes to the Financial Statements of Hügli Holding AG
– Sureties, guarantee commitments and pledges in favour of third parties total to CHF 41.0 million (CHF 41.7million in the previous year).
– No assets have been pledged or assigned to secure own commitments. There are no reservations of owner-ship.
– For details of investments, see separate list on page 63 of the annual report.
– Own shares held by the company: 7’132 bearer shares (7’853 in the previous year) with a par value of CHF9.50 (CHF 20.50 in the previous year) each. In the year reporting, 721 shares (628 in the previous year)were sold to staff as part of a stock owner-ship program at the reduced price of CHF 468.00 (CHF 412.50in the previous year) per share.
– The negative currency differences 2008 reported on group and bank loans in the amount of CHF 2’679’146were put in the income statement. In the previous year positive currency differences in the amount of CHF3’133’053 were put in the income statement, thereof CHF 1’564’167 due to the dissolution of a currencyaccrual.
Disclosures on the Performance of Risk Assessment According to Swiss Law
The Board of the Directors of Hügli Holding AG is the Group’s highest authority for risk assessment. TheGroup-wide risk assessment consists of controlling of risk management procedures and periodic reporting ofGroup Management to the Board of Directors regarding risk identif ication, analysis and monitoring. To gua-rantee early identif ication and management of risks, risk management was assigned to the operating depart-ments within the country organisations, which perform Group functions in the areas of f inancial accountingand reporting, treasury, quality management and production. The reporting on the effectiveness of risk mana-gement to Group Management is carried out by the executive managements of the countries and divisions.
Disclosures on f inancial risk management are presented in note 14 in the Notes to the Consolidated Financi-al Statements.
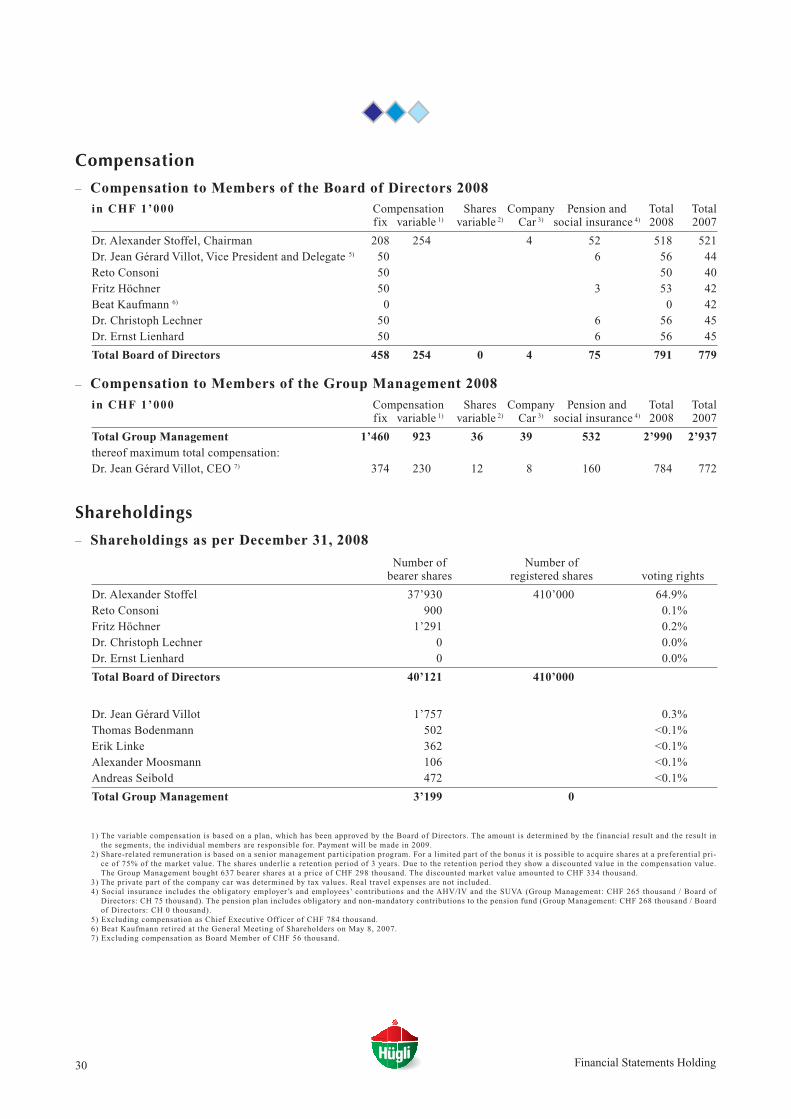
30 Financial Statements Holding
Compensation
– Compensation to Members of the Board of Directors 2008in CHF 1’000 Compensation Shares Company Pension and Total Total
fix variable 1) variable 2) Car 3) social insurance 4) 2008 2007
Dr. Alexander Stoffel, Chairman 208 254 4 52 518 521Dr. Jean Gérard Villot, Vice President and Delegate 5) 50 6 56 44Reto Consoni 50 50 40Fritz Höchner 50 3 53 42Beat Kaufmann 6) 0 0 42Dr. Christoph Lechner 50 6 56 45Dr. Ernst Lienhard 50 6 56 45
Total Board of Directors 458 254 0 4 75 791 779
– Compensation to Members of the Group Management 2008
in CHF 1’000 Compensation Shares Company Pension and Total Totalfix variable 1) variable 2) Car 3) social insurance 4) 2008 2007
Total Group Management 1’460 923 36 39 532 2’990 2’937thereof maximum total compensation:Dr. Jean Gérard Villot, CEO 7) 374 230 12 8 160 784 772
Shareholdings
– Shareholdings as per December 31, 2008
Number of Number of bearer shares registered shares voting rights
Dr. Alexander Stoffel 37’930 410’000 64.9%Reto Consoni 900 0.1%Fritz Höchner 1’291 0.2%Dr. Christoph Lechner 0 0.0%Dr. Ernst Lienhard 0 0.0%
Total Board of Directors 40’121 410’000
Dr. Jean Gérard Villot 1’757 0.3%Thomas Bodenmann 502 <0.1%Erik Linke 362 <0.1%Alexander Moosmann 106 <0.1%Andreas Seibold 472 <0.1%
Total Group Management 3’199 0
1) The variable compensation is based on a plan, which has been approved by the Board of Directors. The amount is determined by the f inancial result and the result inthe segments, the individual members are responsible for. Payment will be made in 2009.
2) Share-related remuneration is based on a senior management participation program. For a limited part of the bonus it is possible to acquire shares at a preferential pri-ce of 75% of the market value. The shares underlie a retention period of 3 years. Due to the retention period they show a discounted value in the compensation value.The Group Management bought 637 bearer shares at a price of CHF 298 thousand. The discounted market value amounted to CHF 334 thousand.
3) The private part of the company car was determined by tax values. Real travel expenses are not included. 4) Social insurance includes the obligatory employer’s and employees’ contributions and the AHV/IV and the SUVA (Group Management: CHF 265 thousand / Board of
Directors: CH 75 thousand). The pension plan includes obligatory and non-mandatory contributions to the pension fund (Group Management: CHF 268 thousand / Boardof Directors: CH 0 thousand).
5) Excluding compensation as Chief Executive Off icer of CHF 784 thousand.6) Beat Kaufmann retired at the General Meeting of Shareholders on May 8, 2007.7) Excluding compensation as Board Member of CHF 56 thousand.
31
Report of the Statutory Auditoron the Financial Statements
As statutory auditor, we have audited the financial statements of Hügli Holding AG, which comprise the balance sheet, income state-ment, statement of changes in equity and notes for the year ended December 31, 2008.
Board of Directors’ ResponsibilityThe board of directors is responsible for the preparation of the financial statements in accordance with the requirements of Swiss lawand the company’s articles of incorporation. This responsibility includes designing, implementing and maintaining an internal controlsystem relevant to the preparation of financial statements that are free from material misstatement, whether due to fraud or error. Theboard of directors is further responsible for selecting and applying appropriate accounting policies and making accounting estimatesthat are reasonable in the circumstances.
Auditor’s ResponsibilityOur responsibility is to express an opinion on these financial statements based on our audit. We conducted our audit in accordance withSwiss law and Swiss Auditing Standards. Those standards require that we plan and perform the audit to obtain reasonable assurancewhether the financial statements are free from material misstatement.
An audit involves performing procedures to obtain audit evidence about the amounts and disclosures in the financial statements. Theprocedures selected depend on the auditor’s judgment, including the assessment of the risks of material misstatement of the financialstatements, whether due to fraud or error. In making those risk assessments, the auditor considers the internal control system relevantto the entity’s preparation of the financial statements in order to design audit procedures that are appropriate in the circumstances, butnot for the purpose of expressing an opinion on the effectiveness of the entity’s internal control system. An audit also includes evalua-ting the appropriateness of the accounting policies used and the reasonableness of accounting estimates made, as well as evaluatingthe overall presentation of the financial statements. We believe that the audit evidence we have obtained is sufficient and appropriateto provide a basis for our audit opinion.
OpinionIn our opinion, the financial statements for the year ended December 31, 2008 comply with Swiss law and the company’s articles ofincorporation.
Report on Other Legal Requirements
We confirm that we meet the legal requirements on licensing according to the Auditor Oversight Act (AOA) and independence (article728 CO and article 11 AOA) and that there are no circumstances incompatible with our independence.
In accordance with article 728a paragraph 1 item 3 CO and Swiss Auditing Standard 890, we confirm that an internal control systemexists, which has been designed for the preparation of financial statements according to the instructions of the board of directors.
We further confirm that the proposed appropriation of available earnings complies with Swiss law and the company’s articles of incor-poration. We recommend that the financial statements submitted to you be approved.
St. Gallen, 20 March 2009
OBT AG
Christian Siegfried Urs FreiSwiss Certified Accountant Swiss Certified Accountant
Auditor in Charge
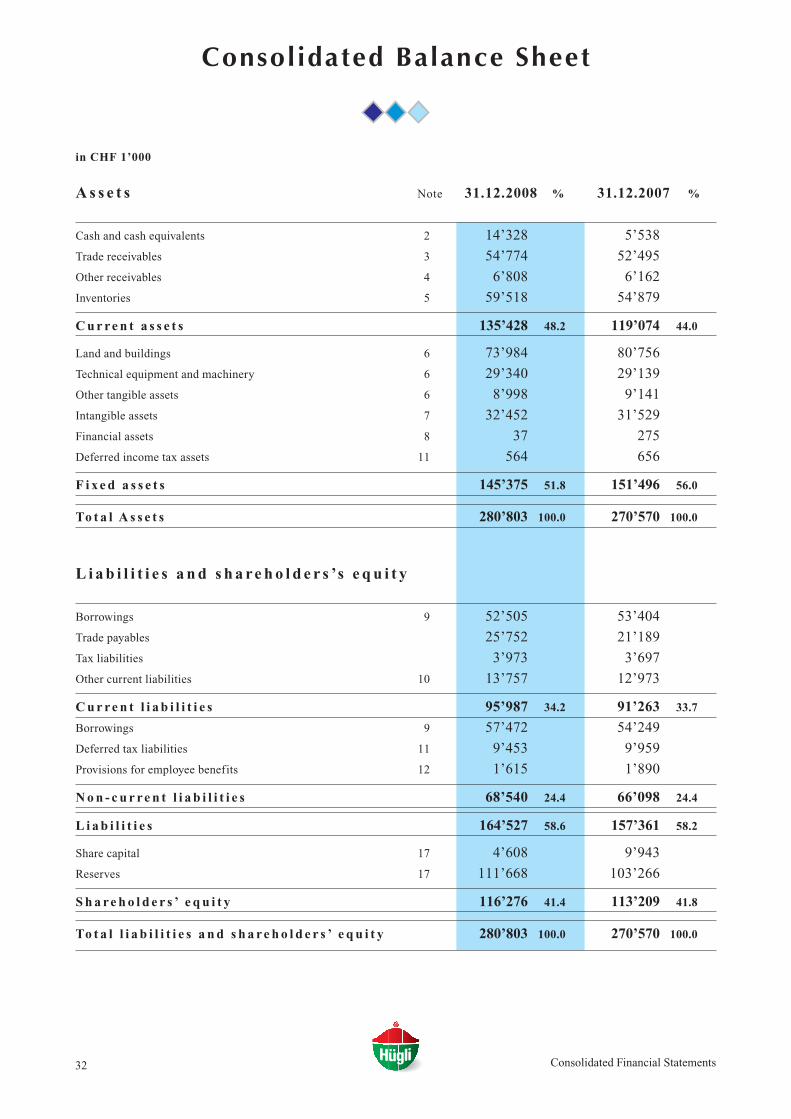
32
in CHF 1’000
A s s e t s Note 31.12.2008 % 31.12.2007 %
Cash and cash equivalents 2 14’328 5’538
Trade receivables 3 54’774 52’495
Other receivables 4 6’808 6’162
Inventories 5 59’518 54’879
C u r re n t a s s e t s 135’428 48.2 119’074 44.0
Land and buildings 6 73’984 80’756
Technical equipment and machinery 6 29’340 29’139
Other tangible assets 6 8’998 9’141
Intangible assets 7 32’452 31’529
Financial assets 8 37 275
Deferred income tax assets 11 564 656
F i x e d a s s e t s 145’375 51.8 151’496 56.0
To t a l A s s e t s 280’803 100.0 270’570 100.0
L i a b i l i t i e s a n d s h a re h o l d e r s ’s e q u i t y
Borrowings 9 52’505 53’404
Trade payables 25’752 21’189
Tax liabilities 3’973 3’697
Other current liabilities 10 13’757 12’973
C u r re n t l i a b i l i t i e s 95’987 34.2 91’263 33.7
Borrowings 9 57’472 54’249
Deferred tax liabilities 11 9’453 9’959
Provisions for employee benefits 12 1’615 1’890
N o n - c u r re n t l i a b i l i t i e s 68’540 24.4 66’098 24.4
L i a b i l i t i e s 164’527 58.6 157’361 58.2
Share capital 17 4’608 9’943
Reserves 17 111’668 103’266
S h a re h o l d e r s ’ e q u i t y 116’276 41.4 113’209 41.8
To t a l l i a b i l i t i e s a n d s h a re h o l d e r s ’ e q u i t y 280’803 100.0 270’570 100.0
Consolidated Financial Statements
Consolidated Balance Sheet
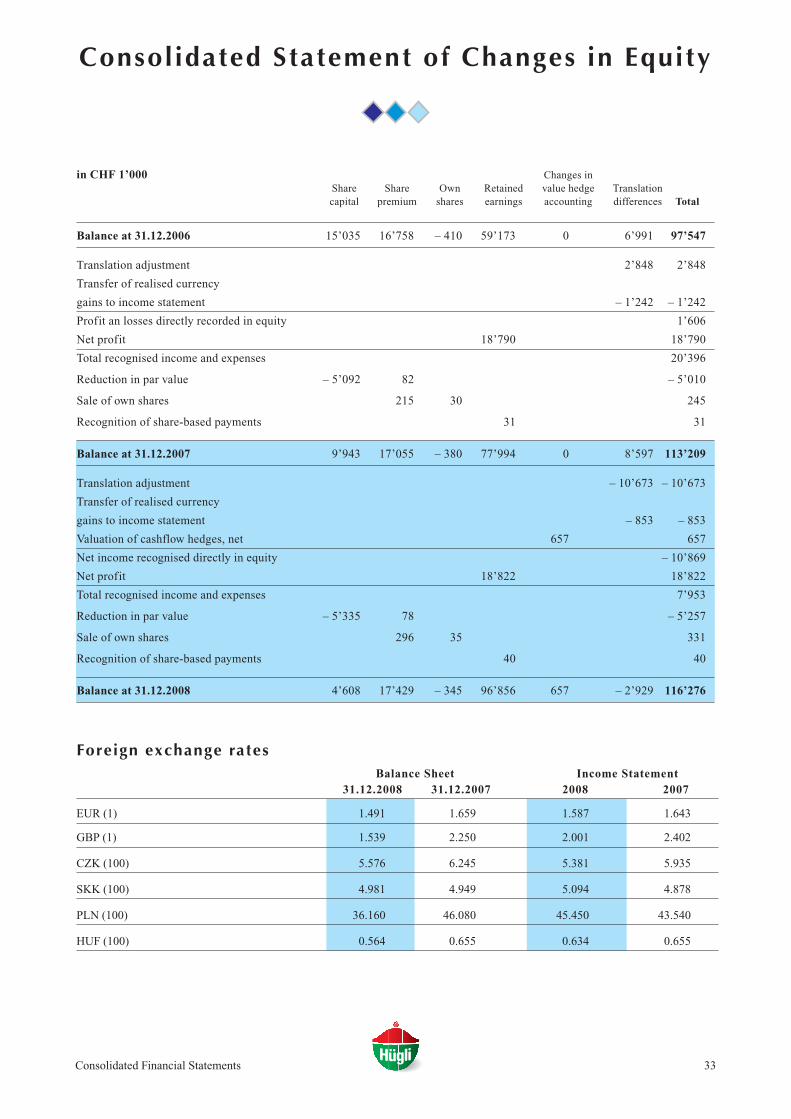
33
Consolidated Statement of Changes in Equity
Foreign exchange rates
Consolidated Financial Statements
Balance Sheet Income Statement31.12.2008 31.12.2007 2008 2007
EUR (1) 1.491 1.659 1.587 1.643
GBP (1) 1.539 2.250 2.001 2.402
CZK (100) 5.576 6.245 5.381 5.935
SKK (100) 4.981 4.949 5.094 4.878
PLN (100) 36.160 46.080 45.450 43.540
HUF (100) 0.564 0.655 0.634 0.655
in CHF 1’000 Changes inShare Share Own Retained value hedge Translationcapital premium shares earnings accounting differences Total
Balance at 31.12.2006 15’035 16’758 – 410 59’173 0 6’991 97’547
Translation adjustment 2’848 2’848
Transfer of realised currency
gains to income statement – 1’242 – 1’242
Profit an losses directly recorded in equity 1’606
Net profit 18’790 18’790
Total recognised income and expenses 20’396
Reduction in par value – 5’092 82 – 5’010
Sale of own shares 215 30 245
Recognition of share-based payments 31 31
Balance at 31.12.2007 9’943 17’055 – 380 77’994 0 8’597 113’209
Translation adjustment – 10’673 – 10’673
Transfer of realised currency
gains to income statement – 853 – 853
Valuation of cashflow hedges, net 657 657
Net income recognised directly in equity – 10’869
Net profit 18’822 18’822
Total recognised income and expenses 7’953
Reduction in par value – 5’335 78 – 5’257
Sale of own shares 296 35 331
Recognition of share-based payments 40 40
Balance at 31.12.2008 4’608 17’429 – 345 96’856 657 – 2’929 116’276
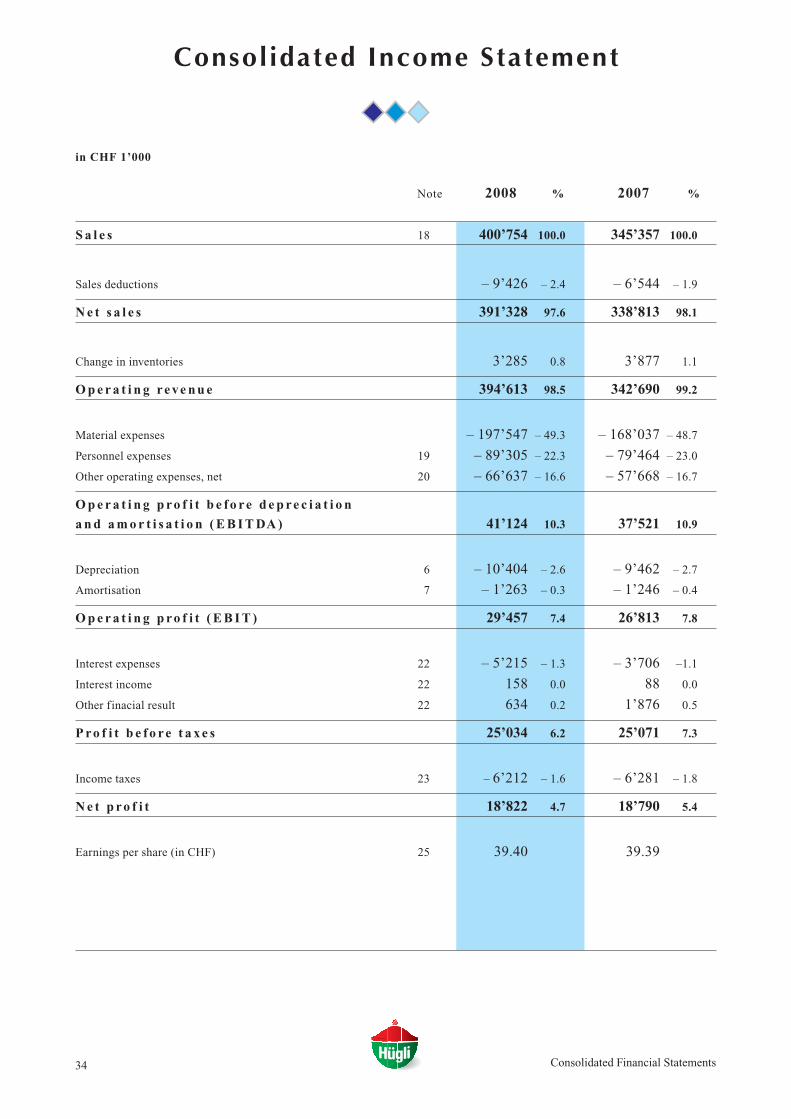
34
Consolidated Income Statement
in CHF 1’000
Note 2008 % 2007 %
S a l e s 18 400’754 100.0 345’357 100.0
Sales deductions – 9’426 – 2.4 – 6’544 – 1.9
N e t s a l e s 391’328 97.6 338’813 98.1
Change in inventories 3’285 0.8 3’877 1.1
O p e r a t i n g re ve n u e 394’613 98.5 342’690 99.2
Material expenses – 197’547 – 49.3 – 168’037 – 48.7
Personnel expenses 19 – 89’305 – 22.3 – 79’464 – 23.0
Other operating expenses, net 20 – 66’637 – 16.6 – 57’668 – 16.7
O p e r a t i n g p ro f i t b e f o re d e p re c i a t i o n
a n d a m o r t i s a t i o n ( E B I T DA ) 41’124 10.3 37’521 10.9
Depreciation 6 – 10’404 – 2.6 – 9’462 – 2.7
Amortisation 7 – 1’263 – 0.3 – 1’246 – 0.4
O p e r a t i n g p ro f i t ( E B I T ) 29’457 7.4 26’813 7.8
Interest expenses 22 – 5’215 – 1.3 – 3’706 –1.1
Interest income 22 158 0.0 88 0.0
Other finacial result 22 634 0.2 1’876 0.5
P ro f i t b e f o re t a x e s 25’034 6.2 25’071 7.3
Income taxes 23 – 6’212 – 1.6 – 6’281 – 1.8
N e t p ro f i t 18’822 4.7 18’790 5.4
Earnings per share (in CHF) 25 39.40 39.39
Consolidated Financial Statements
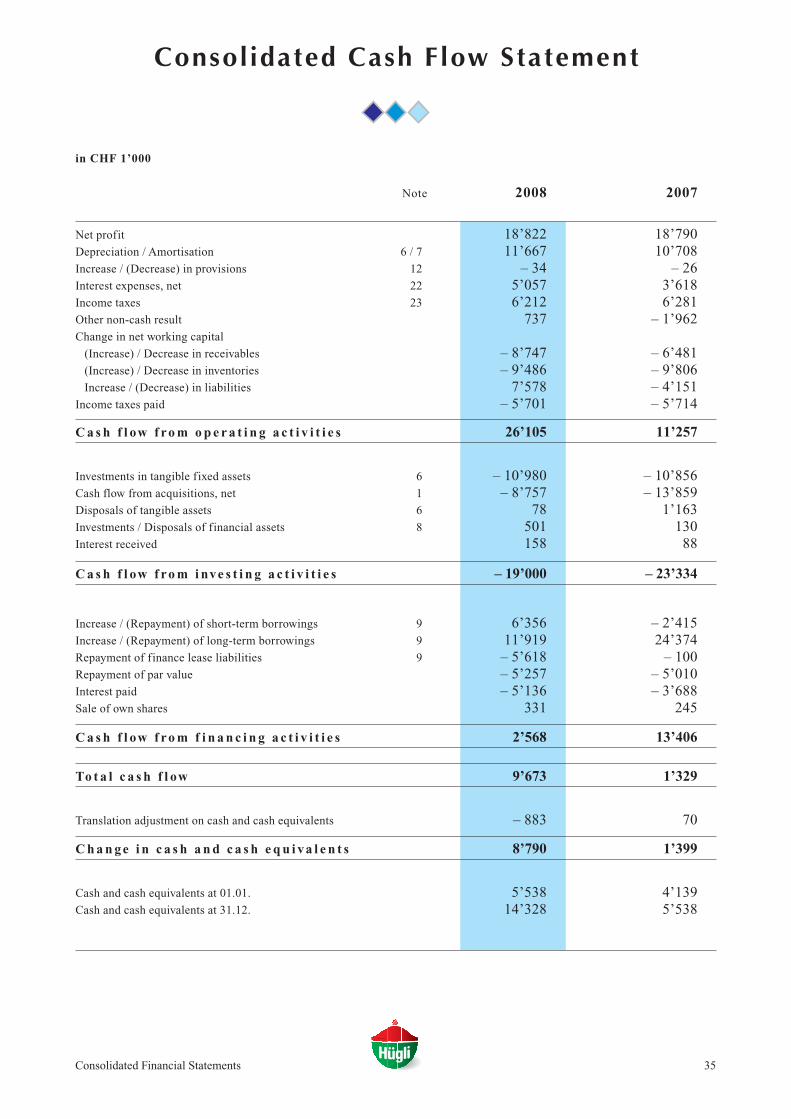
35
Consolidated Cash Flow Statement
in CHF 1’000
Note 2008 2007
Net profit 18’822 18’790Depreciation / Amortisation 6 / 7 11’667 10’708Increase / (Decrease) in provisions 12 – 34 – 26Interest expenses, net 22 5’057 3’618Income taxes 23 6’212 6’281Other non-cash result 737 – 1’962Change in net working capital
(Increase) / Decrease in receivables – 8’747 – 6’481(Increase) / Decrease in inventories – 9’486 – 9’806Increase / (Decrease) in liabilities 7’578 – 4’151
Income taxes paid – 5’701 – 5’714
C a s h f l ow f ro m o p e r a t i n g a c t i v i t i e s 26’105 11’257
Investments in tangible fixed assets 6 – 10’980 – 10’856Cash flow from acquisitions, net 1 – 8’757 – 13’859Disposals of tangible assets 6 78 1’163Investments / Disposals of financial assets 8 501 130Interest received 158 88
C a s h f l ow f ro m i nve s t i n g a c t i v i t i e s – 19’000 – 23’334
Increase / (Repayment) of short-term borrowings 9 6’356 – 2’415Increase / (Repayment) of long-term borrowings 9 11’919 24’374Repayment of finance lease liabilities 9 – 5’618 – 100Repayment of par value – 5’257 – 5’010Interest paid – 5’136 – 3’688Sale of own shares 331 245
C a s h f l ow f ro m f i n a n c i n g a c t i v i t i e s 2’568 13’406
To t a l c a s h f l ow 9’673 1’329
Translation adjustment on cash and cash equivalents – 883 70
C h a n g e i n c a s h a n d c a s h e q u i va l e n t s 8’790 1’399
Cash and cash equivalents at 01.01. 5’538 4’139Cash and cash equivalents at 31.12. 14’328 5’538
Consolidated Financial Statements
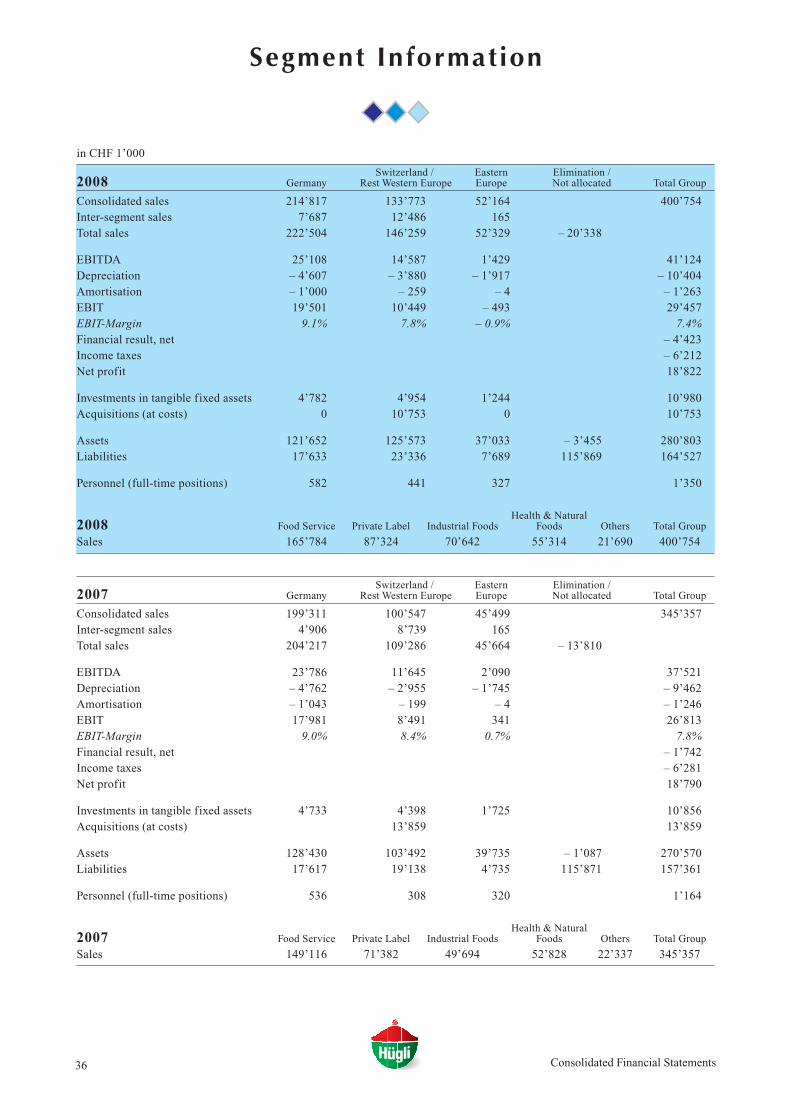
36 Consolidated Financial Statements
Segment Information
in CHF 1’000
Switzerland / Eastern Elimination /2008 Germany Rest Western Europe Europe Not allocated Total Group
Consolidated sales 214’817 133’773 52’164 400’754Inter-segment sales 7’687 12’486 165Total sales 222’504 146’259 52’329 – 20’338
EBITDA 25’108 14’587 1’429 41’124Depreciation – 4’607 – 3’880 – 1’917 – 10’404Amortisation – 1’000 – 259 – 4 – 1’263EBIT 19’501 10’449 – 493 29’457EBIT-Margin 9.1% 7.8% – 0.9% 7.4%Financial result, net – 4’423Income taxes – 6’212Net profit 18’822
Investments in tangible fixed assets 4’782 4’954 1’244 10’980Acquisitions (at costs) 0 10’753 0 10’753
Assets 121’652 125’573 37’033 – 3’455 280’803Liabilities 17’633 23’336 7’689 115’869 164’527
Personnel (full-time positions) 582 441 327 1’350
Health & Natural2008 Food Service Private Label Industrial Foods Foods Others Total Group
Sales 165’784 87’324 70’642 55’314 21’690 400’754
Switzerland / Eastern Elimination /2007 Germany Rest Western Europe Europe Not allocated Total Group
Consolidated sales 199’311 100’547 45’499 345’357Inter-segment sales 4’906 8’739 165Total sales 204’217 109’286 45’664 – 13’810
EBITDA 23’786 11’645 2’090 37’521Depreciation – 4’762 – 2’955 – 1’745 – 9’462Amortisation – 1’043 – 199 – 4 – 1’246EBIT 17’981 8’491 341 26’813EBIT-Margin 9.0% 8.4% 0.7% 7.8%Financial result, net – 1’742Income taxes – 6’281Net profit 18’790
Investments in tangible fixed assets 4’733 4’398 1’725 10’856Acquisitions (at costs) 13’859 13’859
Assets 128’430 103’492 39’735 – 1’087 270’570Liabilities 17’617 19’138 4’735 115’871 157’361
Personnel (full-time positions) 536 308 320 1’164
Health & Natural2007 Food Service Private Label Industrial Foods Foods Others Total Group
Sales 149’116 71’382 49’694 52’828 22’337 345’357
37
Notes to the Consolidated Financial Statements
Corpora te Account ing Pr inc ip l e s
Genera l
The consolidated f inancial statements of the Hügli Group give a true view of the consolidated f inancial position, resultsof operation and cash flows in accordance with the International Reporting Standards (IFRS) and comply with Swiss law.
The following new interpretations on the International Reporting Standards (IFRS) have come into effect for the f inan-cial year 2008:- IFRIC 11 / IFRS 2 – Group and Treasury Share Transactions- IFRIC 12 – Service Concession Arrangements- IFRIC 14 / IAS 19 – The Limit on a Def ined Benef it Asset, Minimum Funding Requirements and their Interaction- IAS 39 / IFRS 7 – Financial Instruments: Recognition and Measurement / Disclosures (Reclassif ication of Assets)These new interpretations and standards have no material effect on the present f inancial statements.
The preparation of the consolidated f inancial statements requires management to make assumptions and estimates thataffect the reported amounts of assets, liabilities, expenses, revenues and contingent liabilities at the date of the consoli-dated f inancial statements. Actual results may differ from these estimates. Material assumptions, which influence the con-solidated f inancial statements of the Hügli Group, include particularly the evaluation of impairments of f ixed assets andthe measurement of tax liabilities.The estimated useful life of tangible f ixed assets can be shortened through altered use of property, plant and equipment.The recoverable amount of intangible assets (mostly goodwill, brands and customer relations) is based on assumptionsof future revenues, margins and discount rates. If these assumptions change, future results may vary considerably fromcurrent calculations. The carrying amount of such assets is documented in notes 6 and 7.The valuation of tax liabilities is subject to the interpretation of tax laws in the respective jurisdictions, who appraisetheir adequacy through f inal assessment and audits by the tax authorities. This can result in material changes to tax expen-se. Furthermore, in order to determine whether tax loss carryforwards may be carried as an asset, it is f irst necessary tocritically assess the probability that there will be future taxable prof it against which to offset them. The budgeted assetsmay not be achieved, due to a variety of influencing factors and developments. The book values are explained in note 11.In the course of their ordinary operating activities, corporate subsidiaries can become involved in litigation. Dependingon the estimate on the part of the Executive Committee, this can result in specif ic provisions. The outcome of these pro-ceedings may result in claims against the Group that cannot be met at all or in full through provisions or insurance cover.
Consolidation is based on the audited f inancial statements of the Hügli corporate subsidiaries for the year ended 31December, prepared in accordance with uniform corporate accounting principles. The consolidated f inancial statementsare based on historical cost, with the exception of investment properties, derivative f inancial instruments and furtherf inancial assets that are stated at fair value.
The Board of Directors of Hügli Holding AG passed the consolidated f inancial statements 2008 on 20 March 2009. Theymust also be approved at the Annual General Meeting on 13 May 2009.
Scope and Pr inc ip l e s o f Conso l ida t ion
The scope of consolidation includes Hügli Holding AG and all Swiss and foreign subsidiaries which the parent company,directly or indirectly, controls either by holding more than 50% of the voting rights or by having otherwise the power togovern their operating and f inancial policies. Complying with the method of full consolidation, assets, liabilities, inco-me and expenses are incorporated fully in the consolidated accounts. Intercompany balances and transactions (accountsreceivable, accounts payable, income and expenses) are eliminated upon consolidation. Minority interests in the equity
Consolidated Financial Statements
38
and net income of consolidated companies are presented separately. Gains arising from intercompany transactions areeliminated in full. Capital consolidation is based on the purchase method, whereby the fair value of assets, liabilities andcontingent liabilities of the acquired subsidiary is cleared against the acquisition cost at the time of acquisition. A posi-tive difference will be recognised as goodwill. Companies acquired in the course of the f inancial year are consolidatedfrom the date on which control is obtained. Companies sold are excluded from the scope of consolidation as of the dateon which control is given up, with any gain or loss recognised in income.Companies in which Hügli Holding AG has a minority interest of at least 20% but less than 50%, or over which it other-wise has signif icant influence, are included in the consolidated f inancial statements using the equity method of accoun-ting and on the consolidated balance sheet presented separately as investments in associates. The share in prof it or lossis recognised and presented separately in the consolidated income statement.Investments with a voting power of less than 20% are stated at fair value and presented under other f inancial assets, withthe unrealised gains and losses recognised directly in the consolidated income statement. An overview of the consolida-ted group of companies is provided on page 63.
Fore ign Currency Trans la t i on
The reporting currency is the Swiss Franc (CHF). If not stated otherwise, all figures presented in these financial statements arerounded to CHF 1’000 and reported in Thousand Swiss Francs (TCHF).Corporate subsidiaries prepare their f inancial statements in local currency. Transactions in foreign currencies are trans-lated at the foreign exchange rate ruling at the date of transaction. Monetary assets and liabilities held in foreign cur-rencies are translated at the spot rate on the balance sheet rate. Foreign currency gains and losses resulting from tran-sactions and from the translation of balance sheet items denominated in foreign currencies are recognised in the conso-lidated income statement. The fair value fluctuations of derivative f inancial instruments used to hedge such balance sheetitems are also recognised in the income statement.
For consolidation purposes, the f inancial statements of the foreign entities are translated into Swiss francs as follows:balance sheets at year-end rates, income and cash flow statements at average rates for the year under review. Any trans-lation adjustment resulting from the translation of balance sheets and income statements, as well as the foreign exchan-ge gains and losses arising from the translation of equity-like corporate loans denominated in foreign currencies, whichare a component of net investments in a subsidiary and the repayment of which is neither planned nor intended, are reco-gnised at the spot rate directly in equity as translation differences. When realised through the sale of a foreign subsidi-ary or the repayment of equity-like corporate loans, the corresponding accumulated translation differences are carriedforward to the income statement.
Account ing Po l i c i e s
Hedge Transactions and Hedge AccountingTo hedge the foreign currency and interest risks Hügli occasionally makes use of forward currency contracts, option con-tracts and swaps, and thereby aims at reducing volatility in the income statement. For a hedging relationship to qualifyas a hedging transaction, it must fulf il various criteria relating to documentation, the probability of occurrence, the effec-tiveness of the hedging instrument, and the reliability of the valuation. On conclusion of a hedging transaction, the Groupdocuments the purpose and the relationship of a hedging instrument with the hedged item based on the Group’s hedgingstrategy. When hedges which qualify for hedge accounting treatment are initially transacted, they are classif ied either ashedging the fair value of a specif ic asset or liability (Fair Value Hedge), as hedging of future highly probably cash flo-ws arising from an expected future transaction (Cash Flow Hedge), or hedging a net investment in a foreign subsidiary. Fluctuations in the market value of reported f inancial instruments or f irm commitments are hedged selectively by meansof fair value hedges. Within the scope of the hedged risk, a market valuation is made of both the underlying and the hed-ging transaction.
Consolidated Financial Statements
39
Fluctuations in the value of cash flow hedge items are recognised in shareholders’ equity if all above mentioned require-ments are fulf illed. The value fluctuations recognised in shareholders’ equity of instruments that are held for the purpo-se of hedging future expenses, sales, f inancial assets or liabilities are recognised in the consolidated income statementon the date of recognition, on which the corresponding underlying transaction is recognised. The value fluctuations reco-gnised in shareholders’ equity of instruments that are held for the purpose of hedging future non-f inancial balance sheetitems are recognised as balance sheet item on the date of recognition of the corresponding underlying transaction. In suchcases, in which the requirements for hedging transactions are no longer fulf illed, the subsequent value fluctuations arerecognised immediately in the consolidated income statement, whereas the accumulated value fluctuations previouslyrecognised in shareholders’ equity are recognised in the consolidated income statement on the date of occurrence of thecorresponding underlying transaction.
The congruent f inancing of the purchasing price of a foreign acquisition with its local functional currency, which doesnot correspond to the Group’s functional currency, constitutes hedging of investments in a foreign subsidiary. The allo-cated bank loans are translated at year-end rates and the unrealised gains and losses are recognised directly in equity, cor-responding to the translation adjustment in the balance sheets of acquired foreign companies, but only as long as the netassets exceed the loans taken up. If loans taken up are higher than the net assets of a subsidiary, the differences resultingfrom foreign currency exchange that form the amount exceeding the loans taken up are recognised with any gain or loss.All external f inancing is formally documented and monitored. The effectivity results from currency congruency and mani-fests itself in offsetting inclusions of income generated by the hedge instrument and translation differences of consoli-dation in the Group’s equity.
Cash and Cash EquivalentsCash and cash equivalents include cash and cash equivalents with an original maturity of up to 3 months. Cash and cashequivalents are stated at nominal value.
Accounts ReceivableAccounts receivable are stated at nominal value less provisions for doubtful debts. Value adjustments for doubtful debtsare established based on maturity structure and identif iable solvency risks. Besides individual values adjustments withrespect to specif ic identif iable risks, value adjustments are also recognised based on statistically determined credit risks.
InventoriesRaw materials and goods held for trading are generally stated at average cost, and internally manufactured products atmanufacturing cost (including direct and indirect labour and materials used). If the net realisable value is lower, valuati-on adjustments are made accordingly. In addition, valuation adjustments are made for inventories with an unsatisfyingturnover or are diff icult to sell.
Tangible Fixed AssetsTangible f ixed assets are stated at acquisition cost less accumulated straight-line depreciation and impairment allowan-ces, if any. In the case of the operating land and buildings, the historical acquisition costs are based on replacement values,which were determined in 1992. These buildings are being depreciated over their remaining useful lives determined byan external real estate assessment prepared in 2004 in connection with the adoption of IFRS. Non-operating buildings arevalued at fair value; the unrealised gains and losses resulting from periodic revaluations, are recognised in the consoli-dated income statement.The useful lives of buildings are 25 to 50 years, of infrastructure 10 to 25 years, of machinery and equipment 5 to 15years, of furniture and vehicles 4 to 10 years and for EDP (hardware and software) 3 to 6 years. Repair and maintenanceexpense is as a matter of principle directly charged to the consolidated income statement as incurred.
LeasingAssets acquired under f inance leases, where substantially all of the risks and rewards are transferred to the Group uponentering into the contract, are capitalised at the lower of minimum lease payments or fair value. Assets are depreciated
Consolidated Financial Statements
40
on a straight-line basis through the estimated useful life. The related outstanding lease liabilities are presented undercurrent and non-current liabilities. Payments made under f inance leases include amounts related to interest, which isrecorded in the consolidated income statement, and amounts related to the repayment of the f inancial lease liabilities. Operating lease payments are charged to the consolidated income statement as incurred.
Intangible AssetsAcquired intangible assets, which yield a f inancial benef it, such as licenses, trademarks and client lists are capitalisedand amortised on a straight-line basis over their expected useful life, usually 5 to 10 years. Goodwill, which represents the difference between the acquisition cost and the fair value of the acquired net assets, iscapitalised. Goodwill and other intangible assets (trademarks) with an indef inite useful life are, in accordance with IFRS3, not systematically amortised. These assets are allocated to the appropriate cash-generating units and tested annuallyfor impairment. If necessary, impairment charges are recognised in the consolidated income statement.
Research and DevelopmentAll research costs are recognised in the consolidated income statement as incurred. In general, the spending on develop-ment costs is not capitalised as an asset in the balance sheet but booked in the income statement as expenses (IAS 38 notfulf illed).
Financial assetsMarketable securities and other f inancial assets are stated at fair value, with unrealised gains and losses recognised inthe consolidated income statement. Own shares are stated at acquisition cost and recognised in equity. Realised gainsand losses from the sale of own shares are recorded in share premium.
ImpairmentThe recoverable amount of non-current assets is reviewed at least once a year. If there is any indication of impairment,an impairment test is performed. If the carrying amount exceeds the recoverable amount, an impairment loss is recogni-sed in the consolidated income statement.
Financial LiabilitiesFinancial liabilities, upon their entering, are stated at fair value less transaction costs, and are later recognised at amor-tised cost, which generally correspond to the nominal value. The related interest income is recognised using the effectiveinterest method in the consolidated income statement
ProvisionsProvisions are recognised for any present legal or constructive obligation incurred as a result of a past event if it is pro-bable that an outflow of economic resources will be required to settle the obligation, and the amount can be estimatedreliably.
TaxesCurrent income taxes are calculated on taxable prof its. Deferred taxes are calculated by applying the balance sheet lia-bility method for the temporary differences between the carrying amount and tax base of assets and liabilities. The cal-culation of deferred taxes is based on the country-specif ic tax rates enacted or substantially enacted at the balance sheetdate. Netting of tax assets and liabilities is performed if they concern the same taxable entity and the same tax authori-ties. Deferred tax assets on tax loss carry forwards are only recognised in the consolidated balance sheet to the extent thatit is probable that future taxable prof its will be available, against which the assets can be utilised. Provisions for taxeswithheld at source on undistributed prof its in foreign subsidiaries are only recorded, if the Group intends dividend pay-ments in the near future.
Employee BenefitsSwiss Group companies sponsor a legally independent pension plan foundation according to Swiss legislation. This foun-
Consolidated Financial Statements
41
dation performs services in case of retirement, death and disability. Generally, it is funded by employer and employee con-tributions. Besides these funding obligations, there are no further f inancial obligations to the Group. This pension planqualif ies as a def ined benef it plan in accordance with IAS 19. Accordingly, the def ined benef it obligation is calculatedapplying the projected unit credit method, based on actuarial assumptions such as expected salary and pension increasesand a discount rate. Calculated current service costs are recognised in the consolidated income statement. Actuarial gainsand losses arise mainly from changes in assumptions and from differences between actuarial assumptions and realisedamounts. They are recognised in the consolidated income statement on a straight-line basis over the average remainingservice years to the extent that they exceed the higher of 10% of the fair value of assets, or 10% of the present value ofthe def ined benef it obligations (“corridor”) Actuarial gains and losses are realised in the income statement and not reco-gnised in equity. Def icits arising from such calculations as of the balance sheet date are recognised according to thismechanism. Employee benef it surpluses are, in compliance with IFRIC 14, only capitalised, if they are actually availableto the Group in the form of expected refunds from the fund or reductions in contributions to the fund.The other Group companies have no material independent pension plan. Pension provisions for retired individuals andother employee benef it obligations are actuarially calculated and recorded in the provisions.Social security plans run by the government, which do not include any future f inancial commitments, are qualif ied as def i-ned contribution plans. The funding of def ined contribution plans normally is based on f ixed percentages of the insuredsalaries. The employer contributions paid into these plans are recognised directly in the consolidated income statement.
Stock Ownership ProgramA stock ownership program allows members of senior management to obtain a limited amount of compensation in formof Group stock at 75% of the fair market value. This special offer is subject to a retention period of 3 years. The diffe-rence between market value and preferential price is recognised as personnel expense.
Segment ReportingThe Hügli Group consists of only one single business unit whose purpose is to develop, produce and distribute foodproducts, namely dry blended products.The segment reporting reflects the operational and production related structure of the Hügli Group. This structure isbased on the production sites including the associated sales companies (country clusters based on the location ofassets); these segments are the basis for risks and returns. Primary segment reporting is prepared according to geogra-phic criteria.The segment “Germany” contains every active Group company in the country; the segment “Switzerland / Rest ofWestern Europe” includes companies in Switzerland (including insignif icant Group functions), Austria, United King-dom and Italy. The “Eastern Europe” segment includes companies in the Czech Republic, the Slovak Republic, Polandand Hungary.
In accordance with IAS 14, the allocation of segment assets and segment borrowing costs based on geographic criteriadoes not allocate the f inancial liabilities and tax assets. The segment result before interest and taxes (EBIT) can there-fore be related to operative net assets.The breakdown of sales based on customer-related geographic markets does not differ signif icantly (more than 10% ofgroup sales) from the primary segments. Due to the various customer segments, a secondary segment reporting of sales f igures relates to divisions / client seg-ments. An objective allocation of the manufacturing facilities (assets and investments) to the sales divisions is not fea-sible; the relevant information is consequently not disclosed.
New IASB Standards that have been approved but not yet appliedThe following new and revised standards and interpretations had been approved by the IASB by the time the consolida-ted f inancial statements were authorised for issue by the Board of Directors. However, they do not take effect until lateron and were not adopted early in preparing this set of consolidated f inancial statements. Since their effect on the con-solidated f inancial statements of the Hügli Group has not yet been systematically analysed, the anticipated effects aremerely an initial estimate on the part of the Executive Committee.
Consolidated Financial Statements
42
Standard / Interpretation Effective date Date planned for adoption by Hügli
IAS 1 rev. – Presentation of Financial Statements * January 1, 2009 Financial year 2009
IFRS 8 – Operative Segments * January 1, 2009 Financial year 2009
IFRS 3 rev. – Business Combinations ** July 1, 2009 Financial year 2010
IAS 27 rev. – Consolidated and Separate Financial Statements ** July 1, 2009 Financial year 2010
* Mainly, it is expected that the consolidated financial statements of Hügli will be affected by adjustments and / or additio-
nal disclosures.
** The effects on the consolidated financial statements of Hügli relate to future transactions and therefore cannot yet be
determined with sufficient certainty.
Further amendments, of which no or no signif icant impacts are expected on the consolidated f inancial statements of Hügli:
Standard / Interpretation Effective date Date planned for adoption by Hügli
IFRIC 13 – Customer Loyalty Programms July 1, 2008 Financial year 2009
IAS 23 rev. – Borrowing Costs January 1, 2009 Financial year 2009
IFRS 2 – Share based Payment - Vesting Conditions January 1, 2009 Financial year 2009
and Cancellations
IAS 32 – Financial Instruments and IAS 1– January 1, 2009 Financial year 2009
Presentation of Financial Statements: Puttable Financial-
Instruments and Obligations Arising on Liquidation
IFRS 1 – First-time Adoption of International January 1, 2009 Financial year 2009
Financial Reporting Standards and IAS 27 –
Consolidated and Separate Financial Statements
IFRIC 15 – Agreements for the construction of Real Estate January 1, 2009 Financial year 2009
IFRIC 16 – Hedges of a Net Investment in a Foreign Operation October 1, 2008 Financial year 2009
IAS 39 – Financial Instruments: July 1, 2009 Financial year 2010
Recognition and Measurement – Eligible Hedged Items
IFRIC 17 – Distributions of Non-cash Assets to Owners July 1, 2009 Financial year 2010
Notes to the conso l ida ted f inanc ia l s ta t ement s
1 Changes in Scope o f Conso l ida t ion
In the current year, an acquisition was effected in the United Kingdom, in the previous year in Italy.
As per 01 January 2007 the Hügli Industrial Foods AG, Steinach, Switzerland, was merged with Hügli Nährmittel AG,
Steinach, Switzerland (absorption fusion). The fusion did not affect the Group’s operational activities or the net assets,
financial position and results of operations.
An overview of all Group companies (all fully consolidated) is presented on page 63 of this annual report.
Name, registered office, investment and acquisition date of the acquired companies:
Contract Foods Ltd., Redditch, UK 100% 31.01.2008
Ali-Big s.r.l., Brivio, Italy 100% 30.06.2007
Consolidated Financial Statements
43
In both acquisitions, directly 100% of the shares were acquired.
Contract Foods Ltd. was established in 1981 near Birmingham. The company manufactures dry blends in the functio-
nal foods domain, which includes food supplements, sports and slimming nutrition, and instant beverages. Relying on
a staff of more than 120, Contract Foods provides a broad range of production-related services, and has become a relia-
ble and approved outsourcing partner of the foods and pharmaceutical industry.
Ali-Big was founded as a family business in the early 1960ies in Brivio at the Southern foot of the Alps. With 70 employ-
ees and high-quality products in the domains of liquid sauces and antipasti, the company has successfully established
its Brand “TuttoGusto” in the domestic and the export market.
The book values of acquired assets and liabilities are as follows:
2008 TCHF Book valuesbefore acquisition Revaluation Acquisition values
Cash and cash equivalents 909 909
Accounts receivable 2’054 2’054
Inventories 1’396 1’396
Tangible fixed assets 1’141 1’054 2’196
Operating liabilities – 2’173 – 520 – 2’693
Financial liabilities – 193 – 193
Provisions / Deferred Taxes – 102 – 150 – 252
Net operating assets 3’032 384 3’416Goodwill 7’337
Acquisitions values 10’753Acquired cash and cash equivalents – 909
Deferred part of purchase price – 1’087
Cash flow acquisitions, net 8’757Thereof: directly costs of acquisition 415
2007 TCHF Book valuesbefore acquisition Revaluation Acquisition values
Cash and cash equivalents 316 316
Accounts receivable 5’845 5’845
Inventories 4’600 – 46 4’554
Tangible fixed assets 1’310 7’707 9’017
Immaterielle Anlagen 701 8’280 8’981
Operating liabilities – 5’219 – 5’219
Financial liabilities – 5’242 – 5’939 – 11’181
Provisions / Deferred Taxes – 527 – 666 – 1’193
Net operating assets 1’784 9’336 11’120Goodwill 3’055
Acquisitions values 14’175Acquired cash and cash equivalents – 316
Cash flow acquisitions, net 13’859Thereof: directly costs of acquisition 430
The book values before the acquisition dates were valued based on cost-benefit considerations and not under IFRS.
In connection with the acquisition of Contract Foods in the current period no intangible assets were identified, as it was
not possible to clearly separate neither a trademark nor a client base. In the previous year, a trademark of TCHF 8’280 was
identified for Ali-Big. The goodwill resulting from the acquisitions represents the expected future economic benefit of the
acquired company that cannot be identified and valued separately. This benefit mainly includes expected synergy effects
due to the development of the production sites on the basis of the acquired infrastructure and the specialised staff.
Consolidated Financial Statements
44
The deferred share of the purchase price is calculated depending on the business development 2008/2009 of Contract
Foods Ltd. and may still vary. The final amount of goodwill can therefore be determined only at the end of the busin-
ess year 2009.
Detailed information on the intangible assets is disclosed in note 7.
Acquisition factors since time of acquisition (included in the consolidated financial statements, in TCHF)
Sales 2008 16'242
EBIT 2008 592
Sales 2007 8'532
EBIT 2007 – 5
Had the acquisitions taken place on 1 January of the respective years, consolidated sales 2008 would have increased by
CHF 1.7 million, and for 2007 by CHF 9.1 million respectively, and group profits 2008 would have risen by CHF 0.2
million and for 2007 by CHF 0.0 million.
2 Cash and Cash Equ iva l en t s
TCHF 2008 2007Bank accounts and cash on hand 14’328 5’538
The bank and postal accounts are current accounts. There were no call assets or fixed investments.
3 Trade Account s Rece ivable
TCHF 2008 2007Trade accounts receivable, gross 55’690 53’320
./. Valuation allowance – 916 – 1’078
Total 54’774 52’495
The ageing structure of trade accounts receivable was at year-end date as follows:
TCHF 2008 2007Not due 35’618 38’135
Overdue within 1 month 13’171 11’369
Overdue between 1 to 3 months 4’878 2’717
Overdue over 3 months 2’023 1’352
./. Valuation allowance – 916 – 1’078
Total 54’774 52’495
Value adjustments on trade accounts receivable have changed as follows:
TCHF 2008 2007At 01.01. 1’078 921
Increase, affecting net income 310 291
Decrease / Utilisation – 390 – 262
Acquisition of subsidiaries 0 101
Exchange differences – 82 27
At 31.12. 916 1’078
The trade accounts receivable, which are not due, mainly arise from long-standing and well-diversified customer rela-
tionships. Based on experience, Hügli does not anticipate any significant defaults.
Consolidated Financial Statements
45
4 Other Account s Rece ivable
TCHF 2008 2007Tax receivables 0 283
Forward exchange contracts 657 0
Other receivables 4’315 3’996
Prepaid expenses / accrued income 1’836 1’883
Total 6’808 6’162
5 Inventor i e s
TCHF 2008 2007Raw materials (incl. packaging material) 25’314 21’017
Manufactured products 27’026 26’427
Trade goods 7’712 7’883
./. Valuation allowance – 534 – 448
Total 59’518 54’879
6 Tang ibl e F ixed Asse t s
2008 Land and Tech. Equip./ Other TOTALTCHF Buildings Machinery tangible assets 2008Acquisition valuesAt 01.01. 107’287 75’188 46’177 228’652Additions 1’163 6’010 3’807 10’980Disposals 0 – 649 – 1’789 – 2’438Transfers 270 0 0 270Acquisition of subsidiaries 43 2’137 16 2’197Exchange differences – 8’031 – 7’183 – 3’765 – 18’979At 31.12. 100’732 75’504 44’446 220’682
Accumulated depreciationAt 01.01. – 26’531 – 46’049 – 37’036 – 109’616Planned depreciation – 2’449 – 4’787 – 3’168 – 10’404Disposals 0 632 1’728 2’360Exchange differences 2’232 4’040 3’028 9’300At 31.12. – 26’748 – 46’164 – 35’448 – 108’360
Carrying values at 01.01. 80’756 29’139 9’141 119’036Carrying values at 31.12. 73’984 29’340 8’998 112’322
2007 Land and Tech. Equip./ Other TOTALTCHF Buildings Machinery tangible assets 2007Acquisition valuesAt 01.01. 97’462 64’413 43’793 205’668Additions 2’608 5’975 2’273 10’856Disposals – 808 – 404 – 1’274 – 2’486Acquisition of subsidiaries 5’480 3’191 346 9’017Exchange differences 2’545 2’013 1’039 5’597At 31.12. 107’287 75’188 46’177 228’652
Accumulated depreciationAt 01.01. – 23’833 – 41’294 – 33’986 – 99’113Planned depreciation – 2’218 – 3’834 – 3’410 – 9’462Disposals 174 245 1’143 1’562Exchange differences – 654 – 1’166 – 783 – 2’603At 31.12. – 26’531 – 46’049 – 37’036 – 109’616
Carrying values at 01.01. 73’629 23’119 9’807 106’555Carrying values at 31.12. 80’756 29’139 9’141 119’036
Consolidated Financial Statements
46
Land and buildings includes non-operating real estate, which is measured at its fair valued of TCHF 1’835 (CHF 2’157
in the previous year). The measurement is based on external assessment. There is no evidence of major changes in this
value. The lease contracts of this property amount to TCHF 424 (TCHF 648 in the previous year), the operational expen-
ses to TCHF 303 (TCHF 252 in the previous year). A rental income liability of TCHF 205, which was valuation adju-
sted in the past, was collected in the previous year. This extraordinary factor had an impact on the stated rental inco-
mes.
Investments in finance leases are disclosed under tangible fixed assets. Their net book value amounts to TCHF 2’335
(TCHF 7’628 in the previous year). There have not been any non-cash additions to investments in finance leases.
The fire insurance value of tangible fixed assets totals TCHF 210’751, whereof TCHF 109’003 is for buildings and
TCHF 101’748 for other tangible assets. In the previous year, the total was TCHF 198’415, whereof TCHF 98’518 was
for buildings and TCHF 99’897 for other tangible assets.
Pledged tangible fixed assets for financial liabilities include: Real estate mortgage rights totalling TCHF 48’162 (TCHF
53’735 in the previous year), thereof the utilised credit amounted to TCHF 20’997 (TCHF 23’942 in the previous year).
7 Intang ibl e Asse t s
2008 Brands, other TOTALTCHF Goodwill intangible assets 2008Acquisition valuesAt 01.01. 13’579 21’339 34’918Additions 0 0 0Transfers 0 – 270 – 270Acquisition of subsidiaries 7’337 0 7’337Exchange differences – 3’284 – 1’961 – 5’245At 31.12. 17’632 19’108 36’740
Accumulated depreciationAt 01.01. 0 – 3’389 – 3’389Planned amortisation 0 – 1’263 – 1’263Exchange differences 0 364 364At 31.12. 0 – 4’288 – 4’288
Carrying values at 01.01. 13’579 17’950 31’529Carrying values at 31.12. 17’632 14’820 32’452
2007 Brands, other TOTALTCHF Goodwill intangible assets 2007Acquisition valuesAt 01.01. 10’338 12’030 22’368Additions 0 0 0Disposals 0 0 0Acquisition of subsidiaries 3’055 8’980 12’035Exchange differences 186 329 515At 31.12. 13’579 21’339 34’918
Accumulated depreciationAt 01.01. 0 – 2’077 – 2’077Planned amortisation 0 – 1’246 – 1’246Disposals 0 0 0Exchange differences 0 – 66 – 66At 31.12. 0 – 3’389 – 3’389
Carrying values at 01.01. 10’338 9’953 20’291Carrying values at 31.12. 13’579 17’950 31’529
Consolidated Financial Statements
47
In connection with the acquisition in the current period, no intangible assets could be separated; in the previous year, a
trademark of TCHF 8’280 had been identified.
The acquired intangible assets were valued based on the income oriented Discounted Cash Flow method (“Relief from
Royalty-Method”) using a discount rate of 7.5%.
The resulting goodwill equals the surplus of the acquisition cost over the fair values of the acquired net assets, and repre-
sents the expected future economic benefit of the acquired companies that cannot be identified and valued separately.
The goodwill positions resulting from the acquisition mainly reflect the expected synergies, future products and the
acquired employees.
The goodwill positions are assigned to cash generating units (CGU), which consist either of Group units that comprise
several companies, or of single Group companies. The allocation of goodwill and the trademarks to the CGUs was as
follows:
2008 Discount rateTCHF Goodwill Brands TOTAL before taxes
CGU Inter-Planing, Germany 6’240 3’407 9’647 12.9%
CGU Fino, Germany 0 2’483 2’483 12.9%
CGU Fino, Switzerland 0 184 184 10.2%
CGU Supro, Switzerland 3’170 1’000 4’170 10.2%
CGU UK, United Kingdom 277 0 277 12.5%
CGU Ali-Big, Italy 2’751 7’455 10’206 13.1%
CGU Contract Foods, United Kingdom 5’194 0 5’194 12.5%
Total 17’632 14’529 32’161
2007 Discount rateTCHF Goodwill Brands TOTAL before taxes
CGU Inter-Planing, Germany 6’943 4’370 11’313 12.9%
CGU Fino, Germany 0 3’229 3’229 12.9%
CGU Fino, Switzerland 0 215 215 10.6%
CGU Supro, Switzerland 3’170 1’150 4’320 10.6%
CGU UK, United Kingdom 405 0 405 12.9%
CGU Ali-Big, Italy 3’061 8’295 11’356 12.9%
Total 13’579 17’259 30’838
The book value of not amortised trademarks amounts to TCHF 7’455 (TCHF 8’295 in the previous year), that of tra-
demarks normally amortised over 10 years to TCHF 7’074 (TCHF 8’964 in the previous year).
The existing goodwill positions and trademarks are tested for impairment at least annually at the CGU level. The value
in use is based on future projected discounted cash flows. Usually, the cash flows correspond to detailed financial plans
that were approved by management and cover the period of the first 3 years. For the subsequent years, expected growth
rates are taken into consideration and for years 11 and beyond, an infinite cash flow value is included in the calculation.
The projections use expected EBITDA growth rates of 5% based on the assessment of future economic developments.
After the period of 10 years, zero growth is applied. The discount rate is between 8.5% and 9.0%, considering specific
risk premiums on the base of the weighted average cost of capital (WACC) of Hügli Group of 8.0%. Because the cash
flow projections are determined after taxes, the established discount rates also allow for the specific tax effects.
Based on the impairment tests and sensitivity analyses as of closing date, the values of all goodwill positions are suppor-
ted. No realistically possible changes are expected to affect the applied key assumptions (discount rate, growth rate) that
may result in recoverable amounts of goodwill, which exceed the respective carrying amounts. This excludes unforeseen
circumstances. Particularly included in this support of goodwill positions is the Group’s latest acquisitions, whose good-
will and trademark are subsumed under the CGU Ali-Big, and goodwill under the CGU Contract Foods respectively.
Consolidated Financial Statements
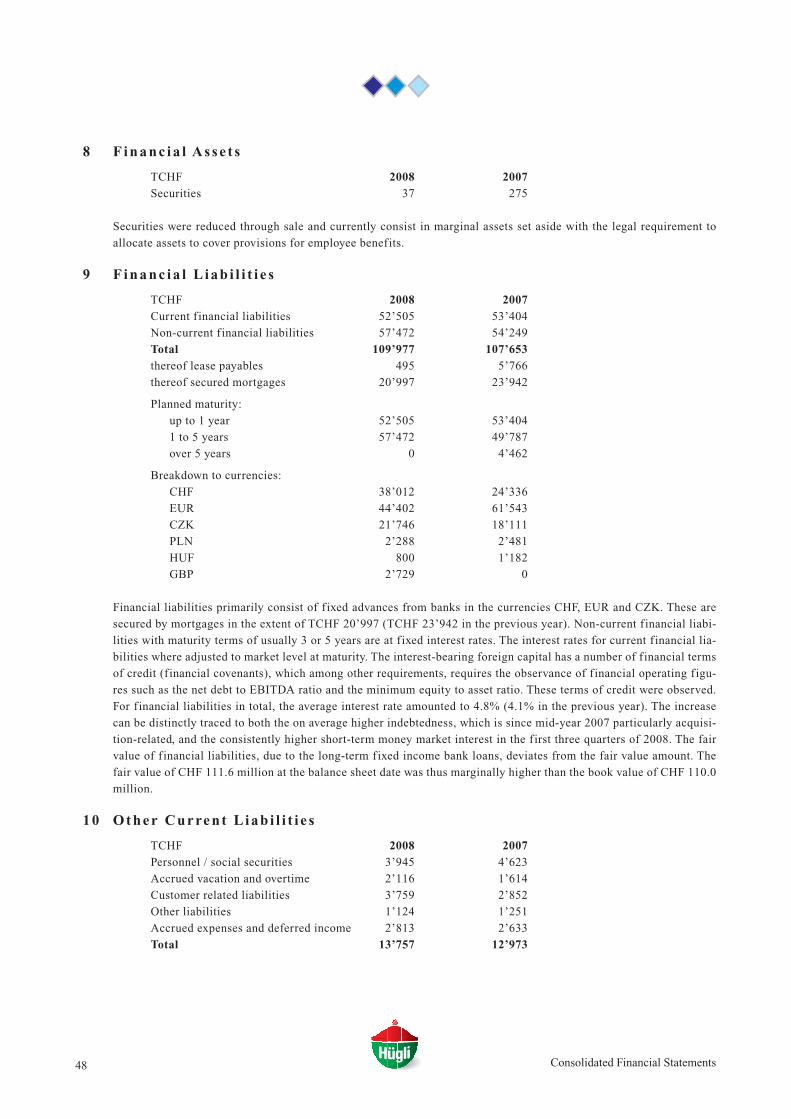
48 Consolidated Financial Statements
8 Financ ia l Asse t s
TCHF 2008 2007Securities 37 275
Securities were reduced through sale and currently consist in marginal assets set aside with the legal requirement to
allocate assets to cover provisions for employee benefits.
9 Financ ia l L iab i l i t i e s
TCHF 2008 2007Current financial liabilities 52’505 53’404
Non-current f inancial liabilities 57’472 54’249
Total 109’977 107’653thereof lease payables 495 5’766
thereof secured mortgages 20’997 23’942
Planned maturity:
up to 1 year 52’505 53’404
1 to 5 years 57’472 49’787
over 5 years 0 4’462
Breakdown to currencies:
CHF 38’012 24’336
EUR 44’402 61’543
CZK 21’746 18’111
PLN 2’288 2’481
HUF 800 1’182
GBP 2’729 0
Financial liabilities primarily consist of f ixed advances from banks in the currencies CHF, EUR and CZK. These are
secured by mortgages in the extent of TCHF 20’997 (TCHF 23’942 in the previous year). Non-current f inancial liabi-
lities with maturity terms of usually 3 or 5 years are at f ixed interest rates. The interest rates for current f inancial lia-
bilities where adjusted to market level at maturity. The interest-bearing foreign capital has a number of financial terms
of credit (financial covenants), which among other requirements, requires the observance of financial operating figu-
res such as the net debt to EBITDA ratio and the minimum equity to asset ratio. These terms of credit were observed.
For financial liabilities in total, the average interest rate amounted to 4.8% (4.1% in the previous year). The increase
can be distinctly traced to both the on average higher indebtedness, which is since mid-year 2007 particularly acquisi-
tion-related, and the consistently higher short-term money market interest in the first three quarters of 2008. The fair
value of financial liabilities, due to the long-term fixed income bank loans, deviates from the fair value amount. The
fair value of CHF 111.6 million at the balance sheet date was thus marginally higher than the book value of CHF 110.0
million.
10 Other Current L iab i l i t i e s
TCHF 2008 2007Personnel / social securities 3’945 4’623
Accrued vacation and overtime 2’116 1’614
Customer related liabilities 3’759 2’852
Other liabilities 1’124 1’251
Accrued expenses and deferred income 2’813 2’633
Total 13’757 12’973
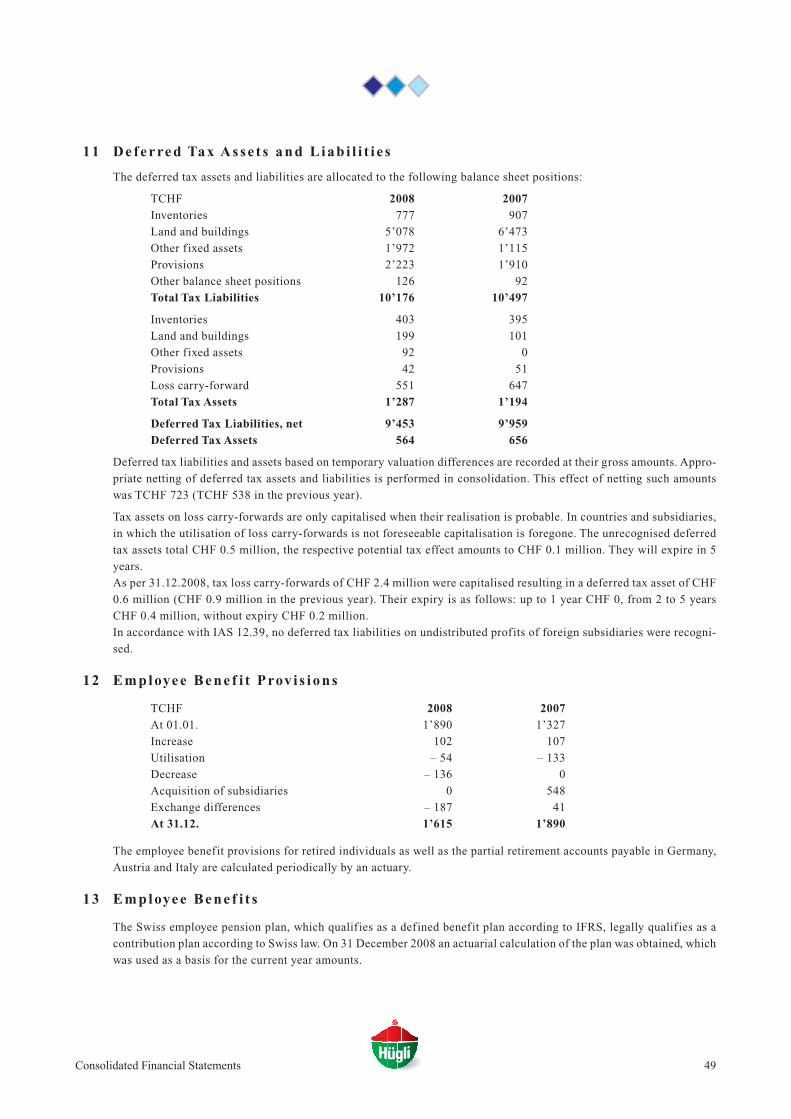
49
11 Deferred Tax Asse t s and L iab i l i t i e s
The deferred tax assets and liabilities are allocated to the following balance sheet positions:
TCHF 2008 2007Inventories 777 907
Land and buildings 5’078 6’473
Other fixed assets 1’972 1’115
Provisions 2’223 1’910
Other balance sheet positions 126 92
Total Tax Liabilities 10’176 10’497
Inventories 403 395
Land and buildings 199 101
Other fixed assets 92 0
Provisions 42 51
Loss carry-forward 551 647
Total Tax Assets 1’287 1’194
Deferred Tax Liabilities, net 9’453 9’959Deferred Tax Assets 564 656
Deferred tax liabilities and assets based on temporary valuation differences are recorded at their gross amounts. Appro-
priate netting of deferred tax assets and liabilities is performed in consolidation. This effect of netting such amounts
was TCHF 723 (TCHF 538 in the previous year).
Tax assets on loss carry-forwards are only capitalised when their realisation is probable. In countries and subsidiaries,
in which the utilisation of loss carry-forwards is not foreseeable capitalisation is foregone. The unrecognised deferred
tax assets total CHF 0.5 million, the respective potential tax effect amounts to CHF 0.1 million. They will expire in 5
years.
As per 31.12.2008, tax loss carry-forwards of CHF 2.4 million were capitalised resulting in a deferred tax asset of CHF
0.6 million (CHF 0.9 million in the previous year). Their expiry is as follows: up to 1 year CHF 0, from 2 to 5 years
CHF 0.4 million, without expiry CHF 0.2 million.
In accordance with IAS 12.39, no deferred tax liabilities on undistributed profits of foreign subsidiaries were recogni-
sed.
12 Employee Bene f i t Prov i s i ons
TCHF 2008 2007At 01.01. 1’890 1’327
Increase 102 107
Utilisation – 54 – 133
Decrease – 136 0
Acquisition of subsidiaries 0 548
Exchange differences – 187 41
At 31.12. 1’615 1’890
The employee benefit provisions for retired individuals as well as the partial retirement accounts payable in Germany,
Austria and Italy are calculated periodically by an actuary.
13 Employee Bene f i t s
The Swiss employee pension plan, which qualifies as a defined benefit plan according to IFRS, legally qualifies as a
contribution plan according to Swiss law. On 31 December 2008 an actuarial calculation of the plan was obtained, which
was used as a basis for the current year amounts.
Consolidated Financial Statements
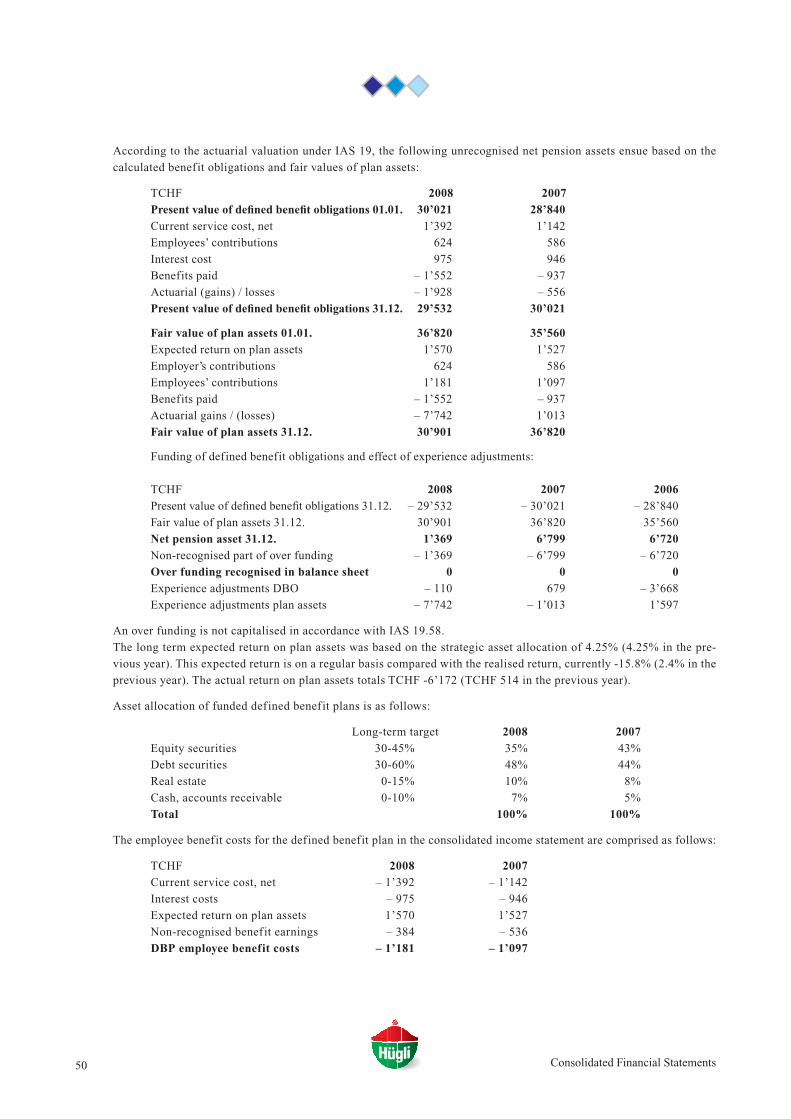
50 Consolidated Financial Statements
According to the actuarial valuation under IAS 19, the following unrecognised net pension assets ensue based on the
calculated benefit obligations and fair values of plan assets:
TCHF 2008 2007Present value of defined benefit obligations 01.01. 30’021 28’840Current service cost, net 1’392 1’142
Employees’ contributions 624 586
Interest cost 975 946
Benefits paid – 1’552 – 937
Actuarial (gains) / losses – 1’928 – 556
Present value of defined benefit obligations 31.12. 29’532 30’021
Fair value of plan assets 01.01. 36’820 35’560Expected return on plan assets 1’570 1’527
Employer’s contributions 624 586
Employees’ contributions 1’181 1’097
Benefits paid – 1’552 – 937
Actuarial gains / (losses) – 7’742 1’013
Fair value of plan assets 31.12. 30’901 36’820
Funding of defined benefit obligations and effect of experience adjustments:
TCHF 2008 2007 2006Present value of defined benefit obligations 31.12. – 29’532 – 30’021 – 28’840
Fair value of plan assets 31.12. 30’901 36’820 35’560
Net pension asset 31.12. 1’369 6’799 6’720Non-recognised part of over funding – 1’369 – 6’799 – 6’720
Over funding recognised in balance sheet 0 0 0Experience adjustments DBO – 110 679 – 3’668
Experience adjustments plan assets – 7’742 – 1’013 1’597
An over funding is not capitalised in accordance with IAS 19.58.
The long term expected return on plan assets was based on the strategic asset allocation of 4.25% (4.25% in the pre-
vious year). This expected return is on a regular basis compared with the realised return, currently -15.8% (2.4% in the
previous year). The actual return on plan assets totals TCHF -6’172 (TCHF 514 in the previous year).
Asset allocation of funded defined benefit plans is as follows:
Long-term target 2008 2007Equity securities 30-45% 35% 43%
Debt securities 30-60% 48% 44%
Real estate 0-15% 10% 8%
Cash, accounts receivable 0-10% 7% 5%
Total 100% 100%
The employee benefit costs for the defined benefit plan in the consolidated income statement are comprised as follows:
TCHF 2008 2007Current service cost, net – 1’392 – 1’142
Interest costs – 975 – 946
Expected return on plan assets 1’570 1’527
Non-recognised benefit earnings – 384 – 536
DBP employee benefit costs – 1’181 – 1’097
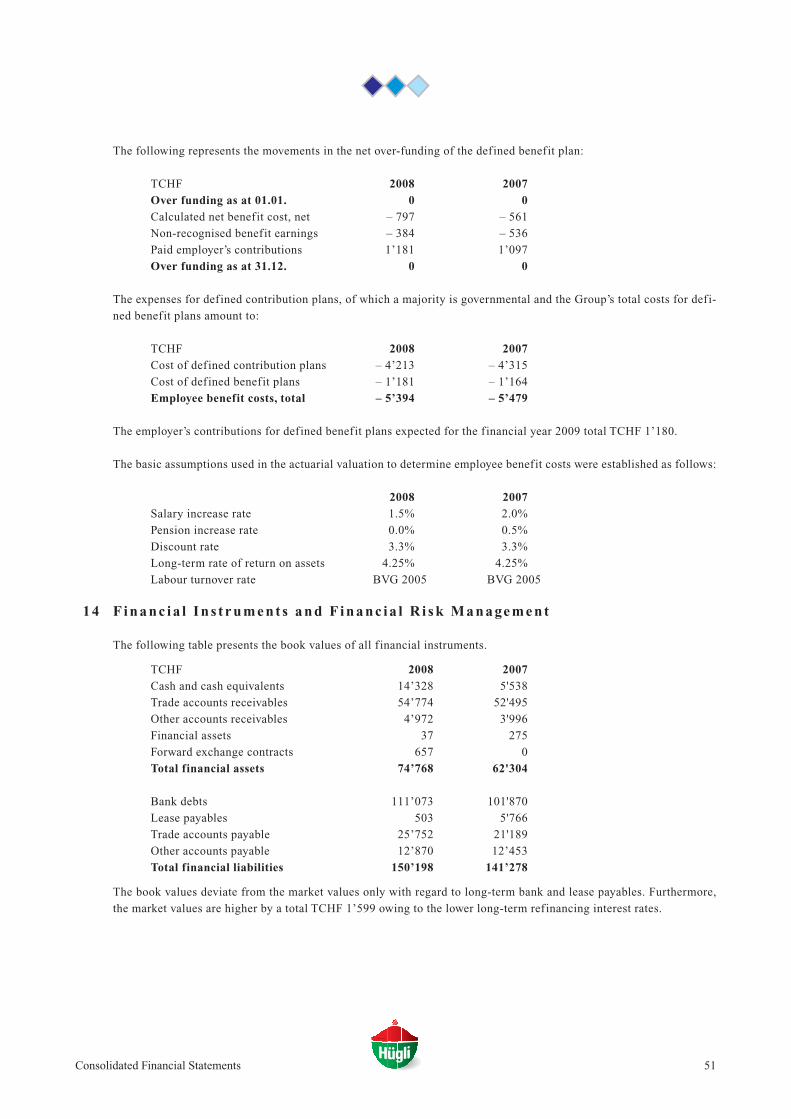
51
The following represents the movements in the net over-funding of the defined benefit plan:
TCHF 2008 2007Over funding as at 01.01. 0 0Calculated net benefit cost, net – 797 – 561
Non-recognised benefit earnings – 384 – 536
Paid employer’s contributions 1’181 1’097
Over funding as at 31.12. 0 0
The expenses for defined contribution plans, of which a majority is governmental and the Group’s total costs for defi-
ned benefit plans amount to:
TCHF 2008 2007Cost of defined contribution plans – 4’213 – 4’315
Cost of defined benefit plans – 1’181 – 1’164
Employee benefit costs, total – 5’394 – 5’479
The employer’s contributions for defined benefit plans expected for the financial year 2009 total TCHF 1’180.
The basic assumptions used in the actuarial valuation to determine employee benefit costs were established as follows:
2008 2007Salary increase rate 1.5% 2.0%
Pension increase rate 0.0% 0.5%
Discount rate 3.3% 3.3%
Long-term rate of return on assets 4.25% 4.25%
Labour turnover rate BVG 2005 BVG 2005
14 Financ ia l Ins t rument s and F inanc ia l R i sk Management
The following table presents the book values of all f inancial instruments.
TCHF 2008 2007Cash and cash equivalents 14’328 5'538
Trade accounts receivables 54’774 52'495
Other accounts receivables 4’972 3'996
Financial assets 37 275
Forward exchange contracts 657 0
Total financial assets 74’768 62'304
Bank debts 111’073 101'870
Lease payables 503 5'766
Trade accounts payable 25’752 21'189
Other accounts payable 12’870 12’453
Total financial liabilities 150’198 141’278
The book values deviate from the market values only with regard to long-term bank and lease payables. Furthermore,
the market values are higher by a total TCHF 1’599 owing to the lower long-term refinancing interest rates.
Consolidated Financial Statements
52
Financial Risk Management Principles
The international business activities of the Hügli Group are exposed to various f inancial risks, in particular cre-
dit risk, market risk (including currency, interest rate and price risk) and liquidity risk. The risk management prin-
ciples are geared to identifying and analysing the risks to which the Group is exposed in a volatile market envi-
ronment and to establish the appropriate control mechanisms. The Group’s department of Finance and Controlling
hedges certain def ined risks in close cooperation with the divisions. The Board of Directors bears ultimate res-
ponsibility for risk management.
Further disclosures on the performance of risk assessment according to the Swiss Code of Obligations (article 663b
paragraph 12) are presented in the Notes to the Financial Statements of Hügli Holding AG.
Credit Risk
The credit risk is the risk of suffering f inancial loss if a customer is unable or unwilling to meet contractual busin-
ess obligations. The Hügli Group’s main credit risks arise from trade accounts receivable. Such liabilities are moni-
tored continuously and systematically. The danger of cluster risks is limited due to the large number and wider
geographical spread of customers. Hügli enters into bank transactions only with important Swiss, German and Aus-
trian f inancial institutions. The credit risk is mainly limited to current bank accounts, and secondarily to transac-
tions involving derivative f inancial instruments. The maximum credit risk is conf ined to the carrying amounts sta-
ted for the individual f inancial assets presented in above table. Hügli has not entered into any guarantees or simi-
lar obligations.
Currency Risk
Hügli operates internationally and is therefore exposed to currency risks. These f inancial risks occur in connec-
tion with transactions, in particular the purchase and sale of goods, which are effected in currencies different from
the functional currency (local currency). Such transactions are performed mainly in Swiss Francs (CHF), Euro
(EUR), British Pounds (GBP), Czech Crowns (CZK), Polish Zloty (PLN) and Hungarian Forint (HUF). Hügli redu-
ces risks decisively by purchasing and producing goods in the functional currency (“congruency” rule). Where this
is not possible or only to a limited extent, currency exposure is generated, predominantly in the exchange rates
CHF/GBP, CHF/EUR, EUR/GBP, CZK/PLN und CZK/HUF. We also restrict the Group’s external f inancing whe-
re possible to currencies, in which medium-term free cash flows can be expected.
At present, currency futures with a maturity of 1 to 18 months for the partial hedging of currency risks of future
highly probable accruals of foreign currencies in EUR are outstanding. The open contract values (nominal values
of hedge transactions) and the positive replacement values (potential return on closure of contracts, or unrealised
prof its before taxes) are as follows:
TCHF 2008 2007Contract value (in EUR) 12’893 0
Positive replacement values 821 0
The following sensitivity analysis of relevant foreign currencies is based on the assumption that monetary balan-
ce sheet items in foreign currency are affected by an exchange rate change of +/– 10% and indicates the impact on
Group prof its 2008. All other variables, particularly interest rates, remain unchanged.
million CHF Change 2008 2007CHF/EUR +/– 10% 0.4 0.1
CHF/GBP +/– 10% 0.2 0.3
CHF/CZK +/– 10% 0.1 0.0
EUR/GBP +/– 10% 0.1 0.0
CZK/PLN +/– 10% 0.2 0.2
CZK/SKK +/– 10% 0.1 0.1
Consolidated Financial Statements
53
Because of the scope of implementation of IFRS the unrecognised business transactions during the year were not
included. The transaction differences during the business year have an essentially higher impact on Group prof it
with volatile currencies.
A change of +/-1% of equity invested in a specif ic currency as per 31.12.2008 would have increased or decreased
the Group’s equity by the following contributions:
million CHF Change 2008 2007EUR +/– 1% 0.8 0.6
GBP +/– 1% 0.1 0.0
CZK +/– 1% 0.1 0.0
Interest-rate Risk
The interest-rate risk is caused by changes in market interest rates and in the risk premiums of the capital markets,
which related to the Group’s investments. The risk of fluctuating interest rate can be limited through the ratio of
f ixed-interest to variable interest liabilities and the ratio of short-term and long-term f inancial liabilities, which
agrees with our risk policy. Due to f inancial liabilities being stated at acquisition cost, changes in interest rates
have no impact on the income statement. A 1% increase (or reduction) of the average interest rate for short-term
variable interest advances would have increased (or reduced) group prof it by CHF 0.5 million (CHF 0.4 million in
the previous year).
Price Risk
The assets set aside as required by law and held in marketable securities to cover recognised provisions for employ-
ee benef its are subject to the price risk (changes in market price). Their extent is not relevant for the Group.
Hügli is exposed to considerably higher risks with regard to the purchase of raw materials that constitutes the lar-
gest cost factor. The purchasing prices of raw materials, in particular of important raw goods such as dairy pro-
ducts, grain, vegetables, vegetable oils, yeasts and spices, depend on supply and demand. Price shifts arise on the
supply side, based on climate-related harvest failures or the use of agricultural areas for the production of (bio)
ethanol, among others. On the demand side, price shifts can be caused by the higher purchasing power of populous
countries or the strong demand for biological products. Hügli limits the market price risks of the most important
products through storage measures and settled purchasing contracts with f ixed maturities. Under certain circum-
stances, Hügli can hedge the raw materials price risk indirectly through the purchase of Agriculture Commodity
Indices.
Liquidity Risk
The liquidity risk is the risk that Hügli is unable to meet its f inancial obligations when they fall due. Liquidity
management consists in holding suff icient liquidity reserves to offset the usual fluctuations. At the same time, the
Group has unused credit lines at its disposal in the event of more serious fluctuations. The total amount of unused
credit lines as per December 31, 2008 was CHF 31.2 million. The credit lines are spread over several banks so that
there is no excessive dependence on any one f inancial institution.
The following table shows the maturity prof ile of contractual f inancial liabilities (including interests) as per the
end of the reporting period:
2008 Carrying Contracted up to 6 to 12 1 to 5 overTCHF values cash flows 6 months months years 5 yearsBank debts 109’482 115’724 53’360 1’151 61’213 0
Lease payables 495 535 153 153 229 0
Trade accounts payable 25’752 25’752 25’752 0 0 0
Other accounts payable 12’870 12’870 12’870 0 0 0
Total 148’599 154’881 92’135 1'304 61’442 0
Consolidated Financial Statements
54 Consolidated Financial Statements
2007 Carrying Contracted up to 6 to 12 1 to 5 overTCHF values cash flows 6 months months years 5 yearsBank debts 101'887 108'474 54'027 1'012 52'575 860
Lease payables 5'766 7'157 460 459 2'128 4'110
Trade accounts payable 21'189 21'189 21'189 0 0 0
Other accounts payable 12’453 12’453 12’453 0 0 0
Total 141’295 149’273 88’129 1'471 54'703 4'970
15 Opera t ing Lease s
The operating lease liabilities are due as follows:
TCHF 2008 2007Due within 1 year 2’534 2’581
Due between 2 to 5 years 2’146 2’597
Due after 5 years 0 0
Total 4’680 5’178
The leasing contracts predominantly consist of motor vehicles for sales force.
16 Cont ingent and Future L iab i l i t i e s , Cap i ta l Commitment s
As per 31 December 2008 and 31 December 2007, there were no positions requiring disclosure.
The Group is currently involved in various legal cases that have arisen from normal business developments. For
these ongoing legal cases, there are in justif ied cases short-term provisions to cover foreseeable risks so that the
effects neither in individual cases nor in total have a signif icant influence on the f inancial position and prof itabi-
lity.
17 Capi ta l Management and Shareho lders ’ Equ i ty
Within capital management, the management of consolidated equity primarily aims at maintaining a solid balan-
ce sheet structure with an appropriate equity ratio (based on continuing values), ensuring the necessary f inancial
scope in order to be able to make investments and acquisitions in the future, and achieving a ROE (Return on equi-
ty) appropriate for the risk.
The monitoring of equity is performed based on following ratios:
- Equity ratio: 41.4% / 41.8% in the previous year (equity in percentage of total assets)
- Gearing: 0.82 / 0.90 in the previous year (ratio of interest bearing net debt to equity)
- Return on equity (ROE): 16.3% / 18.2% in the previous year (group prof it in percentage of average equity)
These ratios are reported to the Executive Committee and the Board of Directors at regular intervals by internal
f inancial reporting. Based on strategic objectives the medium target for the equity ratio is to maintain it over 40%
and to keep gearing below 1. The return on equity should be kept above 15%.
A f inancial covenant of a bank requires a minimal equity ratio that must therefore be maintained above of 35%.
Hügli pursues a results-oriented dividend policy with a ratio of 25% to 30% of the Group’s prof its per share. Sin-
ce 2005, the dividend had been paid out through reduction in par value. The Board of Directors is proposing to the
General Meeting of Shareholders on 13 May 2009 the payout of a dividend in the form of a par value reduction in
the extent of CHF 8.50 per bearer share (CHF 11.00 in the previous year) and CHF 4.25 per registered share (CHF
5.50 in the previous year), alongside a dividend payout of CHF 2.50 per bearer share, and CHF 1.25 per registe-
red share respectively (no dividend in the previous year). The total payout aligns with the level of the previous year
55Consolidated Financial Statements
and corresponds to 28% (28% in the previous year) of Group prof its. Following the distribution, the par value of
the Hügli bearer share will be CHF 1.00 and the par value of the Hügli registered share CHF 0.50.
The shareholder equity per balance sheet date consists in the following:
TCHF 2008 2007Share capital 4’608 9’943
consists of fully paid-in
280'000 bearer shares CHF 9.50 (PY: CHF 20.50)
410'000 registered shares CHF 4.75 (PY: CHF 10.25)
Own shares – 345 – 380
Bearer shares valued at average
acquisition costs of CHF 48.34
Share premium 17’429 17’055
Retained earnings 94’584 86’591
Total 116’276 113’209
Own shares at 01.01. (in units) 7’853 8’481
Sales via stock ownership program – 721 – 628
Own shares at 31.12. (in units) 7’132 7’853
The reduction of share capital in the f iscal year was executed by a reduction (CHF 11.00 in the par value of bea-
rer shares) on 8 August 2008 as decided by the Board of Directors. The share premium increases by the prof it from
the sale of own shares. The amount of TCHF 40 (TCHF 31 in the previous year) relating to the recognised costs of
the senior management participation program was expensed in the income statement. The directly stated results in
the retained earnings mainly relate to translation adjustments of net assets of Group companies and that of equi-
ty-like Group loans denominated in foreign currencies due to the valuation at the balance sheet date. The transla-
tion differences resulting from equity-like Group loans denominated in foreign currencies, which were previous-
ly directly recognised in equity, were in the period of review recognised in the consolidated income statement due
to the realisation of accumulated foreign exchange prof its amounting to TCHF 853 (TCHF 1’242 in the previous
year). The new valuation as per balance sheet date resulted in a loss of TCHF -10’673 (a gain of TCHF 2’848 in
the previous year). In addition, due to hedge accounting, the valuation of cash flow hedges in the amount of TCHF
657 (replacement value TCHF 821 minus deferred taxes of TCHF 164) was reported for the f irst time.
There is no contingent or authorised capital. Furthermore, no conversion or option rights are outstanding.
18 Sales
The segment reporting is presented on page 36 of this annual report. In addition, a breakdown of sales according
to product groups and geographic markets (location of customers) is displayed on page 9.
19 Personnel Costs
TCHF 2008 2007Salaries and wages 74’159 65’170
Social benef its 8’957 8’062
Employee benef it costs 5’394 5’479
Other personnel costs 795 753
Total 89’305 79’464
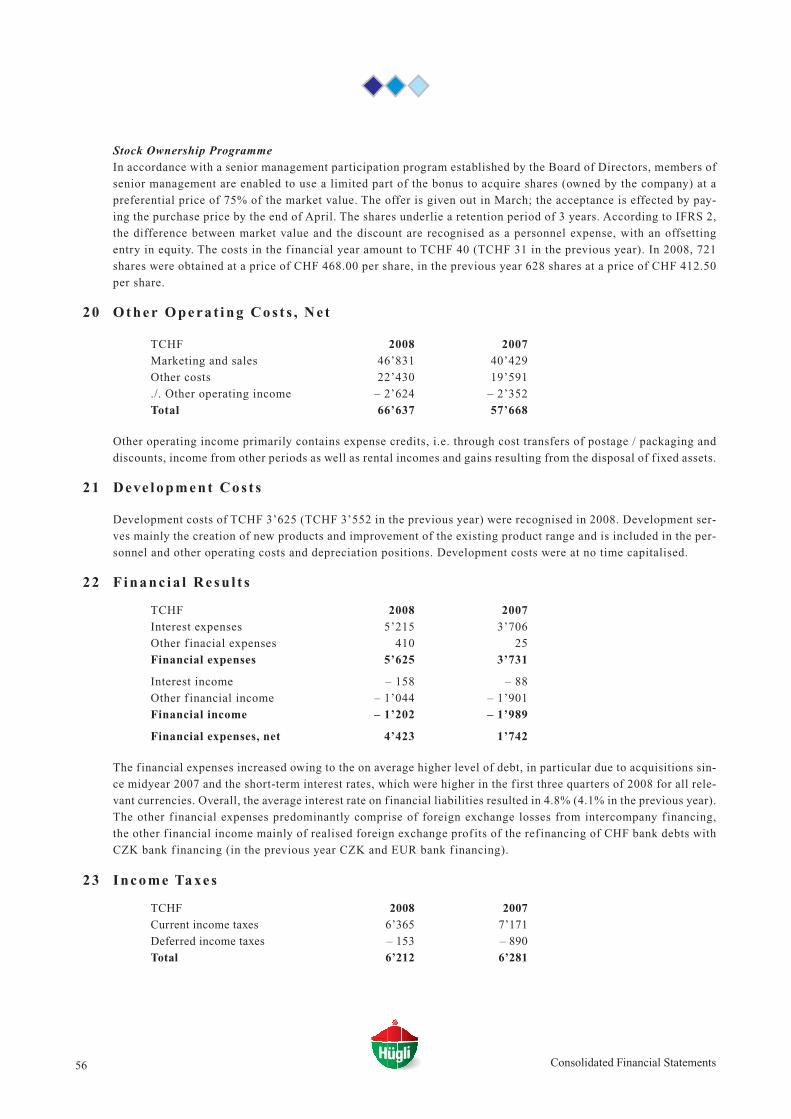
Stock Ownership Programme
In accordance with a senior management participation program established by the Board of Directors, members of
senior management are enabled to use a limited part of the bonus to acquire shares (owned by the company) at a
preferential price of 75% of the market value. The offer is given out in March; the acceptance is effected by pay-
ing the purchase price by the end of April. The shares underlie a retention period of 3 years. According to IFRS 2,
the difference between market value and the discount are recognised as a personnel expense, with an offsetting
entry in equity. The costs in the f inancial year amount to TCHF 40 (TCHF 31 in the previous year). In 2008, 721
shares were obtained at a price of CHF 468.00 per share, in the previous year 628 shares at a price of CHF 412.50
per share.
20 Other Opera t ing Cos t s , Ne t
TCHF 2008 2007Marketing and sales 46’831 40’429
Other costs 22’430 19’591
./. Other operating income – 2’624 – 2’352
Total 66’637 57’668
Other operating income primarily contains expense credits, i.e. through cost transfers of postage / packaging and
discounts, income from other periods as well as rental incomes and gains resulting from the disposal of f ixed assets.
21 Deve lopment Cos t s
Development costs of TCHF 3’625 (TCHF 3’552 in the previous year) were recognised in 2008. Development ser-
ves mainly the creation of new products and improvement of the existing product range and is included in the per-
sonnel and other operating costs and depreciation positions. Development costs were at no time capitalised.
22 Financ ia l Resu l t s
TCHF 2008 2007Interest expenses 5’215 3’706
Other f inacial expenses 410 25
Financial expenses 5’625 3’731
Interest income – 158 – 88
Other f inancial income – 1’044 – 1’901
Financial income – 1’202 – 1’989
Financial expenses, net 4’423 1’742
The f inancial expenses increased owing to the on average higher level of debt, in particular due to acquisitions sin-
ce midyear 2007 and the short-term interest rates, which were higher in the f irst three quarters of 2008 for all rele-
vant currencies. Overall, the average interest rate on f inancial liabilities resulted in 4.8% (4.1% in the previous year).
The other f inancial expenses predominantly comprise of foreign exchange losses from intercompany f inancing,
the other f inancial income mainly of realised foreign exchange prof its of the ref inancing of CHF bank debts with
CZK bank f inancing (in the previous year CZK and EUR bank f inancing).
23 Income Taxes
TCHF 2008 2007Current income taxes 6’365 7’171
Deferred income taxes – 153 – 890
Total 6’212 6’281
56 Consolidated Financial Statements
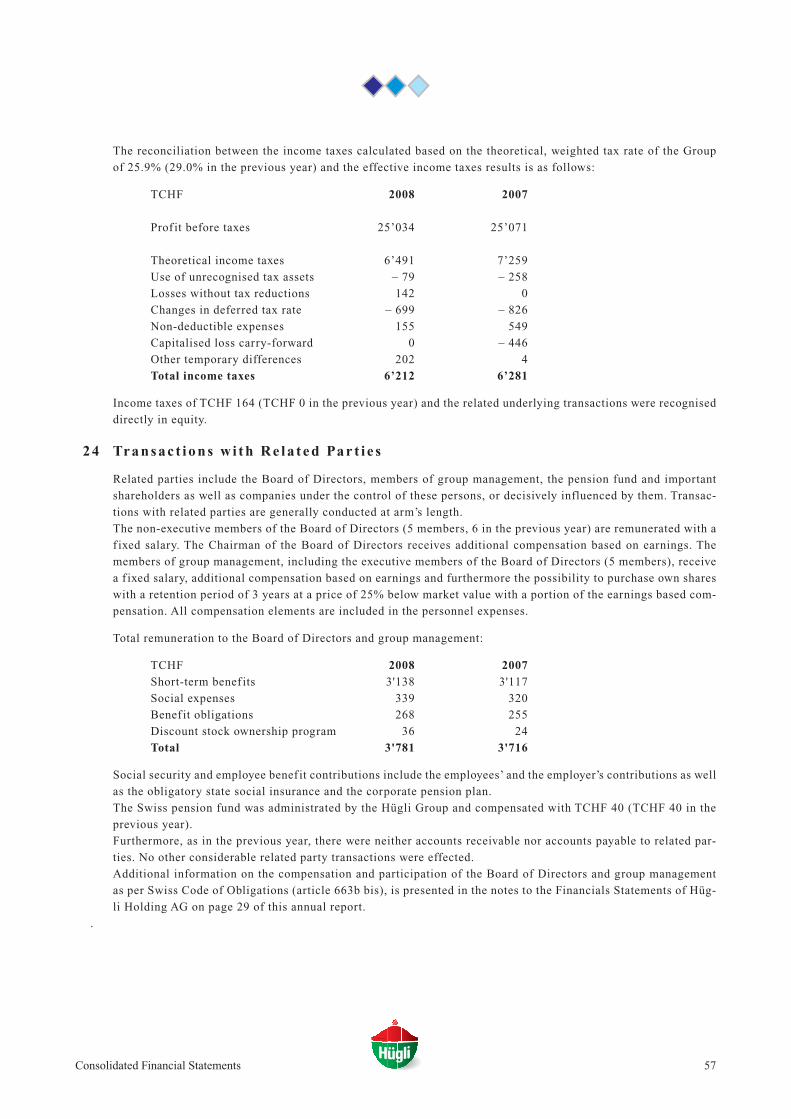
The reconciliation between the income taxes calculated based on the theoretical, weighted tax rate of the Group
of 25.9% (29.0% in the previous year) and the effective income taxes results is as follows:
TCHF 2008 2007
Prof it before taxes 25’034 25’071
Theoretical income taxes 6’491 7’259
Use of unrecognised tax assets – 79 – 258
Losses without tax reductions 142 0
Changes in deferred tax rate – 699 – 826
Non-deductible expenses 155 549
Capitalised loss carry-forward 0 – 446
Other temporary differences 202 4
Total income taxes 6’212 6’281
Income taxes of TCHF 164 (TCHF 0 in the previous year) and the related underlying transactions were recognised
directly in equity.
24 Transac t ions w i th Re la t ed Par t i e s
Related parties include the Board of Directors, members of group management, the pension fund and important
shareholders as well as companies under the control of these persons, or decisively influenced by them. Transac-
tions with related parties are generally conducted at arm’s length.
The non-executive members of the Board of Directors (5 members, 6 in the previous year) are remunerated with a
f ixed salary. The Chairman of the Board of Directors receives additional compensation based on earnings. The
members of group management, including the executive members of the Board of Directors (5 members), receive
a f ixed salary, additional compensation based on earnings and furthermore the possibility to purchase own shares
with a retention period of 3 years at a price of 25% below market value with a portion of the earnings based com-
pensation. All compensation elements are included in the personnel expenses.
Total remuneration to the Board of Directors and group management:
TCHF 2008 2007Short-term benef its 3'138 3'117
Social expenses 339 320
Benef it obligations 268 255
Discount stock ownership program 36 24
Total 3'781 3'716
Social security and employee benef it contributions include the employees’ and the employer’s contributions as well
as the obligatory state social insurance and the corporate pension plan.
The Swiss pension fund was administrated by the Hügli Group and compensated with TCHF 40 (TCHF 40 in the
previous year).
Furthermore, as in the previous year, there were neither accounts receivable nor accounts payable to related par-
ties. No other considerable related party transactions were effected.
Additional information on the compensation and participation of the Board of Directors and group management
as per Swiss Code of Obligations (article 663b bis), is presented in the notes to the Financials Statements of Hüg-
li Holding AG on page 29 of this annual report.
.
57Consolidated Financial Statements
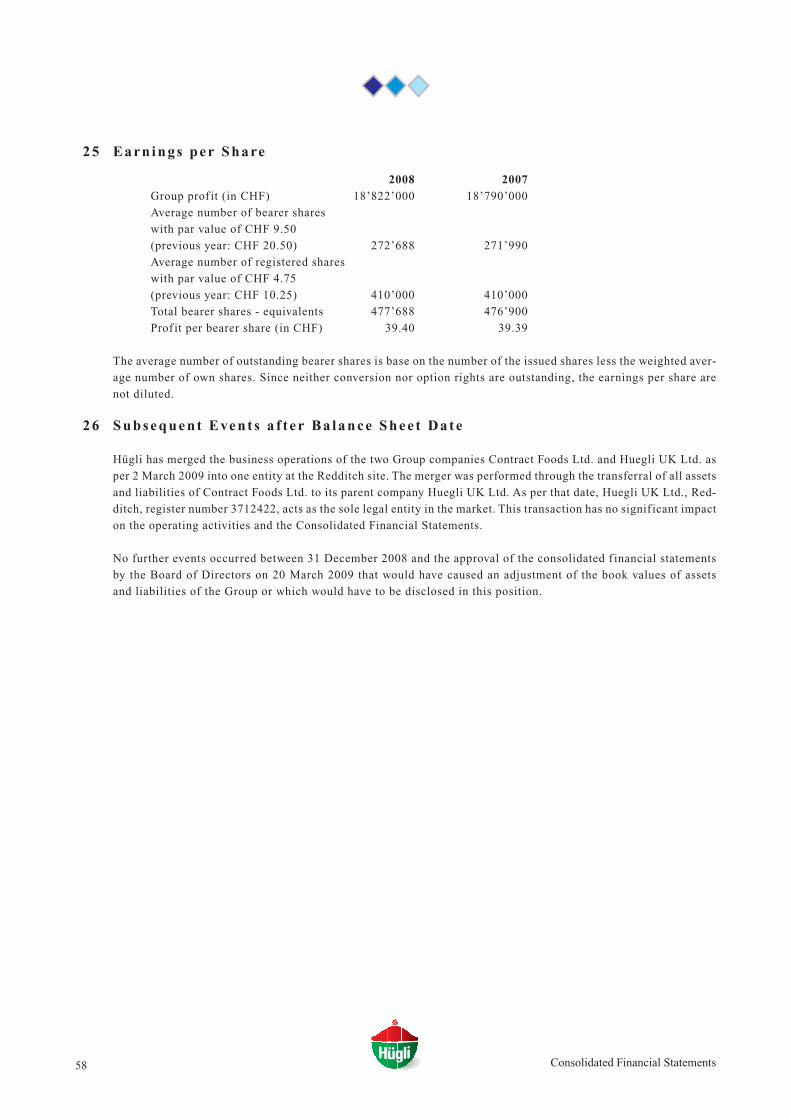
58 Consolidated Financial Statements
25 Earn ings per Share
2008 2007Group prof it (in CHF) 18’822’000 18’790’000
Average number of bearer shares
with par value of CHF 9.50
(previous year: CHF 20.50) 272’688 271’990
Average number of registered shares
with par value of CHF 4.75
(previous year: CHF 10.25) 410’000 410’000
Total bearer shares - equivalents 477’688 476’900
Prof it per bearer share (in CHF) 39.40 39.39
The average number of outstanding bearer shares is base on the number of the issued shares less the weighted aver-
age number of own shares. Since neither conversion nor option rights are outstanding, the earnings per share are
not diluted.
26 Subsequent Event s a f t er Ba lance Shee t Date
Hügli has merged the business operations of the two Group companies Contract Foods Ltd. and Huegli UK Ltd. as
per 2 March 2009 into one entity at the Redditch site. The merger was performed through the transferral of all assets
and liabilities of Contract Foods Ltd. to its parent company Huegli UK Ltd. As per that date, Huegli UK Ltd., Red-
ditch, register number 3712422, acts as the sole legal entity in the market. This transaction has no signif icant impact
on the operating activities and the Consolidated Financial Statements.
No further events occurred between 31 December 2008 and the approval of the consolidated f inancial statements
by the Board of Directors on 20 March 2009 that would have caused an adjustment of the book values of assets
and liabilities of the Group or which would have to be disclosed in this position.
59
Report of the Statutory Auditoron the Consolidated Financial Statements
As statutory auditor, we have audited the consolidated financial statements of Hügli Holding AG, which comprise the consolidatedbalance sheet, consolidated income statement, consolidated statement of changes in equity, consolidated cash flow statement and notesfor the year ended December 31, 2008.
Board of Directors’ ResponsibilityThe board of directors is responsible for the preparation and fair presentation of the consolidated financial statements in accordancewith IFRS and the requirements of Swiss law. This responsibility includes designing, implementing and maintaining an internal con-trol system relevant to the preparation and fair presentation of consolidated financial statements that are free from material misstate-ment, whether due to fraud or error. The board of directors is further responsible for selecting and applying appropriate accountingpolicies and making accounting estimates that are reasonable in the circumstances.
Auditor’s ResponsibilityOur responsibility is to express an opinion on these consolidated financial statements based on our audit. We conducted our audit inaccordance with Swiss law and Swiss Auditing Standards as well as International Standards on Auditing. Those standards require thatwe plan and perform the audit to obtain reasonable assurance whether the consolidated financial statements are free from material mis-statement.
An audit involves performing procedures to obtain audit evidence about the amounts and disclosures in the consolidated financial sta-tements. The procedures selected depend on the auditor’s judgment, including the assessment of the risks of material misstatement ofthe consolidated financial statements, whether due to fraud or error. In making those risk assessments, the auditor considers the inter-nal control system relevant to the entity’s preparation and fair presentation of the consolidated financial statements in order to designaudit procedures that are appropriate in the circumstances, but not for the purpose of expressing an opinion on the effectiveness of theentity’s internal control system. An audit also includes evaluating the appropriateness of the accounting policies used and the reason-ableness of accounting estimates made, as well as evaluating the overall presentation of the consolidated financial statements.We believe that the audit evidence we have obtained is sufficient and appropriate to provide a basis for our audit opinion.
OpinionIn our opinion, the consolidated financial statements for the year ended December 31, 2008 give a true and fair view of the financialposition, the results of operations and the cash flows in accordance with IFRS, as published by the International Accounting StandardsBoard, and comply with Swiss law.
Report on Other Legal Requirements
We confirm that we meet the legal requirements on licensing according to the Auditor Oversight Act (AOA) and independence (article728 CO and article 11 AOA) and that there are no circumstances incompatible with our independence.
In accordance with article 728a paragraph 1 item 3 CO and Swiss Auditing Standard 890, we confirm that an internal control systemexists, which has been designed for the preparation of consolidated financial statements according to the instructions of the board ofdirectors.
We recommend that the consolidated financial statements submitted to you be approved.
St. Gallen, 20 March 2009
OBT AG
Christian Siegfried Urs FreiSwiss Certified Accountant Swiss Certified Accountant
Auditor in Charge
60
Commentary on theconsolidated financial statements 2008
depreciation that occurred in the fourth quarter of 2008especially affected the exchange rates of GBP toCHF/EUR and CZK to PLN/HUF, had substantialnegative effects. This transaction currency exposureincurred through differing currencies of productioncosts and sales is currently heightening the pressure ongross profits. We have nonetheless achieved an overallincrease of profits of +0.4% points in the second seme-ster as compared to the same period in the previousyear. Consequently, the gross profits reduction for theentire business year 2008 resulted in -1.2% points tothe previous year.
The personnel costs grew by 12.4%, consideringthe currency and acquisition effect by 6.9%. This gro-wth in essence corresponds to the necessary adjust-ments of personnel capacity for the production volu-mes that increased by 11.7% to 45’300 tons, as well asto the duly raised salaries at the Group company’s indi-vidual sites. In comparison to the end of 2007, thenumber of full time positions rose organically by 49 or4.2, respectively; the acquisition of the manufacturingcompany Contract Foods Ltd. contributed 137 positi-ons to the increase of staff.
While the other operating expenses in the busin-ess year 2007 had been maintained at the same level asin the previous year, in the period under review theygrew by 15.6%, currency and acquisition adjusted by10.3%. This increase ensued mainly in the areas ofexternal cargos, internal logistics, marketing and sales.Depreciation grew by 10.0%, not considering theacquisitions, it stood only slightly above the previousyear (+1.1%) as did the planned amortisation of acqui-red brands. The above-described factors – sales growthalongside reduced gross profits, and under-proportio-nally rising operating costs – have increased EBIT by9.9% to CHF 29.5 million. The EBIT margin neverthe-less fell slightly from 7.8% to 7.4%, almost exclusive-ly caused by the dilution effect of implemented priceincreases of +4.1%, which were based on the augmen-ted raw materials costs. This nominal sales growthleads to a computed reduction of the EBIT margin ofmore than 0.3% points, despite an unvarying absoluteEBIT and therefore a return on invested capital.
The interest expenses 2008, which increased by40% to CHF 5.2 million were mainly incurred becauseof an acquisition-related indebtedness prevailing sinceJuly 2007. The 2008 average of the gross debt amoun-ted to CHF 108 million, whereas in 2007 it had stoodat CHF 90 million. In addition, the short-term interestrates of the capital market kept rising until the begin-ning of the fourth quarter of 2008, which led to a hig-her average interest of overall 4.8%, as compared to4.1% in 2007. The conditions of financing and loanmargins remained unchanged. The other f inancial
Systematic implementation of corpo-rate s trategy increases sa les andEBIT despi te aggravat ing economiccondit ions
Hügli has again proven that the systematic imple-mentation of the Group’s strategy and the concerteddevelopment of def ined sales channels can furtherstrengthen the Group’s market position. This is reflec-ted in the over-proportional organic sales growth ofannually 7.7% that has been achieved throughout thepast f ive years. Moreover, Hügli made two importantacquisitions in the last two business years, which effec-tively support the Group’s market development in Ita-ly and the United Kingdom with specialised productioncompanies.
As anticipated, the second semester of 2008 sho-wed solid results in spite of a difficult economic envi-ronment. Sales growth amounted to 7.4%, after a stri-kingly dynamic first semester dominated by cyclicalsales and yielding an extraordinary rate of increase of15.3%. The Group’s organic growth of 11.1% repre-sents a further strengthening of all segments; salesvolume increased by 7.0%. In 2008, the two acquisiti-ons contributed CHF 25.9 million to Group sales,which total CHF 400.8 million. Negative currencyeffects yielded a reduction by -3.6%, mostly owing tothe lower value of GBP (-16.7%) and EUR (-3.4%). Inthe segments Germany and Switzerland / Rest ofWestern Europe, sales rose organically by remarkable+11.6% and +11.1%, respectively. Eastern Europe,until recently one of the strong growth segments, in2008 slowed down to a growth rate of 9.4% after havingundergone an extensive restructuring. From the per-spective of Hügli’s divisions, a significant share of thereported increase is attributed to the cyclical PrivateLabel Division with +24.3%. The other divisions,however, have also succeeded in generating considera-ble growth rates of 6.8% (Food Service), 8.2% (Health& Natural Food) and 13.5% (Industrial Foods).
Whereas gross profits had yet felt the full weightof increasing raw materials prices until midyear 2007,the subsequent steep price increases that spread wide-ly across the raw materials and agricultural marketshave been massively affecting gross profits. In the firsthalf of 2008, gross profits stood -2.9% points belowthe previous year’s profits attained in the first semester.The raw materials price have in the second half of 2008finally abated at a high level. We were able to increaseprices and these measures showed – after a turnover ofthe raw materials inventories – a favourable impact.Moreover, thanks to an improved product mix, in par-ticular with a higher share of own products, profitswere further raised. The partially extreme currency
61
income contains foreign exchange gains realised in2008 through the debt conversion of CHF bank debtsto CZK bank debts. The profit from the Group refi-nancing of the previous year, particularly against theEUR, was non-recurring and did not arise in 2008. Thereported tax rate of 24.8% profited in the business yearfrom the tax rate reduction 2009 in the canton of St.Gallen, and respectively the income resulting from therevaluation of deferred tax liabilities. However, themost important influence factor for the reduction of thetheoretical tax rate of 29.0% in the previous year to25.9% in 2008 was the corporate tax reform in Ger-many, which caused a substantial tax rate decrease.
Solid balance sheet structure
The increase of the net operating assets with2.1% to CHF 236.7 million at f irst sight appears to beonly moderate. Nevertheless, this is the result of con-siderably lower year-end rates, for example that ofEUR with -10.1%, CZK with -10.7% and GBP with -31.6%. With respect to the net current assets an ope-rating additional investment of CHF +10.7 million waseffected; on the one hand in receivables as a resultantof sales increased by 11.1%, on the other hand in theform of larger strategic raw materials inventories.Investments in tangible assets of CHF +11.0 millionwere at a balance with a depreciation of CHF -10.4million, so that there were no signif icant changes inoperating terms. The effect of revaluation of tangibleassets alone added up to CHF -9.7 million neverthe-less. An additional impact had the acquisition of Con-tract Foods, through the purchasing costs of CHF+10.8 million, whereof CHF 7.3 million were reco-gnised as intangible assets (goodwill).
Regarding the f inancing, borrowings of CHF107.7 million in the previous year increased to CHF110.0 in the year under review. This change includesan operating increase, overall CHF +12.7 million, aswell as a negative revaluation effect. The maturitystructure comprises of f ixed loans of CHF 57.5 milli-on (52%) with maturities between 1 and 5 years, andshort-term fixed advances of CHF 52.5 million (48%)that are usually extended several times in the year,depending on the current market situation. Equity roseby 2.7% to CHF 116.3 million, which corresponds toan equity ratio of 41.4% of total assets. Along with thereinforcement through retained prof its of annuallyaround 70% to 75% – the foreseen payout rate amountsto 25% - 30% – equity was under massive pressureowing to Group companies’ translation adjustments inforeign currencies and unrealised losses of equity-likecorporate loans, which on the whole totalled CHF 10.7million. Despite this strong effect, the ratio of equityto net debt, the gearing, was reduced from 0.90 to0.82.
Increasing operating cash f low
The operating cash flow (cash flow from opera-ting activities) before changes of net current assetsincreased by 16.0% to CHF 36.8 million. This corre-sponds to the highest cash flow value Hügli has everachieved, after CHF 31.7 million in 2007, CHF 24.5million in 2006, CHF 29.3 million in 2005 and CHF24.0 million in 2004. In the business year 2008, CHF10.7 million thereof were tied up in net current assets,CHF 11.0 million were invested in new tangible assets,and CHF 8.8 million were utilised for the acquisitionof a new Group company. The distribution to sharehol-ders in the form of a repayment of par value of CHF 5.3million and to creditors in the form of interest paym-ents of CHF 5.2 million resulted in a substantial expen-diture. The required f inancing was covered throughborrowings of a total of CHF 12.7 million. Within thefinancing, a property, until now recognised under afinancing lease contract, was purchased and releasedwith a long-term fixed loan.
Prof itabi l i ty below target
The return on invested capital (ROIC) declinedfrom 10.3% to 9.9%. In relation to the internally setweighted average cost of capital (WACC) of 8.0% thisresulted in an additional economic value of 1.9%points. This result is clearly below our internal targetof 3.0% points and a ROIC of 11.0%. This key figurefor profitability was burdened by the acquisitions per-formed in the preceding two years, which acquiredinvested net assets of over CHF 31 million (approxi-mately 13% of the total) and still do not show sufficientearning power due to integration costs and restructu-rings. The return on equity (ROE) decreased from18.2% to 16.3%. The return should in accordance withinternal targets and relating to medium-term projec-tions remain above 15.0% and further strengthen theequity base.
Distribution of dividends
It will be proposed to the Annual General Meetingof Shareholders on 13 May 2009 to approve of a divi-dend payout of CHF 11.00, the amount remainingunchanged as compared to the previous year. Due to thelimitation of reduction in par value to CHF 8.50 –through the reduction in par value of CHF 9.50 to CHF1.00 per bearer share – an additional dividend of grossCHF 2.50 is repaid, which corresponds to a net repay-ment after deduction of the withholding tax of CHF10.125. With regard to the end-year rate of CHF 460 ofthe Hügli share as per 31 December 2008 this relatesto a dividend yield of gross 2.4%.
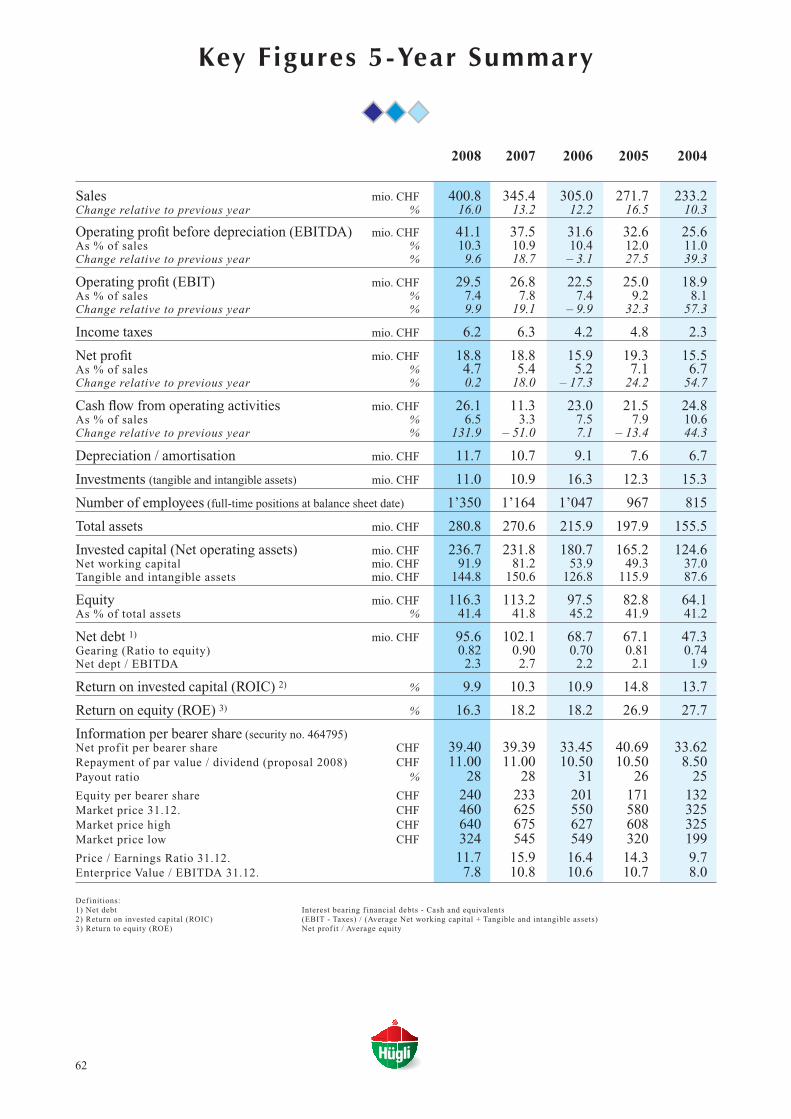
62
Key Figures 5-Year Summary
2008 2007 2006 2005 2004
Sales mio. CHF 400.8 345.4 305.0 271.7 233.2Change relative to previous year % 16.0 13.2 12.2 16.5 10.3
Operating profit before depreciation (EBITDA) mio. CHF 41.1 37.5 31.6 32.6 25.6As % of sales % 10.3 10.9 10.4 12.0 11.0Change relative to previous year % 9.6 18.7 – 3.1 27.5 39.3
Operating profit (EBIT) mio. CHF 29.5 26.8 22.5 25.0 18.9As % of sales % 7.4 7.8 7.4 9.2 8.1Change relative to previous year % 9.9 19.1 – 9.9 32.3 57.3
Income taxes mio. CHF 6.2 6.3 4.2 4.8 2.3
Net profit mio. CHF 18.8 18.8 15.9 19.3 15.5As % of sales % 4.7 5.4 5.2 7.1 6.7Change relative to previous year % 0.2 18.0 – 17.3 24.2 54.7
Cash flow from operating activities mio. CHF 26.1 11.3 23.0 21.5 24.8As % of sales % 6.5 3.3 7.5 7.9 10.6Change relative to previous year % 131.9 – 51.0 7.1 – 13.4 44.3
Depreciation / amortisation mio. CHF 11.7 10.7 9.1 7.6 6.7
Investments (tangible and intangible assets) mio. CHF 11.0 10.9 16.3 12.3 15.3
Number of employees (full-time positions at balance sheet date) 1’350 1’164 1’047 967 815
Total assets mio. CHF 280.8 270.6 215.9 197.9 155.5
Invested capital (Net operating assets) mio. CHF 236.7 231.8 180.7 165.2 124.6Net working capital mio. CHF 91.9 81.2 53.9 49.3 37.0Tangible and intangible assets mio. CHF 144.8 150.6 126.8 115.9 87.6
Equity mio. CHF 116.3 113.2 97.5 82.8 64.1As % of total assets % 41.4 41.8 45.2 41.9 41.2
Net debt 1) mio. CHF 95.6 102.1 68.7 67.1 47.3Gearing (Ratio to equity) 0.82 0.90 0.70 0.81 0.74Net dept / EBITDA 2.3 2.7 2.2 2.1 1.9
Return on invested capital (ROIC) 2) % 9.9 10.3 10.9 14.8 13.7
Return on equity (ROE) 3) % 16.3 18.2 18.2 26.9 27.7
Information per bearer share (security no. 464795)Net prof it per bearer share CHF 39.40 39.39 33.45 40.69 33.62Repayment of par value / dividend (proposal 2008) CHF 11.00 11.00 10.50 10.50 8.50Payout ratio % 28 28 31 26 25Equity per bearer share CHF 240 233 201 171 132Market price 31.12. CHF 460 625 550 580 325Market price high CHF 640 675 627 608 325Market price low CHF 324 545 549 320 199Price / Earnings Ratio 31.12. 11.7 15.9 16.4 14.3 9.7Enterprice Value / EBITDA 31.12. 7.8 10.8 10.6 10.7 8.0
Def initions:1) Net debt Interest bearing f inancial debts - Cash and equivalents2) Return on invested capital (ROIC) (EBIT - Taxes) / (Average Net working capital + Tangible and intangible assets)3) Return to equity (ROE) Net prof it / Average equity
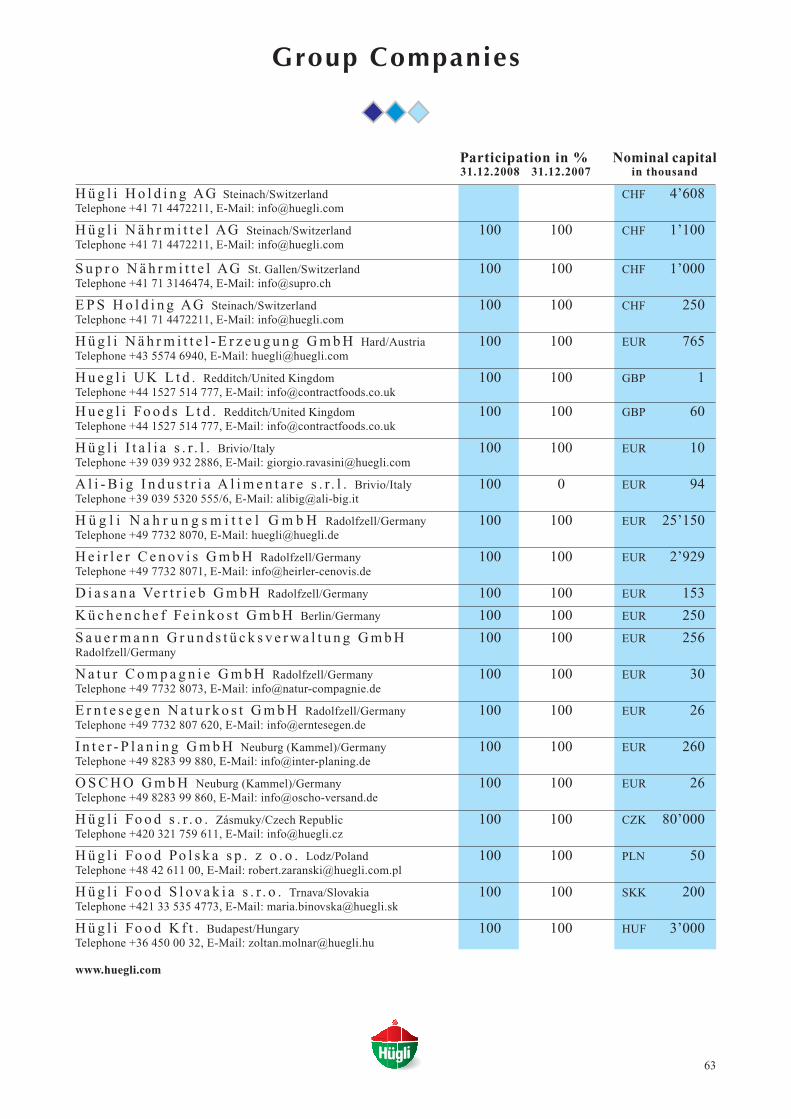
63
Group Companies
Participation in % Nominal capital31.12.2008 31.12.2007 in thousand
H ü g l i H o l d i n g AG Steinach/Switzerland CHF 4’608Telephone +41 71 4472211, E-Mail: [email protected]
H ü g l i N ä h r m i t t e l AG Steinach/Switzerland 100 100 CHF 1’100Telephone +41 71 4472211, E-Mail: [email protected]
S u p r o N ä h r m i t t e l AG St. Gallen/Switzerland 100 100 CHF 1’000Telephone +41 71 3146474, E-Mail: [email protected]
E P S H o l d i n g AG Steinach/Switzerland 100 100 CHF 250Telephone +41 71 4472211, E-Mail: [email protected]
H ü g l i N ä h r m i t t e l - E r z e u g u n g G m b H Hard/Austria 100 100 EUR 765Telephone +43 5574 6940, E-Mail: [email protected]
H u e g l i U K L t d . Redditch/United Kingdom 100 100 GBP 1Telephone +44 1527 514 777, E-Mail: [email protected]
H u e g l i Fo o d s L t d . Redditch/United Kingdom 100 100 GBP 60Telephone +44 1527 514 777, E-Mail: [email protected]
H ü g l i I t a l i a s . r . l . Brivio/Italy 100 100 EUR 10Telephone +39 039 932 2886, E-Mail: [email protected]
A l i - B i g I n d u s t r i a A l i m e n t a r e s . r . l . Brivio/Italy 100 0 EUR 94Telephone +39 039 5320 555/6, E-Mail: [email protected]
H ü g l i N a h r u n g s m i t t e l G m b H Radolfzell/Germany 100 100 EUR 25’150Telephone +49 7732 8070, E-Mail: [email protected]
H e i r l e r C e n ov i s G m b H Radolfzell/Germany 100 100 EUR 2’929Telephone +49 7732 8071, E-Mail: [email protected]
D i a s a n a Ve r t r i e b G m b H Radolfzell/Germany 100 100 EUR 153
K ü c h e n c h e f Fe i n k o s t G m b H Berlin/Germany 100 100 EUR 250
S a u e r m a n n G r u n d s t ü c k s v e r w a l t u n g G m b H 100 100 EUR 256Radolfzell/Germany
N a t u r C o m p a g n i e G m b H Radolfzell/Germany 100 100 EUR 30Telephone +49 7732 8073, E-Mail: [email protected]
E r n t e s e g e n N a t u r k o s t G m b H Radolfzell/Germany 100 100 EUR 26Telephone +49 7732 807 620, E-Mail: [email protected]
I n t e r - P l a n i n g G m b H Neuburg (Kammel)/Germany 100 100 EUR 260Telephone +49 8283 99 880, E-Mail: [email protected]
O S C H O G m b H Neuburg (Kammel)/Germany 100 100 EUR 26Telephone +49 8283 99 860, E-Mail: [email protected]
H ü g l i Fo o d s . r . o . Zásmuky/Czech Republic 100 100 CZK 80’000Telephone +420 321 759 611, E-Mail: [email protected]
H ü g l i Fo o d Po l s k a s p . z o . o . Lodz/Poland 100 100 PLN 50Telephone +48 42 611 00, E-Mail: [email protected]
H ü g l i Fo o d S l ov a k i a s . r . o . Trnava/Slovakia 100 100 SKK 200Telephone +421 33 535 4773, E-Mail: [email protected]
H ü g l i Fo o d K f t . Budapest/Hungary 100 100 HUF 3’000Telephone +36 450 00 32, E-Mail: [email protected]
www.huegli.com
64
Hügli on the Internet
Reports, Media Releases and Share Information:www.huegli.com � Investor Relations
Investor Relat ions
Andreas Seibold, CFOTel. +41 71 447 22 50, Fax. +41 71 447 22 [email protected]
Agenda
15 April 2009
- 07.30 a.m.Media Release: Annual Report 2008
- 10.30 a.m.Media/Analysts’ Conference, Hotel Widder, Zürich
13 May 2009
- 04.30 p.m.Annual General Meeting of Shareholders, Seeparksaal, Arbon
7 August 2009
Repayment of par value / Dividend
14 August 2009
- 07.30 UhrMedia Release: Half-Year Report 2009
Hügli Holding AGBleichestrasse 319323 Steinach, SwitzerlandTel. +41 71 447 22 11, Fax. +41 71 447 29 [email protected]
Forward-looking statements
All statements in this report that do not relate tohistorical facts are forward-looking statements and noguarantees of future performance. Forward-lookingstatements involve risks and uncertainties, namely inreference to basic macroeconomic conditions, con-sumption behaviour, foreign exchange rates, f inancingopportunities, changes of legal provisions or in thepolitical and social environment, the actions of com-petitors, availability of raw material, and general mar-ket conditions. Such circumstances can lead to varian-ce between anticipated and actual results.
Translation: The original of this Annual Report iswritten in German. In the case of inconsistencies bet-ween the German original and this English translation,the German version shall prevail.