Embed Size (px)
Citation preview
40
Annual Report 2007-08
The Indian securities markets witnessed
significant uptrend and volatility in 2007-08.
The equity markets registered gains and the
benchmark indices breached historic highs on
several occasions. However, since mid-
January 2008, stock markets witnessed sharp
corrections in tandem with the global equity
markets. Resources raised by the corporates
from the primary market were substantially
higher indicating the continuation of
investment boom in India. Mutual funds too
mobilised large amount of resources during
2007-08. Sound domestic macro-economic
fundamentals, private corporate profitability
and active buying support from institutional
investors were the major factors that
dominated stock market movement during
2007-08.
1. PRIMARY SECURITIES MARKET
The upward trend in primary market
activities continued in 2007-08. The buoyancy
in the secondary market coupled with strong
macro-economic fundamentals, active
institutional support led by FIIs and mutual
funds encouraged large number of companies
to raise resource from the primary market.
Several large companies mobilised resources
through public issues, rights issues and
Qualified Institutions’ Placement. The
companies in private sector led in raising
resources from primary market during
2007-08.
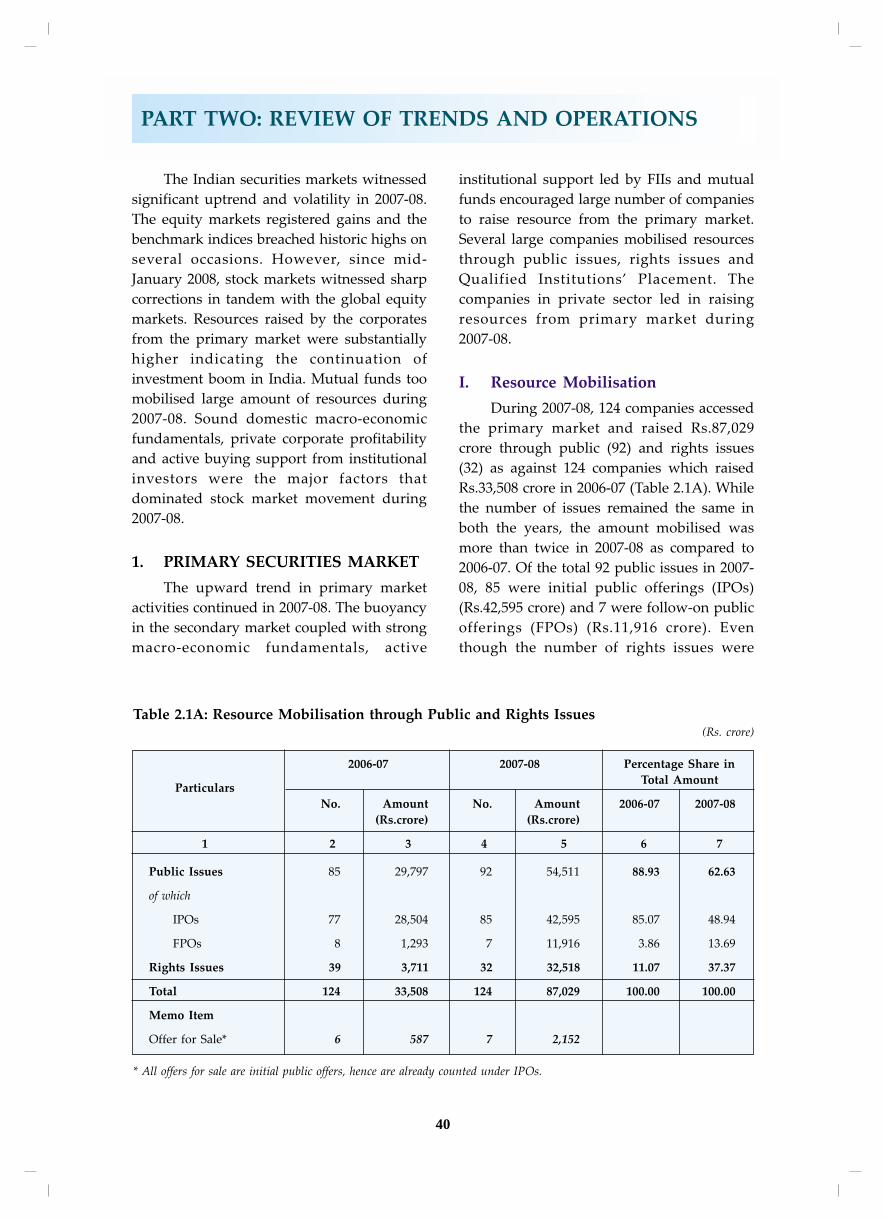
I. Resource Mobilisation
During 2007-08, 124 companies accessed
the primary market and raised Rs.87,029
crore through public (92) and rights issues
(32) as against 124 companies which raised
Rs.33,508 crore in 2006-07 (Table 2.1A). While
the number of issues remained the same in
both the years, the amount mobilised was
more than twice in 2007-08 as compared to
2006-07. Of the total 92 public issues in 2007-
08, 85 were initial public offerings (IPOs)
(Rs.42,595 crore) and 7 were follow-on public
offerings (FPOs) (Rs.11,916 crore). Even
though the number of rights issues were
PART TWO: REVIEW OF TRENDS AND OPERATIONS
Table 2.1A: Resource Mobilisation through Public and Rights Issues(Rs. crore)
2006-07 2007-08 Percentage Share in
ParticularsTotal Amount
No. Amount No. Amount 2006-07 2007-08
(Rs.crore) (Rs.crore)
1 2 3 4 5 6 7
Public Issues 85 29,797 92 54,511 88.93 62.63
of which
IPOs 77 28,504 85 42,595 85.07 48.94
FPOs 8 1,293 7 11,916 3.86 13.69
Rights Issues 39 3,711 32 32,518 11.07 37.37
Total 124 33,508 124 87,029 100.00 100.00
Memo Item
Offer for Sale* 6 587 7 2,152
* All offers for sale are initial public offers, hence are already counted under IPOs.
41
Part Two: Review of Trends and Operations
Table 2.1B: Issues Withdrawn during 2007-08
Name of the Issuer Type Date of Date of Reason for
of Opening Withdrawal Withdrawal by
Issue of Issue of Issue the Company
1 2 3 4 5
IT People (India) Limited FPO 27-08-2007 30-08-2007 Issue failed to generate
adequate response
Wockhardt Hospitals Limited IPO 31-01-2008 07-02-2008 Minimum of 90% subscription
was not received
Emaar MGF Land Limited IPO 01-02-2008 08-02-2008 Company felt that the prevailing
market sentiments were adverse
SVEC Constructions Limited IPO 04-02-2008 12-02-2008 Company felt that the prevailing
market sentiments were adverse
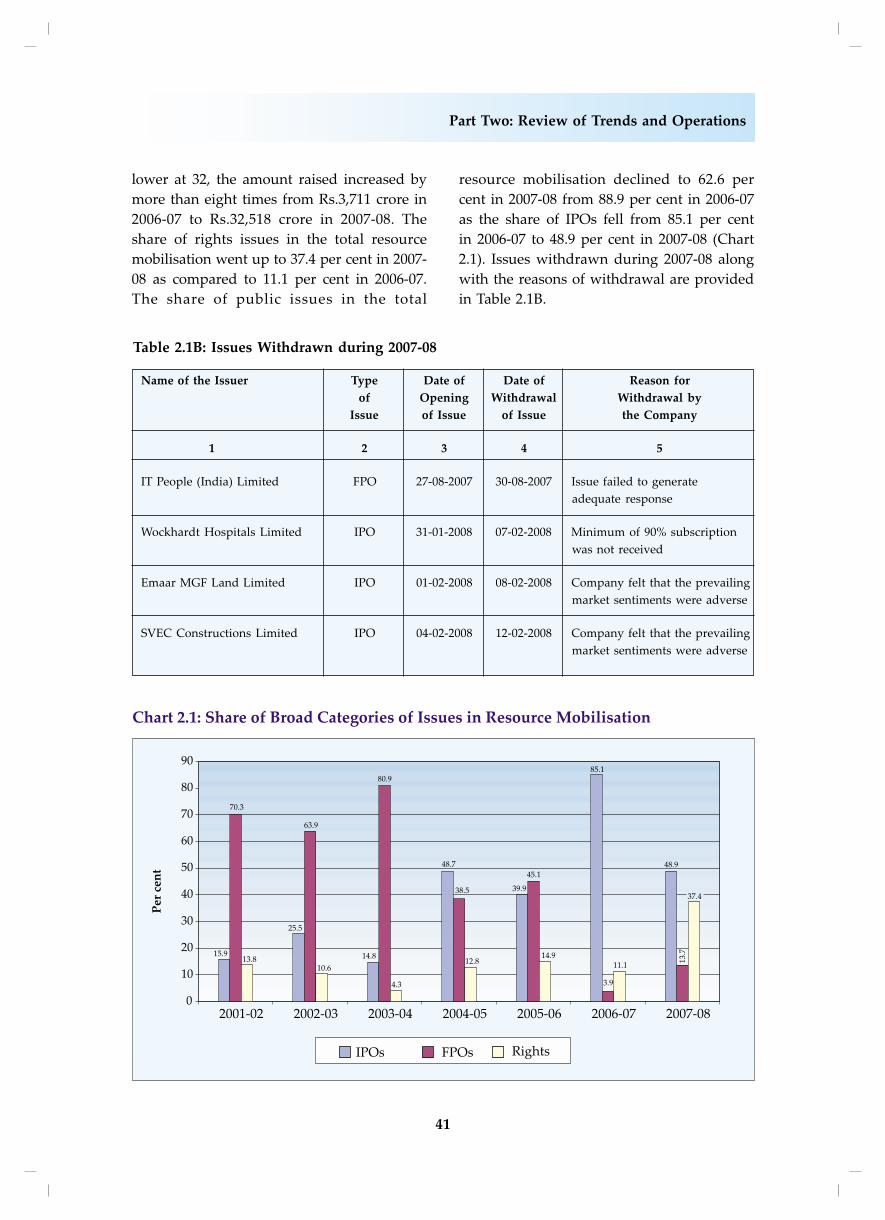
lower at 32, the amount raised increased by
more than eight times from Rs.3,711 crore in
2006-07 to Rs.32,518 crore in 2007-08. The
share of rights issues in the total resource
mobilisation went up to 37.4 per cent in 2007-
08 as compared to 11.1 per cent in 2006-07.
The share of public issues in the total
resource mobilisation declined to 62.6 per
cent in 2007-08 from 88.9 per cent in 2006-07
as the share of IPOs fell from 85.1 per cent
in 2006-07 to 48.9 per cent in 2007-08 (Chart
2.1). Issues withdrawn during 2007-08 along
with the reasons of withdrawal are provided
in Table 2.1B.
42
Annual Report 2007-08
The highest amount was mobilised in
June 2007 (Rs.22,703 crore), followed by
February 2008 (Rs.18,828 crore) and January
2008 (Rs.14,044 crore). However, the number
of issues was the highest in June 2007 (15)
and September 2007 (14).
Listed companies were also allowed to
raise resources from institutional investors
through Qualified Institutions’ Placement
(QIP). During 2007-08, 36 listed companies
raised Rs.25,525 crore through QIP as
compared to 25 companies which raised
Rs.4,963 crore through QIPs in 2006-07
(Table 2.2).
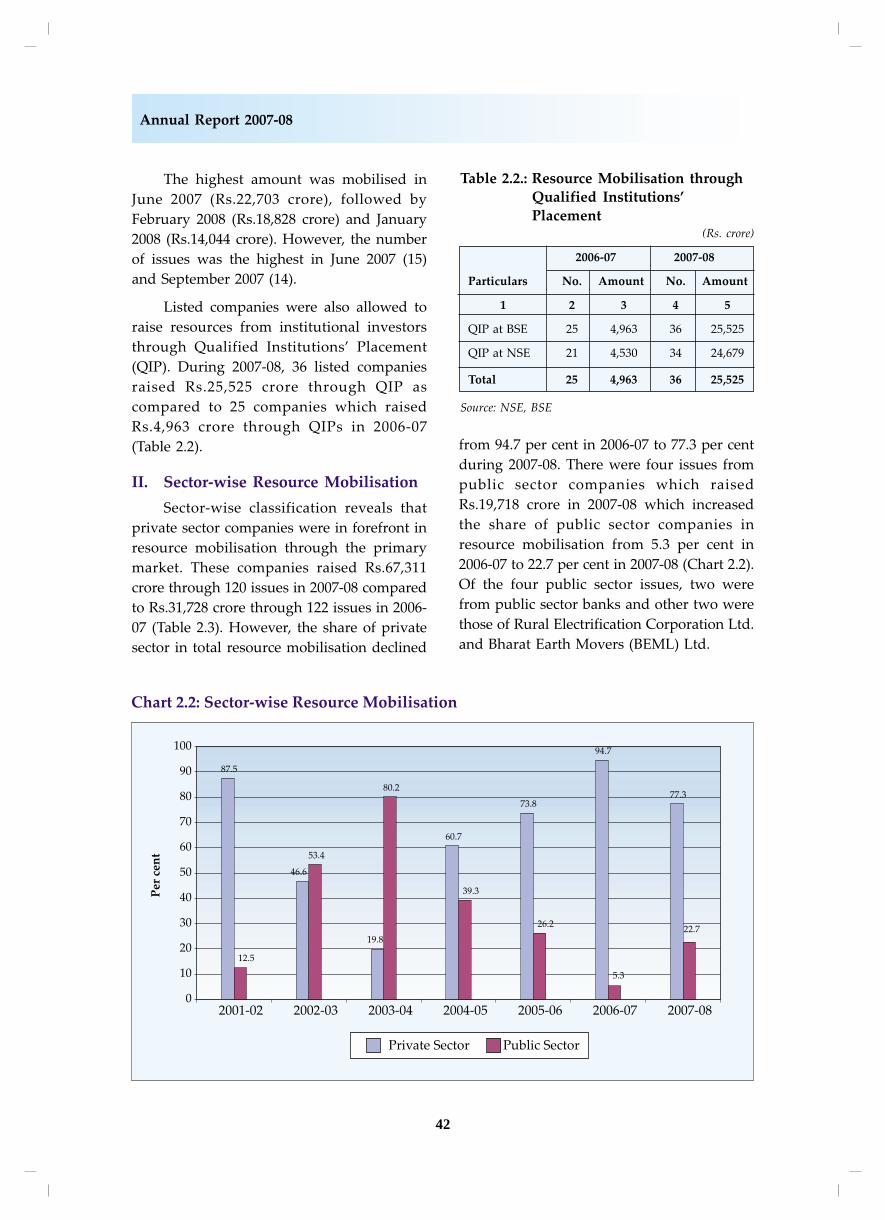
II. Sector-wise Resource Mobilisation
Sector-wise classification reveals that
private sector companies were in forefront in
resource mobilisation through the primary
market. These companies raised Rs.67,311
crore through 120 issues in 2007-08 compared
to Rs.31,728 crore through 122 issues in 2006-
07 (Table 2.3). However, the share of private
sector in total resource mobilisation declined
from 94.7 per cent in 2006-07 to 77.3 per cent
during 2007-08. There were four issues from
public sector companies which raised
Rs.19,718 crore in 2007-08 which increased
the share of public sector companies in
resource mobilisation from 5.3 per cent in
2006-07 to 22.7 per cent in 2007-08 (Chart 2.2).
Of the four public sector issues, two were
from public sector banks and other two were
those of Rural Electrification Corporation Ltd.
and Bharat Earth Movers (BEML) Ltd.
Table 2.2.: Resource Mobilisation through
Qualified Institutions’
Placement(Rs. crore)
2006-07 2007-08
Particulars No. Amount No. Amount
1 2 3 4 5
QIP at BSE 25 4,963 36 25,525
QIP at NSE 21 4,530 34 24,679
Total 25 4,963 36 25,525
Source: NSE, BSE
43
Part Two: Review of Trends and Operations
III. Size-wise Resource Mobilisation
About 87.8 per cent of resource
mobilisation was through issues of above
Rs.500 crore (Table 2.4). The number of issues
above Rs.500 crore category doubled from 11
in 2006-07 to 24 in 2007-08.
The average size of the issue was Rs.702
crore in 2007-08 as against Rs.270 crore in
2006-07. The mean issue-size of the public
issues increased from Rs.351 crore in 2006-
07 to Rs.593 crore in 2007-08. The larger size
of the issues reflected high capital
expenditure plans of companies in view of
strong economic and industrial expansion.
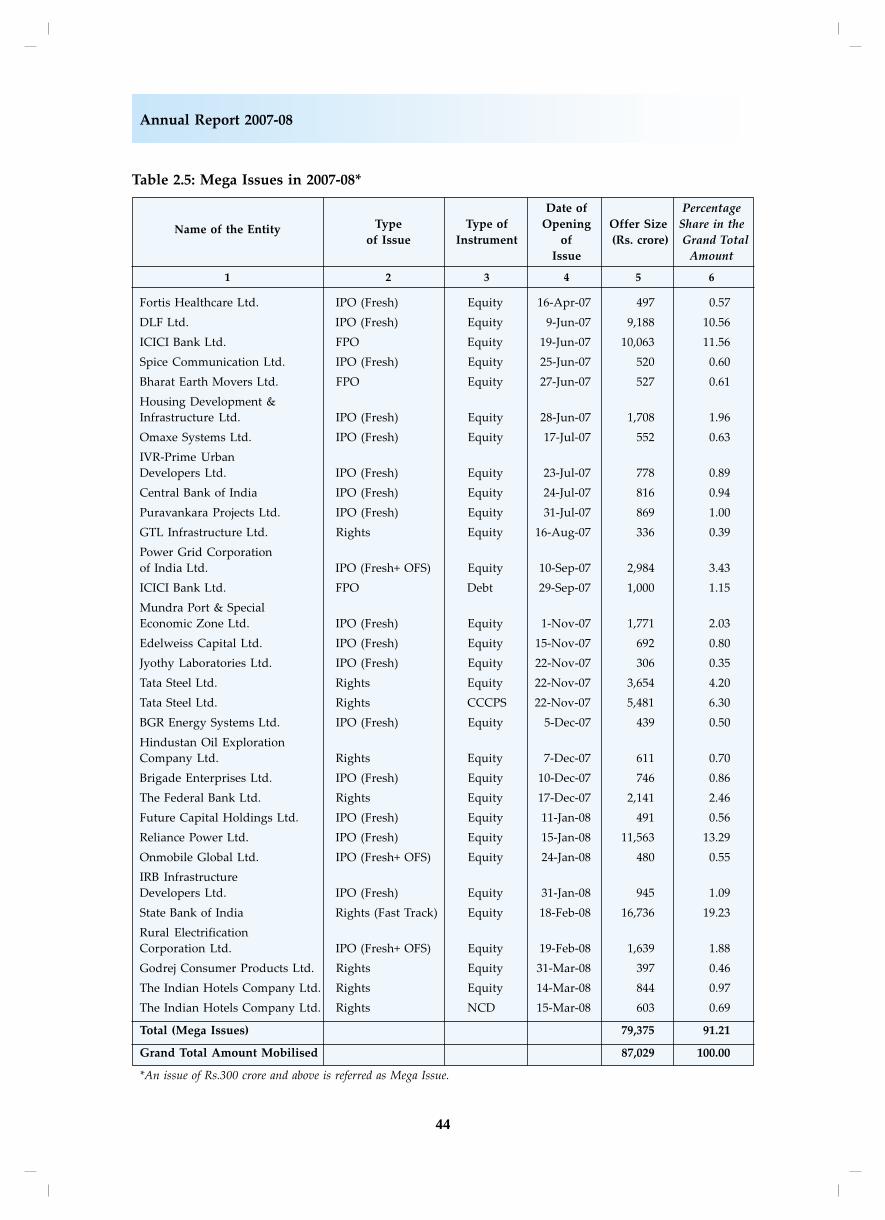
There were 31 mega issues in 2007-08
(Table 2.5). The largest issue during 2007-08
was the rights issue of State Bank of India
(Rs.16,736 crore). The other large issues
include Reliance Power Ltd. (Rs.11,563 crore)
and ICICI Bank Ltd.(Rs.10,063 crore) which
were the largest IPO and FPO, respectively
during the year. Of the total 31 mega issues,
19 were IPOs and nine were rights issues,
and the three were FPOs. Instrument-wise,
28 mega issues were equity issues, and one
each was of debt, CCCPS and NCD issue.
Table 2.3: Sector-wise Resource Mobilisation
2006-07 2007-08Percentage Share
in the Total Amount
Sector No. Amount No. Amount 2006-07 2007-08
(Rs.crore) (Rs.crore)
1 2 3 4 5 6 7
Private 122 31,728 120 67,311 94.69 77.34
Public 2 1,779 4 19,718 5.31 22.66
Total 124 33,508 124 87,029 100.00 100.00
Table 2.4: Size-wise Resource Mobilisation
2006-07 2007-08Percentage Share
in the Total Amount
Issue Size No. Amount No. Amount 2006-07 2007-08
(Rs.crore) (Rs.crore)
1 2 3 4 5 6 7
< Rs.5 crore 3 10 4 16 0.03 0.02
≥ Rs.5 crore & < Rs.10 crore 6 45 1 6 0.14 0.01
≥ Rs.10 crore & < Rs.50 crore 40 1,129 33 920 3.37 1.06
≥ Rs.50 crore & < Rs.100 crore 31 2,386 25 1,669 7.12 1.92
≥ Rs.100 crore & < Rs.500 crore 33 7,537 37 7,999 22.49 9.19
≥ Rs.500 crore 11 22,400 24 76,420 66.85 87.81
Total 124 33,508 124 87,029 100.00 100.00
44
Annual Report 2007-08
Table 2.5: Mega Issues in 2007-08*
Date of Percentage
Name of the Entity Type Type of Opening Offer Size Share in the
of Issue Instrument of (Rs. crore) Grand Total
Issue Amount
1 2 3 4 5 6
Fortis Healthcare Ltd. IPO (Fresh) Equity 16-Apr-07 497 0.57
DLF Ltd. IPO (Fresh) Equity 9-Jun-07 9,188 10.56
ICICI Bank Ltd. FPO Equity 19-Jun-07 10,063 11.56
Spice Communication Ltd. IPO (Fresh) Equity 25-Jun-07 520 0.60
Bharat Earth Movers Ltd. FPO Equity 27-Jun-07 527 0.61
Housing Development &
Infrastructure Ltd. IPO (Fresh) Equity 28-Jun-07 1,708 1.96
Omaxe Systems Ltd. IPO (Fresh) Equity 17-Jul-07 552 0.63
IVR-Prime Urban
Developers Ltd. IPO (Fresh) Equity 23-Jul-07 778 0.89
Central Bank of India IPO (Fresh) Equity 24-Jul-07 816 0.94
Puravankara Projects Ltd. IPO (Fresh) Equity 31-Jul-07 869 1.00
GTL Infrastructure Ltd. Rights Equity 16-Aug-07 336 0.39
Power Grid Corporation
of India Ltd. IPO (Fresh+ OFS) Equity 10-Sep-07 2,984 3.43
ICICI Bank Ltd. FPO Debt 29-Sep-07 1,000 1.15
Mundra Port & Special
Economic Zone Ltd. IPO (Fresh) Equity 1-Nov-07 1,771 2.03
Edelweiss Capital Ltd. IPO (Fresh) Equity 15-Nov-07 692 0.80
Jyothy Laboratories Ltd. IPO (Fresh) Equity 22-Nov-07 306 0.35
Tata Steel Ltd. Rights Equity 22-Nov-07 3,654 4.20
Tata Steel Ltd. Rights CCCPS 22-Nov-07 5,481 6.30
BGR Energy Systems Ltd. IPO (Fresh) Equity 5-Dec-07 439 0.50
Hindustan Oil Exploration
Company Ltd. Rights Equity 7-Dec-07 611 0.70
Brigade Enterprises Ltd. IPO (Fresh) Equity 10-Dec-07 746 0.86
The Federal Bank Ltd. Rights Equity 17-Dec-07 2,141 2.46
Future Capital Holdings Ltd. IPO (Fresh) Equity 11-Jan-08 491 0.56
Reliance Power Ltd. IPO (Fresh) Equity 15-Jan-08 11,563 13.29
Onmobile Global Ltd. IPO (Fresh+ OFS) Equity 24-Jan-08 480 0.55
IRB Infrastructure
Developers Ltd. IPO (Fresh) Equity 31-Jan-08 945 1.09
State Bank of India Rights (Fast Track) Equity 18-Feb-08 16,736 19.23
Rural Electrification
Corporation Ltd. IPO (Fresh+ OFS) Equity 19-Feb-08 1,639 1.88
Godrej Consumer Products Ltd. Rights Equity 31-Mar-08 397 0.46
The Indian Hotels Company Ltd. Rights Equity 14-Mar-08 844 0.97
The Indian Hotels Company Ltd. Rights NCD 15-Mar-08 603 0.69
Total (Mega Issues) 79,375 91.21
Grand Total Amount Mobilised 87,029 100.00
*An issue of Rs.300 crore and above is referred as Mega Issue.
45
Part Two: Review of Trends and Operations
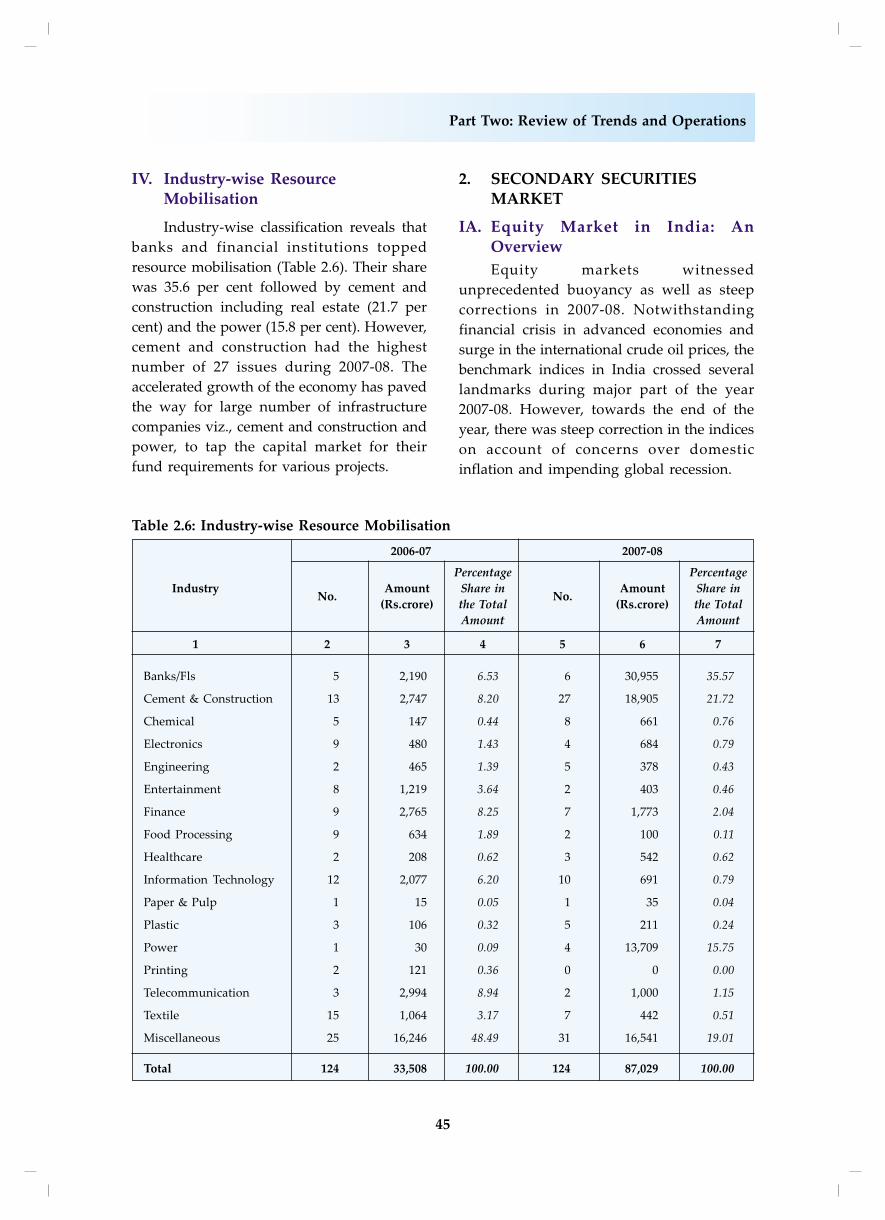
IV. Industry-wise ResourceMobilisation
Industry-wise classification reveals that
banks and financial institutions topped
resource mobilisation (Table 2.6). Their share
was 35.6 per cent followed by cement and
construction including real estate (21.7 per
cent) and the power (15.8 per cent). However,
cement and construction had the highest
number of 27 issues during 2007-08. The
accelerated growth of the economy has paved
the way for large number of infrastructure
companies viz., cement and construction and
power, to tap the capital market for their
fund requirements for various projects.
2. SECONDARY SECURITIESMARKET
IA. Equity Market in India: AnOverview
Equity markets witnessed
unprecedented buoyancy as well as steep
corrections in 2007-08. Notwithstanding
financial crisis in advanced economies and
surge in the international crude oil prices, the
benchmark indices in India crossed several
landmarks during major part of the year
2007-08. However, towards the end of the
year, there was steep correction in the indices
on account of concerns over domestic
inflation and impending global recession.
Table 2.6: Industry-wise Resource Mobilisation
2006-07 2007-08
Percentage Percentage
IndustryNo.
Amount Share inNo.
Amount Share in
(Rs.crore) the Total (Rs.crore) the Total
Amount Amount
1 2 3 4 5 6 7
Banks/Fls 5 2,190 6.53 6 30,955 35.57
Cement & Construction 13 2,747 8.20 27 18,905 21.72
Chemical 5 147 0.44 8 661 0.76
Electronics 9 480 1.43 4 684 0.79
Engineering 2 465 1.39 5 378 0.43
Entertainment 8 1,219 3.64 2 403 0.46
Finance 9 2,765 8.25 7 1,773 2.04
Food Processing 9 634 1.89 2 100 0.11
Healthcare 2 208 0.62 3 542 0.62
Information Technology 12 2,077 6.20 10 691 0.79
Paper & Pulp 1 15 0.05 1 35 0.04
Plastic 3 106 0.32 5 211 0.24
Power 1 30 0.09 4 13,709 15.75
Printing 2 121 0.36 0 0 0.00
Telecommunication 3 2,994 8.94 2 1,000 1.15
Textile 15 1,064 3.17 7 442 0.51
Miscellaneous 25 16,246 48.49 31 16,541 19.01
Total 124 33,508 100.00 124 87,029 100.00
46
Annual Report 2007-08
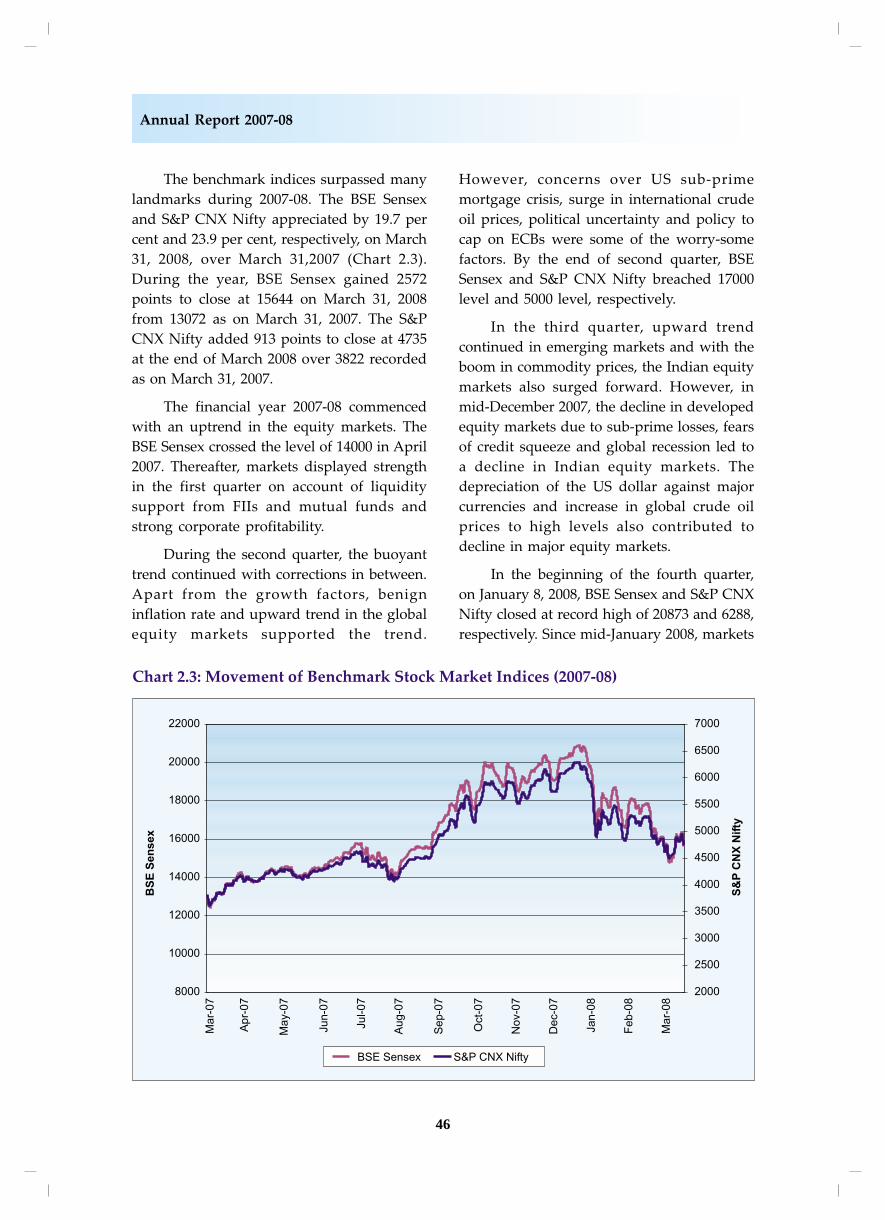
The benchmark indices surpassed many
landmarks during 2007-08. The BSE Sensex
and S&P CNX Nifty appreciated by 19.7 per
cent and 23.9 per cent, respectively, on March
31, 2008, over March 31,2007 (Chart 2.3).
During the year, BSE Sensex gained 2572
points to close at 15644 on March 31, 2008
from 13072 as on March 31, 2007. The S&P
CNX Nifty added 913 points to close at 4735
at the end of March 2008 over 3822 recorded
as on March 31, 2007.
The financial year 2007-08 commenced
with an uptrend in the equity markets. The
BSE Sensex crossed the level of 14000 in April
2007. Thereafter, markets displayed strength
in the first quarter on account of liquidity
support from FIIs and mutual funds and
strong corporate profitability.
During the second quarter, the buoyant
trend continued with corrections in between.
Apart from the growth factors, benign
inflation rate and upward trend in the global
equity markets supported the trend.
However, concerns over US sub-prime
mortgage crisis, surge in international crude
oil prices, political uncertainty and policy to
cap on ECBs were some of the worry-some
factors. By the end of second quarter, BSE
Sensex and S&P CNX Nifty breached 17000
level and 5000 level, respectively.
In the third quarter, upward trend
continued in emerging markets and with the
boom in commodity prices, the Indian equity
markets also surged forward. However, in
mid-December 2007, the decline in developed
equity markets due to sub-prime losses, fears
of credit squeeze and global recession led to
a decline in Indian equity markets. The
depreciation of the US dollar against major
currencies and increase in global crude oil
prices to high levels also contributed to
decline in major equity markets.
In the beginning of the fourth quarter,
on January 8, 2008, BSE Sensex and S&P CNX
Nifty closed at record high of 20873 and 6288,
respectively. Since mid-January 2008, markets
47
Part Two: Review of Trends and Operations
turned volatile. On January 21, 2008, the
markets recorded highest intra-day
corrections in the Indian equity markets so
far. During the month of October 2007 and
January 2008, emerging markets witnessed
higher volatility as compared to other
markets. Indian indices were one of the
highly volatile indices in the world during
January 2008. The annualised volatility of BSE
Sensex and S&P CNX Nifty were 30.6 per
cent and 32.1 per cent, respectively during
2007-08.
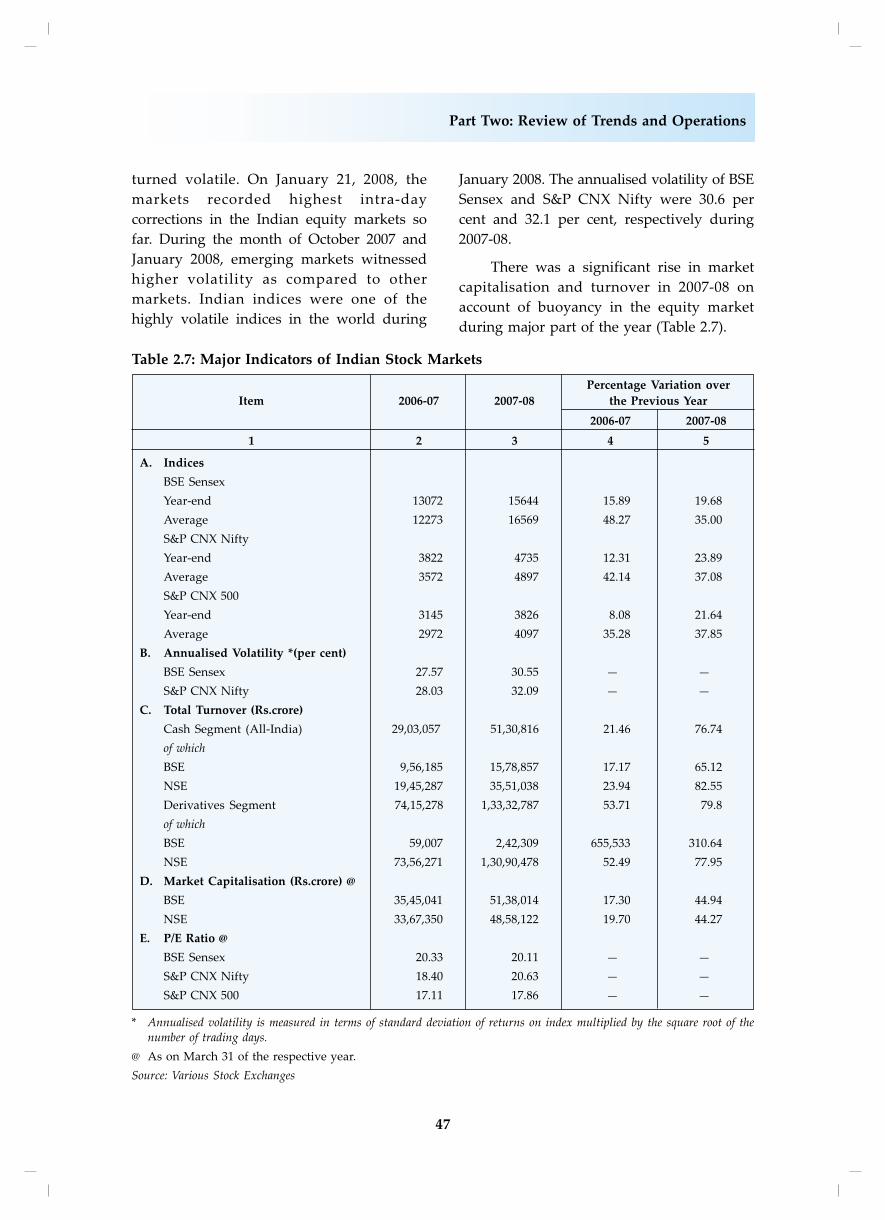
There was a significant rise in market
capitalisation and turnover in 2007-08 on
account of buoyancy in the equity market
during major part of the year (Table 2.7).
Table 2.7: Major Indicators of Indian Stock Markets
Percentage Variation over
Item 2006-07 2007-08 the Previous Year
2006-07 2007-08
1 2 3 4 5
A. Indices
BSE Sensex
Year-end 13072 15644 15.89 19.68
Average 12273 16569 48.27 35.00
S&P CNX Nifty
Year-end 3822 4735 12.31 23.89
Average 3572 4897 42.14 37.08
S&P CNX 500
Year-end 3145 3826 8.08 21.64
Average 2972 4097 35.28 37.85
B. Annualised Volatility *(per cent)
BSE Sensex 27.57 30.55 — —
S&P CNX Nifty 28.03 32.09 — —
C. Total Turnover (Rs.crore)
Cash Segment (All-India) 29,03,057 51,30,816 21.46 76.74
of which
BSE 9,56,185 15,78,857 17.17 65.12
NSE 19,45,287 35,51,038 23.94 82.55
Derivatives Segment 74,15,278 1,33,32,787 53.71 79.8
of which
BSE 59,007 2,42,309 655,533 310.64
NSE 73,56,271 1,30,90,478 52.49 77.95
D. Market Capitalisation (Rs.crore) @
BSE 35,45,041 51,38,014 17.30 44.94
NSE 33,67,350 48,58,122 19.70 44.27
E. P/E Ratio @
BSE Sensex 20.33 20.11 — —
S&P CNX Nifty 18.40 20.63 — —
S&P CNX 500 17.11 17.86 — —
* Annualised volatility is measured in terms of standard deviation of returns on index multiplied by the square root of thenumber of trading days.
@ As on March 31 of the respective year.
Source: Various Stock Exchanges
48
Annual Report 2007-08
In the cash segment, the turnover at BSE
and NSE rose by 65.1 per cent and 82.6 per
cent, respectively in 2007-08 over the previous
year. Significant upward trend was recorded
in the derivatives segment and the combined
derivative turnover at BSE and NSE rose by
79.8 per cent in 2007-08. The market
capitalisation at BSE and NSE witnessed a
rise of 44.9 and 44.3 per cent, respectively
over the previous year. Indian markets with
strong economic growth and good corporate
profitability continued to attract FIIs.
Substantial resource mobilisation by mutual
funds from income/debt oriented schemes
and equity related schemes was another
significant feature of Indian securities market
in 2007-08. Liquidity support by institutional
investors was the major reason for the
buoyancy in the Indian stock markets.
I B. Global Equity Markets: AnOverview
The global equity markets were
dominated by the US sub-prime mortgage
and credit squeeze crisis in 2007-08. The other
key downside risks were inflation, oil prices,
and slowdown in the world economy led by
recession in USA. The main source of
inflationary pressure was on account of rising
commodity prices, particularly food and
crude oil. During the first half of 2007-08, the
upward revision in growth expectations,
robust corporate earnings, increased merger
and acquisition activity and increased risk
appetite led to buoyancy in equity markets
in major economies. However, in the second
half of 2007-08, the re-pricing of risks
resulting from the deterioration in the sub-
prime mortgage sector in US led to decline
in the equity markets in advanced economies.
In the third quarter of 2007-08, the
depreciation of US dollar vis-à-vis major
currencies and rise in international crude oil
prices dampened the market sentiment.
However, emerging markets, India in
particular, recorded gains during the third
quarter due to strong portfolio flows and
robust economic and corporate earnings
growth.
The annual return on a point-to-point
basis was the highest for HERMES index of
Egypt (56.3 per cent) followed by JCI of
Indonesia (33.7 per cent) and IBOV of Brazil
(33.1 per cent) (Chart 2.4). India’s index return
was the fourth highest in the world. All the
advanced equity markets recorded decline
during 2007-08, except Hong Kong. The
decline was the highest for NIKKEI index of
Japan (27.6 per cent) followed by CAC 40
index of France (16.5 per cent) and IGBC
index of Colombia (16.0 per cent).
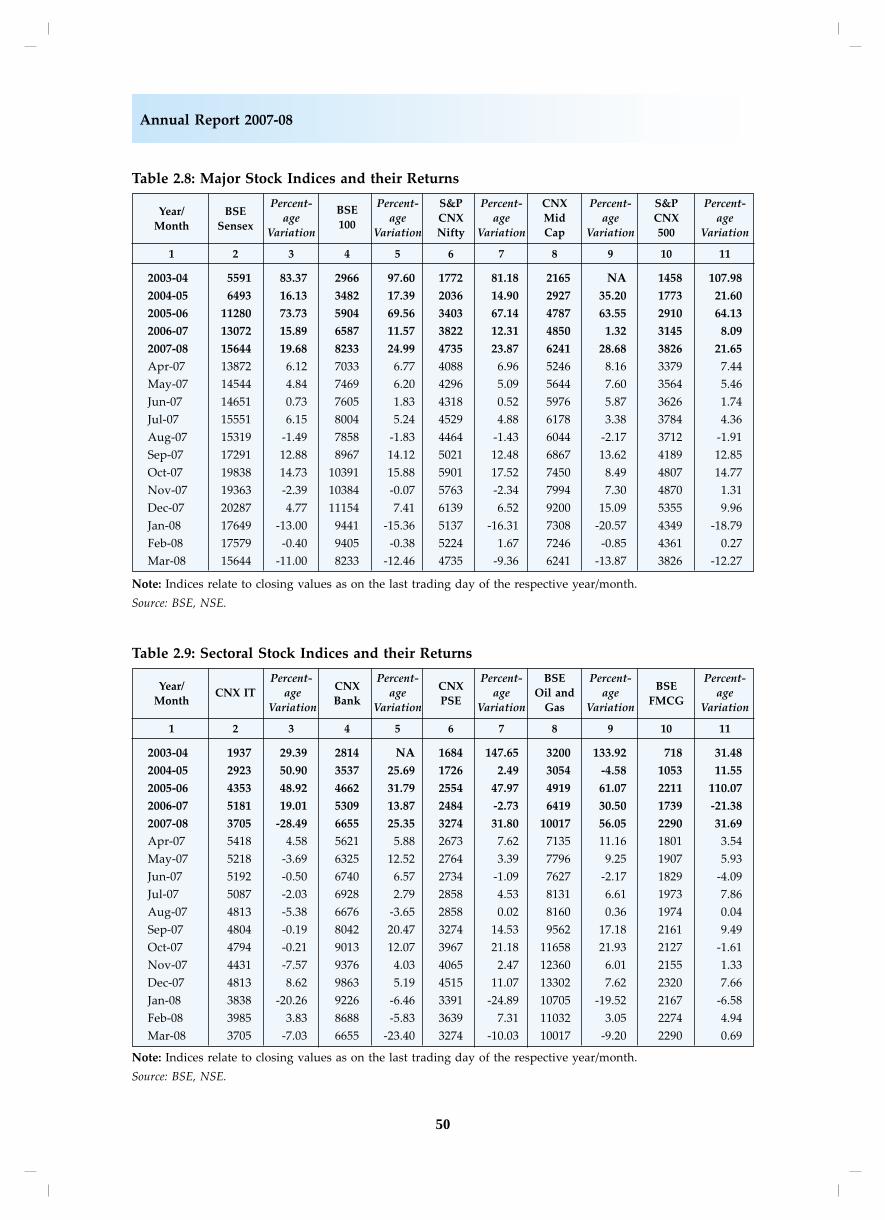
II. Performance of Sectoral Indices
For the major part of 2007-08, the
sectoral indices recorded buoyant
performance. Among the broad-based indices
of BSE, BSE 100 recorded rise of 25.0 per cent,
BSE 200 (24.1 per cent) and BSE 500 (24.3 per
cent) over the previous year (Chart 2.5).
Among the indices of NSE, the S&P CNX 500
and CNX Mid-cap gained by 21.6 per cent
and 28.7 per cent, respectively in 2007-08
(Table 2.8).
The BSE Small-cap index recorded a
gain of 21.2 per cent in 2007-08. Among the
sectoral indices, the highest gain was
recorded by BSE Metal index (65.2 per cent),
BSE Oil and Gas index (56.1 per cent) and
BSE Capital Goods index (54.4 per cent)
(Table 2.8 and 2.9 ). The rise in BSE Metal
index reflected sharp rise in metal prices on
account of commodity boom worldwide. BSE
Oil index rose sharply on account of spiraling
oil prices. The only indices which witnessed
a decline were BSE Teck index (14.3 per cent)
and BSE Auto index (7.1 per cent). The
decline in technology indices was mainly on
account of appreciation in rupee vis-a vis-
dollar which affected the revenue of IT sector
in rupee terms.

49
Part Two: Review of Trends and Operations
50
Annual Report 2007-08
Table 2.8: Major Stock Indices and their Returns
Year/ BSEPercent-
BSEPercent- S&P Percent- CNX Percent- S&P Percent-
Month Sensexage
100age CNX age Mid age CNX age
Variation Variation Nifty Variation Cap Variation 500 Variation
1 2 3 4 5 6 7 8 9 10 11
2003-04 5591 83.37 2966 97.60 1772 81.18 2165 NA 1458 107.98
2004-05 6493 16.13 3482 17.39 2036 14.90 2927 35.20 1773 21.60
2005-06 11280 73.73 5904 69.56 3403 67.14 4787 63.55 2910 64.13
2006-07 13072 15.89 6587 11.57 3822 12.31 4850 1.32 3145 8.09
2007-08 15644 19.68 8233 24.99 4735 23.87 6241 28.68 3826 21.65
Apr-07 13872 6.12 7033 6.77 4088 6.96 5246 8.16 3379 7.44
May-07 14544 4.84 7469 6.20 4296 5.09 5644 7.60 3564 5.46
Jun-07 14651 0.73 7605 1.83 4318 0.52 5976 5.87 3626 1.74
Jul-07 15551 6.15 8004 5.24 4529 4.88 6178 3.38 3784 4.36
Aug-07 15319 -1.49 7858 -1.83 4464 -1.43 6044 -2.17 3712 -1.91
Sep-07 17291 12.88 8967 14.12 5021 12.48 6867 13.62 4189 12.85
Oct-07 19838 14.73 10391 15.88 5901 17.52 7450 8.49 4807 14.77
Nov-07 19363 -2.39 10384 -0.07 5763 -2.34 7994 7.30 4870 1.31
Dec-07 20287 4.77 11154 7.41 6139 6.52 9200 15.09 5355 9.96
Jan-08 17649 -13.00 9441 -15.36 5137 -16.31 7308 -20.57 4349 -18.79
Feb-08 17579 -0.40 9405 -0.38 5224 1.67 7246 -0.85 4361 0.27
Mar-08 15644 -11.00 8233 -12.46 4735 -9.36 6241 -13.87 3826 -12.27
Note: Indices relate to closing values as on the last trading day of the respective year/month.
Source: BSE, NSE.
Table 2.9: Sectoral Stock Indices and their Returns
Year/Percent-
CNXPercent-
CNXPercent- BSE Percent-
BSEPercent-
MonthCNX IT age
Bankage
PSEage Oil and age
FMCGage
Variation Variation Variation Gas Variation Variation
1 2 3 4 5 6 7 8 9 10 11
2003-04 1937 29.39 2814 NA 1684 147.65 3200 133.92 718 31.48
2004-05 2923 50.90 3537 25.69 1726 2.49 3054 -4.58 1053 11.55
2005-06 4353 48.92 4662 31.79 2554 47.97 4919 61.07 2211 110.07
2006-07 5181 19.01 5309 13.87 2484 -2.73 6419 30.50 1739 -21.38
2007-08 3705 -28.49 6655 25.35 3274 31.80 10017 56.05 2290 31.69
Apr-07 5418 4.58 5621 5.88 2673 7.62 7135 11.16 1801 3.54
May-07 5218 -3.69 6325 12.52 2764 3.39 7796 9.25 1907 5.93
Jun-07 5192 -0.50 6740 6.57 2734 -1.09 7627 -2.17 1829 -4.09
Jul-07 5087 -2.03 6928 2.79 2858 4.53 8131 6.61 1973 7.86
Aug-07 4813 -5.38 6676 -3.65 2858 0.02 8160 0.36 1974 0.04
Sep-07 4804 -0.19 8042 20.47 3274 14.53 9562 17.18 2161 9.49
Oct-07 4794 -0.21 9013 12.07 3967 21.18 11658 21.93 2127 -1.61
Nov-07 4431 -7.57 9376 4.03 4065 2.47 12360 6.01 2155 1.33
Dec-07 4813 8.62 9863 5.19 4515 11.07 13302 7.62 2320 7.66
Jan-08 3838 -20.26 9226 -6.46 3391 -24.89 10705 -19.52 2167 -6.58
Feb-08 3985 3.83 8688 -5.83 3639 7.31 11032 3.05 2274 4.94
Mar-08 3705 -7.03 6655 -23.40 3274 -10.03 10017 -9.20 2290 0.69
Note: Indices relate to closing values as on the last trading day of the respective year/month.
Source: BSE, NSE.
51
Part Two: Review of Trends and Operations
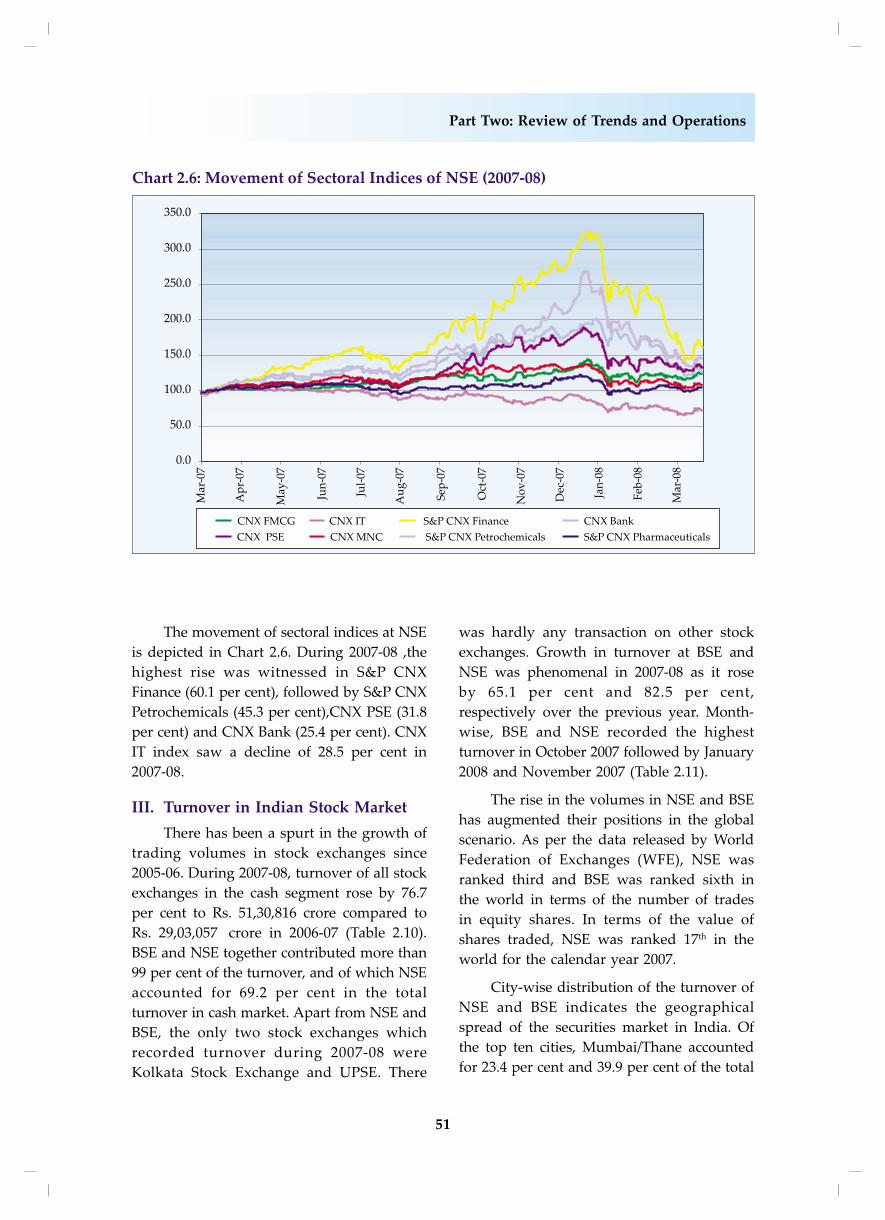
The movement of sectoral indices at NSE
is depicted in Chart 2.6. During 2007-08 ,the
highest rise was witnessed in S&P CNX
Finance (60.1 per cent), followed by S&P CNX
Petrochemicals (45.3 per cent),CNX PSE (31.8
per cent) and CNX Bank (25.4 per cent). CNX
IT index saw a decline of 28.5 per cent in
2007-08.
III. Turnover in Indian Stock Market
There has been a spurt in the growth of
trading volumes in stock exchanges since
2005-06. During 2007-08, turnover of all stock
exchanges in the cash segment rose by 76.7
per cent to Rs. 51,30,816 crore compared to
Rs. 29,03,057 crore in 2006-07 (Table 2.10).
BSE and NSE together contributed more than
99 per cent of the turnover, and of which NSE
accounted for 69.2 per cent in the total
turnover in cash market. Apart from NSE and
BSE, the only two stock exchanges which
recorded turnover during 2007-08 were
Kolkata Stock Exchange and UPSE. There
was hardly any transaction on other stock
exchanges. Growth in turnover at BSE and
NSE was phenomenal in 2007-08 as it rose
by 65.1 per cent and 82.5 per cent,
respectively over the previous year. Month-
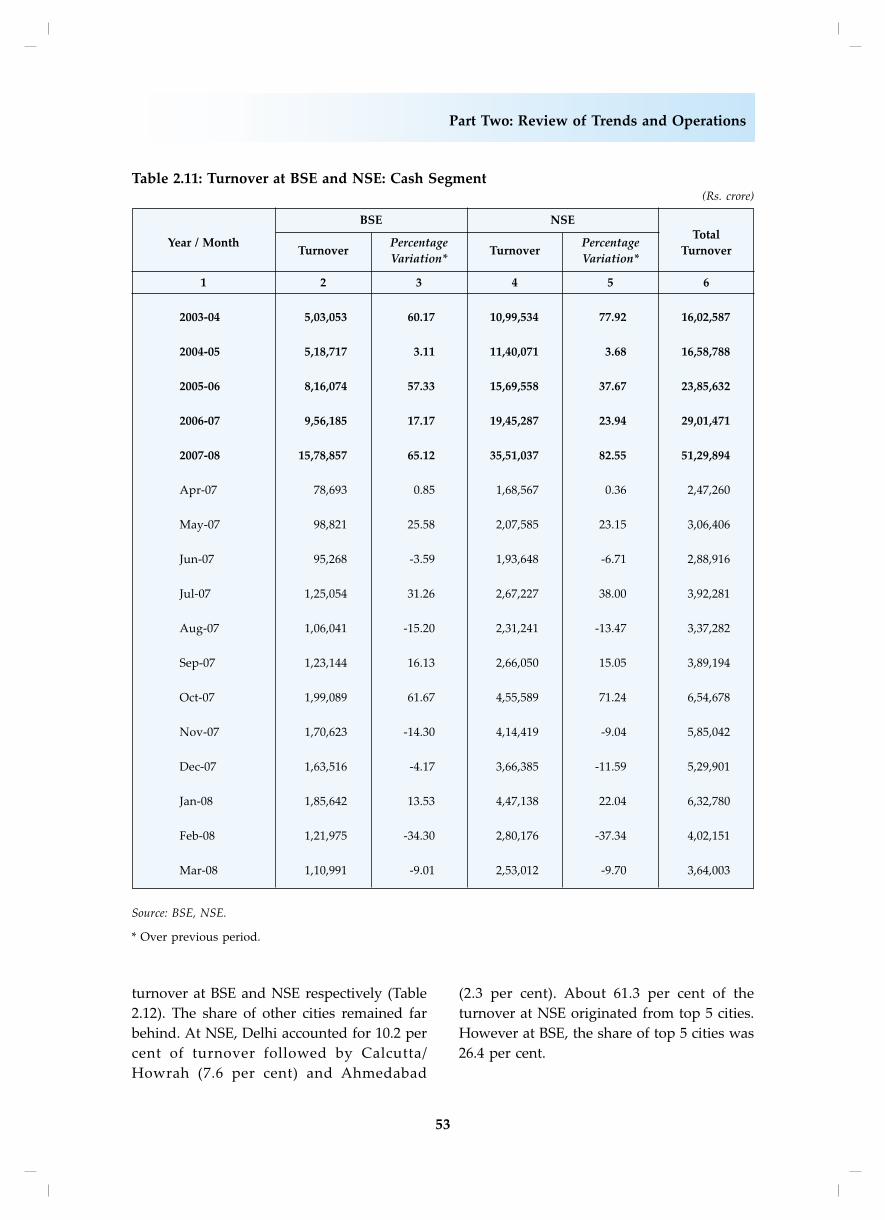
wise, BSE and NSE recorded the highest
turnover in October 2007 followed by January
2008 and November 2007 (Table 2.11).
The rise in the volumes in NSE and BSE
has augmented their positions in the global
scenario. As per the data released by World
Federation of Exchanges (WFE), NSE was
ranked third and BSE was ranked sixth in
the world in terms of the number of trades
in equity shares. In terms of the value of
shares traded, NSE was ranked 17th in the
world for the calendar year 2007.
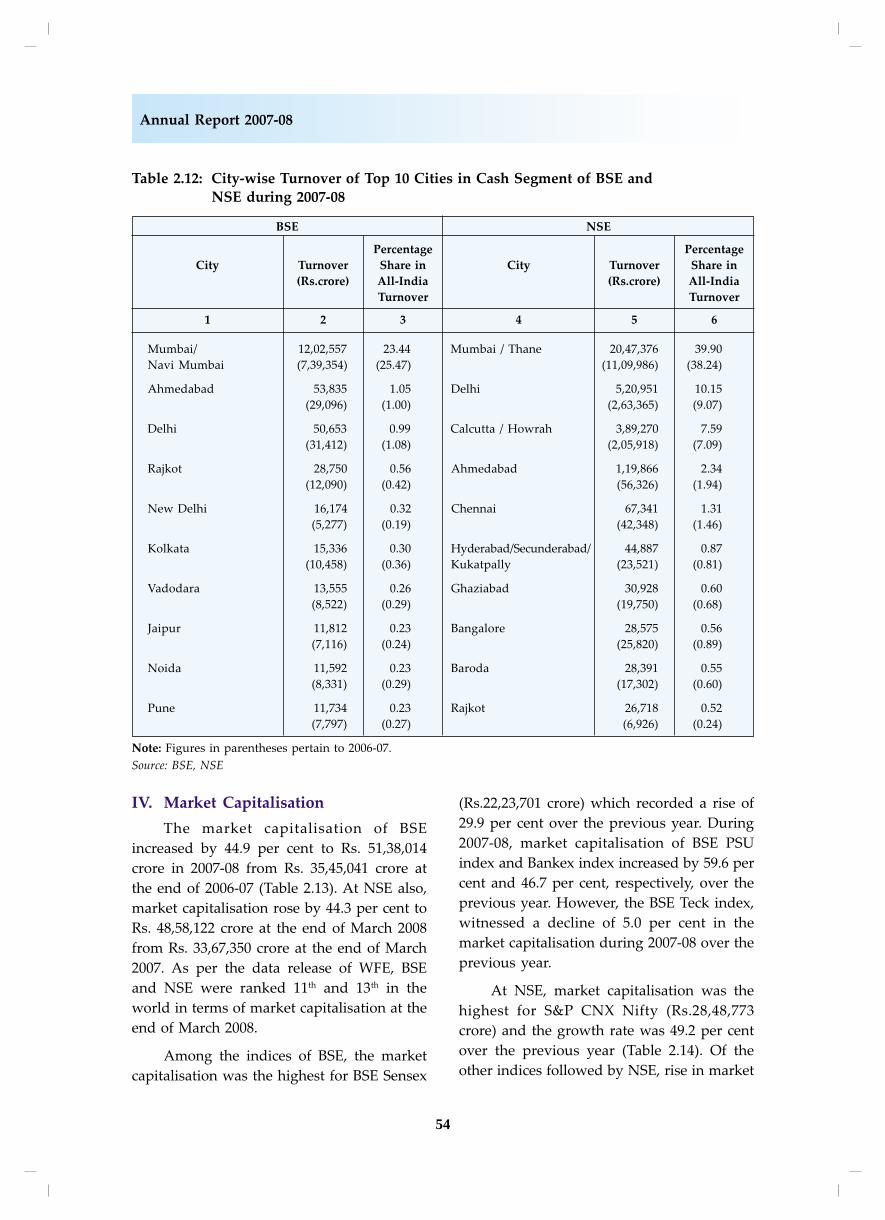
City-wise distribution of the turnover of
NSE and BSE indicates the geographical
spread of the securities market in India. Of
the top ten cities, Mumbai/Thane accounted
for 23.4 per cent and 39.9 per cent of the total
52
Annual Report 2007-08
Table 2.10: Exchange-wise Cash Segment Turnover(Rs. crore)
Stock Exchange 2006-07 2007-08Percentage Share
(2007-08)
1 2 3 4
Recognised Stock Exchanges
Ahmedabad Nil Nil Nil
BSE 9,56,185 15,78,857 30.77
Bangalore Nil Nil Nil
Bhubaneswar Nil Nil Nil
Cochin Nil Nil Nil
Coimbatore Nil NA NA
Delhi Nil Nil Nil
Gauhati Nil Nil Nil
ISE Nil Nil Nil
Jaipur Nil Nil Nil
Kolkata 694 446 0.01
Ludhiana Nil Nil Nil
Madras 1.2 Nil Nil
MPSE Nil Nil Nil
NSE 19,45,287 35,51,037 69.21
OTCEI Nil Nil Nil
Pune Nil Nil Nil
UPSE 799 475 0.01
Vadodara Nil Nil Nil
De-recognised Stock Exchanges
Hyderabad 92 NA NA
Magadh Nil NA NA
Mangalore NA NA NA
SKSE Nil NA NA
Total 29,03,057 51,30,816 100.00
Source: Various Stock Exchanges
53
Part Two: Review of Trends and Operations
turnover at BSE and NSE respectively (Table
2.12). The share of other cities remained far
behind. At NSE, Delhi accounted for 10.2 per
cent of turnover followed by Calcutta/
Howrah (7.6 per cent) and Ahmedabad
(2.3 per cent). About 61.3 per cent of the
turnover at NSE originated from top 5 cities.
However at BSE, the share of top 5 cities was
26.4 per cent.
Table 2.11: Turnover at BSE and NSE: Cash Segment(Rs. crore)
BSE NSE
Year / MonthTurnover
PercentageTurnover
PercentageTotal
Variation* Variation*Turnover
1 2 3 4 5 6
2003-04 5,03,053 60.17 10,99,534 77.92 16,02,587
2004-05 5,18,717 3.11 11,40,071 3.68 16,58,788
2005-06 8,16,074 57.33 15,69,558 37.67 23,85,632
2006-07 9,56,185 17.17 19,45,287 23.94 29,01,471
2007-08 15,78,857 65.12 35,51,037 82.55 51,29,894
Apr-07 78,693 0.85 1,68,567 0.36 2,47,260
May-07 98,821 25.58 2,07,585 23.15 3,06,406
Jun-07 95,268 -3.59 1,93,648 -6.71 2,88,916
Jul-07 1,25,054 31.26 2,67,227 38.00 3,92,281
Aug-07 1,06,041 -15.20 2,31,241 -13.47 3,37,282
Sep-07 1,23,144 16.13 2,66,050 15.05 3,89,194
Oct-07 1,99,089 61.67 4,55,589 71.24 6,54,678
Nov-07 1,70,623 -14.30 4,14,419 -9.04 5,85,042
Dec-07 1,63,516 -4.17 3,66,385 -11.59 5,29,901
Jan-08 1,85,642 13.53 4,47,138 22.04 6,32,780
Feb-08 1,21,975 -34.30 2,80,176 -37.34 4,02,151
Mar-08 1,10,991 -9.01 2,53,012 -9.70 3,64,003
Source: BSE, NSE.
* Over previous period.
54
Annual Report 2007-08
Table 2.12: City-wise Turnover of Top 10 Cities in Cash Segment of BSE and
NSE during 2007-08
BSE NSE
Percentage Percentage
City Turnover Share in City Turnover Share in
(Rs.crore) All-India (Rs.crore) All-India
Turnover Turnover
1 2 3 4 5 6
Mumbai/ 12,02,557 23.44 Mumbai / Thane 20,47,376 39.90
Navi Mumbai (7,39,354) (25.47) (11,09,986) (38.24)
Ahmedabad 53,835 1.05 Delhi 5,20,951 10.15
(29,096) (1.00) (2,63,365) (9.07)
Delhi 50,653 0.99 Calcutta / Howrah 3,89,270 7.59
(31,412) (1.08) (2,05,918) (7.09)
Rajkot 28,750 0.56 Ahmedabad 1,19,866 2.34
(12,090) (0.42) (56,326) (1.94)
New Delhi 16,174 0.32 Chennai 67,341 1.31
(5,277) (0.19) (42,348) (1.46)
Kolkata 15,336 0.30 Hyderabad/Secunderabad/ 44,887 0.87
(10,458) (0.36) Kukatpally (23,521) (0.81)
Vadodara 13,555 0.26 Ghaziabad 30,928 0.60
(8,522) (0.29) (19,750) (0.68)
Jaipur 11,812 0.23 Bangalore 28,575 0.56
(7,116) (0.24) (25,820) (0.89)
Noida 11,592 0.23 Baroda 28,391 0.55
(8,331) (0.29) (17,302) (0.60)
Pune 11,734 0.23 Rajkot 26,718 0.52
(7,797) (0.27) (6,926) (0.24)
Note: Figures in parentheses pertain to 2006-07.
Source: BSE, NSE
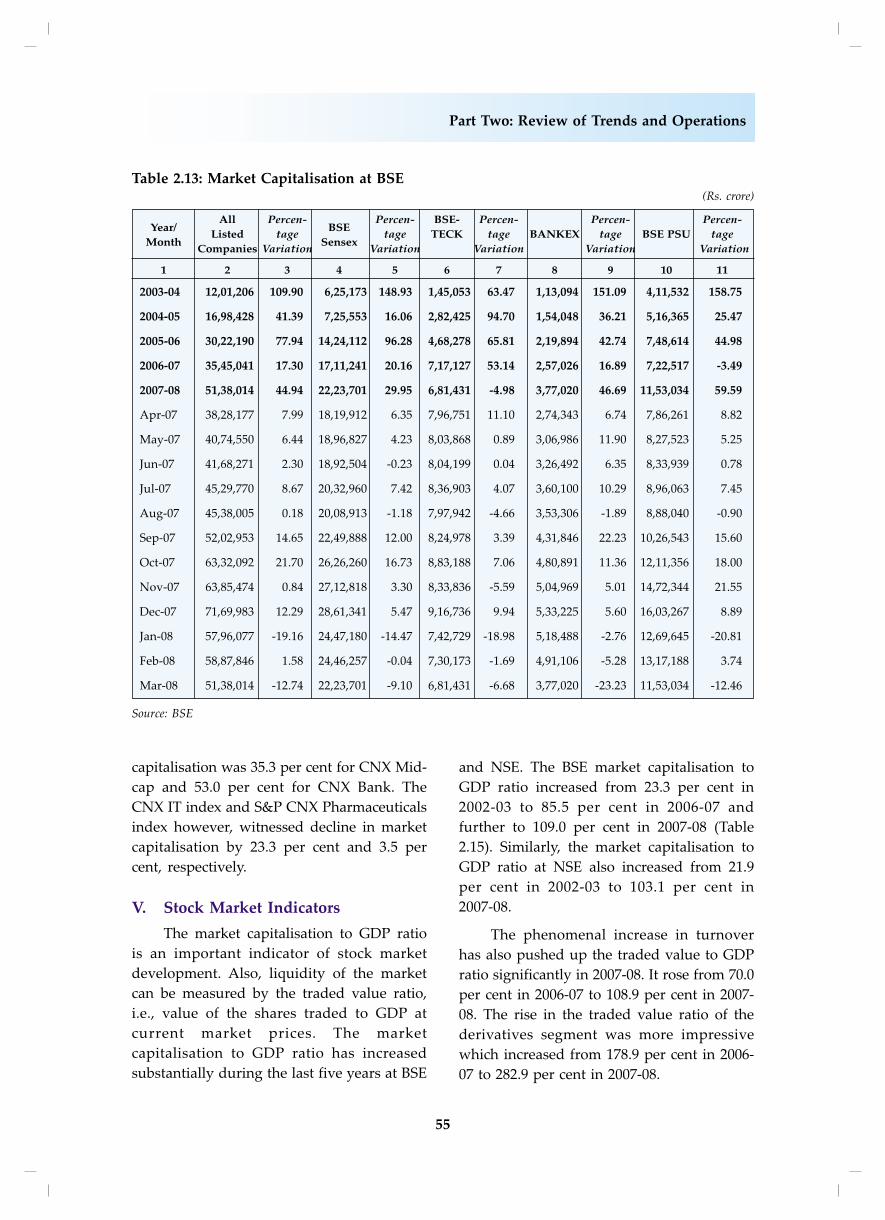
IV. Market Capitalisation
The market capitalisation of BSE
increased by 44.9 per cent to Rs. 51,38,014
crore in 2007-08 from Rs. 35,45,041 crore at
the end of 2006-07 (Table 2.13). At NSE also,
market capitalisation rose by 44.3 per cent to
Rs. 48,58,122 crore at the end of March 2008
from Rs. 33,67,350 crore at the end of March
2007. As per the data release of WFE, BSE
and NSE were ranked 11th and 13th in the
world in terms of market capitalisation at the
end of March 2008.
Among the indices of BSE, the market
capitalisation was the highest for BSE Sensex
(Rs.22,23,701 crore) which recorded a rise of
29.9 per cent over the previous year. During
2007-08, market capitalisation of BSE PSU
index and Bankex index increased by 59.6 per
cent and 46.7 per cent, respectively, over the
previous year. However, the BSE Teck index,
witnessed a decline of 5.0 per cent in the
market capitalisation during 2007-08 over the
previous year.
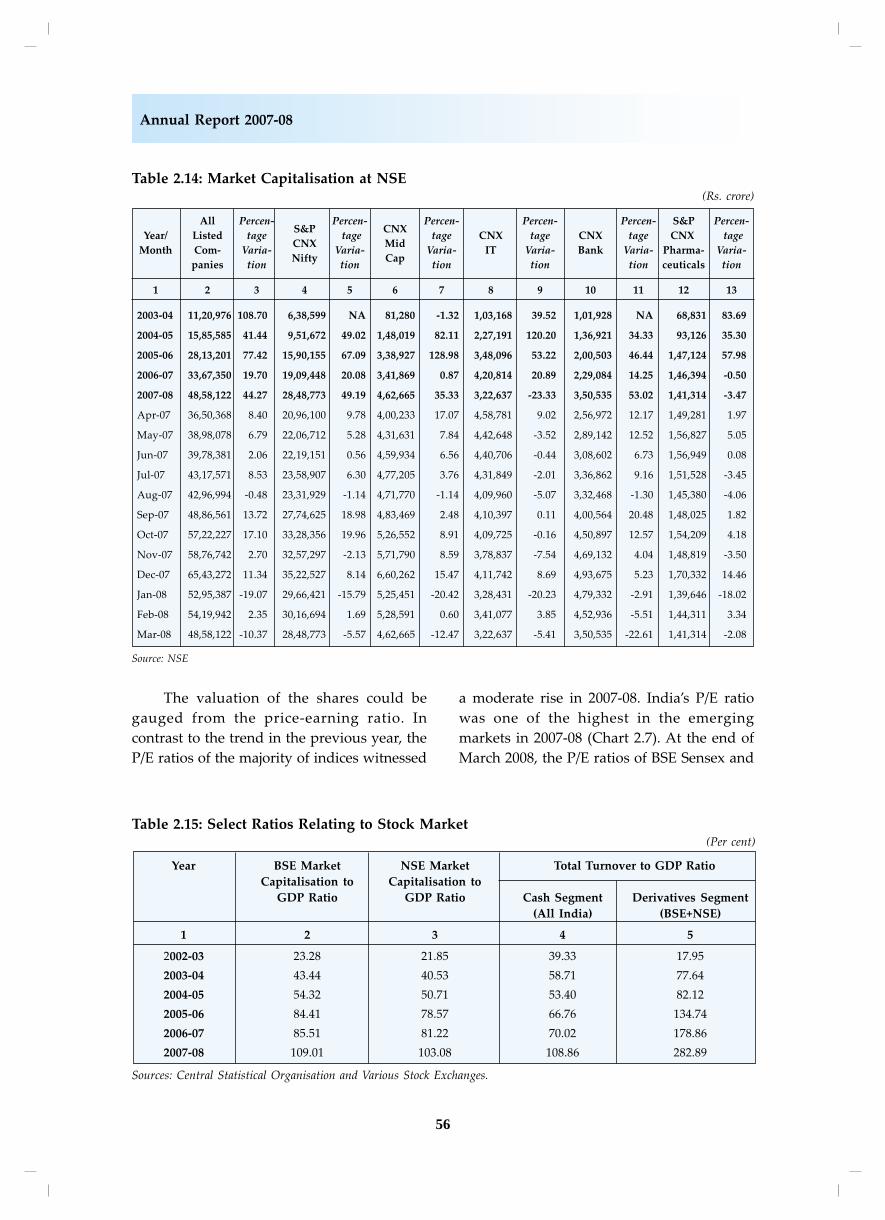
At NSE, market capitalisation was the
highest for S&P CNX Nifty (Rs.28,48,773
crore) and the growth rate was 49.2 per cent
over the previous year (Table 2.14). Of the
other indices followed by NSE, rise in market
55
Part Two: Review of Trends and Operations
capitalisation was 35.3 per cent for CNX Mid-
cap and 53.0 per cent for CNX Bank. The
CNX IT index and S&P CNX Pharmaceuticals
index however, witnessed decline in market
capitalisation by 23.3 per cent and 3.5 per
cent, respectively.
V. Stock Market Indicators
The market capitalisation to GDP ratio
is an important indicator of stock market
development. Also, liquidity of the market
can be measured by the traded value ratio,
i.e., value of the shares traded to GDP at
current market prices. The market
capitalisation to GDP ratio has increased
substantially during the last five years at BSE
and NSE. The BSE market capitalisation to
GDP ratio increased from 23.3 per cent in
2002-03 to 85.5 per cent in 2006-07 and
further to 109.0 per cent in 2007-08 (Table
2.15). Similarly, the market capitalisation to
GDP ratio at NSE also increased from 21.9
per cent in 2002-03 to 103.1 per cent in
2007-08.
The phenomenal increase in turnover
has also pushed up the traded value to GDP
ratio significantly in 2007-08. It rose from 70.0
per cent in 2006-07 to 108.9 per cent in 2007-
08. The rise in the traded value ratio of the
derivatives segment was more impressive
which increased from 178.9 per cent in 2006-
07 to 282.9 per cent in 2007-08.
Table 2.13: Market Capitalisation at BSE (Rs. crore)
Year/All Percen-
BSEPercen- BSE- Percen- Percen- Percen-
MonthListed tage
Sensextage TECK tage BANKEX tage BSE PSU tage
Companies Variation Variation Variation Variation Variation
1 2 3 4 5 6 7 8 9 10 11
2003-04 12,01,206 109.90 6,25,173 148.93 1,45,053 63.47 1,13,094 151.09 4,11,532 158.75
2004-05 16,98,428 41.39 7,25,553 16.06 2,82,425 94.70 1,54,048 36.21 5,16,365 25.47
2005-06 30,22,190 77.94 14,24,112 96.28 4,68,278 65.81 2,19,894 42.74 7,48,614 44.98
2006-07 35,45,041 17.30 17,11,241 20.16 7,17,127 53.14 2,57,026 16.89 7,22,517 -3.49
2007-08 51,38,014 44.94 22,23,701 29.95 6,81,431 -4.98 3,77,020 46.69 11,53,034 59.59
Apr-07 38,28,177 7.99 18,19,912 6.35 7,96,751 11.10 2,74,343 6.74 7,86,261 8.82
May-07 40,74,550 6.44 18,96,827 4.23 8,03,868 0.89 3,06,986 11.90 8,27,523 5.25
Jun-07 41,68,271 2.30 18,92,504 -0.23 8,04,199 0.04 3,26,492 6.35 8,33,939 0.78
Jul-07 45,29,770 8.67 20,32,960 7.42 8,36,903 4.07 3,60,100 10.29 8,96,063 7.45
Aug-07 45,38,005 0.18 20,08,913 -1.18 7,97,942 -4.66 3,53,306 -1.89 8,88,040 -0.90
Sep-07 52,02,953 14.65 22,49,888 12.00 8,24,978 3.39 4,31,846 22.23 10,26,543 15.60
Oct-07 63,32,092 21.70 26,26,260 16.73 8,83,188 7.06 4,80,891 11.36 12,11,356 18.00
Nov-07 63,85,474 0.84 27,12,818 3.30 8,33,836 -5.59 5,04,969 5.01 14,72,344 21.55
Dec-07 71,69,983 12.29 28,61,341 5.47 9,16,736 9.94 5,33,225 5.60 16,03,267 8.89
Jan-08 57,96,077 -19.16 24,47,180 -14.47 7,42,729 -18.98 5,18,488 -2.76 12,69,645 -20.81
Feb-08 58,87,846 1.58 24,46,257 -0.04 7,30,173 -1.69 4,91,106 -5.28 13,17,188 3.74
Mar-08 51,38,014 -12.74 22,23,701 -9.10 6,81,431 -6.68 3,77,020 -23.23 11,53,034 -12.46
Source: BSE
56
Annual Report 2007-08
Table 2.14: Market Capitalisation at NSE(Rs. crore)
All Percen-S&P
Percen-CNX
Percen- Percen- Percen- S&P Percen-
Year/ Listed tageCNX
tageMid
tage CNX tage CNX tage CNX tage
Month Com- Varia-Nifty
Varia-Cap
Varia- IT Varia- Bank Varia- Pharma- Varia-
panies tion tion tion tion tion ceuticals tion
1 2 3 4 5 6 7 8 9 10 11 12 13
2003-04 11,20,976 108.70 6,38,599 NA 81,280 -1.32 1,03,168 39.52 1,01,928 NA 68,831 83.69
2004-05 15,85,585 41.44 9,51,672 49.02 1,48,019 82.11 2,27,191 120.20 1,36,921 34.33 93,126 35.30
2005-06 28,13,201 77.42 15,90,155 67.09 3,38,927 128.98 3,48,096 53.22 2,00,503 46.44 1,47,124 57.98
2006-07 33,67,350 19.70 19,09,448 20.08 3,41,869 0.87 4,20,814 20.89 2,29,084 14.25 1,46,394 -0.50
2007-08 48,58,122 44.27 28,48,773 49.19 4,62,665 35.33 3,22,637 -23.33 3,50,535 53.02 1,41,314 -3.47
Apr-07 36,50,368 8.40 20,96,100 9.78 4,00,233 17.07 4,58,781 9.02 2,56,972 12.17 1,49,281 1.97
May-07 38,98,078 6.79 22,06,712 5.28 4,31,631 7.84 4,42,648 -3.52 2,89,142 12.52 1,56,827 5.05
Jun-07 39,78,381 2.06 22,19,151 0.56 4,59,934 6.56 4,40,706 -0.44 3,08,602 6.73 1,56,949 0.08
Jul-07 43,17,571 8.53 23,58,907 6.30 4,77,205 3.76 4,31,849 -2.01 3,36,862 9.16 1,51,528 -3.45
Aug-07 42,96,994 -0.48 23,31,929 -1.14 4,71,770 -1.14 4,09,960 -5.07 3,32,468 -1.30 1,45,380 -4.06
Sep-07 48,86,561 13.72 27,74,625 18.98 4,83,469 2.48 4,10,397 0.11 4,00,564 20.48 1,48,025 1.82
Oct-07 57,22,227 17.10 33,28,356 19.96 5,26,552 8.91 4,09,725 -0.16 4,50,897 12.57 1,54,209 4.18
Nov-07 58,76,742 2.70 32,57,297 -2.13 5,71,790 8.59 3,78,837 -7.54 4,69,132 4.04 1,48,819 -3.50
Dec-07 65,43,272 11.34 35,22,527 8.14 6,60,262 15.47 4,11,742 8.69 4,93,675 5.23 1,70,332 14.46
Jan-08 52,95,387 -19.07 29,66,421 -15.79 5,25,451 -20.42 3,28,431 -20.23 4,79,332 -2.91 1,39,646 -18.02
Feb-08 54,19,942 2.35 30,16,694 1.69 5,28,591 0.60 3,41,077 3.85 4,52,936 -5.51 1,44,311 3.34
Mar-08 48,58,122 -10.37 28,48,773 -5.57 4,62,665 -12.47 3,22,637 -5.41 3,50,535 -22.61 1,41,314 -2.08
Source: NSE
Table 2.15: Select Ratios Relating to Stock Market(Per cent)
Year BSE Market NSE Market Total Turnover to GDP Ratio
Capitalisation to Capitalisation to
GDP Ratio GDP Ratio Cash Segment Derivatives Segment
(All India) (BSE+NSE)
1 2 3 4 5
2002-03 23.28 21.85 39.33 17.95
2003-04 43.44 40.53 58.71 77.64
2004-05 54.32 50.71 53.40 82.12
2005-06 84.41 78.57 66.76 134.74
2006-07 85.51 81.22 70.02 178.86
2007-08 109.01 103.08 108.86 282.89
Sources: Central Statistical Organisation and Various Stock Exchanges.
The valuation of the shares could be
gauged from the price-earning ratio. In
contrast to the trend in the previous year, the
P/E ratios of the majority of indices witnessed
a moderate rise in 2007-08. India’s P/E ratio
was one of the highest in the emerging
markets in 2007-08 (Chart 2.7). At the end of
March 2008, the P/E ratios of BSE Sensex and
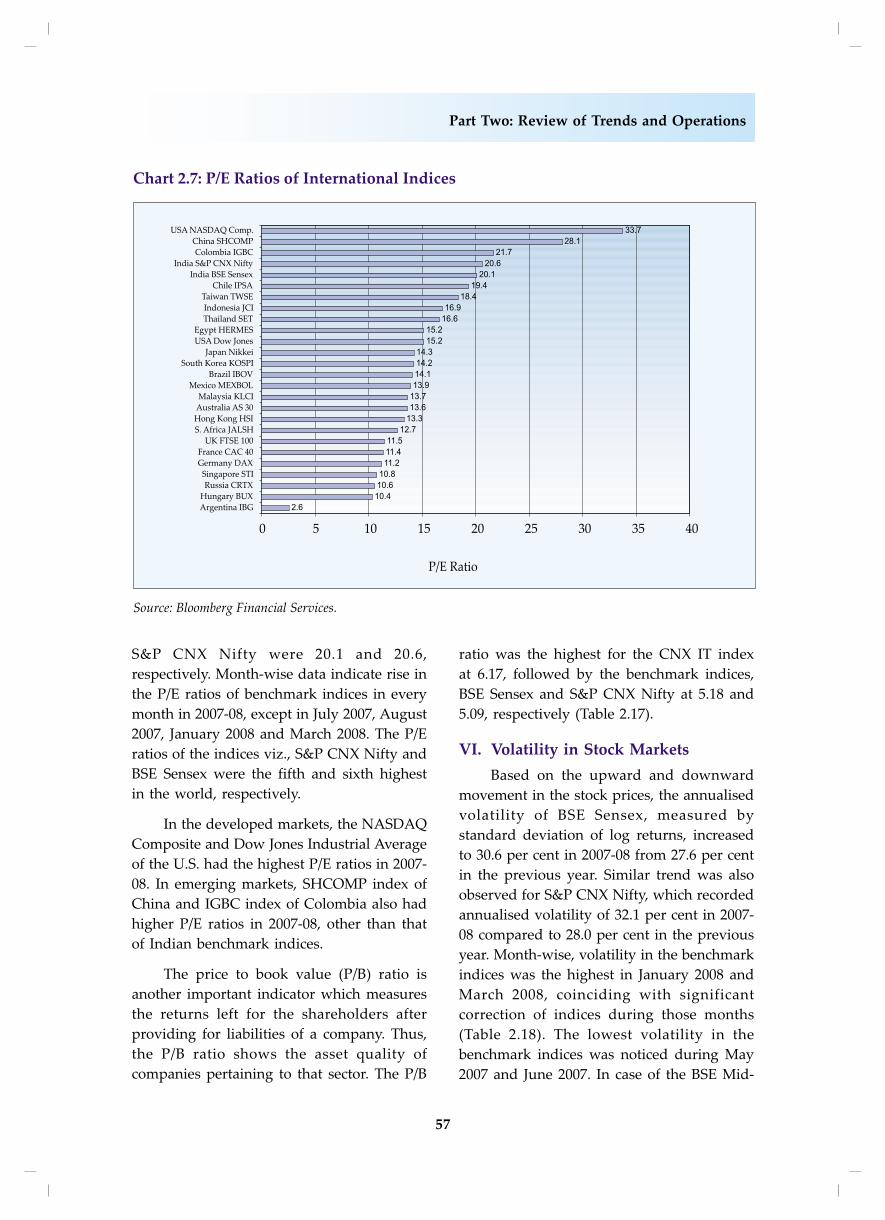
57
Part Two: Review of Trends and Operations
S&P CNX Nifty were 20.1 and 20.6,
respectively. Month-wise data indicate rise in
the P/E ratios of benchmark indices in every
month in 2007-08, except in July 2007, August
2007, January 2008 and March 2008. The P/E
ratios of the indices viz., S&P CNX Nifty and
BSE Sensex were the fifth and sixth highest
in the world, respectively.
In the developed markets, the NASDAQ
Composite and Dow Jones Industrial Average
of the U.S. had the highest P/E ratios in 2007-
08. In emerging markets, SHCOMP index of
China and IGBC index of Colombia also had
higher P/E ratios in 2007-08, other than that
of Indian benchmark indices.
The price to book value (P/B) ratio is
another important indicator which measures
the returns left for the shareholders after
providing for liabilities of a company. Thus,
the P/B ratio shows the asset quality of
companies pertaining to that sector. The P/B
ratio was the highest for the CNX IT index
at 6.17, followed by the benchmark indices,
BSE Sensex and S&P CNX Nifty at 5.18 and
5.09, respectively (Table 2.17).
VI. Volatility in Stock Markets
Based on the upward and downward
movement in the stock prices, the annualised
volatility of BSE Sensex, measured by
standard deviation of log returns, increased
to 30.6 per cent in 2007-08 from 27.6 per cent
in the previous year. Similar trend was also
observed for S&P CNX Nifty, which recorded
annualised volatility of 32.1 per cent in 2007-
08 compared to 28.0 per cent in the previous
year. Month-wise, volatility in the benchmark
indices was the highest in January 2008 and
March 2008, coinciding with significant
correction of indices during those months
(Table 2.18). The lowest volatility in the
benchmark indices was noticed during May
2007 and June 2007. In case of the BSE Mid-
58
Annual Report 2007-08
Table 2.16: Price-Earnings Ratio
Year/ BSE BSE S&P CNX CNX CNX CNXMonth* Sensex 100 CNX Nifty Mid Cap IT Bank PSE
1 2 3 4 5 6 7 8
2003-04 18.57 16.11 20.70 17.15 28.77 9.84 12.37
2004-05 15.61 13.30 14.60 21.93 51.14 10.79 10.57
2005-06 20.92 20.08 20.26 23.09 46.47 15.31 13.66
2006-07 20.33 17.64 18.40 15.58 32.35 14.15 10.61
2007-08 20.11 19.95 20.63 14.75 17.94 16.16 13.47
Apr-07 20.71 18.36 19.48 16.70 30.61 16.16 11.41
May-07 21.05 19.10 20.41 17.28 30.39 17.35 12.49
Jun-07 21.09 20.83 20.60 18.43 30.24 18.52 12.47
Jul-07 21.03 20.61 20.49 17.73 28.01 18.58 12.37
Aug-07 20.76 20.27 20.20 17.45 25.89 18.34 12.38
Sep-07 23.25 23.08 22.58 19.25 25.93 22.10 14.18
Oct-07 25.52 27.16 25.74 20.41 24.77 23.17 16.41
Nov-07 26.23 26.71 25.21 21.45 22.48 24.11 16.89
Dec-07 27.67 28.98 27.62 25.08 24.43 25.37 18.76
Jan-08 21.95 22.52 21.97 18.65 18.10 22.15 13.94
Feb-08 21.99 22.46 22.27 17.47 18.97 20.93 14.97
Mar-08 20.11 19.95 20.63 14.75 17.94 16.16 13.47
* As on March 31 of the respective year/month
Source: BSE, NSE.
Table 2.17: Price to Book-Value Ratio
Year/ BSE BSE S&P CNX CNX CNX CNXMonth* Sensex 100 CNX Nifty Mid Cap IT Bank PSE
1 2 3 4 5 6 7 8
2003-04 3.50 3.09 3.50 1.49 5.70 2.07 2.87
2004-05 3.72 3.23 3.82 2.40 11.28 2.31 2.55
2005-06 5.13 4.37 5.15 4.39 11.96 2.58 3.12
2006-07 5.07 4.43 4.87 3.06 11.68 2.24 2.70
2007-08 5.18 4.98 5.09 2.97 6.17 2.88 3.08
Apr-07 5.09 4.56 5.33 3.45 12.61 2.56 2.90
May-07 4.88 4.56 5.59 3.71 12.04 2.88 3.00
Jun-07 4.78 4.73 5.40 3.72 10.06 2.79 2.97
Jul-07 5.07 4.97 5.31 3.78 9.63 2.96 3.11
Aug-07 4.94 4.67 5.08 3.65 8.17 2.92 3.08
Sep-07 5.53 5.31 5.36 3.81 8.09 3.52 3.24
Oct-07 6.12 6.37 6.18 4.06 8.07 3.97 3.77
Nov-07 6.37 6.36 6.05 4.27 7.40 4.13 3.86
Dec-07 6.71 6.90 6.39 5.00 7.91 4.34 4.28
Jan-08 5.66 5.61 5.38 3.97 6.31 4.22 3.22
Feb-08 5.66 5.64 5.47 3.72 6.55 3.98 3.45
Mar-08 5.18 4.98 5.09 2.97 6.17 2.88 3.08
Note: CNX Bank Index was launched w.e.f. September 15, 2003.
*As on March 31 of the respective year/month
Source: BSE, NSE.

59
Part Two: Review of Trends and Operations
cap and BSE Small-cap indices, the highest
volatility was observed in January 2008.
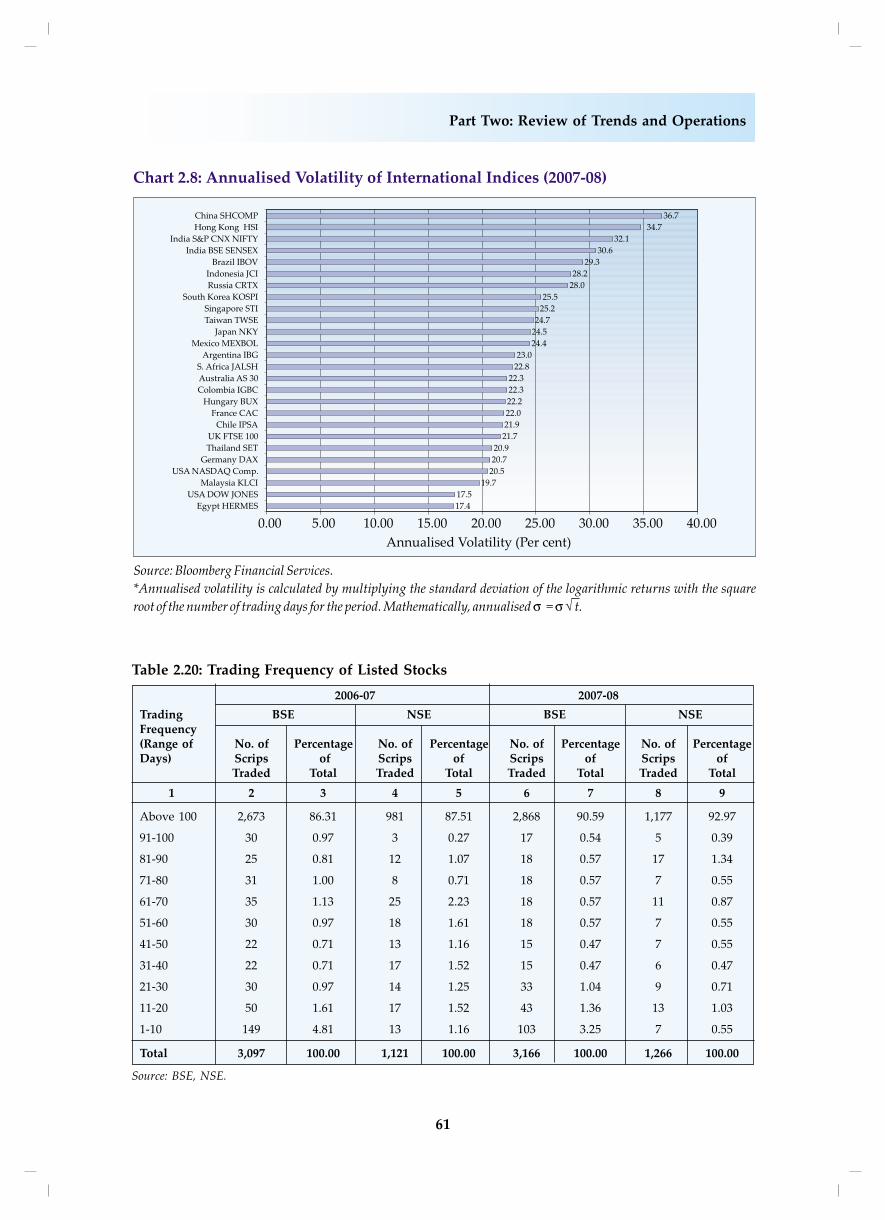
An international comparison of volatility
in stock returns indicates that emerging
markets were more volatile than developed
markets during 2007-08 (Table 2.19 and Chart
2.8). Indian markets were the third most
volatile in the world. China and Hong Kong
were the only markets which were more
volatile than India. Among the developed
markets, the annualised volatility was high
in Hong Kong (34.7 per cent) followed by
Japan (24.5 per cent) and Australia (22.3 per
cent). Apart from India and China, among
the emerging markets, annualised volatility
was higher for Brazil (29.3 per cent),
Indonesia (28.2 per cent) and Russia (27.9
per cent).
VII. Trading Frequency
Trading frequency of stocks in BSE and
NSE gives picture of liquidity in the Indian
securities market. During 2007-08, the average
number of shares traded in BSE was 3,166 as
compared to 3,097 in 2006-07 (Table 2.20). On
the other hand, the average number of shares
traded in NSE were 1,266 in 2007-08
compared to 1,121 in 2006-07. The number
of shares traded above 100 days also
improved in both the stock exchanges which
reflected a rise in frequently traded stocks.
In percentage terms, about 90.6 per cent of
the shares were traded for more than 100
days at BSE compared to 86.3 per cent in
2006-07. Similarly, in NSE too, the percentage
of shares traded increased from 87.5 per cent
in 2006-07 to 93.0 per cent in 2007-08. The
percentage share of stocks traded for less
than 10 days was 3.3 per cent at BSE and 0.6
per cent at NSE in 2007-08.
VIII. Activities of the Regional StockExchanges
Over the years, NSE and BSE have
emerged as the nation-wide stock exchanges
of the country contributing more than 99 per
Table 2.18: Average Daily Volatility of Benchmark Indices(Per cent)
2007-08 BSE Sensex S&P CNX Nifty BSE 100 BSE Small-Cap BSE 500
1 2 3 4 5 6
April 1.68 1.73 1.62 1.10 1.50
May 0.80 0.86 0.81 0.71 0.77
June 0.82 0.84 0.85 0.70 0.81
July 1.07 1.15 1.09 1.10 1.04
August 2.00 2.04 2.07 1.79 2.00
September 1.04 1.08 0.93 0.57 0.85
October 2.34 2.48 2.42 1.67 2.27
November 1.73 1.73 1.77 1.66 1.71
December 1.49 1.60 1.55 1.51 1.50
January 2.89 3.27 3.38 3.56 3.52
February 2.32 2.46 2.37 2.05 2.28
March 3.21 3.04 3.33 3.44 3.27
Note: Volatility is measured in terms of standard deviation and is computed from the returns based on closing
values of indices as on the last date of the month.
Source: BSE, NSE.

60
Annual Report 2007-08
Annua-lisedVolati-lity
Table 2.19: Trends in Daily Volatility of International Stock Market Indices during 2007-08
(Per cent)
Country Index Apr. May Jun. Jul. Aug. Sep. Oct. Nov. Dec. Jan. Feb. Mar.
1 2 3 4 5 6 7 8 9 10 11 12 13 14 15
DEVELOPED MARKETS
USA DJIA 0.49 0.46 0.78 1.04 1.34 0.91 0.84 1.50 1.00 1.48 1.23 1.60 17.47
USA Nasdaq 0.60 0.77 0.84 1.03 1.45 0.98 1.15 1.77 1.30 1.63 1.35 2.02 20.55
UK FTSE 100 0.52 0.55 0.77 1.19 1.95 1.31 0.89 1.48 1.24 2.06 1.73 1.78 21.71
France CAC 0.65 0.60 0.93 1.20 1.71 1.41 0.72 1.29 1.08 2.43 1.72 1.76 22.03
Germany DAX 0.76 0.67 1.24 1.24 1.17 1.05 0.59 1.04 0.93 2.36 1.61 1.86 20.73
Australia AS 30 0.80 0.76 0.82 0.87 1.94 0.87 0.87 1.28 1.11 2.58 1.62 2.04 22.30
Japan NKY 1.02 0.74 0.65 0.84 1.89 1.48 1.02 1.50 1.20 2.76 2.19 2.21 24.45
Hong Kong HSI 0.96 0.96 0.90 1.12 2.38 1.26 2.16 2.84 1.83 4.06 2.46 2.92 34.73
Singapore STI 1.23 0.84 0.84 1.03 2.44 1.31 1.31 1.71 1.26 2.42 1.70 1.81 25.19
EMERGING MARKETS
Taiwan TWSE 0.71 0.63 0.79 1.40 2.32 0.92 1.12 1.82 1.69 2.40 1.62 1.83 24.73
Russia CRTX 1.30 1.49 1.57 1.46 1.67 1.38 1.51 1.33 1.62 3.42 2.22 1.75 27.95
Malaysia KLCI 0.68 0.80 0.59 0.79 1.89 0.67 0.71 0.85 0.81 1.70 0.98 2.73 19.74
South Korea KOSPI 0.71 0.65 1.12 1.55 2.70 1.46 1.58 2.00 1.28 2.00 1.72 1.42 25.45
Thailand SET 0.56 0.72 1.33 1.28 2.10 0.82 1.13 1.36 1.54 1.90 1.17 1.03 20.91
China SHCOMP 1.73 2.30 3.01 2.24 1.91 1.74 2.19 2.29 1.57 2.73 2.88 2.63 36.67
S. Africa JALSH 0.75 1.03 0.91 1.20 2.14 1.24 0.90 1.16 1.47 2.17 1.86 1.71 22.81
Brazil IBOV 0.85 1.31 1.18 1.71 2.21 1.70 1.90 2.31 1.74 2.92 1.77 2.26 29.34
Colombia IGBC 0.85 1.59 0.87 0.79 1.72 0.78 0.98 0.98 1.08 2.79 1.32 1.98 22.29
Hungary BUX 0.81 1.03 1.57 0.97 1.60 1.06 0.69 1.75 1.27 1.83 1.57 2.03 22.15
Egypt HERMES 0.82 0.74 0.91 1.08 1.21 0.87 0.72 1.00 1.21 1.96 1.19 1.14 17.35
Indonesia JCI 1.16 0.81 0.94 1.11 3.18 0.99 1.89 1.37 1.20 3.38 1.23 2.19 28.22
Argentina IBG 0.78 1.04 0.84 1.45 2.62 1.06 0.87 1.48 1.07 2.27 1.05 1.72 23.04
Chile IPSA 0.49 1.38 0.88 0.74 1.77 1.02 0.83 1.41 1.65 2.65 1.31 1.12 21.90
Mexico MEXBOL 0.70 1.23 1.06 1.34 1.83 1.02 1.18 2.19 1.43 2.43 1.81 1.76 24.41
India BSE
Sensex 1.68 0.80 0.82 1.07 2.00 1.04 2.34 1.73 1.49 2.89 2.32 3.21 30.55
India S&P CNX
Nifty 1.75 0.85 0.84 1.16 2.06 1.06 2.46 1.72 1.67 3.29 2.46 3.06 32.09
Source: Bloomberg Financial Services.
61
Part Two: Review of Trends and Operations
Table 2.20: Trading Frequency of Listed Stocks
2006-07 2007-08
Trading BSE NSE BSE NSEFrequency(Range of No. of Percentage No. of Percentage No. of Percentage No. of PercentageDays) Scrips of Scrips of Scrips of Scrips of
Traded Total Traded Total Traded Total Traded Total
1 2 3 4 5 6 7 8 9
Above 100 2,673 86.31 981 87.51 2,868 90.59 1,177 92.97
91-100 30 0.97 3 0.27 17 0.54 5 0.39
81-90 25 0.81 12 1.07 18 0.57 17 1.34
71-80 31 1.00 8 0.71 18 0.57 7 0.55
61-70 35 1.13 25 2.23 18 0.57 11 0.87
51-60 30 0.97 18 1.61 18 0.57 7 0.55
41-50 22 0.71 13 1.16 15 0.47 7 0.55
31-40 22 0.71 17 1.52 15 0.47 6 0.47
21-30 30 0.97 14 1.25 33 1.04 9 0.71
11-20 50 1.61 17 1.52 43 1.36 13 1.03
1-10 149 4.81 13 1.16 103 3.25 7 0.55
Total 3,097 100.00 1,121 100.00 3,166 100.00 1,266 100.00
Source: BSE, NSE.
62
Annual Report 2007-08
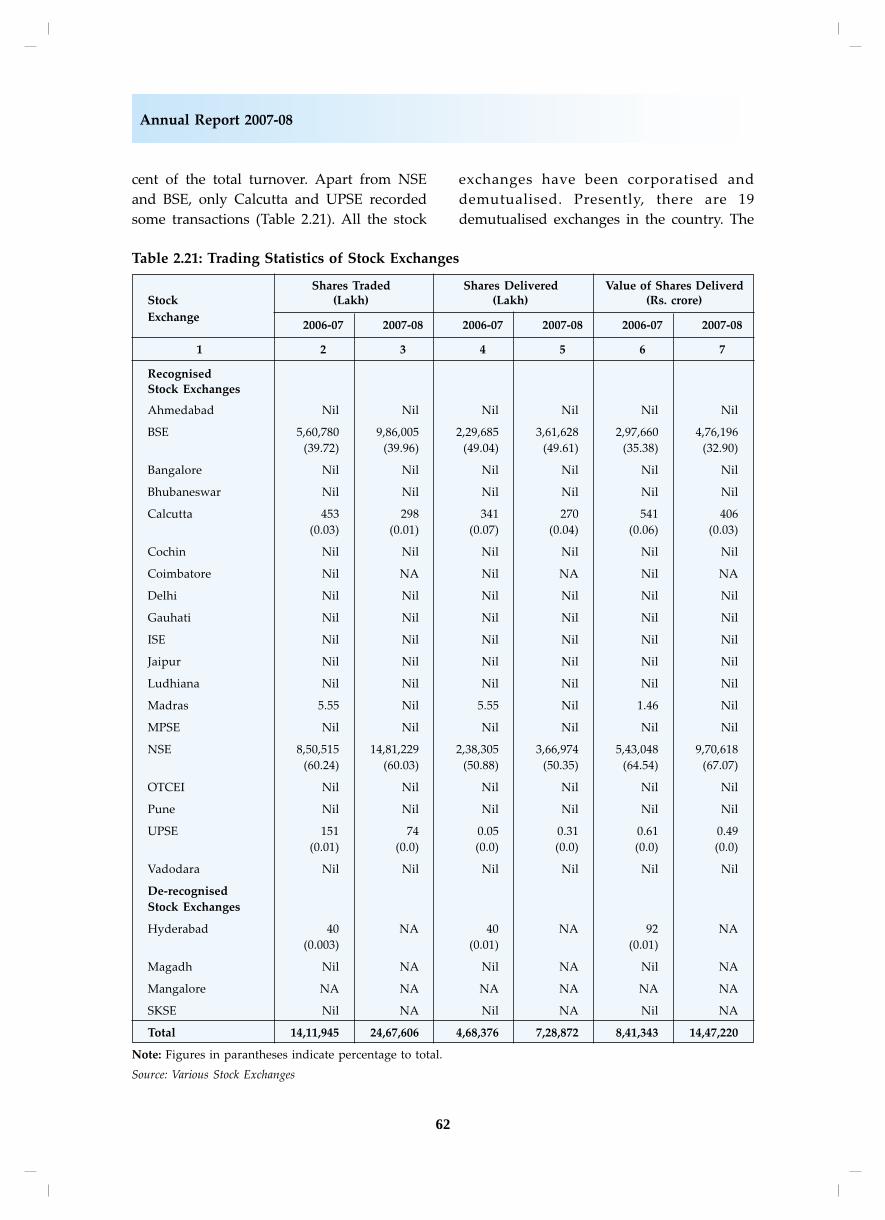
cent of the total turnover. Apart from NSE
and BSE, only Calcutta and UPSE recorded
some transactions (Table 2.21). All the stock
exchanges have been corporatised and
demutualised. Presently, there are 19
demutualised exchanges in the country. The
Table 2.21: Trading Statistics of Stock Exchanges
Shares Traded Shares Delivered Value of Shares DeliverdStock (Lakh) (Lakh) (Rs. crore)
Exchange2006-07 2007-08 2006-07 2007-08 2006-07 2007-08
1 2 3 4 5 6 7
Recognised
Stock Exchanges
Ahmedabad Nil Nil Nil Nil Nil Nil
BSE 5,60,780 9,86,005 2,29,685 3,61,628 2,97,660 4,76,196
(39.72) (39.96) (49.04) (49.61) (35.38) (32.90)
Bangalore Nil Nil Nil Nil Nil Nil
Bhubaneswar Nil Nil Nil Nil Nil Nil
Calcutta 453 298 341 270 541 406
(0.03) (0.01) (0.07) (0.04) (0.06) (0.03)
Cochin Nil Nil Nil Nil Nil Nil
Coimbatore Nil NA Nil NA Nil NA
Delhi Nil Nil Nil Nil Nil Nil
Gauhati Nil Nil Nil Nil Nil Nil
ISE Nil Nil Nil Nil Nil Nil
Jaipur Nil Nil Nil Nil Nil Nil
Ludhiana Nil Nil Nil Nil Nil Nil
Madras 5.55 Nil 5.55 Nil 1.46 Nil
MPSE Nil Nil Nil Nil Nil Nil
NSE 8,50,515 14,81,229 2,38,305 3,66,974 5,43,048 9,70,618
(60.24) (60.03) (50.88) (50.35) (64.54) (67.07)
OTCEI Nil Nil Nil Nil Nil Nil
Pune Nil Nil Nil Nil Nil Nil
UPSE 151 74 0.05 0.31 0.61 0.49
(0.01) (0.0) (0.0) (0.0) (0.0) (0.0)
Vadodara Nil Nil Nil Nil Nil Nil
De-recognised
Stock Exchanges
Hyderabad 40 NA 40 NA 92 NA
(0.003) (0.01) (0.01)
Magadh Nil NA Nil NA Nil NA
Mangalore NA NA NA NA NA NA
SKSE Nil NA Nil NA Nil NA
Total 14,11,945 24,67,606 4,68,376 7,28,872 8,41,343 14,47,220
Note: Figures in parantheses indicate percentage to total.
Source: Various Stock Exchanges
63
Part Two: Review of Trends and Operations
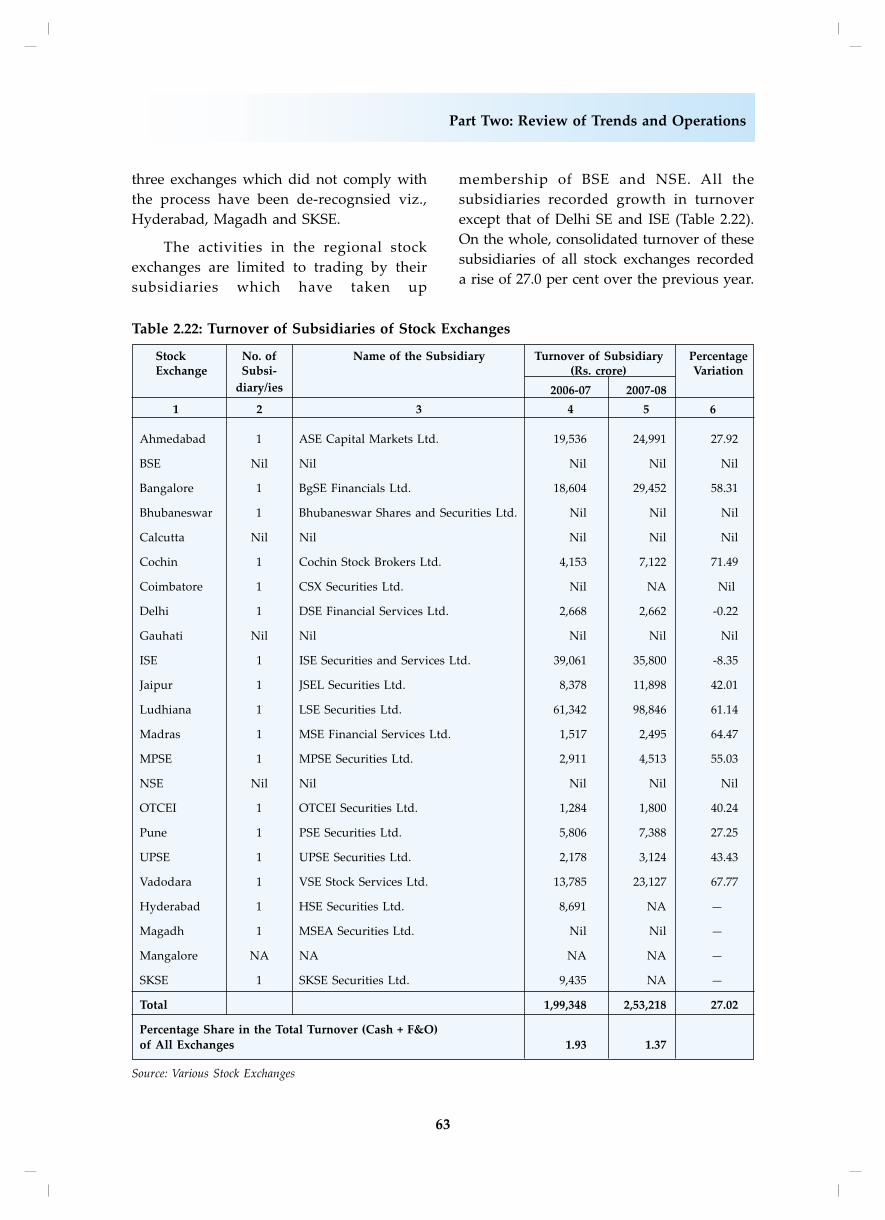
three exchanges which did not comply with
the process have been de-recognsied viz.,
Hyderabad, Magadh and SKSE.
The activities in the regional stock
exchanges are limited to trading by their
subsidiaries which have taken up
membership of BSE and NSE. All the
subsidiaries recorded growth in turnover
except that of Delhi SE and ISE (Table 2.22).
On the whole, consolidated turnover of these
subsidiaries of all stock exchanges recorded
a rise of 27.0 per cent over the previous year.
Table 2.22: Turnover of Subsidiaries of Stock Exchanges
Stock No. of Name of the Subsidiary Turnover of Subsidiary PercentageExchange Subsi- (Rs. crore) Variation
diary/ies 2006-07 2007-08
1 2 3 4 5 6
Ahmedabad 1 ASE Capital Markets Ltd. 19,536 24,991 27.92
BSE Nil Nil Nil Nil Nil
Bangalore 1 BgSE Financials Ltd. 18,604 29,452 58.31
Bhubaneswar 1 Bhubaneswar Shares and Securities Ltd. Nil Nil Nil
Calcutta Nil Nil Nil Nil Nil
Cochin 1 Cochin Stock Brokers Ltd. 4,153 7,122 71.49
Coimbatore 1 CSX Securities Ltd. Nil NA Nil
Delhi 1 DSE Financial Services Ltd. 2,668 2,662 -0.22
Gauhati Nil Nil Nil Nil Nil
ISE 1 ISE Securities and Services Ltd. 39,061 35,800 -8.35
Jaipur 1 JSEL Securities Ltd. 8,378 11,898 42.01
Ludhiana 1 LSE Securities Ltd. 61,342 98,846 61.14
Madras 1 MSE Financial Services Ltd. 1,517 2,495 64.47
MPSE 1 MPSE Securities Ltd. 2,911 4,513 55.03
NSE Nil Nil Nil Nil Nil
OTCEI 1 OTCEI Securities Ltd. 1,284 1,800 40.24
Pune 1 PSE Securities Ltd. 5,806 7,388 27.25
UPSE 1 UPSE Securities Ltd. 2,178 3,124 43.43
Vadodara 1 VSE Stock Services Ltd. 13,785 23,127 67.77
Hyderabad 1 HSE Securities Ltd. 8,691 NA —
Magadh 1 MSEA Securities Ltd. Nil Nil —
Mangalore NA NA NA NA —
SKSE 1 SKSE Securities Ltd. 9,435 NA —
Total 1,99,348 2,53,218 27.02
Percentage Share in the Total Turnover (Cash + F&O)
of All Exchanges 1.93 1.37
Source: Various Stock Exchanges

64
Annual Report 2007-08
However, the total turnover by all
subsidiaries (cash and derivatives taken
together) constituted 1.4 per cent of the gross
turnover of all exchanges in 2007-08
compared to 1.9 per cent in the previous year.
In absolute terms, the highest turnover was
recorded by LSE Securities Ltd., the
subsidiary of Ludhiana stock exchange and
VSE Stock Services Ltd., a subsidiary of
Vadodara Stock Exchange. On a year-on-year
basis, growth in turnover was the highest for
Cochin Stock Brokers Ltd., which recorded
rise of 71.5 per cent.
Among all the exchanges, NSE has the
largest number of brokers followed by BSE,
Calcutta and ISE in 2007-08 (Table 2.23). The
number of brokers witnessed a rise in BSE,
NSE, Ahmedabad, Calcutta and Cochin. On
the other hand, there was a decline in the total
number of brokers at six stock exchanges viz.,
UPSE, OTCEI, Madras stock exchange, Jaipur
stock exchange, ISE and Bhubaneswar stock
exchange. Active brokers as percentage to the
total brokers were very less in most of the
regional stock exchanges. The active brokers
were nil in case of nine regional stock
exchanges. There had been concentration and
consolidation of the broking industry around
BSE and NSE. In fact, at NSE and BSE, the
active brokers as percentage to the total
brokers were 88.6 per cent and 78.8 per cent,
respectively in 2007-08.
IX. Dematerialisation
To improve operational efficiency of the
Indian stock markets, dematerialisation was
introduced in the securities markets in 1996.
Dematerialisation signifies conversion of
share certificates from its physical form to
equivalent number of securities in electronic
form. Two depositories in India, viz.,
National Securities Depository Limited
(NSDL) and Central Depository Services
Limited (CDSL) have set up nation-wide
network with proper infrastructure that
handles the securities held and settled in
dematerialised mode in the Indian stock
markets. The two depositories have put in
place, state of the art technology and advance
computing, security and storage systems
which manage enormous database of
transactions in securities. Concerns relating
to loss, misplacement, theft and damage etc.,
of share certificates have disappeared.
Elimination of risk of bad delivery and faster
transfer of shares have improved the overall
efficiency of stock market transactions.
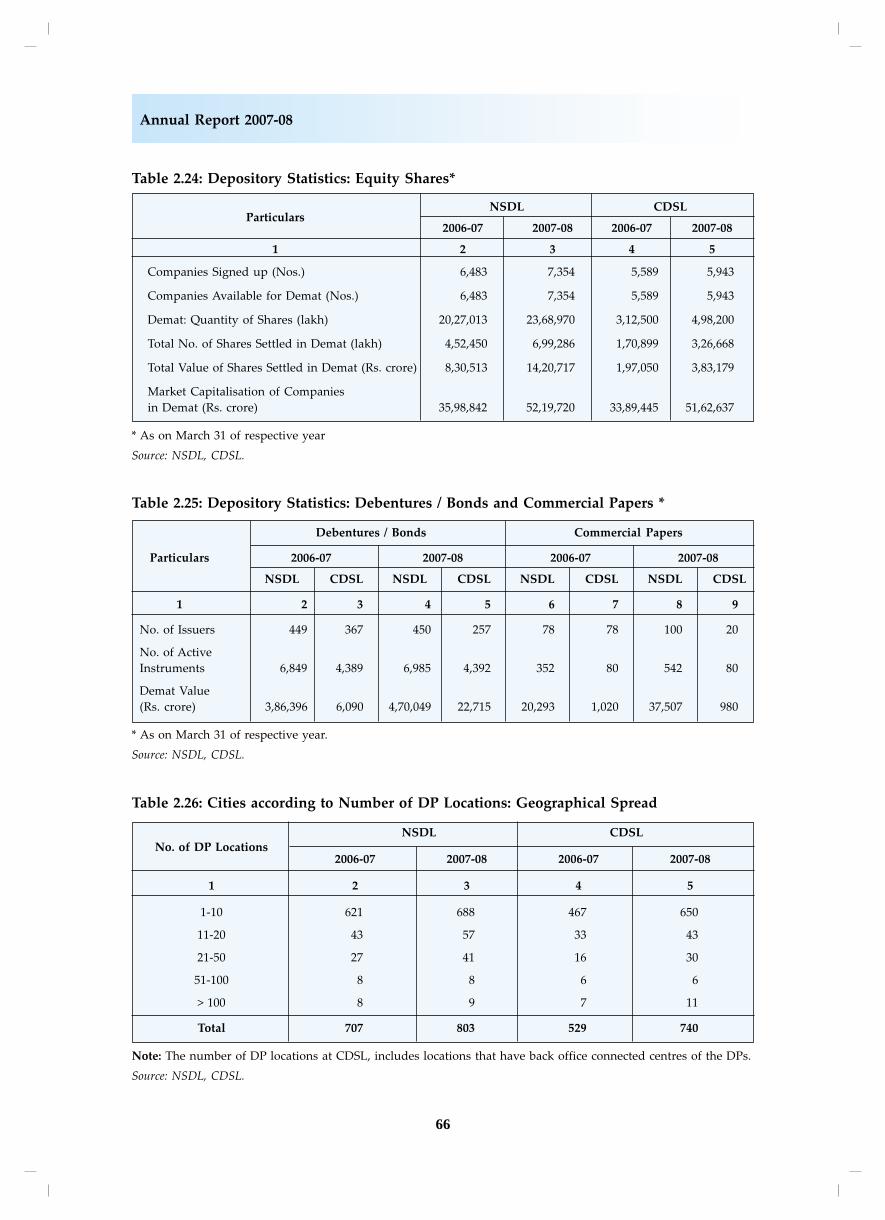
The number of companies signed up for
dematerialisation in NSDL rose to 7,354 in
2007-08 from 6,483 in 2006-07 (Table 2.24A).
In CDSL, the number of companies signed
up increased from 5,589 in 2006-07 to 5,943
in 2007-08. Similarly, the number of
dematerialised shares in NSDL went up by
16.9 per cent to 23,68,970 lakh in 2007-08 from
20,27,013 lakh in 2006-07. In CDSL too, the
number of shares dematerialised rose
significantly by 59.4 per cent to 4,98,200 lakh
in 2007-08 from 3,12,500 lakh in 2006-07. In
both the depositories, there was a substantial
increase in the value of shares settled in
dematerialised mode. While in NSDL, the
total value of demat settled shares rose
substantially by 71.1 per cent to Rs. 14,20,717
crore in 2007-08 from Rs. 8,30,513 crore in
2006-07 , the same in CDSL rose by 94.5 per
cent from Rs. 1,97,050 crore in 2006-07 to
Rs. 3,83,179 crore in 2007-08.
Apart from the shares, dematerialisation
trend continued in other instruments like
commercial papers and bonds. The total
dematerialised value of the commercial
papers at CDSL declined in 2007-08 to Rs.980
crore from Rs.1,020 crore in 2006-07 (Table
2.25). However, demat value of commercial
papers increased at NSDL from Rs.20,293
crore in 2006-07 to Rs.37,507 crore in 2007-
08. There was a considerable increase in the
value of bonds dematerialised at NSDL and
CDSL in 2007-08 over 2006-07.
65
Part Two: Review of Trends and Operations
Table 2.23: Status of Brokers with Stock Exchanges
Total Number of Number of Active Active Stock Brokers asStock Exchange Stock Brokers Stock Brokers Percentage to Total
Number of Stock Brokers
2006-07 2007-08 2006-07 2007-08 2006-07 2007-08
1 2 3 4 5 6 7
Recognised
Stock Exchanges
Ahmedabad 334 339 0 0 0.00 0.00
Bangalore 242 242 0 0 0.00 0.00
BSE 895 945 703 745 78.55 78.84
Bhubaneswar 197 196 10 12 5.08 6.12
Calcutta 942 943 24 21 2.55 2.23
Cochin 412 417 80 84 19.42 20.14
Coimbatore 133 135 0 NA 0.00 NA
Delhi 379 379 0 0 0.00 0.00
Gauhati 58 58 14 15 24.14 25.86
ISE 835 807 545 559 65.27 69.27
Jaipur 479 472 0 0 0.00 0.00
Ludhiana 293 293 126 120 0.00 40.96
MPSE 178 178 0 0 0.00 0.00
Madras 158 157 2 0 1.27 0.00
NSE 1,017 1,084 914 960 89.87 88.56
OTCEI 790 785 0 0 0.00 0.00
Pune 179 179 0 0 0.00 0.00
UPSE 540 244 127 96 23.52 39.34
Vadodara 290 290 0 0 0.00 0.00
De-recognised
Stock Exchanges
Hyderabad 299 304 51 NA 17.06 NA
Magadh 192 197 0 NA 0.00 NA
Mangalore 59 59 NA NA NA NA
SKSE 399 410 0 NA 0.00 NA
Source: Various Stock Exchanges
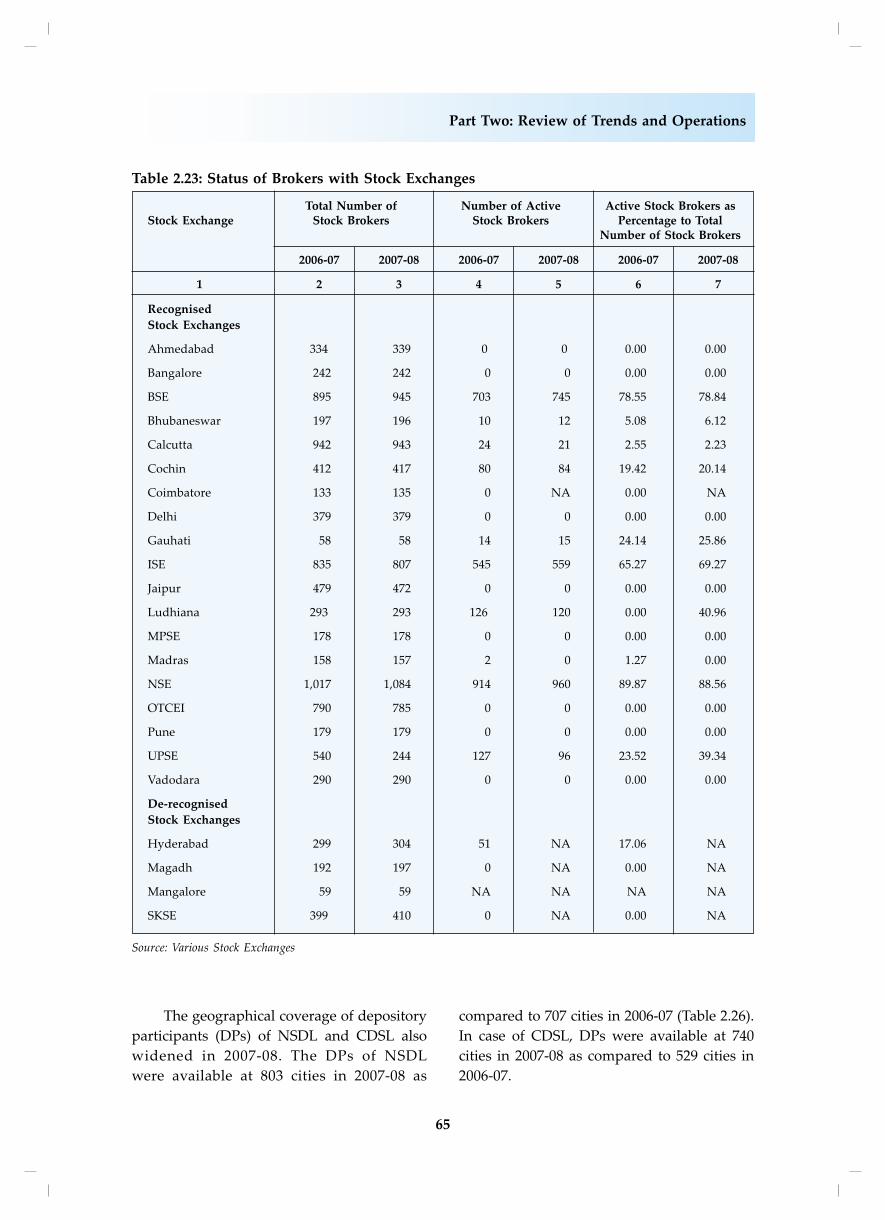
The geographical coverage of depository
participants (DPs) of NSDL and CDSL also
widened in 2007-08. The DPs of NSDL
were available at 803 cities in 2007-08 as
compared to 707 cities in 2006-07 (Table 2.26).
In case of CDSL, DPs were available at 740
cities in 2007-08 as compared to 529 cities in
2006-07.
66
Annual Report 2007-08
Table 2.24: Depository Statistics: Equity Shares*
NSDL CDSLParticulars
2006-07 2007-08 2006-07 2007-08
1 2 3 4 5
Companies Signed up (Nos.) 6,483 7,354 5,589 5,943
Companies Available for Demat (Nos.) 6,483 7,354 5,589 5,943
Demat: Quantity of Shares (lakh) 20,27,013 23,68,970 3,12,500 4,98,200
Total No. of Shares Settled in Demat (lakh) 4,52,450 6,99,286 1,70,899 3,26,668
Total Value of Shares Settled in Demat (Rs. crore) 8,30,513 14,20,717 1,97,050 3,83,179
Market Capitalisation of Companies
in Demat (Rs. crore) 35,98,842 52,19,720 33,89,445 51,62,637
* As on March 31 of respective year
Source: NSDL, CDSL.
Table 2.25: Depository Statistics: Debentures / Bonds and Commercial Papers *
Debentures / Bonds Commercial Papers
Particulars 2006-07 2007-08 2006-07 2007-08
NSDL CDSL NSDL CDSL NSDL CDSL NSDL CDSL
1 2 3 4 5 6 7 8 9
No. of Issuers 449 367 450 257 78 78 100 20
No. of Active
Instruments 6,849 4,389 6,985 4,392 352 80 542 80
Demat Value
(Rs. crore) 3,86,396 6,090 4,70,049 22,715 20,293 1,020 37,507 980
* As on March 31 of respective year.
Source: NSDL, CDSL.
Table 2.26: Cities according to Number of DP Locations: Geographical Spread
NSDL CDSLNo. of DP Locations
2006-07 2007-08 2006-07 2007-08
1 2 3 4 5
1-10 621 688 467 650
11-20 43 57 33 43
21-50 27 41 16 30
51-100 8 8 6 6
> 100 8 9 7 11
Total 707 803 529 740
Note: The number of DP locations at CDSL, includes locations that have back office connected centres of the DPs.
Source: NSDL, CDSL.
67
Part Two: Review of Trends and Operations
X. Derivatives Market in India
A. Trends in Derivative Market
Introduction of exchange traded
derivatives is one of the significant
developments in the history of India’s
securities market. In India, derivatives trading
began with the launch of index futures in
June 2000 followed by index options, single
stock options and single stock futures in 2001.
Interest rate futures were also launched in
June 2003. The two premier stock exchanges,
namely NSE and BSE provide trading
platforms for derivative.
Over the years, turnover on the
derivative market has grown exponentially in
terms of the number of contracts and value.
This trend continued in 2007-08 too.
Presently, the derivatives market in India is
dominated by NSE with its share of over 98
per cent in the total turnover as well as
number of contracts. There had been revival
of derivatives trading at BSE since 2006-07,
which continued in 2007-08 also.
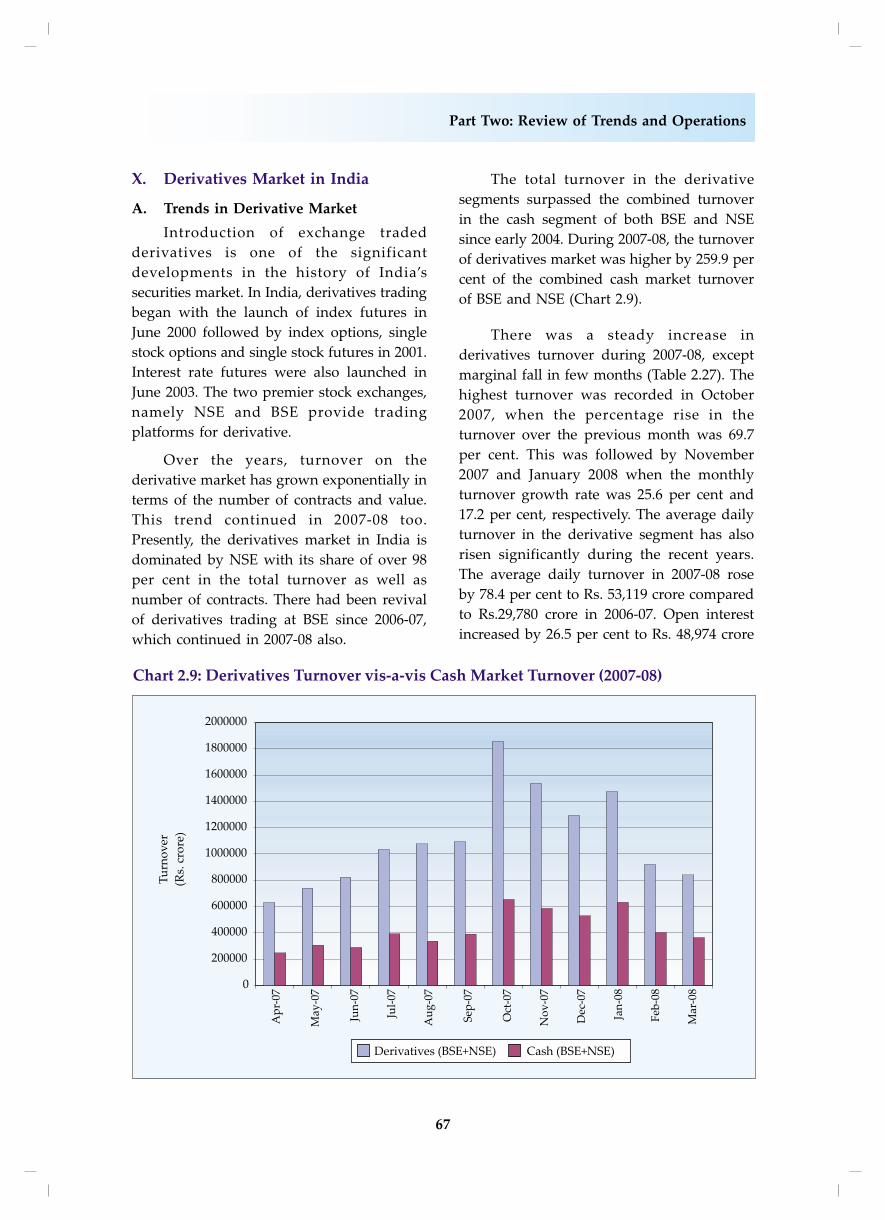
The total turnover in the derivative
segments surpassed the combined turnover
in the cash segment of both BSE and NSE
since early 2004. During 2007-08, the turnover
of derivatives market was higher by 259.9 per
cent of the combined cash market turnover
of BSE and NSE (Chart 2.9).
There was a steady increase in
derivatives turnover during 2007-08, except
marginal fall in few months (Table 2.27). The
highest turnover was recorded in October
2007, when the percentage rise in the
turnover over the previous month was 69.7
per cent. This was followed by November
2007 and January 2008 when the monthly
turnover growth rate was 25.6 per cent and
17.2 per cent, respectively. The average daily
turnover in the derivative segment has also
risen significantly during the recent years.
The average daily turnover in 2007-08 rose
by 78.4 per cent to Rs. 53,119 crore compared
to Rs.29,780 crore in 2006-07. Open interest
increased by 26.5 per cent to Rs. 48,974 crore
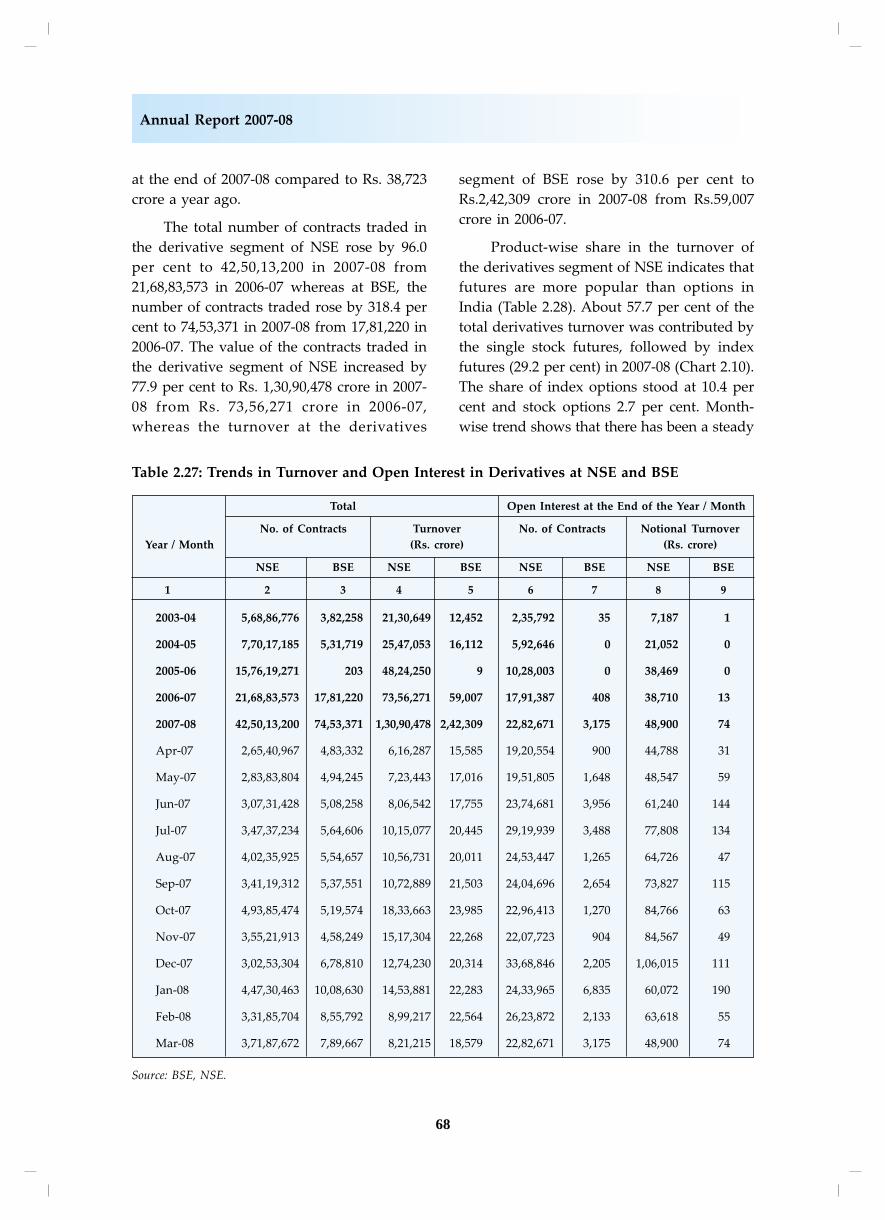
68
Annual Report 2007-08
at the end of 2007-08 compared to Rs. 38,723
crore a year ago.
The total number of contracts traded in
the derivative segment of NSE rose by 96.0
per cent to 42,50,13,200 in 2007-08 from
21,68,83,573 in 2006-07 whereas at BSE, the
number of contracts traded rose by 318.4 per
cent to 74,53,371 in 2007-08 from 17,81,220 in
2006-07. The value of the contracts traded in
the derivative segment of NSE increased by
77.9 per cent to Rs. 1,30,90,478 crore in 2007-
08 from Rs. 73,56,271 crore in 2006-07,
whereas the turnover at the derivatives
segment of BSE rose by 310.6 per cent to
Rs.2,42,309 crore in 2007-08 from Rs.59,007
crore in 2006-07.
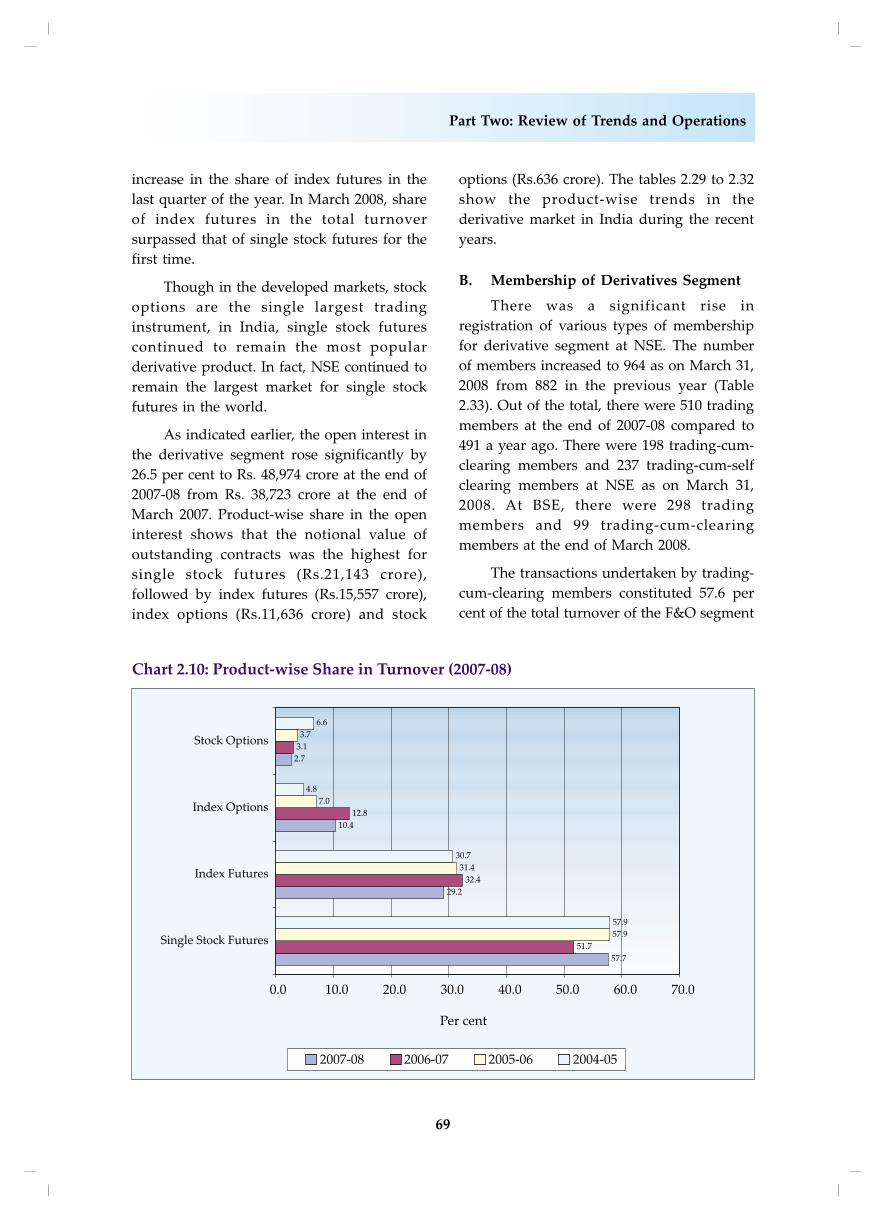
Product-wise share in the turnover of
the derivatives segment of NSE indicates that
futures are more popular than options in
India (Table 2.28). About 57.7 per cent of the
total derivatives turnover was contributed by
the single stock futures, followed by index
futures (29.2 per cent) in 2007-08 (Chart 2.10).
The share of index options stood at 10.4 per
cent and stock options 2.7 per cent. Month-
wise trend shows that there has been a steady
Table 2.27: Trends in Turnover and Open Interest in Derivatives at NSE and BSE
Total Open Interest at the End of the Year / Month
No. of Contracts Turnover No. of Contracts Notional Turnover
Year / Month (Rs. crore) (Rs. crore)
NSE BSE NSE BSE NSE BSE NSE BSE
1 2 3 4 5 6 7 8 9
2003-04 5,68,86,776 3,82,258 21,30,649 12,452 2,35,792 35 7,187 1
2004-05 7,70,17,185 5,31,719 25,47,053 16,112 5,92,646 0 21,052 0
2005-06 15,76,19,271 203 48,24,250 9 10,28,003 0 38,469 0
2006-07 21,68,83,573 17,81,220 73,56,271 59,007 17,91,387 408 38,710 13
2007-08 42,50,13,200 74,53,371 1,30,90,478 2,42,309 22,82,671 3,175 48,900 74
Apr-07 2,65,40,967 4,83,332 6,16,287 15,585 19,20,554 900 44,788 31
May-07 2,83,83,804 4,94,245 7,23,443 17,016 19,51,805 1,648 48,547 59
Jun-07 3,07,31,428 5,08,258 8,06,542 17,755 23,74,681 3,956 61,240 144
Jul-07 3,47,37,234 5,64,606 10,15,077 20,445 29,19,939 3,488 77,808 134
Aug-07 4,02,35,925 5,54,657 10,56,731 20,011 24,53,447 1,265 64,726 47
Sep-07 3,41,19,312 5,37,551 10,72,889 21,503 24,04,696 2,654 73,827 115
Oct-07 4,93,85,474 5,19,574 18,33,663 23,985 22,96,413 1,270 84,766 63
Nov-07 3,55,21,913 4,58,249 15,17,304 22,268 22,07,723 904 84,567 49
Dec-07 3,02,53,304 6,78,810 12,74,230 20,314 33,68,846 2,205 1,06,015 111
Jan-08 4,47,30,463 10,08,630 14,53,881 22,283 24,33,965 6,835 60,072 190
Feb-08 3,31,85,704 8,55,792 8,99,217 22,564 26,23,872 2,133 63,618 55
Mar-08 3,71,87,672 7,89,667 8,21,215 18,579 22,82,671 3,175 48,900 74
Source: BSE, NSE.
69
Part Two: Review of Trends and Operations
increase in the share of index futures in the
last quarter of the year. In March 2008, share
of index futures in the total turnover
surpassed that of single stock futures for the
first time.
Though in the developed markets, stock
options are the single largest trading
instrument, in India, single stock futures
continued to remain the most popular
derivative product. In fact, NSE continued to
remain the largest market for single stock
futures in the world.
As indicated earlier, the open interest in
the derivative segment rose significantly by
26.5 per cent to Rs. 48,974 crore at the end of
2007-08 from Rs. 38,723 crore at the end of
March 2007. Product-wise share in the open
interest shows that the notional value of
outstanding contracts was the highest for
single stock futures (Rs.21,143 crore),
followed by index futures (Rs.15,557 crore),
index options (Rs.11,636 crore) and stock
options (Rs.636 crore). The tables 2.29 to 2.32
show the product-wise trends in the
derivative market in India during the recent
years.
B. Membership of Derivatives Segment
There was a significant rise in
registration of various types of membership
for derivative segment at NSE. The number
of members increased to 964 as on March 31,
2008 from 882 in the previous year (Table
2.33). Out of the total, there were 510 trading
members at the end of 2007-08 compared to
491 a year ago. There were 198 trading-cum-
clearing members and 237 trading-cum-self
clearing members at NSE as on March 31,
2008. At BSE, there were 298 trading
members and 99 trading-cum-clearing
members at the end of March 2008.
The transactions undertaken by trading-
cum-clearing members constituted 57.6 per
cent of the total turnover of the F&O segment
70
Annual Report 2007-08
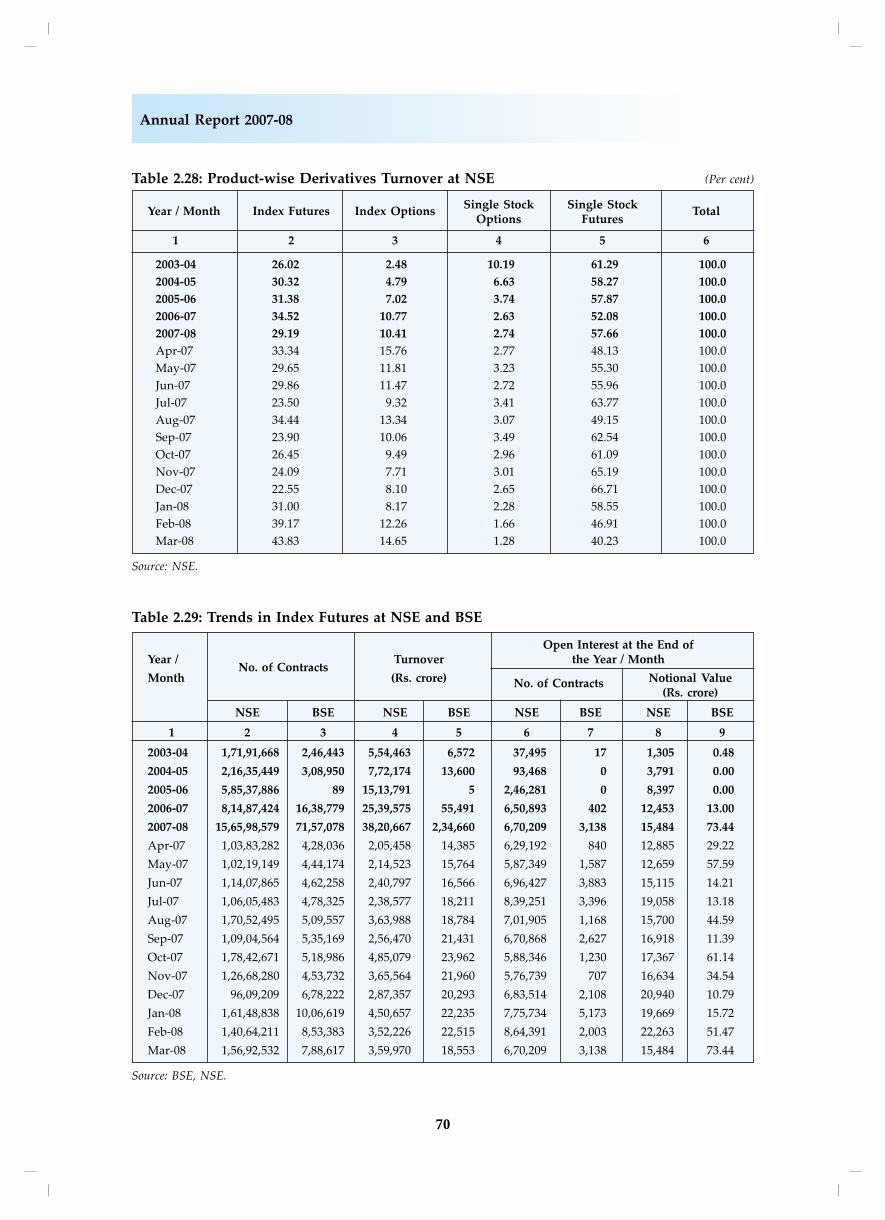
Table 2.28: Product-wise Derivatives Turnover at NSE (Per cent)
Year / Month Index Futures Index OptionsSingle Stock Single Stock
TotalOptions Futures
1 2 3 4 5 6
2003-04 26.02 2.48 10.19 61.29 100.0
2004-05 30.32 4.79 6.63 58.27 100.0
2005-06 31.38 7.02 3.74 57.87 100.0
2006-07 34.52 10.77 2.63 52.08 100.0
2007-08 29.19 10.41 2.74 57.66 100.0
Apr-07 33.34 15.76 2.77 48.13 100.0
May-07 29.65 11.81 3.23 55.30 100.0
Jun-07 29.86 11.47 2.72 55.96 100.0
Jul-07 23.50 9.32 3.41 63.77 100.0
Aug-07 34.44 13.34 3.07 49.15 100.0
Sep-07 23.90 10.06 3.49 62.54 100.0
Oct-07 26.45 9.49 2.96 61.09 100.0
Nov-07 24.09 7.71 3.01 65.19 100.0
Dec-07 22.55 8.10 2.65 66.71 100.0
Jan-08 31.00 8.17 2.28 58.55 100.0
Feb-08 39.17 12.26 1.66 46.91 100.0
Mar-08 43.83 14.65 1.28 40.23 100.0
Source: NSE.
Table 2.29: Trends in Index Futures at NSE and BSE
Open Interest at the End ofYear /
No. of ContractsTurnover the Year / Month
Month (Rs. crore) No. of Contracts Notional Value(Rs. crore)
NSE BSE NSE BSE NSE BSE NSE BSE
1 2 3 4 5 6 7 8 9
2003-04 1,71,91,668 2,46,443 5,54,463 6,572 37,495 17 1,305 0.48
2004-05 2,16,35,449 3,08,950 7,72,174 13,600 93,468 0 3,791 0.00
2005-06 5,85,37,886 89 15,13,791 5 2,46,281 0 8,397 0.00
2006-07 8,14,87,424 16,38,779 25,39,575 55,491 6,50,893 402 12,453 13.00
2007-08 15,65,98,579 71,57,078 38,20,667 2,34,660 6,70,209 3,138 15,484 73.44
Apr-07 1,03,83,282 4,28,036 2,05,458 14,385 6,29,192 840 12,885 29.22
May-07 1,02,19,149 4,44,174 2,14,523 15,764 5,87,349 1,587 12,659 57.59
Jun-07 1,14,07,865 4,62,258 2,40,797 16,566 6,96,427 3,883 15,115 14.21
Jul-07 1,06,05,483 4,78,325 2,38,577 18,211 8,39,251 3,396 19,058 13.18
Aug-07 1,70,52,495 5,09,557 3,63,988 18,784 7,01,905 1,168 15,700 44.59
Sep-07 1,09,04,564 5,35,169 2,56,470 21,431 6,70,868 2,627 16,918 11.39
Oct-07 1,78,42,671 5,18,986 4,85,079 23,962 5,88,346 1,230 17,367 61.14
Nov-07 1,26,68,280 4,53,732 3,65,564 21,960 5,76,739 707 16,634 34.54
Dec-07 96,09,209 6,78,222 2,87,357 20,293 6,83,514 2,108 20,940 10.79
Jan-08 1,61,48,838 10,06,619 4,50,657 22,235 7,75,734 5,173 19,669 15.72
Feb-08 1,40,64,211 8,53,383 3,52,226 22,515 8,64,391 2,003 22,263 51.47
Mar-08 1,56,92,532 7,88,617 3,59,970 18,553 6,70,209 3,138 15,484 73.44
Source: BSE, NSE.
71
Part Two: Review of Trends and Operations
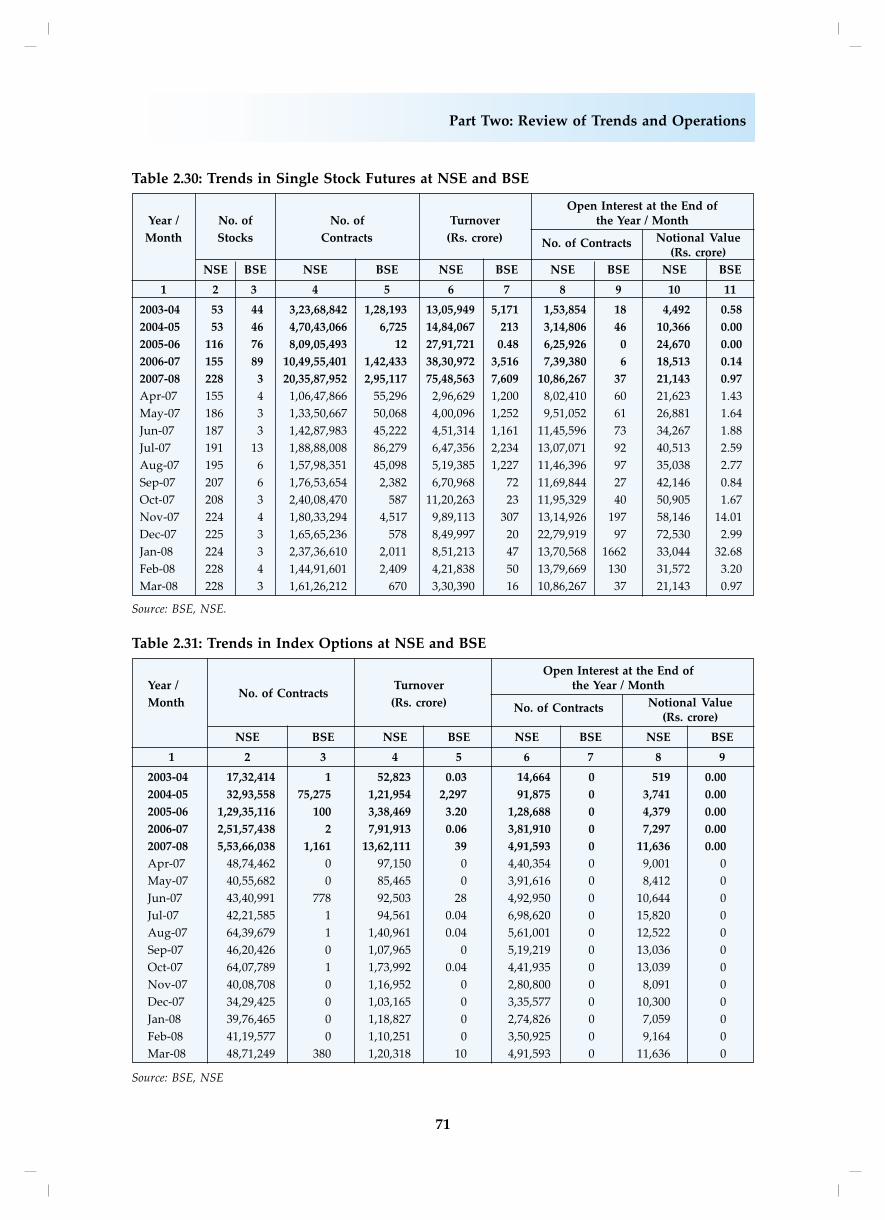
Table 2.30: Trends in Single Stock Futures at NSE and BSE
Open Interest at the End ofYear / No. of No. of Turnover the Year / Month
Month Stocks Contracts (Rs. crore) No. of Contracts Notional Value(Rs. crore)
NSE BSE NSE BSE NSE BSE NSE BSE NSE BSE
1 2 3 4 5 6 7 8 9 10 11
2003-04 53 44 3,23,68,842 1,28,193 13,05,949 5,171 1,53,854 18 4,492 0.58
2004-05 53 46 4,70,43,066 6,725 14,84,067 213 3,14,806 46 10,366 0.00
2005-06 116 76 8,09,05,493 12 27,91,721 0.48 6,25,926 0 24,670 0.00
2006-07 155 89 10,49,55,401 1,42,433 38,30,972 3,516 7,39,380 6 18,513 0.14
2007-08 228 3 20,35,87,952 2,95,117 75,48,563 7,609 10,86,267 37 21,143 0.97
Apr-07 155 4 1,06,47,866 55,296 2,96,629 1,200 8,02,410 60 21,623 1.43
May-07 186 3 1,33,50,667 50,068 4,00,096 1,252 9,51,052 61 26,881 1.64
Jun-07 187 3 1,42,87,983 45,222 4,51,314 1,161 11,45,596 73 34,267 1.88
Jul-07 191 13 1,88,88,008 86,279 6,47,356 2,234 13,07,071 92 40,513 2.59
Aug-07 195 6 1,57,98,351 45,098 5,19,385 1,227 11,46,396 97 35,038 2.77
Sep-07 207 6 1,76,53,654 2,382 6,70,968 72 11,69,844 27 42,146 0.84
Oct-07 208 3 2,40,08,470 587 11,20,263 23 11,95,329 40 50,905 1.67
Nov-07 224 4 1,80,33,294 4,517 9,89,113 307 13,14,926 197 58,146 14.01
Dec-07 225 3 1,65,65,236 578 8,49,997 20 22,79,919 97 72,530 2.99
Jan-08 224 3 2,37,36,610 2,011 8,51,213 47 13,70,568 1662 33,044 32.68
Feb-08 228 4 1,44,91,601 2,409 4,21,838 50 13,79,669 130 31,572 3.20
Mar-08 228 3 1,61,26,212 670 3,30,390 16 10,86,267 37 21,143 0.97
Source: BSE, NSE.
Table 2.31: Trends in Index Options at NSE and BSE
Open Interest at the End ofYear /
No. of ContractsTurnover the Year / Month
Month (Rs. crore) No. of Contracts Notional Value(Rs. crore)
NSE BSE NSE BSE NSE BSE NSE BSE
1 2 3 4 5 6 7 8 9
2003-04 17,32,414 1 52,823 0.03 14,664 0 519 0.00
2004-05 32,93,558 75,275 1,21,954 2,297 91,875 0 3,741 0.00
2005-06 1,29,35,116 100 3,38,469 3.20 1,28,688 0 4,379 0.00
2006-07 2,51,57,438 2 7,91,913 0.06 3,81,910 0 7,297 0.00
2007-08 5,53,66,038 1,161 13,62,111 39 4,91,593 0 11,636 0.00
Apr-07 48,74,462 0 97,150 0 4,40,354 0 9,001 0
May-07 40,55,682 0 85,465 0 3,91,616 0 8,412 0
Jun-07 43,40,991 778 92,503 28 4,92,950 0 10,644 0
Jul-07 42,21,585 1 94,561 0.04 6,98,620 0 15,820 0
Aug-07 64,39,679 1 1,40,961 0.04 5,61,001 0 12,522 0
Sep-07 46,20,426 0 1,07,965 0 5,19,219 0 13,036 0
Oct-07 64,07,789 1 1,73,992 0.04 4,41,935 0 13,039 0
Nov-07 40,08,708 0 1,16,952 0 2,80,800 0 8,091 0
Dec-07 34,29,425 0 1,03,165 0 3,35,577 0 10,300 0
Jan-08 39,76,465 0 1,18,827 0 2,74,826 0 7,059 0
Feb-08 41,19,577 0 1,10,251 0 3,50,925 0 9,164 0
Mar-08 48,71,249 380 1,20,318 10 4,91,593 0 11,636 0
Source: BSE, NSE
72
Annual Report 2007-08
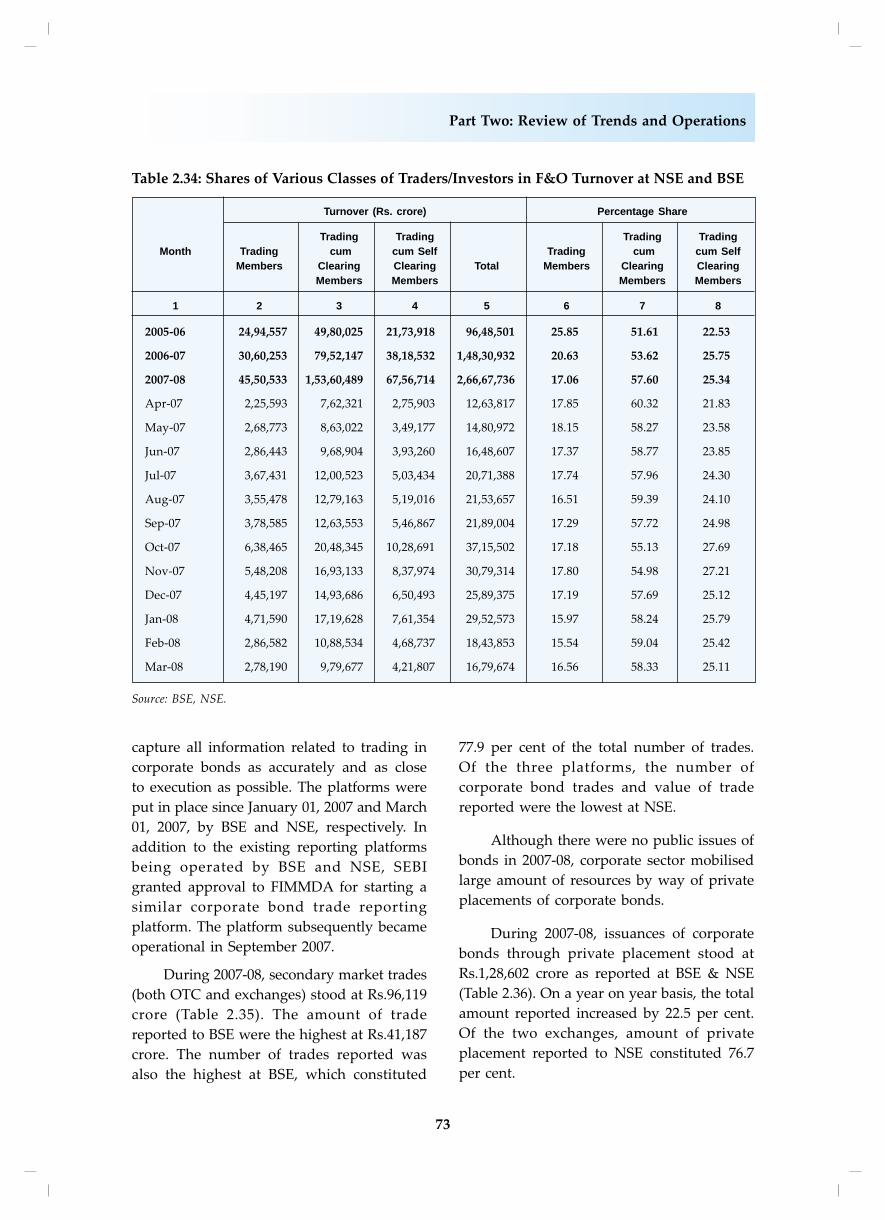
in 2007-08. The percentage share in the traded
value by trading-cum-self clearing members
and trading members was 25.3 per cent and
17.1 per cent, respectively (Table 2.34).
3. DEVELOPMENTS IN BONDMARKET
I. Corporate Bond Market
In India, secondary market trading in
corporate bonds, like in most other countries,
is done over the counter (OTC) between the
counterparties directly or through brokers.
Once trades are executed, they are reported
for information as part of disclosure
requirements. During the last financial year,
SEBI had permitted BSE and NSE to set up
reporting platforms for corporate bonds to
Table 2.33: Category of Members in
Derivatives Segment of NSE
and BSE
Type of Members NSE BSE
1 3 2
Trading Members 510 298
(491) (240)
Professional Clearing 19 5
Members (19) (4)
Trading-cum-Clearing 198 99
Members (176) (71)
Trading-cum-Self-Clearing 237 20
Members (196) (9)
Total 964 422
(882) (324)
Note: Figures in parentheses relate to 2006-07.
Source: BSE, NSE.
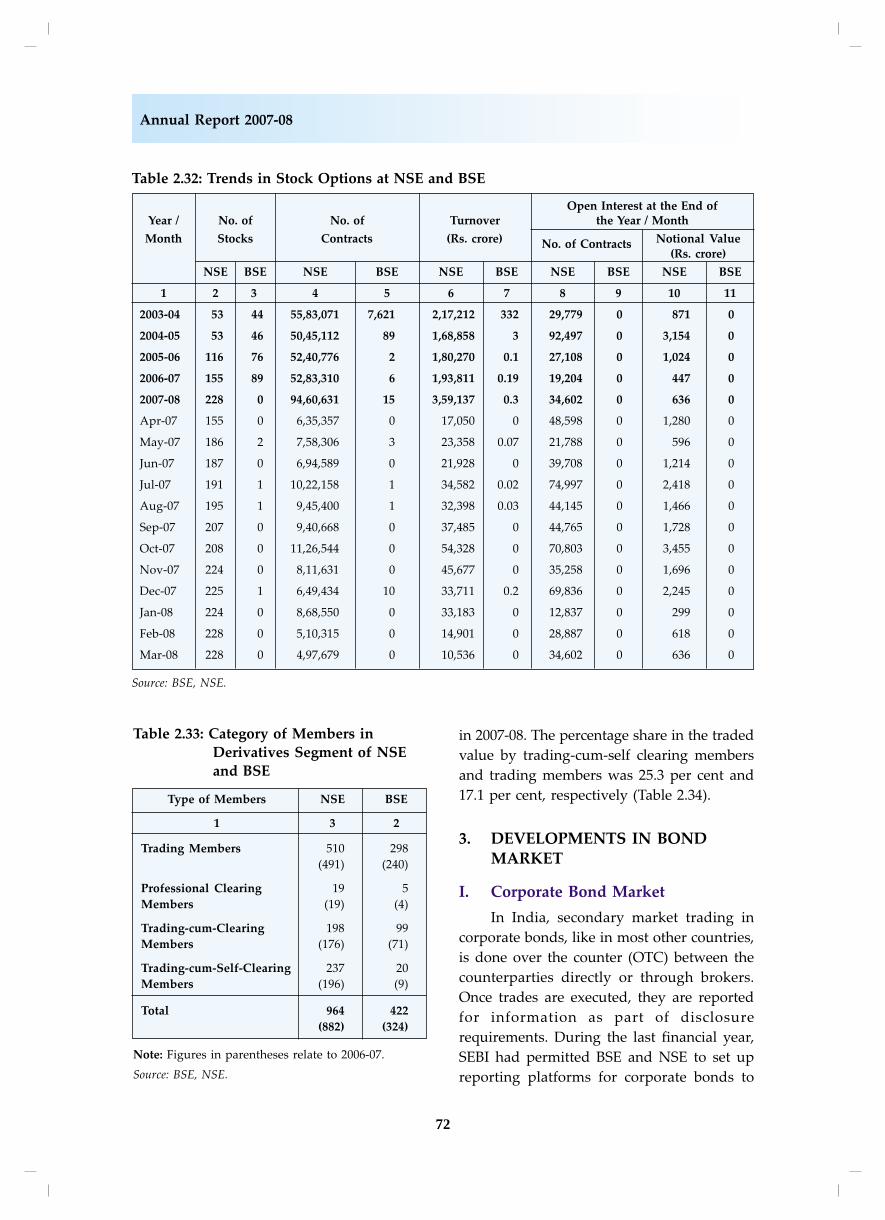
Table 2.32: Trends in Stock Options at NSE and BSE
Open Interest at the End ofYear / No. of No. of Turnover the Year / Month
Month Stocks Contracts (Rs. crore) No. of Contracts Notional Value
(Rs. crore)
NSE BSE NSE BSE NSE BSE NSE BSE NSE BSE
1 2 3 4 5 6 7 8 9 10 11
2003-04 53 44 55,83,071 7,621 2,17,212 332 29,779 0 871 0
2004-05 53 46 50,45,112 89 1,68,858 3 92,497 0 3,154 0
2005-06 116 76 52,40,776 2 1,80,270 0.1 27,108 0 1,024 0
2006-07 155 89 52,83,310 6 1,93,811 0.19 19,204 0 447 0
2007-08 228 0 94,60,631 15 3,59,137 0.3 34,602 0 636 0
Apr-07 155 0 6,35,357 0 17,050 0 48,598 0 1,280 0
May-07 186 2 7,58,306 3 23,358 0.07 21,788 0 596 0
Jun-07 187 0 6,94,589 0 21,928 0 39,708 0 1,214 0
Jul-07 191 1 10,22,158 1 34,582 0.02 74,997 0 2,418 0
Aug-07 195 1 9,45,400 1 32,398 0.03 44,145 0 1,466 0
Sep-07 207 0 9,40,668 0 37,485 0 44,765 0 1,728 0
Oct-07 208 0 11,26,544 0 54,328 0 70,803 0 3,455 0
Nov-07 224 0 8,11,631 0 45,677 0 35,258 0 1,696 0
Dec-07 225 1 6,49,434 10 33,711 0.2 69,836 0 2,245 0
Jan-08 224 0 8,68,550 0 33,183 0 12,837 0 299 0
Feb-08 228 0 5,10,315 0 14,901 0 28,887 0 618 0
Mar-08 228 0 4,97,679 0 10,536 0 34,602 0 636 0
Source: BSE, NSE.
73
Part Two: Review of Trends and Operations
capture all information related to trading in
corporate bonds as accurately and as close
to execution as possible. The platforms were
put in place since January 01, 2007 and March
01, 2007, by BSE and NSE, respectively. In
addition to the existing reporting platforms
being operated by BSE and NSE, SEBI
granted approval to FIMMDA for starting a
similar corporate bond trade reporting
platform. The platform subsequently became
operational in September 2007.
During 2007-08, secondary market trades
(both OTC and exchanges) stood at Rs.96,119
crore (Table 2.35). The amount of trade
reported to BSE were the highest at Rs.41,187
crore. The number of trades reported was
also the highest at BSE, which constituted
77.9 per cent of the total number of trades.
Of the three platforms, the number of
corporate bond trades and value of trade
reported were the lowest at NSE.
Although there were no public issues of
bonds in 2007-08, corporate sector mobilised
large amount of resources by way of private
placements of corporate bonds.
During 2007-08, issuances of corporate
bonds through private placement stood at
Rs.1,28,602 crore as reported at BSE & NSE
(Table 2.36). On a year on year basis, the total
amount reported increased by 22.5 per cent.
Of the two exchanges, amount of private
placement reported to NSE constituted 76.7
per cent.
Table 2.34: Shares of Various Classes of Traders/Investors in F&O Turnover at NSE and BSE
Turnover (Rs. crore) Percentage Share
Trading Trading Trading TradingMonth Trading cum cum Self Trading cum cum Self
Members Clearing Clearing Total Members Clearing ClearingMembers Members Members Members
1 2 3 4 5 6 7 8
2005-06 24,94,557 49,80,025 21,73,918 96,48,501 25.85 51.61 22.53
2006-07 30,60,253 79,52,147 38,18,532 1,48,30,932 20.63 53.62 25.75
2007-08 45,50,533 1,53,60,489 67,56,714 2,66,67,736 17.06 57.60 25.34
Apr-07 2,25,593 7,62,321 2,75,903 12,63,817 17.85 60.32 21.83
May-07 2,68,773 8,63,022 3,49,177 14,80,972 18.15 58.27 23.58
Jun-07 2,86,443 9,68,904 3,93,260 16,48,607 17.37 58.77 23.85
Jul-07 3,67,431 12,00,523 5,03,434 20,71,388 17.74 57.96 24.30
Aug-07 3,55,478 12,79,163 5,19,016 21,53,657 16.51 59.39 24.10
Sep-07 3,78,585 12,63,553 5,46,867 21,89,004 17.29 57.72 24.98
Oct-07 6,38,465 20,48,345 10,28,691 37,15,502 17.18 55.13 27.69
Nov-07 5,48,208 16,93,133 8,37,974 30,79,314 17.80 54.98 27.21
Dec-07 4,45,197 14,93,686 6,50,493 25,89,375 17.19 57.69 25.12
Jan-08 4,71,590 17,19,628 7,61,354 29,52,573 15.97 58.24 25.79
Feb-08 2,86,582 10,88,534 4,68,737 18,43,853 15.54 59.04 25.42
Mar-08 2,78,190 9,79,677 4,21,807 16,79,674 16.56 58.33 25.11
Source: BSE, NSE.
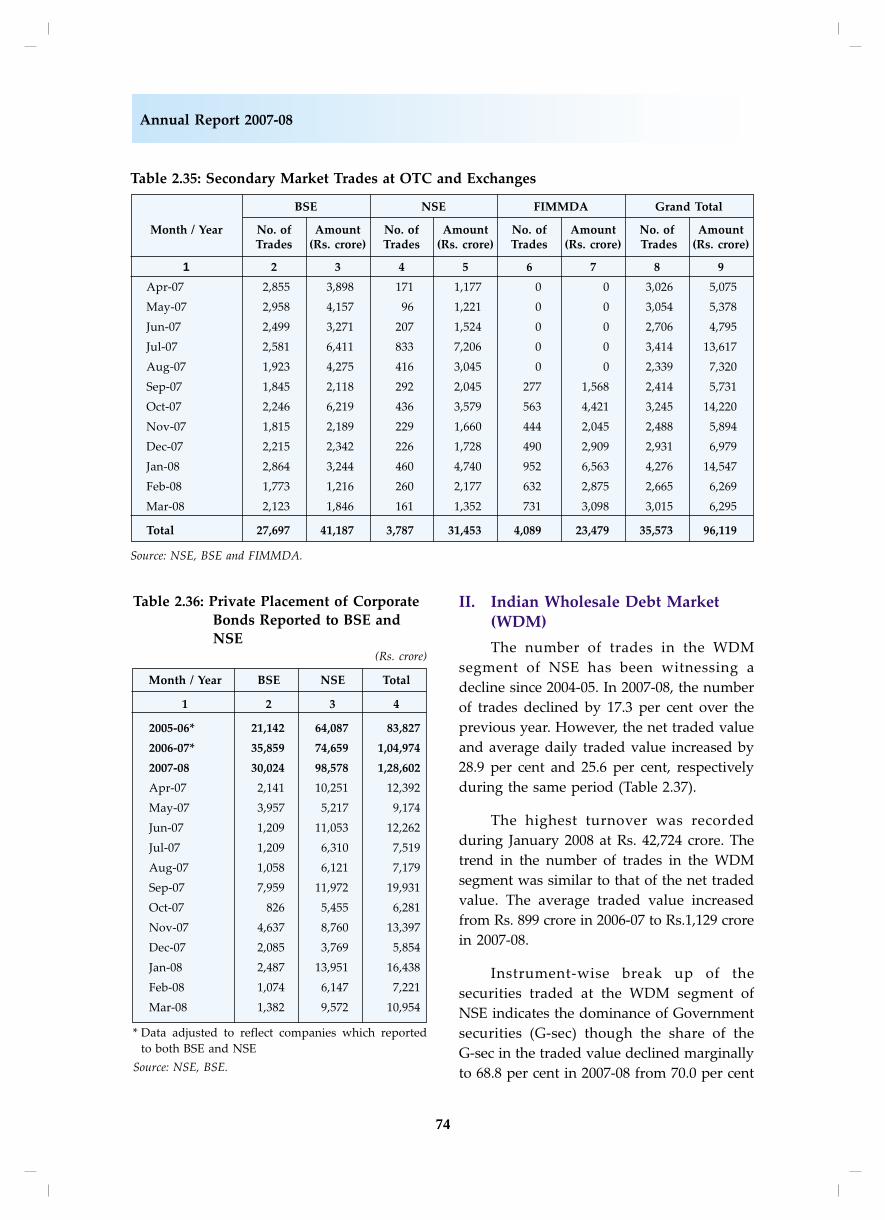
74
Annual Report 2007-08
II. Indian Wholesale Debt Market(WDM)
The number of trades in the WDM
segment of NSE has been witnessing a
decline since 2004-05. In 2007-08, the number
of trades declined by 17.3 per cent over the
previous year. However, the net traded value
and average daily traded value increased by
28.9 per cent and 25.6 per cent, respectively
during the same period (Table 2.37).
The highest turnover was recorded
during January 2008 at Rs. 42,724 crore. The
trend in the number of trades in the WDM
segment was similar to that of the net traded
value. The average traded value increased
from Rs. 899 crore in 2006-07 to Rs.1,129 crore
in 2007-08.
Instrument-wise break up of the
securities traded at the WDM segment of
NSE indicates the dominance of Government
securities (G-sec) though the share of the
G-sec in the traded value declined marginally
to 68.8 per cent in 2007-08 from 70.0 per cent
Table 2.36: Private Placement of Corporate
Bonds Reported to BSE and
NSE(Rs. crore)
Month / Year BSE NSE Total
1 2 3 4
2005-06* 21,142 64,087 83,827
2006-07* 35,859 74,659 1,04,974
2007-08 30,024 98,578 1,28,602
Apr-07 2,141 10,251 12,392
May-07 3,957 5,217 9,174
Jun-07 1,209 11,053 12,262
Jul-07 1,209 6,310 7,519
Aug-07 1,058 6,121 7,179
Sep-07 7,959 11,972 19,931
Oct-07 826 5,455 6,281
Nov-07 4,637 8,760 13,397
Dec-07 2,085 3,769 5,854
Jan-08 2,487 13,951 16,438
Feb-08 1,074 6,147 7,221
Mar-08 1,382 9,572 10,954
* Data adjusted to reflect companies which reported
to both BSE and NSE
Source: NSE, BSE.
Table 2.35: Secondary Market Trades at OTC and Exchanges
BSE NSE FIMMDA Grand Total
Month / Year No. of Amount No. of Amount No. of Amount No. of AmountTrades (Rs. crore) Trades (Rs. crore) Trades (Rs. crore) Trades (Rs. crore)
1 2 3 4 5 6 7 8 9
Apr-07 2,855 3,898 171 1,177 0 0 3,026 5,075
May-07 2,958 4,157 96 1,221 0 0 3,054 5,378
Jun-07 2,499 3,271 207 1,524 0 0 2,706 4,795
Jul-07 2,581 6,411 833 7,206 0 0 3,414 13,617
Aug-07 1,923 4,275 416 3,045 0 0 2,339 7,320
Sep-07 1,845 2,118 292 2,045 277 1,568 2,414 5,731
Oct-07 2,246 6,219 436 3,579 563 4,421 3,245 14,220
Nov-07 1,815 2,189 229 1,660 444 2,045 2,488 5,894
Dec-07 2,215 2,342 226 1,728 490 2,909 2,931 6,979
Jan-08 2,864 3,244 460 4,740 952 6,563 4,276 14,547
Feb-08 1,773 1,216 260 2,177 632 2,875 2,665 6,269
Mar-08 2,123 1,846 161 1,352 731 3,098 3,015 6,295
Total 27,697 41,187 3,787 31,453 4,089 23,479 35,573 96,119
Source: NSE, BSE and FIMMDA.
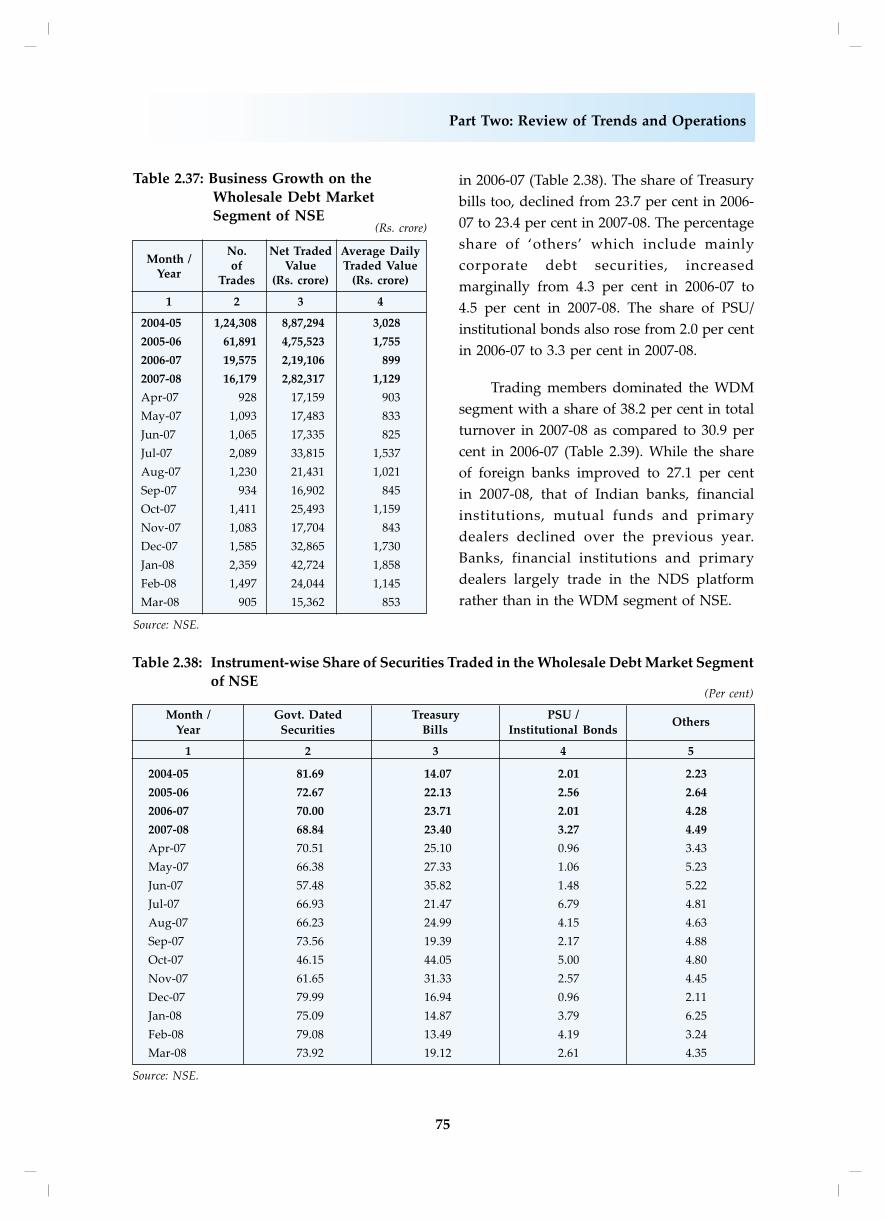
75
Part Two: Review of Trends and Operations
in 2006-07 (Table 2.38). The share of Treasury
bills too, declined from 23.7 per cent in 2006-
07 to 23.4 per cent in 2007-08. The percentage
share of ‘others’ which include mainly
corporate debt securities, increased
marginally from 4.3 per cent in 2006-07 to
4.5 per cent in 2007-08. The share of PSU/
institutional bonds also rose from 2.0 per cent
in 2006-07 to 3.3 per cent in 2007-08.
Trading members dominated the WDM
segment with a share of 38.2 per cent in total
turnover in 2007-08 as compared to 30.9 per
cent in 2006-07 (Table 2.39). While the share
of foreign banks improved to 27.1 per cent
in 2007-08, that of Indian banks, financial
institutions, mutual funds and primary
dealers declined over the previous year.
Banks, financial institutions and primary
dealers largely trade in the NDS platform
rather than in the WDM segment of NSE.
Table 2.37: Business Growth on the
Wholesale Debt Market
Segment of NSE(Rs. crore)
Month /No. Net Traded Average Daily
Yearof Value Traded Value
Trades (Rs. crore) (Rs. crore)
1 2 3 4
2004-05 1,24,308 8,87,294 3,028
2005-06 61,891 4,75,523 1,755
2006-07 19,575 2,19,106 899
2007-08 16,179 2,82,317 1,129
Apr-07 928 17,159 903
May-07 1,093 17,483 833
Jun-07 1,065 17,335 825
Jul-07 2,089 33,815 1,537
Aug-07 1,230 21,431 1,021
Sep-07 934 16,902 845
Oct-07 1,411 25,493 1,159
Nov-07 1,083 17,704 843
Dec-07 1,585 32,865 1,730
Jan-08 2,359 42,724 1,858
Feb-08 1,497 24,044 1,145
Mar-08 905 15,362 853
Source: NSE.
Table 2.38: Instrument-wise Share of Securities Traded in the Wholesale Debt Market Segment
of NSE (Per cent)
Month / Govt. Dated Treasury PSU /Year Securities Bills Institutional Bonds
Others
1 2 3 4 5
2004-05 81.69 14.07 2.01 2.23
2005-06 72.67 22.13 2.56 2.64
2006-07 70.00 23.71 2.01 4.28
2007-08 68.84 23.40 3.27 4.49
Apr-07 70.51 25.10 0.96 3.43
May-07 66.38 27.33 1.06 5.23
Jun-07 57.48 35.82 1.48 5.22
Jul-07 66.93 21.47 6.79 4.81
Aug-07 66.23 24.99 4.15 4.63
Sep-07 73.56 19.39 2.17 4.88
Oct-07 46.15 44.05 5.00 4.80
Nov-07 61.65 31.33 2.57 4.45
Dec-07 79.99 16.94 0.96 2.11
Jan-08 75.09 14.87 3.79 6.25
Feb-08 79.08 13.49 4.19 3.24
Mar-08 73.92 19.12 2.61 4.35
Source: NSE.
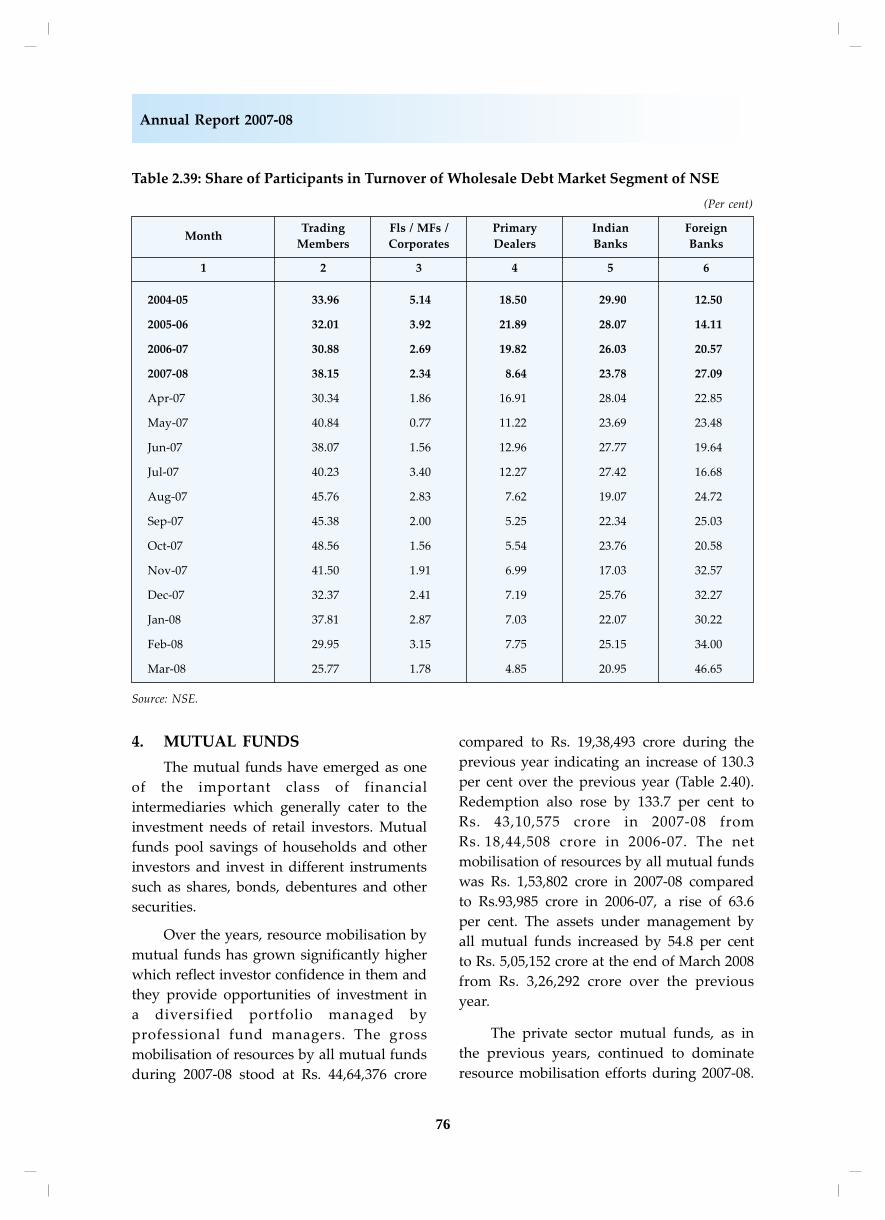
76
Annual Report 2007-08
4. MUTUAL FUNDS
The mutual funds have emerged as one
of the important class of financial
intermediaries which generally cater to the
investment needs of retail investors. Mutual
funds pool savings of households and other
investors and invest in different instruments
such as shares, bonds, debentures and other
securities.
Over the years, resource mobilisation by
mutual funds has grown significantly higher
which reflect investor confidence in them and
they provide opportunities of investment in
a diversified portfolio managed by
professional fund managers. The gross
mobilisation of resources by all mutual funds
during 2007-08 stood at Rs. 44,64,376 crore
compared to Rs. 19,38,493 crore during the
previous year indicating an increase of 130.3
per cent over the previous year (Table 2.40).
Redemption also rose by 133.7 per cent to
Rs. 43,10,575 crore in 2007-08 from
Rs. 18,44,508 crore in 2006-07. The net
mobilisation of resources by all mutual funds
was Rs. 1,53,802 crore in 2007-08 compared
to Rs.93,985 crore in 2006-07, a rise of 63.6
per cent. The assets under management by
all mutual funds increased by 54.8 per cent
to Rs. 5,05,152 crore at the end of March 2008
from Rs. 3,26,292 crore over the previous
year.
The private sector mutual funds, as in
the previous years, continued to dominate
resource mobilisation efforts during 2007-08.
Table 2.39: Share of Participants in Turnover of Wholesale Debt Market Segment of NSE
(Per cent)
MonthTrading Fls / MFs / Primary Indian Foreign
Members Corporates Dealers Banks Banks
1 2 3 4 5 6
2004-05 33.96 5.14 18.50 29.90 12.50
2005-06 32.01 3.92 21.89 28.07 14.11
2006-07 30.88 2.69 19.82 26.03 20.57
2007-08 38.15 2.34 8.64 23.78 27.09
Apr-07 30.34 1.86 16.91 28.04 22.85
May-07 40.84 0.77 11.22 23.69 23.48
Jun-07 38.07 1.56 12.96 27.77 19.64
Jul-07 40.23 3.40 12.27 27.42 16.68
Aug-07 45.76 2.83 7.62 19.07 24.72
Sep-07 45.38 2.00 5.25 22.34 25.03
Oct-07 48.56 1.56 5.54 23.76 20.58
Nov-07 41.50 1.91 6.99 17.03 32.57
Dec-07 32.37 2.41 7.19 25.76 32.27
Jan-08 37.81 2.87 7.03 22.07 30.22
Feb-08 29.95 3.15 7.75 25.15 34.00
Mar-08 25.77 1.78 4.85 20.95 46.65
Source: NSE.
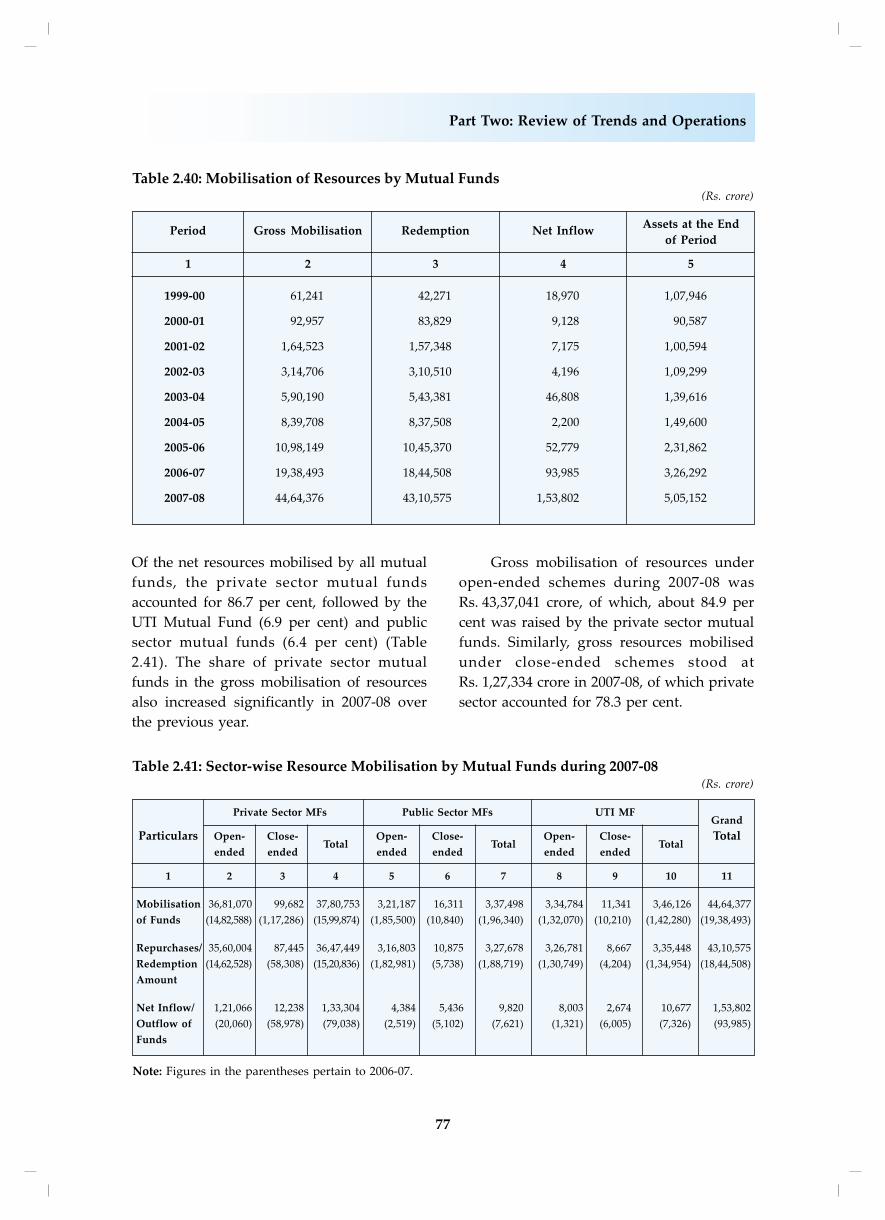
77
Part Two: Review of Trends and Operations
Table 2.40: Mobilisation of Resources by Mutual Funds(Rs. crore)
Period Gross Mobilisation Redemption Net InflowAssets at the End
of Period
1 2 3 4 5
1999-00 61,241 42,271 18,970 1,07,946
2000-01 92,957 83,829 9,128 90,587
2001-02 1,64,523 1,57,348 7,175 1,00,594
2002-03 3,14,706 3,10,510 4,196 1,09,299
2003-04 5,90,190 5,43,381 46,808 1,39,616
2004-05 8,39,708 8,37,508 2,200 1,49,600
2005-06 10,98,149 10,45,370 52,779 2,31,862
2006-07 19,38,493 18,44,508 93,985 3,26,292
2007-08 44,64,376 43,10,575 1,53,802 5,05,152
Table 2.41: Sector-wise Resource Mobilisation by Mutual Funds during 2007-08(Rs. crore)
Private Sector MFs Public Sector MFs UTI MFGrand
Particulars Open- Close-Total
Open- Close-Total
Open- Close-Total
Total
ended ended ended ended ended ended
1 2 3 4 5 6 7 8 9 10 11
Mobilisation 36,81,070 99,682 37,80,753 3,21,187 16,311 3,37,498 3,34,784 11,341 3,46,126 44,64,377
of Funds (14,82,588) (1,17,286) (15,99,874) (1,85,500) (10,840) (1,96,340) (1,32,070) (10,210) (1,42,280) (19,38,493)
Repurchases/ 35,60,004 87,445 36,47,449 3,16,803 10,875 3,27,678 3,26,781 8,667 3,35,448 43,10,575
Redemption (14,62,528) (58,308) (15,20,836) (1,82,981) (5,738) (1,88,719) (1,30,749) (4,204) (1,34,954) (18,44,508)
Amount
Net Inflow/ 1,21,066 12,238 1,33,304 4,384 5,436 9,820 8,003 2,674 10,677 1,53,802
Outflow of (20,060) (58,978) (79,038) (2,519) (5,102) (7,621) (1,321) (6,005) (7,326) (93,985)
Funds
Note: Figures in the parentheses pertain to 2006-07.
Of the net resources mobilised by all mutual
funds, the private sector mutual funds
accounted for 86.7 per cent, followed by the
UTI Mutual Fund (6.9 per cent) and public
sector mutual funds (6.4 per cent) (Table
2.41). The share of private sector mutual
funds in the gross mobilisation of resources
also increased significantly in 2007-08 over
the previous year.
Gross mobilisation of resources under
open-ended schemes during 2007-08 was
Rs. 43,37,041 crore, of which, about 84.9 per
cent was raised by the private sector mutual
funds. Similarly, gross resources mobilised
under close-ended schemes stood at
Rs. 1,27,334 crore in 2007-08, of which private
sector accounted for 78.3 per cent.
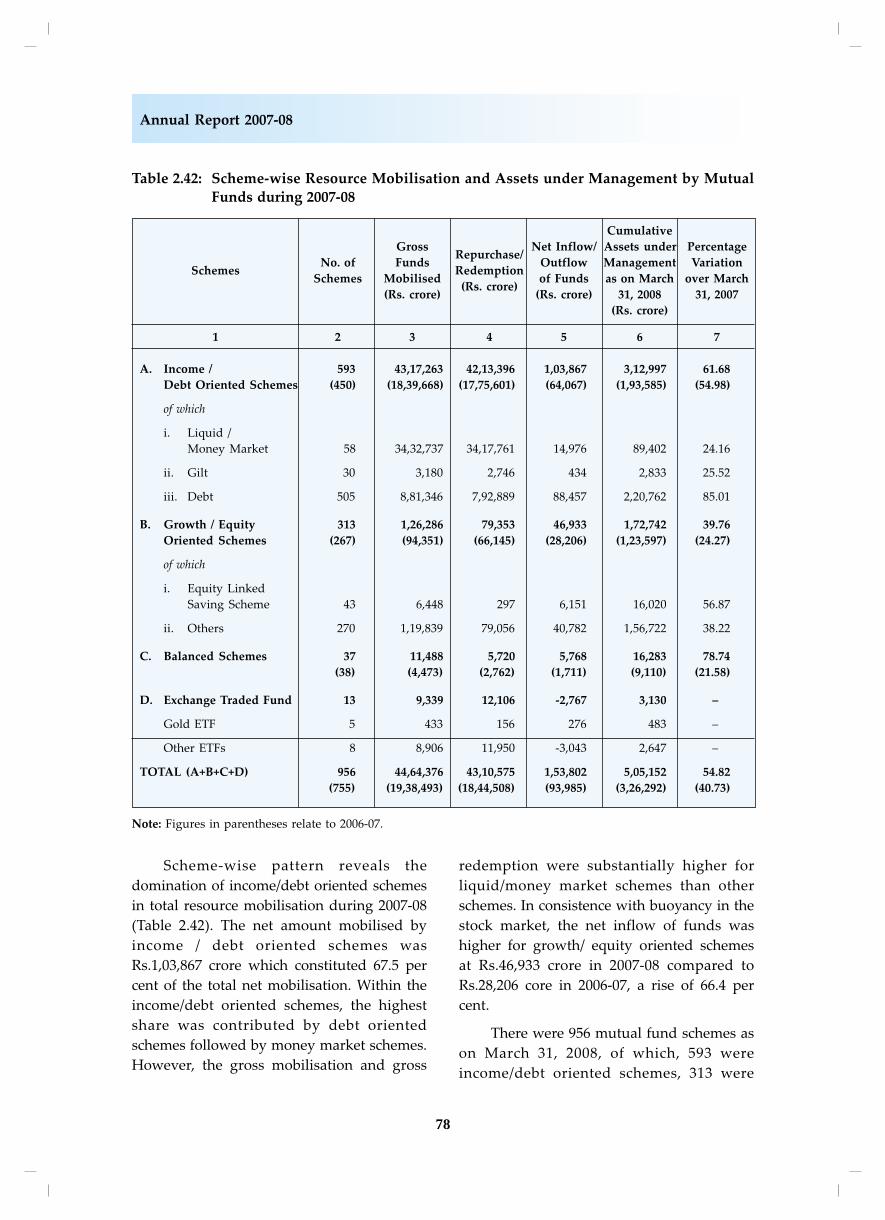
78
Annual Report 2007-08
Scheme-wise pattern reveals the
domination of income/debt oriented schemes
in total resource mobilisation during 2007-08
(Table 2.42). The net amount mobilised by
income / debt oriented schemes was
Rs.1,03,867 crore which constituted 67.5 per
cent of the total net mobilisation. Within the
income/debt oriented schemes, the highest
share was contributed by debt oriented
schemes followed by money market schemes.
However, the gross mobilisation and gross
redemption were substantially higher for
liquid/money market schemes than other
schemes. In consistence with buoyancy in the
stock market, the net inflow of funds was
higher for growth/ equity oriented schemes
at Rs.46,933 crore in 2007-08 compared to
Rs.28,206 core in 2006-07, a rise of 66.4 per
cent.
There were 956 mutual fund schemes as
on March 31, 2008, of which, 593 were
income/debt oriented schemes, 313 were
Table 2.42: Scheme-wise Resource Mobilisation and Assets under Management by Mutual
Funds during 2007-08
Cumulative
GrossRepurchase/
Net Inflow/ Assets under Percentage
SchemesNo. of Funds
RedemptionOutflow Management Variation
Schemes Mobilised(Rs. crore)
of Funds as on March over March
(Rs. crore) (Rs. crore) 31, 2008 31, 2007
(Rs. crore)
1 2 3 4 5 6 7
A. Income / 593 43,17,263 42,13,396 1,03,867 3,12,997 61.68
Debt Oriented Schemes (450) (18,39,668) (17,75,601) (64,067) (1,93,585) (54.98)
of which
i. Liquid /
Money Market 58 34,32,737 34,17,761 14,976 89,402 24.16
ii. Gilt 30 3,180 2,746 434 2,833 25.52
iii. Debt 505 8,81,346 7,92,889 88,457 2,20,762 85.01
B. Growth / Equity 313 1,26,286 79,353 46,933 1,72,742 39.76
Oriented Schemes (267) (94,351) (66,145) (28,206) (1,23,597) (24.27)
of which
i. Equity Linked
Saving Scheme 43 6,448 297 6,151 16,020 56.87
ii. Others 270 1,19,839 79,056 40,782 1,56,722 38.22
C. Balanced Schemes 37 11,488 5,720 5,768 16,283 78.74
(38) (4,473) (2,762) (1,711) (9,110) (21.58)
D. Exchange Traded Fund 13 9,339 12,106 -2,767 3,130 –
Gold ETF 5 433 156 276 483 –
Other ETFs 8 8,906 11,950 -3,043 2,647 –
TOTAL (A+B+C+D) 956 44,64,376 43,10,575 1,53,802 5,05,152 54.82
(755) (19,38,493) (18,44,508) (93,985) (3,26,292) (40.73)
Note: Figures in parentheses relate to 2006-07.
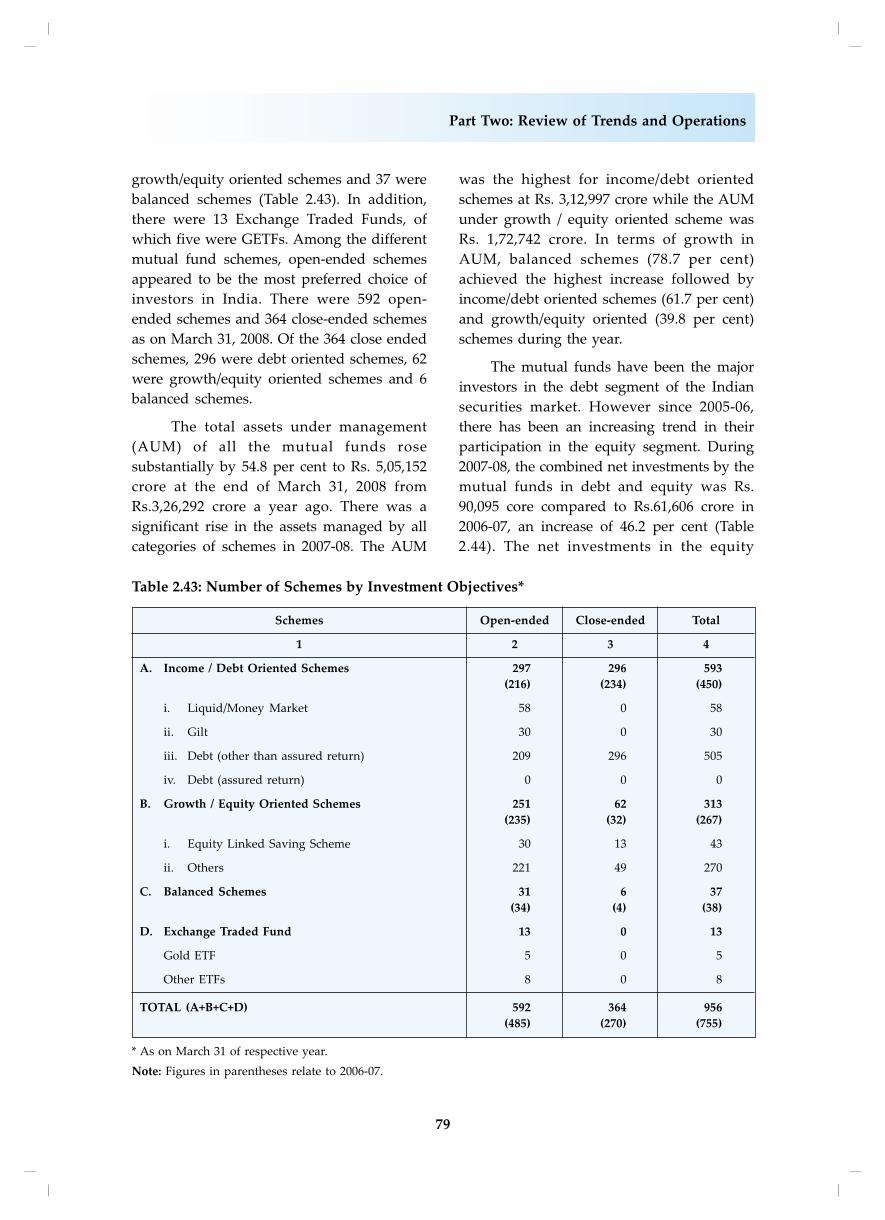
79
Part Two: Review of Trends and Operations
growth/equity oriented schemes and 37 were
balanced schemes (Table 2.43). In addition,
there were 13 Exchange Traded Funds, of
which five were GETFs. Among the different
mutual fund schemes, open-ended schemes
appeared to be the most preferred choice of
investors in India. There were 592 open-
ended schemes and 364 close-ended schemes
as on March 31, 2008. Of the 364 close ended
schemes, 296 were debt oriented schemes, 62
were growth/equity oriented schemes and 6
balanced schemes.
The total assets under management
(AUM) of all the mutual funds rose
substantially by 54.8 per cent to Rs. 5,05,152
crore at the end of March 31, 2008 from
Rs.3,26,292 crore a year ago. There was a
significant rise in the assets managed by all
categories of schemes in 2007-08. The AUM
was the highest for income/debt oriented
schemes at Rs. 3,12,997 crore while the AUM
under growth / equity oriented scheme was
Rs. 1,72,742 crore. In terms of growth in
AUM, balanced schemes (78.7 per cent)
achieved the highest increase followed by
income/debt oriented schemes (61.7 per cent)
and growth/equity oriented (39.8 per cent)
schemes during the year.
The mutual funds have been the major
investors in the debt segment of the Indian
securities market. However since 2005-06,
there has been an increasing trend in their
participation in the equity segment. During
2007-08, the combined net investments by the
mutual funds in debt and equity was Rs.
90,095 core compared to Rs.61,606 crore in
2006-07, an increase of 46.2 per cent (Table
2.44). The net investments in the equity
Table 2.43: Number of Schemes by Investment Objectives*
Schemes Open-ended Close-ended Total
1 2 3 4
A. Income / Debt Oriented Schemes 297 296 593
(216) (234) (450)
i. Liquid/Money Market 58 0 58
ii. Gilt 30 0 30
iii. Debt (other than assured return) 209 296 505
iv. Debt (assured return) 0 0 0
B. Growth / Equity Oriented Schemes 251 62 313
(235) (32) (267)
i. Equity Linked Saving Scheme 30 13 43
ii. Others 221 49 270
C. Balanced Schemes 31 6 37
(34) (4) (38)
D. Exchange Traded Fund 13 0 13
Gold ETF 5 0 5
Other ETFs 8 0 8
TOTAL (A+B+C+D) 592 364 956
(485) (270) (755)
* As on March 31 of respective year.
Note: Figures in parentheses relate to 2006-07.
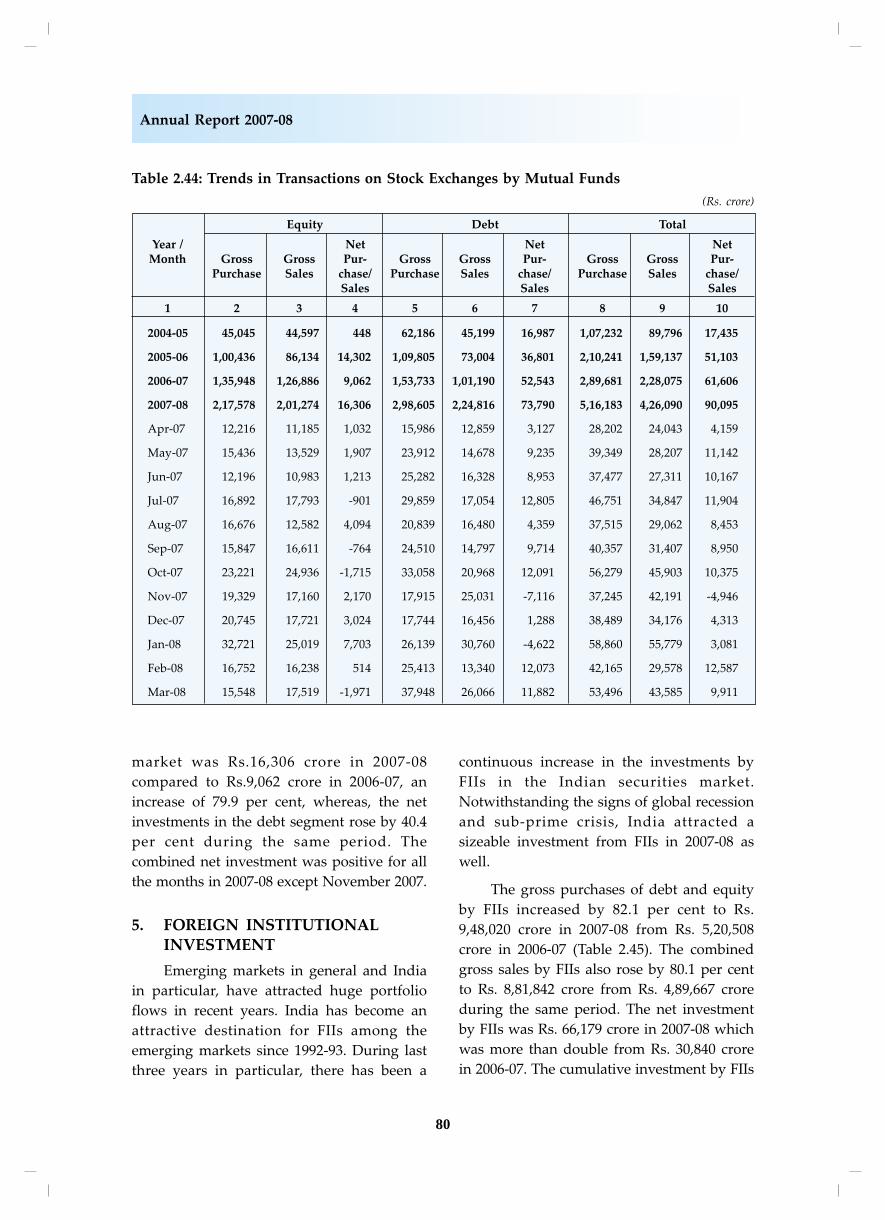
80
Annual Report 2007-08
market was Rs.16,306 crore in 2007-08
compared to Rs.9,062 crore in 2006-07, an
increase of 79.9 per cent, whereas, the net
investments in the debt segment rose by 40.4
per cent during the same period. The
combined net investment was positive for all
the months in 2007-08 except November 2007.
5. FOREIGN INSTITUTIONALINVESTMENT
Emerging markets in general and India
in particular, have attracted huge portfolio
flows in recent years. India has become an
attractive destination for FIIs among the
emerging markets since 1992-93. During last
three years in particular, there has been a
continuous increase in the investments by
FIIs in the Indian securities market.
Notwithstanding the signs of global recession
and sub-prime crisis, India attracted a
sizeable investment from FIIs in 2007-08 as
well.
The gross purchases of debt and equity
by FIIs increased by 82.1 per cent to Rs.
9,48,020 crore in 2007-08 from Rs. 5,20,508
crore in 2006-07 (Table 2.45). The combined
gross sales by FIIs also rose by 80.1 per cent
to Rs. 8,81,842 crore from Rs. 4,89,667 crore
during the same period. The net investment
by FIIs was Rs. 66,179 crore in 2007-08 which
was more than double from Rs. 30,840 crore
in 2006-07. The cumulative investment by FIIs
Table 2.44: Trends in Transactions on Stock Exchanges by Mutual Funds
(Rs. crore)
Equity Debt Total
Year / Net Net NetMonth Gross Gross Pur- Gross Gross Pur- Gross Gross Pur-
Purchase Sales chase/ Purchase Sales chase/ Purchase Sales chase/Sales Sales Sales
1 2 3 4 5 6 7 8 9 10
2004-05 45,045 44,597 448 62,186 45,199 16,987 1,07,232 89,796 17,435
2005-06 1,00,436 86,134 14,302 1,09,805 73,004 36,801 2,10,241 1,59,137 51,103
2006-07 1,35,948 1,26,886 9,062 1,53,733 1,01,190 52,543 2,89,681 2,28,075 61,606
2007-08 2,17,578 2,01,274 16,306 2,98,605 2,24,816 73,790 5,16,183 4,26,090 90,095
Apr-07 12,216 11,185 1,032 15,986 12,859 3,127 28,202 24,043 4,159
May-07 15,436 13,529 1,907 23,912 14,678 9,235 39,349 28,207 11,142
Jun-07 12,196 10,983 1,213 25,282 16,328 8,953 37,477 27,311 10,167
Jul-07 16,892 17,793 -901 29,859 17,054 12,805 46,751 34,847 11,904
Aug-07 16,676 12,582 4,094 20,839 16,480 4,359 37,515 29,062 8,453
Sep-07 15,847 16,611 -764 24,510 14,797 9,714 40,357 31,407 8,950
Oct-07 23,221 24,936 -1,715 33,058 20,968 12,091 56,279 45,903 10,375
Nov-07 19,329 17,160 2,170 17,915 25,031 -7,116 37,245 42,191 -4,946
Dec-07 20,745 17,721 3,024 17,744 16,456 1,288 38,489 34,176 4,313
Jan-08 32,721 25,019 7,703 26,139 30,760 -4,622 58,860 55,779 3,081
Feb-08 16,752 16,238 514 25,413 13,340 12,073 42,165 29,578 12,587
Mar-08 15,548 17,519 -1,971 37,948 26,066 11,882 53,496 43,585 9,911
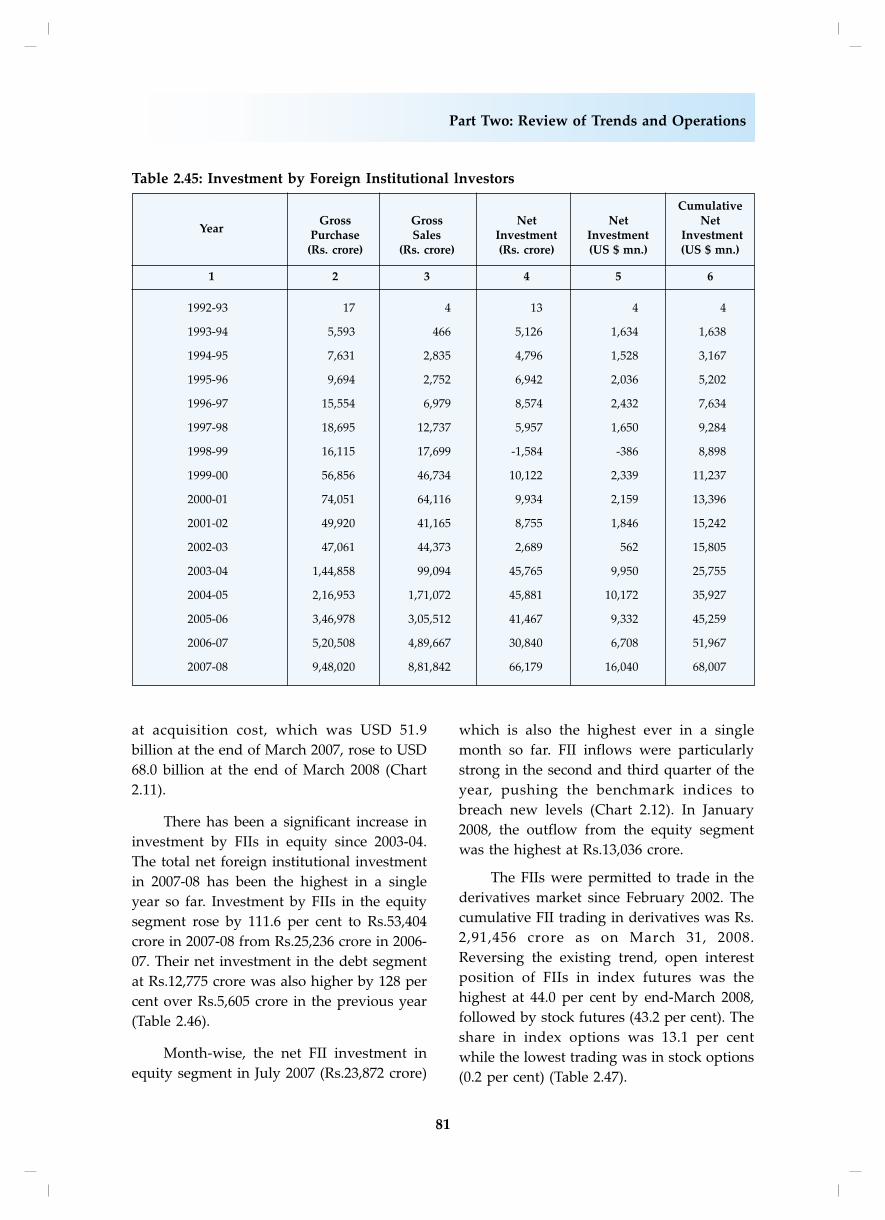
81
Part Two: Review of Trends and Operations
at acquisition cost, which was USD 51.9
billion at the end of March 2007, rose to USD
68.0 billion at the end of March 2008 (Chart
2.11).
There has been a significant increase in
investment by FIIs in equity since 2003-04.
The total net foreign institutional investment
in 2007-08 has been the highest in a single
year so far. Investment by FIIs in the equity
segment rose by 111.6 per cent to Rs.53,404
crore in 2007-08 from Rs.25,236 crore in 2006-
07. Their net investment in the debt segment
at Rs.12,775 crore was also higher by 128 per
cent over Rs.5,605 crore in the previous year
(Table 2.46).
Month-wise, the net FII investment in
equity segment in July 2007 (Rs.23,872 crore)
which is also the highest ever in a single
month so far. FII inflows were particularly
strong in the second and third quarter of the
year, pushing the benchmark indices to
breach new levels (Chart 2.12). In January
2008, the outflow from the equity segment
was the highest at Rs.13,036 crore.
The FIIs were permitted to trade in the
derivatives market since February 2002. The
cumulative FII trading in derivatives was Rs.
2,91,456 crore as on March 31, 2008.
Reversing the existing trend, open interest
position of FIIs in index futures was the
highest at 44.0 per cent by end-March 2008,
followed by stock futures (43.2 per cent). The
share in index options was 13.1 per cent
while the lowest trading was in stock options
(0.2 per cent) (Table 2.47).
Table 2.45: Investment by Foreign Institutional lnvestors
Cumulative
YearGross Gross Net Net Net
Purchase Sales Investment Investment Investment(Rs. crore) (Rs. crore) (Rs. crore) (US $ mn.) (US $ mn.)
1 2 3 4 5 6
1992-93 17 4 13 4 4
1993-94 5,593 466 5,126 1,634 1,638
1994-95 7,631 2,835 4,796 1,528 3,167
1995-96 9,694 2,752 6,942 2,036 5,202
1996-97 15,554 6,979 8,574 2,432 7,634
1997-98 18,695 12,737 5,957 1,650 9,284
1998-99 16,115 17,699 -1,584 -386 8,898
1999-00 56,856 46,734 10,122 2,339 11,237
2000-01 74,051 64,116 9,934 2,159 13,396
2001-02 49,920 41,165 8,755 1,846 15,242
2002-03 47,061 44,373 2,689 562 15,805
2003-04 1,44,858 99,094 45,765 9,950 25,755
2004-05 2,16,953 1,71,072 45,881 10,172 35,927
2005-06 3,46,978 3,05,512 41,467 9,332 45,259
2006-07 5,20,508 4,89,667 30,840 6,708 51,967
2007-08 9,48,020 8,81,842 66,179 16,040 68,007
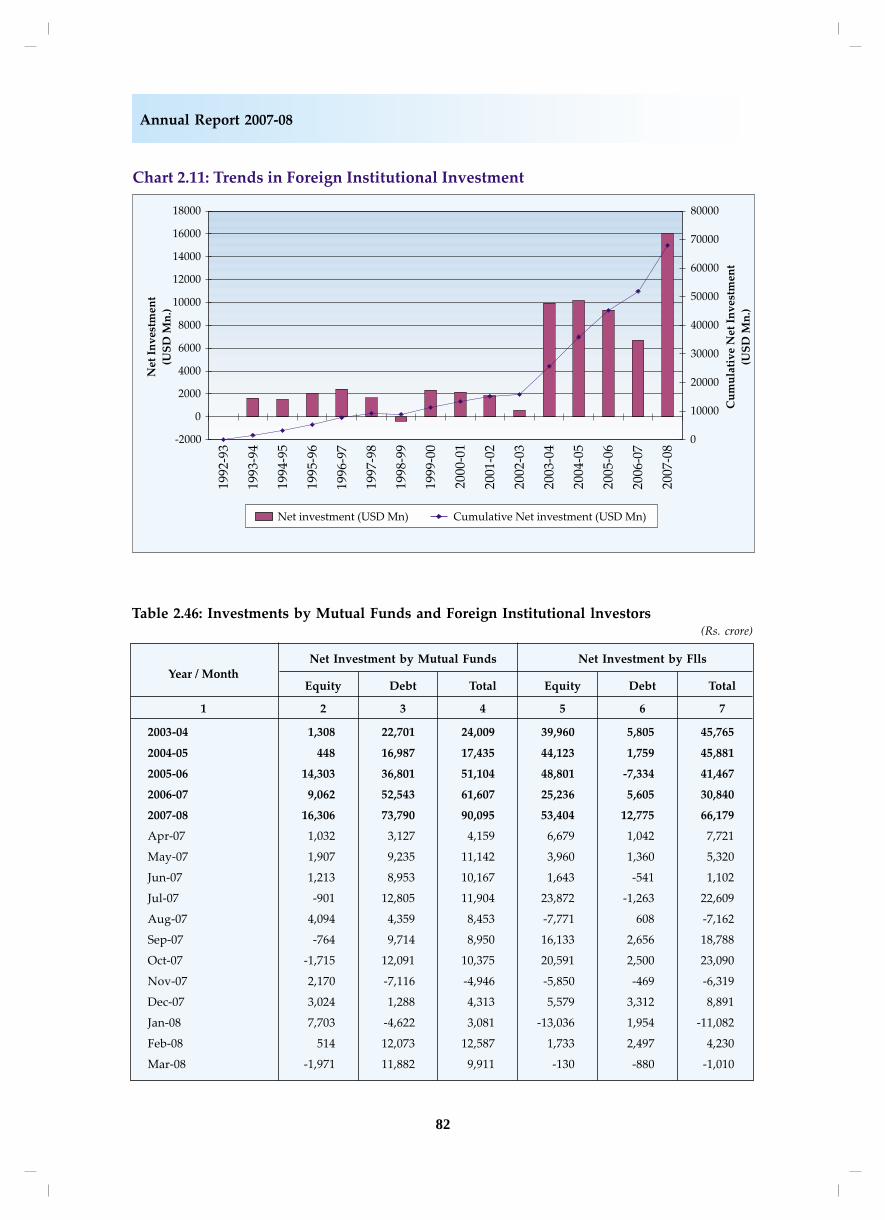
82
Annual Report 2007-08
Table 2.46: Investments by Mutual Funds and Foreign Institutional lnvestors(Rs. crore)
Net Investment by Mutual Funds Net Investment by FllsYear / Month
Equity Debt Total Equity Debt Total
1 2 3 4 5 6 7
2003-04 1,308 22,701 24,009 39,960 5,805 45,765
2004-05 448 16,987 17,435 44,123 1,759 45,881
2005-06 14,303 36,801 51,104 48,801 -7,334 41,467
2006-07 9,062 52,543 61,607 25,236 5,605 30,840
2007-08 16,306 73,790 90,095 53,404 12,775 66,179
Apr-07 1,032 3,127 4,159 6,679 1,042 7,721
May-07 1,907 9,235 11,142 3,960 1,360 5,320
Jun-07 1,213 8,953 10,167 1,643 -541 1,102
Jul-07 -901 12,805 11,904 23,872 -1,263 22,609
Aug-07 4,094 4,359 8,453 -7,771 608 -7,162
Sep-07 -764 9,714 8,950 16,133 2,656 18,788
Oct-07 -1,715 12,091 10,375 20,591 2,500 23,090
Nov-07 2,170 -7,116 -4,946 -5,850 -469 -6,319
Dec-07 3,024 1,288 4,313 5,579 3,312 8,891
Jan-08 7,703 -4,622 3,081 -13,036 1,954 -11,082
Feb-08 514 12,073 12,587 1,733 2,497 4,230
Mar-08 -1,971 11,882 9,911 -130 -880 -1,010
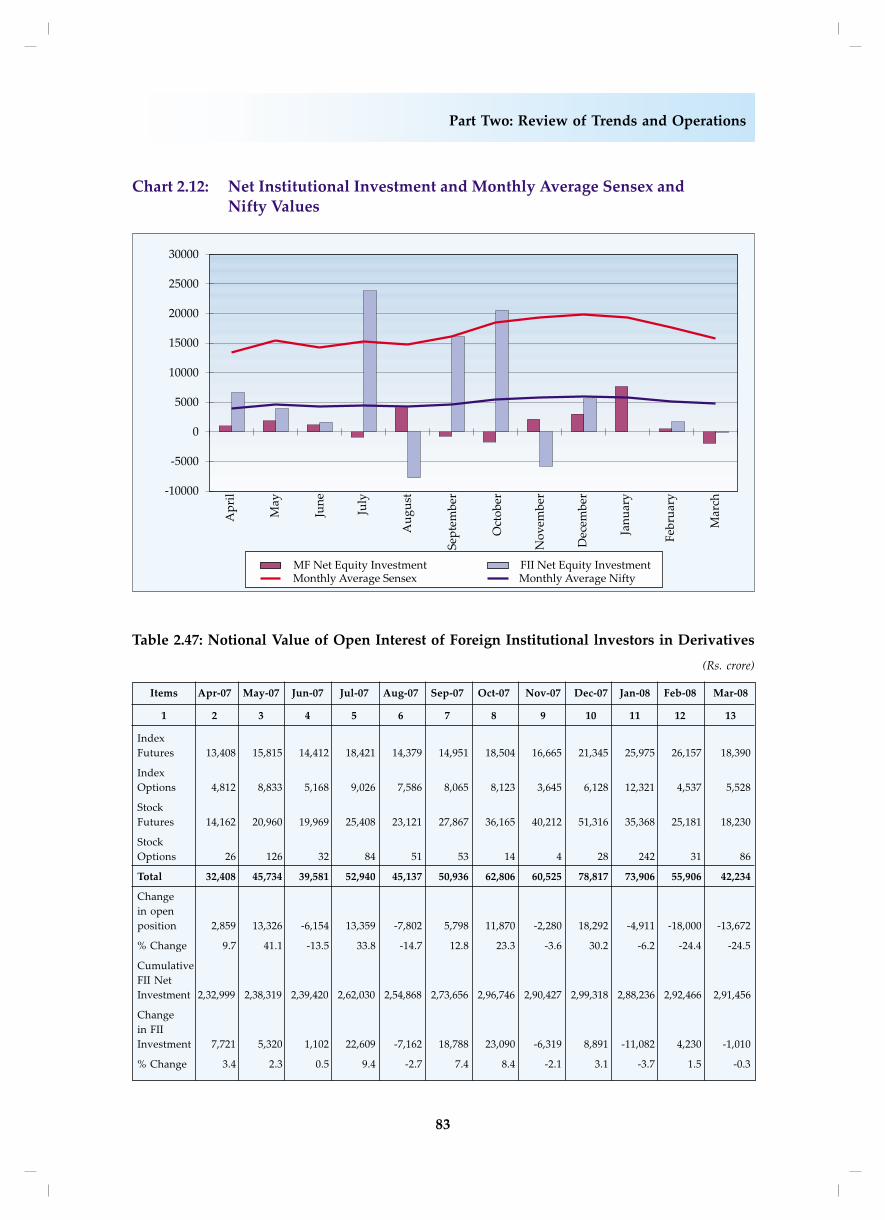
83
Part Two: Review of Trends and Operations
Table 2.47: Notional Value of Open Interest of Foreign Institutional lnvestors in Derivatives
(Rs. crore)
Items Apr-07 May-07 Jun-07 Jul-07 Aug-07 Sep-07 Oct-07 Nov-07 Dec-07 Jan-08 Feb-08 Mar-08
1 2 3 4 5 6 7 8 9 10 11 12 13
Index
Futures 13,408 15,815 14,412 18,421 14,379 14,951 18,504 16,665 21,345 25,975 26,157 18,390
Index
Options 4,812 8,833 5,168 9,026 7,586 8,065 8,123 3,645 6,128 12,321 4,537 5,528
Stock
Futures 14,162 20,960 19,969 25,408 23,121 27,867 36,165 40,212 51,316 35,368 25,181 18,230
Stock
Options 26 126 32 84 51 53 14 4 28 242 31 86
Total 32,408 45,734 39,581 52,940 45,137 50,936 62,806 60,525 78,817 73,906 55,906 42,234
Change
in open
position 2,859 13,326 -6,154 13,359 -7,802 5,798 11,870 -2,280 18,292 -4,911 -18,000 -13,672
% Change 9.7 41.1 -13.5 33.8 -14.7 12.8 23.3 -3.6 30.2 -6.2 -24.4 -24.5
Cumulative
FII Net
Investment 2,32,999 2,38,319 2,39,420 2,62,030 2,54,868 2,73,656 2,96,746 2,90,427 2,99,318 2,88,236 2,92,466 2,91,456
Change
in FII
Investment 7,721 5,320 1,102 22,609 -7,162 18,788 23,090 -6,319 8,891 -11,082 4,230 -1,010
% Change 3.4 2.3 0.5 9.4 -2.7 7.4 8.4 -2.1 3.1 -3.7 1.5 -0.3
84
Annual Report 2007-08
6. MECHANISMS FOR INTER-REGULATORY CO-ORDINATION
Various mechanisms were put in place
for ensuring effective inter-regulatory co-
ordination between various regulators in the
financial market. Some of the mechanisms in
this regard are provided as under:-
I. High Level Co-ordinationCommittee for Financial Markets(HLCCFM)
The HLCCFM is a high level coordination
committee to discuss various policy level
issues which require inter-regulatory co-
ordination between the regulators in the
financial market, viz., RBI, SEBI, Insurance
Regulatory and Development Authority
(IRDA) and Pension Fund Regulatory and
Development Authority (PFRDA). The
Committee was chaired by the Governor, RBI.
Secretary-Ministry of Finance, Chairman -
SEBI, Chairman - IRDA and Chairman -
PFRDA are members of the committee.
During 2007-08, two meetings of the
Committee were held on July 19, 2007 and
January 11, 2008.
II. RBI-SEBI Standing TechnicalCommittee
This is a Standing Committee between
SEBI and RBI that discusses operational
issues between SEBI and RBI which require
inter-regulatory co-ordination.
During 2007-08, two meetings of the
Committee were held on August 14, 2007 and
December 10, 2007.
III. RBI-SEBI Standing TechnicalCommittee on Exchange TradedCurrency and Interest RateDerivatives
A joint RBI - SEBI Standing Technical
Committee on exchange traded currency and
interest rate derivatives had been constituted
with representatives from both RBI and SEBI.
To start with, the committee had been
mandated to evolve norms and oversee the
implementation of exchange traded currency
futures. The committee had submitted its
report on May 29, 2008 with regard to
exchange traded currency futures.
IV. Inter-Regulatory Technical Sub-
Committee of SEBI / IRDA / RBI
Regulated Entities
In addition to the above, there are Inter-
Regulatory Technical sub-committees of SEBI
/ IRDA / RBI Regulated entities which are
sub-committees of the HLCCFM. The Inter-
Regulatory Technical sub-committee of SEBI
regulated entities is chaired by Executive
Director, SEBI and had representatives from
RBI and IRDA. Representatives of BSE and
NSE were invited to attend the meeting of
the said sub-committee. One meeting of the
sub-committee was held during 2007-08 on
September 04, 2007.
The Inter-Regulatory Technical sub-
committees of RBI regulated entities and
IRDA regulated entities were chaired by RBI
and IRDA respectively with representation
from SEBI.
V. Contact Man System
In order to effectively manage financial
crisis or a stress situation which may require
considerable co-ordination amongst different
regulators and market infrastructure agencies
or institutions, a ‘Contact Man System’ was
put in place with representatives from the
various regulatory agencies.