Embed Size (px)
Citation preview

A n n u a l R e p o r t 2 0 0 6Pursuant to the provisions of Article 16 of decision No 5/204/14.11.2000 made by the Capital Market Committee
I N F O R M A T I O N T E C H N O L O G Y S Y S T E M S S. A.

ANNUAL REPORT 2006
ATHENSAPRIL 2007
Information Technology Systems S.A.


CHAPTER ∞
About Unisystems .......................................................................................................................................................∞1
CHAPTER µ
Solutions, Products and Services ....................................................................................................................µ1
CHAPTER C
Unisystems Management.........................................................................................................................................C1
CHAPTER D
Report of the Board of Directors.....................................................................................................................D1
CHAPTER ∂
Condensed Financial Data and Information for the year ended 31 December 2006 (from 1 January 2006 to 31 December 2006)......................................................................................∂1
CHAPTER F
Annual Financial Statements as at 31 December 2006 ..........................................................F1
CHAPTER G
Table of the Company's transactions with affiliated companies or joint ventures..........................................................................................G1
CHAPTER ∏
Information published by Unisystems during 2006Article 10 of Law 3401/2005 ...........................................................................................................................∏1
CHAPTER I
Information regarding the companies that are incorporated in the Financial Statements of Unisystems S.A. .......................................................................................I1
Contents

Annual Report 2 0 0 6
About Unisystems a
1

Unisystems, as one of the largest systems integrators in Greece, has the domainknowledge, technical, and service expertise to deliver a great number of large-scaleprojects in Greece and South Eastern Europe.
Time and again we have proven our ability to move seamlessly from project design toexecution, as well as operational support and maintenance, helping our clients realisebusiness value from their IT investments.
Unisystems advanced methodology for IT solution delivery and implementation,guarantees the high standards of services offered to a wide range of large corporateorganisations in financial, telecommunications and public sectors.
Our successful truck record in the delivery of innovative and reliable solutions is theresult of the continuous effort of our 300 employees whose ability to adapt to newconcepts and deliver consistent results in a dynamic operational environment allows usto meet our client’s expectations. Unisystems is an equal opportunities employer,without discrimination based on race, colour, religion, sexual orientation, disability orage.
Unisystems has been further strengthened in terms of its access to resources, serviceexpertise and international exposure, following the recent acquisition of its majority ofshares by the Infoquest Group.
Annual Report 2 0 0 6
About Unisystems
2
a

Annual Report 2 0 0 6
Solutions, Products and Services b
1

➣ Managed Services
Unisystems provides specialized Managed Services capable of simplifying theoperational demands of your IT infrastructure.
System Administration
Outsourcing of system administration can be provided either at the client’s premises orremotely through a secure connection. This service can include the administration of:
ñ Central servers and active componentsñ Operations monitoring and security controlñ Backup functions and schedulingñ DNS addresses and domain user accountsñ Mail accounts and mail server ñ Software upgrades.
Call Center & Help Desk
Unisystems’ Help Desk is one of the first and most advanced operating in Greece.Manned by an experienced technical team, it delivers a broad spectrum of services thatcan dramatically reduce your operating costs and streamline response to user requests.Unisystems offers flexible billing options that can accommodate your method ofoperation.
Services Available:ñ Remote diagnosis of equipment failureñ Equipment Troubleshooting ñ Application Troubleshooting ñ Remote assistance / desktop grabbing
Applications and Operating Systems Supportedñ MS OS / Unix / Solaris / Linux.ñ MS Exchange Serverñ MS Mail Serverñ MS Officeñ SAP User Screensñ Ability to support Client’s custom applications
Solutions, Products and Services
Annual Report 2 0 0 62
b
Infrastructureñ 8 simultaneous help linesñ Business hours operation (07:30-17:00), with possibility for extensionñ Updates and alerts via phone/SMS/emailñ Supported remote administration suites: Citrix, VNC, Tivoli, Unicenter
Installation Services (Roll out)
Rollout services offer delivery and physical installation of IT equipment anywhere inGreece (and abroad if requested), and its staging, regardless of manufacturer orsupplier. Rollout can also include pilot installation and preparation of thoroughinstallation manuals for subsequent use. Rollouts are always designed to fit the client’sneeds and timeframe. Unisystems has implemented large rollouts in the particularlydemanding facilities of banking organizations and enterprises in the private and publicsector.
Staging
To reduce the possibility of equipment failure and avoid incompatibilities, Unisystemsundertakes the complete assembly and quality control of all equipment before deliveryto client. This process, known as STAGING, is carried out by trained technical staff inthe company’s 4,000 sq. m. repair center, and is certified by ISO 9001 / 2000.
Workstation and Data Center Relocation
For most businesses, the successful relocation of IT equipment to new premises can beparticularly challenging. It requires the synchronization of a number of engineers andsuppliers and the seamless transfer of telephone lines and data, all within a very narrowtimeframe.
Unisystems can undertake the logistical planning and carry out all the necessaryservices for the successful reinstallation of your equipment. Our services include:
ñ Logistics planning and schedulingñ Insurance, unplugging & packing of equipmentñ Transportation and reinstallation of equipmentñ Provision of redundant systems to cope with any mishap ñ On-site engineers during first days of operation in new premises, to ensure
problem-free operation
Annual Report 2 0 0 6 3
Solutions, Products and Services b

Maintenance Services
Unisystems has many years of experience in equipment maintenance services and canprovide multilevel support contracts for all your IT equipment. These contracts providea guaranteed response time all over Greece, together with 24/7 coverage and phonesupport. Unisystems can also offer equipment of comparable or greater capacity until theoriginal malfunctioning equipment is repaired and returned. Unisystems’ Help Desk and24-hour on-call engineers with access to all our computer systems and parts, guaranteethe speedy delivery of all maintenance services.
Warranty Services
For most enterprises, keeping track of equipment warrantees is a time-consuming andinefficient process. In most cases, none has an accurate picture. This means compounddelays in repair time for your vital equipment. Unisystems has access to the productregistration systems of all major manufacturers, keeping you informed of your warranteecoverage. Extensions of the warrantee period can also be offered for select equipment,outside of the manufacturer’s warrantee.
➣ Data Storage Solutions
Unisystems expert staff has the competence to evaluate your existing infrastructure anddesign the right solutions to meet your most demanding objectives.
New technologies deployed simplify the management of complex environments andbring value to the enterprise by enhancing performance, availability, reliability andsecurity.
Unisystems high – quality services help you implement, manage, and maintain complexsolutions for storing, archiving and protecting your business data. We can help youreduce operating costs by optimizing assets, improve efficiency and increaseproductivity.
Annual Report 2 0 0 64
Solutions, Products and Servicesb

Solutions
Data & Storage Consolidationñ Optimizes and consolidates your storage environment to minimize operating
costs and enable your business to adapt quickly and dynamically to enterprisechanges.
Backup & Restore solutions ñ Protect data and improve reliability, recovery, speed and flexibility in backup
and restoring processes. Email archiving
ñ Securely stores and archives electronic correspondence while reducingmanagement costs.
Disaster Recoveryñ Ensure the safe recovery of your IT infrastructure after partial or total failure
Information Lifecycle Managementñ Effective management and administration of all corporate information types, on
demand access and recovery of historical data, storage costs minimization.Business Continuity
ñ Ensure the uninterrupted operation enterprise infrastructure, even in the caseof total disruption of the prime site.
Regulatory Complianceñ Enterprise data compliance with internal governance, and regulatory
requirements.Data Migration
ñ Safely migrate data and upgrade applications without disrupting normalbusiness operation
Storage Virtualizationñ Simplifies data storage management and enables business processes quickly
adapt to ever changing demands
Annual Report 2 0 0 6 5
Solutions, Products and Services b

Consulting Services
Unisystems can provide you with the specialized consulting services that will allow youto make the most out of your existing or planned investment in data storage systems.
The following consulting services are offered:
◗ System Landscaping for Data Storage, Data Protection & Archiving◗ Storage Consolidation◗ Data Protection, Data Replication & Migration throughout the Information
Lifecycle◗ Disaster Recovery◗ Compliance Study to meet International Standards◗ Alignment Study of storage media and processes to better meet your enterprise
needs◗ SLA analysis for use with internal business units◗ Use of best practice policies
System Management Services
Unisystems’ experience and experienced personnel can offer your organization thefollowing consulting and management support services:
◗ Operation and efficiency monitoring for your data storage systems◗ SLA targets monitoring ◗ Optimization of storage environment◗ Design and delivery of highly available storage solutions ◗ Design and implementation of your backup and recovery policies ◗ System and process upgrades to keep you in the forefront of technological
innovation
Support Services
Unisystems’ experienced and highly trained field engineers can deliver the precisesupport services you need to keep your enterprise’s IT infrastructure functioning 24hours a day, 365 days a year.
Annual Report 2 0 0 66
Solutions, Products and Servicesb

The following services are offered:
◗ Call Center◗ Help Desk◗ Immediate Call-back support service◗ On-call support service◗ On-site maintenance◗ Remote maintenance/administration◗ Hardware support up to 24x7 all year round◗ Software support 24x7 all year round◗ Multi-vendor support
Education & Training Services
Unisystems field engineers are certified for the full range of services offered. Weprovide modern training facilities, labs, and state of the art computer rooms that canbe used for the following training services:
◗ Workshops◗ On the job training◗ Application training
➣ System Consolidation Services
System consolidation services simplify the typically complex infrastructure of yourbusiness environment, while reducing operating costs and optimizing existing IT assets.
Unisystems consulting services provide you with the help you need to consolidate andoptimize your infrastructure and human resources capital.
Application and Database Consolidation
Our Application and Database Consolidation solutions help you eliminate isolatedand/or redundant applications. We help you design and implement integrated solutionsthat meet all your business requirements. As the costs of multi-vendor applicationinteroperability often exceeds 30% of an organization’s annual IT budget, ourinformation consolidation solutions allow you to optimize your performance and ITassets by integrating multiple applications and databases into one comprehensiveinformation environment.
Annual Report 2 0 0 6 7
Solutions, Products and Services b

Solutions provided:
ñ Immediate Real-Time access to data ñ Reduced costs through efficiency optimization ñ Streamlined management of multiple data sources ñ Services, applications and database integration ñ Reduced costs, processing time and the assumed risk entailed in upgrading and
expanding multiple applications and databases
Data Center Consolidation
Our Consolidation solutions address all your organizational needs by reducingoperational risk and improving data and systems security, while at the same time theylower management and operating costs.
It is often the case that following organic growth or expansion through MnA, activity,companies will find themselves with redundant IT infrastructure, underutilizedresources and increased maintenance costs. Our Data Center Consolidation services canhelp you eliminate redundant components and impose robust policies to your ITlandscape, allowing for a holistic view of components such as servers, storage, andapplications within a centralized environment.
Our solutions provide:
ñ Increased control over storage and data management ñ Increased security levels through the application of advanced security policyñ Reduced cost and systems management timeñ Optimized systems efficiency levels through effective network management
Systems Management Consolidation
Large enterprises often deploy a multitude of administration and system managementtools for controlling the operation of their infrastructure. This lack of a unified platformcapable of addressing the hole of the IT infrastructure results in suboptimal resourceutilization and increased operational and maintenance costs.
Our solutions services can help your enterprise consolidate to standardized platformsand increase its effectiveness.
Annual Report 2 0 0 68
Solutions, Products and Servicesb

Our solutions provide:
ñ Reduced costs eliminating multi vendor policy. ñ Implementation of best practice policies through a standardized platform. ñ Increased availability for vital business applications.ñ Simplification of SLAs administration ñ Efficient management of printing infrastructure.ñ Resource optimization
Server and Storage Consolidation
As an enterprise expands, so do its needs for people, processes and IT resources tosupport its operations. The result often lacks in strategic vision and execution.
Our server and storage consolidation solutions allow for better control of your systemsby eliminating redundant units and creating robust yet flexible IT infrastructure,capable of adapting to your ever changing needs.
Our solutions provide:
ñ Reduced costs and time and effort required to manage complex ITinfrastructures
ñ Improved resource allocationñ Improved systems availabilityñ Increased security levelsñ Improved user support
➣ ECM Enterprise Content Management
Unisystems partners with leading vendors to ensure its clients a broad range ofsolutions available in the Enterprise Content Management space. Our extensiveexperience along with the technical know-how of our partners allows us to providesolutions to cover all your needs.
Public Sector and Services
Public sector organizations employ a large number of complex and resource inefficientprocesses. Addressing the need to automate such processes is further complicated bythe need to promptly respond to citizen requests. Our Enterprise Content Managementsolutions are ideal means of expediting operations in the Public Sector Domain.
Annual Report 2 0 0 6 9
Solutions, Products and Services b

Unisystems guarantees the proper planning, fast installation and implementation withimmediate gains and increased productivity at all levels.
Financial Sector
The use of technology and information in the financial sector presents a specific set ofimportant challenges. Since enterprise success in this sector is closely involved withcentral management and information distribution, financial organizations urgentlyneed to consolidate their isolated information systems into a single, more efficientsystem. Information is bound to processes. For example, the processing of loans by abank requires a great number of documents or data. Delivering them in the traditionalmanner burdens the enterprise with a large quantity of paper and impedes decisionmaking. Besides which, the documents the client submits, the data and supportingdocuments kept in his file, and the contracts issued by the bank or other legal service,combined with time-consuming, complex procedures, all create substantialadministrative costs for the organization.
By automating document management and issuance, your organization can ensure aunified information repository for all your employees, which allows them to centrallymanage data and immediately locate whatever they need. In a banking institution, suchjob streamlining contributes to increased productivity. At the same time, yourorganization maintains complete control over the flow of all information that isimmediately accessible to each user. Lost documents are a thing of the past, whilestorage and archiving costs are significantly reduced.
Unisystems can address these challenges with Enterprise Content ManagementSolutions.
Insurance Organizations
For today’s insurance organizations, the competitive edge lies in improving clientservice while reducing operating costs. Ever-increasing market competition demandsthat organizations employ a client-centric policy where easy access to all informationis vital. However, the traditional way of document management significantly impedesresponding promptly to client claims, and complicates locating and processing ofrequired documents. The traditional method of insurance claims and compensationsmanagement has become a time-consuming process fraught with inefficiencies.
All these processes are dramatically simplified with our Enterprise Content Managementsolutions. ECM enables multiple users to simultaneously access and work on the samedocument. This means improved responsiveness to client claims.
Annual Report 2 0 0 610
Solutions, Products and Servicesb

Unisystems solutions make it easy to expedite processes, supporting the managementof contracts, computer printouts, and improve internal access to documents.
Telecommunications
Due to changes in the telecommunications sector and increased competition in amarket that until recently was a monopoly, telecommunications organizations areforced to update the ways in which they manage their great volume of documents.When, for example, a new contract is created, the telco organization must manage alarge quantity of information and complete processes that usually entail creating anddistributing many documents: changes in client’s personal data, billing, late payments,suspended service, and contract administration.
Your organization, therefore, must find a solution for facilitating its operation thatallows it to easily interoperate with its existing IT infrastructure.
Enterprise Content Management solutions can automate all these operations and ensurefast and efficient transactions of printouts, forms, bills, files and every type ofinformation in the telecommunications sector.
ECM solutions deliver greater efficiency, improved client service and reduced documentfiling and distribution costs.
At the same time, payment processing and contract renewals are accomplished fasterand more efficiently.
Commerce and Industry
Many commercial and industrial organizations are forced to update their procedures ofdealing with ever increasing quantities of internal and external documentation. Theneed to comply with ISO standards leads to the adoption of standardized operatingprocesses and centralized information management. While the adoption of EnterpriseContent Management Solutions can also assist with the management of internal staffinformation.
Unisystems is actively engaged in the Commerce and Industry Sector, providing verticalsolutions and services that help enterprises improve their efficiently and maximizetheir productivity.
Annual Report 2 0 0 6 11
Solutions, Products and Services b

Proper data management is necessary at every level. Unisystems can provide thesolution: Enterprise Content Management in an industrial organization can improve theworkplace efficiency providing access to information for internal as well as authorizedexternal users, such as certification or audit organizations.
➣ Data Cleansing
Organizations today are challenged to manage large amounts of information frommultiple data sources. They must also respond to the ever increasing demands to deliverthe right information, within or outside the organisation.
In both cases, data quality is the critical component for appropriate decision-makingand insures compliance with specific company policies. Unisystems offers bespoke datacleansing solutions to match your particular business needs. Unisystems has investedin the necessary resources for providing its clients with comprehensive solutions thatcorrect, enhance, identify, and integrate your enterprise data.
Unisystems offers the Greek market a comprehensive portfolio of data cleansing servicesand applications to fit your company’s individual needs. Such solutions follow a provenprocess of data quality control through the following steps:
ñ Analysisñ Standardizationñ Correction ñ Enhancementñ Profilingñ Integration
Data Analysis, Standardization, Correction & Enhancement
Unisystems comprehensive data cleansing solutions are designed to analyze,standardize, correct and enhance your company’s enterprise data, such as:
ñ Names of persons and organizations ñ Sex of person ñ Business informationñ Address information (Country, District, City, Street, Number, Postal Code).ñ Electronic addresses and emailsñ Phone numbersñ Tax Identification Numbers
Annual Report 2 0 0 612
Solutions, Products and Servicesb
Through the use of advanced techniques and special algorithms, Unisystems offers a fullrange of data identification and correction services including:
ñ Assessment, standardization and correction of Greek first and last names,names of geographical locations.
ñ Verification and validation of corporate and personal data.ñ Correction and enhancement of data using additional data sources.ñ Integrating and grouping data in databank spreadsheets for further use.
Profiling and Integration
Unisystems uses identification tools capable of assessing multiple entries withdisparate structures within your organization’s different data sources. We streamlineinformation capture into processes that match your business needs. We offercomprehensive solutions based on:
ñ Integrating different internal and external information sources into a commondatabase to create an accurate overall picture of your company’s data.
ñ Data homogenizing and unique record identification.ñ Robust data integration and validation framework.
➣ Data-Center Services
The ever increasing need for resources in the Data Center combined with the need forhighly trained staff to operate it, make outsourcing a valid option for the majority ofmodern enterprises. In addition to cost savings, outsourcing offers benefits to themanagement by reducing administrating and staffing issues.
This need has led to the development of outsourcing services and the creation of DataCenters. Data Centers are equipped with computing and telecommunications equipmentand the requisite staff to host the computing resources of your company. Unisystemshas invested in creating a state-of-the-art Data Center with infrastructures andorganization, housed in a building custom designed exclusively for this purpose.Unisystems’ Data Center facilities and its expertly trained staff provide you withguaranteed services in the following areas:
Annual Report 2 0 0 6 13
Solutions, Products and Services b

Co-location
Co-location service is the third-party hosting of your equipment and applications at ourData Center facilities. This service is designed for large enterprises as well as small andmidsize organizations that wish to ensure the smooth, reliable operation of their ITinfrastructure.
We offer:
ñ On demand rack space ñ On demand bandwidth capacityñ Remote administration of your systemsñ Management of your DNS records.
Additional Services:
ñ Backupñ Securityñ Monitoring & Reporting Servicesñ Extra IPs & Network optionsñ Statistics
Dedicated Server
Dedicated Hosting services include the leasing and exclusive use of a web or applicationserver, which is hosted at Unisystems’ Data Center and has full-time Internet access.This service provides, installs, monitors and manages your IT infrastructure andoperating systems. At the same time, we provide full administrative access to theinfrastructure.
Annual Report 2 0 0 614
Solutions, Products and Servicesb

Services include:
ñ 10/100Mbps switched LANñ Firewall protection and VLAN technologiesñ Physical Security (restricted access to area)ñ Climate Controlled Environment (ambient temperature 22o C)ñ Fire Protection Systemsñ UPS Power backupñ Requisite Bandwidth for Internet connectionñ ISDN dialup connection for remote server managementñ Physical, restricted access to equipmentñ Data Backup for data stored in local units and in central storage services (if
selected).
Disaster Recovery
Disaster Recovery services ensure that your business continues to operate smoothly inthe event of a disaster.
Critical information contained within your IT infrastructure necessitates the existenceof a backup plan in case any disaster, so that your organization may continue to haveaccess to the data.
Unisystems will customize a solution tailored to your needs and determined by the risksyou want to cover, the recovery time required by your business activity.
➣ Migration Services
Migration Services for your Enterprise’s Servers
Migration to Microsoft® Windows® Server 2003
Migration to Microsoft® Windows® Server 2003 operating system simplifies the overalladministration of your IT infrastructure with standardized, easily adaptableapplications. At the same time, it provides improved safety features while reducingoperating costs.
Annual Report 2 0 0 6 15
Solutions, Products and Services b

Available Services:
ñ Analysis of requirements and strategic planning ñ Architectural scalability ñ Planning migration processes ñ Development of multiple applications monitoring ñ Process applications
As an authorized Microsoft partner, Unisystems has the experience and certifiedpersonnel to assist the migration of your organization to Windows 2000/Windows 2003environments from Novell, Windows NT®, OS/2®, and UNIX®.
From the planning stage to the final implementation, Unisystems assists in the smoothplanning, reduction of operating costs, improved performance, standardization, andconsolidation of your IT systems. We deliver an infrastructure capable of supportingyour existing needs as well as your future business requirements.
Work Station Migration Services
Upgrading the operating system of workstations can present a challenge to anyenterprise, as business operations should be maintained throughout the process smoothand uninterrupted. Unisystems has the experience and tools to meet the demands ofyour enterprise, efficiently. Unisystems utilizes reliable and technically advancedoperating systems available in today’s market for its applications and data migrationsolutions. Enterprises using Unisystems services for systems and applicationsintegration are equipped to deal with problems of compatibility between old and newapplications. Old and new applications can now coexist and co-operate under onecommon operating system at all your workstations.
Unisystems’ highly automated rollout services safeguard personal and corporate data,as well as user access privileges and profiles. This services result in fewer calls to yourhelp desk, and a reduction of up to 30% for costs and 50% for migration time. Anadditional advantage offered by Unisystems solutions is software patch distribution:installation programs / processes for applications, which deliver continuous upgrades.
Annual Report 2 0 0 616
Solutions, Products and Servicesb

Available Services
ñ Evaluation & Design: Evaluation of the existing infrastructure to be migrated.Migration logistics planning, and design.
ñ End to end migration planningñ Software Distribution: Automatic software and application monitoring,
upgrading, distribution through suitable tools.ñ Operating Systems Migration: Provides automated operating systems
migration to new and old workstations, while safeguarding user data.
Unisystems supports the migration from earlier operating systems to latest versionsystems for all the workstations in your enterprise, thereby ensuring the safe andsmooth operation of your business infrastructure.
Unisystems employs a specialized team of system support experts for operating systemsmigration to Microsoft and Linux environments.
Supported Platforms:
I. Migration to Windows XP: Migration of workstation operating systems toWindows 2000/Windows XP (Professional). Delivers all the advantages of thenew editions while avoiding common errors in designing and implementationof these migrations.
II. Migration to SUSE Linux: Migration of workstation operating systems toSUSE Linux Standard 8 or SUSE Linux Enterprise 8. Delivers all the advantagesof the Linux operating environment.
III. Migration to Microsoft Windows Exchange: Migration of your email systemsfrom earlier Exchange, Lotus Notes, Novell GroupWise and other editions toMicrosoft Exchange 2000/2003. Delivers all the advantages of the newMicrosoft Exchange Server including Active Directory integration.
Annual Report 2 0 0 6 17
Solutions, Products and Services b

Unisystems services include:
◗ Migration of user accounts to new Exchange email application◗ Migration of the following data from earlier MS Mail or Exchange editions:
ñ Emailñ Calendarñ Personal Address Booksñ Personal Filesñ Internet email accessñ Connection to other email systems
◗ Central workstation settings
Migration Methodology
Unisystems is certified and at hearse to the migration methodologies followed by allmajor vendors. Our tested and proven 5-stage methodology for operating systemmigration ensures successful completion of the services even in the case of multivendorinfrastructure.
ñ Stage One – Analysis of existing infrastructureñ Stage Two – Users’ Data Collectionñ Stage Three – Application customization & Installationñ Stage Four – User customizationñ Stage Five – Upgrade / Migration completion test
Benefits
ñ Risk mitigation through advanced planning and execution.ñ Network Security Optimization by upgrading your company’s Server operating
systems from non-supported platforms to Microsoft Windows Serverì 2003 orSUSE Linux.
ñ OS support simplification by eliminating multiple operating systems.ñ Operating and Administrative Costs Reduction through the standardization,
consolidation and centralization of your company’s Servers.ñ User Support Services Improvement through increased reliability and
application response time.
Unisystems operating systems migration services are available 24x7x365 to guaranteesmooth operation of your enterprise.
Annual Report 2 0 0 618
Solutions, Products and Servicesb

➣ Nortel Products & Services
Data Networking and Telephony are the cornerstones in the operating infrastructure ofevery modern enterprise. The right infrastructures and appropriate applications ensurethe smooth operation of your business and its efficient communication with theenterprise environment.
Unisystems has extensive experience in implementing data networking systems andtelephone centers, as well as the related applications. Having deployed a large scale ofinstallations in both private and public sectors, we can undertake the study, design,installation, implementation and maintenance of your business networking system –and provide user education and training. In addition we can design and implementComputer Rooms and the requisite structural wiring of new buildings.
As a Nortel’s Gold Solutions Partner, Unisystems vast teams of certified presalesengineers experienced in specialized network support infrastructure and phone systems,as well as applications development.
Unisystems’ experience combined with Nortel’s state-of-the-art technology and large,established market base make Unisystems the ideal partner at providing the bestinfrastructure solutions for both large enterprises and organizations, small as well asmedium-sized businesses.
The telecommunications solutions we offer are as follows:
Converged voice & data networking
Today's enterprise networks are in transition. Business needs demand ever morepowerful, reliable, secure and scalable networks that can lead to increased profitabilityand accelerated business success. Across the network new mission critical applicationsare being deployed to increase employee productivity and decrease operating costs. Fortoday’s Enterprises, gaining a true competitive advantage from their network requiresthat enterprises reduce network complexity and bottlenecks, while providing betterapplication and network response time.
Unisystems designs, implements, installs and supports converged voice & datanetworking solutions in compliance with international standards and the stringentdemands of all data networking solutions that Nortel’s experience offers.
Annual Report 2 0 0 6 19
Solutions, Products and Services b

Nortel’s converged voice & data network solutions enable your enterprise to:
ñ Enhance productivity - Converged networks allow users to receive emails andphone calls from multiple systems through one device.
ñ Reduce costs - Businesses can reduce or eliminate costly long distance and tollcharges for voice and fax with Voice over IP (VoIP).
ñ Enable new online services - Enable "talk to a representative" features on yourwebsite to connect your customers quickly when they have questions.
ñ Streamline your business - By combining your voice and data networksthrough converged technology, businesses can realize significant cost savings.
Data Networks – Cable and Wireless
Nortel’s cable and wireless networking products offer combined solutions capable ofserving all your data & voice management needs.
With Nortel’s reliable, and high-performance data networking products, your enterprisecan enhance its productivity by increasing the accessibility of its communicationsinfrastructures and reducing their costs and complexity. Data networking allows theunimpeded communication between employees, associates, clients and suppliers,whenever and wherever needed.
Wireless LAN solutions portfolio delivers the freedom of mobility for today's businessprofessionals The broad portfolio includes the right solution for any application fromreliable wireless voice and multimedia services to cost-effective indoor/outdoorcoverage and point solutions. This flexibility gives enterprise customers limitlessoptions for growing their WLAN deployment and affords wireless service providers amultitude of new revenue opportunities.
Data Network Security
With the expansion of information traffic and the internet, network security has becomean area of special concern and ever-increasing importance. Your enterprise’s data is asvaluable as its bank deposits. Therefore, protecting your business data with theappropriate security solution is crucial to the success of your enterprise.
Unisystems and Nortel’s innovative security solutions – such as switched Firewalls, VPNconcentrators, Application Switches - can ensure secure data transmission, preventviruses and hackers as well as securely connect remote workers
Annual Report 2 0 0 620
Solutions, Products and Servicesb

Telephony Solutions – Traditional or IP Telephony
Unisystems offers reliable, affordable, state-of-the-art telephony solutions based onNortel’s platforms and applications to satisfy today’s high business demands. With itsextensive experience in designing voice solutions, Nortel delivers incomparableinvestment protection, simplified management, and proven operability.
Nortel’s telephony solutions can ensure to your company sophisticated features thatare simple to use - Nortel provides a telephony system that's straightforward, reliable,cost effective and easy to use, advanced telephony applications - Sophisticatedapplications such as automated attendant, voice mail, skills-based routing and desktopmessaging save time and money, modular architecture for scalable growth - Flexiblescalability options that can be configured for your needs today while offering expansionpossibilities for the future.
Our telephony solutions range in size from 48 to 16,000 ports, and at the same timecan support analogue, digital, wireless as well as IP telephony, distinguishing themfrom traditional telephone centers.
They incorporate VolP ready operability to support unified messaging, auto attendant,CCR trees, DTMF & Speech Recognition IVR applications and other services that offerunlimited business advantages. They provide the requisite software for both local andremote workers (administration).
Customer Contact Solutions
Unisystems is a pioneer in designing reliable and flexible solutions for contact centersusing Nortel Client Contact Solutions Portfolio. These solutions help your companyengage with your customers to deliver a new level of customer service. This extensiveportfolio provides the means for customers to do business with you consistently andseamlessly - anywhere, anyway, and anytime.
Nortel provides the opportunity to better incorporate customer relationship strategiesinto your company's overall operations with tools to manage and understand customerinteractions more powerfully. The Nortel Application Center architecture is designed toaccomplish easy integration and the synergy required to develop solutions tailored toyour specific business needs.
Annual Report 2 0 0 6 21
Solutions, Products and Services b

Self Service Platforms – IVR, Multimedia Applications, Voice Recognition
Nortel Speech and Self-Service portfolio is comprised of complete, turnkey Self-ServicePlatforms, Graphical User Interface (GUI) Tools, Speech Technology, and NetworkServices. Supporting both wireline and wireless applications, these solutions arecustomizable to meet a company's specific business needs.
Using Self-Service products, a business can become accessible to its customers 24 hoursa day, seven days a week. Callers can access a broad range of information simply byresponding to a series of prompts via their telephone.
Unisystems, adding its extensive experience, delivers effective Self Service solutions,including delivery of information, services activation, etc, to a client phone serviceenvironment.
Unisystems’ clients using Nortel solutions include: TIM, Vodafone, Cosmoline, AtticaTelecommunications, Alpha Bank, HSBC, American Express, Royal Bank of Scotland,UBS, Alpha Insurance, Interamerican, Athenenum Intercontinental Hotel, Ledra MariottHotel, Club Med, Olympic Airlines, Delta Milk, Omikron Advertising Group, J+P Avax,Greek Ministry of Justice, Greek Ministry of Culture, Greek Ministry of Health, Ministryof Macedonia & Thrace, et al.
Annual Report 2 0 0 622
Solutions, Products and Servicesb

Unisystems Management
Annual Report 2 0 0 6 1
c

Members of the Board of Directors
Mr. Dimitrios M. Liaroutsos Chairman of the Board of Directors, Non-Executive Member
Mr. George K. DeligiannisManaging Director, Executive Member
Mr. George E. AgouridisVice-Chairman of the Board of Directors, Non-Executive Member
Mr. Andreas G. DrimiotisVice-Chairman of the Board of Directors, Independent Non-Executive Member
Mrs. Liza–Zafeiro–Marina D. VintzileouIndependent Non-Executive Member of the board of Directors
Mr. Aris G. GeorgiadisIndependent Non-Executive Member of the board of Directors
Mr. Apostolos D. LafogiannisExecutive Member of the board of Directors
The top management executives of Unisystems are presently the following:
Full name Sector of Responsibility1. Mr. Dimitrios M. Liaroutsos Chairman2. Mr. George K. Deligiannis Managing Director3. Mr. Dimitrios N. Kisemlis Manager of S/W Development and Support /
Professional Services4. Mr. Periklis L. Nikolaidis Manager of Customer Support Services5. Mr. Apostolos D. Lafogiannis Manager of Financial and Administration Services
Presentation of Curriculum Vitae of Management Executives
MR. DIMITRIOS LIAROUTSOS (1951) – Chairman of the Board of DirectorsAfter completing his studies in food technology and industrial management in England,Mr. Dimitrios Liaroutsos worked, for ten years, in large American and Helleniccompanies that were active in the area of seagoing shipping in New York and London,where he was employed, primarily, in the area of operations and logistics management.Since 1987, he has held administrative positions in Greece (over the past few years hehas held the position of Commercial Manager of Maersk Hellas and, prior thereto, theposition of General Manager / Administrator of Balkan and Black Sea Shipping). Mr.
Unisystems Management
Annual Report 2 0 0 62
c

Dimitrios Liaroutsos has been collaborating with Unisystems since the end of 1999,providing consulting services thereto with regard to the development of new businessactivities. In November 2000, Mr. Dimitrios Liaroutsos was appointed the GeneralManager of Unisystems and, in March 2004, the Managing Director thereof,maintaining, at the same time, his position as the company’s General Manager.In January 2005, Mr. Dimitrios Liaroutsos was elected the Chairman of the Board ofDirectors of Unisystems, maintaining, at the same time, his position as the company’sManaging Director.
MR. GEORGE DELIGIANNIS (1965) – Managing DirectorMr. George Deligiannis graduated with a degree in Electrical Engineering from LeighUniversity, Pennsylvania, U.S.A., and completed his post-graduate studies in ComputerScience at Rensselear Polytechnic University of New York, U.S.A. He was, subsequently,employed by Physical Acoustics Corporation, at Princeton, New Jersey, U.S.A.From January 1990 to March 2006, Mr. George Deligiannis was employed by theINTRACOM Group of Companies. He began his career at INTRASOFT, where he upon itsestablishment, Mr. George Deligiannis held the position of Managing Director ofINTRASOFT International, a company which he developed and managed until March2006. In May 2003, he was elected a member of the Board of Directors of INTRACOM,assuming the position of Vice-President of the IT sector. In December of the same year,Mr. George Deligiannis held the position of Managing Director of INTRACOM, a positionfrom which he resigned in 2006.In December 2006, Mr. George Deligiannis held the position of Managing Director ofUnisystems.
MR. GEORGE AGOURIDIS (1952) – Vice-ChairmanMr. George Agouridis was born in Athens, Greece, where he studied law. He has beenan Athens lawyer since 1979 and is presently a member of the Board of Directors ofUnisystems.
MR. ANDREAS DRIMIOTIS (1940) – Vice-ChairmanMr. Andreas Drimiotis was born in Nicosia, Cyprus, where he studied Civil Engineeringand Information technology. Mr. Andreas Drimiotis was employed as an executive ofUnisystems between 1972 and 1984, he held the position of Managing Director of DeltaInformation Technology Commercial and Manufacturing S.A. and has been the Chairmanof the Board of Directors of Delta Singular S.A. Mr. Andreas Drimiotis is married withtwo children.
MRS. LIZA–ZAFEIRO–MARINA VINTZILEOU (1966) – MemberMrs. Liza–Zafeiro–Marina Vintzileou was born in Madrid, Spain. She studied chemistryat the University of Athens and, subsequently, enrolled in post-graduate courses inMarketing and Economics at the University of Paris No. 10. Mrs. Liza–Zafeiro–Marina
Annual Report 2 0 0 6 3
The Management of Unisystems c

4
Unisystems ManagementcVintzileou has been a member of the Board of Directors of Unisystems since January2000.
MR. ARIS GEORGIADIS (1962) – MemberMr. Aris Georgiadis was born in Athens, Greece, where he studied law. Mr. ArisGeorgiadis has been an Athens lawyer and a Member of the Board of Directors ofUnisystems since December 2006.
MR. APOSTOLOS LAFOGIANNIS (1966) – Member and CFOMr. Apostolos Lafogiannis was born in Tripoli, Greece, and studied Economics in theSchool of Law of the University of Athens. Since 1991, Mr. Apostolos Lafogiannis hasworked in both the industrial sector and services sector in various positions in theFinancial Services of the companies in which he was employed. In 1999, the year inwhich he was employed by Unisystems, Mr. Apostolos Lafogiannis assumed the dutiesof Deputy Manager of Financial and Administration and, subsequently, the duties ofManager of Financial and Administration. Mr. Apostolos Lafogiannis has been a memberof the Board of Directors of Unisystems since May 2002.
MR. PERIKLIS NIKOLAIDIS (1946) – Manager of Customer Support ServicesMr. Periklis Nikolaidis was born in Thessaloniki, Greece. He graduated from the School ofMathematics of the California Institute of Technology, U.S.A., in 1969, where he alsocompleted his post-graduate studies in Information Technology. In June 1975, Mr.Periklis Nikolaidis received a doctorate from the same Institute. Mr. Periklis Nikolaidishas worked as a professor of Mathematics and Programming and as an assistant professorin subjects relating to theory of automata, computability theory and mathematicslanguage. Mr. Periklis Nikolaidis was employed by Unisystems S.A. in 1975 and wasappointed the Manager of Customer Support Services in 2001.
MR. DIMITRIOS KISEMLIS (1947) – Manager of S/W Development and SupportMr. Dimitrios Kisemlis studied mathematics at the University of Athens and received aMasters degree in Information Technology from a foreign university. He was employedby Unisystems S.A. in 1976 initially in the Department of S/W Development andTechnical Support as a Systems Programmer of the central computer systems. Mr.Dimitrios Kisemlis has taken part in work groups for the design and development ofinformation systems and has been appointed the project manager of numerouscomputer projects of strategic importance to Unisystems. Between 1986 and 1988, Mr.Dimitrios Kisemlis held an executive position in the Presales Support and ProductMarketing Department and is presently the Manager of the Department of InformationServices.
Annual Report 2 0 0 6

Report of the Board of Directors d
Annual Report 2 0 0 6 1

2
The present Report of the Board of Directors concerns fiscal year 2006 and is in compliance with theprovisions of the International Financial Reporting Standards (IFRS) that are applied in Greece as of 1rstJanuary 2005.
The present Report presents the main trends and factors influencing the development, performance,condition and position of the company and group’s activities during the fiscal year that ended on 31stDecember 2006, as well as the main trends and factors that may influence the company’s future growth,performance and financial position.
The purpose of the present Management Report is to provide information that will help interested partiesto understand and assess the financial statements within the framework in which the company operates.Assist in evaluating those matters that management considers very important for the company, as well asevaluate the strategies that the company has adopted.
The present Report provides additional information and clarifications on specific items in the financialstatements wherever this was deemed necessary.
The present Report was prepared according to the terms and conditions of article 136 of Law 2190/1920 and,given that the company prepares corporate and consolidated financial statements, it is unified but has as amain and primary point of reference the consolidated financial figures of Unisystems and of the companiesaffiliated therewith. All references to non-financial figures in the analysis that follows have been made tothose specific points where this was deemed expedient or necessary by the Board of Directors so that thosepersons who use the financial statements may better understand the content of the present Report.
Scope of activities
The group is operating in the area of information technology services and each company of the grouphas a distinct role in the framework of its operations as described below:
Unisystems S.A. operates mainly in the provision of integrated IT solutions through theimplementation of turn-key projects, such as development or reengineering of business applications,provision of specialised IT services, as well as a wide range of services, such as installation andtechnical support of hardware and software products, installation and technical support of data andvoice transfer networks, provision of comprehensive technical support throughout Greece on a 24-hour basis, training, consultative services and outsourcing services.
The company is the main associate in Greece of Unisys and EMC, two significant technology andsolutions manufacturers, which gives the company a considerable advantage in terms of its offering.
UniNortel Communications Technologies S.A. expresses Unisystems’ strategic synergy with NortelNetworks. The company, in which Nortel Networks has an equity stake of 30%, is Nortel’s solesolutions organisation for Greece and Cyprus.
Financial Technologies S.A. operates in software development for the financial sector, developingintegrated and expandable solutions.
Report of the Board of Directors of ‘Unisystems IT Systems S.A.for the fiscal year that ended on 31st December 2006
Annual Report 2 0 0 6
d

Expansion of existing activities
Sales and distribution network.
Unisystems’ sales are supported by independent Business Units that are active in the Financial,Public, Private and Telecommunications sectors, all of which are staffed by specialised personnel whohave considerable knowledge of the products, competition and special needs of each vertical market.
The table below presents the sales development of each sector.
2006 2005 ChangeAmount % Amount % Amount %
Financial sector 29,175 57% 21,332 49% 7,843 37%Telecommunications sector 5,393 11% 7,705 18% -2,312 -30%Private sector 7,694 15% 7,721 18% -27 0%Public Sector 8,560 17% 6,964 16% 1,596 23%Total 50,822 43,722 7,100 16%
In 2006, Unisystems recorded a significant increase in sales in a particularly difficult year for the IT sector.
The company’s clientele includes many of the largest companies and organisations of each sector, such asthe Alpha Bank Group of Companies in Greece and abroad, the EFG Eurobank Group of Companies, theNational Bank of Greece, the Agricultural Bank of Greece, Emporiki Bank, Emporiki Credicom, Piraeus Bank,Probank, Proton Bank, Laiki Bank, the Hellenic Telecommunications Organisation, Cosmote, Vodafone, Tim,Attikes Telecommunications, Tellas, Bloomberg Hellas, the Hellenic Ministry of Justice, the Athens BarAssociation, the Hellenic Council of the State, the Hellenic Post, the Hellenic Ministry of National Defence,the Hellenic Aerospace Industry, the Central Securities Depository, First Data Hellas, the ROKAS Group ofCompanies and others.
Sales are carried out from the company’s central offices in Athens and promoted throughout the entire regionin which the company and group operate. As the company operates mainly in the supply of System Integrationsolutions and directed mostly to large clients, the company does not have to develop a distribution network.
UniNortel promotes its solutions and services directly to large clients, while presently developing a network ofresellers.
Financial Technologies S.A. sells its products directly to end users or through IT solutions companies.The company is presently examining the possibilities of developing synergies with companiesestablished abroad to geographically expand its activities.
1.1 New activities
In 2006, Unisystems won an international tender for the operation of the Controlled Parking systemof the Municipality of Athens in collaboration with ParkMobile BV.
The assumption of this type of projects and the subsequent broadening of know-how in the area ofoutsourcing services, a sector in which the Board of Directors believes that Unisystems may expandits activities in the future, constituted one of the company’s most important achievements of 2006.
Annual Report 2 0 0 6 3
Report of the Board of Directors d

1.2 Expansion of existing activities
In 2006, Unisystems managed to increase its backlog of contracts with the Public Sector, anachievement witch established the broader Public sector as its largest client for 2007.
1.3 International activities
Neither the company nor the group have any independent and distinct activities on an internationallevel through permanent presence, affiliated or subsidiary companies.
Unisystems participate in projects within its broader geographical area through the utilisation of itswork force and know how.
Pursuits and strategies
The company’s main objective is to become a key IT solutions supplier in all sectors in witch it’soperates. Providing reliable application and infrastructure solutions, either through synergies orthrough the development of products, utilising it’ s know-how.
To achieve its objectives, Unisystems is investing in human capital as well as developing synergieswith solution vendors (SAP, Documentum, Oracle, etc.).
The company’s decision over the previous years to invest in resources and know how necessary forprojects in the Public sector, is paid off in 2006, despite significant delays in the tendering process.
Unisystems is presently implementing significant projects for the Greek Public Sector, such as projectsconcerning the Regional System of Health and Welfare of the islands of the Cyclades and Crete, themodernisation of military recruitment offices, the computerisation of the services of criminal registersof six Olympic cities, the modernisation of the computer system of the Hellenic Council of the State,the automation of post office boxes, of the Integrated Computer System of the Hellenic GeneralAccounting Office and others.
However, we should note that projects segmentation and the slow pace of introduction of newtenders disproportionately burdens the costs associated with the sector.
Resources employed and other information
The Company presently owns and uses the following installations
Land – Building Installations
1. Part (approximately 50%) of the Doxiadis building office complex located at 24 StratiotikouSyndesmou street, Athens, of a total area of 4,822 square metres.
Annual Report 2 0 0 64
Report of the Board of Directorsd

2. Storage facilities located at 65 Loutrou street, Menidi, of an area of 4,102 square metres on alot of an area of 9,890 square metres.
3. Offices in Thessaloniki, located at 131 Ethnikis Antistaseos street, Kalamaria, of an area of 400square metres, and eight parking spaces.
In March 2006, Unisystems purchased a lot located at 100 Athinon avenue of an area of 1,946.70square metres with the purpose of constructing an office building that will be used to cover thegroup’s future expanding needs.
Unisystems has the necessary funds to finance the group’s expansion into new markets andtechnologies, to the extent that this is deemed necessary, given that its lending activities arenegligible. We should note that Unisystems does not have any liabilities arising from loans.
We believe that the company’s aforementioned capacity will be useful and necessary in the future inclaiming possible co-funded projects, which we believe will be the top priority of organisations in thefollowing years.
Results and prospects
The table below presents, in brief, the company’s and group’s overall results in 2006.
Group Company2006 2005 % change 2006 2005 % change
Sales 52,405 44,332 18% 50,822 43,722 16%Gross profits 12,790 10,708 19% 11,600 10,864 7%Profits before interest, taxes and depreciation 6,396 6,745 -5% 6,648 7,770 -14%Profits before taxes 3,992 3,872 3% 5,358 6,131 -13%Profits after taxes and minority rights 3,261 3,511 -7% 3,879 4,460 -13%
Given the adverse conditions that the company faced in 2006 the results achieved were verysatisfactory.
In this environment, Unisystems increased its turnover by 16%, while the group increased its salesby 18%, despite the fact that it was not accompanied by a proportionate increase in profits, isdeemed, on its own, positive.
UniNortel’s loss for fiscal year 2006 should be viewed within the context of the company’s first yearof operation where such results were expected.
In 2006, Financial Technologies S.A. was burdened with high expenditure arising from thedevelopment and improvement of its products resulting in a a loss for the year. The company has
Annual Report 2 0 0 6 5
Report of the Board of Directors d

undertaken a number of cost cutting measures such as improvement of the utilisation of theresources. Aiming to breakeven in 2007, even without the sale of new end user licences.
Long-term Objectives – Prospects
Unisystems group of companies prospects are particularly positive, as since the IT sector in Greece isexpected to continue to grow at an accelerated pace while the company possesses attributes andcapabilities that sets it apart from its pears.
The Greek IT sector will continue to benefit from the need of the Private sector to modernise itsinfrastructure, in order to respond to increased competition, while the Public Sector will continue toreceive aid from EU support frameworks.
Within this environment, the group’s main competitive advantages are as follows:
– Extensive of know-how in a number of key areas that will play an important role in the IT needs ofour customers in the near future. Such expertise include compliance with regulatory requirements,Business Continuity, transaction processing.
– Ability to provide integrated solutions by combining independent technologies into an effectivesolution for the customer.
Responding to these needs the company is marketing a range of solutions and services addressingspecific needs in each market sector. Such as Core banking, Branch Automation, Call Centres,Internet Banking, Payment Systems, Payment Processing Systems, telco applications and systems.
The Greek public sector seriously lags in IT adoption, consequently planning for massive investmentin order to catch up with other EU countries.
The company is also investing in its capacity to deliver new services particularly in the area ofmanaged services and outsourcing as well as exporting its expertise outside its borders.
Given the nature of the projects targeted, especially those of the public sector, it is difficult toquantify or forecast specific budget goals. Our target is to expand in a profitable way new marketsand services.
We should advise the recipients of this report that, despite the fact that all information relevant to thegoals and aims of the company is presented herein, meeting these goals is not entirely up to themanagement of the company, as unforeseen factors may alter or negatively impact on these stated goals.
Annual Report 2 0 0 66
Report of the Board of Directorsd

Finally, for 2006, the company’s management proposes that profits be distributed as follows:
Net results (profits) of the year before taxes 5,358,117.97(-) Income tax of legal entities 1,359,652.30(-) Differences arising from the tax audit of previous years 296,843.10(+) Deferred income tax 177,057.61(+) Balance of profits of previous years 2,890,329.78
--------------------------------------------------------------------Total 6,769,009.96
----------------------------------------------------------------------------------------------------------------------------------------
Profits to be distributedProfits shall be distributed as follows:
1. Statutory reserve 267,905.892. Dividends to shareholders 1,270,905.205. Extraordinary reserves 3,775,363.006a. Reserves from income exempt from taxation 351,994.967. Fees to directors of the Board of Directors 285,635.008. Profits carried forward 817,205.91
--------------------------------------------------------------------6,769,009.96
----------------------------------------------------------------------------------------------------------------------------------------
Athens, 28 February 2007For the Board of Directors
The Chairman of the Board of DirectorsDimitrios M. Liaroutsos
Certificate of the Certified Auditor Accountant
We hereby certify that the aforementioned Management Report of the Board of Directors, which iscomprised of seven (7) pages [in the original Greek text], is that which is noted in the Audit Report
dated 2 March 2007.
Athens, 2 March 2007The Certified Auditor Accountant
Vasileios I. LoumiotisAssociation of Certified Auditors Accountant Reg. No. 11231
SOL Certified Auditors Societe Anonyme
Annual Report 2 0 0 6 7
Report of the Board of Directors d


e
Annual Report 2 0 0 6 1
Condensed Financial Data and Information for the year ended 31 December 2006
(from 1 January 2006 to 31 December 2006)

Condensed Financial Data and Information for the year ended
31 December 2006 (from 1 January 2006 to 31 December 2006)
Annual Report 2 0 0 62
e

3
Condensed Financial Data and Information for the year ended
31 December 2006 (from 1 January 2006 to 31 December 2006)
Annual Report 2 0 0 6
e

e

Annual Report 2 0 0 6 1
ATHENSFEBRUARY 2007
Annual Financial Statements as at 31 December 2006 (Period from 1 January to 31 December 2006)
Compiled in accordance with the International Financial Reporting Standards f

CONTENTSPAGE
Independet Auditor’s Report..................................................................................................................................................................................3Financial Statements at 31 December 2006.........................................................................................................................................5Balance Sheet ............................................................................................................................................................................................................................5Income Statement.................................................................................................................................................................................................................6Income Statement 4th Quarter 2006..................................................................................................................................................................7Cash Flow Statement...........................................................................................................................................................................................................8Statement of Changes in Equity ..............................................................................................................................................................................9Information about the Company ....................................................................................................................................................................11Notes on the Financial Statements .............................................................................................................................................................12
1. Basis of preparation of financial statements ...........................................................................................................................122. Basis of consolidation.....................................................................................................................................................................................163. Basis of presentation .......................................................................................................................................................................................174. Principal accounting policies ...................................................................................................................................................................175. Financial risk management.........................................................................................................................................................................236. Property, plant and equipment ..............................................................................................................................................................257. Intangible assets..................................................................................................................................................................................................278. Goodwill.........................................................................................................................................................................................................................289. Deferred income tax assets ........................................................................................................................................................................29
10. Available-for-sale financial assets.......................................................................................................................................................3211. Other long-term receivables ......................................................................................................................................................................3312. Inventories .................................................................................................................................................................................................................3313. Trade receivables..................................................................................................................................................................................................3314. Other receivables..................................................................................................................................................................................................3415. Cash and Cash equivalents..........................................................................................................................................................................3416. Equity...............................................................................................................................................................................................................................3417. Retirement benefit obligations ..............................................................................................................................................................3518. Government grants relating to assets..............................................................................................................................................3719. Other non-current liabilities .....................................................................................................................................................................3720. Trade and other payables.............................................................................................................................................................................3821. Borrowings..................................................................................................................................................................................................................3822. Current Income tax liabilities..................................................................................................................................................................3823. Other current liabilities..................................................................................................................................................................................3924. Sales..................................................................................................................................................................................................................................4025. Cost of goods sold ..............................................................................................................................................................................................4026. Employee benefit expense...........................................................................................................................................................................4127. Depreciation and impairment of PPE and intangible assets......................................................................................4128. Other income/(expenses).............................................................................................................................................................................4229. Administrative expenses, Selling and Marketing costs and Research costs ...............................................4230. Finance costs-profit/(expenses)............................................................................................................................................................4331. Results from investing activities ..........................................................................................................................................................4432. Income tax expense ..........................................................................................................................................................................................4433. Earnings per share ..............................................................................................................................................................................................4534. Related – party transactions.....................................................................................................................................................................4635. Commitments and Contingencies..........................................................................................................................................................4736. Fair value of financial instruments.....................................................................................................................................................4837. Restatement of certain items of the individual and consolidated financial statements
for the results of the year 2006............................................................................................................................................................4938. Events after the balance sheet date .................................................................................................................................................50
Annual Report 2 0 0 62
Annual Financial Statements as at 31 December 2006 f

INDEPENDENT AUDITOR’S REPORTTo the Shareholders of Unisystems Information Systems S.A.
Report on the Financial Statements
We have audited the accompanying financial statements of Unisystmes Information Systems S.A. (the"Company") and the consolidated financial statements of the Company and its subsidiaries (the "Group"),which comprise the balance sheet as at 31 December 2006, and the income statement, statement ofchanges in equity and cash flow statement for the year then ended, and a summary of significantaccounting policies and other explanatory notes.
Management’s Responsibility for the Financial Statements
Management is responsible for the preparation and fair presentation of these financial statements inaccordance with International Financial Reporting Standards, as adopted by the European Union (EU). Thisresponsibility includes: designing, implementing and maintaining internal control relevant to thepreparation and fair presentation of financial statements that are free from material misstatement,whether due to fraud or error; selecting and applying appropriate accounting policies; and makingaccounting estimates that are reasonable in the circumstances.
Auditor’s Responsibility
Our responsibility is to express an opinion on these financial statements based on our audit. We conductedour audit in accordance with the Greek Auditing Standards, which are based on the InternationalStandards on Auditing. Those standards require that we comply with ethical requirements and plan andperform the audit to obtain reasonable assurance whether the financial statements are free from materialmisstatement.
An audit involves performing procedures to obtain audit evidence about the amounts and disclosures inthe financial statements. The procedures selected depend on the auditor’s judgment, including theassessment of the risks of material misstatement of the financial statements, whether due to fraud orerror. In making those risk assessments, the auditor considers internal control relevant to the entity’spreparation and fair presentation of the financial statements in order to design audit procedures that areappropriate in the circumstances, but not for the purpose of expressing an opinion on the effectivenessof the entity’s internal control. An audit also includes evaluating the appropriateness of accountingpolicies used and the reasonableness of accounting estimates made by management, as well as evaluatingthe overall presentation of the financial statements.
We believe that the audit evidence we have obtained is sufficient and appropriate to provide a basis forour audit opinion.
Opinion
In our opinion, the accompanying financial statements present fairly, in all material respects, the financialposition of the Company and the Group as of 31 December 2006, and of its financial performance and itscash flows for the year then ended in accordance with International Financial Reporting Standards asadopted by the European Union (EU).
Annual Report 2 0 0 6 3
fAnnual Financial Statements as at 31 December 2006

Without qualifying our opinion, we draw attention to Note 22 in the Notes on the financial statements,where reference is made to the fact that the tax returns of the companies of the Group, have not beenexamined by the tax authorities as yet and, as a consequence, the possibility exists of additional taxes andpenalties being assessed at the time when the returns will be examined and will be accepted as final. Theoutcome of these tax inspections cannot be predicted at present and, therefore, no provision has beenmade in these financial statements in this respect.
Report on Other Legal and Regulatory Requirements
The content of the Report of the Board of Directors is consistent with the aforementioned financialstatements.
Athens, 2 March 2007
VASILIOS I. LOUMIOTISCERTIFIED PUBLIC ACCOUNTANT AUDITOR
SOEL REG. NO. 11231SOL S.A. – CERTIFIED PUBLIC ACCOUNTANTS AUDITORS
3, FOK. NEGRI STREET - ATHENS, GREECE
Annual Report 2 0 0 64
Annual Financial Statements as at 31 December 2006 f

5
fAnnual Financial Statements as at 31 December 2006
Financial Statements at 31 December 2006Balance Sheet
(Amounts expressed in Euro) Group CompanyASSETS Note 31.12.2006 31.12.2005 31.12.2006 31.12.2005
Non-current assets Property, plant and equipment 6 22,974,395.85 17,932,158.89 22,889,236.05 17,826,845.42 Intangible assets 7 2,570,474.89 3,177,873.54 1,512,998.88 1,089,401.69 Goodwill 8 430,913.92 430,913.92 - -Deferred income tax assets 9 1,798,400.23 1,331,011.72 827,774.91 1,105,115.07 Available-for-sale financial assets 10 731,720.04 - 1,642,776.94 1,098,238.03 Other long-term receivables 11 70,081.74 70,081.74 25,745.58 25,745.58
-------------------------------------------------------------------- -------------------------------------------------------------------- -------------------------------------------------------------------- --------------------------------------------------------------------Total non-current assets 28,575,986.67 22,942,039.81 26,898,532.36 21,145,345.79
-------------------------------------------------------------------- -------------------------------------------------------------------- -------------------------------------------------------------------- ---------------------------------------------------------------------------------------------------------------------------------------- -------------------------------------------------------------------- -------------------------------------------------------------------- --------------------------------------------------------------------Current AssetsInventories 12 4,147,971.84 4,296,230.44 4,082,082.10 4,174,161.44 Trade receivables 13 19,736,337.61 21,116,736.31 17,604,146.79 19,598,129.51 Other receivables 14 725,145.62 1,936,446.02 715,808.96 1,013,353.79 Available-for-sale financial assets 10 6,976,542.67 13,035,800.84 6,976,542.67 13,035,800.84 Cash and cash equivalents 15 10,010,690.41 6,648,210.76 9,039,098.63 5,246,172.95
-------------------------------------------------------------------- -------------------------------------------------------------------- -------------------------------------------------------------------- --------------------------------------------------------------------Total current assets 41,596,688.15 47,033,424.37 38,417,679.15 43,067,618.53
-------------------------------------------------------------------- -------------------------------------------------------------------- -------------------------------------------------------------------- --------------------------------------------------------------------Total Assets 70,172,674.82 69,975,464.18 65,316,211.51 64,212,964.32
-------------------------------------------------------------------- -------------------------------------------------------------------- -------------------------------------------------------------------- ---------------------------------------------------------------------------------------------------------------------------------------- -------------------------------------------------------------------- -------------------------------------------------------------------- --------------------------------------------------------------------EQUITYCapital and reserves attributable to Company's equity holders 16Share Capital 11,553,690.00 11,553,690.00 11,553,690.00 11,553,690.00 Share premium 9,999,349.43 9,999,349.43 9,999,349.43 9,999,349.43 Fair value-reserves-land and buildings 11,124,265.24 11,124,265.24 11,124,265.24 11,124,265.24 Fair value - reserves - available-for-sale financial assets (1,301,156.51) (1,228,204.49) (4,458,056.87) (3,784,325.58)Other reserves 13,803,464.51 13,584,732.61 13,800,810.54 13,582,078.63 Retained earnings 4,040,339.05 5,170,595.72 6,769,009.96 7,281,265.10
-------------------------------------------------------------------- -------------------------------------------------------------------- -------------------------------------------------------------------- --------------------------------------------------------------------49,219,951.72 50,204,428.51 48,789,068.30 49,756,322.82
Minority interest 572,301.98 989,177.43 - - -------------------------------------------------------------------- -------------------------------------------------------------------- -------------------------------------------------------------------- --------------------------------------------------------------------
Total Equity 49,792,253.70 51,193,605.94 48,789,068.30 49,756,322.82-------------------------------------------------------------------- -------------------------------------------------------------------- -------------------------------------------------------------------- ---------------------------------------------------------------------------------------------------------------------------------------- -------------------------------------------------------------------- -------------------------------------------------------------------- --------------------------------------------------------------------
LIABILITIESNon-current liabilitiesRetirement benefit obligations 17 1,991,615.78 1,859,560.45 1,861,000.84 1,775,771.91 Government grants relating to assets 18 435,240.42 374,482.10 435,240.42 374,482.10 Other non-current liabilities 19 1,926,124.00 1,076,124.27 1,926,124.00 1,076,124.27
-------------------------------------------------------------------- -------------------------------------------------------------------- -------------------------------------------------------------------- --------------------------------------------------------------------Total non-current liabilities 4,352,980.20 3,310,166.82 4,222,365.26 3,226,378.28
-------------------------------------------------------------------- -------------------------------------------------------------------- -------------------------------------------------------------------- ---------------------------------------------------------------------------------------------------------------------------------------- -------------------------------------------------------------------- -------------------------------------------------------------------- --------------------------------------------------------------------Current liabilitiesTrade and other payables 20 8,152,909.91 8,904,680.78 5,464,349.48 6,014,957.29 Borrowings 21 810,181.28 931,271.57 - - Current income tax liabilities 22 624,070.97 1,211,953.50 624,070.97 1,211,953.50 Other current liabilities 23 6,440,278.76 4,423,785.57 6,216,357.50 4,003,352.43
-------------------------------------------------------------------- -------------------------------------------------------------------- -------------------------------------------------------------------- --------------------------------------------------------------------Total current liabilities 16,027,440.92 15,471,691.42 12,304,777.95 11,230,263.22
-------------------------------------------------------------------- -------------------------------------------------------------------- -------------------------------------------------------------------- --------------------------------------------------------------------Total Liabilities 20,380,421.12 18,781,858.24 16,527,143.21 14,456,641.50
-------------------------------------------------------------------- -------------------------------------------------------------------- -------------------------------------------------------------------- ---------------------------------------------------------------------------------------------------------------------------------------- -------------------------------------------------------------------- -------------------------------------------------------------------- --------------------------------------------------------------------Total Equity and Liabilities 70,172,674.82 69,975,464.18 65,316,211.51 64,212,964.32
-------------------------------------------------------------------- -------------------------------------------------------------------- -------------------------------------------------------------------- ---------------------------------------------------------------------------------------------------------------------------------------- -------------------------------------------------------------------- -------------------------------------------------------------------- --------------------------------------------------------------------
The notes on pages 11-50 are an integral part of these financial statements.
Annual Report 2 0 0 6

Annual Financial Statements as at 31 December 2006 fIncome Statement
Group Company(Amounts expressed in Euro) Notes 1.1-31.12.2006 1.1-31.12.2005 1.1-31.12.2006 1.1-31.12.2005
Sales 24 52,404,682.74 44,332,128.76 50,822,399.16 43,722,354.78
Cost of goods sold 25 (39,614,893.02) (33,623,801.25) (39,222,600.74) (32,858,714.88)-------------------------------------------------------------------- -------------------------------------------------------------------- ------------------------------------------------------------------ --------------------------------------------------------------------
Gross profit 12,789,789.72 10,708,327.51 11,599,798.42 10,863,639.90
Other income/(expenses) - net 28 221,142.84 2,347,754.74 191,966.10 2,281,372.44
Administrative expenses 29 (3,189,488.59) (3,428,066.87) (2,561,368.31) (2,961,816.19)
Research and development costs 29 (1,935,491.98) (1,354,023.08) (614,052.87) (331,424.67)
Selling and marketing costs 29 (4,274,816.88) (4,095,000.91) (3,638,970.47) (3,523,335.30)-------------------------------------------------------------------- -------------------------------------------------------------------- ------------------------------------------------------------------ --------------------------------------------------------------------
Earnings before taxes, financing and
investing results 3,611,135.11 4,178,991.39 4,977,372.87 6,328,436.18
Finance costs - profit/(expenses) 30 (77,256.25) (168,272.94) (77,486.49) (59,347.33)
Results (Profit and Losses)
from investing activities 31 458,231.59 (138,556.95) 458,231.59 (138,556.95)-------------------------------------------------------------------- -------------------------------------------------------------------- ------------------------------------------------------------------ --------------------------------------------------------------------
Profit before income tax 3,992,110.45 3,872,161.50 5,358,117.97 6,130,531.90
Income tax expense 32 (1,148,307.26) (1,128,189.24) (1,479,437.79) (1,670,921.44)-------------------------------------------------------------------- -------------------------------------------------------------------- ------------------------------------------------------------------ --------------------------------------------------------------------
Profit after tax 2,843,803.19 2,743,972.26 3,878,680.18 4,459,610.46 -------------------------------------------------------------------- -------------------------------------------------------------------- ------------------------------------------------------------------ ---------------------------------------------------------------------------------------------------------------------------------------- -------------------------------------------------------------------- ------------------------------------------------------------------ --------------------------------------------------------------------Attributable to:
Equity holders of the Company 3,260,678.64 3,510,512.96 3,878,680.18 4,459,610.46
Minority interest (416,875.45) (766,540.70) - --------------------------------------------------------------------- -------------------------------------------------------------------- ------------------------------------------------------------------ --------------------------------------------------------------------
2,843,803.19 2,743,972.26 3,878,680.18 4,459,610.46-------------------------------------------------------------------- -------------------------------------------------------------------- ------------------------------------------------------------------ ---------------------------------------------------------------------------------------------------------------------------------------- -------------------------------------------------------------------- ------------------------------------------------------------------ --------------------------------------------------------------------
Basic and Diluted earnings per share
(expressed in e) 33 0.08 0.09 0.10 0.12-------------------------------------------------------------------- -------------------------------------------------------------------- ------------------------------------------------------------------ ---------------------------------------------------------------------------------------------------------------------------------------- -------------------------------------------------------------------- ------------------------------------------------------------------ --------------------------------------------------------------------
The notes on pages 11-50 are an integral part of these financial statements.
Annual Report 2 0 0 66

fAnnual Financial Statements as at 31 December 2006
Income Statement 4th Quarter 2006
(Amounts expressed in Euro) Group Company1.10-31.12.2006 1.10-31.12.2005 1.10-31.12.2006 1.10-31.12.2005
Sales 12,170,447.07 11,978,982.05 11,888,935.61 12,591,970.94
Cost of goods sold (10,782,405.66) (8,935,655.60) (10,100,663.60) (9,077,502.37)-------------------------------------------------------------------------------------------------------------------------------------------------------------------------- --------------------------------------------------------------------------------------------------------------------------------------------------------------------------
Gross profit 1,388,041.41 3,043,326.45 1,788,272.01 3,514,468.57
Other income/(expenses) - net 80,460.64 1,659,247.82 61,339.30 1,652,569.68
Administrative expenses (626,767.73) (1,260,813.04) (384,793.22) (1,041,738.40)
Research and development costs (433,645.06) (1,098,949.24) (115,909.92) (76,350.83)
Selling and marketing costs (1,239,672.67) (1,419,071.53) (1,151,242.16) (1,092,565.78)-------------------------------------------------------------------------------------------------------------------------------------------------------------------------- --------------------------------------------------------------------------------------------------------------------------------------------------------------------------
Earnings before taxes, financing and
investing results (831,583.41) 923,740.46 197,666.01 2,956,383.24
Finance costs - profit/(expenses) (116,647.34) (102,858.26) (156,896.41) (10,257.18)
Results (Profit and Losses)
from investing activities (19,258.52) (326,690.65) (19,258.52) (326,690.65)-------------------------------------------------------------------------------------------------------------------------------------------------------------------------- --------------------------------------------------------------------------------------------------------------------------------------------------------------------------
Profit before income tax (967,489.27) 494,191.55 21,511.08 2,619,435.41
Income tax expense 673,218.72 (4,638.24) 291,595.44 (547,370.44)-------------------------------------------------------------------------------------------------------------------------------------------------------------------------- --------------------------------------------------------------------------------------------------------------------------------------------------------------------------
Profit after tax (294,270.55) 489,553.31 313,106.52 2,072,064.97 -------------------------------------------------------------------------------------------------------------------------------------------------------------------------- ---------------------------------------------------------------------------------------------------------------------------------------------------------------------------------------------------------------------------------------------------------------------------------------------------------------------------------------------------- --------------------------------------------------------------------------------------------------------------------------------------------------------------------------Attributable to:
Equity holders of the Company 18,734.55 1,216,155.93 313,106.52 2,072,064.97
Minority interest (313,005.10) (726,602.62) - - -------------------------------------------------------------------------------------------------------------------------------------------------------------------------- --------------------------------------------------------------------------------------------------------------------------------------------------------------------------
(294,270.55) 489,553.31 313,106.52 2,072,064.97-------------------------------------------------------------------------------------------------------------------------------------------------------------------------- ---------------------------------------------------------------------------------------------------------------------------------------------------------------------------------------------------------------------------------------------------------------------------------------------------------------------------------------------------- --------------------------------------------------------------------------------------------------------------------------------------------------------------------------
Basic and Diluted earnings per share
(expressed in e) 0.00 0.03 0.01 0.05-------------------------------------------------------------------------------------------------------------------------------------------------------------------------- ---------------------------------------------------------------------------------------------------------------------------------------------------------------------------------------------------------------------------------------------------------------------------------------------------------------------------------------------------- --------------------------------------------------------------------------------------------------------------------------------------------------------------------------
The notes on pages 11-50 are an integral part of these financial statements
Annual Report 2 0 0 6 7

Annual Financial Statements as at 31 December 2006 fCash Flow Statement
Group Company(Amounts expressed in Euro) Note 1.1 - 31.12.2006 1.1 - 31.12.2005 1.1 - 31.12.2006 1.1 - 31.12.2005 Cash Flows from Operating ActivitiesProfit before taxes 33 3,992,110.45 3,872,161.50 5,358,117.97 6,130,531.90 Plus/Less adjustments for:Depreciation and Amortisation 27 2,785,238.66 2,566,491.03 1,670,778.25 1,441,779.68 Recognised income from government grants 18 (100,920.90) (30,571.34) (100,920.90) (30,571.34)Provisions 982,055.06 (3,029,340.75) 935,228.66 (2,929,498.89)Exchange rate differences (26,121.84) (5,147.04) (5,530.90) 768.08 Discount lump sum settlement of income tax 28 (18,017.52) (10,288.55) (18,017.52) (10,288.55)Results (Profit and Losses) from investing activities 31 (458,231.59) 138,556.95 (458,231.59) 138,556.95 (Profit)/Losses from sale & write off of PPE 28 (3,258.96) (2,208.11) 354.78 (2,208.11)Interest expense and similar charges (less Interest and similar income) 321,018.19 77,684.26 242,679.32 89,733.40
-------------------------------------------------------------------------------------------------------------------------------------------------- --------------------------------------------------------------------------------------------------------------------------------------------------7,473,871.55 3,577,337.95 7,624,458.07 4,828,803.12
Plus/Less adjustments of working capital or related to operating activities:Decrease/(Increase) of inventories 872,314.96 (470,478.32) 816,135.70 (419,616.24)Decrease/(Increase) of Receivables 1,902,868.50 1,177,112.12 1,604,731.50 (1,640,495.05)(Decrease)/Increase of Liabilities (except banks) 1,294,721.01 (1,777,906.45) 1,669,770.46 (1,382,260.01)Less:Interest expense and similar charges paid (320,775.66) (47,368.78) (244,851.62) (139,815.04)Income tax paid (1,541,481.99) (987,594.81) (1,541,481.99) (694,525.58)
-------------------------------------------------------------------------------------------------------------------------------------------------- --------------------------------------------------------------------------------------------------------------------------------------------------Net cash generated from operating activities (a) 9,681,518.37 1,471,101.71 9,928,762.12 552,091.20
-------------------------------------------------------------------------------------------------------------------------------------------------- ---------------------------------------------------------------------------------------------------------------------------------------------------------------------------------------------------------------------------------------------------------------------------------------------------- --------------------------------------------------------------------------------------------------------------------------------------------------Cash Flows from Investing ActivitiesAcquisition of subsidiaries, associates and other investments (7,109,271.04) (2,180,752.60) (7,109,271.04) (3,895,367.50)Proceeds from sales of other investments 12,852,888.37 10,151,625.02 12,852,888.37 10,151,625.02 Purchases of property, plant and equipment (PPE) and intangible assets (7,952,190.30) (2,170,621.47) (7,887,493.14) (972,631.79)Proceeds from sale of PPE and intangible assets 11,315.93 8,920.01 6,315.93 8,820.01 Interest received 13,202.38 53,251.09 2,172.30 50,081.64 Dividends received 31 10,000.00 41,928.96 10,000.00 41,928.96
-------------------------------------------------------------------------------------------------------------------------------------------------- --------------------------------------------------------------------------------------------------------------------------------------------------Net cash generated from Investing Activities (b) (2,174,054.66) 5,904,351.01 (2,125,387.58) 5,384,456.34
-------------------------------------------------------------------------------------------------------------------------------------------------- ---------------------------------------------------------------------------------------------------------------------------------------------------------------------------------------------------------------------------------------------------------------------------------------------------- --------------------------------------------------------------------------------------------------------------------------------------------------Cash Flows from Financing ActivitiesProceeds from minority interest holders due to increase in share capital 297,000.00 Proceeds from government grants relating to assets 18 161,679.22 91,995.25 161,679.22 91,995.25 Net flows from short-term loans (134,535.20) (432,209.83) - - Dividends paid and Directors' fees paid (4,169,621.83) (3,300,035.41) (4,169,621.83) (3,297,531.42)
-------------------------------------------------------------------------------------------------------------------------------------------------- --------------------------------------------------------------------------------------------------------------------------------------------------Net cash generated from Financing Activities (c) (4,142,477.81) (3,343,249.99) (4,007,942.61) (3,205,536.17)
-------------------------------------------------------------------------------------------------------------------------------------------------- ---------------------------------------------------------------------------------------------------------------------------------------------------------------------------------------------------------------------------------------------------------------------------------------------------- --------------------------------------------------------------------------------------------------------------------------------------------------Net increase/(decrease) in cash and cash equivalents for the year (a) + (b) + (c) 3,364,985.90 4,032,202.73 3,795,431.93 2,731,011.37Exchange gains/(losses) on cash and cash equivalents (2,506.25) - (2,506.25) - Cash and cash equivalents at beginning of the year 15 6,648,210.76 2,616,008.03 5,246,172.95 2,515,161.58
-------------------------------------------------------------------------------------------------------------------------------------------------- --------------------------------------------------------------------------------------------------------------------------------------------------Cash and cash equivalents at end of the year 15 10,010,690.41 6,648,210.76 9,039,098.63 5,246,172.95
-------------------------------------------------------------------------------------------------------------------------------------------------- --------------------------------------------------------------------------------------------------------------------------------------------------
The notes on pages 11-50 are an integral part of these financial statements.
Annual Report 2 0 0 68

fAnnual Financial Statements as at 31 December 2006
Statement of Changes in Equity
GroupShare Share Fair value reserves Other Retained Total Minority Total
Capital premium reserves earnings net interest Equityequity
Available-Land & for-sale
(Amounts expressed in Euro) buildings financial assets Balance at 1 January 2005 11,553.690.00 9,999,349.43 11,124,265,24 (2,063,768.95) 12,360,321.43 6,097.317.43 49,071,174.58 1,145,919.78 50,217,094.36Profit for the period 1.1 - 31.12.2005 - - - - - 3,510,512.96 3,510,512.96 (766,540.70) 2,743,972.26Increase in Share Capital with cash payments - - - - - - - 297,000.00 297,000.00Fair value reserve of available-for-sale financial assets - - - 835,564.46 - - 835,564.46 - 835,564.46Reserve arising on acquisition of subsidiary - - - - 1,126.79 121,690.01 122,816.80 313,944.18 436,760.98Set up reserves based on resolution of G.M. - - - - 1,223,284.39 (1,223,284.39) - - -Dividend relating to 2004 - - - - - (3,080,984.00) (3,080,984.00) - (3,080,984.00)Directors' fees - appropriation year 2004 - - - - - (254,656.29) (254,656.29) (1,145.83) (255,802.12)Balance at 31 December 2005 11,553,690.00 9,999,349.43 11,124,265.24 (1,228,204.49) 13,584,732.61 5,170,595.72 50,204,428.51 989,177.43 51,193,605.94Profit for the period 1.1-31.12.2006 - - - - - 3,260,678.64 3,260,678.64 (416,875.45) 2,843,803.19Fair value reserve of available-for-sale financial assets - - - (72,952.02) - - (72,952.02) - (72,952.02)Set up reserves based on resolution of G.M. 218,731.90 (218,731.90) - - -Dividend relating to 2005 - - - - - (3,851,230.00) (3,851,230.00) - (3,851,230.00)Directors’ fees-appropriation year 2005 - - - - - (320,973.41) (320,973.41) - (320,973.41)Balance at 31.12.2006 11,553,690.00 9,999,349.43 11,124,265.24 (1,301,156.51) 13,803,464.51 4,040,339.05 49,219,951.72 572,301.98 49,792,253.70
The notes on pages 11-50 are an integral part of these financial statements.
Annual Report 2 0 0 6 9

Annual Financial Statements as at 31 December 2006 fCompany
Share Share Fair value reserves Other Retained Total capital premium reserves earnings Equity
Available-Land & for-sale
(Amounts expressed in Euro) Buildings financial assets Balance at January 2005 11,553,690.00 9,999,349.43 11,124,265.24 (3,408,409.91) 12,358,794.24 7,379,221.16 49,006,910.16 Profit for the period 1.1 - 31.12.2005 - - - - - 4,459,610.46 4,459,610.46 Fair value reserve of available-for-sale financial assets - - - (375,915.67) - - (375,915.67)Set up reserve based on resolution of G.M. - 1,223,284.39 (1,223,284.39) - Dividend relating to 2004 - - - - - (3,080,984.00) (3,080,984.00)Directors' fees - appropriation year 2004 - - - - - (253,298.13) (253,298.13)Balance at 31 December 2005 11,553,690.00 9,999,349.43 11,124,265.24 (3,784,325.58) 13,582,078.63 7,281,265.10 49,756,322.82 Profit for the period 1.1-31.12.2006 - - - - - 3,878,680.18 3,878,680.18 Fair value reserve of available- for - sale financial assets - - - (673,731.29) - - (673,731.29)
Set up reserve based on resolution of G.M. - - - - 218,731.91 (218,731.91) - Dividend relating to 2005 - - - - - (3,851,230.00) (3,851,230.00)Directors' fees - appropriation year 2005 - - - - - (320,973.41) (320,973.41)Balance at 31 December 2006 11,553,690.00 9,999,349.43 11,124,265.24 (4,458,056.87) 13,800,810.54 6,769,009.96 48,789,068.30
The notes on pages 11-50 are an integral part of these financial statements.
Annual Report 2 0 0 610
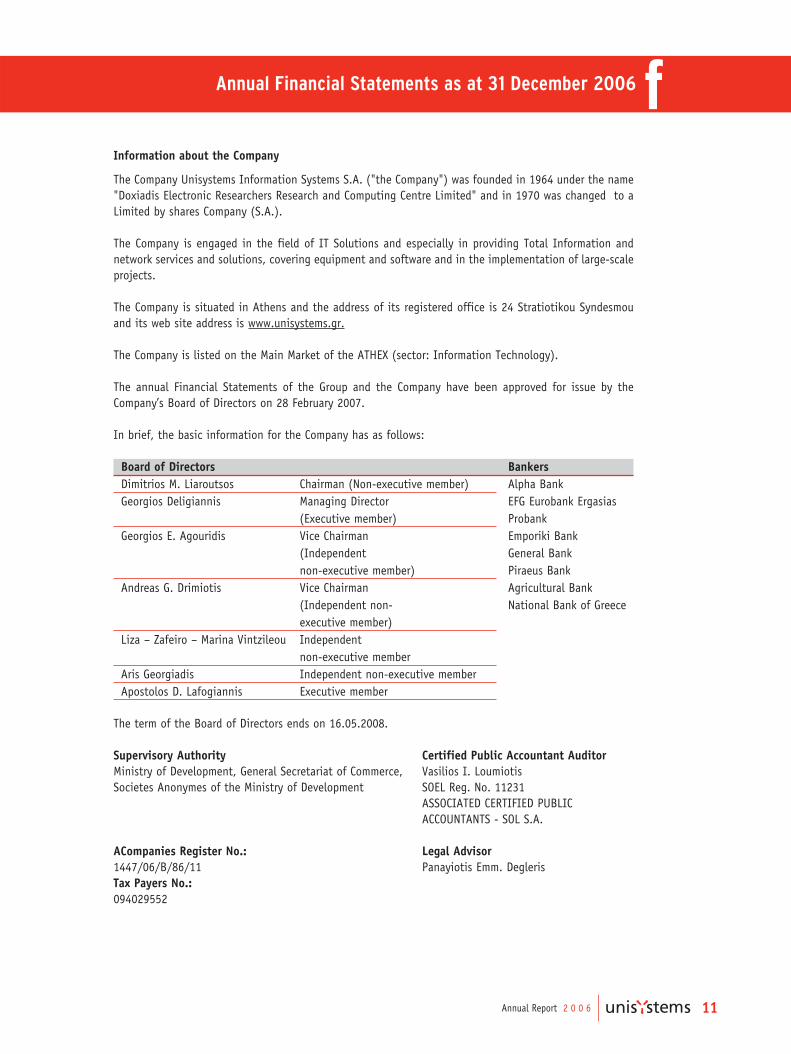
fAnnual Financial Statements as at 31 December 2006
Information about the Company
The Company Unisystems Information Systems S.A. ("the Company") was founded in 1964 under the name"Doxiadis Electronic Researchers Research and Computing Centre Limited" and in 1970 was changed to aLimited by shares Company (S.A.).
The Company is engaged in the field of IT Solutions and especially in providing Total Information andnetwork services and solutions, covering equipment and software and in the implementation of large-scaleprojects.
The Company is situated in Athens and the address of its registered office is 24 Stratiotikou Syndesmouand its web site address is www.unisystems.gr.
The Company is listed on the Main Market of the ATHEX (sector: Information Technology).
The annual Financial Statements of the Group and the Company have been approved for issue by theCompany’s Board of Directors on 28 February 2007.
In brief, the basic information for the Company has as follows:
Board of Directors Bankers Dimitrios M. Liaroutsos Chairman (Non-executive member) Alpha BankGeorgios Deligiannis Managing Director EFG Eurobank Ergasias
(Executive member) Probank Georgios E. Agouridis Vice Chairman Emporiki Bank
(Independent General Banknon-executive member) Piraeus Bank
Andreas G. Drimiotis Vice Chairman Agricultural Bank(Independent non- National Bank of Greeceexecutive member)
Liza – Zafeiro – Marina Vintzileou Independent non-executive member
Aris Georgiadis Independent non-executive memberApostolos D. Lafogiannis Executive member
The term of the Board of Directors ends on 16.05.2008.
Supervisory Authority Certified Public Accountant AuditorMinistry of Development, General Secretariat of Commerce, Vasilios I. LoumiotisSocietes Anonymes of the Ministry of Development SOEL Reg. No. 11231
ASSOCIATED CERTIFIED PUBLICACCOUNTANTS - SOL S.A.
∞Companies Register No.: Legal Advisor1447/06/µ/86/11 Panayiotis Emm. DeglerisTax Payers No.:094029552
Annual Report 2 0 0 6 11

Annual Financial Statements as at 31 December 2006 fNotes on the Financial Statements
1. Basis of preparation of financial statements
The financial statements of "Unisystems Information Systems S.A." at 31 December 2006, covering theperiod from 1 January to 31 December 2006, have been prepared under the historical cost convention, asamended by the adjustment of certain assets and liabilities items at current value, and the going concernbasis and are in accordance with International Financial Reporting Standards (IFRS), that are prescribedby the International Accounting Standards Board (IASB), as well as their interpretations, as published bythe International Financial Reporting Interpretations Committee (I.F.R.I.C.) of the IASB and which havebeen adopted by the European Union.
The International Accounting Standards Board (IASB) has issued a series of standards that are referred toas "IFRS Stable Platform 2005". The Company applies the Standards and refers to the IFRS Stable Platform2005 from 1 January 2005, which includes the following standards:
ñ IAS 1 Presentation of Financial Statementsñ IAS 2 Inventoriesñ IAS 7 Cash Flow Statementsñ IAS 8 Accounting Policies, Changes in Accounting Estimates and Errorsñ IAS 10 Events After the Balance Sheet Dateñ IAS 12 Income Taxesñ IAS 14 Segment Reportingñ IAS 16 Property, Plant and Equipmentñ IAS 17 Leasesñ IAS 18 Revenueñ IAS 19 Employee Benefitsñ IAS 20 Accounting for Government Grants and Disclosure of Government Assistanceñ IAS 21 The Effects of Changes in Foreign Exchange Ratesñ IAS 23 Borrowing Costsñ IAS 24 Related Party Disclosuresñ IAS 26 Accounting and Reporting by Retirement Benefit Plansñ IAS 27 Consolidated and Separate Financial Statementsñ IAS 28 Investments in Associatesñ IAS 30 Disclosures in the Financial Statements of Banks and Similar Financial Institutionsñ IAS 32 Financial instruments: Disclosure and Presentationñ IAS 33 Earnings per Shareñ IAS 34 Interim Financial Reportingñ IAS 36 Impairment of Assetsñ IAS 37 Provisions, Contingent Liabilities and Contingent Assetsñ IAS 38 Intangible Assetsñ IAS 39 Financial Instruments: Recognition and Measurementñ IAS 40 Investment Propertyñ IFRS 1 First-time Adoption of International Financial Reporting Standardsñ IFRS 2 Share-based Paymentñ IFRS 3 Business Combinationsñ IFRS 4 Insurance Contractsñ IFRS 5 Non-current Assets Held for Sale and Discontinued Operations
Annual Report 2 0 0 612

fAnnual Financial Statements as at 31 December 2006
The preparation of financial statements in conformity with IFRS requires the use of certain criticalaccounting estimates. It also requires management to exercise its judgement in the process of applyingthe Company’s policies. Significant management assumptions in the process of applying the company’saccounting policies are mentioned where necessary. The actual results may differ to those estimates.
New accounting standards, interpretations and amendments to existing standards: The InternationalAccounting Standards Board (IASB) as well as the International Financial Reporting InterpretationsCommittee (IFRIC) has already published a series of new accounting standards and interpretations, that aremandatory for the accounting periods beginning on or after 1 January 2006 or later periods. The Companyand Group’s assessment of the impact of these new standards and interpretations is set out below:
ñ IAS 19 (Amendment), "Employee Benefits": (Effective from 1 January 2006). It introduces theoption of an alternative recognition approach for actuarial gains and losses. It may imposeadditional recognition requirements for multi – employer plans where insufficient information isavailable to apply defined benefit accounting. It also adds new disclosure requirements. As theGroup and the Company does not intend to change the accounting policy adopted for recognitionof actuarial gains and losses and does not participate in any multi – employer plans, adoption ofthis amendment only impacts the format and extent of disclosures presented in the accounts.
ñ IAS 39 (Amendment), "Cash Flow Hedge Accounting of Forecast Intragroup Transactions":(Effective from 1 January 2006). The amendment allows the foreign currency risk of a highlyprobable forecast intragroup transaction to qualify as a hedged item in the consolidated financialstatements, provided that: (a) the transaction is denominated in a currency other than thefunctional currency of the entity entering into that transaction and b) the foreign currency riskwill affect the consolidated profit or loss. The Group and Company believes that this amendmentwill not have an impact on its financial statements. The Group and Company apply thisamendment from 1 January 2006.
ñ IAS 39 (Amendment), "The Fair Value Option": (Effective from 1 January 2006). Thisamendment changes the definition of financial instruments classified at fair value through profitor loss and restricts the ability to designate financial instruments as part of this category. TheGroup and Company believes that this amendment should not have a significant impact on theclassification of financial instruments. The Group and Company apply this amendment from 1January 2006.
ñ IAS 39 and IFRS 4 (Amendment), "Financial Guarantee Contracts": (Effective from 1 January2006). This amendment requires issued financial guarantees, other than those previouslyasserted by the entity to be insurance contracts, to be initially recognised at their fair value andsubsequently measured at the higher of: (a) the non amortised balance of the related feesreceived and deferred, and (b) the expenditure required to settle the commitment at the balancesheet date. This amendment has no impact on the financial position of the Group and Company.
Annual Report 2 0 0 6 13

Annual Financial Statements as at 31 December 2006 fñ IFRS 1 (Amendment), "First – time Adoption of International Financial Reporting Standards"
and IFRS 6 (Amendment), "Exploration for and Evaluation of Mineral Resources": (Effectivefrom 1 January 2006). These amendments are not relevant to the Group’s and Company’soperations as the Group and Company are not first – time adopters of IFRS and do not carry outexploration for and evaluation of mineral resources. Therefore, they will have no change on thefinancial statements.
ñ IFRS 6: "Exploration for and Evaluation of Mineral Resources": (Effective from 1 January2006). It is not relevant to the Group and Company and will have no impact on the financialstatements.
ñ IFRS 7: "Financial Instruments. Disclosures": (Effective from 1 January 2007). IFRS 7introduces new disclosures to improve the information about financial instruments. It requiresthe disclosure of qualitative and quantitative information about exposure to risks arising fromfinancial instruments, including specified minimum disclosures about credit risk, liquidity riskand market risk, including sensitivity analysis to market risk. It replaces IAS 30, Disclosures inthe Financial Statements of Banks and Similar Financial Institutions, and disclosurerequirements in IAS 32, Financial Instruments: Disclosure and Presentation. It is applicable toall entities that report under IFRS. The amendment to IAS 1 introduces disclosures about thelevel of an entity’s capital and how it manages capital. It is believed that its application willnot have significant impact on the financial statements of the Company and Group.
ñ IFRS 8: "Operating Segments": (Effective from 1 January 2009). IFRS 8 replaces IAS 14 SegmentReporting and requires an entity to report financial and descriptive information about itsreportable segments. Reportable segments are operating segments or aggregations of operatingsegments that meet specific criteria. Operating segments are components of an entity aboutwhich separate financial information is available that is evaluated regularly by the chiefoperating decision maker in deciding how to allocate resources and in assessing performance.Generally, financial information is required to be reported on the same basis as is used internallyfor evaluating operating segment performance and deciding how to allocate resources tooperating segments. This information may differ to that presented in the balance sheet and theincome statement and entities are required to report explanations and reconciliation as regardsto these differences. The Group is currently assessing the impact of IFRS 8 on the Group’s andCompany’s operations. IFRS 8 has not been adopted yet by the EU.
ñ IFRIC 3: "Emission Rights": The IASB withdrew IFRIC 3 after a short time period.
ñ IFRIC 4: "Determining whether an Arrangement contains a Lease": (Effective from 1 January2006). The determination of whether an arrangement is or contains a lease to be based on thesubstance of the arrangement. It requires an assessment of whether: (a) fulfilment of thearrangement is dependent on the use of a specific asset or assets and (b) the arrangementconveys a right to use the asset. It is not relevant to the Group and Company and will have noimpact on the financial statements.
ñ IFRIC 5: "Rights to Interests arising from Decommissioning, Restoration and EnvironmentalRehabilitation Funds": (Effective from 1 January 2006). IFRIC 5 is not relevant to the Groupand Company and will have no impact on the financial statements.
f
Annual Report 2 0 0 614

fAnnual Financial Statements as at 31 December 2006
ñ IFRIC 6: "Liabilities arising from Participating in a Specific Market – Waste Electrical andElectronic Equipment": (Effective from 1 December 2005). IFRIC 6 is not relevant to the Group’sand Company’s operations, and will have no impact on the financial statements.
ñ IFRIC 7: Applying the Restatement Approach under IAS 29 "Financial Reporting inHyperinflationary Economies": (Effective from 1 March 2006). IFRIC 7 requires in a reportingperiod in which an entity identifies the existence of hyperinflation in the economy of itsfunctional currency, when the economy was not hyperinflationary in the prior period to applythe requirements of IAS 29 as if the economy was always hyperinflationary. IFRIC 7 is notrelevant to the Group’s and Company’s operations and will have no impact on the financialstatements.
ñ IFRIC 8: "Scope of IFRS 2": (Effective from 1 May 2006). IFRIC 8 requires consideration oftransactions involving the issuance of equity instruments -where the identifiable considerationreceived is less than the fair value of the equity instruments issued- to establish whether or notthey fall within the scope of IFRS 2. IFRIC 8 is not relevant and will have no impact on thefinancial statements of the Group and Company.
ñ IFRIC 9: "Reassessment of Embedded Derivatives": (Effective from 1 June 2006). IFRIC 9requires an entity to assess whether an embedded derivative is required to be separated fromthe host contract and accounted for as a derivative when the entity first becomes a party to thecontract. Subsequent reassessment is prohibited unless there is a change in the terms of thecontract that significantly modifies the cash flows that otherwise would be required under thecontract, in which case reassessment is required. IFRIC 9 is not relevant to the Group’s andCompany’s operations and will have no impact on the financial statements.
ñ IFRIC 10: "Interim Financial Reporting and Impairment": (Effective from 1 November 2006).IFRIC 10 may have an impact on the financial statements, in case impairment losses arerecognised in an interim period on goodwill or investments in equity instruments available-for-sale or unlisted equity instruments held at cost, since this impairment cannot be reversed at asubsequent interim or balance sheet date. Management is currently assessing the probableimpact of IFRIC 10 on the Group’s and Company’s operations nevertheless concluded that it willhave no impact on the financial statements of the Group and Company.
ñ IFRIC 11: "IFRS 2 – Group and Treasury Share Transactions": (Effective from 1 March 2007).This Interpretation requires that transactions in which an entity’s employees are granted rightsto equity instruments of the entity shall be accounted for as share-based payment arrangementssettled with equity instruments regardless of whether the entity chooses or is required to buythose equity instruments from another party or the shareholders of the entity provide the equityinstruments needed. The Interpretation also addresses how the subsidiaries should account forin their individual financial statements transactions where the Subsidiary’s employees aregranted rights to equity instruments of the parent company. IFRIC 11 is not relevant to theGroup’s and Company’s operations, however IFRIC 11 has not been adopted yet by the EU.
Annual Report 2 0 0 6 15

Annual Financial Statements as at 31 December 2006 fñ IFRIC 12: "Service Concession Arrangements": (Effective from 1 January 2008). IFRIC 12
provides guidance on the accounting by operators for public-to-private service concessionarrangements in applying the existing International Financial Reporting Standards (IFRS) as howto recognise the obligations that they undertake and the rights concessed to them under therelevant service concession agreements. According to this Interpretation these operators shouldnot recognise the relative infrastructure as tangible assets but in lieu they should recognise afinancial asset instrument or an intangible property asset. IFRIC 12 is not relevant to the Group’sand Company’s operations, however, IFRIC 12 has not been adopted yet by the EU.
2. Basis of consolidation
The Company prepared consolidated financial statements. This consolidation included the followingcompanies with their respective participation percentages:
➢ "Financial Technologies S.A." 54.24%
➢ "Uni-Nortel Communication Technologies (Hellas) S.A." 70.00%
It is also noted that, the Company participates at 31.12.2006 in the Joint-Ventures:
➢ Joint - Venture Unisystems S.A. – Singular Integrator S.A. Athens, for the Computerization ofthe Central Department of the Penal Register of the Ministry of Defence with a percentage of50% and
➢ Joint - Venture Unisystems S.A. – Singular Integrator S.A. Athens, for the Computerization ofthe Department of the Penal Register with the Court of First Instance Prosecutor’s Office of sixcities at a percentage of 50%.
It is noted that, the above Joint-Ventures:
a) Have been established, according to the legislation in effect, for tax purposes and noparticipating interest exists between the Company and these Joint-Ventures.
b) Have all the characteristics of jointly controlled operations, as provided for by IAS 31 par. 13and 14.
c) The Company, through relative billing, has recognised in the individual financial statements theproportion of the fee on the above mentioned projects that have been executed by the JointVentures until 31.12.2006. Therefore, the proportionate consolidation of these Joint Ventureshas been realised in the individual financial statements of the Company, as relatively providedfor in IAS 31 paragraph 15.
Annual Report 2 0 0 616

17
fAnnual Financial Statements as at 31 December 2006 fFor the above mentioned reasons, and because these Joint Ventures do not have significant interest, theywere not included in the consolidation.
The Company in July 2006 founded, jointly with the Dutch company ParkMobile Group B.V. the companyParkMobile Hellas S.A. participating in its share capital with e 800,000.00 or percentage 40%. Thecompany ParkMobile Hellas S.A. has undertaken the implementation of the project "Provision of servicesfor the implementation and operation of the parking control system in central area of the AthensMunicipality". ParkMobile Hellas S.A. was included for first time in the Interim financial statements at 30September 2006 of the Company by the equity method.
3. Basis of presentation
The financial statements are expressed in Euros. The financial statements have been prepared under thehistorical cost convention, except for the company’s property and the available-for-sale securities thathave been valued at fair value.
The policies set out below have been consistently applied for the closing period as for the previous year.
4. Principal accounting policies
The principal accounting policies, based on which are prepared the financial statements and which, byconsistent practice are applied by the Company and the Group, are the following:
(a) Property, plant and equipment
The PPE (except land & buildings) are measured at cost less their accumulated depreciation.
The company’s land and buildings are shown at fair value determined on valuations by an independentvaluer.
Subsequent costs are capitalised only when they increase future economic benefits that are incorporatedin a non-current asset item. All other costs are recognised in the income statement as an expense whenthey incur.
Depreciation is charged to the income statement on a straight-line basis over the useful life of the non-current assets.
The estimated useful life has as follows:
Buildings 12-20 yearsFurniture, fittings & equipment 3-12 yearsComputer software 3-4 years
Annual Report 2 0 0 6

Annual Report 2 0 0 618
Annual Financial Statements as at 31 December 2006 fThe assets’ residual values and useful lives are reviewed at each balance sheet date. An asset’s carryingamount is written down immediately to its recoverable amount if the asset’s carrying amount is greaterthan its estimated recoverable amount.
Gains and losses on disposals are determined by comparing proceeds with carrying amount. These areincluded in the income statement. All other repairs and maintenance are charged to the income statementduring the financial period in which they are incurred.
(b) Intangible assets
Intangible assets, acquired by an enterprise, are recognised at cost.
Research and development: The expenditure in research activities with the prospect of obtaining newscientific or technical knowledge and understanding, is recognised in the income statement whenincurred.
The expenditure in development activities, where the findings of the research are applied to a plan ordesign for the production of new or substantially improved products and process, are capitalised only whenthe product or process is technically and commercially feasible and the company has adequate resourcesto complete the development. The capitalised cost includes the cost of materials, the direct work andappropriate percentage of overhead expenses. All other development expenditure are recognised in theincome statement when they incur. The capitalised development expenditure is shown at cost less theaccumulated depreciation and their impairment losses. Amortisation is calculated using the straight-linemethod over their estimated useful lives 3 to 5 years.
It is deemed that the present value of the anticipated net cash flows from the use or distribution ofintangible assets does not fall short to their respective carrying amounts at 31.12.2006.
Computer Software: Acquired computer software licences are recognised in intangible assets andmeasured at cost, less the accumulated amortisation. Amortisation is calculated using the straight-linemethod over the estimated useful life of the assets, 3 to 5 years.
(c) Investments
Investments in equity securities and other securities: The Company’s financial assets have beenrecognised as available-for-sale assets since they are not held for trading purposes and have not beencreated by the company or are not held to maturity. The available-for-sale assets comprise, shares andmutual fund units.

Annual Report 2 0 0 6 19
fAnnual Financial Statements as at 31 December 2006
Following the initial measurement all available-for-sale assets are measured at fair value.
The fair values of financial instruments are based on their bid prices at the closing date of the balancesheets without deducting the transaction expenses.
The gains and losses arising from a change in the fair value of the available-for-sale financial assets arerecognised directly in equity. When the assets are collected or sold in another manner, the cumulatedprofit or loss that had been recognised in equity is carried to the income statement.
(d) Inventories
The Company’s merchandise is stated at the lower of cost and net realisable value. Net realisable value isthe estimated selling price in the ordinary course of business, less the completion cost and selling andmarketing costs.
The cost of the merchandise is calculated based on the average weighted method.
Sufficient provisions are set up for obsolete and useless inventories. The decreases of the value ofinventories at net realizable value is recognized in the income statement during the period they arepresented.
(e) Impairment of assets
The company’s assets other than inventories and deferred tax assets are assessed at each balance sheetclosing date with the intent to determine whether there is indication that an asset may be impaired. Ifany such indication exists, it should be estimated the recoverable amount of the asset.
An impairment loss is recognised in the income statement when the recoverable amount of the asset islower than the value stated in the balance sheet.
If in a subsequent period the amount of the loss from impairment is reduced and the reduction can becorrelated objectively with a circumstance that came about after the set up of a provision, the provisionis reversed through the income statement except for the cases that are stated in IFRIC 10.
The recoverable amount of an equity security is its fair value. The recoverable amount of a security andbought securities re-estimated at fair value is calculated as the present value of the estimated future cashflows discounted with the current interest rate of the market. The current assets are not discounted.
f

Annual Report 2 0 0 620
Annual Financial Statements as at 31 December 2006 f(f) Trade receivables
Trade receivables, which usually have a settlement term of 30-90 days, are recognised initially attransaction value.
Trade receivables and trade receivables from third parties are reviewed, as to their collectibility, at regulartime periods. A provision for impairment of trade receivables is established when there is objectiveevidence that the Company will not be able to collect all amounts due according to the original term ofreceivables. The amount of the provision is the difference between the asset’s carrying amount and thepresent value of estimated future cash flows, discounted at the effective interest rate. The amount of theprovision is directly recognised in the income statement.
(g) Cash and cash equivalents
Cash and cash equivalents include cash in hand, deposits at other banks and short-term highly liquidinvestments with maturities of three months or less from the date of their acquirement. The financialassets are measured at fair value through the income statement.
(h) Dividends
The dividends of the ordinary shares are recognised as a liability in the period in which the Company’sGeneral Meeting of Shareholders approves the dividends.
(i) Provisions
A provision is recognised in the balance sheet when the Company has a present legal or constructiveobligation as a result of a past event and it is more likely that an outflow of resources will be required tosettle the obligation. If the effect is significant, the provisions are determined by discounting theestimated future cash flows at a rate, which reflects the time value of money and wherever appropriatethe risks specific to the liability. The provisions for guarantees are based on the historic data of theguarantees and the level of all possible outcomes against their relative possibilities when the relativeproducts or services are sold.
(j) Income tax and deferred tax
The charge for the year on Income tax on the results includes the current tax and the deferred tax, thatis the tax or the tax relief relating to the economic benefits arising in the year but have already beenallocated or will be allocated by the tax authorities in different years. Income tax is recognised in theincome statement, besides the tax that concerns transactions recognised directly in equity, therefore, thetax is also recognised directly, in a proportionate manner, in equity.

Annual Report 2 0 0 6 21
fAnnual Financial Statements as at 31 December 2006
Current income tax includes the current liabilities to the tax authorities relating to the payable taxes onthe taxable income for the period and any additional income tax concerning previous years.
Current income tax is calculated according to the effective tax rates and tax laws in the fiscal years inwhich they relate, based on the period’s taxable profit.
Deferred income tax is provided using the liability method, on temporary differences arising between thetax bases of assets and liabilities and their carrying amounts. Deferred income tax is determined using taxrates (and laws) that have been enacted or substantially enacted by the balance sheet date and areexpected to apply when the related deferred income tax asset is realised or the deferred income taxliability is settled. In case it is not possible to determine the time of reversal of the temporary taxdifferences, the tax rate used is that of the fiscal year following that of the balance sheet.
Deferred income tax assets are recognised to the extent that it is probable that future taxable profit willbe available against which the temporary differences can be utilised.
Income tax constitutes an expense, which is recognised in the Income Statement, if the transactions andfinancial events that concern this tax effect are recognised also in the Income Statement. Income taxconstitutes an expense, which is directly recognised in equity, if the transactions and financial events thatconcern this tax effect is recognised also in equity.
Income tax assets and liabilities (current and deferred) are offset when there is a legally enforceable rightto offset current tax assets against current tax liabilities and when the deferred income taxes relate tothe same fiscal authority.
(k) Employee retirement benefit obligations
Short-term employee benefits: Short-term employee benefits towards the employees (except fortermination benefits) in money and in kind are recognised as an expense when accrued. Any unpaidamount is recognised as a liability, while in the case where the amount already paid over exceeds theamount of benefits, the enterprise recognizes the excess amount as an assets item (prepaid expense), onlyto the extent where the prepaid amount will lead to a decrease of future payments or to refund.
Post-employment benefits: Post-employment benefit schemes comprise both defined contribution plansand defined benefit plans.
➢ Defined contribution plans
Based on the defined contribution plan, the company’s obligation (legal) is restricted to the amount thathas been agreed to contribute to the Social Security Fund which handles the contributions and grants thebenefits (pensions, medicare etc.)

Annual Report 2 0 0 622
Annual Financial Statements as at 31 December 2006 fThe accrued cost of the defined contribution plans is recognised as an expense in the period it concerns.
➢ Defined Benefit Plans
According to the Greek labour law, the employees are entitled to termination benefits when employmentis terminated, the value of which depends on their annual compensation, years of service in the Companyand reason for employment termination (dismissal or retirement). In case of resignation or justifieddismissal this right does not apply. The payable amount at retirement amounts to 40% of the total amountthat is paid in case of unjustified dismissal. This plan is a defined benefit plan for the employer and it isnot funded.
The commitment is calculated annually by independent actuaries using the projected unit credit method.A defined benefit plan is a pension plan that is not a defined contribution plan. Typically, defined benefitplans define an amount of pension benefit that an employee will receive on retirement, usually dependenton one or more factors such as age, years of service and compensation. The provisions that concern thecurrent year, are included in the respective employee cost in the accompanying income statement andconsist of the current service cost, the relative finance cost, the actuarial gains and losses that arerecognised and whatever probable additional charges.
The Company recognised the total of the actuarial gains and losses at the date of transition and intendsto recognise in the following years the respective gains and losses in accordance with the specificationsplaced by the International Accounting Standard (IAS 19). The Company, already shows in its balancesheet the aforementioned obligation to its staff.
(l) Foreign currency transactions
Foreign currency transactions are translated using the exchange rates prevailing at the date of thetransactions. The monetary assets and liabilities in foreign currency at the balance sheet date aredenominated in Euro at the prevailing exchange rate at this date. The arising exchange differences fromthe translation are recognised in the income statement. Non-monetary assets and liabilities in foreigncurrencies, shown at fair value, are translated into Euros with the exchange rates prevailing at the datesof the determination of the fair value.
(m) Revenue recognition
Revenue is accounted for only when economic benefits, relating to the transaction, will flow to thecompany. Revenue is recognised as follows:
➢ Sales of goods
Sales of goods are recognised in the income statement, when the significant risks and rewards have beentransferred to the buyer.

Annual Report 2 0 0 6 23
fAnnual Financial Statements as at 31 December 2006
➢ Sales of services
Revenue from the sales of services is recognised in the income statement depending on the stage ofcompletion of the transaction at the balance sheet date. The stage of completion is estimated based onthe certifications of the executed work. Revenue is not recognised when significant uncertainties arise,as regards to the recovery of the due amount with the cost or the probable return of the goods.
➢ Interest income
Interest income is recognised on a time-proportion basis using the effective interest method. When areceivable is impaired, the company reduces the carrying amount to its recoverable amount, being theestimated future cash flow discounted at original effective interest rate of the instrument, and continuesunwinding the discount as interest income. Interest income on impaired loans is recognised using theoriginal effective interest rate.
➢ Revenue from rent
Revenue from rent is recognised with the straight-line method based on the terms of the lease.
(n) Government grants
Government grants are recognised when there is reasonable assurance that the grant will be received andthe company will comply with the conditions attaching to it. The grants that compensate the Companyfor incurred expenses are recognised as income on a systematic basis in the same period the grantexpenses were incurred. The grants received for the cost of an asset are allocated to the income statementas income, on a systematic basis over the useful life of the asset.
(o) Leases
Leases where the lessor retains substantially all the risks and rewards of ownership are classified asoperating leases. Payments made under operating leases are recognised in the income statement,proportionately over the period of the lease.
The Company does not have assets with finance lease agreements.
(p) Segment reporting
A segment is a distinguishable component of an enterprise that is engaged in providing services (businesssegment) or services within a particular economic environment (geographical segment), that is subject torisks and returns that are different from those of segments operating in other economic environments.
f

Annual Report 2 0 0 624
Annual Financial Statements as at 31 December 2006 fThe Company is engaged in activities only in Greece and only in providing information technology services.
(q) Comparatives
The Company, for the preparation of the financial statements for the period ended 31 December 2006,used comparative records of the financial statements for the period ended 31 December 2005.
5. Financial risk management
(a) Financial risk factors
The main financial instruments comprise bank borrowings, cash and short-term deposits. The mostsignificant object of these financial instruments is the provision of financing for the operations of theGroup and the Company. The Company also has other various financial instruments such as tradereceivables and liabilities, which arise directly from its operations. Company Policy during the year, wasand remains not to trade financial instruments.
The company is exposed to a variety of financial risks. The usual risks which theoretically the company issubject to is market risk (interest rate, price risk), credit risk, liquidity risk, cash flow risk.
The main risks arising from the financial instruments of the Company is interest rate risk, liquidity riskand credit risk. The Board of Directors examines and approves principles for overall risk management,which are summarized below.
(b) Risk management policy
➢ Interest rate risk
Interest rate risk is not applicable because it mainly relates to the liabilities in bank financing. TheCompany has no bank borrowings. The low bank borrowings of the Group is deemed that it does notrecommend a significant risk.
➢ Price of goods risk
The risk arising for the Company from changes in prices of goods is minimum.
➢ Credit risk
The Company provides services exclusively to recognised and solvent counterparts. It is the Company’s andthe Group’s policy in general that all customers, to whom services are provided on credit, to be subject toprocedures of credit worthiness. Moreover, the trade receivables are monitored, on a systematic basis,having as a result limiting the risk from doubtful receivables. As regards credit risk arising from the otherfinancial assets of the Company, comprising of cash and cash equivalents, the risk derives from notkeeping the contractual terms from the counter party, with maximum exposure equal to the carryingamount of the instruments. There are no significant concentrations of credit risk at the Company.

Annual Report 2 0 0 6 25
fAnnual Financial Statements as at 31 December 2006
➢ Liquidity risk
The Company and the Group are not exposed to liquidity risk. It is possible, if an expansion of the projectsof the State exists in the framework of the 3rd CSF to be required significant financing which Managementdeems it can secure.
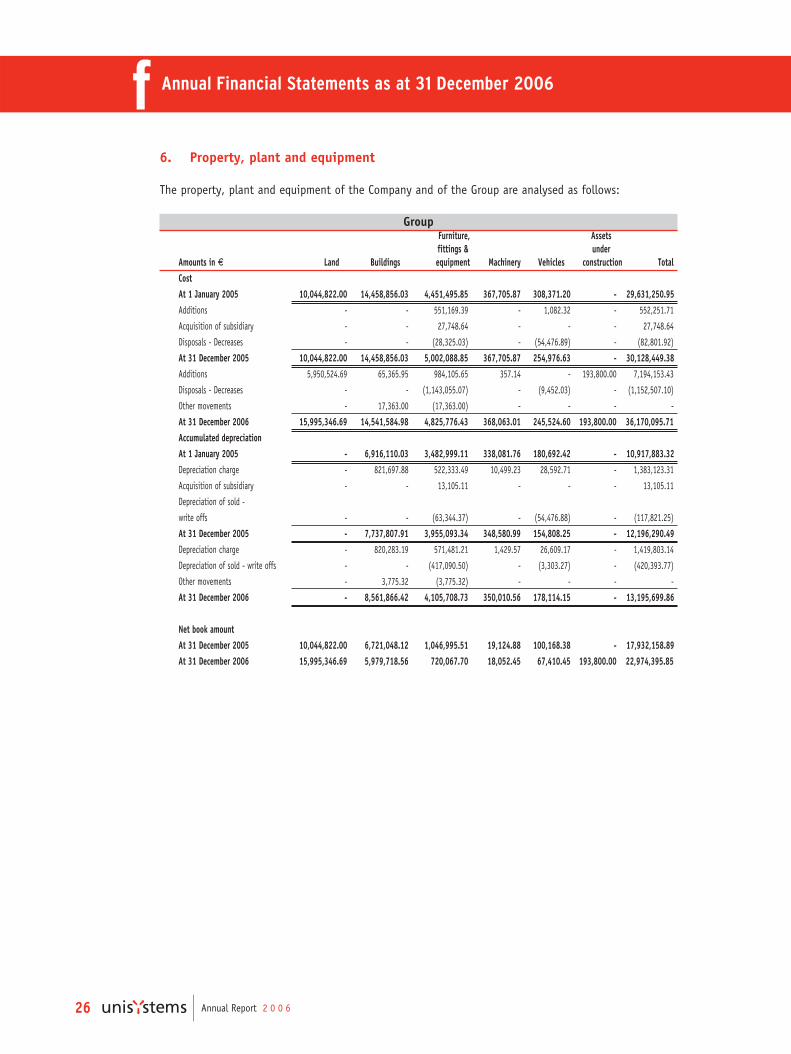
Annual Report 2 0 0 626
Annual Financial Statements as at 31 December 2006 f6. Property, plant and equipment
The property, plant and equipment of the Company and of the Group are analysed as follows:
GroupFurniture, Assets fittings & under
Amounts in e Land Buildings equipment Machinery Vehicles construction Total
Cost
At 1 January 2005 10,044,822.00 14,458,856.03 4,451,495.85 367,705.87 308,371.20 - 29,631,250.95
Additions - - 551,169.39 - 1,082.32 - 552,251.71
Acquisition of subsidiary - - 27,748.64 - - - 27,748.64
Disposals - Decreases - - (28,325.03) - (54,476.89) - (82,801.92)
At 31 December 2005 10,044,822.00 14,458,856.03 5,002,088.85 367,705.87 254,976.63 - 30,128,449.38
Additions 5,950,524.69 65,365.95 984,105.65 357.14 - 193,800.00 7,194,153.43
Disposals - Decreases - - (1,143,055.07) - (9,452.03) - (1,152,507.10)
Other movements - 17,363.00 (17,363.00) - - - -
At 31 December 2006 15,995,346.69 14,541,584.98 4,825,776.43 368,063.01 245,524.60 193,800.00 36,170,095.71
Accumulated depreciation
At 1 January 2005 - 6,916,110.03 3,482,999.11 338,081.76 180,692.42 - 10,917,883.32
Depreciation charge - 821,697.88 522,333.49 10,499.23 28,592.71 - 1,383,123.31
Acquisition of subsidiary - - 13,105.11 - - - 13,105.11
Depreciation of sold -
write offs - - (63,344.37) - (54,476.88) - (117,821.25)
At 31 December 2005 - 7,737,807.91 3,955,093.34 348,580.99 154,808.25 - 12,196,290.49
Depreciation charge - 820,283.19 571,481.21 1,429.57 26,609.17 - 1,419,803.14
Depreciation of sold - write offs - - (417,090.50) - (3,303.27) - (420,393.77)
Other movements - 3,775.32 (3,775.32) - - - -
At 31 December 2006 - 8,561,866.42 4,105,708.73 350,010.56 178,114.15 - 13,195,699.86
Net book amount
At 31 December 2005 10,044,822.00 6,721,048.12 1,046,995.51 19,124.88 100,168.38 - 17,932,158.89
At 31 December 2006 15,995,346.69 5,979,718.56 720,067.70 18,052.45 67,410.45 193,800.00 22,974,395.85

Annual Report 2 0 0 6 27
fAnnual Financial Statements as at 31 December 2006
Company Furniture, Assets fittings & under
Amounts in e Land Buildings equipment Machinery Vehicles construction Total
Cost
At 1 January 2005 10,044,822.00 14,458,856.03 3,892,629.15 367,705.87 308,241.20 - 29,072,254.25
Additions - - 520,199.71 - 924.37 - 521,124.08
Disposals – Decreases - - (25,702.88) - (54,476.89) - (80,179.77)
At 31 December 2005 10,044,822.00 14,458,856.03 4,387,125.98 367,705.87 254,688.68 - 29,513,198.56
Additions 5,950,524.69 60,000.00 927,195.42 357.14 - 193,800.00 7,131,877.25
Disposals - Decreases - - (1,141,195.07) - (9,322.03) - (1,150,517.10)
At 31 December 2006 15,995,346.69 14,518,856.03 4,173,126.33 368,063.01 245,366.65 193,800.00 35,494,558.71
Accumulated depreciation
At 1 January 2005 - 6,916,110.03 3,085,149.92 338,081.76 180,689.16 - 10,520,030.87
Depreciation charge - 821,697.88 420,762.86 10,499.23 28,561.40 - 1,281,521.37
Depreciation of sold -
write offs - - (60,722.22) - (54,476.88) - (115,199.10)
At 31 December 2005 - 7,737,807.91 3,445,190.56 348,580.99 154,773.68 - 11,686,353.14
Depreciation charge - 816,059.04 494,703.23 1,429.57 26,567.71 - 1,338,759.55
Depreciation of sold - write offs - - (416,527.33) - (3,262.70) - (419,790.03)
At 31 December 2006 - 8,553,866.95 3,523,366.46 350,010.56 178,078.69 - 12,605,322.66
Net book amount
At 31 December 2005 10,044,822.00 6,721,048.12 941,935.42 19,124.88 99,915.00 - 17,826,845.42
At 31 December 2006 15,995,346.69 5,964,989.08 649,759.87 18,052.45 67,287.96 193,800.00 22,889,236.05
There are no liens on the non-current assets against borrowings. The Company’s and Group’s non-currentassets have sufficient insurance cover.
It is noted that the Company within the 1st Quarter of 2006 proceeded in the purchase of land situatedat 110 Athinon Avenue in Athens, of a total area 1.936,48 square metres. The purchase of the land wasmade, from a private-owner, against a total consideration of e�5,950,524.69, including acquisition costs(notary fees, transfer tax etc) and will be used for the construction of office building and auxiliary spacethat will meet the housing needs of the Company. The purchase price of the above land has been fullypaid.

Annual Report 2 0 0 628
Annual Financial Statements as at 31 December 2006 f7. Intangible assets
Intangible assets include:
a) The development costs for computer software and other applications, for which the Company believesthat their net value will be fully covered by the future disposals of these products.
b) Acquired Software.
Intangible assets analysed as follows:
GroupOwn-produced Acquired Royalties for use of
Computer Software Computer Software computer – Software Total
Amounts in e
Cost
At 1 January 2005 4,818,519.43 1,029,454.18 - 5,847,973.61
Additions 1,627,215.23 11,126.40 - 1,638,341.63
Acquisition of subsidiary - 19.59 - 19.59
Impairment charge - (9,900.00) - (9,900.00)
At 31 December 2005 6,445,734.66 1,030,700.17 - 7,476,434.83
Additions - 19,165.98 738,870.89 758,036.87
Disposals – Decreases - (19.59) - (19.59)
At 31 December 2006 6,445,734.66 1,049,846.56 738,870.89 8,234,452.11
Accumulated amortisation
At 1 January 2005 2,240,298.53 874,160.05 - 3,114,458.58
Amortisation charge 1,064,612.05 118,755.67 - 1,183,367.72
Acquisition of subsidiary - 734.99 - 734.99
At 31 December 2005 3,304,910.58 993,650.71 - 4,298,561.29
Amortisation charge 1,275,163.25 41,014.21 49,258.06 1,365,435.52
Depreciation of sold-write offs - (19.59) - (19.59)
Other movements (430.95) 430.95 - -
At 31 December 2006 4,579,642.88 1,035,076.28 49,258.06 5,663,977.22
Net book amount
At 31 December 2005 3,140,824.08 37,049.46 - 3,177,873.54
At 31 December 2006 1,866,091.78 14,770.28 689,612.83 2,570,474.89

Annual Report 2 0 0 6 29
fAnnual Financial Statements as at 31 December 2006
CompanyOwn-produced Acquired Royalties for use of
Computer Software Computer Software computer – Software Total
Amounts in e
Cost
At 1 January 2005 769,329.59 1,029,454.18 - 1,798,783.77
Additions 451,507.71 - - 451,507.71
At 31 December 2005 1,220,837.30 1,029,454.18 - 2,250,291.48
Additions - 16,745.00 738,870.89 755,615.89
At 31 December 2006 1,220,837.30 1,046,199.18 738,870.89 3,005,907.37
Accumulated amortisation
At 1 January 2005 126,471.43 874,160.05 - 1,000,631.48
Amortisation charge 42,013.64 118,244.67 - 160,258.31
Acquisition of subsidiary - - - -
At 31 December 2005 168,485.07 992,404.72 - 1,160,889.79
Amortisation charge 244,167.35 38,593.29 49,258.06 332,018.70
Other movements (430.95) 430.95 - -
At 31 December 2006 412,221.47 1,031,428.96 49,258.06 1,492,908.49
Net book amount
At 31 December 2005 1,052,352.23 37,049.46 - 1,089,401.69
At 31 December 2006 808,615.83 14,770.22 689,612.83 1,512,998.88

Annual Report 2 0 0 630
Annual Financial Statements as at 31 December 2006 f8. Goodwill
In the consolidated financial statements as at 31.12.2006 were included the following subsidiarycompanies:
Participation percentageSubsidiaries 31.12.2006 31.12.2005Financial Technologies S.A. 54.24% 54.24%Uni-Nortel Communication Technologies (Hellas) S.A. 70% 70%
In the previous year 2005, the Company increased its participation percentage in the company FinancialTechnologies S.A. by 9.24% and acquired participation percentage of 70% in the company Uni-NortelCommunication Technologies (Hellas) S.A. The fair value of these participations was lower than theiracquisition cost, having as a result to arise goodwill as follows:
Financial Uni-nortel TotalTechnologies S.A. Communication
31.10.2005 Technologies (Hellas) S.A.
31.7.2005Capitalisation of subsidiary's liability to the Company 550,005.51 - 550,005.51 Paid consideration to subsidiary - 850,000.00 850,000.00 Less:Fair value of acquired participation percentage 162,098.65 806,992.94 969,091.59 Goodwill 387,906.86 43,007.06 430,913.92
9. Deferred income tax assets
Income tax assets and liabilities (current and deferred) are offset when there is legally enforceable rightto offset tax assets against tax liabilities and when the income taxes relate to same fiscal authority.
The offset amounts, are as follows:
Group Company31.12.2006 31.12.2005 31.12.2006 31.12.2005
Deferred tax assets 2,021,682.18 1,412,574.78 1,044,205.20 1,183,215.58 Deferred tax liabilities (223,281.95) (81,563.06) (216,430.29) (78,100.51)
1,798,400.23 1,331,011.72 827,774.91 1,105,115.07
The movement of the offset balance of the account, is as follows:
Group Company31.12.2006 31.12.2005 31.12.2006 31.12.2005
Beginning of the year 1,331,011.72 1,108,181.48 1,105,115.07 1,098,192.36 Deferred tax - Income statement 508,188.14 142,980.06 177,057.61 (419,945.58)Deferred tax transferred directly to equity (40,799.63) 79,850.18 (454,397.77) 426,868.29 End of year 1,798,400.23 1,331,011.72 827,774.91 1,105,115.07

Annual Report 2 0 0 6 31
fAnnual Financial Statements as at 31 December 2006
The movement of the accounts of deferred income tax assets and deferred income taxes liabilities, duringthe year without taking into consideration the offsetting, is as follows:
Group
Balance Recognition Recognition Balance1.1.2006 in Income in 31.12.2006
Statement EquityDeferred tax assetsHeld for use PPE 97,424.00 - - 97,424.00 Measurement of securities 119,597.22 - (119,597.22) - Defined employee benefit obligations 472,935.64 33,013.83 (8,045.53) 497,903.94 Recognised tax losses 572,617.92 322,813.04 49,392.28 944,823.24 Provisions for contingent liabilities 150,000.00 331,531.00 - 481,531.00 Total Deferred tax assets 1,412,574.78 687,357.87 (78,250.47) 2,021,682.18
Deferred tax liabilitiesHeld for use PPE - 175,131.17 - 175,131.17Measurement of securities 75,728.84 - (36,434.89) 39,293.95 Provisions 727.99 - 1,019.18 1,747.17 Settlement of exchange differences 5,106.23 4,038.56 (2,035.13) 7,109.66 Total Deferred tax liabilities 81,563.06 179,169.73 (37,450.84) 223,281.95 Balance 1,331,011.72 508,188.14 (40,799.63) 1,798,400.23
Balance Recognition Recognition Balance1.1.2005 in Income in 31.12.2005
Statement EquityDeferred tax assetsHeld for use PPE 97,424.00 - - 97,424.00 Measurement of securities 3,281.33 116,315.89 119,597.22 Defined employee benefit obligations 886,346.75 (430,988.91) 17,577.80 472,935.64 Recognised tax losses - 572,617.92 - 572,617.92 Provisions for contingent liabilities 150,000.00 - - 150,000.00 Total Deferred 1,137,052.08 141,629.01 133,893.69 1,412,574.78 tax assets
Deferred tax liabilitiesMeasurement of securities 26,889.50 - 48,839.34 75,728.84 Provisions - 727.99 - 727.99 Settlement of exchange differences 1,981.10 (2,079.04) 5,204.17 5,106.23 Total Deferred 28,870.60 (1,351.05) 54,043.51 81,563.06 tax liabilitiesBalance 1,108,181.48 142,980.06 79,850.18 1,331,011.72

Annual Report 2 0 0 632
Annual Financial Statements as at 31 December 2006 fCompany
Balance Recognition Recognition Balance1.1.2006 in Income in 31.12.2006
Statement Equity Deferred tax assetsHeld for use PPE 97,424.00 - - 97,424.00 Measurement of securities 491,848.61 - (491,848.61) - Defined employee benefit obligations 443,942.97 21,307.23 - 465,250.20 Provisions for contingent liabilities 150,000.00 331,531.00 - 481,531.00 Total Deferred tax assets 1,183,215.58 352,838.23 (491,848.61) 1,044,205.20
Deferred tax liabilitiesHeld for use PPE - 175,131.17 - 175,131.17 Measurement of securities 76,744.79 - (37,450.84) 39,293.95 Settlement of exchange differences 1,355.72 649.45 - 2,005.17 Total Deferred tax liabilities 78,100.51 175,780.62 (37,450.84) 216,430.29
Balance 1,105,115.07 177,057.61 (454,397.77) 827,774.91
Balance Recognition Recognition Balance 1.1.2005 in Income in 31.12.2005
Statement Equity Deferred tax assetsHeld for use PPE 97,424.00 - - 97,424.00 Measurement of securities 15,125.03 - 476,723.58 491,848.61 Defined employee benefit obligations 864,513.93 (420,570.96) - 443,942.97 Provisions for contingent liabilities 150,000.00 - - 150,000.00 Total Deferred tax assets 1,127,062.96 (420,570.96) 476,723.58 1,183,215.58
Deferred tax liabilitiesMeasurement of securities 26,889.50 - 49,855.29 76,744.79 Settlement of exchange differences 1,981.10 (625.38) - 1,355.72 Total Deferred tax liabilities 28,870.60 (625.38) 49,855.29 78,100.51
Balance 1,098,192.36 (419,945.58) 426,868.29 1,105,115.07
According to the tax law, certain income is not taxed at the time of their acquirement, but during thetime of its distribution to shareholders. The accounting policy of the Company is to recognise deferredincome tax for this income, at the time of its distribution irrespective of the time of its acquirement.
The income tax rate, which the Company is subject to for the year 2006 is 29% (year 2005 32%). Accordingto the tax law in effect, the rates with which is taxed the income of Public Limited Companies (S.A.), isgradually reduced from 35% to 25%. In particular for the year 2006, it is reduced from 32% to 29%respectively, while from the year 2007 and after it is formed to 25%.

Annual Report 2 0 0 6 33
fAnnual Financial Statements as at 31 December 2006
Deferred income tax assets are recognised for tax loss carry-forwards to the extent that the realisation ofthe related tax benefit through the future taxable profits is probable.
10. Available-for-sale financial assets
The available-for-sale financial assets (securities) comprise:
Group Company31.12.2006 31.12.2005 31.12.2006 31.12.2005
Shares listed on ATHEX - 1,454,850.09 - 1,454,850.09 Mutual Fund Units 5,907,175.77 10,816,357.85 5,907,175.77 10,816,357.85 Unlisted shares 1,801,086.94 764,592.90 2,712,143.84 1,862,830.93 Total 7,708,262.71 13,035,800.84 8,619,319.61 14,134,038.87
The unlisted shares were measured at fair value. Their acquisition cost amounts at 31.12.2006 to e�7,356,364.50 and the provision for devaluation to e 4,644,220.66.
Analytically, the shares and securities held by the Company at 31.12.2006 have as follows:
% Acquisition Measurement Value Type Participation Cost differences 31.12.2006 NoteSharesFINANCIAL TECHNOLOGIES S.A. 54.24% 3,217,957.26 (2,779,796.09) 438,161.17 Full consolidation CREATIVE MARKETING S.A. 40% 692,589.87 (692,588.87) 1.00 Not consolidated ITEC S.A. 34% 726,450.47 (726,449.47) 1.00 Not consolidated UNI - NORTEL S.A. 70% 850,000.00 (377,104.27) 472,895.73 Full consolidation PARKMOBILE HELLAS S.A. 40% 800,000.00 (68,281.96) 731,718.04 Equity
method PROBANK S.A. <5% 570,000.00 - 570,000.00 ACROPOLIS PARK HIGH TECHNOLOGY S.A. <5% 499,366.90 - 499,366.90
7,356,364.50 (4,644,220.66) 2,712,143.84 MUTUAL FUND UNITSALPHA INCOME FOREIGN BONDS 5,750,000.00 157,175.77 5,907,175.77 Total 13,106,364.50 (4,487,044.89) 8,619,319.61
In the companies ITEC and Creative Marketing, despite the fact that the Company holds a significantpercentage in the Share Capital it does not have any significant effect, given that the shareholders thatrepresent the balance of the Share Capital of each company control these companies since together theyhold the balance of the Share Capital having the complete majority.
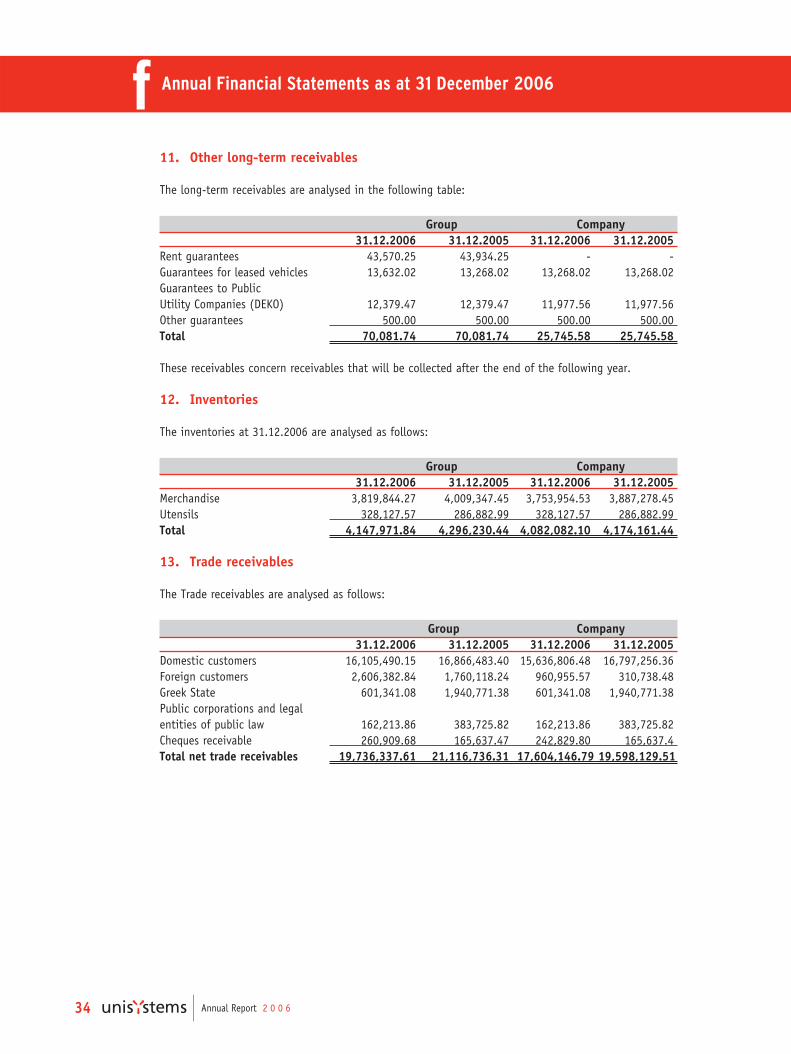
Annual Report 2 0 0 634
Annual Financial Statements as at 31 December 2006 f11. Other long-term receivables
The long-term receivables are analysed in the following table:
Group Company31.12.2006 31.12.2005 31.12.2006 31.12.2005
Rent guarantees 43,570.25 43,934.25 - - Guarantees for leased vehicles 13,632.02 13,268.02 13,268.02 13,268.02 Guarantees to Public Utility Companies (DEKO) 12,379.47 12,379.47 11,977.56 11,977.56 Other guarantees 500.00 500.00 500.00 500.00 Total 70,081.74 70,081.74 25,745.58 25,745.58
These receivables concern receivables that will be collected after the end of the following year.
12. Inventories
The inventories at 31.12.2006 are analysed as follows:
Group Company31.12.2006 31.12.2005 31.12.2006 31.12.2005
Merchandise 3,819,844.27 4,009,347.45 3,753,954.53 3,887,278.45Utensils 328,127.57 286,882.99 328,127.57 286,882.99Total 4,147,971.84 4,296,230.44 4,082,082.10 4,174,161.44
13. Trade receivables
The Trade receivables are analysed as follows:
Group Company31.12.2006 31.12.2005 31.12.2006 31.12.2005
Domestic customers 16,105,490.15 16,866,483.40 15,636,806.48 16,797,256.36Foreign customers 2,606,382.84 1,760,118.24 960,955.57 310,738.48Greek State 601,341.08 1,940,771.38 601,341.08 1,940,771.38Public corporations and legal entities of public law 162,213.86 383,725.82 162,213.86 383,725.82Cheques receivable 260,909.68 165,637.47 242,829.80 165,637.4Total net trade receivables 19,736,337.61 21,116,736.31 17,604,146.79 19,598,129.51

Annual Report 2 0 0 6 35
fAnnual Financial Statements as at 31 December 2006
14. Other receivables
The other receivables are analysed as follows:
Group Company 31.12.2006 31.12.2005 31.12.2006 31.12.2005
Advances to employees 33,759.21 47,032.14 27,346.08 44,900.00 Advances to beneficiaries of fees 34,230.00 65,459.28 34,230.00 65,459.28 Advances to suppliers 25,800.17 155,172.35 25,800.17 155,172.35 Prepaid & withheld taxes to Greek State 476,144.39 850,483.38 474,396.94 747,822.16 Blocked deposits - 800,000.00 - - Deferred charges and Sundry debtors 155,211.85 18,298.87 154,035.77 - Total 725,145.62 1,936,446.02 715,808.96 1,013,353.79
15. Cash and Cash equivalents
The cash and cash equivalents represent cash in hand of the Group companies, bank deposits, cash on firstdemand and have as follows:
Group Company31.12.2006 31.12.2005 31.12.2006 31.12.2005
Cash in hand 722,480.51 391,309.84 718,999.69 390,624.67Cash at bank - current - time 9,278,722.94 6,228,668.01 8,310,611.98 4,827,315.37Cash at bank - in F.C. 9,486.96 28,232.91 9,486.96 28,232.91Total 10,010,690.41 6,648,210.76 9,039,098.63 5,246,172.95
The deposits in F.C. were measured at the official exchange rate of 31.12.2006, while the arising foreignexchange gains and losses were recognised in the income statement.
16. Equity
i) Share capital – Share premium
The Company’s share capital at 31 December 2006 comprises of 38,512,300 ordinary registered shares ofpar value e 0.30 each. All shareholders are entitled to receive the dividends approved and have a votingright per share at the Meetings of the Company’s shareholders. All shares have equal treatment as regardsto the dividend policy of the Company. The total share capital amounts to e 11,553,690.00 and the sharepremium capital from the issue of shares above par to e 9,999,349.43.

Annual Report 2 0 0 636
Annual Financial Statements as at 31 December 2006 fii) Reserves (other)
The Company’s reserves are:
Group Company31.12.2006 31.12.2005 31.12.2006 31.12.2005
Legal reserve 2,978,971.11 2,770,527.75 2,976,317.14 2,767,873.78Special reserves 5,040,364.87 5,040,364.87 5,040,364.87 5,040,364.87Extraordinary reserves 3,383,906.38 3,383,906.38 3,383,906.38 3,383,906.38Reserves at fair value of available-for-salefinancial assets (1,301,156.51) (1,228,204.49) (4,458,056.87) (3,784,325.58)Reserves at fair value of assets 11,124,265.24 11,124,265.24 11,124,265.24 11,124,265.24Tax-free reserves 1,453,122.73 1,453,122.73 1,453,122.73 1,453,122.73Reserves from tax exempted income 832,094.32 821,805.77 832,094.32 821,805.77Reserves from income taxed at special provisions 115,005.10 115,005.11 115,005.10 115,005.10Total 23,626,573.24 23,480,793.36 20,467,018.91 20,922,018.29
The legal reserve is set up, based on L. 2190/1920, with withholding of 5% from the net profit after taxesand before the distribution of dividend, up until it covers the 1/3 of the paid-up share capital.
The special and extraordinary reserves derive from the taxable profit and can be distributed uponresolution of the General Meeting of shareholders, without any tax charge.
The tax-free reserves derive from the gain on sale of securities and from interest income that have beentaxed at special provisions. In the case of the distribution of this amount, it will be taxed with theeffective tax rate of that year.
iii) Retained earnings
In the year 2006, the Group and the Company realised a profitable result of e 2,843,803.19 and e3,878,680.18 respectively, which together with the profit of prior years formed the retained earnings at31.12.2006 of the Group and the Company to e 4,040,339.05 and e�6,769,009.96 respectively.
17. Retirement benefit obligations
The Company recognises, as retirement benefit obligation, the present value of the legal commitment thatit has assumed for the payment of a lump sum compensation to retired personnel. The relative obligationwas determined based on actuarial calculations. in particular, the relative calculation concerned thecalculation of the actuarial sizes required from the specifications placed by the International AccountingStandards (IAS 19) and is mandatory to be recognised in the balance sheet and income statement of eachenterprise.
According to the actuarial calculation carried out by an independent actuary, the enterprise does notofficially or unofficially apply any special benefit plan towards its employees, which may commit it againstbenefits in the cases of staff retirement. The only plan in effect is the contractual obligation based onthe legislation L. 2112/1920 and 3198/1955 in effect concerning provision of lump sum in case ofemployee retirement.

Annual Report 2 0 0 6 37
fAnnual Financial Statements as at 31 December 2006
The relative obligation of the Company, is analysed as follows:
Group Company31.12.2006 31.12.2005 31.12.2004 31.12.2006 31.12.2005 31.12.2004
Present value of accrued liabilities 1,542,324.88 1,859,560.45 3,541,299.74 1,411,709.94 1,775,771.91 3,458,055.73Fair value of plan assets - - - - - -
1,542,324.88 1,859,560.45 3,541,299.74 1,411,709.94 1,775,771.91 3,458,055.73Unrecognised actuarial profit/(losses) 449,290.90 - - 449,290.90 - - Liability in the balance sheet 1,991,615.78 1,859,560.45 3,541,299.74 1,861,000.84 1,775,771.91 3,458,055.73
The movement of the above balance, as well as the amounts recognised in the income statement is asfollows:
Group CompanyBalance of obligation at 1.1.2004 3,412,751.33 3,276,177.19 Service cost period 1.1-31.12.2004 123,689.73 121,927.31 Finance cost period 1,1-31.12.2004 60,844.44 59,951.23 Benefits paid period 1.1-31.12.2004 (55,985.76) - Balance of obligation at 31.12.2004 3,541,299.74 3,458,055.73 Service cost period 1.1-31.12.2005 129,601.54 126,114.31 Finance cost period 1.1-31.12.2005 63,752.09 62,009.95 Acquisition of subsidiary 70,311.19 - Benefits paid period 1.1-31.12.2005 (1,945,404.11) (1,870,408.08)Balance of obligation at 31.12.2005 1,859,560.45 1,775,771.91 Service cost period 1.1-31.12.2006 174,732.19 130,014.75 Finance cost period 1.1-31.12.2006 70,488.75 63,927.79 Unused provisions for employee retirement benefits (562,456.51) (558,004.51)Unrecognised actuarial profit/(losses) 449,290.90 449,290.90 Balance of obligation 31.12.2006 1,991,615.78 1,861,000.84
Group CompanyIncome Statement 1.1.-31.12.2006 1.1.-31.12.2005 1.1.-31.12.2004 1.1.-31.12.2006 1.1.-31.12.2005 1.1.-31.12.2004 Current service cost 174,732.19 129,601.54 123,689.73 130,014.75 126,114.31 121,927.31 Interest cost 70,488.75 63,752.09 60,844.44 63,927.79 62,009.95 59,951.23 Net actuarial losses recognised during the period - - - - - - Total (included in staff costs) 245,220.94 193,353.63 184,534.17 193,942.54 188,124.26 181,878.54
The principal actuarial assumptions used for the above accounting purposes are as follows:
Group CompanyAssumptions 31.12.2006 31.12.2005 31.12.2004 31.12.2006 31.12.2005 31.12.2004Discount rate 4.10% 3.60% 3.60% 4.10% 3.60% 3.60%Future salary increases 3.00% 3.00% 3.00% 3.00% 3.00% 3.00%Average remaining service life 10.17 11.91 11.91 10.17 11.91 11.91

Annual Report 2 0 0 638
Annual Financial Statements as at 31 December 2006 f18. Government grants relating to assets
The movement of government grants relating to assets is analysed as follows:
Group Company Balance at 1.1.2005 313,058.19 313,058.19 Receipts period 1.1-31.12.2005 91,995.25 91,995.25 Transfer to income statement at 1.1-31.12.2005 (30,571.34) (30,571.34)Balance at 31.12.2005 374,482.10 374,482.10 Receipts period 1.1-31.12.2006 161,679.22 161,679.22 Transfer to income statement at 1.1-31.12.2006 (100,920.90) (100,920.90)Balance at 31.12.2006 435,240.42 435,240.42
19. Other non-current liabilities
Group Company31.12.2006 31.12.2005 31.12.2006 31.12.2005
Contingent liabilities 1,926,124.00 1,076,124.27 1,926,124.00 1,076,124.27Total 1,926,124.00 1,076,124.27 1,926,124.00 1,076,124.27
The balance concerns additional amounts, beyond the contractual, that are paid to employees atretirement or any other contingent liabilities according as much as defines IFRS 37 "Contingent Assetsand Contingent Liabilities".
20. Trade and other payables
The balance is analysed as follows:
Group Company31.12.2006 31.12.2005 31.12.2006 31.12.2005
Trade payables - domestic 3,315,461.89 4,257,167.24 4,068,800.83 4,457,231.57 Trade payables - foreign 4,802,889.46 4,585,148.58 1,360,990.09 1,522,841.36 Cheques payable 34,558.56 62,364.96 34,558.56 34,884.36 Total 8,152,909.91 8,904,680.78 5,464,349.48 6,014,957.29

Annual Report 2 0 0 6 39
fAnnual Financial Statements as at 31 December 2006
21. Borrowings
Borrowings are analysed as follows:
Group Company 31.12.2006 31.12.2005 31.12.2006 31.12.2005
Borrowings Bank Borrowings _ ALPHA BANK 588,736.37 600,082.98 - - _ EFG 221,444.91 331,188.59 - - Total bank borrowings 810,181.28 931,271.57 - -
The maturity of the total borrowings is the following:
Up until 6 6 to 12 12 to 24 Group months months months Total 31.12.2005 Total current borrowings - 931,271.57 - 931,271.57 31.12.2006 Total current borrowings 810,181.28 - - 810,181.28
22. Current Income tax liabilities
The balance of the account concerns:
Group Company31.12.2006 31.12.2005 31.12.2006 31.12.2005
Current income tax year 624,070.97 1,211,953.50 624,070.97 1,211,953.50Total 624,070.97 1,211,953.50 624,070.97 1,211,953.50
The tax returns of the Company are submitted, annually, but the profit or losses declared are deemedtemporary up until the time when the tax authorities will examine the returns and accounting books ofthe Company and will finalize the taxes.
From the tax audit carried out of the years 2003, 2004 and 2005, which was finalized within the monthof July 2006, additional income tax and large property tax was assessed, totalling e�352,651.00 whichwas recognised in the results of the current year 2006.

Annual Report 2 0 0 640
Annual Financial Statements as at 31 December 2006 fThe tax returns and the accounting books of the other consolidated companies have not been examinedfor the years, as follows:
Consolidated companies Un-audited tax years
1. Unisystems Information Systems S.A. 20062. Financial Technologies S.A. (FIT) 2003-20063. Uni-Nortel Communication Technologies (Hellas) S.A. 2003-20064. ParkMobile Hellas S.A. -
23. Other current liabilities
The other current liabilities are analysed as follows:
Group Company31.12.2006 31.12.2005 31.12.2006 31.12.2005
Wages and salaries payable 158,754.19 - 158,754.19 - Social Security Institution (IKA) 468,027.23 442,180.43 385,835.75 364,262.85 Other Pension Funds of main insurance 37,816.73 33,859.37 26,364.04 23,313.82 V.A.T. liability 714,977.93 723,519.24 691,939.96 656,105.30 Taxes-duties on staff costs 700,644.02 518,694.69 618,613.85 429,862.80 Taxes-duties on third parties' fees 24,937.30 27,740.30 22,237.30 19,341.46 Surplus tax on property - 228,506.90 - 228,506.90 Other taxes-duties 25,315.36 1,850.84 22,432.36 1,850.84 Other sundry creditors 115,432.68 108,126.11 109,806.73 105,863.34 Accrued expenses (payable) - 900,000.00 - 900,000.00 Deferred income 12,000.00 - - - Other liabilities 2,000.00 28,703.38 - - Advances to customers 4,180,373.32 1,410,604.31 4,180,373.32 1,274,245.12 Total 6,440,278.76 4,423,785.57 6,216,357.50 4,003,352.43

Annual Report 2 0 0 6 41
fAnnual Financial Statements as at 31 December 2006
24. Sales
Group CompanySales 1.1. - 31.12.2006 1.1. - 31.12.2005 1.1. - 31.12.2006 1.1. - 31.12.2005 Sales of merchandise 27,652,931.61 22,593,466.80 27,774,450.61 22,612,108.85 Sales of network products 1,391,031.17 371,994.26 - - Rendering of services 23,360,719.96 21,366,667.70 23,047,948.55 21,110,245.93 Total 52,404,682.74 44,332,128.76 50,822,399.16 43,722,354.78
Group CompanySales per STAKOD-03 1.1. - 31.12.2006 1.1. - 31.12.2005 1.1. - 31.12.2006 1.1. - 31.12.2005 Wholesale of Computers & Peripheral equipment (518.4) 12,227,876.99 19,532,753.61 12,236,446.19 19,551,395.66 Wholesale of other electronic appliances and equipment ( 518.6) 1,405,829.57 371,994.26 - - Rendering of consulting services for information technology materials (721.0) 4,252,753.10 4,102,155.11 4,252,753.10 4,104,004.46 Rendering of consulting services on software & supply of software issues (722.9) 15,486,974.79 3,171,543.21 15,510,679.90 3,060,994.60 Maintenance & repair of software equipment (725.0) 18,694,771.77 17,004,110.71 18,822,519.97 17,005,960.06 Other activities similar to software (726.0) 336,476.52 149,571.86 - - Total 52,404,682.74 44,332,128.76 50,822,399.16 43,722,354.78
25. Cost of goods sold
The analysis of expenses, per category, which compose the cost of goods sold has as follows:
Group Company 1.1. - 31.12.2006 1.1. - 31.12.2005 1.1. - 31.12.2006 1.1. - 31.12.2005
Consumables 21,862,499.47 17,008,684.90 21,114,868.54 17,463,995.33 Staff costs (Note 26) 8,431,692.65 8,598,738.55 8,080,232.47 7,761,357.24 Third party fees and expenses 7,944,237.01 6,412,053.04 8,692,265.23 6,362,506.39 Third party utilities and services 466,360.96 647,882.20 418,976.63 427,170.98 Taxes - duties 34,957.45 42,567.96 36,238.55 35,993.90 Sundry expenses 337,673.75 419,326.75 362,472.29 362,158.66 Depreciation - Amortisation (Note 27) 701,667.79 772,303.88 681,743.09 723,288.41
39,779,089.08 33,901,557.28 39,386,796.80 33,136,470.91 Less: own-used materials (164,196.06) (277,756.03) (164,196.06) (277,756.03)Total 39,614,893.02 33,623,801.25 39,222,600.74 32,858,714.88

Annual Report 2 0 0 642
Annual Financial Statements as at 31 December 2006 f26. Employee benefit expense
The number of employed personnel at 31.12.2006 is analysed as follows:
Group Company1.1. - 31.12.2006 1.1. - 31.12.2005 1.1. - 31.12.2006 1.1. - 31.12.2005
Salaried personnel 308 301 263 254 Wage – earners - - - - Total 308 301 263 254
The benefits to the personnel are analysed as follows:
Group Company1.1. - 31.12.2006 1.1. - 31.12.2005 1.1. - 31.12.2006 1.1. - 31.12.2005
Salaries, Wages & benefits 10,064,714.34 11,475,957.55 9,318,869.78 9,336,652.84Social security costs 2,218,265.86 2,160,442.38 1,816,486.85 1,761,789.54Other expenses & benefits to personnel 645,295.14 842,173.96 614,429.60 842,173.96Employee defined benefit obligations 245,220.94 193,353.63 193,942.54 188,124.26 Total 13,173,496.28 14,671,927.52 11,943,728.77 12,128,740.60
27. Depreciation and impairment of PPE and intangible assets
The depreciation and the impairments charged to the income statement, are analysed as follows:
Group Company 1.1. - 31.12.2006 1.1. - 31.12.2005 1.1. - 31.12.2006 1.1. - 31.12.2005
Depreciation of property, plant and equipment 1,419,803.14 1,383,123.31 1,338,759.55 1,281,521.37 Amortisation of intangible assets 1,365,435.52 1,183,367.72 332,018.70 160,258.31 Impairment of intangible assets - 4,125.00 - - Depreciation of granted PPE and intangible assets (100,920.90) (30,571.34) (100,920.90) (30,571.34)Total depreciation and impairments 2,684,317.76 2,540,044.69 1,569,857.35 1,411,208.34 Less: amounts charged to the production cost (701,667.79) (772,303.88) (681,743.09) (723,288.41)Plus: amounts credited to other income 100,920.90 30,571.34 100,920.90 30,571.34 Total depreciation and impairments charged to the Administrative expenses, Selling and Marketing costs and Research costs 2,083,570.87 1,798,312.15 989,035.16 718,491.27

Annual Report 2 0 0 6 43
fAnnual Financial Statements as at 31 December 2006
28. Other income/(expenses)
The other income/(expenses) of the Company is analysed as follows:
Group Company1.1. - 31.12.2006 1.1. - 31.12.2005 1.1. - 31.12.2006 1.1. - 31.12.2005
Other income Subsidies of operating expenses 13,763.86 59,383.37 12,129.26 48,564.14 Depreciation of grants relating to assets (Note 18) 100,920.90 30,571.34 100,920.90 30,571.34 Insurance reimbursements 13,760.00 4,320.00 13,760.00 4,320.00 Income from rent 17,674.39 31,872.04 20,114.92 31,872.04 Profit from sale of non-current assets 4,910.57 2,730.09 - 2,630.09 Income from unused provisions 4,452.00 2,196,781.69 - 2,140,632.24 Income from rendering accounting services - 35,313.92 - 35,313.92 Discount of lump sum settlement of taxes - duties 18,017.52 10,288.55 18,017.52 10,288.55 Other income 75,042.61 5,614.69 50,542.88 5,442.86
248,541.85 2,376,875.69 215,485.48 2,309,635.18Other expenses Tax fines & penalties (2,320.78) (848.40) (1,420.78) (646.17)Loss on sale and destruction of non-current assets (1,651.61) (2,220.30) (354.78) (2,220.30)Forfeiture - (654.17) - - Taxes - duties - previous years (20,416.34) (9,848.64) (20,416.34) (9,848.64)Other expenses (3,010.28) (15,549.44) (1,327.48) (15,547.63)
(27,399.01) (29,120.95) (23,519.38) (28,262.74)
Total income/(expense) - net 221,142.84 2,347,754.74 191,966.10 2,281,372.44
29. Administrative expenses, Selling and Marketing costs and Research costs
The analysis of the administrative expenses, selling and marketing costs and research costs are analysedas follows:
Group CompanyAdministrative expenses 1.1. - 31.12.2006 1.1. - 31.12.2005 1.1. - 31.12.2006 1.1. - 31.12.2005 Staff costs (Note 26) 1,268,483.89 1,697,946.95 936,142.01 1,382,096.81 Third party fees and expenses 791,612.46 546,760.23 606,703.98 467,523.28 Third party utilities and services 272,156.97 350,689.26 222,533.43 312,309.37 Taxes - duties 93,468.29 102,639.31 90,096.64 99,296.58 Sundry expenses 311,484.55 271,100.14 263,151.04 254,115.68 Depreciation - Amortisation (Note 27) 452,282.43 458,930.98 442,741.21 446,474.47 Total 3,189,488.59 3,428,066.87 2,561,368.31 2,961,816.19

Annual Report 2 0 0 644
Annual Financial Statements as at 31 December 2006 fGroup Company
Selling and marketing costs 1.1. - 31.12.2006 1.1. - 31.12.2005 1.1. - 31.12.2006 1.1. - 31.12.2005Staff costs (Note 26) 3,255,156.02 3,154,969.36 2,709,905.81 2,728,641.26 Third party fees and expenses 178,842.42 102,602.92 268,931.31 95,203.49 Third party utilities and services 159,896.23 188,709.55 101,963.85 145,832.06 Taxes - duties 20,522.97 25,928.67 16,343.80 22,202.13 Sundry expenses 429,957.42 404,677.73 331,663.94 325,816.20 Depreciation - Amortisation (Note 27) 230,441.82 217,075.70 210,161.76 205,640.16 Operating provisions - 1,036.98 - - Total 4,274,816.88 4,095,000.91 3,638,970.47 3,523,335.30
Group Company Research costs 1.1. - 31.12.2006 1.1. - 31.12.2005 1.1. - 31.12.2006 1.1. - 31.12.2005 Staff costs (Note 26) 218,163.72 1,220,272.66 217,448.48 256,645.29 Third party fees and expenses 74,957.10 43,638.84 33,286.00 144.56 Third party utilities and services 184,053.90 107,303.96 4,728.10 2,880.17 Taxes - duties 5,679.10 3,391.66 377.94 419.49 Sundry expenses 51,791.54 32,818.01 22,080.16 4,958.52 Depreciation - Amortisation (Note 27) 1,400,846.62 1,122,305.47 336,132.19 66,376.64 Total 1,935,491.98 2,529,730.60 614,052.87 331,424.67 Own production or improvements of software - (1,175,707.52) - - Total 1,935,491.98 1,354,023.08 614,052.87 331,424.67
30. Finance costs-profit/(expenses)
The analyses of the financial result has as follows:
Group Company 1.1. - 31.12.2006 1.1. - 31.12.2005 1.1. - 31.12.2006 1.1. - 31.12.2005
Finance profit Bank interest & time depositsand other finance profit 13,202.38 2,541.23 2,172.30 897.35 Interest on bonds - 49,184.29 - 49,184.29 Exchange differences 243,761.94 20,961.12 165,192.83 30,386.07
256,964.32 72,686.64 167,365.13 80,467.71 Finance expenses Interest on current borrowings (81,092.30) (97,553.51) - - Commissions on letters of guarantee (147,627.76) (106,753.61) (146,397.76) (105,853.61)Sundry bank expenses& other similar expenses (105,500.51) (36,652.46) (98,453.86) (33,961.43)
(334,220.57) (240,959.58) (244,851.62) (139,815.04)Finance costs-profit/(expenses) - net (77,256.25) (168,272.94) (77,486.49) (59,347.33)
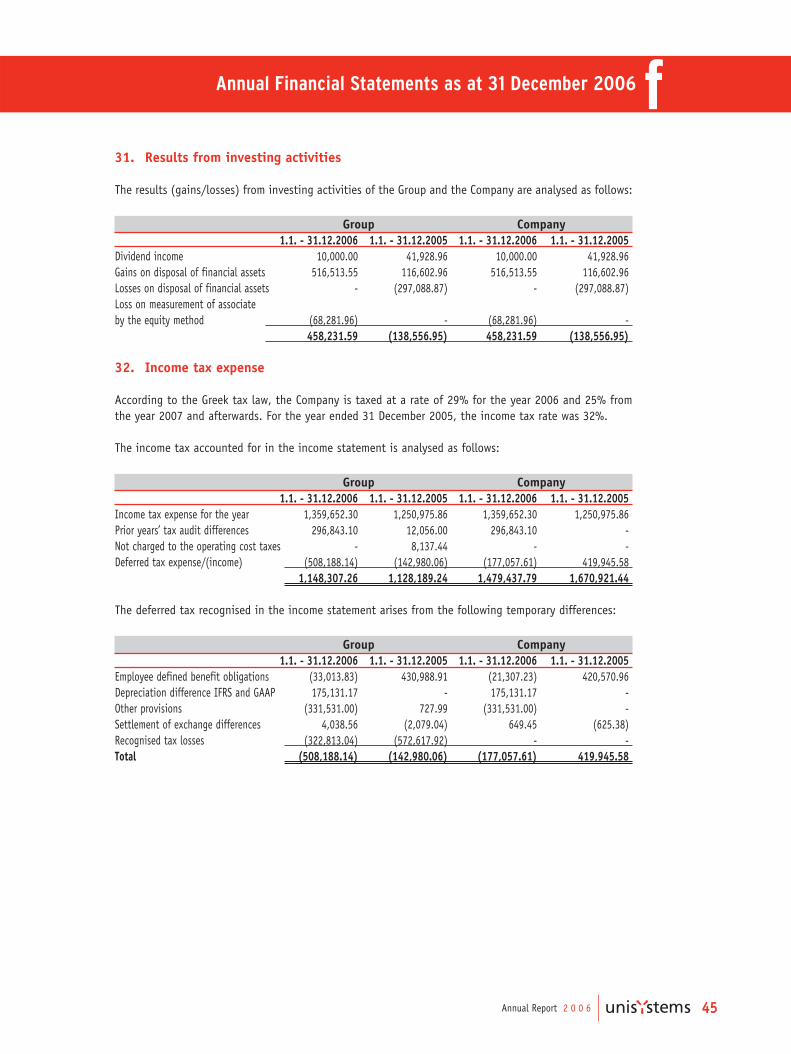
Annual Report 2 0 0 6 45
fAnnual Financial Statements as at 31 December 2006
31. Results from investing activities
The results (gains/losses) from investing activities of the Group and the Company are analysed as follows:
Group Company1.1. - 31.12.2006 1.1. - 31.12.2005 1.1. - 31.12.2006 1.1. - 31.12.2005
Dividend income 10,000.00 41,928.96 10,000.00 41,928.96 Gains on disposal of financial assets 516,513.55 116,602.96 516,513.55 116,602.96 Losses on disposal of financial assets - (297,088.87) - (297,088.87)Loss on measurement of associateby the equity method (68,281.96) - (68,281.96) -
458,231.59 (138,556.95) 458,231.59 (138,556.95)
32. Income tax expense
According to the Greek tax law, the Company is taxed at a rate of 29% for the year 2006 and 25% fromthe year 2007 and afterwards. For the year ended 31 December 2005, the income tax rate was 32%.
The income tax accounted for in the income statement is analysed as follows:
Group Company1.1. - 31.12.2006 1.1. - 31.12.2005 1.1. - 31.12.2006 1.1. - 31.12.2005
Income tax expense for the year 1,359,652.30 1,250,975.86 1,359,652.30 1,250,975.86 Prior years’ tax audit differences 296,843.10 12,056.00 296,843.10 - Not charged to the operating cost taxes - 8,137.44 - - Deferred tax expense/(income) (508,188.14) (142,980.06) (177,057.61) 419,945.58
1,148,307.26 1,128,189.24 1,479,437.79 1,670,921.44
The deferred tax recognised in the income statement arises from the following temporary differences:
Group Company1.1. - 31.12.2006 1.1. - 31.12.2005 1.1. - 31.12.2006 1.1. - 31.12.2005
Employee defined benefit obligations (33,013.83) 430,988.91 (21,307.23) 420,570.96 Depreciation difference IFRS and GAAP 175,131.17 - 175,131.17 - Other provisions (331,531.00) 727.99 (331,531.00) -Settlement of exchange differences 4,038.56 (2,079.04) 649.45 (625.38)Recognised tax losses (322,813.04) (572,617.92) - - Total (508,188.14) (142,980.06) (177,057.61) 419,945.58

Annual Report 2 0 0 646
Annual Financial Statements as at 31 December 2006 fThe tax on the Company’s profit before taxes differs from the theoretical amount that would arise usingthe weighted average tax rate applicable to profits. The difference has as follows:
Group Company1.1. - 31.12.2006 1.1. - 31.12.2005 1.1. - 31.12.2006 1.1. - 31.12.2005
Profit/(loss) before taxes 3,992,110.45 3,872,161.50 5,358,117.97 6,130,531.90 Tax calculated at domestic tax rates applicable to profits in the respective countries (2006 rate 29% & 2005 rate 32%) 1,157,712.03 1,239,091.68 1,553,854.21 1,961,770.20 Increase/decrease of tax from: Income not subject to tax (556,990.05) (78,779.36) (556,990.05) (46,860.71)Expenses not deductible for tax purposes 120,345.51 541,650.84 108,040.29 537,532.37 Part of tax-free profit attributable to parties 41,636.58 46,897.80 41,636.58 46,897.80 Income from taxed provisions of previous years - (835,919.64) - (835,919.64)Tax losses for which no deferred income tax asset was recognised - 164,901.68 - - Difference of tax rate for the year with the rate used for the calculation of deferred tax for the period 81,035.65 35,542.26 28,329.22 - Permanent differences from adjustments to IFRS - 7,352.23 - 49.65 Prior years’ tax audit differences 296,843.10 - 296,843.10 - Other tax adjustments 7,724.44 7,451.75 7,724.44 7,451.77 Income tax expense recognised in income statement 1,148,307.26 1,128,189.24 1,479,437.79 1,670,921.44
33. Earnings per share
Basic
Basic earnings per share is calculated by dividing the profit attributable to equity holders of the parentcompany by the weighted average number of ordinary shares in issue during the year, excluding ordinaryshares purchased by the company and held as treasury shares.
Diluted
Diluted earnings per share is calculated by adjusting the weighted average number of ordinary sharesoutstanding to assume conversion of all dilutive potential ordinary shares. The Company does not havesuch categories of dilutive potential ordinary shares, and, as a consequence, the basic and dilutedearnings per share is equal.

Annual Report 2 0 0 6 47
fAnnual Financial Statements as at 31 December 2006
Group Company1.1-31.12.2006 1.1-31.12.2005 1.1-31.12.2006 1.1-31.12.2005
Profit before taxes 3,992,110.45 3,872,161.50 5,358,117.97 6,130,531.90 Taxes (1,148,307.26) (1,128,189.24) (1,479,437.79) (1,670,921.44)Profit after taxes 2,843,803.19 2,743,972.26 3,878,680.18 4,459,610.46
Attributable to: Equity holders of the Company (1) 3,260,678.64 3,510,512.96 3,878,680.18 4,459,610.46 Minority interest (2) (416,875.45) (766,540.70) - -
2,843,803.19 2,743,972.26 3,878,680.18 4,459,610.46
Number of shares in issue (3 38,512,300 38,512,300 38,512,300 38,512,300
Weighted average number of shares in issue (4) 38,512,300 38,512,300 38,512,300 38,512,300
Basic earnings per share attributable to equity holders (1)/(3) 0.08 0.09 0.10 0.12
34. Related – party transactions
The Company has carried out transactions with related parties such as its shareholders, subsidiaries,associates, members of the Board of Directors, etc.
The intercompany transactions of the Group and the Company has as follows:
Group Company1.1. - 31.12.2006 1.1. - 31.12.2005 1.1. - 31.12.2006 1.1. - 31.12.2005
Sales of goods and services 1,049,900.68 2,180,478.10 1,393,839.19 2,202,818.85 Purchases of goods and services 205,000.00 192,000.00 3,152,217.45 950,053.15 Transactions and directors and key management compensation 1,325,238.96 1,556,390.41 1,265,483.06 1,295,754.94
The above transactions were carried out based on current market terms.
The Year-end balances arising from related-party transactions has as follows:
Group Company 31.12.2006 31.12.2005 31.12.2006 31.12.2005
Receivables from related parties 1,829,553.44 2,962,121.89 2,197,366.78 3,104,060.62 Payables to related parties 15,899.20 17,765.70 792,056.23 90,332.17
There were no loans issued to directors or other key management (and their families).
There were no loans granted to related parties.

Annual Report 2 0 0 648
Annual Financial Statements as at 31 December 2006 f35. Commitments and Contingencies
Operating lease commitments – Where the Company is the lessee
The future minimum lease payments under signed operating lease agreements are as follows:
Group Company2007 2008 2007 2008
Lease rentals – Office space 269,734.26 279,174.95 - - Total 269,734.26 279,174.95 - -
Finance lease commitments
The Company has no finance lease agreements.
Legal matters
The Company encounters certain claims and third party legal actions within the ordinary course ofbusiness. According to management, following the opinion of its legal advisors, the final arrangement ofthese matters is not expected to have a material effect on the financial position or operation of theCompany.
Information in respect of contingent liabilities
The Company and the Group have given at 31.12.2006 and 31.12.2005 per Bank the following letters ofguarantee:
31.12.2006 Participation Received Good
in bids advances performance Total Alpha Bank 8,075,006.81 7,844,876.78 5,589,850.43 21,509,734.02 General Bank of Greece 90,886.00 - 4,877.00 95,763.00 Aspis Bank - - 551.72 551.72 Total 8,165,892.81 7,844,876.78 5,595,279.15 21,606,048.74
31.12.2005 Participation Received Good
in bids advances performance Total Alpha Bank 9,608,337.83 4,963,903.12 3,603,120.60 18,175,361.55 General Bank of Greece 40,000.00 - 44,644.20 84,644.20 Aspis Bank - - 551.72 551.72 Total 9,648,337.83 4,963,903.12 3,648,316.52 18,260,557.47

Annual Report 2 0 0 6 49
fAnnual Financial Statements as at 31 December 2006
There are no disputed or under arbitration cases of national or arbitral courts that may have a materialeffect on the financial position or operation of the company.
There are no real mortgages and pre-notices or any other liens registered on non-current assets forsecuring bank borrowings.
The Company in the year 2006 has given guarantees to Banks in favour of its subsidiary companies of atotal amount e 800,000.00 and e�1,200,000.00 respectively (2005 e�0.00).
36. Fair value of financial instruments
The International Financial Reporting Standards require the enterprises to disclose the fair value of financialinstruments so that of financial assets as also that of financial liabilities, for which it can practically bedetermined a fair value, either these are recognised or not recognised in the Balance Sheet.
Management deems that for the items whose fair value is not disclosed in the financial statements, thecarrying amount as of 31 December 2006 for the financial assets and liabilities approximates their fairvalue, since the largest part of these have maturities of less than 12 months.
The fair value of the off balance sheet items does not have a significant effect.
The determination of the fair values is carried out at a particular time period based on relevant informationof quoted market prices used for financial instruments. These estimates are subjective by nature and inhereuncertainties and issues of critical accounting estimates and judgements and, therefore, cannot be madeout accurately.

Annual Report 2 0 0 650
Annual Financial Statements as at 31 December 2006 f37. Restatement of certain items of the individual and consolidated financial
statements for the results of the year 2006
Individual Income Statement 1.1-31.12.2006Published Restated
items Restatements itemsSales 43,722,354.78 - 43,722,354.78 Cost of goods sold (32,858,714.88) - (32,858,714.88)Gross profit 10,863,639.90 - 10,863,639.90 Other income/(expenses)-net 2,142,815.49 138,556.95 2,281,372.44 Administrative expenses (2,961,816.19) - (2,961,816.19)Research and development costs (331,424.67) - (331,424.67)Selling and marketing costs (3,523,335.30) - (3,523,335.30)Earnings before taxes,financing and investment results 6,189,879.23 138,556.95 6,328,436.18 Finance costs – profit/(expenses) (59,347.33) - (59,347.33)Results from investing activities - (138,556.95) (138,556.95)Profit before income tax 6,130,531.90 - 6,130,531.90 Income tax expense (1,670,921.44) - (1,670,921.44)Profit after tax 4,459,610.46 - 4,459,610.46
Consolidated Income Statement 1.1-31.12.2005Published Restated
items Restatements itemsSales 44,332,128.76 - 44,332,128.76 Cost of goods sold (33,623,801.25) - (33,623,801.25)Gross profit 10,708,327.51 - 10,708,327.51 Other income/(expenses)-net 2,209,197.79 138,556.95 2,347,754.74 Administrative expenses (3,428,066.87) - (3,428,066.87)Research and development costs (1,354,023.08) - (1,354,023.08)Selling and marketing costs (4,095,000.91) - (4,095,000.91)Earnings before taxes,financing and investment results 4,040,434.44 138,556.95 4,178,991.39 Finance costs – profit/(expenses) (168,272.94) - (168,272.94)Results from investing activities - (138,556.95) (138,556.95)Profit before income tax 3,872,161.50 - 3,872,161.50 Income tax expense (1,128,189.24) - (1,128,189.24)Profit after tax 2,743,972.26 - 2,743,972.26
With this restatement were made certain re-statements of income and expenses between the accountOther income/(expenses) and the results from investing activities for reasons of comparability with thepresent period.

Annual Report 2 0 0 6 51
fAnnual Financial Statements as at 31 December 2006
38. Events after the balance sheet date
There are no events after the financial statements date, in respect of which a reference or a correctionshould be made in these financial statements, according to the International Financial ReportingStandards.
It is certified that the integrated financial statements on pages 5 to 50 are those which were approvedat the of 28 February 2007 meeting of the Board of Directors of the Company.
Athens, 28 February 2007
The Chairman of the The Managing Director The Director of FinancialBoard of Directors and Administrative Services
and Member of the B. of D.
Dimitrios M. Liaroutsos Georgios K. Deligiannis Apostolos D. LafogiannisID. No. ∞∂ 063040 ID. No. X 678697 ID. No. ¡ 443900/87
E.C.G. License No. 4754 A’ Class
The above Financial Statements (pages 5 to 50) are those referred to in our Auditor’s Report dated 2 March 2007.
Athens, 2 March 2007
VASILIOS I. LOUMIOTISCertified Public Accountant Auditor
SOEL Reg. No. 11231SOL S.A. – Certified Public Accountants Auditors

g

Table of the Company's transactions with affiliated companies or joint ventures g
Annual Report 2 0 0 6 1

In 2006, the Company proceeded in the following transactions with affiliatedcompanies or joint ventures.
Corporate Name Receivables Liabilities Sales PurchasesFINANCIAL TECHNOLOGIES S.A. 252,553.75 80,149.79 211,951.50 2,383,620.93UNI-NORTEL COMMUNICATIONS TECHNOLOGIES S.A. 115,259.59 696,007.24 131,987.01 563,596.52DRIMIOTIS AND ASSOCIATES SINGLE-MEMBER LIMITED LIABILITY COMPANY 2,850.00 9,707.50 2,395.00 205,000.00ITEC VOCATIONAL TRAINING CENTRE FOR INFORMATION TECHNOLOGY S.A. - 3,660.00 - -CREATIVE MARKETING S.A. - 2,531.70 - -Unisystems S.A. - Singular integrator S.A. Joint Venture (Computerisation of the Central Service of the Criminal Register of the Hellenic Ministry of Justice) 973,877.04 - 17,786.67 -Unisystems S.A. - Singular integrator S.A. Joint Venture (Computerisation of the Service of the Criminal Register of the Prosecutors of the Courts of First Instance of six cities) 852,826,40 - 1,029,719,01 -Totals 2,197,366.78 792,056.23 1,393,839.19 3,152,217.45
All transactions have been completed under normal market conditions.
Table of the Company's transactions
with affiliated companies or joint ventures
Annual Report 2 0 0 62
g

Information published by Unisystems during 2006Article 10 of Law 3401/2005 h
Annual Report 2 0 0 6 1

2
Information published by Unisystems during 2006
Matter DateDisclosure of Transactions 26-1-2006Disclosure of Transactions 27-1-2006Disclosure of Transactions 27-1-2006Disclosure of Transactions 8-2-2006Disclosure of Transactions 8-2-2006Disclosure of Transactions 20-2-2006Disclosure of Transactions 20-2-2006Disclosure of Transactions 23-2-2006Disclosure of Transactions 23-2-2006Announcement of Other Significant Events 23-3-2006Announcement of Other Significant Events 23-3-2006Information of Financial Statements as these have been prepared according to I.A.S. as of 31/12/2005 30-3-2006Information of Consolidated Financial Statements as these have been prepared according to I.A.S. as of 31/12/2005 30-3-2006Announcement of Other Significant Events 31-3-2006Information of Financial Statements as these have been prepared according to I.A.S. as of 31/03/2005 5-4-2006Information of Consolidated Financial Statements as these have been prepared according to I.A.S. as of 31/03/2005 5-4-2006Information of Financial Statements as these have been prepared according to I.A.S. as of 30/06/2005 5-4-2006Information of Financial Statements as these have been prepared according to I.A.S. as of 30/09/2005 5-4-2006Information of Consolidated Financial Statements as these have been prepared according to I.A.S. as of 30/09/2005 5-4-2006Announcement of Other Significant Events 12-4-2006Announcement of the General Meeting of 16/05/2006 19-4-2006Announcement of Other Significant Events 2-5-2006Disclosure of preemptive right dividend cut-off date / payment of dividends 17-5-2006Information of Financial Statements as these have been prepared according to I.A.S. as of 31/03/2006 29-5-2006Information of Consolidated Financial Statements as these have been prepared according to I.A.S. as of 31/03/2006 29-5-2006Announcement of remarks on financial / accounting statements 5-6-2006Confirmation of - Clarifications on publications 6-6-2006Information of Financial Statements as these have been prepared according to I.A.S. as of. 30/06/2006 2-8-2006Information of Consolidated Financial Statements as these have been prepared according to I.A.S. as of 30/06/2006 2-8-2006Announcement of Other Significant Events 4-8-2006Disclosure of Change in Percentage of Shareholders of a Listed Company 29-8-2006Disclosure of Transactions 8-9-2006Disclosure of Change in Percentage of Shareholders of a Listed Company 25-10-2006Disclosure of change in the composition of the Board of Directors or top executive management executives 31-10-2006Disclosure of Transactions 1-11-2006Announcement of Other Significant Events 9-11-2006Disclosure of Change in Percentage of Shareholders of a Listed Company 23-11-2006Disclosure of change in the composition of the Board of Directors or top executive management executives 5-12-2006Disclosure of change in the composition of the Board of Directors or top executive management executives 14-12-2006Information of Financial Statements as these have been prepared according to I.A.S. as of 30/09/2006 15-12-2006Information of Consolidated Financial Statements as these have been prepared according to I.A.S. as of 30/09/2006 15-12-2006
All the above information is published at Unisystems S.A. web site (www.unisystems.gr)
Information published by Unisystems during 2006
Article 10 of Law 3401/2005
Annual Report 2 0 0 6
h

Information regarding the companies that are incorporated inthe Financial Statements of Unisystems S.A. i
Annual Report 2 0 0 6 1

The annual Financial Statements, audit certificates of the Certified Auditor accountantand the Reports of the Board of Directors regarding the companies that are incorporatedin the Financial Statements of Unisystems S.A. have been posted on the company’swebsite (www.unisystems.gr).
Information regarding the companies that are incorporated in the
Financial Statements of Unisystems S.A.
Annual Report 2 0 0 62
i


24, Str. Syndesmou Str., GR-106 73 Athens, ∆el.: +30 210 338 5000, Fax: + 30 210 363 0785, www.unisystems.gr
INFORMATION TECHNOLOGY SYSTEMS S.A.