Embed Size (px)
Citation preview
JPMORGAN CHASE & CO.
Annual Report 2005
JPMorgan Chase & Co.www.jpmorganchase.com
JPM
org
an
Ch
ase
&C
o.
20
05
An
nu
al
Re
po
rt
JPMorgan Chase & Co. (NYSE: JPM) is a leading global financial services firm with assets of $1.2 trillionand operations in more than 50 countries. The firm is a leader in investment banking, financial services for consumers, small business and commercial banking, financial transaction processing, asset and wealthmanagement, and private equity. A component of the Dow Jones Industrial Average, JPMorgan Chaseserves millions of consumers in the United States and many of the world’s most prominent corporate,institutional and government clients under its JPMorgan and Chase brands.
JPMorgan has one of the largest client franchises in the world. Our clients include corporations,institutional investors, hedge funds, governments and affluent individuals in more than 100 countries.
The following businesses use the JPMorgan brand:Investment Bank Asset Management Treasury Services Private BankWorldwide Securities Services Private Client Services
Information about JPMorgan capabilities can be found on jpmorgan.com.
Chase is a leading U.S. financial services brand serving consumers, small businesses, corporations and governments with a full range of banking and asset management products in local markets and throughnational distribution.
The consumer businesses include:Consumer Banking Home FinanceCredit Card Auto FinanceSmall Business Education Finance
The commercial banking businesses include:Middle Market Business CreditMid-Corporate Equipment LeasingReal Estate
Information about Chase capabilities can be found on chase.com.
JPMorgan Chase is the brand used to express JPMorgan Chase & Co., the holding company, and is also used by our Treasury Services business and our Community Development Group.
Information about the firm is available at www.jpmorganchase.com.
JPMorgan Chase & Co.
Corporate headquarters270 Park AvenueNew York, New York 10017-2070Telephone: 212-270-6000http://www.jpmorganchase.com
Principal subsidiariesJPMorgan Chase Bank,
National AssociationChase Bank USA,
National AssociationJ.P. Morgan Securities Inc.
Annual report on Form 10-KThe Annual Report on Form 10-K of JPMorgan Chase & Co. as filed with theSecurities and Exchange Commission will be made available upon request to:
Office of the SecretaryJPMorgan Chase & Co.270 Park AvenueNew York, New York 10017-2070
Stock listingNew York Stock Exchange, Inc.London Stock Exchange LimitedTokyo Stock Exchange
The New York Stock Exchange (NYSE)ticker symbols for stock of JPMorgan Chase & Co. are as follows:
JPM (Common Stock)JPMPRH (Depositary Shares Each
Representing a One-Tenth Interest in 6 5/8% Cumulative Preferred Stock)
Certifications by the Chairman, ChiefExecutive Officer and Chief Financial Officerof JPMorgan Chase & Co. pursuant to Section302 of the Sarbanes-Oxley Act of 2002, havebeen filed as exhibits to the Firm's 2005Annual Report on Form 10-K.
The NYSE requires that the Chief ExecutiveOfficer of a listed company certify annuallythat he or she was not aware of any violationby the company of the NYSE's CorporateGovernance listing standards. Such certificationwas made on June 14, 2005.
Financial information about JPMorgan Chase& Co. can be accessed by visiting the InvestorRelations site of www.jpmorganchase.com.Additional questions should be addressed to:
Investor RelationsJPMorgan Chase & Co.270 Park AvenueNew York, New York 10017-2070Telephone: 212-270-6000
Direct deposit of dividendsFor information about direct deposit of dividends, please contact Mellon InvestorServices LLC.
Stockholder inquiriesContact Mellon Investor Services LLC:
By telephone:
Within the United States, Canada and Puerto Rico: 1-800-758-4651 (toll free)
From all other locations:1-201-680-6578 (collect)
TDD service for the hearing impaired within the United States, Canada and Puerto Rico: 1-800-231-5469 (toll free)
All other locations:1-201-680-6578 (collect)
By mail:
Mellon Investor Services LLC480 Washington Blvd.Jersey City, New Jersey 07310-1900
Duplicate mailingsIf you receive duplicate mailings because you have more than one account listing and you wish to consolidate your accounts, please write to Mellon Investor Services LLC at the address above.
Independent registered publicaccounting firmPricewaterhouseCoopers LLP300 Madison AvenueNew York, New York 10017
DirectorsTo contact any of the Board members pleasemail correspondence to:
JPMorgan Chase & Co.Attention (Board member)Office of the Secretary270 Park AvenueNew York, New York 10017-2070
The corporate governance principles of the board, the charters of the principal board committees and other governanceinformation can be accessed by visitingwww.jpmorganchase.com and clicking on“Governance.”Stockholders may request a copy of such materials by writing to theOffice of the Secretary at the above address.
Transfer agent and registrarMellon Investor Services LLC480 Washington Blvd.Jersey City, New Jersey 07310-1900Telephone: 1-800-758-4651https://vault.melloninvestor.com/isd
Investor Services Program JPMorgan Chase & Co.’s Investor ServicesProgram offers a variety of convenient, low-cost services to make it easier to reinvest dividends and buy and sell shares ofJPMorgan Chase & Co. common stock. Abrochure and enrollment materials may beobtained by contacting the ProgramAdministrator, Mellon Investor Services LLC,by calling 1-800-758-4651, by writing themat the address indicated above or by visitingtheir Web site at www.melloninvestor.com.
This annual report is printed on paper made from well-managed forests and other controlled sources withthe financial section printed on paper containing 20%post-consumer waste (PCW) recycled fibers. The paper is independently certified by SmartWood, a program of the Rainforest Alliance, to the Forest Stewardship Council(FSC) standards.
FSC is an independent nonprofit organization devoted toencouraging the responsible management of the world’sforests. FSC sets high standards to ensure forestry is practiced in an environmentally responsible, socially beneficial and economically viable way.
©2006 JPMorgan Chase & Co. All rights reserved.Printed in the U.S.A.
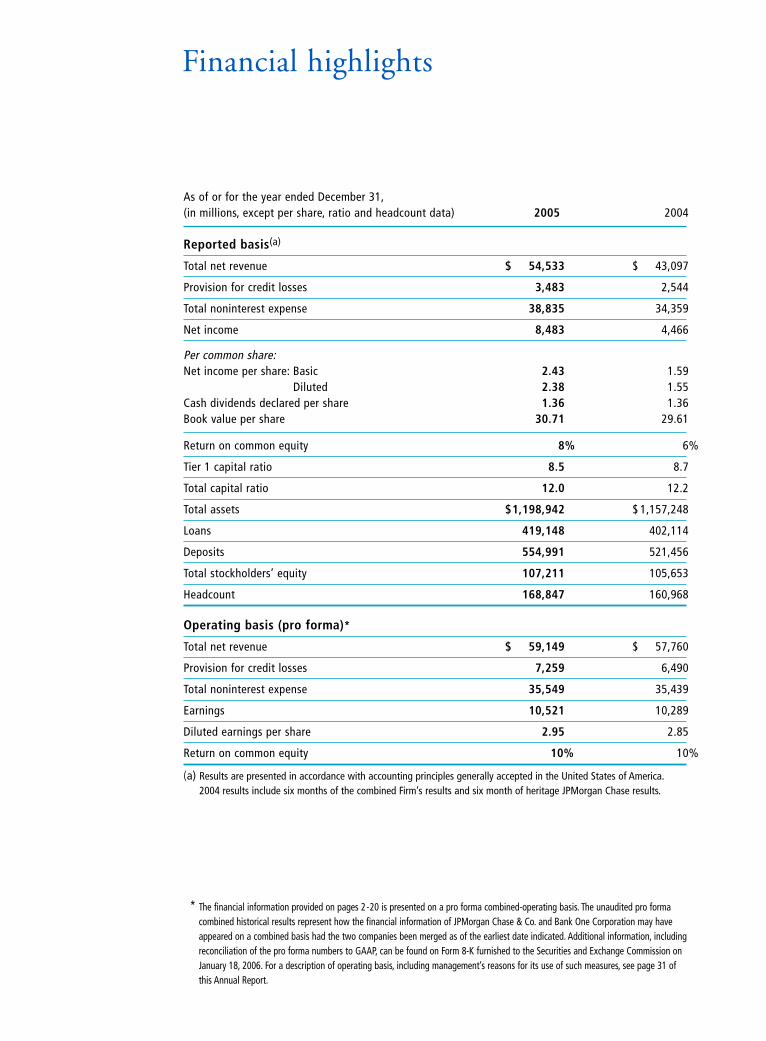
Financial highlights
* The financial information provided on pages 2-20 is presented on a pro forma combined-operating basis. The unaudited pro forma combined historical results represent how the financial information of JPMorgan Chase & Co. and Bank One Corporation may haveappeared on a combined basis had the two companies been merged as of the earliest date indicated. Additional information, includingreconciliation of the pro forma numbers to GAAP, can be found on Form 8-K furnished to the Securities and Exchange Commission onJanuary 18, 2006. For a description of operating basis, including management’s reasons for its use of such measures, see page 31 of this Annual Report.
As of or for the year ended December 31,(in millions, except per share, ratio and headcount data) 2005 2004
Reported basis(a)
Total net revenue $ 54,533 $ 43,097
Provision for credit losses 3,483 2,544
Total noninterest expense 38,835 34,359
Net income 8,483 4,466
Per common share:Net income per share: Basic 2.43 1.59
Diluted 2.38 1.55Cash dividends declared per share 1.36 1.36Book value per share 30.71 29.61
Return on common equity 8% 6%
Tier 1 capital ratio 8.5 8.7
Total capital ratio 12.0 12.2
Total assets $1,198,942 $ 1,157,248
Loans 419,148 402,114
Deposits 554,991 521,456
Total stockholders’ equity 107,211 105,653
Headcount 168,847 160,968
Operating basis (pro forma)*
Total net revenue $ 59,149 $ 57,760
Provision for credit losses 7,259 6,490
Total noninterest expense 35,549 35,439
Earnings 10,521 10,289
Diluted earnings per share 2.95 2.85
Return on common equity 10% 10%
(a) Results are presented in accordance with accounting principles generally accepted in the United States of America.2004 results include six months of the combined Firm’s results and six month of heritage JPMorgan Chase results.

2
s of year-end , I stepped down as CEO ofJPMorgan Chase – turning the leadership of the firm overto my partner, Jamie Dimon, who I believe will prove to beone of the outstanding CEOs the financial services industryhas had in a long time.
As Chairman, I look forward to contributing to our growthby leveraging my global relationships and contacts and byhelping to further develop strategy.
As I look back on my years in the industry, all with thesame organization, I realize how fortunate I have been andwhat an exciting journey I have been on. When I left asmall town in North Carolina to join Chemical Bank in, my goal was to spend two years in New York andthen return to North Carolina. Little did I know I wouldbe part of an industry and a career that were as challengingand rewarding as these have been.
I step down as CEO believing that:
• JPMorgan Chase is very well positioned strategically to beone of the great financial institutions in the world.
• Size does matter in our industry – provided that sizetranslates into operating and scale efficiencies, increasedprofit margins, stronger earnings and leadership positions. And the benefits of size can only be realizedwithin a culture that values teamwork, partnership and execution.
• One should be a leader – not a follower – as our industryirreversibly consolidates in a globalizing world.
• A diversified model will prove to have competitiveadvantage in terms of creating shareholder value over time.
• Managements and boards have to manage with a longer-term outlook and resist the pressures of the quarter-to-quarter mindset of the market.
• Building the best performance culture in the industrywill ensure that all of the inherent potential of size isharvested and maximized.
• Relationships matter – with clients and with each otherinternally – and without them, a firm will never reachits potential and be its best.
• Companies with the highest ethical values, which start atthe top and cascade all the way down, will be the greatcompanies – and we must keep raising the bar on how weachieve this in a large, complex corporation.
• Surrounding yourself with people who are smarter andbetter than you are is critical because your talent poolwill be a key determinant of success.
• I have been one of the most fortunate people in theworld to have had the experience and the success I havehad, and there is not one day that goes by that I don’tthink about this.
So from a small town to a big city – from a small bank to abig bank, I learned much along the way – that you, in fact,never stop learning. You should always commit to be thebest you can be, you should think big and dream big, andyou should think about how you can win and what yourstrategic platform should be to create sustainable share-holder value. And you should do this by always, alwayshaving the right set of values and living by them.
You learn that the peaks and valleys, the successes and fail-ures of your job and life need to be viewed with the properperspective and balance, and only with that balance andperspective can you find true north.
You learn how important your family and friends are inenabling you to maintain the passion and commitment tobe the CEO of a firm like JPMorgan Chase and how privi-leged you’ve been to have been the leader.
Thus, while my JPMorgan Chase career is nearing an end, anew chapter in our company’s long history is beginning. It istime to pass the baton to a new group of leaders, led byJamie Dimon, who will take this firm to the next level ofperformance, harvesting its vast potential and maximizingshareholder value through great execution.
Letter from William B. Harrison, Jr, Chairman
Dear fellow shareholder,
A

Let me close with a profound thanks to our shareholderswho have had the faith to believe in the potential of thisfirm. Thanks to our outstanding Board of Directors fortheir support and wisdom, and I want to express my special gratitude to retiring directors Larry Bossidy andHans Becherer whose advice and counsel over many yearshave been invaluable. Thanks to all of our clients and cus-tomers around the world for the opportunity to serve them.
And thanks – , thanks – to our talented and dedicat-ed employees around the world for what they stand for andfor what they contribute every day.
I could not be more excited and confident about our future.
Sincerely,
William B. Harrison, Jr.Chairman
March ,
3
William B. Harrison, Jr., Chairman James Dimon, Chief Executive Officer
his is my first letter to you as the CEO of JPMorganChase. From a personal standpoint, I want to share withyou some feelings and thoughts. I feel a tremendous mix ofemotions: excitement about our potential, and a great senseof obligation and responsibility both to you, our share-holder, and to those who have built our company over theyears. They have given us an exceptional opportunity – andwe owe them not only our gratitude, but also our commit-ment to deliver on our company’s potential and make themproud of what they have helped to build.
We have accomplished a great deal over the last year, andwe are excited about our progress in and our plans for. The foundation for everything we are doing rests ona set of business principles that we believe, when executedproperly, create great companies. These principles aredescribed on our Web site: www.jpmorganchase.com. Inessence, we strive to:
• Share with you the truth and offer honest assessments of our businesses and our prospects.
• Act with integrity and honor.
• Do the right thing, not necessarily the easy or expedient thing.
• Work hard and with fierce resolve to make this a company of which our shareholders, employees, customers and communities can be proud.
• Focus relentlessly on the execution of our business principles.
There are some specific issues that are integral to the suc-cess of our company. I would like to address them byanswering the following questions:
I. Are we in the right businesses?
II. Can we achieve outstanding performance?
III. Are we properly managing our risks?
IV. Do we have the right people and the right
compensation strategy?
V. Are we a good corporate citizen?
Letter from James Dimon, Chief Executive Officer
Dear fellow shareholder,
T

4
I. Are we in the right businesses?
Let me unequivocally answer this question with a resound-ing “yes,” for three reasons: each business is already wellpositioned – in terms of size and scope – within its specificindustry; there is exceptional value in the linkages amongour businesses; and the company’s size, scale and brands area competitive strength.
Each business is already well positioned within its specific industryOur six major lines of business – Investment Banking,Commercial Banking, Retail Financial Services, CardServices, Asset & Wealth Management, and Treasury &Securities Services – all compete in consolidating industries.Businesses consolidate when the vast economies of scale thatcan be achieved (in systems, operations, distribution, brandand R&D, to name a few) will benefit the customer.
We cannot underestimate the power of these economicforces. Nor can we ignore the inevitable impact they haveon our businesses. But change is hard – and many whoattempt it fail. The winners will be those who can providetheir customers with more access to better financial prod-ucts and services at a lower price. In this environment, size, scale and staying power matter, and all of our corebusinesses already have what it takes to succeed; but as Idiscuss later, we must continue to improve our executionskills to distinguish our company in the marketplace. Ourbusinesses do not and will not want for capital or invest-ment. They are well equipped to survive in good and badtimes, and our customers will continually benefit fromtheir stability and efficiency, as well as the investments weare able to make in technology and innovation.
Our businesses belong together, and there is exceptional value in the linkages among themAs separate entities, our businesses are currently well posi-tioned; together they are even stronger. Putting our busi-nesses together makes sense only if doing so creates valuefor customers and, ultimately, shareholders. It does notwork because we want it to – it only works because it givesthe customer more for less, sooner rather than later. Wehave no interest in selling our customers products that theydo not want or need.
In this context, the term “cross-sell” can be misleading.“Cross-selling” often carries negative connotations – as if itis a forced and unnatural act. In fact, it should be describedmore appropriately as “natural product-line extensions,”which businesses have been doing successfully for hundredsof years. Wal-Mart has continually expanded the types ofproducts it sells. Twenty years ago, who would havethought that it would sell lettuce and tomatoes? Theseproduct-line extensions are true also for Home Depot, com-mercial banks, investment banks, stockbrokers and evenmanufacturers. GE Aircraft Engines now finances and serv-ices what it manufactures. The essence of what makes thissuccessful is that the customer is the winner.
By extending our product lines, we are able to leverage thesubstantial investments we have made to build our distri-bution system (e.g., branches, technology and sales people),strengthen our brand and earn the trust of our customers.For example, today our branches, which are our retailstores, not only accept deposits and provide access to cash,but also sell investments, mortgages, home equity loans,debit and credit cards, and online bill paying services, aswell as small business loans, international funds transfers,payroll services, annuities, etc.
Our clear “natural product” set is financial services, whichis what individuals and businesses want and expect from us.Where the products are “manufactured” is of little interestto them. What is important to them and to us is our ability to provide a better product, or package of products,at a lower cost. Our challenge is to view this from theirperspective and ensure that our collective resources arefocused accordingly.
In addition to providing substantial potential for growth,our mix of businesses presents us with fertile ground forinnovation. Here are a few examples of how our businessesare working together:
Retail and Card Services. The competitive advantage is formidable when our retail bank – which serves almost million households – joins forces with our credit cardcompany, with its million cardholders. This collabora-tion should result in excellent new products that addressspecific consumer needs. For example, we may be able to
5
make life much simpler for our customers by linking creditand debit cards and by offering them other products. Theresults of recent efforts are promising: credit card sales inour retail branches are up nearly % from two years ago.
Commercial Banking and Retail. A strong connection already exists between our Commercial Bank and our retailbranches. In fact, there are few successful commercial banksin America that do not have a retail bank – and for goodreason. A large share of retail business comes from smallbusinesses and mid-sized companies. Many use branches astheir financial back offices for cash, payroll processing andwire transfer services. This interdependency is cost effectivefor us and beneficial to our customers. In addition, businessaccounts often lead to new personal accounts and vice versa.
Investment Banking and Commercial Banking. A natural con-nection exists between an investment bank, which essen-tially serves large public companies, and a commercialbank, which essentially serves mid-sized to small publicand non-public companies. Our Commercial Bank alreadygenerates hundreds of millions of dollars in revenues fromoffering its clients traditional investment banking services(e.g., advisory, debt and equity underwriting). Over thenext few years, we believe that we can double CommercialBanking’s revenues from these activities. In cities likeIndianapolis, Austin, Denver and Tucson – where ourInvestment Bank does not have a physical presence – localbusinesses have strong relationships with our commercialbankers. These bankers know when their clients are con-templating transactions and need access to investmentbanking expertise. The connection is valuable for clientsand beneficial to us. It enables our Investment Bank togenerate revenues from its product expertise that it couldnot have previously produced without the client relation-ship. And it enables the Commercial Bank to better serveits clients by providing them with the additional productsthat they need.
Treasury & Securities Services; Asset & Wealth Management.Another important connection exists between Treasury &Securities Services and our other businesses. Many of ourmajor customers (institutional, middle market, small busi-ness and retail) use TSS for activities such as cash, checks,
ACH payments, wire transfer and custody. TSS generatesapproximately $ billion of annual revenue by serving thesecustomers. Asset & Wealth Management also benefits fromworking with other businesses, including managing assetsfor corporate clients, helping them meet their complex pen-sion and investment needs, and offering products fromacross the company to individual clients.
Plenty of other examples exist, but the critical pointremains: while each business should do well on its own, itshould also be able to capitalize on our company’s extensiveand unique set of products and services to more fully andprofitably meet customer needs. There is certainly no rea-son why they should do worse because they are part of thisinstitution. The key, of course, is that the customers mustbe the winners.
The size and scale of the company are a competitivestrengthThe size, scale and scope of JPMorgan Chase also offer hugeadvantages: economies of scale in operations and systems;diversification of capital, risk and earnings; a great globalbrand; and the capability to make large investments at alower cost of capital. In particular, the benefits of size andscale in operations and systems are vast, and they are real.Our diversified earning streams lower our risk, increase ourcredit ratings and reduce the cost of our capital. And sinceone of our major costs is the cost of money, the ability toraise funds cheaper, better, faster and more effectively aroundthe world than other companies is a major advantage.
But size alone is not enough to win. In fact, if not properlymanaged, it can bring many negatives. Huge companiesoperating in complex, consolidating and fiercely competi-tive industries like ours can only achieve and sustain theirsuccess by competing where the “rubber hits the road” – atthe level of the store, the product and the banker – not atcorporate headquarters. We must equip those employees onthe front lines to be responsive and responsible. The waywe manage our size will reflect how much we recognize andrespect this imperative. Bureaucracy and waste are lethal.To remain healthy and vibrant, we must constantly andconsistently minimize bureaucracy, eliminate waste andinsist upon excellent execution.
6
II. Can we achieve outstanding performance?
“Yes,” but we are not there yet. Good positioning does notassure great performance. Creating great performance is notmystical; it takes consistent effort, focus, hard work anddiscipline.
The starting point for us is to admit where we are. Anyway one analyzes our businesses, for the most part our costsare too high, our returns on capital are too low and ourgrowth is not what it could be.
We are underperforming financially in many areas. Weneed to understand the reasons and focus our energy onmaking improvements, not excuses. We cannot afford towaste time justifying mediocrity. Each line of business now assesses its performance in a rigorous and very detailedway. Each compares results to targets in a variety of areas,including sales force productivity, customer service and systems development.
It is not enough for the overall business to make its profittargets. It would be unacceptable to achieve good financialreturns by reducing expenses that are critical investmentsfor the future or by compromising the quality of businessthat we do. The best way to reach and sustain a higher levelof performance is to get every part of the business to stepup its game. For example, we have some businesses that, ingeneral, achieve adequate returns. These results are oftenproduced when a few exceptional business segments do theheavy lifting for the rest. We cannot use our strengths inone part of our business to subsidize our weaknesses inanother part.
We spend a lot of time on capital and return on capital.How we allocate capital should reflect our understanding ofhow changes in the economy – and the likely length andintensity of the cycles they cause – will affect specific partsof our business. Where will the risks and growth opportu-nities be? For example, there will be another recession; wejust do not know when. What we do know, however, is thatwhen it happens, our annual credit costs will increase sub-stantially. Therefore, when we talk about return on capital,we must look at it through the cycle, not just during thebest parts of the cycle.
Many companies that compete in our businesses have beenwell managed and able to produce excellent results fordecades. We have every reason to be among them. Timewill tell if we are. We have made progress, but not enough.To get outstanding performance, we must instill the follow-ing disciplines deep into the fiber of our company.
Become lean and efficientThis is an imperative. One cannot achieve great perform-ance in fiercely competitive industries without being lean and efficient. It is irresponsible to waste our criticalresources on expenditures that have nothing to do with better serving our clients and building a great company.We need to use our resources to grow, innovate, market,hire productive people and build systems. It is not justabout cutting costs. A company cannot become great justby cutting costs. It is about building better systems to bet-ter serve our customers. It is about paying our people notonly fairly, but effectively, to help create the right behavior.It is about how we run meetings. It is about designing theright products that are also profitable. (Many companiesdesign products that lose money, and they do not evenknow it.) It is about constantly improving productivity.
We must continually ask ourselves: Can the same invest-ment in the same area be better spent? Does every businessstrive to get the most out of its resources? The InvestmentBank, for example, has many businesses, depending uponhow you measure it. Does each business spend its moneyefficiently and wisely? Are we spending the right amountin the right way and expecting the right results? Last year,we spent over $ billion in marketing to get million newcredit card accounts. Can we spend more and get even bet-ter results? We probably can. This year, we want to bothspend more and get more from every dollar we spend.When we determine that we can and are spending moneywisely, we will want to spend more, not less.
Since the merger, we have realized $. billion in mergersavings. However, much more is needed to achieve what wewould consider to be real efficiency. This past year, welaunched and completed major projects aimed at increasingour efficiency and improving our customer service over thelong run. They include:

7
• Completing the largest credit card conversion in history.This effort combined over million heritage Chase andBank One accounts onto a single platform and providedus with a single best-in-class system to better serve ourcustomers (and at a lower cost).
• Integrating and upgrading all of our businesses in Texas – in terms of products, brand, systems and operations – where we have , employees serving million customers.
• Converting all U.S. dollar clearing to one platform glob-ally, an operation that processes an average of $. tril-lion daily for , clients worldwide.
• Executing the largest merger of mutual fund families inU.S. history, affecting . million fund shareholders.
• Completing the first and second construction phases ofour new Global Services Center in Bangalore, India, andhiring , employees to meet increased demand anddeliver more services from India.
• Migrating much of the company’s production, disasterrecovery, and development and test systems into a newdata center. The move increases our data storage capabil-ity, enhances our resiliency, reduces infrastructure pointsof failure and lowers overall cost to the firm.
Over this next year, we will continue to massively upgrade and streamline our systems and operations.Highlights include:
• Converting and upgrading all of our operations in theNew York tri-state market, beginning in the secondquarter. This will be one of the most visible bank con-versions in our industry and will have an impact on allof our businesses – specifically, . million depositaccounts representing over $ billion, and involvesmore than heritage Chase branches and over ,
teller workstations.
• Providing our retail and wholesale customers with uni-form Internet platforms, upgrading loan origination sys-tems and implementing a new mortgage servicing system.
• Substantially improving infrastructure, including datacenters, networks and financial management systems.
We cannot build a great company unless we are unrelentingin our efforts to be a lean and efficient company. This mustbecome a permanent part of our mindset.
Remove barriers to successAs I mentioned before, excessive bureaucracy is lethal. Itslows us down, distracts us from our clients and demoralizesgood employees. We must act with more openness, passionand urgency. The process of busting bureaucracy never ends,but what is different now is that our employees are engagedin challenging the system and solving the problems.
We continue to attack bureaucracy and improve all aspectsof our management practices, including:
• Accountability and decision making: Central to the changeswe have undertaken is the realignment of corporate staff.Now embedded in the businesses are many of the stafffunctions – like finance and systems – that used to be concentrated at the corporate level. The realignment givesour businesses greater ability to manage their supportfunctions. For staff, better access to the businesses theysupport provides them with more knowledge and control.The restructuring will lead to better accountability, transparency and reporting, which in turn will improveexecution and overall corporate risk management.
• Management information and discipline: It is hard to act on the truth if you do not know what it is. We wantmanagers to have the tools and information to run theirbusinesses as if they owned them. With this goal inmind, we now produce thousands of increasingly accu-rate reports that provide managers with specific informa-tion on their performance. In addition, we give themtools to proactively eliminate waste and manage theirresources. Better reporting has dramatically improvedthe effectiveness of our business review meetings.Without this information, these meetings are often awaste of time. They now are convened at many levels ofthe company and focus on where we are and need to be,relative to our own benchmarks and the best performers

8
in each business. As a result of these discussions, we areable to establish real targets for our businesses in termsof growth, margins, returns, market share, etc.
• People practices: We have rationalized human resourceprocesses by eliminating several unnecessary proceduresand personnel to place accountability for managing peo-ple squarely where it belongs – with line managers. Forexample, performance reviews have been revamped andsimplified, training has been streamlined and executivecoaches have been eliminated. (We think coaching is themanager’s job.) Performance reviews should facilitate,not prevent, meaningful, honest and comprehensiveresults-oriented exchanges between managers and theirdirect reports. Yet over time, the process grew to take ona life of its own and became a hindrance. Now the barri-ers are being removed. In addition, we have created aforum for discussion of our talent and made people man-agement generally, and diversity in particular, part of theagenda of senior manager meetings across the company.We remain devoted to our people and their develop-ment, but we will use management accountability, notbureaucratic processes, to prove it. We want our peopleto communicate openly, easily and constructively.
Focus resources where we can succeed and winWe have sold or liquidated several businesses that eitherdid not fit our strategy or did not contribute significantlyto our long-term success. For these reasons, we soldBrownCo, and businesses in manufactured housing andrecreational vehicles. We also announced the sale of ourinsurance business and have dramatically reduced the size ofour auto leasing business.
By discontinuing or reducing our commitment to ancillarybusinesses, we availed ourselves of billions of dollars in cap-ital. We redeployed this capital in businesses where we canwin. For example, we invested in JPMorgan Cazenove, aninvestment banking joint venture in the United Kingdom(which already shows promising results); expanded ourglobal trade management operations with the purchase ofVastera; and acquired the Sears Canada private-label creditcard portfolio. In addition, we have recently completed
the purchase of a consumer educational loan business,Collegiate Funding Services, that both processes and underwrites loans. These are all transactions that positionus for real growth.
We have also freed up and redirected our capital to supportinnovation. We want to make innovation part of our DNA.This does not mean spending hundreds of millions of dollars on failed ideas. It does mean, however, that we will take calculated risks, knowing that some will fail.Progressive thinking should be reflected in every conversa-tion, every analysis, and every product and service we provide. We have many new products coming out this yearthat we think will fill this bill.
The ultimate goal: create organic growthProfitable, sustainable, properly underwritten growth is not a vision. It is the result of excellent management discipline, an unrelenting focus on execution, consistentmanagement of risk, a competitive product set and outstanding customer service.
The level of effort and expense associated with mergeractivities and systems consolidation has been predictablyhuge. So the fact that we were able to absorb the impact –and still cut costs and materially increase investment spend-ing – is a source of pride to all of us. What is even moregratifying, however, is to see evidence of real growth inmost businesses, something that is often a casualty in merger consolidations.
In , real growth – albeit not always great growth –took place across the board. Retail increased its deposits,checking accounts and credit cards. Commercial Bankingachieved growth in leasing, middle market lending and lia-bility balances. Treasury & Securities Services producedmore custody business and had growth in liability balances.Asset & Wealth Management increased the level of assetsunder management. Card Services had growth in new cus-tomers, partners, card receivables and spending. Revenuesin the Investment Bank increased in M&A, asset-backedsecurities, high-yield bonds and energy trading.

9
Equally important, we materially increased investment in areas that will drive future growth. Specifics include: spending hundreds of millions of dollars to open newbranches (this will drive growth in and beyond);adding more retail loan officers; hiring additional privatebankers; funding the build-out of our energy and mortgagetrading capabilities in the Investment Bank; and investingin state-of-the-art “blink” credit card technology (whichenables customers to use credit cards for small paymentswithout having to sign anything). Now being piloted in six cities, blink is an investment that has put us at the fore-front of changes in payment systems and card innovation.
In addition to making across-the-board investments tobuild our businesses, we are making investments in ourinfrastructure that anticipate growth and prepare us to successfully manage it for years to come. In , weinvested over $ billion in platform conversions, includingthose for Texas and Card Services.
By consolidating and improving platforms, we are elimi-nating the inefficiencies and competitive disadvantages associated with multiple operating platforms. In the process,we will create best-in-class platforms in many areas, such asglobal cash clearing, credit card, retail branches and some ofour trading business. We believe that long-term success isnot possible without great systems and operations. They willdrive efficiency, innovation and speed to market. Much ofthis will be accomplished by the end of .
III. Are we properly managing our risks?
Almost all of our businesses are risk-taking businesses –and we spend a great deal of time thinking about allaspects and types of risk inherent in them, including:
• Consumer and wholesale credit risk
• Market and trading risk
• Interest rate and liquidity risk
• Reputation and legal risk
• Operational and catastrophic risk
The notable fact about the first three risk areas is that theyare cyclical, and all of them have elements of unpredictabil-ity. This requires us to be prepared for inevitable cycles. Acompany that properly manages itself in bad times is oftenthe winner. For us, sustaining our strength is a strategicimperative. If we are strong during tough times – whenothers are weak – then the opportunities can be limitless.Protecting the company is paramount. I will highlight thetypes of risks we focus on to give you a sense of the threatthey pose and how we plan for it.
Consumer and wholesale credit riskOver the years, our company has substantially reduced itswholesale credit exposure by using a disciplined process forextending credit and maximizing return on shareholdercapital. In the consumer market, we have controlled ourrisk by limiting the amount of low-prime and sub-primecredit we issue in our card and other consumer businesses.In addition, we have decided, at the expense of losing somevolume, not to offer higher-risk, less-tested loan products,such as negatively amortizing Option ARMs.
While we are taking the right steps, we estimate that in a recession, consumer and wholesale credit costs could possibly get worse by more than $ billion. This dauntingreality requires us to be prepared and well protected.Protection # is having larger and more durable profits toabsorb the losses. We are accomplishing this by increasingour margins virtually across the board. Protection # ismaintaining a fortress balance sheet. We try to understandand manage every asset and every liability and make surethat someone is accountable for each one. It also meansmaintaining, as much as possible, strong loan loss reserves.
Finally, having a well-capitalized firm is critical. With Tier capital at .% and total capital at %, we believe weare there. The important point is that we need to managethe business, the balance sheet and the investments to earnadequate returns through the cycles and to be prepared forsurprises. We do not want to realize high returns at the top,only to give them all back at the worst part of the cycle.

10
Market and trading risk, and interest rate and liquidity riskWe need to manage our risk–return payoff better in .In , our trading volatilities were unacceptably high.The $ billion in trading revenues (not a bad result on itsown) was the result of two great quarters and two quarterswhere we underperformed. We think that is too muchvolatility, and reducing it is one of our priorities. I believewe can accomplish this by continuing to diversify our trad-ing business, by being more disciplined and precise in theexecution of our risk management practices, and by hiringand retaining the best talent. We intend to deliver better,more consistent results over time, while maintaining ouraggregate risk-taking appetite.
The good news is that we have aggressively invested to gener-ate more diversified and consistent returns. For example, wehave added energy trading, and increased our activities inmortgage- and asset-backed securities, and principal invest-ing. We have leadership positions in credit markets and inour derivatives franchises, and we will continue to invest inorder to sustain them. And while in the short run, some ofthis has actually increased volatility, we are convinced thatour efforts – consistently applied – will succeed. However,we caution our shareholders not to expect immediate results.
Interest rate exposure is another area in which financialservices companies can assume excess risk – often at greatperil. As with underwriting credit, good analysis of interestrate exposure is rooted in facts and evaluations that arebased upon a variety of realistic assumptions and scenarios.We devote substantial resources to understanding howinterest rate changes will affect our performance. Thisanalysis should be – and will be – an ongoing process. Webelieve that our company has carefully managed its interestrate risk so that even dramatic moves in rates of several per-centage points cannot alone damage the company.
A healthy liquidity profile is essential to the ongoing via-bility of any company, financial or otherwise. We use a vari-ety of tools to maintain a strong liquidity position at theparent and subsidiary companies, including stress scenarios,collateral management and a conservative debt structure for
the company overall. We engage in a continual dialoguewith major rating agencies, and we are focused on main-taining and improving our strong credit ratings.
Reputation and legal riskThe litigation costs in business are well known. We areintensely focused on ways to safeguard the firm’s reputationand exposure. They include:
• Senior management endorsement of a code of conductthat all employees must sign and adhere to, as well as acommitment to provide appropriate training.
• A strong and independent compliance program thatencourages employees to assist in surfacing complianceand ethical issues, and identifying money laundering andterrorist financing activities.
• A more robust due diligence process focused on securi-ties underwriting transactions, where we have establishedcentralized oversight of our processes and standards.
• A disciplined governance process to address conflicts andreview transactions that may present conflicts that couldharm the firm now or in the future.
• A productive and open dialogue with our regulators andan ongoing emphasis on staying alert to changes in regu-latory standards.
We believe that these actions will mitigate our exposure,but we recognize, unfortunately, that they will not elimi-nate it. We have also implemented a disciplined process tocontinually review our liabilities and establish appropriatelitigation reserves. While we make every effort to properlymanage the company to reduce litigation and legal costs,we believe that our shareholders should assume that highlegal costs will continue for the foreseeable future. Theyshould be viewed, unfortunately, as simply a higher, perma-nent cost of doing business than in the past.
Operational and catastrophic riskThis year, we also made progress in strengthening our oper-ational risk management programs. We have a consistentapproach across all businesses for defining and aggregating

11
our exposure to potential operational loss. This approachhelps us determine whether we will be adequately capital-ized in the event of such a loss. In addition to carefullymanaging operational risk, we need to be prepared forunforeseen disasters. Catastrophic risk can take a variety offorms and significantly impair the performance and theoperations of the company. We have formal disaster recov-ery and contingency plans in place. They worked well dur-ing Hurricane Katrina and the bombings in London, butwe must continue to refine them as new risks appear.
Whatever the type of risk, the key point is that we try tohave a comprehensive approach to managing it. Thisrequires that the right people be in the right jobs and thatthere be clear accountability in each business for managingrisk in addition to rigorous corporate oversight.
IV. Do we have the right people and the right compensation strategy?
At the end of the day, it all comes down to people. We havegreat people in this company. As I travel across the UnitedStates and around the world, I have become increasinglyimpressed with the talent and potential of our employees.Rarely can a company assemble this level of creative fire-power and professional competence.
To maximize the collective strength of our people, we willneed to work better as a team. Great teams are not greatbecause they have star athletes. Great teams are greatbecause the players have learned how to work together andfocus their collective energy and talent on winning. We arein the early stages of building a great team.
The compensation cycle was difficult but productive thisyear. We are getting better at relating pay to performance.But there is still room for improvement. Increasingly, wealso must orient ourselves to absolute performance against best-in-class targets, not simply improvement in performance.We want to be clear and truthful when we rate ourselves,and fair as well as effective when evaluating performance.Good performance goes beyond individual productivity to
include group, unit and company performance. Compensationis not an entitlement; it should reflect an individual’s and ateam’s contribution to helping make this a great company.We want to be one of the best-paying companies – but onlywhen we are one of the best-performing companies.
We also want our employees to feel and act like owners,which is why stock is an important part of our compensa-tion plans. Today more than , employees own, orhave an option to own, approximately % of shares in thecompany. Executive Committee members are required toretain % of their stock awards as long as they are withthe company. And in general, stock options are awarded ona limited basis.
We continually review our benefits programs to assure thatthey are of value to employees and cost effective. For exam-ple, the company has excellent medical benefits programs,but we subsidize them more for lower-paid employees thanwe do for higher-paid employees. (I hope that this instills asense of pride in our managers.)
In addition, we no longer match highly paid employees in their (k); they have adequate pensions. We do notoffer perks to executives like club memberships, financialplanning and leased cars. We are reducing excessive execu-tive severance plans. But more importantly, we are paying our employees more. Our thinking is simple – less compen-sation through entitlements, more from performance. We want to pay more and let our employees spend whatthey earn as they see fit.
We need to constantly remind ourselves that the mostimportant thing we can do for employees is to build ahealthy, vibrant company that treats people with respectand creates opportunity. Morale is not based upon perks;morale builds from respect, growth, innovation and success;from establishing a true meritocracy; from the stock per-forming well; from customers liking to do business with us.A great company will provide people with competitivecompensation, the opportunity to benefit as the companygrows and a rewarding career path.

12
V. Are we a good corporate citizen?
JPMorgan Chase has been – and will continue to be – a good corporate citizen. It is vitally important and enormously gratifying to all of us. Our commitment to our communities is deep, broad and multifaceted. We strive to be a great place to work and do business, and oursuccess allows us to give back to the neighborhoods andcities we serve.
In one sense, we view ourselves as a small business. If wewere the neighborhood store, we would give kids summerjobs, sponsor local sports teams and support community-based organizations. We operate this way in many of ourcommunities around the world, striving to be as supportiveas we can in all the communities we serve.
We add value by focusing on issues that are universallyimportant, including education and community develop-ment. We dedicate resources to develop signature programsthat help communities overcome the challenges they face inthese areas. We are morally, programmatically and institu-tionally committed to inclusiveness and diversity.
JPMorgan Chase contributes more than $ million annu-ally to support local, national and international initiatives.Examples include:
• Chase Early Emergent Leaders in Arizona, where we are funding a leadership and training program, andproviding technological assistance and training in literacy skills.
• Corporation for Supportive Housing in Ohio, wherewe are helping the homeless as well as individuals recov-ering from drug and alcohol addiction by giving themaccess to units of affordable housing and providingthem with the support they need to live independent,responsible and healthy lives.
• South Bank Centre in London, where we are support-ing music and technology education that will help bringartistic programs to thousands of young people.
• DonorsChoose in Chicago, where we are participatingin an effort that uses the Internet to connect donorsnationwide with underserved classrooms. We are helpingto expand this program for public schools in statesaffected by Hurricane Katrina.
• StreetSquash in New York City’s Harlem neighbor-hood, where we are funding a community youth facilitythat will serve over , students through academic andathletic programs.
• Wilmington Housing Partnership in Delaware, whereour support is helping develop over affordable hous-ing units in our local communities.
Our commitment to community involvement goes wellbeyond philanthropy. Across the country and around theworld, we bring this commitment to life through a broadrange of initiatives:
• Community reinvestment. We have received outstand-ing ratings under the Community Reinvestment Act. Inthe past two years, we have fulfilled $ billion of an$ billion, -year commitment in the United Statesto provide community-development loans and invest-ments, small business loans and consumer mortgages forlower-income and minority households.
• Community schools. We support community schools,which cost-effectively provide students in low-incomecommunities with access to a broad range of services,including academic, health and extracurricular activities.In Chicago, we are partnering with the civic community,nonprofit groups and the Chicago Public School systemto bring this model to scale. To date, schools (%)have been converted into community schools.
• Youth opportunity. We provide scholarships andinternships to the underprivileged through our Smart Start program in New York City, and intend toexpand the program to Louisiana in . In both theUnited States and the United Kingdom, we work toplace outstanding students of color in summer internpositions through Sponsors for Educational Opportunity.We are also a significant contributor to UNCF.

13
• Volunteerism. Around the globe, employees buildhomes for people in need, work with children living inhomeless shelters, collect food and gifts at holiday time,offer companionship to seniors, maintain our parks andprovide relief to victims of disasters.
• Workforce development. We help homeless people,welfare recipients, individuals with disabilities, and low-wage workers move toward economic and familystability by supporting organizations like Project Matchand the hiring of individuals through the Chicago-basedCara program.
• Hurricane relief. When Katrina struck the U.S. GulfCoast, we tracked down our employees, guaranteed their jobs and provided funds to help them rebuild theirlives. We offered programs and services to customers and communities, and let our competitors operate out ofour branches.
• Supporting employees serving in the military. Werecognize the hardships employees face when called toactive duty. We are doing whatever we can to supportthem by providing paid military leave, continuing mostbenefits and ensuring their jobs are waiting for themwhen they come home. We do not want to add financialhardship to their great sacrifice.
• Protecting the environment. We have adopted a com-prehensive policy that makes environmental awarenesspart of our business model. We have tackled environ-mental risk management and taken a leadership role toreduce greenhouse gas emissions. We are looking forways to make our facilities more energy efficient andreduce the amount of paper we use.
Of all these worthwhile efforts, the ones I find most person-ally inspiring come from our employees. All over the world,JPMorgan Chase employees of every nationality, race andsocioeconomic background give their time and put theirresources where their hearts are. They consistently standready to support disaster relief around the world, whetherfor victims of hurricanes in Louisiana, earthquakes inPakistan, floods in Mumbai or bombings in London. We take our role as global corporate citizen seriously andpersonally, and I hope that all of our employees are proud of the work we collectively do around the world.
In closing, our progress would not have been possible with-out tremendous dedication and talent at every level. Firstly,I want to thank Bill Harrison for his vision, leadership andgreat partnership. It has been an honor to work with himthroughout this complex merger. The experience has been a rewarding one for me personally. Bill’s openness, honesty,maturity and experience are a great inspiration to me. I look forward to his counsel and support in the future.
In addition, I thank our Board. Like this merger, our Boardhas come together in a very effective way, and has providedgreat advice and guidance to me and the management team.
Finally, I thank the employees of JPMorgan Chase for theiramazing efforts in . We have come a long way and are well on the road to realizing the vast potential of thiscompany. An enormous amount of work remains, but I amconfident that by working together, we will build the bestfinancial services company in the world.
James DimonChief Executive Officer
March ,
14
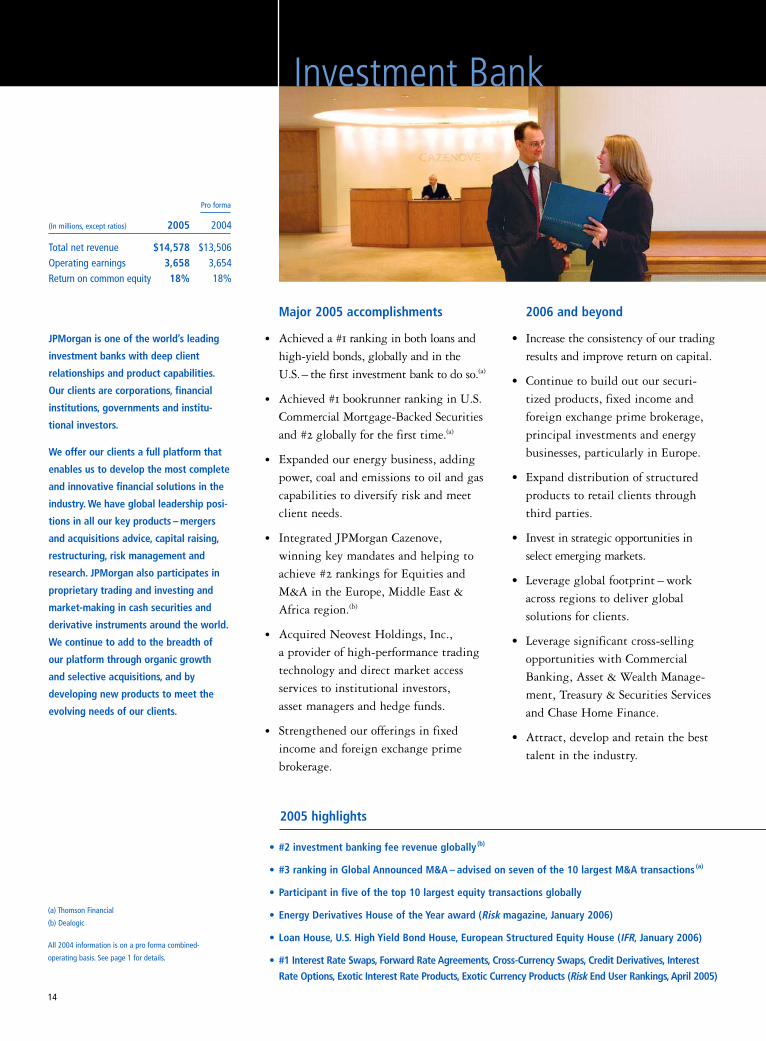
2006 and beyond
• Increase the consistency of our tradingresults and improve return on capital.
• Continue to build out our securi-tized products, fixed income and foreign exchange prime brokerage,principal investments and energybusinesses, particularly in Europe.
• Expand distribution of structuredproducts to retail clients throughthird parties.
• Invest in strategic opportunities inselect emerging markets.
• Leverage global footprint – workacross regions to deliver global solutions for clients.
• Leverage significant cross-sellingopportunities with CommercialBanking, Asset & Wealth Manage-ment, Treasury & Securities Servicesand Chase Home Finance.
• Attract, develop and retain the besttalent in the industry.
Major 2005 accomplishments
• Achieved a # ranking in both loans andhigh-yield bonds, globally and in the U.S.– the first investment bank to do so.(a)
• Achieved # bookrunner ranking in U.S.Commercial Mortgage-Backed Securitiesand # globally for the first time.(a)
• Expanded our energy business, addingpower, coal and emissions to oil and gascapabilities to diversify risk and meetclient needs.
• Integrated JPMorgan Cazenove, winning key mandates and helping toachieve # rankings for Equities andM&A in the Europe, Middle East &Africa region.(b)
• Acquired Neovest Holdings, Inc., a provider of high-performance tradingtechnology and direct market accessservices to institutional investors, asset managers and hedge funds.
• Strengthened our offerings in fixedincome and foreign exchange primebrokerage.
Investment Bank
JPMorgan is one of the world’s leading
investment banks with deep client
relationships and product capabilities.
Our clients are corporations, financial
institutions, governments and institu-
tional investors.
We offer our clients a full platform that
enables us to develop the most complete
and innovative financial solutions in the
industry. We have global leadership posi-
tions in all our key products – mergers
and acquisitions advice, capital raising,
restructuring, risk management and
research. JPMorgan also participates in
proprietary trading and investing and
market-making in cash securities and
derivative instruments around the world.
We continue to add to the breadth of
our platform through organic growth
and selective acquisitions, and by
developing new products to meet the
evolving needs of our clients.
(a) Thomson Financial
(b) Dealogic
All 2004 information is on a pro forma combined-
operating basis. See page 1 for details.
(In millions, except ratios) 2005 2004
Total net revenue $14,578 $13,506Operating earnings 3,658 3,654Return on common equity 18% 18%
Pro forma
2005 highlights
• #2 investment banking fee revenue globally (b)
• #3 ranking in Global Announced M&A – advised on seven of the 10 largest M&A transactions (a)
• Participant in five of the top 10 largest equity transactions globally
• Energy Derivatives House of the Year award (Risk magazine, January 2006)
• Loan House, U.S. High Yield Bond House, European Structured Equity House (IFR, January 2006)
• #1 Interest Rate Swaps, Forward Rate Agreements, Cross-Currency Swaps, Credit Derivatives, Interest
Rate Options, Exotic Interest Rate Products, Exotic Currency Products (Risk End User Rankings, April 2005)
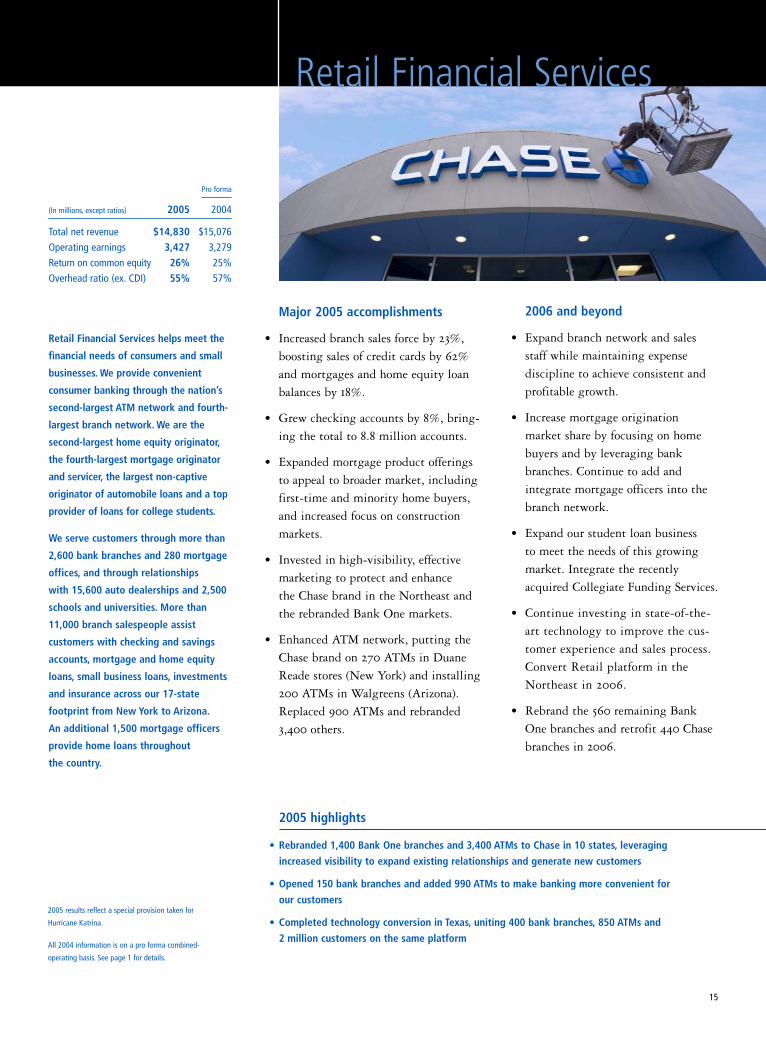
• Rebranded 1,400 Bank One branches and 3,400 ATMs to Chase in 10 states, leveraging
increased visibility to expand existing relationships and generate new customers
• Opened 150 bank branches and added 990 ATMs to make banking more convenient for
our customers
• Completed technology conversion in Texas, uniting 400 bank branches, 850 ATMs and
2 million customers on the same platform
15
2005 highlights
2006 and beyond
• Expand branch network and salesstaff while maintaining expense discipline to achieve consistent andprofitable growth.
• Increase mortgage origination market share by focusing on homebuyers and by leveraging bankbranches. Continue to add and integrate mortgage officers into thebranch network.
• Expand our student loan business to meet the needs of this growingmarket. Integrate the recentlyacquired Collegiate Funding Services.
• Continue investing in state-of-the-art technology to improve the cus-tomer experience and sales process.Convert Retail platform in theNortheast in .
• Rebrand the remaining BankOne branches and retrofit Chasebranches in .
Major 2005 accomplishments
• Increased branch sales force by %,boosting sales of credit cards by %and mortgages and home equity loanbalances by %.
• Grew checking accounts by %, bring-ing the total to . million accounts.
• Expanded mortgage product offeringsto appeal to broader market, includingfirst-time and minority home buyers,and increased focus on constructionmarkets.
• Invested in high-visibility, effectivemarketing to protect and enhance the Chase brand in the Northeast andthe rebranded Bank One markets.
• Enhanced ATM network, putting theChase brand on ATMs in DuaneReade stores (New York) and installing ATMs in Walgreens (Arizona).Replaced ATMs and rebranded, others.
Retail Financial Services helps meet the
financial needs of consumers and small
businesses. We provide convenient
consumer banking through the nation’s
second-largest ATM network and fourth-
largest branch network. We are the
second-largest home equity originator,
the fourth-largest mortgage originator
and servicer, the largest non-captive
originator of automobile loans and a top
provider of loans for college students.
We serve customers through more than
2,600 bank branches and 280 mortgage
offices, and through relationships
with 15,600 auto dealerships and 2,500
schools and universities. More than
11,000 branch salespeople assist
customers with checking and savings
accounts, mortgage and home equity
loans, small business loans, investments
and insurance across our 17-state
footprint from New York to Arizona.
An additional 1,500 mortgage officers
provide home loans throughout
the country.
Retail Financial Services
2005 results reflect a special provision taken for
Hurricane Katrina.
All 2004 information is on a pro forma combined-
operating basis. See page 1 for details.
(In millions, except ratios) 2005 2004
Total net revenue $14,830 $15,076Operating earnings 3,427 3,279Return on common equity 26% 25%Overhead ratio (ex. CDI) 55% 57%
Pro forma

16
2005 highlights
Card Services
Major 2005 accomplishments
• Acquired million net new Visa,MasterCard and private-label accounts.
• Increased our private-label business andgained ability to issue cards in Canadaby acquiring the Sears Canada portfolio.
• Issued more than million Chase cardswith “blink” in several major metro-politan markets, giving cardmembersand merchants a faster, more con-venient way to pay using contactless payment technology.
• Increased merchant processing volumeto $ billion.
• Moved heritage Chase accounts to a new, more flexible and cost-effectiveprocessing system.
• Completed rebranding efforts, changingmore than million cards to the newChase brand. Launched high-profile“Your Choice. Your Chase.” advertisinginitiative.
With more than 110 million cards in
circulation and $142 billion in managed
loans, Chase Card Services is one of
the nation’s largest credit card issuers.
Customers used Chase cards for more
than $300 billion worth of transactions
in 2005.
Chase offers a wide variety of cards to
satisfy the needs of individual consumers,
small businesses and partner organiza-
tions, including cards issued with AARP,
Amazon, America Online, Continental
Airlines, Marriott, Southwest Airlines,
Starbucks, Sony, United Airlines, Universal
Studios, Walt Disney Company, and many
other well-known brands and organiza-
tions. Chase also issues private-label and
co-branded credit cards with Circuit City
and Sears Canada.
Through Chase Paymentech Solutions,
LLC, we are the largest processor
of MasterCard and Visa payments in
the world.
• One of the largest credit card issuers
• More than $300 billion in charge volume
• $142 billion in managed loans
• More than 110 million cards issued
• Largest merchant acquirer in the world through Chase Paymentech Solutions, LLC
• More than 850 credit card partnerships with some of the world’s best-known brands
2006 and beyond
• Develop innovative products and services to create differentiated valuefor consumers and partners and drivegrowth in number of cardmembers,outstandings and sales.
• Expand the markets we serve to reacha broader base of customers.
• Invest in marketing and technologyinitiatives designed to position Chasefor superior long-term growth.
• Cross-sell card products to the firm’scustomers.
• Continue to increase productivity by driving down operating cost peractive account.
• Establish Chase as an iconic brand bycontinually delivering on our brandpromise through our employees, products and innovative new products.
2005 results reflect the impact of newly enacted bank-
ruptcy legislation, as well as a special provision taken for
Hurricane Katrina.
All 2004 information is on a pro forma combined-
operating basis. See page 1 for details.
(In millions, except ratios) 2005 2004
Total net revenue $15,366 $15,001Operating earnings 1,907 1,681Return on common equity 16% 14%Return on outstandings (pre-tax) 2.21% 2.08%
Pro forma
Major 2005 accomplishments
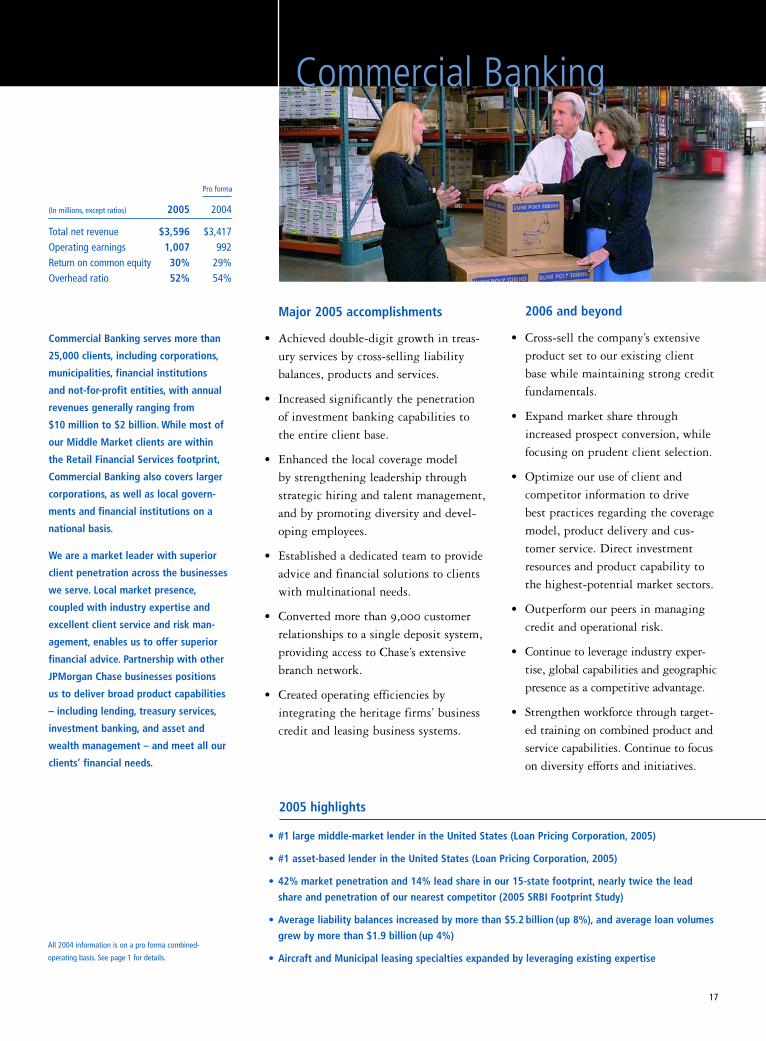
• Achieved double-digit growth in treas-ury services by cross-selling liabilitybalances, products and services.
• Increased significantly the penetrationof investment banking capabilities tothe entire client base.
• Enhanced the local coverage model by strengthening leadership throughstrategic hiring and talent management,and by promoting diversity and devel-oping employees.
• Established a dedicated team to provideadvice and financial solutions to clientswith multinational needs.
• Converted more than , customerrelationships to a single deposit system,providing access to Chase’s extensivebranch network.
• Created operating efficiencies by integrating the heritage firms’ businesscredit and leasing business systems.
• #1 large middle-market lender in the United States (Loan Pricing Corporation, 2005)
• #1 asset-based lender in the United States (Loan Pricing Corporation, 2005)
• 42% market penetration and 14% lead share in our 15-state footprint, nearly twice the lead
share and penetration of our nearest competitor (2005 SRBI Footprint Study)
• Average liability balances increased by more than $5.2 billion (up 8%), and average loan volumes
grew by more than $1.9 billion (up 4%)
• Aircraft and Municipal leasing specialties expanded by leveraging existing expertise
17
(In millions, except ratios) 2005 2004
Total net revenue $3,596 $3,417Operating earnings 1,007 992Return on common equity 30% 29%Overhead ratio 52% 54%
Pro forma
Commercial Banking
2005 highlights
Commercial Banking serves more than
25,000 clients, including corporations,
municipalities, financial institutions
and not-for-profit entities, with annual
revenues generally ranging from
$10 million to $2 billion. While most of
our Middle Market clients are within
the Retail Financial Services footprint,
Commercial Banking also covers larger
corporations, as well as local govern-
ments and financial institutions on a
national basis.
We are a market leader with superior
client penetration across the businesses
we serve. Local market presence,
coupled with industry expertise and
excellent client service and risk man-
agement, enables us to offer superior
financial advice. Partnership with other
JPMorgan Chase businesses positions
us to deliver broad product capabilities
– including lending, treasury services,
investment banking, and asset and
wealth management – and meet all our
clients’ financial needs.
2006 and beyond
• Cross-sell the company’s extensiveproduct set to our existing clientbase while maintaining strong creditfundamentals.
• Expand market share throughincreased prospect conversion, whilefocusing on prudent client selection.
• Optimize our use of client and competitor information to drive best practices regarding the coveragemodel, product delivery and cus-tomer service. Direct investmentresources and product capability tothe highest-potential market sectors.
• Outperform our peers in managingcredit and operational risk.
• Continue to leverage industry exper-tise, global capabilities and geographicpresence as a competitive advantage.
• Strengthen workforce through target-ed training on combined product andservice capabilities. Continue to focuson diversity efforts and initiatives.
All 2004 information is on a pro forma combined-
operating basis. See page 1 for details.

18
Major 2005 accomplishments
• Delivered double-digit revenue growthand increased net earnings by %.
• Acquired Vastera to become the firstfinancial institution to offer a complete,integrated global trade solution sup-porting both the movement of goodsand financial settlements.
• Built out alternative investment servicesby launching JPMorgan Private EquityFund Services, which provides adminis-tration services to global private equityfirms and institutional limited partners.
• Accomplished major merger mile-stones, contributing to the firm’s largestsystems upgrade and the integration ofTexas operations, and creating a singleprocessing platform for U.S. dollarfunds transfers.
• Consolidated two securities processingorganizations into one, WorldwideSecurities Services, to leverage the client base and product offerings and to achieve efficiencies.
2005 highlights
Treasury & Securities Services
Treasury & Securities Services (TSS) is a
global leader in transaction, investment
and information services that support
the needs of chief financial officers,
treasurers, issuers and investors world-
wide. TSS operates through two divisions:
Treasury Services (TS) moves, concen-
trates and invests client money, and
provides trade finance and logistics
solutions. The business ranks first in U.S.
dollar clearing, processing an average
of $3.2 trillion in wire transfers daily.
Worldwide Securities Services (WSS)
safekeeps, values, clears and services
securities and portfolios for investors
and broker-dealers; provides trustee
and agent services; and is a leading
manager of American Depositary
Receipt programs. WSS is the world’s
largest global custodian, with $11.2
trillion in total assets under custody
and $6.8 trillion of trust securities
under administration.
• Double-digit year-over-year growth in assets under custody (up 21%), Automated Clearing
House Originations (up 18%), International Electronic Funds Transfer volume (up 92%) and
wholesale cards issued (up 12%)
• #1 in U.S. Dollar Treasury Clearing(a), Commercial Payments(a), Automated Clearing House
Originations(b), CHIPS(c) and Fedwire(d)
• #1 Trustee for new U.S. Corporate Debt, excluding asset- and mortgage-backed securities
(by number of issues), and Global Trustee of U.S. Collateralized Debt Obligations(e)
• #1 U.S. Commercial Paper Issuing & Paying Agent(e)
• Liability balances increased by $29.3 billion, to $164.3 billion
2006 and beyond
• Focus on product delivery by customer segment.
• Continue to expand alternativeinvestment services.
• Leverage the full capabilities of thefirm to develop innovative solutionsand cross-sell products with theInvestment Bank, CommercialBanking, Small Business and Asset& Wealth Management.
• Achieve market differentiation bydelivering competitively superiorclient service.
• Continue to focus on productivityand expense control to maximizeearnings and fund investments in the business.
• Invest in technology and people to improve productivity and ensurethe reliability needed to supportquality client service and futurebusiness growth.
(a) FImetrix
(b) NACHA
(c) The Clearing House
(d) Federal Reserve
(e) Thomson Financial
All 2004 information is on a pro forma combined-
operating basis. See page 1 for details.
(In millions, except ratios) 2005 2004
Total net revenue $6,241 $ 5,400Operating earnings 1,037 437Return on common equity 55% 23%Pre-tax operating margin 26% 12%
Pro forma

19
2005 highlights
Major 2005 accomplishments
• Achieved record earnings, % revenuegrowth, % earnings growth and a %improvement in pre-tax margin to %.
• Completed the largest U.S. mutual fundmerger in history.
• Surpassed $ billion in Private ClientServices assets under supervision.
• Reached the milestone of million participants in our Retirement PlanServices business.
• Became the largest seller of mutual funds in Europe. Generated more than$ billion of net flows, with $ billionflowing into long-term funds and over $ billion into liquidity funds.
• Delivered strong investment perfor-mance. Globally, % of our long-termmutual fund assets were ranked in first- or second-quartile funds for thefive years ended December , .
Asset & Wealth Management provides
investment advice and management
for institutions and individuals. With
assets under supervision of $1.1 trillion,
we are one of the largest asset and
wealth managers in the world. We serve
four distinct client groups through
three businesses: institutions through
JPMorgan Asset Management;
ultra-high-net-worth clients through
the Private Bank; high-net-worth clients
through Private Client Services; and
retail clients through JPMorgan Asset
Management. The majority of our
client assets are in actively managed
portfolios. We have global investment
expertise in equities, fixed income,
real estate, hedge funds, private equity
and liquidity, including both money-
market instruments and bank deposits.
We also provide trust and estate
services to ultra-high-net-worth and
high-net-worth clients, and retirement
services for corporations and individuals.
2006 and beyond
• Continue to deliver strong investmentperformance through rigorous reviewof investment strategies and diversifi-cation of investment processes.
• Expand third-party distribution of ourinvestment management products andservices, capitalizing on industryshifts toward open architecture andoutsourcing of asset management.
• Respond to increasing demand for absolute-return investing byexpanding our offering of alternativeproducts globally and staying at theforefront of that move.
• Grow our (k) and IRA rolloverretail channels through targeted marketing at both the corporate andparticipant levels and leveraging ourconnectivity with the rest of the firm.
• Extend our Private Bank and Private Client Services footprint,gain efficiencies and expand PrivateClient Services investment offerings.
• $1.1 trillion in total assets under supervision at year-end
• Grew assets under management by $56 billion to a total of $847 billion, including $32 billion of
net flows
• Created shared-services organization to leverage economies of scale between Private Client
Services and the Private Bank
• Sold BrownCo, a discount brokerage firm, for $1.6 billion
• Successfully completed first year of integration with Highbridge, with its assets under
management increasing by 8%
Asset &Wealth Management
All 2004 information is on a pro forma combined-
operating basis. See page 1 for details.
(In millions, except ratios) 2005 2004
Total net revenue $5,664 $4,901Operating earnings 1,216 879Return on common equity 51% 37%Pre-tax operating margin 33% 28%
Pro forma

20
Community Partnership
2005 highlights
Major 2005 accomplishments
• Supported thousands of nonprofit organizations around the world.
• Invested $ billion in the second yearof our -year pledge to invest $
billion in U.S. communities – thelargest commitment by any financialservices firm. Total investment to dateis $ billion.
• Expanded our Community AdvisoryBoard to include members representingcommunities throughout our footprint.
• Increased management accountability forcreating a diverse senior leadership team.
• Implemented a comprehensive environ-mental policy by adopting the EquatorPrinciples, guidelines that promote environmental and social risk manage-ment in project financing. The policy alsoaddresses climate change, sustainableforestry, habitat protection, illegal loggingand the concerns of indigenous peoples.
JPMorgan Chase invests in organizations
and programs that strengthen the
neighborhoods, schools and the econo-
mic vitality of the communities we serve
around the world. We also respond
when disaster strikes. JPMorgan Chase
provided programs and services to
communities devastated by Hurricane
Katrina. We donated millions of dollars
to help relieve suffering caused by the
Gulf Coast storms, and by the London
bombings and the Pakistan earthquake,
as well.
We expanded access to capital in low-
and moderate-income communities,
providing home mortgages, small busi-
ness loans, investments, and innovative
development programs and services.
We took concrete action to protect
the environment, adopting policies and
practices to preserve our planet for
future generations.
Within JPMorgan Chase, we are building
an inclusive culture in which everyone
has the opportunity to contribute,
develop and succeed based on their
talent and skills. In an increasingly
global economy, the diverse experiences
and perspectives of our people are a
critical asset.
• Contributed nearly $112 million to nonprofit organizations worldwide, including funds directed
by employees through our matching-gift and volunteer programs
• Won $75 million New Markets Tax Credit; part of the Community Renewal Tax Relief Act, this
program facilitates investment in low-income areas. Used funds to provide capital at favorable
terms to low-income communities; will also support the work of community-development
financial institutions
• Recognized as a “Low Carbon Leader” by BusinessWeek and the United Kingdom-based Climate
Group for our leadership on climate change in financial services
2006 and beyond
• Continue to work with not-for-profitsaround the world to effect positivechange in the communities where we operate.
• Focus efforts on the credit and com-munity-development needs of NewOrleans and the Gulf Coast region.
• Support our communities in thethird year of our $ billion commitment.
• Continue to develop a diverse pool oftalented employees at all levels to helpus meet the unique financial needs ofdiverse individuals, families, businessesand communities.
• Increase the energy efficiency of ourfacilities and work toward reducingour U.S. greenhouse gas emissionsover time.
• Continue to raise employees’ aware-ness of environmental issues and their relevance to individuals’ day-to-day work.
JPMorgan Chase & Co. / 2005 Annual Report 21
Table of contents
Financial:22 Five-year summary of consolidated financial highlights
Management’s discussion and analysis:
23 Introduction
25 Executive overview
27 Consolidated results of operations
31 Explanation and reconciliation of the Firm’suse of non-GAAP financial measures
34 Business segment results
55 Balance sheet analysis
56 Capital management
58 Off–balance sheet arrangements and contractual cash obligations
60 Risk management
61 Liquidity risk management
63 Credit risk management
75 Market risk management
79 Operational risk management
80 Reputation and fiduciary risk management
80 Private equity risk management
81 Critical accounting estimates used by the Firm
83 Accounting and reporting developments
84 Nonexchange-traded commodity derivative contracts at fair value
Audited financial statements:
85 Management’s report on internal control over financial reporting
86 Report of independent registered public accounting firm
87 Consolidated financial statements
91 Notes to consolidated financial statements
Supplementary information:
133 Selected quarterly financial data
134 Glossary of terms
135 Forward-looking statements
Merger with Bank One CorporationEffective July 1, 2004, Bank One Corporation (“Bank One”) merged with and into JPMorgan Chase & Co. (the “Merger”). As a result of the Merger, each outstanding share of common stock of Bank One was converted in a stock-for-stock exchange into 1.32 shares of common stock of JPMorgan Chase & Co.(“JPMorgan Chase”). The Merger was accounted for using the purchase method of accounting. Accordingly, the Firm’s results of operations for 2004 include sixmonths of the combined Firm’s results and six months of heritage JPMorgan Chase results only and 2003 results of operations reflect the results of heritageJPMorgan Chase only. For additional information regarding the Merger, see Note 2 on page 92 of this Annual Report.
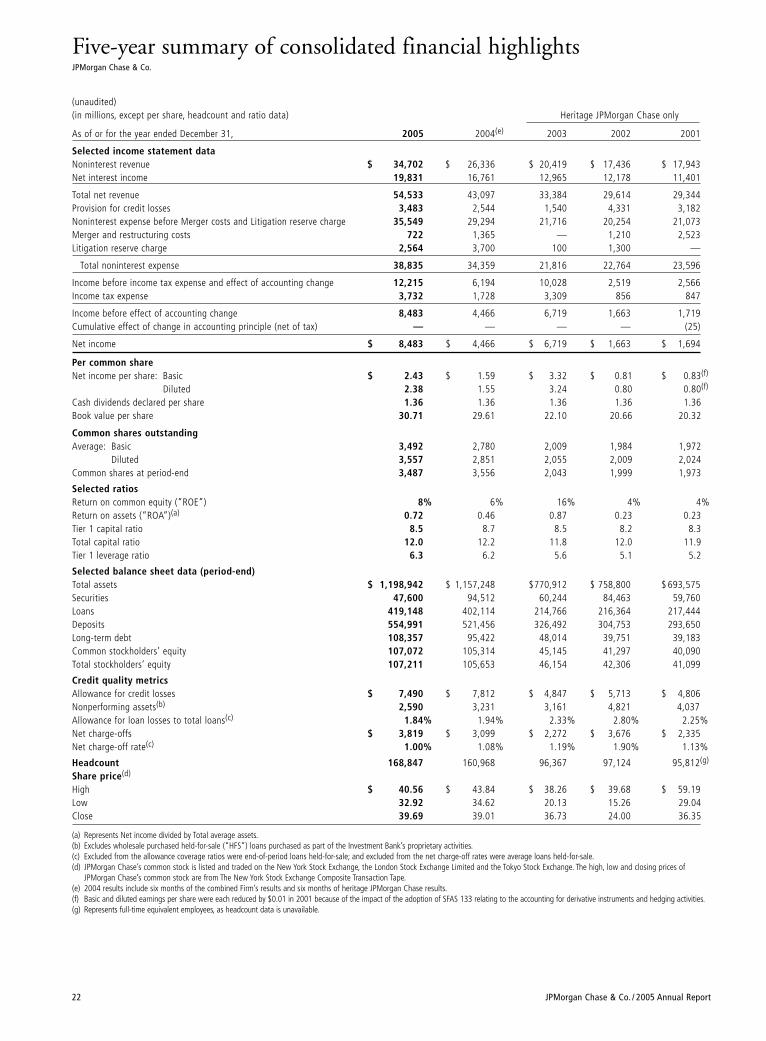
22 JPMorgan Chase & Co. / 2005 Annual Report
(unaudited)(in millions, except per share, headcount and ratio data) Heritage JPMorgan Chase only
As of or for the year ended December 31, 2005 2004(e) 2003 2002 2001
Selected income statement dataNoninterest revenue $ 34,702 $ 26,336 $ 20,419 $ 17,436 $ 17,943Net interest income 19,831 16,761 12,965 12,178 11,401
Total net revenue 54,533 43,097 33,384 29,614 29,344Provision for credit losses 3,483 2,544 1,540 4,331 3,182Noninterest expense before Merger costs and Litigation reserve charge 35,549 29,294 21,716 20,254 21,073Merger and restructuring costs 722 1,365 — 1,210 2,523Litigation reserve charge 2,564 3,700 100 1,300 —
Total noninterest expense 38,835 34,359 21,816 22,764 23,596
Income before income tax expense and effect of accounting change 12,215 6,194 10,028 2,519 2,566Income tax expense 3,732 1,728 3,309 856 847
Income before effect of accounting change 8,483 4,466 6,719 1,663 1,719Cumulative effect of change in accounting principle (net of tax) — — — — (25)
Net income $ 8,483 $ 4,466 $ 6,719 $ 1,663 $ 1,694
Per common shareNet income per share: Basic $ 2.43 $ 1.59 $ 3.32 $ 0.81 $ 0.83(f)
Diluted 2.38 1.55 3.24 0.80 0.80(f)
Cash dividends declared per share 1.36 1.36 1.36 1.36 1.36Book value per share 30.71 29.61 22.10 20.66 20.32
Common shares outstandingAverage: Basic 3,492 2,780 2,009 1,984 1,972
Diluted 3,557 2,851 2,055 2,009 2,024Common shares at period-end 3,487 3,556 2,043 1,999 1,973
Selected ratiosReturn on common equity (“ROE”) 8% 6% 16% 4% 4%Return on assets (“ROA”)(a) 0.72 0.46 0.87 0.23 0.23Tier 1 capital ratio 8.5 8.7 8.5 8.2 8.3Total capital ratio 12.0 12.2 11.8 12.0 11.9Tier 1 leverage ratio 6.3 6.2 5.6 5.1 5.2
Selected balance sheet data (period-end)Total assets $ 1,198,942 $ 1,157,248 $770,912 $ 758,800 $ 693,575Securities 47,600 94,512 60,244 84,463 59,760Loans 419,148 402,114 214,766 216,364 217,444Deposits 554,991 521,456 326,492 304,753 293,650Long-term debt 108,357 95,422 48,014 39,751 39,183Common stockholders’ equity 107,072 105,314 45,145 41,297 40,090Total stockholders’ equity 107,211 105,653 46,154 42,306 41,099
Credit quality metricsAllowance for credit losses $ 7,490 $ 7,812 $ 4,847 $ 5,713 $ 4,806Nonperforming assets(b) 2,590 3,231 3,161 4,821 4,037Allowance for loan losses to total loans(c) 1.84% 1.94% 2.33% 2.80% 2.25%Net charge-offs $ 3,819 $ 3,099 $ 2,272 $ 3,676 $ 2,335Net charge-off rate(c) 1.00% 1.08% 1.19% 1.90% 1.13%
Headcount 168,847 160,968 96,367 97,124 95,812(g)
Share price(d)
High $ 40.56 $ 43.84 $ 38.26 $ 39.68 $ 59.19Low 32.92 34.62 20.13 15.26 29.04Close 39.69 39.01 36.73 24.00 36.35
(a) Represents Net income divided by Total average assets.(b) Excludes wholesale purchased held-for-sale (“HFS”) loans purchased as part of the Investment Bank’s proprietary activities.(c) Excluded from the allowance coverage ratios were end-of-period loans held-for-sale; and excluded from the net charge-off rates were average loans held-for-sale.(d) JPMorgan Chase’s common stock is listed and traded on the New York Stock Exchange, the London Stock Exchange Limited and the Tokyo Stock Exchange. The high, low and closing prices of
JPMorgan Chase’s common stock are from The New York Stock Exchange Composite Transaction Tape.(e) 2004 results include six months of the combined Firm’s results and six months of heritage JPMorgan Chase results.(f) Basic and diluted earnings per share were each reduced by $0.01 in 2001 because of the impact of the adoption of SFAS 133 relating to the accounting for derivative instruments and hedging activities.(g) Represents full-time equivalent employees, as headcount data is unavailable.
Five-year summary of consolidated financial highlightsJPMorgan Chase & Co.
JPMorgan Chase & Co. / 2005 Annual Report 23
the largest noncaptive originator of automobile loans as well as a top providerof loans for college students. Through its Insurance operations, the Firm sells andunderwrites an extensive range of financial protection products and investmentalternatives, including life insurance, annuities and debt protection products.
Card ServicesCard Services (“CS”) is one of the largest issuers of credit cards in the UnitedStates, with more than 110 million cards in circulation, and is the largest merchant acquirer. CS offers a wide variety of products to satisfy the needs of itscardmembers, including cards issued on behalf of many well-known partners,such as major airlines, hotels, universities, retailers and other financial institutions.
Commercial BankingCommercial Banking (“CB”) serves more than 25,000 clients, including corporations, municipalities, financial institutions and not-for-profit entitieswith annual revenues generally ranging from $10 million to $2 billion. Whilemost Middle Market clients are within the Retail Financial Services footprint,CB also covers larger corporations, as well as local governments and financialinstitutions on a national basis. CB is a market leader with superior clientpenetration across the businesses it serves. Local market presence, coupled withindustry expertise and excellent client service and risk management, enableCB to offer superior financial advice. Partnership with other JPMorgan Chasebusinesses positions CB to deliver broad product capabilities – including lending,treasury services, investment banking, and asset and wealth management –and meet its clients’ financial needs.
Treasury & Securities ServicesTreasury & Securities Services (“TSS”) is a global leader in providing transaction,investment and information services to support the needs of corporations,issuers and institutional investors worldwide. TSS is one of the largest cashmanagement providers in the world and a leading global custodian. TheTreasury Services (“TS”) business provides a variety of cash managementproducts, trade finance and logistics solutions, wholesale card products, andshort-term liquidity management tools. The Investor Services (“IS”) businessprovides custody, fund services, securities lending, and performance measure-ment and execution products. The Institutional Trust Services (“ITS”) businessprovides trustee, depository and administrative services for debt and equityissuers. TS partners with the Commercial Banking, Consumer & SmallBusiness Banking and Asset & Wealth Management businesses to serveclients firmwide. As a result, certain TS revenues are included in other seg-ments’ results. TSS combined the management of the IS and ITS businessesunder the name Worldwide Securities Services (“WSS”) to create an integrat-ed franchise which provides custody and investor services as well as securitiesclearance and trust services to clients globally. Beginning January 1, 2006,TSS will report results for two divisions: TS and WSS.
IntroductionJPMorgan Chase & Co. (“JPMorgan Chase” or the “Firm”), a financial holdingcompany incorporated under Delaware law in 1968, is a leading global financialservices firm and one of the largest banking institutions in the United States,with $1.2 trillion in assets, $107 billion in stockholders’ equity and operationsworldwide. The Firm is a leader in investment banking, financial services forconsumers and businesses, financial transaction processing, asset and wealthmanagement and private equity. Under the JPMorgan, Chase and Bank Onebrands, the Firm serves millions of customers in the United States and manyof the world’s most prominent corporate, institutional and government clients.
JPMorgan Chase’s principal bank subsidiaries are JPMorgan Chase Bank,National Association (“JPMorgan Chase Bank”), a national banking associationwith branches in 17 states; and Chase Bank USA, National Association, anational bank that is the Firm’s credit card issuing bank. JPMorgan Chase’sprincipal nonbank subsidiary is J.P. Morgan Securities Inc. (“JPMSI”), theFirm’s U.S. investment banking firm.
JPMorgan Chase’s activities are organized, for management reporting purposes, into six business segments, as well as Corporate. The Firm’s wholesale businesses comprise the Investment Bank, Commercial Banking,Treasury & Securities Services, and Asset & Wealth Management. The Firm’sconsumer businesses comprise Retail Financial Services and Card Services.A description of the Firm’s business segments, and the products and servicesthey provide to their respective client bases, follows.
Investment BankJPMorgan Chase is one of the world’s leading investment banks, as evidenced by the breadth of the Investment Bank client relationships andproduct capabilities. The Investment Bank (“IB”) has extensive relationshipswith corporations, financial institutions, governments and institutionalinvestors worldwide. The Firm provides a full range of investment bankingproducts and services in all major capital markets, including advising oncorporate strategy and structure, capital raising in equity and debt markets,sophisticated risk management, and market-making in cash securities andderivative instruments. The Investment Bank also commits the Firm’s owncapital to proprietary investing and trading activities.
Retail Financial ServicesRetail Financial Services (“RFS”) includes Home Finance, Consumer & SmallBusiness Banking, Auto & Education Finance and Insurance. Through thisgroup of businesses, the Firm provides consumers and small businesses with abroad range of financial products and services including deposits, investments,loans and insurance. Home Finance is a leading provider of consumer realestate loan products and is one of the largest originators and servicers of homemortgages. Consumer & Small Business Banking offers one of the largestbranch networks in the United States, covering 17 states with 2,641 branchesand 7,312 automated teller machines (“ATMs”). Auto & Education Finance is
This section of the Annual Report provides management’s discussion
and analysis (“MD&A”) of the financial condition and results of opera-
tions for JPMorgan Chase. See the Glossary of terms on pages 134–135
for definitions of terms used throughout this Annual Report. The MD&A
included in this Annual Report contains statements that are forward-
looking within the meaning of the Private Securities Litigation Reform
Act of 1995. Such statements are based upon the current beliefs and
expectations of JPMorgan Chase’s management and are subject to
significant risks and uncertainties. These risks and uncertainties could
cause JPMorgan Chase’s results to differ materially from those set forth in
such forward-looking statements. Certain of such risks and uncertainties
are described herein (see Forward-looking statements on page 135 of
this Annual Report) and in the JPMorgan Chase Annual Report on
Form 10–K (“Form 10–K”) for the year ended December 31, 2005, in
Part I, Item 1A: Risk factors, to which reference is hereby made.
Management’s discussion and analysisJPMorgan Chase & Co.
Management’s discussion and analysisJPMorgan Chase & Co.
24 JPMorgan Chase & Co. / 2005 Annual Report
Asset & Wealth ManagementAsset & Wealth Management (“AWM”) provides investment advice and management for institutions and individuals. With Assets under supervision of$1.1 trillion, AWM is one of the largest asset and wealth managers in the world.AWM serves four distinct client groups through three businesses: institutionsthrough JPMorgan Asset Management; ultra-high-net-worth clients through thePrivate Bank; high-net-worth clients through Private Client Services; and retailclients through JPMorgan Asset Management. The majority of AWM’s clientassets are in actively managed portfolios. AWM has global investment expertisein equities, fixed income, real estate, hedge funds, private equity and liquidity,including both money market instruments and bank deposits. AWM also pro-vides trust and estate services to ultra-high-net-worth and high-net-worthclients, and retirement services for corporations and individuals.
2005 Business events Collegiate Funding ServicesOn March 1, 2006, JPMorgan Chase acquired, for approximately $663 million,Collegiate Funding Services, a leader in student loan servicing and consolida-tion. This acquisition will enable the Firm to create a comprehensive educationfinance business.
BrownCoOn November 30, 2005, JPMorgan Chase sold BrownCo, an on-line deep-discount brokerage business, to E*TRADE Financial for a cash purchase priceof $1.6 billion. JPMorgan Chase recognized an after-tax gain of $752 million.
Sears Canada credit card business On November 15, 2005, JPMorgan Chase purchased Sears Canada Inc.’s credit card operation, including both the private-label card accounts and theco-branded Sears MasterCard® accounts. The credit card operation includesapproximately 10 million accounts with $2.2 billion (CAD$2.5 billion) in managed loans. Sears Canada and JPMorgan Chase entered into an ongoingarrangement under which JPMorgan Chase will offer private-label and co-branded credit cards to both new and existing customers of Sears Canada.
Chase Merchant Services, Paymentech integrationOn October 5, 2005, JPMorgan Chase and First Data Corp. completed the integration of the companies’ jointly owned Chase Merchant Services andPaymentech merchant businesses, to be operated under the name of ChasePaymentech Solutions, LLC. The joint venture is the largest financial transactionprocessor in the U.S. for businesses accepting credit card payments via traditionalpoint of sale, Internet, catalog and recurring billing. As a result of the integrationinto a joint venture, Paymentech has been deconsolidated and JPMorgan Chase’sownership interest in this joint venture is accounted for in accordance with theequity method of accounting.
Neovest Holdings, Inc.On September 1, 2005, JPMorgan Chase completed its acquisition of NeovestHoldings, Inc., a provider of high-performance trading technology and directmarket access. This transaction will enable the Investment Bank to offer aleading, broker-neutral trading platform across asset classes to institutionalinvestors, asset managers and hedge funds.
Enron litigation settlementOn June 14, 2005, JPMorgan Chase announced that it had reached an agreement in principle to settle, for $2.2 billion, the Enron class action litigationcaptioned Newby v. Enron Corp. The Firm also recorded a nonoperatingcharge of $1.9 billion (pre-tax) to cover the settlement and to increase itsreserves for certain other remaining material legal matters.
VasteraOn April 1, 2005, JPMorgan Chase acquired Vastera, a provider of globaltrade management solutions, for approximately $129 million. Vastera’s businesswas combined with the Logistics and Trade Services businesses of TSS’Treasury Services unit. Vastera automates trade management processes asso-ciated with the physical movement of goods internationally; the acquisitionenables TS to offer management of information and processes in support ofphysical goods movement, together with financial settlement.
WorldCom litigation settlementOn March 17, 2005, JPMorgan Chase settled, for $2.0 billion, the WorldCom,Inc. class action litigation. In connection with the settlement, JPMorgan Chaseincreased the Firm’s Litigation reserve by $900 million.
JPMorgan PartnersOn March 1, 2005, the Firm announced that the management team of JPMorganPartners, LLC, a private equity unit of the Firm, will become independent when itcompletes the investment of the current $6.5 billion Global Fund, which it advises.The buyout and growth equity professionals of JPMorgan Partners will form anew independent firm, CCMP Capital, LLC, and the venture professionals willseparately form a new independent firm, Panorama Capital, LLC. JPMorgan Chasehas committed to invest the lesser of $875 million or 24.9% of the limited part-nership interests in the fund to be raised by CCMP Capital, and has committedto invest the lesser of $50 million or 24.9% of the limited partnership interestsin the fund to be raised by Panorama Capital. The investment professionals ofCCMP and Panorama will continue to manage the JPMP investments pursuantto a management agreement with the Firm.
CazenoveOn February 28, 2005, JPMorgan Chase and Cazenove Group plc (“Cazenove”)formed a business partnership which combined Cazenove’s investment bankingbusiness and JPMorgan Chase’s U.K.-based investment banking business inorder to provide investment banking services in the United Kingdom andIreland. The new company is called JPMorgan Cazenove Holdings.
Subsequent events Sale of insurance underwriting businessOn February 7, 2006, JPMorgan Chase announced that the Firm has agreedto sell its life insurance and annuity underwriting businesses to Protective Life Corporation for a cash purchase price of approximately $1.2 billion. Thesale, which includes both the heritage Chase insurance business and the lifebusiness that Bank One had bought from Zurich Insurance in 2003, is subjectto normal regulatory approvals and is expected to close in the third quarter of 2006. JPMorgan Chase anticipates the transaction will have no materialimpact on earnings.
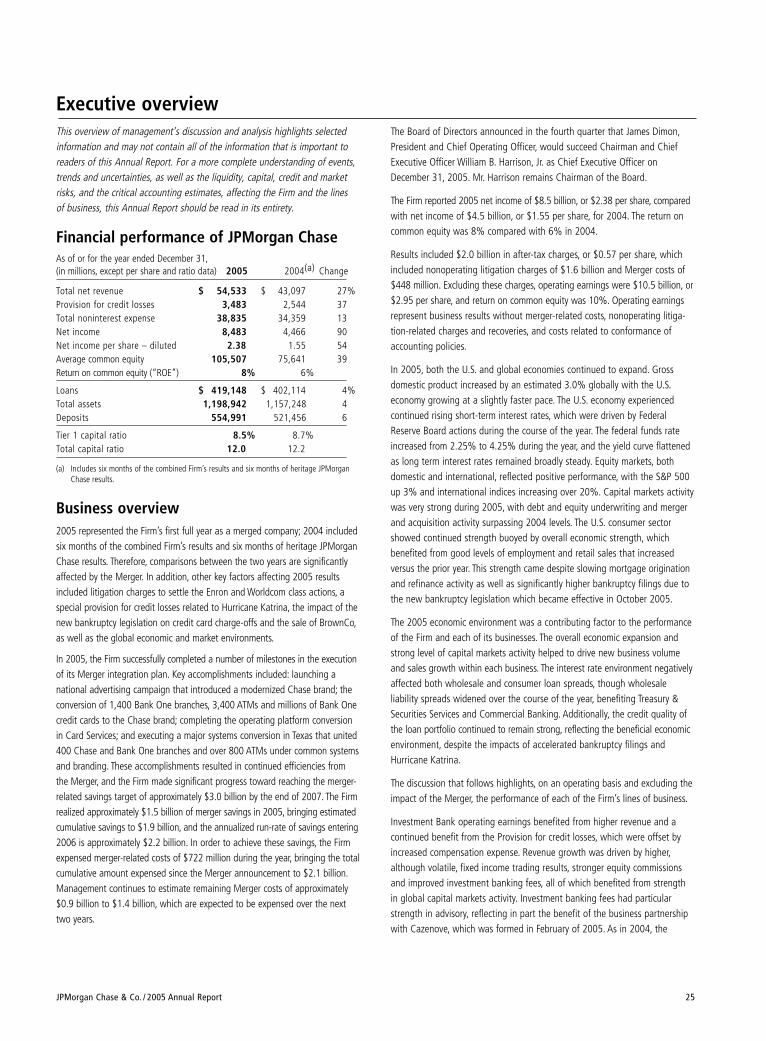
JPMorgan Chase & Co. / 2005 Annual Report 25
Executive overview This overview of management’s discussion and analysis highlights selectedinformation and may not contain all of the information that is important toreaders of this Annual Report. For a more complete understanding of events,trends and uncertainties, as well as the liquidity, capital, credit and marketrisks, and the critical accounting estimates, affecting the Firm and the lines of business, this Annual Report should be read in its entirety.
Financial performance of JPMorgan ChaseAs of or for the year ended December 31,(in millions, except per share and ratio data) 2005 2004(a) Change
Total net revenue $ 54,533 $ 43,097 27%Provision for credit losses 3,483 2,544 37Total noninterest expense 38,835 34,359 13Net income 8,483 4,466 90Net income per share – diluted 2.38 1.55 54Average common equity 105,507 75,641 39Return on common equity (“ROE”) 8% 6%
Loans $ 419,148 $ 402,114 4%Total assets 1,198,942 1,157,248 4Deposits 554,991 521,456 6
Tier 1 capital ratio 8.5% 8.7%Total capital ratio 12.0 12.2
(a) Includes six months of the combined Firm’s results and six months of heritage JPMorganChase results.
Business overview2005 represented the Firm’s first full year as a merged company; 2004 includedsix months of the combined Firm’s results and six months of heritage JPMorganChase results. Therefore, comparisons between the two years are significantlyaffected by the Merger. In addition, other key factors affecting 2005 resultsincluded litigation charges to settle the Enron and Worldcom class actions, aspecial provision for credit losses related to Hurricane Katrina, the impact of thenew bankruptcy legislation on credit card charge-offs and the sale of BrownCo,as well as the global economic and market environments.
In 2005, the Firm successfully completed a number of milestones in the executionof its Merger integration plan. Key accomplishments included: launching anational advertising campaign that introduced a modernized Chase brand; theconversion of 1,400 Bank One branches, 3,400 ATMs and millions of Bank Onecredit cards to the Chase brand; completing the operating platform conversionin Card Services; and executing a major systems conversion in Texas that united400 Chase and Bank One branches and over 800 ATMs under common systemsand branding. These accomplishments resulted in continued efficiencies fromthe Merger, and the Firm made significant progress toward reaching the merger-related savings target of approximately $3.0 billion by the end of 2007. The Firmrealized approximately $1.5 billion of merger savings in 2005, bringing estimatedcumulative savings to $1.9 billion, and the annualized run-rate of savings entering2006 is approximately $2.2 billion. In order to achieve these savings, the Firmexpensed merger-related costs of $722 million during the year, bringing the totalcumulative amount expensed since the Merger announcement to $2.1 billion.Management continues to estimate remaining Merger costs of approximately$0.9 billion to $1.4 billion, which are expected to be expensed over the nexttwo years.
The Board of Directors announced in the fourth quarter that James Dimon,President and Chief Operating Officer, would succeed Chairman and ChiefExecutive Officer William B. Harrison, Jr. as Chief Executive Officer onDecember 31, 2005. Mr. Harrison remains Chairman of the Board.
The Firm reported 2005 net income of $8.5 billion, or $2.38 per share, comparedwith net income of $4.5 billion, or $1.55 per share, for 2004. The return oncommon equity was 8% compared with 6% in 2004.
Results included $2.0 billion in after-tax charges, or $0.57 per share, whichincluded nonoperating litigation charges of $1.6 billion and Merger costs of$448 million. Excluding these charges, operating earnings were $10.5 billion, or$2.95 per share, and return on common equity was 10%. Operating earningsrepresent business results without merger-related costs, nonoperating litiga-tion-related charges and recoveries, and costs related to conformance ofaccounting policies.
In 2005, both the U.S. and global economies continued to expand. Grossdomestic product increased by an estimated 3.0% globally with the U.S.economy growing at a slightly faster pace. The U.S. economy experiencedcontinued rising short-term interest rates, which were driven by FederalReserve Board actions during the course of the year. The federal funds rateincreased from 2.25% to 4.25% during the year, and the yield curve flattenedas long term interest rates remained broadly steady. Equity markets, bothdomestic and international, reflected positive performance, with the S&P 500up 3% and international indices increasing over 20%. Capital markets activitywas very strong during 2005, with debt and equity underwriting and mergerand acquisition activity surpassing 2004 levels. The U.S. consumer sectorshowed continued strength buoyed by overall economic strength, which benefited from good levels of employment and retail sales that increased versus the prior year. This strength came despite slowing mortgage originationand refinance activity as well as significantly higher bankruptcy filings due tothe new bankruptcy legislation which became effective in October 2005.
The 2005 economic environment was a contributing factor to the performanceof the Firm and each of its businesses. The overall economic expansion andstrong level of capital markets activity helped to drive new business volumeand sales growth within each business. The interest rate environment negativelyaffected both wholesale and consumer loan spreads, though wholesale liability spreads widened over the course of the year, benefiting Treasury &Securities Services and Commercial Banking. Additionally, the credit quality ofthe loan portfolio continued to remain strong, reflecting the beneficial economicenvironment, despite the impacts of accelerated bankruptcy filings andHurricane Katrina.
The discussion that follows highlights, on an operating basis and excluding theimpact of the Merger, the performance of each of the Firm’s lines of business.
Investment Bank operating earnings benefited from higher revenue and acontinued benefit from the Provision for credit losses, which were offset byincreased compensation expense. Revenue growth was driven by higher,although volatile, fixed income trading results, stronger equity commissionsand improved investment banking fees, all of which benefited from strength in global capital markets activity. Investment banking fees had particularstrength in advisory, reflecting in part the benefit of the business partnershipwith Cazenove, which was formed in February of 2005. As in 2004, the
Management’s discussion and analysisJPMorgan Chase & Co.
26 JPMorgan Chase & Co. / 2005 Annual Report
Provision for credit losses in 2005 was a benefit to earnings, mainly due tocontinued improvement in the credit quality of the loan portfolio. The increasein expense was primarily the result of higher performance-based incentivecompensation due to increased revenues.
Retail Financial Services operating earnings benefited from the overall strengthof the U.S. economy, which led to increased deposit, home equity and mortgagebalances. In addition to the benefit from higher balances, revenues increaseddue to improved mortgage servicing rights (“MSRs”) risk managementresults. Expenses declined, reflecting ongoing efficiency improvements acrossall businesses even as investments continued in retail banking distributionand sales, with the net addition during the year of 133 branch offices, 662ATMs and over 1,300 personal bankers. These benefits were offset partially by narrower spreads on loans due to the interest rate environment and netlosses associated with loan portfolio sale activity. The provision for credit lossesbenefited from improved credit trends in most consumer lending portfolios andfrom loan portfolio sales, but was affected negatively by a special provisionrelated to Hurricane Katrina.
Card Services operating earnings benefited from lower expenses driven bymerger savings and greater efficiencies from the operating platform conversion,which resulted in lower processing and compensation costs. Revenue benefitedfrom higher loan balances and customer charge volume resulting from marketinginitiatives and increased consumer spending. Partially offsetting this growthwere narrower spreads on loan balances due to an increase in accounts intheir introductory rate period and higher interest rates. The managed provisionfor credit losses increased due to record levels of bankruptcy-related charge-offsrelated to the new bankruptcy legislation that became effective in October2005 and a special provision related to Hurricane Katrina. Despite these events,underlying credit quality remained strong, with a managed net charge-off ratio of5.21%, down from 5.27% in 2004.
Commercial Banking operating earnings benefited from wider spreads and highervolumes related to liability balances and increased loan balances. Partially offset-ting these benefits were narrower loan spreads related to competitive pressuresin some markets and lower deposit-related fees due to higher interest rates.The provision for credit losses increased due to a special provision related toHurricane Katrina, increased loan balances and refinements in the data used toestimate the allowance for credit losses. However, the underlying credit qualityin the portfolio was strong throughout the year, as evidenced by lower netcharge-offs and nonperforming loans compared with 2004.
Treasury & Securities Services operating earnings grew significantly in 2005.Revenue growth resulted from business growth and widening spreads on,and growth in, liability balances, all of which benefited from global economicstrength and capital market activity. Partially offsetting this growth werelower deposit-related fees due to higher interest rates. Expenses decreaseddue to lower software impairment charges, partially offset by higher compen-sation expense resulting from new business growth, the Vastera acquisitioncompleted in April, and by charges taken in the second quarter to terminate aclient contract.
Asset & Wealth Management operating earnings benefited from net assetinflows and asset appreciation, both the result of favorable capital marketsand improved investment performance, which resulted in an increased level ofAssets under management. Results also benefited from the acquisition of amajority interest in Highbridge Capital Management in the fourth quarter of
2004 and growth in deposit and loan balances. Expenses increased due pri-marily to the acquisition of Highbridge and higher performance-based incentivecompensation related to increased revenue.
Corporate segment operating earnings were affected negatively by repositioningof the Treasury Investment portfolio. This decline was offset partially by thegain on the sale of BrownCo of $1.3 billion (pre-tax) and improved PrivateEquity results.
The Firm had, at year-end, total stockholders’ equity of $107 billion, and a Tier 1capital ratio of 8.5%. The Firm purchased $3.4 billion, or 93.5 million shares ofcommon stock during the year.
2006 Business outlookThe following forward-looking statements are based upon the current beliefsand expectations of JPMorgan Chase’s management and are subject to significant risks and uncertainties. These risks and uncertainties could causeJPMorgan Chase’s results to differ materially from those set forth in such forward-looking statements.
JPMorgan Chase’s outlook for 2006 should be viewed against the backdropof the global economy, financial markets and the geopolitical environment, allof which are integrally linked. While the Firm considers outcomes for, and hascontingency plans to respond to, stress environments, the basic outlook for2006 is predicated on the interest rate movements implied in the forward ratecurve for U.S. treasuries, the continuation of favorable U.S. and internationalequity markets and continued expansion of the global economy.
The performance of the Firm’s capital markets and wholesale businesses areaffected by overall global economic growth and by financial market movementsand activity levels. The Investment Bank enters 2006 with a strong investmentbanking fee pipeline and continues to focus on new product expansion initiatives,such as commodities and securitized products, which are intended to benefitgrowth and reduce volatility in trading results over time. Compared with 2005,the Investment Bank anticipates lower credit portfolio revenues due toreduced gains from loan workouts. Asset & Wealth Management anticipatescontinued growth driven by continued net inflows to Assets under supervision.Treasury & Securities Services and Commercial Banking expect growth due toincreased business activity and product sales.
Retail Financial Services anticipates benefiting from the expanded branch network and salesforce, and improved sales productivity and cross-selling inthe branches, partially offset by pressure on loan and deposit spreads due tothe higher interest rate environment. The acquisition of Collegiate FundingServices is expected to contribute modestly to earnings in 2006.
Card Services anticipates that managed receivables will grow in line with the overall credit card industry, benefiting from marketing initiatives, newpartnerships and the acquisition of the Sears Canada credit card business.Revenues and expenses also will reflect the full-year impact of the Paymentechdeconsolidation and the acquisition of the Sears Canada credit card business.
The Corporate segment includes Private Equity, Treasury and other corporatesupport units. The revenue outlook for the Private Equity business is directlyrelated to the strength of the equity markets and the performance of the under-lying portfolio investments. If current market conditions persist, the Firm antici-pates continued realization of private equity gains in 2006, but results can bevolatile from quarter to quarter. It is anticipated that Treasury net interest
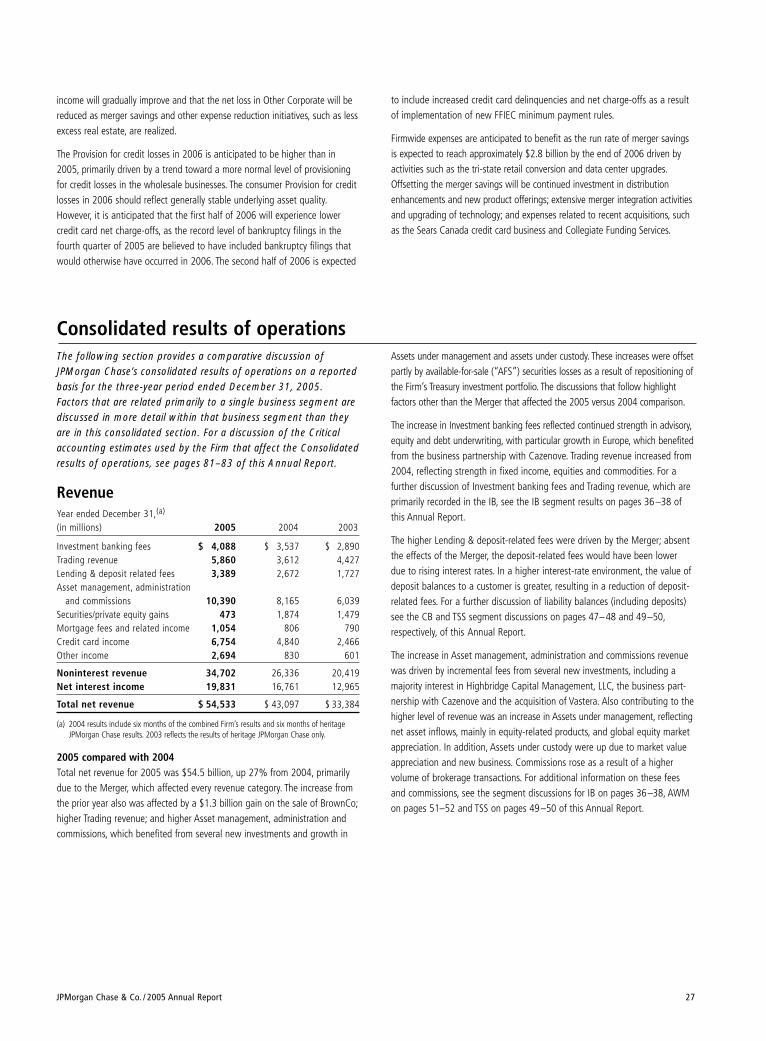
JPMorgan Chase & Co. / 2005 Annual Report 27
income will gradually improve and that the net loss in Other Corporate will bereduced as merger savings and other expense reduction initiatives, such as lessexcess real estate, are realized.
The Provision for credit losses in 2006 is anticipated to be higher than in2005, primarily driven by a trend toward a more normal level of provisioningfor credit losses in the wholesale businesses. The consumer Provision for creditlosses in 2006 should reflect generally stable underlying asset quality.However, it is anticipated that the first half of 2006 will experience lowercredit card net charge-offs, as the record level of bankruptcy filings in thefourth quarter of 2005 are believed to have included bankruptcy filings thatwould otherwise have occurred in 2006. The second half of 2006 is expected
Consolidated results of operationsThe following section provides a comparative discussion ofJPMorgan Chase’s consolidated results of operations on a reportedbasis for the three-year period ended December 31, 2005. Factors that are related primarily to a single business segment arediscussed in more detail within that business segment than theyare in this consolidated section. For a discussion of the Criticalaccounting estimates used by the Firm that affect the Consolidatedresults of operations, see pages 81–83 of this Annual Report.
RevenueYear ended December 31,(a)
(in millions) 2005 2004 2003
Investment banking fees $ 4,088 $ 3,537 $ 2,890Trading revenue 5,860 3,612 4,427Lending & deposit related fees 3,389 2,672 1,727Asset management, administration
and commissions 10,390 8,165 6,039Securities/private equity gains 473 1,874 1,479Mortgage fees and related income 1,054 806 790Credit card income 6,754 4,840 2,466Other income 2,694 830 601
Noninterest revenue 34,702 26,336 20,419Net interest income 19,831 16,761 12,965
Total net revenue $ 54,533 $ 43,097 $ 33,384
(a) 2004 results include six months of the combined Firm’s results and six months of heritageJPMorgan Chase results. 2003 reflects the results of heritage JPMorgan Chase only.
2005 compared with 2004Total net revenue for 2005 was $54.5 billion, up 27% from 2004, primarilydue to the Merger, which affected every revenue category. The increase fromthe prior year also was affected by a $1.3 billion gain on the sale of BrownCo;higher Trading revenue; and higher Asset management, administration andcommissions, which benefited from several new investments and growth in
Assets under management and assets under custody. These increases were offsetpartly by available-for-sale (“AFS”) securities losses as a result of repositioning ofthe Firm’s Treasury investment portfolio. The discussions that follow highlight factors other than the Merger that affected the 2005 versus 2004 comparison.
The increase in Investment banking fees reflected continued strength in advisory,equity and debt underwriting, with particular growth in Europe, which benefitedfrom the business partnership with Cazenove. Trading revenue increased from2004, reflecting strength in fixed income, equities and commodities. For a further discussion of Investment banking fees and Trading revenue, which areprimarily recorded in the IB, see the IB segment results on pages 36 –38 ofthis Annual Report.
The higher Lending & deposit-related fees were driven by the Merger; absentthe effects of the Merger, the deposit-related fees would have been lowerdue to rising interest rates. In a higher interest-rate environment, the value ofdeposit balances to a customer is greater, resulting in a reduction of deposit-related fees. For a further discussion of liability balances (including deposits)see the CB and TSS segment discussions on pages 47–48 and 49–50,respectively, of this Annual Report.
The increase in Asset management, administration and commissions revenuewas driven by incremental fees from several new investments, including amajority interest in Highbridge Capital Management, LLC, the business part-nership with Cazenove and the acquisition of Vastera. Also contributing to thehigher level of revenue was an increase in Assets under management, reflectingnet asset inflows, mainly in equity-related products, and global equity marketappreciation. In addition, Assets under custody were up due to market valueappreciation and new business. Commissions rose as a result of a higher volume of brokerage transactions. For additional information on these feesand commissions, see the segment discussions for IB on pages 36–38, AWMon pages 51–52 and TSS on pages 49–50 of this Annual Report.
to include increased credit card delinquencies and net charge-offs as a resultof implementation of new FFIEC minimum payment rules.
Firmwide expenses are anticipated to benefit as the run rate of merger savingsis expected to reach approximately $2.8 billion by the end of 2006 driven byactivities such as the tri-state retail conversion and data center upgrades.Offsetting the merger savings will be continued investment in distributionenhancements and new product offerings; extensive merger integration activitiesand upgrading of technology; and expenses related to recent acquisitions, suchas the Sears Canada credit card business and Collegiate Funding Services.
Management’s discussion and analysisJPMorgan Chase & Co.
28 JPMorgan Chase & Co. / 2005 Annual Report
The decline in Securities/private equity gains reflected $1.3 billion of securitieslosses, as compared with $338 million of gains in 2004. The losses resultedprimarily from repositioning the Firm’s Treasury investment portfolio inresponse to rising interest rates. The securities losses were offset partly byhigher private equity gains due to a continuation of favorable capital marketsconditions. For a further discussion of Securities/private equity gains, whichare recorded primarily in the Firm’s Treasury and Private Equity businesses, seethe Corporate segment discussion on pages 53–54 of this Annual Report.
Mortgage fees and related income increased due to improvements in riskmanagement results related to MSR assets. Mortgage fees and related incomeexclude the impact of NII and AFS securities gains related to home mortgageactivities. For a discussion of Mortgage fees and related income, which isrecorded primarily in RFS’s Home Finance business, see the segment discussionfor RFS on pages 39–44 of this Annual Report.
Credit card income rose as a result of higher interchange income associatedwith the increase in charge volume. This increase was offset partially by highervolume-driven payments to partners; rewards expense; and the impact of thedeconsolidation of Paymentech, which was deconsolidated upon completionof the integration of Chase Merchant Services and the Paymentech merchantprocessing businesses in 2005. For a further discussion of Credit card income,see CS segment results on pages 45–46 of this Annual Report.
The increase in Other income primarily reflected a $1.3 billion pre-tax gain onthe sale of BrownCo to E*TRADE Financial; higher gains from loan workoutsand loan sales; and higher revenues as a result of a shift from financing leasesto operating leases in the auto business. These gains were offset partly bywrite-downs on auto loans that were transferred to held-for-sale and a one-time gain in 2004 on the sale of an investment.
Net interest income rose as a result of higher average volume of, and widerspreads on, liability balances. Also contributing to the increase was higheraverage volume of wholesale and consumer loans, in particular, home equityand credit card loans. These increases were offset partially by narrowerspreads on consumer and wholesale loans and on trading assets, as well asreduced Treasury investment portfolio levels. The Firm’s total average interest-earning assets in 2005 were $916 billion, up 23% from the prior year. The netinterest yield on these assets, on a fully taxable-equivalent basis, was 2.19%,a decrease of six basis points from the prior year.
2004 compared with 2003Total net revenues, at $43.1 billion, rose by $9.7 billion, or 29%, primarilydue to the Merger, which affected every category of Total net revenue. Thediscussion that follows highlights factors other than the Merger that affectedthe 2004 versus 2003 comparison.
The increase in Investment banking fees was driven by significant gains inunderwriting and advisory activities as a result of increased global market volumes and market share gains. Trading revenue declined by 18%, primarilydue to lower portfolio management results in fixed income and equities.
Lending & deposit related fees were up from 2003 due to the Merger. The risewas offset partially by lower deposit-related fees, as clients paid for serviceswith deposits versus fees due to rising interest rates. Throughout 2004,deposit balances grew in response to rising interest rates.
The increase in Asset management, administration and commissions wasdriven also by the full-year impact of other acquisitions – such as EFS inJanuary 2004, Bank One’s Corporate Trust business in November 2003 andJPMorgan Retirement Plan Services in June 2003 – as well as the effect ofglobal equity market appreciation, net asset inflows and a better productmix. In addition, a more active market for trading activities in 2004 resultedin higher brokerage commissions.
Securities/private equity gains for 2004 rose from the prior year, primarilyfueled by the improvement in the Firm’s private equity investment results. Thischange was offset by lower securities gains on the Treasury investment portfo-lio as a result of lower volumes of securities sold, and lower gains realized onsales due to higher interest rates. Additionally, RFS’s Home Finance businessreported losses in 2004 on AFS securities, as compared with gains in 2003. Fora further discussion of securities gains, see the RFS and Corporate segmentdiscussions on pages 39–44 and 53–54, respectively, of this Annual Report.
Mortgage fees and related income rose as a result of higher servicing revenue;this improvement was offset partially by lower MSR risk management resultsand prime mortgage production revenue, and by lower gains from sales andsecuritizations of subprime loans as a result of management’s decision in2004 to retain these loans. Mortgage fees and related income exclude theimpact of NII and securities gains related to home mortgage activities.
Credit card income increased from 2003 as a result of higher customercharge volume, which resulted in increased interchange income, and highercredit card servicing fees associated with an increase of $19.4 billion in averagesecuritized loans. The increases were offset partially by higher volume-drivenpayments to partners and rewards expense.
The increase in Other income from 2003 reflected gains on leveraged leasetransactions, the sale of an investment in 2004 and higher net results fromcorporate- and bank-owned life insurance policies. These positive factors in2004 were offset partially by gains on sales of several nonstrategic businessesand real estate properties in 2003.
Net interest income rose from 2003 as growth in volumes of consumer loansand deposits, as well as wider spreads on deposits, contributed to higher netinterest income. These positive factors were offset partially by lower wholesaleloan balances in the IB and tighter spreads on loans, investment securities andtrading assets stemming from the rise in interest rates. The Firm’s total averageinterest-earning assets for 2004 were $744 billion, up $154 billion from 2003.The net interest yield on these assets, on a fully taxable-equivalent basis, was2.25% in 2004, an increase of four basis points from the prior year.
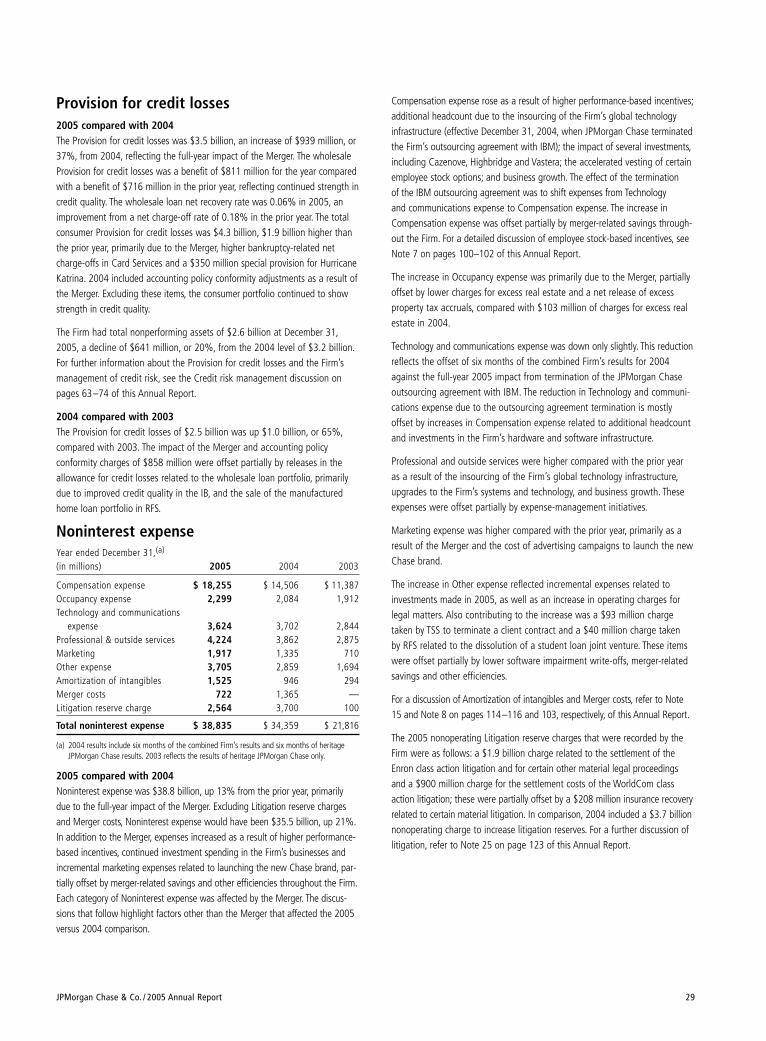
JPMorgan Chase & Co. / 2005 Annual Report 29
Compensation expense rose as a result of higher performance-based incentives;additional headcount due to the insourcing of the Firm’s global technologyinfrastructure (effective December 31, 2004, when JPMorgan Chase terminatedthe Firm’s outsourcing agreement with IBM); the impact of several investments,including Cazenove, Highbridge and Vastera; the accelerated vesting of certainemployee stock options; and business growth. The effect of the termination of the IBM outsourcing agreement was to shift expenses from Technologyand communications expense to Compensation expense. The increase inCompensation expense was offset partially by merger-related savings through-out the Firm. For a detailed discussion of employee stock-based incentives, seeNote 7 on pages 100–102 of this Annual Report.
The increase in Occupancy expense was primarily due to the Merger, partiallyoffset by lower charges for excess real estate and a net release of excessproperty tax accruals, compared with $103 million of charges for excess realestate in 2004.
Technology and communications expense was down only slightly. This reductionreflects the offset of six months of the combined Firm’s results for 2004against the full-year 2005 impact from termination of the JPMorgan Chaseoutsourcing agreement with IBM. The reduction in Technology and communi-cations expense due to the outsourcing agreement termination is mostly offset by increases in Compensation expense related to additional headcountand investments in the Firm’s hardware and software infrastructure.
Professional and outside services were higher compared with the prior yearas a result of the insourcing of the Firm’s global technology infrastructure,upgrades to the Firm’s systems and technology, and business growth. Theseexpenses were offset partially by expense-management initiatives.
Marketing expense was higher compared with the prior year, primarily as aresult of the Merger and the cost of advertising campaigns to launch the newChase brand.
The increase in Other expense reflected incremental expenses related toinvestments made in 2005, as well as an increase in operating charges forlegal matters. Also contributing to the increase was a $93 million chargetaken by TSS to terminate a client contract and a $40 million charge taken by RFS related to the dissolution of a student loan joint venture. These itemswere offset partially by lower software impairment write-offs, merger-relatedsavings and other efficiencies.
For a discussion of Amortization of intangibles and Merger costs, refer to Note15 and Note 8 on pages 114–116 and 103, respectively, of this Annual Report.
The 2005 nonoperating Litigation reserve charges that were recorded by theFirm were as follows: a $1.9 billion charge related to the settlement of theEnron class action litigation and for certain other material legal proceedings and a $900 million charge for the settlement costs of the WorldCom classaction litigation; these were partially offset by a $208 million insurance recoveryrelated to certain material litigation. In comparison, 2004 included a $3.7 billionnonoperating charge to increase litigation reserves. For a further discussion oflitigation, refer to Note 25 on page 123 of this Annual Report.
Provision for credit losses 2005 compared with 2004The Provision for credit losses was $3.5 billion, an increase of $939 million, or37%, from 2004, reflecting the full-year impact of the Merger. The wholesaleProvision for credit losses was a benefit of $811 million for the year comparedwith a benefit of $716 million in the prior year, reflecting continued strength incredit quality. The wholesale loan net recovery rate was 0.06% in 2005, animprovement from a net charge-off rate of 0.18% in the prior year. The totalconsumer Provision for credit losses was $4.3 billion, $1.9 billion higher thanthe prior year, primarily due to the Merger, higher bankruptcy-related netcharge-offs in Card Services and a $350 million special provision for HurricaneKatrina. 2004 included accounting policy conformity adjustments as a result ofthe Merger. Excluding these items, the consumer portfolio continued to showstrength in credit quality.
The Firm had total nonperforming assets of $2.6 billion at December 31,2005, a decline of $641 million, or 20%, from the 2004 level of $3.2 billion.For further information about the Provision for credit losses and the Firm’smanagement of credit risk, see the Credit risk management discussion onpages 63–74 of this Annual Report.
2004 compared with 2003The Provision for credit losses of $2.5 billion was up $1.0 billion, or 65%,compared with 2003. The impact of the Merger and accounting policy conformity charges of $858 million were offset partially by releases in theallowance for credit losses related to the wholesale loan portfolio, primarilydue to improved credit quality in the IB, and the sale of the manufacturedhome loan portfolio in RFS.
Noninterest expenseYear ended December 31,(a)
(in millions) 2005 2004 2003
Compensation expense $ 18,255 $ 14,506 $ 11,387Occupancy expense 2,299 2,084 1,912Technology and communications
expense 3,624 3,702 2,844Professional & outside services 4,224 3,862 2,875Marketing 1,917 1,335 710Other expense 3,705 2,859 1,694Amortization of intangibles 1,525 946 294Merger costs 722 1,365 —Litigation reserve charge 2,564 3,700 100
Total noninterest expense $ 38,835 $ 34,359 $ 21,816
(a) 2004 results include six months of the combined Firm’s results and six months of heritageJPMorgan Chase results. 2003 reflects the results of heritage JPMorgan Chase only.
2005 compared with 2004 Noninterest expense was $38.8 billion, up 13% from the prior year, primarilydue to the full-year impact of the Merger. Excluding Litigation reserve chargesand Merger costs, Noninterest expense would have been $35.5 billion, up 21%.In addition to the Merger, expenses increased as a result of higher performance-based incentives, continued investment spending in the Firm’s businesses andincremental marketing expenses related to launching the new Chase brand, par-tially offset by merger-related savings and other efficiencies throughout the Firm.Each category of Noninterest expense was affected by the Merger. The discus-sions that follow highlight factors other than the Merger that affected the 2005versus 2004 comparison.
Management’s discussion and analysisJPMorgan Chase & Co.
30 JPMorgan Chase & Co. / 2005 Annual Report
2004 compared with 2003Noninterest expense was $34.4 billion in 2004, up $12.5 billion, or 57%,primarily due to the Merger. Excluding $1.4 billion of Merger costs, andLitigation reserve charges, Noninterest expense would have been $29.3 billion,up 35%. The discussion that follows highlights other factors affecting the2004 versus 2003 comparison.
Compensation expense was up from 2003, primarily due to strategic invest-ments in the IB and continuing expansion in RFS. These factors were offsetpartially by ongoing efficiency improvements and merger-related savingsthroughout the Firm, and by a reduction in pension costs. The decline in pension costs was attributable mainly to the increase in the expected returnon plan assets resulting from a discretionary $1.1 billion contribution to theFirm’s pension plan in April 2004, partially offset by changes in actuarialassumptions for 2004 compared with 2003.
The increase in Occupancy expense was offset partly by lower charges for excess real estate, which were $103 million in 2004 compared with $270 million in 2003.
Technology and communications expense was higher than in the prior year as a result of higher costs associated with greater use of outside vendors,primarily IBM, to support the global infrastructure requirements of the Firm.For a further discussion regarding the IBM outsourcing agreement, see theCorporate segment discussion on page 53 of this Annual Report.
Professional & outside services rose due to higher legal costs associated withlitigation matters, as well as outside services stemming from recent acquisi-tions — primarily Electronic Financial Services (“EFS”), and growth in business at TSS and CS.
Marketing expense rose as CS initiated a more robust marketing campaignduring 2004.
Other expense was up due to software impairment write-offs of $224 million,primarily in TSS and Corporate, compared with $60 million in 2003; higheroperating charges for legal matters; and growth in business volume. Theseexpenses were offset partly by a $57 million settlement related to the Enronsurety bond litigation.
For a discussion of Amortization of intangibles and Merger costs, refer toNote 15 and Note 8 on pages 114–116 and 103, respectively.
In June of 2004, JPMorgan Chase recorded a $3.7 billion addition to theLitigation reserve. By comparison, 2003 included a charge of $100 million for Enron-related litigation.
Income tax expenseThe Firm’s Income before income tax expense, Income tax expense and effective tax rate were as follows for each of the periods indicated:
Year ended December 31,(a)
(in millions, except rate) 2005 2004 2003
Income before income tax expense $12,215 $ 6,194 $10,028Income tax expense 3,732 1,728 3,309Effective tax rate 30.6% 27.9% 33.0%
(a) 2004 results include six months of the combined Firm’s results and six months of heritageJPMorgan Chase results. 2003 reflects the results of heritage JPMorgan Chase only.
2005 compared with 2004 The increase in the effective tax rate was primarily the result of higherreported pre-tax income combined with changes in the proportion of incomesubject to federal, state and local taxes. Also contributing to the increasewere lower 2005 nonoperating charges and a gain on the sale of BrownCo,which were taxed at marginal tax rates of 38% and 40%, respectively. Theseincreases were offset partially by a tax benefit of $55 million recorded inconnection with the repatriation of foreign earnings.
2004 compared with 2003The reduction in the effective tax rate for 2004, as compared with 2003,was the result of various factors, including lower reported pre-tax income, ahigher level of business tax credits, and changes in the proportion of incomesubject to federal, state and local taxes, partially offset by purchase accountingadjustments related to leveraged lease transactions. The Merger costs and accounting policy conformity adjustments recorded in 2004, and theLitigation reserve charge recorded in the second quarter of 2004, reflected atax benefit at a 38% marginal tax rate, contributing to the reduction in theeffective tax rate compared with 2003.
JPMorgan Chase & Co. / 2005 Annual Report 31
The Firm prepares its Consolidated financial statements using accountingprinciples generally accepted in the United States of America (“U.S. GAAP”);these financial statements appear on pages 87–90 of this Annual Report.That presentation, which is referred to as “reported basis,” provides the readerwith an understanding of the Firm’s results that can be tracked consistentlyfrom year to year and enables a comparison of the Firm’s performance withother companies’ U.S. GAAP financial statements.
In addition to analyzing the Firm’s results on a reported basis, managementreviews the Firm’s and the lines’ of business results on an operating basis,which is a non-GAAP financial measure. The Firm’s definition of operatingbasis starts with the reported U.S. GAAP results. Operating basis excludes:(i) merger costs, (ii) the nonoperating litigation charges taken and insurancerecoveries received with respect to certain of the Firm’s material litigation;and (iii) costs related to the conformance of certain accounting policies as aresult of the Merger. Management believes these items are not part of theFirm’s normal daily business operations and, therefore, not indicative oftrends, as they do not provide meaningful comparisons with other periods.For additional detail on nonoperating litigation charges, see the Glossary ofterms on page 134 of this Annual Report.
In addition, the Firm manages its lines of business on an operating basis. Inthe case of the Investment Bank, noninterest revenue on an operating basisincludes, in trading-related revenue, net interest income related to tradingactivities. Trading activities generate revenues, which are recorded for U.S.GAAP purposes in two line items on the income statement: trading revenue,which includes the mark-to-market gains or losses on trading positions; andnet interest income, which includes the interest income or expense related tothose positions. The impact of changes in market interest rates will either berecorded in Trading revenue or Net interest income depending on whether thetrading position is a cash security or a derivative. Combining both the tradingrevenue and related net interest income allows management to evaluate theeconomic results of the Investment Bank’s trading activities, which for GAAPpurposes are reported in both Trading revenue and Net interest income. Inmanagement’s view, this presentation also facilitates operating comparisonsto competitors. For a discussion of trading-related revenue, see the IB onpages 36–38 of this Annual Report.
In the case of Card Services, operating basis is also referred to as “managedbasis,” and excludes the impact of credit card securitizations on total net revenue, the provision for credit losses, net charge-offs and loan receivables.This presentation is provided to facilitate operating comparisons to competi-tors. Through securitization, the Firm transforms a portion of its credit cardreceivables into securities, which are sold to investors. The credit card receiv-ables are removed from the consolidated balance sheet through the transferof the receivables to a trust, and the sale of undivided interests to investors that entitle the investors to specific cash flows generated from the credit card receivables. The Firm retains the remaining undivided interests as seller’sinterests, which are recorded in Loans on the Consolidated balance sheets.A gain or loss on the sale of credit card receivables to investors is recorded in
Other income. Securitization also affects the Firm’s Consolidated statementsof income as interest income, certain fee revenue, recoveries in excess ofinterest paid to the investors, gross credit losses and other trust expensesrelated to the securitized receivables are all reclassified into credit cardincome. For a reconciliation of reported to managed basis of Card Servicesresults, see page 46 of this Annual Report. For information regarding loans andresidual interests sold and securitized, see Note 13 on pages 108–111 of thisAnnual Report. JPMorgan Chase uses the concept of “managed receivables”to evaluate the credit performance and overall financial performance of theunderlying credit card loans, both sold and not sold: as the same borrower is continuing to use the credit card for ongoing charges, a borrower’s creditperformance will affect both the loan receivables sold under SFAS 140 andthose not sold. Thus, in its disclosures regarding managed loan receivables,JPMorgan Chase treats the sold receivables as if they were still on the balancesheet in order to disclose the credit performance (such as net charge-offrates) of the entire managed credit card portfolio. In addition, Card Servicesoperations are funded, operating results are evaluated, and decisions aremade about allocating resources such as employees and capital based uponmanaged financial information.
Finally, commencing with the first quarter of 2005, operating revenue (noninterest revenue and net interest income) for each of the segments andthe Firm is presented on a tax-equivalent basis. Accordingly, revenue from taxexempt securities and investments that receive tax credits are presented inthe operating results on a basis comparable to taxable securities and invest-ments. This non-GAAP financial measure allows management to assess the comparability of revenues arising from both taxable and tax-exempt sources.The corresponding income tax impact related to these items is recorded within income tax expense. The Corporate sector’s and the Firm’s operatingrevenue and income tax expense for the periods prior to the first quarter of 2005 have been restated to be similarly presented on a tax-equivalentbasis. This restatement had no impact on the Corporate sector’s or the Firm’soperating earnings.
Management uses certain non-GAAP financial measures at the segment levelbecause it believes these non-GAAP financial measures provide informationto investors in understanding the underlying operational performance andtrends of the particular business segment and facilitate a comparison of thebusiness segment with the performance of competitors.
Explanation and reconciliation of the Firm’s use of non-GAAP financial measures
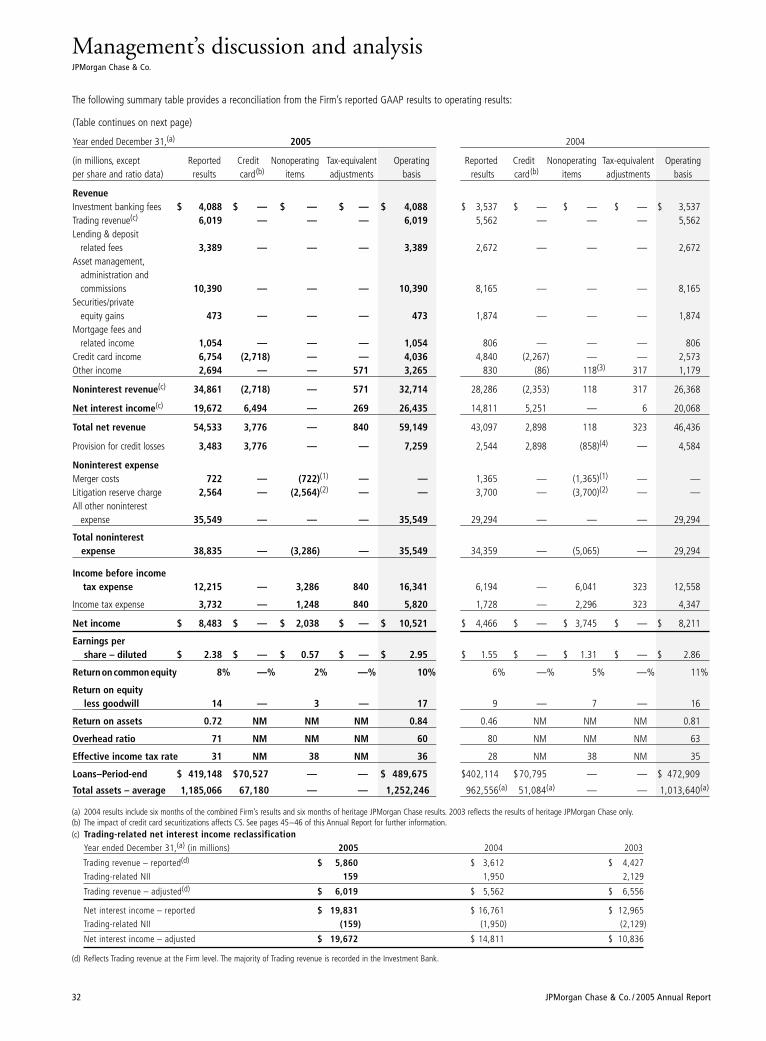
Management’s discussion and analysisJPMorgan Chase & Co.
32 JPMorgan Chase & Co. / 2005 Annual Report
The following summary table provides a reconciliation from the Firm’s reported GAAP results to operating results:
(Table continues on next page)
Year ended December 31,(a) 2005 2004
(in millions, except Reported Credit Nonoperating Tax-equivalent Operating Reported Credit Nonoperating Tax-equivalent Operatingper share and ratio data) results card(b) items adjustments basis results card(b) items adjustments basis
RevenueInvestment banking fees $ 4,088 $ — $ — $ — $ 4,088 $ 3,537 $ — $ — $ — $ 3,537Trading revenue(c) 6,019 — — — 6,019 5,562 — — — 5,562Lending & deposit
related fees 3,389 — — — 3,389 2,672 — — — 2,672Asset management,
administration and commissions 10,390 — — — 10,390 8,165 — — — 8,165
Securities/private equity gains 473 — — — 473 1,874 — — — 1,874
Mortgage fees and related income 1,054 — — — 1,054 806 — — — 806
Credit card income 6,754 (2,718) — — 4,036 4,840 (2,267) — — 2,573Other income 2,694 — — 571 3,265 830 (86) 118(3) 317 1,179
Noninterest revenue(c) 34,861 (2,718) — 571 32,714 28,286 (2,353) 118 317 26,368
Net interest income(c) 19,672 6,494 — 269 26,435 14,811 5,251 — 6 20,068
Total net revenue 54,533 3,776 — 840 59,149 43,097 2,898 118 323 46,436
Provision for credit losses 3,483 3,776 — — 7,259 2,544 2,898 (858)(4) — 4,584
Noninterest expenseMerger costs 722 — (722)(1) — — 1,365 — (1,365)(1) — —Litigation reserve charge 2,564 — (2,564)(2) — — 3,700 — (3,700)(2) — —All other noninterest
expense 35,549 — — — 35,549 29,294 — — — 29,294
Total noninterest expense 38,835 — (3,286) — 35,549 34,359 — (5,065) — 29,294
Income before income tax expense 12,215 — 3,286 840 16,341 6,194 — 6,041 323 12,558
Income tax expense 3,732 — 1,248 840 5,820 1,728 — 2,296 323 4,347
Net income $ 8,483 $ — $ 2,038 $ — $ 10,521 $ 4,466 $ — $ 3,745 $ — $ 8,211
Earnings per share – diluted $ 2.38 $ — $ 0.57 $ — $ 2.95 $ 1.55 $ — $ 1.31 $ — $ 2.86
Returnoncommonequity 8% —% 2% —% 10% 6% —% 5% —% 11%
Return on equityless goodwill 14 — 3 — 17 9 — 7 — 16
Return on assets 0.72 NM NM NM 0.84 0.46 NM NM NM 0.81
Overhead ratio 71 NM NM NM 60 80 NM NM NM 63
Effective income tax rate 31 NM 38 NM 36 28 NM 38 NM 35
Loans–Period-end $ 419,148 $70,527 — — $ 489,675 $402,114 $70,795 — — $ 472,909
Total assets – average 1,185,066 67,180 — — 1,252,246 962,556(a) 51,084(a) — — 1,013,640(a)
(a) 2004 results include six months of the combined Firm’s results and six months of heritage JPMorgan Chase results. 2003 reflects the results of heritage JPMorgan Chase only.(b) The impact of credit card securitizations affects CS. See pages 45–46 of this Annual Report for further information.(c) Trading-related net interest income reclassification
Year ended December 31,(a) (in millions) 2005 2004 2003
Trading revenue – reported(d) $ 5,860 $ 3,612 $ 4,427
Trading-related NII 159 1,950 2,129
Trading revenue – adjusted(d) $ 6,019 $ 5,562 $ 6,556
Net interest income – reported $ 19,831 $ 16,761 $ 12,965
Trading-related NII (159) (1,950) (2,129)
Net interest income – adjusted $ 19,672 $ 14,811 $ 10,836
(d) Reflects Trading revenue at the Firm level. The majority of Trading revenue is recorded in the Investment Bank.
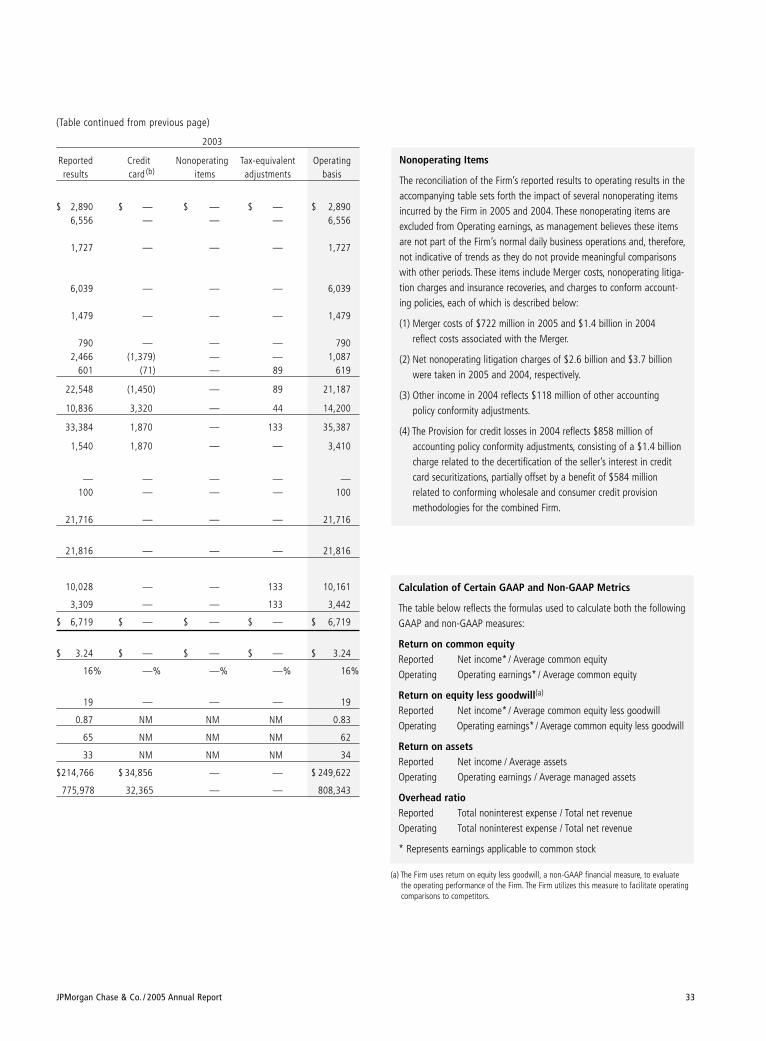
JPMorgan Chase & Co. / 2005 Annual Report 33
Nonoperating Items
The reconciliation of the Firm’s reported results to operating results in theaccompanying table sets forth the impact of several nonoperating itemsincurred by the Firm in 2005 and 2004. These nonoperating items areexcluded from Operating earnings, as management believes these itemsare not part of the Firm’s normal daily business operations and, therefore,not indicative of trends as they do not provide meaningful comparisonswith other periods. These items include Merger costs, nonoperating litiga-tion charges and insurance recoveries, and charges to conform account-ing policies, each of which is described below:
(1) Merger costs of $722 million in 2005 and $1.4 billion in 2004 reflect costs associated with the Merger.
(2) Net nonoperating litigation charges of $2.6 billion and $3.7 billion were taken in 2005 and 2004, respectively.
(3) Other income in 2004 reflects $118 million of other accounting policy conformity adjustments.
(4) The Provision for credit losses in 2004 reflects $858 million ofaccounting policy conformity adjustments, consisting of a $1.4 billioncharge related to the decertification of the seller’s interest in creditcard securitizations, partially offset by a benefit of $584 million related to conforming wholesale and consumer credit provisionmethodologies for the combined Firm.
Calculation of Certain GAAP and Non-GAAP Metrics
The table below reflects the formulas used to calculate both the followingGAAP and non-GAAP measures:
Return on common equityReported Net income* / Average common equityOperating Operating earnings* / Average common equity
Return on equity less goodwill(a)
Reported Net income* / Average common equity less goodwillOperating Operating earnings*/ Average common equity less goodwill
Return on assetsReported Net income / Average assetsOperating Operating earnings / Average managed assets
Overhead ratioReported Total noninterest expense / Total net revenueOperating Total noninterest expense / Total net revenue
* Represents earnings applicable to common stock
(Table continued from previous page)
2003
Reported Credit Nonoperating Tax-equivalent Operatingresults card (b) items adjustments basis
$ 2,890 $ — $ — $ — $ 2,8906,556 — — — 6,556
1,727 — — — 1,727
6,039 — — — 6,039
1,479 — — — 1,479
790 — — — 7902,466 (1,379) — — 1,087
601 (71) — 89 619
22,548 (1,450) — 89 21,187
10,836 3,320 — 44 14,200
33,384 1,870 — 133 35,387
1,540 1,870 — — 3,410
— — — — —100 — — — 100
21,716 — — — 21,716
21,816 — — — 21,816
10,028 — — 133 10,161
3,309 — — 133 3,442
$ 6,719 $ — $ — $ — $ 6,719
$ 3.24 $ — $ — $ — $ 3.24
16% —% —% —% 16%
19 — — — 19
0.87 NM NM NM 0.83
65 NM NM NM 62
33 NM NM NM 34
$214,766 $ 34,856 — — $ 249,622
775,978 32,365 — — 808,343
(a) The Firm uses return on equity less goodwill, a non-GAAP financial measure, to evaluatethe operating performance of the Firm. The Firm utilizes this measure to facilitate operatingcomparisons to competitors.
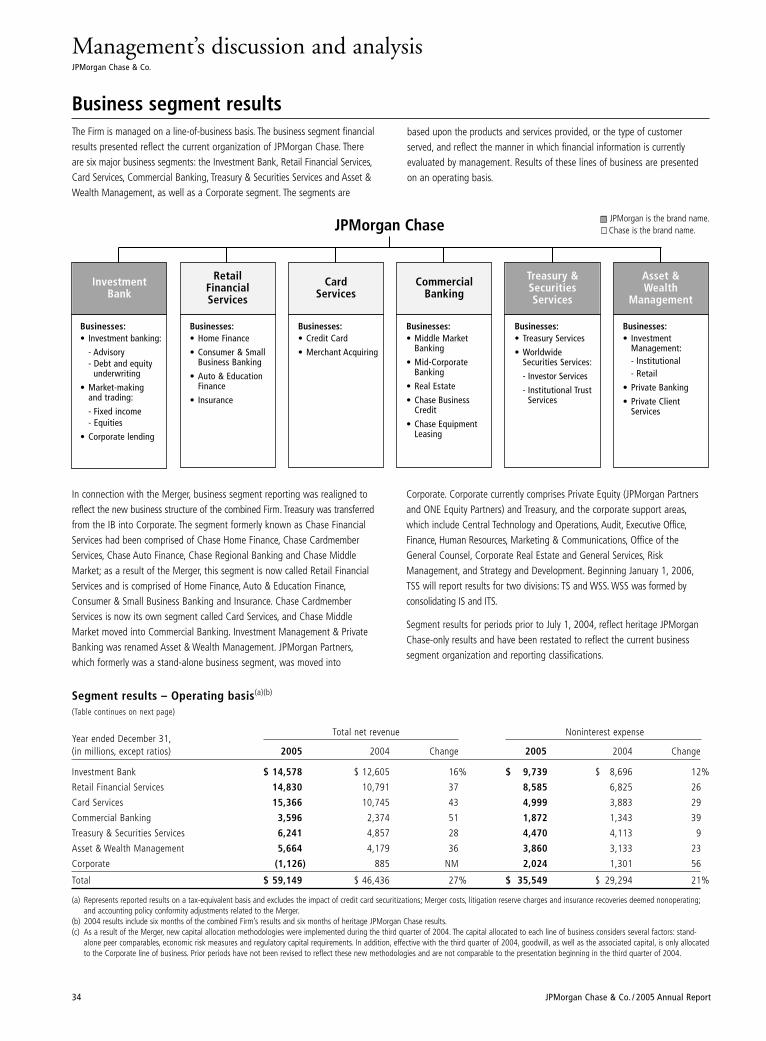
Management’s discussion and analysisJPMorgan Chase & Co.
34 JPMorgan Chase & Co. / 2005 Annual Report
Business segment resultsThe Firm is managed on a line-of-business basis. The business segment financialresults presented reflect the current organization of JPMorgan Chase. Thereare six major business segments: the Investment Bank, Retail Financial Services,Card Services, Commercial Banking, Treasury & Securities Services and Asset &Wealth Management, as well as a Corporate segment. The segments are
based upon the products and services provided, or the type of customerserved, and reflect the manner in which financial information is currentlyevaluated by management. Results of these lines of business are presentedon an operating basis.
Segment results – Operating basis(a)(b)
(Table continues on next page)
Year ended December 31,Total net revenue Noninterest expense
(in millions, except ratios) 2005 2004 Change 2005 2004 Change
Investment Bank $ 14,578 $ 12,605 16% $ 9,739 $ 8,696 12%
Retail Financial Services 14,830 10,791 37 8,585 6,825 26
Card Services 15,366 10,745 43 4,999 3,883 29
Commercial Banking 3,596 2,374 51 1,872 1,343 39
Treasury & Securities Services 6,241 4,857 28 4,470 4,113 9
Asset & Wealth Management 5,664 4,179 36 3,860 3,133 23
Corporate (1,126) 885 NM 2,024 1,301 56
Total $ 59,149 $ 46,436 27% $ 35,549 $ 29,294 21%
(a) Represents reported results on a tax-equivalent basis and excludes the impact of credit card securitizations; Merger costs, litigation reserve charges and insurance recoveries deemed nonoperating;and accounting policy conformity adjustments related to the Merger.
(b) 2004 results include six months of the combined Firm’s results and six months of heritage JPMorgan Chase results.(c) As a result of the Merger, new capital allocation methodologies were implemented during the third quarter of 2004. The capital allocated to each line of business considers several factors: stand-
alone peer comparables, economic risk measures and regulatory capital requirements. In addition, effective with the third quarter of 2004, goodwill, as well as the associated capital, is only allocatedto the Corporate line of business. Prior periods have not been revised to reflect these new methodologies and are not comparable to the presentation beginning in the third quarter of 2004.
In connection with the Merger, business segment reporting was realigned toreflect the new business structure of the combined Firm. Treasury was transferredfrom the IB into Corporate. The segment formerly known as Chase FinancialServices had been comprised of Chase Home Finance, Chase CardmemberServices, Chase Auto Finance, Chase Regional Banking and Chase MiddleMarket; as a result of the Merger, this segment is now called Retail FinancialServices and is comprised of Home Finance, Auto & Education Finance,Consumer & Small Business Banking and Insurance. Chase CardmemberServices is now its own segment called Card Services, and Chase MiddleMarket moved into Commercial Banking. Investment Management & PrivateBanking was renamed Asset & Wealth Management. JPMorgan Partners,which formerly was a stand-alone business segment, was moved into
Corporate. Corporate currently comprises Private Equity (JPMorgan Partnersand ONE Equity Partners) and Treasury, and the corporate support areas,which include Central Technology and Operations, Audit, Executive Office,Finance, Human Resources, Marketing & Communications, Office of theGeneral Counsel, Corporate Real Estate and General Services, RiskManagement, and Strategy and Development. Beginning January 1, 2006,TSS will report results for two divisions: TS and WSS. WSS was formed by consolidating IS and ITS.
Segment results for periods prior to July 1, 2004, reflect heritage JPMorganChase-only results and have been restated to reflect the current business segment organization and reporting classifications.
Asset & Wealth
Management
Businesses:• Treasury Services
• WorldwideSecurities Services:
- Investor Services
- Institutional TrustServices
JPMorgan Chase
Businesses:• Middle Market
Banking
• Mid-CorporateBanking
• Real Estate
• Chase BusinessCredit
• Chase EquipmentLeasing
CommercialBanking
Businesses:• Investment banking:
- Advisory- Debt and equity
underwriting
• Market-makingand trading:
- Fixed income - Equities
• Corporate lending
Investment Bank
Retail FinancialServices
CardServices
Businesses:• Investment
Management:- Institutional- Retail
• Private Banking
• Private ClientServices
Businesses:• Credit Card
• Merchant Acquiring
Businesses:• Home Finance
• Consumer & SmallBusiness Banking
• Auto & EducationFinance
• Insurance
Treasury &Securities Services
■ JPMorgan is the brand name.Chase is the brand name.
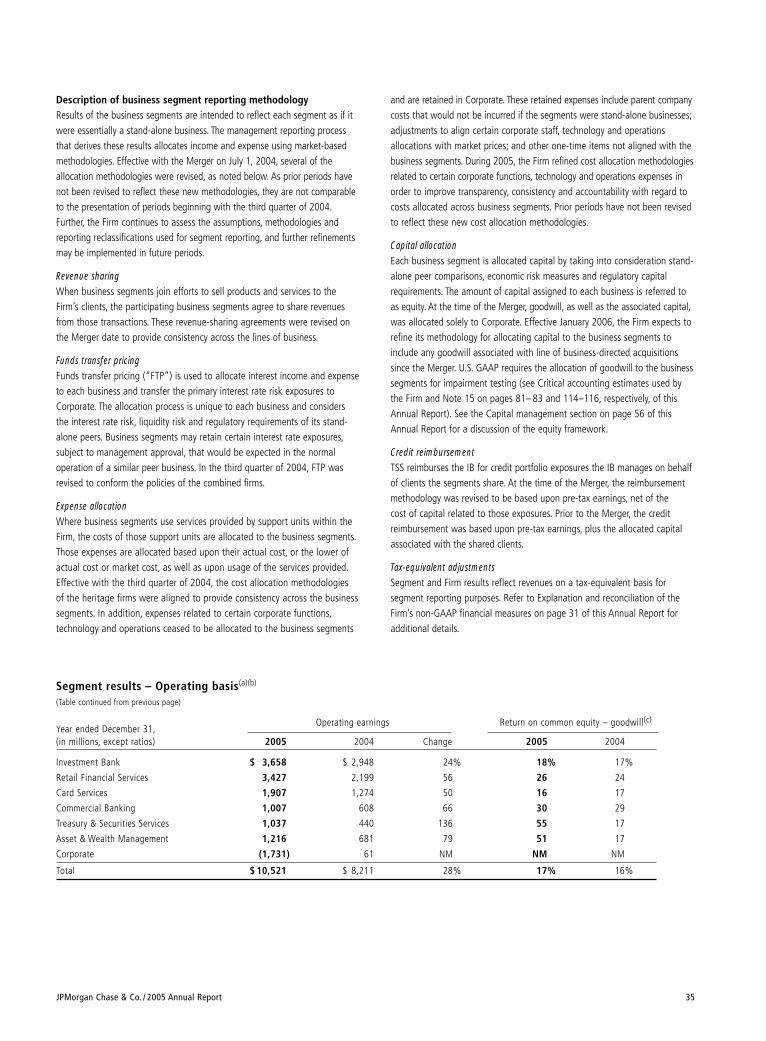
Segment results – Operating basis(a)(b)
(Table continued from previous page)
Year ended December 31,Operating earnings Return on common equity – goodwill(c)
(in millions, except ratios) 2005 2004 Change 2005 2004
Investment Bank $ 3,658 $ 2,948 24% 18% 17%
Retail Financial Services 3,427 2,199 56 26 24
Card Services 1,907 1,274 50 16 17
Commercial Banking 1,007 608 66 30 29
Treasury & Securities Services 1,037 440 136 55 17
Asset & Wealth Management 1,216 681 79 51 17
Corporate (1,731) 61 NM NM NM
Total $ 10,521 $ 8,211 28% 17% 16%
JPMorgan Chase & Co. / 2005 Annual Report 35
and are retained in Corporate. These retained expenses include parent companycosts that would not be incurred if the segments were stand-alone businesses;adjustments to align certain corporate staff, technology and operations allocations with market prices; and other one-time items not aligned with thebusiness segments. During 2005, the Firm refined cost allocation methodologiesrelated to certain corporate functions, technology and operations expenses inorder to improve transparency, consistency and accountability with regard tocosts allocated across business segments. Prior periods have not been revisedto reflect these new cost allocation methodologies.
Capital allocationEach business segment is allocated capital by taking into consideration stand-alone peer comparisons, economic risk measures and regulatory capitalrequirements. The amount of capital assigned to each business is referred toas equity. At the time of the Merger, goodwill, as well as the associated capital,was allocated solely to Corporate. Effective January 2006, the Firm expects torefine its methodology for allocating capital to the business segments toinclude any goodwill associated with line of business-directed acquisitionssince the Merger. U.S. GAAP requires the allocation of goodwill to the businesssegments for impairment testing (see Critical accounting estimates used bythe Firm and Note 15 on pages 81– 83 and 114–116, respectively, of thisAnnual Report). See the Capital management section on page 56 of thisAnnual Report for a discussion of the equity framework.
Credit reimbursementTSS reimburses the IB for credit portfolio exposures the IB manages on behalfof clients the segments share. At the time of the Merger, the reimbursementmethodology was revised to be based upon pre-tax earnings, net of the cost of capital related to those exposures. Prior to the Merger, the credit reimbursement was based upon pre-tax earnings, plus the allocated capitalassociated with the shared clients.
Tax-equivalent adjustmentsSegment and Firm results reflect revenues on a tax-equivalent basis for segment reporting purposes. Refer to Explanation and reconciliation of theFirm’s non-GAAP financial measures on page 31 of this Annual Report foradditional details.
Description of business segment reporting methodology Results of the business segments are intended to reflect each segment as if itwere essentially a stand-alone business. The management reporting processthat derives these results allocates income and expense using market-basedmethodologies. Effective with the Merger on July 1, 2004, several of the allocation methodologies were revised, as noted below. As prior periods havenot been revised to reflect these new methodologies, they are not comparableto the presentation of periods beginning with the third quarter of 2004.Further, the Firm continues to assess the assumptions, methodologies andreporting reclassifications used for segment reporting, and further refinementsmay be implemented in future periods.
Revenue sharingWhen business segments join efforts to sell products and services to theFirm’s clients, the participating business segments agree to share revenuesfrom those transactions. These revenue-sharing agreements were revised onthe Merger date to provide consistency across the lines of business.
Funds transfer pricingFunds transfer pricing (“FTP”) is used to allocate interest income and expenseto each business and transfer the primary interest rate risk exposures toCorporate. The allocation process is unique to each business and considersthe interest rate risk, liquidity risk and regulatory requirements of its stand-alone peers. Business segments may retain certain interest rate exposures,subject to management approval, that would be expected in the normal operation of a similar peer business. In the third quarter of 2004, FTP wasrevised to conform the policies of the combined firms.
Expense allocationWhere business segments use services provided by support units within theFirm, the costs of those support units are allocated to the business segments.Those expenses are allocated based upon their actual cost, or the lower ofactual cost or market cost, as well as upon usage of the services provided.Effective with the third quarter of 2004, the cost allocation methodologies of the heritage firms were aligned to provide consistency across the businesssegments. In addition, expenses related to certain corporate functions,technology and operations ceased to be allocated to the business segments
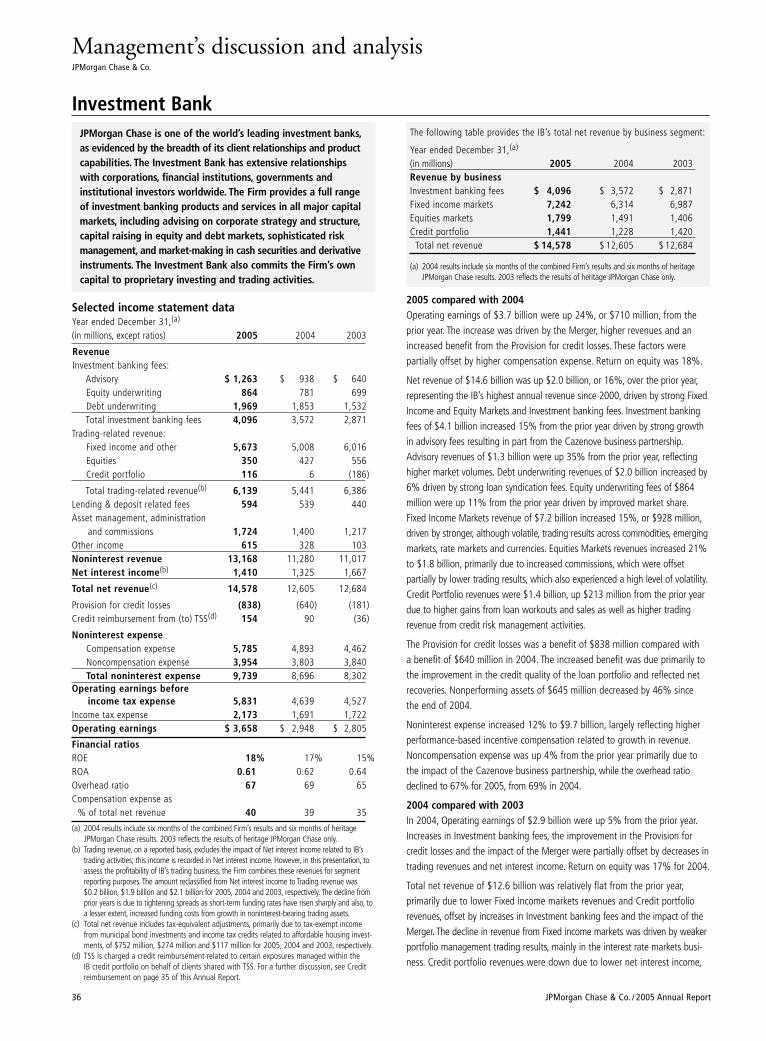
Management’s discussion and analysisJPMorgan Chase & Co.
36 JPMorgan Chase & Co. / 2005 Annual Report
2005 compared with 2004Operating earnings of $3.7 billion were up 24%, or $710 million, from theprior year. The increase was driven by the Merger, higher revenues and anincreased benefit from the Provision for credit losses. These factors were partially offset by higher compensation expense. Return on equity was 18%.
Net revenue of $14.6 billion was up $2.0 billion, or 16%, over the prior year,representing the IB’s highest annual revenue since 2000, driven by strong FixedIncome and Equity Markets and Investment banking fees. Investment bankingfees of $4.1 billion increased 15% from the prior year driven by strong growthin advisory fees resulting in part from the Cazenove business partnership.Advisory revenues of $1.3 billion were up 35% from the prior year, reflectinghigher market volumes. Debt underwriting revenues of $2.0 billion increased by6% driven by strong loan syndication fees. Equity underwriting fees of $864million were up 11% from the prior year driven by improved market share.Fixed Income Markets revenue of $7.2 billion increased 15%, or $928 million,driven by stronger, although volatile, trading results across commodities, emergingmarkets, rate markets and currencies. Equities Markets revenues increased 21%to $1.8 billion, primarily due to increased commissions, which were offset partially by lower trading results, which also experienced a high level of volatility.Credit Portfolio revenues were $1.4 billion, up $213 million from the prior yeardue to higher gains from loan workouts and sales as well as higher trading revenue from credit risk management activities.
The Provision for credit losses was a benefit of $838 million compared with a benefit of $640 million in 2004. The increased benefit was due primarily tothe improvement in the credit quality of the loan portfolio and reflected netrecoveries. Nonperforming assets of $645 million decreased by 46% since the end of 2004.
Noninterest expense increased 12% to $9.7 billion, largely reflecting higherperformance-based incentive compensation related to growth in revenue.Noncompensation expense was up 4% from the prior year primarily due tothe impact of the Cazenove business partnership, while the overhead ratiodeclined to 67% for 2005, from 69% in 2004.
2004 compared with 2003In 2004, Operating earnings of $2.9 billion were up 5% from the prior year.Increases in Investment banking fees, the improvement in the Provision forcredit losses and the impact of the Merger were partially offset by decreases intrading revenues and net interest income. Return on equity was 17% for 2004.
Total net revenue of $12.6 billion was relatively flat from the prior year,primarily due to lower Fixed income markets revenues and Credit portfoliorevenues, offset by increases in Investment banking fees and the impact of theMerger. The decline in revenue from Fixed income markets was driven by weakerportfolio management trading results, mainly in the interest rate markets busi-ness. Credit portfolio revenues were down due to lower net interest income,
Investment BankJPMorgan Chase is one of the world’s leading investment banks,as evidenced by the breadth of its client relationships and productcapabilities. The Investment Bank has extensive relationshipswith corporations, financial institutions, governments and institutional investors worldwide. The Firm provides a full rangeof investment banking products and services in all major capitalmarkets, including advising on corporate strategy and structure,capital raising in equity and debt markets, sophisticated riskmanagement, and market-making in cash securities and derivativeinstruments. The Investment Bank also commits the Firm’s owncapital to proprietary investing and trading activities.
Selected income statement data Year ended December 31,(a)
(in millions, except ratios) 2005 2004 2003
RevenueInvestment banking fees:
Advisory $ 1,263 $ 938 $ 640Equity underwriting 864 781 699Debt underwriting 1,969 1,853 1,532Total investment banking fees 4,096 3,572 2,871
Trading-related revenue:Fixed income and other 5,673 5,008 6,016Equities 350 427 556Credit portfolio 116 6 (186)
Total trading-related revenue(b) 6,139 5,441 6,386Lending & deposit related fees 594 539 440Asset management, administration
and commissions 1,724 1,400 1,217Other income 615 328 103Noninterest revenue 13,168 11,280 11,017Net interest income(b) 1,410 1,325 1,667
Total net revenue(c) 14,578 12,605 12,684
Provision for credit losses (838) (640) (181)Credit reimbursement from (to) TSS(d) 154 90 (36)
Noninterest expenseCompensation expense 5,785 4,893 4,462Noncompensation expense 3,954 3,803 3,840Total noninterest expense 9,739 8,696 8,302
Operating earnings before income tax expense 5,831 4,639 4,527
Income tax expense 2,173 1,691 1,722Operating earnings $ 3,658 $ 2,948 $ 2,805
Financial ratiosROE 18% 17% 15%ROA 0.61 0.62 0.64Overhead ratio 67 69 65Compensation expense as
% of total net revenue 40 39 35
(a) 2004 results include six months of the combined Firm’s results and six months of heritageJPMorgan Chase results. 2003 reflects the results of heritage JPMorgan Chase only.
(b) Trading revenue, on a reported basis, excludes the impact of Net interest income related to IB’strading activities; this income is recorded in Net interest income. However, in this presentation, toassess the profitability of IB’s trading business, the Firm combines these revenues for segmentreporting purposes. The amount reclassified from Net interest income to Trading revenue was $0.2 billion, $1.9 billion and $2.1 billion for 2005, 2004 and 2003, respectively. The decline fromprior years is due to tightening spreads as short-term funding rates have risen sharply and also, toa lesser extent, increased funding costs from growth in noninterest-bearing trading assets.
(c) Total net revenue includes tax-equivalent adjustments, primarily due to tax-exempt incomefrom municipal bond investments and income tax credits related to affordable housing invest-ments, of $752 million, $274 million and $117 million for 2005, 2004 and 2003, respectively.
(d) TSS is charged a credit reimbursement related to certain exposures managed within the IB credit portfolio on behalf of clients shared with TSS. For a further discussion, see Creditreimbursement on page 35 of this Annual Report.
The following table provides the IB’s total net revenue by business segment:
Year ended December 31,(a)
(in millions) 2005 2004 2003Revenue by businessInvestment banking fees $ 4,096 $ 3,572 $ 2,871Fixed income markets 7,242 6,314 6,987Equities markets 1,799 1,491 1,406Credit portfolio 1,441 1,228 1,420
Total net revenue $ 14,578 $ 12,605 $ 12,684
(a) 2004 results include six months of the combined Firm’s results and six months of heritageJPMorgan Chase results. 2003 reflects the results of heritage JPMorgan Chase only.
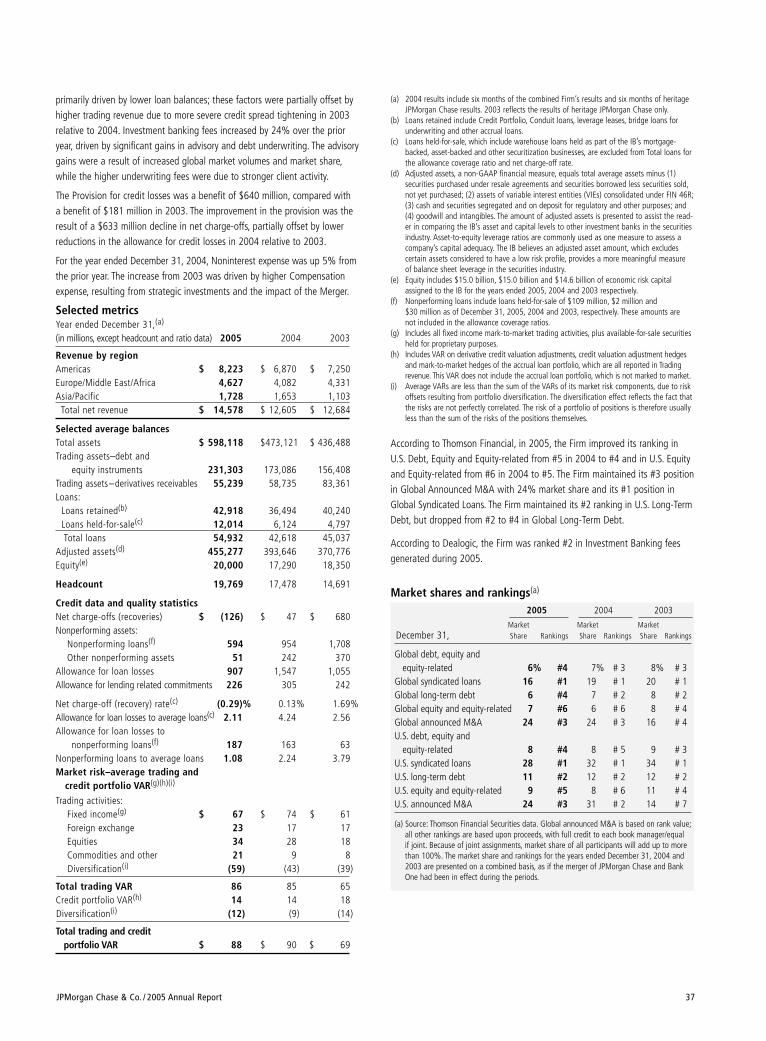
(a) 2004 results include six months of the combined Firm’s results and six months of heritageJPMorgan Chase results. 2003 reflects the results of heritage JPMorgan Chase only.
(b) Loans retained include Credit Portfolio, Conduit loans, leverage leases, bridge loans forunderwriting and other accrual loans.
(c) Loans held-for-sale, which include warehouse loans held as part of the IB’s mortgage-backed, asset-backed and other securitization businesses, are excluded from Total loans forthe allowance coverage ratio and net charge-off rate.
(d) Adjusted assets, a non-GAAP financial measure, equals total average assets minus (1)securities purchased under resale agreements and securities borrowed less securities sold,not yet purchased; (2) assets of variable interest entities (VIEs) consolidated under FIN 46R;(3) cash and securities segregated and on deposit for regulatory and other purposes; and(4) goodwill and intangibles. The amount of adjusted assets is presented to assist the read-er in comparing the IB’s asset and capital levels to other investment banks in the securitiesindustry. Asset-to-equity leverage ratios are commonly used as one measure to assess acompany’s capital adequacy. The IB believes an adjusted asset amount, which excludes certain assets considered to have a low risk profile, provides a more meaningful measure of balance sheet leverage in the securities industry.
(e) Equity includes $15.0 billion, $15.0 billion and $14.6 billion of economic risk capitalassigned to the IB for the years ended 2005, 2004 and 2003 respectively.
(f) Nonperforming loans include loans held-for-sale of $109 million, $2 million and $30 million as of December 31, 2005, 2004 and 2003, respectively. These amounts are not included in the allowance coverage ratios.
(g) Includes all fixed income mark-to-market trading activities, plus available-for-sale securitiesheld for proprietary purposes.
(h) Includes VAR on derivative credit valuation adjustments, credit valuation adjustment hedgesand mark-to-market hedges of the accrual loan portfolio, which are all reported in Tradingrevenue. This VAR does not include the accrual loan portfolio, which is not marked to market.
(i) Average VARs are less than the sum of the VARs of its market risk components, due to riskoffsets resulting from portfolio diversification. The diversification effect reflects the fact thatthe risks are not perfectly correlated. The risk of a portfolio of positions is therefore usuallyless than the sum of the risks of the positions themselves.
According to Thomson Financial, in 2005, the Firm improved its ranking inU.S. Debt, Equity and Equity-related from #5 in 2004 to #4 and in U.S. Equityand Equity-related from #6 in 2004 to #5. The Firm maintained its #3 positionin Global Announced M&A with 24% market share and its #1 position inGlobal Syndicated Loans. The Firm maintained its #2 ranking in U.S. Long-TermDebt, but dropped from #2 to #4 in Global Long-Term Debt.
According to Dealogic, the Firm was ranked #2 in Investment Banking feesgenerated during 2005.
Market shares and rankings(a)
2005 2004 2003
Market Market MarketDecember 31, Share Rankings Share Rankings Share Rankings
Global debt, equity and equity-related 6% #4 7% # 3 8% # 3
Global syndicated loans 16 #1 19 # 1 20 # 1Global long-term debt 6 #4 7 # 2 8 # 2Global equity and equity-related 7 #6 6 # 6 8 # 4Global announced M&A 24 #3 24 # 3 16 # 4U.S. debt, equity and
equity-related 8 #4 8 # 5 9 # 3U.S. syndicated loans 28 #1 32 # 1 34 # 1U.S. long-term debt 11 #2 12 # 2 12 # 2U.S. equity and equity-related 9 #5 8 # 6 11 # 4U.S. announced M&A 24 #3 31 # 2 14 # 7
(a) Source: Thomson Financial Securities data. Global announced M&A is based on rank value;all other rankings are based upon proceeds, with full credit to each book manager/equal if joint. Because of joint assignments, market share of all participants will add up to morethan 100%. The market share and rankings for the years ended December 31, 2004 and2003 are presented on a combined basis, as if the merger of JPMorgan Chase and BankOne had been in effect during the periods.
JPMorgan Chase & Co. / 2005 Annual Report 37
primarily driven by lower loan balances; these factors were partially offset byhigher trading revenue due to more severe credit spread tightening in 2003relative to 2004. Investment banking fees increased by 24% over the prioryear, driven by significant gains in advisory and debt underwriting. The advisorygains were a result of increased global market volumes and market share,while the higher underwriting fees were due to stronger client activity.
The Provision for credit losses was a benefit of $640 million, compared with a benefit of $181 million in 2003. The improvement in the provision was theresult of a $633 million decline in net charge-offs, partially offset by lowerreductions in the allowance for credit losses in 2004 relative to 2003.
For the year ended December 31, 2004, Noninterest expense was up 5% fromthe prior year. The increase from 2003 was driven by higher Compensationexpense, resulting from strategic investments and the impact of the Merger.
Selected metricsYear ended December 31,(a)
(in millions, except headcount and ratio data) 2005 2004 2003
Revenue by regionAmericas $ 8,223 $ 6,870 $ 7,250Europe/Middle East/Africa 4,627 4,082 4,331Asia/Pacific 1,728 1,653 1,103
Total net revenue $ 14,578 $ 12,605 $ 12,684
Selected average balancesTotal assets $ 598,118 $473,121 $ 436,488Trading assets–debt and
equity instruments 231,303 173,086 156,408Trading assets–derivatives receivables 55,239 58,735 83,361Loans:
Loans retained(b) 42,918 36,494 40,240Loans held-for-sale(c) 12,014 6,124 4,797Total loans 54,932 42,618 45,037
Adjusted assets(d) 455,277 393,646 370,776Equity(e) 20,000 17,290 18,350
Headcount 19,769 17,478 14,691
Credit data and quality statisticsNet charge-offs (recoveries) $ (126) $ 47 $ 680Nonperforming assets:
Nonperforming loans(f) 594 954 1,708Other nonperforming assets 51 242 370
Allowance for loan losses 907 1,547 1,055Allowance for lending related commitments 226 305 242
Net charge-off (recovery) rate(c) (0.29)% 0.13% 1.69%Allowance for loan losses to average loans(c) 2.11 4.24 2.56Allowance for loan losses to
nonperforming loans(f) 187 163 63Nonperforming loans to average loans 1.08 2.24 3.79Market risk–average trading and
credit portfolio VAR(g)(h)(i)
Trading activities:Fixed income(g) $ 67 $ 74 $ 61Foreign exchange 23 17 17Equities 34 28 18Commodities and other 21 9 8Diversification(i) (59) (43) (39)
Total trading VAR 86 85 65Credit portfolio VAR(h) 14 14 18Diversification(i) (12) (9) (14)
Total trading and credit portfolio VAR $ 88 $ 90 $ 69
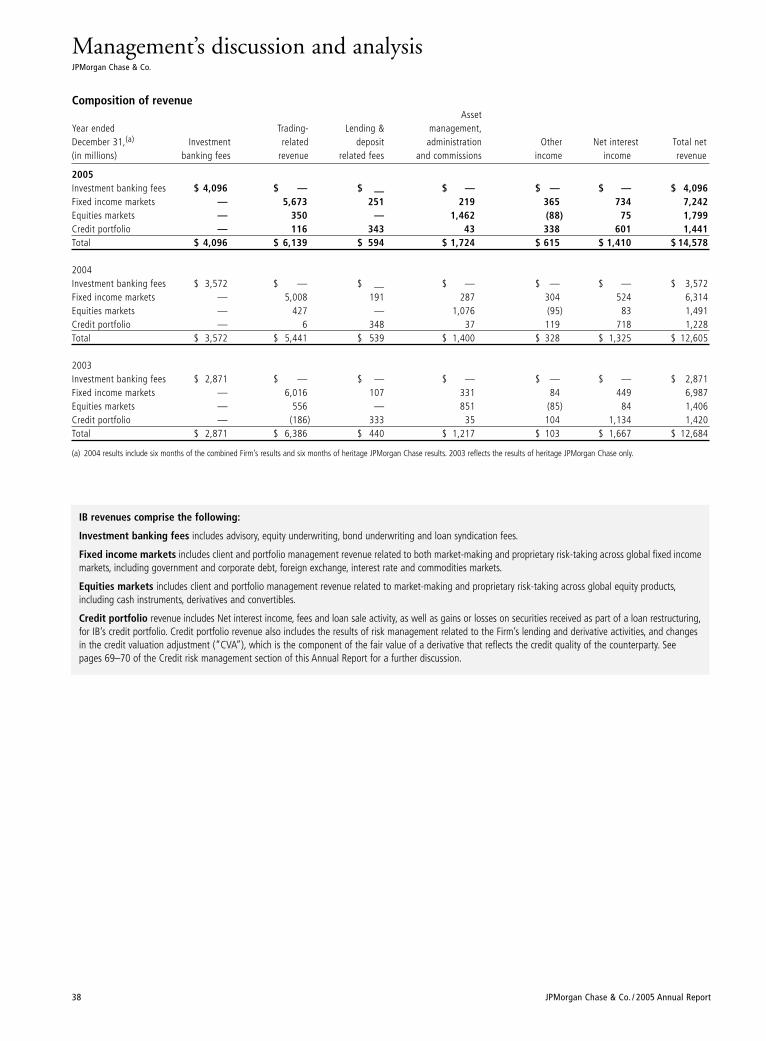
Management’s discussion and analysisJPMorgan Chase & Co.
38 JPMorgan Chase & Co. / 2005 Annual Report
Composition of revenueAsset
Year ended Trading- Lending & management,December 31,(a) Investment related deposit administration Other Net interest Total net(in millions) banking fees revenue related fees and commissions income income revenue
2005Investment banking fees $ 4,096 $ — $ — $ — $ — $ — $ 4,096Fixed income markets — 5,673 251 219 365 734 7,242Equities markets — 350 — 1,462 (88) 75 1,799Credit portfolio — 116 343 43 338 601 1,441Total $ 4,096 $ 6,139 $ 594 $ 1,724 $ 615 $ 1,410 $ 14,578
2004Investment banking fees $ 3,572 $ — $ — $ — $ — $ — $ 3,572Fixed income markets — 5,008 191 287 304 524 6,314Equities markets — 427 — 1,076 (95) 83 1,491Credit portfolio — 6 348 37 119 718 1,228Total $ 3,572 $ 5,441 $ 539 $ 1,400 $ 328 $ 1,325 $ 12,605
2003 Investment banking fees $ 2,871 $ — $ — $ — $ — $ — $ 2,871Fixed income markets — 6,016 107 331 84 449 6,987Equities markets — 556 — 851 (85) 84 1,406Credit portfolio — (186) 333 35 104 1,134 1,420Total $ 2,871 $ 6,386 $ 440 $ 1,217 $ 103 $ 1,667 $ 12,684
(a) 2004 results include six months of the combined Firm’s results and six months of heritage JPMorgan Chase results. 2003 reflects the results of heritage JPMorgan Chase only.
IB revenues comprise the following:
Investment banking fees includes advisory, equity underwriting, bond underwriting and loan syndication fees.
Fixed income markets includes client and portfolio management revenue related to both market-making and proprietary risk-taking across global fixed incomemarkets, including government and corporate debt, foreign exchange, interest rate and commodities markets.
Equities markets includes client and portfolio management revenue related to market-making and proprietary risk-taking across global equity products,including cash instruments, derivatives and convertibles.
Credit portfolio revenue includes Net interest income, fees and loan sale activity, as well as gains or losses on securities received as part of a loan restructuring,for IB’s credit portfolio. Credit portfolio revenue also includes the results of risk management related to the Firm’s lending and derivative activities, and changesin the credit valuation adjustment (“CVA”), which is the component of the fair value of a derivative that reflects the credit quality of the counterparty. Seepages 69–70 of the Credit risk management section of this Annual Report for a further discussion.
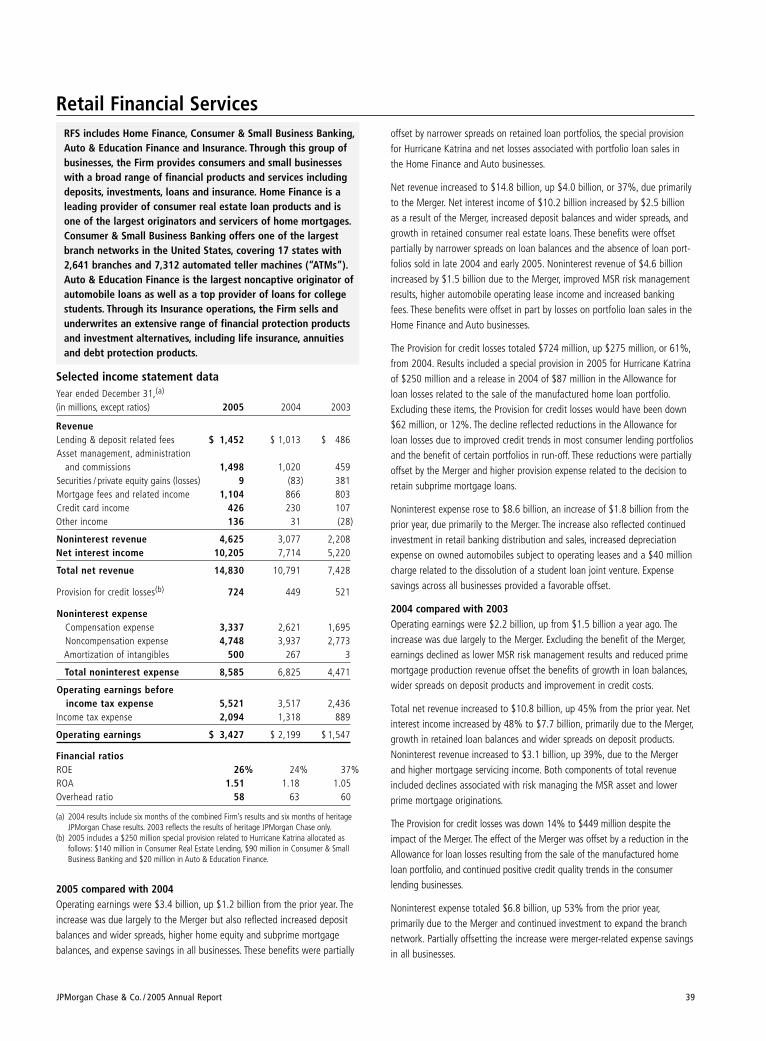
JPMorgan Chase & Co. / 2005 Annual Report 39
Retail Financial ServicesRFS includes Home Finance, Consumer & Small Business Banking,Auto & Education Finance and Insurance. Through this group ofbusinesses, the Firm provides consumers and small businesseswith a broad range of financial products and services includingdeposits, investments, loans and insurance. Home Finance is aleading provider of consumer real estate loan products and isone of the largest originators and servicers of home mortgages.Consumer & Small Business Banking offers one of the largestbranch networks in the United States, covering 17 states with2,641 branches and 7,312 automated teller machines (“ATMs”).Auto & Education Finance is the largest noncaptive originator of automobile loans as well as a top provider of loans for collegestudents. Through its Insurance operations, the Firm sells andunderwrites an extensive range of financial protection productsand investment alternatives, including life insurance, annuitiesand debt protection products.
Selected income statement data Year ended December 31,(a)
(in millions, except ratios) 2005 2004 2003
RevenueLending & deposit related fees $ 1,452 $ 1,013 $ 486Asset management, administration
and commissions 1,498 1,020 459Securities / private equity gains (losses) 9 (83) 381Mortgage fees and related income 1,104 866 803Credit card income 426 230 107Other income 136 31 (28)
Noninterest revenue 4,625 3,077 2,208Net interest income 10,205 7,714 5,220
Total net revenue 14,830 10,791 7,428
Provision for credit losses(b) 724 449 521
Noninterest expenseCompensation expense 3,337 2,621 1,695Noncompensation expense 4,748 3,937 2,773Amortization of intangibles 500 267 3
Total noninterest expense 8,585 6,825 4,471
Operating earnings before income tax expense 5,521 3,517 2,436
Income tax expense 2,094 1,318 889
Operating earnings $ 3,427 $ 2,199 $ 1,547
Financial ratiosROE 26% 24% 37%ROA 1.51 1.18 1.05Overhead ratio 58 63 60
(a) 2004 results include six months of the combined Firm’s results and six months of heritageJPMorgan Chase results. 2003 reflects the results of heritage JPMorgan Chase only.
(b) 2005 includes a $250 million special provision related to Hurricane Katrina allocated as follows: $140 million in Consumer Real Estate Lending, $90 million in Consumer & SmallBusiness Banking and $20 million in Auto & Education Finance.
2005 compared with 2004Operating earnings were $3.4 billion, up $1.2 billion from the prior year. Theincrease was due largely to the Merger but also reflected increased depositbalances and wider spreads, higher home equity and subprime mortgage balances, and expense savings in all businesses. These benefits were partially
offset by narrower spreads on retained loan portfolios, the special provisionfor Hurricane Katrina and net losses associated with portfolio loan sales inthe Home Finance and Auto businesses.
Net revenue increased to $14.8 billion, up $4.0 billion, or 37%, due primarilyto the Merger. Net interest income of $10.2 billion increased by $2.5 billionas a result of the Merger, increased deposit balances and wider spreads, andgrowth in retained consumer real estate loans. These benefits were offset partially by narrower spreads on loan balances and the absence of loan port-folios sold in late 2004 and early 2005. Noninterest revenue of $4.6 billionincreased by $1.5 billion due to the Merger, improved MSR risk managementresults, higher automobile operating lease income and increased bankingfees. These benefits were offset in part by losses on portfolio loan sales in theHome Finance and Auto businesses.
The Provision for credit losses totaled $724 million, up $275 million, or 61%,from 2004. Results included a special provision in 2005 for Hurricane Katrinaof $250 million and a release in 2004 of $87 million in the Allowance forloan losses related to the sale of the manufactured home loan portfolio.Excluding these items, the Provision for credit losses would have been down$62 million, or 12%. The decline reflected reductions in the Allowance forloan losses due to improved credit trends in most consumer lending portfoliosand the benefit of certain portfolios in run-off. These reductions were partiallyoffset by the Merger and higher provision expense related to the decision toretain subprime mortgage loans.
Noninterest expense rose to $8.6 billion, an increase of $1.8 billion from theprior year, due primarily to the Merger. The increase also reflected continuedinvestment in retail banking distribution and sales, increased depreciationexpense on owned automobiles subject to operating leases and a $40 millioncharge related to the dissolution of a student loan joint venture. Expense savings across all businesses provided a favorable offset.
2004 compared with 2003Operating earnings were $2.2 billion, up from $1.5 billion a year ago. Theincrease was due largely to the Merger. Excluding the benefit of the Merger,earnings declined as lower MSR risk management results and reduced primemortgage production revenue offset the benefits of growth in loan balances,wider spreads on deposit products and improvement in credit costs.
Total net revenue increased to $10.8 billion, up 45% from the prior year. Netinterest income increased by 48% to $7.7 billion, primarily due to the Merger,growth in retained loan balances and wider spreads on deposit products.Noninterest revenue increased to $3.1 billion, up 39%, due to the Mergerand higher mortgage servicing income. Both components of total revenueincluded declines associated with risk managing the MSR asset and lowerprime mortgage originations.
The Provision for credit losses was down 14% to $449 million despite theimpact of the Merger. The effect of the Merger was offset by a reduction in theAllowance for loan losses resulting from the sale of the manufactured homeloan portfolio, and continued positive credit quality trends in the consumerlending businesses.
Noninterest expense totaled $6.8 billion, up 53% from the prior year,primarily due to the Merger and continued investment to expand the branchnetwork. Partially offsetting the increase were merger-related expense savingsin all businesses.
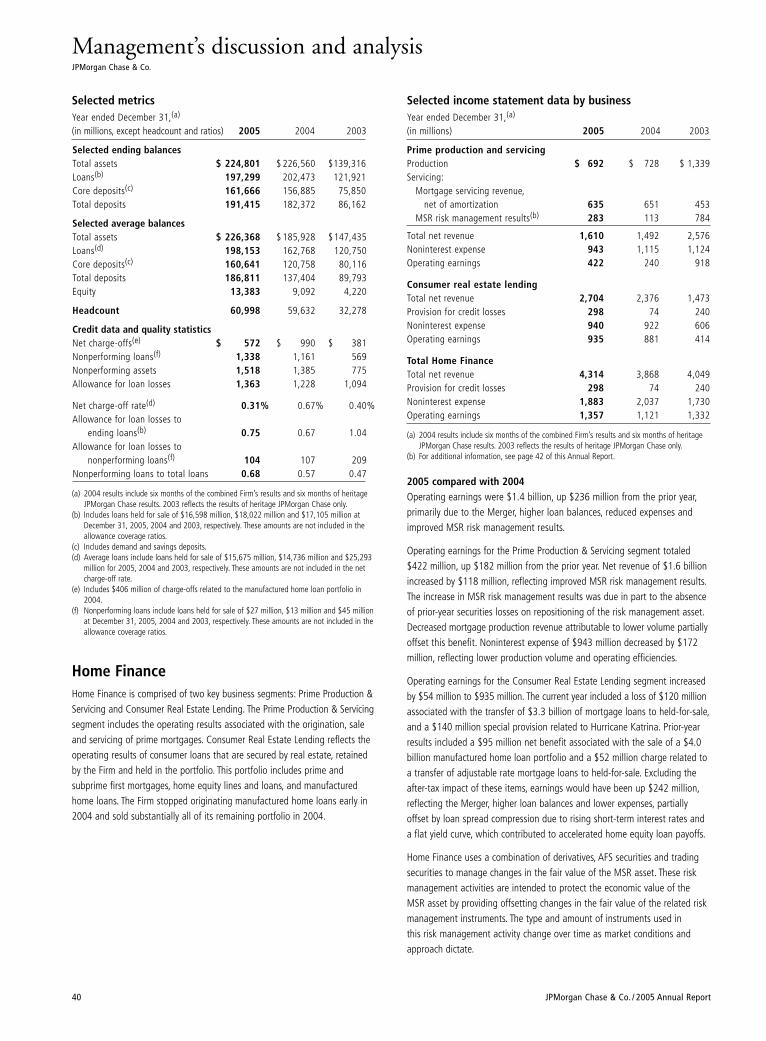
Management’s discussion and analysisJPMorgan Chase & Co.
40 JPMorgan Chase & Co. / 2005 Annual Report
Selected income statement data by businessYear ended December 31,(a)
(in millions) 2005 2004 2003
Prime production and servicingProduction $ 692 $ 728 $ 1,339Servicing:
Mortgage servicing revenue,net of amortization 635 651 453
MSR risk management results(b) 283 113 784
Total net revenue 1,610 1,492 2,576Noninterest expense 943 1,115 1,124Operating earnings 422 240 918
Consumer real estate lendingTotal net revenue 2,704 2,376 1,473Provision for credit losses 298 74 240Noninterest expense 940 922 606Operating earnings 935 881 414
Total Home FinanceTotal net revenue 4,314 3,868 4,049Provision for credit losses 298 74 240Noninterest expense 1,883 2,037 1,730Operating earnings 1,357 1,121 1,332
(a) 2004 results include six months of the combined Firm’s results and six months of heritageJPMorgan Chase results. 2003 reflects the results of heritage JPMorgan Chase only.
(b) For additional information, see page 42 of this Annual Report.
2005 compared with 2004Operating earnings were $1.4 billion, up $236 million from the prior year,primarily due to the Merger, higher loan balances, reduced expenses andimproved MSR risk management results.
Operating earnings for the Prime Production & Servicing segment totaled$422 million, up $182 million from the prior year. Net revenue of $1.6 billionincreased by $118 million, reflecting improved MSR risk management results.The increase in MSR risk management results was due in part to the absenceof prior-year securities losses on repositioning of the risk management asset.Decreased mortgage production revenue attributable to lower volume partiallyoffset this benefit. Noninterest expense of $943 million decreased by $172million, reflecting lower production volume and operating efficiencies.
Operating earnings for the Consumer Real Estate Lending segment increasedby $54 million to $935 million. The current year included a loss of $120 millionassociated with the transfer of $3.3 billion of mortgage loans to held-for-sale,and a $140 million special provision related to Hurricane Katrina. Prior-yearresults included a $95 million net benefit associated with the sale of a $4.0billion manufactured home loan portfolio and a $52 million charge related toa transfer of adjustable rate mortgage loans to held-for-sale. Excluding theafter-tax impact of these items, earnings would have been up $242 million,reflecting the Merger, higher loan balances and lower expenses, partially offset by loan spread compression due to rising short-term interest rates anda flat yield curve, which contributed to accelerated home equity loan payoffs.
Home Finance uses a combination of derivatives, AFS securities and tradingsecurities to manage changes in the fair value of the MSR asset. These riskmanagement activities are intended to protect the economic value of theMSR asset by providing offsetting changes in the fair value of the related riskmanagement instruments. The type and amount of instruments used in this risk management activity change over time as market conditions andapproach dictate.
Selected metricsYear ended December 31,(a)
(in millions, except headcount and ratios) 2005 2004 2003
Selected ending balancesTotal assets $ 224,801 $ 226,560 $139,316Loans(b) 197,299 202,473 121,921Core deposits(c) 161,666 156,885 75,850Total deposits 191,415 182,372 86,162
Selected average balancesTotal assets $ 226,368 $ 185,928 $147,435Loans(d) 198,153 162,768 120,750Core deposits(c) 160,641 120,758 80,116Total deposits 186,811 137,404 89,793Equity 13,383 9,092 4,220
Headcount 60,998 59,632 32,278
Credit data and quality statisticsNet charge-offs(e) $ 572 $ 990 $ 381Nonperforming loans(f) 1,338 1,161 569Nonperforming assets 1,518 1,385 775Allowance for loan losses 1,363 1,228 1,094
Net charge-off rate(d) 0.31% 0.67% 0.40%Allowance for loan losses to
ending loans(b) 0.75 0.67 1.04Allowance for loan losses to
nonperforming loans(f) 104 107 209Nonperforming loans to total loans 0.68 0.57 0.47
(a) 2004 results include six months of the combined Firm’s results and six months of heritageJPMorgan Chase results. 2003 reflects the results of heritage JPMorgan Chase only.
(b) Includes loans held for sale of $16,598 million, $18,022 million and $17,105 million atDecember 31, 2005, 2004 and 2003, respectively. These amounts are not included in theallowance coverage ratios.
(c) Includes demand and savings deposits.(d) Average loans include loans held for sale of $15,675 million, $14,736 million and $25,293
million for 2005, 2004 and 2003, respectively. These amounts are not included in the netcharge-off rate.
(e) Includes $406 million of charge-offs related to the manufactured home loan portfolio in2004.
(f) Nonperforming loans include loans held for sale of $27 million, $13 million and $45 millionat December 31, 2005, 2004 and 2003, respectively. These amounts are not included in theallowance coverage ratios.
Home Finance Home Finance is comprised of two key business segments: Prime Production &Servicing and Consumer Real Estate Lending. The Prime Production & Servicingsegment includes the operating results associated with the origination, saleand servicing of prime mortgages. Consumer Real Estate Lending reflects theoperating results of consumer loans that are secured by real estate, retainedby the Firm and held in the portfolio. This portfolio includes prime and subprime first mortgages, home equity lines and loans, and manufacturedhome loans. The Firm stopped originating manufactured home loans early in2004 and sold substantially all of its remaining portfolio in 2004.

JPMorgan Chase & Co. / 2005 Annual Report 41
During 2005, positive MSR valuation adjustments of $777 million were partially offset by losses of $494 million on risk management instruments,including net interest earned on AFS securities. In 2004, negative MSR valuationadjustments of $248 million were more than offset by $361 million of aggregaterisk management gains, including net interest earned on AFS securities.Unrealized losses on AFS securities were $174 million, $3 million and $144million at December 31, 2005, 2004 and 2003, respectively. For a furtherdiscussion of MSRs, see Critical accounting estimates on page 83 and Note 15on pages 114–116 of this Annual Report.
2004 compared with 2003Operating earnings in the Prime Production & Servicing segment dropped to$240 million from $918 million in the prior year. Results reflected a decreasein prime mortgage production revenue, to $728 million from $1.3 billion, dueto a decline in mortgage originations. Operating earnings were also adverselyaffected by a drop in MSR risk management revenue, to $113 million from$784 million in the prior year. Results in 2004 included realized losses of $89 million on the sale of AFS securities associated with the risk managementof the MSR asset, compared with securities gains of $359 million in the prioryear. Noninterest expense was relatively flat at $1.1 billion.
Operating earnings for the Consumer Real Estate Lending segment more than doubled to $881 million from $414 million in the prior year. The increasewas largely due to the addition of the Bank One home equity lending businessbut also reflected growth in retained loan balances and a $95 million netbenefit associated with the sale of the $4 billion manufactured home loanportfolio; partially offsetting these increases were lower subprime mortgagesecuritization gains as a result of management’s decision in 2004 to retainthese loans. These factors contributed to total net revenue rising 61% to $2.4 billion. The provision for credit losses, at $74 million, decreased by 69%from a year ago. This improvement was the result of an $87 million reductionin the allowance for loan losses associated with the manufactured home loanportfolio sale, improved credit quality and lower delinquencies, partially offsetby the Merger. Noninterest expense totaled $922 million, up 52% from theyear-ago period, largely due to the Merger.
Selected metricsYear ended December 31,(a)
(in millions, except ratios and where otherwise noted) 2005 2004 2003
Origination volume by channel (in billions)Retail $ 83.9 $ 74.2 $ 90.8Wholesale 50.4 48.5 65.6Correspondent 14.0 22.8 44.5Correspondent negotiated transactions 34.5 41.5 83.3
Total 182.8 187.0 284.2Origination volume by business (in billions)
Mortgage $ 128.7 $ 144.6 $ 259.5Home equity 54.1 42.4 24.7
Total 182.8 187.0 284.2
Business metrics (in billions)Third-party mortgage loans
serviced (ending)(b) $ 467.5 $ 430.9 $ 393.7MSR net carrying value (ending) 6.5 5.1 4.8End-of-period loans owned
Mortgage loans held-for-sale 13.7 14.2 15.9Mortgage loans retained 43.0 42.6 34.5Home equity and other loans 76.8 67.9 24.1
Total end of period loans owned 133.5 124.7 74.5Average loans owned
Mortgage loans held-for-sale 12.1 12.1 23.5Mortgage loans retained 46.4 40.7 32.0Home equity and other loans 70.2 47.0 19.4
Total average loans owned 128.7 99.8 74.9Overhead ratio 44% 53% 43%
Credit data and quality statistics30+ day delinquency rate(c) 1.61% 1.27% 1.81%Net charge-offs
Mortgage $ 25 $ 19 $ 26Home equity and other loans(d) 129 554 109
Total net charge-offs 154 573 135Net charge-off rate
Mortgage 0.05% 0.05% 0.08%Home equity and other loans 0.18 1.18 0.56Total net charge-off rate(e) 0.13 0.65 0.26
Nonperforming assets(f) $ 998 $ 844 $ 546
(a) 2004 results include six months of the combined Firm’s results and six months of heritageJPMorgan Chase results. 2003 reflects the results of heritage JPMorgan Chase only.
(b) Includes prime first mortgage loans and subprime loans.(c) Excludes delinquencies related to loans eligible for repurchase as well as loans repurchased
from GNMA pools that are insured by government agencies of $0.9 billion, $0.9 billion and$0.1 billion, for December 31, 2005, 2004 and 2003, respectively. These amounts areexcluded as reimbursement is proceeding normally.
(d) Includes $406 million of charge-offs related to the manufactured home loan portfolio in 2004.(e) Excludes mortgage loans held for sale.(f) Excludes nonperforming assets related to loans eligible for repurchase as well as loans
repurchased from GNMA pools that are insured by government agencies of $1.1 billion,$1.5 billion and $2.3 billion for December 31, 2005, 2004 and 2003, respectively. Theseamounts are excluded as reimbursement is proceeding normally.
Home Finance’s origination channels are comprised of the following:
Retail – Borrowers who are buying or refinancing a home are directlycontacted by a mortgage banker employed by the Firm using a branchoffice, the Internet or by phone. Borrowers are frequently referred to a mortgage banker by real estate brokers, home builders or other third parties.
Wholesale – A third-party mortgage broker refers loan applications to a mortgage banker at the Firm. Brokers are independent loan originatorsthat specialize in finding and counseling borrowers but do not providefunding for loans.
Correspondent – Banks, thrifts, other mortgage banks and other financial institutions sell closed loans to the Firm.
Correspondent negotiated transactions (“CNT”) – Mid- to large-sized mortgage lenders, banks and bank-owned mortgage companies sell servicing to the Firm on an as-originated basis. These transactionssupplement traditional production channels and provide growth opportu-nities in the servicing portfolio in stable and rising-rate periods.
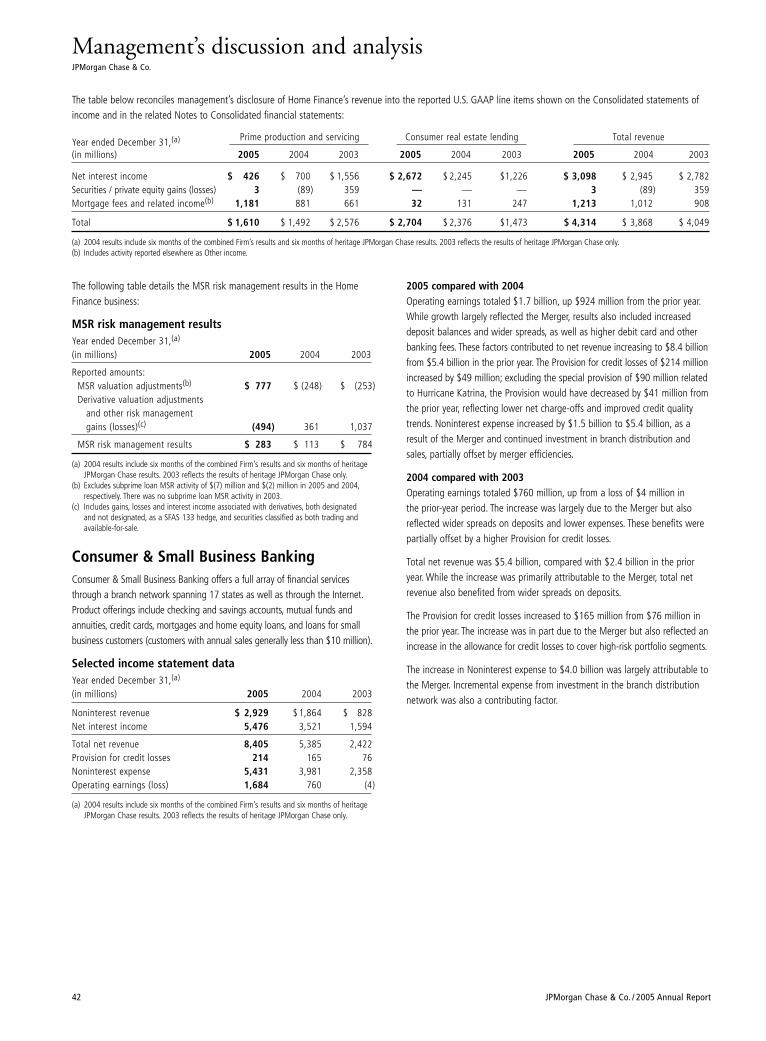
Management’s discussion and analysisJPMorgan Chase & Co.
42 JPMorgan Chase & Co. / 2005 Annual Report
The following table details the MSR risk management results in the HomeFinance business:
MSR risk management resultsYear ended December 31,(a)
(in millions) 2005 2004 2003
Reported amounts:MSR valuation adjustments(b) $ 777 $ (248) $ (253)Derivative valuation adjustments
and other risk management gains (losses)(c) (494) 361 1,037
MSR risk management results $ 283 $ 113 $ 784
(a) 2004 results include six months of the combined Firm’s results and six months of heritageJPMorgan Chase results. 2003 reflects the results of heritage JPMorgan Chase only.
(b) Excludes subprime loan MSR activity of $(7) million and $(2) million in 2005 and 2004,respectively. There was no subprime loan MSR activity in 2003.
(c) Includes gains, losses and interest income associated with derivatives, both designated and not designated, as a SFAS 133 hedge, and securities classified as both trading andavailable-for-sale.
Consumer & Small Business BankingConsumer & Small Business Banking offers a full array of financial servicesthrough a branch network spanning 17 states as well as through the Internet.Product offerings include checking and savings accounts, mutual funds andannuities, credit cards, mortgages and home equity loans, and loans for smallbusiness customers (customers with annual sales generally less than $10 million).
Selected income statement data Year ended December 31,(a)
(in millions) 2005 2004 2003
Noninterest revenue $ 2,929 $ 1,864 $ 828Net interest income 5,476 3,521 1,594
Total net revenue 8,405 5,385 2,422Provision for credit losses 214 165 76Noninterest expense 5,431 3,981 2,358Operating earnings (loss) 1,684 760 (4)
(a) 2004 results include six months of the combined Firm’s results and six months of heritageJPMorgan Chase results. 2003 reflects the results of heritage JPMorgan Chase only.
2005 compared with 2004Operating earnings totaled $1.7 billion, up $924 million from the prior year.While growth largely reflected the Merger, results also included increaseddeposit balances and wider spreads, as well as higher debit card and otherbanking fees. These factors contributed to net revenue increasing to $8.4 billionfrom $5.4 billion in the prior year. The Provision for credit losses of $214 millionincreased by $49 million; excluding the special provision of $90 million relatedto Hurricane Katrina, the Provision would have decreased by $41 million fromthe prior year, reflecting lower net charge-offs and improved credit qualitytrends. Noninterest expense increased by $1.5 billion to $5.4 billion, as aresult of the Merger and continued investment in branch distribution andsales, partially offset by merger efficiencies.
2004 compared with 2003Operating earnings totaled $760 million, up from a loss of $4 million in the prior-year period. The increase was largely due to the Merger but alsoreflected wider spreads on deposits and lower expenses. These benefits werepartially offset by a higher Provision for credit losses.
Total net revenue was $5.4 billion, compared with $2.4 billion in the prioryear. While the increase was primarily attributable to the Merger, total net revenue also benefited from wider spreads on deposits.
The Provision for credit losses increased to $165 million from $76 million inthe prior year. The increase was in part due to the Merger but also reflected anincrease in the allowance for credit losses to cover high-risk portfolio segments.
The increase in Noninterest expense to $4.0 billion was largely attributable tothe Merger. Incremental expense from investment in the branch distributionnetwork was also a contributing factor.
The table below reconciles management’s disclosure of Home Finance’s revenue into the reported U.S. GAAP line items shown on the Consolidated statements ofincome and in the related Notes to Consolidated financial statements:
Year ended December 31,(a) Prime production and servicing Consumer real estate lending Total revenue
(in millions) 2005 2004 2003 2005 2004 2003 2005 2004 2003
Net interest income $ 426 $ 700 $ 1,556 $ 2,672 $ 2,245 $1,226 $ 3,098 $ 2,945 $ 2,782Securities / private equity gains (losses) 3 (89) 359 — — — 3 (89) 359Mortgage fees and related income(b) 1,181 881 661 32 131 247 1,213 1,012 908
Total $ 1,610 $ 1,492 $ 2,576 $ 2,704 $ 2,376 $1,473 $ 4,314 $ 3,868 $ 4,049
(a) 2004 results include six months of the combined Firm’s results and six months of heritage JPMorgan Chase results. 2003 reflects the results of heritage JPMorgan Chase only.(b) Includes activity reported elsewhere as Other income.
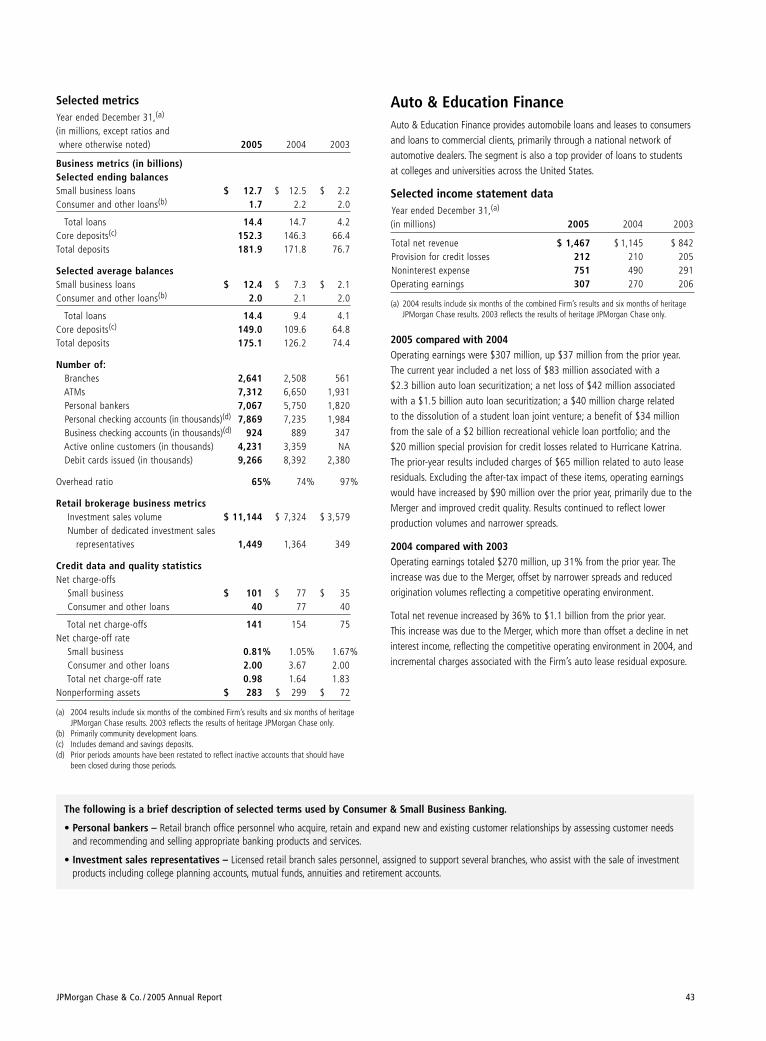
JPMorgan Chase & Co. / 2005 Annual Report 43
Selected metrics Year ended December 31,(a)
(in millions, except ratios and where otherwise noted) 2005 2004 2003
Business metrics (in billions)Selected ending balancesSmall business loans $ 12.7 $ 12.5 $ 2.2Consumer and other loans(b) 1.7 2.2 2.0
Total loans 14.4 14.7 4.2Core deposits(c) 152.3 146.3 66.4Total deposits 181.9 171.8 76.7
Selected average balancesSmall business loans $ 12.4 $ 7.3 $ 2.1Consumer and other loans(b) 2.0 2.1 2.0
Total loans 14.4 9.4 4.1Core deposits(c) 149.0 109.6 64.8Total deposits 175.1 126.2 74.4
Number of:Branches 2,641 2,508 561ATMs 7,312 6,650 1,931Personal bankers 7,067 5,750 1,820Personal checking accounts (in thousands)(d) 7,869 7,235 1,984Business checking accounts (in thousands)(d) 924 889 347Active online customers (in thousands) 4,231 3,359 NADebit cards issued (in thousands) 9,266 8,392 2,380
Overhead ratio 65% 74% 97%
Retail brokerage business metricsInvestment sales volume $ 11,144 $ 7,324 $ 3,579Number of dedicated investment sales
representatives 1,449 1,364 349
Credit data and quality statisticsNet charge-offs
Small business $ 101 $ 77 $ 35Consumer and other loans 40 77 40
Total net charge-offs 141 154 75Net charge-off rate
Small business 0.81% 1.05% 1.67%Consumer and other loans 2.00 3.67 2.00Total net charge-off rate 0.98 1.64 1.83
Nonperforming assets $ 283 $ 299 $ 72
(a) 2004 results include six months of the combined Firm’s results and six months of heritageJPMorgan Chase results. 2003 reflects the results of heritage JPMorgan Chase only.
(b) Primarily community development loans.(c) Includes demand and savings deposits.(d) Prior periods amounts have been restated to reflect inactive accounts that should have
been closed during those periods.
Auto & Education FinanceAuto & Education Finance provides automobile loans and leases to consumersand loans to commercial clients, primarily through a national network ofautomotive dealers. The segment is also a top provider of loans to students at colleges and universities across the United States.
Selected income statement data Year ended December 31,(a)
(in millions) 2005 2004 2003
Total net revenue $ 1,467 $ 1,145 $ 842Provision for credit losses 212 210 205Noninterest expense 751 490 291Operating earnings 307 270 206
(a) 2004 results include six months of the combined Firm’s results and six months of heritageJPMorgan Chase results. 2003 reflects the results of heritage JPMorgan Chase only.
2005 compared with 2004Operating earnings were $307 million, up $37 million from the prior year.The current year included a net loss of $83 million associated with a $2.3 billion auto loan securitization; a net loss of $42 million associatedwith a $1.5 billion auto loan securitization; a $40 million charge related to the dissolution of a student loan joint venture; a benefit of $34 millionfrom the sale of a $2 billion recreational vehicle loan portfolio; and the $20 million special provision for credit losses related to Hurricane Katrina.The prior-year results included charges of $65 million related to auto leaseresiduals. Excluding the after-tax impact of these items, operating earningswould have increased by $90 million over the prior year, primarily due to theMerger and improved credit quality. Results continued to reflect lower production volumes and narrower spreads.
2004 compared with 2003Operating earnings totaled $270 million, up 31% from the prior year. Theincrease was due to the Merger, offset by narrower spreads and reduced origination volumes reflecting a competitive operating environment.
Total net revenue increased by 36% to $1.1 billion from the prior year.This increase was due to the Merger, which more than offset a decline in net interest income, reflecting the competitive operating environment in 2004, andincremental charges associated with the Firm’s auto lease residual exposure.
The following is a brief description of selected terms used by Consumer & Small Business Banking.
• Personal bankers – Retail branch office personnel who acquire, retain and expand new and existing customer relationships by assessing customer needsand recommending and selling appropriate banking products and services.
• Investment sales representatives – Licensed retail branch sales personnel, assigned to support several branches, who assist with the sale of investmentproducts including college planning accounts, mutual funds, annuities and retirement accounts.
The Provision for credit losses totaled $210 million, up 2% from the prioryear. The increase was due to the Merger but was largely offset by a lowerProvision for credit losses, reflecting favorable credit trends.
Noninterest expense increased by 68% to $490 million, largely due to the Merger.
Selected metrics Year ended December 31,(a)
(in millions, except ratios and where otherwise noted) 2005 2004 2003
Business metrics (in billions)End-of-period loans and lease related assets
Loans outstanding $ 44.7 $ 54.6 $ 33.7Lease related assets(b) 5.2 8.0 9.5
Total end-of-period loans and lease related assets 49.9 62.6 43.2
Average loans and lease related assets Loans outstanding(c) $ 48.5 $ 44.3 $ 32.0Lease related assets(d) 6.6 9.0 9.7
Total average loans and lease related assets(c)(d) 55.1 53.3 41.7
Overhead ratio 51% 43% 35%
Credit quality statistics30+ day delinquency rate 1.65% 1.55% 1.42%Net charge-offs
Loans $ 257 $ 219 $ 130Lease receivables(d) 20 44 41
Total net charge-offs 277 263 171Net charge-off rate
Loans(c) 0.57% 0.52% 0.43%Lease receivables 0.32 0.49 0.42
Total net charge-off rate(c) 0.54 0.52 0.43Nonperforming assets $ 237 $ 242 $ 157
(a) 2004 results include six months of the combined Firm’s results and six months of heritageJPMorgan Chase results. 2003 reflects the results of heritage JPMorgan Chase only.
(b) Includes operating lease-related assets of $0.9 billion for 2005. Balances prior to January 1,2005, were insignificant.
(c) Average loans include loans held for sale of $3.5 billion, $2.3 billion and $1.8 billion for,2005, 2004 and 2003, respectively. These are not included in the net charge-off rate.
(d) Includes operating lease-related assets of $0.4 billion for 2005. Balances prior to January 1,2005, were insignificant. These are not included in the net charge-off rate.
InsuranceInsurance is a provider of financial protection products and services, includinglife insurance, annuities and debt protection. Products and services are distributed through both internal lines of business and external markets.On February 7, 2006, the Firm signed a definitive agreement to sell its lifeinsurance and annuity underwriting business.
Selected income statement data Year ended December 31,(a)
(in millions) 2005 2004 2003
Total net revenue $ 644 $ 393 $ 115Noninterest expense 520 317 92Operating earnings 79 48 13Memo: Consolidated gross
insurance-related revenue(b) 1,642 1,191 611
(a) 2004 results include six months of the combined Firm’s results and six months of heritageJPMorgan Chase results. 2003 reflects the results of heritage JPMorgan Chase only.
(b) Includes revenue reported in the results of other businesses.
2005 compared with 2004Operating earnings totaled $79 million, an increase of $31 million from the prioryear, on net revenues of $644 million. The increase was due primarily to theMerger. Results also reflected an increase in proprietary annuity sales commis-sions paid and lower expenses from merger savings and other efficiencies.
2004 compared with 2003 Operating earnings totaled $48 million on Total net revenue of $393 millionin 2004. The increases in Total net revenue and Noninterest expense over theprior year were due almost entirely to the Merger.
Selected metrics Year ended December 31,(a)
(in millions, except where otherwise noted) 2005 2004 2003
Business metrics – ending balancesInvested assets $ 7,767 $ 7,368 $ 1,559Policy loans 388 397 —Insurance policy and claims reserves 7,774 7,279 1,096Term life sales – first year annualized
premiums 60 28 —Term life premium revenues 477 234 —Proprietary annuity sales 706 208 548Number of policies in force – direct/assumed
(in thousands) 2,441 2,611 631Insurance in force – direct/assumed $ 282,903 $ 277,827 $ 31,992Insurance in force – retained 87,753 80,691 31,992A.M. Best rating A A A
(a) 2004 results include six months of the combined Firm’s results and six months of heritageJPMorgan Chase results. 2003 reflects the results of heritage JPMorgan Chase only.
The following is a brief description of selected business metrics within Insurance.
• Proprietary annuity sales represent annuity contracts marketed through and issued by subsidiaries of the Firm.
• Insurance in force – direct/assumed includes the aggregate face amount of insurance policies directly underwritten and assumed through reinsurance.
• Insurance in force – retained includes the aggregate face amounts of insurance policies directly underwritten and assumed through reinsurance, after reduction for face amounts ceded to reinsurers.
Management’s discussion and analysisJPMorgan Chase & Co.
44 JPMorgan Chase & Co. / 2005 Annual Report
JPMorgan Chase & Co. / 2005 Annual Report 45
Card ServicesCard Services is one of the largest issuers of credit cards in theUnited States, with more than 110 million cards in circulation,and is the largest merchant acquirer. CS offers a wide variety of products to satisfy the needs of its cardmembers, includingcards issued on behalf of many well-known partners, such as major airlines, hotels, universities, retailers and other financial institutions.
JPMorgan Chase uses the concept of “managed receivables” to evaluate the credit performance of the underlying credit card loans, both sold and notsold: as the same borrower is continuing to use the credit card for ongoingcharges, a borrower’s credit performance will affect both the receivables sold under SFAS 140 and those not sold. Thus, in its disclosures regardingmanaged receivables, JPMorgan Chase treats the sold receivables as if theywere still on the balance sheet in order to disclose the credit performance(such as net charge-off rates) of the entire managed credit card portfolio.
Operating results exclude the impact of credit card securitizations on revenue,the Provision for credit losses, net charge-offs and receivables. Securitizationdoes not change reported Net income versus operating earnings; however, itdoes affect the classification of items on the Consolidated statements of income.
Selected income statement data – managed basisYear ended December 31,(a)(b)
(in millions, except ratios) 2005 2004 2003
RevenueAsset management,
administration and commissions $ — $ 75 $ 108Credit card income 3,351 2,179 930Other income 212 117 54
Noninterest revenue 3,563 2,371 1,092Net interest income 11,803 8,374 5,052
Total net revenue 15,366 10,745 6,144
Provision for credit losses(c) 7,346 4,851 2,904
Noninterest expenseCompensation expense 1,081 893 582Noncompensation expense 3,170 2,485 1,336Amortization of intangibles 748 505 260
Total noninterest expense 4,999 3,883 2,178
Operating earnings before income tax expense 3,021 2,011 1,062
Income tax expense 1,114 737 379
Operating earnings $ 1,907 $ 1,274 $ 683
Memo: Net securitization gains (amortization) $ 56 $ (8) $ 1
Financial metricsROE 16% 17% 20%Overhead ratio 33 36 35
(a) 2004 results include six months of the combined Firm’s results and six months of heritageJPMorgan Chase results. 2003 reflects the results of heritage JPMorgan Chase only.
(b) As a result of the integration of Chase Merchant Services and Paymentech merchant processing businesses into a joint venture, beginning in the fourth quarter of 2005, Totalnet revenue, Noninterest expense and pre-tax earnings have been reduced to reflect thedeconsolidation of Paymentech. There is no impact to operating earnings.
(c) 2005 includes a $100 million special provision related to Hurricane Katrina.
2005 compared with 2004 Operating earnings of $1.9 billion were up $633 million, or 50%, from theprior year due to the Merger. In addition, lower expenses driven by mergersavings, stronger underlying credit quality and higher revenue from increasedloan balances and charge volume were partially offset by the impact ofincreased bankruptcies.
Net revenue was $15.4 billion, up $4.6 billion, or 43%. Net interest incomewas $11.8 billion, up $3.4 billion, or 41%, primarily due to the Merger, andthe acquisition of a private label portfolio. In addition, higher loan balanceswere partially offset by narrower loan spreads and the reversal of revenuerelated to increased bankruptcies. Noninterest revenue of $3.6 billion was up$1.2 billion, or 50%, due to the Merger and higher interchange income fromhigher charge volume, partially offset by higher volume-driven payments topartners, higher expense related to rewards programs and the impact of thedeconsolidation of Paymentech.
The Provision for credit losses was $7.3 billion, up $2.5 billion, or 51%,primarily due to the Merger, and included the acquisition of a private labelportfolio. The provision also increased due to record bankruptcy-related netcharge-offs resulting from the new bankruptcy legislation, which becameeffective on October 17, 2005. Finally, the Allowance for loan losses wasincreased in part by the special provision for credit losses related to HurricaneKatrina. These factors were partially offset by lower contractual net charge-offs.Despite a record level of bankruptcy losses, the net charge-off rate improved.The managed net charge-off rate was 5.21%, down from 5.27% in the prioryear. The 30-day managed delinquency rate was 2.79%, down from 3.70% in the prior year, driven primarily by accelerated loss recognition of delinquentaccounts as a result of the bankruptcy reform legislation and strong underlyingcredit quality.
Noninterest expense of $5.0 billion increased by $1.1 billion, or 29%, primarilydue to the Merger, which included the acquisition of a private label portfolio.Merger savings, including lower processing and compensation costs and theimpact of the deconsolidation of Paymentech, were partially offset by higherspending on marketing.
2004 compared with 2003Operating earnings of $1.3 billion increased by $591 million compared withthe prior year, primarily due to the Merger. In addition, earnings benefitedfrom higher loan balances and charge volume, partially offset by a higher Provision for credit losses and higher expenses.
Total net revenue of $10.7 billion increased by $4.6 billion. Net interestincome of $8.4 billion increased by $3.3 billion, primarily due to the Mergerand higher loan balances. Noninterest revenue of $2.4 billion increased by$1.3 billion, primarily due to the Merger and increased interchange incomeresulting from higher charge-off volume. These factors were partially offset byhigher volume-driven payments to partners, reflecting the sharing of incomeand increased rewards expense.
The Provision for credit losses of $4.9 billion increased by $1.9 billion, primarilydue to the Merger and growth in credit card receivables. Credit ratios remainedstrong, benefiting from reduced contractual and bankruptcy charge-offs. Thenet charge-off ratio was 5.27%. The 30-day delinquency ratio was 3.70%.
Noninterest expense of $3.9 billion increased by $1.7 billion, primarily relatedto the Merger. In addition, expenses increased due to higher marketingexpenses and volume-based processing expenses, partially offset by lowercompensation expenses.
Management’s discussion and analysisJPMorgan Chase & Co.
46 JPMorgan Chase & Co. / 2005 Annual Report
Selected metricsYear ended December 31,(a)
(in millions, except headcount, ratiosand where otherwise noted) 2005 2004 2003
% of average managed outstandings:Net interest income 8.65% 9.16% 9.95%Provision for credit losses 5.39 5.31 5.72Noninterest revenue 2.61 2.59 2.15Risk adjusted margin(b) 5.88 6.45 6.38Noninterest expense 3.67 4.25 4.29Pre-tax income (ROO) 2.21 2.20 2.09Operating earnings 1.40 1.39 1.35
Business metricsCharge volume (in billions) $ 301.9 $ 193.6 $ 88.2Net accounts opened (in thousands) 21,056 7,523 4,177Credit cards issued (in thousands) 110,439 94,285 35,103Number of registered
Internet customers (in millions) 14.6 13.6 3.7Merchant acquiring business(c)
Bank card volume (in billions) $ 563.1 $ 396.2 $ 261.2Total transactions (in millions)(d) 15,499 9,049 4,254
Selected ending balancesLoans:
Loans on balance sheets $ 71,738 $ 64,575 $ 17,426Securitized loans 70,527 70,795 34,856
Managed loans $142,265 $ 135,370 $ 52,282
Selected average balancesManaged assets $141,933 $ 94,741 $ 51,406Loans:
Loans on balance sheets $ 67,334 $ 38,842 $ 17,604Securitized loans 69,055 52,590 33,169
Managed loans $136,389 $ 91,432 $ 50,773
Equity 11,800 7,608 3,440
Headcount 18,629 19,598 10,612
Credit quality statistics Net charge-offs $ 7,100 $ 4,821 $ 2,996Managed net charge-off rate 5.21% 5.27% 5.90%
Delinquency ratios 30+ days 2.79% 3.70% 4.68%90+ days 1.27 1.72 2.19
Allowance for loan losses $ 3,274 $ 2,994 $ 1,225Allowance for loan losses to
period-end loans 4.56% 4.64% 7.03%
(a) 2004 results include six months of the combined Firm’s results and six months of heritageJPMorgan Chase results. 2003 reflects the results of heritage JPMorgan Chase only.
(b) Represents Total net revenue less Provision for credit losses.(c) Represents 100% of the merchant acquiring business.(d) Prior periods have been restated to conform methodologies following the integration of
Chase Merchant Services and Paymentech merchant processing businesses.
The financial information presented below reconciles reported basis and managed basis to disclose the effect of securitizations.
Year ended December 31,(a)
(in millions) 2005 2004 2003
Income statement dataCredit card income
Reported data for the period $ 6,069 $ 4,446 $ 2,309Securitization adjustments (2,718) (2,267) (1,379)
Managed credit card income $ 3,351 $ 2,179 $ 930
Other incomeReported data for the period $ 212 $ 203 $ 125Securitization adjustments — (86) (71)
Managed other income $ 212 $ 117 $ 54
Net interest incomeReported data for the period $ 5,309 $ 3,123 $ 1,732Securitization adjustments 6,494 5,251 3,320
Managed net interest income $ 11,803 $ 8,374 $ 5,052
Total net revenue(b)
Reported data for the period $ 11,590 $ 7,847 $ 4,274Securitization adjustments 3,776 2,898 1,870
Managed total net revenue $ 15,366 $ 10,745 $ 6,144
Provision for credit lossesReported data for the period(c) $ 3,570 $ 1,953 $ 1,034Securitization adjustments 3,776 2,898 1,870
Managed provision for credit losses $ 7,346 $ 4,851 $ 2,904
Balance sheet – average balancesTotal average assets
Reported data for the period $ 74,753 $ 43,657 $ 19,041Securitization adjustments 67,180 51,084 32,365
Managed average assets $141,933 $ 94,741 $ 51,406
Credit quality statisticsNet charge-offs
Reported net charge-offs data for the period $ 3,324 $ 1,923 $ 1,126
Securitization adjustments 3,776 2,898 1,870
Managed net charge-offs $ 7,100 $ 4,821 $ 2,996
(a) 2004 results include six months of the combined Firm’s results and six months of heritageJPMorgan Chase results. 2003 reflects the results of heritage JPMorgan Chase only.
(b) Includes noninterest revenue and Net interest income.(c) 2005 includes a $100 million special provision related to Hurricane Katrina.
The following is a brief description of selected businessmetrics within Card Services.
• Charge volume – Represents the dollar amount of cardmemberpurchases, balance transfers and cash advance activity.
• Net accounts opened – Includes originations, portfolio purchasesand sales.
• Merchant acquiring business – Represents an entity thatprocesses payments for merchants. JPMorgan Chase is a partner inChase Paymentech Solutions, LLC.
• Bank card volume – Represents the dollar amount of transactionsprocessed for the merchants.
• Total transactions – Represents the number of transactions andauthorizations processed for the merchants.
JPMorgan Chase & Co. / 2005 Annual Report 47
Commercial BankingCommercial Banking serves more than 25,000 clients, includingcorporations, municipalities, financial institutions and not-for-profit entities with annual revenues generally ranging from $10 million to $2 billion. While most Middle Market clients arewithin the Retail Financial Services footprint, CB also coverslarger corporations, as well as local governments and financialinstitutions on a national basis. CB is a market leader with supe-rior client penetration across the businesses it serves. Local mar-ket presence, coupled with industry expertise and excellentclient service and risk management, enable CB to offer superiorfinancial advice. Partnership with other JPMorgan Chase busi-nesses positions CB to deliver broad product capabilities –including lending, treasury services, investment banking, andasset and wealth management – and meet its clients’ financialneeds.
Selected income statement data Year ended December 31,(a)
(in millions, except ratios) 2005 2004 2003
RevenueLending & deposit related fees $ 575 $ 441 $ 301Asset management, administration
and commissions 60 32 19Other income(b) 351 209 73
Noninterest revenue 986 682 393Net interest income 2,610 1,692 959
Total net revenue 3,596 2,374 1,352
Provision for credit losses(c) 73 41 6
Noninterest expenseCompensation expense 661 465 285Noncompensation expense 1,146 843 534Amortization of intangibles 65 35 3
Total noninterest expense 1,872 1,343 822
Operating earnings before income tax expense 1,651 990 524
Income tax expense 644 382 217
Operating earnings $ 1,007 $ 608 $ 307
Financial ratiosROE 30% 29% 29%ROA 1.78 1.67 1.87Overhead ratio 52 57 61
(a) 2004 results include six months of the combined Firm’s results and six months of heritageJPMorgan Chase results. 2003 reflects the results of heritage JPMorgan Chase only.
(b) IB-related and commercial card revenues are included in Other income.(c) 2005 includes a $35 million special provision related to Hurricane Katrina.
Commercial Banking operates in 10 of the top 15 major U.S. metropolitanareas and is divided into three customer segments: Middle Market Banking,Mid-Corporate Banking and Real Estate. General coverage for corporateclients is provided by Middle Market Banking, which covers clients with annualrevenues generally up to $500 million. Mid-Corporate Banking covers clientswith annual revenues generally ranging between $500 million and $2 billionand focuses on clients that have broader investment banking needs. The thirdsegment, Real Estate, serves investors in, and developers of, for-sale housing,multifamily rental, retail, office, and industrial properties. In addition to these
three customer segments, Commercial Banking offers several products to theFirm’s entire customer base: Chase Business Credit, the #1 asset-based lenderfor 2005, provides asset-based financing, syndications, and collateral analysis,and Chase Equipment Leasing offers a variety of equipment finance and leas-ing products, with specialties in aircraft finance, public sector, and informationtechnology. Given this structure, Commercial Banking manages a customerbase and loan portfolio that is highly diversified across a broad range ofindustries and geographic locations.
2005 compared with 2004 Operating earnings of $1.0 billion were up $399 million from the prior year,primarily due to the Merger.
Net revenue of $3.6 billion increased by $1.2 billion, or 51%, primarily as aresult of the Merger. In addition to the overall increase from the Merger, Netinterest income of $2.6 billion was positively affected by wider spreads on higher volume related to liability balances and increased loans, partially offsetby narrower loan spreads. Noninterest revenue of $986 million was lower dueto a decline in deposit-related fees due to higher interest rates, partially offsetby increased investment banking revenue.
Each business within Commercial Banking demonstrated revenue growthover the prior year, primarily due to the Merger. Middle Market revenue was$2.4 billion, an increase of $870 million over the prior year; Mid-CorporateBanking revenue was $548 million, an increase of $181 million; and RealEstate revenue was $534 million, up $166 million. In addition to the Merger,revenue was higher for each business due to wider spreads and higher volumerelated to liability balances and increased investment banking revenue,partially offset by narrower loan spreads.
Provision for credit losses of $73 million increased by $32 million, primarilydue to a special provision related to Hurricane Katrina, increased loan balancesand refinements in the data used to estimate the allowance for credit losses. The credit quality of the portfolio was strong with net charge-offs of $26 million, down $35 million from the prior year, and nonperforming loans of $272 million, down $255 million.
Noninterest expense of $1.9 billion increased by $529 million, or 39%,primarily due to the Merger and to an increase in allocated unit costs forTreasury Services products.
2004 compared with 2003Operating earnings were $608 million, an increase of 98%, primarily due to the Merger.
Total net revenue was $2.4 billion, an increase of 76%, primarily due to theMerger. In addition to the overall increase related to the Merger, Net interestincome of $1.7 billion was positively affected by higher liability balances,partially offset by lower lending-related revenue. Noninterest revenue of$682 million was positively affected by higher investment banking fees andhigher gains on the sale of loans and securities acquired in satisfaction ofdebt, partially offset by lower deposit-related fees, which often decline asinterest rates rise.
The Provision for credit losses was $41 million, an increase of $35 million,primarily due to the Merger. Excluding the impact of the Merger, the provisionwas higher in 2004. Lower net charge-offs in 2004 were partially offset bysmaller reductions in the allowance for credit losses in 2004 relative to 2003.
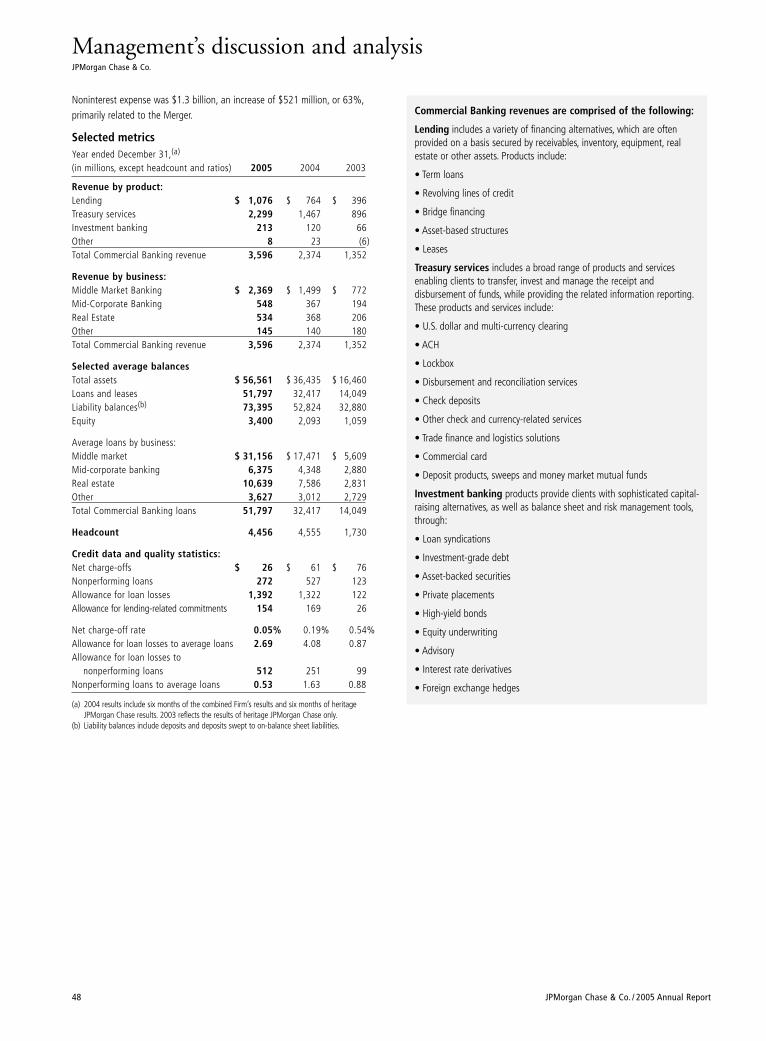
Management’s discussion and analysisJPMorgan Chase & Co.
48 JPMorgan Chase & Co. / 2005 Annual Report
Noninterest expense was $1.3 billion, an increase of $521 million, or 63%,primarily related to the Merger.
Selected metricsYear ended December 31,(a)
(in millions, except headcount and ratios) 2005 2004 2003
Revenue by product:Lending $ 1,076 $ 764 $ 396Treasury services 2,299 1,467 896Investment banking 213 120 66Other 8 23 (6)Total Commercial Banking revenue 3,596 2,374 1,352
Revenue by business:Middle Market Banking $ 2,369 $ 1,499 $ 772Mid-Corporate Banking 548 367 194Real Estate 534 368 206Other 145 140 180Total Commercial Banking revenue 3,596 2,374 1,352
Selected average balancesTotal assets $ 56,561 $ 36,435 $ 16,460Loans and leases 51,797 32,417 14,049Liability balances(b) 73,395 52,824 32,880Equity 3,400 2,093 1,059
Average loans by business:Middle market $ 31,156 $ 17,471 $ 5,609Mid-corporate banking 6,375 4,348 2,880Real estate 10,639 7,586 2,831Other 3,627 3,012 2,729Total Commercial Banking loans 51,797 32,417 14,049
Headcount 4,456 4,555 1,730
Credit data and quality statistics:Net charge-offs $ 26 $ 61 $ 76Nonperforming loans 272 527 123Allowance for loan losses 1,392 1,322 122Allowance for lending-related commitments 154 169 26
Net charge-off rate 0.05% 0.19% 0.54%Allowance for loan losses to average loans 2.69 4.08 0.87Allowance for loan losses to
nonperforming loans 512 251 99Nonperforming loans to average loans 0.53 1.63 0.88
(a) 2004 results include six months of the combined Firm’s results and six months of heritageJPMorgan Chase results. 2003 reflects the results of heritage JPMorgan Chase only.
(b) Liability balances include deposits and deposits swept to on-balance sheet liabilities.
Commercial Banking revenues are comprised of the following:
Lending includes a variety of financing alternatives, which are often provided on a basis secured by receivables, inventory, equipment, realestate or other assets. Products include:
• Term loans
• Revolving lines of credit
• Bridge financing
• Asset-based structures
• Leases
Treasury services includes a broad range of products and servicesenabling clients to transfer, invest and manage the receipt and disbursement of funds, while providing the related information reporting.These products and services include:
• U.S. dollar and multi-currency clearing
• ACH
• Lockbox
• Disbursement and reconciliation services
• Check deposits
• Other check and currency-related services
• Trade finance and logistics solutions
• Commercial card
• Deposit products, sweeps and money market mutual funds
Investment banking products provide clients with sophisticated capital-raising alternatives, as well as balance sheet and risk management tools,through:
• Loan syndications
• Investment-grade debt
• Asset-backed securities
• Private placements
• High-yield bonds
• Equity underwriting
• Advisory
• Interest rate derivatives
• Foreign exchange hedges
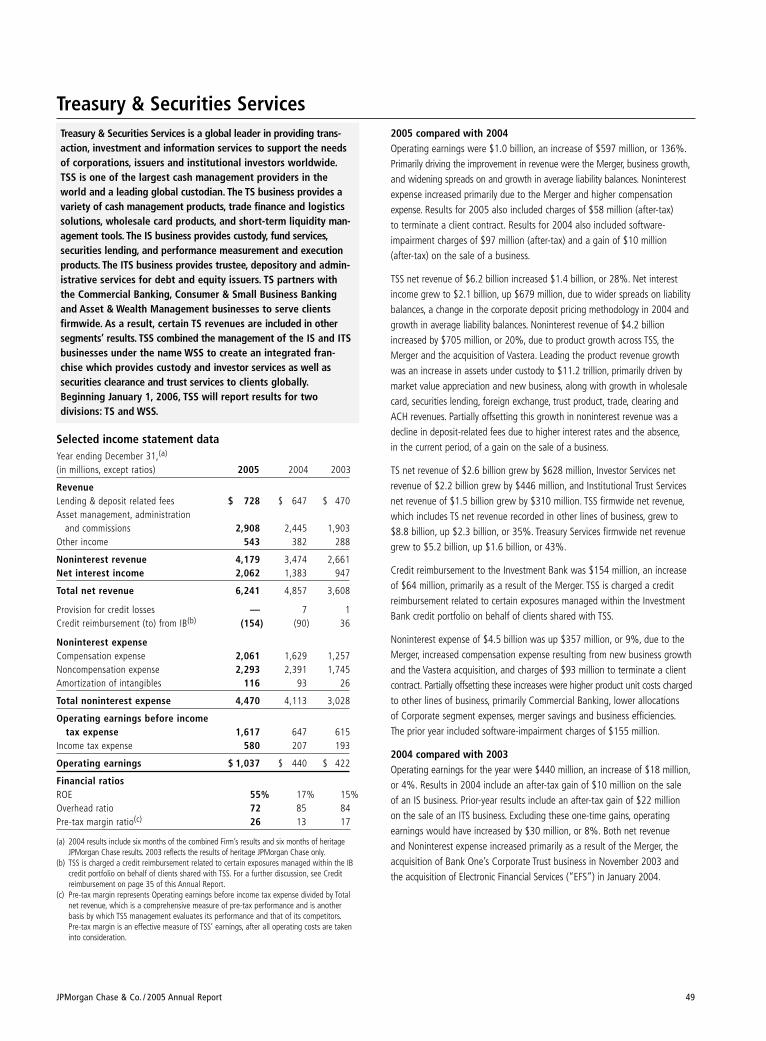
JPMorgan Chase & Co. / 2005 Annual Report 49
Treasury & Securities ServicesTreasury & Securities Services is a global leader in providing trans-action, investment and information services to support the needsof corporations, issuers and institutional investors worldwide.TSS is one of the largest cash management providers in theworld and a leading global custodian. The TS business provides avariety of cash management products, trade finance and logisticssolutions, wholesale card products, and short-term liquidity man-agement tools. The IS business provides custody, fund services,securities lending, and performance measurement and executionproducts. The ITS business provides trustee, depository and admin-istrative services for debt and equity issuers. TS partners withthe Commercial Banking, Consumer & Small Business Bankingand Asset & Wealth Management businesses to serve clientsfirmwide. As a result, certain TS revenues are included in othersegments’ results. TSS combined the management of the IS and ITSbusinesses under the name WSS to create an integrated fran-chise which provides custody and investor services as well assecurities clearance and trust services to clients globally.Beginning January 1, 2006, TSS will report results for two divisions: TS and WSS.
Selected income statement data Year ending December 31,(a)
(in millions, except ratios) 2005 2004 2003
RevenueLending & deposit related fees $ 728 $ 647 $ 470Asset management, administration
and commissions 2,908 2,445 1,903Other income 543 382 288
Noninterest revenue 4,179 3,474 2,661Net interest income 2,062 1,383 947
Total net revenue 6,241 4,857 3,608
Provision for credit losses — 7 1Credit reimbursement (to) from IB(b) (154) (90) 36
Noninterest expenseCompensation expense 2,061 1,629 1,257Noncompensation expense 2,293 2,391 1,745Amortization of intangibles 116 93 26
Total noninterest expense 4,470 4,113 3,028
Operating earnings before income tax expense 1,617 647 615
Income tax expense 580 207 193
Operating earnings $ 1,037 $ 440 $ 422
Financial ratiosROE 55% 17% 15%Overhead ratio 72 85 84Pre-tax margin ratio(c) 26 13 17
(a) 2004 results include six months of the combined Firm’s results and six months of heritageJPMorgan Chase results. 2003 reflects the results of heritage JPMorgan Chase only.
(b) TSS is charged a credit reimbursement related to certain exposures managed within the IBcredit portfolio on behalf of clients shared with TSS. For a further discussion, see Creditreimbursement on page 35 of this Annual Report.
(c) Pre-tax margin represents Operating earnings before income tax expense divided by Totalnet revenue, which is a comprehensive measure of pre-tax performance and is another basis by which TSS management evaluates its performance and that of its competitors.Pre-tax margin is an effective measure of TSS’ earnings, after all operating costs are takeninto consideration.
2005 compared with 2004Operating earnings were $1.0 billion, an increase of $597 million, or 136%.Primarily driving the improvement in revenue were the Merger, business growth,and widening spreads on and growth in average liability balances. Noninterestexpense increased primarily due to the Merger and higher compensationexpense. Results for 2005 also included charges of $58 million (after-tax) to terminate a client contract. Results for 2004 also included software-impairment charges of $97 million (after-tax) and a gain of $10 million (after-tax) on the sale of a business.
TSS net revenue of $6.2 billion increased $1.4 billion, or 28%. Net interestincome grew to $2.1 billion, up $679 million, due to wider spreads on liabilitybalances, a change in the corporate deposit pricing methodology in 2004 andgrowth in average liability balances. Noninterest revenue of $4.2 billionincreased by $705 million, or 20%, due to product growth across TSS, theMerger and the acquisition of Vastera. Leading the product revenue growthwas an increase in assets under custody to $11.2 trillion, primarily driven bymarket value appreciation and new business, along with growth in wholesalecard, securities lending, foreign exchange, trust product, trade, clearing andACH revenues. Partially offsetting this growth in noninterest revenue was adecline in deposit-related fees due to higher interest rates and the absence,in the current period, of a gain on the sale of a business.
TS net revenue of $2.6 billion grew by $628 million, Investor Services net revenue of $2.2 billion grew by $446 million, and Institutional Trust Servicesnet revenue of $1.5 billion grew by $310 million. TSS firmwide net revenue,which includes TS net revenue recorded in other lines of business, grew to$8.8 billion, up $2.3 billion, or 35%. Treasury Services firmwide net revenuegrew to $5.2 billion, up $1.6 billion, or 43%.
Credit reimbursement to the Investment Bank was $154 million, an increaseof $64 million, primarily as a result of the Merger. TSS is charged a creditreimbursement related to certain exposures managed within the InvestmentBank credit portfolio on behalf of clients shared with TSS.
Noninterest expense of $4.5 billion was up $357 million, or 9%, due to theMerger, increased compensation expense resulting from new business growthand the Vastera acquisition, and charges of $93 million to terminate a clientcontract. Partially offsetting these increases were higher product unit costs chargedto other lines of business, primarily Commercial Banking, lower allocations of Corporate segment expenses, merger savings and business efficiencies.The prior year included software-impairment charges of $155 million.
2004 compared with 2003Operating earnings for the year were $440 million, an increase of $18 million,or 4%. Results in 2004 include an after-tax gain of $10 million on the sale of an IS business. Prior-year results include an after-tax gain of $22 million on the sale of an ITS business. Excluding these one-time gains, operating earnings would have increased by $30 million, or 8%. Both net revenue and Noninterest expense increased primarily as a result of the Merger, the acquisition of Bank One’s Corporate Trust business in November 2003 and the acquisition of Electronic Financial Services (“EFS”) in January 2004.
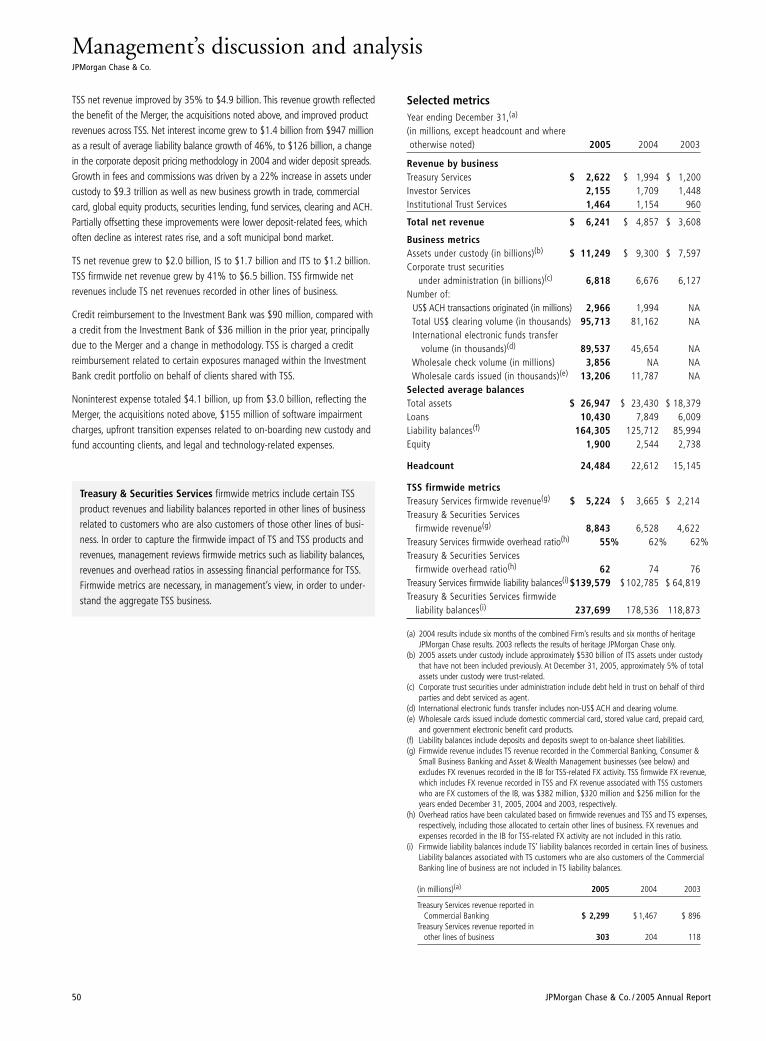
Management’s discussion and analysisJPMorgan Chase & Co.
50 JPMorgan Chase & Co. / 2005 Annual Report
TSS net revenue improved by 35% to $4.9 billion. This revenue growth reflectedthe benefit of the Merger, the acquisitions noted above, and improved productrevenues across TSS. Net interest income grew to $1.4 billion from $947 millionas a result of average liability balance growth of 46%, to $126 billion, a changein the corporate deposit pricing methodology in 2004 and wider deposit spreads.Growth in fees and commissions was driven by a 22% increase in assets undercustody to $9.3 trillion as well as new business growth in trade, commercialcard, global equity products, securities lending, fund services, clearing and ACH.Partially offsetting these improvements were lower deposit-related fees, whichoften decline as interest rates rise, and a soft municipal bond market.
TS net revenue grew to $2.0 billion, IS to $1.7 billion and ITS to $1.2 billion.TSS firmwide net revenue grew by 41% to $6.5 billion. TSS firmwide net revenues include TS net revenues recorded in other lines of business.
Credit reimbursement to the Investment Bank was $90 million, compared witha credit from the Investment Bank of $36 million in the prior year, principallydue to the Merger and a change in methodology. TSS is charged a creditreimbursement related to certain exposures managed within the InvestmentBank credit portfolio on behalf of clients shared with TSS.
Noninterest expense totaled $4.1 billion, up from $3.0 billion, reflecting theMerger, the acquisitions noted above, $155 million of software impairmentcharges, upfront transition expenses related to on-boarding new custody andfund accounting clients, and legal and technology-related expenses.
Selected metrics Year ending December 31,(a)
(in millions, except headcount and where otherwise noted) 2005 2004 2003
Revenue by businessTreasury Services $ 2,622 $ 1,994 $ 1,200Investor Services 2,155 1,709 1,448Institutional Trust Services 1,464 1,154 960
Total net revenue $ 6,241 $ 4,857 $ 3,608
Business metricsAssets under custody (in billions)(b) $ 11,249 $ 9,300 $ 7,597Corporate trust securities
under administration (in billions)(c) 6,818 6,676 6,127Number of:
US$ ACH transactions originated (in millions) 2,966 1,994 NATotal US$ clearing volume (in thousands) 95,713 81,162 NAInternational electronic funds transfer
volume (in thousands)(d) 89,537 45,654 NAWholesale check volume (in millions) 3,856 NA NAWholesale cards issued (in thousands)(e) 13,206 11,787 NA
Selected average balancesTotal assets $ 26,947 $ 23,430 $ 18,379Loans 10,430 7,849 6,009Liability balances(f) 164,305 125,712 85,994Equity 1,900 2,544 2,738
Headcount 24,484 22,612 15,145
TSS firmwide metricsTreasury Services firmwide revenue(g) $ 5,224 $ 3,665 $ 2,214Treasury & Securities Services
firmwide revenue(g) 8,843 6,528 4,622Treasury Services firmwide overhead ratio(h) 55% 62% 62%Treasury & Securities Services
firmwide overhead ratio(h) 62 74 76Treasury Services firmwide liability balances(i) $139,579 $ 102,785 $ 64,819Treasury & Securities Services firmwide
liability balances(i) 237,699 178,536 118,873
(a) 2004 results include six months of the combined Firm’s results and six months of heritageJPMorgan Chase results. 2003 reflects the results of heritage JPMorgan Chase only.
(b) 2005 assets under custody include approximately $530 billion of ITS assets under custodythat have not been included previously. At December 31, 2005, approximately 5% of totalassets under custody were trust-related.
(c) Corporate trust securities under administration include debt held in trust on behalf of thirdparties and debt serviced as agent.
(d) International electronic funds transfer includes non-US$ ACH and clearing volume.(e) Wholesale cards issued include domestic commercial card, stored value card, prepaid card,
and government electronic benefit card products.(f) Liability balances include deposits and deposits swept to on-balance sheet liabilities.(g) Firmwide revenue includes TS revenue recorded in the Commercial Banking, Consumer &
Small Business Banking and Asset & Wealth Management businesses (see below) andexcludes FX revenues recorded in the IB for TSS-related FX activity. TSS firmwide FX revenue,which includes FX revenue recorded in TSS and FX revenue associated with TSS customerswho are FX customers of the IB, was $382 million, $320 million and $256 million for theyears ended December 31, 2005, 2004 and 2003, respectively.
(h) Overhead ratios have been calculated based on firmwide revenues and TSS and TS expenses,respectively, including those allocated to certain other lines of business. FX revenues andexpenses recorded in the IB for TSS-related FX activity are not included in this ratio.
(i) Firmwide liability balances include TS’ liability balances recorded in certain lines of business.Liability balances associated with TS customers who are also customers of the CommercialBanking line of business are not included in TS liability balances.
(in millions)(a) 2005 2004 2003
Treasury Services revenue reported inCommercial Banking $ 2,299 $ 1,467 $ 896
Treasury Services revenue reported inother lines of business 303 204 118
Treasury & Securities Services firmwide metrics include certain TSSproduct revenues and liability balances reported in other lines of businessrelated to customers who are also customers of those other lines of busi-ness. In order to capture the firmwide impact of TS and TSS products andrevenues, management reviews firmwide metrics such as liability balances,revenues and overhead ratios in assessing financial performance for TSS.Firmwide metrics are necessary, in management’s view, in order to under-stand the aggregate TSS business.
Asset & Wealth Management Asset & Wealth Management provides investment advice andmanagement for institutions and individuals. With Assets undersupervision of $1.1 trillion, AWM is one of the largest asset andwealth managers in the world. AWM serves four distinct clientgroups through three businesses: institutions through JPMorganAsset Management; ultra-high-net-worth clients through thePrivate Bank; high-net-worth clients through Private Client Services;and retail clients through JPMorgan Asset Management. Themajority of AWM’s client assets are in actively managed portfolios.AWM has global investment expertise in equities, fixed income,real estate, hedge funds, private equity and liquidity, includingboth money market instruments and bank deposits. AWM alsoprovides trust and estate services to ultra-high-net-worth andhigh-net-worth clients, and retirement services for corporationsand individuals.
Selected income statement dataYear ended December 31,(a)
(in millions, except ratios) 2005 2004 2003
RevenueAsset management, administration
and commissions $ 4,189 $ 3,140 $ 2,258Other income 394 243 224
Noninterest revenue 4,583 3,383 2,482Net interest income 1,081 796 488
Total net revenue 5,664 4,179 2,970
Provision for credit losses(b) (56) (14) 35
Noninterest expenseCompensation expense 2,179 1,579 1,213Noncompensation expense 1,582 1,502 1,265Amortization of intangibles 99 52 8
Total noninterest expense 3,860 3,133 2,486
Operating earnings before income tax expense 1,860 1,060 449
Income tax expense 644 379 162
Operating earnings $ 1,216 $ 681 $ 287
Financial ratiosROE 51% 17% 5%Overhead ratio 68 75 84Pre-tax margin ratio(c) 33 25 15
(a) 2004 results include six months of the combined Firm’s results and six months of heritageJPMorgan Chase results. 2003 reflects the results of heritage JPMorgan Chase only.
(b) 2005 includes a $3 million special provision related to Hurricane Katrina.(c) Pre-tax margin represents Operating earnings before income tax expense divided by Total net
revenue, which is a comprehensive measure of pre-tax performance and is another basis bywhich AWM management evaluates its performance and that of its competitors. Pre-tax marginis an effective measure of AWM’s earnings, after all costs are taken into consideration.
2005 compared with 2004Operating earnings of $1.2 billion were up $535 million from the prior year due to the Merger and increased revenue, partially offset by higher compensation expense.
Net revenue was $5.7 billion, up $1.5 billion, or 36%. Noninterest revenue,primarily fees and commissions, of $4.6 billion was up $1.2 billion, principallydue to the Merger, the acquisition of a majority interest in Highbridge CapitalManagement in 2004, net asset inflows and global equity market appreciation.Net interest income of $1.1 billion was up $285 million, primarily due to theMerger, higher deposit and loan balances, partially offset by narrower depositspreads.
Private Bank client segment revenue of $1.7 billion increased by $135 million.Retail client segment revenue of $1.5 billion increased by $360 million.Institutional client segment revenue was up $504 million to $1.4 billion due tothe acquisition of a majority interest in Highbridge Capital Management. PrivateClient Services client segment revenue grew by $486 million, to $1.0 billion.
Provision for credit losses was a benefit of $56 million, compared with a benefit of $14 million in the prior year, due to lower net charge-offs andrefinements in the data used to estimate the allowance for credit losses.
Noninterest expense of $3.9 billion increased by $727 million, or 23%,reflecting the Merger, the acquisition of Highbridge and increased compensa-tion expense related primarily to higher performance-based incentives.
2004 compared with 2003Operating earnings were $681 million, up 137% from the prior year, duelargely to the Merger but also driven by increased revenue and a decrease in the Provision for credit losses; these were partially offset by higherCompensation expense.
Total net revenue was $4.2 billion, up 41%, primarily due to the Merger.Additionally, fees and commissions increased due to global equity marketappreciation, net asset inflows and the acquisition of JPMorgan Retirement Plan Services (“RPS”) in 2003. Fees and commissions also increased due to animproved product mix, with an increased percentage of assets in higher-yieldingproducts. Net interest income increased due to deposit and loan growth.
The Provision for credit losses was a benefit of $14 million, a decrease of $49 million, due to an improvement in credit quality.
Noninterest expense was $3.1 billion, up 26%, due to the Merger, increasedCompensation expense and increased technology and marketing initiatives.
Selected metrics Year ended December 31,(a)
(in millions, except headcount and ranking data, and where otherwise noted) 2005 2004 2003
Revenue by client segmentPrivate bank $ 1,689 $ 1,554 $ 1,437Retail 1,544 1,184 774Institutional 1,395 891 681Private client services 1,036 550 78
Total net revenue $ 5,664 $ 4,179 $ 2,970
Business metricsNumber of:
Client advisors 1,430 1,333 651Retirement Plan Services participants 1,299,000 918,000 756,000
% of customer assets in 4 & 5 Star Funds(b) 46% 48% 48%% of AUM in 1st and 2nd quartiles:(c)
1 year 69 66 573 years 68 71 695 years 74 68 65
Selected average balancesTotal assets $ 41,599 $ 37,751 $ 33,780Loans 26,610 21,545 16,678Deposits(d) 42,123 32,431 20,576Equity 2,400 3,902 5,507
Headcount 12,127 12,287 8,520
JPMorgan Chase & Co. / 2005 Annual Report 51
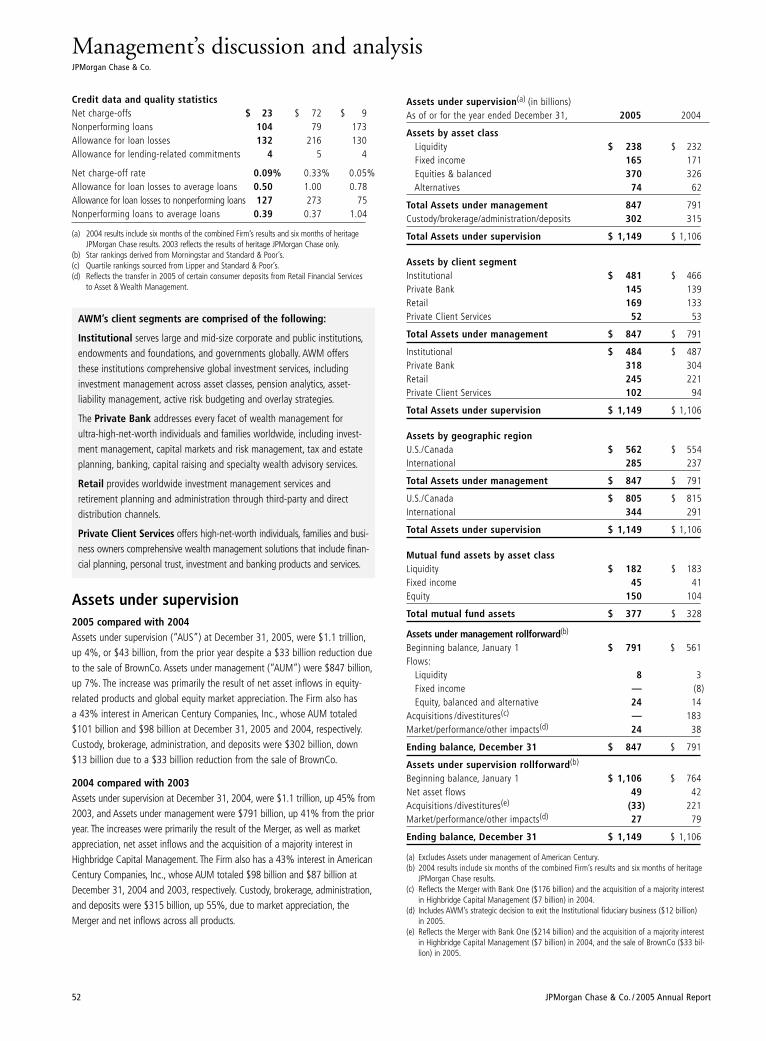
Management’s discussion and analysisJPMorgan Chase & Co.
52 JPMorgan Chase & Co. / 2005 Annual Report
Credit data and quality statisticsNet charge-offs $ 23 $ 72 $ 9Nonperforming loans 104 79 173Allowance for loan losses 132 216 130Allowance for lending-related commitments 4 5 4
Net charge-off rate 0.09% 0.33% 0.05%Allowance for loan losses to average loans 0.50 1.00 0.78Allowance for loan losses to nonperforming loans 127 273 75Nonperforming loans to average loans 0.39 0.37 1.04
(a) 2004 results include six months of the combined Firm’s results and six months of heritageJPMorgan Chase results. 2003 reflects the results of heritage JPMorgan Chase only.
(b) Star rankings derived from Morningstar and Standard & Poor’s.(c) Quartile rankings sourced from Lipper and Standard & Poor’s.(d) Reflects the transfer in 2005 of certain consumer deposits from Retail Financial Services
to Asset & Wealth Management.
Assets under supervision2005 compared with 2004Assets under supervision (“AUS”) at December 31, 2005, were $1.1 trillion,up 4%, or $43 billion, from the prior year despite a $33 billion reduction dueto the sale of BrownCo. Assets under management (“AUM”) were $847 billion,up 7%. The increase was primarily the result of net asset inflows in equity-related products and global equity market appreciation. The Firm also has a 43% interest in American Century Companies, Inc., whose AUM totaled $101 billion and $98 billion at December 31, 2005 and 2004, respectively.Custody, brokerage, administration, and deposits were $302 billion, down$13 billion due to a $33 billion reduction from the sale of BrownCo.
2004 compared with 2003Assets under supervision at December 31, 2004, were $1.1 trillion, up 45% from2003, and Assets under management were $791 billion, up 41% from the prioryear. The increases were primarily the result of the Merger, as well as marketappreciation, net asset inflows and the acquisition of a majority interest inHighbridge Capital Management. The Firm also has a 43% interest in AmericanCentury Companies, Inc., whose AUM totaled $98 billion and $87 billion atDecember 31, 2004 and 2003, respectively. Custody, brokerage, administration,and deposits were $315 billion, up 55%, due to market appreciation, theMerger and net inflows across all products.
Assets under supervision(a) (in billions)As of or for the year ended December 31, 2005 2004
Assets by asset classLiquidity $ 238 $ 232Fixed income 165 171Equities & balanced 370 326Alternatives 74 62
Total Assets under management 847 791Custody/brokerage/administration/deposits 302 315
Total Assets under supervision $ 1,149 $ 1,106
Assets by client segment Institutional $ 481 $ 466Private Bank 145 139Retail 169 133Private Client Services 52 53
Total Assets under management $ 847 $ 791
Institutional $ 484 $ 487Private Bank 318 304Retail 245 221Private Client Services 102 94
Total Assets under supervision $ 1,149 $ 1,106
Assets by geographic regionU.S./Canada $ 562 $ 554International 285 237
Total Assets under management $ 847 $ 791
U.S./Canada $ 805 $ 815International 344 291
Total Assets under supervision $ 1,149 $ 1,106
Mutual fund assets by asset classLiquidity $ 182 $ 183Fixed income 45 41Equity 150 104
Total mutual fund assets $ 377 $ 328
Assets under management rollforward(b)
Beginning balance, January 1 $ 791 $ 561Flows:
Liquidity 8 3Fixed income — (8)Equity, balanced and alternative 24 14
Acquisitions /divestitures(c) — 183Market/performance/other impacts(d) 24 38
Ending balance, December 31 $ 847 $ 791
Assets under supervision rollforward(b)
Beginning balance, January 1 $ 1,106 $ 764Net asset flows 49 42Acquisitions /divestitures(e) (33) 221Market/performance/other impacts(d) 27 79
Ending balance, December 31 $ 1,149 $ 1,106
(a) Excludes Assets under management of American Century.(b) 2004 results include six months of the combined Firm’s results and six months of heritage
JPMorgan Chase results.(c) Reflects the Merger with Bank One ($176 billion) and the acquisition of a majority interest
in Highbridge Capital Management ($7 billion) in 2004.(d) Includes AWM’s strategic decision to exit the Institutional fiduciary business ($12 billion)
in 2005.(e) Reflects the Merger with Bank One ($214 billion) and the acquisition of a majority interest
in Highbridge Capital Management ($7 billion) in 2004, and the sale of BrownCo ($33 bil-lion) in 2005.
AWM’s client segments are comprised of the following:
Institutional serves large and mid-size corporate and public institutions,endowments and foundations, and governments globally. AWM offersthese institutions comprehensive global investment services, includinginvestment management across asset classes, pension analytics, asset-liability management, active risk budgeting and overlay strategies.
The Private Bank addresses every facet of wealth management for ultra-high-net-worth individuals and families worldwide, including invest-ment management, capital markets and risk management, tax and estateplanning, banking, capital raising and specialty wealth advisory services.
Retail provides worldwide investment management services and retirement planning and administration through third-party and direct distribution channels.
Private Client Services offers high-net-worth individuals, families and busi-ness owners comprehensive wealth management solutions that include finan-cial planning, personal trust, investment and banking products and services.
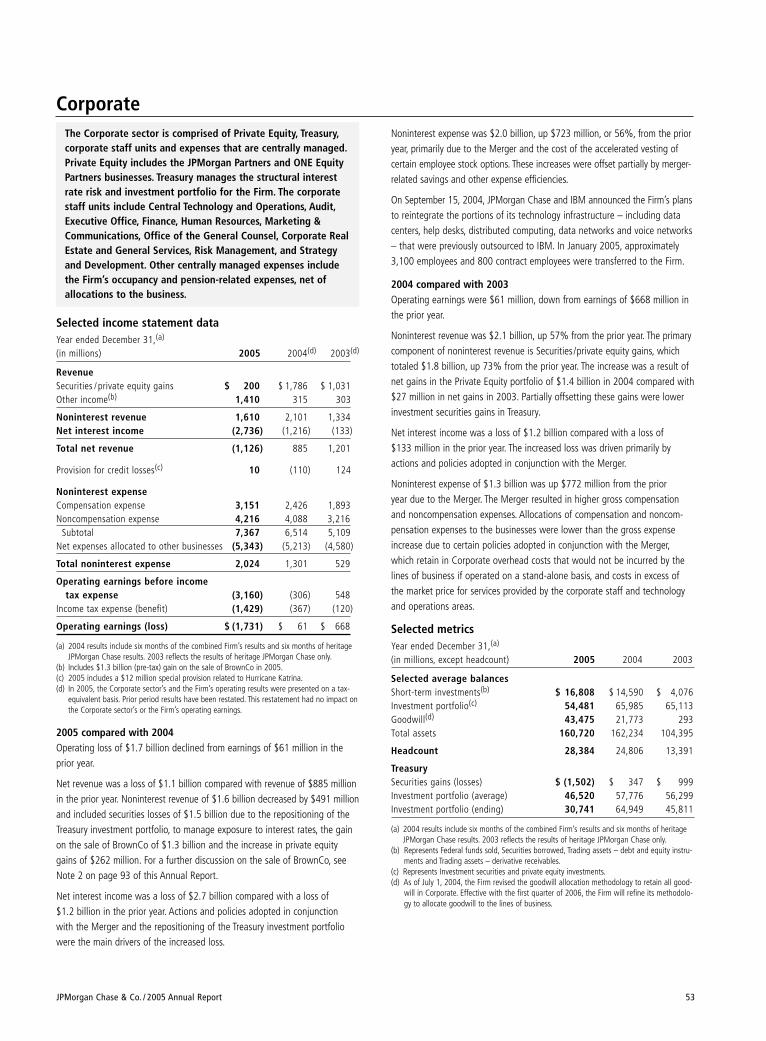
JPMorgan Chase & Co. / 2005 Annual Report 53
CorporateThe Corporate sector is comprised of Private Equity, Treasury,corporate staff units and expenses that are centrally managed.Private Equity includes the JPMorgan Partners and ONE EquityPartners businesses. Treasury manages the structural interestrate risk and investment portfolio for the Firm. The corporatestaff units include Central Technology and Operations, Audit,Executive Office, Finance, Human Resources, Marketing &Communications, Office of the General Counsel, Corporate RealEstate and General Services, Risk Management, and Strategyand Development. Other centrally managed expenses includethe Firm’s occupancy and pension-related expenses, net of allocations to the business.
Selected income statement data Year ended December 31,(a)
(in millions) 2005 2004(d) 2003(d)
RevenueSecurities / private equity gains $ 200 $ 1,786 $ 1,031Other income(b) 1,410 315 303
Noninterest revenue 1,610 2,101 1,334Net interest income (2,736) (1,216) (133)
Total net revenue (1,126) 885 1,201
Provision for credit losses(c) 10 (110) 124
Noninterest expenseCompensation expense 3,151 2,426 1,893Noncompensation expense 4,216 4,088 3,216
Subtotal 7,367 6,514 5,109Net expenses allocated to other businesses (5,343) (5,213) (4,580)
Total noninterest expense 2,024 1,301 529
Operating earnings before income tax expense (3,160) (306) 548
Income tax expense (benefit) (1,429) (367) (120)
Operating earnings (loss) $ (1,731) $ 61 $ 668
(a) 2004 results include six months of the combined Firm’s results and six months of heritageJPMorgan Chase results. 2003 reflects the results of heritage JPMorgan Chase only.
(b) Includes $1.3 billion (pre-tax) gain on the sale of BrownCo in 2005.(c) 2005 includes a $12 million special provision related to Hurricane Katrina.(d) In 2005, the Corporate sector’s and the Firm’s operating results were presented on a tax-
equivalent basis. Prior period results have been restated. This restatement had no impact onthe Corporate sector’s or the Firm’s operating earnings.
2005 compared with 2004 Operating loss of $1.7 billion declined from earnings of $61 million in theprior year.
Net revenue was a loss of $1.1 billion compared with revenue of $885 millionin the prior year. Noninterest revenue of $1.6 billion decreased by $491 millionand included securities losses of $1.5 billion due to the repositioning of theTreasury investment portfolio, to manage exposure to interest rates, the gainon the sale of BrownCo of $1.3 billion and the increase in private equitygains of $262 million. For a further discussion on the sale of BrownCo, seeNote 2 on page 93 of this Annual Report.
Net interest income was a loss of $2.7 billion compared with a loss of $1.2 billion in the prior year. Actions and policies adopted in conjunction with the Merger and the repositioning of the Treasury investment portfoliowere the main drivers of the increased loss.
Noninterest expense was $2.0 billion, up $723 million, or 56%, from the prioryear, primarily due to the Merger and the cost of the accelerated vesting ofcertain employee stock options. These increases were offset partially by merger-related savings and other expense efficiencies.
On September 15, 2004, JPMorgan Chase and IBM announced the Firm’s plansto reintegrate the portions of its technology infrastructure – including datacenters, help desks, distributed computing, data networks and voice networks– that were previously outsourced to IBM. In January 2005, approximately3,100 employees and 800 contract employees were transferred to the Firm.
2004 compared with 2003Operating earnings were $61 million, down from earnings of $668 million inthe prior year.
Noninterest revenue was $2.1 billion, up 57% from the prior year. The primarycomponent of noninterest revenue is Securities/private equity gains, whichtotaled $1.8 billion, up 73% from the prior year. The increase was a result ofnet gains in the Private Equity portfolio of $1.4 billion in 2004 compared with$27 million in net gains in 2003. Partially offsetting these gains were lowerinvestment securities gains in Treasury.
Net interest income was a loss of $1.2 billion compared with a loss of $133 million in the prior year. The increased loss was driven primarily byactions and policies adopted in conjunction with the Merger.
Noninterest expense of $1.3 billion was up $772 million from the prior year due to the Merger. The Merger resulted in higher gross compensationand noncompensation expenses. Allocations of compensation and noncom-pensation expenses to the businesses were lower than the gross expenseincrease due to certain policies adopted in conjunction with the Merger,which retain in Corporate overhead costs that would not be incurred by thelines of business if operated on a stand-alone basis, and costs in excess ofthe market price for services provided by the corporate staff and technologyand operations areas.
Selected metrics Year ended December 31,(a)
(in millions, except headcount) 2005 2004 2003
Selected average balancesShort-term investments(b) $ 16,808 $ 14,590 $ 4,076Investment portfolio(c) 54,481 65,985 65,113Goodwill(d) 43,475 21,773 293Total assets 160,720 162,234 104,395
Headcount 28,384 24,806 13,391
TreasurySecurities gains (losses) $ (1,502) $ 347 $ 999Investment portfolio (average) 46,520 57,776 56,299Investment portfolio (ending) 30,741 64,949 45,811
(a) 2004 results include six months of the combined Firm’s results and six months of heritageJPMorgan Chase results. 2003 reflects the results of heritage JPMorgan Chase only.
(b) Represents Federal funds sold, Securities borrowed, Trading assets – debt and equity instru-ments and Trading assets – derivative receivables.
(c) Represents Investment securities and private equity investments.(d) As of July 1, 2004, the Firm revised the goodwill allocation methodology to retain all good-
will in Corporate. Effective with the first quarter of 2006, the Firm will refine its methodolo-gy to allocate goodwill to the lines of business.
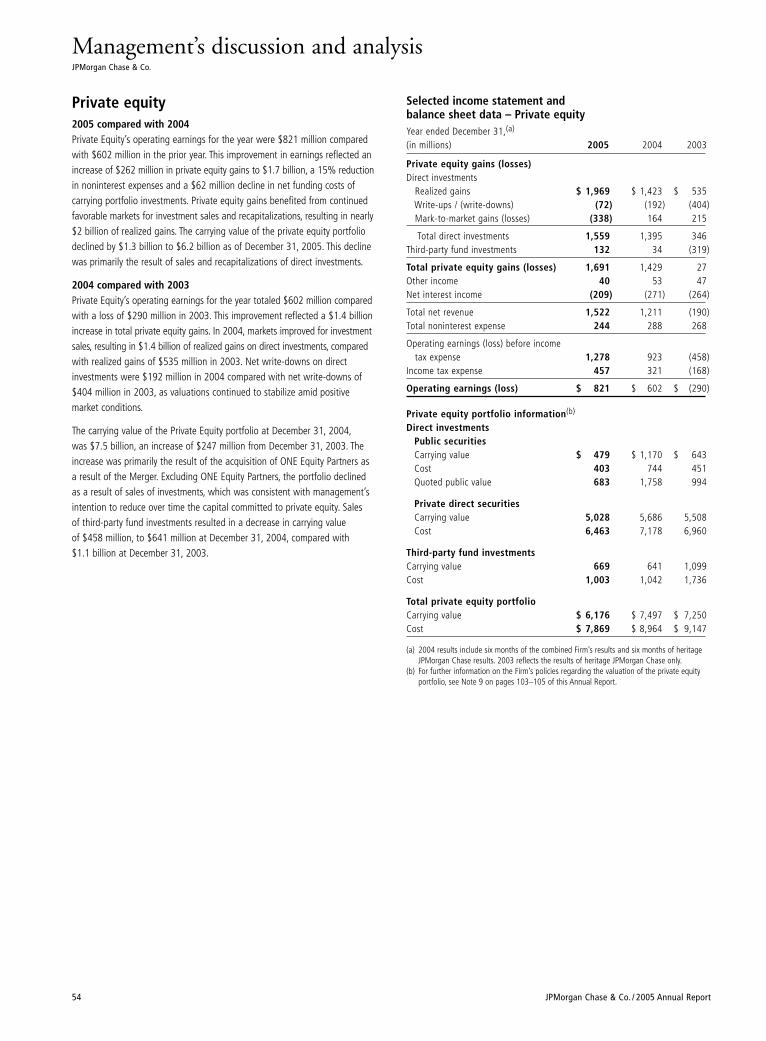
Management’s discussion and analysisJPMorgan Chase & Co.
54 JPMorgan Chase & Co. / 2005 Annual Report
Selected income statement and balance sheet data – Private equityYear ended December 31,(a)
(in millions) 2005 2004 2003
Private equity gains (losses)Direct investments
Realized gains $ 1,969 $ 1,423 $ 535Write-ups / (write-downs) (72) (192) (404)Mark-to-market gains (losses) (338) 164 215
Total direct investments 1,559 1,395 346Third-party fund investments 132 34 (319)
Total private equity gains (losses) 1,691 1,429 27Other income 40 53 47Net interest income (209) (271) (264)
Total net revenue 1,522 1,211 (190)Total noninterest expense 244 288 268
Operating earnings (loss) before income tax expense 1,278 923 (458)
Income tax expense 457 321 (168)
Operating earnings (loss) $ 821 $ 602 $ (290)
Private equity portfolio information(b)
Direct investmentsPublic securitiesCarrying value $ 479 $ 1,170 $ 643Cost 403 744 451Quoted public value 683 1,758 994
Private direct securitiesCarrying value 5,028 5,686 5,508Cost 6,463 7,178 6,960
Third-party fund investmentsCarrying value 669 641 1,099Cost 1,003 1,042 1,736
Total private equity portfolioCarrying value $ 6,176 $ 7,497 $ 7,250Cost $ 7,869 $ 8,964 $ 9,147
(a) 2004 results include six months of the combined Firm’s results and six months of heritageJPMorgan Chase results. 2003 reflects the results of heritage JPMorgan Chase only.
(b) For further information on the Firm’s policies regarding the valuation of the private equityportfolio, see Note 9 on pages 103–105 of this Annual Report.
Private equity2005 compared with 2004Private Equity’s operating earnings for the year were $821 million comparedwith $602 million in the prior year. This improvement in earnings reflected anincrease of $262 million in private equity gains to $1.7 billion, a 15% reductionin noninterest expenses and a $62 million decline in net funding costs of carrying portfolio investments. Private equity gains benefited from continuedfavorable markets for investment sales and recapitalizations, resulting in nearly$2 billion of realized gains. The carrying value of the private equity portfoliodeclined by $1.3 billion to $6.2 billion as of December 31, 2005. This declinewas primarily the result of sales and recapitalizations of direct investments.
2004 compared with 2003Private Equity’s operating earnings for the year totaled $602 million comparedwith a loss of $290 million in 2003. This improvement reflected a $1.4 billionincrease in total private equity gains. In 2004, markets improved for investmentsales, resulting in $1.4 billion of realized gains on direct investments, comparedwith realized gains of $535 million in 2003. Net write-downs on direct investments were $192 million in 2004 compared with net write-downs of$404 million in 2003, as valuations continued to stabilize amid positive market conditions.
The carrying value of the Private Equity portfolio at December 31, 2004,was $7.5 billion, an increase of $247 million from December 31, 2003. Theincrease was primarily the result of the acquisition of ONE Equity Partners asa result of the Merger. Excluding ONE Equity Partners, the portfolio declinedas a result of sales of investments, which was consistent with management’sintention to reduce over time the capital committed to private equity. Sales of third-party fund investments resulted in a decrease in carrying value of $458 million, to $641 million at December 31, 2004, compared with $1.1 billion at December 31, 2003.
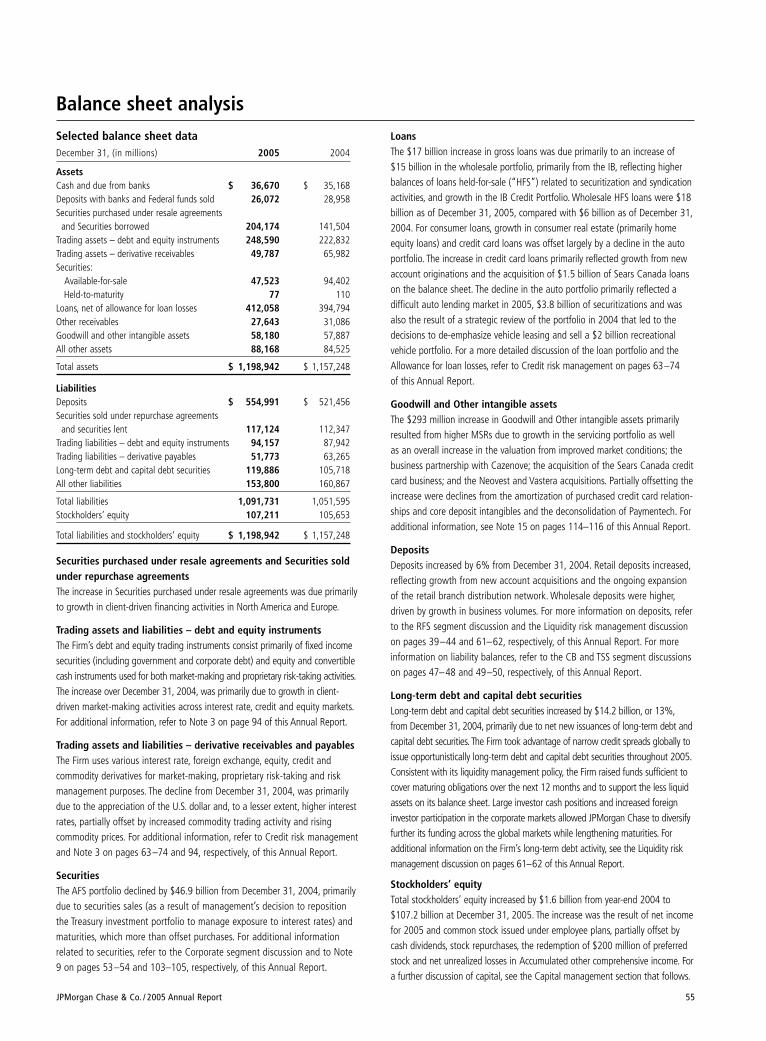
JPMorgan Chase & Co. / 2005 Annual Report 55
Balance sheet analysisSelected balance sheet dataDecember 31, (in millions) 2005 2004
AssetsCash and due from banks $ 36,670 $ 35,168Deposits with banks and Federal funds sold 26,072 28,958Securities purchased under resale agreements
and Securities borrowed 204,174 141,504Trading assets – debt and equity instruments 248,590 222,832Trading assets – derivative receivables 49,787 65,982Securities:
Available-for-sale 47,523 94,402Held-to-maturity 77 110
Loans, net of allowance for loan losses 412,058 394,794Other receivables 27,643 31,086Goodwill and other intangible assets 58,180 57,887All other assets 88,168 84,525
Total assets $ 1,198,942 $ 1,157,248
LiabilitiesDeposits $ 554,991 $ 521,456Securities sold under repurchase agreements
and securities lent 117,124 112,347Trading liabilities – debt and equity instruments 94,157 87,942Trading liabilities – derivative payables 51,773 63,265Long-term debt and capital debt securities 119,886 105,718All other liabilities 153,800 160,867
Total liabilities 1,091,731 1,051,595Stockholders’ equity 107,211 105,653
Total liabilities and stockholders’ equity $ 1,198,942 $ 1,157,248
Securities purchased under resale agreements and Securities soldunder repurchase agreementsThe increase in Securities purchased under resale agreements was due primarilyto growth in client-driven financing activities in North America and Europe.
Trading assets and liabilities – debt and equity instrumentsThe Firm’s debt and equity trading instruments consist primarily of fixed incomesecurities (including government and corporate debt) and equity and convertiblecash instruments used for both market-making and proprietary risk-taking activities.The increase over December 31, 2004, was primarily due to growth in client-driven market-making activities across interest rate, credit and equity markets.For additional information, refer to Note 3 on page 94 of this Annual Report.
Trading assets and liabilities – derivative receivables and payablesThe Firm uses various interest rate, foreign exchange, equity, credit and commodity derivatives for market-making, proprietary risk-taking and riskmanagement purposes. The decline from December 31, 2004, was primarilydue to the appreciation of the U.S. dollar and, to a lesser extent, higher interestrates, partially offset by increased commodity trading activity and rising commodity prices. For additional information, refer to Credit risk managementand Note 3 on pages 63–74 and 94, respectively, of this Annual Report.
SecuritiesThe AFS portfolio declined by $46.9 billion from December 31, 2004, primarilydue to securities sales (as a result of management’s decision to repositionthe Treasury investment portfolio to manage exposure to interest rates) andmaturities, which more than offset purchases. For additional informationrelated to securities, refer to the Corporate segment discussion and to Note9 on pages 53–54 and 103–105, respectively, of this Annual Report.
LoansThe $17 billion increase in gross loans was due primarily to an increase of $15 billion in the wholesale portfolio, primarily from the IB, reflecting higherbalances of loans held-for-sale (“HFS”) related to securitization and syndicationactivities, and growth in the IB Credit Portfolio. Wholesale HFS loans were $18billion as of December 31, 2005, compared with $6 billion as of December 31,2004. For consumer loans, growth in consumer real estate (primarily homeequity loans) and credit card loans was offset largely by a decline in the autoportfolio. The increase in credit card loans primarily reflected growth from newaccount originations and the acquisition of $1.5 billion of Sears Canada loanson the balance sheet. The decline in the auto portfolio primarily reflected a difficult auto lending market in 2005, $3.8 billion of securitizations and wasalso the result of a strategic review of the portfolio in 2004 that led to thedecisions to de-emphasize vehicle leasing and sell a $2 billion recreationalvehicle portfolio. For a more detailed discussion of the loan portfolio and theAllowance for loan losses, refer to Credit risk management on pages 63–74of this Annual Report.
Goodwill and Other intangible assetsThe $293 million increase in Goodwill and Other intangible assets primarilyresulted from higher MSRs due to growth in the servicing portfolio as well as an overall increase in the valuation from improved market conditions; the business partnership with Cazenove; the acquisition of the Sears Canada creditcard business; and the Neovest and Vastera acquisitions. Partially offsetting theincrease were declines from the amortization of purchased credit card relation-ships and core deposit intangibles and the deconsolidation of Paymentech. Foradditional information, see Note 15 on pages 114–116 of this Annual Report.
DepositsDeposits increased by 6% from December 31, 2004. Retail deposits increased,reflecting growth from new account acquisitions and the ongoing expansionof the retail branch distribution network. Wholesale deposits were higher,driven by growth in business volumes. For more information on deposits, referto the RFS segment discussion and the Liquidity risk management discussionon pages 39–44 and 61–62, respectively, of this Annual Report. For moreinformation on liability balances, refer to the CB and TSS segment discussionson pages 47–48 and 49–50, respectively, of this Annual Report.
Long-term debt and capital debt securitiesLong-term debt and capital debt securities increased by $14.2 billion, or 13%,from December 31, 2004, primarily due to net new issuances of long-term debt andcapital debt securities. The Firm took advantage of narrow credit spreads globally toissue opportunistically long-term debt and capital debt securities throughout 2005.Consistent with its liquidity management policy, the Firm raised funds sufficient tocover maturing obligations over the next 12 months and to support the less liquidassets on its balance sheet. Large investor cash positions and increased foreigninvestor participation in the corporate markets allowed JPMorgan Chase to diversifyfurther its funding across the global markets while lengthening maturities. For additional information on the Firm’s long-term debt activity, see the Liquidity riskmanagement discussion on pages 61–62 of this Annual Report.
Stockholders’ equityTotal stockholders’ equity increased by $1.6 billion from year-end 2004 to $107.2 billion at December 31, 2005. The increase was the result of net incomefor 2005 and common stock issued under employee plans, partially offset bycash dividends, stock repurchases, the redemption of $200 million of preferredstock and net unrealized losses in Accumulated other comprehensive income. Fora further discussion of capital, see the Capital management section that follows.
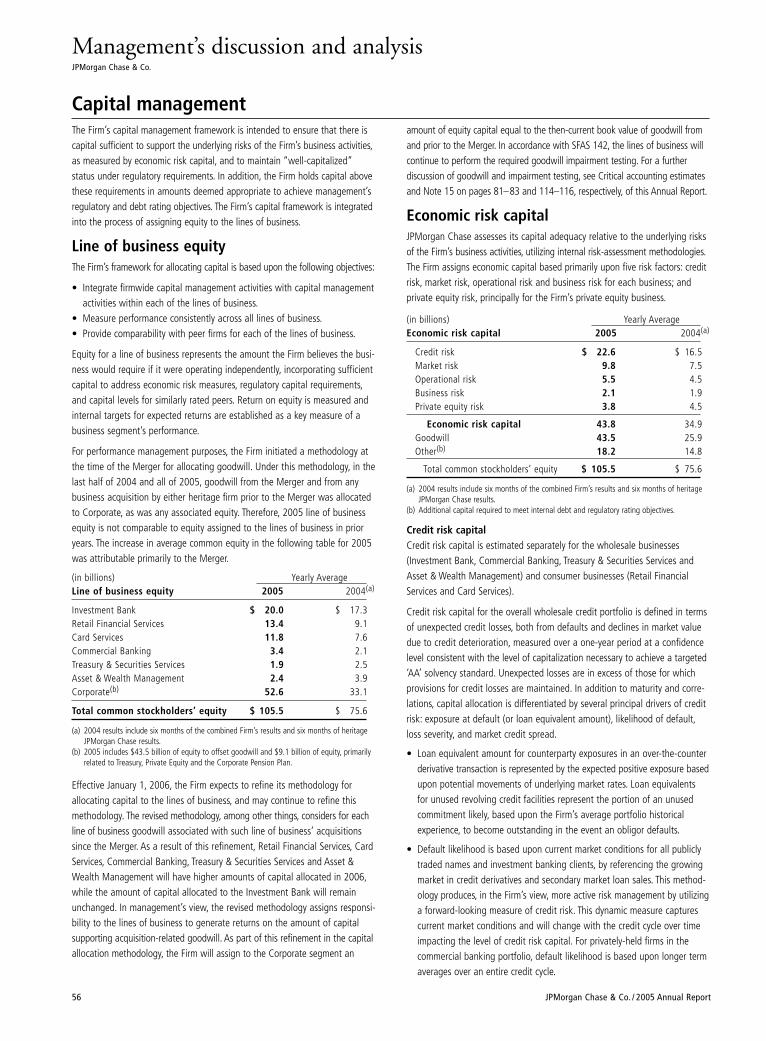
Management’s discussion and analysisJPMorgan Chase & Co.
56 JPMorgan Chase & Co. / 2005 Annual Report
Capital management The Firm’s capital management framework is intended to ensure that there iscapital sufficient to support the underlying risks of the Firm’s business activities,as measured by economic risk capital, and to maintain “well-capitalized”status under regulatory requirements. In addition, the Firm holds capital abovethese requirements in amounts deemed appropriate to achieve management’sregulatory and debt rating objectives. The Firm’s capital framework is integratedinto the process of assigning equity to the lines of business.
Line of business equityThe Firm’s framework for allocating capital is based upon the following objectives:
• Integrate firmwide capital management activities with capital managementactivities within each of the lines of business.
• Measure performance consistently across all lines of business.• Provide comparability with peer firms for each of the lines of business.
Equity for a line of business represents the amount the Firm believes the busi-ness would require if it were operating independently, incorporating sufficientcapital to address economic risk measures, regulatory capital requirements,and capital levels for similarly rated peers. Return on equity is measured andinternal targets for expected returns are established as a key measure of abusiness segment’s performance.
For performance management purposes, the Firm initiated a methodology atthe time of the Merger for allocating goodwill. Under this methodology, in thelast half of 2004 and all of 2005, goodwill from the Merger and from anybusiness acquisition by either heritage firm prior to the Merger was allocatedto Corporate, as was any associated equity. Therefore, 2005 line of businessequity is not comparable to equity assigned to the lines of business in prioryears. The increase in average common equity in the following table for 2005was attributable primarily to the Merger.
(in billions) Yearly AverageLine of business equity 2005 2004(a)
Investment Bank $ 20.0 $ 17.3Retail Financial Services 13.4 9.1Card Services 11.8 7.6Commercial Banking 3.4 2.1Treasury & Securities Services 1.9 2.5Asset & Wealth Management 2.4 3.9Corporate(b) 52.6 33.1
Total common stockholders’ equity $ 105.5 $ 75.6
(a) 2004 results include six months of the combined Firm’s results and six months of heritageJPMorgan Chase results.
(b) 2005 includes $43.5 billion of equity to offset goodwill and $9.1 billion of equity, primarilyrelated to Treasury, Private Equity and the Corporate Pension Plan.
Effective January 1, 2006, the Firm expects to refine its methodology for allocating capital to the lines of business, and may continue to refine thismethodology. The revised methodology, among other things, considers for eachline of business goodwill associated with such line of business’ acquisitionssince the Merger. As a result of this refinement, Retail Financial Services, CardServices, Commercial Banking, Treasury & Securities Services and Asset &Wealth Management will have higher amounts of capital allocated in 2006,while the amount of capital allocated to the Investment Bank will remainunchanged. In management’s view, the revised methodology assigns responsi-bility to the lines of business to generate returns on the amount of capitalsupporting acquisition-related goodwill. As part of this refinement in the capitalallocation methodology, the Firm will assign to the Corporate segment an
amount of equity capital equal to the then-current book value of goodwill fromand prior to the Merger. In accordance with SFAS 142, the lines of business willcontinue to perform the required goodwill impairment testing. For a further discussion of goodwill and impairment testing, see Critical accounting estimatesand Note 15 on pages 81–83 and 114–116, respectively, of this Annual Report.
Economic risk capitalJPMorgan Chase assesses its capital adequacy relative to the underlying risksof the Firm’s business activities, utilizing internal risk-assessment methodologies.The Firm assigns economic capital based primarily upon five risk factors: creditrisk, market risk, operational risk and business risk for each business; and private equity risk, principally for the Firm’s private equity business.
(in billions) Yearly AverageEconomic risk capital 2005 2004(a)
Credit risk $ 22.6 $ 16.5Market risk 9.8 7.5Operational risk 5.5 4.5Business risk 2.1 1.9Private equity risk 3.8 4.5
Economic risk capital 43.8 34.9Goodwill 43.5 25.9Other(b) 18.2 14.8
Total common stockholders’ equity $ 105.5 $ 75.6
(a) 2004 results include six months of the combined Firm’s results and six months of heritageJPMorgan Chase results.
(b) Additional capital required to meet internal debt and regulatory rating objectives.
Credit risk capitalCredit risk capital is estimated separately for the wholesale businesses(Investment Bank, Commercial Banking, Treasury & Securities Services andAsset & Wealth Management) and consumer businesses (Retail FinancialServices and Card Services).
Credit risk capital for the overall wholesale credit portfolio is defined in termsof unexpected credit losses, both from defaults and declines in market valuedue to credit deterioration, measured over a one-year period at a confidencelevel consistent with the level of capitalization necessary to achieve a targeted‘AA’ solvency standard. Unexpected losses are in excess of those for whichprovisions for credit losses are maintained. In addition to maturity and corre-lations, capital allocation is differentiated by several principal drivers of creditrisk: exposure at default (or loan equivalent amount), likelihood of default,loss severity, and market credit spread.
• Loan equivalent amount for counterparty exposures in an over-the-counterderivative transaction is represented by the expected positive exposure basedupon potential movements of underlying market rates. Loan equivalents for unused revolving credit facilities represent the portion of an unusedcommitment likely, based upon the Firm’s average portfolio historical experience, to become outstanding in the event an obligor defaults.
• Default likelihood is based upon current market conditions for all publiclytraded names and investment banking clients, by referencing the growingmarket in credit derivatives and secondary market loan sales. This method-ology produces, in the Firm’s view, more active risk management by utilizinga forward-looking measure of credit risk. This dynamic measure capturescurrent market conditions and will change with the credit cycle over timeimpacting the level of credit risk capital. For privately-held firms in thecommercial banking portfolio, default likelihood is based upon longer termaverages over an entire credit cycle.
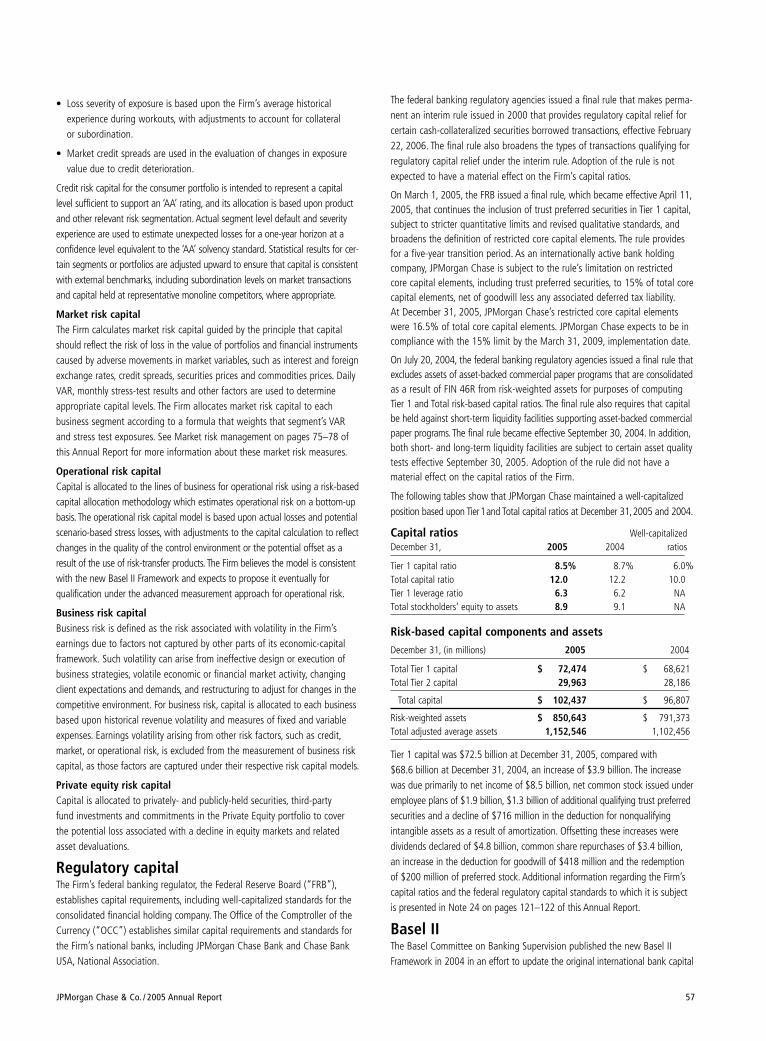
JPMorgan Chase & Co. / 2005 Annual Report 57
• Loss severity of exposure is based upon the Firm’s average historical experience during workouts, with adjustments to account for collateral or subordination.
• Market credit spreads are used in the evaluation of changes in exposurevalue due to credit deterioration.
Credit risk capital for the consumer portfolio is intended to represent a capitallevel sufficient to support an ‘AA’ rating, and its allocation is based upon productand other relevant risk segmentation. Actual segment level default and severityexperience are used to estimate unexpected losses for a one-year horizon at aconfidence level equivalent to the ‘AA’ solvency standard. Statistical results for cer-tain segments or portfolios are adjusted upward to ensure that capital is consistentwith external benchmarks, including subordination levels on market transactionsand capital held at representative monoline competitors, where appropriate.
Market risk capitalThe Firm calculates market risk capital guided by the principle that capitalshould reflect the risk of loss in the value of portfolios and financial instrumentscaused by adverse movements in market variables, such as interest and foreignexchange rates, credit spreads, securities prices and commodities prices. DailyVAR, monthly stress-test results and other factors are used to determineappropriate capital levels. The Firm allocates market risk capital to each business segment according to a formula that weights that segment’s VARand stress test exposures. See Market risk management on pages 75–78 ofthis Annual Report for more information about these market risk measures.
Operational risk capitalCapital is allocated to the lines of business for operational risk using a risk-basedcapital allocation methodology which estimates operational risk on a bottom-upbasis. The operational risk capital model is based upon actual losses and potentialscenario-based stress losses, with adjustments to the capital calculation to reflectchanges in the quality of the control environment or the potential offset as aresult of the use of risk-transfer products. The Firm believes the model is consistentwith the new Basel II Framework and expects to propose it eventually for qualification under the advanced measurement approach for operational risk.
Business risk capital Business risk is defined as the risk associated with volatility in the Firm’s earnings due to factors not captured by other parts of its economic-capitalframework. Such volatility can arise from ineffective design or execution ofbusiness strategies, volatile economic or financial market activity, changingclient expectations and demands, and restructuring to adjust for changes in thecompetitive environment. For business risk, capital is allocated to each businessbased upon historical revenue volatility and measures of fixed and variableexpenses. Earnings volatility arising from other risk factors, such as credit,market, or operational risk, is excluded from the measurement of business riskcapital, as those factors are captured under their respective risk capital models.
Private equity risk capitalCapital is allocated to privately- and publicly-held securities, third-party fund investments and commitments in the Private Equity portfolio to coverthe potential loss associated with a decline in equity markets and relatedasset devaluations.
Regulatory capital The Firm’s federal banking regulator, the Federal Reserve Board (“FRB”),establishes capital requirements, including well-capitalized standards for theconsolidated financial holding company. The Office of the Comptroller of theCurrency (“OCC”) establishes similar capital requirements and standards forthe Firm’s national banks, including JPMorgan Chase Bank and Chase BankUSA, National Association.
The federal banking regulatory agencies issued a final rule that makes perma-nent an interim rule issued in 2000 that provides regulatory capital relief forcertain cash-collateralized securities borrowed transactions, effective February22, 2006. The final rule also broadens the types of transactions qualifying forregulatory capital relief under the interim rule. Adoption of the rule is notexpected to have a material effect on the Firm’s capital ratios.
On March 1, 2005, the FRB issued a final rule, which became effective April 11,2005, that continues the inclusion of trust preferred securities in Tier 1 capital,subject to stricter quantitative limits and revised qualitative standards, andbroadens the definition of restricted core capital elements. The rule providesfor a five-year transition period. As an internationally active bank holdingcompany, JPMorgan Chase is subject to the rule’s limitation on restricted core capital elements, including trust preferred securities, to 15% of total corecapital elements, net of goodwill less any associated deferred tax liability.At December 31, 2005, JPMorgan Chase’s restricted core capital elementswere 16.5% of total core capital elements. JPMorgan Chase expects to be incompliance with the 15% limit by the March 31, 2009, implementation date.
On July 20, 2004, the federal banking regulatory agencies issued a final rule thatexcludes assets of asset-backed commercial paper programs that are consolidatedas a result of FIN 46R from risk-weighted assets for purposes of computingTier 1 and Total risk-based capital ratios. The final rule also requires that capitalbe held against short-term liquidity facilities supporting asset-backed commercialpaper programs. The final rule became effective September 30, 2004. In addition,both short- and long-term liquidity facilities are subject to certain asset qualitytests effective September 30, 2005. Adoption of the rule did not have amaterial effect on the capital ratios of the Firm.
The following tables show that JPMorgan Chase maintained a well-capitalizedposition based upon Tier1and Total capital ratios at December 31,2005 and 2004.
Capital ratios Well-capitalizedDecember 31, 2005 2004 ratios
Tier 1 capital ratio 8.5% 8.7% 6.0%Total capital ratio 12.0 12.2 10.0Tier 1 leverage ratio 6.3 6.2 NATotal stockholders’ equity to assets 8.9 9.1 NA
Risk-based capital components and assetsDecember 31, (in millions) 2005 2004
Total Tier 1 capital $ 72,474 $ 68,621Total Tier 2 capital 29,963 28,186
Total capital $ 102,437 $ 96,807
Risk-weighted assets $ 850,643 $ 791,373Total adjusted average assets 1,152,546 1,102,456
Tier 1 capital was $72.5 billion at December 31, 2005, compared with $68.6 billion at December 31, 2004, an increase of $3.9 billion. The increasewas due primarily to net income of $8.5 billion, net common stock issued underemployee plans of $1.9 billion, $1.3 billion of additional qualifying trust preferredsecurities and a decline of $716 million in the deduction for nonqualifyingintangible assets as a result of amortization. Offsetting these increases weredividends declared of $4.8 billion, common share repurchases of $3.4 billion,an increase in the deduction for goodwill of $418 million and the redemptionof $200 million of preferred stock. Additional information regarding the Firm’scapital ratios and the federal regulatory capital standards to which it is subjectis presented in Note 24 on pages 121–122 of this Annual Report.
Basel IIThe Basel Committee on Banking Supervision published the new Basel IIFramework in 2004 in an effort to update the original international bank capital
Management’s discussion and analysisJPMorgan Chase & Co.
58 JPMorgan Chase & Co. / 2005 Annual Report
accord (“Basel I”), in effect since 1988. The goal of the Basel II Framework isto improve the consistency of capital requirements internationally, make regulatory capital more risk-sensitive, and promote enhanced risk managementpractices among large, internationally active banking organizations. JPMorganChase supports the overall objectives of the Basel II Framework.
U.S. banking regulators are in the process of incorporating the Basel IIFramework into the existing risk-based capital requirements. JPMorgan Chasewill be required to implement advanced measurement techniques in the U.S.by employing internal estimates of certain key risk drivers to derive capitalrequirements. Prior to implementation of the new Basel II Framework, JPMorganChase will be required to demonstrate to its U.S. bank supervisors that its internalcriteria meet the relevant supervisory standards. JPMorgan Chase expects to bein compliance within the established timelines with all relevant Basel II rules.
DividendsThe Firm’s common stock dividend policy reflects JPMorgan Chase’s earningsoutlook, desired payout ratios, need to maintain an adequate capital level andalternative investment opportunities. In 2005, JPMorgan Chase declared a quar-terly cash dividend on its common stock of $0.34 per share. The Firm continuesto target a dividend payout ratio of 30-40% of operating earnings over time.
Stock repurchasesOn July 20, 2004, the Board of Directors approved an initial stock repurchaseprogram in the aggregate amount of $6.0 billion. This amount includes shares
to be repurchased to offset issuances under the Firm’s employee stock-basedplans. The actual amount of shares repurchased is subject to various factors,including market conditions; legal considerations affecting the amount andtiming of repurchase activity; the Firm’s capital position (taking into accountgoodwill and intangibles); internal capital generation; and alternative potentialinvestment opportunities. Under the stock repurchase program, during 2005,the Firm repurchased 93.5 million shares for $3.4 billion at an average priceper share of $36.46. During 2004, the Firm repurchased 19.3 million sharesfor $738 million at an average price per share of $38.27. As of December 31,2005, $1.9 billion of authorized repurchase capacity remained.
The Firm has determined that it may, from time to time, enter into written tradingplans under Rule 10b5-1 of the Securities Exchange Act of 1934 to facilitatethe repurchase of common stock in accordance with the repurchase program.A Rule 10b5-1 repurchase plan would allow the Firm to repurchase sharesduring periods when it would not otherwise be repurchasing common stock –for example, during internal trading “black-out periods.” All purchases under aRule 10b5-1 plan must be made according to a predefined plan that is estab-lished when the Firm is not aware of material nonpublic information.
For additional information regarding repurchases of the Firm’s equity securi-ties, see Part II, Item 5, Market for registrant’s common equity, related stock-holder matters and issuer purchases of equity securities, on page 11 ofJPMorgan Chase’s 2005 Form 10–K.
Off–balance sheet arrangements and contractual cash obligationsSpecial-purpose entitiesJPMorgan Chase is involved with several types of off-balance sheet arrange-ments, including special purpose entities (“SPEs”), lines of credit and loancommitments. The principal uses of SPEs are to obtain sources of liquidity forJPMorgan Chase and its clients by securitizing financial assets, and to createother investment products for clients. These arrangements are an importantpart of the financial markets, providing market liquidity by facilitatinginvestors’ access to specific portfolios of assets and risks. For example, SPEsare integral to the markets for mortgage-backed securities, commercial paper,and other asset-backed securities.
The basic SPE structure involves a company selling assets to the SPE. The SPEfunds the purchase of those assets by issuing securities to investors. To insulateinvestors from creditors of other entities, including the seller of assets, SPEscan be structured to be bankruptcy-remote.
JPMorgan Chase is involved with SPEs in three broad categories: loan securitiza-tions, multi-seller conduits and client intermediation. Capital is held, as deemedappropriate, against all SPE-related transactions and related exposures, such asderivative transactions and lending-related commitments. For a further discussionof SPEs and the Firm’s accounting for them, see Note 1 on page 91, Note 13on pages 108–111 and Note 14 on pages 111–113 of this Annual Report.
The Firm has no commitments to issue its own stock to support any SPEtransaction, and its policies require that transactions with SPEs be conductedat arm’s length and reflect market pricing. Consistent with this policy, noJPMorgan Chase employee is permitted to invest in SPEs with which the Firmis involved where such investment would violate the Firm’s Code of Conduct.These rules prohibit employees from self-dealing and prohibit employees fromacting on behalf of the Firm in transactions with which they or their familyhave any significant financial interest.
For certain liquidity commitments to SPEs, the Firm could be required to providefunding if the credit rating of JPMorgan Chase Bank were downgraded belowspecific levels, primarily P-1, A-1 and F1 for Moody’s, Standard & Poor’s andFitch, respectively. The amount of these liquidity commitments was $71.3 billion and $79.4 billion at December 31, 2005 and 2004, respectively.Alternatively, if JPMorgan Chase Bank were downgraded, the Firm could bereplaced by another liquidity provider in lieu of providing funding under theliquidity commitment, or, in certain circumstances, could facilitate the sale orrefinancing of the assets in the SPE in order to provide liquidity.
Of its $71.3 billion in liquidity commitments to SPEs at December 31, 2005,$38.9 billion was included in the Firm’s other unfunded commitments toextend credit and asset purchase agreements, included in the following table.Of the $79.4 billion of liquidity commitments to SPEs at December 31, 2004,$47.7 billion was included in the Firm’s other unfunded commitments toextend credit and asset purchase agreements. As a result of the Firm’s consol-idation of multi-seller conduits in accordance with FIN 46R, $32.4 billion ofthese commitments, compared with $31.7 billion at December 31, 2004, areexcluded from the following table, as the underlying assets of the SPEs havebeen included on the Firm’s Consolidated balance sheets.
The Firm also has exposure to certain SPEs arising from derivative transactions;these transactions are recorded at fair value on the Firm’s Consolidated balancesheets with changes in fair value (i.e., MTM gains and losses) recorded inTrading revenue. Such MTM gains and losses are not included in the revenueamounts reported in the table below.
The following table summarizes certain revenue information related to variable interest entities (“VIEs”) with which the Firm has significant involvement, and qualifying SPEs (“QSPEs”). The revenue reported in thetable below primarily represents servicing and custodial fee income. For a further discussion of VIEs and QSPEs, see Note 1, Note 13 and Note 14,on pages 91, 108–111 and 111–113, respectively, of this Annual Report.
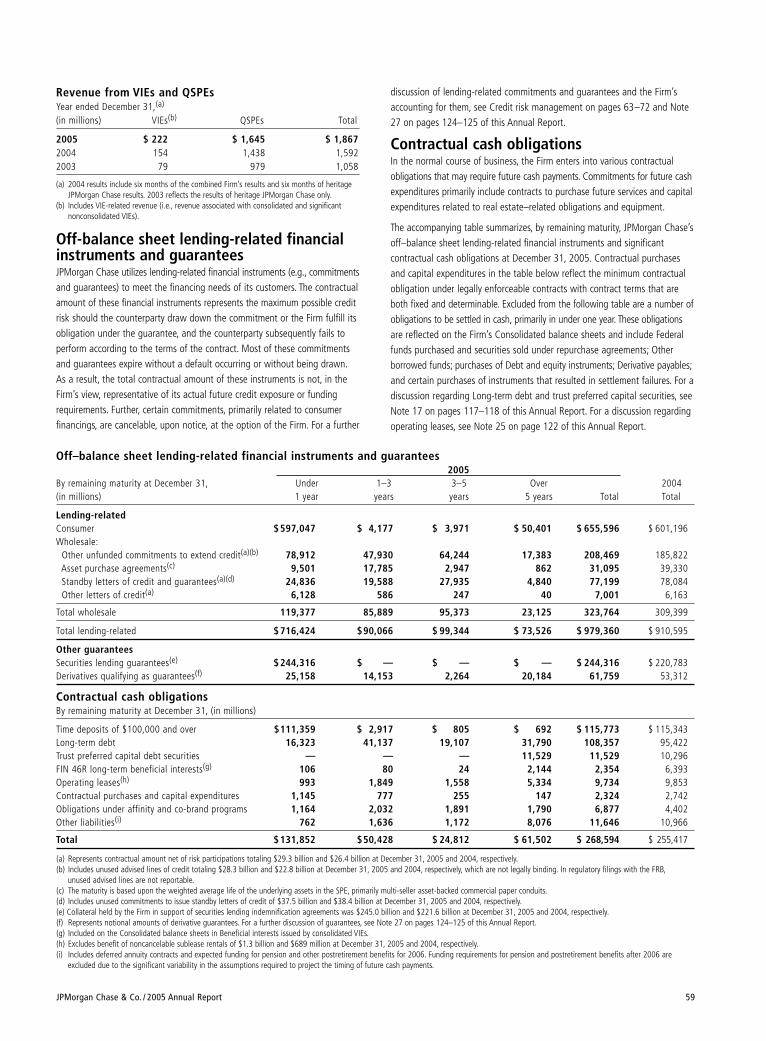
JPMorgan Chase & Co. / 2005 Annual Report 59
Revenue from VIEs and QSPEsYear ended December 31,(a)
(in millions) VIEs(b) QSPEs Total
2005 $ 222 $ 1,645 $ 1,8672004 154 1,438 1,5922003 79 979 1,058
(a) 2004 results include six months of the combined Firm’s results and six months of heritageJPMorgan Chase results. 2003 reflects the results of heritage JPMorgan Chase only.
(b) Includes VIE-related revenue (i.e., revenue associated with consolidated and significant nonconsolidated VIEs).
Off-balance sheet lending-related financialinstruments and guaranteesJPMorgan Chase utilizes lending-related financial instruments (e.g., commitmentsand guarantees) to meet the financing needs of its customers. The contractualamount of these financial instruments represents the maximum possible creditrisk should the counterparty draw down the commitment or the Firm fulfill itsobligation under the guarantee, and the counterparty subsequently fails toperform according to the terms of the contract. Most of these commitmentsand guarantees expire without a default occurring or without being drawn.As a result, the total contractual amount of these instruments is not, in theFirm’s view, representative of its actual future credit exposure or fundingrequirements. Further, certain commitments, primarily related to consumerfinancings, are cancelable, upon notice, at the option of the Firm. For a further
discussion of lending-related commitments and guarantees and the Firm’saccounting for them, see Credit risk management on pages 63–72 and Note27 on pages 124–125 of this Annual Report.
Contractual cash obligationsIn the normal course of business, the Firm enters into various contractual obligations that may require future cash payments. Commitments for future cashexpenditures primarily include contracts to purchase future services and capitalexpenditures related to real estate–related obligations and equipment.
The accompanying table summarizes, by remaining maturity, JPMorgan Chase’soff–balance sheet lending-related financial instruments and significant contractual cash obligations at December 31, 2005. Contractual purchasesand capital expenditures in the table below reflect the minimum contractualobligation under legally enforceable contracts with contract terms that areboth fixed and determinable. Excluded from the following table are a number ofobligations to be settled in cash, primarily in under one year. These obligationsare reflected on the Firm’s Consolidated balance sheets and include Federalfunds purchased and securities sold under repurchase agreements; Other borrowed funds; purchases of Debt and equity instruments; Derivative payables;and certain purchases of instruments that resulted in settlement failures. For adiscussion regarding Long-term debt and trust preferred capital securities, seeNote 17 on pages 117–118 of this Annual Report. For a discussion regardingoperating leases, see Note 25 on page 122 of this Annual Report.
Off–balance sheet lending-related financial instruments and guarantees2005
By remaining maturity at December 31, Under 1–3 3–5 Over 2004(in millions) 1 year years years 5 years Total Total
Lending-relatedConsumer $ 597,047 $ 4,177 $ 3,971 $ 50,401 $ 655,596 $ 601,196Wholesale:
Other unfunded commitments to extend credit(a)(b) 78,912 47,930 64,244 17,383 208,469 185,822Asset purchase agreements(c) 9,501 17,785 2,947 862 31,095 39,330Standby letters of credit and guarantees(a)(d) 24,836 19,588 27,935 4,840 77,199 78,084Other letters of credit(a) 6,128 586 247 40 7,001 6,163
Total wholesale 119,377 85,889 95,373 23,125 323,764 309,399
Total lending-related $ 716,424 $90,066 $ 99,344 $ 73,526 $ 979,360 $ 910,595
Other guaranteesSecurities lending guarantees(e) $ 244,316 $ — $ — $ — $ 244,316 $ 220,783Derivatives qualifying as guarantees(f) 25,158 14,153 2,264 20,184 61,759 53,312
Contractual cash obligationsBy remaining maturity at December 31, (in millions)
Time deposits of $100,000 and over $111,359 $ 2,917 $ 805 $ 692 $ 115,773 $ 115,343Long-term debt 16,323 41,137 19,107 31,790 108,357 95,422Trust preferred capital debt securities — — — 11,529 11,529 10,296FIN 46R long-term beneficial interests(g) 106 80 24 2,144 2,354 6,393Operating leases(h) 993 1,849 1,558 5,334 9,734 9,853Contractual purchases and capital expenditures 1,145 777 255 147 2,324 2,742Obligations under affinity and co-brand programs 1,164 2,032 1,891 1,790 6,877 4,402Other liabilities(i) 762 1,636 1,172 8,076 11,646 10,966
Total $ 131,852 $50,428 $ 24,812 $ 61,502 $ 268,594 $ 255,417
(a) Represents contractual amount net of risk participations totaling $29.3 billion and $26.4 billion at December 31, 2005 and 2004, respectively.(b) Includes unused advised lines of credit totaling $28.3 billion and $22.8 billion at December 31, 2005 and 2004, respectively, which are not legally binding. In regulatory filings with the FRB,
unused advised lines are not reportable.(c) The maturity is based upon the weighted average life of the underlying assets in the SPE, primarily multi-seller asset-backed commercial paper conduits.(d) Includes unused commitments to issue standby letters of credit of $37.5 billion and $38.4 billion at December 31, 2005 and 2004, respectively.(e) Collateral held by the Firm in support of securities lending indemnification agreements was $245.0 billion and $221.6 billion at December 31, 2005 and 2004, respectively.(f) Represents notional amounts of derivative guarantees. For a further discussion of guarantees, see Note 27 on pages 124–125 of this Annual Report.(g) Included on the Consolidated balance sheets in Beneficial interests issued by consolidated VIEs.(h) Excludes benefit of noncancelable sublease rentals of $1.3 billion and $689 million at December 31, 2005 and 2004, respectively.(i) Includes deferred annuity contracts and expected funding for pension and other postretirement benefits for 2006. Funding requirements for pension and postretirement benefits after 2006 are
excluded due to the significant variability in the assumptions required to project the timing of future cash payments.
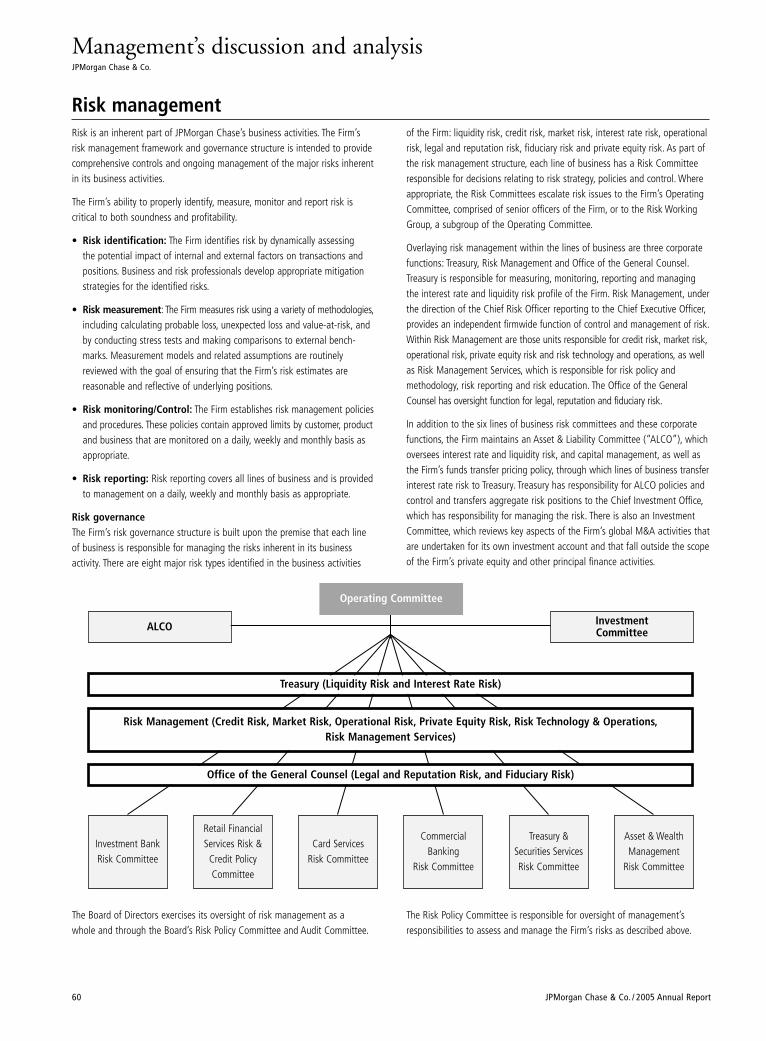
Management’s discussion and analysisJPMorgan Chase & Co.
60 JPMorgan Chase & Co. / 2005 Annual Report
Risk managementRisk is an inherent part of JPMorgan Chase’s business activities. The Firm’srisk management framework and governance structure is intended to providecomprehensive controls and ongoing management of the major risks inherentin its business activities.
The Firm’s ability to properly identify, measure, monitor and report risk is critical to both soundness and profitability.
• Risk identification: The Firm identifies risk by dynamically assessing the potential impact of internal and external factors on transactions andpositions. Business and risk professionals develop appropriate mitigationstrategies for the identified risks.
• Risk measurement: The Firm measures risk using a variety of methodologies,including calculating probable loss, unexpected loss and value-at-risk, andby conducting stress tests and making comparisons to external bench-marks. Measurement models and related assumptions are routinelyreviewed with the goal of ensuring that the Firm’s risk estimates are reasonable and reflective of underlying positions.
• Risk monitoring/Control: The Firm establishes risk management policiesand procedures. These policies contain approved limits by customer, productand business that are monitored on a daily, weekly and monthly basis asappropriate.
• Risk reporting: Risk reporting covers all lines of business and is providedto management on a daily, weekly and monthly basis as appropriate.
Risk governanceThe Firm’s risk governance structure is built upon the premise that each lineof business is responsible for managing the risks inherent in its businessactivity. There are eight major risk types identified in the business activities
of the Firm: liquidity risk, credit risk, market risk, interest rate risk, operationalrisk, legal and reputation risk, fiduciary risk and private equity risk. As part ofthe risk management structure, each line of business has a Risk Committeeresponsible for decisions relating to risk strategy, policies and control. Whereappropriate, the Risk Committees escalate risk issues to the Firm’s OperatingCommittee, comprised of senior officers of the Firm, or to the Risk WorkingGroup, a subgroup of the Operating Committee.
Overlaying risk management within the lines of business are three corporatefunctions: Treasury, Risk Management and Office of the General Counsel.Treasury is responsible for measuring, monitoring, reporting and managingthe interest rate and liquidity risk profile of the Firm. Risk Management, underthe direction of the Chief Risk Officer reporting to the Chief Executive Officer,provides an independent firmwide function of control and management of risk.Within Risk Management are those units responsible for credit risk, market risk,operational risk, private equity risk and risk technology and operations, as wellas Risk Management Services, which is responsible for risk policy andmethodology, risk reporting and risk education. The Office of the GeneralCounsel has oversight function for legal, reputation and fiduciary risk.
In addition to the six lines of business risk committees and these corporatefunctions, the Firm maintains an Asset & Liability Committee (“ALCO”), whichoversees interest rate and liquidity risk, and capital management, as well asthe Firm’s funds transfer pricing policy, through which lines of business transferinterest rate risk to Treasury. Treasury has responsibility for ALCO policies andcontrol and transfers aggregate risk positions to the Chief Investment Office,which has responsibility for managing the risk. There is also an InvestmentCommittee, which reviews key aspects of the Firm’s global M&A activities thatare undertaken for its own investment account and that fall outside the scopeof the Firm’s private equity and other principal finance activities.
Investment Committee
Operating Committee
ALCO
CommercialBanking
Risk Committee
Investment Bank Risk Committee
Retail FinancialServices Risk &
Credit PolicyCommittee
Card ServicesRisk Committee
Treasury & Securities ServicesRisk Committee
Asset & WealthManagement
Risk Committee
Treasury (Liquidity Risk and Interest Rate Risk)
Risk Management (Credit Risk, Market Risk, Operational Risk, Private Equity Risk, Risk Technology & Operations,Risk Management Services)
Office of the General Counsel (Legal and Reputation Risk, and Fiduciary Risk)
The Board of Directors exercises its oversight of risk management as a whole and through the Board’s Risk Policy Committee and Audit Committee.
The Risk Policy Committee is responsible for oversight of management’sresponsibilities to assess and manage the Firm’s risks as described above.
JPMorgan Chase & Co. / 2005 Annual Report 61
Liquidity risk management Liquidity risk arises from the general funding needs of the Firm’s activities andin the management of its assets and liabilities. JPMorgan Chase’s liquiditymanagement framework is intended to maximize liquidity access and minimizefunding costs. Through active liquidity management, the Firm seeks to preservestable, reliable and cost-effective sources of funding. This enables the Firm toreplace maturing obligations when due and fund assets at appropriate matu-rities and rates. To accomplish this task, management uses a variety of liquidityrisk measures that take into consideration market conditions, prevailing interestrates, liquidity needs and the desired maturity profile of liabilities.
GovernanceThe Asset & Liability Committee (“ALCO”) reviews the Firm’s overall liquiditypolicy and oversees the contingency funding plan. The ALCO also providesoversight of the Firm’s exposure to SPEs, with particular focus on the potentialliquidity support requirements that the Firm may have to those SPEs.
Treasury is responsible for formulating the Firm’s liquidity strategy and targets,understanding the Firm’s on- and off-balance sheet liquidity obligations,providing policy guidance, overseeing policy adherence, and maintaining contingency planning and stress testing. In addition, it identifies and measuresinternal and external liquidity warning signals to permit early detection of liquidity issues.
An extension of the Firm’s ongoing liquidity management is its contingencyfunding plan. The goals of the plan are to ensure maintenance of appropriateliquidity during normal and stress periods, measure and project fundingrequirements during periods of stress, and manage access to funding sources.The plan considers temporary and long-term stress scenarios where access to unsecured funding is severely limited or nonexistent. The plan forecastspotential funding needs, taking into account both on- and off-balance sheetexposures, separately evaluating access to funds by the parent holding companyand JPMorgan Chase Bank.
The Firm’s liquidity risk framework also incorporates tools to monitor threeprimary measures of liquidity:
• Holding company short-term position: Measures the parent holding company’s ability to repay all obligations with a maturity of less than oneyear at a time when the ability of the Firm’s subsidiaries to pay dividends tothe parent company is constrained. Holding company short-term position ismanaged to a positive position over time.
• Cash capital surplus: Measures the Firm’s ability to fund assets on a fullycollateralized basis, assuming access to unsecured funding is lost. Thismeasurement is intended to ensure that the illiquid portion of the balancesheet can be funded by equity, long-term debt, trust preferred securitiesand deposits the Firm believes to be core.
• Basic surplus: Measures the Bank’s ability to sustain a 90-day stress eventthat is specific to the Firm where no new funding can be raised to meetobligations as they come due.
Each liquidity position is managed to provide sufficient surplus.
Risk monitoring and reportingTreasury is responsible for measuring, monitoring, reporting and managingthe liquidity profile of the Firm through both normal and stress periods.Treasury analyzes the diversity and maturity structure of the Firm’s sources offunding; and assesses downgrade impact scenarios, contingent fundingneeds, and overall collateral availability and pledging status. A downgradeanalysis considers the impact of both parent and bank level downgrades (one-and two-notch) and calculates the loss of funding and increase in annualfunding costs for both scenarios. A trigger-risk funding analysis considers theimpact of a bank level downgrade through A-1/P-1 as well as the increasedcontingent funding requirements that would be triggered. These liquidity analytics rely on management’s judgment about JPMorgan Chase’s ability toliquidate assets or use them as collateral for borrowings and take into accountcredit risk management’s historical data on the funding of loan commitments(e.g., commercial paper back-up facilities), liquidity commitments to SPEs,commitments with rating triggers and collateral posting requirements. For afurther discussion of SPEs and other off–balance sheet arrangements, seeOff–balance sheet arrangements and contractual cash obligations on pages58–59, as well as Note 1, Note 13, Note 14 and Note 27 on pages 91,108–111, 111–113, and 124–125, respectively, of this Annual Report.
Funding Sources of fundsConsistent with its liquidity management policy, the Firm has raised funds atthe parent holding company sufficient to cover its obligations and those of its nonbank subsidiaries that mature over the next 12 months. Long-termfunding needs for the parent holding company over the next several quartersare expected to be consistent with prior periods.
As of December 31, 2005, the Firm’s liquidity position remained strong basedupon its liquidity metrics. JPMorgan Chase’s long-dated funding, includingcore deposits, exceeds illiquid assets, and the Firm believes its obligations can be met even if access to funding is impaired.
The diversity of the Firm’s funding sources enhances financial flexibility andlimits dependence on any one source, thereby minimizing the cost of funds.The deposits held by the RFS, CB and TSS lines of business are a stable andconsistent source of funding for JPMorgan Chase Bank. As of December 31,2005, total deposits for the Firm were $555 billion, which represented 67% of the Firm’s funding liabilities. A significant portion of the Firm’s retaildeposits are “core” deposits, which are less sensitive to interest rate changesand therefore are considered more stable than market-based deposits. Core
The Audit Committee is responsible for oversight of guidelines and policiesthat govern the process by which risk assessment and management is under-taken. In addition, the Audit Committee reviews with management the systemof internal controls and financial reporting that is relied upon to provide reason-able assurance of compliance with the Firm’s operational risk management
processes. Both committees are responsible for oversight of reputation risk.The Chief Risk Officer and other management report on the risks of the Firmto the Board of Directors, particularly through the Board’s Risk PolicyCommittee and Audit Committee. The major risk types identified by the Firm arediscussed in the following sections.
Management’s discussion and analysisJPMorgan Chase & Co.
62 JPMorgan Chase & Co. / 2005 Annual Report
Credit ratings
The credit ratings of JPMorgan Chase’s parent holding company and each of its significant banking subsidiaries, as of December 31, 2005 and 2004, were as follows:
Short-term debt Senior long-term debt
Moody’s S&P Fitch Moody’s S&P Fitch
JPMorgan Chase & Co. P-1 A-1 F1 Aa3 A+ A+JPMorgan Chase Bank, N.A. P-1 A-1+ F1+ Aa2 AA- A+Chase Bank USA, N.A. P-1 A-1+ F1+ Aa2 AA- A+
deposits include all U.S. deposits insured by the FDIC, up to the legal limit of$100,000 per depositor. In 2005, core bank deposits increased approximately8% from 2004 year-end. In addition to core retail deposits, the Firm benefits fromsubstantial, geographically diverse corporate liability balances originated by TSSand CB through the normal course of business. These franchise-generated coreliability balances are also a stable and consistent source of funding due to thenature of the businesses from which they are generated. For a further discussionof deposit and liability balance trends, see Business Segment Results and BalanceSheet Analysis on pages 34–35 and 55, respectively, of this Annual Report.
Additional sources of funds include a variety of both short- and long-terminstruments, including federal funds purchased, commercial paper, banknotes, medium- and long-term debt, and capital debt securities. This funding is managed centrally, using regional expertise and local market access, toensure active participation in the global financial markets while maintainingconsistent global pricing. These markets serve as a cost-effective and diversified source of funds and are a critical component of the Firm’s liquidity management. Decisions concerning the timing and tenor of accessing thesemarkets are based upon relative costs, general market conditions, prospectiveviews of balance sheet growth and a targeted liquidity profile.
Finally, funding flexibility is provided by the Firm’s ability to access the repoand asset securitization markets. These markets are evaluated on an ongoingbasis to achieve an appropriate balance of secured and unsecured funding.The ability to securitize loans, and the associated gains on those securitizations,are principally dependent upon the credit quality and yields of the assets securitized and are generally not dependent upon the credit ratings of the
issuing entity. Transactions between the Firm and its securitization structuresare reflected in JPMorgan Chase’s consolidated financial statements; these relationships include retained interests in securitization trusts, liquidity facilitiesand derivative transactions. For further details, see Off-balance sheetarrangements and contractual cash obligations and Notes 13 and 27 onpages 58–59, 108–111 and 124–125, respectively, of this Annual Report.
IssuanceCorporate credit spreads widened modestly in 2005 across most industriesand sectors. On an historical basis, credit spreads remain near historic tightlevels as corporate balance sheet cash positions are strong and corporateprofits generally healthy. JPMorgan Chase’s credit spreads performed in linewith peer spreads in 2005.
Continued strong foreign investor participation in the global corporate markets allowed JPMorgan Chase to identify attractive opportunities globally tofurther diversify its funding and capital sources while lengthening maturities.During 2005, JPMorgan Chase issued approximately $43.7 billion of long-termdebt and capital debt securities. These issuances were offset partially by$26.9 billion of long-term debt and capital debt securities that matured orwere redeemed and the Firm’s redemption of $200 million of preferred stock.In addition, in 2005 the Firm securitized approximately $18.1 billion of resi-dential mortgage loans, $15.1 billion of credit card loans and $3.8 billion ofautomobile loans, resulting in pre-tax gains on securitizations of $21 million,$101 million and $9 million, respectively. For a further discussion of loansecuritizations, see Note 13 on pages 108–111 of this Annual Report.
The Firm’s principal insurance subsidiaries had the following financial strengthratings as of December 31, 2005:
Moody’s S&P A.M. Best
Chase Insurance Life and Annuity Company A2 A+ AChase Insurance Life Company A2 A+ A
The cost and availability of unsecured financing are influenced by credit ratings.A reduction in these ratings could adversely affect the Firm’s access to liquiditysources, increase the cost of funds, trigger additional collateral requirementsand decrease the number of investors and counterparties willing to lend.Critical factors in maintaining high credit ratings include a stable and diverse
earnings stream, strong capital ratios, strong credit quality and risk managementcontrols, diverse funding sources and strong liquidity monitoring procedures.
If the Firm’s ratings were downgraded by one notch, the Firm estimates theincremental cost of funds and the potential loss of funding to be negligible.Additionally, the Firm estimates the additional funding requirements for VIEs and other third-party commitments would not be material. In the current environment, the Firm believes a downgrade is unlikely. For additionalinformation on the impact of a credit ratings downgrade on the fundingrequirements for VIEs, and on derivatives and collateral agreements, seeSpecial-purpose entities on pages 58–59 and Ratings profile of derivativereceivables mark-to-market (“MTM”) on page 69, of this Annual Report.
JPMorgan Chase & Co. / 2005 Annual Report 63
Credit risk management Credit risk is the risk of loss from obligor or counterparty default. The Firmprovides credit to customers of all sizes, from large corporate clients to loansfor the individual consumer. The Firm manages the risk/reward relationship ofeach portfolio and discourages the retention of loan assets that do not generatea positive return above the cost of risk-adjusted capital. The majority of theFirm’s wholesale loan originations (primarily to IB clients) continues to be distributed into the marketplace, with residual holds by the Firm averagingless than 10%. Wholesale loans generated by CB and AWM are generallyretained on the balance sheet. With regard to the prime consumer credit market, the Firm focuses on creating a portfolio that is diversified from both a product and a geographical perspective. Within the prime mortgage business,originated loans are retained on the balance sheet as well as selectively sold togovernment agencies; the latter category is routinely classified as held-for-sale.
Credit risk organizationCredit risk management is overseen by the Chief Risk Officer, a member of the Firm’s Operating Committee. The Firm’s credit risk management governance structure consists of the following primary functions:
• establishes a comprehensive credit risk policy framework
• calculates Allowance for credit losses and ensures appropriate credit risk-based capital management
• assigns and manages credit authorities to approve all credit exposure
• monitors and manages credit risk across all portfolio segments
• manages criticized exposures
Risk identificationThe Firm is exposed to credit risk through lending (e.g., loans and lending-related commitments), derivatives trading and capital markets activities.The credit risk function works in partnership with the business segments inidentifying and aggregating exposure across all lines of business.
Risk measurementTo measure credit risk, the Firm employs several methodologies for estimatingthe likelihood of obligor or counterparty default. Losses generated by consumerloans are more predictable than wholesale losses, but are subject to cyclicaland seasonal factors. Although the frequency of loss is higher on consumerloans than on wholesale loans, the severity of loss is typically lower and moremanageable. As a result of these differences, methodologies vary dependingon certain factors, including type of asset (e.g., consumer installment versuswholesale loan), risk measurement parameters (e.g., delinquency status andcredit bureau score versus wholesale risk rating) and risk management andcollection processes (e.g., retail collection center versus centrally managedworkout groups). Credit risk measurement is based upon the amount ofexposure should the obligor or the counterparty default, the probability ofdefault and the loss severity given a default event. Based upon these factorsand related market-based inputs, the Firm estimates both probable and unexpected losses for the wholesale and consumer portfolios. Probable losses,reflected in the Provision for credit losses, are generally statistically-basedestimates of credit losses over time, anticipated as a result of obligor or coun-terparty default. However, probable losses are not the sole indicators of risk.If losses were entirely predictable, the probable loss rate could be factoredinto pricing and covered as a normal and recurring cost of doing business.Unexpected losses, reflected in the allocation of credit risk capital, representthe potential volatility of actual losses relative to the probable level of losses.(Refer to Capital management on pages 56–58 of this Annual Report for afurther discussion of the credit risk capital methodology.) Risk measurementfor the wholesale portfolio is assessed primarily on a risk-rated basis; for theconsumer portfolio, it is assessed primarily on a credit-scored basis.
Risk-rated exposure For portfolios that are risk-rated, probable and unexpected loss calculationsare based upon estimates of probability of default and loss given default.Probability of default is expected default calculated on an obligor basis. Lossgiven default is an estimate of losses that are based upon collateral andstructural support for each credit facility. Calculations and assumptions arebased upon management information systems and methodologies which areunder continual review. Risk ratings are assigned and reviewed on an ongoingbasis by Credit Risk Management and revised, if needed, to reflect the borrowers’current risk profiles and the related collateral and structural positions.
Credit-scored exposureFor credit-scored portfolios (generally held in RFS and CS), probable loss isbased upon a statistical analysis of inherent losses over discrete periods oftime. Probable losses are estimated using sophisticated portfolio modeling,credit scoring and decision-support tools to project credit risks and establishunderwriting standards. In addition, common measures of credit quality derivedfrom historical loss experience are used to predict consumer losses. Other riskcharacteristics evaluated include recent loss experience in the portfolios, changesin origination sources, portfolio seasoning, loss severity and underlying creditpractices, including charge-off policies. These analyses are applied to theFirm’s current portfolios in order to forecast delinquencies and severity oflosses, which determine the amount of probable losses. These factors andanalyses are updated on a quarterly basis.
Risk monitoringThe Firm has developed policies and practices that are designed to preservethe independence and integrity of decision-making and ensure credit risks areaccurately assessed, properly approved, continually monitored and activelymanaged at both the transaction and portfolio levels. The policy frameworkestablishes credit approval authorities, concentration limits, risk-ratingmethodologies, portfolio-review parameters and problem-loan management.Wholesale credit risk is continually monitored on both an aggregate portfoliolevel and on an individual customer basis. For consumer credit risk, the keyfocus items are trends and concentrations at the portfolio level, where potentialproblems can be remedied through changes in underwriting policies andportfolio guidelines. Consumer Credit Risk Management monitors trendsagainst business expectations and industry benchmarks. In order to meetcredit risk management objectives, the Firm seeks to maintain a risk profilethat is diverse in terms of borrower, product type, industry and geographicconcentration. Additional diversification of the Firm’s exposure is accomplishedthrough loan syndication and participations, loan sales, securitizations, creditderivatives and other risk-reduction techniques.
Risk reportingTo enable monitoring of credit risk and decision-making, aggregate creditexposure, credit metric forecasts, hold-limit exceptions and risk profilechanges are reported regularly to senior credit risk management. Detailedportfolio reporting of industry, customer and geographic concentrationsoccurs monthly, and the appropriateness of the allowance for credit losses isreviewed by senior management at least on a quarterly basis. Through therisk reporting and governance structure, credit risk trends and limit exceptionsare provided regularly to, and discussed with, the Operating Committee.
2005 Credit risk overviewThe wholesale portfolio experienced continued credit strength during 2005.Wholesale nonperforming loans were down by $582 million, or 37%, from2004; net recoveries were $77 million compared with net charge-offs of
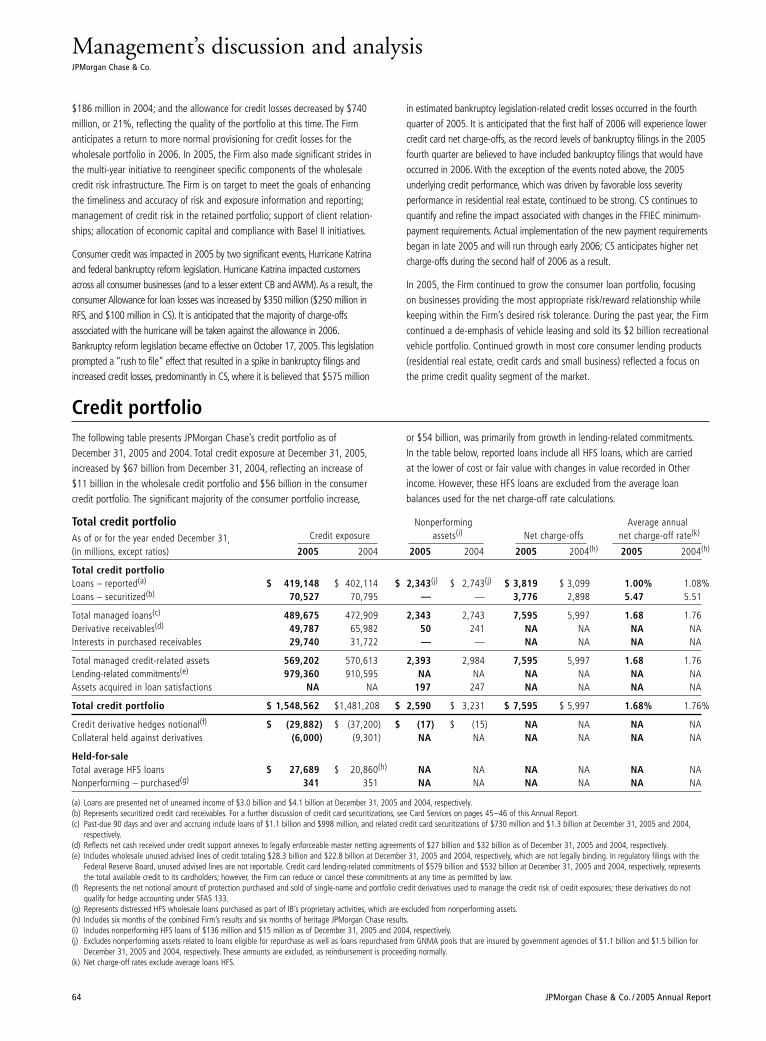
Management’s discussion and analysisJPMorgan Chase & Co.
64 JPMorgan Chase & Co. / 2005 Annual Report
$186 million in 2004; and the allowance for credit losses decreased by $740million, or 21%, reflecting the quality of the portfolio at this time. The Firmanticipates a return to more normal provisioning for credit losses for thewholesale portfolio in 2006. In 2005, the Firm also made significant strides inthe multi-year initiative to reengineer specific components of the wholesalecredit risk infrastructure. The Firm is on target to meet the goals of enhancingthe timeliness and accuracy of risk and exposure information and reporting;management of credit risk in the retained portfolio; support of client relation-ships; allocation of economic capital and compliance with Basel II initiatives.
Consumer credit was impacted in 2005 by two significant events, Hurricane Katrinaand federal bankruptcy reform legislation. Hurricane Katrina impacted customersacross all consumer businesses (and to a lesser extent CB and AWM).As a result, theconsumer Allowance for loan losses was increased by $350 million ($250 million inRFS, and $100 million in CS). It is anticipated that the majority of charge-offs associated with the hurricane will be taken against the allowance in 2006.Bankruptcy reform legislation became effective on October 17, 2005.This legislationprompted a “rush to file” effect that resulted in a spike in bankruptcy filings andincreased credit losses, predominantly in CS, where it is believed that $575 million
in estimated bankruptcy legislation-related credit losses occurred in the fourthquarter of 2005. It is anticipated that the first half of 2006 will experience lowercredit card net charge-offs, as the record levels of bankruptcy filings in the 2005fourth quarter are believed to have included bankruptcy filings that would haveoccurred in 2006. With the exception of the events noted above, the 2005underlying credit performance, which was driven by favorable loss severity performance in residential real estate, continued to be strong. CS continues toquantify and refine the impact associated with changes in the FFIEC minimum-payment requirements. Actual implementation of the new payment requirementsbegan in late 2005 and will run through early 2006; CS anticipates higher netcharge-offs during the second half of 2006 as a result.
In 2005, the Firm continued to grow the consumer loan portfolio, focusing on businesses providing the most appropriate risk/reward relationship whilekeeping within the Firm’s desired risk tolerance. During the past year, the Firmcontinued a de-emphasis of vehicle leasing and sold its $2 billion recreationalvehicle portfolio. Continued growth in most core consumer lending products(residential real estate, credit cards and small business) reflected a focus onthe prime credit quality segment of the market.
Total credit portfolio Nonperforming Average annual
As of or for the year ended December 31, Credit exposure assets(i) Net charge-offs net charge-off rate(k)
(in millions, except ratios) 2005 2004 2005 2004 2005 2004(h) 2005 2004(h)
Total credit portfolioLoans – reported(a) $ 419,148 $ 402,114 $ 2,343(j) $ 2,743(j) $ 3,819 $ 3,099 1.00% 1.08%Loans – securitized(b) 70,527 70,795 — — 3,776 2,898 5.47 5.51
Total managed loans(c) 489,675 472,909 2,343 2,743 7,595 5,997 1.68 1.76Derivative receivables(d) 49,787 65,982 50 241 NA NA NA NAInterests in purchased receivables 29,740 31,722 — — NA NA NA NA
Total managed credit-related assets 569,202 570,613 2,393 2,984 7,595 5,997 1.68 1.76Lending-related commitments(e) 979,360 910,595 NA NA NA NA NA NAAssets acquired in loan satisfactions NA NA 197 247 NA NA NA NA
Total credit portfolio $ 1,548,562 $1,481,208 $ 2,590 $ 3,231 $ 7,595 $ 5,997 1.68% 1.76%
Credit derivative hedges notional(f) $ (29,882) $ (37,200) $ (17) $ (15) NA NA NA NACollateral held against derivatives (6,000) (9,301) NA NA NA NA NA NA
Held-for-saleTotal average HFS loans $ 27,689 $ 20,860(h) NA NA NA NA NA NANonperforming – purchased(g) 341 351 NA NA NA NA NA NA
(a) Loans are presented net of unearned income of $3.0 billion and $4.1 billion at December 31, 2005 and 2004, respectively.(b) Represents securitized credit card receivables. For a further discussion of credit card securitizations, see Card Services on pages 45–46 of this Annual Report.(c) Past-due 90 days and over and accruing include loans of $1.1 billion and $998 million, and related credit card securitizations of $730 million and $1.3 billion at December 31, 2005 and 2004,
respectively.(d) Reflects net cash received under credit support annexes to legally enforceable master netting agreements of $27 billion and $32 billion as of December 31, 2005 and 2004, respectively.(e) Includes wholesale unused advised lines of credit totaling $28.3 billion and $22.8 billion at December 31, 2005 and 2004, respectively, which are not legally binding. In regulatory filings with the
Federal Reserve Board, unused advised lines are not reportable. Credit card lending-related commitments of $579 billion and $532 billion at December 31, 2005 and 2004, respectively, representsthe total available credit to its cardholders; however, the Firm can reduce or cancel these commitments at any time as permitted by law.
(f) Represents the net notional amount of protection purchased and sold of single-name and portfolio credit derivatives used to manage the credit risk of credit exposures; these derivatives do not qualify for hedge accounting under SFAS 133.
(g) Represents distressed HFS wholesale loans purchased as part of IB’s proprietary activities, which are excluded from nonperforming assets.(h) Includes six months of the combined Firm’s results and six months of heritage JPMorgan Chase results.(i) Includes nonperforming HFS loans of $136 million and $15 million as of December 31, 2005 and 2004, respectively.(j) Excludes nonperforming assets related to loans eligible for repurchase as well as loans repurchased from GNMA pools that are insured by government agencies of $1.1 billion and $1.5 billion for
December 31, 2005 and 2004, respectively. These amounts are excluded, as reimbursement is proceeding normally.(k) Net charge-off rates exclude average loans HFS.
The following table presents JPMorgan Chase’s credit portfolio as ofDecember 31, 2005 and 2004. Total credit exposure at December 31, 2005,increased by $67 billion from December 31, 2004, reflecting an increase of$11 billion in the wholesale credit portfolio and $56 billion in the consumercredit portfolio. The significant majority of the consumer portfolio increase,
Credit portfolioor $54 billion, was primarily from growth in lending-related commitments.In the table below, reported loans include all HFS loans, which are carried at the lower of cost or fair value with changes in value recorded in Otherincome. However, these HFS loans are excluded from the average loan balances used for the net charge-off rate calculations.
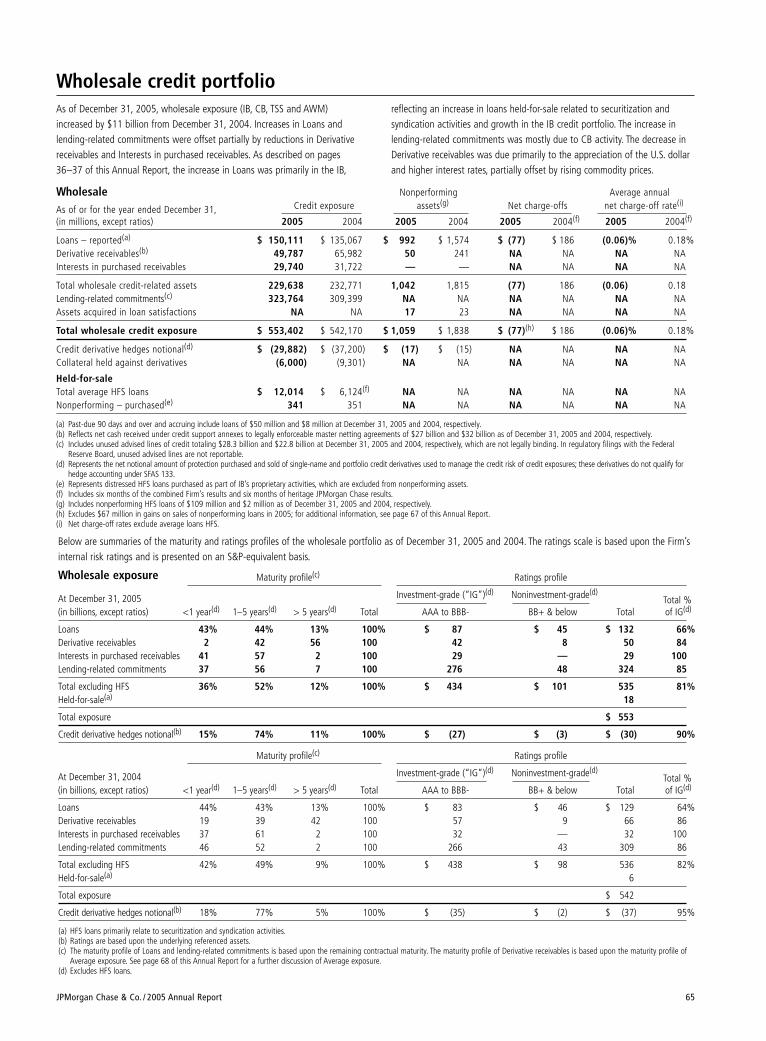
JPMorgan Chase & Co. / 2005 Annual Report 65
Wholesale credit portfolioAs of December 31, 2005, wholesale exposure (IB, CB, TSS and AWM)increased by $11 billion from December 31, 2004. Increases in Loans andlending-related commitments were offset partially by reductions in Derivativereceivables and Interests in purchased receivables. As described on pages36–37 of this Annual Report, the increase in Loans was primarily in the IB,
Wholesale Nonperforming Average annual
As of or for the year ended December 31, Credit exposure assets(g) Net charge-offs net charge-off rate(i)
(in millions, except ratios) 2005 2004 2005 2004 2005 2004(f) 2005 2004(f)
Loans – reported(a) $ 150,111 $ 135,067 $ 992 $ 1,574 $ (77) $ 186 (0.06)% 0.18%Derivative receivables(b) 49,787 65,982 50 241 NA NA NA NAInterests in purchased receivables 29,740 31,722 — — NA NA NA NA
Total wholesale credit-related assets 229,638 232,771 1,042 1,815 (77) 186 (0.06) 0.18Lending-related commitments(c) 323,764 309,399 NA NA NA NA NA NAAssets acquired in loan satisfactions NA NA 17 23 NA NA NA NA
Total wholesale credit exposure $ 553,402 $ 542,170 $ 1,059 $ 1,838 $ (77)(h) $ 186 (0.06)% 0.18%
Credit derivative hedges notional(d) $ (29,882) $ (37,200) $ (17) $ (15) NA NA NA NACollateral held against derivatives (6,000) (9,301) NA NA NA NA NA NA
Held-for-saleTotal average HFS loans $ 12,014 $ 6,124(f) NA NA NA NA NA NANonperforming – purchased(e) 341 351 NA NA NA NA NA NA
(a) Past-due 90 days and over and accruing include loans of $50 million and $8 million at December 31, 2005 and 2004, respectively.(b) Reflects net cash received under credit support annexes to legally enforceable master netting agreements of $27 billion and $32 billion as of December 31, 2005 and 2004, respectively.(c) Includes unused advised lines of credit totaling $28.3 billion and $22.8 billion at December 31, 2005 and 2004, respectively, which are not legally binding. In regulatory filings with the Federal
Reserve Board, unused advised lines are not reportable.(d) Represents the net notional amount of protection purchased and sold of single-name and portfolio credit derivatives used to manage the credit risk of credit exposures; these derivatives do not qualify for
hedge accounting under SFAS 133.(e) Represents distressed HFS loans purchased as part of IB’s proprietary activities, which are excluded from nonperforming assets.(f) Includes six months of the combined Firm’s results and six months of heritage JPMorgan Chase results.(g) Includes nonperforming HFS loans of $109 million and $2 million as of December 31, 2005 and 2004, respectively.(h) Excludes $67 million in gains on sales of nonperforming loans in 2005; for additional information, see page 67 of this Annual Report.(i) Net charge-off rates exclude average loans HFS.
reflecting an increase in loans held-for-sale related to securitization and syndication activities and growth in the IB credit portfolio. The increase inlending-related commitments was mostly due to CB activity. The decrease inDerivative receivables was due primarily to the appreciation of the U.S. dollarand higher interest rates, partially offset by rising commodity prices.
Wholesale exposure Maturity profile(c) Ratings profile
At December 31, 2005 Investment-grade (“IG”)(d) Noninvestment-grade(d)Total %
(in billions, except ratios) <1 year(d) 1–5 years(d) > 5 years(d) Total AAA to BBB- BB+ & below Total of IG(d)
Loans 43% 44% 13% 100% $ 87 $ 45 $ 132 66%Derivative receivables 2 42 56 100 42 8 50 84Interests in purchased receivables 41 57 2 100 29 — 29 100Lending-related commitments 37 56 7 100 276 48 324 85
Total excluding HFS 36% 52% 12% 100% $ 434 $ 101 535 81%Held-for-sale(a) 18
Total exposure $ 553
Credit derivative hedges notional(b) 15% 74% 11% 100% $ (27) $ (3) $ (30) 90%
Maturity profile(c) Ratings profile
At December 31, 2004 Investment-grade (“IG”)(d) Noninvestment-grade(d)Total %
(in billions, except ratios) <1 year(d) 1–5 years(d) > 5 years(d) Total AAA to BBB- BB+ & below Total of IG(d)
Loans 44% 43% 13% 100% $ 83 $ 46 $ 129 64%Derivative receivables 19 39 42 100 57 9 66 86Interests in purchased receivables 37 61 2 100 32 — 32 100Lending-related commitments 46 52 2 100 266 43 309 86
Total excluding HFS 42% 49% 9% 100% $ 438 $ 98 536 82%Held-for-sale(a) 6
Total exposure $ 542
Credit derivative hedges notional(b) 18% 77% 5% 100% $ (35) $ (2) $ (37) 95%
(a) HFS loans primarily relate to securitization and syndication activities.(b) Ratings are based upon the underlying referenced assets.(c) The maturity profile of Loans and lending-related commitments is based upon the remaining contractual maturity. The maturity profile of Derivative receivables is based upon the maturity profile of
Average exposure. See page 68 of this Annual Report for a further discussion of Average exposure.(d) Excludes HFS loans.
Below are summaries of the maturity and ratings profiles of the wholesale portfolio as of December 31, 2005 and 2004. The ratings scale is based upon the Firm’sinternal risk ratings and is presented on an S&P-equivalent basis.
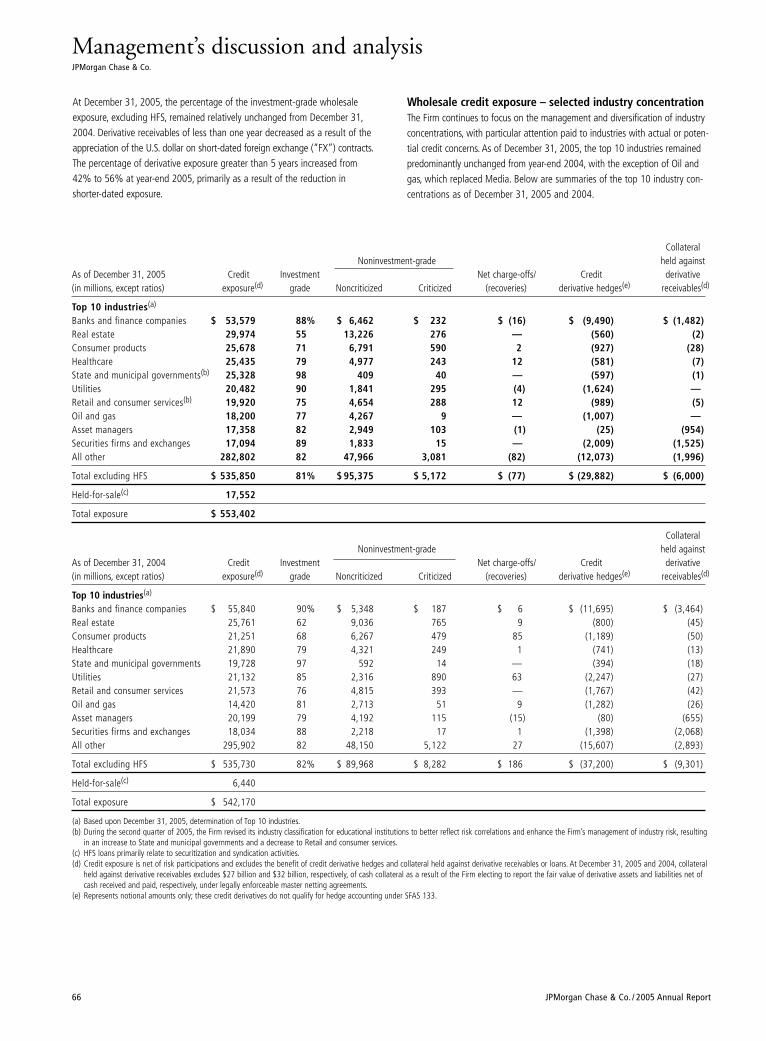
Management’s discussion and analysisJPMorgan Chase & Co.
66 JPMorgan Chase & Co. / 2005 Annual Report
At December 31, 2005, the percentage of the investment-grade wholesaleexposure, excluding HFS, remained relatively unchanged from December 31,2004. Derivative receivables of less than one year decreased as a result of theappreciation of the U.S. dollar on short-dated foreign exchange (“FX”) contracts.The percentage of derivative exposure greater than 5 years increased from42% to 56% at year-end 2005, primarily as a result of the reduction in shorter-dated exposure.
CollateralNoninvestment-grade held against
As of December 31, 2005 Credit Investment Net charge-offs/ Credit derivative(in millions, except ratios) exposure(d) grade Noncriticized Criticized (recoveries) derivative hedges(e) receivables(d)
Top 10 industries(a)
Banks and finance companies $ 53,579 88% $ 6,462 $ 232 $ (16) $ (9,490) $ (1,482)Real estate 29,974 55 13,226 276 — (560) (2)Consumer products 25,678 71 6,791 590 2 (927) (28)Healthcare 25,435 79 4,977 243 12 (581) (7)State and municipal governments(b) 25,328 98 409 40 — (597) (1)Utilities 20,482 90 1,841 295 (4) (1,624) —Retail and consumer services(b) 19,920 75 4,654 288 12 (989) (5)Oil and gas 18,200 77 4,267 9 — (1,007) —Asset managers 17,358 82 2,949 103 (1) (25) (954)Securities firms and exchanges 17,094 89 1,833 15 — (2,009) (1,525)All other 282,802 82 47,966 3,081 (82) (12,073) (1,996)
Total excluding HFS $ 535,850 81% $ 95,375 $ 5,172 $ (77) $ (29,882) $ (6,000)
Held-for-sale(c) 17,552
Total exposure $ 553,402
CollateralNoninvestment-grade held against
As of December 31, 2004 Credit Investment Net charge-offs/ Credit derivative(in millions, except ratios) exposure(d) grade Noncriticized Criticized (recoveries) derivative hedges(e) receivables(d)
Top 10 industries(a)
Banks and finance companies $ 55,840 90% $ 5,348 $ 187 $ 6 $ (11,695) $ (3,464)Real estate 25,761 62 9,036 765 9 (800) (45)Consumer products 21,251 68 6,267 479 85 (1,189) (50)Healthcare 21,890 79 4,321 249 1 (741) (13)State and municipal governments 19,728 97 592 14 — (394) (18)Utilities 21,132 85 2,316 890 63 (2,247) (27)Retail and consumer services 21,573 76 4,815 393 — (1,767) (42)Oil and gas 14,420 81 2,713 51 9 (1,282) (26)Asset managers 20,199 79 4,192 115 (15) (80) (655)Securities firms and exchanges 18,034 88 2,218 17 1 (1,398) (2,068)All other 295,902 82 48,150 5,122 27 (15,607) (2,893)
Total excluding HFS $ 535,730 82% $ 89,968 $ 8,282 $ 186 $ (37,200) $ (9,301)
Held-for-sale(c) 6,440
Total exposure $ 542,170
(a) Based upon December 31, 2005, determination of Top 10 industries.(b) During the second quarter of 2005, the Firm revised its industry classification for educational institutions to better reflect risk correlations and enhance the Firm’s management of industry risk, resulting
in an increase to State and municipal governments and a decrease to Retail and consumer services.(c) HFS loans primarily relate to securitization and syndication activities.(d) Credit exposure is net of risk participations and excludes the benefit of credit derivative hedges and collateral held against derivative receivables or loans. At December 31, 2005 and 2004, collateral
held against derivative receivables excludes $27 billion and $32 billion, respectively, of cash collateral as a result of the Firm electing to report the fair value of derivative assets and liabilities net ofcash received and paid, respectively, under legally enforceable master netting agreements.
(e) Represents notional amounts only; these credit derivatives do not qualify for hedge accounting under SFAS 133.
Wholesale credit exposure – selected industry concentrationThe Firm continues to focus on the management and diversification of industryconcentrations, with particular attention paid to industries with actual or poten-tial credit concerns. As of December 31, 2005, the top 10 industries remainedpredominantly unchanged from year-end 2004, with the exception of Oil andgas, which replaced Media. Below are summaries of the top 10 industry con-centrations as of December 31, 2005 and 2004.
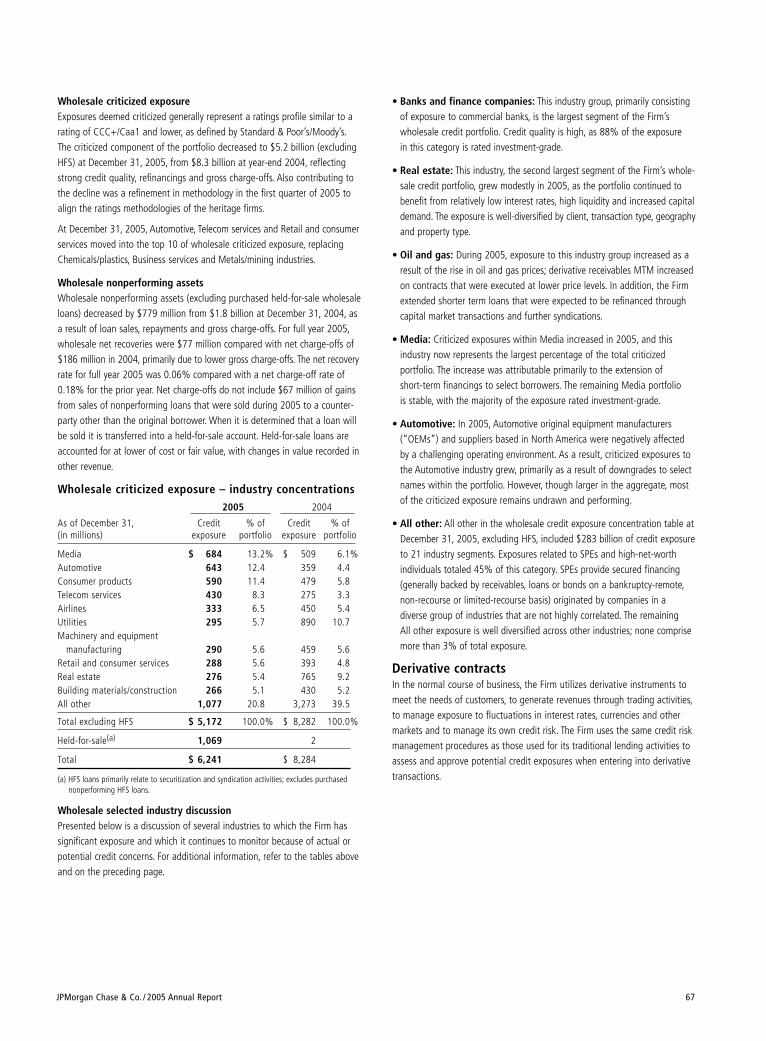
JPMorgan Chase & Co. / 2005 Annual Report 67
• Banks and finance companies: This industry group, primarily consistingof exposure to commercial banks, is the largest segment of the Firm’swholesale credit portfolio. Credit quality is high, as 88% of the exposure in this category is rated investment-grade.
• Real estate: This industry, the second largest segment of the Firm’s whole-sale credit portfolio, grew modestly in 2005, as the portfolio continued tobenefit from relatively low interest rates, high liquidity and increased capitaldemand. The exposure is well-diversified by client, transaction type, geographyand property type.
• Oil and gas: During 2005, exposure to this industry group increased as aresult of the rise in oil and gas prices; derivative receivables MTM increasedon contracts that were executed at lower price levels. In addition, the Firmextended shorter term loans that were expected to be refinanced throughcapital market transactions and further syndications.
• Media: Criticized exposures within Media increased in 2005, and thisindustry now represents the largest percentage of the total criticized portfolio. The increase was attributable primarily to the extension of short-term financings to select borrowers. The remaining Media portfolio is stable, with the majority of the exposure rated investment-grade.
• Automotive: In 2005, Automotive original equipment manufacturers(“OEMs”) and suppliers based in North America were negatively affectedby a challenging operating environment. As a result, criticized exposures tothe Automotive industry grew, primarily as a result of downgrades to selectnames within the portfolio. However, though larger in the aggregate, mostof the criticized exposure remains undrawn and performing.
• All other: All other in the wholesale credit exposure concentration table atDecember 31, 2005, excluding HFS, included $283 billion of credit exposureto 21 industry segments. Exposures related to SPEs and high-net-worthindividuals totaled 45% of this category. SPEs provide secured financing(generally backed by receivables, loans or bonds on a bankruptcy-remote,non-recourse or limited-recourse basis) originated by companies in adiverse group of industries that are not highly correlated. The remaining All other exposure is well diversified across other industries; none comprisemore than 3% of total exposure.
Derivative contractsIn the normal course of business, the Firm utilizes derivative instruments tomeet the needs of customers, to generate revenues through trading activities,to manage exposure to fluctuations in interest rates, currencies and othermarkets and to manage its own credit risk. The Firm uses the same credit riskmanagement procedures as those used for its traditional lending activities toassess and approve potential credit exposures when entering into derivativetransactions.
Wholesale criticized exposureExposures deemed criticized generally represent a ratings profile similar to arating of CCC+/Caa1 and lower, as defined by Standard & Poor’s/Moody’s.The criticized component of the portfolio decreased to $5.2 billion (excludingHFS) at December 31, 2005, from $8.3 billion at year-end 2004, reflectingstrong credit quality, refinancings and gross charge-offs. Also contributing tothe decline was a refinement in methodology in the first quarter of 2005 toalign the ratings methodologies of the heritage firms.
At December 31, 2005, Automotive, Telecom services and Retail and consumerservices moved into the top 10 of wholesale criticized exposure, replacingChemicals/plastics, Business services and Metals/mining industries.
Wholesale nonperforming assetsWholesale nonperforming assets (excluding purchased held-for-sale wholesaleloans) decreased by $779 million from $1.8 billion at December 31, 2004, asa result of loan sales, repayments and gross charge-offs. For full year 2005,wholesale net recoveries were $77 million compared with net charge-offs of$186 million in 2004, primarily due to lower gross charge-offs. The net recoveryrate for full year 2005 was 0.06% compared with a net charge-off rate of0.18% for the prior year. Net charge-offs do not include $67 million of gainsfrom sales of nonperforming loans that were sold during 2005 to a counter-party other than the original borrower. When it is determined that a loan willbe sold it is transferred into a held-for-sale account. Held-for-sale loans areaccounted for at lower of cost or fair value, with changes in value recorded inother revenue.
Wholesale criticized exposure – industry concentrations2005 2004
As of December 31, Credit % of Credit % of(in millions) exposure portfolio exposure portfolio
Media $ 684 13.2% $ 509 6.1%Automotive 643 12.4 359 4.4Consumer products 590 11.4 479 5.8Telecom services 430 8.3 275 3.3Airlines 333 6.5 450 5.4Utilities 295 5.7 890 10.7Machinery and equipment
manufacturing 290 5.6 459 5.6Retail and consumer services 288 5.6 393 4.8Real estate 276 5.4 765 9.2Building materials/construction 266 5.1 430 5.2All other 1,077 20.8 3,273 39.5
Total excluding HFS $ 5,172 100.0% $ 8,282 100.0%
Held-for-sale(a) 1,069 2
Total $ 6,241 $ 8,284
(a) HFS loans primarily relate to securitization and syndication activities; excludes purchasednonperforming HFS loans.
Wholesale selected industry discussionPresented below is a discussion of several industries to which the Firm hassignificant exposure and which it continues to monitor because of actual orpotential credit concerns. For additional information, refer to the tables aboveand on the preceding page.
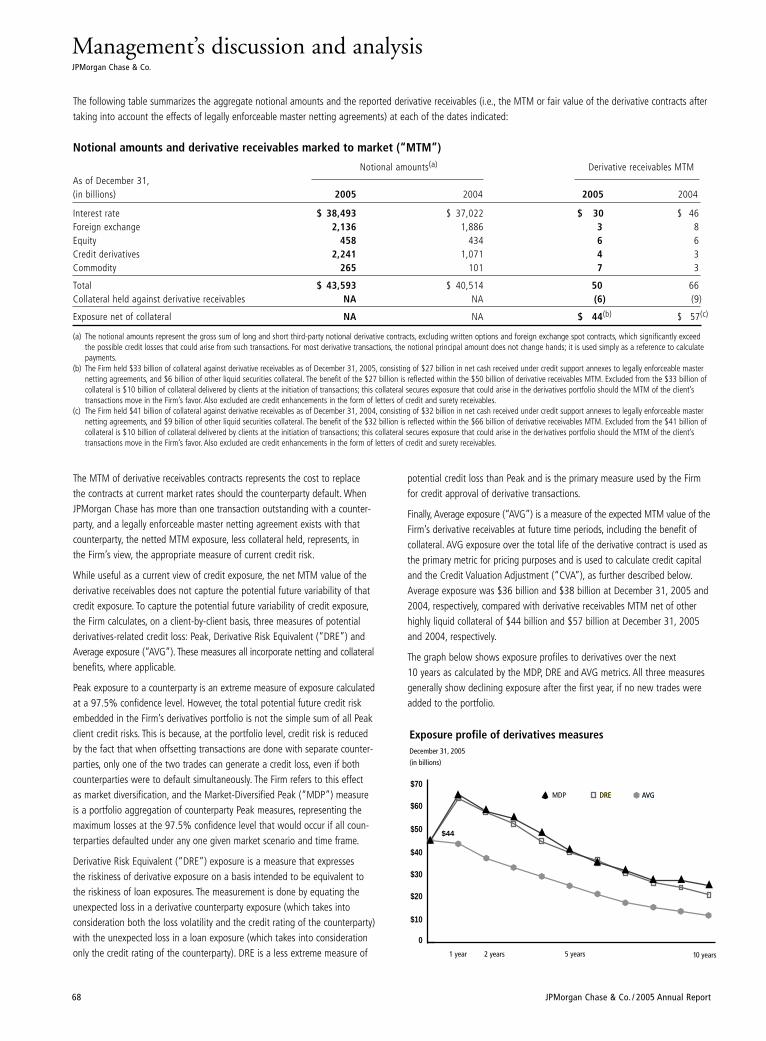
Notional amounts and derivative receivables marked to market (“MTM”)
Notional amounts(a) Derivative receivables MTM As of December 31,(in billions) 2005 2004 2005 2004
Interest rate $ 38,493 $ 37,022 $ 30 $ 46Foreign exchange 2,136 1,886 3 8Equity 458 434 6 6Credit derivatives 2,241 1,071 4 3Commodity 265 101 7 3
Total $ 43,593 $ 40,514 50 66Collateral held against derivative receivables NA NA (6) (9)
Exposure net of collateral NA NA $ 44(b) $ 57(c)
(a) The notional amounts represent the gross sum of long and short third-party notional derivative contracts, excluding written options and foreign exchange spot contracts, which significantly exceedthe possible credit losses that could arise from such transactions. For most derivative transactions, the notional principal amount does not change hands; it is used simply as a reference to calculatepayments.
(b) The Firm held $33 billion of collateral against derivative receivables as of December 31, 2005, consisting of $27 billion in net cash received under credit support annexes to legally enforceable masternetting agreements, and $6 billion of other liquid securities collateral. The benefit of the $27 billion is reflected within the $50 billion of derivative receivables MTM. Excluded from the $33 billion ofcollateral is $10 billion of collateral delivered by clients at the initiation of transactions; this collateral secures exposure that could arise in the derivatives portfolio should the MTM of the client’stransactions move in the Firm’s favor. Also excluded are credit enhancements in the form of letters of credit and surety receivables.
(c) The Firm held $41 billion of collateral against derivative receivables as of December 31, 2004, consisting of $32 billion in net cash received under credit support annexes to legally enforceable masternetting agreements, and $9 billion of other liquid securities collateral. The benefit of the $32 billion is reflected within the $66 billion of derivative receivables MTM. Excluded from the $41 billion ofcollateral is $10 billion of collateral delivered by clients at the initiation of transactions; this collateral secures exposure that could arise in the derivatives portfolio should the MTM of the client’stransactions move in the Firm’s favor. Also excluded are credit enhancements in the form of letters of credit and surety receivables.
Management’s discussion and analysisJPMorgan Chase & Co.
68 JPMorgan Chase & Co. / 2005 Annual Report
0
$10
$20
$30
$40
$50
$60
$70
1 year 2 years 5 years 10 years
MDP AVGAVGDREDRE
Exposure profile of derivatives measuresDecember 31, 2005
(in billions)
$44
The following table summarizes the aggregate notional amounts and the reported derivative receivables (i.e., the MTM or fair value of the derivative contracts aftertaking into account the effects of legally enforceable master netting agreements) at each of the dates indicated:
The MTM of derivative receivables contracts represents the cost to replace the contracts at current market rates should the counterparty default. WhenJPMorgan Chase has more than one transaction outstanding with a counter-party, and a legally enforceable master netting agreement exists with thatcounterparty, the netted MTM exposure, less collateral held, represents, in the Firm’s view, the appropriate measure of current credit risk.
While useful as a current view of credit exposure, the net MTM value of thederivative receivables does not capture the potential future variability of thatcredit exposure. To capture the potential future variability of credit exposure,the Firm calculates, on a client-by-client basis, three measures of potentialderivatives-related credit loss: Peak, Derivative Risk Equivalent (“DRE”) andAverage exposure (“AVG”). These measures all incorporate netting and collateralbenefits, where applicable.
Peak exposure to a counterparty is an extreme measure of exposure calculatedat a 97.5% confidence level. However, the total potential future credit riskembedded in the Firm’s derivatives portfolio is not the simple sum of all Peakclient credit risks. This is because, at the portfolio level, credit risk is reducedby the fact that when offsetting transactions are done with separate counter-parties, only one of the two trades can generate a credit loss, even if bothcounterparties were to default simultaneously. The Firm refers to this effect as market diversification, and the Market-Diversified Peak (“MDP”) measureis a portfolio aggregation of counterparty Peak measures, representing themaximum losses at the 97.5% confidence level that would occur if all coun-terparties defaulted under any one given market scenario and time frame.
Derivative Risk Equivalent (“DRE”) exposure is a measure that expresses the riskiness of derivative exposure on a basis intended to be equivalent tothe riskiness of loan exposures. The measurement is done by equating theunexpected loss in a derivative counterparty exposure (which takes into consideration both the loss volatility and the credit rating of the counterparty)with the unexpected loss in a loan exposure (which takes into considerationonly the credit rating of the counterparty). DRE is a less extreme measure of
potential credit loss than Peak and is the primary measure used by the Firmfor credit approval of derivative transactions.
Finally, Average exposure (“AVG”) is a measure of the expected MTM value of theFirm’s derivative receivables at future time periods, including the benefit ofcollateral. AVG exposure over the total life of the derivative contract is used asthe primary metric for pricing purposes and is used to calculate credit capitaland the Credit Valuation Adjustment (“CVA”), as further described below.Average exposure was $36 billion and $38 billion at December 31, 2005 and2004, respectively, compared with derivative receivables MTM net of otherhighly liquid collateral of $44 billion and $57 billion at December 31, 2005and 2004, respectively.
The graph below shows exposure profiles to derivatives over the next 10 years as calculated by the MDP, DRE and AVG metrics. All three measuresgenerally show declining exposure after the first year, if no new trades wereadded to the portfolio.
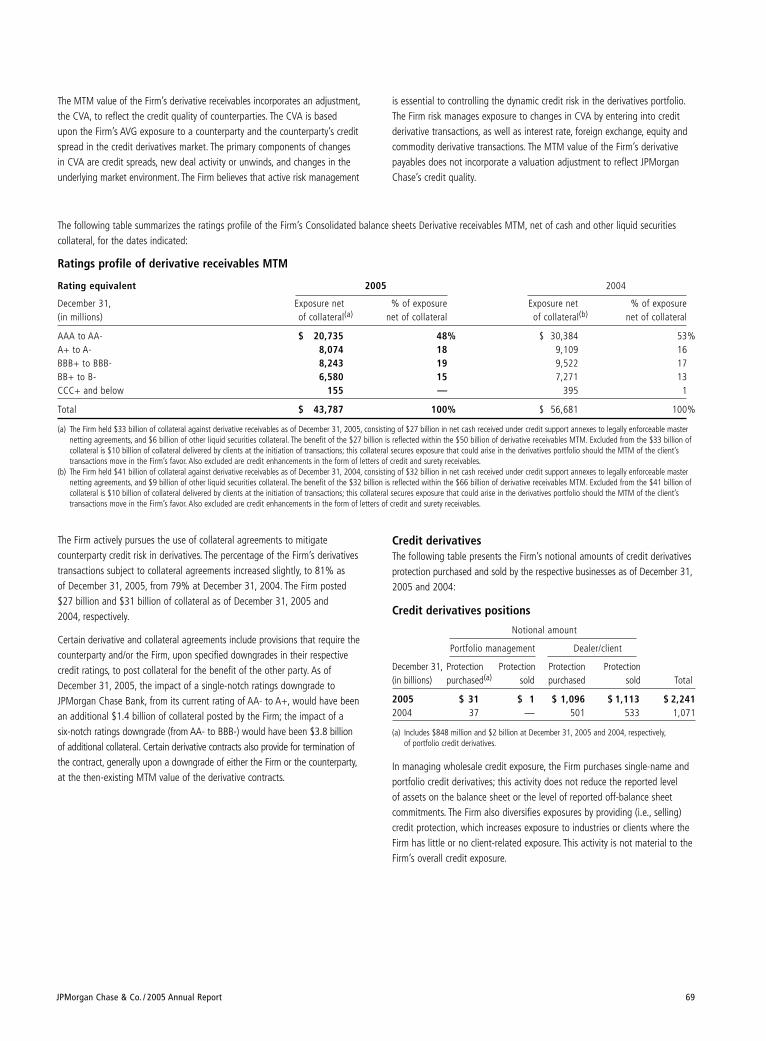
JPMorgan Chase & Co. / 2005 Annual Report 69
The Firm actively pursues the use of collateral agreements to mitigatecounterparty credit risk in derivatives. The percentage of the Firm’s derivativestransactions subject to collateral agreements increased slightly, to 81% as of December 31, 2005, from 79% at December 31, 2004. The Firm posted $27 billion and $31 billion of collateral as of December 31, 2005 and 2004, respectively.
Certain derivative and collateral agreements include provisions that require thecounterparty and/or the Firm, upon specified downgrades in their respectivecredit ratings, to post collateral for the benefit of the other party. As ofDecember 31, 2005, the impact of a single-notch ratings downgrade toJPMorgan Chase Bank, from its current rating of AA- to A+, would have beenan additional $1.4 billion of collateral posted by the Firm; the impact of a six-notch ratings downgrade (from AA- to BBB-) would have been $3.8 billionof additional collateral. Certain derivative contracts also provide for termination ofthe contract, generally upon a downgrade of either the Firm or the counterparty,at the then-existing MTM value of the derivative contracts.
Credit derivativesThe following table presents the Firm’s notional amounts of credit derivativesprotection purchased and sold by the respective businesses as of December 31,2005 and 2004:
Credit derivatives positions
Notional amount
Portfolio management Dealer/client
December 31, Protection Protection Protection Protection(in billions) purchased(a) sold purchased sold Total
2005 $ 31 $ 1 $ 1,096 $ 1,113 $ 2,2412004 37 — 501 533 1,071
(a) Includes $848 million and $2 billion at December 31, 2005 and 2004, respectively,of portfolio credit derivatives.
In managing wholesale credit exposure, the Firm purchases single-name andportfolio credit derivatives; this activity does not reduce the reported level of assets on the balance sheet or the level of reported off-balance sheet commitments. The Firm also diversifies exposures by providing (i.e., selling)credit protection, which increases exposure to industries or clients where theFirm has little or no client-related exposure. This activity is not material to theFirm’s overall credit exposure.
The following table summarizes the ratings profile of the Firm’s Consolidated balance sheets Derivative receivables MTM, net of cash and other liquid securities collateral, for the dates indicated:
Ratings profile of derivative receivables MTM
Rating equivalent 2005 2004
December 31, Exposure net % of exposure Exposure net % of exposure(in millions) of collateral(a) net of collateral of collateral(b) net of collateral
AAA to AA- $ 20,735 48% $ 30,384 53%A+ to A- 8,074 18 9,109 16BBB+ to BBB- 8,243 19 9,522 17BB+ to B- 6,580 15 7,271 13CCC+ and below 155 — 395 1
Total $ 43,787 100% $ 56,681 100%
(a) The Firm held $33 billion of collateral against derivative receivables as of December 31, 2005, consisting of $27 billion in net cash received under credit support annexes to legally enforceable masternetting agreements, and $6 billion of other liquid securities collateral. The benefit of the $27 billion is reflected within the $50 billion of derivative receivables MTM. Excluded from the $33 billion ofcollateral is $10 billion of collateral delivered by clients at the initiation of transactions; this collateral secures exposure that could arise in the derivatives portfolio should the MTM of the client’stransactions move in the Firm’s favor. Also excluded are credit enhancements in the form of letters of credit and surety receivables.
(b) The Firm held $41 billion of collateral against derivative receivables as of December 31, 2004, consisting of $32 billion in net cash received under credit support annexes to legally enforceable masternetting agreements, and $9 billion of other liquid securities collateral. The benefit of the $32 billion is reflected within the $66 billion of derivative receivables MTM. Excluded from the $41 billion ofcollateral is $10 billion of collateral delivered by clients at the initiation of transactions; this collateral secures exposure that could arise in the derivatives portfolio should the MTM of the client’stransactions move in the Firm’s favor. Also excluded are credit enhancements in the form of letters of credit and surety receivables.
The MTM value of the Firm’s derivative receivables incorporates an adjustment,the CVA, to reflect the credit quality of counterparties. The CVA is based upon the Firm’s AVG exposure to a counterparty and the counterparty’s creditspread in the credit derivatives market. The primary components of changes in CVA are credit spreads, new deal activity or unwinds, and changes in theunderlying market environment. The Firm believes that active risk management
is essential to controlling the dynamic credit risk in the derivatives portfolio.The Firm risk manages exposure to changes in CVA by entering into creditderivative transactions, as well as interest rate, foreign exchange, equity andcommodity derivative transactions. The MTM value of the Firm’s derivativepayables does not incorporate a valuation adjustment to reflect JPMorganChase’s credit quality.
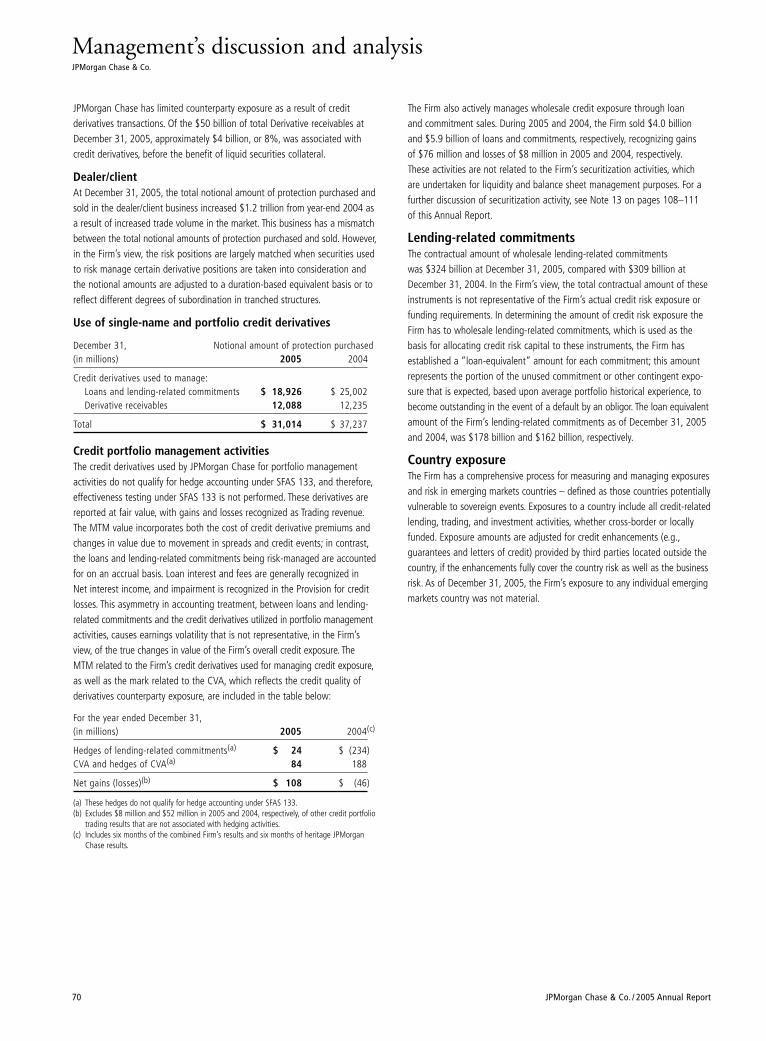
Management’s discussion and analysisJPMorgan Chase & Co.
70 JPMorgan Chase & Co. / 2005 Annual Report
JPMorgan Chase has limited counterparty exposure as a result of credit derivatives transactions. Of the $50 billion of total Derivative receivables atDecember 31, 2005, approximately $4 billion, or 8%, was associated withcredit derivatives, before the benefit of liquid securities collateral.
Dealer/clientAt December 31, 2005, the total notional amount of protection purchased andsold in the dealer/client business increased $1.2 trillion from year-end 2004 asa result of increased trade volume in the market. This business has a mismatchbetween the total notional amounts of protection purchased and sold. However,in the Firm’s view, the risk positions are largely matched when securities usedto risk manage certain derivative positions are taken into consideration andthe notional amounts are adjusted to a duration-based equivalent basis or toreflect different degrees of subordination in tranched structures.
Use of single-name and portfolio credit derivatives
December 31, Notional amount of protection purchased(in millions) 2005 2004
Credit derivatives used to manage:Loans and lending-related commitments $ 18,926 $ 25,002Derivative receivables 12,088 12,235
Total $ 31,014 $ 37,237
Credit portfolio management activitiesThe credit derivatives used by JPMorgan Chase for portfolio managementactivities do not qualify for hedge accounting under SFAS 133, and therefore,effectiveness testing under SFAS 133 is not performed. These derivatives arereported at fair value, with gains and losses recognized as Trading revenue.The MTM value incorporates both the cost of credit derivative premiums andchanges in value due to movement in spreads and credit events; in contrast,the loans and lending-related commitments being risk-managed are accountedfor on an accrual basis. Loan interest and fees are generally recognized in Net interest income, and impairment is recognized in the Provision for creditlosses. This asymmetry in accounting treatment, between loans and lending-related commitments and the credit derivatives utilized in portfolio managementactivities, causes earnings volatility that is not representative, in the Firm’sview, of the true changes in value of the Firm’s overall credit exposure. TheMTM related to the Firm’s credit derivatives used for managing credit exposure,as well as the mark related to the CVA, which reflects the credit quality ofderivatives counterparty exposure, are included in the table below:
For the year ended December 31,(in millions) 2005 2004(c)
Hedges of lending-related commitments(a) $ 24 $ (234)CVA and hedges of CVA(a) 84 188
Net gains (losses)(b) $ 108 $ (46)
(a) These hedges do not qualify for hedge accounting under SFAS 133.(b) Excludes $8 million and $52 million in 2005 and 2004, respectively, of other credit portfolio
trading results that are not associated with hedging activities.(c) Includes six months of the combined Firm’s results and six months of heritage JPMorgan
Chase results.
The Firm also actively manages wholesale credit exposure through loan and commitment sales. During 2005 and 2004, the Firm sold $4.0 billion and $5.9 billion of loans and commitments, respectively, recognizing gains of $76 million and losses of $8 million in 2005 and 2004, respectively.These activities are not related to the Firm’s securitization activities, which are undertaken for liquidity and balance sheet management purposes. For afurther discussion of securitization activity, see Note 13 on pages 108–111of this Annual Report.
Lending-related commitments The contractual amount of wholesale lending-related commitments was $324 billion at December 31, 2005, compared with $309 billion at December 31, 2004. In the Firm’s view, the total contractual amount of theseinstruments is not representative of the Firm’s actual credit risk exposure orfunding requirements. In determining the amount of credit risk exposure theFirm has to wholesale lending-related commitments, which is used as thebasis for allocating credit risk capital to these instruments, the Firm hasestablished a “loan-equivalent” amount for each commitment; this amountrepresents the portion of the unused commitment or other contingent expo-sure that is expected, based upon average portfolio historical experience, tobecome outstanding in the event of a default by an obligor. The loan equivalentamount of the Firm’s lending-related commitments as of December 31, 2005and 2004, was $178 billion and $162 billion, respectively.
Country exposure The Firm has a comprehensive process for measuring and managing exposuresand risk in emerging markets countries – defined as those countries potentiallyvulnerable to sovereign events. Exposures to a country include all credit-relatedlending, trading, and investment activities, whether cross-border or locallyfunded. Exposure amounts are adjusted for credit enhancements (e.g.,guarantees and letters of credit) provided by third parties located outside thecountry, if the enhancements fully cover the country risk as well as the businessrisk. As of December 31, 2005, the Firm’s exposure to any individual emergingmarkets country was not material.
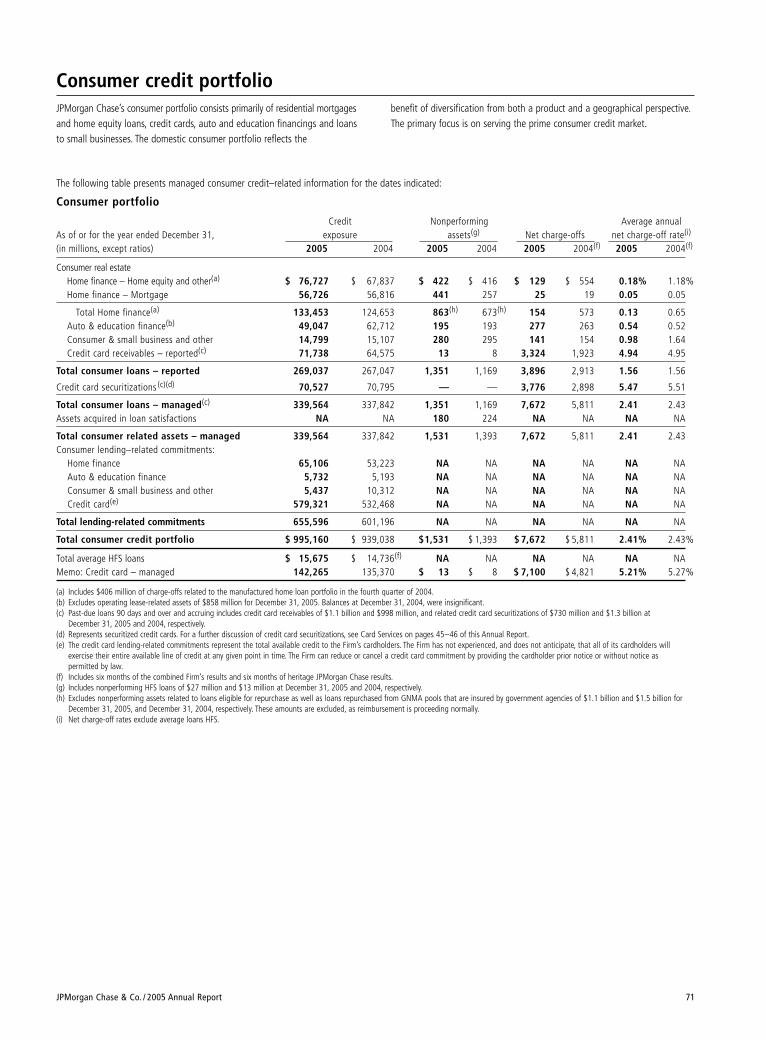
JPMorgan Chase & Co. / 2005 Annual Report 71
Consumer credit portfolio JPMorgan Chase’s consumer portfolio consists primarily of residential mortgagesand home equity loans, credit cards, auto and education financings and loansto small businesses. The domestic consumer portfolio reflects the
benefit of diversification from both a product and a geographical perspective.The primary focus is on serving the prime consumer credit market.
The following table presents managed consumer credit–related information for the dates indicated:
Consumer portfolio
Credit Nonperforming Average annualAs of or for the year ended December 31, exposure assets(g) Net charge-offs net charge-off rate(i)
(in millions, except ratios) 2005 2004 2005 2004 2005 2004(f) 2005 2004(f)
Consumer real estateHome finance – Home equity and other(a) $ 76,727 $ 67,837 $ 422 $ 416 $ 129 $ 554 0.18% 1.18%Home finance – Mortgage 56,726 56,816 441 257 25 19 0.05 0.05
Total Home finance(a) 133,453 124,653 863(h) 673(h) 154 573 0.13 0.65Auto & education finance(b) 49,047 62,712 195 193 277 263 0.54 0.52Consumer & small business and other 14,799 15,107 280 295 141 154 0.98 1.64Credit card receivables – reported(c) 71,738 64,575 13 8 3,324 1,923 4.94 4.95
Total consumer loans – reported 269,037 267,047 1,351 1,169 3,896 2,913 1.56 1.56
Credit card securitizations (c)(d) 70,527 70,795 — — 3,776 2,898 5.47 5.51
Total consumer loans – managed(c) 339,564 337,842 1,351 1,169 7,672 5,811 2.41 2.43Assets acquired in loan satisfactions NA NA 180 224 NA NA NA NA
Total consumer related assets – managed 339,564 337,842 1,531 1,393 7,672 5,811 2.41 2.43Consumer lending–related commitments:
Home finance 65,106 53,223 NA NA NA NA NA NAAuto & education finance 5,732 5,193 NA NA NA NA NA NAConsumer & small business and other 5,437 10,312 NA NA NA NA NA NACredit card(e) 579,321 532,468 NA NA NA NA NA NA
Total lending-related commitments 655,596 601,196 NA NA NA NA NA NA
Total consumer credit portfolio $ 995,160 $ 939,038 $1,531 $ 1,393 $ 7,672 $ 5,811 2.41% 2.43%
Total average HFS loans $ 15,675 $ 14,736(f) NA NA NA NA NA NAMemo: Credit card – managed 142,265 135,370 $ 13 $ 8 $ 7,100 $ 4,821 5.21% 5.27%
(a) Includes $406 million of charge-offs related to the manufactured home loan portfolio in the fourth quarter of 2004.(b) Excludes operating lease-related assets of $858 million for December 31, 2005. Balances at December 31, 2004, were insignificant.(c) Past-due loans 90 days and over and accruing includes credit card receivables of $1.1 billion and $998 million, and related credit card securitizations of $730 million and $1.3 billion at
December 31, 2005 and 2004, respectively.(d) Represents securitized credit cards. For a further discussion of credit card securitizations, see Card Services on pages 45–46 of this Annual Report.(e) The credit card lending-related commitments represent the total available credit to the Firm’s cardholders. The Firm has not experienced, and does not anticipate, that all of its cardholders will
exercise their entire available line of credit at any given point in time. The Firm can reduce or cancel a credit card commitment by providing the cardholder prior notice or without notice as permitted by law.
(f) Includes six months of the combined Firm’s results and six months of heritage JPMorgan Chase results.(g) Includes nonperforming HFS loans of $27 million and $13 million at December 31, 2005 and 2004, respectively.(h) Excludes nonperforming assets related to loans eligible for repurchase as well as loans repurchased from GNMA pools that are insured by government agencies of $1.1 billion and $1.5 billion for
December 31, 2005, and December 31, 2004, respectively. These amounts are excluded, as reimbursement is proceeding normally.(i) Net charge-off rates exclude average loans HFS.
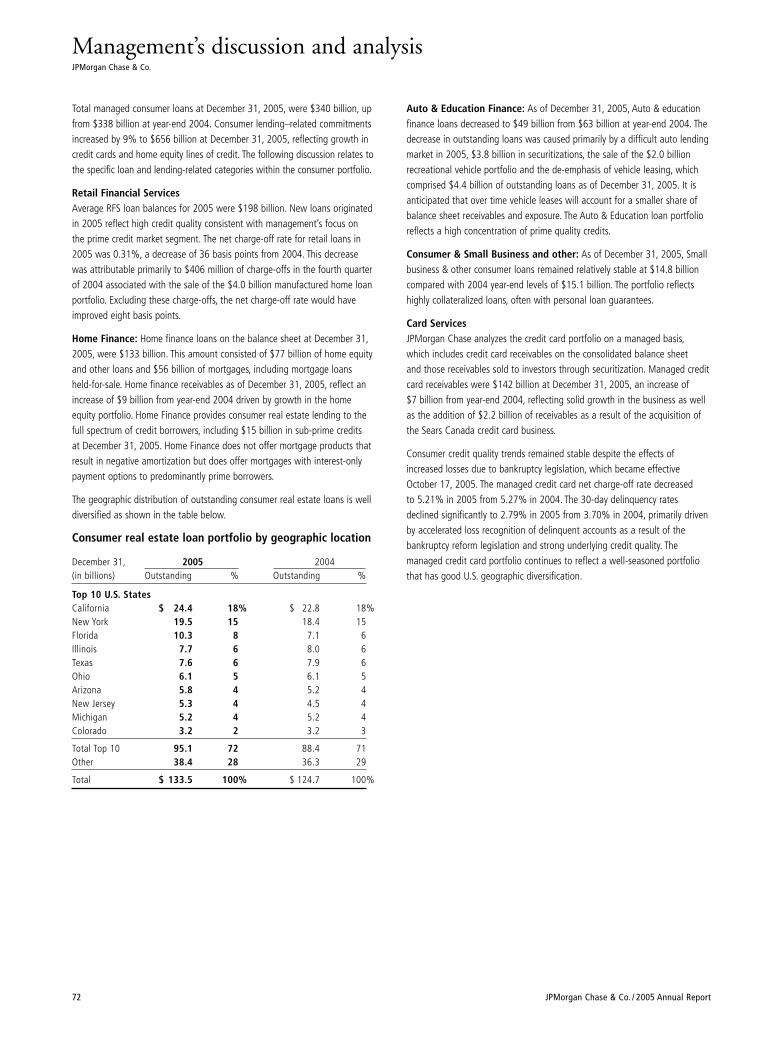
Management’s discussion and analysisJPMorgan Chase & Co.
72 JPMorgan Chase & Co. / 2005 Annual Report
Total managed consumer loans at December 31, 2005, were $340 billion, upfrom $338 billion at year-end 2004. Consumer lending–related commitmentsincreased by 9% to $656 billion at December 31, 2005, reflecting growth incredit cards and home equity lines of credit. The following discussion relates tothe specific loan and lending-related categories within the consumer portfolio.
Retail Financial ServicesAverage RFS loan balances for 2005 were $198 billion. New loans originated in 2005 reflect high credit quality consistent with management’s focus on the prime credit market segment. The net charge-off rate for retail loans in2005 was 0.31%, a decrease of 36 basis points from 2004. This decreasewas attributable primarily to $406 million of charge-offs in the fourth quarterof 2004 associated with the sale of the $4.0 billion manufactured home loanportfolio. Excluding these charge-offs, the net charge-off rate would haveimproved eight basis points.
Home Finance: Home finance loans on the balance sheet at December 31,2005, were $133 billion. This amount consisted of $77 billion of home equityand other loans and $56 billion of mortgages, including mortgage loans held-for-sale. Home finance receivables as of December 31, 2005, reflect anincrease of $9 billion from year-end 2004 driven by growth in the home equity portfolio. Home Finance provides consumer real estate lending to thefull spectrum of credit borrowers, including $15 billion in sub-prime credits at December 31, 2005. Home Finance does not offer mortgage products thatresult in negative amortization but does offer mortgages with interest-onlypayment options to predominantly prime borrowers.
The geographic distribution of outstanding consumer real estate loans is welldiversified as shown in the table below.
Consumer real estate loan portfolio by geographic location
December 31, 2005 2004(in billions) Outstanding % Outstanding %
Top 10 U.S. StatesCalifornia $ 24.4 18% $ 22.8 18%New York 19.5 15 18.4 15Florida 10.3 8 7.1 6Illinois 7.7 6 8.0 6Texas 7.6 6 7.9 6Ohio 6.1 5 6.1 5Arizona 5.8 4 5.2 4New Jersey 5.3 4 4.5 4Michigan 5.2 4 5.2 4Colorado 3.2 2 3.2 3
Total Top 10 95.1 72 88.4 71Other 38.4 28 36.3 29
Total $ 133.5 100% $ 124.7 100%
Auto & Education Finance: As of December 31, 2005, Auto & educationfinance loans decreased to $49 billion from $63 billion at year-end 2004. Thedecrease in outstanding loans was caused primarily by a difficult auto lendingmarket in 2005, $3.8 billion in securitizations, the sale of the $2.0 billionrecreational vehicle portfolio and the de-emphasis of vehicle leasing, whichcomprised $4.4 billion of outstanding loans as of December 31, 2005. It isanticipated that over time vehicle leases will account for a smaller share ofbalance sheet receivables and exposure. The Auto & Education loan portfolioreflects a high concentration of prime quality credits.
Consumer & Small Business and other: As of December 31, 2005, Smallbusiness & other consumer loans remained relatively stable at $14.8 billioncompared with 2004 year-end levels of $15.1 billion. The portfolio reflectshighly collateralized loans, often with personal loan guarantees.
Card ServicesJPMorgan Chase analyzes the credit card portfolio on a managed basis,which includes credit card receivables on the consolidated balance sheet and those receivables sold to investors through securitization. Managed creditcard receivables were $142 billion at December 31, 2005, an increase of $7 billion from year-end 2004, reflecting solid growth in the business as wellas the addition of $2.2 billion of receivables as a result of the acquisition ofthe Sears Canada credit card business.
Consumer credit quality trends remained stable despite the effects ofincreased losses due to bankruptcy legislation, which became effectiveOctober 17, 2005. The managed credit card net charge-off rate decreased to 5.21% in 2005 from 5.27% in 2004. The 30-day delinquency ratesdeclined significantly to 2.79% in 2005 from 3.70% in 2004, primarily drivenby accelerated loss recognition of delinquent accounts as a result of thebankruptcy reform legislation and strong underlying credit quality. The managed credit card portfolio continues to reflect a well-seasoned portfoliothat has good U.S. geographic diversification.
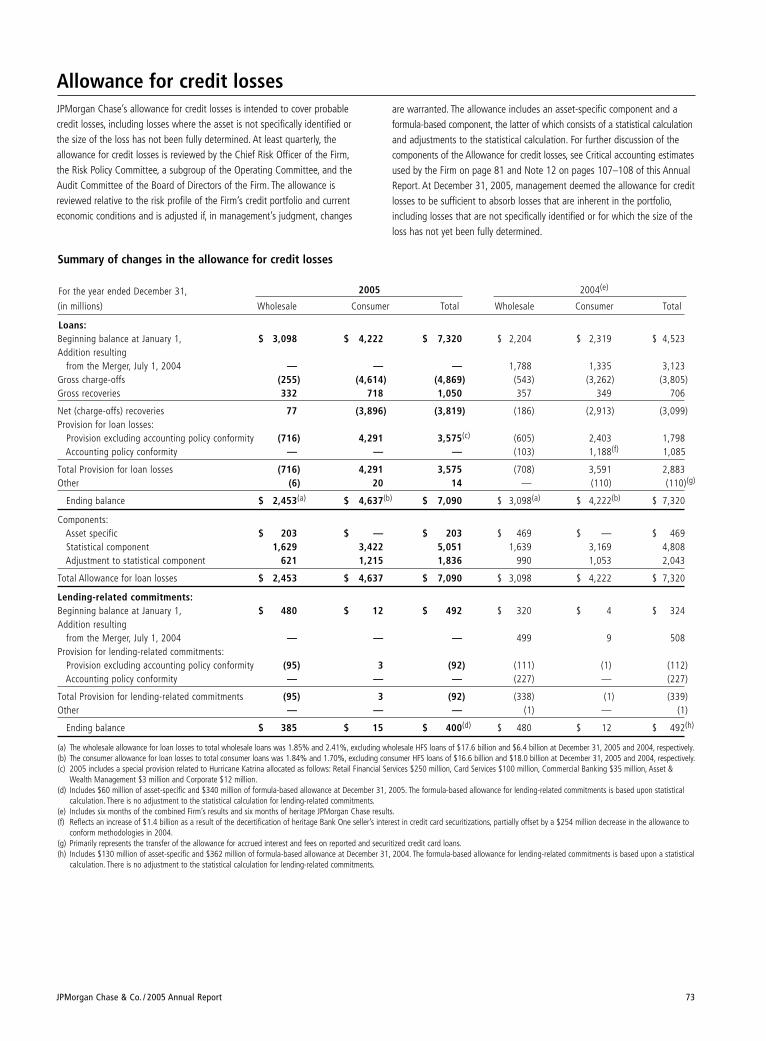
JPMorgan Chase & Co. / 2005 Annual Report 73
Summary of changes in the allowance for credit losses
For the year ended December 31, 2005 2004(e)
(in millions) Wholesale Consumer Total Wholesale Consumer Total
Loans:Beginning balance at January 1, $ 3,098 $ 4,222 $ 7,320 $ 2,204 $ 2,319 $ 4,523Addition resulting
from the Merger, July 1, 2004 — — — 1,788 1,335 3,123Gross charge-offs (255) (4,614) (4,869) (543) (3,262) (3,805)Gross recoveries 332 718 1,050 357 349 706
Net (charge-offs) recoveries 77 (3,896) (3,819) (186) (2,913) (3,099)Provision for loan losses:
Provision excluding accounting policy conformity (716) 4,291 3,575(c) (605) 2,403 1,798Accounting policy conformity — — — (103) 1,188(f) 1,085
Total Provision for loan losses (716) 4,291 3,575 (708) 3,591 2,883Other (6) 20 14 — (110) (110)(g)
Ending balance $ 2,453(a) $ 4,637(b) $ 7,090 $ 3,098(a) $ 4,222(b) $ 7,320
Components:Asset specific $ 203 $ — $ 203 $ 469 $ — $ 469Statistical component 1,629 3,422 5,051 1,639 3,169 4,808Adjustment to statistical component 621 1,215 1,836 990 1,053 2,043
Total Allowance for loan losses $ 2,453 $ 4,637 $ 7,090 $ 3,098 $ 4,222 $ 7,320
Lending-related commitments:Beginning balance at January 1, $ 480 $ 12 $ 492 $ 320 $ 4 $ 324Addition resulting
from the Merger, July 1, 2004 — — — 499 9 508Provision for lending-related commitments:
Provision excluding accounting policy conformity (95) 3 (92) (111) (1) (112)Accounting policy conformity — — — (227) — (227)
Total Provision for lending-related commitments (95) 3 (92) (338) (1) (339)Other — — — (1) — (1)
Ending balance $ 385 $ 15 $ 400(d) $ 480 $ 12 $ 492(h)
(a) The wholesale allowance for loan losses to total wholesale loans was 1.85% and 2.41%, excluding wholesale HFS loans of $17.6 billion and $6.4 billion at December 31, 2005 and 2004, respectively.(b) The consumer allowance for loan losses to total consumer loans was 1.84% and 1.70%, excluding consumer HFS loans of $16.6 billion and $18.0 billion at December 31, 2005 and 2004, respectively.(c) 2005 includes a special provision related to Hurricane Katrina allocated as follows: Retail Financial Services $250 million, Card Services $100 million, Commercial Banking $35 million, Asset &
Wealth Management $3 million and Corporate $12 million.(d) Includes $60 million of asset-specific and $340 million of formula-based allowance at December 31, 2005. The formula-based allowance for lending-related commitments is based upon statistical
calculation. There is no adjustment to the statistical calculation for lending-related commitments.(e) Includes six months of the combined Firm’s results and six months of heritage JPMorgan Chase results.(f) Reflects an increase of $1.4 billion as a result of the decertification of heritage Bank One seller’s interest in credit card securitizations, partially offset by a $254 million decrease in the allowance to
conform methodologies in 2004.(g) Primarily represents the transfer of the allowance for accrued interest and fees on reported and securitized credit card loans.(h) Includes $130 million of asset-specific and $362 million of formula-based allowance at December 31, 2004. The formula-based allowance for lending-related commitments is based upon a statistical
calculation. There is no adjustment to the statistical calculation for lending-related commitments.
Allowance for credit losses JPMorgan Chase’s allowance for credit losses is intended to cover probablecredit losses, including losses where the asset is not specifically identified orthe size of the loss has not been fully determined. At least quarterly, theallowance for credit losses is reviewed by the Chief Risk Officer of the Firm,the Risk Policy Committee, a subgroup of the Operating Committee, and theAudit Committee of the Board of Directors of the Firm. The allowance isreviewed relative to the risk profile of the Firm’s credit portfolio and currenteconomic conditions and is adjusted if, in management’s judgment, changes
are warranted. The allowance includes an asset-specific component and a formula-based component, the latter of which consists of a statistical calculationand adjustments to the statistical calculation. For further discussion of thecomponents of the Allowance for credit losses, see Critical accounting estimatesused by the Firm on page 81 and Note 12 on pages 107–108 of this AnnualReport. At December 31, 2005, management deemed the allowance for creditlosses to be sufficient to absorb losses that are inherent in the portfolio,including losses that are not specifically identified or for which the size of theloss has not yet been fully determined.
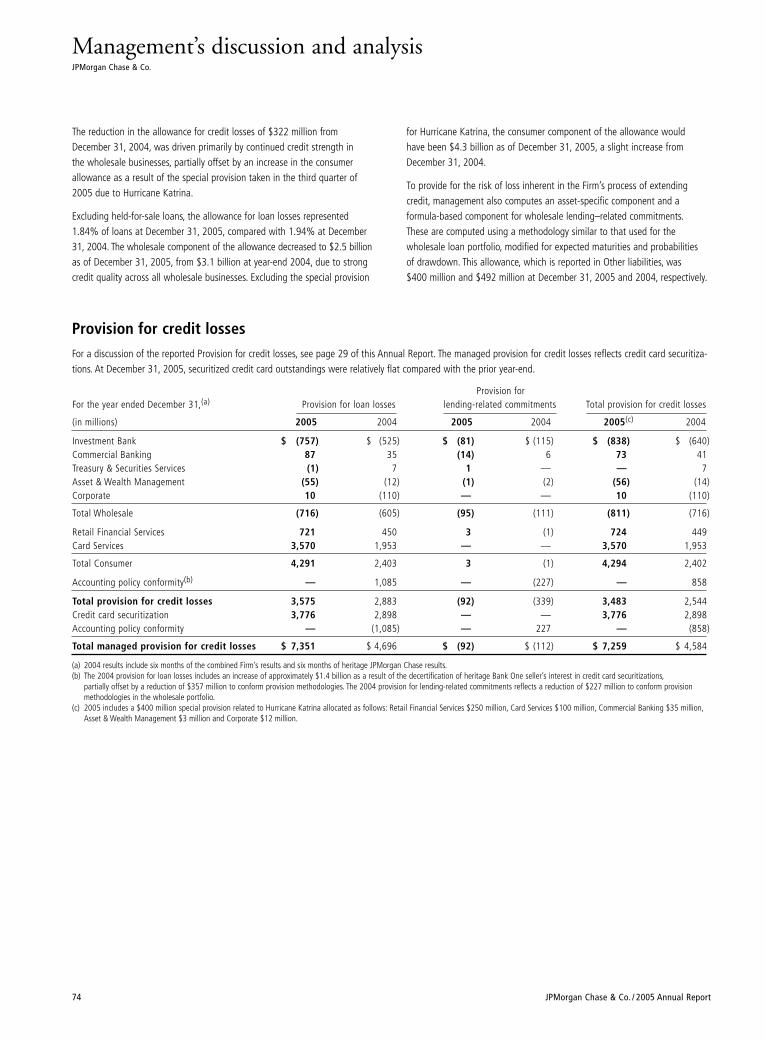
Management’s discussion and analysisJPMorgan Chase & Co.
74 JPMorgan Chase & Co. / 2005 Annual Report
The reduction in the allowance for credit losses of $322 million fromDecember 31, 2004, was driven primarily by continued credit strength in the wholesale businesses, partially offset by an increase in the consumerallowance as a result of the special provision taken in the third quarter of2005 due to Hurricane Katrina.
Excluding held-for-sale loans, the allowance for loan losses represented1.84% of loans at December 31, 2005, compared with 1.94% at December31, 2004. The wholesale component of the allowance decreased to $2.5 billionas of December 31, 2005, from $3.1 billion at year-end 2004, due to strongcredit quality across all wholesale businesses. Excluding the special provision
for Hurricane Katrina, the consumer component of the allowance would have been $4.3 billion as of December 31, 2005, a slight increase fromDecember 31, 2004.
To provide for the risk of loss inherent in the Firm’s process of extendingcredit, management also computes an asset-specific component and a formula-based component for wholesale lending–related commitments.These are computed using a methodology similar to that used for the wholesale loan portfolio, modified for expected maturities and probabilities of drawdown. This allowance, which is reported in Other liabilities, was $400 million and $492 million at December 31, 2005 and 2004, respectively.
Provision for credit lossesFor a discussion of the reported Provision for credit losses, see page 29 of this Annual Report. The managed provision for credit losses reflects credit card securitiza-tions. At December 31, 2005, securitized credit card outstandings were relatively flat compared with the prior year-end.
Provision forFor the year ended December 31,(a) Provision for loan losses lending-related commitments Total provision for credit losses
(in millions) 2005 2004 2005 2004 2005(c) 2004
Investment Bank $ (757) $ (525) $ (81) $ (115) $ (838) $ (640)Commercial Banking 87 35 (14) 6 73 41Treasury & Securities Services (1) 7 1 — — 7Asset & Wealth Management (55) (12) (1) (2) (56) (14)Corporate 10 (110) — — 10 (110)
Total Wholesale (716) (605) (95) (111) (811) (716)
Retail Financial Services 721 450 3 (1) 724 449Card Services 3,570 1,953 — — 3,570 1,953
Total Consumer 4,291 2,403 3 (1) 4,294 2,402
Accounting policy conformity(b) — 1,085 — (227) — 858
Total provision for credit losses 3,575 2,883 (92) (339) 3,483 2,544Credit card securitization 3,776 2,898 — — 3,776 2,898Accounting policy conformity — (1,085) — 227 — (858)
Total managed provision for credit losses $ 7,351 $ 4,696 $ (92) $ (112) $ 7,259 $ 4,584
(a) 2004 results include six months of the combined Firm’s results and six months of heritage JPMorgan Chase results.(b) The 2004 provision for loan losses includes an increase of approximately $1.4 billion as a result of the decertification of heritage Bank One seller’s interest in credit card securitizations,
partially offset by a reduction of $357 million to conform provision methodologies. The 2004 provision for lending-related commitments reflects a reduction of $227 million to conform provisionmethodologies in the wholesale portfolio.
(c) 2005 includes a $400 million special provision related to Hurricane Katrina allocated as follows: Retail Financial Services $250 million, Card Services $100 million, Commercial Banking $35 million,Asset & Wealth Management $3 million and Corporate $12 million.
JPMorgan Chase & Co. / 2005 Annual Report 75
Market risk management Market risk is the exposure to an adverse change in the market value of port-folios and financial instruments caused by a change in market prices or rates.
Market risk management Market Risk Management (“MRM”) is an independent corporate risk governancefunction that identifies, measures, monitors, and controls market risk. It seeksto facilitate efficient risk/return decisions and to reduce volatility in operatingperformance. It strives to make the Firm’s market risk profile transparent tosenior management, the Board of Directors and regulators. Market RiskManagement is overseen by the Chief Risk Officer, a member of the Firm’sOperating Committee. MRM’s governance structure consists of the following primary functions:
• Establishment of a comprehensive market risk policy framework• Independent measurement, monitoring and control
of business segment market risk• Definition, approval and monitoring of limits• Performance of stress testing and qualitative risk assessments
In addition, the Firm’s business segments have valuation control functions thatare responsible for ensuring the accuracy of the valuations of positions thatexpose the Firm to market risk. These groups report primarily into Finance.
Risk identification and classificationMRM works in partnership with the business segments to identify marketrisks throughout the Firm and to refine and monitor market risk policies andprocedures. All business segments are responsible for comprehensive identifi-cation and verification of market risks within their units. Risk-taking businesseshave functions that act independently from trading personnel and areresponsible for verifying risk exposures that the business takes. In addition to providing independent oversight for market risk arising from the businesssegments, MRM also is responsible for identifying exposures which may notbe large within individual business segments, but which may be large for theFirm in aggregate. Regular meetings are held between MRM and the heads ofrisk-taking businesses to discuss and decide on risk exposures in the contextof the market environment and client flows.
Positions that expose the Firm to market risk can be classified into two cate-gories: trading and nontrading risk. Trading risk includes positions that are heldby the Firm as part of a business segment or unit whose main business strategyis to trade or make markets. Unrealized gains and losses in these positions aregenerally reported in trading revenue. Nontrading risk includes securities heldfor longer term investment, mortgage servicing rights, and securities andderivatives used to manage the Firm’s asset/liability exposures. Unrealized gainsand losses in these positions are generally not reported in Trading revenue.
Trading riskFixed income risk (which includes interest rate risk and credit spread risk)involves the potential decline in net income or financial condition due toadverse changes in market rates, whether arising from client activities or proprietary positions taken by the Firm.
Foreign exchange, equities and commodities risks involve the potentialdecline in net income to the Firm due to adverse changes in foreignexchange, equities or commodities markets, whether arising from client activities or proprietary positions taken by the Firm.
Nontrading riskNontrading risk arises from execution of the Firm’s core business strategies,the delivery of products and services to its customers, and the discretionarypositions the Firm undertakes to risk-manage exposures.
These exposures can result from a variety of factors, including differences in the timing among the maturity or repricing of assets, liabilities and off–balance sheet instruments. Changes in the level and shape of marketinterest rate curves also may create interest rate risk, since the repricing characteristics of the Firm’s assets do not necessarily match those of its liabilities. The Firm also is exposed to basis risk, which is the difference in re-pricing characteristics of two floating rate indices, such as the prime rateand 3-month LIBOR. In addition, some of the Firm’s products have embeddedoptionality that impact pricing and balances.
The Firm’s mortgage banking activities also give rise to complex interest raterisks. The interest rate exposure from the Firm’s mortgage banking activities is a result of changes in the level of interest rates, option and basis risk.Option risk arises primarily from prepayment options embedded in mortgagesand changes in the probability of newly-originated mortgage commitmentsactually closing. Basis risk results from different relative movements betweenmortgage rates and other interest rates.
Risk measurementTools used to measure riskBecause no single measure can reflect all aspects of market risk, the Firmuses various metrics, both statistical and nonstatistical, including:
• Nonstatistical risk measures• Value-at-Risk (“VAR”)• Loss advisories• Economic value stress testing• Earnings-at-risk stress testing• Risk identification for large exposures (“RIFLE”)
Nonstatistical risk measuresNonstatistical risk measures other than stress testing include net open positions,basis point values, option sensitivities, market values, position concentrationsand position turnover. These measures provide granular information on theFirm’s market risk exposure. They are aggregated by line of business and by risktype, and are used for monitoring limits, one-off approvals and tactical control.
Value-at-risk JPMorgan Chase’s primary statistical risk measure, VAR, estimates the potentialloss from adverse market moves in an ordinary market environment and provides a consistent cross-business measure of risk profiles and levels ofdiversification. VAR is used for comparing risks across businesses, monitoringlimits, one-off approvals, and as an input to economic capital calculations.VAR provides risk transparency in a normal trading environment.
Each business day the Firm undertakes a comprehensive VAR calculation that includes both its trading and its nontrading activities. VAR for nontradingactivities measures the amount of potential change in fair value of the exposuresrelated to these activities; however, VAR for such activities is not a measure of reported revenue since nontrading activities are generally not marked tomarket through earnings.
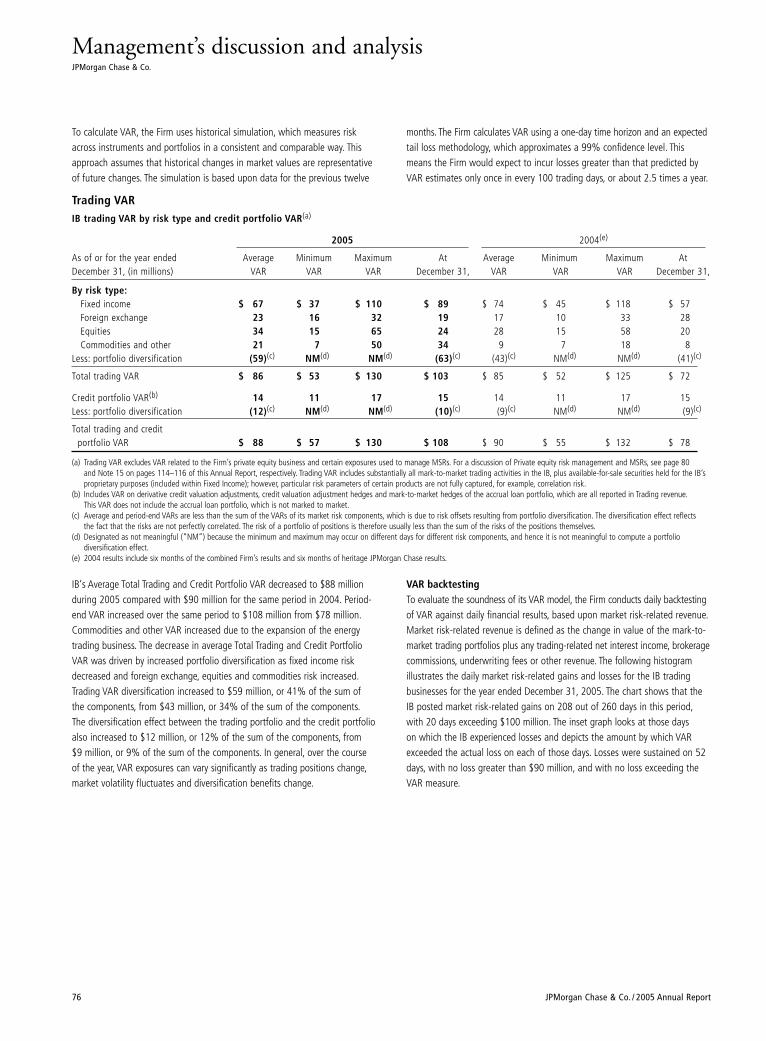
Management’s discussion and analysisJPMorgan Chase & Co.
76 JPMorgan Chase & Co. / 2005 Annual Report
To calculate VAR, the Firm uses historical simulation, which measures riskacross instruments and portfolios in a consistent and comparable way. Thisapproach assumes that historical changes in market values are representativeof future changes. The simulation is based upon data for the previous twelve
months. The Firm calculates VAR using a one-day time horizon and an expectedtail loss methodology, which approximates a 99% confidence level. Thismeans the Firm would expect to incur losses greater than that predicted byVAR estimates only once in every 100 trading days, or about 2.5 times a year.
Trading VARIB trading VAR by risk type and credit portfolio VAR(a)
2005 2004(e)
As of or for the year ended Average Minimum Maximum At Average Minimum Maximum At December 31, (in millions) VAR VAR VAR December 31, VAR VAR VAR December 31,
By risk type:Fixed income $ 67 $ 37 $ 110 $ 89 $ 74 $ 45 $ 118 $ 57Foreign exchange 23 16 32 19 17 10 33 28Equities 34 15 65 24 28 15 58 20Commodities and other 21 7 50 34 9 7 18 8
Less: portfolio diversification (59)(c) NM(d) NM(d) (63)(c) (43)(c) NM(d) NM(d) (41)(c)
Total trading VAR $ 86 $ 53 $ 130 $ 103 $ 85 $ 52 $ 125 $ 72
Credit portfolio VAR(b) 14 11 17 15 14 11 17 15Less: portfolio diversification (12)(c) NM(d) NM(d) (10)(c) (9)(c) NM(d) NM(d) (9)(c)
Total trading and creditportfolio VAR $ 88 $ 57 $ 130 $ 108 $ 90 $ 55 $ 132 $ 78
(a) Trading VAR excludes VAR related to the Firm’s private equity business and certain exposures used to manage MSRs. For a discussion of Private equity risk management and MSRs, see page 80and Note 15 on pages 114–116 of this Annual Report, respectively. Trading VAR includes substantially all mark-to-market trading activities in the IB, plus available-for-sale securities held for the IB’sproprietary purposes (included within Fixed Income); however, particular risk parameters of certain products are not fully captured, for example, correlation risk.
(b) Includes VAR on derivative credit valuation adjustments, credit valuation adjustment hedges and mark-to-market hedges of the accrual loan portfolio, which are all reported in Trading revenue.This VAR does not include the accrual loan portfolio, which is not marked to market.
(c) Average and period-end VARs are less than the sum of the VARs of its market risk components, which is due to risk offsets resulting from portfolio diversification. The diversification effect reflects the fact that the risks are not perfectly correlated. The risk of a portfolio of positions is therefore usually less than the sum of the risks of the positions themselves.
(d) Designated as not meaningful (“NM”) because the minimum and maximum may occur on different days for different risk components, and hence it is not meaningful to compute a portfolio diversification effect.
(e) 2004 results include six months of the combined Firm’s results and six months of heritage JPMorgan Chase results.
IB‘s Average Total Trading and Credit Portfolio VAR decreased to $88 millionduring 2005 compared with $90 million for the same period in 2004. Period-end VAR increased over the same period to $108 million from $78 million.Commodities and other VAR increased due to the expansion of the energytrading business. The decrease in average Total Trading and Credit PortfolioVAR was driven by increased portfolio diversification as fixed income riskdecreased and foreign exchange, equities and commodities risk increased.Trading VAR diversification increased to $59 million, or 41% of the sum ofthe components, from $43 million, or 34% of the sum of the components.The diversification effect between the trading portfolio and the credit portfolioalso increased to $12 million, or 12% of the sum of the components, from $9 million, or 9% of the sum of the components. In general, over the courseof the year, VAR exposures can vary significantly as trading positions change,market volatility fluctuates and diversification benefits change.
VAR backtestingTo evaluate the soundness of its VAR model, the Firm conducts daily backtestingof VAR against daily financial results, based upon market risk-related revenue.Market risk-related revenue is defined as the change in value of the mark-to-market trading portfolios plus any trading-related net interest income, brokeragecommissions, underwriting fees or other revenue. The following histogramillustrates the daily market risk-related gains and losses for the IB tradingbusinesses for the year ended December 31, 2005. The chart shows that theIB posted market risk-related gains on 208 out of 260 days in this period,with 20 days exceeding $100 million. The inset graph looks at those days on which the IB experienced losses and depicts the amount by which VARexceeded the actual loss on each of those days. Losses were sustained on 52days, with no loss greater than $90 million, and with no loss exceeding theVAR measure.
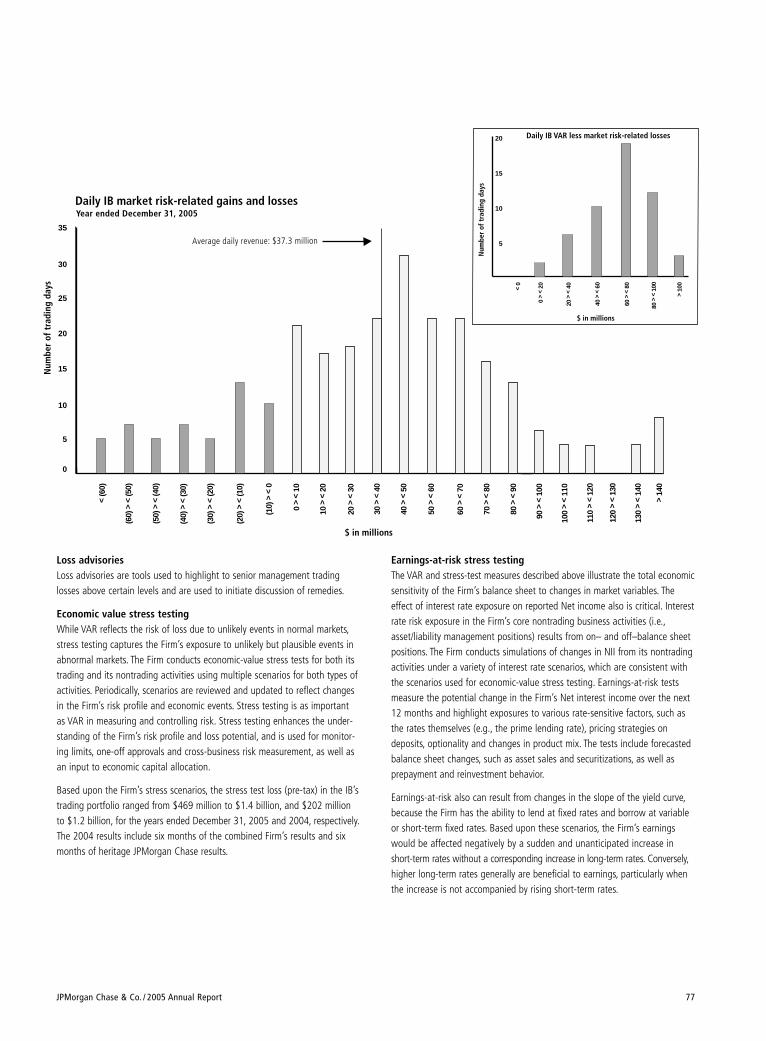
JPMorgan Chase & Co. / 2005 Annual Report 77
< (6
0)
(20)
> <
(10)
(10)
> <
0
0 >
< 10
10 >
< 2
0
20 >
< 3
0
30 >
< 4
0
40 >
< 5
0
50 >
< 6
0
60 >
< 7
0
70 >
< 8
0
80 >
< 9
0
90 >
< 1
00
100
> <
110
> 1
40
(30)
> <
(20)
(40)
> <
(30)
Daily IB market risk-related gains and losses Year ended December 31, 2005
Num
ber
of t
radi
ng d
ays
Average daily revenue: $37.3 million
0
5
10
15
20
25
30
35
$ in millions
5
10
15
20
< 0
0 >
< 20
20 >
< 4
0
40 >
< 6
0
60 >
< 8
0
> 1
00
$ in millions
Num
ber
of t
radi
ng d
ays
Daily IB VAR less market risk-related losses
80 >
< 1
00
110
> <
120
(60)
> <
(50)
(50)
> <
(40)
130
> <
140
120
> <
130
Loss advisoriesLoss advisories are tools used to highlight to senior management tradinglosses above certain levels and are used to initiate discussion of remedies.
Economic value stress testingWhile VAR reflects the risk of loss due to unlikely events in normal markets,stress testing captures the Firm’s exposure to unlikely but plausible events inabnormal markets. The Firm conducts economic-value stress tests for both itstrading and its nontrading activities using multiple scenarios for both types ofactivities. Periodically, scenarios are reviewed and updated to reflect changesin the Firm’s risk profile and economic events. Stress testing is as important as VAR in measuring and controlling risk. Stress testing enhances the under-standing of the Firm’s risk profile and loss potential, and is used for monitor-ing limits, one-off approvals and cross-business risk measurement, as well asan input to economic capital allocation.
Based upon the Firm’s stress scenarios, the stress test loss (pre-tax) in the IB’strading portfolio ranged from $469 million to $1.4 billion, and $202 millionto $1.2 billion, for the years ended December 31, 2005 and 2004, respectively.The 2004 results include six months of the combined Firm’s results and sixmonths of heritage JPMorgan Chase results.
Earnings-at-risk stress testingThe VAR and stress-test measures described above illustrate the total economicsensitivity of the Firm’s balance sheet to changes in market variables. Theeffect of interest rate exposure on reported Net income also is critical. Interestrate risk exposure in the Firm’s core nontrading business activities (i.e.,asset/liability management positions) results from on– and off–balance sheetpositions. The Firm conducts simulations of changes in NII from its nontradingactivities under a variety of interest rate scenarios, which are consistent withthe scenarios used for economic-value stress testing. Earnings-at-risk testsmeasure the potential change in the Firm’s Net interest income over the next12 months and highlight exposures to various rate-sensitive factors, such asthe rates themselves (e.g., the prime lending rate), pricing strategies ondeposits, optionality and changes in product mix. The tests include forecastedbalance sheet changes, such as asset sales and securitizations, as well as prepayment and reinvestment behavior.
Earnings-at-risk also can result from changes in the slope of the yield curve,because the Firm has the ability to lend at fixed rates and borrow at variableor short-term fixed rates. Based upon these scenarios, the Firm’s earningswould be affected negatively by a sudden and unanticipated increase inshort-term rates without a corresponding increase in long-term rates. Conversely,higher long-term rates generally are beneficial to earnings, particularly whenthe increase is not accompanied by rising short-term rates.
Management’s discussion and analysisJPMorgan Chase & Co.
78 JPMorgan Chase & Co. / 2005 Annual Report
Immediate changes in interest rates present a limited view of risk, and so anumber of alternative scenarios also are reviewed. These scenarios include theimplied forward curve, nonparallel rate shifts and severe interest rate shockson selected key rates. These scenarios are intended to provide a comprehensiveview of JPMorgan Chase’s earnings-at-risk over a wide range of outcomes.
JPMorgan Chase’s 12-month pre-tax earnings sensitivity profile as ofDecember 31, 2005 and 2004, follows:
Immediate change in rates
(in millions) +200bp +100bp -100bp
December 31, 2005 $ 265 $ 172 $ (162)December 31, 2004 (557) (164) (180)
The Firm’s risk to rising and falling interest rates is due primarily to correspon-ding increases and decreases in short-term funding costs.
RIFLEIndividuals who manage risk positions, particularly those that are complex,are responsible for identifying potential losses that could arise from specificunusual events, such as a potential tax change, and estimating the probabilitiesof losses arising from such events. This information is entered into the Firm’sRIFLE system and directed to the appropriate level of management, therebypermitting the Firm to identify further earnings vulnerability not adequatelycovered by standard risk measures.
Risk monitoring and controlLimitsMarket risk is controlled primarily through a series of limits. Limits reflect theFirm’s risk appetite in the context of the market environment and businessstrategy. In setting limits, the Firm takes into consideration factors such asmarket volatility, product liquidity, business track record and managementexperience.
MRM regularly reviews and updates risk limits, and senior managementreviews and approves risk limits at least once a year. MRM further controlsthe Firm’s exposure by specifically designating approved financial instrumentsand tenors, known as instrument authorities, for each business segment.
The Firm maintains different levels of limits. Corporate-level limits includeVAR, stress and loss advisories. Similarly, line of business limits include VAR,stress and loss advisories, and are supplemented by nonstatistical measure-
ments and instrument authorities. Businesses are responsible for adhering toestablished limits, against which exposures are monitored and reported. Limitbreaches are reported in a timely manner to senior management, and theaffected business segment is required to take appropriate action to reducetrading positions. If the business cannot do this within an acceptable timeframe,senior management is consulted on the appropriate action.
Qualitative reviewMRM also performs periodic reviews as necessary of both businesses andproducts with exposure to market risk in order to assess the ability of thebusinesses to control their market risk. Strategies, market conditions, productdetails and risk controls are reviewed, and specific recommendations forimprovements are made to management.
Model reviewSome of the Firm’s financial instruments cannot be valued based upon quotedmarket prices but are instead valued using pricing models. Such models areused for management of risk positions, such as reporting against limits, as wellas for valuation. The Model Risk Group, independent of the businesses andMRM, reviews the models the Firm uses and assesses model appropriatenessand consistency. The model reviews consider a number of factors about themodel’s suitability for valuation and risk management of a particular product,including whether it accurately reflects the characteristics of the transactionand its significant risks, the suitability and convergence properties of numericalalgorithms, reliability of data sources, consistency of the treatment with modelsfor similar products, and sensitivity to input parameters and assumptions thatcannot be priced from the market.
Reviews are conducted for new or changed models, as well as previouslyaccepted models, to assess whether there have been any changes in theproduct or market that may impact the model’s validity and whether there are theoretical or competitive developments that may require reassessment of the model’s adequacy. For a summary of valuations based upon models,see Critical Accounting Estimates used by the Firm on pages 81–83 of thisAnnual Report.
Risk reportingNonstatistical exposures, value-at-risk, loss advisories and limit excesses arereported daily for each trading and nontrading business. Market risk exposuretrends, value-at-risk trends, profit and loss changes, and portfolio concentra-tions are reported weekly. Stress test results are reported monthly to businessand senior management.
JPMorgan Chase & Co. / 2005 Annual Report 79
Operational risk management Operational risk is the risk of loss resulting from inadequate or failed processesor systems, human factors or external events.
OverviewOperational risk is inherent in each of the Firm’s businesses and supportactivities. Operational risk can manifest itself in various ways, including errors,business interruptions, inappropriate behavior of employees and vendors thatdo not perform in accordance with outsourcing arrangements. These events canpotentially result in financial losses and other damage to the Firm, includingreputational harm.
To monitor and control operational risk, the Firm maintains a system of com-prehensive policies and a control framework designed to provide a sound andwell-controlled operational environment. The goal is to keep operational risk atappropriate levels, in light of the Firm’s financial strength, the characteristicsof its businesses, the markets in which it operates, and the competitive andregulatory environment to which it is subject. Notwithstanding these control measures, the Firm incurs operational losses.
The Firm’s approach to operational risk management is intended to mitigate suchlosses by supplementing traditional control-based approaches to operationalrisk with risk measures, tools and disciplines that are risk-specific, consistentlyapplied and utilized firmwide. Key themes are transparency of information,escalation of key issues and accountability for issue resolution.
During 2005, the Firm substantially completed the implementation of Phoenix,a new internally-designed operational risk software tool. Phoenix integratesthe individual components of the operational risk management frameworkinto a unified, web-based tool. Phoenix is intended to enable the Firm toenhance its reporting and analysis of operational risk data by enabling riskidentification, measurement, monitoring, reporting and analysis to be done inan integrated manner, thereby enabling efficiencies in the Firm’s managementof its operational risk.
For purposes of identification, monitoring, reporting and analysis, the Firmcategorizes operational risk events as follows:
• Client service and selection• Business practices• Fraud, theft and malice• Execution, delivery and process management• Employee disputes• Disasters and public safety• Technology and infrastructure failures
Risk identification and measurementRisk identification is the recognition of the operational risk events that management believes may give rise to operational losses.
In 2005, JPMorgan Chase substantially completed a multi-year effort toredesign the underlying architecture of its firmwide self-assessment process.The goal of the self-assessment process is for each business to identify thekey operational risks specific to its environment and assess the degree towhich it maintains appropriate controls. Action plans are developed for control issues identified, and businesses are held accountable for tracking and resolving these issues on a timely basis.
All businesses were required to perform self-assessments in 2005. Going forward, the Firm will utilize the self-assessment process as a dynamic riskmanagement tool.
Risk monitoringThe Firm has a process for monitoring operational risk-event data, permittinganalysis of errors and losses as well as trends. Such analysis, performed bothat a line of business level and by risk-event type, enables identification of thecauses associated with risk events faced by the businesses. Where available,the internal data can be supplemented with external data for comparativeanalysis with industry patterns. The data reported will enable the Firm toback-test against self-assessment results.
Risk reporting and analysisOperational risk management reports provide timely and accurate information,including information about actual operational loss levels and self-assessmentresults, to the lines of business and senior management. The purpose of thesereports is to enable management to maintain operational risk at appropriatelevels within each line of business, to escalate issues and to provide consistentdata aggregation across the Firm’s businesses and support areas.
Audit alignment Internal Audit utilizes a risk-based program of audit coverage to provide anindependent assessment of the design and effectiveness of key controls overthe Firm’s operations, regulatory compliance and reporting. Audit partnerswith business management and members of the control community in providingguidance on the operational risk framework and reviewing the effectivenessand accuracy of the business self-assessment process as part of its businessunit audits.
Management’s discussion and analysisJPMorgan Chase & Co.
80 JPMorgan Chase & Co. / 2005 Annual Report
A firm’s success depends not only on its prudent management of liquidity,credit, market and operational risks that are part of its business risks, butequally on the maintenance among many constituents – clients, investors,regulators, as well as the general public – of a reputation for business practicesof the highest quality. Attention to reputation has always been a key aspectof the Firm’s practices, and maintenance of reputation is the responsibility ofeveryone at the Firm. JPMorgan Chase bolsters this individual responsibility in many ways, including through the Firm’s Code of Conduct, training, main-taining adherence to policies and procedures and oversight functions thatapprove transactions. These oversight functions include a Conflicts Office,which examines wholesale transactions with the potential to create conflictsof interest for the Firm.
Policy review officeThe Firm also has a specific structure to address certain transactions withclients, especially complex derivatives and structured finance transactions, thathave the potential to adversely affect its reputation. This structure reinforcesthe Firm’s procedures for examining transactions in terms of appropriateness,ethical issues and reputational risk, and it intensifies the Firm’s scrutiny of thepurpose and effect of its transactions from the client’s point of view, with thegoal that these transactions are not used to mislead investors or others.The structure operates at three levels: as part of every business’ transactionapproval process; through review by regional Reputation Risk Committees;and through oversight by the Policy Review Office.
Primary responsibility for adherence to the policies and procedures designed toaddress reputation risk lies with the business units conducting the transactionsin question. The Firm’s transaction approval process requires review from,among others, internal legal/compliance, conflicts, tax and accounting groups.Transactions involving an SPE established by the Firm receive particular scrutinyintended to ensure that every such entity is properly approved, documented,monitored and controlled.
Business units are also required to submit to regional Reputation RiskCommittees proposed transactions that may give rise to heightened reputationrisk – particularly a client’s motivation and its intended financial disclosure of thetransaction. The committees may approve, reject or require further clarification onor changes to the transactions. The members of these committees are seniorrepresentatives of the business and support units in the region. The committeesmay escalate transaction review to the Policy Review Office.
The Policy Review Office is the most senior approval level for client transactionsinvolving reputation risk issues. The mandate of the Office is to opine on specific transactions brought by the Regional Committees and considerchanges in policies or practices relating to reputation risk. The head of theOffice consults with the Firm’s most senior executives on specific topics andprovides regular updates. Aside from governance and guidance on specifictransactions, the objective of the policy review process is to reinforce a culture, through a “case study” approach, that ensures that all employees,regardless of seniority, understand the basic principles of reputation risk control and can recognize and address issues as they arise.
In 2006, this structure, which until now has been focused primarily onInvestment Bank activities, will be expanded to include the activities ofCommercial Banking and the Private Bank. These lines of business will implement training and review procedures similar to those in the InvestmentBank and their activities also will be subject to the oversight of the PolicyReview Office.
Fiduciary risk managementThe risk management committees within each line of business include in their mandate the oversight of the legal, reputational and, where appropriate,fiduciary risks in their businesses that may produce significant losses or reputational damage. The Fiduciary Risk Management function works with therelevant line of business risk committees to ensure that businesses providinginvestment or risk management products or services that give rise to fiduciaryduties to clients perform at the appropriate standard relative to their fiduciaryrelationship with a client. Of particular focus are the policies and practicesthat address a business’ responsibilities to a client, including client suitabilitydetermination, disclosure obligations, disclosure communications and performance expectations with respect to such of the investment and riskmanagement products or services being provided by the Firm that give rise tosuch fiduciary duties. In this way, the relevant line-of-business risk committees,together with the Fiduciary Risk Management function, provide oversight ofthe Firm’s efforts to monitor, measure and control the risks that may arise inthe delivery of the products or services to clients that give rise to such duties,as well as those stemming from any of the Firm’s fiduciary responsibilities toemployees under the Firm’s various employee benefit plans.
Reputation and fiduciary risk management
Private equity risk managementRisk managementThe Firm makes direct principal investments in private equity. The illiquid natureand long-term holding period associated with these investments differentiatesprivate equity risk from the risk of positions held in the trading portfolios.The Firm’s approach to managing private equity risk is consistent with theFirm’s general risk governance structure. Controls are in place establishingtarget levels for total and annual investment in order to control the overallsize of the portfolio. Industry and geographic concentration limits are in place
intended to ensure diversification of the portfolio, and periodic reviews areperformed on the portfolio to substantiate the valuations of the investments.The Valuation Control Group within the Finance area is responsible forreviewing the accuracy of the carrying values of private equity investmentsheld by Private Equity. At December 31, 2005, the carrying value of the privateequity portfolios of JPMorgan Partners and ONE Equity Partners businesseswas $6.2 billion, of which $479 million represented positions traded in thepublic market.
JPMorgan Chase & Co. / 2005 Annual Report 81
JPMorgan Chase’s accounting policies and use of estimates are integral tounderstanding its reported results. The Firm’s most complex accounting estimates require management’s judgment to ascertain the valuation ofassets and liabilities. The Firm has established detailed policies and controlprocedures intended to ensure that valuation methods, including any judgmentsmade as part of such methods, are well controlled, independently reviewedand applied consistently from period to period. In addition, the policies andprocedures are intended to ensure that the process for changing methodologiesoccurs in a controlled and appropriate manner. The Firm believes its estimatesfor determining the valuation of its assets and liabilities are appropriate. Thefollowing is a brief description of the Firm’s critical accounting estimatesinvolving significant valuation judgments.
Allowance for credit lossesJPMorgan Chase’s allowance for credit losses covers the wholesale and consumer loan portfolios as well as the Firm’s portfolio of wholesale lending-related commitments. The Allowance for loan losses is intended to adjust thevalue of the Firm’s loan assets for probable credit losses as of the balancesheet date. For a further discussion of the methodologies used in establishingthe Firm’s Allowance for credit losses, see Note 12 on pages 107–108 of thisAnnual Report.
Wholesale loans and lending-related commitmentsThe methodology for calculating both the Allowance for loan losses and theAllowance for lending-related commitments involves significant judgment.First and foremost, it involves the early identification of credits that are deteriorating. Second, it involves management judgment to derive loss factors.Third, it involves management judgment to evaluate certain macroeconomicfactors, underwriting standards, and other relevant internal and external factorsaffecting the credit quality of the current portfolio and to refine loss factors tobetter reflect these conditions.
The Firm uses a risk rating system to determine the credit quality of its wholesaleloans. Wholesale loans are reviewed for information affecting the obligor’sability to fulfill its obligations. In assessing the risk rating of a particular loan,among the factors considered include the obligor’s debt capacity and financialflexibility, the level of the obligor’s earnings, the amount and sources forrepayment, the level and nature of contingencies, management strength, andthe industry and geography in which the obligor operates. These factors arebased upon an evaluation of historical and current information, and involvesubjective assessment and interpretation. Emphasizing one factor over another,or considering additional factors that may be relevant in determining the riskrating of a particular loan but which are not currently an explicit part of the Firm’smethodology, could impact the risk rating assigned by the Firm to that loan.
Management applies its judgment to derive loss factors associated with eachcredit facility. These loss factors are determined by facility structure, collateraland type of obligor. Wherever possible, the Firm uses independent, verifiabledata or the Firm’s own historical loss experience in its models for estimatingthese loss factors. Many factors can affect management’s estimates of loss,including volatility of loss given default, probability of default and ratingmigrations. Judgment is applied to determine whether the loss given defaultshould be calculated as an average over the entire credit cycle or at a particularpoint in the credit cycle. The application of different loss given default factorswould change the amount of the Allowance for credit losses determinedappropriate by the Firm. Similarly, there are judgments as to which external
data on probability of default should be used and when they should be used.Choosing data that are not reflective of the Firm’s specific loan portfolio characteristics could also affect loss estimates.
Management also applies its judgment to adjust the loss factors derived,taking into consideration model imprecision, external factors and economicevents that have occurred but are not yet reflected in the loss factors. Theresultant adjustments to the statistical calculation on the performing portfolioare determined by creating estimated ranges using historical experience of bothloss given default and probability of default. Factors related to concentratedand deteriorating industries are also incorporated where relevant. The estimated ranges and the determination of the appropriate point within the range are based upon management’s view of uncertainties that relate to current macroeconomic and political conditions, quality of underwritingstandards and other relevant internal and external factors affecting the creditquality of the current portfolio. The adjustment to the statistical calculation for the wholesale loan portfolio for the period ended December 31, 2005, was$621 million, the higher-end within the range, based upon management’sassessment of current economic conditions.
Consumer loansFor scored loans in the consumer lines of business, loss is primarily determinedby applying statistical loss factors and other risk indicators to pools of loans byasset type. These loss estimates are sensitive to changes in delinquency status,credit bureau scores, the realizable value of collateral and other risk factors.
Adjustments to the statistical calculation are accomplished in part by analyzingthe historical loss experience for each major product segment. Managementanalyzes the range of credit loss experienced for each major portfolio segment,taking into account economic cycles, portfolio seasoning and underwriting criteria, and then formulates a range that incorporates relevant risk factors thatimpact overall credit performance. The recorded adjustment to the statisticalcalculation for the period ended December 31, 2005, was $1.2 billion, basedupon management’s assessment of current economic conditions.
Fair value of financial instruments A portion of JPMorgan Chase’s assets and liabilities are carried at fair value,including trading assets and liabilities, AFS securities and private equityinvestments. Held-for-sale loans, mortgage servicing rights (“MSRs”) andcommodities inventory are carried at the lower of fair value or cost. AtDecember 31, 2005, approximately $386 billion of the Firm’s assets wererecorded at fair value.
The fair value of a financial instrument is defined as the amount at which theinstrument could be exchanged in a current transaction between willing parties, other than in a forced or liquidation sale. The majority of the Firm’s assetsreported at fair value are based upon quoted market prices or on internally developed models that utilize independently sourced market parameters,including interest rate yield curves, option volatilities and currency rates.
The degree of management judgment involved in determining the fair valueof a financial instrument is dependent upon the availability of quoted marketprices or observable market parameters. For financial instruments that areactively traded and have quoted market prices or parameters readily available,there is little-to-no subjectivity in determining fair value. When observablemarket prices and parameters do not exist, management judgment is necessaryto estimate fair value. The valuation process takes into consideration
Critical accounting estimates used by the Firm
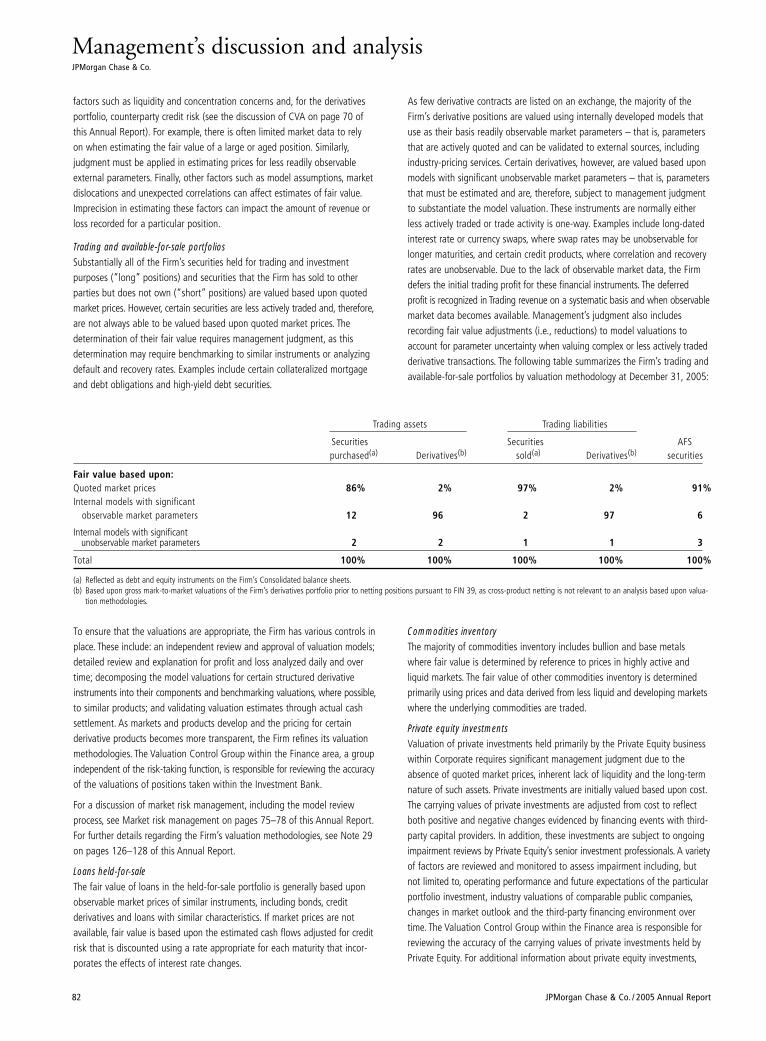
Management’s discussion and analysisJPMorgan Chase & Co.
82 JPMorgan Chase & Co. / 2005 Annual Report
factors such as liquidity and concentration concerns and, for the derivativesportfolio, counterparty credit risk (see the discussion of CVA on page 70 ofthis Annual Report). For example, there is often limited market data to rely on when estimating the fair value of a large or aged position. Similarly,judgment must be applied in estimating prices for less readily observableexternal parameters. Finally, other factors such as model assumptions, marketdislocations and unexpected correlations can affect estimates of fair value.Imprecision in estimating these factors can impact the amount of revenue orloss recorded for a particular position.
Trading and available-for-sale portfoliosSubstantially all of the Firm’s securities held for trading and investment purposes (“long” positions) and securities that the Firm has sold to other parties but does not own (“short” positions) are valued based upon quotedmarket prices. However, certain securities are less actively traded and, therefore,are not always able to be valued based upon quoted market prices. The determination of their fair value requires management judgment, as thisdetermination may require benchmarking to similar instruments or analyzingdefault and recovery rates. Examples include certain collateralized mortgageand debt obligations and high-yield debt securities.
As few derivative contracts are listed on an exchange, the majority of theFirm’s derivative positions are valued using internally developed models thatuse as their basis readily observable market parameters – that is, parametersthat are actively quoted and can be validated to external sources, includingindustry-pricing services. Certain derivatives, however, are valued based uponmodels with significant unobservable market parameters – that is, parametersthat must be estimated and are, therefore, subject to management judgmentto substantiate the model valuation. These instruments are normally eitherless actively traded or trade activity is one-way. Examples include long-datedinterest rate or currency swaps, where swap rates may be unobservable forlonger maturities, and certain credit products, where correlation and recoveryrates are unobservable. Due to the lack of observable market data, the Firmdefers the initial trading profit for these financial instruments. The deferred profit is recognized in Trading revenue on a systematic basis and when observablemarket data becomes available. Management’s judgment also includesrecording fair value adjustments (i.e., reductions) to model valuations toaccount for parameter uncertainty when valuing complex or less actively tradedderivative transactions. The following table summarizes the Firm’s trading andavailable-for-sale portfolios by valuation methodology at December 31, 2005:
Trading assets Trading liabilities
Securities Securities AFSpurchased(a) Derivatives(b) sold(a) Derivatives(b) securities
Fair value based upon:Quoted market prices 86% 2% 97% 2% 91%Internal models with significant
observable market parameters 12 96 2 97 6
Internal models with significantunobservable market parameters 2 2 1 1 3
Total 100% 100% 100% 100% 100%
(a) Reflected as debt and equity instruments on the Firm’s Consolidated balance sheets.(b) Based upon gross mark-to-market valuations of the Firm’s derivatives portfolio prior to netting positions pursuant to FIN 39, as cross-product netting is not relevant to an analysis based upon valua-
tion methodologies.
To ensure that the valuations are appropriate, the Firm has various controls inplace. These include: an independent review and approval of valuation models;detailed review and explanation for profit and loss analyzed daily and overtime; decomposing the model valuations for certain structured derivativeinstruments into their components and benchmarking valuations, where possible,to similar products; and validating valuation estimates through actual cashsettlement. As markets and products develop and the pricing for certain derivative products becomes more transparent, the Firm refines its valuationmethodologies. The Valuation Control Group within the Finance area, a groupindependent of the risk-taking function, is responsible for reviewing the accuracyof the valuations of positions taken within the Investment Bank.
For a discussion of market risk management, including the model reviewprocess, see Market risk management on pages 75–78 of this Annual Report.For further details regarding the Firm’s valuation methodologies, see Note 29on pages 126–128 of this Annual Report.
Loans held-for-saleThe fair value of loans in the held-for-sale portfolio is generally based uponobservable market prices of similar instruments, including bonds, credit derivatives and loans with similar characteristics. If market prices are notavailable, fair value is based upon the estimated cash flows adjusted for creditrisk that is discounted using a rate appropriate for each maturity that incor-porates the effects of interest rate changes.
Commodities inventoryThe majority of commodities inventory includes bullion and base metalswhere fair value is determined by reference to prices in highly active and liquid markets. The fair value of other commodities inventory is determinedprimarily using prices and data derived from less liquid and developing marketswhere the underlying commodities are traded.
Private equity investmentsValuation of private investments held primarily by the Private Equity businesswithin Corporate requires significant management judgment due to theabsence of quoted market prices, inherent lack of liquidity and the long-termnature of such assets. Private investments are initially valued based upon cost.The carrying values of private investments are adjusted from cost to reflectboth positive and negative changes evidenced by financing events with third-party capital providers. In addition, these investments are subject to ongoingimpairment reviews by Private Equity’s senior investment professionals. A varietyof factors are reviewed and monitored to assess impairment including, butnot limited to, operating performance and future expectations of the particularportfolio investment, industry valuations of comparable public companies,changes in market outlook and the third-party financing environment overtime. The Valuation Control Group within the Finance area is responsible forreviewing the accuracy of the carrying values of private investments held byPrivate Equity. For additional information about private equity investments,
JPMorgan Chase & Co. / 2005 Annual Report 83
see the Private equity risk management discussion on page 80 and Note 9 on pages 103–105 of this Annual Report.
MSRs and certain other retained interests in securitizationsMSRs and certain other retained interests from securitization activities do nottrade in an active, open market with readily observable prices. For example,sales of MSRs do occur, but the precise terms and conditions are typically notreadily available. Accordingly, the Firm estimates the fair value of MSRs andcertain other retained interests in securitizations using discounted future cashflow (DCF) models.
For MSRs, the model considers portfolio characteristics, contractually specifiedservicing fees and prepayment assumptions, delinquency rates, late charges,other ancillary revenues, costs to service and other economic factors. Duringthe fourth quarter of 2005, the Company began utilizing an option adjustedspread (“OAS”) valuation approach when determining the fair value of MSRs.This approach, when used in conjunction with the Firm’s proprietary prepaymentmodel, projects MSR cash flows over multiple interest rate scenarios, whichare then discounted at risk-adjusted rates, to estimate an expected fair valueof the MSRs. The OAS valuation approach is expected to provide improvedestimates of fair value. The initial valuation of MSRs under OAS did not havea material impact to the Firm’s financial statements.
For certain other retained interests in securitizations (such as interest onlystrips), a single interest rate path DCF model is used and generally includesassumptions based upon projected finance charges related to the securitizedassets, estimated net credit losses, prepayment assumptions, and contractualinterest paid to the third-party investors. Changes in the assumptions usedmay have a significant impact on the Firm’s valuation of retained interests.
For both MSRs and certain other retained interests in securitizations, the Firmcompares its fair value estimates and assumptions to observable market datawhere available and to recent market activity and actual portfolio experience.Management believes that the assumptions used to estimate fair values aresupportable and reasonable.
For a further discussion of the most significant assumptions used to valueretained interests in securitizations and MSRs, as well as the applicable stresstests for those assumptions, see Notes 13 and 15 on pages 108–111 and114–116, respectively, of this Annual Report.
Goodwill impairmentUnder SFAS 142, goodwill must be allocated to reporting units and tested forimpairment. The Firm tests goodwill for impairment at least annually or morefrequently if events or circumstances, such as adverse changes in the businessclimate, indicate that there may be justification for conducting an interim test.Impairment testing is performed at the reporting-unit level (which is generallyone level below the six major business segments identified in Note 31 onpages 130–131 of this Annual Report, plus Private Equity which is included in Corporate). The first part of the test is a comparison, at the reporting unitlevel, of the fair value of each reporting unit to its carrying amount, includinggoodwill. If the fair value is less than the carrying value, then the second partof the test is needed to measure the amount of potential goodwill impairment.The implied fair value of the reporting unit goodwill is calculated and comparedto the carrying amount of goodwill recorded in the Firm’s financial records.If the carrying value of reporting unit goodwill exceeds the implied fair valueof that goodwill, then the Firm would recognize an impairment loss in theamount of the difference, which would be recorded as a charge against Net income.
The fair values of the reporting units are determined using discounted cashflow models based upon each reporting unit’s internal forecasts. In addition,analysis using market-based trading and transaction multiples, where available,are used to assess the reasonableness of the valuations derived from the discounted cash flow models.
Goodwill was not impaired as of December 31, 2005 or 2004, nor was anygoodwill written off due to impairment during the years ended December 31,2005, 2004 and 2003. See Note 15 on page 114 of this Annual Report foradditional information related to the nature and accounting for goodwill andthe carrying values of goodwill by major business segment.
Accounting for income taxes – repatriation of foreign earningsunder the American Jobs Creation Act of 2004On October 22, 2004, the American Jobs Creation Act of 2004 (the “Act”) wassigned into law. The Act creates a temporary incentive for U.S. companies torepatriate accumulated foreign earnings at a substantially reduced U.S. effectivetax rate by providing a dividends received deduction on the repatriation ofcertain foreign earnings to the U.S. taxpayer (the “repatriation provision”).The new deduction is subject to a number of limitations and requirements.
In the fourth quarter of 2005, the Firm applied the repatriation provision to$1.9 billion of cash from foreign earnings, resulting in a net tax benefit of $55 million. The $1.9 billion of cash will be used in accordance with the Firm’sdomestic reinvestment plan pursuant to the guidelines set forth in the Act.
Accounting for share-based paymentsIn December 2004, the FASB issued SFAS 123R, which revises SFAS 123 andsupersedes APB 25. In March 2005, the Securities and Exchange Commission(“SEC”) issued SAB 107 which provides interpretive guidance on SFAS 123R.Accounting and reporting under SFAS 123R is generally similar to the SFAS123 approach. However, SFAS 123R requires all share-based payments to
employees, including grants of employee stock options, to be recognized inthe income statement based upon their fair values. Pro forma disclosure is nolonger an alternative. SFAS 123R permits adoption using one of two methods– modified prospective or modified retrospective. In April 2005, the SECapproved a new rule that, for public companies, delays the effective date ofSFAS 123R to no later than January 1, 2006. The Firm adopted SFAS 123R on January 1, 2006, under the modified prospective method.
The Firm continued to account for certain stock options that were outstandingas of December 31, 2002, under APB 25 using the intrinsic value method.Therefore, compensation expense for some previously granted awards thatwas not recognized under SFAS 123 will be recognized commencing January 1,2006, under SFAS 123R. Had the Firm adopted SFAS 123R in prior periods,the impact would have approximated that shown in the SFAS 123 pro formadisclosures in Note 7 on pages 100–102 of this Annual Report, which presentsnet income and earnings per share as if all outstanding awards wereaccounted for at fair value.
Prior to adopting SFAS 123R, the Firm’s accounting policy for share-basedpayment awards granted to retirement-eligible employees was to recognize
Accounting and reporting developments
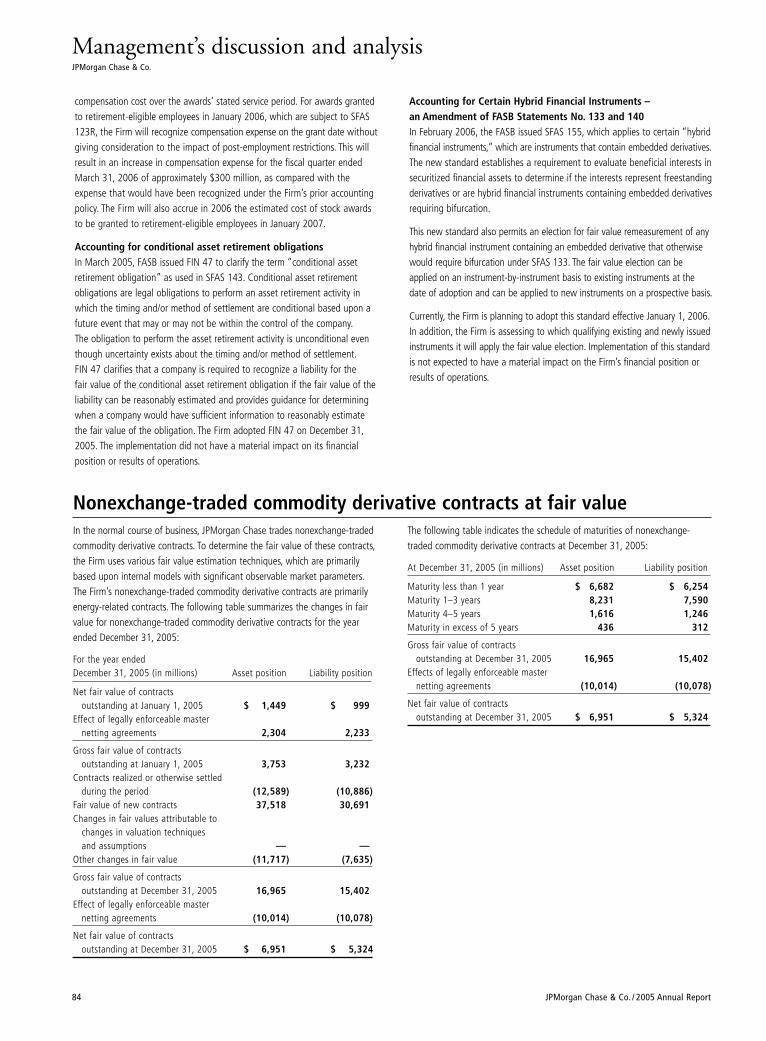
Management’s discussion and analysisJPMorgan Chase & Co.
84 JPMorgan Chase & Co. / 2005 Annual Report
In the normal course of business, JPMorgan Chase trades nonexchange-tradedcommodity derivative contracts. To determine the fair value of these contracts,the Firm uses various fair value estimation techniques, which are primarilybased upon internal models with significant observable market parameters.The Firm’s nonexchange-traded commodity derivative contracts are primarilyenergy-related contracts. The following table summarizes the changes in fairvalue for nonexchange-traded commodity derivative contracts for the yearended December 31, 2005:
For the year ended December 31, 2005 (in millions) Asset position Liability position
Net fair value of contracts outstanding at January 1, 2005 $ 1,449 $ 999
Effect of legally enforceable master netting agreements 2,304 2,233
Gross fair value of contracts outstanding at January 1, 2005 3,753 3,232
Contracts realized or otherwise settled during the period (12,589) (10,886)
Fair value of new contracts 37,518 30,691Changes in fair values attributable to
changes in valuation techniques and assumptions — —
Other changes in fair value (11,717) (7,635)
Gross fair value of contracts outstanding at December 31, 2005 16,965 15,402
Effect of legally enforceable master netting agreements (10,014) (10,078)
Net fair value of contracts outstanding at December 31, 2005 $ 6,951 $ 5,324
The following table indicates the schedule of maturities of nonexchange-traded commodity derivative contracts at December 31, 2005:
At December 31, 2005 (in millions) Asset position Liability position
Maturity less than 1 year $ 6,682 $ 6,254Maturity 1–3 years 8,231 7,590Maturity 4–5 years 1,616 1,246Maturity in excess of 5 years 436 312
Gross fair value of contracts outstanding at December 31, 2005 16,965 15,402
Effects of legally enforceable master netting agreements (10,014) (10,078)
Net fair value of contracts outstanding at December 31, 2005 $ 6,951 $ 5,324
Nonexchange-traded commodity derivative contracts at fair value
compensation cost over the awards’ stated service period. For awards grantedto retirement-eligible employees in January 2006, which are subject to SFAS123R, the Firm will recognize compensation expense on the grant date withoutgiving consideration to the impact of post-employment restrictions. This willresult in an increase in compensation expense for the fiscal quarter endedMarch 31, 2006 of approximately $300 million, as compared with theexpense that would have been recognized under the Firm’s prior accountingpolicy. The Firm will also accrue in 2006 the estimated cost of stock awardsto be granted to retirement-eligible employees in January 2007.
Accounting for conditional asset retirement obligationsIn March 2005, FASB issued FIN 47 to clarify the term “conditional assetretirement obligation” as used in SFAS 143. Conditional asset retirement obligations are legal obligations to perform an asset retirement activity inwhich the timing and/or method of settlement are conditional based upon afuture event that may or may not be within the control of the company.The obligation to perform the asset retirement activity is unconditional eventhough uncertainty exists about the timing and/or method of settlement.FIN 47 clarifies that a company is required to recognize a liability for the fair value of the conditional asset retirement obligation if the fair value of theliability can be reasonably estimated and provides guidance for determiningwhen a company would have sufficient information to reasonably estimatethe fair value of the obligation. The Firm adopted FIN 47 on December 31,2005. The implementation did not have a material impact on its financialposition or results of operations.
Accounting for Certain Hybrid Financial Instruments – an Amendment of FASB Statements No. 133 and 140In February 2006, the FASB issued SFAS 155, which applies to certain “hybridfinancial instruments,” which are instruments that contain embedded derivatives.The new standard establishes a requirement to evaluate beneficial interests insecuritized financial assets to determine if the interests represent freestandingderivatives or are hybrid financial instruments containing embedded derivativesrequiring bifurcation.
This new standard also permits an election for fair value remeasurement of anyhybrid financial instrument containing an embedded derivative that otherwisewould require bifurcation under SFAS 133. The fair value election can beapplied on an instrument-by-instrument basis to existing instruments at thedate of adoption and can be applied to new instruments on a prospective basis.
Currently, the Firm is planning to adopt this standard effective January 1, 2006.In addition, the Firm is assessing to which qualifying existing and newly issuedinstruments it will apply the fair value election. Implementation of this standardis not expected to have a material impact on the Firm’s financial position orresults of operations.
JPMorgan Chase & Co. / 2005 Annual Report 85
Management’s report on internal control over financial reportingJPMorgan Chase & Co.
Management of JPMorgan Chase & Co. is responsible for establishing andmaintaining adequate internal control over financial reporting. Internal controlover financial reporting is a process designed by, or under the supervision of, the Firm’s principal executive, principal operating and principal financialofficers, or persons performing similar functions, and effected by JPMorganChase’s board of directors, management and other personnel, to provide reasonable assurance regarding the reliability of financial reporting and thepreparation of financial statements for external purposes in accordance withaccounting principles generally accepted in the United States of America.
JPMorgan Chase’s internal control over financial reporting includes those policies and procedures that (1) pertain to the maintenance of records, that, inreasonable detail, accurately and fairly reflect the transactions and dispositionsof the Firm’s assets; (2) provide reasonable assurance that transactions arerecorded as necessary to permit preparation of financial statements in accor-dance with generally accepted accounting principles, and that receipts andexpenditures of the Firm are being made only in accordance with authorizationsof JPMorgan Chase’s management and directors; and (3) provide reasonableassurance regarding prevention or timely detection of unauthorized acquisition,use or disposition of the Firm’s assets that could have a material effect on thefinancial statements.
Because of its inherent limitations, internal control over financial reportingmay not prevent or detect misstatements. Also, projections of any evaluationof effectiveness to future periods are subject to the risk that controls maybecome inadequate because of changes in conditions, or that the degree of compliance with the policies or procedures may deteriorate.
Management has completed an assessment of the effectiveness of the Firm’sinternal control over financial reporting as of December 31, 2005. In makingthe assessment, management used the framework in “Internal Control –Integrated Framework” promulgated by the Committee of SponsoringOrganizations of the Treadway Commission, commonly referred to as the“COSO” criteria.
Based upon the assessment performed, management concluded that as ofDecember 31, 2005, JPMorgan Chase’s internal control over financial reportingwas effective based upon the COSO criteria. Additionally, based upon manage-ment’s assessment, the Firm determined that there were no material weak-nesses in its internal control over financial reporting as of December 31, 2005.
Management’s assessment of the effectiveness of the Firm’s internal controlover financial reporting as of December 31, 2005 has been audited byPricewaterhouseCoopers LLP, JPMorgan Chase’s independent registered publicaccounting firm, who also audited the Firm’s financial statements as of andfor the year ended December 31, 2005, as stated in their report which isincluded herein.
William B. Harrison, Jr.Chairman of the Board
James DimonPresident and Chief Executive Officer
Michael J. CavanaghExecutive Vice President and Chief Financial Officer
February 24, 2006
86 JPMorgan Chase & Co. / 2005 Annual Report
Report of Independent Registered Public Accounting FirmTo the Board of Directors and Stockholders of JPMorgan Chase & Co.:
We have completed integrated audits of JPMorgan Chase & Co.’s 2005 and2004 consolidated financial statements and of its internal control over financial reporting as of December 31, 2005, and an audit of its 2003 consolidated financial statements in accordance with the standards of thePublic Company Accounting Oversight Board (United States). Our opinions on JPMorgan Chase & Co.’s 2005, 2004, and 2003 consolidated financialstatements and on its internal control over financial reporting as of December31, 2005, based on our audits, are presented below.
Consolidated financial statementsIn our opinion, the accompanying consolidated balance sheets and the relatedconsolidated statements of income, changes in stockholders’ equity and cashflows present fairly, in all material respects, the financial position of theJPMorgan Chase & Co. and its subsidiaries (the “Company”) at December 31,2005 and 2004, and the results of their operations and their cash flows foreach of the three years in the period ended December 31, 2005 in conformitywith accounting principles generally accepted in the United States of America.These financial statements are the responsibility of the Company’s management.Our responsibility is to express an opinion on these financial statements basedon our audits. We conducted our audits of these statements in accordancewith the standards of the Public Company Accounting Oversight Board(United States). Those standards require that we plan and perform the auditto obtain reasonable assurance about whether the financial statements arefree of material misstatement. An audit of financial statements includesexamining, on a test basis, evidence supporting the amounts and disclosuresin the financial statements, assessing the accounting principles used and significant estimates made by management, and evaluating the overall financial statement presentation. We believe that our audits provide a reasonable basis for our opinion.
Internal control over financial reportingAlso, in our opinion, management’s assessment, included in the accompanyingManagement’s report on internal control over financial reporting, that the Company maintained effective internal control over financial reporting as of December 31, 2005 based on criteria established in Internal Control –Integrated Framework issued by the Committee of Sponsoring Organizationsof the Treadway Commission (COSO), is fairly stated, in all material respects,based on those criteria. Furthermore, in our opinion, the Company maintained,in all material respects, effective internal control over financial reporting as of
PRICEWATERHOUSECOOPERS LLP • 300 MADISON AVENUE • NEW YORK, NY 10017
December 31, 2005, based on criteria established in Internal Control –Integrated Framework issued by the COSO. The Company’s management isresponsible for maintaining effective internal control over financial reportingand for its assessment of the effectiveness of internal control over financialreporting. Our responsibility is to express opinions on management’s assess-ment and on the effectiveness of the Company’s internal control over financialreporting based on our audit. We conducted our audit of internal control overfinancial reporting in accordance with the standards of the Public CompanyAccounting Oversight Board (United States). Those standards require that weplan and perform the audit to obtain reasonable assurance about whethereffective internal control over financial reporting was maintained in all materialrespects. An audit of internal control over financial reporting includes obtainingan understanding of internal control over financial reporting, evaluating management’s assessment, testing and evaluating the design and operatingeffectiveness of internal control, and performing such other procedures as weconsider necessary in the circumstances. We believe that our audit provides areasonable basis for our opinions.
A company’s internal control over financial reporting is a process designed to provide reasonable assurance regarding the reliability of financial reportingand the preparation of financial statements for external purposes in accor-dance with generally accepted accounting principles. A company’s internalcontrol over financial reporting includes those policies and procedures that (i) pertain to the maintenance of records that, in reasonable detail, accuratelyand fairly reflect the transactions and dispositions of the assets of the company;(ii) provide reasonable assurance that transactions are recorded as necessaryto permit preparation of financial statements in accordance with generallyaccepted accounting principles, and that receipts and expenditures of thecompany are being made only in accordance with authorizations of manage-ment and directors of the company; and (iii) provide reasonable assuranceregarding prevention or timely detection of unauthorized acquisition, use, ordisposition of the company’s assets that could have a material effect on thefinancial statements.
Because of its inherent limitations, internal control over financial reportingmay not prevent or detect misstatements. Also, projections of any evaluationof effectiveness to future periods are subject to the risk that controls maybecome inadequate because of changes in conditions, or that the degree ofcompliance with the policies or procedures may deteriorate.
February 24, 2006
Report of independent registered public accounting firmJPMorgan Chase & Co.
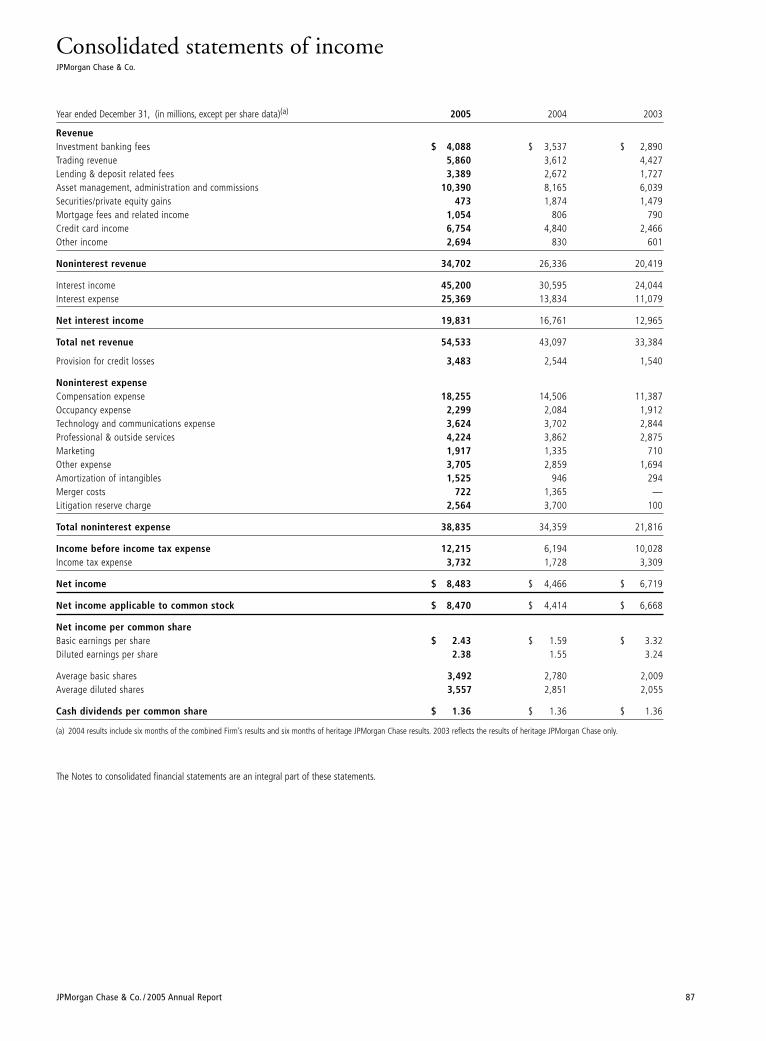
JPMorgan Chase & Co. / 2005 Annual Report 87
Consolidated statements of incomeJPMorgan Chase & Co.
Year ended December 31, (in millions, except per share data)(a) 2005 2004 2003
RevenueInvestment banking fees $ 4,088 $ 3,537 $ 2,890Trading revenue 5,860 3,612 4,427Lending & deposit related fees 3,389 2,672 1,727Asset management, administration and commissions 10,390 8,165 6,039Securities/private equity gains 473 1,874 1,479Mortgage fees and related income 1,054 806 790Credit card income 6,754 4,840 2,466Other income 2,694 830 601
Noninterest revenue 34,702 26,336 20,419
Interest income 45,200 30,595 24,044Interest expense 25,369 13,834 11,079
Net interest income 19,831 16,761 12,965
Total net revenue 54,533 43,097 33,384
Provision for credit losses 3,483 2,544 1,540
Noninterest expenseCompensation expense 18,255 14,506 11,387Occupancy expense 2,299 2,084 1,912Technology and communications expense 3,624 3,702 2,844Professional & outside services 4,224 3,862 2,875Marketing 1,917 1,335 710Other expense 3,705 2,859 1,694Amortization of intangibles 1,525 946 294Merger costs 722 1,365 —Litigation reserve charge 2,564 3,700 100
Total noninterest expense 38,835 34,359 21,816
Income before income tax expense 12,215 6,194 10,028Income tax expense 3,732 1,728 3,309
Net income $ 8,483 $ 4,466 $ 6,719
Net income applicable to common stock $ 8,470 $ 4,414 $ 6,668
Net income per common shareBasic earnings per share $ 2.43 $ 1.59 $ 3.32Diluted earnings per share 2.38 1.55 3.24
Average basic shares 3,492 2,780 2,009Average diluted shares 3,557 2,851 2,055
Cash dividends per common share $ 1.36 $ 1.36 $ 1.36
(a) 2004 results include six months of the combined Firm’s results and six months of heritage JPMorgan Chase results. 2003 reflects the results of heritage JPMorgan Chase only.
The Notes to consolidated financial statements are an integral part of these statements.
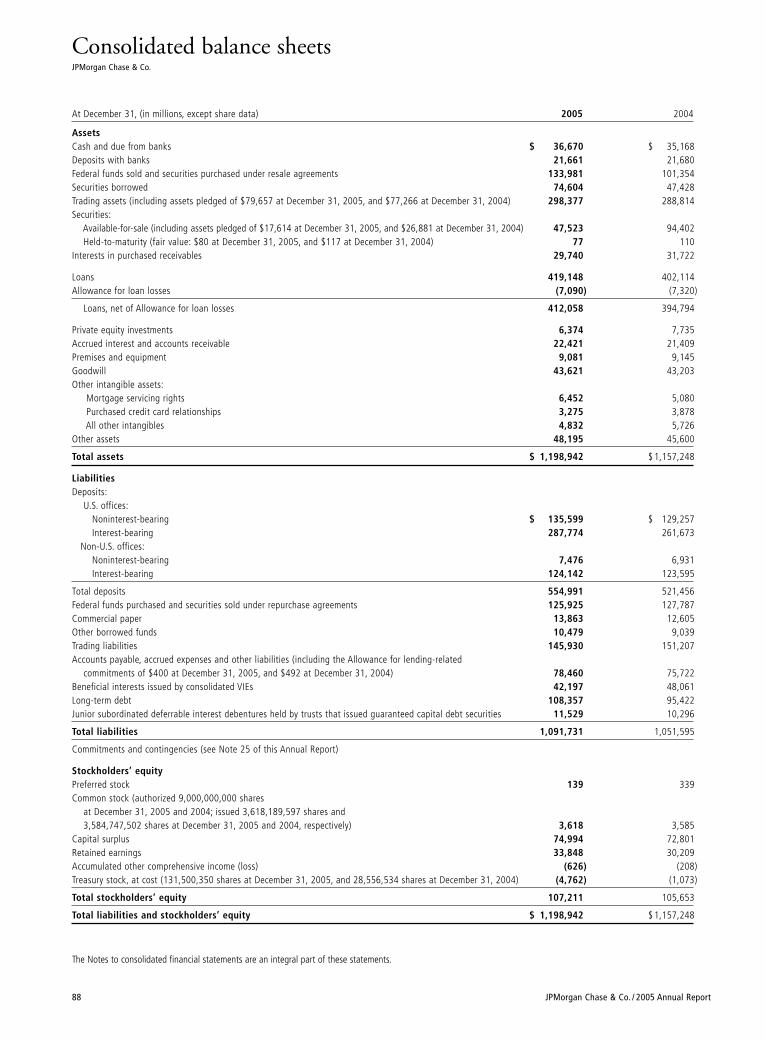
88 JPMorgan Chase & Co. / 2005 Annual Report
Consolidated balance sheetsJPMorgan Chase & Co.
At December 31, (in millions, except share data) 2005 2004
AssetsCash and due from banks $ 36,670 $ 35,168Deposits with banks 21,661 21,680Federal funds sold and securities purchased under resale agreements 133,981 101,354Securities borrowed 74,604 47,428Trading assets (including assets pledged of $79,657 at December 31, 2005, and $77,266 at December 31, 2004) 298,377 288,814Securities:
Available-for-sale (including assets pledged of $17,614 at December 31, 2005, and $26,881 at December 31, 2004) 47,523 94,402Held-to-maturity (fair value: $80 at December 31, 2005, and $117 at December 31, 2004) 77 110
Interests in purchased receivables 29,740 31,722
Loans 419,148 402,114Allowance for loan losses (7,090) (7,320)
Loans, net of Allowance for loan losses 412,058 394,794
Private equity investments 6,374 7,735Accrued interest and accounts receivable 22,421 21,409Premises and equipment 9,081 9,145Goodwill 43,621 43,203Other intangible assets:
Mortgage servicing rights 6,452 5,080Purchased credit card relationships 3,275 3,878All other intangibles 4,832 5,726
Other assets 48,195 45,600
Total assets $ 1,198,942 $ 1,157,248
LiabilitiesDeposits:
U.S. offices:Noninterest-bearing $ 135,599 $ 129,257Interest-bearing 287,774 261,673
Non-U.S. offices:Noninterest-bearing 7,476 6,931Interest-bearing 124,142 123,595
Total deposits 554,991 521,456Federal funds purchased and securities sold under repurchase agreements 125,925 127,787Commercial paper 13,863 12,605Other borrowed funds 10,479 9,039Trading liabilities 145,930 151,207Accounts payable, accrued expenses and other liabilities (including the Allowance for lending-related
commitments of $400 at December 31, 2005, and $492 at December 31, 2004) 78,460 75,722Beneficial interests issued by consolidated VIEs 42,197 48,061Long-term debt 108,357 95,422Junior subordinated deferrable interest debentures held by trusts that issued guaranteed capital debt securities 11,529 10,296
Total liabilities 1,091,731 1,051,595
Commitments and contingencies (see Note 25 of this Annual Report)
Stockholders’ equityPreferred stock 139 339Common stock (authorized 9,000,000,000 shares
at December 31, 2005 and 2004; issued 3,618,189,597 shares and3,584,747,502 shares at December 31, 2005 and 2004, respectively) 3,618 3,585
Capital surplus 74,994 72,801Retained earnings 33,848 30,209Accumulated other comprehensive income (loss) (626) (208)Treasury stock, at cost (131,500,350 shares at December 31, 2005, and 28,556,534 shares at December 31, 2004) (4,762) (1,073)
Total stockholders’ equity 107,211 105,653
Total liabilities and stockholders’ equity $ 1,198,942 $ 1,157,248
The Notes to consolidated financial statements are an integral part of these statements.
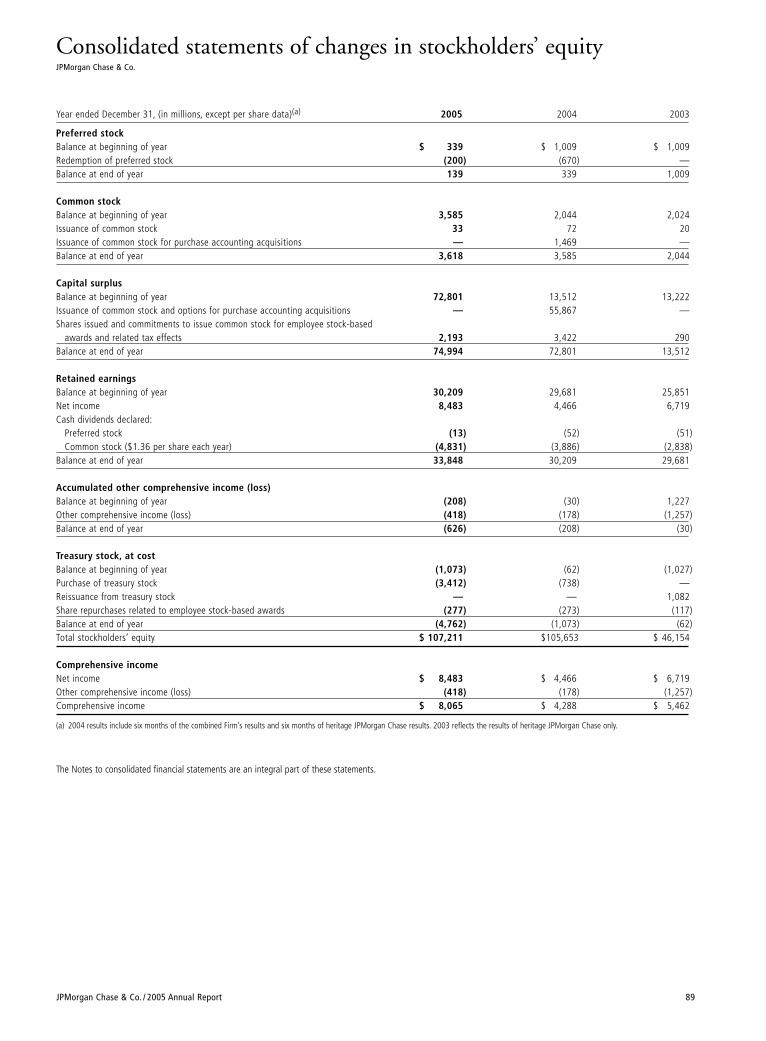
JPMorgan Chase & Co. / 2005 Annual Report 89
Consolidated statements of changes in stockholders’ equityJPMorgan Chase & Co.
Year ended December 31, (in millions, except per share data)(a) 2005 2004 2003
Preferred stockBalance at beginning of year $ 339 $ 1,009 $ 1,009Redemption of preferred stock (200) (670) —Balance at end of year 139 339 1,009
Common stockBalance at beginning of year 3,585 2,044 2,024Issuance of common stock 33 72 20Issuance of common stock for purchase accounting acquisitions — 1,469 —Balance at end of year 3,618 3,585 2,044
Capital surplusBalance at beginning of year 72,801 13,512 13,222Issuance of common stock and options for purchase accounting acquisitions — 55,867 —Shares issued and commitments to issue common stock for employee stock-based
awards and related tax effects 2,193 3,422 290Balance at end of year 74,994 72,801 13,512
Retained earningsBalance at beginning of year 30,209 29,681 25,851Net income 8,483 4,466 6,719Cash dividends declared:
Preferred stock (13) (52) (51)Common stock ($1.36 per share each year) (4,831) (3,886) (2,838)
Balance at end of year 33,848 30,209 29,681
Accumulated other comprehensive income (loss)Balance at beginning of year (208) (30) 1,227Other comprehensive income (loss) (418) (178) (1,257)Balance at end of year (626) (208) (30)
Treasury stock, at costBalance at beginning of year (1,073) (62) (1,027)Purchase of treasury stock (3,412) (738) —Reissuance from treasury stock — — 1,082Share repurchases related to employee stock-based awards (277) (273) (117)Balance at end of year (4,762) (1,073) (62)Total stockholders’ equity $ 107,211 $105,653 $ 46,154
Comprehensive incomeNet income $ 8,483 $ 4,466 $ 6,719Other comprehensive income (loss) (418) (178) (1,257)Comprehensive income $ 8,065 $ 4,288 $ 5,462
(a) 2004 results include six months of the combined Firm’s results and six months of heritage JPMorgan Chase results. 2003 reflects the results of heritage JPMorgan Chase only.
The Notes to consolidated financial statements are an integral part of these statements.
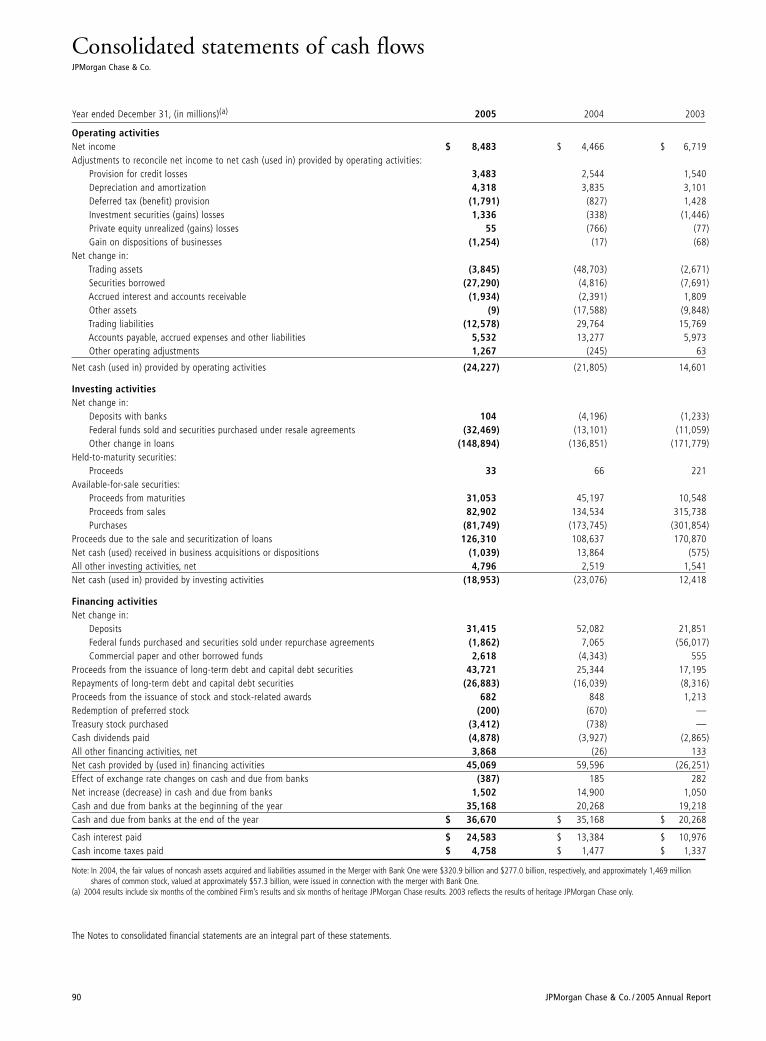
90 JPMorgan Chase & Co. / 2005 Annual Report
Consolidated statements of cash flowsJPMorgan Chase & Co.
Year ended December 31, (in millions)(a) 2005 2004 2003
Operating activitiesNet income $ 8,483 $ 4,466 $ 6,719Adjustments to reconcile net income to net cash (used in) provided by operating activities:
Provision for credit losses 3,483 2,544 1,540Depreciation and amortization 4,318 3,835 3,101Deferred tax (benefit) provision (1,791) (827) 1,428Investment securities (gains) losses 1,336 (338) (1,446)Private equity unrealized (gains) losses 55 (766) (77)Gain on dispositions of businesses (1,254) (17) (68)
Net change in:Trading assets (3,845) (48,703) (2,671)Securities borrowed (27,290) (4,816) (7,691)Accrued interest and accounts receivable (1,934) (2,391) 1,809Other assets (9) (17,588) (9,848)Trading liabilities (12,578) 29,764 15,769Accounts payable, accrued expenses and other liabilities 5,532 13,277 5,973Other operating adjustments 1,267 (245) 63
Net cash (used in) provided by operating activities (24,227) (21,805) 14,601
Investing activitiesNet change in:
Deposits with banks 104 (4,196) (1,233)Federal funds sold and securities purchased under resale agreements (32,469) (13,101) (11,059)Other change in loans (148,894) (136,851) (171,779)
Held-to-maturity securities:Proceeds 33 66 221
Available-for-sale securities:Proceeds from maturities 31,053 45,197 10,548Proceeds from sales 82,902 134,534 315,738Purchases (81,749) (173,745) (301,854)
Proceeds due to the sale and securitization of loans 126,310 108,637 170,870Net cash (used) received in business acquisitions or dispositions (1,039) 13,864 (575)All other investing activities, net 4,796 2,519 1,541Net cash (used in) provided by investing activities (18,953) (23,076) 12,418
Financing activitiesNet change in:
Deposits 31,415 52,082 21,851Federal funds purchased and securities sold under repurchase agreements (1,862) 7,065 (56,017)Commercial paper and other borrowed funds 2,618 (4,343) 555
Proceeds from the issuance of long-term debt and capital debt securities 43,721 25,344 17,195Repayments of long-term debt and capital debt securities (26,883) (16,039) (8,316)Proceeds from the issuance of stock and stock-related awards 682 848 1,213Redemption of preferred stock (200) (670) —Treasury stock purchased (3,412) (738) —Cash dividends paid (4,878) (3,927) (2,865)All other financing activities, net 3,868 (26) 133Net cash provided by (used in) financing activities 45,069 59,596 (26,251)Effect of exchange rate changes on cash and due from banks (387) 185 282Net increase (decrease) in cash and due from banks 1,502 14,900 1,050Cash and due from banks at the beginning of the year 35,168 20,268 19,218Cash and due from banks at the end of the year $ 36,670 $ 35,168 $ 20,268
Cash interest paid $ 24,583 $ 13,384 $ 10,976Cash income taxes paid $ 4,758 $ 1,477 $ 1,337
Note: In 2004, the fair values of noncash assets acquired and liabilities assumed in the Merger with Bank One were $320.9 billion and $277.0 billion, respectively, and approximately 1,469 millionshares of common stock, valued at approximately $57.3 billion, were issued in connection with the merger with Bank One.
(a) 2004 results include six months of the combined Firm’s results and six months of heritage JPMorgan Chase results. 2003 reflects the results of heritage JPMorgan Chase only.
The Notes to consolidated financial statements are an integral part of these statements.
JPMorgan Chase & Co. / 2005 Annual Report 91
When the SPE does not meet the QSPE criteria, consolidation is assessed pur-suant to FIN 46R. Under FIN 46R, a VIE is defined as an entity that: (1) lacksenough equity investment at risk to permit the entity to finance its activitieswithout additional subordinated financial support from other parties; (2) hasequity owners that lack the right to make significant decisions affecting theentity’s operations; and/or (3) has equity owners that do not have an obligationto absorb or the right to receive the entity’s losses or returns.
FIN 46R requires a variable interest holder (i.e., a counterparty to a VIE) toconsolidate the VIE if that party will absorb a majority of the expected lossesof the VIE, receive the majority of the expected residual returns of the VIE, orboth. This party is considered the primary beneficiary. In making this determi-nation, the Firm thoroughly evaluates the VIE’s design, capital structure andrelationships among variable interest holders. When the primary beneficiarycannot be identified through a qualitative analysis, the Firm performs a quan-titative analysis, which computes and allocates expected losses or residualreturns to variable interest holders. The allocation of expected cash flows inthis analysis is based upon the relative contractual rights and preferences of each interest holder in the VIE’s capital structure. For further details, seeNote 14 on pages 111–113 of this Annual Report.
All retained interests and significant transactions between the Firm, QSPEsand nonconsolidated VIEs are reflected on JPMorgan Chase’s Consolidatedbalance sheets or in the Notes to consolidated financial statements.
Investments in companies that are considered to be voting-interest entitiesunder FIN 46R in which the Firm has significant influence over operating and financing decisions are accounted for in accordance with the equitymethod of accounting. These investments are generally included in Otherassets, and the Firm’s share of income or loss is included in Other income.For a discussion of private equity investments, see Note 9 on pages 103–105of this Annual Report.
Assets held for clients in an agency or fiduciary capacity by the Firm are not assets of JPMorgan Chase and are not included in the Consolidated balance sheets.
Use of estimates in the preparation of consolidated financial statementsThe preparation of consolidated financial statements requires management to make estimates and assumptions that affect the reported amounts ofassets, liabilities, revenue, expenses and disclosures of contingent assets and liabilities. Actual results could be different from these estimates.
Note 1 – Basis of presentation JPMorgan Chase & Co. (“JPMorgan Chase” or the “Firm”), a financial holdingcompany incorporated under Delaware law in 1968, is a leading global financial services firm and one of the largest banking institutions in theUnited States, with operations worldwide. The Firm is a leader in investmentbanking, financial services for consumers and businesses, financial transactionprocessing, investment management, private banking and private equity. For adiscussion of the Firm’s business segment information, see Note 31 on pages130–131 of this Annual Report.
The accounting and financial reporting policies of JPMorgan Chase and itssubsidiaries conform to accounting principles generally accepted in the United States of America (“U.S. GAAP”) and prevailing industry practices.Additionally, where applicable, the policies conform to the accounting andreporting guidelines prescribed by bank regulatory authorities.
Certain amounts in the prior periods have been reclassified to conform to thecurrent presentation.
Consolidation The consolidated financial statements include accounts of JPMorgan Chaseand other entities in which the Firm has a controlling financial interest. Allmaterial intercompany balances and transactions have been eliminated.
The usual condition for a controlling financial interest is ownership of amajority of the voting interests of an entity. However, a controlling financialinterest may also exist in entities, such as special purpose entities (“SPEs”),through arrangements that do not involve controlling voting interests.
SPEs are an important part of the financial markets, providing market liquidityby facilitating investors’ access to specific portfolios of assets and risks. Theyare, for example, critical to the functioning of the mortgage- and asset-backed securities and commercial paper markets. SPEs may be organized as trusts, partnerships or corporations and are typically set up for a single,discrete purpose. SPEs are not typically operating entities and usually have alimited life and no employees. The basic SPE structure involves a companyselling assets to the SPE. The SPE funds the purchase of those assets by issu-ing securities to investors. The legal documents that govern the transactiondescribe how the cash earned on the assets must be allocated to the SPE’sinvestors and other parties that have rights to those cash flows. SPEs can bestructured to be bankruptcy-remote, thereby insulating investors from theimpact of the creditors of other entities, including the seller of the assets.
There are two different accounting frameworks applicable to SPEs: the quali-fying SPE (“QSPE”) framework under SFAS 140; and the variable interestentity (“VIE”) framework under FIN 46R. The applicable framework dependson the nature of the entity and the Firm’s relation to that entity. The QSPEframework is applicable when an entity transfers (sells) financial assets to anSPE meeting certain criteria defined in SFAS 140. These criteria are designedto ensure that the activities of the entity are essentially predetermined at theinception of the vehicle and that the transferor of the financial assets cannotexercise control over the entity and the assets therein. Entities meeting thesecriteria are not consolidated by the transferor or other counterparties, as longas they do not have the unilateral ability to liquidate or to cause the entity to no longer meet the QSPE criteria. The Firm primarily follows the QSPEmodel for securitizations of its residential and commercial mortgages, creditcard loans and automobile loans. For further details, see Note 13 on pages108–111 of this Annual Report.
Notes to consolidated financial statementsJPMorgan Chase & Co.
Notes to consolidated financial statementsJPMorgan Chase & Co.
92 JPMorgan Chase & Co. / 2005 Annual Report
Foreign currency translationJPMorgan Chase revalues assets, liabilities, revenues and expenses denomi-nated in foreign currencies into U.S. dollars using applicable exchange rates.
Gains and losses relating to translating functional currency financial statementsfor U.S. reporting are included in Other comprehensive income (loss) withinStockholders’ equity. Gains and losses relating to nonfunctional currencytransactions, including non-U.S. operations where the functional currency isthe U.S. dollar and operations in highly inflationary environments, are reportedin the Consolidated statements of income.
Statements of cash flowsFor JPMorgan Chase’s Consolidated statements of cash flows, cash and cashequivalents are defined as those amounts included in Cash and due from banks.
Significant accounting policiesThe following table identifies JPMorgan Chase’s significant accounting policies and the Note and page where a detailed description of each policycan be found:
Trading activities Note 3 Page 94Other noninterest revenue Note 4 Page 95Pension and other postretirement employee
benefit plans Note 6 Page 96Employee stock-based incentives Note 7 Page 100Securities and private equity investments Note 9 Page 103Securities financing activities Note 10 Page 105Loans Note 11 Page 106Allowance for credit losses Note 12 Page 107Loan securitizations Note 13 Page 108Variable interest entities Note 14 Page 111Goodwill and other intangible assets Note 15 Page 114Premises and equipment Note 16 Page 116Income taxes Note 22 Page 120Accounting for derivative instruments
and hedging activities Note 26 Page 123Off–balance sheet lending-related financial
instruments and guarantees Note 27 Page 124Fair value of financial instruments Note 29 Page 126
Note 2 – Business changes and developmentsMerger with Bank One Corporation Bank One Corporation merged with and into JPMorgan Chase (the“Merger”) on July 1, 2004. As a result of the Merger, each outstanding shareof common stock of Bank One was converted in a stock-for-stock exchangeinto 1.32 shares of common stock of JPMorgan Chase. JPMorgan Chasestockholders kept their shares, which remained outstanding and unchangedas shares of JPMorgan Chase following the Merger. Key objectives of theMerger were to provide the Firm with a more balanced business mix andgreater geographic diversification. The Merger was accounted for using thepurchase method of accounting, which requires that the assets and liabilitiesof Bank One be fair valued as of July 1, 2004. The purchase price to completethe Merger was $58.5 billion.
As part of the Merger, certain accounting policies and practices were conformed,which resulted in $976 million of charges in 2004. The significant componentsof the conformity charges comprised a $1.4 billion charge related to the decer-tification of the seller’s interest in credit card securitizations, and the benefit of a $584 million reduction in the allowance for credit losses as a result of conforming the wholesale and consumer credit provision methodologies.
The final purchase price of the Merger has been allocated to the assetsacquired and liabilities assumed using their fair values as of the merger date.The computation of the purchase price and the allocation of the purchaseprice to the net assets of Bank One – based on their respective fair values as of July 1, 2004 – and the resulting goodwill are presented below.
(in millions, except per share amounts) July 1, 2004
Purchase priceBank One common stock exchanged 1,113Exchange ratio 1.32JPMorgan Chase common stock issued 1,469Average purchase price per
JPMorgan Chase common share(a) $ 39.02$ 57,336
Fair value of employee stock awards and direct acquisition costs 1,210
Total purchase price $ 58,546
Net assets acquired:Bank One stockholders’ equity $ 24,156Bank One goodwill and other intangible assets (2,754)Subtotal 21,402
Adjustments to reflect assets acquired at fair value:
Loans and leases (2,261)Private equity investments (72)Identified intangibles 8,665Pension plan assets (778)Premises and equipment (417)Other assets (267)
Amounts to reflect liabilities assumed at fair value:
Deposits (373)Deferred income taxes 932Other postretirement benefit plan liabilities (49)Other liabilities (1,162)Long-term debt (1,234)
24,386Goodwill resulting from Merger(b) $ 34,160
(a) The value of the Firm’s common stock exchanged with Bank One shareholders was basedon the average closing prices of the Firm’s common stock for the two days prior to, and thetwo days following, the announcement of the Merger on January 14, 2004.
(b) Goodwill resulting from the Merger reflects adjustments of the allocation of the purchaseprice to the net assets acquired through June 30, 2005. Minor adjustments subsequent toJune 30, 2005, are reflected in the December 31, 2005 Goodwill balance in Note 15 onpage 114 of this Annual Report.
JPMorgan Chase & Co. / 2005 Annual Report 93
Condensed statement of net assets acquiredThe following condensed statement of net assets acquired reflects the fairvalue of Bank One net assets as of July 1, 2004.
(in millions) July 1, 2004
AssetsCash and cash equivalents $ 14,669Securities 70,512Interests in purchased receivables 30,184Loans, net of allowance for loan losses 129,650Goodwill and other intangible assets 42,825All other assets 47,739
Total assets $ 335,579
LiabilitiesDeposits $ 164,848Short-term borrowings 9,811All other liabilities 61,494Long-term debt 40,880
Total liabilities 277,033
Net assets acquired $ 58,546
Acquired, identifiable intangible assetsComponents of the fair value of acquired, identifiable intangible assets as ofJuly 1, 2004, were as follows:
Fair value Weighted average Useful life(in millions) life (in years) (in years)
Core deposit intangibles $ 3,650 5.1 Up to 10Purchased credit card relationships 3,340 4.6 Up to 10Other credit card–related intangibles 295 4.6 Up to 10Other customer relationship intangibles 870 4.6–10.5 Up to 20
Subtotal 8,155 5.1 Up to 20Indefinite-lived asset management
intangibles 510 NA NA
Total $ 8,665
Unaudited pro forma condensed combined financial informationThe following unaudited pro forma condensed combined financial informationpresents the results of operations of the Firm had the Merger taken place atJanuary 1, 2003.
Year ended December 31, (in millions, except per share) 2004 2003
Noninterest revenue $ 31,175 $ 28,966Net interest income 21,366 21,715
Total net revenue 52,541 50,681Provision for credit losses 2,727 3,570Noninterest expense 40,504 33,136
Income before income tax expense 9,310 13,975Net income $ 6,544 $ 9,330
Net income per common share:Basic $ 1.85 $ 2.66Diluted 1.81 2.61
Average common shares outstanding:Basic 3,510 3,495Diluted 3,593 3,553
Other business events
Collegiate Funding ServicesOn March 1, 2006, JPMorgan Chase acquired, for approximately $663 million,Collegiate Funding Services, a leader in student loan servicing and consolida-tion. This acquisition will enable the Firm to create a comprehensive educationfinance business.
BrownCo On November 30, 2005, JPMorgan Chase sold BrownCo, an on-line deep-discount brokerage business, to E*TRADE Financial for a cash purchase priceof $1.6 billion. JPMorgan Chase recognized an after-tax gain of $752 million.BrownCo’s results of operations are reported in the Asset & Wealth Managementbusiness segment; however, the gain on the sale, which is recorded in Other income in the Consolidated statements of income, is reported in theCorporate business segment.
Sears Canada credit card business On November 15, 2005, JPMorgan Chase purchased Sears Canada Inc.’s credit card operation, including both the private-label card accounts and theco-branded Sears MasterCard® accounts. The credit card operation includesapproximately 10 million accounts with $2.2 billion (CAD$2.5 billion) in managed loans. Sears Canada and JPMorgan Chase entered into an ongoingarrangement under which JPMorgan Chase will offer private-label and co-branded credit cards to both new and existing customers of Sears Canada.
Chase Merchant Services, Paymentech integrationOn October 5, 2005, JPMorgan Chase and First Data Corp. completed the integration of the companies’ jointly owned Chase Merchant Services andPaymentech merchant businesses, to be operated under the name of ChasePaymentech Solutions, LLC. The joint venture is the largest financial transactionprocessor in the U.S. for businesses accepting credit card payments via traditionalpoint of sale, Internet, catalog and recurring billing. As a result of the integrationinto a joint venture, Paymentech has been deconsolidated and JPMorgan Chase’sownership interest in this joint venture is accounted for in accordance with theequity method of accounting.
Neovest Holdings, Inc.On September 1, 2005, JPMorgan Chase completed its acquisition of NeovestHoldings, Inc., a provider of high-performance trading technology and directmarket access. This transaction will enable the Investment Bank to offer aleading, broker-neutral trading platform across asset classes to institutionalinvestors, asset managers and hedge funds.
VasteraOn April 1, 2005, JPMorgan Chase acquired Vastera, a provider of globaltrade management solutions, for approximately $129 million. Vastera’s businesswas combined with the Logistics and Trade Services businesses of TSS’Treasury Services unit. Vastera automates trade management processes asso-ciated with the physical movement of goods internationally; the acquisitionenables TS to offer management of information and processes in support ofphysical goods movement, together with financial settlement.
Notes to consolidated financial statementsJPMorgan Chase & Co.
94 JPMorgan Chase & Co. / 2005 Annual Report
JPMorgan PartnersOn March 1, 2005, the Firm announced that the management team of JPMorganPartners, LLC, a private equity unit of the Firm, will become independent when itcompletes the investment of the current $6.5 billion Global Fund, which it advises.The buyout and growth equity professionals of JPMorgan Partners will form anew independent firm, CCMP Capital, LLC, and the venture professionals willseparately form a new independent firm, Panorama Capital, LLC. JPMorgan Chasehas committed to invest the lesser of $875 million or 24.9% of the limited part-nership interests in the fund to be raised by CCMP Capital, and has committedto invest the lesser of $50 million or 24.9% of the limited partnership interestsin the fund to be raised by Panorama Capital. The investment professionals ofCCMP and Panorama will continue to manage the JPMP investments pursuantto a management agreement with the Firm.
CazenoveOn February 28, 2005, JPMorgan Chase and Cazenove Group plc (“Cazenove”)formed a business partnership which combined Cazenove’s investment bankingbusiness and JPMorgan Chase’s U.K.-based investment banking business inorder to provide investment banking services in the United Kingdom andIreland. The new company is called JPMorgan Cazenove Holdings.
Other acquisitionsDuring 2004, JPMorgan Chase purchased the Electronic Financial Services(“EFS”) business from Citigroup and acquired a majority interest in hedgefund manager Highbridge Capital Management (“Highbridge”).
Note 3 – Trading activitiesTrading assets include debt and equity securities held for trading purposesthat JPMorgan Chase owns (“long” positions). Trading liabilities include debtand equity securities that the Firm has sold to other parties but does not own(“short” positions). The Firm is obligated to purchase securities at a futuredate to cover the short positions. Included in Trading assets and Trading liabil-ities are the reported receivables (unrealized gains) and payables (unrealizedlosses) related to derivatives. These amounts include the derivative assets andliabilities net of cash received and paid, respectively, under legally enforceablemaster netting agreements. At December 31, 2005, the amount of cash receivedand paid was approximately $26.7 billion and $18.9 billion, respectively. AtDecember 31, 2004, the amount of cash received and paid was approximately$32.2 billion and $22.0 billion, respectively. Trading positions are carried atfair value on the Consolidated balance sheets.
Trading revenueYear ended December 31,(a) (in millions) 2005 2004 2003
Fixed income and other(b) $ 4,554 $ 2,976 $ 4,046Equities(c) 1,271 797 764Credit portfolio(d) 35 (161) (383)
Total $ 5,860 $ 3,612 $ 4,427
(a) 2004 results include six months of the combined Firm’s results and six months of heritageJPMorgan Chase results. 2003 reflects the results of heritage JPMorgan Chase only.
(b) Includes bonds and commercial paper and various types of interest rate derivatives as well as foreign exchange and commodities.
(c) Includes equity securities and equity derivatives.(d) Includes credit derivatives.
Trading assets and liabilitiesThe following table presents the fair value of Trading assets and Trading liabilities for the dates indicated:
December 31, (in millions) 2005 2004
Trading assetsDebt and equity instruments:
U.S. government and federal agency obligations $ 16,283 $ 16,867U.S. government-sponsored enterprise obligations 24,172 23,513Obligations of state and political subdivisions 9,887 3,486Certificates of deposit, bankers’ acceptances
and commercial paper 5,652 7,341Debt securities issued by non-U.S. governments 48,671 50,699Corporate securities and other 143,925 120,926
Total debt and equity instruments 248,590 222,832Derivative receivables:
Interest rate 30,416 45,892Foreign exchange 2,855 7,939Equity 5,575 6,120Credit derivatives 3,464 2,945Commodity 7,477 3,086
Total derivative receivables 49,787 65,982
Total trading assets $ 298,377 $ 288,814
Trading liabilitiesDebt and equity instruments(a) $ 94,157 $ 87,942
Derivative payables:Interest rate 28,488 41,075Foreign exchange 3,453 8,969Equity 11,539 9,096Credit derivatives 2,445 2,499Commodity 5,848 1,626
Total derivative payables 51,773 63,265
Total trading liabilities $ 145,930 $ 151,207
(a) Primarily represents securities sold, not yet purchased.
Average Trading assets and liabilities were as follows for the periods indicated:
Year ended December 31,(a) (in millions) 2005 2004 2003
Trading assets – debt and equity instruments $237,370 $ 200,467 $ 154,597
Trading assets – derivative receivables 57,365 59,521 85,628
Trading liabilities – debt and equity instruments(b) $ 93,102 $ 82,204 $ 72,877
Trading liabilities – derivative payables 55,723 52,761 67,783
(a) 2004 results include six months of the combined Firm’s results and six months of heritageJPMorgan Chase results. 2003 reflects the results of heritage JPMorgan Chase only.
(b) Primarily represents securities sold, not yet purchased.
JPMorgan Chase & Co. / 2005 Annual Report 95
Note 4 – Other noninterest revenue Investment banking feesThis revenue category includes advisory and equity and debt underwriting fees.Advisory fees are recognized as revenue when related services are performed.Underwriting fees are recognized as revenue when the Firm has rendered allservices to the issuer and is entitled to collect the fee from the issuer, as longas there are no other contingencies associated with the fee (e.g., the fee isnot contingent upon the customer obtaining financing). Underwriting fees arenet of syndicate expenses. In addition, the Firm recognizes credit arrangementand syndication fees as revenue after satisfying certain retention, timing andyield criteria.
The following table presents the components of Investment banking fees:
Year ended December 31, (in millions)(a) 2005 2004 2003
Underwriting:Equity $ 864 $ 780 $ 699Debt 1,969 1,859 1,549
Total Underwriting 2,833 2,639 2,248Advisory 1,255 898 642
Total $ 4,088 $ 3,537 $ 2,890
(a) 2004 results include six months of the combined Firm’s results and six months of heritageJPMorgan Chase results. 2003 reflects the results of heritage JPMorgan Chase only.
Lending & deposit related fees This revenue category includes fees from loan commitments, standby lettersof credit, financial guarantees, deposit-related fees in lieu of compensatingbalances, cash management-related activities or transactions, depositaccounts, and other loan servicing activities. These fees are recognized overthe period in which the related service is provided.
Asset management, administration and commissions This revenue category includes fees from investment management and relatedservices, custody and institutional trust services, brokerage services, insurancepremiums and commissions and other products. These fees are recognizedover the period in which the related service is provided.
Mortgage fees and related income This revenue category includes fees and income derived from mortgage origi-nation, sales and servicing, and includes the effect of risk management activitiesassociated with the mortgage pipeline, warehouse and the mortgage servicingrights (“MSRs”) asset (excluding gains and losses on the sale of Available-for-sale (“AFS”) securities). Origination fees and gains or losses on loan sales arerecognized in income upon sale. Mortgage servicing fees are recognized overthe period the related service is provided, net of amortization. Valuationchanges in the mortgage pipeline, warehouse, MSR asset and correspondingrisk management instruments are generally adjusted through earnings asthese changes occur. Net interest income and securities gains and losses onAFS securities used in mortgage-related risk management activities are notincluded in Mortgage fees and related income. For a further discussion ofMSRs, see Note 15 on pages 114–116 of this Annual Report.
Credit card incomeThis revenue category includes interchange income from credit and debit cards,annual fees, and servicing fees earned in connection with securitization activities.Volume-related payments to partners and expenses for rewards programs arealso recorded within Credit card income. Fee revenues are recognized asearned, except for annual fees, which are recognized over a 12-month period.Expenses related to rewards programs are recorded when earned by the customer.
Credit card revenue sharing agreementsThe Firm has contractual agreements with numerous affinity organizationsand co-brand partners, which grant to the Firm exclusive rights to market totheir members or customers. These organizations and partners provide to theFirm their endorsement of the credit card programs, mailing lists, and mayalso conduct marketing activities and provide awards under the various creditcard programs. The terms of these agreements generally range from 3 to 10years. The economic incentives the Firm pays to the endorsing organizationsand partners typically include payments based upon new accounts, activation,charge volumes, and the cost of their marketing activities and awards.
The Firm recognizes the portion of payments based upon new accounts to the affinity organizations and co-brand partners, as deferred loan originationcosts. The Firm defers these costs and amortizes them over 12 months.Payments based upon charge volumes and considered by the Firm as revenuesharing with the affinity organizations and co-brand partners are deductedfrom Credit card income as the related revenue is earned. The Firm expensespayments based upon marketing efforts performed by the endorsing organization or partner to activate a new account as incurred. These costs are recorded within Noninterest expense.
Note 5 – Interest income and interest expenseDetails of Interest income and Interest expense were as follows:
Year ended December 31, (in millions)(a) 2005 2004 2003
Interest incomeLoans $ 26,062 $ 16,771 $ 11,812Securities 3,129 3,377 3,542Trading assets 9,117 7,527 6,592Federal funds sold and securities
purchased under resale agreements 4,125 1,627 1,497Securities borrowed 1,154 463 323Deposits with banks 680 539 214Interests in purchased receivables 933 291 64
Total interest income 45,200 30,595 24,044
Interest expenseInterest-bearing deposits 10,295 4,630 3,604Short-term and other liabilities 9,542 6,260 5,871Long-term debt 4,160 2,466 1,498Beneficial interests issued by
consolidated VIEs 1,372 478 106
Total interest expense 25,369 13,834 11,079
Net interest income 19,831 16,761 12,965Provision for credit losses 3,483 2,544 1,540
Net interest income after provision for credit losses $ 16,348 $ 14,217 $ 11,425
(a) 2004 results include six months of the combined Firm’s results and six months of heritageJPMorgan Chase results. 2003 reflects the results of heritage JPMorgan Chase only.
Notes to consolidated financial statementsJPMorgan Chase & Co.
96 JPMorgan Chase & Co. / 2005 Annual Report
Note 6 – Pension and other postretirementemployee benefit plansNew U.S.-based postretirement plans were introduced in 2005 after the Bank One plans were merged into the heritage JPMorgan Chase plans as of December 31, 2004.
The Firm’s defined benefit pension plans are accounted for in accordance withSFAS 87 and SFAS 88. The postretirement medical and life insurance plans areaccounted for in accordance with SFAS 106.
The Firm uses a measurement date of December 31 for pension and otherpostretirement employee benefit plans. In addition, as of August 1, 2005, theU.S. postretirement medical and life insurance plan was remeasured to reflecta mid-year plan amendment and the final Medicare Part D regulations thatwere issued on January 21, 2005. For the Firm’s defined benefit pension planassets, fair value is used to determine the expected return on pension planassets. For the Firm’s other postretirement employee benefit plan assets, acalculated value that recognizes changes in fair value over a five-year periodis used to determine the expected return on other postretirement employeebenefit plan assets. Unrecognized net actuarial gains and losses and priorservice costs associated with the U.S. defined benefit pension plan are amor-tized over the average future service period of plan participants, which is currently 10 years. For other postretirement employee benefit plans, unrecog-nized gains and losses are also amortized over the average future serviceperiod, which is currently 8 years. However, prior service costs associated withother postretirement employee benefit plans are recognized over the averageyears of service remaining to full eligibility age, which is currently 6 years.
Defined Benefit Pension PlansThe Firm has a qualified noncontributory U.S. defined benefit pension planthat provides benefits to substantially all U.S. employees. The U.S. plan employsa cash balance formula, in the form of salary and interest credits, to determinethe benefits to be provided at retirement, based upon eligible compensationand years of service. Employees begin to accrue plan benefits after completingone year of service, and benefits generally vest after five years of service. TheFirm also offers benefits through defined benefit pension plans to qualifyingemployees in certain non-U.S. locations based upon eligible compensationand years of service.
It is the Firm’s policy to fund the pension plans in amounts sufficient to meetthe requirements under applicable employee benefit and local tax laws. TheFirm did not make any U.S. pension plan contributions in 2005 and basedupon the current funded status of this plan, the Firm does not expect to makesignificant contributions in 2006. In 2004, the Firm made a cash contributionto its U.S. defined benefit pension plan of $1.1 billion, funding the plan to themaximum allowable amount under applicable tax law. Additionally, the Firmmade cash contributions totaling $78 million and $40 million to fully fund theaccumulated benefit obligations of certain non-U.S. defined benefit pensionplans as of December 31, 2005 and 2004, respectively.
Postretirement medical and life insuranceJPMorgan Chase offers postretirement medical and life insurance benefits to certain retirees and qualifying U.S. employees. These benefits vary withlength of service and date of hire and provide for limits on the Firm’s share ofcovered medical benefits. The medical benefits are contributory, while the lifeinsurance benefits are noncontributory. As of August 1, 2005, the eligibilityrequirements for U.S. employees to qualify for subsidized retiree medical coverage were revised and life insurance coverage was eliminated for activeemployees retiring after 2005. Postretirement medical benefits also areoffered to qualifying U.K. employees.
In December 2003, the Medicare Prescription Drug, Improvement andModernization Act of 2003 (the “Act”) was enacted. The Act established aprescription drug benefit under Medicare (“Medicare Part D”) and a federalsubsidy to sponsors of retiree health care benefit plans that provide a benefitthat is at least actuarially equivalent to Medicare Part D. The Firm has deter-mined that benefits provided to certain participants are at least actuariallyequivalent to Medicare Part D and has reflected the effects of the subsidy inthe financial statements and disclosures retroactive to the beginning of 2004(July 1, 2004 for Bank One plans) in accordance with FSP SFAS 106-2.
JPMorgan Chase’s U.S. postretirement benefit obligation is partially funded withcorporate-owned life insurance (“COLI”) purchased on the lives of eligibleemployees and retirees. While the Firm owns the COLI policies, COLI proceeds(death benefits, withdrawals and other distributions) may be used only toreimburse the Firm for net postretirement benefit claim payments and relatedadministrative expenses. The U.K. postretirement benefit plan is unfunded.
The following tables present the funded status and amounts reported on theConsolidated balance sheets, the accumulated benefit obligation and thecomponents of net periodic benefit costs reported in the Consolidated state-ments of income for the Firm’s U.S. and non-U.S. defined benefit pension andpostretirement benefit plans:
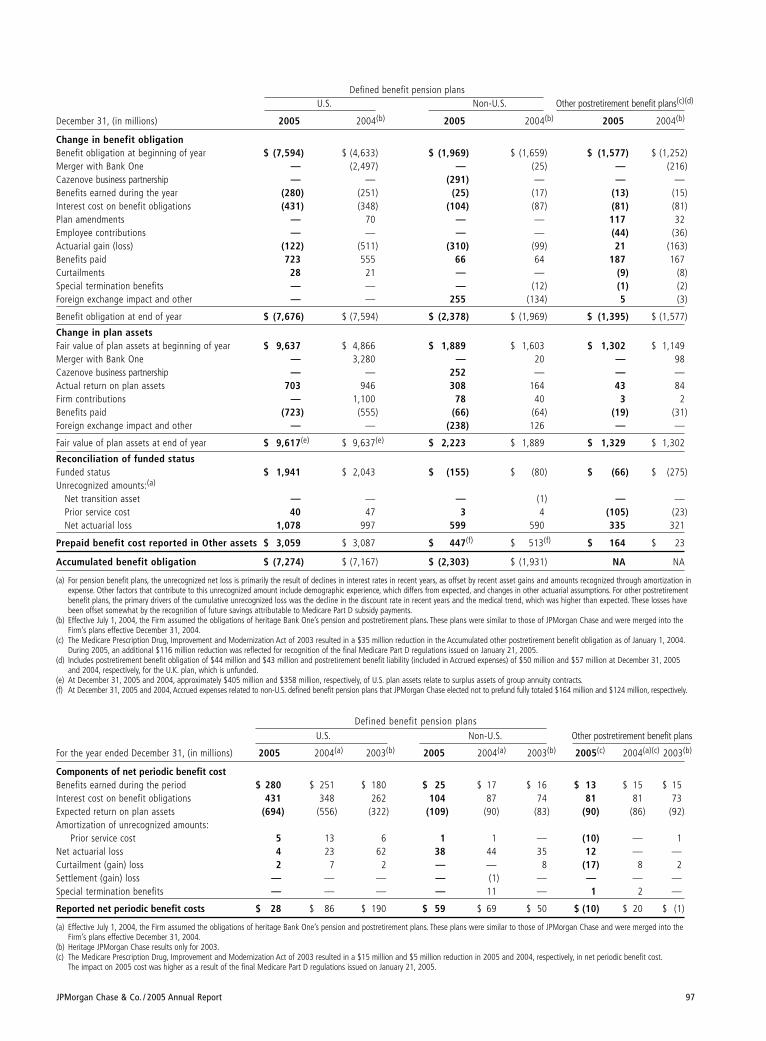
JPMorgan Chase & Co. / 2005 Annual Report 97
Defined benefit pension plansU.S. Non-U.S. Other postretirement benefit plans(c)(d)
December 31, (in millions) 2005 2004(b) 2005 2004(b) 2005 2004(b)
Change in benefit obligationBenefit obligation at beginning of year $ (7,594) $ (4,633) $ (1,969) $ (1,659) $ (1,577) $ (1,252)Merger with Bank One — (2,497) — (25) — (216)Cazenove business partnership — — (291) — — —Benefits earned during the year (280) (251) (25) (17) (13) (15)Interest cost on benefit obligations (431) (348) (104) (87) (81) (81)Plan amendments — 70 — — 117 32Employee contributions — — — — (44) (36)Actuarial gain (loss) (122) (511) (310) (99) 21 (163)Benefits paid 723 555 66 64 187 167Curtailments 28 21 — — (9) (8)Special termination benefits — — — (12) (1) (2)Foreign exchange impact and other — — 255 (134) 5 (3)
Benefit obligation at end of year $ (7,676) $ (7,594) $ (2,378) $ (1,969) $ (1,395) $ (1,577)
Change in plan assetsFair value of plan assets at beginning of year $ 9,637 $ 4,866 $ 1,889 $ 1,603 $ 1,302 $ 1,149Merger with Bank One — 3,280 — 20 — 98Cazenove business partnership — — 252 — — —Actual return on plan assets 703 946 308 164 43 84Firm contributions — 1,100 78 40 3 2Benefits paid (723) (555) (66) (64) (19) (31)Foreign exchange impact and other — — (238) 126 — —
Fair value of plan assets at end of year $ 9,617(e) $ 9,637(e) $ 2,223 $ 1,889 $ 1,329 $ 1,302
Reconciliation of funded statusFunded status $ 1,941 $ 2,043 $ (155) $ (80) $ (66) $ (275)Unrecognized amounts:(a)
Net transition asset — — — (1) — —Prior service cost 40 47 3 4 (105) (23)Net actuarial loss 1,078 997 599 590 335 321
Prepaid benefit cost reported in Other assets $ 3,059 $ 3,087 $ 447(f) $ 513(f) $ 164 $ 23
Accumulated benefit obligation $ (7,274) $ (7,167) $ (2,303) $ (1,931) NA NA
(a) For pension benefit plans, the unrecognized net loss is primarily the result of declines in interest rates in recent years, as offset by recent asset gains and amounts recognized through amortization inexpense. Other factors that contribute to this unrecognized amount include demographic experience, which differs from expected, and changes in other actuarial assumptions. For other postretirementbenefit plans, the primary drivers of the cumulative unrecognized loss was the decline in the discount rate in recent years and the medical trend, which was higher than expected. These losses havebeen offset somewhat by the recognition of future savings attributable to Medicare Part D subsidy payments.
(b) Effective July 1, 2004, the Firm assumed the obligations of heritage Bank One’s pension and postretirement plans. These plans were similar to those of JPMorgan Chase and were merged into theFirm’s plans effective December 31, 2004.
(c) The Medicare Prescription Drug, Improvement and Modernization Act of 2003 resulted in a $35 million reduction in the Accumulated other postretirement benefit obligation as of January 1, 2004.During 2005, an additional $116 million reduction was reflected for recognition of the final Medicare Part D regulations issued on January 21, 2005.
(d) Includes postretirement benefit obligation of $44 million and $43 million and postretirement benefit liability (included in Accrued expenses) of $50 million and $57 million at December 31, 2005and 2004, respectively, for the U.K. plan, which is unfunded.
(e) At December 31, 2005 and 2004, approximately $405 million and $358 million, respectively, of U.S. plan assets relate to surplus assets of group annuity contracts.(f) At December 31, 2005 and 2004, Accrued expenses related to non-U.S. defined benefit pension plans that JPMorgan Chase elected not to prefund fully totaled $164 million and $124 million, respectively.
Defined benefit pension plans
U.S. Non-U.S. Other postretirement benefit plans
For the year ended December 31, (in millions) 2005 2004(a) 2003(b) 2005 2004(a) 2003(b) 2005(c) 2004(a)(c) 2003(b)
Components of net periodic benefit costBenefits earned during the period $ 280 $ 251 $ 180 $ 25 $ 17 $ 16 $ 13 $ 15 $ 15Interest cost on benefit obligations 431 348 262 104 87 74 81 81 73Expected return on plan assets (694) (556) (322) (109) (90) (83) (90) (86) (92)Amortization of unrecognized amounts:
Prior service cost 5 13 6 1 1 — (10) — 1Net actuarial loss 4 23 62 38 44 35 12 — —Curtailment (gain) loss 2 7 2 — — 8 (17) 8 2Settlement (gain) loss — — — — (1) — — — —Special termination benefits — — — — 11 — 1 2 —
Reported net periodic benefit costs $ 28 $ 86 $ 190 $ 59 $ 69 $ 50 $ (10) $ 20 $ (1)
(a) Effective July 1, 2004, the Firm assumed the obligations of heritage Bank One’s pension and postretirement plans. These plans were similar to those of JPMorgan Chase and were merged into theFirm’s plans effective December 31, 2004.
(b) Heritage JPMorgan Chase results only for 2003.(c) The Medicare Prescription Drug, Improvement and Modernization Act of 2003 resulted in a $15 million and $5 million reduction in 2005 and 2004, respectively, in net periodic benefit cost.
The impact on 2005 cost was higher as a result of the final Medicare Part D regulations issued on January 21, 2005.
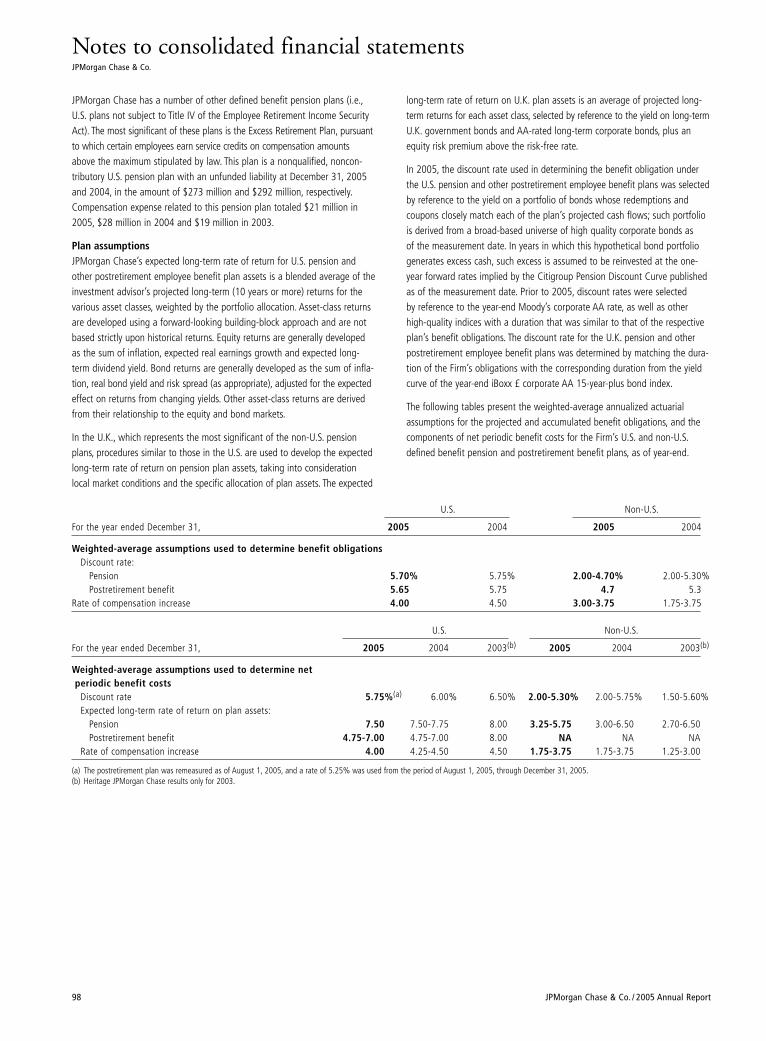
Notes to consolidated financial statementsJPMorgan Chase & Co.
98 JPMorgan Chase & Co. / 2005 Annual Report
U.S. Non-U.S.
For the year ended December 31, 2005 2004 2005 2004
Weighted-average assumptions used to determine benefit obligationsDiscount rate:
Pension 5.70% 5.75% 2.00-4.70% 2.00-5.30%Postretirement benefit 5.65 5.75 4.7 5.3
Rate of compensation increase 4.00 4.50 3.00-3.75 1.75-3.75
U.S. Non-U.S.
For the year ended December 31, 2005 2004 2003(b) 2005 2004 2003(b)
Weighted-average assumptions used to determine netperiodic benefit costs
Discount rate 5.75%(a) 6.00% 6.50% 2.00-5.30% 2.00-5.75% 1.50-5.60%Expected long-term rate of return on plan assets:
Pension 7.50 7.50-7.75 8.00 3.25-5.75 3.00-6.50 2.70-6.50Postretirement benefit 4.75-7.00 4.75-7.00 8.00 NA NA NA
Rate of compensation increase 4.00 4.25-4.50 4.50 1.75-3.75 1.75-3.75 1.25-3.00
(a) The postretirement plan was remeasured as of August 1, 2005, and a rate of 5.25% was used from the period of August 1, 2005, through December 31, 2005.(b) Heritage JPMorgan Chase results only for 2003.
long-term rate of return on U.K. plan assets is an average of projected long-term returns for each asset class, selected by reference to the yield on long-termU.K. government bonds and AA-rated long-term corporate bonds, plus anequity risk premium above the risk-free rate.
In 2005, the discount rate used in determining the benefit obligation underthe U.S. pension and other postretirement employee benefit plans was selectedby reference to the yield on a portfolio of bonds whose redemptions andcoupons closely match each of the plan’s projected cash flows; such portfoliois derived from a broad-based universe of high quality corporate bonds as of the measurement date. In years in which this hypothetical bond portfolio generates excess cash, such excess is assumed to be reinvested at the one-year forward rates implied by the Citigroup Pension Discount Curve publishedas of the measurement date. Prior to 2005, discount rates were selected by reference to the year-end Moody’s corporate AA rate, as well as otherhigh-quality indices with a duration that was similar to that of the respectiveplan’s benefit obligations. The discount rate for the U.K. pension and otherpostretirement employee benefit plans was determined by matching the dura-tion of the Firm’s obligations with the corresponding duration from the yieldcurve of the year-end iBoxx £ corporate AA 15-year-plus bond index.
The following tables present the weighted-average annualized actuarialassumptions for the projected and accumulated benefit obligations, and thecomponents of net periodic benefit costs for the Firm’s U.S. and non-U.S.defined benefit pension and postretirement benefit plans, as of year-end.
JPMorgan Chase has a number of other defined benefit pension plans (i.e.,U.S. plans not subject to Title IV of the Employee Retirement Income SecurityAct). The most significant of these plans is the Excess Retirement Plan, pursuantto which certain employees earn service credits on compensation amountsabove the maximum stipulated by law. This plan is a nonqualified, noncon-tributory U.S. pension plan with an unfunded liability at December 31, 2005and 2004, in the amount of $273 million and $292 million, respectively.Compensation expense related to this pension plan totaled $21 million in2005, $28 million in 2004 and $19 million in 2003.
Plan assumptionsJPMorgan Chase’s expected long-term rate of return for U.S. pension andother postretirement employee benefit plan assets is a blended average of theinvestment advisor’s projected long-term (10 years or more) returns for thevarious asset classes, weighted by the portfolio allocation. Asset-class returnsare developed using a forward-looking building-block approach and are notbased strictly upon historical returns. Equity returns are generally developedas the sum of inflation, expected real earnings growth and expected long-term dividend yield. Bond returns are generally developed as the sum of infla-tion, real bond yield and risk spread (as appropriate), adjusted for the expectedeffect on returns from changing yields. Other asset-class returns are derivedfrom their relationship to the equity and bond markets.
In the U.K., which represents the most significant of the non-U.S. pensionplans, procedures similar to those in the U.S. are used to develop the expectedlong-term rate of return on pension plan assets, taking into considerationlocal market conditions and the specific allocation of plan assets. The expected
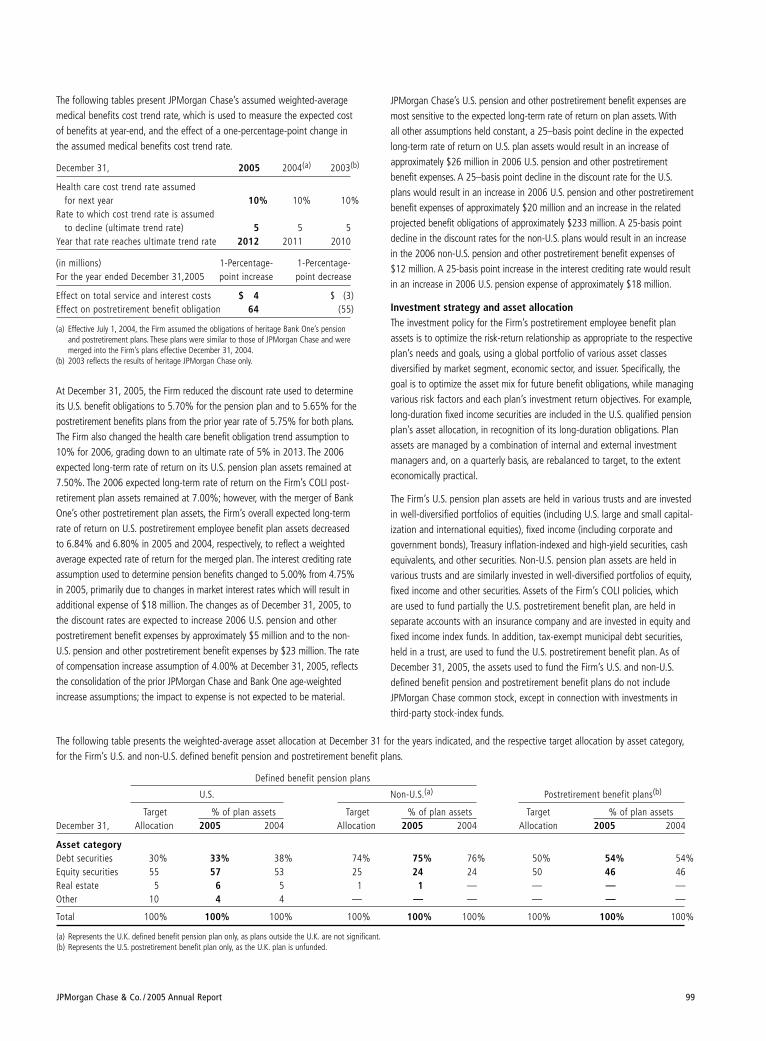
JPMorgan Chase & Co. / 2005 Annual Report 99
JPMorgan Chase’s U.S. pension and other postretirement benefit expenses aremost sensitive to the expected long-term rate of return on plan assets. With all other assumptions held constant, a 25–basis point decline in the expectedlong-term rate of return on U.S. plan assets would result in an increase ofapproximately $26 million in 2006 U.S. pension and other postretirement benefit expenses. A 25–basis point decline in the discount rate for the U.S.plans would result in an increase in 2006 U.S. pension and other postretirementbenefit expenses of approximately $20 million and an increase in the relatedprojected benefit obligations of approximately $233 million. A 25-basis pointdecline in the discount rates for the non-U.S. plans would result in an increasein the 2006 non-U.S. pension and other postretirement benefit expenses of $12 million. A 25-basis point increase in the interest crediting rate would resultin an increase in 2006 U.S. pension expense of approximately $18 million.
Investment strategy and asset allocationThe investment policy for the Firm’s postretirement employee benefit planassets is to optimize the risk-return relationship as appropriate to the respectiveplan’s needs and goals, using a global portfolio of various asset classes diversified by market segment, economic sector, and issuer. Specifically, thegoal is to optimize the asset mix for future benefit obligations, while managingvarious risk factors and each plan’s investment return objectives. For example,long-duration fixed income securities are included in the U.S. qualified pensionplan’s asset allocation, in recognition of its long-duration obligations. Planassets are managed by a combination of internal and external investmentmanagers and, on a quarterly basis, are rebalanced to target, to the extenteconomically practical.
The Firm’s U.S. pension plan assets are held in various trusts and are investedin well-diversified portfolios of equities (including U.S. large and small capital-ization and international equities), fixed income (including corporate and government bonds), Treasury inflation-indexed and high-yield securities, cashequivalents, and other securities. Non-U.S. pension plan assets are held in various trusts and are similarly invested in well-diversified portfolios of equity,fixed income and other securities. Assets of the Firm’s COLI policies, which are used to fund partially the U.S. postretirement benefit plan, are held inseparate accounts with an insurance company and are invested in equity andfixed income index funds. In addition, tax-exempt municipal debt securities,held in a trust, are used to fund the U.S. postretirement benefit plan. As ofDecember 31, 2005, the assets used to fund the Firm’s U.S. and non-U.S.defined benefit pension and postretirement benefit plans do not includeJPMorgan Chase common stock, except in connection with investments inthird-party stock-index funds.
The following tables present JPMorgan Chase’s assumed weighted-averagemedical benefits cost trend rate, which is used to measure the expected costof benefits at year-end, and the effect of a one-percentage-point change inthe assumed medical benefits cost trend rate.
December 31, 2005 2004(a) 2003(b)
Health care cost trend rate assumed for next year 10% 10% 10%
Rate to which cost trend rate is assumed to decline (ultimate trend rate) 5 5 5
Year that rate reaches ultimate trend rate 2012 2011 2010
(in millions) 1-Percentage- 1-Percentage- For the year ended December 31,2005 point increase point decrease
Effect on total service and interest costs $ 4 $ (3)Effect on postretirement benefit obligation 64 (55)
(a) Effective July 1, 2004, the Firm assumed the obligations of heritage Bank One’s pensionand postretirement plans. These plans were similar to those of JPMorgan Chase and weremerged into the Firm’s plans effective December 31, 2004.
(b) 2003 reflects the results of heritage JPMorgan Chase only.
At December 31, 2005, the Firm reduced the discount rate used to determineits U.S. benefit obligations to 5.70% for the pension plan and to 5.65% for thepostretirement benefits plans from the prior year rate of 5.75% for both plans.The Firm also changed the health care benefit obligation trend assumption to10% for 2006, grading down to an ultimate rate of 5% in 2013. The 2006expected long-term rate of return on its U.S. pension plan assets remained at7.50%. The 2006 expected long-term rate of return on the Firm’s COLI post-retirement plan assets remained at 7.00%; however, with the merger of BankOne’s other postretirement plan assets, the Firm’s overall expected long-termrate of return on U.S. postretirement employee benefit plan assets decreasedto 6.84% and 6.80% in 2005 and 2004, respectively, to reflect a weightedaverage expected rate of return for the merged plan. The interest crediting rateassumption used to determine pension benefits changed to 5.00% from 4.75%in 2005, primarily due to changes in market interest rates which will result inadditional expense of $18 million. The changes as of December 31, 2005, tothe discount rates are expected to increase 2006 U.S. pension and otherpostretirement benefit expenses by approximately $5 million and to the non-U.S. pension and other postretirement benefit expenses by $23 million. The rateof compensation increase assumption of 4.00% at December 31, 2005, reflectsthe consolidation of the prior JPMorgan Chase and Bank One age-weightedincrease assumptions; the impact to expense is not expected to be material.
The following table presents the weighted-average asset allocation at December 31 for the years indicated, and the respective target allocation by asset category,for the Firm’s U.S. and non-U.S. defined benefit pension and postretirement benefit plans.
Defined benefit pension plans
U.S. Non-U.S.(a) Postretirement benefit plans(b)
Target % of plan assets Target % of plan assets Target % of plan assetsDecember 31, Allocation 2005 2004 Allocation 2005 2004 Allocation 2005 2004
Asset categoryDebt securities 30% 33% 38% 74% 75% 76% 50% 54% 54%Equity securities 55 57 53 25 24 24 50 46 46Real estate 5 6 5 1 1 — — — —Other 10 4 4 — — — — — —
Total 100% 100% 100% 100% 100% 100% 100% 100% 100%
(a) Represents the U.K. defined benefit pension plan only, as plans outside the U.K. are not significant.(b) Represents the U.S. postretirement benefit plan only, as the U.K. plan is unfunded.
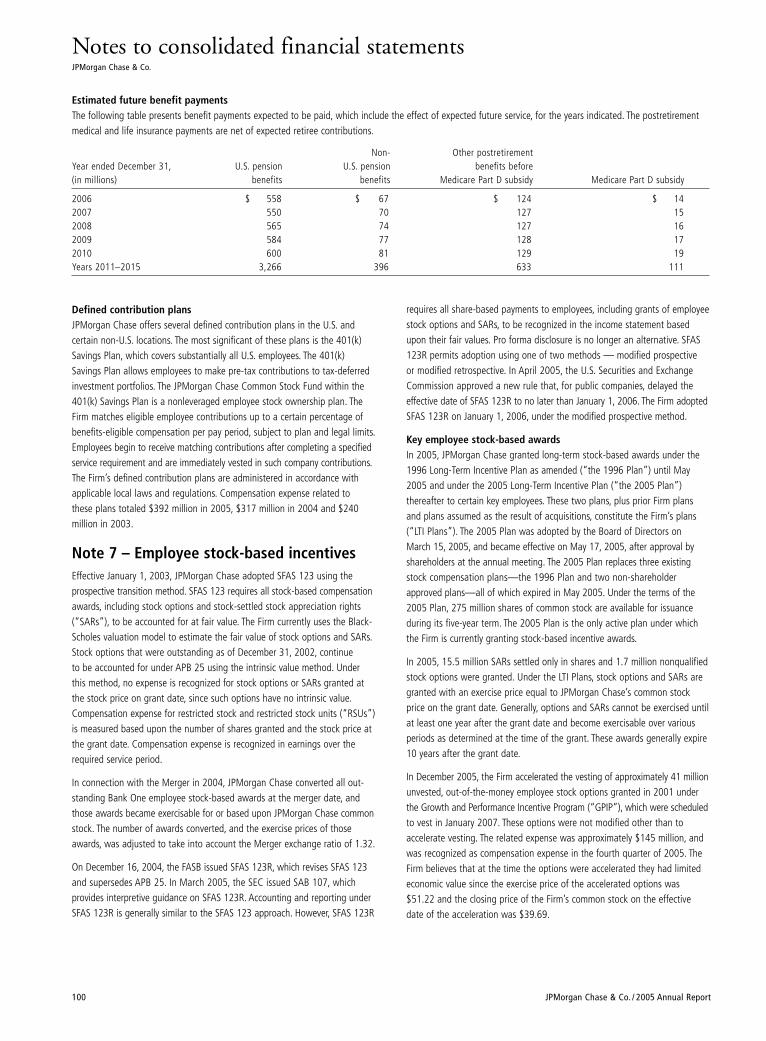
Notes to consolidated financial statementsJPMorgan Chase & Co.
100 JPMorgan Chase & Co. / 2005 Annual Report
Defined contribution plansJPMorgan Chase offers several defined contribution plans in the U.S. and certain non-U.S. locations. The most significant of these plans is the 401(k)Savings Plan, which covers substantially all U.S. employees. The 401(k)Savings Plan allows employees to make pre-tax contributions to tax-deferredinvestment portfolios. The JPMorgan Chase Common Stock Fund within the401(k) Savings Plan is a nonleveraged employee stock ownership plan. TheFirm matches eligible employee contributions up to a certain percentage ofbenefits-eligible compensation per pay period, subject to plan and legal limits.Employees begin to receive matching contributions after completing a specifiedservice requirement and are immediately vested in such company contributions.The Firm’s defined contribution plans are administered in accordance withapplicable local laws and regulations. Compensation expense related to these plans totaled $392 million in 2005, $317 million in 2004 and $240million in 2003.
Note 7 – Employee stock-based incentivesEffective January 1, 2003, JPMorgan Chase adopted SFAS 123 using theprospective transition method. SFAS 123 requires all stock-based compensationawards, including stock options and stock-settled stock appreciation rights(“SARs”), to be accounted for at fair value. The Firm currently uses the Black-Scholes valuation model to estimate the fair value of stock options and SARs.Stock options that were outstanding as of December 31, 2002, continue to be accounted for under APB 25 using the intrinsic value method. Underthis method, no expense is recognized for stock options or SARs granted atthe stock price on grant date, since such options have no intrinsic value.Compensation expense for restricted stock and restricted stock units (“RSUs”)is measured based upon the number of shares granted and the stock price atthe grant date. Compensation expense is recognized in earnings over therequired service period.
In connection with the Merger in 2004, JPMorgan Chase converted all out-standing Bank One employee stock-based awards at the merger date, andthose awards became exercisable for or based upon JPMorgan Chase commonstock. The number of awards converted, and the exercise prices of thoseawards, was adjusted to take into account the Merger exchange ratio of 1.32.
On December 16, 2004, the FASB issued SFAS 123R, which revises SFAS 123and supersedes APB 25. In March 2005, the SEC issued SAB 107, which provides interpretive guidance on SFAS 123R. Accounting and reporting underSFAS 123R is generally similar to the SFAS 123 approach. However, SFAS 123R
requires all share-based payments to employees, including grants of employeestock options and SARs, to be recognized in the income statement basedupon their fair values. Pro forma disclosure is no longer an alternative. SFAS123R permits adoption using one of two methods — modified prospective or modified retrospective. In April 2005, the U.S. Securities and ExchangeCommission approved a new rule that, for public companies, delayed theeffective date of SFAS 123R to no later than January 1, 2006. The Firm adoptedSFAS 123R on January 1, 2006, under the modified prospective method.
Key employee stock-based awardsIn 2005, JPMorgan Chase granted long-term stock-based awards under the1996 Long-Term Incentive Plan as amended (“the 1996 Plan”) until May2005 and under the 2005 Long-Term Incentive Plan (“the 2005 Plan”) thereafter to certain key employees. These two plans, plus prior Firm plansand plans assumed as the result of acquisitions, constitute the Firm’s plans(“LTI Plans”). The 2005 Plan was adopted by the Board of Directors on March 15, 2005, and became effective on May 17, 2005, after approval byshareholders at the annual meeting. The 2005 Plan replaces three existingstock compensation plans—the 1996 Plan and two non-shareholderapproved plans—all of which expired in May 2005. Under the terms of the2005 Plan, 275 million shares of common stock are available for issuanceduring its five-year term. The 2005 Plan is the only active plan under whichthe Firm is currently granting stock-based incentive awards.
In 2005, 15.5 million SARs settled only in shares and 1.7 million nonqualifiedstock options were granted. Under the LTI Plans, stock options and SARs aregranted with an exercise price equal to JPMorgan Chase’s common stockprice on the grant date. Generally, options and SARs cannot be exercised untilat least one year after the grant date and become exercisable over variousperiods as determined at the time of the grant. These awards generally expire10 years after the grant date.
In December 2005, the Firm accelerated the vesting of approximately 41 millionunvested, out-of-the-money employee stock options granted in 2001 underthe Growth and Performance Incentive Program (“GPIP”), which were scheduledto vest in January 2007. These options were not modified other than to accelerate vesting. The related expense was approximately $145 million, andwas recognized as compensation expense in the fourth quarter of 2005. TheFirm believes that at the time the options were accelerated they had limitedeconomic value since the exercise price of the accelerated options was$51.22 and the closing price of the Firm’s common stock on the effectivedate of the acceleration was $39.69.
Estimated future benefit payments The following table presents benefit payments expected to be paid, which include the effect of expected future service, for the years indicated. The postretirementmedical and life insurance payments are net of expected retiree contributions.
Non- Other postretirementYear ended December 31, U.S. pension U.S. pension benefits before(in millions) benefits benefits Medicare Part D subsidy Medicare Part D subsidy
2006 $ 558 $ 67 $ 124 $ 142007 550 70 127 152008 565 74 127 162009 584 77 128 172010 600 81 129 19Years 2011–2015 3,266 396 633 111
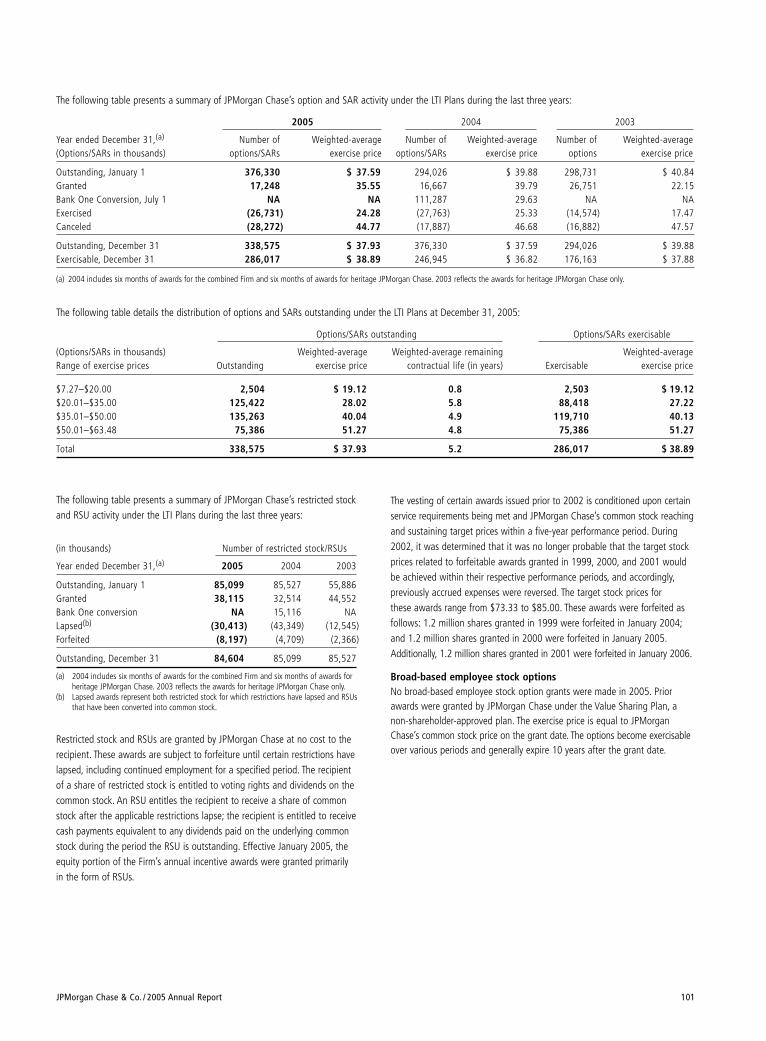
JPMorgan Chase & Co. / 2005 Annual Report 101
The following table presents a summary of JPMorgan Chase’s option and SAR activity under the LTI Plans during the last three years:
2005 2004 2003
Year ended December 31,(a) Number of Weighted-average Number of Weighted-average Number of Weighted-average(Options/SARs in thousands) options/SARs exercise price options/SARs exercise price options exercise price
Outstanding, January 1 376,330 $ 37.59 294,026 $ 39.88 298,731 $ 40.84Granted 17,248 35.55 16,667 39.79 26,751 22.15Bank One Conversion, July 1 NA NA 111,287 29.63 NA NAExercised (26,731) 24.28 (27,763) 25.33 (14,574) 17.47Canceled (28,272) 44.77 (17,887) 46.68 (16,882) 47.57
Outstanding, December 31 338,575 $ 37.93 376,330 $ 37.59 294,026 $ 39.88Exercisable, December 31 286,017 $ 38.89 246,945 $ 36.82 176,163 $ 37.88
(a) 2004 includes six months of awards for the combined Firm and six months of awards for heritage JPMorgan Chase. 2003 reflects the awards for heritage JPMorgan Chase only.
Restricted stock and RSUs are granted by JPMorgan Chase at no cost to therecipient. These awards are subject to forfeiture until certain restrictions havelapsed, including continued employment for a specified period. The recipientof a share of restricted stock is entitled to voting rights and dividends on thecommon stock. An RSU entitles the recipient to receive a share of commonstock after the applicable restrictions lapse; the recipient is entitled to receivecash payments equivalent to any dividends paid on the underlying commonstock during the period the RSU is outstanding. Effective January 2005, theequity portion of the Firm’s annual incentive awards were granted primarily in the form of RSUs.
The vesting of certain awards issued prior to 2002 is conditioned upon certainservice requirements being met and JPMorgan Chase’s common stock reachingand sustaining target prices within a five-year performance period. During2002, it was determined that it was no longer probable that the target stockprices related to forfeitable awards granted in 1999, 2000, and 2001 wouldbe achieved within their respective performance periods, and accordingly,previously accrued expenses were reversed. The target stock prices for these awards range from $73.33 to $85.00. These awards were forfeited asfollows: 1.2 million shares granted in 1999 were forfeited in January 2004;and 1.2 million shares granted in 2000 were forfeited in January 2005.Additionally, 1.2 million shares granted in 2001 were forfeited in January 2006.
Broad-based employee stock optionsNo broad-based employee stock option grants were made in 2005. Priorawards were granted by JPMorgan Chase under the Value Sharing Plan, anon-shareholder-approved plan. The exercise price is equal to JPMorganChase’s common stock price on the grant date. The options become exercisableover various periods and generally expire 10 years after the grant date.
The following table details the distribution of options and SARs outstanding under the LTI Plans at December 31, 2005:
Options/SARs outstanding Options/SARs exercisable
(Options/SARs in thousands) Weighted-average Weighted-average remaining Weighted-averageRange of exercise prices Outstanding exercise price contractual life (in years) Exercisable exercise price
$7.27–$20.00 2,504 $ 19.12 0.8 2,503 $ 19.12$20.01–$35.00 125,422 28.02 5.8 88,418 27.22$35.01–$50.00 135,263 40.04 4.9 119,710 40.13$50.01–$63.48 75,386 51.27 4.8 75,386 51.27
Total 338,575 $ 37.93 5.2 286,017 $ 38.89
The following table presents a summary of JPMorgan Chase’s restricted stockand RSU activity under the LTI Plans during the last three years:
(in thousands) Number of restricted stock/RSUs
Year ended December 31,(a) 2005 2004 2003
Outstanding, January 1 85,099 85,527 55,886Granted 38,115 32,514 44,552Bank One conversion NA 15,116 NALapsed(b) (30,413) (43,349) (12,545)Forfeited (8,197) (4,709) (2,366)
Outstanding, December 31 84,604 85,099 85,527
(a) 2004 includes six months of awards for the combined Firm and six months of awards forheritage JPMorgan Chase. 2003 reflects the awards for heritage JPMorgan Chase only.
(b) Lapsed awards represent both restricted stock for which restrictions have lapsed and RSUsthat have been converted into common stock.
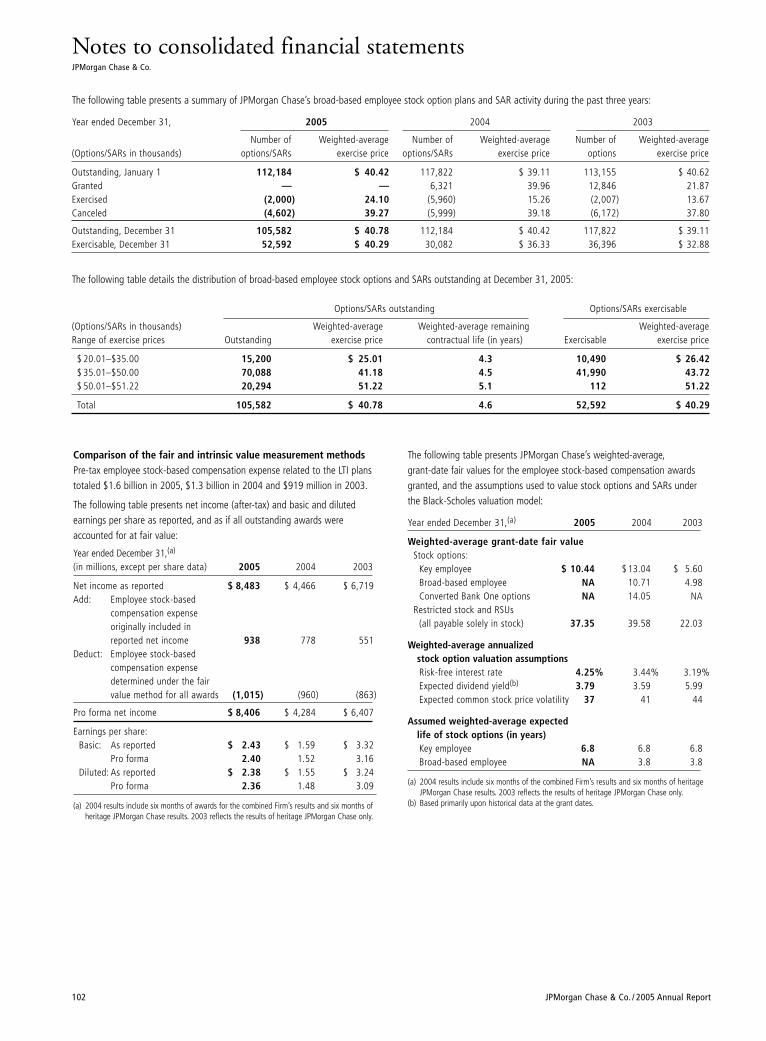
Notes to consolidated financial statementsJPMorgan Chase & Co.
102 JPMorgan Chase & Co. / 2005 Annual Report
The following table details the distribution of broad-based employee stock options and SARs outstanding at December 31, 2005:
Options/SARs outstanding Options/SARs exercisable
(Options/SARs in thousands) Weighted-average Weighted-average remaining Weighted-averageRange of exercise prices Outstanding exercise price contractual life (in years) Exercisable exercise price
$ 20.01–$35.00 15,200 $ 25.01 4.3 10,490 $ 26.42$ 35.01–$50.00 70,088 41.18 4.5 41,990 43.72$ 50.01–$51.22 20,294 51.22 5.1 112 51.22
Total 105,582 $ 40.78 4.6 52,592 $ 40.29
Comparison of the fair and intrinsic value measurement methodsPre-tax employee stock-based compensation expense related to the LTI planstotaled $1.6 billion in 2005, $1.3 billion in 2004 and $919 million in 2003.
The following table presents net income (after-tax) and basic and dilutedearnings per share as reported, and as if all outstanding awards wereaccounted for at fair value:
Year ended December 31,(a)
(in millions, except per share data) 2005 2004 2003
Net income as reported $ 8,483 $ 4,466 $ 6,719Add: Employee stock-based
compensation expense originally included in reported net income 938 778 551
Deduct: Employee stock-based compensation expensedetermined under the fair value method for all awards (1,015) (960) (863)
Pro forma net income $ 8,406 $ 4,284 $ 6,407
Earnings per share:Basic: As reported $ 2.43 $ 1.59 $ 3.32
Pro forma 2.40 1.52 3.16Diluted: As reported $ 2.38 $ 1.55 $ 3.24
Pro forma 2.36 1.48 3.09
(a) 2004 results include six months of awards for the combined Firm’s results and six months ofheritage JPMorgan Chase results. 2003 reflects the results of heritage JPMorgan Chase only.
The following table presents a summary of JPMorgan Chase’s broad-based employee stock option plans and SAR activity during the past three years:
Year ended December 31, 2005 2004 2003
Number of Weighted-average Number of Weighted-average Number of Weighted-average(Options/SARs in thousands) options/SARs exercise price options/SARs exercise price options exercise price
Outstanding, January 1 112,184 $ 40.42 117,822 $ 39.11 113,155 $ 40.62Granted — — 6,321 39.96 12,846 21.87Exercised (2,000) 24.10 (5,960) 15.26 (2,007) 13.67Canceled (4,602) 39.27 (5,999) 39.18 (6,172) 37.80
Outstanding, December 31 105,582 $ 40.78 112,184 $ 40.42 117,822 $ 39.11Exercisable, December 31 52,592 $ 40.29 30,082 $ 36.33 36,396 $ 32.88
The following table presents JPMorgan Chase’s weighted-average,grant-date fair values for the employee stock-based compensation awardsgranted, and the assumptions used to value stock options and SARs underthe Black-Scholes valuation model:
Year ended December 31,(a) 2005 2004 2003
Weighted-average grant-date fair valueStock options:
Key employee $ 10.44 $ 13.04 $ 5.60Broad-based employee NA 10.71 4.98Converted Bank One options NA 14.05 NA
Restricted stock and RSUs (all payable solely in stock) 37.35 39.58 22.03
Weighted-average annualizedstock option valuation assumptionsRisk-free interest rate 4.25% 3.44% 3.19%Expected dividend yield(b) 3.79 3.59 5.99Expected common stock price volatility 37 41 44
Assumed weighted-average expectedlife of stock options (in years)Key employee 6.8 6.8 6.8Broad-based employee NA 3.8 3.8
(a) 2004 results include six months of the combined Firm’s results and six months of heritageJPMorgan Chase results. 2003 reflects the results of heritage JPMorgan Chase only.
(b) Based primarily upon historical data at the grant dates.
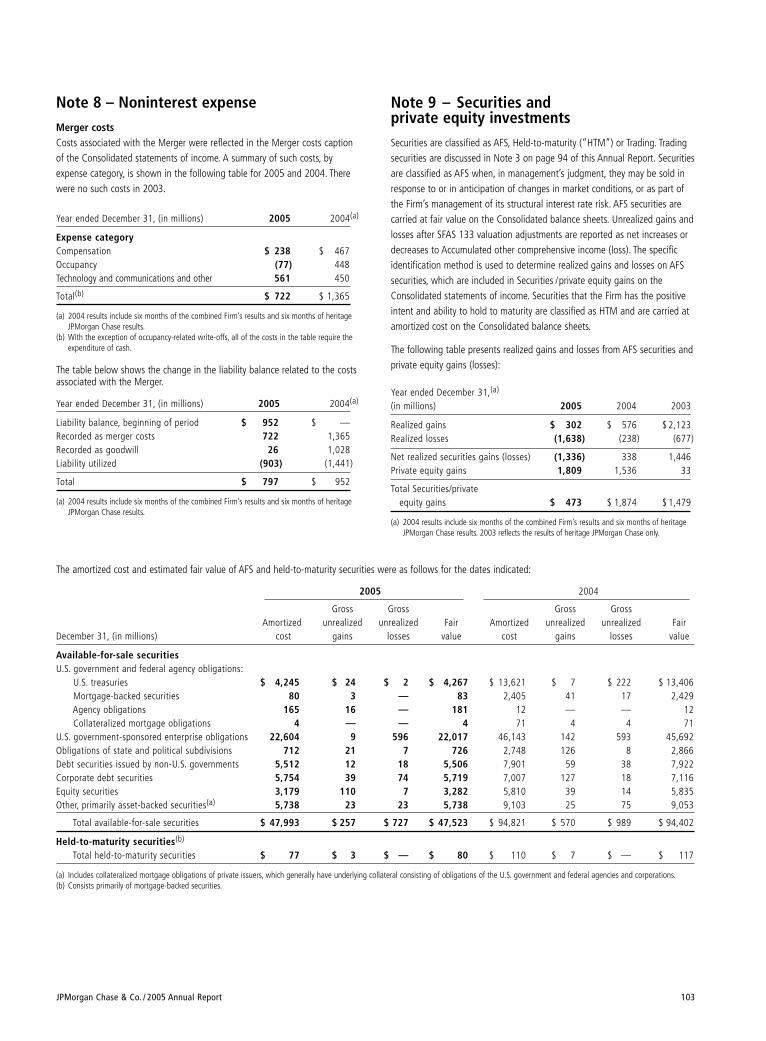
JPMorgan Chase & Co. / 2005 Annual Report 103
Note 9 – Securities and private equity investmentsSecurities are classified as AFS, Held-to-maturity (“HTM”) or Trading. Tradingsecurities are discussed in Note 3 on page 94 of this Annual Report. Securitiesare classified as AFS when, in management’s judgment, they may be sold inresponse to or in anticipation of changes in market conditions, or as part ofthe Firm’s management of its structural interest rate risk. AFS securities arecarried at fair value on the Consolidated balance sheets. Unrealized gains andlosses after SFAS 133 valuation adjustments are reported as net increases ordecreases to Accumulated other comprehensive income (loss). The specificidentification method is used to determine realized gains and losses on AFSsecurities, which are included in Securities /private equity gains on theConsolidated statements of income. Securities that the Firm has the positiveintent and ability to hold to maturity are classified as HTM and are carried atamortized cost on the Consolidated balance sheets.
The following table presents realized gains and losses from AFS securities andprivate equity gains (losses):
Year ended December 31,(a)
(in millions) 2005 2004 2003
Realized gains $ 302 $ 576 $ 2,123Realized losses (1,638) (238) (677)
Net realized securities gains (losses) (1,336) 338 1,446Private equity gains 1,809 1,536 33
Total Securities/private equity gains $ 473 $ 1,874 $ 1,479
(a) 2004 results include six months of the combined Firm’s results and six months of heritageJPMorgan Chase results. 2003 reflects the results of heritage JPMorgan Chase only.
Note 8 – Noninterest expenseMerger costsCosts associated with the Merger were reflected in the Merger costs captionof the Consolidated statements of income. A summary of such costs, byexpense category, is shown in the following table for 2005 and 2004. Therewere no such costs in 2003.
Year ended December 31, (in millions) 2005 2004(a)
Expense categoryCompensation $ 238 $ 467Occupancy (77) 448Technology and communications and other 561 450
Total(b) $ 722 $ 1,365
(a) 2004 results include six months of the combined Firm’s results and six months of heritageJPMorgan Chase results.
(b) With the exception of occupancy-related write-offs, all of the costs in the table require theexpenditure of cash.
The table below shows the change in the liability balance related to the costsassociated with the Merger.
Year ended December 31, (in millions) 2005 2004(a)
Liability balance, beginning of period $ 952 $ —Recorded as merger costs 722 1,365Recorded as goodwill 26 1,028Liability utilized (903) (1,441)
Total $ 797 $ 952
(a) 2004 results include six months of the combined Firm’s results and six months of heritageJPMorgan Chase results.
The amortized cost and estimated fair value of AFS and held-to-maturity securities were as follows for the dates indicated:
2005 2004
Gross Gross Gross GrossAmortized unrealized unrealized Fair Amortized unrealized unrealized Fair
December 31, (in millions) cost gains losses value cost gains losses value
Available-for-sale securitiesU.S. government and federal agency obligations:
U.S. treasuries $ 4,245 $ 24 $ 2 $ 4,267 $ 13,621 $ 7 $ 222 $ 13,406Mortgage-backed securities 80 3 — 83 2,405 41 17 2,429Agency obligations 165 16 — 181 12 — — 12Collateralized mortgage obligations 4 — — 4 71 4 4 71
U.S. government-sponsored enterprise obligations 22,604 9 596 22,017 46,143 142 593 45,692Obligations of state and political subdivisions 712 21 7 726 2,748 126 8 2,866Debt securities issued by non-U.S. governments 5,512 12 18 5,506 7,901 59 38 7,922Corporate debt securities 5,754 39 74 5,719 7,007 127 18 7,116Equity securities 3,179 110 7 3,282 5,810 39 14 5,835Other, primarily asset-backed securities(a) 5,738 23 23 5,738 9,103 25 75 9,053
Total available-for-sale securities $ 47,993 $ 257 $ 727 $ 47,523 $ 94,821 $ 570 $ 989 $ 94,402
Held-to-maturity securities(b)
Total held-to-maturity securities $ 77 $ 3 $ — $ 80 $ 110 $ 7 $ — $ 117
(a) Includes collateralized mortgage obligations of private issuers, which generally have underlying collateral consisting of obligations of the U.S. government and federal agencies and corporations.(b) Consists primarily of mortgage-backed securities.
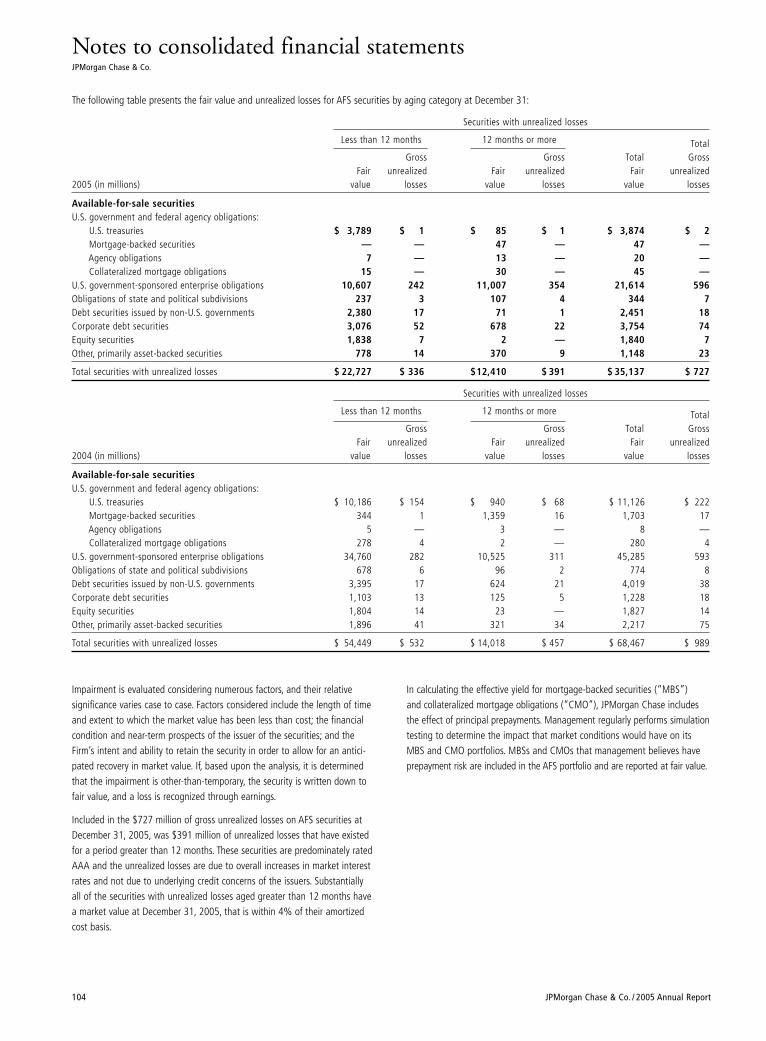
Notes to consolidated financial statementsJPMorgan Chase & Co.
104 JPMorgan Chase & Co. / 2005 Annual Report
The following table presents the fair value and unrealized losses for AFS securities by aging category at December 31:
Securities with unrealized losses
Less than 12 months 12 months or more TotalGross Gross Total Gross
Fair unrealized Fair unrealized Fair unrealized2005 (in millions) value losses value losses value losses
Available-for-sale securitiesU.S. government and federal agency obligations:
U.S. treasuries $ 3,789 $ 1 $ 85 $ 1 $ 3,874 $ 2Mortgage-backed securities — — 47 — 47 —Agency obligations 7 — 13 — 20 —Collateralized mortgage obligations 15 — 30 — 45 —
U.S. government-sponsored enterprise obligations 10,607 242 11,007 354 21,614 596Obligations of state and political subdivisions 237 3 107 4 344 7Debt securities issued by non-U.S. governments 2,380 17 71 1 2,451 18Corporate debt securities 3,076 52 678 22 3,754 74Equity securities 1,838 7 2 — 1,840 7Other, primarily asset-backed securities 778 14 370 9 1,148 23
Total securities with unrealized losses $ 22,727 $ 336 $12,410 $ 391 $ 35,137 $ 727
Securities with unrealized losses
Less than 12 months 12 months or more TotalGross Gross Total Gross
Fair unrealized Fair unrealized Fair unrealized2004 (in millions) value losses value losses value losses
Available-for-sale securitiesU.S. government and federal agency obligations:
U.S. treasuries $ 10,186 $ 154 $ 940 $ 68 $ 11,126 $ 222Mortgage-backed securities 344 1 1,359 16 1,703 17Agency obligations 5 — 3 — 8 —Collateralized mortgage obligations 278 4 2 — 280 4
U.S. government-sponsored enterprise obligations 34,760 282 10,525 311 45,285 593Obligations of state and political subdivisions 678 6 96 2 774 8Debt securities issued by non-U.S. governments 3,395 17 624 21 4,019 38Corporate debt securities 1,103 13 125 5 1,228 18Equity securities 1,804 14 23 — 1,827 14Other, primarily asset-backed securities 1,896 41 321 34 2,217 75
Total securities with unrealized losses $ 54,449 $ 532 $ 14,018 $ 457 $ 68,467 $ 989
Impairment is evaluated considering numerous factors, and their relative significance varies case to case. Factors considered include the length of timeand extent to which the market value has been less than cost; the financial condition and near-term prospects of the issuer of the securities; and theFirm’s intent and ability to retain the security in order to allow for an antici-pated recovery in market value. If, based upon the analysis, it is determinedthat the impairment is other-than-temporary, the security is written down tofair value, and a loss is recognized through earnings.
Included in the $727 million of gross unrealized losses on AFS securities atDecember 31, 2005, was $391 million of unrealized losses that have existedfor a period greater than 12 months. These securities are predominately ratedAAA and the unrealized losses are due to overall increases in market interestrates and not due to underlying credit concerns of the issuers. Substantiallyall of the securities with unrealized losses aged greater than 12 months havea market value at December 31, 2005, that is within 4% of their amortizedcost basis.
In calculating the effective yield for mortgage-backed securities (“MBS”) and collateralized mortgage obligations (“CMO”), JPMorgan Chase includesthe effect of principal prepayments. Management regularly performs simulationtesting to determine the impact that market conditions would have on itsMBS and CMO portfolios. MBSs and CMOs that management believes haveprepayment risk are included in the AFS portfolio and are reported at fair value.
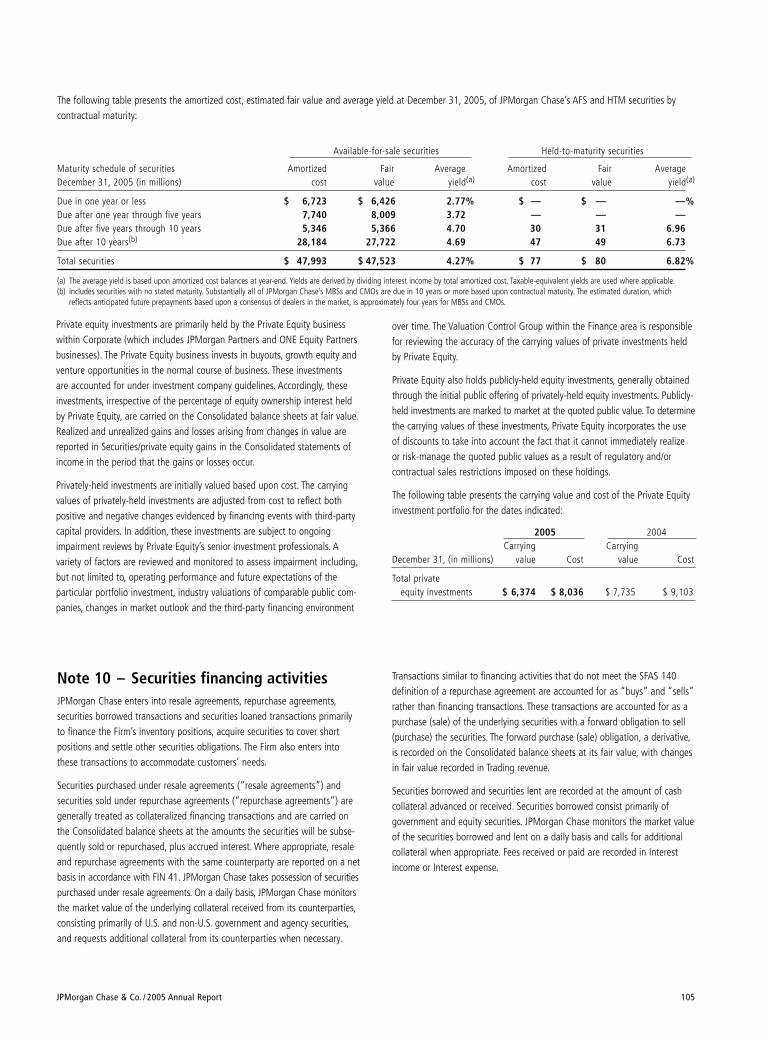
JPMorgan Chase & Co. / 2005 Annual Report 105
The following table presents the amortized cost, estimated fair value and average yield at December 31, 2005, of JPMorgan Chase’s AFS and HTM securities bycontractual maturity:
Available-for-sale securities Held-to-maturity securities
Maturity schedule of securities Amortized Fair Average Amortized Fair AverageDecember 31, 2005 (in millions) cost value yield(a) cost value yield(a)
Due in one year or less $ 6,723 $ 6,426 2.77% $ — $ — —%Due after one year through five years 7,740 8,009 3.72 — — —Due after five years through 10 years 5,346 5,366 4.70 30 31 6.96Due after 10 years(b) 28,184 27,722 4.69 47 49 6.73
Total securities $ 47,993 $ 47,523 4.27% $ 77 $ 80 6.82%
(a) The average yield is based upon amortized cost balances at year-end. Yields are derived by dividing interest income by total amortized cost. Taxable-equivalent yields are used where applicable.(b) Includes securities with no stated maturity. Substantially all of JPMorgan Chase’s MBSs and CMOs are due in 10 years or more based upon contractual maturity. The estimated duration, which
reflects anticipated future prepayments based upon a consensus of dealers in the market, is approximately four years for MBSs and CMOs.
Private equity investments are primarily held by the Private Equity businesswithin Corporate (which includes JPMorgan Partners and ONE Equity Partnersbusinesses). The Private Equity business invests in buyouts, growth equity andventure opportunities in the normal course of business. These investments are accounted for under investment company guidelines. Accordingly, theseinvestments, irrespective of the percentage of equity ownership interest heldby Private Equity, are carried on the Consolidated balance sheets at fair value.Realized and unrealized gains and losses arising from changes in value arereported in Securities/private equity gains in the Consolidated statements ofincome in the period that the gains or losses occur.
Privately-held investments are initially valued based upon cost. The carryingvalues of privately-held investments are adjusted from cost to reflect bothpositive and negative changes evidenced by financing events with third-partycapital providers. In addition, these investments are subject to ongoingimpairment reviews by Private Equity’s senior investment professionals. A variety of factors are reviewed and monitored to assess impairment including,but not limited to, operating performance and future expectations of the particular portfolio investment, industry valuations of comparable public com-panies, changes in market outlook and the third-party financing environment
over time. The Valuation Control Group within the Finance area is responsiblefor reviewing the accuracy of the carrying values of private investments heldby Private Equity.
Private Equity also holds publicly-held equity investments, generally obtainedthrough the initial public offering of privately-held equity investments. Publicly-held investments are marked to market at the quoted public value. To determinethe carrying values of these investments, Private Equity incorporates the useof discounts to take into account the fact that it cannot immediately realizeor risk-manage the quoted public values as a result of regulatory and/or contractual sales restrictions imposed on these holdings.
The following table presents the carrying value and cost of the Private Equityinvestment portfolio for the dates indicated:
2005 2004Carrying Carrying
December 31, (in millions) value Cost value Cost
Total private equity investments $ 6,374 $ 8,036 $ 7,735 $ 9,103
Note 10 – Securities financing activitiesJPMorgan Chase enters into resale agreements, repurchase agreements,securities borrowed transactions and securities loaned transactions primarilyto finance the Firm’s inventory positions, acquire securities to cover shortpositions and settle other securities obligations. The Firm also enters intothese transactions to accommodate customers’ needs.
Securities purchased under resale agreements (“resale agreements”) andsecurities sold under repurchase agreements (“repurchase agreements”) aregenerally treated as collateralized financing transactions and are carried onthe Consolidated balance sheets at the amounts the securities will be subse-quently sold or repurchased, plus accrued interest. Where appropriate, resaleand repurchase agreements with the same counterparty are reported on a netbasis in accordance with FIN 41. JPMorgan Chase takes possession of securitiespurchased under resale agreements. On a daily basis, JPMorgan Chase monitorsthe market value of the underlying collateral received from its counterparties,consisting primarily of U.S. and non-U.S. government and agency securities,and requests additional collateral from its counterparties when necessary.
Transactions similar to financing activities that do not meet the SFAS 140 definition of a repurchase agreement are accounted for as “buys” and “sells”rather than financing transactions. These transactions are accounted for as apurchase (sale) of the underlying securities with a forward obligation to sell(purchase) the securities. The forward purchase (sale) obligation, a derivative,is recorded on the Consolidated balance sheets at its fair value, with changesin fair value recorded in Trading revenue.
Securities borrowed and securities lent are recorded at the amount of cashcollateral advanced or received. Securities borrowed consist primarily of government and equity securities. JPMorgan Chase monitors the market valueof the securities borrowed and lent on a daily basis and calls for additionalcollateral when appropriate. Fees received or paid are recorded in Interestincome or Interest expense.
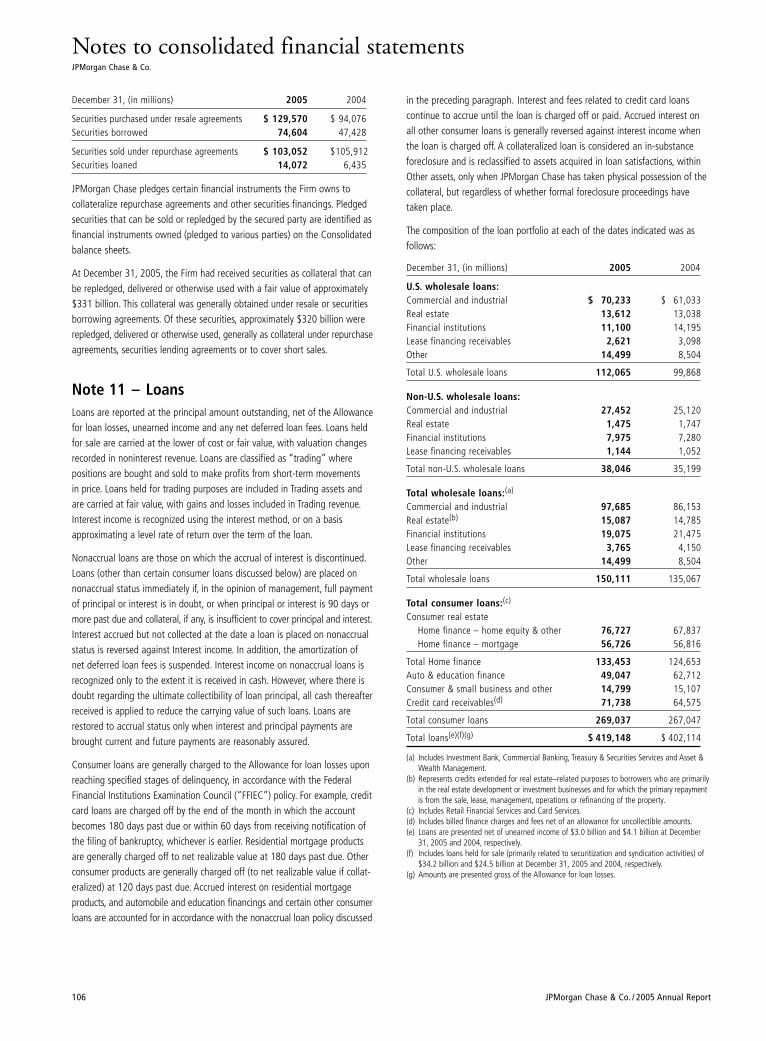
Notes to consolidated financial statementsJPMorgan Chase & Co.
106 JPMorgan Chase & Co. / 2005 Annual Report
December 31, (in millions) 2005 2004
Securities purchased under resale agreements $ 129,570 $ 94,076Securities borrowed 74,604 47,428
Securities sold under repurchase agreements $ 103,052 $105,912Securities loaned 14,072 6,435
JPMorgan Chase pledges certain financial instruments the Firm owns to collateralize repurchase agreements and other securities financings. Pledgedsecurities that can be sold or repledged by the secured party are identified asfinancial instruments owned (pledged to various parties) on the Consolidatedbalance sheets.
At December 31, 2005, the Firm had received securities as collateral that canbe repledged, delivered or otherwise used with a fair value of approximately$331 billion. This collateral was generally obtained under resale or securitiesborrowing agreements. Of these securities, approximately $320 billion wererepledged, delivered or otherwise used, generally as collateral under repurchaseagreements, securities lending agreements or to cover short sales.
Note 11 – LoansLoans are reported at the principal amount outstanding, net of the Allowancefor loan losses, unearned income and any net deferred loan fees. Loans heldfor sale are carried at the lower of cost or fair value, with valuation changesrecorded in noninterest revenue. Loans are classified as “trading” where positions are bought and sold to make profits from short-term movements in price. Loans held for trading purposes are included in Trading assets andare carried at fair value, with gains and losses included in Trading revenue.Interest income is recognized using the interest method, or on a basis approximating a level rate of return over the term of the loan.
Nonaccrual loans are those on which the accrual of interest is discontinued.Loans (other than certain consumer loans discussed below) are placed onnonaccrual status immediately if, in the opinion of management, full paymentof principal or interest is in doubt, or when principal or interest is 90 days ormore past due and collateral, if any, is insufficient to cover principal and interest.Interest accrued but not collected at the date a loan is placed on nonaccrualstatus is reversed against Interest income. In addition, the amortization of net deferred loan fees is suspended. Interest income on nonaccrual loans isrecognized only to the extent it is received in cash. However, where there isdoubt regarding the ultimate collectibility of loan principal, all cash thereafterreceived is applied to reduce the carrying value of such loans. Loans arerestored to accrual status only when interest and principal payments arebrought current and future payments are reasonably assured.
Consumer loans are generally charged to the Allowance for loan losses uponreaching specified stages of delinquency, in accordance with the FederalFinancial Institutions Examination Council (“FFIEC”) policy. For example, creditcard loans are charged off by the end of the month in which the accountbecomes 180 days past due or within 60 days from receiving notification ofthe filing of bankruptcy, whichever is earlier. Residential mortgage productsare generally charged off to net realizable value at 180 days past due. Otherconsumer products are generally charged off (to net realizable value if collat-eralized) at 120 days past due. Accrued interest on residential mortgage products, and automobile and education financings and certain other consumerloans are accounted for in accordance with the nonaccrual loan policy discussed
in the preceding paragraph. Interest and fees related to credit card loans continue to accrue until the loan is charged off or paid. Accrued interest onall other consumer loans is generally reversed against interest income whenthe loan is charged off. A collateralized loan is considered an in-substanceforeclosure and is reclassified to assets acquired in loan satisfactions, withinOther assets, only when JPMorgan Chase has taken physical possession of thecollateral, but regardless of whether formal foreclosure proceedings havetaken place.
The composition of the loan portfolio at each of the dates indicated was asfollows:
December 31, (in millions) 2005 2004
U.S. wholesale loans:Commercial and industrial $ 70,233 $ 61,033Real estate 13,612 13,038Financial institutions 11,100 14,195Lease financing receivables 2,621 3,098Other 14,499 8,504
Total U.S. wholesale loans 112,065 99,868
Non-U.S. wholesale loans:Commercial and industrial 27,452 25,120Real estate 1,475 1,747Financial institutions 7,975 7,280Lease financing receivables 1,144 1,052
Total non-U.S. wholesale loans 38,046 35,199
Total wholesale loans:(a)
Commercial and industrial 97,685 86,153Real estate(b) 15,087 14,785Financial institutions 19,075 21,475Lease financing receivables 3,765 4,150Other 14,499 8,504
Total wholesale loans 150,111 135,067
Total consumer loans:(c)
Consumer real estateHome finance – home equity & other 76,727 67,837Home finance – mortgage 56,726 56,816
Total Home finance 133,453 124,653Auto & education finance 49,047 62,712Consumer & small business and other 14,799 15,107Credit card receivables(d) 71,738 64,575
Total consumer loans 269,037 267,047
Total loans(e)(f)(g) $ 419,148 $ 402,114
(a) Includes Investment Bank, Commercial Banking, Treasury & Securities Services and Asset &Wealth Management.
(b) Represents credits extended for real estate–related purposes to borrowers who are primarilyin the real estate development or investment businesses and for which the primary repaymentis from the sale, lease, management, operations or refinancing of the property.
(c) Includes Retail Financial Services and Card Services.(d) Includes billed finance charges and fees net of an allowance for uncollectible amounts.(e) Loans are presented net of unearned income of $3.0 billion and $4.1 billion at December
31, 2005 and 2004, respectively.(f) Includes loans held for sale (primarily related to securitization and syndication activities) of
$34.2 billion and $24.5 billion at December 31, 2005 and 2004, respectively.(g) Amounts are presented gross of the Allowance for loan losses.
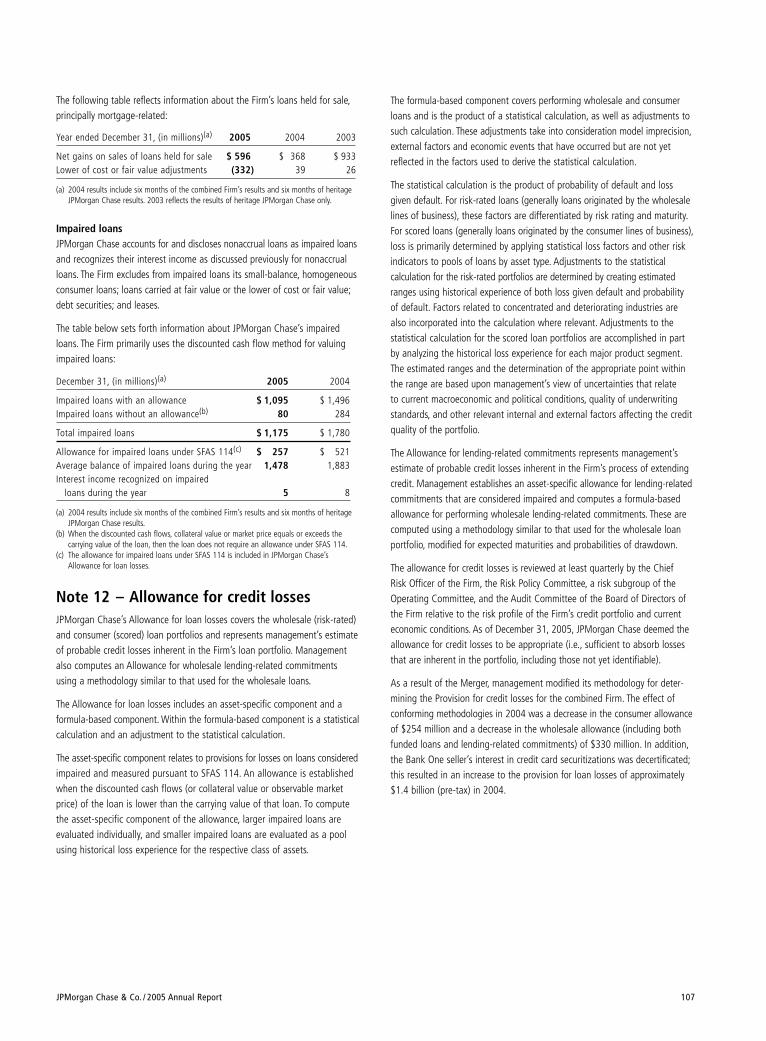
JPMorgan Chase & Co. / 2005 Annual Report 107
The following table reflects information about the Firm’s loans held for sale,principally mortgage-related:
Year ended December 31, (in millions)(a) 2005 2004 2003
Net gains on sales of loans held for sale $ 596 $ 368 $ 933Lower of cost or fair value adjustments (332) 39 26
(a) 2004 results include six months of the combined Firm’s results and six months of heritageJPMorgan Chase results. 2003 reflects the results of heritage JPMorgan Chase only.
Impaired loansJPMorgan Chase accounts for and discloses nonaccrual loans as impaired loansand recognizes their interest income as discussed previously for nonaccrualloans. The Firm excludes from impaired loans its small-balance, homogeneousconsumer loans; loans carried at fair value or the lower of cost or fair value;debt securities; and leases.
The table below sets forth information about JPMorgan Chase’s impairedloans. The Firm primarily uses the discounted cash flow method for valuingimpaired loans:
December 31, (in millions)(a) 2005 2004
Impaired loans with an allowance $ 1,095 $ 1,496Impaired loans without an allowance(b) 80 284
Total impaired loans $ 1,175 $ 1,780
Allowance for impaired loans under SFAS 114(c) $ 257 $ 521Average balance of impaired loans during the year 1,478 1,883Interest income recognized on impaired
loans during the year 5 8
(a) 2004 results include six months of the combined Firm’s results and six months of heritageJPMorgan Chase results.
(b) When the discounted cash flows, collateral value or market price equals or exceeds the carrying value of the loan, then the loan does not require an allowance under SFAS 114.
(c) The allowance for impaired loans under SFAS 114 is included in JPMorgan Chase’sAllowance for loan losses.
Note 12 – Allowance for credit lossesJPMorgan Chase’s Allowance for loan losses covers the wholesale (risk-rated)and consumer (scored) loan portfolios and represents management’s estimateof probable credit losses inherent in the Firm’s loan portfolio. Managementalso computes an Allowance for wholesale lending-related commitmentsusing a methodology similar to that used for the wholesale loans.
The Allowance for loan losses includes an asset-specific component and a formula-based component. Within the formula-based component is a statisticalcalculation and an adjustment to the statistical calculation.
The asset-specific component relates to provisions for losses on loans consideredimpaired and measured pursuant to SFAS 114. An allowance is establishedwhen the discounted cash flows (or collateral value or observable marketprice) of the loan is lower than the carrying value of that loan. To computethe asset-specific component of the allowance, larger impaired loans areevaluated individually, and smaller impaired loans are evaluated as a poolusing historical loss experience for the respective class of assets.
The formula-based component covers performing wholesale and consumerloans and is the product of a statistical calculation, as well as adjustments tosuch calculation. These adjustments take into consideration model imprecision,external factors and economic events that have occurred but are not yetreflected in the factors used to derive the statistical calculation.
The statistical calculation is the product of probability of default and lossgiven default. For risk-rated loans (generally loans originated by the wholesalelines of business), these factors are differentiated by risk rating and maturity.For scored loans (generally loans originated by the consumer lines of business),loss is primarily determined by applying statistical loss factors and other riskindicators to pools of loans by asset type. Adjustments to the statistical calculation for the risk-rated portfolios are determined by creating estimatedranges using historical experience of both loss given default and probabilityof default. Factors related to concentrated and deteriorating industries arealso incorporated into the calculation where relevant. Adjustments to the statistical calculation for the scored loan portfolios are accomplished in partby analyzing the historical loss experience for each major product segment.The estimated ranges and the determination of the appropriate point withinthe range are based upon management’s view of uncertainties that relate to current macroeconomic and political conditions, quality of underwritingstandards, and other relevant internal and external factors affecting the creditquality of the portfolio.
The Allowance for lending-related commitments represents management’s estimate of probable credit losses inherent in the Firm’s process of extendingcredit. Management establishes an asset-specific allowance for lending-relatedcommitments that are considered impaired and computes a formula-basedallowance for performing wholesale lending-related commitments. These arecomputed using a methodology similar to that used for the wholesale loanportfolio, modified for expected maturities and probabilities of drawdown.
The allowance for credit losses is reviewed at least quarterly by the Chief Risk Officer of the Firm, the Risk Policy Committee, a risk subgroup of theOperating Committee, and the Audit Committee of the Board of Directors ofthe Firm relative to the risk profile of the Firm’s credit portfolio and currenteconomic conditions. As of December 31, 2005, JPMorgan Chase deemed theallowance for credit losses to be appropriate (i.e., sufficient to absorb lossesthat are inherent in the portfolio, including those not yet identifiable).
As a result of the Merger, management modified its methodology for deter-mining the Provision for credit losses for the combined Firm. The effect ofconforming methodologies in 2004 was a decrease in the consumer allowanceof $254 million and a decrease in the wholesale allowance (including bothfunded loans and lending-related commitments) of $330 million. In addition,the Bank One seller’s interest in credit card securitizations was decertificated;this resulted in an increase to the provision for loan losses of approximately$1.4 billion (pre-tax) in 2004.
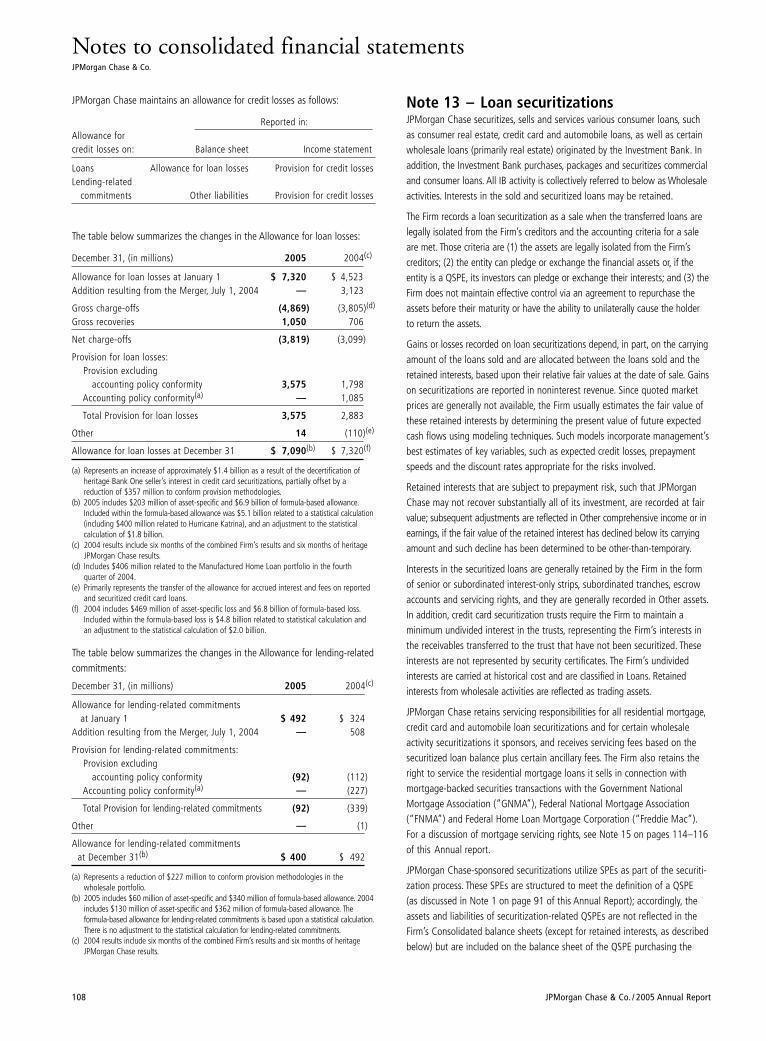
Notes to consolidated financial statementsJPMorgan Chase & Co.
108 JPMorgan Chase & Co. / 2005 Annual Report
JPMorgan Chase maintains an allowance for credit losses as follows:
Reported in:Allowance for credit losses on: Balance sheet Income statement
Loans Allowance for loan losses Provision for credit lossesLending-related
commitments Other liabilities Provision for credit losses
The table below summarizes the changes in the Allowance for loan losses:
December 31, (in millions) 2005 2004(c)
Allowance for loan losses at January 1 $ 7,320 $ 4,523Addition resulting from the Merger, July 1, 2004 — 3,123
Gross charge-offs (4,869) (3,805)(d)
Gross recoveries 1,050 706
Net charge-offs (3,819) (3,099)
Provision for loan losses:Provision excluding
accounting policy conformity 3,575 1,798Accounting policy conformity(a) — 1,085
Total Provision for loan losses 3,575 2,883
Other 14 (110)(e)
Allowance for loan losses at December 31 $ 7,090(b) $ 7,320(f)
(a) Represents an increase of approximately $1.4 billion as a result of the decertification of heritage Bank One seller’s interest in credit card securitizations, partially offset by a reduction of $357 million to conform provision methodologies.
(b) 2005 includes $203 million of asset-specific and $6.9 billion of formula-based allowance.Included within the formula-based allowance was $5.1 billion related to a statistical calculation(including $400 million related to Hurricane Katrina), and an adjustment to the statistical calculation of $1.8 billion.
(c) 2004 results include six months of the combined Firm’s results and six months of heritageJPMorgan Chase results.
(d) Includes $406 million related to the Manufactured Home Loan portfolio in the fourthquarter of 2004.
(e) Primarily represents the transfer of the allowance for accrued interest and fees on reportedand securitized credit card loans.
(f) 2004 includes $469 million of asset-specific loss and $6.8 billion of formula-based loss.Included within the formula-based loss is $4.8 billion related to statistical calculation andan adjustment to the statistical calculation of $2.0 billion.
The table below summarizes the changes in the Allowance for lending-relatedcommitments:
December 31, (in millions) 2005 2004(c)
Allowance for lending-related commitments at January 1 $ 492 $ 324
Addition resulting from the Merger, July 1, 2004 — 508
Provision for lending-related commitments:Provision excluding
accounting policy conformity (92) (112)Accounting policy conformity(a) — (227)
Total Provision for lending-related commitments (92) (339)
Other — (1)
Allowance for lending-related commitments at December 31(b) $ 400 $ 492
(a) Represents a reduction of $227 million to conform provision methodologies in the wholesale portfolio.
(b) 2005 includes $60 million of asset-specific and $340 million of formula-based allowance. 2004includes $130 million of asset-specific and $362 million of formula-based allowance. The formula-based allowance for lending-related commitments is based upon a statistical calculation.There is no adjustment to the statistical calculation for lending-related commitments.
(c) 2004 results include six months of the combined Firm’s results and six months of heritageJPMorgan Chase results.
Note 13 – Loan securitizations JPMorgan Chase securitizes, sells and services various consumer loans, suchas consumer real estate, credit card and automobile loans, as well as certainwholesale loans (primarily real estate) originated by the Investment Bank. Inaddition, the Investment Bank purchases, packages and securitizes commercialand consumer loans. All IB activity is collectively referred to below as Wholesaleactivities. Interests in the sold and securitized loans may be retained.
The Firm records a loan securitization as a sale when the transferred loans arelegally isolated from the Firm’s creditors and the accounting criteria for a saleare met. Those criteria are (1) the assets are legally isolated from the Firm’screditors; (2) the entity can pledge or exchange the financial assets or, if theentity is a QSPE, its investors can pledge or exchange their interests; and (3) theFirm does not maintain effective control via an agreement to repurchase theassets before their maturity or have the ability to unilaterally cause the holderto return the assets.
Gains or losses recorded on loan securitizations depend, in part, on the carryingamount of the loans sold and are allocated between the loans sold and theretained interests, based upon their relative fair values at the date of sale. Gainson securitizations are reported in noninterest revenue. Since quoted marketprices are generally not available, the Firm usually estimates the fair value ofthese retained interests by determining the present value of future expectedcash flows using modeling techniques. Such models incorporate management’sbest estimates of key variables, such as expected credit losses, prepaymentspeeds and the discount rates appropriate for the risks involved.
Retained interests that are subject to prepayment risk, such that JPMorganChase may not recover substantially all of its investment, are recorded at fairvalue; subsequent adjustments are reflected in Other comprehensive income or inearnings, if the fair value of the retained interest has declined below its carryingamount and such decline has been determined to be other-than-temporary.
Interests in the securitized loans are generally retained by the Firm in the formof senior or subordinated interest-only strips, subordinated tranches, escrowaccounts and servicing rights, and they are generally recorded in Other assets.In addition, credit card securitization trusts require the Firm to maintain a minimum undivided interest in the trusts, representing the Firm’s interests inthe receivables transferred to the trust that have not been securitized. These interests are not represented by security certificates. The Firm’s undividedinterests are carried at historical cost and are classified in Loans. Retained interests from wholesale activities are reflected as trading assets.
JPMorgan Chase retains servicing responsibilities for all residential mortgage,credit card and automobile loan securitizations and for certain wholesaleactivity securitizations it sponsors, and receives servicing fees based on thesecuritized loan balance plus certain ancillary fees. The Firm also retains theright to service the residential mortgage loans it sells in connection withmortgage-backed securities transactions with the Government NationalMortgage Association (“GNMA”), Federal National Mortgage Association(“FNMA”) and Federal Home Loan Mortgage Corporation (“Freddie Mac”).For a discussion of mortgage servicing rights, see Note 15 on pages 114–116of this Annual report.
JPMorgan Chase-sponsored securitizations utilize SPEs as part of the securiti-zation process. These SPEs are structured to meet the definition of a QSPE (as discussed in Note 1 on page 91 of this Annual Report); accordingly, theassets and liabilities of securitization-related QSPEs are not reflected in theFirm’s Consolidated balance sheets (except for retained interests, as describedbelow) but are included on the balance sheet of the QSPE purchasing the
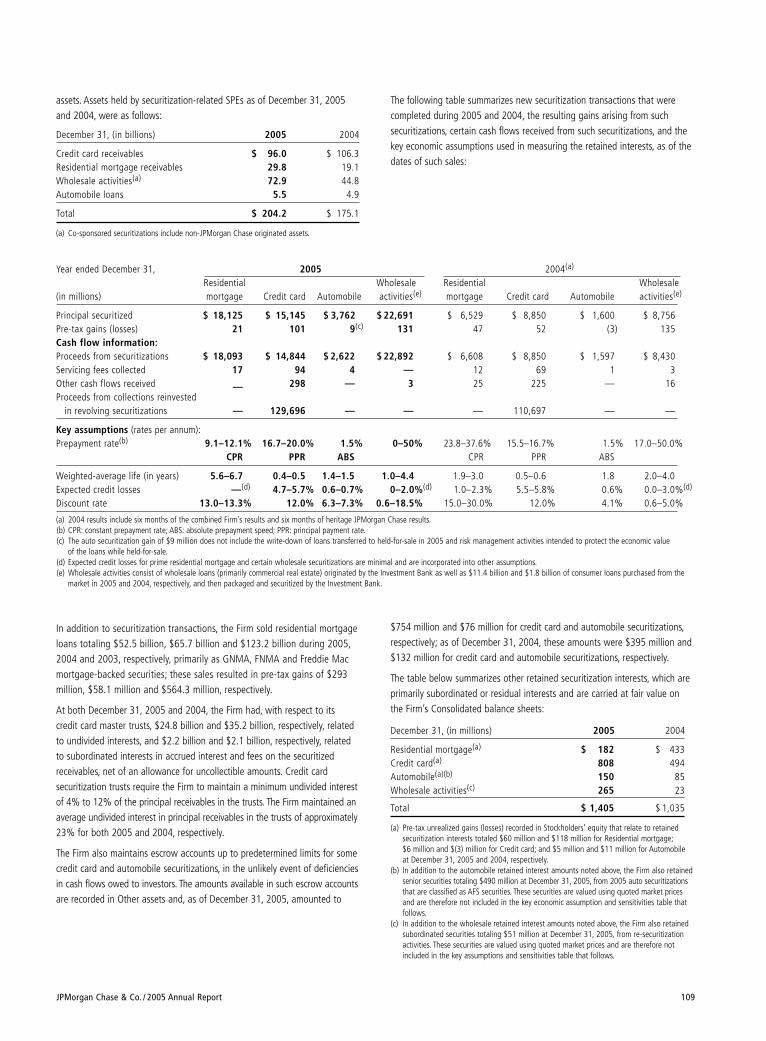
JPMorgan Chase & Co. / 2005 Annual Report 109
Year ended December 31, 2005 2004(a)
Residential Wholesale Residential Wholesale(in millions) mortgage Credit card Automobile activities(e) mortgage Credit card Automobile activities(e)
Principal securitized $ 18,125 $ 15,145 $ 3,762 $ 22,691 $ 6,529 $ 8,850 $ 1,600 $ 8,756Pre-tax gains (losses) 21 101 9(c) 131 47 52 (3) 135Cash flow information:Proceeds from securitizations $ 18,093 $ 14,844 $ 2,622 $ 22,892 $ 6,608 $ 8,850 $ 1,597 $ 8,430Servicing fees collected 17 94 4 — 12 69 1 3Other cash flows received — 298 — 3 25 225 — 16Proceeds from collections reinvested
in revolving securitizations — 129,696 — — — 110,697 — —
Key assumptions (rates per annum):Prepayment rate(b) 9.1–12.1% 16.7–20.0% 1.5% 0–50% 23.8–37.6% 15.5–16.7% 1.5% 17.0–50.0%
CPR PPR ABS CPR PPR ABS
Weighted-average life (in years) 5.6–6.7 0.4–0.5 1.4–1.5 1.0–4.4 1.9–3.0 0.5–0.6 1.8 2.0–4.0Expected credit losses —(d) 4.7–5.7% 0.6–0.7% 0–2.0%(d) 1.0–2.3% 5.5–5.8% 0.6% 0.0–3.0%(d)
Discount rate 13.0–13.3% 12.0% 6.3–7.3% 0.6–18.5% 15.0–30.0% 12.0% 4.1% 0.6–5.0%
(a) 2004 results include six months of the combined Firm’s results and six months of heritage JPMorgan Chase results.(b) CPR: constant prepayment rate; ABS: absolute prepayment speed; PPR: principal payment rate.(c) The auto securitization gain of $9 million does not include the write-down of loans transferred to held-for-sale in 2005 and risk management activities intended to protect the economic value
of the loans while held-for-sale.(d) Expected credit losses for prime residential mortgage and certain wholesale securitizations are minimal and are incorporated into other assumptions.(e) Wholesale activities consist of wholesale loans (primarily commercial real estate) originated by the Investment Bank as well as $11.4 billion and $1.8 billion of consumer loans purchased from the
market in 2005 and 2004, respectively, and then packaged and securitized by the Investment Bank.
assets. Assets held by securitization-related SPEs as of December 31, 2005and 2004, were as follows:
December 31, (in billions) 2005 2004
Credit card receivables $ 96.0 $ 106.3Residential mortgage receivables 29.8 19.1Wholesale activities(a) 72.9 44.8Automobile loans 5.5 4.9
Total $ 204.2 $ 175.1
(a) Co-sponsored securitizations include non-JPMorgan Chase originated assets.
The following table summarizes new securitization transactions that werecompleted during 2005 and 2004, the resulting gains arising from such securitizations, certain cash flows received from such securitizations, and thekey economic assumptions used in measuring the retained interests, as of thedates of such sales:
In addition to securitization transactions, the Firm sold residential mortgageloans totaling $52.5 billion, $65.7 billion and $123.2 billion during 2005,2004 and 2003, respectively, primarily as GNMA, FNMA and Freddie Macmortgage-backed securities; these sales resulted in pre-tax gains of $293million, $58.1 million and $564.3 million, respectively.
At both December 31, 2005 and 2004, the Firm had, with respect to its credit card master trusts, $24.8 billion and $35.2 billion, respectively, relatedto undivided interests, and $2.2 billion and $2.1 billion, respectively, related to subordinated interests in accrued interest and fees on the securitizedreceivables, net of an allowance for uncollectible amounts. Credit card securitization trusts require the Firm to maintain a minimum undivided interestof 4% to 12% of the principal receivables in the trusts. The Firm maintained anaverage undivided interest in principal receivables in the trusts of approximately23% for both 2005 and 2004, respectively.
The Firm also maintains escrow accounts up to predetermined limits for somecredit card and automobile securitizations, in the unlikely event of deficienciesin cash flows owed to investors. The amounts available in such escrow accountsare recorded in Other assets and, as of December 31, 2005, amounted to
$754 million and $76 million for credit card and automobile securitizations,respectively; as of December 31, 2004, these amounts were $395 million and$132 million for credit card and automobile securitizations, respectively.
The table below summarizes other retained securitization interests, which areprimarily subordinated or residual interests and are carried at fair value onthe Firm’s Consolidated balance sheets:
December 31, (in millions) 2005 2004
Residential mortgage(a) $ 182 $ 433Credit card(a) 808 494Automobile(a)(b) 150 85Wholesale activities(c) 265 23
Total $ 1,405 $ 1,035
(a) Pre-tax unrealized gains (losses) recorded in Stockholders’ equity that relate to retainedsecuritization interests totaled $60 million and $118 million for Residential mortgage;$6 million and $(3) million for Credit card; and $5 million and $11 million for Automobile at December 31, 2005 and 2004, respectively.
(b) In addition to the automobile retained interest amounts noted above, the Firm also retainedsenior securities totaling $490 million at December 31, 2005, from 2005 auto securitizationsthat are classified as AFS securities. These securities are valued using quoted market pricesand are therefore not included in the key economic assumption and sensitivities table thatfollows.
(c) In addition to the wholesale retained interest amounts noted above, the Firm also retainedsubordinated securities totaling $51 million at December 31, 2005, from re-securitizationactivities. These securities are valued using quoted market prices and are therefore notincluded in the key assumptions and sensitivities table that follows.
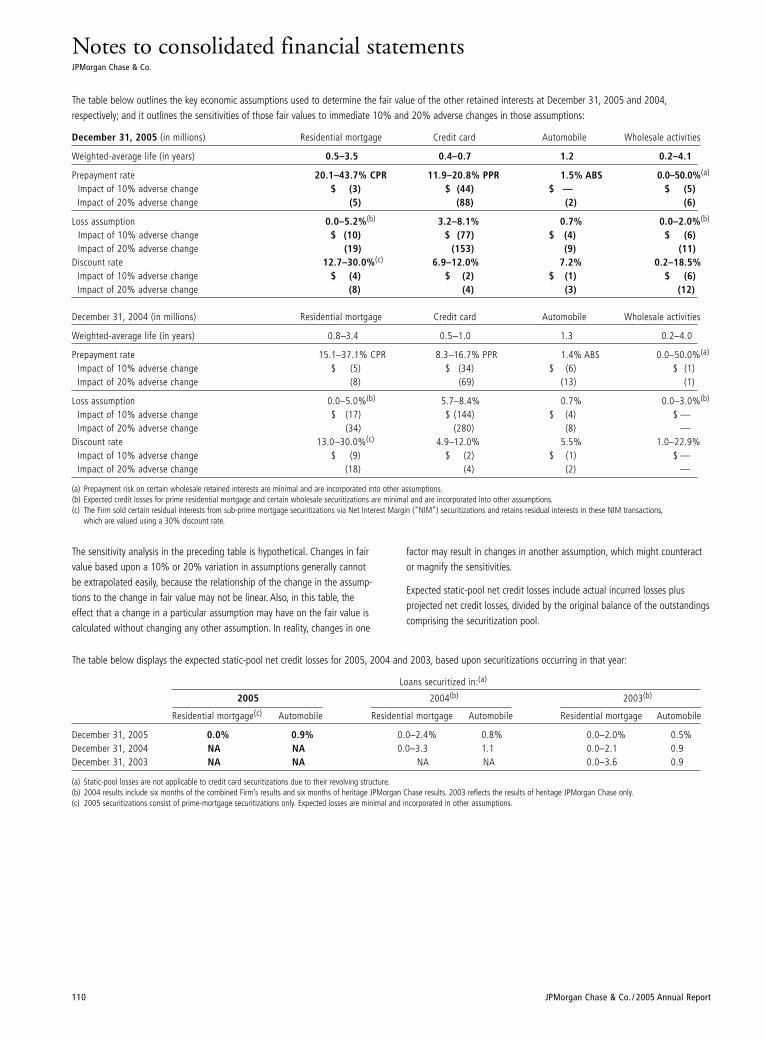
Notes to consolidated financial statementsJPMorgan Chase & Co.
110 JPMorgan Chase & Co. / 2005 Annual Report
The table below outlines the key economic assumptions used to determine the fair value of the other retained interests at December 31, 2005 and 2004,respectively; and it outlines the sensitivities of those fair values to immediate 10% and 20% adverse changes in those assumptions:
December 31, 2005 (in millions) Residential mortgage Credit card Automobile Wholesale activities
Weighted-average life (in years) 0.5–3.5 0.4–0.7 1.2 0.2–4.1
Prepayment rate 20.1–43.7% CPR 11.9–20.8% PPR 1.5% ABS 0.0–50.0%(a)
Impact of 10% adverse change $ (3) $ (44) $ — $ (5)Impact of 20% adverse change (5) (88) (2) (6)
Loss assumption 0.0–5.2%(b) 3.2–8.1% 0.7% 0.0–2.0%(b)
Impact of 10% adverse change $ (10) $ (77) $ (4) $ (6)Impact of 20% adverse change (19) (153) (9) (11)
Discount rate 12.7–30.0%(c) 6.9–12.0% 7.2% 0.2–18.5%Impact of 10% adverse change $ (4) $ (2) $ (1) $ (6)Impact of 20% adverse change (8) (4) (3) (12)
December 31, 2004 (in millions) Residential mortgage Credit card Automobile Wholesale activities
Weighted-average life (in years) 0.8–3.4 0.5–1.0 1.3 0.2–4.0
Prepayment rate 15.1–37.1% CPR 8.3–16.7% PPR 1.4% ABS 0.0–50.0%(a)
Impact of 10% adverse change $ (5) $ (34) $ (6) $ (1)Impact of 20% adverse change (8) (69) (13) (1)
Loss assumption 0.0–5.0%(b) 5.7–8.4% 0.7% 0.0–3.0%(b)
Impact of 10% adverse change $ (17) $ (144) $ (4) $ —Impact of 20% adverse change (34) (280) (8) —
Discount rate 13.0–30.0%(c) 4.9–12.0% 5.5% 1.0–22.9%Impact of 10% adverse change $ (9) $ (2) $ (1) $ —Impact of 20% adverse change (18) (4) (2) —
(a) Prepayment risk on certain wholesale retained interests are minimal and are incorporated into other assumptions.(b) Expected credit losses for prime residential mortgage and certain wholesale securitizations are minimal and are incorporated into other assumptions.(c) The Firm sold certain residual interests from sub-prime mortgage securitizations via Net Interest Margin (“NIM”) securitizations and retains residual interests in these NIM transactions,
which are valued using a 30% discount rate.
The sensitivity analysis in the preceding table is hypothetical. Changes in fairvalue based upon a 10% or 20% variation in assumptions generally cannotbe extrapolated easily, because the relationship of the change in the assump-tions to the change in fair value may not be linear. Also, in this table, theeffect that a change in a particular assumption may have on the fair value iscalculated without changing any other assumption. In reality, changes in one
factor may result in changes in another assumption, which might counteractor magnify the sensitivities.
Expected static-pool net credit losses include actual incurred losses plus projected net credit losses, divided by the original balance of the outstandingscomprising the securitization pool.
The table below displays the expected static-pool net credit losses for 2005, 2004 and 2003, based upon securitizations occurring in that year:
Loans securitized in:(a)
2005 2004(b) 2003(b)
Residential mortgage(c) Automobile Residential mortgage Automobile Residential mortgage Automobile
December 31, 2005 0.0% 0.9% 0.0–2.4% 0.8% 0.0–2.0% 0.5%December 31, 2004 NA NA 0.0–3.3 1.1 0.0–2.1 0.9December 31, 2003 NA NA NA NA 0.0–3.6 0.9
(a) Static-pool losses are not applicable to credit card securitizations due to their revolving structure.(b) 2004 results include six months of the combined Firm’s results and six months of heritage JPMorgan Chase results. 2003 reflects the results of heritage JPMorgan Chase only.(c) 2005 securitizations consist of prime-mortgage securitizations only. Expected losses are minimal and incorporated in other assumptions.
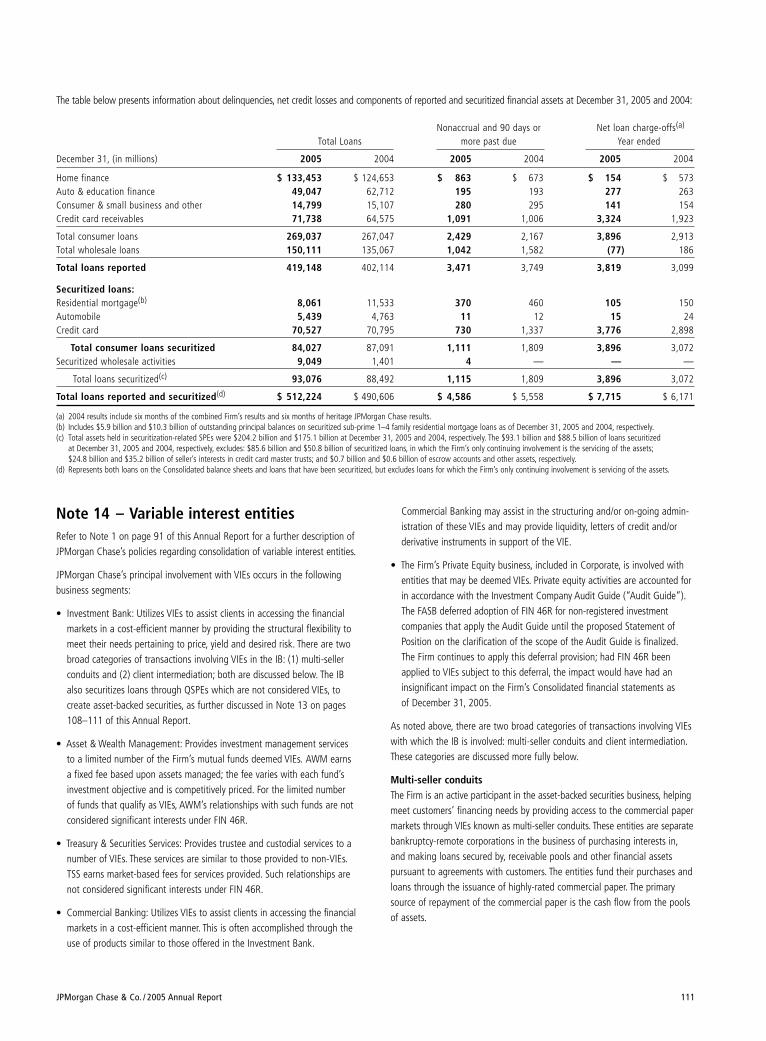
JPMorgan Chase & Co. / 2005 Annual Report 111
The table below presents information about delinquencies, net credit losses and components of reported and securitized financial assets at December 31, 2005 and 2004:
Nonaccrual and 90 days or Net loan charge-offs(a)
Total Loans more past due Year ended
December 31, (in millions) 2005 2004 2005 2004 2005 2004
Home finance $ 133,453 $ 124,653 $ 863 $ 673 $ 154 $ 573Auto & education finance 49,047 62,712 195 193 277 263Consumer & small business and other 14,799 15,107 280 295 141 154Credit card receivables 71,738 64,575 1,091 1,006 3,324 1,923
Total consumer loans 269,037 267,047 2,429 2,167 3,896 2,913Total wholesale loans 150,111 135,067 1,042 1,582 (77) 186
Total loans reported 419,148 402,114 3,471 3,749 3,819 3,099
Securitized loans:Residential mortgage(b) 8,061 11,533 370 460 105 150Automobile 5,439 4,763 11 12 15 24Credit card 70,527 70,795 730 1,337 3,776 2,898
Total consumer loans securitized 84,027 87,091 1,111 1,809 3,896 3,072Securitized wholesale activities 9,049 1,401 4 — — —
Total loans securitized(c) 93,076 88,492 1,115 1,809 3,896 3,072
Total loans reported and securitized(d) $ 512,224 $ 490,606 $ 4,586 $ 5,558 $ 7,715 $ 6,171
(a) 2004 results include six months of the combined Firm’s results and six months of heritage JPMorgan Chase results.(b) Includes $5.9 billion and $10.3 billion of outstanding principal balances on securitized sub-prime 1–4 family residential mortgage loans as of December 31, 2005 and 2004, respectively.(c) Total assets held in securitization-related SPEs were $204.2 billion and $175.1 billion at December 31, 2005 and 2004, respectively. The $93.1 billion and $88.5 billion of loans securitized
at December 31, 2005 and 2004, respectively, excludes: $85.6 billion and $50.8 billion of securitized loans, in which the Firm’s only continuing involvement is the servicing of the assets;$24.8 billion and $35.2 billion of seller’s interests in credit card master trusts; and $0.7 billion and $0.6 billion of escrow accounts and other assets, respectively.
(d) Represents both loans on the Consolidated balance sheets and loans that have been securitized, but excludes loans for which the Firm’s only continuing involvement is servicing of the assets.
Note 14 – Variable interest entitiesRefer to Note 1 on page 91 of this Annual Report for a further description ofJPMorgan Chase’s policies regarding consolidation of variable interest entities.
JPMorgan Chase’s principal involvement with VIEs occurs in the followingbusiness segments:
• Investment Bank: Utilizes VIEs to assist clients in accessing the financialmarkets in a cost-efficient manner by providing the structural flexibility tomeet their needs pertaining to price, yield and desired risk. There are twobroad categories of transactions involving VIEs in the IB: (1) multi-sellerconduits and (2) client intermediation; both are discussed below. The IBalso securitizes loans through QSPEs which are not considered VIEs, to create asset-backed securities, as further discussed in Note 13 on pages108–111 of this Annual Report.
• Asset & Wealth Management: Provides investment management services to a limited number of the Firm’s mutual funds deemed VIEs. AWM earns a fixed fee based upon assets managed; the fee varies with each fund’sinvestment objective and is competitively priced. For the limited number of funds that qualify as VIEs, AWM’s relationships with such funds are notconsidered significant interests under FIN 46R.
• Treasury & Securities Services: Provides trustee and custodial services to anumber of VIEs. These services are similar to those provided to non-VIEs.TSS earns market-based fees for services provided. Such relationships arenot considered significant interests under FIN 46R.
• Commercial Banking: Utilizes VIEs to assist clients in accessing the financialmarkets in a cost-efficient manner. This is often accomplished through theuse of products similar to those offered in the Investment Bank.
Commercial Banking may assist in the structuring and/or on-going admin-istration of these VIEs and may provide liquidity, letters of credit and/orderivative instruments in support of the VIE.
• The Firm’s Private Equity business, included in Corporate, is involved withentities that may be deemed VIEs. Private equity activities are accounted forin accordance with the Investment Company Audit Guide (“Audit Guide”).The FASB deferred adoption of FIN 46R for non-registered investmentcompanies that apply the Audit Guide until the proposed Statement ofPosition on the clarification of the scope of the Audit Guide is finalized.The Firm continues to apply this deferral provision; had FIN 46R beenapplied to VIEs subject to this deferral, the impact would have had aninsignificant impact on the Firm’s Consolidated financial statements as of December 31, 2005.
As noted above, there are two broad categories of transactions involving VIEswith which the IB is involved: multi-seller conduits and client intermediation.These categories are discussed more fully below.
Multi-seller conduits The Firm is an active participant in the asset-backed securities business, helpingmeet customers’ financing needs by providing access to the commercial papermarkets through VIEs known as multi-seller conduits. These entities are separatebankruptcy-remote corporations in the business of purchasing interests in,and making loans secured by, receivable pools and other financial assets pursuant to agreements with customers. The entities fund their purchases andloans through the issuance of highly-rated commercial paper. The primarysource of repayment of the commercial paper is the cash flow from the poolsof assets.
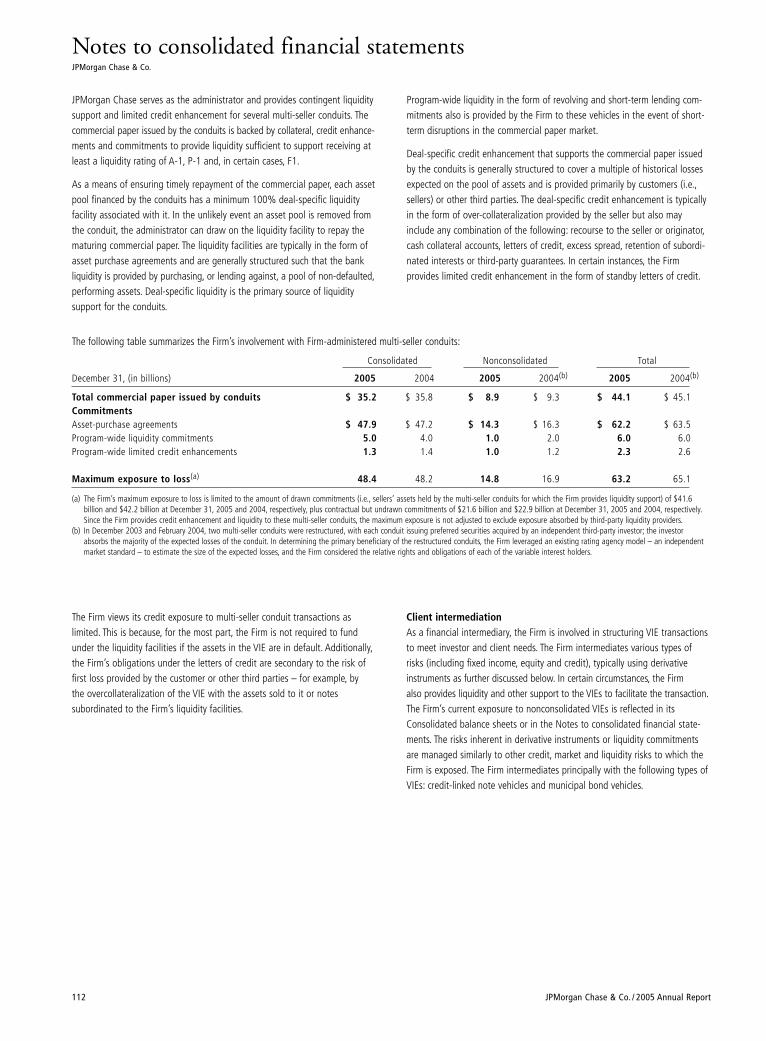
Notes to consolidated financial statementsJPMorgan Chase & Co.
112 JPMorgan Chase & Co. / 2005 Annual Report
Program-wide liquidity in the form of revolving and short-term lending com-mitments also is provided by the Firm to these vehicles in the event of short-term disruptions in the commercial paper market.
Deal-specific credit enhancement that supports the commercial paper issuedby the conduits is generally structured to cover a multiple of historical lossesexpected on the pool of assets and is provided primarily by customers (i.e.,sellers) or other third parties. The deal-specific credit enhancement is typicallyin the form of over-collateralization provided by the seller but also mayinclude any combination of the following: recourse to the seller or originator,cash collateral accounts, letters of credit, excess spread, retention of subordi-nated interests or third-party guarantees. In certain instances, the Firm provides limited credit enhancement in the form of standby letters of credit.
JPMorgan Chase serves as the administrator and provides contingent liquiditysupport and limited credit enhancement for several multi-seller conduits. Thecommercial paper issued by the conduits is backed by collateral, credit enhance-ments and commitments to provide liquidity sufficient to support receiving atleast a liquidity rating of A-1, P-1 and, in certain cases, F1.
As a means of ensuring timely repayment of the commercial paper, each assetpool financed by the conduits has a minimum 100% deal-specific liquidityfacility associated with it. In the unlikely event an asset pool is removed fromthe conduit, the administrator can draw on the liquidity facility to repay thematuring commercial paper. The liquidity facilities are typically in the form ofasset purchase agreements and are generally structured such that the bankliquidity is provided by purchasing, or lending against, a pool of non-defaulted,performing assets. Deal-specific liquidity is the primary source of liquidity support for the conduits.
The following table summarizes the Firm’s involvement with Firm-administered multi-seller conduits:
Consolidated Nonconsolidated Total
December 31, (in billions) 2005 2004 2005 2004(b) 2005 2004(b)
Total commercial paper issued by conduits $ 35.2 $ 35.8 $ 8.9 $ 9.3 $ 44.1 $ 45.1CommitmentsAsset-purchase agreements $ 47.9 $ 47.2 $ 14.3 $ 16.3 $ 62.2 $ 63.5Program-wide liquidity commitments 5.0 4.0 1.0 2.0 6.0 6.0Program-wide limited credit enhancements 1.3 1.4 1.0 1.2 2.3 2.6
Maximum exposure to loss(a) 48.4 48.2 14.8 16.9 63.2 65.1
(a) The Firm’s maximum exposure to loss is limited to the amount of drawn commitments (i.e., sellers’ assets held by the multi-seller conduits for which the Firm provides liquidity support) of $41.6 billion and $42.2 billion at December 31, 2005 and 2004, respectively, plus contractual but undrawn commitments of $21.6 billion and $22.9 billion at December 31, 2005 and 2004, respectively.Since the Firm provides credit enhancement and liquidity to these multi-seller conduits, the maximum exposure is not adjusted to exclude exposure absorbed by third-party liquidity providers.
(b) In December 2003 and February 2004, two multi-seller conduits were restructured, with each conduit issuing preferred securities acquired by an independent third-party investor; the investorabsorbs the majority of the expected losses of the conduit. In determining the primary beneficiary of the restructured conduits, the Firm leveraged an existing rating agency model – an independentmarket standard – to estimate the size of the expected losses, and the Firm considered the relative rights and obligations of each of the variable interest holders.
The Firm views its credit exposure to multi-seller conduit transactions as limited. This is because, for the most part, the Firm is not required to fundunder the liquidity facilities if the assets in the VIE are in default. Additionally,the Firm’s obligations under the letters of credit are secondary to the risk offirst loss provided by the customer or other third parties – for example, by the overcollateralization of the VIE with the assets sold to it or notes subordinated to the Firm’s liquidity facilities.
Client intermediationAs a financial intermediary, the Firm is involved in structuring VIE transactionsto meet investor and client needs. The Firm intermediates various types ofrisks (including fixed income, equity and credit), typically using derivativeinstruments as further discussed below. In certain circumstances, the Firm also provides liquidity and other support to the VIEs to facilitate the transaction.The Firm’s current exposure to nonconsolidated VIEs is reflected in itsConsolidated balance sheets or in the Notes to consolidated financial state-ments. The risks inherent in derivative instruments or liquidity commitmentsare managed similarly to other credit, market and liquidity risks to which theFirm is exposed. The Firm intermediates principally with the following types ofVIEs: credit-linked note vehicles and municipal bond vehicles.
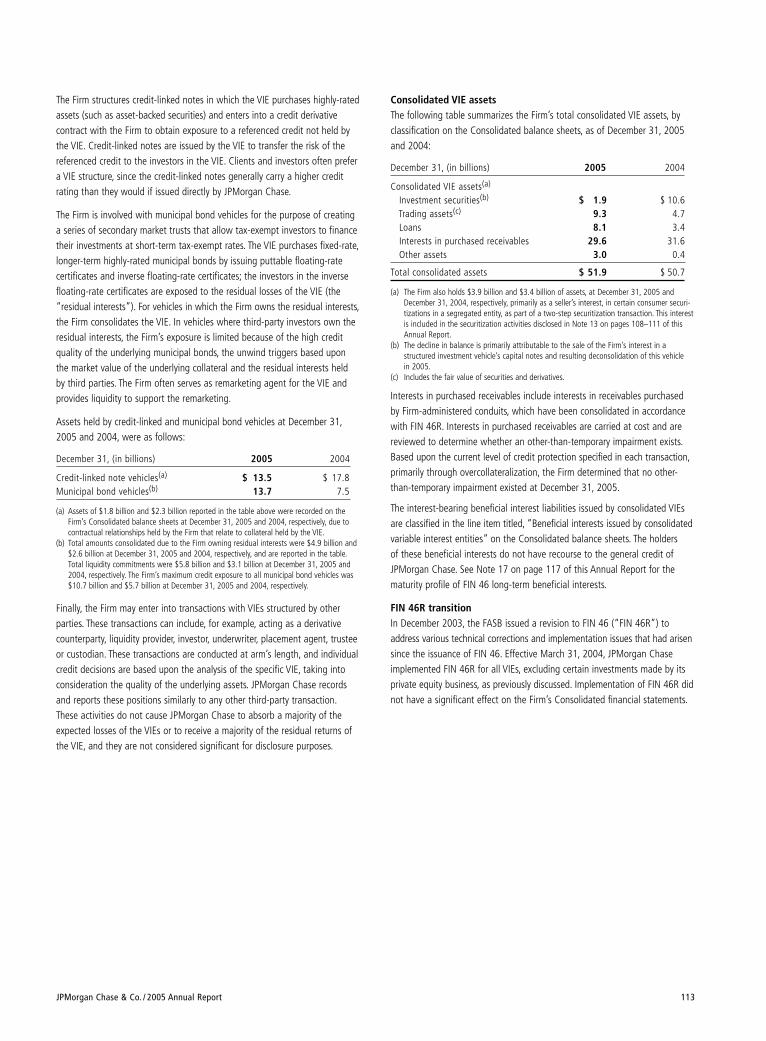
JPMorgan Chase & Co. / 2005 Annual Report 113
The Firm structures credit-linked notes in which the VIE purchases highly-ratedassets (such as asset-backed securities) and enters into a credit derivativecontract with the Firm to obtain exposure to a referenced credit not held bythe VIE. Credit-linked notes are issued by the VIE to transfer the risk of thereferenced credit to the investors in the VIE. Clients and investors often prefera VIE structure, since the credit-linked notes generally carry a higher creditrating than they would if issued directly by JPMorgan Chase.
The Firm is involved with municipal bond vehicles for the purpose of creatinga series of secondary market trusts that allow tax-exempt investors to financetheir investments at short-term tax-exempt rates. The VIE purchases fixed-rate,longer-term highly-rated municipal bonds by issuing puttable floating-ratecertificates and inverse floating-rate certificates; the investors in the inversefloating-rate certificates are exposed to the residual losses of the VIE (the“residual interests”). For vehicles in which the Firm owns the residual interests,the Firm consolidates the VIE. In vehicles where third-party investors own theresidual interests, the Firm’s exposure is limited because of the high creditquality of the underlying municipal bonds, the unwind triggers based uponthe market value of the underlying collateral and the residual interests heldby third parties. The Firm often serves as remarketing agent for the VIE andprovides liquidity to support the remarketing.
Assets held by credit-linked and municipal bond vehicles at December 31,2005 and 2004, were as follows:
December 31, (in billions) 2005 2004
Credit-linked note vehicles(a) $ 13.5 $ 17.8Municipal bond vehicles(b) 13.7 7.5
(a) Assets of $1.8 billion and $2.3 billion reported in the table above were recorded on theFirm’s Consolidated balance sheets at December 31, 2005 and 2004, respectively, due tocontractual relationships held by the Firm that relate to collateral held by the VIE.
(b) Total amounts consolidated due to the Firm owning residual interests were $4.9 billion and$2.6 billion at December 31, 2005 and 2004, respectively, and are reported in the table.Total liquidity commitments were $5.8 billion and $3.1 billion at December 31, 2005 and2004, respectively. The Firm’s maximum credit exposure to all municipal bond vehicles was$10.7 billion and $5.7 billion at December 31, 2005 and 2004, respectively.
Finally, the Firm may enter into transactions with VIEs structured by other parties. These transactions can include, for example, acting as a derivativecounterparty, liquidity provider, investor, underwriter, placement agent, trusteeor custodian. These transactions are conducted at arm’s length, and individualcredit decisions are based upon the analysis of the specific VIE, taking intoconsideration the quality of the underlying assets. JPMorgan Chase recordsand reports these positions similarly to any other third-party transaction.These activities do not cause JPMorgan Chase to absorb a majority of theexpected losses of the VIEs or to receive a majority of the residual returns ofthe VIE, and they are not considered significant for disclosure purposes.
Consolidated VIE assetsThe following table summarizes the Firm’s total consolidated VIE assets, byclassification on the Consolidated balance sheets, as of December 31, 2005and 2004:
December 31, (in billions) 2005 2004
Consolidated VIE assets(a)
Investment securities(b) $ 1.9 $ 10.6Trading assets(c) 9.3 4.7Loans 8.1 3.4Interests in purchased receivables 29.6 31.6Other assets 3.0 0.4
Total consolidated assets $ 51.9 $ 50.7
(a) The Firm also holds $3.9 billion and $3.4 billion of assets, at December 31, 2005 andDecember 31, 2004, respectively, primarily as a seller’s interest, in certain consumer securi-tizations in a segregated entity, as part of a two-step securitization transaction. This interestis included in the securitization activities disclosed in Note 13 on pages 108–111 of thisAnnual Report.
(b) The decline in balance is primarily attributable to the sale of the Firm’s interest in a structured investment vehicle’s capital notes and resulting deconsolidation of this vehicle in 2005.
(c) Includes the fair value of securities and derivatives.
Interests in purchased receivables include interests in receivables purchasedby Firm-administered conduits, which have been consolidated in accordancewith FIN 46R. Interests in purchased receivables are carried at cost and arereviewed to determine whether an other-than-temporary impairment exists.Based upon the current level of credit protection specified in each transaction,primarily through overcollateralization, the Firm determined that no other-than-temporary impairment existed at December 31, 2005.
The interest-bearing beneficial interest liabilities issued by consolidated VIEsare classified in the line item titled, “Beneficial interests issued by consolidatedvariable interest entities” on the Consolidated balance sheets. The holders of these beneficial interests do not have recourse to the general credit ofJPMorgan Chase. See Note 17 on page 117 of this Annual Report for thematurity profile of FIN 46 long-term beneficial interests.
FIN 46R transition In December 2003, the FASB issued a revision to FIN 46 (“FIN 46R”) toaddress various technical corrections and implementation issues that had arisensince the issuance of FIN 46. Effective March 31, 2004, JPMorgan Chaseimplemented FIN 46R for all VIEs, excluding certain investments made by itsprivate equity business, as previously discussed. Implementation of FIN 46R didnot have a significant effect on the Firm’s Consolidated financial statements.
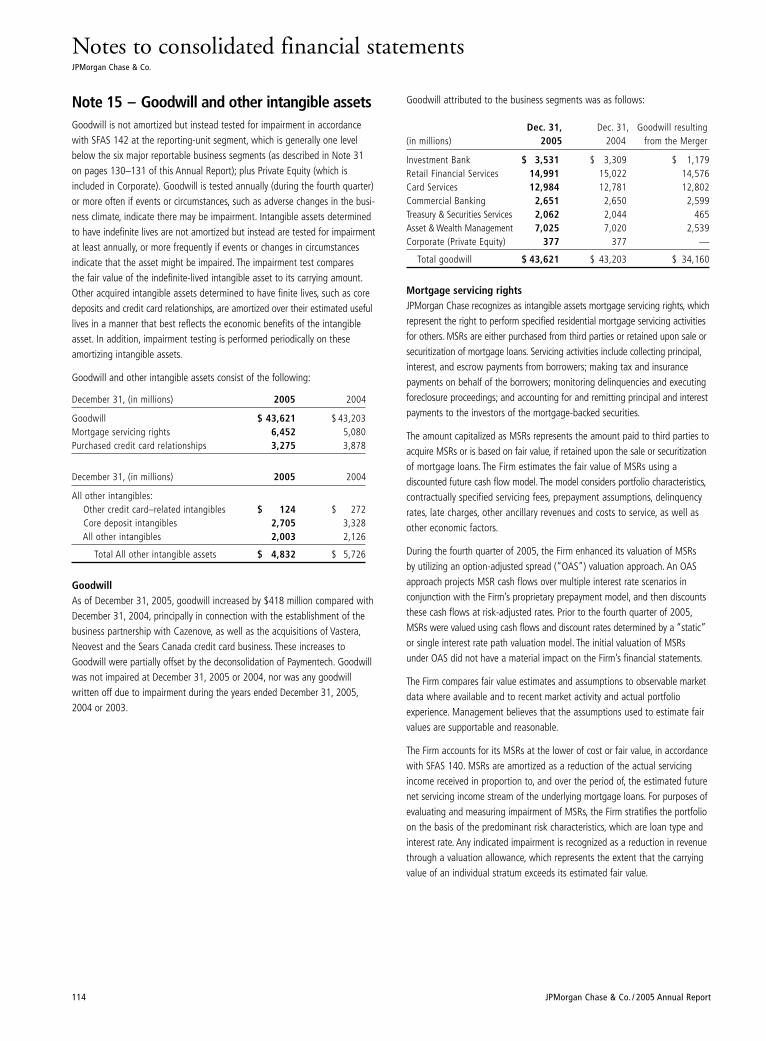
Notes to consolidated financial statementsJPMorgan Chase & Co.
114 JPMorgan Chase & Co. / 2005 Annual Report
Note 15 – Goodwill and other intangible assetsGoodwill is not amortized but instead tested for impairment in accordancewith SFAS 142 at the reporting-unit segment, which is generally one levelbelow the six major reportable business segments (as described in Note 31on pages 130–131 of this Annual Report); plus Private Equity (which isincluded in Corporate). Goodwill is tested annually (during the fourth quarter)or more often if events or circumstances, such as adverse changes in the busi-ness climate, indicate there may be impairment. Intangible assets determinedto have indefinite lives are not amortized but instead are tested for impairmentat least annually, or more frequently if events or changes in circumstancesindicate that the asset might be impaired. The impairment test compares the fair value of the indefinite-lived intangible asset to its carrying amount.Other acquired intangible assets determined to have finite lives, such as coredeposits and credit card relationships, are amortized over their estimated usefullives in a manner that best reflects the economic benefits of the intangibleasset. In addition, impairment testing is performed periodically on theseamortizing intangible assets.
Goodwill and other intangible assets consist of the following:
December 31, (in millions) 2005 2004
Goodwill $ 43,621 $ 43,203Mortgage servicing rights 6,452 5,080Purchased credit card relationships 3,275 3,878
December 31, (in millions) 2005 2004
All other intangibles:Other credit card–related intangibles $ 124 $ 272Core deposit intangibles 2,705 3,328All other intangibles 2,003 2,126
Total All other intangible assets $ 4,832 $ 5,726
GoodwillAs of December 31, 2005, goodwill increased by $418 million compared withDecember 31, 2004, principally in connection with the establishment of thebusiness partnership with Cazenove, as well as the acquisitions of Vastera,Neovest and the Sears Canada credit card business. These increases toGoodwill were partially offset by the deconsolidation of Paymentech. Goodwillwas not impaired at December 31, 2005 or 2004, nor was any goodwill written off due to impairment during the years ended December 31, 2005,2004 or 2003.
Goodwill attributed to the business segments was as follows:
Dec. 31, Dec. 31, Goodwill resulting(in millions) 2005 2004 from the Merger
Investment Bank $ 3,531 $ 3,309 $ 1,179Retail Financial Services 14,991 15,022 14,576Card Services 12,984 12,781 12,802Commercial Banking 2,651 2,650 2,599Treasury & Securities Services 2,062 2,044 465Asset & Wealth Management 7,025 7,020 2,539Corporate (Private Equity) 377 377 —
Total goodwill $ 43,621 $ 43,203 $ 34,160
Mortgage servicing rights JPMorgan Chase recognizes as intangible assets mortgage servicing rights, whichrepresent the right to perform specified residential mortgage servicing activitiesfor others. MSRs are either purchased from third parties or retained upon sale orsecuritization of mortgage loans. Servicing activities include collecting principal,interest, and escrow payments from borrowers; making tax and insurance payments on behalf of the borrowers; monitoring delinquencies and executingforeclosure proceedings; and accounting for and remitting principal and interestpayments to the investors of the mortgage-backed securities.
The amount capitalized as MSRs represents the amount paid to third parties toacquire MSRs or is based on fair value, if retained upon the sale or securitizationof mortgage loans. The Firm estimates the fair value of MSRs using a discounted future cash flow model. The model considers portfolio characteristics,contractually specified servicing fees, prepayment assumptions, delinquencyrates, late charges, other ancillary revenues and costs to service, as well asother economic factors.
During the fourth quarter of 2005, the Firm enhanced its valuation of MSRs by utilizing an option-adjusted spread (“OAS”) valuation approach. An OASapproach projects MSR cash flows over multiple interest rate scenarios in conjunction with the Firm’s proprietary prepayment model, and then discountsthese cash flows at risk-adjusted rates. Prior to the fourth quarter of 2005,MSRs were valued using cash flows and discount rates determined by a “static”or single interest rate path valuation model. The initial valuation of MSRsunder OAS did not have a material impact on the Firm’s financial statements.
The Firm compares fair value estimates and assumptions to observable marketdata where available and to recent market activity and actual portfolio experience. Management believes that the assumptions used to estimate fairvalues are supportable and reasonable.
The Firm accounts for its MSRs at the lower of cost or fair value, in accordancewith SFAS 140. MSRs are amortized as a reduction of the actual servicingincome received in proportion to, and over the period of, the estimated futurenet servicing income stream of the underlying mortgage loans. For purposes ofevaluating and measuring impairment of MSRs, the Firm stratifies the portfolioon the basis of the predominant risk characteristics, which are loan type andinterest rate. Any indicated impairment is recognized as a reduction in revenuethrough a valuation allowance, which represents the extent that the carryingvalue of an individual stratum exceeds its estimated fair value.
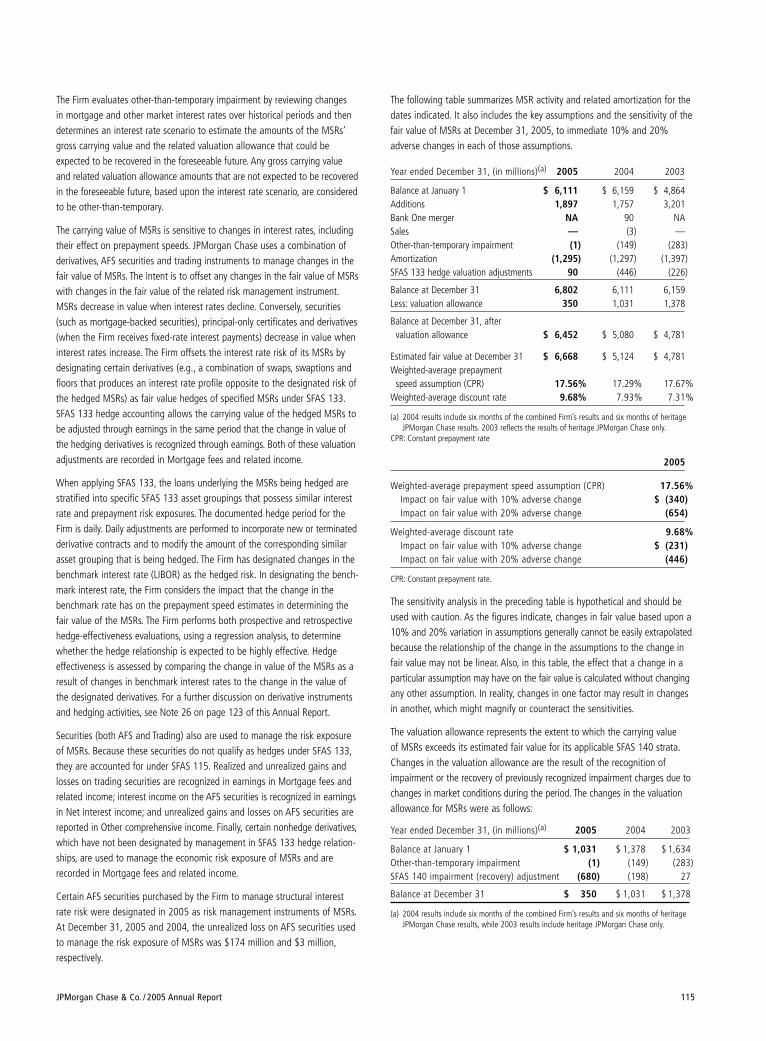
JPMorgan Chase & Co. / 2005 Annual Report 115
The Firm evaluates other-than-temporary impairment by reviewing changes in mortgage and other market interest rates over historical periods and thendetermines an interest rate scenario to estimate the amounts of the MSRs’gross carrying value and the related valuation allowance that could beexpected to be recovered in the foreseeable future. Any gross carrying valueand related valuation allowance amounts that are not expected to be recoveredin the foreseeable future, based upon the interest rate scenario, are consideredto be other-than-temporary.
The carrying value of MSRs is sensitive to changes in interest rates, includingtheir effect on prepayment speeds. JPMorgan Chase uses a combination ofderivatives, AFS securities and trading instruments to manage changes in thefair value of MSRs. The intent is to offset any changes in the fair value of MSRswith changes in the fair value of the related risk management instrument.MSRs decrease in value when interest rates decline. Conversely, securities(such as mortgage-backed securities), principal-only certificates and derivatives(when the Firm receives fixed-rate interest payments) decrease in value wheninterest rates increase. The Firm offsets the interest rate risk of its MSRs bydesignating certain derivatives (e.g., a combination of swaps, swaptions andfloors that produces an interest rate profile opposite to the designated risk ofthe hedged MSRs) as fair value hedges of specified MSRs under SFAS 133.SFAS 133 hedge accounting allows the carrying value of the hedged MSRs tobe adjusted through earnings in the same period that the change in value ofthe hedging derivatives is recognized through earnings. Both of these valuationadjustments are recorded in Mortgage fees and related income.
When applying SFAS 133, the loans underlying the MSRs being hedged arestratified into specific SFAS 133 asset groupings that possess similar interestrate and prepayment risk exposures. The documented hedge period for theFirm is daily. Daily adjustments are performed to incorporate new or terminatedderivative contracts and to modify the amount of the corresponding similarasset grouping that is being hedged. The Firm has designated changes in thebenchmark interest rate (LIBOR) as the hedged risk. In designating the bench-mark interest rate, the Firm considers the impact that the change in thebenchmark rate has on the prepayment speed estimates in determining thefair value of the MSRs. The Firm performs both prospective and retrospectivehedge-effectiveness evaluations, using a regression analysis, to determinewhether the hedge relationship is expected to be highly effective. Hedgeeffectiveness is assessed by comparing the change in value of the MSRs as aresult of changes in benchmark interest rates to the change in the value ofthe designated derivatives. For a further discussion on derivative instrumentsand hedging activities, see Note 26 on page 123 of this Annual Report.
Securities (both AFS and Trading) also are used to manage the risk exposureof MSRs. Because these securities do not qualify as hedges under SFAS 133,they are accounted for under SFAS 115. Realized and unrealized gains andlosses on trading securities are recognized in earnings in Mortgage fees andrelated income; interest income on the AFS securities is recognized in earningsin Net interest income; and unrealized gains and losses on AFS securities arereported in Other comprehensive income. Finally, certain nonhedge derivatives,which have not been designated by management in SFAS 133 hedge relation-ships, are used to manage the economic risk exposure of MSRs and arerecorded in Mortgage fees and related income.
Certain AFS securities purchased by the Firm to manage structural interestrate risk were designated in 2005 as risk management instruments of MSRs.At December 31, 2005 and 2004, the unrealized loss on AFS securities usedto manage the risk exposure of MSRs was $174 million and $3 million,respectively.
The following table summarizes MSR activity and related amortization for thedates indicated. It also includes the key assumptions and the sensitivity of thefair value of MSRs at December 31, 2005, to immediate 10% and 20%adverse changes in each of those assumptions.
Year ended December 31, (in millions)(a) 2005 2004 2003
Balance at January 1 $ 6,111 $ 6,159 $ 4,864Additions 1,897 1,757 3,201Bank One merger NA 90 NASales — (3) —Other-than-temporary impairment (1) (149) (283)Amortization (1,295) (1,297) (1,397)SFAS 133 hedge valuation adjustments 90 (446) (226)
Balance at December 31 6,802 6,111 6,159Less: valuation allowance 350 1,031 1,378
Balance at December 31, after valuation allowance $ 6,452 $ 5,080 $ 4,781
Estimated fair value at December 31 $ 6,668 $ 5,124 $ 4,781Weighted-average prepayment
speed assumption (CPR) 17.56% 17.29% 17.67%Weighted-average discount rate 9.68% 7.93% 7.31%
(a) 2004 results include six months of the combined Firm’s results and six months of heritageJPMorgan Chase results. 2003 reflects the results of heritage JPMorgan Chase only.
CPR: Constant prepayment rate
2005
Weighted-average prepayment speed assumption (CPR) 17.56%Impact on fair value with 10% adverse change $ (340)Impact on fair value with 20% adverse change (654)
Weighted-average discount rate 9.68%Impact on fair value with 10% adverse change $ (231)Impact on fair value with 20% adverse change (446)
CPR: Constant prepayment rate.
The sensitivity analysis in the preceding table is hypothetical and should beused with caution. As the figures indicate, changes in fair value based upon a10% and 20% variation in assumptions generally cannot be easily extrapolatedbecause the relationship of the change in the assumptions to the change infair value may not be linear. Also, in this table, the effect that a change in aparticular assumption may have on the fair value is calculated without changingany other assumption. In reality, changes in one factor may result in changesin another, which might magnify or counteract the sensitivities.
The valuation allowance represents the extent to which the carrying value of MSRs exceeds its estimated fair value for its applicable SFAS 140 strata.Changes in the valuation allowance are the result of the recognition ofimpairment or the recovery of previously recognized impairment charges due tochanges in market conditions during the period. The changes in the valuationallowance for MSRs were as follows:
Year ended December 31, (in millions)(a) 2005 2004 2003
Balance at January 1 $ 1,031 $ 1,378 $ 1,634Other-than-temporary impairment (1) (149) (283)SFAS 140 impairment (recovery) adjustment (680) (198) 27
Balance at December 31 $ 350 $ 1,031 $ 1,378
(a) 2004 results include six months of the combined Firm’s results and six months of heritageJPMorgan Chase results, while 2003 results include heritage JPMorgan Chase only.
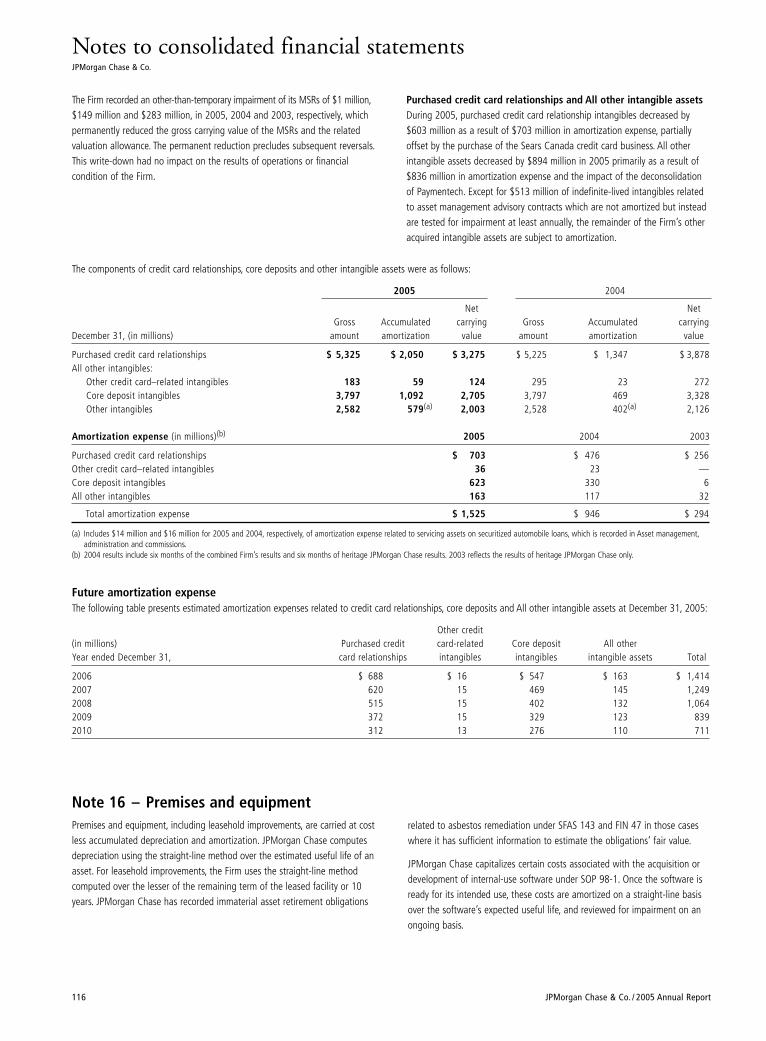
Notes to consolidated financial statementsJPMorgan Chase & Co.
116 JPMorgan Chase & Co. / 2005 Annual Report
The Firm recorded an other-than-temporary impairment of its MSRs of $1 million,$149 million and $283 million, in 2005, 2004 and 2003, respectively, whichpermanently reduced the gross carrying value of the MSRs and the relatedvaluation allowance. The permanent reduction precludes subsequent reversals.This write-down had no impact on the results of operations or financial condition of the Firm.
Purchased credit card relationships and All other intangible assetsDuring 2005, purchased credit card relationship intangibles decreased by$603 million as a result of $703 million in amortization expense, partially offset by the purchase of the Sears Canada credit card business. All otherintangible assets decreased by $894 million in 2005 primarily as a result of$836 million in amortization expense and the impact of the deconsolidationof Paymentech. Except for $513 million of indefinite-lived intangibles relatedto asset management advisory contracts which are not amortized but insteadare tested for impairment at least annually, the remainder of the Firm’s otheracquired intangible assets are subject to amortization.
Note 16 – Premises and equipmentPremises and equipment, including leasehold improvements, are carried at costless accumulated depreciation and amortization. JPMorgan Chase computesdepreciation using the straight-line method over the estimated useful life of anasset. For leasehold improvements, the Firm uses the straight-line methodcomputed over the lesser of the remaining term of the leased facility or 10years. JPMorgan Chase has recorded immaterial asset retirement obligations
related to asbestos remediation under SFAS 143 and FIN 47 in those caseswhere it has sufficient information to estimate the obligations’ fair value.
JPMorgan Chase capitalizes certain costs associated with the acquisition ordevelopment of internal-use software under SOP 98-1. Once the software isready for its intended use, these costs are amortized on a straight-line basisover the software’s expected useful life, and reviewed for impairment on anongoing basis.
The components of credit card relationships, core deposits and other intangible assets were as follows:
2005 2004
Net NetGross Accumulated carrying Gross Accumulated carrying
December 31, (in millions) amount amortization value amount amortization value
Purchased credit card relationships $ 5,325 $ 2,050 $ 3,275 $ 5,225 $ 1,347 $ 3,878All other intangibles:
Other credit card–related intangibles 183 59 124 295 23 272Core deposit intangibles 3,797 1,092 2,705 3,797 469 3,328Other intangibles 2,582 579(a) 2,003 2,528 402(a) 2,126
Amortization expense (in millions)(b) 2005 2004 2003
Purchased credit card relationships $ 703 $ 476 $ 256Other credit card–related intangibles 36 23 —Core deposit intangibles 623 330 6All other intangibles 163 117 32
Total amortization expense $ 1,525 $ 946 $ 294
(a) Includes $14 million and $16 million for 2005 and 2004, respectively, of amortization expense related to servicing assets on securitized automobile loans, which is recorded in Asset management,administration and commissions.
(b) 2004 results include six months of the combined Firm’s results and six months of heritage JPMorgan Chase results. 2003 reflects the results of heritage JPMorgan Chase only.
Future amortization expenseThe following table presents estimated amortization expenses related to credit card relationships, core deposits and All other intangible assets at December 31, 2005:
Other credit (in millions) Purchased credit card-related Core deposit All otherYear ended December 31, card relationships intangibles intangibles intangible assets Total
2006 $ 688 $ 16 $ 547 $ 163 $ 1,4142007 620 15 469 145 1,2492008 515 15 402 132 1,0642009 372 15 329 123 8392010 312 13 276 110 711
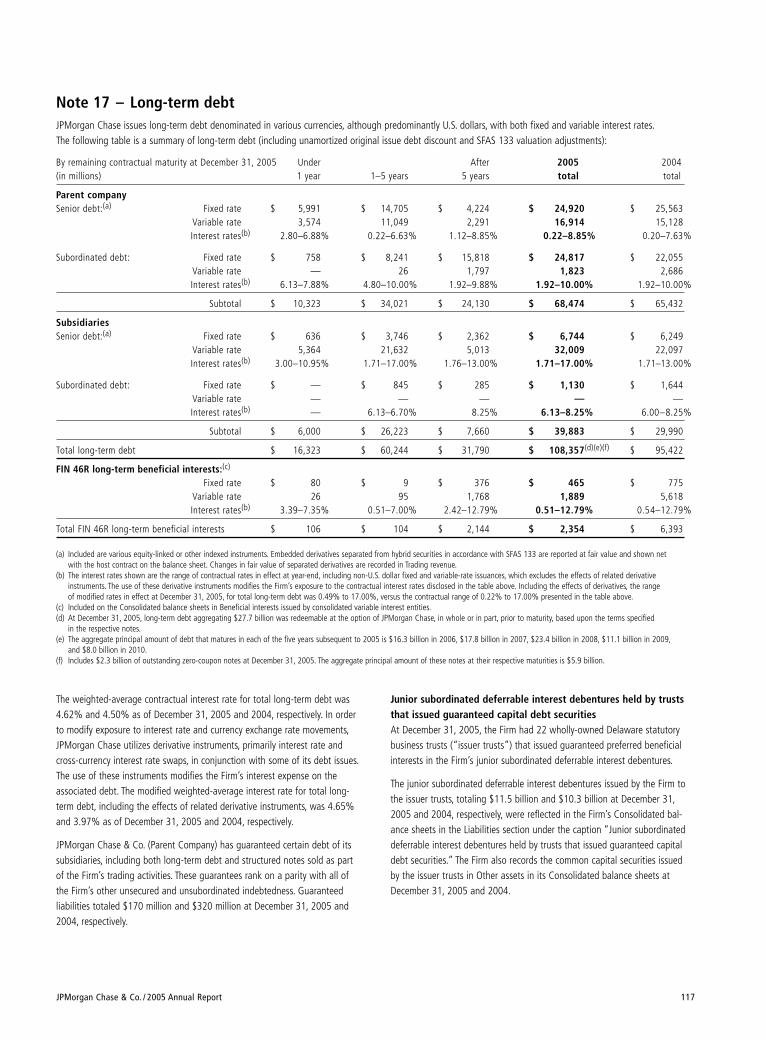
JPMorgan Chase & Co. / 2005 Annual Report 117
Note 17 – Long-term debtJPMorgan Chase issues long-term debt denominated in various currencies, although predominantly U.S. dollars, with both fixed and variable interest rates.The following table is a summary of long-term debt (including unamortized original issue debt discount and SFAS 133 valuation adjustments):
By remaining contractual maturity at December 31, 2005 Under After 2005 2004(in millions) 1 year 1–5 years 5 years total total
Parent companySenior debt:(a) Fixed rate $ 5,991 $ 14,705 $ 4,224 $ 24,920 $ 25,563
Variable rate 3,574 11,049 2,291 16,914 15,128Interest rates(b) 2.80–6.88% 0.22–6.63% 1.12–8.85% 0.22–8.85% 0.20–7.63%
Subordinated debt: Fixed rate $ 758 $ 8,241 $ 15,818 $ 24,817 $ 22,055Variable rate — 26 1,797 1,823 2,686Interest rates(b) 6.13–7.88% 4.80–10.00% 1.92–9.88% 1.92–10.00% 1.92–10.00%
Subtotal $ 10,323 $ 34,021 $ 24,130 $ 68,474 $ 65,432
SubsidiariesSenior debt:(a) Fixed rate $ 636 $ 3,746 $ 2,362 $ 6,744 $ 6,249
Variable rate 5,364 21,632 5,013 32,009 22,097Interest rates(b) 3.00–10.95% 1.71–17.00% 1.76–13.00% 1.71–17.00% 1.71–13.00%
Subordinated debt: Fixed rate $ — $ 845 $ 285 $ 1,130 $ 1,644Variable rate — — — — —Interest rates(b) — 6.13–6.70% 8.25% 6.13–8.25% 6.00–8.25%
Subtotal $ 6,000 $ 26,223 $ 7,660 $ 39,883 $ 29,990
Total long-term debt $ 16,323 $ 60,244 $ 31,790 $ 108,357(d)(e)(f) $ 95,422
FIN 46R long-term beneficial interests:(c)
Fixed rate $ 80 $ 9 $ 376 $ 465 $ 775Variable rate 26 95 1,768 1,889 5,618Interest rates(b) 3.39–7.35% 0.51–7.00% 2.42–12.79% 0.51–12.79% 0.54–12.79%
Total FIN 46R long-term beneficial interests $ 106 $ 104 $ 2,144 $ 2,354 $ 6,393
(a) Included are various equity-linked or other indexed instruments. Embedded derivatives separated from hybrid securities in accordance with SFAS 133 are reported at fair value and shown net with the host contract on the balance sheet. Changes in fair value of separated derivatives are recorded in Trading revenue.
(b) The interest rates shown are the range of contractual rates in effect at year-end, including non-U.S. dollar fixed and variable-rate issuances, which excludes the effects of related derivative instruments. The use of these derivative instruments modifies the Firm’s exposure to the contractual interest rates disclosed in the table above. Including the effects of derivatives, the range of modified rates in effect at December 31, 2005, for total long-term debt was 0.49% to 17.00%, versus the contractual range of 0.22% to 17.00% presented in the table above.
(c) Included on the Consolidated balance sheets in Beneficial interests issued by consolidated variable interest entities.(d) At December 31, 2005, long-term debt aggregating $27.7 billion was redeemable at the option of JPMorgan Chase, in whole or in part, prior to maturity, based upon the terms specified
in the respective notes.(e) The aggregate principal amount of debt that matures in each of the five years subsequent to 2005 is $16.3 billion in 2006, $17.8 billion in 2007, $23.4 billion in 2008, $11.1 billion in 2009,
and $8.0 billion in 2010.(f) Includes $2.3 billion of outstanding zero-coupon notes at December 31, 2005. The aggregate principal amount of these notes at their respective maturities is $5.9 billion.
The weighted-average contractual interest rate for total long-term debt was4.62% and 4.50% as of December 31, 2005 and 2004, respectively. In orderto modify exposure to interest rate and currency exchange rate movements,JPMorgan Chase utilizes derivative instruments, primarily interest rate andcross-currency interest rate swaps, in conjunction with some of its debt issues.The use of these instruments modifies the Firm’s interest expense on theassociated debt. The modified weighted-average interest rate for total long-term debt, including the effects of related derivative instruments, was 4.65%and 3.97% as of December 31, 2005 and 2004, respectively.
JPMorgan Chase & Co. (Parent Company) has guaranteed certain debt of itssubsidiaries, including both long-term debt and structured notes sold as partof the Firm’s trading activities. These guarantees rank on a parity with all ofthe Firm’s other unsecured and unsubordinated indebtedness. Guaranteed liabilities totaled $170 million and $320 million at December 31, 2005 and2004, respectively.
Junior subordinated deferrable interest debentures held by truststhat issued guaranteed capital debt securitiesAt December 31, 2005, the Firm had 22 wholly-owned Delaware statutorybusiness trusts (“issuer trusts”) that issued guaranteed preferred beneficialinterests in the Firm’s junior subordinated deferrable interest debentures.
The junior subordinated deferrable interest debentures issued by the Firm tothe issuer trusts, totaling $11.5 billion and $10.3 billion at December 31,2005 and 2004, respectively, were reflected in the Firm’s Consolidated bal-ance sheets in the Liabilities section under the caption “Junior subordinateddeferrable interest debentures held by trusts that issued guaranteed capitaldebt securities.” The Firm also records the common capital securities issuedby the issuer trusts in Other assets in its Consolidated balance sheets atDecember 31, 2005 and 2004.
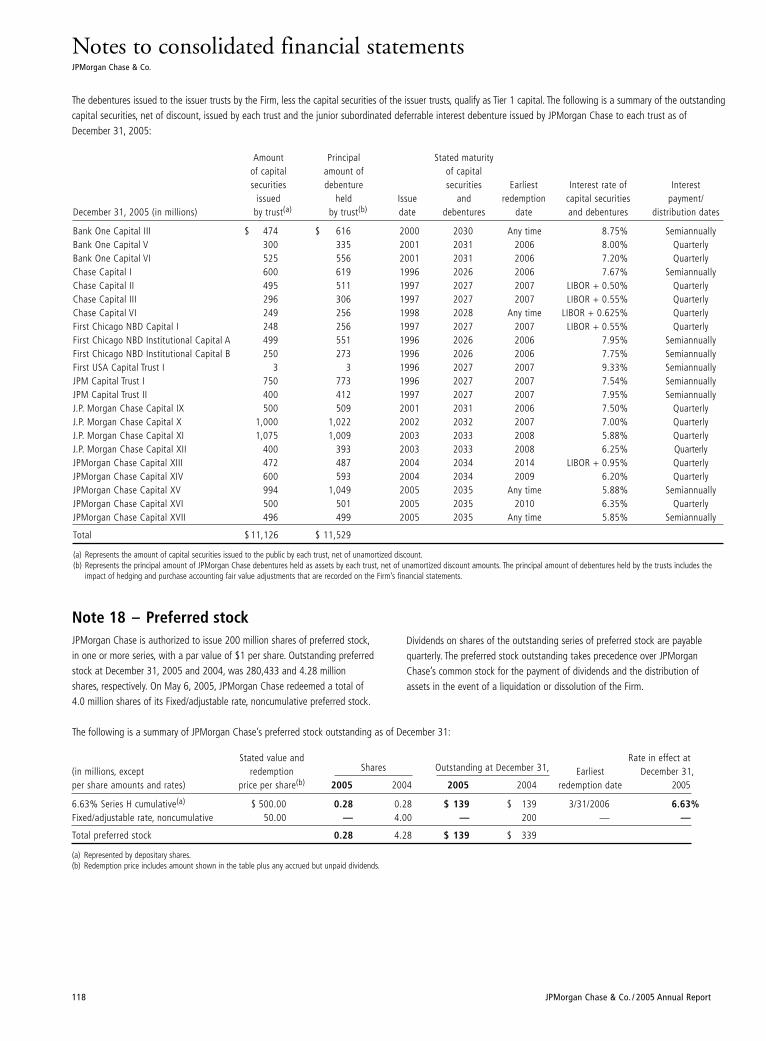
Notes to consolidated financial statementsJPMorgan Chase & Co.
118 JPMorgan Chase & Co. / 2005 Annual Report
The following is a summary of JPMorgan Chase’s preferred stock outstanding as of December 31:
Stated value and Rate in effect at(in millions, except redemption Shares Outstanding at December 31, Earliest December 31,per share amounts and rates) price per share(b) 2005 2004 2005 2004 redemption date 2005
6.63% Series H cumulative(a) $ 500.00 0.28 0.28 $ 139 $ 139 3/31/2006 6.63%Fixed/adjustable rate, noncumulative 50.00 — 4.00 — 200 — —
Total preferred stock 0.28 4.28 $ 139 $ 339
(a) Represented by depositary shares.(b) Redemption price includes amount shown in the table plus any accrued but unpaid dividends.
The debentures issued to the issuer trusts by the Firm, less the capital securities of the issuer trusts, qualify as Tier 1 capital. The following is a summary of the outstandingcapital securities, net of discount, issued by each trust and the junior subordinated deferrable interest debenture issued by JPMorgan Chase to each trust as ofDecember 31, 2005:
Amount Principal Stated maturityof capital amount of of capitalsecurities debenture securities Earliest Interest rate of Interest
issued held Issue and redemption capital securities payment/December 31, 2005 (in millions) by trust(a) by trust(b) date debentures date and debentures distribution dates
Bank One Capital III $ 474 $ 616 2000 2030 Any time 8.75% SemiannuallyBank One Capital V 300 335 2001 2031 2006 8.00% QuarterlyBank One Capital VI 525 556 2001 2031 2006 7.20% QuarterlyChase Capital I 600 619 1996 2026 2006 7.67% SemiannuallyChase Capital II 495 511 1997 2027 2007 LIBOR + 0.50% QuarterlyChase Capital III 296 306 1997 2027 2007 LIBOR + 0.55% QuarterlyChase Capital VI 249 256 1998 2028 Any time LIBOR + 0.625% QuarterlyFirst Chicago NBD Capital I 248 256 1997 2027 2007 LIBOR + 0.55% QuarterlyFirst Chicago NBD Institutional Capital A 499 551 1996 2026 2006 7.95% SemiannuallyFirst Chicago NBD Institutional Capital B 250 273 1996 2026 2006 7.75% SemiannuallyFirst USA Capital Trust I 3 3 1996 2027 2007 9.33% SemiannuallyJPM Capital Trust I 750 773 1996 2027 2007 7.54% SemiannuallyJPM Capital Trust II 400 412 1997 2027 2007 7.95% SemiannuallyJ.P. Morgan Chase Capital IX 500 509 2001 2031 2006 7.50% QuarterlyJ.P. Morgan Chase Capital X 1,000 1,022 2002 2032 2007 7.00% QuarterlyJ.P. Morgan Chase Capital XI 1,075 1,009 2003 2033 2008 5.88% QuarterlyJ.P. Morgan Chase Capital XII 400 393 2003 2033 2008 6.25% QuarterlyJPMorgan Chase Capital XIII 472 487 2004 2034 2014 LIBOR + 0.95% QuarterlyJPMorgan Chase Capital XIV 600 593 2004 2034 2009 6.20% QuarterlyJPMorgan Chase Capital XV 994 1,049 2005 2035 Any time 5.88% SemiannuallyJPMorgan Chase Capital XVI 500 501 2005 2035 2010 6.35% QuarterlyJPMorgan Chase Capital XVII 496 499 2005 2035 Any time 5.85% Semiannually
Total $ 11,126 $ 11,529
(a) Represents the amount of capital securities issued to the public by each trust, net of unamortized discount.(b) Represents the principal amount of JPMorgan Chase debentures held as assets by each trust, net of unamortized discount amounts. The principal amount of debentures held by the trusts includes the
impact of hedging and purchase accounting fair value adjustments that are recorded on the Firm’s financial statements.
Note 18 – Preferred stockJPMorgan Chase is authorized to issue 200 million shares of preferred stock,in one or more series, with a par value of $1 per share. Outstanding preferredstock at December 31, 2005 and 2004, was 280,433 and 4.28 millionshares, respectively. On May 6, 2005, JPMorgan Chase redeemed a total of4.0 million shares of its Fixed/adjustable rate, noncumulative preferred stock.
Dividends on shares of the outstanding series of preferred stock are payablequarterly. The preferred stock outstanding takes precedence over JPMorganChase’s common stock for the payment of dividends and the distribution ofassets in the event of a liquidation or dissolution of the Firm.
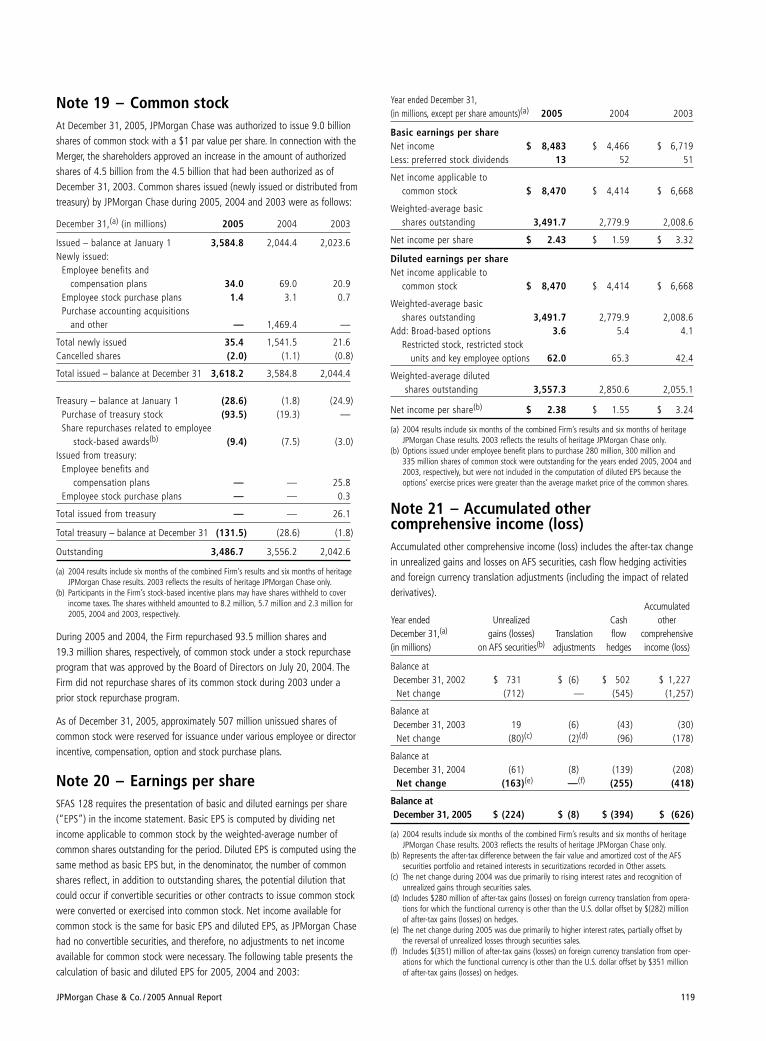
JPMorgan Chase & Co. / 2005 Annual Report 119
Note 19 – Common stockAt December 31, 2005, JPMorgan Chase was authorized to issue 9.0 billionshares of common stock with a $1 par value per share. In connection with theMerger, the shareholders approved an increase in the amount of authorizedshares of 4.5 billion from the 4.5 billion that had been authorized as ofDecember 31, 2003. Common shares issued (newly issued or distributed fromtreasury) by JPMorgan Chase during 2005, 2004 and 2003 were as follows:
December 31,(a) (in millions) 2005 2004 2003
Issued – balance at January 1 3,584.8 2,044.4 2,023.6Newly issued:
Employee benefits and compensation plans 34.0 69.0 20.9
Employee stock purchase plans 1.4 3.1 0.7Purchase accounting acquisitions
and other — 1,469.4 —
Total newly issued 35.4 1,541.5 21.6Cancelled shares (2.0) (1.1) (0.8)
Total issued – balance at December 31 3,618.2 3,584.8 2,044.4
Treasury – balance at January 1 (28.6) (1.8) (24.9)Purchase of treasury stock (93.5) (19.3) —Share repurchases related to employee
stock-based awards(b) (9.4) (7.5) (3.0)Issued from treasury:
Employee benefits and compensation plans — — 25.8
Employee stock purchase plans — — 0.3
Total issued from treasury — — 26.1
Total treasury – balance at December 31 (131.5) (28.6) (1.8)
Outstanding 3,486.7 3,556.2 2,042.6
(a) 2004 results include six months of the combined Firm’s results and six months of heritageJPMorgan Chase results. 2003 reflects the results of heritage JPMorgan Chase only.
(b) Participants in the Firm’s stock-based incentive plans may have shares withheld to coverincome taxes. The shares withheld amounted to 8.2 million, 5.7 million and 2.3 million for2005, 2004 and 2003, respectively.
During 2005 and 2004, the Firm repurchased 93.5 million shares and 19.3 million shares, respectively, of common stock under a stock repurchaseprogram that was approved by the Board of Directors on July 20, 2004. TheFirm did not repurchase shares of its common stock during 2003 under aprior stock repurchase program.
As of December 31, 2005, approximately 507 million unissued shares of common stock were reserved for issuance under various employee or directorincentive, compensation, option and stock purchase plans.
Note 20 – Earnings per shareSFAS 128 requires the presentation of basic and diluted earnings per share(“EPS”) in the income statement. Basic EPS is computed by dividing netincome applicable to common stock by the weighted-average number ofcommon shares outstanding for the period. Diluted EPS is computed using thesame method as basic EPS but, in the denominator, the number of commonshares reflect, in addition to outstanding shares, the potential dilution thatcould occur if convertible securities or other contracts to issue common stockwere converted or exercised into common stock. Net income available forcommon stock is the same for basic EPS and diluted EPS, as JPMorgan Chasehad no convertible securities, and therefore, no adjustments to net incomeavailable for common stock were necessary. The following table presents thecalculation of basic and diluted EPS for 2005, 2004 and 2003:
Year ended December 31,(in millions, except per share amounts)(a) 2005 2004 2003
Basic earnings per shareNet income $ 8,483 $ 4,466 $ 6,719Less: preferred stock dividends 13 52 51
Net income applicable to common stock $ 8,470 $ 4,414 $ 6,668
Weighted-average basic shares outstanding 3,491.7 2,779.9 2,008.6
Net income per share $ 2.43 $ 1.59 $ 3.32
Diluted earnings per shareNet income applicable to
common stock $ 8,470 $ 4,414 $ 6,668
Weighted-average basic shares outstanding 3,491.7 2,779.9 2,008.6
Add: Broad-based options 3.6 5.4 4.1Restricted stock, restricted stock
units and key employee options 62.0 65.3 42.4
Weighted-average diluted shares outstanding 3,557.3 2,850.6 2,055.1
Net income per share(b) $ 2.38 $ 1.55 $ 3.24
(a) 2004 results include six months of the combined Firm’s results and six months of heritageJPMorgan Chase results. 2003 reflects the results of heritage JPMorgan Chase only.
(b) Options issued under employee benefit plans to purchase 280 million, 300 million and 335 million shares of common stock were outstanding for the years ended 2005, 2004 and2003, respectively, but were not included in the computation of diluted EPS because theoptions’ exercise prices were greater than the average market price of the common shares.
Note 21 – Accumulated other comprehensive income (loss)Accumulated other comprehensive income (loss) includes the after-tax changein unrealized gains and losses on AFS securities, cash flow hedging activitiesand foreign currency translation adjustments (including the impact of relatedderivatives).
AccumulatedYear ended Unrealized Cash otherDecember 31,(a) gains (losses) Translation flow comprehensive(in millions) on AFS securities(b) adjustments hedges income (loss)
Balance at December 31, 2002 $ 731 $ (6) $ 502 $ 1,227Net change (712) — (545) (1,257)
Balance at December 31, 2003 19 (6) (43) (30)Net change (80)(c) (2)(d) (96) (178)
Balance at December 31, 2004 (61) (8) (139) (208)Net change (163)(e) —(f) (255) (418)
Balance at December 31, 2005 $ (224) $ (8) $ (394) $ (626)
(a) 2004 results include six months of the combined Firm’s results and six months of heritageJPMorgan Chase results. 2003 reflects the results of heritage JPMorgan Chase only.
(b) Represents the after-tax difference between the fair value and amortized cost of the AFSsecurities portfolio and retained interests in securitizations recorded in Other assets.
(c) The net change during 2004 was due primarily to rising interest rates and recognition of unrealized gains through securities sales.
(d) Includes $280 million of after-tax gains (losses) on foreign currency translation from opera-tions for which the functional currency is other than the U.S. dollar offset by $(282) millionof after-tax gains (losses) on hedges.
(e) The net change during 2005 was due primarily to higher interest rates, partially offset bythe reversal of unrealized losses through securities sales.
(f) Includes $(351) million of after-tax gains (losses) on foreign currency translation from oper-ations for which the functional currency is other than the U.S. dollar offset by $351 millionof after-tax gains (losses) on hedges.
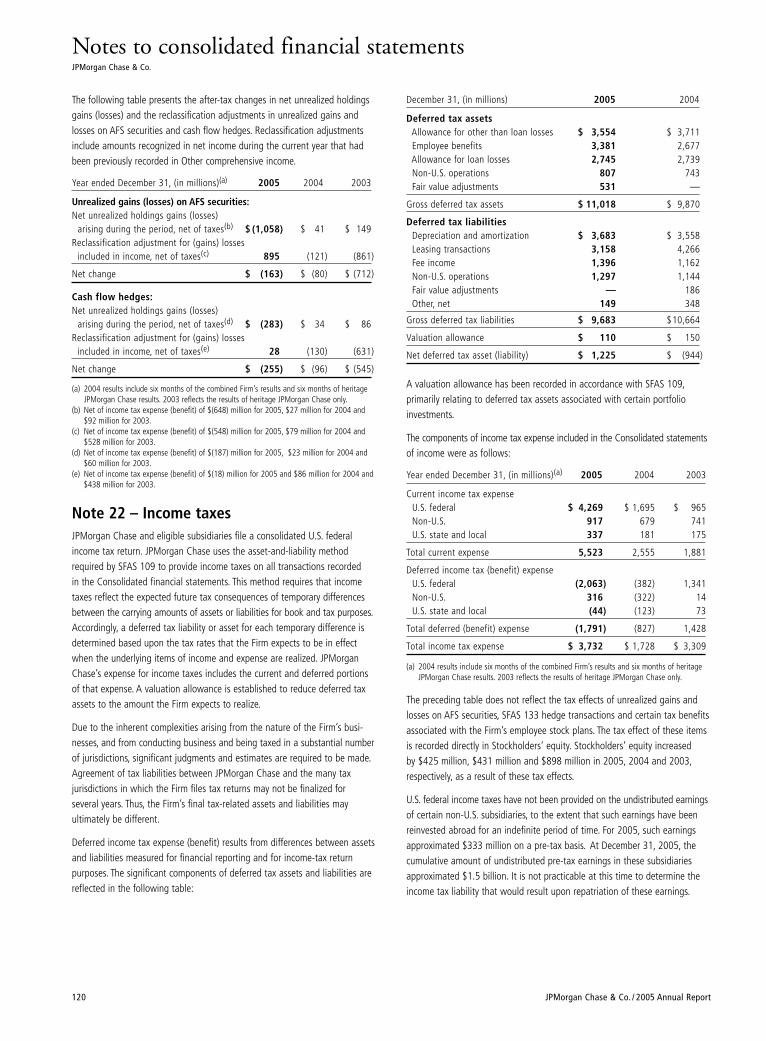
Notes to consolidated financial statementsJPMorgan Chase & Co.
120 JPMorgan Chase & Co. / 2005 Annual Report
The following table presents the after-tax changes in net unrealized holdingsgains (losses) and the reclassification adjustments in unrealized gains andlosses on AFS securities and cash flow hedges. Reclassification adjustmentsinclude amounts recognized in net income during the current year that hadbeen previously recorded in Other comprehensive income.
Year ended December 31, (in millions)(a) 2005 2004 2003
Unrealized gains (losses) on AFS securities:Net unrealized holdings gains (losses)
arising during the period, net of taxes(b) $ (1,058) $ 41 $ 149Reclassification adjustment for (gains) losses
included in income, net of taxes(c) 895 (121) (861)
Net change $ (163) $ (80) $ (712)
Cash flow hedges:Net unrealized holdings gains (losses)
arising during the period, net of taxes(d) $ (283) $ 34 $ 86Reclassification adjustment for (gains) losses
included in income, net of taxes(e) 28 (130) (631)
Net change $ (255) $ (96) $ (545)
(a) 2004 results include six months of the combined Firm’s results and six months of heritageJPMorgan Chase results. 2003 reflects the results of heritage JPMorgan Chase only.
(b) Net of income tax expense (benefit) of $(648) million for 2005, $27 million for 2004 and$92 million for 2003.
(c) Net of income tax expense (benefit) of $(548) million for 2005, $79 million for 2004 and$528 million for 2003.
(d) Net of income tax expense (benefit) of $(187) million for 2005, $23 million for 2004 and$60 million for 2003.
(e) Net of income tax expense (benefit) of $(18) million for 2005 and $86 million for 2004 and$438 million for 2003.
Note 22 – Income taxesJPMorgan Chase and eligible subsidiaries file a consolidated U.S. federalincome tax return. JPMorgan Chase uses the asset-and-liability methodrequired by SFAS 109 to provide income taxes on all transactions recorded in the Consolidated financial statements. This method requires that incometaxes reflect the expected future tax consequences of temporary differencesbetween the carrying amounts of assets or liabilities for book and tax purposes.Accordingly, a deferred tax liability or asset for each temporary difference isdetermined based upon the tax rates that the Firm expects to be in effectwhen the underlying items of income and expense are realized. JPMorganChase’s expense for income taxes includes the current and deferred portionsof that expense. A valuation allowance is established to reduce deferred taxassets to the amount the Firm expects to realize.
Due to the inherent complexities arising from the nature of the Firm’s busi-nesses, and from conducting business and being taxed in a substantial numberof jurisdictions, significant judgments and estimates are required to be made.Agreement of tax liabilities between JPMorgan Chase and the many tax jurisdictions in which the Firm files tax returns may not be finalized for several years. Thus, the Firm’s final tax-related assets and liabilities may ultimately be different.
Deferred income tax expense (benefit) results from differences between assetsand liabilities measured for financial reporting and for income-tax return purposes. The significant components of deferred tax assets and liabilities arereflected in the following table:
December 31, (in millions) 2005 2004
Deferred tax assetsAllowance for other than loan losses $ 3,554 $ 3,711Employee benefits 3,381 2,677Allowance for loan losses 2,745 2,739Non-U.S. operations 807 743Fair value adjustments 531 —
Gross deferred tax assets $ 11,018 $ 9,870
Deferred tax liabilitiesDepreciation and amortization $ 3,683 $ 3,558Leasing transactions 3,158 4,266Fee income 1,396 1,162Non-U.S. operations 1,297 1,144Fair value adjustments — 186Other, net 149 348
Gross deferred tax liabilities $ 9,683 $10,664
Valuation allowance $ 110 $ 150
Net deferred tax asset (liability) $ 1,225 $ (944)
A valuation allowance has been recorded in accordance with SFAS 109,primarily relating to deferred tax assets associated with certain portfolioinvestments.
The components of income tax expense included in the Consolidated statementsof income were as follows:
Year ended December 31, (in millions)(a) 2005 2004 2003
Current income tax expense U.S. federal $ 4,269 $ 1,695 $ 965Non-U.S. 917 679 741U.S. state and local 337 181 175
Total current expense 5,523 2,555 1,881
Deferred income tax (benefit) expense U.S. federal (2,063) (382) 1,341Non-U.S. 316 (322) 14U.S. state and local (44) (123) 73
Total deferred (benefit) expense (1,791) (827) 1,428
Total income tax expense $ 3,732 $ 1,728 $ 3,309
(a) 2004 results include six months of the combined Firm’s results and six months of heritageJPMorgan Chase results. 2003 reflects the results of heritage JPMorgan Chase only.
The preceding table does not reflect the tax effects of unrealized gains andlosses on AFS securities, SFAS 133 hedge transactions and certain tax benefitsassociated with the Firm’s employee stock plans. The tax effect of these itemsis recorded directly in Stockholders’ equity. Stockholders’ equity increased by $425 million, $431 million and $898 million in 2005, 2004 and 2003,respectively, as a result of these tax effects.
U.S. federal income taxes have not been provided on the undistributed earningsof certain non-U.S. subsidiaries, to the extent that such earnings have beenreinvested abroad for an indefinite period of time. For 2005, such earningsapproximated $333 million on a pre-tax basis. At December 31, 2005, thecumulative amount of undistributed pre-tax earnings in these subsidiariesapproximated $1.5 billion. It is not practicable at this time to determine theincome tax liability that would result upon repatriation of these earnings.
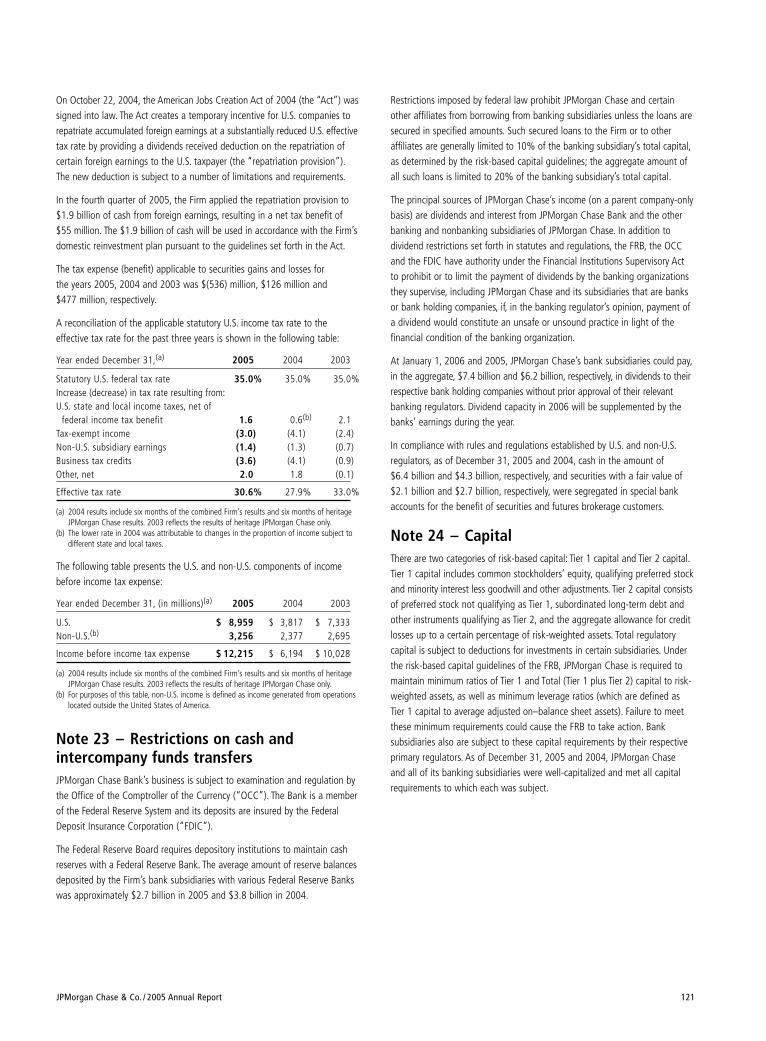
JPMorgan Chase & Co. / 2005 Annual Report 121
Restrictions imposed by federal law prohibit JPMorgan Chase and certainother affiliates from borrowing from banking subsidiaries unless the loans aresecured in specified amounts. Such secured loans to the Firm or to other affiliates are generally limited to 10% of the banking subsidiary’s total capital,as determined by the risk-based capital guidelines; the aggregate amount ofall such loans is limited to 20% of the banking subsidiary’s total capital.
The principal sources of JPMorgan Chase’s income (on a parent company-onlybasis) are dividends and interest from JPMorgan Chase Bank and the otherbanking and nonbanking subsidiaries of JPMorgan Chase. In addition to dividend restrictions set forth in statutes and regulations, the FRB, the OCCand the FDIC have authority under the Financial Institutions Supervisory Actto prohibit or to limit the payment of dividends by the banking organizationsthey supervise, including JPMorgan Chase and its subsidiaries that are banksor bank holding companies, if, in the banking regulator’s opinion, payment ofa dividend would constitute an unsafe or unsound practice in light of thefinancial condition of the banking organization.
At January 1, 2006 and 2005, JPMorgan Chase’s bank subsidiaries could pay,in the aggregate, $7.4 billion and $6.2 billion, respectively, in dividends to theirrespective bank holding companies without prior approval of their relevantbanking regulators. Dividend capacity in 2006 will be supplemented by thebanks’ earnings during the year.
In compliance with rules and regulations established by U.S. and non-U.S.regulators, as of December 31, 2005 and 2004, cash in the amount of $6.4 billion and $4.3 billion, respectively, and securities with a fair value of$2.1 billion and $2.7 billion, respectively, were segregated in special bankaccounts for the benefit of securities and futures brokerage customers.
Note 24 – CapitalThere are two categories of risk-based capital: Tier 1 capital and Tier 2 capital.Tier 1 capital includes common stockholders’ equity, qualifying preferred stockand minority interest less goodwill and other adjustments. Tier 2 capital consistsof preferred stock not qualifying as Tier 1, subordinated long-term debt andother instruments qualifying as Tier 2, and the aggregate allowance for creditlosses up to a certain percentage of risk-weighted assets. Total regulatorycapital is subject to deductions for investments in certain subsidiaries. Underthe risk-based capital guidelines of the FRB, JPMorgan Chase is required tomaintain minimum ratios of Tier 1 and Total (Tier 1 plus Tier 2) capital to risk-weighted assets, as well as minimum leverage ratios (which are defined asTier 1 capital to average adjusted on–balance sheet assets). Failure to meetthese minimum requirements could cause the FRB to take action. Bank subsidiaries also are subject to these capital requirements by their respectiveprimary regulators. As of December 31, 2005 and 2004, JPMorgan Chase and all of its banking subsidiaries were well-capitalized and met all capitalrequirements to which each was subject.
On October 22, 2004, the American Jobs Creation Act of 2004 (the “Act”) wassigned into law. The Act creates a temporary incentive for U.S. companies torepatriate accumulated foreign earnings at a substantially reduced U.S. effectivetax rate by providing a dividends received deduction on the repatriation ofcertain foreign earnings to the U.S. taxpayer (the “repatriation provision”).The new deduction is subject to a number of limitations and requirements.
In the fourth quarter of 2005, the Firm applied the repatriation provision to$1.9 billion of cash from foreign earnings, resulting in a net tax benefit of$55 million. The $1.9 billion of cash will be used in accordance with the Firm’sdomestic reinvestment plan pursuant to the guidelines set forth in the Act.
The tax expense (benefit) applicable to securities gains and losses for the years 2005, 2004 and 2003 was $(536) million, $126 million and $477 million, respectively.
A reconciliation of the applicable statutory U.S. income tax rate to the effective tax rate for the past three years is shown in the following table:
Year ended December 31,(a) 2005 2004 2003
Statutory U.S. federal tax rate 35.0% 35.0% 35.0%Increase (decrease) in tax rate resulting from:U.S. state and local income taxes, net of
federal income tax benefit 1.6 0.6(b) 2.1Tax-exempt income (3.0) (4.1) (2.4)Non-U.S. subsidiary earnings (1.4) (1.3) (0.7)Business tax credits (3.6) (4.1) (0.9)Other, net 2.0 1.8 (0.1)
Effective tax rate 30.6% 27.9% 33.0%
(a) 2004 results include six months of the combined Firm’s results and six months of heritageJPMorgan Chase results. 2003 reflects the results of heritage JPMorgan Chase only.
(b) The lower rate in 2004 was attributable to changes in the proportion of income subject to different state and local taxes.
The following table presents the U.S. and non-U.S. components of incomebefore income tax expense:
Year ended December 31, (in millions)(a) 2005 2004 2003
U.S. $ 8,959 $ 3,817 $ 7,333Non-U.S.(b) 3,256 2,377 2,695
Income before income tax expense $ 12,215 $ 6,194 $ 10,028
(a) 2004 results include six months of the combined Firm’s results and six months of heritageJPMorgan Chase results. 2003 reflects the results of heritage JPMorgan Chase only.
(b) For purposes of this table, non-U.S. income is defined as income generated from operationslocated outside the United States of America.
Note 23 – Restrictions on cash and intercompany funds transfersJPMorgan Chase Bank’s business is subject to examination and regulation bythe Office of the Comptroller of the Currency (“OCC”). The Bank is a memberof the Federal Reserve System and its deposits are insured by the FederalDeposit Insurance Corporation (“FDIC”).
The Federal Reserve Board requires depository institutions to maintain cashreserves with a Federal Reserve Bank. The average amount of reserve balancesdeposited by the Firm’s bank subsidiaries with various Federal Reserve Bankswas approximately $2.7 billion in 2005 and $3.8 billion in 2004.
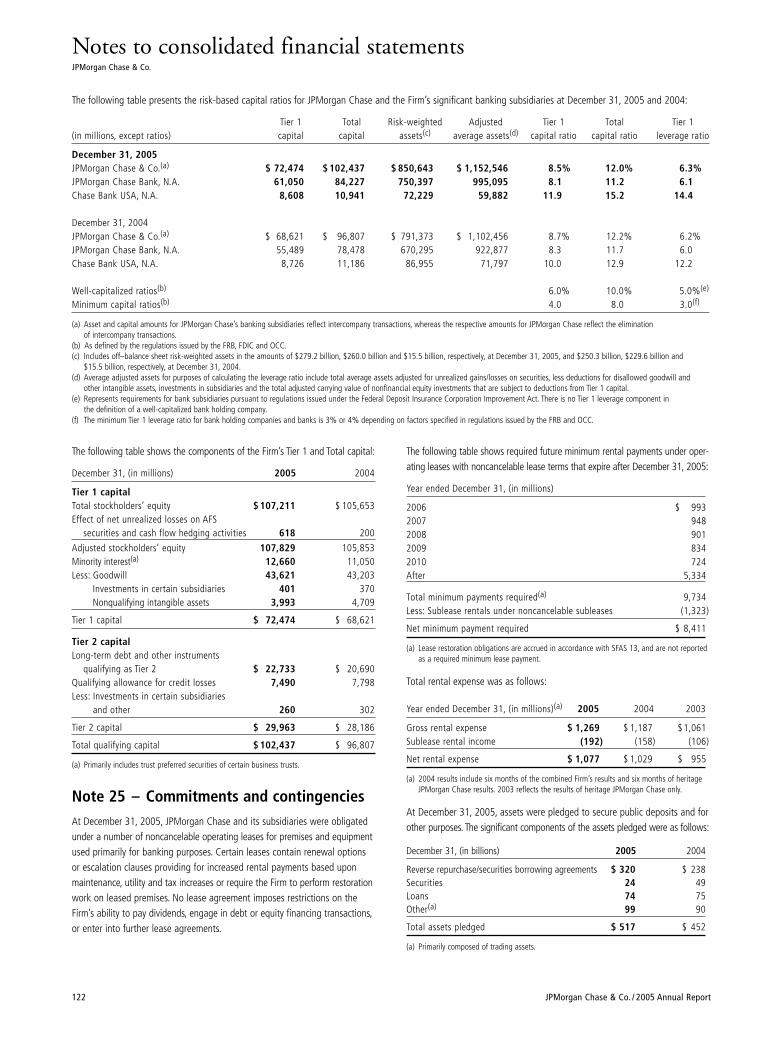
Notes to consolidated financial statementsJPMorgan Chase & Co.
122 JPMorgan Chase & Co. / 2005 Annual Report
The following table presents the risk-based capital ratios for JPMorgan Chase and the Firm’s significant banking subsidiaries at December 31, 2005 and 2004:
Tier 1 Total Risk-weighted Adjusted Tier 1 Total Tier 1(in millions, except ratios) capital capital assets(c) average assets(d) capital ratio capital ratio leverage ratio
December 31, 2005JPMorgan Chase & Co.(a) $ 72,474 $ 102,437 $ 850,643 $ 1,152,546 8.5% 12.0% 6.3%JPMorgan Chase Bank, N.A. 61,050 84,227 750,397 995,095 8.1 11.2 6.1Chase Bank USA, N.A. 8,608 10,941 72,229 59,882 11.9 15.2 14.4
December 31, 2004JPMorgan Chase & Co.(a) $ 68,621 $ 96,807 $ 791,373 $ 1,102,456 8.7% 12.2% 6.2%JPMorgan Chase Bank, N.A. 55,489 78,478 670,295 922,877 8.3 11.7 6.0Chase Bank USA, N.A. 8,726 11,186 86,955 71,797 10.0 12.9 12.2
Well-capitalized ratios(b) 6.0% 10.0% 5.0%(e)
Minimum capital ratios(b) 4.0 8.0 3.0(f)
(a) Asset and capital amounts for JPMorgan Chase’s banking subsidiaries reflect intercompany transactions, whereas the respective amounts for JPMorgan Chase reflect the elimination of intercompany transactions.
(b) As defined by the regulations issued by the FRB, FDIC and OCC.(c) Includes off–balance sheet risk-weighted assets in the amounts of $279.2 billion, $260.0 billion and $15.5 billion, respectively, at December 31, 2005, and $250.3 billion, $229.6 billion and
$15.5 billion, respectively, at December 31, 2004.(d) Average adjusted assets for purposes of calculating the leverage ratio include total average assets adjusted for unrealized gains/losses on securities, less deductions for disallowed goodwill and
other intangible assets, investments in subsidiaries and the total adjusted carrying value of nonfinancial equity investments that are subject to deductions from Tier 1 capital.(e) Represents requirements for bank subsidiaries pursuant to regulations issued under the Federal Deposit Insurance Corporation Improvement Act. There is no Tier 1 leverage component in
the definition of a well-capitalized bank holding company.(f) The minimum Tier 1 leverage ratio for bank holding companies and banks is 3% or 4% depending on factors specified in regulations issued by the FRB and OCC.
The following table shows the components of the Firm’s Tier 1 and Total capital:
December 31, (in millions) 2005 2004
Tier 1 capitalTotal stockholders’ equity $ 107,211 $ 105,653Effect of net unrealized losses on AFS
securities and cash flow hedging activities 618 200
Adjusted stockholders’ equity 107,829 105,853Minority interest(a) 12,660 11,050Less: Goodwill 43,621 43,203
Investments in certain subsidiaries 401 370Nonqualifying intangible assets 3,993 4,709
Tier 1 capital $ 72,474 $ 68,621
Tier 2 capitalLong-term debt and other instruments
qualifying as Tier 2 $ 22,733 $ 20,690Qualifying allowance for credit losses 7,490 7,798Less: Investments in certain subsidiaries
and other 260 302
Tier 2 capital $ 29,963 $ 28,186
Total qualifying capital $ 102,437 $ 96,807
(a) Primarily includes trust preferred securities of certain business trusts.
Note 25 – Commitments and contingenciesAt December 31, 2005, JPMorgan Chase and its subsidiaries were obligatedunder a number of noncancelable operating leases for premises and equipmentused primarily for banking purposes. Certain leases contain renewal optionsor escalation clauses providing for increased rental payments based uponmaintenance, utility and tax increases or require the Firm to perform restorationwork on leased premises. No lease agreement imposes restrictions on theFirm’s ability to pay dividends, engage in debt or equity financing transactions,or enter into further lease agreements.
The following table shows required future minimum rental payments under oper-ating leases with noncancelable lease terms that expire after December 31, 2005:
Year ended December 31, (in millions)
2006 $ 9932007 9482008 9012009 8342010 724After 5,334
Total minimum payments required(a) 9,734Less: Sublease rentals under noncancelable subleases (1,323)
Net minimum payment required $ 8,411
(a) Lease restoration obligations are accrued in accordance with SFAS 13, and are not reportedas a required minimum lease payment.
Total rental expense was as follows:
Year ended December 31, (in millions)(a) 2005 2004 2003
Gross rental expense $ 1,269 $ 1,187 $1,061Sublease rental income (192) (158) (106)
Net rental expense $ 1,077 $ 1,029 $ 955
(a) 2004 results include six months of the combined Firm’s results and six months of heritageJPMorgan Chase results. 2003 reflects the results of heritage JPMorgan Chase only.
At December 31, 2005, assets were pledged to secure public deposits and forother purposes. The significant components of the assets pledged were as follows:
December 31, (in billions) 2005 2004
Reverse repurchase/securities borrowing agreements $ 320 $ 238Securities 24 49Loans 74 75Other(a) 99 90
Total assets pledged $ 517 $ 452
(a) Primarily composed of trading assets.
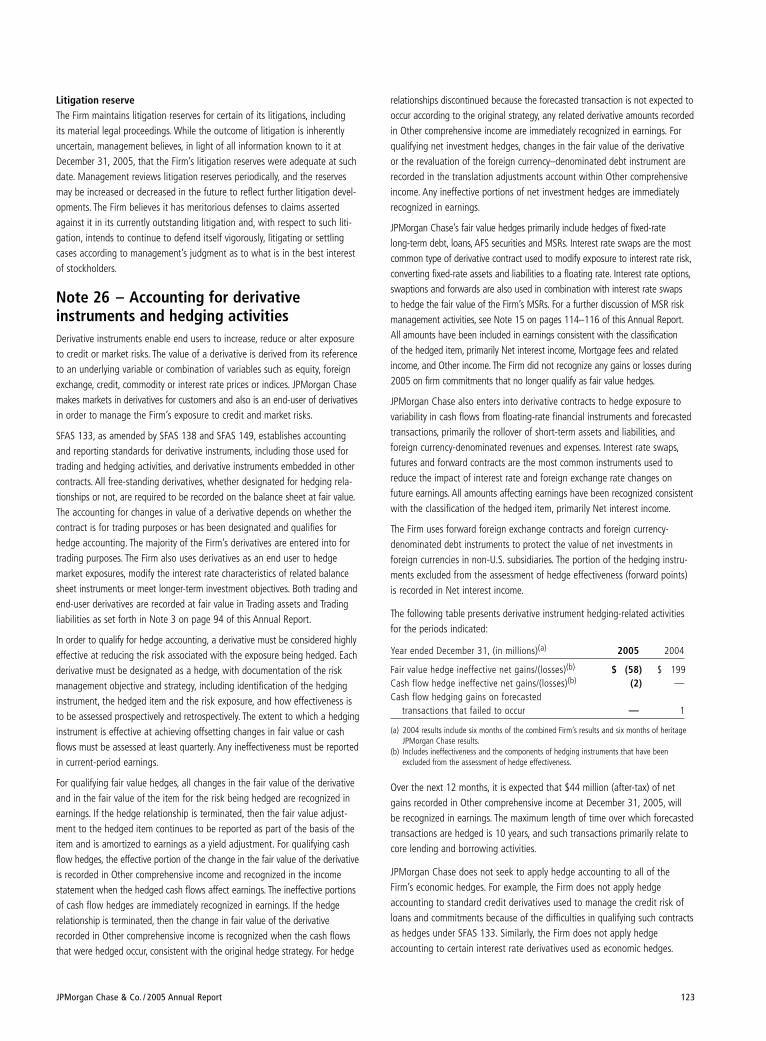
JPMorgan Chase & Co. / 2005 Annual Report 123
Litigation reserveThe Firm maintains litigation reserves for certain of its litigations, including its material legal proceedings. While the outcome of litigation is inherentlyuncertain, management believes, in light of all information known to it atDecember 31, 2005, that the Firm’s litigation reserves were adequate at suchdate. Management reviews litigation reserves periodically, and the reservesmay be increased or decreased in the future to reflect further litigation devel-opments. The Firm believes it has meritorious defenses to claims assertedagainst it in its currently outstanding litigation and, with respect to such liti-gation, intends to continue to defend itself vigorously, litigating or settlingcases according to management’s judgment as to what is in the best interestof stockholders.
Note 26 – Accounting for derivative instruments and hedging activitiesDerivative instruments enable end users to increase, reduce or alter exposureto credit or market risks. The value of a derivative is derived from its referenceto an underlying variable or combination of variables such as equity, foreignexchange, credit, commodity or interest rate prices or indices. JPMorgan Chasemakes markets in derivatives for customers and also is an end-user of derivativesin order to manage the Firm’s exposure to credit and market risks.
SFAS 133, as amended by SFAS 138 and SFAS 149, establishes accountingand reporting standards for derivative instruments, including those used fortrading and hedging activities, and derivative instruments embedded in othercontracts. All free-standing derivatives, whether designated for hedging rela-tionships or not, are required to be recorded on the balance sheet at fair value.The accounting for changes in value of a derivative depends on whether thecontract is for trading purposes or has been designated and qualifies forhedge accounting. The majority of the Firm’s derivatives are entered into fortrading purposes. The Firm also uses derivatives as an end user to hedge market exposures, modify the interest rate characteristics of related balancesheet instruments or meet longer-term investment objectives. Both trading andend-user derivatives are recorded at fair value in Trading assets and Tradingliabilities as set forth in Note 3 on page 94 of this Annual Report.
In order to qualify for hedge accounting, a derivative must be considered highlyeffective at reducing the risk associated with the exposure being hedged. Eachderivative must be designated as a hedge, with documentation of the riskmanagement objective and strategy, including identification of the hedginginstrument, the hedged item and the risk exposure, and how effectiveness isto be assessed prospectively and retrospectively. The extent to which a hedginginstrument is effective at achieving offsetting changes in fair value or cashflows must be assessed at least quarterly. Any ineffectiveness must be reportedin current-period earnings.
For qualifying fair value hedges, all changes in the fair value of the derivativeand in the fair value of the item for the risk being hedged are recognized inearnings. If the hedge relationship is terminated, then the fair value adjust-ment to the hedged item continues to be reported as part of the basis of theitem and is amortized to earnings as a yield adjustment. For qualifying cashflow hedges, the effective portion of the change in the fair value of the derivativeis recorded in Other comprehensive income and recognized in the incomestatement when the hedged cash flows affect earnings. The ineffective portionsof cash flow hedges are immediately recognized in earnings. If the hedge relationship is terminated, then the change in fair value of the derivativerecorded in Other comprehensive income is recognized when the cash flowsthat were hedged occur, consistent with the original hedge strategy. For hedge
relationships discontinued because the forecasted transaction is not expected tooccur according to the original strategy, any related derivative amounts recordedin Other comprehensive income are immediately recognized in earnings. Forqualifying net investment hedges, changes in the fair value of the derivativeor the revaluation of the foreign currency–denominated debt instrument arerecorded in the translation adjustments account within Other comprehensiveincome. Any ineffective portions of net investment hedges are immediatelyrecognized in earnings.
JPMorgan Chase’s fair value hedges primarily include hedges of fixed-rate long-term debt, loans, AFS securities and MSRs. Interest rate swaps are the mostcommon type of derivative contract used to modify exposure to interest rate risk,converting fixed-rate assets and liabilities to a floating rate. Interest rate options,swaptions and forwards are also used in combination with interest rate swaps to hedge the fair value of the Firm’s MSRs. For a further discussion of MSR riskmanagement activities, see Note 15 on pages 114–116 of this Annual Report.All amounts have been included in earnings consistent with the classification of the hedged item, primarily Net interest income, Mortgage fees and relatedincome, and Other income. The Firm did not recognize any gains or losses during2005 on firm commitments that no longer qualify as fair value hedges.
JPMorgan Chase also enters into derivative contracts to hedge exposure tovariability in cash flows from floating-rate financial instruments and forecastedtransactions, primarily the rollover of short-term assets and liabilities, and foreign currency-denominated revenues and expenses. Interest rate swaps,futures and forward contracts are the most common instruments used toreduce the impact of interest rate and foreign exchange rate changes onfuture earnings. All amounts affecting earnings have been recognized consistentwith the classification of the hedged item, primarily Net interest income.
The Firm uses forward foreign exchange contracts and foreign currency-denominated debt instruments to protect the value of net investments in foreign currencies in non-U.S. subsidiaries. The portion of the hedging instru-ments excluded from the assessment of hedge effectiveness (forward points)is recorded in Net interest income.
The following table presents derivative instrument hedging-related activitiesfor the periods indicated:
Year ended December 31, (in millions)(a) 2005 2004
Fair value hedge ineffective net gains/(losses)(b) $ (58) $ 199Cash flow hedge ineffective net gains/(losses)(b) (2) —Cash flow hedging gains on forecasted
transactions that failed to occur — 1
(a) 2004 results include six months of the combined Firm’s results and six months of heritageJPMorgan Chase results.
(b) Includes ineffectiveness and the components of hedging instruments that have been excluded from the assessment of hedge effectiveness.
Over the next 12 months, it is expected that $44 million (after-tax) of netgains recorded in Other comprehensive income at December 31, 2005, will be recognized in earnings. The maximum length of time over which forecastedtransactions are hedged is 10 years, and such transactions primarily relate tocore lending and borrowing activities.
JPMorgan Chase does not seek to apply hedge accounting to all of theFirm’s economic hedges. For example, the Firm does not apply hedgeaccounting to standard credit derivatives used to manage the credit risk ofloans and commitments because of the difficulties in qualifying such contractsas hedges under SFAS 133. Similarly, the Firm does not apply hedgeaccounting to certain interest rate derivatives used as economic hedges.
Notes to consolidated financial statementsJPMorgan Chase & Co.
124 JPMorgan Chase & Co. / 2005 Annual Report
Note 27 – Off-balance sheet lending-relatedfinancial instruments and guaranteesJPMorgan Chase utilizes lending-related financial instruments (e.g., commitmentsand guarantees) to meet the financing needs of its customers. The contractualamount of these financial instruments represents the maximum possible creditrisk should the counterparty draw down the commitment or the Firm fulfillsits obligation under the guarantee, and the counterparty subsequently fails toperform according to the terms of the contract. Most of these commitmentsand guarantees expire without a default occurring or without being drawn.As a result, the total contractual amount of these instruments is not, in theFirm’s view, representative of its actual future credit exposure or fundingrequirements. Further, certain commitments, primarily related to consumerfinancings, are cancelable, upon notice, at the option of the Firm.
To provide for the risk of loss inherent in wholesale-related contracts, anallowance for credit losses on lending-related commitments is maintained.See Note 12 on pages 107–108 of this Annual Report for a further discussionon the allowance for credit losses on lending-related commitments.
The following table summarizes the contractual amounts of off–balance sheet lending-related financial instruments and guarantees and the relatedallowance for credit losses on lending-related commitments at December 31,2005 and 2004:
Off–balance sheet lending-related financial instruments and guarantees
Allowance forContractual lending-related
amount commitments
December 31, (in millions) 2005 2004 2005 2004
Lending-relatedConsumer $ 655,596 $ 601,196 $ 15 $ 12Wholesale:
Other unfunded commitments to extend credit(a)(b)(c) 208,469 185,822 208 183
Asset purchase agreements(d) 31,095 39,330 3 2Standby letters of credit
and guarantees(a)(e) 77,199 78,084 173 292Other letters of credit(a) 7,001 6,163 1 3
Total wholesale 323,764 309,399 385 480
Total lending-related $ 979,360 $ 910,595 $ 400 $ 492
Other guaranteesSecurities lending guarantees(f) $ 244,316 $ 220,783 NA NADerivatives qualifying as
guarantees 61,759 53,312 NA NA
(a) Represents contractual amount net of risk participations totaling $29.3 billion and $26.4 billion at December 31, 2005 and 2004, respectively.
(b) Includes unused advised lines of credit totaling $28.3 billion and $22.8 billion at December 31, 2005 and 2004, respectively, which are not legally binding. In regulatory filings with the FRB, unused advised lines are not reportable.
(c) Excludes unfunded commitments to private third-party equity funds of $242 million and$563 million at December 31, 2005 and 2004, respectively.
(d) Represents asset purchase agreements to the Firm’s administered multi-seller asset-backedcommercial paper conduits, which excludes $32.4 billion and $31.7 billion at December 31,2005 and 2004, respectively, related to conduits that were consolidated in accordance withFIN 46R, as the underlying assets of the conduits are reported in the Firm’s Consolidatedbalance sheets. It also includes $1.3 billion of asset purchase agreements to other third-party entities at December 31, 2005 and $7.5 billion of asset purchase agreements to structured wholesale loan vehicles and other third-party entities at December 31, 2004.
(e) Includes unused commitments to issue standby letters of credit of $37.5 billion and $38.4 billion at December 31, 2005 and 2004, respectively.
(f) Collateral held by the Firm in support of securities lending indemnification agreements was$245.0 billion and $221.6 billion at December 31, 2005 and 2004, respectively.
FIN 45 establishes accounting and disclosure requirements for guarantees,requiring that a guarantor recognize, at the inception of a guarantee, a liabilityin an amount equal to the fair value of the obligation undertaken in issuingthe guarantee. FIN 45 defines a guarantee as a contract that contingentlyrequires the Firm to pay a guaranteed party, based upon: (a) changes in anunderlying asset, liability or equity security of the guaranteed party; or (b) athird party’s failure to perform under a specified agreement. The Firm considersthe following off–balance sheet lending arrangements to be guarantees underFIN 45: certain asset purchase agreements, standby letters of credit and finan-cial guarantees, securities lending indemnifications, certain indemnificationagreements included within third-party contractual arrangements and certainderivative contracts. These guarantees are described in further detail below.
The fair value at inception of the obligation undertaken when issuing theguarantees and commitments that qualify under FIN 45 is typically equal tothe net present value of the future amount of premium receivable under thecontract. The Firm has recorded this amount in Other Liabilities with an offset-ting entry recorded in Other Assets. As cash is received under the contract,it is applied to the premium receivable recorded in Other Assets, and the fair value of the liability recorded at inception is amortized into income asLending & deposit related fees over the life of the guarantee contract. Theamount of the liability related to FIN 45 guarantees recorded at December 31,2005 and 2004, excluding the allowance for credit losses on lending-relatedcommitments and derivative contracts discussed below, was approximately$313 million and $341 million, respectively.
Unfunded commitments to extend credit are agreements to lend only when a customer has complied with predetermined conditions, and they generallyexpire on fixed dates.
The majority of the Firm’s unfunded commitments are not guarantees asdefined in FIN 45, except for certain asset purchase agreements that are prin-cipally used as a mechanism to provide liquidity to SPEs, primarily multi-sellerconduits, as described in Note 14 on pages 111–113 of this Annual Report.Some of these asset purchase agreements can be exercised at any time bythe SPE’s administrator, while others require a triggering event to occur.Triggering events include, but are not limited to, a need for liquidity, a marketvalue decline of the assets or a downgrade in the rating of JPMorgan ChaseBank. These agreements may cause the Firm to purchase an asset from theSPE at an amount above the asset’s fair value, in effect providing a guaranteeof the initial value of the reference asset as of the date of the agreement. Inmost instances, third-party credit enhancements of the SPE mitigate the Firm’spotential losses on these agreements.
Standby letters of credit and financial guarantees are conditional lendingcommitments issued by JPMorgan Chase to guarantee the performance of a customer to a third party under certain arrangements, such as commercialpaper facilities, bond financings, acquisition financings, trade and similartransactions. Approximately 58% of these arrangements mature within three years. The Firm typically has recourse to recover from the customer anyamounts paid under these guarantees; in addition, the Firm may hold cash or other highly liquid collateral to support these guarantees. At December 31,2005 and 2004, the Firm held collateral relating to $9.0 billion and $7.4 billion,respectively, of these arrangements.
JPMorgan Chase & Co. / 2005 Annual Report 125
The Firm holds customers’ securities under custodial arrangements. At times,these securities are loaned to third parties, and the Firm issues securities lendingindemnification agreements to the customer that protect the customer againstthe risk of loss if the third party fails to return the securities. To support theseindemnification agreements, the Firm obtains from the third party cash or otherhighly liquid collateral with a market value exceeding 100% of the value of theloaned securities. If the third-party borrower fails to return the securities, the Firmwould use the collateral to purchase the securities in the market and would beexposed if the value of the collateral fell below 100%. The Firm invests third-party cash collateral received in support of the indemnification agreements. In afew cases where the cash collateral is invested in resale agreements, the Firmindemnifies the third party against reinvestment risk. At December 31, 2005 and2004, the Firm held $245.0 billion and $221.6 billion, respectively, in collateralin support of securities lending indemnification arrangements. Based uponhistorical experience, management expects the risk of loss to be remote.
In connection with issuing securities to investors, the Firm may enter into con-tractual arrangements with third parties that may require the Firm to make apayment to them in the event of a change in tax law or an adverse interpreta-tion of tax law. In certain cases, the contract may also include a terminationclause, which would allow the Firm to settle the contract at its fair value; thus,such a clause would not require the Firm to make a payment under the indemni-fication agreement. Even without the termination clause, management does notexpect such indemnification agreements to have a material adverse effect on theconsolidated financial condition of JPMorgan Chase. The Firm may also enterinto indemnification clauses when it sells a business or assets to a third party,pursuant to which it indemnifies that third party for losses it may incur due toactions taken by the Firm prior to the sale. See below for more informationregarding the Firm’s loan securitization activities. It is difficult to estimate theFirm’s maximum exposure under these indemnification arrangements, sincethis would require an assessment of future changes in tax law and future claimsthat may be made against the Firm that have not yet occurred. However, basedupon historical experience, management expects the risk of loss to be remote.
As part of the Firm’s loan securitization activities, as described in Note 13 onpages 108–111 of this Annual Report, the Firm provides representations andwarranties that certain securitized loans meet specific requirements. The Firmmay be required to repurchase the loans and/or indemnify the purchaser of theloans against losses due to any breaches of such representations or warranties.Generally, the maximum amount of future payments the Firm would berequired to make under such repurchase and/or indemnification provisionswould be equal to the current amount of assets held by such securitization-related SPEs as of December 31, 2005, plus, in certain circumstances, accruedand unpaid interest on such loans and certain expenses. The potential loss dueto such repurchase and/or indemnity is mitigated by the due diligence the Firmperforms before the sale to ensure that the assets comply with the requirementsset forth in the representations and warranties. Historically, losses incurred onsuch repurchases and/or indemnifications have been insignificant, and thereforemanagement expects the risk of material loss to be remote.
The Firm is a partner with one of the leading companies in electronic paymentservices in a joint venture operating under the name of Chase PaymentechSolutions, LLC (the “joint venture”). The joint venture was formed in October2005 as a result of an agreement to integrate the Firm’s jointly-owned ChaseMerchant Services (“CMS”) and Paymentech merchant businesses, the latterof which was acquired as a result of the Merger. The joint venture providesmerchant processing services in the United States and Canada. The joint ventureis liable contingently for processed credit card sales transactions in the event
of a dispute between the cardmember and a merchant. If a dispute isresolved in the cardmember’s favor, the joint venture will credit or refund theamount to the cardmember and charge back the transaction to the merchant.If the joint venture is unable to collect the amount from the merchant, thejoint venture will bear the loss for the amount credited or refunded to thecardmember. The joint venture mitigates this risk by withholding settlement,or by obtaining escrow deposits or letters of credit from certain merchants.However, in the unlikely event that: 1) a merchant ceases operations and isunable to deliver products, services or a refund; 2) the joint venture does nothave sufficient collateral from the merchants to provide customer refunds;and 3) the joint venture does not have sufficient financial resources to providecustomer refunds, the Firm would be liable to refund the cardholder in proportion to its approximate equity interest in the joint venture. For the year ended December 31, 2005, the joint venture, along with the integratedbusinesses of CMS and Paymentech, incurred aggregate credit losses of $11 million on $563 billion of aggregate volume processed, of which theFirm shared liability only on $200 billion of aggregate volume processed.At December 31, 2005, the joint venture held $909 million of collateral.In 2004, the CMS and Paymentech ventures incurred aggregate credit lossesof $7.1 million on $396 billion of aggregate volume processed, of which theFirm shared liability only on $205 billion of aggregate volume processed.At December 31, 2004, the CMS and Paymentech ventures held $620 millionof collateral. The Firm believes that, based upon historical experience and thecollateral held by the joint venture, the fair value of the guarantee would notbe different materially from the credit loss allowance recorded by the jointventure; therefore, the Firm has not recorded any allowance for losses in excess of the allowance recorded by the joint venture.
The Firm is a member of several securities and futures exchanges and clearing-houses both in the United States and overseas. Membership in some of theseorganizations requires the Firm to pay a pro rata share of the losses incurred bythe organization as a result of the default of another member. Such obligationvaries with different organizations. It may be limited to members who dealt withthe defaulting member or to the amount (or a multiple of the amount) of theFirm’s contribution to a members’ guaranty fund, or, in a few cases, it may beunlimited. It is difficult to estimate the Firm’s maximum exposure under thesemembership agreements, since this would require an assessment of future claimsthat may be made against the Firm that have not yet occurred. However, basedupon historical experience, management expects the risk of loss to be remote.
In addition to the contracts described above, there are certain derivative contracts to which the Firm is a counterparty that meet the characteristics ofa guarantee under FIN 45. These derivatives are recorded on the Consolidatedbalance sheets at fair value. These contracts include written put options thatrequire the Firm to purchase assets from the option holder at a specified priceby a specified date in the future, as well as derivatives that effectively guaranteethe return on a counterparty’s reference portfolio of assets. The total notionalvalue of the derivatives that the Firm deems to be guarantees was $62 billionand $53 billion at December 31, 2005 and 2004, respectively. The Firmreduces exposures to these contracts by entering into offsetting transactionsor by entering into contracts that hedge the market risk related to these con-tracts. The fair value related to these contracts was a derivative receivable of$198 million and $180 million, and a derivative payable of $767 million and$622 million at December 31, 2005 and 2004, respectively. Finally, certainwritten put options and credit derivatives permit cash settlement and do not require the option holder or the buyer of credit protection to own the reference asset. The Firm does not consider these contracts to be guaranteesas described in FIN 45.
Notes to consolidated financial statementsJPMorgan Chase & Co.
126 JPMorgan Chase & Co. / 2005 Annual Report
The table below presents both on-balance sheet and off-balance sheet wholesale- and consumer-related credit exposure as of December 31, 2005 and 2004:
2005 2004
Credit On-balance Off-balance Credit On-balance Off-balanceDecember 31, (in billions) exposure(b) sheet(b)(c) sheet(d) exposure(b) sheet(b)(c) sheet(d)
Wholesale-related:Banks and finance companies $ 53.7 $ 20.3 $ 33.4 $ 56.2 $ 25.7 $ 30.5Real estate 32.5 19.0 13.5 28.2 16.7 11.5Consumer products 26.7 10.0 16.7 21.4 7.1 14.3Healthcare 25.5 4.7 20.8 22.0 4.5 17.5State and municipal governments 25.3 6.1 19.2 19.8 4.1 15.7All other wholesale 389.7 169.5 220.2 394.6 174.7 219.9
Total wholesale-related 553.4 229.6 323.8 542.2 232.8 309.4
Consumer-related:Home finance 198.6 133.5 65.1 177.9 124.7 53.2Auto & education finance 54.7 49.0 5.7 67.9 62.7 5.2Consumer & small business and other 20.3 14.8 5.5 25.4 15.1 10.3Credit card receivables(a) 651.0 71.7 579.3 597.0 64.5 532.5
Total consumer-related 924.6 269.0 655.6 868.2 267.0 601.2
Total exposure $ 1,478.0 $ 498.6 $ 979.4 $ 1,410.4 $ 499.8 $ 910.6
(a) Excludes $70.5 billion and $70.8 billion of securitized credit card receivables at December 31, 2005 and 2004, respectively.(b) Includes HFS loans.(c) Represents loans, derivative receivables and interests in purchased receivables.(d) Represents lending-related financial instruments.
Note 28 – Credit risk concentrationsConcentrations of credit risk arise when a number of customers are engaged insimilar business activities or activities in the same geographic region, or when theyhave similar economic features that would cause their ability to meet contractualobligations to be similarly affected by changes in economic conditions.
JPMorgan Chase regularly monitors various segments of the credit risk portfolioto assess potential concentration risks and to obtain collateral when deemednecessary. In the Firm’s wholesale portfolio, risk concentrations are evaluatedprimarily by industry and by geographic region. In the consumer portfolio,concentrations are evaluated primarily by product and by U.S. geographic region.
The Firm does not believe exposure to any one loan product with varyingterms (e.g., interest-only payments for an introductory period) or exposure toloans with high loan-to-value ratios would result in a significant concentration
of credit risk. Terms of loan products and collateral coverage are included inthe Firm’s assessment when extending credit and establishing its allowancefor loan losses.
For further information regarding on–balance sheet credit concentrations by major product and geography, see Note 11 on page 106 of this AnnualReport. For information regarding concentrations of off–balance sheet lending-related financial instruments by major product, see Note 27 on page 124 of this Annual Report. More information about concentrations canbe found in the following tables or discussion in the MD&A:
Wholesale exposure Page 65Wholesale selected industry concentrations Page 66Country exposure Page 70Consumer real estate loan portfolio by geographic location Page 72
Note 29 – Fair value of financial instrumentsThe fair value of a financial instrument is the amount at which the instrumentcould be exchanged in a current transaction between willing parties, otherthan in a forced or liquidation sale.
The accounting for an asset or liability may differ based upon the type ofinstrument and/or its use in a trading or investing strategy. Generally, themeasurement framework in the consolidated financial statements is one ofthe following:
• at fair value on the Consolidated balance sheets, with changes in fair valuerecorded each period in the Consolidated statements of income;
• at fair value on the Consolidated balance sheets, with changes in fair valuerecorded each period in a separate component of Stockholders’ equity andas part of Other comprehensive income;
• at cost (less other-than-temporary impairments), with changes in fair valuenot recorded in the consolidated financial statements but disclosed in thenotes thereto; or
• at the lower of cost or fair value.
The Firm has an established and well-documented process for determiningfair values. Fair value is based upon quoted market prices, where available.If listed prices or quotes are not available, fair value is based upon internally-developed models that primarily use market-based or independent informationas inputs to the valuation model. Valuation adjustments may be necessary toensure that financial instruments are recorded at fair value. These adjustmentsinclude amounts to reflect counterparty credit quality, liquidity and concentration concerns and are based upon defined methodologies that are applied consistently over time.
• Credit valuation adjustments are necessary when the market price (orparameter) is not indicative of the credit quality of the counterparty. As few derivative contracts are listed on an exchange, the majority of derivativepositions are valued using internally developed models that use as theirbasis observable market parameters. Market practice is to quote parametersequivalent to a AA credit rating; thus, all counterparties are assumed tohave the same credit quality. An adjustment is therefore necessary toreflect the credit quality of each derivative counterparty and to arrive atfair value. Without this adjustment, derivative positions would not beappropriately valued.
JPMorgan Chase & Co. / 2005 Annual Report 127
• Liquidity adjustments are necessary when the Firm may not be able toobserve a recent market price for a financial instrument that trades in inactive(or less active) markets. Thus, valuation adjustments for risk of loss due toa lack of liquidity are applied to those positions to arrive at fair value. TheFirm tries to ascertain the amount of uncertainty in the initial valuationbased upon the liquidity or illiquidity, as the case may be, of the market inwhich the instrument trades and makes liquidity adjustments to the financialinstruments. The Firm measures the liquidity adjustment based upon thefollowing factors: (1) the amount of time since the last relevant pricingpoint; (2) whether there was an actual trade or relevant external quote;and (3) the volatility of the principal component of the financial instrument.
• Concentration valuation adjustments are necessary to reflect the cost ofunwinding larger-than-normal market-size risk positions. The cost is deter-mined based upon the size of the adverse market move that is likely tooccur during the extended period required to bring a position down to anonconcentrated level. An estimate of the period needed to reduce, withoutmarket disruption, a position to a nonconcentrated level is generally basedupon the relationship of the position to the average daily trading volume ofthat position. Without these adjustments, larger positions would be valuedat a price greater than the price at which the Firm could exit the positions.
Valuation adjustments are determined based upon established policies and arecontrolled by a price verification group independent of the risk-taking function.Economic substantiation of models, prices, market inputs and revenue throughprice/input testing, as well as backtesting, is done to validate the appropriatenessof the valuation methodology. Any changes to the valuation methodology arereviewed by management to ensure the changes are justified.
The methods described above may produce a fair value calculation that maynot be indicative of net realizable value or reflective of future fair values.Furthermore, the use of different methodologies to determine the fair value of certain financial instruments could result in a different estimate of fairvalue at the reporting date.
Certain financial instruments and all nonfinancial instruments are excludedfrom the scope of SFAS 107. Accordingly, the fair value disclosures requiredby SFAS 107 provide only a partial estimate of the fair value of JPMorganChase. For example, the Firm has developed long-term relationships with itscustomers through its deposit base and credit card accounts, commonlyreferred to as core deposit intangibles and credit card relationships. In theopinion of management, these items, in the aggregate, add significant valueto JPMorgan Chase, but their fair value is not disclosed in this Note.
The following items describe the methodologies and assumptions used, byfinancial instrument, to determine fair value.
Financial assets
Assets for which fair value approximates carrying valueThe Firm considers fair values of certain financial assets carried at cost – includingcash and due from banks, deposits with banks, securities borrowed, short-termreceivables and accrued interest receivable – to approximate their respective car-rying values, due to their short-term nature and generally negligible credit risk.
Assets where fair value differs from costThe Firm’s debt, equity and derivative trading instruments are carried at theirestimated fair value. Quoted market prices, when available, are used to determinethe fair value of trading instruments. If quoted market prices are not available,then fair values are estimated by using pricing models, quoted prices of instru-ments with similar characteristics, or discounted cash flows.
Federal funds sold and securities purchased under resale agreementsFederal funds sold and securities purchased under resale agreements are typically short-term in nature and, as such, for a significant majority of theFirm’s transactions, cost approximates carrying value. This balance sheet itemalso includes structured resale agreements and similar products with long-dated maturities. To estimate the fair value of these instruments, cash flowsare discounted using the appropriate market rates for the applicable maturity.
SecuritiesFair values of actively traded securities are determined by the secondary market, while the fair values for nonactively traded securities are based uponindependent broker quotations.
DerivativesFair value for derivatives is determined based upon the following:
• position valuation, principally based upon liquid market pricing as evidencedby exchange-traded prices, broker-dealer quotations or related input parameters, which assume all counterparties have the same credit rating;
• credit valuation adjustments to the resulting portfolio valuation, to reflectthe credit quality of individual counterparties; and
• other fair value adjustments to take into consideration liquidity, concentrationand other factors.
For those derivatives valued based upon models with significant unobservablemarket parameters, the Firm defers the initial trading profit for these financialinstruments. The deferred profit is recognized in Trading revenue on a systematicbasis (typically straight-line amortization over the life of the instruments) andwhen observable market data becomes available.
The fair value of derivative payables does not incorporate a valuation adjustmentto reflect JPMorgan Chase’s credit quality.
Interests in purchased receivablesThe fair value of variable-rate interests in purchased receivables approximatetheir respective carrying amounts due to their variable interest terms and negligible credit risk. The estimated fair values for fixed-rate interests in purchased receivables are determined using a discounted cash flow analysisusing appropriate market rates for similar instruments.
LoansFair value for loans is determined using methodologies suitable for each typeof loan:
• Fair value for the wholesale loan portfolio is estimated primarily, using thecost of credit derivatives, which is adjusted to account for the differencesin recovery rates between bonds, upon which the cost of credit derivativesis based, and loans.
• Fair values for consumer installment loans (including automobile financings)and consumer real estate, for which market rates for comparable loans are readily available, are based upon discounted cash flows adjusted forprepayments. The discount rates used for consumer installment loans arecurrent rates offered by commercial banks. For consumer real estate,secondary market yields for comparable mortgage-backed securities,adjusted for risk, are used.
• Fair value for credit card receivables is based upon discounted expectedcash flows. The discount rates used for credit card receivables incorporateonly the effects of interest rate changes, since the expected cash flowsalready reflect an adjustment for credit risk.
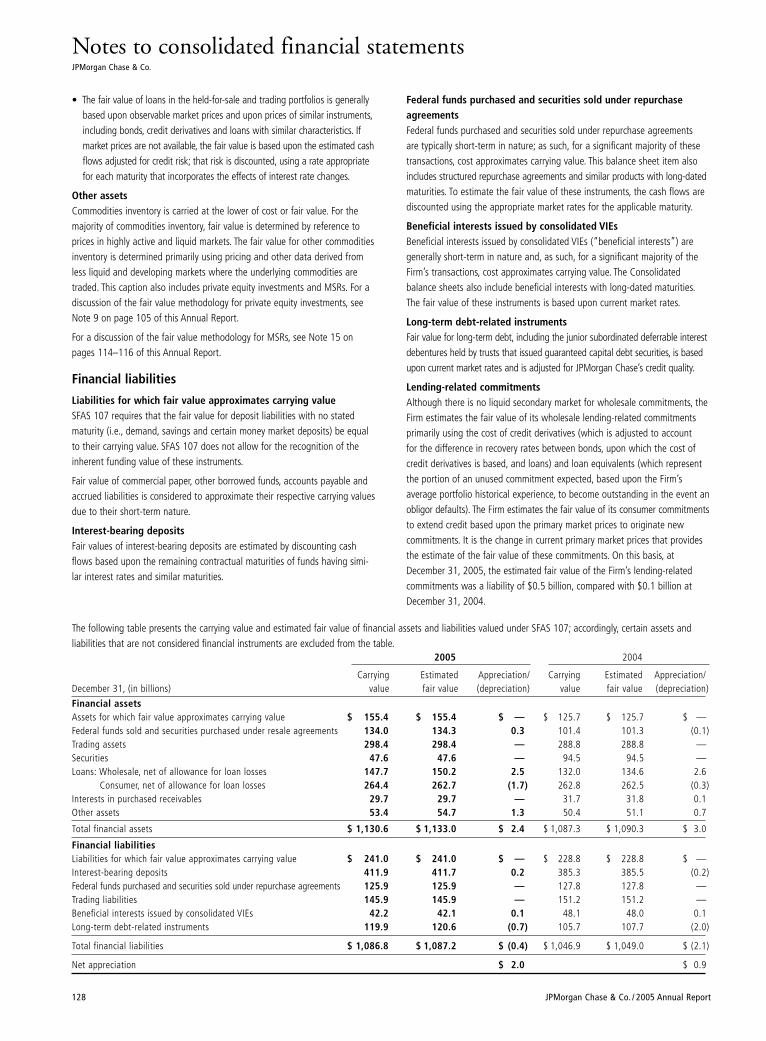
Notes to consolidated financial statementsJPMorgan Chase & Co.
128 JPMorgan Chase & Co. / 2005 Annual Report
• The fair value of loans in the held-for-sale and trading portfolios is generallybased upon observable market prices and upon prices of similar instruments,including bonds, credit derivatives and loans with similar characteristics. Ifmarket prices are not available, the fair value is based upon the estimated cashflows adjusted for credit risk; that risk is discounted, using a rate appropriatefor each maturity that incorporates the effects of interest rate changes.
Other assets Commodities inventory is carried at the lower of cost or fair value. For themajority of commodities inventory, fair value is determined by reference toprices in highly active and liquid markets. The fair value for other commoditiesinventory is determined primarily using pricing and other data derived fromless liquid and developing markets where the underlying commodities aretraded. This caption also includes private equity investments and MSRs. For adiscussion of the fair value methodology for private equity investments, seeNote 9 on page 105 of this Annual Report.
For a discussion of the fair value methodology for MSRs, see Note 15 onpages 114–116 of this Annual Report.
Financial liabilities
Liabilities for which fair value approximates carrying value SFAS 107 requires that the fair value for deposit liabilities with no statedmaturity (i.e., demand, savings and certain money market deposits) be equalto their carrying value. SFAS 107 does not allow for the recognition of theinherent funding value of these instruments.
Fair value of commercial paper, other borrowed funds, accounts payable andaccrued liabilities is considered to approximate their respective carrying valuesdue to their short-term nature.
Interest-bearing depositsFair values of interest-bearing deposits are estimated by discounting cashflows based upon the remaining contractual maturities of funds having simi-lar interest rates and similar maturities.
Federal funds purchased and securities sold under repurchaseagreementsFederal funds purchased and securities sold under repurchase agreements are typically short-term in nature; as such, for a significant majority of thesetransactions, cost approximates carrying value. This balance sheet item alsoincludes structured repurchase agreements and similar products with long-datedmaturities. To estimate the fair value of these instruments, the cash flows arediscounted using the appropriate market rates for the applicable maturity.
Beneficial interests issued by consolidated VIEsBeneficial interests issued by consolidated VIEs (“beneficial interests”) aregenerally short-term in nature and, as such, for a significant majority of theFirm’s transactions, cost approximates carrying value. The Consolidated balance sheets also include beneficial interests with long-dated maturities.The fair value of these instruments is based upon current market rates.
Long-term debt-related instrumentsFair value for long-term debt, including the junior subordinated deferrable interestdebentures held by trusts that issued guaranteed capital debt securities, is basedupon current market rates and is adjusted for JPMorgan Chase’s credit quality.
Lending-related commitmentsAlthough there is no liquid secondary market for wholesale commitments, theFirm estimates the fair value of its wholesale lending-related commitmentsprimarily using the cost of credit derivatives (which is adjusted to account for the difference in recovery rates between bonds, upon which the cost ofcredit derivatives is based, and loans) and loan equivalents (which representthe portion of an unused commitment expected, based upon the Firm’s average portfolio historical experience, to become outstanding in the event anobligor defaults). The Firm estimates the fair value of its consumer commitmentsto extend credit based upon the primary market prices to originate new commitments. It is the change in current primary market prices that providesthe estimate of the fair value of these commitments. On this basis, atDecember 31, 2005, the estimated fair value of the Firm’s lending-relatedcommitments was a liability of $0.5 billion, compared with $0.1 billion atDecember 31, 2004.
The following table presents the carrying value and estimated fair value of financial assets and liabilities valued under SFAS 107; accordingly, certain assets and liabilities that are not considered financial instruments are excluded from the table.
2005 2004
Carrying Estimated Appreciation/ Carrying Estimated Appreciation/December 31, (in billions) value fair value (depreciation) value fair value (depreciation)
Financial assetsAssets for which fair value approximates carrying value $ 155.4 $ 155.4 $ — $ 125.7 $ 125.7 $ —Federal funds sold and securities purchased under resale agreements 134.0 134.3 0.3 101.4 101.3 (0.1)Trading assets 298.4 298.4 — 288.8 288.8 —Securities 47.6 47.6 — 94.5 94.5 —Loans: Wholesale, net of allowance for loan losses 147.7 150.2 2.5 132.0 134.6 2.6
Consumer, net of allowance for loan losses 264.4 262.7 (1.7) 262.8 262.5 (0.3)Interests in purchased receivables 29.7 29.7 — 31.7 31.8 0.1Other assets 53.4 54.7 1.3 50.4 51.1 0.7
Total financial assets $ 1,130.6 $ 1,133.0 $ 2.4 $ 1,087.3 $ 1,090.3 $ 3.0
Financial liabilitiesLiabilities for which fair value approximates carrying value $ 241.0 $ 241.0 $ — $ 228.8 $ 228.8 $ —Interest-bearing deposits 411.9 411.7 0.2 385.3 385.5 (0.2)Federal funds purchased and securities sold under repurchase agreements 125.9 125.9 — 127.8 127.8 —Trading liabilities 145.9 145.9 — 151.2 151.2 —Beneficial interests issued by consolidated VIEs 42.2 42.1 0.1 48.1 48.0 0.1Long-term debt-related instruments 119.9 120.6 (0.7) 105.7 107.7 (2.0)
Total financial liabilities $ 1,086.8 $ 1,087.2 $ (0.4) $ 1,046.9 $ 1,049.0 $ (2.1)
Net appreciation $ 2.0 $ 0.9
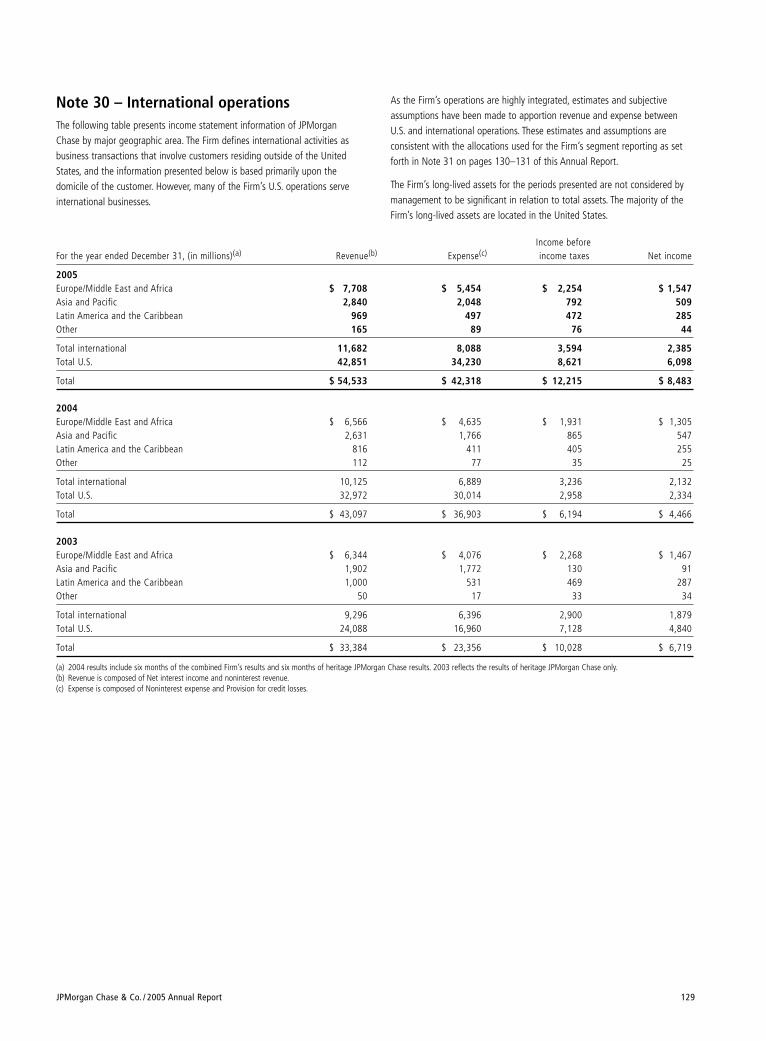
JPMorgan Chase & Co. / 2005 Annual Report 129
Income before For the year ended December 31, (in millions)(a) Revenue(b) Expense(c) income taxes Net income
2005Europe/Middle East and Africa $ 7,708 $ 5,454 $ 2,254 $ 1,547Asia and Pacific 2,840 2,048 792 509Latin America and the Caribbean 969 497 472 285Other 165 89 76 44
Total international 11,682 8,088 3,594 2,385Total U.S. 42,851 34,230 8,621 6,098
Total $ 54,533 $ 42,318 $ 12,215 $ 8,483
2004Europe/Middle East and Africa $ 6,566 $ 4,635 $ 1,931 $ 1,305Asia and Pacific 2,631 1,766 865 547Latin America and the Caribbean 816 411 405 255Other 112 77 35 25
Total international 10,125 6,889 3,236 2,132Total U.S. 32,972 30,014 2,958 2,334
Total $ 43,097 $ 36,903 $ 6,194 $ 4,466
2003Europe/Middle East and Africa $ 6,344 $ 4,076 $ 2,268 $ 1,467Asia and Pacific 1,902 1,772 130 91Latin America and the Caribbean 1,000 531 469 287Other 50 17 33 34
Total international 9,296 6,396 2,900 1,879Total U.S. 24,088 16,960 7,128 4,840
Total $ 33,384 $ 23,356 $ 10,028 $ 6,719
(a) 2004 results include six months of the combined Firm’s results and six months of heritage JPMorgan Chase results. 2003 reflects the results of heritage JPMorgan Chase only.(b) Revenue is composed of Net interest income and noninterest revenue.(c) Expense is composed of Noninterest expense and Provision for credit losses.
Note 30 – International operations The following table presents income statement information of JPMorganChase by major geographic area. The Firm defines international activities asbusiness transactions that involve customers residing outside of the UnitedStates, and the information presented below is based primarily upon thedomicile of the customer. However, many of the Firm’s U.S. operations serveinternational businesses.
As the Firm’s operations are highly integrated, estimates and subjectiveassumptions have been made to apportion revenue and expense betweenU.S. and international operations. These estimates and assumptions are consistent with the allocations used for the Firm’s segment reporting as setforth in Note 31 on pages 130–131 of this Annual Report.
The Firm’s long-lived assets for the periods presented are not considered bymanagement to be significant in relation to total assets. The majority of theFirm’s long-lived assets are located in the United States.
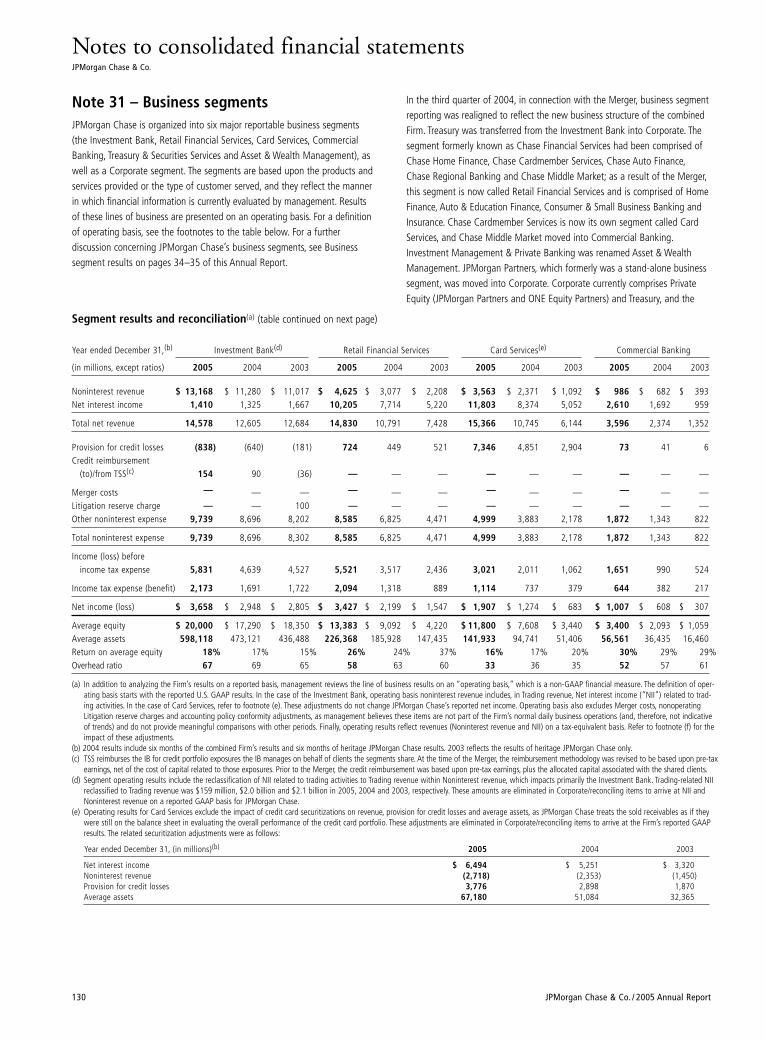
Notes to consolidated financial statementsJPMorgan Chase & Co.
130 JPMorgan Chase & Co. / 2005 Annual Report
Note 31 – Business segments JPMorgan Chase is organized into six major reportable business segments(the Investment Bank, Retail Financial Services, Card Services, CommercialBanking, Treasury & Securities Services and Asset & Wealth Management), aswell as a Corporate segment. The segments are based upon the products andservices provided or the type of customer served, and they reflect the mannerin which financial information is currently evaluated by management. Resultsof these lines of business are presented on an operating basis. For a definitionof operating basis, see the footnotes to the table below. For a further discussion concerning JPMorgan Chase’s business segments, see Businesssegment results on pages 34–35 of this Annual Report.
In the third quarter of 2004, in connection with the Merger, business segmentreporting was realigned to reflect the new business structure of the combinedFirm. Treasury was transferred from the Investment Bank into Corporate. Thesegment formerly known as Chase Financial Services had been comprised ofChase Home Finance, Chase Cardmember Services, Chase Auto Finance,Chase Regional Banking and Chase Middle Market; as a result of the Merger,this segment is now called Retail Financial Services and is comprised of HomeFinance, Auto & Education Finance, Consumer & Small Business Banking andInsurance. Chase Cardmember Services is now its own segment called CardServices, and Chase Middle Market moved into Commercial Banking.Investment Management & Private Banking was renamed Asset & WealthManagement. JPMorgan Partners, which formerly was a stand-alone businesssegment, was moved into Corporate. Corporate currently comprises PrivateEquity (JPMorgan Partners and ONE Equity Partners) and Treasury, and the
Segment results and reconciliation(a) (table continued on next page)
Year ended December 31,(b) Investment Bank(d) Retail Financial Services Card Services(e) Commercial Banking
(in millions, except ratios) 2005 2004 2003 2005 2004 2003 2005 2004 2003 2005 2004 2003
Noninterest revenue $ 13,168 $ 11,280 $ 11,017 $ 4,625 $ 3,077 $ 2,208 $ 3,563 $ 2,371 $ 1,092 $ 986 $ 682 $ 393Net interest income 1,410 1,325 1,667 10,205 7,714 5,220 11,803 8,374 5,052 2,610 1,692 959
Total net revenue 14,578 12,605 12,684 14,830 10,791 7,428 15,366 10,745 6,144 3,596 2,374 1,352
Provision for credit losses (838) (640) (181) 724 449 521 7,346 4,851 2,904 73 41 6Credit reimbursement
(to)/from TSS(c) 154 90 (36) — — — — — — — — —
Merger costs — — — — — — — — — — — —Litigation reserve charge — — 100 — — — — — — — — —Other noninterest expense 9,739 8,696 8,202 8,585 6,825 4,471 4,999 3,883 2,178 1,872 1,343 822
Total noninterest expense 9,739 8,696 8,302 8,585 6,825 4,471 4,999 3,883 2,178 1,872 1,343 822
Income (loss) beforeincome tax expense 5,831 4,639 4,527 5,521 3,517 2,436 3,021 2,011 1,062 1,651 990 524
Income tax expense (benefit) 2,173 1,691 1,722 2,094 1,318 889 1,114 737 379 644 382 217
Net income (loss) $ 3,658 $ 2,948 $ 2,805 $ 3,427 $ 2,199 $ 1,547 $ 1,907 $ 1,274 $ 683 $ 1,007 $ 608 $ 307
Average equity $ 20,000 $ 17,290 $ 18,350 $ 13,383 $ 9,092 $ 4,220 $ 11,800 $ 7,608 $ 3,440 $ 3,400 $ 2,093 $ 1,059Average assets 598,118 473,121 436,488 226,368 185,928 147,435 141,933 94,741 51,406 56,561 36,435 16,460Return on average equity 18% 17% 15% 26% 24% 37% 16% 17% 20% 30% 29% 29%Overhead ratio 67 69 65 58 63 60 33 36 35 52 57 61
(a) In addition to analyzing the Firm’s results on a reported basis, management reviews the line of business results on an “operating basis,” which is a non-GAAP financial measure. The definition of oper-ating basis starts with the reported U.S. GAAP results. In the case of the Investment Bank, operating basis noninterest revenue includes, in Trading revenue, Net interest income (“NII”) related to trad-ing activities. In the case of Card Services, refer to footnote (e). These adjustments do not change JPMorgan Chase’s reported net income. Operating basis also excludes Merger costs, nonoperatingLitigation reserve charges and accounting policy conformity adjustments, as management believes these items are not part of the Firm’s normal daily business operations (and, therefore, not indicativeof trends) and do not provide meaningful comparisons with other periods. Finally, operating results reflect revenues (Noninterest revenue and NII) on a tax-equivalent basis. Refer to footnote (f) for theimpact of these adjustments.
(b) 2004 results include six months of the combined Firm’s results and six months of heritage JPMorgan Chase results. 2003 reflects the results of heritage JPMorgan Chase only.(c) TSS reimburses the IB for credit portfolio exposures the IB manages on behalf of clients the segments share. At the time of the Merger, the reimbursement methodology was revised to be based upon pre-tax
earnings, net of the cost of capital related to those exposures. Prior to the Merger, the credit reimbursement was based upon pre-tax earnings, plus the allocated capital associated with the shared clients.(d) Segment operating results include the reclassification of NII related to trading activities to Trading revenue within Noninterest revenue, which impacts primarily the Investment Bank. Trading-related NII
reclassified to Trading revenue was $159 million, $2.0 billion and $2.1 billion in 2005, 2004 and 2003, respectively. These amounts are eliminated in Corporate/reconciling items to arrive at NII andNoninterest revenue on a reported GAAP basis for JPMorgan Chase.
(e) Operating results for Card Services exclude the impact of credit card securitizations on revenue, provision for credit losses and average assets, as JPMorgan Chase treats the sold receivables as if theywere still on the balance sheet in evaluating the overall performance of the credit card portfolio. These adjustments are eliminated in Corporate/reconciling items to arrive at the Firm’s reported GAAPresults. The related securitization adjustments were as follows:
Year ended December 31, (in millions)(b) 2005 2004 2003
Net interest income $ 6,494 $ 5,251 $ 3,320Noninterest revenue (2,718) (2,353) (1,450)Provision for credit losses 3,776 2,898 1,870Average assets 67,180 51,084 32,365
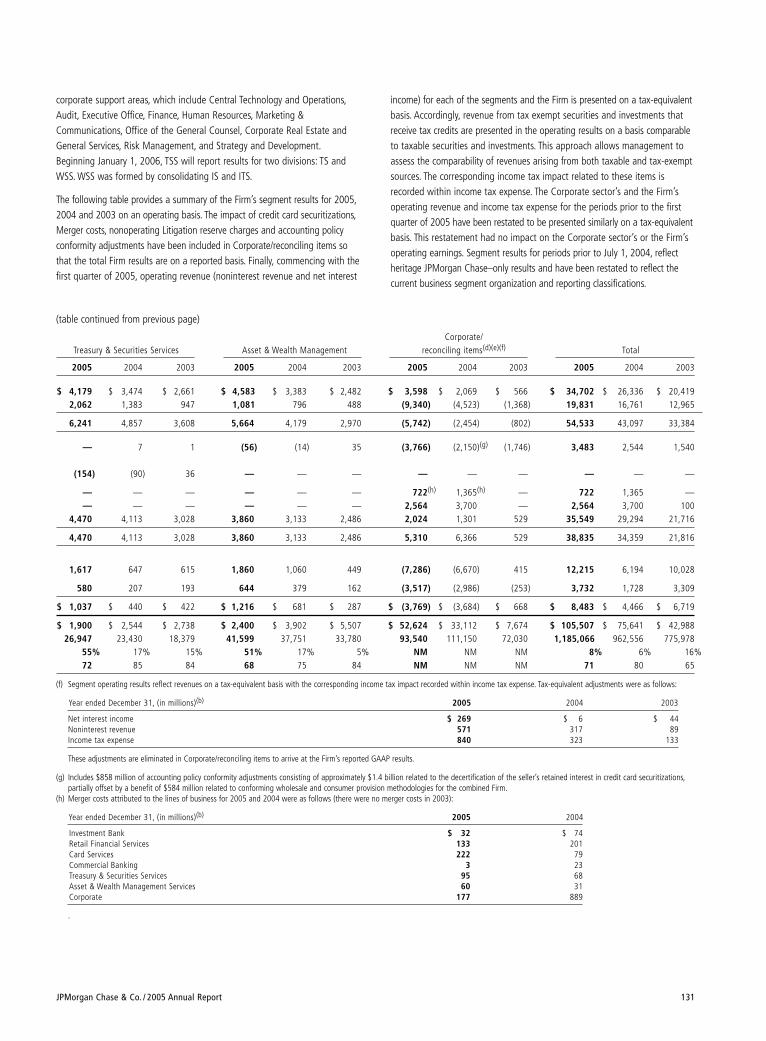
JPMorgan Chase & Co. / 2005 Annual Report 131
(table continued from previous page)
Corporate/Treasury & Securities Services Asset & Wealth Management reconciling items(d)(e)(f) Total
2005 2004 2003 2005 2004 2003 2005 2004 2003 2005 2004 2003
$ 4,179 $ 3,474 $ 2,661 $ 4,583 $ 3,383 $ 2,482 $ 3,598 $ 2,069 $ 566 $ 34,702 $ 26,336 $ 20,4192,062 1,383 947 1,081 796 488 (9,340) (4,523) (1,368) 19,831 16,761 12,965
6,241 4,857 3,608 5,664 4,179 2,970 (5,742) (2,454) (802) 54,533 43,097 33,384
— 7 1 (56) (14) 35 (3,766) (2,150)(g) (1,746) 3,483 2,544 1,540
(154) (90) 36 — — — — — — — — —
— — — — — — 722(h) 1,365(h) — 722 1,365 —— — — — — — 2,564 3,700 — 2,564 3,700 100
4,470 4,113 3,028 3,860 3,133 2,486 2,024 1,301 529 35,549 29,294 21,716
4,470 4,113 3,028 3,860 3,133 2,486 5,310 6,366 529 38,835 34,359 21,816
1,617 647 615 1,860 1,060 449 (7,286) (6,670) 415 12,215 6,194 10,028
580 207 193 644 379 162 (3,517) (2,986) (253) 3,732 1,728 3,309
$ 1,037 $ 440 $ 422 $ 1,216 $ 681 $ 287 $ (3,769) $ (3,684) $ 668 $ 8,483 $ 4,466 $ 6,719
$ 1,900 $ 2,544 $ 2,738 $ 2,400 $ 3,902 $ 5,507 $ 52,624 $ 33,112 $ 7,674 $ 105,507 $ 75,641 $ 42,98826,947 23,430 18,379 41,599 37,751 33,780 93,540 111,150 72,030 1,185,066 962,556 775,978
55% 17% 15% 51% 17% 5% NM NM NM 8% 6% 16%72 85 84 68 75 84 NM NM NM 71 80 65
(f) Segment operating results reflect revenues on a tax-equivalent basis with the corresponding income tax impact recorded within income tax expense. Tax-equivalent adjustments were as follows:
Year ended December 31, (in millions)(b) 2005 2004 2003
Net interest income $ 269 $ 6 $ 44Noninterest revenue 571 317 89Income tax expense 840 323 133
These adjustments are eliminated in Corporate/reconciling items to arrive at the Firm’s reported GAAP results.
(g) Includes $858 million of accounting policy conformity adjustments consisting of approximately $1.4 billion related to the decertification of the seller’s retained interest in credit card securitizations,partially offset by a benefit of $584 million related to conforming wholesale and consumer provision methodologies for the combined Firm.
(h) Merger costs attributed to the lines of business for 2005 and 2004 were as follows (there were no merger costs in 2003):
Year ended December 31, (in millions)(b) 2005 2004
Investment Bank $ 32 $ 74Retail Financial Services 133 201Card Services 222 79Commercial Banking 3 23Treasury & Securities Services 95 68Asset & Wealth Management Services 60 31Corporate 177 889
.
corporate support areas, which include Central Technology and Operations,Audit, Executive Office, Finance, Human Resources, Marketing &Communications, Office of the General Counsel, Corporate Real Estate andGeneral Services, Risk Management, and Strategy and Development.Beginning January 1, 2006, TSS will report results for two divisions: TS andWSS. WSS was formed by consolidating IS and ITS.
The following table provides a summary of the Firm’s segment results for 2005,2004 and 2003 on an operating basis. The impact of credit card securitizations,Merger costs, nonoperating Litigation reserve charges and accounting policyconformity adjustments have been included in Corporate/reconciling items sothat the total Firm results are on a reported basis. Finally, commencing with thefirst quarter of 2005, operating revenue (noninterest revenue and net interest
income) for each of the segments and the Firm is presented on a tax-equivalentbasis. Accordingly, revenue from tax exempt securities and investments thatreceive tax credits are presented in the operating results on a basis comparableto taxable securities and investments. This approach allows management toassess the comparability of revenues arising from both taxable and tax-exemptsources. The corresponding income tax impact related to these items isrecorded within income tax expense. The Corporate sector’s and the Firm’soperating revenue and income tax expense for the periods prior to the firstquarter of 2005 have been restated to be presented similarly on a tax-equivalentbasis. This restatement had no impact on the Corporate sector’s or the Firm’soperating earnings. Segment results for periods prior to July 1, 2004, reflectheritage JPMorgan Chase–only results and have been restated to reflect thecurrent business segment organization and reporting classifications.
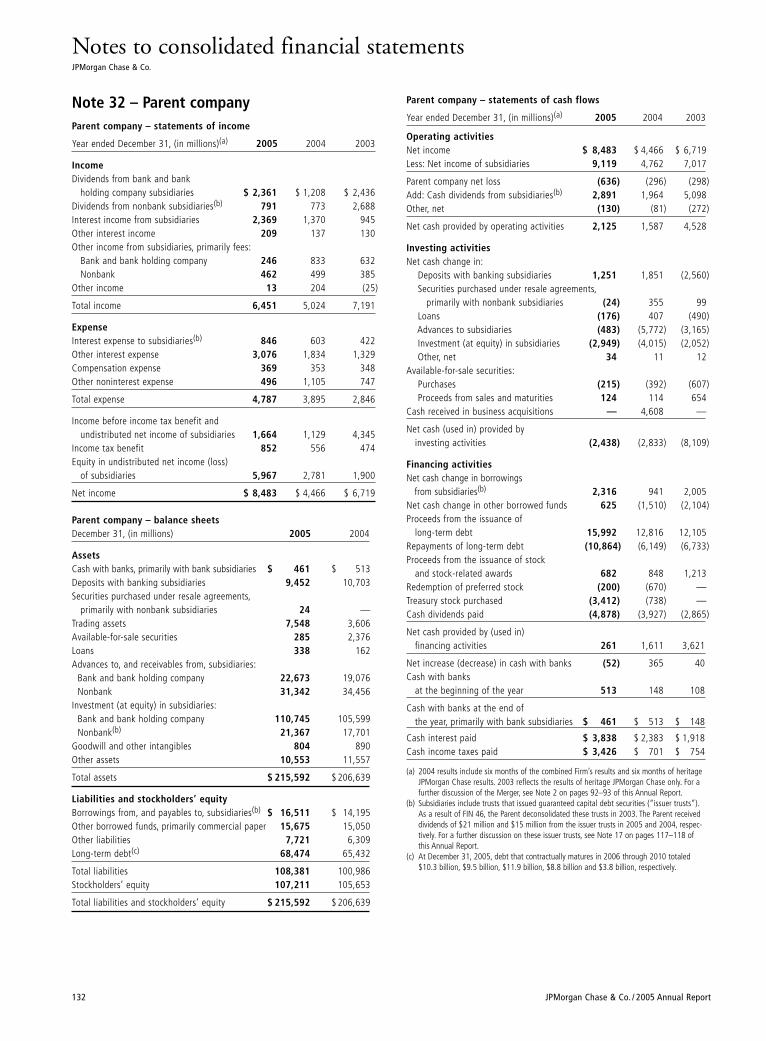
Notes to consolidated financial statementsJPMorgan Chase & Co.
132 JPMorgan Chase & Co. / 2005 Annual Report
Note 32 – Parent companyParent company – statements of income
Year ended December 31, (in millions)(a) 2005 2004 2003
IncomeDividends from bank and bank
holding company subsidiaries $ 2,361 $ 1,208 $ 2,436Dividends from nonbank subsidiaries(b) 791 773 2,688Interest income from subsidiaries 2,369 1,370 945Other interest income 209 137 130Other income from subsidiaries, primarily fees:
Bank and bank holding company 246 833 632Nonbank 462 499 385
Other income 13 204 (25)
Total income 6,451 5,024 7,191
ExpenseInterest expense to subsidiaries(b) 846 603 422Other interest expense 3,076 1,834 1,329Compensation expense 369 353 348Other noninterest expense 496 1,105 747
Total expense 4,787 3,895 2,846
Income before income tax benefit and undistributed net income of subsidiaries 1,664 1,129 4,345
Income tax benefit 852 556 474Equity in undistributed net income (loss)
of subsidiaries 5,967 2,781 1,900
Net income $ 8,483 $ 4,466 $ 6,719
Parent company – balance sheetsDecember 31, (in millions) 2005 2004
AssetsCash with banks, primarily with bank subsidiaries $ 461 $ 513Deposits with banking subsidiaries 9,452 10,703Securities purchased under resale agreements,
primarily with nonbank subsidiaries 24 —Trading assets 7,548 3,606Available-for-sale securities 285 2,376Loans 338 162Advances to, and receivables from, subsidiaries:
Bank and bank holding company 22,673 19,076Nonbank 31,342 34,456
Investment (at equity) in subsidiaries:Bank and bank holding company 110,745 105,599Nonbank(b) 21,367 17,701
Goodwill and other intangibles 804 890Other assets 10,553 11,557
Total assets $ 215,592 $ 206,639
Liabilities and stockholders’ equityBorrowings from, and payables to, subsidiaries(b) $ 16,511 $ 14,195Other borrowed funds, primarily commercial paper 15,675 15,050Other liabilities 7,721 6,309Long-term debt(c) 68,474 65,432
Total liabilities 108,381 100,986Stockholders’ equity 107,211 105,653
Total liabilities and stockholders’ equity $ 215,592 $ 206,639
Parent company – statements of cash flows
Year ended December 31, (in millions)(a) 2005 2004 2003
Operating activitiesNet income $ 8,483 $ 4,466 $ 6,719Less: Net income of subsidiaries 9,119 4,762 7,017
Parent company net loss (636) (296) (298)Add: Cash dividends from subsidiaries(b) 2,891 1,964 5,098Other, net (130) (81) (272)
Net cash provided by operating activities 2,125 1,587 4,528
Investing activitiesNet cash change in:
Deposits with banking subsidiaries 1,251 1,851 (2,560)Securities purchased under resale agreements,
primarily with nonbank subsidiaries (24) 355 99Loans (176) 407 (490)Advances to subsidiaries (483) (5,772) (3,165)Investment (at equity) in subsidiaries (2,949) (4,015) (2,052)Other, net 34 11 12
Available-for-sale securities:Purchases (215) (392) (607)Proceeds from sales and maturities 124 114 654
Cash received in business acquisitions — 4,608 —
Net cash (used in) provided by investing activities (2,438) (2,833) (8,109)
Financing activitiesNet cash change in borrowings
from subsidiaries(b) 2,316 941 2,005Net cash change in other borrowed funds 625 (1,510) (2,104)Proceeds from the issuance of
long-term debt 15,992 12,816 12,105Repayments of long-term debt (10,864) (6,149) (6,733)Proceeds from the issuance of stock
and stock-related awards 682 848 1,213Redemption of preferred stock (200) (670) —Treasury stock purchased (3,412) (738) —Cash dividends paid (4,878) (3,927) (2,865)
Net cash provided by (used in) financing activities 261 1,611 3,621
Net increase (decrease) in cash with banks (52) 365 40Cash with banks
at the beginning of the year 513 148 108
Cash with banks at the end of the year, primarily with bank subsidiaries $ 461 $ 513 $ 148
Cash interest paid $ 3,838 $ 2,383 $ 1,918Cash income taxes paid $ 3,426 $ 701 $ 754
(a) 2004 results include six months of the combined Firm’s results and six months of heritageJPMorgan Chase results. 2003 reflects the results of heritage JPMorgan Chase only. For afurther discussion of the Merger, see Note 2 on pages 92–93 of this Annual Report.
(b) Subsidiaries include trusts that issued guaranteed capital debt securities (“issuer trusts”).As a result of FIN 46, the Parent deconsolidated these trusts in 2003. The Parent receiveddividends of $21 million and $15 million from the issuer trusts in 2005 and 2004, respec-tively. For a further discussion on these issuer trusts, see Note 17 on pages 117–118 of this Annual Report.
(c) At December 31, 2005, debt that contractually matures in 2006 through 2010 totaled$10.3 billion, $9.5 billion, $11.9 billion, $8.8 billion and $3.8 billion, respectively.
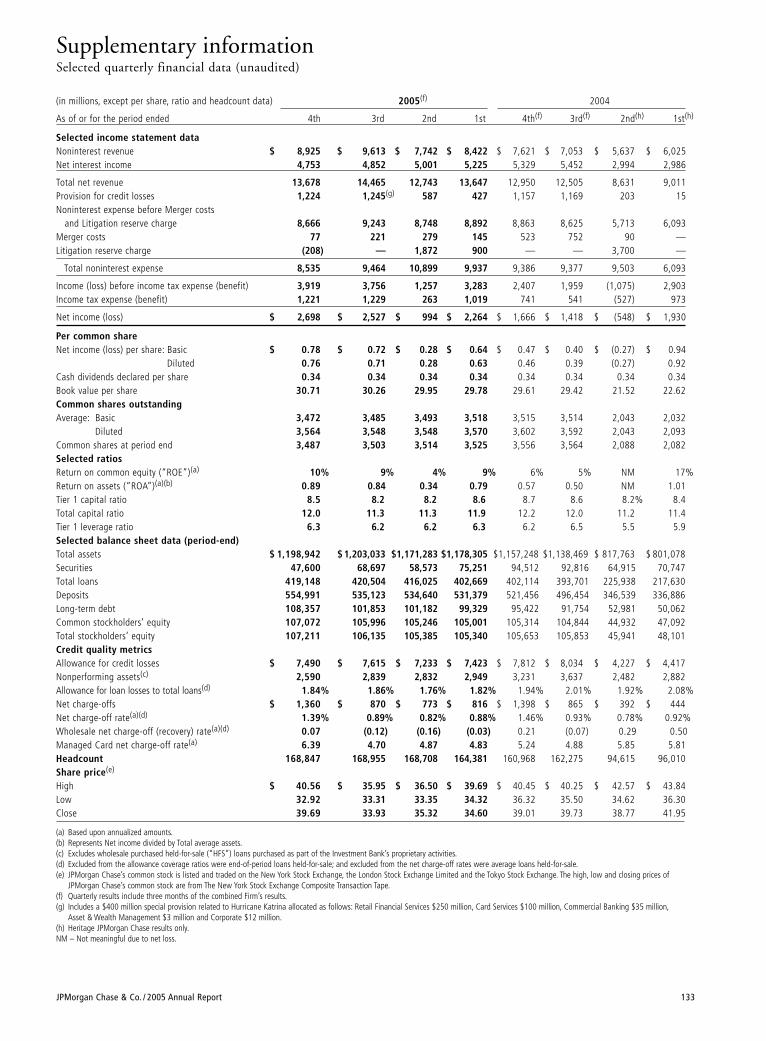
JPMorgan Chase & Co. / 2005 Annual Report 133
Supplementary informationSelected quarterly financial data (unaudited)
(in millions, except per share, ratio and headcount data) 2005(f) 2004
As of or for the period ended 4th 3rd 2nd 1st 4th(f) 3rd(f) 2nd(h) 1st(h)
Selected income statement dataNoninterest revenue $ 8,925 $ 9,613 $ 7,742 $ 8,422 $ 7,621 $ 7,053 $ 5,637 $ 6,025Net interest income 4,753 4,852 5,001 5,225 5,329 5,452 2,994 2,986
Total net revenue 13,678 14,465 12,743 13,647 12,950 12,505 8,631 9,011Provision for credit losses 1,224 1,245(g) 587 427 1,157 1,169 203 15Noninterest expense before Merger costs
and Litigation reserve charge 8,666 9,243 8,748 8,892 8,863 8,625 5,713 6,093Merger costs 77 221 279 145 523 752 90 —Litigation reserve charge (208) — 1,872 900 — — 3,700 —
Total noninterest expense 8,535 9,464 10,899 9,937 9,386 9,377 9,503 6,093
Income (loss) before income tax expense (benefit) 3,919 3,756 1,257 3,283 2,407 1,959 (1,075) 2,903Income tax expense (benefit) 1,221 1,229 263 1,019 741 541 (527) 973
Net income (loss) $ 2,698 $ 2,527 $ 994 $ 2,264 $ 1,666 $ 1,418 $ (548) $ 1,930
Per common shareNet income (loss) per share: Basic $ 0.78 $ 0.72 $ 0.28 $ 0.64 $ 0.47 $ 0.40 $ (0.27) $ 0.94
Diluted 0.76 0.71 0.28 0.63 0.46 0.39 (0.27) 0.92Cash dividends declared per share 0.34 0.34 0.34 0.34 0.34 0.34 0.34 0.34Book value per share 30.71 30.26 29.95 29.78 29.61 29.42 21.52 22.62Common shares outstandingAverage: Basic 3,472 3,485 3,493 3,518 3,515 3,514 2,043 2,032
Diluted 3,564 3,548 3,548 3,570 3,602 3,592 2,043 2,093Common shares at period end 3,487 3,503 3,514 3,525 3,556 3,564 2,088 2,082Selected ratiosReturn on common equity (“ROE”)(a) 10% 9% 4% 9% 6% 5% NM 17%Return on assets (“ROA”)(a)(b) 0.89 0.84 0.34 0.79 0.57 0.50 NM 1.01Tier 1 capital ratio 8.5 8.2 8.2 8.6 8.7 8.6 8.2% 8.4Total capital ratio 12.0 11.3 11.3 11.9 12.2 12.0 11.2 11.4Tier 1 leverage ratio 6.3 6.2 6.2 6.3 6.2 6.5 5.5 5.9Selected balance sheet data (period-end)Total assets $ 1,198,942 $ 1,203,033 $1,171,283 $1,178,305 $1,157,248 $1,138,469 $ 817,763 $ 801,078Securities 47,600 68,697 58,573 75,251 94,512 92,816 64,915 70,747Total loans 419,148 420,504 416,025 402,669 402,114 393,701 225,938 217,630Deposits 554,991 535,123 534,640 531,379 521,456 496,454 346,539 336,886Long-term debt 108,357 101,853 101,182 99,329 95,422 91,754 52,981 50,062Common stockholders’ equity 107,072 105,996 105,246 105,001 105,314 104,844 44,932 47,092Total stockholders’ equity 107,211 106,135 105,385 105,340 105,653 105,853 45,941 48,101Credit quality metricsAllowance for credit losses $ 7,490 $ 7,615 $ 7,233 $ 7,423 $ 7,812 $ 8,034 $ 4,227 $ 4,417Nonperforming assets(c) 2,590 2,839 2,832 2,949 3,231 3,637 2,482 2,882Allowance for loan losses to total loans(d) 1.84% 1.86% 1.76% 1.82% 1.94% 2.01% 1.92% 2.08%Net charge-offs $ 1,360 $ 870 $ 773 $ 816 $ 1,398 $ 865 $ 392 $ 444Net charge-off rate(a)(d) 1.39% 0.89% 0.82% 0.88% 1.46% 0.93% 0.78% 0.92%Wholesale net charge-off (recovery) rate(a)(d) 0.07 (0.12) (0.16) (0.03) 0.21 (0.07) 0.29 0.50Managed Card net charge-off rate(a) 6.39 4.70 4.87 4.83 5.24 4.88 5.85 5.81Headcount 168,847 168,955 168,708 164,381 160,968 162,275 94,615 96,010Share price(e)
High $ 40.56 $ 35.95 $ 36.50 $ 39.69 $ 40.45 $ 40.25 $ 42.57 $ 43.84Low 32.92 33.31 33.35 34.32 36.32 35.50 34.62 36.30Close 39.69 33.93 35.32 34.60 39.01 39.73 38.77 41.95
(a) Based upon annualized amounts.(b) Represents Net income divided by Total average assets.(c) Excludes wholesale purchased held-for-sale (“HFS”) loans purchased as part of the Investment Bank’s proprietary activities.(d) Excluded from the allowance coverage ratios were end-of-period loans held-for-sale; and excluded from the net charge-off rates were average loans held-for-sale.(e) JPMorgan Chase’s common stock is listed and traded on the New York Stock Exchange, the London Stock Exchange Limited and the Tokyo Stock Exchange. The high, low and closing prices of
JPMorgan Chase’s common stock are from The New York Stock Exchange Composite Transaction Tape.(f) Quarterly results include three months of the combined Firm’s results.(g) Includes a $400 million special provision related to Hurricane Katrina allocated as follows: Retail Financial Services $250 million, Card Services $100 million, Commercial Banking $35 million,
Asset & Wealth Management $3 million and Corporate $12 million.(h) Heritage JPMorgan Chase results only.NM – Not meaningful due to net loss.
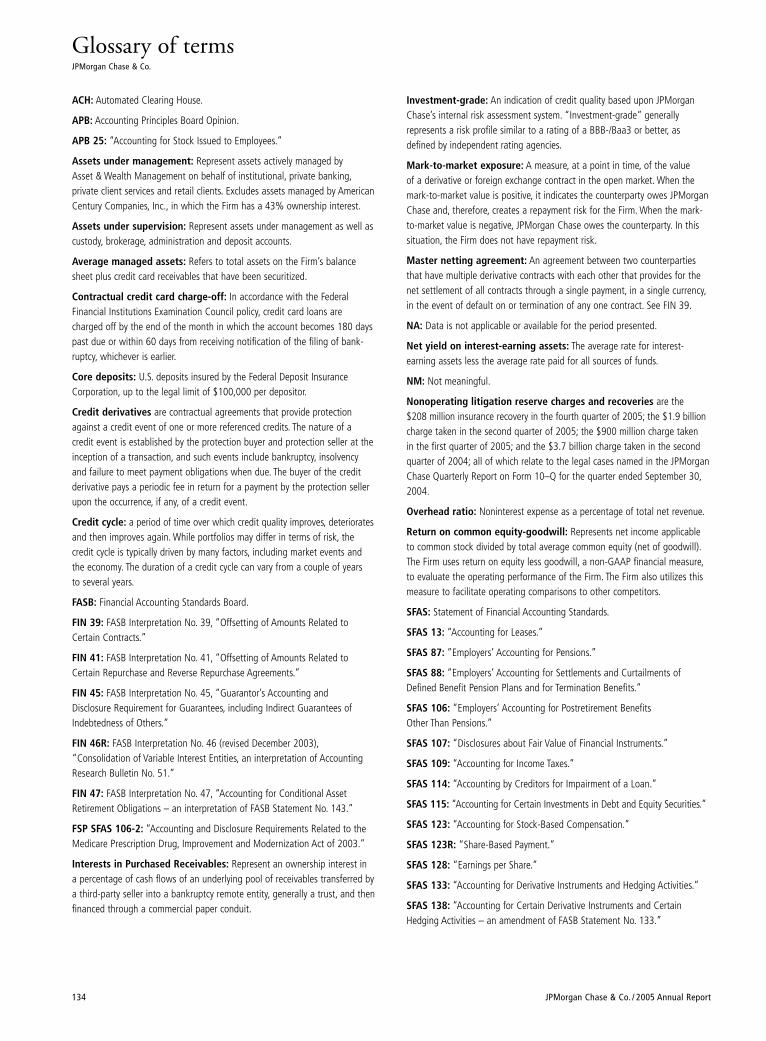
134 JPMorgan Chase & Co. / 2005 Annual Report
Glossary of termsJPMorgan Chase & Co.
ACH: Automated Clearing House.
APB: Accounting Principles Board Opinion.
APB 25: “Accounting for Stock Issued to Employees.”
Assets under management: Represent assets actively managed byAsset & Wealth Management on behalf of institutional, private banking,private client services and retail clients. Excludes assets managed by AmericanCentury Companies, Inc., in which the Firm has a 43% ownership interest.
Assets under supervision: Represent assets under management as well ascustody, brokerage, administration and deposit accounts.
Average managed assets: Refers to total assets on the Firm’s balancesheet plus credit card receivables that have been securitized.
Contractual credit card charge-off: In accordance with the FederalFinancial Institutions Examination Council policy, credit card loans arecharged off by the end of the month in which the account becomes 180 dayspast due or within 60 days from receiving notification of the filing of bank-ruptcy, whichever is earlier.
Core deposits: U.S. deposits insured by the Federal Deposit InsuranceCorporation, up to the legal limit of $100,000 per depositor.
Credit derivatives are contractual agreements that provide protectionagainst a credit event of one or more referenced credits. The nature of a credit event is established by the protection buyer and protection seller at theinception of a transaction, and such events include bankruptcy, insolvencyand failure to meet payment obligations when due. The buyer of the creditderivative pays a periodic fee in return for a payment by the protection sellerupon the occurrence, if any, of a credit event.
Credit cycle: a period of time over which credit quality improves, deterioratesand then improves again. While portfolios may differ in terms of risk, thecredit cycle is typically driven by many factors, including market events andthe economy. The duration of a credit cycle can vary from a couple of years to several years.
FASB: Financial Accounting Standards Board.
FIN 39: FASB Interpretation No. 39, “Offsetting of Amounts Related toCertain Contracts.”
FIN 41: FASB Interpretation No. 41, “Offsetting of Amounts Related toCertain Repurchase and Reverse Repurchase Agreements.”
FIN 45: FASB Interpretation No. 45, “Guarantor’s Accounting and Disclosure Requirement for Guarantees, including Indirect Guarantees ofIndebtedness of Others.”
FIN 46R: FASB Interpretation No. 46 (revised December 2003),“Consolidation of Variable Interest Entities, an interpretation of AccountingResearch Bulletin No. 51.”
FIN 47: FASB Interpretation No. 47, “Accounting for Conditional AssetRetirement Obligations – an interpretation of FASB Statement No. 143.”
FSP SFAS 106-2: “Accounting and Disclosure Requirements Related to theMedicare Prescription Drug, Improvement and Modernization Act of 2003.”
Interests in Purchased Receivables: Represent an ownership interest in a percentage of cash flows of an underlying pool of receivables transferred bya third-party seller into a bankruptcy remote entity, generally a trust, and thenfinanced through a commercial paper conduit.
Investment-grade: An indication of credit quality based upon JPMorganChase’s internal risk assessment system. “Investment-grade” generally represents a risk profile similar to a rating of a BBB-/Baa3 or better, asdefined by independent rating agencies.
Mark-to-market exposure: A measure, at a point in time, of the value of a derivative or foreign exchange contract in the open market. When the mark-to-market value is positive, it indicates the counterparty owes JPMorganChase and, therefore, creates a repayment risk for the Firm. When the mark-to-market value is negative, JPMorgan Chase owes the counterparty. In thissituation, the Firm does not have repayment risk.
Master netting agreement: An agreement between two counterpartiesthat have multiple derivative contracts with each other that provides for thenet settlement of all contracts through a single payment, in a single currency,in the event of default on or termination of any one contract. See FIN 39.
NA: Data is not applicable or available for the period presented.
Net yield on interest-earning assets: The average rate for interest-earning assets less the average rate paid for all sources of funds.
NM: Not meaningful.
Nonoperating litigation reserve charges and recoveries are the $208 million insurance recovery in the fourth quarter of 2005; the $1.9 billioncharge taken in the second quarter of 2005; the $900 million charge taken in the first quarter of 2005; and the $3.7 billion charge taken in the secondquarter of 2004; all of which relate to the legal cases named in the JPMorganChase Quarterly Report on Form 10–Q for the quarter ended September 30,2004.
Overhead ratio: Noninterest expense as a percentage of total net revenue.
Return on common equity-goodwill: Represents net income applicableto common stock divided by total average common equity (net of goodwill).The Firm uses return on equity less goodwill, a non-GAAP financial measure,to evaluate the operating performance of the Firm. The Firm also utilizes thismeasure to facilitate operating comparisons to other competitors.
SFAS: Statement of Financial Accounting Standards.
SFAS 13: “Accounting for Leases.”
SFAS 87: “Employers’ Accounting for Pensions.”
SFAS 88: “Employers’ Accounting for Settlements and Curtailments ofDefined Benefit Pension Plans and for Termination Benefits.”
SFAS 106: “Employers’ Accounting for Postretirement Benefits Other Than Pensions.”
SFAS 107: “Disclosures about Fair Value of Financial Instruments.”
SFAS 109: “Accounting for Income Taxes.”
SFAS 114: “Accounting by Creditors for Impairment of a Loan.”
SFAS 115: “Accounting for Certain Investments in Debt and Equity Securities.”
SFAS 123: “Accounting for Stock-Based Compensation.”
SFAS 123R: “Share-Based Payment.”
SFAS 128: “Earnings per Share.”
SFAS 133: “Accounting for Derivative Instruments and Hedging Activities.”
SFAS 138: “Accounting for Certain Derivative Instruments and CertainHedging Activities – an amendment of FASB Statement No. 133.”
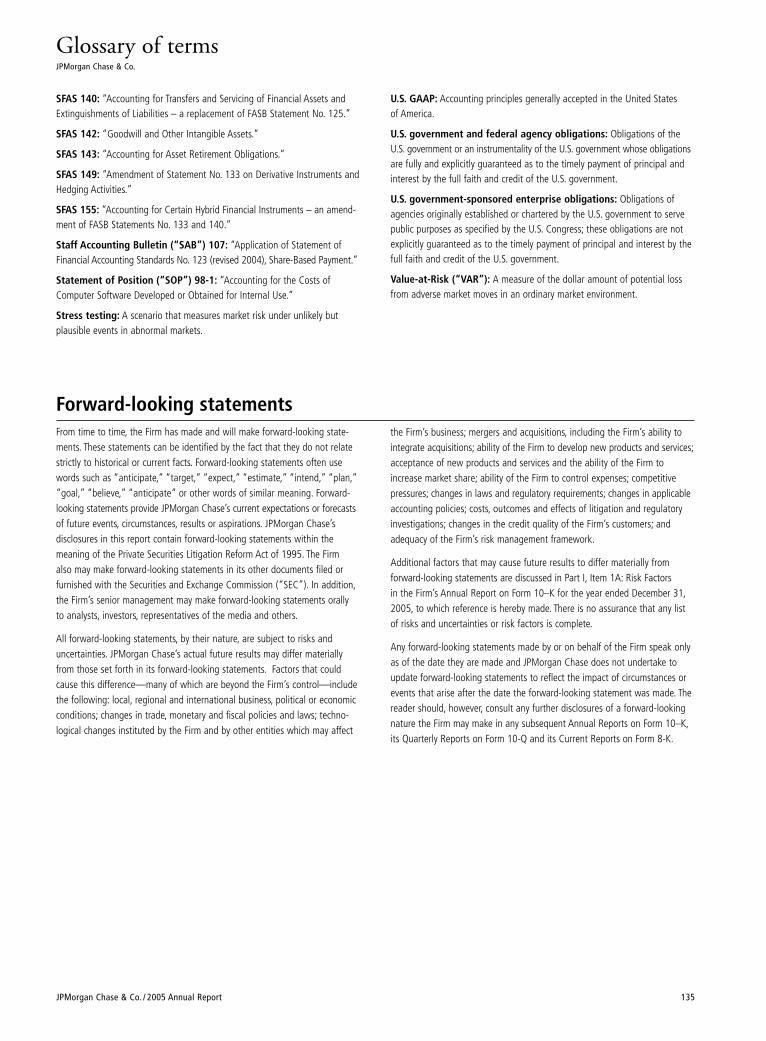
JPMorgan Chase & Co. / 2005 Annual Report 135
Glossary of termsJPMorgan Chase & Co.
SFAS 140: “Accounting for Transfers and Servicing of Financial Assets andExtinguishments of Liabilities – a replacement of FASB Statement No. 125.”
SFAS 142: “Goodwill and Other Intangible Assets.”
SFAS 143: “Accounting for Asset Retirement Obligations.”
SFAS 149: “Amendment of Statement No. 133 on Derivative Instruments andHedging Activities.”
SFAS 155: “Accounting for Certain Hybrid Financial Instruments – an amend-ment of FASB Statements No. 133 and 140.”
Staff Accounting Bulletin (“SAB”) 107: “Application of Statement ofFinancial Accounting Standards No. 123 (revised 2004), Share-Based Payment.”
Statement of Position (“SOP”) 98-1: “Accounting for the Costs ofComputer Software Developed or Obtained for Internal Use.”
Stress testing: A scenario that measures market risk under unlikely butplausible events in abnormal markets.
U.S. GAAP: Accounting principles generally accepted in the United States of America.
U.S. government and federal agency obligations: Obligations of theU.S. government or an instrumentality of the U.S. government whose obligationsare fully and explicitly guaranteed as to the timely payment of principal andinterest by the full faith and credit of the U.S. government.
U.S. government-sponsored enterprise obligations: Obligations ofagencies originally established or chartered by the U.S. government to servepublic purposes as specified by the U.S. Congress; these obligations are notexplicitly guaranteed as to the timely payment of principal and interest by thefull faith and credit of the U.S. government.
Value-at-Risk (“VAR”): A measure of the dollar amount of potential lossfrom adverse market moves in an ordinary market environment.
Forward-looking statementsFrom time to time, the Firm has made and will make forward-looking state-ments. These statements can be identified by the fact that they do not relatestrictly to historical or current facts. Forward-looking statements often usewords such as “anticipate,” “target,” “expect,” “estimate,” “intend,” “plan,”“goal,” “believe,” “anticipate” or other words of similar meaning. Forward-looking statements provide JPMorgan Chase’s current expectations or forecastsof future events, circumstances, results or aspirations. JPMorgan Chase’s disclosures in this report contain forward-looking statements within themeaning of the Private Securities Litigation Reform Act of 1995. The Firm also may make forward-looking statements in its other documents filed orfurnished with the Securities and Exchange Commission (“SEC”). In addition,the Firm’s senior management may make forward-looking statements orally to analysts, investors, representatives of the media and others.
All forward-looking statements, by their nature, are subject to risks anduncertainties. JPMorgan Chase’s actual future results may differ materiallyfrom those set forth in its forward-looking statements. Factors that couldcause this difference—many of which are beyond the Firm’s control—includethe following: local, regional and international business, political or economicconditions; changes in trade, monetary and fiscal policies and laws; techno-logical changes instituted by the Firm and by other entities which may affect
the Firm’s business; mergers and acquisitions, including the Firm’s ability tointegrate acquisitions; ability of the Firm to develop new products and services;acceptance of new products and services and the ability of the Firm toincrease market share; ability of the Firm to control expenses; competitivepressures; changes in laws and regulatory requirements; changes in applicableaccounting policies; costs, outcomes and effects of litigation and regulatoryinvestigations; changes in the credit quality of the Firm’s customers; and adequacy of the Firm’s risk management framework.
Additional factors that may cause future results to differ materially from forward-looking statements are discussed in Part I, Item 1A: Risk Factors in the Firm’s Annual Report on Form 10–K for the year ended December 31,2005, to which reference is hereby made. There is no assurance that any listof risks and uncertainties or risk factors is complete.
Any forward-looking statements made by or on behalf of the Firm speak onlyas of the date they are made and JPMorgan Chase does not undertake toupdate forward-looking statements to reflect the impact of circumstances orevents that arise after the date the forward-looking statement was made. Thereader should, however, consult any further disclosures of a forward-lookingnature the Firm may make in any subsequent Annual Reports on Form 10–K,its Quarterly Reports on Form 10-Q and its Current Reports on Form 8-K.

Ç
Community Advisory Board*
136 JPMorgan Chase & Co. / 2005 Annual Report
Sharon Alexander-HoltCEOThe Urban League of MetropolitanDenver, Inc.Denver, CO
Lauren AndersonExecutive DirectorNeighborhood Housing Services ofNew OrleansNew Orleans, LA
Polly BacaCEO/Executive DirectorLatin American Research andService Agency LARASADenver, CO
Dionne BagsbyRetired CommissionerTarrant CountyFort Worth, TX
Salvador BalcortaExecutive DirectorCentro de Salud Familiar La Fe, Inc.El Paso, TX
Frank BallesterosChief Administrative OfficerPPEP Microbusiness & HousingDevelopment. Corp.Tucson, AZ
Eli BarbosaDirector of NeighborhoodReinvestmentLatin United Community HousingAssociationChicago, IL
Henry BarlowReverend Christ Tabernacle Baptist ChurchChicago, IL
Janie BarreraPresident/CEOACCION TexasSan Antonio, TX
Shaun BellePresident/CEOThe Mt. Hope Housing CompanyBronx, NY
Pascual BlancoExecutive DirectorLa Fuerza Unida Inc.Glen Cove, NY
Sylvia BrooksPresident/CEOHouston Area Urban LeagueHouston, TX
Donnie BrownExecutive DirectorGenesis Housing DevelopmentCorp.Chicago, IL
James BuckleyExecutive DirectorUniversity Neighborhood HousingProgramBronx, NY
Joseph CarbonePresident/CEOThe WorkPlace, Inc.Bridgeport, CT
David ChenExecutive DirectorChinese American Planning CouncilNew York, NY
William ClarkPresident/CEOUrban League of RochesterRochester, NY
Ricardo DiazExecutive DirectorUnited Community CenterMilwaukee, WI
Peter ElkowitzPresidentLong Island Housing PartnershipHauppauge, NY
Ignacio EstebanExecutive DirectorFlorida Community Loan FundOrlando, FL
Ron FafogliaExecutive DirectorTSP Hope, Inc.Springfield, IL
Melissa FlournoyPresident/CEOThe Louisiana Assoc. of NonprofitOrganizations (LANO)Baton Rouge, LA
*Board membership as of January 2006
JPMorgan Chase International Council
Hon. George P. ShultzChairman of the CouncilDistinguished FellowHoover Institution Stanford UniversityStanford, California
Riley P. BechtelChairman and Chief Executive OfficerBechtel Group, Inc.San Francisco, California
Jean-Louis BeffaChairman and Chief Executive OfficerCompagnie de Saint-GobainParis-La Défense, France
Hon. Bill BradleyFormer U.S. SenatorAllen & Company New York, New York
Michael A. ChaneyChairmanNational Australia Bank LimitedPerth, Australia
André DesmaraisPresident and Co-Chief Executive OfficerPower Corporation of CanadaMontreal, Canada
Martin FeldsteinPresident and Chief Executive OfficerNational Bureau of Economic Research, Inc.Cambridge, Massachusetts
Arminio Fraga NetoFounding PartnerGavea Investimentos, Ltd.Rio de Janeiro, Brazil
Xiqing GaoVice ChairmanNational Council for SocialSecurity FundBeijing, The People’s Republic of China
Franz B. HumerChairman and Chief Executive OfficerRoche Holding Ltd.Basel, Switzerland
Abdallah S. Jum’ahPresident and Chief Executive OfficerSaudi Arabian Oil CompanyDhahran, Saudi Arabia
Hon. Henry A. KissingerChairmanKissinger Associates, Inc.New York, New York
Mustafa V. KoçChairman of the Board of DirectorsKoç Holding A.S.Istanbul, Turkey
Hon. Lee Kuan YewMinister MentorRepublic of SingaporeSingapore
Minoru MakiharaSenior Corporate Advisor and Former ChairmanMitsubishi CorporationTokyo, Japan
The Rt. Hon. Brian MulroneySenior PartnerOgilvy RenaultMontreal, Canada
David J. O’ReillyChairman and Chief Executive OfficerChevron CorporationSan Ramon, California
Kai-Uwe RickeChairman of the Board ofManagement Deutsche Telekom AGBonn, Germany
Sir John RoseChief ExecutiveRolls-Royce plcLondon, United Kingdom
Tokyo SexwaleExecutive ChairmanMvelaphanda Holdings LtdJohannesburg, South Africa
Walter V. ShipleyFormer Chairman of the BoardThe Chase Manhattan CorporationNew York, New York
Jess SøderbergPartner and Chief Executive OfficerA.P. Møller-Maersk GroupCopenhagen, Denmark
William S. StavropoulosChairman of the BoardThe Dow Chemical CompanyMidland, Michigan
Ratan Naval TataChairmanTata Sons LimitedMumbai, India
Marco Tronchetti ProveraChairman and Chief Executive Officer Pirelli & C. SpAMilan, Italy
Cees J.A. van LedeFormer Chairman, Board of ManagementAkzo NobelArnhem, The Netherlands
Douglas A. Warner IIIFormer Chairman of the BoardJ.P. Morgan Chase & Co.New York, New York
Ernesto ZedilloDirectorYale Center for the Study of GlobalizationNew Haven, Connecticut
Jaime Augusto Zobel de AyalaPresidentAyala CorporationMakati City, Philippines
Ex-Officio Members
William B. Harrison, Jr.Chairman of the BoardJPMorgan Chase & Co.New York, New York
James Dimon Chief Executive OfficerJPMorgan Chase & Co.New York, New York
Andrew Crockett President JPMorgan Chase InternationalNew York, New York
William M. DaleyChairman of the Midwest RegionJPMorgan Chase & Co.Chicago, Illinois
Walter A. GubertVice Chairman JPMorgan Chase & Co.Chairman JPMorgan Chase EMEALondon, United Kingdom

JPMorgan Chase & Co. / 2005 Annual Report 137
William FreyVice President, DirectorEnterprise Foundation NYC OfficeNew York, NY
Reuben GantExecutive DirectorGreenwood CommunityDevelopment Corp.Tulsa, OK
Reginald GatesPresident/CEODallas Black Chamber of CommerceDallas, TX
Sarah GereckeCEONeighborhood Housing Services of NYCNew York, NY
Christie GillespieExecutive DirectorIndiana Assoc. for CommunityEconomic DevelopmentIndianapolis, IN
Ernest GonzalezCorporate Committee ChairLong Island Hispanic Chamber ofCommerceWest Islip, NY
Dina GonzalezPresidentWest Michigan Hispanic Chamberof CommerceGrand Rapids, MI
Bruce GottschallExecutive DirectorNeighborhood Housing Services of ChicagoChicago, IL
Colvin GrannumPresident/CEOBedford Stuyvesant RestorationCorp.Brooklyn, NY
Meg HallerCEOGary Citywide (CDC)Gary, IN
Don HartmanDeputy DirectorNHS of PhoenixPhoenix, AZ
Roy HastickPresident/CEOCaribbean American Chamber ofCommerce & IndustryBrooklyn, NY
Norman HenryPresidentBuilders of Hope CommunityDevelopment Corp.Dallas, TX
Ralph HollmonPresident/CEOMilwaukee Urban League, Inc.Milwaukee, WI
Kevin JacksonExecutive DirectorChicago Rehab NetworkChicago, IL
Kim JacobsExecutive DirectorWestchester Housing FundHawthorne, NY
Manson JohnsonReverendHolman Street Baptist ChurchHouston, TX
Erma Johnson-HadleyVice Chancellor for Administration Tarrant County College Dist.Fort Worth, TX
Amy KlabenPresident/CEOColumbus Housing Partnership, Inc.Columbus, OH
James KleinExecutive Director Ohio Community DevelopmentFinance FundColumbus, OH
Christopher KuiExecutive DirectorAsian Americans for EqualityNew York, NY
Rhonda Lewis President/CEOBridge Street Development Corp.Brooklyn, NY
William LinderFounderNew Community CorporationNewark, NJ
Fred LucasPresident/CEOFaith Center for CommunityDevelopmentNew York, NY
Norm LyonsCommunity Development Corp.ChairOne Hundred Black Men of GreaterDallasDallas, TX
Richard MansonVice PresidentLISCNew York, NY
Maria MatosExecutive DirectorLatin American Community CenterWilmington, DE
Christie McCravyDirector of HomeownershipProgramsThe Housing Partnership, Inc.Louisville, KY
Luis MirandaChairmanAudubon Partnership for EconomicDevelopmentNew York, NY
Marlon MitchellExecutive DirectorCity of Houston Small BusinessDevelopment Corp.Houston, TX
Andrew J. MooneySenior Program DirectorLocal Initiative Support CorporationChicago, IL
Randy MooreExecutive DirectorCommunity Works in WestVirginia, Inc.Charleston, WV
Gilbert MorenoPresidentAssociation for the Advancementof Mexican AmericansHouston, TX
Vincent MurrayExecutive DirectorBagley Housing Association, Inc.Detroit, MI
Joe MyerExecutive DirectorNCALL ResearchDover, DE
Jeremy NowakPresident/CEOThe Reinvestment FundPhiladelphia, PA
Claudia O'GradyExecutive DirectorMulti-Ethnic Development Corp.Salt Lake City, UT
David PaganExecutive DirectorSouthside United HousingDevelopment Fund Corp.Brooklyn, NY
James PaleyExecutive DirectorNeighborhood Housing Services ofNew HavenNew Haven, CT
John ParvenskyPresidentColorado Coalition for theHomelessDenver, CO
John PritscherPresidentCommunity Investment Corp.Chicago, IL
Kerry QuagliaExecutive DirectorHome Headquarters, Inc.Syracuse, NY
Edwin ReedCFOGreater Allen Cathedral of NY Jamaica, NY
Kathy RicciExecutive DirectorUtah Micro-Enterprise Loan FundSalt Lake City, UT
Gwen RobinsonPresident/CEOHamilton County CommunityAction AgencyCincinnati, OH
Marcos RonquilloLawyerGodwin Gruber, LLPDallas, TX
Clifford RosenthalExecutive DirectorNational Federation of CommunityDevelopment Credit UnionsNew York, NY
Winston RossExecutive DirectorWestchester CommunityOpportunity ProgramElmsford, NY
David ScheckExecutive DirectorNJ Community Capital Corp. Trenton, NJ
Doris SchniderPresidentDelaware Community InvestmentCorp.Wilmington, DE
Shirley StancatoPresident/CEONew Detroit, Inc.Detroit, MI
Thomas StoneExecutive DirectorMt. Pleasant Development NowCleveland, OH
Benjamin Thomas Sr. Pastor Tanner AMEPhoenix, AZ
Valerie ThompsonPresident/CEOUrban League of Greater OklahomaCityOklahoma City, OK
Carlisle ToweryPresidentGreater Jamaica DevelopmentCorp.Jamaica, NY
Margaret TrahanPresident/CEOUnited Way of AcadianaLafayette, LA
Terry TroiaExecutive DirectorProject HospitalityStaten Island, NY
Reginald Tuggle PastorMemorial Presbyterian ChurchRoosevelt, NY
Mark Van BruntExecutive DirectorRaza Development FundPhoenix, AZ
Donna WertenbachPresident/CEOCommunity Economic DevelopmentFundWest Hartford, CT
Lloyd WilliamsPresident/CEOGreater Harlem Chamber ofCommerceNew York, NY
Melinda R. WrightDirectorMomentive Consumer CreditCounseling ServiceIndianapolis, IN
Ravi YalamanchiCEOMetro Housing PartnershipFlint, MI
Diana Yazzie-DevinePresidentNative American ConnectionsPhoenix, AZ
Community Advisory Board* (continued)
*Board membership as of January 2006

138 JPMorgan Chase & Co. / 2005 Annual Report
National Advisory Board
Richard I. BeattieChairmanSimpson Thacher & Bartlett LLP
Leon D. BlackFounding PartnerApollo Management, L.P.
David BondermanFounding PartnerTexas Pacific Group
David A. BrandonChairman and Chief Executive OfficerDomino's Pizza, Inc.
Richard J. BresslerManaging Director and Head of the Strategic Resources GroupThomas H. Lee Partners, LP
Edgar Bronfman, Jr. Chairman and Chief Executive Officer Warner Music Group
Frank A. D’Amelio Executive Vice President and Chief Financial Officer Lucent Technologies
Nancy J. De LisiSenior Vice President of Mergers & Acquisitions Altria Group, Inc.
David F. DeVoeChief Financial OfficerNews Corporation
William T. Dillard IIChairman and Chief Executive Officer Dillard's, Inc.
Paul J. FribourgChairman and Chief Executive OfficerContiGroup Companies, Inc.
Charles E. GoldenExecutive Vice President and Chief Financial OfficerEli Lilly and Company
John B. HessChairman of the Board and Chief Executive Officer Amerada Hess Corporation
Glenn H. HutchinsFounding PartnerSilver Lake Partners
Thomas H. LeeChairman and Chief Executive Officer Thomas H. Lee Capital LLC
David C. McCourtChairman and Chief Executive OfficerGranahan McCourt Capital
Darla D. MooreExecutive Vice PresidentRainwater, Inc.
Patrick J. MooreChairman, President andChief Executive OfficerSmurfit-Stone ContainerCorporation
Michael G. MorrisChairman, President and Chief Executive OfficerAmerican Electric Power
Lewis RanieriChairman and Chief Executive OfficerRanieri & Company
Joseph L. Rice IIIChairman Clayton, Dubilier & Rice, Inc.
David M. RubensteinManaging Director The Carlyle Group
Stephen A. Schwarzman Chairman, Chief Executive Officerand Co-Founder The Blackstone Group
David L. ShedlarzExecutive Vice President and Chief Financial OfficerPfizer Inc.
Henry R. SilvermanChairman and Chief Executive Officer Cendant Corporation
Barry S. Sternlicht Chairman and Chief Executive Officer Starwood Capital Group
Doreen A. Toben Executive Vice President andChief Financial Officer Verizon Communications
Samuel ZellChairman of the Board Equity Group Investments, L.L.C.
Mortimer B. ZuckermanChairman Boston Properties, Inc.
James B. Lee, Jr. Chairman National Advisory Board
Philip C. AckermanChairman, President and Chief Executive OfficerNational Fuel Gas Company
Richard A. BernsteinChairman and Chief Executive OfficerR.A.B. Holdings, Inc.
Robert B. CatellChairman and Chief Executive OfficerKeySpan Energy Corporation
Christopher B. CombeChairman and PresidentCombe Incorporated
Eugene R. CorasantiChairman and Chief Executive OfficerCONMED Corporation
Emil DudaSenior Executive Vice President andChief Financial OfficerLifetime Healthcare Company/Excellus Health Plan Inc.
James N. FernandezExecutive Vice President andChief Financial OfficerTiffany & Company
Charles F. FortgangChairmanM. Fabrikant & Sons, Inc.
Gladys GeorgePresident and Chief Executive OfficerLenox Hill Hospital
Lewis GolubChairman of the BoardThe Golub Corporation
Wallace A. GrahamChairman of the Board and Chief Executive OfficerSchenectady International, Inc.
Peter J. KalletChairman, President and Chief Executive OfficerOneida Ltd.
Charles A. KrasnePresident and Chief Executive OfficerKrasdale Foods, Inc.
Richard W. KunesExecutive Vice Presidentand Chief Financial OfficerEstee Lauder Companies, Inc.
Richard S. LeFrakPresidentLeFrak Organization, Inc.
Leo LiebowitzChief Executive OfficerGetty Realty Corp.
William L. MackCo-Founder and Managing PartnerApollo Real Estate Advisors L.P.
Peter MarksonChairmanParis Accessories, Inc.
Herman I. MerinoffChairman of the BoardThe Charmer Sunbelt Group
John MorphyChief Financial Officer,Secretary and TreasurerPaychex, Inc.
Michael C. NahlSenior Vice President and Chief Financial OfficerAlbany International Corp.
James L. NederlanderPresident Nederlander Producing Company of America, Inc.
Samuel I. Newhouse IIIGeneral ManagerAdvance Publications Inc.
William C. RudinPresidentRudin Management Company, Inc.
Joel SeligmanPresidentUniversity of Rochester
John ShalamChairman and Chief Executive OfficerAudiovox Corporation
Arthur T. ShorinChairman and Chief Executive OfficerThe Topps Company, Inc.
Marie ToulantisChief Executive OfficerBarnes & Noble, Inc.
Kenneth L. WallachChairman, President and Chief Executive OfficerCentral National-Gottesman Inc.
Fred WilponChairmanSterling Equities, Inc.
Regional Advisory Board*
*Board membership as of January 2006
JPMorgan Chase & Co. / 2005 Annual Report 139
Corporate Governance
Governance is a continuing focus at JPMorgan Chase, starting with the boardof directors and continuing throughout the Firm. There are three pillars ofgood governance:• An independent board, accountable to shareholders• Strong internal governance• Alignment with shareholders
Board governanceJPMorgan Chase’s board is experienced, independent and accountable toshareholders. The board’s structure and practices include the following, andmore information on board governance can be found on the Firm’s website(www.jpmorganchase.com):
• effective size: The board’s preference is to maintain a smaller size for effi-ciency and to encourage active dialogue. As retirements occur, the boardwill actively seek to increase diversity among its membership.
• a super-majority of non-management directors: There are only two full-time management members on the board, Bill Harrison and Jamie Dimon.During 2005, Bob Lipp became a part-time member of management toshare his special skills in developing talent within the firm. All other mem-bers of the board are non-management directors that the board hasdetermined to be independent.
• director independence:independent directors – Each of the non-management directors ofJPMorgan Chase was determined by the board to be independent inaccordance with board standards that consider past and current employ-ment relationships; any business relationships with or charitable contribu-tions to entities at which a director serves as an officer; and personalbanking and other financial relationships, which must be on an arm’s-length basis.
executive sessions of directors – In 2005, the board adopted the practiceof meeting without management at each regularly scheduled board meeting.
access to outside resources – Although the main responsibility for provid-ing assistance to the board rests with management, the board and boardcommittees can engage outside expert advice from sources independentof management at the expense of the Firm.
• director accountability:majority voting for directors – In 2005 the board adopted a policy provid-ing that in uncontested elections, any director nominee who receives morewithheld than for votes will tender his or her resignation. Absent a com-pelling reason, the board will accept the resignation.
• director compensation: The board believes it is desirable that a significantportion of overall director compensation be linked to JPMorgan Chasestock, and the board’s total compensation includes approximately one-third cash and two-thirds stock-based compensation in the form of shareequivalents that must be held until a director’s termination of service.
Internal governanceWhile governance begins with the board of directors, managing the enter-prise requires effective governance structures and practices throughout theorganization. The firm as a whole manages by line of business, supported byglobal policies and standards that typically apply to all relevant units regard-less of geography or legal structure. The strength of these global controlprocesses is the foundation of regional and individual subsidiary governance.Three examples of the Firm’s global processes and standards are its risk man-agement structure, policy review process and codes of conduct.
Defined risk governance is a principle of risk management at JPMorganChase. The board of directors exercises oversight of risk management throughthe board as a whole and through the board’s Audit and Risk Policy commit-tees. The charters of these and other board committees are available at theFirm’s website. The board delegates the formulation of policy and day-to-dayrisk oversight to management. The Firm’s risk governance structure is builtupon the premise that each line of business is responsible for managing therisks inherent in its business activity, including liquidity risk, credit risk, marketrisk, interest rate risk, operational risk, legal and reputation risk, fiduciary riskand private equity risk. Each line of business has a risk committee responsiblefor decisions relating to risk strategy, policies and control. Where appropriate,risk committees escalate risk issues to the Firm’s Operating Committee, com-prised of senior officers of the Firm, or to the Risk Working Group, a sub-group of the Operating Committee. Overlaying risk management within thelines of business are three corporate functions: Treasury, Risk Managementand Office of the General Counsel. Treasury is responsible for managing theinterest rate and liquidity profile of the Firm. Risk Management provides anindependent firmwide function of control and management of risk. The Officeof the General Counsel has oversight of legal, reputation and fiduciary risk. Adiscussion of risk management begins at page 60 of this Annual Report.
The policy review process is based on the recognition that a firm’s successrequires maintenance of a reputation for business practices of the highestquality. The Firm has a specific structure to address transactions with clientsthat have the potential to adversely affect the Firm’s reputation. Primaryresponsibility for adherence to the policies and procedures designed toaddress reputation risk lies with business units, which are also required tosubmit to regional Reputation Risk Committees proposed transactions thatmay heighten reputation risk. The committees may approve, reject or requirefurther clarification on or changes to the transaction, or they may escalate thereview to the most senior level of review, the Policy Review Office. The objec-tive of the policy review process is to reinforce a culture that ensures that allemployees understand the basic principles of reputation risk control and canrecognize and address issues as they arise. For a further description of thepolicy review process, see the discussion of reputation and fiduciary risk start-ing at page 80 of this Annual Report.
The Firm has two codes of conduct, one applying to all employees and a sup-plementary code that applies to senior executive and senior financial officers.The Code of Conduct is applicable to all employees and the Firm requires eachemployee to certify annually his or her compliance with the Code. The Firmalso has a Code of Ethics for Finance Professionals to underscore the impor-tance of ethical conduct and compliance with law, particularly as it relates tothe maintenance of the Firm's financial books and records and the preparationof its financial statements. Both codes are available at the Firm’s website.
Alignment with shareholders Good corporate governance requires that compensation policies align withshareholder interests. JPMorgan Chase’s compensation policy for executiveofficers emphasizes performance-based, variable compensation over fixedsalary and uses equity-based awards to align the interests of executive offi-cers with shareholders. Members of the Firm’s Operating Committee arerequired to retain 75% of the net shares received from equity-based awards,after deduction for taxes and exercise costs.

140 JPMorgan Chase & Co. / 2005 Annual Report
Board of Directors
Hans W. Becherer 1,4
Retired Chairman and Chief Executive Officer Deere & Company(Equipment manufacturer)
John H. Biggs 1,3
Former Chairman and Chief Executive OfficerTeachers Insurance and Annuity Association-College RetirementEquities Fund (TIAA-CREF) (Pension fund)
Lawrence A. Bossidy 4,5
Retired Chairman Honeywell International Inc. (Technology and manufacturing)
Stephen B. Burke 2,3
PresidentComcast CableCommunications, Inc.(Cable television)
James S. Crown 4,5
PresidentHenry Crown and Company (Diversified investments)
James Dimon Chief Executive OfficerJPMorgan Chase & Co.
Ellen V. Futter 4,5
President and TrusteeAmerican Museum of Natural History (Museum)
William H. Gray, III 2,4
Senior Advisor, Public Policy& Business DiversityBuchanan Ingersoll PC(Law firm)
William B. Harrison, Jr.Chairman of the BoardJPMorgan Chase & Co.
Laban P. Jackson, Jr. 1,3
Chairman and Chief Executive OfficerClear Creek Properties, Inc.(Real estate development)
John W. Kessler 2,4
OwnerJohn W. Kessler Company and ChairmanThe New Albany Company(Real estate development)
Robert I. Lipp 4,5
Senior AdvisorJPMorgan Chase & Co.
Richard A. Manoogian 1,4
Chairman and Chief Executive OfficerMasco Corporation(Diversified manufacturer)
David C. Novak 2,3
Chairman and Chief Executive OfficerYum! Brands, Inc.(Franchised restaurants)
Lee R. Raymond 2,3
Retired Chairman and Chief Executive OfficerExxon Mobil Corporation (Oil and gas)
William C. Weldon 2,3
Chairman and Chief Executive Officer Johnson & Johnson(Health care products)
Anthony J. HoranSecretary
Mark I. KleinmanTreasury
Joseph L. SclafaniController
James Dimon*Chief Executive Officer
Austin A. Adams*Technology & Operations
Paul BatemanAsset Management
Frank J. Bisignano*Chief Administrative Officer
Steven D. Black*Investment Bank
Philip F. BleserCommercial Banking
John F. Bradley*Human Resources
Douglas L. Braunstein Investment Bank
Richard M. Cashin One Equity Partners
Michael J. Cavanagh*Finance
Michael K. ClarkInstitutional Trust & Investor Services
Andrew CrockettJPMorgan Chase International
William M. DaleyMidwest Region
Klaus DiederichsInvestment Bank
Ina R. Drew*Chief Investment Officer
Patrik L. EdsparrInvestment Bank
Mary E. ErdoesPrivate Bank
Martha J. GalloAudit
Walter A. GubertEurope, Middle East and Africa
Joan Guggenheimer*Legal & Compliance
Carlos M. HernandezInvestment Bank
Lorraine E. HricikTreasury Services
Rick LazioGovernment Affairs & Public Policy
James B. Lee, Jr.Investment Bank
Steve MacLellanPrivate Client Services
Samuel Todd Maclin*Commercial Banking
Jay Mandelbaum*Strategy
Donald H. McCree, IIIInvestment Bank
William H. McDavid*Legal & Compliance
Heidi Miller*Treasury & Securities Services
R. Ralph ParksAsia Pacific
Scott PowellHome Finance
David W. PuthInvestment Bank
Charles W. Scharf*Retail Financial Services
Richard J. Srednicki*Card Services
James E. Staley*Asset & Wealth Management
Don M. Wilson III*Risk Management
Thomas L. WindHome Finance
William T. Winters*Investment Bank
Executive Committee
Other corporate officers
(*denotes member of Operating Committee)
Member of:
1. Audit Committee2. Compensation & Management
Development Committee3. Corporate Governance &
Nominating Committee4. Public Responsibility Committee5. Risk Policy Committee
JPMorgan Chase & Co. (NYSE: JPM) is a leading global financial services firm with assets of $1.2 trillionand operations in more than 50 countries. The firm is a leader in investment banking, financial services for consumers, small business and commercial banking, financial transaction processing, asset and wealthmanagement, and private equity. A component of the Dow Jones Industrial Average, JPMorgan Chaseserves millions of consumers in the United States and many of the world’s most prominent corporate,institutional and government clients under its JPMorgan and Chase brands.
JPMorgan has one of the largest client franchises in the world. Our clients include corporations,institutional investors, hedge funds, governments and affluent individuals in more than 100 countries.
The following businesses use the JPMorgan brand:Investment Bank Asset Management Treasury Services Private BankWorldwide Securities Services Private Client Services
Information about JPMorgan capabilities can be found on jpmorgan.com.
Chase is a leading U.S. financial services brand serving consumers, small businesses, corporations and governments with a full range of banking and asset management products in local markets and throughnational distribution.
The consumer businesses include:Consumer Banking Home FinanceCredit Card Auto FinanceSmall Business Education Finance
The commercial banking businesses include:Middle Market Business CreditMid-Corporate Equipment LeasingReal Estate
Information about Chase capabilities can be found on chase.com.
JPMorgan Chase is the brand used to express JPMorgan Chase & Co., the holding company, and is also used by our Treasury Services business and our Community Development Group.
Information about the firm is available at www.jpmorganchase.com.
JPMorgan Chase & Co.
Corporate headquarters270 Park AvenueNew York, New York 10017-2070Telephone: 212-270-6000http://www.jpmorganchase.com
Principal subsidiariesJPMorgan Chase Bank,
National AssociationChase Bank USA,
National AssociationJ.P. Morgan Securities Inc.
Annual report on Form 10-KThe Annual Report on Form 10-K of JPMorgan Chase & Co. as filed with theSecurities and Exchange Commission will be made available upon request to:
Office of the SecretaryJPMorgan Chase & Co.270 Park AvenueNew York, New York 10017-2070
Stock listingNew York Stock Exchange, Inc.London Stock Exchange LimitedTokyo Stock Exchange
The New York Stock Exchange (NYSE)ticker symbols for stock of JPMorgan Chase & Co. are as follows:
JPM (Common Stock)JPMPRH (Depositary Shares Each
Representing a One-Tenth Interest in 6 5/8% Cumulative Preferred Stock)
Certifications by the Chairman, ChiefExecutive Officer and Chief Financial Officerof JPMorgan Chase & Co. pursuant to Section302 of the Sarbanes-Oxley Act of 2002, havebeen filed as exhibits to the Firm's 2005Annual Report on Form 10-K.
The NYSE requires that the Chief ExecutiveOfficer of a listed company certify annuallythat he or she was not aware of any violationby the company of the NYSE's CorporateGovernance listing standards. Such certificationwas made on June 14, 2005.
Financial information about JPMorgan Chase& Co. can be accessed by visiting the InvestorRelations site of www.jpmorganchase.com.Additional questions should be addressed to:
Investor RelationsJPMorgan Chase & Co.270 Park AvenueNew York, New York 10017-2070Telephone: 212-270-6000
Direct deposit of dividendsFor information about direct deposit of dividends, please contact Mellon InvestorServices LLC.
Stockholder inquiriesContact Mellon Investor Services LLC:
By telephone:
Within the United States, Canada and Puerto Rico: 1-800-758-4651 (toll free)
From all other locations:1-201-680-6578 (collect)
TDD service for the hearing impaired within the United States, Canada and Puerto Rico: 1-800-231-5469 (toll free)
All other locations:1-201-680-6578 (collect)
By mail:
Mellon Investor Services LLC480 Washington Blvd.Jersey City, New Jersey 07310-1900
Duplicate mailingsIf you receive duplicate mailings because you have more than one account listing and you wish to consolidate your accounts, please write to Mellon Investor Services LLC at the address above.
Independent registered publicaccounting firmPricewaterhouseCoopers LLP300 Madison AvenueNew York, New York 10017
DirectorsTo contact any of the Board members pleasemail correspondence to:
JPMorgan Chase & Co.Attention (Board member)Office of the Secretary270 Park AvenueNew York, New York 10017-2070
The corporate governance principles of the board, the charters of the principal board committees and other governanceinformation can be accessed by visitingwww.jpmorganchase.com and clicking on“Governance.”Stockholders may request a copy of such materials by writing to theOffice of the Secretary at the above address.
Transfer agent and registrarMellon Investor Services LLC480 Washington Blvd.Jersey City, New Jersey 07310-1900Telephone: 1-800-758-4651https://vault.melloninvestor.com/isd
Investor Services Program JPMorgan Chase & Co.’s Investor ServicesProgram offers a variety of convenient, low-cost services to make it easier to reinvest dividends and buy and sell shares ofJPMorgan Chase & Co. common stock. Abrochure and enrollment materials may beobtained by contacting the ProgramAdministrator, Mellon Investor Services LLC,by calling 1-800-758-4651, by writing themat the address indicated above or by visitingtheir Web site at www.melloninvestor.com.
This annual report is printed on paper made from well-managed forests and other controlled sources withthe financial section printed on paper containing 20%post-consumer waste (PCW) recycled fibers. The paper is independently certified by SmartWood, a program of the Rainforest Alliance, to the Forest Stewardship Council(FSC) standards.
FSC is an independent nonprofit organization devoted toencouraging the responsible management of the world’sforests. FSC sets high standards to ensure forestry is practiced in an environmentally responsible, socially beneficial and economically viable way.
©2006 JPMorgan Chase & Co. All rights reserved.Printed in the U.S.A.
20%
Cert no. SW -COC-1576

JPMORGAN CHASE & CO.
Annual Report 2005
JPMorgan Chase & Co.www.jpmorganchase.com
JPM
org
an
Ch
ase
&C
o.
20
05
An
nu
al
Re
po
rt