Embed Size (px)
Citation preview
Annual Report – 2005-06.qxd 6/20/08 2:01 PM Page 1
ALABAMA DEPARTMENT OF EDUCATIONJOSEPH B. MORTON, STATE SUPERINTENDENT OF EDUCATION APRIL 2008
No person shall be denied employment, be excluded from participation in, be denied the benefits of, or be subjected to discrimination in any program or activityon the basis of disability, sex, race, religion, national origin, color, or age. Ref: Sec. 1983, Civil Rights Act, 42 U.S.C.; Title VI and VII, Civil Rights Act of 1964;Rehabilitation Act of 1973, Sec. 504; Age Discrimination in Employment Act; Equal Pay Act of 1963; Title IX of the Education Amendment of 1972: Title IXCoordinator, P.O. Box 302101, Montgomery, Alabama 36130-2101 or call (334) 242-8444.
State of Alabama
Department of Education
Joseph B. Morton
State Superintendent of Education
The Honorable Bob Riley
Governor of the State of Alabama
State Capitol
Montgomery, Alabama 36130
Dear Governor Riley:
In accordance with Section 16-3-21, Code of Alabama, 1975, and by
direction of the State Board of Education, I am pleased to submit this
statistical and financial report of operations for the State Department
of Education. This report summarizes the activities and operations of
the State Department of Education for the scholastic year ending
June 30, 2006, and the fiscal year ending September 30, 2006.
Respectfully submitted,
Joseph B. Morton
State Superintendent of Education
Annual Report – 2005-06.qxd 6/20/08 2:01 PM Page 2
1
Tableof Contents
State Board of Education..............................................................................2
Paving the Way for Healthier Students.........................................................3
Public Education in Alabama .......................................................................6
Accountability ...............................................................................................7
Students........................................................................................................8
Staffing..........................................................................................................9
Classroom Improvement.............................................................................12
Adequate Yearly Progress Summary...........................................................16
Alabama Direct Assessment of Writing.......................................................20
Alabama Alternate Assessment (AAA).......................................................20
School System Revenues by Source per Average Daily Membership.........21
School System Expenditures by Function – FY 2006.................................21
School System Enrollment by Gender and Race ........................................21
Alabama High School Graduation Exam (AHSGE) ...................................22
Funding in Public Education.......................................................................24
Funding Allocations – FY 2006...................................................................26
Combined Statement of Revenues..............................................................27
General County System Information ..........................................................28
General City System Information ...............................................................29
Per-Pupil Expenditures by County System.................................................30
Per-Pupil Expenditures by City System .....................................................32
County System Revenues by Source ..........................................................34
City System Revenues by Source ...............................................................36
County System Expenditures by Function .................................................38
City System Expenditures by Function ......................................................40
FY 2006 Expenditures by Fund Type and Object ......................................42
Career and Technical Education Funds and Expenditures List ..................43
Alabama Department of Education Organization Chart .............................44
Annual Report – 2005-06.qxd 6/20/08 2:01 PM Page 1
2
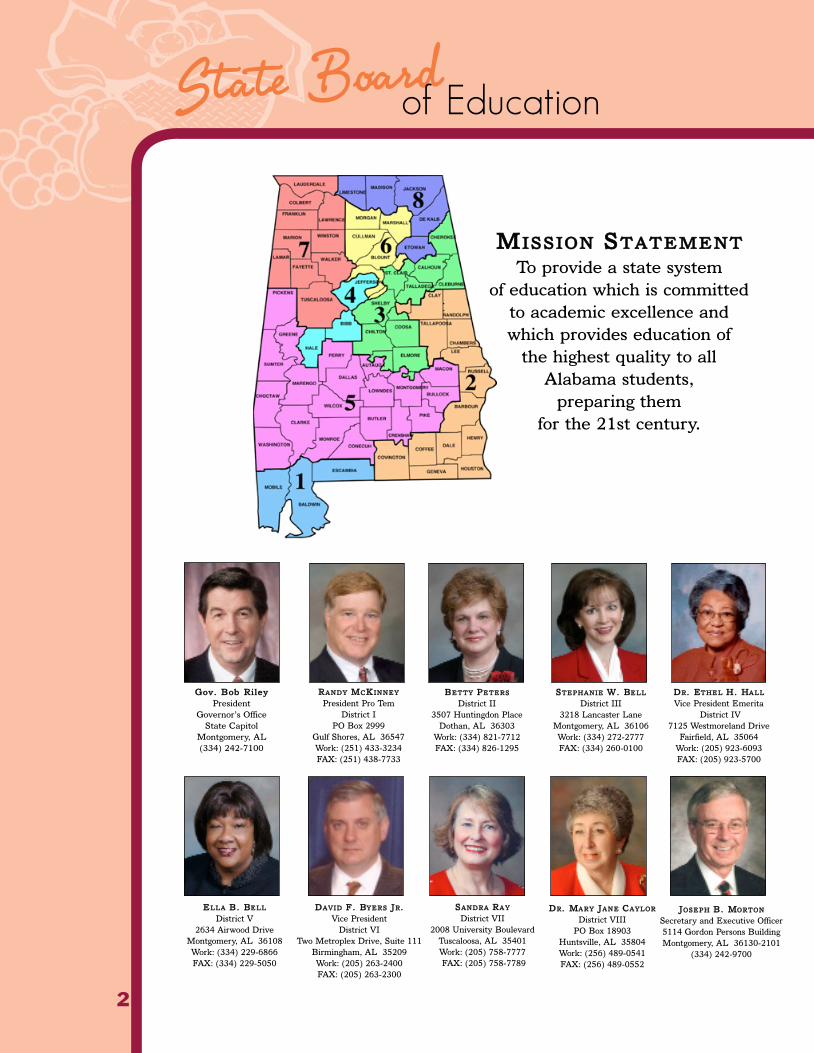
MMIISSSSIIOONN SSTTAATTEEMMEENNTT
To provide a state system
of education which is committed
to academic excellence and
which provides education of
the highest quality to all
Alabama students,
preparing them
for the 21st century.
JJOOSSEEPPHH BB.. MMOORRTTOONN
Secretary and Executive Officer
5114 Gordon Persons Building
Montgomery, AL 36130-2101
(334) 242-9700
DDRR.. MMAARRYY JJAANNEE CCAAYYLLOORR
District VIII
PO Box 18903
Huntsville, AL 35804
Work: (256) 489-0541
FAX: (256) 489-0552
SSAANNDDRRAA RRAAYY
District VII
2008 University Boulevard
Tuscaloosa, AL 35401
Work: (205) 758-7777
FAX: (205) 758-7789
DDAAVVIIDD FF.. BBYYEERRSS JJRR..
Vice President
District VI
Two Metroplex Drive, Suite 111
Birmingham, AL 35209
Work: (205) 263-2400
FAX: (205) 263-2300
EELLLLAA BB.. BBEELLLL
District V
2634 Airwood Drive
Montgomery, AL 36108
Work: (334) 229-6866
FAX: (334) 229-5050
DDRR.. EETTHHEELL HH.. HHAALLLL
Vice President Emerita
District IV
7125 Westmoreland Drive
Fairfield, AL 35064
Work: (205) 923-6093
FAX: (205) 923-5700
SSTTEEPPHHAANNIIEE WW.. BBEELLLL
District III
3218 Lancaster Lane
Montgomery, AL 36106
Work: (334) 272-2777
FAX: (334) 260-0100
BBEETTTTYY PPEETTEERRSS
District II
3507 Huntingdon Place
Dothan, AL 36303
Work: (334) 821-7712
FAX: (334) 826-1295
RRAANNDDYY MMCCKKIINNNNEEYY
President Pro Tem
District I
PO Box 2999
Gulf Shores, AL 36547
Work: (251) 433-3234
FAX: (251) 438-7733
GGoovv.. BBoobb RRiilleeyy
President
Governor’s Office
State Capitol
Montgomery, AL
(334) 242-7100
State Boardof Education
Annual Report – 2005-06.qxd 6/20/08 2:01 PM Page 2

3
The Alabama State Board of Education as well
as public/private entities within communities
statewide are dedicated to helping Alabama
turn the tide on childhood obesity and teaching
our children about the importance of making
healthy lifestyle choices.
Efforts from partners such as the Alabama
Department of Public Health, Blue Cross Blue
Shield of Alabama, the Alabama Department of
Agriculture and Industries and the Alabama
Academy of Pediatrics are vital in providing
solutions to this critical children’s health issue.
KKiiddFFiitt
A program hosted by recording artist Randy
Owen and Alabama’s Commissioner of
Agriculture and Industries Ron Sparks.
KKiiddFFiitt is designed to help our youngest
generation become healthier by helping them
make better decisions about fitness and
nutrition. With the KKiiddFFiitt program, an
informative DVD that shows how to be
healthier, feel better and have more energy was
distributed to K-5 students and parents.
Alabama KKiiddFFiitt is sponsored by Alabama
Power Company and the Alabama Power
Foundation.
WWeellllnneessss,, AAccaaddeemmiiccss && YYoouu ((WWAAYY))
A classroom-based health and academic series
of wellness programs for K-6.
WWAAYY pprriimmaarryy ggooaallss::
• Increase students’ physical activity
• Improve healthy nutritional choices
• Enhance academic performance
• Provide teachers with resources,
professional development and ongoing
support
• Involve parents, family and community
members
TThhee WWAAYY pprrooggrraamm aallssoo pprroovviiddeess
rreessoouurrcceess ffoorr tthhee ssttuuddeennttss ttoo::
• Understand the concept of personal
wellness and health
• Examine their health and habits
• Learn how to make informed decisions
• Handle peer pressure and advertising
traps
• Bring what they learn into the home
This project brings together an impressive
coalition of public and private partners in an
unprecedented way to promote the health of
Alabama’s children and serve as a progressive
model for the rest of the country.
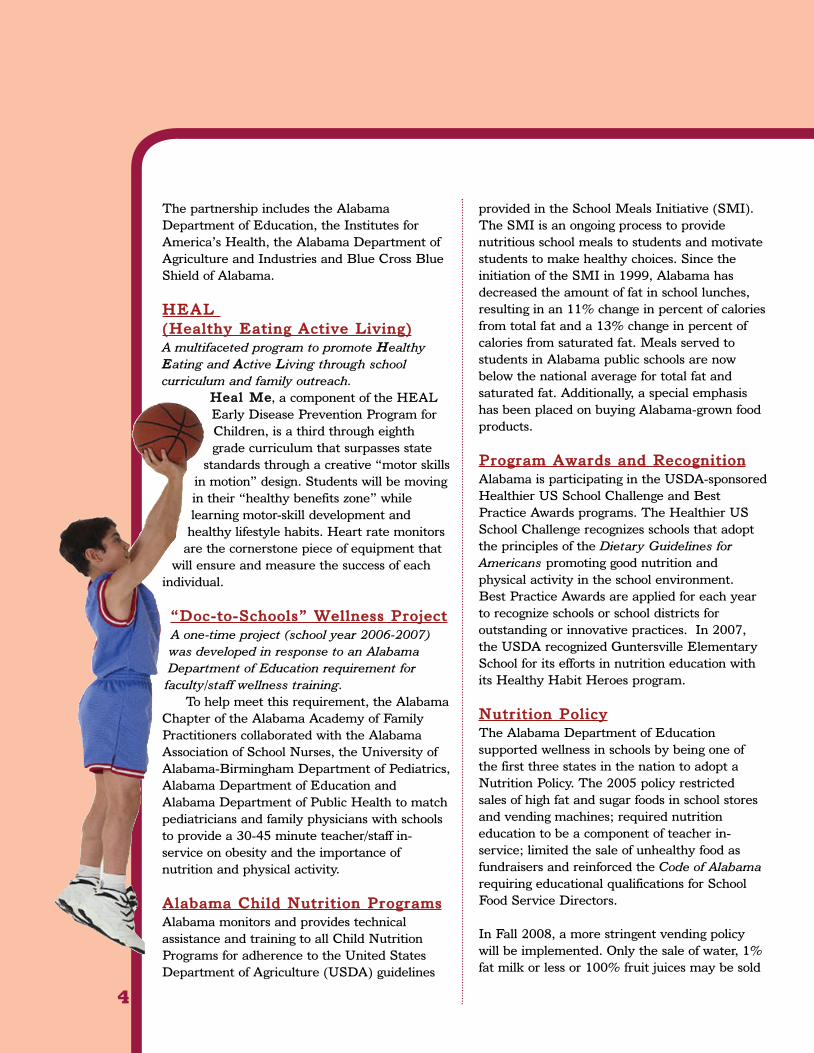
The Alabama Department of Education is strengthening fitness and nutrition
programs in public schools that will promote healthier lifestyles critical to student
achievement.
Paving the Way for Healthier Students
Annual Report – 2005-06.qxd 6/20/08 2:01 PM Page 3
4
The partnership includes the Alabama
Department of Education, the Institutes for
America’s Health, the Alabama Department of
Agriculture and Industries and Blue Cross Blue
Shield of Alabama.
HHEEAALL
((HHeeaalltthhyy EEaattiinngg AAccttiivvee LLiivviinngg))
A multifaceted program to promote HHealthy
EEating and AActive LLiving through school
curriculum and family outreach.
HHeeaall MMee, a component of the HEAL
Early Disease Prevention Program for
Children, is a third through eighth
grade curriculum that surpasses state
standards through a creative “motor skills
in motion” design. Students will be moving
in their “healthy benefits zone” while
learning motor-skill development and
healthy lifestyle habits. Heart rate monitors
are the cornerstone piece of equipment that
will ensure and measure the success of each
individual.
““DDoocc--ttoo--SScchhoooollss”” WWeellllnneessss PPrroojjeecctt
A one-time project (school year 2006-2007)
was developed in response to an Alabama
Department of Education requirement for
faculty/staff wellness training.
To help meet this requirement, the Alabama
Chapter of the Alabama Academy of Family
Practitioners collaborated with the Alabama
Association of School Nurses, the University of
Alabama-Birmingham Department of Pediatrics,
Alabama Department of Education and
Alabama Department of Public Health to match
pediatricians and family physicians with schools
to provide a 30-45 minute teacher/staff in-
service on obesity and the importance of
nutrition and physical activity.
AAllaabbaammaa CChhiilldd NNuuttrriittiioonn PPrrooggrraammss
Alabama monitors and provides technical
assistance and training to all Child Nutrition
Programs for adherence to the United States
Department of Agriculture (USDA) guidelines
provided in the School Meals Initiative (SMI).
The SMI is an ongoing process to provide
nutritious school meals to students and motivate
students to make healthy choices. Since the
initiation of the SMI in 1999, Alabama has
decreased the amount of fat in school lunches,
resulting in an 11% change in percent of calories
from total fat and a 13% change in percent of
calories from saturated fat. Meals served to
students in Alabama public schools are now
below the national average for total fat and
saturated fat. Additionally, a special emphasis
has been placed on buying Alabama-grown food
products.
PPrrooggrraamm AAwwaarrddss aanndd RReeccooggnniittiioonn
Alabama is participating in the USDA-sponsored
Healthier US School Challenge and Best
Practice Awards programs. The Healthier US
School Challenge recognizes schools that adopt
the principles of the Dietary Guidelines for
Americans promoting good nutrition and
physical activity in the school environment.
Best Practice Awards are applied for each year
to recognize schools or school districts for
outstanding or innovative practices. In 2007,
the USDA recognized Guntersville Elementary
School for its efforts in nutrition education with
its Healthy Habit Heroes program.
NNuuttrriittiioonn PPoolliiccyy
The Alabama Department of Education
supported wellness in schools by being one of
the first three states in the nation to adopt a
Nutrition Policy. The 2005 policy restricted
sales of high fat and sugar foods in school stores
and vending machines; required nutrition
education to be a component of teacher in-
service; limited the sale of unhealthy food as
fundraisers and reinforced the Code of Alabama
requiring educational qualifications for School
Food Service Directors.
In Fall 2008, a more stringent vending policy
will be implemented. Only the sale of water, 1%
fat milk or less or 100% fruit juices may be sold
Annual Report – 2005-06.qxd 6/20/08 2:01 PM Page 4
5
in elementary and middle school vending
machines. At high schools, in addition to the
three beverages allowed in elementary and
middle schools, only no/low calorie beverages up
to 25 calories and sports drinks and teas with a
limit of 99 calories may be sold.
Each snack sold in vending machines, school
stores or in school cafeterias must meet the
following requirements:
•• 1100%% oorr lleessss ooff tthhee ddaaiillyy vvaalluuee ooff ffaatt
•• 1100%% oorr lleessss ooff tthhee ddaaiillyy vvaalluuee ooff
ccaarrbboohhyyddrraatteess
•• 336600 mmiilllliiggrraammss oorr lleessss ooff ssooddiiuumm
•• 55%% oorr ggrreeaatteerr ooff eeiitthheerr vviittaammiinn AA,,
vviittaammiinn CC,, iirroonn,, ccaallcciiuumm oorr ffiibbeerr..
These policies can be found at
www.cnp.alsde.edu under Nutrition Policy.
SSppeecciiaall GGrraanntt AApppplliiccaattiioonn AAwwaarrddss
Grant funds from the USDA and Action for
Healthy Kids have been used to help local
school districts with nutrition education events
such as school gardens, health fairs, student-
developed wellness videos and supplemental
purchases of nutrition education materials.
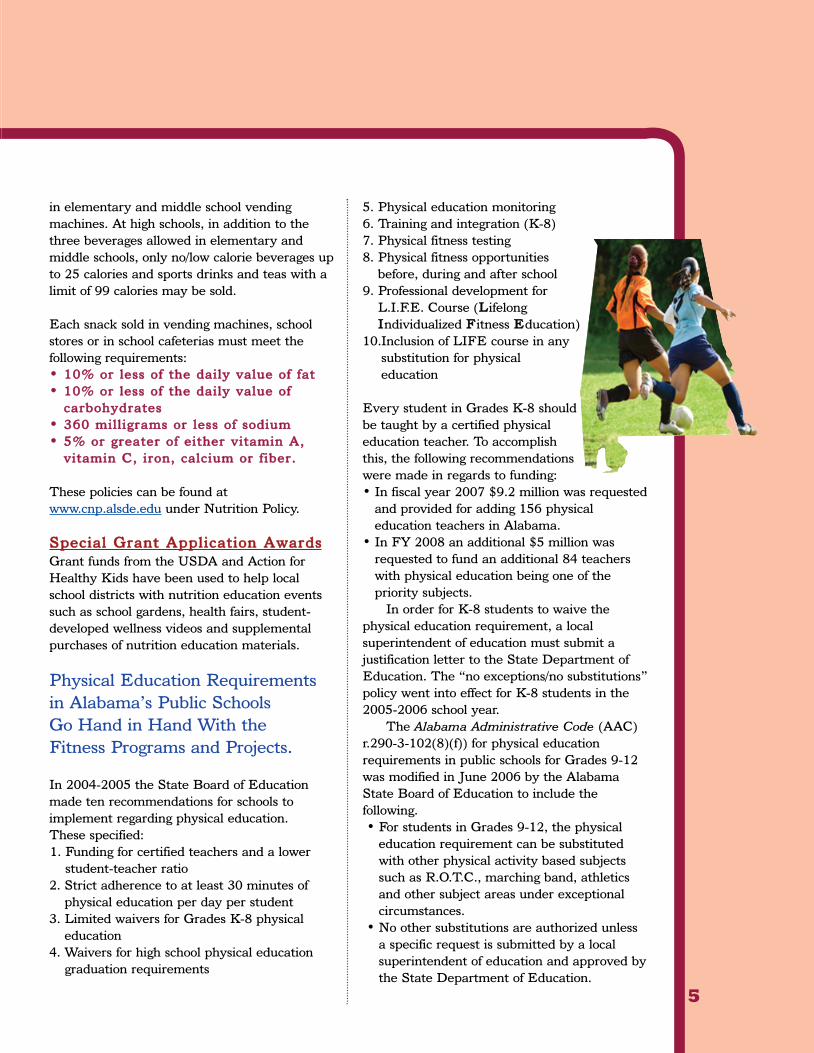
Physical Education Requirements
in Alabama’s Public Schools
Go Hand in Hand With the
Fitness Programs and Projects.
In 2004-2005 the State Board of Education
made ten recommendations for schools to
implement regarding physical education.
These specified:
1. Funding for certified teachers and a lower
student-teacher ratio
2. Strict adherence to at least 30 minutes of
physical education per day per student
3. Limited waivers for Grades K-8 physical
education
4. Waivers for high school physical education
graduation requirements
5. Physical education monitoring
6. Training and integration (K-8)
7. Physical fitness testing
8. Physical fitness opportunities
before, during and after school
9. Professional development for
L.I.F.E. Course (LLifelong
IIndividualized FFitness EEducation)
10.Inclusion of LIFE course in any
substitution for physical
education
Every student in Grades K-8 should
be taught by a certified physical
education teacher. To accomplish
this, the following recommendations
were made in regards to funding:
• In fiscal year 2007 $9.2 million was requested
and provided for adding 156 physical
education teachers in Alabama.
• In FY 2008 an additional $5 million was
requested to fund an additional 84 teachers
with physical education being one of the
priority subjects.
In order for K-8 students to waive the
physical education requirement, a local
superintendent of education must submit a
justification letter to the State Department of
Education. The “no exceptions/no substitutions”
policy went into effect for K-8 students in the
2005-2006 school year.
The Alabama Administrative Code (AAC)
r.290-3-102(8)(f)) for physical education
requirements in public schools for Grades 9-12
was modified in June 2006 by the Alabama
State Board of Education to include the
following.
• For students in Grades 9-12, the physical
education requirement can be substituted
with other physical activity based subjects
such as R.O.T.C., marching band, athletics
and other subject areas under exceptional
circumstances.
• No other substitutions are authorized unless
a specific request is submitted by a local
superintendent of education and approved by
the State Department of Education.
Annual Report – 2005-06.qxd 6/20/08 2:01 PM Page 5
6
ORGANIZATION OF K-12 EDUCATION IN ALABAMA
� AALLAABBAAMMAA LLEEGGIISSLLAATTUURREE – Formulation of Education Laws
� SSTTAATTEE BBOOAARRDD OOFF EEDDUUCCAATTIIOONN – Formulation of Regulations for Implementing Laws
� SSTTAATTEE SSUUPPEERRIINNTTEENNDDEENNTT OOFF EEDDUUCCAATTIIOONN – Administration of the State Department of
Education and Interpretation of Intent of Laws
� SSTTAATTEE DDEEPPAARRTTMMEENNTT OOFF EEDDUUCCAATTIIOONN – Enforcement of Laws and Regulations from the
Alabama Legislature and the State Board of Education
� LLOOCCAALL BBOOAARRDDSS OOFF EEDDUUCCAATTIIOONN – Administration of Programs Within the Laws and
Regulations Set Forth by the Alabama Legislature and the State Board of Education
� LLOOCCAALL SSCCHHOOOOLLSS – Implementation of School-Based Educational Programs As Set Forth by the
Alabama Legislature and the State Board of Education
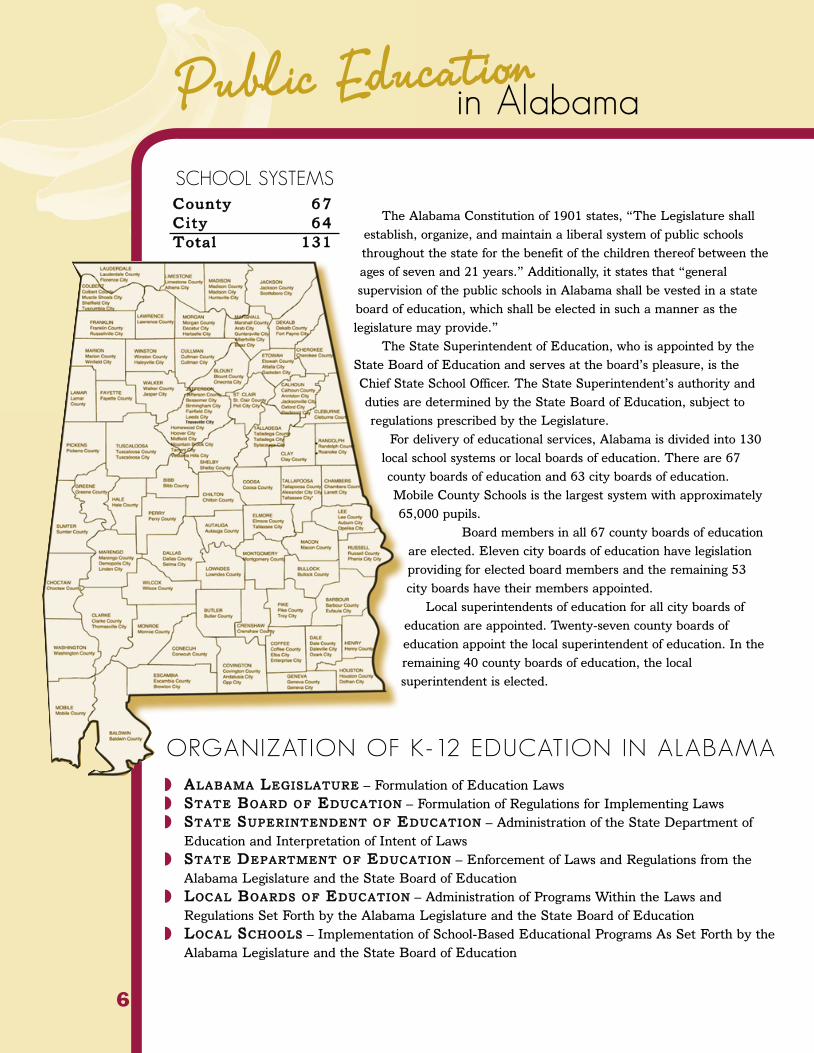
SCHOOL SYSTEMSCCoouunnttyy 6677
CCiittyy 6644
TToottaall 113311
The Alabama Constitution of 1901 states, “The Legislature shall
establish, organize, and maintain a liberal system of public schools
throughout the state for the benefit of the children thereof between the
ages of seven and 21 years.” Additionally, it states that “general
supervision of the public schools in Alabama shall be vested in a state
board of education, which shall be elected in such a manner as the
legislature may provide.”
The State Superintendent of Education, who is appointed by the
State Board of Education and serves at the board’s pleasure, is the
Chief State School Officer. The State Superintendent’s authority and
duties are determined by the State Board of Education, subject to
regulations prescribed by the Legislature.
For delivery of educational services, Alabama is divided into 130
local school systems or local boards of education. There are 67
county boards of education and 63 city boards of education.
Mobile County Schools is the largest system with approximately
65,000 pupils.
Board members in all 67 county boards of education
are elected. Eleven city boards of education have legislation
providing for elected board members and the remaining 53
city boards have their members appointed.
Local superintendents of education for all city boards of
education are appointed. Twenty-seven county boards of
education appoint the local superintendent of education. In the
remaining 40 county boards of education, the local
superintendent is elected.
in AlabamaPublic Education
Annual Report – 2005-06.qxd 6/20/08 2:01 PM Page 6
7
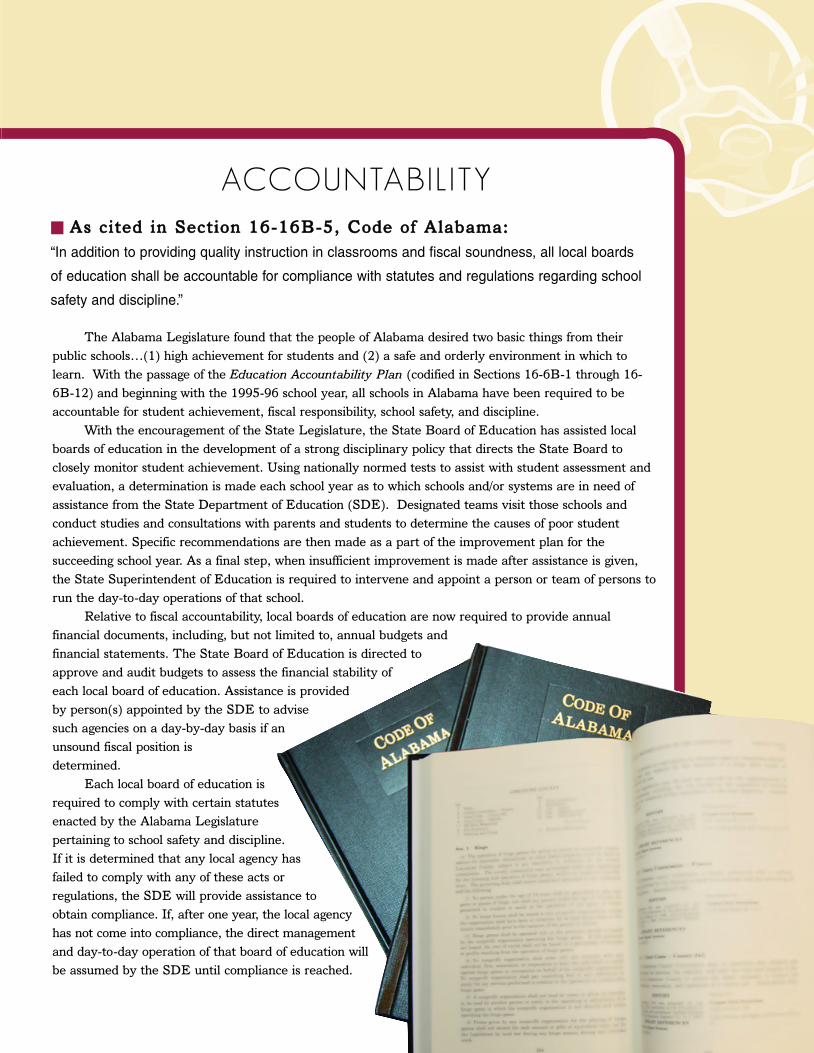
ACCOUNTABILITY
� AAss cciitteedd iinn SSeeccttiioonn 1166--1166BB--55,, CCooddee ooff AAllaabbaammaa::
“In addition to providing quality instruction in classrooms and fiscal soundness, all local boards
of education shall be accountable for compliance with statutes and regulations regarding school
safety and discipline.”
The Alabama Legislature found that the people of Alabama desired two basic things from their
public schools…(1) high achievement for students and (2) a safe and orderly environment in which to
learn. With the passage of the Education Accountability Plan (codified in Sections 16-6B-1 through 16-
6B-12) and beginning with the 1995-96 school year, all schools in Alabama have been required to be
accountable for student achievement, fiscal responsibility, school safety, and discipline.
With the encouragement of the State Legislature, the State Board of Education has assisted local
boards of education in the development of a strong disciplinary policy that directs the State Board to
closely monitor student achievement. Using nationally normed tests to assist with student assessment and
evaluation, a determination is made each school year as to which schools and/or systems are in need of
assistance from the State Department of Education (SDE). Designated teams visit those schools and
conduct studies and consultations with parents and students to determine the causes of poor student
achievement. Specific recommendations are then made as a part of the improvement plan for the
succeeding school year. As a final step, when insufficient improvement is made after assistance is given,
the State Superintendent of Education is required to intervene and appoint a person or team of persons to
run the day-to-day operations of that school.
Relative to fiscal accountability, local boards of education are now required to provide annual
financial documents, including, but not limited to, annual budgets and
financial statements. The State Board of Education is directed to
approve and audit budgets to assess the financial stability of
each local board of education. Assistance is provided
by person(s) appointed by the SDE to advise
such agencies on a day-by-day basis if an
unsound fiscal position is
determined.
Each local board of education is
required to comply with certain statutes
enacted by the Alabama Legislature
pertaining to school safety and discipline.
If it is determined that any local agency has
failed to comply with any of these acts or
regulations, the SDE will provide assistance to
obtain compliance. If, after one year, the local agency
has not come into compliance, the direct management
and day-to-day operation of that board of education will
be assumed by the SDE until compliance is reached.
Annual Report – 2005-06.qxd 6/20/08 2:01 PM Page 7
8
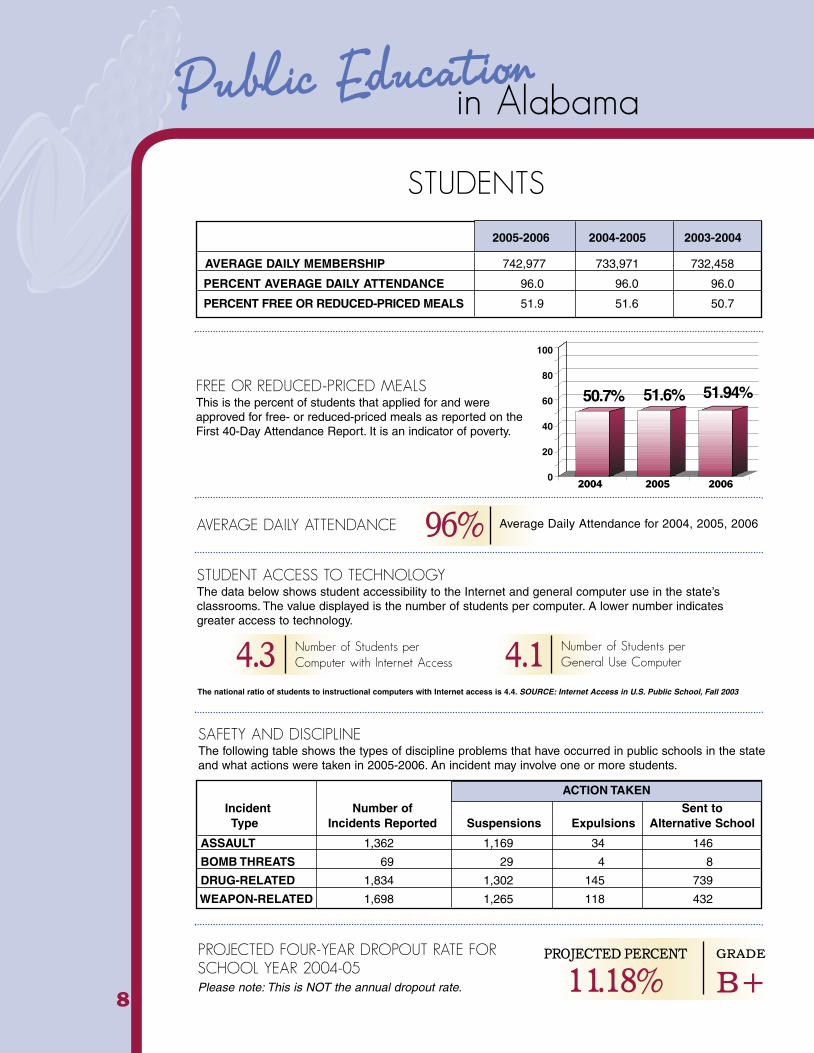
ACTION TAKEN
Incident Number of Sent toType Incidents Reported Suspensions Expulsions Alternative School
ASSAULT 1,362 1,169 34 146
BOMB THREATS 69 29 4 8
DRUG-RELATED 1,834 1,302 145 739
WEAPON-RELATED 1,698 1,265 118 432
STUDENTS
AVERAGE DAILY ATTENDANCE
FREE OR REDUCED-PRICED MEALSThis is the percent of students that applied for and wereapproved for free- or reduced-priced meals as reported on theFirst 40-Day Attendance Report. It is an indicator of poverty.
SAFETY AND DISCIPLINEThe following table shows the types of discipline problems that have occurred in public schools in the stateand what actions were taken in 2005-2006. An incident may involve one or more students.
STUDENT ACCESS TO TECHNOLOGYThe data below shows student accessibility to the Internet and general computer use in the state’sclassrooms. The value displayed is the number of students per computer. A lower number indicatesgreater access to technology.
AVERAGE DAILY MEMBERSHIP 742,977 733,971 732,458
PERCENT AVERAGE DAILY ATTENDANCE 96.0 96.0 96.0
PERCENT FREE OR REDUCED-PRICED MEALS 51.9 51.6 50.7
The national ratio of students to instructional computers with Internet access is 4.4. SOURCE: Internet Access in U.S. Public School, Fall 2003
ACTION TAKEN
2005-2006 2004-2005 2003-2004
PROJECTED FOUR-YEAR DROPOUT RATE FORSCHOOL YEAR 2004-05Please note: This is NOT the annual dropout rate.
4.3 4.1Number of Students perComputer with Internet Access
Number of Students per General Use Computer
PROJECTED PERCENT
11.18%GRADE
B+
96% Average Daily Attendance for 2004, 2005, 2006
Public Education
100
80
60
40
20
0 2004 2005 2006
50.7% 51.6% 51.94%
in Alabama
Annual Report – 2005-06.qxd 6/20/08 2:01 PM Page 8

9
STAFFING
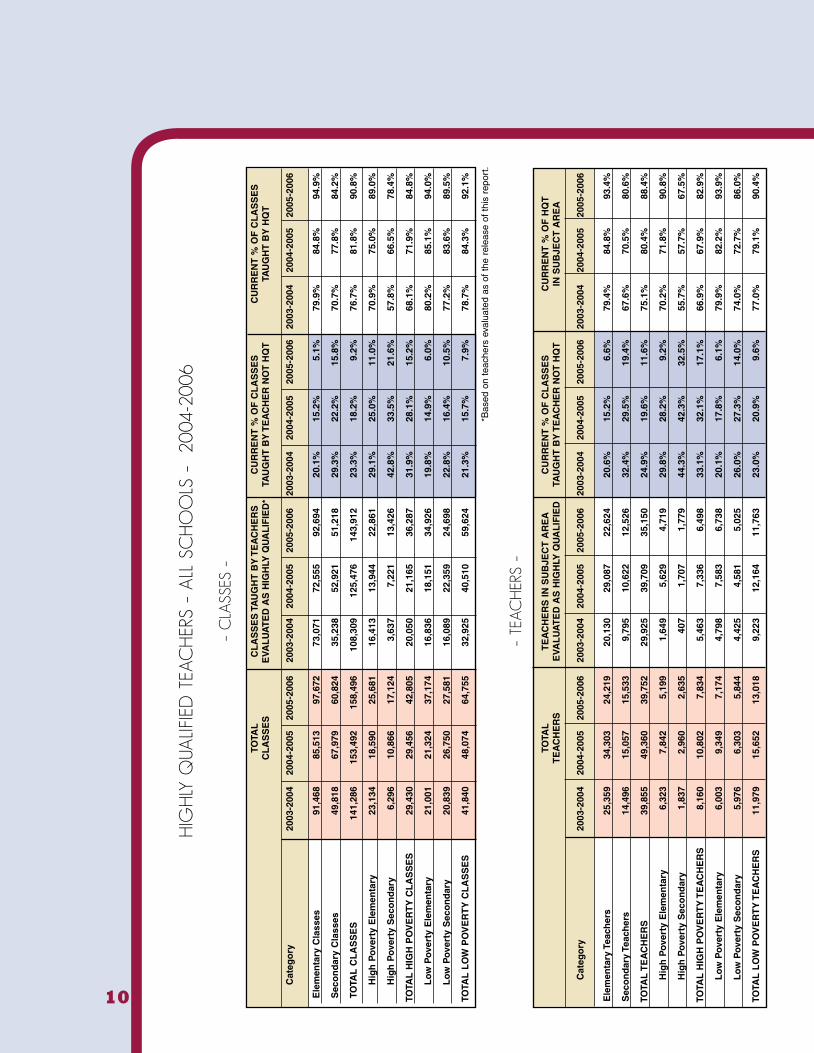
HIGHLY QUALIFIED TEACHERSThe No Child Left Behind Act of 2001 (NCLB) requires that teachers demonstrate subject knowledge andteaching skills in the subject(s) and grade level(s) they teach. The graphs below represent the percent ofcurrent core academic subject classes taught by highly qualified teachers as well as the percent of currentteachers who have met NCLB requirements.
SECONDARY CLASSES 70.7% 77.8% 84.2%
ELEMENTARY CLASSES 79.9% 84.8% 94.9%
2003-2004 2004-2005 2005-2006
PERCENT OF CLASSES TAUGHT BY HIGHLY QUALIFIED TEACHERS
SECONDARY CLASSES 67.6% 70.5% 80.6%
ELEMENTARY CLASSES 79.4% 84.8% 93.4%
2003-2004 2004-2005 2005-2006
PERCENT OF HIGHLY QUALIFIED TEACHERS TEACHING CORE ACADEMIC SUBJECTS
TIMELINE FOR ALL CORE ACADEMIC CLASSES TO BE TAUGHT BY HIGHLY QUALIFIED TEACHERS
TIMELINE FOR ALL CORE SUBJECT TEACHERSBECOMING HIGHLY QUALIFIED
LEGENDACTUALTARGET
0 20 40 60 80 100
2005-2006
2004-2005
2003-2004 76.7%
56.9%
81.8%78.4%
90.8%100%
LEGENDACTUALTARGET
0 20 40 60 80 100
2005-2006
2004-2005
2003-2004 77.1%
56.3%
80.4%78.2%
88.4%100%
Annual Report – 2005-06.qxd 6/20/08 2:01 PM Page 9
10
HIG
HLY
QUA
LIFIE
D T
EAC
HER
S –
ALL
SC
HO
OLS
–
2004
-2006
– C
LASS
ES –
TOTA
LC
LA
SS
ES
TA
UG
HT
BY
TE
AC
HE
RS
CU
RR
EN
T %
OF
CL
AS
SE
SC
UR
RE
NT
% O
F C
LA
SS
ES
CL
AS
SE
SE
VAL
UA
TE
D A
S H
IGH
LY Q
UA
LIF
IED
*TA
UG
HT
BY
TE
AC
HE
R N
OT
HQ
TTA
UG
HT
BY
HQ
T
Cat
ego
ry20
03-2
004
2004
-200
520
05-2
006
2003
-200
420
04-2
005
2005
-200
620
03-2
004
2004
-200
520
05-2
006
2003
-200
420
04-2
005
2005
-200
6
Ele
men
tary
Cla
sses
91,4
6885
,513
97,6
7273
,071
72,5
5592
,694
20.1
%15
.2%
5.1%
79.9
%84
.8%
94.9
%
Sec
on
dar
y C
lass
es49
,818
67,9
7960
,824
35,2
3852
,921
51,2
1829
.3%
22.2
%15
.8%
70.7
%77
.8%
84.2
%
TOTA
L C
LA
SS
ES
141,
286
153,
492
158,
496
108,
309
125,
476
143,
912
23.3
%18
.2%
9.2%
76.7
%81
.8%
90.8
%
Hig
h P
over
ty E
lem
enta
ry
23,1
3418
,590
25,6
8116
,413
13,9
4422
,861
29.1
%25
.0%
11.0
%70
.9%
75.0
%89
.0%
Hig
h P
over
ty S
eco
nd
ary
6,29
610
,866
17,1
243,
637
7,22
113
,426
42.8
%33
.5%
21.6
%57
.8%
66.5
%78
.4%
TOTA
L H
IGH
PO
VE
RT
Y C
LA
SS
ES
29,4
3029
,456
42,8
0520
,050
21,1
6536
,287
31.9
%28
.1%
15.2
%68
.1%
71.9
%84
.8%
Lo
w P
over
ty E
lem
enta
ry21
,001
21,3
2437
,174
16,8
3618
,151
34,9
2619
.8%
14.9
%6.
0%80
.2%
85.1
%94
.0%
Lo
w P
over
ty S
eco
nd
ary
20,8
3926
,750
27,5
8116
,089
22,3
5924
,698
22.8
%16
.4%
10.5
%77
.2%
83.6
%89
.5%
TOTA
L L
OW
PO
VE
RT
Y C
LA
SS
ES
41,8
4048
,074
64,7
5532
,925
40,5
1059
,624
21.3
%15
.7%
7.9%
78.7
%84
.3%
92.1
%
– TE
AC
HER
S –
TOTA
LT
EA
CH
ER
S IN
SU
BJE
CT
AR
EA
CU
RR
EN
T %
OF
CL
AS
SE
SC
UR
RE
NT
% O
F H
QT
TE
AC
HE
RS
EVA
LU
AT
ED
AS
HIG
HLY
QU
AL
IFIE
DTA
UG
HT
BY
TE
AC
HE
R N
OT
HQ
TIN
SU
BJE
CT
AR
EA
Cat
ego
ry20
03-2
004
2004
-200
520
05-2
006
2003
-200
420
04-2
005
2005
-200
620
03-2
004
2004
-200
520
05-2
006
2003
-200
420
04-2
005
2005
-200
6
Ele
men
tary
Tea
cher
s25
,359
34,3
0324
,219
20,1
3029
,087
22,6
2420
.6%
15.2
%6.
6%79
.4%
84.8
%93
.4%
Sec
on
dar
y Te
ach
ers
14,4
9615
,057
15,5
339,
795
10,6
2212
,526
32.4
%29
.5%
19.4
%67
.6%
70.5
%80
.6%
TOTA
L T
EA
CH
ER
S39
,855
49,3
6039
,752
29,9
2539
,709
35,1
5024
.9%
19.6
%11
.6%
75.1
%80
.4%
88.4
%
Hig
h P
over
ty E
lem
enta
ry
6,32
37,
842
5,19
91,
649
5,62
94,
719
29.8
%28
.2%
9.2%
70.2
%71
.8%
90.8
%
Hig
h P
over
ty S
eco
nd
ary
1,83
72,
960
2,63
540
71,
707
1,77
944
.3%
42.3
%32
.5%
55.7
%57
.7%
67.5
%
TOTA
L H
IGH
PO
VE
RT
Y T
EA
CH
ER
S8,
160
10,8
027,
834
5,46
37,
336
6,49
833
.1%
32.1
%17
.1%
66.9
%67
.9%
82
.9%
Lo
w P
over
ty E
lem
enta
ry6,
003
9,34
97,
174
4,79
87,
583
6,73
820
.1%
17.8
%6.
1%
79.9
%82
.2%
93.9
%
Lo
w P
over
ty S
eco
nd
ary
5,97
66,
303
5,84
44,
425
4,58
15,
025
26.0
%27
.3%
14.0
%
74.0
%72
.7%
86.0
%
TOTA
L L
OW
PO
VE
RT
Y T
EA
CH
ER
S11
,979
15,6
5213
,018
9,22
312
,164
11,7
6323
.0%
20.9
%9.
6%
77.0
%79
.1%
90.4
%
*Bas
ed o
n te
ache
rs e
valu
ated
as
of t
he r
elea
se o
f th
is r
epor
t.
Annual Report – 2005-06.qxd 6/20/08 2:01 PM Page 10
11
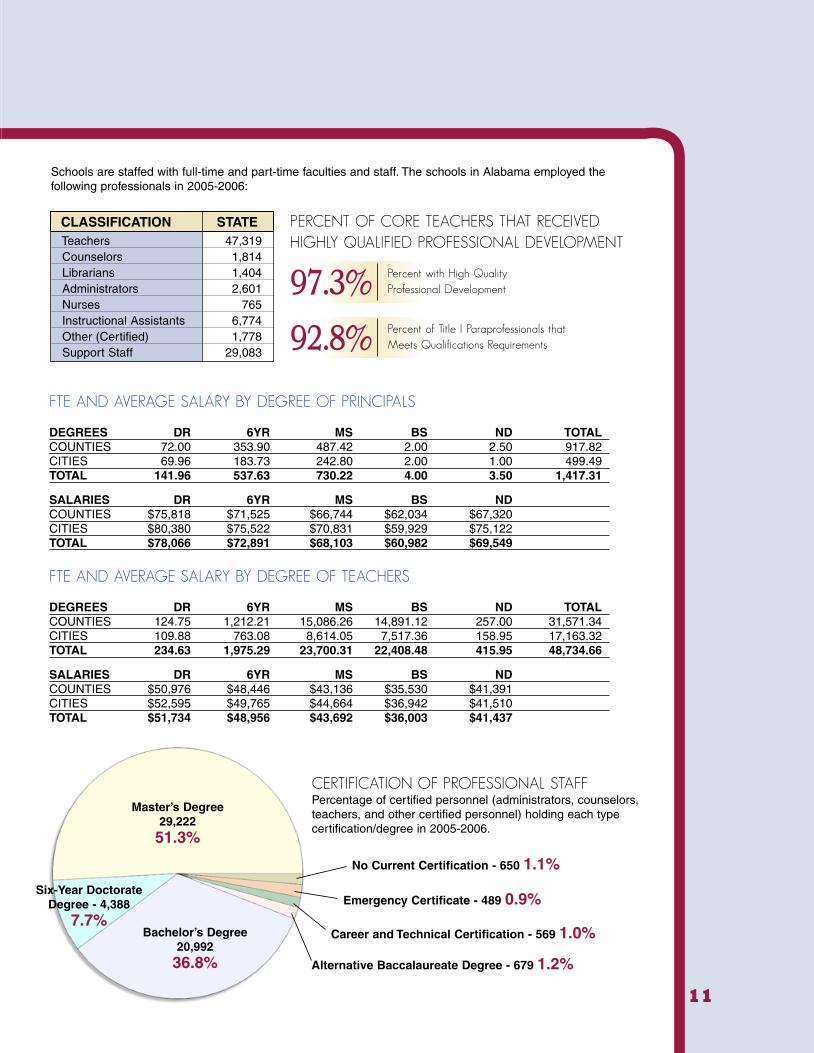
Schools are staffed with full-time and part-time faculties and staff. The schools in Alabama employed thefollowing professionals in 2005-2006:
Teachers 47,319Counselors 1,814Librarians 1,404Administrators 2,601Nurses 765Instructional Assistants 6,774Other (Certified) 1,778Support Staff 29,083
PERCENT OF CORE TEACHERS THAT RECEIVEDHIGHLY QUALIFIED PROFESSIONAL DEVELOPMENT
CLASSIFICATION STATE
97.3%Percent with High QualityProfessional Development
92.8%Percent of Title I Paraprofessionals thatMeets Qualifications Requirements
Master’s Degree29,22251.3%
Bachelor’s Degree20,99236.8%
Six-Year DoctorateDegree - 4,388
7.7%
Alternative Baccalaureate Degree - 679 1.2%
Career and Technical Certification - 569 1.0%
Emergency Certificate - 489 0.9%
No Current Certification - 650 1.1%
CERTIFICATION OF PROFESSIONAL STAFFPercentage of certified personnel (administrators, counselors,teachers, and other certified personnel) holding each typecertification/degree in 2005-2006.
FTE AND AVERAGE SALARY BY DEGREE OF PRINCIPALS
DEGREES DR 6YR MS BS ND TOTALCOUNTIES 72.00 353.90 487.42 2.00 2.50 917.82CITIES 69.96 183.73 242.80 2.00 1.00 499.49TOTAL 141.96 537.63 730.22 4.00 3.50 1,417.31
SALARIES DR 6YR MS BS NDCOUNTIES $75,818 $71,525 $66,744 $62,034 $67,320CITIES $80,380 $75,522 $70,831 $59,929 $75,122TOTAL $78,066 $72,891 $68,103 $60,982 $69,549
FTE AND AVERAGE SALARY BY DEGREE OF TEACHERS
DEGREES DR 6YR MS BS ND TOTALCOUNTIES 124.75 1,212.21 15,086.26 14,891.12 257.00 31,571.34CITIES 109.88 763.08 8,614.05 7,517.36 158.95 17,163.32TOTAL 234.63 1,975.29 23,700.31 22,408.48 415.95 48,734.66
SALARIES DR 6YR MS BS NDCOUNTIES $50,976 $48,446 $43,136 $35,530 $41,391CITIES $52,595 $49,765 $44,664 $36,942 $41,510TOTAL $51,734 $48,956 $43,692 $36,003 $41,437
Annual Report – 2005-06.qxd 6/20/08 2:01 PM Page 11
Response To Intervention (RTI)Response To Intervention (RTI) was formed as a
result of the 2004 Reauthorization of the Individualswith Disabilities Education Act (IDEA) mandate thatrequired school districts nationwide to reduce thenumber of special education placements. RTI is theprocess of addressing the needs of all studentsthrough a continuum of services that provides high-quality instruction and scientific, research-based,tiered intervention strategies aligned with individualstudent needs. Other key components consist offrequent monitoring of student progress to makeresults-based academic or behavioral decisions anddata-based school improvement. The goal is to usestudent response data to make important educationaldecisions such as those regarding placement,intervention, curriculum, and instructional goals.The Alabama Department of Education is in theprocess of developing a statewide plan to address thiseffort. The crux of Alabama’s plan will be to ensurethat all students receive quality instruction that leadsto their academic success.
Alabama Black Belt Arts Education InitiativeThe Alabama Black Belt Arts Education Initiative
(ABBAEI) is a comprehensive, integrated, hands-onschool improvement program that hasbeen adopted by 46 schools in 12 BlackBelt local education agencies. The goal ofthe initiative is to develop quality
comprehensive arts education programs that willprovide opportunities for students in Alabama BlackBelt schools to experience and study the arts, enhancethe quality of education, and achieve academicexcellence. Participating schools utilize the arts toactively engage students in their learning and toexperience the creative process. ABBAEI grantsprovide funds for schoolwide intensive arts educationprofessional development, student performances, arts-related field trips and cultural events, guest artists,equipment and supplies, educational resources,literature, technology, music, and consumable artssupplies. National research documents show how the
arts improve academic achievement, increase
school attendance, and reduce discipline referrals.The primary mission of ABBAEI is to create a cultureof high expectations and continuous improvement asstudents learn in and through the arts. Additionalfunding is needed so that all students in Alabamamay have these opportunities and resources.
Alabama Advanced Placement Advanced Placement (AP) classes approved by the
College Board are currently in place in 155 highschools in Alabama. A total of 259 teacherscholarships are currently funded and 18,950students are enrolled in classes across the state.From school year 2005-06 to 2006-07 Alabama had a23.3% increase in the number of students taking APexams; a 25.3% increase in the number of examstaken; and a 16.6% increase in the number ofqualifying scores (3-5). This compares with a nationalincrease of 9.5% in the number of students takingexams; a 9.8% increase in the number of examstaken; and a 9.3% increase in the number ofqualifying scores.
The following is a year-to-date summary ofinformation on the Advanced Placement using statefunding:
Alabama Math, Science, and Technology Initiative(AMSTI)
The Alabama Math, Science, and TechnologyInitiative (AMSTI) is the Department of Education’sinitiative to improve math and science instructionstatewide. AMSTI prepares students with the
ClassroomImprovement
12
The Classroom Improvement Section of the Alabama Department of Education is responsible for the development,implementation, and assessment of the minimum curriculum content (standards) and course design for K-12students in the public schools. It is responsible for instructional support that includes courses of study, instructionalmaterials and research, curriculum alignment materials, recognition and scholarship programs, the textbookadoption program, high/middle school initiatives, and counseling and guidance services. Implementation of theaccountability law as defined by the Alabama Legislature is supported through the Classroom Improvement Section.
State Funding 2006-2007State Funding Amount $1,000,000Number of School Systems That Applied for Funding 56Total $ Requested $2,500,000AwardsNew Teacher Scholarships ($2,500 per teacher for workshops and instructional materials) 138Existing Teacher Instructional Materials ($1,200 per classroom) 167 Administrator Scholarships ($1,300 per administrator for workshops) 56 Counselor Scholarships($1,300 per counselor for workshops) 63
PSAT/NMSQT Exams for 7,599 students AP Exams for 1,275 studentsVertical Team Training by The College Board ($8,000 per session) N/A
Annual Report – 2005-06.qxd 6/20/08 2:01 PM Page 12
knowledge and skills necessary for success inpostsecondary studies and the workforce.To accomplish this, teachers and administrators
attend AMSTI summer institutes fortwo weeks for two consecutive yearswhere they receive subject- and grade-
specific professional development. Teachers are thenprovided all of the equipment and materials neededto perform the hands-on, activity-based activitieswith their students that they studied at the summerinstitutes. In addition, math and science specialistsmentor the teachers during the school year sothey become proficient at implementing the newteaching strategies.
Forty percent of all Alabama schools are currentlyAMSTI Schools and receive the benefits of theprogram. Funding will increase this number to 60percent of all schools, while continuing to support allpreviously trained schools with equipment,materials, and on-site support from specialists.AMSTI has become a national model for improvingmath and science.
The Alabama Leadership Academy (ALA)The Alabama Leadership Academy (ALA)
was established to increase the achievementof all students in Alabama by supporting thegrowth and development of instructional leaders.Since 2005, the ALA has delivered professionaldevelopment to over 700 schools. School teamscomprised of the principal and two teacher leadersreceived training on data-driven school improvement,brain research related to improving instruction,creation of a high-performance learning culture, anddevelopment and maintenance of professionallearning communities. The implementation of theALA led to the development and convening of TheGovernor’s Congress on School Leadership.
Awards and Scholarships The Classroom Improvement Section coordinates
several state and national programs, contests,awards, and scholarships to recognize exemplaryteachers and students with cash, prizes, andprofessional development opportunities totaling over$50,000. Alabama is represented in Washington byway of three prestigious awards and scholarships.National winners of the Presidential Awards forExcellence in Mathematics and Science Teachingreceive $10,000 and an all-expense-paid trip toWashington, while Alabama’s Preserve America
History Teacher of the Year receives $1,000, acertificate, an archive of books for the school library,an opportunity to receive the national title of historyteacher of the year, and an all-expense-paid trip toWashington. Additionally, two state winners of theUnited States Senate Youth Program/William HearstFoundation receive a $5,000 scholarship and an all-expense-paid trip to Washington to observe oursenators at work. Fifteen recipients of the ColonialWilliamsburg scholarship receive an all-expense-paidtrip to Williamsburg, Virginia, for a week ofprofessional development in Early American History,while professional development opportunities insocial studies are available for K-6 teachers from theJenice Riley Memorial Fund. Fifteenhigh-achieving students from each of theseven congressional districts (105)receive a yearly scholarship of $1,500 forfour years to represent Alabama athundreds of major colleges around the United Statesthrough the Robert C. Byrd Scholarship Program.State-funded Math, Science, and Debate Competition($40,000) enable state winners in the area of mathand science competitions to apply for financialassistance as they travel to national competitions.Two high-achieving science students representAlabama annually at the National Youth ScienceCamp in West Virginia. This is an all-expense-paidtrip provided by the National Youth ScienceFoundation and West Virginia Governor Joe ManchinIII. The Excellence in Recycling Awards teaches thevalue of recycling and solid waste management.Recipients of this award receive a monetary donationto support their recycling programs. World War IIand Korean War Veterans receive high schooldiplomas each year as part of the The Veteran HighSchool Diploma Program. Alabama’s distinguishedauthor Harper Lee is honored with a collaborativepartnership with The University of Alabama HonorsProgram for the To Kill a Mockingbird Essay Contest.
The Governor’s Commission on Quality Teaching (GCQT)
The Governor’s Commission on Quality Teaching(GCQT) commenced work on January 17, 2006, withthe charge from Governor Bob Riley to examine,recommend, and work to implement laws, policies,and practices affecting teachers and teachingeffectiveness to ensure student success in Alabama’spublic schools and to promote the aggressiverecruitment, preparation, support, retention, andgrowth of quality teachers in order to raise
13
Annual Report – 2005-06.qxd 6/20/08 2:01 PM Page 13
student achievement in Alabama. Over the course ofits existence, the GCQT, comprised of 97 individualsincluding instructional leaders and partnersrepresenting a wide range of statewide stakeholdergroups, pursued its work during nine plenarysessions, in meetings of the Commission’s designatedExecutive Committee, and in other scheduled worksessions of the ten established committees. Approvedto date are the new Alabama Quality TeachingStandards and the Alabama Continuum for TeacherDevelopment. The GCQT has also coordinated thesuccessful rollout of the Alabama Teacher Mentoringprogram and the Alabama Take 20, Teaching andLearning Conditions survey. Recommendations fromthe GCQT for 2008-09 include the expansion of theAlabama Teacher Mentoring program to include first-and second-year teachers, further study anddevelopment of a four-tiered teacher certificationsystem, continued funding for a teaching and learningconditions survey, and funding for three pilot teacherpreparation program redesign programs.
The Governor’s Congress on School LeadershipThe Governor’s Congress on School Leadership was
convened by Governor Bob Riley and AlabamaSuperintendent of Education Dr. Joseph Morton inNovember 2004. The Governor’s Congress focuses onsupporting instructional leadership in Alabamaschools by studying existing policy affecting schoolleaders and making recommendations for the future.Approximately 200 stakeholders have participated inpolicy review and recommendations. Approved to dateare new Alabama Standards for Instructional Leaders,a new Alabama Code of Ethics for Educators, andstandards for the redesign of the 13 universityadministrator preparation programs in Alabama.A new professional development process forcertification, a new certification structure, andremoval of on-the-job barriers continue to be thefocus of the Governor’s Congress.
The Teacher Leader Network (TLN)The Teacher Leader Network (TLN) was developed in
2004 to provide opportunities for teachers, withguidance from their principals, to buildleadership responsibilities, thereforebuilding capacity in 65 Alabamaschools that did not make AdequateYearly Progress (AYP). The three-year pilot programsuccessfully focused on school improvement, actionresearch, and mentoring.
Lessons learned from TLN supported the
establishment of Teacher Leader Alabama (TLA). TLAwill continue to build teacher leadership in Alabama’sschools through the work of Leadership Development,the Alabama Council for Leadership Development,and the Governor’s Commission on Quality Teaching.
In 2008-09, TLA is providing the followingprofessional development opportunities statewide:Alabama Standards for Instructional Leaders andTeachers and Differentiated Instruction.
Alabama Essential Elements of School PerformanceReview – The Instructional Review Process
The instructional review process, EssentialElements of School Performance Review, is a tier ofsupport designed to build capacity in school systems.The goal of this evidence-based review process is toassist school systems in creating and sustaining theprocess for continuous school improvement throughthe use of a common core of research-based bestpractices. During the review, nine elements thatresearch shows are the key to school improvementare analyzed. Those nine elements are: instruction;curriculum; classroom assessment; professionaldevelopment; school culture; student, family, andcommunity support; leadership; organizationalstructure and resources; and comprehensive andeffective planning.
Once the school has been selected for a review,the process begins with analysis of multiple sourcesof data by a team made up of State Department ofEducation staff including representatives from FederalPrograms; Alabama Reading Initiative; AlabamaMathematics, Science, and Technology Initiative;Classroom Improvement; and Regional SchoolImprovement staff. The information gained from thiscollaboration is utilized to identify concerns and toformulate specific questions for use in the reviewprocess.
The review takes place over a three-day period andis conducted by a five- to seven-member team using aWeb-based process, Wireless Generation software,and digital pens to gather data through observations,interviews, and document reviews. The evidence isthen assigned a score based on a pre-defined set ofindicators. Using these three processes provides atriangulation of data that assists the team indeveloping an accurate view of the school’s entireinstructional program.
The end product of the process is a report ofindividualized findings that contains best practicerecommendations to guide school improvementdecisions. Attendees at the delivery of the report
14
Annual Report – 2005-06.qxd 6/20/08 2:02 PM Page 14

include the school leadership team, central officerepresentatives, and regional support representatives.This report is then utilized by the school to formulatethe plan for continuous school improvement.
During School Year 2007, 32 reviews wereconducted. The goal for School Year 2008 is tocomplete 58 reviews. There is currently a waiting listof schools that want to participate in the process inSchool Year 2009. Funding is needed to implementthe process in additional schools.
Making Middle Grades WorkIn less than two years, the Alabama Making Middle
Grades Work Network (MMGW) through the AlabamaMiddle School Initiative (AMSI) has grown from eightsites to 70 sites. The MMGW comprehensive schoolimprovement model has been adopted by 70 middleschools statewide. Schools that become part of theMMGW network are expected to use the middlegrades comprehensive improvement framework toshow progress in changing school and classroompractices in ways that advance student achievement.The primary mission of MMGW is to create a cultureof high expectations and continuous improvementthat prepares middle grade students for challenginghigh school studies. States and the Southern RegionalEducation Board (SREB) expect all schools to showconsistent progress until the comprehensiveimprovement framework is fully implemented with allstudents performing at the basic level with increasingpercentages of students performing at the proficientand advanced levels in reading, mathematics, andscience (National Assessment of Educational Progress –NAEP). Each year, SREB leads two technicalassistance (TA) or review visits (TRV) to networkschools as part of the services member states receivefrom SREB. Dr. Dorothy Dolasky, ClassroomImprovement Section, led 12 additional TA/TRV visitsto schools. These visits give both SREB and state stafftremendous insight into what is working and thegains schools are making. Only 1 of the 70 AMSIschools failed to meet AYP this year – that is nothingshort of phenomenal. The professional developmentsupport the AMSI schools are receiving is reallyhaving an impact.
This model is showing such promise that 16 localeducation agencies are systemwide in implementation,and the interest in becoming an MMGW site extendsto 25 more schools. Schools need additional fundingto provide the comprehensive professionaldevelopment available from SREB to deeplyimplement the ten key practices.
Partnerships in Character EducationDue to positive response to the Partnerships in
Character Education program, the responsibility ofthis program has been moved to the local educationagencies. The state level grant has expired.
School Improvement SupportThe 1995 Education Accountability legislation
outlined the Alabama Department of Education’sresponsibilities for providing technical assistance tolow-performing schools. As a result of the passing ofthe No Child Left Behind Act of 2001, the State Boardof Education passed a resolution in 2002 outliningthe development of an assessment and accountabilitysystem. Response to this resolution includes astatewide system of support guided in large part bythe Accountability Roundtable (ART) and the SchoolImprovement staff.
The School Improvement staff is comprised of theART Coordinator, Assistant ART Coordinator, SchoolImprovement Leaders, Regional School ImprovementCoaches, and Peer Mentors. The ART and AssistantART Coordinators serve to ensure the alignment ofthe efforts and school improvement field support.Two School Improvement Leaders (north and south)support the School Improvement field staff incoaching school system personnel as they seek toimplement and monitor the continuous improvementprocess. Regional School Improvement Coaches(RSICs) support district-level personnel in identifyingand prioritizing needs in relation tostudent achievement. RSICs are assignedby the 11 inservice center regions withinthe state. RSICs work closely with StateDepartment of Education staff and otherproviders to offer targeted professionaldevelopment designed to acceleratestudent learning within districts acrossthe state. Peer Mentors support school-level personnel and are assigned toschools based on improvement status(School Improvement Year 3 or more).Additionally, Peer Mentors coach schooladministrators and faculty in the analysisof school assessment data and otherfactors that impact student achievement.
Personnel selected for this program areoutstanding teachers nominated by localsuperintendents. Selected individuals are on loan tothe Alabama Department of Education to providesupport in designated districts and schools.
15
Annual Report – 2005-06.qxd 6/20/08 2:02 PM Page 15
Adequate Yearly Progress
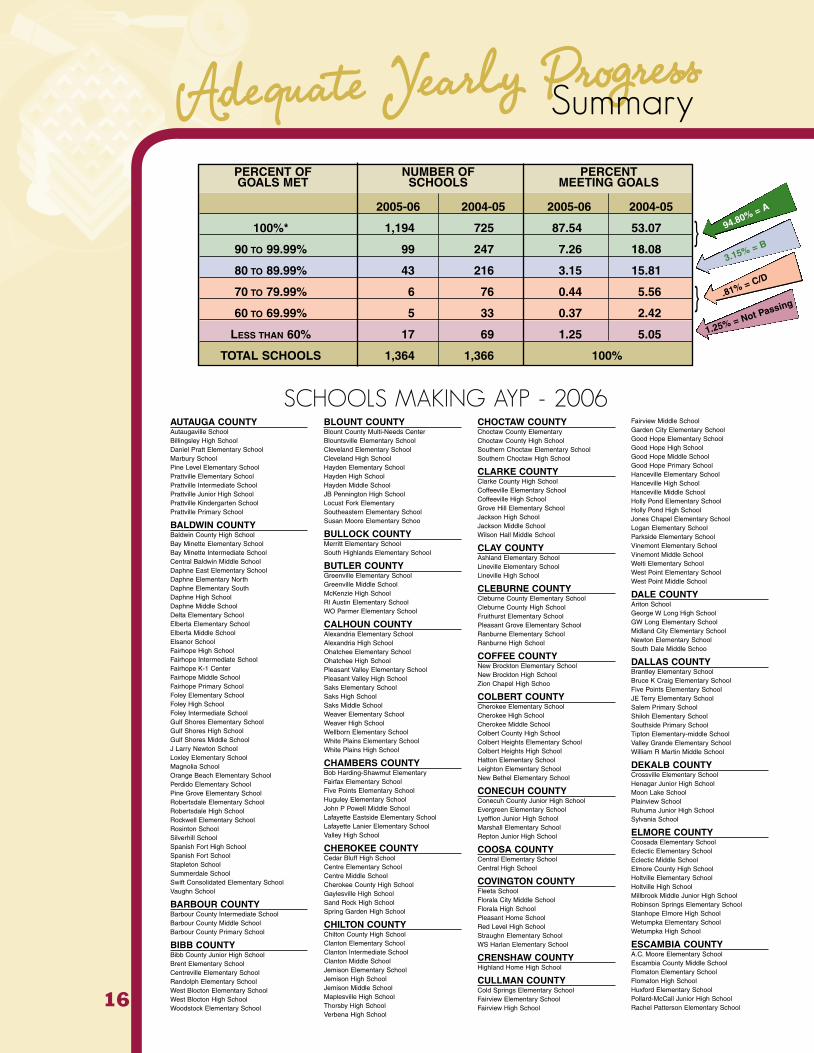
16
PERCENT OF NUMBER OF PERCENTGOALS MET SCHOOLS MEETING GOALS
94.80% = A
3.15% = B
.81% = C/D
{
SCHOOLS MAKING AYP - 2006
1.25% = Not Passing
{
2005-06 2004-05 2005-06 2004-05
100%* 1,194 725 87.54 53.07
90 TO 99.99% 99 247 7.26 18.08
80 TO 89.99% 43 216 3.15 15.81
70 TO 79.99% 6 76 0.44 5.56
60 TO 69.99% 5 33 0.37 2.42
LESS THAN 60% 17 69 1.25 5.05
TOTAL SCHOOLS 1,364 1,366 100%
Summary
AUTAUGA COUNTYAutaugaville SchoolBillingsley High SchoolDaniel Pratt Elementary SchoolMarbury SchoolPine Level Elementary SchoolPrattville Elementary SchoolPrattville Intermediate SchoolPrattville Junior High SchoolPrattville Kindergarten SchoolPrattville Primary School
BALDWIN COUNTYBaldwin County High SchoolBay Minette Elementary SchoolBay Minette Intermediate SchoolCentral Baldwin Middle SchoolDaphne East Elementary SchoolDaphne Elementary NorthDaphne Elementary SouthDaphne High SchoolDaphne Middle SchoolDelta Elementary SchoolElberta Elementary SchoolElberta Middle SchoolElsanor SchoolFairhope High SchoolFairhope Intermediate SchoolFairhope K-1 CenterFairhope Middle SchoolFairhope Primary SchoolFoley Elementary SchoolFoley High SchoolFoley Intermediate SchoolGulf Shores Elementary SchoolGulf Shores High SchoolGulf Shores Middle SchoolJ Larry Newton SchoolLoxley Elementary SchoolMagnolia SchoolOrange Beach Elementary SchoolPerdido Elementary SchoolPine Grove Elementary SchoolRobertsdale Elementary SchoolRobertsdale High SchoolRockwell Elementary SchoolRosinton SchoolSilverhill SchoolSpanish Fort High SchoolSpanish Fort SchoolStapleton SchoolSummerdale SchoolSwift Consolidated Elementary SchoolVaughn School
BARBOUR COUNTYBarbour County Intermediate SchoolBarbour County Middle SchoolBarbour County Primary School
BIBB COUNTYBibb County Junior High SchoolBrent Elementary SchoolCentreville Elementary SchoolRandolph Elementary SchoolWest Blocton Elementary SchoolWest Blocton High SchoolWoodstock Elementary School
BLOUNT COUNTYBlount County Multi-Needs CenterBlountsville Elementary SchoolCleveland Elementary SchoolCleveland High SchoolHayden Elementary SchoolHayden High SchoolHayden Middle SchoolJB Pennington High SchoolLocust Fork ElementarySoutheastern Elementary SchoolSusan Moore Elementary Schoo
BULLOCK COUNTYMerritt Elementary SchoolSouth Highlands Elementary School
BUTLER COUNTYGreenville Elementary SchoolGreenville Middle SchoolMcKenzie High SchoolRl Austin Elementary SchoolWO Parmer Elementary School
CALHOUN COUNTYAlexandria Elementary SchoolAlexandria High SchoolOhatchee Elementary SchoolOhatchee High SchoolPleasant Valley Elementary SchoolPleasant Valley High SchoolSaks Elementary SchoolSaks High SchoolSaks Middle SchoolWeaver Elementary SchoolWeaver High SchoolWellborn Elementary SchoolWhite Plains Elementary SchoolWhite Plains High School
CHAMBERS COUNTYBob Harding-Shawmut ElementaryFairfax Elementary SchoolFive Points Elementary SchoolHuguley Elementary SchoolJohn P Powell Middle SchoolLafayette Eastside Elementary SchoolLafayette Lanier Elementary SchoolValley High School
CHEROKEE COUNTYCedar Bluff High SchoolCentre Elementary SchoolCentre Middle SchoolCherokee County High SchoolGaylesville High SchoolSand Rock High SchoolSpring Garden High School
CHILTON COUNTYChilton County High SchoolClanton Elementary SchoolClanton Intermediate SchoolClanton Middle SchoolJemison Elementary SchoolJemison High SchoolJemison Middle SchoolMaplesville High SchoolThorsby High SchoolVerbena High School
CHOCTAW COUNTYChoctaw County ElementaryChoctaw County High SchoolSouthern Choctaw Elementary SchoolSouthern Choctaw High School
CLARKE COUNTYClarke County High SchoolCoffeeville Elementary SchoolCoffeeville High SchoolGrove Hill Elementary SchoolJackson High SchoolJackson Middle SchoolWilson Hall Middle School
CLAY COUNTYAshland Elementary SchoolLineville Elementary SchoolLineville High School
CLEBURNE COUNTYCleburne County Elementary SchoolCleburne County High SchoolFruithurst Elementary SchoolPleasant Grove Elementary SchoolRanburne Elementary SchoolRanburne High School
COFFEE COUNTYNew Brockton Elementary SchoolNew Brockton High SchoolZion Chapel High Schoo
COLBERT COUNTYCherokee Elementary SchoolCherokee High SchoolCherokee Middle SchoolColbert County High SchoolColbert Heights Elementary SchoolColbert Heights High SchoolHatton Elementary SchoolLeighton Elementary SchoolNew Bethel Elementary School
CONECUH COUNTYConecuh County Junior High SchoolEvergreen Elementary SchoolLyeffion Junior High SchoolMarshall Elementary SchoolRepton Junior High School
COOSA COUNTYCentral Elementary SchoolCentral High School
COVINGTON COUNTYFleeta SchoolFlorala City Middle SchoolFlorala High SchoolPleasant Home SchoolRed Level High SchoolStraughn Elementary SchoolWS Harlan Elementary School
CRENSHAW COUNTYHighland Home High School
CULLMAN COUNTYCold Springs Elementary SchoolFairview Elementary SchoolFairview High School
Fairview Middle SchoolGarden City Elementary SchoolGood Hope Elementary SchoolGood Hope High SchoolGood Hope Middle SchoolGood Hope Primary SchoolHanceville Elementary SchoolHanceville High SchoolHanceville Middle SchoolHolly Pond Elementary SchoolHolly Pond High SchoolJones Chapel Elementary SchoolLogan Elementary SchoolParkside Elementary SchoolVinemont Elementary SchoolVinemont Middle SchoolWelti Elementary SchoolWest Point Elementary SchoolWest Point Middle School
DALE COUNTYAriton SchoolGeorge W Long High SchoolGW Long Elementary SchoolMidland City Elementary SchoolNewton Elementary SchoolSouth Dale Middle Schoo
DALLAS COUNTYBrantley Elementary SchoolBruce K Craig Elementary SchoolFive Points Elementary SchoolJE Terry Elementary SchoolSalem Primary SchoolShiloh Elementary SchoolSouthside Primary SchoolTipton Elementary-middle SchoolValley Grande Elementary SchoolWilliam R Martin Middle School
DEKALB COUNTYCrossville Elementary SchoolHenagar Junior High SchoolMoon Lake SchoolPlainview SchoolRuhuma Junior High SchoolSylvania School
ELMORE COUNTYCoosada Elementary SchoolEclectic Elementary SchoolEclectic Middle SchoolElmore County High SchoolHoltville Elementary SchoolHoltville High SchoolMillbrook Middle Junior High SchoolRobinson Springs Elementary SchoolStanhope Elmore High SchoolWetumpka Elementary SchoolWetumpka High School
ESCAMBIA COUNTYA.C. Moore Elementary SchoolEscambia County Middle SchoolFlomaton Elementary SchoolFlomaton High SchoolHuxford Elementary SchoolPollard-McCall Junior High SchoolRachel Patterson Elementary School
Annual Report – 2005-06.qxd 6/20/08 2:02 PM Page 16
17
W S Neal Elementary SchoolW S Neal Middle School
ETOWAH COUNTYCarlisle Elementary SchoolDuck Springs Elementary SchoolGlencoe Elementary SchoolGlencoe High SchoolGlencoe Middle SchoolHighland Elementary SchoolHokes Bluff Elementary SchoolHokes Bluff High SchoolHokes Bluff Middle SchoolIvalee Elementary SchoolJohn S Jones Elementary SchoolRainbow Middle SchoolSardis High SchoolSouthside Elementary SchoolSouthside High SchoolWest End Elementary SchoolWest End High SchoolWhitesboro Elementary School
FAYETTE COUNTYBerry Elementary SchoolFayette Elementary SchoolFayette Middle School
FRANKLIN COUNTYBelgreen High SchoolEast Franklin Junior High SchoolPhil Campbell Elementary SchoolPhil Campbell High SchoolRed Bay High SchoolTharptown Junior High SchoolVina High School
GENEVA COUNTYGeneva County Elementary SchoolGeneva County Middle SchoolSamson Elementary SchoolSamson Middle SchoolSlocomb Elementary SchoolSlocomb Middle School
GREENE COUNTYCarver Middle SchoolEutaw Primary SchoolParamount Junior High School
HALE COUNTYAkron Community School EastAkron Community School WestGreensboro East Elementary SchoolGreensboro East High SchoolGreensboro West Elementary SchoolGreensboro West High SchoolHale County High SchoolMoundville Elementary SchoolSunshine High School
HENRY COUNTYAbbeville Elementary SchoolAbbeville High SchoolAbbeville Middle SchoolHeadland Elementary SchoolHeadland Middle School
HOUSTON COUNTYAshford Elementary SchoolAshford High SchoolCottonwood High SchoolHouston County High SchoolRehobeth Elementary SchoolRehobeth High SchoolRehobeth Middle SchoolWebb Elementary SchoolWicksburg High SchoolJackson CountyBridgeport Elementary SchoolBridgeport Middle SchoolBryant SchoolDutton Elementary SchoolFlat Rock SchoolHollywood Elementary SchoolMacedonia SchoolNorth Jackson High SchoolNorth Sand Mountain SchoolPaint Rock Valley High SchoolRosalie Elementary SchoolSection High SchoolSkyline High SchoolStevenson Elementary SchoolStevenson Middle School
JEFFERSON COUNTYAdamsville Elementary SchoolBagley Junior High SchoolBottenfield Middle SchoolBragg Middle School
Brighton Middle SchoolBrookville Elementary SchoolBryan Elementary SchoolCenter Point Elementary SchoolChalkville Elementary SchoolClay Elementary SchoolClay-Chalkville High SchoolClay-Chalkville Middle SchoolConcord Elementary SchoolCorner High SchoolCrumly Chapel Elementary SchoolErwin Elementary SchoolErwin High SchoolFultondale Elementary SchoolFultondale High SchoolGardendale Elementary SchoolGardendale High SchoolGrantswood Community Elemen. SchoolGreenwood Elementary SchoolGresham Elementary SchoolGresham Middle SchoolHillview Elementary SchoolHueytown Elementary SchoolHueytown High SchoolHueytown Middle SchoolIrondale Community SchoolKermit Johnson SchoolLipscomb Elementary SchoolMcAdory Elementary SchoolMinor Community SchoolMortimer Jordan High SchoolMount Olive Elementary SchoolNorth Highland Elementary SchoolNorth Jefferson Middle SchoolOak Grove Elementary SchoolPinson Elementary SchoolPinson Valley High SchoolPleasant Grove Elementary SchoolRudd Middle SchoolShades Valley High SchoolSnow Rogers Elementary SchoolWarrior Elementary SchoolWest Jefferson Elementary School
LAMAR COUNTYSouth Lamar SchoolVernon Elementary School
LAUDERDALE COUNTYAnderson Junior High SchoolBrooks Elementary SchoolBrooks High SchoolCentral High SchoolCloverdale Junior High SchoolKilby Laboratory SchoolLauderdale County High SchoolLexington SchoolRogers High SchoolUnderwood Elementary SchoolWaterloo High SchoolWilson High School
LAWRENCE COUNTYEast Lawrence Elementary SchoolEast Lawrence Middle SchoolHatton Elementary SchoolHatton High SchoolHazlewood Elementary SchoolHazlewood High SchoolLawrence County High SchoolMoulton Elementary SchoolMoulton Middle SchoolMount Hope High SchoolR A Hubbard High SchoolSpeake High School
LEE COUNTYBeauregard Elementary SchoolBeauregard High SchoolBeulah Elementary SchoolBeulah High SchoolLoachapoka Elementary SchoolLoachapoka High SchoolSanford Middle SchoolSmiths Station High SchoolSmiths Station IntermediateWacoochee Junior High School
LIMESTONE COUNTYArdmore High SchoolCedar Hill Elementary SchoolClements High SchoolCreekside Elementary SchoolEast Limestone High SchoolElkmont High SchoolJohnson Elementary SchoolOwens Elementary SchoolPiney Chapel Elementary School
Reid Elementary SchoolTanner High SchoolWest Limestone High School
LOWNDES COUNTYCentral Elementary SchoolCentral High SchoolFort Deposit Elementary SchoolHayneville Middle SchoolJackson-Steele Elementary SchoolLowndes County Middle School
MACON COUNTYDC Wolfe SchoolGeorge Washington Carver Elementary SchoolLewis Adams Early Child CenterNotasulga High SchoolTuskegee Institute Middle SchoolTuskegee Public Elementary
MADISON COUNTYBuckhorn High SchoolCentral SchoolEndeavor Elementary SchoolHarvest SchoolHazel Green Elementary SchoolHazel Green High SchoolLynn Fanning Elementary SchoolMadison County Elementary SchoolMadison County High SchoolMadison Cross Roads Elementary SchoolMeridianville Middle SchoolMonrovia Elementary SchoolMonrovia Middle SchoolMount Carmel Elementary SchoolNew Hope Elementary SchoolNew Hope High SchoolNew Market SchoolOwens Cross Roads SchoolRiverton Elementary SchoolRiverton Middle SchoolSparkman Middle SchoolWalnut Grove School
MARENGO COUNTYAmelia L. Johnson High SchoolJohn Essex High SchoolMarengo High SchoolSweet Water High Schoo
MARION COUNTYBrilliant Elementary SchoolBrilliant High SchoolGuin Elementary SchoolHackleburg SchoolHamilton Elementary SchoolHamilton High SchoolHamilton Middle SchoolMarion County High SchoolPhillips Elementary SchoolPhillips High School
MARSHALL COUNTYBrindlee Mountain Middle SchoolClaysville Junior High SchoolDouglas Elementary SchoolDouglas High SchoolDouglas Middle SchoolKate D Smith DAR Elementary SchoolKate D Smith DAR High SchoolKate Duncan Smith DAR MiddleRobert D Sloman PrimaryUnion Grove Elementary School
MOBILE COUNTYAllentown Elementary SchoolBaker High SchoolBen C Rain High SchoolBernice J Causey Middle SchoolBessie C Fonvielle Elementary SchoolBooker T Washington Middle SchoolBreitling Elementary SchoolBurns Middle SchoolCalcedeaver Elementary SchoolCalloway Smith Middle SchoolCF Vigor High SchoolChickasaw School Of Mathematics & ScienceCitronelle High SchoolCora Castlen ElementaryDauphin Island Elementary SchoolDixon Elementary SchoolDunbar Creative Performing ArtsEichold-Mertz Elementary SchoolEight Mile Elementary SchoolElizabeth Fonde Elementary SchoolElsie Collier Elementary SchoolER Dickson Elementary SchoolErwin Craighead Elementary SchoolET Belsaw - Mount Vernon School
Florence Howard Elementary SchoolForest Hill Elementary SchoolGeorge Hall Elementary SchoolGlendale Elementary SchoolGrand Bay Middle SchoolGrant Elementary SchoolHollingers Island Elementary SchoolHolloway ElementaryHutchens Elementary SchoolIndian Springs Elementary SchoolJ E Turner ElementaryJohn Will Elementary SchoolK J Clark Middle SchoolKate Shepard Elementary SchoolLe Flore High SchoolLeinkauf Elementary SchoolLillie B Williamson High SchoolLott Middle SchoolMartha Thomas Elementary SchoolMary B Austin Elementary SchoolMary G Montgomery High SchoolMary W Burroughs Elementary SchoolMaryvale Elementary SchoolMattie T Blount High SchoolMcDavid-Jones Elementary SchoolMeadowlake ElementaryMobile County Training Middle SchoolMorningside Elementary SchoolMurphy High SchoolNan Gray Davis Elementary SchoolNelson Adams Middle SchoolO’Rourke Elementary SchoolOld Shell Creative Performing ArtOlive J Dodge Elementary SchoolOrchard Elementary SchoolPearl Haskew ElementaryPeter F Alba Elementary SchoolPeter Joe Hamilton Elementary SchoolPhillips Preparatory Middle SchoolPillans Middle SchoolRobert E Lee Intermediate Elementary SchoolRobert E Lee Primary Elementary SchoolSaint Elmo Elementary SchoolSaraland Elementary SchoolSatsuma High SchoolSemmes Elementary SchoolSpencer ElementarySW Alabama Regional School Deaf-BlindTanner Williams Elementary SchoolW H Council Traditional SchoolWC Griggs Elementary SchoolWD Robbins Elementary SchoolWestlawn Elementary SchoolWhistler Elementary SchoolWhitley Elementary SchoolWilliam Henry Brazier Elementary SchoolWilmer Elementary SchoolWoodcock Elementary SchoolWP Davidson High School
MONROE COUNTYBeatrice Elementary SchoolJ F Shields High SchoolJ U Blacksher SchoolMonroe County High SchoolMonroe Intermediate SchoolMonroeville Elementary SchoolMonroeville Junior High SchoolMonroeville Middle School
MONTGOMERY COUNTYBaldwin Art And Academics MagnetBear Exploration CenterBooker T Washington Magnet High SchoolBrewbaker Intermediate SchoolBrewbaker Junior High SchoolBrewbaker Primary SchoolBrewbaker Technology Magnet High SchoolCarver Elementary SchoolCatoma Elementary SchoolChildrens CenterChisholm Elementary SchoolCrump Elementary SchoolDalraida Elementary SchoolDannelly Elementary SchoolDavis Elementary SchoolDozier Elementary SchoolDunbar-Ramer SchoolE D Nixon Elementary SchoolFitzpatrick Elementary SchoolFlowers Elementary SchoolFloyd Elementary SchoolFloyd Middle SchoolForest Avenue Elementary SchoolGeorgia Washington Junior High SchoolHalcyon Elementary SchoolHarrison Elementary School
Annual Report – 2005-06.qxd 6/20/08 2:02 PM Page 17

18
Hayneville Road Elementary SchoolHead Elementary SchoolHighland Avenue Elementary SchoolHighland Gardens Elementary SchoolHouston Hill Junior High SchoolJohnson Elementary SchoolLanier Senior High SchoolLoveless Academic Magnet Program High SchoolMacMillan International AcademyMartin Luther King ElementaryMcIntyre Middle SchoolMorningview Elementary SchoolPaterson Elementary SchoolPeterson Elementary SchoolPintlala Elementary SchoolSouthlawn Elementary SchoolT S Morris Elementary SchoolVaughn Road Elementary SchoolWalter T McKee Elementary SchoolWalter T McKee Junior High SchoolWares Ferry Road Elementary SchoolWilliam Silas Garrett Elementary SchoolWynton M Blount Elementary School
MORGAN COUNTYAlbert P Brewer High SchoolCotaco SchoolDanville High SchoolDanville Middle SchoolDanville-Neel Elementary SchoolEva SchoolFalkville Elementary SchoolFalkville High SchoolLaceys Spring Elementary SchoolPriceville Elementary SchoolPriceville High SchoolRyan SchoolSparkman Elementary SchoolUnion Hill SchoolWest Morgan Elementary SchoolWest Morgan High SchoolWest Morgan Middle School
PERRY COUNTYAlbert Turner Sr Elementary SchoolMarion High SchoolUniontown Elementary School
PICKENS COUNTYAliceville Elementary SchoolAliceville High SchoolAliceville Middle SchoolGordo Elementary SchoolGordo High SchoolPickens County High SchoolReform Elementary School
PIKE COUNTYBanks SchoolGoshen Elementary SchoolGoshen High SchoolPike County Elementary School
RANDOLPH COUNTYRandolph County High SchoolRock Mills Junior High SchoolWedowee Middle SchoolWoodland High School
RUSSELL COUNTYDixie Elementary SchoolLadonia Elementary SchoolMount Olive Elementary SchoolOliver Elementary SchoolRussell Elementary School
ST CLAIR COUNTYAshville Elementary SchoolAshville High SchoolAshville Middle SchoolMoody Elementary SchoolMoody Junior High SchoolMoody Middle SchoolOdenville Elementary SchoolOdenville Middle SchoolRagland High SchoolSaint Clair County High SchoolSpringville Elementary SchoolSpringville Middle SchoolSteele Junior High School
SHELBY COUNTYCalera Elementary SchoolCalera High SchoolChelsea Elementary SchoolChelsea High SchoolChelsea Middle SchoolColumbiana Middle SchoolCreek View Elementary SchoolElvin Hill Elementary School
Helena Elementary SchoolHelena Intermediate SchoolInverness Elementary SchoolLinda Nolen Learning CenterMeadow View Elementary SchoolMontevallo Elementary SchoolMontevallo Middle SchoolMt Laurel Elementary SchoolOak Mountain Elementary SchoolOak Mountain High SchoolOak Mountain Intermediate SchoolOak Mountain Middle SchoolPelham High SchoolRiverchase Middle SchoolShelby County High SchoolShelby Elementary SchoolThompson High SchoolThompson Intermediate SchoolThompson Middle SchoolValley Elementary SchoolValley Intermediate SchoolVincent Elementary SchoolVincent Middle High SchoolWilsonville Elementary School
SUMTER COUNTYKinterbish Junior High SchoolLivingston High SchoolLivingston Junior High SchoolNorth Sumter Junior High SchoolSumter County High SchoolYork West End Junior High School
TALLADEGA COUNTYAH Watwood Elementary SchoolBB Comer Memorial Elementary SchoolCharles R Drew Middle SchoolChildersburg Elementary SchoolChildersburg High SchoolChildersburg Middle SchoolFayetteville High SchoolLincoln Elementary SchoolMunford Elementary SchoolMunford Middle SchoolStemley Road Elementary SchoolSycamore SchoolTalladega County Central HighWinterboro High School
TALLAPOOSA COUNTYCouncill Middle SchoolDadeville Elementary SchoolDadeville High SchoolEdward Bell High SchoolHorseshoe Bend High SchoolReeltown High School
TUSCALOOSA COUNTYBrookwood Elementary SchoolBrookwood High SchoolBrookwood Middle SchoolBuhl Elementary SchoolCollins-Riverside Middle SchoolCottondale Elementary SchoolCrestmont Elementary SchoolEchols Middle SchoolEnglewood Elementary SchoolFaucett-Vestavia Elementary SchoolFlatwoods Elementary SchoolHillcrest High SchoolHillcrest Middle SchoolHolt Elementary SchoolHuntington Place Elementary SchoolLloyd Wood Middle SchoolMatthews Elementary SchoolMaxwell Elementary SchoolMyrtlewood Elementary SchoolNorthside High SchoolNorthside Middle SchoolTaylorville Primary SchoolTuscaloosa County High SchoolVance Elementary SchoolWalker Elementary SchoolWestwood Elementary School
WALKER COUNTYBankhead Middle SchoolCarbon Hill Elementary-Junior High SchoolCordova Elementary SchoolCordova High SchoolCurry Elementary SchoolCurry High SchoolCurry Middle SchoolFarmstead Junior High SchoolLupton Junior High SchoolOakman Elementary SchoolOakman High SchoolParrish Elementary SchoolParrish High School
Sipsey Junior High SchoolSumiton Elementary Middle SchoolT S Boyd SchoolTownley Junior High SchoolValley Junior High School
WASHINGTON COUNTYChatom Elementary SchoolFruitdale High SchoolLeroy High SchoolMcIntosh Elementary SchoolMcIntosh High SchoolMillry High SchoolWashington County High School
WILCOX COUNTYABC ElementaryCamden School Of Arts & TechnologyF S Ervin Elementary SchoolGeorge W Watts Elementary SchoolJ E Hobbs Elementary SchoolWilcox Central High School
WINSTON COUNTYAddison Elementary SchoolAddison High SchoolDouble Springs Elementary SchoolDouble Springs Middle SchoolLynn Elementary SchoolLynn High SchoolMeek Elementary SchoolMeek High SchoolWinston County High School
ALBERTVILLE CITYAlabama Avenue Middle SchoolAlbertville Elementary SchoolAlbertville High SchoolBig Spring Lake Kindergarten SchoolEvans Elementary Schoo
ALEXANDER CITYAlexander City Middle SchoolBenjamin Russell High SchoolJim Pearson Elementary SchoolNathaniel H Stephens Elementary SchoolWilliam L Radney Elementary School
ANDALUSIA CITYAndalusia Elementary SchoolAndalusia High SchoolAndalusia Middle School
ANNISTON CITYAnniston High SchoolCobb Elementary SchoolConstantine Elementary SchoolGolden Springs Elementary SchoolRandolph Park Elementary SchoolTenth Street Elementary School
ARAB CITYArab Elementary SchoolArab High SchoolArab Junior High SchoolArab Primary Schoo
ATHENS CITYAthens Elementary SchoolAthens High SchoolAthens Intermediate SchoolAthens Middle SchoolBrookhill Elementary SchoolJames L Cowart Elementary SchoolJulian Newman Elementary School
ATTALLA CITYCurtiston Primary SchoolEtowah High SchoolEtowah Middle SchoolStowers Hill Intermediate Schoo
AUBURN CITYAuburn Early Education CenterAuburn High SchoolAuburn Junior High SchoolCary Woods Elementary SchoolDean Road Elementary SchoolDrake Middle SchoolMargaret Yarbrough SchoolOgletree SchoolWrights Mill Road Elementary School
BESSEMER CITYAbrams Elementary SchoolCharles F Hard Elementary SchoolGreenwood Elementary SchoolJess Lanier High SchoolJonesboro Elementary SchoolWesthills Elementary School
BIRMINGHAM CITYArrington Middle SchoolAvondale Elementary SchoolBarrett Elementary SchoolBush Middle School-MagnetCenter Street MiddleCentral Park Elementary SchoolCharles A Brown Elementary SchoolChristian Alternative SchoolCouncill Elementary SchoolCurry Elementary SchoolDaniel Payne Middle SchoolEnsley High School-MagnetEpic SchoolGaston Elementary SchoolGate City Elementary SchoolGeorge Washington Carver High SchoolGlen Iris Elementary SchoolGoing Elementary School-MagnetGreen Acres Middle SchoolHemphill Elementary SchoolHill Elementary SchoolHudson K-Eight SchoolHuffman High School-MagnetHuffman Middle SchoolInglenook SchoolJackson Elementary SchoolJones Valley Middle SchoolKingston Kindergarten-Eighth Grade SchoolKirby Middle SchoolLewis Elementary SchoolMcElwain Elementary School-MagnetMinor Elementary SchoolN H Price Elementary SchoolNorth Birmingham Elementary SchoolNorth Roebuck Elementary SchoolNorwood Elementary SchoolOliver Elementary SchoolParker High SchoolPowderly Elementary SchoolPrinceton Alternative SchoolRamsay High SchoolRobert C Arthur Elementary SchoolRobert E Lee Elementary SchoolRobinson Elementary SchoolSmith Middle SchoolSouth Hampton ElementarySun Valley Elementary SchoolTR Wright Elementary School-MagnetTuggle Elementary SchoolWashington Elementary SchoolWE Putnam Middle School-MagnetWenonah Elementary SchoolWenonah High SchoolWest End High SchoolWhatley Elementary SchoolWilkerson Middle SchoolWilson Elementary SchoolWylam Elementary School
BOAZ CITYBoaz Elementary SchoolBoaz High SchoolBoaz Intermediate SchoolBoaz Middle SchoolCorley Elementary School
BREWTON CITYBrewton Elementary SchoolBrewton Middle SchoolTR Miller High School
CULLMAN CITYCullman City Primary SchoolCullman High SchoolCullman Middle SchoolEast Elementary SchoolWest Elementary School
DALEVILLE CITYDaleville High SchoolDaleville Middle SchoolNova Learning CenterWindham Elementary School
DECATUR CITYAustinville Elementary SchoolBenjamin Davis Elementary SchoolBrookhaven Middle SchoolCedar Ridge Middle SchoolChestnut Grove Elementary SchoolEastwood Elementary SchoolFrances Nungester Elementary SchoolGordon-Bibb Elementary SchoolJulian Harris Elementary SchoolLeon Sheffield Elementary SchoolOak Park Middle SchoolSomerville Road Elementary SchoolWalter Jackson Elementary School
Annual Report – 2005-06.qxd 6/20/08 2:02 PM Page 18
19
West Decatur Elementary SchoolWoodmeade Elementary School
DEMOPOLIS CITYDemopolis High SchoolDemopolis Middle SchoolUS Jones Elementary SchoolWestside Elementary School
DOTHAN CITYBeverlye Middle SchoolCarver Magnet School For Mathematics,Science and TechnologyCloverdale Elementary SchoolGirard Elementary SchoolGirard Middle SchoolGrandview Elementary SchoolHeard Elementary SchoolHidden Lake Elementary SchoolHighlands Elementary SchoolHoneysuckle Middle SchoolJerry Lee Faine Elementary SchoolKelly Springs Elementary SchoolLandmark Elementary SchoolMontana Academic Magnet SchoolSelma Street Elementary School
ELBA CITYElba Elementary SchoolElba High School
ENTERPRISE CITYCollege Street Elementary SchoolCoppinville SchoolDauphin Junior High SchoolEnterprise High SchoolEnterprise Junior High SchoolHarrand Creek Elementary SchoolHillcrest Elementary SchoolHolly Hill Elementary SchoolPinedale Elementary SchoolRucker Boulevard Elementary School
EUFAULA CITYBluff City Elementary SchoolEufaula High SchoolMoorer Middle SchoolSanford Avenue Elementary SchoolWestern Heights Elementary School
FAIRFIELD CITYDonald Elementary SchoolFairfield High Preparatory SchoolForest Hills Middle SchoolGlen Oaks Elementary SchoolRobinson Elementary School
FLORENCE CITYFlorence Freshman CenterFlorence High SchoolFlorence Middle SchoolForest Hills SchoolHarlan Elementary SchoolHibbett SchoolWeeden Elementary School
FORT PAYNE CITYFort Payne High SchoolFort Payne Middle SchoolWilliams Avenue Elementary SchoolWills Valley Elementary School
GADSDEN CITYCory Middle SchoolDisque Middle SchoolDonehoo Elementary SchoolEura Brown Elementary SchoolGeneral Forrest Middle SchoolGeorge W Floyd Elementary SchoolMitchell Elementary SchoolOscar W Adams Elementary SchoolRay Thompson Elementary SchoolStriplin Elementary SchoolWalnut Park Elementary SchoolGENEVA CITYGeneva High SchoolGeneva Middle SchoolMulkey Elementary School
GUNTERSVILLE CITYCarlisle Park Middle SchoolCherokee Elementary SchoolGuntersville Elementary SchoolGuntersville High School
HALEYVILLE CITYHaleyville Elementary School
HARTSELLE CITYBarkley Bridge Elementary SchoolCrestline Elementary School
FE Burleson Elementary SchoolHartselle High SchoolHartselle Junior High School
HOMEWOOD CITYEdgewood Elementary SchoolHall Kent Elementary SchoolHomewood High SchoolHomewood Middle SchoolShades Cahaba Elementary School
HOOVER CITYBerry Middle SchoolBluff Park Elementary SchoolDeer Valley Elementary SchoolGreen Valley Elementary SchoolGreystone Elementary SchoolGwin Elementary SchoolHoover High SchoolIra F Simmons Middle SchoolRiverchase Elementary SchoolRobert F Bumpus Middle SchoolRocky Ridge Elementary SchoolShades Mountain Elementary SchoolSouth Shades Crest Elementary SchoolSpain Park High SchoolTrace Crossings Elementary School
HUNTSVILLE CITYAcademy For Academics & ArtsAcademy For Science & Foreign LanguageBlossomwood Elementary SchoolChallenger Elementary SchoolChallenger Middle SchoolChapman Elementary SchoolChapman Middle SchoolColumbia High SchoolDavis Hills Middle SchoolEast Clinton Elementary SchoolEdward White Middle SchoolFarley Elementary SchoolHampton Cove ElementaryHampton Cove Middle SchoolHighlands Elementary SchoolHuntsville High SchoolHuntsville Middle SchoolJames E Williams SchoolJO Johnson High SchoolJones Valley Elementary SchoolLakewood Elementary SchoolLincoln Elementary SchoolLouis J Morris Elementary SchoolMartin Luther King Jr Elementary SchoolMcDonnell Elementary SchoolMonte Sano Elementary SchoolMontview Elementary SchoolMountain Gap Elementary SchoolMountain Gap Middle SchoolNew Century Technology Demo High SchoolProvidence SchoolRidgecrest Elementary SchoolRoger B Chaffee Elementary SchoolRolling Hills Elementary SchoolRoy L Stone Middle SchoolTerry Heights Elementary SchoolUniversity Place Elementary SchoolVirgil Grissom High SchoolWeatherly Heights Elementary SchoolWest Huntsville Elementary SchoolWest Mastin Lake Elementary SchoolWhitesburg Elementary SchoolWhitesburg Middle School
JACKSONVILLE CITYJacksonville High SchoolKitty Stone Elementary School
JASPER CITYMaddox Middle SchoolMemorial Park Elementary SchoolNorth Highland SchoolT R Simmons Elementary SchoolWalker High SchoolWest Jasper Elementary School
LANETT CITYLanett Central Elementary SchoolLanett Junior High SchoolLanett Senior High School
LEEDS CITYLeeds Elementary SchoolLeeds High SchoolLeeds Middle SchoolLinden CityGeorge P Austin Junior High SchoolLinden Elementary SchoolLinden High School
MADISON CITYBob Jones High SchoolColumbia Elementary SchoolDiscovery Middle SchoolHeritage Elementary SchoolHorizon Elementary SchoolLiberty Middle SchoolMadison Elementary SchoolRainbow Elementary SchoolWest Madison Elementary School
MIDFIELD CITYMidfield Elementary SchoolMidfield High SchoolRutledge School
MOUNTAIN BROOK CITYBrookwood Forest Elementary SchoolCherokee Bend Elementary SchoolCrestline Elementary SchoolMountain Brook Elementary SchoolMountain Brook High SchoolMountain Brook Junior High School
MUSCLE SHOALS CITYHighland Park Elementary SchoolHowell-Graves PreschoolMcBride Elementary SchoolMuscle Shoals High SchoolMuscle Shoals Middle SchoolWebster Elementary Schoo
ONEONTA CITYOneonta Elementary SchoolOneonta High School
OPELIKA CITYCarver Primary SchoolJeter Primary SchoolMorris Avenue Intermediate SchoolNorthside SchoolOpelika High SchoolOpelika Middle SchoolSouthview Primary SchoolWest Forest Intermediate School
OPP CITYOpp Middle SchoolSouth Highlands Elementary School
OXFORD CITYCE Hanna SchoolColdwater Elementary SchoolDe Armanville Elementary SchoolOxford Elementary SchoolOxford High SchoolOxford Middle School
OZARK CITYCarroll High SchoolD A Smith Middle SchoolHarry N Mixon Elementary SchoolJoseph W Lisenby Elementary SchoolM Thompkins Early Childhood SchoolVivian B Adams School
PELL CITYCoosa Valley Elementary SchoolDuran Junior High SchoolDuran SouthEden Elementary SchoolIola Roberts Elementary SchoolWalter M Kennedy School
PHENIX CITYCentral High SchoolLakewood Elementary SchoolMeadowlane Elementary SchoolPhenix City Elementary SchoolPhenix City Intermediate SchoolRidgecrest Elementary SchoolSherwood Elementary SchoolSouth Girard SchoolWestview Elementary School
PIEDMONT CITYPiedmont Elementary SchoolPiedmont High SchoolPiedmont Middle School
ROANOKE CITYHandley Middle SchoolKnight Enloe Elementary School
RUSSELLVILLE CITYRussellville Elementary SchoolRussellville High SchoolRussellville Middle SchoolWest Elementary School
SCOTTSBORO CITYBrownwood Elementary SchoolCaldwell Elementary SchoolCollins Elementary SchoolScottsboro High SchoolScottsboro Junior High SchoolThurston T Nelson Elementary School
SELMA CITYByrd Elementary SchoolCedar Park Elementary SchoolClark Elementary SchoolEdgewood Elementary SchoolKnox Elementary SchoolMeadowview Elementary SchoolPayne Elementary SchoolSchool Of Discovery Genesis CenterSelma High SchoolSophia P Kingston Elementary School
SHEFFIELD CITYL E Willson Elementary SchoolSheffield High SchoolSheffield Junior High SchoolWA Threadgill Primary School
SYLACAUGA CITYIndian Valley Elementary SchoolNichols-Lawson Middle SchoolPinecrest Elementary SchoolSylacauga High School
TALLADEGA CITYC L Salter Elementary SchoolEvelyn D Houston Elementary SchoolGraham Elementary SchoolNorthside-Henderson Elementary SchoolRaymond L Young Elementary School
TALLASSEE CITYSouthside Middle SchoolTallassee Elementary SchoolTallassee High Schoo
TARRANT CITYTarrant Elementary SchoolTarrant Middle Schoo
THOMASVILLE CITYThomasville Elementary SchoolThomasville High SchoolThomasville Middle School
TROY CITYCharles Henderson High SchoolCharles Henderson MiddleTroy Elementary School
TUSCALOOSA CITYAlberta Elementary SchoolArcadia Elementary SchoolNorthington Elementary SchoolNorthridge High SchoolOak Hill SchoolRock Quarry Elementary SchoolSkyland Elementary SchoolTuscaloosa Middle SchoolUniversity Place Montessori SchoolVerner Elementary SchoolWoodland Forrest Elementary School
TUSCUMBIA CITYDeshler High SchoolDeshler Middle SchoolG W Trenholm Primary SchoolR E Thompson Intermediate School
VESTAVIA HILLS CITYCahaba Heights Community SchoolLiberty Park ElementaryLouis Pizitz Middle SchoolVestavia Hills Elementary CentralVestavia Hills Elementary School EastVestavia Hills Elementary School WestVestavia Hills High School
WINFIELD CITYWinfield Elementary SchoolWinfield High SchoolWinfield Middle School
TRUSSVILLE CITYHewitt-Trussville Middle SchoolPaine Intermediate SchoolPaine Primary School
Annual Report – 2005-06.qxd 6/20/08 2:02 PM Page 19
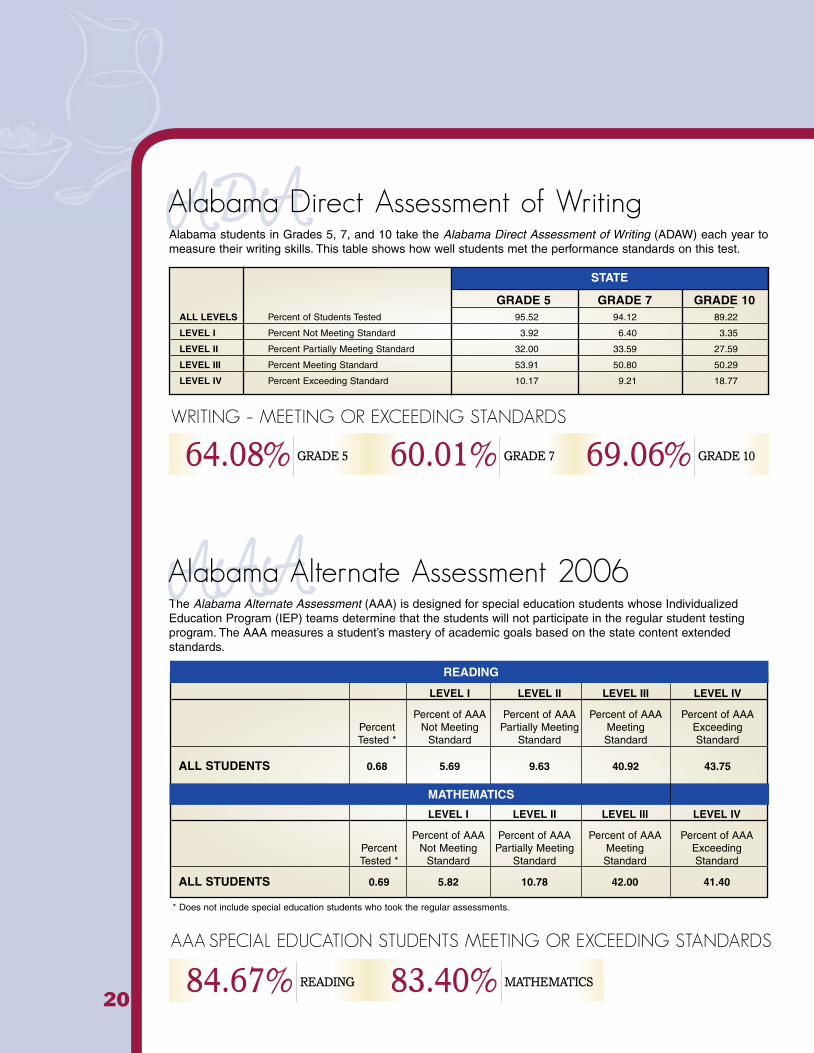
ADA
20
STATE
GRADE 5 GRADE 7 GRADE 10ALL LEVELS Percent of Students Tested 95.52 94.12 89.22
LEVEL I Percent Not Meeting Standard 3.92 6.40 3.35
LEVEL II Percent Partially Meeting Standard 32.00 33.59 27.59
LEVEL III Percent Meeting Standard 53.91 50.80 50.29
LEVEL IV Percent Exceeding Standard 10.17 9.21 18.77
Alabama students in Grades 5, 7, and 10 take the Alabama Direct Assessment of Writing (ADAW) each year tomeasure their writing skills. This table shows how well students met the performance standards on this test.
WRITING – MEETING OR EXCEEDING STANDARDS
STATE
LEVEL I LEVEL II LEVEL III LEVEL IV
Percent of AAA Percent of AAA Percent of AAA Percent of AAAPercent Not Meeting Partially Meeting Meeting ExceedingTested * Standard Standard Standard Standard
ALL STUDENTS 0.68 5.69 9.63 40.92 43.75
LEVEL I LEVEL II LEVEL III LEVEL IV
Percent of AAA Percent of AAA Percent of AAA Percent of AAAPercent Not Meeting Partially Meeting Meeting ExceedingTested * Standard Standard Standard Standard
ALL STUDENTS 0.69 5.82 10.78 42.00 41.40
MATHEMATICS
* Does not include special education students who took the regular assessments.
READING
The Alabama Alternate Assessment (AAA) is designed for special education students whose IndividualizedEducation Program (IEP) teams determine that the students will not participate in the regular student testingprogram. The AAA measures a student’s mastery of academic goals based on the state content extendedstandards.
AAA
69.06% GRADE 1060.01% GRADE 764.08% GRADE 5
83.40% MATHEMATICS84.67% READING
Alabama Direct Assessment of Writing
Alabama Alternate Assessment 2006
AAA SPECIAL EDUCATION STUDENTS MEETING OR EXCEEDING STANDARDS
Annual Report – 2005-06.qxd 6/20/08 2:02 PM Page 20
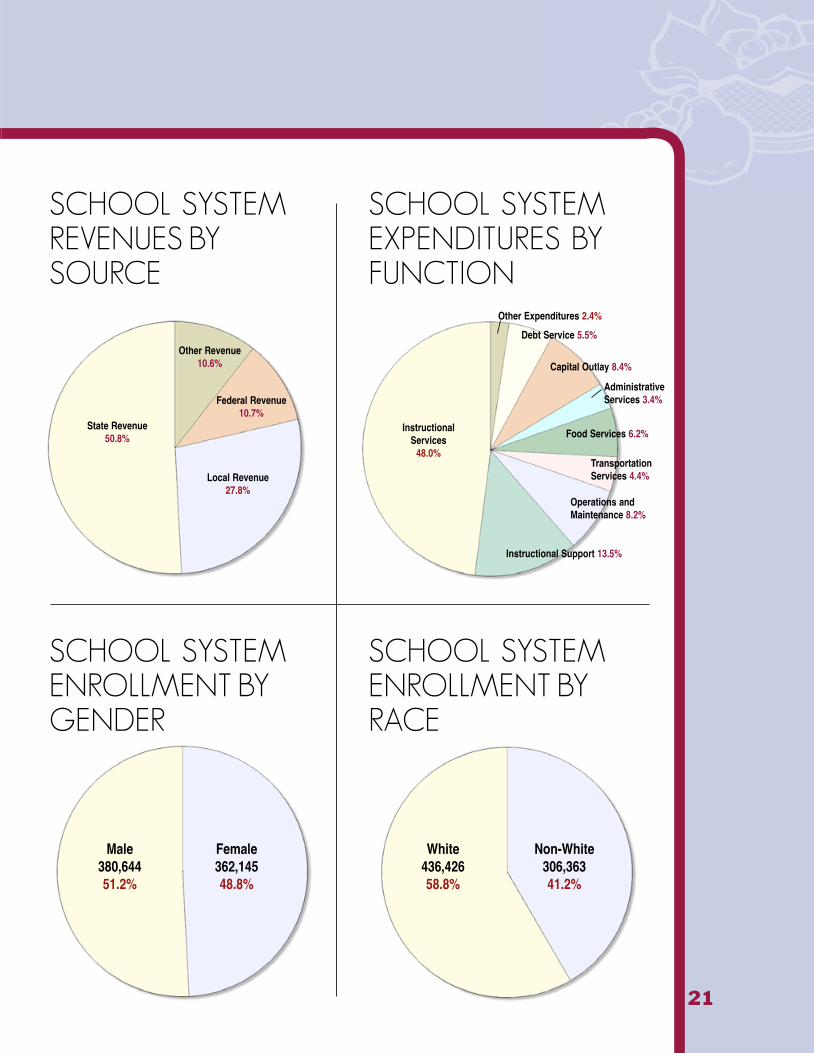
21
SCHOOL SYSTEMEXPENDITURES BYFUNCTION
SCHOOL SYSTEMREVENUES BYSOURCE
SCHOOL SYSTEMENROLLMENT BYRACE
SCHOOL SYSTEMENROLLMENT BYGENDER
InstructionalServices
48.0%
State Revenue50.8%
Male380,64451.2%
Female362,14548.8%
White436,42658.8%
Non-White306,36341.2%
Other Revenue10.6%
Federal Revenue10.7%
Local Revenue27.8%
Other Expenditures 2.4%
Debt Service 5.5%
Capital Outlay 8.4%
Administrative Services 3.4%
Food Services 6.2%
Transportation Services 4.4%
Operations and Maintenance 8.2%
Instructional Support 13.5%
Annual Report – 2005-06.qxd 6/20/08 2:02 PM Page 21
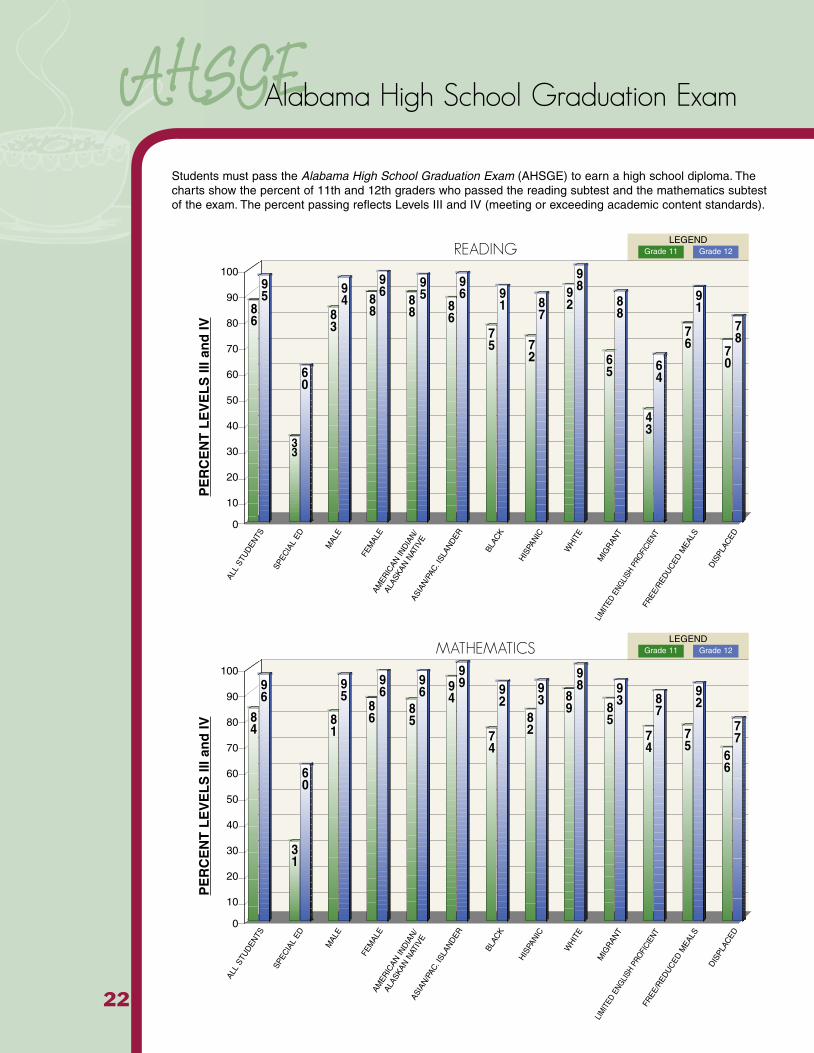
AHSGE
22
READING100
90
80
70
60
50
40
30
20
10
0
PE
RC
EN
T L
EV
EL
S II
I an
d IV
Students must pass the Alabama High School Graduation Exam (AHSGE) to earn a high school diploma. Thecharts show the percent of 11th and 12th graders who passed the reading subtest and the mathematics subtestof the exam. The percent passing reflects Levels III and IV (meeting or exceeding academic content standards).
ALL
STU
DEN
TS
FEM
ALE
WH
ITE
BLAC
K
AMER
ICAN
IND
IAN
/
ALAS
KAN
NAT
IVE
SPEC
IAL
ED
FREE
/RED
UC
ED M
EALS
MAL
E
HIS
PAN
IC
ASIA
N/P
AC. I
SLAN
DER
MIG
RAN
T
LIM
ITED
ENG
LISH
PRO
FICI
ENT
DIS
PLAC
ED
LEGENDGrade 12Grade 11
86
95
70
78
91
76
64
43
65
88
989
287
72
91
75
96
86
958
8
968
8
94
83
60
33
MATHEMATICS100
90
80
70
60
50
40
30
20
10
0
PE
RC
EN
T L
EV
EL
S II
I an
d IV
ALL
STU
DEN
TS
FEM
ALE
WH
ITE
BLAC
K
AMER
ICAN
IND
IAN
/
ALAS
KAN
NAT
IVE
SPEC
IAL
ED
FREE
/RED
UC
ED M
EALS
MAL
E
HIS
PAN
IC
ASIA
N/P
AC. I
SLAN
DER
MIG
RAN
T
LIM
ITED
ENG
LISH
PRO
FICI
ENT
DIS
PLAC
ED
LEGENDGrade 12Grade 11
Alabama High School Graduation Exam
84
96
31
60
81
95
86
96
85
96 9
4
99
74
92
82
93 8
9
98
85
93
74
87
75
92
66
77
Annual Report – 2005-06.qxd 6/20/08 2:02 PM Page 22

READING MATHEMATICS READING MATHEMATICS
Percent Percent Percent Percent Percent Percent Percent PercentTested Level III Level IV Tested Level III Level IV Levels III and IV Levels III and IV
All Students 96.55 64.90 20.73 96.57 65.22 18.39 95.25 95.69
Special Education 85.26 31.57 1.52 85.39 29.22 1.98 60.25 60.22
Male 96.03 64.77 18.53 95.99 63.04 18.39 94.21 94.85
Female 97.05 65.02 22.85 97.13 67.30 18.40 96.21 96.47
American Indian/Alaskan Native 96.96 66.58 21.15 97.47 65.71 19.22 95.32 96.30
Asian/Pacific Islander 91.82 54.79 30.73 91.00 44.94 48.76 95.76 99.25
Black 95.07 67.44 7.93 95.36 65.97 8.03 90.79 92.04
Hispanic 95.46 58.78 12.95 95.96 66.36 15.64 87.31 93.44
White 97.50 63.82 27.77 97.36 65.08 23.67 97.77 97.59
Migrant 98.68 50.67 14.67 98.68 68.00 17.33 87.93 92.99
Limited English Proficient 92.64 40.73 2.32 92.02 59.67 14.67 63.94 86.89
Poverty 95.20 66.75 9.18 95.36 65.95 8.73 90.58 92.23
Displaced 71.97 61.07 9.16 73.63 56.72 9.70 77.61 77.27
23
PERCENT OF POSITIVE PLACEMENTS IN CTEThis represents the percentage of students who completed a career and technical program of studies and took a job in a related field or enrolled in postsecondary studies.
GRADE 11 GRADE 12
PROJECTED PERCENT
53.9%
PROJECTED PERCENT
88.2%
PROJECTED PERCENT
84.9%
GRADE B
CAREER AND TECHNICAL EDUCATION (CTE)Business/Industry Certification (BIC) is a means of assisting CTE programs toimprove by setting standards against which all programs can measure progress.The goal is for all programs to remain in compliance with business/industrystandards. The number indicates the percentage of programs that remain incompliance. The letter grade measures whether or not these programs are ontrack to meet that goal.
PERCENT OF HIGH SCHOOL STUDENTS ENROLLED IN CTE CLASSESThis is the percentage of students in Grades 9-12 who are enrolled in career and technical education coursework as compared to the overall student population in Grades 9-12.
Annual Report – 2005-06.qxd 6/20/08 2:02 PM Page 23
Fundingin Public Education
24
PUBLIC EDUCATION IN ALABAMA IS FUNDEDFROM THREE BASIC SOURCES:1. One source of revenue is the state Education Trust Fund
(ETF), which is funded from tax revenues raised primarilyfrom sales and income taxes.
2. The second source of public education funding is derivedfrom local tax receipts which, as of FY 1998, must beequivalent to 10 mills of school tax based upon the mostcurrent assessed valuation of property. Under the currentlaw, these two sources of revenue create the FoundationProgram Fund to cover the cost of the FoundationProgram calculations.
3. A third revenue source, the Public School Fund, is fundedfrom 3 mills of the 6 1/2 mills of ad valorem tax. ThePublic School Fund is used to fund Capital Projects.
PUBLIC EDUCATION IN ALABAMA� Foundation Program
(1) Education Trust Fund (Sales and Income Tax)(2) Local Tax Receipts (Equivalent to 10 mills)
� Capital Projects(3) Public School Fund (3 mills Ad Valorem Tax)
� The Foundation Program, enacted by the AlabamaLegislature in 1995, is a funding mechanism to calculate thecost for K-12 education. It is designed to give local schoolsystems maximum control of expenditures by apportioningfunds in a “block grant” manner based on cost calculationsusing prior year data, such as average daily membership(ADM). The Foundation Program, as codified in Code ofAlabama, 16-13-231(b), provides the following for theFoundation Program Fund:
� Requirements for Participating in the FoundationProgram Fund
� Determining Cost of Foundation Program� Determining Funds Available to Provide Foundation
Program
PARTICIPATION REQUIREMENTS� The local school system has requirements for participatingin the Foundation Program Fund. Each school system mustreceive local tax receipts equivalent to 10 mills of school taxas computed from the most current assessed valuation ofproperty. The required contribution to the local board’sFoundation Program was phased in over three years. For1995-96 it was 5 mills, for 1996-97 it was 7.5 mills, and in1997-98 and thereafter it increased to 10 mills.� Other participation requirements include the following:
� A minimum of 187-day school year.� A local salary schedule that is at least 100% of salaryamounts specified in the state salary matrix.
� Equitable allocation of state and local FoundationProgram funds to each school based on the currentyear’s actual student populations.
� Submission to the State Superintendent of Education seven program plans.
(1) Building(2) Transportation(3) Professional development
(4) Technology(5) Special education(6) Career and Technical education services(7) Educational services for at-risk students
� State and local Foundation Program funds should beallocated to each school in an equitable manner, based onneeds of the students and schools, as reflected in thecurrent year’s actual student population.� A report should be submitted annually to the State Boardof Education detailing that state/local funds for publiceducation have been allocated (Budgets and FinancialStatements that are Funding, Program, and Cost CenterBased).
DETERMINING COST OF FOUNDATION PROGRAM� The four cost areas within the Foundation Program:
(1) Salary(2) Fringe Benefits(3) Other Current Expense (OCE)(4) Classroom Instructional Support
� Textbooks� Library Enhancement� Technology� Professional Development� Classroom Materials and Supplies
DETERMINING FUNDS AVAILABLE TO PAY FOUNDATION PROGRAM� Once the cost of the Foundation Program is determinedfor a local school system, the ETF funds are calculated.The total Foundation Program cost minus the required local10 mills equals the amount of ETF funds the system willreceive. The ETF funds received by a local school systemare dependent upon and varies based on the local propertyvalues within the school tax districts.
FOUNDATIONPROGRAM
PURPOSE/DESCRIPTION� Priority on K-12 funding� Address equity� Maximize local control – block grants� Identify total state cost of K-12� Annual funding stream for capital projects� Report to the local communities
FUNDING PLAN COMPONENTS� Foundation Program (Funds K-12)� Public School Fund (Funds capital projects)� Transportation� Accountability
TOTAL UNITS EARNEDTotal Units = Teacher Units Earned + Instructional SupportUnits Earned� Principals � Assistant Principals� Counselors � Librarians
Annual Report – 2005-06.qxd 6/20/08 2:02 PM Page 24
25
TEACHER UNITS� ADM – First 40 days (by school and grade)� Grade Divisors
� K-3 = 13.8 � 4-6 = 21.4 � 7-8 = 20.1 � 9-12 = 18
INSTRUCTIONAL SUPPORT UNITS� Average Daily Membership - First 40 days
(by school and grade)� Accreditation standards used in determining instructional
support units earned� Principals � Assistant Principals� Counselors � Librarians
� Area Career and Technical Education Centers� Career and Technical Education Administrators� Career and Technical Education Counselors
DETERMINING THE COST� Salaries/Total Units
� Convert units to dollars using the minimum salaryschedule (180-day contracts)
� Salary funds earned must be used for instructionalsalaries
� Fringe/Total Units� PEEHIP (Health Insurance) � Retirement� Medicare � FICA� Unemployment Compensation� Leave (personal, sick)
� Other Current Expense (OCE)� Amount per unit� Purpose:
- School non-instructional staff salaries and fringes- School operating costs- Central office costs other than transportation- Fringe benefits and pay increases for Child
Nutrition personnel
� Classroom Instructional Support� Teacher materials and supplies $525/unit� Technology $181/unit� Library Enhancement $135/unit� Professional Development $60/unit� Textbooks $67.50/ADM
ALLOCATION OF FUNDS� Local effort required contribution = 10 mills� State funds = total Foundation Program cost – local
effort (10 mills)
CURRENT UNITS – ($$$ FOR GROWTH)� Projections are calculated for budgeting purposes in theappropriation bill using the previous two years’ average dailymembership and average Foundation Program cost per unit.� Actual allocations are made in December based on theincrease in the current year over the prior year average dailymembership using the average Foundation Program unit cost.
BUDGET CONSTRAINTS� Classroom teachers must be paid at least 100% of thesalary matrix.� Salaries expended from Foundation Program funds must beas large as salaries calculated in cost of Foundation Program.� Expenditures for career and technical education must be atleast equal to FY 1995 expenditures.� Expenditures for classroom materials and supplies must bebudgeted for all teachers at same amount per unit asFoundation Program.� Expenditures for textbooks must be budgeted for all currentyear students at the amount per ADM as Foundation Program.� Expenditures for technology, library enhancement, andprofessional development must be budgeted based on thenumber of current year teachers at the amount calculated inthe Foundation Program.
CAPITAL PROJECTS� May be used on:
1. Facilities2. Educational technology and equipment
� Long-range capital plan required� Requires local fund match based on yield per mill per ADMof district ad valorem property tax
TRANSPORTATION� Allocates funds equitably based on statewide averages forcost per student and cost per mile� Designates specific funds set aside for fleet renewal andoperational expenses for the bus fleet.
ACCOUNTABILITY� Must be fiscally accountable� Annual financial documents
� Annual budgets� Financial statements� Cost center based� Program based� Funding source based
� State Board of Education directed to require, approve, andaudit budgets, financial statements, and other necessaryreports to assess financial stability� State Board of Education will provide assistance if fiscallyunsound� Annual Accountability Reports to the public including, butnot limited to, the following:
� Funding and expenditure report� Student achievement report� School safety and discipline report
� Principals and teachers must be given opportunity toparticipate in decisions during budget development concerningthe expenditure of classroom instructional support funds
Annual Report – 2005-06.qxd 6/20/08 2:02 PM Page 25
FundingAllocations
26
STATE ALLOCATIONS - FY 2006Total ADM................................................................................................................................733,925.73Foundation Program Units
Teachers ..............................................................................................................................41,965.00Principals................................................................................................................................1,290.00Assistant Principals ..................................................................................................................697.50Counselors ............................................................................................................................1,464.50Librarians ..............................................................................................................................1,703.75CTE Administrators ....................................................................................................................73.00CTE Counselors..........................................................................................................................54.29
Total Units ................................................................................................................................47,248.04
Foundation Program (State and Local Funds)Salaries ........................................................................................................................1,905,291,077Fringe Benefits ................................................................................................................694,055,561Other Current Expense ............................($13,831/unit) ................................................653,501,982Classroom Instructional Support
Student Materials ........................................($525/unit) ..................................................24,805,240Technology ..................................................($181/unit) ....................................................8,551,901Library Enhancement ..................................($200/unit) ....................................................9,449,608Professional Development..............................($90/unit) ....................................................4,252,329Common Purchase ......................................($100/unit) ....................................................4,724,804Textbooks ................................................($67.50/ADM)..................................................49,540,059
Total Foundation Program ..............................................................................................3,354,172,561
State FundsFoundation Program - ETF ........................................................................................2,978,823,751School Nurses Program ......................................................................................................6,756,889High Hopes ..........................................................................................................................5,885,927Salaries - 1% per Act 97-238 ............................................................................................18,994,724Technology Coordinator ......................................................................................................4,585,000Transportation
Operating Allocation ......................................................................................................229,123,934Fleet Renewal ..........................................($5,413/bus) ..................................................35,254,869
Current Units (FY 2006) ..................................................................................................25,496,816Capital Purchase..............................................................................................................130,000,000At Risk................................................................................................................................30,078,405Preschool Program ..............................................................................................................2,082,711
Total State Funds ..............................................................................................................3,467,083,026
Local FundsFoundation Program ........................................(10 Mills) ................................................375,348,810Capital Purchase......................................(.802587 Mills) ..................................................30,125,016
Total Local Funds ................................................................................................................405,473,826
Annual Report – 2005-06.qxd 6/20/08 2:02 PM Page 26
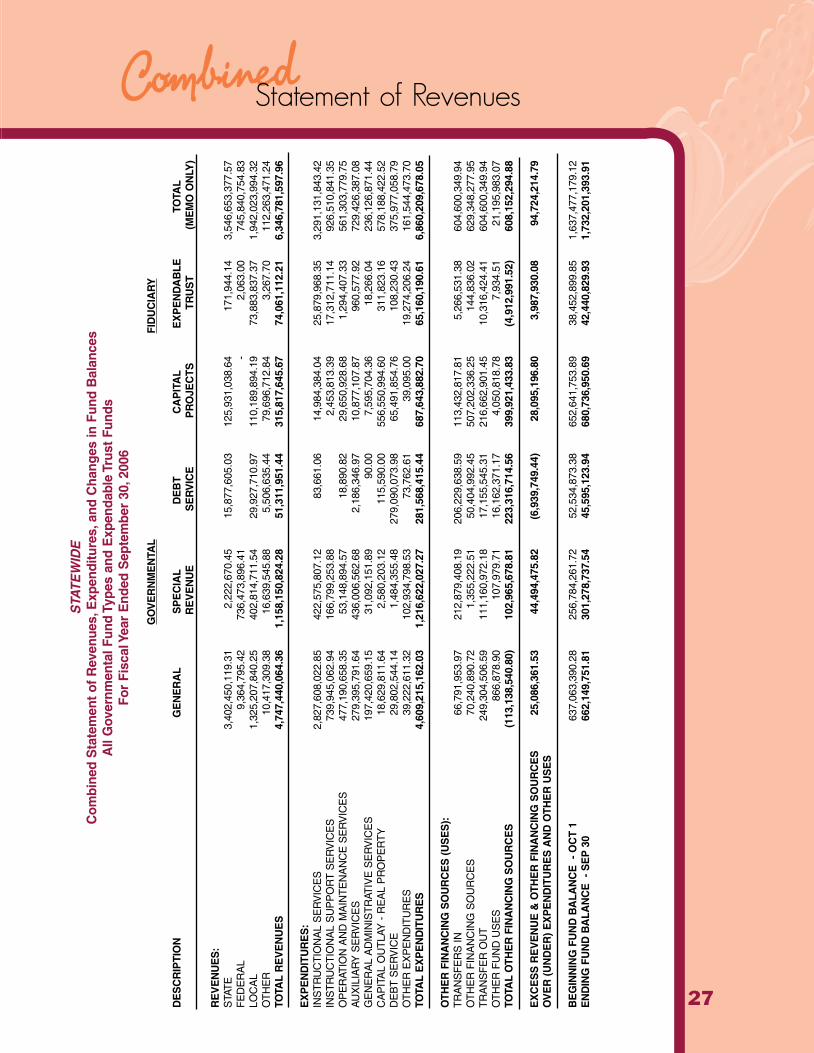
CombinedStatement of Revenues
27
STA
TEW
IDE
Com
bine
d S
tate
men
t of
Rev
enue
s,E
xpen
ditu
res,
and
Cha
nges
in F
und
Bal
ance
sA
ll G
over
nmen
tal F
und
Type
s an
d E
xpen
dabl
e Tr
ust
Fund
sFo
r Fi
scal
Yea
r E
nded
Sep
tem
ber
30,2
006
GO
VE
RN
ME
NTA
LFI
DU
CIA
RY
DE
SC
RIP
TIO
NG
EN
ER
AL
SP
EC
IAL
DE
BT
CA
PIT
AL
EX
PE
ND
AB
LETO
TAL
RE
VE
NU
ES
ER
VIC
EP
RO
JEC
TSTR
US
T(M
EM
O O
NLY
)
RE
VE
NU
ES
:S
TAT
E3,
402,
450,
119.
31
2,22
2,67
0.45
15
,877
,605
.03
12
5,93
1,03
8.64
17
1,94
4.14
3,
546,
653,
377.
57
FE
DE
RA
L9,
364,
795.
42
736,
473,
896.
41
-
2,06
3.00
74
5,84
0,75
4.83
LO
CA
L1,
325,
207,
840.
25
402,
814,
711.
54
29,9
27,7
10.9
7
110,
189,
894.
19
73,8
83,8
37.3
7
1,94
2,02
3,99
4.32
O
TH
ER
10,4
17,3
09.3
8
16,6
39,5
45.8
8
5,50
6,63
5.44
79
,696
,712
.84
3,
267.
70
112,
263,
471.
24
TOTA
L R
EV
EN
UE
S4,
747,
440,
064.
36
1,15
8,15
0,82
4.28
51
,311
,951
.44
31
5,81
7,64
5.67
74
,061
,112
.21
6,
346,
781,
597.
96
EX
PE
ND
ITU
RE
S:
INS
TR
UC
TIO
NA
L S
ER
VIC
ES
2,82
7,60
8,02
2.85
42
2,57
5,80
7.12
83
,661
.06
14
,984
,384
.04
25
,879
,968
.35
3,
291,
131,
843.
42
INS
TR
UC
TIO
NA
L S
UP
PO
RT
SE
RV
ICE
S73
9,94
5,06
2.94
16
6,79
9,25
3.88
2,
453,
813.
39
17,3
12,7
11.1
4
926,
510,
841.
35
OP
ER
ATIO
N A
ND
MA
INT
EN
AN
CE
SE
RV
ICE
S47
7,19
0,65
8.35
53
,148
,894
.57
18
,890
.82
29
,650
,928
.68
1,
294,
407.
33
561,
303,
779.
75
AU
XIL
IAR
Y S
ER
VIC
ES
279,
395,
791.
64
436,
006,
562.
68
2,18
6,34
6.97
10
,877
,107
.87
96
0,57
7.92
72
9,42
6,38
7.08
G
EN
ER
AL
AD
MIN
IST
RAT
IVE
SE
RV
ICE
S19
7,42
0,65
9.15
31
,092
,151
.89
90
.00
7,59
5,70
4.36
18
,266
.04
23
6,12
6,87
1.44
C
AP
ITA
L O
UT
LAY
- R
EA
L P
RO
PE
RT
Y18
,629
,811
.64
2,
580,
203.
12
115,
590.
00
556,
550,
994.
60
311,
823.
16
578,
188,
422.
52
DE
BT
SE
RV
ICE
29,8
02,5
44.1
4
1,48
4,35
5.48
27
9,09
0,07
3.98
65
,491
,854
.76
10
8,23
0.43
37
5,97
7,05
8.79
O
TH
ER
EX
PE
ND
ITU
RE
S39
,222
,611
.32
10
2,93
4,79
8.53
73
,762
.61
39
,095
.00
19
,274
,206
.24
16
1,54
4,47
3.70
TO
TAL
EX
PE
ND
ITU
RE
S4,
609,
215,
162.
03
1,21
6,62
2,02
7.27
28
1,56
8,41
5.44
68
7,64
3,88
2.70
65
,160
,190
.61
6,
860,
209,
678.
05
OTH
ER
FIN
AN
CIN
G S
OU
RC
ES
(U
SE
S):
TR
AN
SF
ER
S IN
66,7
91,9
53.9
7
212,
879,
408.
19
206,
229,
638.
59
113,
432,
817.
81
5,26
6,53
1.38
60
4,60
0,34
9.94
O
TH
ER
FIN
AN
CIN
G S
OU
RC
ES
70,2
40,8
90.7
2
1,35
5,22
2.51
50
,404
,992
.45
50
7,20
2,33
6.25
14
4,83
6.02
62
9,34
8,27
7.95
T
RA
NS
FE
R O
UT
249,
304,
506.
59
111,
160,
972.
18
17,1
55,5
45.3
1
216,
662,
901.
45
10,3
16,4
24.4
1
604,
600,
349.
94
OT
HE
R F
UN
D U
SE
S86
6,87
8.90
10
7,97
9.71
16
,162
,371
.17
4,
050,
818.
78
7,93
4.51
21
,195
,983
.07
TO
TAL
OTH
ER
FIN
AN
CIN
GS
OU
RC
ES
(113
,138
,540
.80)
10
2,96
5,67
8.81
22
3,31
6,71
4.56
39
9,92
1,43
3.83
(4
,912
,991
.52)
60
8,15
2,29
4.88
EX
CE
SS
RE
VE
NU
E &
OTH
ER
FIN
AN
CIN
G S
OU
RC
ES
25
,086
,361
.53
44
,494
,475
.82
(6
,939
,749
.44)
28
,095
,196
.80
3,
987,
930.
08
94,7
24,2
14.7
9 O
VE
R (
UN
DE
R)
EX
PE
ND
ITU
RE
S A
ND
OTH
ER
US
ES
BE
GIN
NIN
G F
UN
D B
ALA
NC
E -
OC
T 1
637,
063,
390.
28
256,
784,
261.
72
52,5
34,8
73.3
8
652,
641,
753.
89
38,4
52,8
99.8
5
1,63
7,47
7,17
9.12
E
ND
ING
FU
ND
BA
LAN
CE
- S
EP
30
662,
149,
751.
81
301,
278,
737.
54
45,5
95,1
23.9
4
680,
736,
950.
69
42,4
40,8
29.9
3
1,73
2,20
1,39
3.91
Annual Report – 2005-06.qxd 6/20/08 2:02 PM Page 27
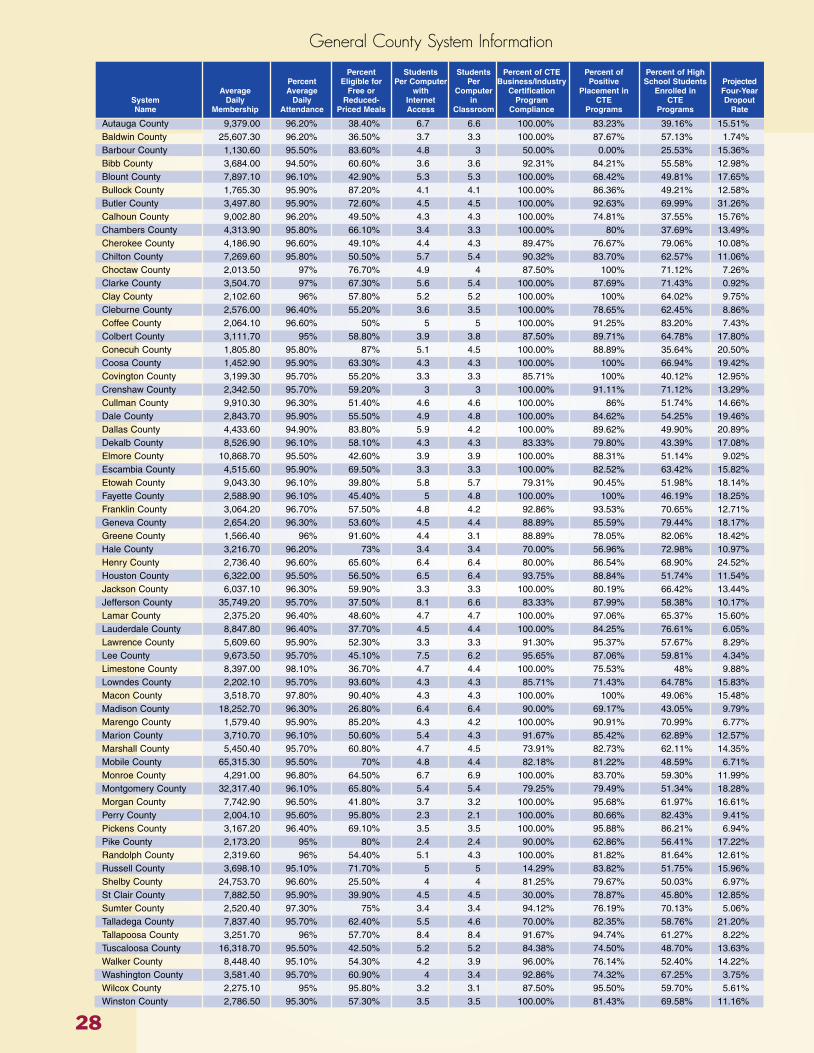
Percent Students Students Percent of CTE Percent of Percent of HighPercent Eligible for Per Computer Per Business/Industry Positive School Students Projected
Average Average Free or with Computer Certification Placement in Enrolled in Four-YearSystem Daily Daily Reduced- Internet in Program CTE CTE DropoutName Membership Attendance Priced Meals Access Classroom Compliance Programs Programs Rate
Autauga County 9,379.00 96.20% 38.40% 6.7 6.6 100.00% 83.23% 39.16% 15.51%Baldwin County 25,607.30 96.20% 36.50% 3.7 3.3 100.00% 87.67% 57.13% 1.74%Barbour County 1,130.60 95.50% 83.60% 4.8 3 50.00% 0.00% 25.53% 15.36%Bibb County 3,684.00 94.50% 60.60% 3.6 3.6 92.31% 84.21% 55.58% 12.98%Blount County 7,897.10 96.10% 42.90% 5.3 5.3 100.00% 68.42% 49.81% 17.65%Bullock County 1,765.30 95.90% 87.20% 4.1 4.1 100.00% 86.36% 49.21% 12.58%Butler County 3,497.80 95.90% 72.60% 4.5 4.5 100.00% 92.63% 69.99% 31.26%Calhoun County 9,002.80 96.20% 49.50% 4.3 4.3 100.00% 74.81% 37.55% 15.76%Chambers County 4,313.90 95.80% 66.10% 3.4 3.3 100.00% 80% 37.69% 13.49%Cherokee County 4,186.90 96.60% 49.10% 4.4 4.3 89.47% 76.67% 79.06% 10.08%Chilton County 7,269.60 95.80% 50.50% 5.7 5.4 90.32% 83.70% 62.57% 11.06%Choctaw County 2,013.50 97% 76.70% 4.9 4 87.50% 100% 71.12% 7.26%Clarke County 3,504.70 97% 67.30% 5.6 5.4 100.00% 87.69% 71.43% 0.92%Clay County 2,102.60 96% 57.80% 5.2 5.2 100.00% 100% 64.02% 9.75%Cleburne County 2,576.00 96.40% 55.20% 3.6 3.5 100.00% 78.65% 62.45% 8.86%Coffee County 2,064.10 96.60% 50% 5 5 100.00% 91.25% 83.20% 7.43%Colbert County 3,111.70 95% 58.80% 3.9 3.8 87.50% 89.71% 64.78% 17.80%Conecuh County 1,805.80 95.80% 87% 5.1 4.5 100.00% 88.89% 35.64% 20.50%Coosa County 1,452.90 95.90% 63.30% 4.3 4.3 100.00% 100% 66.94% 19.42%Covington County 3,199.30 95.70% 55.20% 3.3 3.3 85.71% 100% 40.12% 12.95%Crenshaw County 2,342.50 95.70% 59.20% 3 3 100.00% 91.11% 71.12% 13.29%Cullman County 9,910.30 96.30% 51.40% 4.6 4.6 100.00% 86% 51.74% 14.66%Dale County 2,843.70 95.90% 55.50% 4.9 4.8 100.00% 84.62% 54.25% 19.46%Dallas County 4,433.60 94.90% 83.80% 5.9 4.2 100.00% 89.62% 49.90% 20.89%Dekalb County 8,526.90 96.10% 58.10% 4.3 4.3 83.33% 79.80% 43.39% 17.08%Elmore County 10,868.70 95.50% 42.60% 3.9 3.9 100.00% 88.31% 51.14% 9.02%Escambia County 4,515.60 95.90% 69.50% 3.3 3.3 100.00% 82.52% 63.42% 15.82%Etowah County 9,043.30 96.10% 39.80% 5.8 5.7 79.31% 90.45% 51.98% 18.14%Fayette County 2,588.90 96.10% 45.40% 5 4.8 100.00% 100% 46.19% 18.25%Franklin County 3,064.20 96.70% 57.50% 4.8 4.2 92.86% 93.53% 70.65% 12.71%Geneva County 2,654.20 96.30% 53.60% 4.5 4.4 88.89% 85.59% 79.44% 18.17%Greene County 1,566.40 96% 91.60% 4.4 3.1 88.89% 78.05% 82.06% 18.42%Hale County 3,216.70 96.20% 73% 3.4 3.4 70.00% 56.96% 72.98% 10.97%Henry County 2,736.40 96.60% 65.60% 6.4 6.4 80.00% 86.54% 68.90% 24.52%Houston County 6,322.00 95.50% 56.50% 6.5 6.4 93.75% 88.84% 51.74% 11.54%Jackson County 6,037.10 96.30% 59.90% 3.3 3.3 100.00% 80.19% 66.42% 13.44%Jefferson County 35,749.20 95.70% 37.50% 8.1 6.6 83.33% 87.99% 58.38% 10.17%Lamar County 2,375.20 96.40% 48.60% 4.7 4.7 100.00% 97.06% 65.37% 15.60%Lauderdale County 8,847.80 96.40% 37.70% 4.5 4.4 100.00% 84.25% 76.61% 6.05%Lawrence County 5,609.60 95.90% 52.30% 3.3 3.3 91.30% 95.37% 57.67% 8.29%Lee County 9,673.50 95.70% 45.10% 7.5 6.2 95.65% 87.06% 59.81% 4.34%Limestone County 8,397.00 98.10% 36.70% 4.7 4.4 100.00% 75.53% 48% 9.88%Lowndes County 2,202.10 95.70% 93.60% 4.3 4.3 85.71% 71.43% 64.78% 15.83%Macon County 3,518.70 97.80% 90.40% 4.3 4.3 100.00% 100% 49.06% 15.48%Madison County 18,252.70 96.30% 26.80% 6.4 6.4 90.00% 69.17% 43.05% 9.79%Marengo County 1,579.40 95.90% 85.20% 4.3 4.2 100.00% 90.91% 70.99% 6.77%Marion County 3,710.70 96.10% 50.60% 5.4 4.3 91.67% 85.42% 62.89% 12.57%Marshall County 5,450.40 95.70% 60.80% 4.7 4.5 73.91% 82.73% 62.11% 14.35%Mobile County 65,315.30 95.50% 70% 4.8 4.4 82.18% 81.22% 48.59% 6.71%Monroe County 4,291.00 96.80% 64.50% 6.7 6.9 100.00% 83.70% 59.30% 11.99%Montgomery County 32,317.40 96.10% 65.80% 5.4 5.4 79.25% 79.49% 51.34% 18.28%Morgan County 7,742.90 96.50% 41.80% 3.7 3.2 100.00% 95.68% 61.97% 16.61%Perry County 2,004.10 95.60% 95.80% 2.3 2.1 100.00% 80.66% 82.43% 9.41%Pickens County 3,167.20 96.40% 69.10% 3.5 3.5 100.00% 95.88% 86.21% 6.94%Pike County 2,173.20 95% 80% 2.4 2.4 90.00% 62.86% 56.41% 17.22%Randolph County 2,319.60 96% 54.40% 5.1 4.3 100.00% 81.82% 81.64% 12.61%Russell County 3,698.10 95.10% 71.70% 5 5 14.29% 83.82% 51.75% 15.96%Shelby County 24,753.70 96.60% 25.50% 4 4 81.25% 79.67% 50.03% 6.97%St Clair County 7,882.50 95.90% 39.90% 4.5 4.5 30.00% 78.87% 45.80% 12.85%Sumter County 2,520.40 97.30% 75% 3.4 3.4 94.12% 76.19% 70.13% 5.06%Talladega County 7,837.40 95.70% 62.40% 5.5 4.6 70.00% 82.35% 58.76% 21.20%Tallapoosa County 3,251.70 96% 57.70% 8.4 8.4 91.67% 94.74% 61.27% 8.22%Tuscaloosa County 16,318.70 95.50% 42.50% 5.2 5.2 84.38% 74.50% 48.70% 13.63%Walker County 8,448.40 95.10% 54.30% 4.2 3.9 96.00% 76.14% 52.40% 14.22%Washington County 3,581.40 95.70% 60.90% 4 3.4 92.86% 74.32% 67.25% 3.75%Wilcox County 2,275.10 95% 95.80% 3.2 3.1 87.50% 95.50% 59.70% 5.61%Winston County 2,786.50 95.30% 57.30% 3.5 3.5 100.00% 81.43% 69.58% 11.16%
General County System Information
28
Annual Report – 2005-06.qxd 6/20/08 2:02 PM Page 28
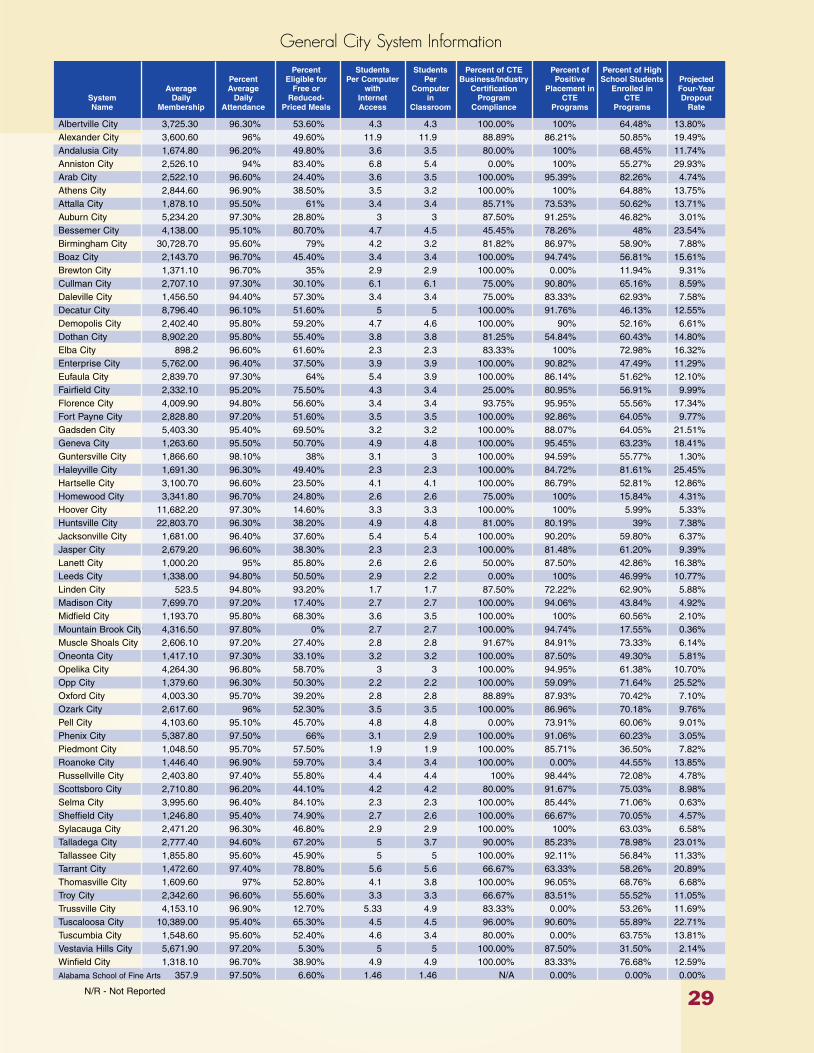
N/R - Not Reported
Percent Students Students Percent of CTE Percent of Percent of HighPercent Eligible for Per Computer Per Business/Industry Positive School Students Projected
Average Average Free or with Computer Certification Placement in Enrolled in Four-YearSystem Daily Daily Reduced- Internet in Program CTE CTE DropoutName Membership Attendance Priced Meals Access Classroom Compliance Programs Programs Rate
Albertville City 3,725.30 96.30% 53.60% 4.3 4.3 100.00% 100% 64.48% 13.80%Alexander City 3,600.60 96% 49.60% 11.9 11.9 88.89% 86.21% 50.85% 19.49%Andalusia City 1,674.80 96.20% 49.80% 3.6 3.5 80.00% 100% 68.45% 11.74%Anniston City 2,526.10 94% 83.40% 6.8 5.4 0.00% 100% 55.27% 29.93%Arab City 2,522.10 96.60% 24.40% 3.6 3.5 100.00% 95.39% 82.26% 4.74%Athens City 2,844.60 96.90% 38.50% 3.5 3.2 100.00% 100% 64.88% 13.75%Attalla City 1,878.10 95.50% 61% 3.4 3.4 85.71% 73.53% 50.62% 13.71%Auburn City 5,234.20 97.30% 28.80% 3 3 87.50% 91.25% 46.82% 3.01%Bessemer City 4,138.00 95.10% 80.70% 4.7 4.5 45.45% 78.26% 48% 23.54%Birmingham City 30,728.70 95.60% 79% 4.2 3.2 81.82% 86.97% 58.90% 7.88%Boaz City 2,143.70 96.70% 45.40% 3.4 3.4 100.00% 94.74% 56.81% 15.61%Brewton City 1,371.10 96.70% 35% 2.9 2.9 100.00% 0.00% 11.94% 9.31%Cullman City 2,707.10 97.30% 30.10% 6.1 6.1 75.00% 90.80% 65.16% 8.59%Daleville City 1,456.50 94.40% 57.30% 3.4 3.4 75.00% 83.33% 62.93% 7.58%Decatur City 8,796.40 96.10% 51.60% 5 5 100.00% 91.76% 46.13% 12.55%Demopolis City 2,402.40 95.80% 59.20% 4.7 4.6 100.00% 90% 52.16% 6.61%Dothan City 8,902.20 95.80% 55.40% 3.8 3.8 81.25% 54.84% 60.43% 14.80%Elba City 898.2 96.60% 61.60% 2.3 2.3 83.33% 100% 72.98% 16.32%Enterprise City 5,762.00 96.40% 37.50% 3.9 3.9 100.00% 90.82% 47.49% 11.29%Eufaula City 2,839.70 97.30% 64% 5.4 3.9 100.00% 86.14% 51.62% 12.10%Fairfield City 2,332.10 95.20% 75.50% 4.3 3.4 25.00% 80.95% 56.91% 9.99%Florence City 4,009.90 94.80% 56.60% 3.4 3.4 93.75% 95.95% 55.56% 17.34%Fort Payne City 2,828.80 97.20% 51.60% 3.5 3.5 100.00% 92.86% 64.05% 9.77%Gadsden City 5,403.30 95.40% 69.50% 3.2 3.2 100.00% 88.07% 64.05% 21.51%Geneva City 1,263.60 95.50% 50.70% 4.9 4.8 100.00% 95.45% 63.23% 18.41%Guntersville City 1,866.60 98.10% 38% 3.1 3 100.00% 94.59% 55.77% 1.30%Haleyville City 1,691.30 96.30% 49.40% 2.3 2.3 100.00% 84.72% 81.61% 25.45%Hartselle City 3,100.70 96.60% 23.50% 4.1 4.1 100.00% 86.79% 52.81% 12.86%Homewood City 3,341.80 96.70% 24.80% 2.6 2.6 75.00% 100% 15.84% 4.31%Hoover City 11,682.20 97.30% 14.60% 3.3 3.3 100.00% 100% 5.99% 5.33%Huntsville City 22,803.70 96.30% 38.20% 4.9 4.8 81.00% 80.19% 39% 7.38%Jacksonville City 1,681.00 96.40% 37.60% 5.4 5.4 100.00% 90.20% 59.80% 6.37%Jasper City 2,679.20 96.60% 38.30% 2.3 2.3 100.00% 81.48% 61.20% 9.39%Lanett City 1,000.20 95% 85.80% 2.6 2.6 50.00% 87.50% 42.86% 16.38%Leeds City 1,338.00 94.80% 50.50% 2.9 2.2 0.00% 100% 46.99% 10.77%Linden City 523.5 94.80% 93.20% 1.7 1.7 87.50% 72.22% 62.90% 5.88%Madison City 7,699.70 97.20% 17.40% 2.7 2.7 100.00% 94.06% 43.84% 4.92%Midfield City 1,193.70 95.80% 68.30% 3.6 3.5 100.00% 100% 60.56% 2.10%Mountain Brook City 4,316.50 97.80% 0% 2.7 2.7 100.00% 94.74% 17.55% 0.36%Muscle Shoals City 2,606.10 97.20% 27.40% 2.8 2.8 91.67% 84.91% 73.33% 6.14%Oneonta City 1,417.10 97.30% 33.10% 3.2 3.2 100.00% 87.50% 49.30% 5.81%Opelika City 4,264.30 96.80% 58.70% 3 3 100.00% 94.95% 61.38% 10.70%Opp City 1,379.60 96.30% 50.30% 2.2 2.2 100.00% 59.09% 71.64% 25.52%Oxford City 4,003.30 95.70% 39.20% 2.8 2.8 88.89% 87.93% 70.42% 7.10%Ozark City 2,617.60 96% 52.30% 3.5 3.5 100.00% 86.96% 70.18% 9.76%Pell City 4,103.60 95.10% 45.70% 4.8 4.8 0.00% 73.91% 60.06% 9.01%Phenix City 5,387.80 97.50% 66% 3.1 2.9 100.00% 91.06% 60.23% 3.05%Piedmont City 1,048.50 95.70% 57.50% 1.9 1.9 100.00% 85.71% 36.50% 7.82%Roanoke City 1,446.40 96.90% 59.70% 3.4 3.4 100.00% 0.00% 44.55% 13.85%Russellville City 2,403.80 97.40% 55.80% 4.4 4.4 100% 98.44% 72.08% 4.78%Scottsboro City 2,710.80 96.20% 44.10% 4.2 4.2 80.00% 91.67% 75.03% 8.98%Selma City 3,995.60 96.40% 84.10% 2.3 2.3 100.00% 85.44% 71.06% 0.63%Sheffield City 1,246.80 95.40% 74.90% 2.7 2.6 100.00% 66.67% 70.05% 4.57%Sylacauga City 2,471.20 96.30% 46.80% 2.9 2.9 100.00% 100% 63.03% 6.58%Talladega City 2,777.40 94.60% 67.20% 5 3.7 90.00% 85.23% 78.98% 23.01%Tallassee City 1,855.80 95.60% 45.90% 5 5 100.00% 92.11% 56.84% 11.33%Tarrant City 1,472.60 97.40% 78.80% 5.6 5.6 66.67% 63.33% 58.26% 20.89%Thomasville City 1,609.60 97% 52.80% 4.1 3.8 100.00% 96.05% 68.76% 6.68%Troy City 2,342.60 96.60% 55.60% 3.3 3.3 66.67% 83.51% 55.52% 11.05%Trussville City 4,153.10 96.90% 12.70% 5.33 4.9 83.33% 0.00% 53.26% 11.69%Tuscaloosa City 10,389.00 95.40% 65.30% 4.5 4.5 96.00% 90.60% 55.89% 22.71%Tuscumbia City 1,548.60 95.60% 52.40% 4.6 3.4 80.00% 0.00% 63.75% 13.81%Vestavia Hills City 5,671.90 97.20% 5.30% 5 5 100.00% 87.50% 31.50% 2.14%Winfield City 1,318.10 96.70% 38.90% 4.9 4.9 100.00% 83.33% 76.68% 12.59%Alabama School of Fine Arts 357.9 97.50% 6.60% 1.46 1.46 N/A 0.00% 0.00% 0.00%
General City System Information
29
Annual Report – 2005-06.qxd 6/20/08 2:02 PM Page 29
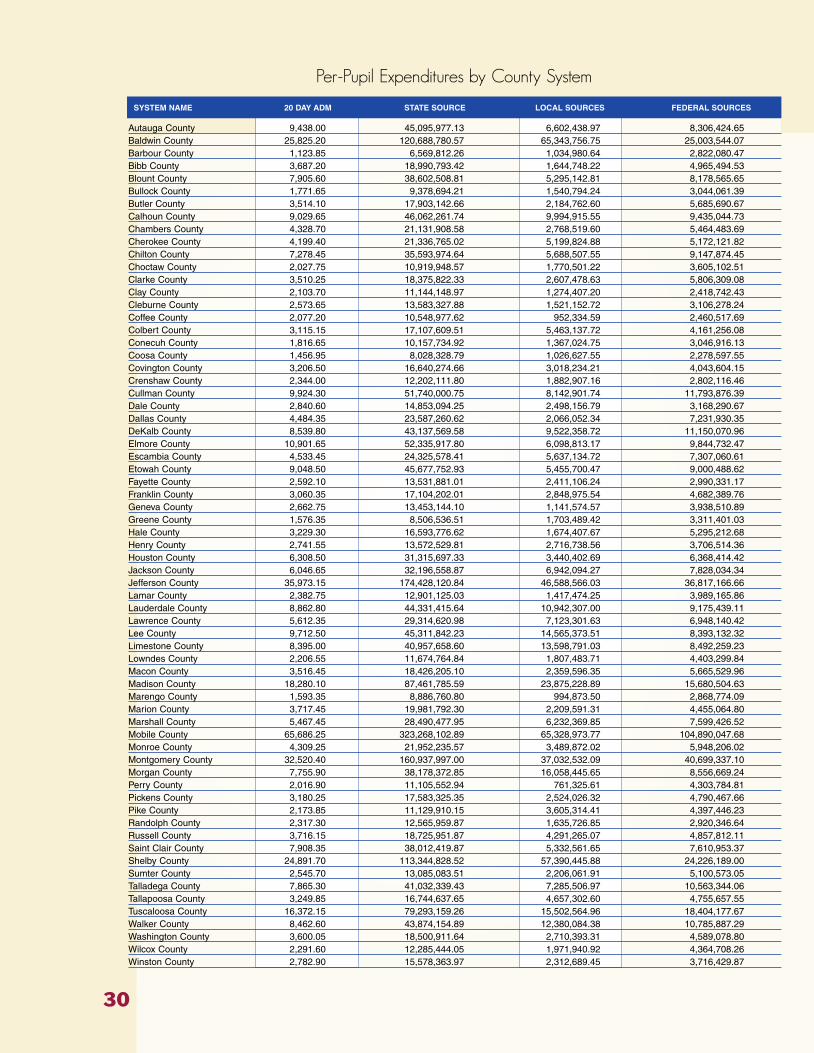
30
Per-Pupil Expenditures by County System
Autauga County 9,438.00 45,095,977.13 6,602,438.97 8,306,424.65Baldwin County 25,825.20 120,688,780.57 65,343,756.75 25,003,544.07Barbour County 1,123.85 6,569,812.26 1,034,980.64 2,822,080.47Bibb County 3,687.20 18,990,793.42 1,644,748.22 4,965,494.53Blount County 7,905.60 38,602,508.81 5,295,142.81 8,178,565.65Bullock County 1,771.65 9,378,694.21 1,540,794.24 3,044,061.39Butler County 3,514.10 17,903,142.66 2,184,762.60 5,685,690.67Calhoun County 9,029.65 46,062,261.74 9,994,915.55 9,435,044.73Chambers County 4,328.70 21,131,908.58 2,768,519.60 5,464,483.69Cherokee County 4,199.40 21,336,765.02 5,199,824.88 5,172,121.82Chilton County 7,278.45 35,593,974.64 5,688,507.55 9,147,874.45Choctaw County 2,027.75 10,919,948.57 1,770,501.22 3,605,102.51Clarke County 3,510.25 18,375,822.33 2,607,478.63 5,806,309.08Clay County 2,103.70 11,144,148.97 1,274,407.20 2,418,742.43Cleburne County 2,573.65 13,583,327.88 1,521,152.72 3,106,278.24Coffee County 2,077.20 10,548,977.62 952,334.59 2,460,517.69Colbert County 3,115.15 17,107,609.51 5,463,137.72 4,161,256.08Conecuh County 1,816.65 10,157,734.92 1,367,024.75 3,046,916.13Coosa County 1,456.95 8,028,328.79 1,026,627.55 2,278,597.55Covington County 3,206.50 16,640,274.66 3,018,234.21 4,043,604.15Crenshaw County 2,344.00 12,202,111.80 1,882,907.16 2,802,116.46Cullman County 9,924.30 51,740,000.75 8,142,901.74 11,793,876.39Dale County 2,840.60 14,853,094.25 2,498,156.79 3,168,290.67Dallas County 4,484.35 23,587,260.62 2,066,052.34 7,231,930.35DeKalb County 8,539.80 43,137,569.58 9,522,358.72 11,150,070.96Elmore County 10,901.65 52,335,917.80 6,098,813.17 9,844,732.47Escambia County 4,533.45 24,325,578.41 5,637,134.72 7,307,060.61Etowah County 9,048.50 45,677,752.93 5,455,700.47 9,000,488.62Fayette County 2,592.10 13,531,881.01 2,411,106.24 2,990,331.17Franklin County 3,060.35 17,104,202.01 2,848,975.54 4,682,389.76Geneva County 2,662.75 13,453,144.10 1,141,574.57 3,938,510.89Greene County 1,576.35 8,506,536.51 1,703,489.42 3,311,401.03Hale County 3,229.30 16,593,776.62 1,674,407.67 5,295,212.68Henry County 2,741.55 13,572,529.81 2,716,738.56 3,706,514.36Houston County 6,308.50 31,315,697.33 3,440,402.69 6,368,414.42Jackson County 6,046.65 32,196,558.87 6,942,094.27 7,828,034.34Jefferson County 35,973.15 174,428,120.84 46,588,566.03 36,817,166.66Lamar County 2,382.75 12,901,125.03 1,417,474.25 3,989,165.86Lauderdale County 8,862.80 44,331,415.64 10,942,307.00 9,175,439.11Lawrence County 5,612.35 29,314,620.98 7,123,301.63 6,948,140.42Lee County 9,712.50 45,311,842.23 14,565,373.51 8,393,132.32Limestone County 8,395.00 40,957,658.60 13,598,791.03 8,492,259.23Lowndes County 2,206.55 11,674,764.84 1,807,483.71 4,403,299.84Macon County 3,516.45 18,426,205.10 2,359,596.35 5,665,529.96Madison County 18,280.10 87,461,785.59 23,875,228.89 15,680,504.63Marengo County 1,593.35 8,886,760.80 994,873.50 2,868,774.09Marion County 3,717.45 19,981,792.30 2,209,591.31 4,455,064.80Marshall County 5,467.45 28,490,477.95 6,232,369.85 7,599,426.52Mobile County 65,686.25 323,268,102.89 65,328,973.77 104,890,047.68Monroe County 4,309.25 21,952,235.57 3,489,872.02 5,948,206.02Montgomery County 32,520.40 160,937,997.00 37,032,532.09 40,699,337.10Morgan County 7,755.90 38,178,372.85 16,058,445.65 8,556,669.24Perry County 2,016.90 11,105,552.94 761,325.61 4,303,784.81Pickens County 3,180.25 17,583,325.35 2,524,026.32 4,790,467.66Pike County 2,173.85 11,129,910.15 3,605,314.41 4,397,446.23Randolph County 2,317.30 12,565,959.87 1,635,726.85 2,920,346.64Russell County 3,716.15 18,725,951.87 4,291,265.07 4,857,812.11Saint Clair County 7,908.35 38,012,419.87 5,332,561.65 7,610,953.37Shelby County 24,891.70 113,344,828.52 57,390,445.88 24,226,189.00Sumter County 2,545.70 13,085,083.51 2,206,061.91 5,100,573.05Talladega County 7,865.30 41,032,339.43 7,285,506.97 10,563,344.06Tallapoosa County 3,249.85 16,744,637.65 4,657,302.60 4,755,657.55Tuscaloosa County 16,372.15 79,293,159.26 15,502,564.96 18,404,177.67Walker County 8,462.60 43,874,154.89 12,380,084.38 10,785,887.29Washington County 3,600.05 18,500,911.64 2,710,393.31 4,589,078.80Wilcox County 2,291.60 12,285,444.05 1,971,940.92 4,364,708.26Winston County 2,782.90 15,578,363.97 2,312,689.45 3,716,429.87
SYSTEM NAME 20 DAY ADM STATE SOURCE LOCAL SOURCES FEDERAL SOURCES
Annual Report – 2005-06.qxd 6/20/08 2:02 PM Page 30
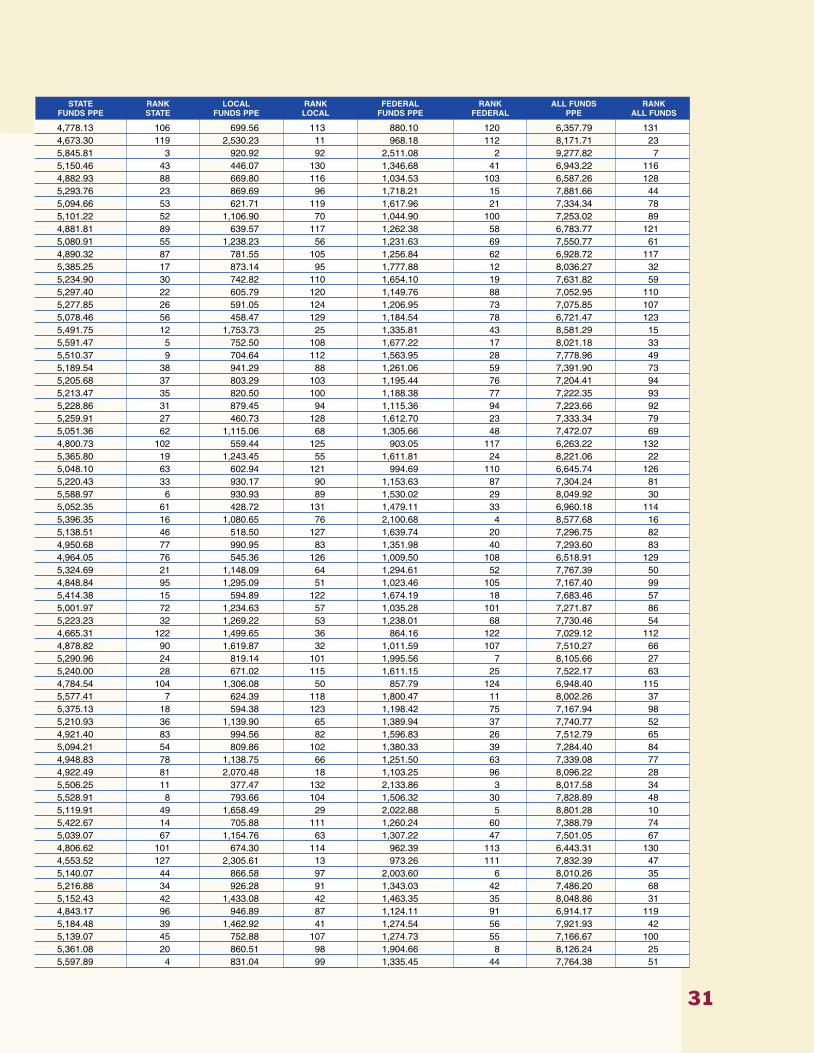
31
4,778.13 106 699.56 113 880.10 120 6,357.79 1314,673.30 119 2,530.23 11 968.18 112 8,171.71 235,845.81 3 920.92 92 2,511.08 2 9,277.82 75,150.46 43 446.07 130 1,346.68 41 6,943.22 1164,882.93 88 669.80 116 1,034.53 103 6,587.26 1285,293.76 23 869.69 96 1,718.21 15 7,881.66 445,094.66 53 621.71 119 1,617.96 21 7,334.34 785,101.22 52 1,106.90 70 1,044.90 100 7,253.02 894,881.81 89 639.57 117 1,262.38 58 6,783.77 1215,080.91 55 1,238.23 56 1,231.63 69 7,550.77 614,890.32 87 781.55 105 1,256.84 62 6,928.72 1175,385.25 17 873.14 95 1,777.88 12 8,036.27 325,234.90 30 742.82 110 1,654.10 19 7,631.82 595,297.40 22 605.79 120 1,149.76 88 7,052.95 1105,277.85 26 591.05 124 1,206.95 73 7,075.85 1075,078.46 56 458.47 129 1,184.54 78 6,721.47 1235,491.75 12 1,753.73 25 1,335.81 43 8,581.29 155,591.47 5 752.50 108 1,677.22 17 8,021.18 335,510.37 9 704.64 112 1,563.95 28 7,778.96 495,189.54 38 941.29 88 1,261.06 59 7,391.90 735,205.68 37 803.29 103 1,195.44 76 7,204.41 945,213.47 35 820.50 100 1,188.38 77 7,222.35 935,228.86 31 879.45 94 1,115.36 94 7,223.66 925,259.91 27 460.73 128 1,612.70 23 7,333.34 795,051.36 62 1,115.06 68 1,305.66 48 7,472.07 694,800.73 102 559.44 125 903.05 117 6,263.22 1325,365.80 19 1,243.45 55 1,611.81 24 8,221.06 225,048.10 63 602.94 121 994.69 110 6,645.74 1265,220.43 33 930.17 90 1,153.63 87 7,304.24 815,588.97 6 930.93 89 1,530.02 29 8,049.92 305,052.35 61 428.72 131 1,479.11 33 6,960.18 1145,396.35 16 1,080.65 76 2,100.68 4 8,577.68 165,138.51 46 518.50 127 1,639.74 20 7,296.75 824,950.68 77 990.95 83 1,351.98 40 7,293.60 834,964.05 76 545.36 126 1,009.50 108 6,518.91 1295,324.69 21 1,148.09 64 1,294.61 52 7,767.39 504,848.84 95 1,295.09 51 1,023.46 105 7,167.40 995,414.38 15 594.89 122 1,674.19 18 7,683.46 575,001.97 72 1,234.63 57 1,035.28 101 7,271.87 865,223.23 32 1,269.22 53 1,238.01 68 7,730.46 544,665.31 122 1,499.65 36 864.16 122 7,029.12 1124,878.82 90 1,619.87 32 1,011.59 107 7,510.27 665,290.96 24 819.14 101 1,995.56 7 8,105.66 275,240.00 28 671.02 115 1,611.15 25 7,522.17 634,784.54 104 1,306.08 50 857.79 124 6,948.40 1155,577.41 7 624.39 118 1,800.47 11 8,002.26 375,375.13 18 594.38 123 1,198.42 75 7,167.94 985,210.93 36 1,139.90 65 1,389.94 37 7,740.77 524,921.40 83 994.56 82 1,596.83 26 7,512.79 655,094.21 54 809.86 102 1,380.33 39 7,284.40 844,948.83 78 1,138.75 66 1,251.50 63 7,339.08 774,922.49 81 2,070.48 18 1,103.25 96 8,096.22 285,506.25 11 377.47 132 2,133.86 3 8,017.58 345,528.91 8 793.66 104 1,506.32 30 7,828.89 485,119.91 49 1,658.49 29 2,022.88 5 8,801.28 105,422.67 14 705.88 111 1,260.24 60 7,388.79 745,039.07 67 1,154.76 63 1,307.22 47 7,501.05 674,806.62 101 674.30 114 962.39 113 6,443.31 1304,553.52 127 2,305.61 13 973.26 111 7,832.39 475,140.07 44 866.58 97 2,003.60 6 8,010.26 355,216.88 34 926.28 91 1,343.03 42 7,486.20 685,152.43 42 1,433.08 42 1,463.35 35 8,048.86 314,843.17 96 946.89 87 1,124.11 91 6,914.17 1195,184.48 39 1,462.92 41 1,274.54 56 7,921.93 425,139.07 45 752.88 107 1,274.73 55 7,166.67 1005,361.08 20 860.51 98 1,904.66 8 8,126.24 255,597.89 4 831.04 99 1,335.45 44 7,764.38 51
STATE RANK LOCAL RANK FEDERAL RANK ALL FUNDS RANKFUNDS PPE STATE FUNDS PPE LOCAL FUNDS PPE FEDERAL PPE ALL FUNDS
Annual Report – 2005-06.qxd 6/20/08 2:02 PM Page 31
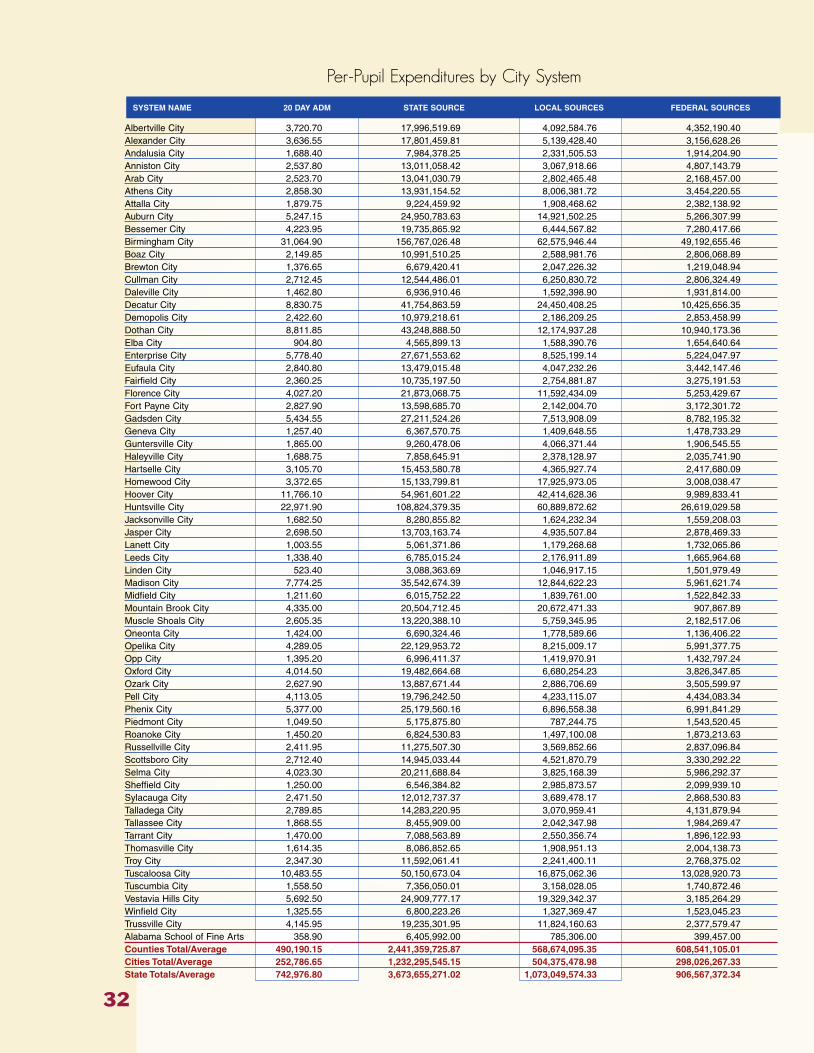
32
Per-Pupil Expenditures by City System
Albertville City 3,720.70 17,996,519.69 4,092,584.76 4,352,190.40Alexander City 3,636.55 17,801,459.81 5,139,428.40 3,156,628.26Andalusia City 1,688.40 7,984,378.25 2,331,505.53 1,914,204.90Anniston City 2,537.80 13,011,058.42 3,067,918.66 4,807,143.79Arab City 2,523.70 13,041,030.79 2,802,465.48 2,168,457.00Athens City 2,858.30 13,931,154.52 8,006,381.72 3,454,220.55Attalla City 1,879.75 9,224,459.92 1,908,468.62 2,382,138.92Auburn City 5,247.15 24,950,783.63 14,921,502.25 5,266,307.99Bessemer City 4,223.95 19,735,865.92 6,444,567.82 7,280,417.66Birmingham City 31,064.90 156,767,026.48 62,575,946.44 49,192,655.46Boaz City 2,149.85 10,991,510.25 2,588,981.76 2,806,068.89Brewton City 1,376.65 6,679,420.41 2,047,226.32 1,219,048.94Cullman City 2,712.45 12,544,486.01 6,250,830.72 2,806,324.49Daleville City 1,462.80 6,936,910.46 1,592,398.90 1,931,814.00Decatur City 8,830.75 41,754,863.59 24,450,408.25 10,425,656.35Demopolis City 2,422.60 10,979,218.61 2,186,209.25 2,853,458.99Dothan City 8,811.85 43,248,888.50 12,174,937.28 10,940,173.36Elba City 904.80 4,565,899.13 1,588,390.76 1,654,640.64Enterprise City 5,778.40 27,671,553.62 8,525,199.14 5,224,047.97Eufaula City 2,840.80 13,479,015.48 4,047,232.26 3,442,147.46Fairfield City 2,360.25 10,735,197.50 2,754,881.87 3,275,191.53Florence City 4,027.20 21,873,068.75 11,592,434.09 5,253,429.67Fort Payne City 2,827.90 13,598,685.70 2,142,004.70 3,172,301.72Gadsden City 5,434.55 27,211,524.26 7,513,908.09 8,782,195.32Geneva City 1,257.40 6,367,570.75 1,409,648.55 1,478,733.29Guntersville City 1,865.00 9,260,478.06 4,066,371.44 1,906,545.55Haleyville City 1,688.75 7,858,645.91 2,378,128.97 2,035,741.90Hartselle City 3,105.70 15,453,580.78 4,365,927.74 2,417,680.09Homewood City 3,372.65 15,133,799.81 17,925,973.05 3,008,038.47Hoover City 11,766.10 54,961,601.22 42,414,628.36 9,989,833.41Huntsville City 22,971.90 108,824,379.35 60,889,872.62 26,619,029.58Jacksonville City 1,682.50 8,280,855.82 1,624,232.34 1,559,208.03Jasper City 2,698.50 13,703,163.74 4,935,507.84 2,878,469.33Lanett City 1,003.55 5,061,371.86 1,179,268.68 1,732,065.86Leeds City 1,338.40 6,785,015.24 2,176,911.89 1,665,964.68Linden City 523.40 3,088,363.69 1,046,917.15 1,501,979.49Madison City 7,774.25 35,542,674.39 12,844,622.23 5,961,621.74Midfield City 1,211.60 6,015,752.22 1,839,761.00 1,522,842.33Mountain Brook City 4,335.00 20,504,712.45 20,672,471.33 907,867.89Muscle Shoals City 2,605.35 13,220,388.10 5,759,345.95 2,182,517.06Oneonta City 1,424.00 6,690,324.46 1,778,589.66 1,136,406.22Opelika City 4,289.05 22,129,953.72 8,215,009.17 5,991,377.75Opp City 1,395.20 6,996,411.37 1,419,970.91 1,432,797.24Oxford City 4,014.50 19,482,664.68 6,680,254.23 3,826,347.85Ozark City 2,627.90 13,887,671.44 2,886,706.69 3,505,599.97Pell City 4,113.05 19,796,242.50 4,233,115.07 4,434,083.34Phenix City 5,377.00 25,179,560.16 6,896,558.38 6,991,841.29Piedmont City 1,049.50 5,175,875.80 787,244.75 1,543,520.45Roanoke City 1,450.20 6,824,530.83 1,497,100.08 1,873,213.63Russellville City 2,411.95 11,275,507.30 3,569,852.66 2,837,096.84Scottsboro City 2,712.40 14,945,033.44 4,521,870.79 3,330,292.22Selma City 4,023.30 20,211,688.84 3,825,168.39 5,986,292.37Sheffield City 1,250.00 6,546,384.82 2,985,873.57 2,099,939.10Sylacauga City 2,471.50 12,012,737.37 3,689,478.17 2,868,530.83Talladega City 2,789.85 14,283,220.95 3,070,959.41 4,131,879.94Tallassee City 1,868.55 8,455,909.00 2,042,347.98 1,984,269.47Tarrant City 1,470.00 7,088,563.89 2,550,356.74 1,896,122.93Thomasville City 1,614.35 8,086,852.65 1,908,951.13 2,004,138.73Troy City 2,347.30 11,592,061.41 2,241,400.11 2,768,375.02Tuscaloosa City 10,483.55 50,150,673.04 16,875,062.36 13,028,920.73Tuscumbia City 1,558.50 7,356,050.01 3,158,028.05 1,740,872.46Vestavia Hills City 5,692.50 24,909,777.17 19,329,342.37 3,185,264.29Winfield City 1,325.55 6,800,223.26 1,327,369.47 1,523,045.23Trussville City 4,145.95 19,235,301.95 11,824,160.63 2,377,579.47Alabama School of Fine Arts 358.90 6,405,992.00 785,306.00 399,457.00Counties Total/Average 490,190.15 2,441,359,725.87 568,674,095.35 608,541,105.01Cities Total/Average 252,786.65 1,232,295,545.15 504,375,478.98 298,026,267.33State Totals/Average 742,976.80 3,673,655,271.02 1,073,049,574.33 906,567,372.34
SYSTEM NAME 20 DAY ADM STATE SOURCE LOCAL SOURCES FEDERAL SOURCES
Annual Report – 2005-06.qxd 6/20/08 2:02 PM Page 32

33
4,836.86 97 1,099.95 72 1,169.72 84 7,106.54 1054,895.15 86 1,413.27 44 868.03 121 7,176.45 964,728.96 112 1,380.90 49 1,133.74 90 7,243.60 905,126.90 48 1,208.89 58 1,894.22 9 8,230.01 215,167.43 40 1,110.46 69 859.24 123 7,137.12 1044,873.93 91 2,801.10 8 1,208.49 72 8,883.52 94,907.28 85 1,015.28 80 1,267.26 57 7,189.82 954,755.11 107 2,843.73 7 1,003.65 109 8,602.50 144,672.37 120 1,525.72 34 1,723.60 14 7,921.70 435,046.44 64 2,014.36 20 1,583.54 27 8,644.34 125,112.69 51 1,204.26 59 1,305.24 49 7,622.19 604,851.94 94 1,487.11 38 885.52 119 7,224.56 914,624.78 125 2,304.50 14 1,034.61 102 7,963.89 394,742.21 109 1,088.60 75 1,320.63 46 7,151.44 1034,728.35 113 2,768.78 9 1,180.61 79 8,677.74 114,532.00 129 902.42 93 1,177.85 81 6,612.27 1274,908.04 84 1,381.66 48 1,241.53 66 7,531.22 625,046.31 65 1,755.52 24 1,828.74 10 8,630.56 134,788.79 103 1,475.36 40 904.06 116 7,168.21 974,744.80 108 1,424.68 43 1,211.68 71 7,381.16 754,548.33 128 1,167.20 62 1,387.65 38 7,103.18 1065,431.33 13 2,878.53 5 1,304.49 50 9,614.36 54,808.76 100 757.45 106 1,121.79 92 6,688.00 1245,007.13 71 1,382.62 47 1,615.99 22 8,005.75 365,064.08 60 1,121.08 67 1,176.02 83 7,361.18 764,965.40 74 2,180.36 17 1,022.28 106 8,168.04 244,653.53 123 1,408.22 45 1,205.47 74 7,267.22 874,975.88 73 1,405.78 46 778.47 128 7,160.12 1014,487.21 131 5,315.10 1 891.89 118 10,694.21 34,671.18 121 3,604.82 3 849.04 125 9,125.03 84,737.28 110 2,650.62 10 1,158.76 86 8,546.67 174,921.76 82 965.37 84 926.72 115 6,813.85 1205,078.07 57 1,828.98 23 1,066.69 98 7,973.74 385,043.47 66 1,175.10 61 1,725.94 13 7,944.50 405,069.50 59 1,626.50 31 1,244.74 64 7,940.74 415,900.58 2 2,000.22 21 2,869.66 1 10,770.46 24,571.85 126 1,652.20 30 766.84 129 6,990.89 1134,965.13 75 1,518.46 35 1,256.89 61 7,740.47 534,730.04 111 4,768.74 2 209.43 132 9,708.20 45,074.32 58 2,210.58 15 837.71 126 8,122.61 264,698.26 116 1,249.01 54 798.04 127 6,745.31 1225,159.64 41 1,915.34 22 1,396.90 36 8,471.89 185,014.63 69 1,017.75 79 1,026.95 104 7,059.33 1094,853.07 93 1,664.03 28 953.13 114 7,470.24 705,284.70 25 1,098.48 73 1,333.99 45 7,717.18 554,813.03 99 1,029.19 78 1,078.05 97 6,920.28 1184,682.83 117 1,282.60 52 1,300.32 51 7,265.75 884,931.75 80 750.11 109 1,470.72 34 7,152.59 1024,705.92 115 1,032.34 77 1,291.69 53 7,029.96 1114,674.85 118 1,480.07 39 1,176.27 82 7,331.19 805,509.89 10 1,667.11 27 1,227.80 70 8,404.81 195,023.66 68 950.75 86 1,487.91 31 7,462.32 715,237.11 29 2,388.70 12 1,679.95 16 9,305.76 64,860.50 92 1,492.81 37 1,160.64 85 7,513.96 645,119.71 50 1,100.76 71 1,481.04 32 7,701.51 564,525.39 130 1,093.01 74 1,061.93 99 6,680.33 1254,822.15 98 1,734.94 26 1,289.88 54 7,846.97 465,009.36 70 1,182.49 60 1,241.45 67 7,433.30 724,938.47 79 954.88 85 1,179.39 80 7,072.74 1084,783.75 105 1,609.67 33 1,242.80 65 7,636.22 584,719.96 114 2,026.33 19 1,117.02 93 7,863.30 454,375.89 132 3,395.58 4 559.55 131 8,331.03 205,130.11 47 1,001.37 81 1,148.99 89 7,280.48 854,639.54 124 2,851.98 6 573.47 130 8,064.99 29
17,848.96 1 2,188.09 16 1,113.00 95 21,150.06 14,980.43 1,160.11 1,241.44 7,381.984,874.84 1,995.26 1,178.96 8,049.074,944.51 1,444.26 1,220.18 7,608.95
STATE RANK LOCAL RANK FEDERAL RANK ALL FUNDS RANKFUNDS PPE STATE FUNDS PPE LOCAL FUNDS PPE FEDERAL PPE ALL FUNDS
Annual Report – 2005-06.qxd 6/20/08 2:02 PM Page 33
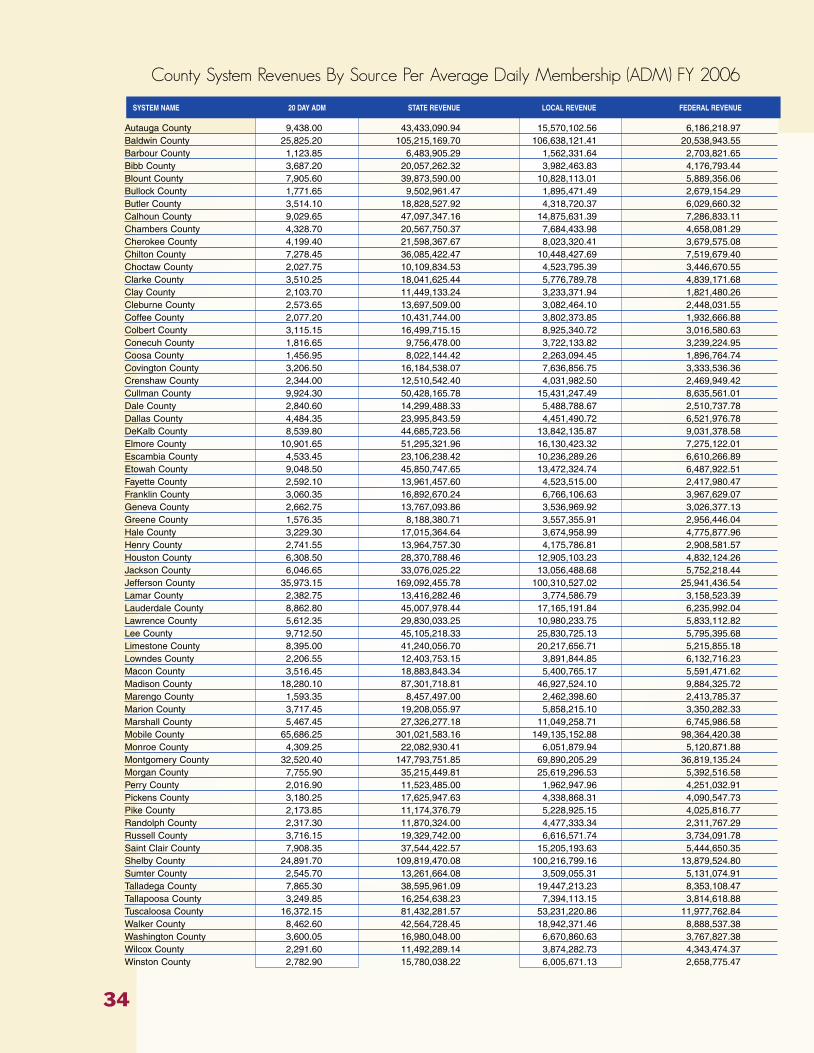
County System Revenues By Source Per Average Daily Membership (ADM) FY 2006
Autauga County 9,438.00 43,433,090.94 15,570,102.56 6,186,218.97 Baldwin County 25,825.20 105,215,169.70 106,638,121.41 20,538,943.55 Barbour County 1,123.85 6,483,905.29 1,562,331.64 2,703,821.65 Bibb County 3,687.20 20,057,262.32 3,982,463.83 4,176,793.44 Blount County 7,905.60 39,873,590.00 10,828,113.01 5,889,356.06 Bullock County 1,771.65 9,502,961.47 1,895,471.49 2,679,154.29 Butler County 3,514.10 18,828,527.92 4,318,720.37 6,029,660.32 Calhoun County 9,029.65 47,097,347.16 14,875,631.39 7,286,833.11 Chambers County 4,328.70 20,567,750.37 7,684,433.98 4,658,081.29 Cherokee County 4,199.40 21,598,367.67 8,023,320.41 3,679,575.08 Chilton County 7,278.45 36,085,422.47 10,448,427.69 7,519,679.40 Choctaw County 2,027.75 10,109,834.53 4,523,795.39 3,446,670.55 Clarke County 3,510.25 18,041,625.44 5,776,789.78 4,839,171.68 Clay County 2,103.70 11,449,133.24 3,233,371.94 1,821,480.26 Cleburne County 2,573.65 13,697,509.00 3,082,464.10 2,448,031.55 Coffee County 2,077.20 10,431,744.00 3,802,373.85 1,932,666.88 Colbert County 3,115.15 16,499,715.15 8,925,340.72 3,016,580.63 Conecuh County 1,816.65 9,756,478.00 3,722,133.82 3,239,224.95 Coosa County 1,456.95 8,022,144.42 2,263,094.45 1,896,764.74 Covington County 3,206.50 16,184,538.07 7,636,856.75 3,333,536.36 Crenshaw County 2,344.00 12,510,542.40 4,031,982.50 2,469,949.42 Cullman County 9,924.30 50,428,165.78 15,431,247.49 8,635,561.01 Dale County 2,840.60 14,299,488.33 5,488,788.67 2,510,737.78 Dallas County 4,484.35 23,995,843.59 4,451,490.72 6,521,976.78 DeKalb County 8,539.80 44,685,723.56 13,842,135.87 9,031,378.58 Elmore County 10,901.65 51,295,321.96 16,130,423.32 7,275,122.01 Escambia County 4,533.45 23,106,238.42 10,236,289.26 6,610,266.89 Etowah County 9,048.50 45,850,747.65 13,472,324.74 6,487,922.51 Fayette County 2,592.10 13,961,457.60 4,523,515.00 2,417,980.47 Franklin County 3,060.35 16,892,670.24 6,766,106.63 3,967,629.07 Geneva County 2,662.75 13,767,093.86 3,536,969.92 3,026,377.13 Greene County 1,576.35 8,188,380.71 3,557,355.91 2,956,446.04 Hale County 3,229.30 17,015,364.64 3,674,958.99 4,775,877.96 Henry County 2,741.55 13,964,757.30 4,175,786.81 2,908,581.57 Houston County 6,308.50 28,370,788.46 12,905,103.23 4,832,124.26 Jackson County 6,046.65 33,076,025.22 13,056,488.68 5,752,218.44 Jefferson County 35,973.15 169,092,455.78 100,310,527.02 25,941,436.54 Lamar County 2,382.75 13,416,282.46 3,774,586.79 3,158,523.39 Lauderdale County 8,862.80 45,007,978.44 17,165,191.84 6,235,992.04 Lawrence County 5,612.35 29,830,033.25 10,980,233.75 5,833,112.82 Lee County 9,712.50 45,105,218.33 25,830,725.13 5,795,395.68 Limestone County 8,395.00 41,240,056.70 20,217,656.71 5,215,855.18 Lowndes County 2,206.55 12,403,753.15 3,891,844.85 6,132,716.23 Macon County 3,516.45 18,883,843.34 5,400,765.17 5,591,471.62 Madison County 18,280.10 87,301,718.81 46,927,524.10 9,884,325.72 Marengo County 1,593.35 8,457,497.00 2,462,398.60 2,413,785.37 Marion County 3,717.45 19,208,055.97 5,858,215.10 3,350,282.33 Marshall County 5,467.45 27,326,277.18 11,049,258.71 6,745,986.58 Mobile County 65,686.25 301,021,583.16 149,135,152.88 98,364,420.38 Monroe County 4,309.25 22,082,930.41 6,051,879.94 5,120,871.88 Montgomery County 32,520.40 147,793,751.85 69,890,205.29 36,819,135.24 Morgan County 7,755.90 35,215,449.81 25,619,296.53 5,392,516.58 Perry County 2,016.90 11,523,485.00 1,962,947.96 4,251,032.91 Pickens County 3,180.25 17,625,947.63 4,338,868.31 4,090,547.73 Pike County 2,173.85 11,174,376.79 5,228,925.15 4,025,816.77 Randolph County 2,317.30 11,870,324.00 4,477,333.34 2,311,767.29 Russell County 3,716.15 19,329,742.00 6,616,571.74 3,734,091.78 Saint Clair County 7,908.35 37,544,422.57 15,205,193.63 5,444,650.35 Shelby County 24,891.70 109,819,470.08 100,216,799.16 13,879,524.80 Sumter County 2,545.70 13,261,664.08 3,509,055.31 5,131,074.91 Talladega County 7,865.30 38,595,961.09 19,447,213.23 8,353,108.47 Tallapoosa County 3,249.85 16,254,638.23 7,394,113.15 3,814,618.88 Tuscaloosa County 16,372.15 81,432,281.57 53,231,220.86 11,977,762.84 Walker County 8,462.60 42,564,728.45 18,942,371.46 8,888,537.38 Washington County 3,600.05 16,980,048.00 6,670,860.63 3,767,827.38 Wilcox County 2,291.60 11,492,289.14 3,874,282.73 4,343,474.37 Winston County 2,782.90 15,780,038.22 6,005,671.13 2,658,775.47
SYSTEM NAME 20 DAY ADM STATE REVENUE LOCAL REVENUE FEDERAL REVENUE
34
Annual Report – 2005-06.qxd 6/20/08 2:02 PM Page 34
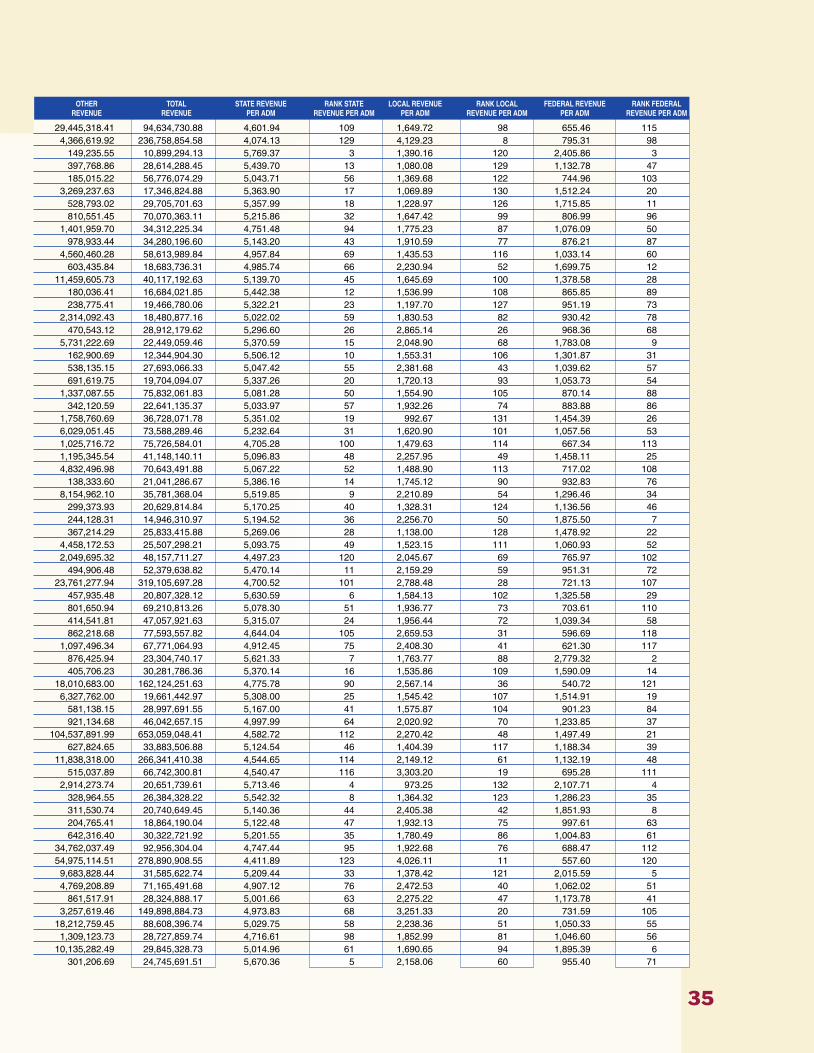
29,445,318.41 94,634,730.88 4,601.94 109 1,649.72 98 655.46 1154,366,619.92 236,758,854.58 4,074.13 129 4,129.23 8 795.31 98
149,235.55 10,899,294.13 5,769.37 3 1,390.16 120 2,405.86 3397,768.86 28,614,288.45 5,439.70 13 1,080.08 129 1,132.78 47185,015.22 56,776,074.29 5,043.71 56 1,369.68 122 744.96 103
3,269,237.63 17,346,824.88 5,363.90 17 1,069.89 130 1,512.24 20528,793.02 29,705,701.63 5,357.99 18 1,228.97 126 1,715.85 11810,551.45 70,070,363.11 5,215.86 32 1,647.42 99 806.99 96
1,401,959.70 34,312,225.34 4,751.48 94 1,775.23 87 1,076.09 50978,933.44 34,280,196.60 5,143.20 43 1,910.59 77 876.21 87
4,560,460.28 58,613,989.84 4,957.84 69 1,435.53 116 1,033.14 60603,435.84 18,683,736.31 4,985.74 66 2,230.94 52 1,699.75 12
11,459,605.73 40,117,192.63 5,139.70 45 1,645.69 100 1,378.58 28180,036.41 16,684,021.85 5,442.38 12 1,536.99 108 865.85 89238,775.41 19,466,780.06 5,322.21 23 1,197.70 127 951.19 73
2,314,092.43 18,480,877.16 5,022.02 59 1,830.53 82 930.42 78470,543.12 28,912,179.62 5,296.60 26 2,865.14 26 968.36 68
5,731,222.69 22,449,059.46 5,370.59 15 2,048.90 68 1,783.08 9162,900.69 12,344,904.30 5,506.12 10 1,553.31 106 1,301.87 31538,135.15 27,693,066.33 5,047.42 55 2,381.68 43 1,039.62 57691,619.75 19,704,094.07 5,337.26 20 1,720.13 93 1,053.73 54
1,337,087.55 75,832,061.83 5,081.28 50 1,554.90 105 870.14 88342,120.59 22,641,135.37 5,033.97 57 1,932.26 74 883.88 86
1,758,760.69 36,728,071.78 5,351.02 19 992.67 131 1,454.39 266,029,051.45 73,588,289.46 5,232.64 31 1,620.90 101 1,057.56 531,025,716.72 75,726,584.01 4,705.28 100 1,479.63 114 667.34 1131,195,345.54 41,148,140.11 5,096.83 48 2,257.95 49 1,458.11 254,832,496.98 70,643,491.88 5,067.22 52 1,488.90 113 717.02 108
138,333.60 21,041,286.67 5,386.16 14 1,745.12 90 932.83 768,154,962.10 35,781,368.04 5,519.85 9 2,210.89 54 1,296.46 34
299,373.93 20,629,814.84 5,170.25 40 1,328.31 124 1,136.56 46244,128.31 14,946,310.97 5,194.52 36 2,256.70 50 1,875.50 7367,214.29 25,833,415.88 5,269.06 28 1,138.00 128 1,478.92 22
4,458,172.53 25,507,298.21 5,093.75 49 1,523.15 111 1,060.93 522,049,695.32 48,157,711.27 4,497.23 120 2,045.67 69 765.97 102
494,906.48 52,379,638.82 5,470.14 11 2,159.29 59 951.31 7223,761,277.94 319,105,697.28 4,700.52 101 2,788.48 28 721.13 107
457,935.48 20,807,328.12 5,630.59 6 1,584.13 102 1,325.58 29801,650.94 69,210,813.26 5,078.30 51 1,936.77 73 703.61 110414,541.81 47,057,921.63 5,315.07 24 1,956.44 72 1,039.34 58862,218.68 77,593,557.82 4,644.04 105 2,659.53 31 596.69 118
1,097,496.34 67,771,064.93 4,912.45 75 2,408.30 41 621.30 117876,425.94 23,304,740.17 5,621.33 7 1,763.77 88 2,779.32 2405,706.23 30,281,786.36 5,370.14 16 1,535.86 109 1,590.09 14
18,010,683.00 162,124,251.63 4,775.78 90 2,567.14 36 540.72 1216,327,762.00 19,661,442.97 5,308.00 25 1,545.42 107 1,514.91 19
581,138.15 28,997,691.55 5,167.00 41 1,575.87 104 901.23 84921,134.68 46,042,657.15 4,997.99 64 2,020.92 70 1,233.85 37
104,537,891.99 653,059,048.41 4,582.72 112 2,270.42 48 1,497.49 21627,824.65 33,883,506.88 5,124.54 46 1,404.39 117 1,188.34 39
11,838,318.00 266,341,410.38 4,544.65 114 2,149.12 61 1,132.19 48515,037.89 66,742,300.81 4,540.47 116 3,303.20 19 695.28 111
2,914,273.74 20,651,739.61 5,713.46 4 973.25 132 2,107.71 4328,964.55 26,384,328.22 5,542.32 8 1,364.32 123 1,286.23 35311,530.74 20,740,649.45 5,140.36 44 2,405.38 42 1,851.93 8204,765.41 18,864,190.04 5,122.48 47 1,932.13 75 997.61 63642,316.40 30,322,721.92 5,201.55 35 1,780.49 86 1,004.83 61
34,762,037.49 92,956,304.04 4,747.44 95 1,922.68 76 688.47 11254,975,114.51 278,890,908.55 4,411.89 123 4,026.11 11 557.60 1209,683,828.44 31,585,622.74 5,209.44 33 1,378.42 121 2,015.59 54,769,208.89 71,165,491.68 4,907.12 76 2,472.53 40 1,062.02 51
861,517.91 28,324,888.17 5,001.66 63 2,275.22 47 1,173.78 413,257,619.46 149,898,884.73 4,973.83 68 3,251.33 20 731.59 105
18,212,759.45 88,608,396.74 5,029.75 58 2,238.36 51 1,050.33 551,309,123.73 28,727,859.74 4,716.61 98 1,852.99 81 1,046.60 56
10,135,282.49 29,845,328.73 5,014.96 61 1,690.65 94 1,895.39 6301,206.69 24,745,691.51 5,670.36 5 2,158.06 60 955.40 71
OTHER TOTAL STATE REVENUE RANK STATE LOCAL REVENUE RANK LOCAL FEDERAL REVENUE RANK FEDERALREVENUE REVENUE PER ADM REVENUE PER ADM PER ADM REVENUE PER ADM PER ADM REVENUE PER ADM
35
Annual Report – 2005-06.qxd 6/20/08 2:02 PM Page 35
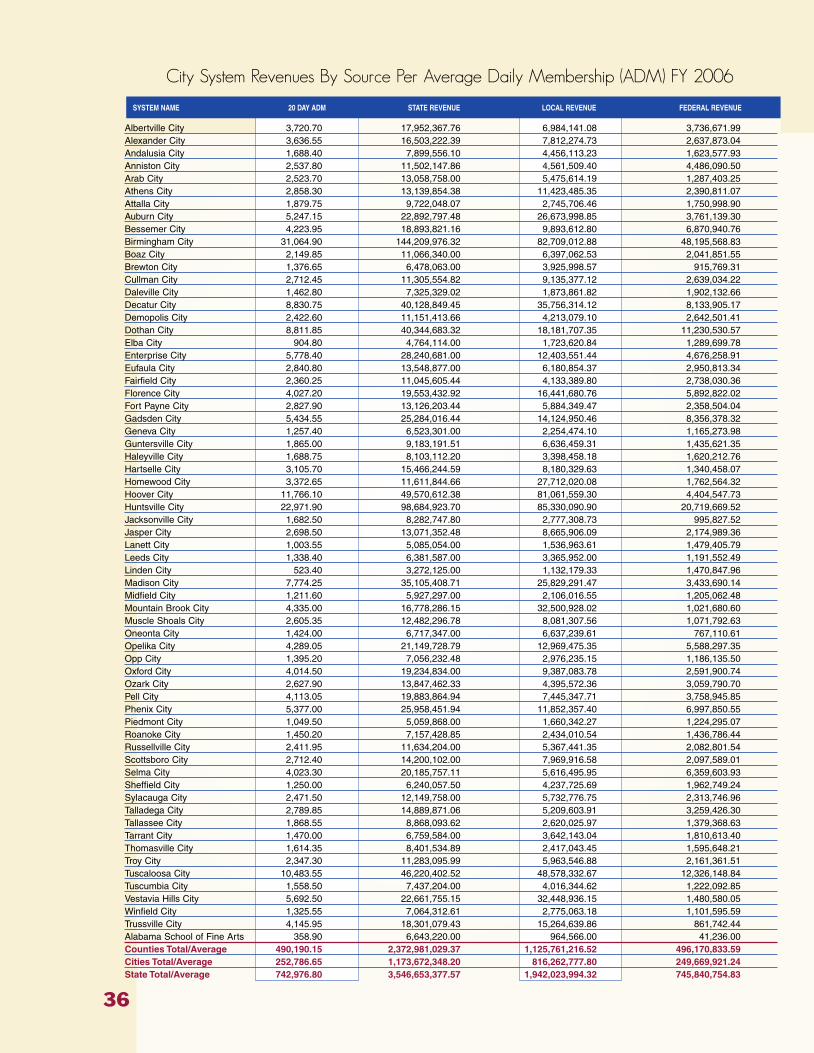
City System Revenues By Source Per Average Daily Membership (ADM) FY 2006
Albertville City 3,720.70 17,952,367.76 6,984,141.08 3,736,671.99 Alexander City 3,636.55 16,503,222.39 7,812,274.73 2,637,873.04 Andalusia City 1,688.40 7,899,556.10 4,456,113.23 1,623,577.93 Anniston City 2,537.80 11,502,147.86 4,561,509.40 4,486,090.50 Arab City 2,523.70 13,058,758.00 5,475,614.19 1,287,403.25 Athens City 2,858.30 13,139,854.38 11,423,485.35 2,390,811.07 Attalla City 1,879.75 9,722,048.07 2,745,706.46 1,750,998.90 Auburn City 5,247.15 22,892,797.48 26,673,998.85 3,761,139.30 Bessemer City 4,223.95 18,893,821.16 9,893,612.80 6,870,940.76 Birmingham City 31,064.90 144,209,976.32 82,709,012.88 48,195,568.83 Boaz City 2,149.85 11,066,340.00 6,397,062.53 2,041,851.55 Brewton City 1,376.65 6,478,063.00 3,925,998.57 915,769.31 Cullman City 2,712.45 11,305,554.82 9,135,377.12 2,639,034.22 Daleville City 1,462.80 7,325,329.02 1,873,861.82 1,902,132.66 Decatur City 8,830.75 40,128,849.45 35,756,314.12 8,133,905.17 Demopolis City 2,422.60 11,151,413.66 4,213,079.10 2,642,501.41 Dothan City 8,811.85 40,344,683.32 18,181,707.35 11,230,530.57 Elba City 904.80 4,764,114.00 1,723,620.84 1,289,699.78 Enterprise City 5,778.40 28,240,681.00 12,403,551.44 4,676,258.91 Eufaula City 2,840.80 13,548,877.00 6,180,854.37 2,950,813.34 Fairfield City 2,360.25 11,045,605.44 4,133,389.80 2,738,030.36 Florence City 4,027.20 19,553,432.92 16,441,680.76 5,892,822.02 Fort Payne City 2,827.90 13,126,203.44 5,884,349.47 2,358,504.04 Gadsden City 5,434.55 25,284,016.44 14,124,950.46 8,356,378.32 Geneva City 1,257.40 6,523,301.00 2,254,474.10 1,165,273.98 Guntersville City 1,865.00 9,183,191.51 6,636,459.31 1,435,621.35 Haleyville City 1,688.75 8,103,112.20 3,398,458.18 1,620,212.76 Hartselle City 3,105.70 15,466,244.59 8,180,329.63 1,340,458.07 Homewood City 3,372.65 11,611,844.66 27,712,020.08 1,762,564.32 Hoover City 11,766.10 49,570,612.38 81,061,559.30 4,404,547.73 Huntsville City 22,971.90 98,684,923.70 85,330,090.90 20,719,669.52 Jacksonville City 1,682.50 8,282,747.80 2,777,308.73 995,827.52 Jasper City 2,698.50 13,071,352.48 8,665,906.09 2,174,989.36 Lanett City 1,003.55 5,085,054.00 1,536,963.61 1,479,405.79 Leeds City 1,338.40 6,381,587.00 3,365,952.00 1,191,552.49 Linden City 523.40 3,272,125.00 1,132,179.33 1,470,847.96 Madison City 7,774.25 35,105,408.71 25,829,291.47 3,433,690.14 Midfield City 1,211.60 5,927,297.00 2,106,016.55 1,205,062.48 Mountain Brook City 4,335.00 16,778,286.15 32,500,928.02 1,021,680.60 Muscle Shoals City 2,605.35 12,482,296.78 8,081,307.56 1,071,792.63 Oneonta City 1,424.00 6,717,347.00 6,637,239.61 767,110.61 Opelika City 4,289.05 21,149,728.79 12,969,475.35 5,588,297.35 Opp City 1,395.20 7,056,232.48 2,976,235.15 1,186,135.50 Oxford City 4,014.50 19,234,834.00 9,387,083.78 2,591,900.74 Ozark City 2,627.90 13,847,462.33 4,395,572.36 3,059,790.70 Pell City 4,113.05 19,883,864.94 7,445,347.71 3,758,945.85 Phenix City 5,377.00 25,958,451.94 11,852,357.40 6,997,850.55 Piedmont City 1,049.50 5,059,868.00 1,660,342.27 1,224,295.07 Roanoke City 1,450.20 7,157,428.85 2,434,010.54 1,436,786.44 Russellville City 2,411.95 11,634,204.00 5,367,441.35 2,082,801.54 Scottsboro City 2,712.40 14,200,102.00 7,969,916.58 2,097,589.01 Selma City 4,023.30 20,185,757.11 5,616,495.95 6,359,603.93 Sheffield City 1,250.00 6,240,057.50 4,237,725.69 1,962,749.24 Sylacauga City 2,471.50 12,149,758.00 5,732,776.75 2,313,746.96 Talladega City 2,789.85 14,889,871.06 5,209,603.91 3,259,426.30 Tallassee City 1,868.55 8,868,093.62 2,620,025.97 1,379,368.63 Tarrant City 1,470.00 6,759,584.00 3,642,143.04 1,810,613.40 Thomasville City 1,614.35 8,401,534.89 2,417,043.45 1,595,648.21 Troy City 2,347.30 11,283,095.99 5,963,546.88 2,161,361.51 Tuscaloosa City 10,483.55 46,220,402.52 48,578,332.67 12,326,148.84 Tuscumbia City 1,558.50 7,437,204.00 4,016,344.62 1,222,092.85 Vestavia Hills City 5,692.50 22,661,755.15 32,448,936.15 1,480,580.05 Winfield City 1,325.55 7,064,312.61 2,775,063.18 1,101,595.59 Trussville City 4,145.95 18,301,079.43 15,264,639.86 861,742.44 Alabama School of Fine Arts 358.90 6,643,220.00 964,566.00 41,236.00 Counties Total/Average 490,190.15 2,372,981,029.37 1,125,761,216.52 496,170,833.59 Cities Total/Average 252,786.65 1,173,672,348.20 816,262,777.80 249,669,921.24 State Total/Average 742,976.80 3,546,653,377.57 1,942,023,994.32 745,840,754.83
SYSTEM NAME 20 DAY ADM STATE REVENUE LOCAL REVENUE FEDERAL REVENUE
36
Annual Report – 2005-06.qxd 6/20/08 2:02 PM Page 36
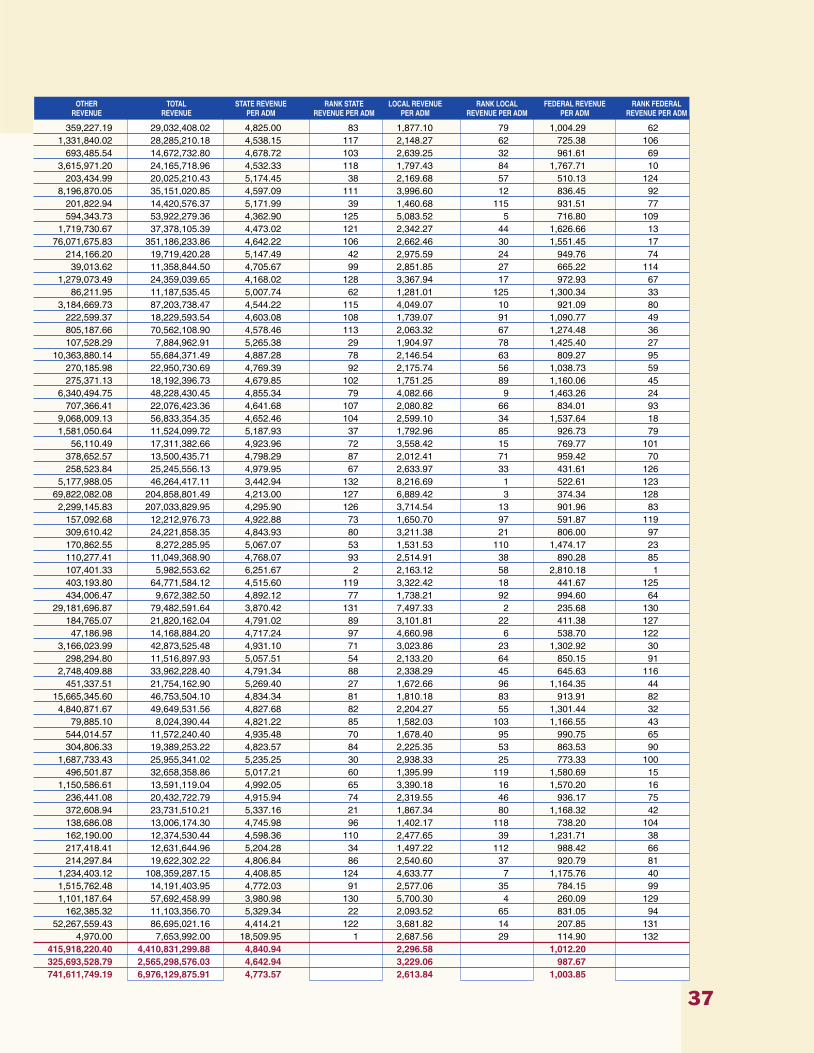
359,227.19 29,032,408.02 4,825.00 83 1,877.10 79 1,004.29 621,331,840.02 28,285,210.18 4,538.15 117 2,148.27 62 725.38 106
693,485.54 14,672,732.80 4,678.72 103 2,639.25 32 961.61 693,615,971.20 24,165,718.96 4,532.33 118 1,797.43 84 1,767.71 10
203,434.99 20,025,210.43 5,174.45 38 2,169.68 57 510.13 1248,196,870.05 35,151,020.85 4,597.09 111 3,996.60 12 836.45 92
201,822.94 14,420,576.37 5,171.99 39 1,460.68 115 931.51 77594,343.73 53,922,279.36 4,362.90 125 5,083.52 5 716.80 109
1,719,730.67 37,378,105.39 4,473.02 121 2,342.27 44 1,626.66 1376,071,675.83 351,186,233.86 4,642.22 106 2,662.46 30 1,551.45 17
214,166.20 19,719,420.28 5,147.49 42 2,975.59 24 949.76 7439,013.62 11,358,844.50 4,705.67 99 2,851.85 27 665.22 114
1,279,073.49 24,359,039.65 4,168.02 128 3,367.94 17 972.93 6786,211.95 11,187,535.45 5,007.74 62 1,281.01 125 1,300.34 33
3,184,669.73 87,203,738.47 4,544.22 115 4,049.07 10 921.09 80222,599.37 18,229,593.54 4,603.08 108 1,739.07 91 1,090.77 49805,187.66 70,562,108.90 4,578.46 113 2,063.32 67 1,274.48 36107,528.29 7,884,962.91 5,265.38 29 1,904.97 78 1,425.40 27
10,363,880.14 55,684,371.49 4,887.28 78 2,146.54 63 809.27 95270,185.98 22,950,730.69 4,769.39 92 2,175.74 56 1,038.73 59275,371.13 18,192,396.73 4,679.85 102 1,751.25 89 1,160.06 45
6,340,494.75 48,228,430.45 4,855.34 79 4,082.66 9 1,463.26 24707,366.41 22,076,423.36 4,641.68 107 2,080.82 66 834.01 93
9,068,009.13 56,833,354.35 4,652.46 104 2,599.10 34 1,537.64 181,581,050.64 11,524,099.72 5,187.93 37 1,792.96 85 926.73 79
56,110.49 17,311,382.66 4,923.96 72 3,558.42 15 769.77 101378,652.57 13,500,435.71 4,798.29 87 2,012.41 71 959.42 70258,523.84 25,245,556.13 4,979.95 67 2,633.97 33 431.61 126
5,177,988.05 46,264,417.11 3,442.94 132 8,216.69 1 522.61 12369,822,082.08 204,858,801.49 4,213.00 127 6,889.42 3 374.34 1282,299,145.83 207,033,829.95 4,295.90 126 3,714.54 13 901.96 83
157,092.68 12,212,976.73 4,922.88 73 1,650.70 97 591.87 119309,610.42 24,221,858.35 4,843.93 80 3,211.38 21 806.00 97170,862.55 8,272,285.95 5,067.07 53 1,531.53 110 1,474.17 23110,277.41 11,049,368.90 4,768.07 93 2,514.91 38 890.28 85107,401.33 5,982,553.62 6,251.67 2 2,163.12 58 2,810.18 1403,193.80 64,771,584.12 4,515.60 119 3,322.42 18 441.67 125434,006.47 9,672,382.50 4,892.12 77 1,738.21 92 994.60 64
29,181,696.87 79,482,591.64 3,870.42 131 7,497.33 2 235.68 130184,765.07 21,820,162.04 4,791.02 89 3,101.81 22 411.38 12747,186.98 14,168,884.20 4,717.24 97 4,660.98 6 538.70 122
3,166,023.99 42,873,525.48 4,931.10 71 3,023.86 23 1,302.92 30298,294.80 11,516,897.93 5,057.51 54 2,133.20 64 850.15 91
2,748,409.88 33,962,228.40 4,791.34 88 2,338.29 45 645.63 116451,337.51 21,754,162.90 5,269.40 27 1,672.66 96 1,164.35 44
15,665,345.60 46,753,504.10 4,834.34 81 1,810.18 83 913.91 824,840,871.67 49,649,531.56 4,827.68 82 2,204.27 55 1,301.44 32
79,885.10 8,024,390.44 4,821.22 85 1,582.03 103 1,166.55 43544,014.57 11,572,240.40 4,935.48 70 1,678.40 95 990.75 65304,806.33 19,389,253.22 4,823.57 84 2,225.35 53 863.53 90
1,687,733.43 25,955,341.02 5,235.25 30 2,938.33 25 773.33 100496,501.87 32,658,358.86 5,017.21 60 1,395.99 119 1,580.69 15
1,150,586.61 13,591,119.04 4,992.05 65 3,390.18 16 1,570.20 16236,441.08 20,432,722.79 4,915.94 74 2,319.55 46 936.17 75372,608.94 23,731,510.21 5,337.16 21 1,867.34 80 1,168.32 42138,686.08 13,006,174.30 4,745.98 96 1,402.17 118 738.20 104162,190.00 12,374,530.44 4,598.36 110 2,477.65 39 1,231.71 38217,418.41 12,631,644.96 5,204.28 34 1,497.22 112 988.42 66214,297.84 19,622,302.22 4,806.84 86 2,540.60 37 920.79 81
1,234,403.12 108,359,287.15 4,408.85 124 4,633.77 7 1,175.76 401,515,762.48 14,191,403.95 4,772.03 91 2,577.06 35 784.15 991,101,187.64 57,692,458.99 3,980.98 130 5,700.30 4 260.09 129
162,385.32 11,103,356.70 5,329.34 22 2,093.52 65 831.05 9452,267,559.43 86,695,021.16 4,414.21 122 3,681.82 14 207.85 131
4,970.00 7,653,992.00 18,509.95 1 2,687.56 29 114.90 132415,918,220.40 4,410,831,299.88 4,840.94 2,296.58 1,012.20 325,693,528.79 2,565,298,576.03 4,642.94 3,229.06 987.67741,611,749.19 6,976,129,875.91 4,773.57 2,613.84 1,003.85
OTHER TOTAL STATE REVENUE RANK STATE LOCAL REVENUE RANK LOCAL FEDERAL REVENUE RANK FEDERALREVENUE REVENUE PER ADM REVENUE PER ADM PER ADM REVENUE PER ADM PER ADM REVENUE PER ADM
37
Annual Report – 2005-06.qxd 6/20/08 2:02 PM Page 37
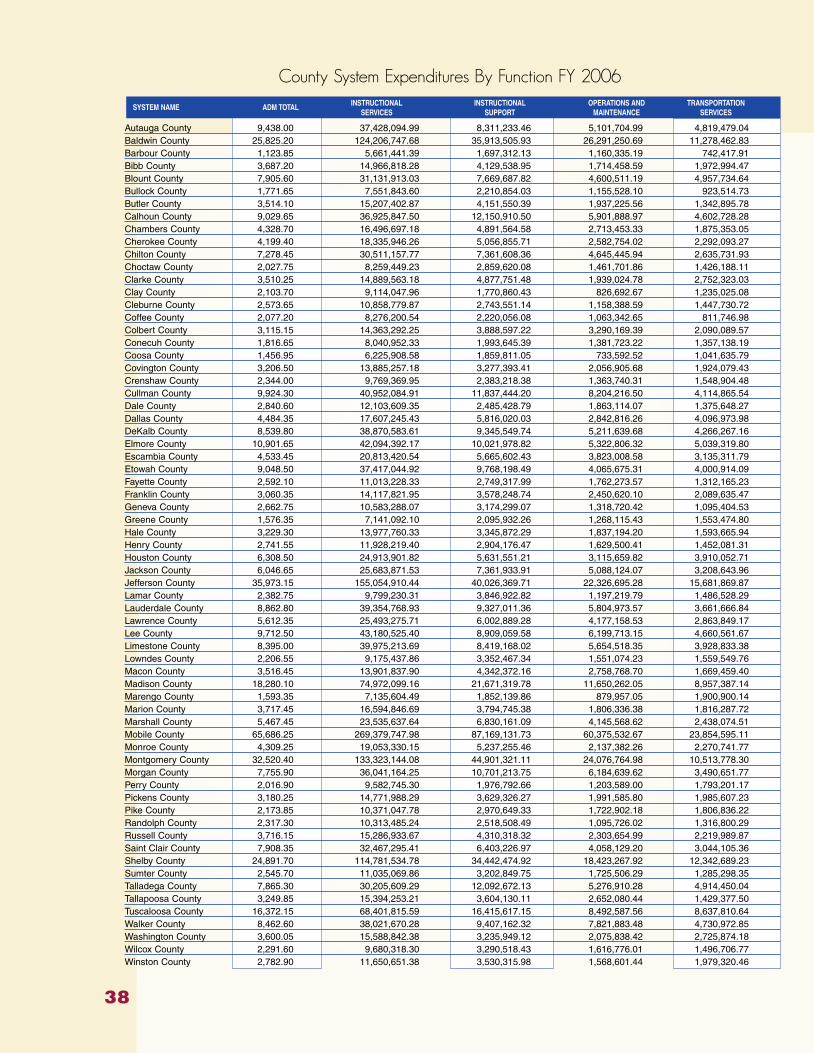
County System Expenditures By Function FY 2006
Autauga County 9,438.00 37,428,094.99 8,311,233.46 5,101,704.99 4,819,479.04 Baldwin County 25,825.20 124,206,747.68 35,913,505.93 26,291,250.69 11,278,462.83 Barbour County 1,123.85 5,661,441.39 1,697,312.13 1,160,335.19 742,417.91 Bibb County 3,687.20 14,966,818.28 4,129,538.95 1,714,458.59 1,972,994.47 Blount County 7,905.60 31,131,913.03 7,669,687.82 4,600,511.19 4,957,734.64 Bullock County 1,771.65 7,551,843.60 2,210,854.03 1,155,528.10 923,514.73 Butler County 3,514.10 15,207,402.87 4,151,550.39 1,937,225.56 1,342,895.78 Calhoun County 9,029.65 36,925,847.50 12,150,910.50 5,901,888.97 4,602,728.28 Chambers County 4,328.70 16,496,697.18 4,891,564.58 2,713,453.33 1,875,353.05 Cherokee County 4,199.40 18,335,946.26 5,056,855.71 2,582,754.02 2,292,093.27 Chilton County 7,278.45 30,511,157.77 7,361,608.36 4,645,445.94 2,635,731.93 Choctaw County 2,027.75 8,259,449.23 2,859,620.08 1,461,701.86 1,426,188.11 Clarke County 3,510.25 14,889,563.18 4,877,751.48 1,939,024.78 2,752,323.03 Clay County 2,103.70 9,114,047.96 1,770,860.43 826,692.67 1,235,025.08 Cleburne County 2,573.65 10,858,779.87 2,743,551.14 1,158,388.59 1,447,730.72 Coffee County 2,077.20 8,276,200.54 2,220,056.08 1,063,342.65 811,746.98 Colbert County 3,115.15 14,363,292.25 3,888,597.22 3,290,169.39 2,090,089.57 Conecuh County 1,816.65 8,040,952.33 1,993,645.39 1,381,723.22 1,357,138.19 Coosa County 1,456.95 6,225,908.58 1,859,811.05 733,592.52 1,041,635.79 Covington County 3,206.50 13,885,257.18 3,277,393.41 2,056,905.68 1,924,079.43 Crenshaw County 2,344.00 9,769,369.95 2,383,218.38 1,363,740.31 1,548,904.48 Cullman County 9,924.30 40,952,084.91 11,837,444.20 8,204,216.50 4,114,865.54 Dale County 2,840.60 12,103,609.35 2,485,428.79 1,863,114.07 1,375,648.27 Dallas County 4,484.35 17,607,245.43 5,816,020.03 2,842,816.26 4,096,973.98 DeKalb County 8,539.80 38,870,583.61 9,345,549.74 5,211,639.68 4,266,267.16 Elmore County 10,901.65 42,094,392.17 10,021,978.82 5,322,806.32 5,039,319.80 Escambia County 4,533.45 20,813,420.54 5,665,602.43 3,823,008.58 3,135,311.79 Etowah County 9,048.50 37,417,044.92 9,768,198.49 4,065,675.31 4,000,914.09 Fayette County 2,592.10 11,013,228.33 2,749,317.99 1,762,273.57 1,312,165.23 Franklin County 3,060.35 14,117,821.95 3,578,248.74 2,450,620.10 2,089,635.47 Geneva County 2,662.75 10,583,288.07 3,174,299.07 1,318,720.42 1,095,404.53 Greene County 1,576.35 7,141,092.10 2,095,932.26 1,268,115.43 1,553,474.80 Hale County 3,229.30 13,977,760.33 3,345,872.29 1,837,194.20 1,593,665.94 Henry County 2,741.55 11,928,219.40 2,904,176.47 1,629,500.41 1,452,081.31 Houston County 6,308.50 24,913,901.82 5,631,551.21 3,115,659.82 3,910,052.71 Jackson County 6,046.65 25,683,871.53 7,361,933.91 5,088,124.07 3,208,643.96 Jefferson County 35,973.15 155,054,910.44 40,026,369.71 22,326,695.28 15,681,869.87 Lamar County 2,382.75 9,799,230.31 3,846,922.82 1,197,219.79 1,486,528.29 Lauderdale County 8,862.80 39,354,768.93 9,327,011.36 5,804,973.57 3,661,666.84 Lawrence County 5,612.35 25,493,275.71 6,002,889.28 4,177,158.53 2,863,849.17 Lee County 9,712.50 43,180,525.40 8,909,059.58 6,199,713.15 4,660,561.67 Limestone County 8,395.00 39,975,213.69 8,419,168.02 5,654,518.35 3,928,833.38 Lowndes County 2,206.55 9,175,437.86 3,352,467.34 1,551,074.23 1,559,549.76 Macon County 3,516.45 13,901,837.90 4,342,372.16 2,758,768.70 1,669,459.40 Madison County 18,280.10 74,972,099.16 21,671,319.78 11,650,262.05 8,957,387.14 Marengo County 1,593.35 7,135,604.49 1,852,139.86 879,957.05 1,900,900.14 Marion County 3,717.45 16,594,846.69 3,794,745.38 1,806,336.38 1,816,287.72 Marshall County 5,467.45 23,535,637.64 6,830,161.09 4,145,568.62 2,438,074.51 Mobile County 65,686.25 269,379,747.98 87,169,131.73 60,375,532.67 23,854,595.11 Monroe County 4,309.25 19,053,330.15 5,237,255.46 2,137,382.26 2,270,741.77 Montgomery County 32,520.40 133,323,144.08 44,901,321.11 24,076,764.98 10,513,778.30 Morgan County 7,755.90 36,041,164.25 10,701,213.75 6,184,639.62 3,490,651.77 Perry County 2,016.90 9,582,745.30 1,976,792.66 1,203,589.00 1,793,201.17 Pickens County 3,180.25 14,771,988.29 3,629,326.27 1,991,585.80 1,985,607.23 Pike County 2,173.85 10,371,047.78 2,970,649.33 1,722,902.18 1,806,836.22 Randolph County 2,317.30 10,313,485.24 2,518,508.49 1,095,726.02 1,316,800.29 Russell County 3,716.15 15,286,933.67 4,310,318.32 2,303,654.99 2,219,989.87 Saint Clair County 7,908.35 32,467,295.41 6,403,226.97 4,058,129.20 3,044,105.36 Shelby County 24,891.70 114,781,534.78 34,442,474.92 18,423,267.92 12,342,689.23 Sumter County 2,545.70 11,035,069.86 3,202,849.75 1,725,506.29 1,285,298.35 Talladega County 7,865.30 30,205,609.29 12,092,672.13 5,276,910.28 4,914,450.04 Tallapoosa County 3,249.85 15,394,253.21 3,604,130.11 2,652,080.44 1,429,377.50 Tuscaloosa County 16,372.15 68,401,815.59 16,415,617.15 8,492,587.56 8,637,810.64 Walker County 8,462.60 38,021,670.28 9,407,162.32 7,821,883.48 4,730,972.85 Washington County 3,600.05 15,588,842.38 3,235,949.12 2,075,838.42 2,725,874.18 Wilcox County 2,291.60 9,680,318.30 3,290,518.43 1,616,776.01 1,496,706.77 Winston County 2,782.90 11,650,651.38 3,530,315.98 1,568,601.44 1,979,320.46
SYSTEM NAME ADM TOTAL INSTRUCTIONAL INSTRUCTIONAL OPERATIONS AND TRANSPORTATIONSERVICES SUPPORT MAINTENANCE SERVICES
38
Annual Report – 2005-06.qxd 6/20/08 2:02 PM Page 38
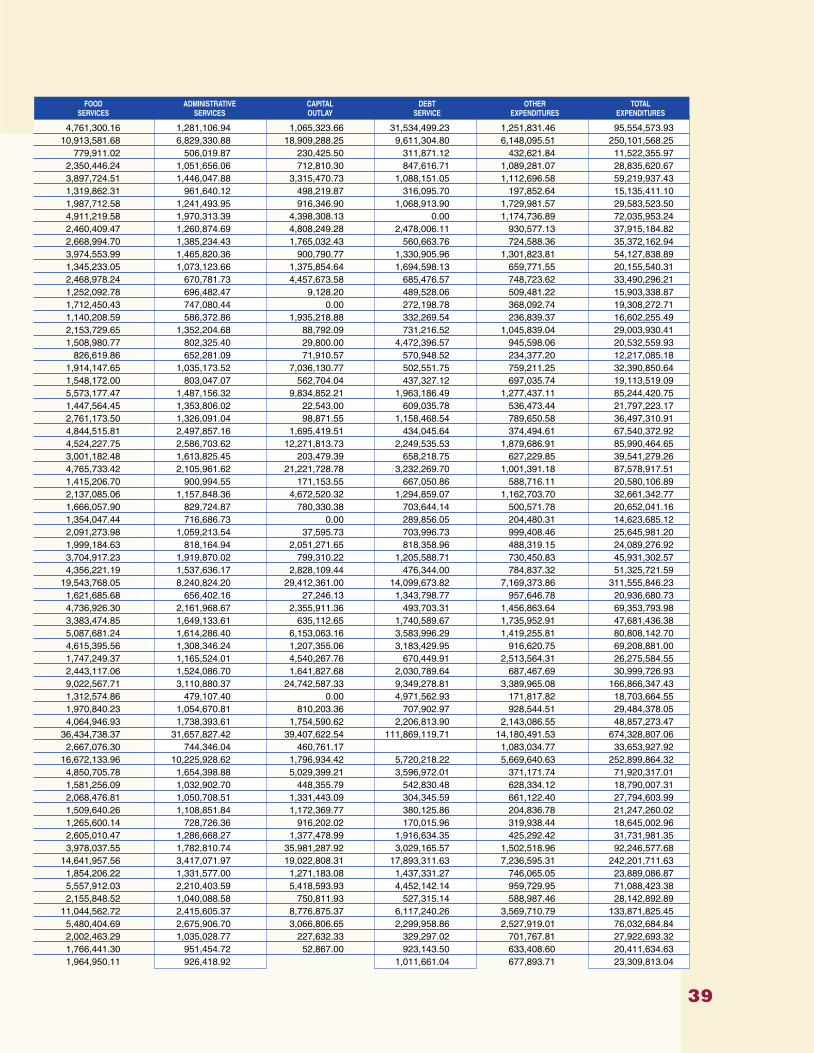
4,761,300.16 1,281,106.94 1,065,323.66 31,534,499.23 1,251,831.46 95,554,573.93 10,913,581.68 6,829,330.88 18,909,288.25 9,611,304.80 6,148,095.51 250,101,568.25
779,911.02 506,019.87 230,425.50 311,871.12 432,621.84 11,522,355.97 2,350,446.24 1,051,656.06 712,810.30 847,616.71 1,089,281.07 28,835,620.67 3,897,724.51 1,446,047.88 3,315,470.73 1,088,151.05 1,112,696.58 59,219,937.43 1,319,862.31 961,640.12 498,219.87 316,095.70 197,852.64 15,135,411.10 1,987,712.58 1,241,493.95 916,346.90 1,068,913.90 1,729,981.57 29,583,523.50 4,911,219.58 1,970,313.39 4,398,308.13 0.00 1,174,736.89 72,035,953.24 2,460,409.47 1,260,874.69 4,808,249.28 2,478,006.11 930,577.13 37,915,184.82 2,668,994.70 1,385,234.43 1,765,032.43 560,663.76 724,588.36 35,372,162.94 3,974,553.99 1,465,820.36 900,790.77 1,330,905.96 1,301,823.81 54,127,838.89 1,345,233.05 1,073,123.66 1,375,854.64 1,694,598.13 659,771.55 20,155,540.31 2,468,978.24 670,781.73 4,457,673.58 685,476.57 748,723.62 33,490,296.21 1,252,092.78 696,482.47 9,128.20 489,528.06 509,481.22 15,903,338.87 1,712,450.43 747,080.44 0.00 272,198.78 368,092.74 19,308,272.71 1,140,208.59 586,372.86 1,935,218.88 332,269.54 236,839.37 16,602,255.49 2,153,729.65 1,352,204.68 88,792.09 731,216.52 1,045,839.04 29,003,930.41 1,508,980.77 802,325.40 29,800.00 4,472,396.57 945,598.06 20,532,559.93
826,619.86 652,281.09 71,910.57 570,948.52 234,377.20 12,217,085.18 1,914,147.65 1,035,173.52 7,036,130.77 502,551.75 759,211.25 32,390,850.64 1,548,172.00 803,047.07 562,704.04 437,327.12 697,035.74 19,113,519.09 5,573,177.47 1,487,156.32 9,834,852.21 1,963,186.49 1,277,437.11 85,244,420.75 1,447,564.45 1,353,806.02 22,543.00 609,035.78 536,473.44 21,797,223.17 2,761,173.50 1,326,091.04 98,871.55 1,158,468.54 789,650.58 36,497,310.91 4,844,515.81 2,497,857.16 1,695,419.51 434,045.64 374,494.61 67,540,372.92 4,524,227.75 2,586,703.62 12,271,813.73 2,249,535.53 1,879,686.91 85,990,464.65 3,001,182.48 1,613,825.45 203,479.39 658,218.75 627,229.85 39,541,279.26 4,765,733.42 2,105,961.62 21,221,728.78 3,232,269.70 1,001,391.18 87,578,917.51 1,415,206.70 900,994.55 171,153.55 667,050.86 588,716.11 20,580,106.89 2,137,085.06 1,157,848.36 4,672,520.32 1,294,859.07 1,162,703.70 32,661,342.77 1,666,057.90 829,724.87 780,330.38 703,644.14 500,571.78 20,652,041.16 1,354,047.44 716,686.73 0.00 289,856.05 204,480.31 14,623,685.12 2,091,273.98 1,059,213.54 37,595.73 703,996.73 999,408.46 25,645,981.20 1,999,184.63 818,164.94 2,051,271.65 818,358.96 488,319.15 24,089,276.92 3,704,917.23 1,919,870.02 799,310.22 1,205,588.71 730,450.83 45,931,302.57 4,356,221.19 1,537,636.17 2,828,109.44 476,344.00 784,837.32 51,325,721.59
19,543,768.05 8,240,824.20 29,412,361.00 14,099,673.82 7,169,373.86 311,555,846.23 1,621,685.68 656,402.16 27,246.13 1,343,798.77 957,646.78 20,936,680.73 4,736,926.30 2,161,968.67 2,355,911.36 493,703.31 1,456,863.64 69,353,793.98 3,383,474.85 1,649,133.61 635,112.65 1,740,589.67 1,735,952.91 47,681,436.38 5,087,681.24 1,614,286.40 6,153,063.16 3,583,996.29 1,419,255.81 80,808,142.70 4,615,395.56 1,308,346.24 1,207,355.06 3,183,429.95 916,620.75 69,208,881.00 1,747,249.37 1,165,524.01 4,540,267.76 670,449.91 2,513,564.31 26,275,584.55 2,443,117.06 1,524,086.70 1,641,827.68 2,030,789.64 687,467.69 30,999,726.93 9,022,567.71 3,110,880.37 24,742,587.33 9,349,278.81 3,389,965.08 166,866,347.43 1,312,574.86 479,107.40 0.00 4,971,562.93 171,817.82 18,703,664.55 1,970,840.23 1,054,670.81 810,203.36 707,902.97 928,544.51 29,484,378.05 4,064,946.93 1,738,393.61 1,754,590.62 2,206,813.90 2,143,086.55 48,857,273.47
36,434,738.37 31,657,827.42 39,407,622.54 111,869,119.71 14,180,491.53 674,328,807.06 2,667,076.30 744,346.04 460,761.17 1,083,034.77 33,653,927.92
16,672,133.96 10,225,928.62 1,796,934.42 5,720,218.22 5,669,640.63 252,899,864.32 4,850,705.78 1,654,398.88 5,029,399.21 3,596,972.01 371,171.74 71,920,317.01 1,581,256.09 1,032,902.70 448,355.79 542,830.48 628,334.12 18,790,007.31 2,068,476.81 1,050,708.51 1,331,443.09 304,345.59 661,122.40 27,794,603.99 1,509,640.26 1,108,851.84 1,172,369.77 380,125.86 204,836.78 21,247,260.02 1,265,600.14 728,726.36 916,202.02 170,015.96 319,938.44 18,645,002.96 2,605,010.47 1,286,668.27 1,377,478.99 1,916,634.35 425,292.42 31,731,981.35 3,978,037.55 1,782,810.74 35,981,287.92 3,029,165.57 1,502,518.96 92,246,577.68
14,641,957.56 3,417,071.97 19,022,808.31 17,893,311.63 7,236,595.31 242,201,711.63 1,854,206.22 1,331,577.00 1,271,183.08 1,437,331.27 746,065.05 23,889,086.87 5,557,912.03 2,210,403.59 5,418,593.93 4,452,142.14 959,729.95 71,088,423.38 2,155,848.52 1,040,088.58 750,811.93 527,315.14 588,987.46 28,142,892.89
11,044,562.72 2,415,605.37 8,776,875.37 6,117,240.26 3,569,710.79 133,871,825.45 5,480,404.69 2,675,906.70 3,066,806.65 2,299,958.86 2,527,919.01 76,032,684.84 2,002,463.29 1,035,028.77 227,632.33 329,297.02 701,767.81 27,922,693.32 1,766,441.30 951,454.72 52,867.00 923,143.50 633,408.60 20,411,634.63 1,964,950.11 926,418.92 1,011,661.04 677,893.71 23,309,813.04
FOOD ADMINISTRATIVE CAPITAL DEBT OTHER TOTALSERVICES SERVICES OUTLAY SERVICE EXPENDITURES EXPENDITURES
39
Annual Report – 2005-06.qxd 6/20/08 2:02 PM Page 39
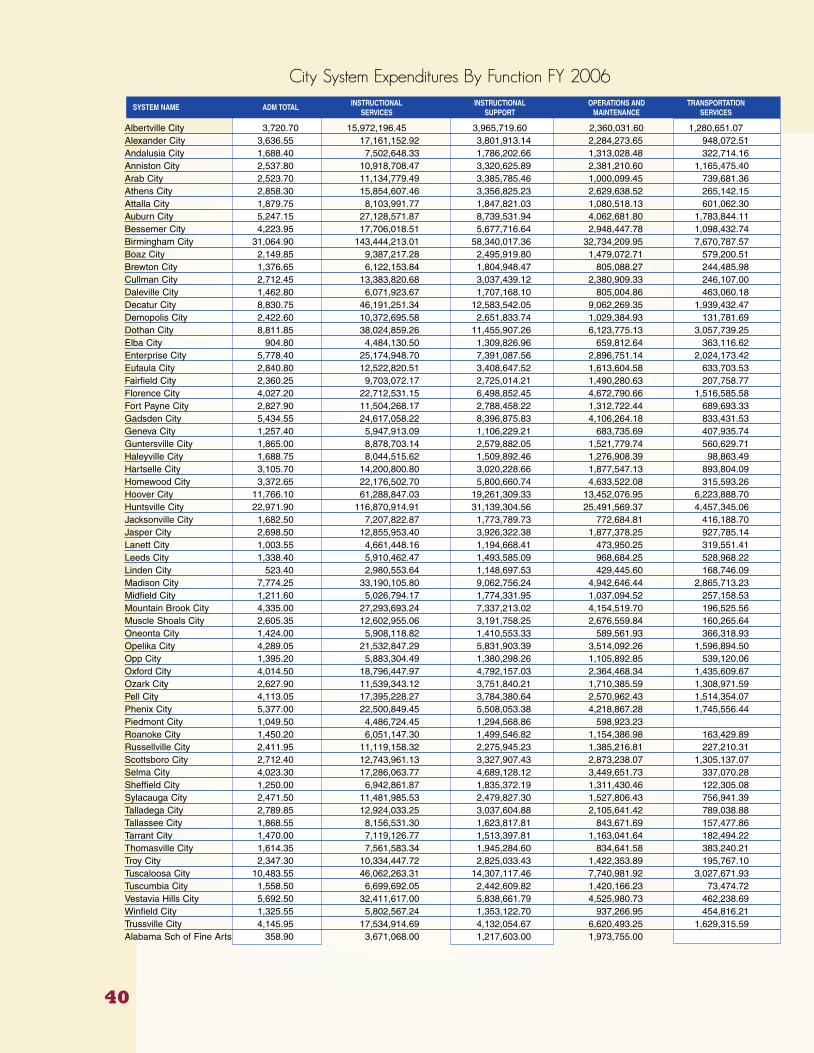
City System Expenditures By Function FY 2006
Albertville City 3,720.70 15,972,196.45 3,965,719.60 2,360,031.60 1,280,651.07 Alexander City 3,636.55 17,161,152.92 3,801,913.14 2,284,273.65 948,072.51 Andalusia City 1,688.40 7,502,648.33 1,786,202.66 1,313,028.48 322,714.16 Anniston City 2,537.80 10,918,708.47 3,320,625.89 2,381,210.60 1,165,475.40 Arab City 2,523.70 11,134,779.49 3,385,785.46 1,000,099.45 739,681.36 Athens City 2,858.30 15,854,607.46 3,356,825.23 2,629,638.52 265,142.15 Attalla City 1,879.75 8,103,991.77 1,847,821.03 1,080,518.13 601,062.30 Auburn City 5,247.15 27,128,571.87 8,739,531.94 4,062,681.80 1,783,844.11 Bessemer City 4,223.95 17,706,018.51 5,677,716.64 2,948,447.78 1,098,432.74 Birmingham City 31,064.90 143,444,213.01 58,340,017.36 32,734,209.95 7,670,787.57 Boaz City 2,149.85 9,387,217.28 2,495,919.80 1,479,072.71 579,200.51 Brewton City 1,376.65 6,122,153.84 1,804,948.47 805,088.27 244,485.98 Cullman City 2,712.45 13,383,820.68 3,037,439.12 2,380,909.33 246,107.00 Daleville City 1,462.80 6,071,923.67 1,707,168.10 805,004.86 463,060.18 Decatur City 8,830.75 46,191,251.34 12,583,542.05 9,062,269.35 1,939,432.47 Demopolis City 2,422.60 10,372,695.58 2,651,833.74 1,029,384.93 131,781.69 Dothan City 8,811.85 38,024,859.26 11,455,907.26 6,123,775.13 3,057,739.25 Elba City 904.80 4,484,130.50 1,309,826.96 659,812.64 363,116.62 Enterprise City 5,778.40 25,174,948.70 7,391,087.56 2,896,751.14 2,024,173.42 Eufaula City 2,840.80 12,522,820.51 3,408,647.52 1,613,604.58 633,703.53 Fairfield City 2,360.25 9,703,072.17 2,725,014.21 1,490,280.63 207,758.77 Florence City 4,027.20 22,712,531.15 6,498,852.45 4,672,790.66 1,516,585.58 Fort Payne City 2,827.90 11,504,268.17 2,788,458.22 1,312,722.44 689,693.33 Gadsden City 5,434.55 24,617,058.22 8,396,875.83 4,106,264.18 833,431.53 Geneva City 1,257.40 5,947,913.09 1,106,229.21 683,735.69 407,935.74 Guntersville City 1,865.00 8,878,703.14 2,579,882.05 1,521,779.74 560,629.71 Haleyville City 1,688.75 8,044,515.62 1,509,892.46 1,276,908.39 98,863.49 Hartselle City 3,105.70 14,200,800.80 3,020,228.66 1,877,547.13 893,804.09 Homewood City 3,372.65 22,176,502.70 5,800,660.74 4,633,522.08 315,593.26 Hoover City 11,766.10 61,288,847.03 19,261,309.33 13,452,076.95 6,223,888.70 Huntsville City 22,971.90 116,870,914.91 31,139,304.56 25,491,569.37 4,457,345.06 Jacksonville City 1,682.50 7,207,822.87 1,773,789.73 772,684.81 416,188.70 Jasper City 2,698.50 12,855,953.40 3,926,322.38 1,877,378.25 927,785.14 Lanett City 1,003.55 4,661,448.16 1,194,668.41 473,950.25 319,551.41 Leeds City 1,338.40 5,910,462.47 1,493,585.09 968,684.25 528,968.22 Linden City 523.40 2,980,553.64 1,148,697.53 429,445.60 168,746.09 Madison City 7,774.25 33,190,105.80 9,062,756.24 4,942,646.44 2,865,713.23 Midfield City 1,211.60 5,026,794.17 1,774,331.95 1,037,094.52 257,158.53 Mountain Brook City 4,335.00 27,293,693.24 7,337,213.02 4,154,519.70 196,525.56 Muscle Shoals City 2,605.35 12,602,955.06 3,191,758.25 2,676,559.84 160,265.64 Oneonta City 1,424.00 5,908,118.82 1,410,553.33 589,561.93 366,318.93 Opelika City 4,289.05 21,532,847.29 5,831,903.39 3,514,092.26 1,596,894.50 Opp City 1,395.20 5,883,304.49 1,380,298.26 1,105,892.85 539,120.06 Oxford City 4,014.50 18,796,447.97 4,792,157.03 2,364,468.34 1,435,609.67 Ozark City 2,627.90 11,539,343.12 3,751,840.21 1,710,385.59 1,308,971.59 Pell City 4,113.05 17,395,228.27 3,784,380.64 2,570,962.43 1,514,354.07 Phenix City 5,377.00 22,500,849.45 5,508,053.38 4,218,867.28 1,745,556.44 Piedmont City 1,049.50 4,486,724.45 1,294,568.86 598,923.23 Roanoke City 1,450.20 6,051,147.30 1,499,546.82 1,154,386.98 163,429.89 Russellville City 2,411.95 11,119,158.32 2,275,945.23 1,385,216.81 227,210.31 Scottsboro City 2,712.40 12,743,961.13 3,327,907.43 2,873,238.07 1,305,137.07 Selma City 4,023.30 17,286,063.77 4,689,128.12 3,449,651.73 337,070.28 Sheffield City 1,250.00 6,942,861.87 1,835,372.19 1,311,430.46 122,305.08 Sylacauga City 2,471.50 11,481,985.53 2,479,827.30 1,527,806.43 756,941.39 Talladega City 2,789.85 12,924,033.25 3,037,604.88 2,105,641.42 789,038.88 Tallassee City 1,868.55 8,156,531.30 1,623,817.81 843,671.69 157,477.86 Tarrant City 1,470.00 7,119,126.77 1,513,397.81 1,163,041.64 182,494.22 Thomasville City 1,614.35 7,561,583.34 1,945,284.60 834,641.58 383,240.21 Troy City 2,347.30 10,334,447.72 2,825,033.43 1,422,353.89 195,767.10 Tuscaloosa City 10,483.55 46,062,263.31 14,307,117.46 7,740,981.92 3,027,671.93 Tuscumbia City 1,558.50 6,699,692.05 2,442,609.82 1,420,166.23 73,474.72 Vestavia Hills City 5,692.50 32,411,617.00 5,838,661.79 4,525,980.73 462,238.69 Winfield City 1,325.55 5,802,567.24 1,353,122.70 937,266.95 454,816.21 Trussville City 4,145.95 17,534,914.69 4,132,054.67 6,620,493.25 1,629,315.59 Alabama Sch of Fine Arts 358.90 3,671,068.00 1,217,603.00 1,973,755.00
SYSTEM NAME ADM TOTAL INSTRUCTIONAL INSTRUCTIONAL OPERATIONS AND TRANSPORTATIONSERVICES SUPPORT MAINTENANCE SERVICES
40
Annual Report – 2005-06.qxd 6/20/08 2:02 PM Page 40
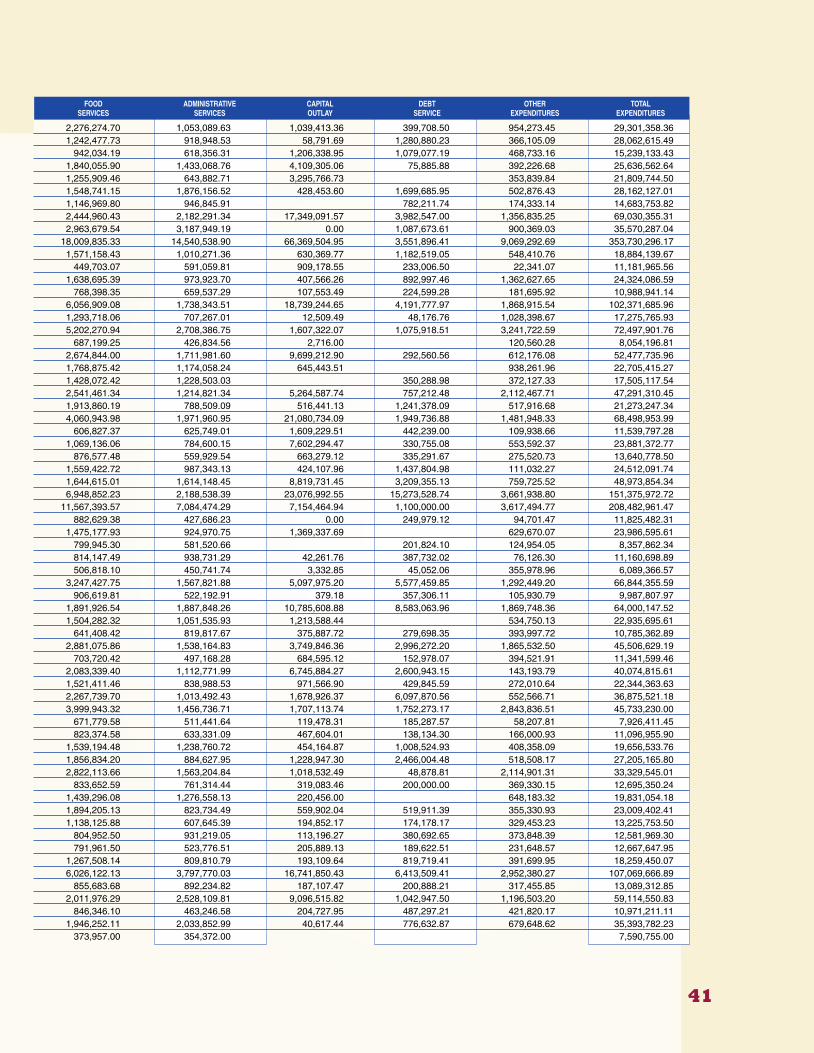
2,276,274.70 1,053,089.63 1,039,413.36 399,708.50 954,273.45 29,301,358.36 1,242,477.73 918,948.53 58,791.69 1,280,880.23 366,105.09 28,062,615.49
942,034.19 618,356.31 1,206,338.95 1,079,077.19 468,733.16 15,239,133.43 1,840,055.90 1,433,068.76 4,109,305.06 75,885.88 392,226.68 25,636,562.64 1,255,909.46 643,882.71 3,295,766.73 353,839.84 21,809,744.50 1,548,741.15 1,876,156.52 428,453.60 1,699,685.95 502,876.43 28,162,127.01 1,146,969.80 946,845.91 782,211.74 174,333.14 14,683,753.82 2,444,960.43 2,182,291.34 17,349,091.57 3,982,547.00 1,356,835.25 69,030,355.31 2,963,679.54 3,187,949.19 0.00 1,087,673.61 900,369.03 35,570,287.04
18,009,835.33 14,540,538.90 66,369,504.95 3,551,896.41 9,069,292.69 353,730,296.17 1,571,158.43 1,010,271.36 630,369.77 1,182,519.05 548,410.76 18,884,139.67
449,703.07 591,059.81 909,178.55 233,006.50 22,341.07 11,181,965.56 1,638,695.39 973,923.70 407,566.26 892,997.46 1,362,627.65 24,324,086.59
768,398.35 659,537.29 107,553.49 224,599.28 181,695.92 10,988,941.14 6,056,909.08 1,738,343.51 18,739,244.65 4,191,777.97 1,868,915.54 102,371,685.96 1,293,718.06 707,267.01 12,509.49 48,176.76 1,028,398.67 17,275,765.93 5,202,270.94 2,708,386.75 1,607,322.07 1,075,918.51 3,241,722.59 72,497,901.76
687,199.25 426,834.56 2,716.00 120,560.28 8,054,196.81 2,674,844.00 1,711,981.60 9,699,212.90 292,560.56 612,176.08 52,477,735.96 1,768,875.42 1,174,058.24 645,443.51 938,261.96 22,705,415.27 1,428,072.42 1,228,503.03 350,288.98 372,127.33 17,505,117.54 2,541,461.34 1,214,821.34 5,264,587.74 757,212.48 2,112,467.71 47,291,310.45 1,913,860.19 788,509.09 516,441.13 1,241,378.09 517,916.68 21,273,247.34 4,060,943.98 1,971,960.95 21,080,734.09 1,949,736.88 1,481,948.33 68,498,953.99
606,827.37 625,749.01 1,609,229.51 442,239.00 109,938.66 11,539,797.28 1,069,136.06 784,600.15 7,602,294.47 330,755.08 553,592.37 23,881,372.77
876,577.48 559,929.54 663,279.12 335,291.67 275,520.73 13,640,778.50 1,559,422.72 987,343.13 424,107.96 1,437,804.98 111,032.27 24,512,091.74 1,644,615.01 1,614,148.45 8,819,731.45 3,209,355.13 759,725.52 48,973,854.34 6,948,852.23 2,188,538.39 23,076,992.55 15,273,528.74 3,661,938.80 151,375,972.72
11,567,393.57 7,084,474.29 7,154,464.94 1,100,000.00 3,617,494.77 208,482,961.47 882,629.38 427,686.23 0.00 249,979.12 94,701.47 11,825,482.31
1,475,177.93 924,970.75 1,369,337.69 629,670.07 23,986,595.61 799,945.30 581,520.66 201,824.10 124,954.05 8,357,862.34 814,147.49 938,731.29 42,261.76 387,732.02 76,126.30 11,160,698.89 506,818.10 450,741.74 3,332.85 45,052.06 355,978.96 6,089,366.57
3,247,427.75 1,567,821.88 5,097,975.20 5,577,459.85 1,292,449.20 66,844,355.59 906,619.81 522,192.91 379.18 357,306.11 105,930.79 9,987,807.97
1,891,926.54 1,887,848.26 10,785,608.88 8,583,063.96 1,869,748.36 64,000,147.52 1,504,282.32 1,051,535.93 1,213,588.44 534,750.13 22,935,695.61
641,408.42 819,817.67 375,887.72 279,698.35 393,997.72 10,785,362.89 2,881,075.86 1,538,164.83 3,749,846.36 2,996,272.20 1,865,532.50 45,506,629.19
703,720.42 497,168.28 684,595.12 152,978.07 394,521.91 11,341,599.46 2,083,339.40 1,112,771.99 6,745,884.27 2,600,943.15 143,193.79 40,074,815.61 1,521,411.46 838,988.53 971,566.90 429,845.59 272,010.64 22,344,363.63 2,267,739.70 1,013,492.43 1,678,926.37 6,097,870.56 552,566.71 36,875,521.18 3,999,943.32 1,456,736.71 1,707,113.74 1,752,273.17 2,843,836.51 45,733,230.00
671,779.58 511,441.64 119,478.31 185,287.57 58,207.81 7,926,411.45 823,374.58 633,331.09 467,604.01 138,134.30 166,000.93 11,096,955.90
1,539,194.48 1,238,760.72 454,164.87 1,008,524.93 408,358.09 19,656,533.76 1,856,834.20 884,627.95 1,228,947.30 2,466,004.48 518,508.17 27,205,165.80 2,822,113.66 1,563,204.84 1,018,532.49 48,878.81 2,114,901.31 33,329,545.01
833,652.59 761,314.44 319,083.46 200,000.00 369,330.15 12,695,350.24 1,439,296.08 1,276,558.13 220,456.00 648,183.32 19,831,054.18 1,894,205.13 823,734.49 559,902.04 519,911.39 355,330.93 23,009,402.41 1,138,125.88 607,645.39 194,852.17 174,178.17 329,453.23 13,225,753.50
804,952.50 931,219.05 113,196.27 380,692.65 373,848.39 12,581,969.30 791,961.50 523,776.51 205,889.13 189,622.51 231,648.57 12,667,647.95
1,267,508.14 809,810.79 193,109.64 819,719.41 391,699.95 18,259,450.07 6,026,122.13 3,797,770.03 16,741,850.43 6,413,509.41 2,952,380.27 107,069,666.89
855,683.68 892,234.82 187,107.47 200,888.21 317,455.85 13,089,312.85 2,011,976.29 2,528,109.81 9,096,515.82 1,042,947.50 1,196,503.20 59,114,550.83
846,346.10 463,246.58 204,727.95 487,297.21 421,820.17 10,971,211.11 1,946,252.11 2,033,852.99 40,617.44 776,632.87 679,648.62 35,393,782.23
373,957.00 354,372.00 7,590,755.00
FOOD ADMINISTRATIVE CAPITAL DEBT OTHER TOTALSERVICES SERVICES OUTLAY SERVICE EXPENDITURES EXPENDITURES
41
Annual Report – 2005-06.qxd 6/20/08 2:02 PM Page 41
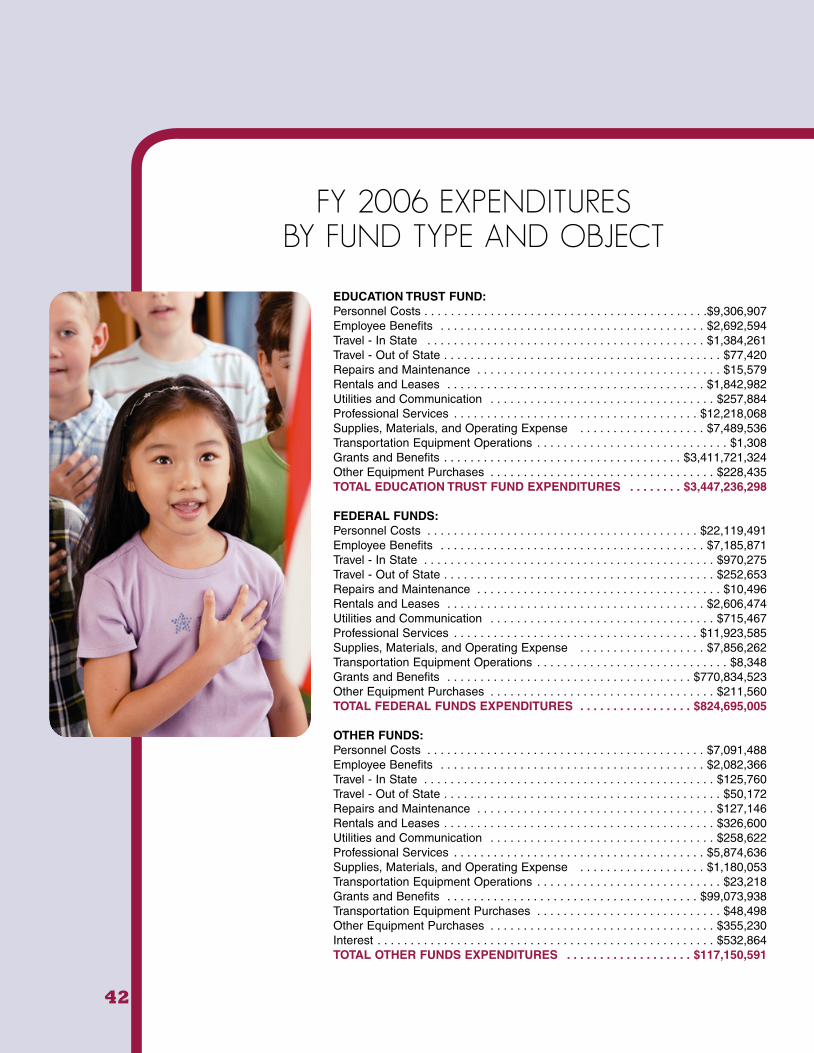
42
EDUCATION TRUST FUND:Personnel Costs . . . . . . . . . . . . . . . . . . . . . . . . . . . . . . . . . . . . . . . . . . .$9,306,907 Employee Benefits . . . . . . . . . . . . . . . . . . . . . . . . . . . . . . . . . . . . . . . . $2,692,594 Travel - In State . . . . . . . . . . . . . . . . . . . . . . . . . . . . . . . . . . . . . . . . . . $1,384,261 Travel - Out of State . . . . . . . . . . . . . . . . . . . . . . . . . . . . . . . . . . . . . . . . . . $77,420 Repairs and Maintenance . . . . . . . . . . . . . . . . . . . . . . . . . . . . . . . . . . . . . $15,579 Rentals and Leases . . . . . . . . . . . . . . . . . . . . . . . . . . . . . . . . . . . . . . . $1,842,982 Utilities and Communication . . . . . . . . . . . . . . . . . . . . . . . . . . . . . . . . . . $257,884 Professional Services . . . . . . . . . . . . . . . . . . . . . . . . . . . . . . . . . . . . . $12,218,068 Supplies, Materials, and Operating Expense . . . . . . . . . . . . . . . . . . . $7,489,536 Transportation Equipment Operations . . . . . . . . . . . . . . . . . . . . . . . . . . . . . $1,308 Grants and Benefits . . . . . . . . . . . . . . . . . . . . . . . . . . . . . . . . . . . . $3,411,721,324 Other Equipment Purchases . . . . . . . . . . . . . . . . . . . . . . . . . . . . . . . . . . $228,435 TOTAL EDUCATION TRUST FUND EXPENDITURES . . . . . . . . $3,447,236,298
FEDERAL FUNDS:Personnel Costs . . . . . . . . . . . . . . . . . . . . . . . . . . . . . . . . . . . . . . . . . $22,119,491 Employee Benefits . . . . . . . . . . . . . . . . . . . . . . . . . . . . . . . . . . . . . . . . $7,185,871 Travel - In State . . . . . . . . . . . . . . . . . . . . . . . . . . . . . . . . . . . . . . . . . . . . $970,275 Travel - Out of State . . . . . . . . . . . . . . . . . . . . . . . . . . . . . . . . . . . . . . . . . $252,653 Repairs and Maintenance . . . . . . . . . . . . . . . . . . . . . . . . . . . . . . . . . . . . . $10,496 Rentals and Leases . . . . . . . . . . . . . . . . . . . . . . . . . . . . . . . . . . . . . . . $2,606,474 Utilities and Communication . . . . . . . . . . . . . . . . . . . . . . . . . . . . . . . . . . $715,467 Professional Services . . . . . . . . . . . . . . . . . . . . . . . . . . . . . . . . . . . . . $11,923,585 Supplies, Materials, and Operating Expense . . . . . . . . . . . . . . . . . . . $7,856,262 Transportation Equipment Operations . . . . . . . . . . . . . . . . . . . . . . . . . . . . . $8,348 Grants and Benefits . . . . . . . . . . . . . . . . . . . . . . . . . . . . . . . . . . . . . $770,834,523 Other Equipment Purchases . . . . . . . . . . . . . . . . . . . . . . . . . . . . . . . . . . $211,560 TOTAL FEDERAL FUNDS EXPENDITURES . . . . . . . . . . . . . . . . . $824,695,005
OTHER FUNDS:Personnel Costs . . . . . . . . . . . . . . . . . . . . . . . . . . . . . . . . . . . . . . . . . . $7,091,488 Employee Benefits . . . . . . . . . . . . . . . . . . . . . . . . . . . . . . . . . . . . . . . . $2,082,366 Travel - In State . . . . . . . . . . . . . . . . . . . . . . . . . . . . . . . . . . . . . . . . . . . . $125,760 Travel - Out of State . . . . . . . . . . . . . . . . . . . . . . . . . . . . . . . . . . . . . . . . . . $50,172 Repairs and Maintenance . . . . . . . . . . . . . . . . . . . . . . . . . . . . . . . . . . . . $127,146 Rentals and Leases . . . . . . . . . . . . . . . . . . . . . . . . . . . . . . . . . . . . . . . . . $326,600 Utilities and Communication . . . . . . . . . . . . . . . . . . . . . . . . . . . . . . . . . . $258,622 Professional Services . . . . . . . . . . . . . . . . . . . . . . . . . . . . . . . . . . . . . . $5,874,636 Supplies, Materials, and Operating Expense . . . . . . . . . . . . . . . . . . . $1,180,053 Transportation Equipment Operations . . . . . . . . . . . . . . . . . . . . . . . . . . . . $23,218 Grants and Benefits . . . . . . . . . . . . . . . . . . . . . . . . . . . . . . . . . . . . . . $99,073,938 Transportation Equipment Purchases . . . . . . . . . . . . . . . . . . . . . . . . . . . . $48,498 Other Equipment Purchases . . . . . . . . . . . . . . . . . . . . . . . . . . . . . . . . . . $355,230 Interest . . . . . . . . . . . . . . . . . . . . . . . . . . . . . . . . . . . . . . . . . . . . . . . . . . . $532,864 TOTAL OTHER FUNDS EXPENDITURES . . . . . . . . . . . . . . . . . . . $117,150,591
FY 2006 EXPENDITURESBY FUND TYPE AND OBJECT
Annual Report – 2005-06.qxd 6/20/08 2:02 PM Page 42
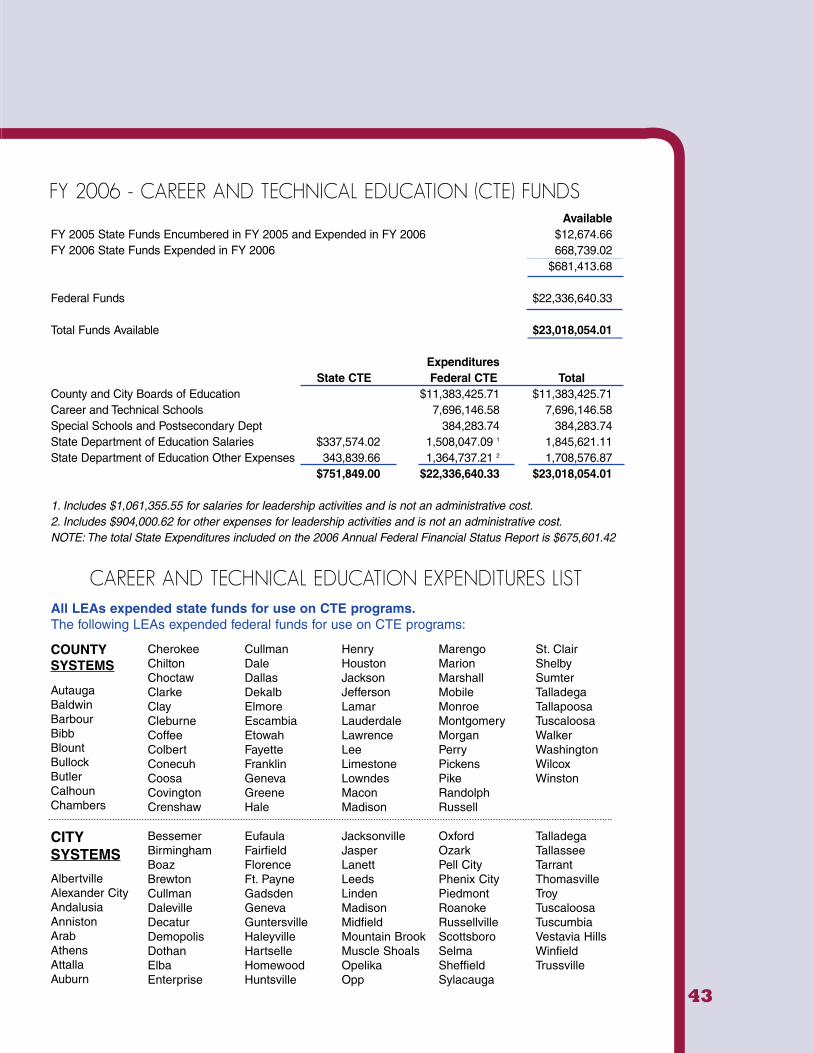
43
AvailableFY 2005 State Funds Encumbered in FY 2005 and Expended in FY 2006 $12,674.66 FY 2006 State Funds Expended in FY 2006 668,739.02
$681,413.68
Federal Funds $22,336,640.33
Total Funds Available $23,018,054.01
ExpendituresState CTE Federal CTE Total
County and City Boards of Education $11,383,425.71 $11,383,425.71 Career and Technical Schools 7,696,146.58 7,696,146.58 Special Schools and Postsecondary Dept 384,283.74 384,283.74 State Department of Education Salaries $337,574.02 1,508,047.09 1 1,845,621.11 State Department of Education Other Expenses 343,839.66 1,364,737.21 2 1,708,576.87
$751,849.00 $22,336,640.33 $23,018,054.01
1. Includes $1,061,355.55 for salaries for leadership activities and is not an administrative cost.2. Includes $904,000.62 for other expenses for leadership activities and is not an administrative cost.NOTE: The total State Expenditures included on the 2006 Annual Federal Financial Status Report is $675,601.42
FY 2006 - CAREER AND TECHNICAL EDUCATION (CTE) FUNDS
All LEAs expended state funds for use on CTE programs.The following LEAs expended federal funds for use on CTE programs:
CAREER AND TECHNICAL EDUCATION EXPENDITURES LIST
COUNTYSYSTEMS
Autauga Baldwin BarbourBibb Blount Bullock Butler Calhoun Chambers
Cherokee Chilton Choctaw Clarke ClayCleburne CoffeeColbertConecuhCoosaCovington Crenshaw
CullmanDale Dallas DekalbElmore Escambia Etowah Fayette FranklinGenevaGreene Hale
Henry Houston Jackson Jefferson Lamar Lauderdale Lawrence Lee Limestone Lowndes Macon Madison
Marengo Marion MarshallMobile Monroe Montgomery Morgan Perry PickensPike Randolph Russell
St. Clair Shelby Sumter Talladega Tallapoosa Tuscaloosa WalkerWashington Wilcox Winston
CITYSYSTEMS
AlbertvilleAlexander CityAndalusiaAnniston Arab Athens Attalla Auburn
Bessemer Birmingham BoazBrewtonCullman Daleville Decatur Demopolis Dothan Elba Enterprise
EufaulaFairfield Florence Ft. Payne Gadsden Geneva Guntersville Haleyville HartselleHomewood Huntsville
Jacksonville JasperLanettLeedsLinden MadisonMidfield Mountain BrookMuscle Shoals OpelikaOpp
Oxford Ozark Pell CityPhenix CityPiedmont Roanoke RussellvilleScottsboro Selma Sheffield Sylacauga
Talladega Tallassee Tarrant Thomasville Troy Tuscaloosa Tuscumbia Vestavia Hills Winfield Trussville
Annual Report – 2005-06.qxd 6/20/08 2:02 PM Page 43
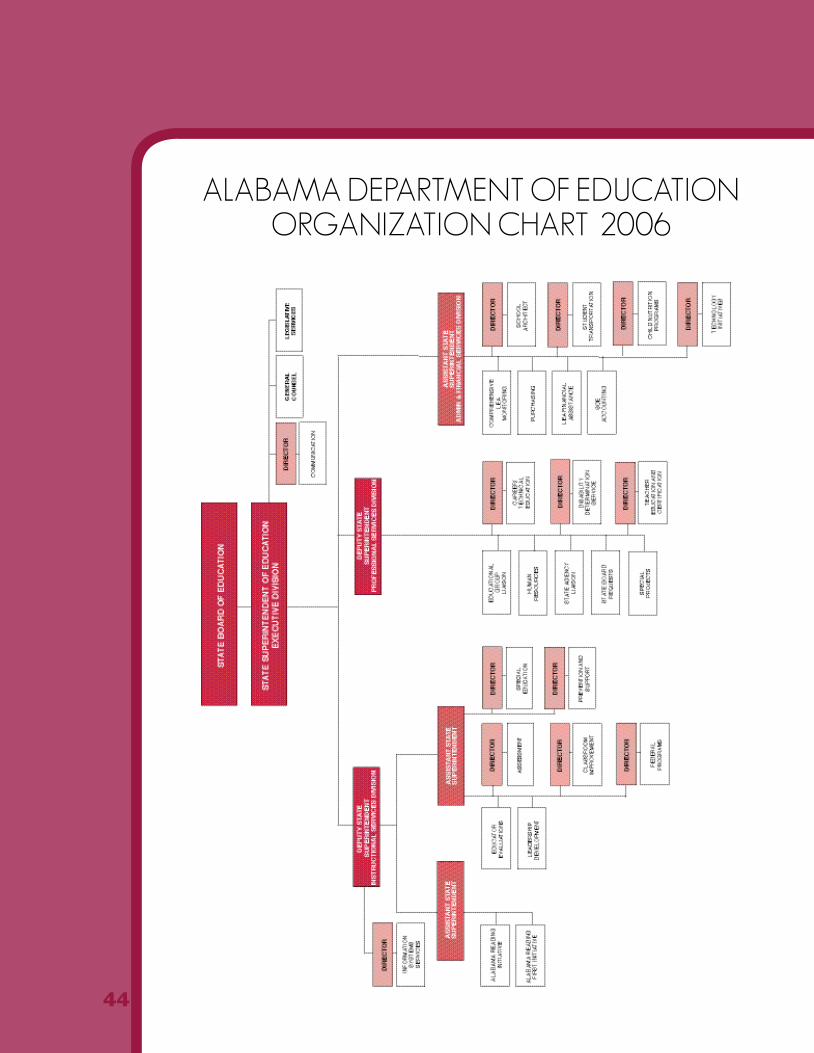
44
ALABAMA DEPARTMENT OF EDUCATIONORGANIZATION CHART 2006
Annual Report – 2005-06.qxd 6/20/08 2:02 PM Page 44

Annual Report – 2005-06.qxd 6/20/08 2:02 PM Page 45

Joseph B. Morton, State Superintendent of Education March 2008Alabama Department of Education
No person shall be denied employment, be excluded from participation in, be denied the benefits of, or be subjected to discrimination inany program or activity on the basis of disability, sex, race, religion, national origin, color, or age. Ref: Sec. 1983, Civil Rights Act, 42 U.S.C.;Title VI and VII, Civil Rights Act of 1964; Rehabilitation Act of 1973, Sec. 504; Age Discrimination in Employment Act; Equal Pay Act of1963; Title IX of the Education Amendment of 1972: Title IX Coordinator, P.O. Box 302101, Montgomery, Alabama 36130-2101 or call (334)242-8444.
Annual Report – 2005-06.qxd 6/20/08 2:02 PM Page 46