Embed Size (px)
Citation preview
2004Maryland Teacher’s & State Employees Supplemental Retirement Plan’s Annual Report
Reaching for New Heights
TABLE OF CONTENTS
SECTION PAGE
I. History of Program 2
II. Board of Trustees & Staff 3
III. Program Highlights & Invested Plan Assets 4
IV. Participant Activity by Plan 6
V. Board Income & Expenditures 9
VI. Investment PerformanceInvestment Contract Pool Rates 9Mutual Fund Rates 10
VII. Plan Comparison Chart 13
The CY2004 Annual Report is broughtto you by the Maryland Teachers andState Employees SupplementalRetirement Plan’s Board of Trustees.
ABOUT THE BOARD
The Maryland Supplemental RetirementPlans are administered by a nine-member Board of Trustees whosemembers are appointed by theGovernor of Maryland to staggeredfour-year terms.
The governor must select threemembers from any of the followingdepartments, agencies or boards: theDepartment of Budget and Manage-ment, the Department of Education,the Comptroller of the Treasury, theState Treasurer’s Office, the MarylandState Retirement and PensionSystems or the Maryland HigherEducation Commission.
Three other members must be eligibleto participate in one or more of theplans, provided that at least one iseligible for the 403(b) plan. Threeadditional members must represent thegeneral public and must not be eligibleto participate in the plans. One of thesemembers must have experience withdeferred compensation and salaryreduction plans.
HISTORY OF PROGRAM
The Maryland Deferred Compensation Program was established forMaryland state employees in 1974 by Executive Order 01.01.1974.19and under Chapter 433 of the Acts of 1974. In 1975, enrollment beganand a seven-member Board of Trustees administered the plan. Subse-quently, the U.S. Congress established the 457(b) Deferred Compen-sation Plan for public employees as part of the Internal Revenue Codein 1978.
Chapter 741 of the Acts of 1985 brought the 457(b) DeferredCompensation Plan under the direction of a nine-member Board ofTrustees. The acts also gave the board authority to administer a403(b) Tax-Deferred Annuity Plan and a 401(k) Savings and Invest-ment Plan. The Maryland 403(b) plan became operational in 1985,and the Maryland 401(k) plan began in 1990. These three plans cameto be known as the Maryland Teachers and State Employees Supple-mental Retirement Plans.
In May of 1998, the governor signed legislation (HB 987/Chapter 530 ofthe Acts of 1998) passed by the Maryland General Assembly that in partprovides for a match to the state’s 457(b), 403(b) and 401(k) supple-mental retirement plans. Effective July 1, 1999, a dollar for dollarmatch became operational at the statutory maximum of up to $600each fiscal year. Three years later, the maximum match was reducedby budget bill language to $500 per participant for the 2003 fiscalyear. Then in fiscal years 2004 and 2005, the match payment wassuspended to reduce personnel expenses. According to the law,state employees who are members of the State Employees Contribu-tory Pension System are eligible for the match. The state’s contribu-tions are immediately vested.
Title 35 of the State Personnel and Pensions Article authorizes theBoard of Trustees to administer the Maryland plans and requires theboard to pay all expenses from fees collected. A state general fundappropriation is not provided in this statute.
In addition to implementing, maintaining and administering the plans,the board is responsible for submitting progress and status reports toparticipants; submitting an annual report to the governor and GeneralAssembly; appointing employees; and hiring consultants, administratorsand other professional assistance. Each board member serves on atleast one committee. The Audit committee reviews and assesses theannual financial statements prepared by the Board’s independentauditor, including expanded procedures to test individual accountsand selected transactions to assure plan integrity. Other reviews suchas periodic State legislative audits are also referred to the Audit com-mittee. The Investment committee is charged with overseeing theinvestment performances of existing investment vehicles and acquiringand developing new products, while considering their appropriatenumber and implementation. The Investment committee worksclosely with the Board’s selected investment advisor and pensionconsultant.
Sources:1. Title 35 of the Personnel and Pensions Article2. Chapter 741 of the Acts of 19853. Internal Revenue Service Private Letter Ruling4. Presentation to the Joint Budget and Audit Committee
by H. Louis Stettler, III, Ph.D., 1985.5. Chapter 530 of the Acts of 19986. Chapter 439 of the Acts of 2002(section 38 of the FY2003 Budget Bill)
2
BOARD CHAIRPERSONMr. Frederick W. PuddesterExecutive Director of Budget, Financial Planning and Analysis- Johns Hopkins University Eligible-Participant Member
BOARD MEMBERSMr. Stephen M. CordiDeputy Comptroller - Office of the ComptrollerState of Maryland Agency Representative
Mr. Dennis J. BellDirector, Office of Finance MTA/MDOTEligible Member
The Honorable Nancy K. KoppTreasurer - State of MarylandState of Maryland Agency Representative
The Honorable Cecilia JanuszkiewiczSecretary, Department of Budget and ManagementState of Maryland Agency Representative
Mr. Thomas D. Broadwater, Jr. Esq.Public Member
Mr. William W. WhitescarverPublic Member
Ms. Marcia ZercoePublic Member
BOARD OF TRUSTEES as of December 31, 2004
BOARD COMMITTEESInvestment CommitteeWilliam Whitescarver - ChairpersonMarcia ZercoeNancy KoppThomas Broadwater
Audit CommitteeDennis Bell - ChairpersonCecilia JanuszkiewiczStephen CordiFred Puddester
BOARD ADVISORS
General Counsel John K. Barry, EsquireAssistant Attorney General, Office of the Comptroller
Independent AuditorsClifton Gunderson, LLPCertified Public Accountants & Consultants
Investment Contract Pool ManagerING Financial Services
Third Party Administrator Nationwide Retirement Solutions, Inc.
General Pension Consultant & Investment Advisor The Segal Company/Segal Advisors, Inc.
3
BOARD STAFF
Michael T. Halpin, CRC, CRAExecutive Director
Roland L. Unger, CPA, CRC, CRADirector of Finance
Bernice K. WeathersSenior Accounting Specialist
Mirza C. TumanonAccounting Specialist
Lillie M. JonesAccounting Assistant
Janet C. WiltFinance Secretary
Jennifer L. KelleyCommunications Specialist
Louis A. Holcomb, Jr., CRCDirector of Participant Services
Charles F. Meigs, Jr., CRCFinancial Field Representative
Joseph J. Bouffard, Jr.Financial Field Representative
Valerie R. Schwaab, CRCFinancial Field Representative
Julia I. Graham, CRCFinancial Field Representative
Richard A. ArthurDirector of Technology
Anna Marie SmithExecutive Assistant
Dianne M. RaitzykOffice Manager
Jacquetta L. RobinsonReceptionist
PROGRAM HIGHLIGHTS
• The number of participant accounts in the 457(b),403(b) and 401(k) plans combined declined by 2.3%,or 148 accounts in 2004. The total participant ac-counts for all of the plans was 65,255.
• At year end, the net assets for all of the plans equaled$1,987,003,962.
• The plans’ mutual fund savings program returned$1,968,713 to participants’ accounts that were in-vested in the funds participating in the rebate program.
• Agency staff participated in 56 pre-retirement seminarsand 30 life-planning seminars and conducted 10 financialseminars, 245 informational booths, 42 orientation/overview seminars, 40 sessions of one-on-one meetings,three financial workshops and three benefit coordinatoracademies during the year. About 18,740 state employ-ees attended these seminars and booths. NationwideRetirement Solutions conducted 1,849 group meetingsacross the state with 23,409 employees attending.
* Participants are those who have account values, including those who are receiving systematic withdrawals
4
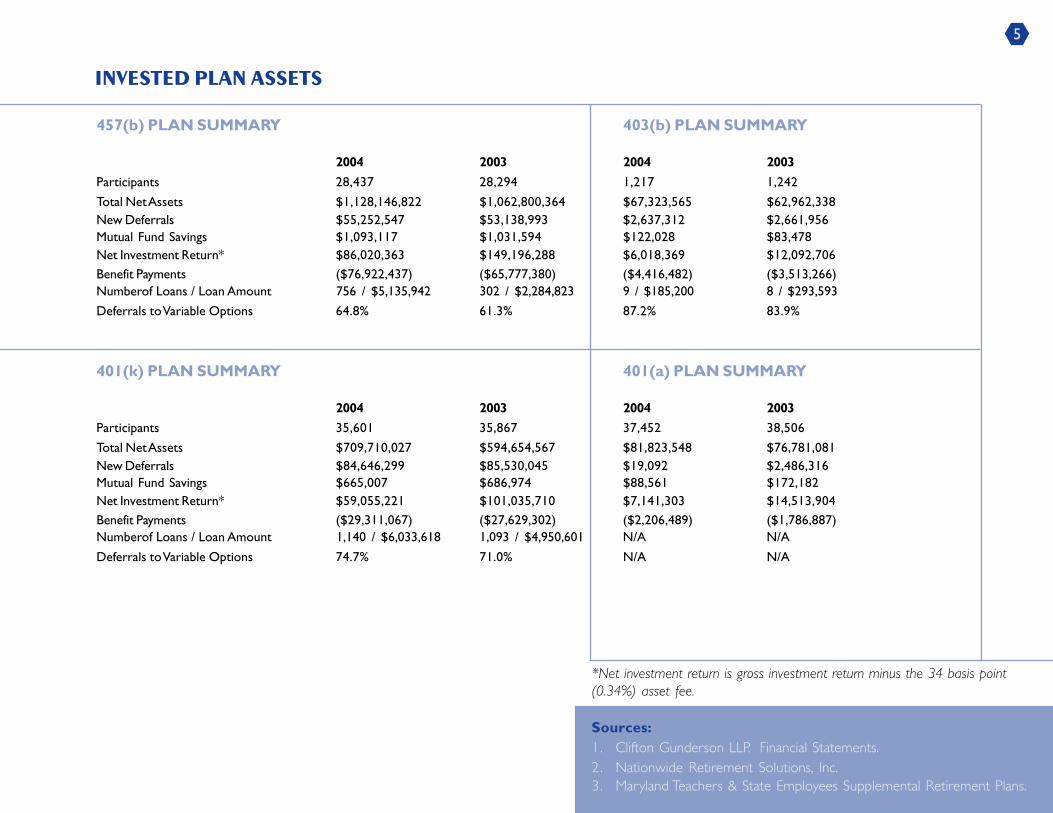
INVESTED PLAN ASSETS
457(b) PLAN SUMMARY 403(b) PLAN SUMMARY
2004 2003 2004 2003
Participants 28,437 28,294 1,217 1,242
Total Net Assets $1,128,146,822 $1,062,800,364 $67,323,565 $62,962,338New Deferrals $55,252,547 $53,138,993 $2,637,312 $2,661,956Mutual Fund Savings $1,093,117 $1,031,594 $122,028 $83,478Net Investment Return* $86,020,363 $149,196,288 $6,018,369 $12,092,706Benefit Payments ($76,922,437) ($65,777,380) ($4,416,482) ($3,513,266)Numberof Loans / Loan Amount 756 / $5,135,942 302 / $2,284,823 9 / $185,200 8 / $293,593
Deferrals to Variable Options 64.8% 61.3% 87.2% 83.9%
401(k) PLAN SUMMARY 401(a) PLAN SUMMARY
2004 2003 2004 2003
Participants 35,601 35,867 37,452 38,506
Total Net Assets $709,710,027 $594,654,567 $81,823,548 $76,781,081New Deferrals $84,646,299 $85,530,045 $19,092 $2,486,316Mutual Fund Savings $665,007 $686,974 $88,561 $172,182Net Investment Return* $59,055,221 $101,035,710 $7,141,303 $14,513,904Benefit Payments ($29,311,067) ($27,629,302) ($2,206,489) ($1,786,887)Numberof Loans / Loan Amount 1,140 / $6,033,618 1,093 / $4,950,601 N/A N/A
Deferrals to Variable Options 74.7% 71.0% N/A N/A
5
*Net investment return is gross investment return minus the 34 basis point(0.34%) asset fee.
Sources:1. Clifton Gunderson LLP. Financial Statements.2. Nationwide Retirement Solutions, Inc.3. Maryland Teachers & State Employees Supplemental Retirement Plans.
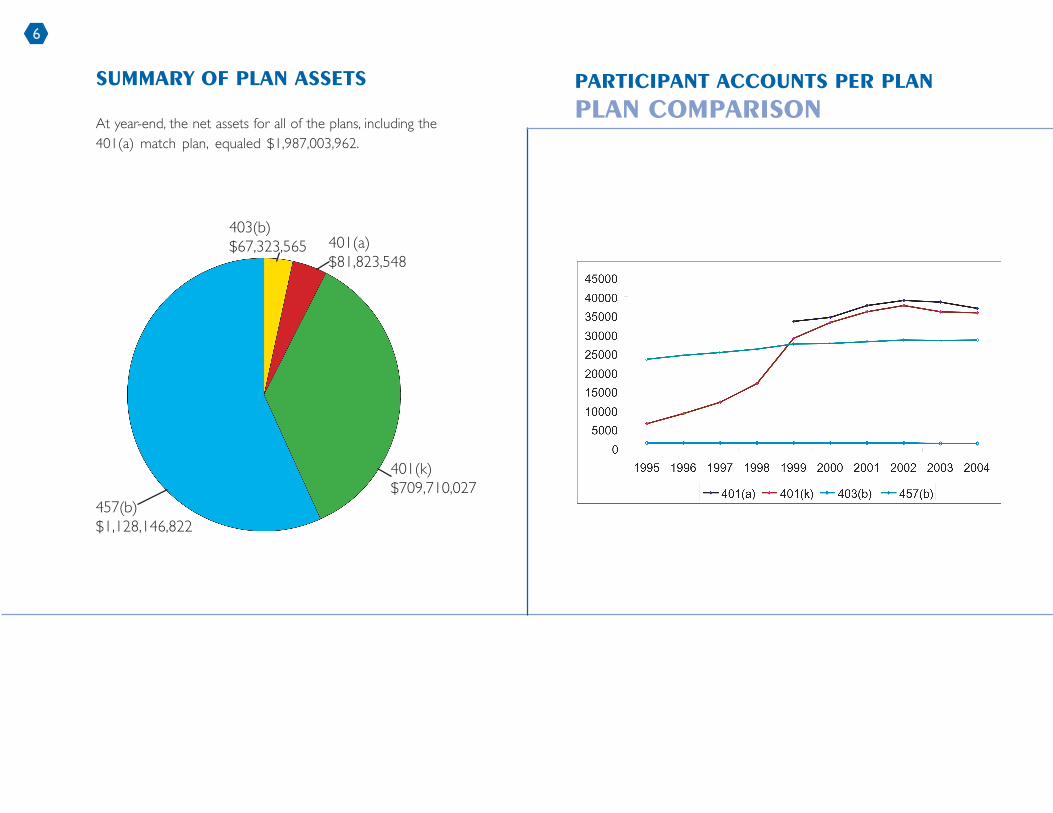
SUMMARY OF PLAN ASSETS
At year-end, the net assets for all of the plans, including the401(a) match plan, equaled $1,987,003,962.
403(b)$67,323,565 401(a)
$81,823,548
457(b)$1,128,146,822
401(k)$709,710,027
PARTICIPANT ACCOUNTS PER PLAN
PLAN COMPARISON
6
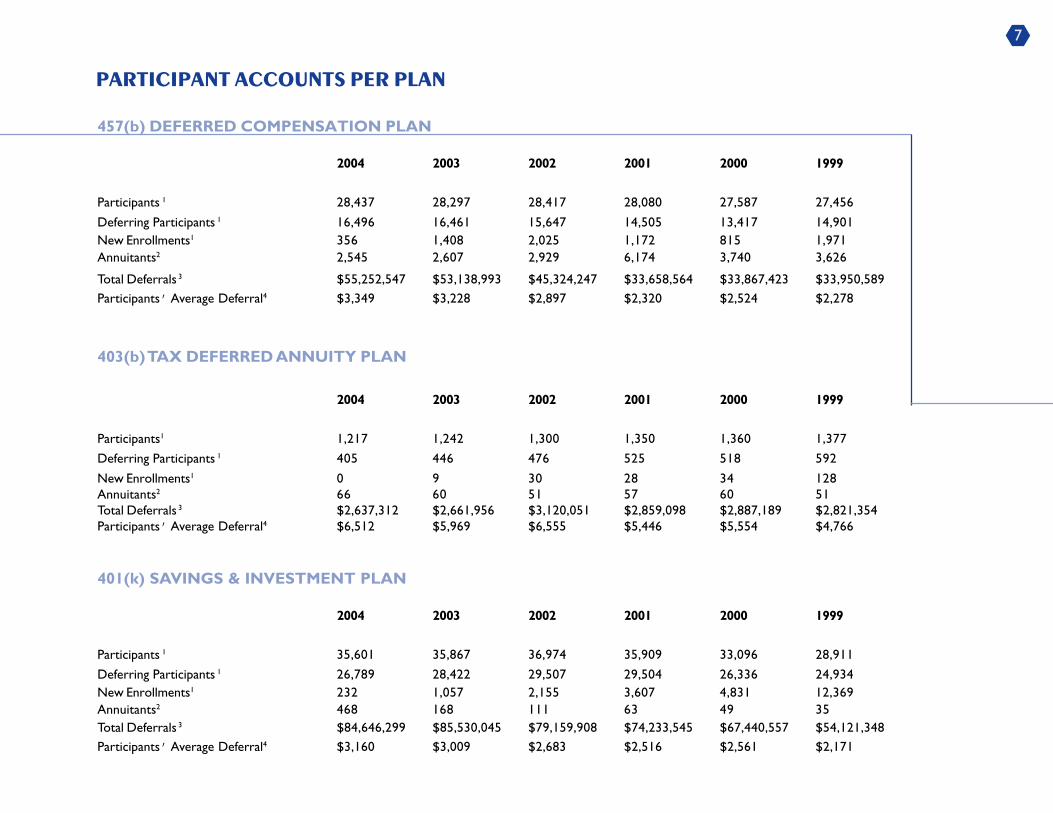
PARTICIPANT ACCOUNTS PER PLAN
457(b) DEFERRED COMPENSATION PLAN
2004 2003 2002 2001 2000 1999
Participants 1 28,437 28,297 28,417 28,080 27,587 27,456
Deferring Participants 1 16,496 16,461 15,647 14,505 13,417 14,901New Enrollments1 356 1,408 2,025 1,172 815 1,971Annuitants2 2,545 2,607 2,929 6,174 3,740 3,626
Total Deferrals 3 $55,252,547 $53,138,993 $45,324,247 $33,658,564 $33,867,423 $33,950,589Participants’ Average Deferral4 $3,349 $3,228 $2,897 $2,320 $2,524 $2,278
403(b) TAX DEFERRED ANNUITY PLAN
2004 2003 2002 2001 2000 1999
Participants1 1,217 1,242 1,300 1,350 1,360 1,377
Deferring Participants 1 405 446 476 525 518 592
New Enrollments1 0 9 30 28 34 128Annuitants2 66 60 51 57 60 51Total Deferrals 3 $2,637,312 $2,661,956 $3,120,051 $2,859,098 $2,887,189 $2,821,354Participants’ Average Deferral4 $6,512 $5,969 $6,555 $5,446 $5,554 $4,766
401(k) SAVINGS & INVESTMENT PLAN
2004 2003 2002 2001 2000 1999
Participants 1 35,601 35,867 36,974 35,909 33,096 28,911
Deferring Participants 1 26,789 28,422 29,507 29,504 26,336 24,934New Enrollments1 232 1,057 2,155 3,607 4,831 12,369Annuitants2 468 168 111 63 49 35Total Deferrals 3 $84,646,299 $85,530,045 $79,159,908 $74,233,545 $67,440,557 $54,121,348Participants’ Average Deferral4 $3,160 $3,009 $2,683 $2,516 $2,561 $2,171
7
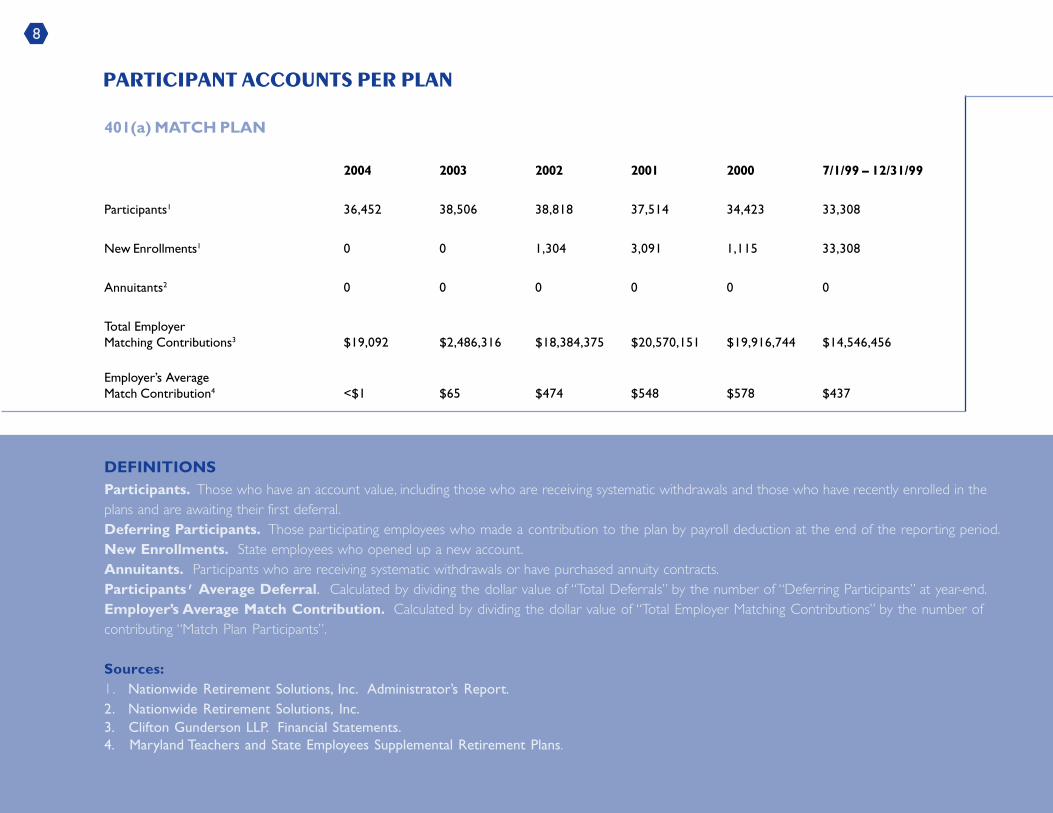
PARTICIPANT ACCOUNTS PER PLAN
401(a) MATCH PLAN
2004 2003 2002 2001 2000 7/1/99 – 12/31/99
Participants1 36,452 38,506 38,818 37,514 34,423 33,308
New Enrollments1 0 0 1,304 3,091 1,115 33,308
Annuitants2 0 0 0 0 0 0
Total EmployerMatching Contributions3 $19,092 $2,486,316 $18,384,375 $20,570,151 $19,916,744 $14,546,456
Employer’s AverageMatch Contribution4 <$1 $65 $474 $548 $578 $437
DEFINITIONSParticipants. Those who have an account value, including those who are receiving systematic withdrawals and those who have recently enrolled in theplans and are awaiting their first deferral.Deferring Participants. Those participating employees who made a contribution to the plan by payroll deduction at the end of the reporting period.New Enrollments. State employees who opened up a new account.Annuitants. Participants who are receiving systematic withdrawals or have purchased annuity contracts.Participants’ Average Deferral. Calculated by dividing the dollar value of “Total Deferrals” by the number of “Deferring Participants” at year-end.Employer’s Average Match Contribution. Calculated by dividing the dollar value of “Total Employer Matching Contributions” by the number ofcontributing “Match Plan Participants”.
Sources:1. Nationwide Retirement Solutions, Inc. Administrator’s Report.2. Nationwide Retirement Solutions, Inc.3. Clifton Gunderson LLP. Financial Statements.4. Maryland Teachers and State Employees Supplemental Retirement Plans.
8
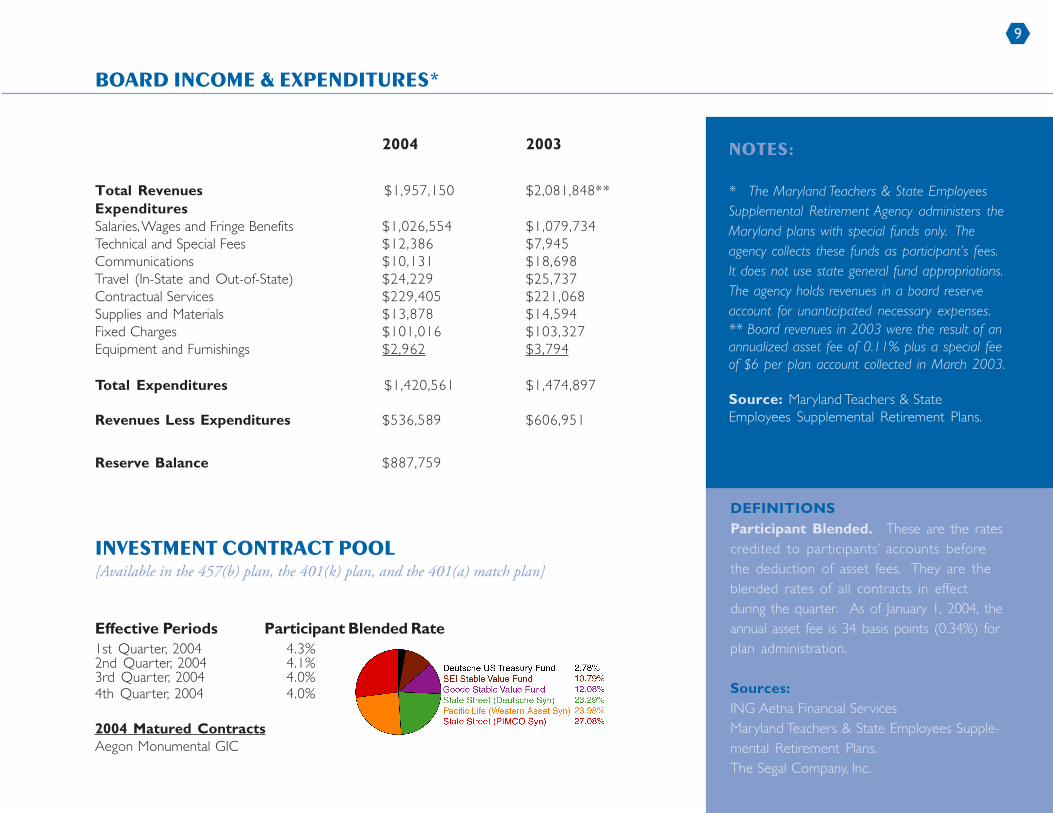
2004 2003
Total Revenues $1,957,150 $2,081,848**ExpendituresSalaries, Wages and Fringe Benefits $1,026,554 $1,079,734Technical and Special Fees $12,386 $7,945Communications $10,131 $18,698Travel (In-State and Out-of-State) $24,229 $25,737Contractual Services $229,405 $221,068Supplies and Materials $13,878 $14,594Fixed Charges $101,016 $103,327Equipment and Furnishings $2,962 $3,794
Total Expenditures $1,420,561 $1,474,897
Revenues Less Expenditures $536,589 $606,951
Reserve Balance $887,759
INVESTMENT CONTRACT POOL
[Available in the 457(b) plan, the 401(k) plan, and the 401(a) match plan]
Effective Periods Participant Blended Rate1st Quarter, 2004 4.3%2nd Quarter, 2004 4.1%3rd Quarter, 2004 4.0%4th Quarter, 2004 4.0%
2004 Matured ContractsAegon Monumental GIC
BOARD INCOME & EXPENDITURES*
NOTES:
* The Maryland Teachers & State EmployeesSupplemental Retirement Agency administers theMaryland plans with special funds only. Theagency collects these funds as participant’s fees.It does not use state general fund appropriations.The agency holds revenues in a board reserveaccount for unanticipated necessary expenses.** Board revenues in 2003 were the result of anannualized asset fee of 0.11% plus a special feeof $6 per plan account collected in March 2003.
Source: Maryland Teachers & StateEmployees Supplemental Retirement Plans.
DEFINITIONSParticipant Blended. These are the ratescredited to par ticipants’ accounts beforethe deduction of asset fees. They are theblended rates of all contracts in effectduring the quarter. As of January 1, 2004, theannual asset fee is 34 basis points (0.34%) forplan administration.
Sources:ING Aetna Financial ServicesMaryland Teachers & State Employees Supple-mental Retirement Plans.The Segal Company, Inc.
9
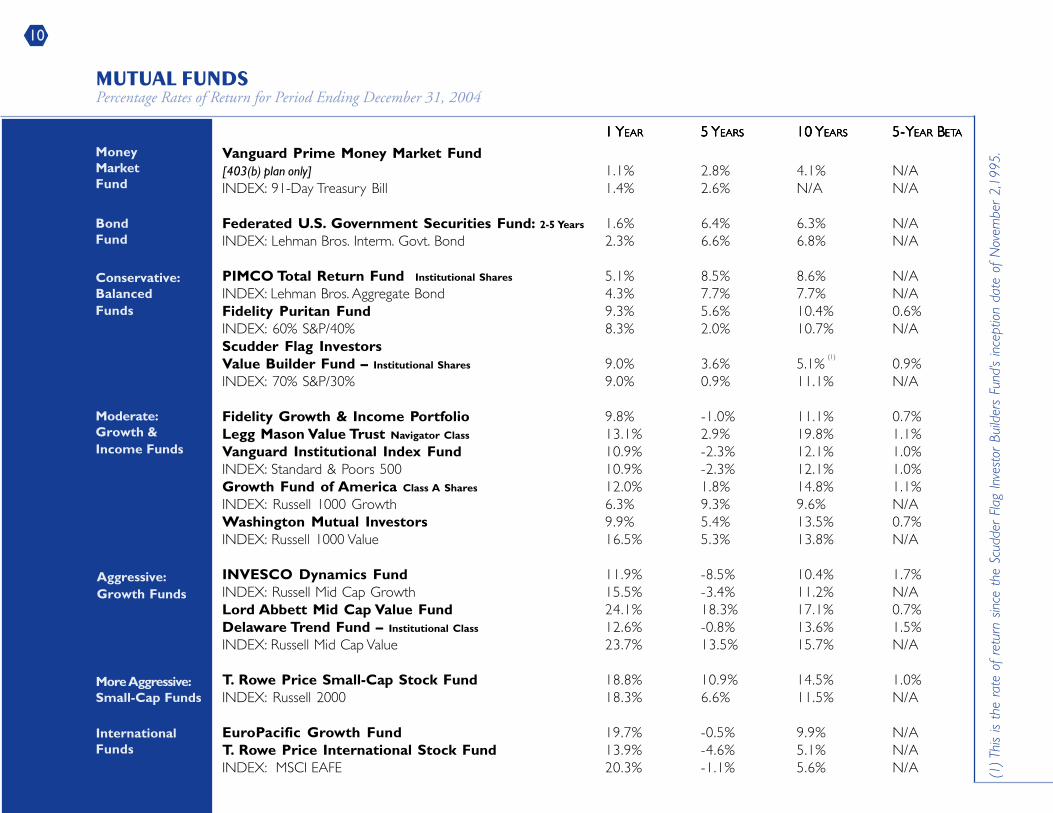
1 1 1 1 1 YYYYYEAREAREAREAREAR 5 5 5 5 5 YYYYYEARSEARSEARSEARSEARS 10 10 10 10 10 YYYYYEARSEARSEARSEARSEARS 5-Y5-Y5-Y5-Y5-YEAREAREAREAREAR B B B B BETETETETETAAAAA
Vanguard Prime Money Market Fund[403(b) plan only] 1.1% 2.8% 4.1% N/AINDEX: 91-Day Treasury Bill 1.4% 2.6% N/A N/A
Federated U.S. Government Securities Fund: 2-5 Years 1.6% 6.4% 6.3% N/AINDEX: Lehman Bros. Interm. Govt. Bond 2.3% 6.6% 6.8% N/A
PIMCO Total Return Fund Institutional Shares 5.1% 8.5% 8.6% N/AINDEX: Lehman Bros. Aggregate Bond 4.3% 7.7% 7.7% N/AFidelity Puritan Fund 9.3% 5.6% 10.4% 0.6%INDEX: 60% S&P/40% 8.3% 2.0% 10.7% N/AScudder Flag InvestorsValue Builder Fund – Institutional Shares 9.0% 3.6% 5.1%
(1)
0.9%INDEX: 70% S&P/30% 9.0% 0.9% 11.1% N/A
Fidelity Growth & Income Portfolio 9.8% -1.0% 11.1% 0.7%Legg Mason Value Trust Navigator Class 13.1% 2.9% 19.8% 1.1%Vanguard Institutional Index Fund 10.9% -2.3% 12.1% 1.0%INDEX: Standard & Poors 500 10.9% -2.3% 12.1% 1.0%Growth Fund of America Class A Shares 12.0% 1.8% 14.8% 1.1%INDEX: Russell 1000 Growth 6.3% 9.3% 9.6% N/AWashington Mutual Investors 9.9% 5.4% 13.5% 0.7%INDEX: Russell 1000 Value 16.5% 5.3% 13.8% N/A
INVESCO Dynamics Fund 11.9% -8.5% 10.4% 1.7%INDEX: Russell Mid Cap Growth 15.5% -3.4% 11.2% N/ALord Abbett Mid Cap Value Fund 24.1% 18.3% 17.1% 0.7%Delaware Trend Fund – Institutional Class 12.6% -0.8% 13.6% 1.5%INDEX: Russell Mid Cap Value 23.7% 13.5% 15.7% N/A
T. Rowe Price Small-Cap Stock Fund 18.8% 10.9% 14.5% 1.0%INDEX: Russell 2000 18.3% 6.6% 11.5% N/A
EuroPacific Growth Fund 19.7% -0.5% 9.9% N/AT. Rowe Price International Stock Fund 13.9% -4.6% 5.1% N/AINDEX: MSCI EAFE 20.3% -1.1% 5.6% N/A
MoneyMarketFund
BondFund
Conservative:BalancedFunds
Moderate:Growth &Income Funds
Aggressive:Growth Funds
More Aggressive:Small-Cap Funds
InternationalFunds
MUTUAL FUNDS
Percentage Rates of Return for Period Ending December 31, 2004
(1) T
his
is th
e ra
te o
f re
turn
sin
ce t
he S
cudd
er F
lag
Inve
stor
Bui
lder
s Fu
nd’s
ince
ptio
n da
te o
f N
ovem
ber
2,19
95.
10
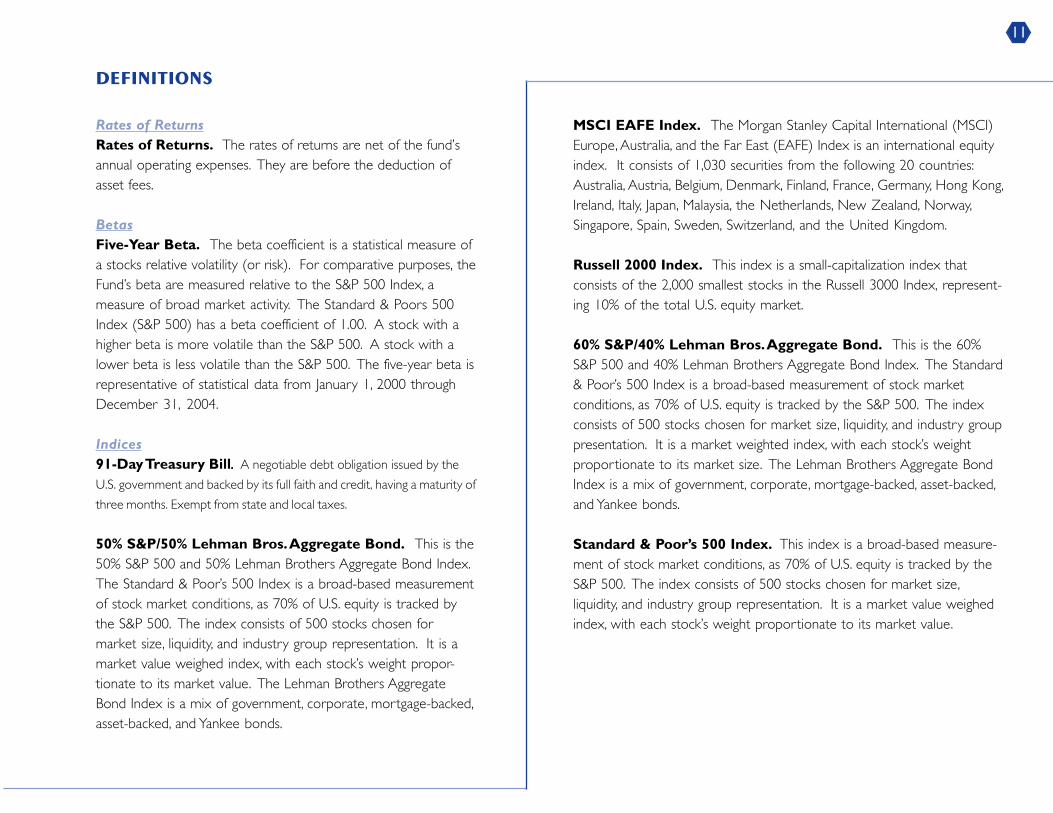
Rates of ReturnsRates of Returns. The rates of returns are net of the fund’sannual operating expenses. They are before the deduction ofasset fees.
BetasFive-Year Beta. The beta coefficient is a statistical measure ofa stocks relative volatility (or risk). For comparative purposes, theFund’s beta are measured relative to the S&P 500 Index, ameasure of broad market activity. The Standard & Poors 500Index (S&P 500) has a beta coefficient of 1.00. A stock with ahigher beta is more volatile than the S&P 500. A stock with alower beta is less volatile than the S&P 500. The five-year beta isrepresentative of statistical data from January 1, 2000 throughDecember 31, 2004.
Indices91-Day Treasury Bill..... A negotiable debt obligation issued by the
U.S. government and backed by its full faith and credit, having a maturity of
three months. Exempt from state and local taxes.
50% S&P/50% Lehman Bros. Aggregate Bond. This is the50% S&P 500 and 50% Lehman Brothers Aggregate Bond Index.The Standard & Poor’s 500 Index is a broad-based measurementof stock market conditions, as 70% of U.S. equity is tracked bythe S&P 500. The index consists of 500 stocks chosen formarket size, liquidity, and industry group representation. It is amarket value weighed index, with each stock’s weight propor-tionate to its market value. The Lehman Brothers AggregateBond Index is a mix of government, corporate, mortgage-backed,asset-backed, and Yankee bonds.
MSCI EAFE Index. The Morgan Stanley Capital International (MSCI)Europe, Australia, and the Far East (EAFE) Index is an international equityindex. It consists of 1,030 securities from the following 20 countries:Australia, Austria, Belgium, Denmark, Finland, France, Germany, Hong Kong,Ireland, Italy, Japan, Malaysia, the Netherlands, New Zealand, Norway,Singapore, Spain, Sweden, Switzerland, and the United Kingdom.
Russell 2000 Index. This index is a small-capitalization index thatconsists of the 2,000 smallest stocks in the Russell 3000 Index, represent-ing 10% of the total U.S. equity market.
60% S&P/40% Lehman Bros. Aggregate Bond. This is the 60%S&P 500 and 40% Lehman Brothers Aggregate Bond Index. The Standard& Poor’s 500 Index is a broad-based measurement of stock marketconditions, as 70% of U.S. equity is tracked by the S&P 500. The indexconsists of 500 stocks chosen for market size, liquidity, and industry grouppresentation. It is a market weighted index, with each stock’s weightproportionate to its market size. The Lehman Brothers Aggregate BondIndex is a mix of government, corporate, mortgage-backed, asset-backed,and Yankee bonds.
Standard & Poor’s 500 Index. This index is a broad-based measure-ment of stock market conditions, as 70% of U.S. equity is tracked by theS&P 500. The index consists of 500 stocks chosen for market size,liquidity, and industry group representation. It is a market value weighedindex, with each stock’s weight proportionate to its market value.
DEFINITIONS
11

S&P BARRA Growth Index. This index takes the stocks inthe S&P 500 and then separates them into equal halves based ontheir price-to-book ratios.
Lehman Bros. Intermediate Gov’t Bond Index. IncludesGovernment Index Issues with a time to maturity between 1 and10 years.
MediansFixed Income – Short Term. Median. This universe includesfunds defined by Morningstar as Short-Term Bond. Short-TermBond funds have an average duration of more than one but lessthan 3.5 years or an average effective maturity of more than onebut less than four years.
Foreign Equity Non-U.S. Median. This universe includesfunds defined by Morningstar as Foreign Stock funds which haveno more than 10% of stocks invested in the United States. Themedian return represents the mid point of this universe.Large Cap Blend Median. This universe includes fundsdefined by Morningstar as Large Blend. Large Blend funds investin a combination of Large Cap Growth and Large Cap Valuestocks. The return represents the mid point of this universe.Market caps greater than $10 billion are considered large cap.
Managed Balanced Median. This universe includes funds defined byMorningstar as Balanced, which includes funds with stock holdings ofgreater than 20% but less than 70% of the portfolio. The return repre-sents the mid-point of this universe.
Mid Cap Growth Median. This universe includes funds defined byMorningstar as Mid-Cap Growth. Mid-Cap Growth funds primarily investin stocks of mid-sized companies which are growing at faster than averagerates. The return represents the mid point of this universe. Market capsgreater than or equal to $2 billion but less than or equal to $10 billion areconsidered mid-cap funds.Small Cap Core Median. This universe includes funds defined byMorningstar as Small Blend. Small Blend funds invest in a combination ofSmall-Cap Growth and Small-Cap Value stocks. The return represents themid point of this universe. All funds with market caps less than $2 billionare considered small-cap funds.
Sources:1. Maryland Teachers and State EmployeesSupplemental Retirement Plans2. The returns for the mutual funds wereprovided by The Segal Company, Inc.3. The 5-Year Betas and definitions wereprovided by The Segal Company, Inc.
12
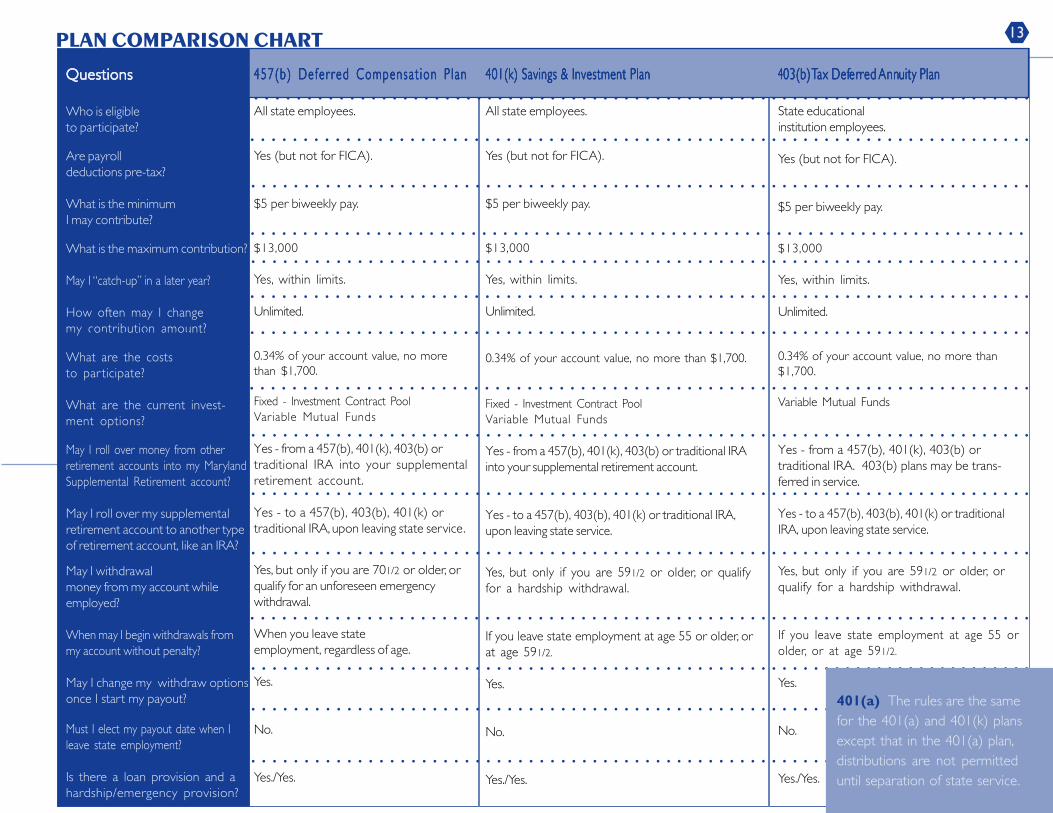
13PLAN COMPARISON CHART
401(k) Savings & Investment Plan401(k) Savings & Investment Plan401(k) Savings & Investment Plan401(k) Savings & Investment Plan401(k) Savings & Investment Plan
All state employees.
Yes (but not for FICA).
$5 per biweekly pay.
$13,000
Yes, within limits.
Unlimited.
0.34% of your account value, no more than $1,700.
Fixed - Investment Contract PoolVariable Mutual Funds
Yes - from a 457(b), 401(k), 403(b) or traditional IRAinto your supplemental retirement account.
Yes - to a 457(b), 403(b), 401(k) or traditional IRA,upon leaving state service.
Yes, but only if you are 591/2 or older, or qualifyfor a hardship withdrawal.
If you leave state employment at age 55 or older, orat age 591/2.
Yes.
No.
Yes./Yes.
457 (b ) De fe r r ed Compensa t i on P l an457 (b ) De fe r r ed Compensa t i on P l an457 (b ) De fe r r ed Compensa t i on P l an457 (b ) De fe r r ed Compensa t i on P l an457 (b ) De fe r r ed Compensa t i on P l an
All state employees.
Yes (but not for FICA).
$5 per biweekly pay.
$13,000
Yes, within limits.
Unlimited.
0.34% of your account value, no morethan $1,700.
Fixed - Investment Contract PoolVariable Mutual Funds
Yes - from a 457(b), 401(k), 403(b) ortraditional IRA into your supplementalretirement account.
Yes - to a 457(b), 403(b), 401(k) ortraditional IRA, upon leaving state service.
Yes, but only if you are 701/2 or older, orqualify for an unforeseen emergencywithdrawal.
When you leave stateemployment, regardless of age.
Yes.
No.
Yes./Yes.
4444403(b) 03(b) 03(b) 03(b) 03(b) TTTTTax Defax Defax Defax Defax Deferererererred red red red red AnnAnnAnnAnnAnnuity Planuity Planuity Planuity Planuity Plan
State educationalinstitution employees.
Yes (but not for FICA).
$5 per biweekly pay.
$13,000
Yes, within limits.
Unlimited.
0.34% of your account value, no more than$1,700.
Variable Mutual Funds
Yes - from a 457(b), 401(k), 403(b) ortraditional IRA. 403(b) plans may be trans-ferred in service.
Yes - to a 457(b), 403(b), 401(k) or traditionalIRA, upon leaving state service.
Yes, but only if you are 591/2 or older, orqualify for a hardship withdrawal.
If you leave state employment at age 55 orolder, or at age 591/2.
Yes.
No.
Yes./Yes.
QuestionsQuestionsQuestionsQuestionsQuestions
Who is eligibleto participate?
Are payrolldeductions pre-tax?
What is the minimumI may contribute?
What is the maximum contribution?
May I “catch-up” in a later year?
How often may I changemy contribution amount?
What are the coststo par ticipate?
What are the current invest-ment options?
May I roll over money from otherretirement accounts into my MarylandSupplemental Retirement account?
May I roll over my supplementalretirement account to another typeof retirement account, like an IRA?
May I withdrawalmoney from my account whileemployed?
When may I begin withdrawals frommy account without penalty?
May I change my withdraw optionsonce I start my payout?
Must I elect my payout date when Ileave state employment?
Is there a loan provision and ahardship/emergency provision?
○ ○ ○ ○ ○ ○ ○ ○ ○ ○ ○ ○ ○ ○ ○ ○ ○ ○ ○ ○ ○ ○ ○ ○ ○ ○ ○ ○ ○ ○ ○ ○ ○ ○ ○ ○ ○ ○ ○ ○ ○ ○ ○ ○ ○ ○ ○ ○ ○ ○ ○ ○ ○ ○ ○ ○ ○ ○ ○ ○ ○ ○ ○ ○ ○ ○ ○ ○ ○ ○ ○ ○ ○ ○ ○ ○ ○ ○ ○ ○ ○ ○ ○ ○ ○ ○ ○ ○ ○ ○ ○ ○
○ ○ ○ ○ ○ ○ ○ ○ ○ ○ ○ ○ ○ ○ ○ ○ ○ ○ ○ ○ ○ ○ ○ ○ ○ ○ ○ ○ ○ ○ ○ ○ ○ ○ ○ ○ ○ ○ ○ ○ ○ ○ ○ ○ ○ ○ ○ ○ ○ ○ ○ ○ ○ ○ ○ ○ ○ ○ ○ ○ ○ ○ ○ ○ ○ ○ ○ ○ ○ ○ ○ ○ ○ ○ ○ ○ ○ ○ ○ ○ ○ ○ ○ ○ ○ ○ ○ ○ ○ ○ ○ ○
○ ○ ○ ○ ○ ○ ○ ○ ○ ○ ○ ○ ○ ○ ○ ○ ○ ○ ○ ○ ○ ○ ○ ○ ○ ○ ○ ○ ○ ○ ○ ○ ○ ○ ○ ○ ○ ○ ○ ○ ○ ○ ○ ○ ○ ○ ○ ○ ○ ○ ○ ○ ○ ○ ○ ○ ○ ○ ○ ○ ○ ○ ○ ○ ○ ○ ○ ○ ○ ○ ○ ○ ○ ○ ○ ○ ○ ○ ○ ○ ○ ○ ○ ○ ○ ○ ○ ○ ○ ○ ○ ○
○ ○ ○ ○ ○ ○ ○ ○ ○ ○ ○ ○ ○ ○ ○ ○ ○ ○ ○ ○ ○ ○ ○ ○ ○ ○ ○ ○ ○ ○ ○ ○ ○ ○ ○ ○ ○ ○ ○ ○ ○ ○ ○ ○ ○ ○ ○ ○ ○ ○ ○ ○ ○ ○ ○ ○ ○ ○ ○ ○ ○ ○ ○ ○ ○ ○ ○ ○ ○ ○ ○ ○ ○ ○ ○ ○ ○ ○ ○ ○ ○ ○ ○ ○ ○ ○ ○ ○ ○ ○ ○ ○
○ ○ ○ ○ ○ ○ ○ ○ ○ ○ ○ ○ ○ ○ ○ ○ ○ ○ ○ ○ ○ ○ ○ ○ ○ ○ ○ ○ ○ ○ ○ ○ ○ ○ ○ ○ ○ ○ ○ ○ ○ ○ ○ ○ ○ ○ ○ ○ ○ ○ ○ ○ ○ ○ ○ ○ ○ ○ ○ ○ ○ ○ ○ ○ ○ ○ ○ ○ ○ ○ ○ ○ ○ ○ ○ ○ ○ ○ ○ ○ ○ ○ ○ ○ ○ ○ ○ ○ ○ ○ ○ ○
○ ○ ○ ○ ○ ○ ○ ○ ○ ○ ○ ○ ○ ○ ○ ○ ○ ○ ○ ○ ○ ○ ○ ○ ○ ○ ○ ○ ○ ○ ○ ○ ○ ○ ○ ○ ○ ○ ○ ○ ○ ○ ○ ○ ○ ○ ○ ○ ○ ○ ○ ○ ○ ○ ○ ○ ○ ○ ○ ○ ○ ○ ○ ○ ○ ○ ○ ○ ○ ○ ○ ○ ○ ○ ○ ○ ○ ○ ○ ○ ○ ○ ○ ○ ○ ○ ○ ○ ○ ○ ○ ○
○ ○ ○ ○ ○ ○ ○ ○ ○ ○ ○ ○ ○ ○ ○ ○ ○ ○ ○ ○ ○ ○ ○ ○ ○ ○ ○ ○ ○ ○ ○ ○ ○ ○ ○ ○ ○ ○ ○ ○ ○ ○ ○ ○ ○ ○ ○ ○ ○ ○ ○ ○ ○ ○ ○ ○ ○ ○ ○ ○ ○ ○ ○ ○ ○ ○ ○ ○ ○ ○ ○ ○ ○ ○ ○ ○ ○ ○ ○ ○ ○ ○ ○ ○ ○ ○ ○ ○ ○ ○ ○ ○
○ ○ ○ ○ ○ ○ ○ ○ ○ ○ ○ ○ ○ ○ ○ ○ ○ ○ ○ ○ ○ ○ ○ ○ ○ ○ ○ ○ ○ ○ ○ ○ ○ ○ ○ ○ ○ ○ ○ ○ ○ ○ ○ ○ ○ ○ ○ ○ ○ ○ ○ ○ ○ ○ ○ ○ ○ ○ ○ ○ ○ ○ ○ ○ ○ ○ ○ ○ ○ ○ ○ ○ ○ ○ ○ ○ ○ ○ ○ ○ ○ ○ ○ ○ ○ ○ ○ ○ ○ ○ ○ ○
○ ○ ○ ○ ○ ○ ○ ○ ○ ○ ○ ○ ○ ○ ○ ○ ○ ○ ○ ○ ○ ○ ○ ○ ○ ○ ○ ○ ○ ○ ○ ○ ○ ○ ○ ○ ○ ○ ○ ○ ○ ○ ○ ○ ○ ○ ○ ○ ○ ○ ○ ○ ○ ○ ○ ○ ○ ○ ○ ○ ○ ○ ○ ○ ○ ○ ○ ○ ○ ○ ○ ○ ○ ○ ○ ○ ○ ○ ○ ○ ○ ○ ○ ○ ○ ○ ○ ○ ○ ○ ○ ○
○ ○ ○ ○ ○ ○ ○ ○ ○ ○ ○ ○ ○ ○ ○ ○ ○ ○ ○ ○ ○ ○ ○ ○ ○ ○ ○ ○ ○ ○ ○ ○ ○ ○ ○ ○ ○ ○ ○ ○ ○ ○ ○ ○ ○ ○ ○ ○ ○ ○ ○ ○ ○ ○ ○ ○ ○ ○ ○ ○ ○ ○ ○ ○ ○ ○ ○ ○ ○ ○ ○ ○ ○ ○ ○ ○ ○ ○ ○ ○ ○ ○ ○ ○ ○ ○ ○ ○ ○ ○ ○ ○
○ ○ ○ ○ ○ ○ ○ ○ ○ ○ ○ ○ ○ ○ ○ ○ ○ ○ ○ ○ ○ ○ ○ ○ ○ ○ ○ ○ ○ ○ ○ ○ ○ ○ ○ ○ ○ ○ ○ ○ ○ ○ ○ ○ ○ ○ ○ ○ ○ ○ ○ ○ ○ ○ ○ ○ ○ ○ ○ ○ ○ ○ ○ ○ ○ ○ ○ ○ ○ ○ ○ ○ ○ ○ ○ ○ ○ ○ ○ ○ ○ ○ ○ ○ ○ ○ ○ ○ ○ ○ ○ ○
○ ○ ○ ○ ○ ○ ○ ○ ○ ○ ○ ○ ○ ○ ○ ○ ○ ○ ○ ○ ○ ○ ○ ○ ○ ○ ○ ○ ○ ○ ○ ○ ○ ○ ○ ○ ○ ○ ○ ○ ○ ○ ○ ○ ○ ○ ○ ○ ○ ○ ○ ○ ○ ○ ○ ○ ○ ○ ○ ○ ○ ○ ○ ○ ○ ○ ○ ○ ○ ○ ○ ○ ○ ○ ○ ○ ○ ○ ○ ○ ○ ○ ○ ○ ○ ○ ○ ○ ○ ○ ○ ○
○ ○ ○ ○ ○ ○ ○ ○ ○ ○ ○ ○ ○ ○ ○ ○ ○ ○ ○ ○ ○ ○ ○ ○ ○ ○ ○ ○ ○ ○ ○ ○ ○ ○ ○ ○ ○ ○ ○ ○ ○ ○ ○ ○ ○ ○ ○ ○ ○ ○ ○ ○ ○ ○ ○ ○ ○ ○ ○ ○ ○ ○ ○ ○ ○ ○ ○ ○ ○ ○ ○ ○ ○ ○ ○ ○ ○ ○ ○ ○ ○ ○ ○ ○ ○ ○ ○ ○ ○ ○ ○ ○
○ ○ ○ ○ ○ ○ ○ ○ ○ ○ ○ ○ ○ ○ ○ ○ ○ ○ ○ ○ ○ ○ ○ ○ ○ ○ ○ ○ ○ ○ ○ ○ ○ ○ ○ ○ ○ ○ ○ ○ ○ ○ ○ ○ ○ ○ ○ ○ ○ ○ ○ ○ ○ ○ ○ ○ ○ ○ ○ ○ ○ ○ ○ ○ ○ ○ ○ ○ ○ ○ ○ ○ ○ ○ ○ ○ ○ ○ ○ ○ ○ ○ ○ ○ ○ ○ ○ ○ ○ ○ ○ ○
○ ○ ○ ○ ○ ○ ○ ○ ○ ○ ○ ○ ○ ○ ○ ○ ○ ○ ○ ○ ○ ○ ○ ○ ○ ○ ○ ○ ○ ○ ○ ○ ○ ○ ○ ○ ○ ○ ○ ○ ○ ○ ○ ○ ○ ○ ○ ○ ○ ○ ○ ○ ○ ○ ○ ○ ○ ○ ○ ○ ○ ○ ○ ○ ○ ○ ○ ○ ○ ○ ○ ○ ○ ○ ○ ○ ○ ○ ○ ○ ○ ○ ○ ○ ○ ○ ○ ○ ○ ○ ○ ○
401(a) The rules are the samefor the 401(a) and 401(k) plansexcept that in the 401(a) plan,distributions are not permitteduntil separation of state service.

Maryland Teachers & State Employees
Supplemental Retirement Plans
William Donald Schaefer Tower
6 Saint Paul Street - Suite 200
Baltimore, MD 21202-1608
1-800-543-5605
www.msrp.state.md.us
Robert L. Ehrlich, Jr.
Governor
Michael S. Steele
Lt. Governor
Frederick W. Puddester
Chairman of the Board of Trustees
Michael T. Halpin, CRC, CRA
Executive Director