Embed Size (px)
DESCRIPTION
Annual Report 2004-2005
Citation preview
2004-2005Annual Report
2004-2005Annual Report
Office of theCounty Assessor
Lawrence E. Stone, Assessor
Bien Abordo Linda Aguilar Gene Almerido Annabelle Alquiza Oscar Amaya Medel Angel Rhonda Armstrong Virgil Atencio Deborah Atencio Sang Au
Tuan Au Isa Ayala Anita Badger George Balster Fred Baltazar Mai Bang Patty Barber Vanessa Barkin Jeff Barlow Denise Barry Cynthia Bartolino
Michael Bautista Rudy Baya Bart Beckner David Bethel Neeraj Bhardwaj Laura Bird Laynette Blackfield Judith Bliss Ray Bramlette Jon Bredeson
Yvette Briddell John Brigandi Gloria Brown Linda Brown Bev Brown Charmaine Cabuag Henry Cajucom
Carol Cal lahan Carlos Cansino Celerina Celeste Debbie Chavez Conrad Chen Roland Child Frances Chin
Jae Choe Michel le Chou Terry Cisneros Gary Clarke Dick Cloyd Pauline Coleman Dan Collins Laura Colunga
Craig Cooper Mike Conroy Lisa Cortez Maureen Cowan Barbara Davidson Ramon DelaCruz Huong Dinh Jim
DiTomaso Rosita Dones Tony Duong Sal Duran Bob Easley Indira Ebenezer Ben Emata Sandy Emerson Barry Eng
Judy Epstein Rocky Erfe Fe Escalante Rey Eugenio Richelle Feldan-Cayol Richard Fisher Geemin
Fong Gemma Foster Nora Frantz Marie Fuentes Lorna Gabon Nora Galvez Madan Ganti Joseph Garcia David
Ginsborg Frank Giordano Bruce Glenday Teresa Gonzalez Florinda Gonzales Manuela Gonzalez Ken Green Sal Gutierrez Gina Hale Ginny Hamley
Andrea Harris Mike Harris Murray Hartmann Jamie Hill Julius Ho Hollis Holladay Janice Hongsathavij Pam Hopkins Angela Huang Chris Hughes
Nora Huynh Jenny Huynh Tri Huynh Richard Itow Sandra Cordy Jellison Dee Jimenez Herb Jubin Judy Junaidy Leslie Kennedy Carol Kested David
King Joan Kirkpatrick Bowman Kong Melissa Kong Jack LaCorte Sue-ee Lai Fred Lam Sue Lambrecht Jack Lee Gilbert Lee Kristen Leglu Kathy
LeGrande Judith Lentz Richard Leong Annie Leung Melody Luong
Eileen Lin Sherry Lin Debbie Loennquist Fraser Louie Trinh
Luu-Nguyen Jacelyn Ma John Maag Joe Machado Bob Madalena
Manuel Mandapant Tracy Martinez Bessie Mascardo
Eric Matsuda Sandra Cordy
M c C u l l o c h Chuck McDonald
Lyn McLain Bob McKibbin Tom
McMullen Karen McPherson Mark
McPherson Rita Medina Rich
M e n d o z a George Mil ler
Chuck Mirrasoul Theresa Montenegro Greg
Monteverde Matt Moore Dale Murphy Susan Murphy Lewis
Nance Manny Natividad Mary Dam Nguyen Wayne Nguyen
Robert Norman Clint Nottingham Brian O’Nei l l Josie Ol ivarez
Richard Osborn Kathleene Ozawa Thelma Paet Ed Palacio Lydia
Paquiz Diane Paskert Imelda Pea Sylvia Pedraza Jyot i Pendse
Stephanie Perez Xuanhuong Pham Phu Phan Arika Pineda
Janene Pratt Grace Quilty John Recchio Marty Reinders Jackie
Regala Carol Rivas Delia Rivas Jim Rizzo Carolynn Roberts
Sylvain Roberts Lisa Rodriguez Romeo Rodriguez Manuela
Rosalez Rebecca Ross Marlene Ross Mohit Sabherwal Gabriel
Sainz Elizabeth Samaro Suzanne
Sanchez Tony Sanchez Ford
Sandberg Patti Santillanez Maria
Sarabia Selu Sataraka Laura
Scott Alfredo Semene Walt
Senter Naren Shah David
Shank Marian Shank Cathy
Sheridan Helen Si lva John Sleeman Bertha Sol iz Mary
Solseng Kimberly Starrett Charlie Steed Marian Stewart Larry Stone
Steven Suehiro Marianne Suriaga Donald Sweet Christine Swensen
Iwona Szatkowska Kevin Tanner Ron Tuel ler Raphael Thomas
Christina Thomas Tara Thomas John Thompkins Karen Tillison
Grace Tolentino Cristina Torio Alan Tran Chuong Tran Khanh
Tran Heather Tran Nicole Tran Alicia Trevino Theresa Trinadad
Joy Tsai Pam Umeda Peter van der Pas Susan Vasconcel los
Jackie Ventimiglia Irene Vera Ben Victorino Al Vieira Susie Vigilante Susie Wang Chris Watts Bob Wellner Jim White Linda Wilson David Wierzba
Barbara Wilcox Linda Wilson Lisa Wong Clyde Wong Andy Wu Lilia Yalong Darleen Yamaki Roger Yamat Laura Yau Will Young Michelle Zaffa Eric
Zamudio Gumer Zavala Janet Zecha
Table of Contents
Message from the Assessor .............................................................. 1
Factors Causing Change to the Assessment Roll ............................. 3
Largest Taxpayers/How Tax Bills are Calculated & Allocated ......... 5
Assessment Roll .............................................................................. 6
Ten-year Roll Summary ................................................................... 7
Assessment Information by City ..................................................... 8
Proposition 8 ................................................................................ 12
Exemptions .................................................................................. 14
Proposition 13 .............................................................................. 15
Department Overview .................................................................. 16
Assessment Information by Property Type ................................... 18
Major New Construction .............................................................. 19
Major Changes in Ownership ........................................................ 19
Frequently Asked Questions ......................................................... 21
Assessment Appeals ...................................................................... 24
Performance Counts ..................................................................... 26
Summary Bay Area Counties Roll Comparison ............................. 28
Explanation of Terms ................................................................... 29
Above are all the permanent employees that contributed to the closing of the 2004-2005 Assessment Roll. The pictured employees are, clockwise,Bowman Kong, Greg Monteverde, Chuck Mirrasoul, Sylvia Pedraza, Cristina Torio, and Arika Pineda.
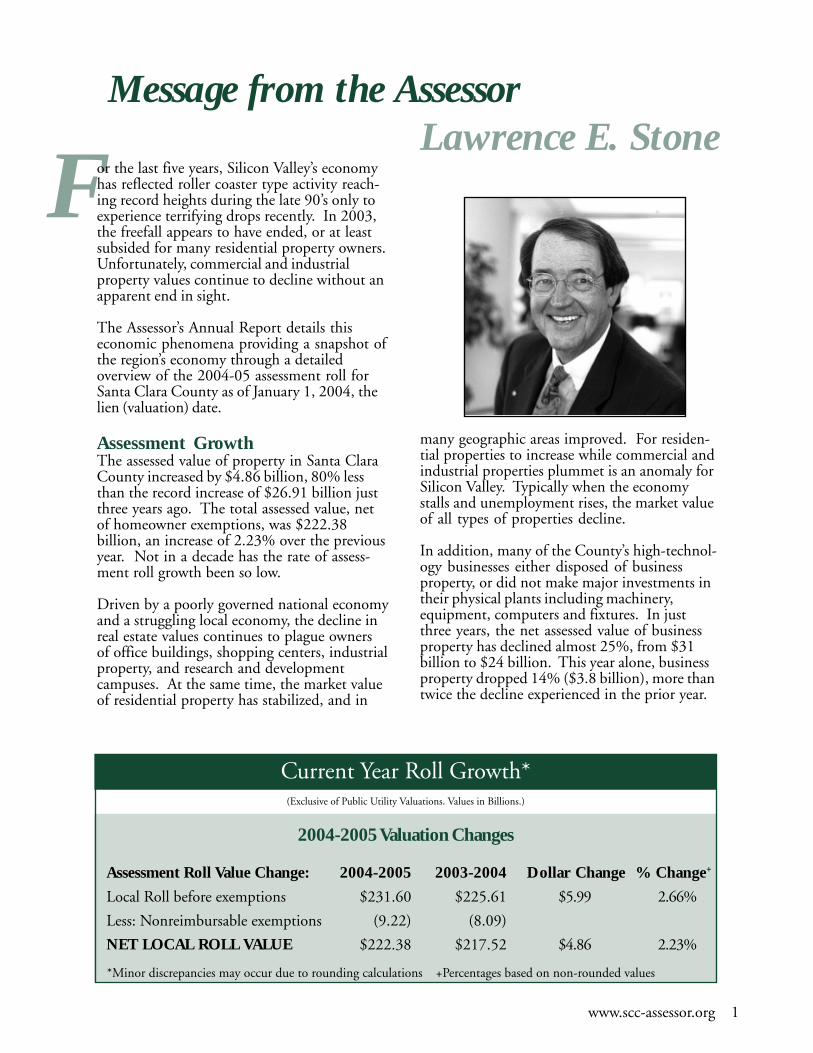
Message from the Assessor Lawrence E. Stone
F
www.scc-assessor.org 1
Current Year Roll Growth*
Assessment Roll Value Change:
Local Roll before exemptions
Less: Nonreimbursable exemptions
NET LOCAL ROLL VALUE
2004-2005
$231.60
(9.22)
$222.38
Dollar Change
$5.99
$4.86
2003-2004
$225.61
(8.09)
$217.52
% Change+
2.66%
2.23%
(Exclusive of Public Utility Valuations. Values in Billions.)
2004-2005 Valuation Changes
*Minor discrepancies may occur due to rounding calculations +Percentages based on non-rounded values
or the last five years, Silicon Valley’s economyhas reflected roller coaster type activity reach-ing record heights during the late 90’s only toexperience terrifying drops recently. In 2003,the freefall appears to have ended, or at leastsubsided for many residential property owners.Unfortunately, commercial and industrialproperty values continue to decline without anapparent end in sight.
The Assessor’s Annual Report details thiseconomic phenomena providing a snapshot ofthe region’s economy through a detailedoverview of the 2004-05 assessment roll forSanta Clara County as of January 1, 2004, thelien (valuation) date.
Assessment GrowthThe assessed value of property in Santa ClaraCounty increased by $4.86 billion, 80% lessthan the record increase of $26.91 billion justthree years ago. The total assessed value, netof homeowner exemptions, was $222.38billion, an increase of 2.23% over the previousyear. Not in a decade has the rate of assess-ment roll growth been so low.
Driven by a poorly governed national economyand a struggling local economy, the decline inreal estate values continues to plague ownersof office buildings, shopping centers, industrialproperty, and research and developmentcampuses. At the same time, the market valueof residential property has stabilized, and in
many geographic areas improved. For residen-tial properties to increase while commercial andindustrial properties plummet is an anomaly forSilicon Valley. Typically when the economystalls and unemployment rises, the market valueof all types of properties decline.
In addition, many of the County’s high-technol-ogy businesses either disposed of businessproperty, or did not make major investments intheir physical plants including machinery,equipment, computers and fixtures. In justthree years, the net assessed value of businessproperty has declined almost 25%, from $31billion to $24 billion. This year alone, businessproperty dropped 14% ($3.8 billion), more thantwice the decline experienced in the prior year.
2 www.scc-assessor.org
The impact was also very uneven throughout theCounty. Cities with the largest concentration ofhigh tech companies experienced the greatestdecline. Sunnyvale, Santa Clara, Milpitas andMountain View, with populations totaling morethan a third of the county, experienced negativegrowth in the assessment roll ranging from -5%to just under -1%. Just three years ago the rateof assessment roll growth for all 15 cities in SantaClara County exceeded 10%, and in some cities,topped 20%. The City of Santa Clara, forexample, went from 19% roll growth in 2001,to -5% in 2004.
It is truly an unusual and hopefully an uncommonphenomenon for a city to experience negativeassessment growth. In contrast, residential com-munities like Los Altos and Los Altos Hillsexperienced growth in excess of 8%.
The decline was more severe for property inredevelopment agencies (RDA) at the center ofSilicon Valley’s commercial and industrial high-technology industry. For example, the followingRDAs all experienced negative assessment growth;San Jose, -11.5%; Santa Clara, -11.28%; Moun-tain View, -7.74%; Cupertino, -4.70%; andCampbell, -1.04%. San Jose topped the list atalmost $2 billion less than the previous year.
The growth in the assessment roll is also impor-tant to the “basic aid” school districts in SantaClara County. A basic aid school district is adistrict in which the property tax revenue gener-ated locally exceeds the State’s formula for schooldistrict funding. Consequently, basic aid schooldistricts have more funds at their disposal becauseof direct access to greater local property tax rev-enue. However, the revenue these school districtsreceive can fluctuate according to changes in theassessed value of property within the districts’ taxrate areas. The basic aid school districts in SantaClara County are: Fremont Union High SchoolDistrict, Lakeside Joint Elementary School Dis-trict, Los Altos Elementary School District, LosGatos Union Elementary School District, LosGatos-Saratoga Joint Union High School District,Mountain View-Los Altos Union High SchoolDistrict, Palo Alto Unified School District,Saratoga Union Elementary School District, SantaClara Unified School District and SunnyvaleElementary School District. Ten of California’s 67basic aid school districts are located in Santa ClaraCounty.
Role of the County Assessor’s OfficeThe Assessor’s Office is responsible for deter-mining the assessed value of all real and businesspersonal property within Santa Clara County.Each year the Assessor’s professional staff pro-vides accurate assessments of all secured andunsecured property. The assessment roll, whichincludes more than 500,000 roll units of realproperty and business assessments, is the basisupon which property taxes are levied.
Property taxes, in turn, provide an essentialsource of revenue to support basic publicservices provided by schools and local govern-ments. These are the public institutions thatform the foundation of our region’s qualityof life.
The Annual Report presents a summary of the2004-2005 assessment roll as of the January 1,2004, lien (valuation) date. The annual assess-ment roll, delivered by the Assessor to theFinance Agency Director on July 1, 2004, is avaluable resource for budgeting and financialplanning by local governmental agencies.
Information in this report reflects all, locallyassessed property, both secured and unsecured.The statistical data also distinguishes betweenbusiness personal property and real property.It summarizes current assessments of the variouscities and unincorporated areas compared toprior years, and illustrates the trends in assess-ment appeals. Assessments of public utilities arethe responsibility of the California State Boardof Equalization, and therefore are not includedin this report.
Factors in Assessment GrowthAssessment roll growth is a result of severalmajor components.
“Real property” is assessed to reflect fair marketvalue when there is a change in ownership ornew construction. The change in assessed valueof individual properties reflects the net differ-ence between the prior assessed value and thenew market value resulting from the change inownership or new construction. Reappraisal asa result of new construction reflects only thevalue added by the new construction.
www.scc-assessor.org 3
Unless property changes ownership or issubject to new construction, Proposition 13limits any increase in assessed value to nomore than 2% annually or the California CPI(1.867% in 2004), whichever is lower. Con-sequently, the value of the assessment roll issignificantly less than the fair market value ofall property in Santa Clara County.
When economic conditions cause a decline inproperty values, the Assessor is required toadjust assessed values to reflect that decline. Ifthe market value of a property as of the lien(valuation) date, January 1, 2004, was lessthan the assessed value, the impacted propertyowner is entitled to a temporary adjustment.This year, the assessed values for 24,743properties were reduced for a total reductionof $10.6 billion from the assessment roll. Bycomparison in 1995, the “bottom” of the lastmajor economic decline, the assessed values of98,000 properties were reduced, reflecting a$5 billion decline in the assessment roll.
Even more dramatic is the fact that 1,352non-residential properties accounted for awhopping 83% ($8.8 billion) of the totalreduction of assessed values. Consequently,while residential properties have experiencedsome volatility, the collapse of commercialand industrial market has been unprec-edented. More than a third of the decreasein assessed values ($4.3 billion) occurred inthe county’s nine redevelopment agencies.
Business personal property, which includescomputers, machinery, equipment and fixtures,also experienced a precipitous decline of $3.8billion, a 14% reduction. Assessed values ofbusiness personal property is determined fromproperty statements filed annually by 55,000businesses in Santa Clara County.
AccomplishmentsDuring the current economic recession, themost serious challenge for the Assessor is toproactively respond to changes in the market-place. The result is a dramatic increase inworkload, accomplished without compromisingproductivity and performance. A sample of ourmajor accomplishments includes:
• Completed the annual assessment roll bythe deadline mandated by law.
• Reduced the assessed values of 24,743properties as mandated by law.
• Completed 98.9% of real propertyvaluations.
• Completed 99.7% of the business personalproperty assessment and audits.
• Completed 99.6% of eligible exemptions.• Resolved a record number of business
personal property assessment appeals.• Continued to enhance the Assessor’s on-line
property “look-up” feature on the Assessor’sweb site (scc-assessor.org), allowing prop-erty owners to access property records anytime of the day or night from a convenientlocation. The site remains among theCounty’s top five most-visited sites.
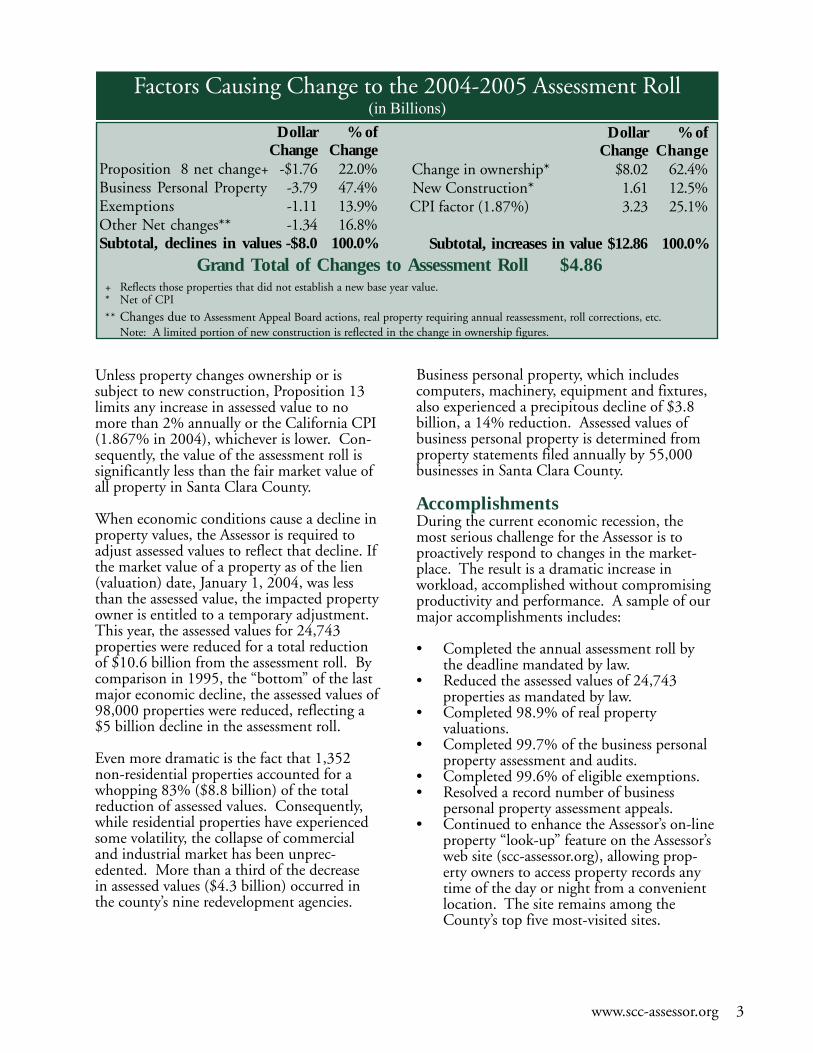
+ Reflects those properties that did not establish a new base year value.* Net of CPI
** Changes due to Assessment Appeal Board actions, real property requiring annual reassessment, roll corrections, etc.Note: A limited portion of new construction is reflected in the change in ownership figures.
Dollar % ofChange Change
Proposition 8 net change+ -$1.76 22.0%Business Personal Property -3.79 47.4%Exemptions -1.11 13.9%Other Net changes** -1.34 16.8%Subtotal, declines in values -$8.0 100.0%
Factors Causing Change to the 2004-2005 Assessment Roll(in Billions)
Dollar % of Change Change
Change in ownership* $8.02 62.4% New Construction* 1.61 12.5% CPI factor (1.87%) 3.23 25.1%
Subtotal, increases in value $12.86 100.0% Grand Total of Changes to Assessment Roll $4.86
4 www.scc-assessor.org
• Audited 99.4% of the 1,192 businessaccounts required by the CaliforniaRevenue and Taxation Code, reflecting anincrease of 17% over the prior year.
• Updated 1,702 Assessor Maps, a 41%increase including 307 new parcel maps.
• Processed 105,467 deeds, creating 114,928title documents, a 9.1% increase over theprior year.
• Achieved full utilization of documentimaging for the processing of homeownerexemption claims, deeds and businessproperty statements.
• Reduced serious backlogs in both map-ping and deed processing throughworkflow streamlining initiatives.
• Successfully implemented the County’snew, on-line paperless accounting system.
• Trained certified appraisers and auditorsbeyond the statutorily required minimum.
• Completed performance evaluations forall employees for the first time in 29 years.
• Launched customer satisfaction surveysfor all divisions.
• Progressed on the design of a new com-puter information system, to meet thechallenges of the next generation.
Trends and Future Goals
With Silicon Valley and the State of Californiamired in deep economic crisis, the Assessor’sOffice, now more than ever, is focused ondeveloping and implementing creative andinnovative solutions to improve efficiency andproductivity while reducing costs.
Some of the major challenges include:• The departure of a significant number of
our most experienced professionals hascreated a major “brain drain.” Twenty-nine employees responded to a “goldenhandshake” incentive offered by theBoard of Supervisors, creating a seriousstaffing crisis.
Many of the mission critical professionalscannot be replaced easily as several years ofdirect involvement is required to appraiselarge commercial, industrial and multifamily properties and to audit major corpo-rations. Regrettably the Board rejected theAssessor’s request for additional resources toencourage the recruitment of new talent.
The 15 cities in Santa Clara County, theCounty itself and public schools will bearthe brunt of the “brain drain”, especially ifthe economy improves and there are insuffi-cient resources to respond to positivechanges in the market place.
• We are committed to replacing the 25 year-old legacy computer system with a modern,state of the art system that will efficientlymeet both the immediate and long-termneeds of the department and Countygovernment.
• We will implement a major reorganizationand consolidation of the Assessor’s publicservice responsibilities to improve bothcustomer service and office security.
Finally, as County Assessor, I will focus attentionand resources on continuous improvementinitiatives based on quality, service, innovation,accountability, and relevant partnerships. TheAssessor’s Office contains a group of employeesthat I believe are among the most talented anddedicated public servants anywhere in govern-ment.
It is our primary objective to treat all propertyowners and tax payers with the highest degreeof courtesy and professionalism.
Lawrence E. StoneAssessor
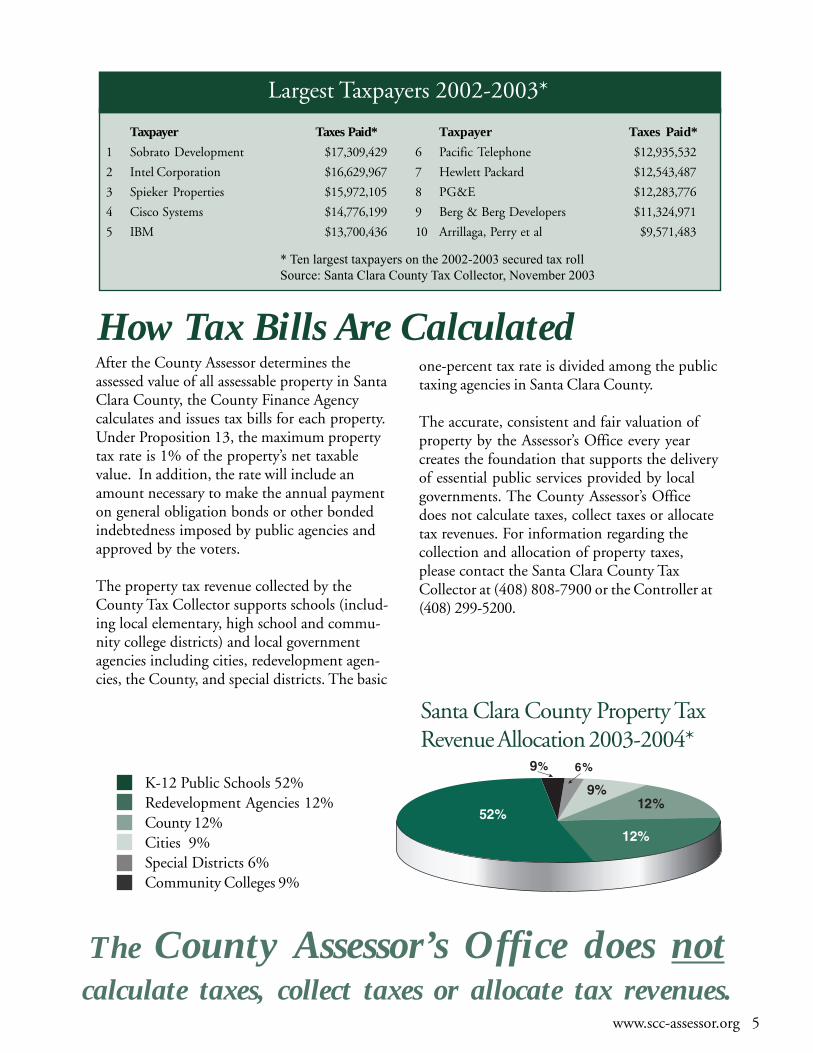
After the County Assessor determines theassessed value of all assessable property in SantaClara County, the County Finance Agencycalculates and issues tax bills for each property.Under Proposition 13, the maximum propertytax rate is 1% of the property’s net taxablevalue. In addition, the rate will include anamount necessary to make the annual paymenton general obligation bonds or other bondedindebtedness imposed by public agencies andapproved by the voters.
The property tax revenue collected by theCounty Tax Collector supports schools (includ-ing local elementary, high school and commu-nity college districts) and local governmentagencies including cities, redevelopment agen-cies, the County, and special districts. The basic
The County Assessor’s Office does notcalculate taxes, collect taxes or allocate tax revenues.
Santa Clara County Property TaxRevenue Allocation 2003-2004*
K-12 Public Schools 52%Redevelopment Agencies 12%County 12%Cities 9%Special Districts 6%Community Colleges 9%
one-percent tax rate is divided among the publictaxing agencies in Santa Clara County.
The accurate, consistent and fair valuation ofproperty by the Assessor’s Office every yearcreates the foundation that supports the deliveryof essential public services provided by localgovernments. The County Assessor’s Officedoes not calculate taxes, collect taxes or allocatetax revenues. For information regarding thecollection and allocation of property taxes,please contact the Santa Clara County TaxCollector at (408) 808-7900 or the Controller at(408) 299-5200.
How Tax Bills Are Calculated
Taxpayer Taxes Paid*
1 Sobrato Development $17,309,429
2 Intel Corporation $16,629,967
3 Spieker Properties $15,972,105
4 Cisco Systems $14,776,199
5 IBM $13,700,436
* Ten largest taxpayers on the 2002-2003 secured tax roll
Source: Santa Clara County Tax Collector, November 2003
Largest Taxpayers 2002-2003*
Taxpayer Taxes Paid*
6 Pacific Telephone $12,935,532
7 Hewlett Packard $12,543,487
8 PG&E $12,283,776
9 Berg & Berg Developers $11,324,971
10 Arrillaga, Perry et al $9,571,483
www.scc-assessor.org 5
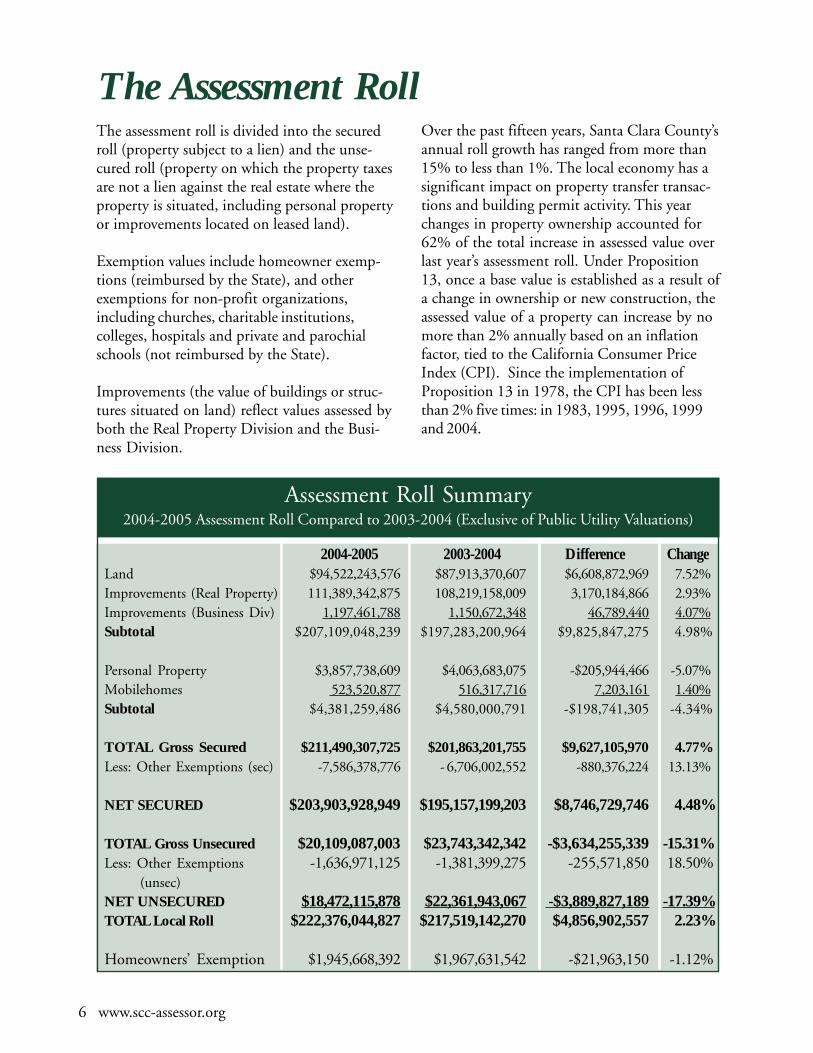
Over the past fifteen years, Santa Clara County’sannual roll growth has ranged from more than15% to less than 1%. The local economy has asignificant impact on property transfer transac-tions and building permit activity. This yearchanges in property ownership accounted for62% of the total increase in assessed value overlast year’s assessment roll. Under Proposition13, once a base value is established as a result ofa change in ownership or new construction, theassessed value of a property can increase by nomore than 2% annually based on an inflationfactor, tied to the California Consumer PriceIndex (CPI). Since the implementation ofProposition 13 in 1978, the CPI has been lessthan 2% five times: in 1983, 1995, 1996, 1999and 2004.
The Assessment RollThe assessment roll is divided into the securedroll (property subject to a lien) and the unse-cured roll (property on which the property taxesare not a lien against the real estate where theproperty is situated, including personal propertyor improvements located on leased land).
Exemption values include homeowner exemp-tions (reimbursed by the State), and otherexemptions for non-profit organizations,including churches, charitable institutions,colleges, hospitals and private and parochialschools (not reimbursed by the State).
Improvements (the value of buildings or struc-tures situated on land) reflect values assessed byboth the Real Property Division and the Busi-ness Division.
Assessment Roll Summary2004-2005 Assessment Roll Compared to 2003-2004 (Exclusive of Public Utility Valuations)
2004-2005 2003-2004 Difference ChangeLand $94,522,243,576 $87,913,370,607 $6,608,872,969 7.52%Improvements (Real Property) 111,389,342,875 108,219,158,009 3,170,184,866 2.93%Improvements (Business Div) 1,197,461,788 1,150,672,348 46,789,440 4.07%Subtotal $207,109,048,239 $197,283,200,964 $9,825,847,275 4.98%
Personal Property $3,857,738,609 $4,063,683,075 -$205,944,466 -5.07%Mobilehomes 523,520,877 516,317,716 7,203,161 1.40%Subtotal $4,381,259,486 $4,580,000,791 -$198,741,305 -4.34%
TOTAL Gross Secured $211,490,307,725 $201,863,201,755 $9,627,105,970 4.77%Less: Other Exemptions (sec) -7,586,378,776 - 6,706,002,552 -880,376,224 13.13%
NET SECURED $203,903,928,949 $195,157,199,203 $8,746,729,746 4.48%
TOTAL Gross Unsecured $20,109,087,003 $23,743,342,342 -$3,634,255,339 -15.31%Less: Other Exemptions -1,636,971,125 -1,381,399,275 -255,571,850 18.50% (unsec)NET UNSECURED $18,472,115,878 $22,361,943,067 -$3,889,827,189 -17.39%TOTAL Local Roll $222,376,044,827 $217,519,142,270 $4,856,902,557 2.23%
Homeowners’ Exemption $1,945,668,392 $1,967,631,542 -$21,963,150 -1.12%
6 www.scc-assessor.org
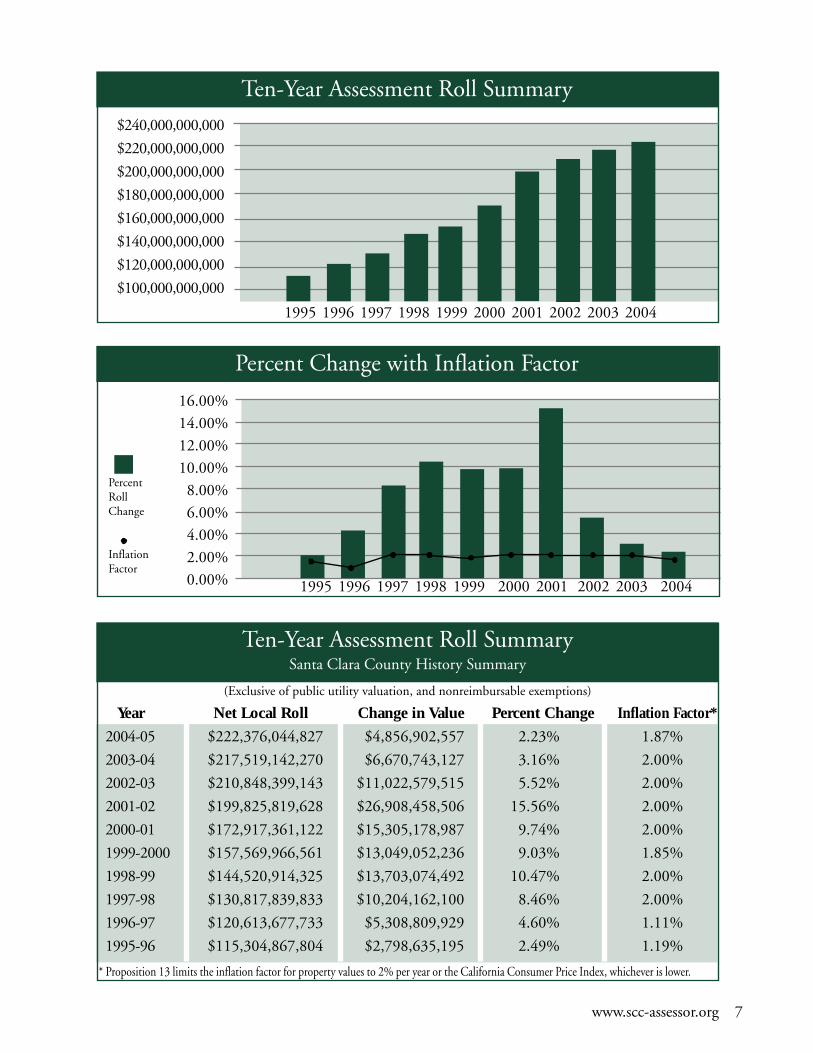
Ten-Year Assessment Roll SummarySanta Clara County History Summary
Year
2004-05
2003-04
2002-03
2001-02
2000-01
1999-2000
1998-99
1997-98
1996-97
1995-96
Net Local Roll
$222,376,044,827
$217,519,142,270
$210,848,399,143
$199,825,819,628
$172,917,361,122
$157,569,966,561
$144,520,914,325
$130,817,839,833
$120,613,677,733
$115,304,867,804
Percent Change
2.23%
3.16%
5.52%
15.56%
9.74%
9.03%
10.47%
8.46%
4.60%
2.49%
Change in Value
$4,856,902,557
$6,670,743,127
$11,022,579,515
$26,908,458,506
$15,305,178,987
$13,049,052,236
$13,703,074,492
$10,204,162,100
$5,308,809,929
$2,798,635,195
Inflation Factor*
1.87%
2.00%
2.00%
2.00%
2.00%
1.85%
2.00%
2.00%
1.11%
1.19%
(Exclusive of public utility valuation, and nonreimbursable exemptions)
* Proposition 13 limits the inflation factor for property values to 2% per year or the California Consumer Price Index, whichever is lower.
$240,000,000,000
$220,000,000,000
$200,000,000,000
$180,000,000,000
$160,000,000,000
$140,000,000,000
$120,000,000,000
$100,000,000,000
Ten-Year Assessment Roll Summary
1995 1996 1997 1998 1999 2000 2001 2002 2003 2004
16.00%14.00%12.00%10.00%8.00%6.00%4.00%2.00%0.00%
Percent Change with Inflation Factor
1995 1996 1997 1998 1999 2000 2001 2002 2003 2004
PercentRollChange
InflationFactor
www.scc-assessor.org 7
8 www.scc-assessor.org
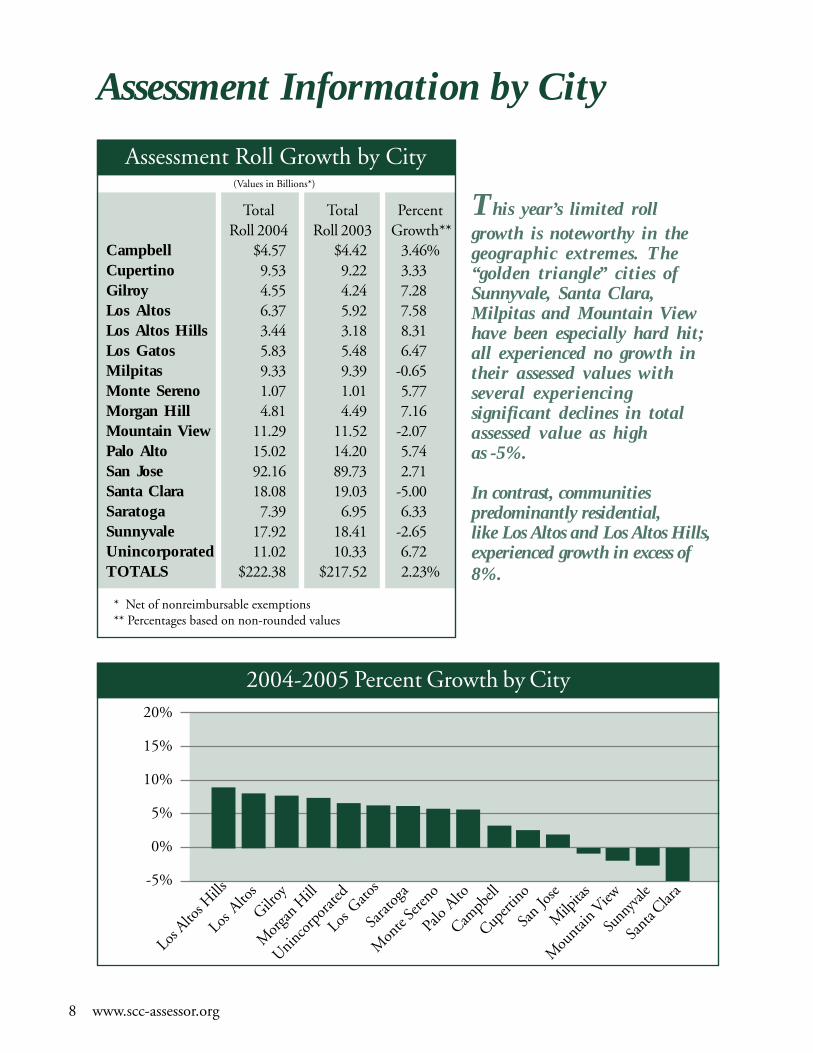
This year’s limited rollgrowth is noteworthy in thegeographic extremes. The“golden triangle” cities ofSunnyvale, Santa Clara,Milpitas and Mountain Viewhave been especially hard hit;all experienced no growth intheir assessed values withseveral experiencingsignificant declines in totalassessed value as highas -5%.
In contrast, communitiespredominantly residential,like Los Altos and Los Altos Hills,experienced growth in excess of8%.
Assessment Information by City
20%
15%
10%
5%
0%
-5%
2004-2005 Percent Growth by City
Sunn
yvale
Mon
te Se
reno
Milp
itas
Sarat
oga
San
Jose
Mor
gan H
ill
Los G
atos
Los A
ltos H
ills
Mou
ntain
View
Los A
ltos
Cupert
ino
Gilroy
Campb
ell
Sant
a Clar
a
Palo
Alto
Uninco
rpor
ated
Assessment Roll Growth by City
* Net of nonreimbursable exemptions** Percentages based on non-rounded values
(Values in Billions*)
Total Total PercentRoll 2004 Roll 2003 Growth**
Campbell $4.57 $4.42 3.46%Cupertino 9.53 9.22 3.33Gilroy 4.55 4.24 7.28Los Altos 6.37 5.92 7.58Los Altos Hills 3.44 3.18 8.31Los Gatos 5.83 5.48 6.47Milpitas 9.33 9.39 -0.65Monte Sereno 1.07 1.01 5.77Morgan Hill 4.81 4.49 7.16Mountain View 11.29 11.52 -2.07Palo Alto 15.02 14.20 5.74San Jose 92.16 89.73 2.71Santa Clara 18.08 19.03 -5.00Saratoga 7.39 6.95 6.33Sunnyvale 17.92 18.41 -2.65Unincorporated 11.02 10.33 6.72TOTALS $222.38 $217.52 2.23%
www.scc-assessor.org 9
$100
$90
$80
$70
$60
$50
$40
$30
$20
$10
$0
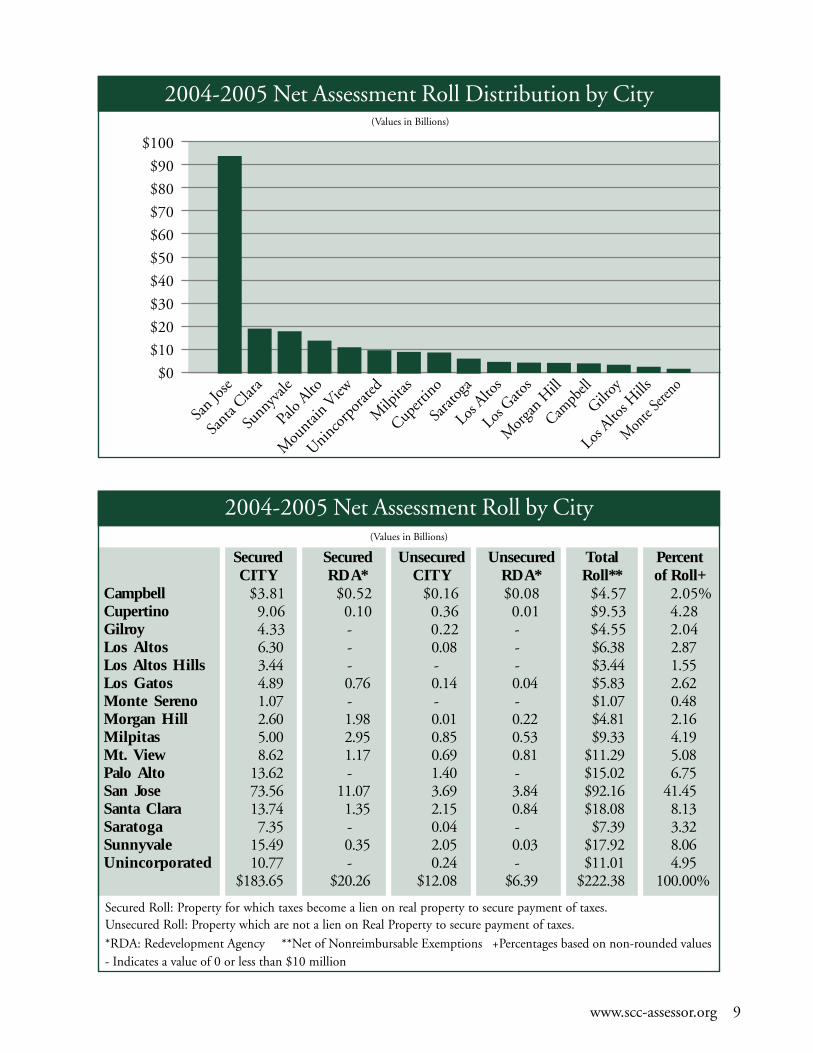
2004-2005 Net Assessment Roll Distribution by City
Campb
ell
Gilroy
Los A
ltos H
ills
Mon
te Ser
eno
Sarat
oga
Los A
ltos
Los G
atos
Mor
gan H
ill
Mou
ntain
View
Uninco
rpor
ated
Milp
itas
Cupert
ino
San J
ose
Sant
a Clar
a
Sunn
yvale
Palo
Alto
(Values in Billions)
2004-2005 Net Assessment Roll by City(Values in Billions)
Secured Roll: Property for which taxes become a lien on real property to secure payment of taxes.Unsecured Roll: Property which are not a lien on Real Property to secure payment of taxes.
*RDA: Redevelopment Agency **Net of Nonreimbursable Exemptions +Percentages based on non-rounded values- Indicates a value of 0 or less than $10 million
Secured Secured Unsecured Unsecured Total PercentCITY RDA* CITY RDA* Roll** of Roll+
Campbell $3.81 $0.52 $0.16 $0.08 $4.57 2.05%Cupertino 9.06 0.10 0.36 0.01 $9.53 4.28Gilroy 4.33 - 0.22 - $4.55 2.04Los Altos 6.30 - 0.08 - $6.38 2.87Los Altos Hills 3.44 - - - $3.44 1.55Los Gatos 4.89 0.76 0.14 0.04 $5.83 2.62Monte Sereno 1.07 - - - $1.07 0.48Morgan Hill 2.60 1.98 0.01 0.22 $4.81 2.16Milpitas 5.00 2.95 0.85 0.53 $9.33 4.19Mt. View 8.62 1.17 0.69 0.81 $11.29 5.08Palo Alto 13.62 - 1.40 - $15.02 6.75San Jose 73.56 11.07 3.69 3.84 $92.16 41.45Santa Clara 13.74 1.35 2.15 0.84 $18.08 8.13Saratoga 7.35 - 0.04 - $7.39 3.32Sunnyvale 15.49 0.35 2.05 0.03 $17.92 8.06Unincorporated 10.77 - 0.24 - $11.01 4.95
$183.65 $20.26 $12.08 $6.39 $222.38 100.00%
10 www.scc-assessor.org
$90
$80
$70
$60
$50
$40
$30
$20
$10
$0
2004-2005 Real Property Distribution by City
Campb
ell
Gilroy
Los A
ltos H
ills
Mon
te Se
reno
Sarat
oga
Los A
ltos
Los G
atos
Mor
gan H
ill
Uninco
rpor
ated
Mou
ntain
View
Cupert
ino
Milp
itas
San
Jose
Sunn
yvale
Sant
a Clar
a
Palo
Alto
(Values in Billions)
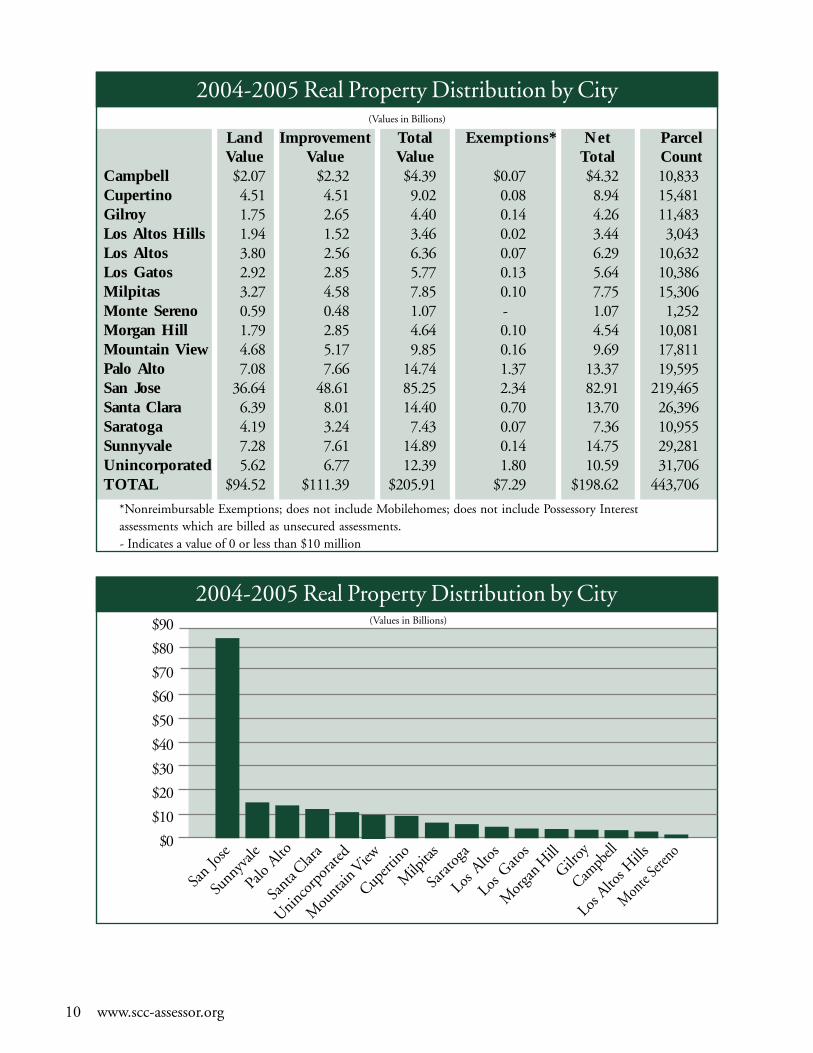
2004-2005 Real Property Distribution by City(Values in Billions)
*Nonreimbursable Exemptions; does not include Mobilehomes; does not include Possessory Interestassessments which are billed as unsecured assessments.
Land Improvement Total Exemptions* Net ParcelValue Value Value Total Count
Campbell $2.07 $2.32 $4.39 $0.07 $4.32 10,833Cupertino 4.51 4.51 9.02 0.08 8.94 15,481Gilroy 1.75 2.65 4.40 0.14 4.26 11,483Los Altos Hills 1.94 1.52 3.46 0.02 3.44 3,043Los Altos 3.80 2.56 6.36 0.07 6.29 10,632Los Gatos 2.92 2.85 5.77 0.13 5.64 10,386Milpitas 3.27 4.58 7.85 0.10 7.75 15,306Monte Sereno 0.59 0.48 1.07 - 1.07 1,252Morgan Hill 1.79 2.85 4.64 0.10 4.54 10,081Mountain View 4.68 5.17 9.85 0.16 9.69 17,811Palo Alto 7.08 7.66 14.74 1.37 13.37 19,595San Jose 36.64 48.61 85.25 2.34 82.91 219,465Santa Clara 6.39 8.01 14.40 0.70 13.70 26,396Saratoga 4.19 3.24 7.43 0.07 7.36 10,955Sunnyvale 7.28 7.61 14.89 0.14 14.75 29,281Unincorporated 5.62 6.77 12.39 1.80 10.59 31,706TOTAL $94.52 $111.39 $205.91 $7.29 $198.62 443,706
- Indicates a value of 0 or less than $10 million
www.scc-assessor.org 11
$12.0
$10.0
$8.0
$6.0
$4.0
$2.0
$0.0
2004-2005 Business Personal Property Distribution by City
Los Alto
s
Sarat
oga
Mon
te Se
reno
Uninco
rporat
ed
Campb
ell
Mor
gan H
ill
Los G
atos
Palo
Alto
Mou
ntain
View
Cupert
inoGilro
y
San
Jose
Sant
a Clar
a
Sunn
yvale
Milp
itas
(Values in Billions)
Los A
ltos H
ills
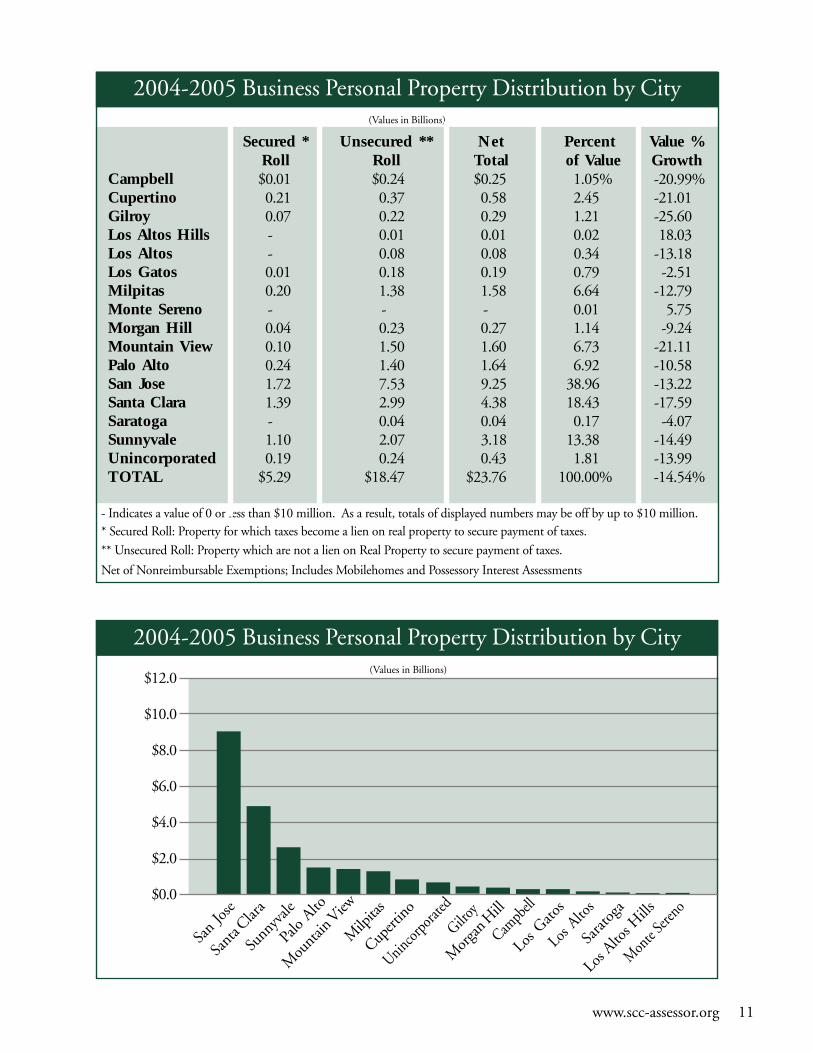
2004-2005 Business Personal Property Distribution by City(Values in Billions)
- Indicates a value of 0 or less than $10 million. As a result, totals of displayed numbers may be off by up to $10 million.* Secured Roll: Property for which taxes become a lien on real property to secure payment of taxes.
** Unsecured Roll: Property which are not a lien on Real Property to secure payment of taxes.
Net of Nonreimbursable Exemptions; Includes Mobilehomes and Possessory Interest Assessments
Secured * Unsecured ** Net Percent Value %Roll Roll Total of Value Growth
Campbell $0.01 $0.24 $0.25 1.05% -20.99%Cupertino 0.21 0.37 0.58 2.45 -21.01Gilroy 0.07 0.22 0.29 1.21 -25.60Los Altos Hills - 0.01 0.01 0.02 18.03Los Altos - 0.08 0.08 0.34 -13.18Los Gatos 0.01 0.18 0.19 0.79 -2.51Milpitas 0.20 1.38 1.58 6.64 -12.79Monte Sereno - - - 0.01 5.75Morgan Hill 0.04 0.23 0.27 1.14 -9.24Mountain View 0.10 1.50 1.60 6.73 -21.11Palo Alto 0.24 1.40 1.64 6.92 -10.58San Jose 1.72 7.53 9.25 38.96 -13.22Santa Clara 1.39 2.99 4.38 18.43 -17.59Saratoga - 0.04 0.04 0.17 -4.07Sunnyvale 1.10 2.07 3.18 13.38 -14.49Unincorporated 0.19 0.24 0.43 1.81 -13.99TOTAL $5.29 $18.47 $23.76 100.00% -14.54%
12 www.scc-assessor.org
2004-2005 Properties withTemporary Declines, Cities
* Represents decline in assessed value had the market value exceededthe proposition 13 protected factored base year value
**Percentages based on non-rounded values
(Values in Billions)
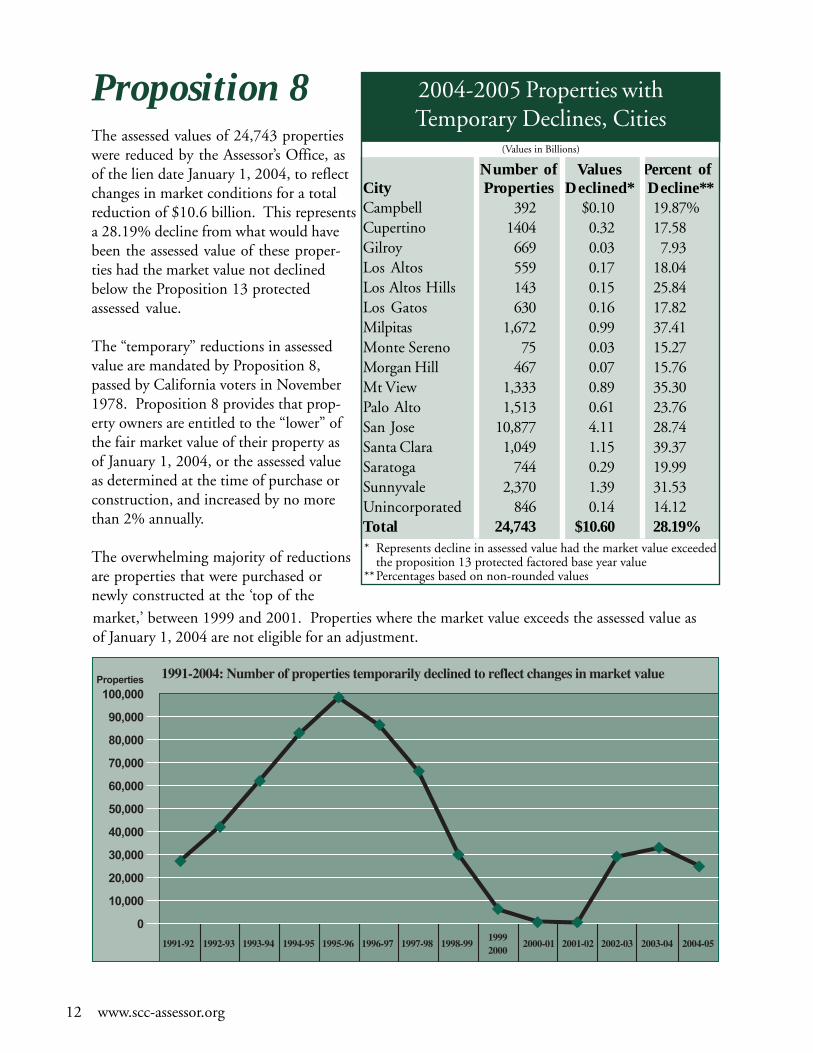
Number of Values Percent ofCity Properties Declined* Decline**Campbell 392 $0.10 19.87%Cupertino 1404 0.32 17.58Gilroy 669 0.03 7.93Los Altos 559 0.17 18.04Los Altos Hills 143 0.15 25.84Los Gatos 630 0.16 17.82Milpitas 1,672 0.99 37.41Monte Sereno 75 0.03 15.27Morgan Hill 467 0.07 15.76Mt View 1,333 0.89 35.30Palo Alto 1,513 0.61 23.76San Jose 10,877 4.11 28.74Santa Clara 1,049 1.15 39.37Saratoga 744 0.29 19.99Sunnyvale 2,370 1.39 31.53Unincorporated 846 0.14 14.12Total 24,743 $10.60 28.19%
Proposition 8The assessed values of 24,743 propertieswere reduced by the Assessor’s Office, asof the lien date January 1, 2004, to reflectchanges in market conditions for a totalreduction of $10.6 billion. This representsa 28.19% decline from what would havebeen the assessed value of these proper-ties had the market value not declinedbelow the Proposition 13 protectedassessed value.
The “temporary” reductions in assessedvalue are mandated by Proposition 8,passed by California voters in November1978. Proposition 8 provides that prop-erty owners are entitled to the “lower” ofthe fair market value of their property asof January 1, 2004, or the assessed valueas determined at the time of purchase orconstruction, and increased by no morethan 2% annually.
The overwhelming majority of reductionsare properties that were purchased ornewly constructed at the ‘top of the
market,’ between 1999 and 2001. Properties where the market value exceeds the assessed value asof January 1, 2004 are not eligible for an adjustment.
Properties
100,000
90,000
80,000
70,000
60,000
50,000
40,000
30,000
20,000
10,000
0
1991-2004: Number of properties temporarily declined to reflect changes in market value
1991-92 1992-93 1993-94 1994-95 1995-96 1996-97 1997-98 1998-99 2000-01 2001-02 2002-03 2003-04 2004-0519992000
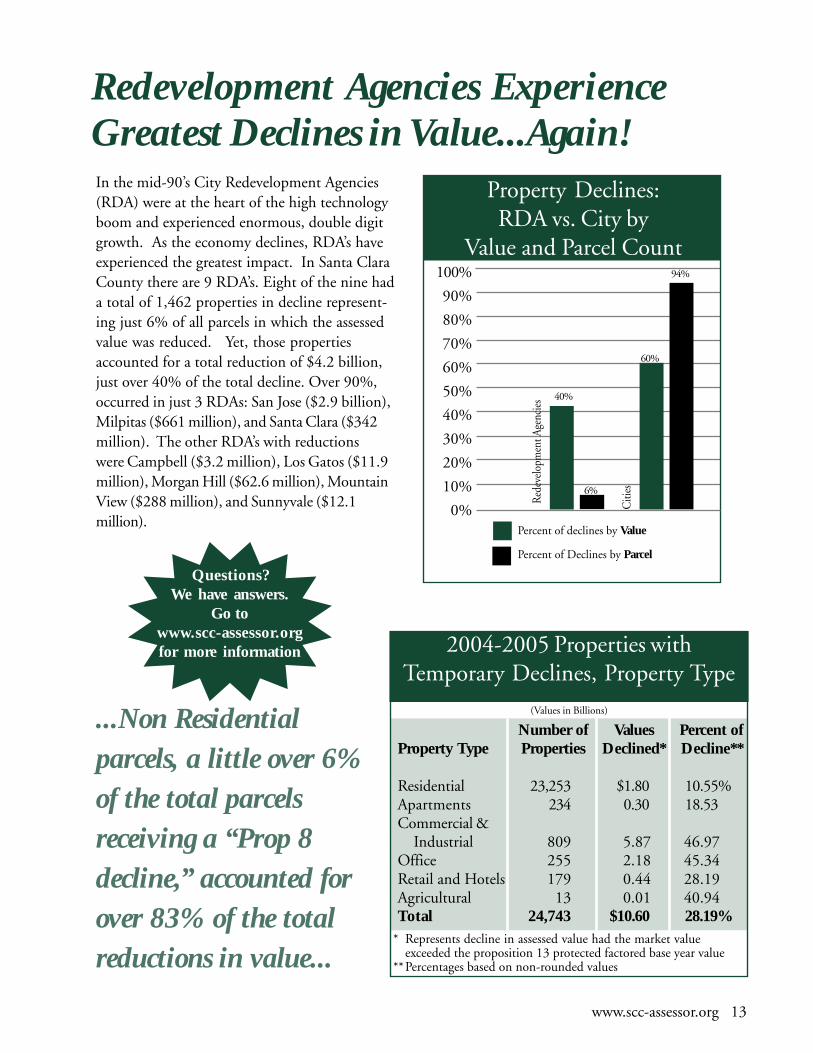
Redevelopment Agencies ExperienceGreatest Declines in Value...Again!
...Non Residentialparcels, a little over 6%of the total parcelsreceiving a “Prop 8decline,” accounted forover 83% of the totalreductions in value...
In the mid-90’s City Redevelopment Agencies(RDA) were at the heart of the high technologyboom and experienced enormous, double digitgrowth. As the economy declines, RDA’s haveexperienced the greatest impact. In Santa ClaraCounty there are 9 RDA’s. Eight of the nine hada total of 1,462 properties in decline represent-ing just 6% of all parcels in which the assessedvalue was reduced. Yet, those propertiesaccounted for a total reduction of $4.2 billion,just over 40% of the total decline. Over 90%,occurred in just 3 RDAs: San Jose ($2.9 billion),Milpitas ($661 million), and Santa Clara ($342million). The other RDA’s with reductionswere Campbell ($3.2 million), Los Gatos ($11.9million), Morgan Hill ($62.6 million), MountainView ($288 million), and Sunnyvale ($12.1million).
www.scc-assessor.org 13
Questions?We have answers.
Go towww.scc-assessor.orgfor more information 2004-2005 Properties with
Temporary Declines, Property Type(Values in Billions)
Number of Values Percent ofProperty Type Properties Declined* Decline**
Residential 23,253 $1.80 10.55%Apartments 234 0.30 18.53Commercial & Industrial 809 5.87 46.97Office 255 2.18 45.34Retail and Hotels 179 0.44 28.19Agricultural 13 0.01 40.94Total 24,743 $10.60 28.19%
* Represents decline in assessed value had the market valueexceeded the proposition 13 protected factored base year value
**Percentages based on non-rounded values
100%
90%
80%
70%
60%
50%
40%
30%
20%
10%
0% Citi
es
40%
6%
60%
94%
Percent of declines by Value
Percent of Declines by Parcel
Property Declines:RDA vs. City by
Value and Parcel Count
Red
evel
opm
ent A
genc
ies
14 www.scc-assessor.org
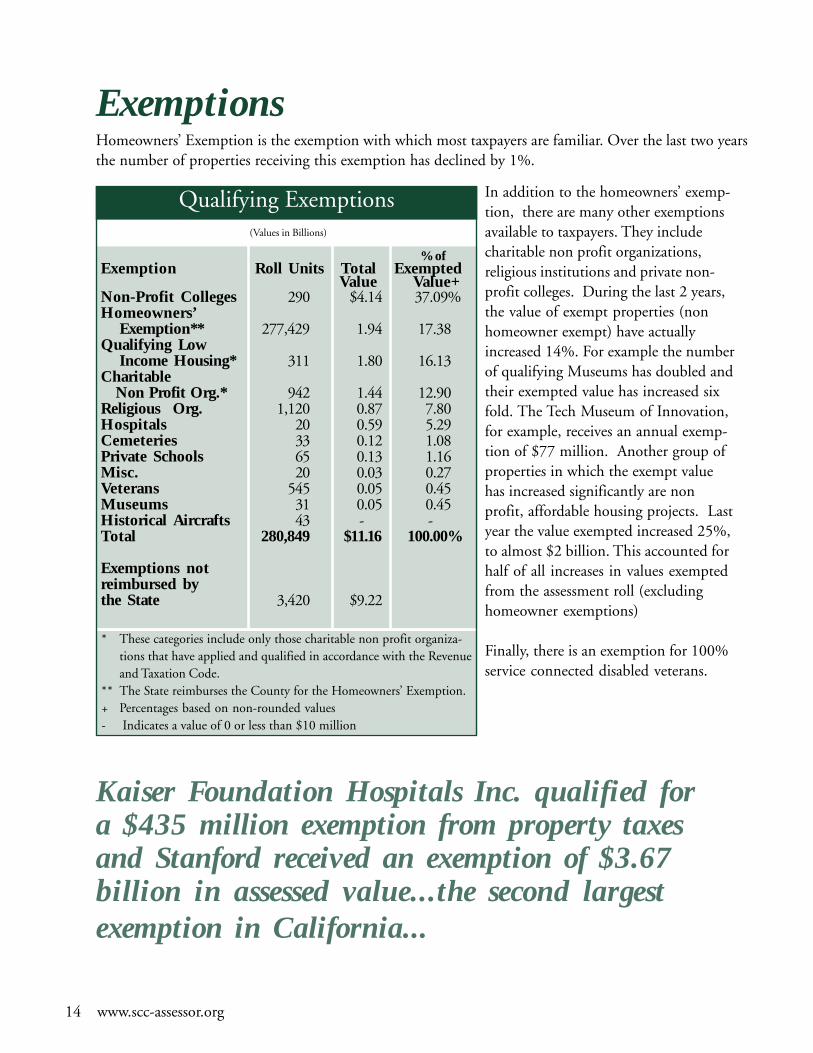
Kaiser Foundation Hospitals Inc. qualified fora $435 million exemption from property taxesand Stanford received an exemption of $3.67billion in assessed value...the second largestexemption in California...
Qualifying Exemptions
% ofExemption Roll Units Total Exempted
Value Value+Non-Profit Colleges 290 $4.14 37.09%Homeowners’ Exemption** 277,429 1.94 17.38Qualifying Low Income Housing* 311 1.80 16.13Charitable Non Profit Org.* 942 1.44 12.90Religious Org. 1,120 0.87 7.80Hospitals 20 0.59 5.29Cemeteries 33 0.12 1.08Private Schools 65 0.13 1.16Misc. 20 0.03 0.27Veterans 545 0.05 0.45Museums 31 0.05 0.45Historical Aircrafts 43 - -Total 280,849 $11.16 100.00%
Exemptions notreimbursed bythe State 3,420 $9.22
(Values in Billions)
* These categories include only those charitable non profit organiza-tions that have applied and qualified in accordance with the Revenueand Taxation Code.
** The State reimburses the County for the Homeowners’ Exemption.+ Percentages based on non-rounded values- Indicates a value of 0 or less than $10 million
In addition to the homeowners’ exemp-tion, there are many other exemptionsavailable to taxpayers. They includecharitable non profit organizations,religious institutions and private non-profit colleges. During the last 2 years,the value of exempt properties (nonhomeowner exempt) have actuallyincreased 14%. For example the numberof qualifying Museums has doubled andtheir exempted value has increased sixfold. The Tech Museum of Innovation,for example, receives an annual exemp-tion of $77 million. Another group ofproperties in which the exempt valuehas increased significantly are nonprofit, affordable housing projects. Lastyear the value exempted increased 25%,to almost $2 billion. This accounted forhalf of all increases in values exemptedfrom the assessment roll (excludinghomeowner exemptions)
Finally, there is an exemption for 100%service connected disabled veterans.
ExemptionsHomeowners’ Exemption is the exemption with which most taxpayers are familiar. Over the last two yearsthe number of properties receiving this exemption has declined by 1%.
Passed by the voters in June, 1978, Proposition13 is an amendment to the California Constitu-tion that limits the assessment and taxation ofproperty in California. It restricts both the taxrate and the rate of increase allowed in assessingreal property as follows:• The property tax cannot exceed 1% of a
property’s taxable value, plus bonds ap-proved by the voters, service fees, improve-ment bonds, and special assessments.
• A property’s original base value is its 1975-76 market value. A new base year value isestablished by reappraisal, whenever thereis a change in ownership or new construc-tion. Except for change in ownership ornew construction, the increase in theassessed value of a property is limited to nomore than 2% per year.
• Business Personal property, boats, airplanesand certain restricted properties are subjectto annual reappraisal and assessment.
• In the case of real property, the adjusted(factored) base year value is the upper limitof value for property tax purposes.
Historically, the market value of real propertyhas increased at a significantly greater rate thanthe assessed value, which is limited to no morethan 2% per year, unless there is a change inownership or new construction.
The result has been a widening disparity be-tween the market value and assessed value ofproperty in Santa Clara County. Long timeproperty owners benefit from lower assessmentswhile new, and frequently younger property
owners, are adversely impacted by assessmentsthat can be as much as ten times greater thanthat of a comparable property held by the longtime owner.
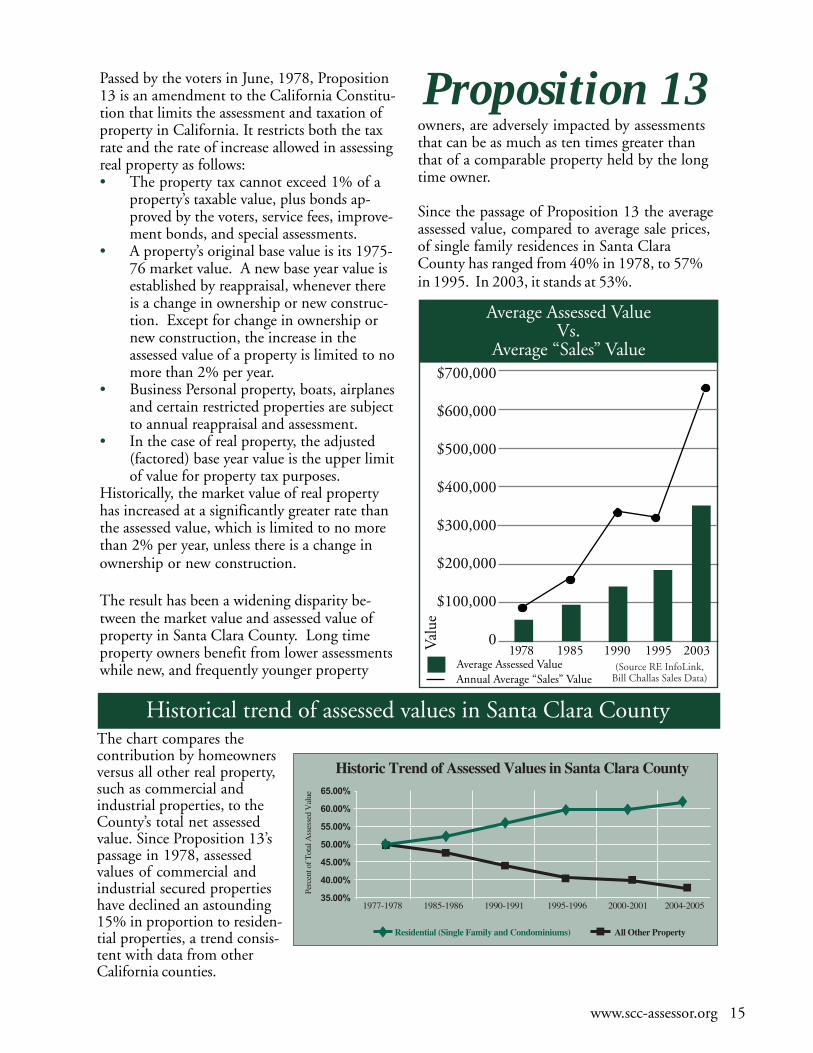
Since the passage of Proposition 13 the averageassessed value, compared to average sale prices,of single family residences in Santa ClaraCounty has ranged from 40% in 1978, to 57%in 1995. In 2003, it stands at 53%.
Historical trend of assessed values in Santa Clara CountyThe chart compares thecontribution by homeownersversus all other real property,such as commercial andindustrial properties, to theCounty’s total net assessedvalue. Since Proposition 13’spassage in 1978, assessedvalues of commercial andindustrial secured propertieshave declined an astounding15% in proportion to residen-tial properties, a trend consis-tent with data from otherCalifornia counties.
Proposition 13
www.scc-assessor.org 15
1978 1985 1990 1995 2003
$700,000
$600,000
$500,000
$400,000
$300,000
$200,000
$100,000
0
Average Assessed ValueVs.
Average “Sales” Value
Average Assessed Value
Val
ue
(Source RE InfoLink,Bill Challas Sales Data)Annual Average “Sales” Value
65.00%
60.00%
55.00%
50.00%
45.00%
40.00%
35.00%
Perc
ent o
f Tot
al A
sses
sed
Val
ue
Historic Trend of Assessed Values in Santa Clara County
1977-1978 1985-1986 1990-1991 1995-1996 2000-2001 2004-2005
Residential (Single Family and Condominiums) All Other Property
16 www.scc-assessor.org
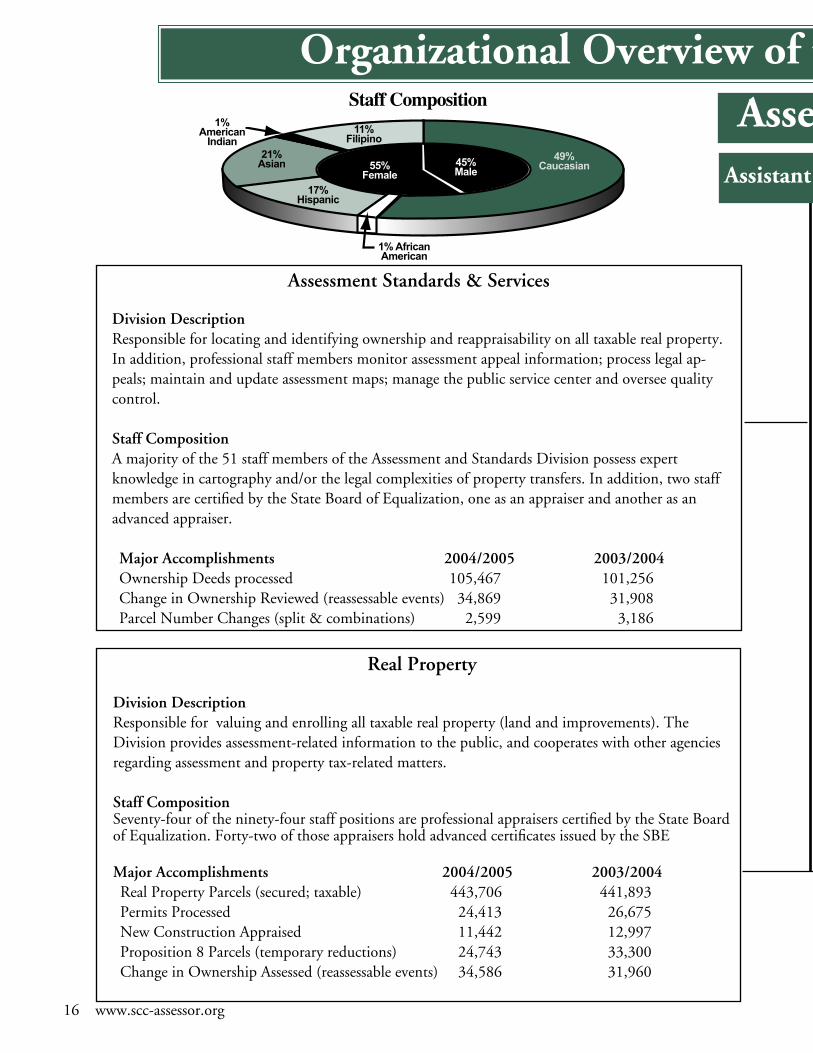
Assessment Standards & Services
Division DescriptionResponsible for locating and identifying ownership and reappraisability on all taxable real property. In addition, professional staff members monitor assessment appeal information; process legal ap-peals; maintain and update assessment maps; manage the public service center and oversee quality control.
Staff CompositionA majority of the 51 staff members of the Assessment and Standards Division possess expert knowledge in cartography and/or the legal complexities of property transfers. In addition, two staff members are certified by the State Board of Equalization, one as an appraiser and another as an advanced appraiser.
Major Accomplishments 2004/2005 2003/2004 Ownership Deeds processed 105,467 101,256 Change in Ownership Reviewed (reassessable events) 34,869 31,908 Parcel Number Changes (split & combinations) 2,599 3,186
Real Property
Division DescriptionResponsible for valuing and enrolling all taxable real property (land and improvements). The Division provides assessment-related information to the public, and cooperates with other agencies regarding assessment and property tax-related matters.
Staff CompositionSeventy-four of the ninety-four staff positions are professional appraisers certified by the State Board of Equalization. Forty-two of those appraisers hold advanced certificates issued by the SBE
Major Accomplishments 2004/2005 2003/2004 Real Property Parcels (secured; taxable) 443,706 441,893 Permits Processed 24,413 26,675 New Construction Appraised 11,442 12,997 Proposition 8 Parcels (temporary reductions) 24,743 33,300 Change in Ownership Assessed (reassessable events) 34,586 31,960
AssessorAssistant Assessor
Organizational Overview of the County Assessor’s Office
1%AmericanIndian
21%Asian
17%Hispanic
1%AfricanAmerican
45%Male
55%Female
����� �����������
49%Caucasian
11%Filipino
www.scc-assessor.org 17
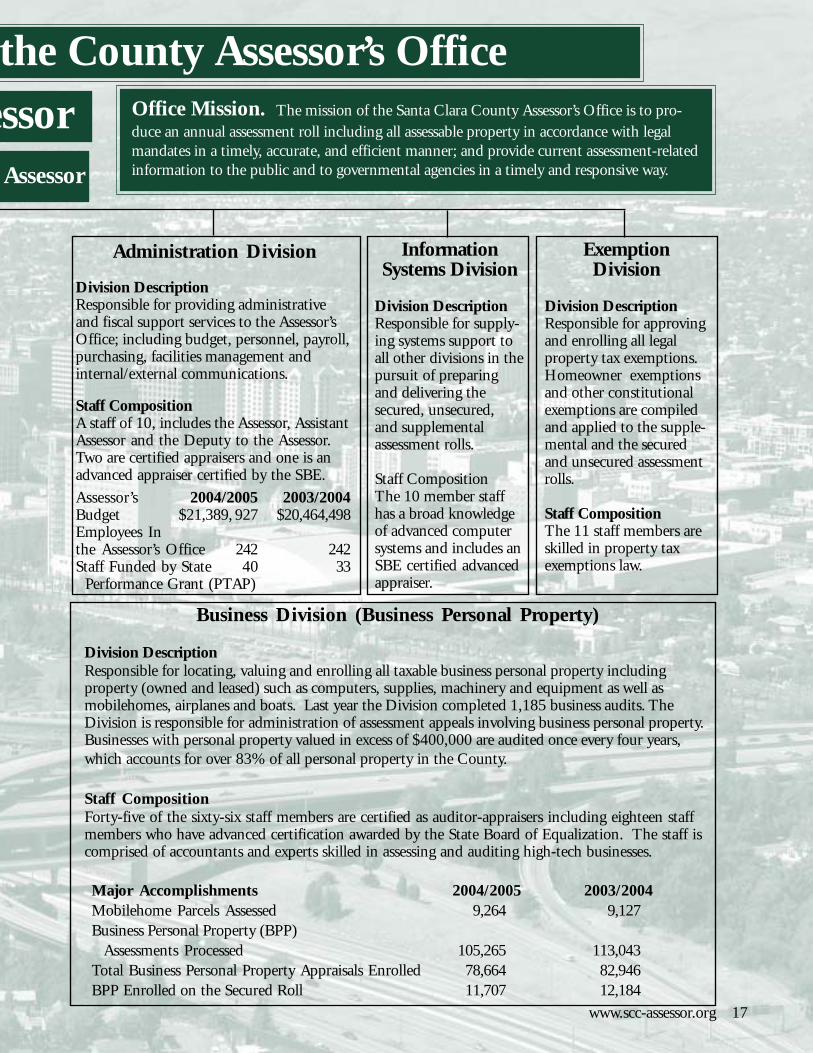
Office Mission. The mission of the Santa Clara County Assessor’s Office is to pro-duce an annual assessment roll including all assessable property in accordance with legalmandates in a timely, accurate, and efficient manner; and provide current assessment-relatedinformation to the public and to governmental agencies in a timely and responsive way.
Business Division (Business Personal Property)
Division DescriptionResponsible for locating, valuing and enrolling all taxable business personal property includingproperty (owned and leased) such as computers, supplies, machinery and equipment as well asmobilehomes, airplanes and boats. Last year the Division completed 1,185 business audits. TheDivision is responsible for administration of assessment appeals involving business personal property.Businesses with personal property valued in excess of $400,000 are audited once every four years,which accounts for over 83% of all personal property in the County.
Staff CompositionForty-five of the sixty-six staff members are certified as auditor-appraisers including eighteen staffmembers who have advanced certification awarded by the State Board of Equalization. The staff iscomprised of accountants and experts skilled in assessing and auditing high-tech businesses.
Major Accomplishments 2004/2005 2003/2004Mobilehome Parcels Assessed 9,264 9,127Business Personal Property (BPP) Assessments Processed 105,265 113,043Total Business Personal Property Appraisals Enrolled 78,664 82,946BPP Enrolled on the Secured Roll 11,707 12,184
Administration Division
Division DescriptionResponsible for providing administrativeand fiscal support services to the Assessor’sOffice; including budget, personnel, payroll,purchasing, facilities management andinternal/external communications.
Staff CompositionA staff of 10, includes the Assessor, AssistantAssessor and the Deputy to the Assessor.Two are certified appraisers and one is anadvanced appraiser certified by the SBE.
Assessor’s 2004/2005 2003/2004Budget $21,389, 927 $20,464,498Employees Inthe Assessor’s Office 242 242Staff Funded by State 40 33 Performance Grant (PTAP)
InformationSystems Division
Division DescriptionResponsible for supply-ing systems support toall other divisions in thepursuit of preparingand delivering thesecured, unsecured,and supplementalassessment rolls.
Staff CompositionThe 10 member staffhas a broad knowledgeof advanced computersystems and includes anSBE certified advancedappraiser.
ExemptionDivision
Division DescriptionResponsible for approvingand enrolling all legalproperty tax exemptions.Homeowner exemptionsand other constitutionalexemptions are compiledand applied to the supple-mental and the securedand unsecured assessmentrolls.
Staff CompositionThe 11 staff members areskilled in property taxexemptions law.
essorAssessor
the County Assessor’s Office
18 www.scc-assessor.org
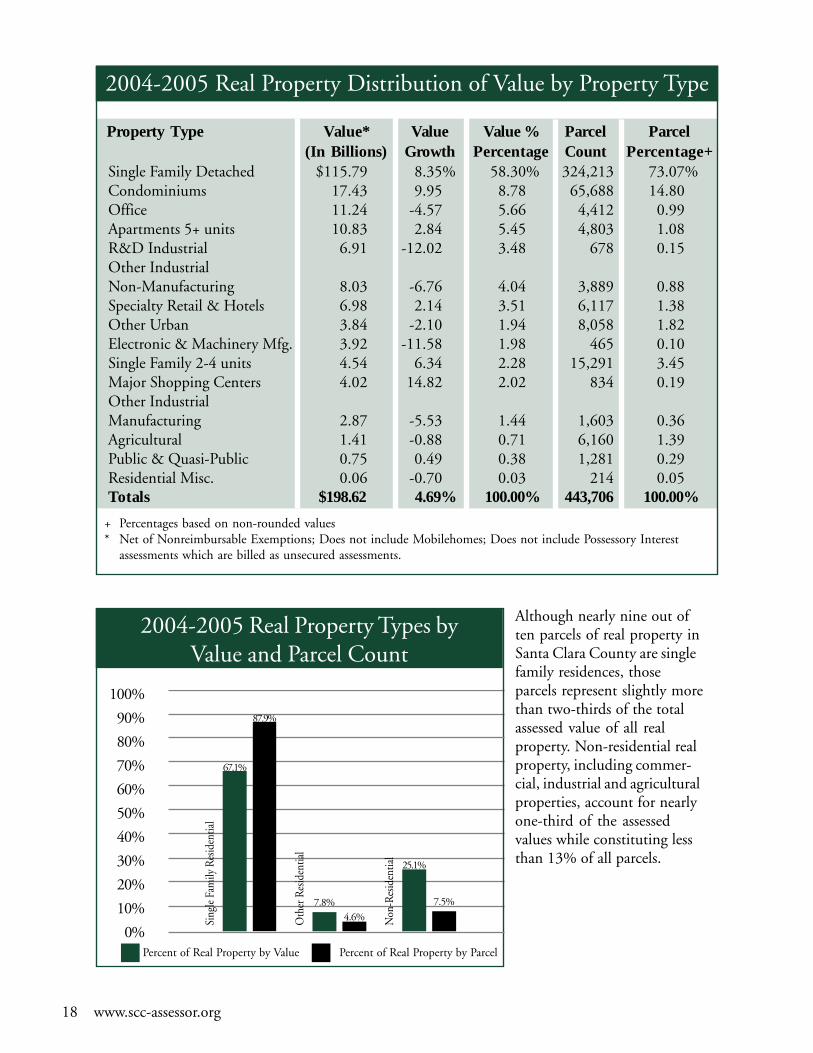
Although nearly nine out often parcels of real property inSanta Clara County are singlefamily residences, thoseparcels represent slightly morethan two-thirds of the totalassessed value of all realproperty. Non-residential realproperty, including commer-cial, industrial and agriculturalproperties, account for nearlyone-third of the assessedvalues while constituting lessthan 13% of all parcels.
+ Percentages based on non-rounded values* Net of Nonreimbursable Exemptions; Does not include Mobilehomes; Does not include Possessory Interest
assessments which are billed as unsecured assessments.
2004-2005 Real Property Distribution of Value by Property Type
Single Family Detached $115.79 8.35% 58.30% 324,213 73.07%Condominiums 17.43 9.95 8.78 65,688 14.80Office 11.24 -4.57 5.66 4,412 0.99Apartments 5+ units 10.83 2.84 5.45 4,803 1.08R&D Industrial 6.91 -12.02 3.48 678 0.15Other IndustrialNon-Manufacturing 8.03 -6.76 4.04 3,889 0.88Specialty Retail & Hotels 6.98 2.14 3.51 6,117 1.38Other Urban 3.84 -2.10 1.94 8,058 1.82Electronic & Machinery Mfg. 3.92 -11.58 1.98 465 0.10Single Family 2-4 units 4.54 6.34 2.28 15,291 3.45Major Shopping Centers 4.02 14.82 2.02 834 0.19Other IndustrialManufacturing 2.87 -5.53 1.44 1,603 0.36Agricultural 1.41 -0.88 0.71 6,160 1.39Public & Quasi-Public 0.75 0.49 0.38 1,281 0.29Residential Misc. 0.06 -0.70 0.03 214 0.05Totals $198.62 4.69% 100.00% 443,706 100.00%
Property Type Value* Value Value % Parcel Parcel(In Billions) Growth Percentage Count Percentage+
100%
90%
80%
70%
60%
50%
40%
30%
20%
10%
0%
Sing
le F
amily
Res
iden
tial
Oth
er R
esid
entia
l
Non
-Res
iden
tial
67.1%
87.9%
7.8%4.6%
25.1%
7.5%
2004-2005 Real Property Types byValue and Parcel Count
Percent of Real Property by Value Percent of Real Property by Parcel
www.scc-assessor.org 19
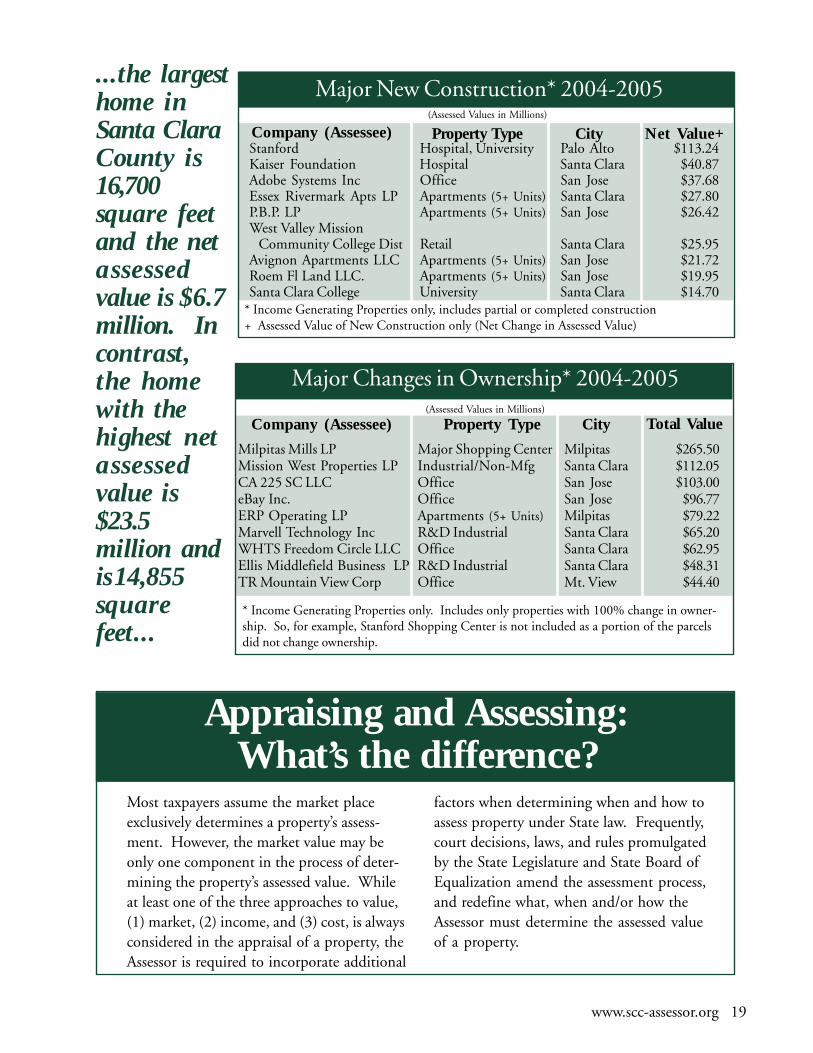
...the largesthome inSanta ClaraCounty is16,700square feetand the netasse s sedvalue is $6.7million. Incontrast,the homewith thehighest netasse s sedvalue is$23.5million andis 14,855squarefeet...
Appraising and Assessing:What’s the difference?
Most taxpayers assume the market placeexclusively determines a property’s assess-ment. However, the market value may beonly one component in the process of deter-mining the property’s assessed value. Whileat least one of the three approaches to value,(1) market, (2) income, and (3) cost, is alwaysconsidered in the appraisal of a property, theAssessor is required to incorporate additional
factors when determining when and how toassess property under State law. Frequently,court decisions, laws, and rules promulgatedby the State Legislature and State Board ofEqualization amend the assessment process,and redefine what, when and/or how theAssessor must determine the assessed valueof a property.
Milpitas Mills LP Major Shopping Center Milpitas $265.50Mission West Properties LP Industrial/Non-Mfg Santa Clara $112.05CA 225 SC LLC Office San Jose $103.00eBay Inc. Office San Jose $96.77ERP Operating LP Apartments (5+ Units) Milpitas $79.22Marvell Technology Inc R&D Industrial Santa Clara $65.20WHTS Freedom Circle LLC Office Santa Clara $62.95Ellis Middlefield Business LP R&D Industrial Santa Clara $48.31TR Mountain View Corp Office Mt. View $44.40
Major New Construction* 2004-2005
Company (Assessee)
* Income Generating Properties only, includes partial or completed construction+ Assessed Value of New Construction only (Net Change in Assessed Value)
Net Value+CityProperty TypeStanford Hospital, University Palo Alto $113.24Kaiser Foundation Hospital Santa Clara $40.87Adobe Systems Inc Office San Jose $37.68Essex Rivermark Apts LP Apartments (5+ Units) Santa Clara $27.80P.B.P. LP Apartments (5+ Units) San Jose $26.42West Valley Mission Community College Dist Retail Santa Clara $25.95Avignon Apartments LLC Apartments (5+ Units) San Jose $21.72Roem Fl Land LLC. Apartments (5+ Units) San Jose $19.95Santa Clara College University Santa Clara $14.70
Company (Assessee)
* Income Generating Properties only. Includes only properties with 100% change in owner-ship. So, for example, Stanford Shopping Center is not included as a portion of the parcelsdid not change ownership.
Total ValueCityProperty Type(Assessed Values in Millions)
Major Changes in Ownership* 2004-2005
(Assessed Values in Millions)
20 www.scc-assessor.org
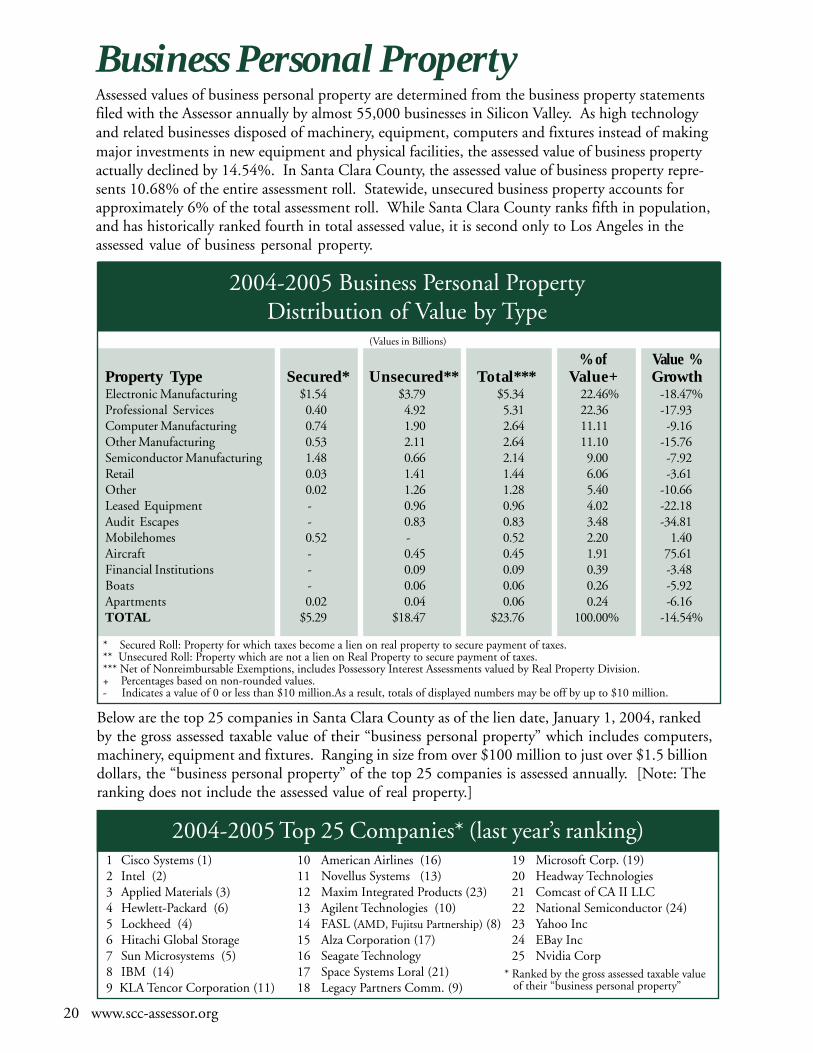
Assessed values of business personal property are determined from the business property statementsfiled with the Assessor annually by almost 55,000 businesses in Silicon Valley. As high technologyand related businesses disposed of machinery, equipment, computers and fixtures instead of makingmajor investments in new equipment and physical facilities, the assessed value of business propertyactually declined by 14.54%. In Santa Clara County, the assessed value of business property repre-sents 10.68% of the entire assessment roll. Statewide, unsecured business property accounts forapproximately 6% of the total assessment roll. While Santa Clara County ranks fifth in population,and has historically ranked fourth in total assessed value, it is second only to Los Angeles in theassessed value of business personal property.
Business Personal Property
Below are the top 25 companies in Santa Clara County as of the lien date, January 1, 2004, rankedby the gross assessed taxable value of their “business personal property” which includes computers,machinery, equipment and fixtures. Ranging in size from over $100 million to just over $1.5 billiondollars, the “business personal property” of the top 25 companies is assessed annually. [Note: Theranking does not include the assessed value of real property.]
1 Cisco Systems (1)2 Intel (2)3 Applied Materials (3)4 Hewlett-Packard (6)5 Lockheed (4)6 Hitachi Global Storage7 Sun Microsystems (5)8 IBM (14)9 KLA Tencor Corporation (11)
10 American Airlines (16)11 Novellus Systems (13)12 Maxim Integrated Products (23)13 Agilent Technologies (10)14 FASL (AMD, Fujitsu Partnership) (8)15 Alza Corporation (17)16 Seagate Technology17 Space Systems Loral (21)18 Legacy Partners Comm. (9)
19 Microsoft Corp. (19)20 Headway Technologies21 Comcast of CA II LLC22 National Semiconductor (24)23 Yahoo Inc24 EBay Inc25 Nvidia Corp
2004-2005 Top 25 Companies* (last year’s ranking)
* Ranked by the gross assessed taxable value of their “business personal property”
2004-2005 Business Personal PropertyDistribution of Value by Type
* Secured Roll: Property for which taxes become a lien on real property to secure payment of taxes.** Unsecured Roll: Property which are not a lien on Real Property to secure payment of taxes.*** Net of Nonreimbursable Exemptions, includes Possessory Interest Assessments valued by Real Property Division.+ Percentages based on non-rounded values.- Indicates a value of 0 or less than $10 million.As a result, totals of displayed numbers may be off by up to $10 million.
% of Value %Property Type Secured* Unsecured** Total*** Value+ GrowthElectronic Manufacturing $1.54 $3.79 $5.34 22.46% -18.47%Professional Services 0.40 4.92 5.31 22.36 -17.93Computer Manufacturing 0.74 1.90 2.64 11.11 -9.16Other Manufacturing 0.53 2.11 2.64 11.10 -15.76Semiconductor Manufacturing 1.48 0.66 2.14 9.00 -7.92Retail 0.03 1.41 1.44 6.06 -3.61Other 0.02 1.26 1.28 5.40 -10.66Leased Equipment - 0.96 0.96 4.02 -22.18Audit Escapes - 0.83 0.83 3.48 -34.81Mobilehomes 0.52 - 0.52 2.20 1.40Aircraft - 0.45 0.45 1.91 75.61Financial Institutions - 0.09 0.09 0.39 -3.48Boats - 0.06 0.06 0.26 -5.92Apartments 0.02 0.04 0.06 0.24 -6.16TOTAL $5.29 $18.47 $23.76 100.00% -14.54%
(Values in Billions)
Q. My house was destroyed by fire, is property taxrelief available until it’s rebuilt?
A. Yes, assuming you qualify. Owners of realproperty who incur significant damages (atleast ten-thousand dollars or more) as theresult of a natural disaster, such as a fire, floodor earthquake, can file for temporary propertytax relief (reassessment) with the Assessor’sOffice. Applicants must file a written applica-tion within 60 days of the disaster. Items suchas home furnishings, personal effects andbusiness inventories are not assessable realproperty.
Q. What can I do if I think my assessment is toohigh? (i.e., higher than market value)
A. Request an informal review by submitting aone-page “assessment review” form which isavailable on-line for printing or downloading atwww.scc-assessor.org. Any supporting data
(appraisals, comparables, multiple listings, etc.)will be helpful in expediting a reduction if anadjustment is warranted. To file a formal appealwith the Assessment Appeals Board, contactthe Clerk of the Board at www.sccgov.org or(408) 299-5001.
Q. How many properties are still protected byProposition 13, passed by the voters in 1978?
A. All properties in Santa Clara County, andthroughout California, receive the full benefitof Proposition 13. Whether a property waspurchased last year or in 1975, every propertyowner receives the same protections andbenefits. The base year value is established atthe time of purchase or new construction, andincreases in the assessed value are limited to aninflation factor of no more than 2% annually.
Frequently Asked Questions
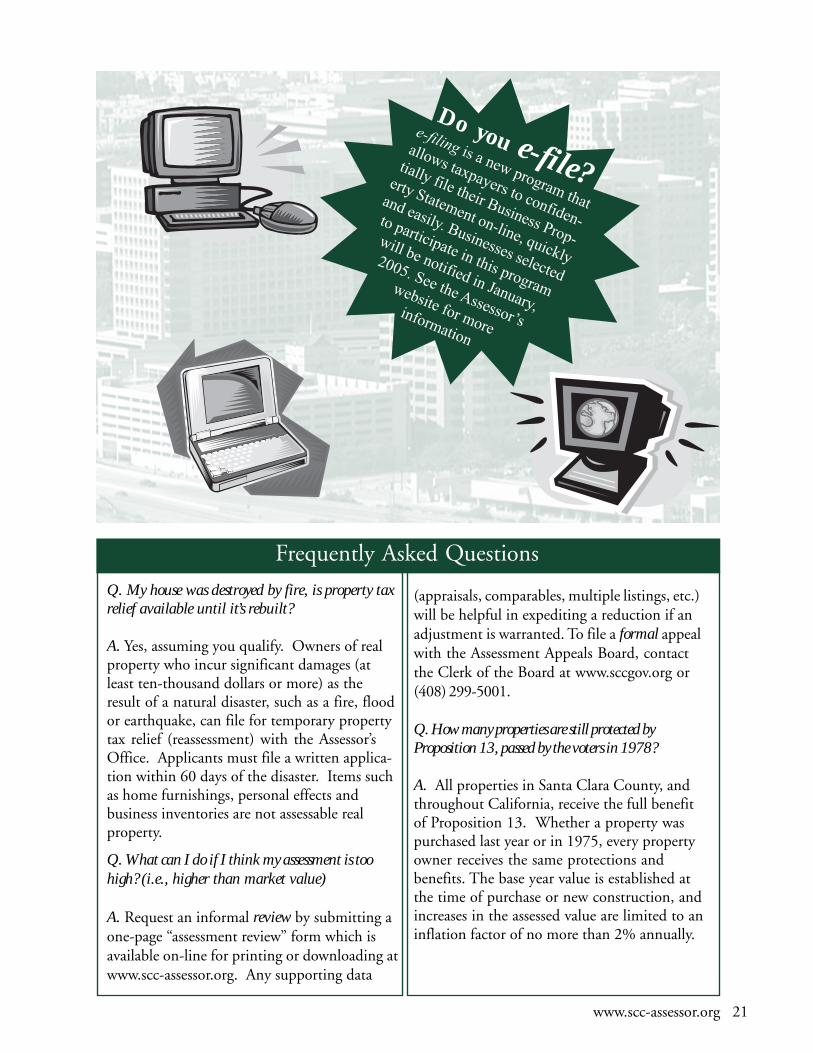
Do you e-file?e-filing is a new program that
allows taxpayers to confiden-
tially file their Business Prop-
erty Statement on-line, quickly
and easily. Businesses selected
to participate in this program
will be notified in January,
2005. See the Assessor’s
website for moreinformation
www.scc-assessor.org 21
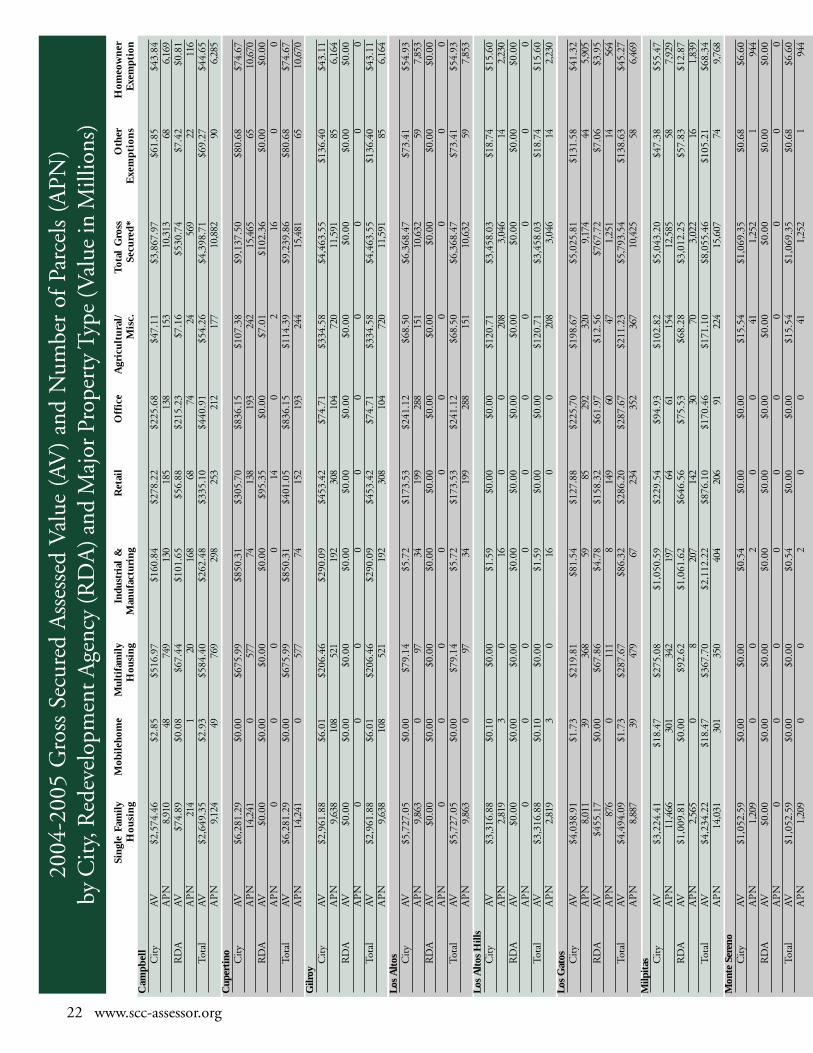
22 www.scc-assessor.org
Sing
le F
amil
yM
obil
ehom
eM
ulti
fam
ily
Indu
stri
al &
Ret
ail
Off
ice
Agr
icul
tura
l/T
otal
Gro
ssO
ther
Hom
eow
ner
Hou
sin
g H
ousi
ngM
anuf
actu
ring
Mis
c.Se
cure
d*E
xem
pti
ons
Exe
mpt
ion
Cam
pbel
lC
ity
AV$2
,574
.46
$2.8
5$5
16.9
7$1
60.8
4$2
78.2
2$2
25.6
8$4
7.11
$3,8
67.9
7$6
1.85
$43.
84A
PN
8,91
048
749
130
185
138
153
10,3
1368
6,16
9R
DA
AV$7
4.89
$0.0
8$6
7.44
$101
.65
$56.
88$2
15.2
3$7
.16
$530
.74
$7.4
2$0
.81
AP
N21
41
2016
868
7424
569
2211
6To
tal
AV$2
,649
.35
$2.9
3$5
84.4
0$2
62.4
8$3
35.1
0$4
40.9
1$5
4.26
$4,3
98.7
1$6
9.27
$44.
65A
PN
9,12
449
769
298
253
212
177
10,8
8290
6,28
5C
uper
tino Cit
yAV
$6,2
81.2
9$0
.00
$675
.99
$850
.31
$305
.70
$836
.15
$107
.38
$9,1
37.5
0$8
0.68
$74.
67A
PN
14,2
410
577
7413
819
324
215
,465
6510
,670
RD
AAV
$0.0
0$0
.00
$0.0
0$0
.00
$95.
35$0
.00
$7.0
1$1
02.3
6$0
.00
$0.0
0A
PN
00
00
140
216
00
Tota
lAV
$6,2
81.2
9$0
.00
$675
.99
$850
.31
$401
.05
$836
.15
$114
.39
$9,2
39.8
6$8
0.68
$74.
67A
PN
14,2
410
577
7415
219
324
415
,481
6510
,670
Gilr
oyC
ity
AV$2
,961
.88
$6.0
1$2
06.4
6$2
90.0
9$4
53.4
2$7
4.71
$334
.58
$4,4
63.5
5$1
36.4
0$4
3.11
AP
N9,
638
108
521
192
308
104
720
11,5
9185
6,16
4R
DA
AV$0
.00
$0.0
0$0
.00
$0.0
0$0
.00
$0.0
0$0
.00
$0.0
0$0
.00
$0.0
0A
PN
00
00
00
00
00
Tota
lAV
$2,9
61.8
8$6
.01
$206
.46
$290
.09
$453
.42
$74.
71$3
34.5
8$4
,463
.55
$136
.40
$43.
11A
PN
9,63
810
852
119
230
810
472
011
,591
856,
164
Los
Alt
os Cit
yAV
$5,7
27.0
5$0
.00
$79.
14$5
.72
$173
.53
$241
.12
$68.
50$6
,368
.47
$73.
41$5
4.93
AP
N9,
863
097
3419
928
815
110
,632
597,
853
RD
AAV
$0.0
0$0
.00
$0.0
0$0
.00
$0.0
0$0
.00
$0.0
0$0
.00
$0.0
0$0
.00
AP
N0
00
00
00
00
0To
tal
AV$5
,727
.05
$0.0
0$7
9.14
$5.7
2$1
73.5
3$2
41.1
2$6
8.50
$6,3
68.4
7$7
3.41
$54.
93A
PN
9,86
30
9734
199
288
151
10,6
3259
7,85
3Lo
s A
ltos
Hill
sC
ity
AV$3
,316
.88
$0.1
0$0
.00
$1.5
9$0
.00
$0.0
0$1
20.7
1$3
,458
.03
$18.
74$1
5.60
AP
N2,
819
30
160
020
83,
046
142,
230
RD
AAV
$0.0
0$0
.00
$0.0
0$0
.00
$0.0
0$0
.00
$0.0
0$0
.00
$0.0
0$0
.00
AP
N0
00
00
00
00
0To
tal
AV$3
,316
.88
$0.1
0$0
.00
$1.5
9$0
.00
$0.0
0$1
20.7
1$3
,458
.03
$18.
74$1
5.60
AP
N2,
819
30
160
020
83,
046
142,
230
Los
Gat
os Cit
yAV
$4,0
38.9
1$1
.73
$219
.81
$81.
54$1
27.8
8$2
25.7
0$1
98.6
7$5
,025
.81
$131
.58
$41.
32A
PN
8,01
139
368
5985
292
320
9,17
444
5,90
5R
DA
AV$4
55.1
7$0
.00
$67.
86$4
.78
$158
.32
$61.
97$1
2.56
$767
.72
$7.0
6$3
.95
AP
N87
60
111
814
960
471,
251
1456
4To
tal
AV$4
,494
.09
$1.7
3$2
87.6
7$8
6.32
$286
.20
$287
.67
$211
.23
$5,7
93.5
4$1
38.6
3$4
5.27
AP
N8,
887
3947
967
234
352
367
10,4
2558
6,46
9M
ilpit
as Cit
yAV
$3,2
24.4
1$1
8.47
$275
.08
$1,0
50.5
9$2
29.5
4$9
4.93
$102
.82
$5,0
43.2
0$4
7.38
$55.
47A
PN
11,4
6630
134
219
764
6115
412
,585
587,
929
RD
AAV
$1,0
09.8
1$0
.00
$92.
62$1
,061
.62
$646
.56
$75.
53$6
8.28
$3,0
12.2
5$5
7.83
$12.
87A
PN
2,56
50
820
714
230
703,
022
161,
839
Tota
lAV
$4,2
34.2
2$1
8.47
$367
.70
$2,1
12.2
2$8
76.1
0$1
70.4
6$1
71.1
0$8
,055
.46
$105
.21
$68.
34A
PN
14,0
3130
135
040
420
691
224
15,6
0774
9,76
8M
onte
Ser
eno
Cit
yAV
$1,0
52.5
9$0
.00
$0.0
0$0
.54
$0.0
0$0
.00
$15.
54$1
,069
.35
$0.6
8$6
.60
AP
N1,
209
00
20
041
1,25
21
944
RD
AAV
$0.0
0$0
.00
$0.0
0$0
.00
$0.0
0$0
.00
$0.0
0$0
.00
$0.0
0$0
.00
AP
N0
00
00
00
00
0To
tal
AV$1
,052
.59
$0.0
0$0
.00
$0.5
4$0
.00
$0.0
0$1
5.54
$1,0
69.3
5$0
.68
$6.6
0A
PN
1,20
90
02
00
411,
252
194
4
2004
-200
5 G
ross
Sec
ured
Ass
esse
d V
alue
(AV
) an
d N
umbe
r of
Par
cels
(A
PN)
by C
ity,
Red
evel
opm
ent A
genc
y (R
DA
) and
Maj
or P
rope
rty
Type
(Val
ue in
Mill
ions
)
www.scc-assessor.org 23
Mor
gan
Hill
Cit
yAV
$2,3
89.5
5$9
.97
$22.
96$2
.23
$39.
90$2
4.50
$108
.38
$2,6
17.2
5$1
9.77
$31.
72A
PN
5,89
613
022
321
528
06,
357
224,
381
RD
AA
V$8
90.9
7$9
.97
$167
.24
$528
.17
$195
.85
$71.
36$1
18.9
4$2
,067
.54
$85.
05$1
3.25
AP
N2,
827
241
282
223
173
7027
94,
095
371,
891
Tota
lAV
$3,2
80.5
2$1
9.94
$190
.19
$530
.40
$235
.75
$95.
87$2
27.3
2$4
,684
.79
$104
.82
$44.
96A
PN
8,72
337
130
422
619
475
559
10,4
5259
6,27
2M
t. V
iew Cit
yAV
$4,8
46.9
0$1
9.47
$1,4
29.8
2$1
,152
.74
$535
.11
$524
.70
$109
.91
$8,7
62.2
1$1
43.5
7$7
4.18
AP
N14
,671
359
1,53
837
638
625
420
517
,789
7710
,591
RD
AAV
$62.
63$1
0.20
$23.
69$6
13.0
6$6
8.30
$362
.05
$31.
77$1
,198
.24
$26.
53$1
.38
AP
N13
716
519
6577
6716
546
219
7To
tal
AV$4
,909
.54
$29.
68$1
,453
.51
$1,7
65.8
0$6
03.4
1$8
86.7
4$1
41.6
8$9
,960
.45
$170
.10
$75.
56A
PN
14,8
0852
41,
557
441
463
321
221
18,3
3579
10,7
88Pa
lo A
lto Cit
yAV
$8,3
29.8
4$0
.06
$741
.00
$1,7
47.5
5$9
72.1
7$1
,559
.30
$266
.59
$15,
018.
54$1
,402
.04
$88.
09A
PN
17,2
017
891
235
480
442
346
19,6
0220
012
,587
RD
AAV
$0.0
0$0
.00
$0.0
0$0
.00
$0.0
0$0
.00
$0.0
0$0
.00
$0.0
0$0
.00
AP
N0
00
00
00
00
0To
tal
AV$8
,329
.84
$0.0
6$7
41.0
0$1
,747
.55
$972
.17
$1,5
59.3
0$2
66.5
9$1
5,01
8.54
$1,4
02.0
4$8
8.09
AP
N17
,201
789
123
548
044
234
619
,602
200
12,5
87Sa
n Jo
se Cit
yAV
$56,
430.
60$2
55.8
3$5
,971
.70
$3,5
49.7
7$3
,902
.85
$1,7
04.1
0$1
,745
.12
$75,
716.
58$2
,156
.60
$947
.29
AP
N19
5,72
24,
971
10,0
031,
646
2,82
51,
380
3,59
822
0,14
51,
090
135,
016
RD
AA
V$7
59.9
3$4
1.28
$909
.09
$5,6
75.0
3$8
32.6
6$2
, 367
.64
$484
.13
$11,
359.
09$2
89.3
2$1
3.71
AP
N2,
310
785
108
939
368
239
327
5,07
646
1,95
9To
tal
AV$5
7,19
0.54
$297
.11
$6,8
80.7
9$9
,224
.80
$4,7
35.5
2$4
,071
.74
$2,2
29.2
3$8
7,07
5.66
$2,4
45.9
2$9
61.0
0A
PN
198,
032
5,75
610
,111
2,58
53,
193
1,61
93,
925
225,
221
1,13
613
6,97
5Sa
nta
Cla
raC
ity
AV$5
,642
.83
$0.1
2$1
,679
.69
$4,4
48.0
8$7
60.5
1$1
,006
.18
$202
.64
$14,
543.
77$8
03.7
1$1
08.5
8A
PN
22,3
941
1,99
793
547
723
023
126
,265
173
15,5
12R
DA
AV$0
.00
$0.0
0$1
6.95
$143
.34
$182
.86
$975
.36
$28.
86$1
,359
.70
$12.
34$0
.00
AP
N0
01
1822
7912
132
40
Tota
lAV
$5,6
42.8
3$0
.12
$1,6
96.6
4$4
,591
.41
$943
.38
$1,9
81.5
3$2
31.5
0$1
5,90
3.47
$816
.05
$108
.58
AP
N22
,394
11,
998
953
499
309
243
26,3
9717
715
,512
Sara
toga C
ity
AV$7
,062
.16
$0.0
5$6
.39
$18.
67$7
9.92
$84.
69$1
02.0
1$7
,427
.65
$73.
75$5
6.99
AP
N10
,390
123
4473
8534
010
,956
518,
146
RD
AAV
$0.0
0$0
.00
$0.0
0$0
.00
$0.0
0$0
.00
$0.0
0$0
.00
$0.0
0$0
.00
AP
N0
00
00
00
00
0To
tal
AV$7
,062
.16
$0.0
5$6
.39
$18.
67$7
9.92
$84.
69$1
02.0
1$7
,427
.65
$73.
75$5
6.99
AP
N10
,390
123
4473
8534
010
,956
518,
146
Sunn
yval
eC
ity
AV$7
,426
.24
$145
.71
$2,1
06.2
0$4
,157
.20
$772
.23
$642
.96
$241
.50
$15,
626.
67$1
34.6
2$1
40.1
2A
PN
25,2
772,
057
2,07
570
436
519
126
530
,934
101
20,0
21R
DA
AV$6
8.43
$0.0
0$3
0.22
$0.0
0$1
17.3
1$1
35.3
7$2
.71
$366
.40
$12.
35$0
.96
AP
N23
80
340
7653
340
43
137
Tota
lAV
$7,4
94.6
7$1
45.7
1$2
,136
.42
$4,1
57.2
0$8
89.5
4$7
78.3
4$2
44.2
1$1
5,99
3.06
$146
.98
$141
.09
AP
N25
,515
2,05
72,
109
704
441
244
268
31,3
3810
420
,158
Uni
ncor
pora
ted
Cit
yAV
$8,6
05.7
1$1
.13
$139
.60
$128
.43
$86.
27$4
9.25
$1,7
64.3
2$1
2,57
8.38
$1,8
03.7
0$1
16.2
1A
PN
23,0
2647
522
360
256
777,
461
31,7
4921
416
,607
RD
AAV
$0.0
0$0
.00
$0.0
0$0
.00
$0.0
0$0
.00
$1.3
2$1
.32
$0.0
0$0
.00
AP
N0
00
00
04
40
0To
tal
AV$8
,605
.71
$1.1
3$1
39.6
0$1
28.4
3$8
6.27
$49.
25$1
,765
.64
$12,
579.
70$1
,803
.70
$116
.21
AP
N23
,026
4752
236
025
677
7,46
531
,753
214
16,6
07Sa
nta
Cla
ra C
ount
yC
ity
AV$1
29,9
11.3
1$4
61.5
2$1
4,07
0.79
$17,
645.
87$8
,717
.24
$7,2
93.9
5$5
,535
.77
$190
,724
.95
$7,0
88.4
8$1
,898
.73
AP
N38
0,73
48,
072
19,7
255,
007
5,86
23,
740
14,7
1543
7,85
52,
322
270,
725
RD
AAV
$3,3
21.8
5$6
1.53
$1,3
75.1
1$8
,127
.63
$2,3
54.1
0$4
,264
.51
$762
.72
$20,
765.
36$4
97.9
0$4
6.93
AP
N9,
167
1,19
258
31,
628
1,08
967
278
415
,115
144
6,70
3To
tal
AV$1
33,2
33.1
7$5
23.0
5$1
5,44
5.90
$25,
773.
51$1
1,07
1.34
$11,
558.
46$6
,298
.49
$211
,490
.31
$7,5
86.3
8$1
,945
.66
AP
N38
9,90
19,
264
20,3
086,
635
6,95
14,
412
15,4
9945
2,97
02,
466
277,
428
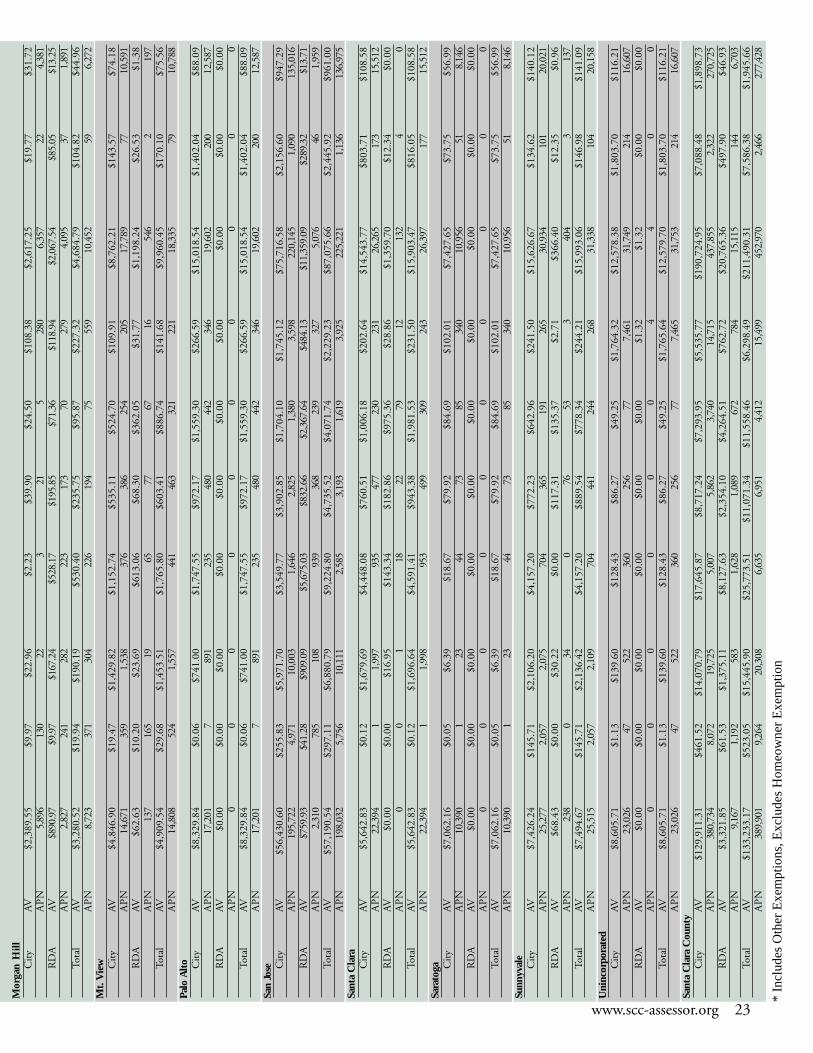
* In
clud
es O
ther
Exe
mpt
ions
, Exc
lude
s H
omeo
wne
r E
xem
ptio
n
...virtually half of all appeals are withdrawn by Applicants...
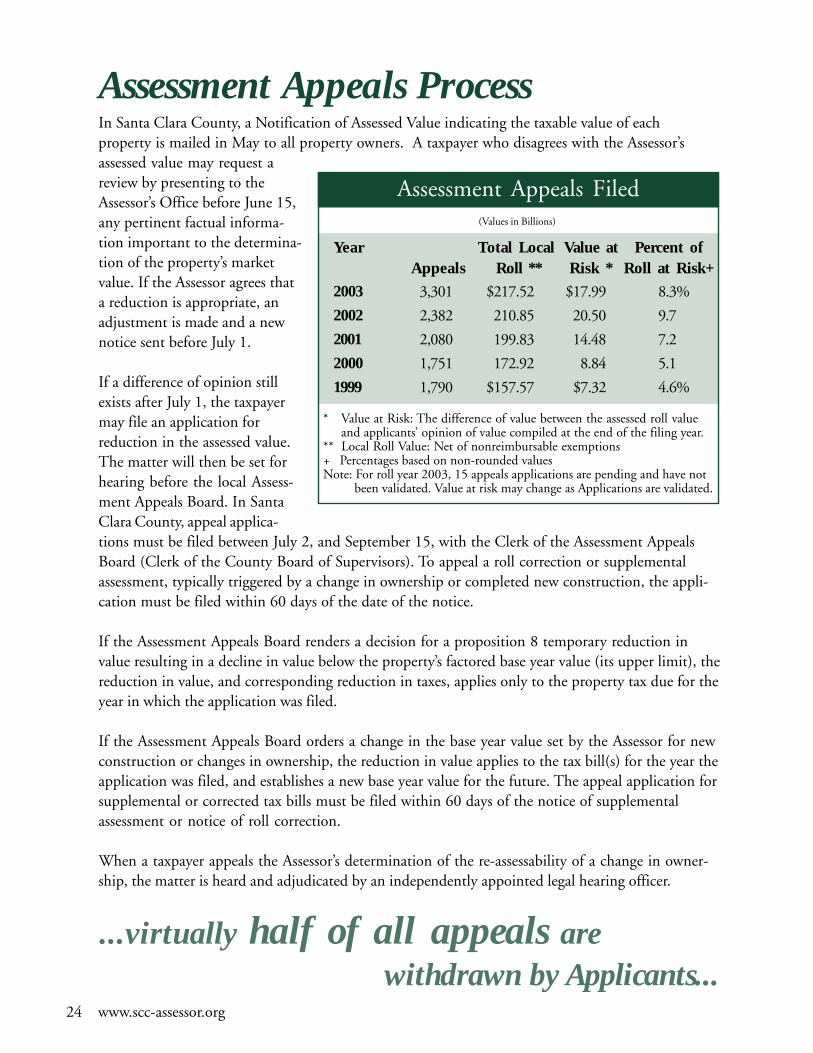
Assessment Appeals ProcessIn Santa Clara County, a Notification of Assessed Value indicating the taxable value of eachproperty is mailed in May to all property owners. A taxpayer who disagrees with the Assessor’sassessed value may request areview by presenting to theAssessor’s Office before June 15,any pertinent factual informa-tion important to the determina-tion of the property’s marketvalue. If the Assessor agrees thata reduction is appropriate, anadjustment is made and a newnotice sent before July 1.
If a difference of opinion stillexists after July 1, the taxpayermay file an application forreduction in the assessed value.The matter will then be set forhearing before the local Assess-ment Appeals Board. In SantaClara County, appeal applica-tions must be filed between July 2, and September 15, with the Clerk of the Assessment AppealsBoard (Clerk of the County Board of Supervisors). To appeal a roll correction or supplementalassessment, typically triggered by a change in ownership or completed new construction, the appli-cation must be filed within 60 days of the date of the notice.
If the Assessment Appeals Board renders a decision for a proposition 8 temporary reduction invalue resulting in a decline in value below the property’s factored base year value (its upper limit), thereduction in value, and corresponding reduction in taxes, applies only to the property tax due for theyear in which the application was filed.
If the Assessment Appeals Board orders a change in the base year value set by the Assessor for newconstruction or changes in ownership, the reduction in value applies to the tax bill(s) for the year theapplication was filed, and establishes a new base year value for the future. The appeal application forsupplemental or corrected tax bills must be filed within 60 days of the notice of supplementalassessment or notice of roll correction.
When a taxpayer appeals the Assessor’s determination of the re-assessability of a change in owner-ship, the matter is heard and adjudicated by an independently appointed legal hearing officer.
Assessment Appeals Filed
Year Total Local Value at Percent ofAppeals Roll ** Risk * Roll at Risk+
2003 3,301 $217.52 $17.99 8.3%
2002 2,382 210.85 20.50 9.7
2001 2,080 199.83 14.48 7.2
2000 1,751 172.92 8.84 5.1
1999 1,790 $157.57 $7.32 4.6%
(Values in Billions)
* Value at Risk: The difference of value between the assessed roll valueand applicants’ opinion of value compiled at the end of the filing year.
** Local Roll Value: Net of nonreimbursable exemptions+ Percentages based on non-rounded valuesNote: For roll year 2003, 15 appeals applications are pending and have not
been validated. Value at risk may change as Applications are validated.
24 www.scc-assessor.org
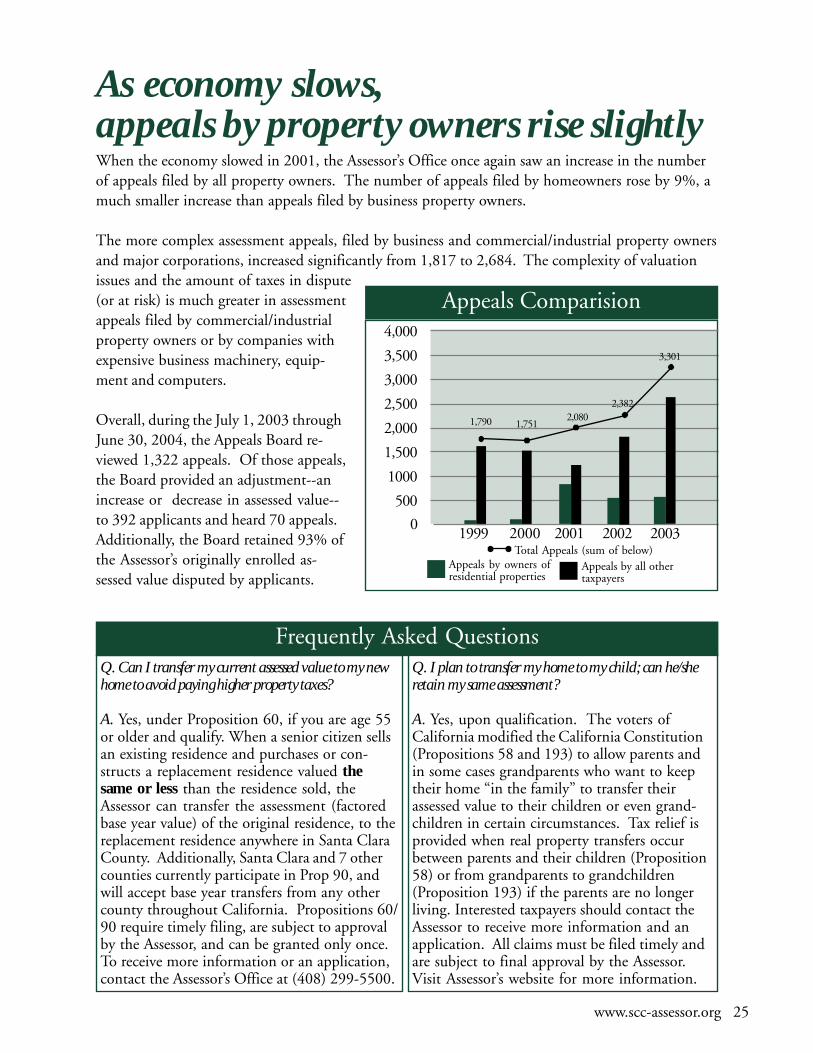
When the economy slowed in 2001, the Assessor’s Office once again saw an increase in the numberof appeals filed by all property owners. The number of appeals filed by homeowners rose by 9%, amuch smaller increase than appeals filed by business property owners.
The more complex assessment appeals, filed by business and commercial/industrial property ownersand major corporations, increased significantly from 1,817 to 2,684. The complexity of valuationissues and the amount of taxes in dispute(or at risk) is much greater in assessmentappeals filed by commercial/industrialproperty owners or by companies withexpensive business machinery, equip-ment and computers.
Overall, during the July 1, 2003 throughJune 30, 2004, the Appeals Board re-viewed 1,322 appeals. Of those appeals,the Board provided an adjustment--anincrease or decrease in assessed value--to 392 applicants and heard 70 appeals.Additionally, the Board retained 93% ofthe Assessor’s originally enrolled as-sessed value disputed by applicants.
www.scc-assessor.org 25
As economy slows,appeals by property owners rise slightly
Q. Can I transfer my current assessed value to my newhome to avoid paying higher property taxes?
A. Yes, under Proposition 60, if you are age 55or older and qualify. When a senior citizen sellsan existing residence and purchases or con-structs a replacement residence valued thesame or less than the residence sold, theAssessor can transfer the assessment (factoredbase year value) of the original residence, to thereplacement residence anywhere in Santa ClaraCounty. Additionally, Santa Clara and 7 othercounties currently participate in Prop 90, andwill accept base year transfers from any othercounty throughout California. Propositions 60/90 require timely filing, are subject to approvalby the Assessor, and can be granted only once.To receive more information or an application,contact the Assessor’s Office at (408) 299-5500.
Q. I plan to transfer my home to my child; can he/sheretain my same assessment?
A. Yes, upon qualification. The voters ofCalifornia modified the California Constitution(Propositions 58 and 193) to allow parents andin some cases grandparents who want to keeptheir home “in the family” to transfer theirassessed value to their children or even grand-children in certain circumstances. Tax relief isprovided when real property transfers occurbetween parents and their children (Proposition58) or from grandparents to grandchildren(Proposition 193) if the parents are no longerliving. Interested taxpayers should contact theAssessor to receive more information and anapplication. All claims must be filed timely andare subject to final approval by the Assessor.Visit Assessor’s website for more information.
Frequently Asked Questions
4,000
3,500
3,000
2,500
2,000
1,500
1000
500
01999 2000 2001 2002 2003
1,7511,790
Total Appeals (sum of below)
2,0802,382
Appeals by all othertaxpayers
Appeals by owners ofresidential properties
3,301
Appeals Comparision
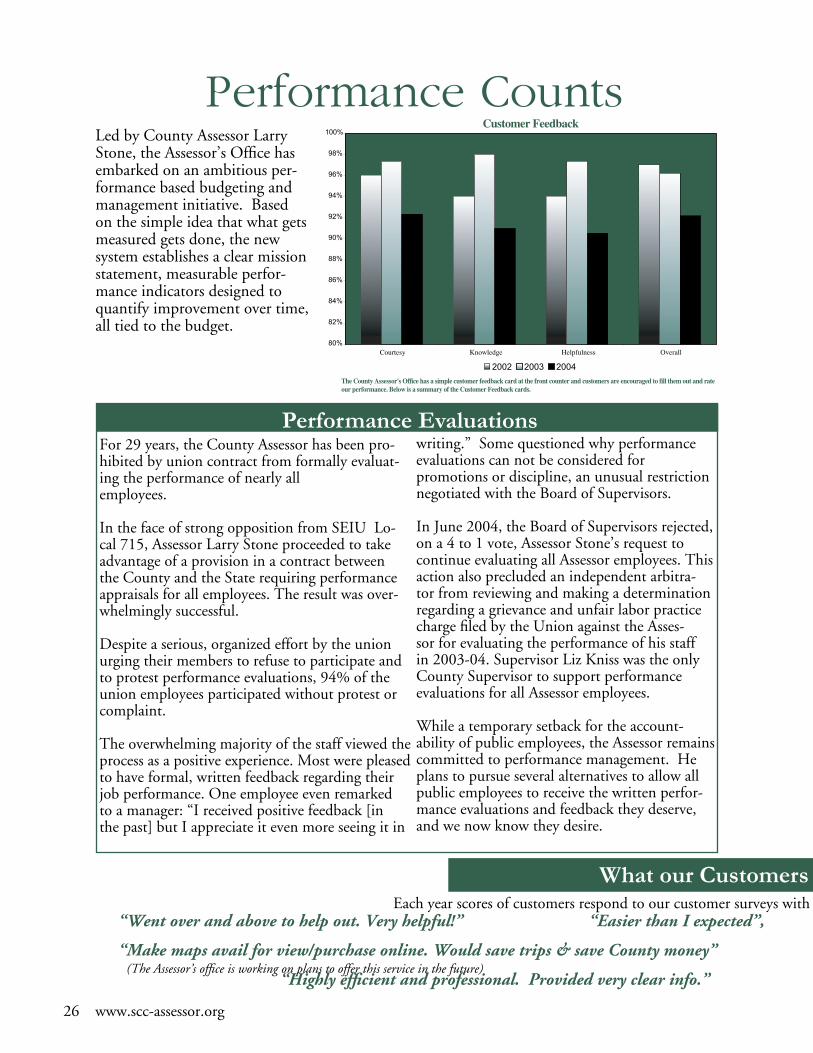
writing.” Some questioned why performance evaluations can not be considered for promotions or discipline, an unusual restriction negotiated with the Board of Supervisors.
In June 2004, the Board of Supervisors rejected, on a 4 to 1 vote, Assessor Stone’s request to continue evaluating all Assessor employees. This action also precluded an independent arbitra-tor from reviewing and making a determination regarding a grievance and unfair labor practice charge filed by the Union against the Asses-sor for evaluating the performance of his staff in 2003-04. Supervisor Liz Kniss was the only County Supervisor to support performance evaluations for all Assessor employees.
While a temporary setback for the account-ability of public employees, the Assessor remains committed to performance management. He plans to pursue several alternatives to allow all public employees to receive the written perfor-mance evaluations and feedback they deserve, and we now know they desire.
Led by County Assessor Larry Stone, the Assessor’s Office has embarked on an ambitious per-formance based budgeting and management initiative. Based on the simple idea that what gets measured gets done, the new system establishes a clear mission statement, measurable perfor-mance indicators designed to quantify improvement over time, all tied to the budget.
Performance Counts
26 www.scc-assessor.org
Performance EvaluationsFor 29 years, the County Assessor has been pro-hibited by union contract from formally evaluat-ing the performance of nearly all employees.
In the face of strong opposition from SEIU Lo-cal 715, Assessor Larry Stone proceeded to take advantage of a provision in a contract between the County and the State requiring performance appraisals for all employees. The result was over-whelmingly successful.
Despite a serious, organized effort by the union urging their members to refuse to participate and to protest performance evaluations, 94% of the union employees participated without protest or complaint.
The overwhelming majority of the staff viewed the process as a positive experience. Most were pleased to have formal, written feedback regarding their job performance. One employee even remarked to a manager: “I received positive feedback [in the past] but I appreciate it even more seeing it in
What our Customers Each year scores of customers respond to our customer surveys with
“Went over and above to help out. Very helpful!” “Easier than I expected”,
“Make maps avail for view/purchase online. Would save trips & save County money”
“Highly efficient and professional. Provided very clear info.” (The Assessor’s office is working on plans to offer this service in the future)
80%
82%
84%
86%
88%
90%
92%
94%
96%
98%
100%
Courtesy Knowledge Helpfulness Overall
2002 2003 2004
Customer Feedback
The County Assessor's Office has a simple customer feedback card at the front counter and customers are encouraged to fill them out and rate our performance. Below is a summary of the Customer Feedback cards.
www.scc-assessor.org 27
1. More than 99% of assessments werecompleted by June 30, 2004.
Why is this important?: The assessment roll isthe basis by which property taxes are levied. Thecompleteness of the assessment roll assures thosepublic agencies dependent upon property taxrevenue that the roll accurately reflects currentmarket activity.
2. 216 is the average number of days todeliver supplemental assessments to theTax Collector.
Why is this important?: Supplemental assess-ments occur upon a ‘change in ownership’ or ‘newconstruction’ of real property. This performancemeasure insures timely notification to thoseproperty owners who acquire or complete newconstruction of their property.
3. 99.4% of assigned mandatory audits werecompleted by June 30, 2004.
Why is this important?: State statute requires theAssessor to audit, every four years, all businesseswith assets valued at $400,000 or more located inSanta Clara County. This performance measuredetermines the timeliness of conducting thesemandatory audits.
4. 314 is the average number of days to closean assessment appeal.
Why is this important?: By statute, assessmentappeals must be resolved within two years offiling, unless a waiver is executed by the taxpayer.This performance measure insures a timely
Performance Measures
The following are the Assessor’s comprehensive performance measures. By reporting high levelquantitative and qualitative data that tracks levels of customer satisfaction, timeliness of productdelivery, accuracy of assessments and overall financial efficiency, these measures will allow the Assessorto identify and record service levels from year to year which are designed to achieve specific continu-ous improvement objectives. The data will be compiled from the results of similar, more detailedmeasures in each Division of the Assessor’s office. The performance measures in each division weredeveloped in collaboration with both line staff and managers.
equalization of assessments for propertyowners.5. Department’s customer satisfaction
rating*Why is this important?: This outcomemeasure rates the satisfaction level of both ourinternal and external customers who rely on theAssessor for timely service and accurateinformation.
6. The Cost Efficiency Index.*Why is this important?: The Cost EfficiencyIndex determines the cost efficiency of pro-ducing a product and/or work item comparedto the base year cost. This information isextremely valuable to policy and decisionmakers charged with meeting performanceobjectives and implementing streamliningprograms.
7. Total expenditures were 102% of thebudget in FY 2003.
Why is this important?: The Budget/CostRatio compares the department’s actual bottomline expenditures at the end of the fiscal year tothe budget to insure that costs do not exceedanticipated resources.
8. The Department’s aggregate perfor-mance indicator of all Divisions *
Why is this important?: This measure takeseach of the divisional performance indicators,assigns a weight, and produces an aggregatedivisional performance index.
* Data to be collected in subsequent year
are sayingcomments about the office and the staff, below is just a small sample.
“People here were very professional and courteous”
“a refreshing change from what I’m used to” “You guys are simply superb”
“Sorry, I don’t remember the lady’s name, but she was great!”
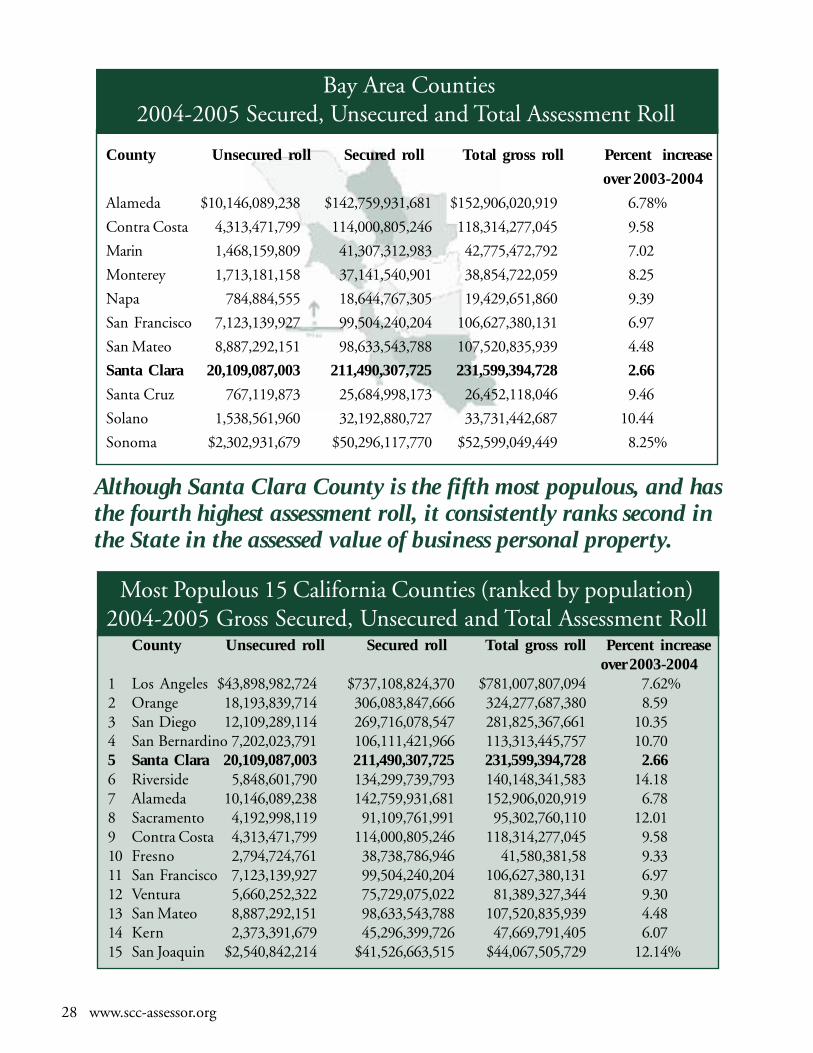
28 www.scc-assessor.org
Although Santa Clara County is the fifth most populous, and hasthe fourth highest assessment roll, it consistently ranks second inthe State in the assessed value of business personal property.
County Unsecured roll Secured roll Total gross roll Percent increase
over 2003-2004
Alameda $10,146,089,238 $142,759,931,681 $152,906,020,919 6.78%
Contra Costa 4,313,471,799 114,000,805,246 118,314,277,045 9.58
Marin 1,468,159,809 41,307,312,983 42,775,472,792 7.02
Monterey 1,713,181,158 37,141,540,901 38,854,722,059 8.25
Napa 784,884,555 18,644,767,305 19,429,651,860 9.39
San Francisco 7,123,139,927 99,504,240,204 106,627,380,131 6.97
San Mateo 8,887,292,151 98,633,543,788 107,520,835,939 4.48
Santa Clara 20,109,087,003 211,490,307,725 231,599,394,728 2.66
Santa Cruz 767,119,873 25,684,998,173 26,452,118,046 9.46
Solano 1,538,561,960 32,192,880,727 33,731,442,687 10.44
Sonoma $2,302,931,679 $50,296,117,770 $52,599,049,449 8.25%
Most Populous 15 California Counties (ranked by population)2004-2005 Gross Secured, Unsecured and Total Assessment Roll
County Unsecured roll Secured roll Total gross roll Percent increaseover 2003-2004
1 Los Angeles $43,898,982,724 $737,108,824,370 $781,007,807,094 7.62%2 Orange 18,193,839,714 306,083,847,666 324,277,687,380 8.593 San Diego 12,109,289,114 269,716,078,547 281,825,367,661 10.354 San Bernardino 7,202,023,791 106,111,421,966 113,313,445,757 10.705 Santa Clara 20,109,087,003 211,490,307,725 231,599,394,728 2.666 Riverside 5,848,601,790 134,299,739,793 140,148,341,583 14.187 Alameda 10,146,089,238 142,759,931,681 152,906,020,919 6.788 Sacramento 4,192,998,119 91,109,761,991 95,302,760,110 12.019 Contra Costa 4,313,471,799 114,000,805,246 118,314,277,045 9.5810 Fresno 2,794,724,761 38,738,786,946 41,580,381,58 9.3311 San Francisco 7,123,139,927 99,504,240,204 106,627,380,131 6.9712 Ventura 5,660,252,322 75,729,075,022 81,389,327,344 9.3013 San Mateo 8,887,292,151 98,633,543,788 107,520,835,939 4.4814 Kern 2,373,391,679 45,296,399,726 47,669,791,405 6.0715 San Joaquin $2,540,842,214 $41,526,663,515 $44,067,505,729 12.14%
Bay Area Counties2004-2005 Secured, Unsecured and Total Assessment Roll
Explanation of Terms*
*Explanation of terms are provided to simplify assessment terminology, but do not replace legal definitions. 29
Taxes imposed on the basis of the property’s value.
The taxable value of a property against which the tax rate is applied.
The person to whom the property is being assessed.
The assessee may file an appeal for reduction of the assessed value on the current local rollduring the regular filing period for that year, between July 2 and September 15 with theClerk of the Board. For supplemental or escape assessments, appeals must be filed within60 days of the mailing of the tax bill or receipt of the notice, whichever is earlier.
A three member panel appointed by the Board of Supervisors, operating under State law,to review and adjust assessments upon request of a taxpayer or his or her agent. (See “as-sessment appeal”)
The official list of all property within the County assessed by the Assessor.
The year following the annual lien date and the regular assessment of property, beginningon July 1.
The discovery of escape property resulting from an audit of the books and records of aprofession, trade or business, for which an assessment is levied outside of the normal as-sessment period for the lien date in question.
The 1975-76 regular roll value serves as the original base value. Thereafter, changes to theassessment on real property value, or a portion thereof, caused by new construction orchanges in ownership create the base year value used in establishing the full cash value ofsuch real property.
“Basic aid” school districts rely principally on locally derived property tax revenues to fundschool operations, rather than on Statewide reallocation formulas based on average dailyattendance and other factors. School districts become “basic aid” when the projected levelof revenues provided by local property taxes exceeds the state formula.
Business personal property is assessable, and includes computers, supplies, office furnitureand equipment, tooling, machinery and equipment. Most business inventory is exempt.(See personal property)
When a transfer of ownership in Real Property occurs, the Assessor determines if a reap-praisal is required under State law. If required, the reappraised value becomes the new basevalue of the property transferred, and a supplemental assessment is enrolled.
Consumer Price Index as determined annually by the California Bureau of LaborStatistics.
Some changes in ownership may be excluded from reappraisal if a timely claim is filed withthe Assessor’s Office that meets the qualifications. Examples include the transfer of realproperty between parents and children or senior citizens over age 55 who replace theirprincipal residence.
Allowance of a deduction from the taxable assessed value of the property as prescribed bylaw.
Ad Valorem Property Tax
Assessed Value
Assessee
Assessment Appeal
Assessment Appeals Board
Assessment Roll
Assessment Roll Year
Audit Escape
Base Year (Value)
Basic Aid
Business Personal Property
Change in Ownership
CPI
Exclusions from Reappraisal
Exemption
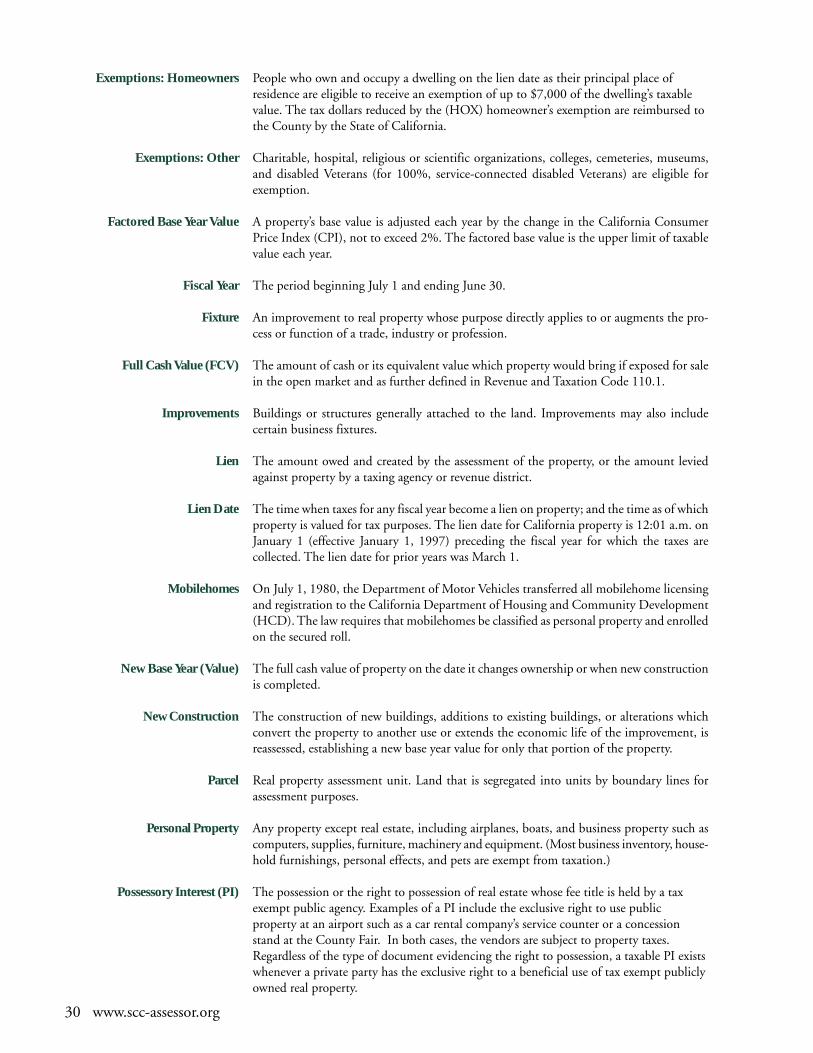
Exemptions: Homeowners
Exemptions: Other
Factored Base Year Value
Fiscal Year
Fixture
Full Cash Value (FCV)
Improvements
Lien
Lien Date
Mobilehomes
New Base Year (Value)
New Construction
Parcel
Personal Property
Possessory Interest (PI)
30 www.scc-assessor.org
People who own and occupy a dwelling on the lien date as their principal place ofresidence are eligible to receive an exemption of up to $7,000 of the dwelling’s taxablevalue. The tax dollars reduced by the (HOX) homeowner’s exemption are reimbursed tothe County by the State of California.
Charitable, hospital, religious or scientific organizations, colleges, cemeteries, museums,and disabled Veterans (for 100%, service-connected disabled Veterans) are eligible forexemption.
A property’s base value is adjusted each year by the change in the California ConsumerPrice Index (CPI), not to exceed 2%. The factored base value is the upper limit of taxablevalue each year.
The period beginning July 1 and ending June 30.
An improvement to real property whose purpose directly applies to or augments the pro-cess or function of a trade, industry or profession.
The amount of cash or its equivalent value which property would bring if exposed for salein the open market and as further defined in Revenue and Taxation Code 110.1.
Buildings or structures generally attached to the land. Improvements may also includecertain business fixtures.
The amount owed and created by the assessment of the property, or the amount leviedagainst property by a taxing agency or revenue district.
The time when taxes for any fiscal year become a lien on property; and the time as of whichproperty is valued for tax purposes. The lien date for California property is 12:01 a.m. onJanuary 1 (effective January 1, 1997) preceding the fiscal year for which the taxes arecollected. The lien date for prior years was March 1.
On July 1, 1980, the Department of Motor Vehicles transferred all mobilehome licensingand registration to the California Department of Housing and Community Development(HCD). The law requires that mobilehomes be classified as personal property and enrolledon the secured roll.
The full cash value of property on the date it changes ownership or when new constructionis completed.
The construction of new buildings, additions to existing buildings, or alterations whichconvert the property to another use or extends the economic life of the improvement, isreassessed, establishing a new base year value for only that portion of the property.
Real property assessment unit. Land that is segregated into units by boundary lines forassessment purposes.
Any property except real estate, including airplanes, boats, and business property such ascomputers, supplies, furniture, machinery and equipment. (Most business inventory, house-hold furnishings, personal effects, and pets are exempt from taxation.)
The possession or the right to possession of real estate whose fee title is held by a taxexempt public agency. Examples of a PI include the exclusive right to use publicproperty at an airport such as a car rental company’s service counter or a concessionstand at the County Fair. In both cases, the vendors are subject to property taxes.Regardless of the type of document evidencing the right to possession, a taxable PI existswhenever a private party has the exclusive right to a beneficial use of tax exempt publiclyowned real property.
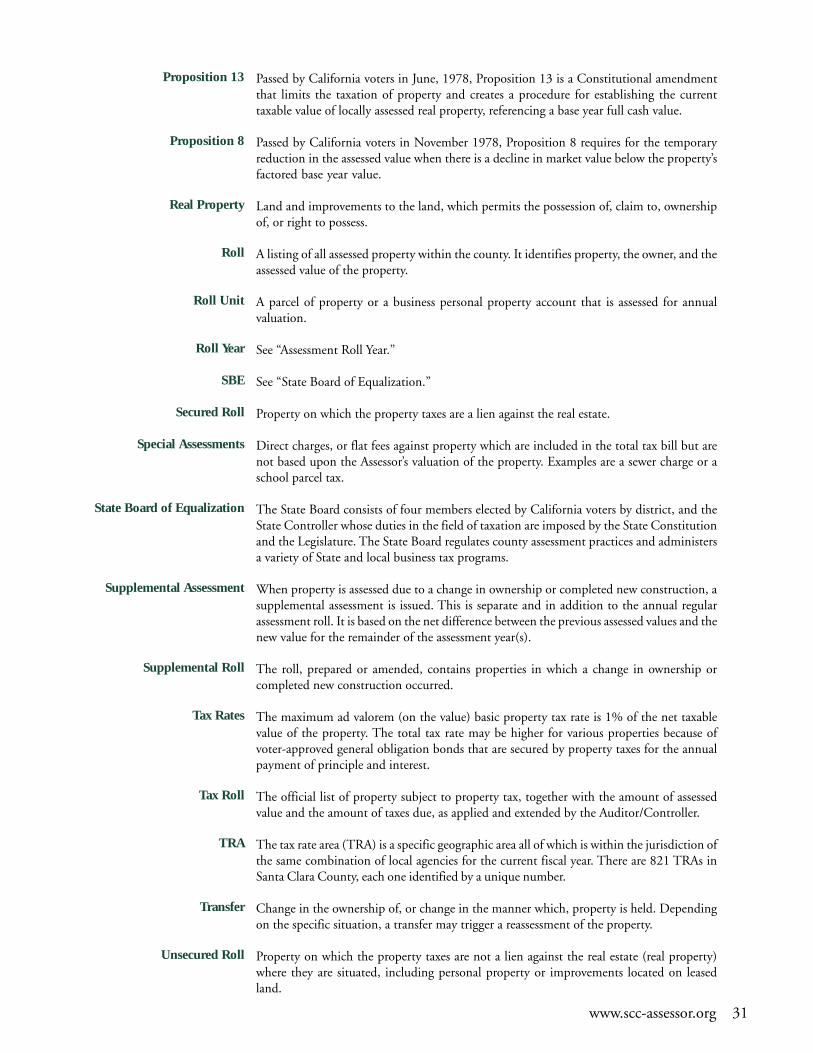
Proposition 13
Proposition 8
Real Property
Roll
Roll Unit
Roll Year
SBE
Secured Roll
Special Assessments
State Board of Equalization
Supplemental Assessment
Supplemental Roll
Tax Rates
Tax Roll
TRA
Transfer
Unsecured Roll
www.scc-assessor.org 31
Passed by California voters in June, 1978, Proposition 13 is a Constitutional amendmentthat limits the taxation of property and creates a procedure for establishing the currenttaxable value of locally assessed real property, referencing a base year full cash value.
Passed by California voters in November 1978, Proposition 8 requires for the temporaryreduction in the assessed value when there is a decline in market value below the property’sfactored base year value.
Land and improvements to the land, which permits the possession of, claim to, ownershipof, or right to possess.
A listing of all assessed property within the county. It identifies property, the owner, and theassessed value of the property.
A parcel of property or a business personal property account that is assessed for annualvaluation.
See “Assessment Roll Year.”
See “State Board of Equalization.”
Property on which the property taxes are a lien against the real estate.
Direct charges, or flat fees against property which are included in the total tax bill but arenot based upon the Assessor’s valuation of the property. Examples are a sewer charge or aschool parcel tax.
The State Board consists of four members elected by California voters by district, and theState Controller whose duties in the field of taxation are imposed by the State Constitutionand the Legislature. The State Board regulates county assessment practices and administersa variety of State and local business tax programs.
When property is assessed due to a change in ownership or completed new construction, asupplemental assessment is issued. This is separate and in addition to the annual regularassessment roll. It is based on the net difference between the previous assessed values and thenew value for the remainder of the assessment year(s).
The roll, prepared or amended, contains properties in which a change in ownership orcompleted new construction occurred.
The maximum ad valorem (on the value) basic property tax rate is 1% of the net taxablevalue of the property. The total tax rate may be higher for various properties because ofvoter-approved general obligation bonds that are secured by property taxes for the annualpayment of principle and interest.
The official list of property subject to property tax, together with the amount of assessedvalue and the amount of taxes due, as applied and extended by the Auditor/Controller.
The tax rate area (TRA) is a specific geographic area all of which is within the jurisdiction ofthe same combination of local agencies for the current fiscal year. There are 821 TRAs inSanta Clara County, each one identified by a unique number.
Change in the ownership of, or change in the manner which, property is held. Dependingon the specific situation, a transfer may trigger a reassessment of the property.
Property on which the property taxes are not a lien against the real estate (real property)where they are situated, including personal property or improvements located on leasedland.
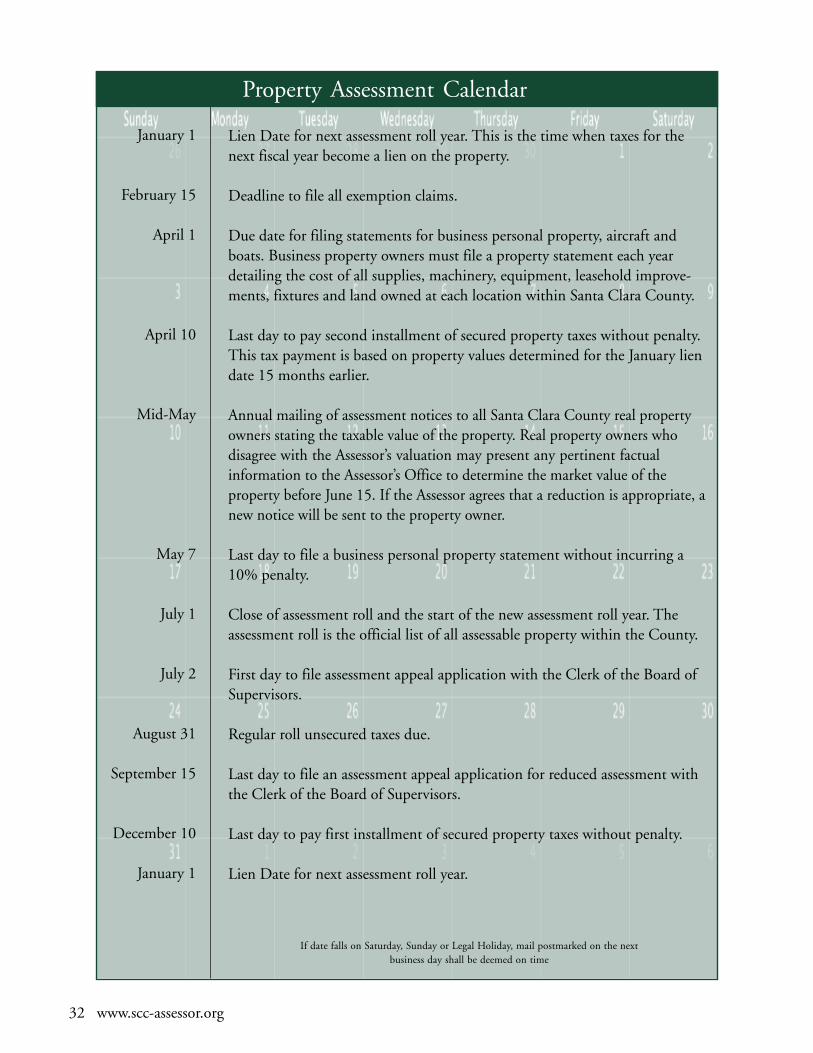
Lien Date for next assessment roll year. This is the time when taxes for thenext fiscal year become a lien on the property.
Deadline to file all exemption claims.
Due date for filing statements for business personal property, aircraft andboats. Business property owners must file a property statement each yeardetailing the cost of all supplies, machinery, equipment, leasehold improve-ments, fixtures and land owned at each location within Santa Clara County.
Last day to pay second installment of secured property taxes without penalty.This tax payment is based on property values determined for the January liendate 15 months earlier.
Annual mailing of assessment notices to all Santa Clara County real propertyowners stating the taxable value of the property. Real property owners whodisagree with the Assessor’s valuation may present any pertinent factualinformation to the Assessor’s Office to determine the market value of theproperty before June 15. If the Assessor agrees that a reduction is appropriate, anew notice will be sent to the property owner.
Last day to file a business personal property statement without incurring a10% penalty.
Close of assessment roll and the start of the new assessment roll year. Theassessment roll is the official list of all assessable property within the County.
First day to file assessment appeal application with the Clerk of the Board ofSupervisors.
Regular roll unsecured taxes due.
Last day to file an assessment appeal application for reduced assessment withthe Clerk of the Board of Supervisors.
Last day to pay first installment of secured property taxes without penalty.
Lien Date for next assessment roll year.
January 1
February 15
April 1
April 10
Mid-May
May 7
July 1
July 2
August 31
September 15
December 10
January 1
Property Assessment Calendar
If date falls on Saturday, Sunday or Legal Holiday, mail postmarked on the nextbusiness day shall be deemed on time
32 www.scc-assessor.org
The Assessor has the responsibility to locate all taxable
property in the County, identify ownership, establish avalue for all property subject to local property taxation,list the value of all property on the assessment roll, and
apply all legal exemptions. The Santa Clara CountyAssessor does not compute property tax bills, collectproperty taxes, establish property tax laws, establish rules
by which property is appraised, or set property tax rates.
Santa Clara County contains more than 443,000 separate
real property parcels. There were over 2,500 changes inparcel numbers, and there were over 90,000 changes inproperty ownership as reflected by deeds and maps filed
in the County Recorder’s Office. The Assessor’s profes-sional staff maintains a comprehensive set of 212Assessor’s parcel map books. The office appraised
more than 11,000 new construction activities, andprocessed more than 105,000 business personalproperty assessments.
The assessments allow the County of Santa Clara and204 local government taxing authorities to set tax rates(as limited by Proposition 13 and other laws), collect
and allocate property tax revenue which supportsessential public services provided by the County, localschools, cities, and special districts.
For information regarding general County financialinformation including taxes by tax rate areas andmethods of property tax revenue allocation contact:Santa Clara County Finance Agency (408) 299-5200
For information about Santa Clara County Assessments:
Public Information and Ownership (408) 299-5500
Real Property (land and improvements) (408) 299-5300
Personal Property, including Business,
Mobilehomes, Boats and Airplanes (408) 299-5400
Property Tax Exemptions (408) 299-6460
Change in Ownership Issues (408) 299-5540
Mapping (408) 299-5550
Administration (408) 299-5570
Administration Fax (408) 297-9526
Assessor Web Site www.scc-assessor.org
County Web Site www.sccgov.org
For information about a tax bill, payments, delinquency,or the phone number of the appropriate agency to contactabout a special assessment, contact:Santa Clara County Tax Collector (408) 808-7900
For information about filing assessment appeals, call:Santa Clara County Assessment Appeals Board Clerk(Clerk of the Board of Supervisors) (408) 299-5001
California State Board of EqualizationThe State Board of Equalization is responsible for assuringthat county property tax assessment practices are equaland uniform throughout the State. For more information,contact the State Board at:
450 N StreetPO Box 942879Sacramento, CA 94279-0001
For general tax information call (800) 400-7115 orwww.boe.ca.govAcknowledgments
Editor: David K. Ginsborg, Deputy to the Assessor Assistance provided by the staff of the Santa Clara County Assessor’s OfficeCover Map designed by Gumersindo ZavalaLayout Production: KurigraphicsPrinted by GSA Printing Services
Disclaimer: This document presents a distribution of the 2004-2005 Santa Clara County property tax local assessment roll by City/RedevelopmentAgency and major property types. It does not include State-assessed property (unitary roll). It is not the source document for deriving the propertytax revenues to be received by any public entity. For example, the Controller’s AB8 calculations do not include aircraft assessed valuation, which isincorporated into this report. Additionally, supplemental assessments are not depicted in the report. Numbers reported in tables and charts reflect upto 0.01 units. Items less than 0.01 units have been reported as a dash. Minor discrepancies may occur due to rounding calculations and/or clarification
in definition of terms.
Published July, 2004.
Responsibility of theAssessor’s Office
299-5500
¿No habla ingles? La Oficina del Tasador tiene empleados que hablan español. Llámenos al (408) 299-5500
U.S
. MA
ILP
OS
TA
GE
PAID
Perm
itN
o. 1406
w Printed on recycled paper w
ith soy based inksX
2199
Office of the C
ounty Assessor
Lawrence E
. Stone, Assessor
County of Santa C
lara Governm
ent Center
70 West H
edding Street, 5th Floor, East W
ingSan Jose, C
alifornia 95110-1771W
ebsite: ww
w.scc-assessor.org
Santa Clara C
ountyB
oard of SupervisorsD
on Gage, D
istrict IB
lanca Alvarado, D
istrict IIPete M
cHugh, D
istrict IIIJim
Beall, D
istrict IVLiz K
niss, District V
County E
xecutivePete K
utras
Mission Statem
entT
he mission of the S anta C
lara County
Assessor’s O
ffice is to produce an annualassessm
ent roll including all assessableproperty in accordance w
ith legal mandates
in a timely, accurate, and efficient m
anner;and provide current assessm
ent-relatedinform
ation to the public and togovernm
ental agencies in a timely
and responsive way.
Please notify us if your address has changed