Embed Size (px)
Citation preview

Annual Report 2001Year ended 31st March, 2001

Profile
Nippon Mining & Metals Co., Ltd., established in April 1992, commenced operations in
November 1992 after taking over the metals business of Nippon Mining Co., Ltd. (cur-
rently Japan Energy Corporation) which had been engaged in the major business lines
of metals (mining, smelting and refining, and metal fabrication) and petroleum (devel-
opment and refining).
Following its establishment as an independent company, and amid drastic changes in
the structure of Japanese industry, Nippon Mining & Metals set the management tar-
gets expressed in the catchphrases, “From quantity to quality,” “a thorough technology-
oriented approach,” and “becoming a truly international enterprise.” In pursuit of these
goals, the Company worked vigorously to effect structural reform and thereby create a
leaner and stronger corporation. These efforts bore fruit in the form of remarkable
improvements in business performance, adding strength to its major businesses of cop-
per smelting and metal fabrication and building a firm foundation for continued growth
as a corporation specializing in nonferrous metals.
Armed with innovative technologies and guided by global business strategies, Nippon
Mining & Metals will continue to move ahead as a world leader in the nonferrous metals
industry.
Contents
Financial Highlights .............................................. 1
Message from the Management ............................ 2
Strategy for Further Growth in the New Century..... 4
At a Glance.......................................................... 6
Metal Production.................................................. 8
Metal Fabrication .................................................14
Recycling & Environmental Services.......................18
Engineering & Consulting and Other Operations ......20
Technology Development Center ...........................2 1
Global Network ....................................................22
Board of Directors & Corporate Auditors ................23
Financial Section..................................................24
Group of Companies .............................................42
Corporate Data ....................................................44
Financial Highlights
Nippon Mining & Metals 1
Nippon Mining & Metals Company, Limited and Consolidated Subsidiaries
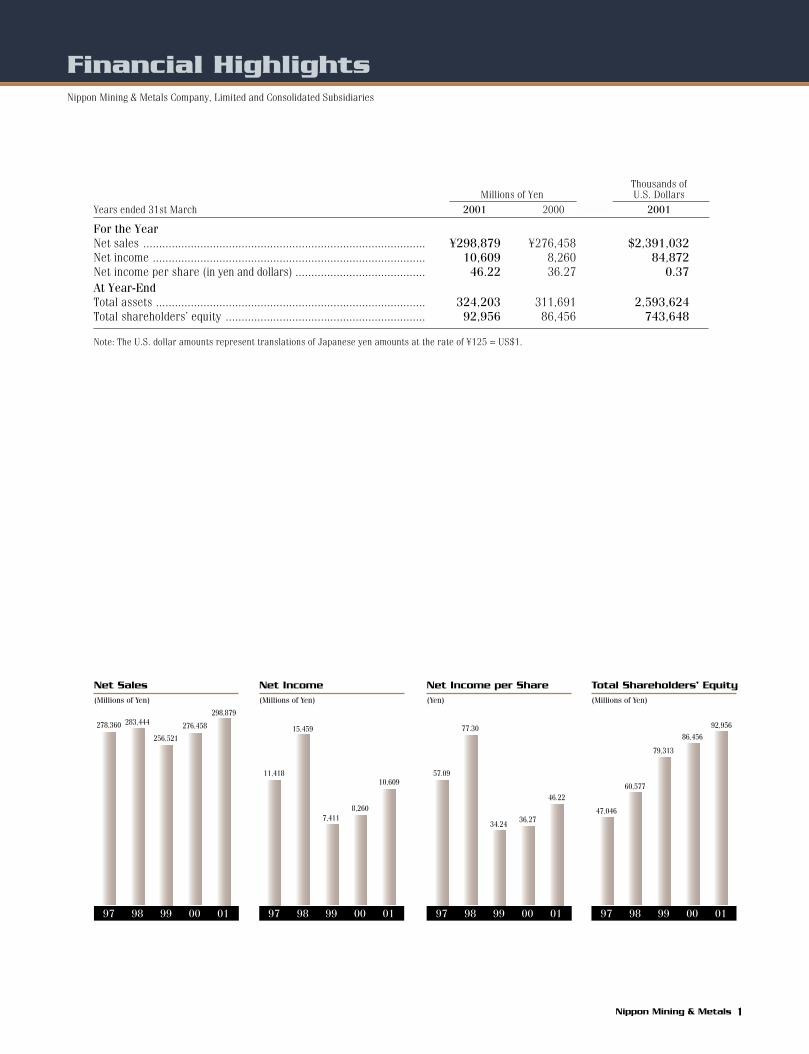
Thousands ofMillions of Yen U.S. Dollars
Years ended 31st March 2001 2000 2001
For the YearNet sales ......................................................................................... ¥298,879 ¥276,458 $2,391,032Net income ...................................................................................... 10,609 8,260 84,872Net income per share (in yen and dollars) ......................................... 46.22 36.27 0.37At Year-EndTotal assets ..................................................................................... 324,203 311,691 2,593,624Total shareholders’ equity ............................................................... 92,956 86,456 743,648
Note: The U.S. dollar amounts represent translations of Japanese yen amounts at the rate of ¥125 = US$1.
278,360
(Millions of Yen)
283,444
256,521
276,458
298,879
97 98 99 00 01
Net Sales
11,418
(Millions of Yen)
15,459
7,4118,260
10,609
97 98 99 00 01
Net Income
47,046
(Millions of Yen)
60,577
79,313
86,456
92,956
97 98 99 00 01
Total Shareholders’ Equity
57.09
(Yen)
77.30
34.2436.27
46.22
97 98 99 00 01
Net Income per Share

Message from the Management
2 Nippon Mining & Metals
Tetsuichi Kagawa resigned in June 2001 due to illnessand Kazuo Oki succeeded him as President andRepresentative Director to share executive duties withTakashi Sakamoto, Chairman and RepresentativeDirector. We both pledge to make all-out efforts toensure further growth and solid achievements for theCompany in the 21st century.
During the term under review, the year ended 31stMarch 2001, the Japanese economy continued on thepath of moderate recovery in the first half of the term,bolstered by increasing IT-related demand. In the sec-ond half, however, the economy showed signs of stag-nation against the backdrop of a decline in exports dueto the slowdown in the U.S. economy and a sharp drop-off in IT-related demand.
Copper, a main product of the Nippon Mining &Metals Group, showed promising signs of a recovery indomestic demand, and its price rose. Fabricated metalproducts held firm during the first half of the term,especially in the copper products area, but demand forspecial steel products declined markedly in the secondhalf of the term.
In view of these circumstances, the Nippon Mining& Metals Group worked intensively to strengthen pro-duction and sales while continuing to improve efficien-cy in business operations across the board. As a result,the Company succeeded in increasing both revenuesand profits, reflecting rising sales of copper and priceincreases in the metal production business, whichmore than offset a reduction in sales in the metal fab-rication business during the second half of the term.
Following are highlights of the term under review.In our main copper smelting and refining business,
we undertook an operational tie-up with Mitsui Mining& Smelting Co., Ltd., beginning in May of 2000, so asto further reinforce our international competitivestrengths. As part of this move, we established twojoint firms: a sales company under the name of PanPacific Copper Co., Ltd. to market products related tocopper smelting and refining operations, and a compa-ny under the name of United Copper Resource Co., Ltd.,which will act as an agent for the procurement of cop-per concentrate. Pan Pacific Copper began operationsin January 2001, and United Copper Resourcelaunched operations in April of the same year.
Nippon Mining & Metals, Mitsui Mining & Smelting,and LG-Nikko Copper Inc., a South Korea-based jointventure formed by a consortium led by Nippon Mining& Metals and Mitsui Mining & Smelting with the LGGroup of South Korea, reached agreement in February2001 on the promotion of their comprehensive alliancein the copper smelting business. The relationshipbetween the three firms will constitute one of theworld’s largest alliances of copper producers.
The Los Pelambres Mine in Chile, a copper mine inwhich Nippon Mining & Metals has an equity stake,began full-scale operations in January 2000. Thismine, which provides a reliable source of copper con-centrate, has contributed to the Company’s earnings
(left) : Takashi SakamotoChairman and Representative Director
(right): Kazuo OkiPresident and Representative Director

Nippon Mining & Metals 3
since its initial fiscal year of production. Metal Fabrication is another key segment that
underpins the Company’s business. Here, theKurami Works in Kanagawa Prefecture stepped upits strategic specialization in high value-addedproducts. We succeeded in significantly enhancingthe performance of phosphor bronze used in elec-tronic components and equipment, and began mar-keting the product in February 2001.
The Company is shifting production of general-purpose products to East Asia, where many currentand potential customers are located. As an initial step,Nippon Mining & Metals and Poongsan Corporation,the largest manufacturer of fabricated copper and cop-per alloy products in South Korea, have launched astrategic alliance in brass strip manufacturing.
Turning to the technological development area,Nippon Mining & Metals, working jointly with MitsuiMining & Smelting, is developing a practical applica-tion of hydro-metallurgical processes for primary sul-fide ore in cooperation with governmental andacademic institutions.
In May 2001, the Company established theExecutive Office to form a direct link to the Board ofDirectors in an effort to further enhance strategicmanagement capabilities.
Business PerformanceThe Company recorded a remarkable upswing in prof-its. On a consolidated basis, net sales rose 8.1% year-on-year to ¥298.9 billion. Income from operationsincreased 13.2% to ¥21.1 billion. Income before spe-cial items climbed 42.8% to ¥22.4 billion, an increasethat is partially attributable to the excellent businessperformance of Minera Los Pelambres, as well as anupsurge in profits by Nippon Mining & Metals. Netincome rose 28.4% to ¥10.6 billion. Return on salesstood at 7.5%, up 1.8 percentage point year on year.Return on equity (ROE) rose to 11.8%, up 1.8 percent-age point on the year.
OutlookThe business environment is forecast to remain severefor a long time. In view of this, the Company will
reaffirm its commitment to policies that emphasizeprofitability.
In the copper smelting and refining business, we areworking to maximize the benefits of our alliance withMitsui Mining & Smelting and LG-Nikko Copper so as toachieve tangible results as soon as possible. In addition,we are attempting to perfect current pyro-metallurgicalprocess techniques as well as to commercialize hydro-metallurgical processes, which are expected to besuperior in terms of the environment and efficiency.
Meanwhile, we are moving aggressively to takeadvantage of opportunities to invest in promisingresource development projects with the objectives ofensuring reliable sources of copper concentrate andsecuring appropriate return on investment.
In metal fabrication, we are reorganizing theKurami Works into a slim and efficient plant specializ-ing in high value-added products.
Meanwhile, we will accelerate the pace of overseastie-ups, including OEM alliances, for general-purposeproducts. Here we are further enhancing our presenceand competitive strengths in the East Asian market.
The Nippon Mining & Metals Group will continue tofulfill its social responsibilities as a natural resource-based firm by operating in keeping with its managerialmotto: “innovation in the productive use of resources.”By making forward-looking moves and grappling boldlywith crucial issues, Nippon Mining & Metals willbecome an internationally recognized leader in thenonferrous materials business.
August 2001
Takashi Sakamoto, Chairman and Representative Director
Kazuo Oki, President and Representative Director

4 Nippon Mining & Metals
We believe the key factors in success in the nonferrous metalsbusiness are the formation of an alliance with strong competitivepower, the procurement of superior mining interests, and thedevelopment of pioneering technology. Achieving these three conditions will put us well on the road to becoming the world’sstrongest manufacturer of nonferrous metals.
With our sound, long-term business strategy and global perspective, we are moving ahead as a world leader in the nonferrous metals industry.
Nippon Mining & Metals begins talks with Mitsui Mining & Smelting regarding tie-up incopper smelting and refining operations
To meet the intensifying international competition in the copper smelting and refiningoperations, Nippon Mining & Metals decided to create a comprehensive business alliance covering various fieldsof copper smelting business with Mitsui Mining & Smelting Co., Ltd. As part of this tie-up, the two companiesjointly established a sales company – Pan Pacific Copper Co., Ltd. – to sell the products of their copper smelting operations, principally copper and sulfuric acid. The company began operation in January of 2001.
Nippon Mining & Metals constructs one of theworld’s premier copper production alliancesthrough tie-up with Mitsui Mining & Metals andLG-Nikko Copper
In February 2001, Nippon Mining & Metals, Mitsui Mining & Smelting, and LG-Nikko Cooper Co., Ltd. agreed to advance a comprehensive alliance coveringvarious aspects of the copper smelting business. This agreement allowed the threecompanies to form one of the world’s leading alliances of copper producers (producing approximately 30% of East Asia’s refined copper, making it the world’ssecond-largest producer).
Nippon Mining & Metals establishes a strategic alliance with PoongsanCorporation, the largest manufacturer of fabricated copper and copperalloy products in South Korea
In April 2001, Nippon Mining & Metals and Poongsan Corporation entered into astrategic alliance through which they constructed a cooperative relationship fortheir brass strip manufacturing and established a joint-venture company, Poongsan-Nikko Tin Plating Corporation, in South Korea, to engage in producing tin-plated copper strips. Through this cooperation in the fabricated metal business,the two companies will jointly strengthen their competitiveness in the East Asianmarket for automobile terminal and connector materials.
May 2000
February 2001
April 2001
Strategy for Further Growth in the New Century

One aspect of the Company’s long-term strategy involves active participation inresource development projects that promise both stable supplies of ore for copper smelting and refining and a good return on investment.
Los Pelambres Mine begins full-scale operation
The Los Pelambres Mine in Chile, a mine in which Nippon Mining & Metals has an equity stake, began full-scale production. The mine generated high earnings during its first year of operation, contributing anexcellent return on capital to the company.
Nippon Mining & Metals cooperates with Mitsui Mining and SmeltingCo., Ltd. to establish an agency for procurement of copper concentrate
In March 2001, we established our second joint-venture company, United Copper Resource Co., Ltd. incooperation with Mitsui Mining and Smelting Co., Ltd. as a result of the comprehensive business alliance.The new company acts as an agent for the procurement of copper concentrate, and it commenced operations in April 2001.
Nippon Mining & Metals 5
We are engaged in development of copper smeltingand refining technology utilizing hydro-metallurgical processes
Jointly with Mitsui Mining & Smelting, and with the cooperation of governmentaland academic institutions, Nippon Mining & Metals has started to develop a practical hydro-metallurgical process for primary sulfide ore.
Nippon Mining & Metals augments production capacity for copper smelting and copper refining
In February 2001, Nippon Mining & Metals augmented its annual production capacity for anode and refined copper from 450,000 tons to 470,000 tons and from420,000 tons to 450,000 tons respectively. Arising primarily from technicalimprovements, the capacity expansion enhanced the competitiveness of the company’s production system.
Nippon Mining & Metals develops high-performance phosphor bronze
Improvements in the production process enabled our development of a new high-performance phosphorbronze alloy that greatly enhances the performance of phosphor bronze for electronic component and electronic device applications. We began marketing of the alloy in February 2001.
October 2000
February 2001
February 2001
January 2000
March 2001

At a Glance Consolidated
Consolidated net salesincreased 8.1% to¥298,879 million(US$2,391,032 thou-sand), and income fromoperations rose 13.2%to ¥21,084 million(US$168,672 thousand).Income before specialitems rose 42.8% to¥22,364 million(US$178,912 thousand),and net incomeincreased 28.4% to¥10,609 million(US$84,872 thousand).
Major products in this segment are refined copper, sulfuric acid, precious metals such asgold and silver, zinc, and rare metals such as indium.
Net sales grew 11.9% to ¥203,665 million due to a rise in sales of refined copper,accompanied by expansion in copper smelting and refining capacity, as well as rising mar-ket prices of metals, and the addition of Pan Pacific Copper Co., Ltd. as a consolidated sub-sidiary. Income from operations rose 24.7% to ¥10,139 million. This was mainlyattributable to an increase in sales of refined copper, increased sales of precious metals inline with the enlargement of recovery facilities for precious and rare metals, and cuttingproduction costs, as well as sales expansion of metal products by Nikko Shoji Co., Ltd.
Major products in this segment are rolled copper products (strips of phosphor bronze,brass, and nickel-silver and copper foils), special steel products (strips of invar, mild steel,stainless steel and titanium), and electronics components.
Despite a rise in sales centering on rolled copper products in the first half, net salesdecreased 3.7% to ¥55,824 million due to deterioration of demand for special steel products in the second half. Income from operations was flat from the previous term, at¥8,919 million, as a decline in the Company’s sales was offset by growth in sales of high-performance and high value-added products, as well as cost reductions, sales increases atWoojin Precision Industry Co., Ltd. and other consolidated subsidiaries.
Major business lines in this segment are engineering and consulting operations.Net sales in this segment rose 33.6% to ¥14,071 million, helped by growth in engineer-
ing operations and promotion of joint purchasing for the Group by Nikko Polytech Co., Ltd.as well as the start-up of an outsourcing business for general administrative services byNikko Corporate Services Center Co., Ltd. Income from operations soared 202.3% to ¥130million.
Other operations comprise the distribution operations of subsidiaries including NikkoLogistics Partners Co., Ltd. and Nippon Marine Co., Ltd.
Net sales fell 6.5% to ¥19,876 million as a result of the transfer of a part of the opera-tions of Nikko Logistics Partners Co., Ltd. to Pan Pacific Copper Co., Ltd. Income fromoperations, however, rose 15.4% to ¥623 million.
Major business lines in this segment include the detoxification and compacting of industri-al waste, the recycling of valuable metals, and the collection of nonferrous metal scrap.
Net sales gained 15.4% to ¥5,443 million thanks to an increase in collection of indus-trial waste, as well as copper and precious metal scrap by Tomakomai Chemical Co., Ltd.and Nikko Tsuruga Recycle Co., Ltd. and the accompanying rise in processing volume.Income from operations rose 42.1% to ¥1,273 million.
Meta
l Pro
ducti
on
Meta
l Fabri
cati
on
Recy
clin
g a
nd
Envir
onm
enta
l Serv
ices
Engin
eeri
ng a
nd
Consult
ing O
pera
tions
Oth
er
Opera
tions
6 Nippon Mining & Metals

Nippon Mining & Metals 7
203,249 207,629
177,870 181,977203,665
97 98 99 00 01
11,828
14,56813,820
8,128
10,139
97 98 99 00 01
169,533
206,307
179,522188,724
205,353
97 98 99 00 01
10,783
7,45310,665
29,865
6,418
97 98 99 00 01
55,447 56,648
48,665
57,974 55,824
97 98 99 00 01
5,525
7,992
4,008
9,025 8,919
97 98 99 00 01
74,36870,118
74,21870,220 68,287
97 98 99 00 01
6,611
3,690
2,6602,053 2,266
97 98 99 00 01
5,205
6,090
3,128
4,716
5,443
97 98 99 00 01
670
910
719
896
1,273
97 98 99 00 01
14,62815,450
14,66813,104 13,418
97 98 99 00 01
1,808
583 593
356
727
97 98 99 00 01
1,998*
10,530
14,071
99 00 01
107*
43
130
99 00 01
4,352*
6,918
9,341
99 00 01
49* 38
345
99 00 01
14,45913,077
24,860
21,26119,876
97 98 99 00 01
411 433 428
540
623
97 98 99 00 01
6,812 5,658
15,421
31,496 31,302
97 98 99 00 01
1,110
305
583
989
2,446
97 98 99 00 01
Net Sales
Millions of Yen
Operating Income
Millions of Yen
Assets
Millions of Yen
Capital Expenditure,Investment and Advance
Millions of Yen
* Figures were extracted from Other Operations in 1999 for comparison purposes.

Metal Production
8 Nippon Mining & Metals
(Thousand Tons)
1999 2000
Global Production of Refined Copper
World Total14,455
World Total14,788 Japan
NM&M 436
(30.3%)
Japan1,342(9.3%)
1,437(9.7%)
Building an Alliance of the World’s Top Copper Producers
Anode Furnace and Anode Casting Wheels, Saganoseki Smelter & Refinery
Saganoseki Smelter& Refinery
Onsan Plant, LG-Nikko Copper Inc.(Source: WBMS July 2001)

Nippon Mining & Metals 9
Throughout the term ended March 2001, NipponMining & Metals moved decisively to further step upcopper production capacity, advance the operationalalliance with Mitsui Mining & Smelting and LG-NikkoCopper, and develop innovative next-generation refin-ing technologies. These moves had beneficial effects,resulting in bolstering the Company’s competitivestrengths still further, ensuring a prominent presencein the East Asian market, and building a world-leadingalliance of copper producers.
The Company has two copper production facilitiesin Japan: the Saganoseki Smelter & Refinery in OitaPrefecture and the Hitachi Works in IbarakiPrefecture. Expansion work completed in February2001 boosted the production capacity of both facili-ties, resulting in a combined annual capacity of470,000 tons in copper smelting and 450,000 tons incopper refining.
Overseas operations also registered favorableresults. LG-Nikko Copper Inc., a joint copper smeltingand refining venture in South Korea, produced 468,000tons of copper in the year ended December 2000.
The annual production capacity of this company isslated to be raised to 510,000 tons around October2002.
Sales of copper have been handled since January2001 entirely by Pan Pacific Copper Co., Ltd., whichwas established as part of the tie-up with MitsuiMining & Smelting Co., Ltd. During the term underreview, the Company sold 445,000 tons of refined cop-per, a year-on-year increase of 3.8%.
A major group company, Tatsuta Electric Wire andCable Co., Ltd. (Osaka, 30.95% equity) sold 35,000tons of electric wires and cables during the year, anincrease of 11.6% from the previous year. JapanCopper Casting Co., Ltd. (Tokyo, 55% equity), pro-duced 80,000 tons of copper cakes and billets, anincrease of 18.8% over the previous year.
In addition, the wire rod plant of ChangzhouJinyuan Copper Co., Ltd., in Changzhou, China, inwhich the Company, along with Tatsuta Electric Wireand Cable Co., Ltd. holds an 18% equity stake, sold121,000 tons of copper wire rods in the year endedDecember 2000, up 75.4% on the year.
(Source: Brook Hunt Copper Metal Service 1st Quarter 2001)
TonsYear ended 31st Volume controlled byDecember, 2000 Total volume (a) Equity stake (b) Nippon Mining & Metals (a) x (b)
Nippon Mining & Metals 436,000 — 436,000
LG-Nikko Copper 468,000 36.8% 172,000
Others* — — 13,000
Total 621,000
Production of
Refined Copper under
the Control of Nippon
Mining & Metals
* “Others” includes SX-EW copper produced at the Collahuasi Mine and the Escondida Mine in Chile, and refinedcopper produced at the Gresik Smelter & Refinery in Indonesia
Rankings of World’s Leading Makers of refinedCopper
NM & M, LG-Nikko Copper andMitsui Mining & Smelting 1,075 (approximately 30%)
East Asia3,700(100%)
(Thousands of Tons)Copper Production in East Asia
Company (country) Thousands of Tons
1 Codelco (Chile) 1,4212 Nippon Mining & Metals 449
LG-Nikko Copper 468Mitsui Mining & Smelting 158
1,0753 Phelps Dodge (U.S.A.) 1,0454 Grupo Mexico (Mexico) 9085 Norddeutsche Aff. (Germany) 551
Copper
Copper Production by
Nippon Mining & Metals,
Mitsui Mining & Smelting
and LG-Nikko Copper Inc. 1,075▼
Metal Production
10 Nippon Mining & Metals
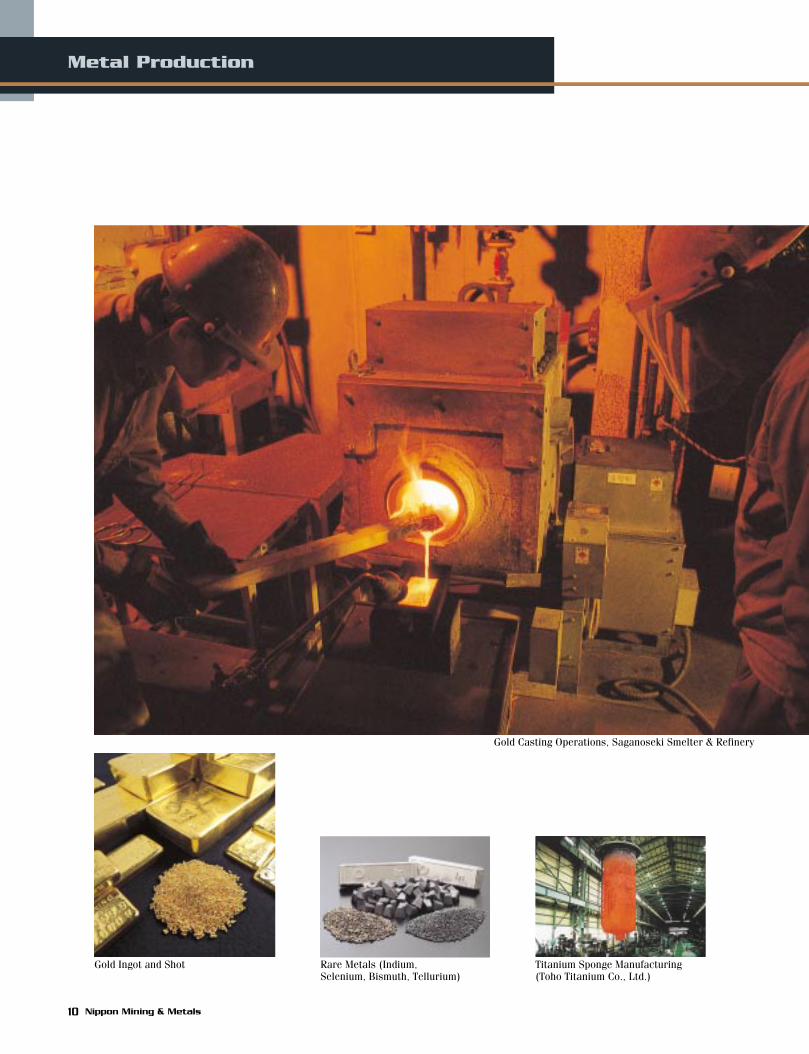
Gold Ingot and Shot Titanium Sponge Manufacturing (Toho Titanium Co., Ltd.)
Rare Metals (Indium,Selenium, Bismuth, Tellurium)
Gold Casting Operations, Saganoseki Smelter & Refinery

The Company sold 31 tons of gold during fiscal 2000,a 1.4% increase over the previous year, and 332 tonsof silver, an 18.1% increase over the previous year.
The Company is the world’s second largest produc-er of indium. It sold 30 tons of indium during fiscal2000, a decrease of 13.0% from the previous year.
The Company’s zinc production is carried out on a tollbasis by the Akita Zinc Co., Ltd. (Tokyo, 24% equity),and the Hachinohe Smelting Co., Ltd. (Tokyo, 27.81%equity). In the year under review, the Company sold103,000 tons of zinc, down 3.9% from the previousyear.
During the term under review, the Company sold1,456,000 tons of sulfuric acid, a year-on-year decreaseof 21.9%. Since January 2001, Pan Pacific Copper Co.,Ltd. has also handled all sales of sulfuric acid.
A major Group company, Toho Titanium Co., Ltd.(Kanagawa, 37.51% equity), manufactures and sellstitanium metals (titanium sponge, titanium ingots,etc.), catalysts for propylene polymerization, electron-ic ceramics materials (high-purity titanium oxides,fine powdered nickel). It sold 9,300 tons of titaniummetals during fiscal 2000, a decrease of 15.4% fromthe previous term.
Nippon Mining & Metals 11
Precious and Rare Metals
Zinc
Sulfuric Acid
Titanium and Other Materials
(Thousand Tons)
1999 2000
Global Production of Refined Zinc
World Total8,361
World Total8,929 Japan
NM&M 100
(15.3%)
Japan633
(7.6%)
654(7.3%)
(Source: ILZSG)
(Tons)
1999 2000
Global Production of Gold
World Total3,189
World Total3,184 Japan
NM&M 30
(22.9%)
Japan107
(3.4%)
131(4.1%)
(Source: GFMS 2001)
(Tons)
1999 2000
Global Production of Silver
World Total22,678
World Total23,940 Japan
NM&M 359
(15.1%)
Japan2,258
(10.0%)
2,385(10.0%)
(Source: World Silver Survey 2001 by Silver Institute)
(Thousand Tons)
1999 2000
Global Production of Sulfuric Acid
World Total158,708
World Total158,645 Japan
NM&M 942
(13.4%)
Japan6,920(4.4%)
7,039(4.4%)
(Source: IFA)

Metal Production Resources Development
12 Nippon Mining & Metals
Los Pelambres Mine (Chile)
Ensuring the long-term, stable procurement of raw materials
Pursuing return on investment in the development of resources
McArthur River Mine (Australia)
Escondida Mine (Chile)
Collahuasi Mine (Chile)

Nippon Mining & Metals 13
The Los Pelambres Mine in Chile (15% equity), whichcommenced production in January 2000, has beenoperating smoothly, and it has proved to be a highlyprofitable mine. It produced 310,000 tons of coppercontained in concentrate in the year ended December2000. We now are in a position to procure 60% of theraw materials we need from mines in which we haveinvested, including the Los Pelambres Mine, theCollahuasi Mine (3.6% equity), and the EscondidaMine (2% equity).
Aside from securing raw materials, we activelyseek the best return on investment in the developmentof resources. Thus we are working to secure new min-ing interests by vigorously taking part in the mostpromising exploration projects throughout the world.
Furthermore, the Company has entered into certainagreements with Cadia Holdings Pty. Ltd., an Australiancorporation, which is a wholly owned subsidiary ofNewcrest Mining Limited, a leading gold mining companyin Australia, regarding the loan facility of constructionfunds of Cadia Holdings' Ridgeway Mine now under con-struction (full-scale operation is expected to start in2002) and the long-term purchase of gold-rich copperconcentrate produced by Cadia Holdings.
The Company obtains the majority of its zinc and leadconcentrate from the Toyoha Mine in Hokkaido (100%equity) and the McArthur River Mine in Australia(15% group equity). The Toyoha Mine produced71,000 tons of zinc concentrate and 10,000 tons oflead concentrate during fiscal 2000. All the zinc con-centrate is shipped to Akita Zinc Co., Ltd., for refining,while the lead concentrate is refined on a toll basis byother companies. The McArthur River Mine produced350,000 tons of zinc/lead bulk concentrate during fis-cal 2000. Together, these two mines supply 50,000tons of zinc to the Company’s toll refining operationsannually. Kagoshima-based Kasuga Mines Co., Ltd.(100% equity) supplied 117,000 tons of gold-bearingsilica ore during the term under review.
Domestic MinesToyoha
Kasuga
JAPAN
Los Pelambres
EscondidaCollahuasi
CHILE
McArthur River
AUSTRALIA
Foreign Investment and advance
Cadia Hill &Ridgeway
Millions of U.S. DollarsEscondida Los Pelambres Collahuasi
(2% equity) (15% equity) (3.6% equity)
Net sales 1,631 604 823
Income before 528 165 183special items
Net income 444 139 155
Business Performance of the Three Nippon Mining & Metals-Affiliated Chilean Copper Mines
Copper
Zinc, Lead and Gold-Bearing Silica
Year ended 31stDecember, 2000
Metal Fabrication
14 Nippon Mining & Metals
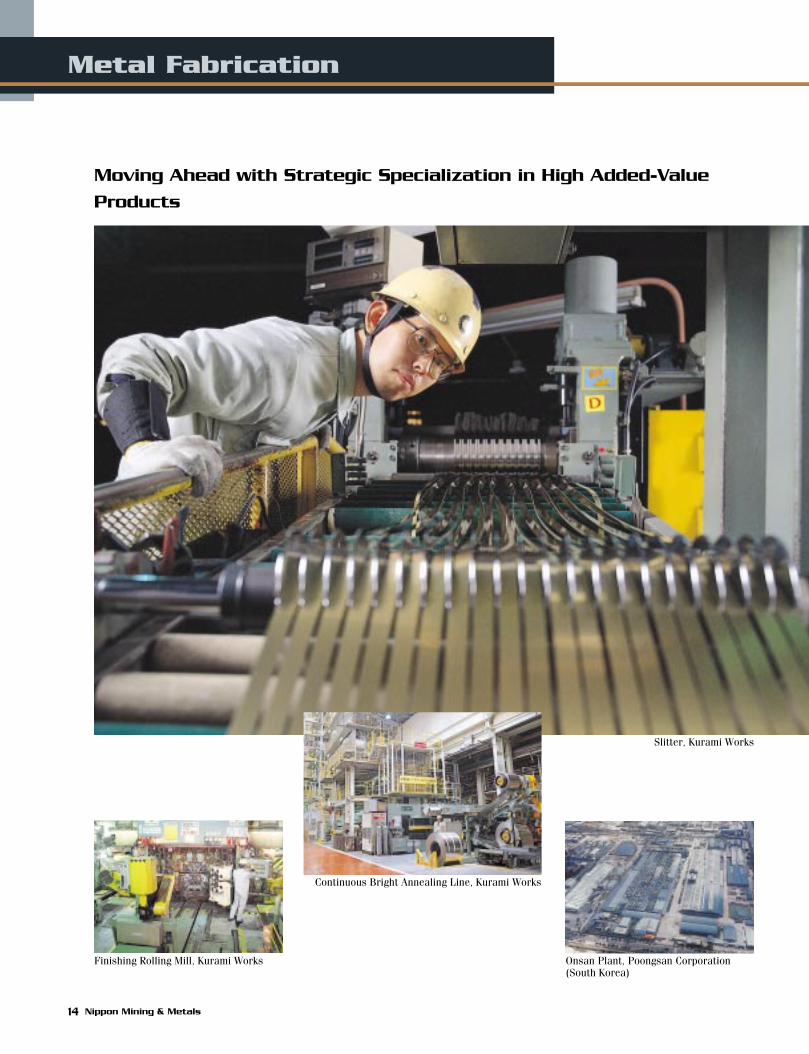
Moving Ahead with Strategic Specialization in High Added-Value
Products
Slitter, Kurami Works
Finishing Rolling Mill, Kurami Works
Continuous Bright Annealing Line, Kurami Works
Onsan Plant, Poongsan Corporation(South Korea)
Nippon Mining & Metals 15
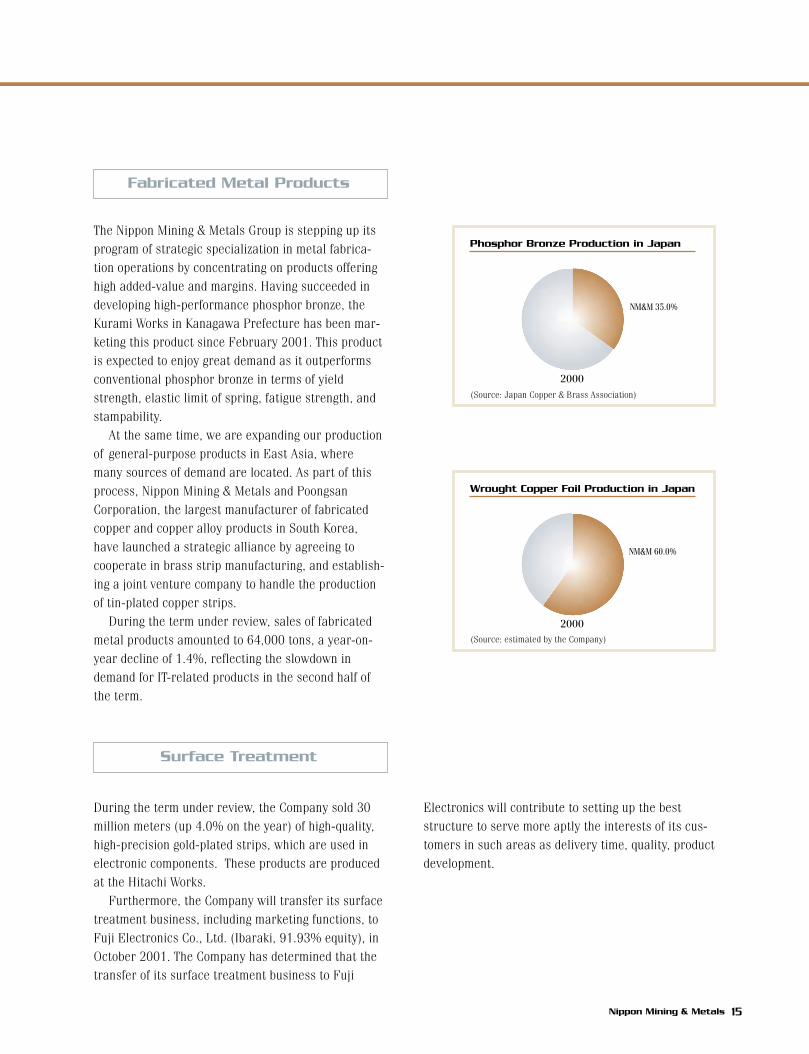
The Nippon Mining & Metals Group is stepping up itsprogram of strategic specialization in metal fabrica-tion operations by concentrating on products offeringhigh added-value and margins. Having succeeded indeveloping high-performance phosphor bronze, theKurami Works in Kanagawa Prefecture has been mar-keting this product since February 2001. This productis expected to enjoy great demand as it outperformsconventional phosphor bronze in terms of yieldstrength, elastic limit of spring, fatigue strength, andstampability.
At the same time, we are expanding our productionof general-purpose products in East Asia, wheremany sources of demand are located. As part of thisprocess, Nippon Mining & Metals and PoongsanCorporation, the largest manufacturer of fabricatedcopper and copper alloy products in South Korea,have launched a strategic alliance by agreeing tocooperate in brass strip manufacturing, and establish-ing a joint venture company to handle the productionof tin-plated copper strips.
During the term under review, sales of fabricatedmetal products amounted to 64,000 tons, a year-on-year decline of 1.4%, reflecting the slowdown indemand for IT-related products in the second half ofthe term.
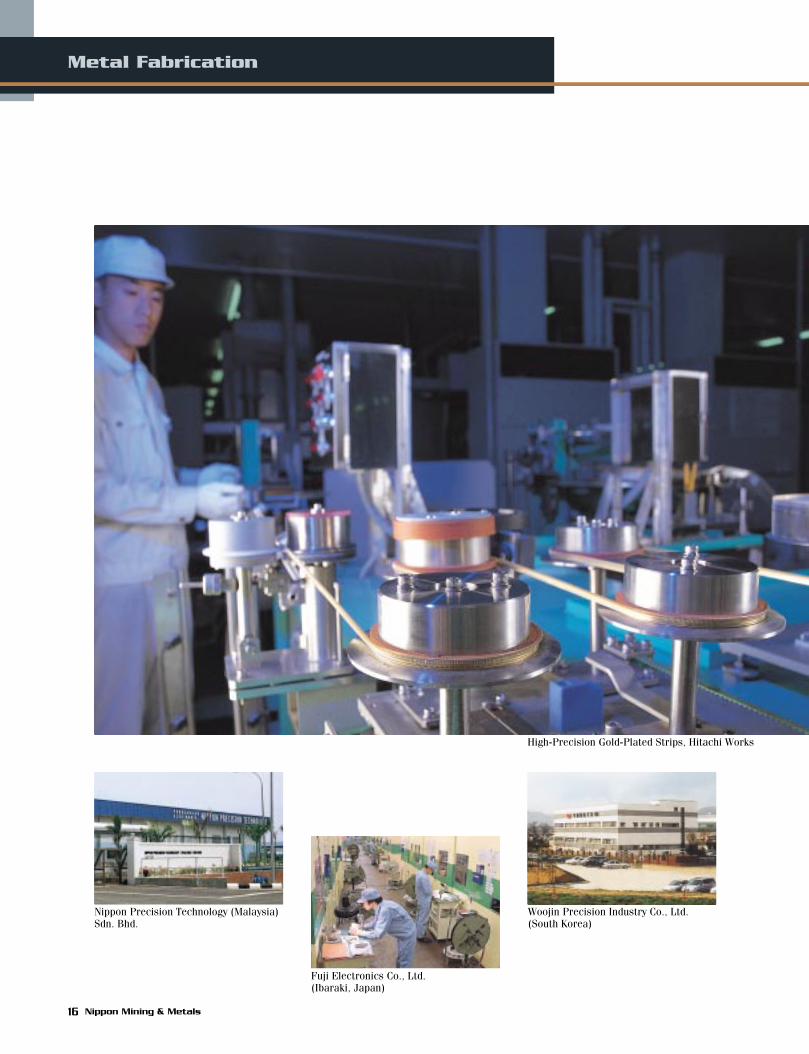
During the term under review, the Company sold 30million meters (up 4.0% on the year) of high-quality,high-precision gold-plated strips, which are used inelectronic components. These products are producedat the Hitachi Works.
Furthermore, the Company will transfer its surfacetreatment business, including marketing functions, toFuji Electronics Co., Ltd. (Ibaraki, 91.93% equity), inOctober 2001. The Company has determined that thetransfer of its surface treatment business to Fuji
Electronics will contribute to setting up the beststructure to serve more aptly the interests of its cus-tomers in such areas as delivery time, quality, productdevelopment.
Fabricated Metal Products
Surface Treatment
2000
Phosphor Bronze Production in Japan
NM&M 35.0%
2000
Wrought Copper Foil Production in Japan
NM&M 60.0%
(Source: Japan Copper & Brass Association)
(Source: estimated by the Company)
Metal Fabrication
16 Nippon Mining & Metals
High-Precision Gold-Plated Strips, Hitachi Works
Nippon Precision Technology (Malaysia) Sdn. Bhd.
Woojin Precision Industry Co., Ltd.(South Korea)
Fuji Electronics Co., Ltd. (Ibaraki, Japan)
Nippon Mining & Metals 17
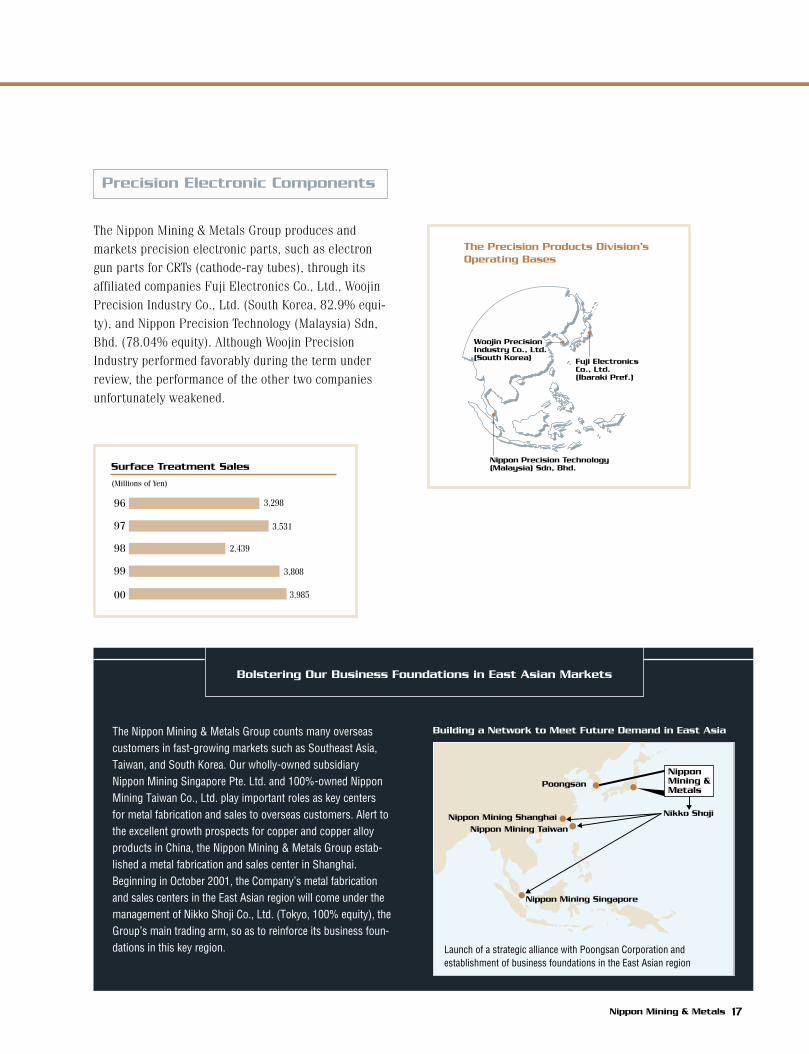
The Nippon Mining & Metals Group produces and markets precision electronic parts, such as electrongun parts for CRTs (cathode-ray tubes), through itsaffiliated companies Fuji Electronics Co., Ltd., WoojinPrecision Industry Co., Ltd. (South Korea, 82.9% equi-ty), and Nippon Precision Technology (Malaysia) Sdn,Bhd. (78.04% equity). Although Woojin PrecisionIndustry performed favorably during the term underreview, the performance of the other two companiesunfortunately weakened.
Precision Electronic Components
The Precision Products Division’s Operating Bases
Fuji Electronics Co., Ltd.(Ibaraki Pref.)
Woojin Precision Industry Co., Ltd.(South Korea)
Nippon Precision Technology(Malaysia) Sdn, Bhd.
96
97
98
99
00
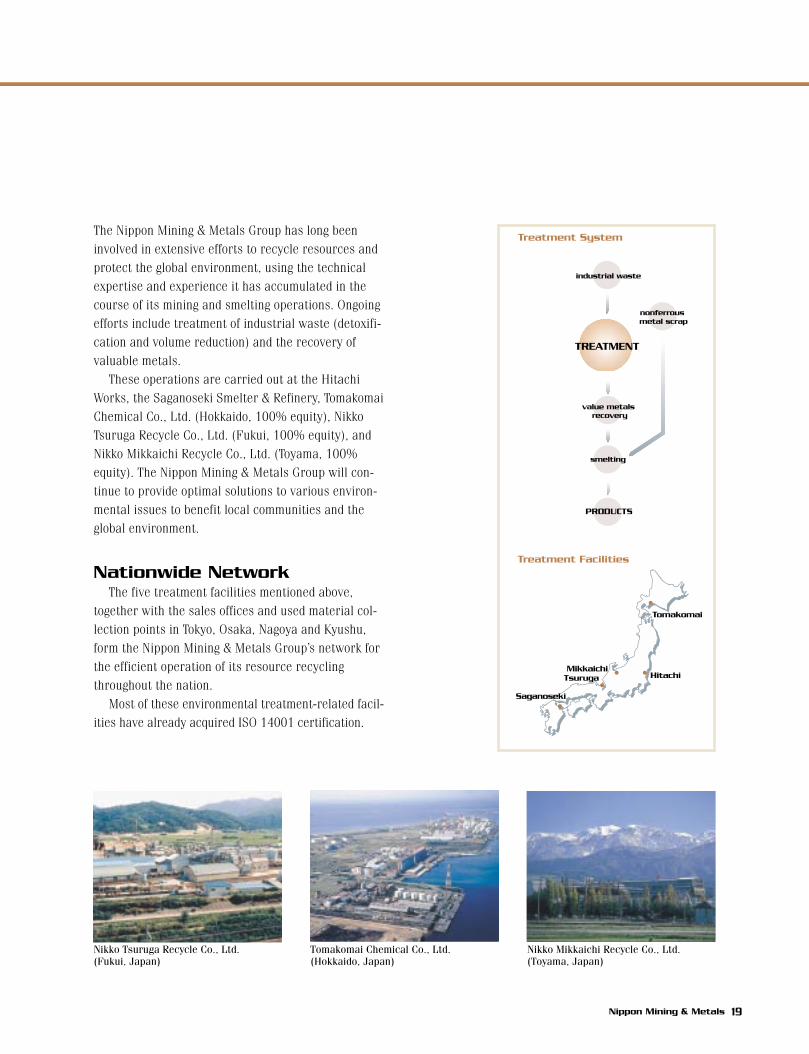
Surface Treatment Sales
3,298
3,531
2,439
3,808
3,985
(Millions of Yen)
The Nippon Mining & Metals Group counts many overseascustomers in fast-growing markets such as Southeast Asia,Taiwan, and South Korea. Our wholly-owned subsidiaryNippon Mining Singapore Pte. Ltd. and 100%-owned NipponMining Taiwan Co., Ltd. play important roles as key centersfor metal fabrication and sales to overseas customers. Alert tothe excellent growth prospects for copper and copper alloyproducts in China, the Nippon Mining & Metals Group estab-lished a metal fabrication and sales center in Shanghai.Beginning in October 2001, the Company’s metal fabricationand sales centers in the East Asian region will come under themanagement of Nikko Shoji Co., Ltd. (Tokyo, 100% equity), theGroup’s main trading arm, so as to reinforce its business foun-dations in this key region.
Nippon Mining Taiwan
Nikko Shoji
Poongsan
Nippon Mining Singapore
Nippon Mining Shanghai
Nippon Mining & Metals
Bolstering Our Business Foundations in East Asian Markets
Building a Network to Meet Future Demand in East Asia
Launch of a strategic alliance with Poongsan Corporation and establishment of business foundations in the East Asian region

Recycling & Environmental Services
18 Nippon Mining & Metals
Incineration Plant, Hitachi Works
Committed to the protection of the global environment by
promoting resource recycling
96
97
98
99
00
Total Waste Treatment Volume at Incineration Plant
58,136
55,013
55,370
58,967
60,698
(Tons)
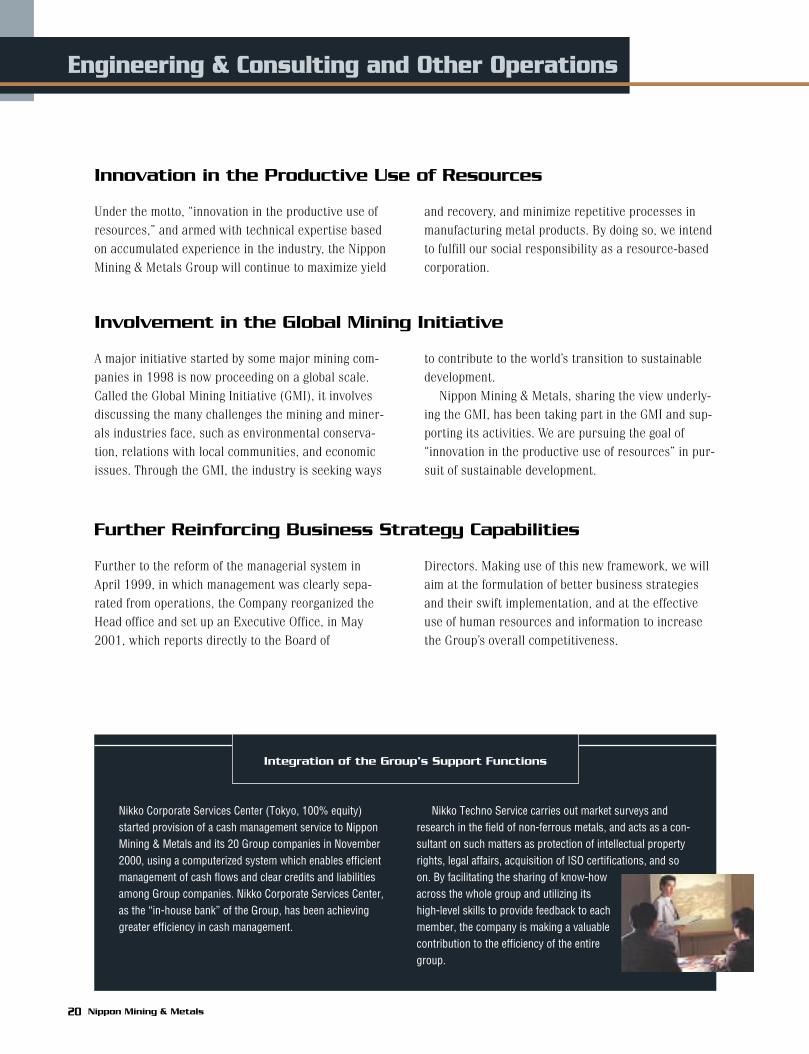
The Nippon Mining & Metals Group has long beeninvolved in extensive efforts to recycle resources andprotect the global environment, using the technicalexpertise and experience it has accumulated in thecourse of its mining and smelting operations. Ongoingefforts include treatment of industrial waste (detoxifi-cation and volume reduction) and the recovery ofvaluable metals.
These operations are carried out at the HitachiWorks, the Saganoseki Smelter & Refinery, TomakomaiChemical Co., Ltd. (Hokkaido, 100% equity), NikkoTsuruga Recycle Co., Ltd. (Fukui, 100% equity), andNikko Mikkaichi Recycle Co., Ltd. (Toyama, 100%equity). The Nippon Mining & Metals Group will con-tinue to provide optimal solutions to various environ-mental issues to benefit local communities and theglobal environment.
Nationwide NetworkThe five treatment facilities mentioned above,
together with the sales offices and used material col-lection points in Tokyo, Osaka, Nagoya and Kyushu,form the Nippon Mining & Metals Group’s network forthe efficient operation of its resource recyclingthroughout the nation.
Most of these environmental treatment-related facil-ities have already acquired ISO 14001 certification.
Nippon Mining & Metals 19
Tomakomai
HitachiMikkaichiTsuruga
Saganoseki
Treatment Facilities
TREATMENT
industrial waste
value metals recovery
smelting
PRODUCTS
Treatment System
nonferrous metal scrap
Nikko Tsuruga Recycle Co., Ltd. (Fukui, Japan)
Tomakomai Chemical Co., Ltd. (Hokkaido, Japan)
Nikko Mikkaichi Recycle Co., Ltd.(Toyama, Japan)
Engineering & Consulting and Other Operations
20 Nippon Mining & Metals
Innovation in the Productive Use of Resources
Under the motto, “innovation in the productive use ofresources,” and armed with technical expertise basedon accumulated experience in the industry, the NipponMining & Metals Group will continue to maximize yield
and recovery, and minimize repetitive processes inmanufacturing metal products. By doing so, we intendto fulfill our social responsibility as a resource-basedcorporation.
Involvement in the Global Mining Initiative
A major initiative started by some major mining com-panies in 1998 is now proceeding on a global scale.Called the Global Mining Initiative (GMI), it involvesdiscussing the many challenges the mining and miner-als industries face, such as environmental conserva-tion, relations with local communities, and economicissues. Through the GMI, the industry is seeking ways
to contribute to the world’s transition to sustainabledevelopment.
Nippon Mining & Metals, sharing the view underly-ing the GMI, has been taking part in the GMI and sup-porting its activities. We are pursuing the goal of“innovation in the productive use of resources” in pur-suit of sustainable development.
Further Reinforcing Business Strategy Capabilities
Further to the reform of the managerial system inApril 1999, in which management was clearly sepa-rated from operations, the Company reorganized theHead office and set up an Executive Office, in May2001, which reports directly to the Board of
Directors. Making use of this new framework, we willaim at the formulation of better business strategiesand their swift implementation, and at the effectiveuse of human resources and information to increasethe Group’s overall competitiveness.
Nikko Corporate Services Center (Tokyo, 100% equity) started provision of a cash management service to NipponMining & Metals and its 20 Group companies in November2000, using a computerized system which enables efficientmanagement of cash flows and clear credits and liabilitiesamong Group companies. Nikko Corporate Services Center,as the “in-house bank” of the Group, has been achievinggreater efficiency in cash management.
Nikko Techno Service carries out market surveys andresearch in the field of non-ferrous metals, and acts as a con-sultant on such matters as protection of intellectual propertyrights, legal affairs, acquisition of ISO certifications, and soon. By facilitating the sharing of know-howacross the whole group and utilizing its high-level skills to provide feedback to eachmember, the company is making a valuablecontribution to the efficiency of the entiregroup.
Integration of the Group’s Support Functions

Technology Development Center
Nippon Mining & Metals 21
Moving Ahead with the Development of Innovative Technologies
and Products
Alert to the future, the Nippon Mining & Metals Groupis working constantly to develop innovative technolo-gies and products. During the term under review, theCompany commenced development of next-generationhydro-metallurgical processes for smelting.
In the area of metal fabrication, we not only devel-oped but also moved ahead with the commercializa-tion of high-performance copper alloy products forconnectors, such as high-performance phosphorbronze and high-performance titanium. Collaborationwith Japan Steel Works, Ltd. to improve the quality ofinvar and raise the efficiency of the invar manufactur-ing process has already succeeded in the commercial-ization of certain products.
In the surface treatment area, we scored advancesin the development of technology to improve the pro-ductivity of the plating process and boost yields.
In the area of recycling and environmental ser-vices, we developed techniques to further enhance theefficiency of processes to treat industrial waste aswell as processes to separate metals from other sub-stances, then to treat and recover them. Our sub-sidiary Nikko Mikkaichi Recycle Co., Ltd. is developingan innovative gasification melting and reductionprocess designed to ensure the safe disposal of indus-trial waste. The heat generated in the process is usedto recover valuable metals such as copper from scrap.
The Company is vigorously working on more environmentally friendly, more efficient next-generation technologies such as hydro-metallurgical processes for copper smelting. In col-laboration with Mitsui Mining & Smelting, we are working on a practical application ofhydro-metallurgical processes for primary sulfide ore based on leaching technology by theIntec Copper Process. This project has begun receiving cooperation from the governmentand academic circles.
Transmission Electron Microscope
Glow DischargeMass Spectrometer
Electron Backscattering Pattern
Next-Generation
Copper Smelting
Technology Project
Inaugurated
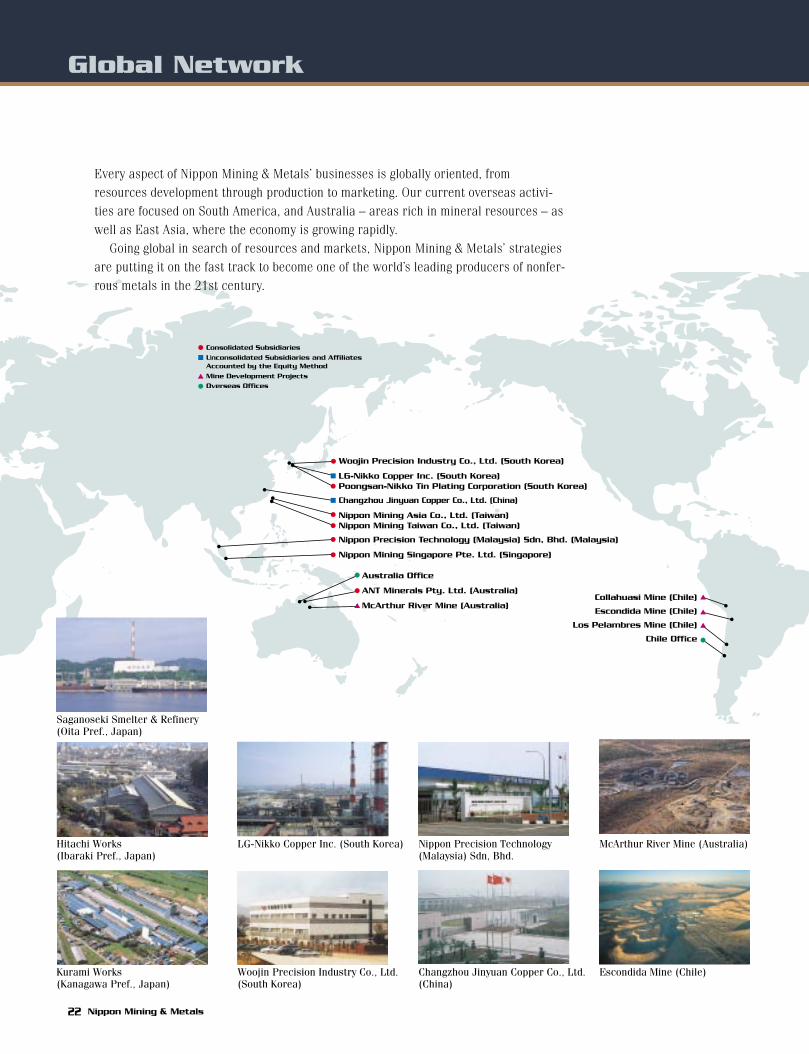
Woojin Precision Industry Co., Ltd. (South Korea)
LG-Nikko Copper Inc. (South Korea)Poongsan-Nikko Tin Plating Corporation (South Korea)
Changzhou Jinyuan Copper Co., Ltd. (China)
Nippon Mining Asia Co., Ltd. (Taiwan)Nippon Mining Taiwan Co., Ltd. (Taiwan)
Nippon Precision Technology (Malaysia) Sdn, Bhd. (Malaysia)
Nippon Mining Singapore Pte. Ltd. (Singapore)
Australia Office
ANT Minerals Pty. Ltd. (Australia)
McArthur River Mine (Australia)Collahuasi Mine (Chile)
Escondida Mine (Chile)
Los Pelambres Mine (Chile)
Chile Office
Overseas Offices
Consolidated Subsidiaries
Unconsolidated Subsidiaries and Affiliates Accounted by the Equity Method
Mine Development Projects
Global Network
22 Nippon Mining & Metals
Saganoseki Smelter & Refinery(Oita Pref., Japan)
Hitachi Works (Ibaraki Pref., Japan)
Kurami Works (Kanagawa Pref., Japan)
LG-Nikko Copper Inc. (South Korea)
Woojin Precision Industry Co., Ltd.(South Korea)
McArthur River Mine (Australia)
Escondida Mine (Chile)
Every aspect of Nippon Mining & Metals’ businesses is globally oriented, fromresources development through production to marketing. Our current overseas activi-ties are focused on South America, and Australia – areas rich in mineral resources – aswell as East Asia, where the economy is growing rapidly.
Going global in search of resources and markets, Nippon Mining & Metals’ strategiesare putting it on the fast track to become one of the world’s leading producers of nonfer-rous metals in the 21st century.
Nippon Precision Technology (Malaysia) Sdn, Bhd.
Changzhou Jinyuan Copper Co., Ltd.(China)
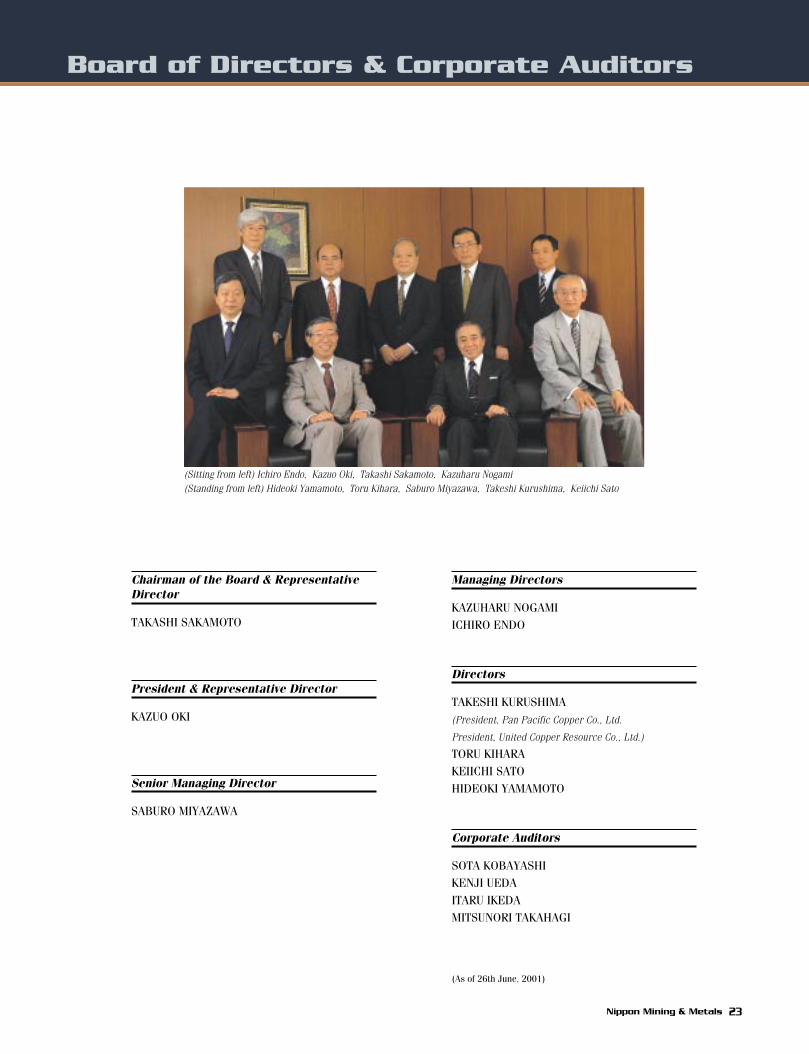
Board of Directors & Corporate Auditors
Nippon Mining & Metals 23
Chairman of the Board & RepresentativeDirector
TAKASHI SAKAMOTO
President & Representative Director
KAZUO OKI
Senior Managing Director
SABURO MIYAZAWA
Managing Directors
KAZUHARU NOGAMI
ICHIRO ENDO
Directors
TAKESHI KURUSHIMA
(President, Pan Pacific Copper Co., Ltd.
President, United Copper Resource Co., Ltd.)
TORU KIHARA
KEIICHI SATO
HIDEOKI YAMAMOTO
Corporate Auditors
SOTA KOBAYASHI
KENJI UEDA
ITARU IKEDA
MITSUNORI TAKAHAGI
(As of 26th June, 2001)
(Sitting from left) Ichiro Endo, Kazuo Oki, Takashi Sakamoto, Kazuharu Nogami(Standing from left) Hideoki Yamamoto, Toru Kihara, Saburo Miyazawa, Takeshi Kurushima, Keiichi Sato

Financial Review
24 Nippon Mining & Metals
Fin
ancia
l Secti
on
Operating ResultsNet sales rose ¥22,421 million, or 8.1%, to ¥298,879million (US$2,391 million). Cost of sales rose ¥19,171million, or 8.1%, to ¥255,459 million (US$2,044 mil-lion). The ratio of costs to net sales leveled off at85.5%. Selling, general, and administrative expensesrose ¥798 million, or 3.7%, to ¥22,336 million(US$179 million). The ratio of SG&A expenses to netsales fell 0.3 percentage point to 7.5%. Income fromoperations rose ¥2,452 million, or 13.2%, to ¥21,084million (US$169 million). Income before special itemsrose ¥6,707 million, or 42.8%, to ¥22,364 million(US$179 million) mainly reflecting a strong businessperformance by the Los Pelambres Mine, an equity-method affiliate, in addition to an increase in incomeby the Company. Consequently, net income rose ¥2,349million, or 28.4%, to ¥10,609 million (US$85 million),while return on equity rose 1.8 percentage point to11.8%. Net income per share (basic) rose ¥9.95 to¥46.22 (US$0.37).
Financial PositionTotal assets rose ¥12,512 million, or 4.0%, to¥324,203 million (US$2,594 million). Current assetsincreased ¥8,167 million, or 6.8%, to ¥127,424 million(US$1,019 million).
Investment and advance increased ¥6,897 million,or 9.7%, to ¥77,931 million (US$623 million).Property, plant and equipment fell ¥91 million, or0.1%, to ¥103,314 million (US$827 million).
Current liabilities fell ¥4,077 million, or 2.9%, to¥138,295 million (US$1,106 million). Long-term liabil-ities increased ¥3,037 million, or 3.8%, to ¥82,248million (US$658 million).
Shareholders’ equity rose ¥6,500 million, or 7.5%,to ¥92,956 million (US$744 million), while the equityratio rose 1.0 percentage point to 28.7%.
Cash FlowsNet cash provided by operating activities came to¥23,943 million (US$192 million), due mainly to¥19,872 million in income before income taxes andminority interest reflecting firm sales.
Net cash used in investing activities stood at ¥8,415million (US$67 million), mainly reflecting a cash out-flow of ¥9,429 million for purchase of property, plantand equipment. By comparison, net cash of ¥31,679million was provided by investing activities in the pre-vious term, due mainly to investment and advance toLG-Nikko Copper Inc.
Net cash used in financing activities came to¥14,775 million (US$118 million), due to a net cashoutflow of ¥13,167 million, by proceeds from andrepayment of long-term debt.
As a result, the term-end balance of cash and cashequivalents, including the effect of exchange ratechanges and adjustments of newly consolidated sub-sidiaries’ balance at the beginning of the term, rose¥1,351 million to ¥6,806 million (US$54 million).

Nippon Mining & Metals 25
278,360
(Millions of Yen)
283,444
256,521
276,458
298,879
97 98 99 00 01
Net Sales
18,434
(Millions of Yen)
23,903
19,082
8,632
21,084
97 98 99 00 01
Income from Operations
11,418
(Millions of Yen)
15,459
7,4118,260
10,609
97 98 99 00 01
Net Income
265,016
(Millions of Yen)
298,317 289,527
311,691
97 98 99 00 01
Total Assets
118,832
47,172
107,040
16,483
122,070
33,425
106,679
2,842
138,970
37,931
105,331
16,085
119,257
71,034
103,432
17,968
324,203
127,424
77,931
103,341
15,507
Current AssetsInvestments and AdvancesProperty, Plant and EquipmentOther Assets
17.8
(%)
20.3
27.4 27.728.7
97 98 99 00 01
Shareholders’ Equity Ratio
27.6
(%)
28.7
10.011.8
97 98 99 00 01
Return on Equity
10.6
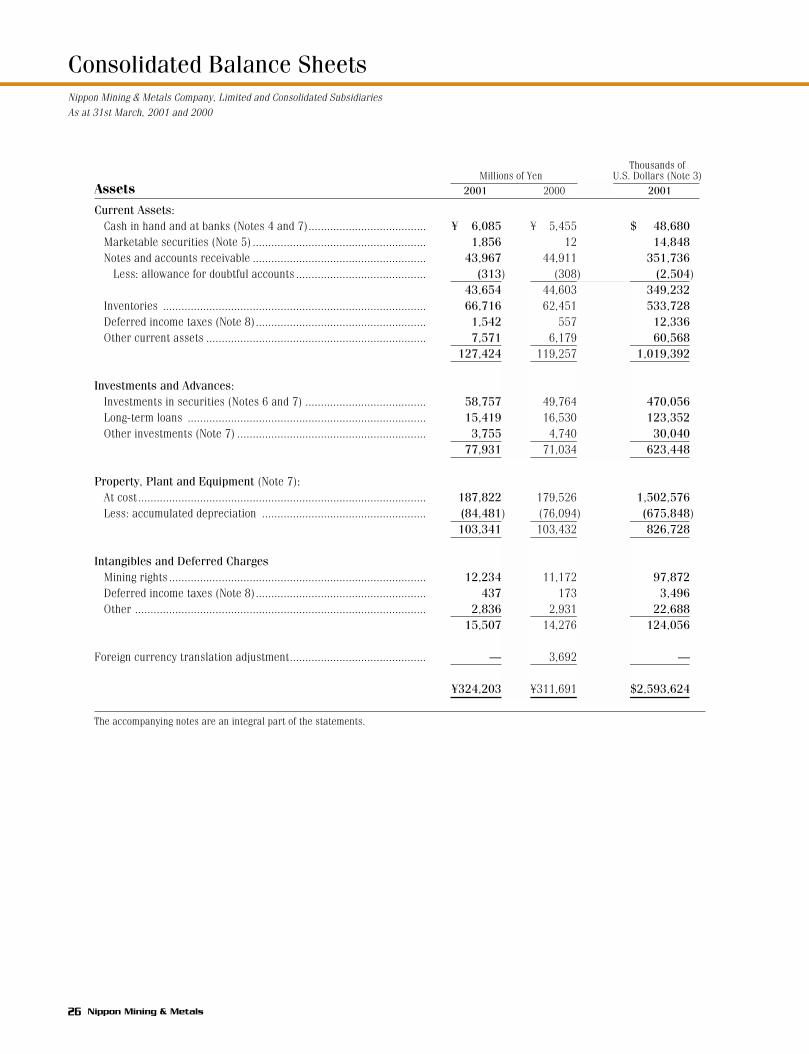
Consolidated Balance Sheets
26 Nippon Mining & Metals
Thousands ofMillions of Yen U.S. Dollars (Note 3)
2001 2000 2001
Current Assets:Cash in hand and at banks (Notes 4 and 7)...................................... ¥ 6,085 ¥ 5,455 $ 48,680Marketable securities (Note 5) ........................................................ 1,856 12 14,848Notes and accounts receivable ........................................................ 43,967 44,911 351,736
Less: allowance for doubtful accounts .......................................... (313) (308) (2,504)43,654 44,603 349,232
Inventories ..................................................................................... 66,716 62,451 533,728Deferred income taxes (Note 8)....................................................... 1,542 557 12,336Other current assets ....................................................................... 7,571 6,179 60,568
127,424 119,257 1,019,392
Investments and Advances:Investments in securities (Notes 6 and 7) ....................................... 58,757 49,764 470,056Long-term loans ............................................................................. 15,419 16,530 123,352Other investments (Note 7) ............................................................. 3,755 4,740 30,040
77,931 71,034 623,448
Property, Plant and Equipment (Note 7):At cost............................................................................................. 187,822 179,526 1,502,576Less: accumulated depreciation ..................................................... (84,481) (76,094) (675,848)
103,341 103,432 826,728
Intangibles and Deferred ChargesMining rights ................................................................................... 12,234 11,172 97,872Deferred income taxes (Note 8)....................................................... 437 173 3,496Other .............................................................................................. 2,836 2,931 22,688
15,507 14,276 124,056
Foreign currency translation adjustment............................................ — 3,692 —
¥324,203 ¥311,691 $2,593,624
The accompanying notes are an integral part of the statements.
Assets
Nippon Mining & Metals Company, Limited and Consolidated SubsidiariesAs at 31st March, 2001 and 2000
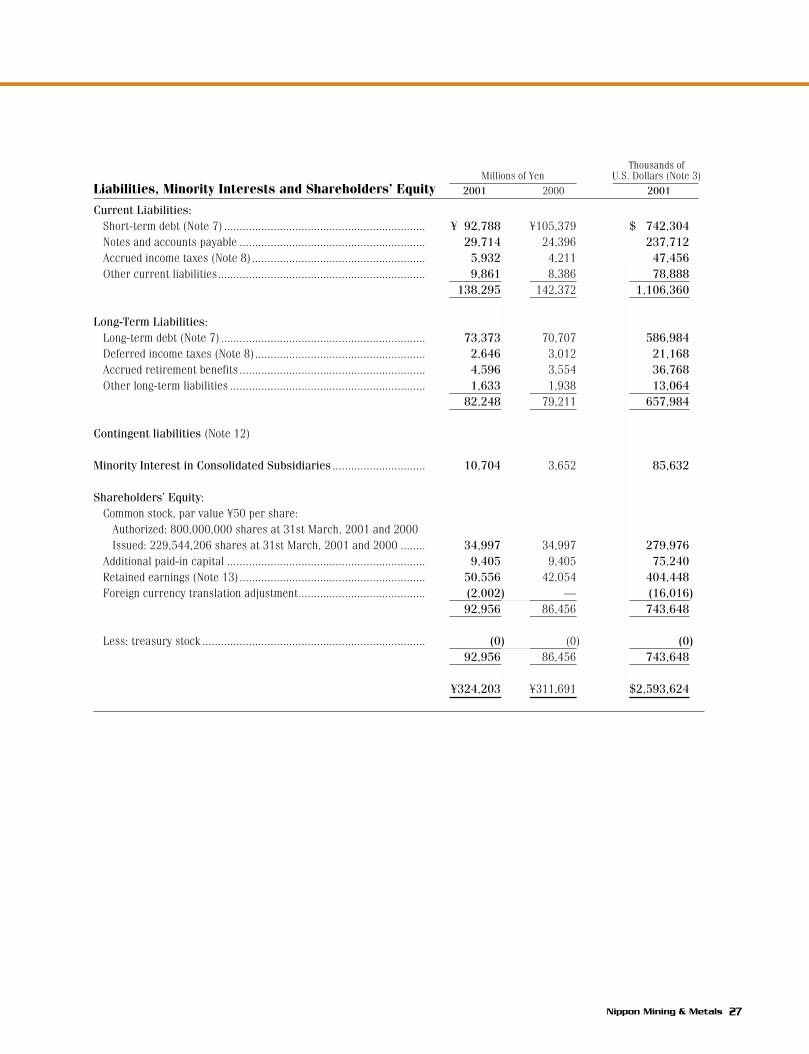
Nippon Mining & Metals 27
Thousands ofMillions of Yen U.S. Dollars (Note 3)
2001 2000 2001
Current Liabilities:Short-term debt (Note 7) ................................................................. ¥ 92,788 ¥105,379 $ 742,304Notes and accounts payable ............................................................ 29,714 24,396 237,712Accrued income taxes (Note 8)........................................................ 5,932 4,211 47,456Other current liabilities................................................................... 9,861 8,386 78,888
138,295 142,372 1,106,360
Long-Term Liabilities:Long-term debt (Note 7) .................................................................. 73,373 70,707 586,984Deferred income taxes (Note 8)....................................................... 2,646 3,012 21,168Accrued retirement benefits ............................................................ 4,596 3,554 36,768Other long-term liabilities ............................................................... 1,633 1,938 13,064
82,248 79,211 657,984
Contingent liabilities (Note 12)
Minority Interest in Consolidated Subsidiaries .............................. 10,704 3,652 85,632
Shareholders’ Equity:Common stock, par value ¥50 per share:
Authorized: 800,000,000 shares at 31st March, 2001 and 2000Issued: 229,544,206 shares at 31st March, 2001 and 2000 ........ 34,997 34,997 279,976
Additional paid-in capital ................................................................ 9,405 9,405 75,240Retained earnings (Note 13)............................................................ 50,556 42,054 404,448Foreign currency translation adjustment......................................... (2,002) — (16,016)
92,956 86,456 743,648
Less: treasury stock ........................................................................ (0) (0) (0)92,956 86,456 743,648
¥324,203 ¥311,691 $2,593,624
Liabilities, Minority Interests and Shareholders’ Equity
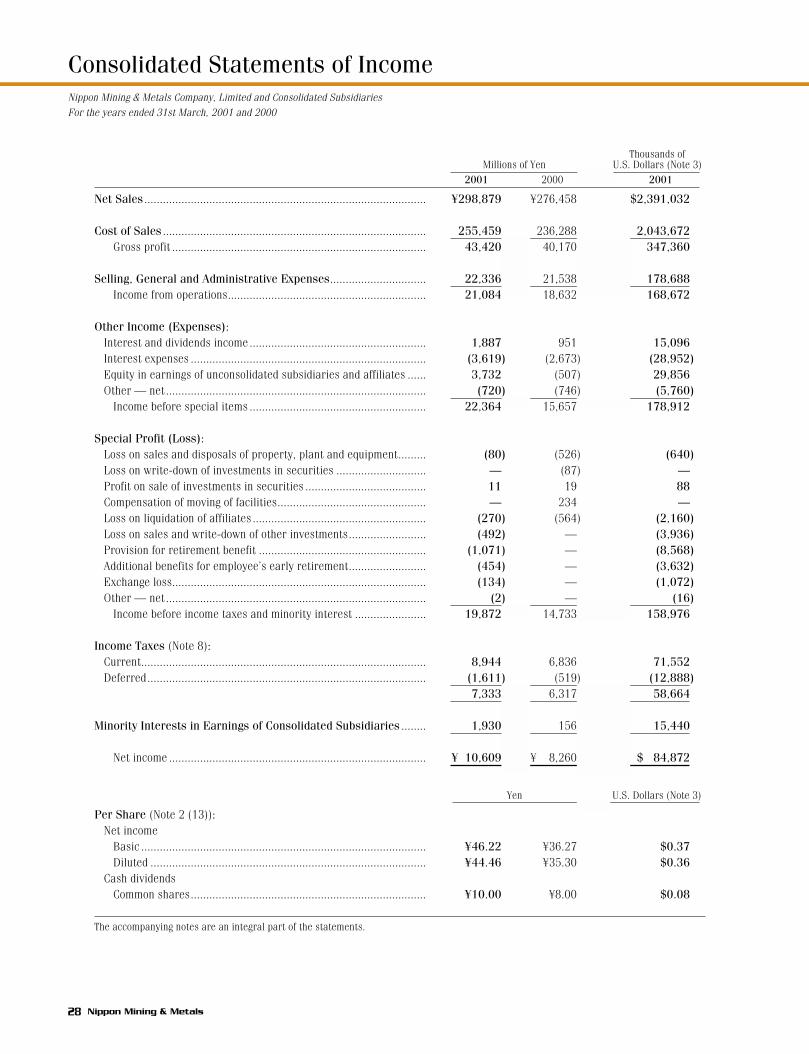
Consolidated Statements of Income
28 Nippon Mining & Metals
Thousands ofMillions of Yen U.S. Dollars (Note 3)
2001 2000 2001
Net Sales ........................................................................................... ¥298,879 ¥276,458 $2,391,032
Cost of Sales ..................................................................................... 255,459 236,288 2,043,672Gross profit .................................................................................. 43,420 40,170 347,360
Selling, General and Administrative Expenses............................... 22,336 21,538 178,688Income from operations................................................................ 21,084 18,632 168,672
Other Income (Expenses):Interest and dividends income......................................................... 1,887 951 15,096Interest expenses ............................................................................ (3,619) (2,673) (28,952)Equity in earnings of unconsolidated subsidiaries and affiliates ...... 3,732 (507) 29,856Other — net .................................................................................... (720) (746) (5,760)
Income before special items ......................................................... 22,364 15,657 178,912
Special Profit (Loss):Loss on sales and disposals of property, plant and equipment......... (80) (526) (640)Loss on write-down of investments in securities ............................. — (87) —Profit on sale of investments in securities ....................................... 11 19 88Compensation of moving of facilities................................................ — 234 —Loss on liquidation of affiliates ........................................................ (270) (564) (2,160)Loss on sales and write-down of other investments......................... (492) — (3,936)Provision for retirement benefit ...................................................... (1,071) — (8,568)Additional benefits for employee’s early retirement......................... (454) — (3,632)Exchange loss.................................................................................. (134) — (1,072)Other — net .................................................................................... (2) — (16)
Income before income taxes and minority interest ....................... 19,872 14,733 158,976
Income Taxes (Note 8):Current............................................................................................ 8,944 6,836 71,552Deferred.......................................................................................... (1,611) (519) (12,888)
7,333 6,317 58,664
Minority Interests in Earnings of Consolidated Subsidiaries ........ 1,930 156 15,440
Net income ................................................................................... ¥ 10,609 ¥ 8,260 $ 84,872
Yen U.S. Dollars (Note 3)
Per Share (Note 2 (13)):Net income
Basic ............................................................................................ ¥46.22 ¥36.27 $0.37Diluted ......................................................................................... ¥44.46 ¥35.30 $0.36
Cash dividendsCommon shares............................................................................ ¥10.00 ¥8.00 $0.08
The accompanying notes are an integral part of the statements.
Nippon Mining & Metals Company, Limited and Consolidated SubsidiariesFor the years ended 31st March, 2001 and 2000
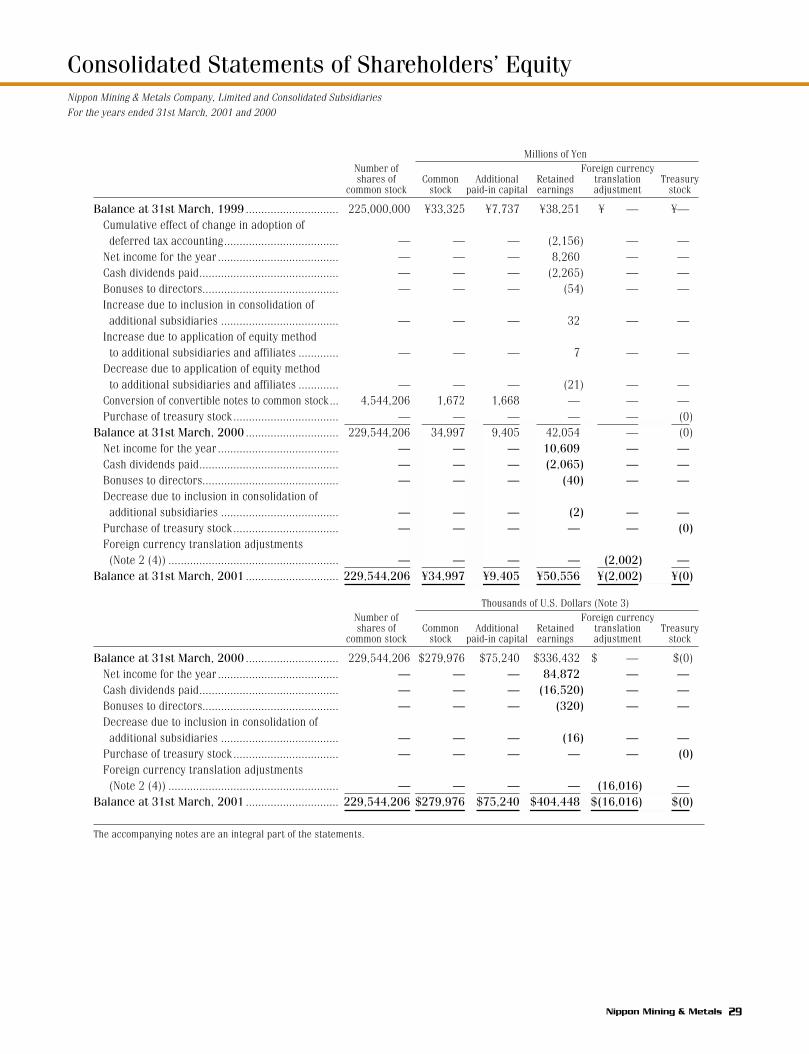
Consolidated Statements of Shareholders’ Equity
Nippon Mining & Metals 29
Millions of YenNumber of Foreign currencyshares of Common Additional Retained translation Treasury
common stock stock paid-in capital earnings adjustment stock
Balance at 31st March, 1999 .............................. 225,000,000 ¥33,325 ¥7,737 ¥38,251 ¥ — ¥—Cumulative effect of change in adoption of deferred tax accounting..................................... — — — (2,156) — —
Net income for the year ....................................... — — — 8,260 — —Cash dividends paid............................................. — — — (2,265) — —Bonuses to directors............................................ — — — (54) — —Increase due to inclusion in consolidation of additional subsidiaries ...................................... — — — 32 — —
Increase due to application of equity method to additional subsidiaries and affiliates ............. — — — 7 — —
Decrease due to application of equity method to additional subsidiaries and affiliates ............. — — — (21) — —
Conversion of convertible notes to common stock ... 4,544,206 1,672 1,668 — — —Purchase of treasury stock .................................. — — — — — (0)
Balance at 31st March, 2000 .............................. 229,544,206 34,997 9,405 42,054 — (0)Net income for the year ....................................... — — — 10,609 — —Cash dividends paid............................................. — — — (2,065) — —Bonuses to directors............................................ — — — (40) — —Decrease due to inclusion in consolidation of additional subsidiaries ...................................... — — — (2) — —
Purchase of treasury stock .................................. — — — — — (0)Foreign currency translation adjustments (Note 2 (4)) ....................................................... — — — — (2,002) —
Balance at 31st March, 2001 .............................. 229,544,206 ¥34,997 ¥9,405 ¥50,556 ¥(2,002) ¥(0)
Thousands of U.S. Dollars (Note 3)Number of Foreign currencyshares of Common Additional Retained translation Treasury
common stock stock paid-in capital earnings adjustment stock
Balance at 31st March, 2000 .............................. 229,544,206 $279,976 $75,240 $336,432 $ — $(0)Net income for the year ....................................... — — — 84,872 — —Cash dividends paid............................................. — — — (16,520) — —Bonuses to directors............................................ — — — (320) — —Decrease due to inclusion in consolidation of additional subsidiaries ...................................... — — — (16) — —
Purchase of treasury stock .................................. — — — — — (0)Foreign currency translation adjustments (Note 2 (4)) ....................................................... — — — — (16,016) —
Balance at 31st March, 2001 .............................. 229,544,206 $279,976 $75,240 $404,448 $(16,016) $(0)
The accompanying notes are an integral part of the statements.
Nippon Mining & Metals Company, Limited and Consolidated SubsidiariesFor the years ended 31st March, 2001 and 2000

Consolidated Statements of Cash Flows
30 Nippon Mining & Metals
Thousands ofMillions of Yen U.S. Dollars (Note 3)
2001 2000 2001
Cash Flows from Operating Activities:Income before income taxes and minority interest .......................... ¥19,872 ¥14,733 $158,976Adjustments for:
Depreciation and amortization ..................................................... 10,264 9,770 82,112Provision for retirement benefits.................................................. 1,230 233 9,840Interest and dividend income........................................................ (1,887) (951) (15,096)Interest expenses ......................................................................... 3,619 2,673 28,952Equity in earnings of unconsolidated subsidiariesand affiliates .............................................................................. (3,732) 507 (29,856)
Decrease (Increase) in notes and accounts receivables................... 1,018 (6,627) 8,144(Increase) Decrease in inventories.................................................. (4,203) 1,987 (33,624)Increase in notes and accounts payable .......................................... 5,197 1,645 41,576Other .............................................................................................. 780 1,117 6,240
Sub total................................................................................. 32,158 25,087 257,264Interest and dividends income received........................................... 2,596 1,688 20,768Interest expenses paid .................................................................... (3,514) (3,144) (28,112)Income taxes paid ........................................................................... (7,297) (4,723) (58,376)
Net cash provided by operating activities ............................... 23,943 18,908 191,544Cash Flows from Investing Activities:
Payments for purchase of property, plant and equipment................ (9,429) (6,589) (75,432)Payments for purchase of investments in securities ........................ (2,171) (15,196) (17,368)Decrease (Increase) in long-term loans receivable.......................... 2,443 (10,348) 19,544Other .............................................................................................. 742 454 5,936
Net cash used in investing activities....................................... (8,415) (31,679) (67,320)Cash Flows from Financing Activities:
Increase (Decrease) in short-term debt (net) .................................. 407 (4,048) 3,256Decrease in commercial paper (net) ............................................... — (2,000) —Proceeds from long-term debt ......................................................... 9,600 21,279 76,800Repayment of long-term debt........................................................... (22,767) (16,149) (182,136)Proceeds from issuance of convertible notes ................................... — 10,000 —Cash dividends paid......................................................................... (2,065) (2,265) (16,520)Cash dividends paid to minorities .................................................... (44) (37) (352)Proceeds from issuance of common stockby minority shareholders............................................................... 91 1,800 728
Other .............................................................................................. 3 (325) 24Net cash provided (used) by financing activities..................... (14,775) 8,255 (118,200)
Effect of Exchange Rate Changes on Cash and Cash Equivalents ... 214 (403) 1,712Net Increase (Decrease) in Cash and Cash Equivalents ............... 967 (4,919) 7,736Cash and Cash Equivalents at Beginning of Year .......................... 5,455 9,725 43,640Adjustments of New Consolidated Subsidiaries on Cash andCash Equivalents............................................................................ 384 649 3,072
Cash and Cash Equivalents at End of Year..................................... ¥ 6,806 ¥ 5,455 $ 54,448
The accompanying notes are an integral part of the statements.
Nippon Mining & Metals Company, Limited and Consolidated SubsidiariesFor the years ended 31st March, 2001 and 2000

Notes to the Consolidated Financial Statements
Nippon Mining & Metals 31
1. Basis of Presenting the Consolidated Financial StatementsThe accompanying consolidated financial statements have been prepared based on the accounts maintained by NIPPONMINING & METALS COMPANY, LIMITED (the “Company”) and its consolidated subsidiaries (the “Companies”) inaccordance with the provisions set forth in the Commercial Code of Japan and the Securities and Exchange Law, and inconformity with accounting principles and practices generally accepted in Japan, which are different in certain respectsfrom the application and disclosure requirements of International Accounting Standards.
Certain items presented in the consolidated financial statements submitted to the Director of Kanto Finance Bureauin Japan have been reclassified in these accounts for the convenience of readers outside Japan.
The consolidated financial statements are not intended to present the consolidated financial position, results ofoperations and cash flows in accordance with accounting principles and practices generally accepted in countries andjurisdictions other than Japan.
The Company is a majority-owned subsidiary of Japan Energy Corporation (“JEC”), a public-owned company in Japan.The Company’s transactions/account balances of material nature with JEC are summarized as follows:
Thousands ofMillions of Yen U.S. Dollars
31st March, 2001 2000 2001
Transaction:Sales of products ...................................................................... ¥6,922 ¥6,438 $55,376
Purchase of raw materials........................................................ ¥ 604 ¥ 875 $ 4,832
Account balance:Accounts receivable.................................................................. ¥ 475 ¥ 598 $ 3,800
Accounts payable...................................................................... ¥ 2 ¥ 79 $ 16
Any other transactions of the Company with JEC are not significant.
2. Summary of Significant Accounting Policies(1) Principles of Consolidation
As at 31st March, 2001, the consolidated financial statements include the accounts of the Company and its 28 significantsubsidiaries (21 domestic subsidiaries and 7 overseas subsidiaries). All significant intercompany accounts andtransactions and unrealized profit among the Companies, if any, have been eliminated in consolidation.
The unconsolidated subsidiaries would have no material effect on the Consolidated Financial Statements of theCompanies and therefore, excluded consolidation.
(2) Investments in Unconsolidated Subsidiaries and AffiliatesThe investments in 1 unconsolidated subsidiary and 16 major affiliates (influencing companies) are accounted for by theequity method. Investments in unconsolidated subsidiaries and affiliates not accounted for by the equity method arestated at cost or less, due to their insignificant effect on the Consolidated Financial Statements of the Companies.
(3) Remeasurement of Assets and Liabilities of the SubsidiariesFull portion of the assets and liabilities of the subsidiaries is marked to fair value as of the acquisition of the control.
(4) Translation of Foreign CurrencyUntil the year ended 31st March, 2000, assets and liabilities denominated in foreign currencies are translated into yenat the historical rate of exchange.
In translating the financial statements of subsidiaries or affiliates stated in foreign currencies into yen, for purposesof consolidation with the Company or for application of equity method, all assets and liabilities are translated at thecurrent exchange rates, while capital stock and the balance of retained earnings are translated at historical rates. Allrevenue and expense items for the year are translated at the current rates.
The difference arising from translation of the foreign currency financial statements is shown as “Foreign CurrencyTranslation Adjustment” in the assets.
Effective from the year ended 31st March, 2001, the Company and its subsidiaries adopted the new Japaneseaccounting standard for foreign currency translation, which is effective for periods beginning on or after 1st April, 2000.Under the new standard, all monetary assets and liabilities denominated in foreign currencies, whether long-term orshort-term, are translated into Japanese yen at the exchange rates prevailing at the balance sheet date. Resulting gainsand losses are included in net profit or loss for the period. The adoption of the new method had no material impact onthe accompanying consolidated financial statements.
Nippon Mining & Metals Company, Limited and Consolidated Subsidiaries
32 Nippon Mining & Metals
The new standard also amended the method of translating foreign currency financial statements of foreignsubsidiaries and affiliates into Japanese yen. Under the new standard, assets and liabilities of the foreign subsidiariesand affiliates are translated into Japanese yen at the exchange rates prevailing at the balance sheet date. Theshareholders’ equity at beginning of the year is translated into Japanese yen at the historical rates. Profit and lossamounts for the year are translated into Japanese yen using the average exchange rate during the year or, alternatively,using the exchange rates prevailing at the balance sheet date. Differences in yen amounts arising from the use ofdifferent rates are presented as “Foreign Currency Translation Adjustment” in the shareholders’ equity. The effect ofadopting the new accounting standard on the accompanying consolidated financial statements was immaterial.
(5) Cash and Cash EquivalentsCash and cash equivalents in the consolidated statements of cash flows are composed of cash in hand, bank deposits ableto be withdrawn on demand and short-term investments with an original maturity of three months or less and whichrepresent a minor risk of fluctuations in value.
(6) Allowance for Doubtful AccountsThe allowance for doubtful accounts is provided in amounts considered sufficient to cover possible losses on collection.
(7) InventoriesInventories are valued at cost as determined by the following methods:
Copper ore and related products...................................................... Mainly, last-in, first-out methodGold and silver................................................................................. Mainly, first-in, first-out methodOther inventories ............................................................................ Mainly, last-in, first-out method
(8) Property, Plant and EquipmentProperty, plant and equipment are mainly depreciated using the straight-line method.
The estimated useful lives for depreciation purposes range as follows:Buildings and Structures.................................................................. 2 to 50 yearsMachinery and equipment................................................................ 2 to 12 years
Normal repairs and maintenance including minor renewals and improvements are charged to income as incurred.(9) Financial Instruments
Until the year ended 31st March, 2000, the policy on accounting for financial instruments were as follows:Marketable securities (current) and investments in securities (non-current) with market quotation on the stock
exchanges are valued at the lower of moving-average cost or market method. Securities in current and non-current portfoliowithout market quotations on stock exchanges are valued at the moving average cost. Derivatives are stated at cost.
Effective from the year ended 31st March, 2001, the Company and its subsidiaries adopted the new Japaneseaccounting standard for financial instruments, which is effective for periods beginning on or after 1st April, 2000.However, mark-to-market accounting for other securities will be effective for period beginning on and after 1st April,2001. As a result of adoption of the new standard, income before income taxes for the year ended 31st March, 2001 hasincreased by 15 million yen, as compared with the amount which would have been reported if the previous standard hadbeen applied consistently.(a) Derivatives
Under the new standard, all derivatives are stated at fair value, with changes in fair value included in net profit orloss for the period in which they arise, except for derivatives that are designated as “hedging instruments” (see (c)Hedge Accounting below).
(b) SecuritiesSecurities held by the Company and its subsidiaries are, under the new standard, classified into two categories:
Investments of the Company in equity securities issued by unconsolidated subsidiaries and affiliates areaccounted for by the equity method. Exceptionally, investments in certain unconsolidated subsidiaries and affiliatesare stated at cost because the effect of application of the equity method would be immaterial.
Other securities for which market quotations are available or unavailable are valued at the moving-average cost,except as stated in the paragraph below.
In cases where the fair value of held-to-maturity debt securities, equity securities issued by unconsolidatedsubsidiaries and affiliates, or other securities has declined significantly and such impairment of the value is notdeemed temporary, those securities are written down to the fair value and the resulting losses are included in netprofit or loss for the period.
(c) Hedge AccountingGains or losses arising from changes in fair value of the derivatives designated as “hedging instruments” are deferredas an asset or liability and included in net profit or loss in the same period during which the gains and losses on thehedged items or transactions are recognized.
The derivatives designated as hedging instruments by the Company are principally interest rate swaps, forwardexchange contracts and commodity futures transactions. The related hedged items are trade accounts receivableand payable, long-term bank loans, and inventories.

Nippon Mining & Metals 33
The Company has a policy to utilize the above hedging instruments in order to reduce the Company’s exposure tothe risk of interest rate fluctuations. Thus, the Company’s purchases of the hedging instruments are limited to, atmaximum, the amounts of the hedged items.
The Company evaluates effectiveness of its hedging activities by reference to the accumulated gains or losses onthe hedging instruments and the related hedged items from the commencement of the hedge.
(10) Income TaxesIncome taxes of the Company and its domestic subsidiaries consist of corporate income taxes, local inhabitants taxes andenterprise taxes.
Income taxes were determined using the asset and liability approach, whereby deferred tax assets and liabilitieswere recognized in respect of temporary differences between the tax basis of assets and liabilities and those as reportedin the financial statements.
(11) Retirement Plan(a) Retirement Benefits to Employees
Until the year ended 31st March, 2000, the balance of accrued employees’ retirement benefits in the accompanyingconsolidated balance sheets represent the amount mainly equivalent to 40 per cent. of such retirement payments theCompany and subsidiaries would have been required to pay, if all eligible employees had retired at the year-end date(as allowed deduction for tax purpose).
In addition to the unfunded lump-sum severance payments described above, eligible employees of the company iscovered by non-contributory trusted pension plan. Eligible employees of 1 consolidated subsidiary are covered bycontributory trusted pension plan.
Effective from the year ended 31st March, 2001, the Company and its subsidiaries adopted the new Japaneseaccounting standard for retirement benefits, which is effective for periods beginning on or after 1st April, 2000. Inaccordance with the new standard, the reserve for retirement benefits as at 31st March, 2001 represents theestimated present value of projected benefit obligations in excess of the fair value of the plan assets except that, aspermitted under the new standard, the unrecognized transition amount arising from adopting the new standard of¥5,354 million at 1st April, 2000 (the beginning of year) and the unrecognized prior service cost are amortized on astraight-line basis over 5 years, and unrecognized actuarial differences are amortized on a straight-line bases overthe period of 5 years from the next year in which they arise. As a result of adopting the new standard, net pensionexpense for the year ended 31st March, 2001 has increased by ¥1,665 million and income before income taxes hasdecreased by ¥1,665 million as compared with the amounts which would have been reported if the previous standardhad been applied consistently.
(b) Retirement Benefits to Directors and Corporate AuditorsThe Company and subsidiaries have provided for accrued cost for retirement benefits to Directors and CorporateAuditors in an amount equivalent to 100 per cent. of such benefits the Company and subsidiaries would be requiredto pay, had all eligible Directors and Corporate Auditors retired at the year-end date.
The balance of “Accrued Retirement Benefits” account in the accompanying consolidated balance sheets includethe accrual for retirement benefits to Directors and Corporate Auditors, which amounted to ¥838 million ($6,704thousand), ¥1,026 million at 31st March, 2001 and 2000, respectively.
(12) Accounting for Finance LeasesFinance leases other than those which are deemed to transfer the ownership of the leased assets to lessees areaccounted for by the method similar to that used for ordinary operating leases.
However, all finance leases relating to the overseas consolidated subsidiaries are recognized as sales/purchases ofassets on installments payments.
(13) Earnings per ShareThe computation of basic net income per common stock is based on the weighted average number of outstanding sharesof common stock. The average number of shares used in the computation was 229,544,000 and 227,732,735 for theyears ended 31st March, 2001 and 2000, respectively.
The diluted net income per share assumes full conversion of outstanding convertible note at the beginning of the year(or at the time of issuance, if after beginning of the year) with an applicable adjustment for related net-of-tax interestexpense, and full exercise of outstanding warrants at the end of the year. The average number of shares used in thecomputation was 238,605,442 for the year ended 31st March, 2001.
Cash dividends per share shown in the statements of income are the amounts applicable to the respective years.
3. United States Dollar AmountsAmounts in U.S. dollars are included solely for the convenience of readers outside Japan. The rate of ¥125=U.S. $1, theapproximate rate of exchange prevailing at 31st March, 2001 has been used in translation. The inclusion of suchamounts is not intended to imply that Japanese yen have been or could be readily converted, realized or settled in U.S.dollars at this rate or any other rate.
34 Nippon Mining & Metals
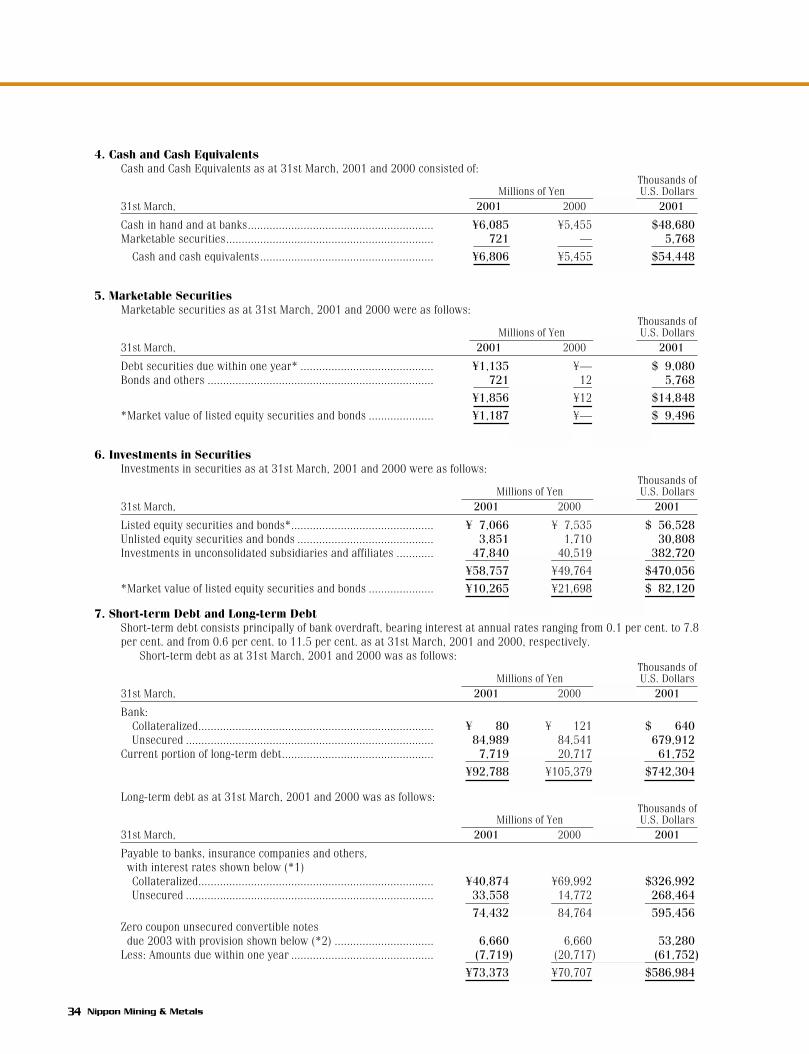
4. Cash and Cash EquivalentsCash and Cash Equivalents as at 31st March, 2001 and 2000 consisted of:
Thousands ofMillions of Yen U.S. Dollars
31st March, 2001 2000 2001
Cash in hand and at banks............................................................ ¥6,085 ¥5,455 $48,680Marketable securities................................................................... 721 — 5,768
Cash and cash equivalents........................................................ ¥6,806 ¥5,455 $54,448
5. Marketable SecuritiesMarketable securities as at 31st March, 2001 and 2000 were as follows:
Thousands ofMillions of Yen U.S. Dollars
31st March, 2001 2000 2001
Debt securities due within one year* ........................................... ¥1,135 ¥— $ 9,080Bonds and others ......................................................................... 721 12 5,768
¥1,856 ¥12 $14,848
*Market value of listed equity securities and bonds ..................... ¥1,187 ¥— $ 9,496
6. Investments in SecuritiesInvestments in securities as at 31st March, 2001 and 2000 were as follows:
Thousands ofMillions of Yen U.S. Dollars
31st March, 2001 2000 2001
Listed equity securities and bonds*.............................................. ¥ 7,066 ¥ 7,535 $ 56,528Unlisted equity securities and bonds ............................................ 3,851 1,710 30,808Investments in unconsolidated subsidiaries and affiliates ............ 47,840 40,519 382,720
¥58,757 ¥49,764 $470,056
*Market value of listed equity securities and bonds ..................... ¥10,265 ¥21,698 $ 82,120
7. Short-term Debt and Long-term DebtShort-term debt consists principally of bank overdraft, bearing interest at annual rates ranging from 0.1 per cent. to 7.8per cent. and from 0.6 per cent. to 11.5 per cent. as at 31st March, 2001 and 2000, respectively.
Short-term debt as at 31st March, 2001 and 2000 was as follows:Thousands of
Millions of Yen U.S. Dollars31st March, 2001 2000 2001
Bank:Collateralized............................................................................ ¥ 80 ¥ 121 $ 640Unsecured ................................................................................ 84,989 84,541 679,912
Current portion of long-term debt................................................. 7,719 20,717 61,752
¥92,788 ¥105,379 $742,304
Long-term debt as at 31st March, 2001 and 2000 was as follows:Thousands of
Millions of Yen U.S. Dollars31st March, 2001 2000 2001
Payable to banks, insurance companies and others, with interest rates shown below (*1)Collateralized............................................................................ ¥40,874 ¥69,992 $326,992Unsecured ................................................................................ 33,558 14,772 268,464
74,432 84,764 595,456Zero coupon unsecured convertible notesdue 2003 with provision shown below (*2) ................................ 6,660 6,660 53,280
Less: Amounts due within one year .............................................. (7,719) (20,717) (61,752)
¥73,373 ¥70,707 $586,984
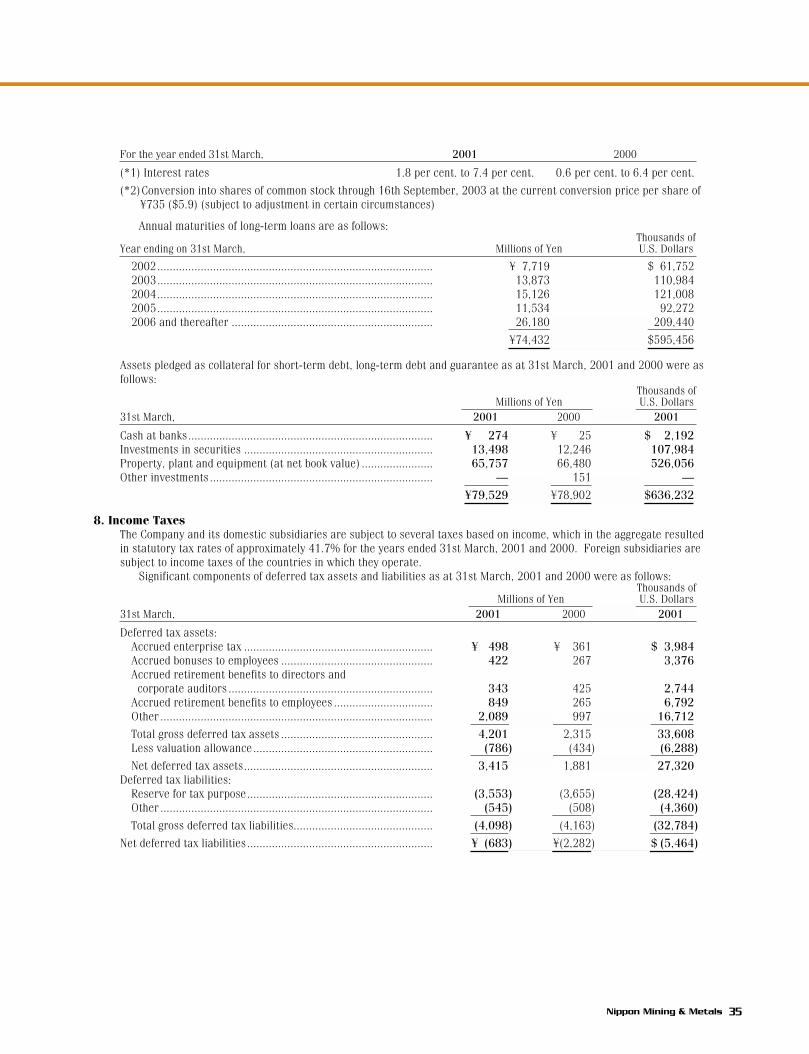
Nippon Mining & Metals 35
For the year ended 31st March, 2001 2000
(*1) Interest rates 1.8 per cent. to 7.4 per cent. 0.6 per cent. to 6.4 per cent.
(*2)Conversion into shares of common stock through 16th September, 2003 at the current conversion price per share of¥735 ($5.9) (subject to adjustment in certain circumstances)
Annual maturities of long-term loans are as follows:Thousands of
Year ending on 31st March, Millions of Yen U.S. Dollars
2002......................................................................................... ¥ 7,719 $ 61,7522003......................................................................................... 13,873 110,9842004......................................................................................... 15,126 121,0082005......................................................................................... 11,534 92,2722006 and thereafter ................................................................. 26,180 209,440
¥74,432 $595,456
Assets pledged as collateral for short-term debt, long-term debt and guarantee as at 31st March, 2001 and 2000 were asfollows:
Thousands ofMillions of Yen U.S. Dollars
31st March, 2001 2000 2001
Cash at banks............................................................................... ¥ 274 ¥ 25 $ 2,192Investments in securities ............................................................. 13,498 12,246 107,984Property, plant and equipment (at net book value) ....................... 65,757 66,480 526,056Other investments ........................................................................ — 151 —
¥79,529 ¥78,902 $636,232
8. Income TaxesThe Company and its domestic subsidiaries are subject to several taxes based on income, which in the aggregate resultedin statutory tax rates of approximately 41.7% for the years ended 31st March, 2001 and 2000. Foreign subsidiaries aresubject to income taxes of the countries in which they operate.
Significant components of deferred tax assets and liabilities as at 31st March, 2001 and 2000 were as follows:Thousands of
Millions of Yen U.S. Dollars31st March, 2001 2000 2001
Deferred tax assets:Accrued enterprise tax ............................................................. ¥ 498 ¥ 361 $ 3,984Accrued bonuses to employees ................................................. 422 267 3,376Accrued retirement benefits to directors andcorporate auditors .................................................................. 343 425 2,744
Accrued retirement benefits to employees ................................ 849 265 6,792Other ........................................................................................ 2,089 997 16,712
Total gross deferred tax assets ................................................. 4,201 2,315 33,608Less valuation allowance.......................................................... (786) (434) (6,288)
Net deferred tax assets............................................................. 3,415 1,881 27,320Deferred tax liabilities:
Reserve for tax purpose............................................................ (3,553) (3,655) (28,424)Other ........................................................................................ (545) (508) (4,360)
Total gross deferred tax liabilities............................................. (4,098) (4,163) (32,784)
Net deferred tax liabilities............................................................ ¥ (683) ¥(2,282) $ (5,464)
36 Nippon Mining & Metals
In assessing the realizability of deferred tax assets, management of the Company considers whether it is more likely thannot that some portion will not be realized. The ultimate realization of deferred tax assets is entirely dependent on thegeneration of future taxable income in specific tax jurisdictions during the periods in which those temporary differencesbecome deductible. Although realization is not assured, management considered the projected future taxable income inmaking this assessment. Based on these factors, management believes it is more likely than not the Company willrealize the benefit of these deductible differences, net of the existing valuation allowances as at 31st March 2001.
Reconciliation between the effective tax rate and the statutory tax rate for the year ended 31st March, 2001 was asfollows:
2001
Statutory tax rate...................................................................................................................................... 41.7%Add (Deduct):
Equity in earning of unrecognized subsidiaries and affiliates ................................................................ (7.8)Valuation allowance recognized on current losses of subsidiaries.......................................................... 2.8Other..................................................................................................................................................... 0.2
Effective rate ............................................................................................................................................ 36.9%
At 31st March, 2000, the difference between the effective tax rate and the statutory tax rate was insignificant.
9. LeasesThe Companies use certain machinery and equipment and other under the finance lease contracts. Total lease paymentswere ¥256 million ($2,048 thousand) and ¥231 million for the years ended 31st March, 2001 and 2000, respectively.
Pro forma information regarding the leased property such as acquisition cost, accumulated depreciation and futureminimum lease payments under finance leases that do not transfer the ownership of the leased property to the lessee forthe years ended 31st March, 2001 and 2000 were as follows:
Thousands ofMillions of Yen U.S. Dollars
Balance as at Balance as atAcquisition Accumulated 31st March, 31st March,
2001 cost depreciation 2001 2001
Machinery and equipment ................................................ ¥ 934 ¥479 ¥455 $3,640Other ............................................................................. 612 301 311 2,488
¥1,546 ¥780 ¥766 $6,128
Millions of YenBalance as at
Acquisition Accumulated 31st March,2000 cost depreciation 2000
Machinery and equipment ................................................ ¥ 752 ¥315 ¥437Other ............................................................................. 612 400 212
¥1,364 ¥715 ¥649
Thousands ofMillions of Yen U.S. Dollars
31st March, 2001 2000 2001
The scheduled maturities of future lease payments, which included the portion of interest thereon, on such lease contracts as at 31st March, 2001 and 2000 were as follows:Due within one year.................................................................. ¥229 ¥199 $1,832Due over one year..................................................................... ¥537 450 4,296
766 ¥649 $6,128
Lease rental expenses for the year............................................... ¥256 ¥231 $2,048
The amounts of acquisition costs and future minimum lease payments under finance leases included the imputed interestexpense portion.
Depreciation expense, which are not reflected in the accompanying consolidated statements of income, computed bythe straight-line method, would be ¥256 million ($2,048 thousand) and ¥231 million for the years ended 31st March,2001 and 2000, respectively.
Nippon Mining & Metals 37
10. Retirement Benefit PlanThe Company and consolidated domestic subsidiaries have adopted a non-contributory defined benefit pension plan andlump-sum payments plan. Additional employees’ retirements benefits which are not required under the current plans wouldbe paid in certain circumstances. Certain consolidated overseas subsidiaries have adopted lump-sum payments plan.
The reserve for retirement benefits as at 31st March, 2001 is analyzed as follows:Thousands of
31st March, 2001 Millions of Yen U.S. Dollars
Projected benefit obligations ........................................................ ¥(11,735) $(93,880)Plan assets................................................................................... 3,730 29,840
(8,005) (64,040)Unrecognized transition amount ................................................... 4,283 34,264Unrecognized prior service cost ................................................... 127 1,016Unrecognized actuarial differences............................................... (163) (1,304)
(3,758) (30,064)Prepaid pension cost .................................................................... — —
¥ (3,758) $(30,064)
Net pension expense related to the retirement benefits for the year ended 31st March, 2001 was as follows:Thousands of
2001 Millions of Yen U.S. Dollars
Service cost.................................................................................. ¥ 815 $ 6,520Interest cost ................................................................................. 249 1,992Expected return on plan assets .................................................... (74) (592)Amortization of transition amount ................................................ 1,071 8,568Amortization of prior service cost................................................. 2 16Amortization of actuarial differences............................................ — —
¥2,063 $16,504
*Additional benefits for employees’ early retirement amounting to ¥454 million ($3,632 thousand) were excluded.
Assumptions used in calculation of the above information were as follows:
As at 31st March, 2001
Discount rate .............................................................................................................. Mainly, 3.0%Expected rate of return on plan assets ....................................................................... Mainly, 3.0%Method of attributing the projected benefits to periods of services ............................. straight-line basisAmortization of unrecognized prior service cost.......................................................... 5 yearsAmortization of unrecognized actuarial differences..................................................... 5 years
(effectively from next fiscal year)Amortization of transition amount............................................................................... 5 years
11. Derivative and Hedging ActivitiesThe Companies use forward currency exchange contracts to hedge against the exchange rate risk associated withmonetary receivables and payables denominated in foreign currencies. Interest rate swap transactions are used in orderto minimize the risk of fluctuation in interest rates on borrowings. The Companies use commodity futures transactions tohedge against changes in the prices of inventories.
Effective from the year ended 31st March, 2001, gains or losses arising from changes in fair value of the derivativesdesignated as “hedging instruments” are deferred as an asset or liability and included in net profit or loss in the sameperiod during which the gains and losses on the hedged items or transactions are recognized. The Company evaluateseffectiveness of its hedging activities by reference to the accumulated gains or losses on the hedging instruments and therelated hedged items from the commencement of the hedges.
The Companies have established a control environment, which includes policies and procedures for risk assessmentsand for the approval, reporting and monitoring of transactions involving derivative financial instruments. The Company’spurchases of the hedging instruments are limited to, at maximum, the amounts of the hedged items. The Companies donot hold or issue derivative financial instruments for trading purposes.
The Companies are exposed to certain market risks arising from their forward exchange contracts and swapagreements. The Companies are also exposed to the risk of credit loss in the event of non-performance by thecounterparties to the currency and interest; however, the Companies do not anticipate nonperformance by any of thesecounterparties all of whom are financial institutions with high credit ratings.
At 31st March, 2001, there is no derivative contracts outstanding other than hedging accounting.

38 Nippon Mining & Metals
12. Contingent LiabilitiesAs at 31st March, 2001, the Companies are contingently liable for guarantee as follows:
Thousands ofMillions of Yen U.S. Dollars
Guarantees of loans from banks ................................................... ¥8,878 $71,024Note receivable discounted........................................................... 88 704Note receivable endorsed ............................................................. 204 1,632Others .......................................................................................... 27 216
13. Subsequent EventThe appropriation of retained earnings of the Company, including cash dividends applicable to the year ended 31stMarch, 2001, which was proposed by the Board of Directors and approved at the shareholders’ meeting held on 26thJune, 2001, was for the purpose of paying cash dividends to shareholders of records at 31st March, 2001, in theaggregate amount of ¥1,147 million ($9,176 thousand) (¥5 per share) and bonuses to directors in the aggregate amountof ¥40 million ($320 thousand).
14. Segment Information(1) Industry Segment Information
The operation of the Company and its consolidated subsidiaries for the years ended 31st March, 2001 and 2000 weresummarized by product group as follows:
Millions of Yen
For the year ended 31st March, 2001
Recycling and EliminationMetal Metal environmental Engineering or common Consolidated
Industry Segment production fabrication services and consulting Other assets* total
SalesSales to outside customers ¥203,665 ¥55,824 ¥ 5,443 ¥14,071 ¥19,876 ¥ — ¥298,879Inter-segment sales 8,047 437 26,418 10,276 13,677 (58,855) —
Total 211,712 56,261 31,861 24,347 33,553 (58,855) 298,879Operating costs and expenses 201,573 47,342 30,588 24,217 32,930 (58,855) 277,795
Operating income ¥ 10,139 ¥ 8,919 ¥ 1,273 ¥ 130 ¥ 623 ¥ — ¥ 21,084
Assets ¥205,353 ¥68,287 ¥13,418 ¥ 9,341 ¥31,302 ¥(3,498) ¥324,203
Depreciation ¥ 5,920 ¥ 3,138 ¥ 574 ¥ 174 ¥ 458 ¥ — ¥ 10,264
Capital expenditure ¥ 4,614 ¥ 2,266 ¥ 727 ¥ 345 ¥ 1,945 ¥ — ¥ 9,897
For the year ended 31st March, 2000
Recycling and EliminationMetal Metal environmental Engineering or common Consolidated
Industry Segment production fabrication services and consulting Other assets* total
SalesSales to outside customers ¥181,977 ¥57,974 ¥ 4,716 ¥10,530 ¥21,261 ¥ — ¥276,458Inter-segment sales 8,250 303 22,983 11,093 11,557 (54,186) —
Total 190,227 58,277 27,699 21,623 32,818 (54,186) 276,458Operating costs and expenses 182,099 49,252 26,803 21,580 32,278 (54,186) 257,826
Operating income ¥ 8,128 ¥ 9,025 ¥ 896 ¥ 43 ¥ 540 ¥ — ¥ 18,632
Assets ¥188,724 ¥70,220 ¥13,104 ¥ 6,918 ¥31,496 ¥ 1,229 ¥311,691
Depreciation ¥ 5,239 ¥ 2,814 ¥ 580 ¥ 65 ¥ 1,072 ¥ — ¥ 9,770
Capital expenditure ¥ 4,061 ¥ 2,017 ¥ 356 ¥ 38 ¥ 717 ¥ — ¥ 7,189

Nippon Mining & Metals 39
Thousands of U.S. Dollars
For the year ended 31st March, 2001
Recycling and EliminationMetal Metal environmental Engineering or common Consolidated
Industry Segment production fabrication services and consulting Other assets* total
SalesSales to outside customers $1,629,320 $446,592 $ 43,544 $112,568 $159,008 $ — $2,391,032Inter-segment sales 64,376 3,496 211,344 82,208 109,416 (470,840) —
Total 1,693,696 450,088 254,888 194,776 268,424 (470,840) 2,391,032Operating costs and expenses 1,612,584 378,736 244,704 193,736 263,440 (470,840) 2,222,360
Operating income $ 81,112 $ 71,352 $ 10,184 $ 1,040 $ 4,984 $ — $ 168,672
Assets $1,642,824 $546,296 $107,344 $ 74,728 $250,416 $(27,984) $2,593,624
Depreciation $ 47,360 $ 25,104 $ 4,592 $ 1,392 $ 3,664 $ — $ 82,112
Capital expenditure $ 36,912 $ 18,128 $ 5,816 $ 2,760 $ 15,560 $ — $ 79,176
* Amounts shown in column “Elimination or common assets” in the above table for the year ended 31st March, 2000 of¥3,692 million are represented by “Foreign Currency Translation Adjustment.”
**Effective from the year ended 31st March, 2001, the Company and its subsidiaries adopted the new Japaneseaccounting standard for retirement benefits, which is effective for periods beginning on or after 1st April, 2000.
As a result of adopting the new standard, operating income for the year ended 31st March, 2001 decreased by¥300 million ($2,400 thousand) in Metal production, ¥207 million ($1,656 thousand) in Metal fabrication, ¥40 million($320 thousand) in Recycling and environmental services, ¥19 million ($152 thousand) in Engineering and consulting,¥28 million ($224 thousand) in Other, as compared with the amounts which would have been reported if the previousmethod had been applied.
(2) Geographic Segment informationSegment information classified by geographic area*** was omitted because a majority of the Companies’ operation wereperformed in Japan.
(3) Export sales and sales by overseas subsidiariesMillions of Yen
North SouthFor the year ended 31st March, 2001 Asia America Europe Oceania America Africa Total
Overseas sales ................................... ¥62,409 ¥2,007 ¥1,154 ¥83 ¥188 ¥30 ¥ 65,871Consolidated sales.............................. — — — — — — ¥298,879Ratio .............................................. 20.9% 0.7% 0.4% 0.0% 0.1% 0.0% 22.0%
North SouthFor the year ended 31st March, 2000 Asia America Europe Oceania America Africa Total
Overseas sales ................................... ¥61,133 ¥1,743 ¥1,677 ¥51 ¥99 ¥45 ¥ 64,748Consolidated sales.............................. — — — — — — ¥276,458Ratio .............................................. 22.1% 0.6% 0.6% 0.0% 0.0% 0.0% 23.4%
Thousands of U.S. Dollars
North SouthFor the year ended 31st March, 2001 Asia America Europe Oceania America Africa Total
Overseas sales ................................... $499,272 $16,056 $9,232 $664 $1,504 $240 $ 526,968Consolidated sales.............................. — — — — — — $2,391,032
***Asia China, Korea, Singapore, Taiwan, IndonesiaNorth America U.S.A.Europe FranceOceania AustraliaSouth America ChileAfrica Namibia

40 Nippon Mining & Metals
15. Related Party TransactionsMaterial transactions of the Company with its related companies and individuals, excluding transactions withconsolidated subsidiaries which are eliminated in the consolidated financial statements and other than those disclosedelsewhere in these financial statements, for the years ended 31st March, 2001 and 2000 were as follows:
Millions of Yen / Thousands of U.S. DollarsTransactions Resulting Accounting Balance
EquityName of ownership Description of For the year endedrelated Paid-in Principal percentage by the Company’s 31st March, At 31st March,
company capital business the Company transactions 2001 2000 Account 2001 2000
ANT Minerals A$19,200 Investments 50% Loans made ¥— ¥ — Long-term ¥6,705 ¥6,705pty. ltd. thousands in McArthur ($ —) loans ($53,640)(Australia) River Mine
Compania $348 Mining of 25% Guarantees of ¥— ¥15,062 — — —Minela Los millions copper project finance ($ —)Pelambres for development(Chile) of mine
The term and conditions of the above transactions are on an arm’s-length basis.
Report of Independent Accountants
Nippon Mining & Metals 41
The Board of DirectorsNIPPON MINING & METALS COMPANY, LIMITED
We have audited the accompanying consolidated balance sheets of NIPPON MINING & METALS COMPANY,LIMITED and its consolidated subsidiaries as of 31st March, 2001 and 2000, and the related consolidatedstatements of income, shareholders’ equity, and cash flows for the years then ended, all expressed inJapanese Yen. Our audits were made in accordance with auditing standards, procedures and practicesgenerally accepted and applied in Japan and, accordingly, included such tests of the accounting records andsuch other auditing procedures as we considered necessary in the circumstances.
In our opinion, the consolidated financial statements referred to above present fairly the consolidatedfinancial position of NIPPON MINING & METALS COMPANY, LIMITED and its consolidated subsidiaries as of31st March, 2001 and 2000, and the consolidated results of their operations and their cash flows for theyears then ended in conformity with accounting principles and practices generally accepted in Japan (seeNote 1) applied on a consistent basis.
As described in Notes 2 (4), (9) and (11), effective from the year ended 31st March, 2001, NIPPON MINING& METALS COMPANY, LIMITED and its consolidated subsidiaries have adopted new Japanese accountingstandards for financial instruments, retirement benefits and foreign currency translation.
The amounts expressed in U.S. dollars, which are provided solely for the convenience of the reader, havebeen translated on the basis set forth in Note 3 to the accompanying consolidated financial statements.
ChuoAoyama Audit Corporation
Tokyo, Japan26th June, 2001

Corporate Data
44 Nippon Mining & Metals
Technology Development CenterHitachi Works
Head Office
Kurami Works, Kawasaki PlantKurami WorksNagoya Office
Osaka OfficeSaganoseki Smelter & Refinery
Kyushu Sales Office
FOUNDED 26th December, 1905
CAPITAL ¥34,997 million (As of 31st March, 2001)
NUMBER OF EMPLOYEES 1,533 (As of 31st March, 2001)
MAIN BUSINESS Resources Development, Smelting, Refining andRecycling of Nonferrous Metals, Nonferrous Metal and Special Alloy Fabrication andEnvironmental Services
HEAD OFFICE 10-1, Toranomon 2-chome, Minato-ku, Tokyo 105-0001Tel 03 (5573) 7200
TECHNOLOGY 1-1-2, Shirogane-cho, Hitachi-shi, DEVELOPMENT CENTER Ibaraki 317-0056
Tel 0294 (23) 7282
DOMESTIC OFFICES Osaka OfficeAqua Dojima Bldg. 8F, 12F, 4-4, Dojima Hama 1-chome, Kita-ku,Osaka-shi, Osaka 530-0004Tel 06 (6345) 6131
Nagoya OfficeYanagibashi-Sanshin Bldg. 7F, 16-28, Meieki-Minami 1-chome, Nakamura-ku, Nagoya-shi, Aichi 450-0003Tel 052 (586) 2421
Kyushu Sales OfficeKyuden-Fudosan Bldg. 5F, 13-8, Yakuin 1-chome,Chuo-ku, Fukuoka-shi, Fukuoka 810-0022Tel 092 (732) 0511
DOMESTIC OPERATING Hitachi WorksUNITS 3453, Miyata-cho, Hitachi-shi,
Ibaraki 317-0055Tel 0294 (23) 7130
Saganoseki Smelter & Refinery3-3382, Seki, Saganoseki-cho, Kitaamabe-gun, Oita 879-2201Tel 097 (575) 3310
Kurami Works3, Kurami, Samukawa-cho, Koza-gun, Kanagawa 253-0101 Tel 0467 (75) 0611
Kurami Works, Kawasaki Plant301, Tsukagoshi 4-chome, Saiwai-ku, Kawasaki-shi, Kanagawa 210-0924Tel 044 (511) 2441
OVERSEAS OFFICES Australia Office34A Bishop St., Stuart Park, N.T. 0820, AustraliaTel [61-8] (8943) 2810
Chile OfficeSan Sebastián 2807 Of. 313, Las Condes, Santiago,Republic of ChileTel [56-2] (234)1842


Printed In Japan
10-1, Toranomon 2-chome, Minato-ku, Tokyo 105-0001 Tel. 03 (5573) 7200
http://www.nikko-metal.co.jp/