Embed Size (px)
Citation preview

FORSCHUNGSZENTRUM ROSSENDORFWISSENSCHAFTLICH-TECHNISCHE BERICHTE
FZR-316April 2001
Annual Report 2000
Institute of Safety Research
Editors:Prof. Dr. F.-P. Weiß
PD Dr. U. Rindelhardt
CONTENTS
Preface
Selected reports 1
Gerhard Grunwald, Thomas Höhne, Sören Kliem, Horst-Michael PrasserPracticability of linear superposition techniques for coolant mixing studies forpressurized water reactors 3
Dieter Baldauf, Jürgen Fietz, Uwe Hampel, Dietrich Hoppe, Horst-Michael Prasser,Cornelius Zippe, Jochen Zschau, Michael Christen, Gotthard WillTime resolving gamma-tomography for periodically changing gas fraction fields 9
Andreas Schaffrath, Anne-Kathrin Krüssenberg, Frank-Peter Weiss,Enno Frerich Hicken, Horst-Michael PrasserTOPFLOW – a new multipurpose thermalhydraulic test facility for the investigationof steady state and transient two phase flow phenomena 15
Eberhard Altstadt, Thomas Mössner, Rainer WeissThe cold water hammer test facility (CWHTF) 22
Eberhard Altstadt, Jürgen Böhmert, Gudrun Müller, Hans-Georg WillschützPre- and post-test calculations of scaled core-meltdown experiments 30
Eckhard Krepper, Dirk Lucas, Horst-Michael PrasserRadial gas fraction profiles in vertical pipe flow 38
Eckhard Krepper, Frank SchäferVerification of the code ATHLET by post-test analysis of two experimentsperformed at the integral test facility CCTF 46
Andreas Schaffrath, Anne-Kathrin Krüssenberg, Ulrike Gocht, Andrej FjodorowComparative assessment of condensation models for horizontal tubes 54
Siegfried Mittag, Sören Kliem, Frank-Peter Weiss, Riitta Kyrki-Rajamäki,Anitta Hämäläinen, Siegfried Langenbuch, Serge Danilin, Jan Hadek,György Hegyi, Alexander Kuchin, Dobromir PanayotovValidation of coupled neutron-kinetic / thermal-hydraulic codes forVVER-type reactors 61
Ulrich RohdeThe modeling of fuel road behaviour under RIA conditions in the code DYN3D 68
Günther Hessel, Holger Kryk, Wilfried Schmitt, Torsten Seiler, Frank-Peter WeissMonitoring systems for batch-reactors using adaptive heat balances 74
Frank Stefani, Gunter Gerbeth, Thomas Gundrum, Agris Gailitis,Olgerts Lielausis, Ernests PlatacisThe saturation regime of the Riga dynamo experiment 83
Janis Priede, Gunter Gerbeth, Yurii GelfgatInstabilities of electromagnetically levitated bodies 87
Jürgen Böhmert, Hans-Werner Viehrig, Andreas UlbrichtComparison of the irradiation effects on microstructure and mechanicalproperties 94
Bertram Böhmer, Ernst Brodkin, Alexei Egorov, Jörg Konheiser, Eckhard Polke,Victor Vikharov, Sergei ZaritskyVerification of neutron transport calculations for nonstandard pessure vesselsurveillance positions in the VVER-1000 Novovoronezh-5 99
Roland Küchler, Klaus Noack, Torsten ZornInvestigation of Calcite dissolution under saturated and unsaturatedwater conditions 105
Summaries of research activities 113
Publications 129
Publications in scientific and technical journals and in conference proceedings 131
Other oral presentations 141
FZR-Reports and other publications 144
Patents 147
Guests 151
Meetings and workshops 157
Seminars of the Institute 161
Lecture courses 167
Departments of the Institute 171
Personnel 175
Preface
The Institute of Safety Research (ISR) is one of the five scientific institutes ofForschungszentrum Rossendorf e. V.. The Forschungszentrum Rossendorf is a member of the"Wissenschaftsgemeinschaft Gottfried Wilhelm Leibniz". As such it is funded by the FederalMinistry of Education and Research and by the Saxon Ministry of Science and Arts with 50%each.
The work of the institute is directed to the assessment and enhancement of the safety of largetechnical plants and to the increase of the effectiveness and environmental sustainability ofthose facilities. Subjects of investigations are equally nuclear plants and installations ofprocess industries. To achieve the above mentioned goals, the institute is engaged in twoscientific fields, i. e. thermo-fluid dynamics including magneto-hydrodynamics (MHD) andmaterials/components safety.
To analyse thermo-fluid dynamic phenomena during normal plant operation and duringaccidents, basic physical models and computer codes are developed for one and two-phaseflows, and for the space and time dependent heat release (neutron kinetics and chemicalreaction kinetics.). That theoretical work is based on experimental investigations of chemicalreaction kinetics including runaway reactions, and of transient two-phase flows. The institutehas started the construction of the multi-purpose TOPFLOW (Transient, Two-Phase Flow)experimental facility. It shall be the specificity of TOPFLOW that it applies advanced two-phase measuring techniques which are developed in the ISR and which allow deep insightinto the flow characteristics over a wide range of the void content and flow velocities.
MHD is relevant to flows of electrically conducting fluids, reaching from liquid metals to saltwater, when there are inherent electromagnetic fields or when they can externally be imposed.The understanding and modeling of MHD effects offers technological and safety relatedapplications in crystal growth, metallurgy, and other areas. However, the Rossendorf MHDdepartment also deals with basic effects like the self-excitation of the magnetic field of theearth. For that, the Institute of Physics in Riga together with the Rossendorf group designedand constructed a sodium flow experiment in Riga. The first experiments of November 1999showing the self excitation of a magnetic field in a suitable liquid metal flow could be provedby repeated experiments in July 2000. Beyond self-excitation the flow could be driven up tosaturation of the magnetic field.
In materials safety, the institute is specialised to the investigation of irradiated nuclear reactormaterials. The susceptibility of the mechanical properties against neutron and gammairradiation and the effect of thermal annealing is evaluated by mechanical tests. Themicrostructural mechanisms of materials degradation are studied by highly resolving methodsof structural analyses like TEM and SAXS and by more integrating methods like SANS.Monte Carlo methods for radiation field calculation have been developed and validated to getreliable information about the fluences to which the components have been exposed.Improved covariance analysis and spectrum adjustment methods are used to adjust thecalculated fluences to activation measurements.Starting from the estimated accident loads (pressure, temperature) and from the mechanicaland thermal properties of the concerned components structural models are developed to assessthe integrity of those components in the considered scenario. One scenario that particularlyhas attracted interest is the in vessel retention of molten corium in LWR. Together with theRoyal Institute of Technology (RIT) in Stockholm where the experiments are being

performed, a finite element model was worked out that allows the prediction of the failuremode and the failure time of the reactor vessel.
The ISR together with the Dresden University of Technology and Hochschule für Technik,Wirtschaft und Sozialwesen (HTWS) Zittau/Görlitz constitutes one of the German centres ofcompetence for nuclear energy and nuclear safety. As such it also takes care for theconservation and promotion of expertise in nuclear engineering.
In 2000, the work of the ISR and of the whole research centre was assessed by a commissionof the German Scientific Council (Deutscher Wissenschaftsrat). As a result, the main fields ofresearch and the general orientations of ISR were positively evaluated. The non-nuclearactivities shall be reinforced by strengthening the work on magneto-hydrodynamics and ontwo-phase flows. Nevertheless, the institute shall and will go on to play its role as centre ofcompetence in nuclear engineering in the framework of the German Association for NuclearCompetence.
The following graphs give an overview about the sources and deployment of funding betweenthe different research tasks. In 2000 35% of the total budget came from external sources, with28% from public research grants and with 7% from research orders mainly by the industry.
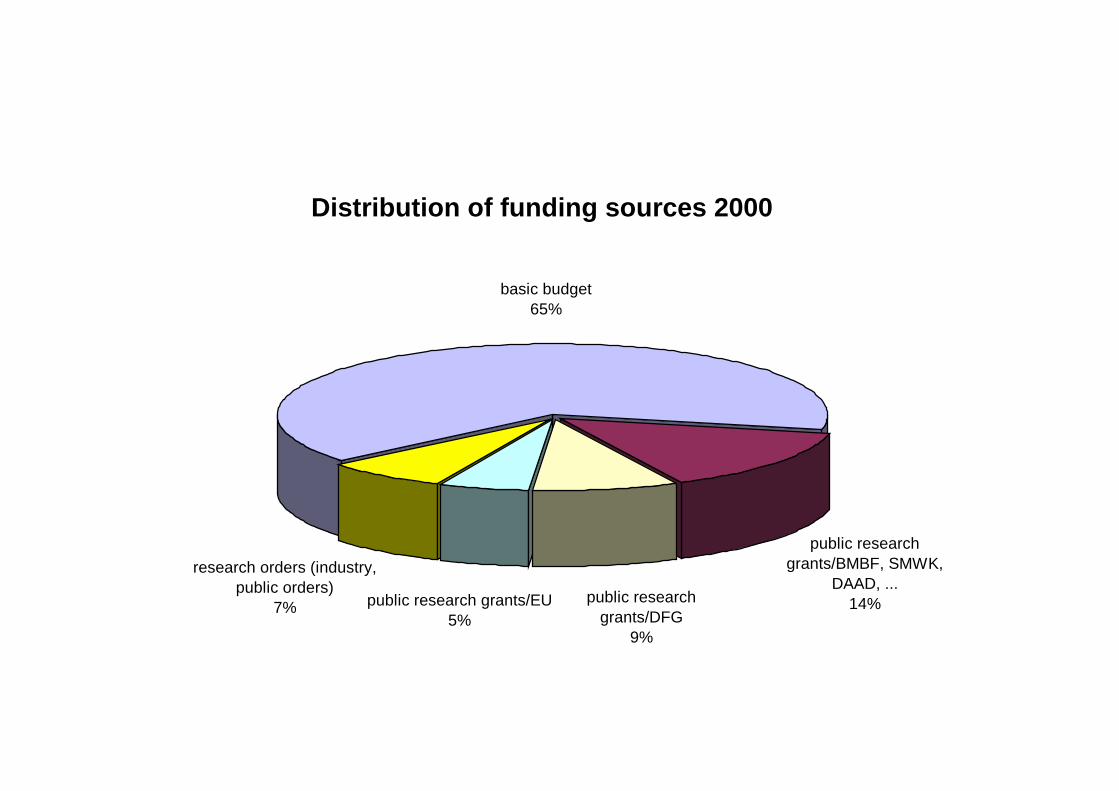
Distribution of funding sources 2000
public research
grants/BMBF, SMWK, DAAD, ...
14%
research orders (industry, public orders)
7%public research
grants/DFG9%
public research grants/EU5%
basic budget65%
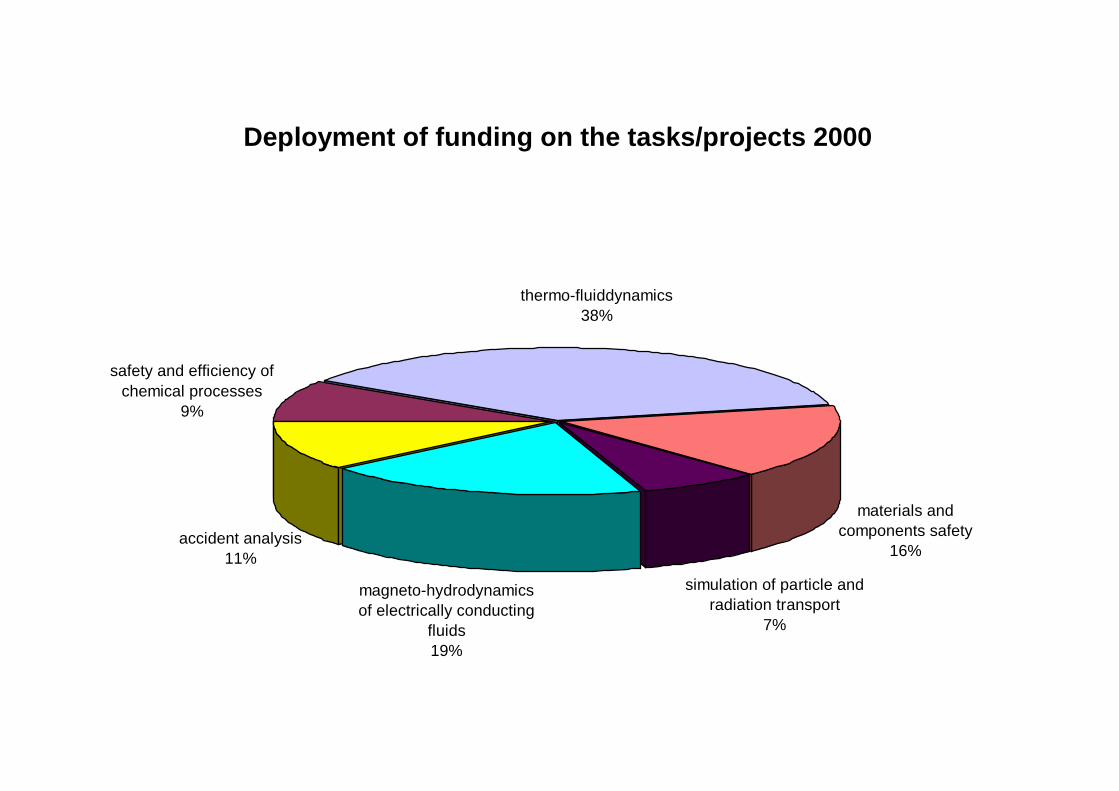
Deployment of funding on the tasks/projects 2000
safety and efficiency of chemical processes
9%
materials and
components safety16%
thermo-fluiddynamics38%
accident analysis11%
simulation of particle and
radiation transport7%
magneto-hydrodynamics
of electrically conducting
fluids19%

1
Selected reports

2
3
PRACTICABILITY OF LINEAR SUPERPOSITION TECHNIQUES FORCOOLANT MIXING STUDIES FOR PRESSURIZED WATER
REACTORS
Gerhard Grunwald, Thomas Höhne, Sören Kliem and Horst-Michael Prasser
1. Introduction
In hypothetical accident scenarios connected with asymmetric perturbations in the primarycircuit of a nuclear power plant (NPP) like overcooling of one loop due to a steam line breakor local boron dilution events, 3D effects have to be considered. Usually, the computationalanalysis of such scenarios is performed within three off-line coupled steps, each of themcarried out independently. First of all, a thermohydraulic analysis of the transient is carriedout by means of an advanced thermohydraulic system code. From that calculation, boundaryconditions are derived for an analysis of the 3D mixing processes inside the reactor pressurevessel (RPV) using a computational fluid dynamics (CFD) code. The results of thiscalculation (temperature or boron concentration distribution at the core inlet) are used in a 3Dneutron kinetics analysis of the reactor core behaviour.
Recently, 3D neutron kinetics core models have been coupled with advanced thermohydraulicsystem codes. To be able to turn from the above described three step off-line approach to afully coupled analysis of the whole process, the implementation of a model is necessary,which links the thermohydraulics of the system code with the thermohydraulics of the coremodel, simulating the 3D mixing effects in the RPV in a realistic way. Due to the largecomputation time, a direct coupling with CFD-codes is presently not practical. Therefore, therealisation of a simplified mixing model is the preferred way to describe the coolant mixing inan appropriate manner.
In this paper, the practicability of a linear superposition technique as a basis for the simplifiedmixing model is investigated.
2. Derivation of the simplified coolant mixing model
In general, the RPV from the inlet nozzles through the downcomer and the lower plenum upto the core inlet presents itself as a highly non-linear system with multiple inputs and outputs.The input signals are time-dependent values for the coolant velocity, enthalpy and boronconcentration at each of the inlet nozzles, which generally can behave in an independentmanner. The output signals are the same quantities at each fuel element position together withbypass positions. The geometrical and constructional details of the RPV determine thetransfer properties of the system in a dominant manner. The only chance to derive a suitablemodel for the description of the coolant mixing, meeting the requirements for use in coupledcodes, is the conversion of the described system into a simplified system with linear transferproperties.
The elimination of the influence of geometry and construction by concentrating on onereactor type simplifies the work. In the first step, only the processes during the start-up of thefirst main coolant pump after flow stagnation will be considered. For that special case thenumber of inputs to the system reduces to one. The splitting of the system into subsystems
4
(for each fuel element position one) creates a group of systems with one input and one output,but different transfer properties.
The disturbance of such a system by a Dirac impulse is an appropriate method for thedetermination of these unknown transfer properties. A disturbance of the system by a functionof any form (for instance: a plug of coolant with lower boron concentration) can berepresented by a linear combination of a sequence of such Dirac impulses. Assuming linearityof the transfer, the same linear combination can be applied to the reconstruction of the answerat the output of the system.
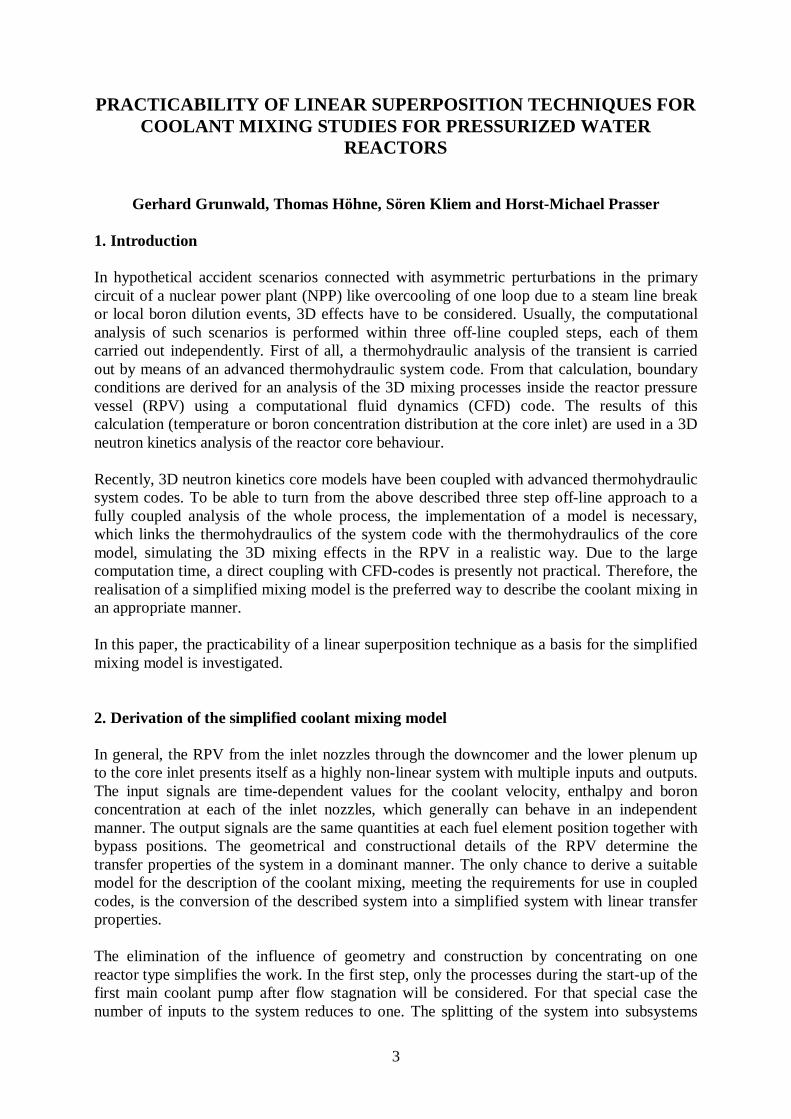
The transfer properties can be determined experimentally or analytically. In this work, anexperimental approach has been applied. For that purpose, experiments at the ROCOM testfacility [1] were carried out. This experimental facility was designed and built especially forthe investigation of coolant mixing phenomena in the downcomer and the lower plenum ofthe German 1300 MW KONVOI reactor. The facility is a 1:5 linearly scaled model equipped
with four loops with fully controllable coolantpumps. Beginning from the cold leg 1 m(corresponding to 5 m in the original) before theentry into the RPV, the inlet nozzle, thedowncomer, the lower plenum, the perforated drumup to the core support plate including thecorresponding penetrations, the model representsthe original reactor with all constructional details inthe given scale. The facility is operated with waterat room temperature and is equipped with differentwire-mesh sensors. The working principle of thesesensors is based on the measurement of theconductivity. Water with different conductivitysimulates the differences in the boron content ortemperature. Particularly, the measurements of twosensors are used for the determination of thetransfer functions of the above introduced systems.One is located in the reactor inlet nozzle of oneloop (pos. 1, fig. 1), the other one measures theconcentration at each fuel element inlet position at
the lower core support plate (pos. 2). From the data provided by the sensors dimensionlessmixing scalars can be derived with a time resolution of 0.05 s. These scalars are defined as
follows: 0
0
σσσσθ
−−=
P
ii , where i is the current measurement position; σi the conductivity at that
position, σ0 the conductivity of the water before the experiment and σP the conductivity in theinjected plug.
For the derivation of the transfer functions, experiments were carried out, where water with ahigh conductivity over a short time (nearly 0.1 s) was injected into the loop with the starting-up pump. A special mixing device, located at the injection position, ensures that the injectedwater is equally distributed over the cross section. It has to be taken into account, that due tothe considered pump start-up process the transfer behaviour changes. Therefore, the timeposition of the injection in the pump start-up ramp has been varied in the differentexperiments. The time dependent mixing scalar was measured at each fuel element position.
Pos. 1
Pos. 2
Fig. 1 Sectional view of theROCOM RPV-model withthe positions of the wire-mesh sensors
5
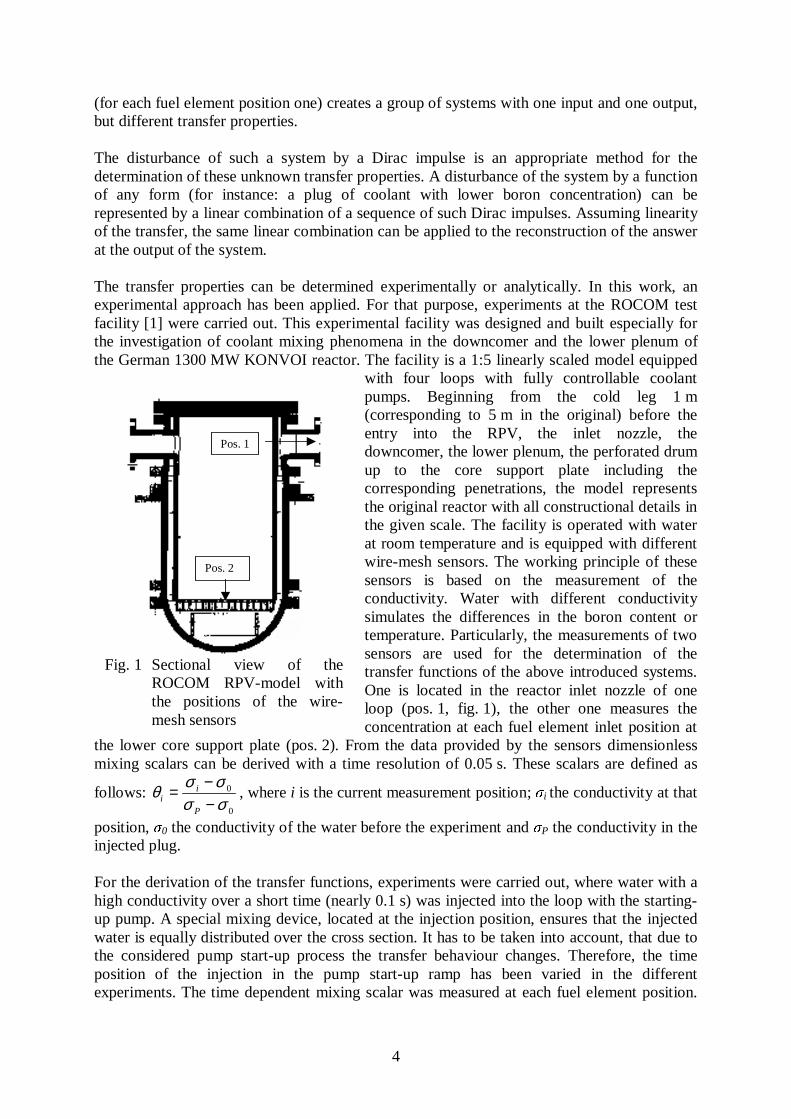
The impulses of three experimental series are shown on fig. 2a, the answers to these impulsesmeasured at a certain fuel element position are shown in fig. 2b.
As can be seen from fig. 2a, the transfer functions of the above introduced systems wereexposed to an input signal, nearly being a Dirac impulse.
Fig. 2a: Examples for the experimental Fig. 2b: Mixing scalars (answer to 2a) at aimpulses certain fuel element position
For an adequate representation of a plug, the limited number of experimental impulses is notsufficient. Therefore, additional impulses were derived by interpolation between theexperimental ones. This was performed to the input and the output signals of the systems inthe same manner. An example for the combination of experimental and interpolated impulsesis shown in fig. 3.
The time course F(t) of the plug to be modeled at the reactor inlet can be reconstructed fromn impulse functions by the following formulae:
)()(1
tgatF j
n
jj ⋅=
=(1)
where gj(t) is the time course of the jth impulse, aj is a weight coefficient, determining the
contribution of the jth impulse to the requested plug. The number n depends on the volume of
the plug to be modeled. The coefficients aj are obtained as solution of a least squaresdeviation problem between measured and approximated plug.
Supposing, that the linearity of the system is ensured, the transient course of the mixing scalarat each fuel element position can be derived in a similar manner using the samecoefficients aj. The time course of the mixing scalar Hk(t) for each k of the 193 fuel elementpositions can be calculated by:
)()(1
thatH j
n
jjk ⋅=
=(2)
where hj(t) is the time course of the jth answer function at the corresponding fuel element
position.
The described linear superposition technique is the main part of a calculation program, calledSemi-Analytical Plug Reconstruction (SAPR) model.
0 5 10 15 20Time [s]
0.00
0.10
0.20
0.30
0.40
mix
ing
scal
ar [-
]
10 15 20 25 30Time [s]
0.000
0.010
0.020
0.030
0.040
mix
ing
scal
ar [-
]
A5 1
A6 2
A7 3
A8 4
A9 5
A106
A117
B3 8
B4 9
B5 10
B6 11
B7 12
B8 13
B9 14
B1015
B1116
B1217
B1318
C2 19
C3 20
C4 21
C5 22
C6 23
C7 24
C8 25
C9 26
C1027
C1128
C1229
C1330
C1431
D2 32
D3 33
D4 34
D5 35
D6 36
D7 37
D8 38
D9 39
D1040
D1141
D1242
D1343
D1444
E1 45
E2 46
E3 47
E4 48
E5 49
E6 50
E7 51
E8 52
E9 53
E1054
E1155
E1256
E1357
E1458
E1559
F1 60
F2 61
F3 62
F4 63
F5 64
F6 65
F7 66
F8 67
F9 68
F1069
F1170
F1271
F1372
F1473
F1574
G1 75
G2 76
G3 77
G4 78
G5 79
G6 80
G7 81
G8 82
G9 83
G1084
G1185
G1286
G1387
G1488
G1589
H1 90
H2 91
H3 92
H4 93
H5 94
H6 95
H7 96
H8 97
H9 98
H1099
H11100
H12101
H13102
H14103
H15104
J1 105
J2 106
J3 107
J4 108
J5 109
J6 110
J7 111
J8 112
J9 113
J10114
J11115
J12116
J13117
J14118
J15119
K1 120
K2 121
K3 122
K4 123
K5 124
K6 125
K7 126
K8 127
K9 128
K10129
K11130
K12131
K13132
K14133
K15134
L1 135
L2 136
L3 137
L4 138
L5 139
L6 140
L7 141
L8 142
L9 143
L10144
L11145
L12146
L13147
L14148
L15149
M2 150
M3 151
M4 152
M5 153
M6 154
M7 155
M8 156
M9 157
M10158
M11159
M12160
M13161
M14162
N2 163
N3 164
N4 165
N5 166
N6 167
N7 168
N8 169
N9 170
N10171
N11172
N12173
N13174
N14175
O3 176
O4 177
O5 178
O6 179
O7 180
O8 181
O9 182
O10183
O11184
O12185
O13186
P5 187
P6 188
P7 189
P8 190
P9 191
P10192
P11193
6
3. Verification of the model
A numerical analysis of a hypothetical deboration event in a German PWR has beenperformed [2]. A plug of lower borated coolant, which goes through the reactor inlet nozzlefrom t = 7 s to t = 14 s during the start-up of the first main coolant pump was assumed in thatwork.
The same boundary conditions were used for generic experiments at the ROCOM test facility.The experimentally created plug is shown on fig. 3.
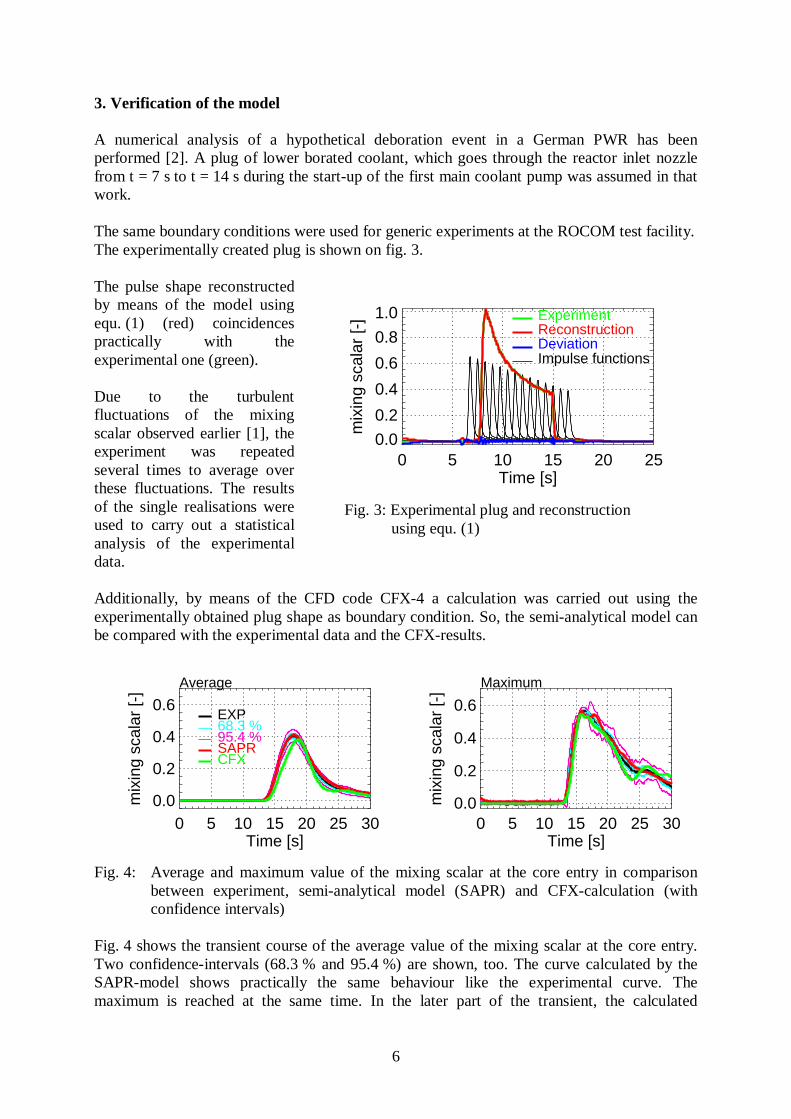
The pulse shape reconstructedby means of the model usingequ. (1) (red) coincidencespractically with theexperimental one (green).
Due to the turbulentfluctuations of the mixingscalar observed earlier [1], theexperiment was repeatedseveral times to average overthese fluctuations. The resultsof the single realisations wereused to carry out a statisticalanalysis of the experimentaldata.
Additionally, by means of the CFD code CFX-4 a calculation was carried out using theexperimentally obtained plug shape as boundary condition. So, the semi-analytical model canbe compared with the experimental data and the CFX-results.
0 5 10 15 20 25 30Time [s]
0.0
0.2
0.4
0.6
mix
ing
scal
ar [-
]
EXP68.3 %95.4 %SAPRCFX
Average
0 5 10 15 20 25 30Time [s]
0.0
0.2
0.4
0.6
mix
ing
scal
ar [-
]
Maximum
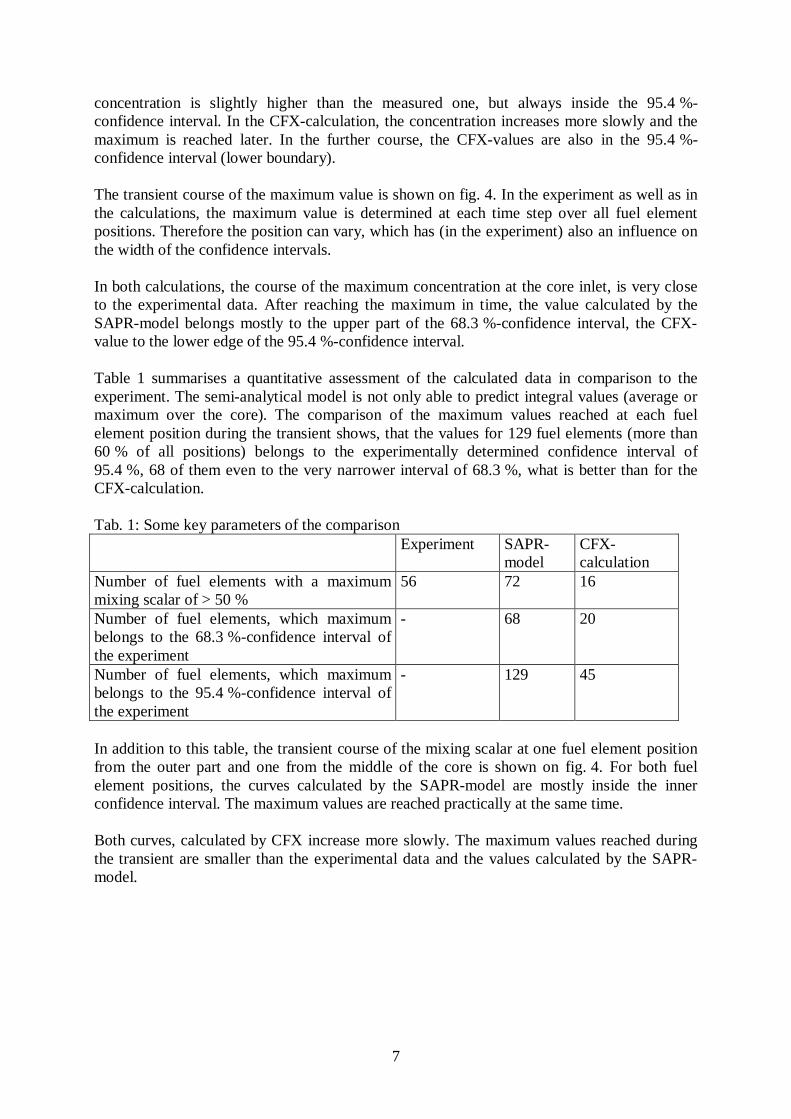
Fig. 4: Average and maximum value of the mixing scalar at the core entry in comparisonbetween experiment, semi-analytical model (SAPR) and CFX-calculation (withconfidence intervals)
Fig. 4 shows the transient course of the average value of the mixing scalar at the core entry.Two confidence-intervals (68.3 % and 95.4 %) are shown, too. The curve calculated by theSAPR-model shows practically the same behaviour like the experimental curve. Themaximum is reached at the same time. In the later part of the transient, the calculated
0 5 10 15 20 25Time [s]
0.0
0.2
0.4
0.6
0.8
1.0
mix
ing
scal
ar [-
] ExperimentReconstructionDeviationImpulse functions
Fig. 3: Experimental plug and reconstructionusing equ. (1)
7
concentration is slightly higher than the measured one, but always inside the 95.4 %-confidence interval. In the CFX-calculation, the concentration increases more slowly and themaximum is reached later. In the further course, the CFX-values are also in the 95.4 %-confidence interval (lower boundary).
The transient course of the maximum value is shown on fig. 4. In the experiment as well as inthe calculations, the maximum value is determined at each time step over all fuel elementpositions. Therefore the position can vary, which has (in the experiment) also an influence onthe width of the confidence intervals.
In both calculations, the course of the maximum concentration at the core inlet, is very closeto the experimental data. After reaching the maximum in time, the value calculated by theSAPR-model belongs mostly to the upper part of the 68.3 %-confidence interval, the CFX-value to the lower edge of the 95.4 %-confidence interval.
Table 1 summarises a quantitative assessment of the calculated data in comparison to theexperiment. The semi-analytical model is not only able to predict integral values (average ormaximum over the core). The comparison of the maximum values reached at each fuelelement position during the transient shows, that the values for 129 fuel elements (more than60 % of all positions) belongs to the experimentally determined confidence interval of95.4 %, 68 of them even to the very narrower interval of 68.3 %, what is better than for theCFX-calculation.
Tab. 1: Some key parameters of the comparisonExperiment SAPR-
modelCFX-calculation
Number of fuel elements with a maximummixing scalar of > 50 %
56 72 16
Number of fuel elements, which maximumbelongs to the 68.3 %-confidence interval ofthe experiment
- 68 20
Number of fuel elements, which maximumbelongs to the 95.4 %-confidence interval ofthe experiment
- 129 45
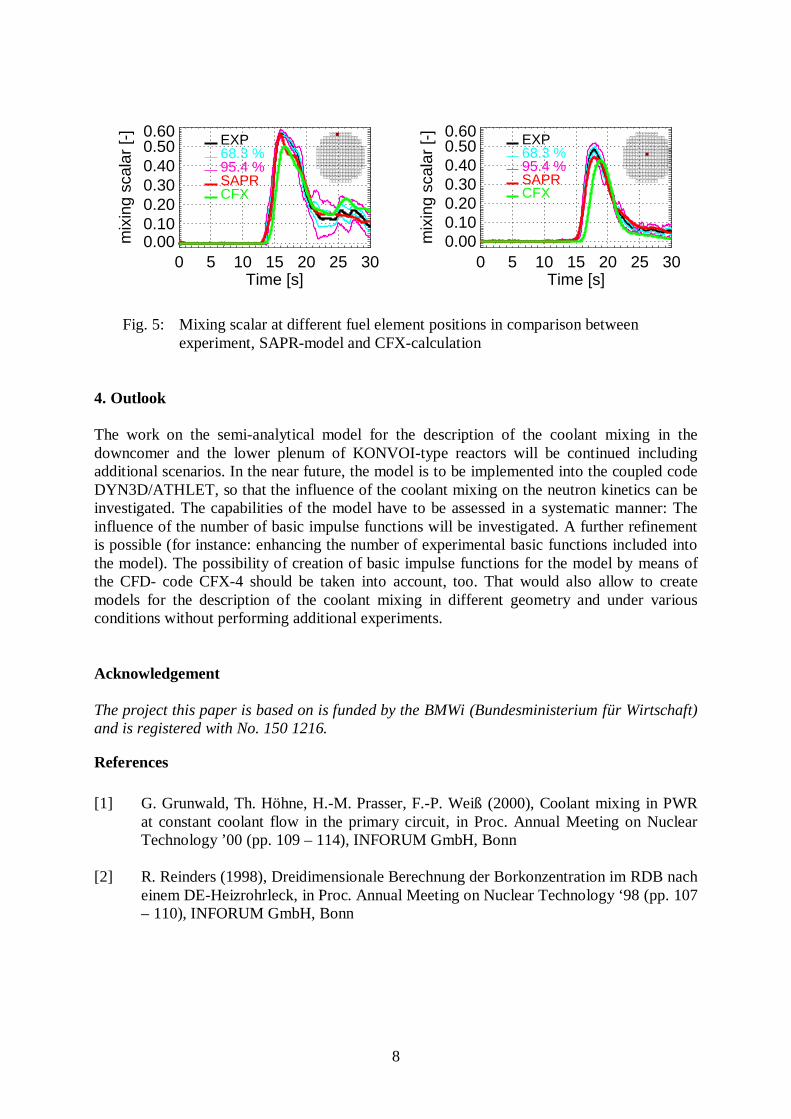
In addition to this table, the transient course of the mixing scalar at one fuel element positionfrom the outer part and one from the middle of the core is shown on fig. 4. For both fuelelement positions, the curves calculated by the SAPR-model are mostly inside the innerconfidence interval. The maximum values are reached practically at the same time.
Both curves, calculated by CFX increase more slowly. The maximum values reached duringthe transient are smaller than the experimental data and the values calculated by the SAPR-model.
8
Fig. 5: Mixing scalar at different fuel element positions in comparison betweenexperiment, SAPR-model and CFX-calculation
4. Outlook
The work on the semi-analytical model for the description of the coolant mixing in thedowncomer and the lower plenum of KONVOI-type reactors will be continued includingadditional scenarios. In the near future, the model is to be implemented into the coupled codeDYN3D/ATHLET, so that the influence of the coolant mixing on the neutron kinetics can beinvestigated. The capabilities of the model have to be assessed in a systematic manner: Theinfluence of the number of basic impulse functions will be investigated. A further refinementis possible (for instance: enhancing the number of experimental basic functions included intothe model). The possibility of creation of basic impulse functions for the model by means ofthe CFD- code CFX-4 should be taken into account, too. That would also allow to createmodels for the description of the coolant mixing in different geometry and under variousconditions without performing additional experiments.
Acknowledgement
The project this paper is based on is funded by the BMWi (Bundesministerium für Wirtschaft)and is registered with No. 150 1216.
References
[1] G. Grunwald, Th. Höhne, H.-M. Prasser, F.-P. Weiß (2000), Coolant mixing in PWRat constant coolant flow in the primary circuit, in Proc. Annual Meeting on NuclearTechnology ’00 (pp. 109 – 114), INFORUM GmbH, Bonn
[2] R. Reinders (1998), Dreidimensionale Berechnung der Borkonzentration im RDB nacheinem DE-Heizrohrleck, in Proc. Annual Meeting on Nuclear Technology ‘98 (pp. 107– 110), INFORUM GmbH, Bonn
0 5 10 15 20 25 30Time [s]
0.000.100.200.300.400.500.60
mix
ing
scal
ar [-
]EXP68.3 %95.4 %SAPRCFX
0 5 10 15 20 25 30Time [s]
0.000.100.200.300.400.500.60
mix
ing
scal
ar [-
]
EXP68.3 %95.4 %SAPRCFX
A5 1
A6 2
A7 3
A8 4
A9 5
A106
A117
B3 8
B4 9
B5 10
B6 11
B7 12
B8 13
B9 14
B1015
B1116
B1217
B1318
C2 19
C3 20
C4 21
C5 22
C6 23
C7 24
C8 25
C9 26
C1027
C1128
C1229
C1330
C1431
D2 32
D3 33
D4 34
D5 35
D6 36
D7 37
D8 38
D9 39
D1040
D1141
D1242
D1343
D1444
E1 45
E2 46
E3 47
E4 48
E5 49
E6 50
E7 51
E8 52
E9 53
E1054
E1155
E1256
E1357
E1458
E1559
F1 60
F2 61
F3 62
F4 63
F5 64
F6 65
F7 66
F8 67
F9 68
F1069
F1170
F1271
F1372
F1473
F1574
G1 75
G2 76
G3 77
G4 78
G5 79
G6 80
G7 81
G8 82
G9 83
G1084
G1185
G1286
G1387
G1488
G1589
H1 90
H2 91
H3 92
H4 93
H5 94
H6 95
H7 96
H8 97
H9 98
H1099
H11100
H12101
H13102
H14103
H15104
J1 105
J2 106
J3 107
J4 108
J5 109
J6 110
J7 111
J8 112
J9 113
J10114
J11115
J12116
J13117
J14118
J15119
K1 120
K2 121
K3 122
K4 123
K5 124
K6 125
K7 126
K8 127
K9 128
K10129
K11130
K12131
K13132
K14133
K15134
L1 135
L2 136
L3 137
L4 138
L5 139
L6 140
L7 141
L8 142
L9 143
L10144
L11145
L12146
L13147
L14148
L15149
M2 150
M3 151
M4 152
M5 153
M6 154
M7 155
M8 156
M9 157
M10158
M11159
M12160
M13161
M14162
N2 163
N3 164
N4 165
N5 166
N6 167
N7 168
N8 169
N9 170
N10171
N11172
N12173
N13174
N14175
O3 176
O4 177
O5 178
O6 179
O7 180
O8 181
O9 182
O10183
O11184
O12185
O13186
P5 187
P6 188
P7 189
P8 190
P9 191
P10192
P11193
9
TIME RESOLVING GAMMA-TOMOGRAPHY FOR PERIODICALLY CHANGINGGAS FRACTION FIELDS
Dieter Baldauf, Jürgen Fietz, Uwe Hampel, Dietrich Hoppe, Horst-Michael Prasser,Cornelius Zippe, Jochen Zschau, Michael Christen1 and Gotthard Will1
1. Introduction
During the last decade, there is a growing interest in pumping two-phase mixtures. A promi-nent example is the tendency to utilise the gas evolved at oil wells, which was usually burnedon site in the past. Often the most economical way to transport the gas is to deliver the oil-gasmixture instead of separating it from the crude oil. Beside displacement pumps, which aredetermining the state of art in this field today, the use of turbo pumps may be of benefit, too.
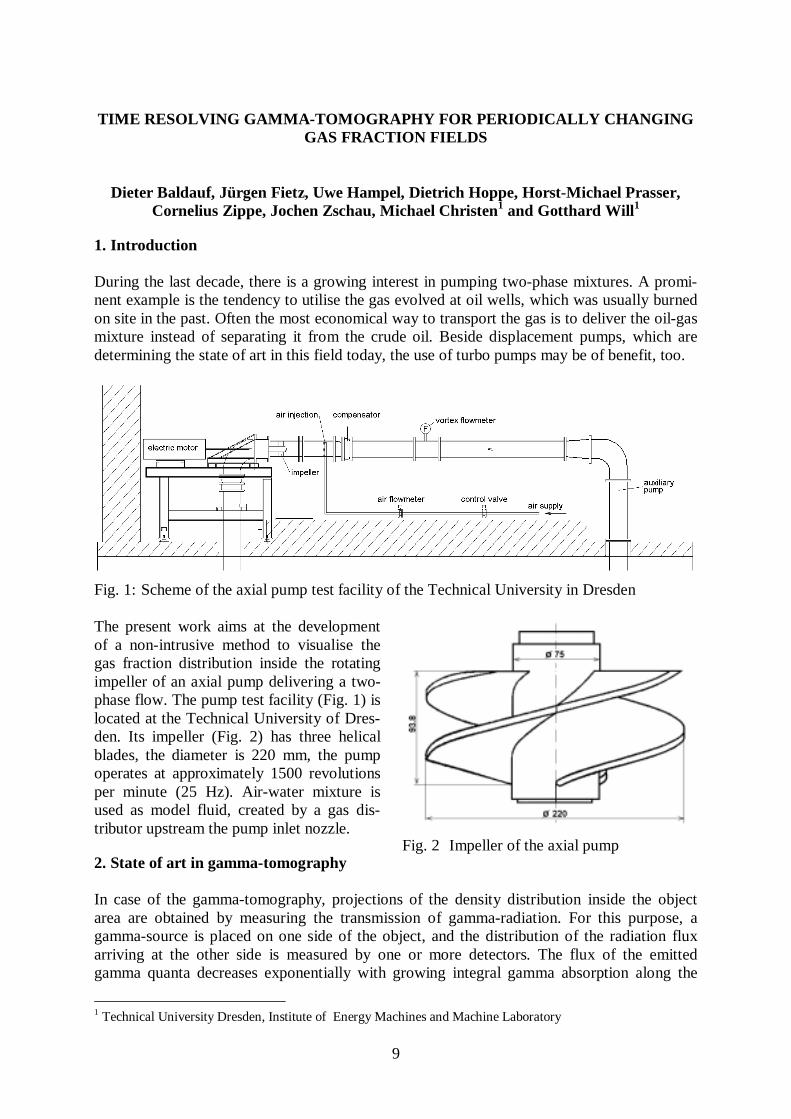
Fig. 1: Scheme of the axial pump test facility of the Technical University in Dresden
The present work aims at the developmentof a non-intrusive method to visualise thegas fraction distribution inside the rotatingimpeller of an axial pump delivering a two-phase flow. The pump test facility (Fig. 1) islocated at the Technical University of Dres-den. Its impeller (Fig. 2) has three helicalblades, the diameter is 220 mm, the pumpoperates at approximately 1500 revolutionsper minute (25 Hz). Air-water mixture isused as model fluid, created by a gas dis-tributor upstream the pump inlet nozzle.
2. State of art in gamma-tomography
In case of the gamma-tomography, projections of the density distribution inside the objectarea are obtained by measuring the transmission of gamma-radiation. For this purpose, agamma-source is placed on one side of the object, and the distribution of the radiation fluxarriving at the other side is measured by one or more detectors. The flux of the emittedgamma quanta decreases exponentially with growing integral gamma absorption along the
1 Technical University Dresden, Institute of Energy Machines and Machine Laboratory
Fig. 2 Impeller of the axial pump
10
chord between source and detector. Classical arrangements consist of a fan-beam source and arow or an arc of detectors to obtain a one-dimensional projection of the measuring cross sec-tion. A set of independent projections for different aspect angles is obtained by rotatingsource and detector array around the object. In some cases, the object is rotated instead of thetomography system [1]. The distribution inside the measuring cross section is calculated fromthe measured projections using tomographic image reconstruction methods.
Usually, the acquisition of the projections is a time consuming process. At first, the statisticsof the gamma-decay has to be considered. Depending on the activity of the source, obtainingone projection with the necessary accuracy usually takes from several seconds to minutes.The acquisition of the number of independent projections necessary for the image reconstruc-tion (≈102) leads to measuring periods in the range of minutes, which cannot be decreasedwithout limitations, even if very strong gamma-sources are applied, because the mechanicalrotation of the source around the object is the only way to change the aspect angle. This is themain problem of applying gamma-tomography to fast transient processes in two-phase flows.
For the visualisation of the instantaneous gas distribution in an axial pump, the framing ratemust be in the range of the rotation frequency divided by the desired angular resolution. Incase of 1500 revolutions per minute a complete set of projections must be obtained withintime intervals of about 100 µs, if an angular resolution of 1 deg is required. A single projec-tion must therefore be acquired within less than 1 µs. This has been not reached by any kindof gamma or X-ray tomography up to now, and it must me doubted whether it is feasible atall. The most advanced X-ray tomography systems worldwide allow to obtain an imagewithin 500 µs [2]. The corresponding X-ray device consists of 66 pulsed X-ray tubes, placedaround the object. These sources are flashing in a successive order to produce a complete setof projections within the imaging period. Beside the problem of further decreasing the meas-uring period, the use of comparatively weak X-ray radiation is limited in the case of technicalmachines like our axial pump due to the high absorption in constructional materials. The latterrequires higher energies of the radiation which can be obtained with moderate efforts fromgamma emitting nuclides only, so that pulsed source techniques cannot be used.
A possible way out is to refrain from the visualisation of instantaneous gas distributions andto restrain to obtain time-averaged void fraction distributions. In order to visualise the voiddistribution inside the rotating impeller we decided to develop a gamma tomograph with atime resolving radiation detection system and to take advantage from the periodicity of thegas fraction distribution inside the impeller in order to perform an ensemble-averaging.
3. Measuring principle
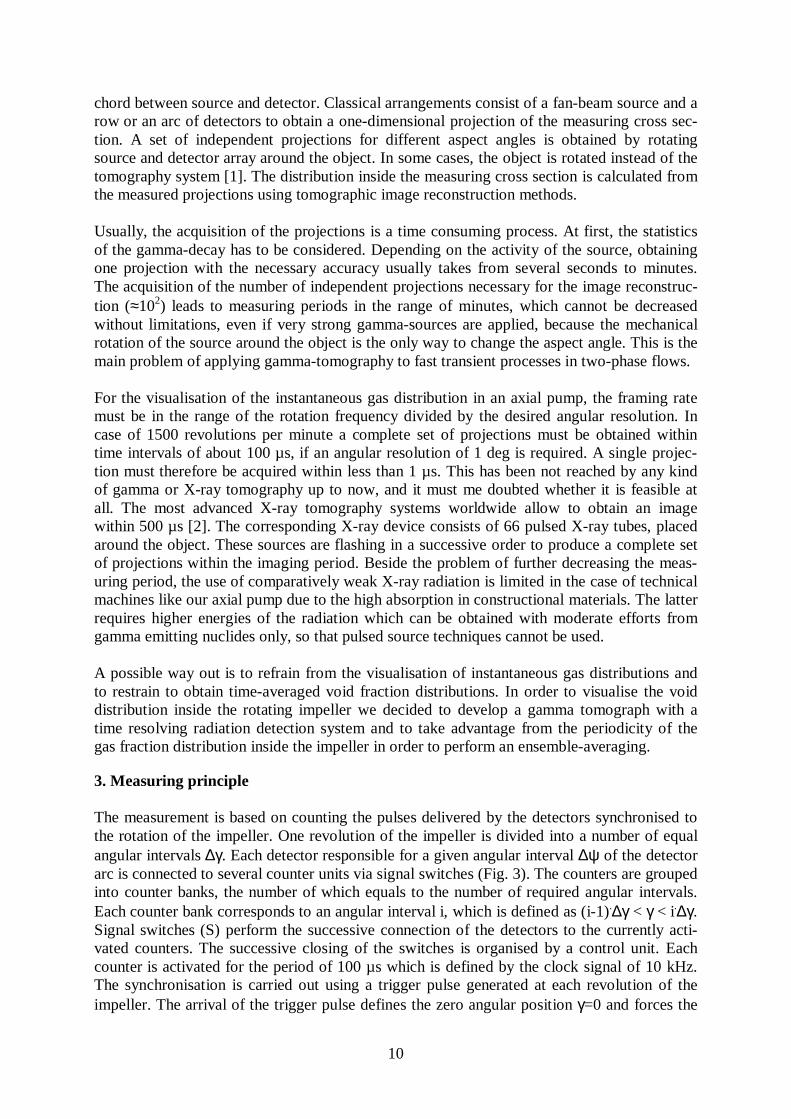
The measurement is based on counting the pulses delivered by the detectors synchronised tothe rotation of the impeller. One revolution of the impeller is divided into a number of equalangular intervals ∆γ. Each detector responsible for a given angular interval ∆ψ of the detectorarc is connected to several counter units via signal switches (Fig. 3). The counters are groupedinto counter banks, the number of which equals to the number of required angular intervals.Each counter bank corresponds to an angular interval i, which is defined as (i-1).∆γ < γ < i.∆γ.Signal switches (S) perform the successive connection of the detectors to the currently acti-vated counters. The successive closing of the switches is organised by a control unit. Eachcounter is activated for the period of 100 µs which is defined by the clock signal of 10 kHz.The synchronisation is carried out using a trigger pulse generated at each revolution of theimpeller. The arrival of the trigger pulse defines the zero angular position γ=0 and forces the
11
control unit to terminate the successive activation of the counters and to restart the countingprocess in the counters of the first bank.
Counters ofdetector 3
Counters ofdetector 4
Counters ofdetector 5
Time controlunit
sync
hron
isat
ion
sign
al
revolutionsensor
impelergamma-source
pumphousing
scintillation
detectors
N(3.∆ψ,1.∆γ)
N(3.∆ψ,2.∆γ)
N(3.∆ψ,3.∆γ)
N(3.∆ψ,4.∆γ)
N(3.∆ψ,5.∆γ)
N(3.∆ψ,6.∆γ)
N(3.∆ψ,7.∆γ)
N(3.∆ψ,8.∆γ)
N(4.∆ψ,1.∆γ)
N(4.∆ψ,2.∆γ)
N(4.∆ψ,3.∆γ)
N(4.∆ψ,4.∆γ)
N(4.∆ψ,5.∆γ)
N(4.∆ψ,6.∆γ)
N(4.∆ψ,7.∆γ)
N(4.∆ψ,8.∆γ)
N(5.∆ψ,1.∆γ)
N(5.∆ψ,2.∆γ)
N(5.∆ψ,3.∆γ)
N(5.∆ψ,4.∆γ)
N(5.∆ψ,5.∆γ)
N(5.∆ψ,6.∆γ)
N(5.∆ψ,7.∆γ)
N(5.∆ψ,8.∆γ)
S3 S4 S5
Clock generator10 kHz
Counterbank 1
Counterbank 2
etc.
Fig. 3: Working principle of the time resolving tomography
To achieve a sufficient statistical accuracy of the counting results N(i.∆ψ,j.∆γ) the measuringprocedure is continued over a large number of pump revolutions. Due to the synchronisationit is guaranteed that each counter collects pulses originating from the detector for the corre-sponding aspect angle ψ, which arrive in the time interval corresponding to the impeller rota-tion angle γ defined for the bank the counter belongs to. Therefore, the device is able to obtainensemble averaged projections of the gamma absorption density distribution, which are re-solved according to the rotatingangle of the impeller.
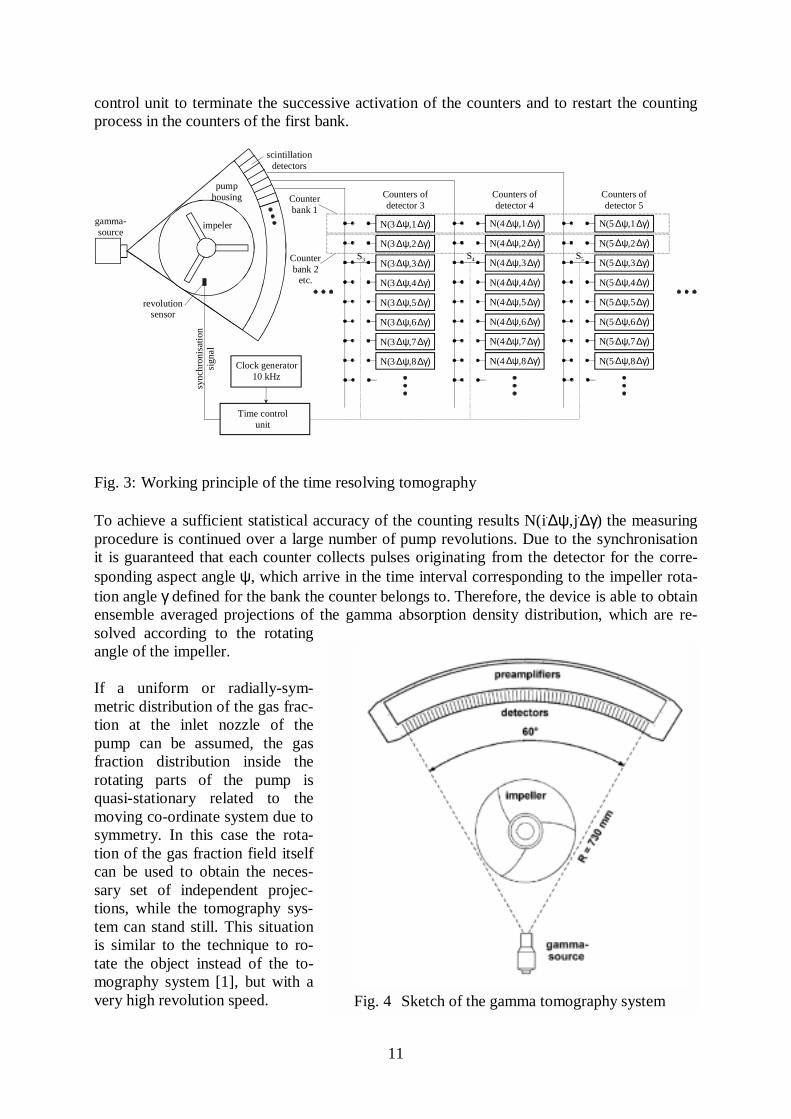
If a uniform or radially-sym-metric distribution of the gas frac-tion at the inlet nozzle of thepump can be assumed, the gasfraction distribution inside therotating parts of the pump isquasi-stationary related to themoving co-ordinate system due tosymmetry. In this case the rota-tion of the gas fraction field itselfcan be used to obtain the neces-sary set of independent projec-tions, while the tomography sys-tem can stand still. This situationis similar to the technique to ro-tate the object instead of the to-mography system [1], but with avery high revolution speed. Fig. 4 Sketch of the gamma tomography system
12
The situation is different, if the gas fraction distribution at the inlet of the axial pump is de-pending from the azimuthal angle in the laboratory co-ordinate system. In this case the voidfraction distribution cannot be regarded as quasi-stationary in the rotating co-ordinate systemof the impeller. The only property which can be used is periodicity in time, i.e. it can be as-sumed that the void distributions found in identical intervals of the rotation angle of the im-peller can be treated as quasi-stationary. To obtain the necessary projections for an imaging ofthis distribution, the tomography system must be rotated around the object, too. The imagehas to be reconstructed from a set of projections for one and the same interval of the impellerrotation angle obtained at the different angular orientations of the tomography system θk =k.∆θ. In this way, for each interval of the impeller rotation angle γj = j.∆γ an individual imagecan be reconstructed. The resulting series of images can be used for an animation of the peri-odically changing void fraction distribution inside the impeller.
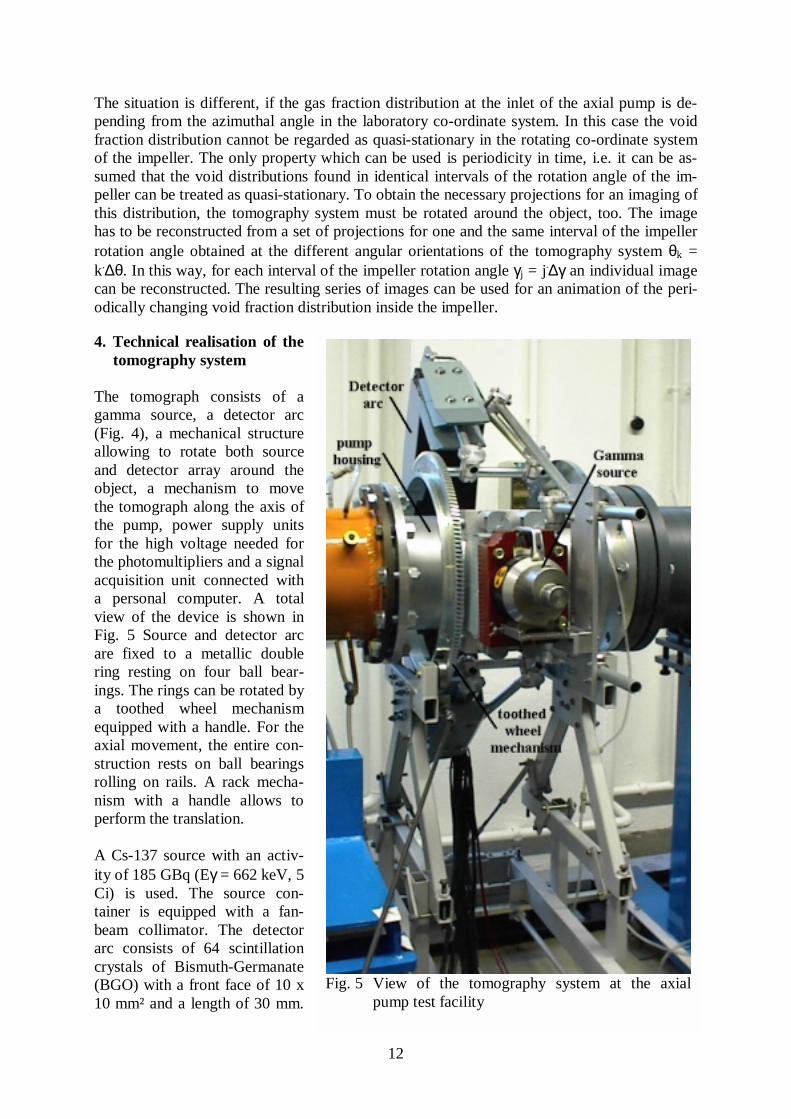
4. Technical realisation of thetomography system
The tomograph consists of agamma source, a detector arc(Fig. 4), a mechanical structureallowing to rotate both sourceand detector array around theobject, a mechanism to movethe tomograph along the axis ofthe pump, power supply unitsfor the high voltage needed forthe photomultipliers and a signalacquisition unit connected witha personal computer. A totalview of the device is shown inFig. 5 Source and detector arcare fixed to a metallic doublering resting on four ball bear-ings. The rings can be rotated bya toothed wheel mechanismequipped with a handle. For theaxial movement, the entire con-struction rests on ball bearingsrolling on rails. A rack mecha-nism with a handle allows toperform the translation.
A Cs-137 source with an activ-ity of 185 GBq (Eγ = 662 keV, 5Ci) is used. The source con-tainer is equipped with a fan-beam collimator. The detectorarc consists of 64 scintillationcrystals of Bismuth-Germanate(BGO) with a front face of 10 x10 mm² and a length of 30 mm.
Fig. 5 View of the tomography system at the axialpump test facility
13
Photo-multipliers are coupled to the side planes of the crystals. The dimensions of the crystalsallow to achieve a resolution of about 5 mm inside the measuring plane. The length of 30 mmis important for a high quantum efficiency at the comparatively high gamma energy.
Preamplifiers with energy discrimination cascades are connected to the photo-multipliers. Thebinary pulses are counted by two banks of 64 hardware counters with a width of 8 bit. Thebanks are swapped periodically each 100 µs. One bank is working in counter mode while theaccumulated counts of the second one are transferred to the data acquisition PC. The counterbanks shown schematically in Fig. 3 are represented by a two-dimensional data array of fourbyte long integer values. The counts from the instantaneously non-active hardware counterbank are added to the corresponding elements of this array, allocated in the RAM of the PC.After completing the data transfer the hardware counters are set to zero. A data acquisitionduring 10 000 revolutions of the impeller (i.e. during a measuring period of about 7 min) issufficient to obtain total count results in the order of magnitude of 104
for each of about 400rotation angle intervals and each of the 64 detector channels.
5. Results
Preliminary measurements were carried out at the operating pump in single phase mode (wa-ter) and in the two-phase mode, i.e. during symmetrical air supply. For calibration purposes,some measurements were taken for the case of the pump filled with air. The obtained tomo-graphic data were processed under the assumption of avoid fraction distribution, which is quasi-stationary in theco-ordinate system rotating together with the impeller.The measurement of effects caused by the unsymmetricalair supply due to stratification in front of the pump areplanned for the future.
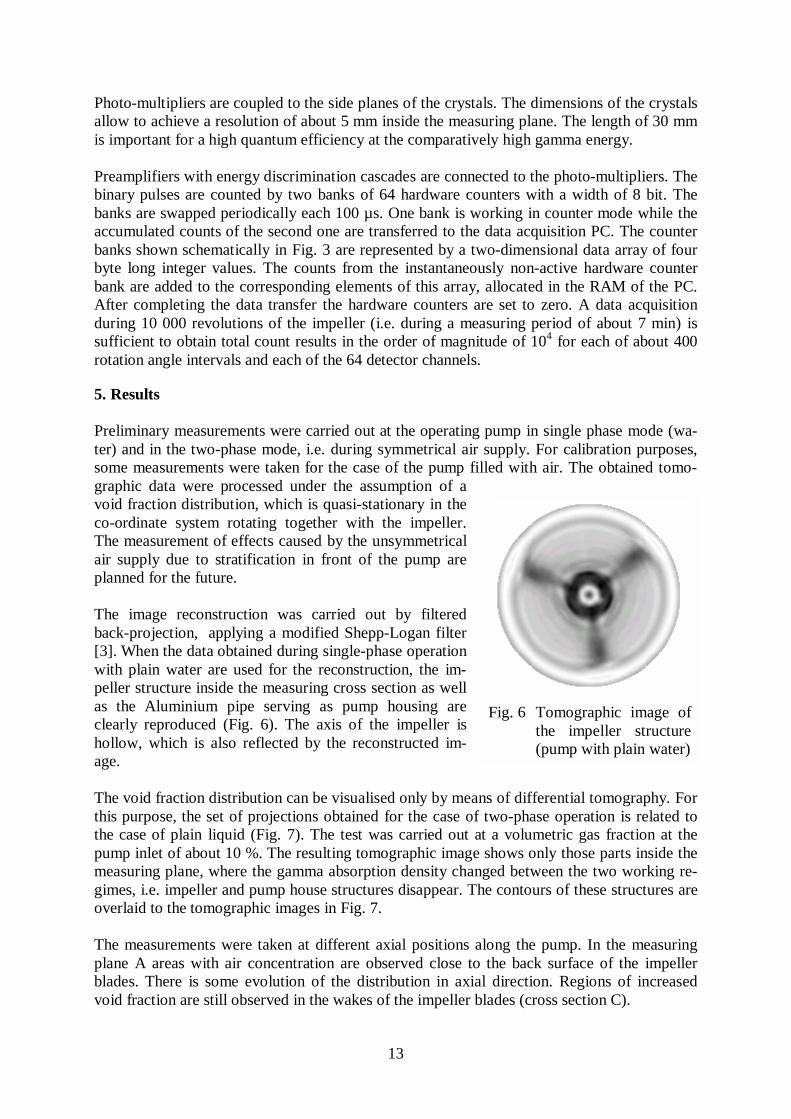
The image reconstruction was carried out by filteredback-projection, applying a modified Shepp-Logan filter[3]. When the data obtained during single-phase operationwith plain water are used for the reconstruction, the im-peller structure inside the measuring cross section as wellas the Aluminium pipe serving as pump housing areclearly reproduced (Fig. 6). The axis of the impeller ishollow, which is also reflected by the reconstructed im-age.
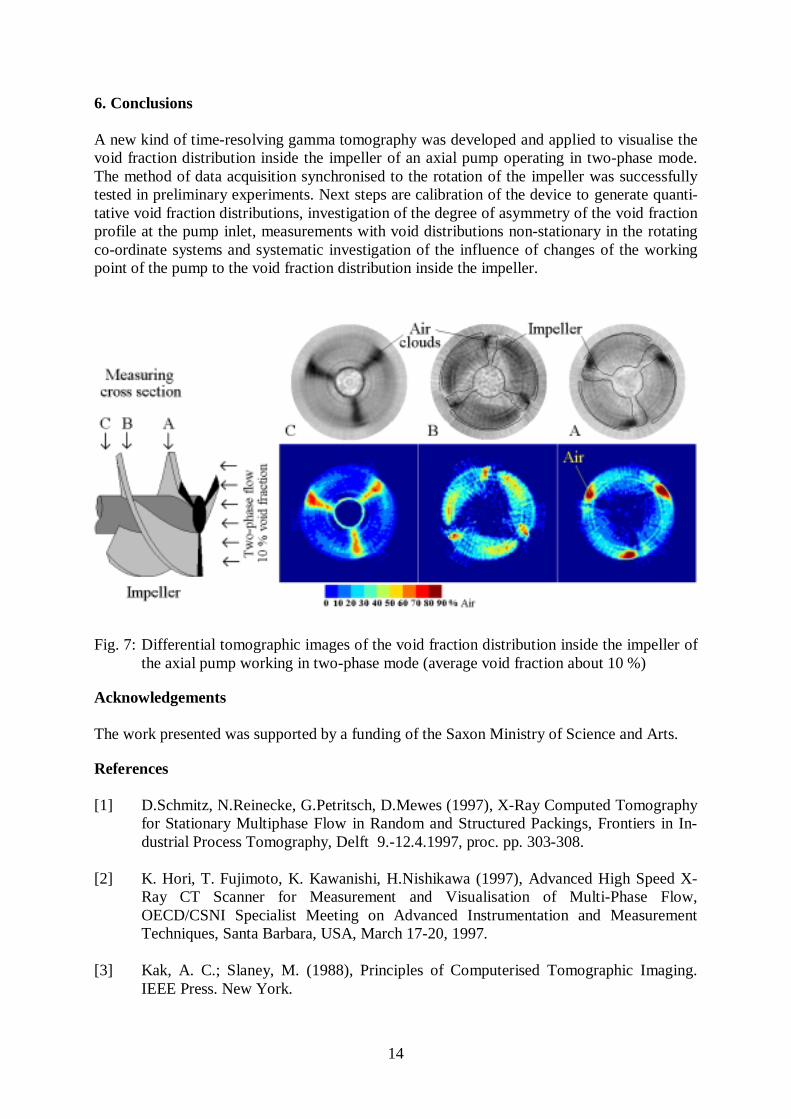
The void fraction distribution can be visualised only by means of differential tomography. Forthis purpose, the set of projections obtained for the case of two-phase operation is related tothe case of plain liquid (Fig. 7). The test was carried out at a volumetric gas fraction at thepump inlet of about 10 %. The resulting tomographic image shows only those parts inside themeasuring plane, where the gamma absorption density changed between the two working re-gimes, i.e. impeller and pump house structures disappear. The contours of these structures areoverlaid to the tomographic images in Fig. 7.
The measurements were taken at different axial positions along the pump. In the measuringplane A areas with air concentration are observed close to the back surface of the impellerblades. There is some evolution of the distribution in axial direction. Regions of increasedvoid fraction are still observed in the wakes of the impeller blades (cross section C).
Fig. 6 Tomographic image ofthe impeller structure(pump with plain water)
14
6. Conclusions
A new kind of time-resolving gamma tomography was developed and applied to visualise thevoid fraction distribution inside the impeller of an axial pump operating in two-phase mode.The method of data acquisition synchronised to the rotation of the impeller was successfullytested in preliminary experiments. Next steps are calibration of the device to generate quanti-tative void fraction distributions, investigation of the degree of asymmetry of the void fractionprofile at the pump inlet, measurements with void distributions non-stationary in the rotatingco-ordinate systems and systematic investigation of the influence of changes of the workingpoint of the pump to the void fraction distribution inside the impeller.
Fig. 7: Differential tomographic images of the void fraction distribution inside the impeller ofthe axial pump working in two-phase mode (average void fraction about 10 %)
Acknowledgements
The work presented was supported by a funding of the Saxon Ministry of Science and Arts.
References
[1] D.Schmitz, N.Reinecke, G.Petritsch, D.Mewes (1997), X-Ray Computed Tomographyfor Stationary Multiphase Flow in Random and Structured Packings, Frontiers in In-dustrial Process Tomography, Delft 9.-12.4.1997, proc. pp. 303-308.
[2] K. Hori, T. Fujimoto, K. Kawanishi, H.Nishikawa (1997), Advanced High Speed X-Ray CT Scanner for Measurement and Visualisation of Multi-Phase Flow,OECD/CSNI Specialist Meeting on Advanced Instrumentation and MeasurementTechniques, Santa Barbara, USA, March 17-20, 1997.
[3] Kak, A. C.; Slaney, M. (1988), Principles of Computerised Tomographic Imaging.IEEE Press. New York.
15
TOPFLOW - A NEW MULTIPURPOSE THERMALHYDRAULICTEST FACILITY FOR THE INVESTIGATION OF STEADY STATE
AND TRANSIENT TWO PHASE FLOW PHENOMENA
Andreas Schaffrath, Anne-Kathrin Krüssenberg, Frank-Peter Weiß,Enno Frerich Hicken1, Horst-Michael Prasser
1. Introduction
The Forschungszentrum Rossendorf (FZR) e.V. is building a new large-scale test facility forthermal hydraulic single effect tests, the TOPFLOW facility. The acronym stands for Tran-sient Two Phase Flow Test Facility. It will mainly be used for the investigation of generic andapplied steady state and transient two phase flow phenomena in power- and process indus-tries. Main research activities are the investigation of:
• transient flow regimes in horizontal, vertical and inclined tubes,
• the dynamic behaviour of interphase areas in gas-liquid flows,
• critical mass flows and oscillations during depressurization of chemical reactors,
• natural convection in large pools with local heating,
• natural convection in parallel channels and feed pipes and
• condensation phenomena.
It is our strategy to use TOPFLOW as a central experimental basis for the nuclear competencecentre, rejoining FZR, the Technical University of Dresden and the University of AppliedSciences Zittau-Görlitz (HTWS) and to offer it to working groups throughout Europe. Theywill be invited to come to Rossendorf with their ideas and to perform their experiments heremaking use of the parameters (power, water and steam mass flow, pressure range, measuringinstrumentation) and the multipurpose character of the test facility.
2. Embedding of TOPFLOW in the matrix of thermal hydraulic test facilities inWestern Europe
TOPFLOW stands in the tradition of single-effect tests in large-scale models of safety relevantcomponents of nuclear plants performed at the NOKO test facility successfully operated at theForschungszentrum Jülich for many years. The new test facility in Rossendorf will beconstructed using parts of NOKO, which will be transferred to the new site. With a series ofimportant new test sections, the profile of TOPFLOW will be shifted from previous investi-gations of passive safety systems for a new generation of nuclear power plants carried out onNOKO to more generic work for both nuclear safety and chemical plant safety and efficiency.Special attention is paid to the experimental support of the development of a new generation ofbest-estimate computer codes for safety analyses, based on three-dimensional CFD techniques.
Main components of NOKO, which are taken over, like the electrical heater and the condensertank, are determining the power, pressure and mass flow ranges of the facility. TOPFLOW and
_______________________________1 Forschungszentrum Jülich, Institut für Sicherheitsforschung und Reaktortechnik
16
NOKO are therefore very close in respect to their scale, which is for many tests close to in-dustrial scale.
The construction of the NOKO test facility was decided by the Ministry for Research andTechnology, SIEMENS, the German Utilities and the Forschungszentrum Jülich in 1993. Inthe first time it was aimed at studying experimentally and analytically the effectiveness of theSWR 1000 emergency condenser. From 1996-1998 the facility was used for a project withinthe 4th
FWP of the EU "European BWR R&D-Cluster for Innovative Passive SafetySystems"; 7 partners participated. In 1997, in addition, 7 partners of an Concerted Action"BWR-CA" took part in this project [1]. This was followed by studies of the behaviour of thebuilding condenser, the passive pressure pulse transmitter of the SWR1000 designed by Sie-mens (see [1] and [2]).
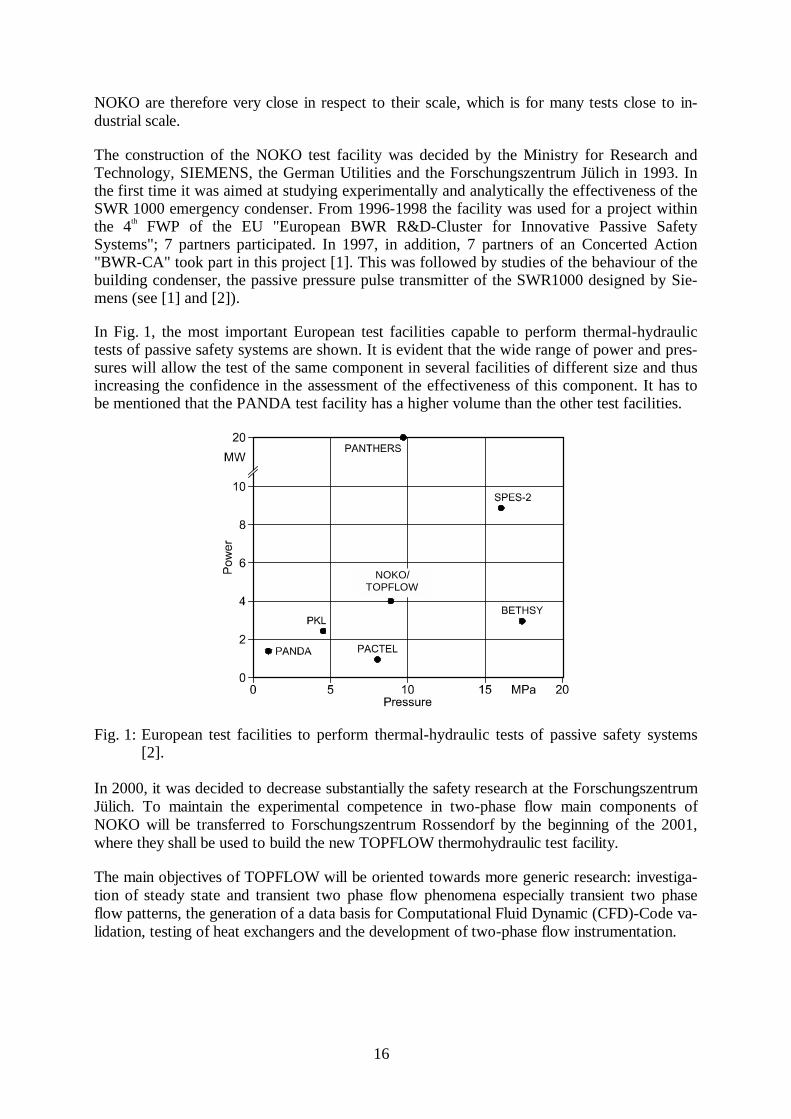
In Fig. 1, the most important European test facilities capable to perform thermal-hydraulictests of passive safety systems are shown. It is evident that the wide range of power and pres-sures will allow the test of the same component in several facilities of different size and thusincreasing the confidence in the assessment of the effectiveness of this component. It has tobe mentioned that the PANDA test facility has a higher volume than the other test facilities.
Fig. 1: European test facilities to perform thermal-hydraulic tests of passive safety systems[2].
In 2000, it was decided to decrease substantially the safety research at the ForschungszentrumJülich. To maintain the experimental competence in two-phase flow main components ofNOKO will be transferred to Forschungszentrum Rossendorf by the beginning of the 2001,where they shall be used to build the new TOPFLOW thermohydraulic test facility.
The main objectives of TOPFLOW will be oriented towards more generic research: investiga-tion of steady state and transient two phase flow phenomena especially transient two phaseflow patterns, the generation of a data basis for Computational Fluid Dynamic (CFD)-Code va-lidation, testing of heat exchangers and the development of two-phase flow instrumentation.
NOKO/TOPFLOW
17
3. TOPFLOW test facility
The TOPFLOW facility is designed for pressures up to 10 MPa and temperatures up to 300°C. The max. steam mass flow is up to 2.6 kg/s, achieved with an electrical heater of 4 MW.The maximum water mass flow less than 50 kg/s.
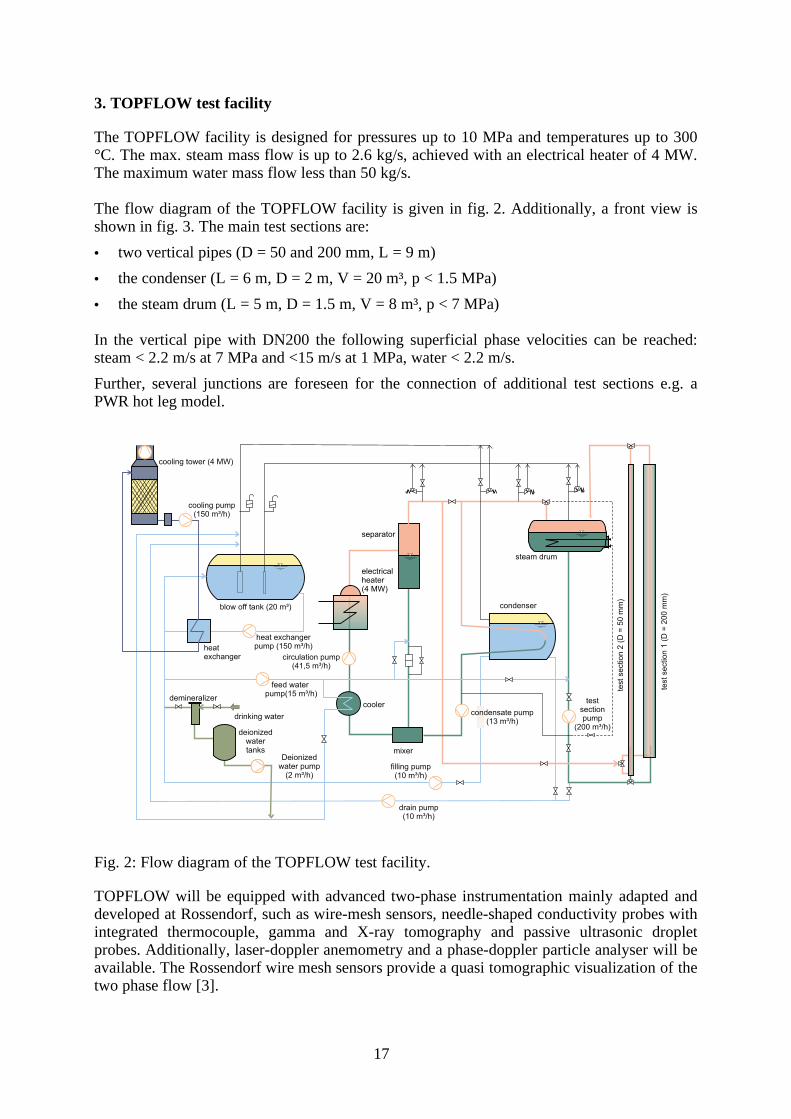
The flow diagram of the TOPFLOW facility is given in fig. 2. Additionally, a front view isshown in fig. 3. The main test sections are:
• two vertical pipes (D = 50 and 200 mm, L = 9 m)
• the condenser (L = 6 m, D = 2 m, V = 20 m³, p < 1.5 MPa)
• the steam drum (L = 5 m, D = 1.5 m, V = 8 m³, p < 7 MPa)
In the vertical pipe with DN200 the following superficial phase velocities can be reached:steam < 2.2 m/s at 7 MPa and <15 m/s at 1 MPa, water < 2.2 m/s.
Further, several junctions are foreseen for the connection of additional test sections e.g. aPWR hot leg model.
cooling tower (4 MW)
cooling pump(150 m³/h)
drain pump(10 m³/h)
heat exchangerpump (150 m³/h)heat
exchanger
cooler
circulation pump(41,5 m³/h)
test
section
1(D
=200
mm
)
testsection
2(D
=5
0m
m)
steam drum
testsectionpump
(200 m³/h)
electricalheater(4 MW)
blow off tank (20 m³)
drinking water
deionizedwatertanks
demineralizer
Deionizedwater pump
(2 m³/h)
condenser
separator
condensate pump(13 m³/h)
filling pump(10 m³/h)
mixer
feed waterpump(15 m³/h)
Fig. 2: Flow diagram of the TOPFLOW test facility.
TOPFLOW will be equipped with advanced two-phase instrumentation mainly adapted anddeveloped at Rossendorf, such as wire-mesh sensors, needle-shaped conductivity probes withintegrated thermocouple, gamma and X-ray tomography and passive ultrasonic dropletprobes. Additionally, laser-doppler anemometry and a phase-doppler particle analyser will beavailable. The Rossendorf wire mesh sensors provide a quasi tomographic visualization of thetwo phase flow [3].
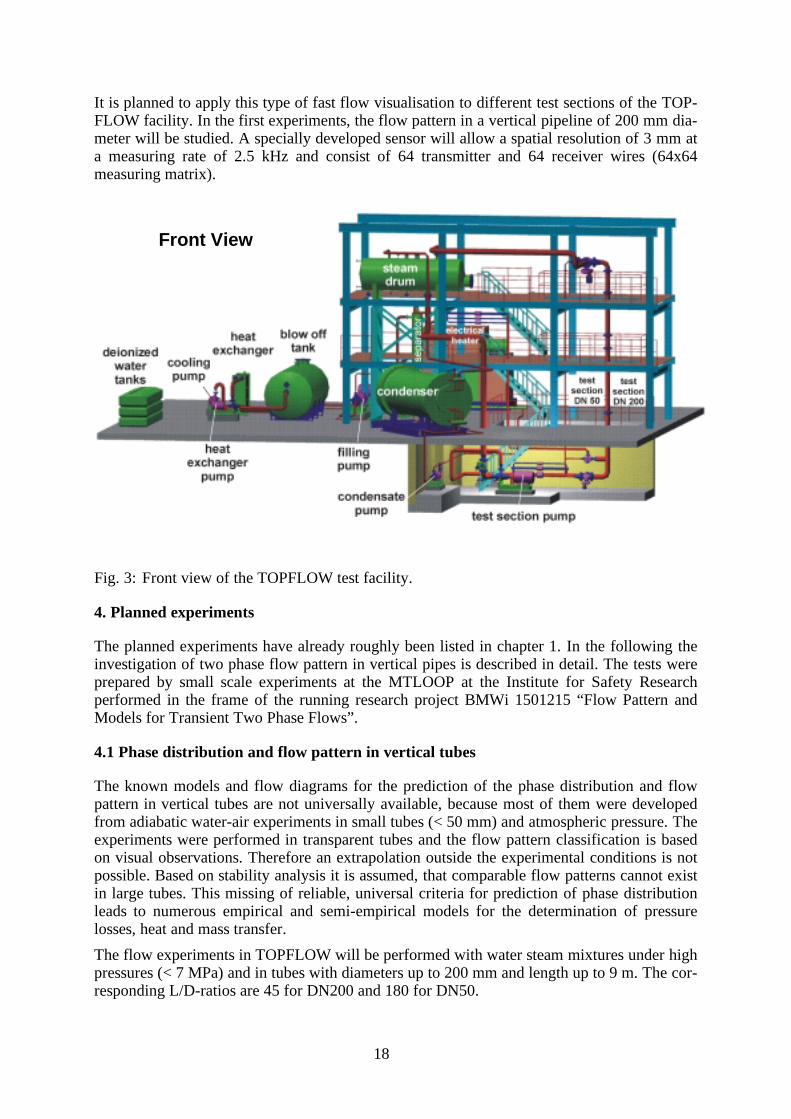
18
It is planned to apply this type of fast flow visualisation to different test sections of the TOP-FLOW facility. In the first experiments, the flow pattern in a vertical pipeline of 200 mm dia-meter will be studied. A specially developed sensor will allow a spatial resolution of 3 mm ata measuring rate of 2.5 kHz and consist of 64 transmitter and 64 receiver wires (64x64measuring matrix).
Fig. 3: Front view of the TOPFLOW test facility.
4. Planned experiments
The planned experiments have already roughly been listed in chapter 1. In the following theinvestigation of two phase flow pattern in vertical pipes is described in detail. The tests wereprepared by small scale experiments at the MTLOOP at the Institute for Safety Researchperformed in the frame of the running research project BMWi 1501215 “Flow Pattern andModels for Transient Two Phase Flows”.
4.1 Phase distribution and flow pattern in vertical tubes
The known models and flow diagrams for the prediction of the phase distribution and flowpattern in vertical tubes are not universally available, because most of them were developedfrom adiabatic water-air experiments in small tubes (< 50 mm) and atmospheric pressure. Theexperiments were performed in transparent tubes and the flow pattern classification is basedon visual observations. Therefore an extrapolation outside the experimental conditions is notpossible. Based on stability analysis it is assumed, that comparable flow patterns cannot existin large tubes. This missing of reliable, universal criteria for prediction of phase distributionleads to numerous empirical and semi-empirical models for the determination of pressurelosses, heat and mass transfer.
The flow experiments in TOPFLOW will be performed with water steam mixtures under highpressures (< 7 MPa) and in tubes with diameters up to 200 mm and length up to 9 m. The cor-responding L/D-ratios are 45 for DN200 and 180 for DN50.
Front View
19
In the first step steady state flow conditions will be investigated for the verification of exist-ing flow pattern maps. The evaluation of void fraction and velocity profiles as a function ofthe distance from the vapour injection shall be measured as well as two phase parameters,which characterize the structure of the two phase flow and allow to derive objective andreproducible criteria for flow pattern classification. The experiments are performed understeady state boundary conditions (pressure, phase mass flow). This kind of flow investigationsshall be extended to bends, junctions, isthmuses and dilations.
4.2 Droplet entrainment and deposit in a PWR hot leg
A typical example for the above mentioned topic is the droplet entrainment and depositduring the end of the blown-down phase of a large break LOCA. After reaching a systempressure less then 2.6 MPa water is injected by the accumulators in both - hot and cold leg ofthe primary circuit.
The water injected into the hot leg flows through the upper plenum to the core. Due to thewetting of the fuel pins 100 - 150 kg/s steam is produced and flows through the hot legs to thesteam generators. In the steam large amounts of liquid droplets (up to 500 - 750 kg/s) areentrained. Most of these droplets are deposited in the upper plenum, only 50 kg/s aredeposited in each hot leg. The scenario described above take places at 0.4 - 2.6 MPa.
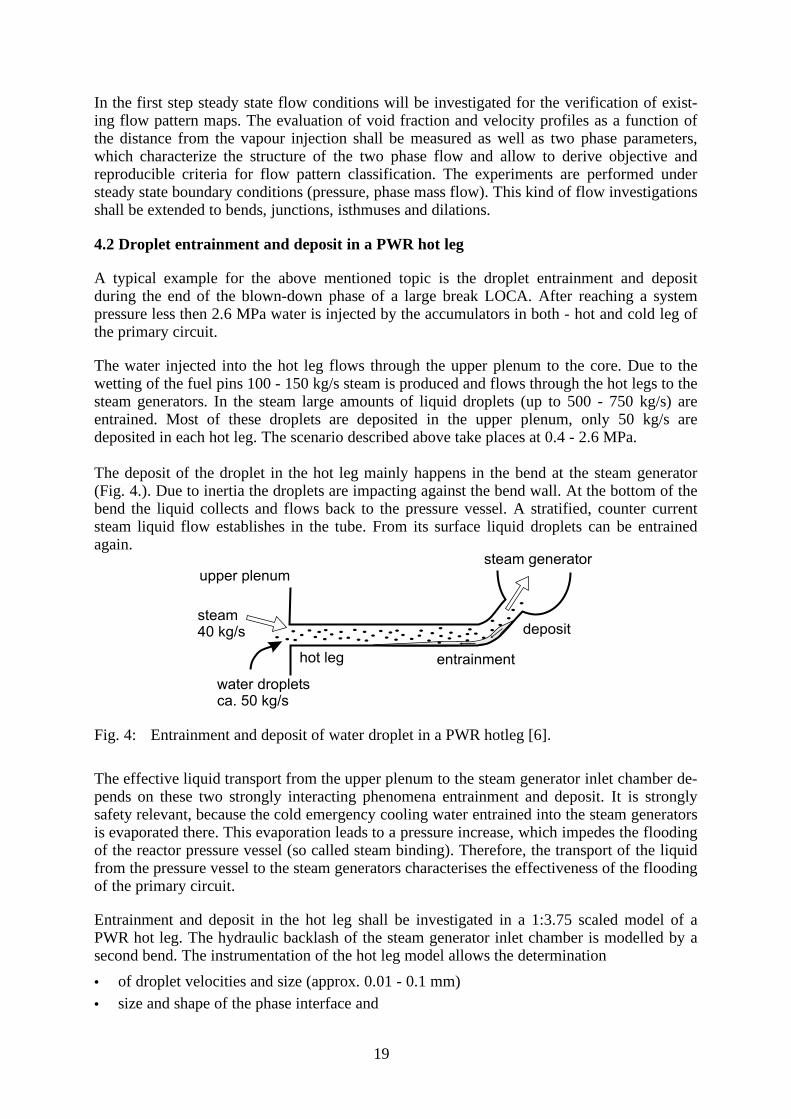
The deposit of the droplet in the hot leg mainly happens in the bend at the steam generator(Fig. 4.). Due to inertia the droplets are impacting against the bend wall. At the bottom of thebend the liquid collects and flows back to the pressure vessel. A stratified, counter currentsteam liquid flow establishes in the tube. From its surface liquid droplets can be entrainedagain.
steam generatorupper plenum
hot leg
deposit
entrainment
water dropletsca. 50 kg/s
steam40 kg/s
Fig. 4: Entrainment and deposit of water droplet in a PWR hotleg [6].
The effective liquid transport from the upper plenum to the steam generator inlet chamber de-pends on these two strongly interacting phenomena entrainment and deposit. It is stronglysafety relevant, because the cold emergency cooling water entrained into the steam generatorsis evaporated there. This evaporation leads to a pressure increase, which impedes the floodingof the reactor pressure vessel (so called steam binding). Therefore, the transport of the liquidfrom the pressure vessel to the steam generators characterises the effectiveness of the floodingof the primary circuit.
Entrainment and deposit in the hot leg shall be investigated in a 1:3.75 scaled model of aPWR hot leg. The hydraulic backlash of the steam generator inlet chamber is modelled by asecond bend. The instrumentation of the hot leg model allows the determination
• of droplet velocities and size (approx. 0.01 - 0.1 mm)• size and shape of the phase interface and
20
• local velocities in the liquid film.
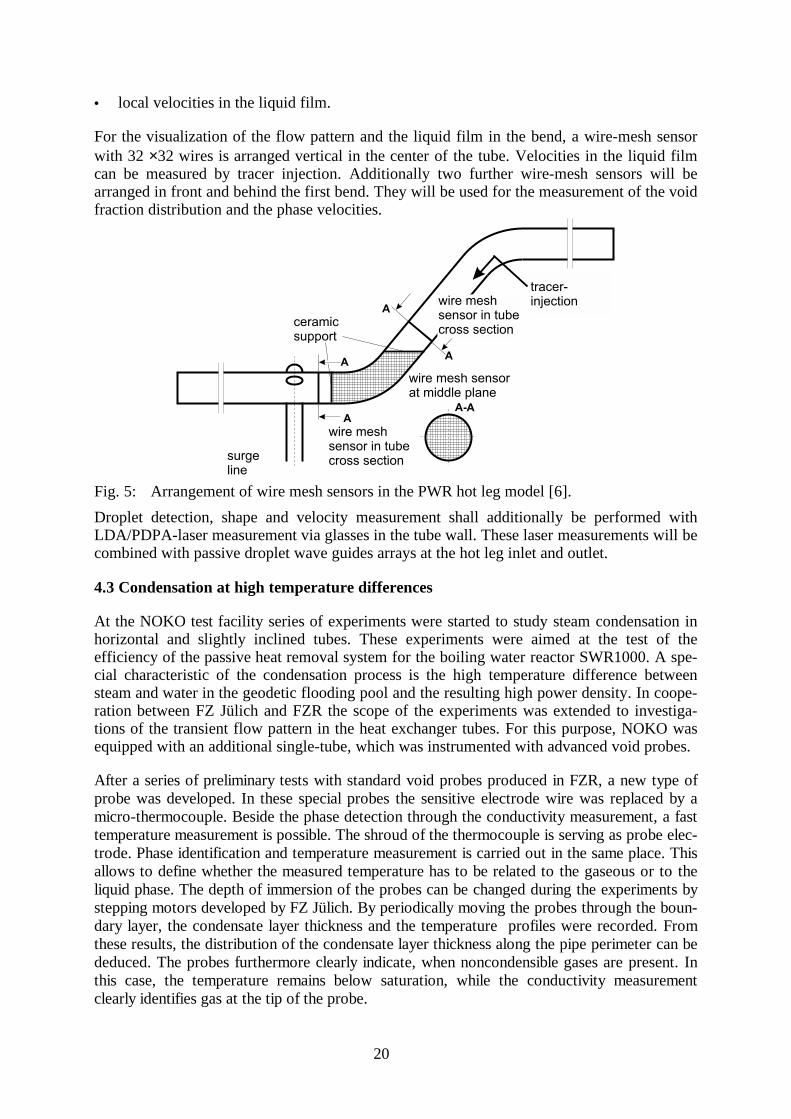
For the visualization of the flow pattern and the liquid film in the bend, a wire-mesh sensorwith 32 ×32 wires is arranged vertical in the center of the tube. Velocities in the liquid filmcan be measured by tracer injection. Additionally two further wire-mesh sensors will bearranged in front and behind the first bend. They will be used for the measurement of the voidfraction distribution and the phase velocities.
A
A-A
A
A
A
surgeline
wire mesh sensorat middle plane
ceramicsupport
wire meshsensor in tubecross section
wire meshsensor in tubecross section
tracer-injection
Fig. 5: Arrangement of wire mesh sensors in the PWR hot leg model [6].
Droplet detection, shape and velocity measurement shall additionally be performed withLDA/PDPA-laser measurement via glasses in the tube wall. These laser measurements will becombined with passive droplet wave guides arrays at the hot leg inlet and outlet.
4.3 Condensation at high temperature differences
At the NOKO test facility series of experiments were started to study steam condensation inhorizontal and slightly inclined tubes. These experiments were aimed at the test of theefficiency of the passive heat removal system for the boiling water reactor SWR1000. A spe-cial characteristic of the condensation process is the high temperature difference betweensteam and water in the geodetic flooding pool and the resulting high power density. In coope-ration between FZ Jülich and FZR the scope of the experiments was extended to investiga-tions of the transient flow pattern in the heat exchanger tubes. For this purpose, NOKO wasequipped with an additional single-tube, which was instrumented with advanced void probes.
After a series of preliminary tests with standard void probes produced in FZR, a new type ofprobe was developed. In these special probes the sensitive electrode wire was replaced by amicro-thermocouple. Beside the phase detection through the conductivity measurement, a fasttemperature measurement is possible. The shroud of the thermocouple is serving as probe elec-trode. Phase identification and temperature measurement is carried out in the same place. Thisallows to define whether the measured temperature has to be related to the gaseous or to theliquid phase. The depth of immersion of the probes can be changed during the experiments bystepping motors developed by FZ Jülich. By periodically moving the probes through the boun-dary layer, the condensate layer thickness and the temperature profiles were recorded. Fromthese results, the distribution of the condensate layer thickness along the pipe perimeter can bededuced. The probes furthermore clearly indicate, when noncondensible gases are present. Inthis case, the temperature remains below saturation, while the conductivity measurementclearly identifies gas at the tip of the probe.
21
The positive results of a series of experiments performed with these probes have shown thatfurther tests are very useful and necessary. Experiments of this kind are therefore included intothe research programme for TOPFLOW.
5. Conclusions and outlook
The new multipurpose thermal hydraulic test facility TOPFLOW (Transient Two Phase FlowTest Facility) is under construction at Forschungszentrum Rossendorf (FZR) e.V. The recon-struction of the building has started in October 2000 and will be finished probably in July2001. The disassembly of the NOKO test facility will take place from January up to February2001. All components, which will be reused are moved to FZR. The construction ofTOPFLOW starts in March 2001 and will be finished at the end of the year. After a 3 monthscommissioning phase, the experiments shall start in April 2002.
In the first configuration, TOPFLOW contains three test sections. These are a large pool witha volume of 20 m³ and a design pressure of 1.1 MPa, a steam drum with a volume of 8 m³and a design pressure of 7 MPa and two vertical test sections with DN50 and DN200, each 9m long. The first experiments aim at the determination of the phase distribution and flowpattern in large vertical tubes under high pressure conditions and the evaluation of the phasedistribution as a function of the distance from the gas injection. Further experiments willinclude bends, junctions, isthmuses and dilations as well as condensation experiments. Thiskind of experiments requires new high resolution two phase flow measuring devices (e.g.needle shaped conductivity probes, wire mesh sensors or γ-ray tomography).
References
[1] E.F. Hicken, K. Verfondern (2000), Investigation of the Effectiveness of InnovativePassive Safety Systems for Boiling Water Reactors, Schriften des ForschungszentrumsJülich, Reihe Energietechnik 11, ISSN 1433-5522.
[2] E.F. Hicken, H. Jaegers, A. Schaffrath, F.-P. Weiss (2000), The NOKO/TOPFLOWFacility for Natural Convection Flow, TCM-Meeting, Vienna.
[2] H.-M. Prasser, A. Böttger, J. Zschau (1997), A New Wire-Mesh Tomograph for Gas-Liquid Flows, Frontiers in Industrial Process Tomography II, Delft, The Netherlands,109-112.
[3] H.-M. Prasser, E. Krepper, D. Lucas (2000), Fast wire-mesh sensors for gas-liquidflows and decompositions of gas fraction profiles according to bubble size classes, Se-cond Japanese-European Two-Phase Flow Group Meeting, Tsukuba, Japan,September 25-29, proceedings on CD-ROM: D-3.pdf
[4] A.-K. Krüssenberg, H.-M. Prasser, A.Schaffrath (1999), A New Criterion for theBubble Slug Transition in Vertical Tubes, Ninth International Topical Meeting on Nu-clear Reactor Thermal Hydraulics (NURETH-9), San Francisco, California, USA, Oc-tober 3-8, proceedings on CD-ROM.
[5] V. Teschendorff, M. Scheurer, H.-G. Sonnenburg (1998), Konzertierte Aktion zurIntegration von CFD-Codes bzw. deren Module in den Systemcode ATHLET zur phy-sikalisch fundierten und sicher skalierbaren Simulation mehrdimensionaler Zweiphasen-strömungen, 12. Sitzung des Projektkommittees “Transienten und Unfallabläufe”, Köln.
[6] A. Schaffrath, H.-M. Prasser, F.-P. Weiß (2001), TOPFLOW - Transient Two PhaseFlow Test Facility - EFRE (European Fund for Reconstruction)-Projektantrag für dieErrichtung einer Mehrzweck-Thermohydraulikversuchsanlage für generische Unter-suchungen von Zweiphasenströmungen und die Validierung von CFD-Codes.
22
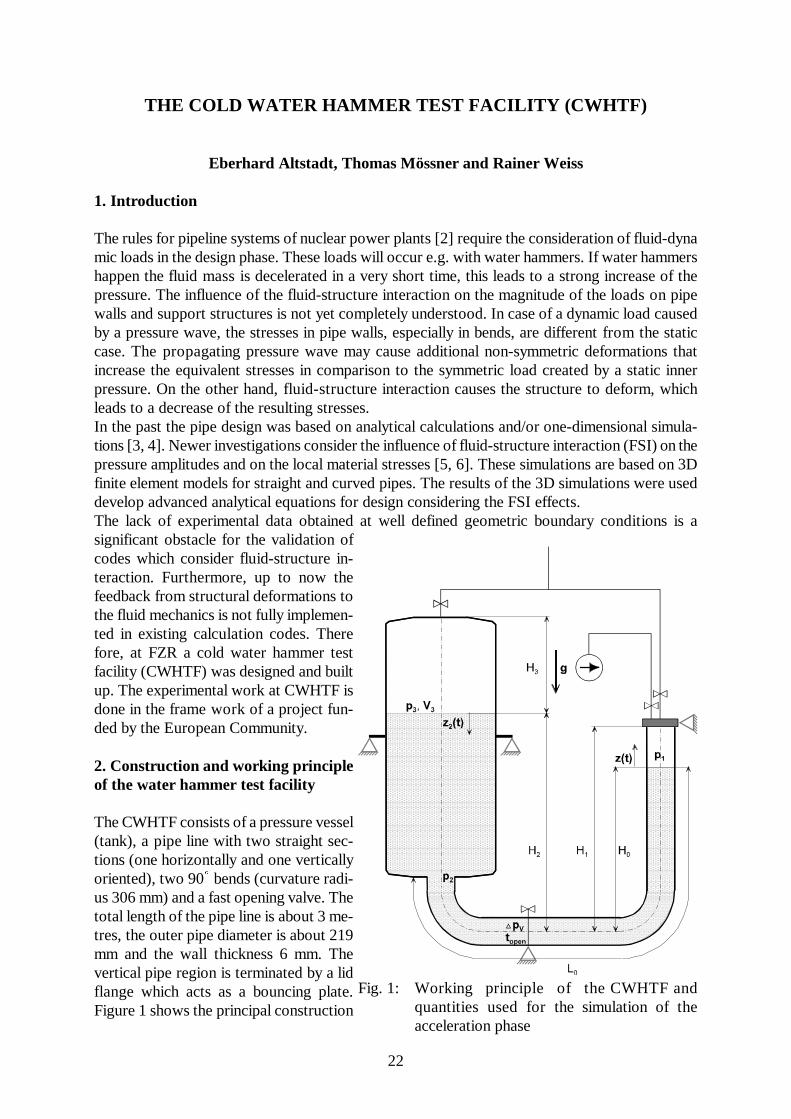
Fig. 1: Working principle of the CWHTF andquantities used for the simulation of theacceleration phase
THE COLD WATER HAMMER TEST FACILITY (CWHTF)
Eberhard Altstadt, Thomas Mössner and Rainer Weiss
1. Introduction
The rules for pipeline systems of nuclear power plants [2] require the consideration of fluid-dynamic loads in the design phase. These loads will occur e.g. with water hammers. If water hammershappen the fluid mass is decelerated in a very short time, this leads to a strong increase of thepressure. The influence of the fluid-structure interaction on the magnitude of the loads on pipewalls and support structures is not yet completely understood. In case of a dynamic load causedby a pressure wave, the stresses in pipe walls, especially in bends, are different from the staticcase. The propagating pressure wave may cause additional non-symmetric deformations thatincrease the equivalent stresses in comparison to the symmetric load created by a static innerpressure. On the other hand, fluid-structure interaction causes the structure to deform, whichleads to a decrease of the resulting stresses. In the past the pipe design was based on analytical calculations and/or one-dimensional simula-tions [3, 4]. Newer investigations consider the influence of fluid-structure interaction (FSI) on thepressure amplitudes and on the local material stresses [5, 6]. These simulations are based on 3Dfinite element models for straight and curved pipes. The results of the 3D simulations were useddevelop advanced analytical equations for design considering the FSI effects.The lack of experimental data obtained at well defined geometric boundary conditions is asignificant obstacle for the validation ofcodes which consider fluid-structure in-teraction. Furthermore, up to now thefeedback from structural deformations tothe fluid mechanics is not fully implemen-ted in existing calculation codes. Therefore, at FZR a cold water hammer testfacility (CWHTF) was designed and builtup. The experimental work at CWHTF isdone in the frame work of a project fun-ded by the European Community.
2. Construction and working principleof the water hammer test facility
The CWHTF consists of a pressure vessel(tank), a pipe line with two straight sec-tions (one horizontally and one verticallyoriented), two 90 bends (curvature radi-us 306 mm) and a fast opening valve. Thetotal length of the pipe line is about 3 me-tres, the outer pipe diameter is about 219mm and the wall thickness 6 mm. Thevertical pipe region is terminated by a lidflange which acts as a bouncing plate.Figure 1 shows the principal construction

23
of the facility.
The water level in the vertical part of the pipeline is adjusted in a certain distance from the lidflange. This free volume above this level is evacuated (p << 1 bar) through a hole in the bouncingplate. During this time the fast acting valve is closed. After the fast opening of the valve the fluidis accelerated until bouncing against the upper lid of vertical pipeline. At that time a waterhammer is induced. The pressure in the tank may be increased by pressurised air (up to 6 bars) toincrease the amplitude of the pressure waves generated. The generated pressure wave travelsback through the bend, causing a strong structural response of the pipe system.
The valve is connected to a spring mechanism which allows the quick opening of the turning platewithin a defined time. The opening time can be varied between 0.02s and 0.5s by changing thepre-stress of the springs. The opening mechanism is hydraulically initiated by loosening the arrestof the pre-stressed springs. This makes no counterthrust onto the pipe system, so the excitationof vibrations is rather low.
The frame is connected to foundation via bolts. The valve flange is also connected to the ground.At the lid flange (bouncing plate) the connections for vacuum pump and for the pressurised aircan be seen. Table 1 contains the principal parameters of the pipe and of the tank:
Table1: Main parameters of the CWHTF
Pipe line
Outer diameter 219 mm
Wall thickness 6.0 mm
Curvature radius of the bend 306 mm
Total pipe length 3.285 m
Internal volume 124 Litres
Design pressure 60 bar
Pressure of plastification 90 bar
Pressure of break 226 bar
Vessel
Outer diameter 800 mm
Wall thickness 6.0 mm
Volume ca. 750 Litres
Design pressure 10 bar
3. Instrumentation
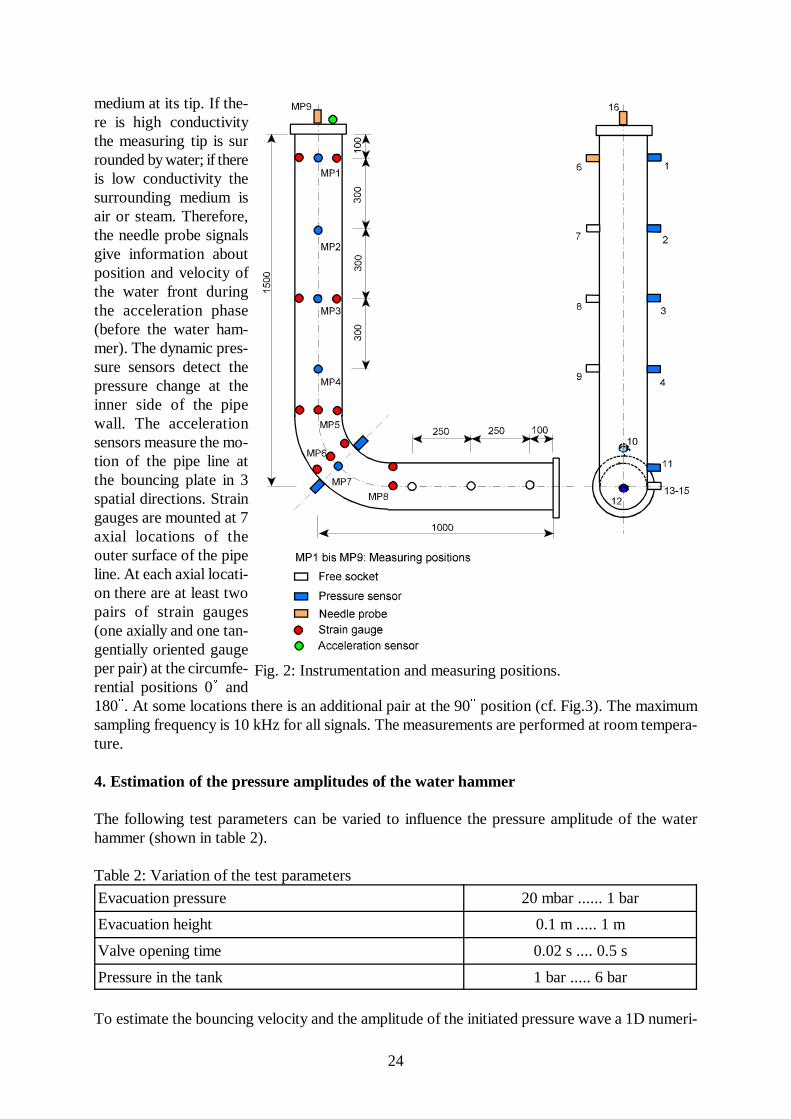
The pipe line is instrumented with a number of sensors between the lid flange and the valve.Dynamic pressures, strains, void fractions and acceleration can be measured. Figure 2 shows thearrangement of the measurement positions. The needle probes measure the conductivity of the
24
Fig. 2: Instrumentation and measuring positions.
medium at its tip. If the-re is high conductivitythe measuring tip is surrounded by water; if thereis low conductivity thesurrounding medium isair or steam. Therefore,the needle probe signalsgive information aboutposition and velocity ofthe water front duringthe acceleration phase(before the water ham-mer). The dynamic pres-sure sensors detect thepressure change at theinner side of the pipewall. The accelerationsensors measure the mo-tion of the pipe line atthe bouncing plate in 3spatial directions. Straingauges are mounted at 7axial locations of theouter surface of the pipeline. At each axial locati-on there are at least twopairs of strain gauges(one axially and one tan-gentially oriented gaugeper pair) at the circumfe-rential positions 0 and180. At some locations there is an additional pair at the 90 position (cf. Fig.3). The maximumsampling frequency is 10 kHz for all signals. The measurements are performed at room tempera-ture.
4. Estimation of the pressure amplitudes of the water hammer
The following test parameters can be varied to influence the pressure amplitude of the waterhammer (shown in table 2).
Table 2: Variation of the test parameters
Evacuation pressure 20 mbar ...... 1 bar
Evacuation height 0.1 m ..... 1 m
Valve opening time 0.02 s .... 0.5 s
Pressure in the tank 1 bar ..... 6 bar
To estimate the bouncing velocity and the amplitude of the initiated pressure wave a 1D numeri-
25
[ ]
[ ]
d
dtz L z g H z
p p p
d
dtz H z g H z
p p
( ) ( )
( ) ( )
⋅ + + ⋅ + = − −
⋅ − − ⋅ − = −
0 02 1
2 2 2 2 23 2
∆ V
ρ
ρ
(1)
[ ( ) ] ( )
[ ( ) ] [ ( ) ( )]
( ) ( )
z L H z z
g H H z p t p p t
z z
⋅ + ⋅ + − ⋅ + ⋅ −
+ ⋅ − + + ⋅ = ⋅ − −
= =
0 22 2 2
0 2 3 1
1 1
11
0 0 0 0
α α α
αρ
∆ V (3)
∆ p t zA
A tz tV
Pipe
Valve
( )
( ) ( )= ⋅ ⋅ −
=ρ ρ
ς2
12
2
2
22 (4)
z tA
Az t z tPipe
Vessel2 ( ) ( ) ( )= = ⋅α (2)
p t pV
V A zp
H
H z tVessel3 3,0
3
3 23,0
3
3
( )( )
= ⋅+
= ⋅+ ⋅α (5)
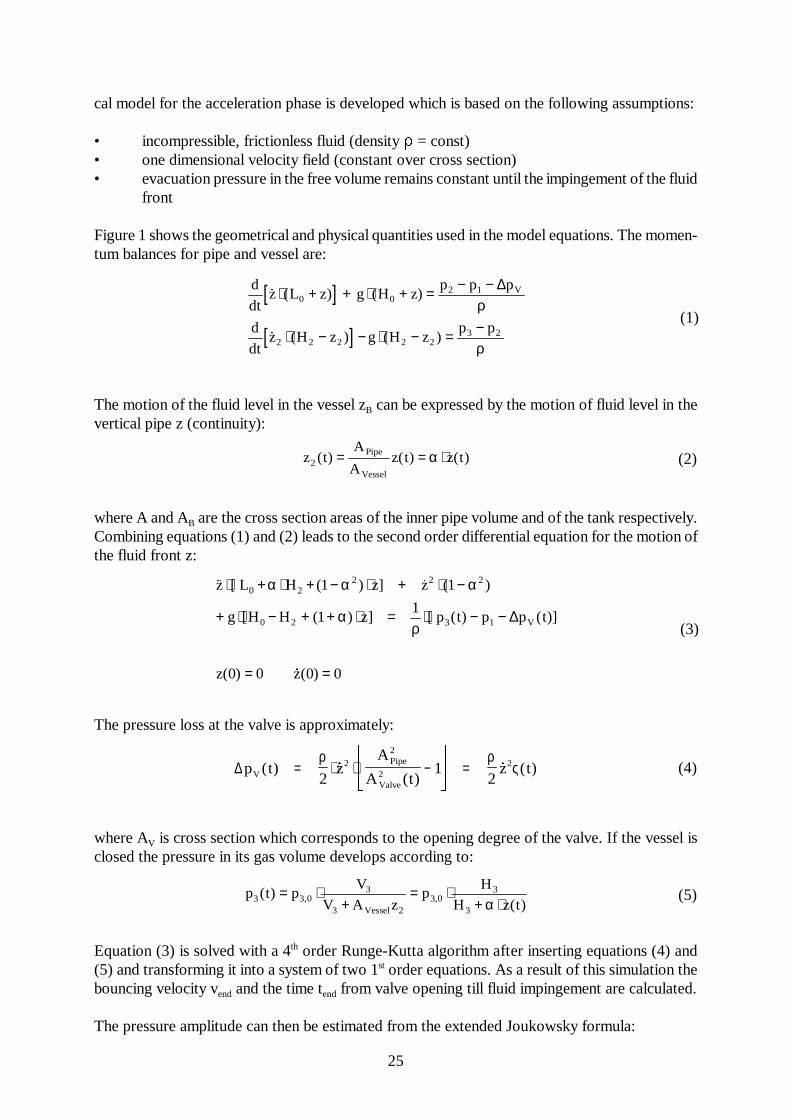
cal model for the acceleration phase is developed which is based on the following assumptions:
• incompressible, frictionless fluid (density = const)• one dimensional velocity field (constant over cross section)• evacuation pressure in the free volume remains constant until the impingement of the fluid
front
Figure 1 shows the geometrical and physical quantities used in the model equations. The momen-tum balances for pipe and vessel are:
The motion of the fluid level in the vessel zB can be expressed by the motion of fluid level in thevertical pipe z (continuity):
where A and AB are the cross section areas of the inner pipe volume and of the tank respectively.Combining equations (1) and (2) leads to the second order differential equation for the motion ofthe fluid front z:
The pressure loss at the valve is approximately:
where AV is cross section which corresponds to the opening degree of the valve. If the vessel isclosed the pressure in its gas volume develops according to:
Equation (3) is solved with a 4th order Runge-Kutta algorithm after inserting equations (4) and(5) and transforming it into a system of two 1st order equations. As a result of this simulation thebouncing velocity vend and the time tend from valve opening till fluid impingement are calculated.
The pressure amplitude can then be estimated from the extended Joukowsky formula:
26
p v cF end F= ⋅ ⋅ ′ρ (6)
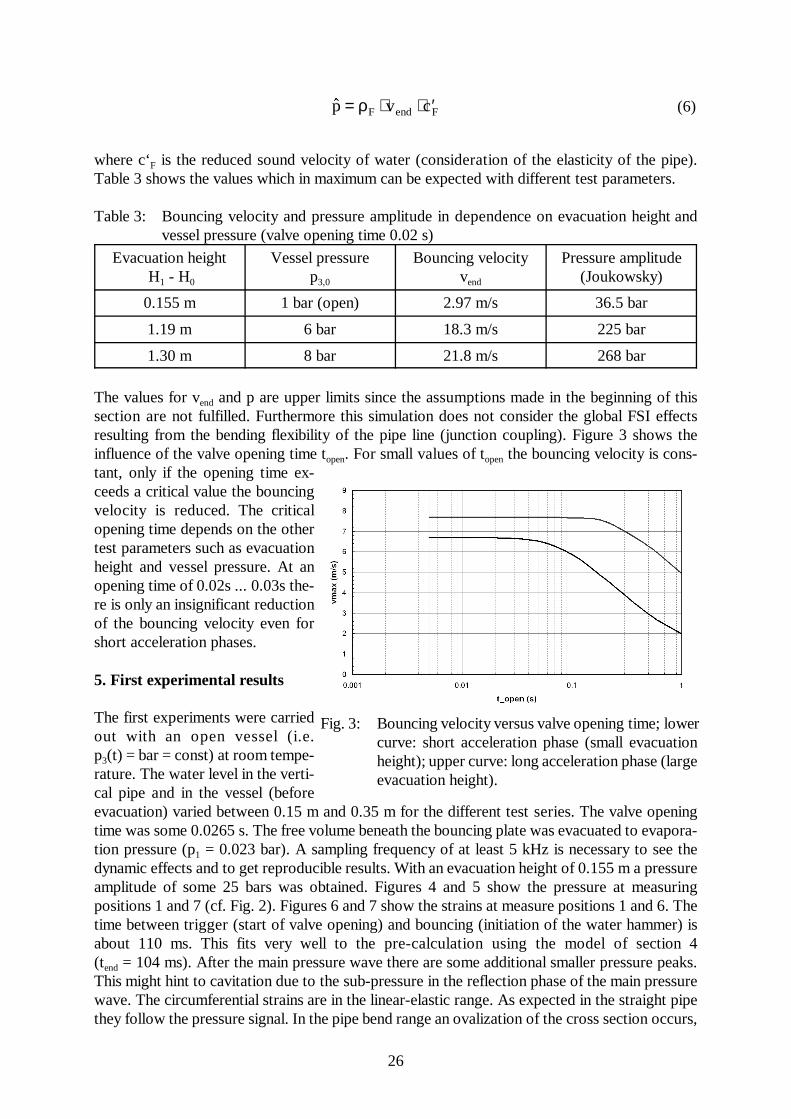
Fig. 3: Bouncing velocity versus valve opening time; lowercurve: short acceleration phase (small evacuationheight); upper curve: long acceleration phase (largeevacuation height).
where c‘F is the reduced sound velocity of water (consideration of the elasticity of the pipe).Table 3 shows the values which in maximum can be expected with different test parameters.
Table 3: Bouncing velocity and pressure amplitude in dependence on evacuation height andvessel pressure (valve opening time 0.02 s)
Evacuation height H1 - H0
Vessel pressurep3,0
Bouncing velocityvend
Pressure amplitude(Joukowsky)
0.155 m 1 bar (open) 2.97 m/s 36.5 bar
1.19 m 6 bar 18.3 m/s 225 bar
1.30 m 8 bar 21.8 m/s 268 bar
The values for vend and p are upper limits since the assumptions made in the beginning of thissection are not fulfilled. Furthermore this simulation does not consider the global FSI effectsresulting from the bending flexibility of the pipe line (junction coupling). Figure 3 shows theinfluence of the valve opening time topen. For small values of topen the bouncing velocity is cons-tant, only if the opening time ex-ceeds a critical value the bouncingvelocity is reduced. The criticalopening time depends on the othertest parameters such as evacuationheight and vessel pressure. At anopening time of 0.02s ... 0.03s the-re is only an insignificant reductionof the bouncing velocity even forshort acceleration phases.
5. First experimental results
The first experiments were carriedout with an open vessel (i.e.p3(t) = bar = const) at room tempe-rature. The water level in the verti-cal pipe and in the vessel (beforeevacuation) varied between 0.15 m and 0.35 m for the different test series. The valve openingtime was some 0.0265 s. The free volume beneath the bouncing plate was evacuated to evapora-tion pressure (p1 = 0.023 bar). A sampling frequency of at least 5 kHz is necessary to see thedynamic effects and to get reproducible results. With an evacuation height of 0.155 m a pressureamplitude of some 25 bars was obtained. Figures 4 and 5 show the pressure at measuringpositions 1 and 7 (cf. Fig. 2). Figures 6 and 7 show the strains at measure positions 1 and 6. Thetime between trigger (start of valve opening) and bouncing (initiation of the water hammer) isabout 110 ms. This fits very well to the pre-calculation using the model of section 4(tend = 104 ms). After the main pressure wave there are some additional smaller pressure peaks.This might hint to cavitation due to the sub-pressure in the reflection phase of the main pressurewave. The circumferential strains are in the linear-elastic range. As expected in the straight pipethey follow the pressure signal. In the pipe bend range an ovalization of the cross section occurs,
27
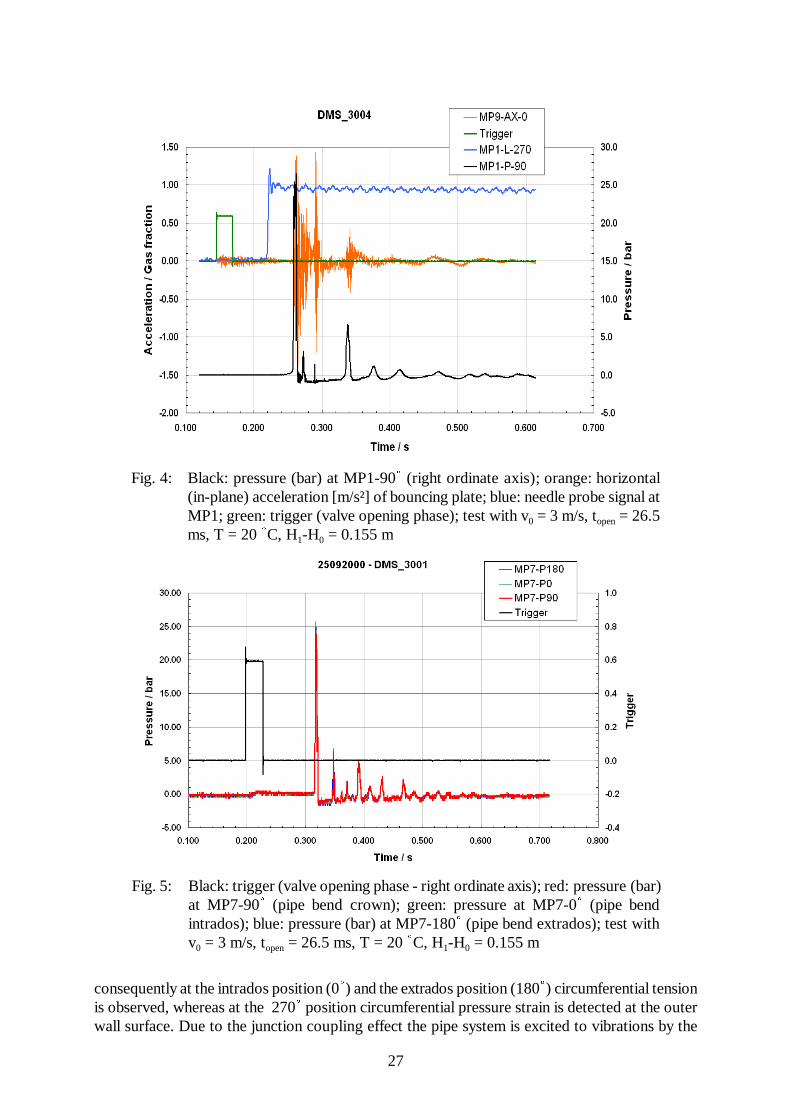
Fig. 4: Black: pressure (bar) at MP1-90 (right ordinate axis); orange: horizontal(in-plane) acceleration [m/s²] of bouncing plate; blue: needle probe signal atMP1; green: trigger (valve opening phase); test with v0 = 3 m/s, topen = 26.5ms, T = 20 C, H1-H0 = 0.155 m
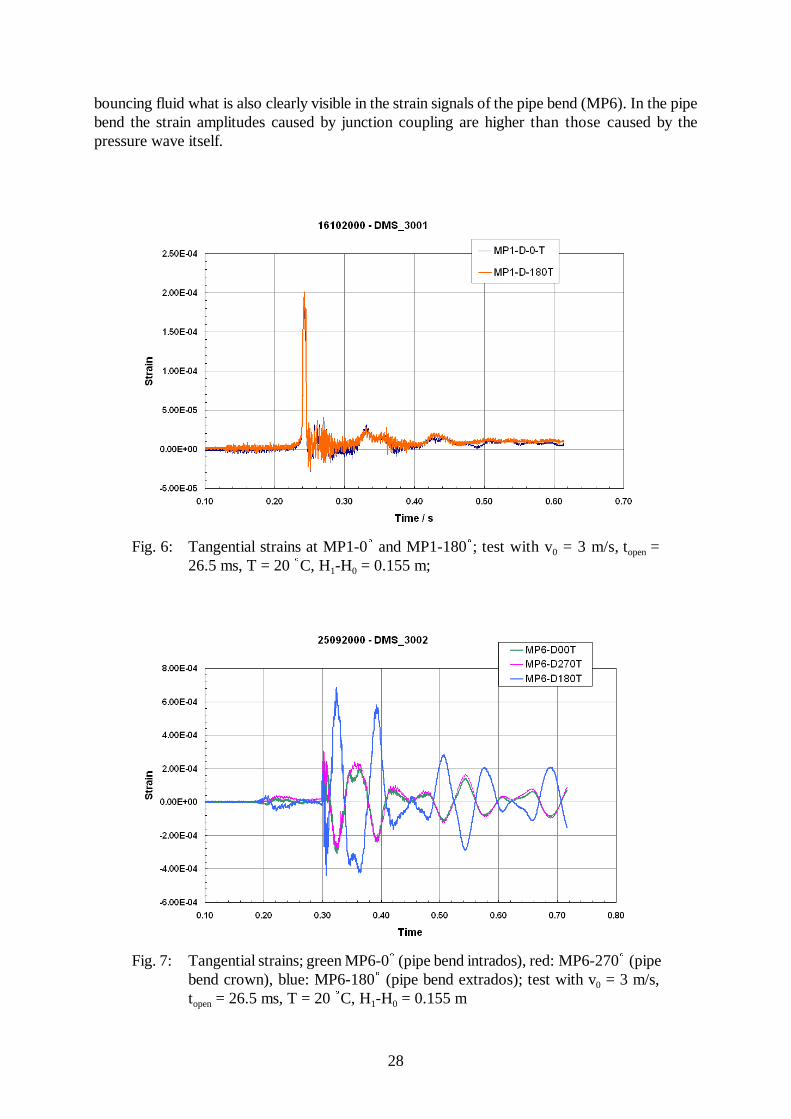
Fig. 5: Black: trigger (valve opening phase - right ordinate axis); red: pressure (bar)at MP7-90 (pipe bend crown); green: pressure at MP7-0 (pipe bendintrados); blue: pressure (bar) at MP7-180 (pipe bend extrados); test withv0 = 3 m/s, topen = 26.5 ms, T = 20 C, H1-H0 = 0.155 m
consequently at the intrados position (0) and the extrados position (180) circumferential tensionis observed, whereas at the 270 position circumferential pressure strain is detected at the outerwall surface. Due to the junction coupling effect the pipe system is excited to vibrations by the
28
Fig. 7: Tangential strains; green MP6-0 (pipe bend intrados), red: MP6-270 (pipebend crown), blue: MP6-180 (pipe bend extrados); test with v0 = 3 m/s,topen = 26.5 ms, T = 20 C, H1-H0 = 0.155 m
Fig. 6: Tangential strains at MP1-0 and MP1-180; test with v0 = 3 m/s, topen =26.5 ms, T = 20 C, H1-H0 = 0.155 m;
bouncing fluid what is also clearly visible in the strain signals of the pipe bend (MP6). In the pipebend the strain amplitudes caused by junction coupling are higher than those caused by thepressure wave itself.

29
6. Conclusions
At the FZR a cold water hammer test facility has been installed. Pressure amplitudes of up to 200bars can be generated. First test have shown that it works as expected. A one-dimensional modelfor the acceleration of the fluid was developed and validated with the results of the first experi-ments. The bouncing velocity is predicted quite well by this model, whereas the pressure am-plitude is over-estimated by some 30-50% since the effect of the junction coupling is not in-cluded.
References
[1] Sicherheitstechnische Regeln des Kerntechnischen Ausschusses (KTA) für den Primär-und Sekundärkreislauf, 3200 ff, aktuelle Version
[2] Handbuch Reaktorsicherheit und Strahlenschutz, Abschnitt 4: Empfehlungen der Reaktor-sicherheitskommission, Herausgeber: Der Bundesminister für Umwelt, Naturschutz undReaktorsicherheit, aktuelle Version
[3] F. Borchsenius, J.-Th. Bornemann (1998), Entwicklungen bei fluiddynamischen Be-rechnungen im atomrechtlichen Aufsichts- und Genehmigungsverfahren, Tagungsberichtder Jahrestagung Kerntechnik 1998, München, ISSN 0720-9207
[4] A.S. Tijsseling (1993), Fluid-structure interaction in case of water hammer with cavitati-on, Ph. D. Thesis, Delft University of Technology, Faculty of Civil Engineering, Commu-nications on Hydraulic and Geotechnical Engineering, Report No. 93-6, Delft, TheNetherlands, 1993, ISSN 0169-6548
[5] T. Repp (1999), Fluid dynamic water hammer simulations with consideration offluid-structure interaction (FSI), Workshop of the initiative for competence maintenancein nuclear technology on the Jahrestagung Kerntechnik 1999, Karlsruhe
[6] T. Repp (2000), Acoustic water hammer simulations with consideration of fluid-structureinteraction (FSI), Workshop of the initiative for competence maintenance in nucleartechnology on the Jahrestagung Kerntechnik 2000, Bonn
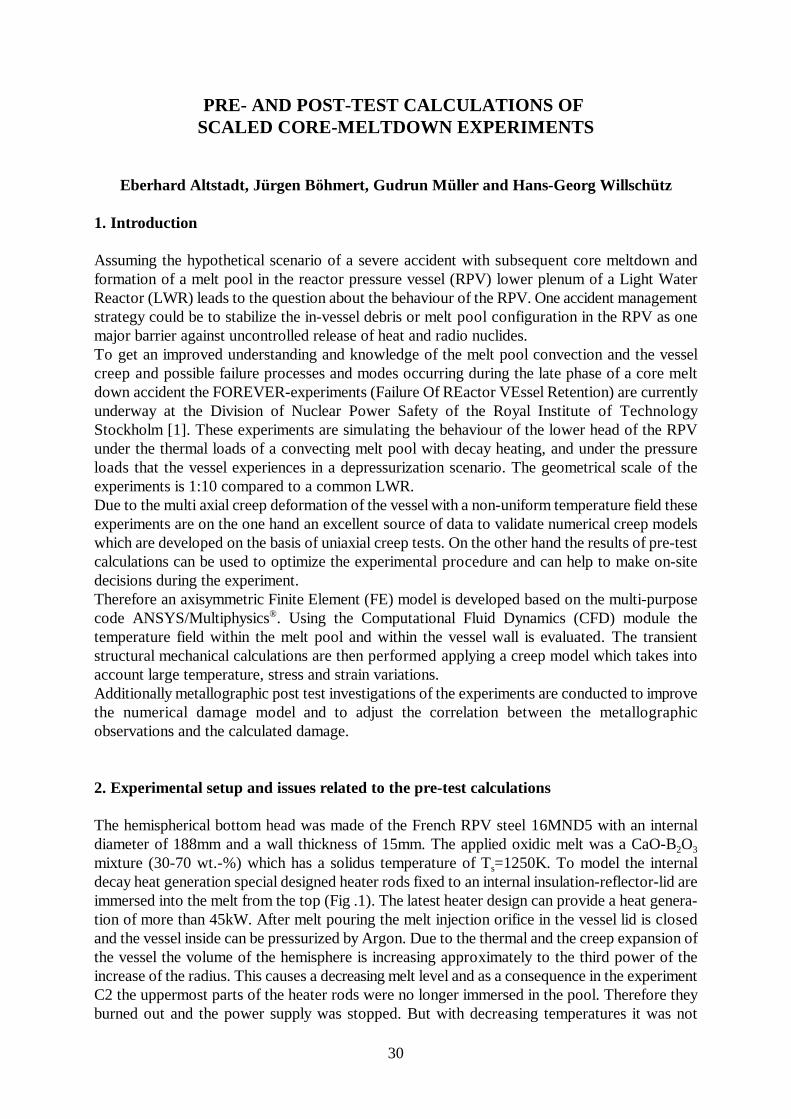
30
PRE- AND POST-TEST CALCULATIONS OF
SCALED CORE-MELTDOWN EXPERIMENTS
Eberhard Altstadt, Jürgen Böhmert, Gudrun Müller and Hans-Georg Willschütz
1. Introduction
Assuming the hypothetical scenario of a severe accident with subsequent core meltdown andformation of a melt pool in the reactor pressure vessel (RPV) lower plenum of a Light WaterReactor (LWR) leads to the question about the behaviour of the RPV. One accident managementstrategy could be to stabilize the in-vessel debris or melt pool configuration in the RPV as onemajor barrier against uncontrolled release of heat and radio nuclides.To get an improved understanding and knowledge of the melt pool convection and the vesselcreep and possible failure processes and modes occurring during the late phase of a core meltdown accident the FOREVER-experiments (Failure Of REactor VEssel Retention) are currentlyunderway at the Division of Nuclear Power Safety of the Royal Institute of TechnologyStockholm [1]. These experiments are simulating the behaviour of the lower head of the RPVunder the thermal loads of a convecting melt pool with decay heating, and under the pressureloads that the vessel experiences in a depressurization scenario. The geometrical scale of theexperiments is 1:10 compared to a common LWR.Due to the multi axial creep deformation of the vessel with a non-uniform temperature field theseexperiments are on the one hand an excellent source of data to validate numerical creep modelswhich are developed on the basis of uniaxial creep tests. On the other hand the results of pre-testcalculations can be used to optimize the experimental procedure and can help to make on-sitedecisions during the experiment.Therefore an axisymmetric Finite Element (FE) model is developed based on the multi-purposecode ANSYS/Multiphysics®. Using the Computational Fluid Dynamics (CFD) module thetemperature field within the melt pool and within the vessel wall is evaluated. The transientstructural mechanical calculations are then performed applying a creep model which takes intoaccount large temperature, stress and strain variations.Additionally metallographic post test investigations of the experiments are conducted to improvethe numerical damage model and to adjust the correlation between the metallographicobservations and the calculated damage.
2. Experimental setup and issues related to the pre-test calculations
The hemispherical bottom head was made of the French RPV steel 16MND5 with an internaldiameter of 188mm and a wall thickness of 15mm. The applied oxidic melt was a CaO-B2O3
mixture (30-70 wt.-%) which has a solidus temperature of Ts=1250K. To model the internaldecay heat generation special designed heater rods fixed to an internal insulation-reflector-lid areimmersed into the melt from the top (Fig .1). The latest heater design can provide a heat genera-tion of more than 45kW. After melt pouring the melt injection orifice in the vessel lid is closedand the vessel inside can be pressurized by Argon. Due to the thermal and the creep expansion ofthe vessel the volume of the hemisphere is increasing approximately to the third power of theincrease of the radius. This causes a decreasing melt level and as a consequence in the experimentC2 the uppermost parts of the heater rods were no longer immersed in the pool. Therefore theyburned out and the power supply was stopped. But with decreasing temperatures it was not
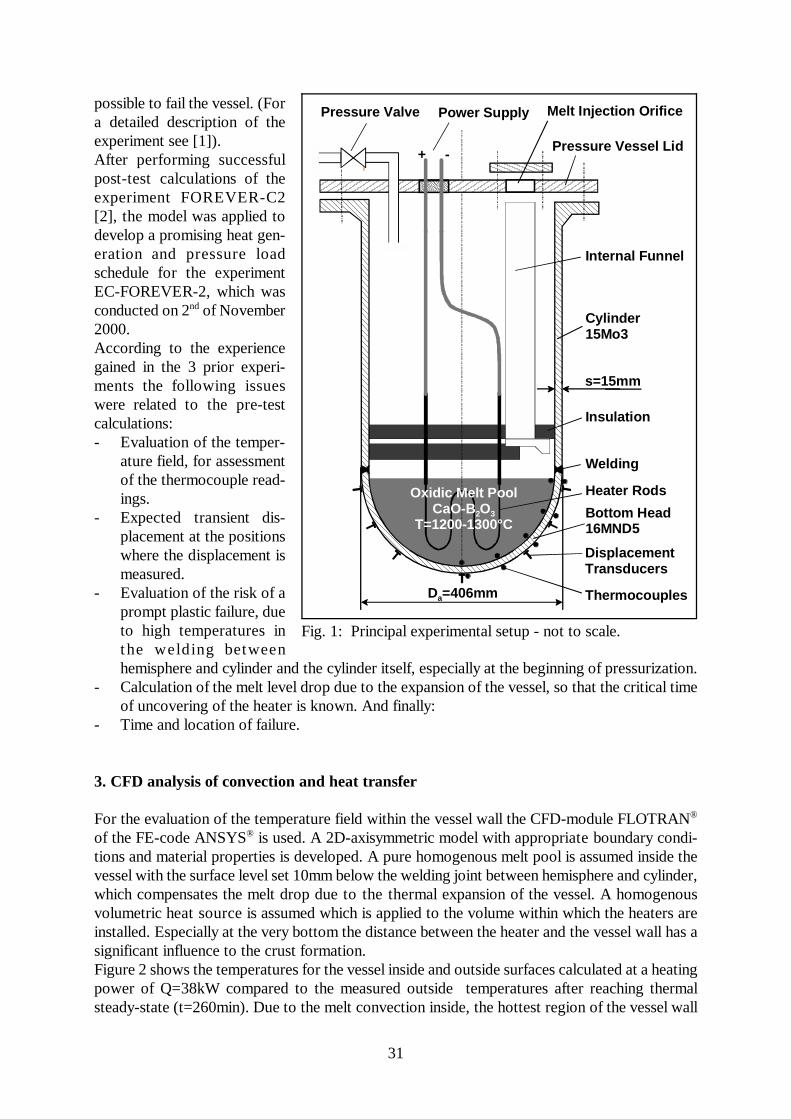
31
Cylinder15Mo3
Bottom Head16MND5
Welding
Insulation
Internal Funnel
Pressure Valve
Pressure Vessel Lid
Oxidic Melt PoolCaO-B2O3
T=1200-1300°C
Heater Rods
Melt Injection Orifice
Da=406mm
+ -
Power Supply
DisplacementTransducers
Thermocouples
s=15mm
Fig. 1: Principal experimental setup - not to scale.
possible to fail the vessel. (Fora detailed description of theexperiment see [1]).After performing successfulpost-test calculations of theexperiment FOREVER-C2[2], the model was applied todevelop a promising heat gen-eration and pressure loadschedule for the experimentEC-FOREVER-2, which wasconducted on 2nd of November2000.According to the experiencegained in the 3 prior experi-ments the following issueswere related to the pre-testcalculations:- Evaluation of the temper-
ature field, for assessmentof the thermocouple read-ings.
- Expected transient dis-placement at the positionswhere the displacement ismeasured.
- Evaluation of the risk of aprompt plastic failure, dueto high temperatures inthe welding betweenhemisphere and cylinder and the cylinder itself, especially at the beginning of pressurization.
- Calculation of the melt level drop due to the expansion of the vessel, so that the critical timeof uncovering of the heater is known. And finally:
- Time and location of failure.
3. CFD analysis of convection and heat transfer
For the evaluation of the temperature field within the vessel wall the CFD-module FLOTRAN®
of the FE-code ANSYS® is used. A 2D-axisymmetric model with appropriate boundary condi-tions and material properties is developed. A pure homogenous melt pool is assumed inside thevessel with the surface level set 10mm below the welding joint between hemisphere and cylinder,which compensates the melt drop due to the thermal expansion of the vessel. A homogenousvolumetric heat source is assumed which is applied to the volume within which the heaters areinstalled. Especially at the very bottom the distance between the heater and the vessel wall has asignificant influence to the crust formation.Figure 2 shows the temperatures for the vessel inside and outside surfaces calculated at a heatingpower of Q=38kW compared to the measured outside temperatures after reaching thermalsteady-state (t=260min). Due to the melt convection inside, the hottest region of the vessel wall
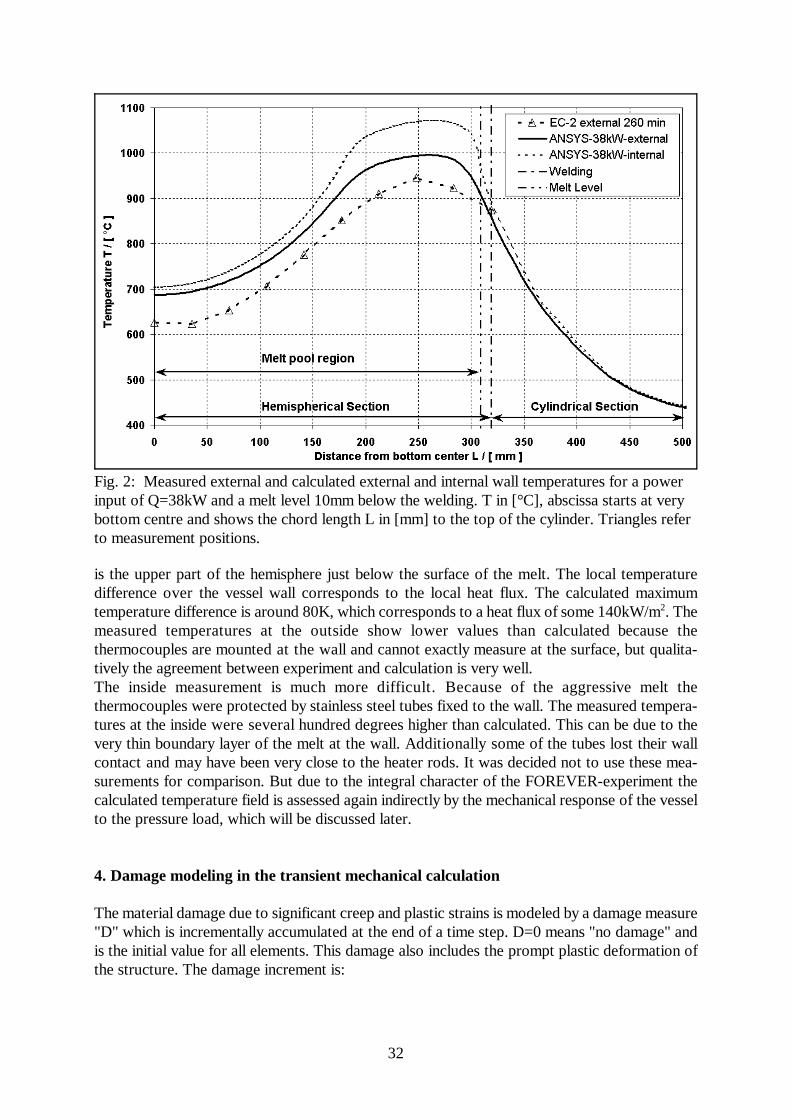
32
Fig. 2: Measured external and calculated external and internal wall temperatures for a powerinput of Q=38kW and a melt level 10mm below the welding. T in [°C], abscissa starts at verybottom centre and shows the chord length L in [mm] to the top of the cylinder. Triangles referto measurement positions.
is the upper part of the hemisphere just below the surface of the melt. The local temperaturedifference over the vessel wall corresponds to the local heat flux. The calculated maximumtemperature difference is around 80K, which corresponds to a heat flux of some 140kW/m2. Themeasured temperatures at the outside show lower values than calculated because thethermocouples are mounted at the wall and cannot exactly measure at the surface, but qualita-tively the agreement between experiment and calculation is very well.The inside measurement is much more difficult. Because of the aggressive melt thethermocouples were protected by stainless steel tubes fixed to the wall. The measured tempera-tures at the inside were several hundred degrees higher than calculated. This can be due to thevery thin boundary layer of the melt at the wall. Additionally some of the tubes lost their wallcontact and may have been very close to the heater rods. It was decided not to use these mea-surements for comparison. But due to the integral character of the FOREVER-experiment thecalculated temperature field is assessed again indirectly by the mechanical response of the vesselto the pressure load, which will be discussed later.
4. Damage modeling in the transient mechanical calculation
The material damage due to significant creep and plastic strains is modeled by a damage measure"D" which is incrementally accumulated at the end of a time step. D=0 means "no damage" andis the initial value for all elements. This damage also includes the prompt plastic deformation ofthe structure. The damage increment is:
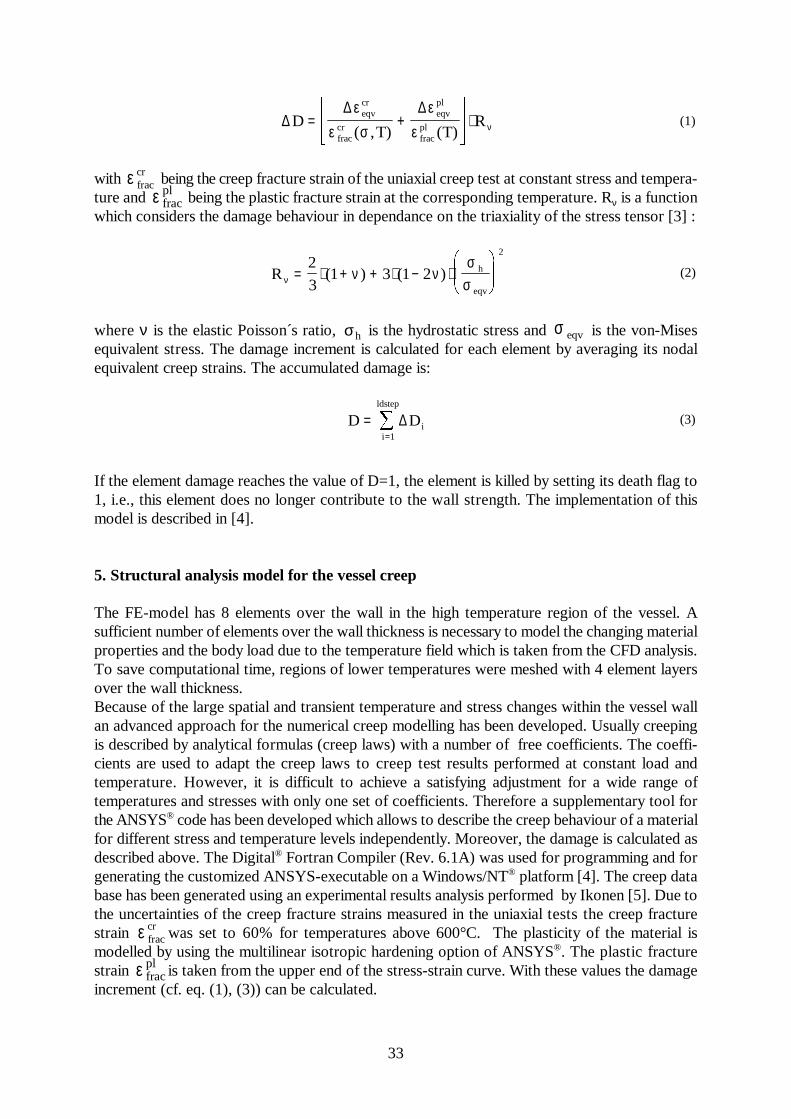
33
∆∆ ε ∆ ε
DT) T)
Reqvcr
fraccr
eqvpl
fracpl= +
⋅ε σ ε ν( , (
(1)
R h
eqvν ν ν
σσ
= ⋅ + + ⋅ − ⋅
2
31 3 1 2
2
( ) ( ) (2)
D Dii
ldstep
== ∆
1
(3)
with being the creep fracture strain of the uniaxial creep test at constant stress and tempera-ε fraccr
ture and being the plastic fracture strain at the corresponding temperature. Rν is a functionε fracpl
which considers the damage behaviour in dependance on the triaxiality of the stress tensor [3] :
where ν is the elastic Poisson´s ratio, is the hydrostatic stress and is the von-Misesσh σ eqv
equivalent stress. The damage increment is calculated for each element by averaging its nodalequivalent creep strains. The accumulated damage is:
If the element damage reaches the value of D=1, the element is killed by setting its death flag to1, i.e., this element does no longer contribute to the wall strength. The implementation of thismodel is described in [4].
5. Structural analysis model for the vessel creep
The FE-model has 8 elements over the wall in the high temperature region of the vessel. Asufficient number of elements over the wall thickness is necessary to model the changing materialproperties and the body load due to the temperature field which is taken from the CFD analysis.To save computational time, regions of lower temperatures were meshed with 4 element layersover the wall thickness.Because of the large spatial and transient temperature and stress changes within the vessel wallan advanced approach for the numerical creep modelling has been developed. Usually creepingis described by analytical formulas (creep laws) with a number of free coefficients. The coeffi-cients are used to adapt the creep laws to creep test results performed at constant load andtemperature. However, it is difficult to achieve a satisfying adjustment for a wide range oftemperatures and stresses with only one set of coefficients. Therefore a supplementary tool forthe ANSYS® code has been developed which allows to describe the creep behaviour of a materialfor different stress and temperature levels independently. Moreover, the damage is calculated asdescribed above. The Digital® Fortran Compiler (Rev. 6.1A) was used for programming and forgenerating the customized ANSYS-executable on a Windows/NT® platform [4]. The creep database has been generated using an experimental results analysis performed by Ikonen [5]. Due tothe uncertainties of the creep fracture strains measured in the uniaxial tests the creep fracturestrain was set to 60% for temperatures above 600°C. The plasticity of the material isε frac
cr
modelled by using the multilinear isotropic hardening option of ANSYS®. The plastic fracturestrain is taken from the upper end of the stress-strain curve. With these values the damageε frac
pl
increment (cf. eq. (1), (3)) can be calculated.
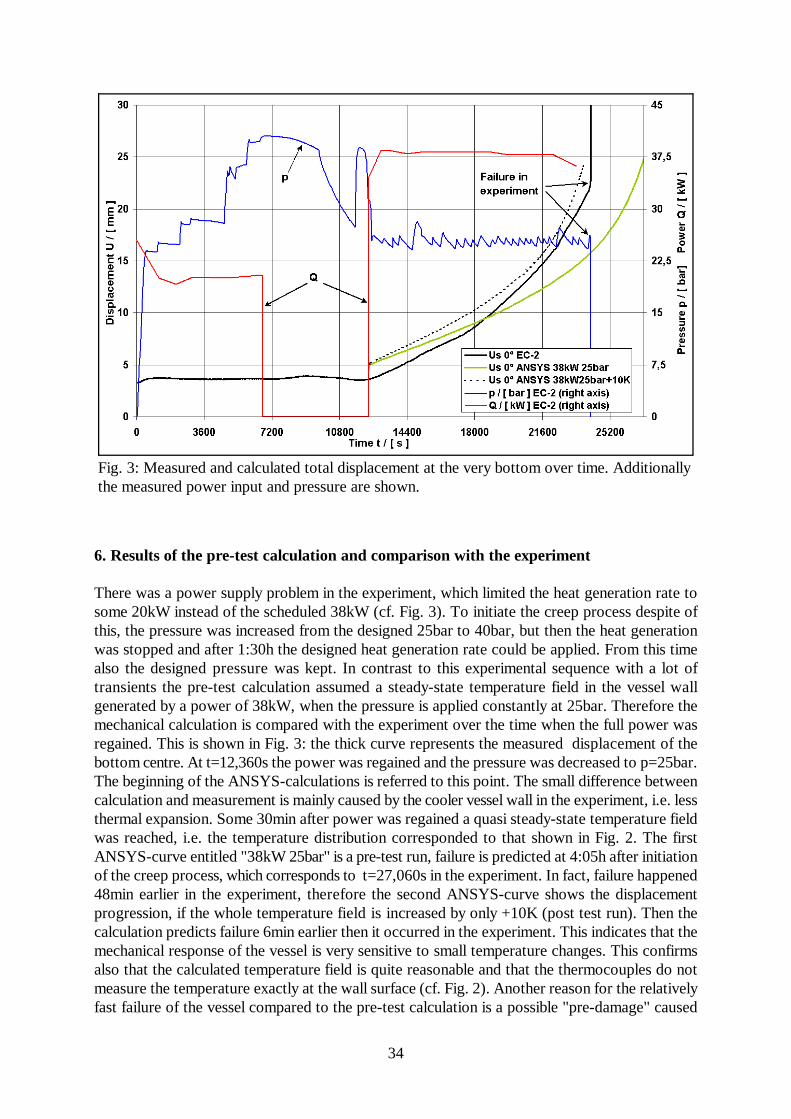
34
6. Results of the pre-test calculation and comparison with the experiment
There was a power supply problem in the experiment, which limited the heat generation rate tosome 20kW instead of the scheduled 38kW (cf. Fig. 3). To initiate the creep process despite ofthis, the pressure was increased from the designed 25bar to 40bar, but then the heat generationwas stopped and after 1:30h the designed heat generation rate could be applied. From this timealso the designed pressure was kept. In contrast to this experimental sequence with a lot oftransients the pre-test calculation assumed a steady-state temperature field in the vessel wallgenerated by a power of 38kW, when the pressure is applied constantly at 25bar. Therefore themechanical calculation is compared with the experiment over the time when the full power wasregained. This is shown in Fig. 3: the thick curve represents the measured displacement of thebottom centre. At t=12,360s the power was regained and the pressure was decreased to p=25bar.The beginning of the ANSYS-calculations is referred to this point. The small difference betweencalculation and measurement is mainly caused by the cooler vessel wall in the experiment, i.e. lessthermal expansion. Some 30min after power was regained a quasi steady-state temperature fieldwas reached, i.e. the temperature distribution corresponded to that shown in Fig. 2. The firstANSYS-curve entitled "38kW 25bar" is a pre-test run, failure is predicted at 4:05h after initiationof the creep process, which corresponds to t=27,060s in the experiment. In fact, failure happened48min earlier in the experiment, therefore the second ANSYS-curve shows the displacementprogression, if the whole temperature field is increased by only +10K (post test run). Then thecalculation predicts failure 6min earlier then it occurred in the experiment. This indicates that themechanical response of the vessel is very sensitive to small temperature changes. This confirmsalso that the calculated temperature field is quite reasonable and that the thermocouples do notmeasure the temperature exactly at the wall surface (cf. Fig. 2). Another reason for the relativelyfast failure of the vessel compared to the pre-test calculation is a possible "pre-damage" caused
Fig. 3: Measured and calculated total displacement at the very bottom over time. Additionallythe measured power input and pressure are shown.
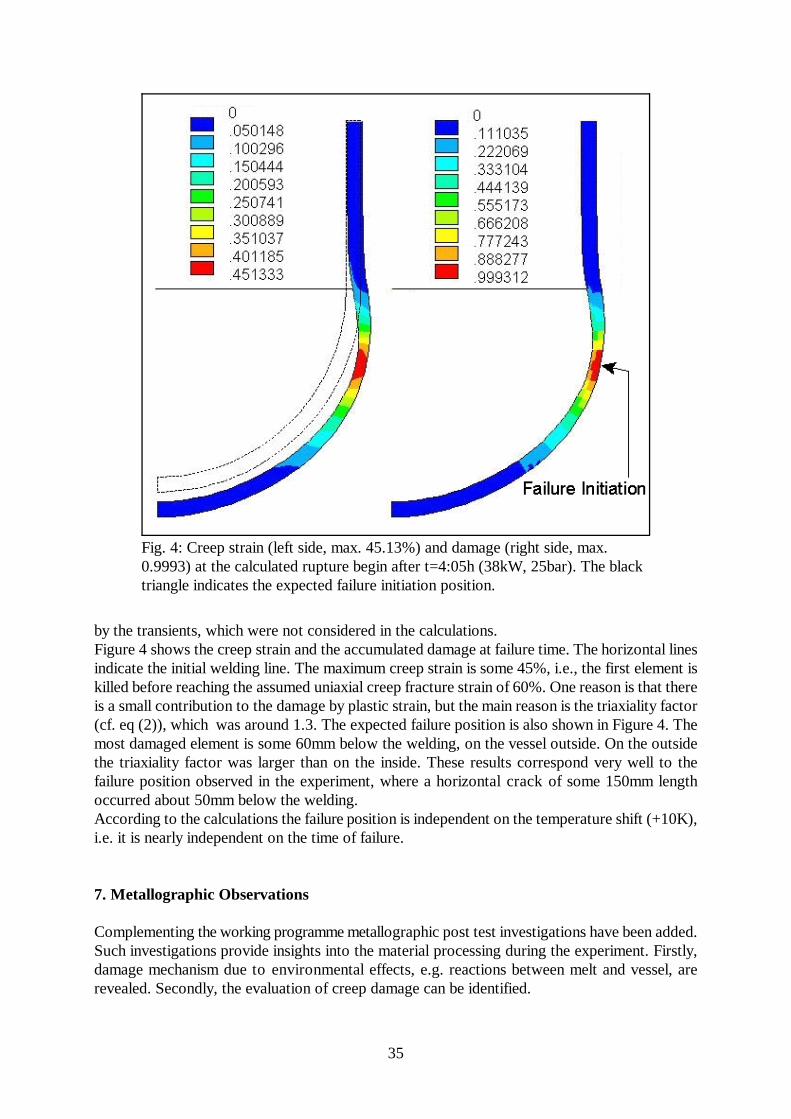
35
Fig. 4: Creep strain (left side, max. 45.13%) and damage (right side, max.0.9993) at the calculated rupture begin after t=4:05h (38kW, 25bar). The blacktriangle indicates the expected failure initiation position.
by the transients, which were not considered in the calculations.Figure 4 shows the creep strain and the accumulated damage at failure time. The horizontal linesindicate the initial welding line. The maximum creep strain is some 45%, i.e., the first element iskilled before reaching the assumed uniaxial creep fracture strain of 60%. One reason is that thereis a small contribution to the damage by plastic strain, but the main reason is the triaxiality factor(cf. eq (2)), which was around 1.3. The expected failure position is also shown in Figure 4. Themost damaged element is some 60mm below the welding, on the vessel outside. On the outsidethe triaxiality factor was larger than on the inside. These results correspond very well to thefailure position observed in the experiment, where a horizontal crack of some 150mm lengthoccurred about 50mm below the welding.According to the calculations the failure position is independent on the temperature shift (+10K),i.e. it is nearly independent on the time of failure.
7. Metallographic Observations
Complementing the working programme metallographic post test investigations have been added.Such investigations provide insights into the material processing during the experiment. Firstly,damage mechanism due to environmental effects, e.g. reactions between melt and vessel, arerevealed. Secondly, the evaluation of creep damage can be identified.
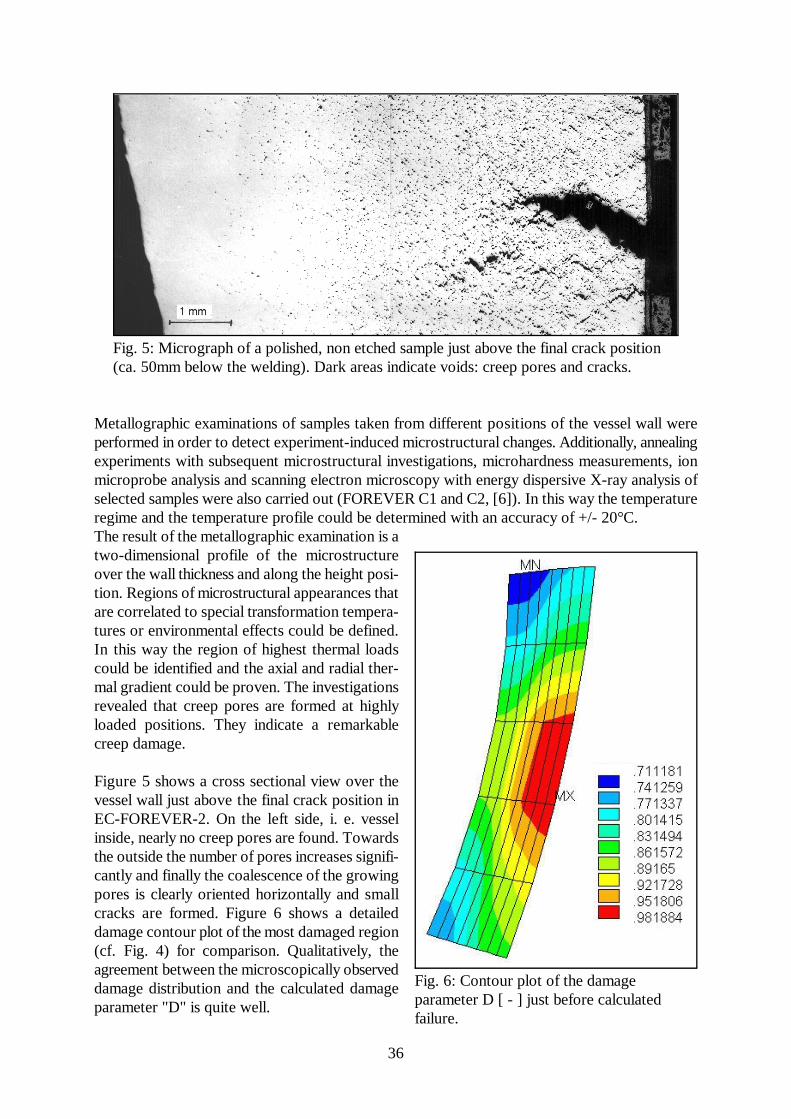
36
Fig. 5: Micrograph of a polished, non etched sample just above the final crack position(ca. 50mm below the welding). Dark areas indicate voids: creep pores and cracks.
Fig. 6: Contour plot of the damageparameter D [ - ] just before calculatedfailure.
Metallographic examinations of samples taken from different positions of the vessel wall wereperformed in order to detect experiment-induced microstructural changes. Additionally, annealingexperiments with subsequent microstructural investigations, microhardness measurements, ionmicroprobe analysis and scanning electron microscopy with energy dispersive X-ray analysis ofselected samples were also carried out (FOREVER C1 and C2, [6]). In this way the temperatureregime and the temperature profile could be determined with an accuracy of +/- 20°C.The result of the metallographic examination is atwo-dimensional profile of the microstructureover the wall thickness and along the height posi-tion. Regions of microstructural appearances thatare correlated to special transformation tempera-tures or environmental effects could be defined.In this way the region of highest thermal loadscould be identified and the axial and radial ther-mal gradient could be proven. The investigationsrevealed that creep pores are formed at highlyloaded positions. They indicate a remarkablecreep damage.
Figure 5 shows a cross sectional view over thevessel wall just above the final crack position inEC-FOREVER-2. On the left side, i. e. vesselinside, nearly no creep pores are found. Towardsthe outside the number of pores increases signifi-cantly and finally the coalescence of the growingpores is clearly oriented horizontally and smallcracks are formed. Figure 6 shows a detaileddamage contour plot of the most damaged region(cf. Fig. 4) for comparison. Qualitatively, theagreement between the microscopically observeddamage distribution and the calculated damageparameter "D" is quite well.
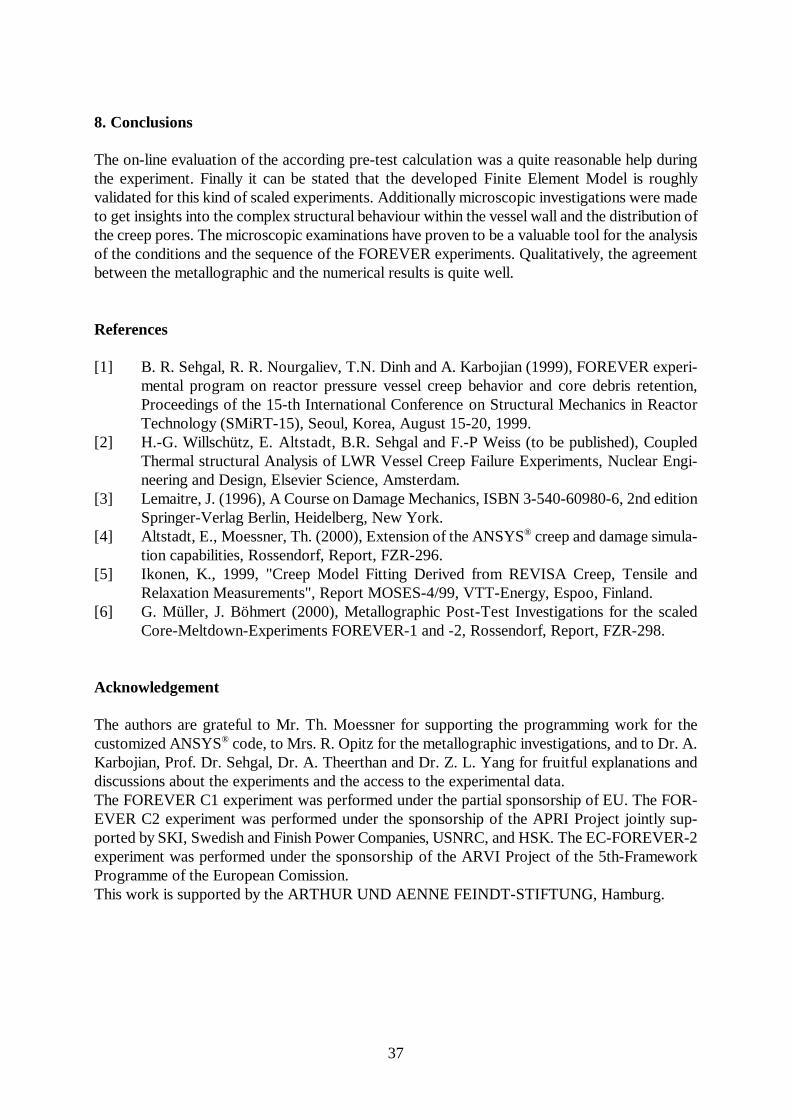
37
8. Conclusions
The on-line evaluation of the according pre-test calculation was a quite reasonable help duringthe experiment. Finally it can be stated that the developed Finite Element Model is roughlyvalidated for this kind of scaled experiments. Additionally microscopic investigations were madeto get insights into the complex structural behaviour within the vessel wall and the distribution ofthe creep pores. The microscopic examinations have proven to be a valuable tool for the analysisof the conditions and the sequence of the FOREVER experiments. Qualitatively, the agreementbetween the metallographic and the numerical results is quite well.
References
[1] B. R. Sehgal, R. R. Nourgaliev, T.N. Dinh and A. Karbojian (1999), FOREVER experi-mental program on reactor pressure vessel creep behavior and core debris retention,Proceedings of the 15-th International Conference on Structural Mechanics in ReactorTechnology (SMiRT-15), Seoul, Korea, August 15-20, 1999.
[2] H.-G. Willschütz, E. Altstadt, B.R. Sehgal and F.-P Weiss (to be published), CoupledThermal structural Analysis of LWR Vessel Creep Failure Experiments, Nuclear Engi-neering and Design, Elsevier Science, Amsterdam.
[3] Lemaitre, J. (1996), A Course on Damage Mechanics, ISBN 3-540-60980-6, 2nd editionSpringer-Verlag Berlin, Heidelberg, New York.
[4] Altstadt, E., Moessner, Th. (2000), Extension of the ANSYS® creep and damage simula-tion capabilities, Rossendorf, Report, FZR-296.
[5] Ikonen, K., 1999, "Creep Model Fitting Derived from REVISA Creep, Tensile andRelaxation Measurements", Report MOSES-4/99, VTT-Energy, Espoo, Finland.
[6] G. Müller, J. Böhmert (2000), Metallographic Post-Test Investigations for the scaledCore-Meltdown-Experiments FOREVER-1 and -2, Rossendorf, Report, FZR-298.
Acknowledgement
The authors are grateful to Mr. Th. Moessner for supporting the programming work for thecustomized ANSYS® code, to Mrs. R. Opitz for the metallographic investigations, and to Dr. A.Karbojian, Prof. Dr. Sehgal, Dr. A. Theerthan and Dr. Z. L. Yang for fruitful explanations anddiscussions about the experiments and the access to the experimental data.The FOREVER C1 experiment was performed under the partial sponsorship of EU. The FOR-EVER C2 experiment was performed under the sponsorship of the APRI Project jointly sup-ported by SKI, Swedish and Finish Power Companies, USNRC, and HSK. The EC-FOREVER-2experiment was performed under the sponsorship of the ARVI Project of the 5th-FrameworkProgramme of the European Comission.This work is supported by the ARTHUR UND AENNE FEINDT-STIFTUNG, Hamburg.
38
RADIAL GAS FRACTION PROFILES IN VERTICAL PIPE FLOW
Eckhard Krepper, Dirk Lucas and Horst-Michael Prasser
1. Introduction
One-dimensional codes are frequently used for the simulation of two phase flow in the field ofdesign, optimization and safety analysis of nuclear and chemical plants. Most of thecorrelations used by these codes e.g. for pressure drop or heat and mass transfer are valid onlyfor a given flow regime. The definition of these flow regimes is based on steady state flowregime maps. Steady state flow maps, however are not able to predict the flow pattern in caseof transient flows. Recently attempts were made to solve this problem by the introduction ofadditional equations for the bubble density or corresponding parameters like bubble diameter,bubble volume or interfacial area. Bubble coalescence and break-up rates, which form thesource terms in these equations, are determined by local events. That means, they depend onlocal parameters of turbulence as well as on the local bubble size distribution.
Forces acting on bubbles in a gas-liquid flow strongly depend on the bubble diameter. This iswell known for the drag force, which was investigated by many authors. In the field of theso-called non-drag forces, which act perpendicular to the flow direction, there are still openquestions. Recently, it was found, that the lift force changes its sign at some critical bubblediameter [1], e.g. in a vertical upwards pipe flow, small bubbles are moved towards the wall,while bubbles with a diameter greater than the critical migrate towards the centre of the tube.Concerning the other non-drag forces, i.e. the lubrication force and the turbulent dispersionforce, there are also still needs to complete the models.
The experimental input for the study of these forces comes mainly from the observation ofsingle bubbles. In this paper a method is introduced, that allows to effectively analyse themotion of bubbles depending on their size in a multi-disperse flow. For this purpose,measurements applying a wire-mesh sensor developed in Forschungszentrum Rossendorf [2],[3] in a vertical upwards flow were carried out. A method to measure bubble size distributionsby evaluating wire-mesh sensor data was presented [4]. The bubble identification algorithmcan be used to decompose radial gas fraction profiles according to bubble size classes.Measurements taken at different distances from a gas injection show the evolution of the gasfraction profiles for different bubble size classes separately. This makes it possible to study thenet motion of the bubbles in the direction perpendicular to the flow, and to check theoreticalmodels of the non-drag forces in a realistic multi-disperse flow [5].
A one-dimensional model is presented, which predicts the radial volume fraction profiles froma given bubble size distribution [6]. It bases on the assumption of equilibrium of the non dragforces acting on a bubble perpendicularly to the flow path. This model together together withappropriate models for local bubble coalescence and break-up could be used for the predictionof the flow pattern.
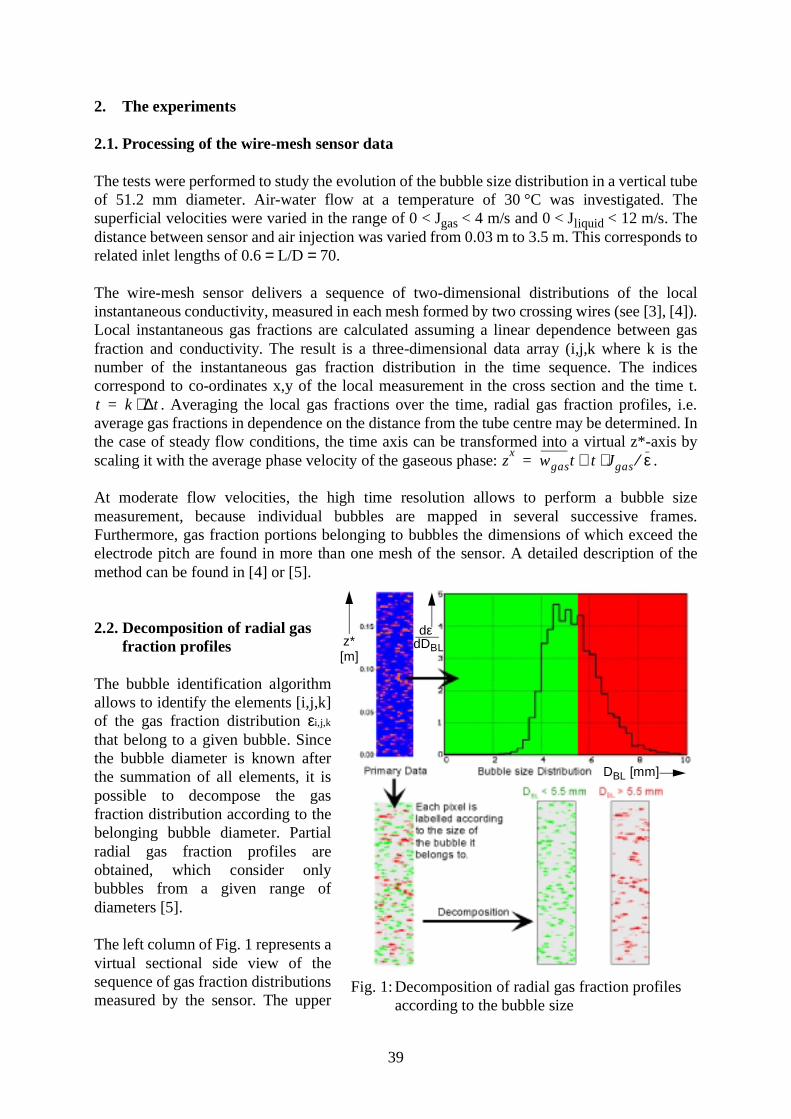
39
2. The experiments
2.1. Processing of the wire-mesh sensor data
The tests were performed to study the evolution of the bubble size distribution in a vertical tubeof 51.2 mm diameter. Air-water flow at a temperature of 30 °C was investigated. Thesuperficial velocities were varied in the range of 0 < Jgas < 4 m/s and 0 < Jliquid < 12 m/s. Thedistance between sensor and air injection was varied from 0.03 m to 3.5 m. This corresponds torelated inlet lengths of 0.6 = L/D = 70.
The wire-mesh sensor delivers a sequence of two-dimensional distributions of the localinstantaneous conductivity, measured in each mesh formed by two crossing wires (see [3], [4]).Local instantaneous gas fractions are calculated assuming a linear dependence between gasfraction and conductivity. The result is a three-dimensional data array (i,j,k where k is thenumber of the instantaneous gas fraction distribution in the time sequence. The indicescorrespond to co-ordinates x,y of the local measurement in the cross section and the time t.
. Averaging the local gas fractions over the time, radial gas fraction profiles, i.e.average gas fractions in dependence on the distance from the tube centre may be determined. Inthe case of steady flow conditions, the time axis can be transformed into a virtual z*-axis byscaling it with the average phase velocity of the gaseous phase: .
At moderate flow velocities, the high time resolution allows to perform a bubble sizemeasurement, because individual bubbles are mapped in several successive frames.Furthermore, gas fraction portions belonging to bubbles the dimensions of which exceed theelectrode pitch are found in more than one mesh of the sensor. A detailed description of themethod can be found in [4] or [5].
2.2. Decomposition of radial gas fraction profiles
The bubble identification algorithmallows to identify the elements [i,j,k]of the gas fraction distribution εi,j,k
that belong to a given bubble. Sincethe bubble diameter is known afterthe summation of all elements, it ispossible to decompose the gasfraction distribution according to thebelonging bubble diameter. Partialradial gas fraction profiles areobtained, which consider onlybubbles from a given range ofdiameters [5].
The left column of Fig. 1 represents avirtual sectional side view of thesequence of gas fraction distributionsmeasured by the sensor. The upper
t k t∆⋅=
zx
wgast t Jgas ε⁄⋅≅=
Fig. 1: Decomposition of radial gas fraction profiles
according to the bubble size
z*[m]
dεdDBL
DBL [mm]
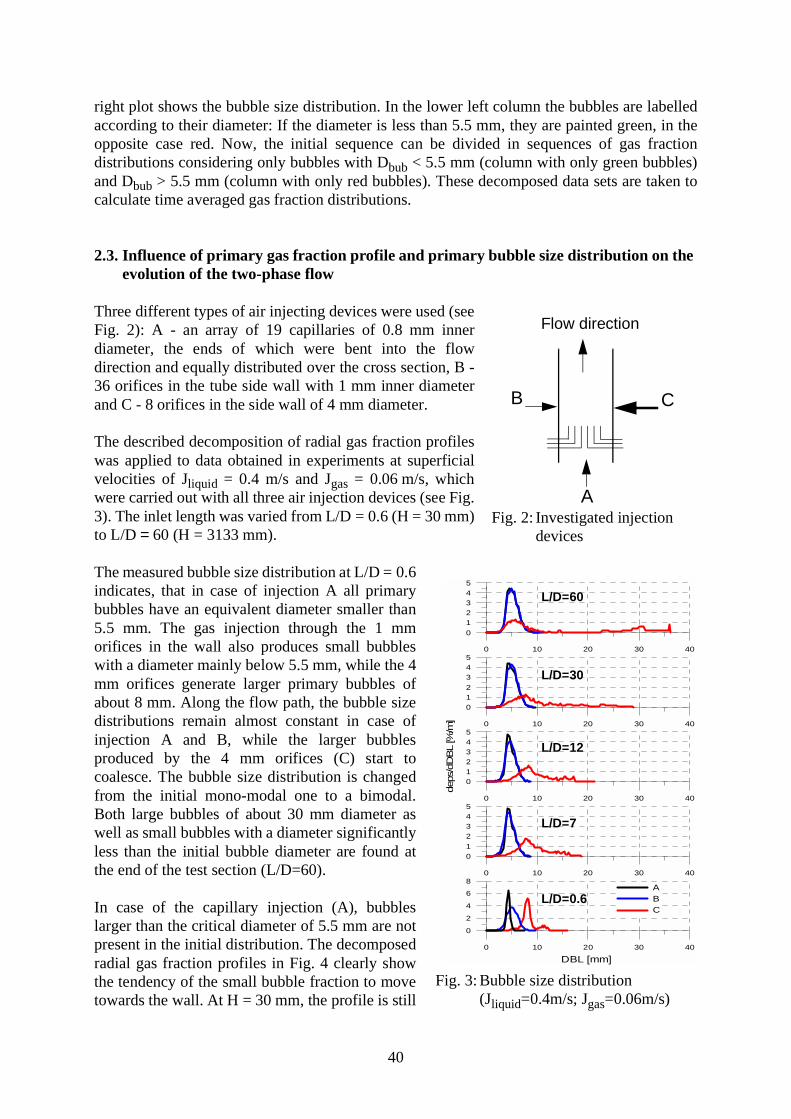
40
0 10 20 30 40
01
2345
0 10 20 30 40
012345
dep
s/dD
BL
[%/m
] 0 10 20 30 40
012
345
0 10 20 30 40
0
12345
0 10 20 30 40
DBL [mm]
0
2
4
6
8ABC
right plot shows the bubble size distribution. In the lower left column the bubbles are labelledaccording to their diameter: If the diameter is less than 5.5 mm, they are painted green, in theopposite case red. Now, the initial sequence can be divided in sequences of gas fractiondistributions considering only bubbles with Dbub < 5.5 mm (column with only green bubbles)and Dbub > 5.5 mm (column with only red bubbles). These decomposed data sets are taken tocalculate time averaged gas fraction distributions.
2.3. Influence of primary gas fraction profile and primary bubble size distribution on the evolution of the two-phase flow
Three different types of air injecting devices were used (seeFig. 2): A - an array of 19 capillaries of 0.8 mm innerdiameter, the ends of which were bent into the flowdirection and equally distributed over the cross section, B -36 orifices in the tube side wall with 1 mm inner diameterand C - 8 orifices in the side wall of 4 mm diameter.
The described decomposition of radial gas fraction profileswas applied to data obtained in experiments at superficialvelocities of Jliquid = 0.4 m/s and Jgas = 0.06 m/s, whichwere carried out with all three air injection devices (see Fig.3). The inlet length was varied from L/D = 0.6 (H = 30 mm)to L/D = 60 (H = 3133 mm).
The measured bubble size distribution at L/D = 0.6indicates, that in case of injection A all primarybubbles have an equivalent diameter smaller than5.5 mm. The gas injection through the 1 mmorifices in the wall also produces small bubbleswith a diameter mainly below 5.5 mm, while the 4mm orifices generate larger primary bubbles ofabout 8 mm. Along the flow path, the bubble sizedistributions remain almost constant in case ofinjection A and B, while the larger bubblesproduced by the 4 mm orifices (C) start tocoalesce. The bubble size distribution is changedfrom the initial mono-modal one to a bimodal.Both large bubbles of about 30 mm diameter aswell as small bubbles with a diameter significantlyless than the initial bubble diameter are found atthe end of the test section (L/D=60).
In case of the capillary injection (A), bubbleslarger than the critical diameter of 5.5 mm are notpresent in the initial distribution. The decomposedradial gas fraction profiles in Fig. 4 clearly showthe tendency of the small bubble fraction to movetowards the wall. At H = 30 mm, the profile is still
Fig. 3: Bubble size distribution
(Jliquid=0.4m/s; Jgas=0.06m/s)
L/D=7
L/D=12
L/D=30
L/D=60
L/D=0.6
A
CB
Flow direction
Fig. 2: Investigated injection
devices
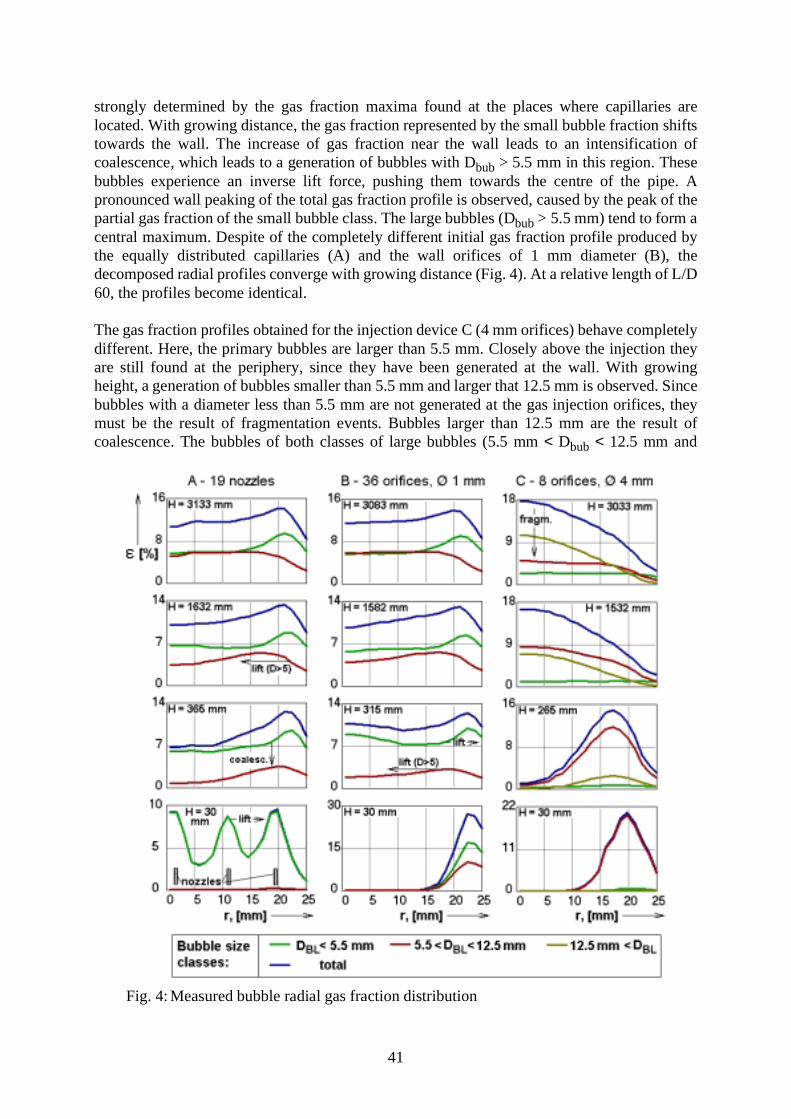
41
strongly determined by the gas fraction maxima found at the places where capillaries arelocated. With growing distance, the gas fraction represented by the small bubble fraction shiftstowards the wall. The increase of gas fraction near the wall leads to an intensification ofcoalescence, which leads to a generation of bubbles with Dbub > 5.5 mm in this region. Thesebubbles experience an inverse lift force, pushing them towards the centre of the pipe. Apronounced wall peaking of the total gas fraction profile is observed, caused by the peak of thepartial gas fraction of the small bubble class. The large bubbles (Dbub > 5.5 mm) tend to form acentral maximum. Despite of the completely different initial gas fraction profile produced bythe equally distributed capillaries (A) and the wall orifices of 1 mm diameter (B), thedecomposed radial profiles converge with growing distance (Fig. 4). At a relative length of L/D60, the profiles become identical.
The gas fraction profiles obtained for the injection device C (4 mm orifices) behave completelydifferent. Here, the primary bubbles are larger than 5.5 mm. Closely above the injection theyare still found at the periphery, since they have been generated at the wall. With growingheight, a generation of bubbles smaller than 5.5 mm and larger that 12.5 mm is observed. Sincebubbles with a diameter less than 5.5 mm are not generated at the gas injection orifices, theymust be the result of fragmentation events. Bubbles larger than 12.5 mm are the result ofcoalescence. The bubbles of both classes of large bubbles (5.5 mm < Dbub < 12.5 mm and
Fig. 4: Measured bubble radial gas fraction distribution
42
12.5 mm < Dbub) are quickly shifted to the centre of the pipe. Although the small bubbles aretransported towards the wall, they are almost uniformly distributed at the end of the testsection. This can be explained by a source of small bubbles due to fragmentation in the centralregion.
During the test presented in Fig. 4, injection device B and C represent the same primary gasfraction profile and device A and B the same primary bubble size distribution. In Fig. 4 the gasfraction profile at the end of the tube is almost the same for injection devices A and B. Thatmeans, that the primary bubble size distribution has a larger influence on the evolution of thetwo phase flow than the primary gas fraction profile.
3. The model
Forces acting perpendicular to the flow direction determine the formation of radialdistributions of the bubbles. The classical lift force is shear-induced and acts toward the wall.Related on the unit volume it can be calculated as
(1)
with a positive lift force coefficient CL. ρL is the liquid density, wg and wl the gas respective theliquid velocity. Tomiyama et al. [1] proposed another kind of transverse lift force, which iscaused by the interaction between the wake and the shear field. It acts to the opposite direction,that means it is also calculated by equation (1), but has a negative coefficient CL. Tomiyamaexpresses both forces summarized as a net transverse lift force with the experimentallydetermined coefficient CT, which depends on the bubble Eötvös number. For the water-airsystem at normal conditions CT changes its sign at the bubble diameter Dbub=5.8 mm, i.e. thenet transverse lift force acts towards the wall for bubbles with a diameter less than 5.8 mm andit acts towards the pipe centre for larger bubbles.
The lubrication force, introduced by Antal et al. [7], drives bubbles away from the wall.Tomiyama [1] developed an modified equation for this force per unit volume:
(2)
with wrel as the velocity difference between liquid and gas, R the tube radius and r the distanceof the bubble from the tube centre. is the normal vector to the wall. The coefficient CW alsodepends on the Eötvös number.
The model does not consider single bubbles, but the radial distributions of volume fractions forsingle bubble classes. The turbulent dispersion force considers the smoothing of these radialgas profiles caused by turbulence. Lahey et al. [8] derived an equation for the force per unitvolume as
(3)
with kl as the turbulent kinetic energy of the liquid and the gradient of the gas volumefraction. Following [1] there is a fluctuating motion of single bubbles, which increases with the
FL CL– ρL wg wl–( ) rot wl( )×=
FW CW
Dbub
2-----------
1
R r–( )2-------------------
1
R r+( )2-------------------–
ρlwrel2
nr–=
nr
FD 0.1– ρlkl α∇=
α∇
43
Eötvös number. It is caused by the deformation of the bubbles. These fluctuations cause anadditional smoothing of the profiles, which is not taken into account by the dispersion forceaccording to equation (3). For this reason a second dispersion force is introduced, whichdepends on the Eötvös number. As reported in [1] the fluctuations were observed at bubbleswith Eötvös numbers larger than about 1. For this reason we stated
(4)
for the new Eötvös number dependent dispersion force.
The parameter CD,Eo is the only new model parameter. According to integral experimental data(see below) CD,Eo = 0.0015 m2/s2 is assumed for Eo>1. For Eo<1 CD,Eo is set to zero.
The radial balance of forces applying equations (1)-(4) results in
(5)
This equation is a first order differential equation with respect to the volume fraction of abubble size class αi(r). It is solved separately for each bubble class. The sum of these profiles isthe radial gas fraction profile. The radial profiles of the turbulent kinetic energy of the liquid kland of the gradient of the liquid velocity dwl/dr are still needed to solve the equation.
The radial profile of the liquid velocity is calculated for a given radial gas distribution using themodel of Sato et al. [9]. They subdivided the eddy diffusivity into a component, whichconsiders the inherent wall turbulence and a component, which considers the turbulence causedby the bubbles. This causes a feedback between the radial gas profile and the radial profile ofliquid velocity. The complete model equations as well as a scheme for a numerical solutionprocedure can be found in [9].
For the calculation of the turbulent kinetic energy the equations of the k-ε model are used. Acommon non-linear differential equation of second order for the steady state turbulent kineticenergy k of the liquid can be derived using the following assumptions:
• The time averaged liquid velocity has only a component in axial direction.• The time averaged liquid velocity is only a function of the radius and does not depend on
the azimuthal position and the height.
There is a very sensitive feedback between the velocity profile and the gas fraction profile. Forthis reason they are calculated within an iteration procedure. An underrelaxation is necessary toguarantee the stability of the iteration. Calculations with an assumed velocity profile accordingto a 1/m-law typical for turbulent flow through a tube have shown, that this feedback is notnegligible. In case of a flow with bubble sizes below 5.8 mm the feedback smoothe the radialgas profiles. The bubbles are located preferably at the wall. For this reason the liquid velocitynear to the wall is increased. This smoothe the velocity profile apart from the wall and reducesthe lift force in the core region of the flow, which acts towards the wall. Otherwise, if aconsiderable fraction of bubbles with a diameter larger than 5.8 mm occurs, there is a positivefeedback between the gas and velocity profiles. The bubbles in the centre accelerate the liquid.For this reason the velocity gradient in the central region increases. This again causes an
FD Eo, C– D Eo, ρl Eo 1–( ) α∇=
0.1kl CD Eo, Eo 1–( )+( )rd
dα i CTwrel rd
dwl CW
Dbub
2-----------
1
R r–( )2-------------------
1
R r+( )2-------------------–
wrel2
+
α i+ 0=
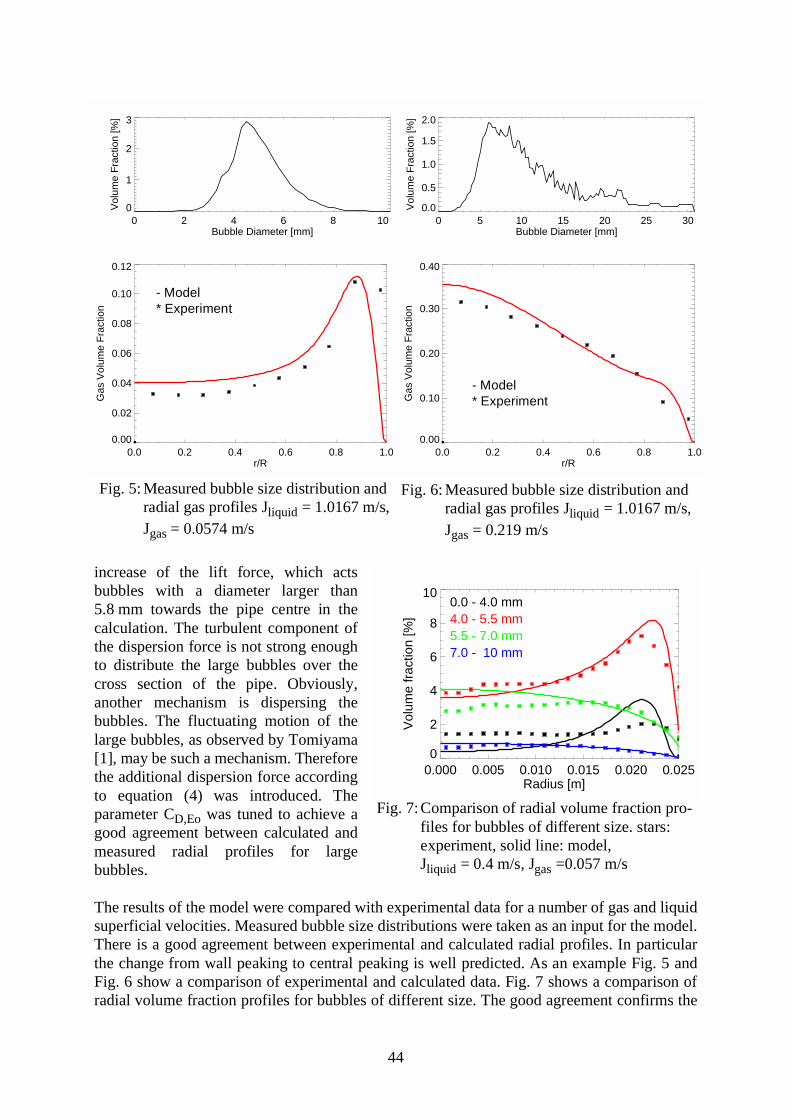
44
0.000 0.005 0.010 0.015 0.020 0.025Radius [m]
0
2
4
6
8
10
Vol
ume
frac
tion
[%]
0.0 - 4.0 mm4.0 - 5.5 mm5.5 - 7.0 mm7.0 - 10 mm
increase of the lift force, which actsbubbles with a diameter larger than5.8 mm towards the pipe centre in thecalculation. The turbulent component ofthe dispersion force is not strong enoughto distribute the large bubbles over thecross section of the pipe. Obviously,another mechanism is dispersing thebubbles. The fluctuating motion of thelarge bubbles, as observed by Tomiyama[1], may be such a mechanism. Thereforethe additional dispersion force accordingto equation (4) was introduced. Theparameter CD,Eo was tuned to achieve agood agreement between calculated andmeasured radial profiles for largebubbles.
The results of the model were compared with experimental data for a number of gas and liquidsuperficial velocities. Measured bubble size distributions were taken as an input for the model.There is a good agreement between experimental and calculated radial profiles. In particularthe change from wall peaking to central peaking is well predicted. As an example Fig. 5 andFig. 6 show a comparison of experimental and calculated data. Fig. 7 shows a comparison ofradial volume fraction profiles for bubbles of different size. The good agreement confirms the
0.0 0.2 0.4 0.6 0.8 1.0r/R
0.00
0.10
0.20
0.30
0.40
Gas
Vol
ume
Fra
ctio
n
0.0 0.2 0.4 0.6 0.8 1.0r/R
0.00
0.02
0.04
0.06
0.08
0.10
0.12
Gas
Vol
ume
Fra
ctio
n
0 5 10 15 20 25 30Bubble Diameter [mm]
0.0
0.5
1.0
1.5
2.0
Vol
ume
Fra
ctio
n [%
]
0 2 4 6 8 10Bubble Diameter [mm]
0
1
2
3V
olum
e F
ract
ion
[%]
- Model* Experiment
- Model* Experiment
Fig. 5: Measured bubble size distribution and
radial gas profiles Jliquid = 1.0167 m/s, Jgas = 0.0574 m/s
Fig. 6: Measured bubble size distribution and
radial gas profiles Jliquid = 1.0167 m/s, Jgas = 0.219 m/s
Fig. 7:Comparison of radial volume fraction pro-files for bubbles of different size. stars: experiment, solid line: model, Jliquid = 0.4 m/s, Jgas =0.057 m/s
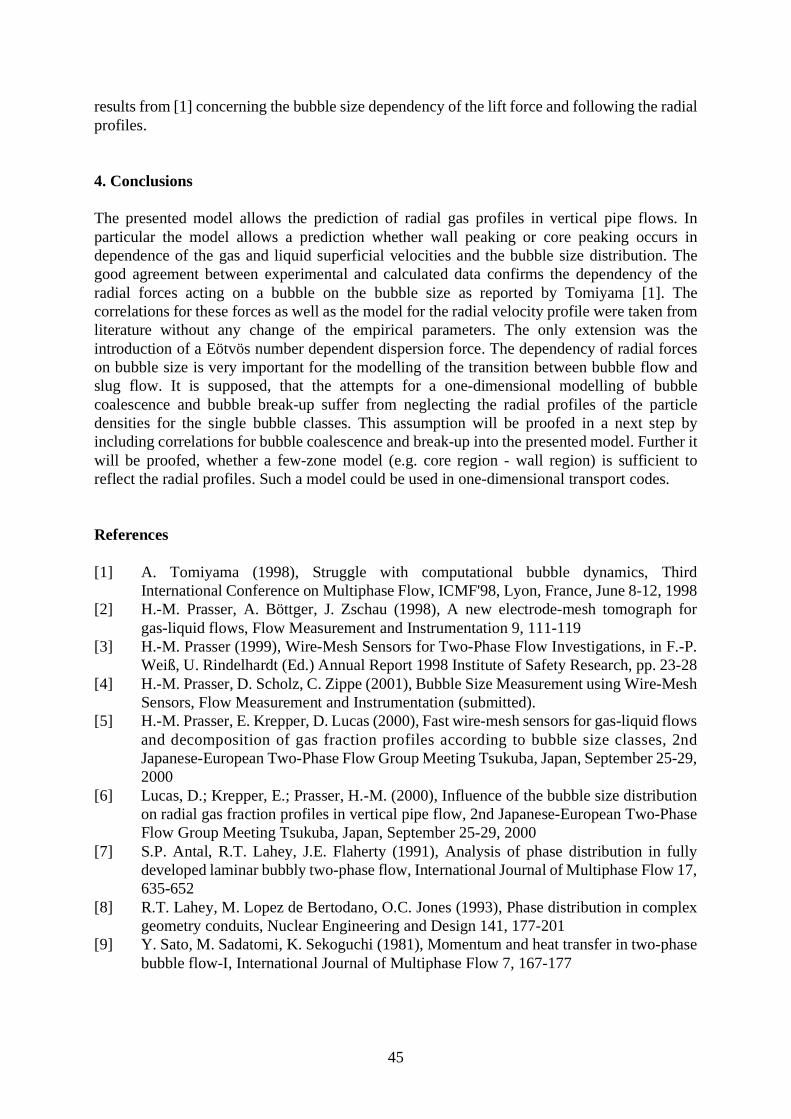
45
results from [1] concerning the bubble size dependency of the lift force and following the radialprofiles.
4. Conclusions
The presented model allows the prediction of radial gas profiles in vertical pipe flows. Inparticular the model allows a prediction whether wall peaking or core peaking occurs independence of the gas and liquid superficial velocities and the bubble size distribution. Thegood agreement between experimental and calculated data confirms the dependency of theradial forces acting on a bubble on the bubble size as reported by Tomiyama [1]. Thecorrelations for these forces as well as the model for the radial velocity profile were taken fromliterature without any change of the empirical parameters. The only extension was theintroduction of a Eötvös number dependent dispersion force. The dependency of radial forceson bubble size is very important for the modelling of the transition between bubble flow andslug flow. It is supposed, that the attempts for a one-dimensional modelling of bubblecoalescence and bubble break-up suffer from neglecting the radial profiles of the particledensities for the single bubble classes. This assumption will be proofed in a next step byincluding correlations for bubble coalescence and break-up into the presented model. Further itwill be proofed, whether a few-zone model (e.g. core region - wall region) is sufficient toreflect the radial profiles. Such a model could be used in one-dimensional transport codes.
References
[1] A. Tomiyama (1998), Struggle with computational bubble dynamics, ThirdInternational Conference on Multiphase Flow, ICMF'98, Lyon, France, June 8-12, 1998
[2] H.-M. Prasser, A. Böttger, J. Zschau (1998), A new electrode-mesh tomograph forgas-liquid flows, Flow Measurement and Instrumentation 9, 111-119
[3] H.-M. Prasser (1999), Wire-Mesh Sensors for Two-Phase Flow Investigations, in F.-P.Weiß, U. Rindelhardt (Ed.) Annual Report 1998 Institute of Safety Research, pp. 23-28
[4] H.-M. Prasser, D. Scholz, C. Zippe (2001), Bubble Size Measurement using Wire-MeshSensors, Flow Measurement and Instrumentation (submitted).
[5] H.-M. Prasser, E. Krepper, D. Lucas (2000), Fast wire-mesh sensors for gas-liquid flowsand decomposition of gas fraction profiles according to bubble size classes, 2ndJapanese-European Two-Phase Flow Group Meeting Tsukuba, Japan, September 25-29,2000
[6] Lucas, D.; Krepper, E.; Prasser, H.-M. (2000), Influence of the bubble size distributionon radial gas fraction profiles in vertical pipe flow, 2nd Japanese-European Two-PhaseFlow Group Meeting Tsukuba, Japan, September 25-29, 2000
[7] S.P. Antal, R.T. Lahey, J.E. Flaherty (1991), Analysis of phase distribution in fullydeveloped laminar bubbly two-phase flow, International Journal of Multiphase Flow 17,635-652
[8] R.T. Lahey, M. Lopez de Bertodano, O.C. Jones (1993), Phase distribution in complexgeometry conduits, Nuclear Engineering and Design 141, 177-201
[9] Y. Sato, M. Sadatomi, K. Sekoguchi (1981), Momentum and heat transfer in two-phasebubble flow-I, International Journal of Multiphase Flow 7, 167-177
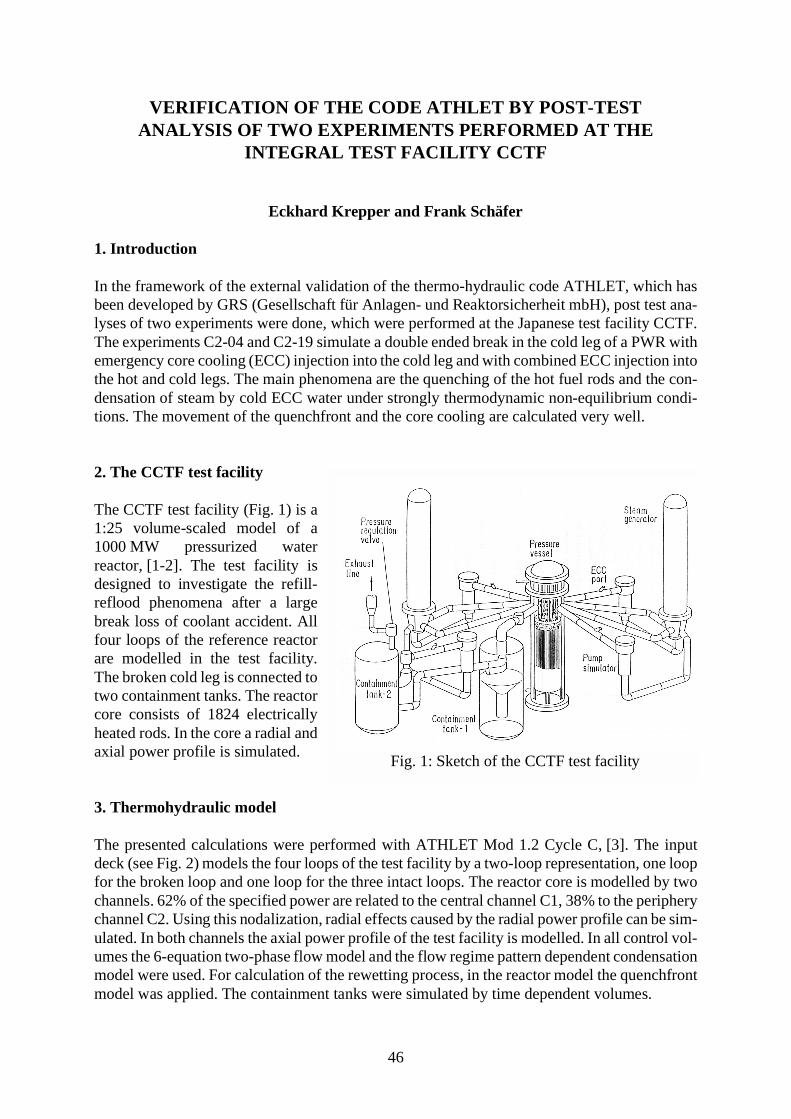
46
VERIFICATION OF THE CODE ATHLET BY POST-TESTANALYSIS OF TWO EXPERIMENTS PERFORMED AT THE
INTEGRAL TEST FACILITY CCTF
Eckhard Krepper and Frank Schäfer
1. Introduction
In the framework of the external validation of the thermo-hydraulic code ATHLET, which hasbeen developed by GRS (Gesellschaft für Anlagen- und Reaktorsicherheit mbH), post test ana-lyses of two experiments were done, which were performed at the Japanese test facility CCTF.The experiments C2-04 and C2-19 simulate a double ended break in the cold leg of a PWR withemergency core cooling (ECC) injection into the cold leg and with combined ECC injection intothe hot and cold legs. The main phenomena are the quenching of the hot fuel rods and the con-densation of steam by cold ECC water under strongly thermodynamic non-equilibrium condi-tions. The movement of the quenchfront and the core cooling are calculated very well.
2. The CCTF test facility
The CCTF test facility (Fig. 1) is a1:25 volume-scaled model of a1000 MW pressurized waterreactor, [1-2]. The test facility isdesigned to investigate the refill-reflood phenomena after a largebreak loss of coolant accident. Allfour loops of the reference reactorare modelled in the test facility.The broken cold leg is connected totwo containment tanks. The reactorcore consists of 1824 electricallyheated rods. In the core a radial andaxial power profile is simulated.
3. Thermohydraulic model
The presented calculations were performed with ATHLET Mod 1.2 Cycle C, [3]. The inputdeck (see Fig. 2) models the four loops of the test facility by a two-loop representation, one loopfor the broken loop and one loop for the three intact loops. The reactor core is modelled by twochannels. 62% of the specified power are related to the central channel C1, 38% to the peripherychannel C2. Using this nodalization, radial effects caused by the radial power profile can be sim-ulated. In both channels the axial power profile of the test facility is modelled. In all control vol-umes the 6-equation two-phase flow model and the flow regime pattern dependent condensationmodel were used. For calculation of the rewetting process, in the reactor model the quenchfrontmodel was applied. The containment tanks were simulated by time dependent volumes.
Fig. 1: Sketch of the CCTF test facility
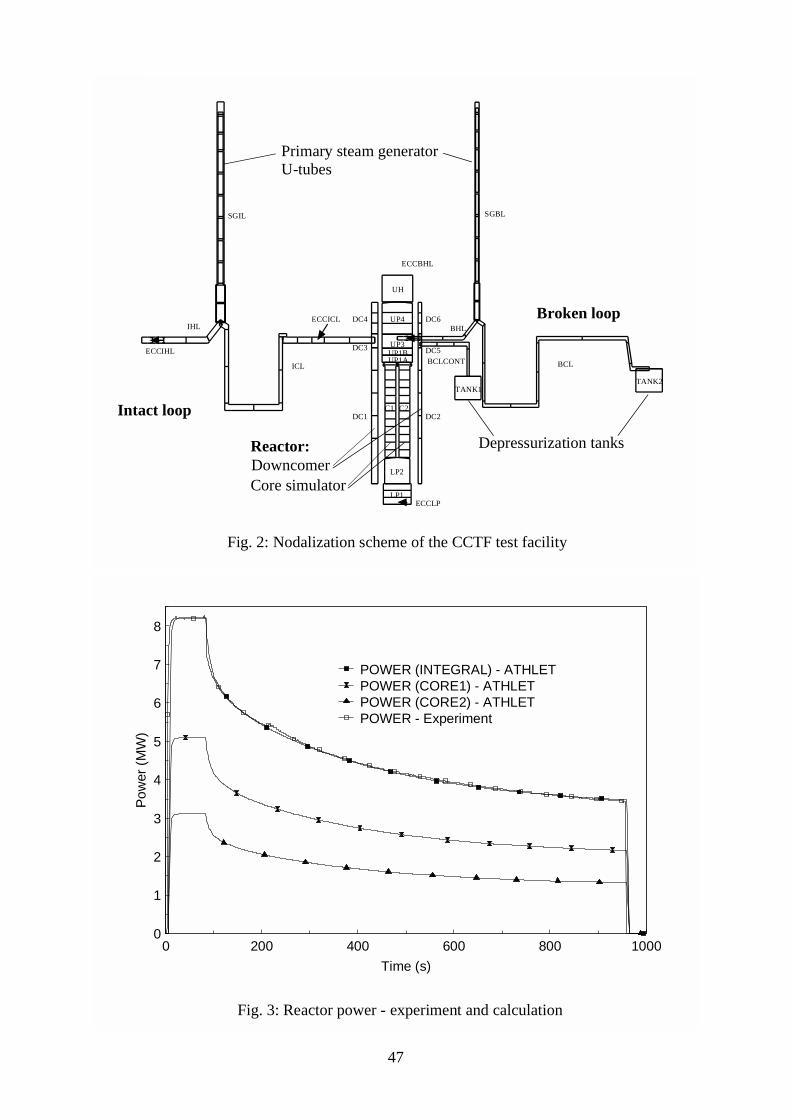
47
S0(m); Sqrt(4*A0/PI)(m)-19. -17. -15. -13. -11. -9. -7. -5. -3. -1. 1. 3. 5. 7. 9. 11. 13. 15. 17. 19.
-1.
0.
1.
2.
3.
4.
5.
6.
7.
8.
9.
10.
11.
12.
13.
14.
15.
16.
17.
18.
LP1
LP2
C1
UP1AUP1BUP3
UP4
UH
C2DC1
DC3
DC4
DC2
DC5
DC6
ICL
SGIL
IHL
BCLCONT
TANK1
BHL
SGBL
BCL
TANK2
ECCICL
ECCIHL
ECCBHL
ECCLP
Reactor:DowncomerCore simulator
Broken loop
Primary steam generatorU-tubes
Depressurization tanks
Fig. 2: Nodalization scheme of the CCTF test facility
Intact loop
0 200 400 600 800 1000
Time (s)
0
1
2
3
4
5
6
7
8
Pow
er (
MW
)
POWER (INTEGRAL) - ATHLETPOWER (CORE1) - ATHLETPOWER (CORE2) - ATHLETPOWER - Experiment
Fig. 3: Reactor power - experiment and calculation
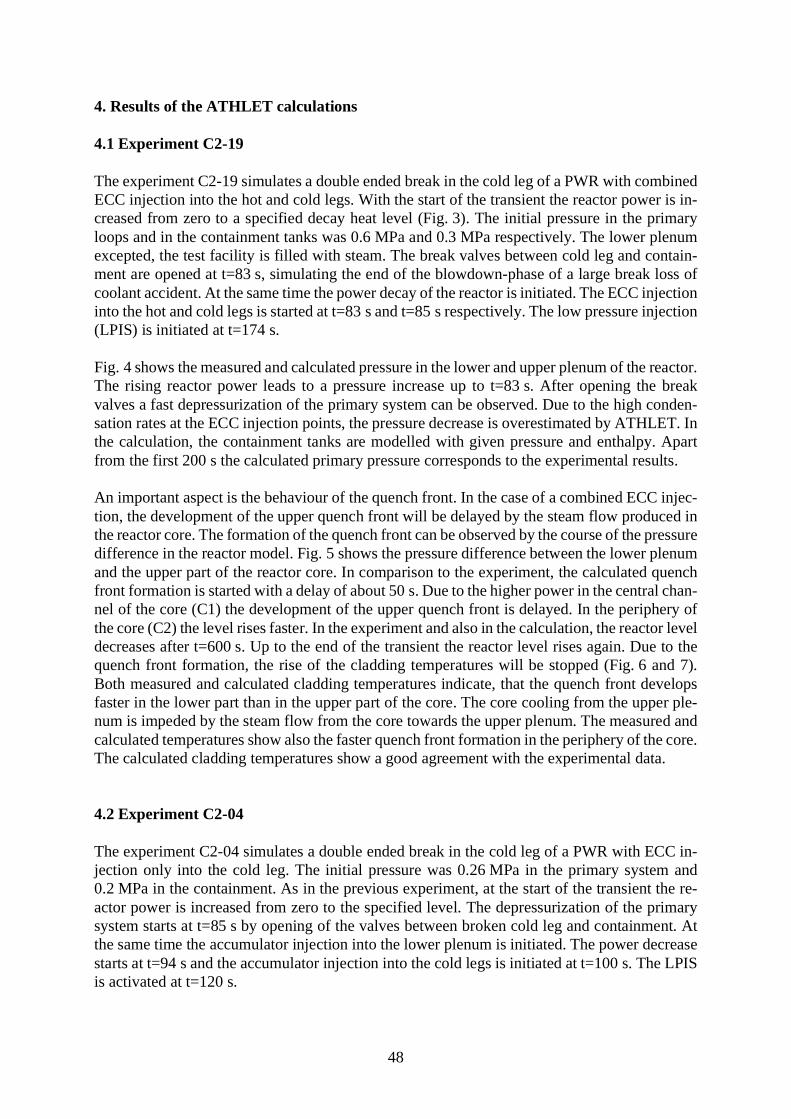
48
4. Results of the ATHLET calculations
4.1 Experiment C2-19
The experiment C2-19 simulates a double ended break in the cold leg of a PWR with combinedECC injection into the hot and cold legs. With the start of the transient the reactor power is in-creased from zero to a specified decay heat level (Fig. 3). The initial pressure in the primaryloops and in the containment tanks was 0.6 MPa and 0.3 MPa respectively. The lower plenumexcepted, the test facility is filled with steam. The break valves between cold leg and contain-ment are opened at t=83 s, simulating the end of the blowdown-phase of a large break loss ofcoolant accident. At the same time the power decay of the reactor is initiated. The ECC injectioninto the hot and cold legs is started at t=83 s and t=85 s respectively. The low pressure injection(LPIS) is initiated at t=174 s.
Fig. 4 shows the measured and calculated pressure in the lower and upper plenum of the reactor.The rising reactor power leads to a pressure increase up to t=83 s. After opening the breakvalves a fast depressurization of the primary system can be observed. Due to the high conden-sation rates at the ECC injection points, the pressure decrease is overestimated by ATHLET. Inthe calculation, the containment tanks are modelled with given pressure and enthalpy. Apartfrom the first 200 s the calculated primary pressure corresponds to the experimental results.
An important aspect is the behaviour of the quench front. In the case of a combined ECC injec-tion, the development of the upper quench front will be delayed by the steam flow produced inthe reactor core. The formation of the quench front can be observed by the course of the pressuredifference in the reactor model. Fig. 5 shows the pressure difference between the lower plenumand the upper part of the reactor core. In comparison to the experiment, the calculated quenchfront formation is started with a delay of about 50 s. Due to the higher power in the central chan-nel of the core (C1) the development of the upper quench front is delayed. In the periphery ofthe core (C2) the level rises faster. In the experiment and also in the calculation, the reactor leveldecreases after t=600 s. Up to the end of the transient the reactor level rises again. Due to thequench front formation, the rise of the cladding temperatures will be stopped (Fig. 6 and 7).Both measured and calculated cladding temperatures indicate, that the quench front developsfaster in the lower part than in the upper part of the core. The core cooling from the upper ple-num is impeded by the steam flow from the core towards the upper plenum. The measured andcalculated temperatures show also the faster quench front formation in the periphery of the core.The calculated cladding temperatures show a good agreement with the experimental data.
4.2 Experiment C2-04
The experiment C2-04 simulates a double ended break in the cold leg of a PWR with ECC in-jection only into the cold leg. The initial pressure was 0.26 MPa in the primary system and0.2 MPa in the containment. As in the previous experiment, at the start of the transient the re-actor power is increased from zero to the specified level. The depressurization of the primarysystem starts at t=85 s by opening of the valves between broken cold leg and containment. Atthe same time the accumulator injection into the lower plenum is initiated. The power decreasestarts at t=94 s and the accumulator injection into the cold legs is initiated at t=100 s. The LPISis activated at t=120 s.
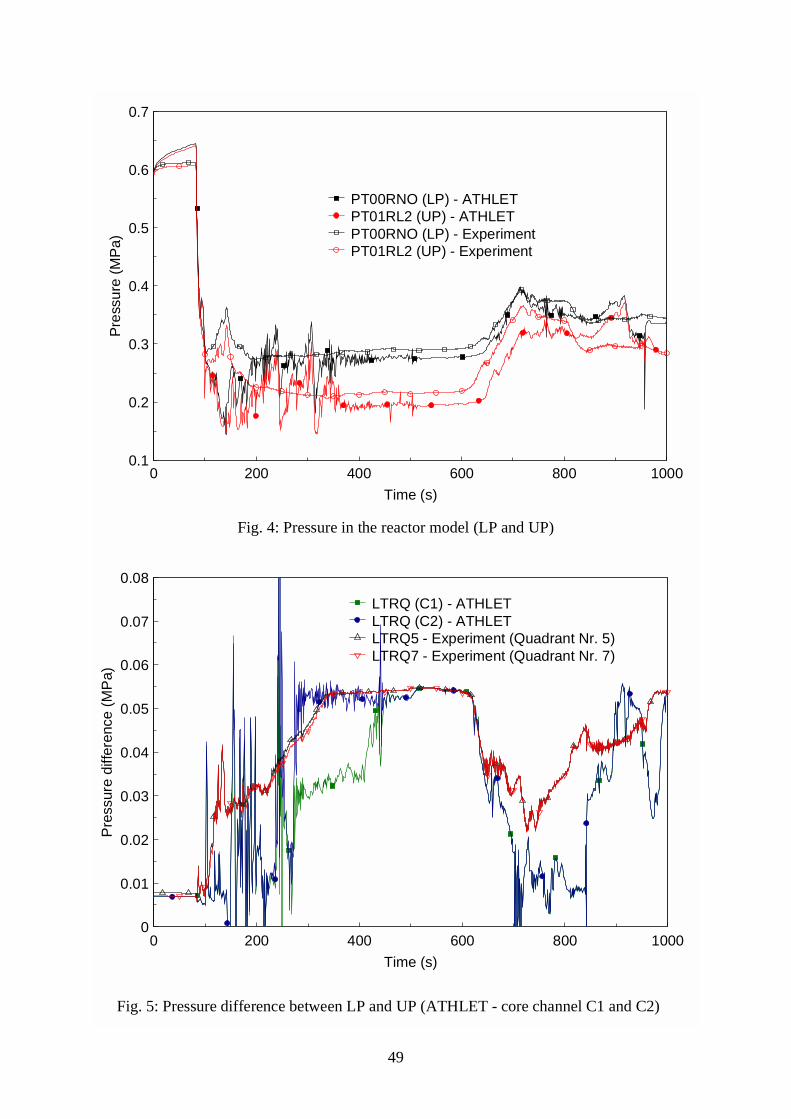
49
0 200 400 600 800 1000
Time (s)
0.1
0.2
0.3
0.4
0.5
0.6
0.7P
ress
ure
(MP
a)
PT00RNO (LP) - ATHLETPT01RL2 (UP) - ATHLETPT00RNO (LP) - ExperimentPT01RL2 (UP) - Experiment
0 200 400 600 800 1000
Time (s)
0
0.01
0.02
0.03
0.04
0.05
0.06
0.07
0.08
Pre
ssur
e di
ffere
nce
(MP
a)
LTRQ (C1) - ATHLETLTRQ (C2) - ATHLETLTRQ5 - Experiment (Quadrant Nr. 5)LTRQ7 - Experiment (Quadrant Nr. 7)
Fig. 5: Pressure difference between LP and UP (ATHLET - core channel C1 and C2)
Fig. 4: Pressure in the reactor model (LP and UP)
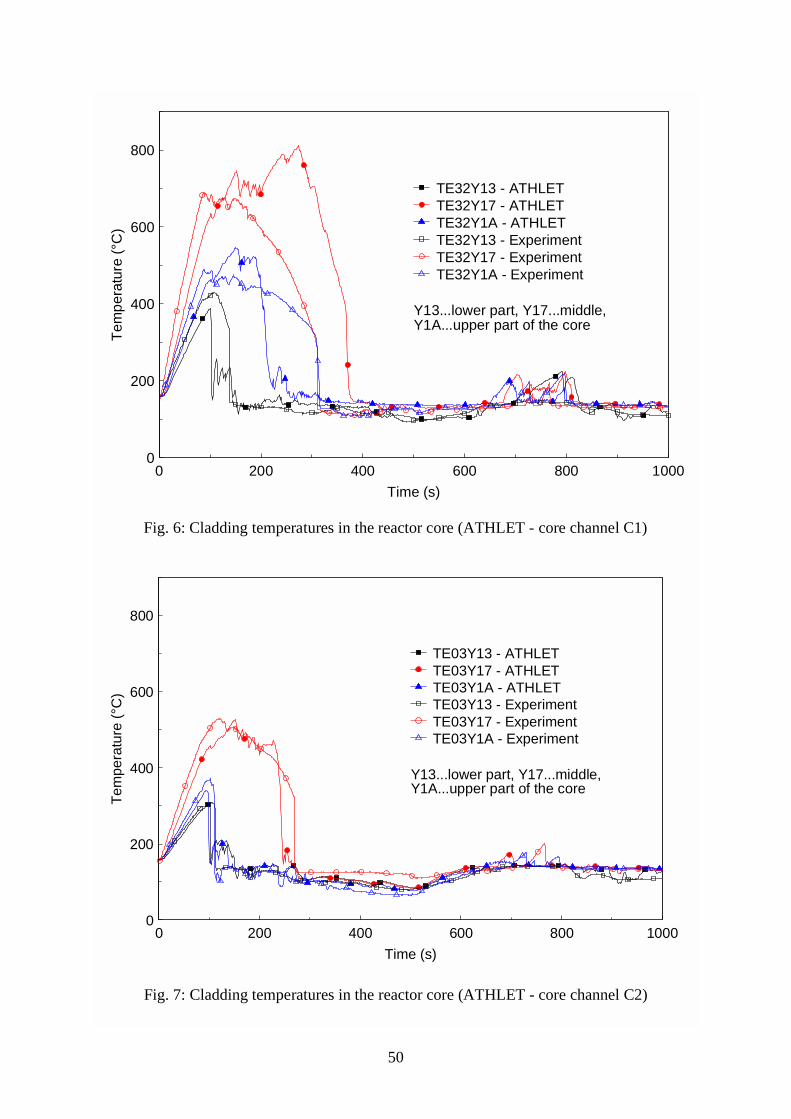
50
0 200 400 600 800 1000
Time (s)
0
200
400
600
800
Tem
pera
ture
(°C
)
TE32Y13 - ATHLETTE32Y17 - ATHLETTE32Y1A - ATHLETTE32Y13 - ExperimentTE32Y17 - ExperimentTE32Y1A - Experiment
Y13...lower part, Y17...middle,Y1A...upper part of the core
0 200 400 600 800 1000
Time (s)
0
200
400
600
800
Tem
pera
ture
(°C
)
TE03Y13 - ATHLETTE03Y17 - ATHLETTE03Y1A - ATHLETTE03Y13 - ExperimentTE03Y17 - ExperimentTE03Y1A - Experiment
Y13...lower part, Y17...middle,Y1A...upper part of the core
Fig. 6: Cladding temperatures in the reactor core (ATHLET - core channel C1)
Fig. 7: Cladding temperatures in the reactor core (ATHLET - core channel C2)
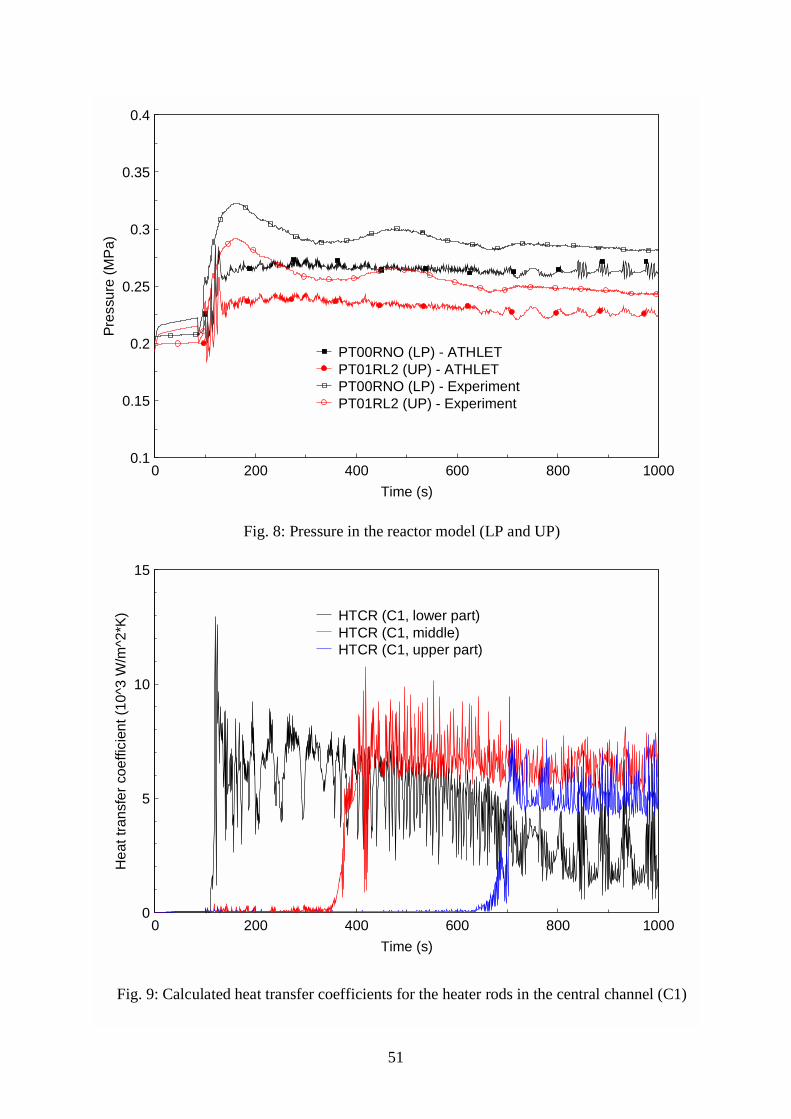
51
0 200 400 600 800 1000
Time (s)
0.1
0.15
0.2
0.25
0.3
0.35
0.4P
ress
ure
(MP
a)
PT00RNO (LP) - ATHLETPT01RL2 (UP) - ATHLETPT00RNO (LP) - ExperimentPT01RL2 (UP) - Experiment
Fig. 8: Pressure in the reactor model (LP and UP)
0 200 400 600 800 1000
Time (s)
0
5
10
15
Hea
t tra
nsfe
r co
effic
ient
(10
^3 W
/m^2
*K) HTCR (C1, lower part)
HTCR (C1, middle)HTCR (C1, upper part)
Fig. 9: Calculated heat transfer coefficients for the heater rods in the central channel (C1)
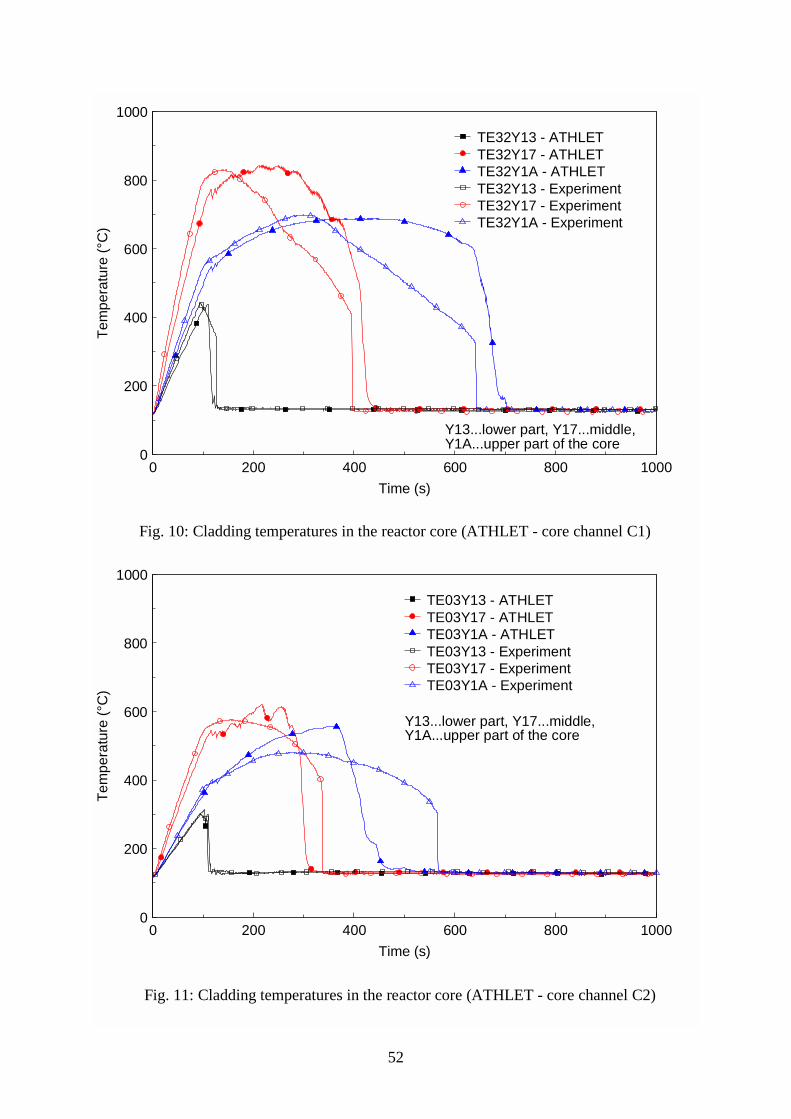
52
0 200 400 600 800 1000
Time (s)
0
200
400
600
800
1000T
empe
ratu
re (
°C)
TE32Y13 - ATHLETTE32Y17 - ATHLETTE32Y1A - ATHLETTE32Y13 - ExperimentTE32Y17 - ExperimentTE32Y1A - Experiment
Y13...lower part, Y17...middle,Y1A...upper part of the core
0 200 400 600 800 1000
Time (s)
0
200
400
600
800
1000
Tem
pera
ture
(°C
)
TE03Y13 - ATHLETTE03Y17 - ATHLETTE03Y1A - ATHLETTE03Y13 - ExperimentTE03Y17 - ExperimentTE03Y1A - Experiment
Y13...lower part, Y17...middle,Y1A...upper part of the core
Fig. 10: Cladding temperatures in the reactor core (ATHLET - core channel C1)
Fig. 11: Cladding temperatures in the reactor core (ATHLET - core channel C2)
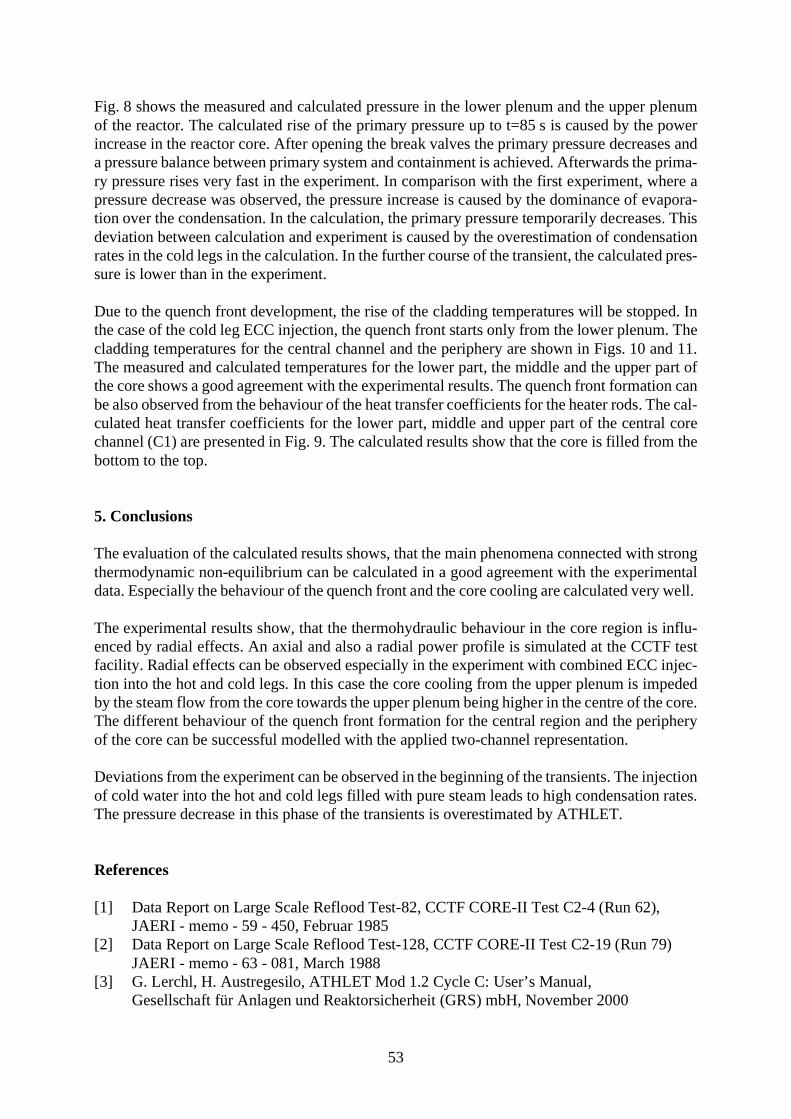
53
Fig. 8 shows the measured and calculated pressure in the lower plenum and the upper plenumof the reactor. The calculated rise of the primary pressure up to t=85 s is caused by the powerincrease in the reactor core. After opening the break valves the primary pressure decreases anda pressure balance between primary system and containment is achieved. Afterwards the prima-ry pressure rises very fast in the experiment. In comparison with the first experiment, where apressure decrease was observed, the pressure increase is caused by the dominance of evapora-tion over the condensation. In the calculation, the primary pressure temporarily decreases. Thisdeviation between calculation and experiment is caused by the overestimation of condensationrates in the cold legs in the calculation. In the further course of the transient, the calculated pres-sure is lower than in the experiment.
Due to the quench front development, the rise of the cladding temperatures will be stopped. Inthe case of the cold leg ECC injection, the quench front starts only from the lower plenum. Thecladding temperatures for the central channel and the periphery are shown in Figs. 10 and 11.The measured and calculated temperatures for the lower part, the middle and the upper part ofthe core shows a good agreement with the experimental results. The quench front formation canbe also observed from the behaviour of the heat transfer coefficients for the heater rods. The cal-culated heat transfer coefficients for the lower part, middle and upper part of the central corechannel (C1) are presented in Fig. 9. The calculated results show that the core is filled from thebottom to the top.
5. Conclusions
The evaluation of the calculated results shows, that the main phenomena connected with strongthermodynamic non-equilibrium can be calculated in a good agreement with the experimentaldata. Especially the behaviour of the quench front and the core cooling are calculated very well.
The experimental results show, that the thermohydraulic behaviour in the core region is influ-enced by radial effects. An axial and also a radial power profile is simulated at the CCTF testfacility. Radial effects can be observed especially in the experiment with combined ECC injec-tion into the hot and cold legs. In this case the core cooling from the upper plenum is impededby the steam flow from the core towards the upper plenum being higher in the centre of the core.The different behaviour of the quench front formation for the central region and the peripheryof the core can be successful modelled with the applied two-channel representation.
Deviations from the experiment can be observed in the beginning of the transients. The injectionof cold water into the hot and cold legs filled with pure steam leads to high condensation rates.The pressure decrease in this phase of the transients is overestimated by ATHLET.
References
[1] Data Report on Large Scale Reflood Test-82, CCTF CORE-II Test C2-4 (Run 62),JAERI - memo - 59 - 450, Februar 1985
[2] Data Report on Large Scale Reflood Test-128, CCTF CORE-II Test C2-19 (Run 79)JAERI - memo - 63 - 081, March 1988
[3] G. Lerchl, H. Austregesilo, ATHLET Mod 1.2 Cycle C: User’s Manual,Gesellschaft für Anlagen und Reaktorsicherheit (GRS) mbH, November 2000
54
COMPARATIVE ASSESSMENT OF CONDENSATIONMODELS FOR HORIZONTAL TUBES
Andreas Schaffrath, Anne-Kathrin Krüssenberg, Ulrike Gocht1 and Andrej Fjodorow1
1. Introduction
The condensation in horizontal tubes plays an important role for the prediction of the operationmode of horizontal steam generators of VVER reactors or passive safety systems for the nextgeneration of nuclear power plants. Two approaches (KONWAR and HOTKON) for modelingthis process have been applied by Forschungszentrum Jülich (FZJ) and University for AppliedSciences Zittau/Görlitz (HTWS) and were implemented into the 1D-thermohydraulic codeATHLET, which is developed by the Gesellschaft für Anlagen- und Reaktorsicherheit (GRS)mbH for the analysis of LOCA and transients in light water reactors [1].
Although the improvements of the condensation models are developed for different applica-tions (VVER steam generators, SWR1000 emergency condenser) with strongly different ope-ration conditions (HORUS: max. temperature difference 30 K, max. mass flow 0.025 kg/s,max. steam velocity 5 m/s, stratified counter-current gas-liquid flow, NOKO: max. temperaturedifference 260 K, max. mass flow 0.75 kg/s, max. steam velocity 35 m/s, annular, stratified,bubble, slug and plug counter-current gas-liquid flow) both models are now compared and as-sessed by Forschungszentrum Rossendorf FZR e.V. For that, post test calculations of four se-lected HORUS (horizontal u-tube steam generator) experiments were performed with ATH-LET/KONWAR and compared with existing ATHLET and ATHLET/HOTKON calculationsof HTWS.
2. Horus test facility
The HORUS II test facility was designed for the investigation of small break loss of coolantaccidents (SBLOCA) in VVER reactors [2]. The crucial component of the separate effect testfacility is the single steam generator tube (length L = 9.2 m, outer diameter D = 16 mm, wallthickness s = 1.5 mm) which is arranged in a tank (length L = 4.62 m, outer diameter D =219.1 mm, wall thickness s = 8.2 mm). The tube is fabricated of the original stainless steelmaterial (X8 CrNiTi 18 10). The design of the test facility allows to adjust the same initialand boundary conditions as during a SBLOCA (primary side pressure up to 8 MPa, secondaryside pressure up to 6.4 MPa and primary and secondary side temperatures up to 300 °C). Thetube is coupled with collectors at the beginning and the end. These collectors are used for theconnection to the necessary support systems (e.g. the steam supply, the venting or the non-condensable injection system) and are volumetrically scaled in 1:1400. They agree inprinciple with the original collectors, but they serve essentially as separators. The HORUS IIfacility is densly equipped with measuring transducers for the acquisition of the thermohy-draulic process parameters such as pressure, temperatures, water level at the primary andsecondary side.
_______________________________1 University of Applied Science Zittau/Görlitz
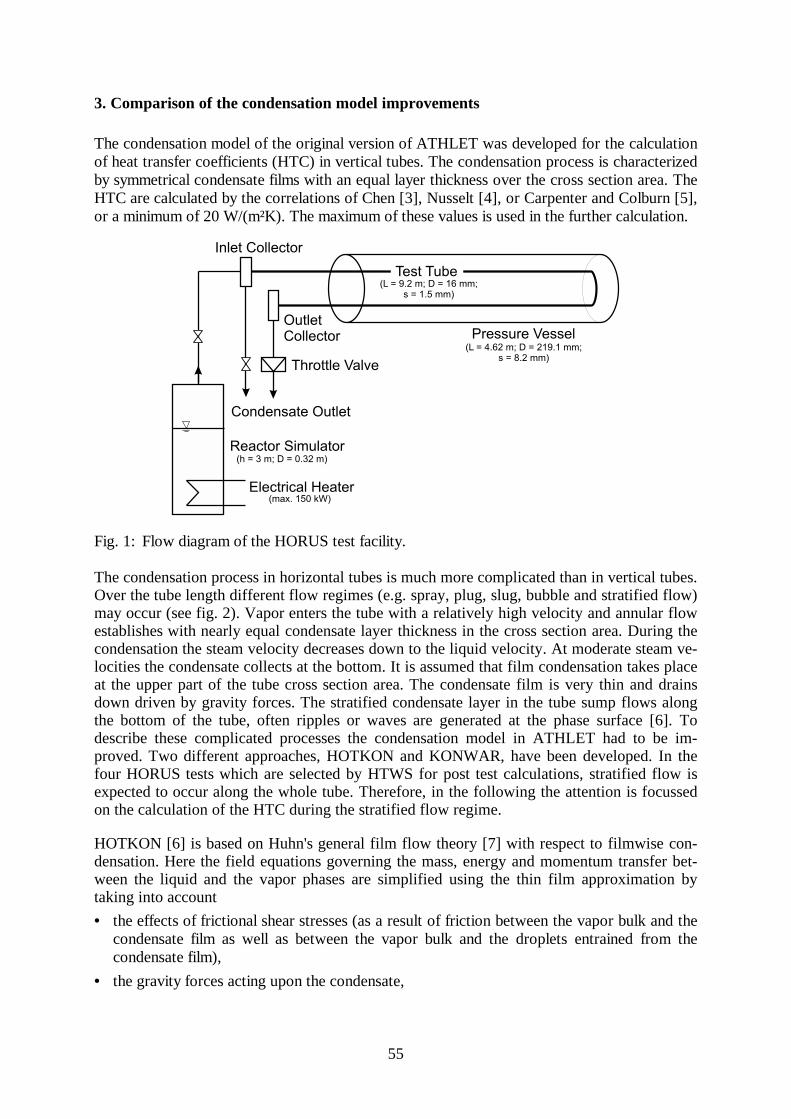
55
3. Comparison of the condensation model improvements
The condensation model of the original version of ATHLET was developed for the calculationof heat transfer coefficients (HTC) in vertical tubes. The condensation process is characterizedby symmetrical condensate films with an equal layer thickness over the cross section area. TheHTC are calculated by the correlations of Chen [3], Nusselt [4], or Carpenter and Colburn [5],or a minimum of 20 W/(m²K). The maximum of these values is used in the further calculation.
Inlet Collector
OutletCollector Pressure Vessel
Condensate Outlet
Throttle Valve
Test Tube
Electrical Heater
(L = 9.2 m; D = 16 mm;s = 1.5 mm)
(L = 4.62 m; D = 219.1 mm;s = 8.2 mm)
Reactor Simulator(h = 3 m; D = 0.32 m)
(max. 150 kW)
Fig. 1: Flow diagram of the HORUS test facility.
The condensation process in horizontal tubes is much more complicated than in vertical tubes.Over the tube length different flow regimes (e.g. spray, plug, slug, bubble and stratified flow)may occur (see fig. 2). Vapor enters the tube with a relatively high velocity and annular flowestablishes with nearly equal condensate layer thickness in the cross section area. During thecondensation the steam velocity decreases down to the liquid velocity. At moderate steam ve-locities the condensate collects at the bottom. It is assumed that film condensation takes placeat the upper part of the tube cross section area. The condensate film is very thin and drainsdown driven by gravity forces. The stratified condensate layer in the tube sump flows alongthe bottom of the tube, often ripples or waves are generated at the phase surface [6]. Todescribe these complicated processes the condensation model in ATHLET had to be im-proved. Two different approaches, HOTKON and KONWAR, have been developed. In thefour HORUS tests which are selected by HTWS for post test calculations, stratified flow isexpected to occur along the whole tube. Therefore, in the following the attention is focussedon the calculation of the HTC during the stratified flow regime.
HOTKON [6] is based on Huhn's general film flow theory [7] with respect to filmwise con-densation. Here the field equations governing the mass, energy and momentum transfer bet-ween the liquid and the vapor phases are simplified using the thin film approximation bytaking into account
• the effects of frictional shear stresses (as a result of friction between the vapor bulk and thecondensate film as well as between the vapor bulk and the droplets entrained from thecondensate film),
• the gravity forces acting upon the condensate,
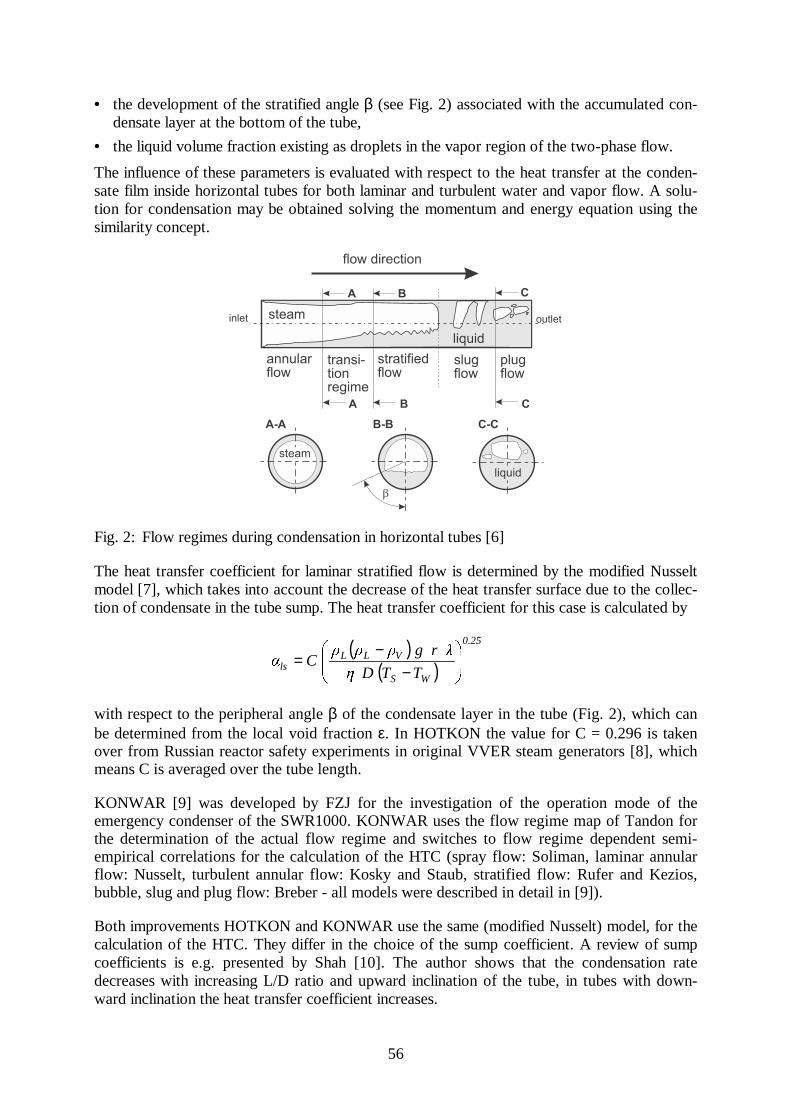
56
• the development of the stratified angle β (see Fig. 2) associated with the accumulated con-densate layer at the bottom of the tube,
• the liquid volume fraction existing as droplets in the vapor region of the two-phase flow.
The influence of these parameters is evaluated with respect to the heat transfer at the conden-sate film inside horizontal tubes for both laminar and turbulent water and vapor flow. A solu-tion for condensation may be obtained solving the momentum and energy equation using thesimilarity concept.
Fig. 2: Flow regimes during condensation in horizontal tubes [6]
The heat transfer coefficient for laminar stratified flow is determined by the modified Nusseltmodel [7], which takes into account the decrease of the heat transfer surface due to the collec-tion of condensate in the tube sump. The heat transfer coefficient for this case is calculated by
( )( )
25.0
WS
VLLls TTDη
λrgρρρCα
−−
=
with respect to the peripheral angle β of the condensate layer in the tube (Fig. 2), which canbe determined from the local void fraction ε. In HOTKON the value for C = 0.296 is takenover from Russian reactor safety experiments in original VVER steam generators [8], whichmeans C is averaged over the tube length.
KONWAR [9] was developed by FZJ for the investigation of the operation mode of theemergency condenser of the SWR1000. KONWAR uses the flow regime map of Tandon forthe determination of the actual flow regime and switches to flow regime dependent semi-empirical correlations for the calculation of the HTC (spray flow: Soliman, laminar annularflow: Nusselt, turbulent annular flow: Kosky and Staub, stratified flow: Rufer and Kezios,bubble, slug and plug flow: Breber - all models were described in detail in [9]).
Both improvements HOTKON and KONWAR use the same (modified Nusselt) model, for thecalculation of the HTC. They differ in the choice of the sump coefficient. A review of sumpcoefficients is e.g. presented by Shah [10]. The author shows that the condensation ratedecreases with increasing L/D ratio and upward inclination of the tube, in tubes with down-ward inclination the heat transfer coefficient increases.
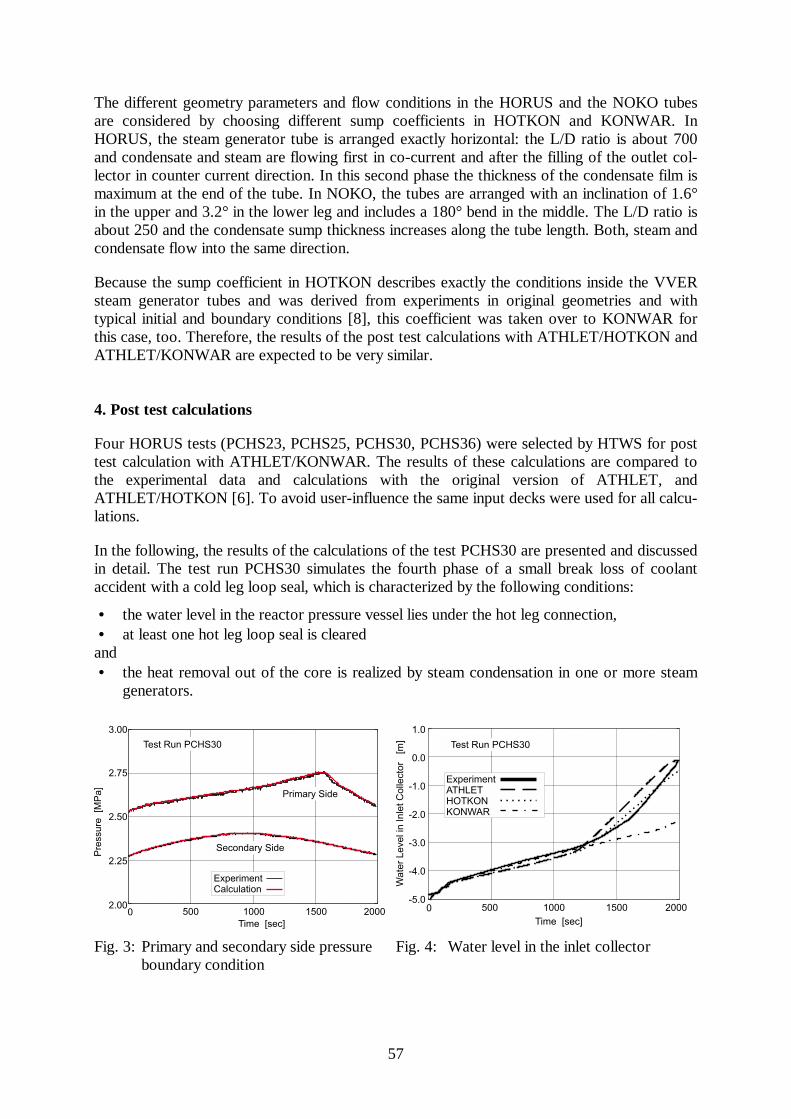
57
The different geometry parameters and flow conditions in the HORUS and the NOKO tubesare considered by choosing different sump coefficients in HOTKON and KONWAR. InHORUS, the steam generator tube is arranged exactly horizontal: the L/D ratio is about 700and condensate and steam are flowing first in co-current and after the filling of the outlet col-lector in counter current direction. In this second phase the thickness of the condensate film ismaximum at the end of the tube. In NOKO, the tubes are arranged with an inclination of 1.6°in the upper and 3.2° in the lower leg and includes a 180° bend in the middle. The L/D ratio isabout 250 and the condensate sump thickness increases along the tube length. Both, steam andcondensate flow into the same direction.
Because the sump coefficient in HOTKON describes exactly the conditions inside the VVERsteam generator tubes and was derived from experiments in original geometries and withtypical initial and boundary conditions [8], this coefficient was taken over to KONWAR forthis case, too. Therefore, the results of the post test calculations with ATHLET/HOTKON andATHLET/KONWAR are expected to be very similar.
4. Post test calculations
Four HORUS tests (PCHS23, PCHS25, PCHS30, PCHS36) were selected by HTWS for posttest calculation with ATHLET/KONWAR. The results of these calculations are compared tothe experimental data and calculations with the original version of ATHLET, andATHLET/HOTKON [6]. To avoid user-influence the same input decks were used for all calcu-lations.
In the following, the results of the calculations of the test PCHS30 are presented and discussedin detail. The test run PCHS30 simulates the fourth phase of a small break loss of coolantaccident with a cold leg loop seal, which is characterized by the following conditions:
• the water level in the reactor pressure vessel lies under the hot leg connection,• at least one hot leg loop seal is cleared
and• the heat removal out of the core is realized by steam condensation in one or more steam
generators.
2.25
2.50
2.00
2.75
3.00
500 1000 1500 2000
Pre
ssure
[MP
a]
Time [sec]
0
ExperimentCalculation
Test Run PCHS30
Secondary Side
Primary Side
500 1000 20000
1.0
0.0
-1.0
-2.0
-3.0
-4.0
-5.0
Wa
ter
Le
ve
lin
Inle
tC
olle
cto
r[m
]
1500
ExperimentATHLETHOTKONKONWAR
Time [sec]
Test Run PCHS30
Fig. 3: Primary and secondary side pressureboundary condition
Fig. 4: Water level in the inlet collector
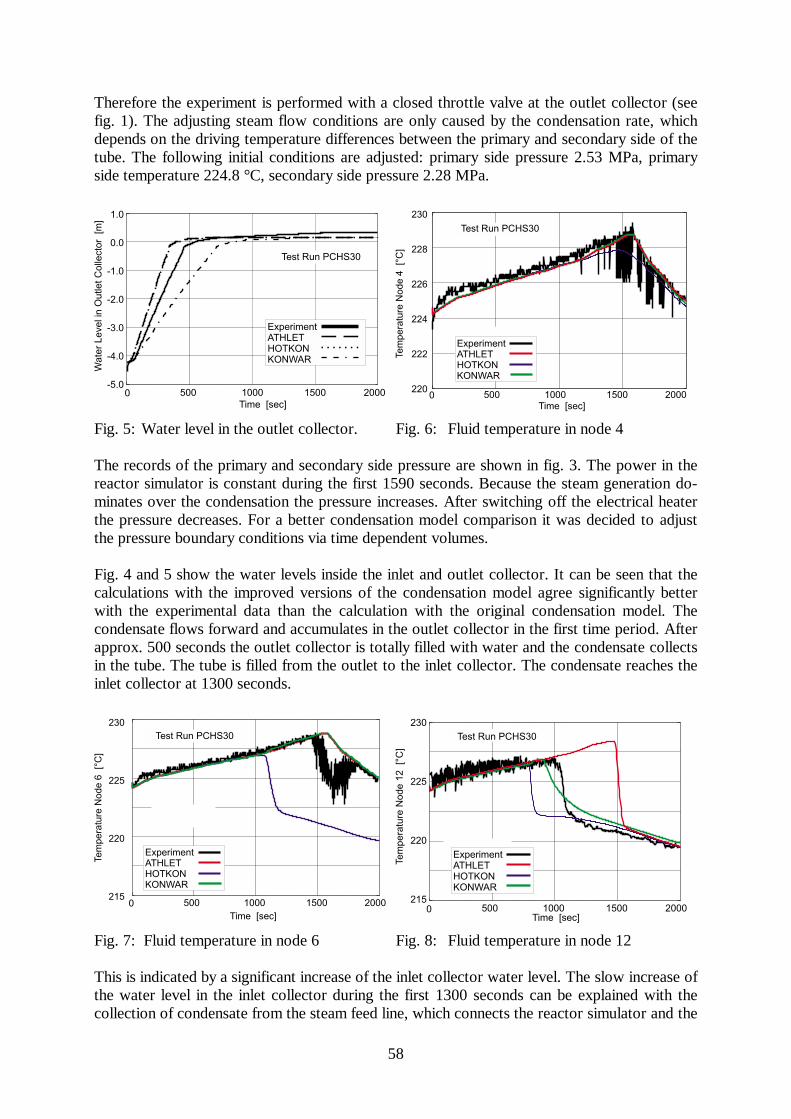
58
Therefore the experiment is performed with a closed throttle valve at the outlet collector (seefig. 1). The adjusting steam flow conditions are only caused by the condensation rate, whichdepends on the driving temperature differences between the primary and secondary side of thetube. The following initial conditions are adjusted: primary side pressure 2.53 MPa, primaryside temperature 224.8 °C, secondary side pressure 2.28 MPa.
1.0
0.0
-1.0
-2.0
-3.0
-4.0
-5.0
Wa
ter
Le
ve
lin
Ou
tle
tC
olle
cto
r[m
]
500 1000 20000 1500
Time [sec]
Test Run PCHS30
ExperimentATHLETHOTKONKONWAR
500 1000 20000 1500
230
228
226
224
222
220Tem
pera
ture
Node
4[°
C]
Time [sec]
Test Run PCHS30
ExperimentATHLETHOTKONKONWAR
Fig. 5: Water level in the outlet collector. Fig. 6: Fluid temperature in node 4
The records of the primary and secondary side pressure are shown in fig. 3. The power in thereactor simulator is constant during the first 1590 seconds. Because the steam generation do-minates over the condensation the pressure increases. After switching off the electrical heaterthe pressure decreases. For a better condensation model comparison it was decided to adjustthe pressure boundary conditions via time dependent volumes.
Fig. 4 and 5 show the water levels inside the inlet and outlet collector. It can be seen that thecalculations with the improved versions of the condensation model agree significantly betterwith the experimental data than the calculation with the original condensation model. Thecondensate flows forward and accumulates in the outlet collector in the first time period. Afterapprox. 500 seconds the outlet collector is totally filled with water and the condensate collectsin the tube. The tube is filled from the outlet to the inlet collector. The condensate reaches theinlet collector at 1300 seconds.
500 1000 20000 1500
230
225
220
215
Tem
pera
ture
Node
6[°
C]
Time [sec]
Test Run PCHS30
ExperimentATHLETHOTKONKONWAR
500 1000 20000 1500
230
225
220
215
Tem
pera
ture
Node
12
[°C
]
Time [sec]
Test Run PCHS30
ExperimentATHLETHOTKONKONWAR
Fig. 7: Fluid temperature in node 6 Fig. 8: Fluid temperature in node 12
This is indicated by a significant increase of the inlet collector water level. The slow increase ofthe water level in the inlet collector during the first 1300 seconds can be explained with thecollection of condensate from the steam feed line, which connects the reactor simulator and the
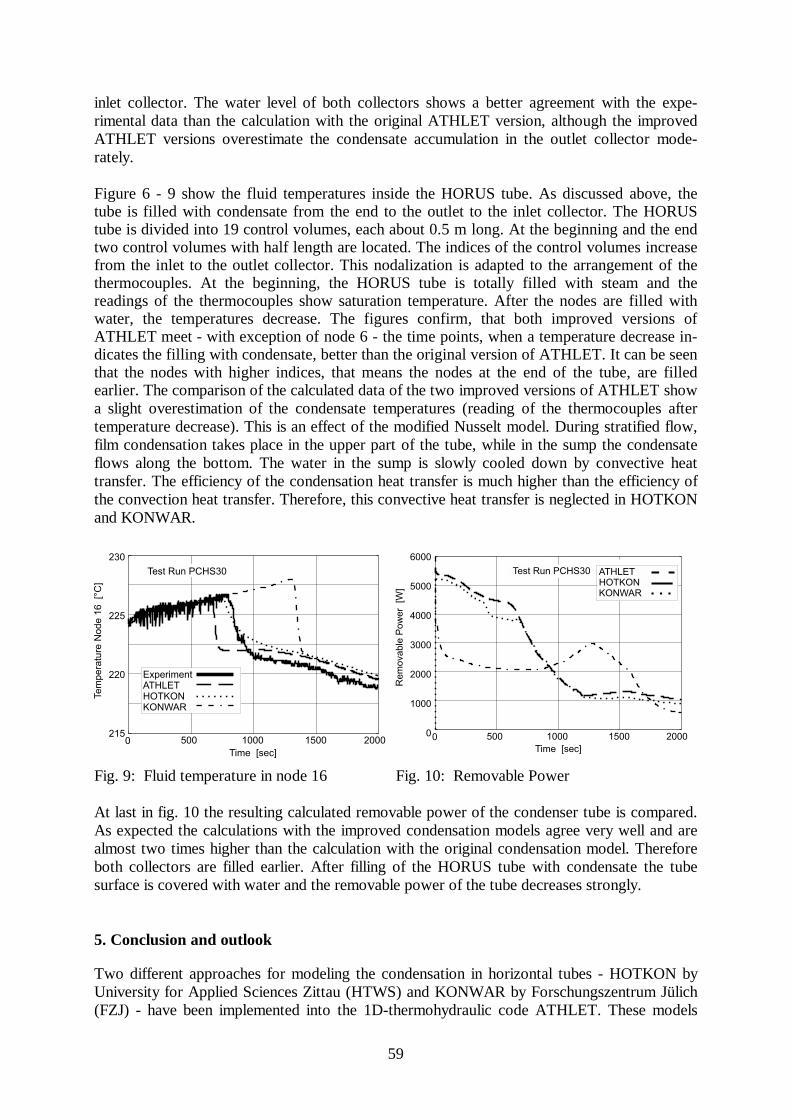
59
inlet collector. The water level of both collectors shows a better agreement with the expe-rimental data than the calculation with the original ATHLET version, although the improvedATHLET versions overestimate the condensate accumulation in the outlet collector mode-rately.
Figure 6 - 9 show the fluid temperatures inside the HORUS tube. As discussed above, thetube is filled with condensate from the end to the outlet to the inlet collector. The HORUStube is divided into 19 control volumes, each about 0.5 m long. At the beginning and the endtwo control volumes with half length are located. The indices of the control volumes increasefrom the inlet to the outlet collector. This nodalization is adapted to the arrangement of thethermocouples. At the beginning, the HORUS tube is totally filled with steam and thereadings of the thermocouples show saturation temperature. After the nodes are filled withwater, the temperatures decrease. The figures confirm, that both improved versions ofATHLET meet - with exception of node 6 - the time points, when a temperature decrease in-dicates the filling with condensate, better than the original version of ATHLET. It can be seenthat the nodes with higher indices, that means the nodes at the end of the tube, are filledearlier. The comparison of the calculated data of the two improved versions of ATHLET showa slight overestimation of the condensate temperatures (reading of the thermocouples aftertemperature decrease). This is an effect of the modified Nusselt model. During stratified flow,film condensation takes place in the upper part of the tube, while in the sump the condensateflows along the bottom. The water in the sump is slowly cooled down by convective heattransfer. The efficiency of the condensation heat transfer is much higher than the efficiency ofthe convection heat transfer. Therefore, this convective heat transfer is neglected in HOTKONand KONWAR.
500 1000 20000 1500
230
225
220
215
Te
mp
era
ture
No
de
16
[°C
]
Time [sec]
Test Run PCHS30
ExperimentATHLETHOTKONKONWAR
500 1000 20000 1500
6000
5000
4000
3000
2000
1000
0
Rem
ovable
Pow
er
[W]
Time [sec]
Test Run PCHS30 ATHLETHOTKONKONWAR
Fig. 9: Fluid temperature in node 16 Fig. 10: Removable Power
At last in fig. 10 the resulting calculated removable power of the condenser tube is compared.As expected the calculations with the improved condensation models agree very well and arealmost two times higher than the calculation with the original condensation model. Thereforeboth collectors are filled earlier. After filling of the HORUS tube with condensate the tubesurface is covered with water and the removable power of the tube decreases strongly.
5. Conclusion and outlook
Two different approaches for modeling the condensation in horizontal tubes - HOTKON byUniversity for Applied Sciences Zittau (HTWS) and KONWAR by Forschungszentrum Jülich(FZJ) - have been implemented into the 1D-thermohydraulic code ATHLET. These models
60
were originally developed for post test calculations of the HORUS and NOKO experiments,which differ extremely concerning the operation conditions. The aim of the performed investi-gation was to broaden the scope of the condensation model improvement KONWAR and tocheck the applicability to post test calculations of HORUS experiments. Therefore, fourHORUS experiments were calculated with ATHLET/KONWAR, and the results were com-pared with the experiments and the calculations with the original version of ATHLET andATHLET/HOTKON, respectively. To avoid a user-influence exactly the same input deckswere used for all calculations.
The post test calculations of the selected HORUS experiments show that the calculations withthe improved condensation models are capable of performing proper calculations. The resultsof the calculations with the improved condensation models are very similar. During these ex-periments stratified flow occurs inside the tubes and both condensation model improvementsuse the same (modified Nusselt) model for the determination of the HTC in this flow regime.This model takes into account the decrease of the heat transfer surface, due to the collectionof condensate in the tube sump. The HTC calculated by the Nusselt model has to bemultiplied with an empirical sump coefficient. The value of this coefficient depends onseveral geometric values (inclination of the tube, length/diameter ratio) and flow conditions(co- or counter-cur-rent flow of steam and condensate). Therefore, it has to be fitted to theconcrete application. A further generalization, that means a model without any empiricalcoefficients which allows calculations of arbitrary geometrical configuration, requires a me-chanistic model for the modeling of the sump influence. That’s why new and well equippedcondensation experiments with high time and spatial resolution measurements of local para-meters are needed.
References
[1] G. Lerchl, H. Austregesilo (1995), ATHLET Mod. 1.1 Cycle C - User's Manual, Ge-sellschaft für Anlagen- und Reaktorsicherheit (GRS) mbH, GRS-P-1, Vol. 1, Oktober1995
[2] S. Alt, W. Lischke (1997), Experiments with the HORUS-II Facility, Proceedings ofthe Fourth International Seminar on Horizontal Steam Generators, 11-13 March, Lap-peenranta, Finnland.
[3] J.C. Chen (1966), Correlation for Boiling Heat Transfer to Satured Fluids in Convec-tive Flow, Ind. Eng. Chem. Proc. Des. Dev. 5, 322
[4] W. Nusselt (1916), Oberflächenkondensation des Wasserdampfes, Zeitschrift des Ver-eins Deutscher Ingenieure 27, 541 and 569
[5] E. F. Carpenter, A. P. Colburn, (1951), The Effect of Vapor Velocity on CondensationInside Tubes, Proceedings of the General Discussion of Heat Transfer, Inst. Mech.Eng., 20
[6] A. Fjodorow, W. Lischke (1998), Modell zur Berechnung von Wärmeübergangskoeffi-zienten bei der Kondensation in horizontalen Rohren für den ATHLET-Code, Zittau,IPM-610205-04
[7] J. Huhn (1983), Eine allgemeine Theorie der Filmströmung und ihre Anwendung, Dis-sertation Technische Universität Dresden
[8] J. N. Kusnezow (1989), Teploobmen i Probleme Besopasnosti Jadernych Reaktorow,Energoatomisdat, Moskau
[9] A. Schaffrath (1997), KONWAR - eine Erweiterung von ATHLET zur Berechnung derKondensation in waagerechten Rohren, Jülich, Jül-3343
[10] M. M. Shah (1979), A General Correlation for Heat Transfer during Film CondensationInside Pipes, Int. J. Heat Mass Transfer 22, 547
61
VALIDATION OF COUPLED NEUTRON-KINETIC / THERMAL-HYDRAULIC CODES FOR VVER-TYPE REACTORS
Siegfried Mittag, Sören Kliem, Frank-Peter Weiss, Riitta Kyrki-Rajamäki 1, AnittaHämäläinen 1, Siegfried Langenbuch 2, Serge Danilin 3, Jan Hadek 4, György Hegyi 5,
Alexander Kuchin 6 and Dobromir Panayotov 7
1. Introduction
Three-dimensional neutron-kinetic core models have been coupled to advanced thermal-hydraulic system codes. These coupled codes can be used for the analysis of the wholereactor system, since they are capable of estimating the feedback effects in a consistentmanner. Such code systems have been developed also for modelling transients in RussianVVER-type reactors. The stand-alone neutronic codes, including their nuclear databases,have already been validated e. g. by using data from experiments in critical facilities andzero-power reactors, in which thermal-hydraulic feedback on neutron kinetics cannot beobserved. The thermal-hydraulic system codes have also been separately validated against alot of experiments in thermal-hydraulic test facilities. The interaction between the neutroniceffects of the reactor core and the thermal-hydraulic behaviour of the plant cannot bemeasured in these experimental facilities, but only in nuclear power plants. Hence in a projectwithin the European Commission's Phare programme (SRR1/95), five well-documentedVVER transients were made available; two of them have been chosen for the code validation[1,2]. The measured VVER data as well as the validation of the burn-up and steady-stateversions of the neutronic codes involved have been described in the Annual Report 1998 [3].
2. Codes
The coupled neutron-kinetic / thermal-hydraulic codes listed below have been validatedagainst measured VVER-440 and VVER-1000 transients. The nuclear data libraries appliedin the calculations have been generated by the codes given in parentheses.
• VTT HEXTRAN/SMABRE [4,5] (VVER-1000: CASMO-4)(VVER-440: CASMO-HEX)
• KI BIPR8/ATHLET [6,7] (KASSETA)• FZR DYN3D/ATHLET [8] (VVER-1000: NESSEL)
(VVER-440: KASSETA)• INRNE DYN3D/ATHLET (NESSEL)• STCNRS DYN3D/ATHLET (NESSEL)• NRI DYN3D/ATHLET (KASSETA)• AEKI KIKO3D/ATHLET [9] (KARATE)
1 VTT Energy/Nuclear Energy, Finland2 GRS, Gesellschaft für Anlagen- und Reaktorsicherheit mbH3 KI - Russian Research Center "Kurchatov Institute"4 NRI Nuclear Research Institute Rez, Czech Republic5 AEKI - KFKI Atomic Energy Research Institute, Hungary6 STCNRS - Scientific & Technical Centre on Nuclear and Radiation Safety, Ukraine7 INRNE - Institute of Nuclear Research and Nuclear Energy, Bulgaria
62
3. Analysis of a VVER-1000 transient measured in Balakovo-4 (Russia)
The initiating event for the transient was the switching-off of one of the two working steamgenerator feed water pumps at full power. Two seconds after the pump failure, the powercontrol system responded by inserting the first control rod group from core top to bottomwithin four seconds. As a result, the neutron power decreased to about 63% of the nominalvalue within 10 seconds. After that, group No. 10 started moving in at the rate of 2 cm/s. Theslow insertion of this group resulted in an additional power decrease to about 45%. Thedifferences between the temperatures of the hot legs and the corresponding cold legs of thefour primary circuit loops decreased proportionally to the thermal power reduction, as all fourpumps continued working. In the secondary circuit, where the transient had been initiated, theflow rate through the second feed water pump that was still in operation, was increased bysome 50% within 16 seconds after the failure of the first pump, in order to partly compensatethe deficient feed water flow. In the following, the flow rate of the second pump was reducedagain to match the decreasing thermal power of the primary circuit. During the wholetransient, the water level in the steam generators was kept well above the heat exchangertubes.
In the transient analysis, the control rod group positions as functions of time were provided asinput to all calculations. Fig. 1 (upper part) depicts the positions of the control rod group 10.The measured pressure in the main steam header (MSH), shown in the lower part of Fig. 1was also applied as a boundary condition, except for the VTT calculations (SMABRE),where the secondary circuit was modelled in more detail. The average cold leg temperature aswell as the calculated and measured reactor power are shown in Fig. 2. The power iscontrolled for the most part by the control rod movements, but there is also an effect of fueland coolant temperature on reactivity and power. The coolant temperature decreases withfalling power, but it is influenced by the pressure in the secondary circuit, too. A rising steamheader pressure means an increasing saturation temperature, which leads to a decreasing heattransfer in the steam generator. The result is a rising cold leg temperature, and vice versa.
In the first seconds of the transient, the power decreases very fast as a result of dropping thefirst control rod group. The minimum is reached at t = 6 s, when the group is fully inserted.The power rise observed in the next few seconds, is mainly caused by the fuel temperaturewhich continues falling after the end of the rod drop (Doppler effect). The respectivemeasured power growth is about 200 MW. The calculated values are between 190 and 300MW. The deviations between the calculations are caused by different temperaturedependencies of the nuclear cross sections and different assumptions on the thermalproperties of the fuel rods. Detailed investigations have shown that the change of the heattransfer coefficient (HTC) in the gas gap between fuel pellets and rod cladding during thetransient is relevant. With dropping fuel temperatures, the gap width increases, which leads toa decreasing HTC. This reduces the fuel temperature decrease. Comparing the results ofDYN3D/ATHLET calculations with constant and changing HTC in the gap [10], performedby FZR, has shown that the difference in the power level of the final state (caused by thiseffect) is about 150 MW.
In the time interval between t = 10 s and t = 60 s, the power is mainly controlled byconstantly inserting control rod group No. 10. However, the cold leg temperature decreasebetween 10 s and 20 s (FZR, INRNE, KI, STCNRS) causes a reactivity increase (moderatordensity feedback), which for the most part compensates the reactivity effect of group 10, sothat the power does not drop much in this short interval. The different modelling of the
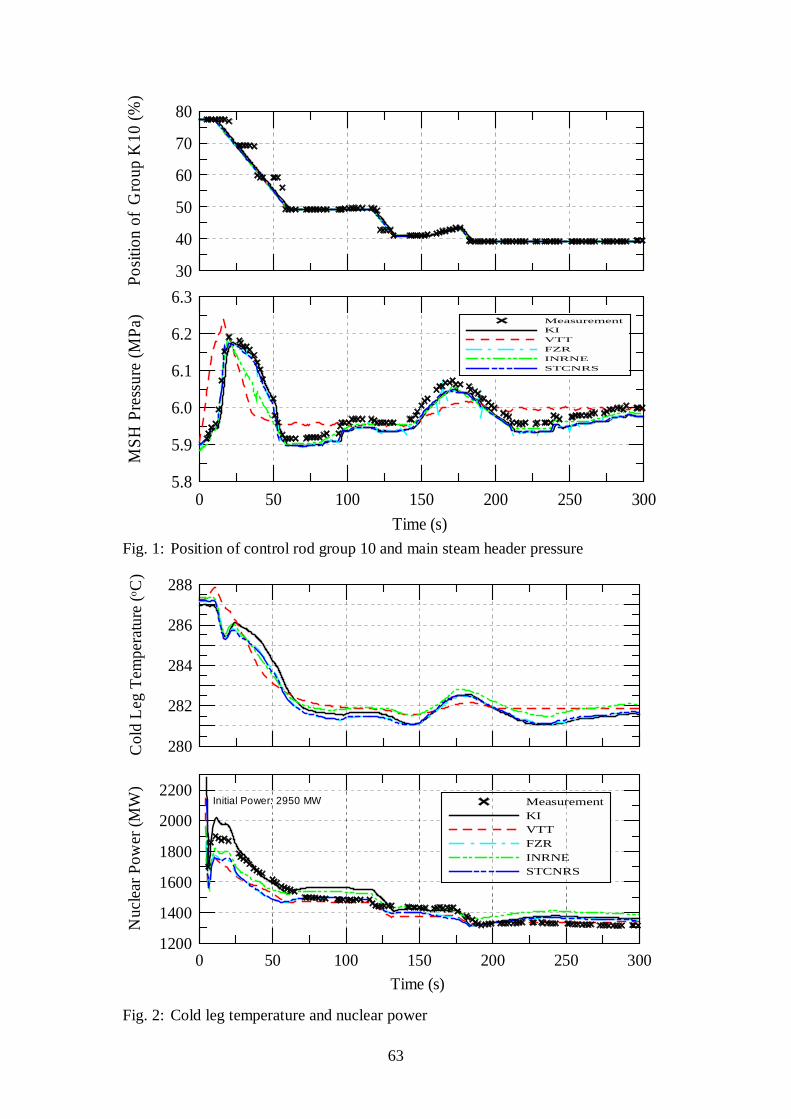
63
Fig. 1: Position of control rod group 10 and main steam header pressure
280
282
284
286
288
Col
d L
eg T
empe
ratu
re (o C
)
0 50 100 150 200 250 300
Time (s)
1200
1400
1600
1800
2000
2200
Nuc
lear
Pow
er (
MW
)
MeasurementKIVTTFZRINRNESTCNRS
Initial Power: 2950 MW
30
40
50
60
70
80Po
sitio
n of
Gro
up K
10 (
%)
0 50 100 150 200 250 300
Time (s)
5.8
5.9
6.0
6.1
6.2
6.3
MS
H P
ress
ure
(MP
a) MeasurementKIVTTFZRINRNESTCNRS
Fig. 2: Cold leg temperature and nuclear power
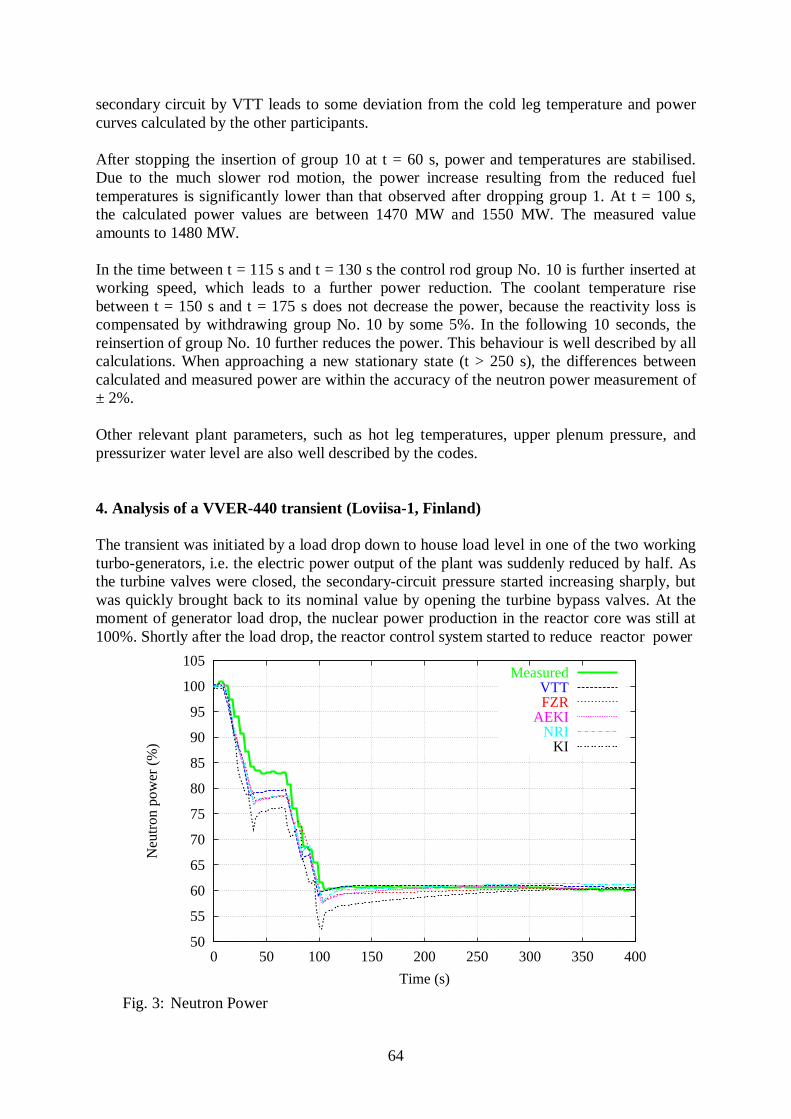
64
secondary circuit by VTT leads to some deviation from the cold leg temperature and powercurves calculated by the other participants.
After stopping the insertion of group 10 at t = 60 s, power and temperatures are stabilised.Due to the much slower rod motion, the power increase resulting from the reduced fueltemperatures is significantly lower than that observed after dropping group 1. At t = 100 s,the calculated power values are between 1470 MW and 1550 MW. The measured valueamounts to 1480 MW.
In the time between t = 115 s and t = 130 s the control rod group No. 10 is further inserted atworking speed, which leads to a further power reduction. The coolant temperature risebetween t = 150 s and t = 175 s does not decrease the power, because the reactivity loss iscompensated by withdrawing group No. 10 by some 5%. In the following 10 seconds, thereinsertion of group No. 10 further reduces the power. This behaviour is well described by allcalculations. When approaching a new stationary state (t > 250 s), the differences betweencalculated and measured power are within the accuracy of the neutron power measurement of± 2%.
Other relevant plant parameters, such as hot leg temperatures, upper plenum pressure, andpressurizer water level are also well described by the codes.
4. Analysis of a VVER-440 transient (Loviisa-1, Finland)
The transient was initiated by a load drop down to house load level in one of the two workingturbo-generators, i.e. the electric power output of the plant was suddenly reduced by half. Asthe turbine valves were closed, the secondary-circuit pressure started increasing sharply, butwas quickly brought back to its nominal value by opening the turbine bypass valves. At themoment of generator load drop, the nuclear power production in the reactor core was still at100%. Shortly after the load drop, the reactor control system started to reduce reactor power
50
55
60
65
70
75
80
85
90
95
100
105
0 50 100 150 200 250 300 350 400
Neu
tron
pow
er (
%)
Time (s)
MeasuredVTTFZR
AEKINRI
KI
Fig. 3: Neutron Power
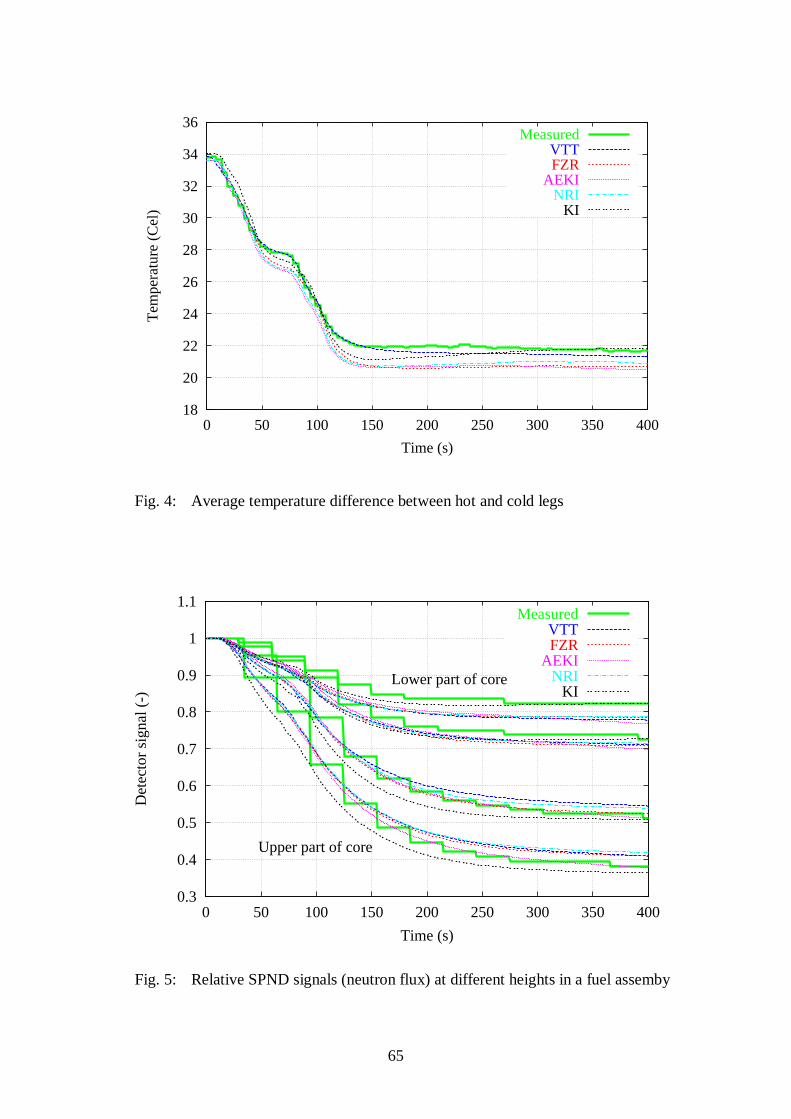
65
18
20
22
24
26
28
30
32
34
36
0 50 100 150 200 250 300 350 400
Tem
pera
ture
(C
el)
Time (s)
MeasuredVTTFZR
AEKINRI
KI
0.3
0.4
0.5
0.6
0.7
0.8
0.9
1
1.1
0 50 100 150 200 250 300 350 400
Det
ecto
r si
gnal
(-)
Time (s)
Lower part of core
Upper part of core
MeasuredVTTFZR
AEKINRI
KI
Fig. 4: Average temperature difference between hot and cold legs
Fig. 5: Relative SPND signals (neutron flux) at different heights in a fuel assemby
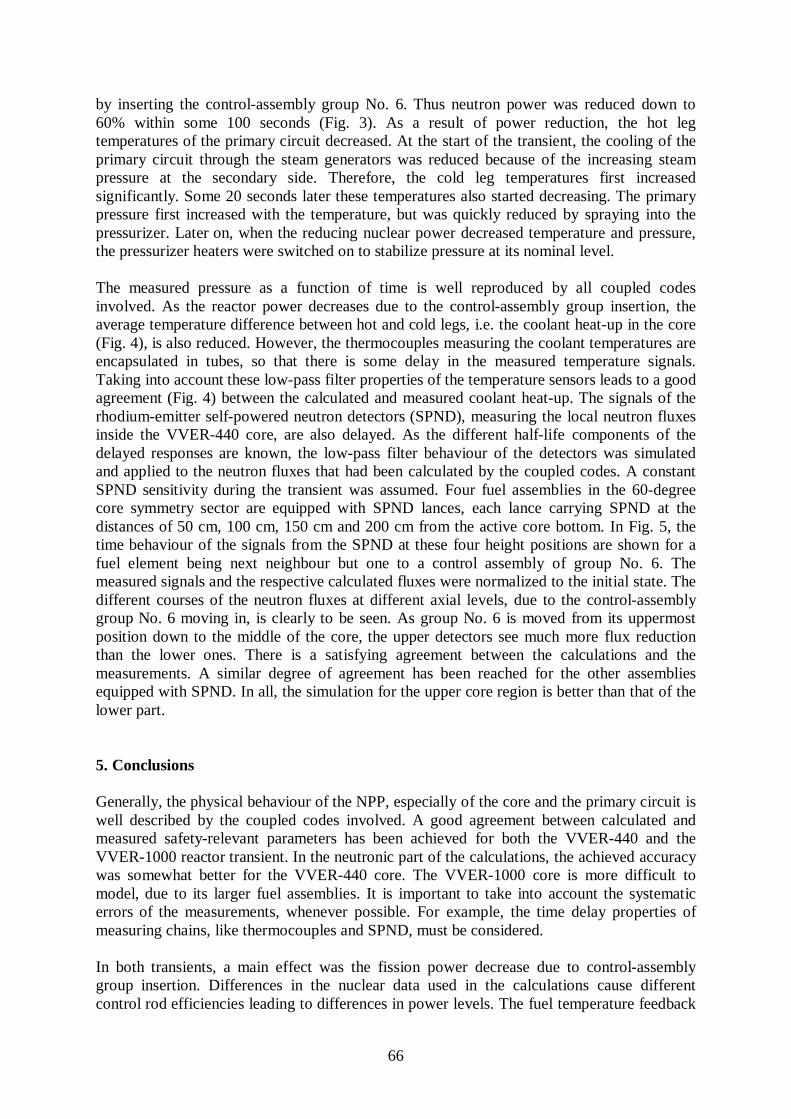
66
by inserting the control-assembly group No. 6. Thus neutron power was reduced down to60% within some 100 seconds (Fig. 3). As a result of power reduction, the hot legtemperatures of the primary circuit decreased. At the start of the transient, the cooling of theprimary circuit through the steam generators was reduced because of the increasing steampressure at the secondary side. Therefore, the cold leg temperatures first increasedsignificantly. Some 20 seconds later these temperatures also started decreasing. The primarypressure first increased with the temperature, but was quickly reduced by spraying into thepressurizer. Later on, when the reducing nuclear power decreased temperature and pressure,the pressurizer heaters were switched on to stabilize pressure at its nominal level.
The measured pressure as a function of time is well reproduced by all coupled codesinvolved. As the reactor power decreases due to the control-assembly group insertion, theaverage temperature difference between hot and cold legs, i.e. the coolant heat-up in the core(Fig. 4), is also reduced. However, the thermocouples measuring the coolant temperatures areencapsulated in tubes, so that there is some delay in the measured temperature signals.Taking into account these low-pass filter properties of the temperature sensors leads to a goodagreement (Fig. 4) between the calculated and measured coolant heat-up. The signals of therhodium-emitter self-powered neutron detectors (SPND), measuring the local neutron fluxesinside the VVER-440 core, are also delayed. As the different half-life components of thedelayed responses are known, the low-pass filter behaviour of the detectors was simulatedand applied to the neutron fluxes that had been calculated by the coupled codes. A constantSPND sensitivity during the transient was assumed. Four fuel assemblies in the 60-degreecore symmetry sector are equipped with SPND lances, each lance carrying SPND at thedistances of 50 cm, 100 cm, 150 cm and 200 cm from the active core bottom. In Fig. 5, thetime behaviour of the signals from the SPND at these four height positions are shown for afuel element being next neighbour but one to a control assembly of group No. 6. Themeasured signals and the respective calculated fluxes were normalized to the initial state. Thedifferent courses of the neutron fluxes at different axial levels, due to the control-assemblygroup No. 6 moving in, is clearly to be seen. As group No. 6 is moved from its uppermostposition down to the middle of the core, the upper detectors see much more flux reductionthan the lower ones. There is a satisfying agreement between the calculations and themeasurements. A similar degree of agreement has been reached for the other assembliesequipped with SPND. In all, the simulation for the upper core region is better than that of thelower part.
5. Conclusions
Generally, the physical behaviour of the NPP, especially of the core and the primary circuit iswell described by the coupled codes involved. A good agreement between calculated andmeasured safety-relevant parameters has been achieved for both the VVER-440 and theVVER-1000 reactor transient. In the neutronic part of the calculations, the achieved accuracywas somewhat better for the VVER-440 core. The VVER-1000 core is more difficult tomodel, due to its larger fuel assemblies. It is important to take into account the systematicerrors of the measurements, whenever possible. For example, the time delay properties ofmeasuring chains, like thermocouples and SPND, must be considered.
In both transients, a main effect was the fission power decrease due to control-assemblygroup insertion. Differences in the nuclear data used in the calculations cause differentcontrol rod efficiencies leading to differences in power levels. The fuel temperature feedback
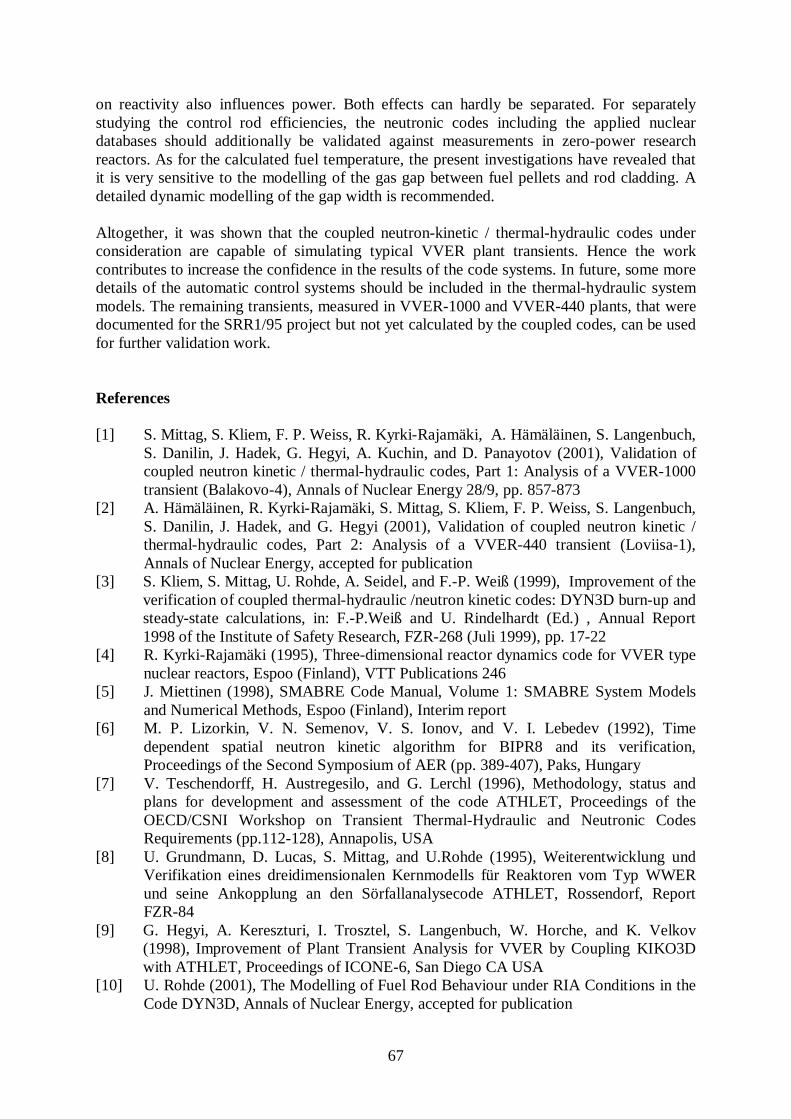
67
on reactivity also influences power. Both effects can hardly be separated. For separatelystudying the control rod efficiencies, the neutronic codes including the applied nucleardatabases should additionally be validated against measurements in zero-power researchreactors. As for the calculated fuel temperature, the present investigations have revealed thatit is very sensitive to the modelling of the gas gap between fuel pellets and rod cladding. Adetailed dynamic modelling of the gap width is recommended.
Altogether, it was shown that the coupled neutron-kinetic / thermal-hydraulic codes underconsideration are capable of simulating typical VVER plant transients. Hence the workcontributes to increase the confidence in the results of the code systems. In future, some moredetails of the automatic control systems should be included in the thermal-hydraulic systemmodels. The remaining transients, measured in VVER-1000 and VVER-440 plants, that weredocumented for the SRR1/95 project but not yet calculated by the coupled codes, can be usedfor further validation work.
References
[1] S. Mittag, S. Kliem, F. P. Weiss, R. Kyrki-Rajamäki, A. Hämäläinen, S. Langenbuch,S. Danilin, J. Hadek, G. Hegyi, A. Kuchin, and D. Panayotov (2001), Validation ofcoupled neutron kinetic / thermal-hydraulic codes, Part 1: Analysis of a VVER-1000transient (Balakovo-4), Annals of Nuclear Energy 28/9, pp. 857-873
[2] A. Hämäläinen, R. Kyrki-Rajamäki, S. Mittag, S. Kliem, F. P. Weiss, S. Langenbuch,S. Danilin, J. Hadek, and G. Hegyi (2001), Validation of coupled neutron kinetic /thermal-hydraulic codes, Part 2: Analysis of a VVER-440 transient (Loviisa-1),Annals of Nuclear Energy, accepted for publication
[3] S. Kliem, S. Mittag, U. Rohde, A. Seidel, and F.-P. Weiß (1999), Improvement of theverification of coupled thermal-hydraulic /neutron kinetic codes: DYN3D burn-up andsteady-state calculations, in: F.-P.Weiß and U. Rindelhardt (Ed.) , Annual Report1998 of the Institute of Safety Research, FZR-268 (Juli 1999), pp. 17-22
[4] R. Kyrki-Rajamäki (1995), Three-dimensional reactor dynamics code for VVER typenuclear reactors, Espoo (Finland), VTT Publications 246
[5] J. Miettinen (1998), SMABRE Code Manual, Volume 1: SMABRE System Modelsand Numerical Methods, Espoo (Finland), Interim report
[6] M. P. Lizorkin, V. N. Semenov, V. S. Ionov, and V. I. Lebedev (1992), Timedependent spatial neutron kinetic algorithm for BIPR8 and its verification,Proceedings of the Second Symposium of AER (pp. 389-407), Paks, Hungary
[7] V. Teschendorff, H. Austregesilo, and G. Lerchl (1996), Methodology, status andplans for development and assessment of the code ATHLET, Proceedings of theOECD/CSNI Workshop on Transient Thermal-Hydraulic and Neutronic CodesRequirements (pp.112-128), Annapolis, USA
[8] U. Grundmann, D. Lucas, S. Mittag, and U.Rohde (1995), Weiterentwicklung undVerifikation eines dreidimensionalen Kernmodells für Reaktoren vom Typ WWERund seine Ankopplung an den Sörfallanalysecode ATHLET, Rossendorf, ReportFZR-84
[9] G. Hegyi, A. Kereszturi, I. Trosztel, S. Langenbuch, W. Horche, and K. Velkov(1998), Improvement of Plant Transient Analysis for VVER by Coupling KIKO3Dwith ATHLET, Proceedings of ICONE-6, San Diego CA USA
[10] U. Rohde (2001), The Modelling of Fuel Rod Behaviour under RIA Conditions in theCode DYN3D, Annals of Nuclear Energy, accepted for publication
68
THE MODELING OF FUEL ROD BEHAVIOUR UNDER RIA CONDITIONS IN THE CODE DYN3D
Ulrich Rohde
1. Introduction
The code DYN3D has been developed in the Research Centre Rossendorf for the analysis ofreactivity initiated accidents (RIA) in light water reactors [1]. It comprises 3D neutron kineticsbased on a nodal expansion approach both for hexagonal and square fuel element geometry anda thermo-hydraulic model of the reactor core. In RIA analysis, the heat transfer from fuel to coo-lant plays an important role. This heat transfer is significantly affected by the behaviour of thegas gap between fuel and cladding, but also by the heat transfer conditions at the cladding sur-face. Therefore, a transient fuel rod behaviour model is implemented into DYN3D [2,3]. Thismodel is coupled with a heat transfer regime map for cladding surface - coolant heat transferranging from subcooled liquid convection conditions to dispersed flow with superheated steam. For the validation of the model, experiments on fuel rod behaviour during RIAs carried out inRussian and Japanese pulsed research reactors are calculated. Because the experiments werecarried out at atmospheric pressure and stagnant flow conditions, additional calculational stu-dies on the fuel rod behaviour during RIAs in power reactors at high pressure and high massflow rate conditions were performed.
2. Fuel rod model
For the estimation of fuel and cladding temperatures the heat conduction equation in one–di-mensional radial geometry is solved numerically taking into account temperature–dependentheat conductivity. However, the main problem of fuel rod behaviour modelling is the determi-nation of heat transfer coefficients αgap in the gas gap between fuel and cladding and αc fromcladding to coolant.
The general assumption of the gas gap behaviour modeling in DYN3D is that the parametersfor the stationary reference state (e.g. geometrical gap width, gas pressure and composition) areknown from detailed fuel rod behaviour codes. The changes of the gas gap parameters duringthe transient process due to variation of gap width, gas temperature and pressure, coolant andfuel - cladding contact pressure are estimated by the DYN3D model.
In the gas gap between fuel and cladding the heat transfer components due to conduction in thegas, radiation and fuel–cladding contact are considered. The heat transfer coefficient due to con-duction in the gas is determined by
where λg,mix is the thermal conductivity of the filling gas mixture. The composition of the fillinggas mixture is a function of the actual depletion state and must be obtained from detailed fuelrod behaviour codes. δgap is the geometrical gap width and is determined by using a thermo-mechanical model. δroug is related to the surface roughness values of fuel and cladding. δext isa gas kinetics extrapolation length. The radiation component αrad is given by the Stefan–Boltz-mann law. In the case of closed gap, heat transfer due to contact conductance is considered:
αcond
λg mix,δgap δroug δext+ +--------------------------------------------= (1)
69
where C, m and n are constants, δsr is the square averaged surface roughness, pcont the contactpressure, H the Meyer hardness of the softer material (fuel or cladding), and λf,c is the effectivethermal conductivity at the fuel-cladding interface.
The contact pressure is estimated based on the following assumptions:
one–dimensional modeling of mechanics in radial direction, linear superposition of radial thermal, elastic and plastic deformations without axial cou-
pling, elastic deformation of the fuel is taken into account only in the case of fuel–cladding con-
tact, plastic deformations of the fuel are not considered, cladding is described in the thin shell approximation.
The cladding stress is determined by the gas pressure inside the cladding, the outer coolant pres-sure and, possibly, the contact pressure. The gas pressure pgas is obtained from the ideal gas lawfor the filling gas and taking into account the change of gas temperature as well as the changeof free volume by changing gas gap width.
The plastic deformation of the cladding is considered in accordance with the creeping law:
where the coefficients K, p and q are material properties. is the strain rate, that means, thetime-derivative of the cladding strain ε = δR/R. Plastic deformation is considered, when thestress exceeds the yield strength σyield, which is a material property and a function of tempera-ture and strain rate.
If the pressure outside the cladding is larger than the inner pressure, prompt creeping of the clad-ding on the fuel is assumed so that the gap vanishes and the cladding stress is zero. If the innerpressure exceeds outer pressure, two different situations are considered. If the gap is closed andthe contact pressure is non-zero, it is assumed that prompt creeping will take place reducing thestress until it becomes equal to the yield strength. If there is no fuel - cladding contact and thegas pressure exceeds the coolant pressure, time-dependent creeping will be considered accor-ding to equation (3). The last situation is typical for low coolant pressures like in RIA experi-ments at pulsed research reactors or in LOCA cases and leads to cladding ballooning, while thefirst one is typical for RIA conditions in power reactors.
A mechanistic model of fuel rod failure during accidents is not included in DYN3D, but someparameters needed for the assessment of fuel rod integrity are provided:
fuel enthalpy for each axial node of the rod, cladding oxide thickness, signalization of possible cladding rupture, when the cladding stress is positive (inner pres-
sure is larger than outer pressure) and exceeds the yield strength.
The cladding oxidation due to metal-water reaction (MWR) at high temperatures is described
αcont
Cλ f c,
δsrn
-------------pcont
H-----------
m
= (2)
ε δRR
------σ
Kε·q
--------- 1 p⁄
= = (3)
ε·
70
by the equation:
where D is the oxide layer thickness , T the cladding surface temperature, C the mass density ofoxygen in ZrO2 , A and B are constants. The MWR is considered as an additional heat sourcein the cladding, but the additional heat transfer resistance at the cladding surface and the changeof mechanical properties of the cladding caused by the oxide layer are not taken into account(restriction to thin oxide layers).
3. Heat transfer regime map
The heat transfer from fuel to coolant is affected not only by the behaviour of the gas gap, butalso by heat transfer conditions at the cladding surface. In DYN3D, a heat transfer regime mapis used which covers all flow regimes from one-phase liquid convection over different boilingheat transfer mechanisms to superheated steam convection.
Appropriate correlations for single phase convection and the region of boiling heat transfer arechosen from [4]. The occurence of heat transfer crisis is determined from various critical heatflux correlations. For low mass flow densities (G << 200 kg/m2s) the Kutateladse correlationfor q“crit with a non-equilibrium correction is used [4]. An additional criterion for the detectionof dryout is considered. After reaching the critical heat flux or critical dryout quality, the heattransfer is decreasing, which leads to an increasing temperature difference between the heatedwall and the fluid. In this unstable transition boiling region the heat flux is interpolated betweenthe critical heat flux value and the value at the minimum stable film boiling point. In the stablepost-crisis region heat transfer correlations for inverted annular or dispersed flow are used. Ad-ditionally, the heat transfer from wall to coolant by radiation is taken into account. After fullevaporation of coolant, heat transfer to superheated steam is estimated by a single phase forcedconvection correlation .
The following additional non-equilibrium corrections due to subcooled liquid are applied to theLeidenfrost or minimum stable film boiling point TMSFB and the heat transfer coefficients in thepost crisis region αpc:
TMSFB = Tsat + 350 + 5.1 (Tsat - Tliq) (5)
αpc(T=Tliq) = αpc(T=Tsat)[1 + 0.025 (Tsat - Tliq)] (6)
The formulaes (5) and (6) are based on correlations proposed by Ohnishi et al. [8].
4. Calculations for RIA experiments
For the validation of the fuel rod and heat transfer model in the code DYN3D several experi-ments known from literature were selected. Experiments on the fuel behaviour during large po-wer pulses were carried out e. g. in the Japanese Nuclear Safety Research Reactor (NSRR) [6],in the Russian research reactors IGR and GIDRA [7] and in the framework of the French CA-BRI experimental program [5]. The NSRR is a modified TRIGA reactor whith a power pulsehalf width of a few milliseconds. The Russian GIDRA reactor contains an aqueous solution ofenriched fuel producing narrow power pulses, while the IGR reactor is a graphite moderated one
Dtd
dD A
C2
------B–T
------ exp= (4)
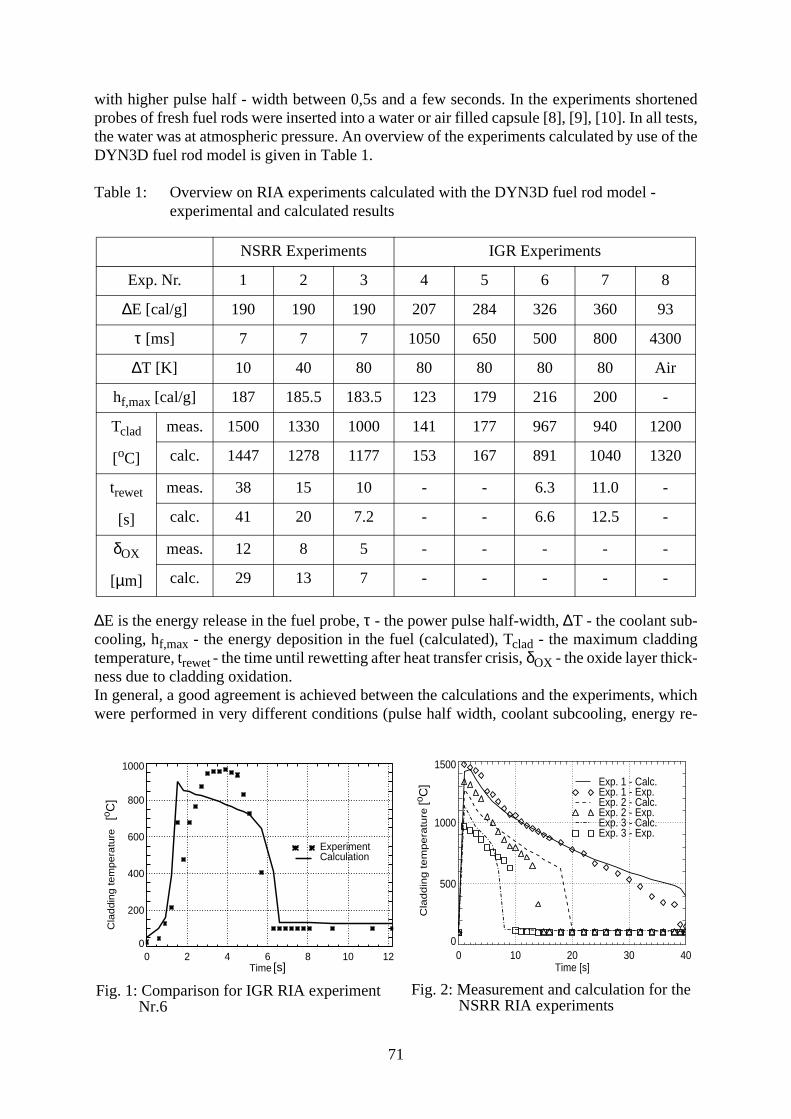
71
with higher pulse half - width between 0,5s and a few seconds. In the experiments shortenedprobes of fresh fuel rods were inserted into a water or air filled capsule [8], [9], [10]. In all tests,the water was at atmospheric pressure. An overview of the experiments calculated by use of theDYN3D fuel rod model is given in Table 1.
Table 1: Overview on RIA experiments calculated with the DYN3D fuel rod model - experimental and calculated results
∆E is the energy release in the fuel probe, τ - the power pulse half-width, ∆T - the coolant sub-cooling, hf,max - the energy deposition in the fuel (calculated), Tclad - the maximum claddingtemperature, trewet - the time until rewetting after heat transfer crisis, δOX - the oxide layer thick-ness due to cladding oxidation. In general, a good agreement is achieved between the calculations and the experiments, whichwere performed in very different conditions (pulse half width, coolant subcooling, energy re-
NSRR Experiments IGR Experiments
Exp. Nr. 1 2 3 4 5 6 7 8
∆E [cal/g] 190 190 190 207 284 326 360 93
τ [ms] 7 7 7 1050 650 500 800 4300
∆T [K] 10 40 80 80 80 80 80 Air
hf,max [cal/g] 187 185.5 183.5 123 179 216 200 -
Tclad
[oC]
meas. 1500 1330 1000 141 177 967 940 1200
calc. 1447 1278 1177 153 167 891 1040 1320
trewet
[s]
meas. 38 15 10 - - 6.3 11.0 -
calc. 41 20 7.2 - - 6.6 12.5 -
δOX
[µm]
meas. 12 8 5 - - - - -
calc. 29 13 7 - - - - -
Fig. 1: Comparison for IGR RIA experiment Nr.6
0 2 4 6 8 10 12Time in s
0
200
400
600
800
1000
Cla
dd
ing
te
mp
era
ture
in C
els
ius
ExperimentCalculation
[o C]
[s]0 10 20 30 40
Time [s]
0
500
1000
1500
Cla
ddin
g tem
pera
ture
[C
] Exp. 1 - Calc.Exp. 1 - Exp.Exp. 2 - Calc.Exp. 2 - Exp.Exp. 3 - Calc.Exp. 3 - Exp.
Fig. 2: Measurement and calculation for theNSRR RIA experiments
[o C]
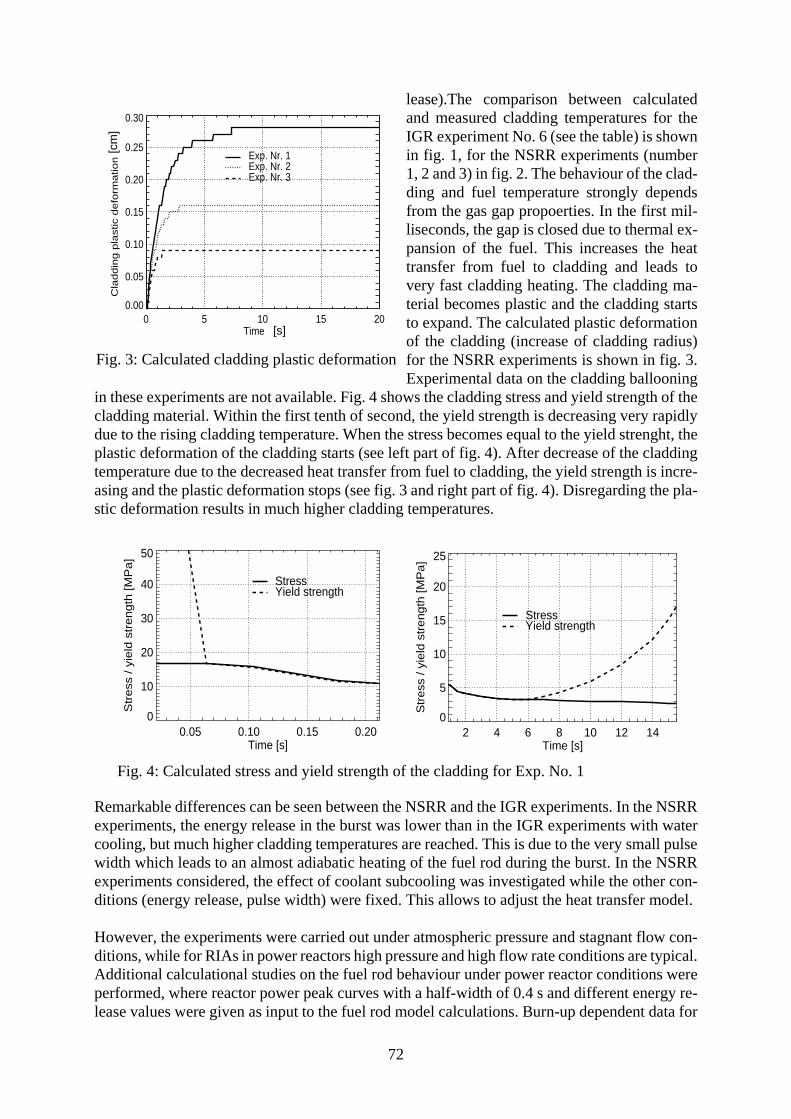
72
lease).The comparison between calculatedand measured cladding temperatures for theIGR experiment No. 6 (see the table) is shownin fig. 1, for the NSRR experiments (number1, 2 and 3) in fig. 2. The behaviour of the clad-ding and fuel temperature strongly dependsfrom the gas gap propoerties. In the first mil-liseconds, the gap is closed due to thermal ex-pansion of the fuel. This increases the heattransfer from fuel to cladding and leads tovery fast cladding heating. The cladding ma-terial becomes plastic and the cladding startsto expand. The calculated plastic deformationof the cladding (increase of cladding radius)for the NSRR experiments is shown in fig. 3.Experimental data on the cladding ballooning
in these experiments are not available. Fig. 4 shows the cladding stress and yield strength of thecladding material. Within the first tenth of second, the yield strength is decreasing very rapidlydue to the rising cladding temperature. When the stress becomes equal to the yield strenght, theplastic deformation of the cladding starts (see left part of fig. 4). After decrease of the claddingtemperature due to the decreased heat transfer from fuel to cladding, the yield strength is incre-asing and the plastic deformation stops (see fig. 3 and right part of fig. 4). Disregarding the pla-stic deformation results in much higher cladding temperatures.
Remarkable differences can be seen between the NSRR and the IGR experiments. In the NSRRexperiments, the energy release in the burst was lower than in the IGR experiments with watercooling, but much higher cladding temperatures are reached. This is due to the very small pulsewidth which leads to an almost adiabatic heating of the fuel rod during the burst. In the NSRRexperiments considered, the effect of coolant subcooling was investigated while the other con-ditions (energy release, pulse width) were fixed. This allows to adjust the heat transfer model.
However, the experiments were carried out under atmospheric pressure and stagnant flow con-ditions, while for RIAs in power reactors high pressure and high flow rate conditions are typical.Additional calculational studies on the fuel rod behaviour under power reactor conditions wereperformed, where reactor power peak curves with a half-width of 0.4 s and different energy re-lease values were given as input to the fuel rod model calculations. Burn-up dependent data for
Fig. 3: Calculated cladding plastic deformation
0 5 10 15 20Time in s
0.00
0.05
0.10
0.15
0.20
0.25
0.30C
lad
din
g p
lastic d
efo
rma
tio
n in
cm
Exp. Nr. 1Exp. Nr. 2Exp. Nr. 3
[s]
[cm
]
Fig. 4: Calculated stress and yield strength of the cladding for Exp. No. 1
0.05 0.10 0.15 0.20 Time [s]
0
10
20
30
40
50
Str
ess
/ y
ield
str
ength
[M
Pa]
StressYield strength
2 4 6 8 10 12 14 Time [s]
0
5
10
15
20
25
Str
ess
/ y
ield
str
ength
[M
Pa]
StressYield strength
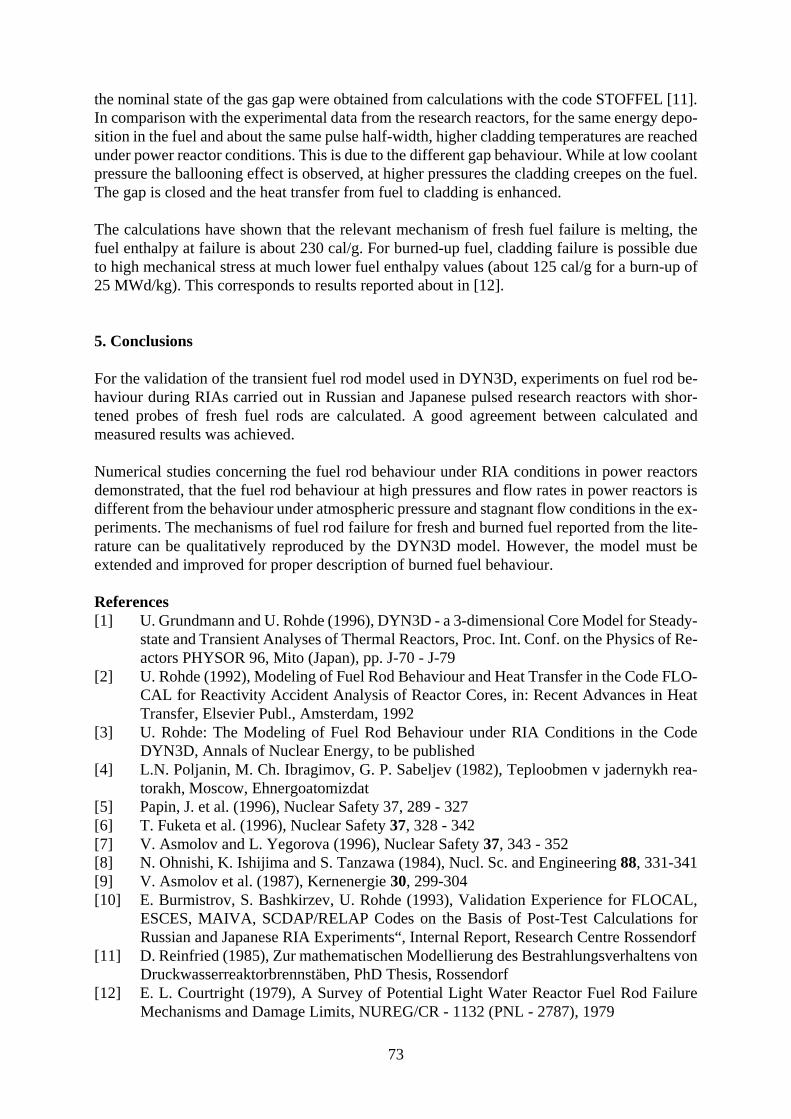
73
the nominal state of the gas gap were obtained from calculations with the code STOFFEL [11].In comparison with the experimental data from the research reactors, for the same energy depo-sition in the fuel and about the same pulse half-width, higher cladding temperatures are reachedunder power reactor conditions. This is due to the different gap behaviour. While at low coolantpressure the ballooning effect is observed, at higher pressures the cladding creepes on the fuel.The gap is closed and the heat transfer from fuel to cladding is enhanced.
The calculations have shown that the relevant mechanism of fresh fuel failure is melting, thefuel enthalpy at failure is about 230 cal/g. For burned-up fuel, cladding failure is possible dueto high mechanical stress at much lower fuel enthalpy values (about 125 cal/g for a burn-up of25 MWd/kg). This corresponds to results reported about in [12].
5. Conclusions
For the validation of the transient fuel rod model used in DYN3D, experiments on fuel rod be-haviour during RIAs carried out in Russian and Japanese pulsed research reactors with shor-tened probes of fresh fuel rods are calculated. A good agreement between calculated andmeasured results was achieved.
Numerical studies concerning the fuel rod behaviour under RIA conditions in power reactorsdemonstrated, that the fuel rod behaviour at high pressures and flow rates in power reactors isdifferent from the behaviour under atmospheric pressure and stagnant flow conditions in the ex-periments. The mechanisms of fuel rod failure for fresh and burned fuel reported from the lite-rature can be qualitatively reproduced by the DYN3D model. However, the model must beextended and improved for proper description of burned fuel behaviour.
References[1] U. Grundmann and U. Rohde (1996), DYN3D - a 3-dimensional Core Model for Steady-
state and Transient Analyses of Thermal Reactors, Proc. Int. Conf. on the Physics of Re-actors PHYSOR 96, Mito (Japan), pp. J-70 - J-79
[2] U. Rohde (1992), Modeling of Fuel Rod Behaviour and Heat Transfer in the Code FLO-CAL for Reactivity Accident Analysis of Reactor Cores, in: Recent Advances in HeatTransfer, Elsevier Publ., Amsterdam, 1992
[3] U. Rohde: The Modeling of Fuel Rod Behaviour under RIA Conditions in the CodeDYN3D, Annals of Nuclear Energy, to be published
[4] L.N. Poljanin, M. Ch. Ibragimov, G. P. Sabeljev (1982), Teploobmen v jadernykh rea-torakh, Moscow, Ehnergoatomizdat
[5] Papin, J. et al. (1996), Nuclear Safety 37, 289 - 327[6] T. Fuketa et al. (1996), Nuclear Safety 37, 328 - 342[7] V. Asmolov and L. Yegorova (1996), Nuclear Safety 37, 343 - 352[8] N. Ohnishi, K. Ishijima and S. Tanzawa (1984), Nucl. Sc. and Engineering 88, 331-341[9] V. Asmolov et al. (1987), Kernenergie 30, 299-304[10] E. Burmistrov, S. Bashkirzev, U. Rohde (1993), Validation Experience for FLOCAL,
ESCES, MAIVA, SCDAP/RELAP Codes on the Basis of Post-Test Calculations forRussian and Japanese RIA Experiments“, Internal Report, Research Centre Rossendorf
[11] D. Reinfried (1985), Zur mathematischen Modellierung des Bestrahlungsverhaltens vonDruckwasserreaktorbrennstäben, PhD Thesis, Rossendorf
[12] E. L. Courtright (1979), A Survey of Potential Light Water Reactor Fuel Rod FailureMechanisms and Damage Limits, NUREG/CR - 1132 (PNL - 2787), 1979
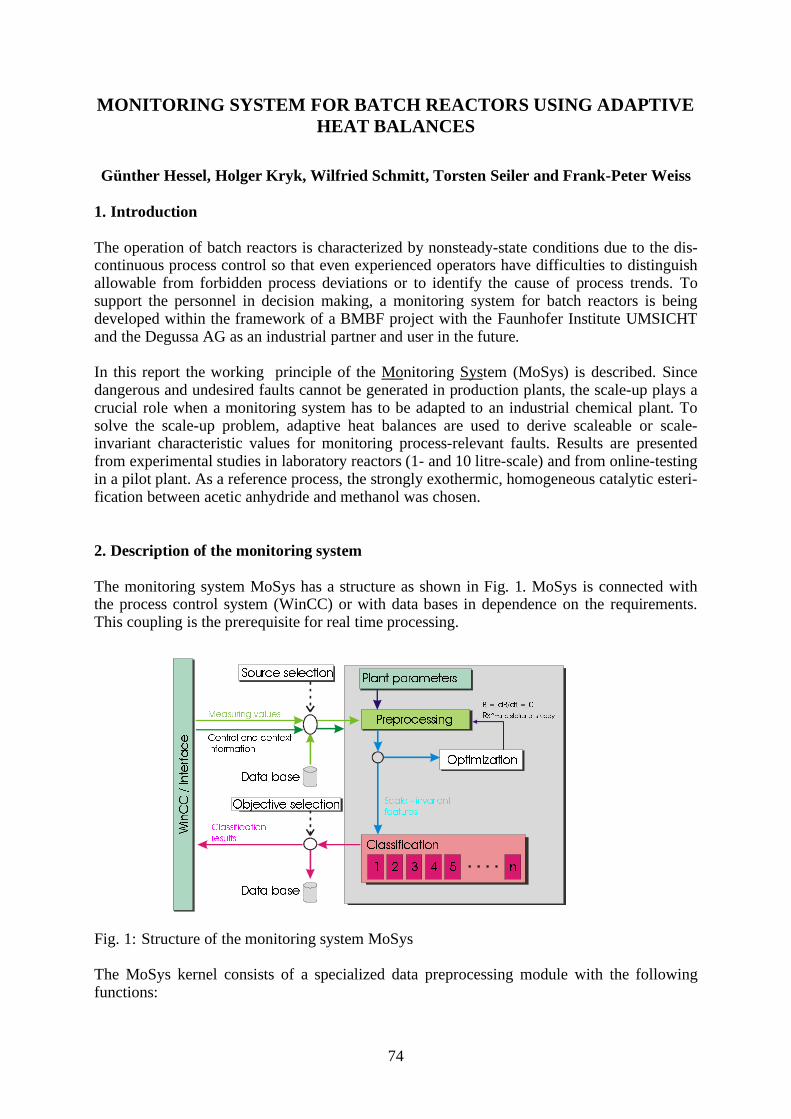
74
MONITORING SYSTEM FOR BATCH REACTORS USING ADAPTIVEHEAT BALANCES
Günther Hessel, Holger Kryk, Wilfried Schmitt, Torsten Seiler and Frank-Peter Weiss
1. Introduction
The operation of batch reactors is characterized by nonsteady-state conditions due to the dis-continuous process control so that even experienced operators have difficulties to distinguishallowable from forbidden process deviations or to identify the cause of process trends. Tosupport the personnel in decision making, a monitoring system for batch reactors is beingdeveloped within the framework of a BMBF project with the Faunhofer Institute UMSICHTand the Degussa AG as an industrial partner and user in the future.
In this report the working principle of the Monitoring System (MoSys) is described. Sincedangerous and undesired faults cannot be generated in production plants, the scale-up plays acrucial role when a monitoring system has to be adapted to an industrial chemical plant. Tosolve the scale-up problem, adaptive heat balances are used to derive scaleable or scale-invariant characteristic values for monitoring process-relevant faults. Results are presentedfrom experimental studies in laboratory reactors (1- and 10 litre-scale) and from online-testingin a pilot plant. As a reference process, the strongly exothermic, homogeneous catalytic esteri-fication between acetic anhydride and methanol was chosen.
2. Description of the monitoring system
The monitoring system MoSys has a structure as shown in Fig. 1. MoSys is connected withthe process control system (WinCC) or with data bases in dependence on the requirements.This coupling is the prerequisite for real time processing.
Fig. 1: Structure of the monitoring system MoSys
The MoSys kernel consists of a specialized data preprocessing module with the followingfunctions:
WinCC / Interface
Preprocessing
Optimization
Classification
Source selection
Objective selection
Data base
Data base
Measuring values
Classification
results
Control and context
information
Scale - invariant
features
B = dB/dt = 0
Rxn-end stationär steady
1 2 3 4 5 n
Plant parameters
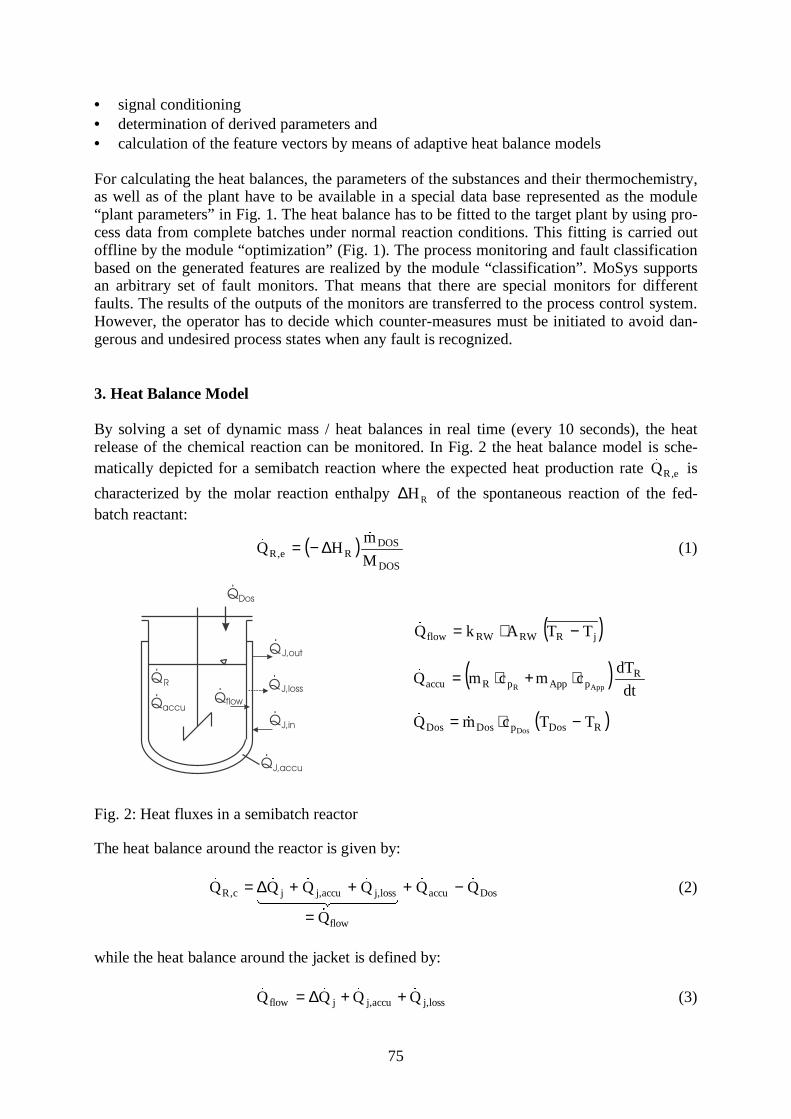
75
• signal conditioning• determination of derived parameters and• calculation of the feature vectors by means of adaptive heat balance models
For calculating the heat balances, the parameters of the substances and their thermochemistry,as well as of the plant have to be available in a special data base represented as the module“plant parameters” in Fig. 1. The heat balance has to be fitted to the target plant by using pro-cess data from complete batches under normal reaction conditions. This fitting is carried outoffline by the module “optimization” (Fig. 1). The process monitoring and fault classificationbased on the generated features are realized by the module “classification”. MoSys supportsan arbitrary set of fault monitors. That means that there are special monitors for differentfaults. The results of the outputs of the monitors are transferred to the process control system.However, the operator has to decide which counter-measures must be initiated to avoid dan-gerous and undesired process states when any fault is recognized.
3. Heat Balance Model
By solving a set of dynamic mass / heat balances in real time (every 10 seconds), the heatrelease of the chemical reaction can be monitored. In Fig. 2 the heat balance model is sche-matically depicted for a semibatch reaction where the expected heat production rate e,RQ is
characterized by the molar reaction enthalpy RH∆ of the spontaneous reaction of the fed-batch reactant:
( )DOS
DOSRe,R M
mHQ
∆−= (1)
( )jRRWRWflow TTAkQ −⋅=
( )dt
dTcmcmQ R
pApppRaccu AppR⋅+⋅=
( )RDospDosDos TTcmQDos
−⋅=
Fig. 2: Heat fluxes in a semibatch reactor
The heat balance around the reactor is given by:
Dosaccu
flow
loss,jaccu,jjc,R QQ
Q
QQQQ
−+
=
++∆= (2)
while the heat balance around the jacket is defined by:
loss,jaccu,jjflow QQQQ ++∆= (3)
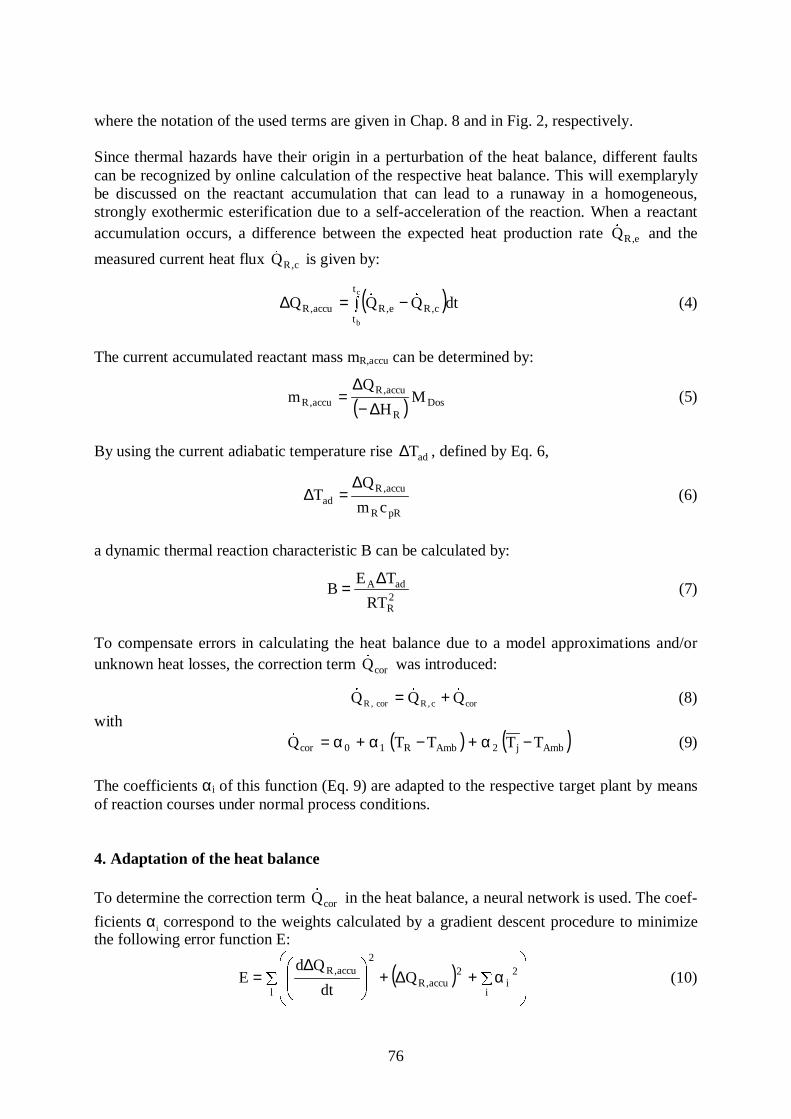
76
where the notation of the used terms are given in Chap. 8 and in Fig. 2, respectively.
Since thermal hazards have their origin in a perturbation of the heat balance, different faultscan be recognized by online calculation of the respective heat balance. This will exemplarylybe discussed on the reactant accumulation that can lead to a runaway in a homogeneous,strongly exothermic esterification due to a self-acceleration of the reaction. When a reactantaccumulation occurs, a difference between the expected heat production rate e,RQ and the
measured current heat flux c,RQ is given by:
( ) −=∆c
b
t
tc,Re,Raccu,R dtQQQ (4)
The current accumulated reactant mass mR,accu can be determined by:
( ) DosR
accu,Raccu,R M
H
Qm
∆−∆
= (5)
By using the current adiabatic temperature rise adT∆ , defined by Eq. 6,
pRR
accu,Rad cm
QT
∆=∆ (6)
a dynamic thermal reaction characteristic B can be calculated by:
2R
adA
RT
TEB
∆= (7)
To compensate errors in calculating the heat balance due to a model approximations and/orunknown heat losses, the correction term corQ was introduced:
corc,Rcor,R QQQ += (8)
with( ) ( )Ambj2AmbR10cor TTTTQ −α+−α+α= (9)
The coefficients αi of this function (Eq. 9) are adapted to the respective target plant by meansof reaction courses under normal process conditions.
4. Adaptation of the heat balance
To determine the correction term corQ in the heat balance, a neural network is used. The coef-
ficients α i correspond to the weights calculated by a gradient descent procedure to minimizethe following error function E:
( )
α+∆+
∆=
l
2
ii
2accu,R
2accu,R Q
dt
QdE (10)
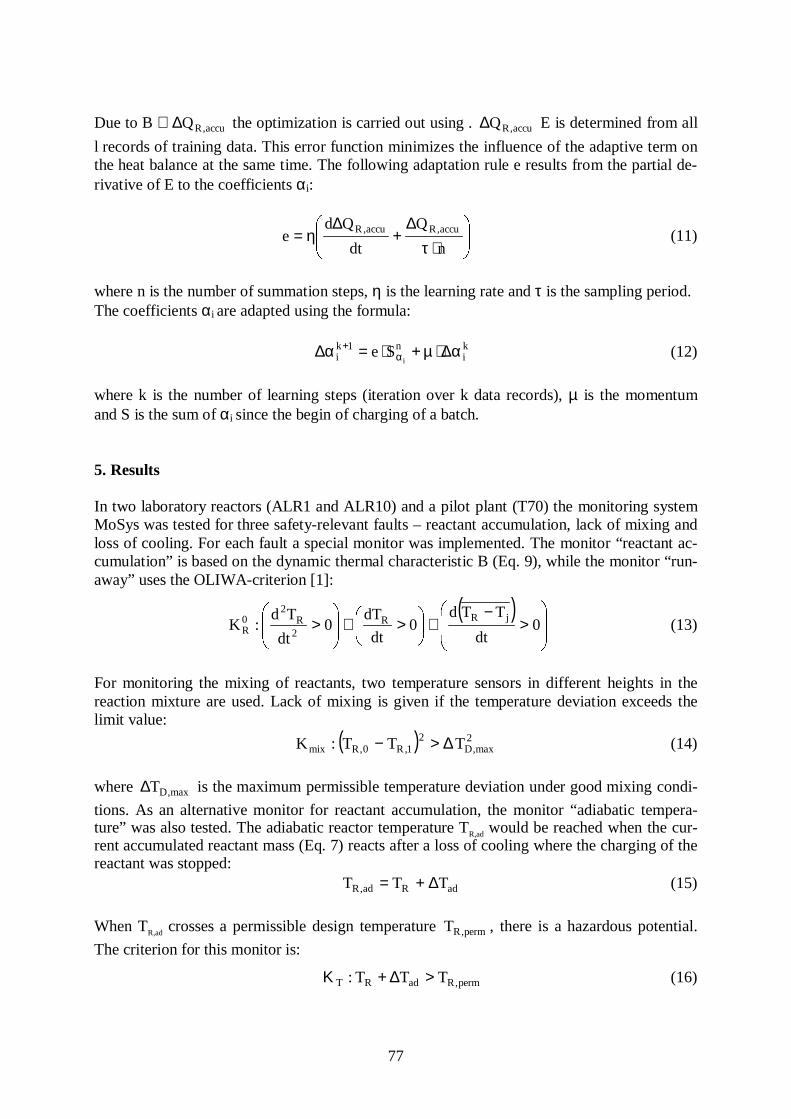
77
Due to B ∼ accu,RQ∆ the optimization is carried out using . accu,RQ∆ E is determined from all
l records of training data. This error function minimizes the influence of the adaptive term onthe heat balance at the same time. The following adaptation rule e results from the partial de-rivative of E to the coefficients αi:
⋅τ∆
+∆
η=n
Q
dt
Qde accu,Raccu,R
(11)
where n is the number of summation steps, η is the learning rate and τ is the sampling period.The coefficients αi are adapted using the formula:
ki
n1ki i
Se α∆⋅µ+⋅=α∆ α+
(12)
where k is the number of learning steps (iteration over k data records), µ is the momentumand S is the sum of αi since the begin of charging of a batch.
5. Results
In two laboratory reactors (ALR1 and ALR10) and a pilot plant (T70) the monitoring systemMoSys was tested for three safety-relevant faults – reactant accumulation, lack of mixing andloss of cooling. For each fault a special monitor was implemented. The monitor “reactant ac-cumulation” is based on the dynamic thermal characteristic B (Eq. 9), while the monitor “run-away” uses the OLIWA-criterion [1]:
( )
>
−∧
>∧
> 0
dt
TTd0
dt
dT0
dt
Td:K
jRR2R
20R (13)
For monitoring the mixing of reactants, two temperature sensors in different heights in thereaction mixture are used. Lack of mixing is given if the temperature deviation exceeds thelimit value:
( ) 2max,D
21,R0,Rmix TTT:K ∆>− (14)
where max,DT∆ is the maximum permissible temperature deviation under good mixing condi-
tions. As an alternative monitor for reactant accumulation, the monitor “adiabatic tempera-ture” was also tested. The adiabatic reactor temperature TR,ad would be reached when the cur-rent accumulated reactant mass (Eq. 7) reacts after a loss of cooling where the charging of thereactant was stopped:
adRad,R TTT ∆+= (15)
When TR,ad crosses a permissible design temperature perm,RT , there is a hazardous potential.
The criterion for this monitor is:
perm,RadRT TTT: >∆+Κ (16)
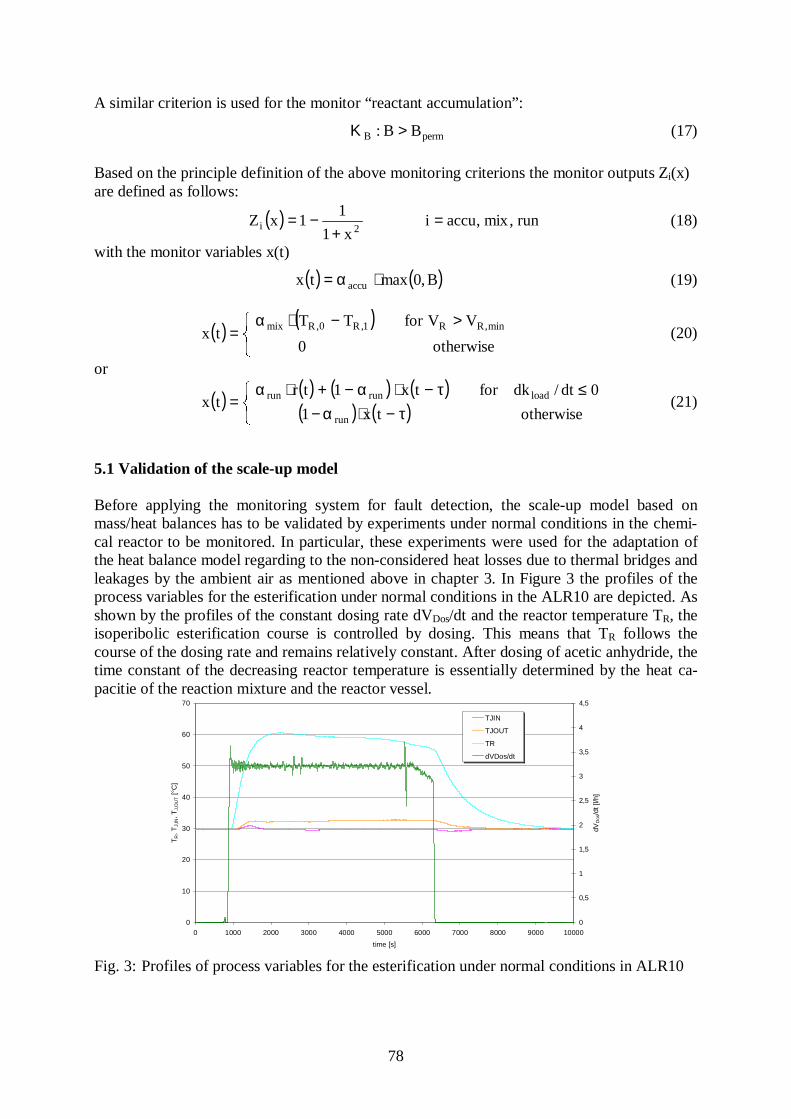
78
A similar criterion is used for the monitor “reactant accumulation”:
permB BB: >Κ (17)
Based on the principle definition of the above monitoring criterions the monitor outputs Zi(x)are defined as follows:
( ) run,mix,accuix1
11xZ
2i =+
−= (18)
with the monitor variables x(t)
( ) ( )B,0maxtx accu ⋅α= (19)
( ) ( ) >−⋅α
=otherwise0
VVforTTtx
min,RR1,R0,Rmix (20)
or
( ) ( ) ( ) ( )( ) ( )
τ−⋅α−≤τ−⋅α−+⋅α
=otherwisetx1
0dt/dkfortx1trtx
run
loadrunrun (21)
5.1 Validation of the scale-up model
Before applying the monitoring system for fault detection, the scale-up model based onmass/heat balances has to be validated by experiments under normal conditions in the chemi-cal reactor to be monitored. In particular, these experiments were used for the adaptation ofthe heat balance model regarding to the non-considered heat losses due to thermal bridges andleakages by the ambient air as mentioned above in chapter 3. In Figure 3 the profiles of theprocess variables for the esterification under normal conditions in the ALR10 are depicted. Asshown by the profiles of the constant dosing rate dVDos/dt and the reactor temperature TR, theisoperibolic esterification course is controlled by dosing. This means that TR follows thecourse of the dosing rate and remains relatively constant. After dosing of acetic anhydride, thetime constant of the decreasing reactor temperature is essentially determined by the heat ca-pacitie of the reaction mixture and the reactor vessel.
Fig. 3: Profiles of process variables for the esterification under normal conditions in ALR10
0
10
20
30
40
50
60
70
0 1000 2000 3000 4000 5000 6000 7000 8000 9000 10000
time [s]
TR, T
J,IN
, TJ,
OU
T [°
C]
0
0,5
1
1,5
2
2,5
3
3,5
4
4,5
dVD
os/d
t [l/h
]
TJIN
TJOUT
TR
dVDos/dt
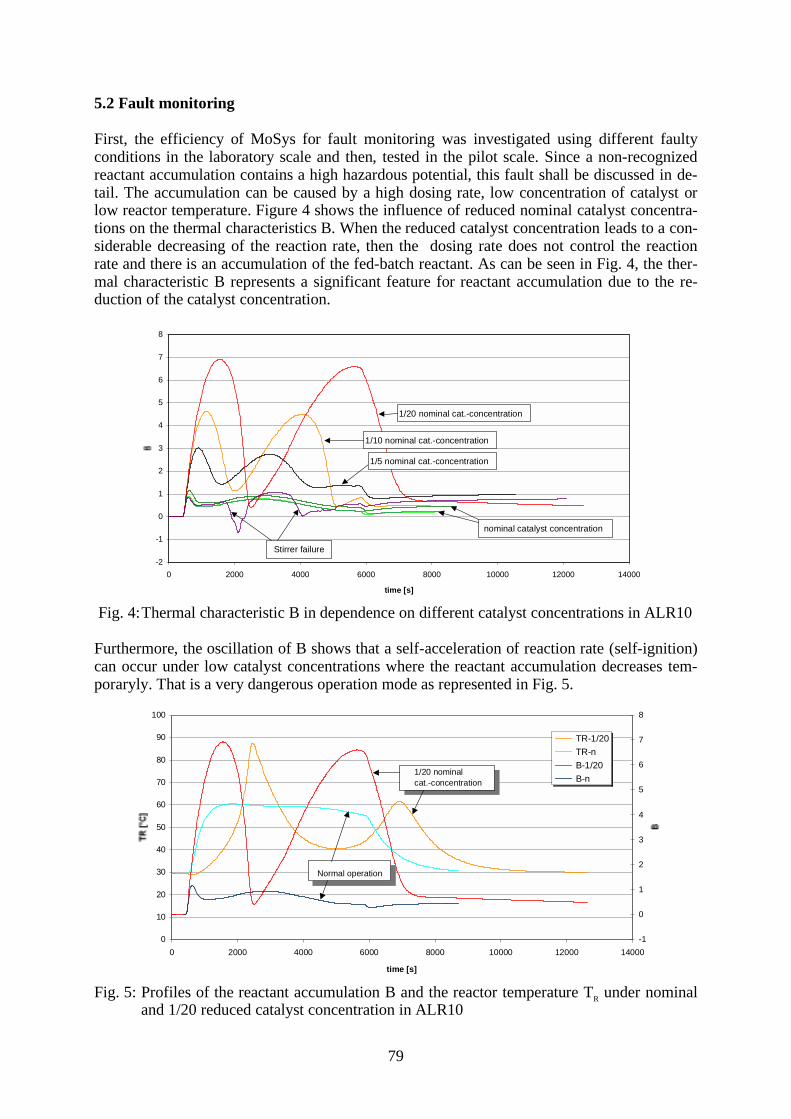
79
5.2 Fault monitoring
First, the efficiency of MoSys for fault monitoring was investigated using different faultyconditions in the laboratory scale and then, tested in the pilot scale. Since a non-recognizedreactant accumulation contains a high hazardous potential, this fault shall be discussed in de-tail. The accumulation can be caused by a high dosing rate, low concentration of catalyst orlow reactor temperature. Figure 4 shows the influence of reduced nominal catalyst concentra-tions on the thermal characteristics B. When the reduced catalyst concentration leads to a con-siderable decreasing of the reaction rate, then the dosing rate does not control the reactionrate and there is an accumulation of the fed-batch reactant. As can be seen in Fig. 4, the ther-mal characteristic B represents a significant feature for reactant accumulation due to the re-duction of the catalyst concentration.
Fig. 4:Thermal characteristic B in dependence on different catalyst concentrations in ALR10
Furthermore, the oscillation of B shows that a self-acceleration of reaction rate (self-ignition)can occur under low catalyst concentrations where the reactant accumulation decreases tem-poraryly. That is a very dangerous operation mode as represented in Fig. 5.
Fig. 5: Profiles of the reactant accumulation B and the reactor temperature TR under nominaland 1/20 reduced catalyst concentration in ALR10
-2
-1
0
1
2
3
4
5
6
7
8
0 2000 4000 6000 8000 10000 12000 14000
time [s]
Stirrer failure
1/10 nominal cat.-concentration
1/20 nominal cat.-concentration
1/5 nominal cat.-concentration
nominal catalyst concentration
0
10
20
30
40
50
60
70
80
90
100
0 2000 4000 6000 8000 10000 12000 14000
time [s]
-1
0
1
2
3
4
5
6
7
8
TR-1/20
TR-n
B-1/20
B-n1/20 nominalcat.-concentration
Normal operation
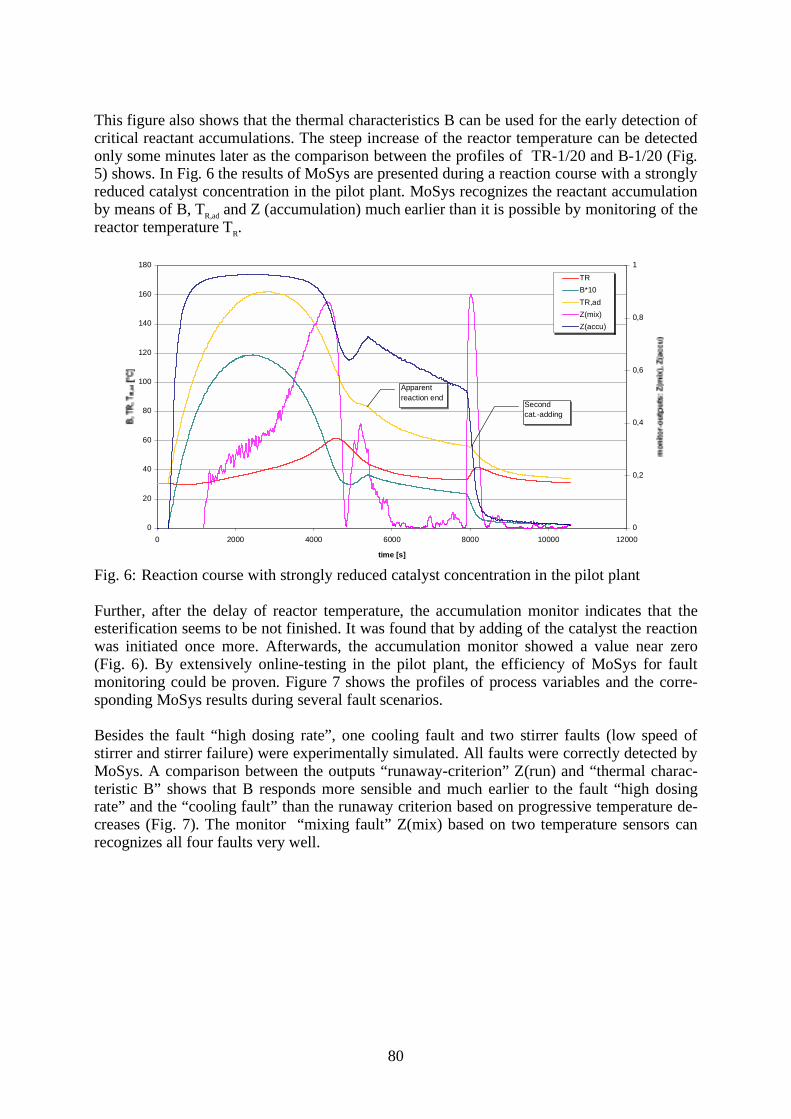
80
This figure also shows that the thermal characteristics B can be used for the early detection ofcritical reactant accumulations. The steep increase of the reactor temperature can be detectedonly some minutes later as the comparison between the profiles of TR-1/20 and B-1/20 (Fig.5) shows. In Fig. 6 the results of MoSys are presented during a reaction course with a stronglyreduced catalyst concentration in the pilot plant. MoSys recognizes the reactant accumulationby means of B, TR,ad and Z (accumulation) much earlier than it is possible by monitoring of thereactor temperature TR.
Fig. 6: Reaction course with strongly reduced catalyst concentration in the pilot plant
Further, after the delay of reactor temperature, the accumulation monitor indicates that theesterification seems to be not finished. It was found that by adding of the catalyst the reactionwas initiated once more. Afterwards, the accumulation monitor showed a value near zero(Fig. 6). By extensively online-testing in the pilot plant, the efficiency of MoSys for faultmonitoring could be proven. Figure 7 shows the profiles of process variables and the corre-sponding MoSys results during several fault scenarios.
Besides the fault “high dosing rate”, one cooling fault and two stirrer faults (low speed ofstirrer and stirrer failure) were experimentally simulated. All faults were correctly detected byMoSys. A comparison between the outputs “runaway-criterion” Z(run) and “thermal charac-teristic B” shows that B responds more sensible and much earlier to the fault “high dosingrate” and the “cooling fault” than the runaway criterion based on progressive temperature de-creases (Fig. 7). The monitor “mixing fault” Z(mix) based on two temperature sensors canrecognizes all four faults very well.
0
20
40
60
80
100
120
140
160
180
0 2000 4000 6000 8000 10000 12000
time [s]
0
0,2
0,4
0,6
0,8
1
TR
B*10
TR,ad
Z(mix)
Z(accu)
Secondcat.-adding
Apparentreaction end
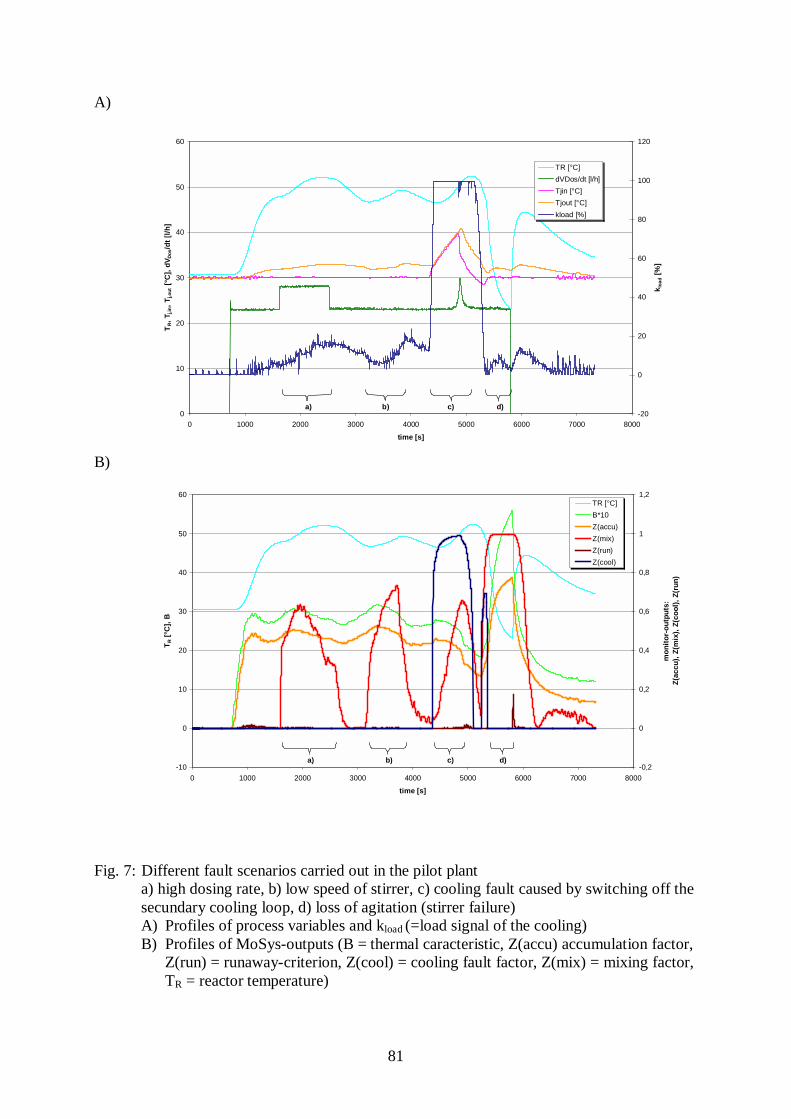
81
A)
B)
Fig. 7: Different fault scenarios carried out in the pilot planta) high dosing rate, b) low speed of stirrer, c) cooling fault caused by switching off thesecundary cooling loop, d) loss of agitation (stirrer failure)A) Profiles of process variables and kload (=load signal of the cooling)B) Profiles of MoSys-outputs (B = thermal caracteristic, Z(accu) accumulation factor,
Z(run) = runaway-criterion, Z(cool) = cooling fault factor, Z(mix) = mixing factor,TR = reactor temperature)
0
10
20
30
40
50
60
0 1000 2000 3000 4000 5000 6000 7000 8000
time [s]
TR,
T j,in
, T
j,out
[°C
], d
VD
os/d
t [l
/h]
-20
0
20
40
60
80
100
120
k loa
d [
%]
TR [°C]
dVDos/dt [l/h]
Tjin [°C]
Tjout [°C]
kload [%]
a) d)b) c)
-10
0
10
20
30
40
50
60
0 1000 2000 3000 4000 5000 6000 7000 8000
time [s]
TR [
°C],
B
-0,2
0
0,2
0,4
0,6
0,8
1
1,2
mo
nit
or-
ou
tpu
ts:
Z(a
ccu
), Z
(mix
), Z
(co
ol)
, Z
(ru
n)
TR [°C]
B*10
Z(accu)
Z(mix)
Z(run)
Z(cool)
a) d)b) c)

82
6. Conclusion
A monitoring system (MoSys) based on adaptive heat balances has been developed for earlyfault detection in strongly exothermic reactions. Its efficiency could experimentally be provenfor a homogeneous esterification model-reaction in the laboratory reactor and pilot plantscale. Experiments under normal and several faulty conditions were carried out in differentreactor scales to prove the adaptation of the monitoring technique to various scales of chemi-cal batch reactors. For the adaptation of the heat balance model to the respective reactor, aneural network was used to determine the corrective term in the heat balance. Results of theonline testing of MoSys showed that it was able to recognize undesired faults correctly. Inparticular, the hazardous reactant accumulation could be detected much earlier than by amonitor based on the OLIWA-criterion for a runaway reaction. Further work is planned todevelop an equivalent monitoring system for the heterogeneous hydrogenation of nitro-aromatic compounds in an industrial chemical plant.
7. References
[1] A. Benuzzi and J. M. Zaldivar, Safety of Chemical Batch Reactors and Storage Tanks,Kluwer Academic Press, 1991, pp. 201-226
8. Notation
Notation: Index list:A heat transfer area accu accumulationB dynamic thermal characteristic App apparatuscp specific heat capacity ad adiabatice adaptation rule Amb ambientEA activation energy c current∆HR
molar reaction enthalpy cor correctedk heat transfer coefficient or b beginkload load signal of the cooling D differenceM molar mass Dos dosingm mass e expectedm mass flux ESA acetic anhydrideP pressure flow flowQ amount of heat in inletQ heat rate or heat flux j jacket
r runaway variable i,l,k,n variable indexR universal gas constant loss lossT temperature max maximumt time mix mixingx monitor variable n number of summation stepsZ monitor output out outletα i
coefficients perm permissible∆ difference or rise R reactionµ momentum Rw reactor jacketη learning rateτ sampling period or time base
83
THE SATURATION REGIME OF THE RIGA DYNAMO EXPERIMENT
Frank Stefani, Gunter Gerbeth, Thomas Gundrum,Agris Gailitis1, Olgerts Lielausis1 and Ernests Platacis1
1. Introduction
Homogeneous dynamo action is responsible for the occurrence of planetary, stellar, and galac-tic magnetic fields. During the last decades, enormous analytical and numerical work had beendevoted to the study of fluid dynamos. At the same time, dynamo science was suffering fromthe lack of any experimental possibility to verify the outcomes of numerical simulations. Thissituation changed on 11 November 1999 when at the Riga dynamo facility magnetic field self-excitation in a liquid metal flow was observed for the very first time. On the back-ground of anamplified external signal, a slowly growing eigenmode of the dynamo was detected for a periodof 15 seconds. Growth rate and frequency of this mode were in surprisingly good correspon-dence with the numerical predictions. The publication [1] of this break-through has found re-markable scientific and public response [2]. For some technical reason, it was not possible toreach the saturation regime which follows the initial kinematic regime characterised by expo-nential growth of the magnetic field. This saturation regime was studied in a second series ofexperiments during 20-25 July 2000.
What is saturation, and why is its experimental investigation so important? Saturation has todo with Lenz’s rule meaning that the generated field inhibits the cause of its own generation.Saturation is a very general feature of all dynamos, whether technical or cosmic ones. Typicallyit leads to an increase in the power which is necessary to keep the dynamo running. The inter-esting thing with fluid dynamos is now that it is not only the overall intensity of the fluid veloc-ity but also its geometrical distribution which can be changed by the back-reaction of the mag-netic field. Hence, the interplay between fluid dynamics and electromagnetic becomes ex-tremely complex, and numerical simulations are still far from realistic in the descriptions ofcosmic dynamos. In the Riga experiment (Fig. 1), the sodium flow is free enough to allow forinteresting deformation effects. This is a remarkable advantage in comparison with theKarlsruhe dynamo facility [3] where the flow structure is extremely rigid due to the experi-mental design comprising 52 wall-separated spin-generators. Thus, the Riga facility provides aunique possibility to study paradigmatically the dynamo behaviour in the non-linear regime.
2. A typical run
In the July 2000 experiment, it was possible to work at considerably lower sodium tempera-tures and hence at higher electrical conductivities. In the following we choose one from a totalof four experimental runs in order to illustrate the behaviour of the dynamo.
Fig. 2a shows the magnetic field signal which was recorded at one of the external Hall sensors(the fourth H from above in Fig. 1) during the whole run, whereas Fig. 2b depicts the signal atthe internal fluxgate sensor (F in Fig. 1) only for the very beginning of the self-excitation. This 1 Institute of Physics, Latvian University, Salaspils, Latvia
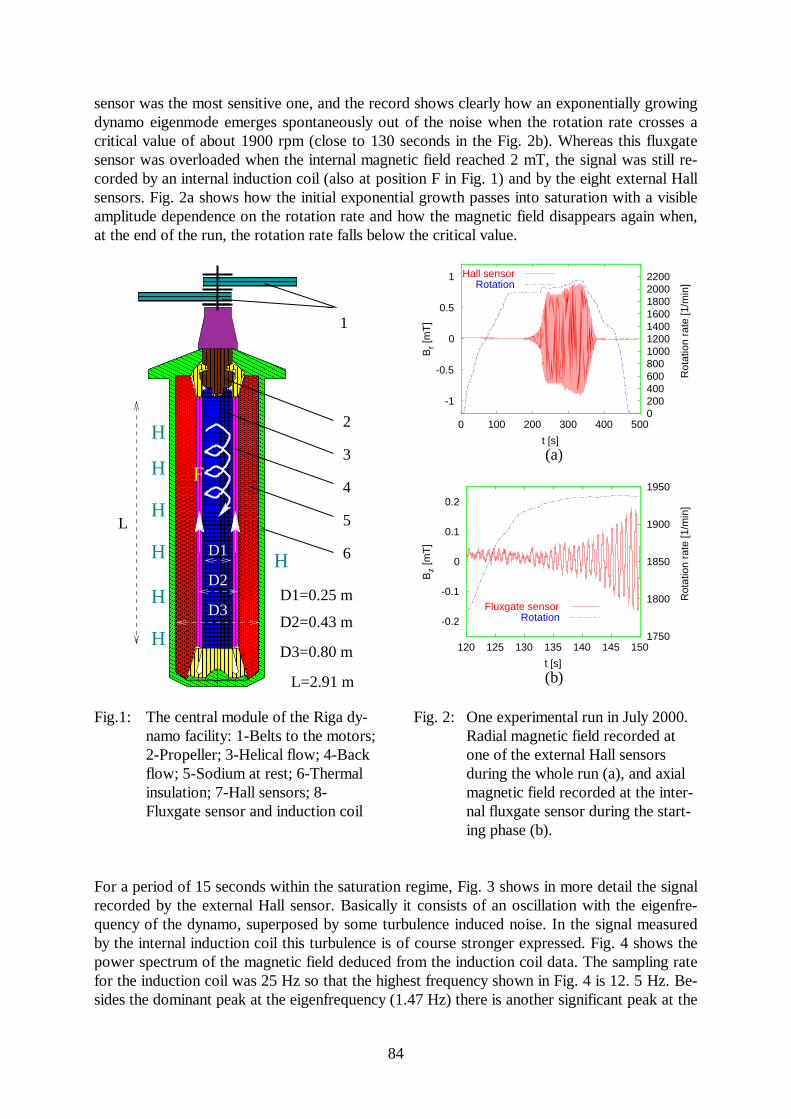
84
sensor was the most sensitive one, and the record shows clearly how an exponentially growingdynamo eigenmode emerges spontaneously out of the noise when the rotation rate crosses acritical value of about 1900 rpm (close to 130 seconds in the Fig. 2b). Whereas this fluxgatesensor was overloaded when the internal magnetic field reached 2 mT, the signal was still re-corded by an internal induction coil (also at position F in Fig. 1) and by the eight external Hallsensors. Fig. 2a shows how the initial exponential growth passes into saturation with a visibleamplitude dependence on the rotation rate and how the magnetic field disappears again when,at the end of the run, the rotation rate falls below the critical value.
L=2.91 m
L
D1
D2
L
2
3
4
5
6
F
H
H
H
H
H
H
H
1
D3D2=0.43 m
D1=0.25 m
D3=0.80 m
-1
-0.5
0
0.5
1
0 100 200 300 400 50002004006008001000120014001600180020002200
Br [
mT
]
Rot
atio
n ra
te [1
/min
]
t [s]
Hall sensorRotation
(a)
-0.2
-0.1
0
0.1
0.2
120 125 130 135 140 145 1501750
1800
1850
1900
1950
Bz
[mT
]
Rot
atio
n ra
te [1
/min
]
t [s]
Fluxgate sensorRotation
(b)
Fig.1: The central module of the Riga dy-namo facility: 1-Belts to the motors;2-Propeller; 3-Helical flow; 4-Backflow; 5-Sodium at rest; 6-Thermalinsulation; 7-Hall sensors; 8-Fluxgate sensor and induction coil
Fig. 2: One experimental run in July 2000.Radial magnetic field recorded atone of the external Hall sensorsduring the whole run (a), and axialmagnetic field recorded at the inter-nal fluxgate sensor during the start-ing phase (b).
For a period of 15 seconds within the saturation regime, Fig. 3 shows in more detail the signalrecorded by the external Hall sensor. Basically it consists of an oscillation with the eigenfre-quency of the dynamo, superposed by some turbulence induced noise. In the signal measuredby the internal induction coil this turbulence is of course stronger expressed. Fig. 4 shows thepower spectrum of the magnetic field deduced from the induction coil data. The sampling ratefor the induction coil was 25 Hz so that the highest frequency shown in Fig. 4 is 12. 5 Hz. Be-sides the dominant peak at the eigenfrequency (1.47 Hz) there is another significant peak at the
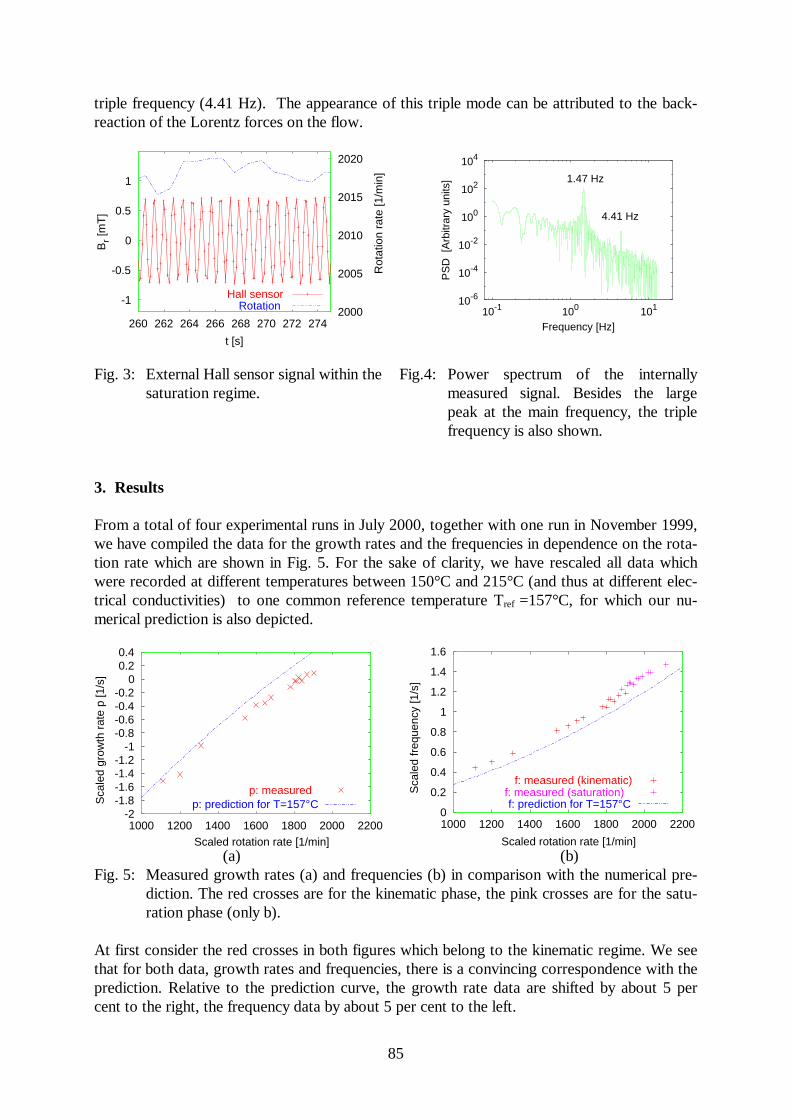
85
triple frequency (4.41 Hz). The appearance of this triple mode can be attributed to the back-reaction of the Lorentz forces on the flow.
-1
-0.5
0
0.5
1
260 262 264 266 268 270 272 2742000
2005
2010
2015
2020
Br [
mT
]
Rot
atio
n ra
te [1
/min
]
t [s]
Hall sensorRotation
10-6
10-4
10-2
100
102
104
10-1 100 101
PS
D [
Arb
itrar
y un
its]
Frequency [Hz]
1.47 Hz
4.41 Hz
Fig. 3: External Hall sensor signal within thesaturation regime.
Fig.4: Power spectrum of the internallymeasured signal. Besides the largepeak at the main frequency, the triplefrequency is also shown.
3. Results
From a total of four experimental runs in July 2000, together with one run in November 1999,we have compiled the data for the growth rates and the frequencies in dependence on the rota-tion rate which are shown in Fig. 5. For the sake of clarity, we have rescaled all data whichwere recorded at different temperatures between 150°C and 215°C (and thus at different elec-trical conductivities) to one common reference temperature Tref =157°C, for which our nu-merical prediction is also depicted.
-2-1.8-1.6-1.4-1.2
-1-0.8-0.6-0.4-0.2
00.20.4
1000 1200 1400 1600 1800 2000 2200
Sca
led
grow
th r
ate
p [1
/s]
Scaled rotation rate [1/min]
p: measuredp: prediction for T=157°C
0
0.2
0.4
0.6
0.8
1
1.2
1.4
1.6
1000 1200 1400 1600 1800 2000 2200
Sca
led
freq
uenc
y [1
/s]
Scaled rotation rate [1/min]
f: measured (kinematic)f: measured (saturation)f: prediction for T=157°C
(a) (b)Fig. 5: Measured growth rates (a) and frequencies (b) in comparison with the numerical pre-
diction. The red crosses are for the kinematic phase, the pink crosses are for the satu-ration phase (only b).
At first consider the red crosses in both figures which belong to the kinematic regime. We seethat for both data, growth rates and frequencies, there is a convincing correspondence with theprediction. Relative to the prediction curve, the growth rate data are shifted by about 5 percent to the right, the frequency data by about 5 per cent to the left.
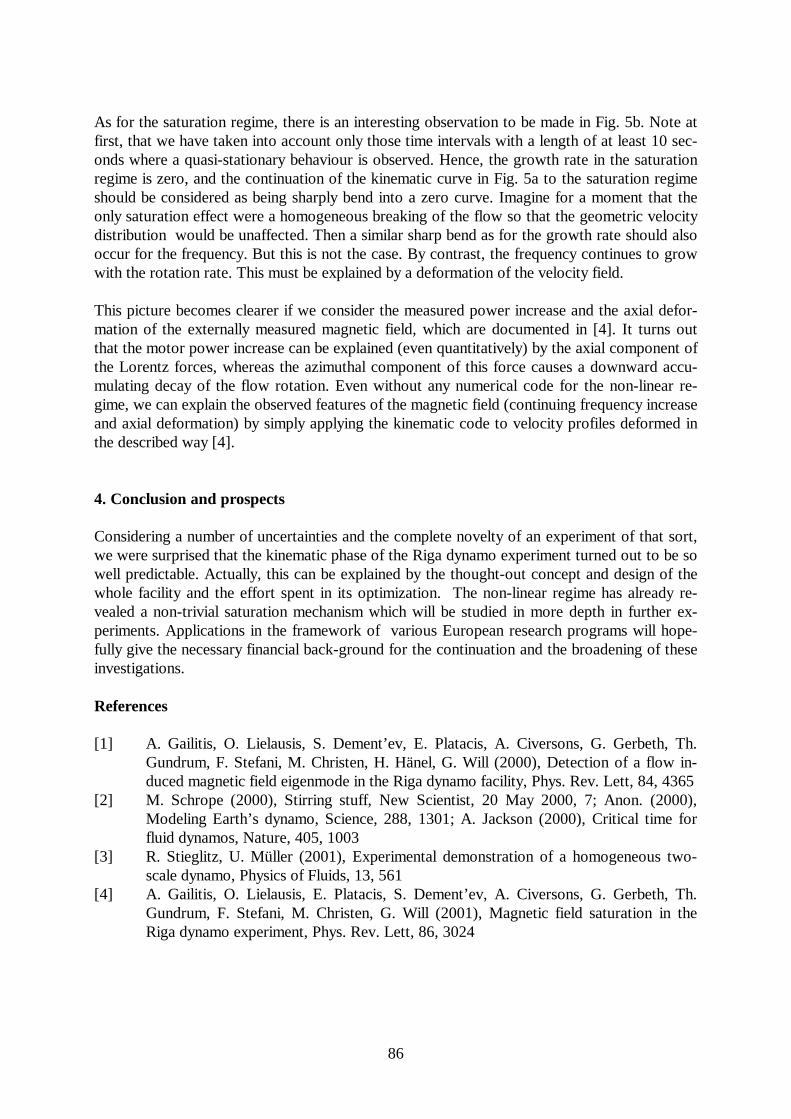
86
As for the saturation regime, there is an interesting observation to be made in Fig. 5b. Note atfirst, that we have taken into account only those time intervals with a length of at least 10 sec-onds where a quasi-stationary behaviour is observed. Hence, the growth rate in the saturationregime is zero, and the continuation of the kinematic curve in Fig. 5a to the saturation regimeshould be considered as being sharply bend into a zero curve. Imagine for a moment that theonly saturation effect were a homogeneous breaking of the flow so that the geometric velocitydistribution would be unaffected. Then a similar sharp bend as for the growth rate should alsooccur for the frequency. But this is not the case. By contrast, the frequency continues to growwith the rotation rate. This must be explained by a deformation of the velocity field.
This picture becomes clearer if we consider the measured power increase and the axial defor-mation of the externally measured magnetic field, which are documented in [4]. It turns outthat the motor power increase can be explained (even quantitatively) by the axial component ofthe Lorentz forces, whereas the azimuthal component of this force causes a downward accu-mulating decay of the flow rotation. Even without any numerical code for the non-linear re-gime, we can explain the observed features of the magnetic field (continuing frequency increaseand axial deformation) by simply applying the kinematic code to velocity profiles deformed inthe described way [4].
4. Conclusion and prospects
Considering a number of uncertainties and the complete novelty of an experiment of that sort,we were surprised that the kinematic phase of the Riga dynamo experiment turned out to be sowell predictable. Actually, this can be explained by the thought-out concept and design of thewhole facility and the effort spent in its optimization. The non-linear regime has already re-vealed a non-trivial saturation mechanism which will be studied in more depth in further ex-periments. Applications in the framework of various European research programs will hope-fully give the necessary financial back-ground for the continuation and the broadening of theseinvestigations.
References
[1] A. Gailitis, O. Lielausis, S. Dement’ev, E. Platacis, A. Civersons, G. Gerbeth, Th.Gundrum, F. Stefani, M. Christen, H. Hänel, G. Will (2000), Detection of a flow in-duced magnetic field eigenmode in the Riga dynamo facility, Phys. Rev. Lett, 84, 4365
[2] M. Schrope (2000), Stirring stuff, New Scientist, 20 May 2000, 7; Anon. (2000),Modeling Earth’s dynamo, Science, 288, 1301; A. Jackson (2000), Critical time forfluid dynamos, Nature, 405, 1003
[3] R. Stieglitz, U. Müller (2001), Experimental demonstration of a homogeneous two-scale dynamo, Physics of Fluids, 13, 561
[4] A. Gailitis, O. Lielausis, E. Platacis, S. Dement’ev, A. Civersons, G. Gerbeth, Th.Gundrum, F. Stefani, M. Christen, G. Will (2001), Magnetic field saturation in theRiga dynamo experiment, Phys. Rev. Lett, 86, 3024
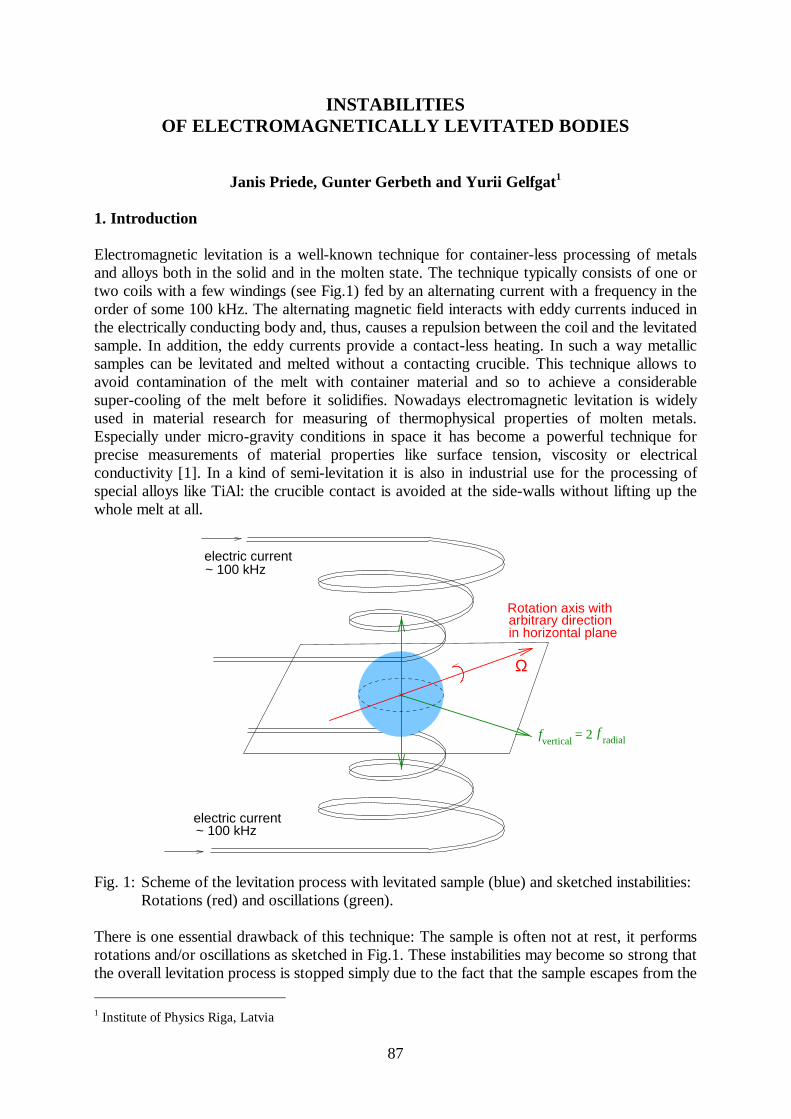
87
INSTABILITIESOF ELECTROMAGNETICALLY LEVITATED BODIES
Janis Priede, Gunter Gerbeth and Yurii Gelfgat1
1. Introduction
Electromagnetic levitation is a well-known technique for container-less processing of metalsand alloys both in the solid and in the molten state. The technique typically consists of one ortwo coils with a few windings (see Fig.1) fed by an alternating current with a frequency in theorder of some 100 kHz. The alternating magnetic field interacts with eddy currents induced inthe electrically conducting body and, thus, causes a repulsion between the coil and the levitatedsample. In addition, the eddy currents provide a contact-less heating. In such a way metallicsamples can be levitated and melted without a contacting crucible. This technique allows toavoid contamination of the melt with container material and so to achieve a considerablesuper-cooling of the melt before it solidifies. Nowadays electromagnetic levitation is widelyused in material research for measuring of thermophysical properties of molten metals.Especially under micro-gravity conditions in space it has become a powerful technique forprecise measurements of material properties like surface tension, viscosity or electricalconductivity [1]. In a kind of semi-levitation it is also in industrial use for the processing ofspecial alloys like TiAl: the crucible contact is avoided at the side-walls without lifting up thewhole melt at all.
Ω
vertical radialf= 2 f
in horizontal planearbitrary directionRotation axis with
electric current~ 100 kHz
electric current~ 100 kHz
Fig. 1: Scheme of the levitation process with levitated sample (blue) and sketched instabilities:Rotations (red) and oscillations (green).
There is one essential drawback of this technique: The sample is often not at rest, it performsrotations and/or oscillations as sketched in Fig.1. These instabilities may become so strong thatthe overall levitation process is stopped simply due to the fact that the sample escapes from the
1 Institute of Physics Riga, Latvia
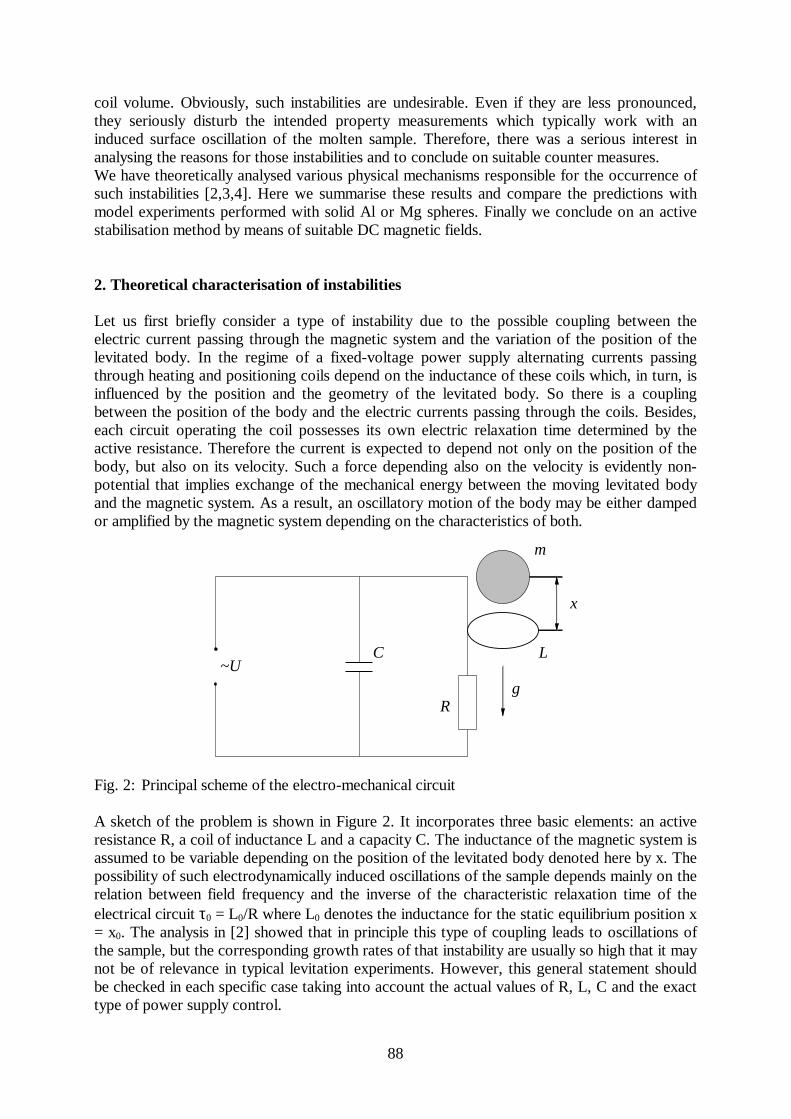
88
coil volume. Obviously, such instabilities are undesirable. Even if they are less pronounced,they seriously disturb the intended property measurements which typically work with aninduced surface oscillation of the molten sample. Therefore, there was a serious interest inanalysing the reasons for those instabilities and to conclude on suitable counter measures.We have theoretically analysed various physical mechanisms responsible for the occurrence ofsuch instabilities [2,3,4]. Here we summarise these results and compare the predictions withmodel experiments performed with solid Al or Mg spheres. Finally we conclude on an activestabilisation method by means of suitable DC magnetic fields.
2. Theoretical characterisation of instabilities
Let us first briefly consider a type of instability due to the possible coupling between theelectric current passing through the magnetic system and the variation of the position of thelevitated body. In the regime of a fixed-voltage power supply alternating currents passingthrough heating and positioning coils depend on the inductance of these coils which, in turn, isinfluenced by the position and the geometry of the levitated body. So there is a couplingbetween the position of the body and the electric currents passing through the coils. Besides,each circuit operating the coil possesses its own electric relaxation time determined by theactive resistance. Therefore the current is expected to depend not only on the position of thebody, but also on its velocity. Such a force depending also on the velocity is evidently non-potential that implies exchange of the mechanical energy between the moving levitated bodyand the magnetic system. As a result, an oscillatory motion of the body may be either dampedor amplified by the magnetic system depending on the characteristics of both.
~U
x
m
g
C
R
L
Fig. 2: Principal scheme of the electro-mechanical circuit
A sketch of the problem is shown in Figure 2. It incorporates three basic elements: an activeresistance R, a coil of inductance L and a capacity C. The inductance of the magnetic system isassumed to be variable depending on the position of the levitated body denoted here by x. Thepossibility of such electrodynamically induced oscillations of the sample depends mainly on therelation between field frequency and the inverse of the characteristic relaxation time of theelectrical circuit τ0 = L0/R where L0 denotes the inductance for the static equilibrium position x= x0. The analysis in [2] showed that in principle this type of coupling leads to oscillations ofthe sample, but the corresponding growth rates of that instability are usually so high that it maynot be of relevance in typical levitation experiments. However, this general statement shouldbe checked in each specific case taking into account the actual values of R, L, C and the exacttype of power supply control.
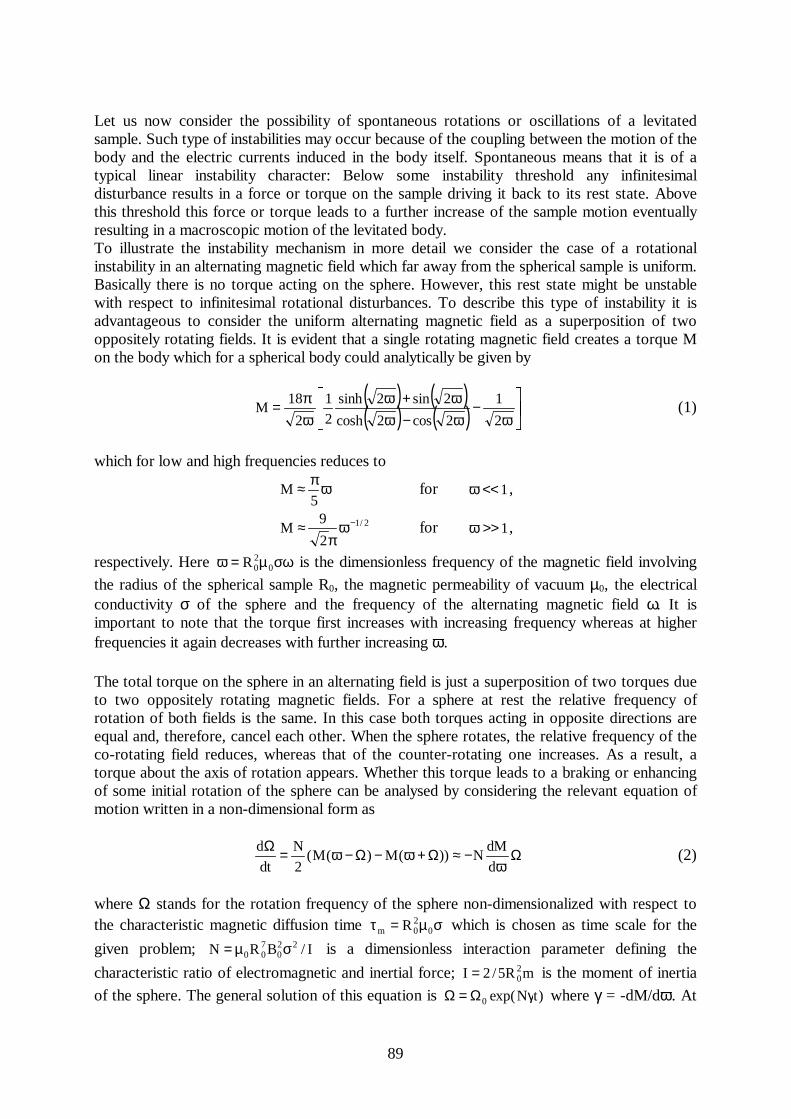
89
Let us now consider the possibility of spontaneous rotations or oscillations of a levitatedsample. Such type of instabilities may occur because of the coupling between the motion of thebody and the electric currents induced in the body itself. Spontaneous means that it is of atypical linear instability character: Below some instability threshold any infinitesimaldisturbance results in a force or torque on the sample driving it back to its rest state. Abovethis threshold this force or torque leads to a further increase of the sample motion eventuallyresulting in a macroscopic motion of the levitated body.To illustrate the instability mechanism in more detail we consider the case of a rotationalinstability in an alternating magnetic field which far away from the spherical sample is uniform.Basically there is no torque acting on the sphere. However, this rest state might be unstablewith respect to infinitesimal rotational disturbances. To describe this type of instability it isadvantageous to consider the uniform alternating magnetic field as a superposition of twooppositely rotating fields. It is evident that a single rotating magnetic field creates a torque Mon the body which for a spherical body could analytically be given by
( ) ( )( ) ( )
ϖ−
ϖ−ϖϖ+ϖ
ϖπ=
2
1
2cos2cosh
2sin2sinh
2
1
2
18M (1)
which for low and high frequencies reduces to
ϖπ≈5
M for 1<<ϖ ,
2/1
2
9M −ϖ
π≈ for 1>>ϖ ,
respectively. Here σωµ=ϖ 020R is the dimensionless frequency of the magnetic field involving
the radius of the spherical sample R0, the magnetic permeability of vacuum µ0, the electricalconductivity σ of the sphere and the frequency of the alternating magnetic field ω. It isimportant to note that the torque first increases with increasing frequency whereas at higherfrequencies it again decreases with further increasing ϖ.
The total torque on the sphere in an alternating field is just a superposition of two torques dueto two oppositely rotating magnetic fields. For a sphere at rest the relative frequency ofrotation of both fields is the same. In this case both torques acting in opposite directions areequal and, therefore, cancel each other. When the sphere rotates, the relative frequency of theco-rotating field reduces, whereas that of the counter-rotating one increases. As a result, atorque about the axis of rotation appears. Whether this torque leads to a braking or enhancingof some initial rotation of the sphere can be analysed by considering the relevant equation ofmotion written in a non-dimensional form as
Ωϖ
−≈Ω+ϖ−Ω−ϖ=Ωd
dMN))(M)(M(
2
N
dt
d(2)
where Ω stands for the rotation frequency of the sphere non-dimensionalized with respect tothe characteristic magnetic diffusion time σµ=τ 0
20m R which is chosen as time scale for the
given problem; I/BRN 220
700 σµ= is a dimensionless interaction parameter defining the
characteristic ratio of electromagnetic and inertial force; mR5/2I 20= is the moment of inertia
of the sphere. The general solution of this equation is )tNexp(0 γΩ=Ω where γ = -dM/dϖ. At
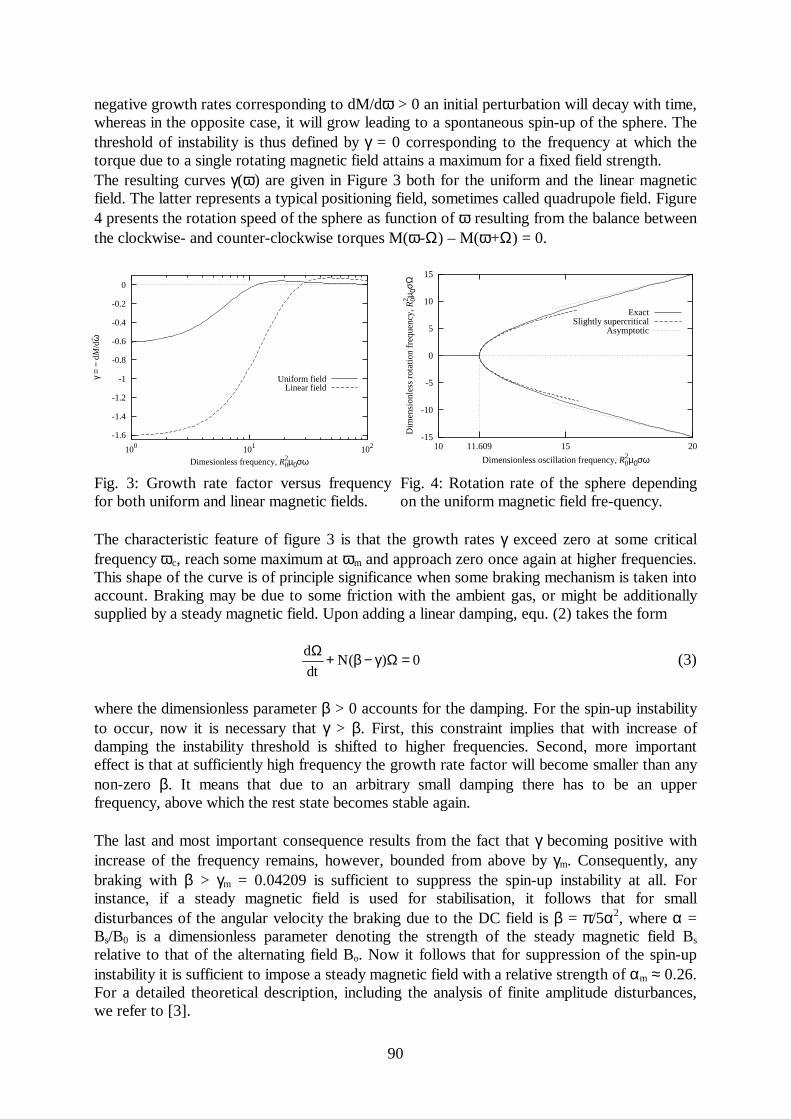
90
negative growth rates corresponding to dM/dϖ > 0 an initial perturbation will decay with time,whereas in the opposite case, it will grow leading to a spontaneous spin-up of the sphere. Thethreshold of instability is thus defined by γ = 0 corresponding to the frequency at which thetorque due to a single rotating magnetic field attains a maximum for a fixed field strength.The resulting curves γ(ϖ) are given in Figure 3 both for the uniform and the linear magneticfield. The latter represents a typical positioning field, sometimes called quadrupole field. Figure4 presents the rotation speed of the sphere as function of ϖ resulting from the balance betweenthe clockwise- and counter-clockwise torques M(ϖ-Ω) – M(ϖ+Ω) = 0.
-1.6
-1.4
-1.2
-1
-0.8
-0.6
-0.4
-0.2
0
100 101 102
γ =
− dM
/d− ω
Dimesionless frequency, R02µ0σω
Uniform fieldLinear field
-15
-10
-5
0
5
10
15
10 11.609 15 20
Dim
ensi
onle
ss r
otat
ion
freq
uenc
y, R
02 µ 0σΩ
Dimensionless oscillation frequency, R02µ0σω
ExactSlightly supercritical
Asymptotic
Fig. 3: Growth rate factor versus frequencyfor both uniform and linear magnetic fields.
Fig. 4: Rotation rate of the sphere dependingon the uniform magnetic field fre-quency.
The characteristic feature of figure 3 is that the growth rates γ exceed zero at some criticalfrequency ϖc, reach some maximum at ϖm and approach zero once again at higher frequencies.This shape of the curve is of principle significance when some braking mechanism is taken intoaccount. Braking may be due to some friction with the ambient gas, or might be additionallysupplied by a steady magnetic field. Upon adding a linear damping, equ. (2) takes the form
0)(Ndt
d =Ωγ−β+Ω(3)
where the dimensionless parameter β > 0 accounts for the damping. For the spin-up instabilityto occur, now it is necessary that γ > β. First, this constraint implies that with increase ofdamping the instability threshold is shifted to higher frequencies. Second, more importanteffect is that at sufficiently high frequency the growth rate factor will become smaller than anynon-zero β. It means that due to an arbitrary small damping there has to be an upperfrequency, above which the rest state becomes stable again.
The last and most important consequence results from the fact that γ becoming positive withincrease of the frequency remains, however, bounded from above by γm. Consequently, anybraking with β > γm = 0.04209 is sufficient to suppress the spin-up instability at all. Forinstance, if a steady magnetic field is used for stabilisation, it follows that for smalldisturbances of the angular velocity the braking due to the DC field is β = π/5α2, where α =Bs/B0 is a dimensionless parameter denoting the strength of the steady magnetic field Bs
relative to that of the alternating field Bo. Now it follows that for suppression of the spin-upinstability it is sufficient to impose a steady magnetic field with a relative strength of αm ≈ 0.26.For a detailed theoretical description, including the analysis of finite amplitude disturbances,we refer to [3].
91
The main theoretical results might be summarised as follows: A levitated sphere may showspontaneous rotations or oscillations if the non-dimensional field frequency exceeds a criticalvalue ϖc. The values are ϖc = 11.609 both for the rotational instability in a uniform field andthe oscillatory instability in a linear magnetic field, but ϖc = 27.682 for a rotational instability ina linear field. There is a frequency ϖm at which the instability growth rate has a maximum.Those values are ϖm = 18.073 both for the rotational instability in a uniform field and theoscillatory instability in a linear magnetic field, but ϖm = 47.196 for a rotational instability in alinear field. There is no oscillatory instability in a uniform alternating magnetic field. In axiallysymmetric levitating fields, the rotation axis is perpendicular to the symmetry axis of thelevitating field which is usually vertical. The spontaneous oscillations occur in vertical andradial directions, where the frequency of vertical oscillations is twice that of the radial ones.The simplest way to avoid such instabilities would be to keep the non-dimensional frequencybelow the threshold ϖc. If this is not possible DC magnetic fields represent a powerful tool foran efficient active damping of all those instabilities. The DC fields must not be very strong, astrength in the order of the levitation field amplitude is sufficient. However, attention must bepaid to the DC field direction. A DC field in direction of the levitating field damps rotationsbut not oscillations. A DC field perpendicular to the levitating field direction dampsoscillations, but not rotations: the rotation axis adapts to the given DC field direction and nodamping of rotation occurs anymore. Hence, sophisticated DC field geometries are necessaryfor an overall stabilisation of the sample.
3. Experimental results
A set of model experiments has been performed in order to verify the theoretical predictions asgiven above. The main goal of the experiment design was to study the stability behaviour ofthe levitated solid spheres just around the critical values of the non-dimensional frequency ϖ.Solid aluminium or magnesium spheres have been used, and their diameter was chosenaccording to the available generator frequencies and the desirable values of ϖ.The levitating system consists of a bottom supporting coil and a top orienting (stabilising) coilwith the levitated sphere between them. The coils are connected in series in such a way that thedirection of currents in these coils is opposite. The interplay of an AC magnetic field with theelectric currents induced by this field in the conducting sphere causes electromagnetic forces inthe sphere. The sphere starts levitating if the upwards directed electromagnetic forcecomponent compensates the gravity forces on the sphere. The solid Al spheres had diametersof 10, 15, 29, 39, 50 and 59 mm, respectively. The stability behaviour was measured by visualobservation of the sample, a point light source and a photodiode to measure rotationaldisturbances, and a set of special capacitance probes to analyse oscillatory disturbances.For more details of the experiments and the stability results we refer to [5]. The main resultscan be summarised as follows:
• The levitation of the sphere is very stable for ϖ < 8. In that parameter range any externaldisturbances to the sphere are quickly damped out, the sample always goes back to its reststate within a few seconds.
• At approximately ϖ ≈ 8 the sphere starts to oscillate.• If ϖ exceeds about 10 the sphere starts to rotate, and the rotation rate increases with
increasing frequency. High rotation rates in the order of several 100s-1 have been observed.
At higher ϖ the sphere performs more and more complex superpositions of rotation andoscillation, destroying for ϖ > 60 the levitation process at all.
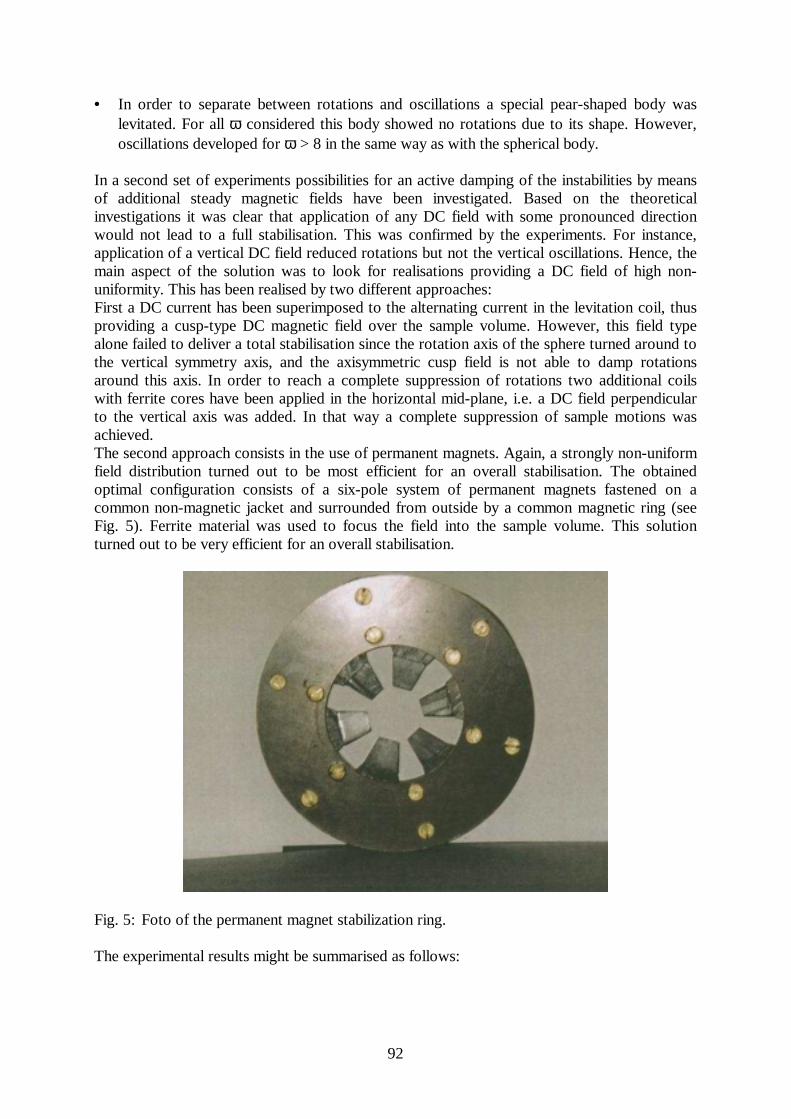
92
• In order to separate between rotations and oscillations a special pear-shaped body waslevitated. For all ϖ considered this body showed no rotations due to its shape. However,oscillations developed for ϖ > 8 in the same way as with the spherical body.
In a second set of experiments possibilities for an active damping of the instabilities by meansof additional steady magnetic fields have been investigated. Based on the theoreticalinvestigations it was clear that application of any DC field with some pronounced directionwould not lead to a full stabilisation. This was confirmed by the experiments. For instance,application of a vertical DC field reduced rotations but not the vertical oscillations. Hence, themain aspect of the solution was to look for realisations providing a DC field of high non-uniformity. This has been realised by two different approaches:First a DC current has been superimposed to the alternating current in the levitation coil, thusproviding a cusp-type DC magnetic field over the sample volume. However, this field typealone failed to deliver a total stabilisation since the rotation axis of the sphere turned around tothe vertical symmetry axis, and the axisymmetric cusp field is not able to damp rotationsaround this axis. In order to reach a complete suppression of rotations two additional coilswith ferrite cores have been applied in the horizontal mid-plane, i.e. a DC field perpendicularto the vertical axis was added. In that way a complete suppression of sample motions wasachieved.The second approach consists in the use of permanent magnets. Again, a strongly non-uniformfield distribution turned out to be most efficient for an overall stabilisation. The obtainedoptimal configuration consists of a six-pole system of permanent magnets fastened on acommon non-magnetic jacket and surrounded from outside by a common magnetic ring (seeFig. 5). Ferrite material was used to focus the field into the sample volume. This solutionturned out to be very efficient for an overall stabilisation.
Fig. 5: Foto of the permanent magnet stabilization ring.
The experimental results might be summarised as follows:
93
• Steady magnetic fields can effectively be used to stabilise levitated samples. Fullstabilisation has been obtained up to ϖ ≈ 100. The necessary DC field strength in thesample volume is in the range of 50-80mT.
• The DC field could be provided by an electrotechnical solution, i.e. the superposition of aDC current to the levitating coil current, or by a suitable arrangement of permanentmagnets. The first approach must be accompanied by an additional horizontal DC fieldcomponent since otherwise rotations around the vertical axis are not damped.
• The spatial non-uniformity of the DC field is crucial for a complete damping of all sampleinstabilities.
4. Conclusions
We have considered various physical mechanisms which may give rise to spontaneousrotations or oscillations of levitated spherical bodies. These instabilities are characterised by afrequency threshold above which they set in spontaneously, and a frequency ϖm at which thegrowth rates attain a maximum. An active damping by means of suitable DC magnetic fields isdeveloped. Whereas a strength of the DC field in the order of the levitating field strength issufficient, attention must be paid to the DC field geometry. The results are verified byexperiments. The possibility of an almost total stabilisation of the levitated sample has beendemonstrated experimentally by two different approaches: first a DC field produced byexternal permanent magnets, second a DC field due to the superposition of a DC current to thealternating current in the levitating coil.
Acknowledgement
The work presented here was supported by German Space Agency (DARA/DLR).
References
[1] I. Egry, J. Szekely (1991), The measurement of thermophysical properties inmicrogravity using electromagnetic levitation. Adv. Space Res., 11(7), 263
[2] J.Priede, G.Gerbeth (1999), Oscillatory and rotational instabilities in electromagneticlevitation. N.El-Kaddah, D.G.C.Robertson, S.T.Johansen, V.R.Voller (Eds.): FluidFlow Phenomena in Metals Processing, 593, TMS, San Diego, USA
[3] J.Priede, G.Gerbeth (2000), Spin-up instability of electromagnetically levitatedspherical bodies. IEEE Transactions on Magnetics, Vol.36, No.1, 349
[4] J.Priede, G.Gerbeth (2000), Oscillatory instability of electromagnetically levitated solidbodies. IEEE Transactions on Magnetics, Vol. 36, No.1, 354
[5] Yu.M.Gelfgat, A.Mikelsons, A.Romancuks, G.Gerbeth (2000), Stability of levitation ofsolid and liquid conducting spheres in high frequency electromagnetic field.Magnetohydrodynamics, Vol.36, No.2, 167
94
COMPARISON OF THE IRRADIATION EFFECTS ONMICROSTRUCTURE AND MECHANICAL PROPERTIES
Jürgen Böhmert, Hans-Werner Viehrig and Andreas Ulbricht
1. Introduction
VVER-type reactor pressure vessel (RPV) steels were irradiated within an extensive irradia-tion programme at the VVER-2 of the Rheinsberg nuclear power plant. Subsequently theywere tested by Charpy impact tests and 3-point bend tests. The results of theses investigationswere already published [1-3]. The different heats of the RPV steels have proved to be differ-ently sensible against radiation embrittlement. Whereas for some heats the ductile brittle tran-sition temperature was hardly shifted to higher temperature, clear effects were indicated inother cases. The finding was not in correspondence to the content of copper and phosphorusknown as promoting radiation embrittlement. In addition to the original working programmesmall angle neutron scattering (SANS) experiments have been applied to study the correlationbetween the effects of the irradiation on the mechanical behaviour and the microstructuralevolution. The investigation is expected to provide to better understanding from the physicalpoint of view.
The results of the SANS study and the comparison with the results of the toughness propertiesare presented in this paper.
2. Experimental
The material investigated comprises 7 heats:
• 4 heats of VVER 440-type RPV steel 15Kh2MFA (code: R1-R3, D25)• 2 heats of VVER 1000-type RPV steel 15Kh2NMFAA (code: R16, R17)• 1 heats of VVER 1000-type weld metal 10KhGNMAA (code: R19).
Most of the heats have a relatively low content of Cu and P. For every heat one set of CharpyV-notch specimens and one set of fatigue pre-cracked specimens of the same type were avail-able in unirradiated, irradiated and, partly, annealed state. With these specimen sets the tran-sition temperature TT related to a Charpy energy of 48 J and the reference temperature To
according to ASTM E 1921-97 were determined. Furthermore the radiation embrittlementcoefficients AF were calculated using the Russian standard PNAE G 7-002-86 (quoted in [4])for evaluating the effect of irradiation
TT = AF ³ (1)
TT = TTF - TTo (2)
is the neutron fluence in 1018 n/cm², TTF, TTo is the transition temperature after irradiation
or in the initial state, respectively. The same procedure was used for the evaluation of the ref-erence temperature shift To.
In Table 1 data of the material composition, the mean fluence and the results of the radiationembrittlement are summarized. More details are presented in [1-3].
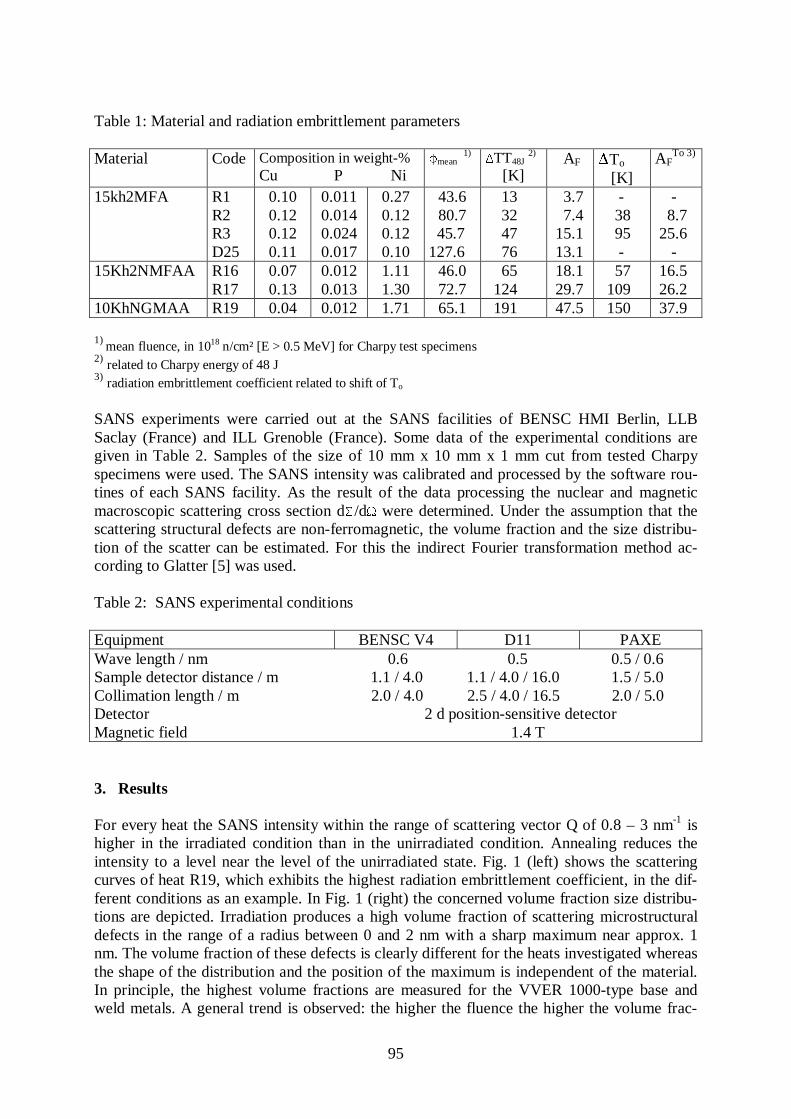
95
Table 1: Material and radiation embrittlement parameters
Material Code Composition in weight-%Cu P Ni
mean 1)
TT48J 2)
[K] AF To
[K]AF
To 3)
15kh2MFA R1R2R3D25
0.100.120.120.11
0.0110.0140.0240.017
0.270.120.120.10
43.680.7
45.7127.6
13 32 47 76
3.7 7.4 15.1 13.1
- 38 95 -
- 8.7 25.6 -
15Kh2NMFAA R16R17
0.070.13
0.0120.013
1.111.30
46.072.7
65 124
18.1 29.7
57 109
16.5 26.2
10KhNGMAA R19 0.04 0.012 1.71 65.1 191 47.5 150 37.9
1) mean fluence, in 1018 n/cm² [E > 0.5 MeV] for Charpy test specimens
2) related to Charpy energy of 48 J
3) radiation embrittlement coefficient related to shift of To
SANS experiments were carried out at the SANS facilities of BENSC HMI Berlin, LLBSaclay (France) and ILL Grenoble (France). Some data of the experimental conditions aregiven in Table 2. Samples of the size of 10 mm x 10 mm x 1 mm cut from tested Charpyspecimens were used. The SANS intensity was calibrated and processed by the software rou-tines of each SANS facility. As the result of the data processing the nuclear and magneticmacroscopic scattering cross section d/d were determined. Under the assumption that thescattering structural defects are non-ferromagnetic, the volume fraction and the size distribu-tion of the scatter can be estimated. For this the indirect Fourier transformation method ac-cording to Glatter [5] was used.
Table 2: SANS experimental conditions
Equipment BENSC V4 D11 PAXEWave length / nm 0.6 0.5 0.5 / 0.6Sample detector distance / m 1.1 / 4.0 1.1 / 4.0 / 16.0 1.5 / 5.0Collimation length / m 2.0 / 4.0 2.5 / 4.0 / 16.5 2.0 / 5.0Detector 2 d position-sensitive detectorMagnetic field 1.4 T
3. Results
For every heat the SANS intensity within the range of scattering vector Q of 0.8 – 3 nm-1 is
higher in the irradiated condition than in the unirradiated condition. Annealing reduces theintensity to a level near the level of the unirradiated state. Fig. 1 (left) shows the scatteringcurves of heat R19, which exhibits the highest radiation embrittlement coefficient, in the dif-ferent conditions as an example. In Fig. 1 (right) the concerned volume fraction size distribu-tions are depicted. Irradiation produces a high volume fraction of scattering microstructuraldefects in the range of a radius between 0 and 2 nm with a sharp maximum near approx. 1nm. The volume fraction of these defects is clearly different for the heats investigated whereasthe shape of the distribution and the position of the maximum is independent of the material.In principle, the highest volume fractions are measured for the VVER 1000-type base andweld metals. A general trend is observed: the higher the fluence the higher the volume frac-
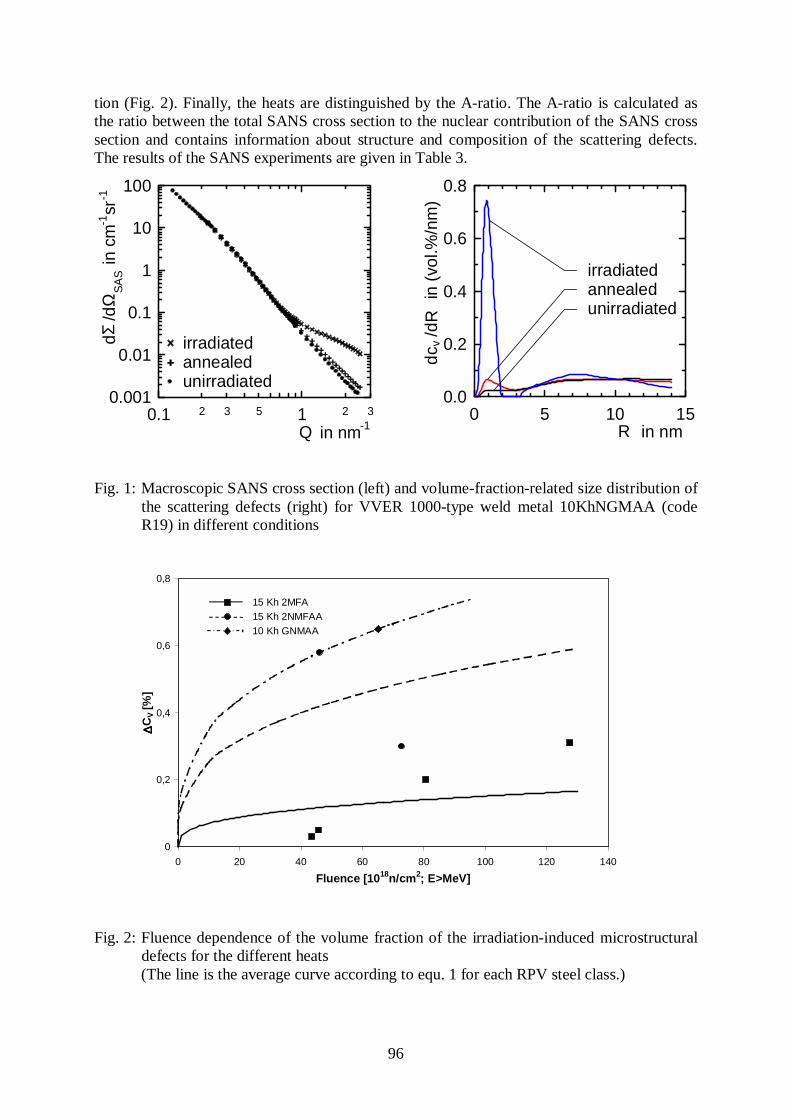
96
tion (Fig. 2). Finally, the heats are distinguished by the A-ratio. The A-ratio is calculated asthe ratio between the total SANS cross section to the nuclear contribution of the SANS crosssection and contains information about structure and composition of the scattering defects.The results of the SANS experiments are given in Table 3.
Fig. 1: Macroscopic SANS cross section (left) and volume-fraction-related size distribution ofthe scattering defects (right) for VVER 1000-type weld metal 10KhNGMAA (codeR19) in different conditions
Fig. 2: Fluence dependence of the volume fraction of the irradiation-induced microstructuraldefects for the different heats(The line is the average curve according to equ. 1 for each RPV steel class.)
2 3 5 2 30.1 10.001
0.01
0.1
1
10
100
a
d /d
in
cm
sr
ΣΩ
-1-1
SA
S
Q in nm-1
irradiatedannealedunirradiated
0 5 10 150.0
0.2
0.4
0.6
0.8
d /d
in
(v
ol.%
/nm
)c
Rv
R in nm
irradiatedannealedunirradiated
0
0,2
0,4
0,6
0,8
0 20 40 60 80 100 120 140
Fluence [1018n/cm2; E>MeV]
∆∆ ∆∆C
V [%
]
15 Kh 2MFA 15 Kh 2NMFAA 10 Kh GNMAA
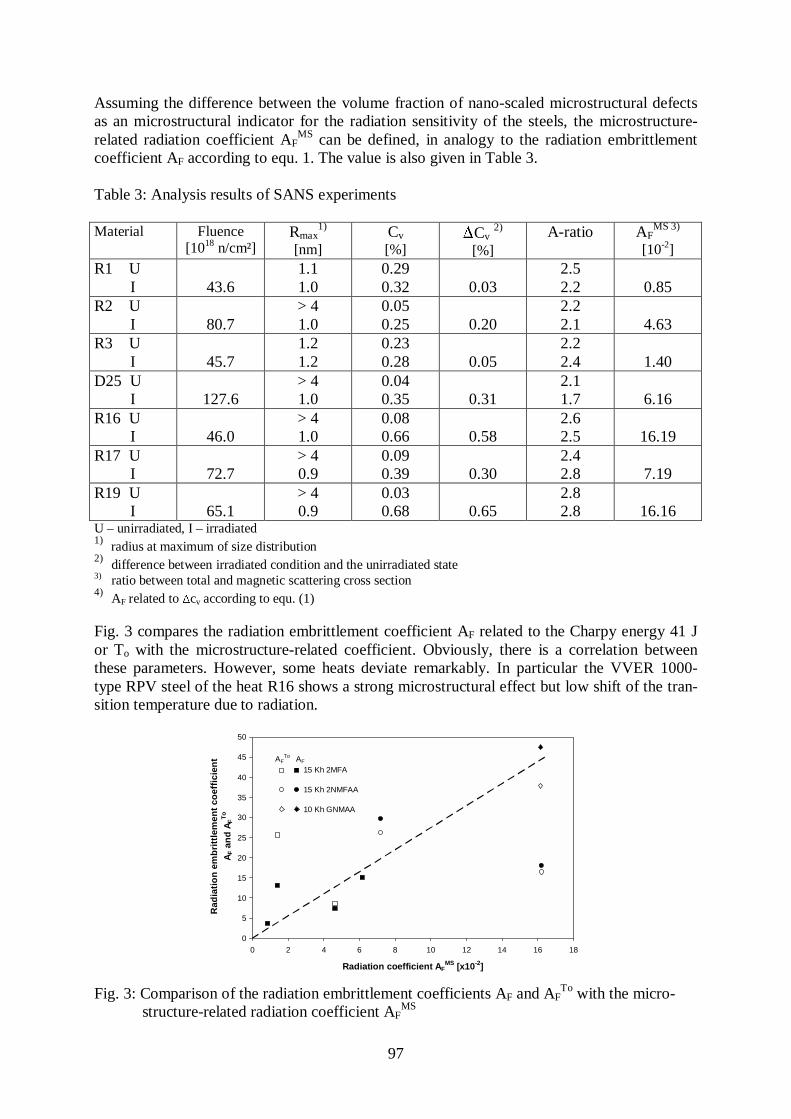
97
Assuming the difference between the volume fraction of nano-scaled microstructural defectsas an microstructural indicator for the radiation sensitivity of the steels, the microstructure-related radiation coefficient AF
MS can be defined, in analogy to the radiation embrittlement
coefficient AF according to equ. 1. The value is also given in Table 3.
Table 3: Analysis results of SANS experiments
Material Fluence[1018
n/cm²]Rmax
1)
[nm]Cv
[%]Cv
2)
[%]A-ratio AF
MS 3)
[10-2]R1 U I 43.6
1.11.0
0.290.32 0.03
2.52.2 0.85
R2 U I 80.7
> 41.0
0.050.25 0.20
2.22.1 4.63
R3 U I 45.7
1.21.2
0.230.28 0.05
2.22.4 1.40
D25 U I 127.6
> 41.0
0.040.35 0.31
2.11.7 6.16
R16 U I 46.0
> 41.0
0.080.66 0.58
2.62.5 16.19
R17 U I 72.7
> 40.9
0.090.39 0.30
2.42.8 7.19
R19 U I 65.1
> 40.9
0.030.68 0.65
2.82.8 16.16
U – unirradiated, I – irradiated1)
radius at maximum of size distribution2)
difference between irradiated condition and the unirradiated state3)
ratio between total and magnetic scattering cross section4)
AF related to cv according to equ. (1)
Fig. 3 compares the radiation embrittlement coefficient AF related to the Charpy energy 41 Jor To with the microstructure-related coefficient. Obviously, there is a correlation betweenthese parameters. However, some heats deviate remarkably. In particular the VVER 1000-type RPV steel of the heat R16 shows a strong microstructural effect but low shift of the tran-sition temperature due to radiation.
Fig. 3: Comparison of the radiation embrittlement coefficients AF and AFTo
with the micro- structure-related radiation coefficient AF
MS
0
5
10
15
20
25
30
35
40
45
50
0 2 4 6 8 10 12 14 16 18
Radiation coefficient AFMS
[x10-2]
Rad
iati
on
em
bri
ttle
men
t co
effi
cien
t A
F an
d A
FT
o
AFTo AF
15 Kh 2MFA
15 Kh 2NMFAA
10 Kh GNMAA
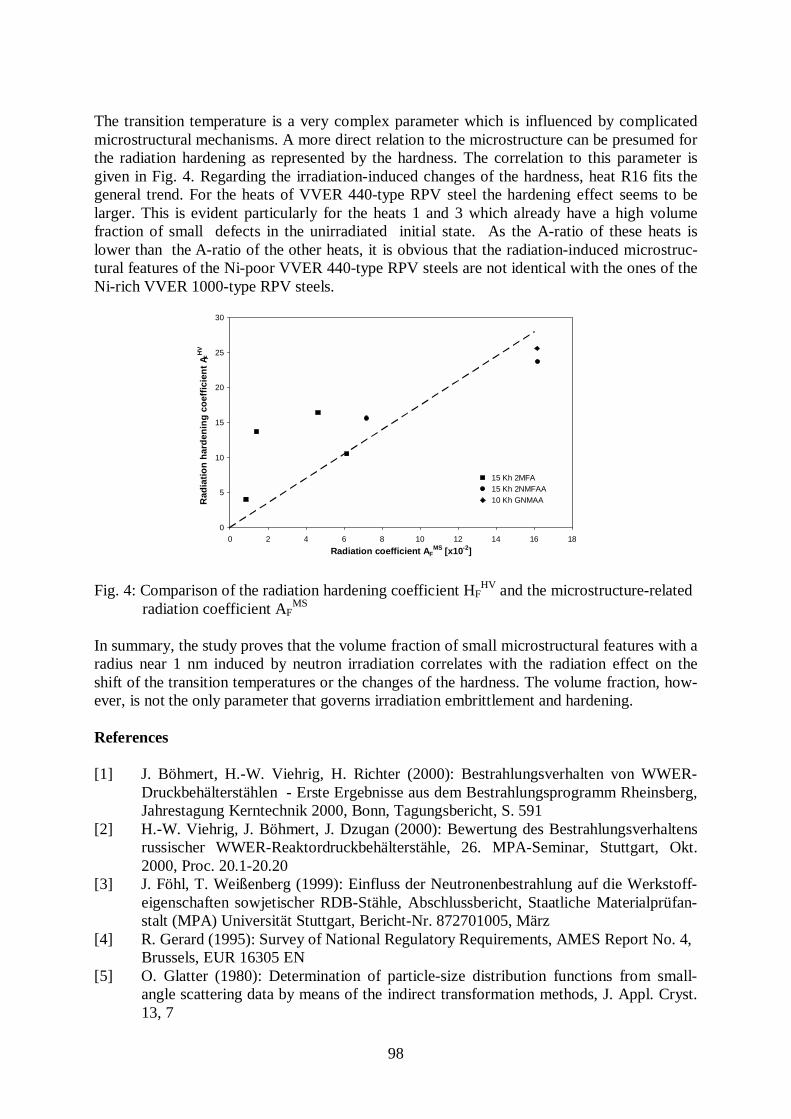
98
The transition temperature is a very complex parameter which is influenced by complicatedmicrostructural mechanisms. A more direct relation to the microstructure can be presumed forthe radiation hardening as represented by the hardness. The correlation to this parameter isgiven in Fig. 4. Regarding the irradiation-induced changes of the hardness, heat R16 fits thegeneral trend. For the heats of VVER 440-type RPV steel the hardening effect seems to belarger. This is evident particularly for the heats 1 and 3 which already have a high volumefraction of small defects in the unirradiated initial state. As the A-ratio of these heats islower than the A-ratio of the other heats, it is obvious that the radiation-induced microstruc-tural features of the Ni-poor VVER 440-type RPV steels are not identical with the ones of theNi-rich VVER 1000-type RPV steels.
Fig. 4: Comparison of the radiation hardening coefficient HFHV
and the microstructure-related radiation coefficient AF
MS
In summary, the study proves that the volume fraction of small microstructural features with aradius near 1 nm induced by neutron irradiation correlates with the radiation effect on theshift of the transition temperatures or the changes of the hardness. The volume fraction, how-ever, is not the only parameter that governs irradiation embrittlement and hardening.
References
[1] J. Böhmert, H.-W. Viehrig, H. Richter (2000): Bestrahlungsverhalten von WWER-Druckbehälterstählen - Erste Ergebnisse aus dem Bestrahlungsprogramm Rheinsberg,Jahrestagung Kerntechnik 2000, Bonn, Tagungsbericht, S. 591
[2] H.-W. Viehrig, J. Böhmert, J. Dzugan (2000): Bewertung des Bestrahlungsverhaltensrussischer WWER-Reaktordruckbehälterstähle, 26. MPA-Seminar, Stuttgart, Okt.2000, Proc. 20.1-20.20
[3] J. Föhl, T. Weißenberg (1999): Einfluss der Neutronenbestrahlung auf die Werkstoff-eigenschaften sowjetischer RDB-Stähle, Abschlussbericht, Staatliche Materialprüfan-stalt (MPA) Universität Stuttgart, Bericht-Nr. 872701005, März
[4] R. Gerard (1995): Survey of National Regulatory Requirements, AMES Report No. 4,Brussels, EUR 16305 EN
[5] O. Glatter (1980): Determination of particle-size distribution functions from small-angle scattering data by means of the indirect transformation methods, J. Appl. Cryst.13, 7
0
5
10
15
20
25
30
0 2 4 6 8 10 12 14 16 18
Radiation coefficient AFMS
[x10-2]
Rad
iati
on
h
ard
enin
g co
effi
cien
t A F
HV
15 Kh 2MFA 15 Kh 2NMFAA 10 Kh GNMAA
99
VERIFICATION OF NEUTRON TRANSPORT CALCULATIONS FORNONSTANDARD PRESSURE VESSEL SURVEILLANCE POSITIONS
IN THE VVER-1000 NOVOVORONEZH-5
Bertram Böhmer, Ernst Brodkin1, Alexei Egorov1, Jörg Konheiser, Eckhard Polke2,Victor Vikhrov1 and Sergei Zaritsky1
1. Introduction
To survey the embrittlement of the reactor pressure vessel, capsules with Charpy specimensmade of pressure vessel steel are irradiated during reactor operation. In the present experimentassemblies of specimens were irradiated during the 17th
fuel cycle in five baffle channels ofthe Novovoronesh VVER-1000. These positions are somewhat below the VVER-1000 stan-dard surveillance positions. This is a region of strong radial and vertical flux gradients wherethe exact calculation of fluences for the irradiated specimens is much more difficult than forthe pressure vessel. Therefore, an investigation program was performed aimed at testing theability to determine reliably the neutron fluences of the specimens. Three independent fluenceand activity calculations were performed by the Russian Research Center "Kurchatov Insti-tute" Moscow (KI), by the Forschungszentrum Rossendorf (FZR) and by the Siemens NuclearPower GmbH, Erlangen (SIE). Each institution used another calculation methodology. Thecalculation results were compared with each other and with neutron induced activities of de-tectors in special monitors as well as with the
55Mn-activities of the irradiated specimens it-self. First results of the intercomparisons are presented in the following. The work was sup-ported by a TACIS project of the European Union.
2. Experiment and Calculation Methods
The location of the assemblies with irradiation capsules at three height levels is illustrated inFig. 1. As example, Fig. 2 shows the arrangement of specimens and neutron monitors for as-sembly 3, level 2. Each monitor contained Fe, Cu and Nb activation detectors, from wich up-to-now only the
54Fe(n,p) and 63Cu(n,α) detectors had been evaluated. Contrary to expecta-
tions, the activities measured in assembly 3 were not symmetric relative to the core centerdirection. The asymmetry was obviously caused by a turn of the assembly around the channelaxis by some degrees. In the following comparisons the experimental activities of the outermonitors and specimens had been corrected for that effect assuming a linear dependence ofthe fluence from the angle. So, for instance, the corrected activities for monitor 1 at Fig. 2 areobtained by A(1)corr
= (A(1)+A(3)) / 2.The fluence and activity calculations for the five irradiated assemblies were performed inde-pendently by the three institutions using the same pin by pin source distributions, geometrydata and material compositions, delivered by KI. KI obtained three-dimensional fluence dis-tributions by synthesis of (r-θ), (r-z) and r calculation results from the SN-codes DORT [1]and ANISN with the 47-group neutron data library BUGLE-96 [2]. For different levels andassemblies six (r-θ)- and two (r-z)-models have been used. The calculations of SIE were per-formed by the three-dimensional SN -code TORT [3] with BUGLE-96. FZR used an improvedversion of the Monte Carlo Code TRAMO [4] and 123 group data generated on the basis of
1 Russian Research Center "Kurchatov Institute", Moscow 123182, Russia
2 Siemens Nuclear Power GmbH, 91058 Erlangen, Germany
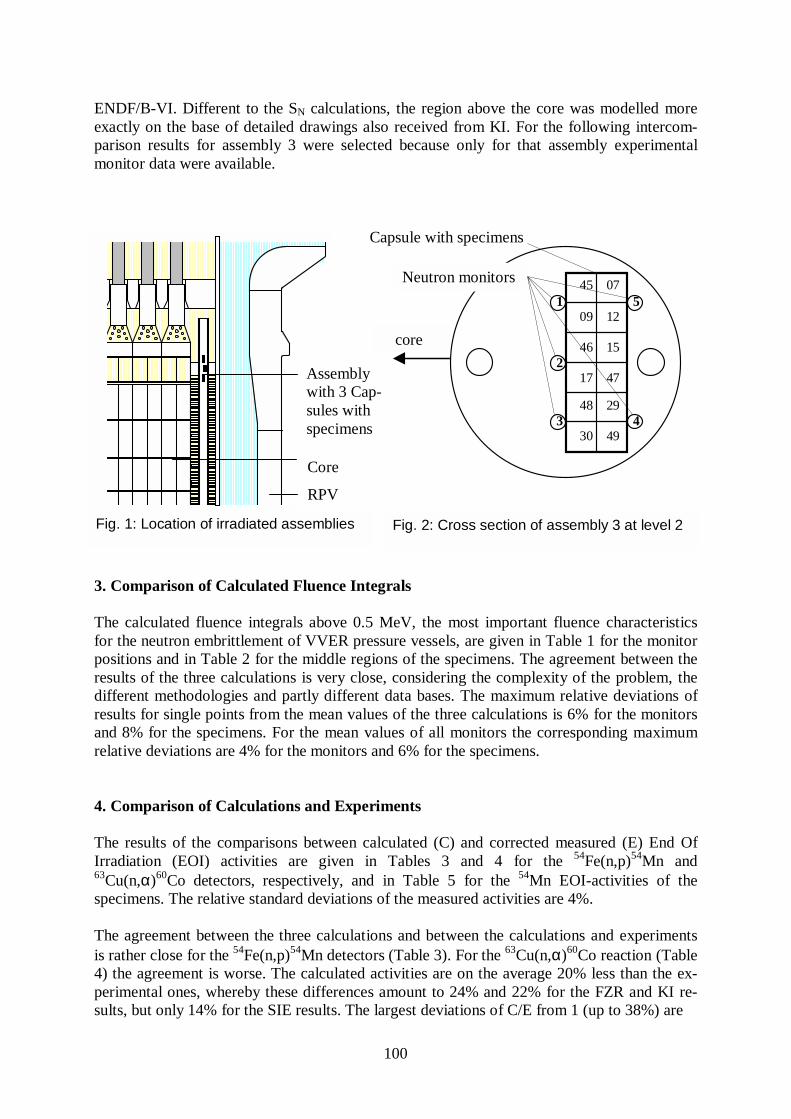
100
ENDF/B-VI. Different to the SN calculations, the region above the core was modelled moreexactly on the base of detailed drawings also received from KI. For the following intercom-parison results for assembly 3 were selected because only for that assembly experimentalmonitor data were available.
3. Comparison of Calculated Fluence Integrals
The calculated fluence integrals above 0.5 MeV, the most important fluence characteristicsfor the neutron embrittlement of VVER pressure vessels, are given in Table 1 for the monitorpositions and in Table 2 for the middle regions of the specimens. The agreement between theresults of the three calculations is very close, considering the complexity of the problem, thedifferent methodologies and partly different data bases. The maximum relative deviations ofresults for single points from the mean values of the three calculations is 6% for the monitorsand 8% for the specimens. For the mean values of all monitors the corresponding maximumrelative deviations are 4% for the monitors and 6% for the specimens.
4. Comparison of Calculations and Experiments
The results of the comparisons between calculated (C) and corrected measured (E) End OfIrradiation (EOI) activities are given in Tables 3 and 4 for the
54Fe(n,p)54Mn and63Cu(n,α)60Co detectors, respectively, and in Table 5 for the
54Mn EOI-activities of thespecimens. The relative standard deviations of the measured activities are 4%.
The agreement between the three calculations and between the calculations and experimentsis rather close for the
54Fe(n,p)54Mn detectors (Table 3). For the 63Cu(n,α)60Co reaction (Table
4) the agreement is worse. The calculated activities are on the average 20% less than the ex-perimental ones, whereby these differences amount to 24% and 22% for the FZR and KI re-sults, but only 14% for the SIE results. The largest deviations of C/E from 1 (up to 38%) are
core
Assemblywith 3 Cap-sules withspecimens
Core
RPV
45 07 1 5 09 12
46 15 2 17 47
48 29 3 4 30 49
Fig. 1: Location of irradiated assemblies Fig. 2: Cross section of assembly 3 at level 2
Capsule with specimens
Neutron monitors
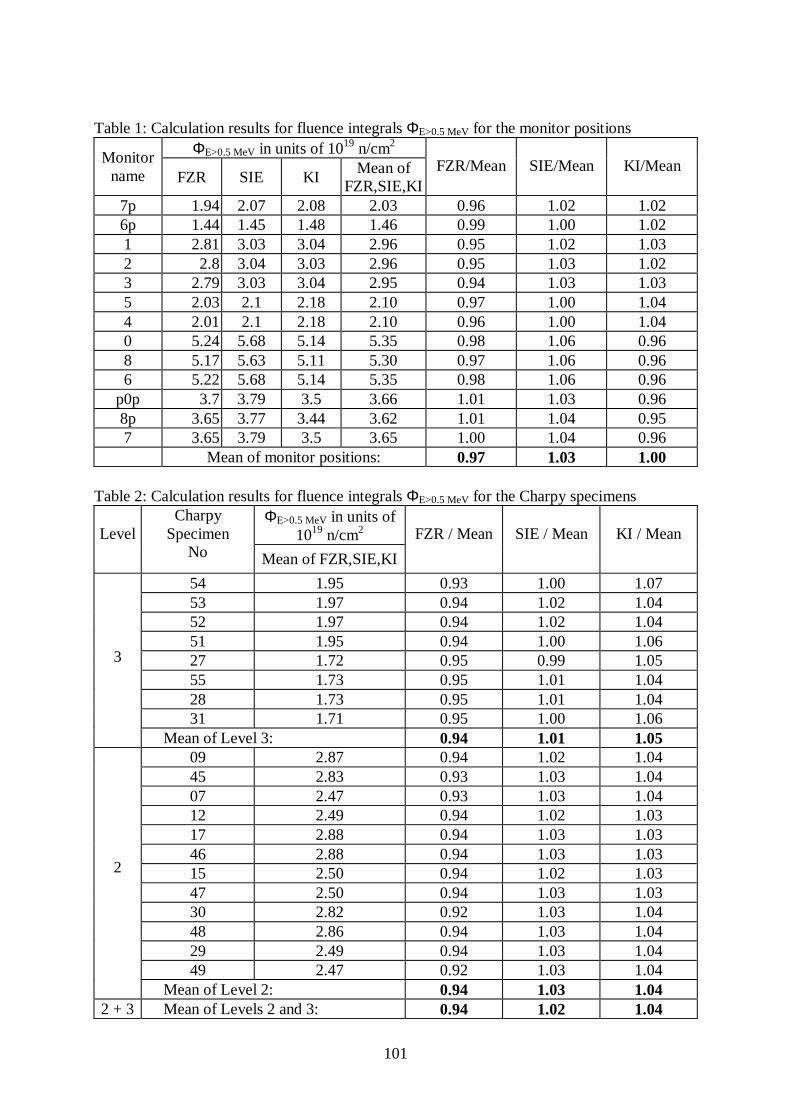
101
Table 1: Calculation results for fluence integrals ΦE>0.5 MeV for the monitor positionsΦE>0.5 MeV in units of 1019
n/cm2
Monitorname FZR SIE KI
Mean ofFZR,SIE,KI
FZR/Mean SIE/Mean KI/Mean
7p 1.94 2.07 2.08 2.03 0.96 1.02 1.026p 1.44 1.45 1.48 1.46 0.99 1.00 1.021 2.81 3.03 3.04 2.96 0.95 1.02 1.032 2.8 3.04 3.03 2.96 0.95 1.03 1.023 2.79 3.03 3.04 2.95 0.94 1.03 1.035 2.03 2.1 2.18 2.10 0.97 1.00 1.044 2.01 2.1 2.18 2.10 0.96 1.00 1.040 5.24 5.68 5.14 5.35 0.98 1.06 0.968 5.17 5.63 5.11 5.30 0.97 1.06 0.966 5.22 5.68 5.14 5.35 0.98 1.06 0.96
p0p 3.7 3.79 3.5 3.66 1.01 1.03 0.968p 3.65 3.77 3.44 3.62 1.01 1.04 0.957 3.65 3.79 3.5 3.65 1.00 1.04 0.96
Mean of monitor positions: 0.97 1.03 1.00
Table 2: Calculation results for fluence integrals ΦE>0.5 MeV for the Charpy specimensΦE>0.5 MeV in units of
1019 n/cm2Level
CharpySpecimen
No Mean of FZR,SIE,KI
FZR / Mean SIE / Mean KI / Mean
54 1.95 0.93 1.00 1.0753 1.97 0.94 1.02 1.0452 1.97 0.94 1.02 1.0451 1.95 0.94 1.00 1.0627 1.72 0.95 0.99 1.0555 1.73 0.95 1.01 1.0428 1.73 0.95 1.01 1.0431 1.71 0.95 1.00 1.06
3
Mean of Level 3: 0.94 1.01 1.0509 2.87 0.94 1.02 1.0445 2.83 0.93 1.03 1.0407 2.47 0.93 1.03 1.0412 2.49 0.94 1.02 1.0317 2.88 0.94 1.03 1.0346 2.88 0.94 1.03 1.0315 2.50 0.94 1.02 1.0347 2.50 0.94 1.03 1.0330 2.82 0.92 1.03 1.0448 2.86 0.94 1.03 1.0429 2.49 0.94 1.03 1.0449 2.47 0.92 1.03 1.04
2
Mean of Level 2: 0.94 1.03 1.042 + 3 Mean of Levels 2 and 3: 0.94 1.02 1.04
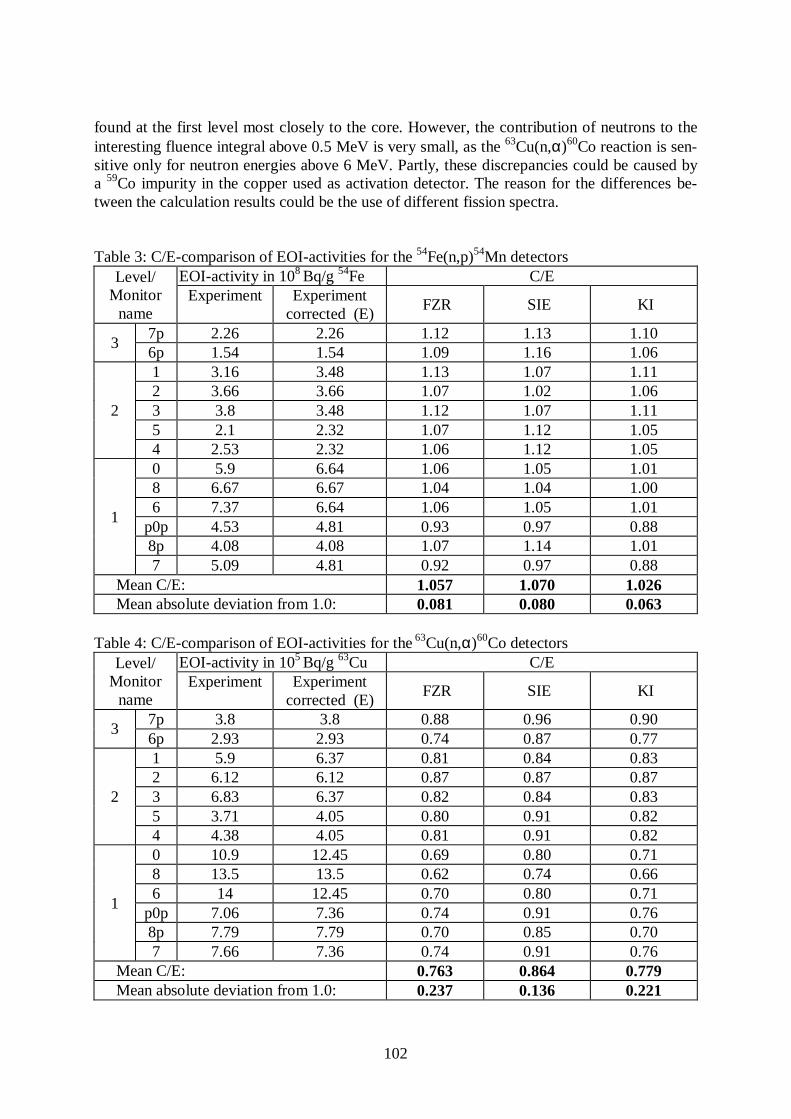
102
found at the first level most closely to the core. However, the contribution of neutrons to theinteresting fluence integral above 0.5 MeV is very small, as the
63Cu(n,α)60Co reaction is sen-sitive only for neutron energies above 6 MeV. Partly, these discrepancies could be caused bya
59Co impurity in the copper used as activation detector. The reason for the differences be-tween the calculation results could be the use of different fission spectra.
Table 3: C/E-comparison of EOI-activities for the 54Fe(n,p)54Mn detectors
EOI-activity in 108 Bq/g 54Fe C/ELevel/
Monitorname
Experiment Experimentcorrected (E)
FZR SIE KI
7p 2.26 2.26 1.12 1.13 1.103
6p 1.54 1.54 1.09 1.16 1.061 3.16 3.48 1.13 1.07 1.112 3.66 3.66 1.07 1.02 1.063 3.8 3.48 1.12 1.07 1.115 2.1 2.32 1.07 1.12 1.05
2
4 2.53 2.32 1.06 1.12 1.050 5.9 6.64 1.06 1.05 1.018 6.67 6.67 1.04 1.04 1.006 7.37 6.64 1.06 1.05 1.01
p0p 4.53 4.81 0.93 0.97 0.888p 4.08 4.08 1.07 1.14 1.01
1
7 5.09 4.81 0.92 0.97 0.88 Mean C/E: 1.057 1.070 1.026 Mean absolute deviation from 1.0: 0.081 0.080 0.063
Table 4: C/E-comparison of EOI-activities for the 63Cu(n,α)60Co detectorsEOI-activity in 105 Bq/g
63Cu C/ELevel/Monitor
nameExperiment Experiment
corrected (E) FZR SIE KI
7p 3.8 3.8 0.88 0.96 0.903
6p 2.93 2.93 0.74 0.87 0.771 5.9 6.37 0.81 0.84 0.832 6.12 6.12 0.87 0.87 0.873 6.83 6.37 0.82 0.84 0.835 3.71 4.05 0.80 0.91 0.82
2
4 4.38 4.05 0.81 0.91 0.820 10.9 12.45 0.69 0.80 0.718 13.5 13.5 0.62 0.74 0.666 14 12.45 0.70 0.80 0.71
p0p 7.06 7.36 0.74 0.91 0.768p 7.79 7.79 0.70 0.85 0.70
1
7 7.66 7.36 0.74 0.91 0.76 Mean C/E: 0.763 0.864 0.779 Mean absolute deviation from 1.0: 0.237 0.136 0.221
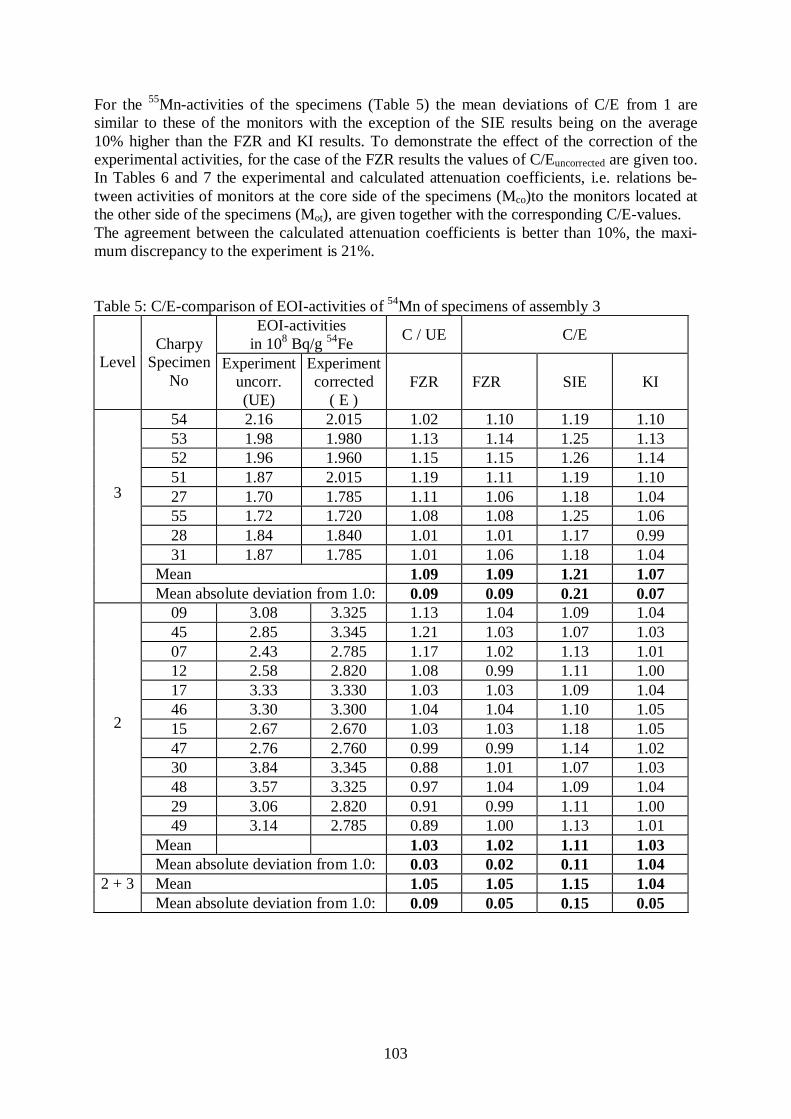
103
For the 55Mn-activities of the specimens (Table 5) the mean deviations of C/E from 1 are
similar to these of the monitors with the exception of the SIE results being on the average10% higher than the FZR and KI results. To demonstrate the effect of the correction of theexperimental activities, for the case of the FZR results the values of C/Euncorrected are given too.In Tables 6 and 7 the experimental and calculated attenuation coefficients, i.e. relations be-tween activities of monitors at the core side of the specimens (Mco)to the monitors located atthe other side of the specimens (Mot), are given together with the corresponding C/E-values.The agreement between the calculated attenuation coefficients is better than 10%, the maxi-mum discrepancy to the experiment is 21%.
Table 5: C/E-comparison of EOI-activities of 54Mn of specimens of assembly 3EOI-activities
in 108 Bq/g
54FeC / UE C/E
LevelCharpy
SpecimenNo
Experimentuncorr.(UE)
Experimentcorrected
( E )FZR FZR SIE KI
54 2.16 2.015 1.02 1.10 1.19 1.1053 1.98 1.980 1.13 1.14 1.25 1.1352 1.96 1.960 1.15 1.15 1.26 1.1451 1.87 2.015 1.19 1.11 1.19 1.1027 1.70 1.785 1.11 1.06 1.18 1.0455 1.72 1.720 1.08 1.08 1.25 1.0628 1.84 1.840 1.01 1.01 1.17 0.9931 1.87 1.785 1.01 1.06 1.18 1.04
Mean 1.09 1.09 1.21 1.07
3
Mean absolute deviation from 1.0: 0.09 0.09 0.21 0.0709 3.08 3.325 1.13 1.04 1.09 1.0445 2.85 3.345 1.21 1.03 1.07 1.0307 2.43 2.785 1.17 1.02 1.13 1.0112 2.58 2.820 1.08 0.99 1.11 1.0017 3.33 3.330 1.03 1.03 1.09 1.0446 3.30 3.300 1.04 1.04 1.10 1.0515 2.67 2.670 1.03 1.03 1.18 1.0547 2.76 2.760 0.99 0.99 1.14 1.0230 3.84 3.345 0.88 1.01 1.07 1.0348 3.57 3.325 0.97 1.04 1.09 1.0429 3.06 2.820 0.91 0.99 1.11 1.0049 3.14 2.785 0.89 1.00 1.13 1.01
Mean 1.03 1.02 1.11 1.03
2
Mean absolute deviation from 1.0: 0.03 0.02 0.11 1.04 Mean 1.05 1.05 1.15 1.042 + 3 Mean absolute deviation from 1.0: 0.09 0.05 0.15 0.05
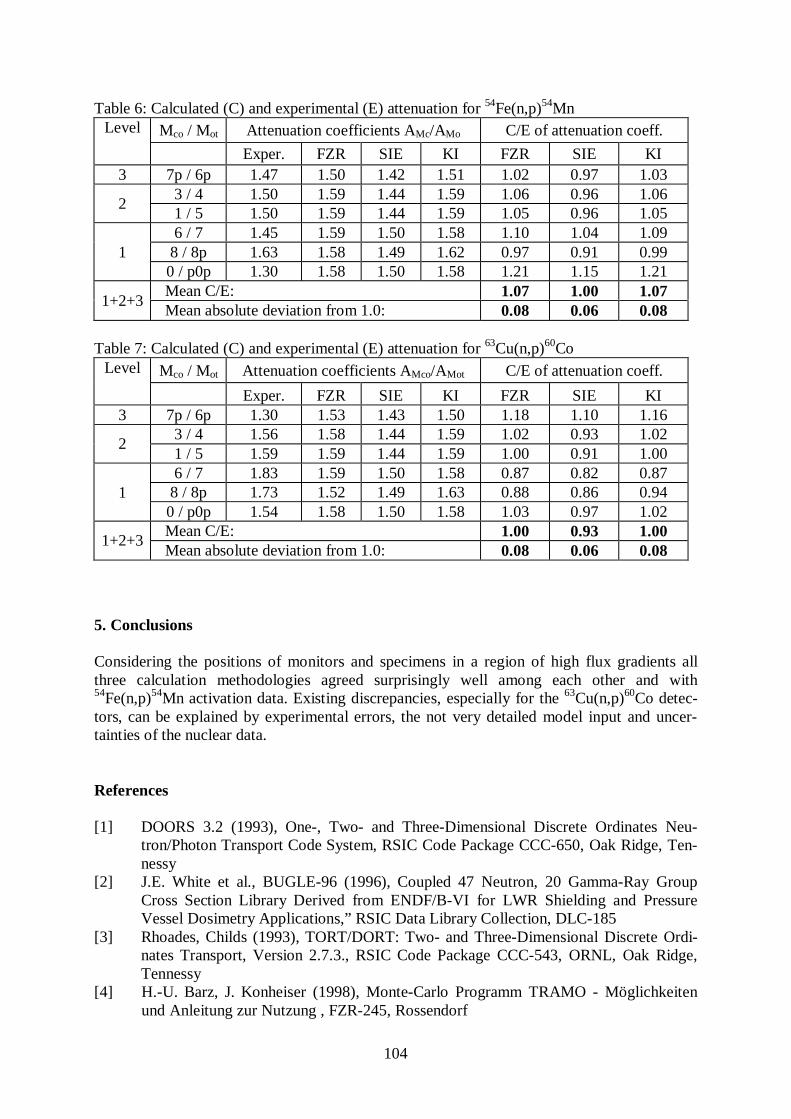
104
Table 6: Calculated (C) and experimental (E) attenuation for 54Fe(n,p)54MnMco / Mot Attenuation coefficients AMc/AMo C/E of attenuation coeff.Level
Exper. FZR SIE KI FZR SIE KI3 7p / 6p 1.47 1.50 1.42 1.51 1.02 0.97 1.03
3 / 4 1.50 1.59 1.44 1.59 1.06 0.96 1.062
1 / 5 1.50 1.59 1.44 1.59 1.05 0.96 1.056 / 7 1.45 1.59 1.50 1.58 1.10 1.04 1.09
8 / 8p 1.63 1.58 1.49 1.62 0.97 0.91 0.9910 / p0p 1.30 1.58 1.50 1.58 1.21 1.15 1.21
Mean C/E: 1.07 1.00 1.071+2+3
Mean absolute deviation from 1.0: 0.08 0.06 0.08
Table 7: Calculated (C) and experimental (E) attenuation for 63Cu(n,p)60Co
Mco / Mot Attenuation coefficients AMco/AMot C/E of attenuation coeff.Level
Exper. FZR SIE KI FZR SIE KI3 7p / 6p 1.30 1.53 1.43 1.50 1.18 1.10 1.16
3 / 4 1.56 1.58 1.44 1.59 1.02 0.93 1.022
1 / 5 1.59 1.59 1.44 1.59 1.00 0.91 1.006 / 7 1.83 1.59 1.50 1.58 0.87 0.82 0.87
8 / 8p 1.73 1.52 1.49 1.63 0.88 0.86 0.9410 / p0p 1.54 1.58 1.50 1.58 1.03 0.97 1.02
Mean C/E: 1.00 0.93 1.001+2+3
Mean absolute deviation from 1.0: 0.08 0.06 0.08
5. Conclusions
Considering the positions of monitors and specimens in a region of high flux gradients allthree calculation methodologies agreed surprisingly well among each other and with54Fe(n,p)54Mn activation data. Existing discrepancies, especially for the
63Cu(n,p)60Co detec-tors, can be explained by experimental errors, the not very detailed model input and uncer-tainties of the nuclear data.
References
[1] DOORS 3.2 (1993), One-, Two- and Three-Dimensional Discrete Ordinates Neu-tron/Photon Transport Code System, RSIC Code Package CCC-650, Oak Ridge, Ten-nessy
[2] J.E. White et al., BUGLE-96 (1996), Coupled 47 Neutron, 20 Gamma-Ray GroupCross Section Library Derived from ENDF/B-VI for LWR Shielding and PressureVessel Dosimetry Applications,” RSIC Data Library Collection, DLC-185
[3] Rhoades, Childs (1993), TORT/DORT: Two- and Three-Dimensional Discrete Ordi-nates Transport, Version 2.7.3., RSIC Code Package CCC-543, ORNL, Oak Ridge,Tennessy
[4] H.-U. Barz, J. Konheiser (1998), Monte-Carlo Programm TRAMO - Möglichkeitenund Anleitung zur Nutzung , FZR-245, Rossendorf
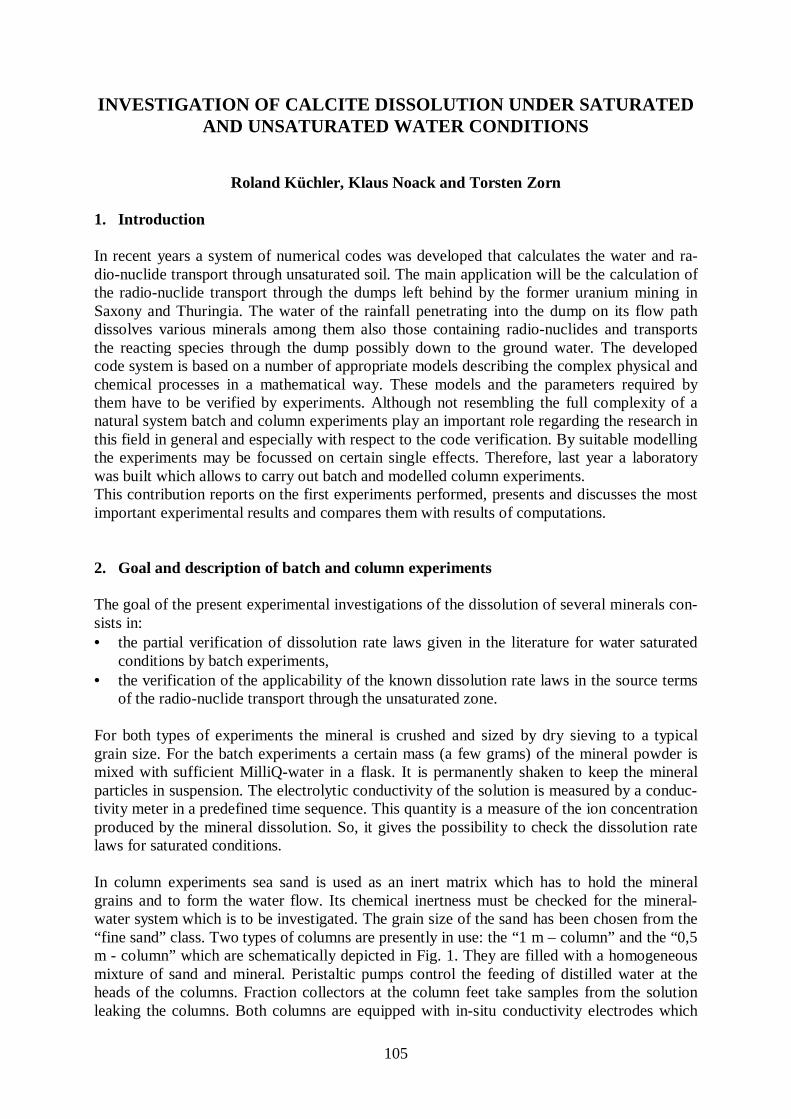
105
INVESTIGATION OF CALCITE DISSOLUTION UNDER SATURATEDAND UNSATURATED WATER CONDITIONS
Roland Küchler, Klaus Noack and Torsten Zorn
1. Introduction
In recent years a system of numerical codes was developed that calculates the water and ra-dio-nuclide transport through unsaturated soil. The main application will be the calculation ofthe radio-nuclide transport through the dumps left behind by the former uranium mining inSaxony and Thuringia. The water of the rainfall penetrating into the dump on its flow pathdissolves various minerals among them also those containing radio-nuclides and transportsthe reacting species through the dump possibly down to the ground water. The developedcode system is based on a number of appropriate models describing the complex physical andchemical processes in a mathematical way. These models and the parameters required bythem have to be verified by experiments. Although not resembling the full complexity of anatural system batch and column experiments play an important role regarding the research inthis field in general and especially with respect to the code verification. By suitable modellingthe experiments may be focussed on certain single effects. Therefore, last year a laboratorywas built which allows to carry out batch and modelled column experiments.This contribution reports on the first experiments performed, presents and discusses the mostimportant experimental results and compares them with results of computations.
2. Goal and description of batch and column experiments
The goal of the present experimental investigations of the dissolution of several minerals con-sists in:• the partial verification of dissolution rate laws given in the literature for water saturated
conditions by batch experiments,• the verification of the applicability of the known dissolution rate laws in the source terms
of the radio-nuclide transport through the unsaturated zone.
For both types of experiments the mineral is crushed and sized by dry sieving to a typicalgrain size. For the batch experiments a certain mass (a few grams) of the mineral powder ismixed with sufficient MilliQ-water in a flask. It is permanently shaken to keep the mineralparticles in suspension. The electrolytic conductivity of the solution is measured by a conduc-tivity meter in a predefined time sequence. This quantity is a measure of the ion concentrationproduced by the mineral dissolution. So, it gives the possibility to check the dissolution ratelaws for saturated conditions.
In column experiments sea sand is used as an inert matrix which has to hold the mineralgrains and to form the water flow. Its chemical inertness must be checked for the mineral-water system which is to be investigated. The grain size of the sand has been chosen from the“fine sand” class. Two types of columns are presently in use: the “1 m – column” and the “0,5m - column” which are schematically depicted in Fig. 1. They are filled with a homogeneousmixture of sand and mineral. Peristaltic pumps control the feeding of distilled water at theheads of the columns. Fraction collectors at the column feet take samples from the solutionleaking the columns. Both columns are equipped with in-situ conductivity electrodes which
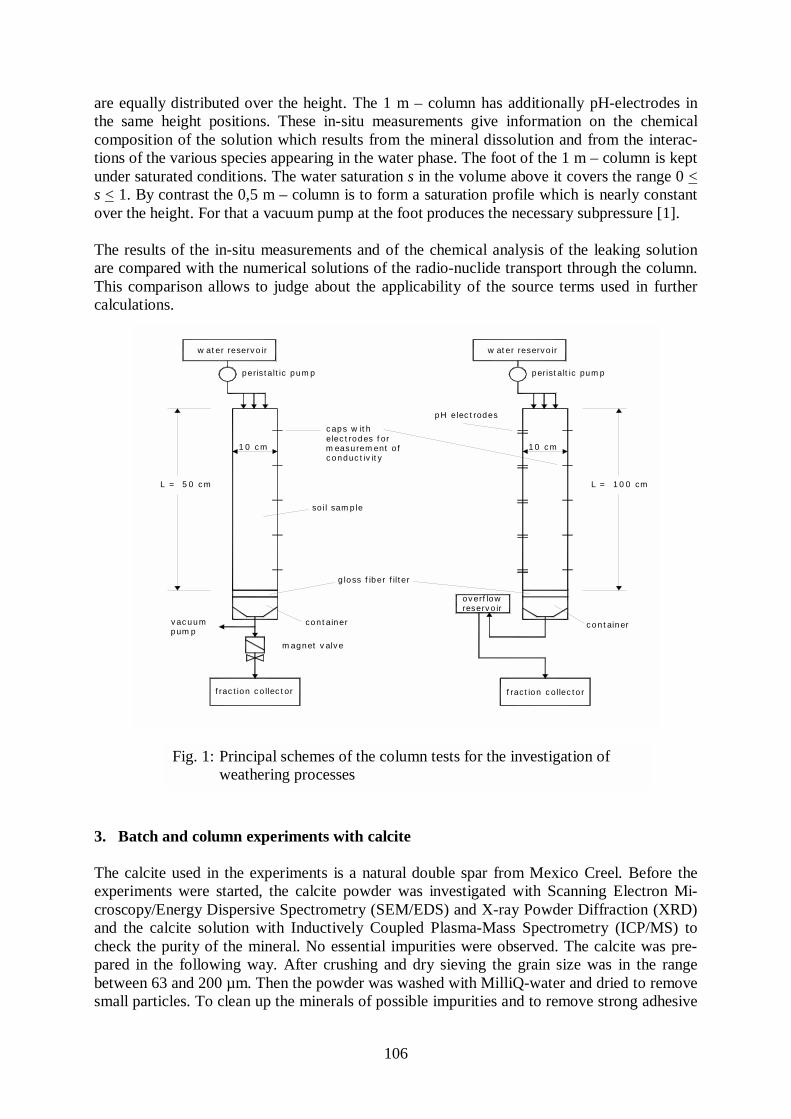
106
are equally distributed over the height. The 1 m – column has additionally pH-electrodes inthe same height positions. These in-situ measurements give information on the chemicalcomposition of the solution which results from the mineral dissolution and from the interac-tions of the various species appearing in the water phase. The foot of the 1 m – column is keptunder saturated conditions. The water saturation s in the volume above it covers the range 0 <s < 1. By contrast the 0,5 m – column is to form a saturation profile which is nearly constantover the height. For that a vacuum pump at the foot produces the necessary subpressure [1].
The results of the in-situ measurements and of the chemical analysis of the leaking solutionare compared with the numerical solutions of the radio-nuclide transport through the column.This comparison allows to judge about the applicability of the source terms used in furthercalculations.
3. Batch and column experiments with calcite
The calcite used in the experiments is a natural double spar from Mexico Creel. Before theexperiments were started, the calcite powder was investigated with Scanning Electron Mi-croscopy/Energy Dispersive Spectrometry (SEM/EDS) and X-ray Powder Diffraction (XRD)and the calcite solution with Inductively Coupled Plasma-Mass Spectrometry (ICP/MS) tocheck the purity of the mineral. No essential impurities were observed. The calcite was pre-pared in the following way. After crushing and dry sieving the grain size was in the rangebetween 63 and 200 µm. Then the powder was washed with MilliQ-water and dried to removesmall particles. To clean up the minerals of possible impurities and to remove strong adhesive
w at er reserv o ir
peris t alt ic pum p
c aps w it h
elec t rodes f or
m easurem ent o f
c onduc t iv it y
so il sam p le
pH elec t rodes
f rac t ion c o llec t or
con t ainer
m agnet v alv e
g loss f iber f il t er
f ract ion c ollec t o r
c on t ainer
perist alt ic pum p
w at er reserv o ir
ov erf low
reserv o ir
L = 5 0 c m L = 1 0 0 cm
1 0 c m 1 0 c m
v ac uum
pum p
Fig. 1: Principal schemes of the column tests for the investigation of weathering processes
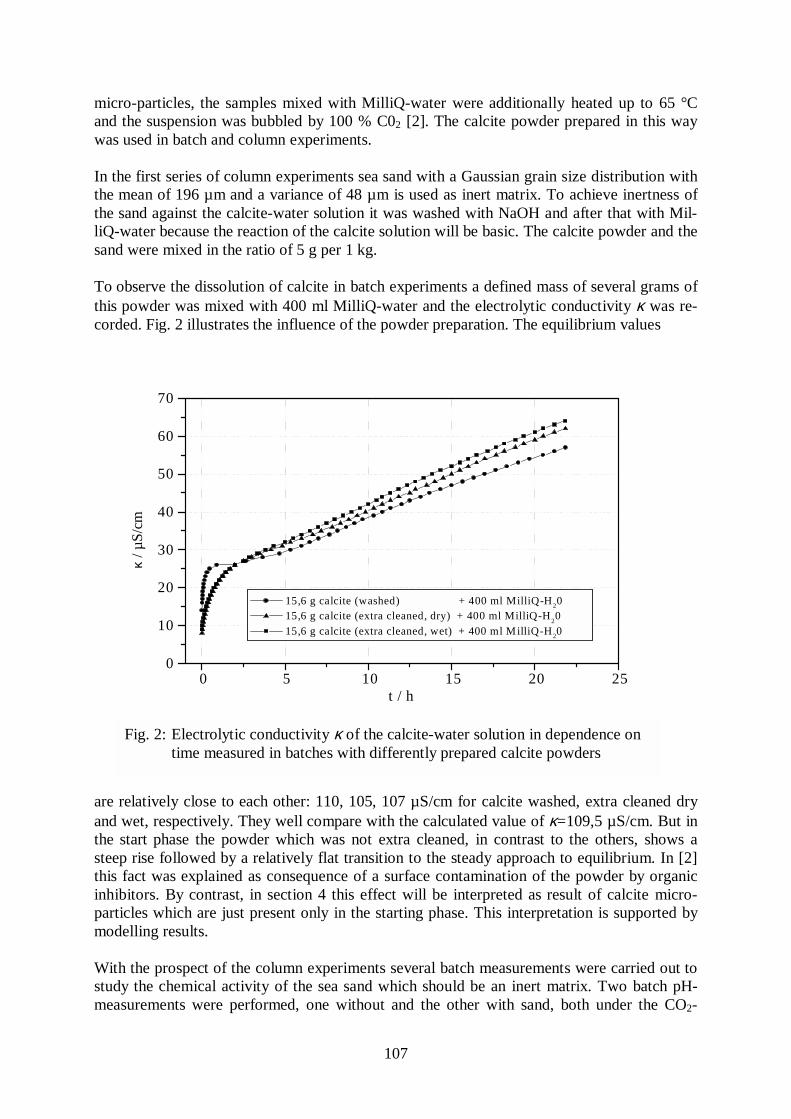
107
micro-particles, the samples mixed with MilliQ-water were additionally heated up to 65 °Cand the suspension was bubbled by 100 % C02 [2]. The calcite powder prepared in this waywas used in batch and column experiments.
In the first series of column experiments sea sand with a Gaussian grain size distribution withthe mean of 196 µm and a variance of 48 µm is used as inert matrix. To achieve inertness ofthe sand against the calcite-water solution it was washed with NaOH and after that with Mil-liQ-water because the reaction of the calcite solution will be basic. The calcite powder and thesand were mixed in the ratio of 5 g per 1 kg.
To observe the dissolution of calcite in batch experiments a defined mass of several grams ofthis powder was mixed with 400 ml MilliQ-water and the electrolytic conductivity κ was re-corded. Fig. 2 illustrates the influence of the powder preparation. The equilibrium values
are relatively close to each other: 110, 105, 107 µS/cm for calcite washed, extra cleaned dryand wet, respectively. They well compare with the calculated value of κ=109,5 µS/cm. But inthe start phase the powder which was not extra cleaned, in contrast to the others, shows asteep rise followed by a relatively flat transition to the steady approach to equilibrium. In [2]this fact was explained as consequence of a surface contamination of the powder by organicinhibitors. By contrast, in section 4 this effect will be interpreted as result of calcite micro-particles which are just present only in the starting phase. This interpretation is supported bymodelling results.
With the prospect of the column experiments several batch measurements were carried out tostudy the chemical activity of the sea sand which should be an inert matrix. Two batch pH-measurements were performed, one without and the other with sand, both under the CO2-
0 5 10 15 20 250
10
20
30
40
50
60
70
15,6 g calcite (washed) + 400 ml MilliQ-H20 15,6 g calcite (extra cleaned, dry) + 400 ml MilliQ-H
20
15,6 g calcite (extra cleaned, wet) + 400 ml MilliQ-H20
κ / µ
S/c
m
t / h
Fig. 2: Electrolytic conductivity κ of the calcite-water solution in dependence on
time measured in batches with differently prepared calcite powders
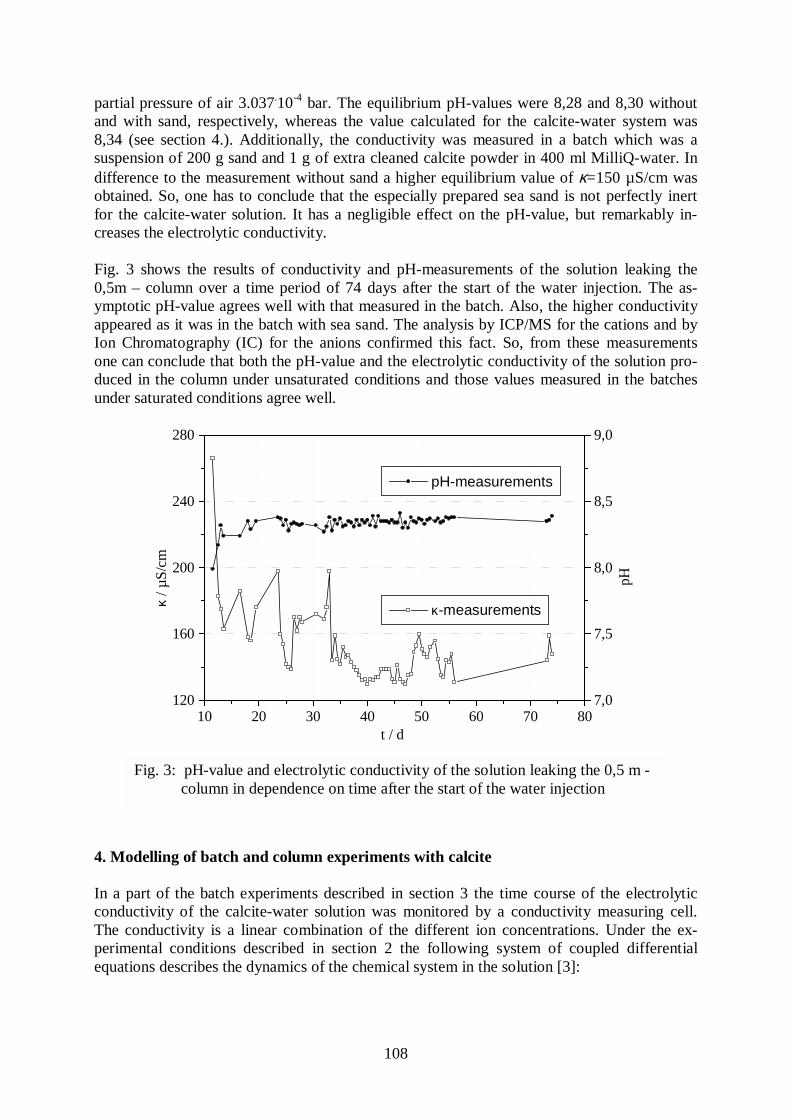
108
partial pressure of air 3.037.10-4 bar. The equilibrium pH-values were 8,28 and 8,30 without
and with sand, respectively, whereas the value calculated for the calcite-water system was8,34 (see section 4.). Additionally, the conductivity was measured in a batch which was asuspension of 200 g sand and 1 g of extra cleaned calcite powder in 400 ml MilliQ-water. Indifference to the measurement without sand a higher equilibrium value of κ=150 µS/cm wasobtained. So, one has to conclude that the especially prepared sea sand is not perfectly inertfor the calcite-water solution. It has a negligible effect on the pH-value, but remarkably in-creases the electrolytic conductivity.
Fig. 3 shows the results of conductivity and pH-measurements of the solution leaking the0,5m – column over a time period of 74 days after the start of the water injection. The as-ymptotic pH-value agrees well with that measured in the batch. Also, the higher conductivityappeared as it was in the batch with sea sand. The analysis by ICP/MS for the cations and byIon Chromatography (IC) for the anions confirmed this fact. So, from these measurementsone can conclude that both the pH-value and the electrolytic conductivity of the solution pro-duced in the column under unsaturated conditions and those values measured in the batchesunder saturated conditions agree well.
4. Modelling of batch and column experiments with calcite
In a part of the batch experiments described in section 3 the time course of the electrolyticconductivity of the calcite-water solution was monitored by a conductivity measuring cell.The conductivity is a linear combination of the different ion concentrations. Under the ex-perimental conditions described in section 2 the following system of coupled differentialequations describes the dynamics of the chemical system in the solution [3]:
Fig. 3: pH-value and electrolytic conductivity of the solution leaking the 0,5 m -column in dependence on time after the start of the water injection
10 20 30 40 50 60 70 80120
160
200
240
280
κ-measurements
t / d
κ /
µS
/cm
7,0
7,5
8,0
8,5
9,0
pH-measurements
pH
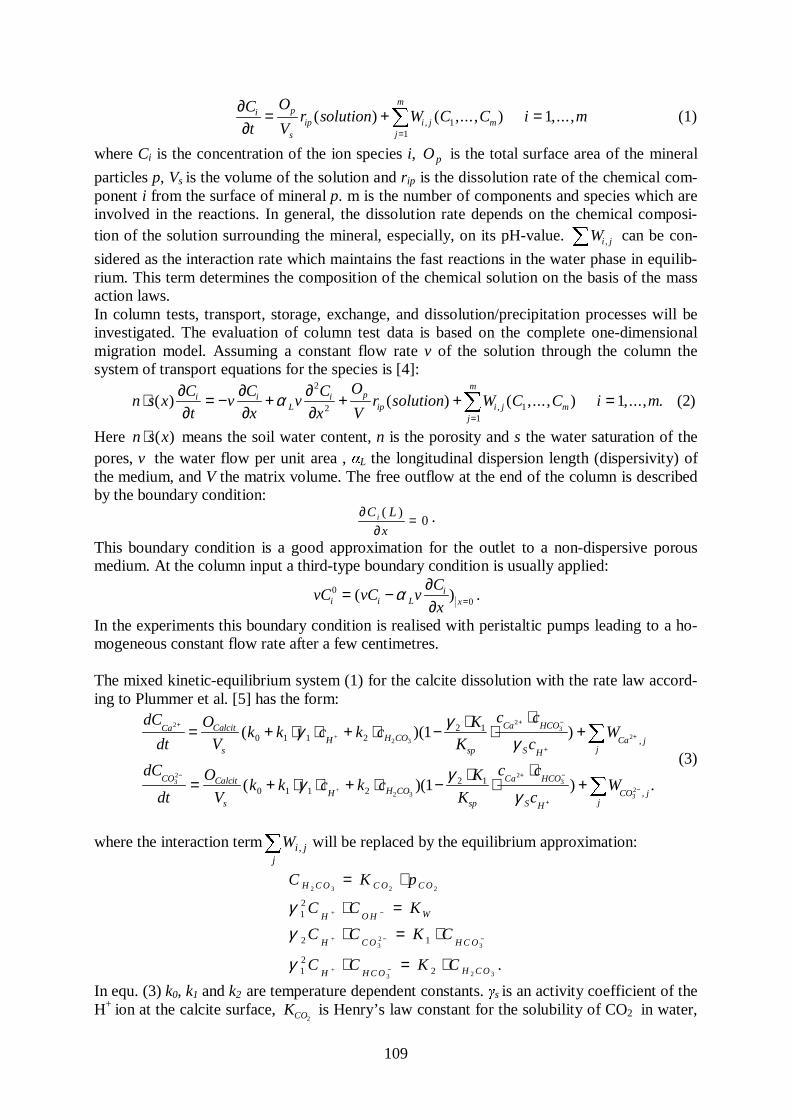
109
∂∂
= + ==
C
t
O
Vr solution W C C i mi p
sip i j m
j
m
( ) ( ,..., ) ,...,, 11
1 (1)
where Ci is the concentration of the ion species i, pO is the total surface area of the mineral
particles p, Vs is the volume of the solution and rip is the dissolution rate of the chemical com-ponent i from the surface of mineral p. m is the number of components and species which areinvolved in the reactions. In general, the dissolution rate depends on the chemical composi-tion of the solution surrounding the mineral, especially, on its pH-value. Wi j, can be con-
sidered as the interaction rate which maintains the fast reactions in the water phase in equilib-rium. This term determines the composition of the chemical solution on the basis of the massaction laws.In column tests, transport, storage, exchange, and dissolution/precipitation processes will beinvestigated. The evaluation of column test data is based on the complete one-dimensionalmigration model. Assuming a constant flow rate v of the solution through the column thesystem of transport equations for the species is [4]:
n s xC
tv
C
xv
C
x
O
Vr solution W C C i mi i
Li p
ip i j mj
m
⋅ ∂∂
= − ∂∂
+ ∂∂
+ + ==( ) ( ) ( ,..., ) ,..., .,α
2
2 11
1 (2)
Here n s x⋅ ( ) means the soil water content, n is the porosity and s the water saturation of thepores, v the water flow per unit area , αL the longitudinal dispersion length (dispersivity) ofthe medium, and V the matrix volume. The free outflow at the end of the column is describedby the boundary condition:
∂∂
=C L
xi ( )
0 .
This boundary condition is a good approximation for the outlet to a non-dispersive porousmedium. At the column input a third-type boundary condition is usually applied:
vC vC vC
xi i Li
x0
0= − ∂∂ =( )α .
In the experiments this boundary condition is realised with peristaltic pumps leading to a ho-mogeneous constant flow rate after a few centimetres.
The mixed kinetic-equilibrium system (1) for the calcite dissolution with the rate law accord-ing to Plummer et al. [5] has the form:
dC
dt
O
Vk k c k c
K
K
c c
cW
dC
dt
O
Vk k c k c
K
K
c c
cW
Ca Calcit
sH H CO
sp
Ca HCO
S HCa j
j
CO Calcit
sH H CO
sp
Ca HCO
S HCO j
j
2
2 3
23
2
32
2 3
23
32
0 1 1 22 1
0 1 1 22 1
1
1
+ + −
+
+
− + −
+
−
= + ⋅ ⋅ + ⋅ − ⋅ ⋅⋅
+
= + ⋅ ⋅ + ⋅ − ⋅ ⋅⋅
+
( )( )
( )( ) .
,
,
γ γγ
γ γγ
+
+
(3)
where the interaction termj
jiW , will be replaced by the equilibrium approximation:
C K p
C C K
C C K C
C C K C
H C O C O C O
H O H W
H C O H C O
H H C O H C O
2 3 2 2
32
3
3 2 3
12
2 1
12
2
= ⋅
⋅ =
⋅ = ⋅
⋅ = ⋅
−
− −
−
γγ
γ
+
+
+ .
In equ. (3) k0, k1 and k2 are temperature dependent constants. γs is an activity coefficient of theH+ ion at the calcite surface, KCO2
is Henry’s law constant for the solubility of CO2 in water,
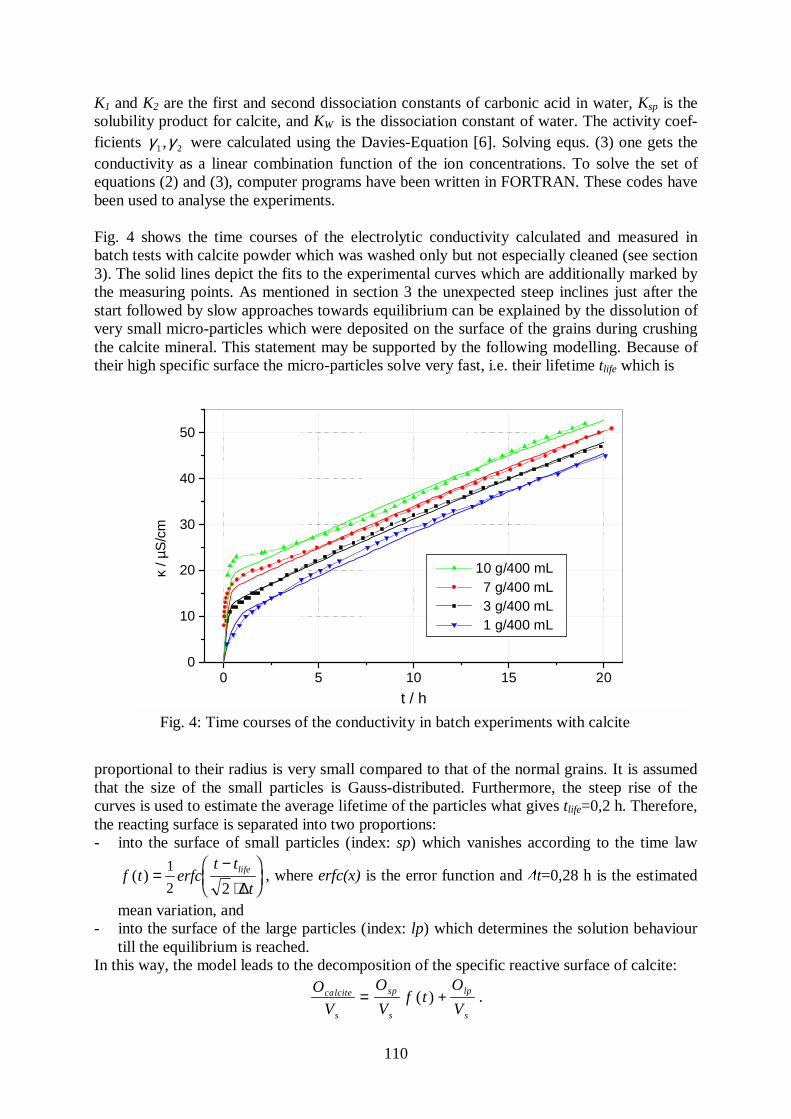
110
K1 and K2 are the first and second dissociation constants of carbonic acid in water, Ksp is thesolubility product for calcite, and KW is the dissociation constant of water. The activity coef-ficients 21 ,γγ were calculated using the Davies-Equation [6]. Solving equs. (3) one gets theconductivity as a linear combination function of the ion concentrations. To solve the set ofequations (2) and (3), computer programs have been written in FORTRAN. These codes havebeen used to analyse the experiments.
Fig. 4 shows the time courses of the electrolytic conductivity calculated and measured inbatch tests with calcite powder which was washed only but not especially cleaned (see section3). The solid lines depict the fits to the experimental curves which are additionally marked bythe measuring points. As mentioned in section 3 the unexpected steep inclines just after thestart followed by slow approaches towards equilibrium can be explained by the dissolution ofvery small micro-particles which were deposited on the surface of the grains during crushingthe calcite mineral. This statement may be supported by the following modelling. Because oftheir high specific surface the micro-particles solve very fast, i.e. their lifetime tlife which is
proportional to their radius is very small compared to that of the normal grains. It is assumedthat the size of the small particles is Gauss-distributed. Furthermore, the steep rise of thecurves is used to estimate the average lifetime of the particles what gives tlife=0,2 h. Therefore,the reacting surface is separated into two proportions:- into the surface of small particles (index: sp) which vanishes according to the time law
f t erfct t
tlife( ) =
−⋅
FHG
IKJ
1
2 2 ∆, where erfc(x) is the error function and ∆t=0,28 h is the estimated
mean variation, and- into the surface of the large particles (index: lp) which determines the solution behaviour
till the equilibrium is reached.In this way, the model leads to the decomposition of the specific reactive surface of calcite:
O
V
O
Vf t
O
Vcalcite
s
sp
s
lp
s
= +( ) .
0 5 10 15 200
10
20
30
40
50
10 g/400 mL
7 g/400 mL 3 g/400 mL 1 g/400 mL
κ / µ
S/c
m
t / h
Fig. 4: Time courses of the conductivity in batch experiments with calcite
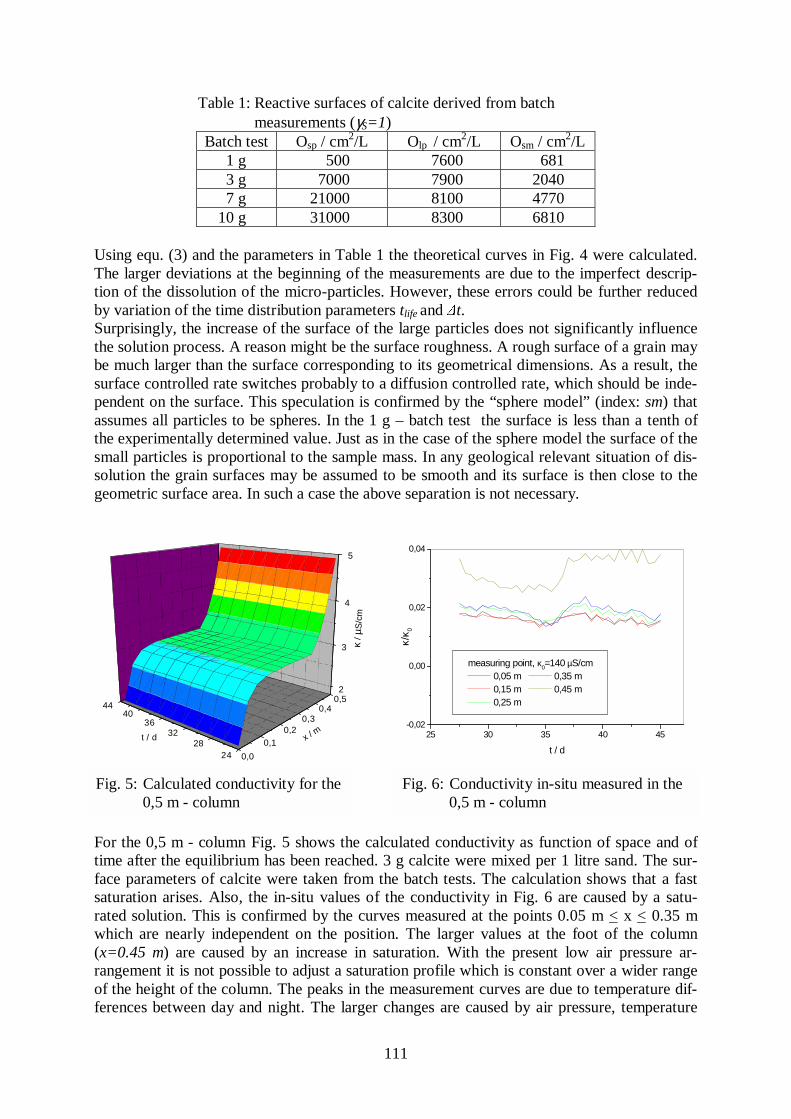
111
Table 1: Reactive surfaces of calcite derived from batchmeasurements (γS=1)
Batch test Osp / cm2/L Olp / cm2/L Osm / cm2/L1 g 500 7600 6813 g 7000 7900 20407 g 21000 8100 4770
10 g 31000 8300 6810
Using equ. (3) and the parameters in Table 1 the theoretical curves in Fig. 4 were calculated.The larger deviations at the beginning of the measurements are due to the imperfect descrip-tion of the dissolution of the micro-particles. However, these errors could be further reducedby variation of the time distribution parameters tlife and ∆t.Surprisingly, the increase of the surface of the large particles does not significantly influencethe solution process. A reason might be the surface roughness. A rough surface of a grain maybe much larger than the surface corresponding to its geometrical dimensions. As a result, thesurface controlled rate switches probably to a diffusion controlled rate, which should be inde-pendent on the surface. This speculation is confirmed by the “sphere model” (index: sm) thatassumes all particles to be spheres. In the 1 g – batch test the surface is less than a tenth ofthe experimentally determined value. Just as in the case of the sphere model the surface of thesmall particles is proportional to the sample mass. In any geological relevant situation of dis-solution the grain surfaces may be assumed to be smooth and its surface is then close to thegeometric surface area. In such a case the above separation is not necessary.
For the 0,5 m - column Fig. 5 shows the calculated conductivity as function of space and oftime after the equilibrium has been reached. 3 g calcite were mixed per 1 litre sand. The sur-face parameters of calcite were taken from the batch tests. The calculation shows that a fastsaturation arises. Also, the in-situ values of the conductivity in Fig. 6 are caused by a satu-rated solution. This is confirmed by the curves measured at the points 0.05 m < x < 0.35 mwhich are nearly independent on the position. The larger values at the foot of the column(x=0.45 m) are caused by an increase in saturation. With the present low air pressure ar-rangement it is not possible to adjust a saturation profile which is constant over a wider rangeof the height of the column. The peaks in the measurement curves are due to temperature dif-ferences between day and night. The larger changes are caused by air pressure, temperature
Fig. 5: Calculated conductivity for the0,5 m - column
25 30 35 40 45-0,02
0,00
0,02
0,04
measuring point, κ0=140 µS/cm 0,05 m 0,35 m 0,15 m 0,45 m 0,25 m
κ/κ 0
t / d0,0
0,10,2
0,30,4
0,5
2428
3236
4044
2
3
4
5
t / d
κ / µ
S/c
m
x / m
Fig. 6: Conductivity in-situ measured in the0,5 m - column
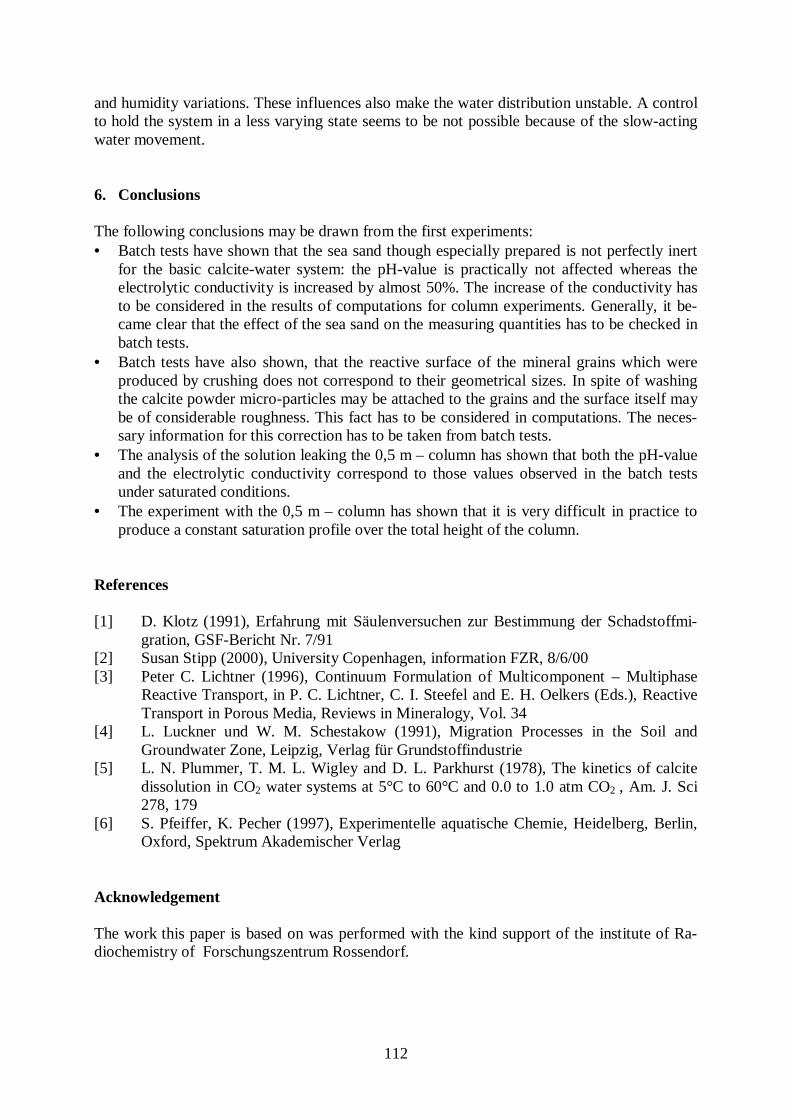
112
and humidity variations. These influences also make the water distribution unstable. A controlto hold the system in a less varying state seems to be not possible because of the slow-actingwater movement.
6. Conclusions
The following conclusions may be drawn from the first experiments:• Batch tests have shown that the sea sand though especially prepared is not perfectly inert
for the basic calcite-water system: the pH-value is practically not affected whereas theelectrolytic conductivity is increased by almost 50%. The increase of the conductivity hasto be considered in the results of computations for column experiments. Generally, it be-came clear that the effect of the sea sand on the measuring quantities has to be checked inbatch tests.
• Batch tests have also shown, that the reactive surface of the mineral grains which wereproduced by crushing does not correspond to their geometrical sizes. In spite of washingthe calcite powder micro-particles may be attached to the grains and the surface itself maybe of considerable roughness. This fact has to be considered in computations. The neces-sary information for this correction has to be taken from batch tests.
• The analysis of the solution leaking the 0,5 m – column has shown that both the pH-valueand the electrolytic conductivity correspond to those values observed in the batch testsunder saturated conditions.
• The experiment with the 0,5 m – column has shown that it is very difficult in practice toproduce a constant saturation profile over the total height of the column.
References
[1] D. Klotz (1991), Erfahrung mit Säulenversuchen zur Bestimmung der Schadstoffmi-gration, GSF-Bericht Nr. 7/91
[2] Susan Stipp (2000), University Copenhagen, information FZR, 8/6/00[3] Peter C. Lichtner (1996), Continuum Formulation of Multicomponent – Multiphase
Reactive Transport, in P. C. Lichtner, C. I. Steefel and E. H. Oelkers (Eds.), ReactiveTransport in Porous Media, Reviews in Mineralogy, Vol. 34
[4] L. Luckner und W. M. Schestakow (1991), Migration Processes in the Soil andGroundwater Zone, Leipzig, Verlag für Grundstoffindustrie
[5] L. N. Plummer, T. M. L. Wigley and D. L. Parkhurst (1978), The kinetics of calcitedissolution in CO2 water systems at 5°C to 60°C and 0.0 to 1.0 atm CO2 , Am. J. Sci278, 179
[6] S. Pfeiffer, K. Pecher (1997), Experimentelle aquatische Chemie, Heidelberg, Berlin,Oxford, Spektrum Akademischer Verlag
Acknowledgement
The work this paper is based on was performed with the kind support of the institute of Ra-diochemistry of Forschungszentrum Rossendorf.

113
Summaries of research activities

114
115
Thermo-fluiddynamics
H. CarlA. SchaffrathP. SchützW. Zimmermann
Thermal hydraulic test facility TOPFLOWTOPFLOW is a large-scale high-temperature and high-pressure testfacility for generic research in the field of transient two-phase flow andfor studies of safety relevant fluid-dynamic problems in components ofnuclear power plants and chemical installations. The design project ofthe facility is completed. The new facility will be built utilisingcomponents of the former NOKO test facility of the Research CentreJülich, which helped to reduce costs to 9 - 10 million DM. Theparameters allow experiments with steam-water mixture at saturationpressures of up to 7 MPa. The facility disposes of an electrical heatingpower of 4 MW. The construction work of the building was started.
A. BöttgerG. GrunwaldT. HöhneS. KliemH.-M. PrasserK.-H. Richter M. TammeJ. Zschau
funded by BMWiand VGB
Coolant mixing in pressurised water reactorsThe work aims at the determination of temperature and boronconcentration distributions at the core entrance during main steam-linebreaks and boron dilution transients. Experiments were carried out at themixing test facility ROCOM modelling the German KONVOI typepressurised water reactor in the scale of 1:5. The disturbance is modelledby injecting salt water as a tracer into the affected loop. A new quality oftests is achieved by using mesh-sensors with numerous measuringpositions in the downcomer and at the core entrance, the high measuringfrequency (up to 200 Hz), the variability of the four-loop test facility andthe direct comparison to CFD calculations. By variation of throttleorifices at the fuel element inlet positions the influence of the hydraulicresistance of the core was studied. Experiments were carried out fordifferent lengths of the deborated plug for different scenarios of start-upof the coolant circulation. For these experiments, the test facility wasequipped with a new fast-acting valve system to create short plugs.Furthermore, the velocity field in the downcomer was investigated usinga Laser Doppler Anemometer. A repeated start-up combined with aspecial ensemble averaging technique allowed to obtain transientvelocity distributions with a time resolution of 0.5 s. From the results thetime constant of the development of large vortices in the downcomercan be deduced.
A. BöttgerJ. FietzF. HenselD. HoppeH.-M. PrasserJ. ZschauC. ZippeW. Zippe
Development and calibration of two-phase flow measurementtechniquesThe qualification of the diversified level indication system for boilingwater reactors developed by FZR was continued according to theGerman reactor safety regulations. The qualification procedure and theseries production will be accomplished by an industrial supplier ofmeasurement instrumentation. FZR contributes as a scientific consultantand performed some finalising development tasks.
The new generation of signal acquisition units for the wire-mesh sensorsfor high-speed visualisation of two-phase flows at 10,000 frames persecond for a 16 x 16 measuring points sensor was extended to 64 x 64
116
Partner:TELETRONIC GbRfunded by BMWi
funded by BMWi
funded by DFG
funded by SMWK
measuring points for the application in a pipe of 200 mm diameter. Theframing rate for this sensor is 2,500 Hz. The sensor will be used for flowpattern studies at the test facility TOPFLOW.
In co-operation with the Technical University of Nishny Novgorod(Russia) a new ultrasonic mesh sensor was developed. The sensor isbased on a system of crossing ultrasonic wave-guides. It iscomplementary to the electrical wire-mesh sensors of FZR, because itcan be applied to non-conducting fluids. The dimensions of the waveguides were decreased to minimise the disturbance of the flow. Theproject was completed by the test of the new sensor design in a steam-water flow at up to 2.5 MPa.
For the investigation of transport processes in bubble columns and foamlayers, a PET detector is under construction. The scanner will allow tomeasure the distribution of a tracer marked by a positron emittingnuclide with a time resolution of better than 1 s. It consists of 8 axiallayers with 16 BGO detectors each. The spatial resolution will be in therange of a centimetre. The mechanical construction of the detectorarrays and the development of the signal acquisition circuitry wasfinished. First tests with NaF labelled with F-18 are planned for the nearfuture.
In co-operation with the Technical University Dresden, a quasi-stroboscopic gamma-tomograph for an axial turbo pump delivering anair-water mixture was developed and constructed. The device was putinto operation. The first imaging of the gas fraction distribution insidethe rotating impeller of the pump were successfully recorded.
A. Grahn Thermoconvection and instabilities at the boundary layer of twonon-miscible liquid reacting componentsFlow instability at the inter-phase surface between two non-miscibleliquids were investigated for the cases of non-reactive mass transfer(extraction) and exothermal reactions at the phase boundary. The workwas concentrated at the continuation of the development of thenumerical model for the two-dimensional flow in the gap. It considersthe chemical reaction, the thermal and concentration effects on the fluiddensity and the surface tension. The model is capable of predicting alltypes of experimentally observed instabilities (density driven circulationcells, double-diffusive fingering regimes, Marangony type instabilities).The quantitative agreement concerning wave lengths and growth ratesmust be further increased.
D. BaldaufD. LucasE. KrepperH.-M. PrasserC. ZippeW. Zippe
Transient two-phase flows in pipelinesIn the frame of a project sponsored by BMWi flow patterns and theirevolution in a vertical tube are investigated. In the last year, experimentswere concentrated on transient flows induced by pulsed air injection.The evaluation of previous measurements with the wire-mesh sensorwas continued. Most important result is the method to decompose radialgas fraction profiles according to bubble-size classes. It was shown that
117
funded by BMWi
cooperation withProf. E. HickenFZ Jülich
changes of the bubble size lead to qualitatively different profiles.Measurements taken by varying the inlet lengths allow to assess the non-drag forces acting on the bubbles and to estimate coalescence andfragmentation rates in dependence from the bubble diameter. Based onthese experimental results, a theoretical method was developed thatdescribes the evolution of the gas fraction profiles decomposedaccording to bubble size classes. The model is able to predict flowpattern transitions.
In the field of diabatic flows, a new type of local void probes wasdeveloped and used for condensation tests at the NOKO test facility inJülich. The probes are equipped with a micro-thermocouple substitutingthe traditional electrode wire. In this way it is possible to detect thephase state and to measure the temperature at accurately the samelocation. This allows to detect non-condensibles in the gas phase and tocharacterise the boundary layer in the liquid phase. Four probes weremounted into a cross section of the single tube of NOKO. They aredriven by step motors, developed by FZ Jülich, which translate theprobes through the boundary layer. The probes were placed at differentangular positions (0, 60, 120, 180 deg) of the horizontal pipe crosssection. The measured data show both thickness and structure of thecondensation layer.
Safety and effectiveness of chemical processes
G. HesselH. KrykW. SchmittT. SeilerF.-P. Weiß
supported byBMBF
Early detection of dangerous and undesired operating states inchemical plantsStudies on the early detection of dangerous and undesired operatingstates are accomplished in cooperation with Fraunhofer UMSICHT andan industrial partner. During the reporting period the ArzneimittelwerkDresden left the project due to structural changes within the company. Inthe meantime the Degussa-Huels AG has taken over this part.The development of a monitoring system based on adaptive heatbalances for batch reactors is the most important contribution of FZR.The adaptation of the heat balance model to the respective plant is doneby a neural network. For each relevant process fault there is a speciallyadaptive monitor. The validation of the heat balance model and faultmonitors was conducted in batch reactors with different volumes (1–10–70-litres) for an exothermically homogeneous esterification reaction.Results of the online testing in the pilot plant (UMSICHT) showed thatthe monitoring system was able to recognize undesired faults correctly.In particular, the hazardous reactant accumulation could be detectedmuch earlier than by a monitor based on increasing rates of the reactortemperature.It is planned to develop an equivalent monitoring system for theheterogeneous hydrogenation reaction in an industrial plant.
118
G. HesselH. KrykB. NollW. SchmittT. SeilerF.-P. WeißT. Willms
supported byindustry and BMBF
Safe and ecofriendly process controlThe knowledge of the thermochemistry during the normal and faultyoperation of batch reactors is a prerequisite for a safe and ecofriendlyprocess control of exothermal reactions in industrial chemical plants.The investigation was focussed on the hydrogenation process carried outby the Degussa-Huels AG. Preliminary tests conducted in an RC1reaction calorimeter under conditions of the industrial plant showed thatthe hydrogen transport from the gas phase to the liquid phase is the ratedetermining step of this hydrogenation. Therfore, first this volumetricmass transfer coefficient had to be measured using an additionalinstrumentation in the industrial plant due to be able to realize similarconditions for process studies in laboratory reactors. Moreover, thethermodynamic parameters of the industrial plant, e.g. the heat transfercoefficient and the heat capacities of the reaction mixture and thereactor, were determined by specific experiments.Besides this, two production samples were taken from all 16 conductedbatches at the end of hydrogenation and analysed by HPLC (highperformance liquid chromatography) in the FZR (cooperation with theInstitute of Bioinorganic and Radio-Pharmaceutical Chemistry of FZR)to assess the process courses regarding to the extent of hydrogenationand the formation of side products as well as to obtain process data fromthe normal operation for the development of a monitoring system. It wasfound that the products were completely hydrogenated and free fromside products to a great extent.
Accident analysis
U. GrundmannS. KliemS. MittagU. RohdeA. Seidel
Development, validation and application of the code complexDYN3D – ATHLETIn the framework of an EU PHARE project under the leadership of FZRwith participants from 8 European countries, different coupled 3D-neutronics/thermohydraulics code systems have been validated againstmeasurement data on real plant transients from VVER type reactors.Two transients, the power drop of one generator down to house loadlevel at the NPP Loviisa (VVER-440) and turning off one of twoworking feedwater pumps at the NPP Balakovo (VVER-1000), havebeen analysed. For the key parameters, a good agreement betweenmeasurements and calculations was achieved. It was found, that thecorrect modelling of the heat transfer in the gas gap between fuel andcladding is significant for the estimation of the fuel temperature Dopplerfeedback, which influences the change of power level during thetransient. As a result of the project, the confidence of the results of thedifferent codes has been improved.The solution of an OECD benchmark exercise comprising the analysisof a main steam line break scenario for a Pressurized Water Reactor hasbeen completed. Due to the overcooling of the reactor connected withpositive reactivity insertion, re-criticality and return to power of the shutdown reactor can occur. More than 14 organisations from 7 countriesparticipated in the benchmark. The results obtained with DYN3D are ingood agreement with the other codes.
119
supported byBMWi and EU
A new version of the code DYN3D was elaborated combining the twoversions for quadratic and hexagonal geometry of fuel assemblies. Anew nodal method for hexagonal fuel assemblies with enhancedaccuracy of the neutronic calculation has been integrated. Assemblydiscontinuity factors (ADF) can be taken into account. The fluxreconstruction method for hexagonal geometry was integrated in thenew version in co-operation with NRI Rez (Czech Republic). A nucleardata library, generated for a KWU Konvoi reactor by TSO Bavaria usingthe code CASMO, has been coupled to DYN3D.A scientific conference on the development, validation and applicationof coupled 3D-neutronics/thermohydraulic codes has been organised inRossendorf under the auspices of the German Nuclear Society. Theparticipation of about 100 experts from research institutes, nuclearpower plants and technical support organisations of the nuclearauthorities proved the scientific authority, which Rossendorf has gainedin this field.
E. KrepperF. Schäfer
supported byBMWi
Validation of thermohydraulic system codesThe analysis of an experiment performed at the Japanese test facilityCCTF simulating a large break loss-of-coolant accident (design basicaccident) with cold leg respective combined cold and hot leg ECCinjection by the help of the thermoydraulic code ATHLET (developedby Gesellschaft für Anlagen- und Reaktorsicherheit) has beencompleted. In this experiment, large counter current flows of water andsteam with condensation occur. The analysis aimed at the validation ofthe six equation code version and of a new condensation model inATHLET. Space-dependent effects in the flooding of the heated-upreactor core simulator had to be taken into account. In general, thecourse of the transient was calculated in good agreement with theexperiment.
E. KrepperT. HöhneS. KliemM. Kliem
Computational fluid dynamics simulations of one and two-phaseflowThe experiments on coolant mixing in PWRs in the ROCOM test facilityhave been accompanied with CFD simulations. Experiments with theinjection of plugs of a tracer fluid (salt water) into a steady state flowfield or during the start-up of circulation have been analysed. A goodagreement between calculation and measurement was achieved even forthe transport of the tracer in the complex instationary flow field duringthe start-up of the circulation. Based on measured response functions forquasi Dirac impulse shaped injections, time-dependent mixing curvesare obtained for each fuel element position by applying linear super-position techniques. This Semi-Analytical Plug Reconstruction modelSAPR is going to be implemented into the code DYN3D.The simulation of experiments performed at the Rossendorf two-phaseflow test loop by using the CFD code CFX has been continued. Itbecomes clear, that for a realistic modelling of the radial gas profile in aflow with higher gas fractions multi-bubble class models consideringbubble forces dependent on the bubble diameter and simulatingcoalescence and break-up of the bubbles have to be applied.
120
partially funded byBMWi
CFD simulations of the natural convection in tanks with local heatsources have been performed. For the validation of the CFD models,international benchmark problems have been solved. Calculations wereperformed for experiments at the NOKO test facility modelling anemergency condenser of a BWR power plant, and for side wall heatedtanks. Modelling the sub-cooled boiling near the heated walls, the flowphenomena in the heated tank have been simulated in qualitatively goodagreement with the experiments. The formation of sharp layers withdifferent temperature has been observed, which break up suddenly ifboiling becomes more intensive.The porous body model developed for 3D flow simulations for thereactor core has been improved by implementing an an-isotropic dragforce model. An experimental set-up will be constructed to validate themodel against flow measurements in rod bundles.
Liquid metal magnetohydrodynamics
I. GrantsV. GalindoV. ShatrovG. Gerbeth
supported bySMWK, BMBF,DFG
Basics of MHD flowsA spectral code has been developed to simulate the flow in a cylindricalcavity driven by a rotating magnetic field. The high-precision spectralapproach delivered a number of important insights into the instabilitydetails of that flow. First, the linear oscillatory instability is not of theTaylor-Görtler type as it has been concluded in all foregoingpublications. Second, there is a high sensitivity of the flow to small butfinite disturbances already about 30% below the linear instabilitythreshold. This sensitivity indicates a non-linear route to turbulence insuch flows.Numerical simulations have been performed for the flow inside amagnetically levitated drop and in an inductively heated crucible. Thebasically axisymmetric flow in a levitated drop becomes oscillatoryunstable in a 3d form with an azimuthal wavenumber of m=3. The flowin an inductively heated melt is strongly 3d. The numerical results differfrom the experimental values due to the significant influence of freesurface flow phenomena not taken into account in the simulation up tonow.
A.CramerI. GrantsJ. PriedeS. EckertG. Gerbeth
Crystal growth and metallurgyThe global heat modelling has been performed for the growth of GaAsin the new Vertical Gradient Freeze facility of Bergakademie Freiberg.The action of an external rotating magnetic field on the melt flow wasespecially designed in order to obtain an almost flat phase boundaryduring the growth process. For that, analytical as well as numericalsolutions for the Stefan problem of the unknown phase boundarybetween melt and crystal have been developed. A significant influenceon the phase boundary geometry is possible which shall now be verifiedin a set of growth experiments. The possibilities for flow control in theFloating-Zone growth process has been analysed with the conclusionthat an influence on the phase boundary geometry is only possible if thedouble vortex structure could be changed. For that a novel magnetic
121
supported bySMWK, DFG
pump principle has been developed working with an additional magneticwinding without own power supply. These theoretical-numericalinvestigations lead to an experimental realization proposal which will beinstalled at a Floating-Zone facility of Institut für Festkörper- undWerkstoffforschung Dresden.
Systematic experiments at the melt extraction model facility gavequantitative results on the influence of the meniscus oscillations on thefibre diameter distribution. The counter measure based on a magneticring on the rotating wheel lead to a significant reduction of the diameterdistribution and smaller mean diameters.
F. StefaniTh. GundrumG. Gerbeth
supported by DFG
Dynamo effectA second measuring campaign was performed at the Riga dynamofacility in July 2000. During three different runs of the facility fullyreproducable results were obtained for the magnetic field generationprocess consisting of the exponential field growth slightly above theinstability threshold, the magnetic field saturation at higher liquid metalvelocities and the exponential decrease of the field if the flow ratefinally decreases below its critical value. The results for the magneticfield frequencies and growth rates agree very well with the numericalsimulations and, in addition, with the first experiments from November1999. A non-trivial backreaction of the magnetic field on the flow hasbeen observed. It consists in an axial shift of the magnetic fieldmaximum due to the breaking Lorentz forces in azimuthal directionwhich result in a decreasing swirl flow axially downwards from thedriving propeller.
T. WeierU. FeyG. MutschkeJ. HüllerG. Gerbeth
supported byBMBF-VDI, DFG
Boundary layer control in electrolytesThe electromagnetically controlled flow around two different airfoilshave been experimentally studied in a salt water flow basin of HSVAHamburg. Two leading effects have been identified: Production of liftdue to the electromagnetically induced circulation, and suppression ofvortex separation at inclined positions. The latter gives a serious liftincrease of up to 80% compared to the uncontrolled case. Numericalsimulations accompany these investigations. They reproduce the maintendencies of the experiments, but are still limited with respect to theReynolds number due to the unknown type of turbulence modellingbeing appropriate for this type of flow control.Small scale model experiments were performed in order to demonstratethe influence of an external magnetic field on the limiting current andthe flow distribution in electrochemical cells. Just by simple adding ofan external permanent magnet a strong influence on the limiting currentdensity as well as on the flow field has been found resulting, e.g., in achange of flow direction close to the electrode surface in a bubbleproducing electrochemical process.
122
V. Shatrov,J. PriedeG. Gerbeth
supported byAstrium GmbHFriedrichshafen
LevitationTwo different ways of active stabilization of electromagneticallylevitated samples were developed. One works with a ring of permanentmagnets, the other with an electrotechnical superposition of a directcurrent to the high-frequency levitating coil. Both give a fullstabilization of the levitated sample. Both methods have been proposedto the company Astrium GmbH for an installation into the hardware ofthe levitation experiments on the International Space Station.
S. EckertW. WitkeTh. GundrumJ. HüllerG. GerbethF. Stefani
supported byEU, DFG
Measuring techniquesThe ultrasonic Doppler velocimetry (UDV) has been tested at highertemperatures for flows of sodium and lead-bismuth. The commerciallyavailable transducers are limited to about 100 °C. Systematicmeasurements have been performed with direct melt contact, through asolid wall of the melt or with an additional wave-guide for temperaturesup to 250°C. Special care and design is needed for the channel wallthickness, the coupling conditions at interfaces and the wetting of theliquid metal to the contacting wall. If this is fulfilled UDV givesinstantaneously a complete velocity profile over the flow cross sectionas demonstrated in the sodium and lead-bismuth experiments. Anindustry oriented European project has been started in order to developUDV up to liquid steel temperatures for applications in metallurgicalindustries.The idea of a magnetic tomography, i.e. reconstruction of the flow fieldout of external magnetic field measurements, has been developed. Ademonstration experiment based on external magnetic field Hallmeasurements was designed which is currently being installed.
Materials and components safety
H.-W. ViehrigS. Schneider
Radioisotope laboratory for machining of specimens for mechanicaltestingIn order to extent the potential to investigate radioactive materials asecond part of the radioisotope laboratory for mechanical testing is built.It includes the hot cells with equipment for machining of specimens andfor additional mechanical tests. The construction of the hot cells isfinished and the machines have been installed. A CNC-controlledelectric discharge machine allows to produce testing specimensaccording to the standards from pieces taken from components ofcurrent or decommissioned nuclear installations like power plants,research reactors or accelerators. Because the commercial machine wasnot suitable for operation under hot cell conditions, the design and someoperational functions must be changed in a substantial extent. Essentialsteps have already been taken, some new assemblies and techniqueswere developed and successfully tested.
123
H.-W. ViehrigG. MüllerJ. Böhmert
supported byBMWi and EU
Evaluation of the neutron embrittlement of Russian reactorpressure vessel steelsBasing on the results of the irradiation programme Rheinsberg the shiftof the ductile brittle transition temperature determined by the Charpyimpact test and the shift of the reference temperature TO using the codeASTM E 1921-97 were compared with the prediction according to theRussian guidelines. For the VVER 440-type reactor pressure vesselsteels the results are in accordance to the Russian guidelines. The VVER1000-type vessel steels show a higher neutron embrittlement. Inparticular the investigated 10KhNGMAA VVER 1000 weld metalexhibits a very large shift of the transition temperature that is notunderstandable on the base of the recent prediction formula.The detrimental effect of nickel that can be derived from the results ofthe Rheinsberg programme is not confirmed by recent investigations ofVVER 1000 weld metal with different content of nickel irradiated atsurveillance position of a VVER 1000. In this study the heat with thehighest nickel content shows the lowest embrittlement. Furthermore fora better understanding of the embrittlement mechanism, the method ofthermal activation analysis was used. The study shows that theirradiation effect is athermal regarding the interrelation between theradiation-induced microstructural features and gliding dislocations. Theeffect does not depend on the nickel content.The shift of the reference temperature TO and the Charpy transitiontemperature shift correlate but the scattering is large. Thus TO datacannot be substituted by the Charpy transition temperature in the frameof safety assessments for the reactor pressure vessel.
H.-W. ViehrigJ. DzuganJ. Böhmert
Methodical studies for the determination of fracture mechanicsparametersThe determination of fracture mechanics parameters from smallspecimens to characterize irradiated materials is still an open issue.Appropriate approaches are the Wallin’s master curve concept or thedetermination of crack resistance curves by single-specimen techniqueslike the unloading compliance method. Wallin`s master curve conceptwas used to determine a dynamic master curve. For this purpose fracturemechanics impact tests were performed and compared with the staticmaster curve. Shape and scattering of the dynamic master curve are notidentical with the static one. Thus the concept cannot be transferredwithout modifying the approach. This needs further work.The unloading compliance technique fails for materials of hightoughness. Under this condition the compliance is not only dependent onthe crack length but also on the displacement. Correction formulaconsider this influence only insufficiently. On the base of acomprehensive data bank suitable approaches were developed for abetter correction. In order to generalize the correction obtainedsensitivity studies by means of FEM modelling are planned.A new method was developed for the determination of crack resistancecurves at 3-point bend specimens of Charpy geometry. The methodsbases on ultrasound flight time measurements of a transverse wavediffracted at the crack tip. The method meets the demands according to
124
the standards for a single specimen technique of crack growthmeasurement.
A. UlbrichtJ. Böhmert
supported byBMWi
Modelling of the neutron embrittlement mechanismSmall angle neutron scattering experiments were carried outaccompanying the mechanical test of the materials from the Rheinsbergirradiation programme. Heats of base and weld material wereinvestigated in as-received, irradiated and post-irradiation annealedconditions. The small angle neutron scattering intensity increases in thescattering vector range between 0.8 and 3 nm-1
for all compositions inthe irradiated state. The size distribution function of the irradiationinduced defects has a pronounced maximum at a radius of 1 nm. Theirvolume contents vary between 0.1 and 0.7 vol.% depending on materialcomposition and increases with increasing neutron fluence. Thecomparison between nuclear and magnetic scattering indicates that themicrostructural features differ in their composition. Thermal annealingreduces the volume fraction of the irradiation defects. The effects ofirradiation on the microstructure reflect the irradiation-caused shift ofthe transition temperature (irradiation embrittlement) or the changes ofhardness (irradiation hardening). Further, the recovery of the mechanicalproperties by annealing corresponds to the restoration of the small angleneutron scattering curve of the as-received state. This is valid as a trendbut there are some irregularities in these relations. Thus neitherirradiation embrittlement nor irradiation hardening can be attributed to asimple microstructural parameter like the volume fraction of nanoscaledefects.
H.-G. WillschützE. Altstadt
In-vessel retention in LWRsConsidering the hypothetical core melt down scenario for a light waterreactor (LWR) the failure mode of the reactor pressure vessel (RPV) hasto be investigated to determine the possible loads on the containment.The FOREVER-experiments, currently underway at the KTH Stockholm(Sweden), are simulating the thermal and pressure loads on the lowerhead for a corium melt pool with internal heat sources. Due to the multi-axial creep deformation of the vessel with a non-uniform temperaturefield these experiments are an excellent source of data for the validationof numerical creep models. Therefore, a Finite Element model has beendeveloped based on a commercial multi-purpose code. Using the CFDmodule the temperature field within the vessel wall is evaluated. Thetransient structural mechanical calculations are performed using a newnumerical approach which avoids the use of a single creep lawemploying constants derived from the data for a limited stress andtemperature range. Instead of this a three-dimensional array is developedwhere the creep strain rate is evaluated according to the values of theactual total strain, temperature and equivalent stress. Care has to beexercised in the comparison of the measured data and the numericalresults. Considering the FOREVER-C2 experiment, for example, therecorded creep process appeared to be tertiary at the first glance. But itcould be shown that a small temperature increase during the creepdeformation caused the observed progressive behaviour. Such
125
considerations provide insight and better predictive capability for thevessel creep behaviour during prototypic severe accident scenarios. Thework has been performed in cooperation with KTH Stockholm (Prof.Sehgal).
E. AltstadtT. MössnerT. ReppR. Weiß
supported byVDEW
Water hammers in pipelinesThe pressure waves induced by a sudden slow down of the fluid flow ina pipeline are modelled on the base of the finite element method. Specialattention is put on the influence of fluid-structure interaction if the pipediameter is relatively large in comparison with the wall thickness. TheFE-codes ADINA and ANSYS are used for modelling. The transientvelocity and pressure distribution is calculated in a straight pipe and in a90° elbow assuming a slightly compressible fluid. The coupling betweenthe elastic pipe wall and the fluid is realized by boundary elements. It isshown that there are local stresses in the elbow which are higher thanthose calculated with conventional uncoupled calculations. It was alsofound that pressure waves propagate in radial direction. Thesecalculations have to be validated. Therefore, at the FZR a cold waterhammer test facility has been installed. Pressure amplitudes of up to 200bars can be generated. First tests have shown that it works as expected.A one-dimensional model for the acceleration of the fluid was developedand validated with the results of the first experiments. The bouncingvelocity is predicted quite well by this model, whereas the pressureamplitude is over_estimated by some 30-50% since the effect of thejunction coupling is not yet included. The work is supported by the EC(5th frame work programme).
M. WernerE. AltstadtS. Perov
Finite Element-Modelling of crack propagation and materialdamageA 3-dimensional FE-Model of a Charpy specimen has been developed.This model includes the kinematics of the roll bearings as well as thecrack opening mechanism. Additionally the influence of the elasticdeformation of the test facility is considered. This might be ofimportance for the correction of experimentally determined compliancefunctions. Two different methods of crack modelling were used: (i) thesubstructure technique based on the concept of linear-elastic fracturemechanics and (ii) the elastic-plastic material behaviour coupled with asimple damage based criterion for crack opening (crack opening isrealized by the node unlocking concept). In the latter concept the crackopening is simulated in a time dependent calculation. The numericalstability was found to be a problem in some cases with large plasticstrain. This might be due to the node unlocking concept. Therefore, anelement deactivation concept is now being tested.In a parallel work the plasticity model of Gurson, Needleman andTveergard was integrated into the finite element code ANSYS. With thatmodel the description of porosity (development of mesoscaled cavities)just before the ductile fracture is possible.
126
Simulation of particle and radiation fields
R. Koch Prototypical nuclear data libraries for the European PressurisedReactorThe new version 1.6 of the neutron and gamma transport code HELIOSfor cell and depletion calculations was installed, tested and debugged. Inaddition, some Fortran 90 programs and UNIX-shell scripts have beenwritten to automate the processing with different data and to extract theresults of HELIOS runs. With the help of HELIOS and this auxiliaryprograms 310 two-groups sets, each for seven depletion steps, werecalculated and prepared for the use in reactor-dynamic calculations withthe DYN3D code. To analyse the cross-sections and other datacalculated with the Program HELIOS 1.6, a module was implemented toimport and plot these results. This module automates the graphicalrepresentation of cross sections over depletion as 2D-plots.
R. KüchlerK. NoackT. Zorn
work performed incooperation withthe Institute ofRadiochemistry ofFZR
Transport of radio-nuclides in the unsaturated zoneIn recent years numerical codes have been developed and were used fortransport calculations of water and chemical species of radio-nuclidesthrough the unsaturated soil. Now the mathematical models of thevarious physical and geo-chemical phenomena and the parametersrequired by them have to be verified by appropriate experiments.Therefore, a laboratory was built which allows to carry out batch andcolumn experiments. The columns are filled with modelled mixturesconsisting of sea sand as quasi-inert matrix and certain minerals whichare of great importance for the radio-nuclide transport in the dumps ofthe former uranium mining in Saxony. At present, research is focused onthe dissolution rates of those minerals under unsaturated conditions.Additionally to the collection of samples of the leaking solution at thefeet of the columns the stand for the column experiments is equippedwith in-situ measuring techniques of the electrolytic conductivity and ofthe pH-value. In the first series of experiments the dissolution behaviourof gypsum and calcite was determined and compared with results ofcalculations based on published dissolution rates. The developed dataacquisition and experiment control proved to work stable over theexperiment time of some months.
K. NoackA. Rogov*
Neutron Laboratory at ELBEThe neutron laboratory at the electron accelerator ELBE will beequipped with a photo-neutron source. The target material stops theelectrons which produce Bremsstrahlung the photons of which thengenerate neutrons by photo-nuclear reactions. The production of photo-neutrons was calculated for different directions around a specified targetby means of the Monte Carlo code MCNP-4B and the results comparedto those which were independently achieved with the code FLUKA bythe TU Dresden. In contrast to FLUKA the MCNP code does not yetallow an automatic run simulating the three coupled particle transports.So, the task was solved by two steps: first, the photon flux distributioninside the target was calculated in an electron/photon transport problemand, second, applying a published reaction model the distribution of
127
* Visitor toForschungszentrumRossendorf
emitted photo-neutrons was calculated and used as source in thesubsequent neutron transport simulation. The results of both codesshowed a very good agreement so that both can be used for targetoptimisation further on.
B. BöhmerJ. KonheiserH. KumpfP. Vladimirov
supported byBMWi
supported by EU
Neutron and Gamma dosimetry of reactor pressure vesselsAs contribution to the BMWi project „Influence of the gammairradiation on the deterioration of reactor pressure vessel materials andon reactor dosimetry measurements“ neutron and gamma flux spectrahave been calculated for two Russian and two German reactor types,partly in co-operation with Russian scientists. Using the calculated fluxspectra damage parameters for the highest flux regions of the reactorpressure vessels have been obtained. More detailed investigations of theimpact of high gamma fluences on the pressure vessel embrittlementwere prepared. Additionally, a model of the development of atomicdisplacement cascades, the formation of copper precipitates, and of theinfluence of gamma irradiation on these processes has been developed.
The recently upgraded geometrical module of the Rossendorf MonteCarlo code TRAMO was successfully tested through fluencecalculations for the irradiation experiment at the Russian VVER-1000Novovonesh-5. The work was carried out within the EU TACIS projectSRR2/95. The obtained calculation results were compared withexperimental values and with results of independent calculations. In bothcases a reasonable agreement was found.
B. BöhmerJ. KonheiserH. KumpfK. Noack
supported by DFG
Increasing the accuracy of neutron and gamma fluencedeterminationA new research project was started that aims at extension andverification of TRAMO for solving neutron-gamma transport problemsand at testing nuclear data libraries. In this project which is supported byDFG partners are involved from the TU Dresden (TUD) and from theHTWS Zittau/Görlitz. First test measurements of neutron and gammaspectra were performed at the horizontal neutron beam channel of thetraining reactor of the TUD. The measurements were performed in theopen beam as well as behind iron and water layers. Calculations with thecode MCNP were used to optimise the measurement set-up. The codeTRAMO was qualified for coupled neutron-gamma calculations and foran improved treatment of thermal neutrons. The needed thermalscattering matrices were calculated with the code NJOY.

128

129
Publications

130
131
Publications in scientific and technical journals and in conferenceproceedings
Altstadt, E.; Willschuetz, H.-G.Creep Modelling for Complex Geometries with Highly Non-uniform TemperatureFields26. MPA-Seminar "Sicherheit und Verfügbarkeit in der Energietechnik", StaatlicheMaterialprüfanstalt Stuttgart, Proc. S. 9.1-9.13, 5.-6.10.2000, Stuttgart
Altstadt, E.; Willschütz, H.-G.Applying ANSYS/Multiphysics with Extended Creep Capabilities to an Integral SevereNuclear Accident Experiment18. CAD-FEM Users´ Meeting, 20.-22. September 2000, Friedrichshafen am Bodensee,Germany, Proceedings Vol.2, 2.5.5.
Anikeev, A. V.; Bagryansky, P. A.; Ivanov, A. A.; Karpushov, A. N.; Korepanov, S. A.;Maximov, V. V.; Murakhtin, S. V.; Smirnov, A. Yu.; Noack, K.; Otto, G.Fast Ion Relaxation and Confinement in the Gas Dynamic TrapNuclear Fusion 40 (2000) 753-765
Aszodi, A.; Krepper, E.; Prasser, H.-M.Experimental and numerical investigation of one and two phase natural convection instorage tanksHeat and Mass Transfer 36 (2000) 6, 497-504
Barz, H.-U.; Böhmer, B.; Konheiser, J.; Stephan, I.Monte Carlo Calculations of Neutron Fluence Spectra, Activation Measurements,Uncertainty Analysis and Spectrum Adjustment for the KORPUS DosimetryBenchmarkTenth International Symposium on Reactordosimetry, 12.- 17. 9. 1999, Osaka, Japan, ASTMSTP 1398
Beyer, M.; Carl, H.; Schumann, P.; Seidel, A.; Weiß, F.-P.; Zschau, J.; Nowak, K.Support of the Ukrainian supervisory authority in establishing a modern nuclear powerplant monitoringKerntechnik Vol. 65; No.1; Februar 2000; Seiten 23 - 27
Boehmert, J.; Ulbricht, A.; Kruykov, A.; Nikolaev, Y.; Dmitry, E.Composition Effects on the Radiation Embrittlement of Iron AlloysEffects of Radiation on Materials: 20th International Symposium, June 2000, ASTM STP1405, S.T. Rosinski, M. L. Grossbeck, T. R. Allen and A. S. Kumar, Eds.
Böhmer, B.; Borodkin, G. I.; Manturov, G. N.Improved Covariance Analysis and Spectrum Adjustment for VVER-1000 PressureVessel FluencesTenth International Symposium on Reactordosimetry, 12.- 17. 9. 1999, Osaka, Japan, ASTMSTP 1398
132
Böhmer, B.; Manturov, G.Neutron Flux Uncertainty and Covariances for Spectrum Adjustment and Estimationsof Pressure Vessel FluencesTenth Symposium of AER on VVER Reactor Physics and Reactor Safety 2000, Moscow(Russia), 18.-22. September 2000, Proceedings pp. p. 345-351
Böhmert, J.; Große, M.Characterization of the Deformation Field Near the Crack-Tip after Bending by SmallAngle X-ray ScatteringConference of the Federation of European Material Societies EUROMAT'99, Sept. 1999,Munich, Microstructural Investigation and Analysis, EUROMAT, Vol. 4, B. Jouffrey and J.Svejcar (Editors), DGM, Weinheim, 2000, pp. 114-120
Böhmert, J.; Viehrig, H.-W.; Richter, H.Bestrahlungsverhalten von WWER-Druckbehälterstählen - Erste Ergebnisse aus demBestrahlungsprogramm RheinsbergJahrestagung Kerntechnik 2000, Bonn, 23.-25. Mai, Tagungsbericht S. 591
Borodkin, G.; Böhmer, B.Validation of 3D Synthesis RPV Neutron Fluence Calculations using VVER-1000 Ex-Vessel Reference Dosimetry Results (Invited Paper)2000 ANS Annual Meeting, San Diego, California, June 4-8 2000, Trans. Am. Nucl. Soc.Vol.82,p.223-225 (2000)
Borodkin, G. I.; Kovalevich, O. M.; Barz, H.-U.; Böhmer, B.; Stephan, I.; Ait Abderrahim,H.; Voorbraak, W.; Hogel, J.; Polke, E.; Schweighofer, W.; Seren, T.; Borodin, A. V.;Vikhrov, V. I.; Lichadeev, V. V.; Markina, N. V.; Grigoriev, E. I.; Troshin, V. S.; Penev, I.;Kinova, L.Balakovo-3 Ex-vessel Exercise: Intercomparison of ResultsTenth International Symposium on Reactordosimetry, 12.- 17. 9. 1999, Osaka, Japan, ASTMSTP 1398
Brodkin, E.; Egorov, A.; Zaritsky, S.; Böhmer, B.CONTRIBUTION OF GAMMA IRRADIATION TO MATERIAL DAMAGE ATVVER PRESSURE VESSELSJahrestagung Kerntechnik 2000, 23.-25.Mai 2000, Bonn, Tagungsbericht S. 597-600
Cramer, A.; Gerbeth, G.; Bojarevics, A.; Gelfgat, Y.Stabilizing the direct melt extraction of intermetallic fibres by magnetic fieldsThe 3rd International Symposium on Electromagnetic Processing of Materials (EPM2000)April 3-6 / Nagoya, Japan, Published by: The Iron and Steel Institute of Japan, pp 147-152
Cumblidge, Stephen E.; Catchen, Gary L.; Motta, Arthur T.; Brauer, G.; Boehmert, J.Effects of Neutron Irradiation and Thermal Annealing on Model Alloys using PositronAnnihilation TechniquesEffects of Radiation on Materials: 20th International Symposium, June 2000, ASTM STP1405, S. T. Rosinski, M. L. Grossbeck, T. R. Allen and A. S. Kumar (Eds.)
133
Dudlik, A.; Hagemann, O.; Fahlenkamp, H.; Prasser, H.-M.Innovative Maßnahmen zur Vermeidung von Druckstößen und Kavitationsschlägen3R international 39 (2000) 11, S. 673-677.
Eckert, S.; Gerbeth, G.Anwendung des Ultraschall-Doppler Verfahrens zur Bestimmung vonGeschwindigkeitsprofilen in Flüssigmetallströmungen5. Seminar für Strömungssensorik an der Universität Rostock, 28./29.09.2000, Shaker-VerlagISBN 3-8265-8163-6
Eckert, S.; Gerbeth, G.; Lielausis, O.The behaviour of gas bubbles in a turbulent liquid metal MHD flow - Part I: Dispersionin quasi-two-dimensional MHD turbulence.International Journal of Multiphase Flow (2000), Vol. 26/1, 45-66
Eckert, S.; Gerbeth, G.; Lielausis, O.The behaviour of gas bubbles in a turbulent liquid metal MHD flow, Part II: Theinfluence of an external magnetic field on the slip ratio in a liquid metal bubbly flowInternational Journal of Multiphase Flow (2000), Vol. 26/1, 67-82
Eckert, S.; Witke, W.; Gerbeth, G.Measuring techniques for model experiments in liquid metal alloysEPM2000, The 3rd International Symposium on Electromagnetic Processing of materials,April 3-6, Nagoya, Japan, Published by: The Iron and Steel Institute of Japan, pp. 43-48
Eckert, S.; Witke, W.; Gerbeth, G.A new mechano-optical technique to measure local velocities in opaque fluidsFlow Measurement and Instrumentation, Vol. 11/2 (2000) 71-78
Gailitis, A.; Lielausis, O.; Dementiev, S.; Platacis, E.; Cifersons, A.; Gerbeth, G.; Gundrum,T.; Stefani, F.; Christen, M.; Hänel, H.; Will, G.Detection of a flow induced magnetic field eigenmode in the Riga dynamo facilityPhysical Review Letters Vol 84, No 19, (2000) 4365-4368
Gelfgat, Yu. M.; Mikelsons, A.; Romancuks, A.; Gerbeth, G.Stability of levitation of solid and liquid conducting spheres in high frequencyelectromagnetic fieldMagnetohydrodynamics, Vol.36, No.2, 167-179, 2000
Gerbeth, G.; Priede, J.Spin-up instability of electromagnetically levitated spherical bodiesIEEE Transactions on Magnetics, Vol. 36. No. 1, Januar 2000
Große, M.; Denner, V.; Böhmert, J.; Mathon, M.-H.Irradiation-induced structural changes in surveillance material of VVER 440-type weldmetalJournal of Nuclear Materials 277 (2000) 280-287
134
Große, M.; Gokhman, A.; Böhmert, J.Dependence of the Ratio between Magnetic and Nuclear Small Angle NeutronScattering on the Size of the HeterogeneitiesNuclear Instruments and Methods in Physics Research B 160 (2000) 515-520
Grundmann, U.; Rohde, U.; Mittag, S.DYN3D - Three Dimensional Core Model for Steady-State and Transient Analysis ofThermal ReactorsPHYSOR 2000 - Advances in Reactor Physics and Mathematics and Computation into theNext Millennium, Pittsburgh (USA), May 7-12,2000, Proceedings on CD-ROM, ANS OrderNo. 2700281
Grundmann, U.; Rohde, U.; Tietsch, W.3D-Kernberechnungen bei Borverdünnung nach kleinen LecksTagungsband der Fachtagung der KTG: "Wechselwirkungen Neutronenphysik undThermofluiddynamik", pp. 5-26 bis 5-38, Forschungszentrum Rossendorf, 31. Januar - 1.Februar 2000
Grunwald, G.; Höhne, T.; Prasser, H.-M.Investigation of coolant mixing in pressurized water reactors at the Rossendorf mixingtest facility ROCOMTagungsband der Fachtagung der KTG: "Wechselwirkungen Neutronenphysik undThermofluiddynamik", pp. 71-77, Forschungszentrum Rossendorf, 31. Januar – 1. Februar2000
Grunwald, G.; Höhne, T.; Prasser, H.-M.Investigation of coolant mixing in pressurized water reactors at the Rossendorf mixingtest facility ROCOM8th International Conference on Nuclear Engineering (ICONE8), Baltimore, USA, April 2-6,2000, Conference CD
Grunwald, G.; Höhne, T.; Prasser, H.-M.; Weiß, F.-P.Coolant Mixing in Pressurized Water Reactors at Constant Coolant Flow in the PrimaryCircuitJahrestagung Kerntechnik 2000, 23.-25. Mai 2000, Bonn, Proceedings pp. 109-114.
Hainoun, A.; Schaffrath, A.Nachrechnung der Oak Ridge Versuche (THTL) zur thermohydraulischen InstabilitätJahrestagung Kerntechnik 2000, Bonn, 23.-25. Mai 2000, Tagungsbericht S. 523-529
Hensel, F.Investigation of a Density Measurement Technique using Positron RadiationApplied Radiation and Isotopes 53 (2000) 617-624
Hessel, G.; Kryk, H.; Schmitt, W.; Seiler, T.; Weiß, F.-P.; Deerberg, G.; Neumann, J.Assessment and Identification of Undesired States in Chemical Semibatch ReactorsUsing Neural NetworksProceedings of IFAC Symposium on Fault Detection, Supervision and Safety for TechnicalProcesses - SAFEPROCESS'2000, Budapest, 14-16 June, 2000, pp. 458-461
135
Hinssen, H.-K.; Krüssenberg, A.-K.; Moormann, R.; Wu, C.-H.Oxidation of innovative carbon based materials for future energy systemsin: High Temperature Materials Chemistry, ed. by K. Hilpert, F.W. Froben, L. Singheiser,Schriften des Forschungszentrums Jülich, Series Energy Technology, (2000), Volume 10,ISBN 3-89336-259-2
Höhne, T.Untersuchung der Kühlmittelvermischung in Druckwasserreaktorenatw 12, S. 774-775
Höhne, T.; Grunwald, G.; Prasser, H.-M.Experimental Investigations on the Four-Loop Test Facility ROCOMKerntechnik 65/5-6, S. 212-215
Ivanov, A. A.; Anikeev, A. V.; Bagryansky, P. A.; Karpushov, A. N.; Kornilov, V. N.;Maximov, V. V.; Noack, K.Axial Distribution of DD-Neutron Yield in GDT under Skew Injection of DeuteriumNeutral BeamsInternational Conference on Open Systems for Plasma Confinement, July 3-6, 2000, Tsukuba,Japan, Proc. in Transactions of Fusion Technology Vol. 39, p. 213 (2001)
Karpushov, Alexander N.; Anikeev, Andrey V.; Noack, K.; Strogalova, Svetlana L.Integrated Transport Code Sytem for Multicomponent High-ß Plasmas in the GasDynamic TrapEPS 27th Conference on Controlled Fusion and Plasma Physics, Budapest, Hungary, 12-16June 2000, Poster P3.019, Proceedings will be published
Kern, T.; Prasser, H.-M.Study of the Foaming Behaviour of a Bubble Column5th German-Japanese Symposium "Bubble Columns", 28-30 May 2000, Dresden, Germany,proceedings pp. 162-167.
Kliem, M.3D flow simulation for a reactor core modelled as porous body by CFX - 4.2 codeJahrestagung Kerntechnik 2000, Bonn, 23.-25. Mai 2000, Tagungsbericht S. 69-73
Kliem, S.; Grundmann, U.; Höhne, T.; Rohde, U.Importance of coolant mixing for accident analyses using coupled codes using thecoupled code DYN3D/ATHLETTagungsband der Fachtagung der KTG: "Wechselwirkungen Neutronenphysik undThermofluiddynamik", pp. 513-525, Forschungszentrum Rossendorf, Januar 2000
Kliem, S.; Grundmann, U.; Rohde, U.Analysis of the OECD MSLB Benchmark using the coupled code DYN3D/ATHLETJahrestagung Kerntechnik 2000, Bonn, 23.-25. Mai 2000, Tagungsbericht S. 7-10

136
Kliem, S.; Grundmann, U.; Rohde, U.Analysis of the OECD MSLB Benchmark using the Coupled Code DYN3D/ATHLETEighth International Conference on Nuclear Engineering (ICONE-8) 2000, Baltimore (USA),2.-6. April 2000, Proceedings (CD-ROM) paper 8696
Kliem, S.; Seidel, A.; Grundmann, U.Definition of the 6th Dynamic AER Benchmark - Main Steam Line Break in a NPP withVVER-440Tenth Symposium of AER on VVER Reactor Physics and Reactor Safety 2000, Moscow(Russia), 18.-22. September 2000, Proceedings pp. 749-762
Kozmenkov, Y.; Orekhov, Y.; Grundmann, U.; Kliem, S.; Rohde, U.; Seidel, A.Benchmarking of DYN3D/RELAP5 Code Package using the Fifth AER DynamicProblem for Coupled CodesTenth Symposium of AER on VVER Reactor Physics and Reactor Safety 2000, Moscow(Russia), 18.-22. September 2000, Proceedings pp. 1043-1048
Krepper, E.; Aszodi, A.Experimental and numerical investigation of one and two phase natural convection inlarge pools3rd European Thermal Science Conference, Heidelberg, September 2000, Proceedings editedby E.W.P. Hahne, W. Heidemann and K. Spindler, 2000 ETS Pisa, Vol. II, pp. 1075-1080,ISBN 88-467-0305-7
Krepper, E.; Prasser, H.-M.Measurements and CFX-simulations of a bubbly flow in a vertical pipe3rd Int. Conf. on Advances in Fluid Mechanics, Montreal May 2000; in: M. Rahman, C.A.Brebbia (Ed.): Advances in Fluid Mechanics III, pp. 23-31, WITPress Southampton, Boston2000, ISBN 1-85312-813-9
Krepper, E.; Prasser, H.-M.Measurements and CFX-simulations of a bubbly flow in a vertical pipeAMIF-ESF Workshop:"Computing methods for two-phase flow", Aussois, January 12-14,2000, Conference-CD
Krepper, E.; Schaffrath, A.; Aszódi, A.Numerical Simulation of the Emergency Condenser of the SWR1000Nuclear Science and Engineering 135 (2000) No.3 267-279
Krüssenberg, A.-K.; Prasser, H.-M.; Schaffrath, A.A New Criterion for the Bubble Slug Transition in Vertical TubesKerntechnik 65/1 (2000) 7-13NURETH-9, San Francisco, California, USA, October 3-8, 1999
Lucas, D.BRICK - a one-dimensional simulation tool for multiphase flow in vesselsChemical Engineering and Technology 23(2000)845-849
137
Lucas, D.; Krepper, E.; Prasser, H.-M.Influence of the bubble size distribution on radial gas fraction profiles in vertical pipeflowSecond Japanese-European Two-Phase Flow Group Meeting, Tsukuba, Japan, September 25-29, 2000, Proceedings on CD-ROM: K-2.pdf
Lucas, D.; Krepper, E.; Prasser, H.-M.Radial Gas Profiles in Vertical Pipe Flow in Dependence on the Bubble Size Distribution38th European Two-Phase Flow Group Meeting, May, 29-31 2000, Karlsruhe, Germany,Paper G4
Mittag, S.; Kliem, S.; Weiß, F.-P.; Kyrki-Rajamäki, R.; Hämäläinen, A.; Langenbuch, S.;Danilin, S.; Hadek, J.; Hegyi, G.; Kuchin, A.; Panayotov, D.Validation of Coupled Codes for VVER Reactors by Analysis of Plant TransientsTagungsband der Fachtagung der KTG: "Wechselwirkungen Neutronenphysik undThermofluiddynamik", pp. 4-55 bis 4-66, Forschungszentrum Rossendorf, 31. Januar - 1.Februar 2000
Mittag, S.; Kliem, S.; Weiß, F.-P.; Kyrki-Rajamäki, R.; Hämäläinen, A.; Langenbuch, S.;Danilin, S.; Hadek, J.; Hegyi, G.; Kuchin, A.; Panayotov, D.Validation of Coupled Codes for VVERs by Analysis of Plant TransientsProceedings of OECD / CSNI workshop on Advanced Thermal-Hydraulic and NeutronicCodes Application, Barcelona (Spain), 10-13 April, 2000, Conference CD
Mittag, S.; Kliem, S.; Weiß, F.-P.; Kyrki-Rajamäki, R.; Hämäläinen, A.; Langenbuch, S.;Danilin, S.; Hadek, J.; Hegyi, G.; Kuchin, A.; Panayotov, D.Validation of coupled neutron-kinetic/thermal-hydraulic codes for VVERsProc. of Tenth Symposium of AER on VVER Reactor Physics and Reactor Safety, Moscow,Russia, September 18-22, 2000, 763-781
Mönch, I.; Stephan, I.; Köthe, A.High-purity niobium for neutron activation detectorsTagung Ultra High Purity Base 1999 Metals, Sendai, JapanMaterial Transactions JIM Vol. 41, 1 (2000) 1ff
Moormann, R.; Hinssen, H.-K.; Latge, Ch.; Dumesnil, J.; Veltkamp, A. C.; Grabon, V.;Beech, D.; Buckthorpe, D.; Dominguez, T.; Krüssenberg, A.-K.; Wu, C. H.Oxidation of carbon based materials for innovative energy systems (HTR, fusionreactor): Status and further needsProc. First Meeting: Survey on Basic Studies in the Field of High Temperature Engineering(including Safety Studies), Paris, France, 27-29 September 1999, 161-172
Noack, K.Monte Carlo Simulations of Neutral Gas and Fast Ion Dynamics in GDT ExperimentsMonte Carlo 2000, International Conference on Advanced Monte Carlo for RadiationPhysics, Particle Transport Simulation and Applications, October 23-26, 2000 - Lisbon,Portugal; Proc. will be published by Springer-Verlag
138
Parts, Ü.; Avilov, V.; Koivuniemi, J. H.; Kopnin, N. B.; Krusius, M.; Ruohio, J. J.; Ruutu, V.M. H.Coexistence of single and double quantum vortex linesPhysical Review B, Vol. 62, No. 9, pp. 5865-5876, 1 September 2000-I
Perov, S.; Altstadt, E.; Weiss, F.-P.; Werner, M.ANALYSIS OF FLUID-STRUCTURE INTERACTION AT WWER-1000 TYPEREACTORS8th International Conference on Nuclear Engineering ICONE8 Baltimore, MD U.S.A., April2-6, 2000, Proceedings on CD-ROM, Paper No. 8446
Perov, S.; Altstadt, E.; Werner, M.Vibration analysis of the pressure vessel internal of WWER-1000 type reactors withconsideration of fluid-structure interactionAnnals of Nucl. Energy 27 (2000) 1441-1457
Prasser, H.-M.; Krepper, E.; Lucas, D.Fast wire-mesh sensors for gas-liquid flows and decomposition of gas fraction profilesaccording to bubble size classesSecond Japanese-European Two-Phase Flow Group Meeting, Tsukuba, Japan, September 25-29, 2000, proceedings on CD-ROM: D-3.pdf
Prasser, H.-M.; Zippe, C.Measurement of Bubble Size Distributions with Wire-Mesh Sensors5th German/Japanese Symposium "Bubble Columns", Dresden, May 28 - 30, 2000,proceedings pp. 223 - 228
Priede, J.; Gerbeth, G.Oscillatory instability of electromagnetically levitated solid bodiesJournal IEEE Transactions on Magnetics, USA, Vol. 36. No. 1, pp. 354-357, January 2000
Priede, J.; Gerbeth, G.; Mikelsons, A.; Gelfgat, Y.Instabilities of electromagnetically levitated bodies and its preventionInternational Symposium on Electromagnetic Processing of Materials, Nagoya, Japan, April3-6, 2000, Published by: The Iron and Steel Institute of Japan, pp 352-357
Repp, T.Fluiddynamic Waterhammer Simulations with Consideration of Fluid-StructureInteractionSammelband Workshop Kompetenzerhalt Kerntechnik, Jahrestagung Kerntechnik, 18.-21.Mai 1999, Karlsruhe; Haag, G. (Ed.), 2000
Rindelhardt, U.; Teichmann, G.Energieertrag von netzgekoppelten PhotovoltaikanlagenErneuerbare Energien Heft 5(Mai)2000, S.50-52
139
Rindelhardt, U.; Teichmann, G.Performance Ratio im Detail: PV-Generatorleistung und AnlagenertragTagungsband 15. Symposium Photovoltaische Solarenergie, 15.-17. März 2000, Staffelstein,S. 331
Rohde, U.; Hensel, F.Measurement and Simulation of the Turbulent Dispersion of a Radioactive Tracer in aTwo-Phase Flow System5th German-japanese Symposium on Bubble Columns, May 28 - 30, 2000, Dresden Proc. pp.235-240
Rohde, U.; Kliem, S.; Seidel, A.; Khalimonchuk, V.; Kuchin, A.On usage of coupled neutron-kinetic and thermal-hydraulic computer codeDYN3D/ATHLET to study safety of VVER-1000 type reactors under transient andemergency operational modesTenth Symposium of AER on VVER Reactor Physics and Reactor Safety 2000, Moscow(Russia), 18.-22. September 2000, Proceedings pp. 913-920
Schaffrath, A.; Krüssenberg, A.-K.Neue Instrumente der Kommunikation: InternetJahrestagung Kerntechnik 2000 - Fachsitzung "Kommunikation mit der Öffentlichkeit -Communication with the Public"; Juni 2000, INFORUM Verlags- undVerwaltungsgesellschaft, Bonn, S. 59-69
Schmitt, W.; Hessel, G.; Kryk, H.; Hulzer, G.Kalorimetrische und FTIR-Untersuchungen zur sicheren Betriebsführung einerGrignardreaktion5. Fachtagung "Anlagen-, Arbeits- und Umweltsicherheit", Köthen 9./10. Nov. 2000, S. 347-352
Stefani, F.; Gerbeth, G.A contactless method for velocity reconstruction in electrically conducting fluidsMeasurement science and technology 11 (2000) 758-765
Stefani, F.; Gerbeth, G.Can we look inside a dynamo?Astronomische Nachrichten (2000) 235-248
Stefani, F.; Gerbeth, G.On the uniqueness of velocity reconstruction in conducting fluids from measurements ofinduced electromagnetic fieldsInverse Problems 16 (2000), pp. 1-9
Stefani, F.; Gerbeth, G.; Rädler, K.-H.Steady dynamos in finite domains: an integral equation approachAstronomische Nachrichten 321 (2000) 65-73
140
Ulbricht, A.; Böhmert, J.; Große, M.; Strunz, P.Small Angle Scattering Study Concerning the Effect of Residual Elements on theRadiation Behaviour of Iron AlloysECNS'99, 2. European Conference on Neutron Scattering, Sept. 1999, Budapest, PHYSICA B276-278 (2000) 936-938Physica B 276-278 (2000) 936-938
Ulbricht, A.; Böhmert, J.; Nikolaev, Y.Nachweis und Analyse neutroneninduzierter Defektstrukturen in EisenlegierungenJahrestagung Kerntechnik 2000, Bonn, 23.-25. Mai, Tagungsbericht S. 587
Viehrig, H.-W.; Boehmert, J.; Dzugan, J.Beitrag zur Bewertung des Bestrahlungsverhaltens russischer WWERReaktordruckbehälterstähle26. MPA-Seminar "Sicherheit und Verfügbarkeit in der Energietechnik", StaatlicheMaterialprüfanstalt Stuttgart, Universität Stuttgart, 5.-6. Oktober 2000, Sammelband, S. 20.1-20.20
Viehrig, H.-W.; Böhmert, J.; Richter, H.; Valo, M.Use of Instrumented Charpy Test for Determination of Ductile Crack InitiationToughnessPendulum Impact Testing: A Century of Progress, ASTM STP 1380, T. Siewert ans M.P.Manahan, Sr., Eds., American Society for Testing and Materials, West Conshohocken, PA,2000, pp. 354-365
Weier, T.; Fey, U.; Gerbeth, G.; Mutschke, G.; Avilov, V.Boundary layer control by means of electromagnetic forcesERCOFTAC bulletin, No. 44, pp. 36-40, March 2000
Weiß, F.-P.; Rohde, U.; Grundmann, U.; Teschendorff, V.; Burtak, F.Aufgabenstellung - Validierung - Anwendung von gekoppelten 3D-Kernmodellen undSystemcodesatw 45. Jg. (2000) Heft 6 - Juni
Willschuetz, H.-G.; Altstadt, E.; Weiss, F.-P.; Sehgal, B. R.A Finite Element model for pre- and posttest calculations of the forever-experiments8th International Conference on Nuclear Engineering (ICONE-8) Baltimore, MD U.S.A.,April 2-6, 2000, Proceedings on CD-ROM, Paper No. 8542
141
Other oral and poster presentations
Avilov, V.Thermal diffusion in laser beam welding of metalsKolloquium Thermo- und Fluiddynamik an der Technischen Universität Ilmenau, November7, 2000
Cramer, A.; Gerbeth, G.; Bojarevics, A.; Gelfgat;, Y.Stabilisation of the melt extraction process by magnetic fieldsInternational Workshop "Electromagnetic Control of Free Surface Flows in MaterialsProcessing" (EFMP 2000) June 4-7, 2000, Ilmenau, Germany
Danilin, S.; Ilieva, B.; Khalimonchuk, V.; Mittag, S.; Weiß, F.-P.Three VVER-1000 Tests Suitable for the Validation of Coupled Neutronic / Thermal-hydraulic CodesNEA/NSC Workshop on the Preservation of Experimental Integral Reactor Physics Data, 18-19 May 2000, Budapest, Hungary
Eckert, S.; Gerbeth, G.; Witke, W.; Langenbrunner, H.MHD turbulence measurements in a sodium channel flow exposed to a transversemagnetic fieldInternational Symposium on Turbulence, Heat and Mass Transfer, Nagoya, Japan, April 3-6,2000
Gailitis, A.; Lielausis, O.; Platacis, E.; Gerbeth, G.; Stefani, F.Riga Dynamo ExperimentNATO Advanced Research Workshop "DYNAMO AND DYNAMICS, A MATHEMATICALCHALLENGE" August 21-26, 2000,Cargese, France
Gailitis, A.; Lielausis, O.; Platacis, E.; Stefani, F.; Gerbeth, G.The Riga Dynamo Experiment: Prognoses, Results, InterpretationSEDI2000 The 7th Symposium of the Study of the Earth's Deep Interior University of Exeter,UK, 30th July - 4th August 2000
Galindo, V.; Gerbeth, G.Crystal growth melt flow control by means of magnetic fields4th International Conference "MHD at dawn of 3rd Millennium", Presqu'ile de Giens,France, September 18-22, 2000
Gerbeth, G.Magnetfeldeinsatz bei Kristallzüchtungen aus der Schmelze - Beispiele undPerspektivenEinladungsvortrag am 19.05.00 am Institut für Kristallzüchtung Berlin
142
Gerbeth, G.Strukturbildung unter Berücksichtigung der Hydrodynamik bei der Erstarrung vonNd-Fe-B-Schmelzen; Teilprojekt: Strömungskontrolle über MagnetfelderKick-Off-Meeting-Meeting zum DFG-Schwerpunktprogramm 1120: Phasenumwandlungen inmehrkomponentigen Schmelzen 30./31.10.2000, Bonn
Gerbeth, G.; Stefani, F.; Gailitis, A.; Lielausis, O.; Platacis, E.Das Rigaer Dynamo-Experimentim Greifswalder Physikalischen Kolloquium, Greifswald, 19.10.2000
Gerbeth, G.; Stefani, F.; Gailitis, A.; Lielausis, O.; Platacis, E.Magnetic field self-excitation in the Riga dynamo experimentICTAM 2000, 20th Int. Congress of Theoretical and Applied Mechanics, Chicago, USA,27.8.-2.9.00
Grants, I.; Gerbeth, G.Rotating magnetic field driven flow: Multiple steady solutions and stability4th International Conference "MHD at dawn of 3rd Millennium", Presqu'ile de Giens,France, September 18-22, 2000
Grants, I.; Gerbeth, G.; Pätzold, O.; Wunderwald, U.; Jenkner, K.Linearization approaches in VGF models: decoupling global radiation transfer and theStefan problemDGKK-Jahrestagung, Freiberg, 11-12.10.00
Hicken, Enno-F.; Jaegers, H.; Schaffrath, A.; Weiß, F.-P.The NOKO/TOPFLOW Facility for Natural Convection FlowTCM Meeting in Vienna (Austria), July 18-21, 2000
Kryk, H.; Hessel, G.; Schmitt, W.; Seiler, T.; Willms, T.Investigations on exothermic semi-batch reactions as a basis of the prevention ofdangerous operating statesFall 2000 DIERS Users Group meeting, October 16-18, Brookline (Boston), MA
Mönch, I.; Stephan, I.; Köthe, A.High-purity niobium for neutron activation detectorsTagung Ultra High Purity Base 1999 Metals, Sendai, Japan
Priede, J.; Cramer, A.; Bojarevics, A.; Gerbeth, G.Experimental and numerical study of anomalous thermocapillary convection in liquidgalliumInternational Workshop "Electromagnetic Control of Free Surface Flows in MaterialsProcessing" (EFMP 2000) June 4-7, 2000, Ilmenau, Germany
Priede, J.; Gerbeth, G.Effect of AC magnetic field on the damping of shape oscillationsof liquid metal droplets4th International Conference "MHD at dawn of 3rd Millennium", Presqu'ile de Giens,France, September 18-22, 2000
143
Priede, J.; Gerbeth, G.; Hermann, R.; Behr, G.; Schultz, L.Control of floating-zone crystal growth in high-frequency magnetic field4th International Conference "MHD at dawn of 3rd Millennium", Presqu'ile de Giens,France, September 18-22, 2000
Schaffrath, A.; Krüssenberg, A.-K.Investigation on multiphase and multicomponent flows - experiments and measurementdevicesPolitecnico di Milano, Dipartimento di Ingegneria Nucleare (2000) Milano, Italy
Shatrov, V.; Galindo, V.; Gerbeth, G.Stability analysis of the flow inside an electromagnetically levitated drop4th International Conference "MHD at dawn of 3rd Millennium", Presqu'ile de Giens,France, September 18-22, 2000
Stefani, F.; Gerbeth, G.A toy model for inverse dynamo theorySEDI2000 The 7th Symposium of the Study of the Earth's Deep Interior University of Exeter,UK, 30th July - 4th August 2000
Stefani, F.; Gerbeth, G.On some inverse problems in MHD4th International Conference "MHD at dawn of 3rd Millennium", Presqu'ile de Giens,France, September 18-22, 2000
Viehrig, H.-W.; Boehmert, J.; Richter, H.Common German/Russian Irradiation Experiment at Rheinsberg NPP - Results of theMechanical TestingWorkshop on VVER-RPV Integrity Assessment - methods and Applications February 23 - 25,2000 at GSR in Cologne (Germany)
Weier, T.; Fey, U.; Gerbeth, G.; Mutschke, G.; Lielausis, O.; Platacis, E.Boundary layer control by means of wall parallel Lorentz forces4th International Conference "MHD at dawn of 3rd Millennium", Presqu'ile de Giens,France, September 18-22, 2000
144
FZR-Reports and other publications
Altstadt, E.; Mössner, T.Extension of the ANSYS® creep and damage simulation capabilitiesWissenschaftlich-Technische Berichte / Forschungszentrum Rossendorf; FZR-296 Juli 2000
Altstadt, E.; Willschütz, H.-G.Development of an Integral Finite Element Model for the Simulation of Scaled Core-Meltdown-ExperimentsWissenschaftlich-Technische Berichte / Forschungszentrum Rossendorf; FZR-292; April 2000
Beyer, M.; Carl, H.; Reitz, T.Unterstützung der ukrainischen Aufsichtsbehörde bei der Einrichtung einerverbesserten betrieblichen Überwachung für das gesamte KKW SaporoshjeWissenschaftlich-Technische Berichte / Forschungszentrum Rossendorf; FZR-297 Juli 2000
Chochlov, V. N.; Duncev, A.; Ivanov, V. V.; Kontelev, V. V.; Melnikov, V. I.; Stoppel, L. K.;Prasser, H.-M.; Zippe, W.; Zschau, J.; Zboray, R.Local and integral ultrasonic gauges for two-phase flow instrumentation in nuclearreactor and safety technologyWissenschaftlich-Technische Berichte / Forschungszentrum Rossendorf; FZR-303 November2000
Gokhman, A.; Boehmert, J.; Ulbricht, A.Contribution to the Determination of Microstructural Parameters from Small AngleScattering Experiments at Reactor Pressure Vessel SteelsWissenschaftlich-Technische Berichte / Forschungszentrum Rossendorf, FZR-288 Februar2000
Grahn, A.; Prasser, H.-M.Dissipative Strukturbildung bei exothermen GrenzflächenreaktionenWissenschaftlich-Technische Berichte / Forschungszentrum Rossendorf; FZR-307 Dezember2000
Grundmann, U.; Kliem, S.; Mittag, S.; Rohde, U.; Seidel, A.; Kozmenkov, Y.; Kumayev, V.Störfallablaufanalysen für neue Reaktorkonzepte und WWER-Reaktoren mit neuemBrennstoffdesign - WTZ mit RusslandWissenschaftlich-Technische Berichte / Forschungszentrum Rossendorf; FZR-302 Oktober2000
Grundmann, U.; Kliem, S.; Rohde, U.; Seidel, A.; Khalimonchuk, V.; Kuchin, A.Beiträge zur Validierung fortgeschrittener Störfallanalysecodes mit 3DNeutronenkinetik - WTZ mit der UkraineWissenschaftlich-Technische Berichte / Forschungszentrum Rossendorf; FZR-301 Oktober2000
145
Hoppe, D.Methodische Grundlagen für die Tomographie durch gefilterte Rückprojektion an einerAxialpumpeWissenschaftlich-Technische Berichte / Forschungszentrum Rossendorf; FZR-306 November2000
Krepper, E.; Schäfer, F.Verifikation des ATHLET-Rechenprogrammes anhand der Nachanalyse zweierExperimente an der CCTF-VersuchsanlageWissenschaftlich-Technische Berichte / Forschungszentrum Rossendorf; FZR-315, März 2001
Müller, G.; Böhmert, J.Metallographic Post Test Investigations for the Scaled Core-Meltdown-ExperimentsFOREVER-1 and -2Wissenschaftlich-Technische Berichte / Forschungszentrum Rossendorf, August 2000, FZR-298
Richter, H.Ermittlung zähbruchmechanischer Kennwerte unter schlagartiger Belastung mittelsSchallemissionWissenschaftlich-Technische Berichte / Forschungszentrum Rossendorf; FZR-299 September2000
Schaffrath, A.; Ringel, H.Modelle zur Bestimmung der Relativbewegung der Phasen in einerZweiphasenstroemung - Stand der TechnikWissenschaftlich-Technische Berichte / Forschungszentrum Rossendorf, FZR-294 Juni 2000
Scholz, D.Bewertung der Genauigkeit eines Gittersensors zur Visualisierung einerZweiphasenströmung durch Vergleich mit optischen HochgeschwindigkeitsaufnahmenWissenschaftlich-Technische Berichte / Forschungszentrum Rossendorf; FZR-300 September2000
Schumann, P.Nutzung der Rauschdiagnostik für Nachweis und Überwachung der Schwingungen vonReaktordruckbehältereinbauten und zur Aufklärung ihrer Ursachen in ostdeutschenKernkraftwerken mit WWER-440/230-Reaktoren der russischen BaureiheWissenschaftlich-Technische Berichte / Forschungszentrum Rossendorf, FZR-304, Oktober2000
Weiß, F.-P.; Rindelhardt, U. (Editors)Anual Report 1999 Institute of Safety ResearchWissenschaftlich-Technische Berichte/Forschungszentrum Rossendorf; FZR-284 Februar2000

146

147
Patents

148

149
Patents
Hoppe, D.; Giera, H.-D.Anordnung zur akustischen VolumenbestimmungDE 198 30 442 A1
Lindau, B.Vorrichtung zum Fördern von Schüttgut mittels VibrationsförderungDE 198 35 530A1
Rindelhardt, U.; Teichmann, G.Verfahren und Schaltungsanordnung zur Maximum-Power-Point-Steuerung vonSolargeneratorenDE 199 04 561 A1
Stefani, F.; Gerbeth, G.; Priede, J.; Thess, A.; Cramer, A.; Eckert, S.Verfahren und Anordnung zur Bestimmung von räumlichenGeschwindigkeitsverteilungen in elektrisch leitfähigen Flüssigkeiten DE 199 22 311 A1
Witke, W.; Gerbeth, G.; Eckert, S.Einrichtung zur lokalen Messung von StrömungsgeschwindigkeitenDE 199 13 484 A1

150

151
Guests

152
153
Guests
Knebel, JoachimForschungszentrum Karlsruhe, Institut für Kern- und Energietechnik01.03.2000 – 03.03.2000
Ilieva, BonkaInstitute for Nuclear Research and Nuclear Energy Sofia, Bulgaria13.03.2000 – 03.04.200003.07.2000 – 10.07.200019.10.2000 – 15.12.2000
Dr. Panayotov, DobromirInstitute for Nuclear Research and Nuclear Energy Sofia, Bulgaria13.03.2000 – 03.04.200003.07.2000 – 10.07.2000
Dr. Perov, SergeyBauman University Moscow, Russia13.03.2000 – 16.04.200005.06.2000 – 10.06.200009.11.2000 – 16.12.2000
Dr. Platacis, ErnestInstitute of Physics Riga, Latvia15.03.2000 – 25.03.2000
Prof. Dr Gailitis, AgrisInstitute of Physics Riga, Latvia15.03.2000 – 25.03.200013.08.2000 –16.09.2000
Prof. Dr. Lielausis, OlgertsInstitute of Physics Riga, Latvia15.03.2000 – 20.04.200026.11.2000 – 22.12.2000
Dr. Priede, JanisInstitute of Physics Riga, Latvia15.03.2000 – 21.04.200011.9.2000 – 20.10.2000
Dr. Ivanov, VadimCenter of Scientific and Technical Services NUKLID Ltd., Russia20.03.2000 – 31.03.200024.11.2000 – 09.12.2000
Prof. Melnikov, VladimirCenter of Scientific and Technical Services NUKLID Ltd., Russia20.03.2000 – 31.03.2000
154
24.11.2000 – 09.12.2000
Chornousova, LyubovUmweltministerium, Kiew, Ukraina04.04.2000 – 07.04.2000
Lukýanskyy, VladislavUmweltministerium, Kiew, Ukraina04.04.2000 – 07.04.2000
Borodkin, GennadySEC NRS of GOSATOMNADZOR Moskau, Russia24.04.2000 – 22.06.200001.11.2000 – 15.12.2000
Maximov, VladimirBudker-Institute Novosibirsk, Russia25.04.2000 – 22.05.2000
Dr. Karpuchov, AlexandreBudker-Institute Novosibirsk, Russia25.04.2000 – 22.05.2000
Schmidt, PaulAuburn University, USA24.05.2000 – 15.07.2000
Khrennikov, NikolaySEC NRS of GOSATOMNADZOR Moskau, Russia29.05.2000 – 04.06.2000
Dr. Oussanov, AlexandreVNIIAES Moscow, Russia05.06.2000 –10.06.2000
Egorova, TatjanaVNIIAES Moscow, Russia05.06.2000 –10.06.2000
Gutsev, DmitriVNIIAES Moscow, Russia05.06.2000 –10.06.2000
Mikhailovich, BorisBen-Gurion-University of the Negev, Beer-Sheva Israel08.06.2000 – 15.06.2000
Dr. Kozmenkov, YaroslavInstitute of Physics and Power Engineering Obninsk, Russia09.07.2000 – 05.08.2000
155
Dr. Kumayev, VladimirInstitute of Physics and Power Engineering Obninsk, Russia09.07.2000 – 05.08.2000
Prof. Gad-el-Hak, MohamedUniversity of Notre Dame, USA20.07.2000 – 23.07.2000
Voskoboinikov, RomanKurchatov Institut Moskau, Russia14.08.2000 – 10.09.2000
Dr. Anikeev, AndreiBudker Institut Novosibirsk, Russia12.09.2000 – 06.10.2000
Dr. Manturov, GuennadiIPPE Obninsk, Russia08.10.2000 – 25.10.2000
Prof. Gokhman, AlexanderSouth Ukrainian Pedagigical University K.D. Ushinski, Dpt. of Physics Odessa, Ukraina10.11.2000 – 21.12.2000
Dr. Waskaas, MagneTelemark University Porsgrunn, Norwegen02.12.2000 – 05.12.2000
Matveyev, Inger HedvigTelemark University Porsgrunn, Norwegen02.12.2000 – 05.12.2000
Kozlov, OlehKernkraftwerk Rovno, Ukraina07.12.2000 – 10.12.2000
Scholz, DaniloHTWS Zittau/Görlitz01.09.2000 – 30.11.200001.12.2000 – 31.12.2000
Kuchin, AlexanderUmweltministerium, Kiew, Ukraina30.01.2000 03.02.2000
Chochlov, ValeryiTU Nizhny Novgorod, Russia24.07.2000 – 31.07.2000

156
Poetefi, GaborTU Budapest, Hungary08.10.2000 – 11.10.2000
Aszodi, AttilaTU Budapest, Hungary08.10.2000 – 11.10.2000
Boros, IldikoTU Budapest, Hungary08.10.2000 – 11.10.2000
Dr. Wagenknecht, MichaelIPM an der HTWS Zittau/Görlitz01.11.2000 – 30.11.2000
Dr. Hadek, JanNRI Rez, Czech Republic01.11.2000 – 15.12.2000
Gocht, ThoralfIPM an der HTWS Zittau/Görlitz01.11.2000 – 31.12.2000
Prof. Ivanov, AlexandreBudker Institut Novosibirsk, Russia06.11.2000 – 17.11.2000

157
Meetings and workshops

158

159
Meetings und workshops
Fachtagung der KTG-Fachgruppen „Thermo- und Fluiddynamik“ und „Reaktorphysik undBerechnungsmethoden“Rossendorf, 31. 01. – 01. 02. 2000
Project Meeting „Vibration Modelling of VVER Type Reactor“Rossendorf, 05. 06. – 07. 06. 2000
4. Workshop „Messtechnik für stationäre und transiente Mehrphasenströmungen“Rossendorf. 16. 11. – 17. 11. 2000

160

161
Seminars of the Institute

162
163
Seminars
Dr. K. Noack, G. Otto, Prof. E. CollatzStand der Forschungen zum Projekt einer Neutronenquelle für die Fusionsmaterialforschungauf der Grundlage einer gasdynamischen Falle13.01.00
H.-G. Willschütz, Dr. E. AltstadtNachrechnungen der FOREVER-Experimente mit dem FEM-Code ANSYS27.01.00
C. BeckertEntwicklung und Anwendung des deterministischen 3D-NeutronentransportprogrammsTransRay11.02.00
Dr. F. Stefani, Dr. G. Gerbeth, T. GundrumErste Ergebnisse des Riager Dynamo-Experiments29.02.00
Dr. J. U. Knebel (FZK)Übersicht über die FZK-Arbeiten zum ADS02.03.00
S. Kliem, Dr. U. GrundmannDie Lösung einer Benchmarkaufgabe der OECD zu einem Störfallszenarium mitFrischdampfleck23.03.00
Dr. C. ZippeGasgehaltsverteilungen in rotierenden Turbomaschinen06.04.00
Dr. V. Lelek (NRI Rez)End of nuclear fuel cycle13.04.00
Dr. S. MittagValidierung gekoppelter neutronenkinetisch-thermohydraulischer Systemcodes11.05.00
Dr. S. Langenbuch (GRS München)Brennstabverhalten unter Störfallbedingungen bei hohem Abbrand16.05.00
C. SchneiderReaktionskinetik und Stofftransport der Hydrier- und Oxidationsstufe des Anthrachinon-Prozesses08.06.00
164
Dr. H.-M. PrasserWechselwirkung der Gittersensoren mit der Zweiphasenströmung – Rückwirkung undMessgenauigkeit22.06.00
Prof. B. R. Sehgal (Royal Institute of Technology, Stockholm)Recent results from LWR severe accident research at the Royal Institute of Technology30.06.00
Prof. M. Gad-el-Hak (University of Notre Dame, USA)The fluid mechanics of microdevices21.07.00
Dr. A. CramerExperimentelle Untersuchung von reverser Marangoni-Konvektion in Gallium24.08.00
Dr. D. LucasBerechnung radialer Gasgehaltsprofile aus gemessenen Blasengrößenverteilungen invertikaler Rohrströmung08.09.00
S. Yokobori (Toshiba Nuclear Engineering Laboratory)Experimental investigation of the heat removal performance of passive safety systems in theGIRAFFE test facility14.09.00
Dr. F. Bergner (TU Dresden)Charakterisierung der Ermüdungsrissausbreitung metallischer Werkstoffe21.09.00
Dr. T. WillmsHPLC-Konzentrationsmessungen bei Hydrierung in Dreiphasensystemen29.09.00
Dr. E. AltstadtEine Versuchsanlage für Druckschläge (Wasserhammer) – Konzept und ersteVersuchsergebnisse19.10.00
F. Schäfer, Dr. E. KrepperNachrechnung thermohydraulischer Experimente an der Versuchsanlage CCTF mit dem CodeATHLET02.11.00
Dr. H.-W. ViehrigBewertung der Probenrekonstitutionstechnik im internationalen Vergleich16.11.00

165
A. GrahnDissipative Strukturbildung bei exothermen Grenzflächenreaktionen07.12.00
Dr. P. Vladimirov (RCC Kurchatov-Institute Moscow)Effect von -radiation on the RPV steel embrittlement14.12.00

166

167
Lecture courses

168

169
Lectures
Frank-Peter WeißZuverlässigkeit und Sicherheit technischer SystemeTU Dresden, Fakultät MaschinenwesenSS 2000 und WS 2000
Udo RindelhardtErneuerbare Energien I und IIUniversität Leipzig, Fakultät für Physik und GeowissenschaftenSS 2000 und WS 2000

170

171
Departments of the Institute

172
173
Institute of Safety Research
Dpt.Accident AnalysisDr. U. RohdeTel.: +49(0)351 260 2040
Dpt.Particle and RadiationTransportDr. K. NoackTel.: +49(0)351 260 3239
Dpt.Materials andComponents SafetyDr. J. BöhmertTel.: +49(0)351 260 3186
Dpt.Magneto-HydrodynamicsDr. G. GerbethTel.: +49(0)351 260 3484
Dpt.Experimental ThermalFluid DynamicsDr. H.-M. PrasserTel.: +49(0)351 260 3460
DirectorateProf. Dr. Frank-Peter WeißTel.: +49(0)351 260 3480
Forschungszentrum Rossendorfe. V.Institute of Safety ResearchPostfach 51 01 19D- 01314 Dresden
Organigram / 30.01.2001

174

175
Personnel

176

177
Director: Prof. Dr. F.-P. Weiß
Scientific StaffAltstadt, Eberhard Dr.Beyer, MatthiasBöhmer, BertramBöhmert, Jürgen Dr.Böttger, ArndCarl, Helmar Dr.Cramer, Andreas Dr.Eckert, Sven Dr.Erlebach, StephanFey, Uwe, Dr.Fietz, Jürgen Dr.Galindo, Vladimir Dr.Gerbeth, Günter Dr.Grants, Ilmars Dr.Grundmann, Ulrich Dr.Grunwald, Gerhard Dr.Hensel, Frank Dr.Hessel, GünterHoppe, Dietrich Dr.Hüller, Jürgen Dr.Kliem, SörenKoch, Reinhard Dr.Konheiser, JörgKrepper, Eckhard Dr.Krüssenberg, Anne-Kathrin Dr.Kryk, Holger Dr.Küchler, Roland Dr.Lindau, Bernd Dr.Lucas, Dirk Dr.Mittag, Siegfried Dr.Mössner, ThomasMüller, Gudrun, Dr.Mutschke, GerdNoack, Klaus Dr.Prasser, Horst-Michael Dr.Richter, Holger Dr.Rindelhardt, Udo PD Dr.Rohde, Ulrich Dr.
Schaffrath, Andreas Dr.Schmitt, Wilfried Dr.Schütz, PeterSeidel, AndreStephan, Ingrid Dr.Stephani, Frank Dr.Viehrig, Hans-Werner Dr.Werner, Matthias Dr.Willms, Thomas Dr.Willschütz, Hans-GeorgWitke, WillyZschau, Jochen Dr.Zippe, Winfried Dr.Zippe, Cornelius Dr.
PhD StudentsBeckert, CarstenGrahn, AlexanderHöhne, ThomasKern, TommyKliem, MargaritaRepp, ThomasSchäfer, FrankUlbricht, AndreasWeier, Tom
Technical StaffBaldauf, DieterBehrens, SieglindeBombis, DorisBorchardt, SteffenEichhorn, ChristineForker, KlausFutterschneider, HeinGundrum, ThomasKunadt, HeikoLeonhardt, Wolf-DietrichLeuner, BerndLosinski, ClaudiaMansel, CatrinNowak, BerndOpitz, RuthOtto, GerlindPietzsch, JensRichter, AnnettRichter, HenryRichter, JoachimRichter, Karl-HeinzRichter, PetraRott, SonjaRussig, HeikoSchleßiger, HeikeSchneider, GiselaSeidler, ChristaSeiler, TorstenSkorupa, UlrichTamme, MarkoTamme, GüntherWebersinke, SteffenWeiß, RainerZimmermann, Wilfried