Embed Size (px)
Citation preview
YOUR ACCESS TO SECURITY
K A B A H O L D I N G L T D
A N N U A L R E P O R T 1 9 9 8 / 9 9
e_00_Titelseite 17.09.1999 17:29 Uhr Seite 1
REPORT
At a Glance 2
Letter to Shareholders 3
Information for Investors 4
Board and Management 8
Development of the Kaba Group in 1998/99 9
Door Systems Division 15
Mechanical and Electromechanical Locks Division 16
Access and Time Control Division 17
Selected Projects 18
On the Threshold to the New Millennium 24
GROUP FINANCIALS
Consolidated Group Balance Sheet 26
Consolidated Group Income Statement 28
Consolidated Group Flow of Funds 29
Notes to the Consolidated Group Financial Statements 30
Legal Structure of the Kaba Group 44
Group Auditor’s Report 46
HOLDING COMPANY FINANCIALS
Holding Company Balance Sheet 48
Holding Company Income Statement and Appropriation of Profit 50
Notes to the Financial Statements 51
Auditor’s Report 53
Comments on the Financial Statements 54
Operative Structure 55
Addresses 56
T A B L E O F C O N T E N T S A N N U A L R E P O R T 1 9 9 8 / 9 9
K A B A H O L D I N G L T D
Cover photo:
The Group Company Kaba Gilgen
supplied the automatic doors for the
Mandalay Bay Trains in Las Vegas.
e_01_07 17.09.1999 18:04 Uhr Seite 1
e_01
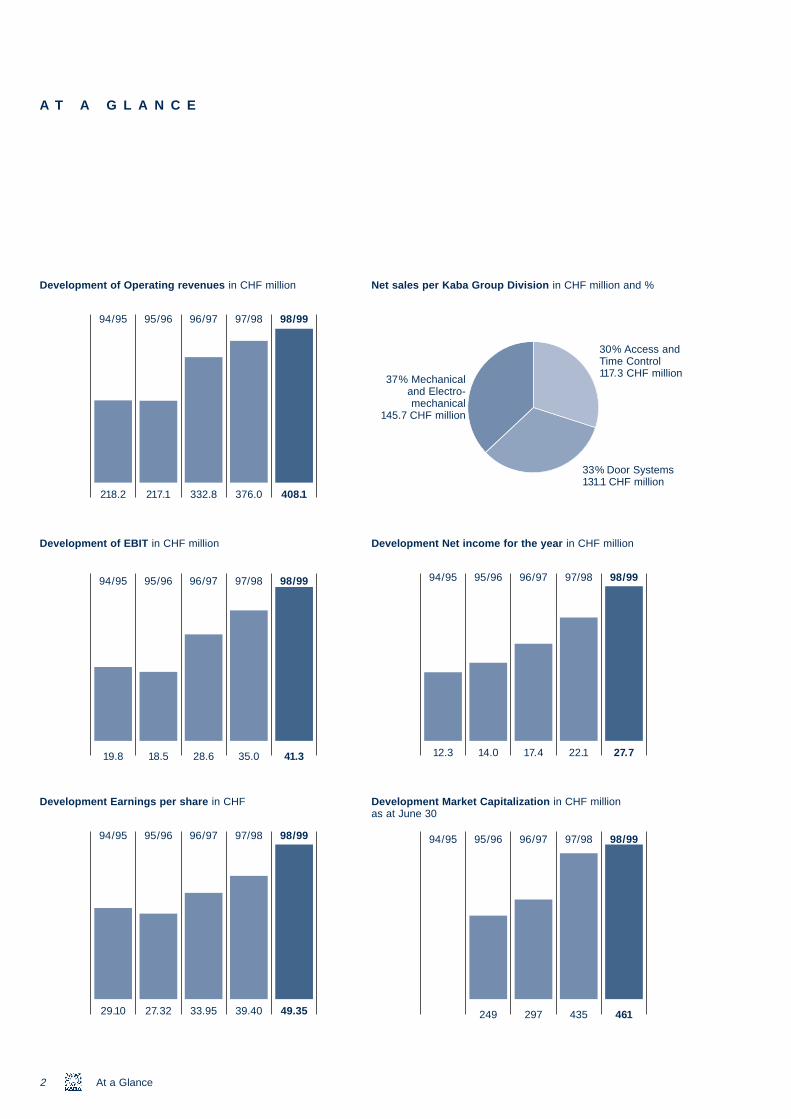
A T A G L A N C E
_07 17.09.1999 18:04 Uhr Seite 2
and
llion
Development of Operating revenues in CHF million
94/95 95/96 96/97 97/98 98/99
33% Door Systems
Development of EBIT in CHF million
218.2 217.1 332.8 376.0 408.1
94/95 95/96 96/97 97/98 98/99
2 At a Glance
Development Earnings per share in CHF
19.8 18.5 28.6 35.0 41.3
94/95 95/96 96/97 97/98 98/99
29.10 27.32 33.95 39.40 49.35
Net sales per Kaba Group Division in CHF million and %
37% Mechanicaland Electro-mechanical
145.7 CHF million
30% Access Time Control117.3 CHF mi
Development Net income for the year in CHF million
131.1 CHF million
94/95 95/96 96/97 97/98 98/99
Development Market Capitalization in CHF million as at June 30
12.3 14.0 17.4 22.1 27.7
94/95 95/96 96/97 97/98 98/99
249 297 435 461
e_01_07 17.09.
L E T T E R T O S H A R E H O L D E R S
Dear Kaba shareholder:
In financial 1998/99, Kaba yet again succeeded in substantially boosting consolidated income – this year by 25.3%
from CHF 22.1 million to CHF 27.7 million. Since it went public in 1995/96, Kaba has generated sustained earnings growth
averaging about 22% per share per annum.
Operating revenues rose by 8.5% to CHF 408.1 million in the year under review, accompanied by a gain in net sales
of 7.6% or CHF 27.9 million to CHF 394.1 million. Of this amount, CHF 7.5 million are attributable to the first-time
consolidation of Inform Objektschutz GmbH in Germany. Currency-adjusted internal growth in a comparable scope of
consolidation amounted to CHF 22.2 million or 6.1%.
The ongoing integration of the companies acquired in the past years as well as operational progress in most other
Group companies resulted in an advance of the EBIT margin, i.e. earnings from operations expressed as a percentage
of operating revenues, from 9.3% in the prior year to 10.1% in the year under review.
The integration of the door systems companies acquired in the United Kingdom effective July 1, 1999, will add further
stimulus within the scope of our globalization drive. This gives us new possibilities in earnings momentum and strongly
suggests that we will continue to achieve our ambitious profit targets in the future.
Numerous investors, particularly international shareholders, rewarded the entrepreneurial dynamic of Kaba, the adoption
of a unified share system and our exemplary information policy with a 22% price gain of Kaba registered shares in the
first half of 1999.
In view of the encouraging developments in the past and of the good outlook for the new financial year, the Board of
Directors proposes that the dividend for the year just ended be increased from CHF 11.50 in the prior year to CHF 12.50
per share.
Current President of the Executive Committee and CEO Ulrich Graf as well as Gerhard Zeidler will be available for
1999 18:04 Uhr Seite 3
3Letter to Shareholders
reelection at the forthcoming General Meeting of Shareholders while Peter Riederer has decided to withdraw. We wish to
express our sincere appreciation to Mr. Riederer for the strong commitment to the Kaba Group which he demonstrated
during 25 years in key positions. As the managing director of Kaba Schliesssysteme AG, then as the Chief Operating
Officer of today’s Mechanical and Electromechanical Locks Division and in his tenure during the past 10 years as a
member of the Board of Directors, Mr. Riederer significantly contributed to the success of the Kaba Group. The Board
intends to submit a successorship proposal on the occasion of the General Meeting in the year 2000.
All of our staff members worked hard to achieve this reassuring profit gain and demonstrated a strong commitment to
performance. They deserve our special commendations.
Rümlang, September 1999
Sincerely yours,
Kaba Holding Ltd
Creed Kuenzle Ulrich Graf
Chairman of the Board President
e_01_
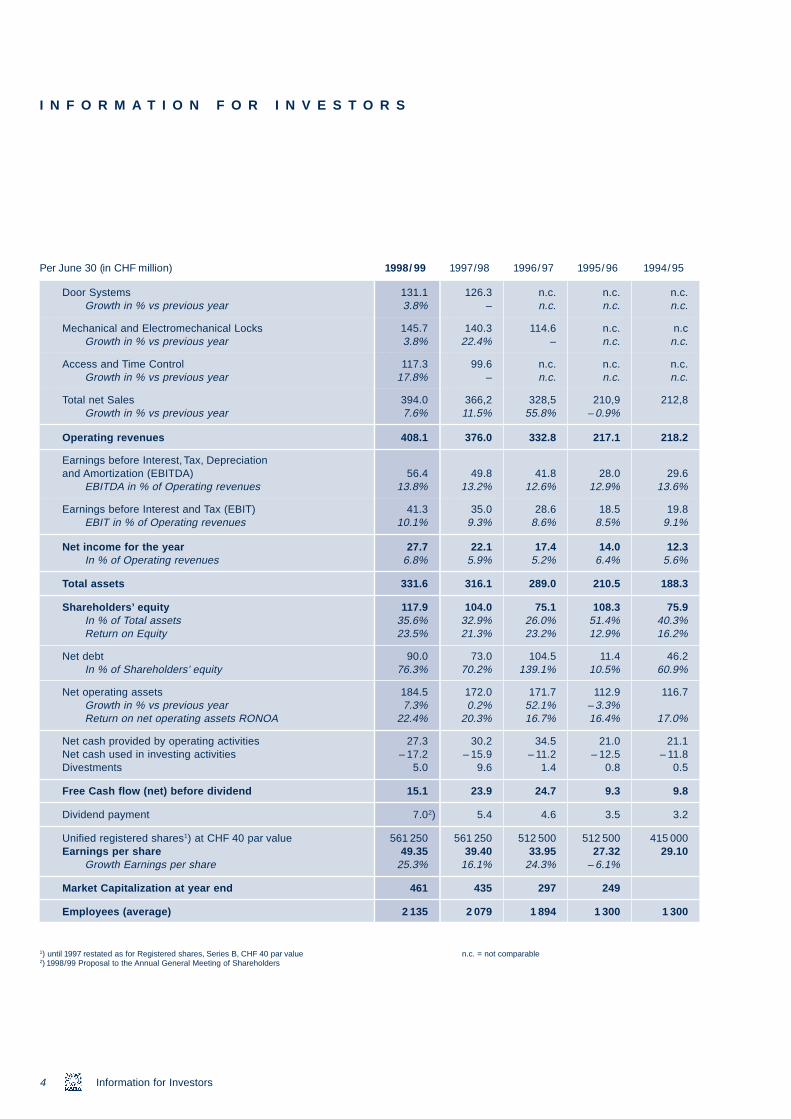
I N F O R M A T I O N F O R I N V E S T O R S
Per June 30 (in CHF million) 1998/99 1997/98 1996/97 1995/96 1994/95
Door Systems 131.1 126.3 n.c. n.c. n.c.Growth in % vs previous year 3.8% – n.c. n.c. n.c.
Mechanical and Electromechanical Locks 145.7 140.3 114.6 n.c. n.cGrowth in % vs previous year 3.8% 22.4% – n.c. n.c.
Access and Time Control 117.3 99.6 n.c. n.c. n.c.Growth in % vs previous year 17.8% – n.c. n.c. n.c.
Total net Sales 394.0 366,2 328,5 210,9 212,8Growth in % vs previous year 7.6% 11.5% 55.8% – 0.9%
Operating revenues 408.1 376.0 332.8 217.1 218.2
Earnings before Interest, Tax, Depreciation and Amortization (EBITDA) 56.4 49.8 41.8 28.0 29.6
EBITDA in % of Operating revenues 13.8% 13.2% 12.6% 12.9% 13.6%
Earnings before Interest and Tax (EBIT) 41.3 35.0 28.6 18.5 19.8EBIT in % of Operating revenues 10.1% 9.3% 8.6% 8.5% 9.1%
Net income for the year 27.7 22.1 17.4 14.0 12.3In % of Operating revenues 6.8% 5.9% 5.2% 6.4% 5.6%
Total assets 331.6 316.1 289.0 210.5 188.3
Shareholders’ equity 117.9 104.0 75.1 108.3 75.9In % of Total assets 35.6% 32.9% 26.0% 51.4% 40.3%Return on Equity 23.5% 21.3% 23.2% 12.9% 16.2%
Net debt 90.0 73.0 104.5 11.4 46.2
07 17.09.1999 18:04 Uhr Seite 4
4 Information for Investors
In % of Shareholders’ equity 76.3% 70.2% 139.1% 10.5% 60.9%
Net operating assets 184.5 172.0 171.7 112.9 116.7Growth in % vs previous year 7.3% 0.2% 52.1% – 3.3%Return on net operating assets RONOA 22.4% 20.3% 16.7% 16.4% 17.0%
Net cash provided by operating activities 27.3 30.2 34.5 21.0 21.1Net cash used in investing activities – 17.2 – 15.9 – 11.2 – 12.5 – 11.8Divestments 5.0 9.6 1.4 0.8 0.5
Free Cash flow (net) before dividend 15.1 23.9 24.7 9.3 9.8
Dividend payment 7.02) 5.4 4.6 3.5 3.2
Unified registered shares1) at CHF 40 par value 561 250 561 250 512 500 512 500 415 000Earnings per share 49.35 39.40 33.95 27.32 29.10
Growth Earnings per share 25.3% 16.1% 24.3% – 6.1%
Market Capitalization at year end 461 435 297 249
Employees (average) 2 135 2 079 1 894 1 300 1 300
1) until 1997 restated as for Registered shares, Series B, CHF 40 par value n.c. = not comparable2) 1998/99 Proposal to the Annual General Meeting of Shareholders
e_01_07 17.09
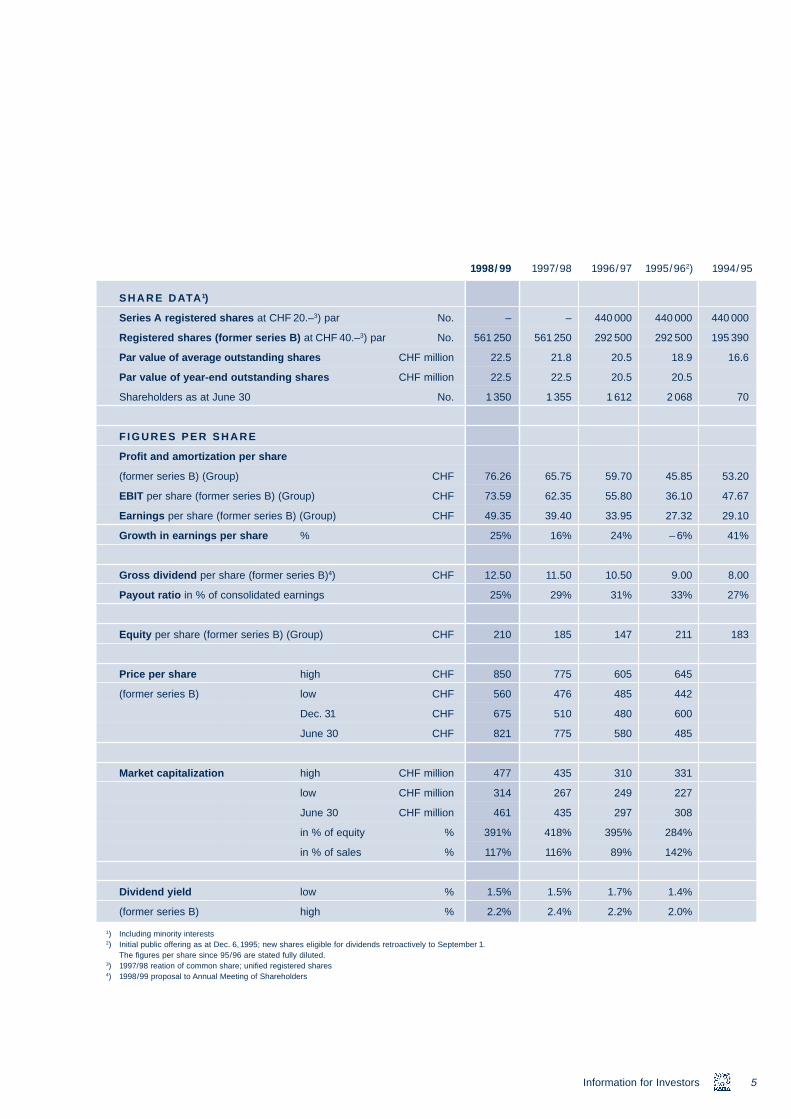
SHARE DATA1)
Series A registered shares at CHF 20.–3) par No. – – 440 000 440 000 440 000
Registered shares (former series B) at CHF 40.–3) par No. 561 250 561 250 292 500 292 500 195 390
Par value of average outstanding shares CHF million 22.5 21.8 20.5 18.9 16.6
Par value of year-end outstanding shares CHF million 22.5 22.5 20.5 20.5
Shareholders as at June 30 No. 1 350 1 355 1 612 2 068 70
F IGURES PER SHARE
Profit and amortization per share
(former series B) (Group) CHF 76.26 65.75 59.70 45.85 53.20
EBIT per share (former series B) (Group) CHF 73.59 62.35 55.80 36.10 47.67
Earnings per share (former series B) (Group) CHF 49.35 39.40 33.95 27.32 29.10
Growth in earnings per share % 25% 16% 24% – 6% 41%
Gross dividend per share (former series B)4) CHF 12.50 11.50 10.50 9.00 8.00
Payout ratio in % of consolidated earnings 25% 29% 31% 33% 27%
Equity per share (former series B) (Group) CHF 210 185 147 211 183
Price per share high CHF 850 775 605 645
1998/99 1997/98 1996/97 1995/962) 1994/95
.1999 18:04 Uhr Seite 5
(former series B) low CHF 560 476 485 442
Dec. 31 CHF 675 510 480 600
June 30 CHF 821 775 580 485
Market capitalization high CHF million 477 435 310 331
low CHF million 314 267 249 227
June 30 CHF million 461 435 297 308
in % of equity % 391% 418% 395% 284%
in % of sales % 117% 116% 89% 142%
Dividend yield low % 1.5% 1.5% 1.7% 1.4%
(former series B) high % 2.2% 2.4% 2.2% 2.0%
1) Including minority interests2) Initial public offering as at Dec. 6, 1995; new shares eligible for dividends retroactively to September 1.
The figures per share since 95/96 are stated fully diluted.3) 1997/98 reation of common share; unified registered shares4) 1998/99 proposal to Annual Meeting of Shareholders
5Information for Investors
e_01
_07 17.09.1999 18:04 Uhr Seite 6I N F O R M A T I O N F O R I N V E S T O R S (cont.)
Schedule
27. 9.1999 Financial press conference
Analysts presentation
Mailing of annual report 98/99
2.11.1999 Annual Meeting of Shareholders
5.11.1999 Maturity dividend, trade ex dividend
March 2000 Letter to shareholders, mid-year
25.9.2000 Letter to shareholders, year-end
Financial press conference
Analysts presentation
Mailing of annual report 1999/2000
24.10.2000 Annual Meeting of Shareholders
8000
Stück
950
CHF
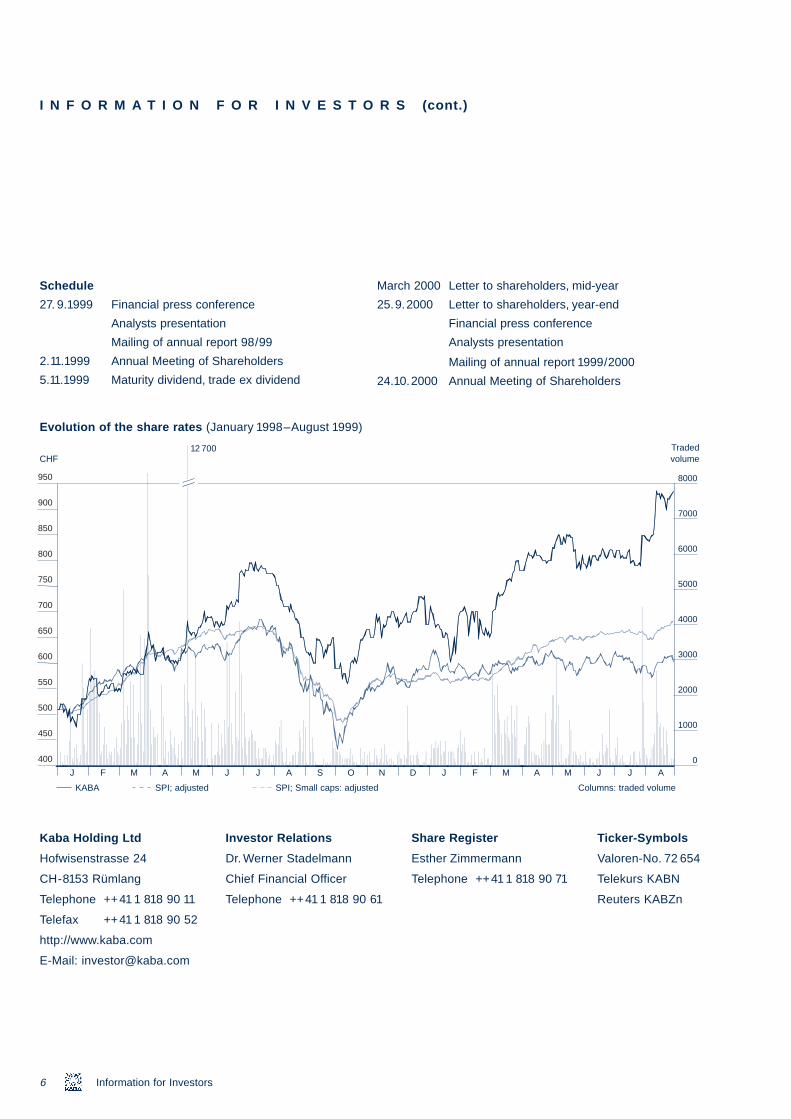
Evolution of the share rates (January 1998–August 1999)
CHF12 700 Traded
volume
900
3000
4000
5000
6000
7000
600
650
700
750
800
850
6 Information for Investors
Kaba Holding Ltd
Hofwisenstrasse 24
CH-8153 Rümlang
Telephone ++41 1 818 90 11
Telefax ++41 1 818 90 52
http://www.kaba.com
E-Mail: [email protected]
Investor Relations
Dr. Werner Stadelmann
Chief Financial Officer
Telephone ++41 1 818 90 61
Share Register
Esther Zimmermann
Telephone ++41 1 818 90 71
Ticker-Symbols
Valoren-No. 72 654
Telekurs KABN
Reuters KABZn
0
1000
2000
400
450
500
550
J F M A M J J A S O N D J F M A M J J A
KABA SPI; adjusted SPI; Small caps: adjusted Columns: traded volume
e_01_07 17.09.
1999 18:04 Uhr Seite 7Transfer and voting right provisions
Shareholders shall be registered with a maximum of 5% of the share capital. Shares held in custody shall not be regis-
tered. The voting rights for any single shareholder are limited to 5% of the aggregate votes. Shareholders registered
prior to the date of the initial public offering are exempt from this limitation.
The Board of Directors may suspend the voting rights of new shareholders to the extent that and as long as, pursuant to
the information available to the Company, the recognition of foreign shareholders might hinder the submission of evi-
dence stipulated by Swiss Federal Law, particularly in conjunction with the Federal Law on the Acquisition of Real Estate
by Foreign Nationals. At the time of printing, no shareholders were subject to this limitation of registration.
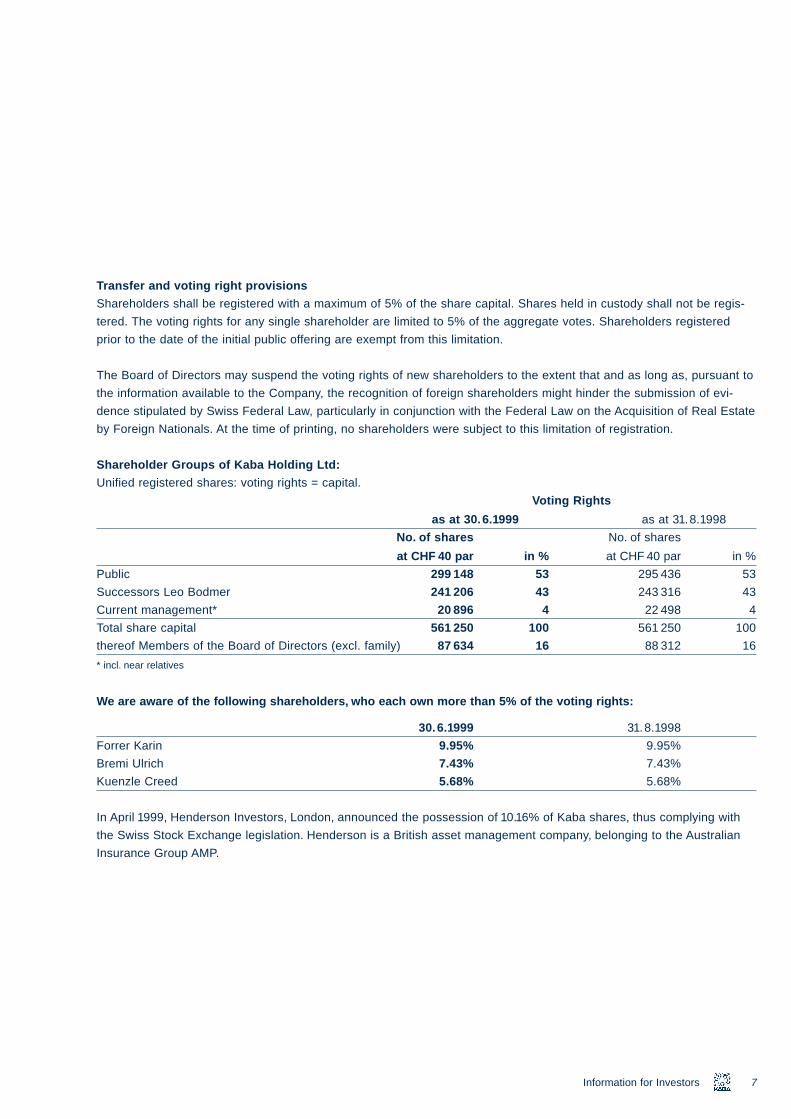
Shareholder Groups of Kaba Holding Ltd:
Unified registered shares: voting rights = capital.
Voting Rights
as at 30.6.1999 as at 31.8.1998
No. of shares No. of shares
at CHF 40 par in % at CHF 40 par in %
Public 299 148 53 295 436 53
Successors Leo Bodmer 241 206 43 243 316 43
Current management* 20 896 4 22 498 4
Total share capital 561 250 100 561 250 100
thereof Members of the Board of Directors (excl. family) 87 634 16 88 312 16
* incl. near relatives
We are aware of the following shareholders, who each own more than 5% of the voting rights:
30.6.1999 31.8.1998
Forrer Karin 9.95% 9.95%
Bremi Ulrich 7.43% 7.43%
Kuenzle Creed 5.68% 5.68%
In April 1999, Henderson Investors, London, announced the possession of 10.16% of Kaba shares, thus complying with
the Swiss Stock Exchange legislation. Henderson is a British asset management company, belonging to the Australian
Insurance Group AMP.
7Information for Investors
e_08
B O A R D A N D M A N A G E M E N T
K A B A H O L D I N G L T D
Board Tenure of office
Creed Kuenzle, Chairman 2001
Ulrich Bremi, Vice-Chairman 2001
Ulrich Graf, Delegate and CEO 1999
_24 17.09.1999 17:47 Uhr Seite 8
Board and Management8
Peter Riederer 1999
Gerhard Zeidler 1999
Thomas Zimmermann 2000
Rudolf W. Weber 2001
Group Management
Ulrich Graf President of the Executive Committee and CEO
Heribert Allemann COO, Mechanical and Electromechanical Locks
Sönke Bandixen COO, Door and Banking Systems
Dr. Werner Stadelmann Chief Financial Officer
Ulrich Wydler COO, Access and Time Control
Auditors
PricewaterhouseCoopers AG,
Zurich
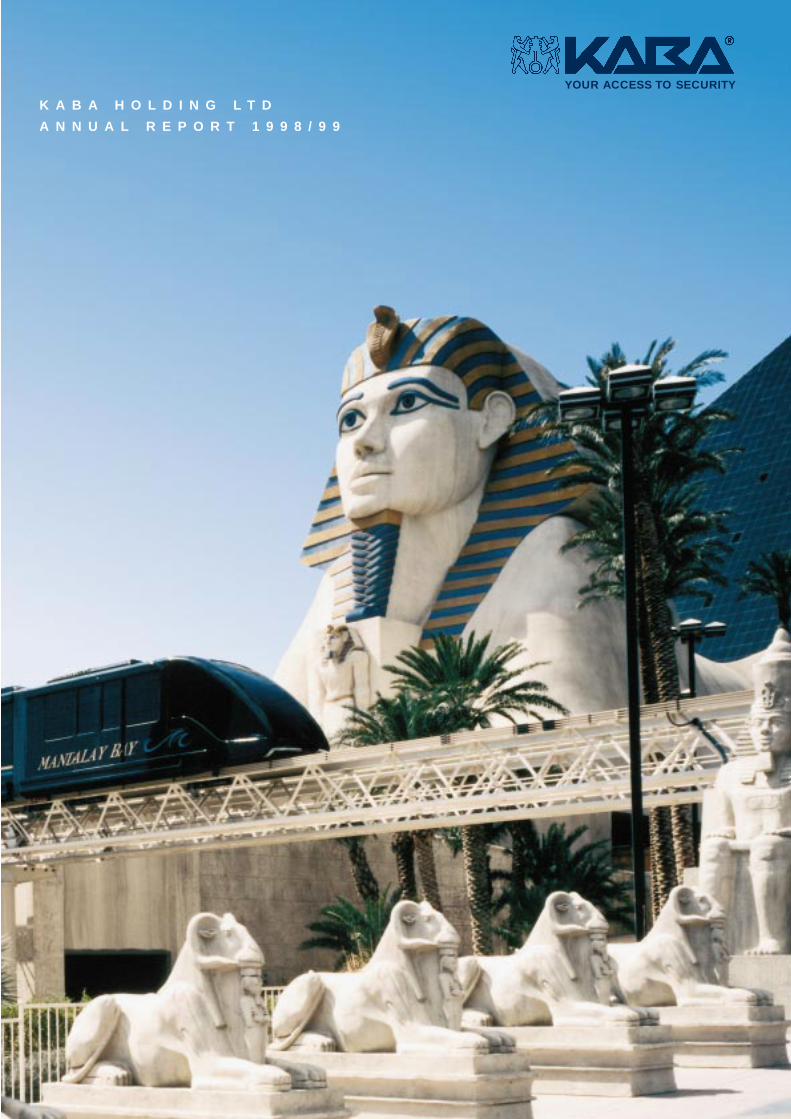
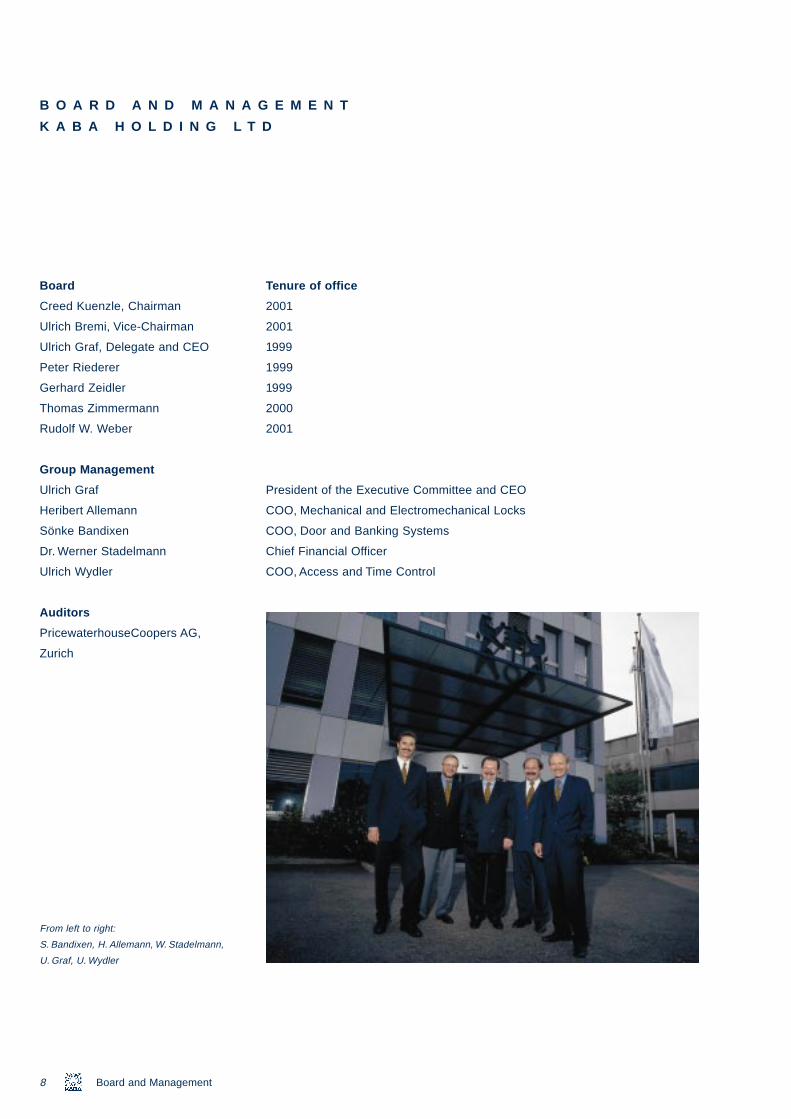
From left to right:
S. Bandixen, H. Allemann, W. Stadelmann,
U. Graf, U. Wydler
e_08_24 17.09.1
D E V E L O P M E N T O F
Market position safeguarded
In the year under review, the Kaba
Group systematically pursued its
“Total Access” acquisition and growth
strategy. With its strong market posi-
tion in door and gate systems, locking
systems, access control, time man-
agement and systems integration of
turnkey security systems – particu-
larly in German-speaking Europe –
Kaba is now undisputedly one of the
international leaders in the domain
of “doorkeeping” products and ser-
vices. With its “Total Access” strategy,
the Kaba Group has been offering
one-stop shopping convenience for
years.
Operating revenues rose by 8.5% to
999 17:47 Uhr Seite 9
CHF 408.1 million in the year under
review. In comparison with the prior
year, consolidated sales advanced
by CHF 27.9 million or 7.6% to
CHF 394.1 million. Currency-adjusted
growth would have been 8.1% to
about CHF 396 million: the firming
Swiss franc diminished the sales gain
by CHF 1.8 million.
The first-time consolidation of Inform
Objektschutz GmbH accounts for
acquired growth amounting to CHF
7.5 million. In a comparable scope of
consolidation, Kaba posted growth
T H E K A B A G R O U P
of CHF 22.2 million or 6.1% and thus
was able to maintain internal growth
clearly over the level of economic
growth in its principal markets.
While the Access and Time Control
Division reported overproportional
growth of 17.8%, the other two
divisions advanced by 5% and 4%,
respectively, after currency adjust-
ment.
Invoiced sales in and from Switzer-
land as well as in and from Ger-
many picked up by 13%. These fig-
ures also include deliveries to
customers outside Switzerland and
Germany. Conversely, currency-
adjusted sales elsewhere in Europe
advanced by 4%. The market
trends in the Far East and in the
USA were encouraging for us as
well. As in the past, the largest con-
tribution from abroad originates in
Germany which accounts for 25% of
sales (previous year 23%). Inform
Objektschutz GmbH in Düsseldorf,
which still operated under that name
a year ago, has meanwhile been
fully consolidated. The strong position
of this systems integration house in
the German banking sector has been
sustainably firmed within the Kaba
family.
I N 1 9 9 8 / 9 9
We are convinced that Kaba will
continue to grow. The “Total Access”
market is detached from the general
trend in the construction industry.
Today, as much as 70% of all “Total
Access” components and systems
are being installed in existing build-
ings. From this point of view, the
underlying market is growing at a
rate of approximately 5 to 6% per
annum, at the same time allowing
Kaba to preserve its already solid
position in the “Total Access” market.
Additionally, the underlying need
for security, organization and conve-
nience is rising steadily. Precisely
this domain is being targeted by
Kaba’s development thrust. Each
9
product innovation is characterized
by a higher level of safety but
also by simplified handling, refined
organizational features and greater
convenience.
Improvement of EBIT margin
In financial 1998/99, the Kaba Group
succeeded in boosting the EBIT
margin (earnings from operations as
a percentage of operating revenues)
from 9.3% to 10.1%. Expressed in
terms of net sales, the advance is
even more impressive: from 9.6% to
10.5%.
Development 1998/99
capital increase in 1997, Kaba
x
a
e_08
In absolute terms, earnings before
interest and taxes (EBIT) picked
up by CHF 6.3 million, which is equiv-
alent to 18% or three times the
growth rate of sales. The Access and
Time Control Division provided the
greatest contribution to this growth.
The development of the reader and
terminal business under the Kaba
Benzing brand was outstanding. Sub-
stantial progress was also achieved
in systems integration, mainly in
Switzerland. The other two divisions –
Door Systems as well as Mechanical
and Electromechanical Locks –
posted gains as well. In this annual
report, the trends of the individual
divisions are described in more detail
further below.
_24 17.09.1999 17:47 Uhr Seite 10
10 Development 1998/99
20% profit benchmark per year
and per share exceeded
In the medium-term time frame, we
project that part of our targeted
average profit growth of at least
20% (per year and per share) will
originate in roughly equal thirds
from sales growth, from EBIT margin
improvements and from suitable
acquisitions. In the year under review,
the goal was attained mostly from
within, i.e. by an improvement of the
EBIT margin and by profitable sales
growth.
Thanks to the good liquidity situation,
the balance of financial expense and
financial income picked up by CHF
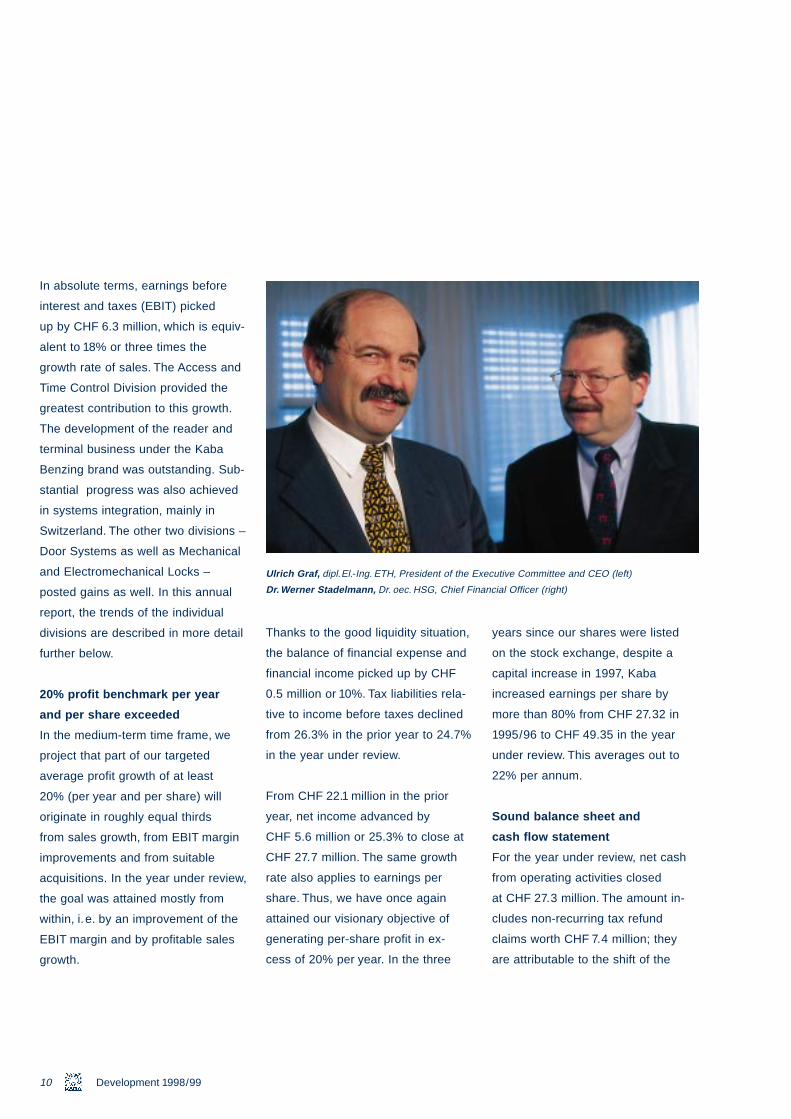
Ulrich Graf, dipl.El.-Ing. ETH, President of the E
Dr. Werner Stadelmann, Dr. oec. HSG, Chief Fin
0.5 million or 10%. Tax liabilities rela-
tive to income before taxes declined
from 26.3% in the prior year to 24.7%
in the year under review.
From CHF 22.1 million in the prior
year, net income advanced by
CHF 5.6 million or 25.3% to close at
CHF 27.7 million. The same growth
rate also applies to earnings per
share. Thus, we have once again
attained our visionary objective of
generating per-share profit in ex-
cess of 20% per year. In the three
years since our shares were listed
on the stock exchange, despite a
ecutive Committee and CEO (left)
ncial Officer (right)
increased earnings per share by
more than 80% from CHF 27.32 in
1995/96 to CHF 49.35 in the year
under review. This averages out to
22% per annum.
Sound balance sheet and
cash flow statement
For the year under review, net cash
from operating activities closed
at CHF 27.3 million. The amount in-
cludes non-recurring tax refund
claims worth CHF 7.4 million; they
are attributable to the shift of the
e_08_24 17.09.
closing data of Kaba Holding Ltd
from August 31 to June 30, and to
particularly high foreign refund
claims. After elimination of this one-
time distortion, adjusted net cash
from operating activities amounted
to CHF 34.7 million (previous year
CHF 30.2 million).
The conversion of internal data pro-
cessing resources at four major sites
burdened this account during the
year under review, causing inventory
and receivables from customers
to rise by 8%. Programs to improve
current asset management have
been initiated.
The item purchase of investments
1999 17:47 Uhr Seite 11
includes prepayments in conjunction
with the acquisition of the door
systems companies in Great Britain
(CHF 18.6 million) which only became
effective as at July 1, 1999.
Despite the partial integration of the
acquired British companies in the
balance sheet as at June 30, 1999,
total assets rose by merely 5% in
comparison with the prior year. The
equity to total assets ratio improved
further, increasing from 32.9% last
year to 35.6% at the end of the year
under review.
Continued pursuit of
the “Total Access” strategy
Our “Total Access” offering is
structured in three divisions:
“Door Systems”, “Mechanical and
Electromechanical Locks” and
“Access and Time Control”.
With prestigious contracts in the
fields of systems integration
and door systems as well as its
work on a comprehensive, futuristic
ticketing solution for Expo.01,
the Swiss National Exposition, the
Door Systems Division further
consolidated its market position both
nationally and internationally. In the
current financial year, the division
will experience a further acceleration
in growth following the acquisitions
in Great Britain.
In the Access and Time Control Divi-
sion, the focus was on the develop-
ment of broader international markets
without compromising the strong
position in Switzerland, the division’s
domestic market. After the transition
to the new millennium, overpropor-
tional growth in electronics will con-
tinue to dominate the division’s busi-
ness. The Electronics Competence
Center affiliated with the division has
perceptibly strengthened the Kaba
Group’s position in the field of secu-
rity components and system software
as a platform for our systems inte-
gration activities. The work of all three
competence centers – for door
systems, for mechatronic locking
systems and for electronics – is
clearly aligned with the fulfillment of
ever-growing customer requirements.
Apart from the globally increasing
significance and recognition of the
Kaba Group and its product/service
mix as well as its repeatedly de-
monstrated ability to efficiently and
resolutely implement even large
international projects, the key growth
stimulus for the future will originate
from a combination of ever-expanding
convenience expectations among
11
customers and end-users, an un-
abated increase in the need for secu-
rity and not least the still swift pro-
liferation of more and more affordable
electronics. The Kaba Group’s
development activities are fully aimed
at these three anchor points.
Corporatewide today, Kaba invests
roughly 5 percent of sales in new
developments, which is about double
that of any other competitor. On
the closing date, about 60 of the
2147 Kaba employees were primarily
active in the development sector. In
Development 1998/99
e_08_
this context, the highlights of the past
financial year include the success-
ful international market launch of a
new Internet-compatible personnel
time and production data acquisition
terminal by Kaba Benzing and
new drives for flexible indoor partition
walls.
The successful introduction of the
Kaba elolegic mechatronic locking
system represents the cornerstone
of a superior modular electromechan-
ical product and service bundle
which in particular enables the Euro-
pean trade to enter the promising
market for mechatronic security solu-
tions.
24 17.09.1999 17:47 Uhr Seite 12
12 Development 1998/99
Moreover, Kaba was able to sub-
stantially improve the price /perfor-
mance ratio of Legic read /write
heads which will further strengthen
the market position of our Legic
identification system.
High shareholder affinity
As we pursue the globalization of
our “Total Access” business, foreign
investors have professed growing
interest in Kaba. During the past year,
the management of the Group enter-
tained intensive contacts particularly
with Anglo-Saxon investors. The inter-
national resonance of our business
strategy has also had a decidedly
positive impact on the price of Kaba
shares. As at June 30, 1999, our
shares were trading at CHF 821
6% higher than the closing price of
CHF 775 on June 30, 1998. In the
first half of 1999, the share price rose
from CHF 675 to CHF 821, posting
a gain of CHF 146 or 22%.
We are particularly pleased to note
that our commitment is acknowledged
by the financial community: Pro
Swiss Invest, an interest group,
ranked Kaba second in the field of
investor relations (previous year:
third). We are especially pleased with
this commendation because this
year, no fewer than 39 companies
were judged according to the new,
stricter criteria. Within this more
sophisticated framework, Kaba even
succeeded in moving up.
Moreover, the Swiss Society for
Financial Analysis and Asset
Management ranked us second
among the candidates for the
Mercury Award. The Society’s
experts characterized Kaba’s infor-
mation policy as “exemplary”
and our Investor’s Handbook as a
“model”.
Acquisition of door systems in
Great Britain effective July 1,1999
During the year under review, the
Kaba Group’s growth was largely
internal. In the current financial year,
following the acquisition of three
companies of the Industrial Doors
Division of Stratagem Group plc as
well as of Adtek Ltd effective July 1,
1999, the Group will experience a
growth thrust based on the expansion
of the scope of consolidation and
concurrently, Kaba has become the
UK market leader in door systems.
In Great Britain, the acquired com-
panies – which operate under the
Henderson-Bostwick brand – have
the largest nationwide service and
repair organization for door systems
with 150 service technicians at
7 support centers. They offer 24-hour
telephone assistance with a call
center. The companies also manufac-
ture and sell industrial doors, i.e.
doors for truck terminals and security
doors for emergency exits.
Moreover, internationally outsourced
components for automatic door
systems are customized and sold
to door and gate manufacturers
under the Garog brand. Hufcor
Limited manufactures and distributes
e_08_24 17.09.
movable partition walls for railway
platforms, hotels and office buildings.
Adtek originated from the European
distribution organization of Stanley.
Stanley is the market leader for auto-
matic door systems in the USA.
Kaba itself has had a presence in
the UK for many years through Kaba
Camor Ltd. This company has been
distributing Kaba Gallenschütz secu-
rity doors as well as automatic doors
made by Kaba Gilgen.
To assure that synergies can be har-
nessed, the activities in Great Britain
will be merged under the Kaba
Door Systems identity, but established
1999 17:47 Uhr Seite 13
Kaba brands will be preserved.
Kaba offers customers single-source
door systems for the front and back
sides of buildings, including security
and environmental control doors,
revolving and swinging doors, sliding
or folding doors, turnstiles and tripod
barriers, acoustic and firestop doors,
architecturally customized and simple
steel doors, doors designed to meet
the needs of people with disabilities,
automated access control and tick-
eting systems, industrial doors and
gates, roll-up, overhead and sectional
doors as well as static or movable
partitions. The service and repair
organization now also supports the
sale of traditional Kaba door
systems and of all other Kaba prod-
ucts. Garog is strongly anchored
in the marketplace with an indirect
distribution organization not only
for door components, but also for all
other Kaba components and prod-
ucts.
The distribution activities of Adtek
in the Netherlands and France will be
segregated and transferred to the
Kaba distribution companies there.
For the Kaba Group, the acquisitions
in Great Britain involve a sales in-
crement of CHF 80 million and about
480 new employees.
From Kaba’s point of view, the British
acquisitions represent a genuine
quantum leap as regards globaliza-
tion. This single move turned Kaba
into the number one door systems
provider in Great Britain. The Group’s
strong position now gives the two
other divisions facilitated access to
the British market.
Due to this growth in Great Britain,
Kaba has also become a major
player in Europe outside the German-
speaking markets. While Kaba
generated 47% of its sales in Switzer-
land during the year under review,
this figure is expected to be about
39% in financial 1999/2000. In the
current year, sales in Europe outside
Switzerland will probably rise to
57% as opposed to 49% during the
year under review.
Earnings from door systems
operations in Great Britain will be
at breakeven at the beginning
of the restructuring and integration
phase.
The new companies are currently
undergoing an evolutionary fit-
ness program. This will help us
13
uphold the objective of generating
part of our targeted future profit
growth through EBIT margin improve-
ments.
However, the significant entrepre-
neurial opportunities associated with
the strong market presence in Great
Britain are even more important.
Indirectly, Kaba’s experience in
Great Britain will also contribute to
strengthening our positions in other
Anglo-Saxon-minded regions such
as Singapore and Hong Kong.
Development 1998/99
on companies that have a significant
installed base and are complemen-
tary to Kaba in terms of geographical
presence and product lines. The
complete integration of such candi-
dates will continue to contribute
to the attainment of the Kaba Group’s
profit growth targets.
Capitalizable investments will again
correspond approximately to depreci-
ation.
For financial 1999/00, we expect a
further growth of net income.
e_08
Outlook
In financial 1999/2000, Kaba will
generate operating revenues in the
magnitude of CHF 500 million and
for financial 2001/2002 is aiming
for CHF 650 million. Another major
acquisition will be required to achieve
the second target.
We continue to project an average
yearly per-share earnings gain
of 20% based on a combination of
internal and acquired growth.
This necessitates continuity in the
planned development of sales
but above all will require above-
average increases in earnings
before interest and taxes (EBIT).
_24 17.09.1999 17:47 Uhr Seite 14
14 Development 1998/99
These EBIT advances will be derived
from the successful further devel-
opment of our traditional components
business in our door systems,
locks and locking systems as well as
access control and time manage-
ment operations. Additionally, we will
generate sales growth and
strengthen our operating margin
through the gradual penetration of
our new market for systems inte-
gration, i.e. the implementation of
single-source “Total Access” solu-
tions. Finally, as set forth within
the scope of our IPO in 1995 and
as described in our Investor’s Hand-
book, we will pursue our acquisition
strategy by seeking and purchasing
suitable candidates. We will focus
e_08_24 17.09.1
999 17:47 Uhr Seite 15focused on automatic, security and
industrial doors and gates. This
offering is backed by a nationwide
service organization with 24-hour
availability.
In all of the division’s production oper-
ations, the introduction of a new sys-
tem platform based on the SAP/R3
enterprise resource planning software
expedited the integration process and
l
.3
m
d Eastern Europe. The multiple
nted during the past financial year
oor systems in Great Britain.
D O O R S Y S T E M S
Two contrary trends impacted the
business of the Door Systems Divi-
sion: the successful development of
the international distribution of Kaba
Gilgen door drives and control ele-
ments contrasted against a slower
dynamic in the security doors sector.
Nonetheless, the Door Systems
Division advanced at a slightly higher
rate than the industry average.
Total sales rose by 4% while orders
received picked up by 15%.
In comparison with the prior year, sa
Division increased by 4% to CHF 131
sales in Europe, the division’s main
characterized the markets in Asia an
acquisition in door systems impleme
makes Kaba the largest provider of d
In conjunction with its existing activi-
ties in Great Britain, Kaba became
the market leader in one fell swoop
this year subsequent to the acqui-
sition of Adtek Ltd in Great Britain
and of its subsidiaries in the Nether-
lands, France and Italy – formerly
the European activities of Stanley, the
American door specialist – as well
as of the Henderson-Bostwick Group
which is an industrial doors specialist.
Kaba Door Systems UK will serve
the British market with an extensive
single-source lineup of products
es generated by the Door Systems
million. The substantial rise in
arket, offset the weakness which
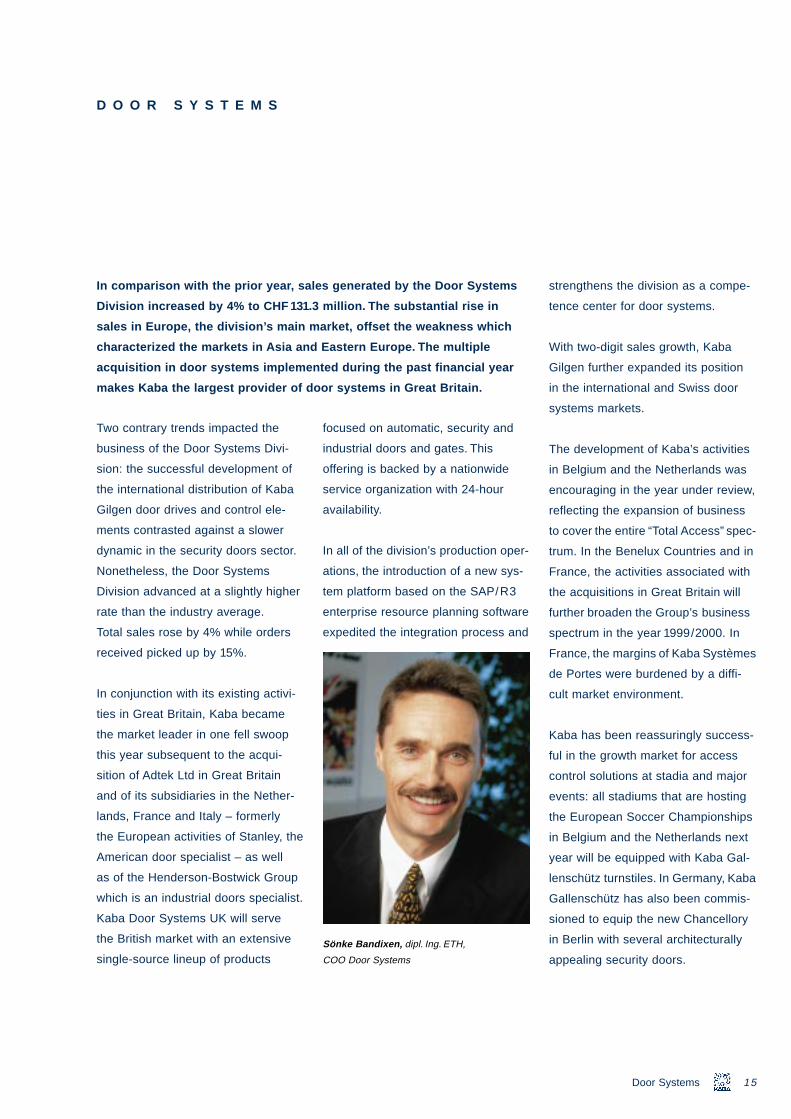
Sönke Bandixen, dipl. Ing. ETH,
COO Door Systems
strengthens the division as a compe-
tence center for door systems.
With two-digit sales growth, Kaba
Gilgen further expanded its position
in the international and Swiss door
systems markets.
The development of Kaba’s activities
in Belgium and the Netherlands was
encouraging in the year under review,
reflecting the expansion of business
to cover the entire “Total Access” spec-
trum. In the Benelux Countries and in
France, the activities associated with
the acquisitions in Great Britain will
further broaden the Group’s business
spectrum in the year 1999/2000. In
France, the margins of Kaba Systèmes
15
de Portes were burdened by a diffi-
cult market environment.
Kaba has been reassuringly success-
ful in the growth market for access
control solutions at stadia and major
events: all stadiums that are hosting
the European Soccer Championships
in Belgium and the Netherlands next
year will be equipped with Kaba Gal-
lenschütz turnstiles. In Germany, Kaba
Gallenschütz has also been commis-
sioned to equip the new Chancellory
in Berlin with several architecturally
appealing security doors.
Door Systems
e_08_
M E C H A N I C A L A N D E L E C T R O M E C H A N I
24 17.09.1999 17:47 Uhr Seite 16
a
The Mechanical and Electromechanic
in the development, manufacture and
16 Mechanical and Electromechanica
The Mechanical and Electromechan-
ical Locks Division achieved sales
growth in Europe, the USA and Asia.
In Europe, business was particularly
brisk in Switzerland, Germany and
Austria. The main engines of growth
were mechatronic products such as
the electronic Kaba elostar lock
vices in the domain of mechanical and
In those national markets in which the
responsibility for the development of
sells products of the Access and Time
operates as a systems integrator at th
sales increased by 4%, at constant ex
previous year and it posted an overpr
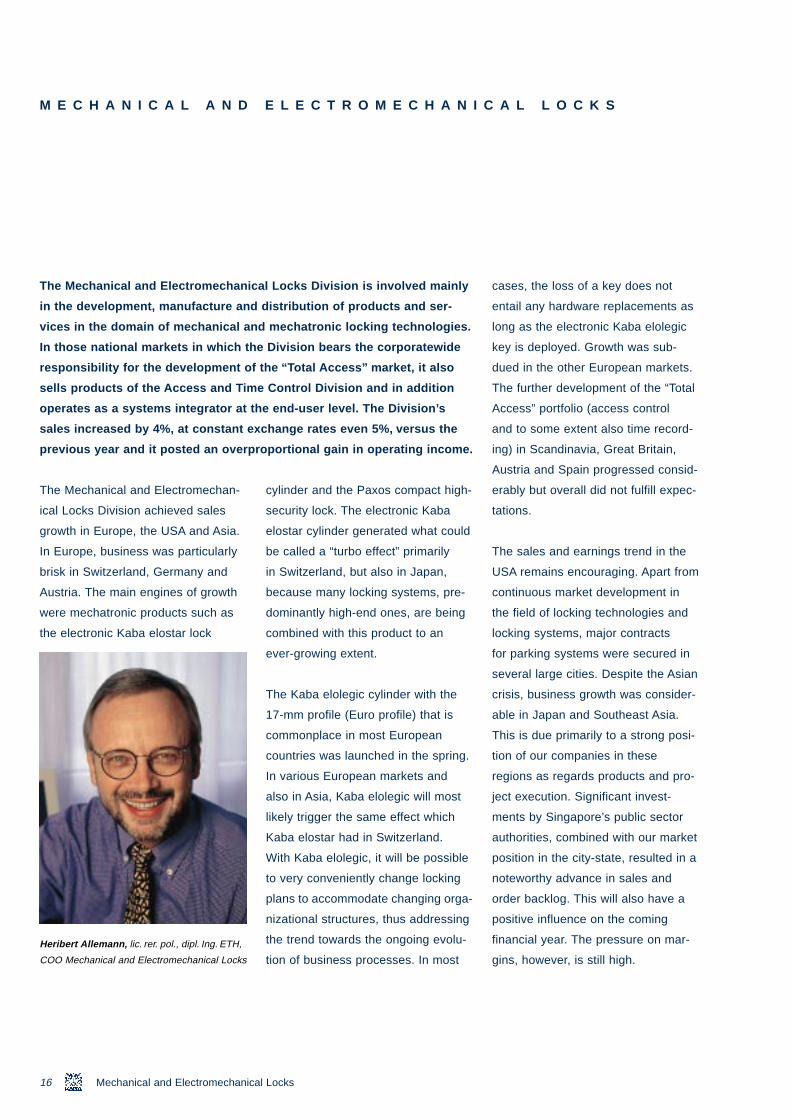
Heribert Allemann, lic. rer. pol., dipl. Ing. ETH,
COO Mechanical and Electromechanical Locks
cylinder and the Paxos compact high-
security lock. The electronic Kaba
elostar cylinder generated what could
be called a “turbo effect” primarily
in Switzerland, but also in Japan,
because many locking systems, pre-
dominantly high-end ones, are being
combined with this product to an
ever-growing extent.
l Locks Division is involved mainly
distribution of products and ser-
mechatronic locking technologies.
Division bears the corporatewide
the “Total Access” market, it also
Control Division and in addition
e end-user level. The Division’s
change rates even 5%, versus the
oportional gain in operating income.
l Locks
The Kaba elolegic cylinder with the
17-mm profile (Euro profile) that is
commonplace in most European
countries was launched in the spring.
In various European markets and
also in Asia, Kaba elolegic will most
likely trigger the same effect which
Kaba elostar had in Switzerland.
With Kaba elolegic, it will be possible
to very conveniently change locking
plans to accommodate changing orga-
nizational structures, thus addressing
the trend towards the ongoing evolu-
tion of business processes. In most
C A L L O C K S
cases, the loss of a key does not
entail any hardware replacements as
long as the electronic Kaba elolegic
key is deployed. Growth was sub-
dued in the other European markets.
The further development of the “Total
Access” portfolio (access control
and to some extent also time record-
ing) in Scandinavia, Great Britain,
Austria and Spain progressed consid-
erably but overall did not fulfill expec-
tations.
The sales and earnings trend in the
USA remains encouraging. Apart from
continuous market development in
the field of locking technologies and
locking systems, major contracts
for parking systems were secured in
several large cities. Despite the Asian
crisis, business growth was consider-
able in Japan and Southeast Asia.
This is due primarily to a strong posi-
tion of our companies in these
regions as regards products and pro-
ject execution. Significant invest-
ments by Singapore’s public sector
authorities, combined with our market
position in the city-state, resulted in a
noteworthy advance in sales and
order backlog. This will also have a
positive influence on the coming
financial year. The pressure on mar-
gins, however, is still high.
e_08_24 17.09.1
999 17:47 Uhr Seite 17i
u
t
i
6
A C C E S S A N D T I M E
The still young Access and Time Con-
trol Division is poised to become a
promising pillar of the Kaba Group:
relative to sales growth, the division
reported a clearly overproportional
rise in consolidated operating profit.
Solid gains were made in time man-
agement and production data acqui-
sition activities. The results for the
year under review are again percep-
tibly better than those of the already
successful previous years. The
In financial 1998/99, the Access and T
sustained growth by gaining 17.8%. D
Division single-handedly generated a
ing the expanded scope of consolida
Inform Objektschutz GmbH in the Div
in an additional sales increment of 7.
performance of the distribution com-
panies in Switzerland and Italy was
particularly impressive. Kaba Benzing
achieved high growth rates in the
export markets of Great Britain,
Scandinavia, Austria and the Benelux
nations. The advances in the pro-
duction data acquisition segment are
particularly noteworthy. After the
transition to the new millennium, the
dynamic of this market is likely to
accelerate due to substantial pent-up
demand. The Division’s collaboration
with SAP in the domains of time man-
agement and production data acquisi-
C O N T R O L
tion took on more extensive dimen-
sions. All necessary product certifica-
tions have now been issued for the
USA as well, giving Kaba Benzing
access to the growth markets in the
USA as an SAP partner. The Group’s
ability to efficiently handle large-
volume projects such as the DG Bank
project was further improved by the
merger of the three German systems
integration companies, effective July
1,1999. Inform Objektschutz GmbH
me Control Division again posted
ring the year under review, the
10.2% increase in sales, not count-
ion. The successful integration of
sion’s German operations resulted
%.
which was acquired during the pre-
vious year was integrated into the
merged entity at the same time. More-
over, the new constellation yields
certain administrative advantages.
The new company, Kaba Systems
GmbH, is headquartered in Dreieich/
Frankfurt and has offices in Dussel-
dorf, Stuttgart and Suhl. A similar
merger implemented in Switzerland a
year earlier – it involved the integra-
tion of the banking equipment busi-
ness and the service organization re-
sulted in substantial profit gains and
a stronger market profile this year. In
Germany, the service organization
which supports all Kaba companies
nationwide, continues to post robust
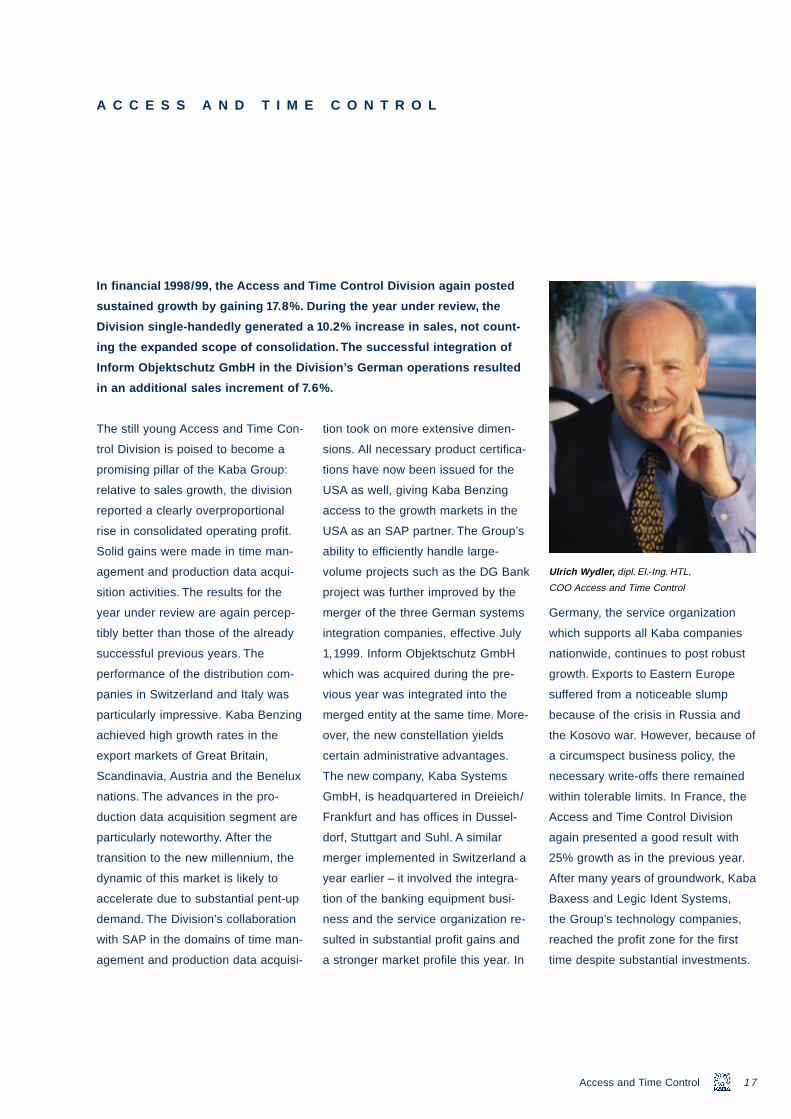
Ulrich Wydler, dipl. El.-Ing. HTL,
COO Access and Time Control
17
growth. Exports to Eastern Europe
suffered from a noticeable slump
because of the crisis in Russia and
the Kosovo war. However, because of
a circumspect business policy, the
necessary write-offs there remained
within tolerable limits. In France, the
Access and Time Control Division
again presented a good result with
25% growth as in the previous year.
After many years of groundwork, Kaba
Baxess and Legic Ident Systems,
the Group’s technology companies,
reached the profit zone for the first
time despite substantial investments.
Access and Time Control

18 Door Systems
Travellers will soon feel like winging from
the JFK International Airport to Manhattan.
Kaba Gilgen supplies platform screen doors
for the new light rail trains.
e_08_24 17.09.1999 17:48 Uhr Seite 18
e_08_24 17.09.1999 17:48 Uhr Seite 19
W I N G I N G T O T H E A I R P O R T
position. The clearly marked door
positions, the train driver’s ability to
approach the station at high speeds
without endangering people on the
platform, and the windproof construc-
tion of the screen allow passengers
to quickly and comfortably board and
leave the train without any risk to
safety. Thus, the new Kaba facilities
will make it possible to adhere to
160 automatic sliding doors and
640 emergency exits at a total of ten
light rail stations. The contract is
worth some CHF 6 million.
Kaba is systematically developing
the quickly growing market segment
for vehicles and trains, not least in
the United States. Three luxurious
Las Vegas hotels are interconnected
by the comfortable, safe and futuristic
Mandalay Bay Trains. Here, Kaba
Gilgen is supplying the door systems
for the trains.
r
w
y
inals – which today frequently
ortened by one hour, thanks to
s.
Within the scope of the light rail proj-
ect, the terminals at JFK Airport will
be interconnected with a 3.2 km long
metro line and then tied into New
York’s subway network with two
feeder lines totaling 10 km in length.
Thus, airline passengers disem-
barking at JFK International Airport
can easily save an hour’s time as
they “wing” it on to downtown Man-
hattan.
Kaba Gilgen – a company of the Doo
the platform screen doors for the new
F. Kennedy Airport in New York. A ne
50-year history of the John F. Kenned
from downtown Manhattan to the term
takes more than 2 hours – is to be sh
latest-generation mass transit system
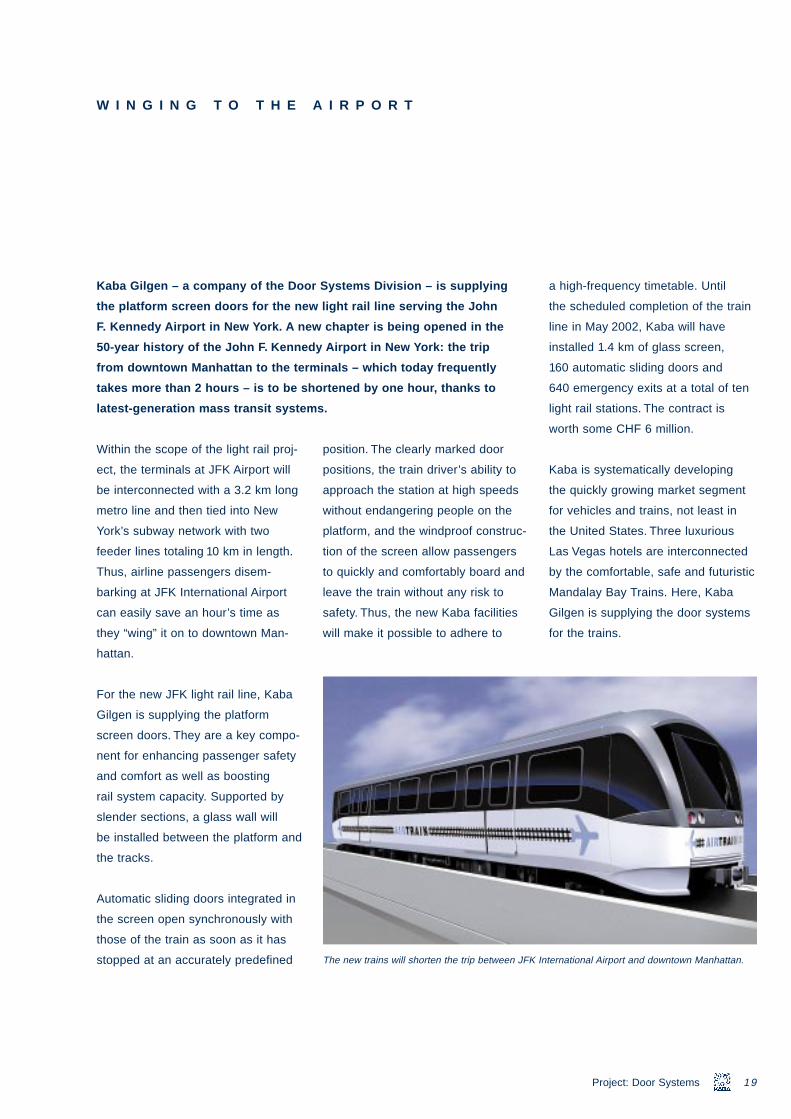
For the new JFK light rail line, Kaba
Gilgen is supplying the platform
screen doors. They are a key compo-
nent for enhancing passenger safety
and comfort as well as boosting
rail system capacity. Supported by
slender sections, a glass wall will
be installed between the platform and
the tracks.
Automatic sliding doors integrated in
the screen open synchronously with
those of the train as soon as it has
stopped at an accurately predefined
Systems Division – is supplying
light rail line serving the John
chapter is being opened in the
Airport in New York: the trip
The new trains will shorten the trip between JFK I
a high-frequency timetable. Until
the scheduled completion of the train
line in May 2002, Kaba will have
installed 1.4 km of glass screen,
19Project: Door Systems
nternational Airport and downtown Manhattan.
20
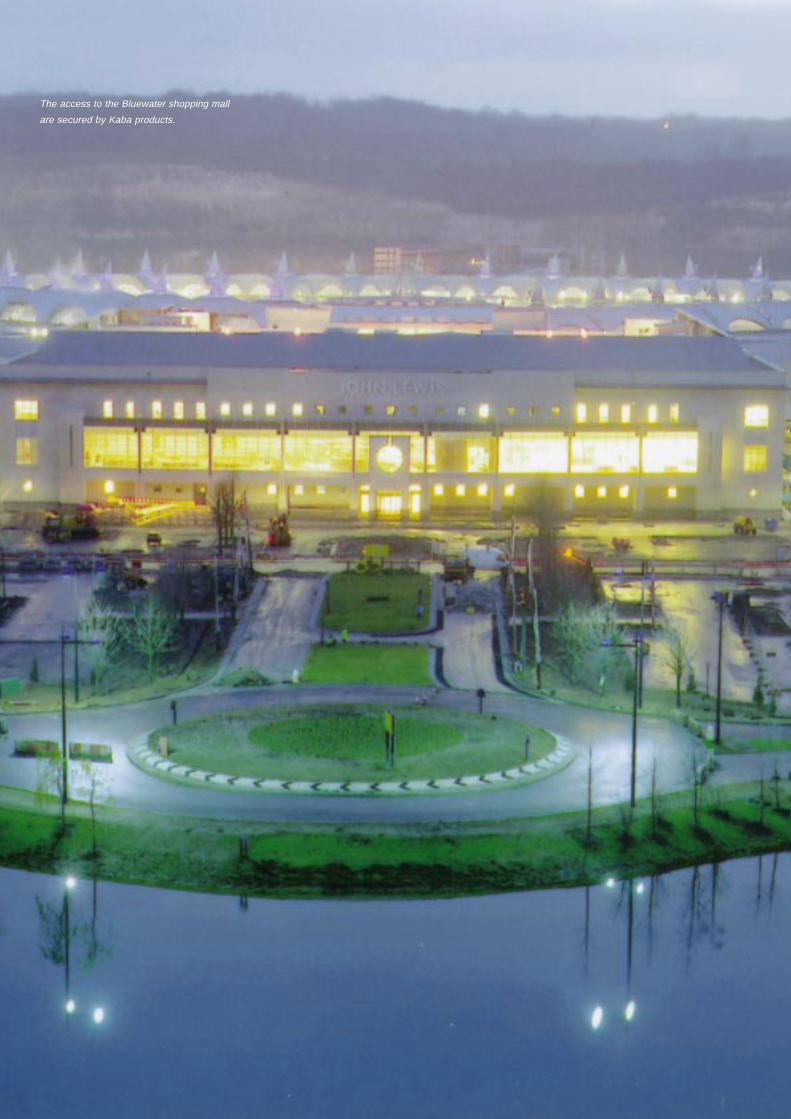
The access to the Bluewater shopping mall
are secured by Kaba products.
e_08_24 17.09.1999 17:49 Uhr Seite 20
e_08_24 17.09.1
999 17:49 Uhr Seite 21O
s
S H O P P I N G – A S B
In the northwestern corner of the
county of Kent in England, the reality
of shopping has attained a new
dimension: as a comprehensive sen-
sual experience which surpasses
the boldest expectations. Bluewater
guarantees enjoyable, stress-free
shopping. Studies of purchasing
habits showed that when shopping,
consumers expect a balanced
combination of retail stores, entertain-
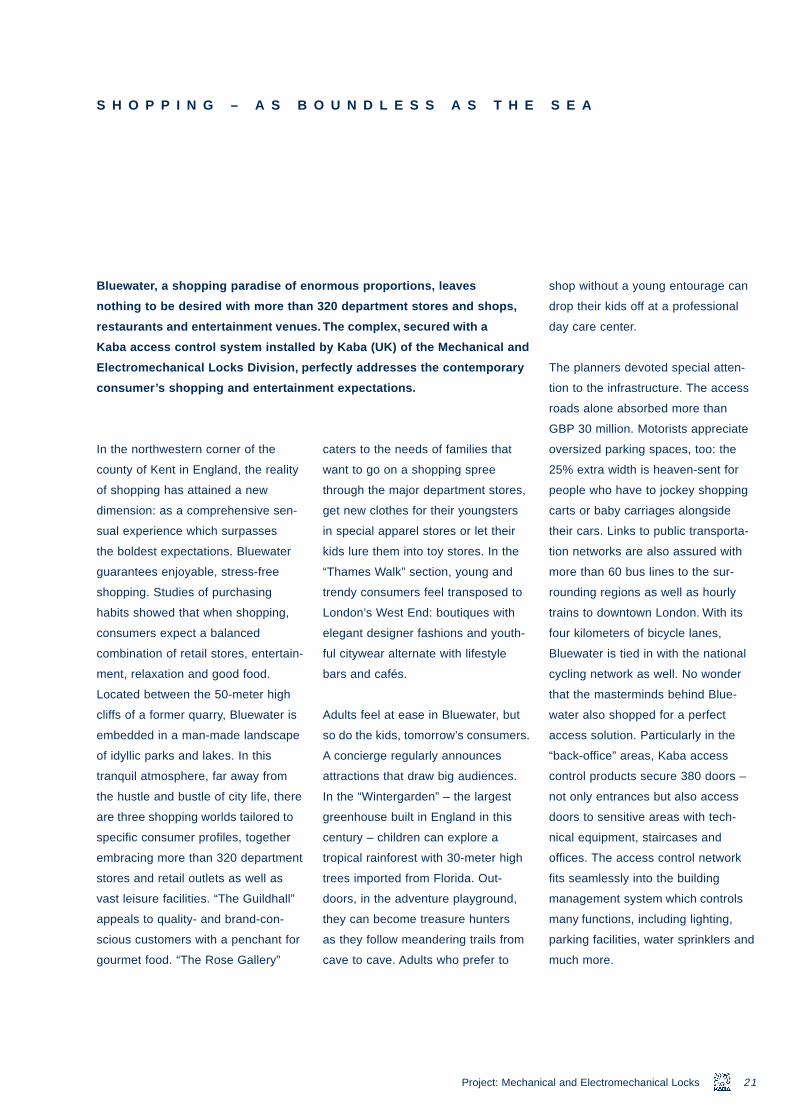
Bluewater, a shopping paradise of en
nothing to be desired with more than
restaurants and entertainment venue
Kaba access control system installed
Electromechanical Locks Division, pe
consumer’s shopping and entertainm
ment, relaxation and good food.
Located between the 50-meter high
cliffs of a former quarry, Bluewater is
embedded in a man-made landscape
of idyllic parks and lakes. In this
tranquil atmosphere, far away from
the hustle and bustle of city life, there
are three shopping worlds tailored to
specific consumer profiles, together
embracing more than 320 department
stores and retail outlets as well as
vast leisure facilities. “The Guildhall”
appeals to quality- and brand-con-
scious customers with a penchant for
gourmet food. “The Rose Gallery”
U N D L E S S A S T H E
caters to the needs of families that
want to go on a shopping spree
through the major department stores,
get new clothes for their youngsters
in special apparel stores or let their
kids lure them into toy stores. In the
“Thames Walk” section, young and
trendy consumers feel transposed to
London’s West End: boutiques with
elegant designer fashions and youth-
ful citywear alternate with lifestyle
ormous proportions, leaves
320 department stores and shops,
. The complex, secured with a
by Kaba (UK) of the Mechanical and
rfectly addresses the contemporary
ent expectations.
bars and cafés.
Adults feel at ease in Bluewater, but
so do the kids, tomorrow’s consumers.
A concierge regularly announces
attractions that draw big audiences.
In the “Wintergarden” – the largest
greenhouse built in England in this
century – children can explore a
tropical rainforest with 30-meter high
trees imported from Florida. Out-
doors, in the adventure playground,
they can become treasure hunters
as they follow meandering trails from
cave to cave. Adults who prefer to
Project: Mechani
S E A
shop without a young entourage can
drop their kids off at a professional
day care center.
The planners devoted special atten-
tion to the infrastructure. The access
roads alone absorbed more than
GBP 30 million. Motorists appreciate
oversized parking spaces, too: the
25% extra width is heaven-sent for
people who have to jockey shopping
carts or baby carriages alongside
their cars. Links to public transporta-
tion networks are also assured with
more than 60 bus lines to the sur-
rounding regions as well as hourly
trains to downtown London. With its
four kilometers of bicycle lanes,
Bluewater is tied in with the national
21
cycling network as well. No wonder
that the masterminds behind Blue-
water also shopped for a perfect
access solution. Particularly in the
“back-office” areas, Kaba access
control products secure 380 doors –
not only entrances but also access
doors to sensitive areas with tech-
nical equipment, staircases and
offices. The access control network
fits seamlessly into the building
management system which controls
many functions, including lighting,
parking facilities, water sprinklers and
much more.
cal and Electromechanical Locks
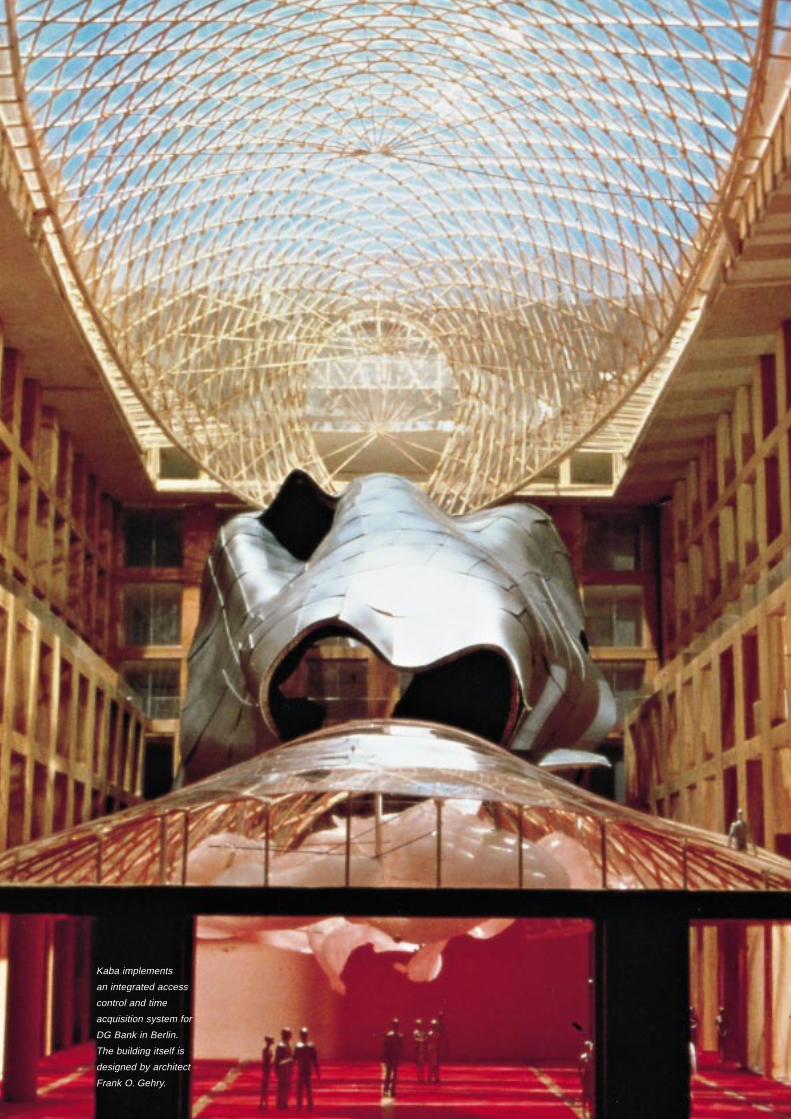
Kaba implements
an integrated access
control and time
acquisition system for
DG Bank in Berlin.
The building itself is
designed by architect
Frank O. Gehry.
e_08_24 17.09.1999 17:50 Uhr Seite 22
e_08_24 17.09.1
999 17:50 Uhr Seite 23k
in
w
a
With total assets of DEM 437 billion
and more than 12,000 employees,
Deutsche Genossenschaftsbank, or
DG Bank for short, ranks among
Germany’s ten largest banks. Apart
from DG Bank proper, people’s
banks and rural credit cooperatives
as well as regional cooperative
central banks belong to this major
banking group. In retail banking,
DG Bank is a competent financial
services provider mainly for medium-
A “ T O T A L A C C E S S
Like its neighboring structures, Fran
DG Bank on the Pariser Platz in Berl
new era in Berlin. Concurrently, the n
is a pilot project for a uniform nation
management system for DG Bank. K
Control Division is implementing this
sized as well as large domestic
and international companies, savings
& loan cooperatives and institutional
investors. In Germany, DG Bank
is also a major underwriter. The insti-
tute’s high-quality banking products
are also available to private and
business customers through the
people’s banks and rural credit co-
operatives.
At the threshold to the new millen-
nium, DG Bank is in the process
of implementing a uniform access
control and time management
system on a nationwide basis. The
standalone solutions at the individual
sites were repeatedly criticized
mainly by those bankers whose activ-
ities necessitate a personal presence
at different buildings. Either they
were escorted into the buildings as
visitors or had to carry a plethora
of different badges and IDs.
Moreover, the extendibility of the
existing standalone solutions had
” S O L U T I O N F O R D
O. Gehry’s new building for
symbolizes the beginning of a
ew headquarters of DG Bank,
ide access control and time
ba Systems of the Time and Access
project.
already been exhausted in many
places. Also, the year-2000 compli-
ance of older systems was not guar-
anteed at several locations, so that
modernizations were imminent. At the
same time, it became obvious that
some cafeteria and vending machine
systems would not be able to handle
the Euro as the new unified currency.
Thus, in 1997, DG Bank drafted an
extensive set of specifications for
a new system. From the very begin-
ning, it postulated a contactless
system based on chip technology
as well as certified interfaces to SAP
software, the possibility of integrating
cafeteria solutions plus add-on func-
tionality with a cash card.
The future system was specified such
that it would become a corporate-
wide solution for access control, door
management and time management
while interfacing with building tech-
nology monitoring functions for facili-
ties such as elevators and lighting
control, burglar alarms and mechan-
ical locking systems.
In conjunction with the invitation to
tender for the new building on the
Pariser Platz in Berlin, Kaba Systems
was chosen to implement this
G B A N K
23
project. The key elements of the Kaba
solution are the remotely readable
and writable Legic chips in employee
cards, various reader types from
Kaba Benzing and – at the heart of
the configuration – the Kaba Exos
system with the certified interface to
SAP’s HR software module.
A general contract between DG Bank
and Kaba now governs the imple-
mentation of the entire project. This
means that 15 sites throughout
Germany will be equipped with the
new configurations.
Project: Access and Time Control
2
O L L E N N I U M
e_08_24 17.09.1999 17:50 Uhr Seite 24
In electronic data processing, a
problem may occur at the transition
to the new millennium because in
past years, programmers often
used only two digits – ones and
tens – to define the year portion of
dates. The digits for the century
and the millennium were ignored.
The reason was the high cost
of memory at that time as well as
the misjudgment of the useful life
of software and products.
At the transition to the next century
or millennium, errors may occur
when dates are retrieved and/or
displayed. The same applies to
N T H E T H R E S H O L
4
calculations based on dates and
values derived from such calcula-
tions.
The Kaba Group has subjected all
products which could be affected
by the Y2K issue to comprehensive
tests. The Group’s more recent
products are largely year-2000-
compatible. For older products,
Kaba will recommend suitable
measures. Our software can only
handle the millennium issue if
the third-party hardware, the asso-
ciated system software and third-
Millennium Problem
party software components are
millennium-compatible too. The
Kaba Group has notified its
customers about suitable measures
within the scope of its capabilities.
Appropriate programs to overcome
the Y2K problem in sensitive
products were launched as early
as 1996. In the case of project-
specific software modifications or
interfaces to other systems, we
recommend that our customers
consult a Kaba specialist to obtain
a detailed analysis.
As far as in-house information
technologies are concerned, we
D T O T H E N E W M I
migrated four of our five largest
production sites to SAP R/3 in
the course of financial 1998/99.
The fifth site was made millennium-
compatible with upgrades and
updates. It will introduce SAP R/3
in the course of financial
2000/2001. The smaller sites are
individually upgrading to modern
data processing systems so
that the millennium transition is
safeguarded from our point of
view.
F I N A N C I A L R E P O R T
GROUP FINANCIALS
Consolidated Group Balance Sheet 26
Consolidated Group Income Statement 28
Consolidated Group Flow of Funds 29
Notes to the Consolidated Group Financial Statements 30
Legal Structure of the Kaba Group 44
Group Auditor’s Report 46
HOLDING COMPANY FINANCIALS
Holding Company Balance Sheet 48
Holding Company Income Statement and Appropriation of Profit 50
Notes to the Financial Statements 51
Auditor’s Report 53
Comments on the Financial Statements 54
Operative Structure 55
Addresses 56
e_25_29 17.09.1999 18:00 Uhr Seite 25
7%
e_25_
C O N S O L I D A T E D G R O U P B A L A N C E S H E E T
A S S E T S
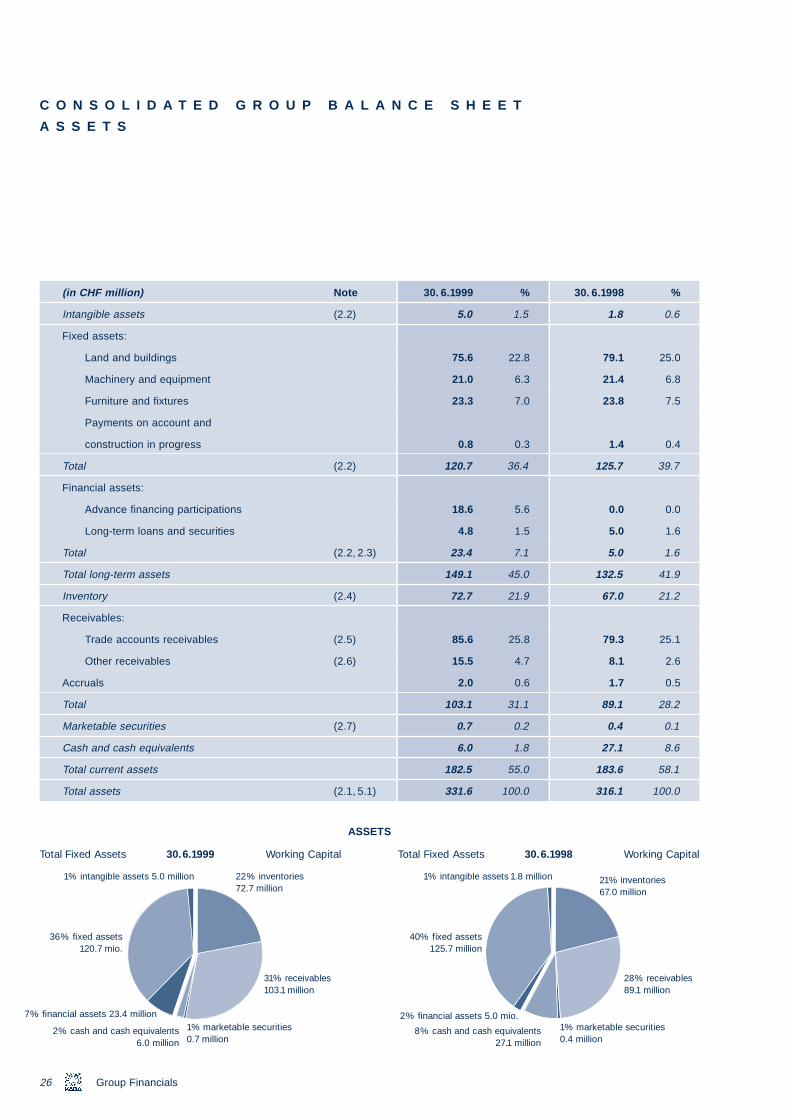
(in CHF million) Note 30. 6.1999 % 30. 6.1998 %
Intangible assets (2.2) 5.0 1.5 1.8 0.6
Fixed assets:
Land and buildings 75.6 22.8 79.1 25.0
Machinery and equipment 21.0 6.3 21.4 6.8
Furniture and fixtures 23.3 7.0 23.8 7.5
Payments on account and
construction in progress 0.8 0.3 1.4 0.4
Total (2.2) 120.7 36.4 125.7 39.7
Financial assets:
29 17.09.1999 18:00 Uhr Seite 26
Advance financing participations 18.6 5.6 0.0 0.0
6.0 1.8 27.1 8.6
Long-term loans and securities
Total (2.2, 2.3)
Total long-term assets
Inventory (2.4)
Receivables:
Trade accounts receivables (2.5)
Other receivables (2.6)
Accruals
Total
Marketable securities (2.7)
Cash and cash equivalents
Group Financials26
Total current assets
Total assets (2.1, 5.1)
Total Fixed Assets 30.6.1999 Working Capital
1% intangible assets 5.0 million
36% fixed assets120.7 mio.
22% inventories72.7 million
31% receivables103.1 million
2% cash and cash equivalents6.0 million
1% marketable securities0.7 million
ASSETS
financial assets 23.4 million
4.8 1.5 5.0 1.6
23.4 7.1 5.0 1.6
149.1 45.0 132.5 41.9
72.7 21.9 67.0 21.2
85.6 25.8 79.3 25.1
15.5 4.7 8.1 2.6
2.0 0.6 1.7 0.5
103.1 31.1 89.1 28.2
0.7 0.2 0.4 0.1
182.5 55.0 183.6 58.1
331.6 100.0 316.1 100.0
2% financial assets 5.0 mio.
1% intangible assets 1.8 million
40% fíxed assets125.7 million
21% inventories67.0 million
28% receivables89.1 million
8% cash and cash equivalents27.1 million
1% marketable securities0.4 million
Total Fixed Assets 30.6.1998 Working Capital
e_25_29 17.09.
S H A R E H O L D E R S ’
E Q U I T Y A N D L I A B I L I T I E S
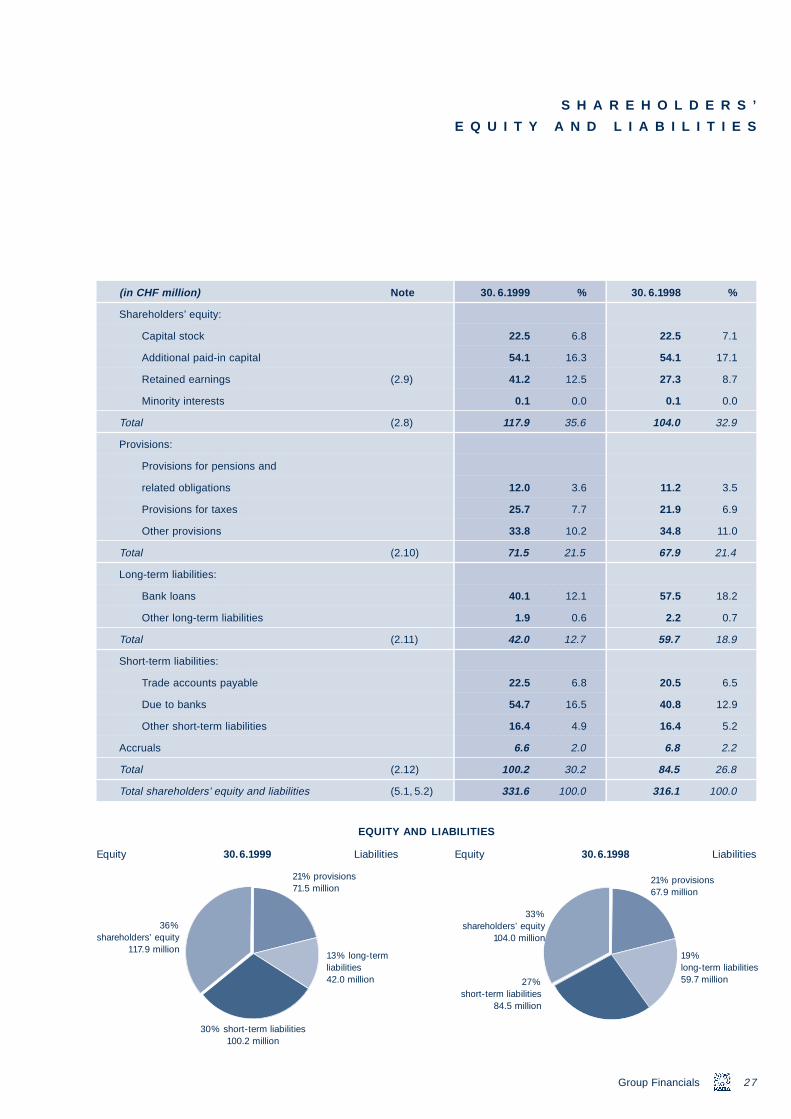
(in CHF million) Note 30. 6.1999 % 30. 6.1998 %
Shareholders’ equity:
Capital stock 22.5 6.8 22.5 7.1
Additional paid-in capital 54.1 16.3 54.1 17.1
Retained earnings (2.9) 41.2 12.5 27.3 8.7
Minority interests 0.1 0.0 0.1 0.0
Total (2.8) 117.9 35.6 104.0 32.9
Provisions:
Provisions for pensions and
related obligations 12.0 3.6 11.2 3.5
1999 18:00 Uhr Seite 27
Provisions for taxes
Other provisions
Total (2.10)
Long-term liabilities:
Bank loans
Other long-term liabilities
Total (2.11)
Short-term liabilities:
Trade accounts payable
Due to banks
Other short-term liabilities
Accruals
Total (2.12)
Total shareholders’ equity and liabilities (5.1, 5.2)
Equity 30.6.1999 Liabilities
30% short-term liabilities 100.2 million
36% shareholders’ equity
117.9 million
21% provisions71.5 million
13% long-termliabilities42.0 million
EQUITY AND LIAB
25.7 7.7 21.9 6.9
33.8 10.2 34.8 11.0
71.5 21.5 67.9 21.4
40.1 12.1 57.5 18.2
1.9 0.6 2.2 0.7
42.0 12.7 59.7 18.9
22.5 6.8 20.5 6.5
54.7 16.5 40.8 12.9
16.4 4.9 16.4 5.2
Group Financials 27
6.6 2.0 6.8 2.2
100.2 30.2 84.5 26.8
331.6 100.0 316.1 100.0
Equity 30.6.1998 Liabilities
33% shareholders’ equity
104.0 million
21% provisions67.9 million
19% long-term liabilities59.7 million27%
short-term liabilities84.5 million
ILITIES
e_25
C O N S O L I D A T E D G R O U P I N C O M E S T A T E M E N T
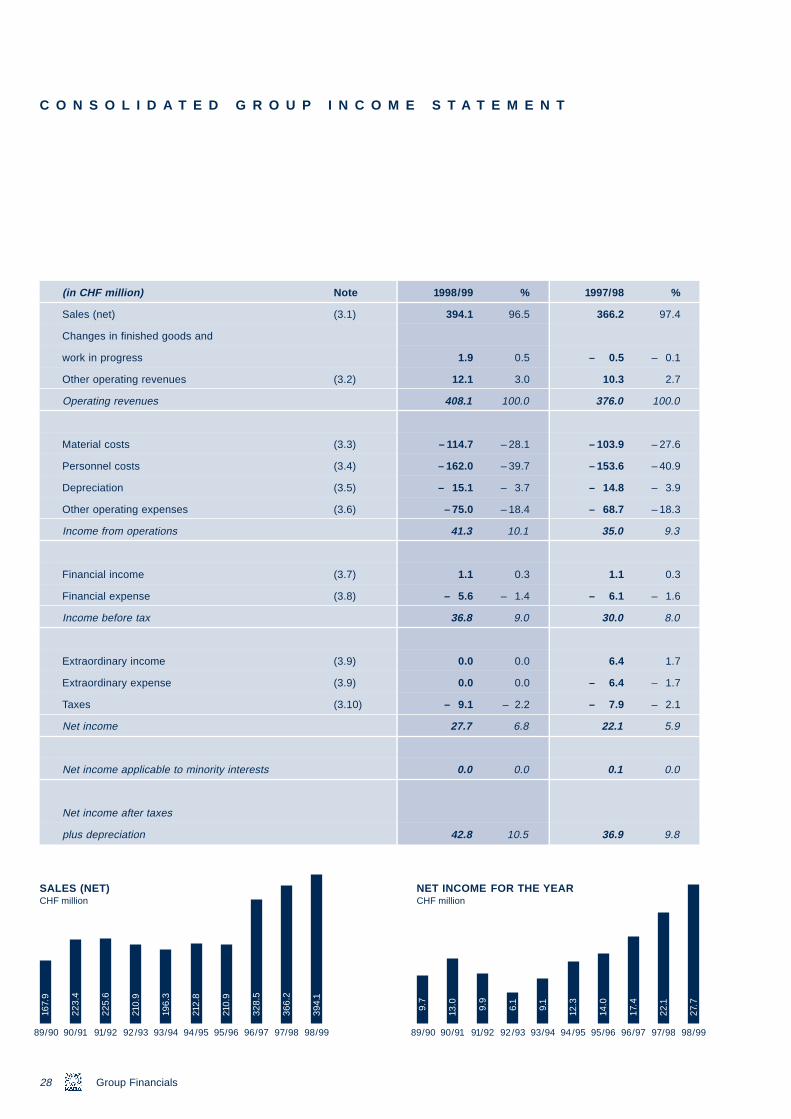
(in CHF million) Note 1998/99 % 1997/98 %
Sales (net) (3.1) 394.1 96.5 366.2 97.4
Changes in finished goods and
work in progress 1.9 0.5 – 0.5 – 0.1
Other operating revenues (3.2) 12.1 3.0 10.3 2.7
Operating revenues 408.1 100.0 376.0 100.0
Material costs (3.3) – 114.7 – 28.1 – 103.9 – 27.6
Personnel costs (3.4) – 162.0 – 39.7 – 153.6 – 40.9
Depreciation (3.5) – 15.1 – 3.7 – 14.8 – 3.9
Other operating expenses (3.6) – 75.0 – 18.4 – 68.7 – 18.3
Income from operations 41.3 10.1 35.0 9.3
_29 17.09.1999 18:00 Uhr Seite 28
)
)
)
)
0)
Financial income (3.7
Financial expense (3.8
Income before tax
Extraordinary income (3.9
Extraordinary expense (3.9
Taxes (3.1
Net income
Group Financials28
Net income applicable to minority interests
Net income after taxes
plus depreciation
167.
9
223.
4
225.
6
210.
9
196.
3
212.
8
210.
9
328.
5
366.
2
394.
1
89/90 90/91 91/92 92/93 93/94 94/95 95/96 96/97 97/98 98/99
SALES (NET)CHF million
1.1 0.3 1.1 0.3
– 5.6 – 1.4 – 6.1 – 1.6
36.8 9.0 30.0 8.0
0.0 0.0 6.4 1.7
0.0 0.0 – 6.4 – 1.7
– 9.1 – 2.2 – 7.9 – 2.1
27.7 6.8 22.1 5.9
0.0 0.0 0.1 0.0
42.8 10.5 36.9 9.8
9.7
13.0 9.9
6.1
9.1
12.3
14.0
17.4
22.1
27.7
89/90 90/91 91/92 92/93 93/94 94/95 95/96 96/97 97/98 98/99
NET INCOME FOR THE YEARCHF million
e_25_29 17.09.1
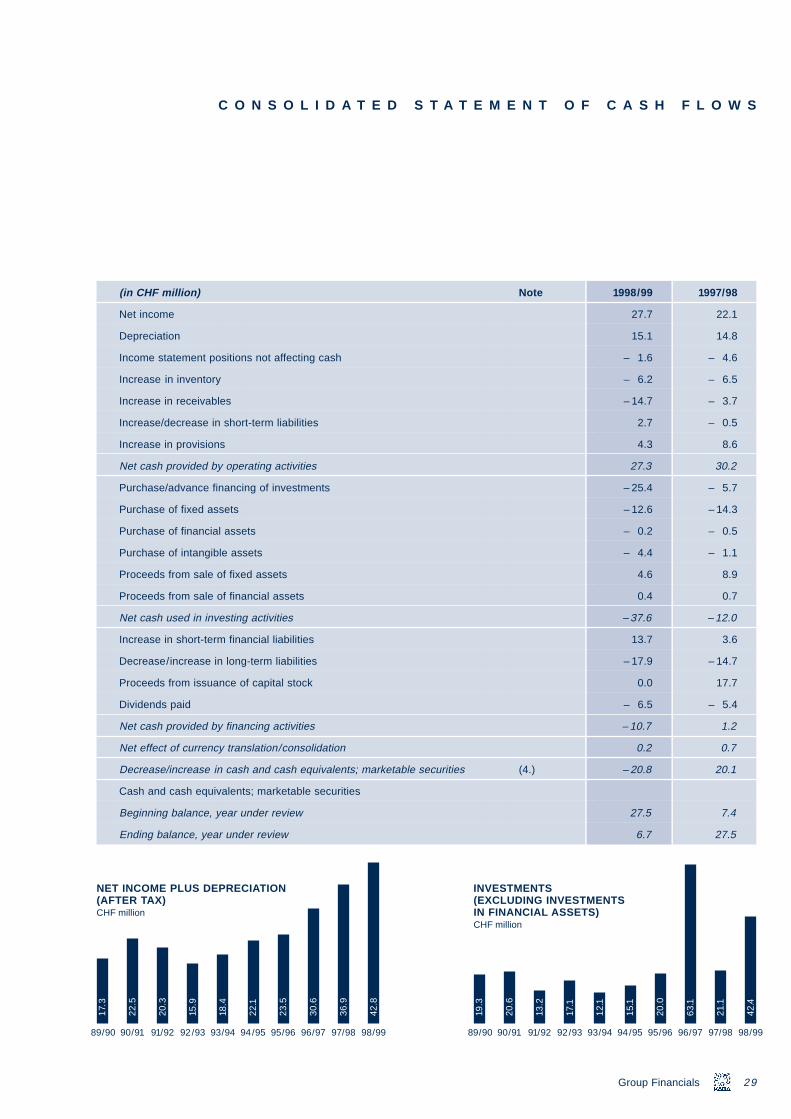
(in CHF million) Note 1998/99 1997/98
Net income 27.7 22.1
Depreciation 15.1 14.8
Income statement positions not affecting cash – 1.6 – 4.6
Increase in inventory – 6.2 – 6.5
Increase in receivables – 14.7 – 3.7
Increase/decrease in short-term liabilities 2.7 – 0.5
Increase in provisions 4.3 8.6
Net cash provided by operating activities 27.3 30.2
Purchase/advance financing of investments – 25.4 – 5.7
Purchase of fixed assets – 12.6 – 14.3
Purchase of financial assets – 0.2 – 0.5
C O N S O L I D A T E D S T A T E M E N T O F C A S H F L O W S
999 18:00 Uhr Seite 29
Purchase of intangible assets
Proceeds from sale of fixed assets
Proceeds from sale of financial assets
Net cash used in investing activities
Increase in short-term financial liabilities
Decrease/increase in long-term liabilities
Proceeds from issuance of capital stock
Dividends paid
Net cash provided by financing activities
Net effect of currency translation/consolidation
Decrease/increase in cash and cash equivalents; marketable securitie
Cash and cash equivalents; marketable securities
Beginning balance, year under review
Ending balance, year under review
17.3
22.5
20.3
15.9
18.4
22.1
23.5
30.6
36.9
42.8
89/90 90/91 91/92 92/93 93/94 94/95 95/96 96/97 97/98 98/99
NET INCOME PLUS DEPRECIATION(AFTER TAX)CHF million
– 4.4 – 1.1
4.6 8.9
0.4 0.7
– 37.6 – 12.0
13.7 3.6
– 17.9 – 14.7
0.0 17.7
– 6.5 – 5.4
– 10.7 1.2
Group Financials 29
0.2 0.7
s (4.) – 20.8 20.1
27.5 7.4
6.7 27.5
19.3
20.6
13.2
17.1
12.1
15.1
20.0
63.1
21.1
42.4
89/90 90/91 91/92 92/93 93/94 94/95 95/96 96/97 97/98 98/99
INVESTMENTS(EXCLUDING INVESTMENTSIN FINANCIAL ASSETS)CHF million
O U
e_30
N O T E S T O T H E C
S T A T E M E N T S
_43 17.09.1999 18:01 Uhr Seite 30
Group Financials30
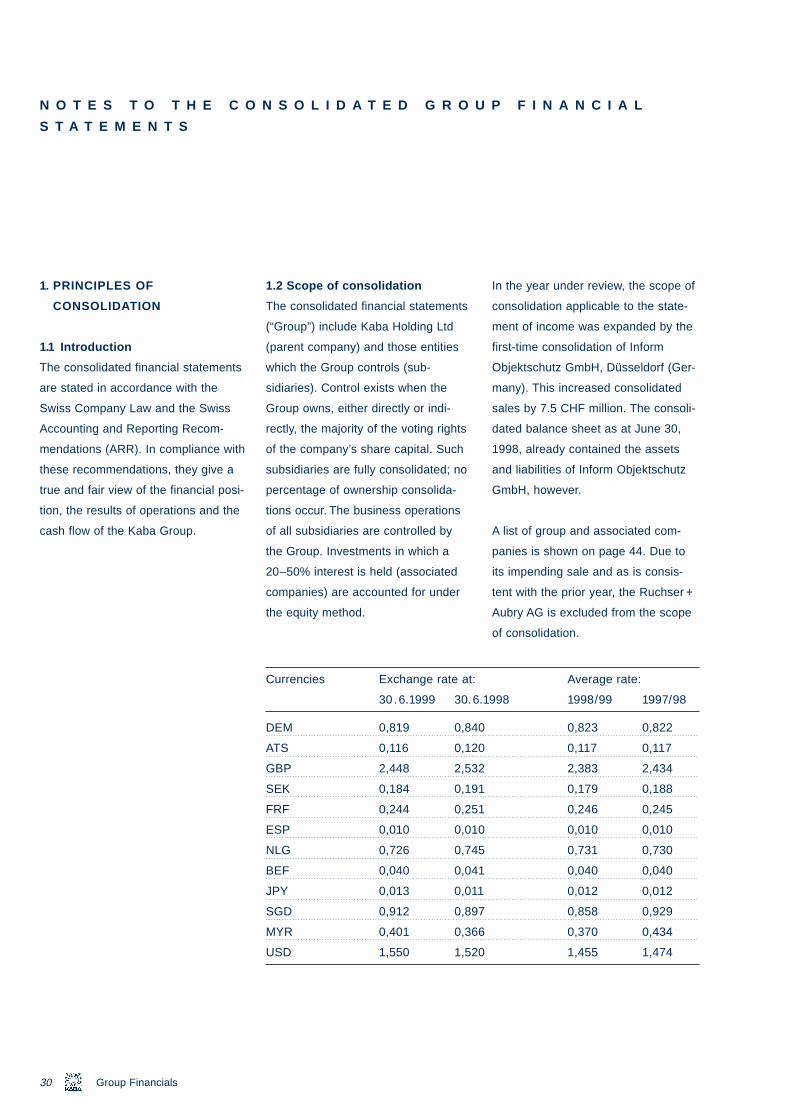
1. PRINCIPLES OF
CONSOLIDATION
1.1 Introduction
The consolidated financial statements
are stated in accordance with the
Swiss Company Law and the Swiss
Accounting and Reporting Recom-
mendations (ARR). In compliance with
these recommendations, they give a
true and fair view of the financial posi-
tion, the results of operations and the
cash flow of the Kaba Group.
N S O L I D A T E D G R O
1.2 Scope of consolidation
The consolidated financial statements
(“Group”) include Kaba Holding Ltd
Currencies Exchange rate at:
30 .6.1999 30.6.
DEM 0,819 0,840
ATS 0,116 0,120
GBP 2,448 2,532
SEK 0,184 0,191
FRF 0,244 0,251
ESP 0,010 0,010
NLG 0,726 0,745
BEF 0,040 0,041
JPY 0,013 0,011
SGD 0,912 0,897
MYR 0,401 0,366
USD 1,550 1,520
P F I N A N C I A L
In the year under review, the scope of
consolidation applicable to the state-
ment of income was expanded by the
(parent company) and those entities
which the Group controls (sub-
sidiaries). Control exists when the
Group owns, either directly or indi-
rectly, the majority of the voting rights
of the company’s share capital. Such
subsidiaries are fully consolidated; no
percentage of ownership consolida-
tions occur. The business operations
of all subsidiaries are controlled by
the Group. Investments in which a
20–50% interest is held (associated
companies) are accounted for under
the equity method.
first-time consolidation of Inform
Objektschutz GmbH, Düsseldorf (Ger-
many). This increased consolidated
sales by 7.5 CHF million. The consoli-
dated balance sheet as at June 30,
1998, already contained the assets
and liabilities of Inform Objektschutz
GmbH, however.
A list of group and associated com-
panies is shown on page 44. Due to
its impending sale and as is consis-
tent with the prior year, the Ruchser +
Aubry AG is excluded from the scope
of consolidation.
Average rate:
1998 1998/99 1997/98
0,823 0,822
0,117 0,117
2,383 2,434
0,179 0,188
0,246 0,245
0,010 0,010
0,731 0,730
0,040 0,040
0,012 0,012
0,858 0,929
0,370 0,434
1,455 1,474
All intercompany transactions and
balances with companies included in
the consolidation are eliminated.
The closing date is identical for all
companies (June 30).
Under the equity method of account-
ing for investments, the change in
the Group’s equity investment is the
change in the associated companies’
equity from the beginning to the end
of the year. This change in equity
investments is disclosed in the finan-
cial statements.
e_30_43 17.09.1
1.3 Consolidation principles
Balance sheets denominated in for-
eign currencies are converted into
Swiss francs using year-end rates
of exchange. Income and expenses
are translated at average rates
of exchange for the year. Translation
differences are taken directly to re-
tained earnings. Significant exchange
rates are as follows (see table on
page 30).
For the purpose of consolidation,
investments in subsidiaries are offset
against the Group’s share of sub-
sidiaries’ equity as at July 1, 1992.
Excesses of equity over investments
are credited based on their nature
to retained earnings. Acquisitions
999 18:01 Uhr Seite 31
made after July 1, 1992 are recorded
under the fair market value method,
under which assets are revalued
at the acquisition date. The excess of
the cost of acquisition of a subsidiary
over the fair value of its attributable
net assets at the date of acquisition
is goodwill charged directly against
retained earnings.
Minority interests in equity and net
income are separately disclosed
in the consolidated group balance
sheet and income statement, respec-
tively.
1.4 Valuation
The valuation of balance sheet
positions is consistent throughout
the Group. Where local accounts
differ, adjustments are made before
including the accounts in consoli-
dation.
Items within a company’s balance
sheet which are denominated in
foreign currencies are translated at
year-end rates. Foreign exchange
transaction losses are reflected in
the income statement.
The basis for valuing assets is
historical cost (purchase price or
production cost). Significant
guidelines for valuing individual
balance sheet positions follow.
31
Purchased intangible assets are
recorded at cost and depreciated
straight-line over a maximum of
five years. Internally created intan-
gible assets are not capitalized.
Further, neither research nor organi-
zational costs are capitalized.
Land is recorded at cost.
Buildings, machinery and equipment
are recorded at cost (as is inven-
tory) and depreciated straight-line
Group Financials
e_30_
over their expected real service
lives.
Permanent reductions in intangible
asset and fixed asset values
are recorded when the impairment
occurs.
Investments (other than associates
accounted for under the equity
method), as well as securities, are
recorded at the lower of cost or
market value.
Receivables, both long- and short-
term, which are considered fully
collectible, are recorded at face value.
Provisions for doubtful accounts
are recorded on a specific identifi-
43 17.09.1999 18:01 Uhr Seite 32
32
cation basis where collectibility is
not expected. In addition, a general
provision based upon historical
experience is recorded to cover other
doubtful accounts receivable.
Raw materials, consumables and
goods for resale are recorded at
cost (purchase costs plus related
procurement costs); work in progress
and finished goods are valued at
production cost. Production costs
include direct raw material costs
as well as an allocation of indirect
material and production costs
Group Financials
(including depreciation of production
equipment). The percentage of
completion method for recognizing
costs and revenue is applied to
long-term production contracts, for
large projects. Inventory is recorded
at the lower of cost or market value.
Provisions are recorded for existing
liabilities which are probable or for
which an amount must be estimated.
Included are provisions for expected
losses from open contracts.
Pension liabilities in Switzerland are
covered by autonomous pension
funds to which contributions are paid
in accordance with a defined con-
tribution plan. The contributions are
paid equally by the employer and
employee. In certain cases, the
employer pays additional voluntary
contributions to the pension funds.
Outside of Switzerland, liabilities to
pension funds are covered by
insurance-based plans, or pension
liabilities recorded in accordance
with actuarial calculations are
recorded.
Income and capital taxes were cor-
rectly accrued and posted and are
disclosed in accordance with industry
practices.
Provisions for deferred taxation
were calculated using the compre-
hensive liability method.This method
takes into account the effects on
current taxation expenses, of timing
differences which arose due to
differences in the value of assets and
liabilities for accounting purposes
and for tax purposes. The deferred
taxation is calculated applying rates
of taxation ruling in the applicable
country.
On the level of the individual sub-
sidiaries the difference in valuation
was offset with the tax losses
carried forward. Deferred tax assets
were not capitalized. Deferred tax
on retained earnings of subsidiaries
was immaterial and was therefore
not provided for.
Liabilities are recorded at face
value, regardless of due date.
Discounts are capitalized and amor-
tized over the life of the underlying
liabilities.
Extraordinary income and expense
items are disclosed separately
in order to allow for a proper
assessment of the company’s
sustainable income generation
potential.
e_30_43 17.09.1
999 18:01 Uhr Seite 3333
1.5 Divisional organization
All divisional results published in
this report apply on the basis of the
divisional structure which became
effective on July 1,1997. Moreover,
the banking equipment business
was integrated in Kaba Security AG
effective July 1,1998, moving from
the Door Systems Division to the
Access and Time Control Division.
The previous-year figures have been
restated as if the new divisional
organization had already been in
place at that time.
Group Financials
e_30
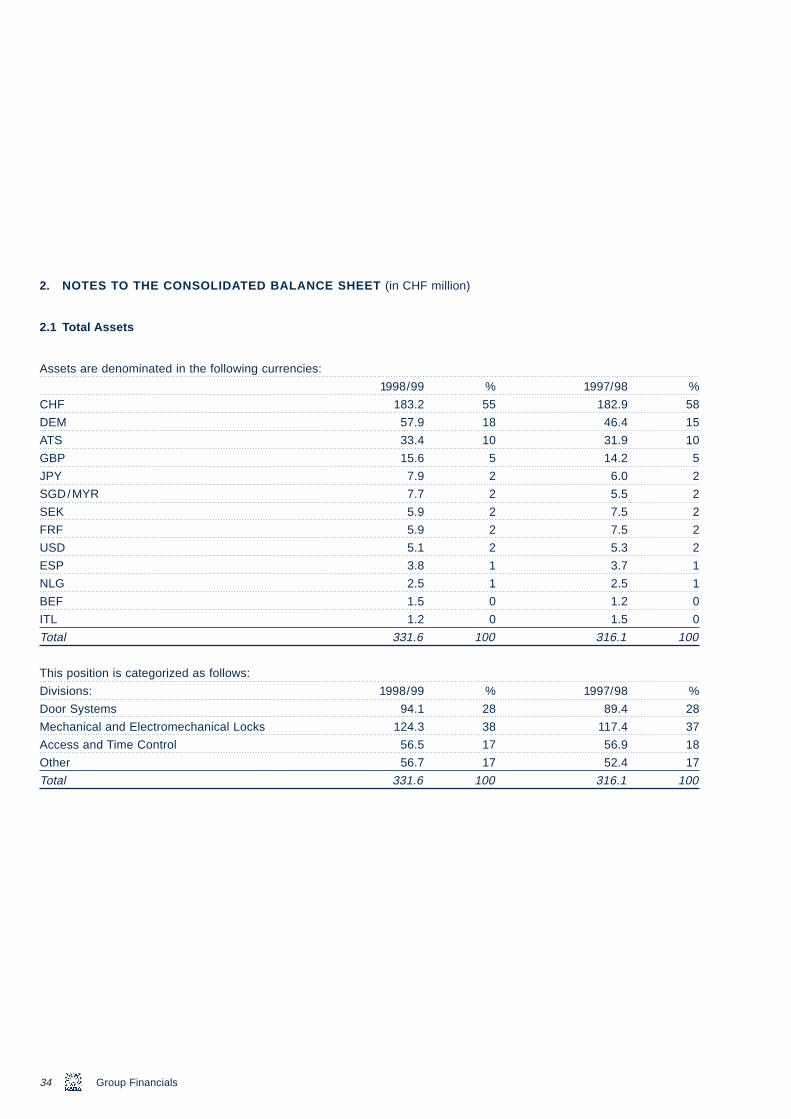
2. NOTES TO THE CONSOLIDATED BALANCE SHEET (in CHF million)
2.1 Total Assets
Assets are denominated in the following currencies:
1998/99 % 1997/98 %
CHF 183.2 55 182.9 58
DEM 57.9 18 46.4 15
ATS 33.4 10 31.9 10
GBP 15.6 5 14.2 5
JPY 7.9 2 6.0 2
_43 17.09.1999 18:01 Uhr Seite 34
34
SGD/MYR 7.7 2 5.5 2
SEK 5.9 2 7.5 2
FRF 5.9 2 7.5 2
USD 5.1 2 5.3 2
ESP 3.8 1 3.7 1
NLG 2.5 1 2.5 1
BEF 1.5 0 1.2 0
ITL 1.2 0 1.5 0
Total 331.6 100 316.1 100
This position is categorized as follows:
Divisions: 1998/99 % 1997/98 %
Door Systems 94.1 28 89.4 28
Mechanical and Electromechanical Locks 124.3 38 117.4 37
Access and Time Control 56.5 17 56.9 18
Other 56.7 17 52.4 17
Total 331.6 100 316.1 100
Group Financials
e_30_43 17.09.1
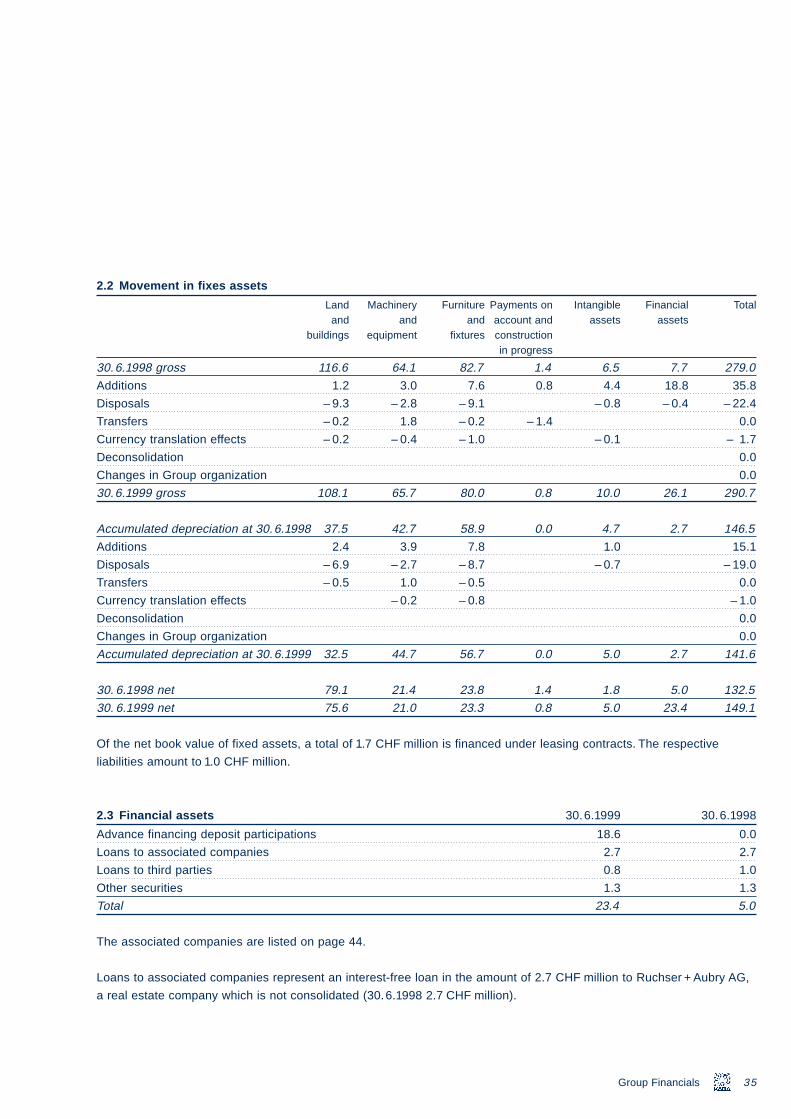
2.2 Movement in fixes assets
Land Machinery Furniture Payments on Intangible Financial Totaland and and account and assets assets
buildings equipment fixtures constructionin progress
30.6.1998 gross 116.6 64.1 82.7 1.4 6.5 7.7 279.0
Additions 1.2 3.0 7.6 0.8 4.4 18.8 35.8
Disposals – 9.3 – 2.8 – 9.1 – 0.8 – 0.4 – 22.4
Transfers – 0.2 1.8 – 0.2 – 1.4 0.0
Currency translation effects – 0.2 – 0.4 – 1.0 – 0.1 – 1.7
Deconsolidation 0.0
999 18:01 Uhr Seite 35
Changes in Group organization 0.0
30.6.1999 gross 108.1 65.7 80.0 0.8 10.0 26.1 290.7
Accumulated depreciation at 30.6.1998 37.5 42.7 58.9 0.0 4.7 2.7 146.5
Additions 2.4 3.9 7.8 1.0 15.1
Disposals – 6.9 – 2.7 – 8.7 – 0.7 – 19.0
Transfers – 0.5 1.0 – 0.5 0.0
Currency translation effects – 0.2 – 0.8 – 1.0
Deconsolidation 0.0
Changes in Group organization 0.0
Accumulated depreciation at 30.6.1999 32.5 44.7 56.7 0.0 5.0 2.7 141.6
30. 6.1998 net 79.1 21.4 23.8 1.4 1.8 5.0 132.5
35
30. 6.1999 net 75.6 21.0 23.3 0.8 5.0 23.4 149.1
Of the net book value of fixed assets, a total of 1.7 CHF million is financed under leasing contracts. The respective
liabilities amount to 1.0 CHF million.
2.3 Financial assets 30.6.1999 30.6.1998
Advance financing deposit participations 18.6 0.0
Loans to associated companies 2.7 2.7
Loans to third parties 0.8 1.0
Other securities 1.3 1.3
Total 23.4 5.0
The associated companies are listed on page 44.
Loans to associated companies represent an interest-free loan in the amount of 2.7 CHF million to Ruchser + Aubry AG,
a real estate company which is not consolidated (30.6.1998 2.7 CHF million).
Group Financials
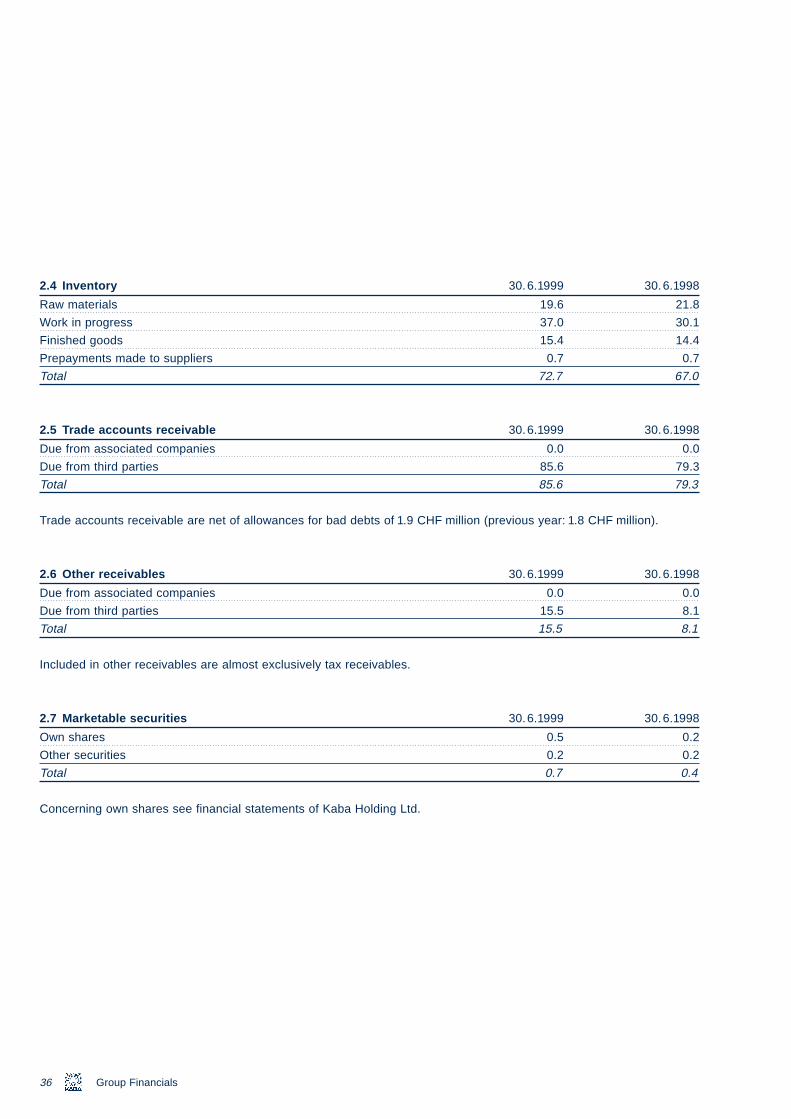
e_30_
43 17.09.1999 18:01 Uhr Seite 362.4 Inventory 30.6.1999 30.6.1998
Raw materials 19.6 21.8
Work in progress 37.0 30.1
Finished goods 15.4 14.4
Prepayments made to suppliers 0.7 0.7
Total 72.7 67.0
2.5 Trade accounts receivable 30.6.1999 30.6.1998
Due from associated companies 0.0 0.0
Due from third parties 85.6 79.3
Total 85.6 79.3
Trade accounts receivable are net of allowances for bad debts of 1.9 CHF million (previous year: 1.8 CHF million).
36
2.6 Other receivables 30.6.1999 30.6.1998
Due from associated companies 0.0 0.0
Due from third parties 15.5 8.1
Total 15.5 8.1
Included in other receivables are almost exclusively tax receivables.
2.7 Marketable securities 30.6.1999 30.6.1998
Own shares 0.5 0.2
Other securities 0.2 0.2
Total 0.7 0.4
Concerning own shares see financial statements of Kaba Holding Ltd.
Group Financials
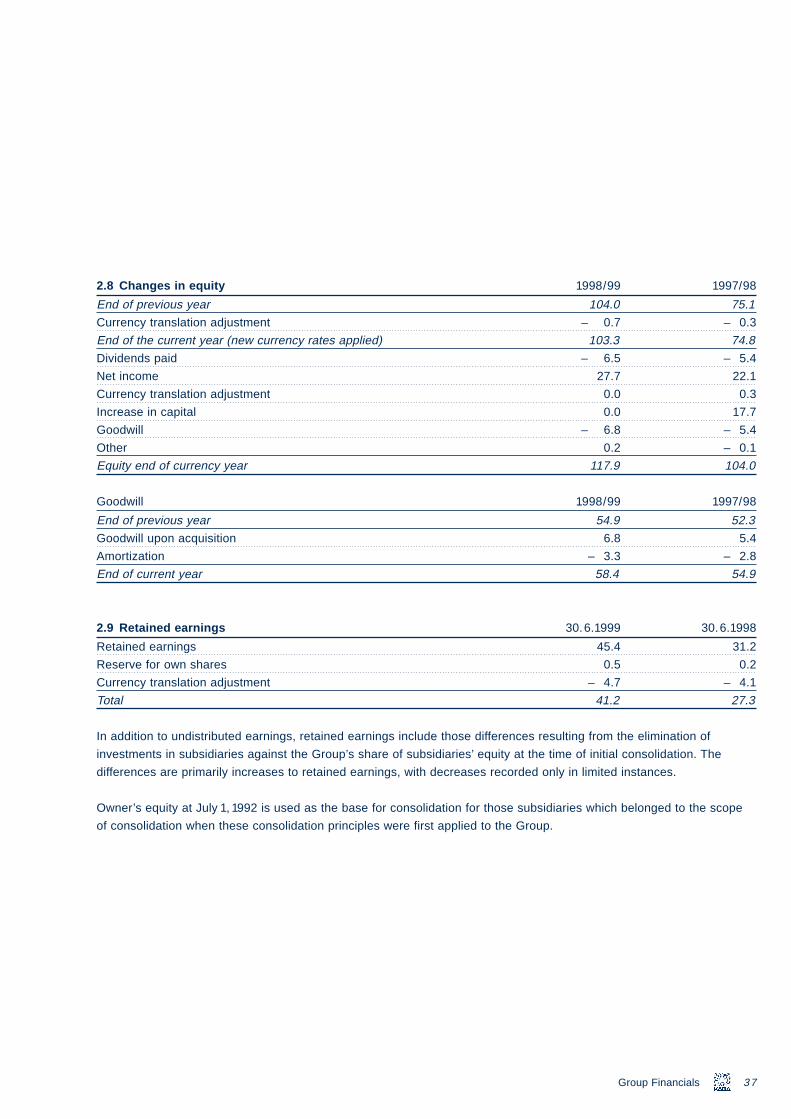
e_30_43 17.09.
1999 18:01 Uhr Seite 372.8 Changes in equity 1998/99 1997/98
End of previous year 104.0 75.1
Currency translation adjustment – 0.7 – 0.3
End of the current year (new currency rates applied) 103.3 74.8
Dividends paid – 6.5 – 5.4
Net income 27.7 22.1
Currency translation adjustment 0.0 0.3
Increase in capital 0.0 17.7
Goodwill – 6.8 – 5.4
Other 0.2 – 0.1
Equity end of currency year 117.9 104.0
Goodwill 1998/99 1997/98
End of previous year 54.9 52.3
37
Goodwill upon acquisition 6.8 5.4
Amortization – 3.3 – 2.8
End of current year 58.4 54.9
2.9 Retained earnings 30.6.1999 30.6.1998
Retained earnings 45.4 31.2
Reserve for own shares 0.5 0.2
Currency translation adjustment – 4.7 – 4.1
Total 41.2 27.3
In addition to undistributed earnings, retained earnings include those differences resulting from the elimination of
investments in subsidiaries against the Group’s share of subsidiaries’ equity at the time of initial consolidation. The
differences are primarily increases to retained earnings, with decreases recorded only in limited instances.
Owner’s equity at July 1, 1992 is used as the base for consolidation for those subsidiaries which belonged to the scope
of consolidation when these consolidation principles were first applied to the Group.
Group Financials
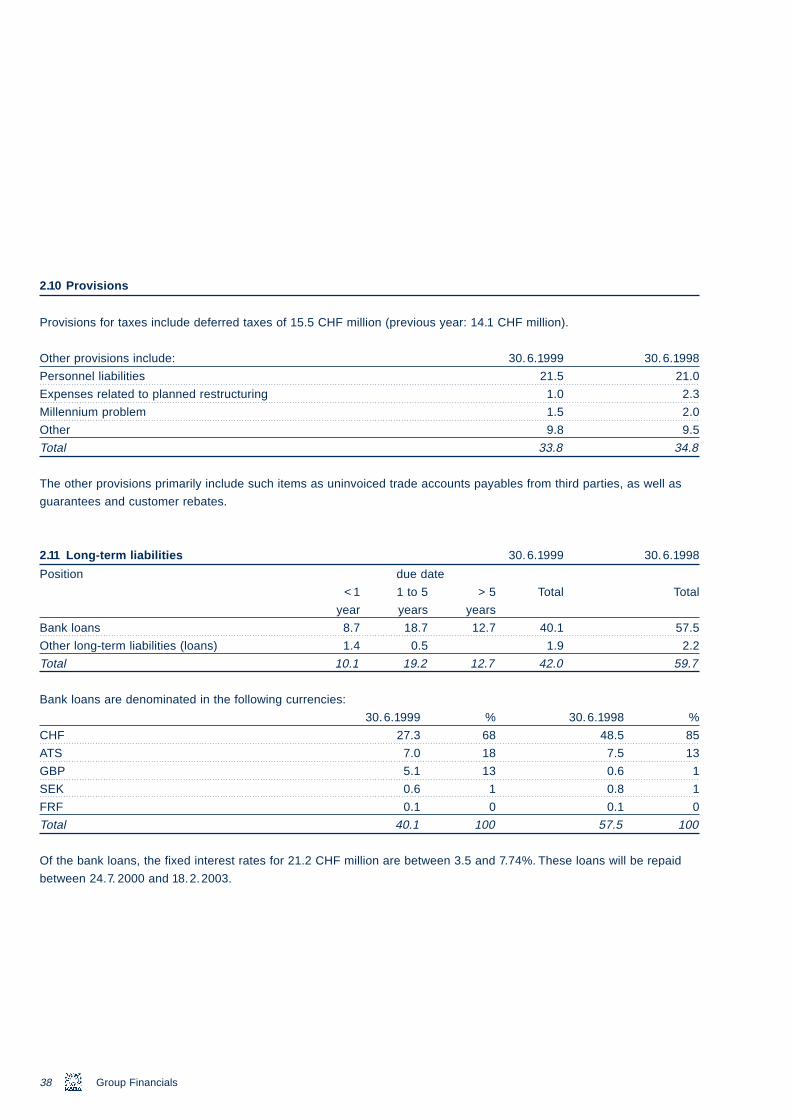
e_30_
43 17.09.1999 18:01 Uhr Seite 382.10 Provisions
Provisions for taxes include deferred taxes of 15.5 CHF million (previous year: 14.1 CHF million).
Other provisions include: 30.6.1999 30.6.1998
Personnel liabilities 21.5 21.0
Expenses related to planned restructuring 1.0 2.3
Millennium problem 1.5 2.0
Other 9.8 9.5
Total 33.8 34.8
The other provisions primarily include such items as uninvoiced trade accounts payables from third parties, as well as
guarantees and customer rebates.
2.11 Long-term liabilities 30.6.1999 30.6.1998
Position due date
38
< 1 1 to 5 > 5 Total Total
year years years
Bank loans 8.7 18.7 12.7 40.1 57.5
Other long-term liabilities (loans) 1.4 0.5 1.9 2.2
Total 10.1 19.2 12.7 42.0 59.7
Bank loans are denominated in the following currencies:
30.6.1999 % 30.6.1998 %
CHF 27.3 68 48.5 85
ATS 7.0 18 7.5 13
GBP 5.1 13 0.6 1
SEK 0.6 1 0.8 1
FRF 0.1 0 0.1 0
Total 40.1 100 57.5 100
Of the bank loans, the fixed interest rates for 21.2 CHF million are between 3.5 and 7.74%. These loans will be repaid
between 24.7. 2000 and 18.2.2003.
Group Financials
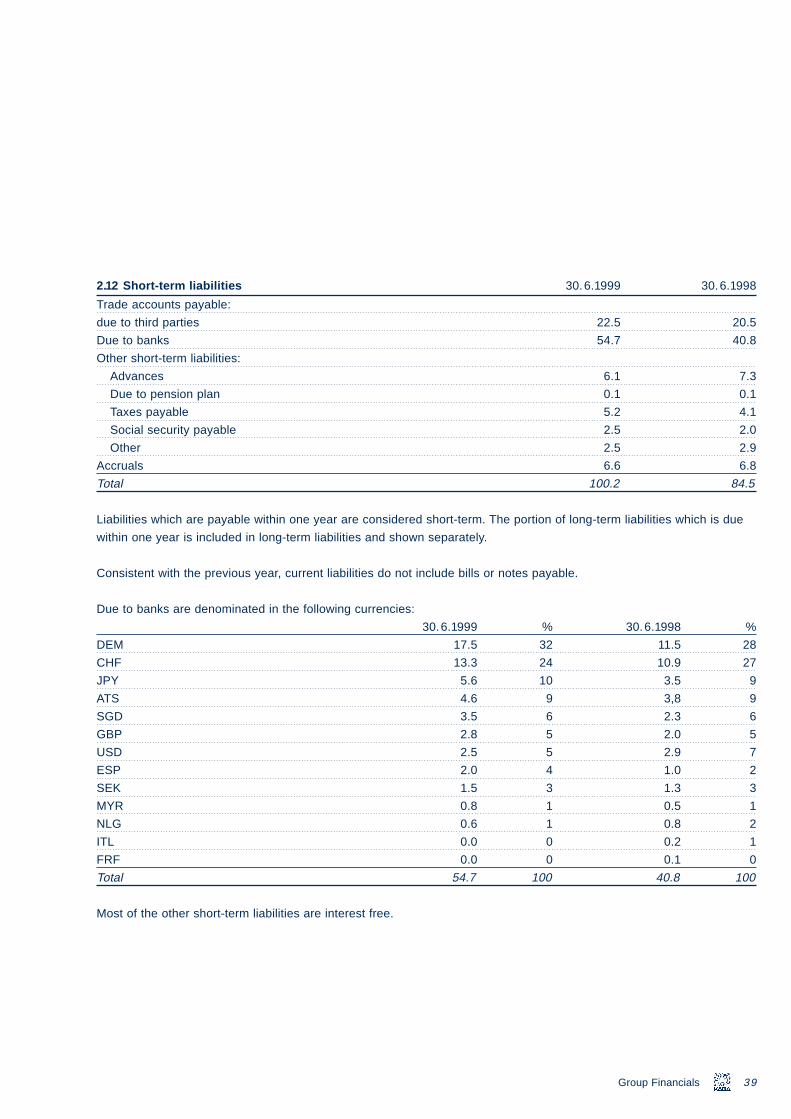
e_30_43 17.09.1
999 18:01 Uhr Seite 392.12 Short-term liabilities 30.6.1999 30.6.1998
Trade accounts payable:
due to third parties 22.5 20.5
Due to banks 54.7 40.8
Other short-term liabilities:
Advances 6.1 7.3
Due to pension plan 0.1 0.1
Taxes payable 5.2 4.1
Social security payable 2.5 2.0
Other 2.5 2.9
Accruals 6.6 6.8
Total 100.2 84.5
Liabilities which are payable within one year are considered short-term. The portion of long-term liabilities which is due
within one year is included in long-term liabilities and shown separately.
Consistent with the previous year, current liabilities do not include bills or notes payable.
Due to banks are denominated in the following currencies:
39
30.6.1999 % 30.6.1998 %
DEM 17.5 32 11.5 28
CHF 13.3 24 10.9 27
JPY 5.6 10 3.5 9
ATS 4.6 9 3,8 9
SGD 3.5 6 2.3 6
GBP 2.8 5 2.0 5
USD 2.5 5 2.9 7
ESP 2.0 4 1.0 2
SEK 1.5 3 1.3 3
MYR 0.8 1 0.5 1
NLG 0.6 1 0.8 2
ITL 0.0 0 0.2 1
FRF 0.0 0 0.1 0
Total 54.7 100 40.8 100
Most of the other short-term liabilities are interest free.
Group Financials
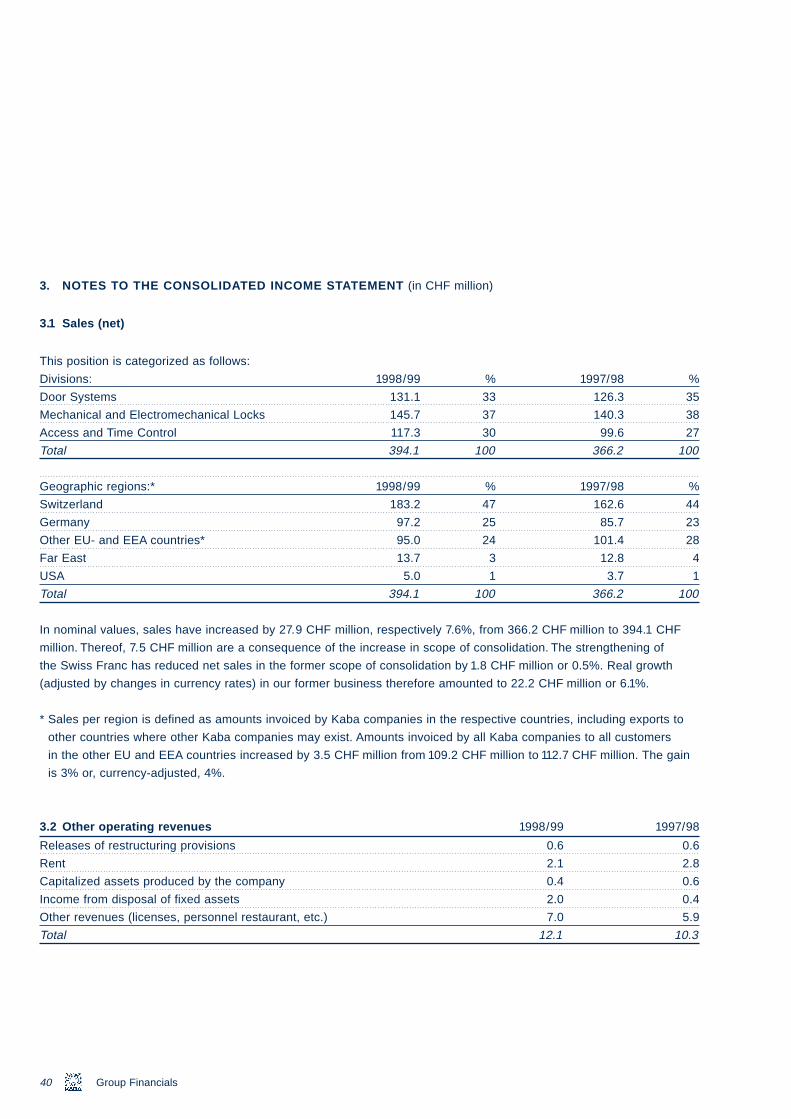
e_30_
3. NOTES TO THE CONSOLIDATED INCOME STATEMENT (in CHF million)
3.1 Sales (net)
This position is categorized as follows:
Divisions: 1998/99 % 1997/98 %
Door Systems 131.1 33 126.3 35
Mechanical and Electromechanical Locks 145.7 37 140.3 38
Access and Time Control 117.3 30 99.6 27
Total 394.1 100 366.2 100
43 17.09.1999 18:01 Uhr Seite 40
Geographic regions:* 1998/99 % 1997/98 %
Switzerland 183.2 47 162.6 44
Germany 97.2 25 85.7 23
Other EU- and EEA countries* 95.0 24 101.4 28
Far East 13.7 3 12.8 4
USA 5.0 1 3.7 1
Total 394.1 100 366.2 100
In nominal values, sales have increased by 27.9 CHF million, respectively 7.6%, from 366.2 CHF million to 394.1 CHF
40
million. Thereof, 7.5 CHF million are a consequence of the increase in scope of consolidation. The strengthening of
the Swiss Franc has reduced net sales in the former scope of consolidation by 1.8 CHF million or 0.5%. Real growth
(adjusted by changes in currency rates) in our former business therefore amounted to 22.2 CHF million or 6.1%.
* Sales per region is defined as amounts invoiced by Kaba companies in the respective countries, including exports to
other countries where other Kaba companies may exist. Amounts invoiced by all Kaba companies to all customers
in the other EU and EEA countries increased by 3.5 CHF million from 109.2 CHF million to 112.7 CHF million. The gain
is 3% or, currency-adjusted, 4%.
3.2 Other operating revenues 1998/99 1997/98
Releases of restructuring provisions 0.6 0.6
Rent 2.1 2.8
Capitalized assets produced by the company 0.4 0.6
Income from disposal of fixed assets 2.0 0.4
Other revenues (licenses, personnel restaurant, etc.) 7.0 5.9
Total 12.1 10.3
Group Financials
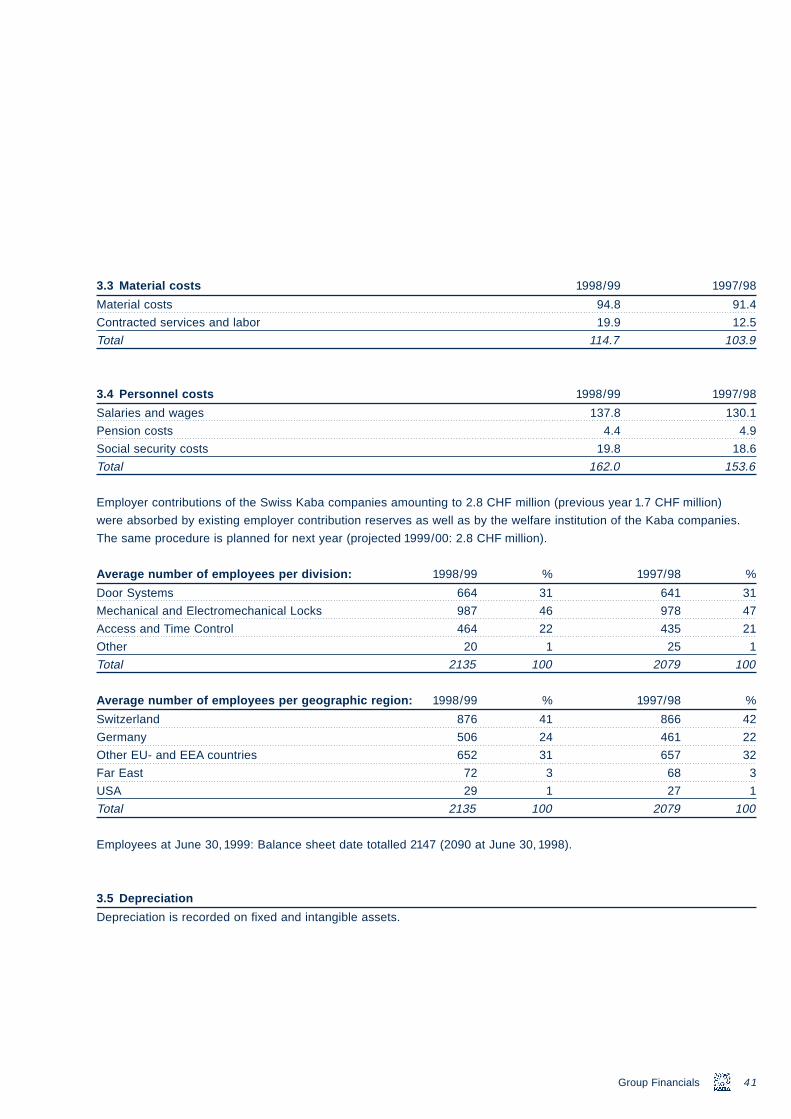
e_30_43 17.09.1
999 18:01 Uhr Seite 413.3 Material costs 1998/99 1997/98
Material costs 94.8 91.4
Contracted services and labor 19.9 12.5
Total 114.7 103.9
3.4 Personnel costs 1998/99 1997/98
Salaries and wages 137.8 130.1
Pension costs 4.4 4.9
Social security costs 19.8 18.6
Total 162.0 153.6
Employer contributions of the Swiss Kaba companies amounting to 2.8 CHF million (previous year 1.7 CHF million)
were absorbed by existing employer contribution reserves as well as by the welfare institution of the Kaba companies.
The same procedure is planned for next year (projected 1999/00: 2.8 CHF million).
Average number of employees per division: 1998/99 % 1997/98 %
Door Systems 664 31 641 31
Mechanical and Electromechanical Locks 987 46 978 47
41
Access and Time Control 464 22 435 21
Other 20 1 25 1
Total 2135 100 2079 100
Average number of employees per geographic region: 1998/99 % 1997/98 %
Switzerland 876 41 866 42
Germany 506 24 461 22
Other EU- and EEA countries 652 31 657 32
Far East 72 3 68 3
USA 29 1 27 1
Total 2135 100 2079 100
Employees at June 30, 1999: Balance sheet date totalled 2147 (2090 at June 30, 1998).
3.5 Depreciation
Depreciation is recorded on fixed and intangible assets.
Group Financials
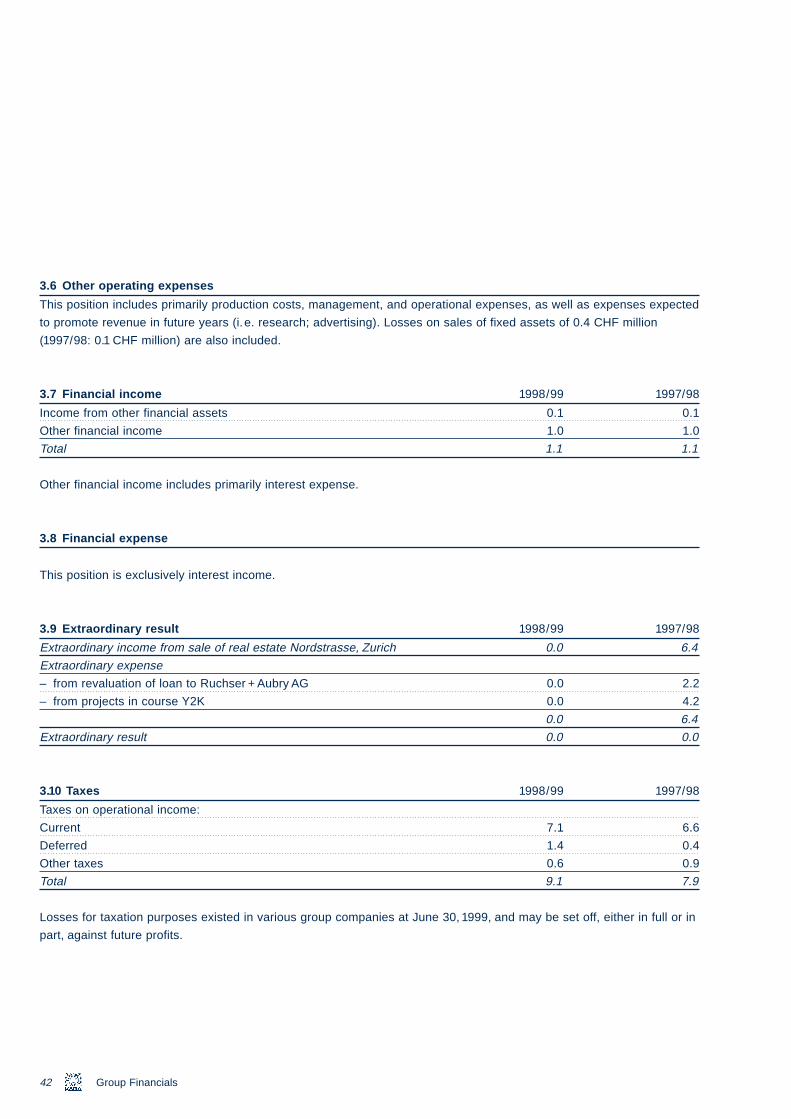
e_30
_43 17.09.1999 18:01 Uhr Seite 423.6 Other operating expenses
This position includes primarily production costs, management, and operational expenses, as well as expenses expected
to promote revenue in future years (i.e. research; advertising). Losses on sales of fixed assets of 0.4 CHF million
(1997/98: 0.1 CHF million) are also included.
3.7 Financial income 1998/99 1997/98
Income from other financial assets 0.1 0.1
Other financial income 1.0 1.0
Total 1.1 1.1
Other financial income includes primarily interest expense.
3.8 Financial expense
This position is exclusively interest income.
3.9 Extraordinary result 1998/99 1997/98
42
Extraordinary income from sale of real estate Nordstrasse, Zurich 0.0 6.4
Extraordinary expense
– from revaluation of loan to Ruchser + Aubry AG 0.0 2.2
– from projects in course Y2K 0.0 4.2
0.0 6.4
Extraordinary result 0.0 0.0
3.10 Taxes 1998/99 1997/98
Taxes on operational income:
Current 7.1 6.6
Deferred 1.4 0.4
Other taxes 0.6 0.9
Total 9.1 7.9
Losses for taxation purposes existed in various group companies at June 30, 1999, and may be set off, either in full or in
part, against future profits.
Group Financials
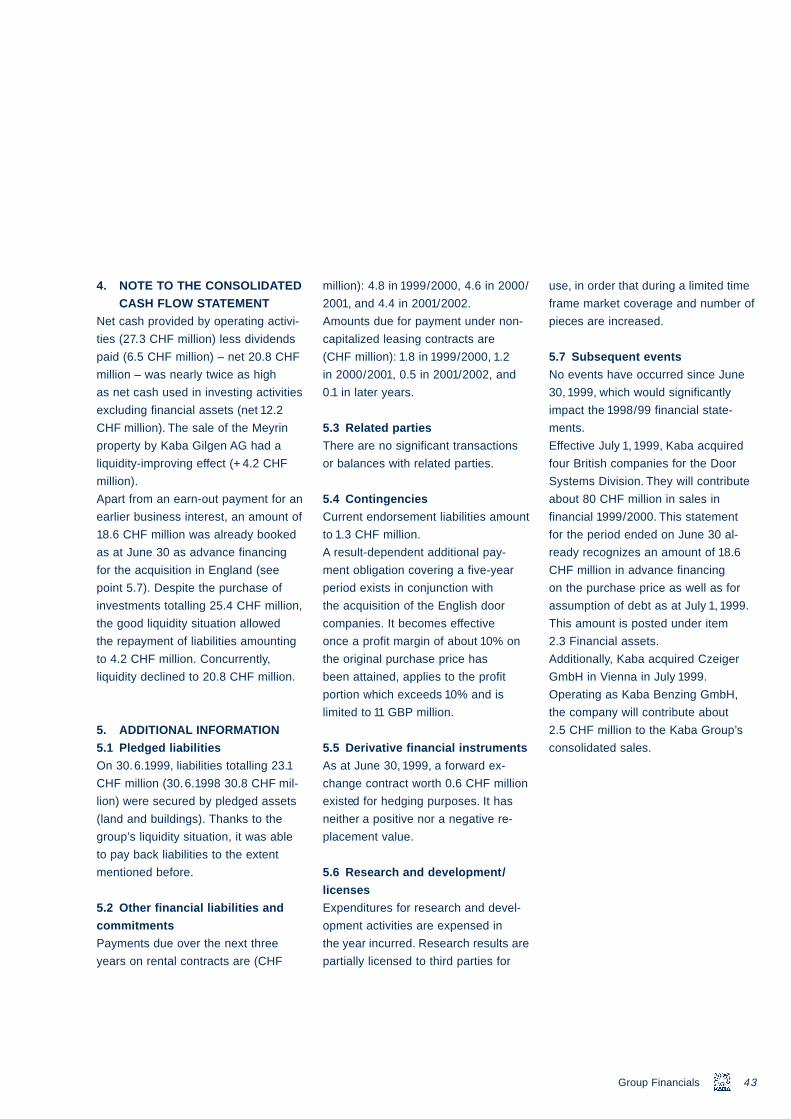
e_30_43 17.09.1
4. NOTE TO THE CONSOLIDATEDCASH FLOW STATEMENT
Net cash provided by operating activi-
ties (27.3 CHF million) less dividends
paid (6.5 CHF million) – net 20.8 CHF
million – was nearly twice as high
as net cash used in investing activities
excluding financial assets (net 12.2
CHF million). The sale of the Meyrin
property by Kaba Gilgen AG had a
liquidity-improving effect (+ 4.2 CHF
million).
Apart from an earn-out payment for an
earlier business interest, an amount of
18.6 CHF million was already booked
as at June 30 as advance financing
for the acquisition in England (see
point 5.7). Despite the purchase of
investments totalling 25.4 CHF million,
the good liquidity situation allowed
the repayment of liabilities amounting
to 4.2 CHF million. Concurrently,
999 18:01 Uhr Seite 43
liquidity declined to 20.8 CHF million.
5. ADDITIONAL INFORMATION5.1 Pledged liabilitiesOn 30.6.1999, liabilities totalling 23.1
CHF million (30.6.1998 30.8 CHF mil-
lion) were secured by pledged assets
(land and buildings). Thanks to the
group’s liquidity situation, it was able
to pay back liabilities to the extent
mentioned before.
5.2 Other financial liabilities andcommitmentsPayments due over the next three
years on rental contracts are (CHF
million): 4.8 in 1999/2000, 4.6 in 2000/
2001, and 4.4 in 2001/2002.
Amounts due for payment under non-
capitalized leasing contracts are
(CHF million): 1.8 in 1999/2000, 1.2
in 2000/2001, 0.5 in 2001/2002, and
0.1 in later years.
5.3 Related partiesThere are no significant transactions
or balances with related parties.
5.4 ContingenciesCurrent endorsement liabilities amount
to 1.3 CHF million.
A result-dependent additional pay-
ment obligation covering a five-year
period exists in conjunction with
the acquisition of the English door
companies. It becomes effective
once a profit margin of about 10% on
the original purchase price has
been attained, applies to the profit
portion which exceeds 10% and is
limited to 11 GBP million.
5.5 Derivative financial instrumentsAs at June 30, 1999, a forward ex-
change contract worth 0.6 CHF million
existed for hedging purposes. It has
neither a positive nor a negative re-
placement value.
5.6 Research and development/licensesExpenditures for research and devel-
opment activities are expensed in
the year incurred. Research results are
partially licensed to third parties for
use, in order that during a limited time
frame market coverage and number of
pieces are increased.
5.7 Subsequent eventsNo events have occurred since June
30, 1999, which would significantly
impact the 1998/99 financial state-
ments.
Effective July 1, 1999, Kaba acquired
four British companies for the Door
Systems Division. They will contribute
about 80 CHF million in sales in
financial 1999/2000. This statement
for the period ended on June 30 al-
ready recognizes an amount of 18.6
CHF million in advance financing
on the purchase price as well as for
assumption of debt as at July 1, 1999.
This amount is posted under item
2.3 Financial assets.
Additionally, Kaba acquired Czeiger
43
GmbH in Vienna in July 1999.
Operating as Kaba Benzing GmbH,
the company will contribute about
2.5 CHF million to the Kaba Group’s
consolidated sales.
Group Financials
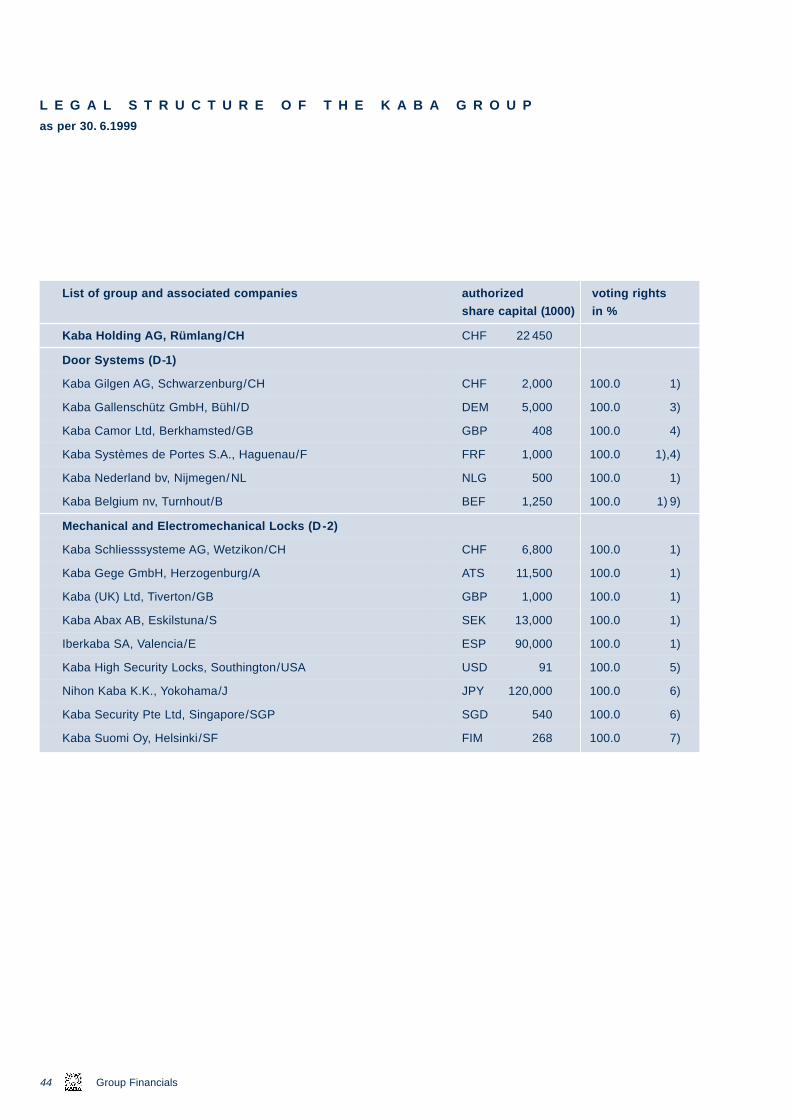
e_44
L E G A L S T R U C T U R E O F T H E K A B A G R O U P
as per 30. 6.1999
List of group and associated companies authorized voting rights
share capital (1000) in %
Kaba Holding AG, Rümlang/CH CHF 22 450
Door Systems (D-1)
Kaba Gilgen AG, Schwarzenburg/CH CHF 2,000 100.0 1)
Kaba Gallenschütz GmbH, Bühl/D DEM 5,000 100.0 3)
Kaba Camor Ltd, Berkhamsted/GB GBP 408 100.0 4)
Kaba Systèmes de Portes S.A., Haguenau/F FRF 1,000 100.0 1),4)
_46 17.09.1999 18:01 Uhr Seite 44
44 Group Financials
Kaba Nederland bv, Nijmegen/NL NLG 500 100.0 1)
Kaba Belgium nv, Turnhout/B BEF 1,250 100.0 1) 9)
Mechanical and Electromechanical Locks (D-2)
Kaba Schliesssysteme AG, Wetzikon/CH CHF 6,800 100.0 1)
Kaba Gege GmbH, Herzogenburg/A ATS 11,500 100.0 1)
Kaba (UK) Ltd, Tiverton/GB GBP 1,000 100.0 1)
Kaba Abax AB, Eskilstuna/S SEK 13,000 100.0 1)
Iberkaba SA, Valencia/E ESP 90,000 100.0 1)
Kaba High Security Locks, Southington/USA USD 91 100.0 5)
Nihon Kaba K.K., Yokohama/J JPY 120,000 100.0 6)
Kaba Security Pte Ltd, Singapore/SGP SGD 540 100.0 6)
Kaba Suomi Oy, Helsinki/SF FIM 268 100.0 7)
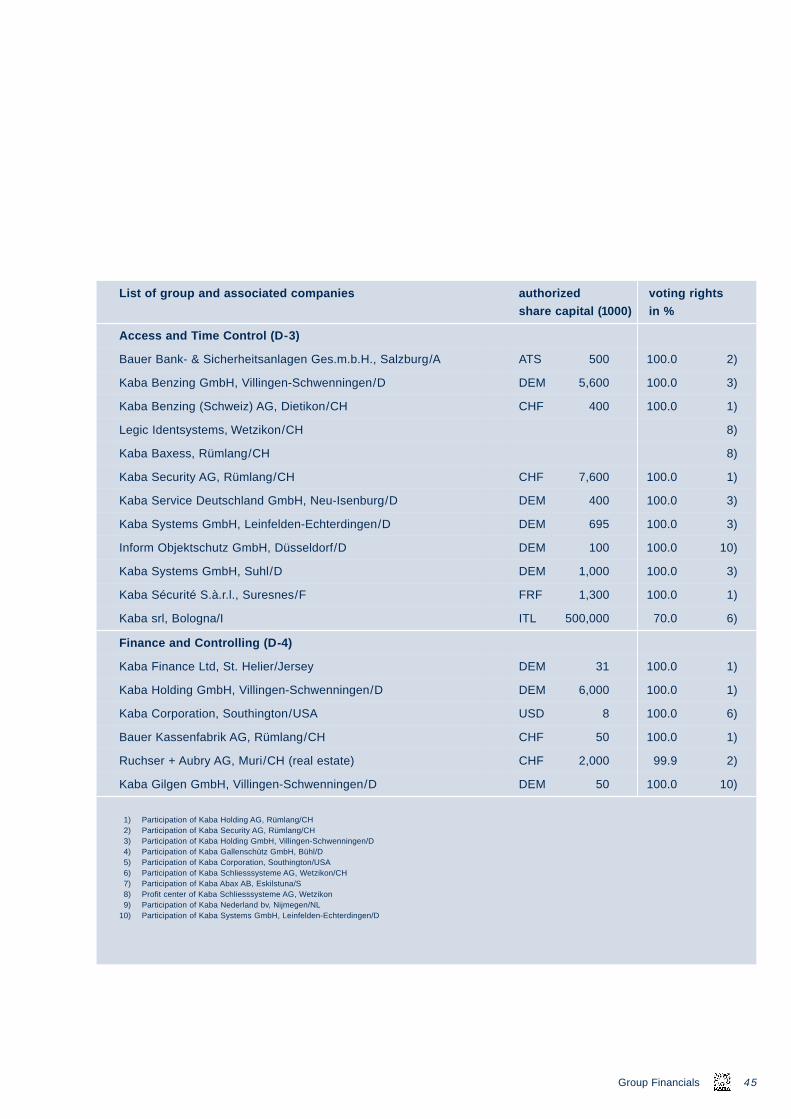
e_44_46 17.09.1
List of group and associated companies authorized voting rights
share capital (1000) in %
Access and Time Control (D-3)
Bauer Bank- & Sicherheitsanlagen Ges.m.b.H., Salzburg/A ATS 500 100.0 2)
Kaba Benzing GmbH, Villingen-Schwenningen/D DEM 5,600 100.0 3)
Kaba Benzing (Schweiz) AG, Dietikon/CH CHF 400 100.0 1)
Legic Identsystems, Wetzikon/CH 8)
Kaba Baxess, Rümlang/CH 8)
Kaba Security AG, Rümlang/CH CHF 7,600 100.0 1)
Kaba Service Deutschland GmbH, Neu-Isenburg/D DEM 400 100.0 3)
Kaba Systems GmbH, Leinfelden-Echterdingen/D DEM 695 100.0 3)
Inform Objektschutz GmbH, Düsseldorf/D DEM 100 100.0 10)
Kaba Systems GmbH, Suhl/D DEM 1,000 100.0 3)
Kaba Sécurité S.à.r.l., Suresnes/F FRF 1,300 100.0 1)
Kaba srl, Bologna/I ITL 500,000 70.0 6)
999 18:01 Uhr Seite 45
45Group Financials
Finance and Controlling (D-4)
Kaba Finance Ltd, St. Helier/Jersey DEM 31 100.0 1)
Kaba Holding GmbH, Villingen-Schwenningen/D DEM 6,000 100.0 1)
Kaba Corporation, Southington/USA USD 8 100.0 6)
Bauer Kassenfabrik AG, Rümlang/CH CHF 50 100.0 1)
Ruchser + Aubry AG, Muri/CH (real estate) CHF 2,000 99.9 2)
Kaba Gilgen GmbH, Villingen-Schwenningen/D DEM 50 100.0 10)
1) Participation of Kaba Holding AG, Rümlang/CH2) Participation of Kaba Security AG, Rümlang/CH3) Participation of Kaba Holding GmbH, Villingen-Schwenningen/D4) Participation of Kaba Gallenschütz GmbH, Bühl/D5) Participation of Kaba Corporation, Southington/USA6) Participation of Kaba Schliesssysteme AG, Wetzikon/CH7) Participation of Kaba Abax AB, Eskilstuna/S8) Profit center of Kaba Schliesssysteme AG, Wetzikon9) Participation of Kaba Nederland bv, Nijmegen/NL
10) Participation of Kaba Systems GmbH, Leinfelden-Echterdingen/D
e_44_
R E P O R T O F T H E G R O U P A U D I T O R S
T O T H E G E N E R A L M E E T I N G
O F K A B A H O L D I N G L T D , R Ü M L A N G
As auditors of the group, we have audited the consolidated financial statements
(balance sheet, income statement, cash flow statement, and notes to the consoli-
dated financial statements / pages 26 to 45) of the Kaba group for the year ended
June 30, 1999.
These consolidated financial statements are the responsibility of the board of
directors. Our responsibility is to express an opinion on these consolidated
financial statements based on our audit. We confirm that we meet the legal
requirements concerning professional qualification and independence.
Our audit was conducted in accordance with auditing standards promulgated by
the profession in Switzerland, which require that an audit be planned and per-
formed to obtain reasonable assurance about whether the consolidated financial
statements are free from material misstatement. We have examined on a test
basis evidence supporting the amounts and disclosures in the consolidated finan-
cial statements. We have also assessed the accounting principles used, signifi-
cant estimates made and the overall consolidated financial statement presenta-
tion. We believe that our audit provides a reasonable basis for our opinion.
In our opinion, the consolidated financial statements give a true and fair view of
the financial position, the results of operations and the cash flows in accordance
with the Accounting and Reporting Recommendations in Switzerland (ARR), and
46 17.09.1999 18:01 Uhr Seite 46
46 Group Financials
comply with the law.
We recommend that the consolidated financial statements submitted to you be
approved.
PricewaterhouseCoopers AG
P. Binz St. Iten
Zurich, September 3, 1999
HOLDING COMPANY FINANCIALS
Holding Company Balance Sheet 48
Holding Company Income Statement and Appropriation of profit 50
Notes to the Financial Statements 51
Auditor’s Report 53
Comments on the Financial Statements 54
Operative Structure 55
Addresses 56
F I N A N C I A L R E V I E W
e_47_53 17.09.1999 18:02 Uhr Seite 47
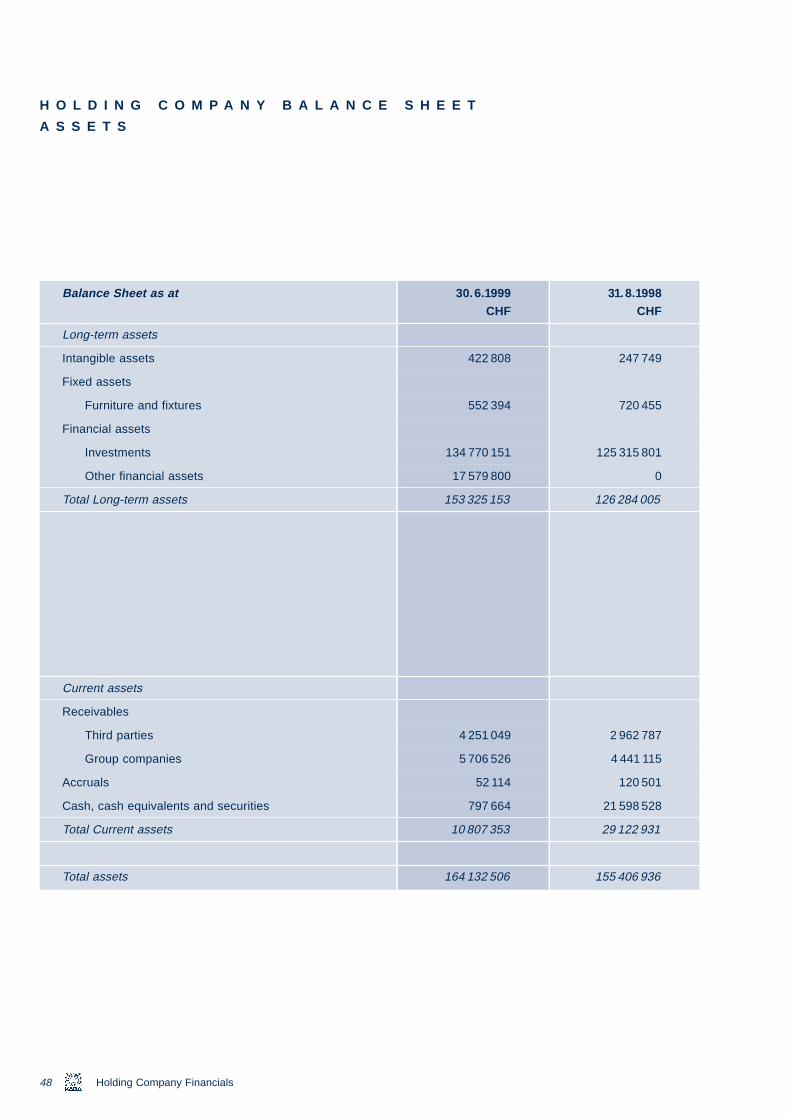
48
H
A
e_47_53
O L D I N G C O M P A N Y B A L A N C E S H E E T
S S E T S
Balance Sheet as at 30.6.1999 31.8.1998
CHF CHF
Long-term assets
Intangible assets 422 808 247 749
Fixed assets
Furniture and fixtures 552 394 720 455
Financial assets
Investments 134 770 151 125 315 801
Other financial assets 17 579 800 0
Total Long-term assets 153 325 153 126 284 005
17.09.1999 18:02 Uhr Seite 48
Holding Company Financials
Current assets
Receivables
Third parties 4 251 049 2 962 787
Group companies 5 706 526 4 441 115
Accruals 52 114 120 501
Cash, cash equivalents and securities 797 664 21 598 528
Total Current assets 10 807 353 29 122 931
Total assets 164 132 506 155 406 936
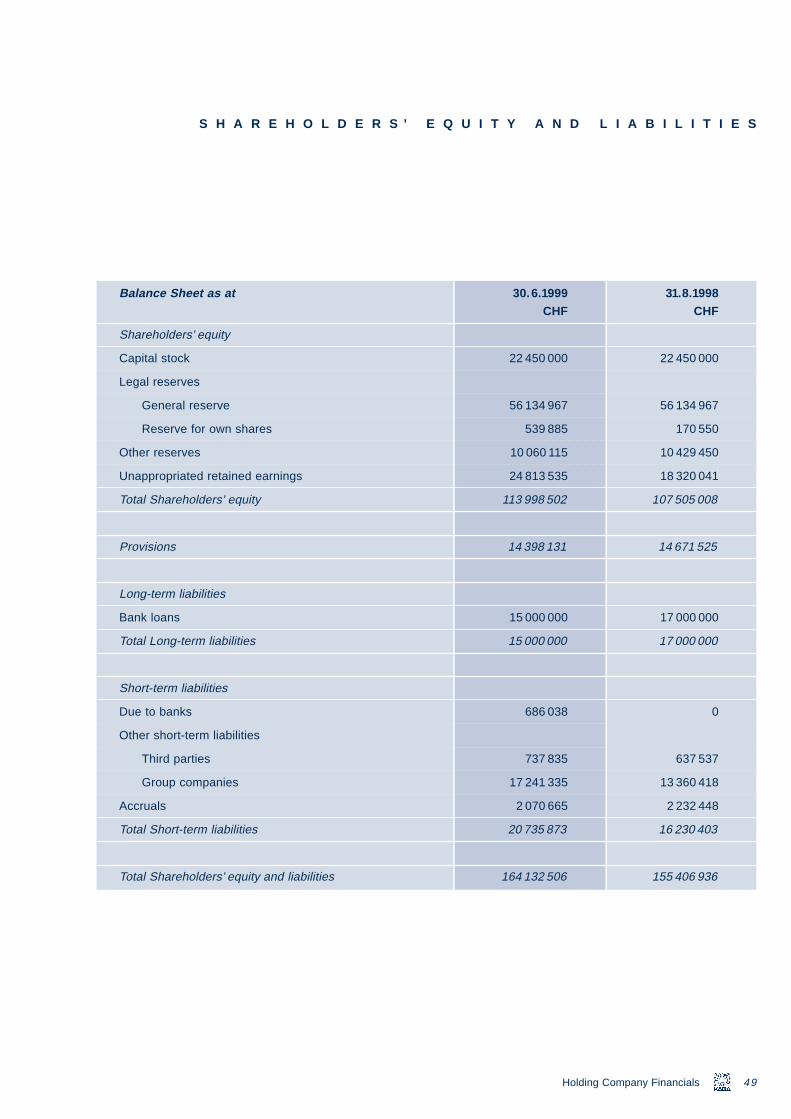
S
e_47_53 17.09.1999
S H A R E H O L D E R S ’ E Q U I T Y A N D L I A B I L I T I E
Balance Sheet as at 30.6.1999 31.8.1998
CHF CHF
Shareholders’ equity
Capital stock 22 450 000 22 450 000
Legal reserves
General reserve 56 134 967 56 134 967
Reserve for own shares 539 885 170 550
Other reserves 10 060 115 10 429 450
Unappropriated retained earnings 24 813 535 18 320 041
Total Shareholders’ equity 113 998 502 107 505 008
Provisions 14 398 131 14 671 525
Long-term liabilities
18:02 Uhr Seite 49
49Holding Company Financials
Bank loans 15 000 000 17 000 000
Total Long-term liabilities 15 000 000 17 000 000
Short-term liabilities
Due to banks 686 038 0
Other short-term liabilities
Third parties 737 835 637 537
Group companies 17 241 335 13 360 418
Accruals 2 070 665 2 232 448
Total Short-term liabilities 20 735 873 16 230 403
Total Shareholders’ equity and liabilities 164 132 506 155 406 936
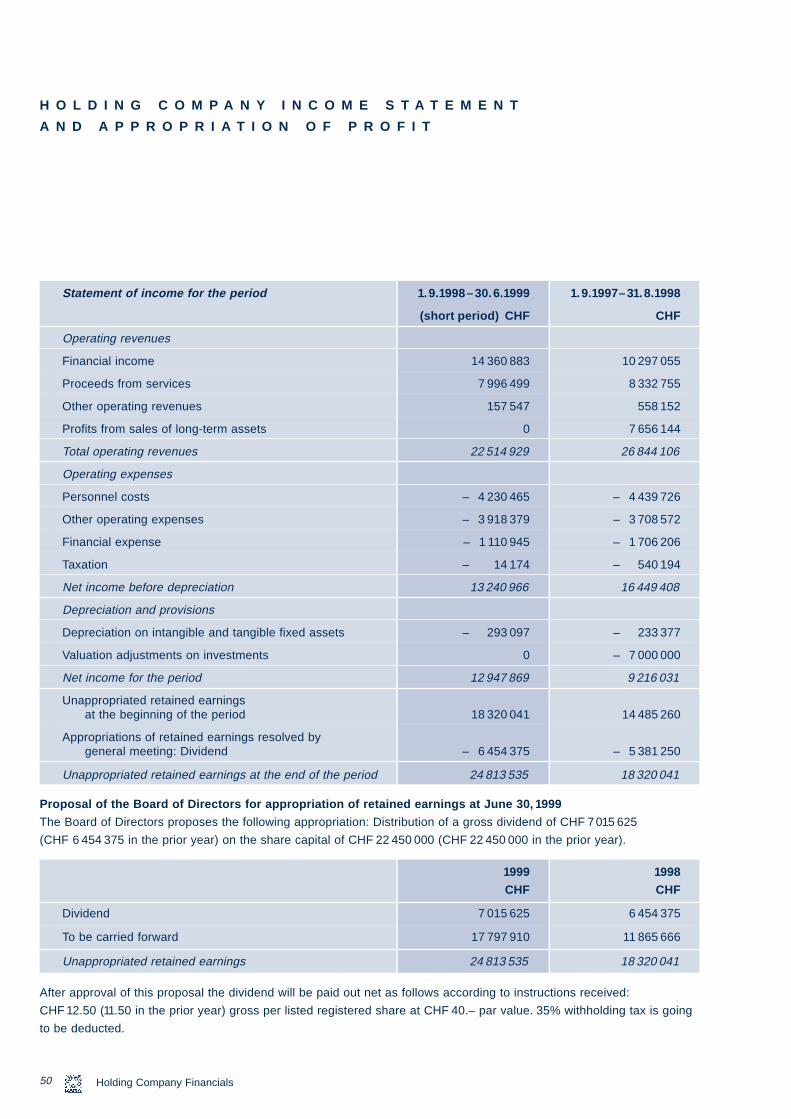
50
H
A
Af
CH
to
Pr
Th
(C
e_47_53
Statement of income for the period 1.9.1998–30.6.1999 1.9.1997–31.8.1998
(short period) CHF CHF
Operating revenues
Financial income 14 360 883 10 297 055
Proceeds from services 7 996 499 8 332 755
Other operating revenues 157 547 558 152
Profits from sales of long-term assets 0 7 656 144
Total operating revenues 22 514 929 26 844 106
Operating expenses
O L D I N G C O M P A N Y I N C O M E S T A T E M E N T
N D A P P R O P R I A T I O N O F P R O F I T
17.09.1999 18:02 Uhr Seite 50
Personnel costs – 4 230 465 – 4 439 726
Other operating expenses – 3 918 379 – 3 708 572
Financial expense – 1 110 945 – 1 706 206
Taxation – 14 174 – 540 194
Net income before depreciation 13 240 966 16 449 408
Depreciation and provisions
Depreciation on intangible and tangible fixed assets – 293 097 – 233 377
Valuation adjustments on investments 0 – 7 000 000
Net income for the period 12 947 869 9 216 031
Unappropriated retained earnings at the beginning of the period 18 320 041 14 485 260
Holding Company Financials
Appropriations of retained earnings resolved by general meeting: Dividend – 6 454 375 – 5 381 250
Unappropriated retained earnings at the end of the period 24 813 535 18 320 041
ter approval of this proposal the dividend will be paid out net as follows according to instructions received:
F 12.50 (11.50 in the prior year) gross per listed registered share at CHF 40.– par value. 35% withholding tax is going
be deducted.
1999 1998
CHF CHF
Dividend 7 015 625 6 454 375
To be carried forward 17 797 910 11 865 666
Unappropriated retained earnings 24 813 535 18 320 041
oposal of the Board of Directors for appropriation of retained earnings at June 30, 1999
e Board of Directors proposes the following appropriation: Distribution of a gross dividend of CHF 7015 625
HF 6 454 375 in the prior year) on the share capital of CHF 22 450 000 (CHF 22 450 000 in the prior year).
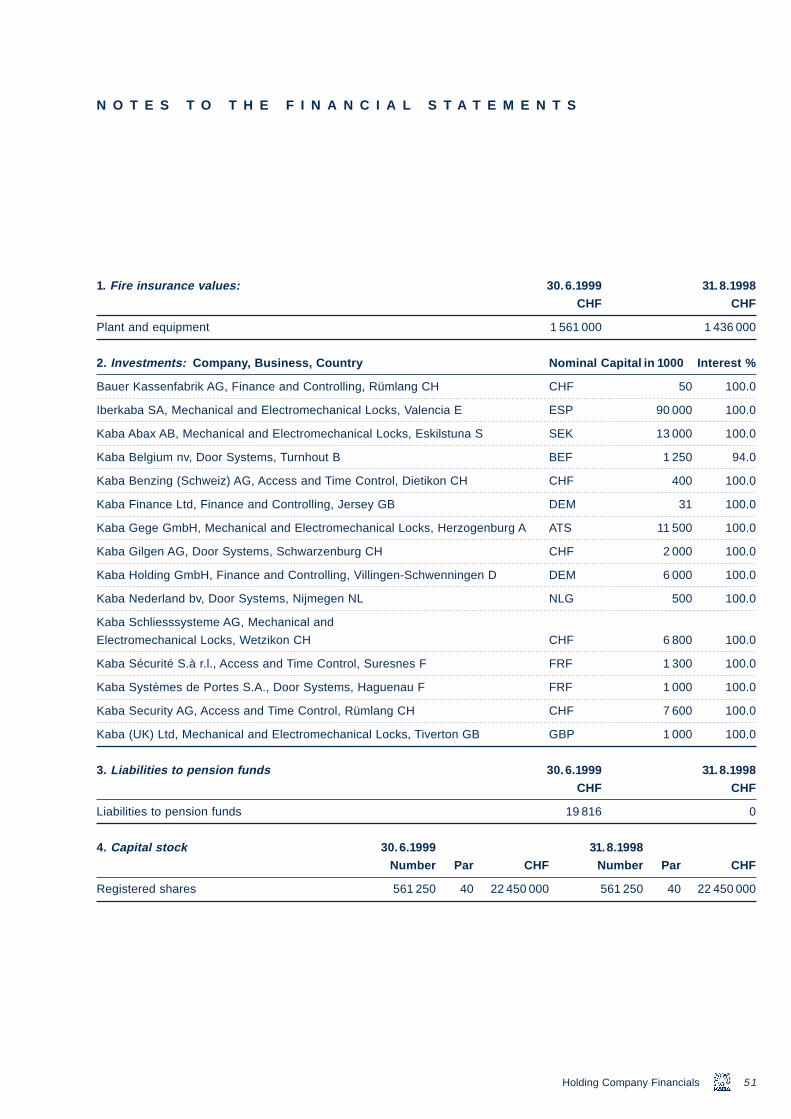
e_47_53 17.09.1
N O T E S T O T H E F I N A N C I A L S T A T E M E N T S
1. Fire insurance values: 30.6.1999 31.8.1998
CHF CHF
Plant and equipment 1 561 000 1 436 000
2. Investments: Company, Business, Country Nominal Capital in 1000 Interest %
Bauer Kassenfabrik AG, Finance and Controlling, Rümlang CH CHF 50 100.0
Iberkaba SA, Mechanical and Electromechanical Locks, Valencia E ESP 90 000 100.0
Kaba Abax AB, Mechanical and Electromechanical Locks, Eskilstuna S SEK 13 000 100.0
999 18:02 Uhr Seite 51
Kaba Belgium nv, Door Systems, Turnhout B BEF 1 250 94.0
Kaba Benzing (Schweiz) AG, Access and Time Control, Dietikon CH CHF 400 100.0
Kaba Finance Ltd, Finance and Controlling, Jersey GB DEM 31 100.0
Kaba Gege GmbH, Mechanical and Electromechanical Locks, Herzogenburg A ATS 11 500 100.0
Kaba Gilgen AG, Door Systems, Schwarzenburg CH CHF 2 000 100.0
Kaba Holding GmbH, Finance and Controlling, Villingen-Schwenningen D DEM 6 000 100.0
Kaba Nederland bv, Door Systems, Nijmegen NL NLG 500 100.0
51Holding Company Financials
Kaba Schliesssysteme AG, Mechanical and
Electromechanical Locks, Wetzikon CH CHF 6 800 100.0
Kaba Sécurité S.à r.l., Access and Time Control, Suresnes F FRF 1 300 100.0
Kaba Systèmes de Portes S.A., Door Systems, Haguenau F FRF 1 000 100.0
Kaba Security AG, Access and Time Control, Rümlang CH CHF 7 600 100.0
Kaba (UK) Ltd, Mechanical and Electromechanical Locks, Tiverton GB GBP 1 000 100.0
3. Liabilities to pension funds 30.6.1999 31.8.1998
CHF CHF
Liabilities to pension funds 19 816 0
4. Capital stock 30.6.1999 31.8.1998
Number Par CHF Number Par CHF
Registered shares 561 250 40 22 450 000 561 250 40 22 450 000
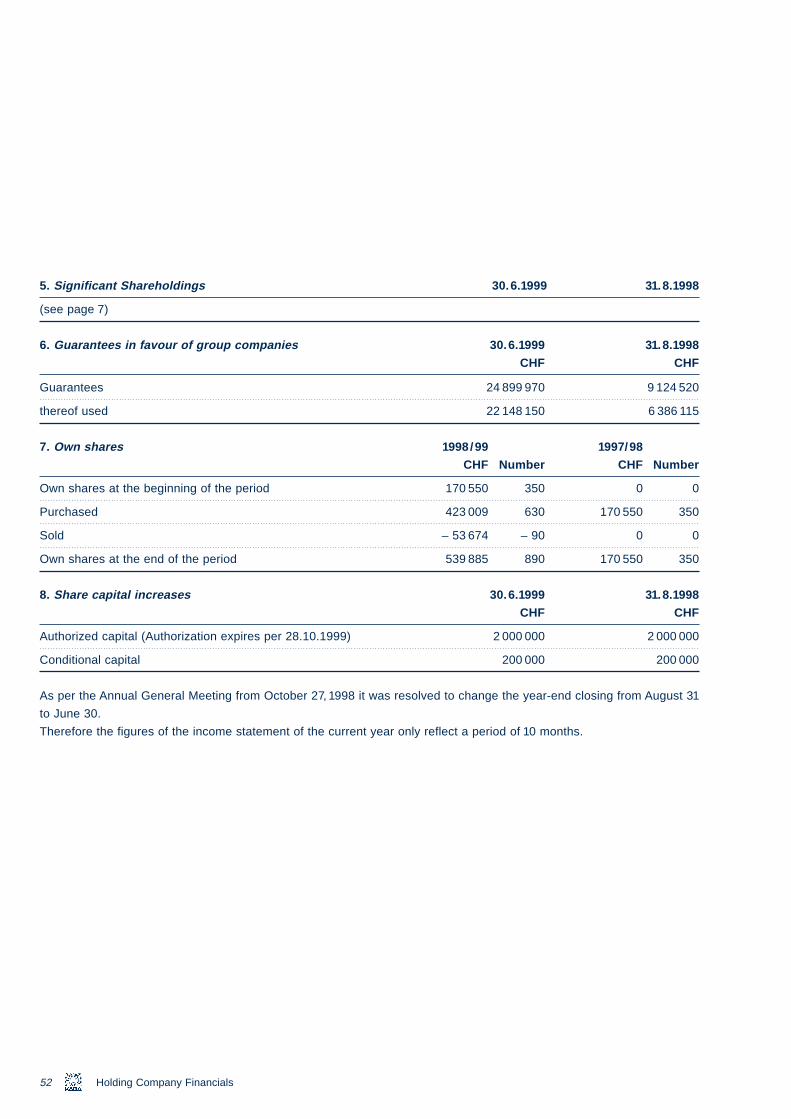
e_47
5. Significant Shareholdings 30.6.1999 31.8.1998
(see page 7)
6. Guarantees in favour of group companies 30.6.1999 31.8.1998
CHF CHF
Guarantees 24 899 970 9 124 520
thereof used 22 148 150 6 386 115
_53 17.09.1999 18:02 Uhr Seite 52
52 Holding Company Financials
7. Own shares 1998/99 1997/98
CHF Number CHF Number
Own shares at the beginning of the period 170 550 350 0 0
Purchased 423 009 630 170 550 350
Sold – 53 674 – 90 0 0
Own shares at the end of the period 539 885 890 170 550 350
8. Share capital increases 30.6.1999 31.8.1998
CHF CHF
Authorized capital (Authorization expires per 28.10.1999) 2 000 000 2 000 000
Conditional capital 200 000 200 000
As per the Annual General Meeting from October 27, 1998 it was resolved to change the year-end closing from August 31
to June 30.
Therefore the figures of the income statement of the current year only reflect a period of 10 months.
e_47_53 17.09.
R E P O R T O F T H E S T A T U T O R Y A U D I T O R S
T O T H E G E N E R A L M E E T I N G
O F K A B A H O L D I N G A G , R Ü M L A N G
As statutory auditors, we have audited the accounting records and the financial
statements (balance sheet, income statement and notes) of Kaba Holding AG for
the period from September 1, 1998 to June 30, 1999.
These financial statements are the responsibility of the board of directors. Our
responsibility is to express an opinion on these financial statements based on our
audit. We confirm that we meet the legal requirements concerning professional
qualification and independence.
Our audit was conducted in accordance with auditing standards promulgated by
the profession, which require that an audit be planned and performed to obtain
reasonable assurance about whether the financial statements are free from mate-
rial misstatement. We have examined on a test basis evidence supporting the
amounts and disclosures in the financial statements. We have also assessed the
accounting principles used, significant estimates made and the overall financial
statement presentation. We believe that our audit provides a reasonable basis for
our opinion.
In our opinion, the accounting records and financial statements and the pro-
posed appropriation of available earnings comply with the law and the company’s
1999 18:02 Uhr Seite 53
53Holding Company Financials
articles of incorporation.
We recommend that the financial statements submitted to you be approved.
PricewaterhouseCoopers AG
P. Binz St. Iten
Zurich, September 3, 1999
E
G
offset by income from investments, to
some extent of an extraordinary
nature, booked during the shorter
report year.
The dividend paid by the holding
company is based on consolidated
e_54
C O M M E N T S O N T H
O F K A B A H O L D I N
BALANCE SHEET
Investments rose by CHF 9.5 million:
The equity capital of Kaba Gege
GmbH of Herzogenburg (Austria) was
increased in view of its acquisition
of Czeiger Benzing GmbH of Vienna
(Austria). In conjunction with the
acquisition of Kaba Gilgen AG, Kaba
Holding AG transferred a result-
dependent backpayment.
Other financial assets as at June 30,
1999, include advance payments
in conjunction with the acquisition of
several companies in England (door
systems) effective July 1,1999.
Receivables from third parties
_58 17.09.1999 18:03 Uhr Seite 54
54
increased again because of with-
holding tax refund claims on
dividends paid by subsidiaries.
The liquidity (cash and cash equiv-
alents) of the holding company from
the prior year was invested in con-
junction with the takeover of the door
business in England.
Net income for the year further aug-
mented shareholders’ equity.
The good liquidity situation made it
possible to repay bank loans on
Holding Company Financials
E F I N A N C I A L S T A T
L T D
maturity (CHF 2 million). Concur-
rently, subsidiaries invested surplus
funds in the holding company,
resulting in a further rise of liabilities
to Group companies.
INCOME STATEMENT
(short period)
The 1998 General Meeting ratified
the rescheduling of the holding com-
pany’s account closing date from
August 31 to June 30. Accordingly,
the income statement only covers
the 10-month period from September
1998 to June 1999.
Financial income comprises income
from investments and interest earned.
Despite the shortened year, income
from investments advanced consider-
ably by CHF 4.1 million.
The item proceeds from services
reflects invoiced services rendered by
holding company personnel.
The extraordinary income from the
sale of long-term assets (property
on Nordstrasse) posted last year was
a non-recurring item and rental pay-
ments (contained in other operating
revenues last year) have ceased.
M E N T S
The items posted under operating
expenses apply to a 10-month period
as opposed to a 12-month period last
year.
Net income for the period under
review rose to CHF 12.9 million (pre-
vious year: CHF 9.2 million). The
elimination of the extraordinary gain
from the sale of assets as well as
the related extraordinary depreciation
posted last year were more than
net income. In view of the improved
Group result in financial 98/99 and
the sound business outlook, the
Board of Directors proposes that the
dividend be increased to CHF 12.50
(previous year: CHF 11.50) per regis-
tered share at CHF 40 par.
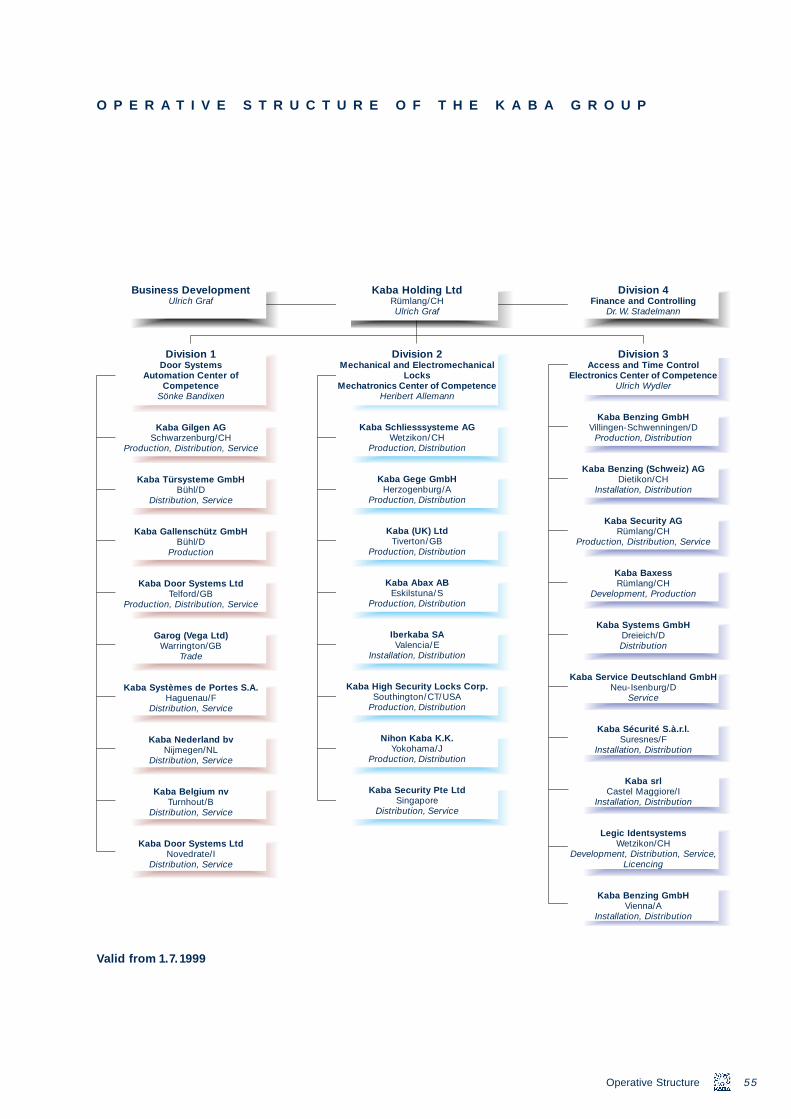
B
Tiverton/GBProduction, Distribution
e_54_58 17.09.1
O P E R A T I V E S T R U
Business DevelopmentUlrich Graf
Division 1Door Systems
Automation Center ofCompetence
Sönke Bandixen
Kaba Gilgen AGSchwarzenburg/CH
Production, Distribution, Service
Kaba Türsysteme GmbHBühl/D
Distribution, Service
Kaba Gallenschütz GmbHBühl/D
Production
999 18:03 Uhr Seite 55
Kaba Door Systems LtdTelford/GB
Production, Distribution, Service
Garog (Vega Ltd)Warrington/GB
Trade
Kaba Systèmes de Portes S.A.Haguenau/F
Distribution, Service
Kaba Nederland bvNijmegen/NL
Distribution, Service
Kaba Belgium nvTurnhout/B
Distribution, Service
Kaba Door Systems LtdNovedrate/I
Distribution, Service
Valid from 1.7.1999
C T U R E O F T H E K A
Kaba Holding LtdRümlang/CHUlrich Graf
Division 2Mechanical and Electromechanical
LocksMechatronics Center of Competence
Heribert Allemann
Kaba Schliesssysteme AGWetzikon/CH
Production, Distribution
Kaba Gege GmbHHerzogenburg/A
Production, Distribution
Kaba (UK) Ltd
Kaba Abax ABEskilstuna/S
Production, Distribution
Iberkaba SAValencia/E
Installation, Distribution
Kaba High Security Locks Corp.Southington/CT/USA
Production, Distribution
Nihon Kaba K.K.Yokohama/J
Production, Distribution
Kaba Security Pte LtdSingapore
Distribution, Service
A G R O U P
Division 4Finance and Controlling
Dr. W. Stadelmann
Division 3Access and Time Control
Electronics Center of CompetenceUlrich Wydler
Kaba Benzing GmbHVillingen-Schwenningen/D
Production, Distribution
Kaba Benzing (Schweiz) AGDietikon/CH
Installation, Distribution
Kaba Security AGRümlang/CH
Production, Distribution, Service
Kaba BaxessRümlang/CH
Development, Production
Kaba Systems GmbH
Operative Structure 55
Dreieich/DDistribution
Kaba Service Deutschland GmbHNeu-Isenburg/D
Service
Kaba Sécurité S.à.r.l.Suresnes/F
Installation, Distribution
Kaba srlCastel Maggiore/I
Installation, Distribution
Legic IdentsystemsWetzikon/CH
Development, Distribution, Service,Licencing
Kaba Benzing GmbHVienna/A
Installation, Distribution
e_54
_58 17.09.1999 18:03 Uhr Seite 56A D D R E S S E S K A B A
Bauer Bank- & SicherheitsanlagenGes.m.b.H.Lidmanskygasse 25/2A-9020 KlagenfurtTel. ++43 463 51 18 63Fax ++43 463 51 51 39GM: Peter Kappeler
Garog (Vega Ltd)Leacroft RoadBirchwoodGB-Warrington WA3 6GGTel. ++44 1925 825 225Fax ++44 1925 820 347GM: David Moore
Iberkaba SA
(As per September, 1999)
56
Cirilo Amoros 77E-46004 ValenciaTel. ++34 96 395 10 97Fax ++34 96 373 89 63GM: Francisco Benlloch
Kaba Abax ABFilargatan 12S-63105 EskilstunaTel. ++46 16 16 15 00Fax ++46 16 51 09 70www.kaba.seGM: Jan O. Ekman
Kaba BaxessHofwisenstrasse 24CH-8153 RümlangTel. ++411 818 93 11Fax ++411 818 93 93www.kaba.com/kbrGM: Mike Segmüller
Addresses
G R O U P
Kaba Belgium nvSlachthuisstraat 68B-2300 TurnhoutTel. ++32 14 401 838Fax ++32 14 401 836GM: Gerard H.A. Brandsen
Kaba Benzing GmbHAlbertistrasse 3D-78056 Villingen-SchwenningenTel. ++49 7720 603 0Fax ++49 7720 603 102www.kaba-benzing.comGM: Bertram Schmitz
Kaba Benzing GmbHDominikanerbastei 6
Kaba Holding AGHofwisenstrasse 248153 RümlangTel. ++411 818 90 11Fax ++411 818 90 [email protected]
A-1010 WienTel. ++43 1 512 79 920Fax ++43 1 512 79 925GM: Jörg Riedl
Kaba Benzing (Schweiz) AGLerzenstrasse 12CH-8953 DietikonTel. ++411 745 15 15Fax ++411 741 43 35www.benzing.chGM: Hanspeter Padrutt
Kaba Door Systems LtdDivisione Porte AutomaticheVia Cesare Cantu 70I-22060 Novedrate (CO)Tel. ++39 031 791 444Fax ++39 031 791 888GM: Filippo Giudice
Kaba Door Systems LtdHalesfield 4TelfordGB-Shropshire TF7 4APTel. ++44 1952 68 21 00Fax ++44 1952 68 21 01GM: Mike Farmer
Kaba Gallenschütz GmbHNikolaus-Otto-Strasse 1D-77815 BühlTel. ++49 7223 286 0Fax ++49 7223 286 111www.kaba-gallenschuetz.deGM: Jakob Gilgen
Kaba Gege GmbH
Wiener Strasse 41–43A-3130 HerzogenburgTel. ++43 2782 808 0Fax ++43 2782 808 505www.kgh.kaba.comGM: Hans WeissenböckKaba Gilgen AGFreiburgstrasse 34CH-3150 SchwarzenburgTel. ++41 31 734 41 11Fax ++41 31 734 43 79GM: Jakob Gilgen
Kaba High Security Locks Corp.Old Turnpike RoadP. O. Box 490Southington, CT 06489, USATel. ++1 860 621 36 01Fax ++1 860 621 97 27GM: Thomas DiVito
e_54_58 17.09.1999 18:03 Uhr Seite 57
Kaba Nederland bvTarweweg 9A / Postbus 6666NL-6503 GD NijmegenTel. ++31 24 352 33 33Fax ++31 24 354 02 11www.kaba.nlGM: Gerard H.A. Brandsen
Kaba Schliesssysteme AGMühlebühlstrasse 23CH-8620 WetzikonTel. ++411 931 61 11Fax ++411 931 63 85
www.ksw.kaba.comGM: Gerhard Wenger (Base Production Centre)GM: George Ulmschneider (Regional Sales and Service Centre Switzerland)Kaba Sécurité S.à.r.l.9,11 Rue PagèsF-92150 SuresnesTel. ++33 141 38 98 60Fax ++33 141 38 01 06GM: Laurent Nuq
Kaba Security AGHofwisenstrasse 24CH-8153 RümlangTel. ++411 818 91 11Fax ++411 818 91 91www.kaba.com/ksrGM: Marcel Zünd
Tel. ++44 1884 256 464
GM = General Manager
Kaba Security Pte Ltd(Malaysia Branch) (993575 D)No. 9 First FloorJalan USJ 10/1A,Taipan, Triangle,Subang Jaya47620 Petaling JayaSelangor Darul EhsanMalaysiaTel. ++60 3 736 06 11Fax ++60 3 736 06 33GM: Roland Teo Tok Chin
Kaba Security Pte LtdBlock 203A, Henderson Road#07-03, Henderson Industrial ParkSGP-159547 SingaporeTel. ++65 275 12 11Fax ++65 275 12 33www.kaba.com.sgGM: Roland Teo Tok Chin
Kaba Service Deutschland GmbHFrankfurter Strasse 151cD-63303 DreieichTel. ++49 6103 9907 200Fax ++49 6103 9907 290GM: Friedhelm Russy
Kaba srlVia B. Buozzi, 33I-40013 Castel Maggiore (BO)Tel ++39 051 417 8311Fax ++39 051 417 8333 GM: Dr. Angelo Vernocchi
Kaba Systèmes de Portes S.à.r.l.34, Rue CapitoB.P. 192F-67506 Haguenau CédexTel. ++33 3 8805 4160Fax ++33 3 8893 6325GM: Jean-Georges Schneider
Kaba Systems GmbHFrankfurter Strasse 151cD-63303 DreieichTel. ++49 6103 9907 0Fax ++49 6103 9907 299GM: Michael Hensel (Deputy GM: Dr. Reinhard Schramm)
Kaba Türsysteme GmbHNikolaus-Otto-Strasse 1D-77815 BühlTel. ++49 7223 9407 0Fax ++49 7223 9407 100www.kaba-tuersysteme.deGM: Jakob Gilgen
Kaba (UK) LtdLower Moor WayTiverton Business ParkGB-Tiverton, Devon EX16 6SS
57
Fax ++44 1884 234 415www.kaba.co.ukGM: Cameron M. McKay
Legic Identsystems Division of Kaba Schliesssysteme AGKastellstrasse 1CH-8623 WetzikonTel. ++411 933 64 64Fax ++411 933 64 65www.legic.comGM: Urs Oechslin
Nihon Kaba K.K.405B, German Industry Center1-18-2 Hakusan, Midori-kuYokohama 226-0006, JapanTel. ++81 45 931 8900Fax ++81 45 931 9100GM: Kaishiro Kato
Addresses

e_54_58 17.09.1999 18:03 Uhr Seite 58
Concept and RealizationPeter Bütikofer AG, Zürich
Technical ProductionNZZ Fretz AG, Schlieren
PhotographyArchives of Kaba CompaniesPortrait and Group picture by Felix Eidenbenz, Uster
This Annual Report isalso published in German.