Embed Size (px)
Citation preview

A n n u a l R e p o r t 2 0 1 1 - 2 0 1 2
AMD Industries Limited

OUR VISION
FINANCIAL INDICATORS FOR PAST 5 YEARS
To take on high growth track by establishing a strong and a supportive link in the total supply chain manegement of our associates.
QUALITY POLICY
We at AMD are committed to control and improve quality, cost and delivery performance through continual improvement of the quality management. We shall increase our market share year after year through improving customer satisfaction.
TOTAL INCOME 18269.84 14051 11822.06 9345.02 8253.19
PBDIT 2872.88 2537.6 2451.63 1972.48 1324.57
PBT 1036.88 769.28 1080.13 696.88 439.69
Provision for taxation
Current 330 180 285.43 178.34 126.79
Deferred 24.03 19.7 161.45 179.18 (11.73)
PAT 650.32 577.32 654.39 339.35 324.63
Cash Profit^ 1412.85 1300.26 1215.6 820.75 704.76
Fixed Assets
Gross Block including Capital WIP 12829.16 12741.94 12044.35 8960.78 9101.17
Net Block 8548.77 9186.14 9206.32 6663.11 7105.42
Equity Share Capital 1916.67 1916.67 1916.67 1916.67 1916.67
Reverses & Surplus 9671.55 9243.99 8890.91 8460.77 8345.66
Networth 11588.22 11160.66 10807.58 10377.45 10262.33
EPS (Rs.) (Annualized) 3.39 3.01 3.41 1.77 1.69
Cash EPS (Rs.) (Annualized) 7.37 6.78 6.34 4.28 3.68
Book Value per share (Rs) 60.46 58.23 56.39 54.14 53.54
^Net of Deferred Tax Liability
PARTICULARS
2012* 2011* 2010 2009 2008
YEAR ENDED 31ST MARCH
(RS. IN LACS)
Va
lue
(R
s.
in L
ac
s)
Total IncomeBook Value per share (Rs)
Book Value per share (Rs)
Va
lue
(R
s.
in L
ac
s)
Net Worth
0
5000
10000
15000
20000
2012 2011 2010 2009 2008
Sales
Profit
0
2000
4000
6000
8000
10000
12000
14000
16000
18000
20000
2012 2011 2010 2009 2008
Year
0
2000
4000
6000
8000
10000
12000
14000
2012 2011 2010 2009 2008
Year
50.00
52.00
54.00
56.00
58.00
60.00
62.00
2012 2011 2010 2009 2008
*Figures of 2011 & 2012 are as per revised Schedule VI of Companies Act, 1956

AMD Industries Limited
CORPORATE INFORMATION
BOARD OF DIRECTORS
Mr. H.S. Gupta
Chairman
Mr. Ashok Gupta
Managing Director
Mr. Adit Gupta
Joint Managing Director
Mr. Mahipal Ahluwalia
Independent Director
Mr. Seshadri Ratnam
Independent Director
Mr. Prabhat KrishnaIndependent Director
COMPANY SECRETARY & COMPLIANCE OFFICER
Mr. Joylin Jain
REGISTERED OFFICE
18, Pusa Road, 1st Floor, Karol Bagh, New Delhi-110 005 Tel.: 91-11-46830202Fax : 91-11-28753591 Email : [email protected] Url : www.amdindustries.com
MANUFACTURING UNITS
1) C-4&C-5, Site 3, Meerut Road, Indl. Area, Ghaziabad, Uttar Pradesh
2) SP-32, RIICO Ind. Area, Neemrana,Rajasthan
SUBSIDIARY COMPANIES
1) AMD Estates & Developers Pvt. Ltd.
2) Prime Techno Build Pvt. Ltd.
CONTENTS
AMD Industries Limited Page No.
Directors’ Report 1
Report on Corporate Governance 4
Auditors’ Certificate on Corporate Governance 9
Secretarial Audit Report 9
Auditors’ Report 10
Balance Sheet 12
Profit & Loss Account 13
Cash Flow Statement 33
AMD Industries Limited (Consolidated)
Auditors’ Report 36
Balance Sheet 37
Profit & Loss Account 38
Cash Flow Statement 58
Proxy Form
Notice Attached in Loose Leaf Form
BANKERS
1) State Bank of India
2) Punjab National Bank
3) Union Bank of India
4) Kotak Mahindra Bank
5) Central Bank of India
STATUTORY AUDITORS
Suresh & Associates,
Chartered Accountants,
3A, Bigjos Tower, Netaji Subhash Place,
Pitam Pura, Delhi - 110 034
INTERNAL AUDITORS
B.L. Khandelwal & Co.
Chartered Accountants
1, Doctor’s Lane, Gole Market
New Delhi-110 001
LEGAL COUNSELS
Mr. Dinesh Kumar Gupta, Advocate
C-58, Vivek Vihar, Phase - I
New Delhi - 110095
SECRETARIAL AUDITORS
M/s AGG & Associates
Company Secretaries
21/16, 2nd Floor, West Patel Nagar
New Delhi - 110008
REGISTRAR & SHARE TRANSFER AGENTS
Bighshare Services Pvt. Ltd.
E-2/3, Ansa Industrial Estate,
Saki Vihar Road, Saki Naka, Mumbai - 400 072
Tel. : +91-22-28470652 Fax: +91-22-28525207

Dear Shareholders,
thYour Directors are pleased to present the 29 Annual Report together with staudited accounts for the financial year ended 31 March 2012.
Financial Results
stThe financial performance of the Company for the financial year ended 31 March, 2012 is summarized below:
(Rs. In Lacs)
Particulars Financial Year Financial Year2011-12 2010-11*
Net Sales/Income from Operation (net of excise duty) 17643.14 13,396.89
Other Operating Income 557.63 4,14.52
Other Income 69.07 239.60
Total 18269.84 14051.01
Profit form operations before Financial Costs, Depreciation, Exceptional Items & Tax Expenses 3114.31 2537.72
Financial Costs 1073.46 1048.24
Profit before Depreciation, Exceptional Item & Taxation 2040.85 1489.48
Depreciation 762.53 720.08
Profit before Exceptional Items and Tax Expenses 1278.32 769.40
Exceptional Items 241.43 0.12
Profit before Tax 1036.89 769.28
Less: Tax Expenses 386.57 191.96
Net Profit for the year / Amount available for Appropriation 650.32 577.32
Appropriations:
General Reserve Nil 20.00
Dividend on Equity Shares 191.67 191.67
Tax on Dividend 31.09 32.57
Balance Carried to Balance Sheet 427.56 333.08
TOTAL 650.32 577.32
*Consequent to the notification of Revised Schedule VI of the Companies stAct, 1956, the Financial Statements for the year ended 31 March, 2012 have
been prepared as per the Revised Schedule VI. Accordingly, the previous year figures have also been reclassified to confirm to this year classification and regrouped wherever necessary.
OPERATIONS REVIEW
Packaging Business:
During the year under review your Company registered a total turnover and other income of Rs. 18269.84 Lacs as compared to previous year’s turnover and other income of Rs. 14051.01 Lacs an increase of 30.03% over the previous year. The Company registered a Profit before Financial Costs, Depreciation & Taxation of Rs. 2872.88 Lacs (excluding income from exceptional items) as compared to Rs. 2537.60 Lacs (excluding income from exceptional items) recording a growth of 13.21%, whereas Net Profit at Rs. 650..32 Lacs as compared to Rs. 577.32 Lacs the previous year, which shows an increase 12.64%. The top line growth was possible due to the business growth in the beverage industry as a whole. However, despite of stiff competitions and financials costs, the company has registered an increase in the profit margins. The growth in the beverage industry is expected to maintain this year with contributory benefits accruing to the packaging business of the Company like previous year.
Textile Business:
The market scenario for the textile industry in the country as a whole remained continuously discouraging. The Company remained on the same policy of putting on hold the Textile project.
Real Estate Business:
The real estate market of the country has started picking up. Development of Commercial Complex at the land of Company’s subsidiary AMD Estates & Developers Private Limited situated at Sector-114, Gurgaon, Haryana has been started in which Company also holds interest. The said development is being carried out by VSR Infratech Private Limited, New Delhi with which AMD Estate & Developers had entered into a Collaboration Agreement for the said development. In coming years this project will also contribute towards revenue.
DIRECTORS’ REPORT
DIVIDEND
Your Directors are pleased to recommend a dividend of Re. 1/- (One) per equity share of face value of Rs. 10/- each for the financial year 2011-12. The dividend, if approved and declared at the ensuing Annual General Meeting will be paid to those shareholders whose name shall appear on the register of members of the Company as on the date of Book Closure to be notified.
FIXED DEPOSITS
During the financial year 2011-12, your Company has not invited or accepted any deposits from the public within the meaning of provisions of Section 58A of the Companies Act, 1956.
MANAGEMENT DISCUSSION AND ANALYSIS
Your Company has put in efforts and strengthened its place in terms of Country’s share for providing packaging range to the soft drinks and other beverages industry. Company’s plants at both the places, i.e. at Ghaziabad, Uttar Pradesh and Neemrana, Rajasthan, are in operations.
Your Company continued catering to the packaging needs of Beverages Industry of the country by way of supplying packaging for carbonated soft drinks (CSD), mineral waters, beer etc. Major chunk of Company’s supply remained to beverages Industry which is growing at about 18% per annum and alcoholic beverages industry mainly beer which is growing at a rate of about 10% per annum. The Company is looking to new market segments such as fruit juices, milk products, edible oil etc. and other cosmetics items which is slowly moving to packaging items remained the same and your Company is capable of manufacturing of those packaging. Your Company therefore, expects development of new market segments in the years to come and making continuous efforts in that direction.
Due to adverse market scenario of Textile Industry in India, the project undertaken by the Company for setting up of integrated Textile Unit at Distt. Haridwar, Uttarakhand has continued to be kept on hold for the time being.
The real estate sector has been picking its’ growth for some time now. The development of commercial complex at the land of Company’s subsidiary AMD Estates & Developers Private Limited situated at Sector 114, Gurgaon, Haryana for which the said subsidiary had entered into a collaboration agreement with VSR Infratech Private Limited, has been started in which Company holds interest. In coming year this will also contribute towards the Company’s revenue.
INDUSTRY SECTORS
PACKAGING
The packaging industry supplying packing solutions to beverages industry are mainly divided into two formats viz., PET Bottles and Glass Bottles.
PET Bottles are also divided into two segments such as Plastic Closures and PET Preforms. Plastic Closures are mainly used in CSD PET Bottles for beverages, mineral water and juices. The requirements of closures with respect to design and quality depend upon the need of the end-user. PET Bottles required by the Beverages Industry are being manufactured & supplied by the Packaging Industry in Preform shapes and being blown-up at the time of filling beverages. Various other end-users have also started using plastic bottles as packaging medium. The usage of PET Bottles shows an increasing trend in products like edible oil, personal care products, pharmaceuticals and confectioneries. The usage of PET Bottles in Alcoholic Beverages Industry is also on the rise.
Glass bottles used as a packaging item requires crown caps as closure. Your Company manufactures Crown Caps which are mainly used as metallic closures for various edible items packed in glass bottles e.g. Carbonated Soft Drinks, Beer, Juices, Sauces, Ready-to-drink Milk products etc.
REAL ESTATE
The Real Estate market is mainly divided into two zone one is the residential and the other is commercial. Your company possesses interest in Commercial land.
OUTLOOK
PACKAGING
The Overall Beverage Packaging Industry is growing at over 12% per annum. The continued trend of shifting customer base from glass bottles to PET Bottles is being seen in a positive note.
Segment Wise/ Product Wise Review
CROWNS CAPS
The use of glass bottles has been seen steady or little bit de-growth whereby the use of Returnable Glass Bottle (RCB) has been seen in reducing trends. Due to which crown market has been recording a sharp negative growth as a packaging item. In order to offset this, your Company is making vigorous efforts to explore the export market. This has recorded in the export sales increase from Rs. 18.50
AMD Industries Limited
29th Annual Report 2011-20121
Crores (in previous year) to Rs. 34.94 Crores in the year. Efforts are being continued to increase the share of exports further.
However, AMD remained one of the dominant players in the crown caps market having approx. 15% market share during the year under review.
PLASTIC CLOSURES
The plastic closure market has been continuously getting its momentum due to increased usage of PET Bottles. The organized market is still dominated by the CSD but it is expected that other usage will also form significant share of the over all market. The demand of plastic closures will increase in segments where PET Bottles are gaining foothold as packaging media like water, juices, edible oil etc.
PET PREFORMS
With the expansion of putting up of one line of Preform at works at Neemrana, Rajasthan the Company’s market share in PET preform market has also
thincreased and after its successful start, the Company has planned to install 6 PET Preform line at its same works and expect to install the same by the end of October, 2012. It will further increase the productions capacity of the Company. The packaging Industry in PET segment has been growing by over 15-20%.
Risk and Concerns
PACKAGING
Increase in raw material cost and pressure on margins have a bearing on the profitability of packaging industry in totality. The Company is likely to be affected by change in governmental policies related to usage of end products.
However, the Company has established itself as quality supplier to its clients and is accepted as reliable player in the industry thereby not only retaining its base but increasing it as well.
Adequacy of Internal Control Systems
The Company has adequate internal control system commensurate with the size of the company. The Company has appointed M/s B.L. Khandelwal & Co., Chartered Accountants, as the Internal Auditor of the Company to carry out the internal audit of the activities of all the divisions of the Company at regular intervals. Their audit reports along with action taken reports thereon are reviewed by the Audit Committee of Directors.
Material Development in Terms of Human Resources
Human Resources are considered to be a form of capital and wealth of the Company. It has been the focus of the management to improve and expand the contribution of its human resources towards attainment of organizational goals and values. The growth of the Company and improvement in the systems has been sustained by the active involvement of the employees with the Management. The technical expertise of the Management has been shared with the employees at the works, which keeps them motivated to meet and surpass the set targets.
Cautionary Statement
Statement in the Management Discussion & Analysis, describing the Company’s objectives, projections and estimates are forward looking statements and progressive within the meaning of applicable laws and regulations.
Actual results may vary from those expressed or implied, depending upon the economic conditions, Government policies and other incidental factors.
DIRECTORS
Mr. Prabhat Krishna, Independent Director of the Company retires by rotation and being eligible offers himself for re-appointment at the ensuing Annual General Meeting.
Mr. M.P. Ahluwalia, Independent Director of the Company retires by rotation and being eligible offers himself for re-appointment at the ensuing Annual General Meeting.
DIRECTORS’ RESPONSIBILITY STATEMENT
Pursuant to the requirement under Section 217 (2AA) of the Companies Act, 1956, with respect to Directors Responsibility Statement, it is hereby confirmed:
A. that in the preparation of Annual Accounts for the financial year 2011-12, the applicable Accounting Standards have been followed along with proper explanations relating to material departures, if any,;
B. that the directors have selected such accounting policies and applied them consistently and made judgments & estimates that are reasonable and prudent so as to give a true and fair view of the state of affairs of the
stCompany as at 31 March, 2012 and of the profit or loss of the Company for that period;
C. that the directors had taken proper & sufficient care for the maintenance of adequate accounting records in accordance with the provisions of The Companies Act, 1956, for safeguarding the assets of the Company and for preventing & detecting the fraud and other irregularities;
D. that the directors had prepared the Annual Accounts for the financial year 2011-12 on a “going concern basis”.
CORPORATE GOVERNANCE REPORT
Your Company reaffirms its commitment to the good corporate governance practices. A detailed report on the Corporate Governance as required pursuant to Clause 49 of the Listing Agreement forms part of the Annual Report. Certificate from the Auditors of the Company, confirming compliance of conditions of Corporate Governance as stipulated under the Clause 49, is annexed to this Report.
AUDITORS
The Statutory Auditors of the Company M/s. Suresh & Associates, Chartered Accountants, New Delhi retire at the ensuing Annual General Meeting and have confirmed their eligibility and willingness to accept office of Statutory Auditors of the Company, if reappointed. The Audit Committee and the Board of Directors recommend to the shareholders for their approval the appointment of M/s. Suresh & Associates, Chartered Accountants, as the Statutory Auditors of the Company for the financial year 2012-13.
SUBSIDIARY COMPANIES:
The Ministry of Company Affairs, Government of India vide its Circular No. th5/12/2007-CL-III dated 8 February, 2011 has granted general exemption under
Section 212(8) of the Companies Act, 1956, from attaching the balance sheet, profit and loss account and other documents of the subsidiary companies to the balance sheet of the Company subject to the fulfillment of certain conditions by the Company. Further as required under the said Circular, the Company undertakes that the annual accounts of its subsidiary companies and the related detailed information shall be made available to the shareholders of the holding and subsidiary companies seeking such information at any point of time. The annual accounts of the subsidiary companies shall also be kept for inspection by any shareholders in the Head Office of the Company at Delhi and of subsidiary companies concerned.
As required in the above said Circular and the current listing norms, Consolidated Financial Statements of the Company and its subsidiaries are being published in the current year’s Annual Report.
ENERGY CONSERVATION, TECHNOLOGY ABSORPTION & FOREIGN EXCHANGE
A. Conservation of Energy
Energy conservation, wherever possible, is being implemented. However, continuous efforts to conserve and optimize the use of energy through improved operational methods and other means have always been the endeavour of the Company to implement.
B. Technology Absorption
The Company believes that technological obsolescence is practical reality. Our research and development activities will help us gear for future opportunities. We invest and encourage continuous innovation.
C. Foreign Exchange Earning & Outgo
Company has been continuously making efforts to increase its export. During the year under consideration, the Company has used Foreign Exchange equivalent to Rs. 4876.93 Lacs (previous year Rs 3692.21 Lacs) and earned Foreign Exchange equivalent to Rs. 3494.40 Lacs (previous year Rs. 1873.25 Lacs).
PARTICULARS OF EMPLOYEES
A list of the employees of the Company who were in receipt of the such remuneration during the financial year 2011-12 which requires to be disclosed in this report under Section 217 (2A) of the Companies Act, 1956 read with Companies (Particulars of Employees) Rules, 1975 as amended upto date is annexed herewith as Annexure-I.
ACKNOWLEDGEMENT
Your Directors take this opportunity to express their sincere appreciation of the cooperation and support extended by the Shareholders, Bankers, Financial Institutions, Government Departments, Regulatory Bodies, Customers and other Business Constituents during the year under review.
Your Directors wish to place on record their appreciation for the committed services of the executives, staff and workers of the Company.
On behalf of the Board of Directors
Place: New Delhi Harswarup GuptardDate: 23 May, 2012 (Chairman)
AMD Industries Limited
29th Annual Report 2011-2012 2

AMD Industries Limited
REPORT ON CORPORATE GOVERNANCE
Pursuant to Clause 49 of the Listing Agreement, Report on Corporate Governance is attached and forms part of the Directors Report.
1. Company's Philosophy on Code of Corporate Governance
Corporate Governance is an integral part of values, ethics and best business practices followed by the Company. It envisages attainment of highest levels of transparency, accountability and equity in all facets of its operations and in all its interactions with its stakeholders, including shareholders, employees, lenders and the Government. The core values of the Company are:
Ø Commitment to excellence and customer satisfaction.
Ø Maximizing long term shareholders worth.
Ø Socially valued enterprise and
Ø Caring for people and environment.
2. Board of Directors
The Board of Directors of the Company comprised of six Directors out of which there are three Promoter Directors and three Independent Directors. Composition of the Board and category of Directors are as follows:
I Composition of the Board
S.No. Name of Director Designation Category
1. Mr. Harswarup Gupta Chairman Executive Director
2. Mr. Ashok Gupta Managing Director Executive Director
3. Mr. Adit Gupta Wholetime Director Executive Director
4. Mr. Mahipal Ahluwalia Independent Director Non-Executive Director
5. Mr. Seshadri Ratnam Independent Director Non-Executive Director
6. Mr. Prabhat Krishna Independent Director Non-Executive Director
II Attendance of Directors at Board Meetings, last Annual General Meeting and number of other Directorships and Chairmanships/Memberships of Committees of each Director in various companies.
Name of Director Attendance of meetings Number of other Number ofduring 2011-12 Directorships in other Memberships/ Chairmanships
Public Companies as on 31.3.2012 of Committees of other Companies
Board Meetings Last AGM No
Mr. Harswarup Gupta 2 No 1 Nil
Mr. Ashok Gupta 3 Yes 1 Nil
Mr. Adit Gupta 2 Yes 1 Nil
Mr. Mahipal Ahluwalia 4 Yes 0 Nil
Mr. Seshadri Ratnam 3 No 0 Nil
Mr. Prabhat Krishna 4 Yes 1 01
III Details of the meetings of the Board of Directors of the Company held during 2011-12.
S.No. Date of Board Meeting Total Strength of Board No. of Directors Present at the Meeting
1. 27-05-2011 6 5
2. 02-08-2011 6 5
3. 02-11-2011 6 4
4. 31-01-2012 6 4
IV. Code of Conduct
The “Code of Conduct” is already circulated and posted on the Company's website. The persons concerned have given their declarations for compliance with the code for the financial year ended 31st March, 2012.
3. Audit Committee
Pursuant to terms of reference as prescribed under Clause 49 and Section 292A of the Companies Act, 1956, the Audit Committee of the Company has been duly constituted. The terms of reference, inter alia, include the Company's financial reporting process, disclosures of all the information to ensure that the financial statements are correct, sufficient and credible, reviewing annual and quarterly statement before submission to the Board and reviewing the adequacy of internal control systems with the management, the external and the internal Auditor.
The Audit committee reviews with management and also with the statutory and internal auditors, all aspects of the financial results, effectiveness of internal audit / processes, taxation matters and other key areas. The audit committee also recommends the appointments and remuneration of the internal auditors and statutory auditors to the Board considering independence and effectiveness.
I. Composition of Audit Committee
S.No. Name of Member Designation in Committee Designation in Company
1. Mr. S. Ratnam Chairman Independent director
2. Mr. Mahipal Ahluwalia Member Independent director
3. Mr. Adit Gupta Member Whole time Director
4. Mr. Prabhat Krishna Member Independent Director
AMD Industries LimitedP
art
icu
lars
of
Em
plo
yees p
urs
uan
t to
Secti
on
217(2
A)
of
the C
om
pan
ies A
ct,
1956 r
ead
wit
h C
om
pan
ies (
Part
icu
lars
of
Em
plo
yees)
Ru
les, 1975,
AE
mp
loyed
th
rou
gh
ou
t th
e y
ear
an
d in
rece
ipt
of
rem
un
era
tio
n a
gg
reg
ati
ng
Rs. 60,0
0,0
00/-
or
mo
re p
er
an
nu
m f
or
F. Y
. 2011-2
012.
Nam
e
Desig
nati
on
Qu
alifi
cati
on
sR
em
un
era
tio
nE
xp
eri
en
ce
Date
of
Ag
eL
ast
Em
plo
ym
en
t h
eld
(R
s.)
(Years
)A
pp
oin
tmen
t (Y
ears
)(E
mp
loyer/
Desig
nati
on
)
1.
Sh. A
shok
Gupta
Man
agin
g D
irect
or
B.S
c. (
Hons.
)1,0
0,4
4,9
88.0
034
17-1
2-1
983
59
Ow
n b
usi
ness
2.
Sh. H
ars
waru
p G
upta
Exe
cutiv
e C
hairm
an
Gra
duate
100,4
5,1
56.0
051
17-1
2-1
983
83
Ow
n b
usi
ness
3.
Sh. A
dit
Gupta
Wh
ole
tim
e D
irect
or
B.S
c.(C
hem
ical E
ngg.)
100,3
9,6
00.0
013
14-1
1-2
005
33
N.A
.
& M
BA
(F
inance
)
BE
mp
loyed
fo
r th
e p
art
of
the y
ear
an
d in
re
ceip
t o
f re
mu
nera
tio
n a
gg
reg
ati
ng
Rs. 5,0
0,0
00/-
or
mo
re p
er
mo
nth
.
Nam
e
Desig
nati
on
Qu
alifi
cati
on
sR
em
un
era
tio
nE
xp
eri
en
ce
Date
of
Ag
eL
ast
Em
plo
ym
en
t h
eld
(R
s.)
(Years
)A
pp
oin
tmen
t (Y
ears
)(E
mp
loyer/
Desig
nati
on
)
N
.A.
No
tes
1.
Sh. H
.S. G
upta
, S
hri A
shok
Gupta
and S
h. A
dit
Gupta
are
rela
ted to e
ach
oth
er.
2.
None o
f th
e E
mplo
yees
exc
ept S
h. H
ars
waru
p G
upta
, S
h. A
shok
Gupta
, and S
h. A
dit
Gupta
hold
s m
ore
than 2
% e
quity
Share
s of th
e C
om
pany.
3.
Rem
unera
tion in
cludes
sala
ry, allo
wance
, co
mm
issi
on a
nd m
oneta
ry v
alu
e o
f all
perq
uis
ites
as
valu
ed u
nder
Inco
me T
ax
Rule
s, 1
962.
4.
Natu
re o
f E
mplo
yment in
all
case
s is
on c
ontr
act
ual b
asi
s exc
ept in
case
of D
irect
ors
, w
hose
term
s have
been a
ppro
ved b
y th
e S
hare
hold
ers
.
5.
All
the e
mplo
yees
have
adequate
exp
erience
to d
isch
arg
e the r
esp
onsi
bili
ties
ass
igned to them
and their d
esi
gnatio
ns
are
indic
ativ
e o
f th
eir n
atu
re o
f dutie
s.
For
and o
n b
ehalf
of th
e B
oard
Hars
waru
p G
upta
Chairm
an
29th Annual Report 2011-20123 29th Annual Report 2011-2012 4

AMD Industries Limited
REPORT ON CORPORATE GOVERNANCE
Pursuant to Clause 49 of the Listing Agreement, Report on Corporate Governance is attached and forms part of the Directors Report.
1. Company's Philosophy on Code of Corporate Governance
Corporate Governance is an integral part of values, ethics and best business practices followed by the Company. It envisages attainment of highest levels of transparency, accountability and equity in all facets of its operations and in all its interactions with its stakeholders, including shareholders, employees, lenders and the Government. The core values of the Company are:
Ø Commitment to excellence and customer satisfaction.
Ø Maximizing long term shareholders worth.
Ø Socially valued enterprise and
Ø Caring for people and environment.
2. Board of Directors
The Board of Directors of the Company comprised of six Directors out of which there are three Promoter Directors and three Independent Directors. Composition of the Board and category of Directors are as follows:
I Composition of the Board
S.No. Name of Director Designation Category
1. Mr. Harswarup Gupta Chairman Executive Director
2. Mr. Ashok Gupta Managing Director Executive Director
3. Mr. Adit Gupta Wholetime Director Executive Director
4. Mr. Mahipal Ahluwalia Independent Director Non-Executive Director
5. Mr. Seshadri Ratnam Independent Director Non-Executive Director
6. Mr. Prabhat Krishna Independent Director Non-Executive Director
II Attendance of Directors at Board Meetings, last Annual General Meeting and number of other Directorships and Chairmanships/Memberships of Committees of each Director in various companies.
Name of Director Attendance of meetings Number of other Number ofduring 2011-12 Directorships in other Memberships/ Chairmanships
Public Companies as on 31.3.2012 of Committees of other Companies
Board Meetings Last AGM No
Mr. Harswarup Gupta 2 No 1 Nil
Mr. Ashok Gupta 3 Yes 1 Nil
Mr. Adit Gupta 2 Yes 1 Nil
Mr. Mahipal Ahluwalia 4 Yes 0 Nil
Mr. Seshadri Ratnam 3 No 0 Nil
Mr. Prabhat Krishna 4 Yes 1 01
III Details of the meetings of the Board of Directors of the Company held during 2011-12.
S.No. Date of Board Meeting Total Strength of Board No. of Directors Present at the Meeting
1. 27-05-2011 6 5
2. 02-08-2011 6 5
3. 02-11-2011 6 4
4. 31-01-2012 6 4
IV. Code of Conduct
The “Code of Conduct” is already circulated and posted on the Company's website. The persons concerned have given their declarations for compliance with the code for the financial year ended 31st March, 2012.
3. Audit Committee
Pursuant to terms of reference as prescribed under Clause 49 and Section 292A of the Companies Act, 1956, the Audit Committee of the Company has been duly constituted. The terms of reference, inter alia, include the Company's financial reporting process, disclosures of all the information to ensure that the financial statements are correct, sufficient and credible, reviewing annual and quarterly statement before submission to the Board and reviewing the adequacy of internal control systems with the management, the external and the internal Auditor.
The Audit committee reviews with management and also with the statutory and internal auditors, all aspects of the financial results, effectiveness of internal audit / processes, taxation matters and other key areas. The audit committee also recommends the appointments and remuneration of the internal auditors and statutory auditors to the Board considering independence and effectiveness.
I. Composition of Audit Committee
S.No. Name of Member Designation in Committee Designation in Company
1. Mr. S. Ratnam Chairman Independent director
2. Mr. Mahipal Ahluwalia Member Independent director
3. Mr. Adit Gupta Member Whole time Director
4. Mr. Prabhat Krishna Member Independent Director
AMD Industries Limited
Part
icu
lars
of
Em
plo
yees p
urs
uan
t to
Secti
on
217(2
A)
of
the C
om
pan
ies A
ct,
1956 r
ead
wit
h C
om
pan
ies (
Part
icu
lars
of
Em
plo
yees)
Ru
les, 1975,
AE
mp
loyed
th
rou
gh
ou
t th
e y
ear
an
d in
rece
ipt
of
rem
un
era
tio
n a
gg
reg
ati
ng
Rs. 60,0
0,0
00/-
or
mo
re p
er
an
nu
m f
or
F. Y
. 2011-2
012.
Nam
e
Desig
nati
on
Qu
alifi
cati
on
sR
em
un
era
tio
nE
xp
eri
en
ce
Date
of
Ag
eL
ast
Em
plo
ym
en
t h
eld
(R
s.)
(Years
)A
pp
oin
tmen
t (Y
ears
)(E
mp
loyer/
Desig
nati
on
)
1.
Sh. A
shok
Gupta
Man
agin
g D
irect
or
B.S
c. (
Hons.
)1,0
0,4
4,9
88.0
034
17-1
2-1
983
59
Ow
n b
usi
ness
2.
Sh. H
ars
waru
p G
upta
Exe
cutiv
e C
hairm
an
Gra
duate
100,4
5,1
56.0
051
17-1
2-1
983
83
Ow
n b
usi
ness
3.
Sh. A
dit
Gupta
Wh
ole
tim
e D
irect
or
B.S
c.(C
hem
ical E
ngg.)
100,3
9,6
00.0
013
14-1
1-2
005
33
N.A
.
& M
BA
(F
inance
)
BE
mp
loyed
fo
r th
e p
art
of
the y
ear
an
d in
re
ceip
t o
f re
mu
nera
tio
n a
gg
reg
ati
ng
Rs. 5,0
0,0
00/-
or
mo
re p
er
mo
nth
.
Nam
e
Desig
nati
on
Qu
alifi
cati
on
sR
em
un
era
tio
nE
xp
eri
en
ce
Date
of
Ag
eL
ast
Em
plo
ym
en
t h
eld
(R
s.)
(Years
)A
pp
oin
tmen
t (Y
ears
)(E
mp
loyer/
Desig
nati
on
)
N
.A.
No
tes
1.
Sh. H
.S. G
upta
, S
hri A
shok
Gupta
and S
h. A
dit
Gupta
are
rela
ted to e
ach
oth
er.
2.
None o
f th
e E
mplo
yees
exc
ept S
h. H
ars
waru
p G
upta
, S
h. A
shok
Gupta
, and S
h. A
dit
Gupta
hold
s m
ore
than 2
% e
quity
Share
s of th
e C
om
pany.
3.
Rem
unera
tion in
cludes
sala
ry, allo
wance
, co
mm
issi
on a
nd m
oneta
ry v
alu
e o
f all
perq
uis
ites
as
valu
ed u
nder
Inco
me T
ax
Rule
s, 1
962.
4.
Natu
re o
f E
mplo
yment in
all
case
s is
on c
ontr
act
ual b
asi
s exc
ept in
case
of D
irect
ors
, w
hose
term
s have
been a
ppro
ved b
y th
e S
hare
hold
ers
.
5.
All
the e
mplo
yees
have
adequate
exp
erience
to d
isch
arg
e the r
esp
onsi
bili
ties
ass
igned to them
and their d
esi
gnatio
ns
are
indic
ativ
e o
f th
eir n
atu
re o
f dutie
s.
For
and o
n b
ehalf
of th
e B
oard
Hars
waru
p G
upta
Chairm
an
29th Annual Report 2011-20123 29th Annual Report 2011-2012 4
AMD Industries Limited
7. General Body Meetings
I. Details of last three Annual General Meetings
Date of Meeting Place Time Details of Special Resolution Passed therein
23-09-2009 Daffodils Hotels, Tania Farms Complex, 10.30 AM 1. Re-appointment of Mr. Ashok Gupta, Managing Director Chatterpur Mandir Road, Satbari Village, of the Company for a further period of 3 years
New Delhi- 30 2. Re-appointment of Mr. Harswarup Gupta, Executive Chairman of the Company for a further period of 3 years
3. Re-appointment of Mr. Adit Gupta as Whole Time Director of the Company for a further period of 3 years
4. Appointment of Ms. Vidhi Gupta as Manager – Business Development u/s 314(1) of the Act.
24-09-2010 Daffodils Hotels, Tania Farms Complex, 10.30 AM Nil Chatterpur Mandir Road, Satbari Village, New Delhi- 30
23-09-2011 Daffodils Hotels, Tania Farms Complex, 10.30 AM 1. Re-appointment of Mr. Ashok Gupta, Managing Director
Chatterpur Mandir Road, Satbari Village, of the Company for a further period of 3 years
New Delhi- 30 2. Re-appointment of Mr. Harswarup Gupta, Executive Chairman of the Company for a further period of 3 years
3. Re-appointment of Mr. Adit Gupta as Whole Time Director of the Company for a further period of 3 years
4. Revision in remuneration of Ms. Vidhi Gupta, Manager- Business Development
5. Appointment of Ms. Mamta Gupta as Manager – Business Development u/s 314(1) of the Act.
II. Postal Ballot
The Company did not pass any special resolution through postal ballot in the financial year 2011-12.
8. Disclosures
a. Related party transactions have been suitably disclosed in the Notes to the Accounts in compliance to Accounting Standards issued by the Institute of Chartered Accountants of India. However, there are no materially significant related party transactions which have potential conflict with the interests of the Company at large.
b. During the last three financial years there was no penalty, restrictions of any kind and of any nature, has been imposed by the SEBI, Stock Exchange or any other Statutory Body relating to Capital Market.
c. Whistle Blower Policy: However, there is no specific Whistle Blower Policy laid down in the organization, but the Management always encourages the Employees of the Company, to detect any actual or suspected fraud, unethical behavior, and be notified the same to the management for its suitable resolution/rectification. There was no incidence highlighted during the financial year 2011-12 within the framework of such encouragement.
d. Following are the Details of Compliance of Mandatory and Non Mandatory Requirements of Corporate Governance:
I. Mandatory Requirement
The Company is fully compliant with the applicable mandatory requirements of the revised Clause 49 which are listed below:
Particulars Clause of Compliance Listing agreement StatusYes/No
I. Board of Directors 49 I
(A) Composition of Board 49(IA) Yes
(B) Non-executive Directors' compensation & disclosures 49 (IB) Yes
(C) Other provisions as to Board and Committees 49 (IC) Yes
(D) Code of Conduct 49 (ID) Yes
II. Audit Committee 49 (II)
(A) Qualified & Independent Audit Committee 49 (IIA)* Yes
(B) Meeting of Audit Committee 49 (IIB) Yes
(C) Powers of Audit Committee 49 (IIC) Yes
(D) Role of Audit Committee 49 II(D) Yes
(E) Review of Information by Audit Committee 49 (IIE) Yes
III. Subsidiary Companies 49 (III) Yes
IV. Disclosures 49 (IV)
(A) Basis of related party transactions 49 (IV A) Yes
(B) Disclosures of accounting treatment 49 (IV B) Yes
(C) Board Disclosures – Risk Management 49 (IV C) Yes
(D) Proceeds from public issues, rights issues, preferential issues etc. 49 (IV D) N.A
(E) Remuneration of Directors 49 (IV E) Yes
(F) Management 49 (IV F) Yes
(G) Shareholders 49 (IV G) Yes
V. CEO/CFO Certification 49 (V) Yes
VI. Report on Corporate Governance 49 (VI) Yes
VII. Compliance 49(VII) Yes
Ÿ Mr. Seshadri Ratnam was not present in the last Annual Genera Meeting of the Company due to ill health.
II. Non-Mandatory Requirement
1. Pursuant to provisions of Schedule XIII of the Companies Act, 1956, the Company has constituted a Remuneration Committee which is a non mandatory requirement under the Clause 49 of the Listing Agreement.
AMD Industries Limited
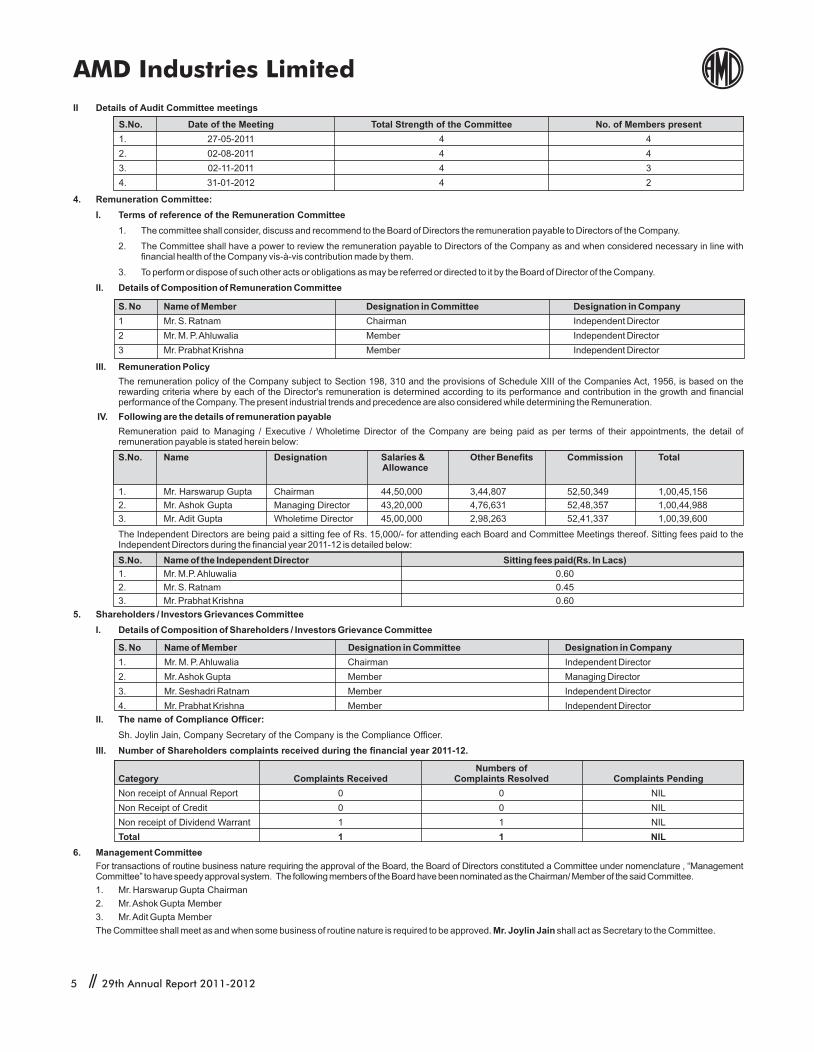
II Details of Audit Committee meetings
S.No. Date of the Meeting Total Strength of the Committee No. of Members present
1. 27-05-2011 4 4
2. 02-08-2011 4 4
3. 02-11-2011 4 3
4. 31-01-2012 4 2
4. Remuneration Committee:
I. Terms of reference of the Remuneration Committee
1. The committee shall consider, discuss and recommend to the Board of Directors the remuneration payable to Directors of the Company.
2. The Committee shall have a power to review the remuneration payable to Directors of the Company as and when considered necessary in line with financial health of the Company vis-à-vis contribution made by them.
3. To perform or dispose of such other acts or obligations as may be referred or directed to it by the Board of Director of the Company.
II. Details of Composition of Remuneration Committee
S. No Name of Member Designation in Committee Designation in Company
1 Mr. S. Ratnam Chairman Independent Director
2 Mr. M. P. Ahluwalia Member Independent Director
3 Mr. Prabhat Krishna Member Independent Director
III. Remuneration Policy
The remuneration policy of the Company subject to Section 198, 310 and the provisions of Schedule XIII of the Companies Act, 1956, is based on the rewarding criteria where by each of the Director's remuneration is determined according to its performance and contribution in the growth and financial performance of the Company. The present industrial trends and precedence are also considered while determining the Remuneration.
IV. Following are the details of remuneration payable
Remuneration paid to Managing / Executive / Wholetime Director of the Company are being paid as per terms of their appointments, the detail of remuneration payable is stated herein below:
S.No. Name Designation Salaries & Other Benefits Commission Total Allowance
1. Mr. Harswarup Gupta Chairman 44,50,000 3,44,807 52,50,349 1,00,45,156
2. Mr. Ashok Gupta Managing Director 43,20,000 4,76,631 52,48,357 1,00,44,988
3. Mr. Adit Gupta Wholetime Director 45,00,000 2,98,263 52,41,337 1,00,39,600
The Independent Directors are being paid a sitting fee of Rs. 15,000/- for attending each Board and Committee Meetings thereof. Sitting fees paid to the Independent Directors during the financial year 2011-12 is detailed below:
S.No. Name of the Independent Director Sitting fees paid(Rs. In Lacs)
1. Mr. M.P. Ahluwalia 0.60
2. Mr. S. Ratnam 0.45
3. Mr. Prabhat Krishna 0.60
5. Shareholders / Investors Grievances Committee
I. Details of Composition of Shareholders / Investors Grievance Committee
S. No Name of Member Designation in Committee Designation in Company
1. Mr. M. P. Ahluwalia Chairman Independent Director
2. Mr. Ashok Gupta Member Managing Director
3. Mr. Seshadri Ratnam Member Independent Director
4. Mr. Prabhat Krishna Member Independent Director
II. The name of Compliance Officer:
Sh. Joylin Jain, Company Secretary of the Company is the Compliance Officer.
III. Number of Shareholders complaints received during the financial year 2011-12.
Numbers ofCategory Complaints Received Complaints Resolved Complaints Pending
Non receipt of Annual Report 0 0 NIL
Non Receipt of Credit 0 0 NIL
Non receipt of Dividend Warrant 1 1 NIL
Total 1 1 NIL
6. Management Committee
For transactions of routine business nature requiring the approval of the Board, the Board of Directors constituted a Committee under nomenclature , “Management Committee” to have speedy approval system. The following members of the Board have been nominated as the Chairman/ Member of the said Committee.
1. Mr. Harswarup Gupta Chairman
2. Mr. Ashok Gupta Member
3. Mr. Adit Gupta Member
The Committee shall meet as and when some business of routine nature is required to be approved. Mr. Joylin Jain shall act as Secretary to the Committee.
29th Annual Report 2011-20125 29th Annual Report 2011-2012 6

AMD Industries Limited
7. General Body Meetings
I. Details of last three Annual General Meetings
Date of Meeting Place Time Details of Special Resolution Passed therein
23-09-2009 Daffodils Hotels, Tania Farms Complex, 10.30 AM 1. Re-appointment of Mr. Ashok Gupta, Managing Director Chatterpur Mandir Road, Satbari Village, of the Company for a further period of 3 years
New Delhi- 30 2. Re-appointment of Mr. Harswarup Gupta, Executive Chairman of the Company for a further period of 3 years
3. Re-appointment of Mr. Adit Gupta as Whole Time Director of the Company for a further period of 3 years
4. Appointment of Ms. Vidhi Gupta as Manager – Business Development u/s 314(1) of the Act.
24-09-2010 Daffodils Hotels, Tania Farms Complex, 10.30 AM Nil Chatterpur Mandir Road, Satbari Village, New Delhi- 30
23-09-2011 Daffodils Hotels, Tania Farms Complex, 10.30 AM 1. Re-appointment of Mr. Ashok Gupta, Managing Director
Chatterpur Mandir Road, Satbari Village, of the Company for a further period of 3 years
New Delhi- 30 2. Re-appointment of Mr. Harswarup Gupta, Executive Chairman of the Company for a further period of 3 years
3. Re-appointment of Mr. Adit Gupta as Whole Time Director of the Company for a further period of 3 years
4. Revision in remuneration of Ms. Vidhi Gupta, Manager- Business Development
5. Appointment of Ms. Mamta Gupta as Manager – Business Development u/s 314(1) of the Act.
II. Postal Ballot
The Company did not pass any special resolution through postal ballot in the financial year 2011-12.
8. Disclosures
a. Related party transactions have been suitably disclosed in the Notes to the Accounts in compliance to Accounting Standards issued by the Institute of Chartered Accountants of India. However, there are no materially significant related party transactions which have potential conflict with the interests of the Company at large.
b. During the last three financial years there was no penalty, restrictions of any kind and of any nature, has been imposed by the SEBI, Stock Exchange or any other Statutory Body relating to Capital Market.
c. Whistle Blower Policy: However, there is no specific Whistle Blower Policy laid down in the organization, but the Management always encourages the Employees of the Company, to detect any actual or suspected fraud, unethical behavior, and be notified the same to the management for its suitable resolution/rectification. There was no incidence highlighted during the financial year 2011-12 within the framework of such encouragement.
d. Following are the Details of Compliance of Mandatory and Non Mandatory Requirements of Corporate Governance:
I. Mandatory Requirement
The Company is fully compliant with the applicable mandatory requirements of the revised Clause 49 which are listed below:
Particulars Clause of Compliance Listing agreement StatusYes/No
I. Board of Directors 49 I
(A) Composition of Board 49(IA) Yes
(B) Non-executive Directors' compensation & disclosures 49 (IB) Yes
(C) Other provisions as to Board and Committees 49 (IC) Yes
(D) Code of Conduct 49 (ID) Yes
II. Audit Committee 49 (II)
(A) Qualified & Independent Audit Committee 49 (IIA)* Yes
(B) Meeting of Audit Committee 49 (IIB) Yes
(C) Powers of Audit Committee 49 (IIC) Yes
(D) Role of Audit Committee 49 II(D) Yes
(E) Review of Information by Audit Committee 49 (IIE) Yes
III. Subsidiary Companies 49 (III) Yes
IV. Disclosures 49 (IV)
(A) Basis of related party transactions 49 (IV A) Yes
(B) Disclosures of accounting treatment 49 (IV B) Yes
(C) Board Disclosures – Risk Management 49 (IV C) Yes
(D) Proceeds from public issues, rights issues, preferential issues etc. 49 (IV D) N.A
(E) Remuneration of Directors 49 (IV E) Yes
(F) Management 49 (IV F) Yes
(G) Shareholders 49 (IV G) Yes
V. CEO/CFO Certification 49 (V) Yes
VI. Report on Corporate Governance 49 (VI) Yes
VII. Compliance 49(VII) Yes
Ÿ Mr. Seshadri Ratnam was not present in the last Annual Genera Meeting of the Company due to ill health.
II. Non-Mandatory Requirement
1. Pursuant to provisions of Schedule XIII of the Companies Act, 1956, the Company has constituted a Remuneration Committee which is a non mandatory requirement under the Clause 49 of the Listing Agreement.
AMD Industries Limited
II Details of Audit Committee meetings
S.No. Date of the Meeting Total Strength of the Committee No. of Members present
1. 27-05-2011 4 4
2. 02-08-2011 4 4
3. 02-11-2011 4 3
4. 31-01-2012 4 2
4. Remuneration Committee:
I. Terms of reference of the Remuneration Committee
1. The committee shall consider, discuss and recommend to the Board of Directors the remuneration payable to Directors of the Company.
2. The Committee shall have a power to review the remuneration payable to Directors of the Company as and when considered necessary in line with financial health of the Company vis-à-vis contribution made by them.
3. To perform or dispose of such other acts or obligations as may be referred or directed to it by the Board of Director of the Company.
II. Details of Composition of Remuneration Committee
S. No Name of Member Designation in Committee Designation in Company
1 Mr. S. Ratnam Chairman Independent Director
2 Mr. M. P. Ahluwalia Member Independent Director
3 Mr. Prabhat Krishna Member Independent Director
III. Remuneration Policy
The remuneration policy of the Company subject to Section 198, 310 and the provisions of Schedule XIII of the Companies Act, 1956, is based on the rewarding criteria where by each of the Director's remuneration is determined according to its performance and contribution in the growth and financial performance of the Company. The present industrial trends and precedence are also considered while determining the Remuneration.
IV. Following are the details of remuneration payable
Remuneration paid to Managing / Executive / Wholetime Director of the Company are being paid as per terms of their appointments, the detail of remuneration payable is stated herein below:
S.No. Name Designation Salaries & Other Benefits Commission Total Allowance
1. Mr. Harswarup Gupta Chairman 44,50,000 3,44,807 52,50,349 1,00,45,156
2. Mr. Ashok Gupta Managing Director 43,20,000 4,76,631 52,48,357 1,00,44,988
3. Mr. Adit Gupta Wholetime Director 45,00,000 2,98,263 52,41,337 1,00,39,600
The Independent Directors are being paid a sitting fee of Rs. 15,000/- for attending each Board and Committee Meetings thereof. Sitting fees paid to the Independent Directors during the financial year 2011-12 is detailed below:
S.No. Name of the Independent Director Sitting fees paid(Rs. In Lacs)
1. Mr. M.P. Ahluwalia 0.60
2. Mr. S. Ratnam 0.45
3. Mr. Prabhat Krishna 0.60
5. Shareholders / Investors Grievances Committee
I. Details of Composition of Shareholders / Investors Grievance Committee
S. No Name of Member Designation in Committee Designation in Company
1. Mr. M. P. Ahluwalia Chairman Independent Director
2. Mr. Ashok Gupta Member Managing Director
3. Mr. Seshadri Ratnam Member Independent Director
4. Mr. Prabhat Krishna Member Independent Director
II. The name of Compliance Officer:
Sh. Joylin Jain, Company Secretary of the Company is the Compliance Officer.
III. Number of Shareholders complaints received during the financial year 2011-12.
Numbers ofCategory Complaints Received Complaints Resolved Complaints Pending
Non receipt of Annual Report 0 0 NIL
Non Receipt of Credit 0 0 NIL
Non receipt of Dividend Warrant 1 1 NIL
Total 1 1 NIL
6. Management Committee
For transactions of routine business nature requiring the approval of the Board, the Board of Directors constituted a Committee under nomenclature , “Management Committee” to have speedy approval system. The following members of the Board have been nominated as the Chairman/ Member of the said Committee.
1. Mr. Harswarup Gupta Chairman
2. Mr. Ashok Gupta Member
3. Mr. Adit Gupta Member
The Committee shall meet as and when some business of routine nature is required to be approved. Mr. Joylin Jain shall act as Secretary to the Committee.
29th Annual Report 2011-20125 29th Annual Report 2011-2012 6

AMD Industries Limited
h. Registrar and Share Transfer Agent:
Bigshare Services Private LimitedE-2/3, Ansa Industrial Estate,Saki Naka Mumbai-400072Phone # 91-22-28470652Fax # 91-22-28525207.
i. Share Transfer System:
Company's shares are being transferable both in Demat & Physical mode. The transfers of shares in case of dematerialised form are being conduced through Depository Participants (DP). For the transfer of physical shares Company's Registrar at above mentioned address is to be contacted. Further to expedite the process of transfer of physical shares, the Company has authorized the Officials of the Company in compliance with Clause 49 of the Listing Agreement.
stj. Distribution of share holding (as on 31 March 2012)
S.No. Range Total Holders % of Total Holders Total Holding % of Total Capital
1 1-500 11352 85.1421 1683895 8.7855
2 501-1000 1063 7.9727 897599 4.6831
3 1001-2000 470 3.5251 735554 3.8377
4 2001-3000 176 1.3200 447941 2.3371
5 3001-4000 61 0.4575 222200 1.1593
6 4001-5000 51 0.3825 242612 1.2658
7 5001-10000 84 0.6300 583397 3.0438
8 10001 -999999999 76 0.5700 14353551 74.8878
Total 13333 100.00stk. Statement showing Shareholding Pattern as on 31 March 2012
Category Category of Shareholder Total No. of Total %Code Shares Shareholding
A Shareholding of Promoter and promoter group
1. Indian 11547571 60.25
2. Foreign 0.00 0.00
Total (A) 11547571 60.25
B Public Shareholdings
1. Institutions 0.00 0.00
2. Non - Institutions 7619178 39.75
Total (B) 7619178 39.75
C Shares held by custodians and against which 0.00 0.00
Depository Receipts have been issued
Grand Total (A+B+C) 19,166,749 100.00stl. Dematerialization and liquidity of share (as on 31 March 2012)
stAs on 31 March, 2012 99.99% shares of the Company were held in dematerialized form.
None of the shares of the Company are Locked-in.
m. Plant Locations.
S. No. Plant Location Product
1 C-4 & 5, Site No. 3, Meerut Road Indl. Area, Ghaziabad, U.P. 201001. CSD Closures and PET Preforms
2 SP- 32 RIICO Industrial Area, Neemrana, (Rajasthan) Crown Caps, CSD Closures and PET Preforms
n. Address for correspondence:
AMD Industries Limited18, First Floor, Pusa Road, Karol Bagh, New Delhi 110005E-mail:[email protected].
For and on behalf of Board of Directors
Place : New Delhi Ashok GuptardDate : 23 May 2012 Managing Director
a. Comparison of share of Company with indices
AMD Share Price-BSE
0.00
5.00
10.00
15.00
20.00
25.00
Months
0.00
5000.00
10000.00
15000.00
20000.00
25000.00
price
Sensex
Pri
ce
Sen
sex
May
-11
Jun-
11
Jul-1
1
Aug-1
1
Sep-1
1
Oct-1
1
Nov
-11
Dec
-11
Jan-
12
Feb-1
2
Mar
-12
Apr-1
1
AMD Share Price-NSE
0
5
10
15
20
25
Months
Pri
ce
0.00
2000.00
4000.00
6000.00
Price NIFTY
Nif
ty
May
-11
Jun-
11
Jul-1
1
Aug-1
1
Sep-1
1
Oct-1
1
Nov
-11
Dec
-11
Jan-
12
Feb-1
2
Mar
-12
Apr-1
1
1000.00
3000.00
5000.00
7000.00
AMD Industries Limited
Profile of Directors
Mr. H. S. Gupta
Aged about 83 years is one of the founder promoters and Directors of the company. He has been associated with the packaging industry for more than 51 years. He started his new glass bottles trading business in Calcutta in the year 1958 in name and style of Ashoka Sales Agency. He is the Executive Chairman of the Company. Mr. Harswarup Gupta is also running a charitable trust viz. Shakuntala Gupta Trust which is established for philanthropic activities. The Trust runs a high school at Village Kakore, Distt. Bulandshahar, Uttar Pradesh.
Mr. Ashok Gupta
Aged about 59 years is son of Shri Harswarup Gupta and Managing Director of AMD Industries Limited. Mr. Ashok Gupta is a Bachelor of Science and enriched with an experience of more than 34 years in Industrial and Commercial activities. He commenced business in the year 1974 by setting up a unit under the name and style of Shyam Industries to manufacture pilfer proof Aluminum caps mainly used by liquor industry.
Mr. Ashok Gupta has traveled widely and has attended many prestigious seminars and exhibitions in India and abroad including Inter Pack and Metpack Dusserdolf, Germany, Pet Exhibition- Munich. He also participated as a Guest Speaker on the subject “The Growing Trends of Pet Industry in Asia Pacific Market” organized in Germany by PET PLANET, one of the Worlds's most read PET magazines. He also attended textile exhibition in Singapore held in October 2005. Mr. Ashok Gupta looks after the day-to-day operations of the Company since its inception. He is a founder promoter and Managing Director of the Company.
Mr. Adit Gupta
Aged about 33 years is the son of Shri Ashok Gupta. He has completed his B.Sc. in Chemical Engineering stream from Virginia, USA and MBA (Finance) from Boston, USA. Mr. Adit Gupta has been involved in business development and promotion function of AMD Industries Ltd. since 1999. In the year 1999 he underwent a training course at Sacmi, Italy to get first hand experience of beverage packaging trends and know-how in plastics and crowns manufacturing. He has joined the Board of AMD Industries Limited on 14-11-2005 as the Director of the Company & further subsequently appointed as Whole Time Director w.e.f 14-06-2006
Mr.Adit Gupta was actively involved as a team leader for implementation of Company's expansion and diversification projects of PET and Plastic closures in the year 2002 and 2003. He later went to Boston for his MBA degree course and during that MBA program he attended Kortec Seminar. Kortec is a leading technology company in Barrier PET Preforms for Beer operations. He is one of the promoter directors of the company and looks after business development function of the company.
Mr. Mahipal Ahluwalia
Mr. Mahipal Ahluwalia is a Lawyer and having more than 34 years of experience in handling Legal cases both in High Court as well as in Supreme Court. He is Non- Executive Independent Director of the company.
Mr. Seshadri Ratnam
Mr. Seshadri Ratnam is a B.Sc. (Hons) (Physics) and FCA from the Institute of Chartered Accountants of England & Wales, London, U.K. He has over 39 years of experience in the field of Corporate Laws, Finance and Taxation. He has also been involved in financial consultancies relating to fund raising through GDRs, IPOs and also through agencies like ADB, World Bank etc. He was Director Finance of Uttaranchal Jal Vidyut Nigam Limited. He has also worked in the capacity of Director Finance of Bharti Telecom.
Mr. Prabhat Krishna
Mr. Prabhat Krishna aged about 64 years, Mr. Prabhat Krishna is a retired banker from State Bank of India. He is B. Tech (Chem) from IIT, New Delhi. He started his career with a Chemical Consultancy firm. He joined SBI as Probationary Officer in 1973. He kept on moving on different position within the Bank and handled Corporate Account with a minimum limit of Rs.50 Crores & above. Mr. Prabhat Krishna worked with the Bank for 35 years and retired in November 2007.
8. Means of Communication
I. In terms of requirements of Clause 41 of the Listing Agreement the Quarterly/ Annual Financial Results of the Company are being published in newspapers and are also being displayed on the Website of the Company i.e.
ii. The Quarterly/Annual Financial Results of the Company are being published normally in the following newspapers:
1. Business Standard, Delhi.
2. Jansatta
3. Financial Express
9. General Shareholders Information
a. Annual General Meeting details:-th1. Date : 28 September, 2012
2. Time : 10:30 A.M.
3. Venue : Daffodils Hotels, Tania Farms Complex, Chattarpur Mandir Road, Satbari Village, New Delhi-110030.
stb. Financial Year : 2011-2012 (ended on 31 March 2012).th thc. Book Closure Date: 24 September, 2012 to 28 September, 2012 (Both days- inclusive).
thd. Dividend Payment Date:- On or after 6 October 2012.
e. Shares of Company are listed on:-
a. National Stock Exchange (NSE) and
b. Bombay Stock Exchange (BSE)
f. Stock Code: 532828 – BSE
AMDIND – NSE
g. The monthly high and low stock price during the financial year 2010-11 is under.
BSE Price NSE Price
Month High Price (in Rs.) Low Price (in Rs.) High Price (in Rs.) Low Price (in Rs.)
Apr-11 19.45 16.55 19.55 16.60
May-11 17.40 15.20 17.40 14.30
Jun-11 18.55 15.95 18.50 15.90
Jul-11 19.00 17.05 19.90 15.05
Aug-11 22.80 17.50 23.00 17.20
Sep-11 21.50 19.00 22.80 18.40
Oct-11 20.00 17.10 20.00 17.10
Nov-11 19.95 12.45 19.90 12.25
Dec-11 16.15 12.70 16.10 12.40
Jan-12 17.35 13.40 17.30 13.30
Feb-12 18.00 15.00 17.55 15.00
Mar-12 16.25 14.10 16.50 13.85
www.amdindustries.com.
29th Annual Report 2011-20127 29th Annual Report 2011-2012 8

AMD Industries Limited
AUDITOR’S CERTIFICATE ON CORPORATE GOVERNANCE
To,
The Members,
AMD Industries Limited
We have examined the compliance of the conditions of Corporate Governance by AMD Industries Limited, for the Financial Year ended on 31st March 2012, as stipulated in Clause 49 of the Listing Agreement of the said company with the stock exchange(s).
The compliance of conditions of corporate governance is the responsibility of the Management of the Company. Our examination has been limited to a review of the procedures and implementation thereof, adopted by the Company for ensuring the compliance with conditions of Corporate Governance. It is neither an audit nor an expression of opinion on financial statements of the Company.
In our opinion and to best of our information and according to the explanations given to us, and the representations made by the Directors and the Management of the Company, we certify that the Company has compiled with the conditions of
corporate governance in the listing Agreement with Stock Exchanges .
We state that in respect of investor's grievances received during the year ended on 31st March 2012, no investor grievances is pending for a period exceeding one month against the company as per records maintained by the company.
We further state that such compliances is neither an assurance as to the future viability of the company nor the efficiency and effectiveness with which the management has conducted the affairs of the company.
For Suresh & Associates
Chartered Accountants.
(CA - Narendra Arora)PartnerM. No. 088256FRN:003316NPlace: Delhi
rdDate 23 May 2012
To
The Board of Directors
AMD Industries Limitedst18, 1 Floor, Pusa Road, Karol Bagh
New Delhi – 110 005.
Sub: Secretarial Audit Report in respect of the Secretarial Audit conducted on the
various compliances made by the Company during period ended on 31st March,
2012.
Dear Sirs,
Pursuant to our appointment as the Secretarial Auditor of the Company for
conducting a detailed secretarial audit in respect of various compliances made by
the Company under the Companies Act, 1956, The Depositories Act, 1996, SEBI
Act, 1992, SEBI (Substantial Acquisition of Shares & Takeover) Guidelines, 1997,
SEBI (Prohibition of Insider Trading) Regulations, 1992, The Securities Contract
Regulation Act, 1956 and the Listing Agreement entered into by the Company
with the Bombay Stock Exchange Limited (BSE) and the National Stock
Exchange (NSE) covering therein the period commencing from 01.04.2011 and
ending on 31.3.2012, we hereby report as under :
We have examined the various registers, records, books and papers as required
to be maintained and filed by the Company under the above mentioned
enactments, rules, regulations and procedures prescribed there under and we
have also examined the information and explanations given to us by the
Management and the Compliance Officer of the Company, and pursuant thereto
our report has been segregated in two parts, one covering the report on the
compliances made by the Company under the Companies Act, 1956 and the
second covering the report on the compliances made by the Company under
SEBI Act and various Guidelines prescribed there under, SCRA, Depositories Act
and the Listing Agreement, which is given as under :
I. Report on the Compliances made by the Company under the
Companies Act, 1956 and rules and Regulations prescribed there
under:
We have perused that the Company has complied with the provisions of
Companies Act, 1956, Rules & Regulations made there under and the
Memorandum & Articles of Association of the Company with regard to:
a. Maintenance of various Statutory Registers and filing of forms &
returns with necessary attachments with the Registrar of Companies.
b. Constitution of proper Board, due Compliances & Disclosures by the
Members of the Board to the Company and to the Authorities
prescribed wherever required, conducting of Board Meetings by
serving appropriate notices within the time prescribed, conducting of
meetings of the shareholders within the time prescribed by serving
appropriate and timely notices, recording and signing of Minutes of
the Board Meetings and the Shareholders Meetings within the time
prescribed, appointment, reappointment, rotation of Directors
SECRETARIAL AUDIT REPORTFor the year ended 31st March, 2012
including Managing Director and the Whole Time Directors and
payment of remuneration within the prescribed ceilings.
c. The appointment and the reappointment of Auditors of the Company
and the payment of remuneration to the Auditors of the Company.
d. Transfer of Company's Shares, Declaration & payment of dividend to
the shareholders of the Company.
e. Borrowings from the Banks and/or financial institutions and
registration, modification and satisfaction of charges thereof, inter
corporate loans, investments, guarantees, affixation of Common Seal
of the Company, publication of name of the Company.
f. Generally, all other applicable provisions of the Act, Rules &
Regulations made there under.
II. Report on the Compliances made by the Company under the SEBI Act,
various Guidelines prescribed thereunder, SCRA, Depositories Act
and the Listing Agreement :
We have perused that the Company is regular in compliances as prescribed
under the provisions of SEBI Act, various Guidelines prescribed there
under, SCRA, Depositories Act and the Listing Agreement which are
reported as under:
a. The Company has complied with the provisions of Depositories Act,
Bye-laws framed there under with regard to dematerialization/
rematerialisation of securities and reconciliation of records of
dematerialized securities.
b. The Company has complied with the requirements as prescribed
under the Listing Agreement entered into by the Company with the
BSE and the NSE. The Company is regular in getting its various
notices & financial results published in Hindi and English newspapers
as required under the said agreement.
c. The Company has complied with the provisions of SEBI (Substantial
Acquisition of Shares & Takeovers) Regulations, 1997.
d. Pursuant to the provisions of SEBI (Prohibition of Insider Trading)
Regulations, 1992, in terms of explanations, none of the employees of
the company traded any shares during share trading window closure
during year under review and the Company has adopted the Code of
Internal Procedure and Conduct as prescribed duly approved by the
Management Committee of the Company.
For AGG & Associates
Company Secretaries
Amar Gopal Gambhir
Place : New Delhi Practicing Company Secretaryst Dated: 31 July, 2012 FCS : 3668, CP:3653
AMD Industries Limited
AUDITOR’S REPORT
To
The Members of
M/s. AMD INDUSTRIES LIMITED
1. We have audited the attached Balance Sheet of AMD INDUSTRIES LIMITED as at 31st March, 2012, Profit and Loss Account and also the Cash Flow Statement for the year ended on that date annexed thereto. These financial statements are the responsibility of the Company's management. Our responsibility is to express an opinion on these financial statements based on our audit.
2. We have conducted audit in accordance with auditing standards generally accepted in India. Those standards require that we plan and perform the audit to obtain reasonable assurance about whether the financial statements are free of material misstatement. An audit includes examining, on a test basis, evidence supporting the amounts and disclosures in the financial statements. An audit also includes assessing the accounting principles used and significant estimates made by management, as well as evaluating the overall financial statement presentation. We believe that our audit provides a reasonable basis for our opinion.
3. As required by the Companies (Auditor's Report) Order, 2003 issued by the Central Government of India in terms of sub-section (4A) of section 227 of the Companies Act. 1956, we enclose in the Annexure, a statement on the matters specified in paragraphs 4 and 5 of the said Order.
4. Further to our comments in the Annexure referred to above, we report that:-
(i) We have obtained all the information and explanations, which to the best of our knowledge and belief were necessary for the purpose of our audit ;
(ii) In our opinion, proper books of account as required by law have been kept by the company so far as appears from our examination of those books ;
(iii) The Balance Sheet, Profit and Loss Account and Cash Flow Statement, dealt with by this report, are in agreement with the books of account ;
(iv) In our opinion, the Balance Sheet, Profit and Loss Account and Cash Flow Statement, dealt with by this report, comply with the accounting standards referred to in sub-section (3C) of section 211 of the Companies Act, 1956 ;
(v) On the basis of written representations received from the directors, as on 31st March, 2012, and taken on record by the Board of Directors, we report that none of the Directors is disqualified as on 31st March 2012 from being appointed as a director in terms of clause (g) of sub-section (1) of section 274 of the Companies Act. 1956 ;
(vi) In our opinion and to the best of our information and according to the explanations given to us, the said accounts give the information required by the Companies Act, 1956, in the manner so required and give a true and fair view in conformity with the accounting principles generally accepted in India:
(a) in the case of the balance Sheet, of the state of affairs of the Company as at 31st March, 2012 and
(b) in the case of the Profit and Loss Account, of the profit for the year ended on that date.
(c) in the case of Cash Flow Statement, of the cash flows for the year ended on that date.
For SURESH & ASSOCIATES
CHARTERED ACCOUNTANTS
(CA NARENDRA ARORA)PARTNER
M No. 088256FRN: 003316N
ANNEXURE TO AUDITOR’S REPORT
Referred to Paragraph 3 of our report of even date attached
(i) a) The company is maintaining proper records showing full particulars including quantitative details and situation of fixed assets.
b) Some of the fixed assets of the company have been physically verified during the year by the management in accordance with program of verification, which in our opinion provide for physical verification of all the fixed assets at reasonable intervals. According to information and explanation given to us, no material discrepancies have been noticed on such verification.
c) No fixed assets have been disposed off during the year which may affect the going concern concept.
(ii) a&b) As explained to us, the inventory has been physically verified by the management at reasonable intervals during the year. In our opinion, the frequency of such verification is reasonable considering size and nature of the business.
c) In our opinion and according to information and explanation given to us, the procedures of physical verification of inventory, followed by the management, are reasonable and adequate. No serious discrepancies have been noticed in physical verification.
(iii) a) The company has taken secured or unsecured loans from the entities, listed in the register maintained under section 301 of the Companies Act, 1956.
b) The rate of interest and other terms and conditions of loans are not prejudicial to the interest of the company.
c) As per information given to us, the repayment of principal amount and interest are regular.
d) There has not been any instance of overdue exceeding rupees one lac during the year.
(iv) In our opinion and according to information and explanation given to us, there are adequate internal control procedures commensurate with the size and nature of the company for purchase of inventory and fixed assets and sale of goods. There is no continuing failure to correct major weakness in internal control.
(v) a) According to the information and explanation given to us, the company has entered into transaction pursuance of contract or arrangement entered in register maintained under section 301 of the Companies Act, 1956.
b) In our opinion and as per information given to us, such transactions are made at prevailing market price.
(vi) In our opinion and explanation given to us, the company has not accepted any public deposit and the directives issued by the RBI and the provisions of 58A and 58AA of the Act and rules framed there under, wherever applicable, have been complied with.
(vii) In our opinion, the company has an internal audit system commensurate with it size and nature of business.
(viii) The maintenance of the cost record have not been prescribed by the Central Government under section 209(1)(d) of Companies Act, 1956 to the company.
(ix) a) According to books of accounts examined by us and explanation given to us company is generally regular in depositing undisputed statutory dues and there are no undisputed statutory dues payable in respect of PF, ESI, Income Tax, Sales Tax, Wealth Tax Custom Duty, Excise Duty, Cess and other statutory dues.
FRN: 003316N
Place: New Delhi.rdDate: 23 May, 2012
29th Annual Report 2011-20129 29th Annual Report 2011-2012 10

AMD Industries Limited
b) According to information given to us certain dues of sales Tax/Income-tax/custom duty/wealth tax/excise duty/cess have not been deposited by the company till 31.03.2012 on account of dispute pending before concerned authority details of such dues are given below.
S. No. Period Amount Description Appeal pending before
1 A.Y. 1999-00 to 2006-07 9,50,962/- Local Sales Tax raised by U.P. Local Sales Supreme Court Tax Authorities
2. A.Y. 1999-00 to 2006-07 31,18,745/- Central Sales Tax raised by U.P. Trade Tax Supreme Court Assessing Authorities
3. A.Y. 2002-03 1,34,83,805 Central Sales Tax raised by U.P. Trade Tax Remand back to Original assessing authorityAssessing Authorities by Appellate Authority
4. A.Y. 2003-04 10,31,276/- Central Sales Tax raised by U.P. Trade Tax Adl. Commissioner Appeal (Trade Tax)-IIIAssessing Authorities Ghaziabad
5. A.Y. 2001-02 11,45,102/- Entry tax raised by UP Trade Tax Authorities Jt. Commissioner Appeal (trade tax)-III, Ghaziabad
6. A.Y. 2002-03 11,40,307/- Entry tax raised by UPTrade Tax Authorities Supreme Court
(x) There are no accumulated losses of the company. The company has also not incurred any cash losses during the financial year and nor in immediately preceding financial year.
(xi) As per explanation and information provided to us company has not defaulted in repayment of dues to a financial institution or banks.
(xii) The company has not granted loan and advances on basis of security by way of pledged of shares, debentures, other securities.
(xiii) Provisions of clause (xiii) are not applicable to the company.
(xiv) As per information given to us company is not dealing or trading in shares, securities, debentures and other investments.
(xv) In our opinion and according to the information and explanations given to us, the terms and conditions on which the Company has given guarantee for loans taken by others from banks or financial institutions are not prime-facie prejudicial to the interest of the Company.
(xvi) To the best of our knowledge & belief and according to information given to us term loan availed by company were prima facie applied by company during the year for the purpose for which they were obtained.
(xvii) As per information & explanation given to us and overall examination of balance sheet of the company we report that funds raised on short-term basis have prima facie not been used for long-term investment and vice versa.
(xviii)As per information and explanation given to us the company has not made preferential allotment of shares to parties and companies covered in register maintained under section 301 of the Companies Act.
(xix) As per information & explanation given to us the company has not issued any debentures and no security has been created against the debenture.
(xx) During the year, company has not raised money by way public issue of equity shares.
(xxi) As per information & explanation given to us no fraud has been noticed or reported during the year.
7. A.Y. 2004-05 16,37,643/- Entry tax raised by UPTrade Tax Authorities Allahabad High Court has dismissed the WP.The Company is in the process of filing of SLP before Hon’ble Supreme Court .
8. F.Y. 2001-02 2,00,000/- Labour Dispute Labour Court-1, Ghaziabad
9. A.Y. 2005-06 4,74,111/- Central Sales Tax raised by U.P. Trade Tax Commissioner Appeal (trade tax)-I, GhaziabadAssessing Authorities
10. A.Y. 2007-2008 2,02,382/- Trade Tax raised by U.P. Trade Tax Addl. Commissioner Appeal (Trade Tax)-III,Assessing Authorities. Ghaziabad
11. A.Y. 2003-04 9,31,360/- Refund claim denied by Excise Authorities. Central Excise, Service Tax Appellate Tribunal,New Delhi
12. A.Y. 2003-04 1,10,000/- Interest on Excise Duty raised by Remand back to Dy. Commissioner, CentralCommissioner Appeal, Ghaziabad Excise, Ghaziabad by Appellate Authority
13. A.Y 2005-06 2,20,397/- Entry tax raised by UPTrade Tax Authorities Supreme Court
14. A.Y 2007-08 38,09,702/- UPVAT raised due to Classification of Addl. Commissioner (Appeals) GhaziabadPreform by Assessing Authorities
15. A.Y 2010-11 3,22,000/- Claim filed under the Employee Deputy Commissioner, Nimri Colony, Ashok Compensation Act ,1923. Vihar, New Delhi
For SURESH & ASSOCIATES FRN: 003316N
CHARTERED ACCOUNTANTS
Place: New Delhi.rdDate: 23 May, 2012 (CA NARENDRA ARORA)
PARTNERM No. 088256
FRN: 003316N
29th Annual Report 2011-201211

ST BALANCE SHEET AS AT 31 MARCH 2012
The accompanying Notes 1 to 28 form integral part of these Financial Statements
In terms of our report of even date attached. For and on behalf of Board of Directors
for SURESH & ASSOCIATESFRN No. 003316N CHARTERED ACCOUNTANTS
(Ashok Gupta) (Mahipal Ahluwalia)Managing Director Director DIN - 00031630 DIN - 00588626
[CA NARENDRA ARORA]PARTNER Company SecretaryMembership No. 088256 FRN No. 003316N
(Arun Kumar Gupta) (Joylin Jain)General Manager-Finance & Account
Place: New DelhirdDate : 23 May, 2012
AMD Industries Limited
Particulars Note No. As at 31st March, 2012 As at 31st March, 2011
Rs. Rs.
A EQUITY AND LIABILITIES
1 Shareholders’ funds
(a) Share capital / Head Office Account 3 191,667,490.00 191,667,490.00
(b) Reserves and surplus 4 967,155,519.89 924,399,843.58
1,158,823,009.89 1,116,067,333.58
2 Non-current liabilities
(a) Long-term borrowings 5 282,235,890.02 413,267,495.51
(b) Deferred tax liabilities (net) 27.5 84,712,213.00 82,309,196.00
(c) Other long-term liabilities 6 925,475.00 427,026.00
(d) Long-term provisions 7 14,575,032.00 12,879,715.00
382,448,610.02 508,883,432.51
3 Current liabilities
(a) Short-term borrowings 8 353,580,544.39 299,685,713.86
(b) Trade payables 9 230,353,091.88 362,266,355.18
(c) Other current liabilities 10 172,331,301.57 154,323,617.13
(d) Short-term provisions 11 151,427,154.88 197,423,838.86
907,692,092.72 1,013,699,525.03
TOTAL 2,448,963,712.63 2,638,650,291.12
B ASSETS
1 Non-current assets
(a) Fixed assets
(i) Tangible assets 12.A 853,633,911.23 917,893,984.54
(ii) Intangible assets 12.B 1,242,671.00 720,442.00
854,876,582.23 918,614,426.54
(b) Non-current investments 13 55,985,585.69 55,523,885.69
(c) Long-term loans and advances 14 525,393,845.00 548,024,702.17
1,436,256,012.92 1,522,163,014.40
2 Current assets
(a) Inventories 15 369,527,275.94 486,606,011.93
(b) Trade receivables 16 365,804,877.15 259,885,339.08
(c) Cash and cash equivalents 17 42,230,423.72 70,291,322.21
(d) Short-term loans and advances 18 117,349,649.79 104,260,644.84
(e) Other current assets 19 117,795,473.11 195,443,958.66
1,012,707,699.71 1,116,487,276.72
TOTAL 2,448,963,712.63 2,638,650,291.12
See accompanying notes forming part of the financial statements
29th Annual Report 2011-2012 12

AMD Industries LimitedSTSTATEMENT OF PROFIT AND LOSS FOR THE YEAR ENDED 31 MARCH 2012 NOTES FORMING PART OF THE FINANCIAL STATEMENTS
AMD Industries Limited
The accompanying Notes 1 to 28 form integral part of these Financial Statements
In terms of our report of even date attached. For and on behalf of Board of Directors
for SURESH & ASSOCIATESFRN No. 003316N CHARTERED ACCOUNTANTS
(Ashok Gupta) (Mahipal Ahluwalia)Managing Director Director DIN - 00031630 DIN - 00588626
[CA NARENDRA ARORA] (Arun Kumar Gupta) (Joylin Jain)PARTNER General Manager-Finance & Account Company SecretaryMembership No. 088256 FRN No. 003316N
Place: New DelhirdDate : 23 May, 2012
Particulars Note No. For the year ended
31st March, 2012 31st March, 2011
Rs. Rs.
A
1 Revenue from operations (gross) 20 2,040,350,781.97 1,547,860,850.41
Less: Excise duty 20 220,273,280.00 166,720,518.00
Revenue from operations (net) 1,820,077,501.97 1,381,140,332.41
2 Other income 21 6,906,700.33 23,959,671.87
3 Total revenue (1+2) 1,826,984,202.30 1,405,100,004.28
4 Expenses
(a) Cost of materials consumed 22.a 1,020,337,916.99 846,801,644.93
(b) Purchases of stock-in-trade 22.b 2,045,732.50 1,280,737.50
(c) Changes in inventories of finished goods, work-in-progress and stock-in-trade 22.c 57,401,160.00 (84,534,233.00)
(d) Employee benefits expense 23 114,407,012.40 83,866,946.81
(e) Finance costs 24 107,345,584.29 104,823,827.06
(f) Depreciation and amortisation expense 12.C 76,253,471.34 72,007,971.22
(g) Other expenses 25 369,647,966.50 303,913,604.69
Total expenses 1,747,438,844.02 1,328,160,499.21
5 Profit / (Loss) before exceptional and extraordinary items and tax (3 - 4) 79,545,358.28 76,939,505.07
6 Exceptional items - Profit/(Loss) on Sale/Written Off of Fixed Assets 24,143,537.03 (11,525.78)
7 Profit / (Loss) before extraordinary items and tax (5 + 6) 103,688,895.31 76,927,979.29
8 Extraordinary items - -
9 Profit / (Loss) before tax (7 + 8) 103,688,895.31 76,927,979.29
10 Tax expense:
(a) Current tax expense for current year 33,000,000.00 18,000,000.00
(b) (Less): MAT credit - -
(c) Current tax expense relating to prior years 3,254,127.00 (774,489.00)
(d) Net current tax expense 36,254,127.00 17,225,511.00
(e) Deferred tax 2,403,017.00 1,970,192.00
38,657,144.00 19,195,703.00
11 Profit / (Loss) from continuing operations (9 +10) 65,031,751.31 57,732,276.29
B DISCONTINUING OPERATIONS
12.i Profit / (Loss) from discontinuing operations (before tax) - -
12.ii Gain / (Loss) on disposal of assets / settlement of liabilities attributable
to the discontinuing operations - -
- -
12.iii Add / (Less): Tax expense of discontinuing operations
(a) on ordinary activities attributable to the discontinuing operations - -
(b) on gain / (loss) on disposal of assets / settlement of liabilities - -
- -
- -
13 Profit / (Loss) from discontinuing operations (12.i + 12.ii + 12.iii) - -
C TOTAL OPERATIONS
14 Profit / (Loss) for the year (11 + 13) 65,031,751.31 57,732,276.29
15.i Earnings per share (of Rs.10/- each):
(a) Basic
(i) Continuing operations 27.4.a 3.39 3.01
(ii) Total operations 27.4.b 3.39 3.01
(b) Diluted
(i) Continuing operations 27.4.e 3.39 3.01
(ii) Total operations 27.4.f 3.39 3.01
15.ii Earnings per share (excluding extraordinary items) (of Rs.10/- each):
(a) Basic
(i) Continuing operations 27.4.c 3.39 3.01
(ii) Total operations 27.4.d 3.39 3.01
(b) Diluted
(i) Continuing operations 27.4.g 3.39 3.01
(ii) Total operations 27.4.h 3.39 3.01
See accompanying notes forming part of the financial statements
For the year ended
CONTINUING OPERATIONS
Note Particulars
1 Corporate information
The Compnay is engaged in the Manufacturing of Pet Preform,Crown Caps and CSD Closures.The company is continuously catering to the packaging needs of Beverages and Beer Industry of the country and abroad.The company has also interest in the Real Estates.
2 Significant accounting policies
2.1 Basis of accounting and preparation of financial statements
The financial statements of the Company have been prepared in accordance with the Generally Accepted Accounting Principles in India (Indian GAAP) to comply with the Accounting Standards notified under the Companies (Accounting Standards) Rules, 2006 (as amended) and the relevant provisions of the Companies Act, 1956. The financial statements have been prepared on accrual basis under the historical cost convention.The accounting policies adopted in the preparation of the financial statements are consistent with those followed in the previous year.
2.2 Use of estimates
The preparation of the financial statements in conformity with Indian GAAP requires the Management to make estimates and assumptions considered in the reported amounts of assets and liabilities (including contingent liabilities) and the reported income and expenses during the year. The Management believes that the estimates used in preparation of the financial statements are prudent and reasonable. Future results could differ due to these estimates and the differences between the actual results and the estimates are recognised in the periods in which the results are known / materialise.
2.3 Inventories
Inventories
(i) Raw Material
At cost or net realizable value (on FIFO basis) whichever is lower (Rejected raw material at cost Less claim received thereon)
ii) Finished Goods
At cost or net realizable value whichever is lower. For arriving at the cost for this purpose the cost includes material cost and manufacturing expenses.
iii) Semi Finished Goods
At cost of input plus apportioned overhead expenses and depreciation.
iv) Job work in Process
At apportioned manufacturing expenses and depreciation.
v) Stores and Spares
At cost or net realizable value (on FIFO basis) whichever is lower.
vi) Scrap
At estimated realizable value.
vii) Real Estates Inventory
At cost plus cost of improvement.
In order to comply with the mandatory requirements of Accounting Standard -2 ‘Valuation of inventories’ prescribed by the Institute of Chartered Accountants of India; The Company has adopted the exclusive method of the excise duty
2.4 Cash and cash equivalents (for purposes of Cash Flow Statement)
Cash comprises cash on hand and demand deposits with banks. Cash equivalents are short-term balances (with an original maturity of three months or less from the date of acquisition), highly liquid investments that are readily convertible into known amounts of cash and which are subject to insignificant risk of changes in value.
2.5 Cash flow statement
Cash flows are reported using the indirect method, whereby profit / (loss) before extraordinary items and tax is adjusted for the effects of transactions of non-cash nature and any deferrals or accruals of past or future cash receipts or payments. The cash flows from operating, investing and financing activities of the Company are segregated based on the available information.
2.6 Depreciation and Amortisation
The depreciation on Plant & Machinery including Moulds installed in Neemrana Unit and Ghaziabad Unit has been provided on ’Multiple Shift Basis’. The depreciation on all assets has been provided on ‘straight-line method’ at the rates prescribed in Schedule XIV of the Companies Act, 1956. ‘Depreciation has been provided on the straight-line method as per the rates prescribed in Schedule XIV to the Companies Act, 1956 except in respect of the following categories of assets, in whose case the life of the assets has been assessed as under:
2.7 Revenue recognition
Revenue in respect of sale of products is recognised on delivery, which coincides with the transfer of risk and rewards of ownership. Discounts given / accrued to customers at the time of despatch are considered as trade discounts and netted from sales.
Sales made to Nepal and Bhutan has been treated as export sale. However there is no inflow of Foreign Exchange on sales to Nepal and Bhutan.
Job work of Preform Completed and lying in Factories as on 31st March 2012 has been shown as inventory under the head Job Work in Process.
Interest income is recognized on an accrual basis on time proportionate basis, based on interest rates implicit in the transaction.
2.8 Other income
Dividend income is recognized on receipt basis.
2.9 Tangible fixed assets
Fixed assets are carried at cost less accumulated depreciation and impairment losses, if any. The cost of fixed assets includes interest on borrowings attributable to acquisition of qualifying fixed assets up to the date the asset is ready for its intended use and other incidental expenses incurred up to that date. Exchange differences arising on restatement / settlement of long-term foreign currency borrowings relating to acquisition of depreciable fixed assets are adjusted to the cost of the respective assets and depreciated over the remaining useful life of such assets. Machinery spares which can be used only in connection with an item of fixed asset and whose use is expected to be irregular are capitalised and depreciated over the useful life of the principal item of the relevant assets. Subsequent expenditure relating to fixed assets is capitalised only if such expenditure results in an increase in the future benefits from such asset beyond its previously assessed standard of performance.
Fixed assets acquired and put to use for project purpose are capitalised and depreciation thereon is included in the project cost till commissioning of the project.
CENVAT Credit availed on acquisition of fixed assets is reduced from the cost of concerned assets.
Fixed assets acquired in full or part exchange for another asset are recorded at the fair market value or the net book value of the asset given up, adjusted for any balancing cash consideration. Fair market value is determined either for the assets acquired or asset given up, whichever is more clearly evident. Fixed assets acquired in exchange for securities of the Company are recorded at the fair market value of the assets or the fair market value of the securities issued, whichever is more clearly evident.
Capital work-in-progress:
Projects under which assets are not ready for their intended use and other capital work-in-progress are carried at cost, comprising direct cost, related incidental expenses and attributable interest.
29th Annual Report 2011-201213 29th Annual Report 2011-2012 14

AMD Industries Limited
2.10 Intangible assetsIntangible assets are carried at cost less accumulated amortisation and impairment losses, if any. The cost of an intangible asset comprises its purchase price, including any import duties and other taxes (other than those subsequently recoverable from the taxing authorities), and any directly attributable expenditure on making the asset ready for its intended use and net of any trade discounts and rebates. Subsequent expenditure on an intangible asset after its purchase / completion is recognised as an expense when incurred unless it is probable that such expenditure will enable the asset to generate future economic benefits in excess of its originally assessed standards of performance and such expenditure can be measured and attributed to the asset reliably, in which case such expenditure is added to the cost of the asset.
2.11 Foreign currency transactions and translationsInitial recognitionTransactions in foreign currencies entered into by the Company and its integral foreign operations are accounted at the exchange rates prevailing on the date of the transaction or at rates that closely approximate the rate at the date of the transaction.Measurement of foreign currency monetary items at the Balance Sheet dateForeign currency monetary items (other than derivative contracts) of the Company and its net investment in non-integral foreign operations outstanding at the Balance Sheet date are restated at the year-end rates.In the case of integral operations, assets and liabilities (other than non-monetary items), are translated at the exchange rate prevailing on the Balance Sheet date. Non-monetary items are carried at historical cost. Revenue and expenses are translated at the average exchange rates prevailing during the year. Exchange differences arising out of these translations are charged to the Statement of Profit and Loss.Treatment of exchange differencesExchange differences arising on settlement / restatement of short-term foreign currency monetary assets and liabilities of the Company and its integral foreign operations are recognised as income or expense in the Statement of Profit and Loss. The exchange differences on restatement / settlement of loans to non-integral foreign operations that are considered as net investment in such operations are accumulated in a “Foreign currency translation reserve” until disposal / recovery of the net investment.The exchange differences arising on restatement / settlement of long-term foreign currency monetary items are capitalised as part of the depreciable fixed assets to which the monetary item relates and depreciated over the remaining useful life of such assets or amortised on settlement / over the maturity period of such items if such items do not relate to acquisition of depreciable fixed assets. The unamortised balance is carried in the Balance Sheet as “Foreign currency monetary item translation difference account” net of the tax effect thereon.Accounting of forward contractsPremium / discount on forward exchange contracts, which are not intended for trading or speculation purposes, are amortised over the period of the contracts if such contracts relate to monetary items as at the Balance Sheet date.
2.12 Government grants, subsidies and export incentivesExport benefits are accounted for in the year of exports based on eligibility and when there is no uncertainty in receiving the same.
2.13 InvestmentsLong-term investments , are carried individually at cost less provision for diminution, other than temporary, in the value of such investments. Current investments are carried individually, at the lower of cost and fair value. Cost of investments include acquisition charges such as brokerage, fees and duties.
2.14 Employee benefitsEmployee benefits include provident fund, superannuation fund, gratuity fund, compensated absences, long service awards and post-employment medical benefits.Defined contribution plansThe Company’s contribution to provident fund and superannuation fund are considered as defined contribution plans and are charged as an expense as they fall due based on the amount of contribution required to be made.Defined benefit plansFor defined benefit plans in the form of gratuity fund and post-employment medical benefits, the cost of providing benefits is determined using the Projected Unit Credit method, with actuarial valuations being carried out at each Balance Sheet date. Actuarial gains and losses are recognised in the Statement of Profit and Loss in the period in which they occur. Past service cost is recognised immediately to the extent that the benefits are already vested and otherwise is amortised on a straight-line basis over the average period until the benefits become vested. The retirement benefit obligation recognised in the Balance Sheet represents the present value of the defined benefit obligation as adjusted for unrecognised past service cost, as reduced by the fair value of scheme assets. Any asset resulting from this calculation is limited to past service cost, plus the present value of available refunds and reductions in future contributions to the schemes.Short-term employee benefitsThe undiscounted amount of short-term employee benefits expected to be paid in exchange for the services rendered by employees are recognised during the year when the employees render the service. These benefits include performance incentive and compensated absences which are expected to occur within twelve months after the end of the period in which the employee renders the related service. The cost of such compensated absences is accounted as under :(a) in case of accumulated compensated absences, when employees render the services that increase their entitlement of future compensated absences; and(b) in case of non-accumulating compensated absences, when the absences occur.Long-term employee benefitsCompensated absences which are not expected to occur within twelve months after the end of the period in which the employee renders the related service are recognised as a liability at the present value of the defined benefit obligation as at the Balance Sheet date less the fair value of the plan assets out of which the obligations are expected to be settled. Long Service Awards are recognised as a liability at the present value of the defined benefit obligation as at the Balance Sheet date.
2.15 Borrowing costsBorrowing costs include interest, amortisation of ancillary costs incurred and exchange differences arising from foreign currency borrowings to the extent they are regarded as an adjustment to the interest cost. Costs in connection with the borrowing of funds to the extent not directly related to the acquisition of qualifying assets are charged to the Statement of Profit and Loss over the tenure of the loan. Borrowing costs, allocated to and utilised for qualifying assets, pertaining to the period from commencement of activities relating to construction / development of the qualifying asset upto the date of capitalisation of such asset is added to the cost of the assets. Capitalisation of borrowing costs is suspended and charged to the Statement of Profit and Loss during extended periods when active development activity on the qualifying assets is interrupted.
2.16 Segment reportingThe Company identifies primary segments based on the dominant source, nature of risks and returns and the internal organisation and management structure. The operating segments are the segments for which separate financial information is available and for which operating profit/loss amounts are evaluated regularly by the executive Management in deciding how to allocate resources and in assessing performance.
2.17 LeasesWhere the Company as a lessor leases assets under finance leases, such amounts are recognised as receivables at an amount equal to the net investment in the lease and the finance income is recognised based on a constant rate of return on the outstanding net investment.Assets leased by the Company in its capacity as lessee where substantially all the risks and rewards of ownership vest in the Company are classified as finance leases. Such leases are capitalised at the inception of the lease at the lower of the fair value and the present value of the minimum lease payments and a liability is created for an equivalent amount. Each lease rental paid is allocated between the liability and the interest cost so as to obtain a constant periodic rate of interest on the outstanding liability for each year.Lease arrangements where the risks and rewards incidental to ownership of an asset substantially vest with the lessor are recognised as operating leases. Lease rentals under operating leases are recognised in the Statement of Profit and Loss on a straight-line basis.
AMD Industries Limited
NOTES FORMING PART OF THE FINANCIAL STATEMENTS NOTES FORMING PART OF THE FINANCIAL STATEMENTS
2.18 Earnings per share
Basic earnings per share is computed by dividing the profit / (loss) after tax (including the post tax effect of extraordinary items, if any) by the weighted average number of equity shares outstanding during the year. Diluted earnings per share is computed by dividing the profit / (loss) after tax (including the post tax effect of extraordinary items, if any) as adjusted for dividend, interest and other charges to expense or income relating to the dilutive potential equity shares, by the weighted average number of equity shares considered for deriving basic earnings per share and the weighted average number of equity shares which could have been issued on the conversion of all dilutive potential equity shares. Potential equity shares are deemed to be dilutive only if their conversion to equity shares would decrease the net profit per share from continuing ordinary operations. Potential dilutive equity shares are deemed to be converted as at the beginning of the period, unless they have been issued at a later date. The dilutive potential equity shares are adjusted for the proceeds receivable had the shares been actually issued at fair value (i.e. average market value of the outstanding shares). Dilutive potential equity shares are determined independently for each period presented. The number of equity shares and potentially dilutive equity shares are adjusted for share splits / reverse share splits and bonus shares, as appropriate.
2.19 Taxes on income
Current tax is the amount of tax payable on the taxable income for the year as determined in accordance with the provisions of the Income Tax Act, 1961.
Minimum Alternate Tax (MAT) paid in accordance with the tax laws, which gives future economic benefits in the form of adjustment to future income tax liability, is considered as an asset if there is convincing evidence that the Company will pay normal income tax. Accordingly, MAT is recognised as an asset in the Balance Sheet when it is probable that future economic benefit associated with it will flow to the Company.
Deferred tax is recognised on timing differences, being the differences between the taxable income and the accounting income that originate in one period and are capable of reversal in one or more subsequent periods. Deferred tax is measured using the tax rates and the tax laws enacted or substantially enacted as at the reporting date. Deferred tax liabilities are recognised for all timing differences. Deferred tax assets in respect of unabsorbed depreciation and carry forward of losses are recognised only if there is virtual certainty that there will be sufficient future taxable income available to realise such assets. Deferred tax assets are recognised for timing differences of other items only to the extent that reasonable certainty exists that sufficient future taxable income will be available against which these can be realised. Deferred tax assets and liabilities are offset if such items relate to taxes on income levied by the same governing tax laws and the Company has a legally enforceable right for such set off. Deferred tax assets are reviewed at each Balance Sheet date for their realisability.
Current and deferred tax relating to items directly recognised in equity are recognised in equity and not in the Statement of Profit and Loss.
2.20 Impairment of assets
The carrying values of assets / cash generating units at each Balance Sheet date are reviewed for impairment. If any indication of impairment exists, the recoverable amount of such assets is estimated and impairment is recognised, if the carrying amount of these assets exceeds their recoverable amount. The recoverable amount is the greater of the net selling price and their value in use. Value in use is arrived at by discounting the future cash flows to their present value based on an appropriate discount factor. When there is indication that an impairment loss recognised for an asset in earlier accounting periods no longer exists or may have decreased, such reversal of impairment loss is recognised in the Statement of Profit and Loss, except in case of revalued assets.
2.21 Provisions and contingencies
A provision is recognised when the Company has a present obligation as a result of past events and it is probable that an outflow of resources will be required to settle the obligation in respect of which a reliable estimate can be made. Provisions (excluding retirement benefits) are not discounted to their present value and are determined based on the best estimate required to settle the obligation at the Balance Sheet date. These are reviewed at each Balance Sheet date and adjusted to reflect the current best estimates. Contingent liabilities are disclosed in the Notes.
NOTE 3 SHARE CAPITAL (CONTD.)
ParticularsNotes:
(i) Details of shares held by the holding company, the ultimate holding company, their subsidiaries and associates:Particulars Opening Balance Fresh issue Bonus ESOP Conversion Buy back Other changes Closing BalanceEquity shares with voting rightsYear ended 31 March, 2012- Number of shares 19,166,749.00 Nil Nil Nil Nil Nil Nil 19,166,749.00 - Amount (Rs.) 191,667,490.00 Nil Nil Nil Nil Nil Nil 191,667,490.00 Year ended 31 March, 2011- Number of shares 19,166,749.00 Nil Nil Nil Nil Nil Nil 19,166,749.00 - Amount (Rs.) 191,667,490.00 Nil Nil Nil Nil Nil Nil 191,667,490.00
(ii) Details of shares held by each shareholder holding more than 5% shares:
Class of shares / As at 31st March, 2012 As at 31st March, 2011Name of shareholder Number of shares % holding in that Number of shares % holding in that
held class of Shares held class of SharesEquity shares with voting rights
Harswarup Gupta 2,575,604.00 13.4379% 2,508,002.00 13.0852%Ashok Gupta 3,427,796.00 17.8841% 2,895,596.00 15.1074%Chitra Gupta 1,200,945.00 6.2658% 1,200,945.00 6.2658%Adit Gupta 3,264,126.00 17.0301% 2,821,926.00 14.7230%
Ashok Sons (HUF) 982,500.00 5.1261% 982,500.00 5.1261%
NOTE 3 SHARE CAPITAL
Particulars As at 31st March, 2012 As at 31st March, 2011
Number of shares Rs. Number of shares Rs.
(a) AuthorisedEquity shares of Rs.10/- each with voting rights 25,000,000.00 .00
(b) Issued
Equity shares of Rs.10/- each with voting rights 19,166,749.00 191,667,490.00 19,166,749.00 191,667,490.00 19,166,749.00 191,667,490.00 19,166,749.00 191,667,490.00
(c) Subscribed and fully paid upEquity shares of Rs.10/- each with voting rights 19,166,749.00 191,667,490.00 19,166,749.00 191,667,490.00
19,166,749.00 191,667,490.00 19,166,749.00 191,667,490.00
Total 19,166,749.00 191,667,490.00 19,166,749.00 191,667,490.00
250,000,000 25,000,000.00 250,000,000.0025,000,000.00 250,000,000.00 25,000,000.00 250,000,000.00
29th Annual Report 2011-201215 29th Annual Report 2011-2012 16

AMD Industries Limited
Note :
Details of Repayment Terms and Security against the Term Loans
Particulars Repayment Terms Security
ICICI Bank Repayble in 60 Monthly EMI Hypothecation of Vehicle acquired out of Loans
Kotak Mahindra Bank Repayble in 60 Monthly EMI Hypothecation of Vehicle acquired out of Loan
Standard Chartered Bank Repayble in 168 Monthly EMI Mortgage of Personal Property of Director and the Personal Guarantee of the Directors
Standard Chartered Bank Repayble in 177 Monthly EMI Mortgage of Personal Property of Director and the Personal Guarantee of the Directors
Standard Chartered Bank Repayble in 211 Monthly EMI Mortgage of Immovable Properties of the Company at DLF,Pinnacle & DLF Courtyard and the Personal Guarantee of the Directors
Standard Chartered Bank Repayble in 187 Monthly EMI Mortgage of Immovable Properties of the Company at DLF,Pinnacle & DLF Courtyard and the Personal Guarantee of the Directors
NOTES FORMING PART OF THE FINANCIAL STATEMENTS
NOTE 6 OTHER LONG-TERM LIABILITIES
Particulars As at 31st March, 2012 As at 31st March, 2011
Rs. Rs.
(a) Trade Payables:
(i) Acceptances - -
(ii) Other than Acceptances 415,475.00 187,026.00
(b) Others:
(i) Trade / security deposits received 510,000.00 240,000.00
Total 925,475.00 427,026.00
NOTE 7 LONG-TERM PROVISIONS
Particulars As at 31st March, 2012 As at 31st March, 2011
Rs. Rs.
(a) Provision for employee benefits:
(i) Provision for gratuity (net) (Refer Note 27.1.a) 5,655,170.00 4,653,968.00
(ii) Provision for other employee benefits (Leave Encashment) (Refer Note 27.1.a) 2,919,862.00 2,225,747.00
8,575,032.00 6,879,715.00
(b) Provision - Others:
(i) Provision for other contingencies (Refer Note 27.6) 6,000,000.00 6,000,000.00
(vi) Provision - others
6,000,000.00 6,000,000.00
Total 14,575,032.00 12,879,715.00
NOTE 8 SHORT-TERM BORROWINGS
Particulars As at 31st March, 2012 As at 31st March, 2011
Rs. Rs.
(a) Loans repayable on demand
From banks
Secured 288,739,858.39 244,525,570.86
Unsecured 38,854,784.00 -
327,594,642.39 244,525,570.86
(b) Loans and advances from related parties
Secured - -
Unsecured 25,985,902.00 55,160,143.00
25,985,902.00 55,160,143.00
Total 353,580,544.39 299,685,713.86
Notes:
Details of Security against the Short Term Borrowings from Banks
Particulars Security
State Bank of India First Pari Passu charge over Current assets of the company and 2nd parri passu charge over the fixed assets of the company except vehicles & immovable properties of the company specifically mortage to other lenders.The same is also secured by way of mortagage of personal property of the Director and the Personal Guarantee of the Directors.
Kotak Mahindra Bank First Pari Passu charge over Current assets of the company and 2nd parri passu charge over the fixed assets of the company except vehicles & immovable properties of the company specifically mortage to other lenders.The same is also secured by way of mortagage of personal property of the Director and the Personal Guarantee of the Directors.
Central Bank of India Mortagage of personal property of the Director and the Personal Guarantee of the Directors.
Punjab National Bank Repayble in 16 Quarterly First Pari Passu charge over fixed assets of the company except vehicles & immovableInstallments and Interest Payable properties of the company specifically mortgage to other lenders. The same is also Monthly secured by 2nd Pari Passu charge over the current assets of the company and the
personal guarantee of the directors and corporate guarantee of subsidiary company AMD Estates & Developers (P) Limited
Punjab National Bank Repayble in 60 Monthly Installments First Pari Passu charge over fixed assets of the company except vehicles &and Interest Payable Monthly immovable properties of the company specifically mortgage to other lenders. The
same is also secured by 2nd Pari Passu charge over the current assets of the company and the personal guarantee of the directors and corporate guarantee of subsidiary company AMD Estates & Developers (P) Limited
Union Bank of India Repayble in 60 Monthly Installments First Pari Passu charge over fixed assets of the company except vehicles &and Interest Payable Monthly immovable properties of the company specifically mortgage to other lenders. The
same is also secured by 2nd Pari Passu charge over the current assets of the company and the personal guarantee of the directors and corporate guarantee & mortgage of Land and Building of another Company.
Kotak Mahindra Bank Repayble in 68 Monthly EMI Mortgage of Immovable Properties of the Company at Digital Green, Gurgaon andthe Personal Guarantee of the Directors
Indiabulls Housing Finance Repayble in 84 Monthly EMI Mortgage of Immovable Properties of the Company at Mohali and the PersonalLtd. Guarantee of the Directors
Tata Capital Limited Repayble in 36 Monthly EMI Hypothecation of Vehicle acquired out of Loan
NOTES FORMING PART OF THE FINANCIAL STATEMENTS
NOTE 4 RESERVES AND SURPLUS
AMD Industries Limited
Particulars As at 31st March, 2012 As at 31st March, 2011
Rs. Rs.
(a) Securities premium account
Opening balance 650,390,253.28 650,390,253.28
Add : Premium on shares issued during the year
Less : Utilised during the year for: - -
Issuing bonus shares - -
Writing off preliminary expenses - -
Writing off shares / debentures issue expenses - -
Premium on redemption of redeemable preference shares / debentures - -
Buy back of shares - -
Others - -
Closing balance 650,390,253.28 650,390,253.28
(b) General reserve
Opening balance 27,326,418.51 25,326,418.51
Add: Transferred from surplus in Statement of Profit and Loss - 2,000,000.00
Less: Utilised / transferred during the year for: - -
Issuing bonus shares - -
Others - -
Closing balance 27,326,418.51 27,326,418.51
(c) Surplus / (Deficit) in Statement of Profit and Loss
Opening balance 246,683,171.79 213,375,033.50
Add: Profit / (Loss) for the year 65,031,751.31 57,732,276.29
Amounts transferred from:
General reserve - -
Other reserves - -
Less: Interim dividend - -
Dividends proposed to be distributed to equity shareholders (Re 1/- per share) 19,166,749.00 19,166,749.00
Dividends proposed to be distributed to preference shareholders - -
Tax on dividend 3,109,326.00 3,257,389.00
Transferred to:
General reserve - 2,000,000.00
Capital redemption reserve - -
Debenture redemption reserve - -
Other reserves - -
Closing balance 289,438,848.10 246,683,171.79
Total 967,155,519.89 924,399,843.58
NOTE 5 LONG-TERM BORROWINGS
Particulars As at 31st March, 2012 As at 31st March, 2011
Rs. Rs.
(a) Term loans
From banks
Secured 265,347,541.23 392,878,511.33
Unsecured - -
265,347,541.23 392,878,511.33
From other parties
Secured 16,888,348.79 20,388,984.18
Unsecured - -
16,888,348.79 20,388,984.18
Total 282,235,890.02 413,267,495.51
29th Annual Report 2011-201217 29th Annual Report 2011-2012 18

AMD Industries Limited
NOTES FORMING PART OF THE FINANCIAL STATEMENTS
NOTE 12 FIXED ASSETS
A. Tangible assets Gross block
Balance Additions Disposals Acquisitions Reclassified Revaluation Effect of Borrowing Other Balance as at through as held for increase foreign cost adjustments as at
1 April, 2011 business sale currency capitalised 31st March, combinations exchange 2012
differences Rs. Rs. Rs. Rs. Rs. Rs. Rs. Rs. Rs. Rs.
(a) LandFreehold 151,750,097.47 - - 151,750,097.47 Leasehold 9,932,321.00 - 481,786.00 9,450,535.00
(b) BuildingsOwn use 105,661,039.91 - 6,451,787.90 99,209,252.01 Given under operating lease
(c) Plant and EquipmentOwned 950,998,524.56 16,049,682.00 2,429,920.76 964,618,285.80 Taken under finance leaseGiven under operating lease
(d) Furniture and FixturesOwned 20,107,785.04 611,493.00 457,689.44 20,261,588.60 Taken under finance leaseGiven under operating lease
(e) VehiclesOwned 23,573,760.13 56,187.00 - 23,629,947.13 Taken under finance leaseGiven under operating lease
(f) Office equipmentOwned 10,705,859.49 1,035,903.00 - 11,741,762.49 Taken under finance leaseGiven under operating lease
(g) Leasehold improvementsOwnedTaken under finance leaseGiven under operating lease
(h) Others (specify nature), e.g. Railway sidings, etc.OwnedTaken under finance leaseGiven under operating lease
Total 1,272,729,387.60 17,753,265.00 9,821,184.10 1,280,661,468.49
Previous year 1,202,970,147.03 88,634,196.89 18,874,956.34 1,272,729,387.58
A. Tangible assets
Balance Depreciation / Eliminated Eliminated on Impairment Reversal of Other Balance Balance Balance as at amortisation on disposal reclassification losses impairment adjustments as at as at as at
1 April, 2011 expense for of assets as held for recognised in losses 31st March, 31st March, 31st March, the year sale statement of recognised in 2012 2012 2011
profit and loss Statement of Profit and Loss
Rs. Rs. Rs. Rs. Rs. Rs. Rs. Rs. Rs. Rs.
(a) LandFreehold - - - - 151,750,097.47 151,750,097.47 Leasehold 241,517.82 1,700.00 243,217.82 0.00 9,450,535.00 9,690,803.18
(b) BuildingsOwn use 14,651,607.19 3,341,384.00 2,415,831.89 15,577,159.30 83,632,092.71 91,009,432.72 Given under operating lease
(c) Plant and EquipmentOwned 316,680,594.30 68,337,313.00 841,241.89 384,176,665.41 580,441,620.39 634,317,930.26 Taken under finance leaseGiven under operating lease
(d) Furniture and FixturesOwned 6,115,523.87 1,227,787.00 293,449.53 7,049,861.34 13,211,727.26 13,992,261.17 Taken under finance leaseGiven under operating lease
(e) VehiclesOwned 9,694,956.90 2,161,692.00 - 11,856,648.90 11,773,298.24 13,878,803.24 Taken under finance leaseGiven under operating lease
(f) Office equipmentOwned 7,451,202.99 916,019.34 - 8,367,222.33 3,374,540.16 3,254,656.50 Taken under finance leaseGiven under operating lease
(g) Leasehold improvementsOwnedTaken under finance leaseGiven under operating lease
(h) Others (specify nature), e.g. Railway sidings, etc.OwnedTaken under finance leaseGiven under operating lease
Total 354,835,403.06 75,985,895.34 3,793,741.13 427,027,557.27 853,633,911.23 917,893,984.54
Previous year 283,296,068.38 71,770,479.22 231,144.56 354,835,403.04 917,893,984.54 919,674,078.65
Accumulated depreciation and impairment Net block
AMD Industries Limited
NOTES FORMING PART OF THE FINANCIAL STATEMENTS
NOTE 9 TRADE PAYABLES
Particulars As at 31st March, 2012 As at 31st March, 2011
Rs. Rs.
(a) Trade payables:
Acceptances
Other than Acceptances 230,353,091.88 362,266,355.18
Total 230,353,091.88 362,266,355.18
NOTE 10 OTHER CURRENT LIABILITIES
Particulars As at 31st March, 2012 As at 31st March, 2011
Rs. Rs.
(a) Current maturities of long-term debt (Refer Note (i) below) 135,128,849.39 133,312,432.61
(b) Other payables
(i) Statutory remittances (Contributions to PF and ESIC, Withholding Taxes, Excise Duty,
VAT, Service Tax, etc.) 5,576,610.73 1,274,971.62
(ii) Interest accrued on trade payables - 905,214.00
(iii) Advances from customers 2,635,275.35 10,025,751.12
(iv) Others (Expenses Payable) 28,990,566.10 8,805,247.78
Total 172,331,301.57 154,323,617.13
Note (i): Current maturities of long-term debt (Refer Notes in Note 5 - Long-term borrowings for details of security and guarantee):
Particulars As at 31st March, 2012 As at 31st March, 2011
Rs. Rs.
(a) Term loans
From banks - -
Secured 131,800,653.00 130,340,460.16
Unsecured - -
131,800,653.00 130,340,460.16
From other parties
Secured 3,328,196.39 2,971,972.45
Unsecured - -
3,328,196.39 2,971,972.45
Total 135,128,849.39 133,312,432.61
NOTE 11 SHORT-TERM PROVISIONS
Particulars As at 31st March, 2012 As at 31st March, 2011
Rs. Rs.
(a) Provision for employee benefits:
(i) Provision for bonus 2,815,448.00 2,489,636.00
2,815,448.00 2,489,636.00
(b) Provision - Others:
(i) Provision for tax (net of advance tax Rs.2,40,55,788.00 (As at 31 March,
2011 Rs.1,96,87,170.88)) 8,944,212.00 (1,687,170.88)
(ii) Provision for Wealth Tax 75,000.00 75,000.00
(iii) Provision for proposed equity dividend 19,166,749.00 19,166,749.00
(iv) Provision for tax on proposed dividends 3,109,326.00 3,257,389.00
(v) Provision - (i) Forward Contract Payble 113,751,827.70 166,337,776.30
(ii) Deferred Forward Premium 3,564,592.18 7,784,459.44
148,611,706.88 194,934,202.86
Total 151,427,154.88 197,423,838.86
29th Annual Report 2011-201219 29th Annual Report 2011-2012 20

AMD Industries Limited
NOTES FORMING PART OF THE FINANCIAL STATEMENTS
NOTE 12 FIXED ASSETS
A. Tangible assets Gross block
Balance Additions Disposals Acquisitions Reclassified Revaluation Effect of Borrowing Other Balance as at through as held for increase foreign cost adjustments as at
1 April, 2011 business sale currency capitalised 31st March, combinations exchange 2012
differences Rs. Rs. Rs. Rs. Rs. Rs. Rs. Rs. Rs. Rs.
(a) LandFreehold 151,750,097.47 - - 151,750,097.47 Leasehold 9,932,321.00 - 481,786.00 9,450,535.00
(b) BuildingsOwn use 105,661,039.91 - 6,451,787.90 99,209,252.01 Given under operating lease
(c) Plant and EquipmentOwned 950,998,524.56 16,049,682.00 2,429,920.76 964,618,285.80 Taken under finance leaseGiven under operating lease
(d) Furniture and FixturesOwned 20,107,785.04 611,493.00 457,689.44 20,261,588.60 Taken under finance leaseGiven under operating lease
(e) VehiclesOwned 23,573,760.13 56,187.00 - 23,629,947.13 Taken under finance leaseGiven under operating lease
(f) Office equipmentOwned 10,705,859.49 1,035,903.00 - 11,741,762.49 Taken under finance leaseGiven under operating lease
(g) Leasehold improvementsOwnedTaken under finance leaseGiven under operating lease
(h) Others (specify nature), e.g. Railway sidings, etc.OwnedTaken under finance leaseGiven under operating lease
Total 1,272,729,387.60 17,753,265.00 9,821,184.10 1,280,661,468.49
Previous year 1,202,970,147.03 88,634,196.89 18,874,956.34 1,272,729,387.58
A. Tangible assets
Balance Depreciation / Eliminated Eliminated on Impairment Reversal of Other Balance Balance Balance as at amortisation on disposal reclassification losses impairment adjustments as at as at as at
1 April, 2011 expense for of assets as held for recognised in losses 31st March, 31st March, 31st March, the year sale statement of recognised in 2012 2012 2011
profit and loss Statement of Profit and Loss
Rs. Rs. Rs. Rs. Rs. Rs. Rs. Rs. Rs. Rs.
(a) LandFreehold - - - - 151,750,097.47 151,750,097.47 Leasehold 241,517.82 1,700.00 243,217.82 0.00 9,450,535.00 9,690,803.18
(b) BuildingsOwn use 14,651,607.19 3,341,384.00 2,415,831.89 15,577,159.30 83,632,092.71 91,009,432.72 Given under operating lease
(c) Plant and EquipmentOwned 316,680,594.30 68,337,313.00 841,241.89 384,176,665.41 580,441,620.39 634,317,930.26 Taken under finance leaseGiven under operating lease
(d) Furniture and FixturesOwned 6,115,523.87 1,227,787.00 293,449.53 7,049,861.34 13,211,727.26 13,992,261.17 Taken under finance leaseGiven under operating lease
(e) VehiclesOwned 9,694,956.90 2,161,692.00 - 11,856,648.90 11,773,298.24 13,878,803.24 Taken under finance leaseGiven under operating lease
(f) Office equipmentOwned 7,451,202.99 916,019.34 - 8,367,222.33 3,374,540.16 3,254,656.50 Taken under finance leaseGiven under operating lease
(g) Leasehold improvementsOwnedTaken under finance leaseGiven under operating lease
(h) Others (specify nature), e.g. Railway sidings, etc.OwnedTaken under finance leaseGiven under operating lease
Total 354,835,403.06 75,985,895.34 3,793,741.13 427,027,557.27 853,633,911.23 917,893,984.54
Previous year 283,296,068.38 71,770,479.22 231,144.56 354,835,403.04 917,893,984.54 919,674,078.65
Accumulated depreciation and impairment Net block
AMD Industries Limited
NOTES FORMING PART OF THE FINANCIAL STATEMENTS
NOTE 9 TRADE PAYABLES
Particulars As at 31st March, 2012 As at 31st March, 2011
Rs. Rs.
(a) Trade payables:
Acceptances
Other than Acceptances 230,353,091.88 362,266,355.18
Total 230,353,091.88 362,266,355.18
NOTE 10 OTHER CURRENT LIABILITIES
Particulars As at 31st March, 2012 As at 31st March, 2011
Rs. Rs.
(a) Current maturities of long-term debt (Refer Note (i) below) 135,128,849.39 133,312,432.61
(b) Other payables
(i) Statutory remittances (Contributions to PF and ESIC, Withholding Taxes, Excise Duty,
VAT, Service Tax, etc.) 5,576,610.73 1,274,971.62
(ii) Interest accrued on trade payables - 905,214.00
(iii) Advances from customers 2,635,275.35 10,025,751.12
(iv) Others (Expenses Payable) 28,990,566.10 8,805,247.78
Total 172,331,301.57 154,323,617.13
Note (i): Current maturities of long-term debt (Refer Notes in Note 5 - Long-term borrowings for details of security and guarantee):
Particulars As at 31st March, 2012 As at 31st March, 2011
Rs. Rs.
(a) Term loans
From banks - -
Secured 131,800,653.00 130,340,460.16
Unsecured - -
131,800,653.00 130,340,460.16
From other parties
Secured 3,328,196.39 2,971,972.45
Unsecured - -
3,328,196.39 2,971,972.45
Total 135,128,849.39 133,312,432.61
NOTE 11 SHORT-TERM PROVISIONS
Particulars As at 31st March, 2012 As at 31st March, 2011
Rs. Rs.
(a) Provision for employee benefits:
(i) Provision for bonus 2,815,448.00 2,489,636.00
2,815,448.00 2,489,636.00
(b) Provision - Others:
(i) Provision for tax (net of advance tax Rs.2,40,55,788.00 (As at 31 March,
2011 Rs.1,96,87,170.88)) 8,944,212.00 (1,687,170.88)
(ii) Provision for Wealth Tax 75,000.00 75,000.00
(iii) Provision for proposed equity dividend 19,166,749.00 19,166,749.00
(iv) Provision for tax on proposed dividends 3,109,326.00 3,257,389.00
(v) Provision - (i) Forward Contract Payble 113,751,827.70 166,337,776.30
(ii) Deferred Forward Premium 3,564,592.18 7,784,459.44
148,611,706.88 194,934,202.86
Total 151,427,154.88 197,423,838.86
29th Annual Report 2011-201219 29th Annual Report 2011-2012 20

AMD Industries Limited
NOTES FORMING PART OF THE FINANCIAL STATEMENTSNOTE 14 LONG-TERM LOANS AND ADVANCES
Particulars As at 31st March, 2012 As at 31st March, 2011
Rs. Rs.
(a) Capital advancesSecured, considered good - - Unsecured, considered good 131,434,437.00 124,470,600.00 Doubtful - -
131,434,437.00 124,470,600.00 Less: Provision for doubtful advances - -
131,434,437.00 124,470,600.00(b) Security deposits
Secured, considered good - - Unsecured, considered good 16,693,811.00 25,163,227.00Doubtful - -
16,693,811.00 25,163,227.00Less: Provision for doubtful deposits - -
16,693,811.00 25,163,227.00 (c) Loans and advances to related parties
Secured, considered good - - Unsecured, considered good 372,584,398.00 394,287,085.17 Doubtful - -
372,584,398.00 394,287,085.17 Less: Provision for doubtful loans and advances - -
372,584,398.00 394,287,085.17(d) Prepaid expenses - Unsecured, considered good 104,000.00 126,000.00(e) Other loans and advances (Advances to suppliers)
Secured, considered good - -Unsecured, considered good 440,237.00 442,807.00Doubtful - -
440,237.00 442,807.00Less: Provision for other doubtful loans and advances - -
440,237.00 442,807.00(f) Other loans and advances
Secured, considered good - -Unsecured, considered good 4,136,962.00 3,534,983.00 Doubtful - -
4,136,962.00 3,534,983.00 Less: Provision for other doubtful loans and advances - -
4,136,962.00 3,534,983.00
Total 525,393,845.00 548,024,702.17
NOTE 15 INVENTORIES(At lower of cost and net realisable value)
Particulars As at 31st March, 2012 As at 31st March, 2011Rs. Rs.
(a) Raw materials 215,381,180.01 232,263,296.00 Goods-in-transit 24,724,168.00 76,923,664.00
240,105,348.01 309,186,960.00 (b) Work-in-progress @ (Refer Note below) 17,974,600.00 22,414,100.00
Goods-in-transit - - 17,974,600.00 22,414,100.00
(c) Finished goods (other than those acquired for trading) 33,677,400.00 89,198,690.00 Goods-in-transit - -
33,677,400.00 89,198,690.00(d) Stock-in-trade (acquired for trading) 2,300.00 2,300.00
Goods-in-transit - - 2,300.00 2,300.00
(e) Stores and spares 67,245,407.93 53,891,873.93 Goods-in-transit - -
67,245,407.93 53,891,873.93 (f) Others - Packing Materials 4,334,531.00 6,329,489.00
Goods-in-transit - - 4,334,531.00 6,329,489.00
(g) Others - Waste & Scrap 6,187,689.00 5,582,599.00 Goods-in-transit - -
6,187,689.00 5,582,599.00 Total 369,527,275.94 486,606,011.93
Note: Details of inventory of work-in-progress
Particulars As at 31st March, 2012 As at 31st March, 2011Rs. Rs.
Pet PreformCSD Closures 4,302,600.00 706,100.00 Crown Caps 3,500,200.00 6,547,900.00 Job Work (Pet Preform) 10,171,800.00 15,160,100.00
17,974,600.00 22,414,100.00
AMD Industries Limited
B. Intangible assets Gross block
Balance Additions Disposals Acquisitions Reclassified Revaluation Effect of Borrowing Other Balance as at through as held for increase foreign cost adjustments as at
1 April, 2011 business sale currency capitalised 31st March, combinations exchange 2012
differences Rs. Rs. Rs. Rs. Rs. Rs. Rs. Rs. Rs. Rs.
(a) Computer Software 1,465,100.00 789,805.00 - - - - - - - 2,254,905.00
Total 1,465,100.00 789,805.00 - - - - - - - 2,254,905.00
Previous year 1,465,100.00 - - - - - - - - 1,465,100.00
NOTES FORMING PART OF THE FINANCIAL STATEMENTS
NOTE 12 FIXED ASSETS
B. Intangible assets
Balance Depreciation / Eliminated Eliminated on Impairment Reversal of Other Balance Balance Balance as at amortisation on disposal reclassification losses impairment adjustments as at as at as at
1 April, 2011 expense for of assets as held for recognised in losses 31st March, 31st March, 31st March, the year sale statement of recognised in 2012 2012 2011
profit and loss Statement of Profit and Loss
Rs. Rs. Rs. Rs. Rs. Rs. Rs. Rs. Rs. Rs.
(a) Computer Software 744,658.00 267,576.00 - - - - - 1,012,234.00 1,242,671.00 720,442.00
Total 744,658.00 267,576.00 - - - - - 1,012,234.00 1,242,671.00 720,442.00
Previous year 507,166.00 237,492.00 - - - - - 744,658.00 720,442.00 957,934.00
Accumulated depreciation and impairment Net block
C. Depreciation and amortisation relating to continuing operations:
Particulars As at 31st March, 2012 As at 31st March, 2011
Rs. Rs.
Depreciation and amortisation for the year on tangible assets as per Note 12 A 75,985,895.34 71,770,479.22
Depreciation and amortisation for the year on intangible assets as per Note 12 B 267,576.00 237,492.00
Less: Utilised from revaluation reserve - -
Depreciation and amortisation relating to discontinuing operations - -
Depreciation and amortisation relating to continuing operations 76,253,471.34 72,007,971.22
NOTE 13 NON-CURRENT INVESTMENT
Particulars As at 31st March, 2012 As at 31st March, 2011
Quoted # Unquoted # Total Quoted Unquoted TotalRs. Rs. Rs. Rs. Rs. Rs.
Investments (At cost):A. Trade @
(a) Investment in equity instruments (give details separately for fully / partly paid up instruments)
(i) of subsidiaries 52,000,000.00 52,000,000.00 52,000,000.00 52,000,000.00 52,00,000(As at 31 March, 2011: 52,00,000) shares of Rs.10 each fully paid up in AMD Estates & Developers (P) Limited
- 52,000,000.00 52,000,000.00 - 52,000,000.00 52,000,000.00
Total - Trade (A) - 52,000,000.00 52,000,000.00 52,000,000.00 52,000,000.00
Particulars As at 31st March, 2012 As at 31st March, 2011
Quoted Unquoted Total Quoted Unquoted TotalRs. Rs. Rs. Rs. Rs. Rs.
B. Other investments(a) Investment in equity instruments
(give details separately for fully / partly paid up instruments)
(i) of other STL Global Limited(50000 Equity Shares fully paid up) 3,321,885.69 - 3,321,885.69 3,321,885.69 - 3,321,885.69 (Market Value Rs.176500/- for 50000 Shares @ Rs.3.53 each as on 31.03.2012)
3,321,885.69 - 3,321,885.69 3,321,885.69 - 3,321,885.69 (b) Investment in mutual funds(i) SBI One India Fund - Dividend 100,000.00 100,000.00 100,000.00 100,000.00
(10000 Units at Rs.10 Each)(ii) SBI Infrastructure Fund - I - Growth 100,000.00 100,000.00 100,000.00 100,000.00
(10000 Units at Rs.10 Each)(iii) Union KBC Equity Fund Growth 500,000.00 500,000.00
(50000 Units at Rs.10 Each)700,000.00 700,000.00 200,000.00 200,000.00
Total - Other investments (B) 4,021,885.69 4,021,885.69 3,521,885.69 3,521,885.69
Total (A+B) 4,021,885.69 52,000,000.00 56,021,885.69 3,521,885.69 52,000,000.00 55,521,885.69
Less: Provision for diminution in value of investments 36,300.00 (2,000.00)
Total 55,985,585.69 55,523,885.69
Aggregate amount of quoted investments 4,021,885.69 3,521,885.69
Aggregate amount of unquoted investments 52,000,000.00 52,000,000.00
29th Annual Report 2011-201221 29th Annual Report 2011-2012 22

AMD Industries Limited
NOTES FORMING PART OF THE FINANCIAL STATEMENTS
NOTE 18 SHORT-TERM LOANS AND ADVANCES (CONTD.)
Note: Short-term loans and advances include amounts due from:
Particulars As at 31st March, 2012 As at 31st March, 2011Rs. Rs.
Directors - -Other officers of the Company - -Firms in which any director is a partner - -Private companies in which any director is a director or member - -
- -
NOTE 19 OTHER CURRENT ASSETS
Particulars As at 31st March, 2012 As at 31st March, 2011Rs. Rs.
(a) Accruals(i) Interest accrued on deposits 1,422,543.90 1,569,315.00
(b) Others(i) Others - (i) Forward Contract Receivables 111,277,384.15 180,578,165.82
(ii) Exports Incentive Receivables 5,095,545.06 13,296,477.84
Total 117,795,473.11 195,443,958.66
NOTE 20 REVENUE FROM OPERATIONS
Particulars For the year ended For the year ended 31st March, 2012 31st March, 2011
Rs. Rs.
(a) Sale of products @ (Refer Note (i) below) 1,746,847,489.25 1,317,264,455.03 (b) Sale of services @ (Refer Note (ii) below) 237,740,383.51 189,144,770.38 (c) Other operating revenues # (Refer Note (iii) below) 55,762,909.21 41,451,625.00
2,040,350,781.97 1,547,860,850.41 Less:
(d) Excise duty 220,273,280.00 166,720,518.00
Total 1,820,077,501.97 1,381,140,332.41
Note Particulars For the year ended For the year ended 31st March, 2012 31st March, 2011
Rs. Rs.
(i) Sale of products comprises:Manufactured goodsCrown Caps 796,862,252.00 678,183,677.61 CSD Closures 403,100,890.21 276,992,032.98 Pet - Preforms 546,576,913.04 361,939,440.44 Others
Total - Sale of manufactured goods 1,746,540,055.25 1,317,115,151.03
Traded goodsOthers 307,434.00 149,304.00
Total - Sale of traded goods 307,434.00 149,304.00
Total - Sale of products 1,746,847,489.25 1,317,264,455.03
(ii) Sale of services comprises :Jobwork - Pet Preform 237,740,383.51 189,144,770.38
Total - Sale of services 237,740,383.51 189,144,770.38
(iii) Other operating revenues comprise:Sale of scrap 28,645,223.57 22,258,413.00 Duty drawback and other export incentives 18,921,121.00 11,616,358.00 Others - Discount on Purchase 8,196,564.64 7,576,854.00
Total - Other operating revenues 55,762,909.21 41,451,625.00
NOTE 21 OTHER INCOME
Particulars For the year ended For the year ended 31st March, 2012 31st March, 2011
Rs. Rs.
(a) Interest income (Refer Note (i) below) 4,891,094.41 22,893,444.80 (b) Dividend income:
from current investments - -subsidiaries - - joint ventures - - associates - - others - - from long-term investmentssubsidiaries - - joint ventures - - associates - -others 18,900.00 10,075.00
(c) Other non-operating income (net of expenses directly attributable to such income) (Refer Note (ii) below) 1,996,705.92 1,056,152.07 Total 6,906,700.33 23,959,671.87
AMD Industries Limited
NOTES FORMING PART OF THE FINANCIAL STATEMENTS
NOTE 16 TRADE RECEIVABLES
Particulars As at 31st March, 2012 As at 31st March, 2011
Rs. Rs.
Trade receivables outstanding for a period exceeding six months from the date they were due for payment #Secured, considered good - - Unsecured, considered good 17,298,634.03 14,317,058.04 Doubtful 1,592,552.00 1,592,552.00
18,891,186.03 15,909,610.04 Less: Provision for doubtful trade receivables - -
18,891,186.03 15,909,610.04 Other Trade receivablesSecured, considered good - -Unsecured, considered good 346,913,691.12 243,975,729.04 Doubtful - -
346,913,691.12 243,975,729.04 Less: Provision for doubtful trade receivables - -
346,913,691.12 243,975,729.04 Total 365,804,877.15 259,885,339.08
Note: Trade receivables include debts due from:
Particulars As at 31st March, 2012 As at 31st March, 2011Rs. Rs.
Directors - - Other officers of the Company - - Firms in which any director is a partner - - Private companies in which any director is a director or member - -
- -
NOTE 17 CASH AND CASH EQUIVALENTS
Particulars As at 31st March, 2012 As at 31st March, 2011Rs. Rs.
(a) Cash on hand 88,120.80 176,406.80
(b) Cheques, drafts on hand - -
(c) Balances with banks
(i) In current accounts 7,611,895.82 3,432,500.56
(ii) In EEFC accounts 583,515.10 509,299.00
(iii) In earmarked accounts
- Balances held as margin money or security against borrowings, guarantees and other commitments (Refer Note (i) below) 33,802,504.00 66,104,194.00
(d) Others - Foreign Currency in Hand 144,388.00 68,921.85
Total 42,230,423.72 70,291,322.21
NOTE 18 SHORT-TERM LOANS AND ADVANCES
Particulars As at 31st March, 2012 As at 31st March, 2011Rs. Rs.
(a) Loans and advances to employeesSecured, considered good - -Unsecured, considered good 641,533.00 649,826.00Doubtful - -
641,533.00 649,826.00Less: Provision for doubtful loans and advances - -
641,533.00 649,826.00 (b) Prepaid expenses - Unsecured, considered good 2,182,620.40 2,269,548.68 (c) Balances with government authorities
Unsecured, considered good(i) CENVAT credit receivable 82,346,890.80 79,563,193.61 (ii) VAT credit receivable 2,808,364.00 385,745.00 (iii) Service Tax credit receivable 24,249,673.02 17,420,408.04
(d) Others (Advances to Suppliers))Secured, considered good - -Unsecured, considered good 5,120,568.57 3,971,923.51Doubtful - -
5,120,568.57 3,971,923.51 Less: Provision for other doubtful loans and advances - -
5,120,568.57 3,971,923.51
Total 117,349,649.79 104,260,644.84
29th Annual Report 2011-201223 29th Annual Report 2011-2012 24

AMD Industries Limited
NOTES FORMING PART OF THE FINANCIAL STATEMENTS
NOTE 18 SHORT-TERM LOANS AND ADVANCES (CONTD.)
Note: Short-term loans and advances include amounts due from:
Particulars As at 31st March, 2012 As at 31st March, 2011Rs. Rs.
Directors - -Other officers of the Company - -Firms in which any director is a partner - -Private companies in which any director is a director or member - -
- -
NOTE 19 OTHER CURRENT ASSETS
Particulars As at 31st March, 2012 As at 31st March, 2011Rs. Rs.
(a) Accruals(i) Interest accrued on deposits 1,422,543.90 1,569,315.00
(b) Others(i) Others - (i) Forward Contract Receivables 111,277,384.15 180,578,165.82
(ii) Exports Incentive Receivables 5,095,545.06 13,296,477.84
Total 117,795,473.11 195,443,958.66
NOTE 20 REVENUE FROM OPERATIONS
Particulars For the year ended For the year ended 31st March, 2012 31st March, 2011
Rs. Rs.
(a) Sale of products @ (Refer Note (i) below) 1,746,847,489.25 1,317,264,455.03 (b) Sale of services @ (Refer Note (ii) below) 237,740,383.51 189,144,770.38 (c) Other operating revenues # (Refer Note (iii) below) 55,762,909.21 41,451,625.00
2,040,350,781.97 1,547,860,850.41 Less:
(d) Excise duty 220,273,280.00 166,720,518.00
Total 1,820,077,501.97 1,381,140,332.41
Note Particulars For the year ended For the year ended 31st March, 2012 31st March, 2011
Rs. Rs.
(i) Sale of products comprises:Manufactured goodsCrown Caps 796,862,252.00 678,183,677.61 CSD Closures 403,100,890.21 276,992,032.98 Pet - Preforms 546,576,913.04 361,939,440.44 Others
Total - Sale of manufactured goods 1,746,540,055.25 1,317,115,151.03
Traded goodsOthers 307,434.00 149,304.00
Total - Sale of traded goods 307,434.00 149,304.00
Total - Sale of products 1,746,847,489.25 1,317,264,455.03
(ii) Sale of services comprises :Jobwork - Pet Preform 237,740,383.51 189,144,770.38
Total - Sale of services 237,740,383.51 189,144,770.38
(iii) Other operating revenues comprise:Sale of scrap 28,645,223.57 22,258,413.00 Duty drawback and other export incentives 18,921,121.00 11,616,358.00 Others - Discount on Purchase 8,196,564.64 7,576,854.00
Total - Other operating revenues 55,762,909.21 41,451,625.00
NOTE 21 OTHER INCOME
Particulars For the year ended For the year ended 31st March, 2012 31st March, 2011
Rs. Rs.
(a) Interest income (Refer Note (i) below) 4,891,094.41 22,893,444.80 (b) Dividend income:
from current investments - -subsidiaries - - joint ventures - - associates - - others - - from long-term investmentssubsidiaries - - joint ventures - - associates - -others 18,900.00 10,075.00
(c) Other non-operating income (net of expenses directly attributable to such income) (Refer Note (ii) below) 1,996,705.92 1,056,152.07 Total 6,906,700.33 23,959,671.87
AMD Industries Limited
NOTES FORMING PART OF THE FINANCIAL STATEMENTS
NOTE 16 TRADE RECEIVABLES
Particulars As at 31st March, 2012 As at 31st March, 2011
Rs. Rs.
Trade receivables outstanding for a period exceeding six months from the date they were due for payment #Secured, considered good - - Unsecured, considered good 17,298,634.03 14,317,058.04 Doubtful 1,592,552.00 1,592,552.00
18,891,186.03 15,909,610.04 Less: Provision for doubtful trade receivables - -
18,891,186.03 15,909,610.04 Other Trade receivablesSecured, considered good - -Unsecured, considered good 346,913,691.12 243,975,729.04 Doubtful - -
346,913,691.12 243,975,729.04 Less: Provision for doubtful trade receivables - -
346,913,691.12 243,975,729.04 Total 365,804,877.15 259,885,339.08
Note: Trade receivables include debts due from:
Particulars As at 31st March, 2012 As at 31st March, 2011Rs. Rs.
Directors - - Other officers of the Company - - Firms in which any director is a partner - - Private companies in which any director is a director or member - -
- -
NOTE 17 CASH AND CASH EQUIVALENTS
Particulars As at 31st March, 2012 As at 31st March, 2011Rs. Rs.
(a) Cash on hand 88,120.80 176,406.80
(b) Cheques, drafts on hand - -
(c) Balances with banks
(i) In current accounts 7,611,895.82 3,432,500.56
(ii) In EEFC accounts 583,515.10 509,299.00
(iii) In earmarked accounts
- Balances held as margin money or security against borrowings, guarantees and other commitments (Refer Note (i) below) 33,802,504.00 66,104,194.00
(d) Others - Foreign Currency in Hand 144,388.00 68,921.85
Total 42,230,423.72 70,291,322.21
NOTE 18 SHORT-TERM LOANS AND ADVANCES
Particulars As at 31st March, 2012 As at 31st March, 2011Rs. Rs.
(a) Loans and advances to employeesSecured, considered good - -Unsecured, considered good 641,533.00 649,826.00Doubtful - -
641,533.00 649,826.00Less: Provision for doubtful loans and advances - -
641,533.00 649,826.00 (b) Prepaid expenses - Unsecured, considered good 2,182,620.40 2,269,548.68 (c) Balances with government authorities
Unsecured, considered good(i) CENVAT credit receivable 82,346,890.80 79,563,193.61 (ii) VAT credit receivable 2,808,364.00 385,745.00 (iii) Service Tax credit receivable 24,249,673.02 17,420,408.04
(d) Others (Advances to Suppliers))Secured, considered good - -Unsecured, considered good 5,120,568.57 3,971,923.51Doubtful - -
5,120,568.57 3,971,923.51 Less: Provision for other doubtful loans and advances - -
5,120,568.57 3,971,923.51
Total 117,349,649.79 104,260,644.84
29th Annual Report 2011-201223 29th Annual Report 2011-2012 24

AMD Industries Limited
NOTE 23 EMPLOYEE BENEFITS EXPENSE
Particulars For the year ended For the year ended 31st March, 2012 31st March, 2011
Rs. Rs.
Salaries and wages 110,438,900.00 80,476,795.81 Contributions to provident and other funds (Refer Note 30.4) 2,462,980.40 2,209,679.00 Staff welfare expenses 1,505,132.00 1,180,472.00
Total 114,407,012.40 83866946.81
NOTE 24 FINANCE COSTS
Particulars For the year ended For the year ended 31st March, 2012 31st March, 2011
Rs. Rs.
(a) Interest expense on:(i) Borrowings 93,306,835.60 89,206,820.18 (ii) Trade payables 7,916,169.21 9,930,824.63
(b) Other borrowing costs - Processing Fees 2,299,852.73 7,768,409.00 (c) Net (gain) / loss on foreign currency transactions and translation (considered as finance cost) 3,822,726.75 (2,082,226.75)
Total 107,345,584.29 104,823,827.06
Note 25 Other expenses
Particulars For the year ended For the year ended 31st March, 2012 31st March, 2011
Rs. Rs.
Business promotion 755,084.41 1,308,722.78 Communication 2,792,601.57 3,195,874.04 Consumption of stores and spare parts 6,680,405.20 5,686,941.92 Consumption of packing materials 50,071,993.82 52,529,043.36 Commission Paid 49,723,901.35 51,280,116.50 Donations and contributions 103,100.00 507,301.00 Freight and forwarding 46,369,461.66 34,973,538.93 Legal and professional 5,710,322.89 4,906,579.50 Net loss on foreign currency transactions and translation (other than considered as finance cost) 25,070,748.89 (16,906,315.51)Payments to auditors (Refer Note (i) below) 752,500.00 645,000.00 Printing and stationery 1,337,467.00 827,121.00 Power and fuel 98,125,198.00 89,742,493.96 Insurance 3,848,442.14 3,615,759.42 Rates and taxes 1,097,919.00 1,173,719.98 Rent including lease rentals 19,889,408.81 14,466,086.19 Repairs and maintenance - Buildings 3,842,222.50 1,907,358.03 Repairs and maintenance - Machinery 13,866,022.75 10,160,071.39 Repairs and maintenance - Others 4,122,190.43 3,385,743.00 Sales discount 9,238,892.72 12,410,080.00 Travelling and conveyance 13,442,077.86 13,779,677.07 Water 120,385.00 98,746.00 Adjustments to the carrying amount of investments (other than subsidiaries) (net) - reduction in the carrying amount of -current investmentslong-term investments 38,300.00 8,100.00 Prior period items (net) (Refer Note (ii) below) - - Miscellaneous expenses 12,649,320.50 14,211,846.13
Total 369,647,966.50 303,913,604.69
NOTE 25 OTHER EXPENSES (CONTD.)
Notes: Particulars For the year ended For the year ended 31st March, 2012 31st March, 2011
Rs. Rs.
(i) Payments to the auditors comprises (net of service tax input credit, where applicable):As auditors - statutory audit 520,000.00 435,000.00 For taxation audit fees 130,000.00 115,000.00 For taxation matters 62,000.00 50,000.00 For company law matters - - For management services - - For other services 40,500.00 45,000.00 Reimbursement of expenses
Total 752,500.00 645,000.00
(ii) Details of Prior period items (net)Prior period expenses - - Prior period income - -
Total - -
NOTES FORMING PART OF THE FINANCIAL STATEMENTS
AMD Industries Limited
NOTES FORMING PART OF THE FINANCIAL STATEMENTS
Particulars For the year ended For the year ended 31st March, 2012 31st March, 2011
Rs. Rs.
(i) Interest income comprises:Interest from banks on:deposits 2,769,140.11 2,147,403.80 other balancesInterest on loans and advances 960,736.30 319,620.00 Interest on overdue trade receivables (1,384,981.00) 2,353,999.00 Interest income from current investmentssubsidiaries - - joint ventures - - associates - - others - - Interest income from long term investmentssubsidiaries 2,546,199.00 18,072,422.00 joint ventures - - associates - - others - - Total - Interest income 4,891,094.41 22,893,444.80
NOTE 21 OTHER INCOME (CONTD.)
Note Particulars For the year ended For the year ended 31st March, 2012 31st March, 2011
Rs. Rs.
(ii) Other non-operating income comprises:Rental income from investment properties 1,680,806.00 1,005,000.00 Prior period items (net) (Refer Note (iii) below) - - Miscellaneous income 315,899.92 51,152.07 Total - Other non-operating income 1,996,705.92 1,056,152.07
(iii) Details of Prior period items (net)Prior period income (give details) - - Prior period expenses (give details) - - Total - -
NOTE 22.a COST OF MATERIALS CONSUMED
Particulars For the year ended For the year ended 31st March, 2012 31st March, 2011
Rs. Rs.
Opening stock 309,186,960.00 220,894,059.00 Add: Purchases 951,256,305.00 935,094,545.93
1,260,443,265.00 1,155,988,604.93 Less: Closing stock 240,105,348.01 309,186,960.00 Cost of material consumed 1,020,337,916.99 846,801,644.93 Material consumed comprises:Tin Free Sheets 354,248,609.00 350,616,129.00 Polypropylene 168,509,861.00 128,692,410.00 Resin 341,512,408.00 230,920,453.00 Other items 156,067,038.99 136,572,652.93 Total 1,020,337,916.99 846,801,644.93
- -
NOTE 22.b PURCHASE OF TRADED GOODS
Particulars For the year ended For the year ended 31st March, 2012 31st March, 2011
Rs. Rs.
Traded good - Real Estates - DLF Pinnacle 247,826.00 -Traded good - Real Estates - DLF Courtyard 1,706,714.00 1,200,000.00 Others 91,192.50 80,737.50
Total 2,045,732.50 1,280,737.50
NOTE 22.c CHANGES IN INVENTORIES OF FINISHED GOODS, WORK-IN-PROGRESS AND STOCK-IN-TRADE
Particulars For the year ended For the year ended 31st March, 2012 31st March, 2011
Rs. Rs.
Inventories at the end of the year:
Finished goods 33,677,400.00 89,198,690.00 Work-in-progress 17,974,600.00 22,414,100.00 Stock-in-trade - Real Estates 44,181,401.93 42,226,861.93 Stock-in-trade -Waste & Scrap 6,187,689.00 5,582,599.00 Stock-in-trade - Trading Goods 2,300.00 2,300.00
102,023,390.93 159,424,550.93 Inventories at the beginning of the year:Finished goods 89,198,690.00 22,243,679.00 Work-in-progress 22,414,100.00 6,608,300.00 Stock-in-Trade - Real Estates 42,226,861.93 41,026,861.93 Stock-in-trade -Waste & Scrap 5,582,599.00 5,011,477.00 Stock-in-trade - Trading Goods 2,300.00 -
159,424,550.93 74,890,317.93
Net (increase) / decrease 57,401,160.00 (84,534,233.00)
29th Annual Report 2011-201225 29th Annual Report 2011-2012 26

AMD Industries Limited
NOTE 23 EMPLOYEE BENEFITS EXPENSE
Particulars For the year ended For the year ended 31st March, 2012 31st March, 2011
Rs. Rs.
Salaries and wages 110,438,900.00 80,476,795.81 Contributions to provident and other funds (Refer Note 30.4) 2,462,980.40 2,209,679.00 Staff welfare expenses 1,505,132.00 1,180,472.00
Total 114,407,012.40 83866946.81
NOTE 24 FINANCE COSTS
Particulars For the year ended For the year ended 31st March, 2012 31st March, 2011
Rs. Rs.
(a) Interest expense on:(i) Borrowings 93,306,835.60 89,206,820.18 (ii) Trade payables 7,916,169.21 9,930,824.63
(b) Other borrowing costs - Processing Fees 2,299,852.73 7,768,409.00 (c) Net (gain) / loss on foreign currency transactions and translation (considered as finance cost) 3,822,726.75 (2,082,226.75)
Total 107,345,584.29 104,823,827.06
Note 25 Other expenses
Particulars For the year ended For the year ended 31st March, 2012 31st March, 2011
Rs. Rs.
Business promotion 755,084.41 1,308,722.78 Communication 2,792,601.57 3,195,874.04 Consumption of stores and spare parts 6,680,405.20 5,686,941.92 Consumption of packing materials 50,071,993.82 52,529,043.36 Commission Paid 49,723,901.35 51,280,116.50 Donations and contributions 103,100.00 507,301.00 Freight and forwarding 46,369,461.66 34,973,538.93 Legal and professional 5,710,322.89 4,906,579.50 Net loss on foreign currency transactions and translation (other than considered as finance cost) 25,070,748.89 (16,906,315.51)Payments to auditors (Refer Note (i) below) 752,500.00 645,000.00 Printing and stationery 1,337,467.00 827,121.00 Power and fuel 98,125,198.00 89,742,493.96 Insurance 3,848,442.14 3,615,759.42 Rates and taxes 1,097,919.00 1,173,719.98 Rent including lease rentals 19,889,408.81 14,466,086.19 Repairs and maintenance - Buildings 3,842,222.50 1,907,358.03 Repairs and maintenance - Machinery 13,866,022.75 10,160,071.39 Repairs and maintenance - Others 4,122,190.43 3,385,743.00 Sales discount 9,238,892.72 12,410,080.00 Travelling and conveyance 13,442,077.86 13,779,677.07 Water 120,385.00 98,746.00 Adjustments to the carrying amount of investments (other than subsidiaries) (net) - reduction in the carrying amount of -current investmentslong-term investments 38,300.00 8,100.00 Prior period items (net) (Refer Note (ii) below) - - Miscellaneous expenses 12,649,320.50 14,211,846.13
Total 369,647,966.50 303,913,604.69
NOTE 25 OTHER EXPENSES (CONTD.)
Notes: Particulars For the year ended For the year ended 31st March, 2012 31st March, 2011
Rs. Rs.
(i) Payments to the auditors comprises (net of service tax input credit, where applicable):As auditors - statutory audit 520,000.00 435,000.00 For taxation audit fees 130,000.00 115,000.00 For taxation matters 62,000.00 50,000.00 For company law matters - - For management services - - For other services 40,500.00 45,000.00 Reimbursement of expenses
Total 752,500.00 645,000.00
(ii) Details of Prior period items (net)Prior period expenses - - Prior period income - -
Total - -
NOTES FORMING PART OF THE FINANCIAL STATEMENTS
AMD Industries Limited
NOTES FORMING PART OF THE FINANCIAL STATEMENTS
Particulars For the year ended For the year ended 31st March, 2012 31st March, 2011
Rs. Rs.
(i) Interest income comprises:Interest from banks on:deposits 2,769,140.11 2,147,403.80 other balancesInterest on loans and advances 960,736.30 319,620.00 Interest on overdue trade receivables (1,384,981.00) 2,353,999.00 Interest income from current investmentssubsidiaries - - joint ventures - - associates - - others - - Interest income from long term investmentssubsidiaries 2,546,199.00 18,072,422.00 joint ventures - - associates - - others - - Total - Interest income 4,891,094.41 22,893,444.80
NOTE 21 OTHER INCOME (CONTD.)
Note Particulars For the year ended For the year ended 31st March, 2012 31st March, 2011
Rs. Rs.
(ii) Other non-operating income comprises:Rental income from investment properties 1,680,806.00 1,005,000.00 Prior period items (net) (Refer Note (iii) below) - - Miscellaneous income 315,899.92 51,152.07 Total - Other non-operating income 1,996,705.92 1,056,152.07
(iii) Details of Prior period items (net)Prior period income (give details) - - Prior period expenses (give details) - - Total - -
NOTE 22.a COST OF MATERIALS CONSUMED
Particulars For the year ended For the year ended 31st March, 2012 31st March, 2011
Rs. Rs.
Opening stock 309,186,960.00 220,894,059.00 Add: Purchases 951,256,305.00 935,094,545.93
1,260,443,265.00 1,155,988,604.93 Less: Closing stock 240,105,348.01 309,186,960.00 Cost of material consumed 1,020,337,916.99 846,801,644.93 Material consumed comprises:Tin Free Sheets 354,248,609.00 350,616,129.00 Polypropylene 168,509,861.00 128,692,410.00 Resin 341,512,408.00 230,920,453.00 Other items 156,067,038.99 136,572,652.93 Total 1,020,337,916.99 846,801,644.93
- -
NOTE 22.b PURCHASE OF TRADED GOODS
Particulars For the year ended For the year ended 31st March, 2012 31st March, 2011
Rs. Rs.
Traded good - Real Estates - DLF Pinnacle 247,826.00 -Traded good - Real Estates - DLF Courtyard 1,706,714.00 1,200,000.00 Others 91,192.50 80,737.50
Total 2,045,732.50 1,280,737.50
NOTE 22.c CHANGES IN INVENTORIES OF FINISHED GOODS, WORK-IN-PROGRESS AND STOCK-IN-TRADE
Particulars For the year ended For the year ended 31st March, 2012 31st March, 2011
Rs. Rs.
Inventories at the end of the year:
Finished goods 33,677,400.00 89,198,690.00 Work-in-progress 17,974,600.00 22,414,100.00 Stock-in-trade - Real Estates 44,181,401.93 42,226,861.93 Stock-in-trade -Waste & Scrap 6,187,689.00 5,582,599.00 Stock-in-trade - Trading Goods 2,300.00 2,300.00
102,023,390.93 159,424,550.93 Inventories at the beginning of the year:Finished goods 89,198,690.00 22,243,679.00 Work-in-progress 22,414,100.00 6,608,300.00 Stock-in-Trade - Real Estates 42,226,861.93 41,026,861.93 Stock-in-trade -Waste & Scrap 5,582,599.00 5,011,477.00 Stock-in-trade - Trading Goods 2,300.00 -
159,424,550.93 74,890,317.93
Net (increase) / decrease 57,401,160.00 (84,534,233.00)
29th Annual Report 2011-201225 29th Annual Report 2011-2012 26

AMD Industries LimitedAMD Industries Limited
NOTES FORMING PART OF THE FINANCIAL STATEMENTS
NOTE 26 ADDITIONAL INFORMATION TO THE FINANCIAL STATEMENTS
Particulars As at 31st March, 2012 As at 31st March, 2011Rs. Rs.
26.1 Contingent liabilities and commitments (to the extent not provided for)(i) Contingent liabilities
(a) Claims against the Company not acknowledged as debt Nil Nil (b) Guarantees - Corporate Guarantee for Subsidiary Company
i.e. AMD Estates and Developers (P) Limited 230,000,000.00 230,000,000.00 (c) Other money for which the Company is contingently liable Nil Nil
26.2 The Company has not received any Memorandum, (as required to be filed by the supplier which are registered with the Notified Authority under the provisions of stthe Micro, Small & Medium Enterprises Development Act, 2006) claiming their status as on 31 March 2012 as Micro, Small and Medium Enterprise.
Consequently, interest paid/payable to these parties during the year is NIL.26.3 Disclosure as per Clause 32 of the Listing Agreements with the Stock Exchanges
Loans and advances in the nature of loans given to subsidiaries:
Name of the party Relationship Amount Maximum balance outstanding as at outstanding during
31 March, 2012 the year
AMD Estates and Developers (P) Limited Subsidiary 372,584,398.00 394,228,085.17(394,287,085.17) (502,586,573.17)
Note: Figures in bracket relate to the previous year.
Note Particulars
26.4 Details on derivatives instruments and unhedged foreign currency exposures
I. The following derivative positions are open as at 31 March, 2012. These transactions have been undertaken to act as economic hedges for the Company’s exposures to various risks in foreign exchange markets and may / may not qualify or be designated as hedging instruments. (a) Forward exchange contracts and options [being derivative instruments], which are not intended for trading or speculative purposes but for hedge
purposes to establish the amount of reporting currency required or available at the settlement date of certain payables and receivables.(i) Outstanding forward exchange contracts entered into by the Company as on 31 March, 2012
Currency Amount Buy / Sell Cross currency
USD 612,877.74 Buy Rupees USD (1,050,000.00) Buy Rupees USD 2,836,482.32 Sell Rupees USD (4,775,370.13) Sell Rupees Note: Figures in brackets relate to the previous year
II. The year-end foreign currency exposures that have not been hedged by a derivative instrument or otherwise are given below:
As at 31st March, 2012 As at 31st March, 2011Receivable/ Receivable/ (Payable) Receivable/ Receivable/ (Payable)(Payable) in Foreign currency (Payable) in Foreign currency
Rs. (indicate amount with currency) Rs. (indicate amount with currency) Nil Nil Nil Nil
(47573795.00) (USD 929965.80) (43608171.00) (USD976666.76) (14925522.00) (EURO 218400) (3,761,828.00) (EURO 59484.95)
Note Particulars
26.5 Value of imports calculated on CIF basis : As at 31st March, 2012 As at 31st March, 2011Rs. Rs.
Raw materials 490,364,583.95 475,192,400.33 Spare parts 3,342,847.58 8,329,932.99 Capital goods 10,553,037.25 39,471,020.00
26.6 Expenditure in foreign currency : As at 31st March, 2012 As at 31st March, 2011Rs. Rs.
Commission 2,605,271.00 1,529,261.50 Others 803,616.36 1,960,068.00
26.7 Details of consumption of imported and indigenous itemsFor the year ended
31 March, 2012 Rs. %
ImportedRaw materials 484,283,904.08 47.46
(365,731,518.20) (43.19)Total 484,283,904.08 47.46
(365,731,518.20) (43.19)For the year ended
31 March, 2012
Rs. %
IndigenousRaw materials 536,054,012.07 52.54
(481,070,126.70) (56.81)Total 536,054,012.07 52.54
(481,070,126.70) (56.81)Note: Figures / percentages in brackets relates to the previous year
NOTES FORMING PART OF THE FINANCIAL STATEMENTS
As at 31st March, 2012 As at 31st March, 2011Rs. Rs.
26.8 Earnings in foreign exchange:Export of goods calculated on FOB basis 349,439,908.21 187,325,213.04
26.9 In the opinion of the Board, assets other than fixed assets and non-current investments have a value on realisation in the ordinary course of business at least equal to the amount at which they are stated.
NOTE 27 DISCLOSURES UNDER ACCOUNTING STANDARDS
27.1 Employee benefit plans
27.1.a Defined benefit plans
The Company offers the following employee benefit schemes to its employees:
i. Gratuity
ii. Other defined benefit plans (Leave Encashment)
The following table sets out the funded status of the defined benefit schemes and the amount recognised in the financial statements:
Rs.
Particulars For the year ended For the year ended31st March, 2012 31st March, 2011
Gratuity Other defined Gratuity Other defined benefit plans benefit plans
(Leave Encashment) (Leave Encahsment)
Components of employer expenseCurrent service cost 1,038,230.00 874,831.00 868,686.00 613,306.00 Interest cost 372,317.00 178,060.00 264,003.00 143,007.00 Expected return on plan assets - - - - Curtailment cost / (credit) - - - - Settlement cost / (credit) - - - - Past service cost - - 87,728.00 -Actuarial losses/(gains) 201,270.00 170,731.00 48,893.00 57,883.00 Total expense recognised in the Statement of Profit and Loss 1,611,817.00 1,223,622.00 1,269,310.00 814,196.00 Actual contribution and benefit payments for yearActual benefit payments (610,615.00) (529,507.00) - (376,034.00)Actual contributionsNet asset / (liability) recognised in the Balance SheetPresent value of defined benefit obligation 4,653,968.00 2,225,747.00 3,384,658.00 1,787,585.00 Fair value of plan assetsFunded status [Surplus / (Deficit)] 1,001,202.00 694,115.00 1,269,310.00 438,162.00 Unrecognised past service costsNet asset / (liability) recognised in the Balance Sheet 5,655,170.00 2,919,862.00 4,653,968.00 2,225,747.00
Note 27 Disclosures under Accounting Standards (contd.) - - - -
Rs.
Particulars For the year ended For the year ended31st March, 2012 31st March, 2011
Gratuity Other defined Gratuity Other defined benefit plans benefit plans
(Leave Encashment) (Leave Encahsment)
Change in defined benefit obligations (DBO) during the yearPresent value of DBO at beginning of the year 4,653,968.00 2,225,747.00 3,384,658.00 1,787,585.00 Current service cost 1,038,230.00 874,831.00 868,686.00 613,306.00 Interest cost 372,317.00 178,060.00 264,003.00 143,007.00 Curtailment cost / (credit) - -Settlement cost / (credit) - -Plan amendments - -Acquisitions - -Actuarial (gains) / losses 201,270.00 170,731.00 48,893.00 57,883.00 Past service cost - - 87,728.00 - Benefits paid (610,615.00) (529,507.00) - (376,034.00)Present value of DBO at the end of the year 5,655,170.00 2,919,862.00 4,653,968.00 2,225,747.00 Change in fair value of assets during the yearPlan assets at beginning of the year - - - -Acquisition adjustment - - - - Expected return on plan assets - - - - Actual company contributions - - - - Actuarial gain / (loss) - - - - Benefits paid - - - -Plan assets at the end of the year - - - - Actual return on plan assets - - - -
29th Annual Report 2011-201227 29th Annual Report 2011-2012 28

AMD Industries LimitedAMD Industries Limited
NOTES FORMING PART OF THE FINANCIAL STATEMENTS NOTES FORMING PART OF THE FINANCIAL STATEMENTS
Composition of the plan assets is as follows:Government bonds - - - - PSU bonds - - - - Equity mutual funds - - - - Others - - - - Actuarial assumptionsDiscount rate 8.60% 8.60% 8.00% 8.00%Expected return on plan assets - - - -Salary escalation 7.50% 7.50% 7.50% 7.50%Attrition - - - - Medical cost inflation - - - - Mortality tables - - - - Performance percentage considered - - - - Estimate of amount of contribution in the immediate next year - - - -
27.2 Segment information
The Company has identified business segments as its primary segment and geographic segments as its secondary segment. Business segments are primarily Packaging,Textile and Real Estate. Revenues and expenses directly attributable to segments are reported under each reportable segment. Expenses which are not directly identifiable to each reportable segment have been allocated on the basis of associated revenues of the segment and manpower efforts. All other expenses which are not attributable or allocable to segments have been disclosed as unallocable expenses. Assets and liabilities that are directly attributable or allocable to segments are disclosed under each reportable segment. All other assets and liabilities are disclosed as unallocable. Fixed assets that are used interchangeably amongst segments are not allocated to primary and secondary segments. Geographical revenues are allocated based on the location of the customer. Geographic segments of the Company are Americas (including Canada and South American countries), Europe, India and Others.
Particulars For the year ended 31st March, 2012
Business segments Total
PACKAGING TEXTILE REAL ESTATE Eliminations
Rs. Rs. Rs. Rs. Rs.
Revenue 1,820,077,501.97 - - - 1,820,077,501.97 (1,381,140,332.41) (-) (-) (-) (1,381,140,332.41)
Inter-segment revenue - - - - - (-) (-) (-) (-) (-)
Total 1,820,077,501.97 - - - 1,820,077,501.97 (1,381,140,332.41) (-) (-) (-) (1,381,140,332.41)
Segment result 101,249,718.79 - -4,467,523.81 - 96,782,194.98 (56,938,835.03) - (-3970527.61) (-) (52,968,307.42)
Unallocable expenses (net) - (-)
Operating income 96,782,194.98 (52,968,307.42)
Other income (net) 6,906,700.33 (23,959,671.87)
Profit before taxes 103,688,895.31 (76,927,979.29)
Tax expense 38,657,144.00 (19,195,703.00)
Net profit for the year 65,031,751.31 (57,732,276.29)
Note 27 Disclosures under Accounting Standards (contd.) --
Note Particulars For the year ended 31st March, 2012
Business segments Total
PACKAGING TEXTILE REAL ESTATERs. Rs. Rs. Rs.
Segment assets 1,806,284,712.23 173,913,200.47 468,765,799.93 2,448,963,712.63(1,976,223,143.55) (173,913,200.47) (488,513,947.10) (2,638,650,291.12)
Unallocable assets - - - -(-) (-) (-) (-)
Total assets 1,806,284,712.23 173,913,200.47 468,765,799.93 2,448,963,712.63(1,976,223,143.55) (173,913,200.47) (488,513,947.10) (2,638,650,291.12)
Segment liabilities 2,419,870,205.29 - 29,093,507.34 2,448,963,712.63(2,608,836,582.28) (-) (29,813,708.84) (2,638,650,291.12)
Unallocable liabilities - - - -(-) (-) (-) (-)
Total liabilities 2,419,870,205.29 - 29,093,507.34 2,448,963,712.63(2,608,836,582.28) (-) (29,813,708.84) (2,638,650,291.12)
Other informationCapital expenditure (allocable) - - - -
(-) (-) (-) (-)Capital expenditure (unallocable) - - - -
(-) (-) (-) (-)Depreciation and amortisation (allocable) - - - -
(-) (-) (-) (-)Depreciation and amortisation (unallocable) - - - -
(-) (-) (-) (-)Other significant non-cash expenses (allocable) (give details) - - - -
(-) (-) (-) (-)Other significant non-cash expenses (unallocable) - - - -
(-) (-) (-) (-)
Note 27 Disclosures under Accounting Standards (contd.)
Note Particulars
The geographic segments individually contributing 10 percent or more of the Company’s revenues and segment assets are shown separately:
Geographic Segment Revenues Segment assets Capital expenditureFor the year ended As at incurred during the year
31 March, 2012 31 March, 2012 ended 31 March, 2012
Rs. Rs. Rs.
Americas - - -
(-) (-) (-)
Europe - - -
(-) (-) (-)
India 1,470,637,593.76 2,448,963,712.63 -
(1,193,815,119.37) (2,638,650,291.12) (-)
Others 349,439,908.21 - -
(187,325,213.04) (-) (-)
Note: Figures in bracket relates to the previous year
27.3 Related party transactions27.3.a Details of related parties:
Description of relationship Names of related parties Subsidiary Company AMD Estates and Developers (P) Limited and Prime Techno Build Private Limited Key Management Personnel (KMP) Sh. H.S.Gupta,Sh, Ashok Gupta and Sh. Adit Gupta Relatives of KMP Ms. Vidhi Gupta,Ms. Mamta Gupta and Mrs. Chitra Gupta Company in which KMP / Relatives of KMP can exercise significant influence Kadam Trees Properties (P) Limited and Ashoka Productions and Communications (P) Limited Note: Related parties have been identified by the Management.
Details of related party transactions during the year ended 31 March, 2012 and balances outstanding as at 31 March, 2012: Rs.
27.3.b AMD Estates Ashoka Kadam Trees Sh. H.S. Sh. Ashok Sh. Adit Ms. Vidhi Ms. Mamta Mrs. Chitra Totaland Developers Productions Properties (P) Gupta Gupta Gupta Gupta Gupta Gupta
(P) Limited and Limited Communications
(P) Limited
Remuneration - - - 10,045,156.00 10,044,988.00 10,039,600.00 1,151,700.00 1,168,200.00 - 32,449,644.00
(-) (-) (-) (4,795,156.00) (4,794,988.00) (4,787,773.00) (588,400.00) (228,500.00) (-) (15,194,817.00)
Rent Paid - - 1,380,000.00 - 1,035,000.00 8,694,000.00 - - 1,380,000.00 12,489,000.00
(-) (-) (1,200,000.00) (-) (900,000.00) (7,560,000.00) (-) (-) (1,200,000.00) (10,860,000.00)
Interest paid on Unsecured Loan - 4,773,121.00 - 685,532.00 762,984.00 391,282.00 - - - 6,612,919.00
(-) (2,314,028.00) (-) (1,330,179.00) (552,793.00) (940,752.00) (-) (-) (-) (5,137,752.00)
Interest received on Loan given 2,546,199.00 - - - - - - - - 2,546,199.00
(18,072,422.00) (-) (-) (-) (-) (-) (-) (-) (-) (18,072,422.00)
Repayment of Unsecured loan - 34,477,312.00 - 68,553.00 14,952,167.00 6,039,128.00 - - - 55,537,160.00
(-) (1,231,403.00) (-) (18,186,465.00) (21,368,339.00) (24,309,010.00) (-) (-) (-) (65,095,217.00)
Unsecured Loan Received - 6,773,121.00 - 685,532.00 16,012,984.00 2,891,282.00 - - - 26,362,919.00
(-) (45,814,028.00) (-) (13,830,179.00) (18,513,217.00) (16,440,752.00) (-) (-) (-) (94,598,176.00)
Loan & Advances Paid 58,427,002.00 - - - - - - - - 58,427,002.00
(141,706,037.00) (-) (-) (-) (-) (-) (-) (-) (-) (141,706,037.00)
Loan & Advances Received 80,129,689.17 - - - - - - - - 80,129,689.17
(244,854,913.00) (-) (-) (-) (-) (-) (-) (-) (-) (244,854,913.00)
Refund of Security provided
ag. Rent of Guest House - - 11,450,000.00 - - - - - - 11,450,000.00
(-) (-) (550,000.00) (-) (-) (-) (-) (-) (-) (550,000.00)
Balances outstanding at the
end of the year
Loans & Advances - Given 372,584,398.00 - - - - - - - - 372,584,398.00
(394,287,085.17) (-) (-) (-) (-) (-) (-) (-) (-) (394,287,085.17)
Loans & Advances - Taken - 16,878,434.00 - 6,314,140.00 1,917,542.00 875,786.00 - - - 25,985,902.00
(-) (44,582,625.00) (-) (5,697,161.00) (856,725.00) (4,023,632.00) (-) (-) (-) (55,160,143.00)
Note: Figures in bracket relates
to the previous year
Note 27.4 Disclosures under Accounting Standards (contd.)
Note Particulars As at 31st March, 2012 As at 31st March, 2011Rs. Rs.
27.4 Earnings per shareBasic
27.4.a Continuing operationsNet profit / (loss) for the year from continuing operations 65,031,751.31 57,732,276.29 Less: Preference dividend and tax thereon - -Net profit / (loss) for the year from continuing operations attributable to the equity shareholders 65,031,751.31 57,732,276.29 Weighted average number of equity shares 19,166,749.00 19,166,749.00Par value per share 10.00 10.00Earnings per share from continuing operations - Basic 3.39 3.01
29th Annual Report 2011-201229 29th Annual Report 2011-2012 30

AMD Industries LimitedAMD Industries Limited
NOTES FORMING PART OF THE FINANCIAL STATEMENTS NOTES FORMING PART OF THE FINANCIAL STATEMENTS
Note Particulars As at 31st March, 2012 As at 31st March, 2011Rs. Rs.
27.4.b Total operations
Net profit / (loss) for the year 65,031,751.31 57,732,276.29
Less: Preference dividend and tax thereon - -
Net profit / (loss) for the year attributable to the equity shareholders 65,031,751.31 57,732,276.29
Weighted average number of equity shares 19,166,749.00 19,166,749.00
Par value per share 10.00 10.00
Earnings per share - Basic 3.39 3.01
Basic (excluding extraordinary items)
27.4.c Continuing operations
Net profit / (loss) for the year from continuing operations 65,031,751.31 57,732,276.29
(Add) / Less: Extraordinary items (net of tax) relating to continuing operations - -
Less: Preference dividend and tax thereon - -
Net profit / (loss) for the year from continuing operations attributable to the equity
shareholders, excluding extraordinary items 65,031,751.31 57,732,276.29
Weighted average number of equity shares 19,166,749.00 19,166,749.00
Par value per share 10.00 10.00
Earnings per share from continuing operations, excluding extraordinary items - Basic 3.39 3.01
27.4.d Total operations
Net profit / (loss) for the year 65,031,751.31 57,732,276.29
(Add) / Less: Extraordinary items (net of tax) - -
Less: Preference dividend and tax thereon - -
Net profit / (loss) for the year attributable to the equity shareholders,
excluding extraordinary items 65,031,751.31 57,732,276.29
Weighted average number of equity shares 19,166,749.00 19,166,749.00
Par value per share 10.00 10.00
Earnings per share, excluding extraordinary items - Basic 3.39 3.01
Diluted
The diluted earnings per share has been computed by dividing the Net Profit After Tax
available for Equity Shareholders by the weighted average number of equity shares,
after giving dilutive effect of the outstanding Warrants, Stock Options and Convertible
bonds for the respective periods. Since, the effect of the conversion of Preference shares
was anti-dilutive, it has been ignored.
27.4.e Continuing operations
Net profit / (loss) for the year from continuing operations 65,031,751.31 57,732,276.29
Less: Preference dividend and tax thereon - -
Net profit / (loss) for the year attributable to the equity shareholders from continuing operations 65,031,751.31 57,732,276.29
Add: Interest expense and exchange fluctuation on convertible bonds (net) - -
Profit / (loss) attributable to equity shareholders from continuing operations (on dilution) 65,031,751.31 57,732,276.29
Weighted average number of equity shares for Basic EPS 19,166,749.00 19,166,749.00
Add: Effect of warrants, ESOPs and Convertible bonds which are dilutive - -
Weighted average number of equity shares - for diluted EPS 19,166,749.00 19,166,749.00
Par value per share 10.00 10.00
Earnings per share, from continuing operations - Diluted 3.39 3.01
27.4.f Total operations
Net profit / (loss) for the year 65,031,751.31 57,732,276.29
Less: Preference dividend and tax thereon - -
Net profit / (loss) for the year attributable to the equity shareholders 65,031,751.31 57,732,276.29
Add: Interest expense and exchange fluctuation on convertible bonds (net) - -
Profit / (loss) attributable to equity shareholders (on dilution) 65,031,751.31 57,732,276.29
Weighted average number of equity shares for Basic EPS 19,166,749.00 19,166,749.00
Add: Effect of Warrants, ESOPs and Convertible bonds which are dilutive - -
Weighted average number of equity shares - for diluted EPS 19,166,749.00 19,166,749.00
Par value per share 10.00 10.00
Earnings per share - Diluted 3.39 3.01
Diluted (excluding extraordinary items)
27.4.g Continuing operations
Net profit / (loss) for the year from continuing operations 65,031,751.31 57,732,276.29
(Add) / Less: Extraordinary items (net of tax) - -
Less: Preference dividend and tax thereon - -
Net profit / (loss) for the year from continuing operations attributable to
the equity shareholders, excluding extraordinary items 65,031,751.31 57,732,276.29
Add: Interest expense and exchange fluctuation on convertible bonds (net) - -
Profit / (loss) from continuing operations attributable to equity shareholders (on dilution) 65,031,751.31 57,732,276.29
Weighted average number of equity shares for Basic EPS 19,166,749.00 19,166,749.00
Add: Effect of Warrants, ESOPs and Convertible bonds which are dilutive - -
Weighted average number of equity shares - for diluted EPS 19,166,749.00 19,166,749.00
Par value per share 10.00 10.00
Earnings per share, from continuing operations, excluding extraordinary items - Diluted 3.39 3.01
Note Particulars As at 31st March, 2012 As at 31st March, 2011Rs. Rs.
27.4.h Total operationsNet profit / (loss) for the year 65,031,751.31 57,732,276.29 (Add) / Less: Extraordinary items (net of tax) - -Less: Preference dividend and tax thereon - -Net profit / (loss) for the year attributable to the equity shareholders, excluding extraordinary items 65,031,751.31 57,732,276.29 Add: Interest expense and exchange fluctuation on convertible bonds (net) - -Profit / (loss) attributable to equity shareholders (on dilution) 65,031,751.31 57,732,276.29 Weighted average number of equity shares for Basic EPS 19,166,749.00 19,166,749.00Add: Effect of Warrants, ESOPs and Convertible bonds which are dilutive - -Weighted average number of equity shares - for diluted EPS 19,166,749.00 19,166,749.00Par value per share 10.00 10.00Earnings per share, excluding extraordinary items - Diluted 3.39 3.01
27.5 Deferred tax (liability) / assetTax effect of items constituting deferred tax liabilityOn difference between book balance and tax balance of fixed assets 90,536,072.00 90,609,474.00 On expenditure deferred in the books but allowable for tax purposes - - On items included in Reserves and surplus pending amortisation into the Statement of Profit and Loss - - Others - - Tax effect of items constituting deferred tax liability 90,536,072.00 90,609,474.00 Tax effect of items constituting deferred tax assetsProvision for compensated absences, gratuity and other employee benefits 2,926,203.00 2,338,415.00 Provision for doubtful debts / advances - -Disallowances under Section 40(a)(i), 43B of the Income Tax Act, 1961 - - On difference between book balance and tax balance of fixed assetsUnabsorbed depreciation carried forwardBrought forward business lossesOn items included in Reserves and surplus pending amortisation into the Statement of Profit and Loss 2,897,656.00 5,795,312.00 Others - 166,551.00 Tax effect of items constituting deferred tax assets 5,823,859.00 8,300,278.00 Net deferred tax (liability) / asset (84,712,213.00) (82,309,196.00)
Note 27.6 Disclosures under Accounting Standards (contd.)
Note Particulars
27.6 Details of provisions
The Company has made provision for various contractual obligations and disputed liabilities based on its assessment of the amount it estimates to incur to meet such obligations, details of which are given below:
Particulars As at Additions Utilisation Reversal As at1st April, 2011 (withdrawn 31st March,
as no longer 2012required)
Rs. Rs. Rs. Rs. Rs.
Provision for other contingencies:(i) Sales Tax Demand for the Year 1999-2000
to 2006-2007 4,100,000.00 - - - 4,100,000.00 (4,100,000.00) - - - (4,100,000.00)
(ii) Entry Tax for the Year 2004-2005 and 2005-2006 1,900,000.00 - - - 1,900,000.00 (1,900,000.00) - - - (1,900,000.00)
Total 6,000,000.00 - - - 6,000,000.00 (6,000,000.00) - - - (6,000,000.00)
Note: - Figures in brackets relate to the previous year.
Note 28 Previous year’s figures
28 The Revise3d Schedule VI has become effective from 1 April, 2011 for the preparation of financial statements. This has significantly impacted the disclosure and presentation made in the financial statements. Previous year’s figures have been regrouped / reclassified wherever necessary to correspond with the current year’s classification / disclosure.
29th Annual Report 2011-201231 29th Annual Report 2011-2012 32

AMD Industries LimitedAMD Industries Limited
CASH FLOW STATEMENT FOR THE YEAR ENDED 31 MARCH, 2012
Particulars For the year ended
31st March, 2012 31st March, 2011
Rs. Rs. Rs. Rs.
A. Cash flow from operating activities
Net Profit / (Loss) before extraordinary items and tax 103,688,895.31 76,927,979.29
Adjustments for:
Depreciation and amortisation 76,253,471.34 72,007,971.22
Provision for impairment of fixed assets and intangibles - -
Amortisation of share issue expenses and discount on shares - 195,100.00
(Profit) / loss on sale / write off of assets (24,143,537.03) 11,525.78
Expense on employee stock option scheme - -
Finance costs 107,345,584.29 104,823,827.06
Interest income (4,891,094.91) (22,893,444.80)
Dividend income (18,900.00) (10,075.00)
Net (gain) / loss on sale of investments - -
Rental income from investment properties (1,680,806.00) (1,005,000.00)
Rental income from operating leases - -
Share of profit from partnership firms - -
Share of profit from AOPs - -
Share of profit from LLPs - -
Liabilities / provisions no longer required written back - -
Adjustments to the carrying amount of investments 38,300.00 8,100.00
Provision for losses of subsidiary companies - -
Provision for doubtful trade and other receivables,
loans and advances - -
Provision for estimated loss on derivatives - -
Provision for warranty - -
Provision for estimated losses on onerous contracts - -
Provision for contingencies - -
Other non-cash charges (specify) - -
Net unrealised exchange (gain) / loss (11,115.15) 152,891,902.54 (652.85) 153,137,351.41
Operating profit / (loss) before working capital changes 256,580,797.85 230,065,330.70
Changes in working capital:
Adjustments for (increase) / decrease in operating assets:
Inventories 117,078,735.99 (180,473,303.00)
Trade receivables (105,919,538.07) (56,112,802.10)
Short-term loans and advances (13,089,004.95) (33,985,895.28)
Long-term loans and advances 928,170.00 (21,060,984.00)
Other current assets 77,648,485.55 (100,314,751.04)
Other non-current assets - -
Adjustments for increase / (decrease) in operating liabilities:
Trade payables (131,913,263.30) 40,143,032.33
Other current liabilities 18,007,684.44 49,235,086.81
Other long-term liabilities 498,449.00 187,026.00
Short-term provisions (56,554,035.86) 89,674,714.74
Long-term provisions 1,695,317.00 (91,619,000.20) 3,495,057.00 (209,212,818.54)
164,961,797.65 20,852,512.16
Cash flow from extraordinary items - -
Cash generated from operations 164,961,797.65 20,852,512.16
Net income tax (paid) / refunds (25,622,744.12) (31,911,527.88)
139,339,053.53 (11,059,015.72)
Net cash flow from / (used in) operating activities (A) 139,339,053.53 (11,059,015.72)
B. Cash flow from investing activities
Capital expenditure on fixed assets, including capital advances (18,543,070.00) (70,074,910.89)
Proceeds from sale of fixed assets 30,170,980.00 73,000.00
Inter-corporate deposits (net) (27,704,191.00) 44,582,625.00
Bank balances not considered as Cash and cash equivalents
- Placed - -
- Matured - -
Current investments not considered as Cash and cash equivalents
- Purchased - -
- Proceeds from sale - -
Purchase of long-term investments
- Subsidiaries - -
- Associates - -
For the year ended
Particulars For the year ended For the year ended31st March, 2012 31st March, 2011
Rs. Rs. Rs. Rs.
- Joint ventures - -
- Business units - -
- Others (500,000.00) -
Proceeds from sale of long-term investments
- Subsidiaries - -
- Associates - -
- Joint ventures - -
- Business units - -
- Others - -
Loans given
- Subsidiaries (58,427,002.00) (141,706,037.00)
- Associates (21,059,848.00) (63,863,814.00)
- Joint ventures - -
- Others - -
Loans realised
- Subsidiaries 80,129,689.17 244,854,913.00
- Associates 19,589,798.00 48,784,148.00
- Joint ventures - -
- Others - -
Interest received
- Subsidiaries 2,546,199.00 18,072,422.00
- Associates -
- Joint ventures -
- Others 2,344,895.91 4,821,022.80
Dividend received
- Subsidiaries -
- Associates -
- Joint ventures -
- Others 18,900.00 10,075.00
Rental income from investment properties 1,680,806.00 1,005,000.00
Rental income from operating leases - -
Amounts received from partnership firms - -
Amounts received from AOPs - -
Amounts received from LLPs - 10,247,157.08 - 86,558,443.91
Cash flow from extraordinary items - -
10,247,157.08 86,558,443.91
Net cash flow from / (used in) investing activities (B) 10,247,157.08 86,558,443.91
C. Cash flow from financing activities
Proceeds from issue of equity shares - -
Proceeds from issue of preference shares - -
Redemption / buy back of preference / equity shares - -
Proceeds from issue of share warrants - -
Share application money received / (refunded) - -
Proceeds from long-term borrowings 9,005,251.90 151,405,914.00
Repayment of long-term borrowings (140,036,857.39) (156,406,854.47)
Net increase / (decrease) in working capital borrowings 83,069,071.53 70,041,580.80
Proceeds from other short-term borrowings -
Repayment of other short-term borrowings -
Finance cost (107,345,584.29) (104,823,827.06)
Dividends paid (19,166,749.00) (19,166,749.00)
Tax on dividend (3,183,357.00) (177,658,224.25) (3,257,389.00) (62,207,324.73)
Cash flow from extraordinary items - -(177,658,224.25) (62,207,324.73)
Net cash flow from / (used in) financing activities (C) (177,658,224.25) (62,207,324.73)
Net increase / (decrease) in Cash and cash
equivalents (A+B+C) (28,072,013.64) 13,292,103.46
Cash and cash equivalents at the beginning of the year 70,291,322.21 56,998,565.90
Effect of exchange differences on restatement of foreign
currency Cash and cash equivalents 11,115.15 652.85
Cash and cash equivalents at the end of the year 42,230,423.72 70,291,322.21
Reconciliation of Cash and cash equivalents with
the Balance Sheet:
29th Annual Report 2011-201233 29th Annual Report 2011-2012 34

AMD Industries Limited
The accompanying Notes 1 to 28 form integral part of these Financial Statements
In terms of our report of even date attached. For and on behalf of Board of Directors
for SURESH & ASSOCIATESFRN No. 003316N CHARTERED ACCOUNTANTS
(Ashok Gupta) (Mahipal Ahluwalia)Managing Director Director DIN - 00031630 DIN - 00588626
[CA NARENDRA ARORA] (Arun Kumar Gupta) (Joylin Jain)PARTNER General Manager-Finance & Account Company SecretaryMembership No. 088256 FRN No. 003316N
Place: New DelhirdDate : 23 May, 2012
31st March, 2012 31st March, 2011
Rs. Rs. Rs. Rs.
Cash and cash equivalents as per Balance Sheet
(Refer Note 17) 42,230,423.72 70,291,322.21
Less: Bank balances not considered as Cash and
cash equivalents as
defined in AS 3 Cash Flow Statements (give details) - -
Net Cash and cash equivalents (as defined in AS 3
Cash Flow Statements) included in Note 19 42,230,423.72 70,291,322.21
Add: Current investments considered as part of Cash and
cash equivalents (as defined in AS 3 Cash Flow Statements)
(Refer Note (ii) to Note 16 Current investments) - -
Cash and cash equivalents at the end of the year * 42,230,423.72 70,291,322.21
* Comprises:
(a) Cash on hand 88,120.80 176,406.80
(b) Cheques, drafts on hand - -
(c) Balances with banks
(i) In current accounts 7,611,895.82 3,432,500.56
(ii) In EEFC accounts 583,515.10 509,299.00
(iii) In earmarked accounts (give details) (Refer Note (ii) below) 33,802,504.00 66,104,194.00
(d) Others - Foreign Currency in hand 144,388.00 68,921.85
(e) Current investments considered as part of Cash and cash
equivalents (Refer Note (ii) to Note 16 Current investments) -
42,230,423.72 70291322.21
Notes:
(i) The Cash Flow Statement reflects the combined cash flows pertaining to continuing and discounting operations.
(ii) These earmarked account balances with banks can be utilised only for the specific identified purposes.
The accompanying Notes 1 to 28 form integral part of these Financial Statements
Particulars For the year ended For the year ended
29th Annual Report 2011-201235

AMD Industries Limited (Consolidated)
AUDITOR’S REPORT TO THE BOARD OF DIRECTORS OF AMD INDUSTRIES LIMITED ON THE CONSOLIDATED FINANCIAL STATEMENTS OF AMD INDUSTRIES LIMITED
We have examined the attached Consolidated Balance Sheet of AMD Industries Limited and its subsidiaries as at March 31, 2012 , consolidated
Profit and Loss account and consolidated Cash Flow Statement for the period then ended.
These Financial Statements are the responsibility of the AMD Industries Limited Management. Our responsibility is to express an opinion on these
Financial Statements based on our audit. We conducted our audit in accordance with generally accepted auditing standards of India. These
Standards require that we plan and perform the audit to obtain reasonable assurance whether the Financial Statements are prepared, in all material
respects, in accordance with an identified financial reporting framework and are free of material misstatements. An audit includes examining on a
test basis, evidence supporting the amounts and disclosures in the Financial Statements. An audit also includes assessing the accounting
principles used and significant estimates made by management, as well as evaluating the overall Financial Statements. We believe that our audit
provides a reasonable basis for our opinion.
We did not audit the Financial Statements of subsidiaries, whose Financial Statements reflect total assets (net) of Rs 717998667.09 as at March 31,
2012 and total losses of Rs.2213172.00 for the period then ended. These Financial Statements have been audited by other auditors, whose reports
have been furnished to us, and our opinion, insofar as it relates to the amounts included in respect of the subsidiaries, is based solely on the report of
the other auditors.
We Report that the Consolidated Financial Statements have been prepared by the Company in accordance with the requirements of Accounting
Standard (AS) 21, Consolidated Financial Statements, issued by the Institute of Chartered Accountants of India and on the basis of the separate
audited Financial Statements of AMD Industries Limited and its subsidiaries included in the Consolidated Financial Statements.
On the basis of the information and explanation given to us and on the consideration of the separate audit report on individual audited Financial
Statements of AMD Industries Limited and its aforesaid subsidiaries, we are of the opinion that :
1. The Consolidated Balance sheet gives a true and fair view of the Consolidated state of affairs of AMD Industries Limited and its subsidiaries as
at March 31, 2012; and
2. The Consolidated Profit and Loss Account gives a true and fair view of the Consolidated results of operations of AMD Industries Limited and its
subsidiaries for the period then ended.
3. The Consolidated Cash Flow Statement gives a true and fair view of the Consolidated results of cash flow of AMD Industries Limited and its
subsidiaries for the period then ended.
For SURESH & ASSOCIATES FRN: 003316N
CHARTERED ACCOUNTANTS
(CA NARENDRA ARORA)PARTNER
M No. 088256
Place: New Delhi.rdDate: 23 May, 2012
29th Annual Report 2011-2012 36

ST CONSOLIDATED BALANCE SHEET AS AT 31 MARCH 2012
The accompanying Notes 1 to 28 form integral part of these Financial Statements
In terms of our report of even date attached. For and on behalf of Board of Directors
for SURESH & ASSOCIATESFRN No. 003316N CHARTERED ACCOUNTANTS
(Ashok Gupta) (Mahipal Ahluwalia)Managing Director Director DIN - 00031630 DIN - 00588626
[CA NARENDRA ARORA] (Arun Kumar Gupta)PARTNER General Manager-Finance & AccountMembership No. 088256 FRN No. 003316N
(Joylin Jain)Company Secretary
Place: New DelhirdDate : 23 May, 2012
AMD Industries Limited (Consolidated)
Particulars Note No. As at 31st March, 2012 As at 31st March, 2011
Rs. Rs.
A EQUITY AND LIABILITIES
1 Shareholders’ funds
(a) Share capital / Head Office Account 3 191,667,490.00 191,667,490.00
(b) Reserves and surplus 4 823,811,919.49 784,753,291.18
(c) Minority Interest 42,875,399.00 43,937,722.00
1,058,354,808.49 1,020,358,503.18
2 Non-current liabilities
(a) Long-term borrowings 5 449,519,128.51 593,057,300.00
(b) Deferred tax liabilities (net) 27.5 84,656,732.00 82,256,772.00
(c) Other long-term liabilities 6 925,475.00 427,026.00
(d) Long-term provisions 7 14,575,032.00 12,879,715.00
549,676,367.51 688,620,813.00
3 Current liabilities
(a) Short-term borrowings 8 353,580,544.39 299,685,713.86
(b) Trade payables 9 230,499,732.88 362,333,555.18
(c) Other current liabilities 10 261,268,383.57 233,271,555.64
(d) Short-term provisions 11 151,427,154.88 197,423,838.86
996,775,815.72 1,092,714,663.54
TOTAL 2,604,806,991.72 2,801,693,979.72
B ASSETS
1 Non-current assets
(a) Fixed assets
(i) Tangible assets 12.A 853,978,983.23 918,186,329.54
(ii) Intangible assets 12.B 1,242,671.00 720,442.00
855,221,654.23 918,906,771.54
(b) Goodwill on Consolidation 281,267.00 281,267.00
(c) Non-current investments 13 3,985,585.69 3,523,885.69
(d) Long-term loans and advances 14 152,809,447.00 153,737,617.00
(e) Other non-current assets 1,012,297,953.92 1,076,449,541.23
2 Current assets
(a) Inventories 15 886,152,699.01 973,448,045.60
(b) Trade receivables 16 365,804,877.15 259,885,339.08
(c) Cash and cash equivalents 17 44,319,410.74 131,079,047.31
(d) Short-term loans and advances 18 178,436,577.79 165,388,047.84
(e) Other current assets 19 117,795,473.11 195,443,958.66
1,592,509,037.80 1,725,244,438.49
TOTAL 2,604,806,991.72 2,801,693,979.72
See accompanying notes forming part of the financial statements - -
AMD Industries Limited (Consolidated)STCONSOLIDATED STATEMENT OF PROFIT AND LOSS FOR THE YEAR ENDED 31 MARCH 2012
The accompanying Notes 1 to 28 form integral part of these Financial Statements
In terms of our report of even date attached. For and on behalf of Board of Directors
for SURESH & ASSOCIATESFRN No. 003316N CHARTERED ACCOUNTANTS
(Ashok Gupta) (Mahipal Ahluwalia)Managing Director Director DIN - 00031630 DIN - 00588626
[CA NARENDRA ARORA] (Arun Kumar Gupta) (Joylin Jain)PARTNER General Manager-Finance & Account Company SecretaryMembership No. 088256 FRN No. 003316N
Place: New DelhirdDate : 23 May, 2012
Particulars Note No. For the year ended
31st March, 2012 31st March, 2011
Rs. Rs.
A CONTINUING OPERATIONS
1 Revenue from operations (gross) 20 2,040,350,781.97 1,547,860,850.41
Less: Excise duty 20 220,273,280.00 166,720,518.00
Revenue from operations (net) 1,820,077,501.97 1,381,140,332.41
2 Other income 21 4,362,461.33 5,887,249.87
3 Total revenue (1+2) 1,824,439,963.30 1,387,027,582.28
4 Expenses
(a) Cost of materials consumed 22.a 1,020,337,916.99 846,801,644.93
(b) Purchases of stock-in-trade 22.b 2,045,732.50 1,280,737.50
(c) Changes in inventories of finished goods, work-in-progress and stock-in-trade 22.c 57,401,160.00 (84,534,233.00)
(d) Employee benefits expense 23 114,872,284.40 84,043,593.81
(e) Finance costs 24 107,345,584.29 104,823,827.06
(f) Depreciation and amortisation expense 12.C 76,343,358.34 72,108,321.22
(g) Other expenses 25 371,310,996.50 305,265,176.69
Total expenses 1,749,657,033.02 1,329,789,068.21
5 Profit / (Loss) before exceptional and extraordinary items and tax (3 - 4) 74,782,930.28 57,238,514.07
6 Exceptional items - Profit/(Loss) on Sale/Written Off of Fixed Assets 24,143,537.03 (11,525.78)
7 Profit / (Loss) before extraordinary items and tax (5 + 6) 98,926,467.31 57,226,988.29
8 Extraordinary items - -
9 Profit / (Loss) before tax (7 + 8) 98,926,467.31 57,226,988.29
10 Tax expense:
(a) Current tax expense for current year 33,000,000.00 18,000,000.00
(b) (Less): MAT credit - -
(c) Current tax expense relating to prior years 3,254,127.00 (774,489.00)
(d) Net current tax expense 36,254,127.00 17,225,511.00
(e) Deferred tax 2,399,960.00 1,964,377.00
38,654,087.00 19,189,888.00
11 Profit / (Loss) from continuing operations (9 +10) 60,272,380.31 38,037,100.29
11.1 Less/(Add) : Minority Interest (1,062,323.00) (778,922.00)
B DISCONTINUING OPERATIONS
12.i Profit / (Loss) from discontinuing operations (before tax) - -
12.ii Gain / (Loss) on disposal of assets / settlement of liabilities attributable to the
discontinuing operations - -
- -
12.iii Add / (Less): Tax expense of discontinuing operations
(a) on ordinary activities attributable to the discontinuing operations - -
(b) on gain / (loss) on disposal of assets / settlement of liabilities - -
- -
- -
13 Profit / (Loss) from discontinuing operations (12.i + 12.ii + 12.iii) - -
C TOTAL OPERATIONS
14 Profit / (Loss) for the year (11 + 13) 61,334,703.31 38,816,022.29
15.i Earnings per share (of Rs.10/- each):
(a) Basic
(i) Continuing operations 27.4.a 3.14 1.98
(ii) Total operations 27.4.b 3.20 1.98
(b) Diluted
(i) Continuing operations 27.4.e 3.14 1.98
(ii) Total operations 27.4.f 3.20 1.98
15.ii Earnings per share (excluding extraordinary items) (of Rs.10/- each):
(a) Basic
(i) Continuing operations 27.4.c 3.14 1.98
(ii) Total operations 27.4.d 3.20 1.98
(b) Diluted
(i) Continuing operations 27.4.g 3.14 1.98
(ii) Total operations 27.4.h 3.20 1.98
See accompanying notes forming part of the financial statements
For the year ended
29th Annual Report 2011-201237 29th Annual Report 2011-2012 38

NOTES FORMING PART OF THE FINANCIAL STATEMENTS
AMD Industries Limited (Consolidated)
Note Particulars
1 Corporate information
The Company is engaged in the Manufacturing of Pet Preform, Crown Caps and CSD Closures. The company is continuously catering to the packaging needs of Beverages and Beer Industry of the country and abroad. The company has also interest in the Real Estates.
2 Significant accounting policies
2.1 Basis of accounting and preparation of financial statements
The financial statements of the Company have been prepared in accordance with the Generally Accepted Accounting Principles in India (Indian GAAP) to comply with the Accounting Standards notified under the Companies (Accounting Standards) Rules, 2006 (as amended) and the relevant provisions of the Companies Act, 1956. The financial statements have been prepared on accrual basis under the historical cost convention. The accounting policies adopted in the preparation of the financial statements are consistent with those followed in the previous year.
2.2 Use of estimates
The preparation of the financial statements in conformity with Indian GAAP requires the Management to make estimates and assumptions considered in the reported amounts of assets and liabilities (including contingent liabilities) and the reported income and expenses during the year. The Management believes that the estimates used in preparation of the financial statements are prudent and reasonable. Future results could differ due to these estimates and the differences between the actual results and the estimates are recognised in the periods in which the results are known / materialise.
2.3 Inventories
Inventories
(i) Raw Material
At cost or net realizable value (on FIFO basis) whichever is lower (Rejected raw material at cost Less claim received thereon)
ii) Finished Goods
At cost or net realizable value whichever is lower. For arriving at the cost for this purpose the cost includes material cost and manufacturing expenses.
iii) Semi Finished Goods
At cost of input plus apportioned overhead expenses and depreciation.
iv) Job work in Process
At apportioned manufacturing expenses and depreciation.
v) Stores and Spares
At cost or net realizable value (on FIFO basis) whichever is lower.
vi) Scrap
At estimated realizable value.
vii) Real Estates Inventory
At cost plus cost of improvement.
In order to comply with the mandatory requirements of Accounting Standard -2 ‘Valuation of inventories’ prescribed by the Institute of Chartered Accountants of India; The Company has adopted the exclusive method of the excise duty.
2.4 Cash and cash equivalents (for purposes of Cash Flow Statement)
Cash comprises cash on hand and demand deposits with banks. Cash equivalents are short-term balances (with an original maturity of three months or less from the date of acquisition), highly liquid investments that are readily convertible into known amounts of cash and which are subject to insignificant risk of changes in value.
2.5 Cash flow statement
Cash flows are reported using the indirect method, whereby profit / (loss) before extraordinary items and tax is adjusted for the effects of transactions of non-cash nature and any deferrals or accruals of past or future cash receipts or payments. The cash flows from operating, investing and financing activities of the Company are segregated based on the available information.
2.6 Depreciation and Amortisation
The depreciation on Plant & Machinery including Moulds installed in Neemrana Unit and Ghaziabad Unit has been provided on ’Multiple Shift Basis’. The depreciation on all assets has been provided on ‘straight-line method’ at the rates prescribed in Schedule XIV of the Companies Act, 1956. ‘Depreciation has been provided on the straight-line method as per the rates prescribed in Schedule XIV to the Companies Act, 1956 except in respect of the following categories of assets, in whose case the life of the assets has been assessed as under:
2.7 Revenue recognition
Revenue in respect of sale of products is recognised on delivery, which coincides with the transfer of risk and rewards of ownership. Discounts given / accrued to customers at the time of despatch are considered as trade discounts and netted from sales. Sales made to Nepal and Bhutan has been treated as export sale. However there is no inflow of Foreign Exchange on sales to Nepal and Bhutan. Job work of Preform Completed and lying in Factories as on 31st March 2012 has been shown as inventory under the head Job Work in Process. Interest income is recognized on an accrual basis on time proportionate basis, based on interest rates implicit in the transaction.
2.8 Other income
Dividend income is recognized on receipt basis.
2.9 Tangible fixed assets
Fixed assets are carried at cost less accumulated depreciation and impairment losses, if any. The cost of fixed assets includes interest on borrowings attributable to acquisition of qualifying fixed assets up to the date the asset is ready for its intended use and other incidental expenses incurred up to that date. Exchange differences arising on restatement / settlement of long-term foreign currency borrowings relating to acquisition of depreciable fixed assets are adjusted to the cost of the respective assets and depreciated over the remaining useful life of such assets. Machinery spares which can be used only in connection with an item of fixed asset and whose use is expected to be irregular are capitalised and depreciated over the useful life of the principal item of the relevant assets. Subsequent expenditure relating to fixed assets is capitalised only if such expenditure results in an increase in the future benefits from such asset beyond its previously assessed standard of performance.
Fixed assets acquired and put to use for project purpose are capitalised and depreciation thereon is included in the project cost till commissioning of the project.
CENVAT Credit availed on acquisition of fixed assets is reduced from the cost of concerned assets.
Fixed assets acquired in full or part exchange for another asset are recorded at the fair market value or the net book value of the asset given up, adjusted for any balancing cash consideration. Fair market value is determined either for the assets acquired or asset given up, whichever is more clearly evident. Fixed assets acquired in exchange for securities of the Company are recorded at the fair market value of the assets or the fair market value of the securities issued, whichever is more clearly evident.
Capital work-in-progress:
Projects under which assets are not ready for their intended use and other capital work-in-progress are carried at cost, comprising direct cost, related incidental expenses and attributable interest.
2.10 Intangible assets
Intangible assets are carried at cost less accumulated amortisation and impairment losses, if any. The cost of an intangible asset comprises its purchase price, including any import duties and other taxes (other than those subsequently recoverable from the taxing authorities), and any directly attributable expenditure on making the asset ready for its intended use and net of any trade discounts and rebates. Subsequent expenditure on an intangible asset after its purchase / completion is recognised as an expense when incurred unless it is probable that such expenditure will enable the asset to generate future economic benefits in excess of its originally assessed standards of performance and such expenditure can be measured and attributed to the asset reliably, in which case such expenditure is added to the cost of the asset.
2.11 Foreign currency transactions and translations
Initial recognition
Transactions in foreign currencies entered into by the Company and its integral foreign operations are accounted at the exchange rates prevailing on the date of the transaction or at rates that closely approximate the rate at the date of the transaction.
Measurement of foreign currency monetary items at the Balance Sheet date
Foreign currency monetary items (other than derivative contracts) of the Company and its net investment in non-integral foreign operations outstanding at the Balance Sheet date are restated at the year-end rates.In the case of integral operations, assets and liabilities (other than non-monetary items), are translated at the exchange rate prevailing on the Balance Sheet date. Non-monetary items are carried at historical cost. Revenue and expenses are translated at the average exchange rates prevailing during the year. Exchange differences arising out of these translations are charged to the Statement of Profit and Loss.
Treatment of exchange differences
Exchange differences arising on settlement / restatement of short-term foreign currency monetary assets and liabilities of the Company and its integral foreign operations are recognised as income or expense in the Statement of Profit and Loss. The exchange differences on restatement / settlement of loans to non-integral foreign operations that are considered as net investment in such operations are accumulated in a “Foreign currency translation reserve” until disposal / recovery of the net investment.The exchange differences arising on restatement / settlement of long-term foreign currency monetary items are capitalised as part of the depreciable fixed assets to which the monetary item relates and depreciated over the remaining useful life of such assets or amortised on settlement / over the maturity period of such items if such items do not relate to acquisition of depreciable fixed assets. The unamortised balance is carried in the Balance Sheet as “Foreign currency monetary item translation difference account” net of the tax effect thereon.
Accounting of forward contracts
Premium / discount on forward exchange contracts, which are not intended for trading or speculation purposes, are amortised over the period of the contracts if such contracts relate to monetary items as at the Balance Sheet date.
2.12 Government grants, subsidies and export incentives
Export benefits are accounted for in the year of exports based on eligibility and when there is no uncertainty in receiving the same.
2.13 Investments
Long-term investments , are carried individually at cost less provision for diminution, other than temporary, in the value of such investments. Current investments are carried individually, at the lower of cost and fair value. Cost of investments include acquisition charges such as brokerage, fees and duties.
2.14 Employee benefits
Employee benefits include provident fund, superannuation fund, gratuity fund, compensated absences, long service awards and post-employment medical benefits.
Defined contribution plans
The Company’s contribution to provident fund and superannuation fund are considered as defined contribution plans and are charged as an expense as they fall due based on the amount of contribution required to be made.
Defined benefit plans
For defined benefit plans in the form of gratuity fund and post-employment medical benefits, the cost of providing benefits is determined using the Projected Unit Credit method, with actuarial valuations being carried out at each Balance Sheet date. Actuarial gains and losses are recognised in the Statement of Profit and Loss in the period in which they occur. Past service cost is recognised immediately to the extent that the benefits are already vested and otherwise is amortised on a straight-line basis over the average period until the benefits become vested. The retirement benefit obligation recognised in the Balance Sheet represents the present value of the defined benefit obligation as adjusted for unrecognised past service cost, as reduced by the fair value of scheme assets. Any asset resulting from this calculation is limited to past service cost, plus the present value of available refunds and reductions in future contributions to the schemes.
Short-term employee benefits
The undiscounted amount of short-term employee benefits expected to be paid in exchange for the services rendered by employees are recognised during the year when the employees render the service. These benefits include performance incentive and compensated absences which are expected to occur within twelve months after the end of the period in which the employee renders the related service. The cost of such compensated absences is accounted as under :(a) in case of accumulated compensated absences, when employees render the services that increase their entitlement of future compensated absences; and(b) in case of non-accumulating compensated absences, when the absences occur.
Long-term employee benefits
Compensated absences which are not expected to occur within twelve months after the end of the period in which the employee renders the related service are recognised as a liability at the present value of the defined benefit obligation as at the Balance Sheet date less the fair value of the plan assets out of which the obligations are expected to be settled. Long Service Awards are recognised as a liability at the present value of the defined benefit obligation as at the Balance Sheet date.
2.15 Borrowing costs
Borrowing costs include interest, amortisation of ancillary costs incurred and exchange differences arising from foreign currency borrowings to the extent they are regarded as an adjustment to the interest cost. Costs in connection with the borrowing of funds to the extent not directly related to the acquisition of qualifying assets are charged to the Statement of Profit and Loss over the tenure of the loan. Borrowing costs, allocated to and utilised for qualifying assets, pertaining to the period from commencement of activities relating to construction / development of the qualifying asset upto the date of capitalisation of such asset is added to the cost of the assets. Capitalisation of borrowing costs is suspended and charged to the Statement of Profit and Loss during extended periods when active development activity on the qualifying assets is interrupted.
2.16 Segment reporting
The Company identifies primary segments based on the dominant source, nature of risks and returns and the internal organisation and management structure. The operating segments are the segments for which separate financial information is available and for which operating profit/loss amounts are evaluated regularly by the executive Management in deciding how to allocate resources and in assessing performance.
2.17 Leases
Where the Company as a lessor leases assets under finance leases, such amounts are recognised as receivables at an amount equal to the net investment in the lease and the finance income is recognised based on a constant rate of return on the outstanding net investment.Assets leased by the Company in its capacity as lessee where substantially all the risks and rewards of ownership vest in the Company are classified as finance leases. Such leases are capitalised at the inception of the lease at the lower of the fair value and the present value of the minimum lease payments and a liability is created for an equivalent amount. Each lease rental paid is allocated between the liability and the interest cost so as to obtain a constant periodic rate of interest on the outstanding liability for each year.Lease arrangements where the risks and rewards incidental to ownership of an asset substantially vest with the lessor are recognised as operating leases. Lease rentals under operating leases are recognised in the Statement of Profit and Loss on a straight-line basis.
AMD Industries Limited (Consolidated)
NOTES FORMING PART OF THE FINANCIAL STATEMENTS
29th Annual Report 2011-201239 29th Annual Report 2011-2012 40

NOTES FORMING PART OF THE FINANCIAL STATEMENTS
AMD Industries Limited (Consolidated)
Note Particulars
1 Corporate information
The Company is engaged in the Manufacturing of Pet Preform, Crown Caps and CSD Closures. The company is continuously catering to the packaging needs of Beverages and Beer Industry of the country and abroad. The company has also interest in the Real Estates.
2 Significant accounting policies
2.1 Basis of accounting and preparation of financial statements
The financial statements of the Company have been prepared in accordance with the Generally Accepted Accounting Principles in India (Indian GAAP) to comply with the Accounting Standards notified under the Companies (Accounting Standards) Rules, 2006 (as amended) and the relevant provisions of the Companies Act, 1956. The financial statements have been prepared on accrual basis under the historical cost convention. The accounting policies adopted in the preparation of the financial statements are consistent with those followed in the previous year.
2.2 Use of estimates
The preparation of the financial statements in conformity with Indian GAAP requires the Management to make estimates and assumptions considered in the reported amounts of assets and liabilities (including contingent liabilities) and the reported income and expenses during the year. The Management believes that the estimates used in preparation of the financial statements are prudent and reasonable. Future results could differ due to these estimates and the differences between the actual results and the estimates are recognised in the periods in which the results are known / materialise.
2.3 Inventories
Inventories
(i) Raw Material
At cost or net realizable value (on FIFO basis) whichever is lower (Rejected raw material at cost Less claim received thereon)
ii) Finished Goods
At cost or net realizable value whichever is lower. For arriving at the cost for this purpose the cost includes material cost and manufacturing expenses.
iii) Semi Finished Goods
At cost of input plus apportioned overhead expenses and depreciation.
iv) Job work in Process
At apportioned manufacturing expenses and depreciation.
v) Stores and Spares
At cost or net realizable value (on FIFO basis) whichever is lower.
vi) Scrap
At estimated realizable value.
vii) Real Estates Inventory
At cost plus cost of improvement.
In order to comply with the mandatory requirements of Accounting Standard -2 ‘Valuation of inventories’ prescribed by the Institute of Chartered Accountants of India; The Company has adopted the exclusive method of the excise duty.
2.4 Cash and cash equivalents (for purposes of Cash Flow Statement)
Cash comprises cash on hand and demand deposits with banks. Cash equivalents are short-term balances (with an original maturity of three months or less from the date of acquisition), highly liquid investments that are readily convertible into known amounts of cash and which are subject to insignificant risk of changes in value.
2.5 Cash flow statement
Cash flows are reported using the indirect method, whereby profit / (loss) before extraordinary items and tax is adjusted for the effects of transactions of non-cash nature and any deferrals or accruals of past or future cash receipts or payments. The cash flows from operating, investing and financing activities of the Company are segregated based on the available information.
2.6 Depreciation and Amortisation
The depreciation on Plant & Machinery including Moulds installed in Neemrana Unit and Ghaziabad Unit has been provided on ’Multiple Shift Basis’. The depreciation on all assets has been provided on ‘straight-line method’ at the rates prescribed in Schedule XIV of the Companies Act, 1956. ‘Depreciation has been provided on the straight-line method as per the rates prescribed in Schedule XIV to the Companies Act, 1956 except in respect of the following categories of assets, in whose case the life of the assets has been assessed as under:
2.7 Revenue recognition
Revenue in respect of sale of products is recognised on delivery, which coincides with the transfer of risk and rewards of ownership. Discounts given / accrued to customers at the time of despatch are considered as trade discounts and netted from sales. Sales made to Nepal and Bhutan has been treated as export sale. However there is no inflow of Foreign Exchange on sales to Nepal and Bhutan. Job work of Preform Completed and lying in Factories as on 31st March 2012 has been shown as inventory under the head Job Work in Process. Interest income is recognized on an accrual basis on time proportionate basis, based on interest rates implicit in the transaction.
2.8 Other income
Dividend income is recognized on receipt basis.
2.9 Tangible fixed assets
Fixed assets are carried at cost less accumulated depreciation and impairment losses, if any. The cost of fixed assets includes interest on borrowings attributable to acquisition of qualifying fixed assets up to the date the asset is ready for its intended use and other incidental expenses incurred up to that date. Exchange differences arising on restatement / settlement of long-term foreign currency borrowings relating to acquisition of depreciable fixed assets are adjusted to the cost of the respective assets and depreciated over the remaining useful life of such assets. Machinery spares which can be used only in connection with an item of fixed asset and whose use is expected to be irregular are capitalised and depreciated over the useful life of the principal item of the relevant assets. Subsequent expenditure relating to fixed assets is capitalised only if such expenditure results in an increase in the future benefits from such asset beyond its previously assessed standard of performance.
Fixed assets acquired and put to use for project purpose are capitalised and depreciation thereon is included in the project cost till commissioning of the project.
CENVAT Credit availed on acquisition of fixed assets is reduced from the cost of concerned assets.
Fixed assets acquired in full or part exchange for another asset are recorded at the fair market value or the net book value of the asset given up, adjusted for any balancing cash consideration. Fair market value is determined either for the assets acquired or asset given up, whichever is more clearly evident. Fixed assets acquired in exchange for securities of the Company are recorded at the fair market value of the assets or the fair market value of the securities issued, whichever is more clearly evident.
Capital work-in-progress:
Projects under which assets are not ready for their intended use and other capital work-in-progress are carried at cost, comprising direct cost, related incidental expenses and attributable interest.
2.10 Intangible assets
Intangible assets are carried at cost less accumulated amortisation and impairment losses, if any. The cost of an intangible asset comprises its purchase price, including any import duties and other taxes (other than those subsequently recoverable from the taxing authorities), and any directly attributable expenditure on making the asset ready for its intended use and net of any trade discounts and rebates. Subsequent expenditure on an intangible asset after its purchase / completion is recognised as an expense when incurred unless it is probable that such expenditure will enable the asset to generate future economic benefits in excess of its originally assessed standards of performance and such expenditure can be measured and attributed to the asset reliably, in which case such expenditure is added to the cost of the asset.
2.11 Foreign currency transactions and translations
Initial recognition
Transactions in foreign currencies entered into by the Company and its integral foreign operations are accounted at the exchange rates prevailing on the date of the transaction or at rates that closely approximate the rate at the date of the transaction.
Measurement of foreign currency monetary items at the Balance Sheet date
Foreign currency monetary items (other than derivative contracts) of the Company and its net investment in non-integral foreign operations outstanding at the Balance Sheet date are restated at the year-end rates.In the case of integral operations, assets and liabilities (other than non-monetary items), are translated at the exchange rate prevailing on the Balance Sheet date. Non-monetary items are carried at historical cost. Revenue and expenses are translated at the average exchange rates prevailing during the year. Exchange differences arising out of these translations are charged to the Statement of Profit and Loss.
Treatment of exchange differences
Exchange differences arising on settlement / restatement of short-term foreign currency monetary assets and liabilities of the Company and its integral foreign operations are recognised as income or expense in the Statement of Profit and Loss. The exchange differences on restatement / settlement of loans to non-integral foreign operations that are considered as net investment in such operations are accumulated in a “Foreign currency translation reserve” until disposal / recovery of the net investment.The exchange differences arising on restatement / settlement of long-term foreign currency monetary items are capitalised as part of the depreciable fixed assets to which the monetary item relates and depreciated over the remaining useful life of such assets or amortised on settlement / over the maturity period of such items if such items do not relate to acquisition of depreciable fixed assets. The unamortised balance is carried in the Balance Sheet as “Foreign currency monetary item translation difference account” net of the tax effect thereon.
Accounting of forward contracts
Premium / discount on forward exchange contracts, which are not intended for trading or speculation purposes, are amortised over the period of the contracts if such contracts relate to monetary items as at the Balance Sheet date.
2.12 Government grants, subsidies and export incentives
Export benefits are accounted for in the year of exports based on eligibility and when there is no uncertainty in receiving the same.
2.13 Investments
Long-term investments , are carried individually at cost less provision for diminution, other than temporary, in the value of such investments. Current investments are carried individually, at the lower of cost and fair value. Cost of investments include acquisition charges such as brokerage, fees and duties.
2.14 Employee benefits
Employee benefits include provident fund, superannuation fund, gratuity fund, compensated absences, long service awards and post-employment medical benefits.
Defined contribution plans
The Company’s contribution to provident fund and superannuation fund are considered as defined contribution plans and are charged as an expense as they fall due based on the amount of contribution required to be made.
Defined benefit plans
For defined benefit plans in the form of gratuity fund and post-employment medical benefits, the cost of providing benefits is determined using the Projected Unit Credit method, with actuarial valuations being carried out at each Balance Sheet date. Actuarial gains and losses are recognised in the Statement of Profit and Loss in the period in which they occur. Past service cost is recognised immediately to the extent that the benefits are already vested and otherwise is amortised on a straight-line basis over the average period until the benefits become vested. The retirement benefit obligation recognised in the Balance Sheet represents the present value of the defined benefit obligation as adjusted for unrecognised past service cost, as reduced by the fair value of scheme assets. Any asset resulting from this calculation is limited to past service cost, plus the present value of available refunds and reductions in future contributions to the schemes.
Short-term employee benefits
The undiscounted amount of short-term employee benefits expected to be paid in exchange for the services rendered by employees are recognised during the year when the employees render the service. These benefits include performance incentive and compensated absences which are expected to occur within twelve months after the end of the period in which the employee renders the related service. The cost of such compensated absences is accounted as under :(a) in case of accumulated compensated absences, when employees render the services that increase their entitlement of future compensated absences; and(b) in case of non-accumulating compensated absences, when the absences occur.
Long-term employee benefits
Compensated absences which are not expected to occur within twelve months after the end of the period in which the employee renders the related service are recognised as a liability at the present value of the defined benefit obligation as at the Balance Sheet date less the fair value of the plan assets out of which the obligations are expected to be settled. Long Service Awards are recognised as a liability at the present value of the defined benefit obligation as at the Balance Sheet date.
2.15 Borrowing costs
Borrowing costs include interest, amortisation of ancillary costs incurred and exchange differences arising from foreign currency borrowings to the extent they are regarded as an adjustment to the interest cost. Costs in connection with the borrowing of funds to the extent not directly related to the acquisition of qualifying assets are charged to the Statement of Profit and Loss over the tenure of the loan. Borrowing costs, allocated to and utilised for qualifying assets, pertaining to the period from commencement of activities relating to construction / development of the qualifying asset upto the date of capitalisation of such asset is added to the cost of the assets. Capitalisation of borrowing costs is suspended and charged to the Statement of Profit and Loss during extended periods when active development activity on the qualifying assets is interrupted.
2.16 Segment reporting
The Company identifies primary segments based on the dominant source, nature of risks and returns and the internal organisation and management structure. The operating segments are the segments for which separate financial information is available and for which operating profit/loss amounts are evaluated regularly by the executive Management in deciding how to allocate resources and in assessing performance.
2.17 Leases
Where the Company as a lessor leases assets under finance leases, such amounts are recognised as receivables at an amount equal to the net investment in the lease and the finance income is recognised based on a constant rate of return on the outstanding net investment.Assets leased by the Company in its capacity as lessee where substantially all the risks and rewards of ownership vest in the Company are classified as finance leases. Such leases are capitalised at the inception of the lease at the lower of the fair value and the present value of the minimum lease payments and a liability is created for an equivalent amount. Each lease rental paid is allocated between the liability and the interest cost so as to obtain a constant periodic rate of interest on the outstanding liability for each year.Lease arrangements where the risks and rewards incidental to ownership of an asset substantially vest with the lessor are recognised as operating leases. Lease rentals under operating leases are recognised in the Statement of Profit and Loss on a straight-line basis.
AMD Industries Limited (Consolidated)
NOTES FORMING PART OF THE FINANCIAL STATEMENTS
29th Annual Report 2011-201239 29th Annual Report 2011-2012 40

AMD Industries Limited (Consolidated)
2.18 Earnings per share
Basic earnings per share is computed by dividing the profit / (loss) after tax (including the post tax effect of extraordinary items, if any) by the weighted average number of equity shares outstanding during the year. Diluted earnings per share is computed by dividing the profit / (loss) after tax (including the post tax effect of extraordinary items, if any) as adjusted for dividend, interest and other charges to expense or income relating to the dilutive potential equity shares, by the weighted average number of equity shares considered for deriving basic earnings per share and the weighted average number of equity shares which could have been issued on the conversion of all dilutive potential equity shares. Potential equity shares are deemed to be dilutive only if their conversion to equity shares would decrease the net profit per share from continuing ordinary operations. Potential dilutive equity shares are deemed to be converted as at the beginning of the period, unless they have been issued at a later date. The dilutive potential equity shares are adjusted for the proceeds receivable had the shares been actually issued at fair value (i.e. average market value of the outstanding shares). Dilutive potential equity shares are determined independently for each period presented. The number of equity shares and potentially dilutive equity shares are adjusted for share splits / reverse share splits and bonus shares, as appropriate.
2.19 Taxes on income
Current tax is the amount of tax payable on the taxable income for the year as determined in accordance with the provisions of the Income Tax Act, 1961.
Minimum Alternate Tax (MAT) paid in accordance with the tax laws, which gives future economic benefits in the form of adjustment to future income tax liability, is considered as an asset if there is convincing evidence that the Company will pay normal income tax. Accordingly, MAT is recognised as an asset in the Balance Sheet when it is probable that future economic benefit associated with it will flow to the Company.
Deferred tax is recognised on timing differences, being the differences between the taxable income and the accounting income that originate in one period and are capable of reversal in one or more subsequent periods. Deferred tax is measured using the tax rates and the tax laws enacted or substantially enacted as at the reporting date. Deferred tax liabilities are recognised for all timing differences. Deferred tax assets in respect of unabsorbed depreciation and carry forward of losses are recognised only if there is virtual certainty that there will be sufficient future taxable income available to realise such assets. Deferred tax assets are recognised for timing differences of other items only to the extent that reasonable certainty exists that sufficient future taxable income will be available against which these can be realised. Deferred tax assets and liabilities are offset if such items relate to taxes on income levied by the same governing tax laws and the Company has a legally enforceable right for such set off. Deferred tax assets are reviewed at each Balance Sheet date for their realisability.
Current and deferred tax relating to items directly recognised in equity are recognised in equity and not in the Statement of Profit and Loss.
2.20 Impairment of assets
The carrying values of assets / cash generating units at each Balance Sheet date are reviewed for impairment. If any indication of impairment exists, the recoverable amount of such assets is estimated and impairment is recognised, if the carrying amount of these assets exceeds their recoverable amount. The recoverable amount is the greater of the net selling price and their value in use. Value in use is arrived at by discounting the future cash flows to their present value based on an appropriate discount factor. When there is indication that an impairment loss recognised for an asset in earlier accounting periods no longer exists or may have decreased, such reversal of impairment loss is recognised in the Statement of Profit and Loss, except in case of revalued assets.
2.21 Provisions and contingencies
A provision is recognised when the Company has a present obligation as a result of past events and it is probable that an outflow of resources will be required to settle the obligation in respect of which a reliable estimate can be made. Provisions (excluding retirement benefits) are not discounted to their present value and are determined based on the best estimate required to settle the obligation at the Balance Sheet date. These are reviewed at each Balance Sheet date and adjusted to reflect the current best estimates. Contingent liabilities are disclosed in the Notes.
NOTE 3 SHARE CAPITAL (CONTD.)
ParticularsNotes:
(i) Details of shares held by the holding company, the ultimate holding company, their subsidiaries and associates:Particulars Opening Balance Fresh issue Bonus ESOP Conversion Buy back Other changes Closing BalanceEquity shares with voting rightsYear ended 31 March, 2012- Number of shares 19,166,749.00 Nil Nil Nil Nil Nil Nil 19,166,749.00 - Amount (Rs.) 191,667,490.00 Nil Nil Nil Nil Nil Nil 191,667,490.00 Year ended 31 March, 2011- Number of shares 19,166,749.00 Nil Nil Nil Nil Nil Nil 19,166,749.00 - Amount (Rs.) 191,667,490.00 Nil Nil Nil Nil Nil Nil 191,667,490.00
(ii) Details of shares held by each shareholder holding more than 5% shares:
Class of shares / As at 31st March, 2012 As at 31st March, 2011Name of shareholder Number of shares % holding in that Number of shares % holding in that
held class of Shares held class of SharesEquity shares with voting rights
Harswarup Gupta 2,575,604.00 13.4379% 2,508,002.00 13.0852%Ashok Gupta 3,427,796.00 17.8841% 2,895,596.00 15.1074%Chitra Gupta 1,200,945.00 6.2658% 1,200,945.00 6.2658%Adit Gupta 3,264,126.00 17.0301% 2,821,926.00 14.7230%
Ashok Sons (HUF) 982,500.00 5.1261% 982,500.00 5.1261%
NOTE 3 SHARE CAPITAL
Particulars As at 31st March, 2012 As at 31st March, 2011
Number of shares Rs. Number of shares Rs.
(a) AuthorisedEquity shares of Rs.10/- each with voting rights 25,000,000.00 .00
(b) Issued
Equity shares of Rs.10/- each with voting rights 19,166,749.00 191,667,490.00 19,166,749.00 191,667,490.00 19,166,749.00 191,667,490.00 19,166,749.00 191,667,490.00
(c) Subscribed and fully paid upEquity shares of Rs.10/- each with voting rights 19,166,749.00 191,667,490.00 19,166,749.00 191,667,490.00
19,166,749.00 191,667,490.00 19,166,749.00 191,667,490.00
Total 19,166,749.00 191,667,490.00 19,166,749.00 191,667,490.00
250,000,000 25,000,000.00 250,000,000.0025,000,000.00 250,000,000.00 25,000,000.00 250,000,000.00
Note :
Details of Repayment Terms and Security against the Term Loans
Particulars Repayment Terms Security
ICICI Bank Repayble in 60 Monthly EMI Hypothecation of Vehicle acquired out of Loans
Kotak Mahindra Bank Repayble in 60 Monthly EMI Hypothecation of Vehicle acquired out of Loan
Standard Chartered Bank Repayble in 168 Monthly EMI Mortgage of Personal Property of Director and the Personal Guarantee of the Directors
Standard Chartered Bank Repayble in 177 Monthly EMI Mortgage of Personal Property of Director and the Personal Guarantee of the Directors
Standard Chartered Bank Repayble in 211 Monthly EMI Mortgage of Immovable Properties of the Company at DLF,Pinnacle & DLF Courtyard and the Personal Guarantee of the Directors
Standard Chartered Bank Repayble in 187 Monthly EMI Mortgage of Immovable Properties of the Company at DLF,Pinnacle & DLF Courtyard and the Personal Guarantee of the Directors
NOTES FORMING PART OF THE FINANCIAL STATEMENTS
NOTE 4 RESERVES AND SURPLUS
AMD Industries Limited (Consolidated)
Particulars As at 31st March, 2012 As at 31st March, 2011
Rs. Rs.
(a) Securities premium account
Opening balance 650,390,253.28 650,390,253.28
Add : Premium on shares issued during the year
Less : Utilised during the year for: - -
Issuing bonus shares - -
Writing off preliminary expenses - -
Writing off shares / debentures issue expenses - -
Premium on redemption of redeemable preference shares / debentures - -
Buy back of shares - -
Others - -
Closing balance 650,390,253.28 650,390,253.28
(b) General reserve
Opening balance 27,326,418.51 25,326,418.51
Add: Transferred from surplus in Statement of Profit and Loss - 2,000,000.00
Less: Utilised / transferred during the year for: - -
Issuing bonus shares - -
Others - -
Closing balance 27,326,418.51 27,326,418.51
(c) Surplus / (Deficit) in Statement of Profit and Loss
Opening balance 107,036,619.39 92,644,735.10
Add: Profit / (Loss) for the year 61,334,703.31 38,816,022.29
Amounts transferred from:
General reserve - -
Other reserves - -
Less: Interim dividend - -
Dividends proposed to be distributed to equity shareholders (Re 1/- per share) 19,166,749.00 19,166,749.00
Dividends proposed to be distributed to preference shareholders - -
Tax on dividend 3,109,326.00 3,257,389.00
Transferred to:
General reserve - 2,000,000.00
Capital redemption reserve - -
Debenture redemption reserve - -
Other reserves - -
Closing balance 146,095,247.70 107,036,619.39
Total 823,811,919.49 784,753,291.18
NOTE 5 LONG-TERM BORROWINGS
Particulars As at 31st March, 2012 As at 31st March, 2011
Rs. Rs.
(a) Term loans
From banks
Secured 403,630,779.72 562,668,315.82
Unsecured - -
403,630,779.72 562,668,315.82
From other parties
Secured 16,888,348.79 20,388,984.18
Unsecured 29,000,000.00 10,000,000.00
45,888,348.79 30,388,984.18
Total 449,519,128.51 593,057,300.00
29th Annual Report 2011-201241 29th Annual Report 2011-2012 42
NOTES FORMING PART OF THE FINANCIAL STATEMENTS

AMD Industries Limited (Consolidated)
NOTES FORMING PART OF THE FINANCIAL STATEMENTS
NOTE 6 OTHER LONG-TERM LIABILITIES
Particulars As at 31st March, 2012 As at 31st March, 2011
Rs. Rs.
(a) Trade Payables:
(i) Acceptances - -
(ii) Other than Acceptances 415,475.00 187,026.00
(b) Others:
(i) Trade / security deposits received 510,000.00 240,000.00
Total 925,475.00 427,026.00
NOTE 7 LONG-TERM PROVISIONS
Particulars As at 31st March, 2012 As at 31st March, 2011
Rs. Rs.
(a) Provision for employee benefits:
(i) Provision for gratuity (net) (Refer Note 27.1.a) 5,655,170.00 4,653,968.00
(ii) Provision for other employee benefits (Leave Encashment) (Refer Note 27.1.a) 2,919,862.00 2,225,747.00
8,575,032.00 6,879,715.00
(b) Provision - Others:
(i) Provision for other contingencies (Refer Note 27.6) 6,000,000.00 6,000,000.00
(vi) Provision - others
6,000,000.00 6,000,000.00
Total 14,575,032.00 12,879,715.00
NOTE 8 SHORT-TERM BORROWINGS
Particulars As at 31st March, 2012 As at 31st March, 2011
Rs. Rs.
(a) Loans repayable on demand
From banks
Secured 288,739,858.39 244,525,570.86
Unsecured 38,854,784.00 -
327,594,642.39 244,525,570.86
(b) Loans and advances from related parties
Secured - -
Unsecured 25,985,902.00 55,160,143.00
25,985,902.00 55,160,143.00
Total 353,580,544.39 299,685,713.86
Notes:
Details of Security against the Short Term Borrowings from Banks
Particulars Security
State Bank of India First Pari Passu charge over Current assets of the company and 2nd parri passu charge over the fixed assets of the company except vehicles & immovable properties of the company specifically mortage to other lenders.The same is also secured by way of mortagage of personal property of the Director and the Personal Guarantee of the Directors.
Kotak Mahindra Bank First Pari Passu charge over Current assets of the company and 2nd parri passu charge over the fixed assets of the company except vehicles & immovable properties of the company specifically mortage to other lenders.The same is also secured by way of mortagage of personal property of the Director and the Personal Guarantee of the Directors.
Central Bank of India Mortagage of personal property of the Director and the Personal Guarantee of the Directors.
Punjab National Bank Repayble in 16 Quarterly First Pari Passu charge over fixed assets of the company except vehicles & immovableInstallments and Interest Payable properties of the company specifically mortgage to other lenders. The same is also Monthly secured by 2nd Pari Passu charge over the current assets of the company and the
personal guarantee of the directors and corporate guarantee of subsidiary company AMD Estates & Developers (P) Limited
Punjab National Bank Repayble in 60 Monthly Installments First Pari Passu charge over fixed assets of the company except vehicles &and Interest Payable Monthly immovable properties of the company specifically mortgage to other lenders. The
same is also secured by 2nd Pari Passu charge over the current assets of the company and the personal guarantee of the directors and corporate guarantee of subsidiary company AMD Estates & Developers (P) Limited
Union Bank of India Repayble in 60 Monthly Installments First Pari Passu charge over fixed assets of the company except vehicles &and Interest Payable Monthly immovable properties of the company specifically mortgage to other lenders. The
same is also secured by 2nd Pari Passu charge over the current assets of the company and the personal guarantee of the directors and corporate guarantee & mortgage of Land and Building of another Company.
Kotak Mahindra Bank Repayble in 68 Monthly EMI Mortgage of Immovable Properties of the Company at Digital Green, Gurgaon andthe Personal Guarantee of the Directors
Indiabulls Housing Finance Repayble in 84 Monthly EMI Mortgage of Immovable Properties of the Company at Mohali and the PersonalLtd. Guarantee of the Directors
Tata Capital Limited Repayble in 36 Monthly EMI Hypothecation of Vehicle acquired out of Loan
AMD Industries Limited (Consolidated)
NOTES FORMING PART OF THE FINANCIAL STATEMENTS
NOTE 9 TRADE PAYABLES
Particulars As at 31st March, 2012 As at 31st March, 2011
Rs. Rs.
(a) Trade payables:
Acceptances
Other than Acceptances 230,499,732.88 362,333,555.18
Total 230,499,732.88 362,333,555.18
NOTE 10 OTHER CURRENT LIABILITIES
Particulars As at 31st March, 2012 As at 31st March, 2011Rs. Rs.
(a) Current maturities of long-term debt (Refer Note (i) below) 166,635,415.39 161,159,562.12
(b) Interest Accrued and due on borrowings 3,840,736.00 893,589.00
(c) Other payables
(i) Statutory remittances (Contributions to PF and ESIC, Withholding Taxes, Excise Duty,
VAT, Service Tax, etc.) 6,019,036.73 1,412,506.62
(ii) Interest accrued on trade payables - 905,214.00
(iii) Tarde and Security Deposit 41,100,000.00 40,000,000.00
(iv) Advances from customers 4,660,012.35 10,025,751.12
(v) Others (Expenses Payable and Advances) 39,013,183.10 18,874,932.78
Total 261,268,383.57 233,271,555.64
Note (i): Current maturities of long-term debt (Refer Notes in Note 5 - Long-term borrowings for details of security and guarantee):
Particulars As at 31st March, 2012 As at 31st March, 2011Rs. Rs.
(a) Term loans
From banks - -
Secured 163,307,219.00 158,187,589.67
Unsecured - -
163,307,219.00 158,187,589.67
From other parties
Secured 3,328,196.39 2,971,972.45
Unsecured - -
3,328,196.39 2,971,972.45
Total 166,635,415.39 161,159,562.12
NOTE 11 SHORT-TERM PROVISIONS
Particulars As at 31st March, 2012 As at 31st March, 2011
Rs. Rs.
(a) Provision for employee benefits:
(i) Provision for bonus 2,815,448.00 2,489,636.00
2,815,448.00 2,489,636.00
(b) Provision - Others:
(i) Provision for tax (net of advance tax Rs.2,40,55,788.00 (As at 31 March,
2011 Rs.1,96,87,170.88)) 8,944,212.00 (1,687,170.88)
(ii) Provision for Wealth Tax 75,000.00 75,000.00
(iii) Provision for proposed equity dividend 19,166,749.00 19,166,749.00
(iv) Provision for tax on proposed dividends 3,109,326.00 3,257,389.00
(v) Provision - (i) Forward Contract Payble 113,751,827.70 166,337,776.30
(ii) Deferred Forward Premium 3,564,592.18 7,784,459.44
148,611,706.88 194,934,202.86
Total 151,427,154.88 197,423,838.86
29th Annual Report 2011-201243 29th Annual Report 2011-2012 44

AMD Industries Limited (Consolidated)
NOTES FORMING PART OF THE FINANCIAL STATEMENTS
NOTE 12 FIXED ASSETS
A. Tangible assets Gross block
Balance Additions Disposals Acquisitions Reclassified Revaluation Effect of Borrowing Other Balance as at through as held for increase foreign cost adjustments as at
1 April, 2011 business sale currency capitalised 31st March, combinations exchange 2012
differences Rs. Rs. Rs. Rs. Rs. Rs. Rs. Rs. Rs. Rs.
(a) LandFreehold 151,750,097.47 - - 151,750,097.47 Leasehold 9,932,321.00 - 481,786.00 9,450,535.00
(b) BuildingsOwn use 105,661,039.91 - 6,451,787.90 99,209,252.01 Given under operating lease
(c) Plant and EquipmentOwned 950,998,524.56 16,049,682.00 2,429,920.76 964,618,285.80 Taken under finance leaseGiven under operating lease
(d) Furniture and FixturesOwned 20,107,785.04 611,493.00 457,689.44 20,261,588.60 Taken under finance leaseGiven under operating lease
(e) VehiclesOwned 24,512,927.13 56,187.00 - 24,569,114.13 Taken under finance leaseGiven under operating lease
(f) Office equipmentOwned 10,720,859.49 1,178,517.00 - 11,899,376.49 Taken under finance leaseGiven under operating lease
(g) Leasehold improvementsOwnedTaken under finance leaseGiven under operating lease
(h) Others (specify nature), e.g. Railway sidings, etc.OwnedTaken under finance leaseGiven under operating lease
Total 1,273,683,554.60 17,895,879.00 9,821,184.10 1,281,758,249.49
Previous year 1,203,924,314.03 88,634,196.89 18,874,956.34 1,273,683,554.58
A. Tangible assets
Balance Depreciation / Eliminated Eliminated on Impairment Reversal of Other Balance Balance Balance as at amortisation on disposal reclassification losses impairment adjustments as at as at as at
1 April, 2011 expense for of assets as held for recognised in losses 31st March, 31st March, 31st March, the year sale statement of recognised in 2012 2012 2011
profit and loss Statement of Profit and Loss
Rs. Rs. Rs. Rs. Rs. Rs. Rs. Rs. Rs. Rs.
(a) LandFreehold - - - - 151,750,097.47 151,750,097.47 Leasehold 241,517.82 1,700.00 243,217.82 0.00 9,450,535.00 9,690,803.18
(b) BuildingsOwn use 14,651,607.19 3,341,384.00 2,415,831.89 15,577,159.30 83,632,092.71 91,009,432.72 Given under operating lease
(c) Plant and EquipmentOwned 316,680,594.30 68,337,313.00 841,241.89 384,176,665.41 580,441,620.39 634,317,930.26 Taken under finance leaseGiven under operating lease
(d) Furniture and FixturesOwned 6,115,523.87 1,227,787.00 293,449.53 7,049,861.34 13,211,727.26 13,992,261.17 Taken under finance leaseGiven under operating lease
(e) VehiclesOwned 10,351,257.90 2,234,926.00 - 12,586,183.90 11,982,930.24 14,161,669.24 Taken under finance leaseGiven under operating lease
(f) Office equipmentOwned 7,456,723.99 932,672.34 - 8,389,396.33 3,509,980.16 3,264,135.50 Taken under finance leaseGiven under operating lease
(g) Leasehold improvementsOwnedTaken under finance leaseGiven under operating lease
(h) Others (specify nature), e.g. Railway sidings, etc.OwnedTaken under finance leaseGiven under operating lease
Total 355,497,225.06 76,075,782.34 3,793,741.13 427,779,266.27 853,978,983.23 918,186,329.54
Previous year 283,857,540.38 71,870,829.22 231,144.56 355,497,225.04 918,186,329.54 920,066,773.65
Accumulated depreciation and impairment Net block
AMD Industries Limited (Consolidated)
B. Intangible assets Gross block
Balance Additions Disposals Acquisitions Reclassified Revaluation Effect of Borrowing Other Balance as at through as held for increase foreign cost adjustments as at
1 April, 2011 business sale currency capitalised 31st March, combinations exchange 2012
differences Rs. Rs. Rs. Rs. Rs. Rs. Rs. Rs. Rs. Rs.
(a) Computer Software 1,465,100.00 789,805.00 - - - - - - - 2,254,905.00
Total 1,465,100.00 789,805.00 - - - - - - - 2,254,905.00
Previous year 1,465,100.00 - - - - - - - - 1,465,100.00
NOTES FORMING PART OF THE FINANCIAL STATEMENTS
NOTE 12 FIXED ASSETS
B. Intangible assets
Balance Depreciation / Eliminated Eliminated on Impairment Reversal of Other Balance Balance Balance as at amortisation on disposal reclassification losses impairment adjustments as at as at as at
1 April, 2011 expense for of assets as held for recognised in losses 31st March, 31st March, 31st March, the year sale statement of recognised in 2012 2012 2011
profit and loss Statement of Profit and Loss
Rs. Rs. Rs. Rs. Rs. Rs. Rs. Rs. Rs. Rs.
(a) Computer Software 744,658.00 267,576.00 - - - - - 1,012,234.00 1,242,671.00 720,442.00
Total 744,658.00 267,576.00 - - - - - 1,012,234.00 1,242,671.00 720,442.00
Previous year 507,166.00 237,492.00 - - - - - 744,658.00 720,442.00 957,934.00
Accumulated depreciation and impairment Net block
C. Depreciation and amortisation relating to continuing operations:
Particulars As at 31st March, 2012 As at 31st March, 2011
Rs. Rs.
Depreciation and amortisation for the year on tangible assets as per Note 12 A 76,075,782.34 71,870,829.22
Depreciation and amortisation for the year on intangible assets as per Note 12 B 267,576.00 237,492.00
Less: Utilised from revaluation reserve - -
Depreciation and amortisation relating to discontinuing operations - -
Depreciation and amortisation relating to continuing operations 76,343,358.34 72,108,321.22
NOTE 13 NON-CURRENT INVESTMENT
Particulars As at 31st March, 2012 As at 31st March, 2011
Quoted # Unquoted # Total Quoted Unquoted TotalRs. Rs. Rs. Rs. Rs. Rs.
Investments (At cost):A. Trade @
(a) Investment in equity instruments (give details separately for fully / partly paid up instruments)
(i) of subsidiaries - - - - -
- - - - -
Total - Trade (A) - - - - -
Particulars As at 31st March, 2012 As at 31st March, 2011
Quoted Unquoted Total Quoted Unquoted TotalRs. Rs. Rs. Rs. Rs. Rs.
B. Other investments(a) Investment in equity instruments
(give details separately for fully / partly paid up instruments)
(i) of other STL Global Limited(50000 Equity Shares fully paid up) 3,321,885.69 - 3,321,885.69 3,321,885.69 - 3,321,885.69 (Market Value Rs.176500/- for 50000 Shares @ Rs.3.53 each as on 31.03.2012)
3,321,885.69 - 3,321,885.69 3,321,885.69 - 3,321,885.69 (b) Investment in mutual funds(i) SBI One India Fund - Dividend 100,000.00 100,000.00 100,000.00 100,000.00
(10000 Units at Rs.10 Each)(ii) SBI Infrastructure Fund - I - Growth 100,000.00 100,000.00 100,000.00 100,000.00
(10000 Units at Rs.10 Each)(iii) Union KBC Equity Fund Growth 500,000.00 500,000.00
(50000 Units at Rs.10 Each)700,000.00 700,000.00 200,000.00 200,000.00
Total - Other investments (B) 4,021,885.69 4,021,885.69 3,521,885.69 3,521,885.69
Total (A+B) 4,021,885.69 - 4,021,885.69 3,521,885.69 - 3,521,885.69
Less: Provision for diminution in value of investments 36,300.00 (2,000.00)
Total 3,985,585.69 3,523,885.69
Aggregate amount of quoted investments 4,021,885.69 3,521,885.69
Aggregate amount of unquoted investments - -
29th Annual Report 2011-201245 29th Annual Report 2011-2012 46

AMD Industries Limited (Consolidated)
NOTES FORMING PART OF THE FINANCIAL STATEMENTS
NOTE 12 FIXED ASSETS
A. Tangible assets Gross block
Balance Additions Disposals Acquisitions Reclassified Revaluation Effect of Borrowing Other Balance as at through as held for increase foreign cost adjustments as at
1 April, 2011 business sale currency capitalised 31st March, combinations exchange 2012
differences Rs. Rs. Rs. Rs. Rs. Rs. Rs. Rs. Rs. Rs.
(a) LandFreehold 151,750,097.47 - - 151,750,097.47 Leasehold 9,932,321.00 - 481,786.00 9,450,535.00
(b) BuildingsOwn use 105,661,039.91 - 6,451,787.90 99,209,252.01 Given under operating lease
(c) Plant and EquipmentOwned 950,998,524.56 16,049,682.00 2,429,920.76 964,618,285.80 Taken under finance leaseGiven under operating lease
(d) Furniture and FixturesOwned 20,107,785.04 611,493.00 457,689.44 20,261,588.60 Taken under finance leaseGiven under operating lease
(e) VehiclesOwned 24,512,927.13 56,187.00 - 24,569,114.13 Taken under finance leaseGiven under operating lease
(f) Office equipmentOwned 10,720,859.49 1,178,517.00 - 11,899,376.49 Taken under finance leaseGiven under operating lease
(g) Leasehold improvementsOwnedTaken under finance leaseGiven under operating lease
(h) Others (specify nature), e.g. Railway sidings, etc.OwnedTaken under finance leaseGiven under operating lease
Total 1,273,683,554.60 17,895,879.00 9,821,184.10 1,281,758,249.49
Previous year 1,203,924,314.03 88,634,196.89 18,874,956.34 1,273,683,554.58
A. Tangible assets
Balance Depreciation / Eliminated Eliminated on Impairment Reversal of Other Balance Balance Balance as at amortisation on disposal reclassification losses impairment adjustments as at as at as at
1 April, 2011 expense for of assets as held for recognised in losses 31st March, 31st March, 31st March, the year sale statement of recognised in 2012 2012 2011
profit and loss Statement of Profit and Loss
Rs. Rs. Rs. Rs. Rs. Rs. Rs. Rs. Rs. Rs.
(a) LandFreehold - - - - 151,750,097.47 151,750,097.47 Leasehold 241,517.82 1,700.00 243,217.82 0.00 9,450,535.00 9,690,803.18
(b) BuildingsOwn use 14,651,607.19 3,341,384.00 2,415,831.89 15,577,159.30 83,632,092.71 91,009,432.72 Given under operating lease
(c) Plant and EquipmentOwned 316,680,594.30 68,337,313.00 841,241.89 384,176,665.41 580,441,620.39 634,317,930.26 Taken under finance leaseGiven under operating lease
(d) Furniture and FixturesOwned 6,115,523.87 1,227,787.00 293,449.53 7,049,861.34 13,211,727.26 13,992,261.17 Taken under finance leaseGiven under operating lease
(e) VehiclesOwned 10,351,257.90 2,234,926.00 - 12,586,183.90 11,982,930.24 14,161,669.24 Taken under finance leaseGiven under operating lease
(f) Office equipmentOwned 7,456,723.99 932,672.34 - 8,389,396.33 3,509,980.16 3,264,135.50 Taken under finance leaseGiven under operating lease
(g) Leasehold improvementsOwnedTaken under finance leaseGiven under operating lease
(h) Others (specify nature), e.g. Railway sidings, etc.OwnedTaken under finance leaseGiven under operating lease
Total 355,497,225.06 76,075,782.34 3,793,741.13 427,779,266.27 853,978,983.23 918,186,329.54
Previous year 283,857,540.38 71,870,829.22 231,144.56 355,497,225.04 918,186,329.54 920,066,773.65
Accumulated depreciation and impairment Net block
AMD Industries Limited (Consolidated)
B. Intangible assets Gross block
Balance Additions Disposals Acquisitions Reclassified Revaluation Effect of Borrowing Other Balance as at through as held for increase foreign cost adjustments as at
1 April, 2011 business sale currency capitalised 31st March, combinations exchange 2012
differences Rs. Rs. Rs. Rs. Rs. Rs. Rs. Rs. Rs. Rs.
(a) Computer Software 1,465,100.00 789,805.00 - - - - - - - 2,254,905.00
Total 1,465,100.00 789,805.00 - - - - - - - 2,254,905.00
Previous year 1,465,100.00 - - - - - - - - 1,465,100.00
NOTES FORMING PART OF THE FINANCIAL STATEMENTS
NOTE 12 FIXED ASSETS
B. Intangible assets
Balance Depreciation / Eliminated Eliminated on Impairment Reversal of Other Balance Balance Balance as at amortisation on disposal reclassification losses impairment adjustments as at as at as at
1 April, 2011 expense for of assets as held for recognised in losses 31st March, 31st March, 31st March, the year sale statement of recognised in 2012 2012 2011
profit and loss Statement of Profit and Loss
Rs. Rs. Rs. Rs. Rs. Rs. Rs. Rs. Rs. Rs.
(a) Computer Software 744,658.00 267,576.00 - - - - - 1,012,234.00 1,242,671.00 720,442.00
Total 744,658.00 267,576.00 - - - - - 1,012,234.00 1,242,671.00 720,442.00
Previous year 507,166.00 237,492.00 - - - - - 744,658.00 720,442.00 957,934.00
Accumulated depreciation and impairment Net block
C. Depreciation and amortisation relating to continuing operations:
Particulars As at 31st March, 2012 As at 31st March, 2011
Rs. Rs.
Depreciation and amortisation for the year on tangible assets as per Note 12 A 76,075,782.34 71,870,829.22
Depreciation and amortisation for the year on intangible assets as per Note 12 B 267,576.00 237,492.00
Less: Utilised from revaluation reserve - -
Depreciation and amortisation relating to discontinuing operations - -
Depreciation and amortisation relating to continuing operations 76,343,358.34 72,108,321.22
NOTE 13 NON-CURRENT INVESTMENT
Particulars As at 31st March, 2012 As at 31st March, 2011
Quoted # Unquoted # Total Quoted Unquoted TotalRs. Rs. Rs. Rs. Rs. Rs.
Investments (At cost):A. Trade @
(a) Investment in equity instruments (give details separately for fully / partly paid up instruments)
(i) of subsidiaries - - - - -
- - - - -
Total - Trade (A) - - - - -
Particulars As at 31st March, 2012 As at 31st March, 2011
Quoted Unquoted Total Quoted Unquoted TotalRs. Rs. Rs. Rs. Rs. Rs.
B. Other investments(a) Investment in equity instruments
(give details separately for fully / partly paid up instruments)
(i) of other STL Global Limited(50000 Equity Shares fully paid up) 3,321,885.69 - 3,321,885.69 3,321,885.69 - 3,321,885.69 (Market Value Rs.176500/- for 50000 Shares @ Rs.3.53 each as on 31.03.2012)
3,321,885.69 - 3,321,885.69 3,321,885.69 - 3,321,885.69 (b) Investment in mutual funds(i) SBI One India Fund - Dividend 100,000.00 100,000.00 100,000.00 100,000.00
(10000 Units at Rs.10 Each)(ii) SBI Infrastructure Fund - I - Growth 100,000.00 100,000.00 100,000.00 100,000.00
(10000 Units at Rs.10 Each)(iii) Union KBC Equity Fund Growth 500,000.00 500,000.00
(50000 Units at Rs.10 Each)700,000.00 700,000.00 200,000.00 200,000.00
Total - Other investments (B) 4,021,885.69 4,021,885.69 3,521,885.69 3,521,885.69
Total (A+B) 4,021,885.69 - 4,021,885.69 3,521,885.69 - 3,521,885.69
Less: Provision for diminution in value of investments 36,300.00 (2,000.00)
Total 3,985,585.69 3,523,885.69
Aggregate amount of quoted investments 4,021,885.69 3,521,885.69
Aggregate amount of unquoted investments - -
29th Annual Report 2011-201245 29th Annual Report 2011-2012 46

AMD Industries Limited (Consolidated)
NOTES FORMING PART OF THE FINANCIAL STATEMENTSNOTE 14 LONG-TERM LOANS AND ADVANCES
Particulars As at 31st March, 2012 As at 31st March, 2011
Rs. Rs.
(a) Capital advancesSecured, considered good - - Unsecured, considered good 131,434,437.00 124,470,600.00 Doubtful - -
131,434,437.00 124,470,600.00 Less: Provision for doubtful advances - -
131,434,437.00 124,470,600.00 (b) Security deposits
Secured, considered good - - Unsecured, considered good 16,693,811.00 25,163,227.00 Doubtful - -
16,693,811.00 25,163,227.00 Less: Provision for doubtful deposits - -
16,693,811.00 25,163,227.00 (c) Loans and advances to related parties
Secured, considered good - - Unsecured, considered good - - Doubtful - -
- - Less: Provision for doubtful loans and advances - -
- - (d) Prepaid expenses - Unsecured, considered good 104,000.00 126,000.00 (e) Other loans and advances (Advances to suppliers)
Secured, considered good - - Unsecured, considered good 440,237.00 442,807.00 Doubtful - -
440,237.00 442,807.00 Less: Provision for other doubtful loans and advances - -
440,237.00 442,807.00 (f) Other loans and advances
Secured, considered good - - Unsecured, considered good 4,136,962.00 3,534,983.00 Doubtful - -
4,136,962.00 3,534,983.00 Less: Provision for other doubtful loans and advances - -
4,136,962.00 3,534,983.00
Total 152,809,447.00 153,737,617.00
NOTE 15 INVENTORIES(At lower of cost and net realisable value)
Particulars As at 31st March, 2012 As at 31st March, 2011Rs. Rs.
(a) Raw materials 215,381,180.01 232,263,296.00 Goods-in-transit 24,724,168.00 76,923,664.00
240,105,348.01 309,186,960.00 (b) Work-in-progress @ (Refer Note below) 17,974,600.00 22,414,100.00
Goods-in-transit - - 17,974,600.00 22,414,100.00
(c) Finished goods (other than those acquired for trading) 33,677,400.00 89,198,690.00 Goods-in-transit - -
33,677,400.00 89,198,690.00 (d) Stock-in-trade (acquired for trading) 2,300.00 2,300.00
Goods-in-transit - - 2,300.00 2,300.00
(e) Stores and spares 67,245,407.93 53,891,873.93 Goods-in-transit - -
67,245,407.93 53,891,873.93 (f) Others - Packing Materials 4,334,531.00 6,329,489.00
Goods-in-transit - - 4,334,531.00 6,329,489.00
(g) Others - Waste & Scrap 6,187,689.00 5,582,599.00 Goods-in-transit - -
6,187,689.00 5,582,599.00 (h) Others :
(i) Project at Gurgaon 349,880,786.83 328,472,389.52 (i) Project at Rewari 166,744,636.24 158,369,644.15
516,625,423.07 486,842,033.67
Total 886,152,699.01 973,448,045.60
Note: Details of inventory of work-in-progress
Particulars As at 31st March, 2012 As at 31st March, 2011Rs. Rs.
Pet PreformCSD Closures 4,302,600.00 706,100.00 Crown Caps 3,500,200.00 6,547,900.00 Job Work (Pet Preform) 10,171,800.00 15,160,100.00
17,974,600.00 22,414,100.00
AMD Industries Limited (Consolidated)
NOTES FORMING PART OF THE FINANCIAL STATEMENTS
NOTE 16 TRADE RECEIVABLES
Particulars As at 31st March, 2012 As at 31st March, 2011
Rs. Rs.
Trade receivables outstanding for a period exceeding six months from the date they were due for payment #
Secured, considered good - - Unsecured, considered good 17,298,634.03 14,317,058.04 Doubtful 1,592,552.00 1,592,552.00
18,891,186.03 15,909,610.04 Less: Provision for doubtful trade receivables - -
18,891,186.03 15,909,610.04 Other Trade receivables
Secured, considered good - -Unsecured, considered good 346,913,691.12 243,975,729.04 Doubtful - -
346,913,691.12 243,975,729.04 Less: Provision for doubtful trade receivables - -
346,913,691.12 243,975,729.04
Total 365,804,877.15 259,885,339.08
Note: Trade receivables include debts due from:
Particulars As at 31st March, 2012 As at 31st March, 2011Rs. Rs.
Directors - - Other officers of the Company - - Firms in which any director is a partner - - Private companies in which any director is a director or member - -
- -
NOTE 17 CASH AND CASH EQUIVALENTS
Particulars As at 31st March, 2012 As at 31st March, 2011Rs. Rs.
(a) Cash on hand 113,137.25 199,445.25
(b) Cheques, drafts on hand - -
(c) Balances with banks
(i) In current accounts 9,675,866.39 64,197,187.21
(ii) In EEFC accounts 583,515.10 509,299.00
(iii) In earmarked accounts
- Balances held as margin money or security against borrowings, guarantees and other
commitments (Refer Note (i) below) 33,802,504.00 66,104,194.00
(d) Others - Foreign Currency in Hand 144,388.00 68,921.85
Total 44,319,410.74 131,079,047.31
NOTE 18 SHORT-TERM LOANS AND ADVANCES
Particulars As at 31st March, 2012 As at 31st March, 2011Rs. Rs.
(a) Loans and advances to employeesSecured, considered good - - Unsecured, considered good 641,533.00 649,826.00 Doubtful - -
641,533.00 649,826.00 Less: Provision for doubtful loans and advances - -
641,533.00 649,826.00 (b) Prepaid expenses - Unsecured, considered good 2,193,437.40 2,281,660.68 (c) Balances with government authorities
Unsecured, considered good(i) CENVAT credit receivable 82,346,890.80 79,563,193.61 (ii) VAT credit receivable 2,808,364.00 385,745.00 (iii) Service Tax credit receivable 24,249,673.02 17,420,408.04 (iv) Others 76,111.00 115,291.00
(d) Others (Advances to Suppliers)Secured, considered good - - Unsecured, considered good 66,120,568.57 64,971,923.51 Doubtful - -
66,120,568.57 64,971,923.51 Less: Provision for other doubtful loans and advances - -
66,120,568.57 64,971,923.51
Total 178,436,577.79 165,388,047.84
29th Annual Report 2011-201247 29th Annual Report 2011-2012 48

AMD Industries Limited (Consolidated)
NOTES FORMING PART OF THE FINANCIAL STATEMENTS
NOTE 18 SHORT-TERM LOANS AND ADVANCES (CONTD.)
Note: Short-term loans and advances include amounts due from:
Particulars As at 31st March, 2012 As at 31st March, 2011Rs. Rs.
Directors - -Other officers of the Company - -Firms in which any director is a partner - -Private companies in which any director is a director or member - -
- -
NOTE 19 OTHER CURRENT ASSETS
Particulars As at 31st March, 2012 As at 31st March, 2011Rs. Rs.
(a) Accruals(i) Interest accrued on deposits 1,422,543.90 1,569,315.00
(b) Others(i) Others - (i) Forward Contract Receivables 111,277,384.15 180,578,165.82
(ii) Exports Incentive Receivables 5,095,545.06 13,296,477.84
Total 117,795,473.11 195,443,958.66
NOTE 20 REVENUE FROM OPERATIONS
Particulars For the year ended For the year ended 31st March, 2012 31st March, 2011
Rs. Rs.
(a) Sale of products @ (Refer Note (i) below) 1,746,847,489.25 1,317,264,455.03 (b) Sale of services @ (Refer Note (ii) below) 237,740,383.51 189,144,770.38 (c) Other operating revenues # (Refer Note (iii) below) 55,762,909.21 41,451,625.00
2,040,350,781.97 1,547,860,850.41 Less:
(d) Excise duty 220,273,280.00 166,720,518.00
Total 1,820,077,501.97 1,381,140,332.41
Note Particulars For the year ended For the year ended 31st March, 2012 31st March, 2011
Rs. Rs.
(i) Sale of products comprises:Manufactured goodsCrown Caps 796,862,252.00 678,183,677.61 CSD Closures 403,100,890.21 276,992,032.98 Pet - Preforms 546,576,913.04 361,939,440.44 Others
Total - Sale of manufactured goods 1,746,540,055.25 1,317,115,151.03
Traded goodsOthers 307,434.00 149,304.00
Total - Sale of traded goods 307,434.00 149,304.00
Total - Sale of products 1,746,847,489.25 1,317,264,455.03
(ii) Sale of services comprises :Jobwork - Pet Preform 237,740,383.51 189,144,770.38
Total - Sale of services 237,740,383.51 189,144,770.38
(iii) Other operating revenues comprise:Sale of scrap 28,645,223.57 22,258,413.00 Duty drawback and other export incentives 18,921,121.00 11,616,358.00 Others - Discount on Purchase 8,196,564.64 7,576,854.00
Total - Other operating revenues 55,762,909.21 41,451,625.00
NOTE 21 OTHER INCOME
Particulars For the year ended For the year ended 31st March, 2012 31st March, 2011
Rs. Rs.
(a) Interest income (Refer Note (i) below) 2,346,855.41 4,821,022.80 (b) Dividend income:
from current investments - - subsidiaries - - joint ventures - - associates - - others - -
from long-term investmentssubsidiaries - - joint ventures - - associates - - others 18,900.00 10,075.00
(c) Other non-operating income (net of expenses directly attributable to such income) (Refer Note (ii) below) 1,996,705.92 1,056,152.07
Total 4,362,461.33 5,887,249.87
AMD Industries Limited (Consolidated)
NOTES FORMING PART OF THE FINANCIAL STATEMENTS
Particulars For the year ended For the year ended 31st March, 2012 31st March, 2011
Rs. Rs.
(i) Interest income comprises:Interest from banks on:
deposits 2,769,140.11 2,147,403.80 other balances
Interest on loans and advances 960,736.30 319,620.00 Interest on overdue trade receivables (1,384,981.00) 2,353,999.00 Interest income from current investments
subsidiaries - - joint ventures - - associates - - others - -
Interest income from long term investmentssubsidiaries - - joint ventures - - associates - - others - -
Interest on Income Tax Refund 1,960.00 -
Total - Interest income 2,346,855.41 4,821,022.80
NOTE 21 OTHER INCOME (CONTD.)
Note Particulars For the year ended For the year ended 31st March, 2012 31st March, 2011
Rs. Rs.
(ii) Other non-operating income comprises:Rental income from investment properties 1,680,806.00 1,005,000.00 Prior period items (net) (Refer Note (iii) below) - - Miscellaneous income 315,899.92 51,152.07 Total - Other non-operating income 1,996,705.92 1,056,152.07
(iii) Details of Prior period items (net)Prior period income (give details) - - Prior period expenses (give details) - - Total - -
NOTE 22.a COST OF MATERIALS CONSUMED
Particulars For the year ended For the year ended 31st March, 2012 31st March, 2011
Rs. Rs.
Opening stock 309,186,960.00 220,894,059.00 Add: Purchases 951,256,305.00 935,094,545.93
1,260,443,265.00 1,155,988,604.93 Less: Closing stock 240,105,348.01 309,186,960.00 Cost of material consumed 1,020,337,916.99 846,801,644.93 Material consumed comprises:Tin Free Sheets 354,248,609.00 350,616,129.00 Polypropylene 168,509,861.00 128,692,410.00 Resin 341,512,408.00 230,920,453.00 Other items 156,067,038.99 136,572,652.93
Total 1,020,337,916.99 846,801,644.93
NOTE 22.b PURCHASE OF TRADED GOODS
Particulars For the year ended For the year ended 31st March, 2012 31st March, 2011
Rs. Rs.
Traded good - Real Estates - DLF Pinnacle 247,826.00 -Traded good - Real Estates - DLF Courtyard 1,706,714.00 1,200,000.00 Others 91,192.50 80,737.50
Total 2,045,732.50 1,280,737.50
NOTE 22.c CHANGES IN INVENTORIES OF FINISHED GOODS, WORK-IN-PROGRESS AND STOCK-IN-TRADE
Particulars For the year ended For the year ended 31st March, 2012 31st March, 2011
Rs. Rs.
Inventories at the end of the year:Finished goods 33,677,400.00 89,198,690.00 Work-in-progress 17,974,600.00 22,414,100.00 Stock-in-trade - Real Estates 44,181,401.93 42,226,861.93 Stock-in-trade -Waste & Scrap 6,187,689.00 5,582,599.00 Stock-in-trade - Trading Goods 2,300.00 2,300.00
102,023,390.93 159,424,550.93 Inventories at the beginning of the year:Finished goods 89,198,690.00 22,243,679.00 Work-in-progress 22,414,100.00 6,608,300.00 Stock-in-Trade - Real Estates 42,226,861.93 41,026,861.93 Stock-in-trade -Waste & Scrap 5,582,599.00 5,011,477.00 Stock-in-trade - Trading Goods 2,300.00 -
159,424,550.93 74,890,317.93
Net (increase) / decrease 57,401,160.00 (84,534,233.00)
29th Annual Report 2011-201249 29th Annual Report 2011-2012 50

AMD Industries Limited (Consolidated)
NOTES FORMING PART OF THE FINANCIAL STATEMENTS
NOTE 18 SHORT-TERM LOANS AND ADVANCES (CONTD.)
Note: Short-term loans and advances include amounts due from:
Particulars As at 31st March, 2012 As at 31st March, 2011Rs. Rs.
Directors - -Other officers of the Company - -Firms in which any director is a partner - -Private companies in which any director is a director or member - -
- -
NOTE 19 OTHER CURRENT ASSETS
Particulars As at 31st March, 2012 As at 31st March, 2011Rs. Rs.
(a) Accruals(i) Interest accrued on deposits 1,422,543.90 1,569,315.00
(b) Others(i) Others - (i) Forward Contract Receivables 111,277,384.15 180,578,165.82
(ii) Exports Incentive Receivables 5,095,545.06 13,296,477.84
Total 117,795,473.11 195,443,958.66
NOTE 20 REVENUE FROM OPERATIONS
Particulars For the year ended For the year ended 31st March, 2012 31st March, 2011
Rs. Rs.
(a) Sale of products @ (Refer Note (i) below) 1,746,847,489.25 1,317,264,455.03 (b) Sale of services @ (Refer Note (ii) below) 237,740,383.51 189,144,770.38 (c) Other operating revenues # (Refer Note (iii) below) 55,762,909.21 41,451,625.00
2,040,350,781.97 1,547,860,850.41 Less:
(d) Excise duty 220,273,280.00 166,720,518.00
Total 1,820,077,501.97 1,381,140,332.41
Note Particulars For the year ended For the year ended 31st March, 2012 31st March, 2011
Rs. Rs.
(i) Sale of products comprises:Manufactured goodsCrown Caps 796,862,252.00 678,183,677.61 CSD Closures 403,100,890.21 276,992,032.98 Pet - Preforms 546,576,913.04 361,939,440.44 Others
Total - Sale of manufactured goods 1,746,540,055.25 1,317,115,151.03
Traded goodsOthers 307,434.00 149,304.00
Total - Sale of traded goods 307,434.00 149,304.00
Total - Sale of products 1,746,847,489.25 1,317,264,455.03
(ii) Sale of services comprises :Jobwork - Pet Preform 237,740,383.51 189,144,770.38
Total - Sale of services 237,740,383.51 189,144,770.38
(iii) Other operating revenues comprise:Sale of scrap 28,645,223.57 22,258,413.00 Duty drawback and other export incentives 18,921,121.00 11,616,358.00 Others - Discount on Purchase 8,196,564.64 7,576,854.00
Total - Other operating revenues 55,762,909.21 41,451,625.00
NOTE 21 OTHER INCOME
Particulars For the year ended For the year ended 31st March, 2012 31st March, 2011
Rs. Rs.
(a) Interest income (Refer Note (i) below) 2,346,855.41 4,821,022.80 (b) Dividend income:
from current investments - - subsidiaries - - joint ventures - - associates - - others - -
from long-term investmentssubsidiaries - - joint ventures - - associates - - others 18,900.00 10,075.00
(c) Other non-operating income (net of expenses directly attributable to such income) (Refer Note (ii) below) 1,996,705.92 1,056,152.07
Total 4,362,461.33 5,887,249.87
AMD Industries Limited (Consolidated)
NOTES FORMING PART OF THE FINANCIAL STATEMENTS
Particulars For the year ended For the year ended 31st March, 2012 31st March, 2011
Rs. Rs.
(i) Interest income comprises:Interest from banks on:
deposits 2,769,140.11 2,147,403.80 other balances
Interest on loans and advances 960,736.30 319,620.00 Interest on overdue trade receivables (1,384,981.00) 2,353,999.00 Interest income from current investments
subsidiaries - - joint ventures - - associates - - others - -
Interest income from long term investmentssubsidiaries - - joint ventures - - associates - - others - -
Interest on Income Tax Refund 1,960.00 -
Total - Interest income 2,346,855.41 4,821,022.80
NOTE 21 OTHER INCOME (CONTD.)
Note Particulars For the year ended For the year ended 31st March, 2012 31st March, 2011
Rs. Rs.
(ii) Other non-operating income comprises:Rental income from investment properties 1,680,806.00 1,005,000.00 Prior period items (net) (Refer Note (iii) below) - - Miscellaneous income 315,899.92 51,152.07 Total - Other non-operating income 1,996,705.92 1,056,152.07
(iii) Details of Prior period items (net)Prior period income (give details) - - Prior period expenses (give details) - - Total - -
NOTE 22.a COST OF MATERIALS CONSUMED
Particulars For the year ended For the year ended 31st March, 2012 31st March, 2011
Rs. Rs.
Opening stock 309,186,960.00 220,894,059.00 Add: Purchases 951,256,305.00 935,094,545.93
1,260,443,265.00 1,155,988,604.93 Less: Closing stock 240,105,348.01 309,186,960.00 Cost of material consumed 1,020,337,916.99 846,801,644.93 Material consumed comprises:Tin Free Sheets 354,248,609.00 350,616,129.00 Polypropylene 168,509,861.00 128,692,410.00 Resin 341,512,408.00 230,920,453.00 Other items 156,067,038.99 136,572,652.93
Total 1,020,337,916.99 846,801,644.93
NOTE 22.b PURCHASE OF TRADED GOODS
Particulars For the year ended For the year ended 31st March, 2012 31st March, 2011
Rs. Rs.
Traded good - Real Estates - DLF Pinnacle 247,826.00 -Traded good - Real Estates - DLF Courtyard 1,706,714.00 1,200,000.00 Others 91,192.50 80,737.50
Total 2,045,732.50 1,280,737.50
NOTE 22.c CHANGES IN INVENTORIES OF FINISHED GOODS, WORK-IN-PROGRESS AND STOCK-IN-TRADE
Particulars For the year ended For the year ended 31st March, 2012 31st March, 2011
Rs. Rs.
Inventories at the end of the year:Finished goods 33,677,400.00 89,198,690.00 Work-in-progress 17,974,600.00 22,414,100.00 Stock-in-trade - Real Estates 44,181,401.93 42,226,861.93 Stock-in-trade -Waste & Scrap 6,187,689.00 5,582,599.00 Stock-in-trade - Trading Goods 2,300.00 2,300.00
102,023,390.93 159,424,550.93 Inventories at the beginning of the year:Finished goods 89,198,690.00 22,243,679.00 Work-in-progress 22,414,100.00 6,608,300.00 Stock-in-Trade - Real Estates 42,226,861.93 41,026,861.93 Stock-in-trade -Waste & Scrap 5,582,599.00 5,011,477.00 Stock-in-trade - Trading Goods 2,300.00 -
159,424,550.93 74,890,317.93
Net (increase) / decrease 57,401,160.00 (84,534,233.00)
29th Annual Report 2011-201249 29th Annual Report 2011-2012 50

AMD Industries Limited (Consolidated)
NOTE 23 EMPLOYEE BENEFITS EXPENSE
Particulars For the year ended For the year ended 31st March, 2012 31st March, 2011
Rs. Rs.
Salaries and wages 110,904,172.00 80,653,442.81 Contributions to provident and other funds (Refer Note 30.4) 2,462,980.40 2,209,679.00 Staff welfare expenses 1,505,132.00 1,180,472.00
Total 114,872,284.40 84043593.81
NOTE 24 FINANCE COSTS
Particulars For the year ended For the year ended 31st March, 2012 31st March, 2011
Rs. Rs.
(a) Interest expense on:(i) Borrowings 93,306,835.60 89,206,820.18 (ii) Trade payables 7,916,169.21 9,930,824.63
(b) Other borrowing costs - Processing Fees 2,299,852.73 7,768,409.00 (c) Net (gain) / loss on foreign currency transactions and translation (considered as finance cost) 3,822,726.75 (2,082,226.75)
Total 107,345,584.29 104,823,827.06
NOTE 25 OTHER EXPENSES
Particulars For the year ended For the year ended 31st March, 2012 31st March, 2011
Rs. Rs.
Business promotion 755,084.41 1,308,722.78 Communication 2,792,601.57 3,195,874.04 Consumption of stores and spare parts 6,680,405.20 5,686,941.92 Consumption of packing materials 50,071,993.82 52,529,043.36 Commission Paid 49,723,901.35 51,280,116.50 Donations and contributions 103,100.00 507,301.00 Freight and forwarding 46,369,461.66 34,973,538.93 Legal and professional 7,100,232.89 5,919,108.50 Net loss on foreign currency transactions and translation (other than considered as finance cost) 25,070,748.89 (16,906,315.51)Payments to auditors (Refer Note (i) below) 774,972.00 667,060.00 Printing and stationery 1,387,719.00 829,096.00 Power and fuel 98,134,168.00 89,743,623.96 Insurance 3,860,735.14 3,629,731.42Rates and taxes 1,112,669.00 1,173,719.98 Rent including lease rentals 19,889,408.81 14,466,086.19 Repairs and maintenance - Buildings 3,842,222.50 1,907,358.03 Repairs and maintenance - Machinery 13,866,022.75 10,160,071.39 Repairs and maintenance - Others 4,130,569.43 3,385,743.00 Sales discount 9,238,892.72 12,410,080.00 Travelling and conveyance 13,510,017.86 13,878,485.07 Water 120,385.00 98,746.00 Adjustments to the carrying amount of investments (other than subsidiaries) (net) - reduction in the carrying amount of -current investmentslong-term investments 38,300.00 8,100.00 Prior period items (net) (Refer Note (ii) below) - - Miscellaneous expenses 12,737,384.50 14,412,944.13
Total 371,310,996.50 305,265,176.69
NOTE 25 OTHER EXPENSES (CONTD.)
Notes: Particulars For the year ended For the year ended 31st March, 2012 31st March, 2011
Rs. Rs.
(i) Payments to the auditors comprises (net of service tax input credit, where applicable):As auditors - statutory audit 542,472.00 457,060.00 For taxation audit fees 130,000.00 115,000.00 For taxation matters 62,000.00 50,000.00 For company law matters - - For management services - - For other services 40,500.00 45,000.00 Reimbursement of expenses
Total 774,972.00 667,060.00
(ii) Details of Prior period items (net)Prior period expenses - - Prior period income - -
Total - -
NOTES FORMING PART OF THE FINANCIAL STATEMENTS
AMD Industries Limited (Consolidated)
NOTES FORMING PART OF THE FINANCIAL STATEMENTS
NOTE 26 ADDITIONAL INFORMATION TO THE FINANCIAL STATEMENTS
Particulars As at 31st March, 2012 As at 31st March, 2011Rs. Rs.
26.1 Contingent liabilities and commitments (to the extent not provided for)(i) Contingent liabilities
(a) Claims against the Company not acknowledged as debt Nil Nil (b) Guarantees - Corporate Guarantee for Subsidiary Company
i.e. AMD Estates and Developers (P) Limited 230,000,000.00 230,000,000.00 (c) Other money for which the Company is contingently liable Nil Nil
26.2 The Company has not received any Memorandum, (as required to be filed by the supplier which are registered with the Notified Authority under the provisions of stthe Micro, Small & Medium Enterprises Development Act, 2006) claiming their status as on 31 March 2012 as Micro, Small and Medium Enterprise.
Consequently, interest paid/payable to these parties during the year is NIL.26.3 Disclosure as per Clause 32 of the Listing Agreements with the Stock Exchanges
Loans and advances in the nature of loans given to subsidiaries:
Name of the party Relationship Amount Maximum balance outstanding as at outstanding during
31 March, 2012 the year
AMD Estates and Developers (P) Limited Subsidiary 372,584,398.00 394,228,085.17(394,287,085.17) (502,586,573.17)
Note: Figures in bracket relate to the previous year.
Note Particulars
26.4 Details on derivatives instruments and unhedged foreign currency exposures
I. The following derivative positions are open as at 31 March, 2012. These transactions have been undertaken to act as economic hedges for the Company’s exposures to various risks in foreign exchange markets and may / may not qualify or be designated as hedging instruments. (a) Forward exchange contracts and options [being derivative instruments], which are not intended for trading or speculative purposes but for hedge
purposes to establish the amount of reporting currency required or available at the settlement date of certain payables and receivables.(i) Outstanding forward exchange contracts entered into by the Company as on 31 March, 2012
Currency Amount Buy / Sell Cross currency
USD 612,877.74 Buy Rupees USD (1,050,000.00) Buy Rupees USD 2,836,482.32 Sell Rupees USD (4,775,370.13) Sell Rupees Note: Figures in brackets relate to the previous year
II. The year-end foreign currency exposures that have not been hedged by a derivative instrument or otherwise are given below:
As at 31st March, 2012 As at 31st March, 2011Receivable/ Receivable/ (Payable) Receivable/ Receivable/ (Payable)(Payable) in Foreign currency (Payable) in Foreign currency
Rs. (indicate amount with currency) Rs. (indicate amount with currency) Nil Nil Nil Nil
(47573795.00) (USD 929965.80) (43608171.00) (USD976666.76) (14925522.00) (EURO 218400) (3,761,828.00) (EURO 59484.95)
Note Particulars
26.5 Value of imports calculated on CIF basis : As at 31st March, 2012 As at 31st March, 2011Rs. Rs.
Raw materials 490,364,583.95 475,192,400.33 Spare parts 3,342,847.58 8,329,932.99 Capital goods 10,553,037.25 39,471,020.00
26.6 Expenditure in foreign currency : As at 31st March, 2012 As at 31st March, 2011Rs. Rs.
Commission 2,605,271.00 1,529,261.50 Others 803,616.36 1,960,068.00
26.7 Details of consumption of imported and indigenous itemsFor the year ended
31 March, 2012 Rs. %
ImportedRaw materials 484,283,904.08 47.46
(365,731,518.20) (43.19)Total 484,283,904.08 47.46
(365,731,518.20) (43.19)For the year ended
31 March, 2012
Rs. %
IndigenousRaw materials 536,054,012.07 52.54
(481,070,126.70) (56.81)Total 536,054,012.07 52.54
(481,070,126.70) (56.81)Note: Figures / percentages in brackets relates to the previous year
29th Annual Report 2011-201251 29th Annual Report 2011-2012 52

AMD Industries Limited (Consolidated)
NOTES FORMING PART OF THE FINANCIAL STATEMENTS
As at 31st March, 2012 As at 31st March, 2011Rs. Rs.
26.8 Earnings in foreign exchange:Export of goods calculated on FOB basis 349,439,908.21 187,325,213.04
26.9 In the opinion of the Board, assets other than fixed assets and non-current investments have a value on realisation in the ordinary course of business at least equal to the amount at which they are stated.
NOTE 27 DISCLOSURES UNDER ACCOUNTING STANDARDS
27.1 Employee benefit plans
27.1.a Defined benefit plans
The Company offers the following employee benefit schemes to its employees:
i. Gratuity
ii. Other defined benefit plans (Leave Encashment)
The following table sets out the funded status of the defined benefit schemes and the amount recognised in the financial statements:
Rs.
Particulars For the year ended For the year ended31st March, 2012 31st March, 2011
Gratuity Other defined Gratuity Other defined benefit plans benefit plans
(Leave Encashment) (Leave Encahsment)
Components of employer expenseCurrent service cost 1,038,230.00 874,831.00 868,686.00 613,306.00 Interest cost 372,317.00 178,060.00 264,003.00 143,007.00 Expected return on plan assets - - - - Curtailment cost / (credit) - - - - Settlement cost / (credit) - - - - Past service cost - - 87,728.00 -Actuarial losses/(gains) 201,270.00 170,731.00 48,893.00 57,883.00 Total expense recognised in the Statement of Profit and Loss 1,611,817.00 1,223,622.00 1,269,310.00 814,196.00 Actual contribution and benefit payments for yearActual benefit payments (610,615.00) (529,507.00) - (376,034.00)Actual contributionsNet asset / (liability) recognised in the Balance SheetPresent value of defined benefit obligation 4,653,968.00 2,225,747.00 3,384,658.00 1,787,585.00 Fair value of plan assetsFunded status [Surplus / (Deficit)] 1,001,202.00 694,115.00 1,269,310.00 438,162.00 Unrecognised past service costsNet asset / (liability) recognised in the Balance Sheet 5,655,170.00 2,919,862.00 4,653,968.00 2,225,747.00
Note 27 Disclosures under Accounting Standards (contd.) - - - -
Rs.
Particulars For the year ended For the year ended31st March, 2012 31st March, 2011
Gratuity Other defined Gratuity Other defined benefit plans benefit plans
(Leave Encashment) (Leave Encahsment)
Change in defined benefit obligations (DBO) during the yearPresent value of DBO at beginning of the year 4,653,968.00 2,225,747.00 3,384,658.00 1,787,585.00 Current service cost 1,038,230.00 874,831.00 868,686.00 613,306.00 Interest cost 372,317.00 178,060.00 264,003.00 143,007.00 Curtailment cost / (credit) - -Settlement cost / (credit) - -Plan amendments - -Acquisitions - -Actuarial (gains) / losses 201,270.00 170,731.00 48,893.00 57,883.00 Past service cost - - 87,728.00 - Benefits paid (610,615.00) (529,507.00) - (376,034.00)Present value of DBO at the end of the year 5,655,170.00 2,919,862.00 4,653,968.00 2,225,747.00 Change in fair value of assets during the yearPlan assets at beginning of the year - - - -Acquisition adjustment - - - - Expected return on plan assets - - - - Actual company contributions - - - - Actuarial gain / (loss) - - - - Benefits paid - - - -Plan assets at the end of the year - - - - Actual return on plan assets - - - -
AMD Industries Limited (Consolidated)
NOTES FORMING PART OF THE FINANCIAL STATEMENTS
Composition of the plan assets is as follows:Government bonds - - - - PSU bonds - - - - Equity mutual funds - - - - Others - - - - Actuarial assumptionsDiscount rate 8.60% 8.60% 8.00% 8.00%Expected return on plan assets - - - -Salary escalation 7.50% 7.50% 7.50% 7.50%Attrition - - - - Medical cost inflation - - - - Mortality tables - - - - Performance percentage considered - - - - Estimate of amount of contribution in the immediate next year - - - -
27.2 Segment information
The Company has identified business segments as its primary segment and geographic segments as its secondary segment. Business segments are primarily Packaging,Textile and Real Estate. Revenues and expenses directly attributable to segments are reported under each reportable segment. Expenses which are not directly identifiable to each reportable segment have been allocated on the basis of associated revenues of the segment and manpower efforts. All other expenses which are not attributable or allocable to segments have been disclosed as unallocable expenses. Assets and liabilities that are directly attributable or allocable to segments are disclosed under each reportable segment. All other assets and liabilities are disclosed as unallocable. Fixed assets that are used interchangeably amongst segments are not allocated to primary and secondary segments. Geographical revenues are allocated based on the location of the customer. Geographic segments of the Company are Americas (including Canada and South American countries), Europe, India and Others.
Particulars For the year ended 31st March, 2012
Business segments Total
PACKAGING TEXTILE REAL ESTATE Eliminations
Rs. Rs. Rs. Rs. Rs.
Revenue 1,820,077,501.97 - - - 1,820,077,501.97 (1,381,140,332.41) (-) (-) (-) (1,381,140,332.41)
Inter-segment revenue - - - - - (-) (-) (-) (-) (-)
Total 1,820,077,501.97 - - - 1,820,077,501.97 (1,381,140,332.41) (-) (-) (-) (1,381,140,332.41)
Segment result 101,249,718.79 - -6,685,712.81 - 94,564,005.98 (56,938,835.03) - (-5599096.61) (-) (51,339,738.42)
Unallocable expenses (net) - (-)
Operating income 94,564,005.98 (51,339,738.42)
Other income (net) 4,362,461.33 (5,887,249.87)
Profit before taxes 98,926,467.31 (57,226,988.29)
Tax expense 38,654,087.00 (19,189,888.00
Net profit for the year 60,272,380.31 (38,037,100.29
Minority Interest -1,062,323.00(-778922.00)
Net profit for the year (excluding minority interest) 61,334,703.31 (38,816,022.29)
Note 27 Disclosures under Accounting Standards (contd.) --
Note Particulars For the year ended 31st March, 2012
Business segments Total
PACKAGING TEXTILE REAL ESTATE
Rs. Rs. Rs. Rs.
Segment assets 1,668,713,722.23 173,913,200.47 762,180,069.02 2,604,806,991.72 (1,841,201,409.55) (173,913,200.47) (786,579,369.70) (2,801,693,979.72)
Unallocable assets - - - -(-) (-) (-) (-)
Total assets 1,668,713,722.23 173,913,200.47 762,180,069.02 2,604,806,991.72 (1,841,201,409.55) (173,913,200.47) (786,579,369.70) (2,801,693,979.72)
Segment liabilities 2,276,471,123.89 - 328,335,867.83 2,604,806,991.72 (2,469,137,605.88) (-) (332,556,373.84) (2,801,693,979.72)
Unallocable liabilities - - - -(-) (-) (-) (-)
Total liabilities 2,276,471,123.89 - 328,335,867.83 2,604,806,991.72 (2,469,137,605.88) (-) (332,556,373.84) (2,801,693,979.72)
Other informationCapital expenditure (allocable) - - - -
(-) (-) (-) (-)Capital expenditure (unallocable) - - - -
(-) (-) (-) (-)Depreciation and amortisation (allocable) - - - -
(-) (-) (-) (-)Depreciation and amortisation (unallocable) - - - -
(-) (-) (-) (-)Other significant non-cash expenses (allocable) (give details) - - - -
(-) (-) (-) (-)Other significant non-cash expenses (unallocable) - - - -
(-) (-) (-) (-)
29th Annual Report 2011-201253 29th Annual Report 2011-2012 54

AMD Industries Limited (Consolidated)
NOTES FORMING PART OF THE FINANCIAL STATEMENTS
Note 27 Disclosures under Accounting Standards (contd.)
Note Particulars
The geographic segments individually contributing 10 percent or more of the Company’s revenues and segment assets are shown separately:
Geographic Segment Revenues Segment assets Capital expenditureFor the year ended As at incurred during the year
31 March, 2012 31 March, 2012 ended 31 March, 2012
Rs. Rs. Rs.
Americas - - -
(-) (-) (-)
Europe - - -
(-) (-) (-)
India 1,470,637,593.76 2,604,806,991.72 -
(1,193,815,119.37) (2,801,693,979.72) (-)
Others 349,439,908.21 - -
(187,325,213.04) (-) (-)
Note: Figures in bracket relates to the previous year
27.3 Related party transactions27.3.a Details of related parties:
Description of relationship Names of related parties Subsidiary Company AMD Estates and Developers (P) Limited and Prime Techno Build Private Limited Key Management Personnel (KMP) Sh. H.S.Gupta,Sh, Ashok Gupta and Sh. Adit Gupta Relatives of KMP Ms. Vidhi Gupta,Ms. Mamta Gupta, Mrs. Geetika Gupta and Mrs. Chitra Gupta Company in which KMP / Relatives of KMP can exercise significant influence Kadam Trees Properties (P) Limited and Ashoka Productions and Communications (P) Limited Note: Related parties have been identified by the Management.
Details of related party transactions during the year ended 31 March, 2012 and balances outstanding as at 31 March, 2012: Rs.
27.3.b Ashoka Kadam Trees Sh. H.S. Sh. Ashok Sh. Adit Ms. Vidhi Ms. Mamta Mrs Mrs. Chitra TotalProductions Properties (P) Gupta Gupta Gupta Gupta Gupta Geetika Gupta
and Limited GuptaCommunications
(P) Limited
Remuneration - - 10,045,156.00 10,044,988.00 10,039,600.00 1,151,700.00 1,168,200.00 - - 32,449,644.00
(-) (-) (4,795,156.00) (4,794,988.00) (4,787,773.00) (588,400.00) (228,500.00) (-) (-) (15,194,817.00)
Rent Paid - 1,380,000.00 - 1,035,000.00 8,694,000.00 - - - 1,380,000.00 12,489,000.00
(-) (1,200,000.00) (-) (900,000.00) (7,560,000.00) (-) (-) (-) (1,200,000.00) (10,860,000.00)
Interest paid on Unsecured Loan 4,773,121.00 - 685,532.00 762,984.00 391,282.00 - - 1,307,231.00 1,967,377.00 9,887,527.00
(2,314,028.00) (-) (1,330,179.00) (552,793.00) (940,752.00) (-) (-) (992,877.00) (-) (6,130,629.00)
Interest received on Loan given - - - - - - - - - 2,546,199.00
(-) (-) (-) (-) (-) (-) (-) (-) (-) (18,072,422.00)
Repayment of Unsecured loan 34,477,312.00 - 68,553.00 14,952,167.00 6,039,128.00 - - - 6,000,000.00 61,537,160.00
(1,231,403.00) (-) (18,186,465.00) (21,368,339.00) (24,309,010.00) (-) (-) (-) (-) (65,095,217.00)
Unsecured Loan Received 6,773,121.00 - 685,532.00 16,012,984.00 2,891,282.00 - - - 25,000,000.00 51,362,919.00
(45,814,028.00) (-) (13,830,179.00) (18,513,217.00) (16,440,752.00) (-) (-) (10,000,000.00) (-) (104,598,176.00)
Loan & Advances Paid - - - - - - - - - 58,427,002.00
(-) (-) (-) (-) (-) (-) (-) (-) (-) (141,706,037.00)
Loan & Advances Received - - - - - - - - - 80,129,689.17
(-) (-) (-) (-) (-) (-) (-) (-) (-) (244,854,913.00)
Refund of Security provided
ag. Rent of Guest House - 11,450,000.00 - - - - - - - 11,450,000.00
(-) (550,000.00) (-) (-) (-) (-) (-) (-) (-) (550,000.00)
Balances outstanding at the
end of the year
Loans & Advances - Given - - - - - - - - - 372,584,398.00
(-) (-) (-) (-) (-) (-) (-) (-) (-) (394,287,085.17)
Loans & Advances - Taken 16,878,434.00 - 6,314,140.00 1,917,542.00 875,786.00 - - 10,000,000.00 19,000,000.00 54,985,902.00
(44,582,625.00) (-) (5,697,161.00) (856,725.00) (4,023,632.00) (-) (-) (10,000,000.00) (-) (65,160,143.00)
Note: Figures in bracket
relates to the previous year
Note 27.4 Disclosures under Accounting Standards (contd.)
Note Particulars As at 31st March, 2012 As at 31st March, 2011Rs. Rs.
27.4 Earnings per shareBasic
27.4.a Continuing operationsNet profit / (loss) for the year from continuing operations 60,272,380.31 38,037,100.29 Less: Preference dividend and tax thereon - -Net profit / (loss) for the year from continuing operations attributable to the equity shareholders 60,272,380.31 38,037,100.29 Weighted average number of equity shares 19,166,749.00 19,166,749.00 Par value per share 10.00 10.00Earnings per share from continuing operations - Basic 3.14 1.98
AMD Industries Limited (Consolidated)
NOTES FORMING PART OF THE FINANCIAL STATEMENTS
Note Particulars As at 31st March, 2012 As at 31st March, 2011Rs. Rs.
27.4.b Total operations
Net profit / (loss) for the year 61,334,703.31 38,816,022.29
Less: Preference dividend and tax thereon - -
Net profit / (loss) for the year attributable to the equity shareholders 61,334,703.31 38,816,022.29
Weighted average number of equity shares 19,166,749.00 19,166,749.00
Par value per share 10.00 10.00
Earnings per share - Basic 3.2 2.03
Basic (excluding extraordinary items)
27.4.c Continuing operations
Net profit / (loss) for the year from continuing operations 60,272,380.31 38,037,100.29
(Add) / Less: Extraordinary items (net of tax) relating to continuing operations - -
Less: Preference dividend and tax thereon - -
Net profit / (loss) for the year from continuing operations attributable to the equity shareholders,
excluding extraordinary items 60,272,380.31 38,037,100.29
Weighted average number of equity shares 19,166,749.00 19,166,749.00
Par value per share 10.00 10.00
Earnings per share from continuing operations, excluding extraordinary items - Basic 3.14 1.98
27.4.d Total operations
Net profit / (loss) for the year 61,334,703.31 38,816,022.29
(Add) / Less: Extraordinary items (net of tax) - -
Less: Preference dividend and tax thereon - -
Net profit / (loss) for the year attributable to the equity shareholders, excluding extraordinary items 61,334,703.31 38,816,022.29
Weighted average number of equity shares 19,166,749.00 19,166,749.00
Par value per share 10.00 10.00
Earnings per share, excluding extraordinary items - Basic 3.2 2.03
Diluted
The diluted earnings per share has been computed by dividing the Net Profit After Tax available for
Equity Shareholders by the weighted average number of equity shares, after giving dilutive
effect of the outstanding Warrants, Stock Options and Convertible bonds for the respective periods.
Since, the effect of the conversion of Preference shares was anti-dilutive, it has been ignored.
27.4.e Continuing operations
Net profit / (loss) for the year from continuing operations 60,272,380.31 38,037,100.29
Less: Preference dividend and tax thereon - -
Net profit / (loss) for the year attributable to the equity shareholders from continuing operations 60,272,380.31 38,037,100.29
Add: Interest expense and exchange fluctuation on convertible bonds (net) - -
Profit / (loss) attributable to equity shareholders from continuing operations (on dilution) 60,272,380.31 38,037,100.29
Weighted average number of equity shares for Basic EPS 19,166,749.00 19,166,749.00
Add: Effect of warrants, ESOPs and Convertible bonds which are dilutive - -
Weighted average number of equity shares - for diluted EPS 19,166,749.00 19,166,749.00
Par value per share 10.00 10.00
Earnings per share, from continuing operations - Diluted 3.14 1.98
27.4.f Total operations
Net profit / (loss) for the year 61,334,703.31 38,816,022.29
Less: Preference dividend and tax thereon - -
Net profit / (loss) for the year attributable to the equity shareholders 61,334,703.31 38,816,022.29
Add: Interest expense and exchange fluctuation on convertible bonds (net) - -
Profit / (loss) attributable to equity shareholders (on dilution) 61,334,703.31 38,816,022.29
Weighted average number of equity shares for Basic EPS 19,166,749.00 19,166,749.00
Add: Effect of Warrants, ESOPs and Convertible bonds which are dilutive - -
Weighted average number of equity shares - for diluted EPS 19,166,749.00 19,166,749.00
Par value per share 10.00 10.00
Earnings per share - Diluted 3.2 2.03
Diluted (excluding extraordinary items)
27.4.g Continuing operations
Net profit / (loss) for the year from continuing operations 60,272,380.31 38,037,100.29
(Add) / Less: Extraordinary items (net of tax) - -
Less: Preference dividend and tax thereon - -
Net profit / (loss) for the year from continuing operations attributable to the equity shareholders,
excluding extraordinary items 60,272,380.31 38,037,100.29
Add: Interest expense and exchange fluctuation on convertible bonds (net) - -
Profit / (loss) from continuing operations attributable to equity shareholders (on dilution) 60,272,380.31 38,037,100.29
Weighted average number of equity shares for Basic EPS 19,166,749.00 19,166,749.00
Add: Effect of Warrants, ESOPs and Convertible bonds which are dilutive - -
Weighted average number of equity shares - for diluted EPS 19,166,749.00 19,166,749.00
Par value per share 10.00 10.00
Earnings per share, from continuing operations, excluding extraordinary items - Diluted 3.14 1.98
29th Annual Report 2011-201255 29th Annual Report 2011-2012 56

AMD Industries Limited (Consolidated)
NOTES FORMING PART OF THE FINANCIAL STATEMENTS
Note Particulars As at 31st March, 2012 As at 31st March, 2011
Rs. Rs.
27.4.h Total operations
Net profit / (loss) for the year 61,334,703.31 38,816,022.29
(Add) / Less: Extraordinary items (net of tax) - -
Less: Preference dividend and tax thereon - -
Net profit / (loss) for the year attributable to the equity shareholders, excluding extraordinary items 61,334,703.31 38,816,022.29
Add: Interest expense and exchange fluctuation on convertible bonds (net) - -
Profit / (loss) attributable to equity shareholders (on dilution) 61,334,703.31 38,816,022.29
Weighted average number of equity shares for Basic EPS 19,166,749.00 19,166,749.00
Add: Effect of Warrants, ESOPs and Convertible bonds which are dilutive - -
Weighted average number of equity shares - for diluted EPS 19,166,749.00 19,166,749.00 Par value per share 10.00 10.00Earnings per share, excluding extraordinary items - Diluted 3.2 2.03
27.5 Deferred tax (liability) / assetTax effect of items constituting deferred tax liabilityOn difference between book balance and tax balance of fixed assets 90,536,072.00 90,609,474.00 On expenditure deferred in the books but allowable for tax purposes - - On items included in Reserves and surplus pending amortisation into the Statement of Profit and Loss - - Others - - Tax effect of items constituting deferred tax liability 90,536,072.00 90,609,474.00 Tax effect of items constituting deferred tax assetsProvision for compensated absences, gratuity and other employee benefits 2,981,684.00 2,390,839.00 Provision for doubtful debts / advances - -Disallowances under Section 40(a)(i), 43B of the Income Tax Act, 1961 - - On difference between book balance and tax balance of fixed assetsUnabsorbed depreciation carried forwardBrought forward business lossesOn items included in Reserves and surplus pending amortisation into the Statement of Profit and Loss 2,897,656.00 5,795,312.00 Others - 166,551.00
Tax effect of items constituting deferred tax assets 5,879,340.00 8,352,702.00
Net deferred tax (liability) / asset (84,656,732.00) (82,256,772.00)
Note 27.6 Disclosures under Accounting Standards (contd.)
Note Particulars
27.6 Details of provisions
The Company has made provision for various contractual obligations and disputed liabilities based on its assessment of the amount it estimates to incur to meet such obligations, details of which are given below:
Particulars As at Additions Utilisation Reversal As at1st April, 2011 (withdrawn 31st March,
as no longer 2012required)
Rs. Rs. Rs. Rs. Rs.
Provision for other contingencies:(i) Sales Tax Demand for the Year 1999-2000
to 2006-2007 4,100,000.00 - - - 4,100,000.00 (4,100,000.00) - - - (4,100,000.00)
(ii) Entry Tax for the Year 2004-2005 and 2005-2006 1,900,000.00 - - - 1,900,000.00 (1,900,000.00) - - - (1,900,000.00)
Total 6,000,000.00 - - - 6,000,000.00 (6,000,000.00) - - - (6,000,000.00)
Note: - Figures in brackets relate to the previous year.
Note 28 Previous year’s figures
28 The Revised Schedule VI has become effective from 1 April, 2011 for the preparation of financial statements. This has significantly impacted the disclosure and presentation made in the financial statements. Previous year's figures have been regrouped / reclassified wherever necessary to correspond with the current year's classification / disclosure.
AMD Industries Limited (Consolidated)
CONSOLIDATED CASH FLOW STATEMENT FOR THE YEAR ENDED 31 MARCH, 2012
For the year ended
Particulars 31st March, 2012 31st March, 2011
Rs. Rs. Rs. Rs.
A. A. Cash flow from operating activities
Net Profit / (Loss) before extraordinary items and tax 98,926,467.31 57,226,988.29
Adjustments for:
Depreciation and amortisation 76,343,358.34 72,108,321.22
Provision for impairment of fixed assets and intangibles - -
Amortisation of share issue expenses and discount on shares - 351,778.00
(Profit) / loss on sale / write off of assets (24,143,537.03) 11,525.78
Expense on employee stock option scheme - -
Finance costs 107,345,584.29 104,823,827.06
Interest income (2,346,855.41) (4,821,022.80)
Dividend income (18,900.00) (10,075.00)
Net (gain) / loss on sale of investments - -
Rental income from investment properties (1,680,806.00) (1,005,000.00)
Rental income from operating leases - -
Share of profit from partnership firms - -
Share of profit from AOPs - -
Share of profit from LLPs - -
Liabilities / provisions no longer required written back - -
Adjustments to the carrying amount of investments 38,300.00 8,100.00
Provision for losses of subsidiary companies - -
Provision for doubtful trade and other receivables, loans and advances - -
Provision for estimated loss on derivatives - -
Provision for warranty - -
Provision for estimated losses on onerous contracts - -
Provision for contingencies - -
Other non-cash charges (specify) - -
Net unrealised exchange (gain) / loss (11,115.15) 155,526,029.04 (652.85) 171,466,801.41
Operating profit / (loss) before working capital changes 254,452,496.35 228,693,789.70
Changes in working capital:
Adjustments for (increase) / decrease in operating assets:
Inventories 87,295,346.59 (80,833,551.67)
Trade receivables (105,919,538.07) (56,112,802.10)
Short-term loans and advances (13,048,529.95) (29,469,236.78)
Long-term loans and advances 928,170.00 (15,243,866.00)
Other current assets 77,648,485.55 (100,314,751.04)
Other non-current assets - -
Adjustments for increase / (decrease) in operating liabilities:
Trade payables (131,833,822.30) 40,143,432.33
Other current liabilities 27,996,827.93 94,938,502.32
Other long-term liabilities 498,449.00 187,026.00
Short-term provisions (59,737,392.86) 80,600,206.91
Long-term provisions 1,695,317.00 (114,476,687.11) 3,495,057.00 (62,609,983.03)
139,975,809.24 166,083,806.67
Cash flow from extraordinary items - -
Cash generated from operations 139,975,809.24 166,083,806.67
Net income tax (paid) / refunds (25,622,744.12) (31,911,527.88)
114,353,065.12 134,172,278.79
Net cash flow from / (used in) operating activities (A) 114,353,065.12 134,172,278.79
B. Cash flow from investing activities
Capital expenditure on fixed assets, including capital advances (18,685,684.00) (70,074,910.89)
Proceeds from sale of fixed assets 30,170,980.00 73,000.00
Inter-corporate deposits (net) (27,704,191.00) 44,582,625.00
Bank balances not considered as Cash and cash equivalents
- Placed - -
- Matured - -
Current investments not considered as Cash and cash equivalents
- Purchased - -
- Proceeds from sale - -
Purchase of long-term investments
- Subsidiaries - -
- Associates - -
- Joint ventures - -
For the year ended
29th Annual Report 2011-201257 29th Annual Report 2011-2012 58

AMD Industries Limited (Consolidated)
For the year ended For the year ended
Particulars 31st March, 2012 31st March, 2011
Rs. Rs. Rs. Rs.
- Business units - -
- Others (500,000.00) -
Proceeds from sale of long-term investments
- Subsidiaries - -
- Associates - -
- Joint ventures - -
- Business units - -
- Others - -
Loans given
- Subsidiaries - -
- Associates (27,059,848.00) (63,863,814.00)
- Joint ventures - -
- Others - -
Loans realised
- Subsidiaries - -
- Associates 44,589,798.00 58,784,148.00
- Joint ventures
- Others
Interest received
- Subsidiaries - -
- Associates - -
- Joint ventures - -
- Others 2,346,855.41 4,821,022.80
Dividend received
- Subsidiaries - -
- Associates - -
- Joint ventures - -
- Others 18,900.00 10,075.00
Rental income from investment properties 1,680,806.00 1,005,000.00
Rental income from operating leases - -
Amounts received from partnership firms - -
Amounts received from AOPs - -
Amounts received from LLPs - 4,857,616.41 - (24,662,854.09)
Cash flow from extraordinary items - -
4,857,616.41 (24,662,854.09)
Net cash flow from / (used in) investing activities (B) 4,857,616.41 (24,662,854.09)
C. Cash flow from financing activities
Proceeds from issue of equity shares - -
Proceeds from issue of preference shares - -
Redemption / buy back of preference / equity shares - -
Proceeds from issue of share warrants - -
Share application money received / (refunded) - -
Proceeds from long-term borrowings 9,005,251.90 201,405,914.00
Repayment of long-term borrowings (171,543,423.39) (185,180,597.98)
Net increase / (decrease) in working capital borrowings 83,069,071.53 70,041,580.80
Proceeds from other short-term borrowings - -
Repayment of other short-term borrowings - -
Finance cost (107,345,584.29) (104,823,827.06)
Dividends paid (19,166,749.00) (19,166,749.00)
Tax on dividend (205,981,433.25) (37,723,679.24)
- -
Cash flow from extraordinary items - -
(205,981,433.25) (37,723,679.24)
Net cash flow from / (used in) financing activities (C) (205,981,433.25) (37,723,679.24)
Net increase / (decrease) in Cash and cash equivalents (A+B+C) (86,770,751.72) 71,785,745.46
Cash and cash equivalents at the beginning of the year 131,079,047.31 59,292,649.00
Effect of exchange differences on restatement of foreign
currency Cash and cash equivalents 11,115.15 652.85
Cash and cash equivalents at the end of the year 44,319,410.74 131,079,047.31
Reconciliation of Cash and cash equivalents with the
Balance Sheet:
Cash and cash equivalents as per Balance Sheet (Refer Note 17) 44,319,410.74 131,079,047.31
AMD Industries Limited (Consolidated)
In terms of our report of even date attached. For and on behalf of Board of Directors
for SURESH & ASSOCIATESFRN No. 003316N CHARTERED ACCOUNTANTS
(Ashok Gupta) (Mahipal Ahluwalia)Managing Director Director DIN - 00031630 DIN - 00588626
[CA NARENDRA ARORA] (Arun Kumar Gupta) (Joylin Jain)PARTNER General Manager-Finance & Account Company SecretaryMembership No. 088256 FRN No. 003316N
Place: New DelhirdDate : 23 May, 2012
Particulars 31st March, 2012 31st March, 2011
Rs. Rs. Rs. Rs.
Less: Bank balances not considered as Cash and cash
equivalents as defined in AS 3 Cash Flow Statements (give details) - -
Net Cash and cash equivalents (as defined in AS 3 Cash Flow
Statements) included in Note 19 44,319,410.74 131,079,047.31
Add: Current investments considered as part of Cash and cash
equivalents (as defined in AS 3 Cash Flow Statements)
(Refer Note (ii) to Note 16 Current investments) - -
Cash and cash equivalents at the end of the year * 44,319,410.74 131,079,047.31
* Comprises:
(a) Cash on hand 113,137.25 199,445.25
(b) Cheques, drafts on hand - -
(c) Balances with banks
(i) In current accounts 9,675,866.39 64,197,187.21
(ii) In EEFC accounts 583,515.10 509,299.00
(iii) In earmarked accounts (give details)
(Refer Note (ii) below) 33,802,504.00 66,104,194.00
(d) Others - Foreign Currency in hand 144,388.00 68,921.85
(e) Current investments considered as part of Cash and
cash equivalents (Refer Note (ii) to Note 16 Current
investments) - -
44,319,410.74 131,079,047.31
Notes:
(i) The Cash Flow Statement reflects the combined cash flows pertaining to continuing and discounting operations..
(ii) These earmarked account balances with banks can be utilised only for the specific identified purposes.
The accompanying Notes 1 to 28 form integral part of these Financial Statements
For the year ended For the year ended
29th Annual Report 2011-201259 29th Annual Report 2011-2012 60

AMD Industries Limited (Consolidated)
For the year ended For the year ended
Particulars 31st March, 2012 31st March, 2011
Rs. Rs. Rs. Rs.
- Business units - -
- Others (500,000.00) -
Proceeds from sale of long-term investments
- Subsidiaries - -
- Associates - -
- Joint ventures - -
- Business units - -
- Others - -
Loans given
- Subsidiaries - -
- Associates (27,059,848.00) (63,863,814.00)
- Joint ventures - -
- Others - -
Loans realised
- Subsidiaries - -
- Associates 44,589,798.00 58,784,148.00
- Joint ventures
- Others
Interest received
- Subsidiaries - -
- Associates - -
- Joint ventures - -
- Others 2,346,855.41 4,821,022.80
Dividend received
- Subsidiaries - -
- Associates - -
- Joint ventures - -
- Others 18,900.00 10,075.00
Rental income from investment properties 1,680,806.00 1,005,000.00
Rental income from operating leases - -
Amounts received from partnership firms - -
Amounts received from AOPs - -
Amounts received from LLPs - 4,857,616.41 - (24,662,854.09)
Cash flow from extraordinary items - -
4,857,616.41 (24,662,854.09)
Net cash flow from / (used in) investing activities (B) 4,857,616.41 (24,662,854.09)
C. Cash flow from financing activities
Proceeds from issue of equity shares - -
Proceeds from issue of preference shares - -
Redemption / buy back of preference / equity shares - -
Proceeds from issue of share warrants - -
Share application money received / (refunded) - -
Proceeds from long-term borrowings 9,005,251.90 201,405,914.00
Repayment of long-term borrowings (171,543,423.39) (185,180,597.98)
Net increase / (decrease) in working capital borrowings 83,069,071.53 70,041,580.80
Proceeds from other short-term borrowings - -
Repayment of other short-term borrowings - -
Finance cost (107,345,584.29) (104,823,827.06)
Dividends paid (19,166,749.00) (19,166,749.00)
Tax on dividend (205,981,433.25) (37,723,679.24)
- -
Cash flow from extraordinary items - -
(205,981,433.25) (37,723,679.24)
Net cash flow from / (used in) financing activities (C) (205,981,433.25) (37,723,679.24)
Net increase / (decrease) in Cash and cash equivalents (A+B+C) (86,770,751.72) 71,785,745.46
Cash and cash equivalents at the beginning of the year 131,079,047.31 59,292,649.00
Effect of exchange differences on restatement of foreign
currency Cash and cash equivalents 11,115.15 652.85
Cash and cash equivalents at the end of the year 44,319,410.74 131,079,047.31
Reconciliation of Cash and cash equivalents with the
Balance Sheet:
Cash and cash equivalents as per Balance Sheet (Refer Note 17) 44,319,410.74 131,079,047.31
AMD Industries Limited (Consolidated)
In terms of our report of even date attached. For and on behalf of Board of Directors
for SURESH & ASSOCIATESFRN No. 003316N CHARTERED ACCOUNTANTS
(Ashok Gupta) (Mahipal Ahluwalia)Managing Director Director DIN - 00031630 DIN - 00588626
[CA NARENDRA ARORA] (Arun Kumar Gupta) (Joylin Jain)PARTNER General Manager-Finance & Account Company SecretaryMembership No. 088256 FRN No. 003316N
Place: New DelhirdDate : 23 May, 2012
Particulars 31st March, 2012 31st March, 2011
Rs. Rs. Rs. Rs.
Less: Bank balances not considered as Cash and cash
equivalents as defined in AS 3 Cash Flow Statements (give details) - -
Net Cash and cash equivalents (as defined in AS 3 Cash Flow
Statements) included in Note 19 44,319,410.74 131,079,047.31
Add: Current investments considered as part of Cash and cash
equivalents (as defined in AS 3 Cash Flow Statements)
(Refer Note (ii) to Note 16 Current investments) - -
Cash and cash equivalents at the end of the year * 44,319,410.74 131,079,047.31
* Comprises:
(a) Cash on hand 113,137.25 199,445.25
(b) Cheques, drafts on hand - -
(c) Balances with banks
(i) In current accounts 9,675,866.39 64,197,187.21
(ii) In EEFC accounts 583,515.10 509,299.00
(iii) In earmarked accounts (give details)
(Refer Note (ii) below) 33,802,504.00 66,104,194.00
(d) Others - Foreign Currency in hand 144,388.00 68,921.85
(e) Current investments considered as part of Cash and
cash equivalents (Refer Note (ii) to Note 16 Current
investments) - -
44,319,410.74 131,079,047.31
Notes:
(i) The Cash Flow Statement reflects the combined cash flows pertaining to continuing and discounting operations..
(ii) These earmarked account balances with banks can be utilised only for the specific identified purposes.
The accompanying Notes 1 to 28 form integral part of these Financial Statements
For the year ended For the year ended
29th Annual Report 2011-201259 29th Annual Report 2011-2012 60

Regd. Office : 18, Pusa Road First Floor, Karol Bagh, New Delhi-110 005
Regd. Office : 18, Pusa Road First Floor, Karol Bagh, New Delhi-110 005
ATTENDANCE SLIP
PROXY FORM
Folio No./DP ID/Client ID #
No. of Equity Shares heldthI hereby record my presence at the 29 Annual General Meeting of the Company being held at Daffodils
thHotels, Tania Farms Complex, Chattarpur Mandir Road, Satbari Village, New Delhi-110 030, on Friday the 28 September, 2012 at 10.30 A.M.
Name of the Shareholder(in block letter)
Name of Proxy/AuthorisedRepresentative attending* (in block letter)
Signature of the Shareholder or Proxy
*Strike out whichever is not applicable
# Applicable for investors holding shares in dematerialised form
Notes : Please produce this Admission Slip duly filled and signed at the entrance of the meeting hall. Shareholders intending to appoint a proxy may use the Proxy Form given below.
Signature of the attending Shareholder/Proxy/Authorised Representative*
I /We...........................................................................................................................................................
of.......................................................... being a member / members of AMD Industries Ltd. hereby appoint
Shri/Smt./Km...................................... ................................... of .................................................................. or
failing him Shri/Smt./Km./....................................................of................................................................... or
failing him Shri/Smt./Km./....................................................of................................................................... as my / thour proxy in my / our absence to attend and vote for me / us and on my / our behalf at the 29 Annual General
Meeting of the Company to be held at Daffodils Hotels, Tania Farms Complex, Chattarpur Mandir Road, Satbari thVillage, New Delhi-110 030 on Friday, the 28 September, 2012 at 10.30 A.M. and at any adjournment thereof.
Signed this................ day of ...................2012
Folio No./DP ID/Client ID #
No. of Equity Shares heldSignature(s).....................................
Affix
Rupees 1/-
Revenue
Stamp
# Applicable for Shareholders holding shares in dematerialised form.
Notes : The proxy, in order to be effective, should be duly completed, stamped and signed and must be deposited at the Registered Office of the Company at 18, Pusa Road, First Floor, Karol Bagh, New Delhi - 110 005, at least 48 hours before the scheduled time.
AMD Industries Limited(Formerly known as AMD Metplast Ltd.)
AMD Industries Limited(Formerly known as AMD Metplast Ltd.)
29th Annual Report 2011-201261
NOTE

Regd. Office : 18, Pusa Road First Floor, Karol Bagh, New Delhi-110 005
Regd. Office : 18, Pusa Road First Floor, Karol Bagh, New Delhi-110 005
ATTENDANCE SLIP
PROXY FORM
Folio No./DP ID/Client ID #
No. of Equity Shares heldthI hereby record my presence at the 29 Annual General Meeting of the Company being held at Daffodils
thHotels, Tania Farms Complex, Chattarpur Mandir Road, Satbari Village, New Delhi-110 030, on Friday the 28 September, 2012 at 10.30 A.M.
Name of the Shareholder(in block letter)
Name of Proxy/AuthorisedRepresentative attending* (in block letter)
Signature of the Shareholder or Proxy
*Strike out whichever is not applicable
# Applicable for investors holding shares in dematerialised form
Notes : Please produce this Admission Slip duly filled and signed at the entrance of the meeting hall. Shareholders intending to appoint a proxy may use the Proxy Form given below.
Signature of the attending Shareholder/Proxy/Authorised Representative*
I /We...........................................................................................................................................................
of.......................................................... being a member / members of AMD Industries Ltd. hereby appoint
Shri/Smt./Km...................................... ................................... of .................................................................. or
failing him Shri/Smt./Km./....................................................of................................................................... or
failing him Shri/Smt./Km./....................................................of................................................................... as my / thour proxy in my / our absence to attend and vote for me / us and on my / our behalf at the 29 Annual General
Meeting of the Company to be held at Daffodils Hotels, Tania Farms Complex, Chattarpur Mandir Road, Satbari thVillage, New Delhi-110 030 on Friday, the 28 September, 2012 at 10.30 A.M. and at any adjournment thereof.
Signed this................ day of ...................2012
Folio No./DP ID/Client ID #
No. of Equity Shares heldSignature(s).....................................
Affix
Rupees 1/-
Revenue
Stamp
# Applicable for Shareholders holding shares in dematerialised form.
Notes : The proxy, in order to be effective, should be duly completed, stamped and signed and must be deposited at the Registered Office of the Company at 18, Pusa Road, First Floor, Karol Bagh, New Delhi - 110 005, at least 48 hours before the scheduled time.
AMD Industries Limited(Formerly known as AMD Metplast Ltd.)
AMD Industries Limited(Formerly known as AMD Metplast Ltd.)
29th Annual Report 2011-201261
NOTE


An effort towards Corporate Social Responsibility :An effort towards Corporate Social Responsibility :
With the kind efforts of Mr. Harswarup Gupta,
the Chairman of the Company, the education
institution established under the name
“Keshav Madhav Saraswati Vidhya Mandir”
in highly backward and remote area at village
Kakore, Distt. Gautam Budh Nagar, Uttar
Pradesh has made its own recognition in the
area. With the continued efforts of the
Chairman the said education institution is
touching its new heights. The institution has thgot the recognition upto 12 standard by the
Central Board of Secondary Education and
now children of the School are not required to
look for another school which is far away thplace for their education beyond 10
standard. Inspite of having in the backward
area it has been achieving excellent result,
year to year. The school is also planing to
expand not only in education but also in
sports and other curricular activities. The
management has added more class rooms
due to increase in strength of students during
the year
KESHAV MADHAV SARASWATI VIDHYA MANDIR, KAKORE (G.B. NAGAR)KESHAV MADHAV SARASWATI VIDHYA MANDIR, KAKORE (G.B. NAGAR)

AMD Industries Limited
18, Pusa Road, 1st Floor, Karol Bagh, New Delhi 110 005Tel. : 91-11-28753136, 28750649/50
Fax : 91-11-28753591email : [email protected]
Url : www.amdindustries.com
(Formerly known as AMD Metplast Ltd.)
Printe
d b
y : M
od
ern
, m
odern
sysc
orp
@gm
ail.
coom
![NERCTranslate this page 201602 Modifications to CIP...%PDF-1.5 %âãÏÓ 14051 0 obj > endobj 14072 0 obj >/Filter/FlateDecode/ID[]/Index[14051 42]/Info 14050 0 R/Length 105/Prev 1251851/Root](https://img.pdfslide.us/doc/110x75/5acf2a797f8b9aca598c10ae/nerctranslate-this-201602-modifications-to-cippdf-15-14051-0-obj-endobj-14072.jpg)