Embed Size (px)
Citation preview

ANNUAL PERFORMANCE REPORT FOR WATER SERVICE PROVIDERS IN KOSOVO IN 2017
Performance report of water supply licensed companies, wastewater service and bulk untreated water supply
June 2018

PERFORMANCE REPORT RWC - 2017
2
Water Service Regulatory Authoritety
Vission
“Water and Wastewater efficient, safe and quality service for all customers throughout Kosovo”
Mission
“Regulation of water service in an effective and transparent manner in accordance with good European
practice, which ensures that water and wastewater service deliver qualitative, sustainable services with
affordable prices throughout Kosovo, having into consideration environmental and public health protection”

PERFORMANCE REPORT RWC - 2017
3
CONTENT
FOREWORD .......................................................................................................................................................................... 5
ROLE AND RESPONSIBILITIES OF WSRA ......................................................................................................................... 6
1. INTRODUCTION ............................................................................................................................................................. 7
2. SECTOR DEVELOPMENTS ........................................................................................................................................... 8
3. INDIVIDUAL PERFORMANCE RWCs .......................................................................................................................... 10
3.1. WATER SUPPLY ....................................................................................................................................... 10
3.2. WASTEWATER SERVICES ........................................................................................................................ 25
3.3. FINANCIAl PERFORMANCE OF RWC ........................................................................................................ 32
3.4. THE OVERALL PERFORMANCE OF RWCs ................................................................................................ 35
4. PERFORMANC OF THE SECTOR OF WATER SERVICE .......................................................................................... 42
4.1. WATER PRODUCED, SALES AND NRW .................................................................................................... 42
4.2. SERVICE COVERAGE ............................................................................................................................... 43
4.3. PLANNED REVENUES, TURNOVER AND COLLECTED CASH .................................................................... 44
4.4 CAPITAL INVESTMENTS FOR WATER SUPPLY AND WASTEWATER SERVICES ....................................... 45
5. PERFORMANCE OF NPE “IBËR- LEPENCI” ............................................................................................................... 47
6. ACTIVITIES OF THE CCC ............................................................................................................................................ 48
7. CHALLENGES FOR THE FUTURE .............................................................................................................................. 49
APPENDIX 1: QUALITY AND DETAILED PERFORMANCE DATA .................................................................................... 51
APPENDIX 2: DEFINITIONS AND RATIONALITY .............................................................................................................. 68
APPENDIX 3: SUMMARY STATEMENT OF INCOME ........................................................................................................ 74
APPENDIX 4: TARIFF STATEMENT 2017 AND (2018-2020) ............................................................................................. 77
ANNEX 5: Summary of performance indicators -2017 ......................................................................................................... 79
ANNEX 6: Statistical data - 2017 ......................................................................................................................................... 80
APPENDIX 7: CONTACT DETAILS ..................................................................................................................................... 82
APPENDIX 8: SERVICE AREAS OF WRC .......................................................................................................................... 83

PERFORMANCE REPORT RWC - 2017
4
ACRONYMS AND ABBREVIATIONS
WSRA Water Services Regulatory Authority
KAS Kosovo Agency of Statistics
RBP Regulatory Business Plans
RAB Regulatory Asset Base
BD Boards of Directors
KNIPH Kosovo National Institute of Public Health
CPIK Consumer Price Index in Kosovo
IMCW Inter-Ministerial Council on Waters
RWC Regional Water Company
CCC Customer Consultative Committees
MESP Ministry of Environment and Spatial Planning
MED Ministry of Economic Development
AMP Annual Monitoring Plan
PMUPOE Policy and Monitoring Unit of Publicly Owned Enterprises
WC Water Centre
NRW Non-Revenue Water
AI Administrative Instruction
RAG Regulatory Accounting Guidelines
SCO Swiss Cooperation Office in Kosovo
SP Service Providers
GIG Geografic Information System
KPI Key Performance Indicators

PERFORMANCE REPORT RWC - 2017
5
FOREWORD
Like every year, also during the 2017, through monitoring the performance of licensed water service providers, the Water Service Regulatory Authority (WSRA) assessed the performance and stagnation of water service providers. The information, analysis, monitored and audited data that are presented in this report reflect the state of the sector and the level of services provided.
Through monitoring and evaluating performance, in addition to promoting competition among service providers by making comparative assessment, the WSRA primary goal is to improve the performance and efficient functioning of service providers. Although service providers are improving in certain areas year by year, there are still areas where improvement is unsatisfactory and their improvement requires the support of all stakeholders in the water sector.
As a result of investments in increasing drinking water production capacities, regular supply of customers has improved continuously – in 2017 within the water supply sector by the required standard of 24 hours has reached 23.7hours.
Improvements has also been noted in the coverage of water services (water supply and wastewater services), however to achieve the required standards, further engagement with a focus on coverage with wastewater services is needed.
Wastewater treatment remains one of the biggest challenges that the sector will face in the years to come.
Based on the projections of expenditures, capital investments and return on equity, the WSRA sets the tariffs through which expenditure providers are allowed to invest in order to improve the services but has resulted that the realization of planned investments in general has not been met.
In order to ensure the realization of investments and long-term financial sustainability, service providers need to improve the collection level. Improving this indicator requires engagement by developing sustainable action plans, improving regular meter readings, regular billing, and undertaking timely and operational measures for irresponsible customers.
Non-revenue water continues to be among the main concerns of the sector. Reducing NRW is priority for all service providers but also for other stakeholders. In this regard, service providers supported by an inter-institutional group have also developed strategies and action plans for reducing NRW.
During the performance assessment for 2017, we made some changes to the overall performance assessment of service providers by adding two new indicators: Non-revenue water and Regulatory Reporting, as well as changing the importance weight of indicators in the indicator scheme performance key.
In order to provide accurate and reliable data, WSRA supported by the SDC-funded project has developed a guide for advancing the monitoring system at WSRA and RWCs and the annual audit inspection module. In order to advance, provide credible data and facilitate the monitoring process, it is proposed to develop adequate electronic data storage and management systems.
Improving the performance of the sector, providing services according to the standards and sustainability of service providers is closely related to the engagement of all stakeholders, especially the support of the Government of the Republic of Kosovo and international donors.
WSRA has been and will always be ready to support service providers in their efforts for sustainable development and improvement.
I would like to thank the management and staff of the Regional Water Companies for Co-operation and the WSRA staff contributing to the drafting of this report.
Yours sincerely,
Raif Preteni, Director of the WSRA

PERFORMANCE REPORT RWC - 2017
6
ROLE AND RESPONSIBILITIES OF WSRA
Based on the Law No. 05/L -042, for the Regulation of Water Services, WSRA has the mandate to regulate the water sector and water service providers in Kosovo.
WSRA does this by:
Licensing service providers and monitoring the implementation of the terms set forth the service licence;
Defining service tariffs for service providers and ensuring that tariffs are fair, reasonable and enable financial sustainability of service providers;
Establishing service standards and monitoring their implementation by service providers;
Establishing the Customer Consultative Committees in seven regions of Kosovo;
Drafting and approving: regulations, standards, and regulatory decisions in accordance with authorizations under this law and other applicable laws;
Inspecting the level of performance of service standards and overseeing the enforcement of legal acts of the Authority.
Monitoring and reporting of performance of water service providers in Kosovo is done in order to promote competition by benchmarking which as a final goal, has improved their performance.
The Authority collects data and information (monthly and annual reports) in accordance with defined formats and deadlines, not limited to financial, operational and customer service data needed to exercise its responsibilities under this law or of other applicable laws in the country.
WSRA continuously year after year monitors the services provided by service providers that have to comply with the tariff objectives and the set levels of service standards. WSRA publishes periodic and annual performance reports and other reports that reveal in detail the performance assessment achieved in order to:
Ensure the efficient functioning of service providers and the sector within the minimum standards of service,
Determine the level at which service providers meet the objectives set by the tariff process as well;
Identify corrective actions that may be needed to improve the situation.
Performance monitoring and comparative assessment is one of the mechanisms that WSRA uses to motivate RWCs to improve their performance.

PERFORMANCE REPORT RWC - 2017
7
1. INTRODUCTION
This report details the performance of seven Regional Water Companies (RWCs), which provide water and wastewater services as well as an enterprise that offers untreated water for some of the RWCs.
RWCs are public enterprises organized on a regional basis as joint stock companies (JSC). They have a clear legal and financial identity and are administered according to the principles of corporate governance. The Government of Kosovo is a shareholder and supervisor of their business. The Government of Kosovo is a shareholder and supervisor of their business. In terms of economic regulation and quality of services they have undergone a regulatory process led by WSRA.
RWCs provide their services – water supply and wastewater services in 34 municipalities of Kosovo. The report does not contain the performance of service providers that provide their services in the northern part of Kosovo (northern Mitrovica, Zubin Potok, Leposavic and Zvecan), as they have not been licensed and subject to the regulatory process. Also, there were not included the new established Municipalities such as Shtërpce, Novoberde, Partesh, Kllokot, Ranillug and Hani i Elezit, which are foreseen to be integrated into the respective regional companies after the rehabilitation of their infrastructure. It is expected that this will happen at the end of the first six months of 2018.
The performance of public services in this report is described on the basis of the comparision of performance indicators for 2017 compared with 2016, achievements in meeting the tariff obligarions and local service statndards.
The main purpose of this report is not only to promote the assessment of the service quality level of all Water Service Providers, but also for the collection, dissemination and publication of comparative performance information between them.
In addition, the report lists the RWCs on the basis of progress and performance improvement in the provision of water services, based on the methodology, criteria and key performance indicators, detailed in the annual monitoring plan.
Data and information on the preparation of the report have been collected by the RWCs through monthly and annual format. The data used in this report have been audited and verified by WSRA under a detailed audit/verification format, aiming to confirm: accuracy of data reliability and consistency. The data was eventually agreed by the water service providers.
Some reported data have also been used by government institutions: KSHPK (for water quality assessment) and KAS (for assessing the coverage of the population with services and financial aspects).
The report consists of four central parts as follows:
o Part A provides data on the performance the RWC divided into four specific areas: water supply, wastewater services, financial performance of the RWCs, and overall performance appraisal.
o Part B provides data on the overall performance of the Water Supply and Wastewater services for a five year period (2013-2017), through several key performance indicators including: water produced, sales and NRW, service coverage, planned revenues, turnover and call received as well as capital investments for water supply and wastewater services.
o Part C provides data and information on the performance of the only bulk water supplier, PHE Ibër-Lepenci, as well as
o Pjesa D describes activity of CCC, and assesses their performance in addressing customer complaints in their respective regions.
Annexes: provides statistical data, tables with detailed performance, regulatory and tariff summary statements, data
definitions and indicators, contact details and other valuable information.

PERFORMANCE REPORT RWC - 2017
8
2. SECTOR DEVELOPMENTS
2.1 Procesi tarifor 2018-2020
The WSRA has set new tariffs for water supply and wastewater services to be implemented by each of the seven Regional Water Companies (RWC), for the next three years, 2018-2020. Tariff charges are based on projections of expenditures, capital investments and a return on equity. Water companies have provided data on their business plans on which are based on our tariff decisions and from past experience we have shown more realistic about our expectations regarding efficiency improvements. As part of the process of setting these tariffs the WSRA has consulted with Costumer Consultative Committees representing customers’ interests, there have also been public debates with citizens as well as stakeholder consultations. We have noticed that customer demand for a better service has increased and as a result we are confident that customers will be willing to pay more to provide improvements in the water and wastewater service they receive. . WSRA has decided to reduce the inter-subsidy rate for volumetric water tariffs. WSRA has also reduced fixed monthly tariffs for non-household customers (Institutions, Business and Industry) from 3 euro to 2 euro per months, while fixed tariffs for household customers remained the same and in the amount of 1 euro per month. As a result of the reduction of cross-subsidization to all RWCs, we have reduced volumetric tariffs for water services for all non-household customers for three years of the tariff process. It should be noted that during the last three years there has been no increase in any RWCs. Balanced tariff increase for household customers is based on reducing the inter-subsidization rate between domestic and non-household customers and increasing water production by the RWC in view of expanding services and increasing the level of coverage of water supply. In order to provide 24 hour water supply, RWC ‘Prishtina’ has constructed a water treatment plant, and taking into account that the water plant in Shkabaj, constructed by RWC ‘Prishtina’, besides donations, a large part has been financed by the loan around 22m Euros, which in turn influences the increase of water tariffs for customers in the Prishtina region. During the 2018-2020 tariff process, wastewater treatment plants in the Prizren and Gjakova regions are expected to be operational. In order to cover the costs of operation and maintenance is expected to have wastewater volumetric tariff increment 2019 and 2020 (depending on when the wastewater treatment plant is activated). In order to reduce water losses WSRA has foreseen and approved the reduction of water losses by 2% per year for the three years of tariff process (in total 6%). WSRA annually publishes the annual performance report of licensed companies for the provision of water supply services and wastewater services and RWC over these years have realized only a small part of the planned investment to improve the services, over the next three years this should be improved. We have allowed realistic investment opportunities but in order for these investments to be funded it is imperative that RWCs improve revenue collection from customers. Without these financial means, RWCs are powerless to meet their level of services and investment obligations. Customers should also be more aware that bills need to be paid. WSRA is working with companies to ensure that fair policies and practices will be applied if it comes to the disconnection of water supply service. Regarding the cases of customers who have real difficulties to pay, they should be assisted by the responsible institutions – the Government of Kosovo.
Tariffs in Kosovo are still much smaller than those in other European countries, where service levels are much higher. Soon we expect tariffs to increase significantly, especially for wastewater treatment. Investments in this regard have started, and they will be considerable, as the requirements for meeting EU environmental criteria are great.

PERFORMANCE REPORT RWC - 2017
9
2.2 Law on public debts forgiveness
In August 2015, the Law on Public Debts Forgiveness entered into force. Under this Law, Kosovo citizens could repay their debt by the end of 2008 provided that from 2009 until the end of 2014 they would meet their obligations. Initially, the period for cancellation of the repayment of debts lasted until August 2016. Then, the same law was amended and completed in January 2017, to continue the debt relief period by September 1 of that year. In order that as many citizens /customers or business to benefit from this law. Beneficiaries of the Debt relief were also customers who had sums of unpaid public debts to Regional Water Companies. By this law Government intended to stimulate customers for their payments for services provided in the years to come.
The forgiveness of public debts is not e new practice in the water service sector. Indeed, the earlier UNMIK Regulation 2004/49, which enter into force on November 26, 2004, on the activity of water and wastewater service providers has allowed the forgiveness of old debts within the first six months of entry in force of this regulation. The forgiveness of old debts included customer debts up to while December 31, 2000, at 100% for all categories of customers, while continuing the forgiveness of debts for the household and commercial-industrial customer category by the end of 2001 to 50%. This debt forgiveness was also conditioned by the signing of the service contract as well as the payment of the remaining debt of entry and adherence to the payment agreement which could not be paid under the regulation. Although there has been some implementation by some of the RWCs it has not followed any further information on the level of implementation either by the Regulator, Government or even the RWC itself.
The implementation of the Law Debt Forgiveness in the Performance of Water Companies in 2016, compared to 2015, had a direct impact on the collection of previous debts that customers had towards RWCs. The collection rate in 2016 rose to 86% from 74% as it was in 2015, and was characterized by a higher rate of improvement of 12%, while in cash, the improvement in collection was over €4.6 mil. more.The trend of improving the collection rate continued in 2017, although the improvement rate was lower than in 2016 by 2%. In total customer debt to all RWCs (excluding RWC “Hidrodrini”)1 was over 108.1 mil. out of this value were forgiven €19.1 mil. or 18%. €13.1 mil. or reprogrammed rate relative to total debt was 12%, while the value of cash-settled debt was €5,2 mil.
The improvement of the RWC’s financial base, the impact of the implementation of cancellation of the repayment of
financial debts, as well as the rate of collection is evident, the expected impact was also recorded in profitability, the
trend was positive by 0.7%, in 2015/2016. However, the highest trend in this indicator with 2.67% is seen in 2017, as the total operating costs under regulatory accounting are lower due to debt reduction carried forward from 2016. As a
final result, all RWCs, surely reflect further on raising service standards, with benefits for all their customers.
1 RWC “Hidrodrini” has not submitted any additional information.

PERFORMANCE REPORT RWC - 2017
10
3. INDIVIDUAL PERFORMANCE RWCs
This part of the report focuses on the main performance indicators that directly affect customer services. A more detailed overview of performance that includes more indicators is presented in Appendix 1 of this report.
3.1. WATER SUPPLY
This sub-section of the report analyzes the individual performance of the seven RWCs in relation to the water supply service in 2017 and compares performance with the previous year 2016, and also against the targets/expectations that were included in tariff review 2017. We have divided this analysis into three main sub-parts: non-financial
(technical), non-financial (commercial) and financial, in some important indicators.
3.1.1 Non-financial (technical)
Non-financial (technical) performance focuses on technical aspects of water supply such as service quality and operational aspects with a focus on those indicators that directly affect customer service –water quality, water pressure, and continuity of water supply, pipe cracks and non-revenue water.
Water quality
Water quality is a very important standard due to its health impact on customers. Water quality refers to the microbiological and physic-chemical characteristics, in relation to a number of local standards within which the compatibility can be assessed. The water quality analysis in this report was made on the basis of reports submitted by NIPHK, which also has the responsibility for monitoring and ensuring the quality of water supplied by the RWCs.
Figure 1. % of past tests
In figure.1, the percentage of test results, Microbiological and physic-chemical tests that exceed the foreseen quality,
microbiological and physic-chemical results in the reporting period is presented. In total there are 8,180 samples
analyzed by NIPHK in 2017, out of which 5,858 were subjected to microbiological testing, while failures only 5
samples or 0.1% them were identified.
In the physicochemical aspects, a total of 2,322 samples were analyzed and only 10 of them or 0.4%, failed to meet
the parametric values of standard.
FE
GJI
PR
MIT
PE
GJA
PZ
Water Quality
2016
2017
80% 100% 80% 100%
Bacteriological tests Chemical tests

PERFORMANCE REPORT RWC - 2017
11
Tab.1. Rate (%) of bacteriological and physico –chemical tests in accordance with water quality standards and RWCs
RWC Prishtina Hidroregjioni
Jugor Hidrodrini Mitrovica Gjakova Bifurkacioni Hidromorava
Sector average
Microbiological 99.9% 100% 100% 100% 100% 99.4% 99.5% 99.9%
physico –chemical
99.1% 100% 100% 100% 100% 95.9% 100% 99.6%
Average of RWC
99.7% 100% 100% 100% 100% 98.4% 99.7% 99.8%
The tests found that overall compliance in seven RWCs was 99.8% in line with parametric values of local standards, meaning that the quality of water supplied by RWCs is good with further improvement of water quality in 2017/2016.
So far, only to RWCs ‘Prishtina’ and ‘Gjakova’, have been able to conduct an on the-spot monitoring in their accredited
laboratories, the rest of the RWCs have this contracted service with NIPHK. Other companies should continue with the
accreditation process of the laboratories and equip them with the necessary staff and equipment to carry out their own
monitoring of the quality of water – in accordance with AI 16/2012.
Water Pressure
It is a key performance indicator and important service standard and represents the average rate of property served during
the reporting period that occurred in RWCs areas that regularly face pressure lower than the minimum level of pressure.
Insufficient short-term low pressure periods are not included. It is the responsibility of the service providers to ensure
adequate pressure (not less than-1.5 bar and not more than -7 bar), in the customer connection pipe. Providing pressure
on the maximum reference value (7 bar), is the responsibility of the customers themselves. Customers expect their Service
Provider to supply sufficient pressure and steady flow (adequate pressure to carry out their household tasks).
Figure 2. Shows the ratio of reported property to low pressure problems.
It seems that neither of the RWCs has shown significant problems for providing pressure to the distribution network.
Companies have also received little customer complaints regarding this aspect. However, WSRA has limited confidence in
the results of its analysis, about the number of properties affected by low or high pressure in their water supply taps. None
of the RWC has been able to provide reliable data for pressure measurements, so we cannot say for sure that the situation
is worse or better that that shown in Figure 2. Companies should provide reliable information for management on the
0.00% 1.00% 2.00% 3.00% 4.00% 5.00% 6.00% 7.00% 8.00% 9.00% 10.00%
PR
GJI
FE
GJA
PZ
PE
MIT 2017
2016
Pressure in network
% of properties with pressure reduce

PERFORMANCE REPORT RWC - 2017
12
pressures in their service pipes and the entire service area by setting pressure management areas with sufficient number
of measuring points (gauge) and establishing an on-line monitoring and testing system.
Continuity of water supplies
Indicates the property (customer) rate served in the reporting period with continuous water supply divided into three
categories: properties that have 24 hours supply, 18-23 hours supply and properties with less than 18 hours supply,
excluding special cases that may occur such as: outages from any technical problem or disruption to the Company’s
planned work.
Figure 3. % of customers with regular drinking water supply
The continuity of water supply in 2017 has improved significantly, improvement is evident in RWC ‘Prishtina’ and ‘Mitrovica’, these two companies now have enough capacity to continuously supply their customers within their service areas..
Small problems mainly of technical nature remain in the RWC ‘Bifurkacion’, ‘Hidroregjioni jugor’ and ‘Hidromorava’.
Average hours of supply of water supply services per day from RWCs at sector have have increased from 22.96 for 2016 to 23.7 in 2017. Only the company ‘Prishtina’ and ‘Bifurkacioni’, have registered reductions in hours of water supply.
Even in this WSRA indicator, there is a dozen reserves in its credibility because the data on the affected properties and the length of the reductions are evaluated, none of the companies have established a verifiable system, the SCADA system is missing distribution network and the reduction areas are not defined in any sustainable application such as SIG.
All companies excluded RWC ‘Bifurkacioni’ henceforth should be limited to increasing production. The focus should be on
managing water production and billing as well as eliminating current operational-technical problems. Any investment in
increasing production capacities will impact on the unnecessary increase in operating and capital costs.
0% 20% 40% 60% 80% 100%
PR
FE
MIT
PZ
GJI
PE
GJA
Service reliability
24 hr supply%
18-23 hr supply %
<18 hr supply %

PERFORMANCE REPORT RWC - 2017
13
Cracks in Pipes
This indicator is related to the total number of cracks in pipes per year per km of pipe (excluding connection service pipes.
Figure 4. Cracks in water supply pipes
This figure shows the values of cracks in pipes for the 100 km pipeline of the main water supply network for each RWC. Water network cracks/defects reported in 2017 per 100 km range from 605 cracks/defects in the Southern Hydro-region to 72 cracked water pipes per 100 km network in ‘Prishtina’. The average water cracks/defects throughout the country during 2017 is 233/100 km. Performance has been marked by RWC ‘Hidroregjion Jugor’ with 605 cracked water pipes /100km of the water distribution network.
It seems that the obsolete network pipes, and the lack of proper maintenance, seem to be the main factors for this poor performance.
Cracked/defects of water pipes per 100 km of the water supply network tell us about the performance of the water supply
network as the network is porous. The higher the rate the more it will affect the loss of water and its quality.
Non-revenue water
Non-revenue water (NRW), is the difference between the amount of treated and distributed water in the network relative to
the amount of non-revenue. Otherwise it is a quantity of water that does not generate income for the RWCs.
RWCs were challenged by a high level of NRW. An internationally accepted reference rate that we have accepted as a reasonable target suggested that NRW is less than 25% of total water produced and distributed to customers.
462
403
270
239
215
202
172
75
605
411
257
248
233
209
175
72
0 200 400 600 800
PZ
GJA
FE
PE
Avg
MIT
GJI
PR
Number of defects in the water supply network per 100 km
2017
2016
PERFORMANCE REPORT RWC - 2017
14
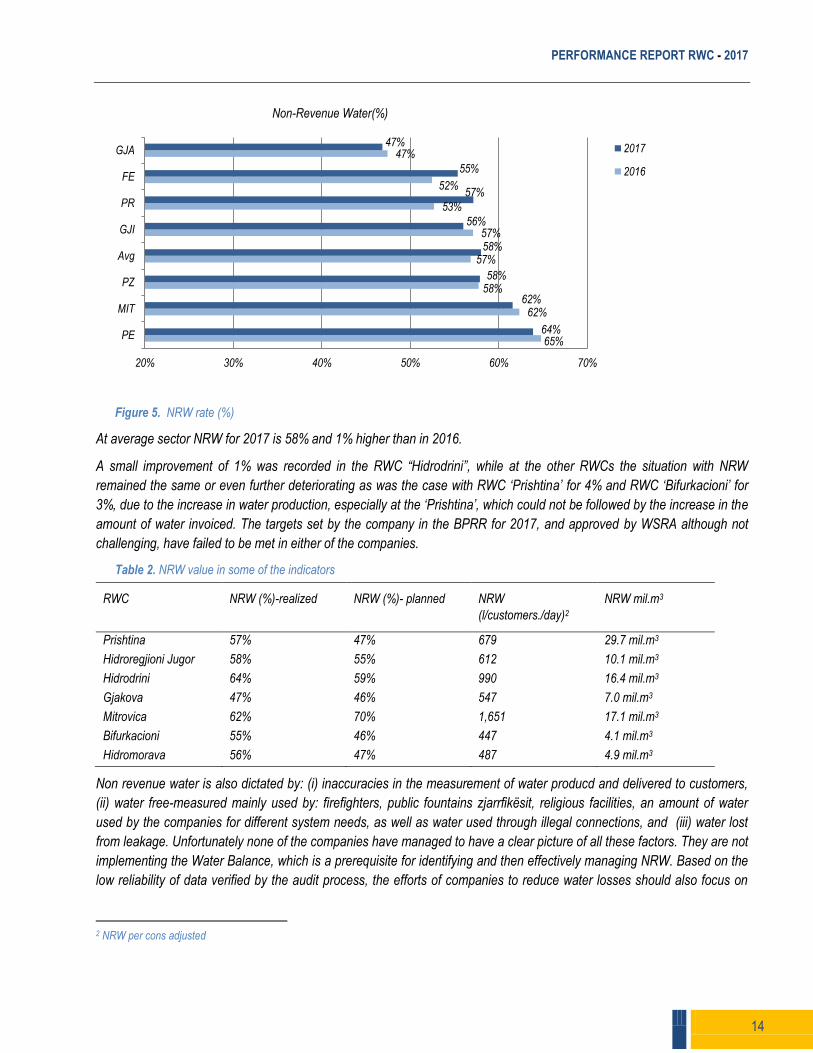
Figure 5. NRW rate (%)
At average sector NRW for 2017 is 58% and 1% higher than in 2016.
A small improvement of 1% was recorded in the RWC “Hidrodrini”, while at the other RWCs the situation with NRW
remained the same or even further deteriorating as was the case with RWC ‘Prishtina’ for 4% and RWC ‘Bifurkacioni’ for
3%, due to the increase in water production, especially at the ‘Prishtina’, which could not be followed by the increase in the
amount of water invoiced. The targets set by the company in the BPRR for 2017, and approved by WSRA although not
challenging, have failed to be met in either of the companies.
Table 2. NRW value in some of the indicators
RWC NRW (%)-realized NRW (%)- planned NRW
(l/customers./day)2
NRW mil.m3
Prishtina 57% 47% 679 29.7 mil.m3
Hidroregjioni Jugor 58% 55% 612 10.1 mil.m3
Hidrodrini 64% 59% 990 16.4 mil.m3
Gjakova 47% 46% 547 7.0 mil.m3
Mitrovica 62% 70% 1,651 17.1 mil.m3
Bifurkacioni 55% 46% 447 4.1 mil.m3
Hidromorava 56% 47% 487 4.9 mil.m3
Non revenue water is also dictated by: (i) inaccuracies in the measurement of water producd and delivered to customers,
(ii) water free-measured mainly used by: firefighters, public fountains zjarrfikësit, religious facilities, an amount of water
used by the companies for different system needs, as well as water used through illegal connections, and (iii) water lost
from leakage. Unfortunately none of the companies have managed to have a clear picture of all these factors. They are not
implementing the Water Balance, which is a prerequisite for identifying and then effectively managing NRW. Based on the
low reliability of data verified by the audit process, the efforts of companies to reduce water losses should also focus on
2 NRW per cons adjusted
65%
62%
58%
57%
57%
53%
52%
47%
64%
62%
58%
58%
56%
57%
55%
47%
20% 30% 40% 50% 60% 70%
PE
MIT
PZ
Avg
GJI
PR
FE
GJA
Non-Revenue Water(%)
2017
2016

PERFORMANCE REPORT RWC - 2017
15
improving the accuracy of water meters. In particular, water meters and customer water meter must be tested in terms of
volumetric measurement on a regular basis.
The challenge of reducing NRW has also been addressed by the responsible institutions (Government of e Kosovo and
WSRA). RWCs have drafted individual strategies for reducing water losses. An inter-institutional group (KNMU. NJPM-NP,
WSRA and SHUKOS), is monitoring periodically the implementation of action plans and assessing the progress in
reducing NRW. Reducing water losses for companies is expected to bring benefits in several key areas such as: good
water resource management, performance enhancing, financial-operational, maintaining system integrity by reducing
system interruptions and reducing potential for contamination within the water distribution system.
3.1.2 Non-financial (commercial)
Non-financial (commercial) performance focuses on commercial aspects of water supply such as service coverage, water
measurement, and focusing on aspects that affect customers.
Coverage with water supply services
Coverage with water supply services is defined as the percentage of the population within the service area with provision
of water supply service from RWC through the public supply network.
Figure 6. % of population coverage with water supply services
The coverage of the water supply services in 2017at the sector level reaches 94% which is 3% higher than in the previous 2016.
RWC ‘Prishtina’, Radoniqi and Hidrodrini, have achieved high coverage of the population with services within their respective service areas.
Low coverage with water supply services in 2017 continues to be in RWC ‘Hidroregjioni Jugor’ with 70%, ‘Hidromorava’ with 75% and ‘Mitrovica’ with 76%.
The large flow of residents from the rural areas to the cities, the movement of the population towards the capital (Prishtina)
has made RWC ‘Prishtina’ to provide services to a greater number of people currently resident in other part of Kosovo but
who currently work and live in the area of this company. Also, some of the RWCs offer their services beyond their service
69%
71%
71%
89%
91%
99%
100%
100%
70%
75%
76%
93%
94%
100%
100%
100%
0% 20% 40% 60% 80% 100%
PZ
GJI
MIT
FE
Avg
PE
GJA
PR
Water supply service coverage
2017
2016

PERFORMANCE REPORT RWC - 2017
16
area, as is the case with RWC ‘Gjakova’, which also provides services to a number of villages in the municipality of
Prizren.
This indicator was analyzed by taking into account the data derived from the latest 2011 household census of KAS, and
corrected by us, based on the household’s growth coefficient year after year, in relation to the number of current bills
reported by the RWC. We have asked the RWC to provide more recent household data, from the municipalities where they
provide and their services in the hope that they are more up to date and as such they could not have been provided, so
even in this case in the indicators we have a dose of reserve on the objectivity of the analyses.
Measuring water
Measuring consumed water is prerequisite to charge customers on the basis of their real consumption and can help
promote the careful use of water so it is an important means of controlling water consumption and losses.
Figure 7. The proportion of households customer with water meters
Figure 7, shows the ratio of household meter water coverage to reach RWC as well as the average of the sector. In general, the average water metering ratio for the households’ category has increased by 1%, and in 2017 it reached 93%.
Improvements in the rate of customer equipment with water meters during 2017 are recorded in some of the companies including RWC ‘Mitrovica’, ‘Hidromorava’, ‘Bifurkacioni’ and ‘Hidroregjioni Jugor’.
None of the RWCs have reached the 100% rate, their home water meters measurements at best are RWC ‘Prishtina’ and ‘Gjakova’ with 98%, while RWC “Mitrovica” and ‘Hidromorava”, still remain below the average level of the sector with only 68%, respectively 87%. In 2017/2016 both these companies have been gradually increasing.
It is legal obligation (Law no. 05/L -042, for Regulation of water services), for companies to bill their customers by meter reading. WSRA require RWCs to have a more dynamic improvement in this indicator, especially RWCs to have a more dynamic improvement in this indicator, especially RWC ‘Mitrovica’ and ‘Hidromorava’.
Companies should identify the importance of accurate measurement; from the point of view of revenue recovery from
billing and perhaps even more important, identifying where water losses occur. It is a reality for the moment that the
overwhelming majority of water meters in the country are in service for about 10-15 years or more. Water meters must be
maintained and replaced according to a RWC implementation program, due to regular consumption and obsolescence, as
the meters slow down and become less accurate over time.
64%
86%
92%
92%
94%
95%
97%
97%
68%
87%
93%
93%
95%
96%
98%
98%
0% 20% 40% 60% 80% 100%
MIT
GJI
FE
Avg
PZ
PE
GJA
PR
Proporcion of households customer with water meters
2017
2016

PERFORMANCE REPORT RWC - 2017
17
Complaints
Number of complaints is an important indicator for assessing how much customers are satisfied with the service received
from their service provider. Customer awareness plays a critical role in ensuring that complaints are reported and resolved
within a defined legal timeframe.
Figure 8. Number of complaints for water utilities
From figure 8, we can see an overview of the number of complaints registered by each of the RWCs. In total there were 19,759 addressed to all RWCs, their number increased by around 5000 or 37% compared to 2016. This increase was mainly due to the number of complaints addressed to RWC ‘Mitrovica’. The total average of complaints per 1000/customers in 2017 is 59/1000 customers. Less complaints from other companies were deposited in RWC ‘Gjakova’ (14), ‘Bifurkacion’(10) and ‘Hidromorava’ 100 per 1000/customers
Most commercial nature complaints have been related to debt disputes, debt-repayment and lump sum payments. Whilst in technical terms more customers have complained about: water supply outages , water leaks, water meter faults or even water pressure issues, usually when the pressure is too low, but occasionally even for high pressure.
This increase in the number of complaints, not necessary showing a deterioration in the level of service, may be more related to the fact that companies are being taken and better managed with customer complaints and returning their trust to service providers, as their complaints are being addressed.
The authority has allocated a low credential rating to customer complaint data. During the audit process we have established that regarding the registration of customer complaints, most companies have software applications –relevant modules (CRM), but are not up-to-date complaints are kept Excel diary and distributed to various departments of the company.
RWCs should maintain an updated customer complaints register and resolve them within a legally-defined time-limit under
the Regulation on Minimum Standards for services.
1,468
3,001
1,420
1,309
508
189
10
177
4,342
808
119
714
253
6,908
3,607
1,417
1,309
185
84
9
93
4,239
1,048
85
95
414
266
- 1,000 2,000 3,000 4,000 5,000 6,000 7,000 8,000 9,000
MIT
PR
PZ
PE
GJI
GJA
FE
2016 Technical complaints 2016 Commercial complaints 2017 Technical complaints 2017 Commercial complaints
Complaints in water service

PERFORMANCE REPORT RWC - 2017
18
3.1.3 Financial
Financial performance focuses on financial aspects of water supply such as sales, unit costs and capital expenditures of
water supply. All the financial values expressed in euro are adjusted based on mid-2017 prices, to ensure proper year-to-
date comparisons.
The volum of water sold
The water volum represents how much water was sold in relation to the planned sales of RWCs tariff applications for the
2017 tariff review process.
Figure 9. Quantitative rates for water sold by RWCs in relation to business plan estimates
The RWCs have planned in 2017, to sell a total of 68.6 mil.m3, water for their customers, currently at 59.9.mil m3, for
districts of 8.7mil.m3 , or 13%, less than planned for their business plans for the same year.
Total water sector sales in the sector increased from 57.6 mil.m3 in 2016 to 59.9 mil.m3 in 2017, which is equivalent to an
increase of about 2.3 mil/m3 or 4%. Otherwise RWCS currently continue to bill-sell only about 40%, of the total water
produced and distributed to their customers.
The average sales rate in relation to planned sales remained at the same level as 87%, in these to years vite(2016-2017).
RWC ‘Mitrovica’ with (7%) reported a higher rate of progress in relation to its 2017planning, otherwise it si significantly
below the sector’s average in achieving water sales planning
RWC ‘Gjakova’, reported higher water sales in relation to planning among other RWCs, reaching sales at 98% planning
rate. Sales realized by RWC ‘Gjakova’ were slightly lower than in 2016.
RWC ‘Prishtina’, ‘Hidroregjjioni Jugor’, ‘Bifurkacioni’ and ‘Mitrovica’, have failed most in achieving quantitative sales targets
in 2017.
The main reasons for increasing the sales of water in business plans of the RWCs were the projections for increasing
customer ties and increasing production. This under-performance of the RWC for the failure of water sales will affect the
provision of sufficient revenue for the financial needs of RWCs, in particular for the financing of capital investments.
78%
78%
84%
85%
87%
89%
90%
107%
80%
85%
77%
87%
87%
90%
91%
98%
40% 60% 80% 100% 120%
PZ
MIT
FE
PR
Avg
GJI
PE
GJA
Water sales relative to planned
2017
2016

PERFORMANCE REPORT RWC - 2017
19
Value of sales (EUR)
The total value of water sales is an important indicator of financial performance by covering operating and capital
maintenance costs by creating financial sustainability.
The figure below shows the performance of water sales compared to the planned estimates as defined in the RWC tariff
applications for the tariff review process 2015-2017.
Figure 10. The rate of the sales value of the water supply (EUR) in relation to planned sales
During 2017, the sales value for each RWC was lower than the planned sales value, mainly due to poor sales volumes
forecasts as described aboe ( figura10).
Failure to realize sales volumes also reflected the value of sales and as such has completely affected by RWC with regard
to the financial resources that would be needed to meet their investment plans.
The sales value realized for 2017 at the level of the water supply sector was € 29,4mil. while the planned €33,8 m meant
that 87% of sales were realized from what was planned and is the lower by 3% compared to 2016 that was 90%.
Regarding the performance of sales at company level, RWC “Hidromorava” has this year with the highest target rate of
94% exceeding the previous yea 2016 for 1 %, while RWC “Bifurkacioni” reached only 81% of the target at the same time
by fall of 8% from 2016, the result of which was almost the same level of billing in the euro without any change from the
previous year while the planned billing was more ambitious (10% ) in 2017 compared to 2016.
89%
83%
83%
91%
90%
97%
97%
93%
81%
81%
86%
87%
87%
92%
92%
94%
40% 60% 80% 100%
FE
PZ
MIT
PR
Avg.
GJA
PE
GJI
Water supply sales value relative to plan estimates
2017
2016

PERFORMANCE REPORT RWC - 2017
20
Figure 11, Value of sales of water supply (%), during 2017 compared to 2016
From figure 11, it si noted that nearly all sales companies have shown progress during the reporting period 2017 compared
with 2016, with the exception of two companies RWC “Bifurkacioni” and RWC “Hidroregjioni Jugor”.
Even this year as last year, RWC “Mitrovica” is the company which leads with the highest sales, an increase of 13.90%
compared to 2016, the result of which was the increase of the number of customers connected in the water supply service
by 9%, reflecting also the increase in volumetric sales growth by 12%.
Sector- level sales in 2017 are higher by 3.55% as a result of volumetric sales gowth by 4% .
Costs per unit of water produced3
The cost per unit of water produced is also an important financial indicator based on which we understand the costs per m3
of water produced.
Figure 12. Value of sales of water supply (%), during 2017 compared to 2016
3 Unti costs for the previous year 2016 are adjusted for the inflacion rate 1.015.
13.90%
7.88%
5.21%
3.55%
3%
0.81%
-0.17%
-0.80%
-3% 2% 7% 12% 17%
MIT
GJI
GJA
Avg.
PR
PE
FE
PZ
Water supply sales value 2017 relative to 2016
% change on prev year
0.083
0.064
0.046
0.055
0.047
0.045
0.029
0.006
0.088
0.064
0.054
0.049
0.048
0.045
0.025
0.004
- 0.020 0.040 0.060 0.080 0.100
PZ
GJI
MIT
PR
FE
Avg.
GJA
PE 2017
2016
Water production unit costs

PERFORMANCE REPORT RWC - 2017
21
The average cost of a water unit production in 2017 has not changed compared to 2016, it remains the same as
€0.045/m3.
There is wide variacion in production costs in RWCs, which is largely influenced by the tye of supply source, depending on
whether the source is surface or groundwater, and from other factors such as the way of capiture and quality exploited
water.
This is a concretet case at the RWC “Hidroregjioni Jugor”, where the high cost of producing water is influence by high
costs of water treatment, in particular by high energy and fuel costs during the operacion of the pumps.
While at the lowest cost now for many years RWC ‘Hidrodrini’ brings with €0.004 /m3,
Total cost per unit for water supply
The total cost per unit for water supply activities is the total costs for water supply (including operating costs and capital
maintenance costs excluding capital return on capital and bad debts4) in relation to the volume of water sold for the same
reporting period..
Figure 13. Cost per unit of water supply EURO –per m3 të of water sold
In 2017 at sector level, the cost per unit of water supply was €0.38 /m3, which compared to the previous year there was an
increase of €0.01/m3.
In addition to RWC “Mitrovica” and RWC “Hidromorava”, which in 2017, showed positive downward trends of €0.01 /m3
(Mitrovica) respectively 0.02 EUR/m3 (Hidromorava), all other companies recorded negative trends in this indicator. The
increase in unit water costs supplied to most companies can be attributed to the apparent increase in total operating costs
of water services, despite the volumes increase in water supply.
Unlike previous years this year RWC “Hidroregjioni Jugor” brings with the highest cost opf water supply by €0.44 /m3,
marking an increase also compared with the previous year of €0.040 /m3 as a result of non-growth volumes sales, while
operating costs including capital maintenance have risen to 9%.
4 Bad debts under the Regulatory Accounting Guidlines are defined as amounts of uncollected income from the previous year.
0.42
0.40
0.40
0.41
0.36
0.37
0.29
0.25
0.43
0.44
0.41
0.39
0.39
0.38
0.28
0.26
- 0.10 0.20 0.30 0.40 0.50
PR
PZ
FE
GJI
GJA
Avg.
MIT
PE
2017
2016
Water supply unit costs (operations+capital maintenance)

PERFORMANCE REPORT RWC - 2017
22
The total cost per unit for water supply realized in relation to the planned one
The total cost per unit of water supply is a financial indicator that is ranked in the group of key indicators based on which
the water supply performance is measured.
Inidicator graphically presented bellow shows tha ratio between the cost per unit of water supply realized and the cost per
unit of planned water supply.
Figure 14. Unit cost of water supply in relation to planned unit costs (%)
At the sector level, meeting the water supply unit cost target in 2017 has further deviated from the planned 90%, but
compared to the previous year, it has improved by 12% from 10% to 98%.
The best performance in this indicator was achieved by RWC ‘Mitrovica’, with unit cost at 88% level, desired by all
companies and which was achieved thanks to the subsidy that this company received by covering expenses operating
water at the level of 38%.
Poor performance is shown by RWC ‘Bifurkacioni’. Owing to the high rate of operating costs, the non-realization of capital
investments and sales of water to the planned values, during the tariff process 2015-2017 respectively in 2017).
Capital expenditures for water supply
The tariff review process 2015-2017 included provisions for capital expenditures both for capital maintenance as well as for
capital increase. Much of these expenditures, especially those for capital maintenance, were expected to be financed by
the RWC’s own financial resources and are therefore included in the tariffs. We are disappointed when we see that the
actual capital expenditures undertaken by the RWC in the last three years are neglibible compared to those planned.
Another worring thing is that companies almost all capital expenditures or better to say at the level of 95% of them have
dedicated to the expansion of capital expenditures and the rest of 5% to capital maintenance, a fact which results in the
sektor growth is a proof of this failure to undertake effective capital maintenance activities within the network. The NRW
sector growth is a proof of this failure to undertake effective capital maintenance activities within the network.
134%
117%
137%
115%
110%
112%
106%
87%
128%
110%
109%
107%
98%
97%
90%
88%
0% 40% 80% 120% 160%
FE
PZ
GJI
GJA
Avg.
PE
PR
MIT
Water supply unit costs relative to planned unit costs
2017
2016

PERFORMANCE REPORT RWC - 2017
23
Figure 1. Capital expenditures for water supply in relation to planned ones
As evidenced by the current expenditures in the majority of RWCs, with the exception of RWCs “Prishtina” and “Mitrovica”
were lower than the expected level and starting with 3% of WRC “Hidroregjioni Jugor” up to 25.5% of RWC “Hidrodrini”.
Unlike previous years where most of the investments realized and declared by companies were mainly form grants
(development donations) this year, investments from own source revenues accounted for 56% of the total nvestments
amount.
The value of investiments from own source revenues for 2017 was around € 30 million while the rest of the grants.
Nat sector level for 2017 companies from own source revenues are planning to spend about 3 million euros ahihc are
covered by approved tariffs, but most of them except the RWC “Prishtina” have not even reached 50% of them realize.
Table.3. Value of investiments in the water service from own source revenues and grants for 2017
Company Inv. in production Inv.in distribution Inv.in business activities Total
Prishtina 15,479,874 25,188,156 169,357 40,837,387
Hidroregjioni Jugor 113,420 49,899 55,195 218,514
Hidrodrini 7,620 390,034 98,411 496,065
Mitrovica 10,392,020 1,964,858 17,942 12,374,820
Gjakova 0.00 788,809 429,575 1,218,384
Bifurkacioni 21,382 141,828 42,754 205,964
Hidromorava 19,453 9,663 6,640 35,756
Total 26,033,769 28,533,247 819,874 55,386,8905
5 Investments realized over the recent years, but finalized in 2017(RWC Prishtina and Mitrovica)
3%
5%
15%
20%
25%
225%
315%
3482%
0% 1000% 2000% 3000% 4000%
PZ
GJI
GJA
FE
PE
Avg.
MIT
PR
Water supply capital expenditure relative to planned 2017

PERFORMANCE REPORT RWC - 2017
24
This year RWC ‘Prishtina’, with the realization of capital expenditures of 40.1 million euros, and 70% of it is realized from
own source revenues. With these expenditures, the aim is to improve the continuity of water supply (mainly with the
construction of water plant at Shkabaj,a project planned in 2014, the installation of pumps, reservoirs, etc).
RWC ‘Mitrovica’ from the total investment value of 12.3 milion euros received 100% of the grants, most of them have
realized growing non-infrastructure resources and mainly for the counstrucion of the water plant in Shipol, while another
part in the growth and renewal of the distribution infrastructure, specifically in rehabilitation and construction of the new
water supply network.
RWC ‘Gjakova”,”Hidroregjioni Jugor” and “Hidrodrini’ have realize mainly expending infrastructure and non-infrastructure
and expansion of water plant, extension of pipelines, renewal and construction of the water supply nework, construction of
pump stations, installation of water meters, water filtering equipment, opening of wells, building of joints etc.
The company that has realized the least investments in water services has been RWC ‘Hidromorava’, with 35,756 euros or
4.6% of the planned one.

PERFORMANCE REPORT RWC - 2017
25
3.2. WASTEWATER SERVICES
This sub-section analyzes the RWCs’ performance in relation to wastewater services in 2017 and compares trends with the previous year 2016 and an analysis versus the targets/expectations included in tariff review 2017. As for water supply we share this analysis into three main sub-sections: non-financial (technical), non-financial (commercial) and financial.
3.2.1 Non-Financial (Technical)
Non-financial (technical) performance focuses on technical aspects of wastewater services such as: the quality of
wastewater and services levels with focus on those aspects that have a direct impact on customers.
The quality of wastewater discharged
Currently the wastewater treatment service in the country is very low, there is only one wastewater treatment plant in Skenderaj managed by RWC ‘Mitrovica’ and some small village-level plants managed by RWC ‘Prishtina’, from which we could not provide adequate data. The rest of the wastewater discharged by RWCs is logical to assume that they fail to meet environmental standards. We are hoping that in the coming years this service will be functional, as we have entered a phase of: planning, investments considerable capacity is now being built in the Prizren region.
Frequency of sewer overflows
It shows the number of reported incidents of sewerage collapses reported by RWC (or identified by RWC staff) in the
reported period relative to the length of sewerage network. This indicator assesses the performance of the sewage network
respectively the density of sewer overruns per 100 km of the grid.
Figure 16. Number of overflows per 100 km
Only RWC Hidroregjioni Jugor , ‘Prishtina’ and ‘Bifurkacioni’, have reported data on sewer overflows. While RWC
‘Prishtina’ has reported a decrease in sewer overflows from 463 to 304, per 100/km, two other RWC ‘Hidroregjoni Jugor’
with 450 and ‘Bifurkacioni’ with 298 overflows per 100km, reported overflows age growth in 2017/2016.
The low density of overflows in the RWC ‘Hidrodrini’, ‘Mitrovica’, ‘Hidromorava’ and ‘Gjakova’, is due to the fact that these
have not reported data.
This large number of overflows reported by some of the RWCs reflect the poor state of the sewerage network and also
show poor usage practices (such as dumping solid waste in wells) and also network overload.
384
463
246
262
450
304
298
226
0 200 400 600
PZ
PR
FE
Avg
GJA
GJI
MIT
PE
Sewer overflows per 100 km
2017
2016

PERFORMANCE REPORT RWC - 2017
26
The service provider should develop and implement a program to inspect and clean the sewerage pipes. The whole
sewage network should be cleaned at least once in five (5) years. While the inspection of all sewage manholes should be
carried out at least once in (2) years and their repair should be done depending on the need.
3.2.2 Non-financial (commercial)
Non-financial (commercial) performance focuses on commercial aspects of wastewater services such as service coverage
and complaints.
Coverage of wastewater services (sewage)
Coverage of wastewater services is defined as the percentage of the population within the service area that has the service of sewage (sewage).
Figure 17. Population coverage with wastewater services (%)
The coverage with the wastewater service at the sector level during 2017 reaches the level of 74%.
The highest level of coverage with wastewater services in 2017 has reached the ‘Prishtina’, as is the coverage of water supply services; it is worth noting that it was influenced by the large influx of residents’ movement from other cities and registration of them as households or customers of this company.
The low level of coverage with wastewater service continues to be in RWC ‘Hidrodrini’ service area by 44%, which is 5% more than in the previous year, 2016.
Also, this indicator similar to the water supply coverage has been analyzed, taking into account the data from the latest
2011 household census by Kosovo Agency of Statistics corrected on the basis of the household growth factor in the year
after year, in relation to the number of actual bills reported to the RWC.
Complaints
This indicator represents the total number of complaints received by RWCs regarding service levels (sewerage floods, etc)
as well as the financial and commercial aspects related to wastewater service during the reporting period (tariffs, etc.)
39%
54%
59%
58%
72%
69%
77%
96%
44%
59%
62%
65%
72%
74%
81%
100%
0% 20% 40% 60% 80% 100%
PE
MIT
PZ
GJI
GJA
Avg
FE
PR
Wastewater service coverage
2017
2016

PERFORMANCE REPORT RWC - 2017
27
Figure 18. Population coverage with wastewater services
The number of complaints received by the RWCs for wastewater services in 2017 has increased by around 1500 in relation to 2016. There were a total of 6746, complaints in the wastewater service in 2017 which is equivalent to 24 complaints per 1000/customers.
The majority of complaints for all RWCs have been related to operational issues such as sewer overflows including floods and sewage purification, and smell from wastewater treatment works. Customers have complained less about commercial issues in the wastewater service.
Customers who receive poor service or are dissatisfied with any aspect of the wastewater service (sewage) offered to
them have the right to complain. The number of complaints can be taken as a reflection of customers’ discontent and
greater customers’ awareness of the right to dignified services and the proper handling of their complaints
2.2.3. Financial
Financial performance focuses on the financial aspects of wastewater-sewage services such as sales, unit costs and
capital costs for wastewater.
Value fo sales of wastewater services (EUR)
The figure below shows the performance of sales of wastewater services compared to planned estimates as set out in the
RWC tariff applications for tariff review process 2015-2017.
-
144
951
316
0
3,627
63
1,437
964
0
155
1
3,551
558
0
0
0
11
22
0
47
- 500 1,000 1,500 2,000 2,500 3,000 3,500 4,000
MIT
GJI
PE
GJA
FE
PR
PZ
2016 Technical complaints 2016 Commercial complaints 2017 Technical complaints 2017 Commercial complaints
Complaints in wastewater service

PERFORMANCE REPORT RWC - 2017
28
Figure 19. Value (EUR) of sales of wastewater services in relation to planning
Unlike water sales in relatikon to the plan where their performance was poor, with no exception to all companies, the
contaminated waters three out of seven RWCs showed good performance at actual sales in relation to the plan, even
exceeding those for 15% (Hidromorava), 13%(Gjakova), and 12% (Hidrodrini).
The sales value realized for 2017 at the level of the water supply sector was €3,873,041 while the planned,165,383€
means that 93% of sales were realized from what was planned, and it was lower by 3% compared with 2016 that was 90%.
Even this year RWC ‘Hidromorava” has achieved the highest percentage of planned sales compared to other companies
with 15% while remaining in the same postion as the previous year, while the lowest percentage of realizeion of sales for
wastewater in relation to plan like water sales remains the RWC “Bifurkacioni” with 82% with a decrease of 1% compared
to the previous year.
Relative value of sales of wastewater services
Figure 20. Value of sales of wastewater services during 2017 compared with 2016
83%
86%
88%
91%
88%
94%
114%
104%
83%
88%
92%
95%
94%
100%
113%
115%
0% 20% 40% 60% 80% 100% 120%
FE
PZ
PR
Avg.
MIT
PE
GJA
GJI
Wastewaster sales relative to planned sales
2017
2016
-3.37%
0.07%
2.31%
2.66%
3.46%
8.85%
8.81%
9.91%
-4% -2% 0% 2% 4% 6% 8% 10%
FE
PZ
PR
GJA
Avg.
PE
GJI
MIT
Proportion of sales of wastewater services during 2017 in relation to 2016
% change on prev year

PERFORMANCE REPORT RWC - 2017
29
The figure above shows trends in the value of sales realized during the reporting period 2017 compared wit 2016, from
which it si noticed that six of the seven RWCs have made progress in this indicator during 2017 compared to 2016, with
the exception of RWC “Bifurkacioni”.
RWC “Mitrovica” is a company that achieved the highest sales in 2017 with 9.91% compared to 2016 , the result of which
wes the increase of the number of customers in the wastewater service for 11%, thus also affecting volumetric sales
growth.
In absolute terms, sector-level sales in 2017 are 3.46% higher than in 2016.
Total cost unit for wastewater service
The costs per unit of wastewater services are defined as annual costs for serviced household customers6.
Figure 21. Unit cost of wastewater services- EUR for household customers
The unit cost of wastewater services a sector level in 2017 compared to 2016 has been higher for 0.417 EUR/m3 or 8%.
As seen from the figure above in three out of seven companies for 2017 we saw a decrease in unit cost for wastewater
service, the result of which was the decrease in the number of households served, despite the increase in total
expenditures for wastewater.
The lowest cost in this indicator for 2017 has RWC ‘Prishtina’, with 1.45 EUR/cons. with an increase of 0.10 EUR/cons.
Compared to the previous year, while the highest cost for 2017 compared with 2016 remains the RWC “Bifurkacioni”, with
an increase of 1.21 EUR/m3 or 11%, the result of which was the high operating costs, despite the increase of the number
of customers.
At the same time we see that the RWC “Hidrodrini” is the company that has acghived this with a higher cost per unit of
wastewater in 2017 compared to 2016 and that of 3.09 euros or 68%, as a result of this change (cost increase) has been
mainly the increase of capital maintenance costs for wastewater services at 197%.
7 The unit cost of 2016 is adjusted for the inflation rate.
10.60
10.39
8.59
4.52
8.16
6.24
5.28
1.35
11.82
10.69
8.24
7.62
7.33
6.08
5.69
1.45
0.00 4.00 8.00 12.00 16.00 20.00
FE
PZ
MIT
PE
GJA
GJI
Avg.
PR
Wastewater services unit costs (operations & capital maintenance)
2017
2016

PERFORMANCE REPORT RWC - 2017
30
Total cost per unit of wastewater services in relation to the planned one
Total cost per unit of wastewater services is also an important financial indicator which is ranked in the group of key
indicator based on which the performance of wastewater is measured. .
The indicator graphically presented below shows the ratio between unit cost of wastewater services realized (operating
costs including capital maintenance / households equivalents8) and the unit cost of planned wastewater services (operating
costs including capital maintenance / household customer equivalents)
Figure 22. Unit cost of wastewater services in relation to planned unti costs (%)
The unit costs realized in relation to the planned ones derived from the 2015-2017 tariff review (adjusted by price level in
2014), nearly all RWC were lower, and this shows no greater efficiency thatn was planned because the planned unit cost
involved considerable costs for infrastructure renewal and depreciation at current cost of new assets and none of them
managed to realize it.
Although RWC “Hidroregjioni Jugor”, compared to other companies, has reached the highest percentage of realization
from the planned target, yet it does not show good performance, because it has exceeded operating costs by 155%
without realizing either 2% of expenditures for capital maintenance
Capital expenditures for wastewater
The represent the total capital expenditures realized for maintenance and capital increase in wastewater service in relation
to capital expenditures approved in business plan for 2017.
8 Served household customers are defined as the current number of household customers plus the number of non-household customers converted to household customers ekuivalent base donte proporcional share of cunsumed water.
18%
50%
64%
53%
72%
51%
63%
121%
15%
40%
41%
46%
50%
66%
67%
109%
0% 50% 100% 150% 200%
PR
GJA
MIT
Avg.
GJI
PE
FE
PZ
Wastwater service unit costs relative to planned unit costs
2017
2016

PERFORMANCE REPORT RWC - 2017
31
.
Figure 23. Capital expenditures for wastewater service in relation to planned ones (%)
Even the same wastewater service as the water supply service, companies for 2017, envisaged substantial provisions of
about €14 milion for capital increase and capital maintenance, which were foreseen to be provided both by own funds and
donations, but in reality actual expenditures were much lower than the expected level, with the exception of RWC
“Prishtina”, which has invested heavily in investments in relacion to the plan.
Even this year most of the investments made for wastewater are from own source revenues of € 349,705 or 95% of the
total investiment amount, while the rest are grants totaling €19,814.
For 2017 companies from own source revenues are planning to spend around 500,000 euros, which are covered by
approved tariffs, and companies for 2017 according to the plan realized 82% of what was planned.
Table. 4, Realized value of investiments in wastewater service from own source revenues and grants for the year 2017
RWC Inv.in collection Inv.in treatment inv.in discharge inv. current business Total
Prishtina 214,063 0 0 5,286 219,349
Hidroregjioni Jugor 0 0 0 8,102 8,102
Hidrodrini 83,608 0 0 10,080 93,688
Mitrovica 0 0 0 1,994 1,994
Gjakova 10,815 0 0 22,609 33,424
Bifurkacioni 0 0 0 10,688 10,688
Hidromorava 1,774 0 0 500 2,274
Total 310,260 0 0 59,259 369,519
0%
1%
1%
2%
3%
33%
47%
1,902%
0% 500% 1000% 1500% 2000%
PZ
GJA
MIT
GJI
Avg.
PE
FE
PR
Wastwater supply capital expenditure relative to planed (2017)

PERFORMANCE REPORT RWC - 2017
32
3.3. FINANCIAl PERFORMANCE OF RWC
Revenue collection
Efficiency of collection represents the report of collection of revenues billed during the year for the supply of water and
wastewater services excluding other charges, such as connection fees and other revenues that companies may have as
part of the business. This one of the most significant managerial indicators which, in addition to the billing efficiency and
the reduction of water losses, have direct impacts on the company’s financial sustainability.
Figure 24.Revenue collection / billing rate (excluding other operating income)
The collection rate for water and wastewater service bills as the sector average for 2017 was 84% and is 2% lower than in
2016.
As noted in figure performance and progress and the best on the collection rate has reached RWC “Hidroregjioni Jugor”
with 95%, which occurred as a result of debt cancellations based on the Law on public debts forgiveness, reprogramming
of debts with installments, ongoing work with private bailiffs, etc. Good performance in this indicator has also shown the
RWC “Hidrodrini” with a 2% increase compard to the previous yeaer, while the other RWCs without exception have
shown negative trends.
The planned 2017 target at the sector level was 82%, while this target at the sector level at present hs been exceeded by
2%.
Low colelcgtion efficiency is generally affected by non-payment of invoces by household customers, but part of commercial
and institutional customers from which companies can not collect the payment.
59%
82%
78%
82%
86%
95%
92%
87%
56%
79%
80%
81%
84%
87%
88%
95%
40% 60% 80% 100%
MIT
GJI
PE
FE
Avg.
GJA
PR
PZ
Revenue collection efficiency
2017
2016

PERFORMANCE REPORT RWC - 2017
33
Table 5. Collectio rate by customer category and total for 2016-2017
Category ofcustomers Prishtina Hidroregjioni Jugor Hidrodrini Mitrovica Gjakova Bifurkacioni Hidromorava
2016 2017 2016 2017 2016 2017 2016 2017 2016 2017 2016 2017 2016 2017
Households 87% 85% 88% 98% 77% 78% 50% 48% 93% 88% 79% 81% 78% 76%
com.-industrial 103% 90% 64% 69% 82% 88% 117% 69% 92% 83% 92% 95% 89% 93%
Institututions 99% 98% 119% 108% 79% 80% 69% 97% 115% 83% 89% 57% 98% 89%
Total 92% 88% 87% 95% 78% 80% 59% 56% 95% 87% 82% 81% 82% 79%
Tablea.5, gives and overview of the collection rate for the to years 2016 and 2017, divided by customer categories, from
which we note that the imprvement of the collection rate in the there categories of customers in most companies still
remains a challenge to improve.
Thie year the RWC ‘Hidroregjioni Jugor” holds the rekord with 98% of household receipts, as well as the category of
institutions with 108%, wjhile RWC “Bifurkacioni” leads with the highest % in the category of business with 95%.
In RWC ‘Mitrovica’, household customers, are seen from the table above, remain the weakest debt payers, only 48% of
them manage to settle the debt for the service provided by their servilce provider.
Even in 2017, the main measure applied to collecting customer debts was the implementation of the Law on public debt
forgiveness which continued until September 2017. Some RWCs also implemented operational measures (disconnection)
and legal ones (egagement of bailiffs), to improve collection efficiency.
Improving collection efficiency requires permanent and continuous engagement by developing sustainable action plans,
improving regular meters reading, regular billing, and undertaking timely and operational measures for irresponsible
customers.
Return to capital
We already know that from the tariff process 2009-2011 we introduced the concept that the RWC s are getting the return
on capital as a necessary condition to reach a sufficient level of borrower to attract the much needed investments in the
sector.
For the 2015-2017 tariff process based on the good practices of Western European countries, we have proposed a true
return value (after inflation) of 4% to the Regulatory Asset Base (RAB)9.
9 For further details on the Regulatory Asset Base (how it is defined, and determined, etc.) refer to the WSRA Regulatory Accounting Guidelines

PERFORMANCE REPORT RWC - 2017
34
Figure.25. Return to the Regulatory Asset Base–RAB (%)
Return on capital at sector level has significantly improved for 2017 compared with 2016 and that of 2.67%.
As noted above, all companies have had pozitive returns from 1.2% of RWC “Bifurkacioni” up to 6.5% of RWC
“Hidroregjioni Jugor”, of which value we understand that companies have reached their incomes cover high operating
expenses including provisioning of bad debts and capial maintenance.
The highest rerformance and improvement in 2017 at the return rate was achieved by RWC ‘Hidroregjioni Jugor” with
8.31% from -1.8% in 2016 to 6.5% in 2016. This cange is so high, despote the reduction of expenditures which has made
this company compared to the previous year, can be mainly dedicated to raising revenue from regular billing, including the
subsidy10 that the company has received from this company.
10 The subvention has been received by the municipality to cover wastewater operational costs.
-5.5%
3.0%
1.3%
0.9% 2.6%
5.7%
2.2%
-1.8%
1.2%
3.2%
3.4%
4.4%
5.3%
5.9%
6.2%
6.5%
-8% -4% 0% 4% 8%
FE
PE
MIT
GJI
Avg.
PR
GJA
PZ
Return on RAB
2017
2016
PERFORMANCE REPORT RWC - 2017
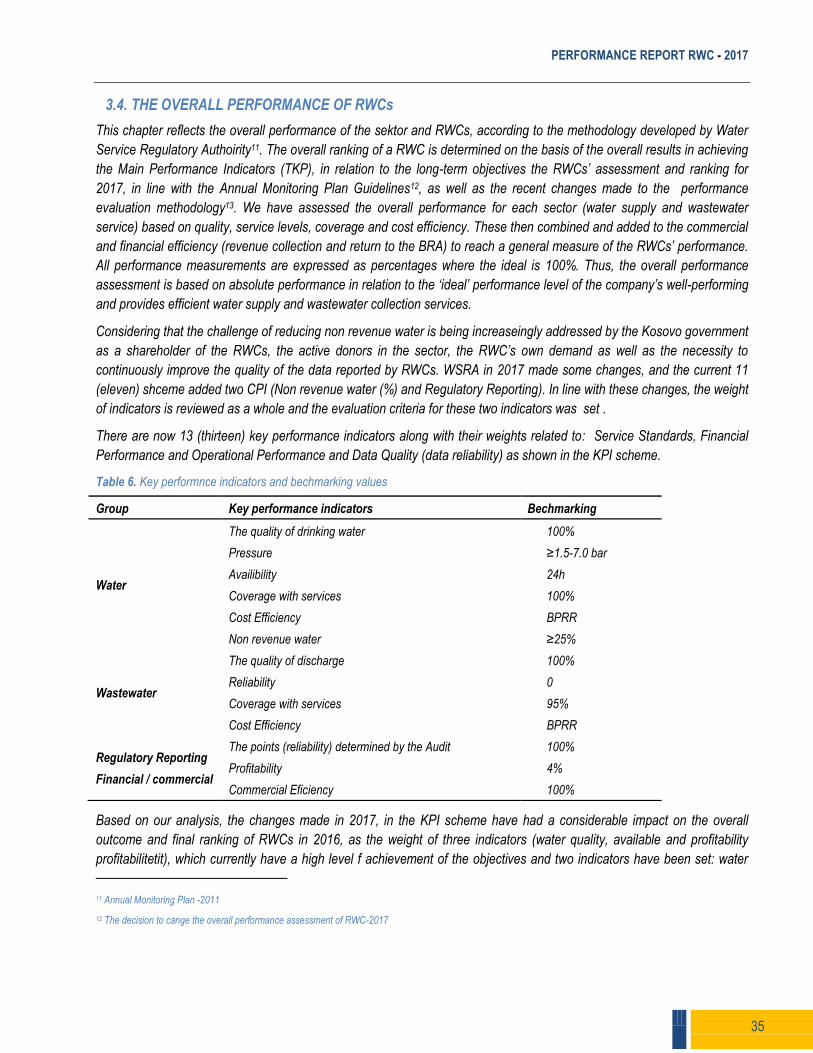
35
3.4. THE OVERALL PERFORMANCE OF RWCs
This chapter reflects the overall performance of the sektor and RWCs, according to the methodology developed by Water
Service Regulatory Authoirity11. The overall ranking of a RWC is determined on the basis of the overall results in achieving
the Main Performance Indicators (TKP), in relation to the long-term objectives the RWCs’ assessment and ranking for
2017, in line with the Annual Monitoring Plan Guidelines12, as well as the recent changes made to the performance
evaluation methodology13. We have assessed the overall performance for each sector (water supply and wastewater
service) based on quality, service levels, coverage and cost efficiency. These then combined and added to the commercial
and financial efficiency (revenue collection and return to the BRA) to reach a general measure of the RWCs’ performance.
All performance measurements are expressed as percentages where the ideal is 100%. Thus, the overall performance
assessment is based on absolute performance in relation to the ‘ideal’ performance level of the company’s well-performing
and provides efficient water supply and wastewater collection services.
Considering that the challenge of reducing non revenue water is being increaseingly addressed by the Kosovo government
as a shareholder of the RWCs, the active donors in the sector, the RWC’s own demand as well as the necessity to
continuously improve the quality of the data reported by RWCs. WSRA in 2017 made some changes, and the current 11
(eleven) shceme added two CPI (Non revenue water (%) and Regulatory Reporting). In line with these changes, the weight
of indicators is reviewed as a whole and the evaluation criteria for these two indicators was set .
There are now 13 (thirteen) key performance indicators along with their weights related to: Service Standards, Financial
Performance and Operational Performance and Data Quality (data reliability) as shown in the KPI scheme.
Table 6. Key performnce indicators and bechmarking values
Based on our analysis, the changes made in 2017, in the KPI scheme have had a considerable impact on the overall
outcome and final ranking of RWCs in 2016, as the weight of three indicators (water quality, available and profitability
profitabilitetit), which currently have a high level f achievement of the objectives and two indicators have been set: water
11 Annual Monitoring Plan -2011
12 The decision to cange the overall performance assessment of RWC-2017
Group Key performance indicators Bechmarking
Water
The quality of drinking water 100%
Pressure ≥1.5-7.0 bar
Availibility 24h
Coverage with services 100%
Cost Efficiency BPRR
≥25% Non revenue water
Wastewater
The quality of discharge 100%
Reliability 0
Coverage with services 95%
Cost Efficiency BPRR
Regulatory Reporting
Financial / commercial
The points (reliability) determined by the Audit
Profitability
Commercial Eficiency
100%
4%
100%

PERFORMANCE REPORT RWC - 2017
36
losses and data reliability, which leave a lot of space to fill, especially the NRW indicator is at a very low level and far from
the acceptable target. Taking into account when assessing overall performance in this report, I will only be limited to the
overall performance assesment for 2017, without making comparisons for the 2016.
3.4.1. PERFORMANCE OF WATER SUPPLY
This part of the report presents an assessment of the overall performance of the seven RWCs in the water supply service.
It is based on a comparative assessment of the company’s ‘ideal’ of expected performance, which works well and provides
efficient water supply. The annual performance assessment of the water supply services is done through the following
indicators:
(i) Coverage of service water supply in the service area,
(ii) The quality of water supplied
(iii) Water pressure,
(iv) Availability,
(v) Cost Efficiency,
(vi) Non-Revenue Water
Figure 26. It presents the results in the assessment of the performance of the water supply and raniking of the RWC (2017)
The overall performance of the water supply service on average in 2017, compared to the overall target level of a 45%,
reached 34.2% .
RWC ‘Gjakova’, has shown the best performance in water supply in 4 of the 6 key indicators in this service. Performance in
indicators: water quality, pressure, supply continuity and service coverage is complete at this company. While NRW and
Cost Efficiency are two of the indicators that need to pay attention to the management of this company to gain further
improvement. Currently, the RWC ‘Gjakova’ performance, is at level 38.1% of the possible target of 45%.
0% 20% 40% 60% 80% 100%
PZ
UR
GJI
MIT
PR
PE
GJA
Ideal
Water services overall performance
2017 Water quality 2017 Pressure 2017 Availability 2017 Service coverage 2017 Cost efficiency 2017 NRW

PERFORMANCE REPORT RWC - 2017
37
In RWC Hidroregjioni jugor’, has been shown the poorest performance by all RWC. There are three indicators (water
supply coverage, NRW and cost efficiency) where the improvement area is visible.
Table 7. Results for overall performance of water supply in 2017
RWC Water quality Pressure Supply Y Coverage NRW Cost Effic Total for RWC
Ideal 25.0% 5.0% 20.0% 20.0% 20.0% 10.0% 45%
GJA 25.0% 5.0% 20.0% 20.0% 8.0% 6.7% 38.1%
PE 25.0% 5.0% 20.0% 20.0% 0.0% 8.7% 35.4%
PR 24.9% 5.0% 15.5% 20.0% 1.5% 10.0% 34.6%
MIT 25.0% 5.0% 19.3% 15.2% 0.0% 10.0% 33.6%
GJI 24.9% 5.0% 20.0% 15.0% 2.3% 6.2% 33.0%
FE 24.6% 5.0% 18.4% 18.5% 2.7% 2.5% 32.3%
PZ 25.0% 5.0% 19.9% 14.1% 1.2% 6.1% 32.1%
Sector 24.9% 5.0% 19.2% 17.5% 2.2% 7.2% 34.2%
Standard service indicators are predominantly stable, although there is still room for improvement in the service coverate
indicator and continuity of supply by some of the RWCs.
Water qulaity, is at a satisfactory level, seven RWC in total have managed to improve even further the water quality, only
0.1%, is deviation from the target.
Pressure on the distribution network has been fully met, none of the RWCs have reported having difficulties in providein
adequate pressure.
Continuity of supply has improved, investments in RWC ‘Prishtina’ and ‘Mitrovica’, in the expansion of production
capacities, have reflected on the improvement of this indicator. Commitment is still required from RWC ‘Bifurkacioni’,
‘Prishtina’ and ‘Mitrovica’. Currently the target compliance level is 19.2% of the total possible 20% of this indicator.
Service coverage, on average, has increased, but coverage of water supply services remains low in the RWC KRU
(Hidroregjioni Jugor, Hidromorava and Mitrovica).
NRW is one of the indicators that is much to be desired. There are two RWCs Mitrovica and Hidrodrini, which have not
been able to provide any points of this indicator, NRW norm in these two companies is over 60%. The best position out of
all other RWCs is RWC ‘Gjakova’(8.0%). The average sector rate in this indicator, in relation to the target (20%), is very
low, only (2.2%).
Cost Efficiency in the water supply service in relation to planned costs has also improved, A high level of cost efficiency
has occurred in RWC Mitrovica’ ande ‘Prishtina’. While RWC’Bifurkacioni’, the cost efficiency is very low with only 2.5% of
the total 10%.

PERFORMANCE REPORT RWC - 2017
38
3.4.2 PERFORMANCE OF WASTWATER SERVICES
The overall performance evaluation of the seven RWCs in the wastewater services is also based on a comparative
assessment of the company’s “ideal” performance of the well-functiong company and provides efficient wastewater
services. The annual performance assessment of wastewater services is carried out through the following four indicators:
(i) Coverage with sewerage system for wastewater in service areas,
(ii) The quality of wastewawter discharged,
(iii) Reliability of wastewater services,
(iv) Cost efficiency.
The overall performance of the wastewater service in average in 2017, in relation to the target ideal general level of 35%,
rached 13.81% .
Figure 27. The overall performance of wastewater services -2017
The overall performance assessment for wastewater services this year is based on only two indicator (service coverage
as well as cost efficiency). The other two indicators (the quality of discharge and reliability) of the first associated with
wastewater treatment is limited and lack of quality data and standards of water. Similarly, since the reliability for all RWCs
(measured on the basis of flooding / overflows 100 km pipes per year) is higher than the absolute maximum of 10 from the
ideal level, and data from some RWCs, others were reported, this indicator has not been evaluated.
In total, the performance diagram shown in fig 27, illustrates the need for significant investments in the improvement of
wastewater infrastructure, including: the development of wastewater treatment plants and associated facilities.
0% 20% 40% 60% 80% 100%
PE
PZ
MIT
GJI
GJA
FE
PR
Ideal
EUR (2010)
Wastewater services overall performance
2017 Discharge quality 2017 Reliability 2017 Service coverage 2017 Cost efficiency

PERFORMANCE REPORT RWC - 2017
39
Table 8. Results of overall performance in wastewater service in 2017
RWC The quality of
discharge Reliability Coverage Cost Effic. Total
Ideal 20% 20% 50% 10% 35%
PR 0.0% 0.0% 50.0% 4.2% 19.0%
FE 0.0% 0.0% 40.4% 6.4% 16.4%
GJA 0.0% 0.0% 36.0% 8.8% 15.7%
GJI 0.0% 0.0% 32.6% 5.8% 13.5%
MIT 0.0% 0.0% 29.3% 3.7% 11.5%
PZ 0.0% 0.0% 30.9% 1.9% 11.5%
PE 0.0% 0.0% 21.9% 4.2% 9.1%
Sector 0.0% 0.0% 34.5% 5.0% 13.8%
The coverage of wastewater service at the general level in 2017, has improved, the total score is 13,8%, which is 21.2%
lower than the target level targeted at the service by 35%. RWC ’Hidrodrin’ and ‘Mitrovica’, ‘Hidroregjioni jugor’ and
‘Hidromorava’, have significantly less coverage of wastewater services compared to other RWCs and are far from the
target objective of this indicator. Unit costs realized in relation to those planned for 2017, in all RWCs were lower, and this
shows lower efficiency than planned.
The cost efficiency in the wastewater service is at 5%. The best performance in this indicator has been marked by RWC
‘Gjakova’, while a very low level of cost efficiency has shown RWC ‘Hidroregjion Jugor’.
RWC ‘Prishtina’, has the best performance in this service compared to the other companies, whith a gradual improvement
trend. While the company with the poorest performance continues to be RWC ‘Hidrodrini’.
3.4.2. OVERALL PERFORMANCE
The overall performance of RWCs brings together the performance of two business sectors: water supply and waswater
services, as well as broader commercial aspects (profitability and revenue collection) as well as regulatory reporting.
(i) The overall water supply performance,
(ii) The overall wastewater services performance,,
(iii) Regulatory reporting,
(iv) Profitability,
(v) Commerical Efficiency

PERFORMANCE REPORT RWC - 2017
40
Figure 28. Overall Performance of RWCs in 2017
The overall performance of RWCs 2017, has reached 62.5%. A total improvement is needed for 37.5%, to reach the
maximum of 100%. Clearly, with no exception, RWC are operating at much lower levels than would be considered a
minimum level, eg. Let’s say,80% of the ideal. It is well known that the main reason for overall performance is wastewater
services and lack of treatment. Non-revenue water to the water supply service as well commercial efficiency (collection).
Figure 28, reflects the RWC ranking according to their performance for 2017, and in relation to the ideal company.
Based on the general criteria for ranking, RWC ‘Gjakova’ and RWC ‘Prishtina’, came out as the best companies in the
overall performance (in the provision of water service), after they scored points. On the other hand, RWC ‘Mitrovica’, was
the weakest performer in overall performance.
Table 9. Results of overall performance RWC in 2017
RWC Water supply Wastewater Profitability Collection Regulatory reporting Total points
Ideal 45.0% 35.0% 5.0% 10.0% 5.0% 100.0%
GJA 38.2% 15.6% 5.0% 6.8% 4.9% 70%
PR 34.6% 19.0% 5.0% 7.0% 4.8% 70%
PZ 32.1% 11.5% 5.0% 8.7% 4.6% 62%
GJI 33.0% 13.5% 5.0% 4.9% 4.9% 61%
FE 32.3% 16.4% 1.5% 5.2% 4.6% 60%
PE 35.4% 9.1% 4.0% 5.0% 4.3% 58%
MIT 33.6% 11.5% 4.3% 0.0% 4.2% 54%
Total 34.2% 13.8% 4.6% 5.4% 4.6% 62%
- 38%
0% 20% 40% 60% 80% 100%
MIT
PE
FE
GJI
PZ
PR
GJA
Ideal
Overall performance of RWC
2017 Water supply 2017 Wastevater 2017 Profitability 2017 Commercial efficiency 2017 Regulatory reporting

PERFORMANCE REPORT RWC - 2017
41
Water supply, the overall performance of the water supply service on average in 2017, compard to the overall target level
of 45%, reached 34.2%. although positive trends are evicent in water quality and supply continuity, there is a lack of a
10.8%, rate, progress to achieve full efficiency in this service. Large potencial for existing improvement especially in the
NRW indicator, but considerable improvement is also required for coverage of water supply services and cost efficiency.
Wastewater service is significantly lower than that of water supply. In 2017, the level reached is 13.8%, from the possible
maximum of 35%, improvements have been made to Service Coverage and Cost Efficiency, although wastewater
treatement is still low.
Profitability represents the actual return to the regulatory asset base in relation to the projected return on capital. For the
tariff process (2015-2017), the rate of return on capital was 4%. The sector’s average profitabilityrate for 2017, was at the
level of 5.3%, which was significantly better than the previous year (2016). Without exception all RWCs have had positive
returns. There are 5 RWCs (Prishtina, Gjakova, Bifurkacion, Hidroregjion Jugor, and Hidromorava) that have achieved
maximum performance on the level of profitability. The overall performance in this indicator was realized at 4.6%, out of
total of 5%.
Collection Efficiency is currently at half of the objectives targets with 5.4% points reached from the 10% maximual
allocation for this indicator. The efficiency of the collection year after year is imrproving, in the last two years there has
been a great progress. All RWCs have made improvements. RWC ‘Hidroregjioni jugor’ with 8.7%, RWC ‘Prishtina’ with
7%, and Gjakova with 6.8%, showed the best performance from all other RWCs in this indicator in 2017. The significantly
lower rate on the collection rate, there is still ‘Mitrovica’. Progress is being shown to be very difficult, especially the
challenge remains to improve the collection of household and business customers.
Regulatory reporting, the quality of the reported data is evalualed through the audit /verification process based on how
the RWCs’ data retenation practices comply with a set of assessment criteria set out in the ‘Guide to the Advancement of
the Monitoring System in WSRA and RWCs.’ The overall average of this indicator is at 4.6% of the total 5%. The WSRA’s
concerns still remain regarding the reliability of some operational data (water production, pressurei, reduction (limited-
capacityproperties). Database, financial and customer service is generally maintained in advanced software modules and
these data in general have proven to be more reliable.

PERFORMANCE REPORT RWC - 2017
42
4. PERFORMANC OF THE SECTOR OF WATER SERVICE
The water service area (water supply and wastewater services) in Kosovo is divided into seven regions. WSRA has licensed seven RWCs (Regional Water Company) on the basis of legal responsibilities to provide these services within their respective areas. RWC are the only public companies responsible for providing water services.
This part of the report presents the joint performance of seven RWCs through several important indicators focusing on
production, sales, coverage, turnover, investments, etc. The analyzed indicators were taken over a five-year period in
order to have a clearer picture of trends in the development of these indicators.
4.1. WATER PRODUCED, SALES AND NRW
The figure below shows the NRW trend at the level in relation to production and sales of water for the period 2013-2017.
Figure 29. Quantitative production, billing and NRW
The amount of water produced by seven companies has been increasing steadily. Total water production from RWCs has
increased from 134.4 mil. m3 in 2013 to 154.2 mil.m3 in 2017, which is equal to 15% or in quantitative terms around 20
mil.m3 (an increase during the 5 year period (a drop in production occurred in 2014 when it was an extreme period of
drought.)
The main growth of water production has occurred at RWC “Prishtina” and RWC “Mitrovica” as a result of the increase of
new production in these two companies which was the first necessary to improve the continuity of water supply.
Volume sales of water, 2017/2013 have also increased by about 6.7, mil.,m3. Currently, the sales volume is 64,7mil.m3.
With the growth of water production, the volume of non-revenue water in 2017, this value is quite high, about 89.4 mil.m3,
or about 13 mil.m3 more than non revenue water, compared to 2013.
It is evident that the trend of water production has not been followed by a similar increase in billing efficiency, affecting that
NRW increase both in quantitative and percentage terms to be higher in 2017.
58,081,289 55,850,398 59,743,615 62,073,994 64,794,837
76,377,955 75,977,769 77,300,666 81,662,581
-
50,000,000
100,000,000
150,000,000
2013 2014 2015 2016 2017
143,736,575 water production
Non-revenue water
Water sales
Water production, sales and NRW
Vo
lum
e (m
3)
154,220,031 131,828,167
137,044,281 134,459,244
89,425,194

PERFORMANCE REPORT RWC - 2017
43
4.2. SERVICE COVERAGE
In the RWC service area, it is estimated that a population of 1.7 million people lives, of whom about 1.6 million people or 94%, receiving secure water supply services, the rest of the local population is estimated to be in the mainly rural areas have separate water supply systems or even individual systems, which are not managed by the RWC. With wastewater services are about 1.2 million people or 74%.
The total number of customers in 2017 was 338,154 with an increase of 10,868 compared to the previous year. Household
customers have increased by 10,412 while non households (commercial-Industrial and institutional), for 456 customers.
Figure 30. Service coverage
Service coverage has been steadily improving even in 2017, the average coverage of the population with water supply services is 94%, which is 12% higher than in 2013, while the average coverage of wastewater services is 74%, and in this five year period has increased by 14%.
Table 10. the coverage rate of the population with service for the period 2013 - 2017
Service coverage Water supply Wastewater (sewerage)
2013 82% 60%
2014 84% 62%
2015 87% 65%
2016 91% 69%
2017 94% 74%
0%
25%
50%
75%
100%
2013 2014 2015 2016 2017
Service coverage (mid year estimates)
Water supply Wastewater supply

PERFORMANCE REPORT RWC - 2017
44
4.3. PLANNED REVENUES, TURNOVER AND COLLECTED CASH
Turnover means revenues from regular billing and other operating revenues for water and wastewater services.
Figure 29, shows the average turnover and revenue efficiency over 5 years, and provide a clear picture of turnover and
revenue over the years eliminating distortions that may occur during a financial year.
Figure 31. Financial performance of the sector
Turnover14 efficiency at sectorial monetary value in 201715, has marked a slight improvement at € 841 thousand or expressed in percentage by 3% compard to 2016, this slight improvement is attributed to the expension of the base customers, year after year, and then increasing the efficiency of billing revenues. The turnover in 2017/2013, in monetary value has improved for €4.1 milion, or expressed in percentage 14%. Unlike the Turnover Efficiency, Efficiency of Collection in 2017 compared to 2013 has marked a significant higher improvement compared to €7.1 million, or expressed in percentage by 36%, whiel compared to the previous year 2016 there remained ate the same level. The collection rate in relation to sector-level billing in 2017 was 84% or 2% lower compared to 2016, while compared to 2013 the rate of collection is 13% higher.
14 Turnover included revenues from regular billing for water and wastwater service as well as revenues form other operational activities, Cash included collection from regular billing for water and wastewater services as well as revenues from othe operating activities.
0
10,000,000
20,000,000
30,000,000
40,000,000
2013 2014 2015 2016 2017
Year
Planned turnover, actual turnover and collected cash
Planned turnover
Planned cash received
Turnover
Cash

PERFORMANCE REPORT RWC - 2017
45
Table 11. Turnover and collection by years
The 84% of collection efficiency is on average satisfied, as still 16% of customer debts remain uncollected even though companies have been trying to apply water disconnection, cancelation of npayable old debts and addressing debts collection through private bailiffs, reprogramming debts still have not reached the appropriate level of 100%.
4.4 CAPITAL INVESTMENTS FOR WATER SUPPLY AND WASTEWATER SERVICES
This section presents the analysis of capital expenditures of seven RWCs, the real and planned capital expenditures over the tariff process (2012-2014) which is completed and the current process (2015-2017).
It is clear that funding to the water and wastewater sector needs support and efforts co-ordinated by different actors. Although there have been funds channeled towards investments in this sector, there is still a need to do much more, given the huge investment requirements.
Of all RWCs, it is expected to realize significant investments in the water supply and wastewater service and from the total
amount planned for the three-year tariff period (2015-2017), of approximately €132 million, with one separation of
approximately 2/3 or 70% in water supply and 1/3 or 30% in wastewater service.RWCs’ own funds are planned to be
invested around €14 million capital expenditures in both services (water supply and wastewater services)
Table 12. Total value of capital expenditures for water supply and wastewater service
Company 2013 2014 2015 2016 2017
RWC ‘Prishtina’ 9,027,945 1,592,704 964,011 750,874 40,844,354
RWC ‘Hidroregjioni Jugor’ 1,552,776 909,195 1,154,620 1,185,597 314,301
RWC ‘Hidrodrini’ 901,5647 802,008 2,034,939 243,840 516,038
RWC ‘Mitrovica’ 2,060,993 0.00 - 8,377,055 12,374,820
RWC ‘Radoniqi’ 1,348,647 1,166,757 1,310,426 2,140,844 1,243,658
RWC ‘Bifurkacioni’ 58,461 3,060,203 279,182 156,414 210,232
RWC ‘Hidromorava’ 32,350 1,971,971 204,840 118,783 253,006
Total 14,982,737 9,502,839 5,948,018 12,973,406 55,756,409
The value of investments over these five years has been around 99 million Euros, funds invested mainly by donors, and a small share of RWCs. In relacion to the planned value the realizacion of investments reaches the leve of 54%.
Years Turnover Collection/cash Cash/Turnover
2013 29,715,954.43 21,225,741.79 71%
2014 29,296,792.70 21,890,722.67 75%
2015 32,125,817.68 23,969,835.35 75%
2016 32,980,466.89 28,486,856.51 86%
2017 33,821,692.45 28,393,970.12 84%

PERFORMANCE REPORT RWC - 2017
46
Of the total over these five years around 53.2 million. Euros were realized by RWC “Prishtina”, while rewer capital
expenditures were realized at RWC “Hidromorava”(2.6 million Euros).
The lack of realization of planned investments and dynamics planned in most of the companies, either by own funds or by donor funding, will not bring abort planned improvements in partikular, will have an impact on the lack of proper maintenance and growth assets that are prerquisites for providing good and sustainable services.

PERFORMANCE REPORT RWC - 2017
47
5. PERFORMANCE OF NPE “IBËR- LEPENCI”
WSRA is responsible for regulating the part of the PHE ‘Ibër Lepenci’,which is related to the supply of bulk water for RWC Mitrovica’ and RWC ‘Prishtina’ respectively for O.U. ‘Drenas’.
Below we provide some statistical data and some performance indicators to see trends in performance development in
2017 compared to 2016.
Table 13. Statistical data for NPE 'Ibër-Lepenc'
Statistical data 2016 / 2017 2016 2017
Bulk water volume billed (m3) 24,240,235 38,040,970
Billing for bulk water (€) 539,543 1,265,859
Collection for bulk water (€) 239,014 762,739
The cost of operation for bulk water supply (€) 665,709 969,911
Number of employees engaged in bulk water supply 39 51
The amount of water sold in 2017, was increased by about 14.mil m3, water sold to RWC ‘Prishtina’, as a demand for the new factory in Shkabaj.
Since the nature of bulk water service is different from drinking water activities, and the absence of the companies of the same nature of domestic supply, the ability to evaluate performance is limited only to some financial indicators and only to NPE ‘Iber Lepenc'i’ . In table x, an overview of the financial indicators is provided on the basis of which the PHE ‘Ibër lepenci’ can be estimated during 2017 compared with 2016.
In table 14, an overview of the financial indicators is provided on the basis of which the PHE ‘Ibër lepenci’ can be estimated
during 2017 compared with 2016
Table 14. Performance indicator of NPE ‘Ibër-Lepenci’
Performance indicator 2016 2017
Collection rate 44% 79%
Working standard 0.81 1.00
Work coverage rate 0.36 0.79
Unit operating cost (€/m3) 0.03 0.03
As is apparent from the table almost all the financial indicators of this Enterprise have made progress in 2017 compared to 2016.
The collection rate in 2017 has increased by 35% compared to 2016, and this has been the result of collection at the level of 80% of RWC “Mitrovica”, and RWC “Prishtina”, of the billed amount.
Increasing the collection rate has also led to a higher rate of coverage than 2016, from 0.36 to 0.79; however, this level remains below the desired level to cover the costs incurred during 2017.
Operational costs per unit in 2017 remained at the same level as 2016, of 0.03 Euro/m3.
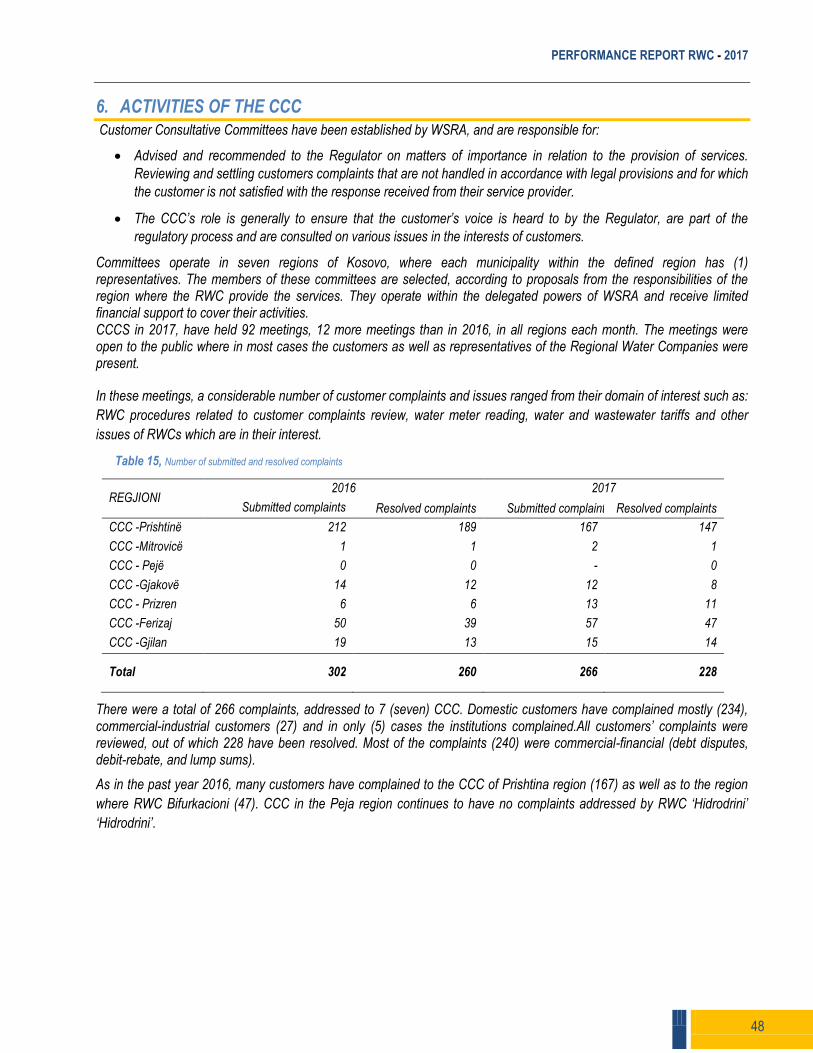
PERFORMANCE REPORT RWC - 2017
48
6. ACTIVITIES OF THE CCC
Customer Consultative Committees have been established by WSRA, and are responsible for:
Advised and recommended to the Regulator on matters of importance in relation to the provision of services.
Reviewing and settling customers complaints that are not handled in accordance with legal provisions and for which
the customer is not satisfied with the response received from their service provider.
The CCC’s role is generally to ensure that the customer’s voice is heard to by the Regulator, are part of the
regulatory process and are consulted on various issues in the interests of customers.
Committees operate in seven regions of Kosovo, where each municipality within the defined region has (1) representatives. The members of these committees are selected, according to proposals from the responsibilities of the region where the RWC provide the services. They operate within the delegated powers of WSRA and receive limited financial support to cover their activities. CCCS in 2017, have held 92 meetings, 12 more meetings than in 2016, in all regions each month. The meetings were open to the public where in most cases the customers as well as representatives of the Regional Water Companies were present.
In these meetings, a considerable number of customer complaints and issues ranged from their domain of interest such as:
RWC procedures related to customer complaints review, water meter reading, water and wastewater tariffs and other
issues of RWCs which are in their interest.
Table 15, Number of submitted and resolved complaints
REGJIONI 2016 2017
Submitted complaints Resolved complaints Submitted complaints Resolved complaints
CCC -Prishtinë 212 189 167 147
CCC -Mitrovicë 1 1 2 1
CCC - Pejë 0 0 - 0
CCC -Gjakovë 14 12 12 8
CCC - Prizren 6 6 13 11
CCC -Ferizaj 50 39 57 47
CCC -Gjilan 19 13 15 14
Total 302 260 266 228
There were a total of 266 complaints, addressed to 7 (seven) CCC. Domestic customers have complained mostly (234), commercial-industrial customers (27) and in only (5) cases the institutions complained.All customers’ complaints were reviewed, out of which 228 have been resolved. Most of the complaints (240) were commercial-financial (debt disputes, debit-rebate, and lump sums).
As in the past year 2016, many customers have complained to the CCC of Prishtina region (167) as well as to the region
where RWC Bifurkacioni (47). CCC in the Peja region continues to have no complaints addressed by RWC ‘Hidrodrini’
‘Hidrodrini’.

PERFORMANCE REPORT RWC - 2017
49
7. CHALLENGES FOR THE FUTURE
Effective water management services
Water and wastewater service providers face many challenges that are essential for effective management of services,
from the organizational aspect of jobs and staff, communication between internal management and external actors,
improvement of financial and operational sustainability, and up to of the customer services. We have consistently
discussed the challenges of service providers in this section of this report as well, discussing overall challenges –
“Effective Water Management”, focusing on two aspects: asset management and water loss management, both with
great impact on the operational-financial sustainability of companies. Currently these two issues are a priority and as such
are addressed by both service providers and local institutions and donors.
Asset Management
Asset management is one of the main business components that should be the foundation/promoter for all activities exercised by the water company. As such, it is not a side activity that can end in a given time, but is a continuous process. Outdated and non-functional infrastructure needs more attention and asset management need for intensive repair and replacement efforts. All water and wastewater systems are made up of assets such as pipes, valves, reservoirs, pumps, wells, treatment facilities and any other components that are part of the system. Assets that are part of the water and wastewater system lose value over time and with the deterioration of the system. In parallel with this deterioration it may become more difficult provide the desired service level from the company’s customers. Operating and maintenance costs will increase as well as obsolete assets.
Asset management for water utilities is more complex than for most other sectors due to the number, types, age, condition and location of the assets, the size of asset investment, and the difficulty of inspection and maintenance of burial assets. This complexity is often accompanied by a lack of finance, information and skills that may hamper the acquisition, maintenance, revision and replacement of assets at the optimal time. Lack of investment in asset maintenance given that most of the large water and wastewater systems in Kosovo were developed in the 1980s and earlier, and this fact implies that today water companies in Kosovo are facing huge, and growing expenses, for maintenance they cannot afford.
In Kosovo the water sector is regulated at central level by the Water Utility Regulatory Authority, mandate given by Law no. 05/L -042 on Regulation of Water Services. Among other responsibilities, this Law grants WSRA mandate to approve the ‘Asset Management Plan’. WSRA has focused on this issue, and has consistently helped but also urged companies to draft their asset management plans. In has drafted the ‘Asset Management Planning Guide’ for those involved in the management of water assets in Kosovo, mainly the RWCs and the Water Regulator. For the RWCs to have them available an asset in the asset management process and to the Regulator to assist in the determination of tariff decisions, based on appropriate asset management planning related to the levels of customer service.
In Kosovo, asset management is not currently practically planned and asset maintenance and capital investment are generally made ad-hoc, responding to urgent needs or system failures. As a consequence, the asset base continues to deteriorate year-by-year. By introducing a strategic asset management approach, RWCs can begin to plan how to change this steady decline in asset base by understanding what is needed and how much it can cost.
During the application for tariff process 2018-2020, only three RWCs KRU (Hidromorava, Hidrodrin and Gjakova) have
submitted PMA. However, these submitted plans are not sufficiently satisfactory and that work is still to be done.
Through a disciplined approach to asset management, the above needs and costs can be determined. Analysis of asset
management should be submitted to the PMA, which is used to inform the Business Plan and the Tariff Application for the
Regulator. In this way WSRA can ensure that by not leaving aside affordability issues, which is the definition of tariff that
reflects the true cost of maintaining the asset base to ensure the required levels of service in the most cost-effective
manner, in a transparent and accountable manner.

PERFORMANCE REPORT RWC - 2017
50
Water loss management NRW
One of the main challenges faced by water service providers in Kosovo continues to be the large proportion of water loss in distribution networks. High level of NRW (58%) reflect a large volumes of water lost through leakage (abort 90.mil. m3 per year ), treated water and not billed to customers, or both, seriously affect sustainability financial enterprises of the water utilities, through the loss of revenues and the increase of the operational costs this is something that the management of the companies cannot be ignored. Remember that the cheapest water you will ever have is the water your already have in your system!, is a saying that has been heard times when water loss issues are discussed.
Reducing these water losses is critical to efficient resource utilization, efficient servile management, increased customer
satisfaction, and the postponement of large capital investment in capacity building. In fact, the costs of improving service
delivery are much lower when investments are made in reducing water losses than through investment in capital projects
to increase supply capacities. WSRA for the NRW reduction need has sent an ‘Open letter to Seven Regional Water
Companies’ in which expressed its concern and at the same time presented several NRW management proposals. We
have supported the recent initiative by the Inter-Ministerial Water Council (WNRM) for drafting RWC’s strategies for
reducing water losses, and we have expressed our commitment to help within the inter-institutional group on a periodic
basis to appreciate the efforts and progress of the RWC in meeting the objective set in their respective strategies.
WSRA has carefully reviewed this and with the interest considering that for reduction of basic water losses it is for the RWCs to have a strategy with a NRW reduction plan detailing all the components needed to make progress in this challenge, as they have been presented in the RWC’s strategy, attached to the action plan for reducing the commercial and physical losses.
In this regard WSRA suggests RWC to:
Calculate the NRW balance/ Assessment of water losses by International Water Association (IWA) – as a basis for
NRW reduction strategy. Water balance calculation is a prerequisite for the planning and implementation of the appropriate
NRW, i.e., reliable water balance calculations should be made to help understand the level, causes and costs of NRW.
Determine the team and the adequate management of the action (action plan) for reducing NRW by making
available all the resources at company level such as: GIS/Autocad technicians, operating and managerial staff, meter
readers, administrative staff, staff from the billing/customer services department, and establish good communication links.
It is also very important that all available resources be distributed over a longer period of time, as reducing NRW is a long-
term activity.
Development of performance indicators, (PI), including the Infrastructure Flow Index (IFI), and the Economic Leakage Rate (ELR), which are important indicators for RWCs to work efficiently and comparatively, commercially and technically.
In the ‘Open Letter to the Seven Regional Wate Companies’, submitted before the tariff process 2018-2020, for reducing
NRW, WSRA has stated that its position as a regulator is to protect customers from inefficiency financing. Therefore, we
believe that reducing losses to the objective of the economic level of real losses is the strategy that provides the best value
for customers. We acknowledge that securing the necessary finances is crucial, but without big investments companies
have no way of doing more, especially in reducing commercial losses. We ask the RWCs, prior to the next tariff review
(2021-2023), to include each of the company’s strategies in their business plans and to benefit from the strategies that will
be implemented on the tariff outcomes. However, WSRA will support the RWCs with all available mechanisms (tariff
processes, performance evaluation, evaluation and improvement of accuracy and reliability of data, etc.), in terms of
reducing NRW.

PERFORMANCE REPORT RWC - 2017
51
APPENDIX 1: QUALITY AND DETAILED PERFORMANCE DATA
a) Qualitety of data
In order to produce more objective information, the data reported by the RWC through reporting formats have undergone a regular annual audit/verification process by WSRA, which was carried out during April 2018, and included data for year 2017.
The accuracy and reliability of the reported data has been assessed by the audit team based on how the RWC’s data retention practices comply with a specific set of assessment criteria from the ‘The Monitoring System Enhancement Guide in the WSRA and in RWC’.
Percentage of data confidentiality (rate), served as an input when calculating the RWC’s final performance evaluation.
Credibility grades (gradations), are: 100%; 50% and 0%. The description of the meaning of each grade for each data item
is provided by the relevant audit/inspection module.
Table 16, Average data reliability by groupings in RWCs
RWC RWC data, non-financial water supply and volumetric water sales
non-financial wastewater service
The financial water and wastewater data
Weighted average total
Prishtina 85% 79% 99% 96%
Hidroregjioni
Jugor
87% 87% 92% 91%
Hidrodrini 84% 58% 88% 85%
Gjakova 92% 89% 100% 98%
Mitrovica 88% 53% 85% 83%
Bifurkacioni 88% 84% 92% 91%
Hidromorava 88% 95% 100% 98%
The conclusions drawn from RWC’s information system analysis in the context of the possibility of generating accurate and reliable data are provided in detail in the audit/verification reports. In this report we have presented a general summary of findings from the evaluation of data quality.
The final average value of data reliability for RWCs is from: 83% in RWC ‘Mitrovica’ up to 98% in RWC ‘Gjakova’ and ‘Hidromorava’.
Reliability of non-financial data for water supply ranges from that of 84% lower in RWC ‘Hidrodrini’ to the highest in RWC ‘Gjakova’ with 92%, in this group in the biggest concerns are on as follows:
Water production, not all resources used currently have water meters in use – some of them are also ineffective, meaning a significant amount of water produced is evaluated through alternative methods. In none of the RWCs, it has not been possible to prove (conformity) and water meter testing. Excluding some of new plants built at the RWCs (Shkabaj, Albanik, Badovc, Drenas, Shipol, Balincë, Përlepnicë, Velekincë, Letnicë), the SCADA system was not installed, the water data monitoring is mainly kept in diary and formats of reports that are not verifiable and
fully reliable.
Pressure (water pressure), in almost all RWCs, is measured in a limited way. In RWC ‘Mitrovica’ pressure is monitored through a greater number of manometers, through the software application (telemetry) of water

PERFORMANCE REPORT RWC - 2017
52
pressures, although there are many obstacles during monitoring – software or manometers are ineffective. In RWC ‘Gjakova pressure transduction is done manually on the manometers located at the pump stations. In general, none of the RWCs have been deployed for printing management and the SCADA system is not installed.
Water losses, RWCs do not apply any module to calculate the Water Balance. Data on water losses are estimated
according to different proportions.
The total length of the water supply and sewerage network has not yet been fully updated in SIG. In general, collection and maintenance of data on network length is poor, excluding RWC (Hidrodrini, Gjakova, Hidromorava, Hidroregjioni Jugor, which have updated a large part of the water supply and sewerage network.
Defects / cracks on water supply systems and sewer overflows/failures are kept in Excel in monthly reports as well as in case files. In some of the RWCs, there are relevant software applications (CRM) for recording faults, and overflows but the same are not up-to-date.
Data on customers in the water service are kept in the system for managing commercial information in the billing module sewerage.
Complaints for the water are kept in Excel format: namely complaints filing reports. In some RWCs (Gjakova, Hidromorava and Bifurkacioni), there are application modules where complaints are up-to-date and regularly
updated.
The reliability of non-financial data – wastewater ranges from 53% to RWC Mitrovica’ to 95% in ‘Hidromorava’.
Significant problems are presented in the data for sewer overflows and failures, customer complaints. These data are kept in hard copy or even in electronic formats (excel). Some companies have adequate software modules for customer information management (CRM), but have not updated them.
The data for customers is largely reliable, and they are kept in billing modules of existing software.
Reliability of financial data ranges from 85% in RWC “Mitrovica” until full reliability of 100% of RWC “Hidromorava” and
RWC “Gjakova”..
Companies have advanced financial retention programs (Navision, Alfa Business, Asseco, Pronet, Rikont Informatika) and data depending on their nature are kept in the relevant modules (accounting and billing).
Revenues from sales, operating expenses, capital expenditures for water and wastewater are generally kept in the Accounting/Billing Module. Most of the programs allow the allocation of operating and capital costs even at cost centers based on regulatory requirements, but with some minor interventions then in Excel.
Current cost depreciation and regulatory asset base for water and wastewater is realized on the basis of an integrated Excel application, previously acquired by WSRA. As the current financial information management
systems do not offer the possibility of depreciating assets under regulatory requirements.
b) General recommendations – Improving data reliability
In order to advance the system of retention, management and credibility of the reported data, as indicated in the ‘Guide to advancing the monitoring system in WSRA and RWCs’. WSRA recommends the following:
Enhance the system of recording, storage and processing of data through an integrated electronic monitoring
system.
Installing water meters in all sources of water production, replacing and testing outdated / damaged water
meters to produce accurate and reliable information.,
Establishment of a SCADA control and supervision system, for the control of treated water and the control of
water distributed across the entire water treatment and distribution system throughout the service area of the
company.

PERFORMANCE REPORT RWC - 2017
53
Establishment of pressure management program with sufficient equipment (manometers), and installation of
the (SCADA), monitoring and control system to measure and provide reliable data for the entire supply area and for
the network, distributor of water.
Continuation with the use / updating of the geographic- GIS to maintain accurate information on the lengths of
water supply and sewerage networks, defects / repairs. Locate the zoning divisions of water loss management,
pressure, complaints, water outages and reductions, etc. .
Calculating the water balance according to the IWA Module to define, manage and reduce NRW, as well as
reporting data from this module.
Updating the commercial information system, and database-modules with data on billing, customer complaints,
meter reading, contracts etc., and connecting this system to the Geographic Information System (GIS),
Engaging professional and skilled staff, well-trained professionals to work with existing and advanced software
applications, which in the near future need to be secured.
c) Detailed performance data
Data and performance indicators in use meet all the requirements of good and effective performance measurement for the needs and purpose of Regulatory Processes, local institutions with decision-making responsibilities in this sector, valuable information for donors, customers, service providers and the public wide.
For the need of this report, other data provided and published by the responsible institutions such as the data reporter by the NIHPK (water quality) or Kosovo Agency of Statistics (inflation rate, population and household statistics). During the compilation of the performance report for 2017, WSRA considered only the data found during the audit process. .
Detailed statistics of the seven RWCs are presented in the following tables. The information thus presented is based on the regular submission of reports to WSRA.
Data on population statistics, number of customers, length of pipes, etc. there are no end-year but are estimated
average of the year.
Financial data expressed in EUR, are adjusted to mid- 2014 (when the three-year tariffs 2015-2017 were set) and
in line with published inflation statistics to enable appropriate comparisons from year to year.
Financial data are reported in accordance with “Regulatory Accounting Guidelines” (RAG)”, and in particular:
The determination of the value of the assets is made on the basis of the Regulatory Asset Base,
Capital maintenance is defined as a combination of infrastructure renewals and depreciation at the current cost of
non-infrastructure assets,
Provision of bad debts (settlement) is defined as amount of unearned income from the previous year.

PERFORMANCE REPORT RWC - 2017
54
RWC Prishtina (Prishtinë)
Category / sub-category
Sub-sub- category
Indicator Ref Njësia 2016 2017
W - Water supply
Non-financial (technical)
Standardet e shërbimit
Cilësia
Cilësia e ujit (bakteriologjike) W.1.A.01 % e tes. të kaluara
99.3% 99.9%
Cilësia e ujit (fizike dhe kimike) W.1.A.02 % e tes. të kaluara
92.5% 99.1%
Shtypja
Pronat e ndikuara nga shtypja e ulët W.1.A.03 Nr 122 81
Pronat e ndikuara nga shtypja e ulët W.1.A.04 % e pronave 0.12% 0.07%
Besueshmëria Pronat që furnizohen 24 orë me ujë W.1.A.05 Nr 28,707 85,310
Pronat që furnizohen 24 orë me ujë W.1.A.06 % e pronave 27% 77%
Pronat që furnizohen 18-24 orë me ujë W.1.A.07 Nr 55,361 16,676
Pronat që furnizohen 18-24 orë me ujë W.1.A.08 % e pronave 53% 15%
Pronat që furnizohen më pak se 18 orë me ujë W.1.A.09 Nr 20,694 8,926
Pronat që furnizohen më pak se 18 orë me ujë W.1.A.10 % e pronave 20% 8%
Infrastructure serviceability
Non-revenue water
Non revenue water (total) W.1.B.01 m3 per day 23,630,379
29,757,221
Non revenue water (per connection) W.1.B.02 litres per cust. per day
548 652
Non revenue water (per connection) - adjusted W.1.B.03 litres per cust. per day
620 679
Non revenue water (relative to production) W.1.B.04 % production 53% 57%
Pipe bursts Pipe network bursts frequency W.1.B.05 bursts per month 112 114
Pipe network bursts per 100 km of pipe W.1.B.06 Nr / 100 km 75 72
Non-financial (commercial)
Service coverage
Households Households served W.2.A.01 Nr 104,762 110,912
Coverage (households served relative to total) W.2.A.02 % total households
112% 117%
New connections New connections (household) W.2.A.03 Nr 7,796 4,504
New connections (commercial and institutional) W.2.A.04 Nr 760 727
Metering Metering rate Metered households relative to total households W.2.B.01 % households 97% 98%
Metered com & inst relative to total com & inst. W.2.B.02 % com & inst 100% 100%
Meters installed Meters installed (households) W.2.B.03 Nr 430 570
Meters installed (com & inst) W.2.B.04 Nr 21 24
Complaints Complaints Complaints received (technical) W.2.C.01 Nr 3,001 3,607
Complaints received (commercial) W.2.C.02 Nr 4,342 4,239
Financial
Sales Volumes Volume of sales to households (metered) W.3.A.01 m3 15,991,355 16,927,981
Volume of sales to households (metered) relative to plan estimates W.3.A.02 % of plan estimate
80% 86%
Volume of sales to households (un-metered) W.3.A.03 m3 719,651 762,413
Volume of sales to households (un-metered) relative to plan estimates W.3.A.04 % of plan estimate
783% N/A
Volume of sales to com & inst (metered) W.3.A.05 m3 4,486,130 4,621,711
Volume of sales to com & inst (metered) relative to plan estimates W.3.A.06 % of plan estimate
90% 77%
Volume of sales to com & inst (un-metered) W.3.A.07 m3 18,683 18,057
Volume of sales to com & inst (un-metered) relative to plan estimates W.3.A.08 % of plan estimate
0% N/A
Values Value of water sales to households W.3.A.09 EUR 7,904,831 8,244,302
Value of water sales to households relative to plan estimates W.3.A.10 % of plan estimate
89% 91%
Value of water sales to com & inst W.3.A.11 EUR 4,509,197 4,546,996
Value of water sales to com & inst relative to plan estimates W.3.A.12 % of plan estimate
95% 79%
Unit costs Production Unit operational cost of water production W.3.B.01 EUR/m3 0.055 0.049
Unit total cost of water production W.3.B.02 EUR/m3
0.059 0.055
Total costs Unit cost of water sold W.3.B.03 EUR/m3 0.421 0.426
Unit cost of water sold and paid for W.3.B.04 EUR/m3 N/A N/A
Capital expenditure
Capital maintenance
Total capital maintenance expenditure W.3.C.01 EUR 2,924 0
Total capital maintenance expenditure relative to plan W.3.C.02 % of plan estimate
0% 0%
Total capital maintenance expenditure relative to RAB W.3.C.03 % of RAB 0% 0%
Capital enhancement
Total capital enhancement expenditure W.3.C.04 EUR 609,422 40,837,387
Total capital enhancement expenditure relative to plan W.3.C.05 % of plan estimate
9.1% 11391%

PERFORMANCE REPORT RWC - 2017
55
Category / sub-category
Sub-sub- category
Indicator Ref Unit 2016 2017
S - Sewerage (wastewater)
Non-financial (technical)
Standards of service
Discharge quality Discharge quality S.1.A.01 % pass N/A N/A
Reliability Sewer overflows Sewer overflows S.1.B.01 Nr 3,315 3,321
Sewer overflows per 100 km of pipe S.1.B.02 Nr per 100 km 463 304
Serviceability
Sewer collapses Sewer collapses S.1.C.01 Nr 0 0
Sewer collapses per 100 km of pipe S.1.C.02 Nr per 100 km 0 0
WWTP overflows Wastewater treatment plan overflows S.1.C.03 Nr N/A N/A
Non-financial (commercial)
Service coverage
Households Households served S.2.A.01 Nr 89,782 95,695
Coverage (households served relative to total) S.2.A.02 % total households
96% 101%
Households served with wastewater treatment S.2.A.03 Nr 0 0
Coverage (households served with wastewater treatment relative to total) S.2.A.04 % households 0% 0%
New connections New connections (household) S.2.A.05 Nr 7,347 4,480
New connections (commercial and institutional) S.2.A.06 Nr 742 661
Complaints Complaints Complaints received (technical) S.2.B.01 Nr 3,627 3,551
Complaints received (commercial) S.2.B.02 Nr 0 0
Financial
Sales Values Value of sales to households S.3.A.01 EUR 725,452 758,772
Value of sales to households relative to plan S.3.A.02 % of plan estimate
90% 93%
Value of sales to com & inst S.3.A.03 EUR 489,453 484,184
Value of sales to com & inst relative to plan S.3.A.04 % of plan estimate
94% 76%
Unit costs
Treatment and disposal
Unit operational cost of treatment and disposal per m3 S.3.B.01 EUR/m3 N/A N/A
Unit total cost of treatment and disposal per m3 S.3.B.02 EUR/m3 N/A N/A
Unit operational cost of treatment and disposal per household S.3.B.03 EUR/ household
N/A N/A
Unit total cost of treatment and disposal per household S.3.B.04 EUR/ household
N/A N/A
Collection Unit operational cost of wastewater collection per household S.3.B.05 EUR/ household
N/A N/A
Unit total cost of wastewater collection per household S.3.B.06 EUR/ household
N/A N/A
Unit operational cost of wastewater services per household S.3.B.07 EUR/ household 1.26 1.32
Unit total cost of wastewater services per household S.3.B.08 EUR/ household 1.35 1.45
Capital expenditure
Capital maintenance
Total capital maintenance expenditure S.3.C.01 EUR 0 0
Total capital maintenance expenditure relative to plan S.3.C.02 % of plan estimate
0% 0%
Total capital maintenance expenditure relative to RAB S.3.C.03 % of RAB 0% 0%
Capital enhancement
Total capital enhancement expenditure S.3.C.04 EUR 138,528 219,349
Total capital enhancement expenditure relative to plan S.3.C.05 % of plan estimate
237% 1,874%
F – Financial
Sales and revenue collection
Sales Total sales F.1.A.01 EUR 13,628,933 14,034,254
Total sales relative to plan F.1.A.02 % of plan estimate
91% 86%
Collection efficiency Total revenue collection F.1.B.01 EUR 12,590,030 12,348,231
Total revenue collection out-performance F.1.B.02 EUR 621,321 -1,581,093
Total revenue collection out-performance(relative) F.1.B.03 % of plan estimate
105% 89%
Total revenues written off F.1.B.04 EUR 3,218,596 1,038,903
Total revenues written off relative to billing F.1.B.05 % of billing 24% 7%
Revenue collection relative to billing F.1.B.06 % of billing 92% 88%
Accounts receivable F.1.B.07 EUR N/A N/A
Accounts receivable relative to turnover F.1.B.08 Days turnover N/A N/A
Key financial values and ratios
Values Free cash flow F.2.A.01 EUR N/A N/A
Ratios
Returns Free cash flow F.2.B.01 % 5,71% 5,92%
Return on capital F.2.B.02 % N/A N/A
Ratios Cost of debit F.2.B.03 normë N/A N/A
Gearing F.2.B.04 normë N/A N/A
Cash interest cover F.2.B.05 normë N/A N/A
Free cash flow F.2.B.06 normë N/A N/A

PERFORMANCE REPORT RWC - 2017
56
RWC Hidroregjioni Jugor (Prizren))
Category / sub-category
Sub-sub- category
Indicator Ref Category / sub-category
Sub-sub- category
Indicator
W - Water supply
Non-financial (technical)
Standards of service Quality
Water quality (bacteriological) W.1.A.01 % pass 98.5% 100%
Water quality (physical and chemical) W.1.A.02 % pass 94% 100%
Pressure
Properties affected by low pressure W.1.A.03 Nr 0 0
Properties affected by low pressure W.1.A.04 % properties 0% 0%
Reliability Properties with 24 hour supply W.1.A.05 Nr 37,663 39,287
Properties with 24 hour supply W.1.A.06 % properties 99% 99%
Properties with 18-24 hour supply W.1.A.07 Nr 100 200
Properties with 18-24 hour supply W.1.A.08 % properties 0% 1%
Properties with less than 18 hours supply W.1.A.09 Nr 200 0
Properties with less than 18 hours supply W.1.A.10 % properties 1% 0%
Infrastructure serviceability
Non-revenue water
Non revenue water (total) W.1.B.01 m3 per day 10,025,665 10,115,569
Non revenue water (per connection) W.1.B.02 litres per cust. per day
629 612
Non revenue water (per connection) - adjusted W.1.B.03 litres per cust. per day
630 612
Non revenue water (relative to production) W.1.B.04 % production 58% 58%
Pipe bursts Pipe network bursts frequency W.1.B.05 bursts per month
196 257
Pipe network bursts per 100 km of pipe W.1.B.06 Nr / 100 km 462 605
Non-financial (commercial)
Service coverage
Households Households served W.2.A.01 Nr 37,964 39,487
Coverage (households served relative to total) W.2.A.02 % total households
69% 70%
New connections
New connections (household) W.2.A.03 Nr 1,781 1,266
New connections (commercial and institutional) W.2.A.04 Nr 91 98
Metering Metering rate Metered households relative to total households W.2.B.01 % households 94% 95%
Metered com & inst relative to total com & inst. W.2.B.02 % com & inst 97% 97%
Meters installed Meters installed (households) W.2.B.03 Nr 1,862 543
Meters installed (com & inst) W.2.B.04 Nr 199 66
Complaints Complaints Complaints received (technical) W.2.C.01 Nr 1,420 1,417
Complaints received (commercial) W.2.C.02 Nr 808 1,048
Financial
Sales Volumes Volume of sales to households (metered) W.3.A.01 m3 5,379,416 5,501,868
Volume of sales to households (metered) relative to plan estimates W.3.A.02 % of plan estimate
71% 75%
Volume of sales to households (un-metered) W.3.A.03 m3 795,034 679,994
Volume of sales to households (un-metered) relative to plan estimates W.3.A.04 % of plan estimate
271% N/A
Volume of sales to com & inst (metered) W.3.A.05 m3 1,055,358 1,085,840
Volume of sales to com & inst (metered) relative to plan estimates W.3.A.06 % of plan estimate
66% 67%
Volume of sales to com & inst (un-metered) W.3.A.07 m3 115,740 99,154
Volume of sales to com & inst (un-metered) relative to plan estimates W.3.A.08 % of plan estimate
2,391% N/A
Values Value of water sales to households W.3.A.09 EUR 2,720,157 2,695,988
Value of water sales to households relative to plan estimates W.3.A.10 % of plan estimate
84% 83%
Value of water sales to com & inst W.3.A.11 EUR 1,029,341 1,023,657
Value of water sales to com & inst relative to plan estimates W.3.A.12 % of plan estimate
81% 77%
Unit costs Production Unit operational cost of water production W.3.B.01 EUR/m3 0.083 0.088
Unit total cost of water production W.3.B.02 EUR/m3 0.086 0.094
Total costs Unit cost of water sold W.3.B.03 EUR/m3 0.402 0.437
Unit cost of water sold and paid for W.3.B.04 EUR/m3 N/A N/A
Capital expenditure
Capital maintenance
Total capital maintenance expenditure W.3.C.01 EUR 24,241 59,293
Total capital maintenance expenditure relative to plan W.3.C.02 % of plan estimate
0% 2%
Total capital maintenance expenditure relative to RAB W.3.C.03 % of RAB 0.3% 0.8%
Capital enhancement
Total capital enhancement expenditure W.3.C.04 EUR 1,158,566 159,221
Total capital enhancement expenditure relative to plan W.3.C.05 % of plan estimate
13% 4.1%

PERFORMANCE REPORT RWC - 2017
57
Category / sub-category
Sub-sub- category
Indicator Ref Unit 2016 2017
S - Sewerage (wastewater)
Non-financial (technical)
Standards of service Discharge quality Discharge quality S.1.A.01 % pass
N/A N/A
Reliability Sewer overflows Sewer overflows S.1.B.01 Nr
1,036 1,215
Sewer overflows per 100 km of pipe S.1.B.02 Nr per 100 km 384 450
Serviceability
Sewer collapses Sewer collapses S.1.C.01 Nr 59 77
Sewer collapses per 100 km of pipe S.1.C.02 Nr per 100 km 21.85 28.52
WWTP overflows Wastewater treatment plan overflows S.1.C.03 Nr N/A N/A
Non-financial (commercial)
Service coverage
Households Households served S.2.A.01 Nr 32,860 34,747
Coverage (households served relative to total) S.2.A.02 % total households 59% 62%
Households served with wastewater treatment S.2.A.03 Nr 0 0
Coverage (households served with wastewater treatment relative to total) S.2.A.04 % households 0% 0%
New connections New connections (household) S.2.A.05 Nr 2,010 1,763
New connections (commercial and institutional) S.2.A.06 Nr 78 127
Complaints Complaints Complaints received (technical) S.2.B.01 Nr 63 558
Complaints received (commercial) S.2.B.02 Nr 24 47
Financial
Sales Values Value of sales to households S.3.A.01 EUR 323,971 324,659
Value of sales to households relative to plan S.3.A.02 % of plan estimate 93% 95.5%
Value of sales to com & inst S.3.A.01 EUR 127,181 126,804
Value of sales to com & inst relative to plan S.3.A.02 % of plan estimate 76% 72%
Unit costs
Treatment and disposal
Unit operational cost of treatment and disposal per m3 S.3.B.01 EUR/m3 N/A N/A
Unit total cost of treatment and disposal per m3 S.3.B.02 EUR/m3 N/A N/A
Unit operational cost of treatment and disposal per household S.3.B.03 EUR/ household N/A N/A
Unit total cost of treatment and disposal per household S.3.B.04 EUR/ household N/A N/A
Collection Unit operational cost of wastewater collection per household S.3.B.05 EUR/ household N/A N/A
Unit total cost of wastewater collection per household S.3.B.06 EUR/ household N/A N/A
Unit operational cost of wastewater services per household S.3.B.07 EUR/ household 10.34 10.64
Unit total cost of wastewater services per household S.3.B.08 EUR/ household 10.39 10.69
Capital expenditure
Capital maintenance
Total capital maintenance expenditure S.3.C.01 EUR 1,142 0
Total capital maintenance expenditure relative to plan S.3.C.02 % of plan estimate 0% 0%
Total capital maintenance expenditure relative to RAB S.3.C.03 % of RAB 0% 0%
Capital enhancement
Total capital enhancement expenditure S.3.C.04 EUR 1,648 8,102
Total capital enhancement expenditure relative to plan S.3.C.05 % of plan estimate 0% 0.12%
F – Financial
Sales and revenue collection
Sales Total sales F.1.A.01 EUR 4,200,651 4,171,108
Total sales relative to plan F.1.A.02 % of plan estimate 83% 82%
Collection efficiency Total revenue collection F.1.B.01 EUR 3,666,487 3,946,679
Total revenue collection out-performance F.1.B.02 EUR -364,058 -217,809
Total revenue collection out-performance(relative) F.1.B.03 % of plan estimate 91% 95%
Total revenues written off F.1.B.04 EUR 1,089,703 534,164
Total revenues written off relative to billing F.1.B.05 % of billing 26% 13%
Revenue collection relative to billing F.1.B.06 % of billing 87% 95%
Accounts receivable F.1.B.07 EUR N/A N/A
Accounts receivable relative to turnover F.1.B.08 Days turnover N/A N/A
Key financial values and ratios
Values Free cash flow F.2.A.01 EUR N/A N/A
Ratios
Returns Return on capital F.2.B.01 % -1.76% 6.55%
Cost of debt F.2.B.02 % N/A N/A
Ratios Gearing F.2.B.03 ratio N/A N/A
Cash interest cover F.2.B.04 ratio N/A N/A
Cash interest cover F.2.B.05 normë N/A N/A
Free cash flow F.2.B.06 normë N/A N/A

PERFORMANCE REPORT RWC - 2017
58
RWC Hidrodrini (Peja)
Category / sub-category
Sub-sub- category
Indicator Ref Unit 2016 2017
W - Water supply
Non-financial (technical)
Standards of service
Quality
Water quality (bacteriological) W.1.A.01 % pass 98.9% 100%
Water quality (physical and chemical) W.1.A.02 % pass 94% 100%
Pressure
Properties affected by low pressure W.1.A.03 Nr 0 0
Properties affected by low pressure W.1.A.04 % properties 0% 0%
Reliability
Properties with 24 hour supply W.1.A.05 Nr 39,107 40,282
Properties with 24 hour supply W.1.A.06 % properties 100% 100%
Properties with 18-24 hour supply W.1.A.07 Nr 14 0
Properties with 18-24 hour supply W.1.A.08 % properties 0% 0%
Properties with less than 18 hours supply W.1.A.09 Nr 0 0
Properties with less than 18 hours supply W.1.A.10 % properties 0% 0%
Infrastructure serviceability
Non-revenue water
Non revenue water (total) W.1.B.01 m3 per day 16,556,768 16,390,162
Non revenue water (per connection) W.1.B.02 litres per cust. per day
1,026 990
Non revenue water (per connection) - adjusted W.1.B.03 litres per cust. per day
1,026 990
Non revenue water (relative to production) W.1.B.04 % production 65% 64%
Pipe bursts Pipe network bursts frequency W.1.B.05 bursts per month 158 203
Pipe network bursts per 100 km of pipe W.1.B.06 Nr / 100 km 239 248
Non-financial (commercial)
Service coverage
Households Households served W.2.A.01 Nr 39,121 40,282
Coverage (households served relative to total) W.2.A.02 % total households 99% 101%
New connections New connections (household) W.2.A.03 Nr 1,756 566
New connections (commercial and institutional) W.2.A.04 Nr 252 -278
Metering
Metering rate Metered households relative to total households W.2.B.01 % households 95% 96%
Metered com & inst relative to total com & inst. W.2.B.02 % com & inst 95% 97%
Meters installed Meters installed (households) W.2.B.03 Nr 2,970 1,540
Meters installed (com & inst) W.2.B.04 Nr 423 0
Complaints Complaints Complaints received (technical) W.2.C.01 Nr 1,309 1,309
Complaints received (commercial) W.2.C.02 Nr 85 85
Financial
Sales
Volumes
Volume of sales to households (metered) W.3.A.01 m3 7,048,032 7,118,989
Volume of sales to households (metered) relative to plan estimates W.3.A.02 % of plan estimate 88% 85%
Volume of sales to households (un-metered) W.3.A.03 m3 178,891 170,025
Volume of sales to households (un-metered) relative to plan estimates W.3.A.04 % of plan estimate 90% N/A
Volume of sales to com & inst (metered) W.3.A.05 m3 1,772,266 1,967,781
Volume of sales to com & inst (metered) relative to plan estimates W.3.A.06 % of plan estimate 100% 109%
Volume of sales to com & inst (un-metered) W.3.A.07 m3 7,769 13,000
Volume of sales to com & inst (un-metered) relative to plan estimates W.3.A.08 % of plan estimate 78% N/A
Values
Value of water sales to households W.3.A.09 EUR 2,218,711 2,184,746
Value of water sales to households relative to plan estimates W.3.A.10 % of plan estimate 94% 87%
Value of water sales to com & inst W.3.A.11 EUR 1,038,824 1,099,260
Value of water sales to com & inst relative to plan estimates W.3.A.12 % of plan estimate 104% 106%
Unit costs
Production Unit operational cost of water production W.3.B.01 EUR/m3 0.006 0.004
Unit total cost of water production W.3.B.02 EUR/m3 0.007 0.005
Total costs Unit cost of water sold W.3.B.03 EUR/m3 0.252 0.257
Unit cost of water sold and paid for W.3.B.04 EUR/m3 N/A N/A
Capital expenditure
Capital maintenance
Total capital maintenance expenditure W.3.C.01 EUR 2,172 343,497
Total capital maintenance expenditure relative to plan W.3.C.02 % of plan estimate 2% 25%
Total capital maintenance expenditure relative to RAB W.3.C.03 % of RAB 0% 4.6%
Capital enhancement
Total capital enhancement expenditure W.3.C.04 EUR 151,424 152,568
Total capital enhancement expenditure relative to plan W.3.C.05 % of plan estimate 48% 27%

PERFORMANCE REPORT RWC - 2017
59
Category / sub-category
Sub-sub- category
Indicator Ref Unit 2016 2017
S - Sewerage (wastewater)
Non-financial (technical)
Standards of service Discharge quality Discharge quality S.1.A.01 % pass N/A N/A
Reliability Sewer overflows Sewer overflows S.1.B.01 Nr 0 0
Sewer overflows per 100 km of pipe S.1.B.02 Nr per 100 km 0 0
Serviceability
Sewer collapses Sewer collapses S.1.C.01 Nr 525 0
Sewer collapses per 100 km of pipe S.1.C.02 Nr per 100 km 343 0
WWTP overflows Wastewater treatment plan overflows S.1.C.03 Nr N/A N/A
Non-financial (commercial)
Service coverage
Households Households served S.2.A.01 Nr 15,353 17,521
Coverage (households served relative to total) S.2.A.02 % total households 39% 44%
Households served with wastewater treatment S.2.A.03 Nr 0 0
Coverage (households served with wastewater treatment relative to total) S.2.A.04 % households 0% 0%
New connections New connections (household) S.2.A.05 Nr 756 3,580
New connections (commercial and institutional) S.2.A.06 Nr 86 249
Complaints Complaints Complaints received (technical) S.2.B.01 Nr 951 0
Complaints received (commercial) S.2.B.02 Nr 0 0
Financial
Sales Values Value of sales to households S.3.A.01 EUR 184,041 204,499
Value of sales to households relative to plan S.3.A.02 % of plan estimate 98% 114%
Value of sales to com & inst S.3.A.01 EUR 147,461 156,356
Value of sales to com & inst relative to plan S.3.A.02 % of plan estimate 103% 109%
Unit costs
Treatment and disposal
Unit operational cost of treatment and disposal per m3 S.3.B.01 EUR/m3 N/A N/A
Unit total cost of treatment and disposal per m3 S.3.B.02 EUR/m3 N/A N/A
Unit operational cost of treatment and disposal per household S.3.B.03 EUR/ household N/A N/A
Unit total cost of treatment and disposal per household S.3.B.04 EUR/ household N/A N/A
Collection Unit operational cost of wastewater collection per household S.3.B.05 EUR/ household N/A N/A
Unit total cost of wastewater collection per household S.3.B.06 EUR/ household N/A N/A
Unit operational cost of wastewater services per household S.3.B.07 EUR/ household 4.41 7.32
Unit total cost of wastewater services per household S.3.B.08 EUR/ household 4.52 7.62
Capital expenditure
Capital maintenance
Total capital maintenance expenditure S.3.C.01 EUR 177 5,769
Total capital maintenance expenditure relative to plan S.3.C.02 % of plan estimate 0% 5.68%
Total capital maintenance expenditure relative to RAB S.3.C.03 % of RAB 0% 0.4%
Capital enhancement
Total capital enhancement expenditure S.3.C.04 EUR 90,068 87,919
Total capital enhancement expenditure relative to plan S.3.C.05 % of plan estimate 14% 47%
F – Financial
Sales and revenue collection
Sales Total sales F.1.A.01 % of plan estimate 3,589,037 3,644,861
Total sales relative to plan F.1.A.02 EUR 97% 94%
Collection efficiency Total revenue collection F.1.B.01 EUR 2,807,793 2,914,263
Total revenue collection out-performance F.1.B.02 % of plan estimate -55,146 -221,603
Total revenue collection out-performance(relative) F.1.B.03 EUR 98% 93%
Total revenues written off F.1.B.04 % of billing 969,027 781,244
Total revenues written off relative to billing F.1.B.05 % of billing 27% 21%
Revenue collection relative to billing F.1.B.06 EUR 78% 80%
Accounts receivable F.1.B.07 Days turnover N/A N/A
Accounts receivable relative to turnover F.1.B.08 % of plan estimate N/A N/A
Key financial values and ratios
Values Free cash flow F.2.A.01 EUR N/A N/A
Ratios Returns Return on capital F.2.B.01 % 3.0% 3.2%
Cost of debt F.2.B.02 % N/A N/A
Ratios Gearing F.2.B.03 ratio N/A N/A
Cash interest cover F.2.B.04 ratio N/A N/A
Cash interest cover F.2.B.05 normë N/A N/A
Free cash flow F.2.B.06 normë N/A N/A

PERFORMANCE REPORT RWC - 2017
60
RWC Mitrovica (Mitrovica)
Category / sub-category
Sub-sub- category
Indicator Ref Unit 2016 2017
W - Water supply
Non-financial (technical)
Standards of service Quality
Water quality (bacteriological) W.1.A.01 % pass 99% 100%
Water quality (physical and chemical) W.1.A.02 % pass 100% 100%
Pressure
Properties affected by low pressure W.1.A.03 Nr 1,225 0
Properties affected by low pressure W.1.A.04 % properties 5.1% 0%
Reliability Properties with 24 hour supply W.1.A.05 Nr 22,327 25,162
Properties with 24 hour supply W.1.A.06 % properties 93% 97%
Properties with 18-24 hour supply W.1.A.07 Nr 0 0
Properties with 18-24 hour supply W.1.A.08 % properties 0% 0%
Properties with less than 18 hours supply W.1.A.09 Nr 1,741 850
Properties with less than 18 hours supply W.1.A.10 % properties 7% 3%
Infrastructure serviceability
Non-revenue water Non revenue water (total) W.1.B.01 m3 per day 15,703,746 17,135,593
Non revenue water (per connection) W.1.B.02 litres per cust. per day
1,606 1,638
Non revenue water (per connection) - adjusted W.1.B.03 litres per cust. per day
1,635 1,651
Non revenue water (relative to production) W.1.B.04 % production 62% 62%
Pipe bursts Pipe network bursts frequency W.1.B.05 bursts per month 117 135
Pipe network bursts per 100 km of pipe W.1.B.06 Nr / 100 km 202 209
Non-financial (commercial)
Service coverage
Households Households served W.2.A.01 Nr 24,068 26,012
Coverage (households served relative to total) W.2.A.02 % total households 71% 76%
New connections New connections (household) W.2.A.03 Nr 1,683 2,206
New connections (commercial and institutional) W.2.A.04 Nr -472 320
Metering
Metering rate Metered households relative to total households W.2.B.01 % households 64% 68%
Metered com & inst relative to total com & inst. W.2.B.02 % com & inst 89% 87%
Meters installed Meters installed (households) W.2.B.03 Nr 630 2,227
Meters installed (com & inst) W.2.B.04 Nr 0 175
Complaints Complaints Complaints received (technical) W.2.C.01 Nr 1,468 6,908
Complaints received (commercial) W.2.C.02 Nr 177 93
Financial
Sales Volumes Volume of sales to households (metered) W.3.A.01 m3 2,464,143 2,904,109
Volume of sales to households (metered) relative to plan estimates W.3.A.02 % of plan estimate 48% 56%
Volume of sales to households (un-metered) W.3.A.03 m3 2,015,598 2,261,099
Volume of sales to households (un-metered) relative to plan estimates W.3.A.04 % of plan estimate 261% N/A
Volume of sales to com & inst (metered) W.3.A.05 m3 546,379 618,847
Volume of sales to com & inst (metered) relative to plan estimates W.3.A.06 % of plan estimate 95% 79%
Volume of sales to com & inst (un-metered) W.3.A.07 m3 26,064 56,839
Volume of sales to com & inst (un-metered) relative to plan estimates W.3.A.08 % of plan estimate 477% N/A
Values Value of water sales to households W.3.A.09 EUR 1,899,343 2,151,735
Value of water sales to households relative to plan estimates W.3.A.10 % of plan estimate 80% 86%
Value of water sales to com & inst W.3.A.11 EUR 499,568 580,546
Value of water sales to com & inst relative to plan estimates W.3.A.12 % of plan estimate 99.8% 87%
Unit costs Production Unit operational cost of water production W.3.B.01 EUR/m3 0.046 0.054
Unit total cost of water production W.3.B.02 EUR/m3 0.047 0.054
Total costs Unit cost of water sold W.3.B.03 EUR/m3 0.294 0.285
Unit cost of water sold and paid for W.3.B.04 EUR/m3 N/A N/A
Capital expenditure
Capital maintenance
Total capital maintenance expenditure W.3.C.01 EUR 0 1,964,858
Total capital maintenance expenditure relative to plan W.3.C.02 % of plan estimate 0% 73%
Total capital maintenance expenditure relative to RAB W.3.C.03 % of RAB 0% 41.5%
Capital enhancement
Total capital enhancement expenditure W.3.C.04 EUR 8,376,622 10,409,962
Total capital enhancement expenditure relative to plan W.3.C.05 % of plan estimate 847% 838%

PERFORMANCE REPORT RWC - 2017
61
Category / sub-category
Sub-sub- category Indicator Ref Unit 2016 2017
S - Sewerage (wastewater)
Non-financial (technical)
Standards of service Discharge quality Discharge quality S.1.A.01 % pass N/A N/A
Reliability Sewer overflows Sewer overflows S.1.B.01 Nr 0 0
Sewer overflows per 100 km of pipe S.1.B.02 Nr per 100 km 0 0
Serviceability
Sewer collapses Sewer collapses S.1.C.01 Nr 0 1,592
Sewer collapses per 100 km of pipe S.1.C.02 Nr per 100 km 0 706
WWTP overflows Wastewater treatment plan overflows S.1.C.03 Nr N/A N/A
Non-financial (commercial)
Service coverage
Households Households served S.2.A.01 Nr 18,357 20,060
Coverage (households served relative to total) S.2.A.02 % total households 54% 59%
Households served with wastewater treatment S.2.A.03 Nr 0 0
Coverage (households served with wastewater treatment relative to total) S.2.A.04 % households 0% 0%
New connections New connections (household) S.2.A.05 Nr 1,461 1,946
New connections (commercial and institutional) S.2.A.06 Nr -148 315
Complaints Complaints Complaints received (technical) S.2.B.01 Nr 0 1,437
Complaints received (commercial) S.2.B.02 Nr 0 0
Financial
Sales Values Value of sales to households S.3.A.01 EUR 332,646 375,282
Value of sales to households relative to plan S.3.A.02 % of plan estimate 89% 94%
Value of sales to com & inst S.3.A.01 EUR 131,904 135,316
Value of sales to com & inst relative to plan S.3.A.02 % of plan estimate 110% 80%
Unit costs
Treatment and disposal
Unit operational cost of treatment and disposal per m3 S.3.B.01 EUR/m3 N/A N/A
Unit total cost of treatment and disposal per m3 S.3.B.02 EUR/m3 N/A N/A
Unit operational cost of treatment and disposal per household S.3.B.03 EUR/ household N/A N/A
Unit total cost of treatment and disposal per household S.3.B.04 EUR/ household N/A N/A
Collection Unit operational cost of wastewater collection per household S.3.B.05 EUR/ household N/A N/A
Unit total cost of wastewater collection per household S.3.B.06 EUR/ household N/A N/A
Unit operational cost of wastewater services per household S.3.B.07 EUR/ household 8.58 8.23
Unit total cost of wastewater services per household S.3.B.08 EUR/ household 8.59 8.24
Capital expenditure
Capital maintenance
Total capital maintenance expenditure S.3.C.01 EUR 0 0
Total capital maintenance expenditure relative to plan S.3.C.02 % of plan estimate 0% 0%
Total capital maintenance expenditure relative to RAB S.3.C.03 % of RAB 0% 0%
Capital enhancement
Total capital enhancement expenditure S.3.C.04 EUR 433 1,994
Total capital enhancement expenditure relative to plan S.3.C.05 % of plan estimate 0 1.9%
F – Financial
Sales and revenue collection
Sales Total sales F.1.A.01 EUR 2,863,462 3,242,879
Total sales relative to plan F.1.A.02 % of plan estimate 85% 87%
Collection efficiency Total revenue collection F.1.B.01 EUR 1,677,036 1,811,478
Total revenue collection out-performance F.1.B.02 EUR -531,971 -885,635
Total revenue collection out-performance(relative) F.1.B.03 % of plan estimate 76% 67%
Total revenues written off F.1.B.04 EUR 1,191,090 1,186,426
Total revenues written off relative to billing F.1.B.05 % of billing 42% 37%
Revenue collection relative to billing F.1.B.06 % of billing 59% 56%
Accounts receivable F.1.B.07 EUR N/A N/A
Accounts receivable relative to turnover F.1.B.08 Days turnover N/A N/A
Key financial values and ratios
Values Free cash flow F.2.A.01 EUR N/A N/A
Ratios
Returns Return on capital F.2.B.01 % 1.3% 3.4%
Cost of debt F.2.B.02 % N/A N/A
Ratios Gearing F.2.B.03 ratio N/A N/A
Cash interest cover F.2.B.04 ratio N/A N/A
Cash interest cover F.2.B.05 normë N/A N/A
Free cash flow F.2.B.06 normë N/A N/A

PERFORMANCE REPORT RWC - 2017
62
RWC Gjakova (Gjakova)
Category / sub-category
Sub-sub- category
Indicator Ref Unit 2016 2017
W - Water supply
Non-financial (technical)
Standards of service Quality
Water quality (bacteriological) W.1.A.01 % pass 99.7% 100%
Water quality (physical and chemical) W.1.A.02 % pass 100% 100%
Pressure
Properties affected by low pressure W.1.A.03 Nr 0 0
Properties affected by low pressure W.1.A.04 % properties 0% 0%
Reliability Properties with 24 hour supply W.1.A.05 Nr 29,734 31,210
Properties with 24 hour supply W.1.A.06 % properties 100% 100%
Properties with 18-24 hour supply W.1.A.07 Nr 0 0
Properties with 18-24 hour supply W.1.A.08 % properties 0% 0%
Properties with less than 18 hours supply W.1.A.09 Nr 0 0
Properties with less than 18 hours supply W.1.A.10 % properties 0% 0%
Infrastructure serviceability
Non-revenue water Non revenue water (total) W.1.B.01 m3 per day 7,230,107 7,017,591
Non revenue water (per connection) W.1.B.02 litres per cust. per day
590 547
Non revenue water (per connection) - adjusted W.1.B.03 litres per cust. per day
590 547
Non revenue water (relative to production) W.1.B.04 % production 47% 47%
Pipe bursts Pipe network bursts frequency W.1.B.05 bursts per month 211 249
Pipe network bursts per 100 km of pipe W.1.B.06 Nr / 100 km 403 411
Non-financial (commercial)
Service coverage
Households Households served W.2.A.01 Nr 29,734 31,210
Coverage (households served relative to total) W.2.A.02 % total households 102% 103%
New connections New connections (household) W.2.A.03 Nr 1,562 1,390
New connections (commercial and institutional) W.2.A.04 Nr 51 144
Metering
Metering rate Metered households relative to total households W.2.B.01 % households 97% 98%
Metered com & inst relative to total com & inst. W.2.B.02 % com & inst 100% 100%
Meters installed Meters installed (households) W.2.B.03 Nr 357 95
Meters installed (com & inst) W.2.B.04 Nr 39 31
Complaints Complaints Complaints received (technical) W.2.C.01 Nr 189 84
Complaints received (commercial) W.2.C.02 Nr 714 414
Financial
Sales Volumes Volume of sales to households (metered) W.3.A.01 m3 6,789,131 6,264,199
Volume of sales to households (metered) relative to plan estimates W.3.A.02 % of plan estimate 110% 92%
Volume of sales to households (un-metered) W.3.A.03 m3 356,874 357,147
Volume of sales to households (un-metered) relative to plan estimates W.3.A.04 % of plan estimate 71% N/A
Volume of sales to com & inst (metered) W.3.A.05 m3 871,862 1,342,682
Volume of sales to com & inst (metered) relative to plan estimates W.3.A.06 % of plan estimate 104% 158%
Volume of sales to com & inst (un-metered) W.3.A.07 m3 0 0
Volume of sales to com & inst (un-metered) relative to plan estimates W.3.A.08 % of plan estimate 0% N/A
Values Value of water sales to households W.3.A.09 EUR 2,605,106 2,669,565
Value of water sales to households relative to plan estimates W.3.A.10 % of plan estimate 96% 87%
Value of water sales to com & inst W.3.A.11 EUR 721,618 830,472
Value of water sales to com & inst relative to plan estimates W.3.A.12 % of plan estimate 100% 111%
Unit costs Production Unit operational cost of water production W.3.B.01 EUR/m3 0.029 0.025
Unit total cost of water production W.3.B.02 EUR/m3 0.033 0.029
Total costs Unit cost of water sold W.3.B.03 EUR/m3 0.362 0.390
Unit cost of water sold and paid for W.3.B.04 EUR/m3 N/A N/A
Capital expenditure
Capital maintenance
Total capital maintenance expenditure W.3.C.01 EUR 110,560 470,471
Total capital maintenance expenditure relative to plan W.3.C.02 % of plan estimate 14% 8.28%
Total capital maintenance expenditure relative to RAB W.3.C.03 % of RAB 1.5% 6.2%
Capital enhancement
Total capital enhancement expenditure W.3.C.04 EUR 1,926,611 747,913
Total capital enhancement expenditure relative to plan W.3.C.05 % of plan estimate 171% 28 %

PERFORMANCE REPORT RWC - 2017
63
Category / sub-category
Sub-sub- category Indicator Ref Unit 2016 2017
S - Sewerage (wastewater)
Non-financial (technical)
Standards of service Discharge quality Discharge quality S.1.A.01 % pass N/A N/A
Reliability Sewer overflows Sewer overflows S.1.B.01 Nr 0 0
Sewer overflows per 100 km of pipe S.1.B.02 Nr per 100 km 0 0
Serviceability
Sewer collapses Sewer collapses S.1.C.01 Nr 8 12
Sewer collapses per 100 km of pipe S.1.C.02 Nr per 100 km 9.88 14.81
WWTP overflows Wastewater treatment plan overflows S.1.C.03 Nr N/A N/A
Non-financial (commercial)
Service coverage
Households Households served S.2.A.01 Nr 20,878 21,858
Coverage (households served relative to total) S.2.A.02 % total households 72% 72%
Households served with wastewater treatment S.2.A.03 Nr 0 0
Coverage (households served with wastewater treatment relative to total) S.2.A.04 % households 0% 0%
New connections New connections (household) S.2.A.05 Nr 1,067 893
New connections (commercial and institutional) S.2.A.06 Nr -72 220
Complaints Complaints Complaints received (technical) S.2.B.01 Nr 316 155
Complaints received (commercial) S.2.B.02 Nr 75 11
Financial
Sales Values Value of sales to households S.3.A.01 EUR 362,414 377,900
Value of sales to households relative to plan S.3.A.02 % of plan estimate 108% 110%
Value of sales to com & inst S.3.A.01 EUR 158,361 156,734
Value of sales to com & inst relative to plan S.3.A.02 % of plan estimate 127% 120%
Unit costs
Treatment and disposal
Unit operational cost of treatment and disposal per m3 S.3.B.01 EUR/m3 N/A N/A
Unit total cost of treatment and disposal per m3 S.3.B.02 EUR/m3 N/A N/A
Unit operational cost of treatment and disposal per household S.3.B.03 EUR/ household N/A N/A
Unit total cost of treatment and disposal per household S.3.B.04 EUR/ household N/A N/A
Collection Unit operational cost of wastewater collection per household S.3.B.05 EUR/ household N/A N/A
Unit total cost of wastewater collection per household S.3.B.06 EUR/ household N/A N/A
Unit operational cost of wastewater services per household S.3.B.07 EUR/ household 7.52 6.89
Unit total cost of wastewater services per household S.3.B.08 EUR/ household 8.16 7.33
Capital expenditure
Capital maintenance
Total capital maintenance expenditure S.3.C.01 EUR 3,661 10,909
Total capital maintenance expenditure relative to plan S.3.C.02 % of plan estimate 10% 26.9%
Total capital maintenance expenditure relative to RAB S.3.C.03 % of RAB 0% 0%
Capital enhancement
Total capital enhancement expenditure S.3.C.04 EUR 100,012 22,515
Total capital enhancement expenditure relative to plan S.3.C.05 % of plan estimate 2.2% 0.4%
F – Financial
Sales and revenue collection
Sales Total sales F.1.A.01 EUR 3,847,499 4,034,671
Total sales relative to plan F.1.A.02 % of plan estimate 99% 94%
Collection efficiency Total revenue collection F.1.B.01 EUR 3,639,457 3,512,467
Total revenue collection out-performance F.1.B.02 EUR 599,133 17,816
Total revenue collection out-performance(relative) F.1.B.03 % of plan estimate 120% 101%
Total revenues written off F.1.B.04 EUR 636,599 208,042
Total revenues written off relative to billing F.1.B.05 % of billing 17% 5%
Revenue collection relative to billing F.1.B.06 % of billing 95% 87%
Accounts receivable F.1.B.07 EUR N/A N/A
Accounts receivable relative to turnover F.1.B.08 Days turnover N/A N/A
Key financial values and ratios
Values Free cash flow F.2.A.01 EUR N/A N/A
Ratios
Returns Return on capital F.2.B.01 % 2.2% 6.2%
Cost of debt F.2.B.02 % N/A N/A
Ratios Gearing F.2.B.03 ratio N/A N/A
Cash interest cover F.2.B.04 ratio N/A N/A
Cash interest cover F.2.B.05 normë N/A N/A
Free cash flow F.2.B.06 normë N/A N/A

PERFORMANCE REPORT RWC - 2017
64
RWC Bifurkacioni (Ferizaj)
Category / sub-category
Sub-sub- category
Indicator Ref Unit 2016 2017
W - Water supply
Non-financial (technical)
Standards of service Quality
Water quality (bacteriological) W.1.A.01 % pass 98.6% 99.4%
Water quality (physical and chemical) W.1.A.02 % pass 96.7% 95.9%
Pressure
Properties affected by low pressure W.1.A.03 Nr 1,943 0
Properties affected by low pressure W.1.A.04 % properties 8.9% 0%
Reliability Properties with 24 hour supply W.1.A.05 Nr 10,216 20,928
Properties with 24 hour supply W.1.A.06 % properties 47% 91%
Properties with 18-24 hour supply W.1.A.07 Nr 9,864 732
Properties with 18-24 hour supply W.1.A.08 % properties 45% 3%
Properties with less than 18 hours supply W.1.A.09 Nr 1,851 1,442
Properties with less than 18 hours supply W.1.A.10 % properties 8% 6%
Infrastructure serviceability
Non-revenue water Non revenue water (total) W.1.B.01 m3 per day 3,816,466 4,134,392
Non revenue water (per connection) W.1.B.02 litres per cust. per day
428 438
Non revenue water (per connection) - adjusted W.1.B.03 litres per cust. per day
464 447
Non revenue water (relative to production) W.1.B.04 % production 52% 55%
Pipe bursts Pipe network bursts frequency W.1.B.05 bursts per month 56 67
Pipe network bursts per 100 km of pipe W.1.B.06 Nr / 100 km 270 257
Non-financial (commercial)
Service coverage
Households Households served W.2.A.01 Nr 21,931 23,102
Coverage (households served relative to total) W.2.A.02 % total households 89% 93%
New connections New connections (household) W.2.A.03 Nr 1,352 990
New connections (commercial and institutional) W.2.A.04 Nr 393 103
Metering
Metering rate Metered households relative to total households W.2.B.01 % households 92% 93%
Metered com & inst relative to total com & inst. W.2.B.02 % com & inst 91% 89%
Meters installed Meters installed (households) W.2.B.03 Nr 1,542 1,183
Meters installed (com & inst) W.2.B.04 Nr 178 147
Complaints Complaints Complaints received (technical) W.2.C.01 Nr 10 9
Complaints received (commercial) W.2.C.02 Nr 253 266
Financial
Sales Volumes Volume of sales to households (metered) W.3.A.01 m3 2,589,886 2,538,170
Volume of sales to households (metered) relative to plan estimates W.3.A.02 % of plan estimate 72% 66%
Volume of sales to households (un-metered) W.3.A.03 m3 497,934 386,976
Volume of sales to households (un-metered) relative to plan estimates W.3.A.04 % of plan estimate 296% N/A
Volume of sales to com & inst (metered) W.3.A.05 m3 318,040 376,086
Volume of sales to com & inst (metered) relative to plan estimates W.3.A.06 % of plan estimate 139% 164%
Volume of sales to com & inst (un-metered) W.3.A.07 m3 53,136 33,610
Volume of sales to com & inst (un-metered) relative to plan estimates W.3.A.08 % of plan estimate 40% N/A
Values Value of water sales to households W.3.A.09 EUR 1,307,540 1,264,463
Value of water sales to households relative to plan estimates W.3.A.10 % of plan estimate 86.5% 75%
Value of water sales to com & inst W.3.A.11 EUR 326,403 366,740
Value of water sales to com & inst relative to plan estimates W.3.A.12 % of plan estimate 102% 110%
Unit costs Production Unit operational cost of water production W.3.B.01 EUR/m3 0.047 0.048
Unit total cost of water production W.3.B.02 EUR/m3 0.048 0.049
Total costs Unit cost of water sold W.3.B.03 EUR/m3 0.401 0.411
Unit cost of water sold and paid for W.3.B.04 EUR/m3 N/A N/A
Capital expenditure
Capital maintenance
Total capital maintenance expenditure W.3.C.01 EUR 144,365 157,160
Total capital maintenance expenditure relative to plan W.3.C.02 % of plan estimate 39% 18%
Total capital maintenance expenditure relative to RAB W.3.C.03 % of RAB 4.2% 4.6%
Capital enhancement
Total capital enhancement expenditure W.3.C.04 EUR 6,853 48,804
Total capital enhancement expenditure relative to plan W.3.C.05 % of plan estimate 85% 44%

PERFORMANCE REPORT RWC - 2017
65
Category / sub-category
Sub-sub- category Indicator Ref Unit 2016 2017
S - Sewerage (wastewater)
Non-financial (technical)
Standards of service Discharge quality Discharge quality S.1.A.01 % pass N/A N/A
Reliability Sewer overflows Sewer overflows S.1.B.01 Nr 556 698
Sewer overflows per 100 km of pipe S.1.B.02 Nr per 100 km 246 298
Serviceability
Sewer collapses Sewer collapses S.1.C.01 Nr 0 2
Sewer collapses per 100 km of pipe S.1.C.02 Nr per 100 km 0 0.85
WWTP overflows Wastewater treatment plan overflows S.1.C.03 Nr N/A N/A
Non-financial (commercial)
Service coverage
Households Households served S.2.A.01 Nr 19,144 20,194
Coverage (households served relative to total) S.2.A.02 % total households 77% 81%
Households served with wastewater treatment S.2.A.03 Nr 0 0
Coverage (households served with wastewater treatment relative to total) S.2.A.04 % households 0% 0%
New connections New connections (household) S.2.A.05 Nr 1,218 881
New connections (commercial and institutional) S.2.A.06 Nr 26 64
Complaints Complaints Complaints received (technical) S.2.B.01 Nr 0 1
Complaints received (commercial) S.2.B.02 Nr 53 22
Financial
Sales Values Value of sales to households S.3.A.01 EUR 328,521 308,761
Value of sales to households relative to plan S.3.A.02 % of plan estimate 75% 74%
Value of sales to com & inst S.3.A.01 EUR 123,083 127,603
Value of sales to com & inst relative to plan S.3.A.02 % of plan estimate 111% 116%
Unit costs
Treatment and disposal
Unit operational cost of treatment and disposal per m3 S.3.B.01 EUR/m3 N/A N/A
Unit total cost of treatment and disposal per m3 S.3.B.02 EUR/m3 N/A N/A
Unit operational cost of treatment and disposal per household S.3.B.03 EUR/ household N/A N/A
Unit total cost of treatment and disposal per household S.3.B.04 EUR/ household N/A N/A
Collection Unit operational cost of wastewater collection per household S.3.B.05 EUR/ household N/A N/A
Unit total cost of wastewater collection per household S.3.B.06 EUR/ household N/A N/A
Unit operational cost of wastewater services per household S.3.B.07 EUR/ household 10.31 11.54
Unit total cost of wastewater services per household S.3.B.08 EUR/ household 10.6 11.82
Capital expenditure
Capital maintenance
Total capital maintenance expenditure S.3.C.01 EUR 5,196 0
Total capital maintenance expenditure relative to plan S.3.C.02 % of plan estimate 3% 0%
Total capital maintenance expenditure relative to RAB S.3.C.03 % of RAB 0.6% 0%
Capital enhancement
Total capital enhancement expenditure S.3.C.04 EUR 0 10,688
Total capital enhancement expenditure relative to plan S.3.C.05 % of plan estimate 0% 52.60%
F – Financial
Sales and revenue collection
Sales Total sales F.1.A.01 EUR 2,085,547 2,067,567
Total sales relative to plan F.1.A.02 % of plan estimate 88% 81%
Collection efficiency Total revenue collection F.1.B.01 EUR 1,701,017 1,672,185
Total revenue collection out-performance F.1.B.02 EUR -23,637 -296,867
Total revenue collection out-performance(relative) F.1.B.03 % of plan estimate 99% 85%
Total revenues written off F.1.B.04 EUR 782,066 384,530
Total revenues written off relative to billing F.1.B.05 % of billing 37% 19%
Revenue collection relative to billing F.1.B.06 % of billing 82% 81%
Accounts receivable F.1.B.07 EUR N/A N/A
Accounts receivable relative to turnover F.1.B.08 Days turnover N/A N/A
Key financial values and ratios
Values Free cash flow F.2.A.01 EUR N/A N/A
Ratios
Returns Return on capital F.2.B.01 % -5.5% 1.2%
Cost of debt F.2.B.02 % N/A N/A
Ratios Gearing F.2.B.03 ratio N/A N/A
Cash interest cover F.2.B.04 ratio N/A N/A
Cash interest cover F.2.B.05 normë N/A N/A
Free cash flow F.2.B.06 normë N/A N/A

PERFORMANCE REPORT RWC - 2017
66
RWC Hidromorava (Gjilan)
Category / sub-category
Sub-sub- category
Indicator Ref Unit 2016 2017
W - Water supply
Non-financial (technical)
Standards of service Quality
Water quality (bacteriological) W.1.A.01 % pass 96.7% 99.5%
Water quality (physical and chemical) W.1.A.02 % pass 100% 100%
Pressure
Properties affected by low pressure W.1.A.03 Nr 248 5
Properties affected by low pressure W.1.A.04 % properties 1.06% 0.02%
Reliability Properties with 24 hour supply W.1.A.05 Nr 22,962 24,681
Properties with 24 hour supply W.1.A.06 % properties 99% 100%
Properties with 18-24 hour supply W.1.A.07 Nr 139 13
Properties with 18-24 hour supply W.1.A.08 % properties 1% 0%
Properties with less than 18 hours supply W.1.A.09 Nr 141 25
Properties with less than 18 hours supply W.1.A.10 % properties 1% 0%
Infrastructure serviceability
Non-revenue water Non revenue water (total) W.1.B.01 m3 per day 4,699,450 4,874,666
Non revenue water (per connection) W.1.B.02 litres per cust. per day
499 487
Non revenue water (per connection) - adjusted W.1.B.03 litres per cust. per day
500 487
Non revenue water (relative to production) W.1.B.04 % production 57% 56%
Pipe bursts Pipe network bursts frequency W.1.B.05 bursts per month 48 49
Pipe network bursts per 100 km of pipe W.1.B.06 Nr / 100 km 172 175
Non-financial (commercial)
Service coverage
Households Households served W.2.A.01 Nr 23,242 24,719
Coverage (households served relative to total) W.2.A.02 % total households 71% 75%
New connections New connections (household) W.2.A.03 Nr 3,464 -510
New connections (commercial and institutional) W.2.A.04 Nr 962 -658
Metering
Metering rate Metered households relative to total households W.2.B.01 % households 86% 87%
Metered com & inst relative to total com & inst. W.2.B.02 % com & inst 78% 79%
Meters installed Meters installed (households) W.2.B.03 Nr 227 824
Meters installed (com & inst) W.2.B.04 Nr 30 165
Complaints Complaints Complaints received (technical) W.2.C.01 Nr 508 185
Complaints received (commercial) W.2.C.02 Nr 119 95
Financial
Sales Volumes Volume of sales to households (metered) W.3.A.01 m3 2,578,614 2,858,577
Volume of sales to households (metered) relative to plan estimates W.3.A.02 % of plan estimate 84% 75%
Volume of sales to households (un-metered) W.3.A.03 m3 485,075 462,676
Volume of sales to households (un-metered) relative to plan estimates W.3.A.04 % of plan estimate 108% N/A
Volume of sales to com & inst (metered) W.3.A.05 m3 423,698 468,859
Volume of sales to com & inst (metered) relative to plan estimates W.3.A.06 % of plan estimate 99% 118%
Volume of sales to com & inst (un-metered) W.3.A.07 m3 45,913 40,680
Volume of sales to com & inst (un-metered) relative to plan estimates W.3.A.08 % of plan estimate 143% N/A
Values Value of water sales to households W.3.A.09 EUR 1,279,856 1,379,875
Value of water sales to households relative to plan estimates W.3.A.10 % of plan estimate 92.1% 88.2%
Value of water sales to com & inst W.3.A.11 EUR 378,367 409,031
Value of water sales to com & inst relative to plan estimates W.3.A.12 % of plan estimate 97.1% 119.6%
Unit costs Production Unit operational cost of water production W.3.B.01 EUR/m3 0.064 0.064
Unit total cost of water production W.3.B.02 EUR/m3 0.067 0.067
Total costs Unit cost of water sold W.3.B.03 EUR/m3 0.413 0.392
Unit cost of water sold and paid for W.3.B.04 EUR/m3 N/A N/A
Capital expenditure
Capital maintenance
Total capital maintenance expenditure W.3.C.01 EUR 23,129 22,093
Total capital maintenance expenditure relative to plan W.3.C.02 % of plan estimate 2% 6.8%
Total capital maintenance expenditure relative to RAB W.3.C.03 % of RAB 0.9% 0.8%
Capital enhancement
Total capital enhancement expenditure W.3.C.04 EUR 93,562 13,663
Total capital enhancement expenditure relative to plan W.3.C.05 % of plan estimate 15% 3%

PERFORMANCE REPORT RWC - 2017
67
Category / sub-category
Sub-sub- category Indicator Ref Unit 2016 2017
S - Sewerage (wastewater)
Non-financial (technical)
Standards of service Discharge quality Discharge quality S.1.A.01 % pass N/A N/A
Reliability Sewer overflows Sewer overflows S.1.B.01 Nr 0 0
Sewer overflows per 100 km of pipe S.1.B.02 Nr per 100 km 0 0
Serviceability
Sewer collapses Sewer collapses S.1.C.01 Nr 0 0
Sewer collapses per 100 km of pipe S.1.C.02 Nr per 100 km 0 0
WWTP overflows Wastewater treatment plan overflows S.1.C.03 Nr N/A N/A
Non-financial (commercial)
Service coverage
Households Households served S.2.A.01 Nr 18,927 21,508
Coverage (households served relative to total) S.2.A.02 % total households 58% 65%
Households served with wastewater treatment S.2.A.03 Nr 0 0
Coverage (households served with wastewater treatment relative to total) S.2.A.04 % households 0% 0%
New connections New connections (household) S.2.A.05 Nr 4,014 1,147
New connections (commercial and institutional) S.2.A.06 Nr 210 150
Complaints Complaints Complaints received (technical) S.2.B.01 Nr 144 964
Complaints received (commercial) S.2.B.02 Nr 4 0
Financial
Sales Values Value of sales to households S.3.A.01 EUR 221,897 241,234
Value of sales to households relative to plan S.3.A.02 % of plan estimate 109% 106%
Value of sales to com & inst S.3.A.01 EUR 87,052 94,937
Value of sales to com & inst relative to plan S.3.A.02 % of plan estimate 133% 143%
Unit costs
Treatment and disposal
Unit operational cost of treatment and disposal per m3 S.3.B.01 EUR/m3 N/A N/A
Unit total cost of treatment and disposal per m3 S.3.B.02 EUR/m3 N/A N/A
Unit operational cost of treatment and disposal per household S.3.B.03 EUR/ household N/A N/A
Unit total cost of treatment and disposal per household S.3.B.04 EUR/ household N/A N/A
Collection Unit operational cost of wastewater collection per household S.3.B.05 EUR/ household N/A N/A
Unit total cost of wastewater collection per household S.3.B.06 EUR/ household N/A N/A
Unit operational cost of wastewater services per household S.3.B.07 EUR/ household 5.80 5.67
Unit total cost of wastewater services per household S.3.B.08 EUR/ household 6.24 6.08
Capital expenditure
Capital maintenance
Total capital maintenance expenditure S.3.C.01 EUR 0 0
Total capital maintenance expenditure relative to plan S.3.C.02 % of plan estimate 0% 0%
Total capital maintenance expenditure relative to RAB S.3.C.03 % of RAB 0% 0%
Capital enhancement
Total capital enhancement expenditure S.3.C.04 EUR 2,092 2,274
Total capital enhancement expenditure relative to plan S.3.C.05 % of plan estimate 0.3% 16.60%
F – Financial
Sales and revenue collection
Sales Total sales F.1.A.01 EUR 1,967,172 2,125,077
Total sales relative to plan F.1.A.02 % of plan estimate 96% 97%
Collection efficiency Total revenue collection F.1.B.01 EUR 1,606,870 1,687,392
Total revenue collection out-performance F.1.B.02 EUR -6,620 -146,580
Total revenue collection out-performance(relative) F.1.B.03 % of plan estimate 100% 92%
Total revenues written off F.1.B.04 EUR 414,361 360,301
Total revenues written off relative to billing F.1.B.05 % of billing 21% 17%
Revenue collection relative to billing F.1.B.06 % of billing 82% 79%
Accounts receivable F.1.B.07 EUR N/A N/A
Accounts receivable relative to turnover F.1.B.08 Days turnover
Key financial values and ratios
Values Free cash flow F.2.A.01 EUR N/A N/A
Ratios
Returns Return on capital F.2.B.01 % 0.9% 4.4%
Cost of debt F.2.B.02 % N/A N/A
Ratios Gearing F.2.B.03 ratio N/A N/A
Cash interest cover F.2.B.04 ratio N/A N/A
Cash interest cover F.2.B.05 normë N/A N/A
Free cash flow F.2.B.06 normë N/A N/A

PERFORMANCE REPORT RWC - 2017
68
APPENDIX 2: DEFINITIONS AND RATIONALITY
A Definitions of performance indicators
Section Reference Indicator Unit Definition
W - Water supply
Non-financial (technical)
Standards of service
W.1.A.01 Water quality (bacteriological) % pass Percentage of bacteriological test results passing prescribed standards for bacteriological quality in the reporting period.
W.1.A.02 Water quality (physical and chemical) % pass Percentage of physical and chemical test results passing prescribed standards for physical and chemical quality in the reporting period.
W.1.A.03 Properties affected by low pressure Nr Average number of served properties over the reporting period situated in zones that regularly experience pressure below minimum pressure levels. Does not include short term intermittent periods of low pressure.
W.1.A.04 Properties affected by low pressure % properties Average number of properties defined in W.1.A.3 divided by estimated number of served propertied in the service areas
W.1.A.05 Properties with 24 hour supply Nr Average number of properties in the reporting period that enjoy continual water supply (excluding exceptional supply disruptions) for 23 or more hours per day.
W.1.A.06 Properties with 24 hour supply % properties Percentage of served properties in the reporting period that enjoy continual water supply (excluding exceptional supply disruptions) for 23 or more hours per day.
W.1.A.07 Properties with 18-24 hour supply Nr Average number of properties in the reporting period that enjoy continual water supply (excluding exceptional supply disruptions) for 18-23 hours per day.
W.1.A.08 Properties with 18-24 hour supply % properties Percentage of served properties in the reporting period that enjoy continual water supply (excluding exceptional supply disruptions) for 18-23 or more hours per day.
W.1.A.09 Properties with less than 18 hours supply Nr Average number of properties in the reporting period that enjoy continual water supply (excluding exceptional supply disruptions) for less than 18 hours per day.
W.1.A.10 Properties with less than 18 hours supply % properties Percentage of served properties in the reporting period that enjoy continual water supply (excluding exceptional supply disruptions) for less than 18 hours per day.
Infrastructure serviceability
W.1.B.01 Non revenue water (total) m3 per day Average volume of NRW (difference between water production and water sold) per day over the reporting period
W.1.B.02 Non revenue water (per connection) litres per cust. per day
Average volume of NRW divided by the total number of connections in the service area.
W.1.B.03 Non revenue water (per connection) - adjusted litres per cust. per day
Average volume of NRW divided by the total number of connections in the service area adjusted for restricted supplies.
W.1.B.04 Non revenue water (relative to production) % production Total volume of NRW divided by total volume of production
W.1.B.05 Pipe network bursts frequency bursts per month Average number of pipe bursts per month
W.1.B.06 Pipe network bursts per 100 km of pipe Nr / 100 km Total number of pipe bursts per year per 100 km of pipe (excluding service connections)
Non-financial (commercial)
Service coverage
W.2.A.01 Households served Nr Total average number of households over the reporting period served with a piped water supply in the defined service area
W.2.A.02 Coverage (households served relative to total) % total households
Total average number of households over the reporting period served with a piped water supply in the service area divided by the total average number of households (served and un-served) in the defined service area.
W.2.A.03 New connections (household) Nr Total number of new water supply connections to households (excluded reconnections) over the reporting period.
W.2.A.04 New connections (commercial and institutional) Nr Total number of new water supply connections to commercial and institutional customers (excluded reconnections) over the reporting period.
Metering
W.2.B.01 Metered households relative to total households % households Average number of metered (meters functioning) households over the reporting period divided by the average number of households served with a piped water supply in the service area as defined in licence agreements.
W.2.B.02 Metered com & inst relative to total com & inst. % com & inst Average number of metered (meters functioning) commercial and institutional customers over the reporting period divided by the average number of commercial and institutional customers served with a piped water supply in the service area as defined in licence agreements.
W.2.B.03 Meters installed (households) Nr Total household meters installed in the reporting period.
W.2.B.04 Meters installed (com & inst) Nr Total commercial and institutional customer meters installed in the reporting period.
Complaints
W.2.C.01 Complaints received (technical) Nr Total number of complaints received by the RWC in relation to levels of service (poor water quality, pressure, reliability, disruption due to construction activities and other technical issues) in the reporting period.
W.2.C.02 Complaints received (commercial) Nr Total number of complaints received by the RWC in relation to water supply billing and tariffs in the reporting period.
Financial
Sales
W.3.A.01 Volume of sales to households (metered) m3 Total volume of water sold to metered households in reporting period.
W.3.A.02 Volume of sales to households (metered) relative to plan estimates
% of plan estimate
Total volume of water sold to metered households in reporting period divided by volume of metered household sales estimated in the business plan for the same reporting period
W.3.A.03 Volume of sales to households (un-metered) m3 Total volume of water sold to un-metered households in reporting period.
W.3.A.04 Volume of sales to households (un-metered) relative to plan estimates
% of plan estimate
Total volume of water sold to un-metered households in reporting period divided by volume of un-metered household sales estimated in the business plan for the same reporting period
W.3.A.05 Volume of sales to com & inst (metered) m3 Total volume of water sold to metered commercial and institutional customers in reporting period.
W.3.A.06 Volume of sales to com & inst (metered) relative to plan estimates
% of plan estimate
Total volume of water sold to metered commercial and institutional customers in reporting period divided by volume of metered household sales estimated in the business plan for the same reporting period
W.3.A.07 Volume of sales to com & inst (un-metered) m3 Total volume of water sold to un-metered commercial and institutional customers in reporting period.
W.3.A.08 Volume of sales to com & inst (un-metered) relative to plan estimates
% of plan estimate
Total volume of water sold to un-metered commercial and institutional customers in reporting period divided by volume of un-metered household sales estimated in the business plan for the same reporting period
W.3.A.09 Value of water sales to households EUR Total EUR value of water sales to households including fixed monthly charge component of tariff.
W.3.A.10 Value of water sales to households relative to plan estimates
% of plan estimate
Total value of water sold to households in reporting period divided by value of water sold estimated in the business plan for the same reporting period (adjusted for inflation)

PERFORMANCE REPORT RWC - 2017
69
Section Reference Indicator Unit Definition
W.3.A.11 Value of water sales to com & inst EUR Total EUR value of water sales to commercial and institutional customers including fixed monthly charge component of tariff.
W.3.A.12 Value of water sales to com & inst relative to plan estimates
% of plan estimate
Total value of water sold to commercial and institutional customers in reporting period divided by value of water sold estimated in the business plan for the same reporting period (adjusted for inflation)
Unit costs
W.3.B.01 Unit operational cost of water production EUR/m3 Total operating cost of water production in the reporting period divided by the volume of water produced in the same period
W.3.B.02 Unit total cost of water production EUR/m3 Total cost (operating + capital maintenance provisions) of water production in the reporting period divided by the volume of water produced in the same period
W.3.B.03 Unit cost of water sold EUR/m3 Total cost (operating + capital maintenance provisions) of the water supply business activity in the reporting period divided by the volume of water sold in the same period
W.3.B.04 Unit cost of water sold and paid for EUR/m3 Total cost (operating + capital maintenance provisions) of the water supply business activity in the reporting period divided by the volume of water sold and paid for in the same period
Capital expenditure
W.3.C.01 Total capital maintenance expenditure EUR Total capital maintenance expenditure (infrastructure renewals + investment in non-infrastructure capital maintenance).
W.3.C.02 Total capital maintenance expenditure relative to plan
% of plan estimate
Total capital maintenance expenditure (infrastructure renewals + investment in non-infrastructure capital maintenance) divided by infrastructure renewals and current cost depreciation provisions in the business plan.
W.3.C.03 Total capital maintenance expenditure relative to RAB
% of RAB Total capital maintenance expenditure (infrastructure renewals + investment in non-infrastructure capital maintenance) divided by the regulatory asset base value of water assets.
W.3.C.04 Total capital enhancement expenditure EUR Total capital enhancement expenditure (infrastructure enhancement + investment in non-infrastructure capital enhancement).
W.3.C.05 Total capital enhancement expenditure relative to plan
% of plan estimate
Total capital enhancement expenditure (infrastructure enhancement + investment in non-infrastructure capital enhancement) divided by infrastructure enhancement and non-infrastructure enhancement provisions in the business plan.
S - Sewerage (wastewater)
Non-financial (technical)
Standards of service S.1.A.01 Discharge quality % pass Percentage of wastewater treatment plant effluent quality tests passing prescribed standards for environmental quality in the reporting period.
Reliability
S.1.B.01 Sewer overflows Nr Number of reported incidents of sewer flooding reported to the RWC (or identified by RWC personnel) in the reporting period
S.1.B.02 Sewer overflows per 100 km of pipe Nr per 100 km Number of reported incidents of sewer flooding reported to the RWC (or identified by RWC personnel) in the reporting period divided by the length of sewer network x 100.
Serviceability
S.1.C.01 Sewer collapses Nr Number of reported incidents of sewer collapses reported to the RWC (or identified by RWC personnel) in the reporting period.
S.1.C.02 Sewer collapses per 100 km of pipe Nr per 100 km Number of reported incidents of sewer collapses reported to the RWC (or identified by RWC personnel) in the reporting period divided by the length of sewer network x 100
S.1.C.03 Wastewater treatment plan overflows Nr Number of incidents of wastewater treatment plant overflows in the reporting period
Non-financial (commercial)
Service coverage
S.2.A.01 Households served Nr Total average number of households over the reporting period served with water borne piped sewerage system (including those connected to well functioning septic tanks in rural and semi-rural areas) in the service area as defined in licence agreements.
S.2.A.02 Coverage (households served relative to total) % total households
Total average number of households over the reporting period served with water borne piped sewerage system (including those connected to well functioning septic tanks in rural and semi-rural areas) in the service area divided by the total average number of households (served and un-served) in the defined service area.
S.2.A.03 Households served with wastewater treatment Nr Total average number of households over the reporting period served with water borne piped sewerage system leading to a wastewater treatment plant (including well functioning septic tanks in rural and semi-rural areas) in the service area as defined in licence agreements
S.2.A.04 Coverage (households served with wastewater treatment relative to total)
% households
Total average number of households over the reporting period served with water borne piped sewerage system leading to a wastewater treatment plant (including well functioning septic tanks in rural and semi-rural areas) in the service area divided by the total average number of households (served and un-served) in the defined service area.
S.2.A.05 New connections (household) Nr Total number of new sewerage connections to households (excluded reconnections) over the reporting period.
S.2.A.06 New connections (commercial and institutional) Nr Total number of new sewerage connections to commercial and institutional customers (excluded reconnections) over the reporting period.
Complaints
S.2.B.01 Complaints received (technical) Nr Total number of complaints received by the RWC in relation to levels of service (sewer overflows etc. in the reporting period.
S.2.B.02 Complaints received (commercial) Nr Total number of complaints received by the RWC in relation to wastewater billing and tariffs in the reporting period.
Financial
Sales
S.3.A.01 Value of sales to households EUR Total EUR value of wastewater services sales to households
S.3.A.02 Value of sales to households relative to plan % of plan estimate
Total value of wastewater services sold to households in reporting period divided by value of wastewater services sold estimated in the business plan for the same reporting period (adjusted for inflation)
S.3.A.03 Value of sales to com & inst EUR Total EUR value of wastewater services sales to commercial and institutional customers
S.3.A.04 Value of sales to com & inst relative to plan % of plan estimate
Total value of wastewater services sold to commercial and institutional customers in reporting period divided by value of wastewater services sold estimated in the business plan for the same reporting period (adjusted for inflation)
Unit costs
S.3.B.01 Unit operational cost of treatment and disposal per m3
EUR/m3 Total operating cost of wastewater treatment and disposal in the reporting period divided by the measured volume of wastewater delivered to the wastewater treatment plants in the same period
S.3.B.02 Unit total cost of treatment and disposal per m3 EUR/m3 Total cost (operating + capital maintenance provisions) of wastewater treatment and disposal in the reporting period divided by the volume of wastewater delivered in the same period
S.3.B.03 Unit operational cost of treatment and disposal per household
EUR/ household Total operating cost of wastewater treatment and disposal in the reporting period divided by the average number of households and household equivalents served by wastewater treatment facilities in the same period
S.3.B.04 Unit total cost of treatment and disposal per household
EUR/ household Total cost (operating + capital maintenance provisions) of wastewater treatment and disposal in the reporting period divided by the average number of households and household equivalents served by wastewater treatment facilities in the same period
S.3.B.05 Unit operational cost of wastewater collection per household
EUR/ household Total operating cost of the wastewater collection in the reporting period divided by the average number of households and household equivalents in the same period

PERFORMANCE REPORT RWC - 2017
70
Section Reference Indicator Unit Definition
S.3.B.06 Unit total cost of wastewater collection per household
EUR/ household Total cost (operating + capital maintenance provisions) of the wastewater collection in the reporting period divided by the average number of households and household equivalents in the same period
S.3.B.07 Unit operational cost of wastewater services per household
EUR/ household Total operating cost of the wastewater services business activity in the reporting period divided by the average number of households and household equivalents in the same period
S.3.B.08 Unit total cost of wastewater services per household EUR/ household Total cost (operating + capital maintenance provisions) of the wastewater services business activity in the reporting period divided by the average number of households and household equivalents in the same period
Capital expenditure
S.3.C.01 Total capital maintenance expenditure EUR Total capital maintenance expenditure (infrastructure renewals + investment in non-infrastructure capital maintenance).
S.3.C.02 Total capital maintenance expenditure relative to plan
% of plan estimate
Total capital maintenance expenditure (infrastructure renewals + investment in non-infrastructure capital maintenance) divided by infrastructure renewals and current cost depreciation provisions in the business plan.
S.3.C.03 Total capital maintenance expenditure relative to RAB
% of RAB Total capital maintenance expenditure (infrastructure renewals + investment in non-infrastructure capital maintenance) divided by the regulatory asset base value of wastewater assets.
S.3.C.04 Total capital enhancement expenditure EUR Total capital enhancement expenditure (infrastructure enhancement + investment in non-infrastructure capital enhancement)
S.3.C.05 Total capital enhancement expenditure relative to plan
% of plan estimate
Total wastewater capital enhancement expenditure (infrastructure enhancement + investment in non-infrastructure capital enhancement) divided by wastewater infrastructure enhancement and non-infrastructure enhancement provisions in the business plan
F – Financial
Sales and revenue collection
Sales
F.1.A.01 Total sales EUR Total value of services (water and wastewater) sold (billing) excluding connection fees and other income in the reporting period.
F.1.A.02 Total sales relative to plan % of plan estimate
Total value of services (water and wastewater) sold (billing) excluding connection fees and other income in the reporting period divided by the total sales estimated in the business plan for the same reporting period
Revenue collection
F.1.B.01 Total revenue collection EUR Total cash received from water sales (excluding connection fees and other income) in the reporting period.
F.1.B.02 Total revenue collection out-performance EUR Total cash received from water sales (excluding connection fees and other income) in the reporting period less the cash receipts from sales expected in the business plan over the same period
F.1.B.03 Total revenue collection out-performance(relative) % of plan estimate
Total cash received from water sales (excluding connection fees and other income) in the reporting period divided by the cash receipts from sales expected in the business plan over the same period
F.1.B.04 Total revenues written off EUR Total revenues written off (excluding connection fees and other income) in accordance with RAG in the reporting period
F.1.B.05 Total revenues written off relative to billing % of billing Total revenues written off in accordance with RAG in the reporting period divided by the total sales (excluding connection fees and other income) over the same period.
F.1.B.06 Revenue collection relative to billing % of billing Total cash received from water sales (excluding connection fees and other income) in the reporting period divided by the total billing (excluding connection fees and other income)
F.1.B.07 Accounts receivable EUR Total accounts receivable after write offs (not more than 12 months old) from billed sales (excluding connection fees and other income) in the reporting period
F.1.B.08 Accounts receivable relative to turnover Days turnover Total accounts receivable (not more than 12 months old) from billed sales divided by total sales (excluding connection fees and other income) in the reporting period multiplied by 365.
Key financial values and ratios
Values F.2.A.01 Free cash flow EUR Total net cash flow from operations over the reporting period.
Ratios
F.2.B.01 Return on capital % Total net income from operating activities before interest, dividends and corporation taxes divided by average regulatory asset base (RAB) over the reporting period.
F.2.B.02 Cost of debt % Total interest payments made in the reporting period divided by the average value of debt in the reporting period.
F.2.B.03 Gearing ratio Long-term debt divided by regulatory asset base (a slight deviation from gearing as defined in conventional financial accounting)
F.2.B.04 Cash interest cover ratio Net cash flow before interest and taxes divided by interest payments in the reporting period.
F.2.B.05 Funds from operations/debt ratio Net cash flow from operating activities less tax paid less net interest paid, all divided by net debt
F.2.B.06 Debt service coverage ratio ratio Net cash flow from operating activities less net interest paid less repayment of principal, all divided by debt service (interest and repayment of principal)

PERFORMANCE REPORT RWC - 2017
71
B Rationality for measuring performance
Perofrmance measuring criteria of water supply service and wastwater services are such that a score of 100% indicate the
level of service provision compared to a modern performance of service efficient and functional water supply.
Performance measurement structure
Group Performance measurement Weight of heaviness of sub-group
Weight of heaviness of group
Water Drinking water quality 25%
100% 45%
100%
Pressure 5%
Availability 20%
Service coverage 20%
Cost efficiency 10%
Discharge quality 20%
Wastewater Reliability 20%
100% 35%
Service coverage 20%
Cost efficiency 50%
Profitability
Commercial efficiency 10%
Regualtory
reporting Drinking water quality 5% 5%
Financial /
commercial
Pressure 5% 15%
Availability 10%

PERFORMANCE REPORT RWC - 2017
72
Criteria, definitions, coefficient and calculations for performance measurement Parameter Performance measurement criteria
Water supply performance measurement
Water quality Definition: The combination of bacteriological and physical/chemical test performance on the basis of 75:25 relative weighting Performance category weighting: 25% Calculation: [ U.1.A.01 x 0.75 + U.1.A.02 x 0.25] x 25%
Pressure Definition: The percentage of properties unaffected by pressure falling below minimum pressure levels and physical/chemical test performance on the basis of 75:25 relative weighting Performance category weighting: 5% Calculation: [100% - U.1.A.04] x 5%
Availability Definition: Defined as the (adjusted) percentage of properties unaffected by iregular intermittent supplies. This indicator is adjusted to reflect the degree by which those affected by supply interruptions are affected by weighting the number of households with a supply less than 18 hrs with factor of 2. Performance category weighting: 20% Calculation: [100% - 0.5 x U.1.A.08 – U.1.A.10] x 20%
Service Coverage Definition: The percentage of population in the service area served with a piped water supply. Performance category weighting: 20% Calculation: [U.2.A.02] x 20%
Non-revenue water Definition: Total NRW volume divided by total volume of water produced Performance category weighting: 20% Calculation: NRW(%)*20%*Kb,Kb-Credibility weighing (derived from audit process -2016), If NRW(%) ≤25%=20% Or NRW(%) ≥ 60% = 0% Else [60%- NRW%]/35% ] x 20%
Cost Efficiency
Definition: The unit cost of water sold relative to the unit cost estimated in the tariff review (UWT) (excluding return on capital). A unit cost of less than or equal to 90% of UT will score 100% and a unit cost equal to or exceeding 140% of UWT will score 0%. Unit costs between 90% and 140% of UWT are calculated pro-rata Performance category weighting: 10% Calculation: If W.3.B.03 ≥ 140% x UWT = 0% ose If W.3.B.03 ≤ 90% x UWT = 100% x 10% = 10% Else [[140% - (W.3.B.03UWT] / 50%] x 10%
Wastewater services performance measurement
Wastewater discharge quality
Definition: As no discharge quality monitoring is undertaken a surrogate indicator based upon the percentage of population served by functioning wastewater treatment facilities (including well functioning septic tanks in rural and semi-rural areas) is applied. Performance category weighting: 20% Calculation: [S.2.A.04] x 20%
Reliability
Definition: The annual number of sewer overflow incidents per 100 km of pipe relative to an ideal level of 0 to a maximum of 100 Performance category weighting: 20% Calculation: If S.1.B.02 ≥ 100 = 0% Else [100 - S.1.B.02 ] x 20%
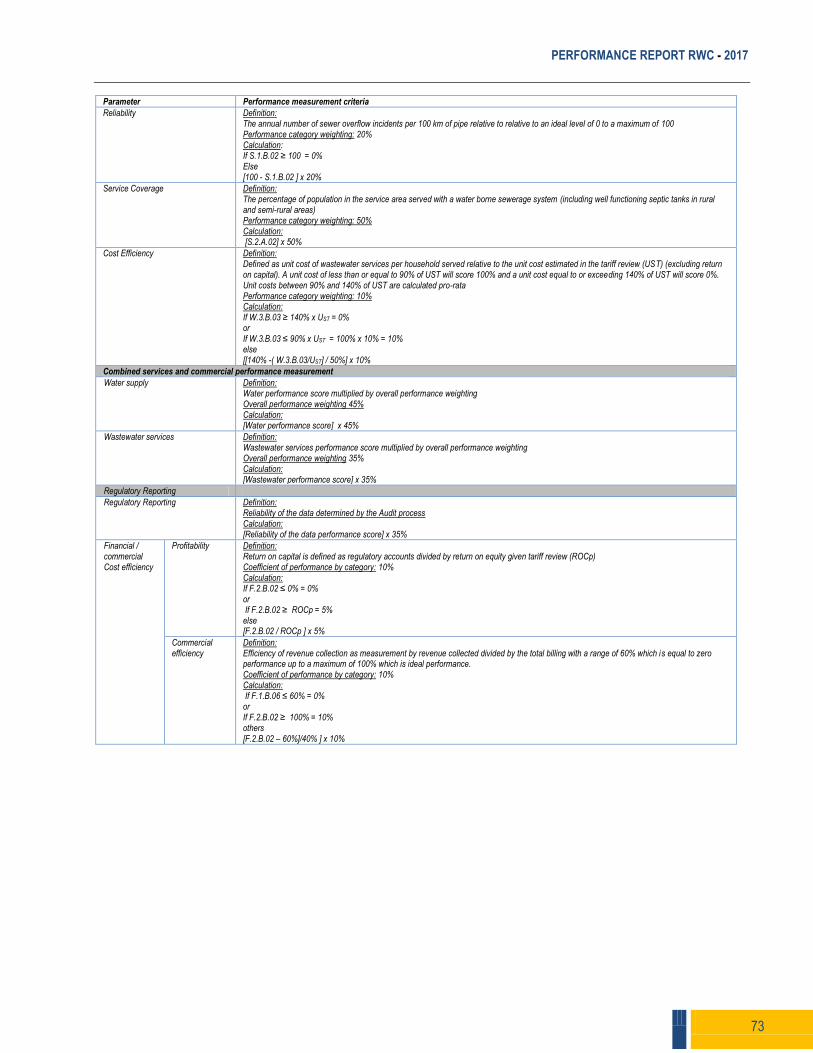
PERFORMANCE REPORT RWC - 2017
73
Parameter Performance measurement criteria
Reliability Definition: The annual number of sewer overflow incidents per 100 km of pipe relative to relative to an ideal level of 0 to a maximum of 100 Performance category weighting: 20% Calculation: If S.1.B.02 ≥ 100 = 0% Else [100 - S.1.B.02 ] x 20%
Service Coverage Definition: The percentage of population in the service area served with a water borne sewerage system (including well functioning septic tanks in rural and semi-rural areas) Performance category weighting: 50% Calculation: [S.2.A.02] x 50%
Cost Efficiency
Definition: Defined as unit cost of wastewater services per household served relative to the unit cost estimated in the tariff review (UST) (excluding return on capital). A unit cost of less than or equal to 90% of UST will score 100% and a unit cost equal to or exceeding 140% of UST will score 0%. Unit costs between 90% and 140% of UST are calculated pro-rata Performance category weighting: 10% Calculation: If W.3.B.03 ≥ 140% x UST = 0% or If W.3.B.03 ≤ 90% x UST = 100% x 10% = 10% else [[140% -( W.3.B.03/UST] / 50%] x 10%
Combined services and commercial performance measurement
Water supply Definition: Water performance score multiplied by overall performance weighting Overall performance weighting 45% Calculation: [Water performance score] x 45%
Wastewater services
Definition: Wastewater services performance score multiplied by overall performance weighting Overall performance weighting 35% Calculation: [Wastewater performance score] x 35%
Regulatory Reporting
Regulatory Reporting Definition: Reliability of the data determined by the Audit process Calculation: [Reliability of the data performance score] x 35%
Financial / commercial Cost efficiency
Profitability Definition: Return on capital is defined as regulatory accounts divided by return on equity given tariff review (ROCp) Coefficient of performance by category: 10% Calculation: If F.2.B.02 ≤ 0% = 0% or If F.2.B.02 ≥ ROCp = 5% else [F.2.B.02 / ROCp ] x 5%
Commercial efficiency
Definition: Efficiency of revenue collection as measurement by revenue collected divided by the total billing with a range of 60% which is equal to zero performance up to a maximum of 100% which is ideal performance. Coefficient of performance by category: 10% Calculation: If F.1.B.06 ≤ 60% = 0% or If F.2.B.02 ≥ 100% = 10% others [F.2.B.02 – 60%]/40% ] x 10%

PERFORMANCE REPORT RWC - 2017
74
APPENDIX 3: SUMMARY STATEMENT OF INCOME
RWC Prishtina (Pristina)
2016 2017
Turnover 13,791,273 14,220,388
Operating costs 8,699,898 9,259,418
Net operating income (excluding capital maintenance) 5,091,375 4,960,970
Capital maintenance (infrastructure renewals + cc depreciation) 256,227 434,584
Net operating income (including capital maintenance) 4,835,148 4,526,386
Provision for bad debts 3,171,686 1,038,903
Net operating income (after bad debts) 1,663,462 3,487,484
Interest on long term loans 0 0
Pre-tax profit 1,663,462 3,487,484
Taxation on profits 0 0
Net post-tax profit 1,663,462 3,487,484
RWC Hidroregjioni Jugor (Prizren)
2016 2017
Turnover 4,217,604 4,696,383
Operating costs 3,268,639 3,557,617
Net operating income (excluding capital maintenance) 948,965 1,138,766
Capital maintenance (infrastructure renewals + cc depreciation) 58,077 119,778
Net operating income (including capital maintenance) 890,888 1,018,988
Provision for bad debts 1,073,821 534,164
Net operating income (after bad debts) (-182,933) 484,824
Interest on long term loans 0 0
Pre-tax profit (-182,933) 484,824
Taxation on profits 0 0
Net post-tax profit (-182,933) 484,824
RWC Hidrodrini (Peja)
2016 2017
Turnover 3,558,375 3,685,243
Operating costs 2,299,252 2,455,076
Net operating income (excluding capital maintenance) 1,259,123 1,230,167
Capital maintenance (infrastructure renewals + cc depreciation) 54,229 158,417
Net operating income (including capital maintenance) 1,204,894 1,071,750
Provision for bad debts 954,904 781,244
Net operating income (after bad debts) 249,990 290,506
Interest on long term loans 0 0
Pre-tax profit 249,990 290,506
Taxation on profits 0 0
Net post-tax profit 249,990 290,506

PERFORMANCE REPORT RWC - 2017
75
RWC Mitrovica (Mitrovica)
2016 2017
Turnover 3,711,121 4,261,956
Operating costs 2,447,903 2,833,324
Net operating income (excluding capital maintenance) 1,263,218 1,428,632
Capital maintenance (infrastructure renewals + cc depreciation) 19,999 19,719
Net operating income (including capital maintenance) 1,243,219 1,408,913
Provision for bad debts 1,173,730 1,186,426
Net operating income (after bad debts) 69,488 222,487
Interest on long term loans 0 0
Pre-tax profit 69,488 222,487
Taxation on profits 0 0
Net post-tax profit 69,488 222,487
RWC Gjakova (Gjakova)
2016 2017
Turnover 3,878,317 4,101,534
Operating costs 2,846,672 2,934,500
Net operating income (excluding capital maintenance) 1,031,645 1,167,034
Capital maintenance (infrastructure renewals + cc depreciation) 216,296 378,762
Net operating income (including capital maintenance) 815,349 788,272
Provision for bad debts 627,321 208,042
Net operating income (after bad debts) 188,028 580,230
Interest on long term loans 0 0
Pre-tax profit 188,028 580,230
Taxation on profits 0 0
Net post-tax profit 188,028 580,230
RWC Bifurkacioni (Ferizaj)
2016 2017
Turnover 2,132,695 2,088,128
Operating costs 1,571,806 1,626,040
Net operating income (excluding capital maintenance) 560,888 462,088
Capital maintenance (infrastructure renewals + cc depreciation) 29,837 26,597
Net operating income (including capital maintenance) 531,051 435,491
Provision for bad debts 770,668 384,530
Net operating income (after bad debts) (-239,617) 50,961
Interest on long term loans 0 0
Pre-tax profit (-239,617) 50,961
Taxation on profits 0 0
Net post-tax profit (-239,617) 50,961

PERFORMANCE REPORT RWC - 2017
76
RWC Hidromorava (Gjilan)
2016 2017
Turnover 2,027,254 2,191,104
Operating costs 1,528,580 1,618,641
Net operating income (excluding capital maintenance) 498,674 572,463
Capital maintenance (infrastructure renewals + cc depreciation) 61,686 39,668
Net operating income (including capital maintenance) 436,988 532,795
Provision for bad debts 408,322 360,301
Net operating income (after bad debts) 28,666 172,494
Interest on long term loans 0 0
Pre-tax profit 28,666 172,494
Taxation on profits 0 0
Net post-tax profit 28,666 172,494

PERFORMANCE REPORT RWC - 2017
77
APPENDIX 4: TARIFF STATEMENT 2017 AND (2018-2020)
Current tariff statements for 2017
Unit RW
C P
rish
tin
a
RW
C H
idro
reg
jion
i Ju
go
r
RW
C H
idro
dri
ni
RW
C M
itro
vica
RW
C R
ado
niq
i
RW
C B
ifu
rkac
ion
i
RW
C H
idro
mo
rava
Households
Water supply monthly charge EUR/ month 1.00 1.00 1.00 1.00 1.00 1.00 1.00
Water supply volume charge EUR/m3 0.39 0.36 0.24 0.36 0.36 0.34 0.33
Wastewater charge (based on consumed water amount) EUR/m3 0.05 0.06 0.06 0.09 0.09 0.12 0.08
Commercial and Institutional consumers
Water supply monthly charge EUR/ month 3.00 3.00 3.00 3.00 3.00 3.00 3.00
Water supply volume charge EUR/m3 0.88 0.69 0.48 0.73 0.71 0.69 0.65
Wastewater charge (based on consumed water amount) EUR/m3 0.11 0.11 0.13 0.23 0.22 0.29 0.20
Tariffs applicable for 2017 2018 (1 January - 31 December 2018)
Unit RW
C P
rish
tin
a
RW
C H
idro
reg
jion
i Ju
go
r
RW
C H
idro
dri
ni
RW
C M
itro
vica
RW
C R
ado
niq
i
RW
C B
ifu
rkac
ion
i
RW
C H
idro
mo
rava
Households
Water supply monthly charge EUR/ month 1.00 1.00 1.00 1.00 1.00 1.00 1.00
Water supply volume charge EUR/m3 0.42 0.37 0.25 0.36 0.37 0.35 0.34
Wastewater charge (based on consumed water amount) EUR/m3 0.05 0.07 0.07 0.09 0.10 0.12 0.08
Commercial and Institutional consumers
Water supply monthly charge EUR/ month 2.00 2.00 2.00 2.00 2.00 2.00 2.00
Water supply volume charge EUR/m3 0.85 0.67 0.46 0.72 0.67 0.71 0.69
Wastewater charge (based on consumed water amount) EUR/m3 0.11 0.16 0.15 0.19 0.23 0.25 0.17
Tariffs for 2019 without inflation (1 January - 31 December 2019)
Unit RW
C P
rish
tin
a
RW
C H
idro
reg
jion
i Ju
go
r
RW
C H
idro
dri
ni
RW
C M
itro
vica
RW
C R
ado
niq
i
RW
C B
ifu
rkac
ion
i
RW
C H
idro
mo
rava
Households
Water supply monthly charge EUR/ month 1.00 1.00 1.00 1.00 1.00 1.00 1.00
Water supply volume charge EUR/m3 0.4129 0.3577 0.2428 0.3483 0.3605 0.3404 0.3312
Wastewater charge (based on consumed water amount) EUR/m3 0.0461 0.1277 0.0674 0.0870 0.1005 0.1138 0.0745
Commercial and Institutional consumers
Water supply monthly charge EUR/ month 2.00 2.00 2.00 2.00 2.00 2.00 2.00
Water supply volume charge EUR/m3 0.7433 0.6438 0.4371 0.6270 0.6489 0.6127 0.5962
Wastewater charge (based on consumed water amount) EUR/m3 0.1032 0.2810 0.1483 0.1913 0.2211 0.2503 0.1638

PERFORMANCE REPORT RWC - 2017
78
Tariffs for 2020 without inflation (1 January - 31 December 2020)
Unit RW
C P
rish
tin
a
RW
C H
idro
reg
jion
i Ju
go
r
RW
C H
idro
dri
ni
RW
C M
itro
vica
RW
C R
ado
niq
i
RW
C B
ifu
rkac
ion
i
RW
C H
idro
mo
rava
Households
Water supply monthly charge EUR/ month 1.00 1.00 1.00 1.00 1.00 1.00 1.00
Water supply volume charge EUR/m3 0.4089 0.3505 0.2358 0.3409 0.3551 0.3310 0.3246
Wastewater charge (based on consumed water amount) EUR/m3 0.0452 0.1238 0.0674 0.0870 0.1533 0.1138 0.0720
Commercial and Institutional consumers
Water supply monthly charge EUR/ month 2.00 2.00 2.00 2.00 2.00 2.00 2.00
Water supply volume charge EUR/m3 0.6542 0.6309 0.4245 0.5454 0.6392 0.5296 0.5194
Wastewater charge (based on consumed water amount) EUR/m3 0.1012 0.2724 0.1483 0.1913 0.3372 0.2503 0.1584

PERFORMANCE REPORT RWC - 2017
79
ANNEX 5: Summary of performance indicators -2017
Indicators Prishtina Hidroregjioni Hidrodrini Mitrovica Radoniqi Bifurkacioni Hidromorava Sector
Water service coverage (%) 100% 70% 100% 76% 100% 93% 75% 94%
Wastewater service coverage (%) 100% 62% 44% 59% 72% 81% 65% 74%
Water production (l/p/d) 244 199 313 448 260 140 236 256
Water sales (l/p/d) 105 84 113 209 138 63 104 111
Billed water for households (l/d) 83 70 89 101 115 55 90 84
Billed water for households (%) 79% 84% 79% 88% 83% 88% 87% 82%
Billed water for industrial – commercial consumers (%)
11% 8% 10% 4% 9% 8% 9% 9%
Billed water for institutional consumers (%)
9% 8% 11% 7% 8% 4% 5% 9%
Non-revenue water (%) 57% 58% 64% 62% 47% 55% 56% 58%
Failed tests in total (%) 0.3% 0% 0% 0% 0% 1.6% 0.3% 0.2%
Percentage of read consumption (%)
97% 89% 98% 78% 96% 87% 87% 92%
Efficiency of total staff ('000 consumers)
4.1 7 4.7 8.1 7.5 7.7 5.7 5.7
Operational expenses(€/m3/produced)16
0.17 0.18 0.09 0.11 0.18 0.18 0.17 0.15
Operational expenses (€/cons.)- water
71 67 49 88 76 51 55 67
Operational expenses (€/cons.)-wastewater
0.12 11 8.97 4.52 4.75 8.56 4.56 4.42
Capital expenses (€/cons.)- water 320 5 11 413 34 8 1 164
Sales income (€/cons.)- wastewater
100 81 72 91 98 62 67 87
Sales income (€/cons.)- wastewater
11.1 10.9 15.5 21.5 20.8 18.8 13.8 14.2
No. of service complaints ('000 cons.)
61 54 31 234 14 10 10 59
Collection (%) 88% 95% 80% 56% 87% 81% 79% 84%
Collection rate - households (%) 85% 98% 78% 48% 88% 81% 76% 81%
Collection rate - commercial/industrial consumers
90% 69% 88% 68% 83% 95% 93% 86%
Collection rate- institutional consumers
98% 108% 80% 97% 83% 57% 89% 94%
Labour coverage norm 1.35 1.13 1.20 0.65 1.22 1.04 1.08 1.17
16This indicator takes into account all operating costs for water supply services (e.g. production, distribution and business activity), which differs from the indicator presented in this report in the part of the costs, which indicator is based only on operating costs for production of water.

PERFORMANCE REPORT RWC - 2017
80
ANNEX 6: Statistical data - 2017
Data Prishtina Hidroregjioni Hidrodrini Mitrovica Radoniqi Bifurkacioni Hidromorava Total
Produced water (m3) 52,087,383 17,482,425 25,659,957 27,833,955 14,981,619 7,469,234 8,705,458 154,220,031
No. of consumers total-water
127,635 45,997 45,495 29,929 35,887 26,378 26,833 338,154
Total consumers with meters
125,006 43,884 44,361 21,076 35,316 24,620 24,430 318,693
Complaints - Water 7,846 2,465 1,394 7,001 498 275 280 19,759
Operational expenses - Water
9,091,342 3,097,972 2,233,460 2,632,101 2,737,313 1,350,532 1,471,911 22,614,631
Capital expenses- Water
40,837,387 218,514 496,065 12,374,820 1,218,384 205,964 35,756 55,386,890
Capital expenses from RWC- Water
28,633,745 202,308 310,247 0 628,016 59,390 35,756 29,869,462
Quantity of billed water m3 22,330,162 7,366,856 9,269,795
5,840,894 10,698,36217
7,964,028 3,334,842 3,830,792 64,794,837
Billed water for consumers with meters
21,549,692 6,587,708 9,086,770 3,522,956 7,606,881 2,914,256 3,327,436 54,595,699
Income from fixed tariffs
1,848,570 677,021 643,737 408,306 513,418 372,409 365,366 4,828,827
Total revenues for water supply
10,942,728 3,042,624 2,640,269 2,323,975 2,986,619 1,258,794 1,423,540 24,618,549
Other operational expenses- Water
169,384 85,319 24,229 19,125 60,123 12,193 65,070 435,444
No. consumers-Wastewater
112,049 41,403 23,226 23,748 25,745 23,155 24,335 273,661
No. of Complaints- Wastewater
3,551 605 0 1,437 166 23 964 6,746
Operational expenses for services of Wastewater
168,076 459,645 221,616 201,223 197,187 275,508 146,730 1,669,985
Total capital expenses- Wastewater
219,349 8,102 93,688 1,994 33,424, 10,688 2,274 369,519
Total capital expenses by RWC - Wastewater
217,250 6,967 93,688 0 18,838 10,688 2,274 349,705
Invoicing m3 for services of Wastewater
19,622,699 6,562,592 4,610,058 4,515,332 4,927,342 3,024,328 3,495,895 46,758,246
Incomes from sales - Wastewater.
1,242,956 451,463 360,855 510,598 534,634 436,364 336,171 3,873,041
Other operational Incomes - Wastewater
16,750 4,114 16,153 12,750 6,740 8,368 957 65,832
17 In the amount of 10,698,362, including billing for the northern part

PERFORMANCE REPORT RWC - 2017
81
Total expenses for Water and Wastewater
9,259,418 3,557,617 2,455,076 2,833,324 2,934,500 1,626,040 1,618,641 24,284,616
Total collected cash 12,348,231 3,946,679 2,914,263 1,811,478 3,512,467 1,672,184 1,687,392 27,892,694
Total staff 529 324 212 243 270 204 154 1,936
Total population 500,315 343,848 224,257 184,724 153,451 158,552 134,797 1,699,944
Population coverage with water services
585,369 240,694 224,257 140,390 158,055 145,868 101,098 1,595,730
Population coverage with wastewater services
505,318 213,186 98,673 107,140 109,768 128,427 87,618 1,250,130
Length of water system
1,892 509 970 856 741 350 285 5,603
Length of wastewater system
1,093 270 160 235 81 238 285 2,362

PERFORMANCE REPORT RWC - 2017
82
APPENDIX 7: CONTACT DETAILS
Regional Water Companies
Water Service Regulatory Authority
WSRA Name Phone No. E-mail address Address
Director Raif Preteni 038/249 165 111 [email protected] Str. Ali Pashë Tepelena, Prishtina, 10000
Deputy Director Xhelal Selmani 038/249 165/114 [email protected] Str. Ali Pashë Tepelena, Prishtina, 10000
Head of Law and Licensing Department
A.Behxhet Bala 038/249 165/112 behxhet.bala@ arru-rks.org Str. Ali Pashë Tepelena, Prishtina, 10000
Head of Performance and Monitoring Department
Qamil Musa 038/249 165/121 qamil.musa@ arru-rks.org Str. Ali Pashë Tepelena, Prishtina, 10000
Head of Tariff Regulatory Finances Department
Refik Rama 038/249 165/120 refik.ramaj@ arru-rks.org Str. Ali Pashë Tepelena, Prishtina, 10000
Head of Administration and Finances Department
Ramiz Krasniqi 038/249 165/110 ramiz.krasniqi@ arru-rks.org Str. Ali Pashë Tepelena, Prishtina, 10000
Contact person for consumers
Behxhet Bala 038/249 165/101 [email protected] Str. Ali Pashë Tepelena, Prishtina, 10000
Customers Consultative Committees
CCC Name Position Municipality E-mail
CCC Prishtina Avdi Gjonbalaj Chairperson Prishtina [email protected]
CCC Prizren Merita Gorani Chairperson Prizren [email protected]
CCC Peja Ilirjana Dukaj Chairperson Pea [email protected]
CCC Mitrovica Adem Kërleshi Chairperson Mitrovica [email protected]
CCC Gjakova Erlinda Rizvanolli Chairperson Gjakova [email protected]
CCC Ferizaj Ilmi Mustafa Chairperson Ferizaj [email protected]
CCC Gjilan Dritë Kajtazi Chairperson Gjilan [email protected]
RWC Chief Executive Officer
Phone No. E-mail address Address
RWC Prishtina (Prishtina)
Ilir Avdullahu
038/540 749 ext.128
[email protected] Str. Tahir Zajmi, PN , Prishtinë 10000
RWC Hidroregjioni Jugor (Prizren)
Besim Baraliu 029/244 150 [email protected] Str . Vatra Shqiptare, Prizren, 20000
RWC Hidrodrini (Peja) Agron Tigani 039/432 355 [email protected] Str . Lekë Dukagjini, no.156, Peja 30000,
RWC Mitrovica (Mitrovica)
Sami Miftari 028/533 707 [email protected] Str . Bislim Bajgora , NN, Mitrovica 40000
RWC Radoniqi (Gjakova)
Ismet Ahmeti 0390/320 503 [email protected] Str . UÇK, no.07, Gjakova, 50000
RWC Hidromorava (Gjilan)
Muhamed Suliqi 0280/321 104 [email protected] Str . UÇK, NN, Gjilan 60000
RWC Bifurkacioni (Ferizaj)
Xhabir Morina 0290/320 650 [email protected] Str . Enver Topalli, no.42/A, Ferizaj, 70000
NPH Ibër-Lepenc Berat Lushtaku 038/225 007 [email protected] Rr. Bill Klinton no.13, Prishtina, 10000

PERFORMANCE REPORT RWC - 2017
83
APPENDIX 8: SERVICE AREAS OF WRC
18 Although in the service area of the RWC “Hidroregjioni Jugor”, due to lack of water capacity, the customer of the municipality of Mamusha currently do not relieve water supply serviles from this company
RWC Prishtina
RWC Hidroregjioni jugor
RWC Hidrodrini
RWC Mitrovica
RWC Radoniqi
RWC Bifurkacioni
RWC Hidromorava
Municipalities nut covered by the RWCs’ services
Prishtinë Podujevë Fushë Kosovë Obiliq Lipjan Drenas Shtime Graçanicë
Prizreni Suhareka Malisheva Dragashi Mamusha 18
Pejë Klinë Istog Junik Deçan
Mitrovicë Skënderaj Vushtrri
Gjakova Rahoveci Prizren (disa fshatra)
Ferizaj Kaçanik
Gjilani Kamenica Vitia
Novobërda Zubin Potoku Leposaviçi Zveçani Shtërpce, Hani i Elezit, Partesh, Rani llug, Mitrovica e Veriut, Kllokot
RWC
Prishtina
RWC
HidroregjioniJugor
RWC
Hidrodrini
RWC
Mitrovica
RWC
Radoniqi
RWC
Bifurkacioni
RWC
Hidromorava
-Prishtina
-Podujeva
-Fushë Kosova
-Obiliçi-Lipjani
-Shtimja
-Drenasi
-Graqanica
-Prizreni
-Suhareka
-Malisheva-Dragashi
-Mamusha
-Peja-Istogu
-Klina
-Juniku
-Mitrovica
-Skenderaj
-Vushtria
-Gjakova-Rahoveci
-Ferizaj -Gjilani-Kamenica
-Vitia
-Novoberda
-Zubin Potoku
-Leposaviqi
-Shtërpca
-Deqani
-Kaçaniku
-Zveçani
Municipalities
that are not
provided with
water service
RWC
Prishtina
RWC
Mitrovica
RWC
Hidrodrini
RWC
Radoniqi
RWCHidroregjioni
Jugor
RWC
Bifurkacioni
RWC
Hidromorava