Embed Size (px)
Citation preview

to 31 December 2014
nopsema.gov.au
Annual offshore performance report
Regulatory information about the Australian offshore petroleum industry

Preface
Welcome to the Annual Offshore Performance Report published by the National Offshore Petroleum Safety and Environmental Management Authority (NOPSEMA). This report contains data gathered through NOPSEMA’s regulatory functions covering occupational health and safety, well (structural) integrity and environmental management of offshore petroleum facilities and activities in Commonwealth waters (and coastal waters where functions had been conferred) to 31 December 2014.
Copies of this report are available to download at nopsema.gov.au or by contacting:
NOPSEMA Communications
GPO Box 2568 Perth WA 6001
phone: +61 8 6188 8700email: [email protected]
© Commonwealth of Australia 2015
This report contains data gathered through the exercise of NOPSEMA’s regulatory powers and functions in Commonwealth waters (and coastal waters where powers and functions have been conferred) under the Offshore Petroleum and Greenhouse Gas Storage Act 2006. The report is intended to provide general information only and its contents should not be relied on as advice on the law, nor treated as a substitute for professional advice. Every effort has been made to ensure the accuracy of the material contained in the report.
NOPSEMA, on behalf of the Commonwealth disclaims to the extent permitted by law, all liability (including negligence) for claims of losses, expenses, damages and costs that may be incurred as a result of information in this report. Reference to the Commonwealth includes a reference to any contractor, agent or employee of the Commonwealth.

nopsema.gov.au 1
Contents
Message from the Chief Executive Officer 2
Executive summary 4
Introduction 6
1. Industry activity 91.1 Duty holders, facilities, wells and petroleum activities 101.2 Hours worked offshore 12
2. Fatalities and injuries 142.1 Fatalities 152.2 Major injuries 152.3 Total recordable cases 152.4 Lost time injuries 162.5 Alternative duties injuries 162.6 Medical treatment injuries 172.7 Injuries by facility type 182.8 Injury classification 19
3. Incidents 203.1 Occupational health and safety incidents 213.2 Spotlight on hydrocarbon releases 233.3 Environmental incidents 243.4 Occupational health and safety incident root causes 26
4. Complaints 305. Investigations 33
5.1 Investigations of accidents and dangerous occurrences 345.2 Investigations of environmental management 39
6. Assessment and submission 426.1 Submission types 42
6.2 Assessment notification time 44
6.3 Assessment outcomes 44
6.4 Spotlight on environment plan assessment timeframes 47
7. Inspections 487.1 Number of inspections 48
7.2 Inspection scopes 49
7.3 Occupational health and safety inspections 49
7.4 Environmental management inspections 50
8. Topic-based inspections 518.1 Blowout preventer and associated well control equipment 51
8.2 Control of ignition sources – hazardous area equipment 53
8.3 Performance standards 56
8.4 Operator auditing 58
8.5 Consultation with relevant persons 59
9. Enforcements 609.1 Enforcement action types 61
Appendix 1. 64Appendix 2. 66Appendix 3. 67Appendix 4. 68Glossary 76References 80
Contents

ANNUAL OFFSHORE PERFORMANCE REPORT 20142
Message from the Chief Executive Officer
As the national regulator for offshore petroleum and greenhouse gas storage safety, well integrity and environmental management, NOPSEMA is committed to working with industry to drive improved performance and to further reduce the impact of petroleum activities on human health and safety and the environment. Understanding industry performance is an essential element in identifying areas for potential improvement. NOPSEMA’s Annual offshore performance report contributes to this understanding by providing the industry, the offshore workforce and the wider community with key performance indicator data. This data is gathered by NOPSEMA from industry submissions such as incident and injury reports, and through the exercise of our regulatory functions. Sharing this data benefits everybody by helping to identify patterns and trends that inform where best to focus resources to drive improved safety and environmental outcomes.
Industry performance in 2014 was encouraging, with reductions in the number of reportable incidents, dangerous occurrences, accidents and reportable environmental management incidents. These positive results are especially pleasing given the upward trend in total hours worked offshore.
It is also pleasing that the rate of occurrences for damage to safety critical equipment and other incidents requiring immediate attention has improved in recent years. However, the occurrence of unplanned events requiring the implementation of emergency response plans has been trending upward for the past decade. This trend could be due to a number of factors. For example, the ageing nature of facilities in some parts of Australia mean they can be more vulnerable to unplanned events. The data provides some support for this hypothesis as a significant number of unplanned events occurred on ageing facilities.
Ageing facilities also place an increased burden on resources as they often require more maintenance and repair. Deficient preventive maintenance is a major cause of occupational health and safety incidents, being the second largest cause in 2014. It also has the potential to create environmental impacts, as has been seen with unplanned hydrocarbon releases from ageing pipeline infrastructure. It is crucial that operators of aged or ageing facilities ensure that integrity management systems and processes are applied robustly together with regular audits to ensure their continued quality and effectiveness.
The continued high rating for preventive maintenance as a root cause of incidents leads me to another issue that warrants attention, namely the industry response to falling oil and gas prices. As previously mentioned, NOPSEMA analyses a wide range of data to identify emerging trends and bring them to the attention of industry. The data we consider includes anecdotal experience which we then seek to verify (or refute) using hard data. Anecdotal experience from some other jurisdictions internationally suggests that industry maintenance performance often drops around four to six months after a large fall in the oil price.
NOPSEMA has drawn attention to this correlation by raising it with industry leaders and the media to alert industry, the workforce and other stakeholders to the need for vigilance. We have also been reviewing our data to see if this experience has been replicated in Australia. I am pleased to report that this has not been the case historically and the evidence does not suggest the emergence of a correlation in Australia with the current downturn in prices. Industry can be proud of its efforts in Australia to maintain safety performance as financial pressures increase. The community can also take some comfort in this data as the offshore oil and gas industry grapples with the difficulties of low prices.
Nevertheless, NOPSEMA will continue to monitor this issue and duty holders should keep in mind that any changes in processes that have to be made as a result of reduced budgets should not compromise safety and environmental outcomes in any way.

nopsema.gov.au 3
Message from the Chief Executive Officer
The data is less encouraging in regard to uncontrolled hydrocarbon releases reported to NOPSEMA. The majority of these releases during 2014 were in the lower release category of 1-300kg, however the releases are still a concern due to the risk of ignition and potentially serious OHS and environmental consequences. Accordingly, it is a reminder for industry to lift performance and ensure compliance with commitments made in safety cases, well operations plans and environment plans.
NOPSEMA actively inspects industry compliance with legislative duties and will continue to focus on areas where industry can improve. In 2014 NOPSEMA conducted the highest number of inspections since its establishment in 2005. This upward trend is expected to continue as NOPSEMA maintains safety and integrity oversight and increases environmental management inspections.
I am also pleased to report that environmental assessment timeframes have continued to fall, with 2014 seeing a 40% decrease on 2013 timeframes. This reduction can be attributed to both higher quality submissions from titleholders, which reflect a greater understanding within the industry of environment plan content requirements, as well as regulatory amendments that allow NOPSEMA to request further information whilst assessing a submission.
The reduction is also pleasing considering the environmental streamlining that occurred in 2014, whereby NOPSEMA became the sole regulator for petroleum activities in Commonwealth waters, taking over the approvals previously granted by the Department of the Environment under the Environment Protection and Biodiversity Conservation Act 1999. NOPSEMA is committed to reducing duplication and regulatory burden through streamlining and simplifying regulatory requirements. We will continue to work with industry and other stakeholders to consolidate current industry and regulatory practice.
I would like to reiterate that improvement is a shared responsibility between industry and NOPSEMA. I encourage everyone involved in the offshore petroleum industry to share the findings in this report so that together we can continue to drive improvement and excellence in Australia’s offshore petroleum industry.
Stuart SmithCEO National Offshore Petroleum Safety and Environmental Management Authority
... duty holders should keep in mind that any changes in processes that have to be made as a result of reduced budgets should not compromise safety and environmental outcomes in any way.

ANNUAL OFFSHORE PERFORMANCE REPORT 20144
Executive summary
It should be noted that all annual data in this publication refers to the relevant calendar year (i.e. for the period 1 January to 31 December 2014).
Industry activity
The number of reported hours worked offshore increased from 13.4 million in 2013 to 14.3 million in 2014. They included:
• 35 facility operators across 148 active facilities, such as pipelines and production platforms• 26 titleholders undertaking 119 petroleum activities.
Fatalities and injuries
In 2014, there were no fatalities.
Nineteen injuries were reported on mobile offshore drilling units (MODUs), the highest number of injuries suffered by the offshore workforce across all facility types.
The rate of injuries requiring three or more days off work decreased to 0.49, the lowest level recorded since 2005.
Incidents
In 2014, the rate of accidents reached the lowest level recorded since 2005, at 0.49 per million hours worked offshore.
Dangerous occurrence numbers dropped by 15 (4%) from 356 in 2013 to 347 in 2014.
The number of uncontrolled hydrocarbon releases increased from 20 in 2013 to 25 in 2014.
Complaints about industry
Four complaints about duty holder performance were made to NOPSEMA during 2014. Of these complaints, two related to health and safety matters and two related to environmental management matters.

Executive summary
Investigations
Two major investigations into separate accidents have been completed, including the investigations into the death of two offshore workers during drilling operations on the Stena Clyde mobile offshore drilling unit in 2012. Both investigations have proceeded to prosecution proceedings in Magistrate’s Courts.
NOPSEMA also investigated:
• 7 high risk category incidents• 3 instances were information was provided to NOPSEMA• 2 complaints• 1 reportable environmental incident.
Assessments and submissions
Duty holders made a total of 469 submissions to NOPSEMA in 2014:
• 165 related to occupational health and safety • 163 related to well integrity and well activities• 75 related to environmental management• 10 related to petroleum safety zones• 56 related to regulatory advice sought by other agencies.
Inspections
In 2014, NOPSEMA conducted 146 inspections, covering a total of 202 facilities, titles, wells and petroleum activities, to determine compliance by offshore petroleum duty holders for risk management and impacts on health and safety, well or structural integrity and the environment.
Enforcements
NOPSEMA issued 26 enforcement actions against 14 operators, titleholders or activity operators in 2014, comprising:
• 13 improvement notices• 7 written advice or warnings• 4 prohibition notices• 2 prosecution briefs.
nopsema.gov.au 5

ANNUAL OFFSHORE PERFORMANCE REPORT 20146
Introduction
Background
NOPSEMA is Australia’s independent regulator of offshore petroleum and greenhouse gas storage health and safety, well integrity and environmental management. Following government acceptance of recommendations made by the Montara Commission of Inquiry, the remit of the National Offshore Petroleum Safety Authority (NOPSA) was expanded to establish NOPSEMA on 1 January 2012.
NOPSEMA is responsible for regulating offshore petroleum and greenhouse gas storage activities. NOPSEMA’s role includes:
• working with the industry, workforce, stakeholders and other authorities to ensure the offshore petroleum and greenhouse gas storage industry properly controls all safety, integrity and environmental risks
• independently administering offshore petroleum safety, well integrity and environmental management legislation
• promoting a legislative framework that encourages continuous improvement of safety, well integrity and environmental performance of the offshore petroleum industry
• developing its people, processes and systems to deliver efficient and effective regulation.
By law, offshore petroleum activities cannot commence before the duty holder has demonstrated to NOPSEMA’s satisfaction that the relevant risk management requirements will be met. This is achieved through NOPSEMA’s assessment of the duty holders’ documented submissions, which must demonstrate that risks to health and safety will be reduced to as low as reasonably practicable (ALARP), and impacts and risks to the environment will be reduced to ALARP and acceptable levels.
Jurisdiction for safety, well integrity and environmental management
Note: State and Northern Territory coastal waters conform more or less to the Australian continent and associated islands. Commonwealth waters extend seaward from the edge of the three nautical mile limit of designated coastal waters, to the outer extent of the Australian Exclusive Economic Zone at 200 nautical miles.
Figure 1.
NOPSEMACommonwealth waters
State waters
Relevant State/NT ministeror
NOPSEMA where powers and functions conferred

nopsema.gov.au 7
Introduction
The key risk management regulatory documents submitted by duty holders to NOPSEMA are:
• Safety case – covering an operator’s management of health and safety risk• Well operations management plan (WOMP) – covering a titleholder’s
management of risk from well activities• Environment plan – covering a titleholder’s management of impacts and
risks to the environment.
NOPSEMA’s jurisdiction covers all offshore petroleum facilities and activities in Commonwealth waters, as well as designated coastal waters where regulatory functions have been conferred. Jurisdictions where powers to regulate are not conferred remain the responsibility of the relevant state or Northern Territory (NT). Currently Victoria has conferred OHS and well integrity to NOPSEMA.
NOPSEMA makes regulatory decisions according to processes, criteria and legislated functions under the Offshore Petroleum and Greenhouse Gas Storage Act 2006 (OPGGS Act) and associated Regulations.
NOPSEMA publishes its corporate plan, annual report, industry performance data, guidance on NOPSEMA’s approach to administering the legislation, safety alerts and other publications and reports at nopsema.gov.au.
ScopeThis Annual offshore performance report includes information collected by NOPSEMA (and NOPSA) in the exercise of its functions and powers within its jurisdiction from 1 January 2005 to 31 December 2014. The information has been obtained through the full range of NOPSEMA’s regulatory activities, including inspections and investigations, and for the period in which its legislated functions were in place.
NOPSEMA publishes this information collected under the OPGGS Act and associated Regulations as part of its role to promote compliance by, and share lessons learnt with, the offshore petroleum industry.
Data qualityNOPSEMA has made every endeavour to ensure the data included in this report is accurate at the time of publication. Possible under-reporting, the subjective nature of qualitative data and legislative amendments may have influenced the results. Data is also subject to vary as further information becomes available and any significant variations are noted accordingly within the document.
Both numbers and rates are variously discussed throughout this report to gain additional clarification. ‘Rates per million hours worked’ is an industry standard, and are calculated by dividing the total number against the total reported hours worked offshore and standardising to one million hours. These allow better comparison between operators and facilities and over time allows for the identification of trends. The total number of an incident type for example, may increase from one year to the next but may not be of concern if there is also a proportionate increase in the amount of offshore hours worked. In this instance, the total number would increase but the incident rate would remain the same.
Percentages are used in selected charts and data tables to assist with comparisons over time and to highlight proportions. Totals may not always equal 100% due to rounding (decimal points) or because not all categories may be included in the topic under discussion, often only the top five or six categories of concern are discussed to maintain brevity.
Brief accompanying text is provided for charts and tables to assist in conveying the statistical information presented in this report. NOPSEMA cautions against extrapolation of the data.

Introduction
Our VisionSafe and environmentally responsible Australian offshore petroleum and greenhouse gas storage industries.
Our MissionTo independently and professionally regulate offshore safety, well integrity and environmental management.
Our Values• Professional – we will at all times be objective, accountable and
maintain a high degree of professionalism in our interaction with each other and with stakeholders.
• Ethical – we will demonstrate leadership, respect and integrity in all we do.
• Independent – we will make our decisions impartially, efficiently and in accordance with the law.
NOPSEMA’s jurisdiction covers all offshore petroleum facilities and activities in Commonwealth waters, as well as designated coastal waters where regulatory functions have been conferred.
ANNUAL OFFSHORE PERFORMANCE REPORT 20148

nopsema.gov.au 9
1. Industry activity
NOPSEMA collects data relating to offshore petroleum industry activity using the reports and submissions it receives from industry, supplemented with other information. The total reported hours worked offshore on mobile and fixed facilities in 2014 was 14.3 million, up from 13.4 million in 2013.
An offshore petroleum duty holder making submissions to NOPSEMA may be:
• an operator of a facility (i.e. the organisation responsible for the day-to-day management and control of a facility)
• a titleholder (i.e. the organisation that holds a permit to conduct offshore petroleum activities, such as drilling and production).
Operators are responsible for making submissions under OHS related legislation, whilst titleholders are responsible for making submissions under environment management and well operations related legislation.
NOPSEMA divides offshore petroleum industry activity into categories according to:
• the type of facility being operated (e.g. pipeline, production platform, fixed or mobile facility)
• the type of activity being carried out (e.g. drilling, seismic survey, production)• the regulatory permission or document covering a facility or activity
(e.g. safety case, WOMP, environment plan etc.).
Activity overview 2014:
• The number of duty holders actively operating offshore facilities increased from 32 in 2013 to 35 in 2014
• Of the 148 facilities operating in NOPSEMA’s jurisdiction in 2014, pipelines accounted for 51%, followed by production platforms (manned and not normally manned) at 22%
• The number of petroleum activities authorised through accepted environment plans decreased from 192 in 2013 to 119 in 2014
• The number of titleholders that had environment plans accepted decreased from 38 in 2013 to 26 in 2014.
Industry activity and regulatory submissions
Category Type 2013 2014
Occupational health and safety (OHS)1 Active facility operators
32 35
Active facilities 141 148
Environmental management (EM)2 Titleholders 38 26
Activities 192 119
Table 1.
1 Based on the number of distinct facility operators and facilities that submitted monthly injury reports to NOPSEMA. 2 Based on the number of distinct titleholders and activities from accepted environment plans. An environment plan can contain more than one activity, and for the purposes of this report activities are counted according
to Environment Plan Levy categories (from the Offshore Petroleum and Greenhouse Gas Storage (Regulatory Levies) Regulations 2004).

Industry activity
1.1 Duty holders, facilities, wells and petroleum activities
NOPSEMA refers collectively to the parties with legislated responsibilities under the OPGGS Act as ‘duty holders’.
Active duty holder The number of active facility operators registered with NOPSEMA increased from 32 to 35 in 2014. Facility operators are classified as ‘active’ based on their submission to NOPSEMA of one or more monthly injury summary reports during a reporting period. Facility operators classified as ‘inactive’ may be registered with NOPSEMA, but not undertaking offshore petroleum activity in NOPSEMA’s jurisdiction in a given period. For more information about NOPSEMA’s OHS regulatory activities, see the ‘Safety resources’ page at nopsema.gov.au.
There were 31 active titleholders who made WOMP or well activity submissions in 2014, compared to 28 in 2013.
There were 32 titleholders conducting, or due to conduct, petroleum activities under an accepted environment plan in 2014, compared to 43 in 2013.
FacilitiesThere were 148 active facilities under NOPSEMA’s jurisdiction in 2014, an increase from 141 in 2013. The number of offshore petroleum facilities operating under NOPSEMA’s jurisdiction fluctuates depending on a number of factors, such as mobile facilities entering and departing the jurisdiction, or whether a state or territory has conferred functions on NOPSEMA to regulate in designated coastal waters.
Facility types under NOPSEMA jurisdiction – 2014
Pipeline 76
Production platform (normally attended and not normally attended) 32
Floating (production) storage and offloading facility (FPSO, FSO) 11
Accommodation, construction and pipelay vessel (Vessels) 17
Mobile offshore drilling unit (MODU) 12
Table 2.
3 ‘Titleholders’ data is not available for all years. NOPSEMA commenced regulating well integrity from April 2011 and environmental management from 1 January 2012.
Figure 2.3
ANNUAL OFFSHORE PERFORMANCE REPORT 201410

Industry activity
WellsNOPSEMA is responsible for assessing applications for approval to undertake well activities (AAUWAs) and WOMPs submitted by titleholders. NOPSEMA identifies titles and wells, and categorises well activities from these submissions according to the Offshore Petroleum and Greenhouse Gas Storage (Resource Management and Administration) Regulations 2011.
Petroleum activitiesA total of 119 petroleum activities were authorised through accepted environment plans in 2014. Of these, 42% were operations of production facilities or pipelines, 19% were ‘other petroleum activities’ such as repairs to subsea installations, production cessation and non-production phases prior to decommissioning, 16% were drilling activities, 14% were seismic surveys, 7% were geophysical or geotechnical surveys and 2% were construction activities. Overall, this number of activities represented a decrease of 38% from the 192 petroleum activities authorised through accepted environment plans in 2013.
NOPSEMA categorises petroleum activities according to those listed in the Offshore Petroleum and Greenhouse Gas Storage (Regulatory Levies) Regulations 2004.
For more information about NOPSEMA’s environmental management regulatory functions, see the ‘Environmental resources’ page at nopsema.gov.au.
4 An increase in facility numbers in 2007 and 2010 reflects legislative changes requiring submission by duty holders of a pipeline management plan (2007) and separate categories for state and Commonwealth pipeline licences (2010). The decrease in the number of facilities recorded in 2012 reflects changes to conferral arrangements for offshore petroleum facilities in Western Australian designated coastal waters.
Figure 3.4
Figure 4.
nopsema.gov.au 11

Industry activity
1.2 Hours worked offshoreBased on regulatory (injury summary) reports submitted by industry to NOPSEMA, the number of hours worked offshore increased 7% from 13.4 million in 2013 to 14.3 million in 2014.
In 2014, 66% of the hours worked took place on mobile facilities and 34% on fixed facilities.
5
Annual total hours worked offshore
Year Number
2005 9 713 226
2006 10 001 240
2007 11 220 997
2008 12 994 161
2009 14 742 651
2010 13 412 651
2011 14 139 881
2012 15 683 057
2013 13 358 703
2014 14 342 211
Table 3.
Figure 5.
Image courtesy of Polarcus Limited.
ANNUAL OFFSHORE PERFORMANCE REPORT 201412

ANNUAL OFFSHORE PERFORMANCE REPORT 201414
2. Fatalities and injuries
NOPSEMA notes that the rate of injuries per million hours worked has again declined across all categories, including major injuries with the lowest rate recorded since the commencement of this data set. However, offshore workers continue to suffer work related injuries preventing them from performing their normal duties. MODUs have consistently accounted for the highest number of injuries suffered by the offshore workforce across all facility types, followed by production platforms. Duty holders must continue to strive for better health and safety outcomes for offshore workers.
NOPSEMA compiles injury data from mandatory monthly reports submitted by operators to NOPSEMA. By law, the injury summary reports cover all fatalities, injuries, illness and disease suffered by workers offshore requiring medical treatment or time off regular duties. The injury summary reports are distinct from notifications of accidents and dangerous occurrences, which must be made to NOPSEMA as soon as reasonably practicable following the event. See Chapter 3 for more information about accidents and dangerous occurrences.
While injury rates are not necessarily an indicator of major accident events, the lowering of injury rates since 2008 should still be commended as this represents actual harm avoided and demonstrates continuing efforts by operators in keeping the workforce injury free. NOPSEMA calculates the injury rate by taking the total number of injuries recorded against the total hours worked and then standardising to one million hours. This allows for direct comparison between years. The average number of injuries reported per year since 2005 is 121.

Fatalities and injuries
2.1 FatalitiesThere were no offshore fatalities in 2014.
In 2014 NOPSEMA completed its investigation into the double fatality on the Stena Clyde MODU in the Bass Strait on 27 August 2012. Legal proceedings commenced through the Magistrates’ Court of Victoria with the assistance of the Commonwealth Director of Public Prosecutions (CDPP) for specific breaches of the OPGGS Act. More information about NOPSEMA’s independent investigation into the accident and preliminary considerations is available at nopsema.gov.au. See also Chapter 5.
2.2 Major injuriesThere was one major injury recorded in 2014. See Chapter 5 for more information on NOPSEMA’s investigations.
The rate of major injuries has fluctuated between 0.07 and 0.92 per million hours worked. Since 2008, the rate has trended downwards to a low of 0.07 in 2014.
2.3 Total recordable casesTotal recordable cases (TRCs) are calculated by adding the number of lost time injuries (LTIs), alternative duties injuries (ADIs) and medical treatment injuries (MTIs).
In summary: TRCs = LTIs + ADIs + MTIs.
The total number of injuries reported for 2014 was 58, of which 44% were ADIs i.e. a work-related injury that is not major and results in the worker not being fit to perform their regular job. See 2.5 below for more information on ADIs.
The rate of total recordable cases decreased to 4.04 in 2014. This represents the lowest number since recording commenced. See Appendices 1 and 2 for more information about the classification of injuries and groups.
Figure 8.
Figure 6.
Figure 7.
nopsema.gov.au 15

Fatalities and injuries
2.4 Lost time injuries
Lost time injuries ≥3 daysThe rate for LTIs requiring three or more days away from work has continued to decrease since 2010. The rate in 2014 was the lowest level recorded since recording began in 2005 at 0.49.
In 2014, seven injuries were reported in this category, accounting for 12.1% of all reported injuries5.
Lost time injuries <3 daysThe rate of LTIs requiring less than three days away from work increased slightly from zero in 2013 to 0.07 in 2014. One injury was reported in this category during 2014.
2.5 Alternative duties injuriesThe rate of injuries preventing an offshore worker from carrying out their normal duties to full capacity has remained relatively stable since 2011.
In 2014, 26 injuries in this category were reported, accounting for 45% of all reported injuries. Of these 26 injuries:
• 54% were attributed to non-powered hand tools, appliances and equipment• 42% involved the hand, fingers or thumb• 39% were wounds, lacerations, amputations or internal organ damage• 31% were traumatic joint/ligament or muscle/tendon injuries.
The rate of ADIs decreased from 1.95 per million hours in 2013, to 1.81 per million hours in 2014.
5 Injury summary reports are distinct from initial notifications of accidents and dangerous occurrences, which must be made to NOPSEMA as soon as reasonably practicable following the event. An operator may re-categorise injuries in an injury summary report as a result of increased knowledge about the impact of the event.
Figure 10.
Figure 9.
Figure 11.
ANNUAL OFFSHORE PERFORMANCE REPORT 201416

Fatalities and injuries
2.6 Medical treatment injuriesThe rate of MTIs has shown an overall decreasing trend. In 2014 it reached the lowest level recorded since 2005, at 1.60 per million hours.
There were 23 injuries reported in this category during 2014, accounting for 39.7% of all reported injuries.
Figure 12.
Image courtesy of ExxonMobil Australia.
nopsema.gov.au 17

Fatalities and injuries
2.7 Injuries by facility type
Total recordable cases by facility typeSince 2006, injuries on MODUs have typically accounted for the highest number of injuries (total recordable cases) by facility type. In 2014, 19 injuries were reported on MODUs compared to 16 on platforms, the next highest category. The number of injuries reported on FPSO/FSOs decreased from 15 in 2013 to 11 in 2014.
Injury rates by facility typeThere have been improvements in the rates of injuries recorded both in the fixed and mobile facilities categories. The TRC rate for both FPSOs (fixed) and MODUs are the lowest recorded to date, at 5.75 and 3.47 respectively.
Between 2005 and 2013, the TRC rate on FPSOs was the highest recorded for all facility types. However in 2014, there was one injury recorded whilst divers were working on a pipeline which increased the TRC rate for this facility type up to 32.73, the highest rate of all facility types. This single incident had a profound effect due to the low number of hours recorded against pipelines (being not normally attended) and may be regarded as an outlier.
The rate of injuries on vessel facilities (including pipelay and heavy-lift vessels) decreased to 2.14 in 2013, from 2.34 in 2013.
Figure 14.
Figure 15.
Figure 13.
ANNUAL OFFSHORE PERFORMANCE REPORT 201418

Fatalities and injuries
2.8 Injury classificationA review of recorded injuries reported to NOPSEMA in 2014 against the Type of Occurrence Classification System (TOOCS) used by Safe Work Australia6 shows:
Nature of injuries• 44% of injuries reported in 2014 were ‘wounds, lacerations, amputations
or internal organ damage’• 21% of reported injuries were ‘traumatic joint, ligament and muscle,
or tendon’ injuries.
Location of injuries• 46% of reported injuries were to workers’ hands. Of these, 35% were
either wounds, lacerations or amputations• 75% of ‘traumatic joint/ligament and muscle/tendon’ injuries affected
the shoulders or knees.
Mechanism of incidents• 45% of reported injuries were caused by workers being hit by moving objects• 16% of reported injuries were due to workers hitting stationary objects• 14% of reported injuries were caused by body-stressing.
Agency of injuries• non-powered hand-tools, appliances and equipment were involved in 45%
of all reported injuries.
For more information about TOOCS, go to the Safe Work Australia website.
6 NOPSEMA and Safe Work Australia operate under entirely separate legislation. NOPSEMA has no role in workers’ compensation arrangements in Australia and refers to the TOOCS system in this report as an information tool only.
Figure 16.
Figure 17.
nopsema.gov.au 19
ANNUAL OFFSHORE PERFORMANCE REPORT 201420
3. Incidents
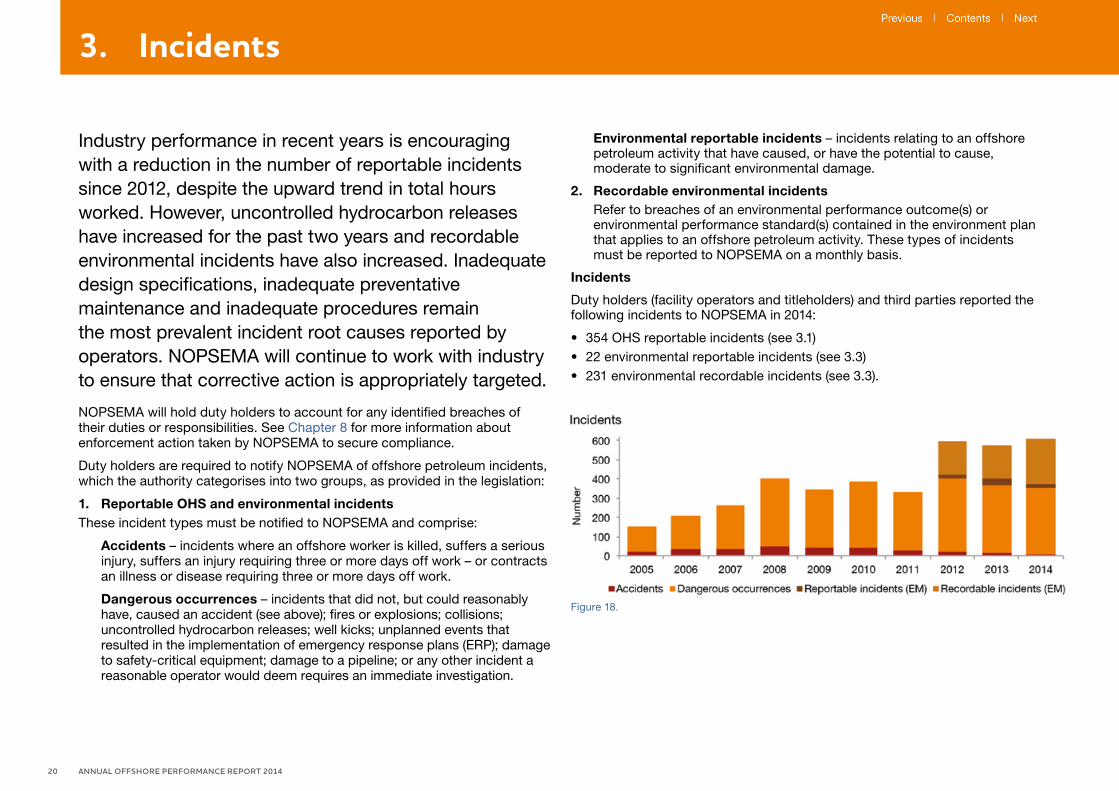
Industry performance in recent years is encouraging with a reduction in the number of reportable incidents since 2012, despite the upward trend in total hours worked. However, uncontrolled hydrocarbon releases have increased for the past two years and recordable environmental incidents have also increased. Inadequate design specifications, inadequate preventative maintenance and inadequate procedures remain the most prevalent incident root causes reported by operators. NOPSEMA will continue to work with industry to ensure that corrective action is appropriately targeted.
NOPSEMA will hold duty holders to account for any identified breaches of their duties or responsibilities. See Chapter 8 for more information about enforcement action taken by NOPSEMA to secure compliance.
Duty holders are required to notify NOPSEMA of offshore petroleum incidents, which the authority categorises into two groups, as provided in the legislation:
1. Reportable OHS and environmental incidentsThese incident types must be notified to NOPSEMA and comprise:
Accidents – incidents where an offshore worker is killed, suffers a serious injury, suffers an injury requiring three or more days off work – or contracts an illness or disease requiring three or more days off work.
Dangerous occurrences – incidents that did not, but could reasonably have, caused an accident (see above); fires or explosions; collisions; uncontrolled hydrocarbon releases; well kicks; unplanned events that resulted in the implementation of emergency response plans (ERP); damage to safety-critical equipment; damage to a pipeline; or any other incident a reasonable operator would deem requires an immediate investigation.
Environmental reportable incidents – incidents relating to an offshore petroleum activity that have caused, or have the potential to cause, moderate to significant environmental damage.
2. Recordable environmental incidents Refer to breaches of an environmental performance outcome(s) or
environmental performance standard(s) contained in the environment plan that applies to an offshore petroleum activity. These types of incidents must be reported to NOPSEMA on a monthly basis.
Incidents
Duty holders (facility operators and titleholders) and third parties reported the following incidents to NOPSEMA in 2014:
• 354 OHS reportable incidents (see 3.1)• 22 environmental reportable incidents (see 3.3)• 231 environmental recordable incidents (see 3.3).
copied from word doc
Figure 18.

nopsema.gov.au 21
3.1 Occupational health and safety incidentsOf the 354 OHS incidents reported in 2014, seven were classified as accidents and 347 as dangerous occurrences. The total number of OHS incidents represents a 4% decrease from 2013.
AccidentsThe number of accidents decreased from 13 in 2013 to seven in 2014 (46%). The accident rate for 2014 reached the lowest level recorded since 2005 at 0.49.
The seven accidents reported to NOPSEMA in 2014 comprised one serious injury and six lost time injuries requiring three or more days off duty. For more information, see Chapter 2, Chapter 5 and Appendices 1, 2 and 3.
Dangerous occurrencesCompared to 2013, the overall number of dangerous occurrences decreased by 15 (4%) to 347 in 2014. However, the rate of dangerous occurrences increased for the following incident categories:
• could have caused incapacitation ≥3 days• fire or explosion• uncontrolled HC gas release >300 kg• uncontrolled PL release >80 – 12 500 L• unplanned event – implement ERP.
7 NOPSEMA calculates incident rates by using the total number of incidents or type of incident reported divided by the total hours worked and then standardising to one million hours. This allows for direct increase in the rate of reported OHS incidents from 2005 to 2008 may reflect a combination of factors, including increased operator awareness of legislated reporting requirements and/or an increase in offshore petroleum activity.
The number of accidents decreased from 13 in 2013 to seven in 2014 (46%). The accident rate for 2014 reached the lowest level recorded since 2005 at 0.49.
Figure 19.7
Figure 20.
Incidents

Incidents
A range of incident types are categorised as dangerous occurrences, as stated in the OPGGS Act, and listed in Appendix 3.
‘Potential injuries’ comprises two dangerous occurrence categories:
Could have caused death or serious injury
Could have caused incapacity (Lost time injury>3 days).
In recent years the rate of potential injuries has exhibited a downward trend, reaching its lowest ever reported level at 2.51 in 2014 (was 3.07 in 2013).
The incident rate for marine collision decreased from 0.22 in 2013 to 0.14 in 2014. However, whilst remaining low, the rate of fires or explosions increased slightly from 0.30 in 2013 to 0.56 in 2014.
The rate of reported damage to safety-critical equipment incidents decreased from 7.41 in 2013 to 5.44 in 2014.
There was a decrease in reported incidents classified as ‘Other kind needing immediate investigation’, from 41 in 2013 to 24 in 2014, related to a variety of incidents such as dropped objects, facility integrity and spills (non-hydrocarbon). The incident rates for this category decreased from 3.07 in 2013 to 1.67 in 2014.
The rate of unplanned events requiring ERP incidents increased from 11.00 in 2013 to 12.13 in 2014.
Figure 21.
Figure 22.
ANNUAL OFFSHORE PERFORMANCE REPORT 201422

Incidents
3.2 Spotlight on hydrocarbon releases
For the second consecutive year the number of uncontrolled hydrocarbon releases reported to NOPSEMA has risen, with a 25% increase against 2013 figures (from 20 to 25). This trend is of concern due to the risk of ignition and potential OHS and environmental consequences.
The root causes reported for OHS-related uncontrolled hydrocarbon releases in 2014 indicate a need for greater focus by industry on design (37%), preventative maintenance (14%) and procedures (14%). However, it is encouraging to see a continued reduction since 2012 of releases attributed to management system issues and defective parts/equipment.
It should be noted that some reported incidents constitute both OHS and environment incidents, as the release of hydrocarbons can qualify under both sets of reporting criteria. There were five uncontrolled releases reported as both OHS and environmental hydrocarbon releases in 2014.
The majority of uncontrolled hydrocarbon releases reported in 2014 occurred at fixed platform facilities. Of the 25 releases that occurred in 2014, 13 were at normally attended platforms, six were from FPSOs, four were at not normally attended platforms and two were from pipelines.
NOPSEMA notes that while the majority of the hydrocarbon releases reported are in the lowest mass category, the rate of OHS gas releases per 100 million barrels of oil equivalent in Australia is consistently higher than the reported International Regulators Forum (IRF) average (at the time of publication IRF data for 2014 was not available).
Figure 24.
Figure 25.
Figure 23.
nopsema.gov.au 23

Incidents
3.3 Environmental incidents
Reportable environmental incidentsThe number of reportable environmental incidents reported to NOPSEMA decreased from 31 in 2013 to 22 in 2014. The incidents occurred across a range of petroleum activities, including seismic surveys, construction and installation work, drilling and operations. Of the 22 incidents reported in 2014, 13 (59%) were hydrocarbon vapour or petroleum liquid releases and eight (36%) were chemical releases.
Six of the hydrocarbon vapour releases were due to flares being extinguished, commonly due to high winds. Other releases included one incident of a crude oil leak from a subsea pipeline, one incident of well fluids leaking from a subsea control module, and five leaks of petroleum-based liquids or gas from topside equipment.
Chemical releases were a mix of topside and subsea leaks and spills, caused by slow leaks in equipment, machinery breakdowns or accidental overboard disposal due to operator error.
While environmental impacts from these releases were not significant, the incidents indicate a need to improve prevention measures to avoid loss of containment.
Figure 26.
ANNUAL OFFSHORE PERFORMANCE REPORT 201424
Incidents
Figure 27.
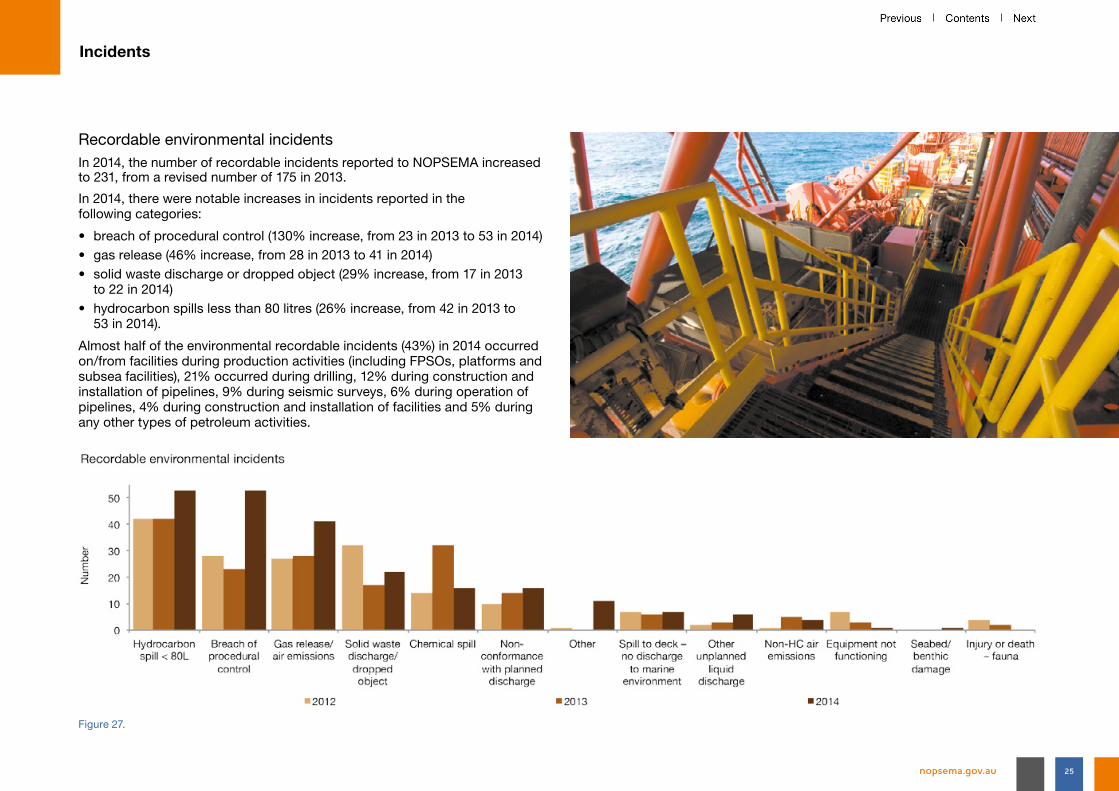
Recordable environmental incidentsIn 2014, the number of recordable incidents reported to NOPSEMA increased to 231, from a revised number of 175 in 2013.
In 2014, there were notable increases in incidents reported in the following categories:
• breach of procedural control (130% increase, from 23 in 2013 to 53 in 2014) • gas release (46% increase, from 28 in 2013 to 41 in 2014)• solid waste discharge or dropped object (29% increase, from 17 in 2013
to 22 in 2014)• hydrocarbon spills less than 80 litres (26% increase, from 42 in 2013 to
53 in 2014).
Almost half of the environmental recordable incidents (43%) in 2014 occurred on/from facilities during production activities (including FPSOs, platforms and subsea facilities), 21% occurred during drilling, 12% during construction and installation of pipelines, 9% during seismic surveys, 6% during operation of pipelines, 4% during construction and installation of facilities and 5% during any other types of petroleum activities.
nopsema.gov.au 25
Incidents
3.4 Occupational health and safety incident root causes
As part of the legislative requirement for operators to report accidents and dangerous occurrences to NOPSEMA, operators are required to provide a root cause analysis as part of each accident or dangerous occurrence report.8 This requirement contributes to a better understanding of the factors influencing offshore incidents and informs improvements to design, training, systems, processes and equipment in support of better safety outcomes.
The consistent pattern of root causes identified in incident reports to NOPSEMA indicates operators have an opportunity to focus their risk management and control measures on particular problem areas and yield better safety outcomes.
In recognition that many operators refer to the TapRoot® scheme to identify root causes of incidents, NOPSEMA converts other reported root cause categories to the TapRoot® classifications, to present information consistently. Under the TapRoot® scheme, causes of OHS incidents are divided into two categories:
• human performance difficulties• equipment difficulties.
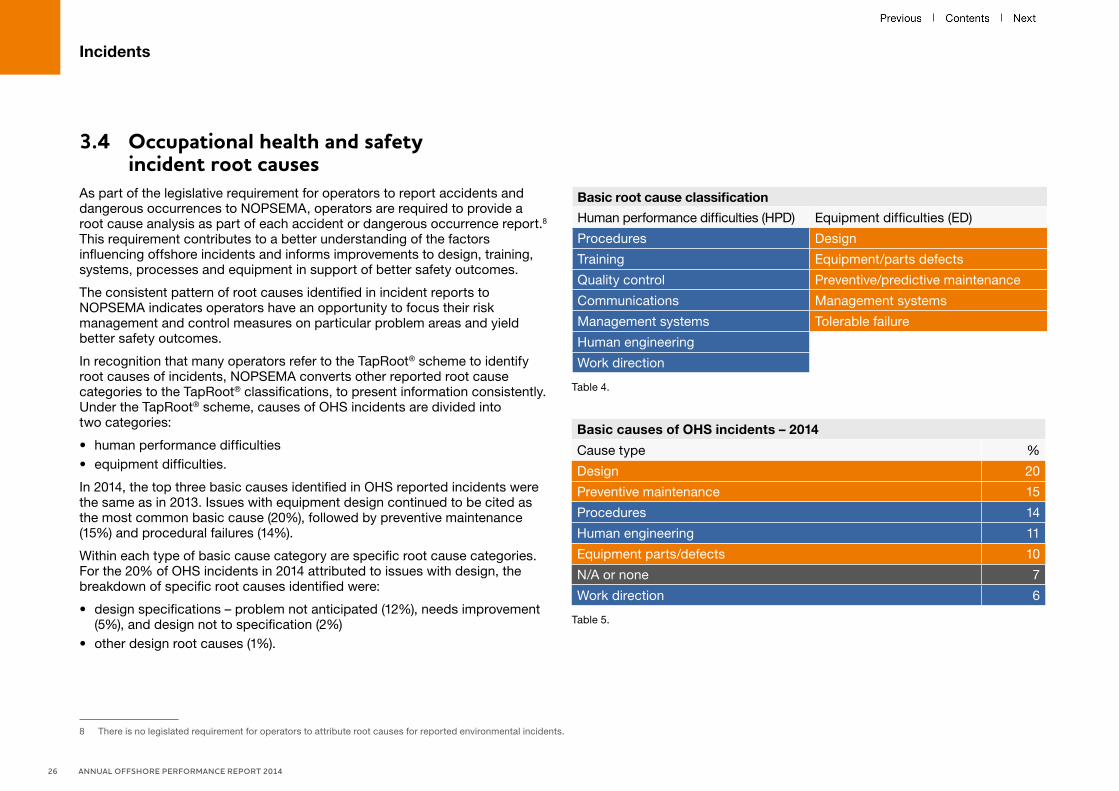
In 2014, the top three basic causes identified in OHS reported incidents were the same as in 2013. Issues with equipment design continued to be cited as the most common basic cause (20%), followed by preventive maintenance (15%) and procedural failures (14%).
Within each type of basic cause category are specific root cause categories. For the 20% of OHS incidents in 2014 attributed to issues with design, the breakdown of specific root causes identified were:
• design specifications – problem not anticipated (12%), needs improvement (5%), and design not to specification (2%)
• other design root causes (1%).
Basic root cause classification
Human performance difficulties (HPD) Equipment difficulties (ED)
Procedures Design
Training Equipment/parts defects
Quality control Preventive/predictive maintenance
Communications Management systems
Management systems Tolerable failure
Human engineering
Work direction
Table 4.
Basic causes of OHS incidents – 2014
Cause type %
Design 20
Preventive maintenance 15
Procedures 14
Human engineering 11
Equipment parts/defects 10
N/A or none 7
Work direction 6
Table 5.
8 There is no legislated requirement for operators to attribute root causes for reported environmental incidents.
ANNUAL OFFSHORE PERFORMANCE REPORT 201426

Incidents
AccidentsThe top basic root causes identified by operators for accidents were procedures (23%), design (23%), human engineering (15%) and work direction (15%).
Accident basic causes
2005 2006 2007 2008 2009 2010 2011 2012 2013 2014
Procedures Human engineering
Procedures Procedures Procedures Work direction
Procedures Management systems – people
Work direction
Procedures
Work direction
Work direction
Work direction
Work direction
Work direction
Procedures Work direction
Human engineering
Design Design
Human engineering
Training Human engineering
Human engineering
Human engineering
Design Human engineering
Procedures Procedures Human engineering
Training Procedures Training Training Design Training Management systems – people
Work direction
Human engineering
Work direction
Equipment parts/defects
Management systems – people
Equipment parts/defects
Communica-tions
Other Human engineering
Design Design Training Quality control
Table 6.
The consistent pattern of root causes identified in incident reports to NOPSEMA indicates operators have an opportunity to focus their risk management and control measures on particular problem areas and yield better safety outcomes.
nopsema.gov.au 27

Incidents
Dangerous occurrencesOperators continue to report problems associated with equipment design as responsible for the majority of notified dangerous occurrences (20% of all root causes identified in 2014). The second most prevalent basic root cause was preventive maintenance (15%), followed by procedures (14%).
Dangerous occurrences basic causes
2005 2006 2007 2008 2009 2010 2011 2012 2013 2014Procedures Procedures Procedures Procedures Procedures Design Design Design Design Design
Preventive maintenance
Preventive maintenance
Design Equipment parts/defects
Design Procedures Procedures Procedures Preventative maintenance
Preventative maintenance
Work direction
Work direction
Preventive maintenance
Design Equipment parts/defects
Preventive maintenance
Preventive maintenance
Preventive maintenance
Procedures Procedures
Other Management systems – people
Equipment parts/defects
Preventive maintenance
Human engineering
Equipment parts/defects
Equipment parts/defects
Equipment parts/defects
Management systems – people
Human engineering
Design Design Work direction
Work direction
Preventive maintenance
Management systems – people
Management systems – people
Management systems – people
Human engineering
Equipment parts/defects
Table 7.
In 2014, the top three basic causes identified in OHS reported incidents were the same as in 2013. Issues with equipment design continued to be cited as the most common basic cause (20%), followed by preventive maintenance (15%) and procedural failures (14%).
ANNUAL OFFSHORE PERFORMANCE REPORT 201428
nopsema.gov.au 29

ANNUAL OFFSHORE PERFORMANCE REPORT 201430
4. Complaints
As part of NOPSEMA’s role to secure compliance by offshore petroleum duty holders, NOPSEMA receives and investigates complaints about conditions and issues that may affect the occupational health and safety of workers at a facility, or the environmental management of an activity. NOPSEMA encourages members of the offshore workforce to first raise any health and safety or environmental management concerns with facility/activity management and safety committee representatives.
NOPSEMA received four complaints in 2014. Two complaints were related to occupational health and safety on a facility and two related to environmental management matters. Each complaint was investigated by the applicable NOPSEMA regulatory division.
Complaint numbers9
Complaint type 2005 2006 2007 2008 2009 2010 2011 2012 2013 2014
Occupational health and safety 34 38 28 28 16 16 24 5 5 2
Environmental management - - - - - - - 0 3 2
Table 8.
9 From 2012, NOPSEMA introduced a category for information only. These are not reflected in the table from 2012 onwards.
NOPSEMA encourages members of the offshore workforce to raise any health and safety or environmental management concerns with facility/activity management and safety committee representatives.

nopsema.gov.au 31
In 2012, NOPSEMA introduced a new category of incident into its regulatory management system called, ‘Information provided to NOPSEMA’. This category is used when NOPSEMA receives information from stakeholders where, for example:
• the event is not notifiable under the regulations• the information does not form the basis of a complaint • it is unclear for what purpose the information is being provided.
Prior to 2012, some of these types of notifications were classified as ‘complaints’ based on interpretation of the information provided. This is reflected in both Table 9 and Figure 28 below, where there are a higher number of recorded complaints prior to 2012.
In 2014 NOPSEMA received 17 ‘Information provided to NOPSEMA’ notifications. These were dealt with depending upon the nature of the issue, such as through investigation, through inclusion as a topic in a subsequent inspection, or other actions as appropriate.
NOPSEMA calculates the complaint rate by taking the total number of complaints recorded against the total hours worked in a calendar year and then standardising to one million hours. The overall complaint rate for 2014 is 0.28 per million hours worked, compared to 0.75 in 2013.
Figure 28.
Image courtesy of Woodside Energy Limited.
Complaints

Complaints
Complaint10 topics
Topic 2005 2006 2007 2008 2009 2010 2011 2012 2013 2014
Management issues 6 12 3 8 3 5 8 2 3 0
Culture/general safety issues 6 10 4 3 6 5 9 1 3 0
Work procedures/methods/practices 3 4 5 5 5 8 6 0 2 0
Competency/staffing 4 9 4 5 3 2 4 0 0 0
Equipment 5 5 6 5 4 3 1 1 0 0
Safety-critical equipment 4 5 7 2 2 2 5 0 0 0
Work environment – noise, heat, pollution 5 7 4 3 1 2 2 0 1 1
Services/galley/accommodation 3 2 2 3 2 2 2 1 0 0
Reporting investigations/incidents, remedial actions 2 1 5 2 0 2 3 1 0 0
Fatigue/shifts/rosters 2 3 1 5 2 1 1 1 0 0
Bullying/intimidation 1 1 2 2 1 1 5 2 3 0
Cyclone evacuations 0 3 1 1 1 2 3 0 0 1
HSR matters/safety committees 1 1 1 1 0 2 0 0 0 0
General environmental matters/pollution - - - - - - - 0 1 0
Stakeholder consultation activities - - - - - - - 0 3 2
Timing of petroleum activities - - - - - - - 0 3 0
Total topics 42 63 45 45 30 37 49 9 19 4
Total complaints 34 38 28 28 16 16 24 5 8 4
Table 9.
10 From 2012, NOPSEMA introduced a category, ‘Information provided to NOPSEMA’. These are not reflected in the table from 2012 onwards. Please note that multiple topics can be covered by a single complaint.
ANNUAL OFFSHORE PERFORMANCE REPORT 201432

nopsema.gov.au 33
5. Investigations
NOPSEMA conducts independent investigations into accidents, dangerous occurrences, reportable environmental incidents and complaints to identify breaches of the OPGGS Act and associated regulations, and to share key lessons with industry.
Major investigations are initiated where a breach is significant enough that prosecution may be warranted. Investigations can be lengthy and complex, involving the review of considerable amounts of evidentiary material, and may result in NOPSEMA requiring duty holders to take corrective actions. An investigation can also result in NOPSEMA initiating enforcement action (for more information on enforcements see Chapter 9).
Duty holders are required by law to notify NOPSEMA of certain incidents. NOPSEMA received and processed 370 incident notifications in 2014, a reduction from the 401 received and processed in 2013. A number of the incidents received in 2014 were escalated to an investigation. The summaries included in this chapter contain root causes11 (for OHS incidents) and corrective actions identified or taken by the operator. The OPGGS Act does not provide for NOPSEMA to publish full inspection (investigation) reports12.
NOPSEMA also investigated circumstances where a complaint was made or information was provided to NOPSEMA. To protect the identity of complainants and informants and encourage continued reporting, NOPSEMA does not include details of investigations in this report where it is not possible to ensure the confidentiality of a complainant or informant. For more information about complaints relating to offshore health, safety and environmental management matters, see Chapter 4.
NOPSEMA’s preference in receiving notifications of accidents, dangerous occurrences and reportable environmental incidents is by telephone. All duty holders are encouraged to use the dedicated notification phone line (08) 6461 7090.
For more information about reporting an accident, dangerous occurrence or environmental incident, see the guidance on reporting and notification under the ‘Safety’ and ‘Environment’ tabs at nopsema.gov.au
11 For more information about incident root cause classification, see Chapter 3 and Appendix 312 Distribution of reports from NOPSEMA investigations into health and safety matters is covered in Schedule 3 to the OPGGS Act, whilst environmental management matters are covered in Schedule 2A of the OPGGS Act.

Investigations
5.1 Investigations of accidents and dangerous occurrences13
During 2014, seven incidents had high risk categories and were subsequently investigated as a priority. These have been summarised in the tables below. In addition, a further 36 significant incidents of lower risk category were subsequently included as inspection topic items and included for follow up at the next planned periodic inspection visit to the applicable facility.
The OHS incidents listed in these tables are grouped by facility type and then in chronological order. The summaries list the facility operator and facility on which the incident occurred. For more information about the incident notification classification, see Appendix 3.
FPSO incidents
Dangerous occurrence – could have caused death or serious injury – loss of control of crane boom
Apache Energy Limited Balnaves (FPSO) 25 September 2014
Incident description During back-loading operations whilst slewing back inboard, the crane driver lost all control of the crane boom’s slewing. Despite activating the emergency stop, the boom continued to swing inboard. There was no load on the hook at the time of slewing failure
Immediate cause Loose slew pinion gear bolts
Root causes The slew pinion gear bolts were found loose during the last vendor maintenance visit and were re-torqued but not lock wired
Corrective actions Slew bolts retained with lock wire. Three monthly planned maintenance schedule amended to include visual inspection of bolting and lock wire
Further actions Eleven recommendations
Dangerous occurrence – other kind needing immediate investigation – shutdown valve failed to close
Woodside Energy Ltd CWLH OKHA (FPSO) 31 December 2014
Incident description Shutdown valve (SDV) on the by-pass to the export gas compressor discharge header did not close on demand
Immediate cause Suspected undersized actuator
Root causes SDV actuator was prevented from closing due to debris that had gathered on the operating spindle
Corrective actions Alternative actuator options are being reviewed
Further actions None
13 For more information about the classification of offshore incidents, see Chapter 3. For an explanation of the terms used in this chapter, see Appendix 1, 2 and 3 and the Glossary.
ANNUAL OFFSHORE PERFORMANCE REPORT 201434

Investigations
MODU incidents
Dangerous occurrence – could have caused death or serious injury – man fell off monkey board
Sedco Forex International Inc Jack Bates (MODU) 7 March 2014
Incident description A member of the drill crew fell off the monkey board whilst attempting to untangle a tugger wire. The crew member did not hook up his harness when he got onto the monkey board. The crew member managed to grab hold of the tugger wire and slid down it to the rig floor without injury. The company treated the incident as a violation of safety procedures
Immediate cause The crew member did not attach the inertia reel to his harness while he was working on the fingerboard area of the monkey board. Lifting operations continued with the tugger wire while he was freeing it, consequently he was 'pulled' from the monkey board
Root causes Inadequate planning, risk assessment and management of the operation. The risk assessment was completed verbally and not through the management of change (MoC) process. Inadequate communication – only one person in the team was notified that someone was going aloft to free up the captured wire in the derrick
Corrective actions Revise the applicable rig recommended procedures and written risk assessments to also include simultaneous tasks and communication issues, redesign and replace the fingerboard storm bar and review the accountability of responsible persons
Further actions One improvement notice was issued to the operator that addressed the operator’s planning and risk management system. Twelve recommendations were made as a result of the investigation
nopsema.gov.au 35

Investigations
Vessel incidents
Dangerous occurrence – could have caused death or serious injury – crane wire rope change out rigging failure
Allseas Construction Contractors SA Solitaire (Accommodation/construction/pipelay vessel) 8 February 2014
Incident description The operation was spooling off the main crane wire. Whilst the crane was paying wire out, the take-up winch was spooling on. The rig-up was through a series of snatch blocks including the use of a forklift truck used to hold a snatch block and wire off the deck. The crane suddenly stopped paying wire out while the winch continued to spool on. The rigging became overloaded which caused an eight tonne hold-back sling deck to part and the forklift to fall over. The worker sitting in the forklift was wearing a seatbelt and was not thrown out or injured
Immediate cause When the hold-back sling parted, the load from the main hoist wire was transferred to the forklift causing the forklift to fall over onto the deck
Root causes Inadequate planning process. There was also a fault in the encoder in the crane, although this was unknown to anyone prior to the event
Corrective actions A safety flash was issued fleet wide. The crane was inspected and repaired. A fleet wide procedure was developed for changing crane cables. Training was provided for construction supervisors. A procedure was developed for non-standard or critical rigging arrangements
Further actions Four improvement notices and eight recommendations were issued in connection with this investigation for:
• late reporting of the incident to NOPSEMA• interference with the accident site without gaining permission from a NOPSEMA Inspector• failure to provide effective operational specific procedures• failure to have a management system in place for carrying out effective operational risk assessments
ANNUAL OFFSHORE PERFORMANCE REPORT 201436

Investigations
Dangerous occurrence – could have caused death or serious injury – loss of control of crane hook
Saipem (Portugal) Comercio Maritimo Semac 1 (Accommodation/construction/pipelay vessel) 6 October 2014
Incident description After completing crane operations and moving the crane to a safe position, a short time passed following which the hook free fell about 15 metres to the deck
Immediate cause Crane hook free fall to deck
Root causes The park brake relay and clutch quick-release valves failed to function. A diaphragm inside the relay units failed due to normal wear and tear. Shift change over inspection was not conducted. The correct operation to power off the crane was not fully followed
Corrective actions Park relay air relay valve and clutch quick release valve to be replaced. Maintenance review/amendment for replacement frequency of crane parts. Pre-use inspection of cranes by mechanics. Crane power off procedure placed in crane cabs
Further actions None
Dangerous occurrence – could have caused death or serious injury – dropped object
Heerema Marine Contractors Nederland S.E. Aegir (Accommodation/construction/pipelay vessel) 16 October 2014
Incident description During hoisting using a crane winch tugger, the hook assembly/wire came in contact with the protection bar on the outer edge of the Aux-2 access platform. A horizontal section of the protection bar was dislodged and fell approximately 20 metres to the hangar roof below
Immediate cause Design specifications
Root causes The design of the protective bar allowed for entanglement. Further the block arrangement for winch was too close to platform construction
Corrective actions A deflection plate has been installed to the outer edge of the protection bar to prevent future potential entanglement. Routine inspection of the crane boom/platform location under the boom for possible areas where winch wire can become snagged
Further actions None
nopsema.gov.au 37
Investigations
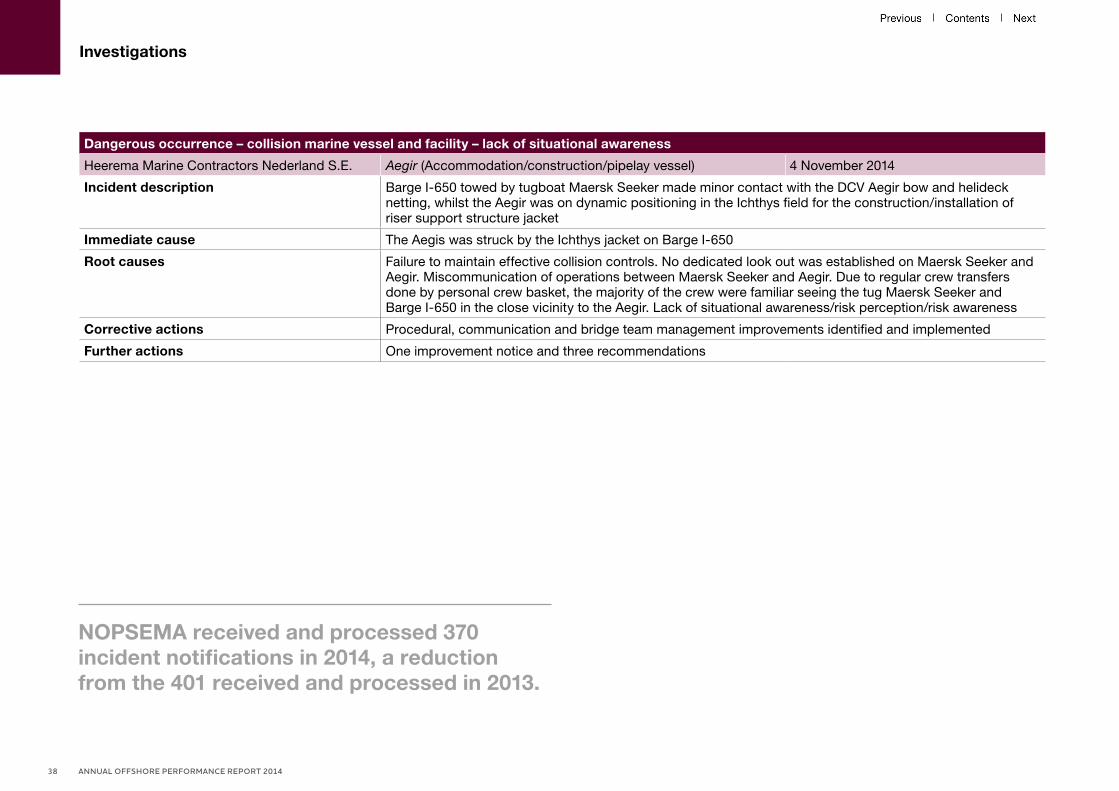
Dangerous occurrence – collision marine vessel and facility – lack of situational awareness
Heerema Marine Contractors Nederland S.E. Aegir (Accommodation/construction/pipelay vessel) 4 November 2014
Incident description Barge I-650 towed by tugboat Maersk Seeker made minor contact with the DCV Aegir bow and helideck netting, whilst the Aegir was on dynamic positioning in the Ichthys field for the construction/installation of riser support structure jacket
Immediate cause The Aegis was struck by the Ichthys jacket on Barge I-650
Root causes Failure to maintain effective collision controls. No dedicated look out was established on Maersk Seeker and Aegir. Miscommunication of operations between Maersk Seeker and Aegir. Due to regular crew transfers done by personal crew basket, the majority of the crew were familiar seeing the tug Maersk Seeker and Barge I-650 in the close vicinity to the Aegir. Lack of situational awareness/risk perception/risk awareness
Corrective actions Procedural, communication and bridge team management improvements identified and implemented
Further actions One improvement notice and three recommendations
NOPSEMA received and processed 370 incident notifications in 2014, a reduction from the 401 received and processed in 2013.
ANNUAL OFFSHORE PERFORMANCE REPORT 201438

Investigations
5.2 Investigations of environmental management There were no major investigations initiated in 2014, however, NOPSEMA carried out environment investigations relating to one reportable environmental incident, two complaints and three instances where information was provided to NOPSEMA. Details of these have been summarised in the table below and, where relevant, the titleholder and environment plan in force for the activity are listed.
Information provided to NOPSEMA – oil spill – unknown source
Unknown Ninety-Mile Beach, Gippsland region, Victoria 14 March 2014
Nature of information The Victorian Department of Transport, Planning and Local Infrastructure (DTPLI) contacted NOPSEMA with reports of oil tar balls that had been observed washing up on 90 Mile Beach in the Gippsland region triggering a clean-up operation. DTPLI were in control of the response. NOPSEMA cooperated with the Victorian government and conducted an investigation
Immediate cause Oil tar balls washed up on 90 Mile beach
Outcome of investigation No leaks or spills were identified from offshore petroleum activities. Victorian authorities analysed the chemical properties of the tar balls, but were unable to identify a match with a range of possible sources. The investigation was closed
Complaint – seismic survey – failure to notify stakeholders
GX Technology Australia Pty Ltd Westralia SPAN marine seismic survey environment plan 14 May 2014
Complaint description Unknown vessel conducting a seismic survey in the Timor Sea north-west of Darwin which had not been notified to stakeholders
Immediate cause Change in activity timeframe
Outcome of investigation NOPSEMA investigation identified the titleholder, GX Technology Australia Pty Ltd, and established that the seismic survey activity had been undertaken a year later than stated in the accepted environment plan. Formal letter of warning of non-compliance issued by NOPSEMA (see Chapter 9 Enforcements)
nopsema.gov.au 39

Investigations
Information provided to NOPSEMA – drilling
Santos Browse Pty Ltd Browse drilling environment plan WA-274-P 5 August 2014
Nature of information Santos Browse Pty Ltd was conducting exploration drilling at a location different to that described in its environment plan
Immediate cause Change in activity location
Outcome of investigation Investigation concluded that the new drilling location represented no significant change to environmental impacts and risks and concluded that the activity was being conducted under the environment plan in force. Informant advised of outcome
Complaint – consultation
Origin Energy Resources Limited Enterprise 3D seismic survey (Otway Basin) environment plan 11 November 2014
Complaint description Stakeholders reported to NOPSEMA that they had not been consulted prior to the Enterprise seismic survey by Origin Energy Resources Ltd in the Otway region
Immediate cause Complaint
Outcome of investigation A review of documentation and other information relating to consultation efforts for the activity identified that the titleholder had carried out consultation in accordance with the regulations and the environment plan in force.
Complainant advised of outcome of investigation and provided clarification on consultation conducted some time earlier, as well as other consultation in progress
ANNUAL OFFSHORE PERFORMANCE REPORT 201440

Investigations
Information provided to NOPSEMA – whale stranding
Unknown Ardrossan, Gulf of St Vincent, South Australia 8 December 2014
Nature of information The South Australian Department of Environment, Water and Natural Resources (DEWNR) contacted NOPSEMA with a report of seven sperm whales stranding near Ardrossan in the Gulf of St Vincent. Potential connection with seismic surveys was suggested by several parties
Immediate cause Immediate cause of strandings is unknown
Outcome of investigation This investigation remains open. NOPSEMA has sought independent advice from the Marine Mammals Centre within the Australian Antarctic Division about historical correlation between seismic activities and whale stranding. NOPSEMA has also inspected whale sighting records, vessel tracks and activity logs from titleholders undertaking active seismic surveys in South Australia and Victoria and gathered historical data on whale strandings in Australia. At the time of publication of this report, autopsy results were not available. Based on information collected to date no connection has been identified between the strandings and marine seismic surveys (or other offshore petroleum activities)
Reportable incident – hydrocarbon release
Esso Australia Resources Pty Ltd Central Fields environment plan 28 December 2014
Incident description Oil sheen was observed approximately 500 metres west of the Cobia platform. After observing the sheen for approximately 20 minutes, the platform was shut down and the pipeline was depressurised. The size of the release was estimated to be in the range of 223 to 2255 litres of crude oil, based on the appearance and extent of the sheen. Aerial surveillance the following day spotted no further signs of release and the sheen had dissipated
Immediate cause Leak in the Cobia to Halibut oil pipeline
Outcome of investigation Corrective actions included shutting down the platform and depressurising the pipeline. The titleholder is evaluating options to repair the leak
nopsema.gov.au 41

ANNUAL OFFSHORE PERFORMANCE REPORT 201442
6. Assessment and submission
Under NOPSEMA’s jurisdiction, no petroleum activity can commence without NOPSEMA first ‘accepting’ the regulatory submission relating to the facility, well activity or petroleum activity. ‘Acceptance’ occurs once NOPSEMA is satisfied that the duty holder has taken into consideration all practicable risk reduction measures for the activity.
Duty holders must satisfy NOPSEMA that they will implement control measures that reduce risks to the workforce and the environment, at or near a facility, pipeline or well to ALARP. An environment plan submission must also satisfy NOPSEMA that environmental impacts and risks will be of an acceptable level.
6.1 Submission typesThe regulatory documents required to be submitted for assessment to NOPSEMA cover the occupational health and safety, well integrity and environmental management functions performed by NOPSEMA.
Changes to the Offshore Petroleum and Greenhouse Gas Storage (Environment) Regulations 2009 (Environment Regulations) in 2014 to streamline offshore petroleum environmental approvals introduced a new type of submission, the offshore project proposal (OPP). This type of submission is required for new large-scale petroleum development projects in Commonwealth waters. No OPPs were submitted for assessment in 2014.
Information gained from NOPSEMA inspections and investigations may be used to inform an assessment. Similarly, the outcomes of assessment contribute to development of NOPSEMA’s ongoing inspection of duty holder’s compliance with the Regulations.
For more information about assessments and regulatory documents, see the ‘Safety’, ‘Well integrity’ and ‘Environmental management’ pages at nopsema.gov.au.
Figure 29.

Assessment and submissions
Number of submissionsIn 2014 NOPSEMA received 469 submissions from duty holders.
Number of assessment submissions
Submission types 2005 2006 2007 2008 2009 2010 2011 2012 2013 2014
Occupational health and safety
Safety case new 20 11 22 29 17 26 25 27 20 28
Safety case revised 68 105 93 109 110 74 151 106 69 62
Diving project plan 14 9 1 0 0 0 0 0 0 0
Diving SMS new 0 0 2 2 6 5 6 5 1 0
Diving SMS revised 10 0 1 4 2 1 3 4 1 6
Diving start-up notice 19 25 23 14 14 24 20 23 24 20
Pipeline SMP new 6 11 3 7 2 2 2 0 0 0
Pipeline SMP revised 1 2 4 17 10 3 9 0 0 0
Scope of validation 1 2 21 78 46 53 63 55 45 49
Request for exemption 0 0 2 2 1 0 0 0 0 0
Well integrity Well activity approval - - - - - - 141 162 87 131
WOMP new - - - - - - 28 27 26 23
WOMP variation - - - - - - 1 4 6 9
Environmental management
Environment plan new - - - - - - - 92 79 57
Environment plan revised - - - - - - - 11 40 18
Offshore Project Proposals - - - - - - - - - 0
Petroleum safety zones PSZ application new - - - - - - - 7 3 10
PSZ application renewal - - - - - - - 3 2 0
PSZ access application - - - - - - - 0 1 0
ATBA access application - - - - - - - 5 5 0
Other Regulatory advice to other agencies 7 14 16 19 8 3 10 6 18 56
Total 146 179 187 281 216 191 459 537 427 469
Table 10.
nopsema.gov.au 43
Assessment and submissions
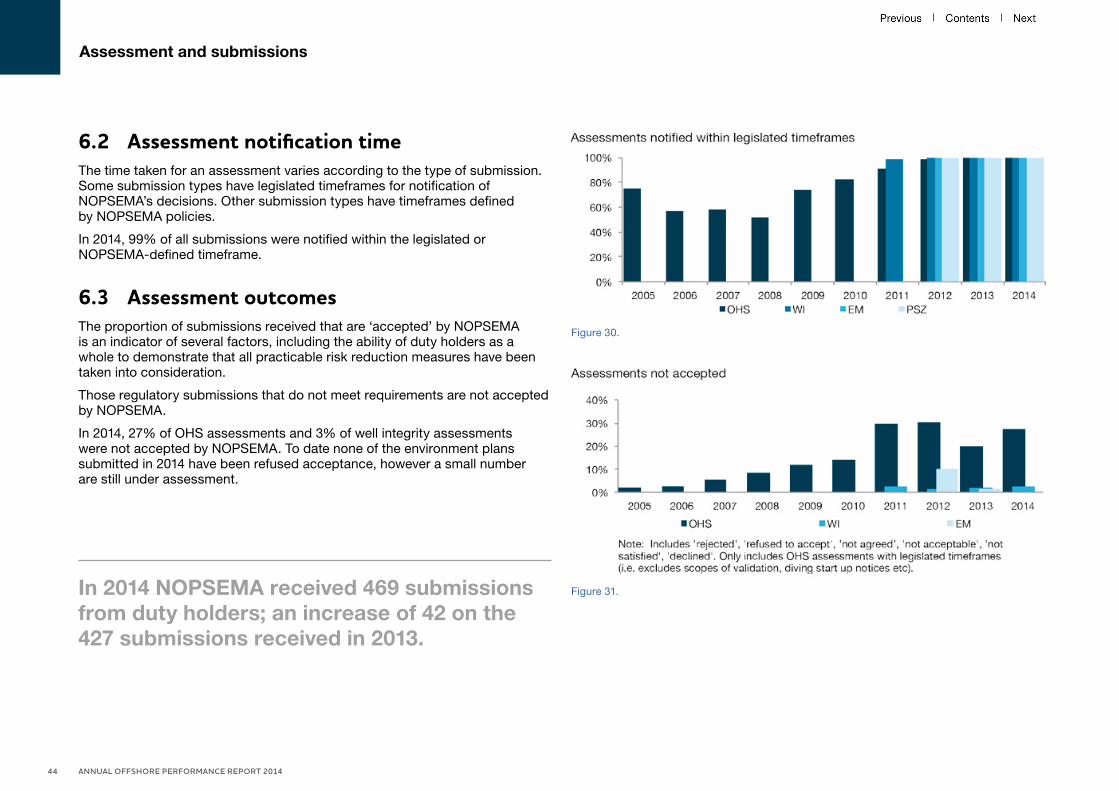
6.2 Assessment notification time The time taken for an assessment varies according to the type of submission. Some submission types have legislated timeframes for notification of NOPSEMA’s decisions. Other submission types have timeframes defined by NOPSEMA policies.
In 2014, 99% of all submissions were notified within the legislated or NOPSEMA-defined timeframe.
6.3 Assessment outcomesThe proportion of submissions received that are ‘accepted’ by NOPSEMA is an indicator of several factors, including the ability of duty holders as a whole to demonstrate that all practicable risk reduction measures have been taken into consideration.
Those regulatory submissions that do not meet requirements are not accepted by NOPSEMA.
In 2014, 27% of OHS assessments and 3% of well integrity assessments were not accepted by NOPSEMA. To date none of the environment plans submitted in 2014 have been refused acceptance, however a small number are still under assessment.
Figure 30.
Figure 31.In 2014 NOPSEMA received 469 submissions from duty holders; an increase of 42 on the 427 submissions received in 2013.
ANNUAL OFFSHORE PERFORMANCE REPORT 201444

Assessment and submissions
Safety casesNOPSEMA rejected 22 out of the 90 safety cases submitted in 2014. Of these, 13 were new safety cases and 9 were revisions.
Safety case assessments
Outcome 201314 2014
In progress 0 0% 1 1%
Accepted 65 73% 66 74%
Recalled15 2 2% 1 1%
Rejected 22 25% 22 24%
Total 89 100% 90 100%
Table 11.
Well operations management plansIn 2014, of the 32 WOMPs submitted, NOPSEMA accepted 29, rejected two and one was recalled by the titleholder. Coincidentally the figures for 2014 are the same as 2013.
WOMP assessments
Outcome 2013 2014
In progress 0 0% 0 0%
Accepted 29 91% 29 91%
Returned 0 0% 0 0%
Recalled 1 3% 1 3%
Rejected 2 6% 2 6%
Total 32 100% 32 100%
Table 12.
14 Figures for 2013 may differ slightly from last year’s publication, due to assessments previously classified as ‘In progress’ having since been completed and re-categorised. 15 Submissions that are lodged with NOPSEMA and subsequently withdrawn by the organisation.
Figure 32.
Image courtesy of ExxonMobil Australia.
nopsema.gov.au 45
Assessment and submissions
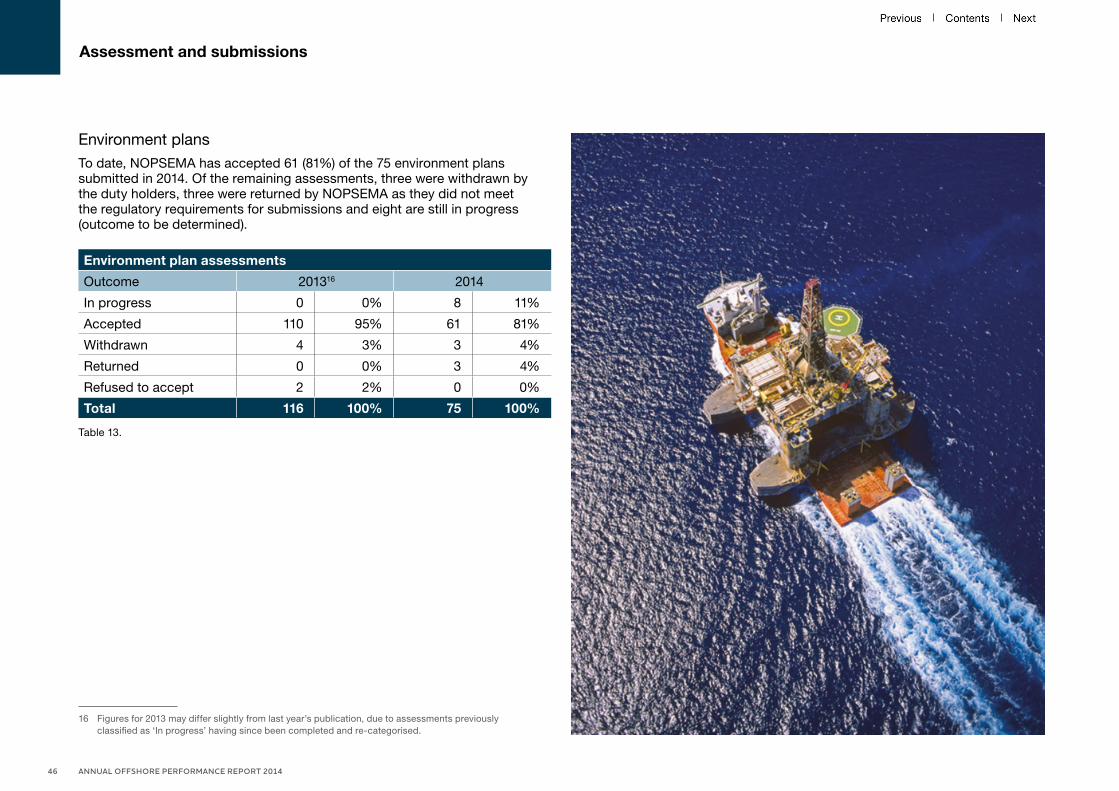
Environment plansTo date, NOPSEMA has accepted 61 (81%) of the 75 environment plans submitted in 2014. Of the remaining assessments, three were withdrawn by the duty holders, three were returned by NOPSEMA as they did not meet the regulatory requirements for submissions and eight are still in progress (outcome to be determined).
Environment plan assessments
Outcome 201316 2014
In progress 0 0% 8 11%
Accepted 110 95% 61 81%
Withdrawn 4 3% 3 4%
Returned 0 0% 3 4%
Refused to accept 2 2% 0 0%
Total 116 100% 75 100%
Table 13.
16 Figures for 2013 may differ slightly from last year’s publication, due to assessments previously classified as ‘In progress’ having since been completed and re-categorised.
ANNUAL OFFSHORE PERFORMANCE REPORT 201446

nopsema.gov.au 47
Assessment and submissions
6.4 Spotlight on environment plan assessment timeframes
The total average assessment timeframe for environment plans has decreased from 115 days in 2013 to 68 days in 2014. This timeframe includes both the time taken by NOPSEMA to assess the plan and time given to duty holders in opportunities to make modifications or provide more information, in accordance with the Environment Regulations. The reduction in average assessment timeframes since 2013 reflects an improved capacity by duty holders to submit environment plans that meet the legislative requirements, amendments that enabled NOPSEMA to request further written information, as well as improvements by NOPSEMA to communicate and clarify these requirements in correspondence and liaison meetings.
The time required by NOPSEMA to assess an environment plan varies according to factors such as the complexity of the activity and the quality of the duty holder’s submission. However, NOPSEMA’s total average assessment timeframes decreased for all activity types between 2013 and 2014.
Note that the ‘Other’ category includes surveys other than seismic, as well as other miscellaneous petroleum-related activities such as preparations for subsea installation works, remediation and one-off discharges.
NOPSEMA publishes quarterly updated average assessment timeframes on the ‘Environment Plans’ page at nopsema.gov.au.
Figure 33.
Figure 34.

ANNUAL OFFSHORE PERFORMANCE REPORT 201448
7. Inspections
17 For more information about the Final Government response to the Report of the Montara Commission of Inquiry (2011) and establishment of NOPSEMA, go to the ‘History of NOPSEMA’ webpage at nopsema.gov.au.
NOPSEMA conducts inspections to monitor duty holders’ compliance with their legislative duties and determine if they have implemented, and are complying with, the risk management systems described in their accepted regulatory submissions. Where duty holders are found not to be in compliance, NOPSEMA takes action to enforce improved performance.
In 2014, the total number of inspections conducted by NOPSEMA continued to increase. This increase maintains the steady rise in facility inspections initiated in response to the Montara well blowout in the Timor Sea (2009) and Macondo well blowout in the Gulf of Mexico (2010), as well as the addition of both well integrity inspections (2011) and environmental management inspections (2012) to NOPSEMA’s regulatory remit.17
Environmental management inspections have grown rapidly from seven in 2012, to 23 in 2013 and to 30 in 2014. This trend is anticipated to continue with NOPSEMA setting a target of 60 environmental management inspections for 2015.
For more information about NOPSEMA inspections, see the ‘Inspections’ page at nopsema.gov.au. For summaries of enforcement action issued by NOPSEMA, see Chapter 9.
7.1 Number of inspectionsIn 2014, 146 inspections were conducted (covering a total of 202 facilities, titles and petroleum activities). This was an increase on the 127 inspections (over 145 facilities, titles and petroleum activities) conducted in 2013 and represents the highest number of inspections carried out in a year to date.
Figure 35.

Inspections
7.2 Inspection scopesNOPSEMA considers a wide range of potential scope items when planning an inspection. Any number of these items may be selected for focus by NOPSEMA inspectors during an inspection. NOPSEMA issues inspection reports and recommendations to duty holders based on findings against inspection scope items. Where appropriate, enforcement notices may be issued however, these notices will only be issued to address immediate threats to health, safety, or the environment, or for breaches of the legislation.
Common scope items covered in planned inspections during 2014 include:
• loss of containment• emergency management• dropped objects• fire• permit to work• lifeboats• pipelines• diving• emissions and discharges (planned or unplanned)• consultation.
7.3 Occupational health and safety inspectionsIn 2014, 1415 recommendations were raised during OHS inspections following identification of:
• non-compliance to safety case commitments, management systems and procedures
• degradation of integrity of equipment • improvement opportunities based on industry good practice.
The greatest number of recommendations from inspections related to ‘loss of containment’ (i.e. the unplanned release of gas and liquid hydrocarbons) followed by ‘emergency management’ and ‘general occupational health hazards’.
Examples of OHS inspection recommendations – 2014
Ensure that regular engineering assessments are conducted to ensure all electrical powered equipment that will remain operational during emergency conditions complies with Zone 2 hazardous area requirements
Ensure that measures are in place to maintain compliance with the internal and external inspection requirements, and defined inspection frequency, identified in the corrosion management plan and the pressure containment integrity performance standard
Ensure the ERP is adequately set out in the diving project plan to meet the regulatory requirements of the Offshore Petroleum and Greenhouse Gas Storage (Safety) Regulations 2009 (Safety Regulations) sub-regulation 4.16(1)(h)
Ensure that the operator has included and scheduled in the computerised maintenance management system (CMMS) the requirements for a third party inspection of portable lifting appliances
In 2014, 146 inspections were conducted (covering a total of 202 facilities, titles and petroleum activities). This was an increase on the 127 inspections (over 145 facilities, titles and petroleum activities) conducted in 2013 and represents the highest number of inspections carried out in a year to date.
Table 14.
nopsema.gov.au 49

Inspections
Examples of OHS inspection recommendations – 2014
Conduct a review of the 2010 dropped object inspection plan and associated checklists against the annual scope of work that is undertaken by third party contractors to align, where possible and enhance the drill crew monthly inspections
Ensure suitable emergency lighting is provided at the forward and aft life-raft stations and the aft lifeboat muster station to reduce evacuation risks to ALARP
Ensure that lifeboat maintenance routines take into account the original equipment manufacturers recommended maintenance routines
Ensure that the function testing routine for fuel system quick closing valves incorporates a recording mechanism that specifies the pass or fail criteria for each valve and allows for the maintainer to record the test result
Conduct an engineering assessment to determine if the electrical trunk vent louvres on all decks provide the appropriate fire protection rating. If not, upgrade the fire protection rating of the electrical trunk vent louvres to reduce fire risks to ALARP
Ensure that all personnel utilising the permit to work (PTW) system are trained and competent to perform their roles; and ensure that area authorities are trained and deemed competent to carry out their position as required by the permit
Ensure that the PTW, job safety analysis and tool box talks systems are effectively implemented at the facility
Table 14. (cont'd)
7.4 Environmental management inspectionsEnvironmental management inspections in 2014 covered a range of petroleum activities, including production facilities, drilling and seismic surveys. Inspections were conducted at duty holders’ offices as well as offshore. Many of these inspections identified non-compliances with the accepted environment plan and opportunities for improvement, with the greatest number relating to the management of planned emissions and discharges.
Examples of environmental management inspection recommendations – 2014
Ensure the maintenance schedule for key equipment is accessible at all times so that the duty holder has the ability to monitor ongoing environmental performance
Confirm that monitoring equipment is in service and calibrated before commencing discharge of produced formation water
Ensure that biannual chemical characterisation of produced formation water addresses the suite of chemical analytes identified in the environment plan
Conduct regular inspections of the drainage in the sack-room to ensure that no discharge to the marine environment can occur
Where chemicals do not meet the minimum specified environmental requirements, investigate alternatives as directed in the control of hazardous substances management standard
Ensure that all contractors implementing operational and scientific monitoring programs have the relevant competencies and training as specified by in the environment plan
Ensure that checklists are completed to verify that solids control equipment is tested and operational prior to receiving synthetic based mud on board
Ensure that tracker buoys are included in a preventative maintenance system
Ensure the offshore induction process is reviewed to reflect the requirements contained within the environment plan
Table 15.
ANNUAL OFFSHORE PERFORMANCE REPORT 201450

nopsema.gov.au 51
8. Topic-based inspections
NOPSEMA focuses some of its inspection effort on selected risk area topics that have common relevance to either all of the Australian offshore petroleum industry or to a particular sector within the industry.
In 2014, NOPSEMA concluded a series of health and safety topic-based inspections covering blowout preventer (BOP) and associated well control equipment, control of ignition sources, hazardous area equipment, performance standards and operator audit. In selecting the themed inspection topics, NOPSEMA used intelligence gathered from:
• learnings from major incidents globally• international regulators• incident reports submitted to NOPSEMA • previous NOPSEMA inspection findings to identify areas that warranted
particular attention by duty holders to improve health and safety outcomes.
These topic-based inspections were included as part of NOPSEMA’s ongoing program of planned, risk-based occupational health and safety inspections.
NOPSEMA also completed a series of environmental inspections on appropriate consultation by petroleum titleholders, prompted by complaints to NOPSEMA from other users of the marine area. These inspections involved further examination of information provided in environment plan assessments.
This chapter shares NOPSEMA’s general observations for the benefit of the broader industry, offshore workers and community stakeholders.
For information about NOPSEMA’s planned inspection program, see Chapter 7. For information about enforcement action, such as improvement notices issued by NOPSEMA, see Chapter 8.
8.1 Blowout preventer and associated well control equipment
An uncontrolled flow from a well, if ignited, can result in a fire or explosion with the potential to cause critical harm to persons and the facility. In the event of primary well control loss, BOP and associated well control equipment are the critical safety systems on a drilling facility. The consequences of a loss of well control were seen in the 2010 Macondo catastrophe in the Gulf of Mexico, where a factor in the incident was the performance of the drilling rig BOP. Following the incident the American Petroleum Institute Recommended Practice 53 (API RP 53) for ‘Blowout prevention equipment systems for drilling wells’, was reviewed and replaced with the more stringent American Petroleum Institute Standard 53 (API STD 53) in November 2012.
The new API STD 53 was developed in conjunction with the global oil and gas industry to assist in promoting personnel safety, public safety, integrity of drilling equipment, and preservation of the environment for land and marine drilling operations and is considered to be ‘good industry practice’. Two key improvements addressed in API STD 53 are:
• well defined periodic maintenance and inspection requirements• detailed shear ram considerations, configuration and spacing.
With regards to well control, NOPSEMA’s inspection focus was driven by operators’ commitments made in their facility safety case and the performance standards set for safety critical equipment. NOPSEMA selected a number of operators to assess the effectiveness of their management of the safety critical BOP and well control systems for the prevention of major accident events (MAEs). The inspections focused on areas of design/implementation, functionality, availability, maintainability/reliability, survivability, audits and training/competency.
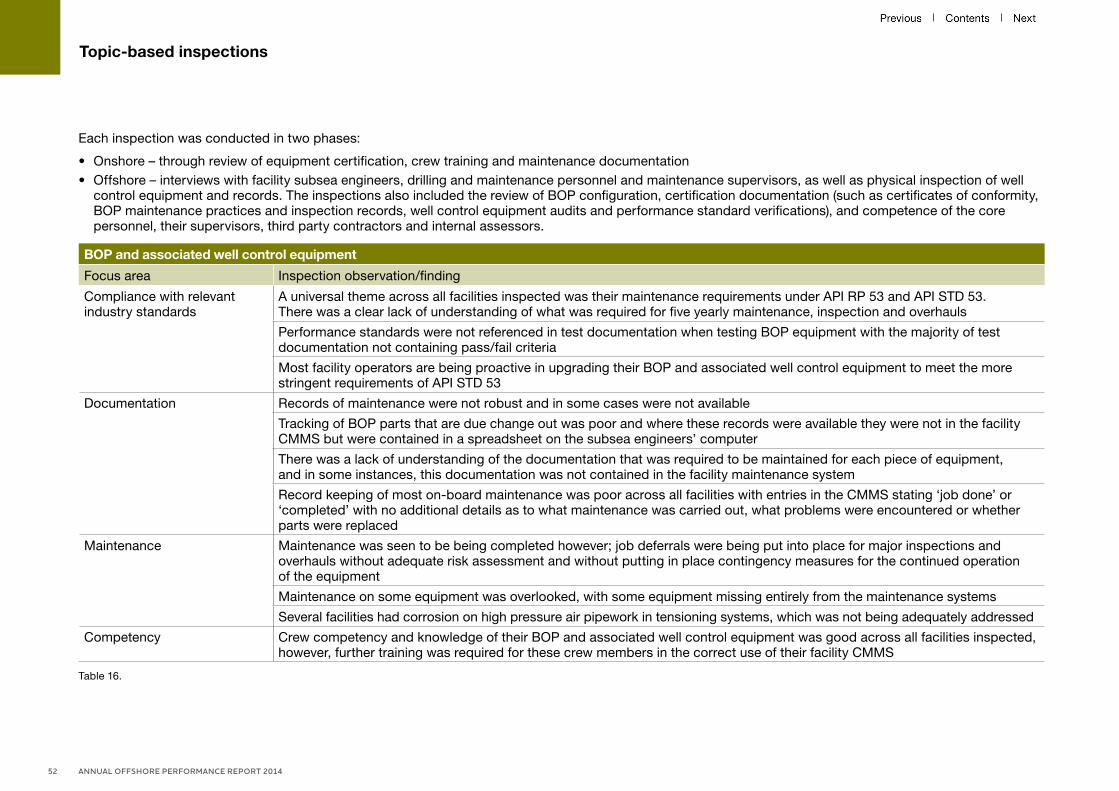
Topic-based inspections
Each inspection was conducted in two phases:
• Onshore – through review of equipment certification, crew training and maintenance documentation• Offshore – interviews with facility subsea engineers, drilling and maintenance personnel and maintenance supervisors, as well as physical inspection of well
control equipment and records. The inspections also included the review of BOP configuration, certification documentation (such as certificates of conformity, BOP maintenance practices and inspection records, well control equipment audits and performance standard verifications), and competence of the core personnel, their supervisors, third party contractors and internal assessors.
BOP and associated well control equipment
Focus area Inspection observation/finding
Compliance with relevant industry standards
A universal theme across all facilities inspected was their maintenance requirements under API RP 53 and API STD 53. There was a clear lack of understanding of what was required for five yearly maintenance, inspection and overhauls
Performance standards were not referenced in test documentation when testing BOP equipment with the majority of test documentation not containing pass/fail criteria
Most facility operators are being proactive in upgrading their BOP and associated well control equipment to meet the more stringent requirements of API STD 53
Documentation Records of maintenance were not robust and in some cases were not available
Tracking of BOP parts that are due change out was poor and where these records were available they were not in the facility CMMS but were contained in a spreadsheet on the subsea engineers’ computer
There was a lack of understanding of the documentation that was required to be maintained for each piece of equipment, and in some instances, this documentation was not contained in the facility maintenance system
Record keeping of most on-board maintenance was poor across all facilities with entries in the CMMS stating ‘job done’ or ‘completed’ with no additional details as to what maintenance was carried out, what problems were encountered or whether parts were replaced
Maintenance Maintenance was seen to be being completed however; job deferrals were being put into place for major inspections and overhauls without adequate risk assessment and without putting in place contingency measures for the continued operation of the equipment
Maintenance on some equipment was overlooked, with some equipment missing entirely from the maintenance systems
Several facilities had corrosion on high pressure air pipework in tensioning systems, which was not being adequately addressed
Competency Crew competency and knowledge of their BOP and associated well control equipment was good across all facilities inspected, however, further training was required for these crew members in the correct use of their facility CMMS
Table 16.
ANNUAL OFFSHORE PERFORMANCE REPORT 201452
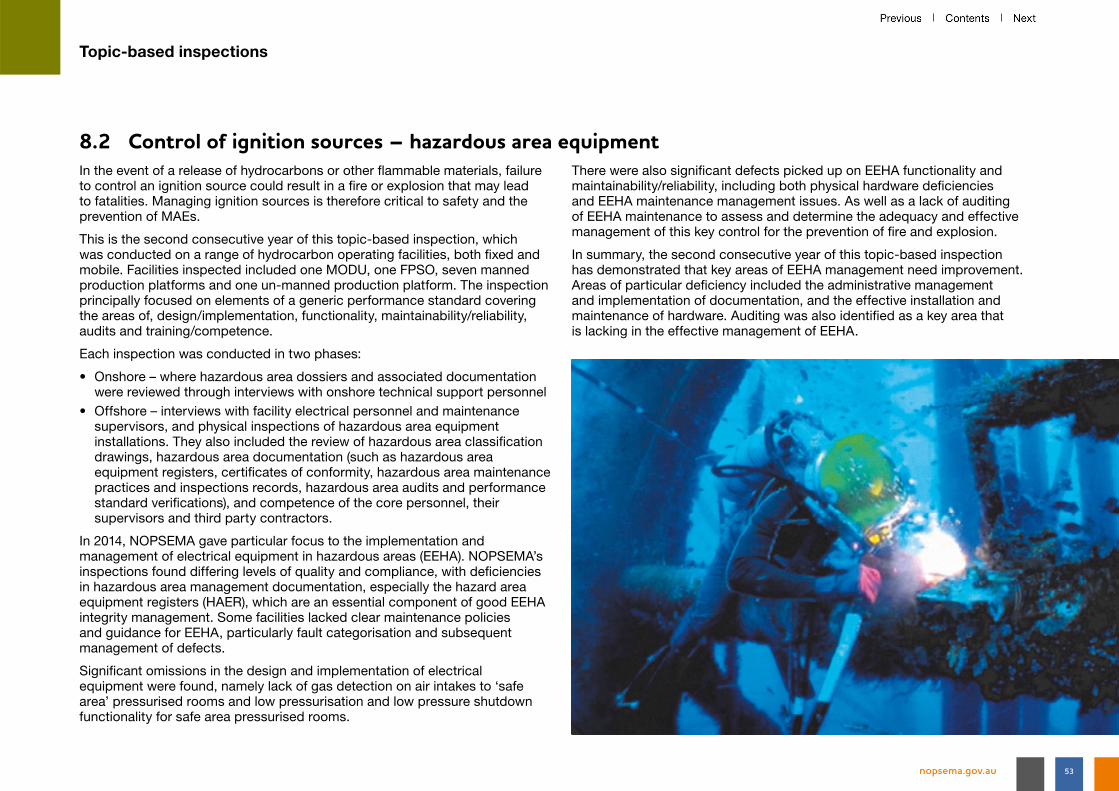
Topic-based inspections
8.2 Control of ignition sources – hazardous area equipment In the event of a release of hydrocarbons or other flammable materials, failure to control an ignition source could result in a fire or explosion that may lead to fatalities. Managing ignition sources is therefore critical to safety and the prevention of MAEs.
This is the second consecutive year of this topic-based inspection, which was conducted on a range of hydrocarbon operating facilities, both fixed and mobile. Facilities inspected included one MODU, one FPSO, seven manned production platforms and one un-manned production platform. The inspection principally focused on elements of a generic performance standard covering the areas of, design/implementation, functionality, maintainability/reliability, audits and training/competence.
Each inspection was conducted in two phases:
• Onshore – where hazardous area dossiers and associated documentation were reviewed through interviews with onshore technical support personnel
• Offshore – interviews with facility electrical personnel and maintenance supervisors, and physical inspections of hazardous area equipment installations. They also included the review of hazardous area classification drawings, hazardous area documentation (such as hazardous area equipment registers, certificates of conformity, hazardous area maintenance practices and inspections records, hazardous area audits and performance standard verifications), and competence of the core personnel, their supervisors and third party contractors.
In 2014, NOPSEMA gave particular focus to the implementation and management of electrical equipment in hazardous areas (EEHA). NOPSEMA’s inspections found differing levels of quality and compliance, with deficiencies in hazardous area management documentation, especially the hazard area equipment registers (HAER), which are an essential component of good EEHA integrity management. Some facilities lacked clear maintenance policies and guidance for EEHA, particularly fault categorisation and subsequent management of defects.
Significant omissions in the design and implementation of electrical equipment were found, namely lack of gas detection on air intakes to ‘safe area’ pressurised rooms and low pressurisation and low pressure shutdown functionality for safe area pressurised rooms.
There were also significant defects picked up on EEHA functionality and maintainability/reliability, including both physical hardware deficiencies and EEHA maintenance management issues. As well as a lack of auditing of EEHA maintenance to assess and determine the adequacy and effective management of this key control for the prevention of fire and explosion.
In summary, the second consecutive year of this topic-based inspection has demonstrated that key areas of EEHA management need improvement. Areas of particular deficiency included the administrative management and implementation of documentation, and the effective installation and maintenance of hardware. Auditing was also identified as a key area that is lacking in the effective management of EEHA.
nopsema.gov.au 53
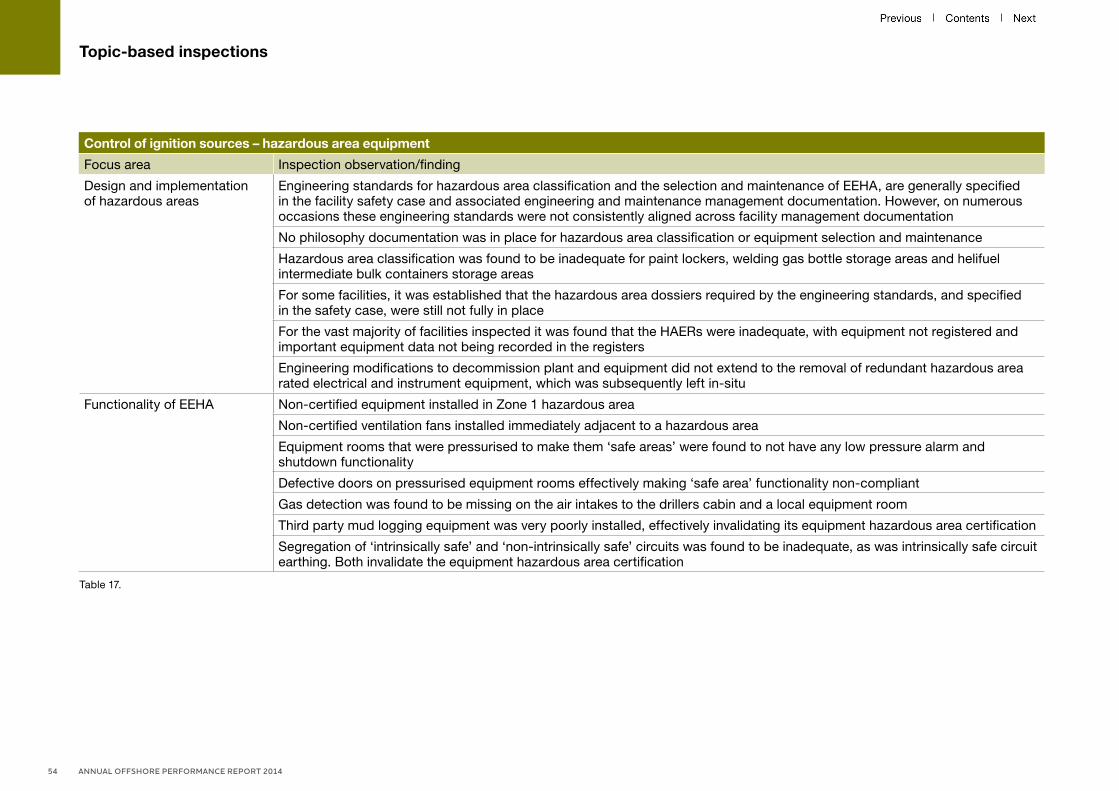
Topic-based inspections
Control of ignition sources – hazardous area equipment
Focus area Inspection observation/finding
Design and implementation of hazardous areas
Engineering standards for hazardous area classification and the selection and maintenance of EEHA, are generally specified in the facility safety case and associated engineering and maintenance management documentation. However, on numerous occasions these engineering standards were not consistently aligned across facility management documentation
No philosophy documentation was in place for hazardous area classification or equipment selection and maintenance
Hazardous area classification was found to be inadequate for paint lockers, welding gas bottle storage areas and helifuel intermediate bulk containers storage areas
For some facilities, it was established that the hazardous area dossiers required by the engineering standards, and specified in the safety case, were still not fully in place
For the vast majority of facilities inspected it was found that the HAERs were inadequate, with equipment not registered and important equipment data not being recorded in the registers
Engineering modifications to decommission plant and equipment did not extend to the removal of redundant hazardous area rated electrical and instrument equipment, which was subsequently left in-situ
Functionality of EEHA Non-certified equipment installed in Zone 1 hazardous area
Non-certified ventilation fans installed immediately adjacent to a hazardous area
Equipment rooms that were pressurised to make them ‘safe areas’ were found to not have any low pressure alarm and shutdown functionality
Defective doors on pressurised equipment rooms effectively making ‘safe area’ functionality non-compliant
Gas detection was found to be missing on the air intakes to the drillers cabin and a local equipment room
Third party mud logging equipment was very poorly installed, effectively invalidating its equipment hazardous area certification
Segregation of ‘intrinsically safe’ and ‘non-intrinsically safe’ circuits was found to be inadequate, as was intrinsically safe circuit earthing. Both invalidate the equipment hazardous area certification
Table 17.
ANNUAL OFFSHORE PERFORMANCE REPORT 201454
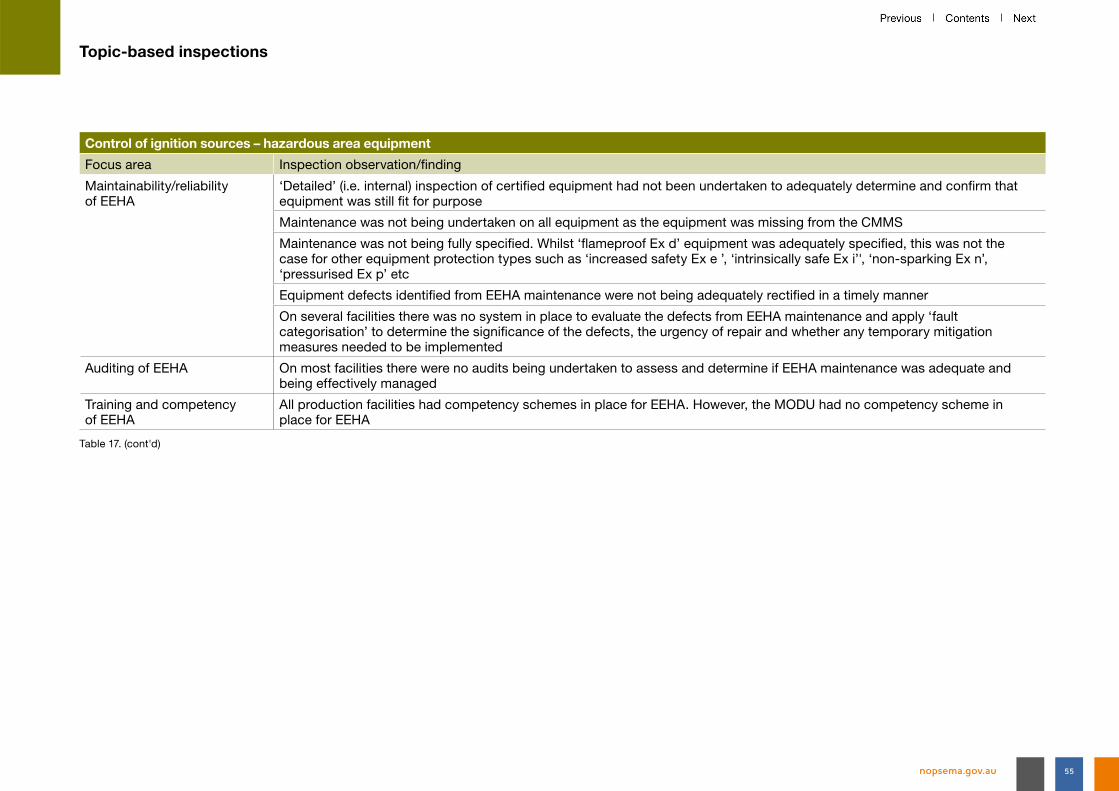
Topic-based inspections
Control of ignition sources – hazardous area equipment
Focus area Inspection observation/finding
Maintainability/reliability of EEHA
‘Detailed’ (i.e. internal) inspection of certified equipment had not been undertaken to adequately determine and confirm that equipment was still fit for purpose
Maintenance was not being undertaken on all equipment as the equipment was missing from the CMMS
Maintenance was not being fully specified. Whilst ‘flameproof Ex d’ equipment was adequately specified, this was not the case for other equipment protection types such as ‘increased safety Ex e ’, ‘intrinsically safe Ex i’', ‘non-sparking Ex n’, ‘pressurised Ex p’ etc
Equipment defects identified from EEHA maintenance were not being adequately rectified in a timely manner
On several facilities there was no system in place to evaluate the defects from EEHA maintenance and apply ‘fault categorisation’ to determine the significance of the defects, the urgency of repair and whether any temporary mitigation measures needed to be implemented
Auditing of EEHA On most facilities there were no audits being undertaken to assess and determine if EEHA maintenance was adequate and being effectively managed
Training and competency of EEHA
All production facilities had competency schemes in place for EEHA. However, the MODU had no competency scheme in place for EEHA
Table 17. (cont'd)
nopsema.gov.au 55
Topic-based inspections
8.3 Performance standardsThe use of performance standards is a well proven concept as a basis for managing the risks of MAEs. Performance standards are the parameters against which MAE controls are assessed to ensure they reduce risk to ALARP. They are established by the operator based on the performance required of a system, item of equipment, person, or procedure which is used as a basis for managing the risk of a MAE. The robust development and effective use of performance standards significantly contributes to the demonstration that control measures for the prevention and mitigation of MAEs are being appropriately and adequately managed.
The content and structure of performance standards are developed based on the ‘goal setting’ legislative framework by considering a range of different input sources, including:
• local or international engineering standards and specifications• facility basis for design• statutory or classification society rules.
The implementation of performance standards implicitly requires a review of maintenance management systems and quality management assurance activities to ensure performance against the criteria is being tested; and that the results are measured, recorded and assessed to assure the effectiveness of the risk controls.
In order to be assured of the sustained integrity of their risk control measures, facility operators must have a risk management strategy that includes continuous monitoring and assessment of compliance with appropriate performance standards.
In 2014, NOPSEMA conducted inspections on the topic of performance standards on a number of manned, unmanned, fixed and floating facilities. The selected facilities had different management systems, safety-critical controls and performance standards reflecting different type of facilities, organisational structures and their level of organisational maturity.
All operators inspected had some elements of a performance standards management system in place with focus on performance standards for technical (hardware) safety-critical controls. Most weaknesses were identified in the areas of lack of performance standards for procedural (software) safety-critical controls and lack of traceability of how performance standards were developed.
NOPSEMA has found that operators are generally good at identifying performance standards for safety-critical controls and linking them to MAEs, but are generally poor at formulating and implementing them in a way that will deliver the full benefits of a well-established and comprehensive performance standard system.
The content and structure of performance standards are developed based on the ‘goal setting’ legislative framework.
ANNUAL OFFSHORE PERFORMANCE REPORT 201456

Topic-based inspections
Performance standards
Focus area Inspection observation/finding
Implemented Performance standards are clearly linked to safety-critical controls
A documented system is usually in place for the identification of safety-critical controls and generation and implementation of performance standards
Performance standards for hardware/technical controls are usually in place
Performance standards for procedural (software) controls are often missing
The source of performance standards was often not defined, e.g. formal safety assessment studies, design specifications, industry codes or standards
Functional Generally, performance standards were found to be well structured and addressed functionality, availability, reliability, survivability and dependency
Contingency measures for cases where hardware/technical controls fail to meet their performance standards were found to be in place for most facilities
Some facilities had significantly fewer performance standards for preventative safety-critical controls (with the majority of the performance standards in place for mitigating controls)
Despite having different meanings, availability and reliability were often combined into a single measure of performance
Monitoring and auditing In many instances performance standards were found to be non-specific and thus difficult to measure and monitor
There was often no mechanism in place to monitor performance standards to ensure their currency
Monitoring (trending) of safety-critical controls against performance standards was not done in the majority of cases. Consequently, decline in performance of safety-critical control was typically not used to schedule and carry out preventive maintenance or repairs
Competency Some facility personnel had limited knowledge of performance standards, their importance and linkages to the safety-critical controls and corresponding MAEs
Table 18.
nopsema.gov.au 57

Topic-based inspections
8.4 Operator auditingNOPSEMA conducted topic based inspections on operators’ internal auditing processes.
The inspections covered a range of facilities that had differing safety-critical equipment, performance standards and safety management systems. This included FPSOs, normally attended production platforms and normally unattended wellhead platforms. The aim was to identify and highlight areas of good auditing practices and to identify areas for improvement.
All facility operators inspected had a documented auditing system at the corporate level; however, the level to which these auditing systems were implemented was variable. While personnel at the facility management level were found to have a general understanding of the purpose of audits, this appeared to be limited to checking that management systems were functional rather than a broader understanding that an auditing system should:
• promote compliance• identify areas of non-compliance• investigate reasons for non-compliance• recommend corrective actions• seek continual improvement.
Overall, these findings correlate with the findings of the previous topic-based inspections of operator audit in 2012. This highlights that general improvements are still required to ensure critical controls are audited and that performance standards are defined.
Facility operators are reminded of regulation 2.6 of the Safety Regulations, which require the safety case to demonstrate that there are effective means of ensuring:
• continual and systematic identification of deficiencies in the safety management system (SMS)
• continual and systematic improvement of the SMS.
Operator auditing
Focus area Inspection observation/finding
Audit plans While most operators maintained a facility audit plan, the plans were in some cases not fully implemented
The frequency of audits is often insufficient to promote compliance
Audit plans are not comprehensive, with many systems/areas not audited. Some examples include performance standards, third party contractors, and the audit system itself
Independent verification Few operators have used an independent competent person to audit their own auditing systems to verify whether it is achieving the system objectives
Independence, training and competence
Some audits are conducted by operations personnel who have not received training in auditing techniques and are not fully independent of the facility or the systems being audited
Investigate non-compliance and corrective actions
While audit reports contained corrective actions, these were primarily associated with remedial actions to correct the immediate cause of the non-conformance, rather than identifying and correcting the root causes behind the non-conformance
Table 19.
ANNUAL OFFSHORE PERFORMANCE REPORT 201458

Topic-based inspections
8.5 Consultation with relevant persons Consultation with people or organisations whose functions, interests or activities may be affected by petroleum activities (‘relevant persons’) is an important requirement of the Environment Regulations. In many situations, genuine and transparent consultation contributes key information to the assessment of environmental impacts and risks, and is valuable in demonstrating that these are reduced to ALARP and acceptable levels, throughout the life of the activity.
In 2014, NOPSEMA received an increase in complaints and enquiries from people with interests or activities in the marine area, regarding the consultation practices of petroleum titleholders undertaking exploration activities.
As a result, NOPSEMA completed a targeted inspection program, involving seven petroleum activities by six different titleholders. The activities included six seismic surveys and a geophysical survey, which were being undertaken in Commonwealth waters adjacent to South Australia, Victoria and Western Australia. NOPSEMA’s inspections were conducted at various stages of the activities, including prior to, during and following completion of the surveys.
Consultation arrangements that were examined in the inspections included:
• planning-stage consultation with relevant persons, as required by the Environment Regulations during preparation of environment plans
• arrangements to consult on an ongoing basis during the activity.
Analysis of the inspection findings identified a generally high level of compliance, with areas for improvement that may assist titleholders in planning and implementing consultation in their petroleum activities.
Consultation with relevant persons
Focus area Inspection observation or finding
Planning-stage consultation To maintain transparency in the consultation process, titleholders must provide meaningful and appropriate responses to relevant persons. On occasions, relevant persons submitted objections and claims during consultation but did not receive direct feedback from the titleholder on how these objections and claims were taken into account by the titleholder
Ongoing consultation Providing sufficient information and time to consult is important not only during preparation of an environment plan, but also in the event of a change in the petroleum activity (e.g. a change in timeframe for a survey).
Titleholders should ensure that they have processes in place to manage change with arrangements to provide relevant persons with sufficient information and time for them to make an informed assessment of the possible consequences. The functions, interests and activities of relevant persons vary considerably and changes to petroleum activities may result in unforeseen impacts
A formalised consultation plan may better enable titleholders to demonstrate that any arrangements in place meet the needs of relevant persons. Input should be sought from relevant persons to develop these plans well in advance of the activity. This cooperative, transparent approach could prevent potential conflict while the activity is underway
Titleholders should seek input from relevant persons so that consultation methods are tailored to address their needs and circumstances. Consultation methods should be established well in advance of the activity to allow for dissemination of information and a wide understanding of the arrangements in place
Table 20.
nopsema.gov.au 59

ANNUAL OFFSHORE PERFORMANCE REPORT 201460
9. Enforcements
NOPSEMA takes action to enforce compliance (enforcement action) when it identifies non-compliance with obligations imposed by the OPGGS Act and associated regulations.
Compliance and enforcement actions available to NOPSEMA are:
• prohibition notices• do not disturb notices• improvement notices• directions• request to revise a permissioning document• withdrawal of acceptance of a permissioning document• infringement notices• injunctions• civil penalties• prosecution• adverse publicity orders.
The ability to select from a range of enforcement actions, depending upon the severity of the misconduct or breach of statutory requirements, enables the application of an appropriately proportionate and targeted enforcement action which can also be directed at achieving future behavioural change, in addition to a return to compliance. The range of enforcement actions also allow NOPSEMA inspectors to determine an initial enforcement expectation in each case and modify it if required based on a range of potentially material factors. NOPSEMA’s enforcement actions are informed by:
• assessments• planned inspections• investigations and reporting of accidents, dangerous occurrences and
reported environmental incidents• investigation of complaints• duty holder compliance history and previous enforcement actions• Australian and international incidents• industry trends.
It should be noted that continued non-compliance that is subject to an enforcement action can result in escalation of the initial action with criminal and civil penalties being pursued as appropriate.
NOPSEMA inspectors are guided by NOPSEMA policy when choosing appropriate enforcement action(s) to obtain a duty holder’s compliance with the legislation. For more information about NOPSEMA’s enforcement policy, see the ‘Enforcement’ page at nopsema.gov.au.

Enforcements
9.1 Enforcement action typesNOPSEMA issued 26 enforcement actions18 in 2014 against 14 duty holders from the following regulatory divisions:
Enforcement actions – 2014Regulatory division Number %
Occupational health and safety 25 96
Well integrity 0 0
Environmental management 1 4Total 26 100
Table 21.
Of the 25 OHS enforcements in 2014, nine (36%) related to FPSOs, nine (36%) to vessels, six (24%) to MODUs and one (4%) related to platforms.
The single environmental management enforcement action was a written warning for a seismic survey that was carried out contrary to the environment plan in force.
18 This does not include verbal warnings or advice, revocation of directions and investigation-related notices (e.g. ‘do not disturb’ notices and ‘removal of plant or sample’ notices).
Enforcements – 2014
Topic areaEnforcement action id no. Issue summary Type No.
Prosecution briefN/A 553 Prosecution brief relating to incident involving the death of two members of the workforce OHS 1
N/A 555 Prosecution brief relating to the import and supply of a high pressure underwater spray gun OHS 1
Subtotal 2Prohibition notice
Design 538 Un-certified electrical equipment installed in Zone 1 hazardous area OHS 1
541 Unsafe pipe unbundling table/machine OHS 1
557 Lifeboat manufacturers design specification exceeded OHS 1
570 Operation of un-certified forklift in hazardous areas OHS 1
Subtotal 4
Figure 36.
Table 22.
nopsema.gov.au 61

Enforcements
Enforcements – 2014
Topic areaEnforcement action id no. Issue summary Type No.
Improvement noticeDesign 573 and 574 Failure of blowdown valves to meet performance standard OHS 2Hazardous substance 556 Fire/explosion hazard from epoxy powder OHS 1Noise exposure 560 Personnel exposed to excessive noise levels OHS 1Risk assessment and procedural controls
545 Crane spooling activity undertaken with ineffective procedures to identify operation specific activities and controls
OHS 1
549 Crane spooling activity undertaken with ineffective risk assessment to identify operation specific activities and controls
OHS 1
552 Work in the drilling derrick undertaken with ineffective risk assessment OHS 1Systems, policies, administrative controls
548 Failure to implement permit to work and energy isolation system OHS 1559 Failure to implement management of change process OHS 1571 Failure to maintain effective vessel collision controls OHS 1
Late notification of dangerous occurrence
543 Reported to NOPSEMA approximately 55 hours after incident occurred OHS 1
Interference with incident site
544 Interference with the incident site without OHS inspector authorisation OHS 1
Maintenance management 539 Failure to maintain BOP in accordance with safety case commitments and API RP 53 OHS 1Subtotal 13Written advice/warningUndertaking activity contrary to environment plan
556 Seismic survey carried out a year later than stated in the environment plan EM 1
Safety case non-compliance
558 Contravention of safety case commitments to maintain class certification for safety-critical elements OHS 1
Systems, policies, administrative controls
572 Failure to implement MoC process OHS 1
Reporting 540 Operator reminded on numerous occasions that final report was overdue but it was still not submitted OHS 1547 and 550 Late receipt of final report for dangerous occurrence OHS 2561 Failure to submit three day report OHS 1
Subtotal 7Total 26
Table 22. (cont'd)
ANNUAL OFFSHORE PERFORMANCE REPORT 201462

nopsema.gov.au 63

ANNUAL OFFSHORE PERFORMANCE REPORT 201464
Appendix 1.
Classification of fatalities and injuries (as per SCAP 905 & Australian Standard AS1885.1-1990)
Code Category Definition
FT Fatality Any work-related death that occurs within one year of the incident:
• includes missing persons• does not include fatalities that are due to natural causes
MI Major injury Any work related injury that results in:
• amputation: includes whole or partial amputation of parts of the body (does not include loss of fleshy tip of finger, nail, or tooth)
• skeletal injuries: includes bone fractures (including chipped or cracked bone or hairline fractures) and dislocation• burns: only if the injured person becomes unconscious, is admitted to hospital, or requires resuscitation• injuries to internal organs: only if the injured person becomes unconscious, is admitted to hospital, or
requires resuscitation• eye injuries resulting in loss of sight (permanent or temporary)• eye injuries resulting in a penetrating eye injury or a chemical or hot metal burn to the eye• any acute illness caused by exposure to harmful chemicals or biological agents and physiological effects
e.g. decompression illness, loss of hearing, and radiation sickness• hypothermia or heat-induced illness (unconsciousness)• any injury resulting in unconsciousness, resuscitation, or admittance to hospital

nopsema.gov.au 65
Appendix 1.
Code Category Definition
LTI ≥3 Lost time injury ≥3 days Any work-related injury (other than a ‘major injury’) which results in a person being unfit for work on any day after the day of occurrence of the injury and remains off work for three days or more
Any day includes rest days, weekend days, leave days, public holidays, or days after ceasing employment
LTI <3 Lost time injury <3 Any work-related injury (other than a ‘major injury’) which results in a person being unfit for work on any day after the day of occurrence of the injury and remains off work for one or more days but less than three days
Any day includes rest days, weekend days, leave days, public holidays, or days after ceasing employment
ADI Alternative duties injury Any work-related injury (other than a ‘major injury’) which results in a person being unfit for full performance of their regular job on any day after the occupational injury
Work performed might be: an assignment to a temporary job, part-time work at the regular job or working full-time in the regular job, but not performing all the usual duties of the job
Where no meaningful work is being performed, the incident should be recorded as a lost workday case
MTI Medical treatment injury Cases that are not severe enough to result in lost work day cases or alternative duty cases but are more severe than requiring simple first aid treatment
Note: For more information about these codes and categories, see NOPSEMA’s guidelines – ‘N0300 – GL0033 – Guideline on monthly reporting – deaths and injuries’ under the ‘Safety – Reporting Accidents and Dangerous Occurrences – Forms – Monthly Summary Report’ at the ‘Reporting accidents and dangerous occurrences’ tab at nopsema.gov.au

ANNUAL OFFSHORE PERFORMANCE REPORT 201466
Appendix 2.
Injury groups
Group code Group name Category Category name
TRCs Total recordable cases LTI ≥3 days Lost time injury of three or more days
LTI <3 Lost time injury of less than three days
ADI Alternative duties injury
MTI Medical treatment injury
LTIs Lost time injuries LTI ≥3 days Lost time injury of three or more days
LTI <3 days Lost time injury of less than three days
MTI Medical Treatment Injury MTI See Guidance – GL0033
ADI Alternative Duty Injury ADI See Guidance – GL0033
Note: For more information about these codes and categories, see NOPSEMA’s guidelines – ‘N0300 – GL0033 – Guideline on monthly reporting – deaths and injuries’ under the ‘Safety – Reporting Accidents and Dangerous Occurrences – Forms – Monthly Summary Report’ at the ‘Reporting accidents and dangerous occurrences’ tab at nopsema.gov.au

nopsema.gov.au 67
Appendix 3.
Incident notification and reporting categorisation scheme
Incident type
OHS incidents Accidents • Death or serious injury• Incapacitation ≥3 days LTI
Dangerous occurrences • Could have caused death or serious injury• Could have caused incapacitation ≥3 days LTI• Fire or explosion• Collision – marine vessel and facility• Uncontrolled HC release >1-300 kg• Uncontrolled HC release >300 kg• Uncontrolled PL release >80-12 500 L• Uncontrolled PL release >12 500 L
• Unplanned event – implement ERP• Damage to safety-critical equipment• Other kind needing immediate investigation• Pipeline – kind needing immediate• investigation• Pipeline – substantial risk of accident• Pipeline – significant damage• Well kick >50 barrels
Environmental incidents Reportable • Hydrocarbon vapour/petroleum fluid release• Chemical release• Drilling fluid/mud release• Fauna incident• Matters protected under Part 3 of the EPBC Act• Other
Recordable • Non-hydrocarbon air emissions• Hydrocarbon gas release/air emissions• Hydrocarbon spill <80 L• Chemical spill• Other unplanned liquid discharge• Spill to deck – no discharge to
marine environment
• Non-conformance with planned discharge• Solid waste discharge/dropped object • Injury or death – fauna• Seabed/benthic damage• Equipment not functioning• Breach of procedural control• Other

ANNUAL OFFSHORE PERFORMANCE REPORT 201468
Appendix 4.
Data tables for charts
1. Industry activityFigure 2 – Active duty holders
2005 2006 2007 2008 2009 2010 2011 2012 2013 2014Facility operators (OHS) 30 30 35 35 40 37 39 36 32 35Titleholders (WI) 14 27 28 31Titleholders (EM) 37 43 32
Figure 3 – Facility types
2005 2006 2007 2008 2009 2010 2011 2012 2013 2014Platforms 54 54 53 55 60 58 57 32 31 32FPSOs/FSOs 12 13 14 14 14 15 14 13 11 11MODUs 16 13 14 15 19 14 16 12 12 12Vessels 10 9 11 12 17 10 13 14 12 17Pipelines 6 16 68 68 70 110 109 80 83 76Total 98 105 160 164 180 207 209 151 149 148
Figure 4 – Petroleum activity types
2013 2014Operations 29% 42%Other petroleum activity 3% 19%Drilling 32% 16%Seismic 10% 14%Other surveys 10% 7%Construction 16% 2%
Figure 5 – Total offshore hours worked
2005 2006 2007 2008 2009 2010 2011 2012 2013 2014Fixed 6,045,187 5,489,338 5,183,438 5,541,693 6,030,100 7,372,400 7,197,149 7,359,360 5,958,080 4,876,541Mobile 3,668,039 4,511,902 6,037,559 7,452,468 8,712,551 6,040,231 6,942,732 8,323,697 7,400,623 9,465,947Total 9,713,226 10,001,240 11,220,997 12,994,161 14,742,651 13,412,631 14,139,881 15,683,057 13,358,703 14,342,488
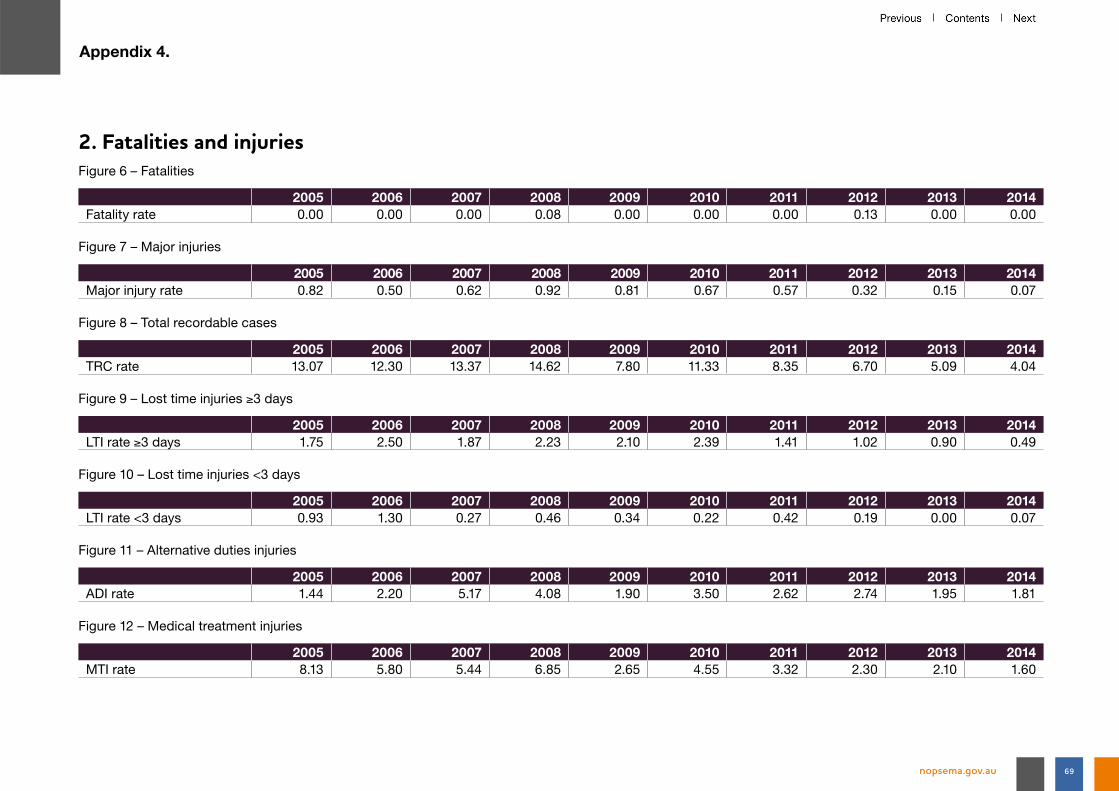
Appendix 4.
2. Fatalities and injuriesFigure 6 – Fatalities
2005 2006 2007 2008 2009 2010 2011 2012 2013 2014Fatality rate 0.00 0.00 0.00 0.08 0.00 0.00 0.00 0.13 0.00 0.00
Figure 7 – Major injuries
2005 2006 2007 2008 2009 2010 2011 2012 2013 2014Major injury rate 0.82 0.50 0.62 0.92 0.81 0.67 0.57 0.32 0.15 0.07
Figure 8 – Total recordable cases
2005 2006 2007 2008 2009 2010 2011 2012 2013 2014TRC rate 13.07 12.30 13.37 14.62 7.80 11.33 8.35 6.70 5.09 4.04
Figure 9 – Lost time injuries ≥3 days
2005 2006 2007 2008 2009 2010 2011 2012 2013 2014LTI rate ≥3 days 1.75 2.50 1.87 2.23 2.10 2.39 1.41 1.02 0.90 0.49
Figure 10 – Lost time injuries <3 days
2005 2006 2007 2008 2009 2010 2011 2012 2013 2014LTI rate <3 days 0.93 1.30 0.27 0.46 0.34 0.22 0.42 0.19 0.00 0.07
Figure 11 – Alternative duties injuries
2005 2006 2007 2008 2009 2010 2011 2012 2013 2014ADI rate 1.44 2.20 5.17 4.08 1.90 3.50 2.62 2.74 1.95 1.81
Figure 12 – Medical treatment injuries
2005 2006 2007 2008 2009 2010 2011 2012 2013 2014MTI rate 8.13 5.80 5.44 6.85 2.65 4.55 3.32 2.30 2.10 1.60
nopsema.gov.au 69

2. Fatalities and injuries (cont’d)
Figure 13 – Total recordable cases by facility type
2005 2006 2007 2008 2009 2010 2011 2012 2013 2014Pipelines 0 0 0 0 0 0 0 0 0 1Vessels 14 6 16 44 30 17 26 17 5 11Platforms 55 32 42 33 25 43 26 31 20 16MODUs 31 48 63 84 38 43 41 31 28 19FPSO/FSOs 27 37 29 29 22 42 25 26 15 11Total 127 123 150 190 115 145 118 105 68 58
Figure 14 – Total recordable cases for fixed facilities
2005 2006 2007 2008 2009 2010 2011 2012 2013 2014Pipelines 0.00 0.00 0.00 0.00 0.00 0.00 0.00 0.00 0.00 32.73Platforms 12.65 9.16 13.07 10.80 7.21 9.82 5.58 6.23 5.47 5.46FPSO/FSOs 16.35 20.42 14.88 12.36 8.78 14.98 9.84 11.53 6.94 5.75
Figure 15 – Total recordable cases for mobile facilities
2005 2006 2007 2008 2009 2010 2011 2012 2013 2014Vessels 13.43 5.24 9.37 18.79 7.84 13.44 8.30 5.07 2.34 2.14MODUs 11.81 14.26 14.55 16.44 7.78 9.00 10.76 6.23 5.32 3.47
Figure 16 – Total recordable cases – mechanism of incident
2012 2013 2014Hit by moving objects 33.33% 44.12% 44.83%Hitting objects 9.52% 22.06% 15.52%Body stressing 20.95% 14.71% 13.79%Falls, trips, slips 14.29% 7.35% 6.90%Chemicals and other substances 1.90% 1.47% 5.17%Heat, electricity, environmental 0.95% 1.47% 3.45%Unspecified (incl. other, multiple) 19.05% 8.82% 10.34%Total 100.00% 100.00% 100.00%
Appendix 4.
ANNUAL OFFSHORE PERFORMANCE REPORT 201470

Appendix 4.
Figure 17 – Total recordable cases – agency of injury
2012 2013 2014Non-powered equipment 40.95% 44.12% 43.10%Machinery/fixed plant 20.00% 20.59% 24.14%Chemicals and other substances 6.67% 19.12% 8.62%Powered equipment 2.86% 2.94% 5.17%Mobile plant/transport 1.90% 0.00% 5.17%Environmental and biological agencies 2.86% 0.00% 3.45%Unspecified 24.76% 13.24% 10.34%Total 100.00% 100.00% 100.00%
3. IncidentsFigure 18 – Incidents
2005 2006 2007 2008 2009 2010 2011 2012 2013 2014Accidents 21 34 32 47 41 43 29 21 13 7Dangerous occurrences 133 173 231 357 307 345 306 383 356 347Reportable incidents (EM) 18 31 22Recordable incidents (EM) 46 54 41
Figure 19 – Accidents
2005 2006 2007 2008 2009 2010 2011 2012 2013 2014Accident rate 2.16 3.40 2.85 3.62 2.78 3.21 2.05 1.34 0.97 0.49
Figure 20 – Dangerous occurrences
2005 2006 2007 2008 2009 2010 2011 2012 2013 2014Dangerous occurrence rate 13.69 17.30 20.59 27.47 20.82 25.72 21.64 24.42 26.65 24.19
nopsema.gov.au 71

Appendix 4.
3. Incidents (cont’d)Figure 21 – Dangerous occurrences – potential injuries, collisions, fires
2005 2006 2007 2008 2009 2010 2011 2012 2013 2014Fire or explosion 0.72 0.70 0.89 1.08 0.95 0.52 0.85 0.57 0.22 0.56Collision marine vessel and facility 0.41 0.90 0.18 0.62 0.75 0.52 0.42 0.13 0.22 0.14Potential injuries 5.56 6.60 6.77 6.39 5.56 4.25 4.60 3.89 3.07 2.51
Figure 22 – Dangerous occurrences – ERP implementation, SCE damage, other
2005 2006 2007 2008 2009 2010 2011 2012 2013 2014Damage to safety-critical equipment 0.72 2.00 2.50 6.70 4.21 5.29 5.66 8.16 7.49 5.44Unplanned event – implement ERP 1.34 1.70 3.83 7.08 5.83 10.14 6.93 8.93 11.00 12.20Other kind needing immediate investigation 3.71 3.40 3.74 3.85 1.83 2.53 1.06 1.59 3.07 1.60
Figure 23 – OHS hydrocarbon releases
2005 2006 2007 2008 2009 2010 2011 2012 2013 2014Uncontrolled HC release > 1-300kg 11 15 21 18 15 22 18 13 19 20Uncontrolled HC release > 300 kg 1 3 1 3 5 3 2 3 0 3Uncontrolled PL release > 80-12 500L 0 1 6 2 3 7 9 1 1 2Uncontrolled PL release > 1-300kg 0 0 0 0 1 0 0 0 0 0
Figure 24 – Total OHS gas releases
2005 2006 2007 2008 2009 2010 2011 2012 2013 2014Australia – rate per 100 million BOE 6.22 8.04 9.06 8.72 7.46 8.78 7.13 5.26 5.97 6.74IRF Countries – rate per 100 million BOE 3.93 4.50 4.73 3.39 4.86 4.84 4.62 4.03 3.81
ANNUAL OFFSHORE PERFORMANCE REPORT 201472

Appendix 4.
Figure 25 – Hydrocarbon releases basic causes – OHS
2012 2013 2014Design 15.15% 33.33% 37.25%Procedures 6.06% 12.82% 13.73%Preventive maintenance 9.09% 20.51% 13.73%Management systems (people) 27.27% 10.26% 7.84%Human engineering 0.00% 5.13% 5.88%Tolerable failure 3.03% 10.26% 5.88%Equipment parts/defects 9.09% 5.13% 3.92%
Figure 26 – Reportable environmental incidents
2012 2013 2014Hydrocarbon vapour/petroleum fluid release 2 6 13Chemical release 7 14 8Fauna incident 4 5 1Drilling fluid/mud release 5 4 0Other 0 2 0
Figure 27 – Recordable environmental incidents
2012 2013 2014Hydrocarbon spill < 80L 42 42 53Breach of procedural control 28 23 53Gas release/air emissions 27 28 41Solid waste discharge/dropped object 32 17 22Chemical spill 14 32 16Non-conformance with planned discharge 10 14 16Other 1 0 11Spill to deck – no discharge to marine environment 7 6 7Other unplanned liquid discharge 2 3 6Non-HC air emissions 1 5 4Equipment not functioning 7 3 1Seabed/benthic damage 0 0 1Injury or death – fauna 4 2 0
nopsema.gov.au 73

Appendix 4.
4. Complaints
Figure 28 – Complaints
2005 2006 2007 2008 2009 2010 2011 2012 2013 2014OHS complaint rate 2.99 3.50 1.96 1.92 0.81 1.12 1.63 0.32 0.45 0.21EM complaint rate 0.00 0.30 0.14
6. Assessments and submissionsFigure 29 – Submissions
2005 2006 2007 2008 2009 2010 2011 2012 2013 2014OHS 127 156 165 265 202 167 269 220 160 165WI 170 193 119 162EM 103 119 75PSZ 0 0 0 0 0 0 0 15 11 10
Figure 30 – Assessments notified within legislated timeframes
2005 2006 2007 2008 2009 2010 2011 2012 2013 2014OHS 75% 57% 58% 52% 74% 83% 91% 98% 100% 100%WI 99% 100% 100% 99%EM 100% 100% 100%PSZ 100% 100% 100%
Figure 31 – Assessments not accepted
2005 2006 2007 2008 2009 2010 2011 2012 2013 2014OHS 2% 3% 6% 9% 12% 14% 30% 30% 20% 27%WI 3% 2% 2% 3%EM 10% 2%
Figure 32 – Safety cases rejected
2005 2006 2007 2008 2009 2010 2011 2012 2013 2014% rejected 2.27% 3.45% 7.83% 9.42% 11.02% 17.00% 35.63% 18.80% 24.72% 24.44%
ANNUAL OFFSHORE PERFORMANCE REPORT 201474
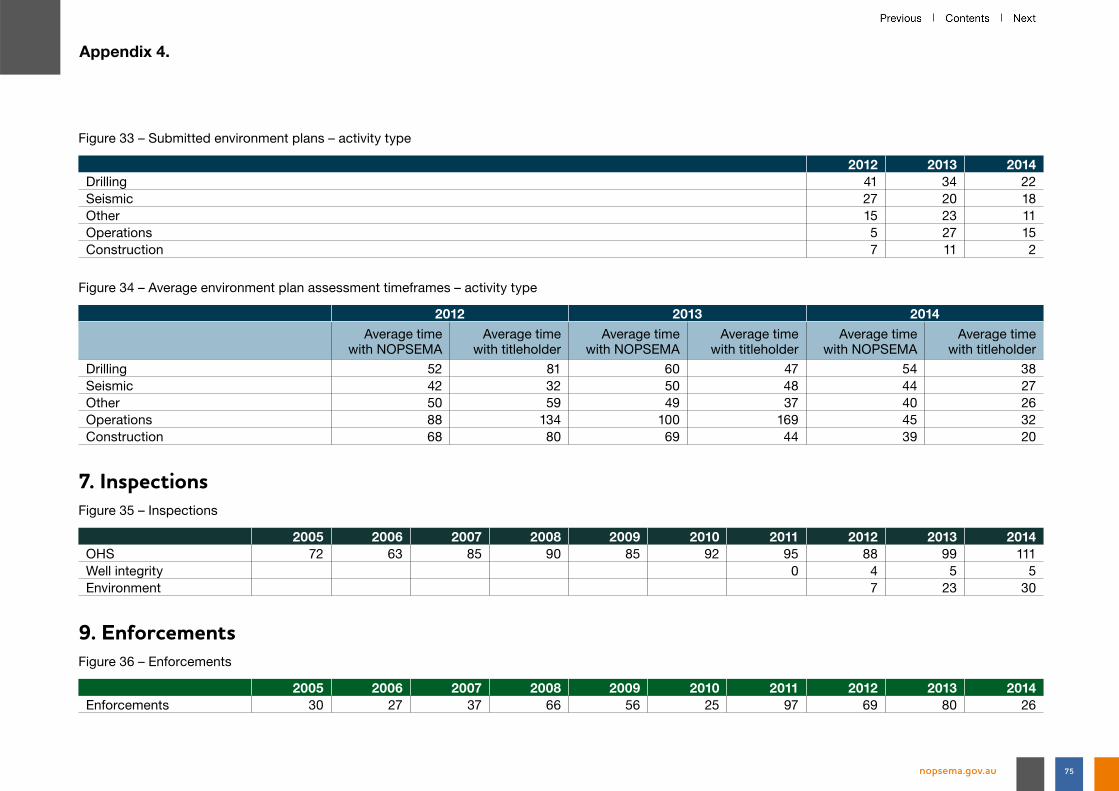
Appendix 4.
Figure 33 – Submitted environment plans – activity type
2012 2013 2014Drilling 41 34 22Seismic 27 20 18Other 15 23 11Operations 5 27 15Construction 7 11 2
Figure 34 – Average environment plan assessment timeframes – activity type
2012 2013 2014
Average time with NOPSEMA
Average time with titleholder
Average time with NOPSEMA
Average time with titleholder
Average time with NOPSEMA
Average time with titleholder
Drilling 52 81 60 47 54 38Seismic 42 32 50 48 44 27Other 50 59 49 37 40 26Operations 88 134 100 169 45 32Construction 68 80 69 44 39 20
7. InspectionsFigure 35 – Inspections
2005 2006 2007 2008 2009 2010 2011 2012 2013 2014OHS 72 63 85 90 85 92 95 88 99 111Well integrity 0 4 5 5Environment 7 23 30
9. EnforcementsFigure 36 – Enforcements
2005 2006 2007 2008 2009 2010 2011 2012 2013 2014Enforcements 30 27 37 66 56 25 97 69 80 26
nopsema.gov.au 75

ANNUAL OFFSHORE PERFORMANCE REPORT 201476
Glossary
Acronyms and common terms Term DefinitionAAUWA Applications for approval to undertake well activityActivity or petroleum activity As defined in the Offshore Petroleum and Greenhouse Gas Storage (Environment) Regulations 2009Actuator A servomechanism that supplies and transmits a measured amount of energy for the operation of another mechanism
or systemADI Alternative duties injuriesALARP As low as reasonably practicable. A principle that provides a means for assessing the tolerability of riskAPI STD 53 American Petroleum Institute Standard 53API RP 53 American Petroleum Institute Recommended Practice 53ATBA Area to be avoidedBlowout An uncontrolled release of hydrocarbons from a wellBOP Blow out preventerCMMS Computerised maintenance management systemDangerous occurrence See definition in clause 82 of Schedule 3 to the OPGGS ActDEWNR Department of Environment, Water and Natural Resources – South AustraliaDPP Diving project planDTPLI Department of Transport, Planning and Local Infrastructure – VictoriaDROPS Dropped objects prevention schemeDuty holders Parties with legislative responsibilities under the Offshore Petroleum Greenhouse Gas Storage Act 2006ED Equipment difficultiesEEHA Electrical equipment in hazardous areasEM Environmental managementEP Environment planERP Emergency response planEx d, e, I, n, p etc. These refer to electrical equipment protection level categories. For more information see IEC/EN Standard 60079
Explosive Atmospheres Fingerboard The working platform approximately halfway up the derrick or mast in which the derrickman stores drill pipe and
drill collars

Glossary
Term Definition
Facility A vessel, structure or pipeline at which offshore petroleum operations are being performed – defined in Clause 4 of Schedule 3 to the Offshore Petroleum and Greenhouse Gas Storage Act 2006
The following categories of facilities are recognised within the legislation:Accommodation, construction and pipelay vessel
A maritime vessel used in the construction of subsea infrastructure
Floating production, storage and offloading vessel (FPSO)
Similar in appearance to an oil tanker and carries production and processing facilities, with the addition of storage tanks for the crude oil recovered from the wells
Floating storage and offloading vessel (FSO)
Similar to an FPSO with reduced production and processing facilities
Large production platform A large scale production facility, which can be a floating or fixed marine vessel (conducting specific activities at a location)Mobile offshore drilling unit (MODU)
An offshore facility (capable of independent navigation) used for drilling or servicing a well for petroleum
Pipeline A pipe or system of pipes in an offshore area used for conveying petroleum (whether or not the petroleum is recovered from an offshore area)
Production platform (with drilling or no drilling, can be attended (manned) or not normally attended (unmanned))
A platform from which development wells are drilled that also houses processing plant and other equipment
HAER Hazardous area equipment registerHC Hydrocarbon(s) – organic compounds of carbon and hydrogenHPD Human performance difficultiesHSR Health and safety representativeImprovement notice A notice issued to the operator of a facility requiring action to prevent any further contravention or likely contravention
of listed OHS lawLTI Lost time injuryMAE Major accident eventMoC Management of changeMonkey board The catwalk along the side of the derrickMTI Medical treatment injuriesN/A Not applicableNOPSA National Offshore Petroleum Safety Authority (NOPSEMA superseded NOPSA on 1 January 2012)
Acronyms and common terms (cont’d)
nopsema.gov.au 77

Glossary
Term Definition
NOPSEMA National Offshore Petroleum Safety and Environmental Management AuthorityNOPTA National Offshore Petroleum Titles AdministratorNT Northern TerritoryOEM Original equipment manufacturerOHS Occupational health and safetyOperator In relation to a facility or proposed facility, the person who, under the Regulations, is registered by NOPSEMA
as the operator of that facility or proposed facility (as defined in Clause 5 of Schedule 3 of the OPGGS Act)OPGGS Act Abbreviation of the Offshore Petroleum and Greenhouse Gas Storage Act 2006Personal safety A category of risk management focusing on injuries such as slips, trips, falls, ‘struck-by’ incidents and strains; Personal
safety programs place an emphasis on personal behaviour and the wearing of personal protective equipmentPerformance standard Are the parameters against which control measures for MAEs are assessed to ensure they reduce the risks to ALARP
on an on-going basisPTW Permit to workPipeline Pipeline See “Facility”Process safety A category of risk management focusing on the prevention of uncontrolled releases of hydrocarbons, chemicals, energy,
or other potentially dangerous materials (including steam) during the course of facility processes and which can cause major accident events. Process safety involves, for example, the prevention of leaks, spills, equipment malfunction, overpressures, over-temperatures, corrosion, metal fatigue and other similar conditions. Process safety programs focus on design of facilities, maintenance of equipment, alarms, effective control points, procedures and training
Prohibition notice A notice issued to the operator of a facility in order to remove an immediate threat to the health or safety of any personPSMP Pipeline safety management plan, a plan for managing OHS risks to personnel at or near pipeline facilitiesPSZ Petroleum safety zoneQA Quality assuranceQC Quality checkRisk assessment The purpose of a risk assessment is to provide the operator of a facility with a detailed understanding of all aspects
of the risks to people that may arise at or near the facilityROV Remotely operated vehicleSC Safety case; A document prepared and submitted by an operator of a facility to NOPSEMA that identifies the hazards
and risks at the facility, describes how the risks are controlled and the health and safety management systems which are in place to ensure that the controls are effectively and consistently applied
SCAP Safety case administration procedure
Acronyms and common terms (cont’d)
ANNUAL OFFSHORE PERFORMANCE REPORT 201478

Acronyms and common terms (cont’d)
Glossary
Term Definition
SDV Shutdown valveSMP Safety management planSMS Safety management systemTapRoot® A system for root cause analysisTitleholder The permittee of a petroleum exploration permit, the lessee of a petroleum retention lease, or the licensee of a petroleum
production licence (as defined in subsection 51 and 572(1) of the OPGGS ActTOOCS Type of occurrence classification systemTRC Total recordable casesTugger wire A wire used in winching operationsWellhead A general term used to describe the component at the surface of an oil or gas well that provides the structural and
pressure-containing interface for the drilling and production equipmentWI Well integrityWOMP Well operations management plan, a document that the titleholder must submit which should specify acceptable
methods of conducting well operations in accordance with sound engineering principles and good oilfield practiceWHS Act The Work Health and Safety Act 2011Zone 1 hazardous area Gas, vapour or mist will be present or expected to be present for long periods under normal operating conditions
(0.1-10% of the time)
nopsema.gov.au 79

ANNUAL OFFSHORE PERFORMANCE REPORT 201480
References
Borthwick, David AO PSM 2010, Report of the Montara Commission of Inquiry, Commonwealth of Australia, Canberra
Department of Resources, Energy and Tourism 2011, Final Government Response to the Montara Commission of Inquiry, Commonwealth of Australia, Canberra
Department of Primary Industry and Energy 1995, Procedures and Records for Administration of Safety for Offshore Petroleum Facilities, Offshore Petroleum and Greenhouse Gas Storage Act 2006, Safety Case Administration Procedure National Accident/Incident Database (SCAP 905)
National Offshore Petroleum Safety and Environmental Management Authority 2014, Offshore Health and Safety Performance Report, NOPSEMA, Perth
National Offshore Petroleum Safety and Environmental Management Authority 2013, Offshore Health and Safety Performance Report, NOPSEMA, Perth
National Offshore Petroleum Safety and Environmental Management Authority 2012, Offshore Health and Safety Performance Report, NOPSEMA, Perth
National Offshore Petroleum Safety Authority 2010, Offshore Health and Safety Performance Report, NOPSA, Perth
Standards Australia 1990, Workplace Injury and disease recoding standard, Australian Standard AS1885-1. 1-1990
Legislation
Offshore Petroleum and Greenhouse Gas Storage Act 2006 (Cth.) (No 14) 2006 as amended.
Offshore Petroleum and Greenhouse Gas Storage (Environment) Regulations 2009 (Cth.) Statutory Rules 1999 (No. 228) as amended and made under the Offshore Petroleum and Greenhouse Gas Storage Act 2006
Offshore Petroleum and Greenhouse Gas Storage (Safety) Regulations 2009 (Cth.) Select Legislative Instrument 2009 (No. 382) as amended and made under the Offshore Petroleum and Greenhouse Gas Storage Act 2006
Offshore Petroleum and Greenhouse Gas Storage (Resource Management and Administration) Regulations 2011
Regulatory Levies Act 2003. Offshore Petroleum and Greenhouse Gas Storage (Regulatory Levies) Act 2003 (Cth.) (No. 117) of 2003 as amended
Regulatory Levies Regulations 2004. Offshore Petroleum and Greenhouse Gas Storage (Regulatory Levies) Regulations 2004 (Cth.) Statutory Rules 2004 (No. 315) made under the Offshore Petroleum (Regulatory Levies) Act 2003
Image courtesy of Apache Corporation.
nopsema.gov.au 81

ISSN 2202-1167
Head Office, Perth
Level 8, 58 Mounts Bay Road, Perth WA 6000 GPO Box 2568, PERTH WA 6001
phone: +61 8 6188 8700 fax: +61 8 6188 8737 email: [email protected]
Melbourne
Ground Floor, 493 St Kilda Road, Melbourne VIC 3004 PO Box 7104, St Kilda Road VIC 8004
phone: +61 3 8866 5700 fax: +61 3 8866 5706
ABN 22 385 178 289
National Offshore Petroleum Safety and Environmental Management Authority (NOPSEMA)