Embed Size (px)
Citation preview

Project No: 101-16945-00 Date: March 2016
– WSP Canada Inc. 1450 – 1st Ave. W. Suite 101 Owen Sound, ON N4K 6W2 Phone: 519-376-7612 Fax: 519-376-8008 www.wspgroup.com
ANNUAL MONITORING REPORT - 2015
KINLOSS LANDFILL SITE
Township of Huron-Kinloss

WSP Canada Inc. 1450 – 1st Ave. W. Suite 101 Owen Sound, ON N4K 6W2 Phone: 519-376-7612 Fax: 519-376-8008 www.wspgroup.com
WSP Canada Inc. Adress line 1 Adress line 2 Adress line 3 www.wspgroup.com
WSP Canada Inc. Adress line 1 Adress line 2 Adress line 3 www.wspgroup.com
101-16945-00 March 2, 2016 Mr. Hugh Nichol, Director of Public Works Township of Huron-Kinloss P.O. Box 130 21 Queen Street RIPLEY, ON N0G 2R0 Re: Kinloss Landfill Site, Township of Huron-Kinloss 2015 Annual Monitoring Report Information
Dear Mr. Nichol: Please find enclosed a copy of the report entitled, “Kinloss Landfill Site, Township of Huron-Kinloss, Annual Monitoring Report – 2015”, dated March 2016. By means of a copy of this letter, we are forwarding two (2) copies of the above mentioned annual report to Mr. Ian Mitchell, District Engineer, Ministry of the Environment and Climate Change, Owen Sound, for review. If you have any questions, please contact me at this office. Yours truly, WSP Canada Inc. Stephen J. Cobean, P.Eng. NRM/dlw Encl. cc Mr. Ian Mitchell, District Engineer, Ministry of the Environment and Climate
Change, Owen Sound

i
Annual Monitoring Report - 2015, Kinloss Landfill Site WSP Township of Huron-Kinloss No 101-16945-00 March 2016
TABLE OF CONTENTS 1 INTRODUCTION ............................................................................. 1
1.1 BACKGROUND..................................................................................................... 1
1.2 PURPOSE ............................................................................................................. 1
2 SITE USAGE .................................................................................. 2
3 SITE LIFE ....................................................................................... 3
4 BURNING OPERATIONS ............................................................... 4
5 RECYCLING/WASTE REDUCTION ............................................... 5
5.1 SCRAP METAL AND TIRES ................................................................................ 5
5.2 RECYCLABLE MATERIALS ................................................................................ 5
5.3 E-WASTE, BALE WRAP AND MATTRESSES .................................................... 5
5.4 SUMMARY OF RECYCLING/WASTE REDUCTION ........................................... 6
6 LANDFILL OPERATIONS .............................................................. 7
7 MONITORING ................................................................................. 8
7.1 CURRENT MONITORING PROGRAM ................................................................. 8
7.2 SHALLOW GROUNDWATER CONFIGURATION ............................................. 10
7.3 GROUNDWATER MONITORING RESULTS ..................................................... 11
7.3.1 BACKGROUND GROUNDWATER CHEMISTRY ............................................... 11
7.3.2 LEACHATE MONITORING ................................................................................. 12
7.3.3 DOWNGRADIENT GROUNDWATER MONITORING ........................................ 12
7.4 SURFACE WATER MONITORING ..................................................................... 14
7.5 REASONABLE USE ........................................................................................... 14
7.6 BUFFER LANDS ................................................................................................. 17
7.7 METHANE GAS .................................................................................................. 18

ii
WSP Annual Monitoring Report - 2015, Kinloss Landfill Site No 101-16945-00 Township of Huron-Kinloss March 2016
7.8 PROPOSED FUTURE MONITORING PROGRAM ............................................ 18
8 CONCLUSIONS ............................................................................ 19
9 RECOMMENDATIONS ................................................................. 20

iii
Annual Monitoring Report - 2015 WSP Township of Huron-Kinloss No 101-16945-00 March 2016
T A B L E S
Table 1 Summary of 2009 to 2015 Recycling Data Table 2 Kinloss Landfill Site Monitoring Well Security Table 3 Summary of Groundwater Elevations Table 4 Reasonable Use Criteria Table 5 Summary of Methane Monitoring Results Table 6 Proposed Future Monitoring Program
F I G U R E S
Figure 1 Hydrograph – All Wells except OW13 Figure 2 Hydrograph – OW13 Figure 3 Indicator Parameters – Spring Figure 4 Indicator Parameters – Fall Figure 5 Chloride vs. Time Figure 6 Indicator Parameters – Surface Water
M A P S
Map 1 Regional Location Map Map 2 Existing Conditions Map Map 3 Groundwater Flow
A P P E N D I C E S
Appendix A Provisional Certificate of Approval Appendix B 2015 Landfill Correspondence Appendix C Cross-Section and Borehole Logs Appendix D BASWR Recycling Data Appendix E Certificate of Analysis and Lab Results Appendix F Summary of Groundwater Results F.1 Summary of Groundwater Results (pre – 2007) – R.J. Burnside F.2 Summary of Groundwater Results (2007 – present) Appendix G Summary of Surface Water Results G.1 Summary of Surface Water Results (pre – 2007) – R.J. Burnside G.2 Summary of Surface Water Results (2007 – Present) Appendix H Buffer Lands Certificate of Registration and Lease Agreement Appendix I Monitoring & Screening Checklist

1
Annual Monitoring Report - 2015, Kinloss Landfill Site WSP Township of Huron-Kinloss No 101-16945-00 March 2016
1 INTRODUCTION
1.1 BACKGROUND
The Kinloss Site is located on the north half of Part Lot 16, Concession 6 in the former Township of Kinloss
in the amalgamated Township of Huron-Kinloss (Township). Refer to Map 1 for the regional location of the
site.
The landfill site is 6.0 hectare in area, all of which is approved by the Certificate of Approval. The primary
landfilling area is 3.9 hectares in area and is located within the approved area. The Township also owns a
3.0 hectare parcel of land immediately south of the landfill site and holds a 99 year lease on a 12.3 hectare
property abutting the eastern property of the landfill site. The respective locations of the aforementioned
properties are presented in Map 2, Existing Conditions.
The landfill operates in accordance with Certificate of Approval No. A272801 issued on October 1, 1980,
amended in February 1993 and February 1996. The Certificate of Approval and amendments are enclosed
in Appendix A.
1.2 PURPOSE
The purpose of this report is to provide an annual report regarding the operation and monitoring of the
landfill. Annual Monitoring Reports are a required condition of the Certificate of Approval (Appendix A).

SOURCE: MAPART CORP. 1:250,000 MAP OF WEST CENTRAL ONTARIO 1990/1991
2000
1000
5000 METRES25000
0 50005000
10000
20000 FEET
101-1450 1st AVENUE WOWEN SOUND (ONTARIO) CANADA N4K 6W2
TEL.: 519-376-7612 | FAX: 519-376-8008 | WWW.WSPGROUP.COM MAP 1
REGIONAL LOCATION MAP
KINLOSS LANDFILL SITE
TOWNSHIP OF HURON-KINLOSS

1020m±
ORIGINAL ROAD ALLOWANCE BETWEEN CONCESSIONS 5 AND 6
215.5m
215.5m
176.5m
176.5m
101-1450 1st AVENUE WOWEN SOUND (ONTARIO) CANADA N4K 6W2
TEL.: 519-376-7612 | FAX: 519-376-8008 | WWW.WSPGROUP.COM MAP 2
EXISTING CONDITIONS MAP
KINLOSS LANDFILL SITE
TOWNSHIP OF HURON-KINLOSS

2
WSP Annual Monitoring Report - 2015, Kinloss Landfill Site No 101-16945-00 Township of Huron-Kinloss March 2016
2 SITE USAGE
The Kinloss Landfill continues to accept recyclable materials from the former Village of Lucknow and
Township of Kinloss. The acceptance of household waste was discontinued on August 1, 2002.
Household waste from the Township of Kinloss is landfilled at the Huron Landfill. The Huron Landfill
(Certificate of Approval No. A272601) is owned and operated by the Township of Huron-Kinloss. The ability
to accept waste from both the former Township of Kinloss and former Village of Lucknow at the Huron
Landfill was approved by the Ministry of the Environment (MOE), now the Ministry of the Environment and
Climate Change (MOECC) in 2010.

3
Annual Monitoring Report - 2015, Kinloss Landfill Site WSP Township of Huron-Kinloss No 101-16945-00 March 2016
3 SITE LIFE
The acceptance of household waste at the Kinloss Landfill was discontinued in August, 2002. However the
site continues to receive recyclable and burnable materials from residents of the former Township of
Kinloss and the Village of Lucknow.
Based on information from the 2006 Annual Monitoring Report (R.J. Burnside & Associates Ltd.) the
estimated remaining capacity of the site is 137,000 m3. This estimation is based on a site survey completed
in August, 2003. However, this estimation was based on a cross-sectional survey of the waste surface
only, followed by end-method volumetric calculations. It is recommended that once landfilling commences
again, annual topographic surveys be completed. Data collected from these surveys coupled with
computer modelling will allow for more accurate determination of annual landfilled volumes and remaining
site life.

4
WSP Annual Monitoring Report - 2015, Kinloss Landfill Site No 101-16945-00 Township of Huron-Kinloss March 2016
4 BURNING OPERATIONS
Burning operations are conducted at the site. In accordance with MOECC Guideline C-7 Burning at Landfill
Sites, only segregated brush, lumber and clean wood may be burned at the site. Burning operations take
place in a separate area as shown in Map 2. Burning operations are conducted when the site is closed to
the public and weather conditions are favourable. Township Staff ensure that only designated materials are
in the burn pile before burning and supervise all burning operations.

5
Annual Monitoring Report - 2015, Kinloss Landfill Site WSP Township of Huron-Kinloss No 101-16945-00 March 2016
5 RECYCLING/WASTE REDUCTION
As of August 1, 2002, the Kinloss Landfill ceased acceptance of household waste. Recyclables, scrap
metal, white goods, brush, tires and burnables from the former Township of Kinloss and the Village of
Lucknow are still accepted. Household waste from the former Township of Kinloss is transported to the
Huron Landfill via curbside pickup. Household waste from the Village of Lucknow is landfilled at the Mid-
Huron Landfill.
Bruce Area Solid Waste Recycling (BASWR) has provided curbside waste and blue box collection for the
municipality since August, 2002. Residents of the former Township of Kinloss and the Village of Lucknow
can also bring their recyclables and burnables to the landfill during open hours.
All waste diversion totals for 2015 are combined for all Township landfills.
5.1 SCRAP METAL AND TIRES
In 2015, 159.10 tonnes of scrap metal was removed from the Huron and Kinloss landfills by Triple M Metal
LP.
In 2015, the number of tires removed from the Huron and Kinloss landfills as part of the Ontario Tire
Stewardship Program was a total of 2,648 tires at an approximate mass of 156.50 tonnes.
It is recommended that scrap metal and tires be removed by a recycling contractor when the quantity of the
segregated material justifies removal.
5.2 RECYCLABLE MATERIALS
The service area of the Kinloss Landfill is provided with regular Blue Box pickup on a bi-weekly basis, as is
the whole of the Township of Huron-Kinloss. Blue Box pickup is provided by Bruce Area Solid Waste
Recycling (BASWR).
Recycling bins are also located on-site as shown in Map 2. Cardboard recycling as well as regular Blue
Box material recycling bins are available. BASWR picks up the materials from these bins on a regular
basis.
The 2015 recycling data summaries for the Township from BASWR are enclosed in Appendix D.
5.3 E-WASTE, BALE WRAP AND MATTRESSES
E-waste and bale wrap are diverted from landfilling within the Township as well. In 2015, a total of 24.55
tonnes of E-waste and 4.07 tonnes of plastic bale wrap was diverted. E-waste is not accepted at the
Kinloss Landfill Site.
In 2015, the Township initiated a mattress diversion program. A total of 120 mattresses were diverted,
resulting in an estimated 4.08 tonnes of diverted waste.

6
WSP Annual Monitoring Report - 2015, Kinloss Landfill Site No 101-16945-00 Township of Huron-Kinloss March 2016
5.4 SUMMARY OF RECYCLING/WASTE REDUCTION
Table 1 summarizes the recycling and diverted materials data for the Township (both the Kinloss and
Huron Landfills are represented) over the past five (5) years. As shown in Table 1, the recyclable tonnages
have been relatively consistent over time. The 2015 tonnage of recyclables (442 tonnes) was up from the
2014 tonnage (349 tonnes). When all segregated materials are included, the total tonnage diverted from
both Township landfills (Kinloss and Huron) is 790 tonnes in 2015. This tonnage represents a 25%
diversion rate for the Township. The estimated saving in landfill space is 1,580 m3. The Township should
be commended on conducting a successful recycling program and are encouraged to continue promoting
recycling.

TABLE 1SUMMARY OF RECYCLING DATAHURON and KINLOSS LANDFILLS
Recyclable Product Weight Volume Weight Volume Weight Volume Weight Volume Weight Volume(Tonnes) Saved (Tonnes) Saved (Tonnes) Saved (Tonnes) Saved (Tonnes) Saved
(m3) (m3) (m3) (m3) (m3)Newspaper 178.32 356.64 168.83 337.66 169.55 339.10 123.03 246.06 140.29 280.58Steel (Cans, etc.) 29.71 59.42 24.76 49.52 29.02 58.04 22.97 45.94 25.75 51.50Aluminum 12.04 24.08 8.82 17.64 10.22 20.44 9.50 19.00 8.27 16.54Glass (Flint & Coloured) 48.23 96.46 50.45 100.90 51.94 103.88 44.34 88.68 49.67 99.34Plastic (HDPE & PET) 43.45 86.90 48.59 97.18 50.38 100.76 47.86 95.72 58.70 117.40White Paper 7.80 15.60 20.94 41.88 21.61 43.22 15.64 31.28 17.29 34.58Boxboard 35.02 70.04 37.67 75.34 41.81 83.62 35.36 70.72 42.35 84.70Corrugated Cardboard 97.94 195.88 93.27 186.54 105.94 211.88 50.26 100.52 99.54 199.08Total Recyclables 452.51 905.02 453.33 906.66 480.47 960.94 348.96 697.92 441.86 883.72
Tires 103.00 206.00 106.69 213.38 156.13 312.26 106.81 213.63 156.50 313.00Scrap Metal 126.92 253.84 155.97 311.94 186.18 372.36 114.14 228.28 159.10 318.20Bale Wrap 8.1 16.20 12.57 25.14 24.06 48.12 0 0 4.07 8.14E-waste 11.52 23.04 20.31 40.62 20.21 40.42 18.02 36.04 24.55 49.10Mattresses 4.08 8.16Total Segregated 249.54 499.08 295.54 591.08 386.58 773.16 238.97 477.95 348.30 696.60
Total Diverted 702.05 1404.10 748.87 1497.74 867.05 1734.10 587.93 1175.87 790.16 1580.32
Notes: 1. Data obtained from BASWRA and Township.2. Assumed compaction density is 500 kg/m 3.3. Tires are converted to a volume by a factor of 8 tires/m 3.4. Recyclable tonnages are for the entire Township excluding Lucknow.5. Tonnages of scrap metal and tires are combined totals for Kinloss and Huron Landfills.
20152014201320122011
G:\2010\OS\401 - Environment\101-16945-00 - Kinloss WDS\Reports\Monitoring 2015\Table 1.xls

7
Annual Monitoring Report - 2015, Kinloss Landfill Site WSP Township of Huron-Kinloss No 101-16945-00 March 2016
6 LANDFILL OPERATIONS
The Kinloss Landfill Site is open to residents during the months of May to October for the acceptance of
recyclables, scrap metal, tires, burnables and brush. The operating hours during these months are on
Saturdays from 10:00 a.m. to 2:00 p.m. The site is closed from November to April.
The access road is gravel and well maintained by the Township. Access to the site is controlled by a
lockable steel cable between a rigid steel frame. Fencing is in place around the entire perimeter of the site.
Signage at the front gate identifies who may use the site, hours of operation, Certificate of Approval
number, acceptable waste types and emergency contact information. The existing topography and
vegetation provide screening.
Township staff indicated no complaints regarding the operation of the Kinloss Landfill were received in
2015.

8
WSP Annual Monitoring Report - 2015, Kinloss Landfill Site No 101-16945-00 Township of Huron-Kinloss March 2016
7 MONITORING
7.1 CURRENT MONITORING PROGRAM
The monitoring of the groundwater and surface water at the Kinloss Landfill enables the determination of
the flow direction and concentration of the landfill generated leachate plume. The monitoring program is
also a requirement of the Certificate of Approval for the site. Samples are obtained twice per year (spring
and fall) from the monitoring wells and surface water stations. In addition, water level elevations are
obtained twice per year to confirm the groundwater flow direction. The monitoring program has been in
existence since 1988. Currently, groundwater elevations are relative to a historic survey with an inferred
benchmark.
The monitoring program dictates that each observation well sampled be purged prior to actual sampling to
obtain the most representative groundwater sample possible. To purge a well, a volume of water
equivalent to three (3) well casing volumes is removed from the well, or purged dry and allowed to recover
prior to sample collection.
Each sample obtained from an observation well is simultaneously field filtered. The sampling and filtering
device utilized is the Waterra manual pumping unit equipped with a disposable high turbidity 0.45 micron in-
line filter.
The monitoring well system is summarized in Table 2. The monitoring wells OW4 to OW11 were installed
by backhoe in 1985. These wells are relatively rudimentary in construction. The remaining wells were
drilled in 1997 to 2004 and are constructed of 2” diameter PVC casing and 1.5 m PVC well screens. In
addition, these wells are sand filter packed around the screened area and sealed with bentonite above the
well screen. All of the wells are protected by a lockable steel casing and have dedicated Waterra sampling
tubes and foot valves.
Well inspections are conducted in conjunction with semi-annual sampling in spring and fall. As shown in
Table 2, all monitoring wells are protected with lockable steel casings.

9
Annual Monitoring Report - 2015, Kinloss Landfill Site WSP Township of Huron-Kinloss No 101-16945-00 March 2016
Table 2 Kinloss Landfill Site
Monitoring Well Security
Observation Well
Well Protection
Well Security Condition
May 2015
October 2015
May 2015
October 2015
OW4 Steel Casing and Lid
Locked Locked Good Good
OW5 Steel Casing and Lid
Locked Locked Good Good
OW6 Steel Casing and Lid
Locked Locked Good
Good
OW7 Steel Casing and Lid
Locked Locked Good Good.
OW9 Steel Casing and Lid
Locked Locked Unknown Unknown
OW11 Steel Casing and Lid
Locked Locked Unknown Unknown
OW12 Steel Casing and Lid
Locked Unlocked
(vandalized)
Good Good
OW13S Steel Casing and Lid
Locked Locked Good Good
OW13I Steel Casing and Lid
Locked Locked Good Good
OW13D Steel Casing and Lid
Locked Locked Good
Good
OW14 Steel Casing and Lid
Locked Locked Good Good
Notes:
1. OW = Observation Well, S = Shallow , I = Intermediate and D = Deep 2. Wells OW4, OW5, OW6, OW7, OW9 & OW11 were installed by backhoe in 1985. Wells OW12
and OW13S were drilled in 1997. OW14 was drilled in 2003 and OW13I & OW13D were drilled in 2004. OW14 was decommissioned and replaced with OW14-14 on October 28, 2014.
3. OW9 and OW11 are inactive wells on the site and are not part of the sampling program.
In addition to the monitoring wells there are two (2) surface water stations that are sampled semi-annually.
These two (2) stations are located on the creek immediately east of the site. SW1 is the upstream sampling
location and SW2 is the downstream sampling location. The locations of both surface water stations are
shown in Map 2, Existing Conditions.
In 2006, three (3) gas probes were installed at the site. The logs detailing the construction details of the
three (3) gas probes are enclosed in Appendix C. Prior to the installation of these gas probes, methane
readings were obtained from the headspace of the monitoring wells. Methane monitoring was conducted in
January, July and November 2015. Frozen ground conditions were encountered during the January

10
WSP Annual Monitoring Report - 2015, Kinloss Landfill Site No 101-16945-00 Township of Huron-Kinloss March 2016
monitoring event. It is noted that gas probe GP1 had been unlocked and vandalized prior to the October
2015 monitoring event. There did not appear to be any permanent damage to the probe.
In 2015, water level elevations were measured and wells purged and sampled on May 20 and October 27,
2015. All samples collected during the monitoring program were transferred to coolers with ice and
submitted under chain-of-custody via overnight courier to Caduceon Environmental Laboratories for
analysis. The certificates of analysis and lab results are enclosed in Appendix E.
7.2 SHALLOW GROUNDWATER CONFIGURATION
In order to determine the groundwater gradient and flow direction in 2015, water level measurements were
obtained on May 20, 2015.
A summary of the water table elevation data from 1989 to 2015 is presented in Table 3. Figure 1 is a
hydrograph for all of the monitoring wells except OW13S, OW13I and OW13D. The results for the OW13
wells are summarized in Figure 2. As shown in Table 3 and Figures 1 and 2, there are seasonal
fluctuations shown by many of the wells. In general, groundwater elevations are higher in the spring and
lower in the fall. The upgradient wells in the northwest area of the site (OW7 and OW12) appear to be
effected more by seasonal fluctuations than the wells in other areas.
The groundwater regime beneath the landfill site may act as a “mixing” reservoir for the leachate generated
in the refuse. The groundwater flow system is also a transporting medium for conveying potential
contaminants away from the landfill area. As a result, the impact assessment of the site is dependent, to a
large extent, on the groundwater distribution, flow rate, and flow pattern.
Flow in a groundwater reservoir occurs, under the influence of gravity, from points of high hydraulic
potential to points of lower hydraulic potential. The actual flow path will follow a three-dimensional route
along the strata of least resistance. Resistance to flow is measured in terms of the hydraulic conductivity of
the deposit and the hydraulic gradient across the flow path. A cross-section of the site and borehole logs
for each of the monitoring wells is identified on the map enclosed in Appendix C for reference.
The site Cross-Section (Appendix C) shows that the groundwater elevations in a west-east direction
through the landfill mound are relatively flat indicating a relatively low hydraulic gradient. The sand zone
under the waste appears to be largely unsaturated. The capping of the landfill may be limiting infiltration.
The landfill is located on a topographic high which is limited in size. From the groundwater elevations
(Table 3), the inferred shallow groundwater flow configuration is shown in Map 3, Groundwater Flow.
The groundwater contours in Map 3 are based on groundwater level measurements obtained on May 20,
2015. It should be noted that the contours are considered reliable only in the vicinity of the wells, however
a reasonable interpretation of the contours can be made on the basis that the water table is generally a
subdued reflection of surface topography. Groundwater flow lines drawn perpendicular to groundwater
contours indicate that the inferred flow direction is generally toward the east, as shown in Map 3. The flow
pattern is consistent with past results. On May 20, 2015, the horizontal hydraulic gradient east of the landfill
mound was observed to range from 0.01 m/m in the southeast corner to 0.03 m/m in the northeast, as
shown in Map 3.

TABLE 3Summary of Groundwater Elevations
Kinloss Landfill
Ground Elevation (m) 81.1 80.3 79.7 83 97.9 80.4 80.4 80.4 91.9Top of Casing (m) 81.3 80.5 80 83.2 98.7 81.2 81.1 81.1 92.8
Date of Water LevelMeasurement
Nov-85 80.89 80.21 79.6 82.21Dec-87 80.61 80.33 79.61 82.57Nov-89 80.66 80.25 79.53 81.86Dec-89 80.51 80.25 79.56 81.95Aug-90 80.34 79.88 79.16 81.34Jan-91 80.31 79.6Apr-91 80.77 80.41 79.61 82.66Jun-91 80.73 80.29 79.58 81.76Oct-91 80.59 80.17 79.56 81.35Jul-92 80.48 80.04 79.13 81.52Oct-92 80.55 79.97 79.49 81.84Jun-93 80.67 80.08 79.5 81.69Sep-93 80.45 79.95 79.46 81.18Jun-94 80.65 80.03 79.51 81.97Oct-94 80.52 79.97 79.47 81.66May-95 80.56 80.02 79.44 81.81Sep-95 80.37 79.92 79.23 81.54May-96 80.9 80.32 79.63 82.78Sep-96 80.77 80.11 79.53 81.56May-97 80.82 80.18 79.57 82.17Sep-97 80.52 80.06 79.38 81.18 81.45 80.16May-98 80.71 80.09 79.33 81.74 82 80.25Sep-98 80.28 80.13 78.99 DRY 81 79.99May-99 80.56 80.05 79.4 81.8 81.09 80.19Sep-99 79.95 79.51 78.66 DRY 80.57 79.86May-00 80.52 79.96 79.35 81.91 81.09 80.15Sep-00 80.73 80.14 79.5 82.01 81.45 80.22May-01 80.84 80.19 79.49 81.83 82.53 80.28Sep-01 80.44 79.9 79.26 DRY 81.36 80.12May-02 80.84 79.86 79.28 82.11 82.51 80.31Sep-02 80.15 79.55 78.91 DRY 81.31 79.94May-03 80.79 80.11 79.56 82.43 81.23 80.3Oct-03 80.62 80.04 79.52 81.87 80.96 80.22 80.8May-04 80.82 80.11 79.63 82.37 82.52 80.28 81.68Sep-04 80.35 79.82 79.02 81.22 81.44 80.12 80.09 80.12 81.04May-05 80.58 80.04 79.43 81.89 81.89 80.32 80.26 80.31 81.4Sep-05 80.42 80.02 79.38 DRY 80.93 80.22 80.16 80.14 DRYApr-06 80.72 80.19 79.48 82.57 82.32 80.39 80.35 80.41 81.61Oct-06 80.35 79.97 79.41 DRY 81 80.21 80.15 80.09 80.7Jul-07 NA 79.36 77.95 81.18 81.62 80.02 79.67 79.83 81.18Dec-07 80.68 79.69 79.2 DRY 80.53 79.9 79.89 80.01 80.42Jul-08 80.42 79.62 79.06 81.74 81.94 80.02 79.83 80.15 81.44Dec-08 80.66 80.04 79.47 82.34 81.44 80.2 80.24 80.28 DRYJul-09 80.48 79.71 79.19 81.62 82.32 80.17 80.28 80.25 81.66Dec-09 80.47 80.07 79.15 81.98 80.82 80.15 80.28 80.24 DRYMar-10 80.69 80.15 79.56 82.35 81.14 80.25 80.23 80.36 80.97Jun-11 80.67 79.88 79.40 81.76 82.15 80.25 80.36 80.38 81.57Oct-11 80.50 80.15 79.50 Dry 80.80 80.18 80.28 80.26 80.81Jun-12 80.32 79.78 79.12 81.47 81.42 80.05 80.14 80.16 81.06Oct-12 80.25 80.07 79.38 Dry 80.53 80.06 80.13 80.10 80.30Jun-13 80.58 80.17 79.46 81.83 82.13 80.26 80.35 80.39 81.55Nov-13 80.68 80.04 79.55 82.66 81.24 80.31 80.40 80.41 81.10Jul-14 80.66 79.99 79.51 81.71 82.33 80.31 80.40 80.41 81.66Oct-14 80.75 80.33 79.57 81.92 81.39 80.31 80.39 80.38 81.02May-15 80.61 79.94 79.41 81.82 81.78 80.25 80.34 80.35 81.32Oct-15 80.22 79.87 79.35 Dry 80.73 80.06 80.13 80.10 80.53
Note: Elevations are not geodetic and relate to an inferred benchmark.
OW13I OW13D OW14OW4 OW5 OW6 OW7 OW12 OW13S
G:\2010\OS\401 - Environment\101-16945-00 - Kinloss WDS\Reports\Monitoring 2015\Table 3 & Figures 1 & 2.xls

G:\2010\OS\401 - Environment\101-16945-00 - Kinloss WDS\Reports\Monitoring 2015\Table 3 & Figures 1 & 2.xls
77
78
79
80
81
82
83
Jan-84 Jan-86 Jan-88 Jan-90 Jan-92 Jan-94 Jan-96 Jan-98 Jan-00 Jan-02 Jan-04 Jan-06 Jan-08 Jan-10 Jan-12 Jan-14 Jan-16
GR
OU
ND
WAT
ER E
LEVA
TIO
N (m
)
DATE
FIGURE 1HYDROGRAPH (excluding OW13)
KINLOSS LANDFILL
OW4
OW5
OW6
OW7
OW12
OW14

G:\2010\OS\401 - Environment\101-16945-00 - Kinloss WDS\Reports\Monitoring 2015\Table 3 & Figures 1 & 2.xls
79.5
79.75
80
80.25
80.5
Jan-97 Jan-99 Jan-01 Jan-03 Jan-05 Jan-07 Jan-09 Jan-11 Jan-13 Jan-15 Jan-17
GR
OU
ND
WAT
ER E
LEVA
TIO
N (m
)
DATE
FIGURE 2HYDROGRAPH - OW13
KINLOSS LANDFILL
OW13S
OW13I
OW13D

1020m±
ORIGINAL ROAD ALLOWANCE BETWEEN CONCESSIONS 5 AND 6
215.5m
215.5m
176.5m
176.5m
8
1
.0
8
0
.5
8
0
.0
8
0
.
0
8
0
.
5
79.5
7
9
.
5
8
1
.5
81.5
8
1
.
0
101-1450 1st AVENUE WOWEN SOUND (ONTARIO) CANADA N4K 6W2
TEL.: 519-376-7612 | FAX: 519-376-8008 | WWW.WSPGROUP.COM MAP 3
GROUNDWATER FLOW-MAY 20, 2015
KINLOSS LANDFILL SITE
TOWNSHIP OF HURON-KINLOSS
80.5

11
Annual Monitoring Report - 2015, Kinloss Landfill Site WSP Township of Huron-Kinloss No 101-16945-00 March 2016
Wells OW13S, OW13I and OW13D were constructed in close proximity to each other. Their close relation
allows for the determination of vertical hydraulic gradient in this area of the site. OW13S is screened at the
top of sand and gravel unit. OW13I is screened at the bottom of the sand and gravel unit. OW13D is
screened in the underlying silt till. The well logs for all three (3) wells are enclosed in Appendix C. During
the May 20, 2015 water level monitoring, the vertical gradient was 0.02 m/m upward between OW13S and
OW13D. As shown in Table 3, the groundwater elevations of OW13I and OW13D have only a negligible
difference in 2015. In most cases the vertical gradient is slightly upward. The vertical gradients for each
monitoring event are all relatively low, in the same scale as the horizontal gradients. The vertical gradient
between OW13S and OW13I had been downward since monitoring began at OW13I in September 2004,
and continued to remain downward until July 2008. However, since December 2008 the vertical gradient
has been consistently upward, reporting an upward gradient of 0.02 m/m and 0.01 m/m on May 20, 2015
and October 27, 2015, respectively, between these monitoring points. Further monitoring of the vertical
gradient should be conducted in order to observe any trends in the vertical gradient at the landfill.
7.3 GROUNDWATER MONITORING RESULTS
Figure 3 is a summary of indicator parameters that are commonly representative of leachate impacts (i.e.
chloride, hardness, DOC and conductivity). Figure 3 summarizes the spring 2015 results. Figure 4 is a
graph of chloride concentration over time for the monitoring wells. Chloride is often used as an indicator
parameter for leachate impacts as chloride is relatively mobile and non-reactive.
Historic groundwater chemistry results are summarized in Appendix F. Also included in Appendix F are
the results for 2015 monitoring.
7.3.1 BACKGROUND GROUNDWATER CHEMISTRY
In order to evaluate the impact of landfill leachate on the local groundwater system, it is necessary to
determine background conditions. These background conditions reflect the naturally occurring levels of
various parameters and provide a reference point to determine the magnitude of leachate impacts. The
background conditions reflect conditions unaffected by the landfill operation. Based on the groundwater
flow configuration (Map 3), monitoring wells OW6, OW7 and OW12 are located upgradient or cross-
gradient of the landfilled area.
In past reports, monitoring wells OW7 and OW12 have been considered as background monitors. However
the MOE, in their review of the 2006 Annual Monitoring Report (correspondence enclosed in Appendix B),
recommended that a new well be considered as a background well due to difficulties with monitoring wells
OW7 and OW12. OW12 has exhibited indicator parameters elevated with respect to other monitoring wells.
OW7 is not an ideal background well as it is often dry during sampling events. Historically, the MOECC had
recommended the consideration of OW6 as a background well due to the historic water quality and its
cross-gradient location. The water quality of OW6 relative to other wells is illustrated in Figure 3. The
groundwater elevations illustrated in Map 3 confirm OW6 is in a cross-gradient location. In 2016, the
Township anticipates increasing the depth of OW9 and OW11. These wells would offer a better idea of
current background groundwater conditions in the vicinity of the landfill.

G:\2010\OS\401 - Environment\101-16945-00 - Kinloss WDS\Reports\Monitoring 2015\Figures 3 & 5.xls
0
100
200
300
400
500
600
700
Chloride (mg/L)x10 Hardness (mg/L) DOC (mg/L)x10 Conductivity (us/cm)/10
CO
NC
ENTR
ATIO
N
PARAMETERS
FIGURE 3INDICATOR PARAMETERS - SPRING 2015 - MONITORING WELLS
KINLOSS LANDFILL
OW4
OW5
OW6
OW13D
OW13I
OW13S
OW14
Note: OW6 is considered a background well.

G:\2010\OS\401 - Environment\101-16945-00 - Kinloss WDS\Reports\Monitoring 2015\Figure 4.xls
0
25
50
75
100
125
150
175
200
225
250
Jan-96 Jan-98 Jan-00 Jan-02 Jan-04 Jan-06 Jan-08 Jan-10 Jan-12 Jan-14 Jan-16
CH
LOR
IDE
CO
NC
EN
TRA
TIO
N (
mg/
L)
DATE
FIGURE 4CHLORIDE VS TIME - MONITORING WELLS
KINLOSS LANDFILL
OW4
OW5
OW6
OW7
OW12
OW13S
OW13I
OW13D
OW14

12
WSP Annual Monitoring Report - 2015, Kinloss Landfill Site No 101-16945-00 Township of Huron-Kinloss March 2016
The 2015 results for a number of leachate indicator parameters for OW6 are summarized as follows:
OW6 Results
Indicator Spring 2015 Fall 2015
Chloride 2.79 mg/L 3.67 mg/L
Conductivity 585 µS/cm 571 µS/cm
Hardness 285 mg/L 280 mg/L
Dissolved Organic Carbon 1.9 mg/L 11 mg/L
7.3.2 LEACHATE MONITORING
In order to determine leachate strength and characteristics, monitoring data from wells OW4, OW13 and
OW14 have been used in the past. These wells are the closest downgradient wells to the waste and
historic monitoring data have indicated leachate indicators are occurring above background concentrations.
7.3.3 DOWNGRADIENT GROUNDWATER MONITORING
As shown in Map 3, the following wells are located downgradient of the filled waste:
Downgradient Wells
OW4 OW5 OW13S OW13I OW13D OW14
Figure 3 illustrates the indicator results for these wells for the spring and fall monitoring respectively.
Figure 4 is a plot of chloride over time for the monitoring wells.
OW4 and OW5 are located approximately 20 m and 50 m respectively downgradient of the fill area as
shown in Map 3. As shown in Figure 3, the leachate indicator parameters for OW4 are elevated with
respect to other wells. The OW4 results for July and October were also elevated in ammonia and TKN.
Leachate impacts are expected as OW4 is located immediately downgradient of the landfill mound. As
shown in Figure 4, the concentration of chloride has been decreasing over time since 2004 with occasional
fluctuations, indicating leachate strength may be decreasing with time. The parameters of conductivity and
sodium have also decreased over time. The results for OW5 are near background indicating leachate
impacts have not migrated to the north or northeast. As shown in Figure 3, the concentrations of selected
leachate parameters for OW5 are similar to those of the background well OW6.

13
Annual Monitoring Report - 2015, Kinloss Landfill Site WSP Township of Huron-Kinloss No 101-16945-00 March 2016
In 2014, OW14-03 was replaced with OW14-14 and extended below the waste fill until it intersected the
lower fall water table. OW14 is screened in silty fine sand. Figure 3 illustrates the May 2015 results for
OW14-14 plotted against other wells. As shown in Figure 3, the results for OW14-14 are above
background (OW6) but less than downgradient well OW4 for the main leachate parameters, excluding
chloride. The 2007 to 2015 results for OW14 wells (Appendix F) indicate parameters elevated relative to
background concentrations. Elevated concentrations of iron (17.4 mg/L) in OW14-14, in May 2015, indicate
a reducing environment, which is typical of groundwater downgradient of a landfill. This parameter
appeared to be increasing over time but subject to significant variation. Based on the overall results, landfill
impacts in monitor OW14-14 were present, but were not high enough for groundwater at this monitor to be
considered leachate. In OW14-14 leachate parameters are lower than were observed in OW14-03.
Effectively, leachate impacts do not appear to be migrating vertically downward.
As shown in the Cross-Section (Appendix C), OW13S is screened at the top of the sand and gravel unit.
OW13I is screened at the bottom of the sand and gravel unit. OW13D is screened in the underlying silt till.
Historically, leachate impacts in the silt till unit (at OW13D) are negligible. The monitoring results for
OW13D indicate near background concentrations for leachate parameters. Effectively, leachate does not
appear to be impacting the silt till layer underlying the super-positioned landfill and sand overburden
aquifer.
OW13S and OW13I continue to show elevated levels of organic nitrogen, hardness, DOC and sulphate.
However, landfill parameters such as chloride and iron continue to be reported in 2015 at concentrations
much lower than one would expect for leachate impacted water. Iron concentrations in OW13S and OW13I
are below concentrations reported in leachate monitor OW4.
Effectively, the 2015 chemistry results at OW4 and OW13D indicate that the landfill cap, in combination with
the upward gradient observed at the OW13 well nest, appears to be limiting leachate impacts
downgradient. However, some leachate impacts have migrated eastward in the shallow region of the
sand/gravel aquifer. Based on the interpreted hydraulic gradient (slightly upward as stated in Section 7.2)
and the reported leachate parameter concentrations at OW4 and OW13D, the leachate impacts are likely
moving in a near horizontal direction with little to no downward flow into the underlying silt till. This scenario
means the leachate impacts are confined to the sand unit and have not migrated downward into the
underlying silt till. It is also noted that the interpreted horizontal hydraulic gradient in the southeast area of
the site is also relatively low (0.01 m/m as stated in Section 7.2). Therefore the groundwater migration in
general will be relatively low in velocity.
The MOECC provided correspondence regarding the groundwater monitoring program in 2015 on August
20, 2015. As part of this correspondence, an August 14, 2015 memorandum from MOECC hydrogeologist,
Mr. Simon Thuss was forwarded to the Township. WSP responded to this memorandum on October 8,
2015. The comments brought forward in MOECC correspondence have been largely addressed in WSP’s
response. The exception being the reassessment of reasonable use criteria, which is discussed in Section
7.5 of this report. Further, the Township anticipates the installation and deepening of wells discussed in
correspondence during the 2016 dry period.
Topographic survey data is not available at the Kinloss Waste Disposal Site. Due to the inactive status at
the landfill, WSP Canada Inc. (WSP) proposes completion of a topographic survey at the Site when the Site
resumes accepting waste.

14
WSP Annual Monitoring Report - 2015, Kinloss Landfill Site No 101-16945-00 Township of Huron-Kinloss March 2016
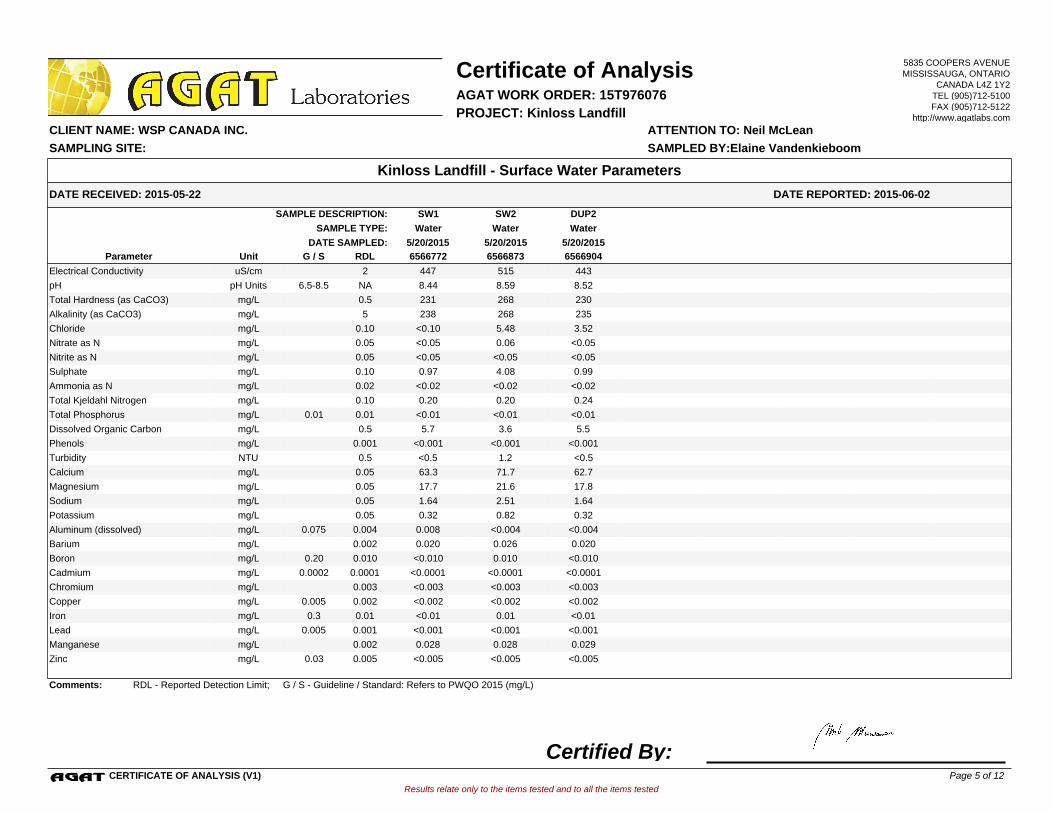
7.4 SURFACE WATER MONITORING
Surface water samples were obtained on May 20, 2015 and October 27, 2015. There are two (2) surface
water sampling stations. Both surface water stations are located on the creek which runs parallel to the
eastern boundary of the site. This creek flows in a northerly direction and is a tributary of Kinloss Creek.
SW1 is upgradient of the landfill, and is located at the south end of the culvert under Concession Road 5/6
as shown in Map 2. SW2 is downgradient of the landfill, and is located approximately 150 m north of the
northeast corner of the site.
The results of the 2007 to 2015 surface water sampling are summarized in the Surface Water Results
(Appendix G). The lab detection limits and Provincial Water Quality Objectives (PWQO) are also included
in the summaries. Any exceedances of PWQO are indicated by shaded cell. Past surface water monitoring
in 2007 determined there were some upstream occurrences of poor water quality (i.e. elevated metals)
based on monitoring results of SW1. Figure 5 compares leachate indicators for the May 20, 2015 sampling
event.
PWQO was not exceeded at the upgradient and downgradient surface water stations in 2015 for any
parameters. Historically, there have been some exceedances of the PWQO at both the upgradient and
downgradient monitoring points for metals. The last exceedance was for iron in 2012. Effectively, the
concentrations of metals at SW1 and SW2 should continue to be monitored in 2016.
The MOECC did not provide correspondence regarding the surface water monitoring program in 2015. A
synopsis of the 2014 correspondence was that no changes in the monitoring program should be made.
7.5 REASONABLE USE
In accordance with the appropriate Reasonable Use Guideline criteria (RUC) for particular reasonable uses,
a change in quality of the groundwater on an adjacent property will be accepted only as follows:
The quality cannot be degraded by an amount in excess of 50% of the difference between
background and the Ontario Drinking Water Standards for non-health related parameters and in
excess of 25% of the difference between background and the Ontario Drinking Water Standards for
health-related parameters. Background is considered to be the quality of the groundwater prior to
any man-made contamination.
In accessing the amount of degradation that is acceptable, consideration is given to the natural,
uncontaminated quality of the water, the present quality of the groundwater and potential contamination of
the groundwater from all sources.
The maximum concentration of a particular contaminant that would be acceptable in the groundwater
beneath an adjacent property is calculated in accordance with the following relationship.
Cm = Cb + x (Cr-Cb)
Where Cm = maximum concentration accepted
Cb = background concentration

G:\2010\OS\401 - Environment\101-16945-00 - Kinloss WDS\Reports\Monitoring 2015\Figures 3 & 5.xls
0
10
20
30
40
50
60
Chloride (mg/L) Hardness (mg/L)/10 DOC (mg/L) Conductivity (us/cm)/10
CO
NC
ENTR
ATI
ON
PARAMETERS
FIGURE 5INDICATOR PARAMETERS - May 2015- SURFACE WATER
KINLOSS LANDFILL
SW1
SW2
SW1 - Upstream SampleSW2 - Downstream Sample

15
Annual Monitoring Report - 2015, Kinloss Landfill Site WSP Township of Huron-Kinloss No 101-16945-00 March 2016
Cr = maximum concentration permitted in accordance with the Ontario Drinking
Water Standards.
x = a constant that reduces the contamination to a level that is considered by
the MOECC to have a negligible effect on the water use (i.e. 0.5 for non-
health parameters; 0.25 for health parameters).
As stated in Section 7.3.1, it is agreed that pending the 2016 drilling program, monitoring well OW6 is a
suitable “background” monitoring well. The MOECC Landfill Guidelines states the following regarding
establishing Background Concentration: The background concentration of a contaminant in the ground
water of receptor aquifer is the median value for that contaminant based on all ground water samples taken
from the receptor aquifer in accordance with the following rules:
1. At least five samples must be taken.
2. The samples must be taken at or near the site boundary where potential impact is being examined.
3. The samples must not be taken from locations known to be or likely to be contaminated by human
activity.
OW6 monitoring meets the above requirements. In order to determine potential Reasonable Use
parameters, the median values of the following parameters (all within Ontario Drinking Water Standards
(ODWS)) were calculated using concentrations reported since 2007:
Alkalinity
Boron
Chloride
Dissolved Organic Carbon (DOC)
Sodium
In their August 14, 2015, memorandum (Appendix B), the MOECC had recommended the inclusion of
hardness, iron, manganese, sulphate, nitrate and nitrite in the RUC annual evaluation.
The Township understands the intent of the RUC evaluation as a tool to determine if groundwater
downgradient of the landfill is being impacted beyond a reasonable criteria. At the Kinloss Waste Disposal
Site, the RUC evaluation is being used to determine the extent of leachate migration off-site.
The MOECC recommendation to add hardness, iron, manganese and sulphate are reasonable, given
elevated concentrations of these parameters are typically associated with leachate. However, the Kinloss
Waste Disposal Site is known to have leachate leaving the property boundary of the site. Effectively, the
evaluation of upwards of eleven (11) parameters, including nitrate and nitrite, in the RUC evaluation is
considered excessive.
As per WSP’s October 8, 2015, response to the MOECC, WSP does not feel that nitrate and nitrite should
be included in the RUC annual evaluation due to the typical lack of these parameters in reducing
groundwater conditions, typically associated with leachate impacted groundwater. Further to this, the

16
WSP Annual Monitoring Report - 2015, Kinloss Landfill Site No 101-16945-00 Township of Huron-Kinloss March 2016
landfill is located in a rural setting and nitrogen inputs to soil by surrounding agricultural practices are
expected to vary annually and confound results of groundwater in background monitoring
points. Effectively, an RUC for these parameters will be difficult to establish with any accuracy.
Of the remaining proposed additions to the RUC evaluation, hardness, iron, manganese and sulphate,
WSP would suggest the inclusion of only iron. Elevated sulphate concentrations in site wells are believed
to be confounded due to natural condition, given the abundance of other leachate indicator parameters for
evaluation, it is suggested that sulphate not be used for RUC evaluation. The inclusion of manganese is
considered redundant, given that iron is being evaluated for RUC and that elevated levels of these
parameters are typically more indicative of a reducing environment or natural conditions, than of the actual
leachate. In addition, WSP would suggest the removal of sodium from the RUC evaluation due to its
redundancy with chloride already being evaluated. Hardness would make an effective indicator parameter,
however concentrations in the background OW6 well exceed the RUC value and are comparable to
downgradient concentrations at the OW13 well nest. Effectively, the following parameters have been
evaluated for RUC in 2015:
Alkalinity
Boron
Chloride
DOC
Iron
It is noted that iron is typically in exceedance of the ODWS in background groundwater. The results of the
RUC evaluation have been summarized in Table 4.
Monitoring well OW13D has been used as a RUC monitors due to its proximity to the property line and
downgradient location. The 2015 results for this well for the Reasonable Use parameters are summarized
in Table 4.
All exceedances of RUC are shaded in Table 4. As shown in Table 4, monitoring wells OW13S and
OW13I exceeded the RUC for alkalinity in both May and October 2015. Additionally, OW13I exceeded the
RUC for DOC in May only. OW13D exceeded the RUC for iron in October 2015.
As a result of RUC concentrations continuing to be exceeded at these monitoring points, a letter was issued
on July 16, 2012 on behalf of the Township to the MOE outlining the results and recommended actions. In
this letter GENIVAR (now WSP) indicated that they believed the leachate impacts at OW13S and OW13I
likely represented a slug of leachate passing the monitoring point, which should be naturally attenuated in
the downgradient contaminant zone. MOE correspondence dated July 26, 2012 agreed with this
assessment.
In 2015, concentrations of RUC parameters remained elevated at OW13S and OW13I. Alkalinity remained
above the RUC concentration, but appears to be variable between years. No clear trend is apparent with
this parameter in OW13S and OW13I. Aside from alkalinity, only DOC was identified above the RUC in
OW13I during the spring monitoring event. Effectively, it would appear that the slug of leachate expected
by WSP in 2012 has started to move past the OW13 well nest. OW13S and OW13I continue to be

Table 4Reasonable Use CriteriaKinloss Landfill
OW13S
7/6/2009 12/5/2009 3/23/2010 6/14/2011 10/17/2011 6/20/2012 10/25/2012 6/17/2013 11/20/2013 7/9/2014 10/29/2014 5/20/2015 10/27/2015
Alkalinity(as CaCO3) 269 30 - 500 OG 384 378 391 NotSampled 417 512 424 495 387 448 421 385 400 484
Boron 0.023 5 IMAC 2.51 1.1 1.2 0.947 - 1.10 1.00 0.884 0.826 0.978 1.01 0.969 0.933Chloride 4.3 250 AO 127 39 32 19.9 27.1 19.6 21.7 11.7 7.7 4.9 13.1 <0.50 18.1DOC 1.6 5 AO 3.3 3.7 4.1 2.9 4.6 3.1 4.0 6.2 8.7 6.8 5.7 3.3 2.9Iron 0.7 0.3 AO 0.5 - - <0.005 <0.005 <0.005 <0.005 <0.005 <0.005 <0.005 <0.005 <0.010 <0.010
Notes:1. Result concentrations reported in mg/L, unless otherwise indicated.2. Shaded cell indicates parameter exceeded RUC.3. Standard/Objective determined from Ontario Drinking Water Standards, Objectives and Guidelines (Revised June 2006).4. OG = Operational Guideline AO = Aesthetic Objective IMAC = Interim Maximum Acceptable Concentration5. Background concentration from average concentration at OW6 since 2007.
Chemical Parameter BackgroundConcentration
Standard /Objective Type RUC
Page 1 of 3 G:\2010\OS\401 - Environment\101-16945-00 - Kinloss WDS\Reports\Monitoring 2015\Kinloss GW Quality.xls

Table 4Reasonable Use CriteriaKinloss Landfill
OW13 I
7/6/2009 12/5/2009 3/23/2010 6/14/2011 10/17/2011 6/20/2012 10/25/2012 6/17/2013 11/20/2013 7/9/2014 10/29/2014 5/20/2015 10/27/2015
Alkalinity(as CaCO3) 269 30 - 500 OG 384 355 374 NotSampled 430 511 510 535 507 523 487 501 490 496
Boron 0.023 5 IMAC 2.51 1.2 1.2 0.985 - 1.06 0.948 0.851 0.813 0.862 0.902 0.900 0.878Chloride 4.3 250 AO 127 39 38 30.2 33.8 33.7 33.0 26.8 19.1 10.2 27.9 25.8 22.5DOC 1.6 5 AO 3.3 2.7 4 2.9 3.8 3.9 4.6 9.2 10.9 6.9 7.5 4.1 3.0Iron 0.7 0.3 AO 0.5 - - <0.005 <0.005 <0.005 <0.005 <0.005 <0.005 <0.005 <0.005 <0.010 <0.010
Notes:1. Result concentrations reported in mg/L, unless otherwise indicated.2. Shaded cell indicates parameter exceeded RUC.3. Standard/Objective determined from Ontario Drinking Water Standards, Objectives and Guidelines (Revised June 2006).4. OG = Operational Guideline AO = Aesthetic Objective IMAC = Interim Maximum Acceptable Concentration5. Background concentration from average concentration at OW6 since 2007.
Chemical Parameter Median Standard /Objective Type RUC
Page 2 of 3 G:\2010\OS\401 - Environment\101-16945-00 - Kinloss WDS\Reports\Monitoring 2015\Kinloss GW Quality.xls

Table 4Reasonable Use CriteriaKinloss Landfill
OW13 D
7/6/2009 12/5/2009 3/23/2010 6/14/2011 10/17/2011 6/20/2012 10/25/2012 6/17/2013 11/20/2013 7/9/2014 10/29/2014 5/20/2015 10/27/2015Alkalinity(as CaCO3) 269 30 - 500 OG 384 234 260 240 244 274 254 349 234 268 219 256 263 357Boron 0.023 5 IMAC 2.51 0.043 0.19 0.045 0.053 - 0.104 0.289 0.061 0.127 0.046 0.141 0.114 0.301Chloride 4.3 250 AO 127 7 13 10 6.6 12.2 9.6 19.5 6.6 9.8 6.6 9.7 10.2 16.1DOC 1.6 5 AO 3.3 0.7 1.6 0.9 0.7 2.7 1.0 2.3 2.6 3.9 2.5 4.1 1.8 1.5Iron 0.7 0.3 AO 0.5 0.64 1.2 - 0.111 0.611 0.36 0.799 0.376 0.595 0.270 0.591 0.118 0.766
Notes:1. Result concentrations reported in mg/L, unless otherwise indicated.2. Shaded cell indicates parameter exceeded RUC.3. Standard/Objective determined from Ontario Drinking Water Standards, Objectives and Guidelines (Revised June 2006).4. OG = Operational Guideline AO = Aesthetic Objective IMAC = Interim Maximum Acceptable Concentration5. Background concentration from average concentration at OW6 since 2007.
Chemical Parameter Median Standard /Objective Type RUC
Page 3 of 3 G:\2010\OS\401 - Environment\101-16945-00 - Kinloss WDS\Reports\Monitoring 2015\Kinloss GW Quality.xls

17
Annual Monitoring Report - 2015, Kinloss Landfill Site WSP Township of Huron-Kinloss No 101-16945-00 March 2016
impacted by leachate, as evidenced by the elevated leachate parameter concentrations and potentially the
remaining elevated alkalinity RUC exceedances. Effectively, further monitoring is recommended.
Therefore the shallow aquifer in the southeast corner of the property remains impacted by leachate.
OW13D does not appear to be impacted, which is likely a result of the fine soil conditions and upward
gradient below the Kinloss Waste disposal Site. Only iron exceeds the RUC at OW13D in 2015, but has
historically exceeded intermittently at this location and is likely affected by natural conditions.
As shown in Map 2, there are substantial buffer lands downgradient of OW13S. These buffer lands are
leased by the Township. In their review of the 2006 Annual Monitoring Report, the Ministry requested
additional information regarding the buffer property. The following section provides additional information
and discussion on leachate impacts within this area.
7.6 BUFFER LANDS
In their review of the 2006 Annual Monitoring Report, the MOE asked the following question regarding the
buffer lands:
Are the lands to the east leased by the Township a part of a formal Contaminant Attenuation Zone?
The buffer lands are shown in Map 2. The lands are approximately 12.1 hectares (30 acres) in area and
are located on Part Lot 17, Concession 6, former Township of Kinloss, County of Bruce.
These buffer lands provide approximately 130 m of downgradient property to allow for additional leachate
attenuation before the groundwater migrates off Township controlled property.
Appendix H contains a copy of legal agreement between the Township and the owners of the buffer lands.
A copy of the Certificate of Registration, lease agreement and legal survey are enclosed in Appendix H.
The lease agreement allows the lands to be used for contaminant attenuation. Access to the property for
monitoring purposes is allowed through the agreement. The lease agreement was in effect from January 1,
1999 and has a 99 year term.
Therefore the buffer lands east of the landfill site meet the requirements of a formal Contaminant
Attenuation Zone.
Correspondence from the MOECC on August 14, 2015, acknowledged WSP’s identification of leachate
impacts at the site boundary in well OW13S and OW13I. This correspondence also noted that since
leachate has been identified within the CAZ, the Township must work to delineate the plume within the CAZ
and ensure that it stays confined within this area.
The Township plans to install additional wells within the CAZ during the dry period of 2016. These wells will
be used to define the extent of the plume within the CAZ and ensure that the leachate does not migrate
beyond the boundaries of the CAZ.

18
WSP Annual Monitoring Report - 2015, Kinloss Landfill Site No 101-16945-00 Township of Huron-Kinloss March 2016
7.7 METHANE GAS
In 2006, three (3) methane gas probes were installed on-site to allow for the monitoring of methane in the
unsaturated overburden. The locations of these three (3) gas probes: GP1, GP2 and GP3 are illustrated in
Map 2. The construction details of the gas probes are provided in Appendix C.
The methane monitoring results for 2007 – 2014 have been included in Table 5. Based on the monitoring
results it does not appear as if methane is migrating through the unsaturated overburden.
Table 5 Summary of Methane Monitoring Results
Date GP1 GP2 GP3
July/07 0 0 0
Jan/08 0 0 0
Jul/ 08 0 0 0
Jan/09 0 0 0
Dec/09 0 0 0
Mar/10 0 0 0
Feb/11 0 0 0
Mar/12 0 0 0
Feb/13 0 0 0
Jan/14 0 0 0
May/15 0 0 0
Oct/15 0 0 0
Notes: 1. All readings shown in % gas by volume.
7.8 PROPOSED FUTURE MONITORING PROGRAM
The summary of the proposed monitoring program is given in Table 6. This proposed program is based on
past monitoring. The parameters outlined in Table 6 include the usual leachate indicators (i.e. chloride,
iron, conductivity, sulphate, DOC, ammonia, etc.), as well as additional parameters to characterize the
quality and extent of the leachate plume. If changes in leachate characteristics are observed in the future,
this list of parameters will be modified.
Attempts to sample all surface water stations and monitoring wells will be made twice per year.

G:\2010\OS\401 - Environment\101-16945-00 - Kinloss WDS\Reports\Monitoring 2015\Table 6.docx
Table 6
Kinloss Landfill Site
Monitoring Program
Monitoring Location Proposed Sampling
Spring 2016 Proposed Sampling
Fall 2016
OW4
OW5
OW6
OW7
OW12
OW13S
OW13I
OW13D
OW14
SW1
SW2
Notes:
1. indicates to be sampled.
2. The lab parameters to be tested for groundwater and surface water will include:
Alkalinity DOC
Ammonia Hardness
Anions – Cl, NO2, NO3, SO4 Phenols
Conductivity pH
Dissolved metals by ICPMS TKN
Total phosphorus (SW’s only)
3. At all monitoring wells and SW stations the following field measurements should be
obtained:
Temperature
pH
Conductivity
4. In addition methane measurements from GP1, GP2 and GP3 will be obtained in spring,
fall and once under frozen conditions.

19
Annual Monitoring Report - 2015, Kinloss Landfill Site WSP Township of Huron-Kinloss No 101-16945-00 March 2016
8 CONCLUSIONS
1. Currently, the Kinloss Landfill is not receiving domestic waste, only recyclable and burnable
materials. The remaining capacity of the site is estimated to be 137,000 m3.
2. Burning operations in 2015 were conducted in accordance with MOECC Guideline C-7.
3. Security and control of the site in 2015 continued to be good. However, OW12 was found to have
its lock cut off at some point between the spring and fall sampling event.
4. The Blue Box Recycling Program diverted 442 tonnes of recyclable materials and approximately
239 tonnes of scrap metal, tires, E-waste, bale wrap and mattresses from the entire Township of
Huron-Kinloss, excluding Lucknow. Including all of the segregated waste, a total of 790 tonnes of
materials were diverted from both Township landfills (Kinloss and Huron) in 2015. The total
tonnage diverted is higher than the 2014 value of 588 tonnes.
5. In 2015, groundwater flow on the site was to the east and slightly upward.
6. Leachate impacts are being observed in the shallow aquifer downgradient of the landfill (OW4,
OW13S and OW13I). Leachate impacts are not expected in the silt till underlying the sand aquifer
(OW13D).
7. Surface water monitoring indicates the downstream (SW2) water quality of the stream east of the
landfill is generally similar to the upstream (SW1) water quality. PWQO was not exceeded for any
of the monitored parameters in upstream and downstream samples in 2015.
8. Reasonable Use parameters and criteria have been developed based on the background results of
OW6. Exceedance of alkalinity and DOC parameters was continued to be observed at OW13S and
OW13I. However, the slug of leachate moving through this downgradient area appears to be
nearly finished passing OW13. Exceedance of iron was observed at OW13D in October 2015.
9. Methane monitoring indicates no evidence of methane migration or build up in the unsaturated
overburden.

20
WSP Annual Monitoring Report - 2015, Kinloss Landfill Site No 101-16945-00 Township of Huron-Kinloss March 2016
9 RECOMMENDATIONS
Based on the foregoing, the following is recommended:
1. The Township should continue to promote recycling both at home and at the landfill site.
2. The monitoring program of semi-annual sampling of the nine (9) monitoring wells and two (2)
surface water stations should continue in 2016. Gas probes GP1, GP2 and GP3 should also be
monitored annually for methane under frozen conditions.
3. Effort should be given to ensure sampling events are conducted during periods of favourable
weather conditions.
4. This report is to be submitted to the MOECC for review and comment.
PREPARED BY
Neil R. McLean, M.Sc., P.Geo.
REVIEWED BY
Stephen J. Cobean, P.Eng. NRM/dlw

Appendix A
PROVISIONAL CERTIFICATE OF APPROVAL


Appendix B
2015 LANDFILL CORRESPONDENCE


Appendix C
CROSS-SECTION AND BOREHOLE LOGS


Appendix D
BASWR RECYCLING DATA

TOTAL TOTAL TONS TOTAL MTTONS TO DATE TO DATE
Newspaper 13.71 154.67 140.29 33.46
Steel Cans 2.52 28.39 25.75Aluminum 0.81 9.12 8.27Mixed Glass 4.85 54.76 49.67HDPE Plastic 2.80 31.57 28.63PET Plastic 2.94 33.16 30.07White Paper 1.69 19.06 17.29Boxboard 4.14 46.69 42.35Cardboard 10.08 109.74 99.54
TOTAL 43.54 487.16 441.85TOTAL TO DATE 487.16
Municipality of HURON-KINLOSSDecember 2015 BASWR Tons Diverted from Landfill

Appendix E
CERTIFICATE OF ANALYSIS AND LAB RESULTS

CLIENT NAME: WSP CANADA INC.1450 1ST AVENUE WEST OWEN SOUND, ON N4K6W2 (519) 376-7612
5835 COOPERS AVENUEMISSISSAUGA, ONTARIO
CANADA L4Z 1Y2TEL (905)712-5100FAX (905)712-5122
http://www.agatlabs.com
Mike Muneswar, BSc (Chem), Senior Inorganic AnalystWATER ANALYSIS REVIEWED BY:
DATE REPORTED:
PAGES (INCLUDING COVER): 12
Jun 02, 2015
VERSION*: 1
Should you require any information regarding this analysis please contact your client services representative at (905) 712-5100
15T976076AGAT WORK ORDER:
ATTENTION TO: Neil McLean
PROJECT: Kinloss Landfill
Laboratories (V1) Page 1 of 12
All samples will be disposed of within 30 days following analysis. Please contact the lab if you require additional sample storage time.
AGAT Laboratories is accredited to ISO/IEC 17025 by the Canadian Association for Laboratory Accreditation Inc. (CALA) and/or Standards Council of Canada (SCC) for specific tests listed on the scope of accreditation. AGAT Laboratories (Mississauga) is also accredited by the Canadian Association for Laboratory Accreditation Inc. (CALA) for specific drinking water tests. Accreditations are location and parameter specific. A complete listing of parameters for each location is available from www.cala.ca and/or www.scc.ca. The tests in this report may not necessarily be included in the scope of accreditation.
Association of Professional Engineers, Geologists and Geophysicists of Alberta (APEGGA)Western Enviro-Agricultural Laboratory Association (WEALA)Environmental Services Association of Alberta (ESAA)
Member of:
*NOTES
Results relate only to the items tested and to all the items tested

OW4 OW12OW5 OW6 OW7SAMPLE DESCRIPTION:
WaterWater Water Water WaterSAMPLE TYPE:
5/20/20155/20/20155/20/2015 5/20/2015 5/20/2015DATE SAMPLED:
65666476566623 RDL 6566628 RDL 6566634 6566641 RDLG / S RDLUnitParameter
1360 2 497 2 585 478 2Electrical Conductivity 8272uS/cm
7.87 NA 8.44 NA 8.40 8.45 NApH 8.40NA(6.5-8.5)pH Units
559 0.5 243 0.5 285 248 0.5Total Hardness (as CaCO3) 4070.5(80-100)mg/L
683 5 240 5 308 259 5Alkalinity (as CaCO3) 3345(30-500)mg/L
14.3 0.10 2.60 0.20 2.79 1.40 0.10Chloride 6.900.50250mg/L
<0.25 0.05 <0.05 0.10 <0.10 <0.10 0.05Nitrate as N 2.370.2510.0mg/L
<0.25 0.05 <0.05 0.10 <0.10 <0.10 0.05Nitrite as N <0.050.251.0mg/L
29.0 0.10 24.2 0.20 7.03 2.17 0.10Sulphate 99.50.50500mg/L
21.0 0.02 <0.02 0.02 0.21 <0.02 0.02Ammonia as N <0.020.4mg/L
22.2 0.10 <0.10 0.10 0.43 <0.10 0.10Total Kjeldahl Nitrogen 0.220.20mg/L
8.5 0.5 1.1 0.5 1.9 1.2 0.5Dissolved Organic Carbon 2.00.55mg/L
<0.001 0.001 <0.001 0.001 <0.001 <0.001 0.001Phenols <0.0010.001mg/L
166 0.05 56.4 0.05 74.8 68.5 0.05Calcium 70.50.10mg/L
35.2 0.05 24.7 0.05 23.9 18.8 0.05Magnesium 56.10.10mg/L
27.0 0.05 2.96 0.05 5.32 0.82 0.05Sodium 7.660.1020 (200)mg/L
19.1 0.05 0.71 0.05 0.71 0.41 0.05Potassium 13.60.10mg/L
0.019 0.004 0.005 0.004 0.005 0.004 0.004Aluminum 0.0040.0040.1mg/L
0.169 0.002 0.074 0.002 0.063 0.007 0.002Barium 0.0660.0021mg/L
0.395 0.010 0.014 0.010 0.015 <0.010 0.010Boron 0.5050.0105mg/L
<0.001 0.001 <0.001 0.001 <0.001 <0.001 0.001Cadmium <0.0010.0010.005mg/L
<0.003 0.003 <0.003 0.003 <0.003 <0.003 0.003Chromium <0.0030.0030.05mg/L
<0.003 0.003 <0.003 0.003 <0.003 <0.003 0.003Copper <0.0030.0031mg/L
17.2 0.010 0.267 0.010 1.38 <0.010 0.010Iron <0.0100.0100.3mg/L
<0.002 0.002 <0.002 0.002 <0.002 <0.002 0.002Lead <0.0020.0020.01mg/L
0.885 0.002 0.255 0.002 0.231 0.111 0.002Manganese <0.0020.0020.05mg/L
0.006 0.005 0.005 0.005 0.007 <0.005 0.005Zinc <0.0050.0055mg/L
Results relate only to the items tested and to all the items tested
DATE RECEIVED: 2015-05-22
Certificate of Analysis
ATTENTION TO: Neil McLeanCLIENT NAME: WSP CANADA INC.
AGAT WORK ORDER: 15T976076
DATE REPORTED: 2015-06-02
PROJECT: Kinloss Landfill
Kinloss Landfill - Groundwater Parameters
SAMPLED BY:Elaine VandenkieboomSAMPLING SITE:
5835 COOPERS AVENUEMISSISSAUGA, ONTARIO
CANADA L4Z 1Y2TEL (905)712-5100FAX (905)712-5122
http://www.agatlabs.com
CERTIFICATE OF ANALYSIS (V1)
Certified By:Page 2 of 12

OW13S OW13I OW13D OW14/14SAMPLE DESCRIPTION:
WaterWater Water WaterSAMPLE TYPE:
5/20/20155/20/20155/20/2015 5/20/2015DATE SAMPLED:
6566655 RDL 6566672 RDL 6566680 RDL 6566698G / S RDLUnitParameter
1230 2 1390 2 647 2 970Electrical Conductivity 2uS/cm
8.25 NA 8.16 NA 8.36 NA 7.82pH NA(6.5-8.5)pH Units
573 0.5 664 0.5 270 0.5 471Total Hardness (as CaCO3) 0.5(80-100)mg/L
400 5 490 5 263 5 506Alkalinity (as CaCO3) 5(30-500)mg/L
<0.50 0.50 25.8 0.20 10.2 0.50 4.77Chloride 0.50250mg/L
3.25 0.25 1.69 0.10 <0.10 0.25 <0.25Nitrate as N 0.2510.0mg/L
<0.25 0.25 <0.25 0.10 <0.10 0.25 <0.25Nitrite as N 0.251.0mg/L
269 0.50 279 0.20 69.9 0.50 15.1Sulphate 0.50500mg/L
0.52 0.02 1.26 0.02 0.03 0.08 4.46Ammonia as N 0.02mg/L
0.84 0.10 2.30 0.10 0.11 0.10 5.40Total Kjeldahl Nitrogen 0.10mg/L
3.3 0.5 4.1 0.5 1.8 0.5 7.0Dissolved Organic Carbon 0.55mg/L
<0.001 0.001 <0.001 0.001 <0.001 0.001 <0.001Phenols 0.001mg/L
121 0.10 137 0.05 63.9 0.05 158Calcium 0.05mg/L
65.8 0.10 78.2 0.05 26.7 0.05 18.6Magnesium 0.05mg/L
15.0 0.10 30.2 0.05 15.7 0.05 4.91Sodium 0.0520 (200)mg/L
26.1 0.10 24.5 0.05 1.72 0.05 9.33Potassium 0.05mg/L
0.011 0.004 0.058 0.004 <0.004 0.004 0.008Aluminum 0.0040.1mg/L
0.047 0.002 0.066 0.002 0.092 0.002 0.049Barium 0.0021mg/L
0.969 0.010 0.900 0.010 0.114 0.010 0.186Boron 0.0105mg/L
<0.001 0.001 <0.001 0.001 <0.001 0.001 <0.001Cadmium 0.0010.005mg/L
<0.003 0.003 <0.003 0.003 <0.003 0.003 <0.003Chromium 0.0030.05mg/L
0.004 0.003 <0.003 0.003 <0.003 0.003 <0.003Copper 0.0031mg/L
<0.010 0.010 <0.010 0.010 0.118 0.010 17.4Iron 0.0100.3mg/L
<0.002 0.002 <0.002 0.002 <0.002 0.002 <0.002Lead 0.0020.01mg/L
0.036 0.002 0.133 0.002 0.023 0.002 0.301Manganese 0.0020.05mg/L
0.005 0.005 0.010 0.005 <0.005 0.005 <0.005Zinc 0.0055mg/L
Results relate only to the items tested and to all the items tested
DATE RECEIVED: 2015-05-22
Certificate of Analysis
ATTENTION TO: Neil McLeanCLIENT NAME: WSP CANADA INC.
AGAT WORK ORDER: 15T976076
DATE REPORTED: 2015-06-02
PROJECT: Kinloss Landfill
Kinloss Landfill - Groundwater Parameters
SAMPLED BY:Elaine VandenkieboomSAMPLING SITE:
5835 COOPERS AVENUEMISSISSAUGA, ONTARIO
CANADA L4Z 1Y2TEL (905)712-5100FAX (905)712-5122
http://www.agatlabs.com
CERTIFICATE OF ANALYSIS (V1)
Certified By:Page 3 of 12

DUP1SAMPLE DESCRIPTION:
WaterSAMPLE TYPE:
5/20/2015DATE SAMPLED:
6566724G / S RDLUnitParameter
587Electrical Conductivity 2uS/cm
8.35pH NA(6.5-8.5)pH Units
281Total Hardness (as CaCO3) 0.5(80-100)mg/L
307Alkalinity (as CaCO3) 5(30-500)mg/L
2.82Chloride 0.20250mg/L
<0.10Nitrate as N 0.1010.0mg/L
<0.10Nitrite as N 0.101.0mg/L
6.93Sulphate 0.20500mg/L
0.20Ammonia as N 0.02mg/L
0.47Total Kjeldahl Nitrogen 0.10mg/L
1.8Dissolved Organic Carbon 0.55mg/L
<0.001Phenols 0.001mg/L
73.2Calcium 0.05mg/L
23.8Magnesium 0.05mg/L
5.27Sodium 0.0520 (200)mg/L
0.73Potassium 0.05mg/L
0.004Aluminum 0.0040.1mg/L
0.063Barium 0.0021mg/L
0.016Boron 0.0105mg/L
<0.001Cadmium 0.0010.005mg/L
<0.003Chromium 0.0030.05mg/L
<0.003Copper 0.0031mg/L
1.38Iron 0.0100.3mg/L
<0.002Lead 0.0020.01mg/L
0.231Manganese 0.0020.05mg/L
0.007Zinc 0.0055mg/L
Comments: RDL - Reported Detection Limit; G / S - Guideline / Standard: Refers to O.Reg.169/03(mg/L)
6566623-6566724 Samples required dilution prior to analysis in order to keep the analytes within the calibration range of the instruments and/or to minimize any matrix interferences; the RDLs were adjusted to reflect the dilution.
Results relate only to the items tested and to all the items tested
DATE RECEIVED: 2015-05-22
Certificate of Analysis
ATTENTION TO: Neil McLeanCLIENT NAME: WSP CANADA INC.
AGAT WORK ORDER: 15T976076
DATE REPORTED: 2015-06-02
PROJECT: Kinloss Landfill
Kinloss Landfill - Groundwater Parameters
SAMPLED BY:Elaine VandenkieboomSAMPLING SITE:
5835 COOPERS AVENUEMISSISSAUGA, ONTARIO
CANADA L4Z 1Y2TEL (905)712-5100FAX (905)712-5122
http://www.agatlabs.com
CERTIFICATE OF ANALYSIS (V1)
Certified By:Page 4 of 12
SW2SW1 DUP2SAMPLE DESCRIPTION:
WaterWaterWaterSAMPLE TYPE:
5/20/2015 5/20/20155/20/2015DATE SAMPLED:
6566772 6566873 6566904G / S RDLUnitParameter
447 515 443Electrical Conductivity 2uS/cm
8.44 8.59 8.52pH NA6.5-8.5pH Units
231 268 230Total Hardness (as CaCO3) 0.5mg/L
238 268 235Alkalinity (as CaCO3) 5mg/L
<0.10 5.48 3.52Chloride 0.10mg/L
<0.05 0.06 <0.05Nitrate as N 0.05mg/L
<0.05 <0.05 <0.05Nitrite as N 0.05mg/L
0.97 4.08 0.99Sulphate 0.10mg/L
<0.02 <0.02 <0.02Ammonia as N 0.02mg/L
0.20 0.20 0.24Total Kjeldahl Nitrogen 0.10mg/L
<0.01 <0.01 <0.01Total Phosphorus 0.010.01mg/L
5.7 3.6 5.5Dissolved Organic Carbon 0.5mg/L
<0.001 <0.001 <0.001Phenols 0.001mg/L
<0.5 1.2 <0.5Turbidity 0.5NTU
63.3 71.7 62.7Calcium 0.05mg/L
17.7 21.6 17.8Magnesium 0.05mg/L
1.64 2.51 1.64Sodium 0.05mg/L
0.32 0.82 0.32Potassium 0.05mg/L
0.008 <0.004 <0.004Aluminum (dissolved) 0.0040.075mg/L
0.020 0.026 0.020Barium 0.002mg/L
<0.010 0.010 <0.010Boron 0.0100.20mg/L
<0.0001 <0.0001 <0.0001Cadmium 0.00010.0002mg/L
<0.003 <0.003 <0.003Chromium 0.003mg/L
<0.002 <0.002 <0.002Copper 0.0020.005mg/L
<0.01 0.01 <0.01Iron 0.010.3mg/L
<0.001 <0.001 <0.001Lead 0.0010.005mg/L
0.028 0.028 0.029Manganese 0.002mg/L
<0.005 <0.005 <0.005Zinc 0.0050.03mg/L
Comments: RDL - Reported Detection Limit; G / S - Guideline / Standard: Refers to PWQO 2015 (mg/L)
Results relate only to the items tested and to all the items tested
DATE RECEIVED: 2015-05-22
Certificate of Analysis
ATTENTION TO: Neil McLeanCLIENT NAME: WSP CANADA INC.
AGAT WORK ORDER: 15T976076
DATE REPORTED: 2015-06-02
PROJECT: Kinloss Landfill
Kinloss Landfill - Surface Water Parameters
SAMPLED BY:Elaine VandenkieboomSAMPLING SITE:
5835 COOPERS AVENUEMISSISSAUGA, ONTARIO
CANADA L4Z 1Y2TEL (905)712-5100FAX (905)712-5122
http://www.agatlabs.com
CERTIFICATE OF ANALYSIS (V1)
Certified By:Page 5 of 12

6566623 O.Reg.169/03(mg/L) Kinloss Landfill - Groundwater Parameters Alkalinity (as CaCO3) (30-500) 683OW4
6566623 O.Reg.169/03(mg/L) Kinloss Landfill - Groundwater Parameters Dissolved Organic Carbon 5 8.5OW4
6566623 O.Reg.169/03(mg/L) Kinloss Landfill - Groundwater Parameters Iron 0.3 17.2OW4
6566623 O.Reg.169/03(mg/L) Kinloss Landfill - Groundwater Parameters Manganese 0.05 0.885OW4
6566623 O.Reg.169/03(mg/L) Kinloss Landfill - Groundwater Parameters Sodium 20 (200) 27.0OW4
6566623 O.Reg.169/03(mg/L) Kinloss Landfill - Groundwater Parameters Total Hardness (as CaCO3) (80-100) 559OW4
6566628 O.Reg.169/03(mg/L) Kinloss Landfill - Groundwater Parameters Manganese 0.05 0.255OW5
6566628 O.Reg.169/03(mg/L) Kinloss Landfill - Groundwater Parameters Total Hardness (as CaCO3) (80-100) 243OW5
6566634 O.Reg.169/03(mg/L) Kinloss Landfill - Groundwater Parameters Iron 0.3 1.38OW6
6566634 O.Reg.169/03(mg/L) Kinloss Landfill - Groundwater Parameters Manganese 0.05 0.231OW6
6566634 O.Reg.169/03(mg/L) Kinloss Landfill - Groundwater Parameters Total Hardness (as CaCO3) (80-100) 285OW6
6566641 O.Reg.169/03(mg/L) Kinloss Landfill - Groundwater Parameters Manganese 0.05 0.111OW7
6566641 O.Reg.169/03(mg/L) Kinloss Landfill - Groundwater Parameters Total Hardness (as CaCO3) (80-100) 248OW7
6566647 O.Reg.169/03(mg/L) Kinloss Landfill - Groundwater Parameters Total Hardness (as CaCO3) (80-100) 407OW12
6566655 O.Reg.169/03(mg/L) Kinloss Landfill - Groundwater Parameters Total Hardness (as CaCO3) (80-100) 573OW13S
6566672 O.Reg.169/03(mg/L) Kinloss Landfill - Groundwater Parameters Manganese 0.05 0.133OW13I
6566672 O.Reg.169/03(mg/L) Kinloss Landfill - Groundwater Parameters Sodium 20 (200) 30.2OW13I
6566672 O.Reg.169/03(mg/L) Kinloss Landfill - Groundwater Parameters Total Hardness (as CaCO3) (80-100) 664OW13I
6566680 O.Reg.169/03(mg/L) Kinloss Landfill - Groundwater Parameters Total Hardness (as CaCO3) (80-100) 270OW13D
6566698 O.Reg.169/03(mg/L) Kinloss Landfill - Groundwater Parameters Alkalinity (as CaCO3) (30-500) 506OW14/14
6566698 O.Reg.169/03(mg/L) Kinloss Landfill - Groundwater Parameters Dissolved Organic Carbon 5 7.0OW14/14
6566698 O.Reg.169/03(mg/L) Kinloss Landfill - Groundwater Parameters Iron 0.3 17.4OW14/14
6566698 O.Reg.169/03(mg/L) Kinloss Landfill - Groundwater Parameters Manganese 0.05 0.301OW14/14
6566698 O.Reg.169/03(mg/L) Kinloss Landfill - Groundwater Parameters Total Hardness (as CaCO3) (80-100) 471OW14/14
6566724 O.Reg.169/03(mg/L) Kinloss Landfill - Groundwater Parameters Iron 0.3 1.38DUP1
6566724 O.Reg.169/03(mg/L) Kinloss Landfill - Groundwater Parameters Manganese 0.05 0.231DUP1
6566724 O.Reg.169/03(mg/L) Kinloss Landfill - Groundwater Parameters Total Hardness (as CaCO3) (80-100) 281DUP1
6566873 PWQO 2015 (mg/L) Kinloss Landfill - Surface Water Parameters pH 6.5-8.5 8.59SW2
6566904 PWQO 2015 (mg/L) Kinloss Landfill - Surface Water Parameters pH 6.5-8.5 8.52DUP2
Results relate only to the items tested and to all the items tested
Guideline Violation
ATTENTION TO: Neil McLeanCLIENT NAME: WSP CANADA INC.
AGAT WORK ORDER: 15T976076
PROJECT: Kinloss Landfill
SAMPLEID GUIDELINE ANALYSIS PACKAGE PARAMETER GUIDEVALUE RESULTSAMPLE TITLE
5835 COOPERS AVENUEMISSISSAUGA, ONTARIO
CANADA L4Z 1Y2TEL (905)712-5100FAX (905)712-5122
http://www.agatlabs.com
GUIDELINE VIOLATION (V1) Page 6 of 12

Kinloss Landfill - Groundwater Parameters
Electrical Conductivity 6568588 1020 1030 1.0% < 2 103% 80% 120% NA NA
pH 6568588 8.34 8.43 1.1% NA 99% 90% 110% NA NA
Alkalinity (as CaCO3) 6568588 214 219 2.3% < 5 93% 80% 120% NA NA
Chloride 6566680 6566680 10.2 10.2 0.0% < 0.10 104% 90% 110% 102% 90% 110% 104% 80% 120%
Nitrate as N
6566680 6566680 < 0.10 <0.10 0.0% < 0.05 91% 90% 110% 98% 90% 110% 103% 80% 120%
Nitrite as N 6566680 6566680 < 0.10 <0.10 0.0% < 0.05 NA 90% 110% 100% 90% 110% 99% 80% 120%
Sulphate 6566680 6566680 69.9 69.0 1.3% < 0.10 93% 90% 110% 98% 90% 110% 100% 80% 120%
Ammonia as N 6574320 0.06 0.06 0.0% < 0.02 94% 90% 110% 99% 90% 110% 101% 80% 120%
Total Kjeldahl Nitrogen 6566647 6566647 0.22 0.20 9.5% < 0.10 100% 80% 120% 98% 80% 120% 98% 70% 130%
Dissolved Organic Carbon
6571436 2.9 3.0 3.4% < 0.5 109% 90% 110% 97% 90% 110% 97% 80% 120%
Phenols 6566623 6566623 < 0.001 <0.001 0.0% < 0.001 98% 90% 110% 103% 90% 110% 102% 80% 120%
Calcium 6566647 6566647 70.5 71.9 2.0% < 0.05 98% 90% 110% 99% 90% 110% 94% 70% 130%
Magnesium 6566647 6566647 56.1 55.9 0.4% < 0.05 101% 90% 110% 102% 90% 110% 95% 70% 130%
Sodium 6566647 6566647 7.66 7.63 0.4% < 0.05 98% 90% 110% 96% 90% 110% 95% 70% 130%
Potassium
6566647 6566647 13.6 13.6 0.1% < 0.05 101% 90% 110% 102% 90% 110% 101% 70% 130%
Aluminum 6566628 6566628 0.005 0.004 NA < 0.004 91% 90% 110% 93% 90% 110% 92% 70% 130%
Barium 6566628 6566628 0.074 0.074 0.0% < 0.002 94% 90% 110% 100% 90% 110% 103% 70% 130%
Boron 6566628 6566628 0.014 0.014 0.0% < 0.010 104% 90% 110% 101% 90% 110% 105% 70% 130%
Cadmium 6566628 6566628 < 0.001 <0.001 0.0% < 0.001 102% 90% 110% 100% 90% 110% 104% 70% 130%
Chromium
6566628 6566628 < 0.003 <0.003 0.0% < 0.003 99% 90% 110% 98% 90% 110% 102% 70% 130%
Copper 6566628 6566628 < 0.003 <0.003 0.0% < 0.003 98% 90% 110% 98% 90% 110% 92% 70% 130%
Iron 6566628 6566628 0.267 0.256 4.2% < 0.010 103% 90% 110% 108% 90% 110% 94% 70% 130%
Lead 6566628 6566628 < 0.002 <0.002 0.0% < 0.002 91% 90% 110% 94% 90% 110% 93% 70% 130%
Manganese 6566628 6566628 0.255 0.253 0.8% < 0.002 96% 90% 110% 96% 90% 110% 96% 70% 130%
Zinc
6566628 6566628 0.005 <0.005 0.0% < 0.005 102% 90% 110% 102% 90% 110% 104% 70% 130%
Comments: NA signifies Not Applicable.RPD Qualifier for Aluminum:The average for the sample and duplicate is less than 5X RDL, thus, lab's RPD acceptance criteria are not applicable.
Kinloss Landfill - Surface Water Parameters
Total Phosphorus 6566501 <0.01 <0.01 0.0% < 0.01 97% 90% 110% 97% 90% 110% 100% 70% 130%
Aluminum (dissolved) 6572314 0.010 0.009 0.0% < 0.004 93% 90% 110% 94% 90% 110% 89% 70% 130%
Barium 6566628 0.074 0.074 0.9% < 0.002 94% 90% 110% 100% 90% 110% 103% 70% 130%
Boron 6566628 0.014 0.014 0.0% < 0.010 104% 90% 110% 101% 90% 110% 105% 70% 130%
Cadmium
6566628 <0.0001 <0.0001 0.0% < 0.0001 102% 90% 110% 100% 90% 110% 104% 70% 130%
Chromium 6566628 <0.003 <0.003 0.0% < 0.003 99% 90% 110% 98% 90% 110% 102% 70% 130%
Copper 6566628 <0.002 <0.002 0.0% < 0.002 98% 90% 110% 98% 90% 110% 92% 70% 130%
Iron 6566628 0.27 0.26 3.9% < 0.01 103% 90% 110% 108% 90% 110% 94% 70% 130%
Lead 6566628 <0.001 <0.001 0.0% < 0.001 91% 90% 110% 94% 90% 110% 93% 70% 130%
Manganese
6566628 0.255 0.253 0.9% < 0.002 96% 90% 110% 96% 90% 110% 96% 70% 130%
Zinc 6566628 0.005 <0.005 0.0% < 0.005 102% 90% 110% 102% 90% 110% 104% 70% 130%
Results relate only to the items tested and to all the items tested
SAMPLING SITE: SAMPLED BY:Elaine Vandenkieboom
AGAT WORK ORDER: 15T976076
Dup #1 RPDMeasured
ValueRecovery Recovery
Quality Assurance
ATTENTION TO: Neil McLean
CLIENT NAME: WSP CANADA INC.
PROJECT: Kinloss Landfill
Water Analysis
UpperLower
AcceptableLimits
BatchPARAMETERSample
IdDup #2
UpperLower
AcceptableLimits
UpperLower
AcceptableLimits
MATRIX SPIKEMETHOD BLANK SPIKEDUPLICATERPT Date: Jun 02, 2015 REFERENCE MATERIAL
MethodBlank
5835 COOPERS AVENUEMISSISSAUGA, ONTARIO
CANADA L4Z 1Y2TEL (905)712-5100FAX (905)712-5122
http://www.agatlabs.com
QUALITY ASSURANCE REPORT (V1) Page 7 of 12
AGAT Laboratories is accredited to ISO/IEC 17025 by the Canadian Association for Laboratory Accreditation Inc. (CALA) and/or Standards Council of Canada (SCC) for specific tests listed on the scope of accreditation. AGAT Laboratories (Mississauga) is also accredited by the Canadian Association for Laboratory Accreditation Inc. (CALA) for specific drinking water tests. Accreditations are location and parameter specific. A complete listing of parameters for each location is available from www.cala.ca and/or www.scc.ca. The tests in this report may not necessarily be included in the scope of accreditation.

Certified By:
Results relate only to the items tested and to all the items tested
SAMPLING SITE: SAMPLED BY:Elaine Vandenkieboom
AGAT WORK ORDER: 15T976076
Dup #1 RPDMeasured
ValueRecovery Recovery
Quality Assurance
ATTENTION TO: Neil McLean
CLIENT NAME: WSP CANADA INC.
PROJECT: Kinloss Landfill
Water Analysis (Continued)
UpperLower
AcceptableLimits
BatchPARAMETERSample
IdDup #2
UpperLower
AcceptableLimits
UpperLower
AcceptableLimits
MATRIX SPIKEMETHOD BLANK SPIKEDUPLICATERPT Date: Jun 02, 2015 REFERENCE MATERIAL
MethodBlank
5835 COOPERS AVENUEMISSISSAUGA, ONTARIO
CANADA L4Z 1Y2TEL (905)712-5100FAX (905)712-5122
http://www.agatlabs.com
QUALITY ASSURANCE REPORT (V1) Page 8 of 12
AGAT Laboratories is accredited to ISO/IEC 17025 by the Canadian Association for Laboratory Accreditation Inc. (CALA) and/or Standards Council of Canada (SCC) for specific tests listed on the scope of accreditation. AGAT Laboratories (Mississauga) is also accredited by the Canadian Association for Laboratory Accreditation Inc. (CALA) for specific drinking water tests. Accreditations are location and parameter specific. A complete listing of parameters for each location is available from www.cala.ca and/or www.scc.ca. The tests in this report may not necessarily be included in the scope of accreditation.

Water Analysis
Electrical Conductivity INOR-93-6000 SM 2510 B PC TITRATE
pH INOR-93-6000 SM 4500-H+ B PC TITRATE
Total Hardness (as CaCO3) MET-93-6105 EPA SW-846 6010C & 200.7 ICP/OES
Alkalinity (as CaCO3) INOR-93-6000 SM 2320 B PC TITRATE
Chloride INOR-93-6004 SM 4110 B ION CHROMATOGRAPH
Nitrate as N INOR-93-6004 SM 4110 B ION CHROMATOGRAPH
Nitrite as N INOR-93-6004 SM 4110 B ION CHROMATOGRAPH
Sulphate INOR-93-6004 SM 4110 B ION CHROMATOGRAPH
Ammonia as N INOR-93-6059QuikChem 10-107-06-1-J & SM 4500 NH3-F
LACHAT FIA
Total Kjeldahl Nitrogen INOR-93-6048QuikChem 10-107-06-2-I & SM 4500-Norg D
LACHAT FIA
Dissolved Organic Carbon INOR-93-6049 EPA 415.1 & SM 5310 B SHIMADZU CARBON ANALYZER
Phenols INOR-93-6050 MOE ROPHEN-E 3179 & SM 5530 D TECHNICON AUTO ANALYZER
Calcium MET-93-6105 EPA SW-846 6010C & 200.7 ICP/OES
Magnesium MET-93-6105 EPA SW-846 6010C & 200.7 ICP/OES
Sodium MET-93-6105 EPA SW-846 6010C & 200.7 ICP/OES
Potassium MET-93-6105 EPA SW-846 6010C & 200.7 ICP/OES
Aluminum MET-93-6103 EPA SW-846 6020A & 200.8 ICP-MS
Barium MET-93-6103 EPA SW-846 6020A & 200.8 ICP-MS
Boron MET-93-6103 EPA SW-846 6020A & 200.8 ICP-MS
Cadmium MET-93-6103 EPA SW-846 6020A & 200.8 ICP-MS
Chromium MET-93-6103 EPA SW-846 6020A & 200.8 ICP-MS
Copper MET-93-6103 EPA SW-846 6020A & 200.8 ICP-MS
Iron MET-93-6103 EPA SW-846 6020A & 200.8 ICP-MS
Lead MET-93-6103 EPA SW-846 6020A & 200.8 ICP-MS
Manganese MET-93-6103 EPA SW-846 6020A & 200.8 ICP-MS
Zinc MET-93-6103 EPA SW-846 6020A & 200.8 ICP-MS
Electrical Conductivity INOR-93-6000 SM 2510 B PC TITRATE
pH INOR-93-6000 SM 4500-H+ B PC TITRATE
Total Hardness (as CaCO3) MET-93-6105 EPA SW-846 6010C & 200.7 ICP/OES
Alkalinity (as CaCO3) INOR-93-6000 SM 2320 B PC TITRATE
Chloride INOR-93-6004 SM 4110 B ION CHROMATOGRAPH
Nitrate as N INOR-93-6004 SM 4110 B ION CHROMATOGRAPH
Nitrite as N INOR-93-6004 SM 4110 B ION CHROMATOGRAPH
Sulphate INOR-93-6004 SM 4110 B ION CHROMATOGRAPH
Ammonia as N INOR-93-6059QuikChem 10-107-06-1-J & SM 4500 NH3-F
LACHAT FIA
Ammonia as N INOR-93-6002 AQ2 EPA-103A & SM 4500 NH3-F AQ-2 DISCRETE ANALYZER
Total Kjeldahl Nitrogen INOR-93-6048QuikChem 10-107-06-2-I & SM 4500-Norg D
LACHAT FIA
Total Phosphorus INOR-93-6022 SM 4500-P B&E SPECTROPHOTOMETER
Dissolved Organic Carbon INOR-93-6049 EPA 415.1 & SM 5310 B SHIMADZU CARBON ANALYZER
Phenols INOR-93-6050 MOE ROPHEN-E 3179 & SM 5530 D TECHNICON AUTO ANALYZER
Turbidity INOR-93-6044 SM 2130 B NEPHELOMETER
Calcium MET-93-6105 EPA SW-846 6010C & 200.7 ICP/OES
Magnesium MET-93-6105 EPA SW-846 6010C & 200.7 ICP/OES
Sodium MET-93-6105 EPA SW-846 6010C & 200.7 ICP/OES
Potassium MET-93-6105 EPA SW-846 6010C & 200.7 ICP/OES
Aluminum (dissolved) MET-93-6103 EPA SW-846 6020A & 200.8 ICP-MS
Results relate only to the items tested and to all the items tested
SAMPLING SITE: SAMPLED BY:Elaine Vandenkieboom
AGAT WORK ORDER: 15T976076
Method Summary
ATTENTION TO: Neil McLean
CLIENT NAME: WSP CANADA INC.
PROJECT: Kinloss Landfill
AGAT S.O.P ANALYTICAL TECHNIQUELITERATURE REFERENCEPARAMETER
5835 COOPERS AVENUEMISSISSAUGA, ONTARIO
CANADA L4Z 1Y2TEL (905)712-5100FAX (905)712-5122
http://www.agatlabs.com
METHOD SUMMARY (V1) Page 9 of 12

Barium MET-93-6103 EPA SW-846 6020A & 200.8 ICP-MS
Boron MET-93-6103 EPA SW-846 6020A & 200.8 ICP-MS
Cadmium MET-93-6103 EPA SW-846 6020A & 200.8 ICP-MS
Chromium MET-93-6103 EPA SW-846 6020A & 200.8 ICP-MS
Copper MET-93-6103 EPA SW-846 6020A & 200.8 ICP-MS
Iron MET-93-6103 EPA SW-846 6020A & 200.8 ICP-MS
Lead MET-93-6103 EPA SW-846 6020A & 200.8 ICP-MS
Manganese MET-93-6103 EPA SW-846 6020A & 200.8 ICP-MS
Zinc MET-93-6103 EPA SW-846 6020A & 200.8 ICP-MS
Results relate only to the items tested and to all the items tested
SAMPLING SITE: SAMPLED BY:Elaine Vandenkieboom
AGAT WORK ORDER: 15T976076
Method Summary
ATTENTION TO: Neil McLean
CLIENT NAME: WSP CANADA INC.
PROJECT: Kinloss Landfill
AGAT S.O.P ANALYTICAL TECHNIQUELITERATURE REFERENCEPARAMETER
5835 COOPERS AVENUEMISSISSAUGA, ONTARIO
CANADA L4Z 1Y2TEL (905)712-5100FAX (905)712-5122
http://www.agatlabs.com
METHOD SUMMARY (V1) Page 10 of 12
CLIENT NAME: WSP CANADA INC.1450 1ST AVENUE WEST OWEN SOUND, ON N4K6W2 (519) 376-7612
5835 COOPERS AVENUEMISSISSAUGA, ONTARIO
CANADA L4Z 1Y2TEL (905)712-5100FAX (905)712-5122
http://www.agatlabs.com
Parvathi Malemath, Data ReviewerWATER ANALYSIS REVIEWED BY:
DATE REPORTED:
PAGES (INCLUDING COVER): 10
Nov 10, 2015
VERSION*: 1
Should you require any information regarding this analysis please contact your client services representative at (905) 712-5100
15T036635AGAT WORK ORDER:
ATTENTION TO: Neil McLean
PROJECT: 121-60018-11
Laboratories (V1) Page 1 of 10
All samples will be disposed of within 30 days following analysis. Please contact the lab if you require additional sample storage time.
AGAT Laboratories is accredited to ISO/IEC 17025 by the Canadian Association for Laboratory Accreditation Inc. (CALA) and/or Standards Council of Canada (SCC) for specific tests listed on the scope of accreditation. AGAT Laboratories (Mississauga) is also accredited by the Canadian Association for Laboratory Accreditation Inc. (CALA) for specific drinking water tests. Accreditations are location and parameter specific. A complete listing of parameters for each location is available from www.cala.ca and/or www.scc.ca. The tests in this report may not necessarily be included in the scope of accreditation.
Association of Professional Engineers and Geoscientists of Alberta (APEGA)Western Enviro-Agricultural Laboratory Association (WEALA)Environmental Services Association of Alberta (ESAA)
Member of:
*NOTES
Results relate only to the items tested and to all the items testedAll reportable information as specified by ISO 17025:2005 is available from AGAT Laboratories upon request

OW4 OW13sOW5 OW6 OW12SAMPLE DESCRIPTION:
WaterWater Water Water WaterSAMPLE TYPE:
10/27/2015 10/27/201510/27/2015 10/27/2015 10/27/2015DATE SAMPLED:
71457017145666 RDL 7145679 7145689 RDL 7145695 RDLG / S RDLUnitParameter
1270 2 502 571 2 772 2Electrical Conductivity 12802uS/cm
7.80 NA 7.84 8.05 NA 8.07 NApH 7.97NA(6.5-8.5)pH Units
607 0.5 257 280 0.5 397 0.5Total Hardness (as CaCO3) 6260.5(80-100)mg/L
664 5 265 306 5 343 5Alkalinity (as CaCO3) 4845(30-500)mg/L
12.7 0.20 3.19 3.67 0.50 7.50 0.50Chloride 18.11.0250mg/L
<0.5 0.10 <0.10 <0.10 0.25 1.98 0.25Nitrate as N 2.340.510.0mg/L
<0.5 0.10 <0.10 <0.10 0.25 <0.25 0.25Nitrite as N <0.250.51.0mg/L
57.4 0.20 21.9 15.0 0.50 96.8 0.50Sulphate 2791.0500mg/L
21.2 0.02 0.07 0.26 0.02 <0.02 0.02Ammonia as N 1.070.4mg/L
5.9 0.5 0.8 1.1 0.5 1.8 0.5Dissolved Organic Carbon 2.90.55mg/L
22.4 0.10 0.23 0.51 0.10 0.18 0.10Total Kjeldahl Nitrogen 2.500.20mg/L
<0.001 0.001 <0.001 <0.001 0.001 <0.001 0.001Phenols <0.0010.001mg/L
179 0.05 61.2 73.4 0.05 70.9 0.10Calcium 1370.05mg/L
38.8 0.05 25.3 23.6 0.05 53.5 0.10Magnesium 69.00.05mg/L
25.9 0.05 3.20 6.45 0.05 7.08 0.10Sodium 19.00.0520 (200)mg/L
22.4 0.05 0.90 0.93 0.05 12.3 0.10Potassium 30.80.05mg/L
0.006 0.004 0.004 <0.004 0.004 <0.004 0.004Aluminum 0.0050.0040.1mg/L
0.177 0.002 0.087 0.079 0.002 0.068 0.002Barium 0.0610.0021mg/L
0.322 0.010 0.018 0.020 0.010 0.374 0.010Boron 0.9330.0105mg/L
<0.001 0.001 <0.001 <0.001 0.001 <0.001 0.001Cadmium <0.0010.0010.005mg/L
0.004 0.003 <0.003 <0.003 0.003 <0.003 0.003Chromium <0.0030.0030.05mg/L
<0.003 0.003 <0.003 <0.003 0.003 <0.003 0.003Copper <0.0030.0031mg/L
13.0 0.010 0.140 0.403 0.010 <0.010 0.010Iron <0.0100.0100.3mg/L
<0.002 0.002 <0.002 <0.002 0.002 <0.002 0.002Lead <0.0020.0020.01mg/L
0.787 0.002 0.245 0.135 0.002 <0.002 0.002Manganese 0.0550.0020.05mg/L
<0.005 0.005 0.008 0.008 0.005 <0.005 0.005Zinc <0.0050.0055mg/L
Results relate only to the items tested and to all the items tested
DATE RECEIVED: 2015-10-29
Certificate of Analysis
ATTENTION TO: Neil McLeanCLIENT NAME: WSP CANADA INC.
AGAT WORK ORDER: 15T036635
DATE REPORTED: 2015-11-10
PROJECT: 121-60018-11
Kinloss - Groundwater Parameters
SAMPLED BY:Elaine VandenkieboomSAMPLING SITE:Kinloss Landfill
5835 COOPERS AVENUEMISSISSAUGA, ONTARIO
CANADA L4Z 1Y2TEL (905)712-5100FAX (905)712-5122
http://www.agatlabs.com
CERTIFICATE OF ANALYSIS (V1)
Certified By:Page 2 of 10

OW13I OW13D OW14/14 DUP#1SAMPLE DESCRIPTION:
WaterWater Water WaterSAMPLE TYPE:
10/27/2015 10/27/201510/27/2015 10/27/2015DATE SAMPLED:
7145746 RDL 7145748 7145755 RDL 7145763G / S RDLUnitParameter
1310 2 911 948 2 573Electrical Conductivity 2uS/cm
8.04 NA 7.93 7.80 NA 7.97pH NA(6.5-8.5)pH Units
662 0.5 457 505 0.5 283Total Hardness (as CaCO3) 0.5(80-100)mg/L
496 5 357 531 5 308Alkalinity (as CaCO3) 5(30-500)mg/L
22.5 0.50 16.1 3.76 0.20 3.60Chloride 0.50250mg/L
1.64 0.25 <0.25 <0.25 0.10 <0.10Nitrate as N 0.2510.0mg/L
<0.25 0.25 <0.25 <0.25 0.10 <0.10Nitrite as N 0.251.0mg/L
281 0.50 148 26.0 0.20 15.3Sulphate 0.50500mg/L
1.48 0.02 0.17 1.71 0.02 0.27Ammonia as N 0.02mg/L
3.0 0.5 1.5 5.0 0.5 1.0Dissolved Organic Carbon 0.55mg/L
2.49 0.10 0.28 4.65 0.10 0.48Total Kjeldahl Nitrogen 0.10mg/L
<0.001 0.001 <0.001 <0.001 0.001 <0.001Phenols 0.001mg/L
145 0.05 105 169 0.05 74.1Calcium 0.10mg/L
72.9 0.05 47.2 20.1 0.05 23.9Magnesium 0.10mg/L
25.0 0.05 23.7 3.64 0.05 6.49Sodium 0.1020 (200)mg/L
27.5 0.05 3.85 8.68 0.05 0.99Potassium 0.10mg/L
<0.004 0.004 <0.004 0.007 0.004 <0.004Aluminum 0.0040.1mg/L
0.070 0.002 0.163 0.044 0.002 0.082Barium 0.0021mg/L
0.878 0.010 0.301 0.161 0.010 0.022Boron 0.0105mg/L
<0.001 0.001 <0.001 <0.001 0.001 <0.001Cadmium 0.0010.005mg/L
<0.003 0.003 <0.003 <0.003 0.003 <0.003Chromium 0.0030.05mg/L
<0.003 0.003 <0.003 <0.003 0.003 <0.003Copper 0.0031mg/L
<0.010 0.010 0.766 3.07 0.010 0.419Iron 0.0100.3mg/L
<0.002 0.002 <0.002 <0.002 0.002 <0.002Lead 0.0020.01mg/L
0.131 0.002 0.028 0.291 0.002 0.141Manganese 0.0020.05mg/L
<0.005 0.005 <0.005 <0.005 0.005 0.009Zinc 0.0055mg/L
Comments: RDL - Reported Detection Limit; G / S - Guideline / Standard: Refers to O.Reg.169/03(mg/L)
7145666-7145763 Samples required dilution prior to analysis in order to keep the analytes within the calibration range of the instruments and to minimize any matrix interferences; the RDLs were adjusted to reflect the dilution.
Results relate only to the items tested and to all the items tested
DATE RECEIVED: 2015-10-29
Certificate of Analysis
ATTENTION TO: Neil McLeanCLIENT NAME: WSP CANADA INC.
AGAT WORK ORDER: 15T036635
DATE REPORTED: 2015-11-10
PROJECT: 121-60018-11
Kinloss - Groundwater Parameters
SAMPLED BY:Elaine VandenkieboomSAMPLING SITE:Kinloss Landfill
5835 COOPERS AVENUEMISSISSAUGA, ONTARIO
CANADA L4Z 1Y2TEL (905)712-5100FAX (905)712-5122
http://www.agatlabs.com
CERTIFICATE OF ANALYSIS (V1)
Certified By:Page 3 of 10

SW2SW1 DUP#2SAMPLE DESCRIPTION:
WaterWaterWaterSAMPLE TYPE:
10/27/2015 10/27/201510/27/2015DATE SAMPLED:
7145783 7145809 7145817G / S RDLUnitParameter
464 570 462Electrical Conductivity 2uS/cm
8.08 8.15 8.10pH NA6.5-8.5pH Units
249 299 247Total Hardness (as CaCO3) 0.5mg/L
248 286 244Alkalinity (as CaCO3) 5mg/L
8.01 9.05 8.02Chloride 0.20mg/L
<0.10 <0.10 <0.10Nitrate as N 0.10mg/L
<0.10 <0.10 <0.10Nitrite as N 0.10mg/L
2.98 22.5 2.82Sulphate 0.20mg/L
<0.02 <0.02 <0.02Ammonia as N 0.02mg/L
<0.01 <0.01 <0.01Total Phosphorus 0.010.03mg/L
5.5 3.5 5.5Dissolved Organic Carbon 0.5mg/L
0.23 0.13 0.24Total Kjeldahl Nitrogen 0.10mg/L
<0.001 <0.001 <0.001Phenols 0.0010.001mg/L
<0.5 <0.5 <0.5Turbidity 0.5NTU
68.8 79.8 68.2Calcium 0.05mg/L
18.8 24.3 18.6Magnesium 0.05mg/L
2.58 3.95 2.57Sodium 0.05mg/L
0.55 1.33 0.53Potassium 0.05mg/L
<0.004 <0.004 <0.004Aluminum (dissolved) 0.0040.075mg/L
0.016 0.034 0.015Barium 0.002mg/L
<0.010 0.020 <0.010Boron 0.0100.20mg/L
<0.0001 <0.0001 <0.0001Cadmium 0.00010.0002mg/L
<0.003 <0.003 <0.003Chromium 0.003mg/L
<0.002 <0.002 <0.002Copper 0.0020.005mg/L
0.10 <0.01 0.11Iron 0.010.3mg/L
<0.001 <0.001 <0.001Lead 0.0010.005mg/L
0.024 0.011 0.027Manganese 0.002mg/L
<0.005 <0.005 <0.005Zinc 0.0050.02mg/L
Results relate only to the items tested and to all the items tested
DATE RECEIVED: 2015-10-29
Certificate of Analysis
ATTENTION TO: Neil McLeanCLIENT NAME: WSP CANADA INC.
AGAT WORK ORDER: 15T036635
DATE REPORTED: 2015-11-10
PROJECT: 121-60018-11
Kinloss - Surface Water Parameters
SAMPLED BY:Elaine VandenkieboomSAMPLING SITE:Kinloss Landfill
5835 COOPERS AVENUEMISSISSAUGA, ONTARIO
CANADA L4Z 1Y2TEL (905)712-5100FAX (905)712-5122
http://www.agatlabs.com
CERTIFICATE OF ANALYSIS (V1)
Certified By:Page 4 of 10
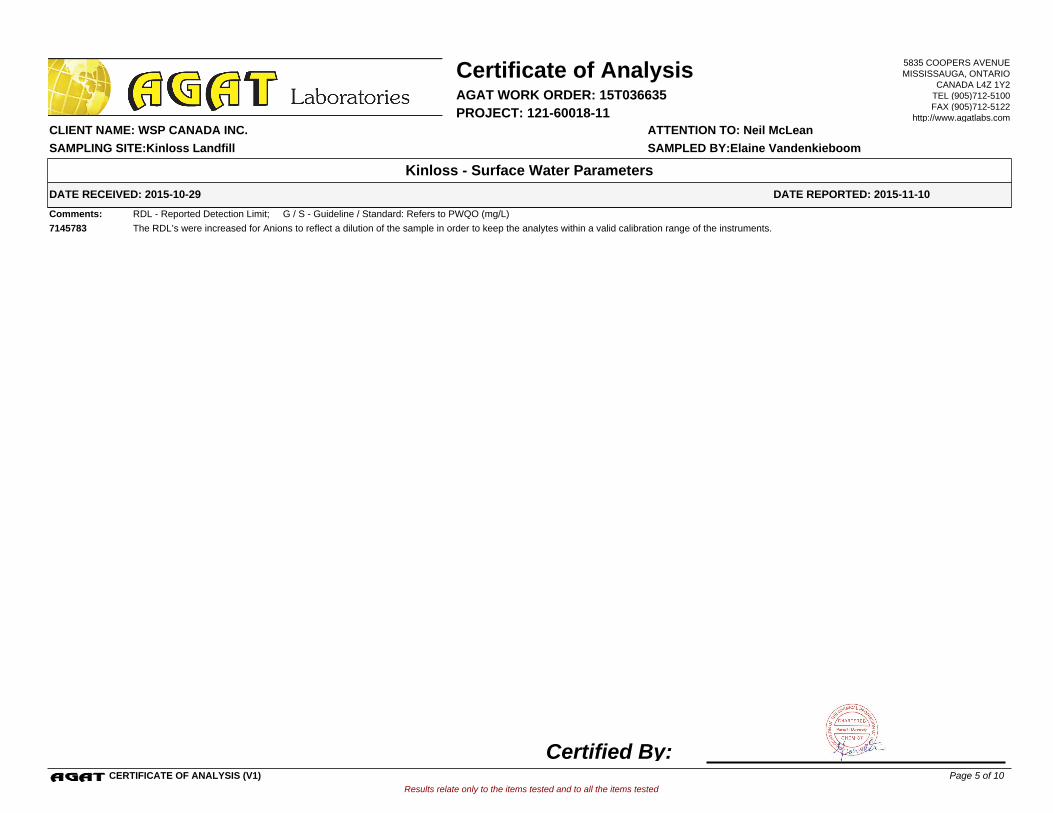
Results relate only to the items tested and to all the items tested
DATE RECEIVED: 2015-10-29
Certificate of Analysis
ATTENTION TO: Neil McLeanCLIENT NAME: WSP CANADA INC.
AGAT WORK ORDER: 15T036635
DATE REPORTED: 2015-11-10
PROJECT: 121-60018-11
Kinloss - Surface Water Parameters
SAMPLED BY:Elaine VandenkieboomSAMPLING SITE:Kinloss Landfill
5835 COOPERS AVENUEMISSISSAUGA, ONTARIO
CANADA L4Z 1Y2TEL (905)712-5100FAX (905)712-5122
http://www.agatlabs.com
Comments: RDL - Reported Detection Limit; G / S - Guideline / Standard: Refers to PWQO (mg/L)
7145783 The RDL’s were increased for Anions to reflect a dilution of the sample in order to keep the analytes within a valid calibration range of the instruments.
CERTIFICATE OF ANALYSIS (V1)
Certified By:Page 5 of 10
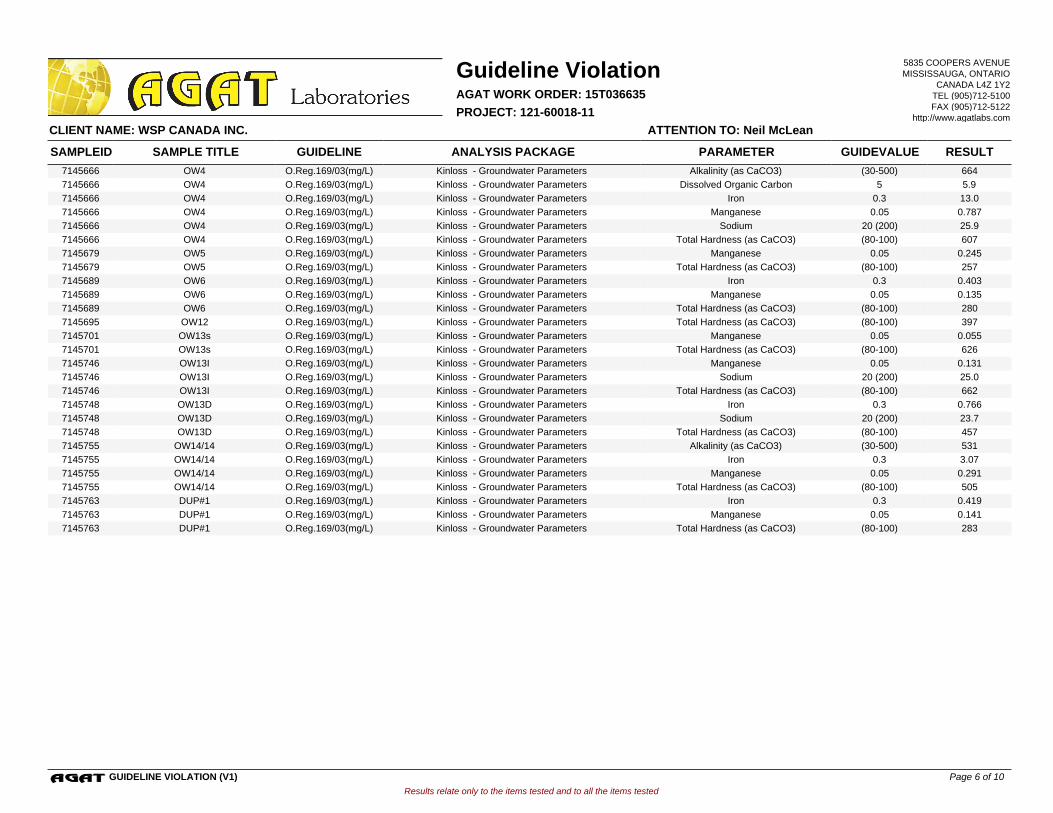
7145666 O.Reg.169/03(mg/L) Kinloss - Groundwater Parameters Alkalinity (as CaCO3) (30-500) 664OW4
7145666 O.Reg.169/03(mg/L) Kinloss - Groundwater Parameters Dissolved Organic Carbon 5 5.9OW4
7145666 O.Reg.169/03(mg/L) Kinloss - Groundwater Parameters Iron 0.3 13.0OW4
7145666 O.Reg.169/03(mg/L) Kinloss - Groundwater Parameters Manganese 0.05 0.787OW4
7145666 O.Reg.169/03(mg/L) Kinloss - Groundwater Parameters Sodium 20 (200) 25.9OW4
7145666 O.Reg.169/03(mg/L) Kinloss - Groundwater Parameters Total Hardness (as CaCO3) (80-100) 607OW4
7145679 O.Reg.169/03(mg/L) Kinloss - Groundwater Parameters Manganese 0.05 0.245OW5
7145679 O.Reg.169/03(mg/L) Kinloss - Groundwater Parameters Total Hardness (as CaCO3) (80-100) 257OW5
7145689 O.Reg.169/03(mg/L) Kinloss - Groundwater Parameters Iron 0.3 0.403OW6
7145689 O.Reg.169/03(mg/L) Kinloss - Groundwater Parameters Manganese 0.05 0.135OW6
7145689 O.Reg.169/03(mg/L) Kinloss - Groundwater Parameters Total Hardness (as CaCO3) (80-100) 280OW6
7145695 O.Reg.169/03(mg/L) Kinloss - Groundwater Parameters Total Hardness (as CaCO3) (80-100) 397OW12
7145701 O.Reg.169/03(mg/L) Kinloss - Groundwater Parameters Manganese 0.05 0.055OW13s
7145701 O.Reg.169/03(mg/L) Kinloss - Groundwater Parameters Total Hardness (as CaCO3) (80-100) 626OW13s
7145746 O.Reg.169/03(mg/L) Kinloss - Groundwater Parameters Manganese 0.05 0.131OW13I
7145746 O.Reg.169/03(mg/L) Kinloss - Groundwater Parameters Sodium 20 (200) 25.0OW13I
7145746 O.Reg.169/03(mg/L) Kinloss - Groundwater Parameters Total Hardness (as CaCO3) (80-100) 662OW13I
7145748 O.Reg.169/03(mg/L) Kinloss - Groundwater Parameters Iron 0.3 0.766OW13D
7145748 O.Reg.169/03(mg/L) Kinloss - Groundwater Parameters Sodium 20 (200) 23.7OW13D
7145748 O.Reg.169/03(mg/L) Kinloss - Groundwater Parameters Total Hardness (as CaCO3) (80-100) 457OW13D
7145755 O.Reg.169/03(mg/L) Kinloss - Groundwater Parameters Alkalinity (as CaCO3) (30-500) 531OW14/14
7145755 O.Reg.169/03(mg/L) Kinloss - Groundwater Parameters Iron 0.3 3.07OW14/14
7145755 O.Reg.169/03(mg/L) Kinloss - Groundwater Parameters Manganese 0.05 0.291OW14/14
7145755 O.Reg.169/03(mg/L) Kinloss - Groundwater Parameters Total Hardness (as CaCO3) (80-100) 505OW14/14
7145763 O.Reg.169/03(mg/L) Kinloss - Groundwater Parameters Iron 0.3 0.419DUP#1
7145763 O.Reg.169/03(mg/L) Kinloss - Groundwater Parameters Manganese 0.05 0.141DUP#1
7145763 O.Reg.169/03(mg/L) Kinloss - Groundwater Parameters Total Hardness (as CaCO3) (80-100) 283DUP#1
Results relate only to the items tested and to all the items tested
Guideline Violation
ATTENTION TO: Neil McLeanCLIENT NAME: WSP CANADA INC.
AGAT WORK ORDER: 15T036635
PROJECT: 121-60018-11
SAMPLEID GUIDELINE ANALYSIS PACKAGE PARAMETER GUIDEVALUE RESULTSAMPLE TITLE
5835 COOPERS AVENUEMISSISSAUGA, ONTARIO
CANADA L4Z 1Y2TEL (905)712-5100FAX (905)712-5122
http://www.agatlabs.com
GUIDELINE VIOLATION (V1) Page 6 of 10

Kinloss - Surface Water Parameters
Electrical Conductivity 7157966 310 308 0.6% < 2 99% 80% 120% NA NA
pH 7157966 7.78 7.81 0.4% NA 100% 90% 110% NA NA
Alkalinity (as CaCO3) 7157966 92 93 1.1% < 5 97% 80% 120% NA NA
Chloride 7145695 7145695 7.50 7.54 0.5% < 0.10 109% 90% 110% 106% 90% 110% 101% 80% 120%
Nitrate as N
7145695 7145695 1.98 1.97 0.5% < 0.05 91% 90% 110% 105% 90% 110% 98% 80% 120%
Nitrite as N 7145695 7145695 <0.25 <0.25 NA < 0.05 NA 90% 110% 100% 90% 110% 100% 80% 120%
Sulphate 7145695 7145695 96.8 96.4 0.4% < 0.10 94% 90% 110% 104% 90% 110% 97% 80% 120%
Ammonia as N 7145817 7145817 <0.02 <0.02 NA < 0.02 93% 90% 110% 100% 90% 110% 92% 80% 120%
Total Phosphorus 7145783 7145783 <0.01 <0.01 NA < 0.01 97% 90% 110% 101% 90% 110% 101% 70% 130%
Dissolved Organic Carbon
7152436 12.8 11.8 8.1% < 0.5 101% 90% 110% 97% 90% 110% 90% 80% 120%
Total Kjeldahl Nitrogen 7145689 7145689 0.51 0.48 NA < 0.10 105% 80% 120% 100% 80% 120% 102% 70% 130%
Phenols 7145666 7145666 <0.001 <0.001 NA < 0.001 96% 90% 110% 101% 90% 110% 100% 80% 120%
Turbidity 7145745 1.4 1.3 NA < 0.5 92% 90% 110% NA NA
Calcium 7145695 7145695 70.9 71.3 0.6% < 0.05 97% 90% 110% 97% 90% 110% 99% 70% 130%
Magnesium
7145695 7145695 53.5 53.2 0.6% < 0.05 92% 90% 110% 92% 90% 110% 97% 70% 130%
Sodium 7145695 7145695 7.08 7.12 0.6% < 0.05 96% 90% 110% 96% 90% 110% 102% 70% 130%
Potassium 7145695 7145695 12.3 12.5 1.6% < 0.05 101% 90% 110% 100% 90% 110% 104% 70% 130%
Aluminum (dissolved) 7145783 7145783 <0.004 <0.004 NA < 0.004 99% 90% 110% 104% 90% 110% 97% 70% 130%
Barium 7145666 7145666 0.177 0.176 0.6% < 0.002 103% 90% 110% 107% 90% 110% 102% 70% 130%
Boron
7145666 7145666 0.322 0.341 5.7% < 0.010 98% 90% 110% 105% 90% 110% 103% 70% 130%
Cadmium 7145666 7145666 <0.0001 <0.0001 NA < 0.0001 101% 90% 110% 109% 90% 110% 123% 70% 130%
Chromium 7145666 7145666 0.004 0.004 NA < 0.003 99% 90% 110% 103% 90% 110% 107% 70% 130%
Copper 7145666 7145666 <0.002 <0.002 NA < 0.002 104% 90% 110% 110% 90% 110% 111% 70% 130%
Iron 7145666 7145666 13.0 12.8 1.6% < 0.01 101% 90% 110% 104% 90% 110% 119% 70% 130%
Lead
7145666 7145666 <0.001 <0.001 NA < 0.001 102% 90% 110% 101% 90% 110% 104% 70% 130%
Manganese 7145666 7145666 0.787 0.772 1.9% < 0.002 105% 90% 110% 106% 90% 110% 116% 70% 130%
Zinc 7145666 7145666 <0.005 <0.005 NA < 0.005 107% 90% 110% 110% 90% 110% 117% 70% 130%
Comments: NA signifies Not Applicable.Duplicate Qualifier: As the measured result approaches the RL (Reporting Limit), the uncertainty associated with the value increases dramatically, thus duplicate acceptance limits apply only where the average of the two duplicates is greater than five times the RL.
Certified By:
Results relate only to the items tested and to all the items tested
SAMPLING SITE:Kinloss Landfill SAMPLED BY:Elaine Vandenkieboom
AGAT WORK ORDER: 15T036635
Dup #1 RPDMeasured
ValueRecovery Recovery
Quality Assurance
ATTENTION TO: Neil McLean
CLIENT NAME: WSP CANADA INC.
PROJECT: 121-60018-11
Water Analysis
UpperLower
AcceptableLimits
BatchPARAMETERSample
IdDup #2
UpperLower
AcceptableLimits
UpperLower
AcceptableLimits
MATRIX SPIKEMETHOD BLANK SPIKEDUPLICATERPT Date: Nov 10, 2015 REFERENCE MATERIAL
MethodBlank
5835 COOPERS AVENUEMISSISSAUGA, ONTARIO
CANADA L4Z 1Y2TEL (905)712-5100FAX (905)712-5122
http://www.agatlabs.com
QUALITY ASSURANCE REPORT (V1) Page 7 of 10
AGAT Laboratories is accredited to ISO/IEC 17025 by the Canadian Association for Laboratory Accreditation Inc. (CALA) and/or Standards Council of Canada (SCC) for specific tests listed on the scope of accreditation. AGAT Laboratories (Mississauga) is also accredited by the Canadian Association for Laboratory Accreditation Inc. (CALA) for specific drinking water tests. Accreditations are location and parameter specific. A complete listing of parameters for each location is available from www.cala.ca and/or www.scc.ca. The tests in this report may not necessarily be included in the scope of accreditation.

Water Analysis
Electrical Conductivity INOR-93-6000 SM 2510 B PC TITRATE
pH INOR-93-6000 SM 4500-H+ B PC TITRATE
Total Hardness (as CaCO3) MET-93-6105 EPA SW-846 6010C & 200.7 ICP/OES
Alkalinity (as CaCO3) INOR-93-6000 SM 2320 B PC TITRATE
Chloride INOR-93-6004 SM 4110 B ION CHROMATOGRAPH
Nitrate as N INOR-93-6004 SM 4110 B ION CHROMATOGRAPH
Nitrite as N INOR-93-6004 SM 4110 B ION CHROMATOGRAPH
Sulphate INOR-93-6004 SM 4110 B ION CHROMATOGRAPH
Ammonia as N INOR-93-6059QuikChem 10-107-06-1-J & SM 4500 NH3-F
LACHAT FIA
Dissolved Organic Carbon INOR-93-6049 EPA 415.1 & SM 5310 B SHIMADZU CARBON ANALYZER
Total Kjeldahl Nitrogen INOR-93-6048QuikChem 10-107-06-2-I & SM 4500-Norg D
LACHAT FIA
Phenols INOR-93-6050 MOE ROPHEN-E 3179 & SM 5530 D TECHNICON AUTO ANALYZER
Calcium MET-93-6105 EPA SW-846 6010C & 200.7 ICP/OES
Magnesium MET-93-6105 EPA SW-846 6010C & 200.7 ICP/OES
Sodium MET-93-6105 EPA SW-846 6010C & 200.7 ICP/OES
Potassium MET-93-6105 EPA SW-846 6010C & 200.7 ICP/OES
Aluminum MET-93-6103 EPA SW-846 6020A & 200.8 ICP-MS
Barium MET-93-6103 EPA SW-846 6020A & 200.8 ICP-MS
Boron MET-93-6103 EPA SW-846 6020A & 200.8 ICP-MS
Cadmium MET-93-6103 EPA SW-846 6020A & 200.8 ICP-MS
Chromium MET-93-6103 EPA SW-846 6020A & 200.8 ICP-MS
Copper MET-93-6103 EPA SW-846 6020A & 200.8 ICP-MS
Iron MET-93-6103 EPA SW-846 6020A & 200.8 ICP-MS
Lead MET-93-6103 EPA SW-846 6020A & 200.8 ICP-MS
Manganese MET-93-6103 EPA SW-846 6020A & 200.8 ICP-MS
Zinc MET-93-6103 EPA SW-846 6020A & 200.8 ICP-MS
Total Phosphorus INOR-93-6022 SM 4500-P B&E SPECTROPHOTOMETER
Turbidity INOR-93-6044 SM 2130 B NEPHELOMETER
Aluminum (dissolved) MET-93-6103 EPA SW-846 6020A & 200.8 ICP-MS
Results relate only to the items tested and to all the items tested
SAMPLING SITE:Kinloss Landfill SAMPLED BY:Elaine Vandenkieboom
AGAT WORK ORDER: 15T036635
Method Summary
ATTENTION TO: Neil McLean
CLIENT NAME: WSP CANADA INC.
PROJECT: 121-60018-11
AGAT S.O.P ANALYTICAL TECHNIQUELITERATURE REFERENCEPARAMETER
5835 COOPERS AVENUEMISSISSAUGA, ONTARIO
CANADA L4Z 1Y2TEL (905)712-5100FAX (905)712-5122
http://www.agatlabs.com
METHOD SUMMARY (V1) Page 8 of 10

Appendix F
SUMMARY OF GROUNDWATER RESULTS

APPENDIX F-1
SUMMARY OF GROUNDWATER RESULTS (PRE-2007) – R.J. BURNSIDE


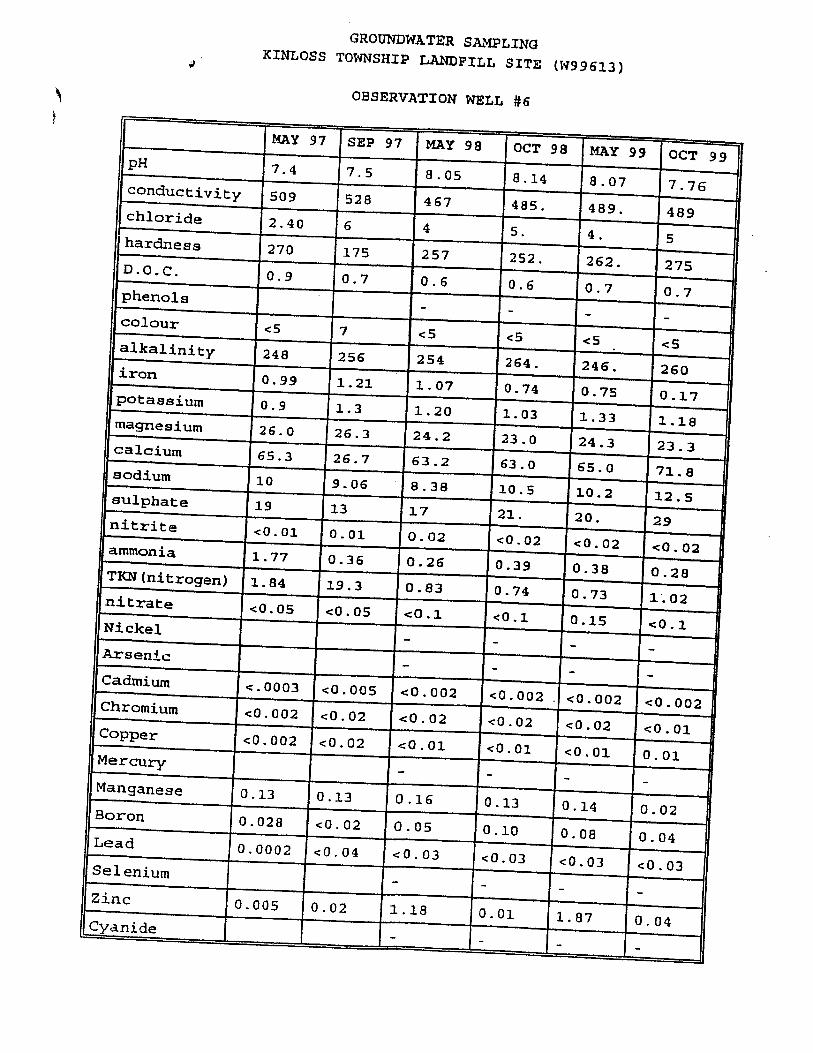

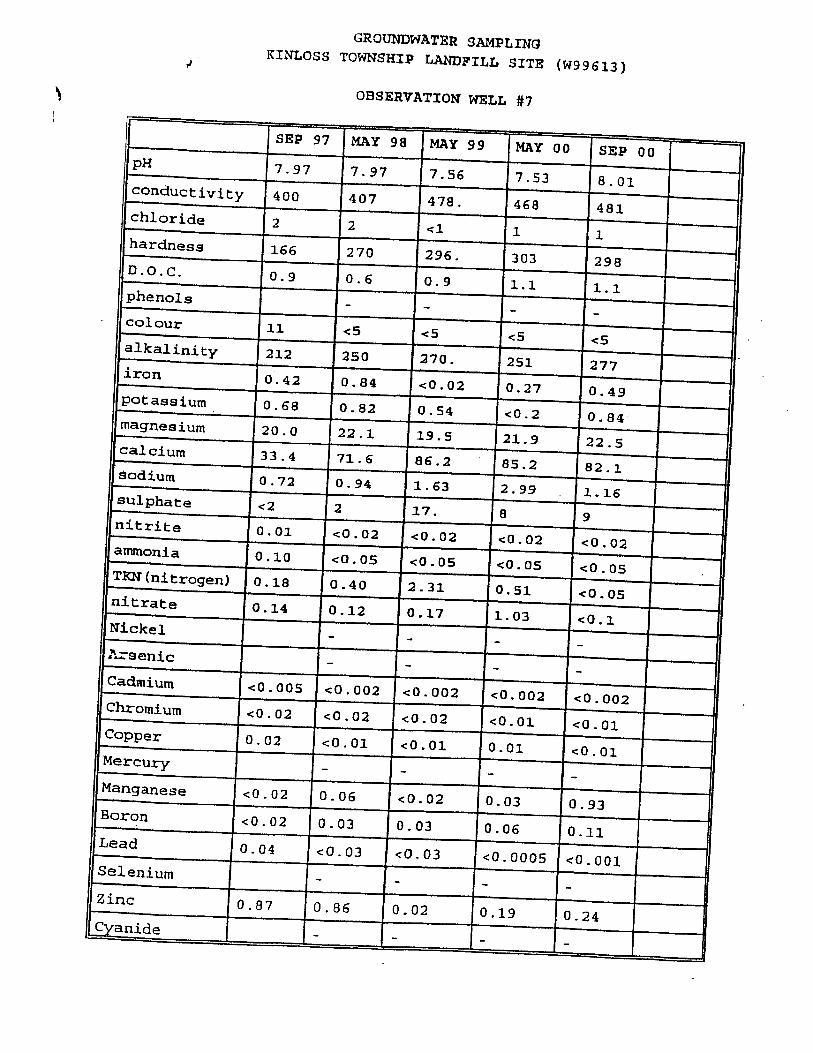


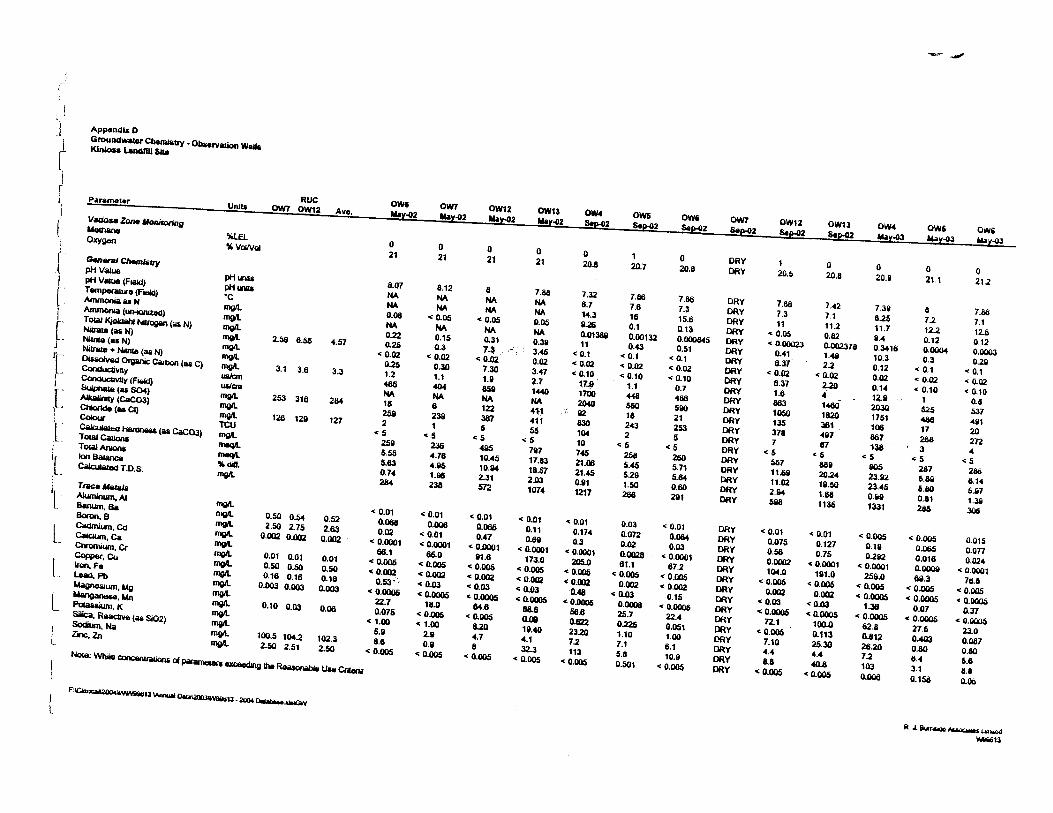


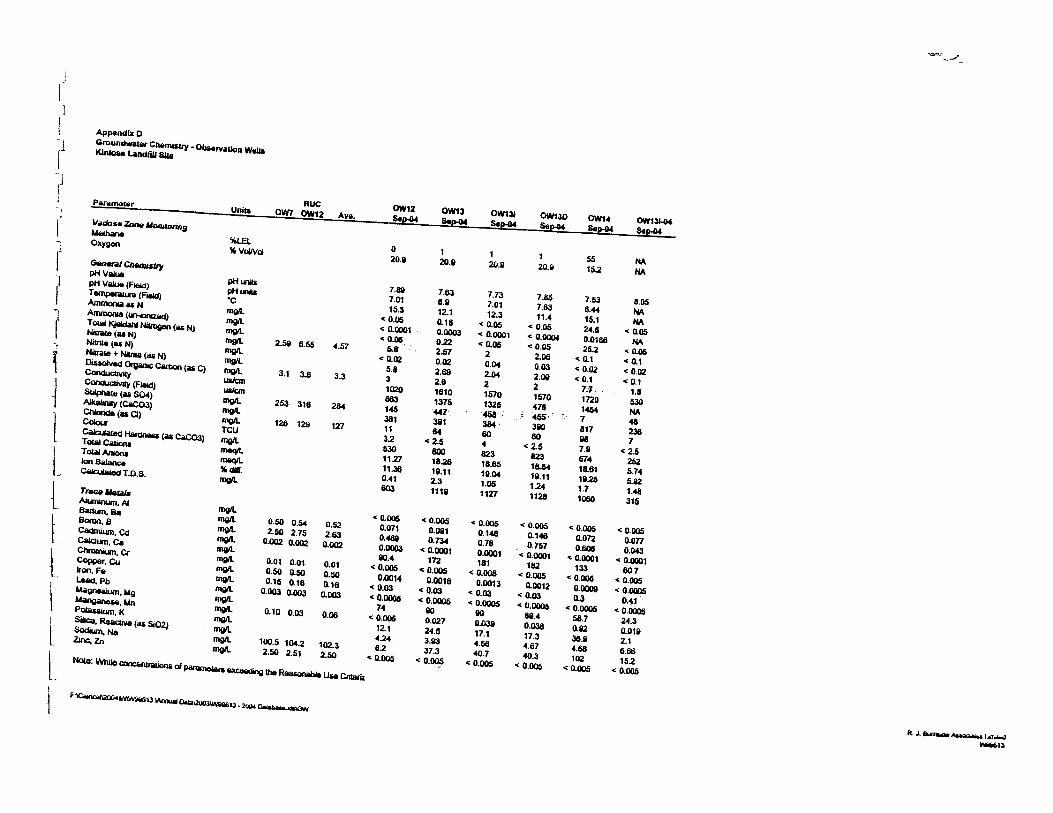


APPENDIX F-2
SUMMARY OF GROUNDWATER RESULTS (2007 – PRESENT)

HISTORICAL WELL WATER QUALITYKINLOSS LANDFILL
OW4 OW4 OW4 OW4 OW4 OW4 OW4 OW4 OW4 OW4 OW4 OW4Chemical ODWQSParameter 1/6/2008 7/21/2008 12/14/2008 7/6/2009 12/5/2009 3/23/2010 6/14/2011 10/17/2011 6/20/2012 10/25/2012 6/17/2013 11/20/2013Alkalinity(as CaCO3) 30 - 500 [OG] 925 922 828 853 709 697 590 792 840 836 756 734Chloride 250 [AO] 120 71 47 54 25 19 30.4 31.5 27.7 20.9 16.1 28.8Nitrate(as N) 10 (MAC) d nd nd nd nd nd 0.4 <0.1 <0.1 <0.1 0.3 11 <0.1Nitrite(as N) 1 (MAC) d nd nd nd nd 0.03 0.01 <0.1 <0.1 <0.1 <0.1 <0.1 <0.1Ammonia(as N) 31.8 27 28 40 28 19 28.6 36.1 25.1 20.8 15.6 22.3Total Kjeldahl Nitrogen(as N) 27 27 29 33 27 20 34.5 31.1 25.5 26.0 18.2 28.6Organic Nitrogen 0.15 0 0 1 0 0 1 5.9 <0.01 0.40 5.2 2.6 6.3Phenols nd 0.003 nd 0.01 nd <0.001 0.005 0.004 <0.001 <0.001 <0.001 0.002Dissolved Organic Carbon(DOC) 5.0 [AO] 15.5 14.8 11 14.7 9.1 6.5 12.6 10.8 11.2 8.6 17.8 23.2Conductivity (us/cm) 2060 1930 1690 1760 1470 1410 1670 1640 1530 1440 1430 1290pH 7.7 7.7 7.5 7.4 7.7 7.5 7.19 7.25 7.33 7.26 7.44 7.48Sulphate (as SO4) 250 (AO) 72 57 85 51 84 79 33 54 32 65 66 56Sulphide nd nd - - - - - - - - - -Hardness(as CaCO3) 80-100 [OG] 710 720 690 650 600 650 699 728 610 688 668 587Aluminum 0.1 [OG] 0.006 0.005 nd 0.007 nd <0.005 0.06 0.06 0.05 0.06 0.06 0.07Barium 1.0 [MAC] 0.29 0.25 0.22 0.25 0.16 0.18 0.243 0.238 0.211 0.204 0.192 0.192Boron 5 [IMAC] 0.36 0.35 0.35 0.44 0.34 0.27 0.488 - 0.424 0.381 0.385 0.371Cadmium 0.005 (MAC) 0.0005 nd nd nd 0.0006 <0.0001 <0.00002 <0.00002 <0.00002 0.00010 <0.00002 <0.00002Calcium - 188 190 190 180 170 190 191 203 165 201 199 172Chromium 0.05 (MAC) nd nd nd nd nd <0.005 <0.002 <0.002 <0.002 <0.002 <0.002 <0.002Copper 1.0 [AO] 0.001 nd nd nd 0.001 0.001 <0.002 <0.002 <0.002 <0.002 <0.002 0.0024Iron 0.3 [AO] 13 8.8 6.2 17 1.6 16 19.0 17.2 15.6 14.5 13.9 13.1Lead 0.01 (MAC)c nd nd nd nd nd <0.0005 <0.00002 <0.00002 0.00006 0.00003 <0.00002 0.00006Magnesium - 57.1 58 52 51 43 44 52.9 53.5 48.2 45.0 41.7 38.3Manganese 0.05 [AO] 0.56 0.76 0.93 0.76 0.63 0.840 0.906 0.753 0.868 0.758 0.839 0.683Potassium - 30 32 29 29 27 20 29.6 33.0 25.6 24.7 21.4 21.3Sodium 200 [AO] 160 110 82 87 44 40 61.8 62.3 49.0 46.9 29.2 44.8Zinc 5.0 [AO] 0.006 0.01 0.014 nd 0.016 0.026 <0.005 <0.005 0.012 0.005 <0.005 <0.005
NOTES:1. All results expresses in mg/L unless otherwise noted.2. ODWQS is the Ontario Drinking Water Quality Standards, MOE, revised 2001.3. MAC maximum acceptable concentration ODWQS.4. IMAC indicates an interim maximum acceptable concentration ODWQS.5. AO indicates an aesthetic objective ODWQS, not health related.6. OG indicates an operational guideline ODWQS, not health related.7. c indicates that the guideline applies to water at the point of consumption.8. d, where nitrate and nitrite are present the total of the two should not exceed 10 mg/L.9. nd indicates parameter not detected.10. Shaded values indicate exceedance of ODWQS.
G:\2010\OS\401 - Environment\101-16945-00 - Kinloss WDS\Reports\Monitoring 2015\Kinloss GW Quality.xls
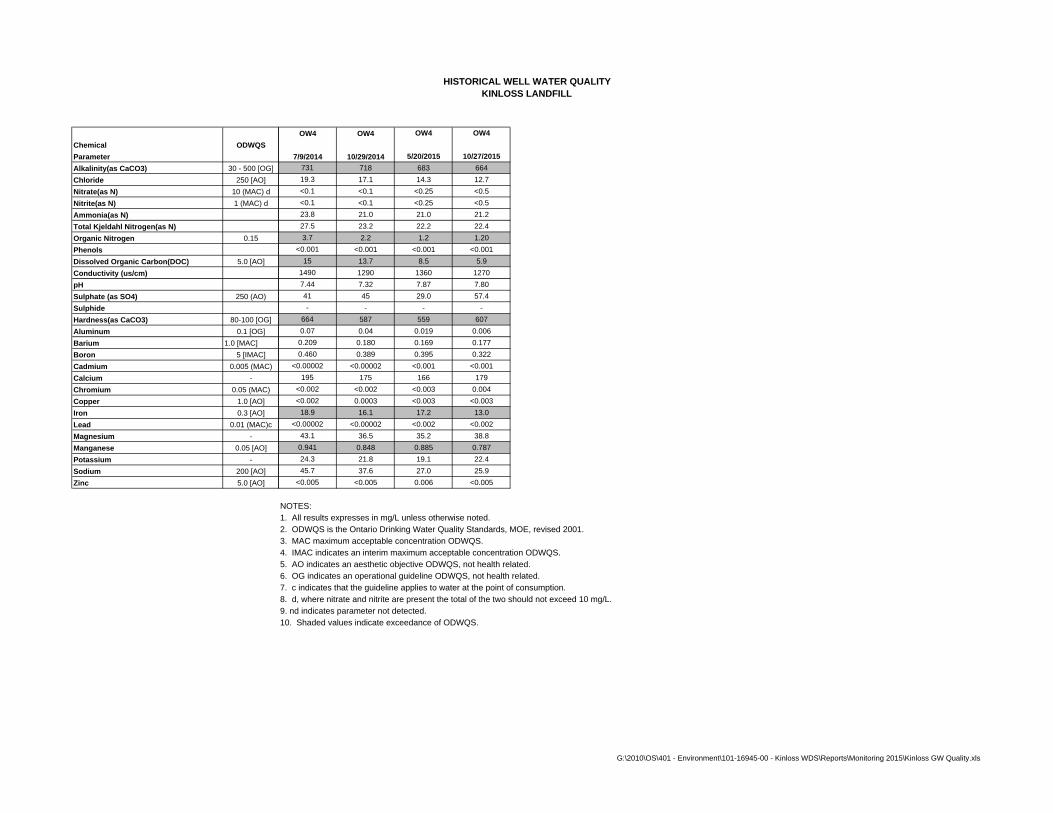
HISTORICAL WELL WATER QUALITYKINLOSS LANDFILL
Chemical ODWQSParameterAlkalinity(as CaCO3) 30 - 500 [OG]Chloride 250 [AO]Nitrate(as N) 10 (MAC) dNitrite(as N) 1 (MAC) dAmmonia(as N)Total Kjeldahl Nitrogen(as N)Organic Nitrogen 0.15PhenolsDissolved Organic Carbon(DOC) 5.0 [AO]Conductivity (us/cm)pHSulphate (as SO4) 250 (AO)SulphideHardness(as CaCO3) 80-100 [OG]Aluminum 0.1 [OG]Barium 1.0 [MAC]Boron 5 [IMAC]Cadmium 0.005 (MAC)Calcium -Chromium 0.05 (MAC)Copper 1.0 [AO]Iron 0.3 [AO]Lead 0.01 (MAC)cMagnesium -Manganese 0.05 [AO]Potassium -Sodium 200 [AO]Zinc 5.0 [AO]
OW4 OW4 OW4 OW4
7/9/2014 10/29/2014 5/20/2015 10/27/2015731 718 683 66419.3 17.1 14.3 12.7<0.1 <0.1 <0.25 <0.5<0.1 <0.1 <0.25 <0.523.8 21.0 21.0 21.227.5 23.2 22.2 22.43.7 2.2 1.2 1.20
<0.001 <0.001 <0.001 <0.00115 13.7 8.5 5.9
1490 1290 1360 12707.44 7.32 7.87 7.8041 45 29.0 57.4- - - -
664 587 559 6070.07 0.04 0.019 0.006
0.209 0.180 0.169 0.1770.460 0.389 0.395 0.322
<0.00002 <0.00002 <0.001 <0.001195 175 166 179
<0.002 <0.002 <0.003 0.004<0.002 0.0003 <0.003 <0.003
18.9 16.1 17.2 13.0<0.00002 <0.00002 <0.002 <0.002
43.1 36.5 35.2 38.80.941 0.848 0.885 0.78724.3 21.8 19.1 22.445.7 37.6 27.0 25.9
<0.005 <0.005 0.006 <0.005
NOTES:1. All results expresses in mg/L unless otherwise noted.2. ODWQS is the Ontario Drinking Water Quality Standards, MOE, revised 2001.3. MAC maximum acceptable concentration ODWQS.4. IMAC indicates an interim maximum acceptable concentration ODWQS.5. AO indicates an aesthetic objective ODWQS, not health related.6. OG indicates an operational guideline ODWQS, not health related.7. c indicates that the guideline applies to water at the point of consumption.8. d, where nitrate and nitrite are present the total of the two should not exceed 10 mg/L.9. nd indicates parameter not detected.10. Shaded values indicate exceedance of ODWQS.
G:\2010\OS\401 - Environment\101-16945-00 - Kinloss WDS\Reports\Monitoring 2015\Kinloss GW Quality.xls

HISTORICAL WELL WATER QUALITYKINLOSS LANDFILL
OW5 OW5 OW5 OW5 OW5 OW5 OW5 OW5 OW5 OW5 OW5 OW5Chemical ODWQSParameter 7/16/2007 12/8/2007 7/21/2008 12/7/2008 7/6/2009 12/5/2009 3/23/2010 6/14/2011 10/17/2011 6/20/2012 10/25/2012 6/17/2013Alkalinity(as CaCO3) 30 - 500 [OG] 250 288 237 243 248 242 281 263 263 247 295 244Chloride 250 [AO] 6 4 4 4 3 3 4 2.8 2.8 2.7 2.6 2.7Nitrate(as N) 10 (MAC) d nd nd nd nd nd nd <0.1 <0.1 <0.1 <0.1 <0.1 <0.1Nitrite(as N) 1 (MAC) d nd nd nd nd nd nd <0.01 <0.1 <0.1 <0.1 <0.1 <0.1Ammonia(as N) 0.14 nd 0.16 0.13 0.07 nd <0.05 0.03 0.11 0.11 0.07 0.09Total Kjeldahl Nitrogen(as N) 0.5 0.2 0.9 0.7 0.9 0.5 0.6 0.90 0.25 0.50 0.38 0.80Organic Nitrogen 0.15 0.36 0 0.74 0.57 0.83 0.5 <0.55 0.87 0.14 0.39 0.31 0.71Phenols nd nd nd nd nd nd <0.001 0.003 <0.001 <0.001 <0.001 <0.001Dissolved Organic Carbon(DOC) 5.0 [AO] 1.9 0.8 1 0.7 0.8 1.1 0.8 0.8 1.2 1.3 2.3 12.6Conductivity (us/cm) 498 556 493 504 513 509 560 520 537 497 518 501pH 8.2 8.2 8.1 8 7.9 8.1 8.2 7.76 7.86 8.01 7.87 7.94Sulphate (as SO4) 250 (AO) 25 11 28 28 29 28 29 26 19 25 8 23Hardness(as CaCO3) 80-100 [OG] 270 290 240 250 270 260 250 254 302 258 284 257Aluminum 0.1 [OG] nd nd nd nd nd nd <0.005 0.02 0.03 0.02 0.03 0.03Barium 1.0 [MAC] 0.077 0.081 0.071 0.072 0.086 0.078 0.066 0.076 0.092 0.084 0.088 0.084Boron 5 [IMAC] nd 0.019 0.014 0.011 0.022 0.018 0.012 0.016 - 0.019 0.010 0.016Cadmium 0.005 (MAC) nd 0.0011 nd 0.0003 nd 0.0002 0.0001 <0.00002 <0.00002 <0.00002 0.00004 <0.00002Calcium - 64 68 54 58 61 60 56 55.0 70.7 58.8 66.3 59.3Chromium 0.05 (MAC) nd nd nd nd nd nd <0.005 <0.002 <0.002 <0.002 <0.002 <0.002Copper 1.0 [AO] nd 0.002 nd 0.001 nd 0.001 0.004 <0.002 <0.002 <0.002 <0.002 <0.002Iron 0.3 [AO] 0.13 nd 0.13 nd nd nd <0.1 0.013 0.037 0.047 0.160 0.317Lead 0.01 (MAC)c nd nd nd nd nd nd <0.0005 0.00009 0.00004 <0.00002 0.00003 <0.00002Magnesium - 28 29 27 26 28 27 27 28.3 30.6 27.0 28.8 26.4Manganese 0.05 [AO] 0.28 0.006 0.22 0.38 0.56 0.003 0.200 0.215 0.276 0.222 0.196 0.347Potassium - 0.87 0.92 2.3 0.93 0.84 0.83 1.1 0.8 1.0 0.8 0.8 0.7Sodium 200 [AO] 3.4 3.4 6.4 3.3 5.2 3.3 31 15.6 3.7 3.5 3.2 3.3Zinc 5.0 [AO] 0.006 nd 0.01 0.068 nd 0.019 0.110 0.261 0.140 0.031 0.016 <0.005
NOTES:1. All results expresses in mg/L unless otherwise noted.2. ODWQS is the Ontario Drinking Water Quality Standards, MOE, revised 2001.3. MAC maximum acceptable concentration ODWQS.4. IMAC indicates an interim maximum acceptable concentration ODWQS.5. AO indicates an aesthetic objective ODWQS, not health related.6. OG indicates an operational guideline ODWQS, not health related.7. c indicates that the guideline applies to water at the point of consumption.8. d, where nitrate and nitrite are present the total of the two should not exceed 10 mg/L.9. nd indicates parameter not detected.10. Shaded values indicate exceedance of ODWQS.
G:\2010\OS\401 - Environment\101-16945-00 - Kinloss WDS\Reports\Monitoring 2015\Kinloss GW Quality.xls

HISTORICAL WELL WATER QUALITYKINLOSS LANDFILL
Chemical ODWQSParameterAlkalinity(as CaCO3) 30 - 500 [OG]Chloride 250 [AO]Nitrate(as N) 10 (MAC) dNitrite(as N) 1 (MAC) dAmmonia(as N)Total Kjeldahl Nitrogen(as N)Organic Nitrogen 0.15PhenolsDissolved Organic Carbon(DOC) 5.0 [AO]Conductivity (us/cm)pHSulphate (as SO4) 250 (AO)Hardness(as CaCO3) 80-100 [OG]Aluminum 0.1 [OG]Barium 1.0 [MAC]Boron 5 [IMAC]Cadmium 0.005 (MAC)Calcium -Chromium 0.05 (MAC)Copper 1.0 [AO]Iron 0.3 [AO]Lead 0.01 (MAC)cMagnesium -Manganese 0.05 [AO]Potassium -Sodium 200 [AO]Zinc 5.0 [AO]
OW5 OW5 OW5 OW5 OW5
11/20/2013 7/9/2014 10/29/2014 5/20/2015 10/27/2015250 236 243 240 2652.4 2.3 2.8 2.60 3.190.1 <0.1 0.1 <0.05 <0.10
<0.1 <0.1 <0.1 <0.05 <0.100.07 0.08 0.06 <0.02 0.070.22 0.20 0.14 <0.10 0.230.15 0.12 0.08 <0.10 0.16
<0.001 <0.001 <0.001 <0.001 <0.0013 2.7 2.3 1.1 0.8
426 501 470 497 5028.01 7.96 7.90 8.44 7.8423 24 24 24.2 21.9
240 277 260 243 2570.04 0.11 0.02 0.005 0.004
0.079 0.087 0.082 0.074 0.0870.014 0.016 0.020 0.014 0.018
<0.00002 <0.00002 <0.00002 <0.001 <0.00155.4 65.7 60.6 56.4 61.2
<0.002 <0.002 <0.002 <0.003 <0.003<0.0001 <0.002 0.0002 <0.003 <0.003
0.068 0.214 0.128 0.267 0.140<0.00002 <0.00002 <0.00002 <0.002 <0.002
24.6 27.4 26.4 24.7 25.30.211 0.328 0.200 0.255 0.245
0.7 0.8 0.9 0.71 0.902.9 3.5 3.2 2.96 3.20
0.015 0.006 0.012 0.005 0.008
NOTES:1. All results expresses in mg/L unless otherwise noted.2. ODWQS is the Ontario Drinking Water Quality Standards, MOE, revised 2001.3. MAC maximum acceptable concentration ODWQS.4. IMAC indicates an interim maximum acceptable concentration ODWQS.5. AO indicates an aesthetic objective ODWQS, not health related.6. OG indicates an operational guideline ODWQS, not health related.7. c indicates that the guideline applies to water at the point of consumption.8. d, where nitrate and nitrite are present the total of the two should not exceed 10 mg/L.9. nd indicates parameter not detected.10. Shaded values indicate exceedance of ODWQS.
G:\2010\OS\401 - Environment\101-16945-00 - Kinloss WDS\Reports\Monitoring 2015\Kinloss GW Quality.xls

HISTORICAL WELL WATER QUALITYKINLOSS LANDFILL
OW6 OW6 OW6 OW6 OW6 OW6 OW6 OW6 OW6 OW6 OW6 OW6Chemical ODWQS (dup) (dup)Parameter 7/16/2007 12/8/2007 7/21/2008 12/14/2008 7/6/2009 12/5/2009 3/23/2010 6/14/2011 10/17/2011 10/17/2011 6/20/2012 6/20/2012Alkalinity(as CaCO3) 30 - 500 [OG] 254 246 251 255 245 257 259 278 265 266 270 270Chloride 250 [AO] 8 9 5 5 4 3 6 3.1 3.3 3.3 3.3 3.3Nitrate(as N) 10 (MAC) d nd nd nd nd nd nd <0.1 <0.1 <0.1 <0.1 0.1 <0.1Nitrite(as N) 1 (MAC) d nd nd nd nd nd nd <0.01 <0.1 <0.1 <0.1 <0.1 <0.1Ammonia(as N) 0.24 0.16 0.38 0.19 0.27 0.3 0.22 0.11 0.29 0.30 0.28 0.29Total Kjeldahl Nitrogen(as N) 0.4 0.4 5 1.3 4 7 7 1.17 2.06 1.95 0.61 0.52Organic Nitrogen 0.15 0.16 0.24 4.62 1.11 3.73 6.7 6.78 1.06 1.77 1.65 0.33 0.23Phenols nd nd nd nd nd nd <0.001 <0.001 <0.001 <0.001 <0.001 <0.001Dissolved Organic Carbon(DOC) 5.0 [AO] 1.4 0.8 1.8 0.6 0.8 1 0.8 1.1 1.5 1.3 0.9 1.1Conductivity (us/cm) 507 534 518 508 496 512 513 528 543 537 522 521pH 8.1 8.1 8 8.1 7.8 7.9 7.9 7.58 7.79 7.82 8.06 8.06Sulphate (as SO4) 250 (AO) 21 26 24 20 20 20 17 14 16 16 13 13Hardness(as CaCO3) 80-100 [OG] 270 230 240 250 230 240 240 267 285 286 257 268Aluminum 0.1 [OG] 0.01 nd nd nd nd nd <0.005 0.03 0.04 0.04 0.02 0.02Barium 1.0 [MAC] 0.086 0.072 0.079 0.067 0.066 0.062 0.060 0.074 0.081 0.081 0.073 0.077Boron 5 [IMAC] 0.028 0.027 0.026 0.026 0.027 0.024 0.019 0.023 - - 0.027 0.028Cadmium 0.005 (MAC) nd nd 0.0001 nd nd nd <0.0001 <0.00002 <0.00002 <0.00002 <0.00002 <0.00002Calcium - 68 57 58 61 58 59 58 67.4 72.8 73.0 64.5 67.5Chromium 0.05 (MAC) nd nd nd nd nd nd <0.005 <0.002 <0.002 <0.002 <0.002 <0.002Copper 1.0 [AO] nd nd nd 0.001 nd 0.001 <0.001 <0.002 <0.002 <0.002 <0.002 0.008Iron 0.3 [AO] 0.24 0.63 0.59 0.24 0.95 nd 0.540 0.975 0.567 0.624 0.733 0.768Lead 0.01 (MAC)c nd 0.0026 nd nd 0.0017 nd 0.0005 <0.00002 <0.00002 <0.00002 <0.00002 0.00027Magnesium - 25 22 22 23 21 22 23 23.9 25.1 25.2 23.2 24.1Manganese 0.05 [AO] 0.057 0.073 0.061 0.047 0.041 0.016 0.045 0.093 0.098 0.099 0.091 0.094Potassium - 1.1 0.83 2.6 1 0.8 0.82 0.7 0.8 1.1 1.1 0.9 0.9Sodium 200 [AO] 14 12 14 11 11 10 9.1 8.3 9.8 9.9 8.3 8.5Zinc 5.0 [AO] nd nd 0.006 nd nd nd <0.005 <0.005 <0.005 <0.005 <0.005 0.005
NOTES:1. All results expresses in mg/L unless otherwise noted.2. ODWQS is the Ontario Drinking Water Quality Standards, MOE, revised 2001.3. MAC maximum acceptable concentration ODWQS.4. IMAC indicates an interim maximum acceptable concentration ODWQS.5. AO indicates an aesthetic objective ODWQS, not health related.6. OG indicates an operational guideline ODWQS, not health related.7. c indicates that the guideline applies to water at the point of consumption.8. d, where nitrate and nitrite are present the total of the two should not exceed 10 mg/L.9. nd indicates parameter not detected.8. d, where nitrate and nitrite are present the total of the two should not exceed 10 mg/L.9. < indicates parameter not detected above method detection limit.10. <T indicates a detection of a Trace amount less than the method detection limit.11. S.E. indicates a sampling error.12. nd indicates parameter not detected.13. Shaded values indicate exceedance of ODWQS.
G:\2010\OS\401 - Environment\101-16945-00 - Kinloss WDS\Reports\Monitoring 2015\Kinloss GW Quality.xls

HISTORICAL WELL WATER QUALITYKINLOSS LANDFILL
Chemical ODWQSParameterAlkalinity(as CaCO3) 30 - 500 [OG]Chloride 250 [AO]Nitrate(as N) 10 (MAC) dNitrite(as N) 1 (MAC) dAmmonia(as N)Total Kjeldahl Nitrogen(as N)Organic Nitrogen 0.15PhenolsDissolved Organic Carbon(DOC) 5.0 [AO]Conductivity (us/cm)pHSulphate (as SO4) 250 (AO)Hardness(as CaCO3) 80-100 [OG]Aluminum 0.1 [OG]Barium 1.0 [MAC]Boron 5 [IMAC]Cadmium 0.005 (MAC)Calcium -Chromium 0.05 (MAC)Copper 1.0 [AO]Iron 0.3 [AO]Lead 0.01 (MAC)cMagnesium -Manganese 0.05 [AO]Potassium -Sodium 200 [AO]Zinc 5.0 [AO]
OW6 OW6 OW6 OW6 OW6 OW6 OW6 OW6 OW6 OW6 OW6 OW6Dup#2 Dup#2 Dup#1 DUP1 DUP1
10/25/2012 6/17/2013 11/20/2013 11/20/2013 7/9/2014 7/9/2014 10/29/2014 10/29/2014 5/20/2015 5/20/2015 10/27/2015 10/27/2015271 274 265 263 271 269 291 295 308 307 306 3084.1 3.7 3.2 3.2 3.1 3.3 2.9 2.9 2.79 2.82 3.67 3.60
<0.1 0.1 <0.1 <0.1 <0.1 <0.1 <0.1 <0.1 <0.10 <0.10 <0.10 <0.10<0.1 <0.1 <0.1 <0.1 <0.1 <0.1 <0.1 <0.1 <0.10 <0.10 <0.10 <0.100.25 0.30 0.21 0.2 0.33 0.34 0.23 0.23 0.21 0.20 0.26 0.275.17 5.61 21.8 20.2 2.58 1.34 1.32 1.16 0.43 0.47 0.51 0.484.92 5.31 21.59 20.0 2.25 1.00 1.09 0.93 0.22 0.27 0.25 0.21
<0.001 <0.001 <0.001 <0.001 <0.001 <0.001 <0.001 <0.001 <0.001 <0.001 <0.001 <0.0011.6 3.0 3.4 3.7 2.9 2.8 3.2 3 1.9 1.8 1.1 1.0509 535 436 440 547 555 531 534 585 587 571 5737.80 7.91 8.03 8.07 7.93 7.96 7.82 7.85 8.40 8.35 8.05 7.9717 13 14 14 11 11 10 10 7.03 6.93 15.0 15.3
263 249 227 241 280 277 283 279 285 281 280 2830.04 0.03 0.04 0.03 0.05 0.02 0.02 0.02 0.005 0.004 <0.004 <0.004
0.084 0.077 0.075 0.08 0.076 0.075 0.070 0.069 0.063 0.063 0.079 0.0820.016 0.022 0.019 0.022 0.022 0.022 0.022 0.023 0.015 0.016 0.020 0.022
<0.00002 0.00002 <0.00002 <0.00002 <0.00002 <0.00002 <0.00002 <0.00002 <0.001 <0.001 <0.001 <0.00167.8 62.6 57 60.7 72.0 71.2 72.5 71 74.8 73.2 73.4 74.1
<0.002 <0.002 <0.002 <0.002 <0.002 <0.002 <0.002 <0.002 <0.003 <0.003 <0.003 <0.003<0.002 <0.002 0.0001 0.0001 <0.002 <0.002 <0.0001 <0.0001 <0.003 <0.003 <0.003 <0.0030.150 0.909 0.256 0.268 0.953 0.956 1.10 1.10 1.38 1.38 0.403 0.419
0.00002 <0.00002 <0.00002 <0.00002 <0.00002 <0.00002 <0.00002 <0.00002 <0.002 <0.002 <0.002 <0.00222.7 22.5 20.6 21.7 24.4 24.2 24.7 24.6 23.9 23.8 23.6 23.9
0.094 0.089 0.085 0.09 0.114 0.115 0.125 0.125 0.231 0.231 0.135 0.1410.9 0.8 0.8 0.8 1.0 0.9 0.9 0.9 0.71 0.73 0.93 0.998.7 9.2 8 8.6 8.9 8.8 6.6 6.5 5.32 5.27 6.45 6.49
<0.005 <0.005 <0.005 <0.005 <0.005 <0.005 <0.005 <0.005 0.007 0.007 0.008 0.009
NOTES:1. All results expresses in mg/L unless otherwise noted.2. ODWQS is the Ontario Drinking Water Quality Standards, MOE, revised 2001.3. MAC maximum acceptable concentration ODWQS.4. IMAC indicates an interim maximum acceptable concentration ODWQS.5. AO indicates an aesthetic objective ODWQS, not health related.6. OG indicates an operational guideline ODWQS, not health related.7. c indicates that the guideline applies to water at the point of consumption.8. d, where nitrate and nitrite are present the total of the two should not exceed 10 mg/L.9. nd indicates parameter not detected.8. d, where nitrate and nitrite are present the total of the two should not exceed 10 mg/L.9. < indicates parameter not detected above method detection limit.10. <T indicates a detection of a Trace amount less than the method detection limit.11. S.E. indicates a sampling error.12. nd indicates parameter not detected.13. Shaded values indicate exceedance of ODWQS.
G:\2010\OS\401 - Environment\101-16945-00 - Kinloss WDS\Reports\Monitoring 2015\Kinloss GW Quality.xls

HISTORICAL WELL WATER QUALITYKINLOSS LANDFILL
OW7 OW7 OW7 OW7 OW7 OW7 OW7 OW7 OW7 OW7 OW7 OW7Chemical ODWQSParameter 7/16/2007 7/21/2008 12/7/2008 7/6/2009 12/5/2009 3/23/2010 6/14/2011 10/17/2011 6/20/2012 10/25/2012 6/17/2013 11/20/2013Alkalinity(as CaCO3) 30 - 500 [OG] 269 248 278 242 349 284 252 Dry 273 Dry 269 288Chloride 250 [AO] 4 2 2 4 nd 3 0.9 0.9 1.1 0.8Nitrate(as N) 10 (MAC) d IS nd nd 0.1 nd <0.1 <0.1 <0.1 0.1 0.1Nitrite(as N) 1 (MAC) d IS nd nd nd nd <0.01 <0.1 <0.1 <0.1 <0.1Ammonia(as N) IS 0.08 0.06 0.08 nd <0.05 <0.01 0.03 <0.01 <0.01Total Kjeldahl Nitrogen(as N) IS 2.1 0.7 4 2 3 0.77 0.12 4.48 30.9Organic Nitrogen 0.15 IS 2.02 0.64 3.92 2 <2.95 <0.77 0.09 4.48 30.9Phenols IS nd nd nd nd <0.001 <0.001 <0.001 <0.001 <0.001Dissolved Organic Carbon(DOC) 5.0 [AO] IS 3.1 0.9 0.8 1.2 0.9 0.8 0.8 3.7 3.4Conductivity (us/cm) 478 459 502 458 626 526 457 493 497 442pH 8.2 8.1 7.9 7.8 7.9 7.9 7.62 8.06 7.86 7.86Sulphate (as SO4) 250 (AO) 4 4 4 4 2 3 3 2 3 3Hardness(as CaCO3) 80-100 [OG] 250 250 280 220 370 290 259 288 268 264Aluminum 0.1 [OG] IS nd nd nd nd <0.005 0.02 0.03 0.03 0.03Barium 1.0 [MAC] IS 0.008 0.007 0.006 0.008 0.006 0.008 0.007 0.010 0.007Boron 5 [IMAC] IS nd nd nd nd <0.01 0.006 0.011 0.006 <0.005Cadmium 0.005 (MAC) IS nd nd 0.0011 0.0003 0.0002 0.00005 0.00003 0.00008 <0.00002Calcium - IS 69 76 61 100 79 71.1 79.6 74.1 73Chromium 0.05 (MAC) IS nd nd nd nd <0.005 <0.002 <0.002 <0.002 <0.002Copper 1.0 [AO] IS 0.001 0.001 0.002 nd 0.001 <0.002 <0.002 <0.002 0.0002Iron 0.3 [AO] IS nd nd nd nd <0.1 <0.005 0.019 0.009 0.01Lead 0.01 (MAC)c IS nd nd nd nd <0.0005 <0.00002 <0.00002 <0.00002 <0.00002Magnesium - IS 19 21 15 28 23 19.8 21.5 20.2 19.8Manganese 0.05 [AO] IS 0.012 0.007 0.032 0.027 0.240 0.104 0.043 0.119 0.179Potassium - IS 2.2 0.67 0.61 0.54 0.62 0.5 0.7 0.7 0.4Sodium 200 [AO] IS 3.9 1.2 1.2 0.89 4.2 0.9 0.8 1.6 0.8Zinc 5.0 [AO] IS 0.006 nd 0.01 nd 0.006 <0.005 <0.005 0.039 <0.005
NOTES:1. All results expresses in mg/L unless otherwise noted.2. ODWQS is the Ontario Drinking Water Quality Standards, MOE, revised 2001.3. MAC maximum acceptable concentration ODWQS.4. IMAC indicates an interim maximum acceptable concentration ODWQS.5. AO indicates an aesthetic objective ODWQS, not health related.6. OG indicates an operational guideline ODWQS, not health related.7. c indicates that the guideline applies to water at the point of consumption.8. d, where nitrate and nitrite are present the total of the two should not exceed 10 mg/L.9. nd indicates parameter not detected.8. d, where nitrate and nitrite are present the total of the two should not exceed 10 mg/L.9. < indicates parameter not detected above method detection limit.10. <T indicates a detection of a Trace amount less than the method detection limit.11. S.E. indicates a sampling error.12. nd indicates parameter not detected.13. IS indicates insufficient sample for analysis.14. Shaded values indicate exceedance of ODWQS.
G:\2010\OS\401 - Environment\101-16945-00 - Kinloss WDS\Reports\Monitoring 2015\Kinloss GW Quality.xls

HISTORICAL WELL WATER QUALITYKINLOSS LANDFILL
Chemical ODWQSParameterAlkalinity(as CaCO3) 30 - 500 [OG]Chloride 250 [AO]Nitrate(as N) 10 (MAC) dNitrite(as N) 1 (MAC) dAmmonia(as N)Total Kjeldahl Nitrogen(as N)Organic Nitrogen 0.15PhenolsDissolved Organic Carbon(DOC) 5.0 [AO]Conductivity (us/cm)pHSulphate (as SO4) 250 (AO)Hardness(as CaCO3) 80-100 [OG]Aluminum 0.1 [OG]Barium 1.0 [MAC]Boron 5 [IMAC]Cadmium 0.005 (MAC)Calcium -Chromium 0.05 (MAC)Copper 1.0 [AO]Iron 0.3 [AO]Lead 0.01 (MAC)cMagnesium -Manganese 0.05 [AO]Potassium -Sodium 200 [AO]Zinc 5.0 [AO]
OW7 OW7 OW7 OW7
7/9/2014 10/29/2014 5/20/2015 10/27/2015262 312 259 Dry1.0 1.4 1.400.1 <0.1 <0.10
<0.1 <0.1 <0.10<0.01 <0.01 <0.020.99 0.39 <0.100.99 0.39 <0.10
<0.001 <0.001 <0.0012.8 4.5 1.2504 549 4787.87 7.69 8.45
2 1 2.17299 324 2480.03 0.02 0.004
0.010 0.009 0.007<0.005 0.011 <0.010
<0.00002 <0.00002 <0.00183.3 89.2 68.5
<0.002 <0.002 <0.003<0.002 0.0003 <0.0030.010 0.214 <0.010
0.00003 <0.00002 <0.00222.1 24.6 18.8
0.239 0.333 0.1110.7 0.7 0.411.1 1.0 0.82
0.006 <0.005 <0.005
NOTES:1. All results expresses in mg/L unless otherwise noted.2. ODWQS is the Ontario Drinking Water Quality Standards, MOE, revised 2001.3. MAC maximum acceptable concentration ODWQS.4. IMAC indicates an interim maximum acceptable concentration ODWQS.5. AO indicates an aesthetic objective ODWQS, not health related.6. OG indicates an operational guideline ODWQS, not health related.7. c indicates that the guideline applies to water at the point of consumption.8. d, where nitrate and nitrite are present the total of the two should not exceed 10 mg/L.9. nd indicates parameter not detected.8. d, where nitrate and nitrite are present the total of the two should not exceed 10 mg/L.9. < indicates parameter not detected above method detection limit.10. <T indicates a detection of a Trace amount less than the method detection limit.11. S.E. indicates a sampling error.12. nd indicates parameter not detected.13. IS indicates insufficient sample for analysis.14. Shaded values indicate exceedance of ODWQS.
G:\2010\OS\401 - Environment\101-16945-00 - Kinloss WDS\Reports\Monitoring 2015\Kinloss GW Quality.xls

HISTORICAL WELL WATER QUALITYKINLOSS LANDFILL
OW12 OW12 OW12 OW12 OW12 OW12 OW12 OW12 OW12 OW12 OW12 OW12Chemical ODWQSParameter 7/16/2007 12/8/2007 7/21/2008 12/14/2008 7/6/2009 12/5/2009 3/23/2010 6/14/2011 10/17/2011 6/19/2012 10/25/2012 6/17/2013Alkalinity(as CaCO3) 30 - 500 [OG] 381 359 359 383 365 372 369 384 366 360 365 359Chloride 250 [AO] 21 17 19 17 17 9 11 4.7 6.2 7.1 6.1 4.9Nitrate(as N) 10 (MAC) d 4.4 3.9 4.8 4.4 4.1 3.4 3.0 1.7 2.0 1.7 1.5 1.5Nitrite(as N) 1 (MAC) d nd 0.01 nd nd nd nd 0.04 <0.1 <0.1 <0.1 <0.1 <0.1Ammonia(as N) 0.19 IS 0.11 nd 0.06 IS 0.09 <0.01 <0.01 0.03 <0.01 <0.01Total Kjeldahl Nitrogen(as N) 0.7 IS 3 0.8 6 IS 4 0.79 1.00 0.49 0.16 1.21Organic Nitrogen 0.15 0.51 IS 2.89 nd 5.94 IS 3.91 <0.79 <1.00 0.46 0.16 1.21Phenols nd IS nd nd nd IS <0.001 <0.001 <0.001 <0.001 <0.001 <0.001Dissolved Organic Carbon(DOC) 5.0 [AO] 6.1 IS 2 2 2.3 IS 2.2 1.4 1.9 2.1 1.8 4.5Conductivity (us/cm) 942 977 1000 994 993 919 904 813 914 873 831 821pH 8.2 8.1 8.1 8 7.8 7.9 7.9 7.58 7.84 8.04 7.82 7.94Sulphate (as SO4) 250 (AO) 157 148 164 157 160 120 130 84 125 127 119 89Hardness(as CaCO3) 80-100 [OG] 580 490 530 560 550 470 490 459 538 487 478 426Aluminum 0.1 [OG] nd nd nd nd nd IS <0.005 0.03 0.04 0.02 0.04 0.03Barium 1.0 [MAC] 0.081 0.073 0.081 0.086 0.085 IS 0.075 0.069 0.083 0.081 0.074 0.078Boron 5 [IMAC] 0.52 0.48 0.45 0.46 0.53 IS 0.44 0.424 - 0.549 0.485 0.328Cadmium 0.005 (MAC) 0.0006 0.0003 nd 0.0002 0.0002 IS 0.0001 <0.00002 <0.00002 0.00003 <0.00002 <0.00002Calcium - 98 88 89 92 95 IS 80 88.8 89.9 83.9 82.8 78.6Chromium 0.05 (MAC) nd nd nd nd nd IS <0.005 <0.002 <0.002 <0.002 <0.002 <0.002Copper 1.0 [AO] 0.002 0.001 0.002 0.001 0.001 IS <0.001 <0.002 <0.002 <0.002 <0.002 <0.002Iron 0.3 [AO] nd nd nd nd nd IS <0.01 <0.005 <0.005 <0.005 <0.005 <0.005Lead 0.01 (MAC)c nd nd nd nd nd IS <0.0005 <0.00002 <0.00002 <0.00002 <0.00002 <0.00002Magnesium - 82 65 74 81 76 IS 70 57.8 76.3 67.4 65.8 55.8Manganese 0.05 [AO] 0.003 0.077 0.002 nd nd IS 0.037 <0.001 <0.001 <0.001 <0.001 <0.001Potassium - 12 9.6 14 15 14 IS 12 10.6 15.9 12.2 11.1 12.0Sodium 200 [AO] 9.7 8 12 11 11 IS 9.2 8.1 10.5 9.4 9.1 6.2Zinc 5.0 [AO] nd nd 0.006 nd nd IS <0.005 <0.005 0.005 <0.005 <0.005 <0.005
NOTES:1. All results expresses in mg/L unless otherwise noted.2. ODWQS is the Ontario Drinking Water Quality Standards, MOE, revised 2001.3. MAC maximum acceptable concentration ODWQS.4. IMAC indicates an interim maximum acceptable concentration ODWQS.5. AO indicates an aesthetic objective ODWQS, not health related.6. OG indicates an operational guideline ODWQS, not health related.7. c indicates that the guideline applies to water at the point of consumption.8. d, where nitrate and nitrite are present the total of the two should not exceed 10 mg/L.9. nd indicates parameter not detected.8. d, where nitrate and nitrite are present the total of the two should not exceed 10 mg/L.9. < indicates parameter not detected above method detection limit.10. <T indicates a detection of a Trace amount less than the method detection limit.11. S.E. indicates a sampling error.12. nd indicates parameter not detected.13. IS indicates insufficient sample for analysis.14. Shaded values indicate exceedance of ODWQS.
G:\2010\OS\401 - Environment\101-16945-00 - Kinloss WDS\Reports\Monitoring 2015\Kinloss GW Quality.xls

HISTORICAL WELL WATER QUALITYKINLOSS LANDFILL
Chemical ODWQSParameterAlkalinity(as CaCO3) 30 - 500 [OG]Chloride 250 [AO]Nitrate(as N) 10 (MAC) dNitrite(as N) 1 (MAC) dAmmonia(as N)Total Kjeldahl Nitrogen(as N)Organic Nitrogen 0.15PhenolsDissolved Organic Carbon(DOC) 5.0 [AO]Conductivity (us/cm)pHSulphate (as SO4) 250 (AO)Hardness(as CaCO3) 80-100 [OG]Aluminum 0.1 [OG]Barium 1.0 [MAC]Boron 5 [IMAC]Cadmium 0.005 (MAC)Calcium -Chromium 0.05 (MAC)Copper 1.0 [AO]Iron 0.3 [AO]Lead 0.01 (MAC)cMagnesium -Manganese 0.05 [AO]Potassium -Sodium 200 [AO]Zinc 5.0 [AO]
OW12 OW12 OW12 OW12 OW12
11/20/2013 7/9/2014 10/29/2014 5/20/2015 10/27/2015357 327 337 334 3435.7 3.7 6.0 6.90 7.501.5 1.1 2.0 2.37 1.98
<0.1 <0.1 <0.1 <0.05 <0.25<0.01 <0.01 <0.01 <0.02 <0.020.95 0.65 0.21 0.22 0.180.95 0.65 0.21 0.22 0.18
<0.001 <0.001 <0.001 <0.001 <0.0015.4 3.3 3.9 2.0 1.8709 726 770 827 7727.96 7.94 7.83 8.40 8.07109 52 93 99.5 96.8405 378 428 407 3970.03 0.02 0.02 0.004 <0.004
0.067 0.044 0.069 0.066 0.0680.439 0.317 0.501 0.505 0.374
<0.00002 <0.00002 <0.00002 <0.001 <0.00171 70.9 74.4 70.5 70.9
<0.002 <0.002 <0.002 <0.003 <0.0030.0008 <0.002 0.0015 <0.003 <0.003<0.005 <0.005 <0.005 <0.010 <0.010
<0.00002 <0.00002 0.00002 <0.002 <0.00255.3 48.7 58.9 56.1 53.5
<0.001 <0.001 <0.001 <0.002 <0.0029.4 11.1 12.2 13.6 12.37.7 5.8 7.5 7.66 7.08
<0.005 <0.005 <0.005 <0.005 <0.005
NOTES:1. All results expresses in mg/L unless otherwise noted.2. ODWQS is the Ontario Drinking Water Quality Standards, MOE, revised 2001.3. MAC maximum acceptable concentration ODWQS.4. IMAC indicates an interim maximum acceptable concentration ODWQS.5. AO indicates an aesthetic objective ODWQS, not health related.6. OG indicates an operational guideline ODWQS, not health related.7. c indicates that the guideline applies to water at the point of consumption.8. d, where nitrate and nitrite are present the total of the two should not exceed 10 mg/L.9. nd indicates parameter not detected.8. d, where nitrate and nitrite are present the total of the two should not exceed 10 mg/L.9. < indicates parameter not detected above method detection limit.10. <T indicates a detection of a Trace amount less than the method detection limit.11. S.E. indicates a sampling error.12. nd indicates parameter not detected.13. IS indicates insufficient sample for analysis.14. Shaded values indicate exceedance of ODWQS.
G:\2010\OS\401 - Environment\101-16945-00 - Kinloss WDS\Reports\Monitoring 2015\Kinloss GW Quality.xls

HISTORICAL WELL WATER QUALITYKINLOSS LANDFILL
OW13 S OW13 S OW13 S OW13 S OW13 S OW13 S OW13 S OW13 S OW13 S OW13 S OW13 S OW13 SChemical ODWQS Dup#2Parameter 7/16/2007 12/8/2007 7/21/2008 12/14/2008 7/6/2009 12/5/2009 6/14/2011 10/17/2011 6/20/2012 10/25/2012 10/25/2012 6/17/2013Alkalinity(as CaCO3) 30 - 500 [OG] 381 385 376 371 378 391 417 512 424 495 495 387Chloride 250 [AO] 74 80 63 54 39 32 19.9 27.1 19.6 21.7 21.8 11.7Nitrate(as N) 10 (MAC) d 5.5 6.7 6.3 7.9 5.8 10 3.0 2.4 3.8 3.4 3.4 2.6Nitrite(as N) 1 (MAC) d 0.02 0.04 nd nd 0.02 nd <0.1 <0.1 <0.1 <0.1 <0.1 <0.1Ammonia(as N) 0.16 0.1 0.11 0.1 0.21 0.62 <0.01 2.56 0.63 3.55 3.59 0.44Total Kjeldahl Nitrogen(as N) 0.6 0.6 3 5 6 4 1.51 4.58 0.90 7.37 7.93 2.54Organic Nitrogen 0.15 0.44 0.5 2.89 4.9 5.79 3.38 <1.51 2.02 0.27 3.82 4.34 2.10Phenols nd nd nd nd nd nd <0.001 <0.001 <0.001 <0.001 <0.001 <0.001Dissolved Organic Carbon(DOC) 5.0 [AO] 3.4 3.4 3.7 3.9 3.7 4.1 2.9 4.6 3.1 4.0 4.1 6.2Conductivity (us/cm) 1680 2020 1840 1870 1620 1740 1300 1520 1390 1460 1450 1210pH 8 7.9 7.9 7.8 7.6 7.7 7.44 7.55 7.64 7.64 7.62 7.77Sulphate (as SO4) 250 (AO) 546 626 585 632 450 510 306 295 352 335 337 264Hardness(as CaCO3) 80-100 [OG] 1100 1100 920 1000 860 850 712 847 722 889 879 609Aluminum 0.1 [OG] 0.014 nd nd nd nd nd 0.04 0.05 0.04 0.05 0.06 0.04Barium 1.0 [MAC] 0.086 81 0.079 0.078 0.068 0.055 0.055 0.073 0.069 0.063 0.063 0.049Boron 5 [IMAC] 1.2 1.2 1.2 1.2 1.1 1.2 0.947 - 1.10 1.00 1.00 0.884Cadmium 0.005 (MAC) 0.0013 0.0003 nd 0.0002 nd nd <0.00002 <0.00002 0.00015 0.00002 0.00002 <0.00002Calcium - 220 230 190 220 170 170 145 176 134 197 191 130Chromium 0.05 (MAC) nd nd nd nd nd nd <0.002 <0.002 <0.002 <0.002 <0.002 <0.002Copper 1.0 [AO] 0.002 0.002 0.003 0.002 0.001 0.002 <0.002 0.003 0.002 0.003 0.003 0.003Iron 0.3 [AO] nd nd nd nd nd nd <0.005 <0.005 <0.005 <0.005 <0.005 <0.005Lead 0.01 (MAC)c nd nd nd nd nd nd <0.00002 <0.00002 <0.00002 <0.00002 <0.00002 <0.00002Magnesium - 130 120 110 120 100 100 84.7 99.3 93.8 96.4 98.0 68.8Manganese 0.05 [AO] 0.056 0.05 nd nd 0.035 0.26 0.091 0.047 0.042 0.119 0.118 0.041Potassium - 30 37 32 36 33 33 32.4 39.9 34.2 36.1 36.6 26.4Sodium 200 [AO] 53 48 46 48 39 37 23.2 33.4 23.8 26.8 27.2 17.4Zinc 5.0 [AO] nd nd nd nd nd nd <0.005 <0.005 <0.005 <0.005 <0.005 <0.005
NOTES:1. All results expresses in mg/L unless otherwise noted.2. ODWQS is the Ontario Drinking Water Quality Standards, MOE, revised 2001.3. MAC maximum acceptable concentration ODWQS.4. IMAC indicates an interim maximum acceptable concentration ODWQS.5. AO indicates an aesthetic objective ODWQS, not health related.6. OG indicates an operational guideline ODWQS, not health related.7. c indicates that the guideline applies to water at the point of consumption.8. d, where nitrate and nitrite are present the total of the two should not exceed 10 mg/L.9. nd indicates parameter not detected.8. d, where nitrate and nitrite are present the total of the two should not exceed 10 mg/L.9. < indicates parameter not detected above method detection limit.10. <T indicates a detection of a Trace amount less than the method detection limit.11. S.E. indicates a sampling error.12. nd indicates parameter not detected.13. Shaded values indicate exceedance of ODWQS.
G:\2010\OS\401 - Environment\101-16945-00 - Kinloss WDS\Reports\Monitoring 2015\Kinloss GW Quality.xls

HISTORICAL WELL WATER QUALITYKINLOSS LANDFILL
Chemical ODWQSParameterAlkalinity(as CaCO3) 30 - 500 [OG]Chloride 250 [AO]Nitrate(as N) 10 (MAC) dNitrite(as N) 1 (MAC) dAmmonia(as N)Total Kjeldahl Nitrogen(as N)Organic Nitrogen 0.15PhenolsDissolved Organic Carbon(DOC) 5.0 [AO]Conductivity (us/cm)pHSulphate (as SO4) 250 (AO)Hardness(as CaCO3) 80-100 [OG]Aluminum 0.1 [OG]Barium 1.0 [MAC]Boron 5 [IMAC]Cadmium 0.005 (MAC)Calcium -Chromium 0.05 (MAC)Copper 1.0 [AO]Iron 0.3 [AO]Lead 0.01 (MAC)cMagnesium -Manganese 0.05 [AO]Potassium -Sodium 200 [AO]Zinc 5.0 [AO]
OW13 S OW13 S OW13 S OW13 S OW13 S
11/20/2013 7/9/2014 10/29/2014 5/20/2015 10/27/2015448 421 385 400 4847.7 4.9 13.1 <0.50 18.13.7 2.9 4.1 3.25 2.34
<0.1 <0.1 <0.1 <0.25 <0.252.03 1.00 1.64 0.52 1.074.59 1.73 2.09 0.84 2.502.56 0.73 0.45 0.32 1.43
<0.001 <0.001 <0.001 <0.001 <0.0018.7 6.8 5.7 3.3 2.9
1170 1290 1220 1230 12807.72 7.73 7.62 8.25 7.97303 257 299 269 279621 692 647 573 6260.06 0.04 0.03 0.011 0.005
0.053 0.054 0.049 0.047 0.0610.826 0.978 1.01 0.969 0.933
0.00004 <0.00002 <0.00002 <0.001 <0.001131 148 136 121 137
<0.002 <0.002 <0.002 <0.003 <0.0030.0038 <0.002 0.0021 0.004 <0.003<0.005 <0.005 <0.005 <0.010 <0.010
<0.00002 <0.00002 <0.00002 <0.002 <0.00271.6 78.3 74.6 65.8 69.0
0.053 0.065 0.049 0.036 0.05526.7 29.8 28.9 26.1 30.819.7 22.7 17.1 15.0 19.0
<0.005 <0.005 <0.005 0.005 <0.005
NOTES:1. All results expresses in mg/L unless otherwise noted.2. ODWQS is the Ontario Drinking Water Quality Standards, MOE, revised 2001.3. MAC maximum acceptable concentration ODWQS.4. IMAC indicates an interim maximum acceptable concentration ODWQS.5. AO indicates an aesthetic objective ODWQS, not health related.6. OG indicates an operational guideline ODWQS, not health related.7. c indicates that the guideline applies to water at the point of consumption.8. d, where nitrate and nitrite are present the total of the two should not exceed 10 mg/L.9. nd indicates parameter not detected.8. d, where nitrate and nitrite are present the total of the two should not exceed 10 mg/L.9. < indicates parameter not detected above method detection limit.10. <T indicates a detection of a Trace amount less than the method detection limit.11. S.E. indicates a sampling error.12. nd indicates parameter not detected.13. Shaded values indicate exceedance of ODWQS.
G:\2010\OS\401 - Environment\101-16945-00 - Kinloss WDS\Reports\Monitoring 2015\Kinloss GW Quality.xls

HISTORICAL WELL WATER QUALITYKINLOSS LANDFILL
OW13 I OW13 I OW13 I OW13 I OW13 I OW13 I OW13 I OW13 I OW13 I OW13 I OW13 I OW13 IChemical ODWQS Duplicate #1Parameter 7/16/2007 12/8/2007 7/21/2008 12/14/2008 7/6/2009 12/5/2009 6/14/2011 10/17/2011 6/20/2012 10/25/2012 6/17/2013 6/17/2013Alkalinity(as CaCO3) 30 - 500 [OG] 372 370 350 327 355 374 430 511 510 535 507 507Chloride 250 [AO] 66 74 55 53 39 38 30.2 33.8 33.7 33.0 26.8 26.8Nitrate(as N) 10 (MAC) d 3.8 5.1 4.5 5.1 5.4 6 2.5 1.5 1.8 1.6 1.3 1.3Nitrite(as N) 1 (MAC) d nd nd nd nd nd nd <0.1 <0.1 <0.1 <0.1 <0.1 <0.1Ammonia(as N) nd nd 0.1 0.16 0.08 0.07 <0.01 0.11 0.88 1.33 1.16 1.18Total Kjeldahl Nitrogen(as N) 0.4 0.4 1.4 3 5 5 0.62 1.00 1.30 2.55 3.40 3.15Organic Nitrogen 0.15 nd nd 1.3 2.84 4.92 4.93 <0.62 0.89 0.42 1.22 2.24 1.97Phenols nd nd nd nd nd nd <0.001 <0.001 <0.001 <0.001 <0.001 <0.001Dissolved Organic Carbon(DOC) 5.0 [AO] 2.9 2.8 3 3 2.7 4 2.9 3.8 3.9 4.6 9.2 8.3Conductivity (us/cm) 1530 1830 1690 1610 890 1680 1440 1550 1520 1470 1470 1470pH 8.1 7.9 7.9 8 7.7 7.7 7.39 7.55 7.70 7.49 7.69 7.72Sulphate (as SO4) 250 (AO) 475 546 533 512 470 500 378 317 345 317 298 294Hardness(as CaCO3) 80-100 [OG] 1000 990 840 770 890 910 791 909 809 884 737 725Aluminum 0.1 [OG] nd nd nd nd nd 0.006 0.04 0.06 0.04 0.05 0.05 0.05Barium 1.0 [MAC] 0.078 0.09 0.059 0.057 0.065 0.072 0.061 0.072 0.075 0.069 0.063 0.062Boron 5 [IMAC] 1.1 1.1 0.92 0.86 1.2 1.2 0.985 - 1.06 0.948 0.851 0.841Cadmium 0.005 (MAC) 0.0004 0.0002 0.0007 0.0002 nd 0.0001 0.00004 <0.00002 <0.00002 <0.00002 0.00004 0.00004Calcium - 220 220 180 160 180 180 162 188 154 193 160 157Chromium 0.05 (MAC) nd nd nd nd nd nd <0.002 <0.002 <0.002 <0.002 <0.002 <0.002Copper 1.0 [AO] 0.002 0.002 0.002 0.002 0.002 0.002 <0.002 <0.002 0.003 0.003 <0.002 0.002Iron 0.3 [AO] nd nd nd nd nd nd <0.005 <0.005 <0.005 <0.005 <0.005 <0.005Lead 0.01 (MAC)c nd nd nd nd nd nd <0.00002 <0.00002 <0.00002 <0.00002 <0.00002 <0.00002Magnesium - 120 110 98 90 110 110 93.2 107 103 97.5 82.3 81.1Manganese 0.05 [AO] nd nd nd nd 0.004 nd 0.018 0.011 0.034 0.048 0.088 0.087Potassium - 26 26 25 25 30 28 24.8 31.8 27.0 28.6 22.6 22.2Sodium 200 [AO] 52 48 44 37 40 40 30.9 39.7 37.7 34.2 33.8 33.2Zinc 5.0 [AO] nd nd 0.007 0.008 nd nd 0.005 <0.005 <0.005 <0.005 <0.005 <0.005
NOTES:1. All results expresses in mg/L unless otherwise noted.2. ODWQS is the Ontario Drinking Water Quality Standards, MOE, revised 2001.3. MAC maximum acceptable concentration ODWQS.4. IMAC indicates an interim maximum acceptable concentration ODWQS.5. AO indicates an aesthetic objective ODWQS, not health related.6. OG indicates an operational guideline ODWQS, not health related.7. c indicates that the guideline applies to water at the point of consumption.8. d, where nitrate and nitrite are present the total of the two should not exceed 10 mg/L.9. nd indicates parameter not detected.8. d, where nitrate and nitrite are present the total of the two should not exceed 10 mg/L.9. < indicates parameter not detected above method detection limit.10. <T indicates a detection of a Trace amount less than the method detection limit.11. S.E. indicates a sampling error.12. nd indicates parameter not detected.13. Shaded values indicate exceedance of ODWQS.
G:\2010\OS\401 - Environment\101-16945-00 - Kinloss WDS\Reports\Monitoring 2015\Kinloss GW Quality.xls

HISTORICAL WELL WATER QUALITYKINLOSS LANDFILL
Chemical ODWQSParameterAlkalinity(as CaCO3) 30 - 500 [OG]Chloride 250 [AO]Nitrate(as N) 10 (MAC) dNitrite(as N) 1 (MAC) dAmmonia(as N)Total Kjeldahl Nitrogen(as N)Organic Nitrogen 0.15PhenolsDissolved Organic Carbon(DOC) 5.0 [AO]Conductivity (us/cm)pHSulphate (as SO4) 250 (AO)Hardness(as CaCO3) 80-100 [OG]Aluminum 0.1 [OG]Barium 1.0 [MAC]Boron 5 [IMAC]Cadmium 0.005 (MAC)Calcium -Chromium 0.05 (MAC)Copper 1.0 [AO]Iron 0.3 [AO]Lead 0.01 (MAC)cMagnesium -Manganese 0.05 [AO]Potassium -Sodium 200 [AO]Zinc 5.0 [AO]
OW13 I OW13 I OW13 I OW13 I OW13 I
11/20/2013 7/9/2014 10/29/2014 5/20/2015 10/27/2015523 487 501 490 49619.1 10.2 27.9 25.8 22.50.7 1.2 1.3 1.69 1.64
<0.1 <0.1 <0.1 <0.25 <0.251.08 1.41 1.55 1.26 1.482.86 2.20 2.20 2.30 2.491.78 0.79 0.65 1.04 1.01
0.008 <0.001 <0.001 <0.001 <0.00110.9 6.9 7.5 4.1 3.01260 1450 1350 1390 13107.75 7.69 7.46 8.16 8.04268 268 252 279 281714 767 725 664 6620.05 0.04 0.03 0.058 <0.004
0.064 0.067 0.064 0.066 0.0700.813 0.862 0.902 0.900 0.878
<0.00002 <0.00002 <0.00002 <0.001 <0.001152 166 154 137 145
<0.002 <0.002 <0.002 <0.003 <0.0030.0027 0.002 0.0029 <0.003 <0.003<0.005 <0.005 <0.005 <0.010 <0.010
<0.00002 <0.00002 0.00005 <0.002 <0.00281.5 85.5 82.9 78.2 72.9
0.087 0.117 0.115 0.133 0.13121.5 22.8 24.1 24.5 27.533.4 34.6 29.9 30.2 25.0
<0.005 <0.005 <0.005 0.010 <0.005
NOTES:1. All results expresses in mg/L unless otherwise noted.2. ODWQS is the Ontario Drinking Water Quality Standards, MOE, revised 2001.3. MAC maximum acceptable concentration ODWQS.4. IMAC indicates an interim maximum acceptable concentration ODWQS.5. AO indicates an aesthetic objective ODWQS, not health related.6. OG indicates an operational guideline ODWQS, not health related.7. c indicates that the guideline applies to water at the point of consumption.8. d, where nitrate and nitrite are present the total of the two should not exceed 10 mg/L.9. nd indicates parameter not detected.8. d, where nitrate and nitrite are present the total of the two should not exceed 10 mg/L.9. < indicates parameter not detected above method detection limit.10. <T indicates a detection of a Trace amount less than the method detection limit.11. S.E. indicates a sampling error.12. nd indicates parameter not detected.13. Shaded values indicate exceedance of ODWQS.
G:\2010\OS\401 - Environment\101-16945-00 - Kinloss WDS\Reports\Monitoring 2015\Kinloss GW Quality.xls

HISTORICAL WELL WATER QUALITYKINLOSS LANDFILL
OW13 D OW13 D OW13 D OW13 D OW13 D OW13 D OW13 D OW13 D OW13 D OW13 D OW13 D OW13 DChemical ODWQSParameter 7/16/2007 12/8/2007 7/21/2008 12/14/2008 7/6/2009 12/5/2009 3/23/2010 6/14/2011 10/17/2011 6/20/2012 10/25/2012 6/17/2013Alkalinity(as CaCO3) 30 - 500 [OG] 240 288 231 235 234 260 240 244 274 254 349 234Chloride 250 [AO] 10 31 8 10 7 13 10 6.6 12.2 9.6 19.5 6.6Nitrate(as N) 10 (MAC) d nd nd 0.1 nd 0.1 0.1 0.1 <0.1 <0.1 <0.1 <0.1 0.1Nitrite(as N) 1 (MAC) d nd 0.03 nd 0.3 nd nd <0.01 <0.1 <0.1 <0.1 <0.1 <0.1Ammonia(as N) 0.13 0.15 0.22 0.28 0.26 0.25 <0.05 0.03 0.09 0.13 0.06 0.09Total Kjeldahl Nitrogen(as N) 0.2 0.4 1 1.5 5 nd 0.5 0.35 0.33 0.15 0.51 0.90Organic Nitrogen 0.15 0.07 0.25 0.78 1.22 4.74 nd <0.45 0.32 0.24 0.02 0.45 0.81Phenols nd nd nd nd nd nd nd <0.001 <0.001 <0.001 <0.001 <0.001Dissolved Organic Carbon(DOC) 5.0 [AO] 1 2 1 0.7 0.7 1.6 0.9 0.7 2.7 1.0 2.3 2.6Conductivity (us/cm) 516 1000 546 538 544 764 575 545 750 624 934 547pH 8.2 8.1 8.2 8.2 8 8 8.0 7.73 7.87 8.05 7.74 7.95Sulphate (as SO4) 250 (AO) 45 193 42 47 44 130 62 50 111 75 172 51Hardness(as CaCO3) 80-100 [OG] 260 640 230 240 220 340 230 235 367 284 445 224Aluminum 0.1 [OG] nd nd nd nd nd nd nd 0.03 0.05 0.02 0.05 0.03Barium 1.0 [MAC] 0.096 0.22 0.085 0.089 0.082 0.12 0.086 0.090 0.128 0.108 0.158 0.087Boron 5 [IMAC] 0.044 0.45 0.04 0.057 0.043 0.19 0.045 0.053 - 0.104 0.289 0.061Cadmium 0.005 (MAC) 0.0004 0.001 nd nd 0.0003 nd 0.0001 <0.00002 <0.00002 <0.00002 <0.00002 <0.00002Calcium - 61 140 54 55 51 79 55 56.1 87.3 66.8 104 53.2Chromium 0.05 (MAC) nd nd nd nd nd nd nd <0.002 <0.002 <0.002 <0.002 <0.002Copper 1.0 [AO] nd 0.002 nd 0.001 nd 0.001 nd <0.002 <0.002 <0.002 <0.002 <0.002Iron 0.3 [AO] 0.46 0.72 nd nd 0.64 1.2 nd 0.111 0.611 0.360 0.799 0.376Lead 0.01 (MAC)c nd nd nd nd nd nd 0.0006 <0.00002 <0.00002 <0.00002 0.00006 <0.00002Magnesium - 26 69 23 24 21 36 23 22.9 36.2 28.4 45.2 22.1Manganese 0.05 [AO] 0.014 0.032 0.022 0.01 0.012 0.019 0.015 0.013 0.016 0.016 0.024 0.012Potassium - 1 3.6 0.86 1 0.82 1.3 0.91 1.0 1.7 1.3 2.5 1.1Sodium 200 [AO] 16 39 14 15 14 19 14 13.9 21.4 16.3 24.1 14.0Zinc 5.0 [AO] nd nd nd nd nd nd nd <0.005 0.008 <0.005 <0.005 <0.005
NOTES:1. All results expresses in mg/L unless otherwise noted.2. ODWQS is the Ontario Drinking Water Quality Standards, MOE, revised 2001.3. MAC maximum acceptable concentration ODWQS.4. IMAC indicates an interim maximum acceptable concentration ODWQS.5. AO indicates an aesthetic objective ODWQS, not health related.6. OG indicates an operational guideline ODWQS, not health related.7. c indicates that the guideline applies to water at the point of consumption.8. d, where nitrate and nitrite are present the total of the two should not exceed 10 mg/L.9. nd indicates parameter not detected.8. d, where nitrate and nitrite are present the total of the two should not exceed 10 mg/L.9. < indicates parameter not detected above method detection limit.10. <T indicates a detection of a Trace amount less than the method detection limit.11. S.E. indicates a sampling error.12. nd indicates parameter not detected.13. Shaded values indicate exceedance of ODWQS.
G:\2010\OS\401 - Environment\101-16945-00 - Kinloss WDS\Reports\Monitoring 2015\Kinloss GW Quality.xls

HISTORICAL WELL WATER QUALITYKINLOSS LANDFILL
Chemical ODWQSParameterAlkalinity(as CaCO3) 30 - 500 [OG]Chloride 250 [AO]Nitrate(as N) 10 (MAC) dNitrite(as N) 1 (MAC) dAmmonia(as N)Total Kjeldahl Nitrogen(as N)Organic Nitrogen 0.15PhenolsDissolved Organic Carbon(DOC) 5.0 [AO]Conductivity (us/cm)pHSulphate (as SO4) 250 (AO)Hardness(as CaCO3) 80-100 [OG]Aluminum 0.1 [OG]Barium 1.0 [MAC]Boron 5 [IMAC]Cadmium 0.005 (MAC)Calcium -Chromium 0.05 (MAC)Copper 1.0 [AO]Iron 0.3 [AO]Lead 0.01 (MAC)cMagnesium -Manganese 0.05 [AO]Potassium -Sodium 200 [AO]Zinc 5.0 [AO]
OW13 D OW13 D OW13 D OW13 D OW13 D
11/20/2013 7/9/2014 10/29/2014 5/20/2015 10/27/2015268 219 256 263 3579.8 6.6 9.7 10.2 16.1
<0.1 <0.1 <0.1 <0.10 <0.25<0.1 <0.1 <0.1 <0.10 <0.250.09 0.10 0.10 0.03 0.170.22 0.22 0.31 0.11 0.280.13 0.12 0.21 0.08 0.11
<0.001 <0.001 <0.001 <0.001 <0.0013.9 2.5 4.1 1.8 1.5569 536 612 647 9118 8.03 7.86 8.36 7.93
85 46 79 69.9 148278 237 293 270 4570.04 0.02 0.02 <0.004 <0.004
0.102 0.080 0.102 0.092 0.1630.127 0.046 0.141 0.114 0.301
<0.00002 <0.00002 <0.00002 <0.001 <0.00165.4 57.5 68.8 63.9 105
<0.002 <0.002 <0.002 <0.003 <0.0030.0002 <0.002 0.0002 <0.003 <0.0030.595 0.270 0.591 0.118 0.766
<0.00002 <0.00002 <0.00002 <0.002 <0.00227.9 22.7 29.4 26.7 47.2
0.015 0.013 0.018 0.023 0.0281.6 1 1.6 1.72 3.85
16.2 14.3 16.5 15.7 23.7<0.005 <0.005 <0.005 <0.005 <0.005
NOTES:1. All results expresses in mg/L unless otherwise noted.2. ODWQS is the Ontario Drinking Water Quality Standards, MOE, revised 2001.3. MAC maximum acceptable concentration ODWQS.4. IMAC indicates an interim maximum acceptable concentration ODWQS.5. AO indicates an aesthetic objective ODWQS, not health related.6. OG indicates an operational guideline ODWQS, not health related.7. c indicates that the guideline applies to water at the point of consumption.8. d, where nitrate and nitrite are present the total of the two should not exceed 10 mg/L.9. nd indicates parameter not detected.8. d, where nitrate and nitrite are present the total of the two should not exceed 10 mg/L.9. < indicates parameter not detected above method detection limit.10. <T indicates a detection of a Trace amount less than the method detection limit.11. S.E. indicates a sampling error.12. nd indicates parameter not detected.13. Shaded values indicate exceedance of ODWQS.
G:\2010\OS\401 - Environment\101-16945-00 - Kinloss WDS\Reports\Monitoring 2015\Kinloss GW Quality.xls

HISTORICAL WELL WATER QUALITYKINLOSS LANDFILL
OW14 OW14 OW14 OW14 OW14 OW14 OW14 OW14 OW14 OW14 OW14 OW14Chemical ODWQS Dup#1Parameter 7/16/2007 7/21/2008 7/6/2009 12/5/2009 3/23/2010 6/14/2011 6/14/2011 10/17/2011 6/20/2012 10/25/2012 6/17/2013 11/20/2013Alkalinity(as CaCO3) 30 - 500 [OG] 702 633 600 IS 619 590 597 548 550 Dry 581 535Chloride 250 [AO] 11 8 9 IS 12 3.4 3.4 3.0 4.3 5.3 2.8Nitrate(as N) 10 (MAC) d nd nd nd IS <0.1 <0.1 <0.1 <0.1 <0.1 0.2 <0.1Nitrite(as N) 1 (MAC) d nd nd nd IS <0.01 <0.1 <0.1 <0.1 <0.1 <0.1 <0.1Ammonia(as N) 14.5 11 16 IS 11 8.36 8.75 7.14 6.05 4.73 4.42Total Kjeldahl Nitrogen(as N) 12 11 14 IS 11 10.6 10.2 7.22 6.77 8.06 7.24Organic Nitrogen 0.15 0 0 0 IS 0 2.24 1.45 0.08 0.72 3.33 2.82Phenols 0.006 0.001 0.004 IS 0.004 0.007 0.008 0.006 0.004 0.006 0.006Dissolved Organic Carbon(DOC) 5.0 [AO] 8.7 9.2 8.9 IS 8.2 9.3 9.5 8.2 7.7 21.1 16.4Conductivity (us/cm) 1160 1190 1120 IS 1170 1040 1040 1050 1050 988 857pH 8 7.8 7.4 IS 7.4 7.09 7.01 7.15 7.34 7.27 7.32Sulphate (as SO4) 250 (AO) 16 35 1 IS 34 8 8 5 22 8 22Hardness(as CaCO3) 80-100 [OG] 590 560 520 IS 560 528 529 556 512 499 499Aluminum 0.1 [OG] 0.009 0.007 0.007 IS 0.006 0.05 0.05 0.06 0.05 0.05 0.06Barium 1.0 [MAC] 0.071 0.068 0.089 IS 0.072 0.087 0.087 0.082 0.062 0.054 0.05Boron 5 [IMAC] 0.45 0.35 0.390 IS 0.30 0.286 0.287 - 0.329 0.166 0.142Cadmium 0.005 (MAC) 0.0002 nd 0.0003 IS 0.0001 <0.00002 <0.00002 <0.00002 0.00004 0.00004 0.0001Calcium - 160 160 160 IS 170 142 142 181 159 166 167Chromium 0.05 (MAC) nd nd nd IS nd <0.002 <0.002 <0.002 <0.002 <0.002 <0.002Copper 1.0 [AO] 0.001 0.001 nd IS 0.002 <0.002 <0.002 <0.002 <0.002 <0.002 0.0004Iron 0.3 [AO] 0.69 1.9 6.5 IS 12 20.0 20.1 24.4 19.4 32.6 25.3Lead 0.01 (MAC)c nd nd nd IS nd <0.00002 <0.00002 0.00002 <0.00002 0.00005 <0.00002Magnesium - 44 38 30 IS 33 42.3 42.4 24.8 27.6 20.5 20Manganese 0.05 [AO] 4.7 5.3 2.7 IS 2 0.807 0.815 0.665 0.296 0.912 0.433Potassium - 25 22 22 IS 18 26.1 26.2 28.9 18.3 9.1 9.4Sodium 200 [AO] 45 34 18 IS 15 8.2 8.2 6.9 8.4 5.8 4Zinc 5.0 [AO] nd 0.006 nd IS 0.010 <0.005 <0.005 <0.005 0.008 <0.005 <0.005
NOTES:1. All results expresses in mg/L unless otherwise noted.2. ODWQS is the Ontario Drinking Water Quality Standards, MOE, revised 2001.3. MAC maximum acceptable concentration ODWQS.4. IMAC indicates an interim maximum acceptable concentration ODWQS.5. AO indicates an aesthetic objective ODWQS, not health related.6. OG indicates an operational guideline ODWQS, not health related.7. c indicates that the guideline applies to water at the point of consumption.8. d, where nitrate and nitrite are present the total of the two should not exceed 10 mg/L.9. nd indicates parameter not detected.8. d, where nitrate and nitrite are present the total of the two should not exceed 10 mg/L.9. < indicates parameter not detected above method detection limit.10. <T indicates a detection of a Trace amount less than the method detection limit.11. S.E. indicates a sampling error.12. nd indicates parameter not detected.13. IS indicates insufficient sample for analysis.14. Shaded values indicate exceedance of ODWQS.
G:\2010\OS\401 - Environment\101-16945-00 - Kinloss WDS\Reports\Monitoring 2015\Kinloss GW Quality.xls

HISTORICAL WELL WATER QUALITYKINLOSS LANDFILL
Chemical ODWQSParameterAlkalinity(as CaCO3) 30 - 500 [OG]Chloride 250 [AO]Nitrate(as N) 10 (MAC) dNitrite(as N) 1 (MAC) dAmmonia(as N)Total Kjeldahl Nitrogen(as N)Organic Nitrogen 0.15PhenolsDissolved Organic Carbon(DOC) 5.0 [AO]Conductivity (us/cm)pHSulphate (as SO4) 250 (AO)Hardness(as CaCO3) 80-100 [OG]Aluminum 0.1 [OG]Barium 1.0 [MAC]Boron 5 [IMAC]Cadmium 0.005 (MAC)Calcium -Chromium 0.05 (MAC)Copper 1.0 [AO]Iron 0.3 [AO]Lead 0.01 (MAC)cMagnesium -Manganese 0.05 [AO]Potassium -Sodium 200 [AO]Zinc 5.0 [AO]
12. nd indicates parameter not detected.13. IS indicates insufficient sample for analysis.14. Shaded values indicate exceedance of ODWQS.
OW14 OW14 OW14 OW14
7/9/2014 10/29/2014 5/20/2015 10/27/2015523 597 506 5312.9 7.7 4.77 3.760.1 0.1 <0.25 <0.25
<0.1 <0.1 <0.25 <0.256.38 5.73 4.46 1.717.93 6.46 5.40 4.651.55 0.73 0.94 2.94
0.003 0.003 <0.001 <0.00115.7 9.8 7.0 5.01060 1080 970 9487.35 7.5 7.82 7.8019 34 15.1 26.0
559 574 471 5050.05 0.04 0.008 0.007
0.062 0.237 0.049 0.0440.228 0.216 0.186 0.161
<0.00002 0.00004 <0.001 <0.001182 184 158 169
<0.002 0.003 <0.003 <0.003<0.002 0.0012 <0.003 <0.003
36.6 0.172 17.4 3.07<0.00002 <0.00002 <0.002 <0.002
25.3 27.9 18.6 20.10.704 0.741 0.301 0.29111.3 15.7 9.33 8.686.7 7.9 4.91 3.64
<0.005 0.022 <0.005 <0.005
NOTES:1. All results expresses in mg/L unless otherwise noted.2. ODWQS is the Ontario Drinking Water Quality Standards, MOE, revised 2001.3. MAC maximum acceptable concentration ODWQS.4. IMAC indicates an interim maximum acceptable concentration ODWQS.5. AO indicates an aesthetic objective ODWQS, not health related.6. OG indicates an operational guideline ODWQS, not health related.7. c indicates that the guideline applies to water at the point of consumption.8. d, where nitrate and nitrite are present the total of the two should not exceed 10 mg/L.9. nd indicates parameter not detected.8. d, where nitrate and nitrite are present the total of the two should not exceed 10 mg/L.9. < indicates parameter not detected above method detection limit.10. <T indicates a detection of a Trace amount less than the method detection limit.11. S.E. indicates a sampling error.12. nd indicates parameter not detected.13. IS indicates insufficient sample for analysis.14. Shaded values indicate exceedance of ODWQS.
G:\2010\OS\401 - Environment\101-16945-00 - Kinloss WDS\Reports\Monitoring 2015\Kinloss GW Quality.xls

Appendix G
SUMMARY OF SURFACE WATER RESULTS

APPENDIX G-1
SUMMARY OF SURFACE WATER RESULTS (PRE-2007) – R.J. BURNSIDE


APPENDIX G-2
SUMMARY OF SURFACE WATER RESULTS (2007 – PRESENT)

Surface Water Quality ResultsKinloss Landfill - 2007 to 2015
Surface Water Station SW 1 SW 1 SW 1 SW 1 SW 1 SW 1 SW 1 SW 1 SW 1 Dup#2 SW 1 SW1 SW1Date 16-Jul-07 8-Dec-07 21-Jul-08 14-Dec-08 6-Jul-09 5-Dec-09 23-Mar-10 14-Jun-11 14-Jun-11 17-Oct-11 20-Jun-12 25-Oct-12
Units RDL PWQOINORGANICSTotal Ammonia-N mg/L 0.05 0.06 ND 0.05 0.05 0.05 ND <0.05 <0.01 <0.01 <0.01 0.03 <0.01Calculated Un-ionized Ammonia mg/L 2 0.02 (10) 0.003 0 0.0018 0.0006 0.001 - <0.004 <0.01 - - <0.02 <0.02Conductivity umho/cm 538 449 476 435 487 385 403 469 470 440 532 450Total Dissolved Solids mg/L 1 352 286 330 NA NA NA NA 265 294 233 276 292Dissolved Organic Carbon mg/L 0.1 3.6 8.8 10.3 4.7 7.1 8.3 5.0 8.0 8.2 12.3 2.0 11.6Orthophosphate mg/L 0.01 ND ND ND NA NA NA NA NA NA NA NA NATotal Phosphorus mg/L 0.002 0.03(9) NA NA NA 0.009 0.01 ND <0.002 <0.01 <0.01 <0.01 0.01 0.02pH pH 6.5 - 8.5 8.3 8.1 8.1 8.1 7.9 8.2 8.1 7.72 7.79 7.94 8.07 7.37Phenol-4AAP mg/L 0.001 0.001 ND ND ND ND ND ND <0.001 <0.001 <0.001 <0.001 <0.001 <0.001Dissolved Sulphate (SO4) mg/L 1 13 43 ND 2 ND ND <1 1 1 11 <1 61Turbidity 0.7 1.3 0.4 NA 0.8 0.2 0.4 0.4 0.4 1.3 7.0 1.2Alkalinity (Total as CaCO3) mg/L 1 (7) 287 183 257 229 260 200 213 256 255 212 274 200Dissolved Chloride (Cl) mg/L 1 8 9 5 5 5 4 5 4.1 4.1 4.3 5.4 6.5Nitrite (N) mg/L 0.01 ND ND ND ND ND ND <0.01 <0.1 <0.1 <0.1 <0.1 <0.1Nitrate (N) mg/L 0.1 0.2 0.1 ND 0.4 ND 0.1 0.3 <0.1 <0.1 <0.1 <0.1 <0.1Nitrate + Nitrite mg/L 0.1 0.2 0.1 ND 0.4 ND 0.1 0.3 <0.2 <0.2 <0.2 <0.2 <0.2Hardness mg/L 210 299 311 251 295 288
Surface Water Station SW 1 SW 1 SW 1 SW 1 SW 1 SW 1 SW 1 SW 1 SW 1 Dup#2 SW 1 SW1 SW1Date 16-Jul-07 8-Dec-07 21-Jul-08 14-Dec-08 6-Jul-09 5-Dec-09 23-Mar-10 14-Jun-11 14-Jun-11 17-Oct-11 20-May-12 25-Oct-12
Units RDL PWQOMETALSTotal Aluminum (Al) µg/L 1 75 (8) 9200 6 ND ND 11 ND <5 30 50 20 20 50Total Barium (Ba) µg/L 5 18 13 27 12 25 12 16 24 30 17 32 26Total Boron (B) µg/L 10 200 (I) ND ND ND ND ND ND <10 10 11 99 8 <5Total Cadmium (Cd) µg/L 0.1 0.5 (3) 680 2.5 0.1 ND 0.5 0.2 <0.1 <0.02 <0.02 <0.02 <0.02 0.04Total Calcium (Ca) µg/L 200 35000 60000 76000 65000 75000 58000 60000 81300 84700 68200 80400 80100Total Chromium (Cr) µg/L 5 100 ND ND ND ND ND ND <5 <2 <2 <2 <2 <2Total Copper (Cu) µg/L 1 5 (4) 69000 1 ND ND 1 ND <1 <2 <2 <2 0.3 <2Total Iron (Fe) µg/L 50 300 300 ND ND ND 220 ND <100 59 56 32 912 24Total Lead (Pb) µg/L 0.5 25 (5) 150 ND ND ND ND ND <0.5 <0.02 0.02 <0.02 0.03 0.04Total Magnesium (Mg) µg/L 50 89000 18000 22000 21000 23000 18000 18000 23300 24200 19700 22900 21300Total Manganese (Mn) µg/L 2 14000 3 110 ND 140 2 7 18 21 13 1030 13Total Potassium (K) µg/L 200 8000 360 540 390 230 600 520 400 500 1000 300 700Total Sodium (Na) µg/L 100 4800 1400 1300 1200 1400 1100 1200 1500 1600 1400 2100 2500Total Zinc (Zn) µg/L 5 30 (6) 270000 ND ND ND 8 ND <5 <5 <5 <5 <5 <5
ND = Not detectedNA = Not analyzedRDL = Reportable Detection Limit
Surface Water Station SW 1 SW 1 SW 1 SW 1 SW 1 SW 1 SW 1 SW 1 SW 1 Dup#2 SW 1 SW1 SW1Date 16-Jul-07 8-Dec-07 21-Jul-08 14-Dec-08 6-Jul-09 5-Dec-09 23-Mar-10 14-Jun-11 14-Jun-11 17-Oct-11 20-May-12 25-Oct-12FIELD MEASUREMENTS UnitsTemperature Degrees C 22.5 1.3 19.2 1.6 15.2 3.1 10.6 24.2 - 9.86 25 15.2Conductivity µmhos 580 700 590 490 510 260 400 430 - 404 493 448pH 7.20 7.79 7.99 8.00 8.07 8.58 8.60 8.3 - 7.55 7.15 7.65
NOTES: 7. Alkalinity should not be decreased by more than 25 % of the natural concentration.1. PWQO indicates Provicial Water Quality Objectives. 8. Interim PWQO = 75 µg/L for pH >6.5 to 9.0.2. (I) indicates interim PWQO 9. PWQO = 0.020 mg/L to avoid nuisance algae growth, PWQO = 0.010 mg/L for high level of protection3. Cadmium Interim PWQO = 0.5 µg/L (for Hardness >100 mg/L as CaCO3) PWQO = 0.030 mg/L for prevention of excessive plant growth4. Copper Interim PWQO = 5 µg/L(for Hardness >20 mg/L) 10. PWQO for un-ionized ammonia5. Revised Interim PWQO = 5 µg/L (for Alkalinity > 80 mg/L (as CaCO3) 11. Unionized Ammonia: fraction (f) = 1/(10pka - pH + 1); pka = 0.09018 + 2729.92/T, (T-273.164 (oC))
6. Zinc Revised Interim PWQO = 20 µg/L 12. Shaded values indicates exceedance of PWQO.
Page 1 of 4 G:\2010\OS\401 - Environment\101-16945-00 - Kinloss WDS\Reports\Monitoring 2015\Kinloss SW Quality.xls

Surface Water StationDate
Units RDL PWQOINORGANICSTotal Ammonia-N mg/L 0.05Calculated Un-ionized Ammonia mg/L 2 0.02 (10)Conductivity umho/cmTotal Dissolved Solids mg/L 1Dissolved Organic Carbon mg/L 0.1Orthophosphate mg/L 0.01Total Phosphorus mg/L 0.002 0.03(9)pH pH 6.5 - 8.5Phenol-4AAP mg/L 0.001 0.001Dissolved Sulphate (SO4) mg/L 1TurbidityAlkalinity (Total as CaCO3) mg/L 1 (7)Dissolved Chloride (Cl) mg/L 1Nitrite (N) mg/L 0.01Nitrate (N) mg/L 0.1Nitrate + Nitrite mg/L 0.1Hardness mg/L
Surface Water StationDate
Units RDL PWQOMETALSTotal Aluminum (Al) µg/L 1 75 (8)Total Barium (Ba) µg/L 5Total Boron (B) µg/L 10 200 (I)Total Cadmium (Cd) µg/L 0.1 0.5 (3)Total Calcium (Ca) µg/L 200Total Chromium (Cr) µg/L 5 100Total Copper (Cu) µg/L 1 5 (4)Total Iron (Fe) µg/L 50 300Total Lead (Pb) µg/L 0.5 25 (5)Total Magnesium (Mg) µg/L 50Total Manganese (Mn) µg/L 2Total Potassium (K) µg/L 200Total Sodium (Na) µg/L 100Total Zinc (Zn) µg/L 5 30 (6)
ND = Not detectedNA = Not analyzedRDL = Reportable Detection Limit
Surface Water StationDateFIELD MEASUREMENTS UnitsTemperature Degrees CConductivity µmhospH
NOTES:1. PWQO indicates Provicial Water Quality Objectives.2. (I) indicates interim PWQO3. Cadmium Interim PWQO = 0.5 µg/L (for Hardness >100 mg/L as CaCO3)4. Copper Interim PWQO = 5 µg/L(for Hardness >20 mg/L)5. Revised Interim PWQO = 5 µg/L (for Alkalinity > 80 mg/L (as CaCO3)6. Zinc Revised Interim PWQO = 20 µg/L
Surface Water Quality ResultsKinloss Landfill - 2007 to 2015
SW1 SW1 Dup#2 SW1 SW1 SW1 Dup#2 SW1 SW1(Dup#2) SW1 SW1(DUP2) SW1 SW1(DUP2)17-Jun-13 17-Jun-13 20-Nov-13 9-Jul-14 9-Jul-14 29-Oct-14 29-Oct-14 20-May-15 20-May-15 27-Oct-15 27-Oct-15
0.02 <0.01 <0.01 <0.01 <0.01 <0.01 <0.01 <0.02 <0.02 <0.02 <0.02<0.02 - <0.02 <0.02 - <0.02 - <0.02 - <0.02 -479 476 371 455 453 432 428 447 443 464 462237 235 220 252 243 224 225 - - - -11.8 11.8 9.5 12.4 13.0 10.2 10.1 5.7 5.5 5.5 5.5NA NA NA NA NA NA NA NA NA NA NA
<0.01 <0.01 <0.01 <0.01 <0.01 <0.01 <0.01 <0.01 <0.01 <0.01 <0.017.97 8.00 8.09 8.05 8.06 7.97 7.94 8.44 8.52 8.08 8.10
<0.001 <0.001 <0.001 <0.001 <0.001 <0.001 <0.001 <0.001 <0.001 <0.001 <0.0011 1 4 <1 <1 1 1 0.97 0.99 2.98 2.82
1.1 1.5 0.5 0.5 0.3 0.9 0.8 <0.5 <0.5 <0.5 <0.5253 251 223 233 232 230 228 238 235 248 2444.1 3.8 4.4 2.3 2.3 3.9 3.9 <0.10 3.52 8.01 8.02
<0.1 <0.1 <0.1 <0.1 <0.1 <0.1 <0.1 <0.05 <0.05 <0.10 <0.10<0.1 0.1 0.2 <0.1 <0.1 0.1 0.1 <0.05 <0.05 <0.10 <0.10<0.2 <0.1 <0.2 <0.1 <0.1 <0.1 <0.1 <0.05 <0.05 <0.10 <0.10221 220 216 305 281 224 227 231 230 249 247
SW1 SW1 Dup#2 SW1 SW1 SW1 Dup#2 SW1 SW1(Dup#2) SW1 SW1(DUP2) SW1 SW1(DUP2)17-Jun-13 17-Jun-13 20-Nov-13 9-Jul-14 9-Jul-14 29-Oct-14 29-Oct-14 20-May-15 20-May-15 27-Oct-15 27-Oct-15
20 30 30 30 20 20 70 8 <4 <4 <420 20 11 26 24 15 22 20 20 16 1510 9 <5 7 6 <5 <5 <10 <10 <10 <10
<0.02 <0.02 <0.02 <0.02 <0.02 <0.02 <0.02 <0.1 <0.1 <0.1 <0.160200 59800 57500 84900 77900 60000 61400 63300 62700 68800 68200
<2 <2 <2 <2 <2 <2 <2 <3 <3 <3 <32 <0.1 0.3 <0.1 <0.1 <0.1 1.5 <2 <2 <2 <2
47 46 7 76 47 53 89 <10 <10 100 1100.03 <0.02 <0.02 <0.02 <0.02 <0.02 <0.02 <1 <1 <1 <1
17100 17100 17500 22600 20900 18100 17800 17700 17800 18800 1860026 27 2 30 24 14 25 28 29 24 27
300 300 400 600 600 800 800 320 320 550 5301600 1700 1600 1600 1500 1600 2000 1640 1640 2580 2570
<5 <5 <5 8 8 6 44 <5 <5 <5 <5
SW1 SW1 Dup#2 SW1 SW1 SW1 Dup#2 SW1 SW1(Dup#2) SW1 SW1(DUP2) SW1 SW1(DUP2)17-Jun-13 17-Jun-13 20-Nov-13 9-Jul-14 9-Jul-14 29-Oct-14 29-Oct-14 20-May-15 20-May-15 27-Oct-15 27-Oct-15
24.6 - 2.6 23.9 - 9.0 - 18.4 - 8.6 -511 - 356 442 - 416 - 427 - 436 -7.65 - 7.90 7.39 - 7.80 - 7.58 - 7.36 -
7. Alkalinity should not be decreased by more than 25 % of the natural concentration.8. Interim PWQO = 75 µg/L for pH >6.5 to 9.0.9. PWQO = 0.020 mg/L to avoid nuisance algae growth, PWQO = 0.010 mg/L for high level of protection PWQO = 0.030 mg/L for prevention of excessive plant growth10. PWQO for un-ionized ammonia11. Unionized Ammonia: fraction (f) = 1/(10pka - pH + 1); pka = 0.09018 + 2729.92/T, (T-273.164 (oC))
12. Shaded values indicates exceedance of PWQO.
Page 2 of 4 G:\2010\OS\401 - Environment\101-16945-00 - Kinloss WDS\Reports\Monitoring 2015\Kinloss SW Quality.xls

Surface Water StationDate
Units RDL PWQOINORGANICSTotal Ammonia-N mg/L 0.05Calculated Un-ionized Ammonia mg/L 2 0.02 (10)Conductivity umho/cmTotal Dissolved Solids mg/L 1Dissolved Organic Carbon mg/L 0.1Orthophosphate mg/L 0.01Total Phosphorus mg/L 0.002 0.03(9)pH pH 6.5 - 8.5Phenol-4AAP mg/L 0.001 0.001Dissolved Sulphate (SO4) mg/L 1TurbidityAlkalinity (Total as CaCO3) mg/L 1 (7)Dissolved Chloride (Cl) mg/L 1Nitrite (N) mg/L 0.01Nitrate (N) mg/L 0.1Nitrate + Nitrite mg/L 0.1Hardness mg/L
Surface Water StationDate
Units RDL PWQOMETALSTotal Aluminum (Al) µg/L 1 75 (8)Total Barium (Ba) µg/L 5Total Boron (B) µg/L 10 200 (I)Total Cadmium (Cd) µg/L 0.1 0.5 (3)Total Calcium (Ca) µg/L 200Total Chromium (Cr) µg/L 5 100Total Copper (Cu) µg/L 1 5 (4)Total Iron (Fe) µg/L 50 300Total Lead (Pb) µg/L 0.5 25 (5)Total Magnesium (Mg) µg/L 50Total Manganese (Mn) µg/L 2Total Potassium (K) µg/L 200Total Sodium (Na) µg/L 100Total Zinc (Zn) µg/L 5 30 (6)
ND = Not detectedNA = Not analyzedRDL = Reportable Detection Limit
Surface Water StationDateFIELD MEASUREMENTS UnitsTemperature Degrees CConductivity µmhospH
NOTES:1. PWQO indicates Provicial Water Quality Objectives.2. (I) indicates interim PWQO3. Cadmium Interim PWQO = 0.5 µg/L (for Hardness >100 mg/L as CaCO3)4. Copper Interim PWQO = 5 µg/L(for Hardness >20 mg/L)5. Revised Interim PWQO = 5 µg/L (for Alkalinity > 80 mg/L (as CaCO3)6. Zinc Revised Interim PWQO = 20 µg/L
Surface Water Quality ResultsKinloss Landfill - 2007 to 2014
SW 2 SW 2 SW 2 SW 2 SW 2 SW 2 SW 2 SW 2 SW 2 SW 2 Dup#1 SW 2 SW 2 Dup#216-Jul-07 8-Dec-07 21-Jul-08 14-Dec-08 6-Jul-09 5-Dec-09 23-Mar-10 14-Jun-11 17-Oct-11 17-Oct-11 20-Jun-12 20-Jun-12
0.07 ND 0.09 ND 0.05 ND <0.05 <0.01 <0.01 <0.01 0.02 0.070.003 - 0.003 ND 0.001 - <0.003 <0.01 - - <0.02 -500 518 561 490 533 512 493 507 514 514 540 534340 330 380 NA NA NA NA 294 287 291 301 2818.7 4.5 7.0 3.8 4.3 5.3 3.3 4.7 7.8 7.7 2.5 8.6ND ND ND NA NA NA NA NA NA NA NA NANA NA NA 0.011 0.013 0.004 0.004 0.01 <0.01 <0.01 0.02 0.028.2 8.2 8.3 8.1 8.1 8.2 8.2 8.10 7.96 8.01 7.85 8.32
0.001 ND ND ND ND ND <0.001 <0.001 <0.001 <0.001 <0.001 <0.001ND 40 7 15 6 14 14 4 19 19 9 <10.8 0.5 4.9 NA 1.3 0.6 0.6 1.5 0.6 0.7 6.9 5.5277 227 298 249 280 251 245 277 246 248 289 285
6 10 8 7 7 11 11 4.8 6.0 6.0 6.1 5.3ND ND ND ND ND ND <0.01 <0.1 <0.1 <0.1 <0.1 <0.10.3 0.1 0.1 0.2 0.1 0.1 0.3 0.1 <0.1 0.1 0.3 <0.10.3 0.1 0.1 0.2 0.1 0.1 0.3 <0.2 <0.2 <0.2 <0.3 <0.2
250 330 312 320 309 290
SW 2 SW 2 SW 2 SW 2 SW 2 SW 2 SW 2 SW 2 SW 2 SW 2 Dup#1 SW 2 SW 2 Dup#216-Jul-07 8-Dec-07 21-Jul-08 14-Dec-08 6-Jul-09 5-Dec-09 23-Mar-10 14-Jun-11 17-Oct-11 17-Oct-11 20-Jun-12 20-Jun-12
10 9 140 17 12 12 52 50 20 20 70 2029 27 41 19 31 23 25 30 36 33 34 3114 ND 15 ND 14 ND 15 12 109 107 12 80.1 0.8 0.5 1.0 0.9 0.1 0.1 <0.02 <0.02 <0.02 <0.02 <0.02
92000 70000 91000 68000 82000 73000 72000 88700 83500 85800 81800 79100ND ND ND ND ND ND <5 <2 <2 <2 35 15ND ND 1 ND ND ND 1 <2 <2 <2 0.4 0.3580 ND 550 ND ND ND <100 111 47 41 399 782ND ND 1.7 ND ND ND <0.5 0.14 0.09 0.07 0.25 0.04
25000 22000 27000 22000 26000 24000 22000 26300 25000 25700 25400 22500360 8 220 9 43 13 15 49 15 18 66 987ND 880 1100 960 760 1100 1100 1000 1700 1800 900 300
2200 3800 3100 2900 2800 3200 2900 2600 3500 3600 3100 2100ND ND 7 ND 7 ND <5 <5 <5 <5 <5 <5
SW 2 SW 2 SW 2 SW 2 SW 2 SW 2 SW 2 SW 2 SW 2 SW 2 Dup#1 SW 2 SW 2 Dup#216-Jul-07 8-Dec-07 21-Jul-08 14-Dec-08 6-Jul-09 5-Dec-09 23-Mar-10 14-Jun-11 17-Oct-11 17-Oct-11 20-Jun-12 20-Jun-12
18.7 2.7 19.1 1.6 15.2 3.8 7.7 15 9.68 - 18.3 -520 390 530 560 540 270 440 480 471 - 482 -8.20 8.34 8.15 7.93 7.93 8.49 8.67 8.2 7.60 - 8.08 -
7. Alkalinity should not be decreased by more than 25 % of the natural concentration.8. Interim PWQO = 75 µg/L for pH >6.5 to 9.0.9. PWQO = 0.020 mg/L to avoid nuisance algae growth, PWQO = 0.010 mg/L for high level of protection PWQO = 0.030 mg/L for prevention of excessive plant growth10. PWQO for un-ionized ammonia11. Unionized Ammonia: fraction (f) = 1/(10pka - pH + 1); pka = 0.09018 + 2729.92/T, (T-273.164 (oC))
12. Shaded values indicates exceedance of PWQO.
Page 3 of 4 G:\2010\OS\401 - Environment\101-16945-00 - Kinloss WDS\Reports\Monitoring 2015\Kinloss SW Quality.xls

Surface Water StationDate
Units RDL PWQOINORGANICSTotal Ammonia-N mg/L 0.05Calculated Un-ionized Ammonia mg/L 2 0.02 (10)Conductivity umho/cmTotal Dissolved Solids mg/L 1Dissolved Organic Carbon mg/L 0.1Orthophosphate mg/L 0.01Total Phosphorus mg/L 0.002 0.03(9)pH pH 6.5 - 8.5Phenol-4AAP mg/L 0.001 0.001Dissolved Sulphate (SO4) mg/L 1TurbidityAlkalinity (Total as CaCO3) mg/L 1 (7)Dissolved Chloride (Cl) mg/L 1Nitrite (N) mg/L 0.01Nitrate (N) mg/L 0.1Nitrate + Nitrite mg/L 0.1Hardness mg/L
Surface Water StationDate
Units RDL PWQOMETALSTotal Aluminum (Al) µg/L 1 75 (8)Total Barium (Ba) µg/L 5Total Boron (B) µg/L 10 200 (I)Total Cadmium (Cd) µg/L 0.1 0.5 (3)Total Calcium (Ca) µg/L 200Total Chromium (Cr) µg/L 5 100Total Copper (Cu) µg/L 1 5 (4)Total Iron (Fe) µg/L 50 300Total Lead (Pb) µg/L 0.5 25 (5)Total Magnesium (Mg) µg/L 50Total Manganese (Mn) µg/L 2Total Potassium (K) µg/L 200Total Sodium (Na) µg/L 100Total Zinc (Zn) µg/L 5 30 (6)
ND = Not detectedNA = Not analyzedRDL = Reportable Detection Limit
Surface Water StationDateFIELD MEASUREMENTS UnitsTemperature Degrees CConductivity µmhospH
NOTES:1. PWQO indicates Provicial Water Quality Objectives.2. (I) indicates interim PWQO3. Cadmium Interim PWQO = 0.5 µg/L (for Hardness >100 mg/L as CaCO3)4. Copper Interim PWQO = 5 µg/L(for Hardness >20 mg/L)5. Revised Interim PWQO = 5 µg/L (for Alkalinity > 80 mg/L (as CaCO3)6. Zinc Revised Interim PWQO = 20 µg/L
Surface Water Quality ResultsKinloss Landfill - 2007 to 2014
SW 2 SW 2 Dup#1 SW 2 SW 2 SW 2 Dup#1 SW 2 SW 2 SW 2 SW 225-Oct-12 25-Oct-12 17-Jun-13 20-Nov-13 20-Nov-13 9-Jul-14 29-Oct-14 20-May-15 27-Oct-15
<0.01 <0.01 <0.01 <0.01 <0.01 <0.01 <0.01 <0.02 <0.02<0.02 - <0.02 <0.02 - <0.02 <0.02 <0.02 <0.02523 523 520 397 404 505 512 515 570364 353 259 246 246 276 269 -5.7 6.3 8.5 7.9 7.8 9.2 8.1 3.6 3.5NA NA NA NA NA NA NA NA NA
<0.01 <0.01 0.01 <0.01 <0.01 <0.01 <0.01 <0.01 <0.017.72 7.84 8.14 8.18 8.17 8.12 7.98 8.59 8.15
<0.001 <0.001 <0.001 <0.001 <0.001 <0.001 <0.001 <0.001 <0.00141 41 4 7 7 3 4 4.08 22.51.4 1.1 3.8 1.7 1.9 2.2 0.3 1.2 <0.5314 307 272 243 244 259 266 268 2867.5 7.5 4.8 4.7 4.6 4.6 5.8 5.48 9.05
<0.1 <0.1 <0.1 <0.1 <0.1 <0.1 <0.1 <0.05 <0.10<0.1 <0.1 0.1 0.1 0.1 0.1 0.1 0.06 <0.10<0.2 <0.2 <0.1 <0.1 <0.1 <0.1 <0.1 <0.06 <0.10349 331 237 243 243 310 275 268 299
SW 2 SW 2 Dup#1 SW 2 SW 2 SW 2 Dup#1 SW 2 SW 2 SW 2 SW 225-Oct-12 25-Oct-12 17-Jun-13 20-Nov-13 20-Nov-13 9-Jul-14 29-Oct-14 20-May-15 27-Oct-15
40 40 60 70 70 50 30 <4 <444 47 27 21 21 31 23 26 3418 16 13 8 8 12 11 10 20
<0.02 <0.02 0.22 <0.02 <0.02 <0.02 <0.02 <0.1 <0.193200 88700 63700 64100 64100 84500 72500 71700 79800
6 17 <2 <2 <2 <2 <2 <3 <3<2 <2 2.4 0.3 0.4 <0.1 0.1 <2 <236 51 98 52 56 116 38 10 <0.10
<0.02 <0.02 0.62 0.17 0.16 0.16 <0.02 <1 <128100 26700 19000 20100 20100 24100 22900 21600 24300
10 8 50 21 21 42 19 28 111300 1200 700 800 800 1000 1400 820 13304700 4400 2400 2300 2300 2700 2700 2510 3950<5 <5 <5 <5 <5 7 5 <5 <5
SW 2 SW 2 Dup#1 SW 2 SW 2 SW 2 Dup#1 SW 2 SW 2 SW 2 SW 225-Oct-12 25-Oct-12 17-Jun-13 20-Nov-13 20-Nov-13 9-Jul-14 29-Oct-14 20-May-15 27-Oct-15
12.3 - 16.1 3.0 - 16.0 8.7 10.2 8.6498 - 549 398 - 486 489 483 5248.86 - 8.11 7.84 - 7.87 7.81 7.79 7.63
7. Alkalinity should not be decreased by more than 25 % of the natural concentration.8. Interim PWQO = 75 µg/L for pH >6.5 to 9.0.9. PWQO = 0.020 mg/L to avoid nuisance algae growth, PWQO = 0.010 mg/L for high level of protection PWQO = 0.030 mg/L for prevention of excessive plant growth10. PWQO for un-ionized ammonia11. Unionized Ammonia: fraction (f) = 1/(10pka - pH + 1); pka = 0.09018 + 2729.92/T, (T-273.164 (oC))
12. Shaded values indicates exceedance of PWQO.
Page 4 of 4 G:\2010\OS\401 - Environment\101-16945-00 - Kinloss WDS\Reports\Monitoring 2015\Kinloss SW Quality.xls

Appendix H
BUFFER LANDS CERTIFICATE OF REGISTRATION AND LEASE
AGREEMENT

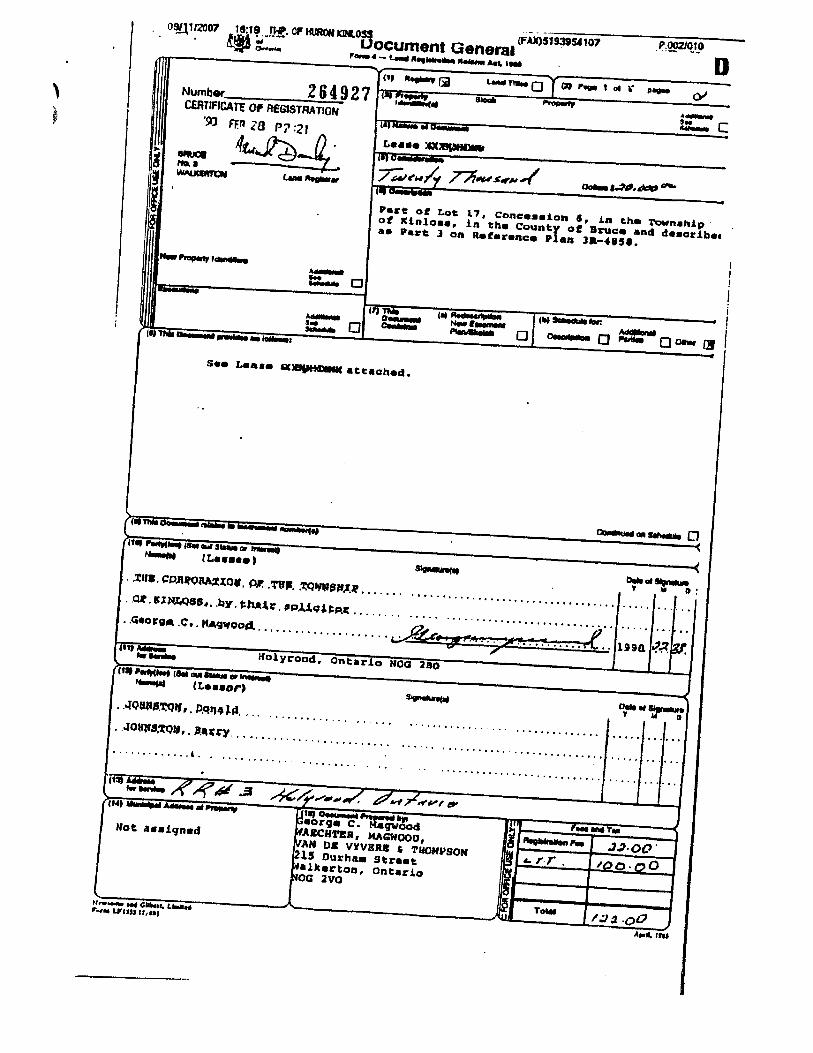


Appendix I
MONITORING & SCREENING CHECKLIST