Embed Size (px)
Citation preview
M e ko n g R i v e r C o m m i s s i o n
Annual Mekong FloodReport 2006
M a r c h 2 0 0 7
Mekong River Commission
P.O.Box 6101, 184 Fa Ngoum Road, Unit 18, Ban Sithane Neua,Sikhottabong District, Vientiane Lao PDR
Telephone: (856) 21 263 263 Facsimile: (856) 21 263 264E-mmail: [email protected] Website: www.mrcmekong.org
ISSN: 1728-3248

Annual Mekong Flood Report 2006
MekongRiverCommission
March 2007
ISSN No 1728 3248
ii
Published in Vientiane, Lao PDR in March 2007 by the Mekong River CommissionAlso available on the MRC website: www.mrcmekong.org
Cite this document as:
MRC (2007) Annual Mekong Flood Report 2006, Mekong River Commission, Vientiane. 76pp.
The opinions and interpretation expressed within are those of the authors and do not necessarily reflect the views of the Mekong River Commission.
Editor: Dr. Tim Burnhill
© Mekong River Commission184 Fa Ngoum Road, Unit 18, Ban Sithane Neua, Sikhottabong District,Vientiane 01000, Lao PDRTelephone: (856-21) 263 263 Facsimile: (856-21) 263 264E-mail: [email protected]: www.mrcmekong.org
iii
Foreword
It is my pleasure to introduce the second Annual Mekong Flood Report, a major output from the Mekong River Commission’s Flood Management and Mitigation Programme (FMMP) Regional Flood Management and Mitigation Centre.
The 2006 Annual Flood Report aims to fulfil two primary roles: a summary of the flood year 2006 and a collation of important data on the flood regime. These data will, in time, accumulate to provide a primary regional resource for flood research and the collation of historical reference material. The report is also considered a valuable contribution to the goals of the MRC Strategic Plan 2006-2010, in particular where it addresses issues such as basinwide impact assessment and enhancement of the MRC knowledge base.
In order to understand floods and their effects it is important to view them in an historical context, which is why this year we have designed the report to introduce more information on floods in the Mekong basin, by putting them into a global context and taking a look at the historical geography of floods on the Mekong mainstream. This report also examines the nature and analysis of floods on large rivers as well as temporal aspects of the Mekong flood regime.
Individual country reports present specific events of the 2006 Flood Season with reports of economic and social impact. The countries presented a broader picture during the 5th Annual Mekong Flood Forum, held in Ho Chi Minh City, Viet Nam in May 2007.
The 2006 report has been produced in a more condensed form with an emphasis on important data depicted in graphical form to make the information accessible and easily assimilated. The report has been divided into an area of main text with specific statistical data presented in detail in appendices for reference purposes. The appendices also provide the results of a statistical analysis of the discharge data at the major hydrometric stations on the mainstream and the water-level data in the Tonle Sap system, the floodplain regions and the Delta.
The 2006 flood season is also discussed in terms of its hydrological and meteorological aspects with particular emphasis on water levels in the Tonle Sap floodplain of Cambodia and the Viet Nam Delta region. It also looks at the hydrology of major tributaries.
This is the first ‘theme’ based Annual Mekong Flood Report. In this report the emphasis is on data analysis and the temporal and spatial nature of floods and flooding in the Mekong region. We feel this theme concept will, over coming years, enable MRC to build up a complete picture of all aspects of the Mekong flood regime and become a valuable source of data for the FMMP and a solid source of information for all those involved in flood management and mitigation in the basin. This report will be widely disseminated among stakeholders in the basin and welcome any comments from readers.
Dr Olivier CogelsChief Executive Officer Mekong River Commission Secretariat

iv
v
Table of Contents
Foreword iii
Acknowledgements vii
Summary ix
1. Introduction 11.1 Introduction 11.2 Report Structure and Summary of Contents 2
2. About Floods in the Mekong Basin 52.1 Flood magnitudes on the Mekong in their global context 52.2 The historical geography of floods on the Mekong mainstream 72.3 The nature and analysis of floods on large rivers 142.4 Temporal aspects of the Mekong flood regime 18
3. The 2006 Flood Season 233.1 Hydrological and meteorological aspects 233.2 The 2006 flood season: conditions over the Cambodian floodplain and in the
Delta in Viet Nam 29
4. Cambodia 2006 Country Report 354.1 General situation 354.2 Lessons learnt from a field trip to Kampong Cham, Kratie and
Stung Treng—24th to 26th October 2006 35
5. Lao PDR 2006 Country Report 375.1 General situation 375.2 Flash flooding in Luang Namtha province 375.3 Flash flooding in Attapeu province 385.4 Damage and impacts 395.5 Lessons learnt 39
6. Thailand 2006 Country Report 416.1 General situation 416.2 Specific events 416.3 Flash flooding in the Thai Mekong region and bordering provinces 426.4 Damages and costs 43
7. Viet Nam 2006 Country Report 457.1 Conditions over the Se San and Sre Pok River basins 457.2 Flooding in the Mekong Delta 457.3 Flood damage 467.4 Lessons learnt 47
8. Summary Conclusions and Recommendations 498.1 Summary conclusions 498.2 Recommendations and lessons 49
vi
Annual Mekong Flood Report 2006
9. References 51
Appendix 1. Statistical Analysis of Annual Flood Risk on the Mainstream Mekong 53
Appendix 2. Rating Equations and Flood Alarm Levels 59
Appendix 3. Mekong Mainstream: Summary Hydrological Statistics for the 2006 Flood Season 61
Appendix 4. Cambodia: 2006 Flood Loss and Damage Data 63
Appendix 5. Extent of the 2006 Flood in the Great Lake/Tonle Sap System and in the Mekong Delta 65
Appendix 6. Lao PDR: 2006 Flood Loss and Damage Data 67
Appendix 7. Thailand: 2006 Flooded Districts and Estimated National Loss and Damage 69
Appendix 8. Viet Nam: National Flood Warning and Alarm Levels and 2006 Flood Loss and Damage Data. 71
Appendix 9. Largest meteorological floods for global river basins larger than half a million square kilometres 75
vii
Acknowledgements
This report was prepared within the framework of the Flood Management and Mitigation Programme (FMMP) activities of the Mekong River Commission Secretariat (MRCS). The authors wish to thank the National Coordinators at the National Mekong Committees of Cambodia, Lao PDR, Thailand and Viet Nam for their support and guidance in the drafting of this report. Dartmouth Flood Observatory, Dartmouth College, USA, the Canadian Space Agency, together with Hatfield Consultants Ltd, Canada, provided the satellite images used in support of the text.
Mr Eric Tilman compiled data gathered from the four member countries and supplied the basis for the country assessments of damages and losses as well as the information used to create some of the graphs.
Contributing authors: Dr Peter Adamson and Dr Chusit Apirumanekul
Graphic design: Dr Tim Burnhill
viii
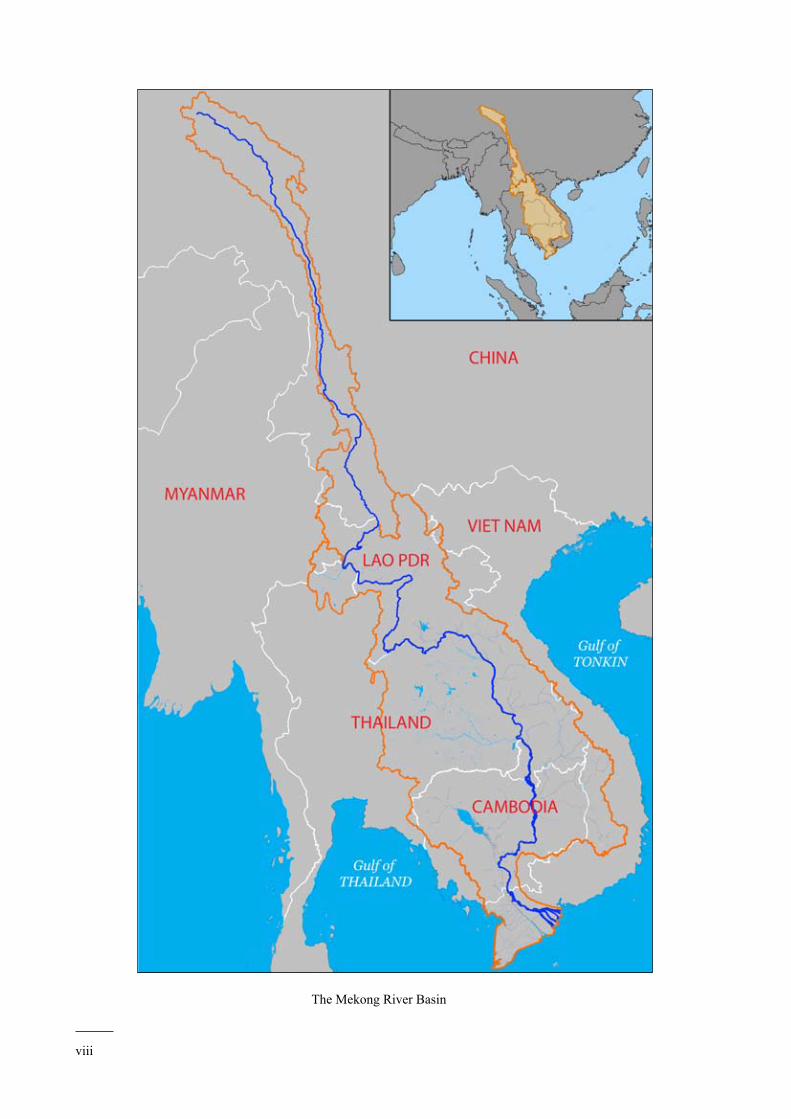
The Mekong River Basin
ix
Summary
1. Introduction
The 2006 Annual Flood Report aims to fulfil two primary roles: it provides a summary of the flood year 2006 and it collates important data on the flood regime. These data will, in time, accumulate to provide a primary regional resource for flood research and the collation of historical reference material.
2. About floods in the Mekong Basin
2.1 The size of Mekong floods in their global context
Based on the data in the World Catalogue of Large Floods (IAHS. 2003), extreme floods on the Mekong are compared to those upon other global river systems with catchments in excess of 500,000 km2, revealing that the river is amongst the world maxima classified upon the basis of peak discharge per unit area and very close to the global limit for rainfall generated flood runoff.
2.2 The historical geography of floods on the Mekong mainstream
An analysis is undertaken of the temporal and spatial nature of floods along the Mekong mainstream, revealing that the river basin is far from geographically homogenous with regard to the nature and severity of the flood season in any given year.
2.3 The nature and analysis of floods on large rivers
The quantitative definition of the magnitude of a flood exclusively in terms of its peak discharge is a useful and sufficient statistic in the case of small river basins where the duration of flood events is usually only a matter of several days. On large rivers the flood hydrograph has a much longer duration, which in the case of the Mekong is a matter of several months. The multivariate aspects of the hydrograph therefore need to be simultaneously taken into account in the assessment of flood risk and magnitude. In this report modern multivariate statistical technology is used; this brings together the peak flood discharge, the volume of the flood hydrograph and the duration of flows above critical thresholds.
2.4 Temporal aspects of the Mekong flood regime
The onset and duration of the flood season in the Lower Mekong Basin is clearly an important variable from year to year. In keeping with broader definitions of hydrological seasonality on the mainstream adopted by the Environment and Fisheries Programmes within the Mekong River Commission (MRC), four flow seasons are identified, namely the flood season, the dry season and two transition seasons. The hydrological indices adopted to define the onset and closure of each one are presented along with a historical assessment of how these dates have
x
Annual Mekong Flood Report 2006
varied from year to year. It is demonstrated that these temporal variables have been remarkably consistent over the last 80 to 90 years and have a surprisingly small inter-annual variability. Studies of the palaeoclimate during the Holocene are quoted that suggest these temporal aspects of the Mekong flood regime have been unchanged over the last 5,000 to 6,000 years.
Throughout Part 1 the events of 2006 are set within this wider geographical, historical and temporal context and a number of graphical techniques are presented that could be adopted as standards for the comparative assessment of the Mekong flood for any year that is under consideration.
3 The 2006 flood season
3.1 Hydrological and meteorological aspects
The total volume of flows during the flood season of 2006, throughout the mainstream, was below average and in parts, significantly so. This deficit becomes more evident towards the downstream regions, particularly at Pakse and Kratie. The defining feature of the year’s flood hydrology, however, is the second peak to the hydrograph during October, which brought about the only time of the year that discharges consistently approximated or exceeded their long term daily averages. This second peak was the response to Severe Tropical Storm Xangsane, which tracked over the Mekong Basin during the first week of October. Without this event, the flood volumes in the lower regions of the basin would have been amongst the lowest on record. Peak flows in response to Xangsane were not excessive.
3.2 Water levels in the Tonle Sap floodplain of Cambodia and the Delta in Viet Nam
Clearly these reflect the magnitude of discharges entering these lower regions of the Mekong system and were therefore generally below average. Once again, the conditions of 2006 are firmly set within their historical context. In this regard, the water levels for the Tonle Sap system as far back as 1924 are reviewed and some exploratory statistical analyses undertaken. The incidence and role of typhoon incursions into these regions of the Lower Basin are considered and some and their impacts upon the distribution of storm rainfall revealed.
3.3 Regional summary and tributary flood hydrology during 2006
Apart from the mainstream, arguably the major regional flooding took place in Northern Thailand where flash flooding occurred along the northern tributaries, such as the Nam Mae Kham, Nam Mae Kok and Nam Mae Ing, causing very considerable damage. The period between July and October saw a number of such events, which also caused excessive water levels in Northern Lao PDR, along the Luang Namtha, for example. These episodes are synthesized and summarised in terms of cause and effect.
xi
Annual Mekong Flood Report 2006
4 Overview of annual flood reports
4.1 Lao PDR
During 2006 localised flash flooding in Luang Namtha and Attapeu Provinces were the only noteworthy flood incidents that occurred in Lao PDR. Events in Luang Namtha during the second week of August were in response to orographically induced monsoonal storms which produced 230 mm to 270 mm of rainfall over the first 10 days of the month. The flooding in Attapeu Province during the first week of October was attributable to the incursion of Severe Tropical Storm Xangsane. Elsewhere the only meteorological episodes of any significance were local storms over Vientiane which caused brief urban flooding in March, May and October and a highly localised ‘whirlwind’ which moved at high speed through the Chanthabouly district of the Capital at 7:25pm on the 5 May 2006, with wind speeds of over 100 km/h (30 m/sec) causing severe but very local structural damage.
4.2 Thailand
During 2006 Thailand was badly affected nationwide by floods from several storms, most particularly from Severe Tropical Storm Xangsane, which turned into a tropical depression in the country. Out of 75 provinces, 46 were locally inundated. By mid-October, Thailand’s Department of Disaster Prevention and Mitigation (DDPM) reported that 47 people had been killed, two were missing and more than 2.4 million people had been affected to various degrees over the country as a whole. Approximate losses are estimated to be of the order of US$8 million.
4.3 Cambodia
In Cambodia conditions during the 2006 flood season were below average both in terms of peak and volume. The flood peak was in fact amongst the lowest recorded over the past 80 or more years. The maximum discharge for the year occurred in mid-August, after which water levels decreased considerably until early October and the passage across the region of Severe Tropical Storm Xangsane. This weather system generated a slightly lower second peak in mid-October, an uncommon feature of the annual hydrograph. As a result of these below normal seasonal flows no significant crop losses were reported, with the exception of the fact that the unseasonally late second peak led to the inundation of some low lying areas. Some early flood recession rice plantings were lost and a second replanting was required. No flood damage to infrastructure took place during the year.
4.4 Viet Nam
The moderate to below average 2006 flood regime in the Delta during the year meant that direct flood damage was not severe. However, the late appearance of flood peaks did bring about some unfavourable conditions for agriculture. What widespread inundation there was occurred when high tides combined with incoming flood flows from upstream, which occurred three times during August and September. The associated water levels at most stations were higher than Alert Level 3 (see Appendix 8) over a duration of one to three hours, though actual inundation
xii
Annual Mekong Flood Report 2006
was often longer due to poor drainage capacity (VNMC 2006 Annual Flood Report). By far the major damage during the year was associated with Tropical Storm Durian during the first week of December which generated extreme wind speeds and tidal surges. Immediate needs following this national disaster were estimated by the UN to be of the order of US$60 million.
5. Summary conclusions and recommendations
5.1 Summary conclusions
Regionally, the flood season of 2006 saw below average conditions both in terms of flow volumes and peak discharges, most particularly on the lower mainstream downstream of Vientiane. To the north, however, flash flooding in Thailand and Lao PDR resulted in significant damage and loss. Deep monsoonal depressions that were largely confined to these northern Provinces were generally responsible, though the wider regional impacts of Severe Tropical Storm Xangsane played a major role in early October, particularly in the south of Lao PDR. The major regional disaster in 2006 was the result of Tropical Storm Durian during December when extreme windspeeds and tidal surges caused immense damage in the Delta and southern coastal regions of Viet Nam.
5.2 Recommendations and lessons
The hydrological and water level data and information available for the mainstream are more than sufficient for a comprehensive assessment of the annual flood from year to year. Analyses of these historical data that have been reported here provide a framework for the objective and more perceptive evaluation of annual floods on the mainstream within their wider temporal and geographical context.
Tributary data analysis and information are far less complete at present, which amounts to a significant shortcoming, given the hazard of flash flooding in these river systems. The FMMP T2 Flood Risk Mapping Project on the Nam Mae Kok in northern Thailand is a recognition of this. Its modest extension to provide a regional flood risk analysis for the tributary systems upstream of Vientiane in both Thailand and Lao PDR would provide substantial ‘add on’ value. The HYCOS Project will also contribute much to the understanding of the flood hydrology of these tributary rivers.
In the longer term HYCOS will also add to the meteorological knowledge base and the nature of the linkages between regional storm rainfall and flood runoff. For the present purposes of the Annual Flood Report, however, daily satellite based rainfall estimates at the regional scale are sufficient and appropriate.
Finally, it is recommended that the Annual Flood Report be ‘theme’ based. Here the emphasis is on data analysis and the temporal and spatial nature of floods and flooding in the Mekong region. Such material provides an important supplement to the framework of knowledge within which the FMMP is being undertaken as well as contributing basic insight into the regime of the Mekong that are a necessary in many other contexts, for example the assessment of the environmental impacts of basin development. Other annual themes that should be considered are the socio-economic benefits, or otherwise, of the flood regime, meteorological aspects and

xiii
Annual Mekong Flood Report 2006
the potential consequences of climate change, including links with El Nino Southern Oscillation (ENSO). The flood report should also provide a medium for reporting FMMP progress in the interests of dissemination to the wider audience and stakeholders.

xiv
Annual Mekong Flood Report 2006
1
1. Introduction
1.1 Introduction
This Annual Flood Report for 2006 represents the second such document produced within the framework of the MRC’s Flood Management and Mitigation Programme (FMMP). The first Report for 2005 should be regarded as exploratory in that it uncovered the constraints and challenges that inevitably arise when seeking to produce a consistent and coherent account of each year’s Mekong flood regime and its impacts. Through discussion and feedback, this earlier account has helped to sharpen awareness of precisely what the objectives are and the document content and structure required to achieve them.
It now seems clear that the Annual Flood Report should aim to fulfil two primary roles. It should at one and the same time:
Provide a sound summary overview of the flood conditions over the year in question. This material should be presented in a way that strikes a balance between technical and quantitative detail and the needs of the wider target audience, a large part of which will be non-technical. The text should realise the first objective of providing a prompt retrospective of the foregoing flood season and setting it within its historical context.
The second role of the report is a longer term one. It should act as a repository for the appropriate data, which would cover the geophysical (hydrology, meteorology), geo-spatial (maps, GIS material, satellite images) and socio-economic (flood inundation, agricultural, damage surveys ) aspects of the flood regime and its impacts. These data will in time accumulate to provide a primary regional resource for flood research and the collation of historical reference material. Such data should be clearly set out in appendices and might also be stored digitally.
It is self evident that any appraisal of flood conditions in a given year must be considered within their historical context. This 2006 Report therefore gives this aspect very particular attention and presents a number of ways of setting out the data in the form of summary graphics that, it is suggested, are a far more effective means of gaining insight than simply tabulating the unprocessed data and information. If the structure and content of the Flood Report from year to year is to be consistent, it is also the case that a number of these graphics will need to be adopted as a standard.
A final theme needs to be emphasised at this point. Conventionally, floods and flooding are perceived as geophysical hazards within a common framework of natural disasters that also covers storms and hurricanes, earthquakes, volcanic eruptions, landslides and tsunami. In each case, socio-economic losses and damage increase exponentially with event magnitude and as a function of civil exposure and vulnerability. Such hazards are perceived as random events with entirely negative impacts, ignoring the fact that floods also have a positive ecological and socio-economic function and that great civilizations have developed within flood plains,
•
•
2
Annual Mekong Flood Report 2006
where on the face of it, exposure and vulnerability have been high. Such societies have included Sumerian Mesopotamia along the Lower Tigris and Euphrates Rivers, the founding cultures of China in the Yellow River Valley and the Angkor civilization of the Lower Mekong Basin itself. Exploiting the benefits and avoiding the risks of the annual flood stimulated such societies to put greater efforts into social organisation and water management systems, which endorsed them as landmark civilisations.
Historical cultures that exploited the benefits of floodplains and contemporary societies that continue to do so, such as those in the Lower Mekong, therefore face a ‘two-tailed’ flood hazard. (see Webby et al, 2006). Either the annual flood is too small, leading to reduced agricultural output or too large, resulting in inundation, crop losses and general socio-economic damage. The dis-benefits arising from the ‘failure’ of the flood season must not therefore be ignored or even made light of. As will be seen, historically some of these deficiencies in the flood season hydrology of the Mekong have been quite spectacular.
1.2 Report Structure and Summary of Contents
The main text of the Report is laid out in such a way that there is a logical progression from the creation of an awareness of the nature and history of the flood regime of the Mekong towards a specific evaluation of events in 2006 and how they lie within this historical context. The causes and impacts of flood conditions during the 2006 season are evaluated, with the Country Reports, providing the major sources of information and data. The main text focuses on the interpretation and summary of this material, which is collectively presented in detail in the Appendices for reference purposes. An objective has been to keep the length of the main text modest and tabulate the minimum amount of data required, leaving it for presentation in the Appendices. The appendices also provide the results of a statistical analysis of the discharge data at the major hydrometric stations on the mainstream and the water level data in the Tonle Sap system, the flood plain regions and the delta. There is, in addition, a summary tabulation of the key quantitative features of the major historical flood events at each site, along with the current rating equations, specifying the relationship between water level and depth. The assembly of such material in the Appendices broadens the utility of this Annual Report to provide a basic source of reference.

3
Annual Mekong Flood Report 2006
4
Annual Mekong Flood Report 2006
0
5000
10 000
15 000
20 000
25 000
Jan. Feb. Mar. Apr. May Jun. Jul. Aug. Sept. Oct. Nov. Dec.
Rio Uruguay at Concordia , South America, 1993Catchment 250 000 km2
Dai
ly D
isch
arg
e
0
50
100
150
200
250
300
350
Jan. Feb. Mar. Apr. May Jun. Jul. Aug. Sept. Oct. Nov. Dec.
Thames at Teddington, UK ,1985Catchment 9700 km2
Dai
ly D
isch
arg
e
Jan. Feb. Mar. Apr. May Jun. Jul. Aug. Sept. Oct. Nov. Dec.
Chenab at Marala, Pakistan, 1993Catchment 34 000 km2
Dai
ly D
isch
arg
e0
2000
4000
6000
8000
10 000
0
10 000
20 000
30 000
40 000
50 000
Jan. Feb. Mar. Apr. May Jun. Jul. Aug. Sept. Oct. Nov. Dec.
Mekong at Kratie, 2000Catchment 646 000 km2
Dai
ly D
isch
arg
e
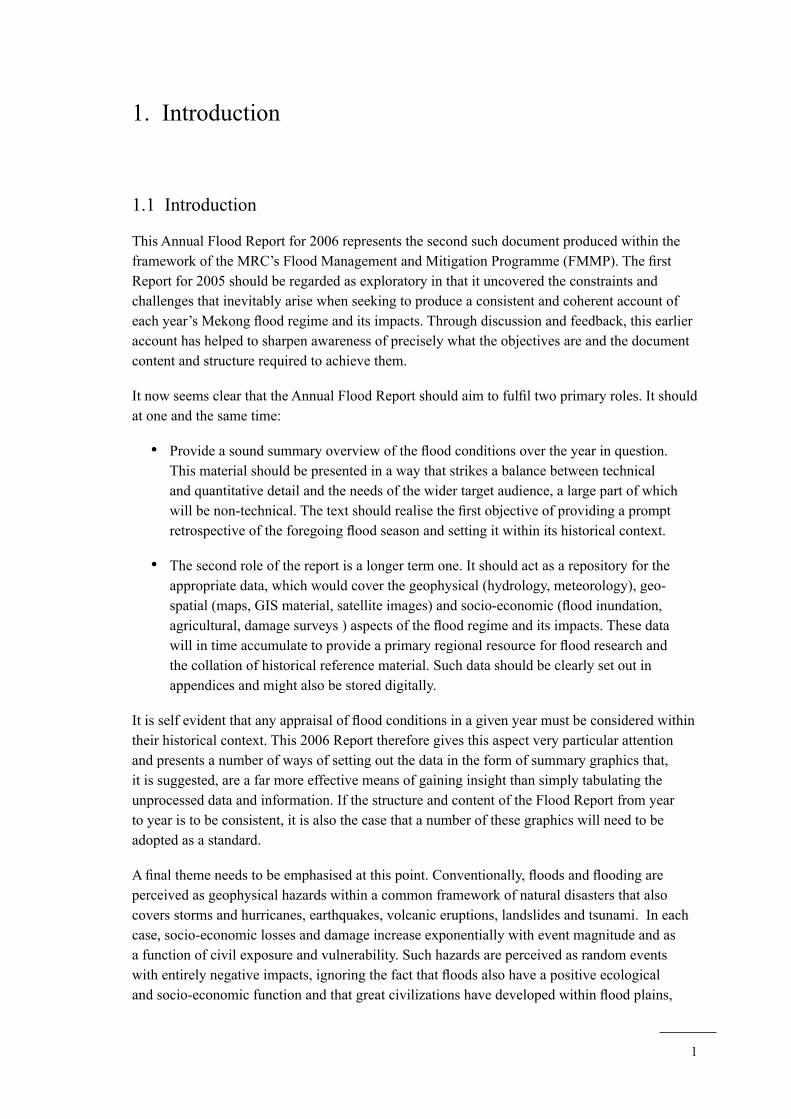
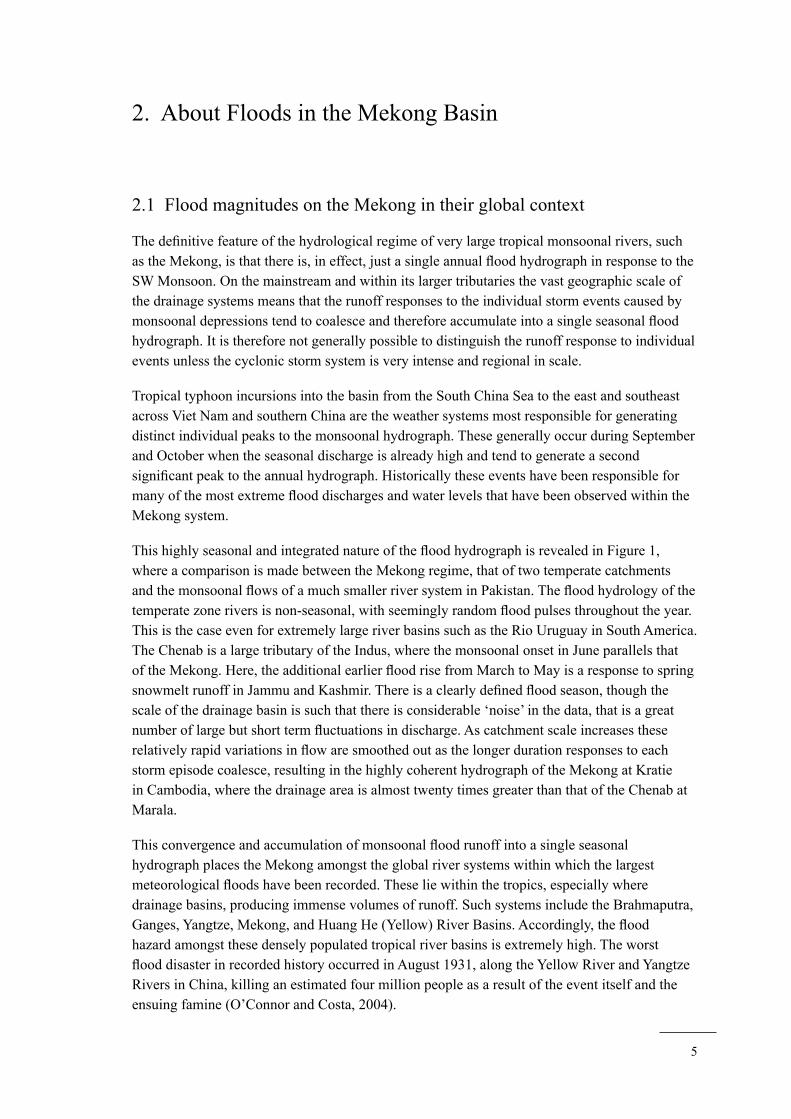
Figure 1. Comparative hydrological regimes of temperate (left) and monsoonal (right) river systems.
5
2. About Floods in the Mekong Basin
2.1 Flood magnitudes on the Mekong in their global context
The definitive feature of the hydrological regime of very large tropical monsoonal rivers, such as the Mekong, is that there is, in effect, just a single annual flood hydrograph in response to the SW Monsoon. On the mainstream and within its larger tributaries the vast geographic scale of the drainage systems means that the runoff responses to the individual storm events caused by monsoonal depressions tend to coalesce and therefore accumulate into a single seasonal flood hydrograph. It is therefore not generally possible to distinguish the runoff response to individual events unless the cyclonic storm system is very intense and regional in scale.
Tropical typhoon incursions into the basin from the South China Sea to the east and southeast across Viet Nam and southern China are the weather systems most responsible for generating distinct individual peaks to the monsoonal hydrograph. These generally occur during September and October when the seasonal discharge is already high and tend to generate a second significant peak to the annual hydrograph. Historically these events have been responsible for many of the most extreme flood discharges and water levels that have been observed within the Mekong system.
This highly seasonal and integrated nature of the flood hydrograph is revealed in Figure 1, where a comparison is made between the Mekong regime, that of two temperate catchments and the monsoonal flows of a much smaller river system in Pakistan. The flood hydrology of the temperate zone rivers is non-seasonal, with seemingly random flood pulses throughout the year. This is the case even for extremely large river basins such as the Rio Uruguay in South America. The Chenab is a large tributary of the Indus, where the monsoonal onset in June parallels that of the Mekong. Here, the additional earlier flood rise from March to May is a response to spring snowmelt runoff in Jammu and Kashmir. There is a clearly defined flood season, though the scale of the drainage basin is such that there is considerable ‘noise’ in the data, that is a great number of large but short term fluctuations in discharge. As catchment scale increases these relatively rapid variations in flow are smoothed out as the longer duration responses to each storm episode coalesce, resulting in the highly coherent hydrograph of the Mekong at Kratie in Cambodia, where the drainage area is almost twenty times greater than that of the Chenab at Marala.
This convergence and accumulation of monsoonal flood runoff into a single seasonal hydrograph places the Mekong amongst the global river systems within which the largest meteorological floods have been recorded. These lie within the tropics, especially where drainage basins, producing immense volumes of runoff. Such systems include the Brahmaputra, Ganges, Yangtze, Mekong, and Huang He (Yellow) River Basins. Accordingly, the flood hazard amongst these densely populated tropical river basins is extremely high. The worst flood disaster in recorded history occurred in August 1931, along the Yellow River and Yangtze Rivers in China, killing an estimated four million people as a result of the event itself and the ensuing famine (O’Connor and Costa, 2004).
6
Annual Mekong Flood Report 2006
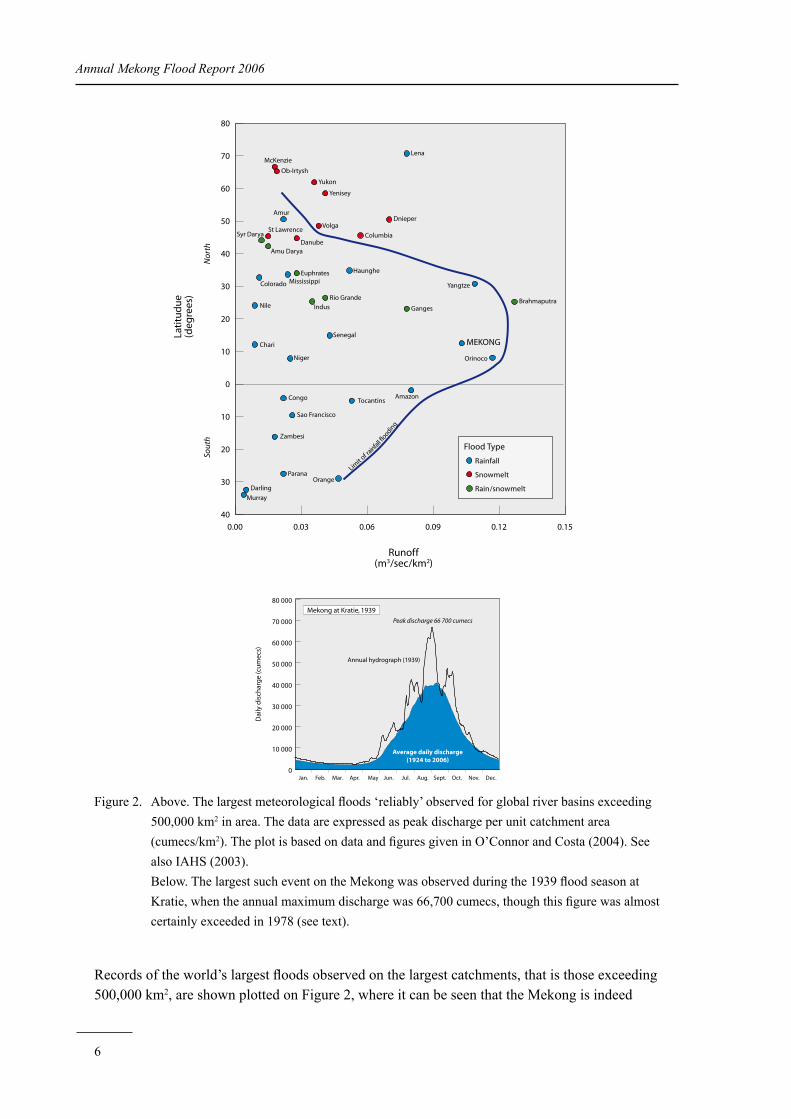
Figure 2. Above. The largest meteorological floods ‘reliably’ observed for global river basins exceeding 500,000 km2 in area. The data are expressed as peak discharge per unit catchment area (cumecs/km2). The plot is based on data and figures given in O’Connor and Costa (2004). See also IAHS (2003).
Below. The largest such event on the Mekong was observed during the 1939 flood season at Kratie, when the annual maximum discharge was 66,700 cumecs, though this figure was almost certainly exceeded in 1978 (see text).
Records of the world’s largest floods observed on the largest catchments, that is those exceeding 500,000 km2, are shown plotted on Figure 2, where it can be seen that the Mekong is indeed
0.00 0.03 0.06 0.09 0.12 0.15
40
30
20
10
0
10
20
30
40
50
60
70
80
Amazon
Murray
Darling
Chari
Nile
Colorado
Syr Darya
Amu Darya
St Lawrence
Zambesi
Ob-Irtysh
McKenzie
Parana
Congo
Amur
Mississippi
Niger
Sao Francisco
Euphrates
Danube
Indus
Yukon
Volga
Rio Grande
Yenisey
Senegal
Haunghe
Tocantins
Columbia
Orange
Dnieper
Ganges
MEKONG
Orinoco
Yangtze
Brahmaputra
Lena
Limit of rainfall f
loodin
g
Runoff(m3/sec/km2)
Lati
tud
ue
(deg
rees
)
Sout
hN
orth
Flood Type
Rainfall
Snowmelt
Rain/snowmelt
0
10 000
20 000
30 000
40 000
50 000
60 000
70 000
80 000
Jan. Feb. Mar. Apr. May Jun. Jul. Aug. Sept. Oct. Nov. Dec.
Mekong at Kratie, 1939
Average daily discharge(1924 to 2006)
Annual hydrograph (1939)
Dai
ly d
isch
arg
e (c
um
ecs)
Peak discharge 66 700 cumecs
7
Annual Mekong Flood Report 2006
amongst the global maxima1. The data are expressed as peak flood discharge per unit basin area or cumecs/km2. The ‘record’ historical event observed for the Mekong on this basis occurred on 3rd September 1939 at Kratie in Cambodia, where the drainage area is 646,000 km2 (see Figure 3 for a map of locations referred to in the text). This 1939 hydrograph is included in Figure 2, though it is almost certain that the peak discharge of 66,700 cumecs was exceeded in 1978 when the maximum historical peak flow between 1924 and 2006 was observed upstream at Pakse. At this time, only water level observations are available further downstream at Kratie, but based on a statistical analysis of the historical joint distribution of daily flows between these two mainstream locations, it is reliably estimated that the 1978 peak at Kratie was in excess of 77,000 cumecs, which places the Mekong even closer to the global limit for rainfall generated flood runoff.
There is a pronounced global pattern to the distribution of these extreme meteorological floods2. They are generally confined to areas of the tropics between 10 and 30 degrees north in Asia and between 10 degrees north and south of the equator in South America. The large rivers of tropical Africa, such as the Congo, have relatively modest flood regimes in terms of unit area discharge, which is attributable to a combination of low relief and less extreme tropical rainfall climates.
2.2 The historical geography of floods on the Mekong mainstream
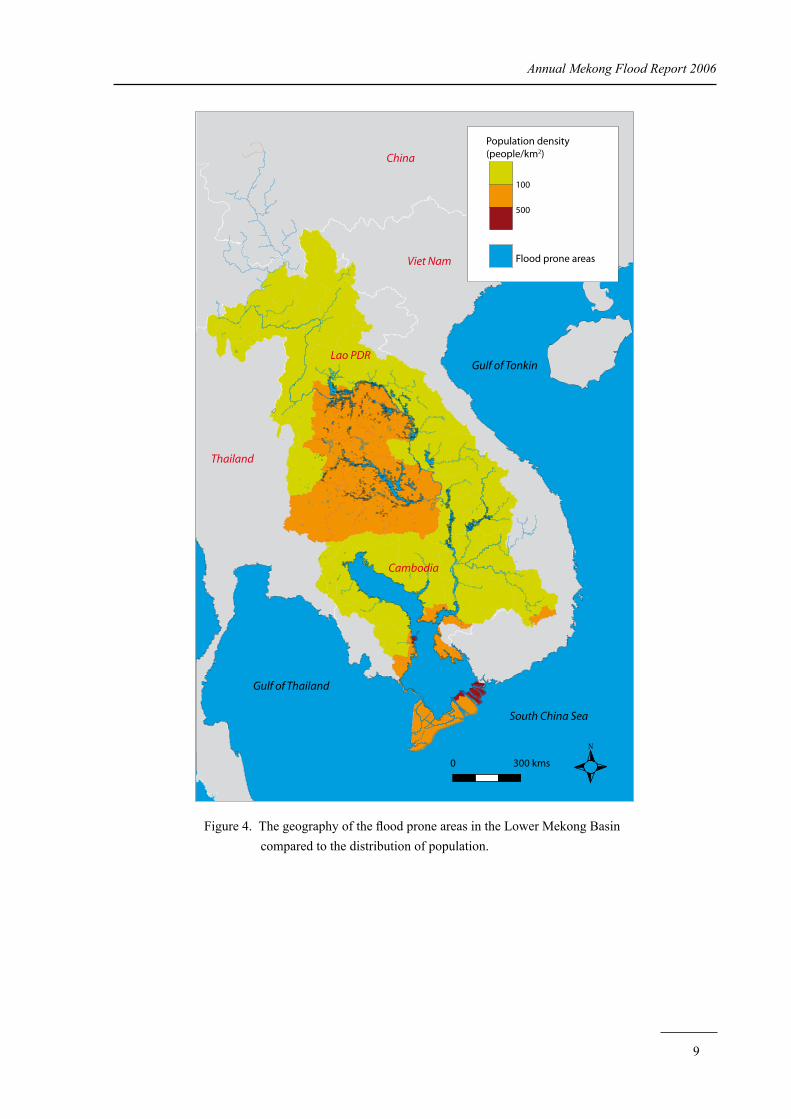
The geographical distribution of significant flood hazard in the Lower Mekong Basin shows a close link to that of the regional population (Figure 4). Regions of high population density are generally those most exposed to flood inundation. This is consistent with the fact that in tropical regions floodplains provide the most fertile land areas and historically therefore they have witnessed the greatest levels of socio-economic development. A meaningful knowledge of the nature, history and geography of the regional flood regime is therefore basic to effective flood mitigation and management.
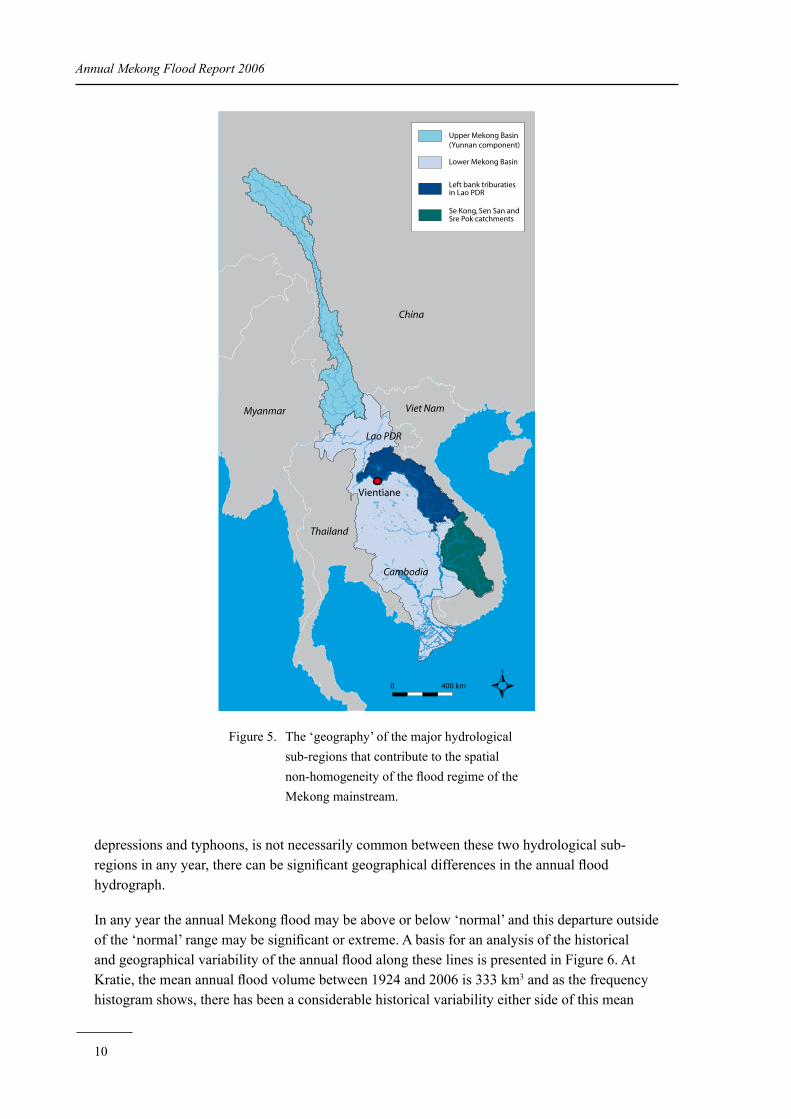
The annual flood regime of the Mekong is not geographically homogeneous in terms of its nature and magnitude from year to year. There is a significant discontinuity evident between the hydrological sub-regions upstream and downstream of Vientiane. The explanation is, however, quite straightforward. Upstream of Vientiane the nature of the flood hydrology in any year is dictated by outflows from Tibet and China—the so called ‘Yunnan Component’ of the overall Mekong regime. Downstream, the large left bank tributaries, particularly those that lie in Lao PDR (the Nam Ngum, Nam Theun, Se Bang Hieng and the Se Kong) and the Se San and Sre Pok, which enter the mainstream from Cambodia and Viet Nam, progressively mask the Yunnan Component. It is their contribution to the mainstream flow that becomes the foremost influence on the variability of flood season conditions from year to year. (See Figure 5, which maps this regional geography of the Mekong flood regime.) Because the incidence, severity and impact of the weather systems that determine the magnitude of the annual flood, such as monsoonal
1 The data upon which this plot is based is given in Appendix 9.
2 During the Quaternary Period, the largest known floods had a peak discharge of close to 20 million cumecs. These were, however, non-meteorological and were the result of the breaching of ice dams formed during glacial periods. Other cataclysmic floods result from the failure of other types of natural dams, such as blockages caused by landslides. For example, analysis of dam breaks reveals that the failure of a rock-slide dam on the upper Indus in Pakistan in 1841 triggered a peak discharge of 540,000 cumecs (see O’Connor and Costa, 2004 and Schroder et al., 1991).
8
Annual Mekong Flood Report 2006
China
Viet Nam
Cambodia
Thailand
Lao PDR
Upper Mekong Basin
Lower Mekong Basin
Vientiane
Pakse
Nong Khai
Nakhon Phanom
Luang Prabang
Chiang Saen
Chiang Khan
Mukdahan
Khong Chiam
Stung Treng
Kratie
Phnom Penh
Kampong Luong
Prek Kdam
Chao Doc
Manwan Dam
Jinghong
Great Lake
Nam Tha
Nam Theun
Nam Chi
Se Kong
Se San
Sre Pok
Tan Chao
N a m Mae Kok
Nam MunN
amNgum Nam
Hinboun
0 300 kms
Gulf of Thailand
South China Sea
Gulf of Tonkin
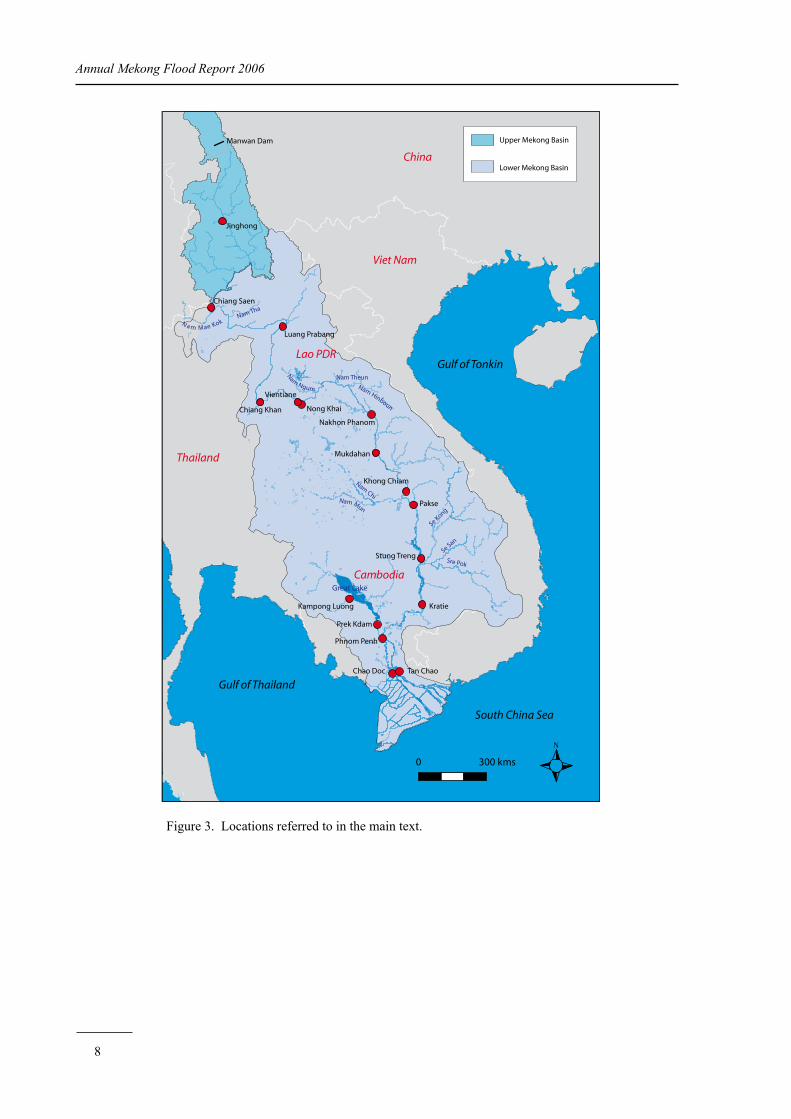
Figure 3. Locations referred to in the main text.
9
Annual Mekong Flood Report 2006
100
Population density (people/km2)
500
China
Viet Nam
Cambodia
Thailand
Lao PDR
0 300 kms
Gulf of Thailand
South China Sea
Gulf of Tonkin
Flood prone areas
Figure 4. The geography of the flood prone areas in the Lower Mekong Basin compared to the distribution of population.
10
Annual Mekong Flood Report 2006
depressions and typhoons, is not necessarily common between these two hydrological sub-regions in any year, there can be significant geographical differences in the annual flood hydrograph.
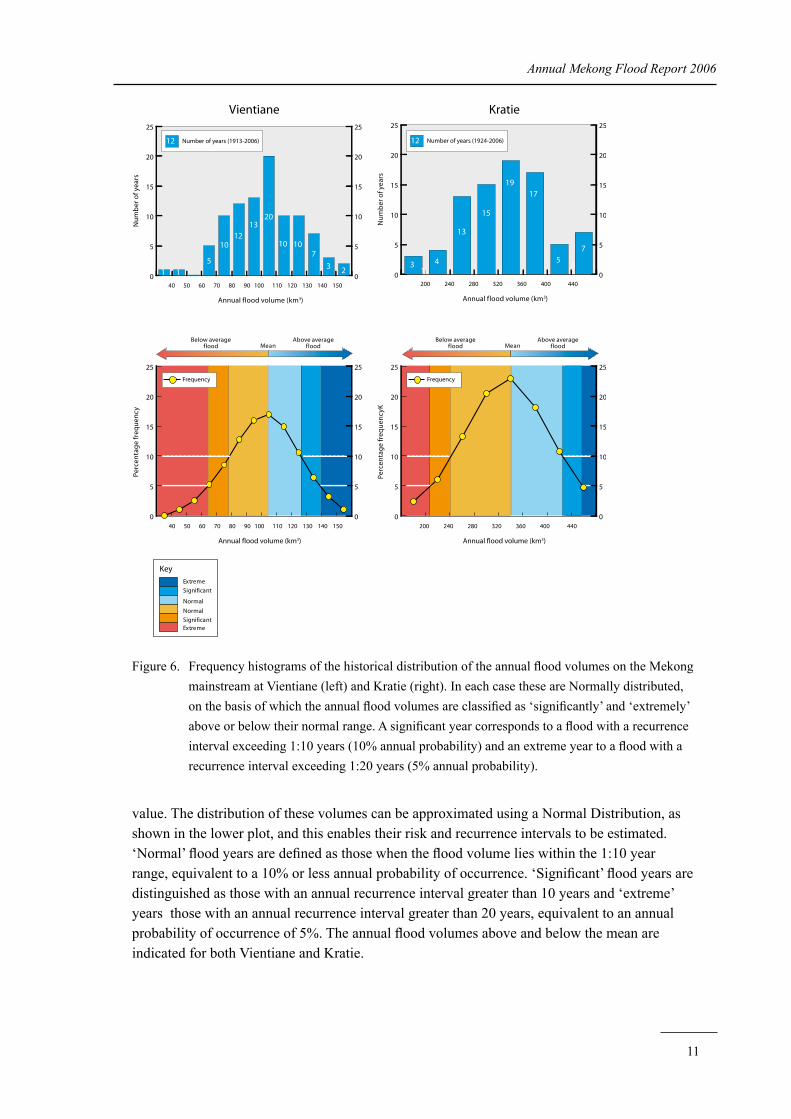
In any year the annual Mekong flood may be above or below ‘normal’ and this departure outside of the ‘normal’ range may be significant or extreme. A basis for an analysis of the historical and geographical variability of the annual flood along these lines is presented in Figure 6. At Kratie, the mean annual flood volume between 1924 and 2006 is 333 km3 and as the frequency histogram shows, there has been a considerable historical variability either side of this mean
China
Viet NamMyanmar
Cambodia
Thailand
Lao PDR
Upper Mekong Basin(Yunnan component)
Lower Mekong Basin
Left bank triburatiesin Lao PDR
Vientiane
Se Kong, Sen San andSre Pok catchments
0 400 km
Figure 5. The ‘geography’ of the major hydrological sub-regions that contribute to the spatial non-homogeneity of the flood regime of the Mekong mainstream.
11
Annual Mekong Flood Report 2006
value. The distribution of these volumes can be approximated using a Normal Distribution, as shown in the lower plot, and this enables their risk and recurrence intervals to be estimated. ‘Normal’ flood years are defined as those when the flood volume lies within the 1:10 year range, equivalent to a 10% or less annual probability of occurrence. ‘Significant’ flood years are distinguished as those with an annual recurrence interval greater than 10 years and ‘extreme’ years those with an annual recurrence interval greater than 20 years, equivalent to an annual probability of occurrence of 5%. The annual flood volumes above and below the mean are indicated for both Vientiane and Kratie.
0
5
10
15
20
25
0
5
10
15
20
25
1 1
5
1012
1320
10 107
3 2
Number of years (1913-2006)12
40 50 60 70 80 90 100 110 120 130 140 150
40 50 60 70 80 90 100 110 120 130 140 150
0
5
10
15
20
25
0
5
10
15
20
25
Mean
Perc
enta
ge
freq
uen
cy
Annual flood volume (km3)
Annual flood volume (km3)
Nu
mb
er o
f yea
rs
Frequency
Below averageflood
Above averageflood
0
5
10
15
20
25
0
5
10
15
20
25
13 4
13
19
15
17
53
7
Number of years (1924-2006)12
200 240 280 320 360 400 440
Annual flood volume (km3)
Nu
mb
er o
f yea
rs
Mean
Perc
enta
ge
freq
uen
cyK
Annual flood volume (km3)
Frequency
Below averageflood
Above averageflood
200 240 280 320 360 400 440
Significant
Significant
Extreme
Extreme
Normal
Normal
Key
Vientiane Kratie
0
5
10
15
20
25
0
5
10
15
20
25
Figure 6. Frequency histograms of the historical distribution of the annual flood volumes on the Mekong mainstream at Vientiane (left) and Kratie (right). In each case these are Normally distributed, on the basis of which the annual flood volumes are classified as ‘significantly’ and ‘extremely’ above or below their normal range. A significant year corresponds to a flood with a recurrence interval exceeding 1:10 years (10% annual probability) and an extreme year to a flood with a recurrence interval exceeding 1:20 years (5% annual probability).
12
Annual Mekong Flood Report 2006
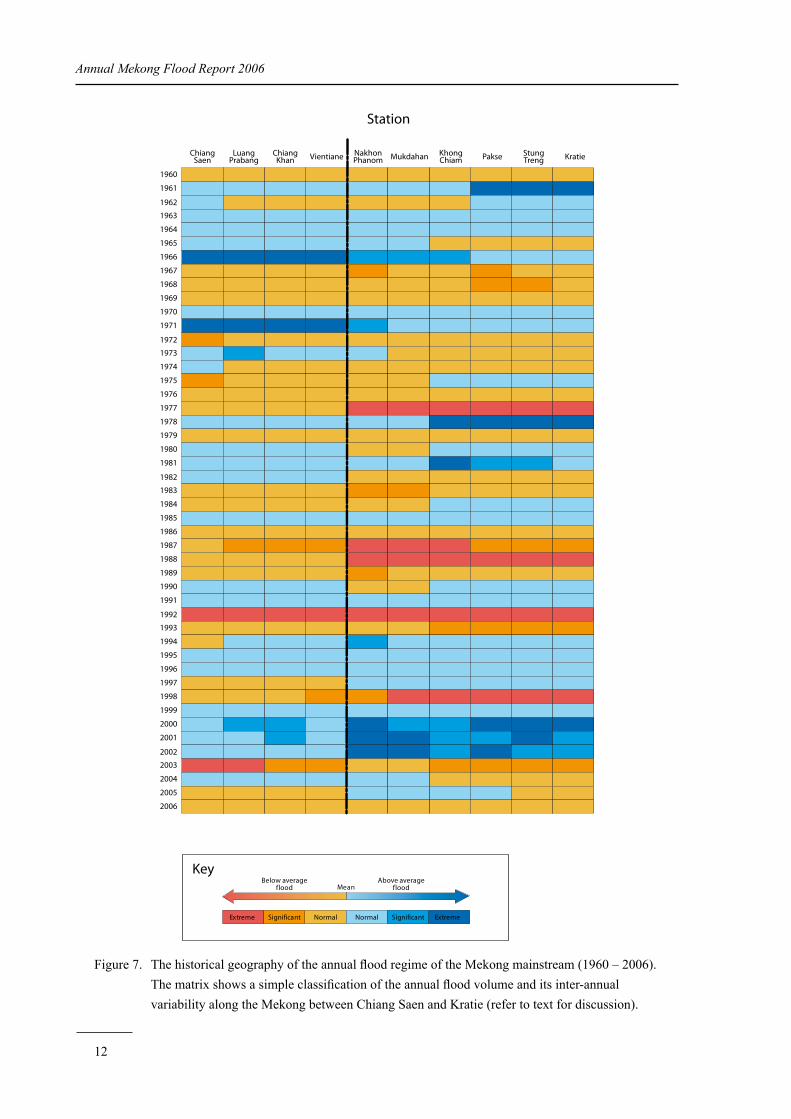
Figure 7. The historical geography of the annual flood regime of the Mekong mainstream (1960 – 2006). The matrix shows a simple classification of the annual flood volume and its inter-annual variability along the Mekong between Chiang Saen and Kratie (refer to text for discussion).
1960
1961
1962
1963
1964
1965
1966
1967
1968
1969
1970
1971
1972
1973
1974
1975
1976
1977
1978
1979
1980
1981
1982
1983
1984
1985
1986
1987
1988
1989
1990
1991
1992
1993
1994
1995
1996
1997
1998
1999
2000
2001
2002
2003
2004
2005
2006
ChiangSaen
LuangPrabang
ChiangKhan Vientiane Nakhon
Phanom Mukdahan KhongChiam Pakse Stung
Treng Kratie
MeanBelow average
floodAbove average
flood
SignificantSignificant ExtremeExtreme Normal Normal
Key
Station
13
Annual Mekong Flood Report 2006
On the basis of this classification, Figure 7 portrays the historical geography of floods along the Mekong mainstream between Chiang Saen and Kratie for the 47 years from 1960 to 2006. The annual flood season flow volumes for each year at ten of the major river gauging locations have been classified as described into ‘significantly’ and ‘extremely’ above and below normal. The result is the flood ‘category matrix’, as shown in the figure:
The discontinuity up and downstream of Vientiane is clearly distinguishable. For example, the largest flood event recorded at Chiang Saen, Luang Prabang, Chiang Khan and Vientiane, in 1966, diminishes in severity downstream. At Pakse and beyond conditions in 1966 fall into the ‘normal range’. This came about because this flood was the result of Typhoon Phyllis which tracked over northern Lao PDR and southern Yunnan, where extreme levels of runoff were generated in late September. Phyllis did not have any significant impacts further towards the south, where flood season volumes were unexceptional. Consequently there was an insufficient further accumulation of the annual flood volume for it to remain classified as severe or significant beyond Khong Chiam. A rather similar situation came about in 1971.
Correspondingly, ‘significant’ and ‘severe’ large annual floods can be confined to the hydrological sub-region downstream of Vientiane, as is the case during 2000, 2001 and 2002. This occurs during years when monsoonal depressions and tropical storms generate exceptional volumes of flood runoff within the large left bank tributary catchments, while monsoonal rainfall upstream of Vientiane is less excessive.
In some years, the occurrence of these exceptional flood volumes can be even more confined geographically, for example in 1961 and 1978. This is generally due to tropical storms and typhoons tracking over the far south of the Mekong system only. This was the case in 1978 when Typhoon Joe moved in over these downstream regions and was responsible for the highest annual flood peak recorded at Pakse (56,000 cumecs) and Kratie (77,000 cumecs) over the past 80 or more years (see Chapter 2 and Figure 2). Upstream, in contrast, the 1978 flood season was unremarkable both in terms of peak and volume.
‘Significantly’ and ‘extremely’ below average annual flood volumes can also exhibit this same type of geographical non-homogeneity. For example, during 1977, 1988 and 1998 such conditions were largely confined the regions downstream of Vientiane. An exception is 1992 (Figure 8), a year during which daily discharges during the flood season rarely came even close to their long term average and the seasonal flood volume fell to more than 40% below normal (see Figure 8). These unprecedented conditions existed throughout the basin.
•
•
•
•
14
Annual Mekong Flood Report 2006
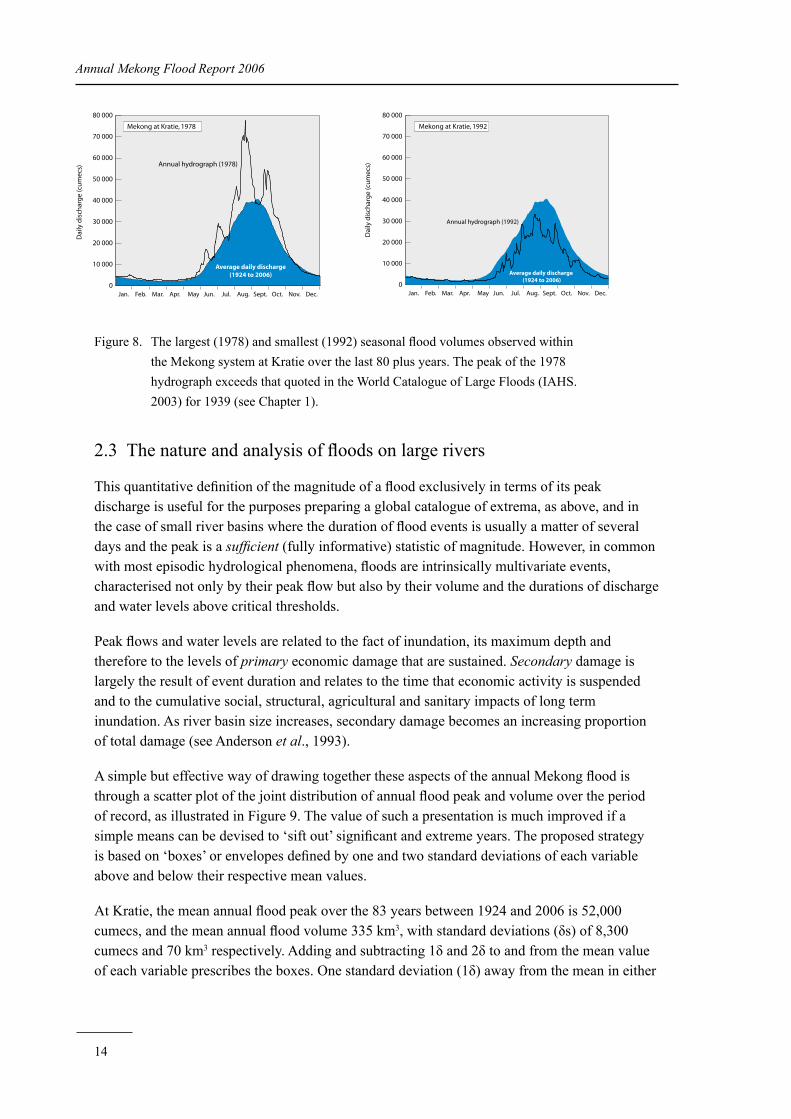
2.3 The nature and analysis of floods on large rivers
This quantitative definition of the magnitude of a flood exclusively in terms of its peak discharge is useful for the purposes preparing a global catalogue of extrema, as above, and in the case of small river basins where the duration of flood events is usually a matter of several days and the peak is a sufficient (fully informative) statistic of magnitude. However, in common with most episodic hydrological phenomena, floods are intrinsically multivariate events, characterised not only by their peak flow but also by their volume and the durations of discharge and water levels above critical thresholds.
Peak flows and water levels are related to the fact of inundation, its maximum depth and therefore to the levels of primary economic damage that are sustained. Secondary damage is largely the result of event duration and relates to the time that economic activity is suspended and to the cumulative social, structural, agricultural and sanitary impacts of long term inundation. As river basin size increases, secondary damage becomes an increasing proportion of total damage (see Anderson et al., 1993).
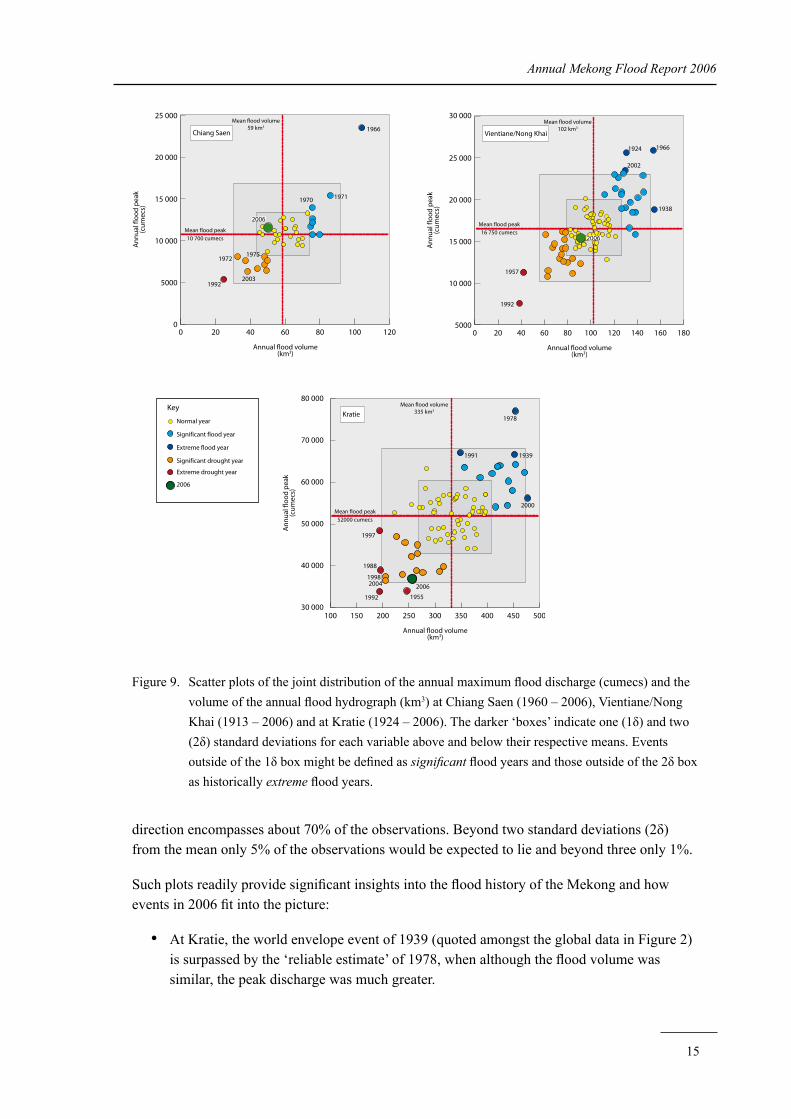
A simple but effective way of drawing together these aspects of the annual Mekong flood is through a scatter plot of the joint distribution of annual flood peak and volume over the period of record, as illustrated in Figure 9. The value of such a presentation is much improved if a simple means can be devised to ‘sift out’ significant and extreme years. The proposed strategy is based on ‘boxes’ or envelopes defined by one and two standard deviations of each variable above and below their respective mean values.
At Kratie, the mean annual flood peak over the 83 years between 1924 and 2006 is 52,000 cumecs, and the mean annual flood volume 335 km3, with standard deviations (δs) of 8,300 cumecs and 70 km3 respectively. Adding and subtracting 1δ and 2δ to and from the mean value of each variable prescribes the boxes. One standard deviation (1δ) away from the mean in either
0
10 000
20 000
30 000
40 000
50 000
60 000
70 000
80 000
Jan. Feb. Mar. Apr. May Jun. Jul. Aug. Sept. Oct. Nov. Dec.
Mekong at Kratie, 1978
Annual hydrograph (1978)
Dai
ly d
isch
arg
e (c
um
ecs)
Average daily discharge(1924 to 2006)
0
10 000
20 000
30 000
40 000
50 000
60 000
70 000
80 000
Jan. Feb. Mar. Apr. May Jun. Jul. Aug. Sept. Oct. Nov. Dec.
Mekong at Kratie, 1992
Average daily discharge (1924 to 2006)
Annual hydrograph (1992)
Dai
ly d
isch
arg
e (c
um
ecs)
Figure 8. The largest (1978) and smallest (1992) seasonal flood volumes observed within the Mekong system at Kratie over the last 80 plus years. The peak of the 1978 hydrograph exceeds that quoted in the World Catalogue of Large Floods (IAHS. 2003) for 1939 (see Chapter 1).
15
Annual Mekong Flood Report 2006
Figure 9. Scatter plots of the joint distribution of the annual maximum flood discharge (cumecs) and the volume of the annual flood hydrograph (km3) at Chiang Saen (1960 – 2006), Vientiane/Nong Khai (1913 – 2006) and at Kratie (1924 – 2006). The darker ‘boxes’ indicate one (1δ) and two (2δ) standard deviations for each variable above and below their respective means. Events outside of the 1δ box might be defined as significant flood years and those outside of the 2δ box as historically extreme flood years.
0 20 40 60 80 100 1200
5000
10 000
15 000
20 000
25 000
An
nu
al fl
oo
d p
eak
(cu
mec
s)
Annual flood volume(km3)
Mean flood peak
10 700 cumecs
Mean flood volume59 km3
1971
1966
2003
1970
19751972
2006
1992
Chiang Saen
0 20 40 60 80 100 120 140 160 1805000
10 000
15 000
20 000
25 000
30 000
An
nu
al fl
oo
d p
eak
(cu
mec
s)
Annual flood volume(km3)
Mean flood peak
16 750 cumecs
Mean flood volume102 km3
2002
19661924
1938
1957
1992
2006
Vientiane/Nong Khai
100 150 200 250 300 350 400 450 50030 000
40 000
50 000
60 000
70 000
80 000
An
nu
al fl
oo
d p
eak
(cu
mec
s)
Annual flood volume(km3)
Mean flood peak
52000 cumecs
Mean flood volume335 km3
1978
1991 1939
2000
1997
19551992
1988
2006
19982004
KratieNormal year
Extreme flood year
Significant flood year
Extreme drought year
Significant drought year
2006
Key
direction encompasses about 70% of the observations. Beyond two standard deviations (2δ) from the mean only 5% of the observations would be expected to lie and beyond three only 1%.
Such plots readily provide significant insights into the flood history of the Mekong and how events in 2006 fit into the picture:
At Kratie, the world envelope event of 1939 (quoted amongst the global data in Figure 2) is surpassed by the ‘reliable estimate’ of 1978, when although the flood volume was similar, the peak discharge was much greater.
•
16
Annual Mekong Flood Report 2006
The more recent extreme event of 2000 observed at Kratie killed more than 800 people and resulted in economic damage assessed at more than US$400 million (ADB figures). It was, however, entirely the result of an unprecedented flood volume of almost 480 km3. The flood peak was only marginally above average, with an average recurrence interval of less than five years (Appendix 2). Such an observation underscores the point that flood maxima alone are not a satisfactory measure of flood magnitude and therefore of potential flood damage on large rivers such as the Mekong.
The flood conditions of 2006 at Kratie were significantly below average and in terms of the peak flood discharge, especially low, in fact at an estimated 36,900 cumecs the forth lowest annual maximum since 1924. The 2006 flood season therefore joins the assembly of low peak and low volume flood hydrographs of 1955, 1988, 1992, 1993, 1998 and 2004. A point to note is that since 1924, six of the seven ‘driest’ flood seasons on record at Kratie have occurred during the last 20 years.
Upstream, at Vientiane, 2006 flood mainstream conditions were conclusively average, both in terms of peak and volume. This difference in the conditions between here and Kratie and the fact that, other than the ‘driest’ season on record (1992), there is little commonality with respect to the classification of the flood seasons from year to year, is a significant aspect of the regional flood hydrology.
As expected, given this geographical pattern of the mainstream flood regime, the 2006 flood peak and volume further upstream at Chiang Saen were both average and consistent with those at Vientiane in terms of their historical content.
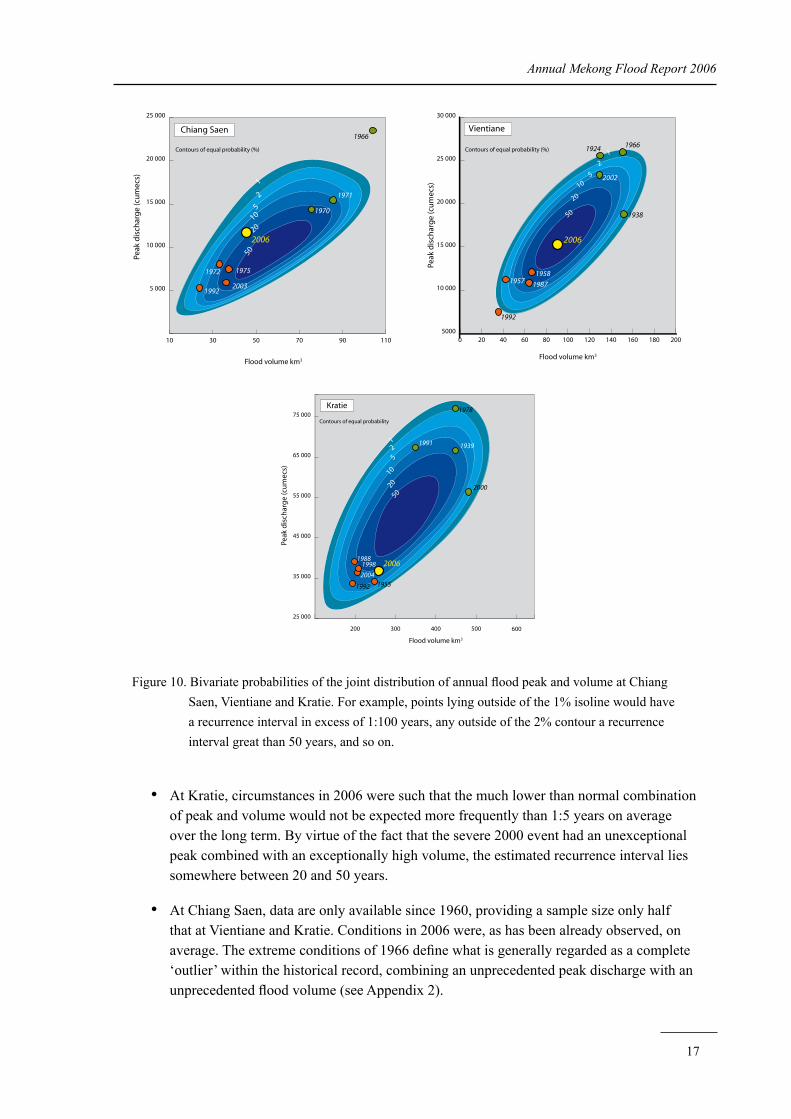
A natural development of scatter plots such as these is the development of a bi-variate statistical theory for extreme values, within which the joint probability of combinations of flood peak and volume can be estimated. The development and application of such contemporary statistical methodology is reported in Adamson et al. (1999), using long term daily flow data for the Mekong to provide an example. The type of result that can be obtained is illustrated in Figure 10:
The plots show the bivariate density of flood risk, taking the two key components of the flood hydrograph simultaneously into account and setting them within a common probabilistic framework. In so doing a more complete picture of flood risk emerges. The isolines are of equal percentage probability. Flood years that lie outside of the 1% isoline would have a return period exceeding 1:100 years in terms of the relationship between flood peak and volume, those beyond the 2% isoline a 1:50 year recurrence and so on. Years that lie within the 50% probability contour may generally be regarded as being typical in terms of both flood peak and volume.
At Vientiane, conditions during 2006 were typical, while those that were experienced in 1966 are estimated to have a risk of occurrence of between 50 and 100 years. Correspondingly, the extremely low flood peak and volume of 1992 have a joint risk of occurrence in excess of 1:100 years.
•
•
•
•
•
•
17
Annual Mekong Flood Report 2006
Figure 10. Bivariate probabilities of the joint distribution of annual flood peak and volume at Chiang Saen, Vientiane and Kratie. For example, points lying outside of the 1% isoline would have a recurrence interval in excess of 1:100 years, any outside of the 2% contour a recurrence interval great than 50 years, and so on.
1
2
510
20
50
Contours of equal probability (%)
Flood volume km3
Peak
dis
char
ge
(cu
mec
s)
2006
1970
1975
10 30 50 70 90 110
5 000
10 000
15 000
20 000
25 000
1966
1971
19922003
1972
Chiang Saen
1
25
1020
50
Flood volume km3
Contours of equal probability
2006
200 300 400 500 600
25 000
35 000
45 000
55 000
65 000
75 000
Peak
dis
char
ge
(cu
mec
s)
19391991
2000
1988
1978
2004
1992
1998
1955
Kratie
1
2
5
10
20
50
Flood volume km3
Peak
dis
char
ge
(cu
mec
s)
Contours of equal probability (%) 1924 1966
2002
1938
1957
2006
0 20 40 60 80 100 120 140 160 180 2005000
10 000
15 000
20 000
25 000
30 000
1992
1987
1958
Vientiane
At Kratie, circumstances in 2006 were such that the much lower than normal combination of peak and volume would not be expected more frequently than 1:5 years on average over the long term. By virtue of the fact that the severe 2000 event had an unexceptional peak combined with an exceptionally high volume, the estimated recurrence interval lies somewhere between 20 and 50 years.
At Chiang Saen, data are only available since 1960, providing a sample size only half that at Vientiane and Kratie. Conditions in 2006 were, as has been already observed, on average. The extreme conditions of 1966 define what is generally regarded as a complete ‘outlier’ within the historical record, combining an unprecedented peak discharge with an unprecedented flood volume (see Appendix 2).
•
•
18
Annual Mekong Flood Report 2006
2.4 Temporal aspects of the Mekong flood regime
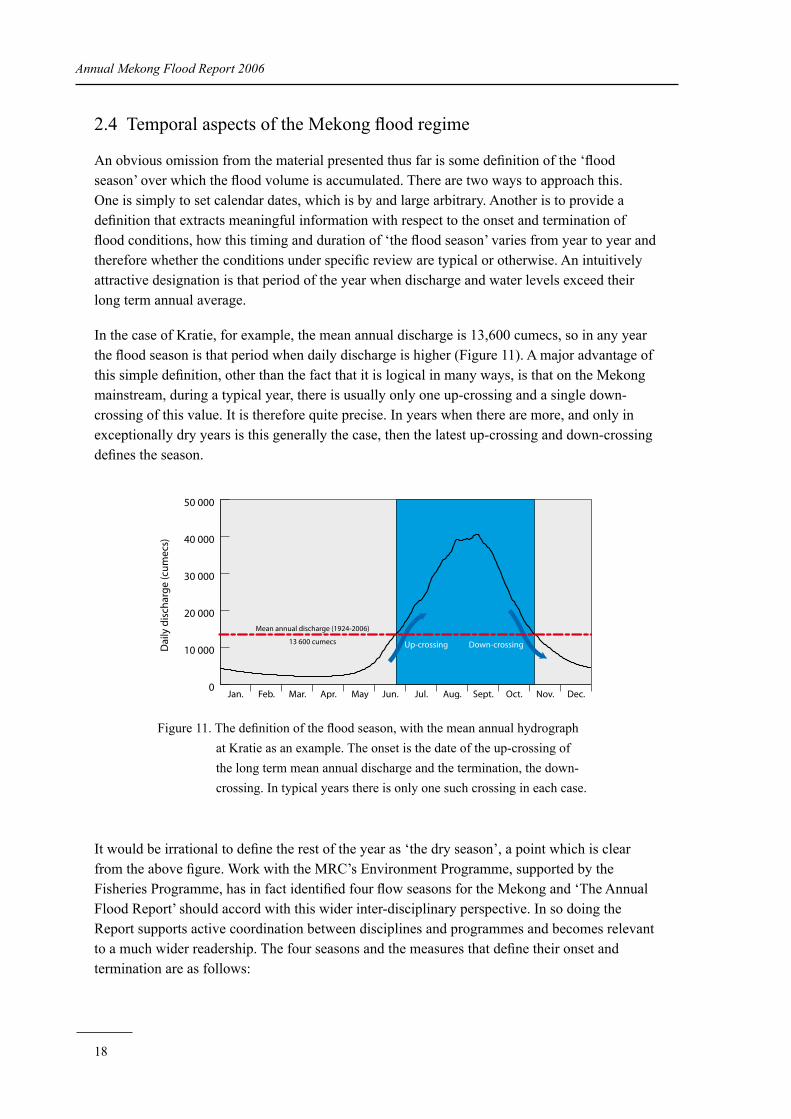
An obvious omission from the material presented thus far is some definition of the ‘flood season’ over which the flood volume is accumulated. There are two ways to approach this. One is simply to set calendar dates, which is by and large arbitrary. Another is to provide a definition that extracts meaningful information with respect to the onset and termination of flood conditions, how this timing and duration of ‘the flood season’ varies from year to year and therefore whether the conditions under specific review are typical or otherwise. An intuitively attractive designation is that period of the year when discharge and water levels exceed their long term annual average.
In the case of Kratie, for example, the mean annual discharge is 13,600 cumecs, so in any year the flood season is that period when daily discharge is higher (Figure 11). A major advantage of this simple definition, other than the fact that it is logical in many ways, is that on the Mekong mainstream, during a typical year, there is usually only one up-crossing and a single down-crossing of this value. It is therefore quite precise. In years when there are more, and only in exceptionally dry years is this generally the case, then the latest up-crossing and down-crossing defines the season.
It would be irrational to define the rest of the year as ‘the dry season’, a point which is clear from the above figure. Work with the MRC’s Environment Programme, supported by the Fisheries Programme, has in fact identified four flow seasons for the Mekong and ‘The Annual Flood Report’ should accord with this wider inter-disciplinary perspective. In so doing the Report supports active coordination between disciplines and programmes and becomes relevant to a much wider readership. The four seasons and the measures that define their onset and termination are as follows:
Figure 11. The definition of the flood season, with the mean annual hydrograph at Kratie as an example. The onset is the date of the up-crossing of the long term mean annual discharge and the termination, the down-crossing. In typical years there is only one such crossing in each case.
0
10 000
20 000
30 000
40 000
50 000
Jan. Feb. Mar. Apr. May Jun. Jul. Aug. Sept. Oct. Nov. Dec.
Mean annual discharge (1924-2006)
13 600 cumecs Up-crossing Down-crossing Dai
ly d
isch
arg
e (c
um
ecs)
19
Annual Mekong Flood Report 2006
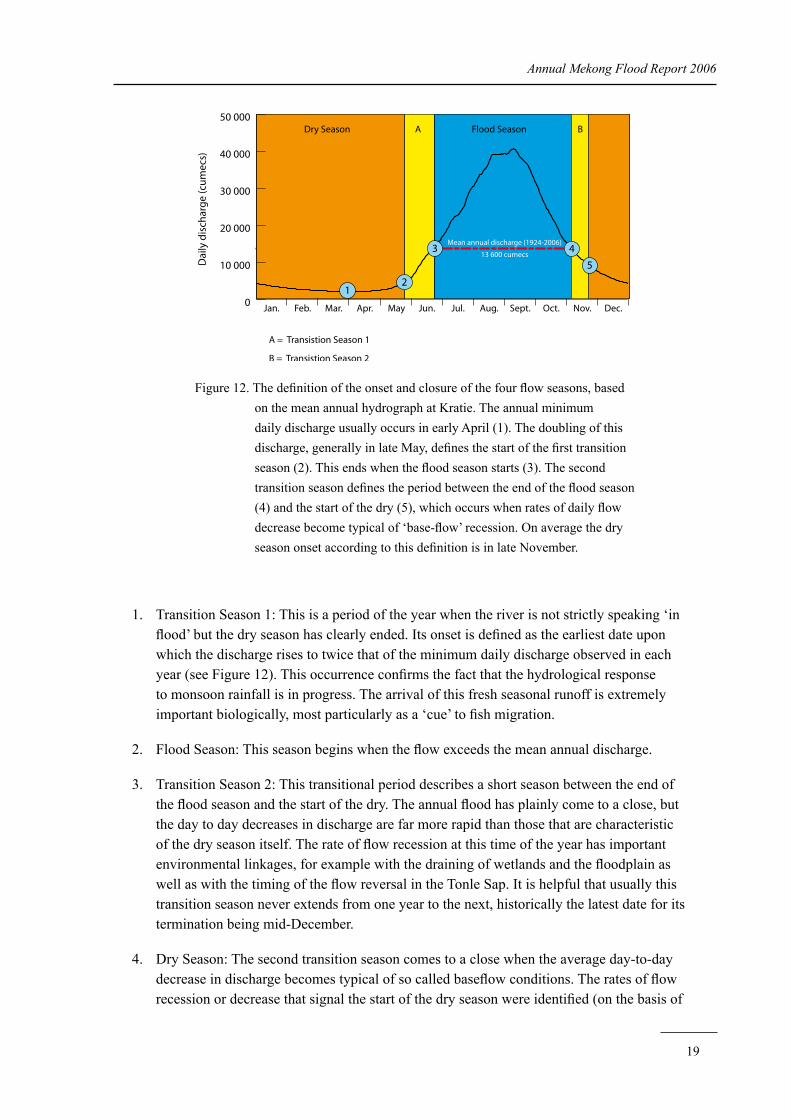
Figure 12. The definition of the onset and closure of the four flow seasons, based on the mean annual hydrograph at Kratie. The annual minimum daily discharge usually occurs in early April (1). The doubling of this discharge, generally in late May, defines the start of the first transition season (2). This ends when the flood season starts (3). The second transition season defines the period between the end of the flood season (4) and the start of the dry (5), which occurs when rates of daily flow decrease become typical of ‘base-flow’ recession. On average the dry season onset according to this definition is in late November.
Mean annual discharge (1924-2006)
13 600 cumecs
0
10 000
20 000
30 000
40 000
50 000
Jan. Feb. Mar. Apr. May Jun. Jul. Aug. Sept. Oct. Nov. Dec.
Flood Season Dry Season A B
A = Transistion Season 1
B = Transistion Season 2
1
5
43
2
Dai
ly d
isch
arg
e (c
um
ecs)
Transition Season 1: This is a period of the year when the river is not strictly speaking ‘in flood’ but the dry season has clearly ended. Its onset is defined as the earliest date upon which the discharge rises to twice that of the minimum daily discharge observed in each year (see Figure 12). This occurrence confirms the fact that the hydrological response to monsoon rainfall is in progress. The arrival of this fresh seasonal runoff is extremely important biologically, most particularly as a ‘cue’ to fish migration.
Flood Season: This season begins when the flow exceeds the mean annual discharge.
Transition Season 2: This transitional period describes a short season between the end of the flood season and the start of the dry. The annual flood has plainly come to a close, but the day to day decreases in discharge are far more rapid than those that are characteristic of the dry season itself. The rate of flow recession at this time of the year has important environmental linkages, for example with the draining of wetlands and the floodplain as well as with the timing of the flow reversal in the Tonle Sap. It is helpful that usually this transition season never extends from one year to the next, historically the latest date for its termination being mid-December.
Dry Season: The second transition season comes to a close when the average day-to-day decrease in discharge becomes typical of so called baseflow conditions. The rates of flow recession or decrease that signal the start of the dry season were identified (on the basis of
1.
2.
3.
4.
20
Annual Mekong Flood Report 2006
some research) as the onset of a rate of decrease in daily flows of 1%, averaged over two weeks. This proved to be a consistent indicator along the mainstream.
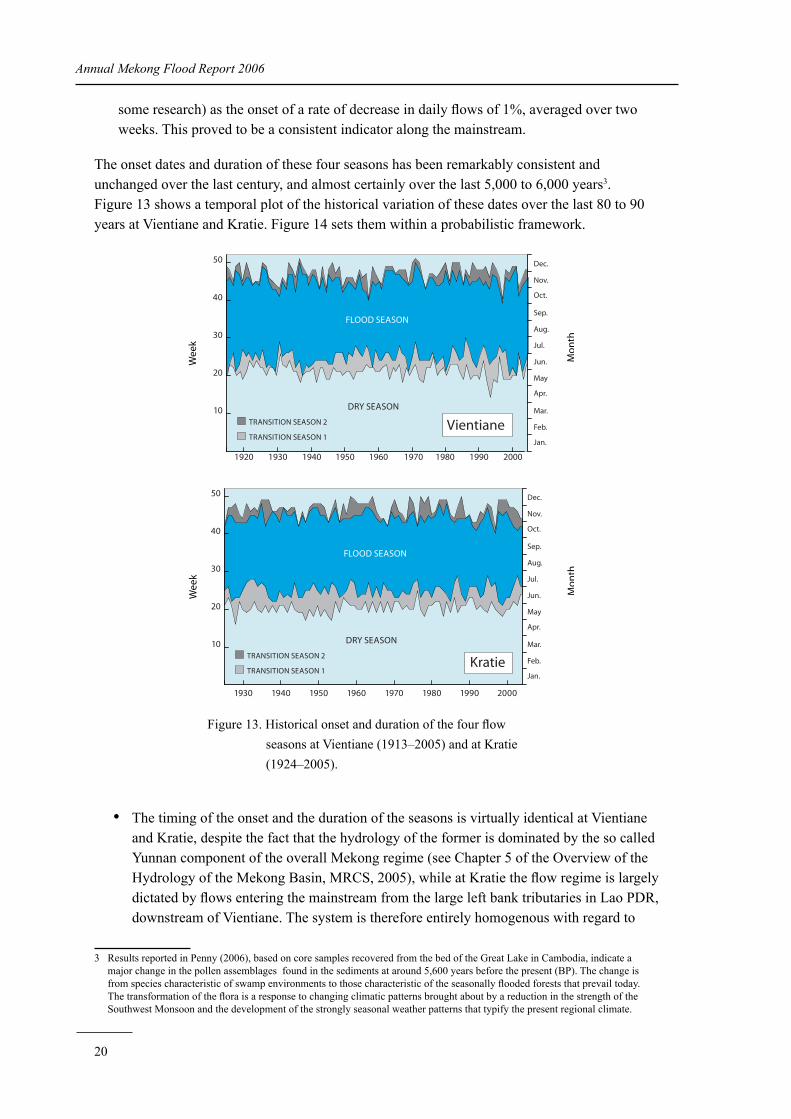
The onset dates and duration of these four seasons has been remarkably consistent and unchanged over the last century, and almost certainly over the last 5,000 to 6,000 years3. Figure 13 shows a temporal plot of the historical variation of these dates over the last 80 to 90 years at Vientiane and Kratie. Figure 14 sets them within a probabilistic framework.
The timing of the onset and the duration of the seasons is virtually identical at Vientiane and Kratie, despite the fact that the hydrology of the former is dominated by the so called Yunnan component of the overall Mekong regime (see Chapter 5 of the Overview of the Hydrology of the Mekong Basin, MRCS, 2005), while at Kratie the flow regime is largely dictated by flows entering the mainstream from the large left bank tributaries in Lao PDR, downstream of Vientiane. The system is therefore entirely homogenous with regard to
3 Results reported in Penny (2006), based on core samples recovered from the bed of the Great Lake in Cambodia, indicate a major change in the pollen assemblages found in the sediments at around 5,600 years before the present (BP). The change is from species characteristic of swamp environments to those characteristic of the seasonally flooded forests that prevail today. The transformation of the flora is a response to changing climatic patterns brought about by a reduction in the strength of the Southwest Monsoon and the development of the strongly seasonal weather patterns that typify the present regional climate.
•
Figure 13. Historical onset and duration of the four flow seasons at Vientiane (1913–2005) and at Kratie (1924–2005).
10
20
30
40
50
FLOOD SEASON
DRY SEASON
TRANSITION SEASON 1
TRANSITION SEASON 2
Jan.
Feb.
Mar.
Apr.
May
Jun.
Jul.
Aug.
Sep.
Oct.
Nov.
Dec.
200019901980197019601950194019301920
Wee
kW
eek
Mo
nth
Mo
nth
TRANSITION SEASON 2
20001990198019701960195019401930
10
20
30
40
50
FLOOD SEASON
DRY SEASON
TRANSITION SEASON 1Jan.
Feb.
Mar.
Apr.
May
Jun.
Jul.
Aug.
Sep.
Oct.
Nov.
Dec.
Vientiane
Kratie
21
Annual Mekong Flood Report 2006
these temporal aspects of its hydrology. However, it is not homogenous with respect to the incidence and severity of floods from year to year upstream and downstream of Vientiane (See Chapter 2.2).
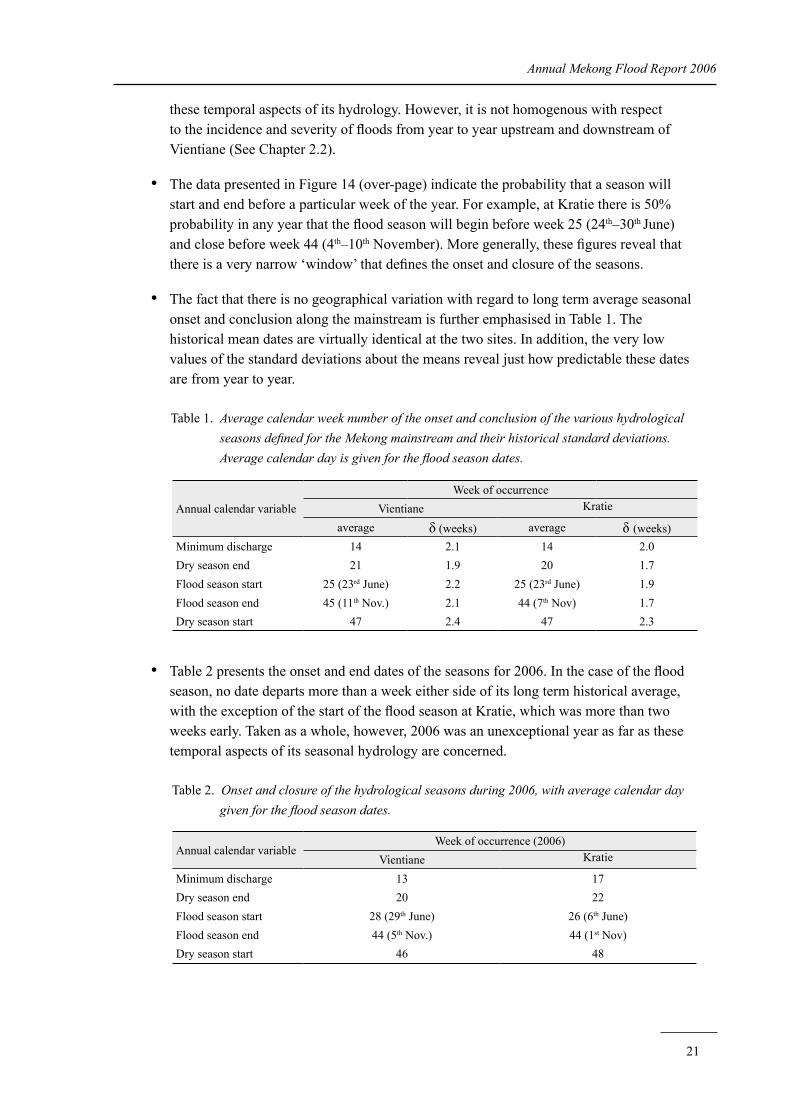
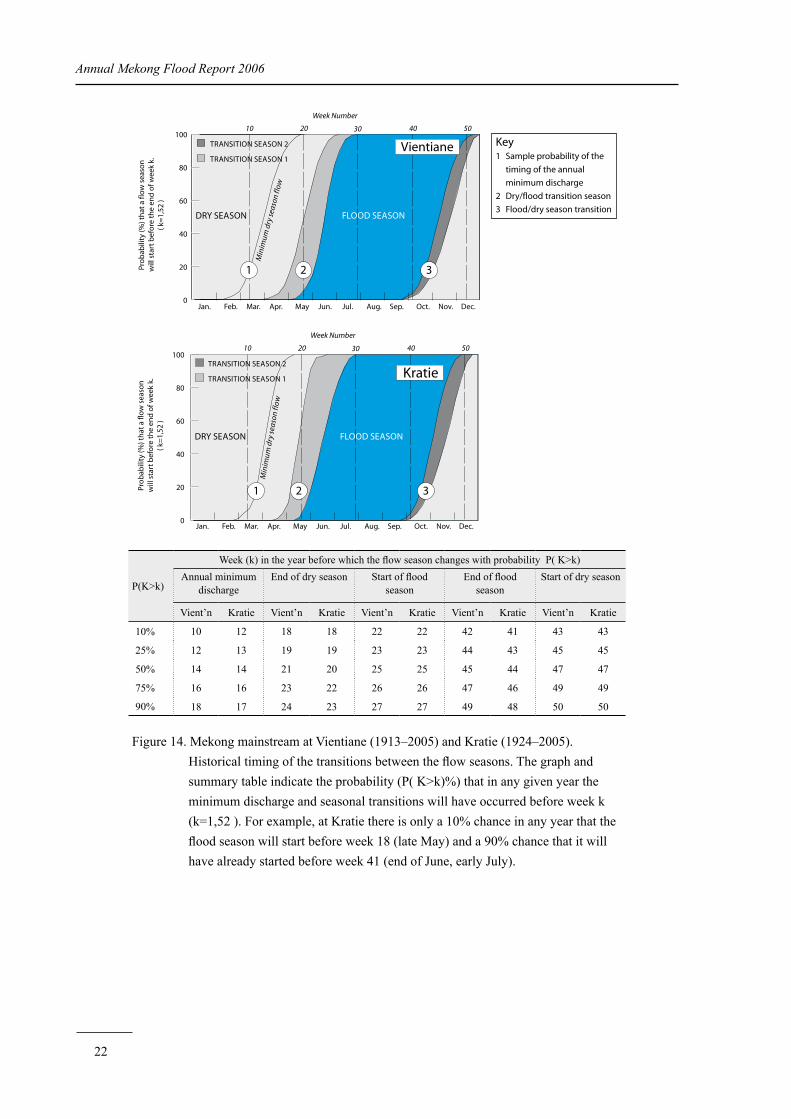
The data presented in Figure 14 (over-page) indicate the probability that a season will start and end before a particular week of the year. For example, at Kratie there is 50% probability in any year that the flood season will begin before week 25 (24th–30th June) and close before week 44 (4th–10th November). More generally, these figures reveal that there is a very narrow ‘window’ that defines the onset and closure of the seasons.
The fact that there is no geographical variation with regard to long term average seasonal onset and conclusion along the mainstream is further emphasised in Table 1. The historical mean dates are virtually identical at the two sites. In addition, the very low values of the standard deviations about the means reveal just how predictable these dates are from year to year.
Table 1. Average calendar week number of the onset and conclusion of the various hydrological seasons defined for the Mekong mainstream and their historical standard deviations. Average calendar day is given for the flood season dates.
Table 2 presents the onset and end dates of the seasons for 2006. In the case of the flood season, no date departs more than a week either side of its long term historical average, with the exception of the start of the flood season at Kratie, which was more than two weeks early. Taken as a whole, however, 2006 was an unexceptional year as far as these temporal aspects of its seasonal hydrology are concerned.
Table 2. Onset and closure of the hydrological seasons during 2006, with average calendar day given for the flood season dates.
•
•
•
Annual calendar variableWeek of occurrence
Vientiane Kratie
average δ (weeks) average δ (weeks)Minimum discharge 14 2.1 14 2.0Dry season end 21 1.9 20 1.7Flood season start 25 (23rd June) 2.2 25 (23rd June) 1.9Flood season end 45 (11th Nov.) 2.1 44 (7th Nov) 1.7Dry season start 47 2.4 47 2.3
Annual calendar variableWeek of occurrence (2006)
Vientiane Kratie
Minimum discharge 13 17Dry season end 20 22Flood season start 28 (29th June) 26 (6th June) Flood season end 44 (5th Nov.) 44 (1st Nov)Dry season start 46 48
22
Annual Mekong Flood Report 2006
Figure 14. Mekong mainstream at Vientiane (1913–2005) and Kratie (1924–2005). Historical timing of the transitions between the flow seasons. The graph and summary table indicate the probability (P( K>k)%) that in any given year the minimum discharge and seasonal transitions will have occurred before week k (k=1,52 ). For example, at Kratie there is only a 10% chance in any year that the flood season will start before week 18 (late May) and a 90% chance that it will have already started before week 41 (end of June, early July).
0
20
40
60
80
100
FLOOD SEASONDRY SEASON
Min
imum
dry
seas
onfl
ow
TRANSITION SEASON 2
TRANSITION SEASON 1
10 20 30 40 50
Week Number
Jan. Feb. Mar. Apr. May Jun. Jul. Aug. Sep. Oct. Nov. Dec.
Pro
bab
ility
(%) t
hat
a fl
ow
sea
son
w
ill s
tart
bef
ore
th
e en
d o
f wee
k k.
( k=
1,52
)
0
20
40
60
80
100
FLOOD SEASONDRY SEASON
Min
imum
dry
seas
onfl
ow
TRANSITION SEASON 2
TRANSITION SEASON 1
10 20 30 40 50
Week Number
Jan. Feb. Mar. Apr. May Jun. Jul. Aug. Sep. Oct. Nov. Dec.
Pro
bab
ility
(%) t
hat
a fl
ow
sea
son
w
ill s
tart
bef
ore
th
e en
d o
f wee
k k.
( k=
1,52
)
1 2 3
1 2 3
Key1 Sample probability of the
timing of the annual
minimum discharge
2 Dry/flood transition season
3 Flood/dry season transition
Vientiane
Kratie
P(K>k)
Week (k) in the year before which the flow season changes with probability P( K>k)Annual minimum
dischargeEnd of dry season Start of flood
seasonEnd of flood
seasonStart of dry season
Vient’n Kratie Vient’n Kratie Vient’n Kratie Vient’n Kratie Vient’n Kratie
10% 10 12 18 18 22 22 42 41 43 43
25% 12 13 19 19 23 23 44 43 45 45
50% 14 14 21 20 25 25 45 44 47 47
75% 16 16 23 22 26 26 47 46 49 49
90% 18 17 24 23 27 27 49 48 50 50
23
3. The 2006 Flood Season
3.1 Hydrological and meteorological aspects
It has already been established that, from a hydrological perspective, flood conditions along the mainstream during 2006 were geographically quite variable.
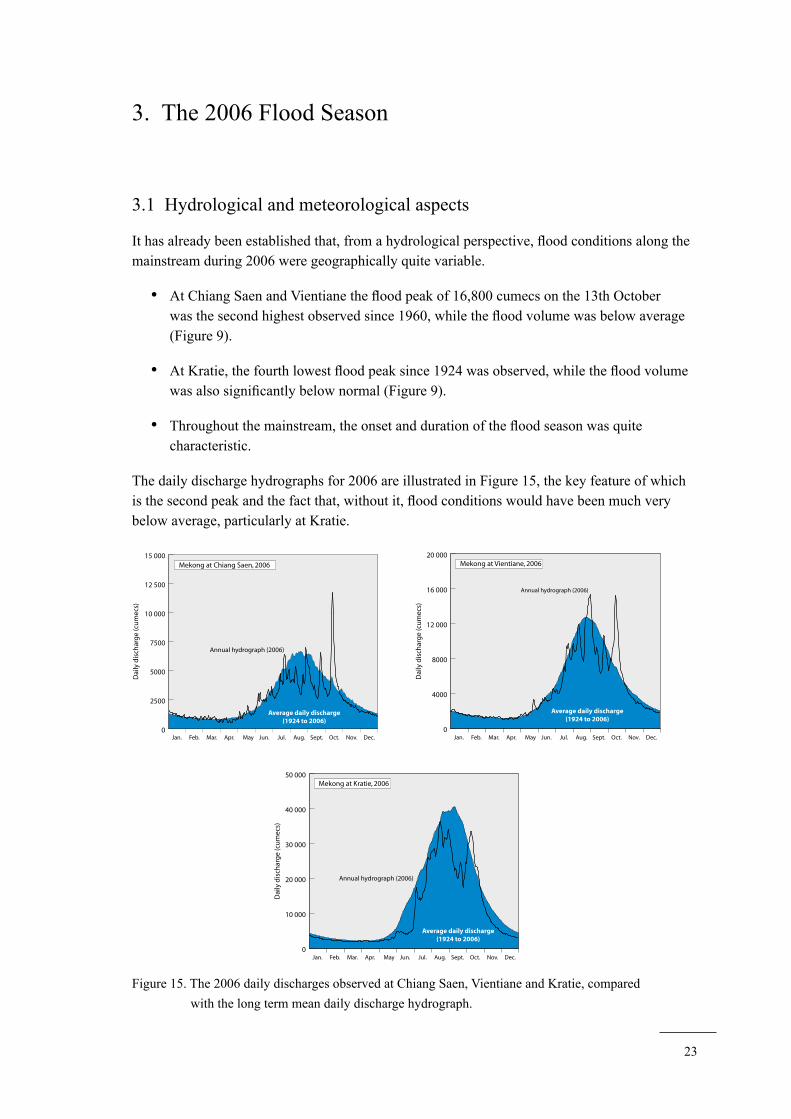
At Chiang Saen and Vientiane the flood peak of 16,800 cumecs on the 13th October was the second highest observed since 1960, while the flood volume was below average (Figure 9).
At Kratie, the fourth lowest flood peak since 1924 was observed, while the flood volume was also significantly below normal (Figure 9).
Throughout the mainstream, the onset and duration of the flood season was quite characteristic.
The daily discharge hydrographs for 2006 are illustrated in Figure 15, the key feature of which is the second peak and the fact that, without it, flood conditions would have been much very below average, particularly at Kratie.
•
•
•
0
2500
5000
7500
10 000
12 500
15 000
Jan. Feb. Mar. Apr. May Jun. Jul. Aug. Sept. Oct. Nov. Dec.
Mekong at Chiang Saen, 2006
Annual hydrograph (2006)
Dai
ly d
isch
arg
e (c
um
ecs)
Average daily discharge(1924 to 2006)
0
4000
8000
12 000
16 000
20 000
Jan. Feb. Mar. Apr. May Jun. Jul. Aug. Sept. Oct. Nov. Dec.
Mekong at Vientiane, 2006
Annual hydrograph (2006)
Dai
ly d
isch
arg
e (c
um
ecs)
Average daily discharge(1924 to 2006)
0
10 000
20 000
30 000
40 000
50 000
Jan. Feb. Mar. Apr. May Jun. Jul. Aug. Sept. Oct. Nov. Dec.
Mekong at Kratie, 2006
Annual hydrograph (2006)
Dai
ly d
isch
arg
e (c
um
ecs)
Average daily discharge(1924 to 2006)
Figure 15. The 2006 daily discharges observed at Chiang Saen, Vientiane and Kratie, compared with the long term mean daily discharge hydrograph.
24
Annual Mekong Flood Report 2006
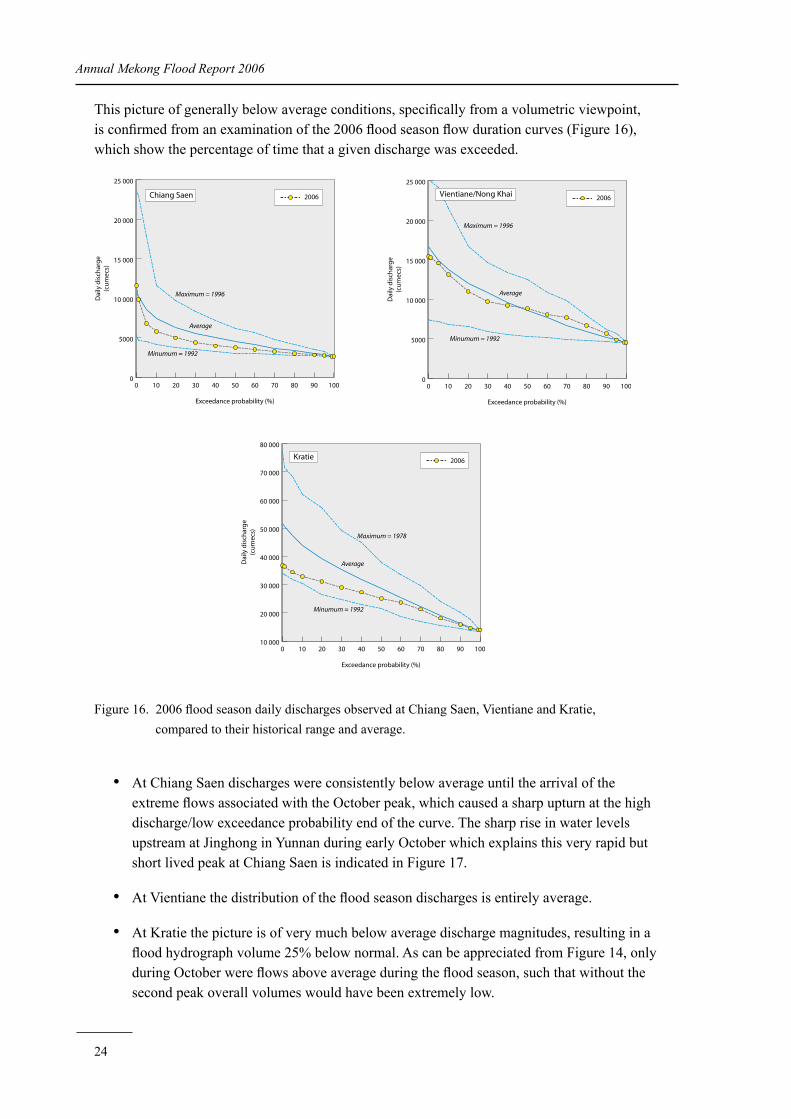
This picture of generally below average conditions, specifically from a volumetric viewpoint, is confirmed from an examination of the 2006 flood season flow duration curves (Figure 16), which show the percentage of time that a given discharge was exceeded.
At Chiang Saen discharges were consistently below average until the arrival of the extreme flows associated with the October peak, which caused a sharp upturn at the high discharge/low exceedance probability end of the curve. The sharp rise in water levels upstream at Jinghong in Yunnan during early October which explains this very rapid but short lived peak at Chiang Saen is indicated in Figure 17.
At Vientiane the distribution of the flood season discharges is entirely average.
At Kratie the picture is of very much below average discharge magnitudes, resulting in a flood hydrograph volume 25% below normal. As can be appreciated from Figure 14, only during October were flows above average during the flood season, such that without the second peak overall volumes would have been extremely low.
•
•
•
0 10 20 30 40 50 60 70 80 90 1000
5000
10 000
15 000
20 000
25 000
Exceedance probability (%)
Dai
ly d
isch
arg
e(c
um
ecs)
Maximum = 1996
Average
Minumum = 1992
2006Chiang Saen
0 10 20 30 40 50 60 70 80 90 1000
5000
10 000
15 000
20 000
25 000
Exceedance probability (%)
Dai
ly d
isch
arg
e(c
um
ecs)
Maximum = 1996
Average
Minumum = 1992
2006Vientiane/Nong Khai
0 10 20 30 40 50 60 70 80 90 10010 000
20 000
30 000
40 000
50 000
60 000
70 000
80 000
Exceedance probability (%)
Dai
ly d
isch
arg
e(c
um
ecs)
Maximum = 1978
Average
Minumum = 1992
2006Kratie
Figure 16. 2006 flood season daily discharges observed at Chiang Saen, Vientiane and Kratie, compared to their historical range and average.
25
Annual Mekong Flood Report 2006
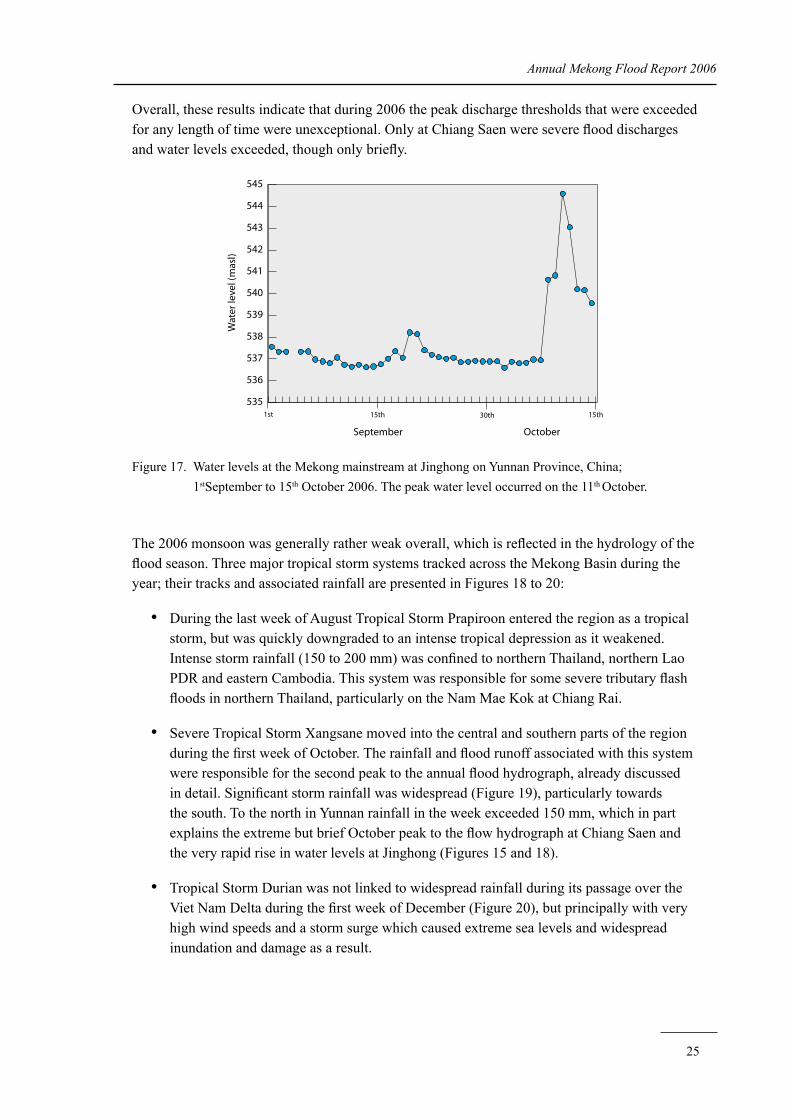
Overall, these results indicate that during 2006 the peak discharge thresholds that were exceeded for any length of time were unexceptional. Only at Chiang Saen were severe flood discharges and water levels exceeded, though only briefly.
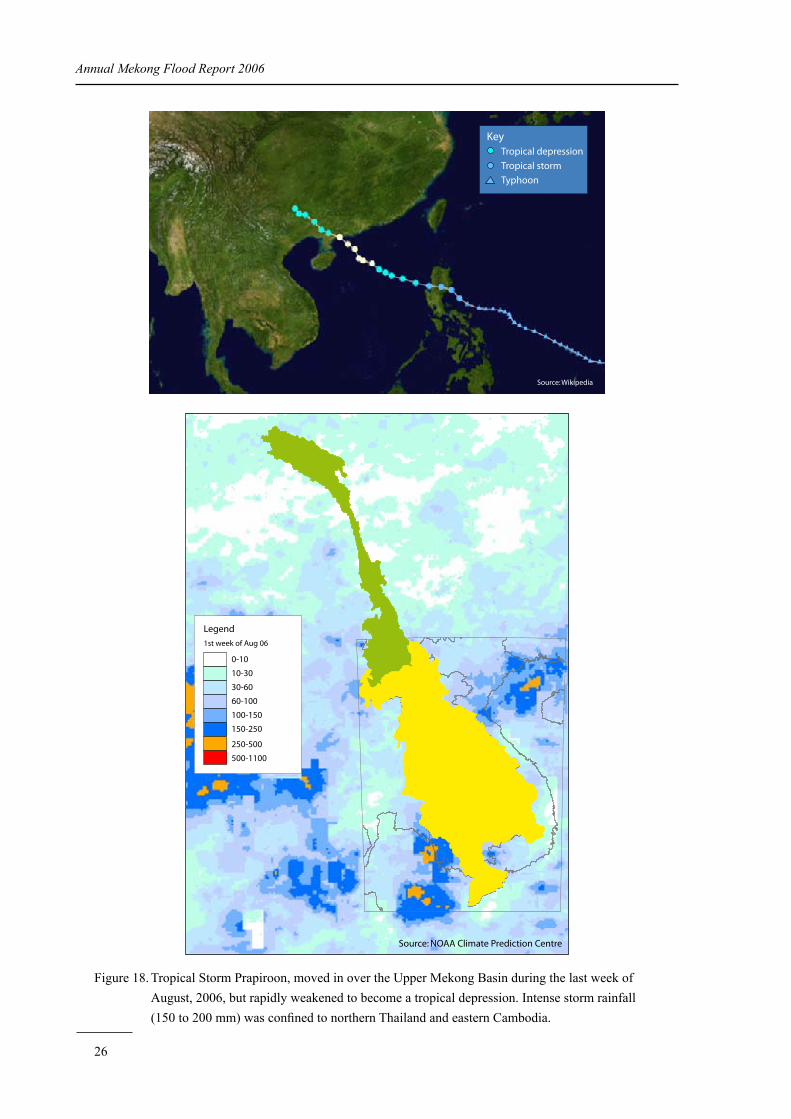
The 2006 monsoon was generally rather weak overall, which is reflected in the hydrology of the flood season. Three major tropical storm systems tracked across the Mekong Basin during the year; their tracks and associated rainfall are presented in Figures 18 to 20:
During the last week of August Tropical Storm Prapiroon entered the region as a tropical storm, but was quickly downgraded to an intense tropical depression as it weakened. Intense storm rainfall (150 to 200 mm) was confined to northern Thailand, northern Lao PDR and eastern Cambodia. This system was responsible for some severe tributary flash floods in northern Thailand, particularly on the Nam Mae Kok at Chiang Rai.
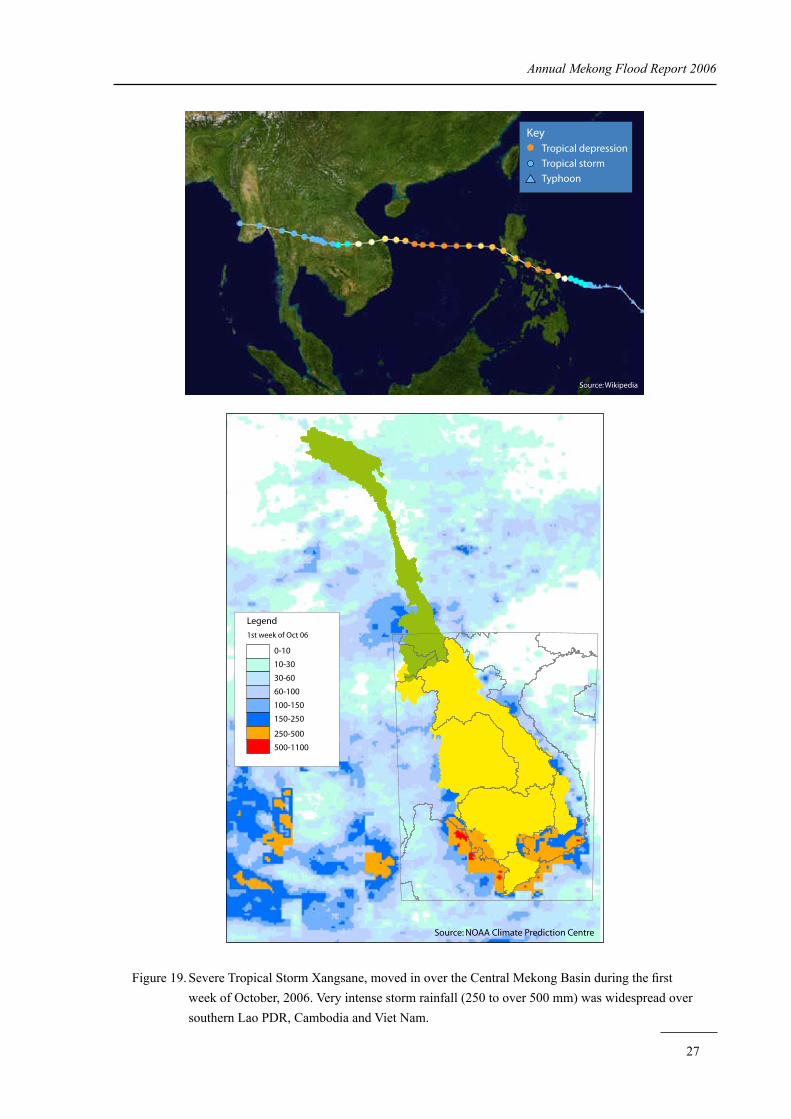
Severe Tropical Storm Xangsane moved into the central and southern parts of the region during the first week of October. The rainfall and flood runoff associated with this system were responsible for the second peak to the annual flood hydrograph, already discussed in detail. Significant storm rainfall was widespread (Figure 19), particularly towards the south. To the north in Yunnan rainfall in the week exceeded 150 mm, which in part explains the extreme but brief October peak to the flow hydrograph at Chiang Saen and the very rapid rise in water levels at Jinghong (Figures 15 and 18).
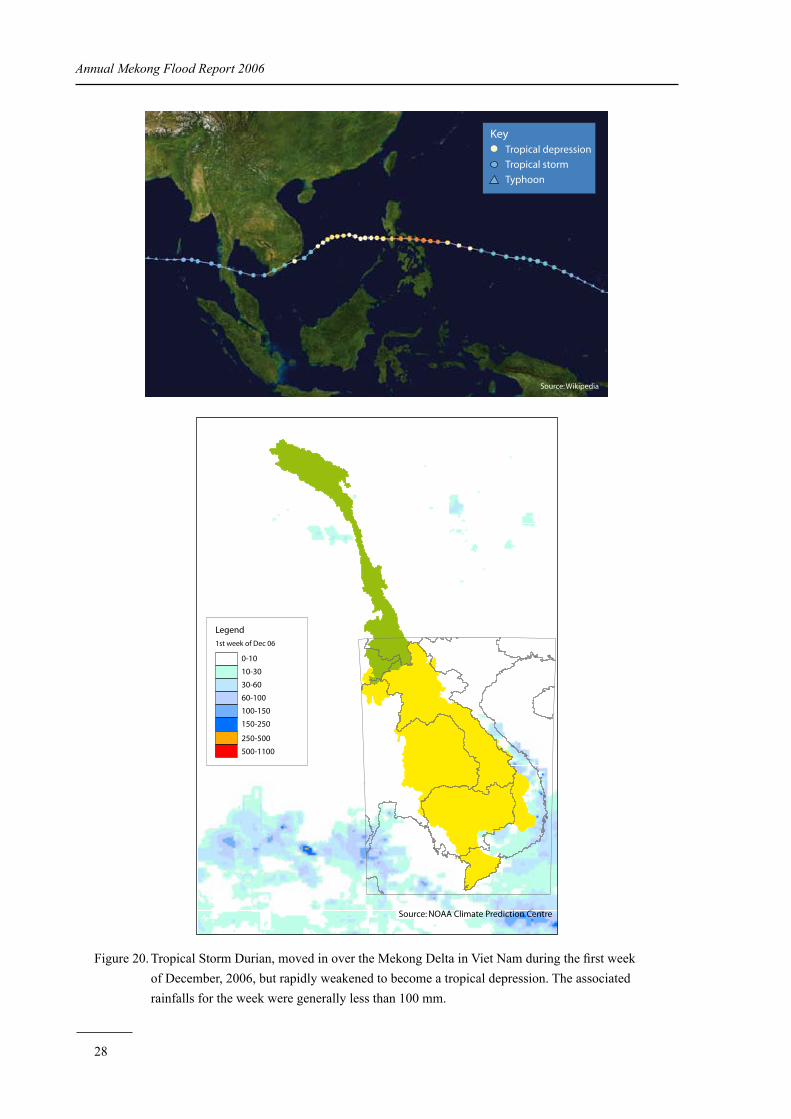
Tropical Storm Durian was not linked to widespread rainfall during its passage over the Viet Nam Delta during the first week of December (Figure 20), but principally with very high wind speeds and a storm surge which caused extreme sea levels and widespread inundation and damage as a result.
•
•
•
1st 15th15th 30th
535
536
537
538
539
540
541
542
543
544
545
September October
Wat
er le
vel (
mas
l)
Figure 17. Water levels at the Mekong mainstream at Jinghong on Yunnan Province, China; 1stSeptember to 15th October 2006. The peak water level occurred on the 11th October.
26
Annual Mekong Flood Report 2006
Typhoon
Tropical storm
Tropical depression
Key
Source: Wikipedia
Legend
1st week of Aug 06
0-10
10-30
30-60
60-100
100-150
150-250
250-500
500-1100
Source: NOAA Climate Prediction Centre
Figure 18. Tropical Storm Prapiroon, moved in over the Upper Mekong Basin during the last week of August, 2006, but rapidly weakened to become a tropical depression. Intense storm rainfall (150 to 200 mm) was confined to northern Thailand and eastern Cambodia.
27
Annual Mekong Flood Report 2006
Typhoon
Tropical storm
Tropical depression
Key
Source: Wikipedia
Legend
1st week of Oct 06
0-10
10-30
30-60
60-100
100-150
150-250
250-500
500-1100
Source: NOAA Climate Prediction Centre
Figure 19. Severe Tropical Storm Xangsane, moved in over the Central Mekong Basin during the first week of October, 2006. Very intense storm rainfall (250 to over 500 mm) was widespread over southern Lao PDR, Cambodia and Viet Nam.
28
Annual Mekong Flood Report 2006
Typhoon
Tropical storm
Tropical depression
Key
Source: Wikipedia
Legend
1st week of Dec 06
0-10
10-30
30-60
60-100
100-150
150-250
250-500
500-1100
Source: NOAA Climate Prediction Centre
Figure 20. Tropical Storm Durian, moved in over the Mekong Delta in Viet Nam during the first week of December, 2006, but rapidly weakened to become a tropical depression. The associated rainfalls for the week were generally less than 100 mm.
29
Annual Mekong Flood Report 2006
3.2 The 2006 flood season: conditions over the Cambodian floodplain and in the Delta in Viet Nam
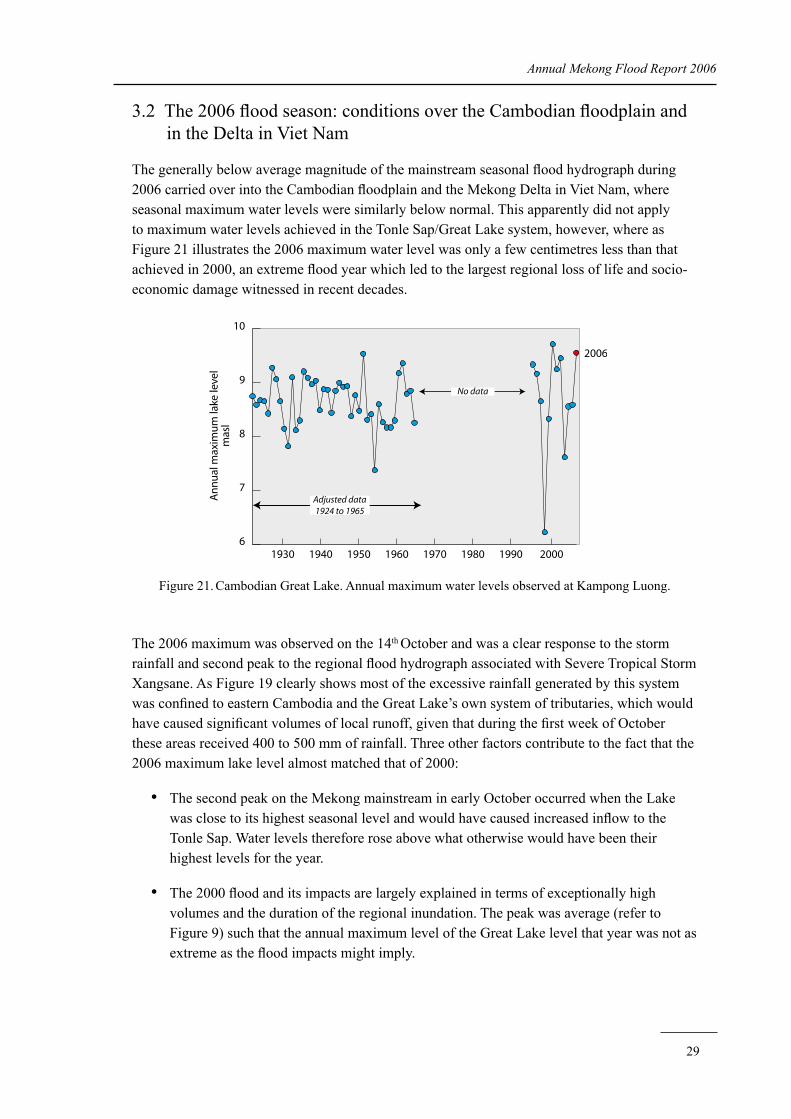
The generally below average magnitude of the mainstream seasonal flood hydrograph during 2006 carried over into the Cambodian floodplain and the Mekong Delta in Viet Nam, where seasonal maximum water levels were similarly below normal. This apparently did not apply to maximum water levels achieved in the Tonle Sap/Great Lake system, however, where as Figure 21 illustrates the 2006 maximum water level was only a few centimetres less than that achieved in 2000, an extreme flood year which led to the largest regional loss of life and socio-economic damage witnessed in recent decades.
The 2006 maximum was observed on the 14th October and was a clear response to the storm rainfall and second peak to the regional flood hydrograph associated with Severe Tropical Storm Xangsane. As Figure 19 clearly shows most of the excessive rainfall generated by this system was confined to eastern Cambodia and the Great Lake’s own system of tributaries, which would have caused significant volumes of local runoff, given that during the first week of October these areas received 400 to 500 mm of rainfall. Three other factors contribute to the fact that the 2006 maximum lake level almost matched that of 2000:
The second peak on the Mekong mainstream in early October occurred when the Lake was close to its highest seasonal level and would have caused increased inflow to the Tonle Sap. Water levels therefore rose above what otherwise would have been their highest levels for the year.
The 2000 flood and its impacts are largely explained in terms of exceptionally high volumes and the duration of the regional inundation. The peak was average (refer to Figure 9) such that the annual maximum level of the Great Lake level that year was not as extreme as the flood impacts might imply.
•
•
6
7
8
9
10
2006
Adjusted data1924 to 1965
No data
1930 1940 1950 1960 1970 1980 1990 2000
An
nu
al m
axim
um
lake
leve
lm
asl
Figure 21. Cambodian Great Lake. Annual maximum water levels observed at Kampong Luong.
30
Annual Mekong Flood Report 2006
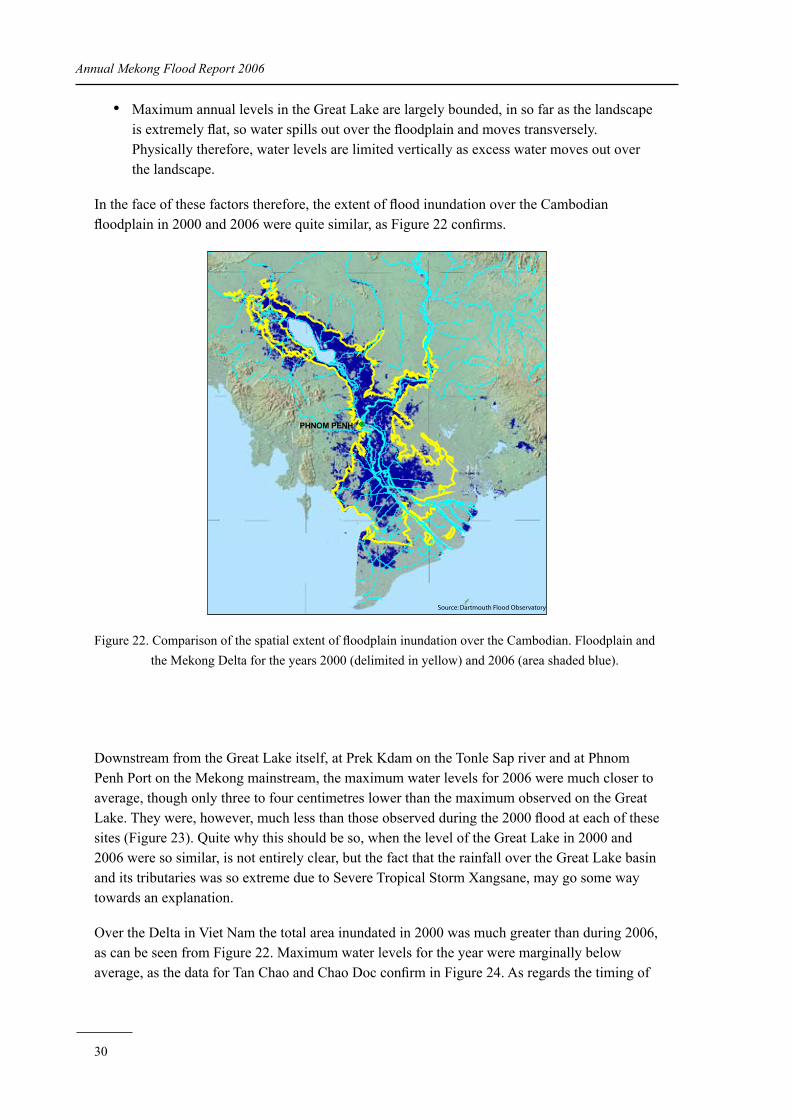
Maximum annual levels in the Great Lake are largely bounded, in so far as the landscape is extremely flat, so water spills out over the floodplain and moves transversely. Physically therefore, water levels are limited vertically as excess water moves out over the landscape.
In the face of these factors therefore, the extent of flood inundation over the Cambodian floodplain in 2000 and 2006 were quite similar, as Figure 22 confirms.
Downstream from the Great Lake itself, at Prek Kdam on the Tonle Sap river and at Phnom Penh Port on the Mekong mainstream, the maximum water levels for 2006 were much closer to average, though only three to four centimetres lower than the maximum observed on the Great Lake. They were, however, much less than those observed during the 2000 flood at each of these sites (Figure 23). Quite why this should be so, when the level of the Great Lake in 2000 and 2006 were so similar, is not entirely clear, but the fact that the rainfall over the Great Lake basin and its tributaries was so extreme due to Severe Tropical Storm Xangsane, may go some way towards an explanation.
Over the Delta in Viet Nam the total area inundated in 2000 was much greater than during 2006, as can be seen from Figure 22. Maximum water levels for the year were marginally below average, as the data for Tan Chao and Chao Doc confirm in Figure 24. As regards the timing of
•
Source: Dartmouth Flood Observatory
Figure 22. Comparison of the spatial extent of floodplain inundation over the Cambodian. Floodplain and the Mekong Delta for the years 2000 (delimited in yellow) and 2006 (area shaded blue).
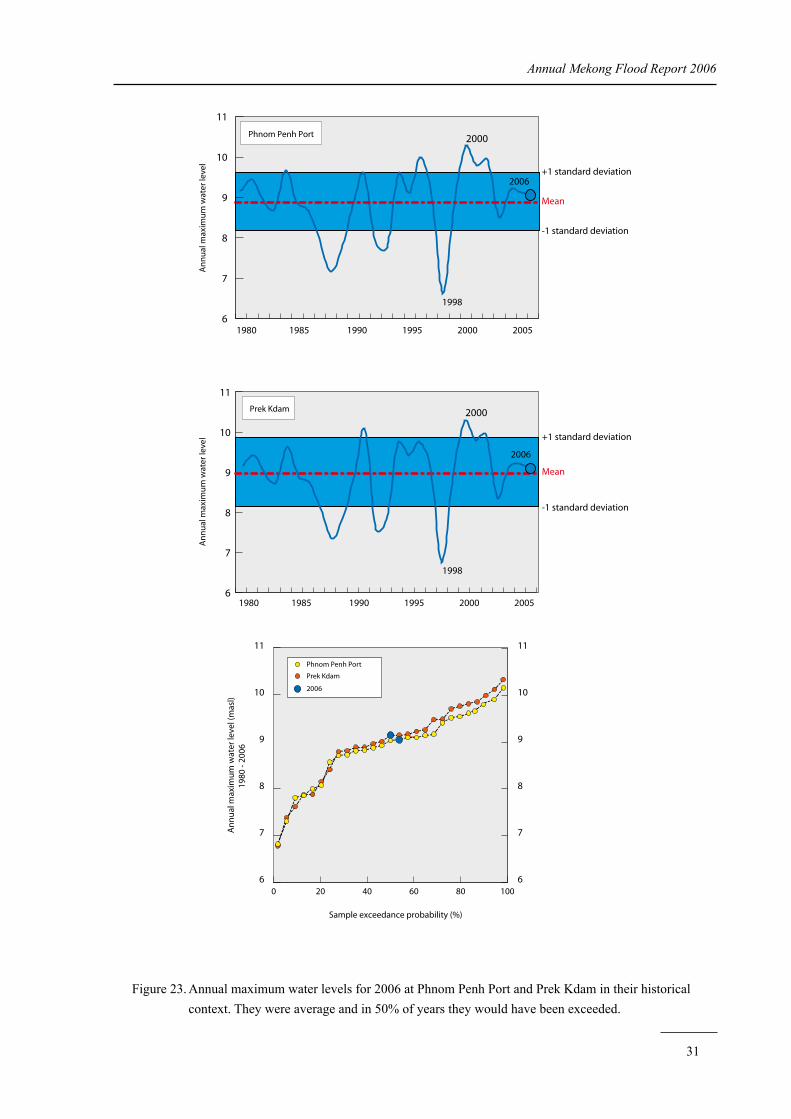
31
Annual Mekong Flood Report 2006
An
nu
al m
axim
um
wat
er le
vel
Phnom Penh Port
6
7
8
9
10
11
Mean
+1 standard deviation
-1 standard deviation
2006
1985 1990 1995 2000 20051980
1998
2000
Figure 23. Annual maximum water levels for 2006 at Phnom Penh Port and Prek Kdam in their historical context. They were average and in 50% of years they would have been exceeded.
6
7
8
9
10
11
An
nu
al m
axim
um
wat
er le
vel
Prek Kdam
2006
1985 1990 1995 2000 20051980
1998
Mean
+1 standard deviation
-1 standard deviation
2000
0 20 40 60 80 1006
7
8
9
10
11
6
7
8
9
10
11
Sample exceedance probability (%)
An
nu
al m
axim
um
wat
er le
vel (
mas
l)19
80 -
2006
Phnom Penh Port
Prek Kdam
2006
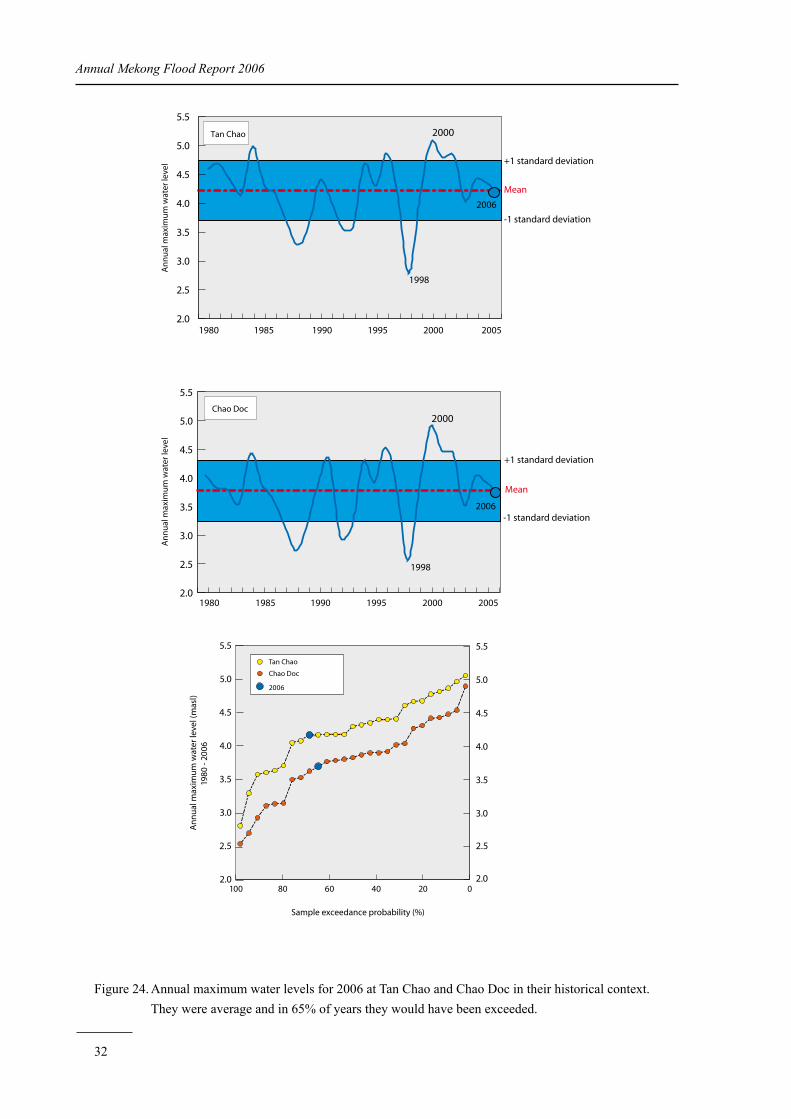
32
Annual Mekong Flood Report 2006
An
nu
al m
axim
um
wat
er le
vel
Tan Chao
2.0
2.5
3.0
3.5
4.0
4.5
5.0
5.5
Mean
+1 standard deviation
-1 standard deviation
1985 1990 1995 2000 20051980
1998
2006
2000
Figure 24. Annual maximum water levels for 2006 at Tan Chao and Chao Doc in their historical context. They were average and in 65% of years they would have been exceeded.
2.0
2.5
3.0
3.5
4.0
4.5
5.0
5.5
An
nu
al m
axim
um
wat
er le
vel
Chao Doc
2006
1985 1990 1995 2000 20051980
1998
Mean
+1 standard deviation
-1 standard deviation
2000
0204060801002.0
2.5
3.0
3.5
4.0
4.5
5.0
5.5
Sample exceedance probability (%)
An
nu
al m
axim
um
wat
er le
vel (
mas
l)19
80 -
2006
Tan Chao
Chao Doc
2006
2.0
2.5
3.0
3.5
4.0
4.5
5.0
5.5
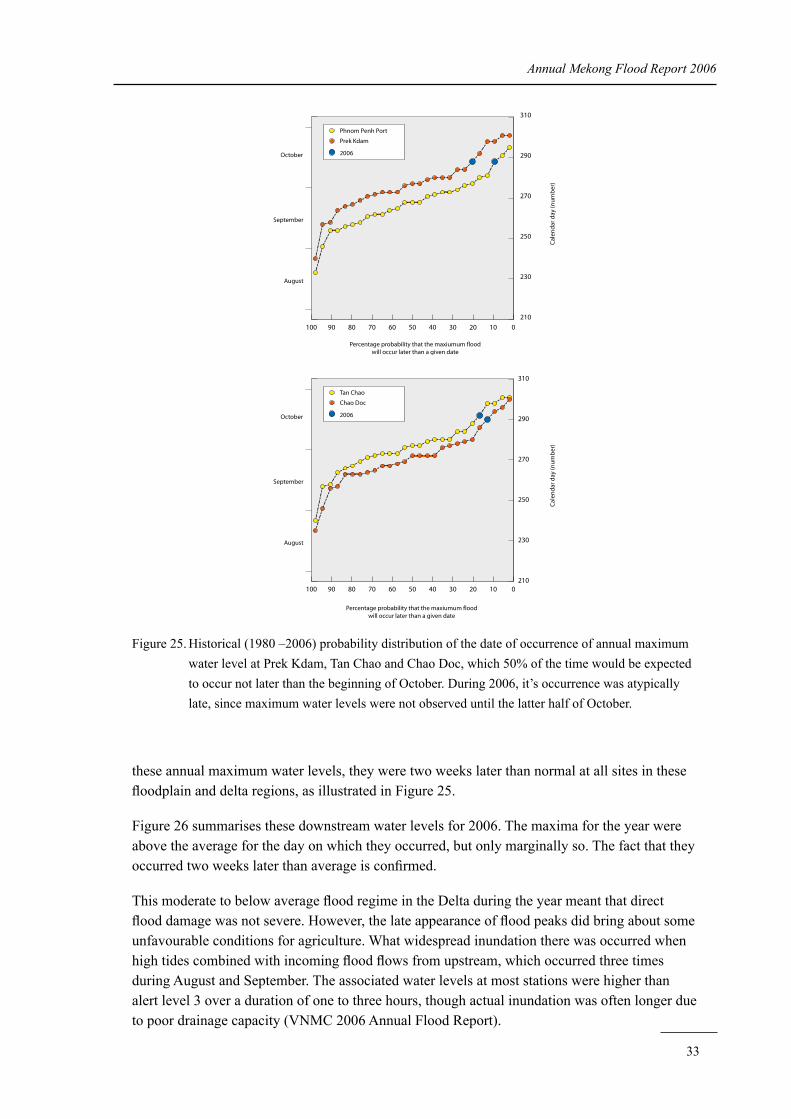
33
Annual Mekong Flood Report 2006
these annual maximum water levels, they were two weeks later than normal at all sites in these floodplain and delta regions, as illustrated in Figure 25.
Figure 26 summarises these downstream water levels for 2006. The maxima for the year were above the average for the day on which they occurred, but only marginally so. The fact that they occurred two weeks later than average is confirmed.
This moderate to below average flood regime in the Delta during the year meant that direct flood damage was not severe. However, the late appearance of flood peaks did bring about some unfavourable conditions for agriculture. What widespread inundation there was occurred when high tides combined with incoming flood flows from upstream, which occurred three times during August and September. The associated water levels at most stations were higher than alert level 3 over a duration of one to three hours, though actual inundation was often longer due to poor drainage capacity (VNMC 2006 Annual Flood Report).
0102030405060708090100
210
230
250
270
290
310
Percentage probability that the maxiumum floodwill occur later than a given date
Cal
end
ar d
ay (n
um
ber
)
Phnom Penh Port
Prek Kdam
2006October
September
August
0102030405060708090100210
230
250
270
290
310
Cal
end
ar d
ay (n
um
ber
)
Tan Chao
Chao Doc
2006October
September
August
Percentage probability that the maxiumum floodwill occur later than a given date
Figure 25. Historical (1980 –2006) probability distribution of the date of occurrence of annual maximum water level at Prek Kdam, Tan Chao and Chao Doc, which 50% of the time would be expected to occur not later than the beginning of October. During 2006, it’s occurrence was atypically late, since maximum water levels were not observed until the latter half of October.
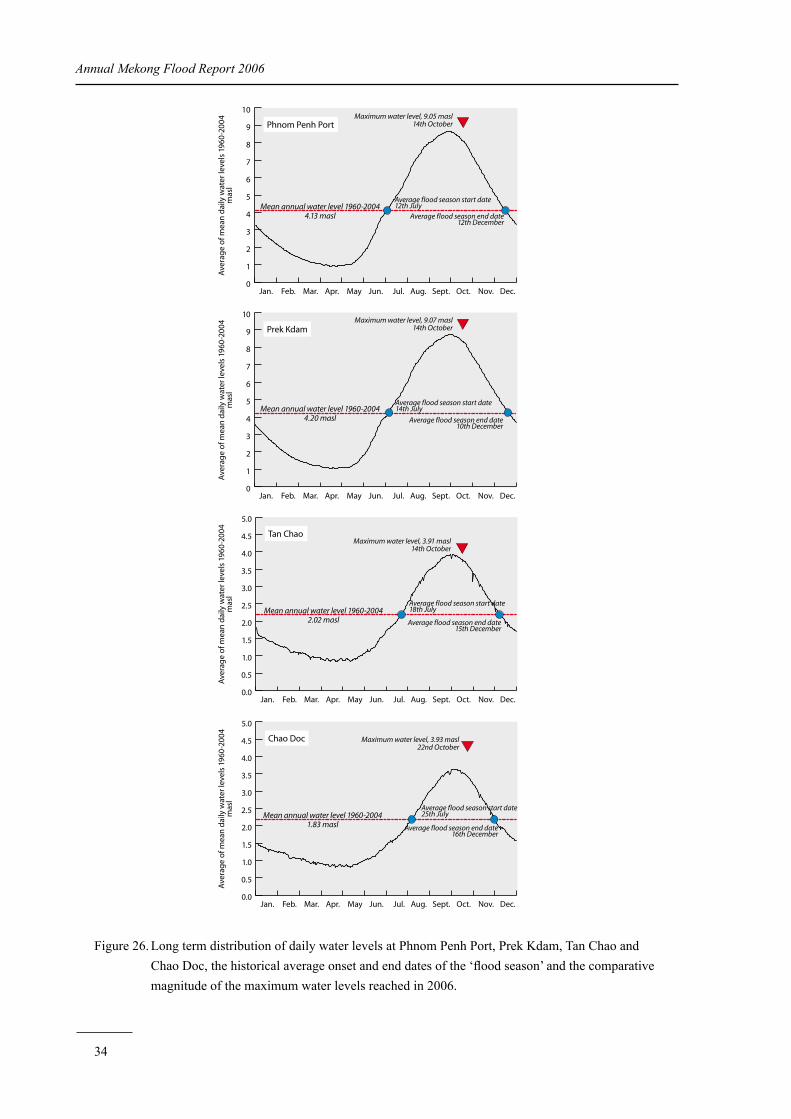
34
Annual Mekong Flood Report 2006
Figure 26. Long term distribution of daily water levels at Phnom Penh Port, Prek Kdam, Tan Chao and Chao Doc, the historical average onset and end dates of the ‘flood season’ and the comparative magnitude of the maximum water levels reached in 2006.
0
1
2
3
4
5
6
7
8
9
10
Jan. Feb. Mar. Apr. May Jun. Jul. Aug. Sept. Oct. Nov. Dec.
Ave
rag
e o
f mea
n d
aily
wat
er le
vels
196
0-2
004
mas
l
Phnom Penh PortMaximum water level, 9.05 masl
14th October
Mean annual water level 1960-20044.13 masl
Average flood season start date12th July
Average flood season end date12th December
0
1
2
3
4
5
6
7
8
9
10
Jan. Feb. Mar. Apr. May Jun. Jul. Aug. Sept. Oct. Nov. Dec.
Ave
rag
e o
f mea
n d
aily
wat
er le
vels
196
0-2
004
mas
l
Prek KdamMaximum water level, 9.07 masl
14th October
Mean annual water level 1960-20044.20 masl
Average flood season start date14th July
Average flood season end date10th December
0.0
0.5
1.0
1.5
2.0
2.5
3.0
3.5
4.0
4.5
5.0
Jan. Feb. Mar. Apr. May Jun. Jul. Aug. Sept. Oct. Nov. Dec.
Ave
rag
e o
f mea
n d
aily
wat
er le
vels
196
0-2
004
mas
l
Tan ChaoMaximum water level, 3.91 masl
14th October
Mean annual water level 1960-20042.02 masl
Average flood season start date18th July
Average flood season end date15th December
0.0
0.5
1.0
1.5
2.0
2.5
3.0
3.5
4.0
4.5
5.0
Jan. Feb. Mar. Apr. May Jun. Jul. Aug. Sept. Oct. Nov. Dec.
Ave
rag
e o
f mea
n d
aily
wat
er le
vels
196
0-2
004
mas
l
Chao Doc Maximum water level, 3.93 masl22nd October
Mean annual water level 1960-20041.83 masl
Average flood season start date25th July
Average flood season end date16th December
35
4. Cambodia 2006 Country Report
4.1 General situation
In Cambodia conditions during the 2006 flood season were below average both in terms of peak and volume. The flood peak was, in fact, amongst the lowest recorded over the last 80 or more years. The maximum discharge for the year occurred in mid August, after which water levels decreased considerably until early October and the passage across the region of Severe Tropical Storm Xangsane. This weather system generated a slightly lower second peak in mid October, an uncommon feature of the annual hydrograph. As a result of these below normal seasonal flows no significant crop losses were reported, with the exception of the fact that the unseasonally late second peak led to the inundation of some low lying areas. Some early flood recession rice plantings were lost and a second replanting was required.
No flood damage to infrastructure was recorded for the year.
4.2 Lessons learnt from a field trip to Kampong Cham, Kratie and Stung Treng—24th to 26th October 2006
Kampong Cham: The major flood related issues here are river bank erosion, the regular loss of crops and damage to property, domestic and commercial disruption, low levels of social awareness of the flood hazard, inadequate institutional capacity to receive and disseminate flood warnings and inadequate investment in flood mitigation and rehabilitation measures.
Kampong Cham: The present warning flood stage of the Mekong at Kampong Cham needs urgent review since in the recent past, during 2000, 2001, 2002, parts of the city were flooded despite the fact that the flood stage of 16.20 masl had not been reached. Frequency analyses of long term annual maximum water levels between 1930 and 2006 indicate that the flood warning stage of 15.20 masl has a return period of less than 4 years.
Kratie: The western part of the town was flooded at a Mekong River level of 22.05 masl, noting that the flood level at the hydrometric gauge is 21.9 masl. (Appendix 2). The 2006 maximum flood did not reach the warning level at any of the villages equipped with flood referencing facilities. It would be useful to establish the flood marks from the most recent 2000–2002 floods at each village as reference levels for issuing flood warning.
Kratie: The province has identified a total of 97 safe areas. Some provide emergency living accommodation during floods while others provide refuge for farm stock, which is generally the major family asset. Accessibility can be difficult during the dry season since access roads can be very poor. During the flood season, however, they are easily
•
•
•
•
36
Annual Mekong Flood Report 2006
accessible by boat. One pilot site with an area of 55 ha has been identified and will be equipped with facilities such as water supply, sanitation and proper access roads.
Stung Treng: The town has no protection from flood inundation, which is mainly caused by high water levels in the Mekong mainstream and backwater in three major local tributaries.
Stung Treng:The strategic location of the Stung Treng hydrometric station at the head of the major part of the Cambodian floodplain downstream is a key element within the regional flood forecasting network. The reliability of the station is not, however, what it should be under these circumstances. Forecasting accuracy could be improved in conjunction with data observed at Siem Pang and Chant Ngoy on the Sekong, at Andaung Meas, Veun Sai and Ban Kamphun on the Se San and at the Lumphat on the Sre Pok. Some of these stations, however, have ceased to operate and transmit data due to poor maintenance schedules and a lack of investment
Stung Treng. The reference levels used by the Regional Flood Management and Mitigation Centre at the Stung Treng are 10.7 masl for the alarm stage and 12.0 masl for the flood stage. These correspond to annual return periods of two and slightly less than fifteen years, which appears to be inconsistent and illogical.
Stung Treng: Provincially, 116 flood refuges have been identified, though only a few are equipped with even basic facilities such as water supply and toilets. Effective evacuation to them during a flood emergency is a village responsibility, though the capacity to organise and coordinate the process is not well developed. Nor are the means in place to transmit prompt flood warnings to vulnerable villages.
•
•
•
•
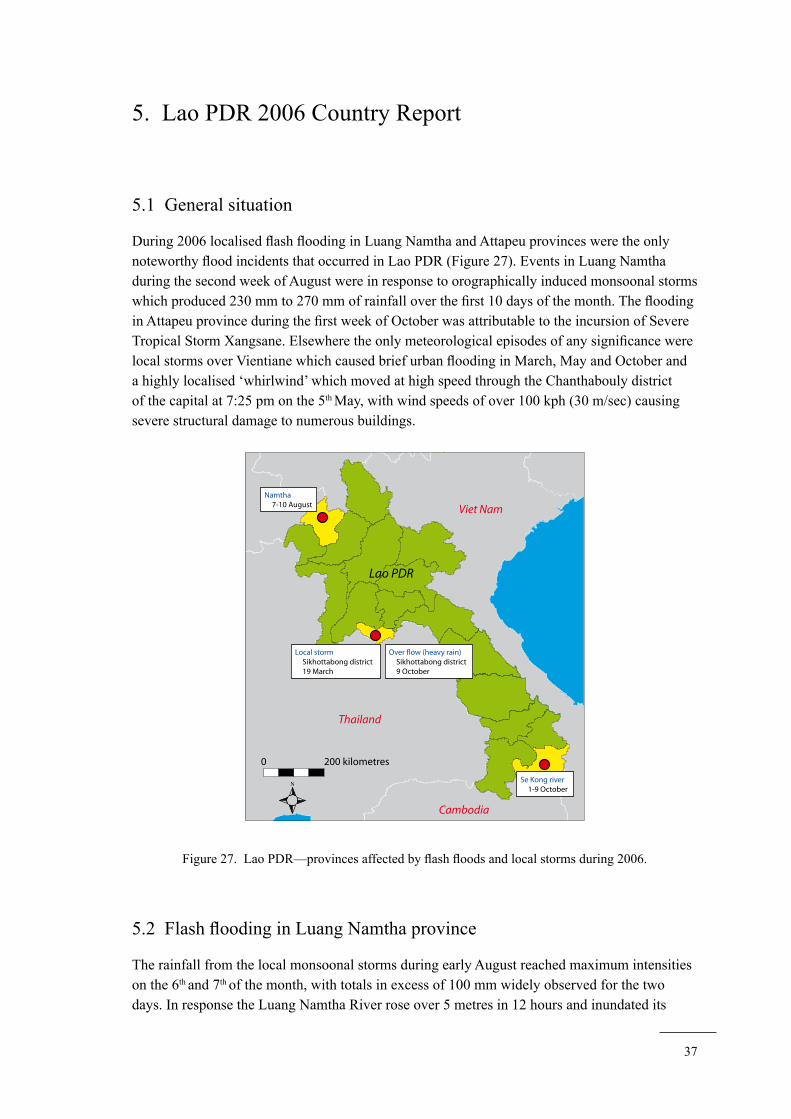
37
5. Lao PDR 2006 Country Report
5.1 General situation
During 2006 localised flash flooding in Luang Namtha and Attapeu provinces were the only noteworthy flood incidents that occurred in Lao PDR (Figure 27). Events in Luang Namtha during the second week of August were in response to orographically induced monsoonal storms which produced 230 mm to 270 mm of rainfall over the first 10 days of the month. The flooding in Attapeu province during the first week of October was attributable to the incursion of Severe Tropical Storm Xangsane. Elsewhere the only meteorological episodes of any significance were local storms over Vientiane which caused brief urban flooding in March, May and October and a highly localised ‘whirlwind’ which moved at high speed through the Chanthabouly district of the capital at 7:25 pm on the 5th May, with wind speeds of over 100 kph (30 m/sec) causing severe structural damage to numerous buildings.
Figure 27. Lao PDR—provinces affected by flash floods and local storms during 2006.
5.2 Flash flooding in Luang Namtha province
The rainfall from the local monsoonal storms during early August reached maximum intensities on the 6th and 7th of the month, with totals in excess of 100 mm widely observed for the two days. In response the Luang Namtha River rose over 5 metres in 12 hours and inundated its
Thailand
Viet Nam
Cambodia
Lao PDR
Se Kong river 1-9 October
Over flow (heavy rain) Sikhottabong district 9 October
Local storm Sikhottabong district 19 March
Namtha 7-10 August
0 200 kilometres
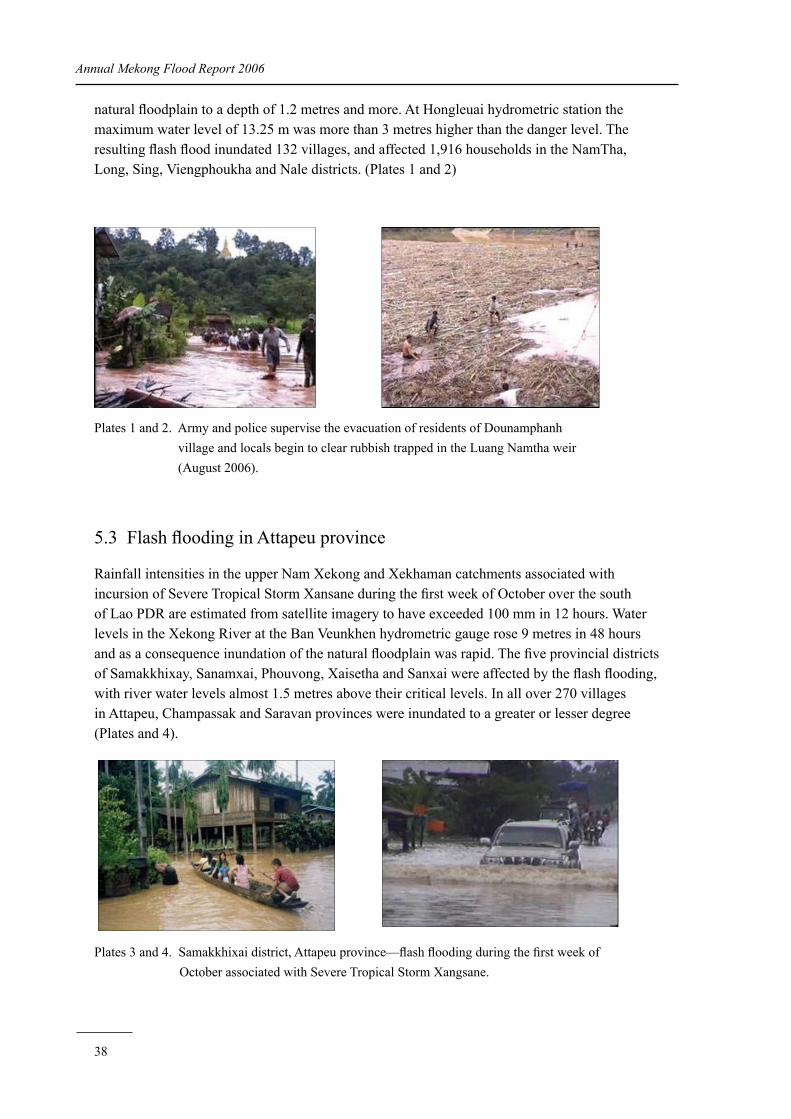
38
Annual Mekong Flood Report 2006
natural floodplain to a depth of 1.2 metres and more. At Hongleuai hydrometric station the maximum water level of 13.25 m was more than 3 metres higher than the danger level. The resulting flash flood inundated 132 villages, and affected 1,916 households in the NamTha, Long, Sing, Viengphoukha and Nale districts. (Plates 1 and 2)
Plates 1 and 2. Army and police supervise the evacuation of residents of Dounamphanh village and locals begin to clear rubbish trapped in the Luang Namtha weir (August 2006).
5.3 Flash flooding in Attapeu province
Rainfall intensities in the upper Nam Xekong and Xekhaman catchments associated with incursion of Severe Tropical Storm Xansane during the first week of October over the south of Lao PDR are estimated from satellite imagery to have exceeded 100 mm in 12 hours. Water levels in the Xekong River at the Ban Veunkhen hydrometric gauge rose 9 metres in 48 hours and as a consequence inundation of the natural floodplain was rapid. The five provincial districts of Samakkhixay, Sanamxai, Phouvong, Xaisetha and Sanxai were affected by the flash flooding, with river water levels almost 1.5 metres above their critical levels. In all over 270 villages in Attapeu, Champassak and Saravan provinces were inundated to a greater or lesser degree (Plates and 4).
Plates 3 and 4. Samakkhixai district, Attapeu province—flash flooding during the first week of October associated with Severe Tropical Storm Xangsane.
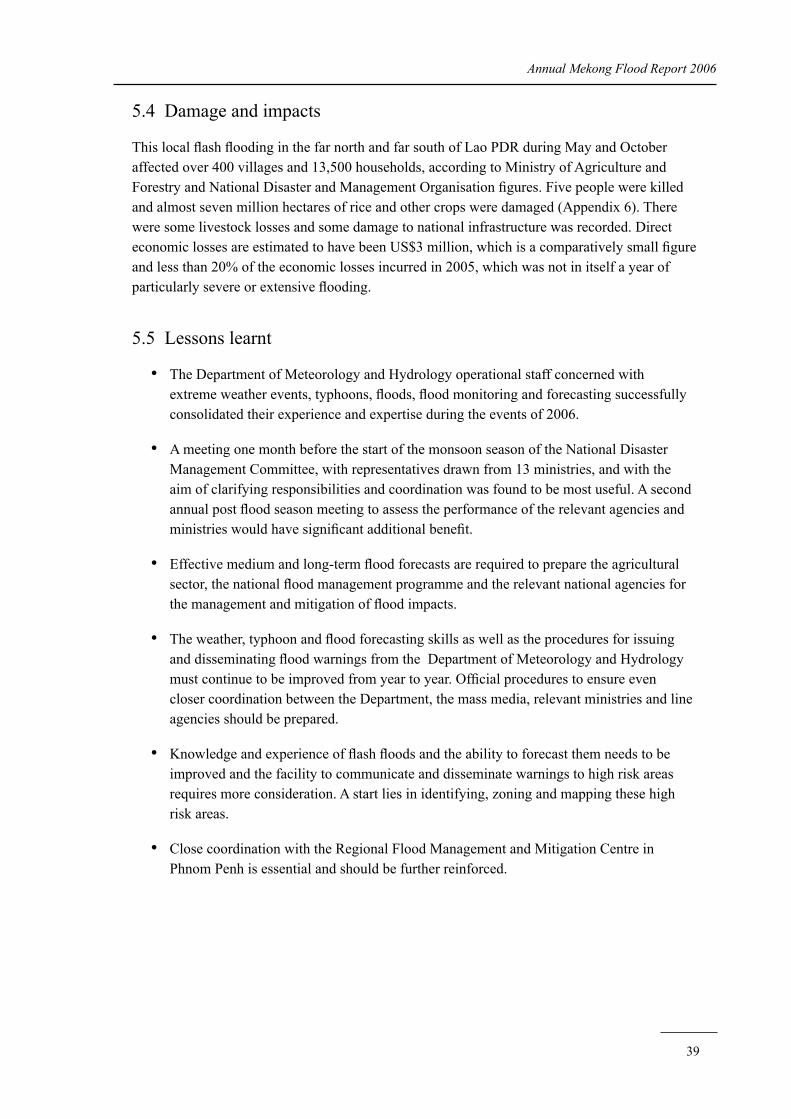
39
Annual Mekong Flood Report 2006
5.4 Damage and impacts
This local flash flooding in the far north and far south of Lao PDR during May and October affected over 400 villages and 13,500 households, according to Ministry of Agriculture and Forestry and National Disaster and Management Organisation figures. Five people were killed and almost seven million hectares of rice and other crops were damaged (Appendix 6). There were some livestock losses and some damage to national infrastructure was recorded. Direct economic losses are estimated to have been US$3 million, which is a comparatively small figure and less than 20% of the economic losses incurred in 2005, which was not in itself a year of particularly severe or extensive flooding.
5.5 Lessons learnt
The Department of Meteorology and Hydrology operational staff concerned with extreme weather events, typhoons, floods, flood monitoring and forecasting successfully consolidated their experience and expertise during the events of 2006.
A meeting one month before the start of the monsoon season of the National Disaster Management Committee, with representatives drawn from 13 ministries, and with the aim of clarifying responsibilities and coordination was found to be most useful. A second annual post flood season meeting to assess the performance of the relevant agencies and ministries would have significant additional benefit.
Effective medium and long-term flood forecasts are required to prepare the agricultural sector, the national flood management programme and the relevant national agencies for the management and mitigation of flood impacts.
The weather, typhoon and flood forecasting skills as well as the procedures for issuing and disseminating flood warnings from the Department of Meteorology and Hydrology must continue to be improved from year to year. Official procedures to ensure even closer coordination between the Department, the mass media, relevant ministries and line agencies should be prepared.
Knowledge and experience of flash floods and the ability to forecast them needs to be improved and the facility to communicate and disseminate warnings to high risk areas requires more consideration. A start lies in identifying, zoning and mapping these high risk areas.
Close coordination with the Regional Flood Management and Mitigation Centre in Phnom Penh is essential and should be further reinforced.
•
•
•
•
•
•

40
Annual Mekong Flood Report 2006
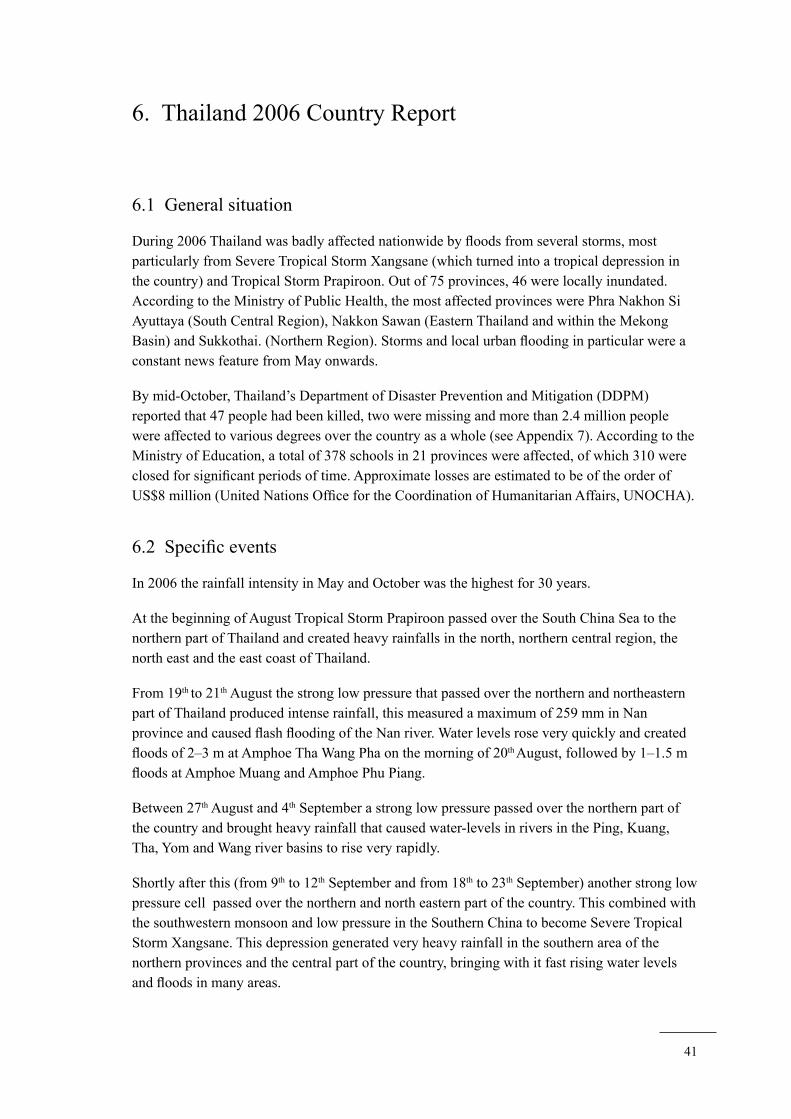
41
6. Thailand 2006 Country Report
6.1 General situation
During 2006 Thailand was badly affected nationwide by floods from several storms, most particularly from Severe Tropical Storm Xangsane (which turned into a tropical depression in the country) and Tropical Storm Prapiroon. Out of 75 provinces, 46 were locally inundated. According to the Ministry of Public Health, the most affected provinces were Phra Nakhon Si Ayuttaya (South Central Region), Nakkon Sawan (Eastern Thailand and within the Mekong Basin) and Sukkothai. (Northern Region). Storms and local urban flooding in particular were a constant news feature from May onwards.
By mid-October, Thailand’s Department of Disaster Prevention and Mitigation (DDPM) reported that 47 people had been killed, two were missing and more than 2.4 million people were affected to various degrees over the country as a whole (see Appendix 7). According to the Ministry of Education, a total of 378 schools in 21 provinces were affected, of which 310 were closed for significant periods of time. Approximate losses are estimated to be of the order of US$8 million (United Nations Office for the Coordination of Humanitarian Affairs, UNOCHA).
6.2 Specific events
In 2006 the rainfall intensity in May and October was the highest for 30 years.
At the beginning of August Tropical Storm Prapiroon passed over the South China Sea to the northern part of Thailand and created heavy rainfalls in the north, northern central region, the north east and the east coast of Thailand.
From 19th to 21th August the strong low pressure that passed over the northern and northeastern part of Thailand produced intense rainfall, this measured a maximum of 259 mm in Nan province and caused flash flooding of the Nan river. Water levels rose very quickly and created floods of 2–3 m at Amphoe Tha Wang Pha on the morning of 20th August, followed by 1–1.5 m floods at Amphoe Muang and Amphoe Phu Piang.
Between 27th August and 4th September a strong low pressure passed over the northern part of the country and brought heavy rainfall that caused water-levels in rivers in the Ping, Kuang, Tha, Yom and Wang river basins to rise very rapidly.
Shortly after this (from 9th to 12th September and from 18th to 23th September) another strong low pressure cell passed over the northern and north eastern part of the country. This combined with the southwestern monsoon and low pressure in the Southern China to become Severe Tropical Storm Xangsane. This depression generated very heavy rainfall in the southern area of the northern provinces and the central part of the country, bringing with it fast rising water levels and floods in many areas.
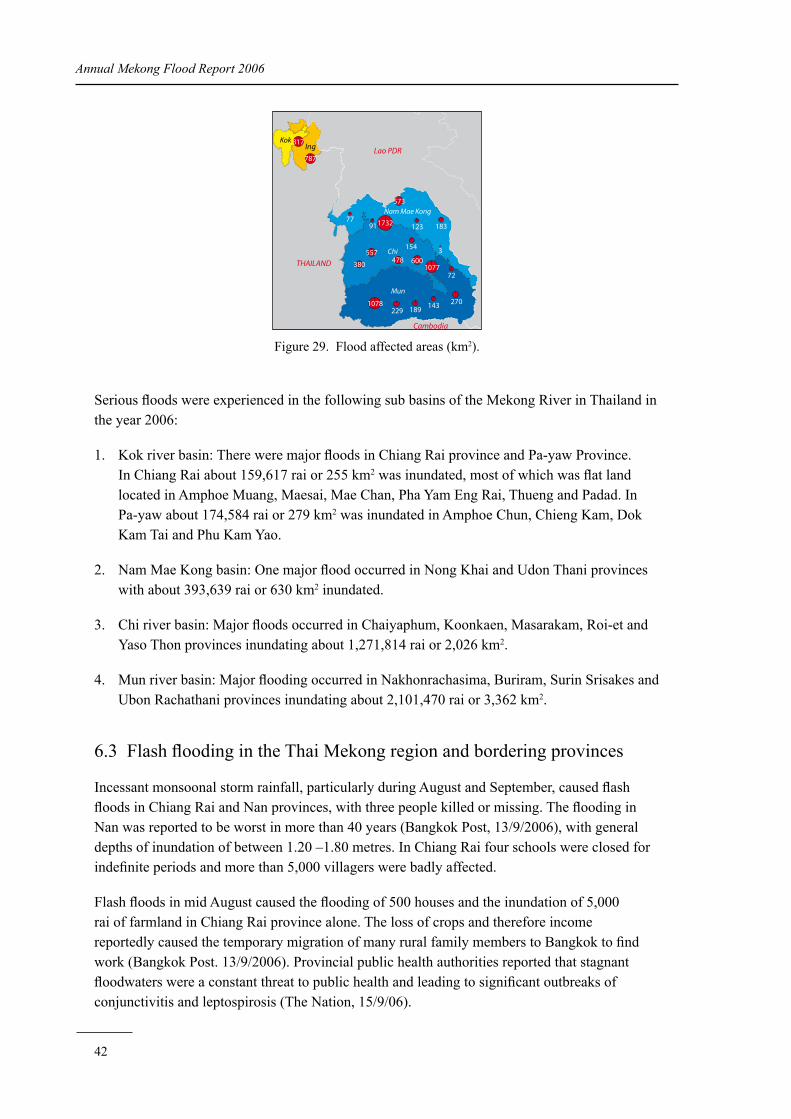
42
Annual Mekong Flood Report 2006
Figure 29. Flood affected areas (km2).
Serious floods were experienced in the following sub basins of the Mekong River in Thailand in the year 2006:
Kok river basin: There were major floods in Chiang Rai province and Pa-yaw Province. In Chiang Rai about 159,617 rai or 255 km2 was inundated, most of which was flat land located in Amphoe Muang, Maesai, Mae Chan, Pha Yam Eng Rai, Thueng and Padad. In Pa-yaw about 174,584 rai or 279 km2 was inundated in Amphoe Chun, Chieng Kam, Dok Kam Tai and Phu Kam Yao.
Nam Mae Kong basin: One major flood occurred in Nong Khai and Udon Thani provinces with about 393,639 rai or 630 km2 inundated.
Chi river basin: Major floods occurred in Chaiyaphum, Koonkaen, Masarakam, Roi-et and Yaso Thon provinces inundating about 1,271,814 rai or 2,026 km2.
Mun river basin: Major flooding occurred in Nakhonrachasima, Buriram, Surin Srisakes and Ubon Rachathani provinces inundating about 2,101,470 rai or 3,362 km2.
6.3 Flash flooding in the Thai Mekong region and bordering provinces
Incessant monsoonal storm rainfall, particularly during August and September, caused flash floods in Chiang Rai and Nan provinces, with three people killed or missing. The flooding in Nan was reported to be worst in more than 40 years (Bangkok Post, 13/9/2006), with general depths of inundation of between 1.20 –1.80 metres. In Chiang Rai four schools were closed for indefinite periods and more than 5,000 villagers were badly affected.
Flash floods in mid August caused the flooding of 500 houses and the inundation of 5,000 rai of farmland in Chiang Rai province alone. The loss of crops and therefore income reportedly caused the temporary migration of many rural family members to Bangkok to find work (Bangkok Post. 13/9/2006). Provincial public health authorities reported that stagnant floodwaters were a constant threat to public health and leading to significant outbreaks of conjunctivitis and leptospirosis (The Nation, 15/9/06).
1.
2.
3.
4.
557
229 189143 270
Mun
Chi
Nam Mae Kong
KokIng Lao PDR
THAILAND
Cambodia
817
787
77911732
573
123 183
154 3
721077
600478557
380
1078
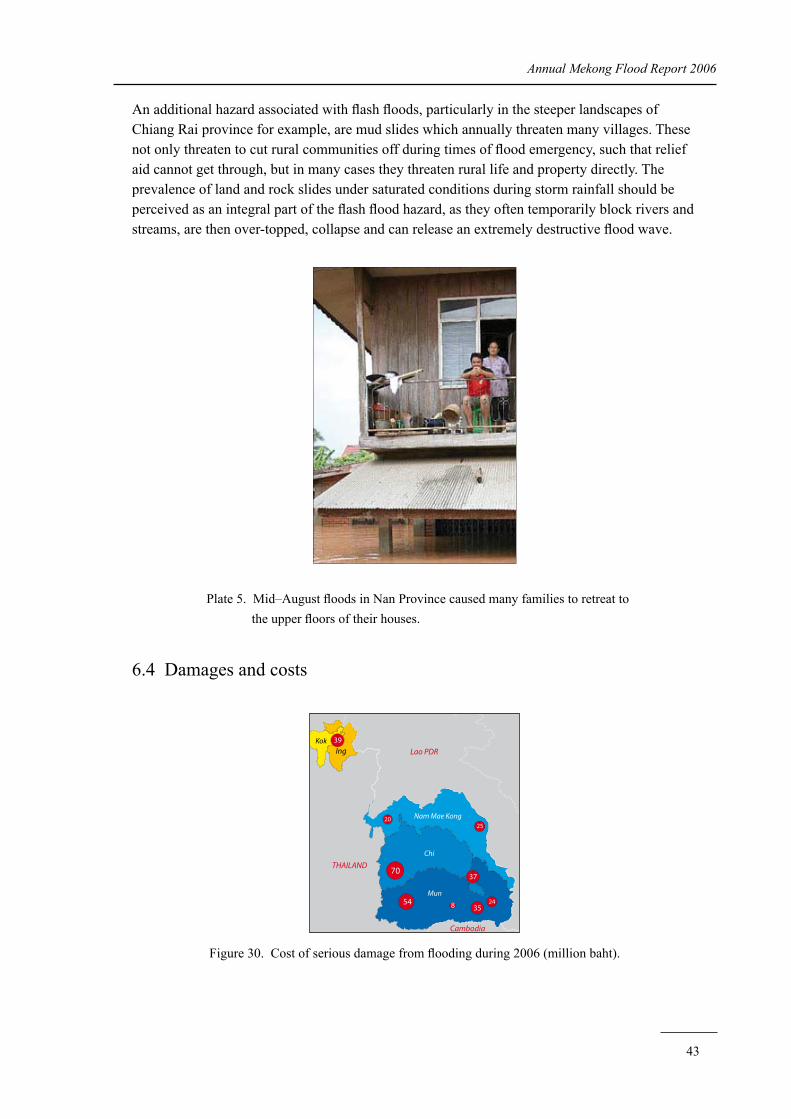
43
Annual Mekong Flood Report 2006
An additional hazard associated with flash floods, particularly in the steeper landscapes of Chiang Rai province for example, are mud slides which annually threaten many villages. These not only threaten to cut rural communities off during times of flood emergency, such that relief aid cannot get through, but in many cases they threaten rural life and property directly. The prevalence of land and rock slides under saturated conditions during storm rainfall should be perceived as an integral part of the flash flood hazard, as they often temporarily block rivers and streams, are then over-topped, collapse and can release an extremely destructive flood wave.
Plate 5. Mid–August floods in Nan Province caused many families to retreat to the upper floors of their houses.
6.4 Damages and costs
Figure 30. Cost of serious damage from flooding during 2006 (million baht).
39
2025
37
2435854
70
Mun
Chi
Nam Mae Kong
KokIng Lao PDR
THAILAND
Cambodia
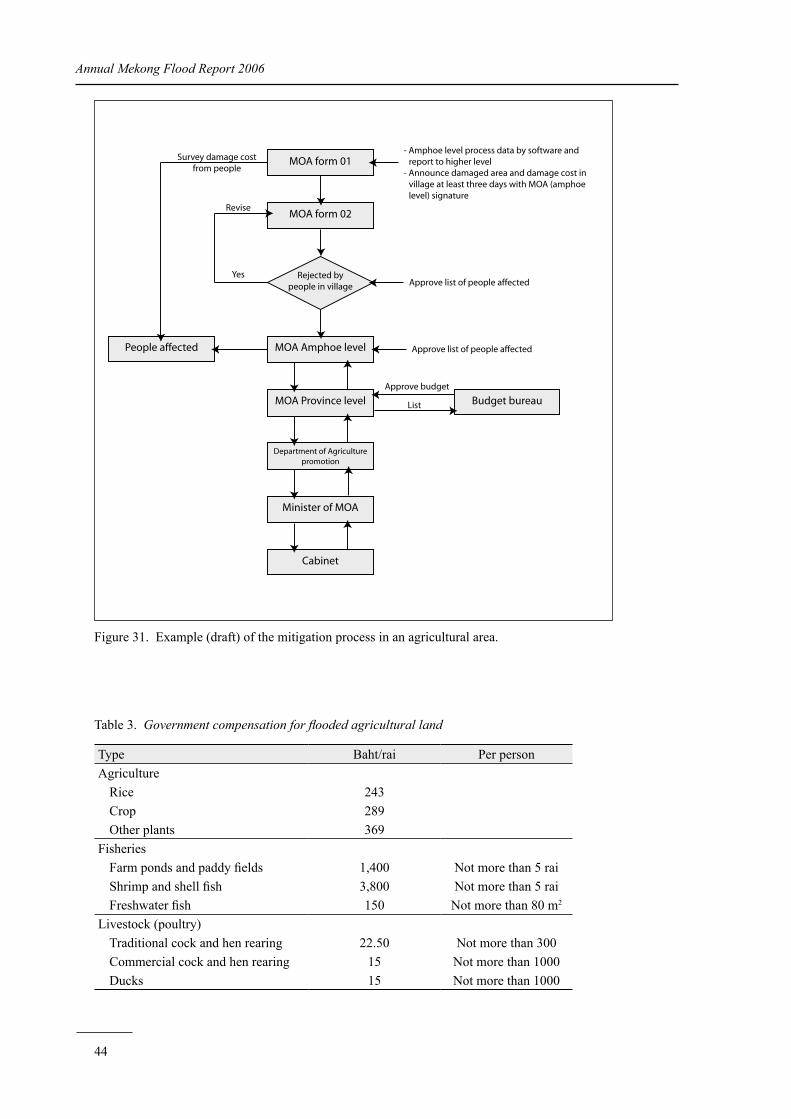
44
Annual Mekong Flood Report 2006
Figure 31. Example (draft) of the mitigation process in an agricultural area.
Table 3. Government compensation for flooded agricultural land
Type Baht/rai Per personAgriculture
Rice 243Crop 289Other plants 369
FisheriesFarm ponds and paddy fields 1,400 Not more than 5 raiShrimp and shell fish 3,800 Not more than 5 raiFreshwater fish 150 Not more than 80 m2
Livestock (poultry)Traditional cock and hen rearing 22.50 Not more than 300Commercial cock and hen rearing 15 Not more than 1000Ducks 15 Not more than 1000
MOA form 01
MOA form 02
MOA Province level
MOA Amphoe level
Department of Agriculturepromotion
Minister of MOA
Cabinet
Budget bureau
People affected
Rejected by people in village
Approve budget
List
Survey damage costfrom people
Revise
Yes
Approve list of people affected
Approve list of people affected
- Amphoe level process data by software and report to higher level
- Announce damaged area and damage cost in village at least three days with MOA (amphoe level) signature
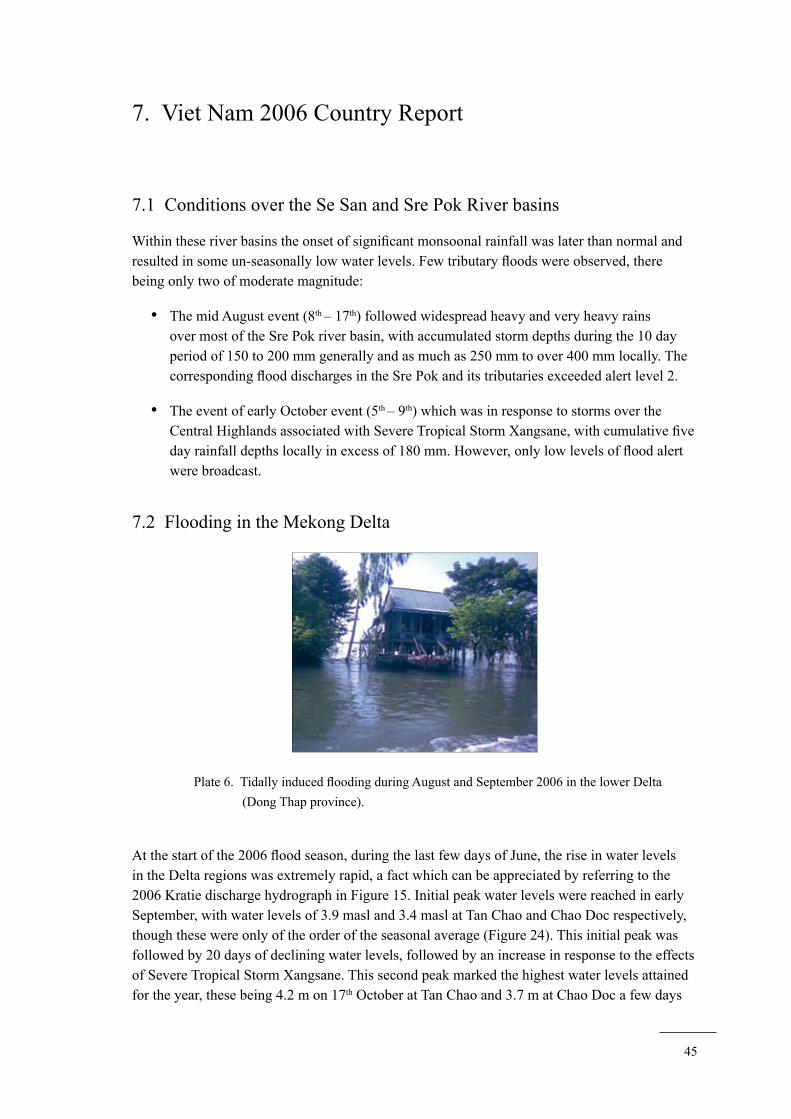
45
7. Viet Nam 2006 Country Report
7.1 Conditions over the Se San and Sre Pok River basins
Within these river basins the onset of significant monsoonal rainfall was later than normal and resulted in some un-seasonally low water levels. Few tributary floods were observed, there being only two of moderate magnitude:
The mid August event (8th – 17th) followed widespread heavy and very heavy rains over most of the Sre Pok river basin, with accumulated storm depths during the 10 day period of 150 to 200 mm generally and as much as 250 mm to over 400 mm locally. The corresponding flood discharges in the Sre Pok and its tributaries exceeded alert level 2.
The event of early October event (5th – 9th) which was in response to storms over the Central Highlands associated with Severe Tropical Storm Xangsane, with cumulative five day rainfall depths locally in excess of 180 mm. However, only low levels of flood alert were broadcast.
7.2 Flooding in the Mekong Delta
Plate 6. Tidally induced flooding during August and September 2006 in the lower Delta (Dong Thap province).
At the start of the 2006 flood season, during the last few days of June, the rise in water levels in the Delta regions was extremely rapid, a fact which can be appreciated by referring to the 2006 Kratie discharge hydrograph in Figure 15. Initial peak water levels were reached in early September, with water levels of 3.9 masl and 3.4 masl at Tan Chao and Chao Doc respectively, though these were only of the order of the seasonal average (Figure 24). This initial peak was followed by 20 days of declining water levels, followed by an increase in response to the effects of Severe Tropical Storm Xangsane. This second peak marked the highest water levels attained for the year, these being 4.2 m on 17th October at Tan Chao and 3.7 m at Chao Doc a few days
•
•
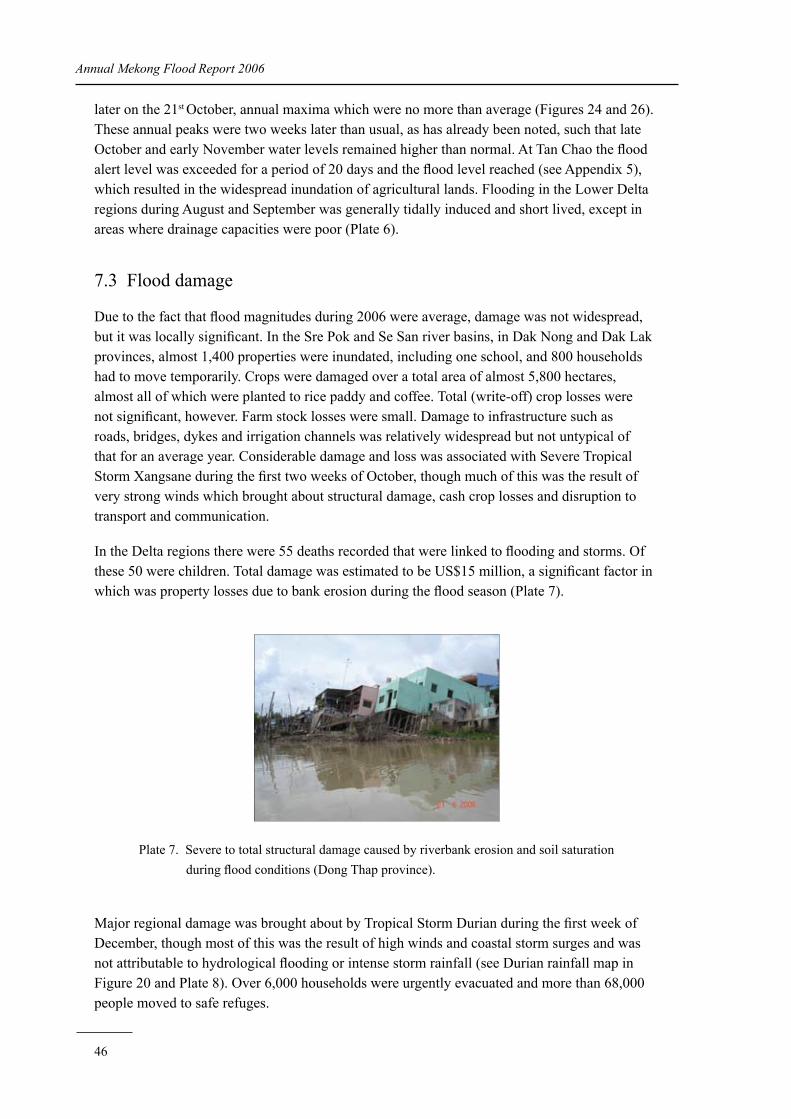
46
Annual Mekong Flood Report 2006
later on the 21st October, annual maxima which were no more than average (Figures 24 and 26). These annual peaks were two weeks later than usual, as has already been noted, such that late October and early November water levels remained higher than normal. At Tan Chao the flood alert level was exceeded for a period of 20 days and the flood level reached (see Appendix 5), which resulted in the widespread inundation of agricultural lands. Flooding in the Lower Delta regions during August and September was generally tidally induced and short lived, except in areas where drainage capacities were poor (Plate 6).
7.3 Flood damage
Due to the fact that flood magnitudes during 2006 were average, damage was not widespread, but it was locally significant. In the Sre Pok and Se San river basins, in Dak Nong and Dak Lak provinces, almost 1,400 properties were inundated, including one school, and 800 households had to move temporarily. Crops were damaged over a total area of almost 5,800 hectares, almost all of which were planted to rice paddy and coffee. Total (write-off) crop losses were not significant, however. Farm stock losses were small. Damage to infrastructure such as roads, bridges, dykes and irrigation channels was relatively widespread but not untypical of that for an average year. Considerable damage and loss was associated with Severe Tropical Storm Xangsane during the first two weeks of October, though much of this was the result of very strong winds which brought about structural damage, cash crop losses and disruption to transport and communication.
In the Delta regions there were 55 deaths recorded that were linked to flooding and storms. Of these 50 were children. Total damage was estimated to be US$15 million, a significant factor in which was property losses due to bank erosion during the flood season (Plate 7).
Plate 7. Severe to total structural damage caused by riverbank erosion and soil saturation during flood conditions (Dong Thap province).
Major regional damage was brought about by Tropical Storm Durian during the first week of December, though most of this was the result of high winds and coastal storm surges and was not attributable to hydrological flooding or intense storm rainfall (see Durian rainfall map in Figure 20 and Plate 8). Over 6,000 households were urgently evacuated and more than 68,000 people moved to safe refuges.
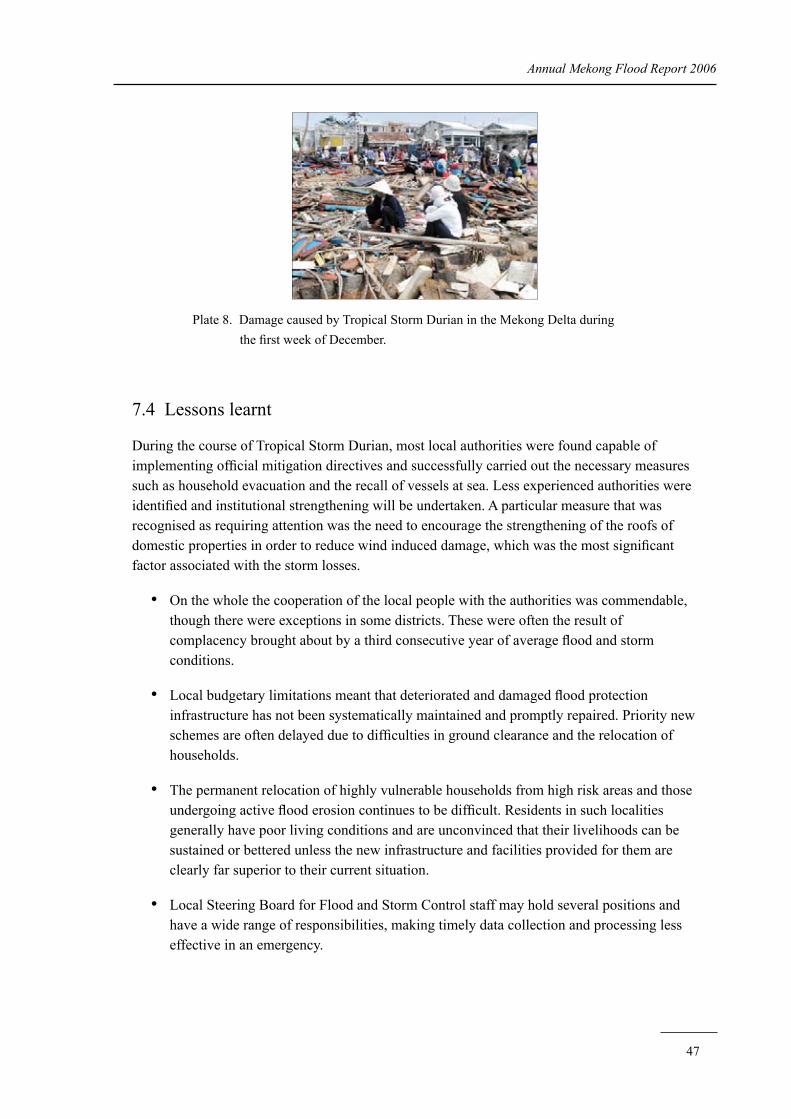
47
Annual Mekong Flood Report 2006
Plate 8. Damage caused by Tropical Storm Durian in the Mekong Delta during the first week of December.
7.4 Lessons learnt
During the course of Tropical Storm Durian, most local authorities were found capable of implementing official mitigation directives and successfully carried out the necessary measures such as household evacuation and the recall of vessels at sea. Less experienced authorities were identified and institutional strengthening will be undertaken. A particular measure that was recognised as requiring attention was the need to encourage the strengthening of the roofs of domestic properties in order to reduce wind induced damage, which was the most significant factor associated with the storm losses.
On the whole the cooperation of the local people with the authorities was commendable, though there were exceptions in some districts. These were often the result of complacency brought about by a third consecutive year of average flood and storm conditions.
Local budgetary limitations meant that deteriorated and damaged flood protection infrastructure has not been systematically maintained and promptly repaired. Priority new schemes are often delayed due to difficulties in ground clearance and the relocation of households.
The permanent relocation of highly vulnerable households from high risk areas and those undergoing active flood erosion continues to be difficult. Residents in such localities generally have poor living conditions and are unconvinced that their livelihoods can be sustained or bettered unless the new infrastructure and facilities provided for them are clearly far superior to their current situation.
Local Steering Board for Flood and Storm Control staff may hold several positions and have a wide range of responsibilities, making timely data collection and processing less effective in an emergency.
•
•
•
•

48
Annual Mekong Flood Report 2006
Wave and wind protection for local infrastructure lags behind that for hydrological flooding, which as the damage from Durian illustrated, requires attention in order to reduce the losses to national assets from tropical storms.
•
49
8. Summary Conclusions and Recommendations
8.1 Summary conclusions
Regionally, the flood season of 2006 saw below average conditions both in terms of flow volumes and peak discharges, most particularly on the lower mainstream downstream of Vientiane. To the north, however, flash flooding in Thailand and Lao PDR resulted in significant damage and loss. Deep monsoonal depressions that were largely confined to these northern provinces were generally responsible, though the wider regional impacts of Severe Tropical Storm Xangsane played a major role in early October, particularly in the south of Lao PDR. The major regional disaster in 2006 was the result of Tropical Storm Durian during December when extreme windspeeds and tidal surges caused immense damage in the Delta and southern coastal regions of Viet Nam.
8.2 Recommendations and lessons
The hydrological and water level data and information available for the mainstream are more than sufficient for a comprehensive assessment of the annual flood from year to year. Analyses of these historical data that have been reported here provide a framework for the objective and more perceptive evaluation of annual floods on the mainstream within their wider temporal and geographical context.
Tributary data analysis and information are far less complete at present, which amounts to a significant shortcoming, given the hazard of flash flooding in these river systems. The FMMP T2 Flood Risk Mapping Project on the Nam Mae Kok in northern Thailand is a recognition of this. Its modest extension to provide a regional flood risk analysis for the tributary systems upstream of Vientiane in both Thailand and Lao PDR would provide substantial ‘add on’ value. The HYCOS Project will also contribute much to the understanding of the flood hydrology of these tributary rivers.
In the longer term HYCOS will also add to the meteorological knowledge base and the nature of the linkages between regional storm rainfall and flood runoff. For the present purposes of the Annual Flood Report, however, daily satellite based rainfall estimates at the regional scale are sufficient and appropriate.
Finally, it is recommended that the Annual Flood Report be ‘theme’ based. Here the emphasis is on data analysis and the temporal and spatial nature of floods and flooding in the Mekong region. Such material provides an important supplement to the framework of knowledge within which the FMMP is being undertaken as well as contributing basic insight into the regime of the Mekong that are a necessary in many other contexts, for example the assessment of the environmental impacts of basin development. Other annual themes that should be considered are the socio-economic benefits and dis-benefits of the flood regime, meteorological aspects and the potential consequences of climate change, including links with ENSO. The report should

50
Annual Mekong Flood Report 2006
also provide a medium for reporting FMMP progress in the interests of dissemination to the wider audience and stakeholders.
51
9. References
Adamson, P.T., Metcalfe, A.V. and B. Parmentier (1999) Bivariate extreme value distributions: An application of the Gibbs Sampler to the analysis of floods. Water Resources Research 35 (9). pp 2825 – 2832.
Anderson, R.J., dos Santos, N. and H.F. Diaz. (1993). An analysis of flooding in the Parana/Paraguay River Basin. Laten Dissemination Note 5. Latin America and Caribbean Technical Dept. Environment Division. World Bank. Washington DC.
IAHS (2003) World Catalogue of Maximum Observed Floods (ed: R. Herschy). IAHS Publ. 284. IAHS Press, Wallingford, UK. (see also the introduction by John Rodda at http://www.cig.ensmp.fr/~iahs/redbooks/a284/28400e.htm and the review by Zbyszek Kundzewicz in IAHS newsletter 79, January 2004 at http://www.cig.ensmp.fr/~iahs/newsletters/news79/NL79.pdf).
Fumihiko, I. and Dang Van To (1997) Flood and Typhoon Disasters in Viet Nam in the Half Century Since 1950. Natural Hazards 15(1).
O’Connor, J.E. and J.E. Costa (2004) The world’s largest floods, past and present—Their causes and magnitudes. U.S. Geological Survey Circular 1254, 13 pp.
Linhart, H. and W. Zucchini (1984 ) Model Selection. John Wiley Series in Applied Probability and Mathemetical Statistics. New York.
Penny, D. (2006) The Holocene history and development of the Tonle Sap, Cambodia. Quaternary Science Reviews 25, 310-322.
Shroder, J.F. Jr., Cornwell, K., and M.S. Khan, (1991) Catastrophic breakout floods in the western Himalaya, Pakistan. Geological Society of America Abstracts 23(5), p. 87.
Webby, B., Adamson, P.T., Boland, J., Howlett, P. and A.V. Metcalfe (2006) Conditional Value at Risk (CVaR) analysis of flooding in the Lower Mekong Basin. In: Proceedings of the 3rd IAHS International Symposium on Integrated Water Resources Management. Ruhr University, Bochum. Germany.

52
Annual Mekong Flood Report 2006
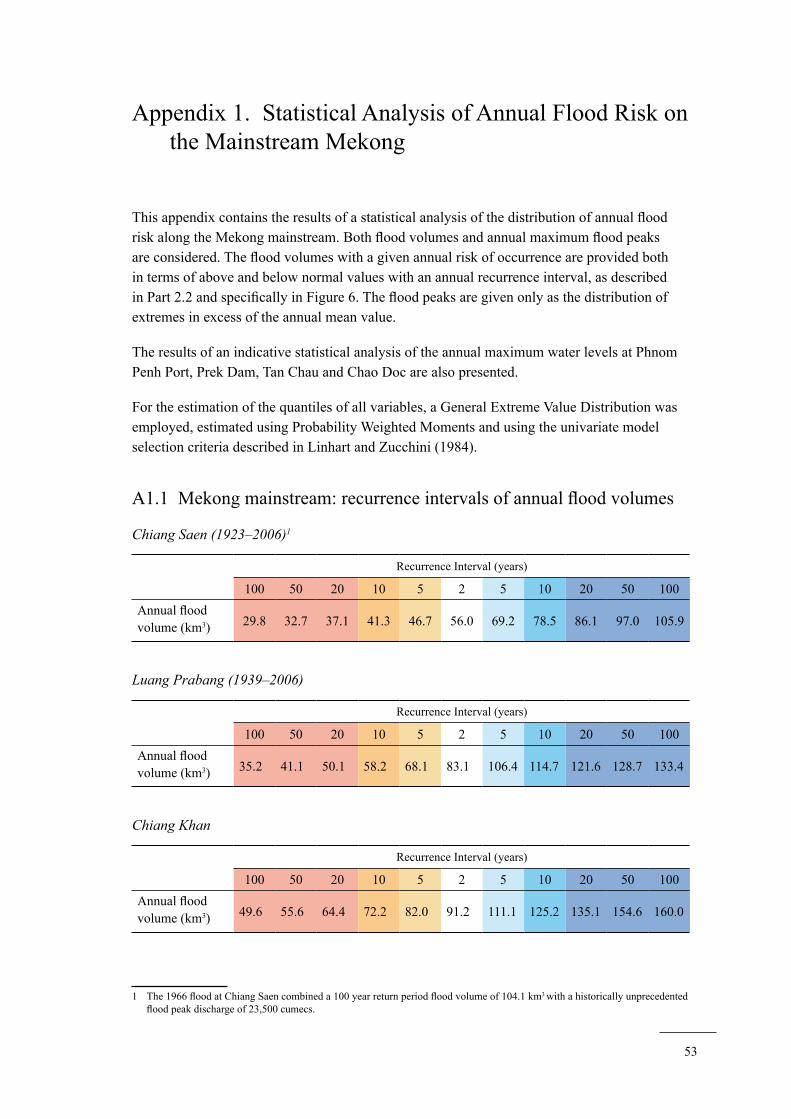
53
Appendix 1. Statistical Analysis of Annual Flood Risk on the Mainstream Mekong
This appendix contains the results of a statistical analysis of the distribution of annual flood risk along the Mekong mainstream. Both flood volumes and annual maximum flood peaks are considered. The flood volumes with a given annual risk of occurrence are provided both in terms of above and below normal values with an annual recurrence interval, as described in Part 2.2 and specifically in Figure 6. The flood peaks are given only as the distribution of extremes in excess of the annual mean value.
The results of an indicative statistical analysis of the annual maximum water levels at Phnom Penh Port, Prek Dam, Tan Chau and Chao Doc are also presented.
For the estimation of the quantiles of all variables, a General Extreme Value Distribution was employed, estimated using Probability Weighted Moments and using the univariate model selection criteria described in Linhart and Zucchini (1984).
A1.1 Mekong mainstream: recurrence intervals of annual flood volumes
Chiang Saen (1923–2006)�
Recurrence Interval (years)
100 50 20 10 5 2 5 10 20 50 100Annual flood volume (km3) 29.8 32.7 37.1 41.3 46.7 56.0 69.2 78.5 86.1 97.0 105.9
Luang Prabang (1939–2006)
Recurrence Interval (years)
100 50 20 10 5 2 5 10 20 50 100Annual flood volume (km3) 35.2 41.1 50.1 58.2 68.1 83.1 106.4 114.7 121.6 128.7 133.4
Chiang Khan
Recurrence Interval (years)
100 50 20 10 5 2 5 10 20 50 100Annual flood volume (km3) 49.6 55.6 64.4 72.2 82.0 91.2 111.1 125.2 135.1 154.6 160.0
1 The 1966 flood at Chiang Saen combined a 100 year return period flood volume of 104.1 km3 with a historically unprecedented flood peak discharge of 23,500 cumecs.
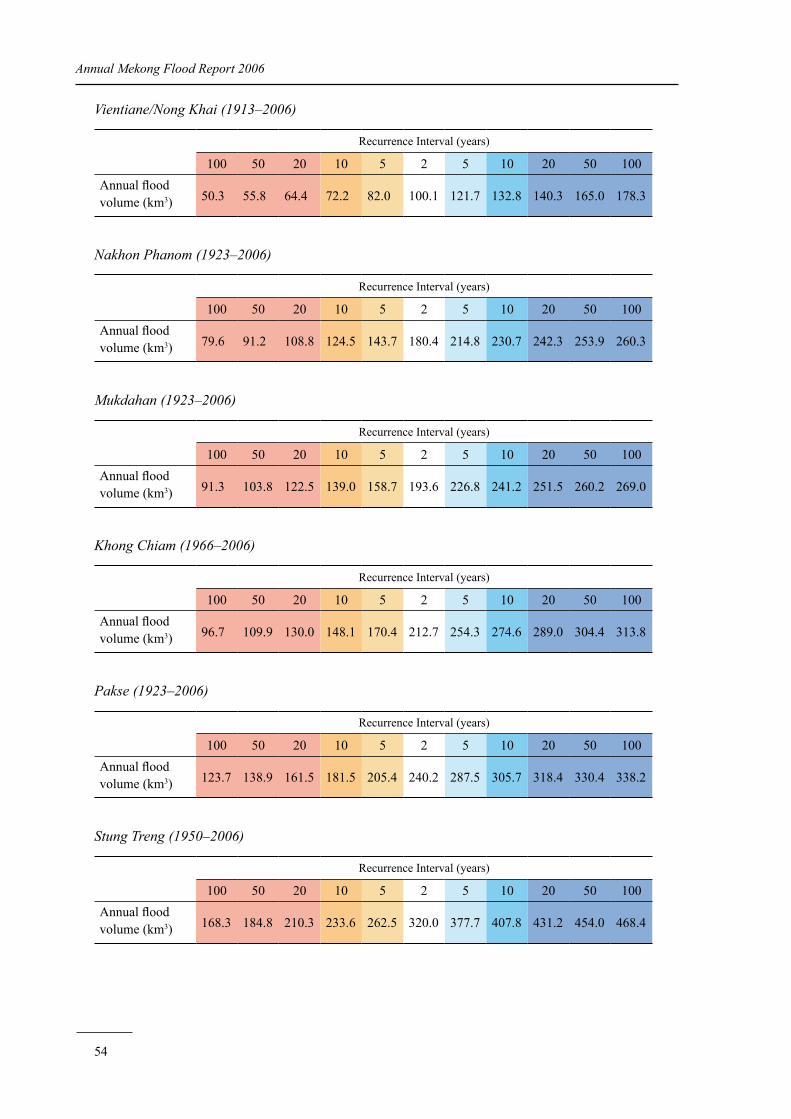
54
Annual Mekong Flood Report 2006
Vientiane/Nong Khai (1913–2006)
Recurrence Interval (years)
100 50 20 10 5 2 5 10 20 50 100Annual flood volume (km3) 50.3 55.8 64.4 72.2 82.0 100.1 121.7 132.8 140.3 165.0 178.3
Nakhon Phanom (1923–2006)
Recurrence Interval (years)
100 50 20 10 5 2 5 10 20 50 100Annual flood volume (km3) 79.6 91.2 108.8 124.5 143.7 180.4 214.8 230.7 242.3 253.9 260.3
Mukdahan (1923–2006)
Recurrence Interval (years)
100 50 20 10 5 2 5 10 20 50 100Annual flood volume (km3) 91.3 103.8 122.5 139.0 158.7 193.6 226.8 241.2 251.5 260.2 269.0
Khong Chiam (1966–2006)
Recurrence Interval (years)
100 50 20 10 5 2 5 10 20 50 100Annual flood volume (km3) 96.7 109.9 130.0 148.1 170.4 212.7 254.3 274.6 289.0 304.4 313.8
Pakse (1923–2006)
Recurrence Interval (years)
100 50 20 10 5 2 5 10 20 50 100Annual flood volume (km3) 123.7 138.9 161.5 181.5 205.4 240.2 287.5 305.7 318.4 330.4 338.2
Stung Treng (1950–2006)
Recurrence Interval (years)
100 50 20 10 5 2 5 10 20 50 100Annual flood volume (km3) 168.3 184.8 210.3 233.6 262.5 320.0 377.7 407.8 431.2 454.0 468.4
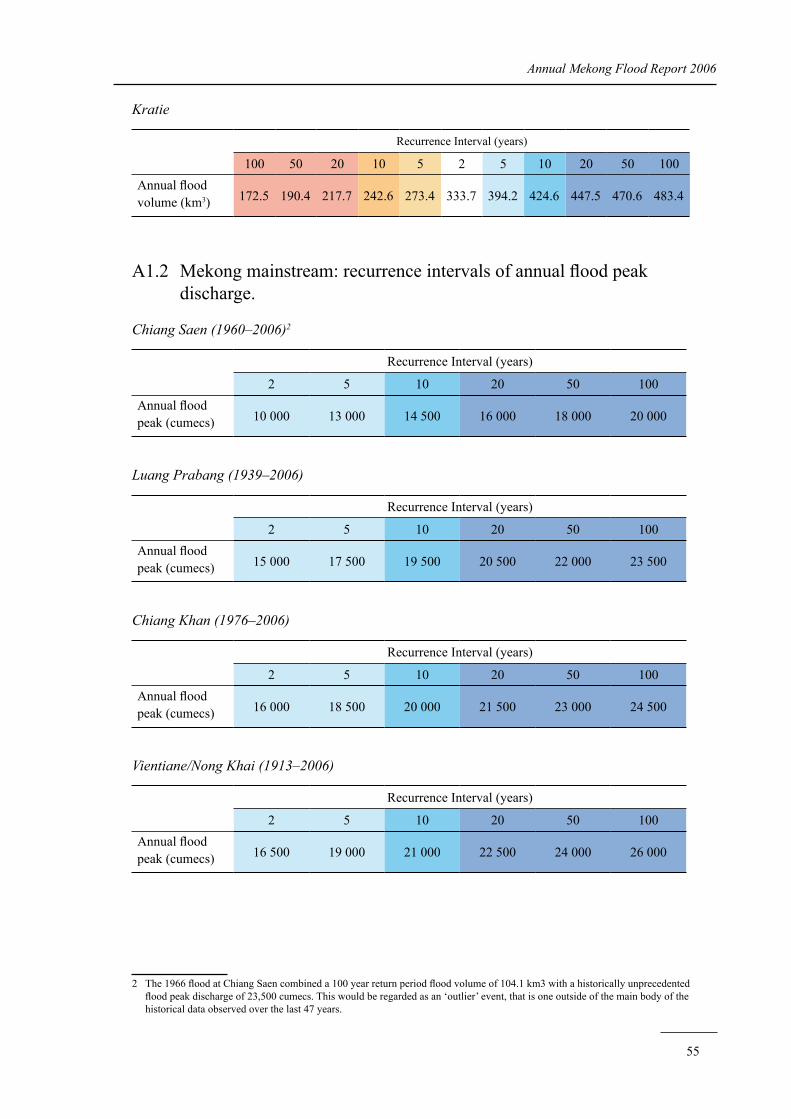
55
Annual Mekong Flood Report 2006
Kratie
Recurrence Interval (years)
100 50 20 10 5 2 5 10 20 50 100Annual flood volume (km3) 172.5 190.4 217.7 242.6 273.4 333.7 394.2 424.6 447.5 470.6 483.4
A1.2 Mekong mainstream: recurrence intervals of annual flood peak discharge.
Chiang Saen (1960–2006)2
Recurrence Interval (years)
2 5 10 20 50 100Annual flood peak (cumecs) 10 000 13 000 14 500 16 000 18 000 20 000
Luang Prabang (1939–2006)
Recurrence Interval (years)
2 5 10 20 50 100Annual flood peak (cumecs) 15 000 17 500 19 500 20 500 22 000 23 500
Chiang Khan (1976–2006)
Recurrence Interval (years)
2 5 10 20 50 100Annual flood peak (cumecs) 16 000 18 500 20 000 21 500 23 000 24 500
Vientiane/Nong Khai (1913–2006)
Recurrence Interval (years)
2 5 10 20 50 100Annual flood peak (cumecs) 16 500 19 000 21 000 22 500 24 000 26 000
2 The 1966 flood at Chiang Saen combined a 100 year return period flood volume of 104.1 km3 with a historically unprecedented flood peak discharge of 23,500 cumecs. This would be regarded as an ‘outlier’ event, that is one outside of the main body of the historical data observed over the last 47 years.
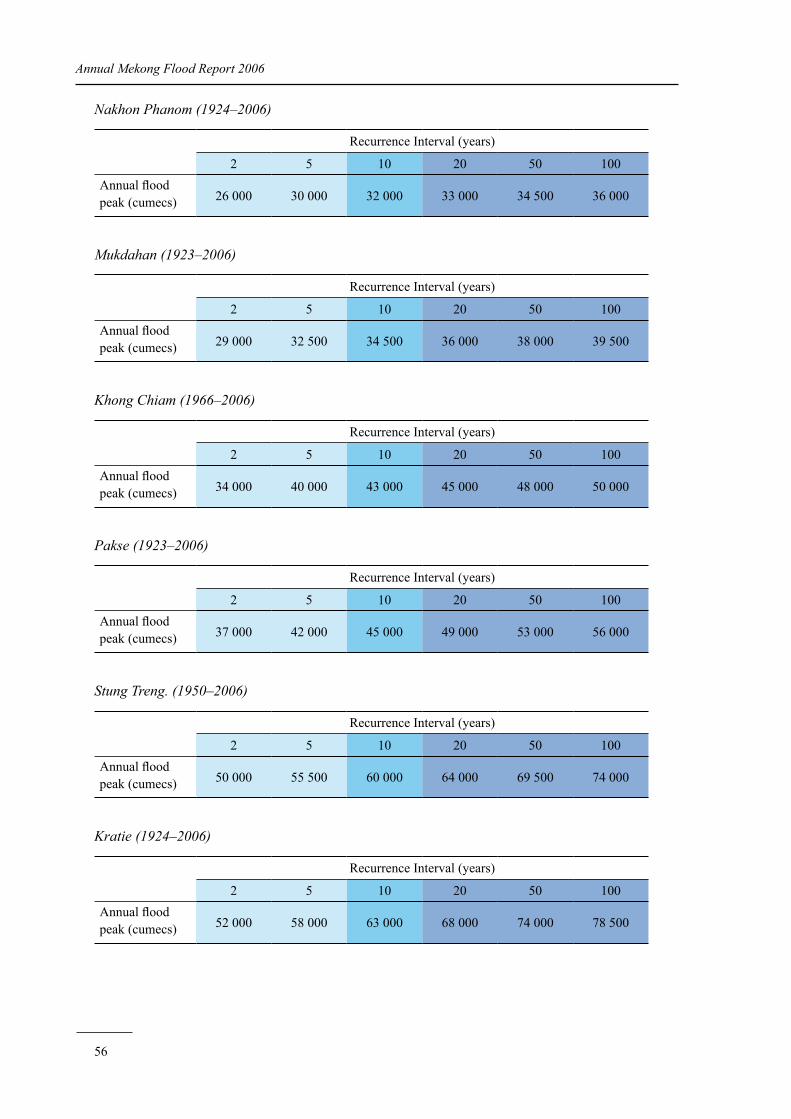
56
Annual Mekong Flood Report 2006
Nakhon Phanom (1924–2006)
Recurrence Interval (years)
2 5 10 20 50 100Annual flood peak (cumecs) 26 000 30 000 32 000 33 000 34 500 36 000
Mukdahan (1923–2006)
Recurrence Interval (years)
2 5 10 20 50 100Annual flood peak (cumecs) 29 000 32 500 34 500 36 000 38 000 39 500
Khong Chiam (1966–2006)
Recurrence Interval (years)
2 5 10 20 50 100Annual flood peak (cumecs) 34 000 40 000 43 000 45 000 48 000 50 000
Pakse (1923–2006)
Recurrence Interval (years)
2 5 10 20 50 100Annual flood peak (cumecs) 37 000 42 000 45 000 49 000 53 000 56 000
Stung Treng. (1950–2006)
Recurrence Interval (years)
2 5 10 20 50 100Annual flood peak (cumecs) 50 000 55 500 60 000 64 000 69 500 74 000
Kratie (1924–2006)
Recurrence Interval (years)
2 5 10 20 50 100Annual flood peak (cumecs) 52 000 58 000 63 000 68 000 74 000 78 500
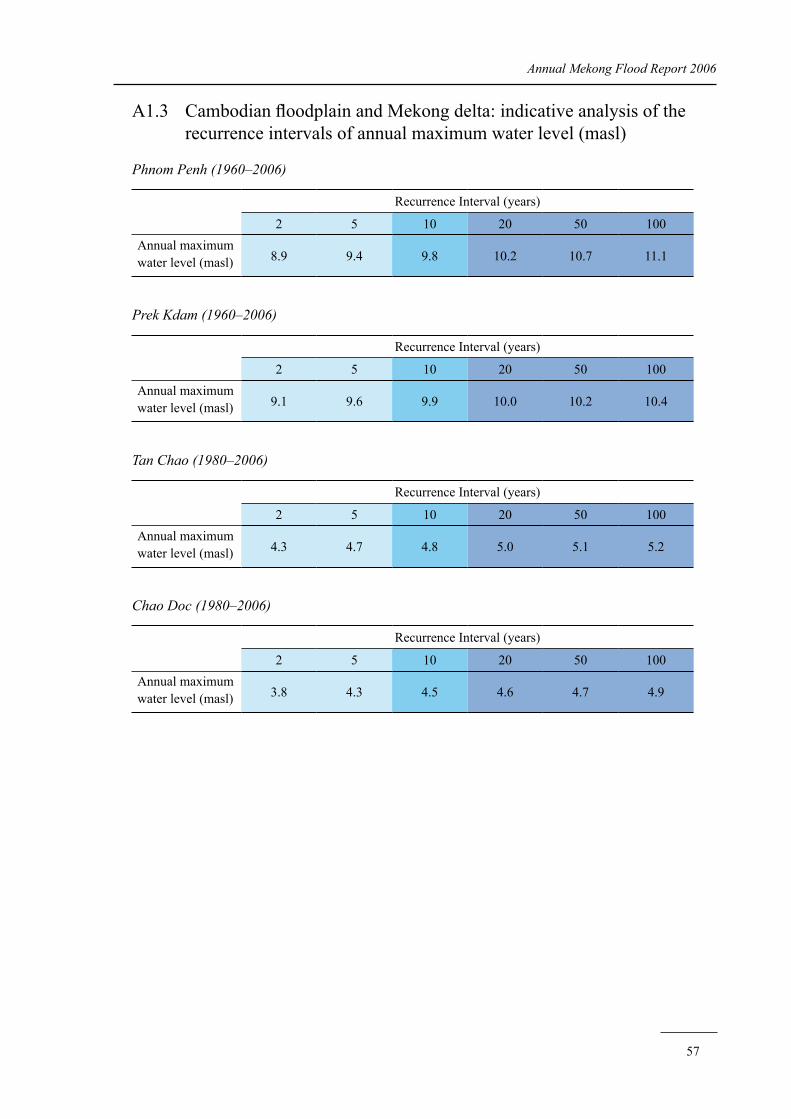
57
Annual Mekong Flood Report 2006
A1.3 Cambodian floodplain and Mekong delta: indicative analysis of the recurrence intervals of annual maximum water level (masl)
Phnom Penh (1960–2006)
Recurrence Interval (years)
2 5 10 20 50 100Annual maximum water level (masl) 8.9 9.4 9.8 10.2 10.7 11.1
Prek Kdam (1960–2006)
Recurrence Interval (years)
2 5 10 20 50 100Annual maximum water level (masl) 9.1 9.6 9.9 10.0 10.2 10.4
Tan Chao (1980–2006)
Recurrence Interval (years)
2 5 10 20 50 100Annual maximum water level (masl) 4.3 4.7 4.8 5.0 5.1 5.2
Chao Doc (1980–2006)
Recurrence Interval (years)
2 5 10 20 50 100Annual maximum water level (masl) 3.8 4.3 4.5 4.6 4.7 4.9

58
Annual Mekong Flood Report 2006
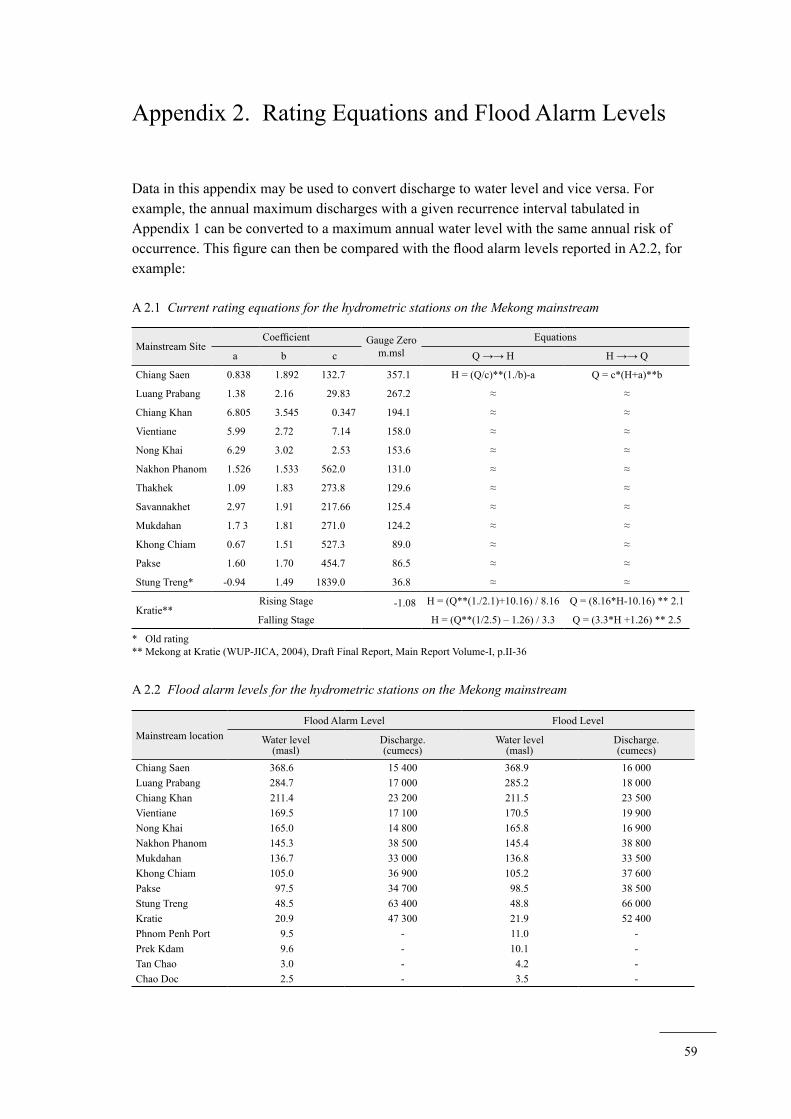
59
Appendix 2. Rating Equations and Flood Alarm Levels
Data in this appendix may be used to convert discharge to water level and vice versa. For example, the annual maximum discharges with a given recurrence interval tabulated in Appendix 1 can be converted to a maximum annual water level with the same annual risk of occurrence. This figure can then be compared with the flood alarm levels reported in A2.2, for example:
A 2.1 Current rating equations for the hydrometric stations on the Mekong mainstream
Mainstream SiteCoefficient Gauge Zero
m.mslEquations
a b c Q →→ H H →→ Q
Chiang Saen 0.838 1.892 132.7 357.1 H = (Q/c)**(1./b)-a Q = c*(H+a)**b
Luang Prabang 1.38 2.16 29.83 267.2 ≈ ≈
Chiang Khan 6.805 3.545 0.347 194.1 ≈ ≈
Vientiane 5.99 2.72 7.14 158.0 ≈ ≈
Nong Khai 6.29 3.02 2.53 153.6 ≈ ≈
Nakhon Phanom 1.526 1.533 562.0 131.0 ≈ ≈
Thakhek 1.09 1.83 273.8 129.6 ≈ ≈
Savannakhet 2.97 1.91 217.66 125.4 ≈ ≈
Mukdahan 1.7 3 1.81 271.0 124.2 ≈ ≈
Khong Chiam 0.67 1.51 527.3 89.0 ≈ ≈
Pakse 1.60 1.70 454.7 86.5 ≈ ≈
Stung Treng* -0.94 1.49 1839.0 36.8 ≈ ≈
Kratie**Rising Stage -1.08 H = (Q**(1./2.1)+10.16) / 8.16 Q = (8.16*H-10.16) ** 2.1
Falling Stage H = (Q**(1/2.5) – 1.26) / 3.3 Q = (3.3*H +1.26) ** 2.5
* Old rating** Mekong at Kratie (WUP-JICA, 2004), Draft Final Report, Main Report Volume-I, p.II-36
A 2.2 Flood alarm levels for the hydrometric stations on the Mekong mainstream
Mainstream locationFlood Alarm Level Flood Level
Water level(masl)
Discharge.(cumecs)
Water level(masl)
Discharge.(cumecs)
Chiang Saen 368.6 15 400 368.9 16 000Luang Prabang 284.7 17 000 285.2 18 000Chiang Khan 211.4 23 200 211.5 23 500Vientiane 169.5 17 100 170.5 19 900Nong Khai 165.0 14 800 165.8 16 900Nakhon Phanom 145.3 38 500 145.4 38 800Mukdahan 136.7 33 000 136.8 33 500Khong Chiam 105.0 36 900 105.2 37 600Pakse 97.5 34 700 98.5 38 500Stung Treng 48.5 63 400 48.8 66 000Kratie 20.9 47 300 21.9 52 400Phnom Penh Port 9.5 - 11.0 -Prek Kdam 9.6 - 10.1 -Tan Chao 3.0 - 4.2 -Chao Doc 2.5 - 3.5 -

60
Annual Mekong Flood Report 2006
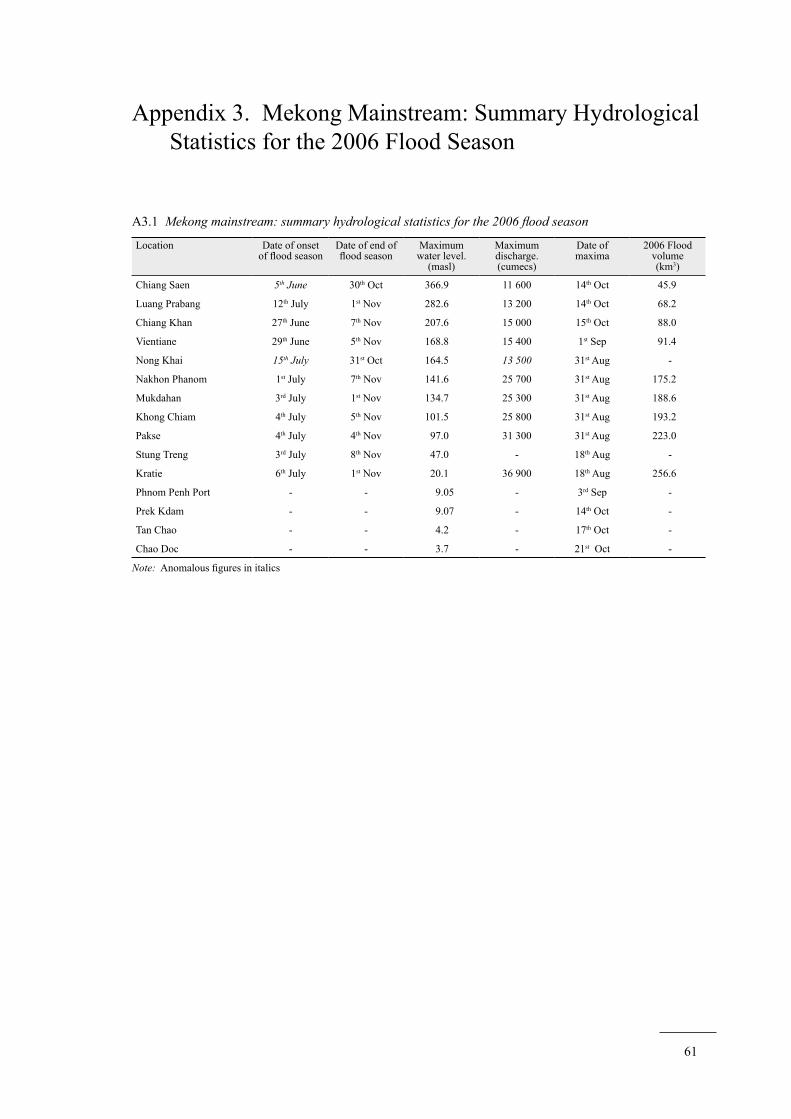
61
Appendix 3. Mekong Mainstream: Summary Hydrological Statistics for the 2006 Flood Season
A3.1 Mekong mainstream: summary hydrological statistics for the 2006 flood season
Location Date of onset of flood season
Date of end of flood season
Maximum water level.
(masl)
Maximum discharge.(cumecs)
Date of maxima
2006 Flood volume(km3)
Chiang Saen 5th June 30th Oct 366.9 11 600 14th Oct 45.9
Luang Prabang 12th July 1st Nov 282.6 13 200 14th Oct 68.2
Chiang Khan 27th June 7th Nov 207.6 15 000 15th Oct 88.0
Vientiane 29th June 5th Nov 168.8 15 400 1st Sep 91.4
Nong Khai �5th July 31st Oct 164.5 �3 500 31st Aug -
Nakhon Phanom 1st July 7th Nov 141.6 25 700 31st Aug 175.2
Mukdahan 3rd July 1st Nov 134.7 25 300 31st Aug 188.6
Khong Chiam 4th July 5th Nov 101.5 25 800 31st Aug 193.2
Pakse 4th July 4th Nov 97.0 31 300 31st Aug 223.0
Stung Treng 3rd July 8th Nov 47.0 - 18th Aug -
Kratie 6th July 1st Nov 20.1 36 900 18th Aug 256.6
Phnom Penh Port - - 9.05 - 3rd Sep -
Prek Kdam - - 9.07 - 14th Oct -
Tan Chao - - 4.2 - 17th Oct -
Chao Doc - - 3.7 - 21st Oct -
Note: Anomalous figures in italics

62
Annual Mekong Flood Report 2006
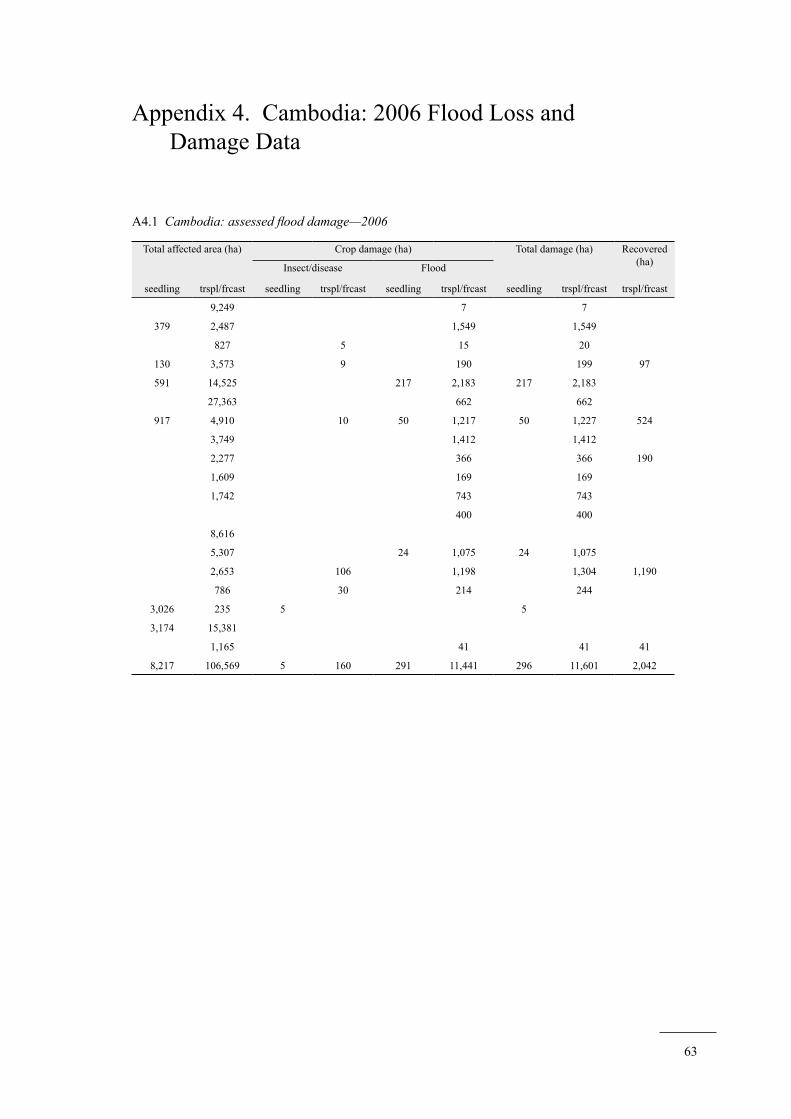
63
Appendix 4. Cambodia: 2006 Flood Loss and Damage Data
A4.1 Cambodia: assessed flood damage—2006
Total affected area (ha) Crop damage (ha) Total damage (ha) Recovered (ha)Insect/disease Flood
seedling trspl/frcast seedling trspl/frcast seedling trspl/frcast seedling trspl/frcast trspl/frcast
9,249 7 7
379 2,487 1,549 1,549
827 5 15 20
130 3,573 9 190 199 97
591 14,525 217 2,183 217 2,183
27,363 662 662
917 4,910 10 50 1,217 50 1,227 524
3,749 1,412 1,412
2,277 366 366 190
1,609 169 169
1,742 743 743
400 400
8,616
5,307 24 1,075 24 1,075
2,653 106 1,198 1,304 1,190
786 30 214 244
3,026 235 5 5
3,174 15,381
1,165 41 41 41
8,217 106,569 5 160 291 11,441 296 11,601 2,042

64
Annual Mekong Flood Report 2006
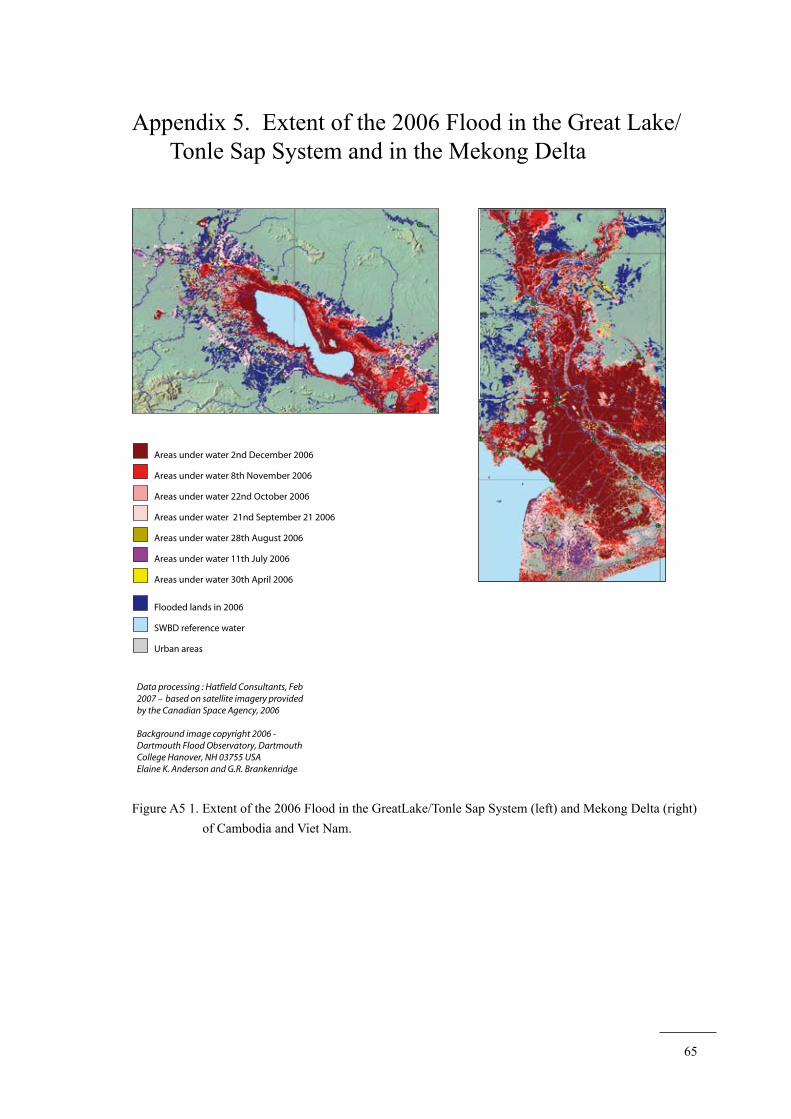
65
Appendix 5. Extent of the 2006 Flood in the Great Lake/Tonle Sap System and in the Mekong Delta
Figure A5 1. Extent of the 2006 Flood in the GreatLake/Tonle Sap System (left) and Mekong Delta (right) of Cambodia and Viet Nam.
Areas under water 21nd September 21 2006
Areas under water 28th August 2006
Areas under water 11th July 2006
Areas under water 30th April 2006
Areas under water 22nd October 2006
Areas under water 8th November 2006
Flooded lands in 2006
SWBD reference water
Urban areas
Data processing : Hatfield Consultants, Feb2007 – based on satellite imagery providedby the Canadian Space Agency, 2006
Background image copyright 2006 - Dartmouth Flood Observatory, Dartmouth College Hanover, NH 03755 USAElaine K. Anderson and G.R. Brankenridge
Areas under water 2nd December 2006

66
Annual Mekong Flood Report 2006
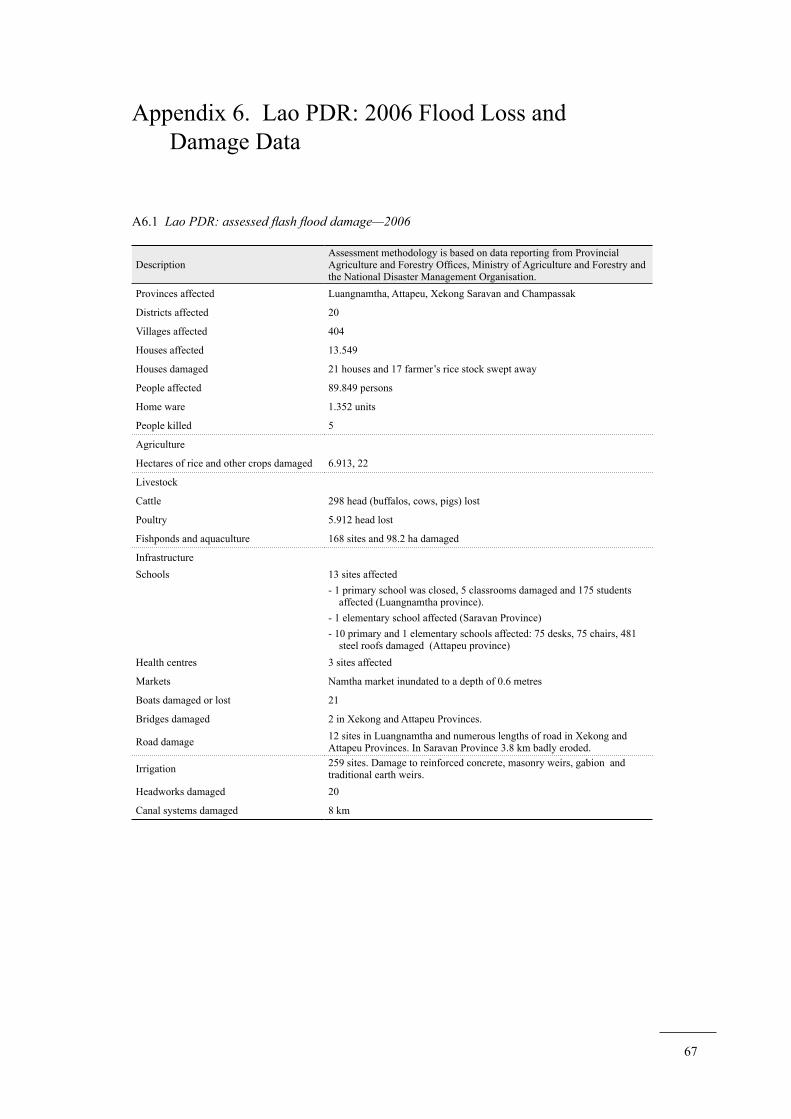
67
Appendix 6. Lao PDR: 2006 Flood Loss and Damage Data
A6.1 Lao PDR: assessed flash flood damage—2006
DescriptionAssessment methodology is based on data reporting from Provincial Agriculture and Forestry Offices, Ministry of Agriculture and Forestry and the National Disaster Management Organisation.
Provinces affected Luangnamtha, Attapeu, Xekong Saravan and Champassak
Districts affected 20
Villages affected 404
Houses affected 13.549
Houses damaged 21 houses and 17 farmer’s rice stock swept away
People affected 89.849 persons
Home ware 1.352 units
People killed 5
Agriculture
Hectares of rice and other crops damaged 6.913, 22
Livestock
Cattle 298 head (buffalos, cows, pigs) lost
Poultry 5.912 head lost
Fishponds and aquaculture 168 sites and 98.2 ha damaged
InfrastructureSchools 13 sites affected
- 1 primary school was closed, 5 classrooms damaged and 175 students affected (Luangnamtha province).
- 1 elementary school affected (Saravan Province)- 10 primary and 1 elementary schools affected: 75 desks, 75 chairs, 481
steel roofs damaged (Attapeu province)Health centres 3 sites affected
Markets Namtha market inundated to a depth of 0.6 metres
Boats damaged or lost 21
Bridges damaged 2 in Xekong and Attapeu Provinces.
Road damage 12 sites in Luangnamtha and numerous lengths of road in Xekong and Attapeu Provinces. In Saravan Province 3.8 km badly eroded.
Irrigation 259 sites. Damage to reinforced concrete, masonry weirs, gabion and traditional earth weirs.
Headworks damaged 20
Canal systems damaged 8 km

68
Annual Mekong Flood Report 2006
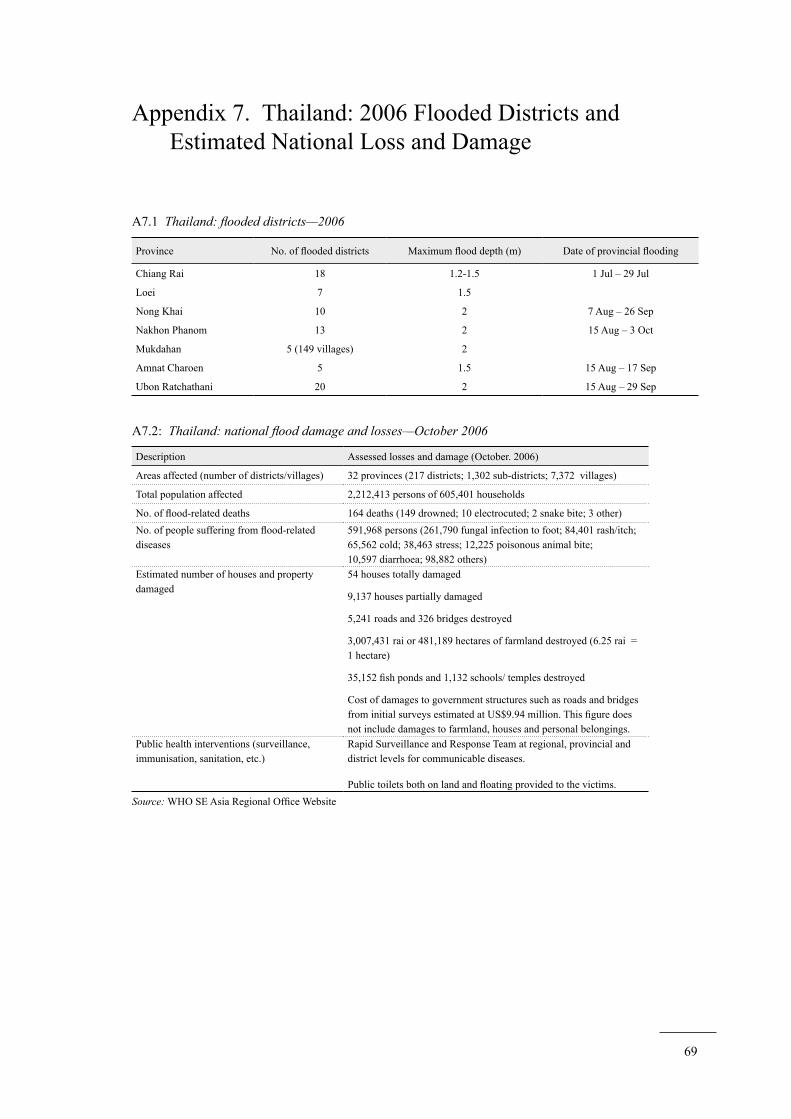
69
Appendix 7. Thailand: 2006 Flooded Districts and Estimated National Loss and Damage
A7.1 Thailand: flooded districts—2006
Province No. of flooded districts Maximum flood depth (m) Date of provincial flooding
Chiang Rai 18 1.2-1.5 1 Jul – 29 Jul
Loei 7 1.5
Nong Khai 10 2 7 Aug – 26 Sep
Nakhon Phanom 13 2 15 Aug – 3 Oct
Mukdahan 5 (149 villages) 2
Amnat Charoen 5 1.5 15 Aug – 17 Sep
Ubon Ratchathani 20 2 15 Aug – 29 Sep
A7.2: Thailand: national flood damage and losses—October 2006
Description Assessed losses and damage (October. 2006)
Areas affected (number of districts/villages) 32 provinces (217 districts; 1,302 sub-districts; 7,372 villages)
Total population affected 2,212,413 persons of 605,401 households
No. of flood-related deaths 164 deaths (149 drowned; 10 electrocuted; 2 snake bite; 3 other) No. of people suffering from flood-related diseases
591,968 persons (261,790 fungal infection to foot; 84,401 rash/itch; 65,562 cold; 38,463 stress; 12,225 poisonous animal bite; 10,597 diarrhoea; 98,882 others)
Estimated number of houses and property damaged
54 houses totally damaged
9,137 houses partially damaged
5,241 roads and 326 bridges destroyed
3,007,431 rai or 481,189 hectares of farmland destroyed (6.25 rai = 1 hectare)
35,152 fish ponds and 1,132 schools/ temples destroyed
Cost of damages to government structures such as roads and bridges from initial surveys estimated at US$9.94 million. This figure does not include damages to farmland, houses and personal belongings.
Public health interventions (surveillance, immunisation, sanitation, etc.)
Rapid Surveillance and Response Team at regional, provincial and district levels for communicable diseases.
Public toilets both on land and floating provided to the victims.Source: WHO SE Asia Regional Office Website

70
Annual Mekong Flood Report 2006

71
Appendix 8. Viet Nam: National Flood Warning and Alarm Levels and 2006 Flood Loss and Damage Data
A8.1 Viet Nam: National flood warning levels
Warning (Alarm) Level I: Flood stage reaches flood protection dike footing. Potential inundation of low lying unprotected areas. Initial warnings issued to local authorities.
Warning (Alarm) Level II: Flood stage reaches dike body or inundation risk to unprotected populated areas with associated risk of property damage
Warning (Alarm) Level III: Flood stage close to dike crest elevation threatening serious inundation and threat to life, property and economic activity
Emergency Warning Level: Flood stage exceeds dike crest elevation.
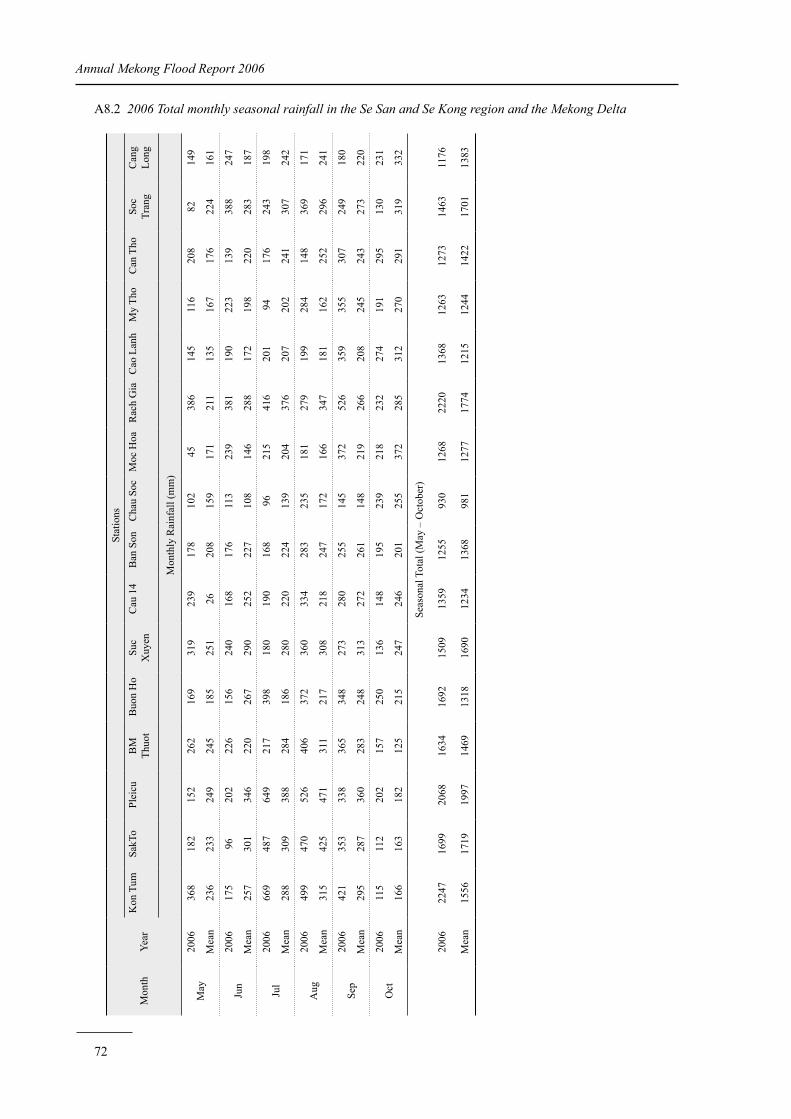
72
Annual Mekong Flood Report 2006
Mon
thYe
ar
Stat
ions
Kon
Tum
SakT
oPl
eicu
BM
Th
uot
Buo
n H
oSu
c X
uyen
Cau
14
Ban
Son
Cha
u So
cM
oc H
oaR
ach
Gia
Cao
Lan
hM
y Th
oC
an T
hoSo
c Tr
ang
Can
g Lo
ng
Mon
thly
Rai
nfal
l (m
m)
May
2006
368
182
152
262
169
319
239
178
102
4538
614
511
620
882
149
Mea
n23
623
324
924
518
525
126
208
159
171
211
135
167
176
224
161
Jun
2006
175
9620
222
615
624
016
817
611
323
938
119
022
313
938
824
7
Mea
n25
730
134
622
026
729
025
222
710
814
628
817
219
822
028
318
7
Jul
2006
669
487
649
217
398
180
190
168
9621
541
620
194
176
243
198
Mea
n28
830
938
828
418
628
022
022
413
920
437
620
720
224
130
724
2
Aug
2006
499
470
526
406
372
360
334
283
235
181
279
199
284
148
369
171
Mea
n31
542
547
131
121
730
821
824
717
216
634
718
116
225
229
624
1
Sep
2006
421
353
338
365
348
273
280
255
145
372
526
359
355
307
249
180
Mea
n29
528
736
028
324
831
327
226
114
821
926
620
824
524
327
322
0
Oct
2006
115
112
202
157
250
136
148
195
239
218
232
274
191
295
130
231
Mea
n16
616
318
212
521
524
724
620
125
537
228
531
227
029
131
933
2
Seas
onal
Tot
al (M
ay –
Oct
ober
)
2006
2247
1699
2068
1634
1692
1509
1359
1255
930
1268
2220
1368
1263
1273
1463
1176
Mea
n15
5617
1919
9714
6913
1816
9012
3413
6898
112
7717
7412
1512
4414
2217
0113
83
A8.2 2006 Total monthly seasonal rainfall in the Se San and Se Kong region and the Mekong Delta
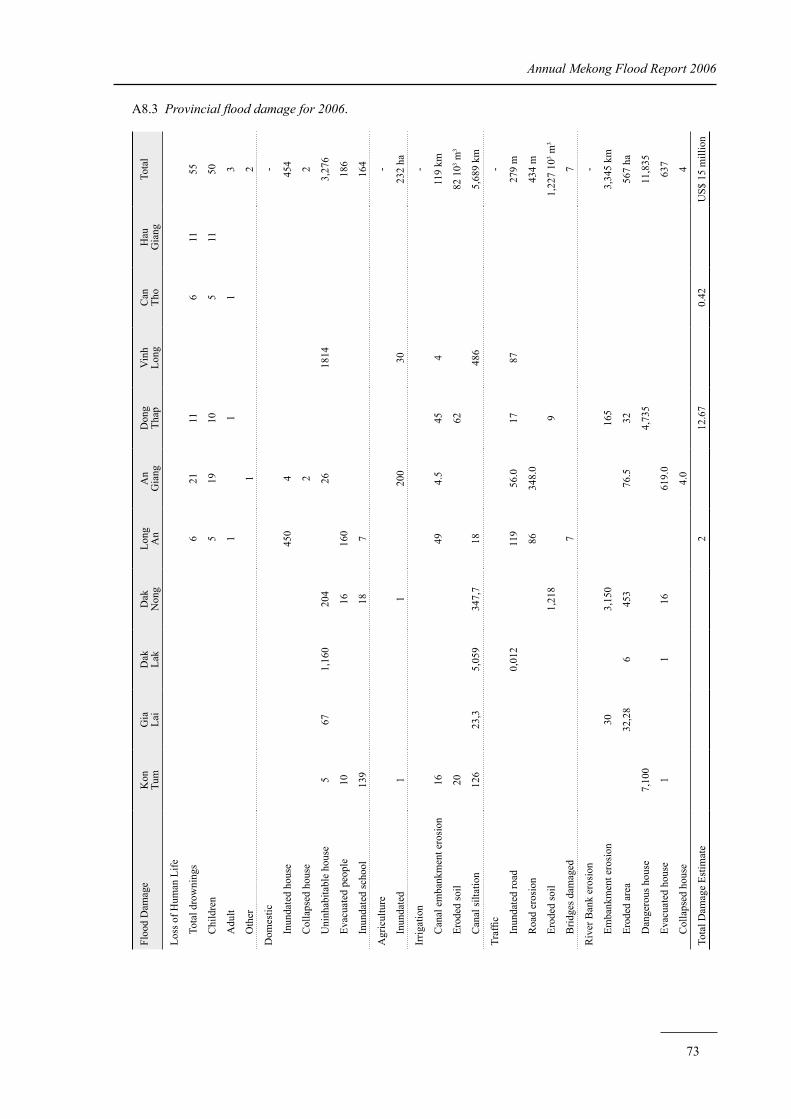
73
Annual Mekong Flood Report 2006
A8.3 Provincial flood damage for 2006.
Floo
d D
amag
eK
onTu
mG
iaLa
iD
akLa
kD
akN
ong
Long
An
An
Gia
ngD
ong
Thap
Vin
hLo
ngC
anTh
oH
auG
iang
Tota
l
Loss
of H
uman
Life
Tota
l dro
wni
ngs
621
116
1155
Chi
ldre
n5
1910
511
50
Adu
lt1
11
3
Oth
er1
2
Dom
estic
-
Inun
date
d ho
use
450
445
4
Col
laps
ed h
ouse
22
Uni
nhab
itabl
e ho
use
567
1,16
020
426
1814
3,27
6
Evac
uate
d pe
ople
1016
160
186
Inun
date
d sc
hool
139
187
164
Agr
icul
ture
-
Inun
date
d1
120
030
232
ha
Irrig
atio
n-
Can
al e
mba
nkm
ent e
rosi
on16
494.
545
411
9 km
Erod
ed so
il20
6282
103 m
3
Can
al si
ltatio
n12
623
,35,
059
347,
718
486
5,68
9 km
Traf
fic-
Inun
date
d ro
ad0,
012
119
56.0
1787
279
m
Roa
d er
osio
n86
348.
043
4 m
Erod
ed so
il1,
218
91,
227
103 m
3
Brid
ges d
amag
ed7
7
Riv
er B
ank
eros
ion
-
Emba
nkm
ent e
rosi
on30
3,15
016
53,
345
km
Erod
ed a
rea
32,2
86
453
76.5
3256
7 ha
Dan
gero
us h
ouse
7,10
04,
735
11,8
35
Evac
uate
d ho
use
11
1661
9.0
637
Col
laps
ed h
ouse
4.0
4
Tota
l Dam
age
Estim
ate
212
.67
0.42
US$
15
mill
ion
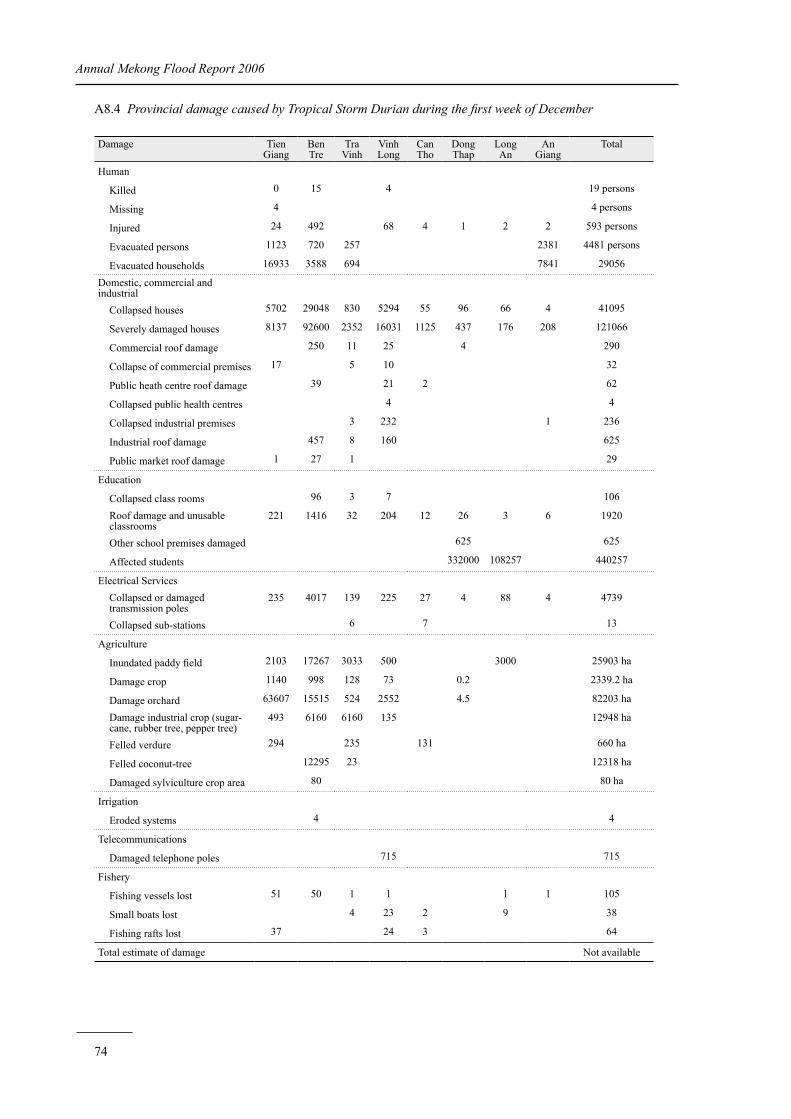
74
Annual Mekong Flood Report 2006
A8.4 Provincial damage caused by Tropical Storm Durian during the first week of December
Damage TienGiang
BenTre
TraVinh
VinhLong
CanTho
DongThap
LongAn
AnGiang
Total
Human
Killed 0 15 4 19 persons
Missing 4 4 persons
Injured 24 492 68 4 1 2 2 593 persons
Evacuated persons 1123 720 257 2381 4481 persons
Evacuated households 16933 3588 694 7841 29056
Domestic, commercial and industrial
Collapsed houses 5702 29048 830 5294 55 96 66 4 41095
Severely damaged houses 8137 92600 2352 16031 1125 437 176 208 121066
Commercial roof damage 250 11 25 4 290
Collapse of commercial premises 17 5 10 32
Public heath centre roof damage 39 21 2 62
Collapsed public health centres 4 4
Collapsed industrial premises 3 232 1 236
Industrial roof damage 457 8 160 625
Public market roof damage 1 27 1 29
Education
Collapsed class rooms 96 3 7 106
Roof damage and unusable classrooms
221 1416 32 204 12 26 3 6 1920
Other school premises damaged 625 625
Affected students 332000 108257 440257
Electrical ServicesCollapsed or damaged transmission poles
235 4017 139 225 27 4 88 4 4739
Collapsed sub-stations 6 7 13
Agriculture
Inundated paddy field 2103 17267 3033 500 3000 25903 ha
Damage crop 1140 998 128 73 0.2 2339.2 ha
Damage orchard 63607 15515 524 2552 4.5 82203 ha
Damage industrial crop (sugar-cane, rubber tree, pepper tree)
493 6160 6160 135 12948 ha
Felled verdure 294 235 131 660 ha
Felled coconut-tree 12295 23 12318 ha
Damaged sylviculture crop area 80 80 ha
Irrigation
Eroded systems 4 4
Telecommunications
Damaged telephone poles 715 715
Fishery
Fishing vessels lost 51 50 1 1 1 1 105
Small boats lost 4 23 2 9 38
Fishing rafts lost 37 24 3 64
Total estimate of damage Not available
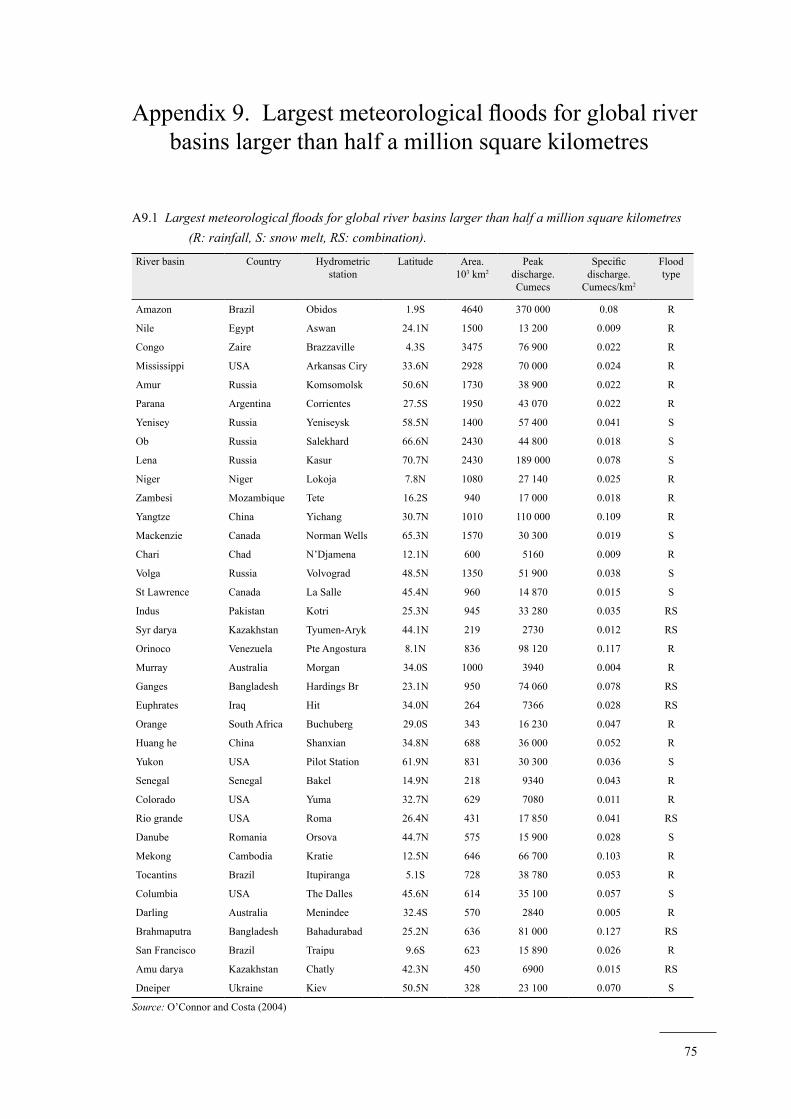
75
Appendix 9. Largest meteorological floods for global river basins larger than half a million square kilometres
A9.1 Largest meteorological floods for global river basins larger than half a million square kilometres (R: rainfall, S: snow melt, RS: combination).
River basin Country Hydrometric station
Latitude Area.103 km2
Peak discharge.Cumecs
Specific discharge.
Cumecs/km2
Flood type
Amazon Brazil Obidos 1.9S 4640 370 000 0.08 R
Nile Egypt Aswan 24.1N 1500 13 200 0.009 R
Congo Zaire Brazzaville 4.3S 3475 76 900 0.022 R
Mississippi USA Arkansas Ciry 33.6N 2928 70 000 0.024 R
Amur Russia Komsomolsk 50.6N 1730 38 900 0.022 R
Parana Argentina Corrientes 27.5S 1950 43 070 0.022 R
Yenisey Russia Yeniseysk 58.5N 1400 57 400 0.041 S
Ob Russia Salekhard 66.6N 2430 44 800 0.018 S
Lena Russia Kasur 70.7N 2430 189 000 0.078 S
Niger Niger Lokoja 7.8N 1080 27 140 0.025 R
Zambesi Mozambique Tete 16.2S 940 17 000 0.018 R
Yangtze China Yichang 30.7N 1010 110 000 0.109 R
Mackenzie Canada Norman Wells 65.3N 1570 30 300 0.019 S
Chari Chad N’Djamena 12.1N 600 5160 0.009 R
Volga Russia Volvograd 48.5N 1350 51 900 0.038 S
St Lawrence Canada La Salle 45.4N 960 14 870 0.015 S
Indus Pakistan Kotri 25.3N 945 33 280 0.035 RS
Syr darya Kazakhstan Tyumen-Aryk 44.1N 219 2730 0.012 RS
Orinoco Venezuela Pte Angostura 8.1N 836 98 120 0.117 R
Murray Australia Morgan 34.0S 1000 3940 0.004 R
Ganges Bangladesh Hardings Br 23.1N 950 74 060 0.078 RS
Euphrates Iraq Hit 34.0N 264 7366 0.028 RS
Orange South Africa Buchuberg 29.0S 343 16 230 0.047 R
Huang he China Shanxian 34.8N 688 36 000 0.052 R
Yukon USA Pilot Station 61.9N 831 30 300 0.036 S
Senegal Senegal Bakel 14.9N 218 9340 0.043 R
Colorado USA Yuma 32.7N 629 7080 0.011 R
Rio grande USA Roma 26.4N 431 17 850 0.041 RS
Danube Romania Orsova 44.7N 575 15 900 0.028 S
Mekong Cambodia Kratie 12.5N 646 66 700 0.103 R
Tocantins Brazil Itupiranga 5.1S 728 38 780 0.053 R
Columbia USA The Dalles 45.6N 614 35 100 0.057 S
Darling Australia Menindee 32.4S 570 2840 0.005 R
Brahmaputra Bangladesh Bahadurabad 25.2N 636 81 000 0.127 RS
San Francisco Brazil Traipu 9.6S 623 15 890 0.026 R
Amu darya Kazakhstan Chatly 42.3N 450 6900 0.015 RS
Dneiper Ukraine Kiev 50.5N 328 23 100 0.070 S
Source: O’Connor and Costa (2004)

76
Annual Mekong Flood Report 2006


M e ko n g R i v e r C o m m i s s i o n
Annual Mekong FloodReport 2006
M a r c h 2 0 0 7
Mekong River Commission
P.O.Box 6101, 184 Fa Ngoum Road, Unit 18, Ban Sithane Neua,Sikhottabong District, Vientiane Lao PDR
Telephone: (856) 21 263 263 Facsimile: (856) 21 263 264E-mmail: [email protected] Website: www.mrcmekong.org
ISSN: 1728-3248