Embed Size (px)
Citation preview
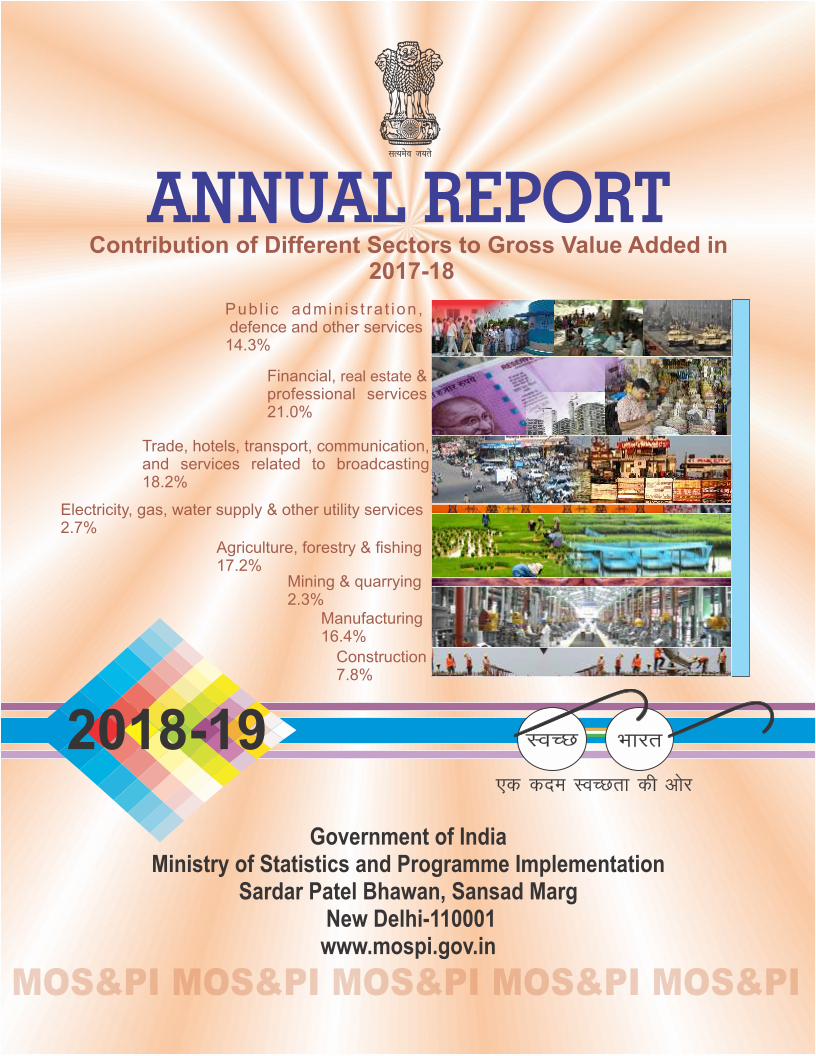
Annual Report2018-19
Government of IndiaMinistry of Statistics and Programme ImplementationSardar Patel Bhawan, Sansad Marg, New Delhi-110001
http://www.mospi.gov.in

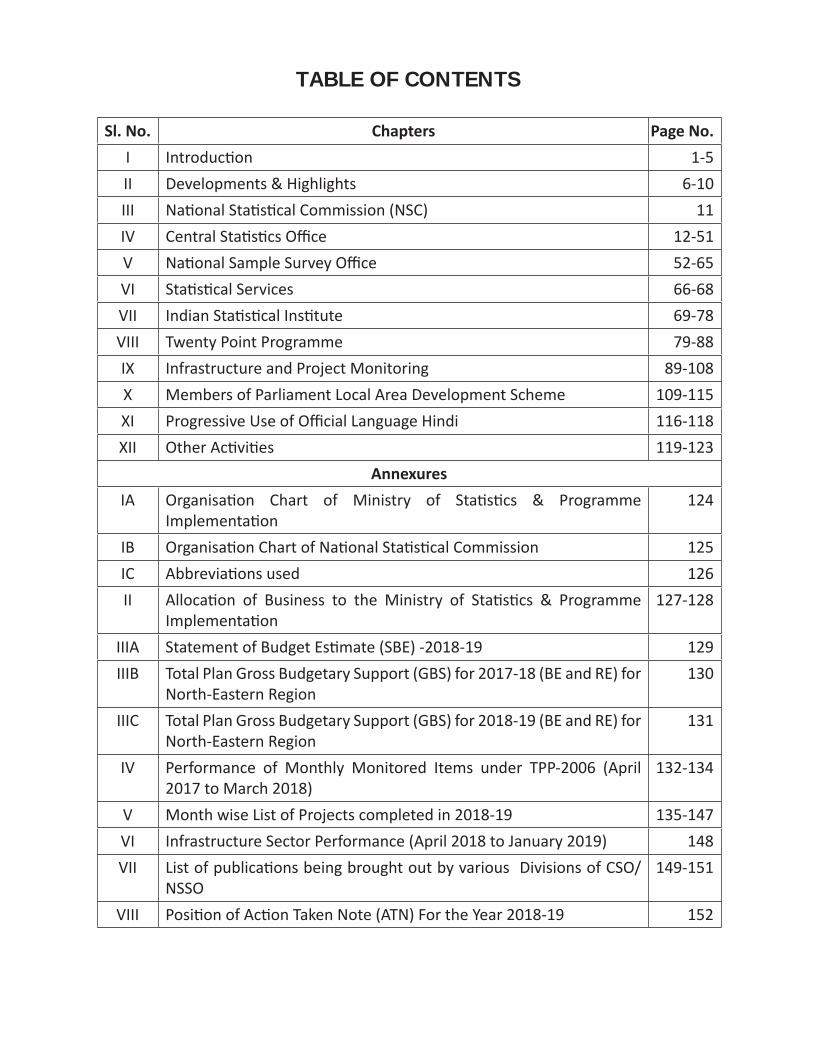
TABLE OF CONTENTS
Sl. No. Chapters Page No.
I Introduction 1-5II Developments & Highlights 6-10III National Statistical Commission (NSC) 11IV Central Statistics Office 12-51V National Sample Survey Office 52-65VI Statistical Services 66-68VII Indian Statistical Institute 69-78VIII Twenty Point Programme 79-88IX Infrastructure and Project Monitoring 89-108X Members of Parliament Local Area Development Scheme 109-115XI Progressive Use of Official Language Hindi 116-118XII Other Activities 119-123
Annexures
IA Organisation Chart of Ministry of Statistics & Programme Implementation
124
IB Organisation Chart of National Statistical Commission 125IC Abbreviations used 126II Allocation of Business to the Ministry of Statistics & Programme
Implementation127-128
IIIA Statement of Budget Estimate (SBE) -2018-19 129IIIB Total Plan Gross Budgetary Support (GBS) for 2017-18 (BE and RE) for
North-Eastern Region130
IIIC Total Plan Gross Budgetary Support (GBS) for 2018-19 (BE and RE) for North-Eastern Region
131
IV Performance of Monthly Monitored Items under TPP-2006 (April 2017 to March 2018)
132-134
V Month wise List of Projects completed in 2018-19 135-147VI Infrastructure Sector Performance (April 2018 to January 2019) 148VII List of publications being brought out by various Divisions of CSO/
NSSO149-151
VIII Position of Action Taken Note (ATN) For the Year 2018-19 152

1
CHAPTER – I
INTRODUCTION
1.1 The Ministry of Statistics and Programme Implementation (MoSPI) came into existence as an independent Ministry on 15th October 1999 after the merger of the Department of Statistics and the Department of Programme Implementation. The Ministry has two wings, one relating to Statistics and the other relating to Programme Implementation. The Statistics Wing re-designated as National Statistics Office (NSO) consists of the Central Statistics Office (CSO) and National Sample Survey Office (NSSO). CSO is an attached Office and NSSO is a subordinate Office under the control of Ministry of Statistics and Programme Implementation (S&PI). The Programme Implementation Wing has three Divisions, namely, (i) Twenty Point Programme (ii) Infrastructure and Project Monitoring and (iii) Member of Parliament Local Area Development Scheme. Besides these two wings, there is a National Statistical Commission (NSC) created through a Resolution of Government of India (MoSPI) and one autonomous institute viz. Indian Statistical Institute (ISI) declared as an institute of national importance by an Act of Parliament. The organisation chart of the Ministry is at Annexure–IA to IB. Abbreviations used in this report are at Annexure –IC.
1.2 The Ministry of Statistics and Programme Implementation attaches considerable importance to coverage and quality aspects of statistics released in the country. The statistics released are based on administrative sources, surveys and censuses conducted by the Central and State Governments and non-official sources and studies. The surveys conducted by the Ministry are based on scientific sampling methods and are supervised by the National Statistical Commission. Data is collected through dedicated field staff who are regularly trained in the concepts and definitions of the items and the scope of the survey. In line with the emphasis on the quality of statistics released by the Ministry, the methodological issues concerning the compilation of national accounts are overseen by an Advisory Committee on National Accounts, industrial statistics by a Standing Committee on Industrial Statistics and price and cost of living indices by a Technical Advisory Committee on Price Indices. The Ministry compiles data sets based on current data, after applying standard statistical techniques and extensive scrutiny and supervision.
1.3 India is a subscriber to the International Monetary Fund’s (IMF) Special Data Dissemination Standards (SDDS) and is currently fulfilling the Standards. The Ministry maintains an ‘Advance Release Calendar’ for its data categories covered under the SDDS, which is disseminated on the Ministry’s website as well as on the
2
Dissemination Standards Bulletin Board (DSBB) of the IMF. The Ministry releases the datasets covered under the Real Sector of SDDS through press notes and its web-site simultaneously. The Ministry has been designated as the Nodal Ministry to facilitate the implementation of the SAARC Social Charter in India. The Ministry is entrusted with the statistical tracking of Millennium Development Goals in India. The Ministry organises technical meetings on a regular basis on various topics to assess the data-gaps in the system and the quality of statistics currently released. The CSO staff participates in meetings and seminars organised by international and regional organizations, such as, the United Nations Economic and Social Commission for Asia and the Pacific (UNESCAP), on statistical compilations and international practices. India has a strong system of official statistics and is among the leading countries in the area of official statistics. The Ministry’s officials have been associated with international agencies on the development of methodologies, particularly in the areas of national accounts, informal sector statistics, large-scale sample surveys, conduct of censuses, service sector statistics, non-observed economy, social sector statistics, environmental statistics and classifications. The contribution of the Ministry’s officials in international meetings on these subjects is highly appreciated.
1.4 Statistics Day: In recognition of the notable contributions made by (Late) Professor Prasanta Chandra Mahalanobis in the field of economic planning and statistical development, the Government of India has designated 29th June every year, coinciding with his birth anniversary, as the Statistics Day in the category of Special Day to be celebrated at the national level. The objective of this Day is to create public awareness, among the people specially the younger generation for drawing inspirations from (Late) Prof. Mahalanobis about the role of statistics in socio-economic planning and policy formulation.
1.5 The 12th Statistics Day and the closing ceremony of the 125th Birth Anniversary of Prof. P. C. Mahalanobis was celebrated on 29th June 2018, all over India by the Ministry of Statistics and Programme Implementation, State Governments, National Sample Survey Offices spread throughout the country, Indian Statistical Institute (ISI), Universities/Departments, etc. by organizing Seminars, Conferences, Debates, Quiz Programmes, Lecture Series, Essay Competitions, etc. The main function was organized jointly by the Ministry of Statistics & Programme Implementation and Indian Statistical Institute (ISI) on 29th June 2018 at Kolkata. A commemorative coin of `125 denomination and a circulation coin of `5 denomination were released as a mark of respect to Prof. Mahalanobis on the occasion.
Conference of Central and State Statistical Organizations (COCSSO)
1.6 As a part of the mechanism set up by the Government for coordinating the activities in the field of statistics in different States/UTs and Central Ministries/
3
Departments, the Ministry organizes Conference of Central and State Statistical Organizations (COCSSO) every year. This is a major forum for discussing important statistical issues by the Central and State statistical agencies with the objective of putting in coordinated efforts for availability of reliable and timely statistics to planners and policy makers for informed decision making and good governance.
1.7 The Ministry had organized 25th COCSSO was held during 18th-19th January 2018 in Bengaluru, Karnataka, in collaboration with the Directorate of Economics & Statistics, Government of Karnataka. The theme of the Conference was “Administrative Statistics”. The 26th COCSSO was held during 15th-16th November 2018 in Dharamshala, Himachal Pradesh, in collaboration with the Directorate of Economics & Statistics, Government of Himachal Pradesh. The theme of the Conference was “Quality Assurance in Official Statistics”.
1.8 The Statistics Wing of the Ministry is mandated with the following responsibilities:
(i) acts as the nodal agency for planned development of the statistical system in the country, lays down and maintains norms and standards in the field of statistics involving concepts and definitions, methodology of data collection, processing of data and dissemination of results;
(ii) coordinates the statistical work in respect of the Ministries/Departments of the Government of India and State Statistical Bureaus (SSBs), advises the Ministries/Departments of the Government of India on statistical methodology and on statistical analysis of data;
(iii) prepares national accounts as well as publishes annual estimates of national product, government and private consumption expenditure, capital formation, savings, estimates of capital stock and consumption of fixed capital, as also the state level gross capital formation of supra-regional sectors and prepares comparable estimates of State Domestic Product (SDP) at current prices;
(iv) maintains liaison with international statistical organisations, such as, the United Nations Statistical Division (UNSD), the Economic and Social Commission for Asia and the Pacific (ESCAP), the Statistical Institute for Asia and the Pacific (SIAP), the International Monetary Fund (IMF), the Asian Development Bank (ADB), the Food and Agriculture Organisation (FAO), the International Labour Organisation (ILO), etc;
(v) compiles and releases the Index of Industrial Production (IIP) every month in the form of ‘quick estimates’, conducts the Annual Survey of Industries (ASI), and provides statistical information to assess and evaluate the changes in the growth, composition and structure of the organised manufacturing sector;
4
(vi) organises and conducts periodic all-India Economic Censuses and follow-up enterprise surveys, provides an in-house facility to process the data collected through various socio-economic surveys and follow-up enterprise surveys of Economic Censuses;
(vii) conducts large scale all-India sample surveys for creating the database needed for studying the impact of specific problems for the benefit of different population groups in diverse socio-economic areas, such as employment, consumer expenditure, housing conditions and environment, literacy levels, health, nutrition, family welfare, etc;
(viii) examines the survey reports from the technical angle and evaluates the sampling design including survey feasibility studies in respect of surveys conducted by NSSO and other Central Ministries and Departments;
(ix) disseminates statistical information on various aspects through a number of publications distributed to Government, Semi-Government, Private data users/ agencies and disseminates data, on request, to the United Nations agencies like the UNSD, ESCAP, ILO and other international agencies;
(x) releases grants-in-aid to registered Non-Governmental Organisations (NGO) and Research Institutions of repute for undertaking special studies or surveys, printing of statistical reports, and financing seminars, workshops and conferences relating to different subject areas of official statistics.
1.9 The Programme Implementation Wing of the Ministry has the following responsibilities:-
(i) monitoring the performance of the country’s eleven key infrastructure sectors, viz., Power, Coal, Steel, Railways, Telecommunications, Ports, Fertilizers, Cement, Petroleum & Natural Gas, Roads and Civil Aviation;
(ii) monitoring of all Central Sector Projects costing `150 crore and above; and
(iii) monitoring implementation of Member of Parliament Local Area Development Scheme (MPLADS).
1.10 The Administration Division of the Ministry:functions as the Cadre Controlling Authority of offices of Indian Statistical Service (ISS) and Subordinate Statistical Service (SSS) cadres including matters relating to their training, career progression and manpower planning.
5
1.11 This Ministry also acts as the nodal Ministry for the Indian Statistical Institute (ISI) and ensures its functioning in accordance with the provisions of the Indian Statistical Institute Act, 1959 (57 of 1959).
1.12 The Allocation of Business to the Ministry of Statistics and Programme Implementation is placed at Annexure-II. A website (http://www.mospi.gov.in) of the Ministry has been designed, created and is being maintained by the Computer Centre within data storage and Dissemination Divisions of CSO of the Ministry. A large number of reports of the Ministry are available on the website for access/use of various stakeholders. System of on-line registration has also been introduced for downloading/viewing the reports.
1.13 The total budget allocation of the Ministry for the year 2018-19 was ̀ 4859.00 crore (Scheme and Non- Scheme), out of which `3950.00 crore was for MPLADS, `4158.00 crore for Scheme (including MPLADS) and `701.00 crore was for Non- Scheme. The requirements and priorities of its attached and subordinate offices were kept in view while making budgetary allocations to them by this Ministry.
6
CHAPTER – II
DEVELOPMENT AND HIGHLIGHTS
Highlights of achievements of the Ministry during 2018-19 (till 31st March 2019) are as follows:
2. Central Statistics Office (CSO)
2.1 National Accounts Division (NAD)
• NAD of CSO is responsible for preparation of national accounts, which include the estimates of Gross Domestic Product (GDP), National Income, Government/Private Final Consumption Expenditure, Capital Formation and Savings along with details of transactions of institutional sectors. The NAD brings out annually a publication titled “National Accounts Statistics”, containing these statistics.
• NAD is also responsible for preparation and release of Supply-Use Tables (SUT) and Input-Output Transaction Tables (IOTT) from time to time.
• NAD maintains liaison with international organizations on statistical matters related to national accounts.
2.2 Price Statistics Division (PSD)
• Consumer Price Index (Rural, Urban, and Combined): CSO started compiling Consumer Price Index (CPI) with Base Year (2010=100) for all India and States/UTs with effect from January 2011. The Base Year of the CPI has been revised from 2010=100 to 2012=100, incorporating many methodological improvements in consonance with the international practices. During March 2018 to March 2019 (Provisional), the all India year on year inflation rate based on CPI (General) for the combined sector (i.e. current month over same month of last year) was reported highest at 4.92% in June 2018 and the lowest at 1.97% in January 2019.
• International Comparison Programme (ICP): India has been participating in International Comparison Programme since 1970. Current ICP round, ICP-2017, was started in April 2017 for which price collection was carried out NSSO for Household sector and by PSD for Machinery & Equipment and Construction sector. These prices were submitted to Asian Development Bank (ADB) for inter-country validation for compilation of Purchasing Power Parity (PPP) under ICP 2017. This indicator helps in comparing the GDP of different countries/economies across the world.
7
2.3 Economic Statistics Division (ESD)
Index of industrial Production: The Index of Industrial Production (IIP) which is a unit free number based on data of fixed items from a fixed panel of factories that reflects short term changes in the manufacturing sector is being released on a monthly basis with a lime lag of 6 weeks.
During the year, all India Index of Industrial Production (IIP) with base year (2011-12=100) was released every month on due date. In addition to regular release of all India IIP, a workshop on implementation of the Collection of Statistics Act, 2008 was held in September 2018 to strengthen the data collection. Further, to facilitate the release of IIP at State level, five Regional Conferences were conducted during the year 2018-19.
The all India IIP data (sectoral and use-based category) with metadata, and details of its methodology are made available on the website of the Ministry (http://www.mospi.gov.in/iip-2011-12-series) for public access.
Seventh Economic Census: The preparatory work for undertaking the Seventh Economic Census is in progress. The Seventh Economic Census is being conducted in the year 2019 on a IT platform through CSC, e-Governance Services India Ltd, a Special Purpose Vehicle (SPV) under the Ministry of Electronics and Information Technology (MeITy), as an implementing agency.
2.4 Social Statistics Division (SSD)
Important Developments during 2018-19: The Government has approved constitution of a High Level Steering Committee (HLSC) under the chairmanship of Chief Statistician of India and Secretary, MoSPI with members from NITI Aayog, Ministry of Home Affairs, Ministry of Health and Family Welfare, Ministry of Environment, Forest and Climate Change, Ministry of Finance and Ministry of Statistics and Programme Implementation, to periodically review and refine the National Indicator Framework.
A Memorandum of Understanding (MoU) was signed between MoSPI and United Nations Resident Coordinator (UNRC) on 15th March 2018 with overall purpose to collaborate on issues related to Statistical Monitoring of Goals and Targets of SDGs including use of new technology.
Publications brought out by the Social Statistics Division during 2018-19: One of the activities of the Ministry of Statistics and Programme Implementation is to disseminate statistical information on environment and various social and demographic aspects. Accordingly, SSD has brought out following publications during 2018-19.
8
• The Annual publication Women and Men in India 2017 and Women and Men in India 2018 were published during January 2018 and March 2019 respectively. The publication provides Gender Disaggregated data on various socio-economic aspects including health, education, participation in economy, decision making, social obstacles on women empowerment, etc.
• The Annual publication ‘SAARC Social Charter-India Country Report 2018’ was published during January 2019. SAARC Social Charter, published in alternate years, provide the statistical tool to quantify the success in achieving the objectives of social and economic development that are in conformity with the principal goals of SAARC.
• The annual publication ‘Compendium of Environment Statistics – India’ was replaced by the publication ‘EnviStats India’, which was released in March 2018. The publication is based on FDES-2013, which is prescribed by UNSD for environment statistics.
• The Adhoc publication ‘Children in India 2018 – A Statistical Appraisal’ was published during April 2018. The publication gives consolidated and updated statistics on the status of children in India.
• The publication ‘India in Figures 2018’ was released in June 2018. The publication covers snapshots of data covering wide variety of sectors such as, socio-economic indicators, poverty, infrastructure, education, sanitation, energy and environment among others.
• A supplement to the publication ‘EnviStats India’ based on the System of Environmental Economic Accounting- Central Framework (SEEA-CF) was released in September 2018, which gives the aggregate environment accounts for India with the asset accounts in physical terms of four vital natural resources – forest, land, minerals and water. This is the first official publication on environmental accounts in the country.
• The annual publication on environment statistics ‘EnviStats India 2019, Vol.I-Environment Statistics’ was released in March 2019. The publication is based on FDES-2013 prescribed by UNSD for compilation of environment statistics.
• ‘Sustainable Development Goals, National Indicator Framework Baseline Report 2015-16’ was published provisionally in March 2019 and uploaded on the website of the Ministry. The publication contains data snapshot, goal wise chapter description including definition, computation, sources, metadata and data of national indicators.
9
2.5 National Sample Survey Office (NSSO)
• The nationwide Labour Force Survey, namely, ‘Periodic Labour Force Survey’ (PLFS) was launched from 1st April 2017. The main objective of the PLFS is to measure quarterly changes of various indicators of the labour market in urban areas as well as to generate the annual estimates of different labour force indicators both in rural and urban areas. The first results of the PLFS is set to be made available by 2019 and on regular basis thereafter.
• NSSO conducted a ‘Swachh Bharat Survey’ alongside its 75th Round (July 2017-June 2018) Survey. The ‘Swachh Bharat Survey’ was conducted during the first two Sub-Rounds of the 75th Round (July-December 2017). The survey report has been released in October 2018. The report provides indicators on the use of toilets by the households and disposal of solid and liquid wastes. This is second such report after the release of the first one in April 2016.
• The next phase of Urban Frame Survey (UFS) (2017-2022) has commenced in November 2017. During this phase of UFS, the frame and related details are being digitized. Different UFS operations are being carried out using mobile/web applications developed in collaboration with National Remote Sensing Centre (NRSC), Hyderabad. Boundaries of blocks/wards/Investigator units (IV Units) /towns are being drawn on satellite imagery obtained from Bhuvan portal using Quantum Geographic Information System (QGIS) software. The mobile app for UFS work has been developed and development of the web portal is in advanced stage.
• The nationwide Time Use Survey (TUS) is being conducted for the first time from 1st January 2019 to December 2019. The TUS will enable measuring time spent by individuals on different activities. The primary objective of TUS is to measure participation of men, women and other groups of persons in paid and unpaid activities.
2.6 Annual Survey of Industries (ASI)
• Now data for ASI is collected directly from the manufacturing units for compilation of its result through a web-based system of data collection.
2.7 Members of Parliament Local Area Development (MPLAD) Scheme.
• `50462.25 crore has been released since the inception of the scheme up to 31st March 2019.
• As per the information received from the Districts, an expenditure of `48997.07 crore has been incurred under the scheme up to 31st March 2019.
10
• The percentage of expenditure over release is 97.1 as on 31st March 2019, since inception of the scheme.
• `3949.50 crore has been released in the current financial year up to 31st March 2019 and an expenditure of `5012.13 crore has been made (including unspent amounts of previous years).
• Annual Review Meetings with the Secretaries of State Nodal Departments are being held regularly for monitoring of release of funds and taking stock of the implementation of the scheme in the States/UTs. During the financial year 2018-19, All India Review Meeting was held on 30th August 2018.
• Financial and technical assistance are being provided to States/ UTs to conduct training programmes for State/District officials to facilitate better implementation of the scheme. Ministry is providing training to the States/UTs for operationalising the newly developed integrated MPLADS website.
11
CHAPTER – III
NATIONAL STATISTICAL COMMISSION (NSC)
3.1 The Government of India through a Resolution dated 1st June 2005 decided to set up the National Statistical Commission (NSC). The setting up of the NSC followed the decision of the Cabinet to accept a recommendation of the Rangarajan Commission, which reviewed the Indian Statistical System in 2001. The NSC was initially constituted on 12th July 2006 and it has been functioning since then. The NSC has a part-time Chairperson and four part-time Members, each having specialization and experience in specified statistical fields. Besides, Chief Executive Officer of the NITI Aayog is the ex-officio member of the NSC. The maximum tenure of a part-time Chairperson/Member is three years. The Chief Statistician of India is the Secretary to the NSC. He is also the Secretary to the Government of India in the Ministry of Statistics & Programme Implementation.
3.2 The posts of Chairperson and four part-time Members in the NSC are vacant as on 31st March 2019.
3.3 The functions of the NSC are laid down in the Government of India Resolution dated 1st June 2005. The Resolution provides for submission of Annual Report on its activities by the NSC for each financial year and its laying in both the Houses of the Parliament or concerned State Legislatures, as the case may be, along with memorandum of action taken on the recommendations therein. Hence, the reports of the Commission are laid before both the Houses of the Parliament, separately.
12
CHAPTER – IV
CENTRAL STATISTICS OFFICE
4.1 The Central Statistics Office (CSO), an attached office of the Ministry, coordinates the statistical activities in the country and evolves statistical standards. Its activities inter-alia include compilation of National Accounts, Index of Industrial Production, Consumer Price Indices for Urban/Rural/ Combined, Human Development Statistics including Gender Statistics, conduct of Annual Survey of Industries and Economic Census and imparting training in Official Statistics. CSO also assists in the development of statistics in the States and Union Territories and disseminates Energy Statistics, Social and Environmental Statistics and prepares the National Industrial Classification.
National Accounts Division
4.2 The National Accounts Division (NAD) of CSO is responsible for preparation of national accounts, which include the estimates of Gross Domestic Product (GDP), National Income, Government/Private Final Consumption Expenditure, Capital Formation and Savings along with details of transactions of institutional sectors. NAD brings out annually a publication titled ‘National Accounts Statistics’, containing these statistics. NAD is also responsible for preparation and release of Supply-Use Tables (SUT). NAD maintains liaison with international organizations on statistical matters related to national accounts.
4.3 NAD provides technical assistance and support to the State/ UT Directorates of Economics & Statistics (DESs) on compilation of estimates of State Income and related aggregates, including estimates of State Domestic Product. State level estimates of Gross Value Added (GVA) and Gross Fixed Capital Formation (GFCF) in respect of supra-regional sectors, namely, Railways, Communication, Services related to Broadcasting, Financial Services and Central Government Administration are furnished by NAD for the purpose.
4.4 In order to ensure comparability between the National and State level estimates, NAD conducts discussion every year with State/UT DESs on estimates of Gross and Net State Domestic Products (GSDP/NSDP).
4.5 In compliance with the Special Data Dissemination Standards of the International Monetary Fund (IMF) and as per the policy of Ministry, NAD releases annual and quarterly estimates of GDP as per pre-specified Advance Release Calendar of the Ministry. Details are given below:
13
Calendar for Quarterly estimates of GDP (1) Q3 OF 2018-19 : 28th February 2019 (2) Q4 OF 2018-19 : 31st May 2019 (3) Q1 OF 2019-20 : 30th August 2019 (4) Q2 OF 2019-20 : 29th November 2019
Where, Q1: April-June, Q2: July-September, Q3: October-December and Q4: January-March
Calendar for Annual estimates of GDP(1) FIRST ADVANCE ESTIMATES FOR 2018-19 : 07th January 2019(2) FIRST REVISED ESTIMATES FOR 2017-18 : 31st January 2019(3) SECOND ADVANCE ESTIMATES FOR 2018-19 : 28th February 2019(4) PROVISIONAL ESTIMATES FOR 2018-19 : 31st May 2019
4.6 NAD’s publications, data releases and reports published during the year 2018-19 (till 31st March 2019) which are also available on the official website are given below:
Table-4.1
S. No.
Description of the publication/ data release/ report
Date of release Manner of release
1. First Advance Estimates of National Income, 2017-18
5th January 2018 Press Note
2. First Revised Estimates of National Income, Consumption Expenditure, Saving and Capital Formation (2016-17)
31st January 2018 Press Note
3. Second Advance Estimates of National Income, 2017-18 and Quarterly Estimates of Gross Domestic Product for the Third Quarter (Oct-Dec), 2017-18
28th February 2018
Press Note
4. Payroll Reporting in India: An Employment Perspective
2nd May 2018 Press Note
5. Payroll Reporting in India: An Employment Perspective
25th May 2018 Press Note
14
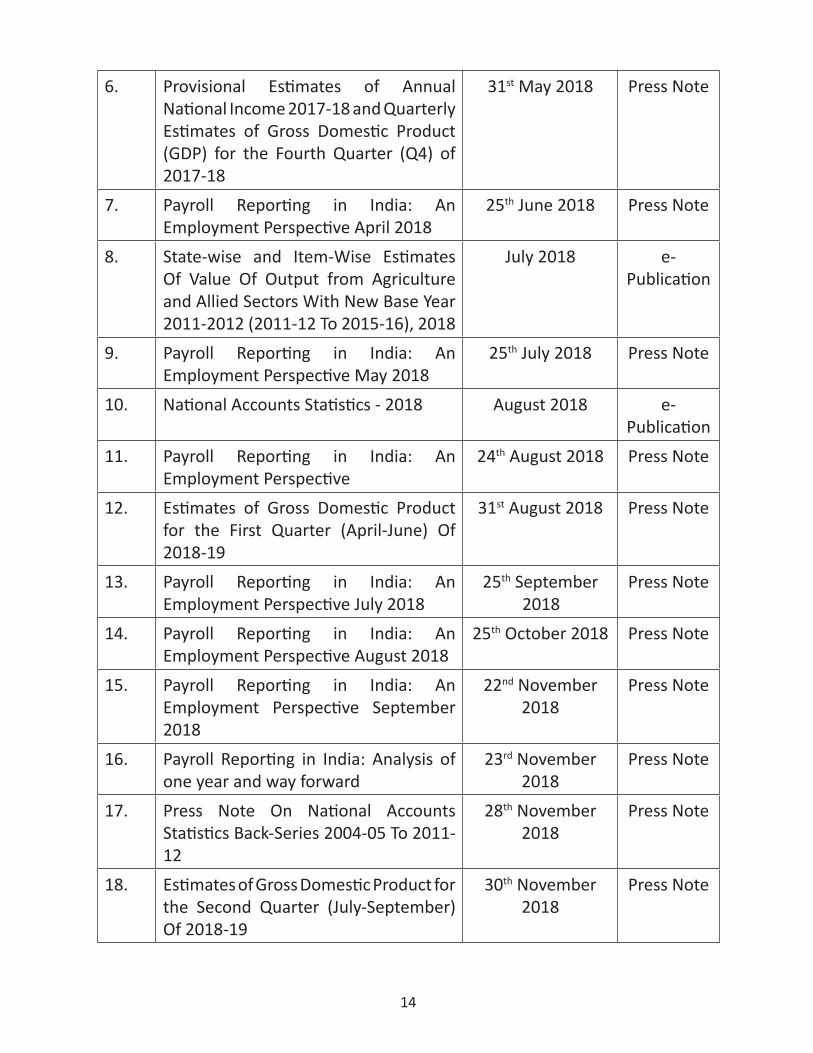
6. Provisional Estimates of Annual National Income 2017-18 and Quarterly Estimates of Gross Domestic Product (GDP) for the Fourth Quarter (Q4) of 2017-18
31st May 2018 Press Note
7. Payroll Reporting in India: An Employment Perspective April 2018
25th June 2018 Press Note
8. State-wise and Item-Wise Estimates Of Value Of Output from Agriculture and Allied Sectors With New Base Year 2011-2012 (2011-12 To 2015-16), 2018
July 2018 e- Publication
9. Payroll Reporting in India: An Employment Perspective May 2018
25th July 2018 Press Note
10. National Accounts Statistics - 2018 August 2018 e- Publication
11. Payroll Reporting in India: An Employment Perspective
24th August 2018 Press Note
12. Estimates of Gross Domestic Product for the First Quarter (April-June) Of 2018-19
31st August 2018 Press Note
13. Payroll Reporting in India: An Employment Perspective July 2018
25th September 2018
Press Note
14. Payroll Reporting in India: An Employment Perspective August 2018
25th October 2018 Press Note
15. Payroll Reporting in India: An Employment Perspective September 2018
22nd November 2018
Press Note
16. Payroll Reporting in India: Analysis of one year and way forward
23rd November 2018
Press Note
17. Press Note On National Accounts Statistics Back-Series 2004-05 To 2011-12
28th November 2018
Press Note
18. Estimates of Gross Domestic Product for the Second Quarter (July-September) Of 2018-19
30th November 2018
Press Note
15
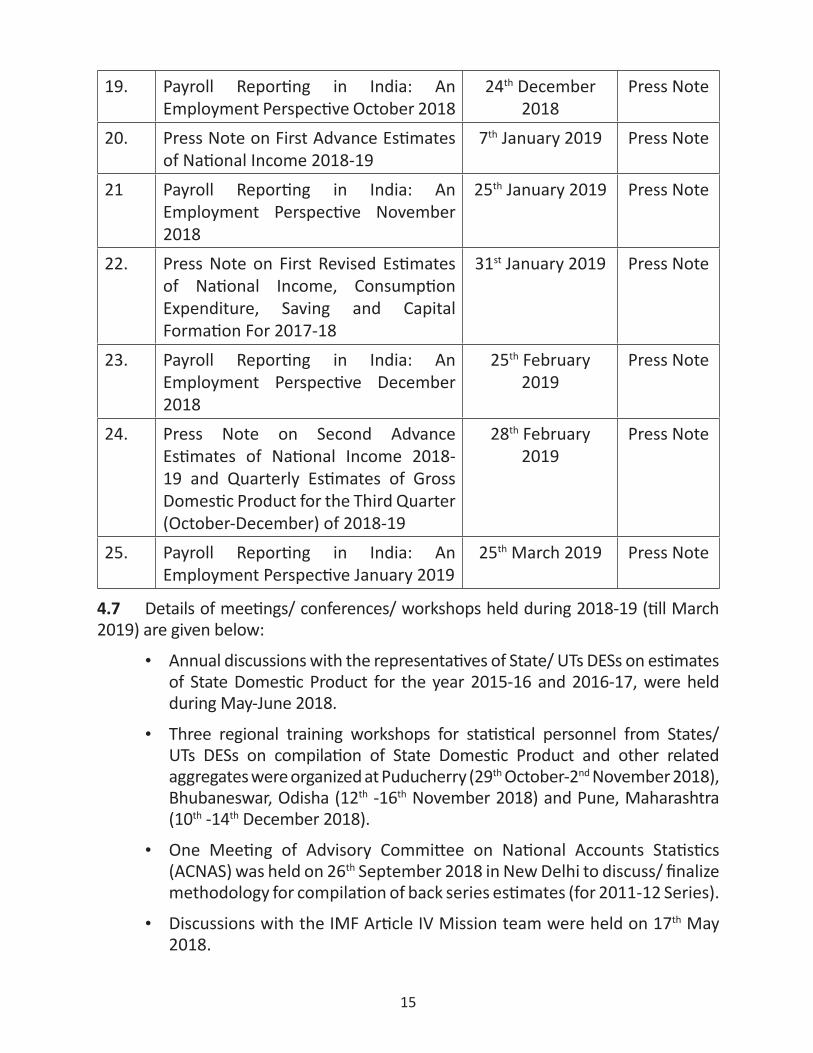
19. Payroll Reporting in India: An Employment Perspective October 2018
24th December 2018
Press Note
20. Press Note on First Advance Estimates of National Income 2018-19
7th January 2019 Press Note
21 Payroll Reporting in India: An Employment Perspective November 2018
25th January 2019 Press Note
22. Press Note on First Revised Estimates of National Income, Consumption Expenditure, Saving and Capital Formation For 2017-18
31st January 2019 Press Note
23. Payroll Reporting in India: An Employment Perspective December 2018
25th February 2019
Press Note
24. Press Note on Second Advance Estimates of National Income 2018-19 and Quarterly Estimates of Gross Domestic Product for the Third Quarter (October-December) of 2018-19
28th February 2019
Press Note
25. Payroll Reporting in India: An Employment Perspective January 2019
25th March 2019 Press Note
4.7 Details of meetings/ conferences/ workshops held during 2018-19 (till March 2019) are given below:
• Annual discussions with the representatives of State/ UTs DESs on estimates of State Domestic Product for the year 2015-16 and 2016-17, were held during May-June 2018.
• Three regional training workshops for statistical personnel from States/UTs DESs on compilation of State Domestic Product and other related aggregates were organized at Puducherry (29th October-2nd November 2018), Bhubaneswar, Odisha (12th -16th November 2018) and Pune, Maharashtra (10th -14th December 2018).
• One Meeting of Advisory Committee on National Accounts Statistics (ACNAS) was held on 26th September 2018 in New Delhi to discuss/ finalize methodology for compilation of back series estimates (for 2011-12 Series).
• Discussions with the IMF Article IV Mission team were held on 17th May 2018.
16
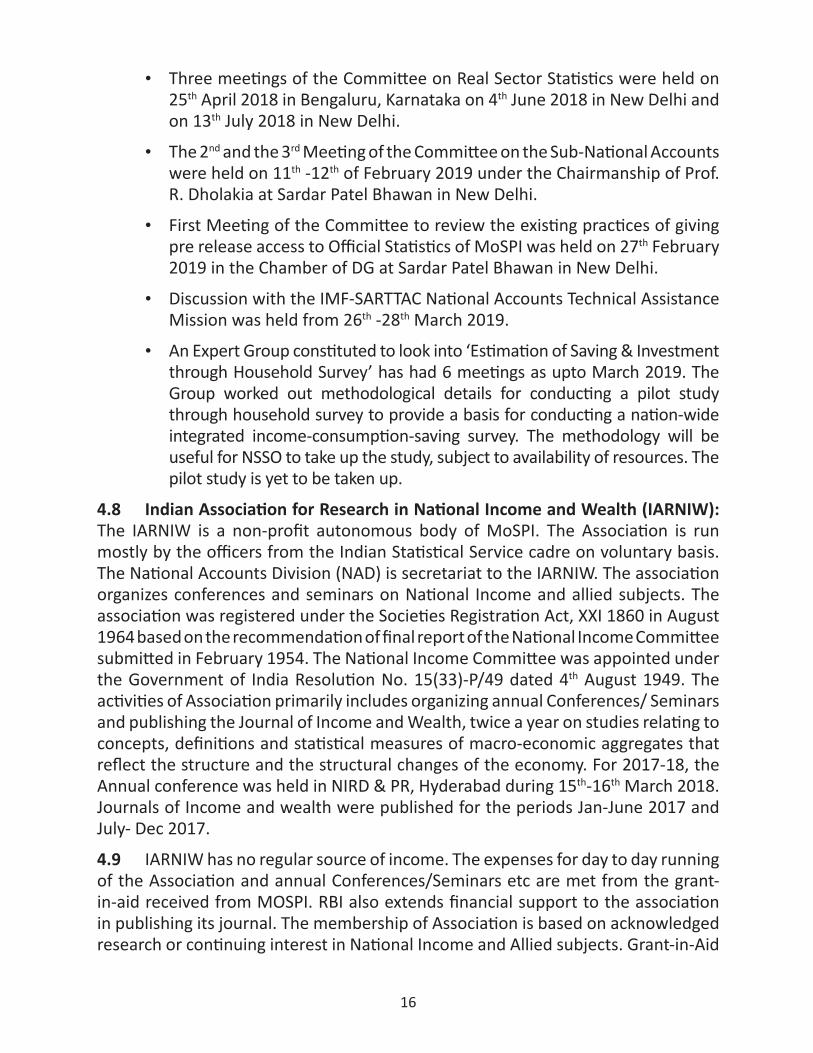
• Three meetings of the Committee on Real Sector Statistics were held on 25th April 2018 in Bengaluru, Karnataka on 4th June 2018 in New Delhi and on 13th July 2018 in New Delhi.
• The 2nd and the 3rd Meeting of the Committee on the Sub-National Accounts were held on 11th -12th of February 2019 under the Chairmanship of Prof. R. Dholakia at Sardar Patel Bhawan in New Delhi.
• First Meeting of the Committee to review the existing practices of giving pre release access to Official Statistics of MoSPI was held on 27th February 2019 in the Chamber of DG at Sardar Patel Bhawan in New Delhi.
• Discussion with the IMF-SARTTAC National Accounts Technical Assistance Mission was held from 26th -28th March 2019.
• An Expert Group constituted to look into ‘Estimation of Saving & Investment through Household Survey’ has had 6 meetings as upto March 2019. The Group worked out methodological details for conducting a pilot study through household survey to provide a basis for conducting a nation-wide integrated income-consumption-saving survey. The methodology will be useful for NSSO to take up the study, subject to availability of resources. The pilot study is yet to be taken up.
4.8 Indian Association for Research in National Income and Wealth (IARNIW): The IARNIW is a non-profit autonomous body of MoSPI. The Association is run mostly by the officers from the Indian Statistical Service cadre on voluntary basis. The National Accounts Division (NAD) is secretariat to the IARNIW. The association organizes conferences and seminars on National Income and allied subjects. The association was registered under the Societies Registration Act, XXI 1860 in August 1964 based on the recommendation of final report of the National Income Committee submitted in February 1954. The National Income Committee was appointed under the Government of India Resolution No. 15(33)-P/49 dated 4th August 1949. The activities of Association primarily includes organizing annual Conferences/ Seminars and publishing the Journal of Income and Wealth, twice a year on studies relating to concepts, definitions and statistical measures of macro-economic aggregates that reflect the structure and the structural changes of the economy. For 2017-18, the Annual conference was held in NIRD & PR, Hyderabad during 15th-16th March 2018. Journals of Income and wealth were published for the periods Jan-June 2017 and July- Dec 2017.
4.9 IARNIW has no regular source of income. The expenses for day to day running of the Association and annual Conferences/Seminars etc are met from the grant-in-aid received from MOSPI. RBI also extends financial support to the association in publishing its journal. The membership of Association is based on acknowledged research or continuing interest in National Income and Allied subjects. Grant-in-Aid
17
released by MOSPI for 2017-18 ̀ 5.85 lakh and the amount spent was ̀ 6.8 lakh. The additional amount was met through subscriptions and bank interest. During the current year 2018-19 `6.9 Lakh have been budgeted.
4.10 Subsequent to the updation of ISO 9001 version, NAD initiated the process of the transition from ISO 9001:2008 certification, which was received in the year 2015, to ISO 9001:2015. The staff of NAD was familiarized with the changes through a two day workshop by the experts from Bureau of Indian Standards (BIS), new quality documents were prepared, internal audits were carried out and reports were submitted to the Management Review Committee. During the period, the Division also got itself audited externally by BIS for obtaining the new certification.
Price Statistics
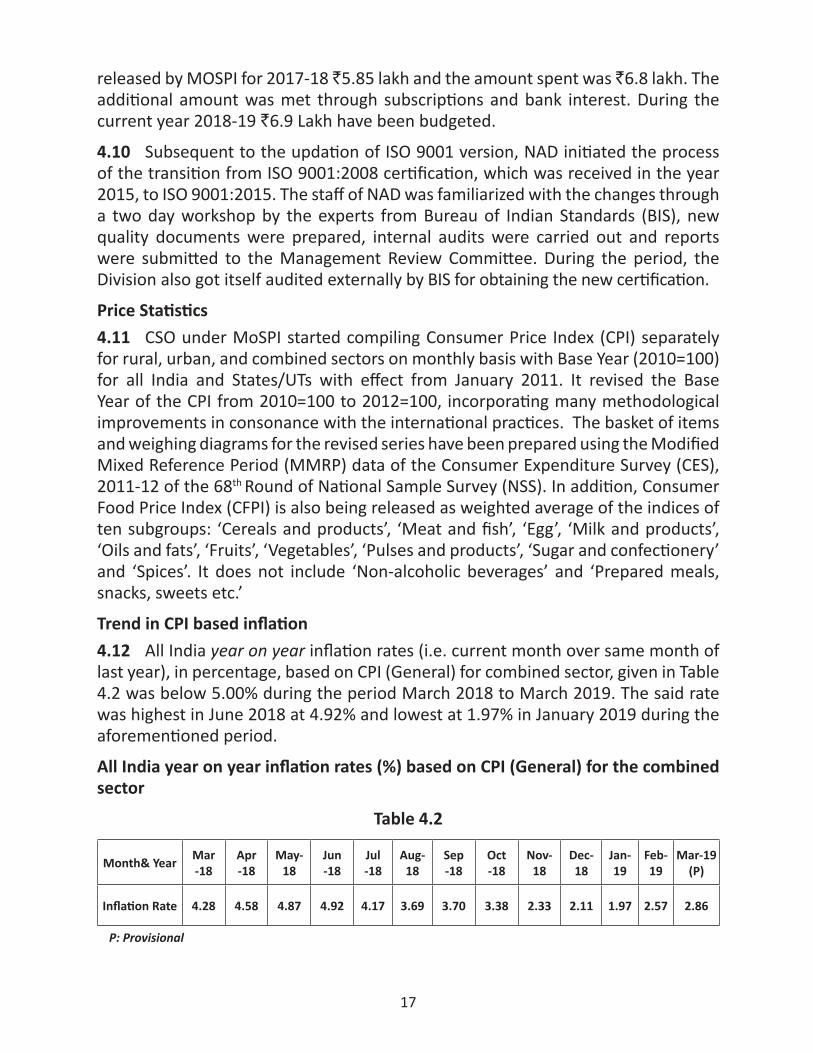
4.11 CSO under MoSPI started compiling Consumer Price Index (CPI) separately for rural, urban, and combined sectors on monthly basis with Base Year (2010=100) for all India and States/UTs with effect from January 2011. It revised the Base Year of the CPI from 2010=100 to 2012=100, incorporating many methodological improvements in consonance with the international practices. The basket of items and weighing diagrams for the revised series have been prepared using the Modified Mixed Reference Period (MMRP) data of the Consumer Expenditure Survey (CES), 2011-12 of the 68th Round of National Sample Survey (NSS). In addition, Consumer Food Price Index (CFPI) is also being released as weighted average of the indices of ten subgroups: ‘Cereals and products’, ‘Meat and fish’, ‘Egg’, ‘Milk and products’, ‘Oils and fats’, ‘Fruits’, ‘Vegetables’, ‘Pulses and products’, ‘Sugar and confectionery’ and ‘Spices’. It does not include ‘Non-alcoholic beverages’ and ‘Prepared meals, snacks, sweets etc.’
Trend in CPI based inflation
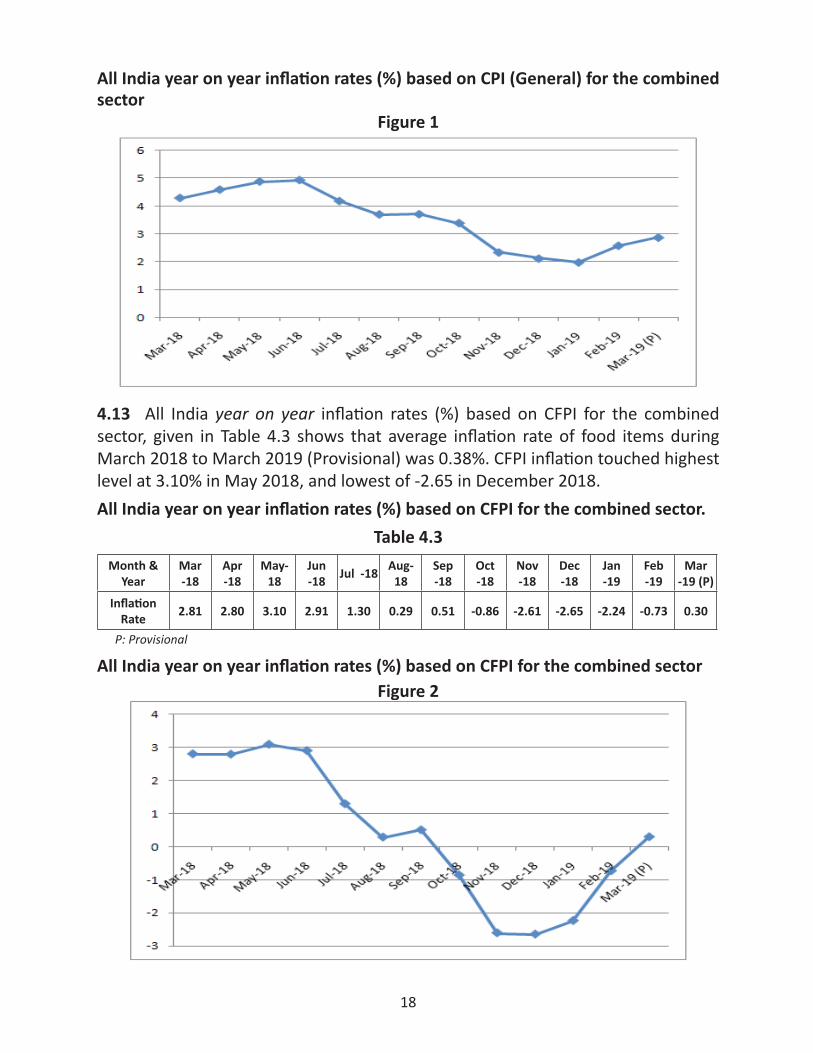
4.12 All India year on year inflation rates (i.e. current month over same month of last year), in percentage, based on CPI (General) for combined sector, given in Table 4.2 was below 5.00% during the period March 2018 to March 2019. The said rate was highest in June 2018 at 4.92% and lowest at 1.97% in January 2019 during the aforementioned period.
All India year on year inflation rates (%) based on CPI (General) for the combined sector
Table 4.2
Month& YearMar -18
Apr -18
May-18
Jun -18
Jul -18
Aug-18
Sep -18
Oct -18
Nov-18
Dec-18
Jan-19
Feb-19
Mar-19 (P)
Inflation Rate 4.28 4.58 4.87 4.92 4.17 3.69 3.70 3.38 2.33 2.11 1.97 2.57 2.86
P: Provisional
18
All India year on year inflation rates (%) based on CPI (General) for the combined sector
Figure 1
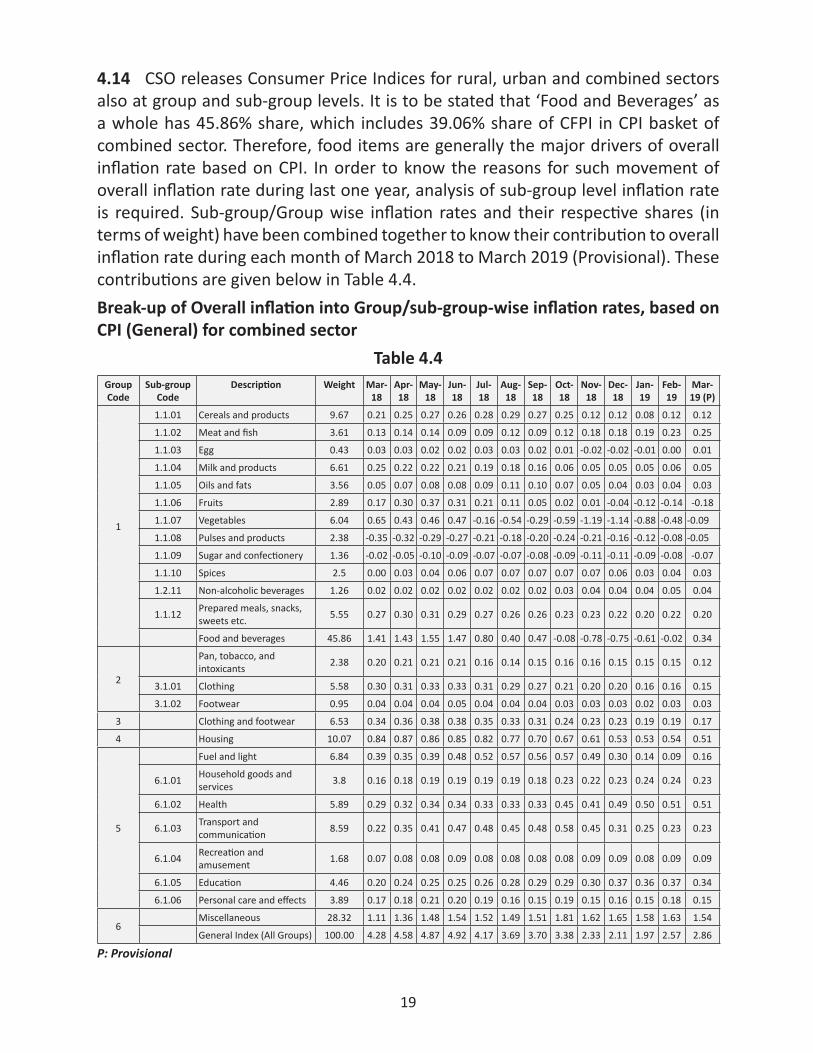
4.13 All India year on year inflation rates (%) based on CFPI for the combined sector, given in Table 4.3 shows that average inflation rate of food items during March 2018 to March 2019 (Provisional) was 0.38%. CFPI inflation touched highest level at 3.10% in May 2018, and lowest of -2.65 in December 2018.All India year on year inflation rates (%) based on CFPI for the combined sector.
Table 4.3
Month & Year
Mar -18
Apr -18
May-18
Jun -18
Jul -18Aug-
18Sep -18
Oct -18
Nov -18
Dec -18
Jan -19
Feb -19
Mar -19 (P)
Inflation Rate
2.81 2.80 3.10 2.91 1.30 0.29 0.51 -0.86 -2.61 -2.65 -2.24 -0.73 0.30
P: Provisional
All India year on year inflation rates (%) based on CFPI for the combined sectorFigure 2
19
4.14 CSO releases Consumer Price Indices for rural, urban and combined sectors also at group and sub-group levels. It is to be stated that ‘Food and Beverages’ as a whole has 45.86% share, which includes 39.06% share of CFPI in CPI basket of combined sector. Therefore, food items are generally the major drivers of overall inflation rate based on CPI. In order to know the reasons for such movement of overall inflation rate during last one year, analysis of sub-group level inflation rate is required. Sub-group/Group wise inflation rates and their respective shares (in terms of weight) have been combined together to know their contribution to overall inflation rate during each month of March 2018 to March 2019 (Provisional). These contributions are given below in Table 4.4. Break-up of Overall inflation into Group/sub-group-wise inflation rates, based on CPI (General) for combined sector
Table 4.4Group Code
Sub-group Code
Description Weight Mar-18
Apr-18
May-18
Jun-18
Jul-18
Aug-18
Sep-18
Oct-18
Nov-18
Dec-18
Jan-19
Feb-19
Mar-19 (P)
1
1.1.01 Cereals and products 9.67 0.21 0.25 0.27 0.26 0.28 0.29 0.27 0.25 0.12 0.12 0.08 0.12 0.12
1.1.02 Meat and fish 3.61 0.13 0.14 0.14 0.09 0.09 0.12 0.09 0.12 0.18 0.18 0.19 0.23 0.25
1.1.03 Egg 0.43 0.03 0.03 0.02 0.02 0.03 0.03 0.02 0.01 -0.02 -0.02 -0.01 0.00 0.01
1.1.04 Milk and products 6.61 0.25 0.22 0.22 0.21 0.19 0.18 0.16 0.06 0.05 0.05 0.05 0.06 0.05
1.1.05 Oils and fats 3.56 0.05 0.07 0.08 0.08 0.09 0.11 0.10 0.07 0.05 0.04 0.03 0.04 0.03
1.1.06 Fruits 2.89 0.17 0.30 0.37 0.31 0.21 0.11 0.05 0.02 0.01 -0.04 -0.12 -0.14 -0.18
1.1.07 Vegetables 6.04 0.65 0.43 0.46 0.47 -0.16 -0.54 -0.29 -0.59 -1.19 -1.14 -0.88 -0.48 -0.09
1.1.08 Pulses and products 2.38 -0.35 -0.32 -0.29 -0.27 -0.21 -0.18 -0.20 -0.24 -0.21 -0.16 -0.12 -0.08 -0.05
1.1.09 Sugar and confectionery 1.36 -0.02 -0.05 -0.10 -0.09 -0.07 -0.07 -0.08 -0.09 -0.11 -0.11 -0.09 -0.08 -0.07
1.1.10 Spices 2.5 0.00 0.03 0.04 0.06 0.07 0.07 0.07 0.07 0.07 0.06 0.03 0.04 0.03
1.2.11 Non-alcoholic beverages 1.26 0.02 0.02 0.02 0.02 0.02 0.02 0.02 0.03 0.04 0.04 0.04 0.05 0.04
1.1.12 Prepared meals, snacks, sweets etc. 5.55 0.27 0.30 0.31 0.29 0.27 0.26 0.26 0.23 0.23 0.22 0.20 0.22 0.20
Food and beverages 45.86 1.41 1.43 1.55 1.47 0.80 0.40 0.47 -0.08 -0.78 -0.75 -0.61 -0.02 0.34
2
Pan, tobacco, and intoxicants 2.38 0.20 0.21 0.21 0.21 0.16 0.14 0.15 0.16 0.16 0.15 0.15 0.15 0.12
3.1.01 Clothing 5.58 0.30 0.31 0.33 0.33 0.31 0.29 0.27 0.21 0.20 0.20 0.16 0.16 0.15
3.1.02 Footwear 0.95 0.04 0.04 0.04 0.05 0.04 0.04 0.04 0.03 0.03 0.03 0.02 0.03 0.03
3 Clothing and footwear 6.53 0.34 0.36 0.38 0.38 0.35 0.33 0.31 0.24 0.23 0.23 0.19 0.19 0.17
4 Housing 10.07 0.84 0.87 0.86 0.85 0.82 0.77 0.70 0.67 0.61 0.53 0.53 0.54 0.51
5
Fuel and light 6.84 0.39 0.35 0.39 0.48 0.52 0.57 0.56 0.57 0.49 0.30 0.14 0.09 0.16
6.1.01 Household goods and services 3.8 0.16 0.18 0.19 0.19 0.19 0.19 0.18 0.23 0.22 0.23 0.24 0.24 0.23
6.1.02 Health 5.89 0.29 0.32 0.34 0.34 0.33 0.33 0.33 0.45 0.41 0.49 0.50 0.51 0.51
6.1.03 Transport and communication 8.59 0.22 0.35 0.41 0.47 0.48 0.45 0.48 0.58 0.45 0.31 0.25 0.23 0.23
6.1.04 Recreation and amusement 1.68 0.07 0.08 0.08 0.09 0.08 0.08 0.08 0.08 0.09 0.09 0.08 0.09 0.09
6.1.05 Education 4.46 0.20 0.24 0.25 0.25 0.26 0.28 0.29 0.29 0.30 0.37 0.36 0.37 0.34
6.1.06 Personal care and effects 3.89 0.17 0.18 0.21 0.20 0.19 0.16 0.15 0.19 0.15 0.16 0.15 0.18 0.15
6Miscellaneous 28.32 1.11 1.36 1.48 1.54 1.52 1.49 1.51 1.81 1.62 1.65 1.58 1.63 1.54
General Index (All Groups) 100.00 4.28 4.58 4.87 4.92 4.17 3.69 3.70 3.38 2.33 2.11 1.97 2.57 2.86
P: Provisional
20
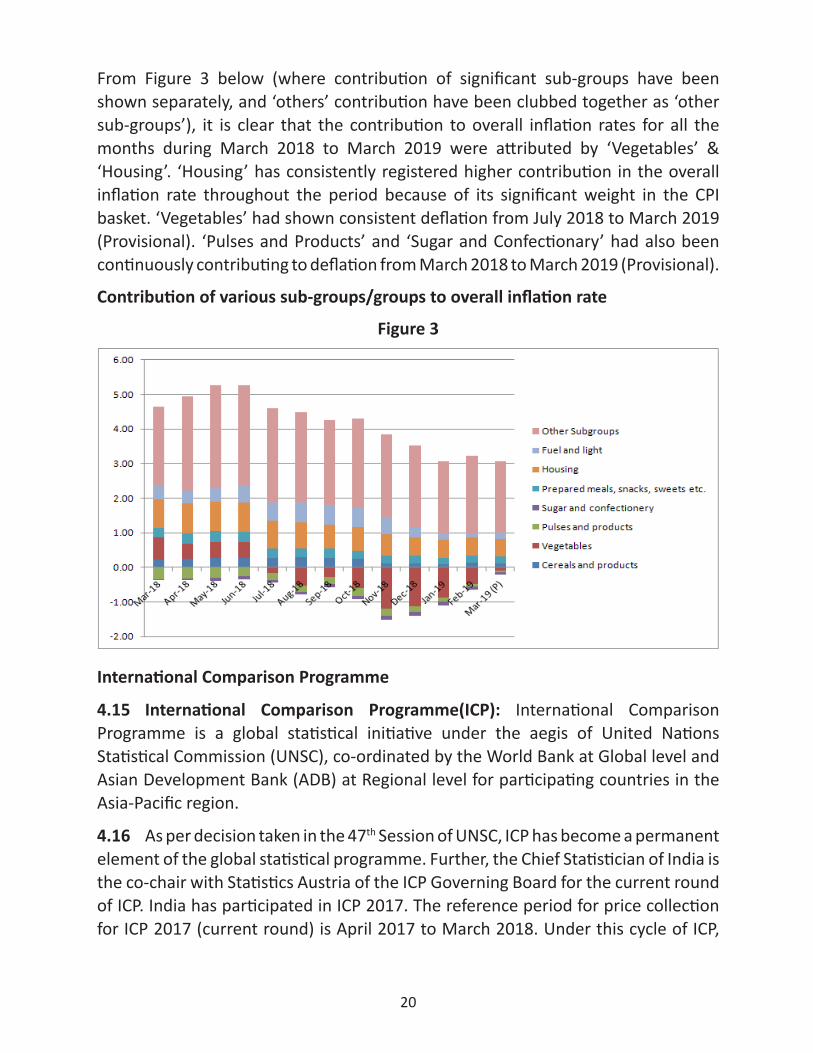
From Figure 3 below (where contribution of significant sub-groups have been shown separately, and ‘others’ contribution have been clubbed together as ‘other sub-groups’), it is clear that the contribution to overall inflation rates for all the months during March 2018 to March 2019 were attributed by ‘Vegetables’ & ‘Housing’. ‘Housing’ has consistently registered higher contribution in the overall inflation rate throughout the period because of its significant weight in the CPI basket. ‘Vegetables’ had shown consistent deflation from July 2018 to March 2019 (Provisional). ‘Pulses and Products’ and ‘Sugar and Confectionary’ had also been continuously contributing to deflation from March 2018 to March 2019 (Provisional).
Contribution of various sub-groups/groups to overall inflation rate
Figure 3
International Comparison Programme
4.15 International Comparison Programme(ICP): International Comparison Programme is a global statistical initiative under the aegis of United Nations Statistical Commission (UNSC), co-ordinated by the World Bank at Global level and Asian Development Bank (ADB) at Regional level for participating countries in the Asia-Pacific region.
4.16 As per decision taken in the 47th Session of UNSC, ICP has become a permanent element of the global statistical programme. Further, the Chief Statistician of India is the co-chair with Statistics Austria of the ICP Governing Board for the current round of ICP. India has participated in ICP 2017. The reference period for price collection for ICP 2017 (current round) is April 2017 to March 2018. Under this cycle of ICP,
21
928 products/items were priced for different categories of consumption under Household sector. Prices were collected from 320 rural markets and 577 urban markets in the first phase for items pertaining to ‘Food’, ‘Clothing & Footwear’ and from 108 urban markets in the second phase of the survey period for items other than ‘Food’, ‘Clothing and Footwear’. 196 items were priced under ‘Machinery & Equipment’ category and 58 items were priced under ‘Construction’ category.
Index of Industrial Production (IIP)
4.17 CSO compiles the Index of Industrial Production (IIP) using secondary data received from 14 source agencies in various Ministries/Departments or their attached/subordinate offices.
4.18 IIP is released every month in the form of Quick Estimates with a time-lag of 6 weeks as per the Special Data Dissemination Standard (SDDS) norms of IMF. Apart from breakup of the index for mining, manufacturing and electricity sectors, the estimates are also simultaneously being released as per Use-based classification viz., Primary Goods, Capital Goods, Intermediate Goods, Infrastructure/Construction Goods, Consumer durables and Consumer non-durables. These estimates are revised subsequently on receipt of updated production data from the 14 source agencies. The major source of data for IIP is, however, the Department of Industrial Policy and Promotion that supplies data for 322 out of 407 item groups with a weight of 47.54% in overall IIP.
4.19 The press releases, data (sectoral and use-based category) metadata, and details of methodology of all India IIP with base year 2011-12 are made available on the website (http://www.mospi.gov.in/iip-2011-12-series) for public access.
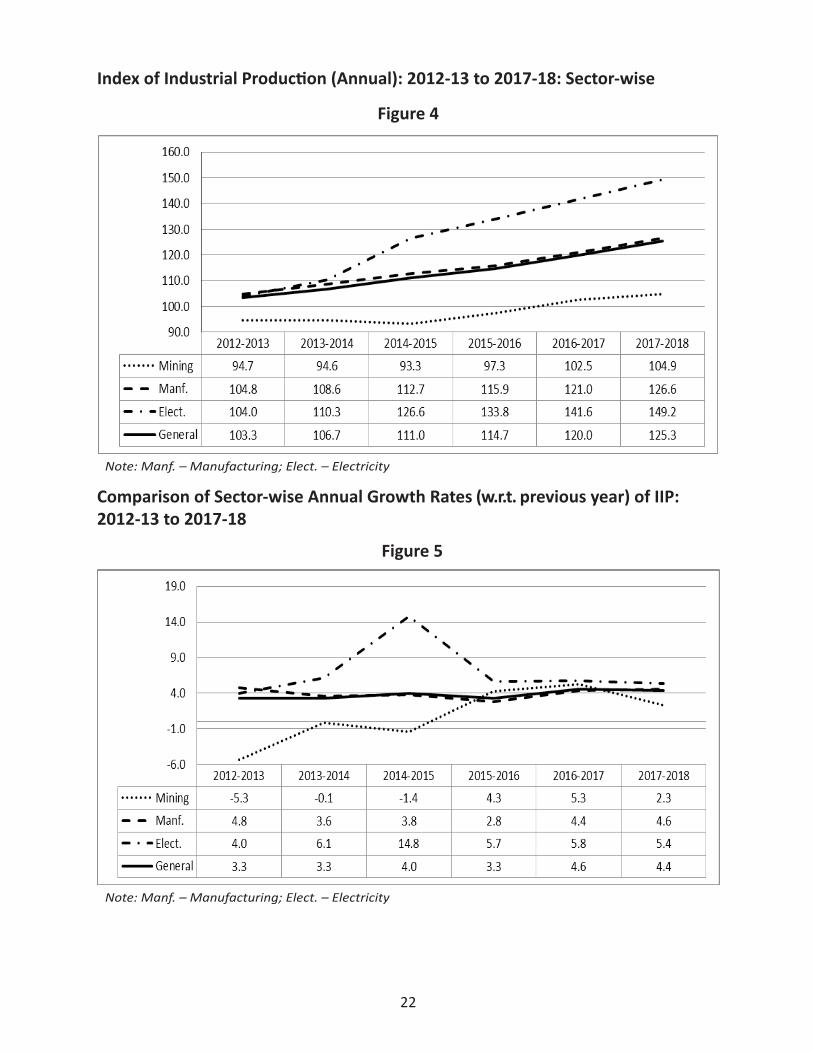
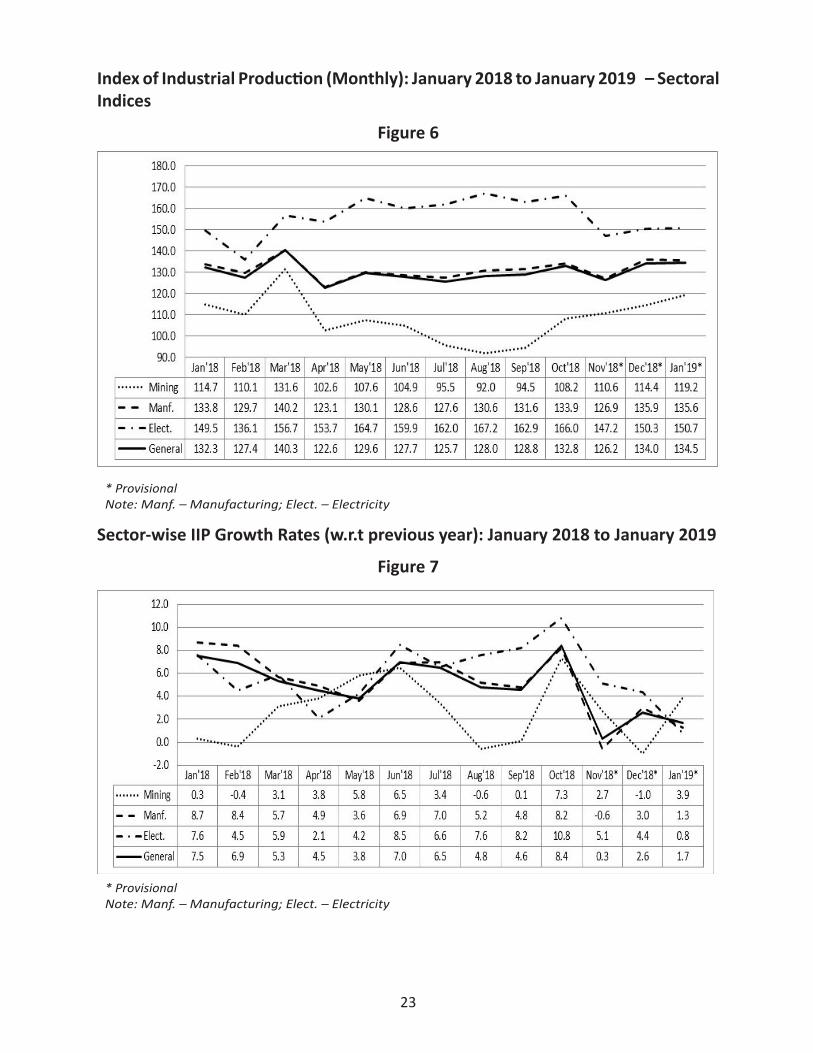
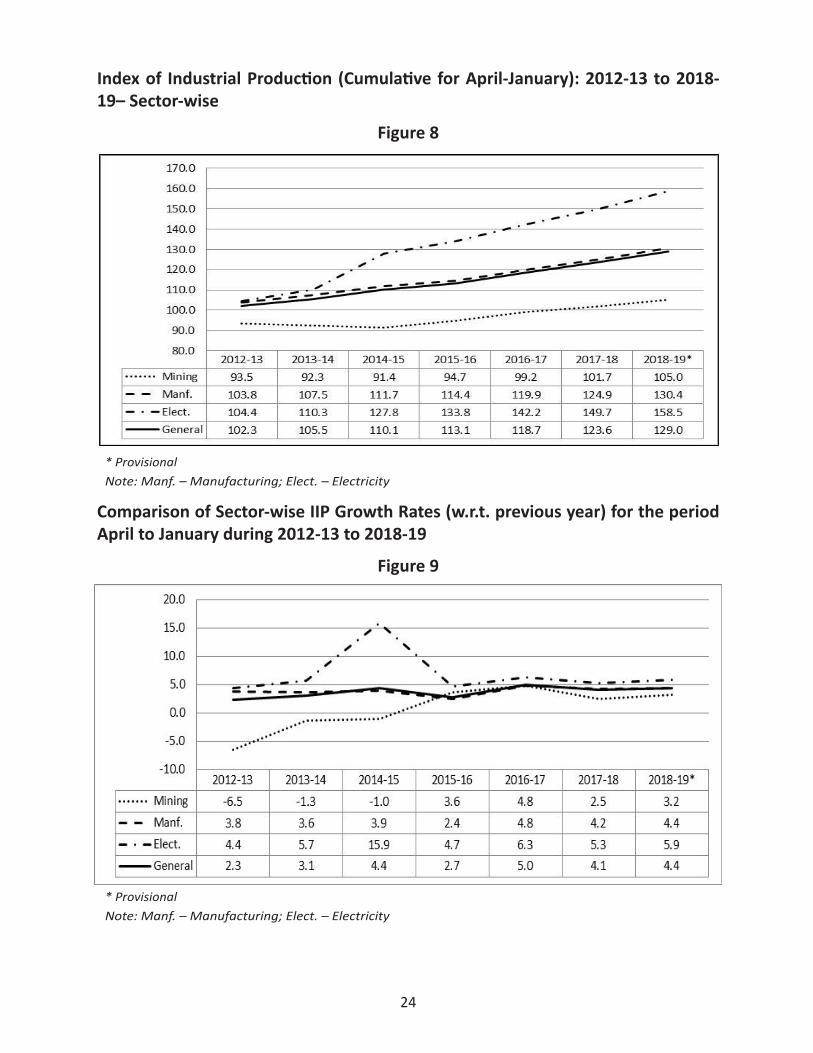
4.20 The sector-wise annual indices of industrial production and its growth rates from 2012-13 to 2017-18, monthly indices & growth rates from January 2018 to January 2019 and the cumulative indices & growth rates from 2012-13 to 2018-19 (till January 2019) are depicted in the charts given below:
22
Index of Industrial Production (Annual): 2012-13 to 2017-18: Sector-wise
Figure 4
Note: Manf. – Manufacturing; Elect. – Electricity
Comparison of Sector-wise Annual Growth Rates (w.r.t. previous year) of IIP: 2012-13 to 2017-18
Figure 5
Note: Manf. – Manufacturing; Elect. – Electricity
23
Index of Industrial Production (Monthly): January 2018 to January 2019 – Sectoral Indices
Figure 6
* ProvisionalNote: Manf. – Manufacturing; Elect. – Electricity
Sector-wise IIP Growth Rates (w.r.t previous year): January 2018 to January 2019
Figure 7
* ProvisionalNote: Manf. – Manufacturing; Elect. – Electricity
24
Index of Industrial Production (Cumulative for April-January): 2012-13 to 2018-19– Sector-wise
Figure 8
* ProvisionalNote: Manf. – Manufacturing; Elect. – Electricity
Comparison of Sector-wise IIP Growth Rates (w.r.t. previous year) for the period April to January during 2012-13 to 2018-19
Figure 9
* ProvisionalNote: Manf. – Manufacturing; Elect. – Electricity
25
Regional Conference on State IIP
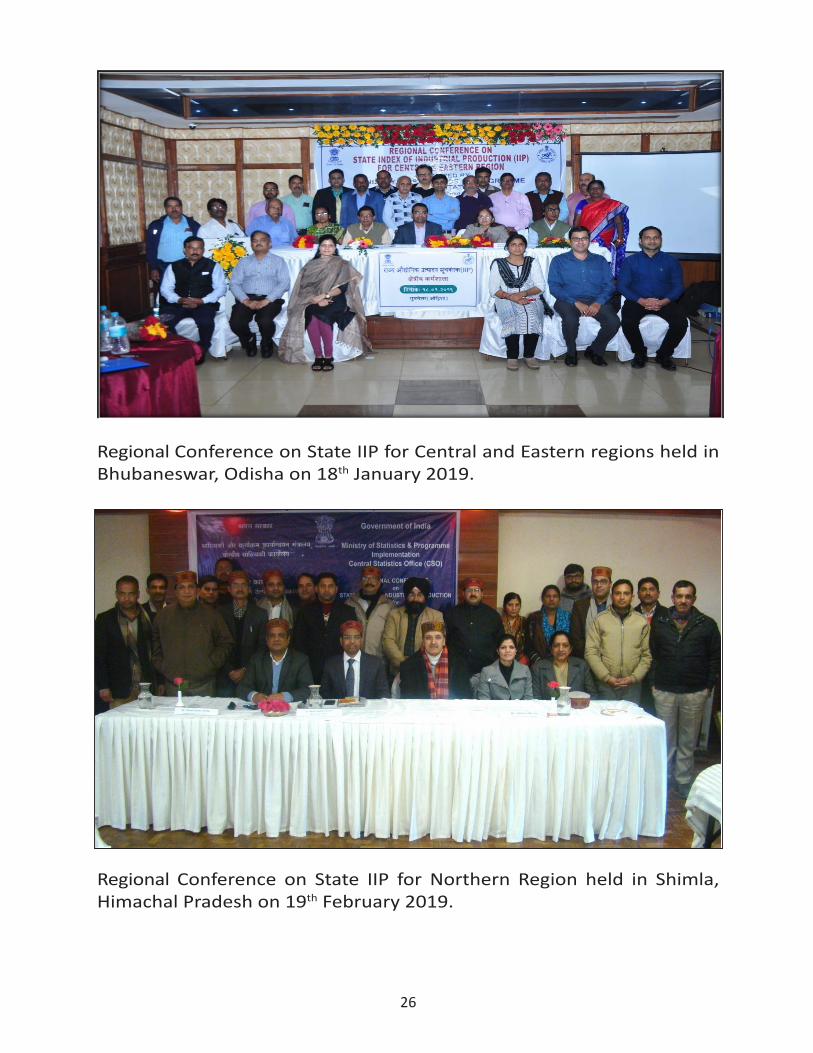
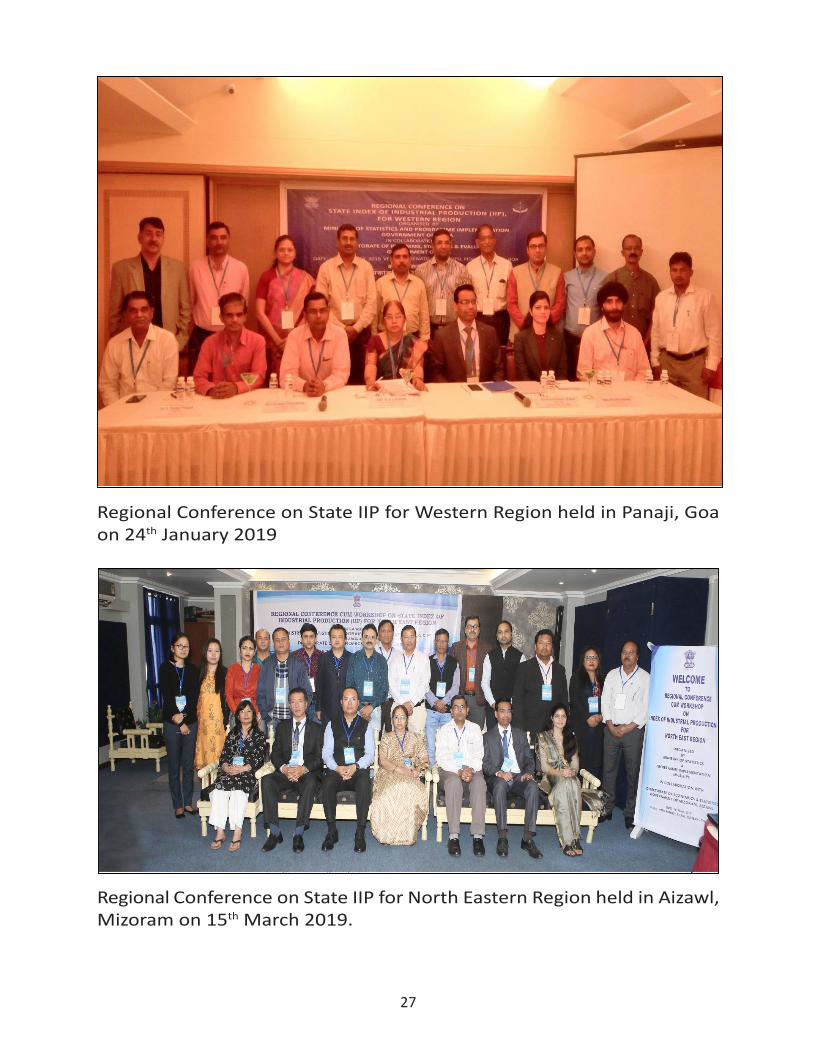
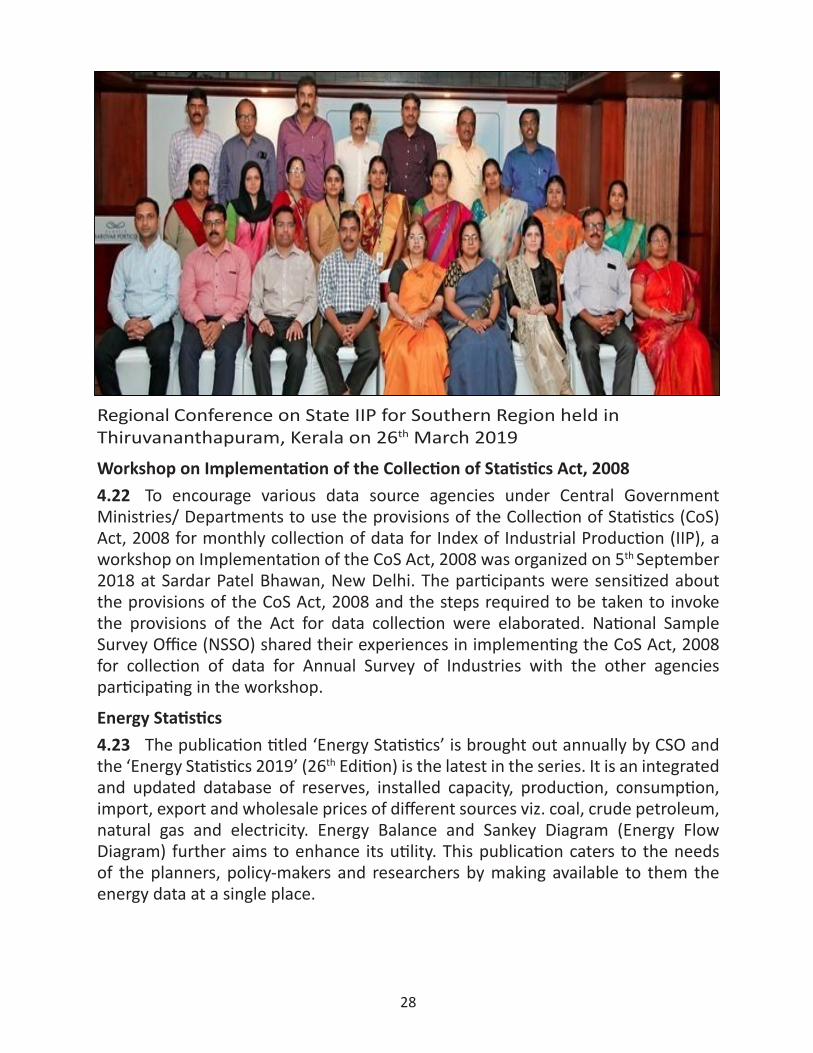
4.21 To facilitate compilation of State level IIP in line with all India IIP with base 2011-12, CSO, in collaboration with State Governments, conducted five Regional Conferences with States during the year 2018-19. The Regional Conference for States of Central and Eastern regions was held in Bhubaneswar, Odisha on 18th January 2019; Regional Conference for States of Western region was held in Panaji, Goa on 24th January 2019; Regional Conference for States of Northern region was held in Shimla, Himachal Pradesh on 19th February 2019; Regional Conference for States of North Eastern region was held in Aizawl, Mizoram on 15th March 2019; and Regional Conference for States of Southern region was held in Thiruvananthapuram, Kerala on 26th March 2019. Matters related to improvement of data collection & quality, compilation, and dissemination strategies of State IIP with base year 2011-12 were discussed.
So far, 18 States namely, Jammu & Kashmir, Punjab, Haryana, Himachal Pradesh, Delhi, Uttar Pradesh, West Bengal, Sikkim, Assam, Manipur, Tripura, Gujarat, Rajasthan, Karnataka, Kerala, Tamil Nadu, Andhra Pradesh and Telangana are compiling State level IIP with base 2011-12. Some other States namely, Goa, Chhattisgarh, Meghalaya, Maharashtra, Madhya Pradesh, Odisha and Uttarakhand are in final stages of compilation of State level IIP.
26
Regional Conference on State IIP for Central and Eastern regions held in Bhubaneswar, Odisha on 18th January 2019.
Regional Conference on State IIP for Northern Region held in Shimla, Himachal Pradesh on 19th February 2019.
27
Regional Conference on State IIP for Western Region held in Panaji, Goa on 24th January 2019
Regional Conference on State IIP for North Eastern Region held in Aizawl, Mizoram on 15th March 2019.
28
Regional Conference on State IIP for Southern Region held in Thiruvananthapuram, Kerala on 26th March 2019
Workshop on Implementation of the Collection of Statistics Act, 2008
4.22 To encourage various data source agencies under Central Government Ministries/ Departments to use the provisions of the Collection of Statistics (CoS) Act, 2008 for monthly collection of data for Index of Industrial Production (IIP), a workshop on Implementation of the CoS Act, 2008 was organized on 5th September 2018 at Sardar Patel Bhawan, New Delhi. The participants were sensitized about the provisions of the CoS Act, 2008 and the steps required to be taken to invoke the provisions of the Act for data collection were elaborated. National Sample Survey Office (NSSO) shared their experiences in implementing the CoS Act, 2008 for collection of data for Annual Survey of Industries with the other agencies participating in the workshop.
Energy Statistics
4.23 The publication titled ‘Energy Statistics’ is brought out annually by CSO and the ‘Energy Statistics 2019’ (26th Edition) is the latest in the series. It is an integrated and updated database of reserves, installed capacity, production, consumption, import, export and wholesale prices of different sources viz. coal, crude petroleum, natural gas and electricity. Energy Balance and Sankey Diagram (Energy Flow Diagram) further aims to enhance its utility. This publication caters to the needs of the planners, policy-makers and researchers by making available to them the energy data at a single place.
29
Economic Census
4.24 The 7th Economic Census (EC) is being conducted by the ESD, CSO in 2019 under Capacity Development Scheme. The CCEA has approved the conduct of 7th EC at a cost of `913 Crores.
The Seventh Economic Census is being conducted on an IT based platform for the first time. In this regard CSC, e-Governance Services India ltd, a Special Purpose Vehicle (SPV) under Ministry of Electronics and Information Technology (MoEIT), Government of India, has been engaged as the implementing agency. CSC, SPV have more than 3 lakhs Common Services Centres (CSC) across the country, which are managed by the Village Level Entrepreneurs (VLE), which are generally the local people.
For the purpose of 7th EC the following committees have been formed:• A Steering Committee under the Chairmanship of Secretary (S&PI) has been
formed for overall guidance, conduct, implementation and monitoring of the 7th EC project.
• An Expert Committee under the Chairmanship of DG(ES) has also been formed for overall guidance on technical aspects.
State/UTs Governments have also been involved for the supervision and monitoring of the work of 7th EC. State Governments have also been requested to form State Level Coordination Committee (SLCC) and District Level Coordination Committees (DLCC) for smooth conduct of 7th EC.
The preparatory work, like development of IT application, MIS dashboards, training manuals, FAQs, media content and capacity developments is in progress and the field work is likely to be started in June-July of 2019.
Social Statistics
4.25 The Social Statistics Division is responsible for coordinating development of social, environment and multi-domain statistics. The ambit of Social Statistics covers population, human development including health and education, employment, social justice and time use, while that of multi-domain statistics includes poverty, gender, persons with disabilities, indicators related to Millennium Development Goals (MDGs), Sustainable Development Goals (SDGs), SAARC Development Goals and SAARC Social Charter.
Development of Global Indicator Framework for Sustainable Development Goals (SDGs)
4.26 On 25th September 2015, the Heads of State and Government and High Representatives meeting at United Nations Headquarters in New York adopted the resolution titled ‘Transforming Our World: the 2030 Agenda for Sustainable Development’ adopting a set of global Sustainable Development Goals which
30
will transform the world up to 2030. These are universal goals and targets which involve the entire world, developed and developing countries alike. They are integrated and indivisible and balance the three dimensions of sustainable development viz, Economic, Social and Environmental.
4.27 MoSPI is involved in the global efforts by the UN Statistical Commission to develop and refine an indicator framework for global monitoring of SDGs. India is a member of the Inter-Agency and Expert Group on Sustainable Development Goal Indicators (IAEG-SDGs). At the fourth meeting of the IAEG-SDG, a list of Global indicators of SDGs was finalized, which was later adopted by the General Assembly on 6th July 2017. The Global Indicator Framework consists of 232 unique indicators.
4.28 In India, the National Institution for Transforming India (NITI) Aayog has been entrusted with the responsibility for identification of national targets and assigning them to the Ministries/Departments concerned for implementation. MoSPI has developed the National Indicator Framework (NIF) which will help in measuring the progress of the SDGs and associated targets at national level based on the data provided by various Ministries/ Departments implementing the SDGs concerned.
4.29 The Government has approved constitution of a High Level Steering Committee (HLSC) under the chairmanship of Chief Statistician of India and Secretary, Ministry of Statistics and Programme Implementation (MoSPI) with members from NITI Aayog, Ministry of Home Affairs, Ministry of Health and Family Welfare, Ministry of Environment, Forest and Climate Change, Ministry of Finance and Ministry of Statistics and Programme Implementation, to periodically review and refine the National Indicator Framework for monitoring the SDGs and associated targets.
4.30 The NIF has been developed based on a national consultation process involving Ministries/Departments of the Government, State Governments, UN agencies and other stakeholders. The NIF, consisting of 306 indicators, was uploaded in the Ministry’s website https://mospi.gov.in in November 2018.
MoSPI has released a provisional Baseline Report of SDGs-NIF with base year 2015-16 which will help in setting a benchmark for measuring SDGs with associated targets upto 2030. The report is placed on the website of the Ministry.
4.31 MoSPI is developing a SDG Dashboard on National Indicator Framework in collaboration with the office of UNRC, India. Besides, a web page on SDGs has been created and uploaded on MoSPI’s website.
An Memorandum of Understanding (MoU) was signed between MoSPI and United Nations Resident Coordinator (UNRC) on 15th March 2018 with overall purpose to collaborate on issues related to Statistical monitoring of Goals and targets of SDGs including use of new technology.
31
4.32 A meeting under the chairmanship of Shri Pravin Srivastava, Chief Statistician of India and Secretary, MoSPI was held between the Ministry of Statistics and Programme Implementation (MoSPI) and the United Nations (UN) in India on 20th November 2018. The meeting brought together all the agencies of the United Nations who are based India and working with various line Ministries and State Governments on SDG monitoring and the MoSPI on to one platform for sharing of experiences and expertise under one common framework.
Environment Statistics & Accounts
4.33 The activities of the Social Statistics Division in respect of official statistics on environment in India can be classified into two major domains - Environment Statistics & Environment Accounts. Some of the activities taken up by the Division in this context during 2018-19 are highlighted in the following paragraphs.
Environment Statistics
4.34 Continuing its effort to collate and release statistical information on all the aspects of environment, the Division released “EnviStats India 2019; Vol.I-Environment Statistics” in March 2019. The publication is based on FDES-2013 prescribed by UNSD for compilation of environment statistics and provides information on the six fundamental components prescribed in the FDES 2013 namely (i) Environmental Conditions and Quality; (ii) Environmental Resources and their use; (iii) Residuals (iv) Extreme Events and Disasters; (v) Human Settlements and Environmental Health; and (vi) Environment Protection, Management and Engagement. The publication aids in pointing out significant changes over the years, which can help in identifying important issues and/or areas of particular concern for policy-makers.
Environment Accounts
4.35 Environmental accounts help incorporate the value of natural capital into the national accounting framework alongside other forms of capital. Integrated environmental-economic accounts can help in understanding the relationship between environment and the economy, thereby enabling sustainable use of natural capital. As a first milestone in this direction, the Division released in September 2018 the asset accounts, at state and national levels, of four vital natural resources – forest, land, minerals and water in the publication, “EnviStats-India 2018: Supplement on Environmental Accounts”.
Apart from this publication, in order to mainstream natural capital accounts in policy-making, the Division is coordinating the project on “Natural Capital Accounting and Valuation of Ecosystem Services”. This EU-funded project is under implementation as a partnership project between United Nations Statistics Division
32
(UNSD), the United Nations Environment and the Secretariat of the Convention of Biological Diversity and is likely to propel India on the path of compilation of ecosystem accounts. Under the project, a Landscape Assessment was conducted to review existing ecosystem accounting initiatives and literature in India and to take stock of data sources for compiling ecosystem accounts, the report of which has been hosted on UNSD’s website. This assessment has helped the Division draw up a line of action for furthering the work of ecosystem accounting.
Gender Statistics
4.36 The Social Statistics Division provides technical guidance to other Ministries/Departments on issues related to collection, compilation of Gender Statistics in the Country. India is member in the Inter-Agency and Expert Group on Gender Statistics and other International forum on Gender Statistics. The Ministry participates in Conferences/Forums on Gender Statistics to understand its development in international scenario and to put forth the India’s view points. A senior officer from Social Statistics Division (SSD) of the Ministry participated in the 12th meeting of Inter-Agency Expert Group on Gender Statistics (IAEGS) and the 7th Global Forum on Gender Statistics at Tokyo, Japan during 13th -16th November 2018.
SAARC Development Goals and SAARC Social Charter
4.37 The Ministry of Statistics and Programme Implementation is the designated nodal Ministry for statistical coordination and statistical monitoring of implementation of the SAARC Social Charter in the country. The SAARC Development Goals and SAARC Social Charter measures the extent of achievements of the Government policies for poverty alleviation, enhancement of income levels, providing better healthcare facilities, raising the literacy levels and thereby raising the standards of living of its citizens. The publications on SAARC Development Goals and SAARC Social Charter, published in alternate years, provide the statistical tool to quantify the success in achieving the objectives of social and economic development that are in conformity with the principal goals of SAARC.
Food and nutrition security analysis
4.38 A Country Strategic Plan (CSP) 2015-18 has been signed between the Ministry of Agriculture & Farmers Welfare, Government of India (GOI) and UN World Food Program (WFP) in August 2015, through which WFP intends to focus on supporting the GOI to make significant and measurable progress in respect of i) Ensuring access to safe, nutritious and sufficient food for all people all year round and ii) Ensuring ending malnutrition according to internationally agreed targets, with a focus on curtailing stunting and wasting for children under five years of age, and addressing the nutritional needs of adolescent girls, pregnant and lactating women, and older persons.
33
Under these overall objectives, MoSPI is the nodal agency for supporting food and nutrition security analysis. For the purpose, with the help of World Food Programme (WFP), India country office, this Ministry has the following national level joint activities under the overall framework of CSP 2015-18:
• Preparation of a Food and Nutrition Security Atlas with states as the unit of analysis; and
• Installation of capacity for food and nutrition security analysis within the MoSPI.
Human Resource Development
4.39 National Statistical Systems Training Academy (NSSTA) located at Greater Noida along with the Training Unit located at Pushpa Bhawan, Madangir Road, New Delhi functions as the Training Division of the Central Statistics Office (Social Statistics).
4.40 NSSTA earlier known as the National Academy of Statistical Administration (NASA), which came into existence on 13th February 2009, is a premier Institute primarily fostering human resource development in Official Statistics at national and state level. The Academy is actively engaged in building capacities in the area of Official Statistics and related disciplines at the national / sub- national as also at the international level, particularly amongst developing & SAARC countries. The Academy confronted with the challenge of keeping the statistical workforce abreast with and updated on with the dynamics of the socio-economic environment and technological and methodological advances, has been continuously striving not only to develop updated course material, revise course curriculum etc; but also to implement effective delivery mechanisms by focusing on pedagogy, all encompassed in its focused training strategy directed at both newly inducted as well as in-service statistical personnel of Central and State/ UT Governments. The main aims and objectives of the Academy are as under:
• To create a pool of trained manpower in theoretical and applied statistics to effectively manage both the current and emerging challenges of data collection, collation, Analysis and dissemination for better formulation of policies and plans for the country;
• To train statistical as well as non-statistical manpower in undertaking monitoring and evaluation of large scale programmes/ projects, through specialized short/ medium term training programmes; and
• To create a pool of trainers and develop training material via course-ware in consultation and collaboration with academicians, researchers and professionals from universities, external professional institutions and UN/ bilateral agencies.
34
4.41 The training strategy adopted entails conducting both induction and refresher training programmes at the NSSTA and outsourcing some trainings to several other identified reputed and specialized institutions. The programmes cater to the need based training of the statistical personnel working in the Central Government, namely, the Indian Statistical Service (ISS) officers, Sub-ordinate Statistical Service (SSS) officials of the Central Government, Statistical Officers from State/UT Governments and Public sector Undertakings, in the identified subject areas.
4.42 The NSSTA also regularly provides technical support in terms of capacity development of the statistical personnel of the friendly and neighboring Asian and African countries. As a result, request based training programmes are regularly conducted and organized at NSSTA.
4.43 The NSSTA has also been making efforts to sensitize the potential human resources through awareness programmes in official statistics, both at its campus and at various universities. These programmes also include training of faculty and students from various Universities at NSSTA as well as organizing awareness programmes at selected Universities by the officers of the Academy & CSO. NSSTA continues to organize this activity every year, as it has been found very useful by the community of users of official statistics.
Amenities:
4.44 The NSSTA is equipped with the modern state-of-the art facilities for training and boarding and lodging for trainees. The complex of the Academy comprises three well organized building blocks, namely, the Academic and Administrative Block, Hostel Block and the Residential Block, surrounded by well-maintained landscapes. The facilities available in the Academic and Administrative Blocks, also include a Conference Hall, with a seating capacity of around 60 persons; a centrally air conditioned Auditorium, namely, the ‘Mahalanobis Auditorium’, with a seating capacity for around 160 persons; five lecture/Training /seminar Halls, fitted with latest computerized teaching aids; a library, namely the Sukhatme Library; IT teaching computer laboratory equipped with adequate infrastructure to conduct training for about 30 trainees at any point of time, in terms of hands-on- training and lodging facilities for 100 trainees, with the aid of 40 Single Bed and 30 Double Bed air-conditioned Rooms. The recreational facilities available in the campus include those for indoor games like Billiards, Table tennis etc. & outdoor games like Volleyball and Badminton.
4.45 In order to keep pace with the emerging new technologies, especially in the domain of Information and Communication Technology (ICT), the NSSTA has taken various steps towards office automation. For this, a significant IT infrastructure in terms of servers such as blade server, database server, exchange server etc., along with requisite software has been put in place within the premises
35
of the Academy, in order to make available all the necessary IT facilities not only to the NSSTA officials but more importantly, also to the trainees.
Training Programme Approval Committee (TPAC)
4.46 In order to look after and guide NSSTA on various training programmes, a High Level Committee namely, “Training Programme Approval Committee” (TPAC) has been constituted with senior officers of the Government of India and a few subject experts from reputed Institutes as members. The Committee assesses and approves the need-based training calendar on an annual basis, besides reviewing the syllabi, duration and training methodology for all the modules. Most of the courses are conducted at NSSTA while some of the specialized courses are outsourced to reputed institutes/ organizations in Delhi or outside, with proven credentials. Subjects covered in the various programmes conducted by NSSTA mainly include those in the areas of Official Statistical Systems, Theoretical & Applied Statistics, large scale sample surveys, SNA 1993 & 2008, Data Management Techniques, Information Technology, Management, Financial Management, Micro and Macro Economics, Econometrics etc.
Regular Training Scheduled at NSSTA
4.47 The training programmes conducted or organized by NSSTA are as follows:
• Two year Induction Training for the officers of the Indian Statistical Service (ISS);
• Induction training programmes for the Subordinate Statistical Service (SSS) Officers, including Training of Trainers (TOT’s) for these courses;
• Refresher Training Courses/seminars/workshops for the in-service ISS Officers and senior Officers of Central Ministries/Departments, State/UT-Directorates of Economics & Statistics & other Line Departments;
• Request- Based Refresher Training programmes for officers from Central/ State/ UTs;
• Exposure programme on Official Statistical System to the M. Stat. Students from the Indian Statistical Institute (ISI), Kolkata and other centres;
• Awareness programmes on “Official Statistics” for students and faculty members of universities; and
• Internship Programmes for post graduate students in Statistics of Indian Universities.
4.48 For the purpose of specialized training, NSSTA collaborates with various reputed/specialized Institutes viz. IIMs; IIRS, Dehradun; ASCI, Hyderabad; Labour Bureau, Shimla; IIPA, Delhi; IIPS; Mumbai; C R Rao AIMSC Hyderabad; Dr. MCRHRD,
36
Hyderabad; ISI, Kolkata; Delhi School of Economics Delhi; IASRI, Delhi; ISEC, Bangalore etc.
4.49 Training of State Statistical Personnel: Regular as also demand based Training Programmes are conducted from time to time for State Governments/UTs in certain specified subjects and areas of their interest. Besides these, tailor-made training courses, based on specific requests received from the States and UTs, are also conducted at the NSSTA.
4.50 International Training Programmes:(i) NSSTA in collaboration with International Statistical Education Centre
(ISEC), Kolkata, under the aegis of Indian Statistical Institute (ISI), Kolkata conducts 10 days Training on “Official Statistics & Related Methodology” out of the total period of 10- month duration International Statistical Education Centre (ISEC) course for the international participants (formally titled ‘Statistical Theory and Applications’), conducted by ISI, Kolkata;
(ii) Short term i.e. one-two week training programmes and study visits for the statistical personnel/ participants from countries in the South Asian Association for Regional Cooperation (SAARC) region, Asia & Pacific, Africa and other countries, conducted at the request of Statistical Institute for Asia and the Pacific (SIAP), United Nations Economic and Social Commission for Asia and the Pacific (UNESCAP), Food and Agriculture Organization (FAO), World Bank or the National Statistical Offices (NSOs) of the countries; and
(iii) International Conferences, Seminars and Workshops on emerging areas of Official Statistics.
Data Storage and Dissemination Division (DSDD)
4.51 Data Storage and Dissemination Division (including Computer Centre) is equipped with latest computer systems and servers. The Data Center of the Ministry is operational round the clock i.e. 365x24x7 to facilitate the data requirements of the national and international users. DSDD is being headed by Additional Director General (ISS).
Division is also harnessing the benefits of cloud computing through GOI Cloud Services wherein several web applications of the Ministry such as Consumer Price Index(CPI), International Household Survey Network(IHSN), Computer-assisted personal interviewing (CAPI), etc. have been hosted for better utilization of the infrastructure and speed.
Main Projects of the DSDD:4.52 Data Preparation, Processing and Dissemination:
As per the “National Policy on Dissemination of Data” approved by the
37
Cabinet in September 1999, the DSDD (including Computer Centre) has been entrusted with the responsibility of creation and maintenance of the National Data Warehouse on Official Statistics and dissemination of unit level data to users.
Division is the repository of a large volume of micro data generated through various Socio-economic Surveys, Economic Censuses, Enterprise Surveys and the Annual Survey of Industries conducted by the NSSO and the CSO. These data are being disseminated regularly to a large number of national and international users.
Consumer Price Index:
4.53 DSDD processes the price data received from Rural and Urban sectors and compiles the CPI for the release of CPI by CSO. Price Collection Software developed by Computer Centre which is running across the FOD offices in urban sector has been modified. Computer Centre has developed the CPI Archival Web Portal Software for easy retrieval of CPI data.
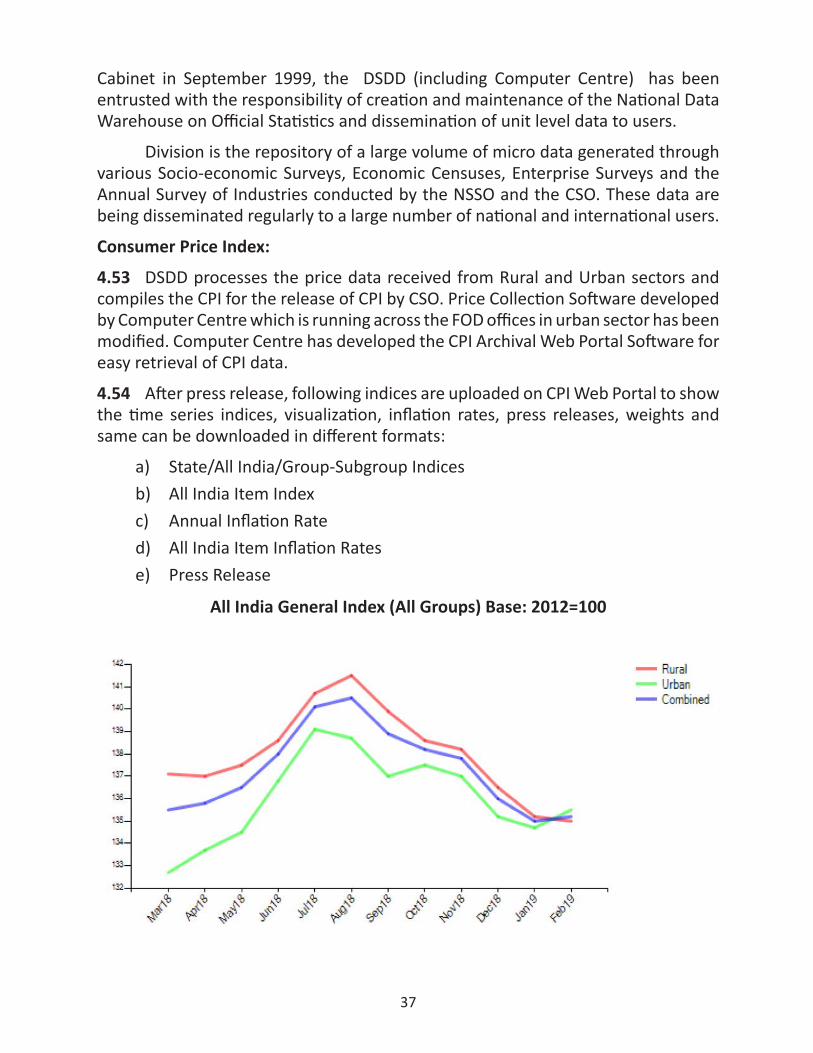
4.54 After press release, following indices are uploaded on CPI Web Portal to show the time series indices, visualization, inflation rates, press releases, weights and same can be downloaded in different formats:
a) State/All India/Group-Subgroup Indicesb) All India Item Indexc) Annual Inflation Rated) All India Item Inflation Ratese) Press Release
All India General Index (All Groups) Base: 2012=100

38
All India Consumer Food Price Index Base: 2012=100
National Data Warehouse on Official Statistics
4.55 Data Storage & Data Dissemination Division(including Computer Centre) is the repository of a large amount of micro data collected through various socio-economic surveys, economic censuses, enterprise surveys, price surveys and annual survey of industries conducted by the NSSO and the CSO which is disseminated to users across the globe as per ‘National Policy on Dissemination of Data‘.
Data Storage & Data Dissemination Division (including Computer Centre) is responsible for creation and maintenance of the National Data Warehouse of Official Statistics and dissemination of unit level data to users.
A web-based integrated information portal (including National Data Warehouse on Official Statistics) is being proposed to address the challenges of data collection, validation, analytics, dissemination and optimal usage of official statistical data.
Web Site of the Ministry
4.56 DSDD is the Nodal Agency to develop, update and maintain the website of the Ministry (http://www.mospi.gov.in). It is an integrated platform for all the divisions of the ministry having all the statistical publications/reports, metadata, external links to CPI & IIP and SDGs.
Survey Data cataloguing using IHSN Tool kit software
4.57 This division has developed user friendly web portal for Meta Data & Micro Data Dissemination of census and survey data by adopting a international standard methods using NADA 4.0 software provided by the International Household Survey
39
Network (IHSN) and the Micro data Management Toolkit software. These datasets can be exported into different formats like SPSS, SAS, STATA, CSV and delimited text file.
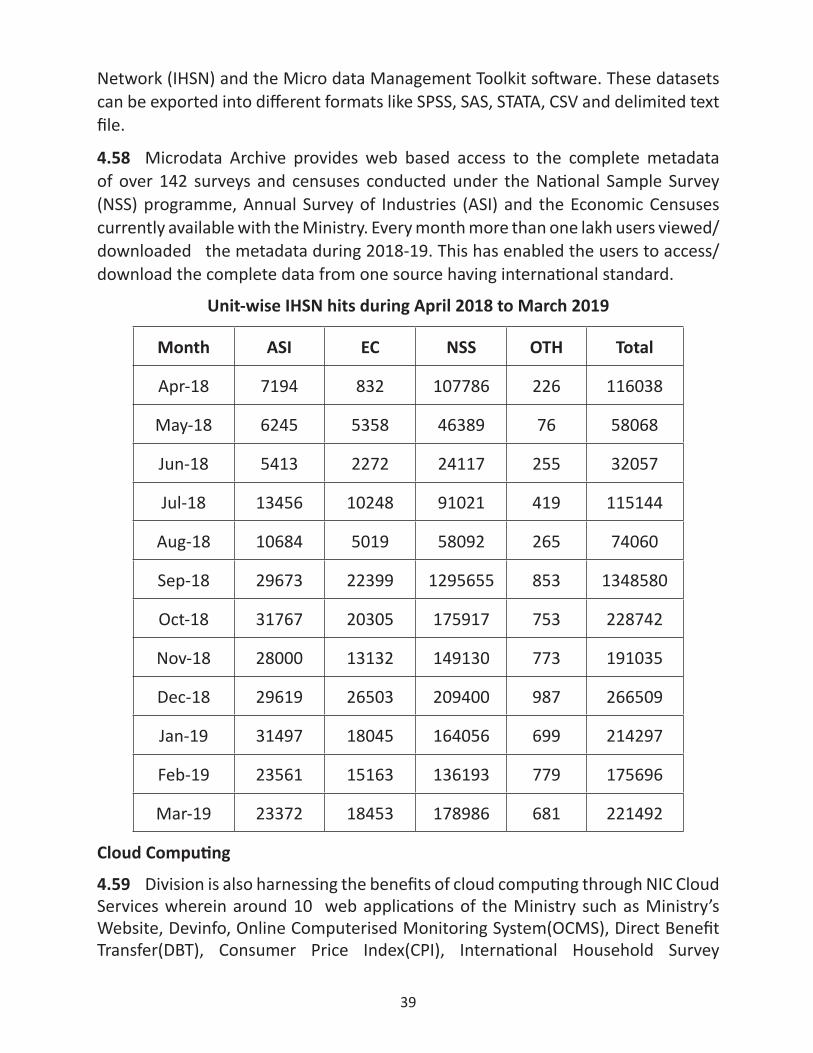
4.58 Microdata Archive provides web based access to the complete metadata of over 142 surveys and censuses conducted under the National Sample Survey (NSS) programme, Annual Survey of Industries (ASI) and the Economic Censuses currently available with the Ministry. Every month more than one lakh users viewed/downloaded the metadata during 2018-19. This has enabled the users to access/download the complete data from one source having international standard.
Unit-wise IHSN hits during April 2018 to March 2019
Month ASI EC NSS OTH Total
Apr-18 7194 832 107786 226 116038
May-18 6245 5358 46389 76 58068
Jun-18 5413 2272 24117 255 32057
Jul-18 13456 10248 91021 419 115144
Aug-18 10684 5019 58092 265 74060
Sep-18 29673 22399 1295655 853 1348580
Oct-18 31767 20305 175917 753 228742
Nov-18 28000 13132 149130 773 191035
Dec-18 29619 26503 209400 987 266509
Jan-19 31497 18045 164056 699 214297
Feb-19 23561 15163 136193 779 175696
Mar-19 23372 18453 178986 681 221492
Cloud Computing
4.59 Division is also harnessing the benefits of cloud computing through NIC Cloud Services wherein around 10 web applications of the Ministry such as Ministry’s Website, Devinfo, Online Computerised Monitoring System(OCMS), Direct Benefit Transfer(DBT), Consumer Price Index(CPI), International Household Survey
40
Network(IHSN), Computer-assisted personal interviewing (CAPI) conducting PLFS Survey, Voorburg etc. have been hosted which minimizes the cost of infrastructure & manpower and better security.
Training Activities:-
4.60 The Division provides faculty services to NSSTA for conducting IT courses for officers/ officials of States/UTs and Central Government Departments. Faculty of DSDD was nominated to deliver lectures on “Core including a part of Big Data, DWH and Data Analytics” for ISS Probationers, 40th Batch w.e.f. 21st May 2018 to 20th August 2018 at NSSTA, Greater NOIDA.
This Division is also providing internship to the students sponsored by various Universities/ Institutions for developing IT related projects. Four interns have successfully completed internship programme during 2018-19 in the scheme for the ‘Internship for Post Graduate/ Researchers Scholars’ of the Ministry using NSS data of different rounds for study and Analysis with Analytical R Software.
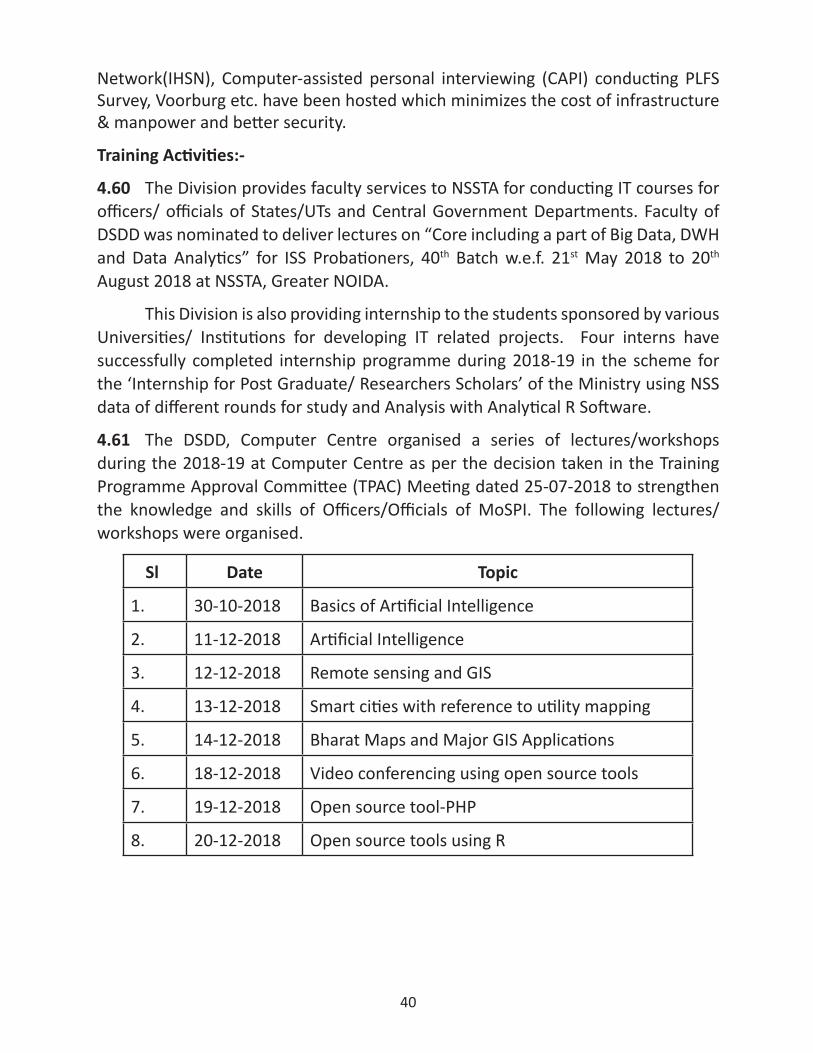
4.61 The DSDD, Computer Centre organised a series of lectures/workshops during the 2018-19 at Computer Centre as per the decision taken in the Training Programme Approval Committee (TPAC) Meeting dated 25-07-2018 to strengthen the knowledge and skills of Officers/Officials of MoSPI. The following lectures/workshops were organised.
Sl Date Topic
1. 30-10-2018 Basics of Artificial Intelligence
2. 11-12-2018 Artificial Intelligence
3. 12-12-2018 Remote sensing and GIS
4. 13-12-2018 Smart cities with reference to utility mapping
5. 14-12-2018 Bharat Maps and Major GIS Applications
6. 18-12-2018 Video conferencing using open source tools
7. 19-12-2018 Open source tool-PHP
8. 20-12-2018 Open source tools using R
41
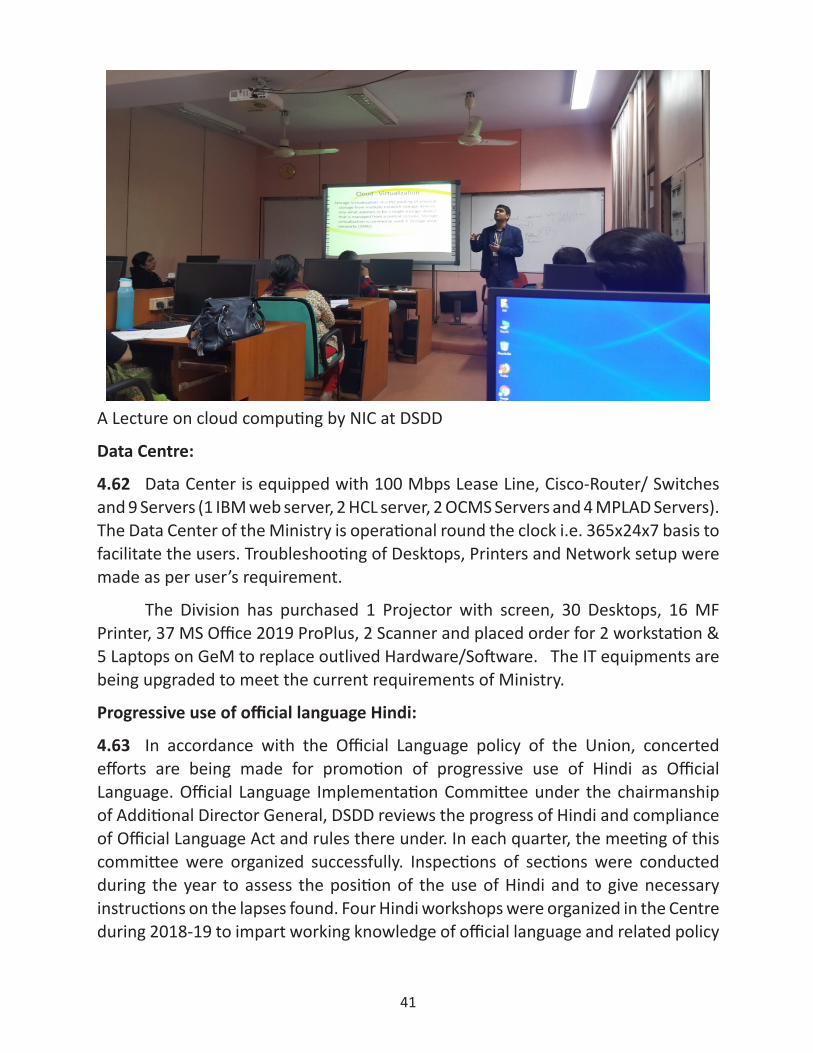
A Lecture on cloud computing by NIC at DSDD
Data Centre:
4.62 Data Center is equipped with 100 Mbps Lease Line, Cisco-Router/ Switches and 9 Servers (1 IBM web server, 2 HCL server, 2 OCMS Servers and 4 MPLAD Servers). The Data Center of the Ministry is operational round the clock i.e. 365x24x7 basis to facilitate the users. Troubleshooting of Desktops, Printers and Network setup were made as per user’s requirement.
The Division has purchased 1 Projector with screen, 30 Desktops, 16 MF Printer, 37 MS Office 2019 ProPlus, 2 Scanner and placed order for 2 workstation & 5 Laptops on GeM to replace outlived Hardware/Software. The IT equipments are being upgraded to meet the current requirements of Ministry.
Progressive use of official language Hindi:
4.63 In accordance with the Official Language policy of the Union, concerted efforts are being made for promotion of progressive use of Hindi as Official Language. Official Language Implementation Committee under the chairmanship of Additional Director General, DSDD reviews the progress of Hindi and compliance of Official Language Act and rules there under. In each quarter, the meeting of this committee were organized successfully. Inspections of sections were conducted during the year to assess the position of the use of Hindi and to give necessary instructions on the lapses found. Four Hindi workshops were organized in the Centre during 2018-19 to impart working knowledge of official language and related policy
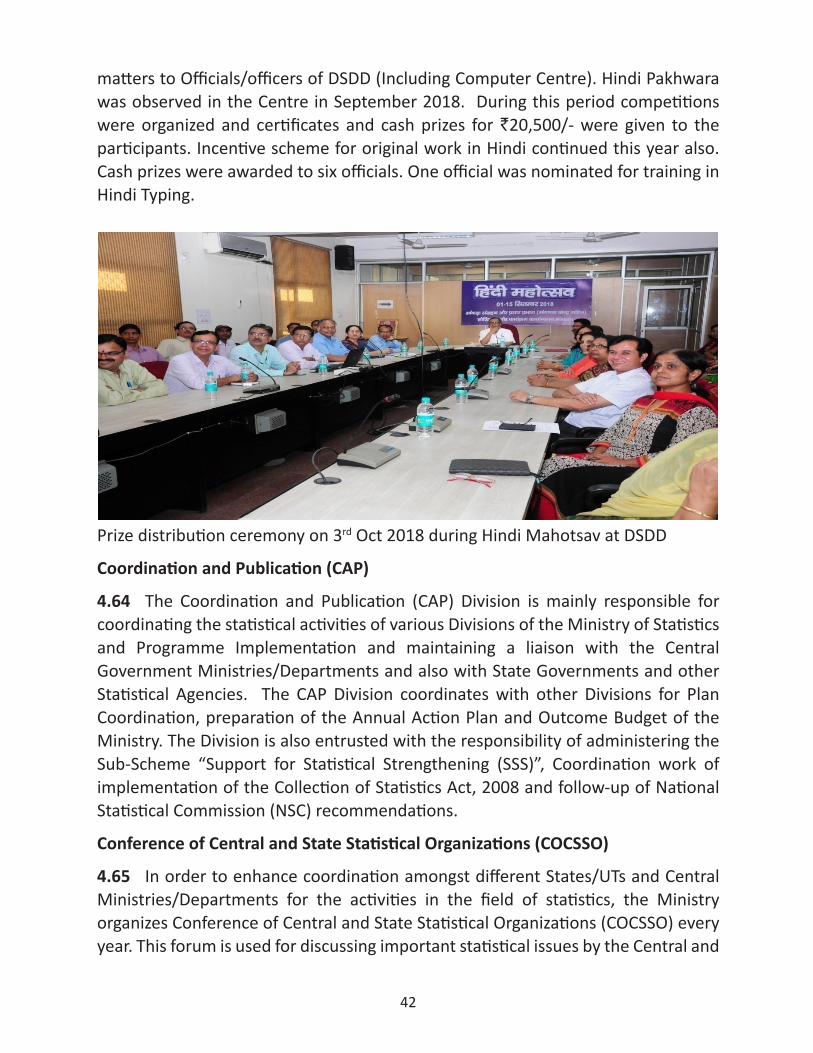
42
matters to Officials/officers of DSDD (Including Computer Centre). Hindi Pakhwara was observed in the Centre in September 2018. During this period competitions were organized and certificates and cash prizes for `20,500/- were given to the participants. Incentive scheme for original work in Hindi continued this year also. Cash prizes were awarded to six officials. One official was nominated for training in Hindi Typing.
Prize distribution ceremony on 3rd Oct 2018 during Hindi Mahotsav at DSDD
Coordination and Publication (CAP)
4.64 The Coordination and Publication (CAP) Division is mainly responsible for coordinating the statistical activities of various Divisions of the Ministry of Statistics and Programme Implementation and maintaining a liaison with the Central Government Ministries/Departments and also with State Governments and other Statistical Agencies. The CAP Division coordinates with other Divisions for Plan Coordination, preparation of the Annual Action Plan and Outcome Budget of the Ministry. The Division is also entrusted with the responsibility of administering the Sub-Scheme “Support for Statistical Strengthening (SSS)”, Coordination work of implementation of the Collection of Statistics Act, 2008 and follow-up of National Statistical Commission (NSC) recommendations.
Conference of Central and State Statistical Organizations (COCSSO)
4.65 In order to enhance coordination amongst different States/UTs and Central Ministries/Departments for the activities in the field of statistics, the Ministry organizes Conference of Central and State Statistical Organizations (COCSSO) every year. This forum is used for discussing important statistical issues by the Central and
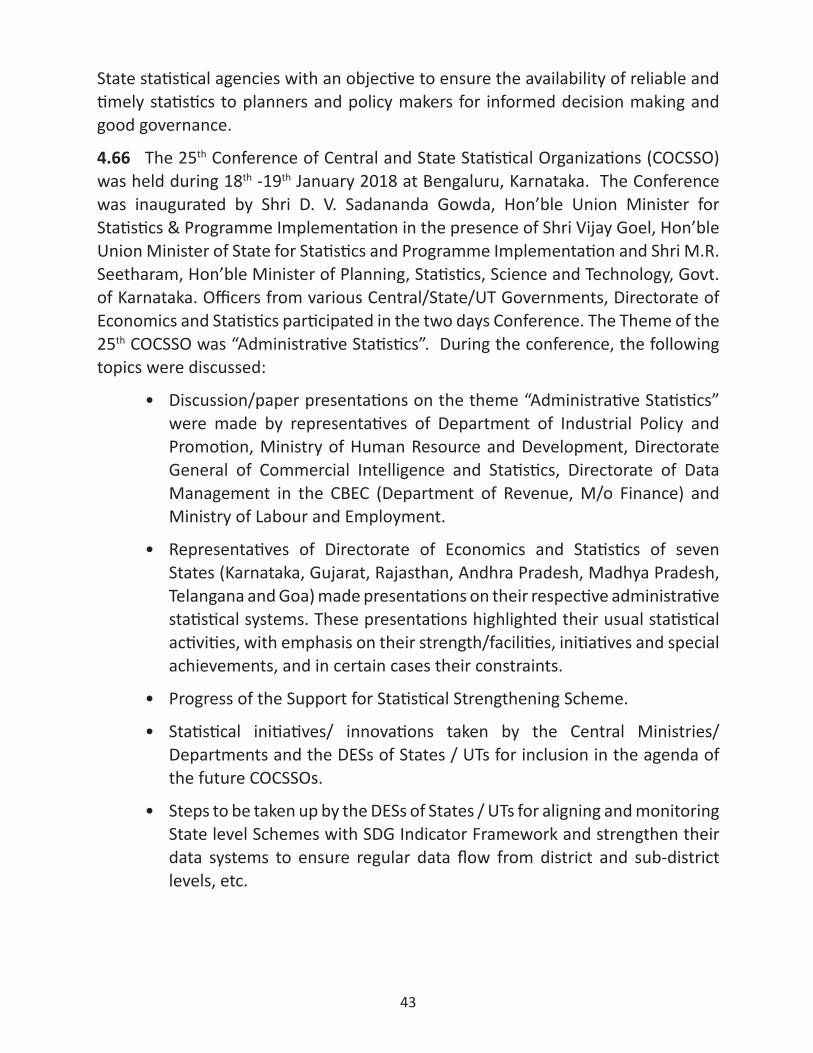
43
State statistical agencies with an objective to ensure the availability of reliable and timely statistics to planners and policy makers for informed decision making and good governance.
4.66 The 25th Conference of Central and State Statistical Organizations (COCSSO) was held during 18th -19th January 2018 at Bengaluru, Karnataka. The Conference was inaugurated by Shri D. V. Sadananda Gowda, Hon’ble Union Minister for Statistics & Programme Implementation in the presence of Shri Vijay Goel, Hon’ble Union Minister of State for Statistics and Programme Implementation and Shri M.R. Seetharam, Hon’ble Minister of Planning, Statistics, Science and Technology, Govt. of Karnataka. Officers from various Central/State/UT Governments, Directorate of Economics and Statistics participated in the two days Conference. The Theme of the 25th COCSSO was “Administrative Statistics”. During the conference, the following topics were discussed:
• Discussion/paper presentations on the theme “Administrative Statistics” were made by representatives of Department of Industrial Policy and Promotion, Ministry of Human Resource and Development, Directorate General of Commercial Intelligence and Statistics, Directorate of Data Management in the CBEC (Department of Revenue, M/o Finance) and Ministry of Labour and Employment.
• Representatives of Directorate of Economics and Statistics of seven States (Karnataka, Gujarat, Rajasthan, Andhra Pradesh, Madhya Pradesh, Telangana and Goa) made presentations on their respective administrative statistical systems. These presentations highlighted their usual statistical activities, with emphasis on their strength/facilities, initiatives and special achievements, and in certain cases their constraints.
• Progress of the Support for Statistical Strengthening Scheme.
• Statistical initiatives/ innovations taken by the Central Ministries/ Departments and the DESs of States / UTs for inclusion in the agenda of the future COCSSOs.
• Steps to be taken up by the DESs of States / UTs for aligning and monitoring State level Schemes with SDG Indicator Framework and strengthen their data systems to ensure regular data flow from district and sub-district levels, etc.
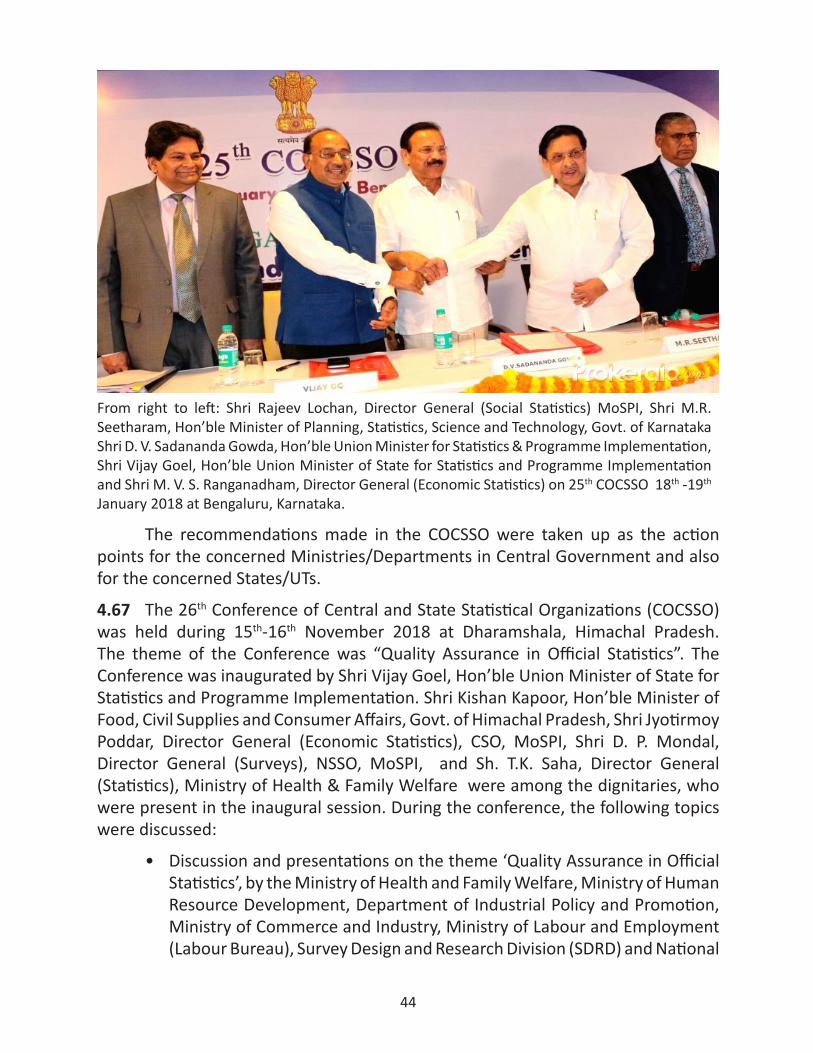
44
From right to left: Shri Rajeev Lochan, Director General (Social Statistics) MoSPI, Shri M.R. Seetharam, Hon’ble Minister of Planning, Statistics, Science and Technology, Govt. of Karnataka Shri D. V. Sadananda Gowda, Hon’ble Union Minister for Statistics & Programme Implementation, Shri Vijay Goel, Hon’ble Union Minister of State for Statistics and Programme Implementation and Shri M. V. S. Ranganadham, Director General (Economic Statistics) on 25th COCSSO 18th -19th January 2018 at Bengaluru, Karnataka.
The recommendations made in the COCSSO were taken up as the action points for the concerned Ministries/Departments in Central Government and also for the concerned States/UTs.
4.67 The 26th Conference of Central and State Statistical Organizations (COCSSO) was held during 15th-16th November 2018 at Dharamshala, Himachal Pradesh. The theme of the Conference was “Quality Assurance in Official Statistics”. The Conference was inaugurated by Shri Vijay Goel, Hon’ble Union Minister of State for Statistics and Programme Implementation. Shri Kishan Kapoor, Hon’ble Minister of Food, Civil Supplies and Consumer Affairs, Govt. of Himachal Pradesh, Shri Jyotirmoy Poddar, Director General (Economic Statistics), CSO, MoSPI, Shri D. P. Mondal, Director General (Surveys), NSSO, MoSPI, and Sh. T.K. Saha, Director General (Statistics), Ministry of Health & Family Welfare were among the dignitaries, who were present in the inaugural session. During the conference, the following topics were discussed:
• Discussion and presentations on the theme ‘Quality Assurance in Official Statistics’, by the Ministry of Health and Family Welfare, Ministry of Human Resource Development, Department of Industrial Policy and Promotion, Ministry of Commerce and Industry, Ministry of Labour and Employment (Labour Bureau), Survey Design and Research Division (SDRD) and National
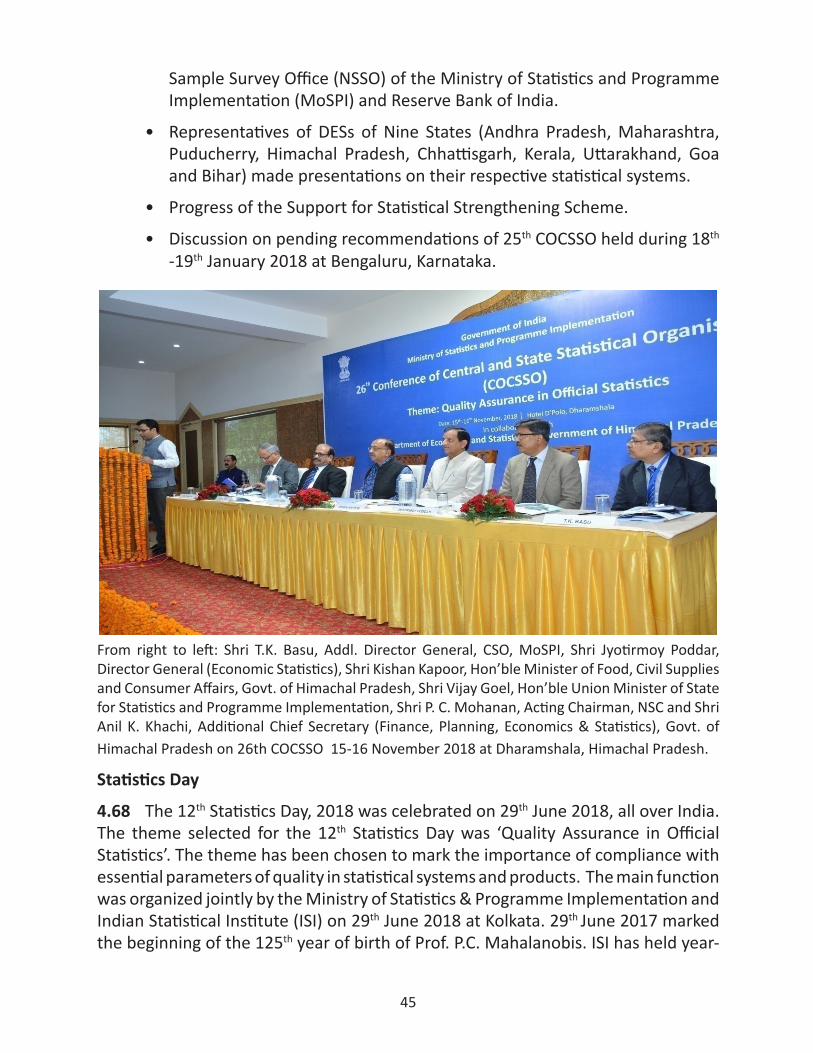
45
Sample Survey Office (NSSO) of the Ministry of Statistics and Programme Implementation (MoSPI) and Reserve Bank of India.
• Representatives of DESs of Nine States (Andhra Pradesh, Maharashtra, Puducherry, Himachal Pradesh, Chhattisgarh, Kerala, Uttarakhand, Goa and Bihar) made presentations on their respective statistical systems.
• Progress of the Support for Statistical Strengthening Scheme.
• Discussion on pending recommendations of 25th COCSSO held during 18th -19th January 2018 at Bengaluru, Karnataka.
From right to left: Shri T.K. Basu, Addl. Director General, CSO, MoSPI, Shri Jyotirmoy Poddar, Director General (Economic Statistics), Shri Kishan Kapoor, Hon’ble Minister of Food, Civil Supplies and Consumer Affairs, Govt. of Himachal Pradesh, Shri Vijay Goel, Hon’ble Union Minister of State for Statistics and Programme Implementation, Shri P. C. Mohanan, Acting Chairman, NSC and Shri Anil K. Khachi, Additional Chief Secretary (Finance, Planning, Economics & Statistics), Govt. of Himachal Pradesh on 26th COCSSO 15-16 November 2018 at Dharamshala, Himachal Pradesh.
Statistics Day
4.68 The 12th Statistics Day, 2018 was celebrated on 29th June 2018, all over India. The theme selected for the 12th Statistics Day was ‘Quality Assurance in Official Statistics’. The theme has been chosen to mark the importance of compliance with essential parameters of quality in statistical systems and products. The main function was organized jointly by the Ministry of Statistics & Programme Implementation and Indian Statistical Institute (ISI) on 29th June 2018 at Kolkata. 29th June 2017 marked the beginning of the 125th year of birth of Prof. P.C. Mahalanobis. ISI has held year-
46
round celebrations which culminated on 29th June 2018. Shri M. Venkaiah Naidu, Hon’ble Vice President of India graced the occasion as the Chief Guest. Shri D. V. Sadananda Gowda, Union Minister for Statistics & Programme Implementation, Shri Bratya Basu, Hon’ble Minister of Information Technology and Electronics, Govt. of West Bengal, Dr. Vijay Kelkar, President, ISI and Prof. Goverdhan Mehta, Chairman, ISI Council were also present. On the occasion, Hon’ble Vice President of India released a commemorative coin of `125 and circulation coin of `5 denomination as a mark of respect/homage to Prof. Mahalanobis. The winners of Prof. P.V. Sukhatme Award 2018 and Prof. C.R. Rao Award 2017 were felicitated for their notable contribution in the field of Statistics. Statistics Day Celebrations were also held throughout the country by the field offices of National Sample Survey Office, State Governments and Universities/Departments by organizing Seminars, Conferences, Debates, Quiz Programmes, Lectures, Essay Competitions, etc.
From right to left: Shri Bratva Basu,Hon’ble Minister of Information Technology and Electronics,Govt. of West Bengal, Shri M Venkaiah Naidu, Hon’ble Vice President of India and Shri D. V. Sadananda Gowda, Hon’ble Union Minister for Statistics & Programme Implementation, on 12th Statistics Day on 29th June 2017 at Kolkata, West Bengal.
4.69 CAP Division coordinates with the Central Subject Ministries through the Statistical Coordinators designated by the concerned Central Ministries for the matters related to recommendations of Rangarajan Commission and other statistical matters. This Division also coordinates with the Directorate of Economics & Statistics (DESs) of all States/UTs through the Deputy Director Generals of NSSO, FOD posted in the State Headquarters, designated as State Coordinators by the MoSPI to coordinate with the State/UT DESs on critical issues.
47
Smart India Hackathon (SIH) 2019
4.70 The Ministry has participated in Smart India Hackathon (SIH) 2019 during 1st -2nd March 2019 at Guwahati for identifying technological innovations in Official Statistics. The following problem statements were considered for SIH 2019:
• Automation of statistical information compilation process • Preparation of Gross Value Added (GVA) and storing in database• Preparation of Dashboard for National Accounts • Crowd sourcing of the works for Members of Parliament
• Information Management System
Round Table Conference on Data for New India
4.71 The Round Table Conference on Data for New India was orgnised at Vigyan Bhawan in New Delhi on 9th -10th July 2018. The Conference was inaugurated by Sh. Sadanand Gowda, Hon’ble Union Minister for Statistics and Programme Implementation in the presence of Sh. Vijay Goel, Hon’ble Minister of State for Statistics and Programme Implementation.
4.72 The discussions during the Conference were led by the Chief Statistician of India and Secretary (S&PI). Approximately 100 participants were attended the conference, both international and national, to discuss the reform agenda for the Indian Statistical System. The National Statisticians of U.K., Canada and Australia were attended. The Round Table Conference is a precursor to the range of reforms being initiated by MoSPI under the Capacity Development Scheme and World Bank funded reforms.
Study visit of the Statistics and Informatics Division (SID), Government of Bangladesh:
4.73 The CAP Division coordinated the study visit of The Statistics and Informatics Division (SID), Government of Bangladesh from 31st July 2018 to 3rd August 2018. SID is the administrative authority of Bangladesh Bureau of Statistics (BBS), the National Statistical Office of Bangladesh, and is responsible to support BBS in formulating programmes and policies for better implementation of its functions.
4.74 The purpose is to study the statistical systems as part of the implementation of National Strategy for the development of Statistics (NSDS), a nationally-owned statistical master plan which is designed for the systematic development of National Statistical System (NSS) of Bangladesh. The SID has also undertaken a project entitled Modernization and Strengthening of SID for capacity development of SID/BBS officials.
48
4.75 The SID, acknowledged the expertise and experience of India in the relevant fields of generating official statistics, and expressed the keenness to know the statistical system of India particularly for the sample surveys. They were also hopeful that experience on Indian Statistical System would benefit them significantly.
Updation and uploading of Central Acts on India code portal (ICP):
4.76 The CAP Division coordinated the activities for updation and hosting of Central Acts viz., ‘The Collection of Statistics Act, 2008’, ‘The Indian Statistical Institute Act, 1959’ and subordinate legislations including Rules, Regulations, Notifications and Circulars were uploaded on the India Code Portal (ICP).
General Guidelines on Quality Assurance for Official Statistics
4.77 In accordance with the Generic National Quality Assurance Framework of the United Nations Statistical Commission, MoSPI has notified General Guidelines on Quality Assurance for Official Statistics on 6th April 2018 for use and voluntary compliance by all officers dealing with statistical matters including administrative statistics. These guidelines are useful to producers of official statistics in designing any statistical collection or product and are also helpful to users in making informed decisions regarding the use of statistical products.
General Guidelines on Socio-Economic Indices
4.78 MoSPI, has notified broad guidelines for use by various official agencies for production and dissemination of various socio-economic indices on 25th April 2018. These guidelines, which have been formulated on the basis of the recommendations of the National Statistical Commission, will streamline and further strengthen the system of official statistics to provide better service to the policy makers, researchers, businesses and the public at large.
Project on Modernization of Indian Statistical System
4.79 The World Bank has undertaken a review of the Statistical System in the country during the period from 26th November 2018 to 7th December 2018. In connection with the World Bank funded project titled National Programme for improving quality of Statistical Products. Apart from various divisions of CSO and NSSO the team visited Central Ministries/Departments/Organisations namely Ministry of Corporate Affairs, GSTN, Reserve Bank of India and Labour Bureau to understand their respective data management system. The team also interacted with DES Maharashtra and DES Haryana to appreciate their present system, challenges and their vision. The officials of various Central Ministries and Departments also made presentations before the Mission about their Statistical Products. CAP division coordinated with The World Bank Team.
49
Support for Statistical Strengthening Project (SSSP)
4.80 The Support for Statistical Strengthening (SSS) is an ongoing scheme aiming to improve the statistical capacity and operations of State Statistical Systems for collecting, compiling and disseminating reliable official statistics. A total of `650.43 crores had been earlier approved for the scheme. When the final approval of CCEA for continuation of the scheme till March 2020 was received in September 2018, an amount of ̀ 264 crores was received for the 3 year period from 2017-18 to 2019-20.
Scheme is implemented through the State Directorates of Economics & Statistics, as per the approved activities/targets/outputs detailed out in the State’s specific MoUs signed between the Govt. of India and respective States/UTs.4.120 The Scheme is presently a Central Sector sub-Scheme with 100% funding from the Centre, under the umbrella scheme of Capacity Development. It is presently being implemented in 20 States and proposed to be extended to remaining States/UTs.
4.81 In the States, implementation of the Scheme has resulted in improvements in the compilation of core indicators, creation of data bases for policy planning in States and sub-States levels, and improved capacity building. The thrust of the Scheme is now on achieving tangible statistical outcomes/products, thereby improving the States Statistical Systems and taking them to the next level of development.
4.82 Some Major Activities/Highlights
• Two High Level Steering Committees (HLSC) on SSS Scheme under chairmanship of Secretary, MoSPI were held. The State Programmes of Himachal Pradesh and Assam were approved in the 1st meeting on 30th January 2018 and the State Programmes of Puducherry, Uttrakhand, Uttar Pradesh and Meghalaya were approved in the 2nd meeting on 22nd May 2018. Accordingly, MoUs were signed with six new States viz. Himachal Pradesh, Uttar Pradesh, Uttarakhand, Puducherry, Assam and Meghalaya and they have joined the scheme.
• Review with the North-East States was undertaken in Shillong on 26th April 2018, along with Workshop conducted by DSDD. The status of current implementing states of Mizoram, Manipur and Sikkim were reviewed. Discussions were held with the new states of Meghalaya, Tripura and Nagaland to finalize their State Programme. The state programme of Meghalaya was finalised.
• In the meeting held at Vigyan Bhawan on 21.05.2018 under the chairmanship of Secretary, MoSPI, for review of Development of State/Sub-State level Statistical Indicators, the status of pending works in current states was reviewed. The new states who had not yet finalised their programmes were asked to expedite them.
50
• Hon’ble Minister reviewed the implementation of scheme in Mizoram on 15th July 2018. He expressed satisfaction on the proper implementation and 94% utilization.
• In the 26th Conference of Central and State Statistical Organization (COCSSO) at Dharamshala in Himachal Pradesh during 15th-16th November 2018, the implementation of the SSS Scheme in all implementing States was reviewed.
• The 23rd meeting of the Eastern Zonal Council held in Kolkata on 1st October 2018 under the Chairmanship of Hon’ble Union Home Minister, in which Hon’ble Chief Minister of West Bengal, Dy. Chief Minister of Bihar and Chief Minister of Jharkhand and Finance Minister of Odisha were present and agenda issues pertaining to SSS scheme were discussed with Jharkhand, Bihar, West Bengal and Odisha.
• A Technical Advisory Committee (TAC) for Support for Statistical Strengthening (SSS) Sub - Scheme was constituted under the chairmanship of DG (ES) to consider gamut of issues to improve the implementation of the scheme and faster utilization of funds. Based on the recommendations of the TAC, the Operational Guidelines of the Scheme were revised.
PFMS
4.83 Steps have been taken to operationalize the PFMS System. In this regard all the States are advised to register their Bank account on the PFMS portal and book all the transactions under the “Expenditure, Advance and Transfer” module of PFMS regularly.
The Collection of Statistics Act, 2008 (COS Act, 2008)
4.84 According to provisions of the Collection of Statistics Rules 2011, the Additional Director General handling statistical coordination in the Ministry of Statistics and Programme Implementation has been designated as the Nodal Officer for exercising powers and performing duties under the aforesaid rules, through notification dated the 13th September 2018.
Coordination and follow up of NSC Recommendations
4.85 The CAP Division is also responsible for coordination and follow up of recommendations of Rangarajan Commission. The Commission chaired by Dr. C. Rangarajan in its comprehensive report (August 2001) made 623 recommendations for the improvement of the Indian Statistical System. During a review in its 60th Meeting held on September 2013, Out of 623 recommendations in all, 147 recommendations have been taken as implemented, 09 Recommendations have
51
been Rejected/Dropped and 467 recommendations are still pending. NSC observed that it requires a thorough review to prepare a fresh list of recommendations that need to be pursued in the present context. The Committee has reviewed the recommendations of the Rangarajan Commission under the Chairmanship of ADG (CAP) in its 8th meeting. Based on the meeting, 478 recommendations are taken as implemented, 17 Recommendations are Rejected/Dropped and 116 recommendations are still pending.
4.86 The National Statistical Commission is mandated inter-alia to evolve standard statistical concepts, definitions, classifications and methodology in different area in official statistics, monitor and review the functioning of the Statistical System in the light of the laid down policies, standard & methodology and to recommend measures for enhanced performance.
4.87 During the year 2017-18, the National Statistical Commission reviewed some of the Statistical Activities of the Ministry. Based on the recommendations made by the NSC, CAP Division is coordinating with the concerned stakeholders for follow up.
4.88 Annual Reports of the National Statistical Commission (NSC) along with ATRs for the years 2016-17 and 2017-18 have been laid in Lok Sabha and Rajya Sabha.
Memorandum of Understanding (MoU)
4.89 A Memorandum of Understanding (MoU) was signed between Ministry of Statistics and Programme Implementation (MoSPI), and National Council of Applied Economic Research (NCAER) to use new data technologies, knowledge generation and knowledge sharing, and capacity building in the field of Official Statistics, on 29th January 2019.
Data Dissemination
4.90 Revised Data Dissemination Guidelines of MoSPI were finalized.
50th Session of the UN Statistical Commission
4.91 The Ministry has participated in the 50th Session of the UN Statistical Commission (UNSC) during 5th-8th March, 2019 organised at New York for discussion ranging from, Open Data, National Accounts, Environmental Statistics, Education Statistics, Health Statistics etc.
Media Cell
4.92 The Ministry has engaged Broadcast Engineering Consultants India Limited (BECIL) to provide services of media cell and maintenance related to Communication Analytics and Social Media Marketing of the Ministry on 18.03.2019.
52
CHAPTER V
NATIONAL SAMPLE SURVEY OFFICE
Organisation and Functions:
5.1 The National Sample Survey Office (NSSO) in Ministry of Statistics & Programme Implementation is responsible for conduct of large scale sample surveys in diverse fields on All India basis. Primary data is collected regularly through nation-wide household surveys on various Socio Economic subjects, Annual Survey of Industries (ASI) under the Collection of Statistics Act and Enterprise Surveys as a follow up of the Economic Census. Besides these surveys, NSSO collects data on rural and urban prices and plays a significant role in the improvement of crop statistics through supervision of the area enumeration and crop estimation surveys of the state agencies. It also maintains a frame of urban area units for drawing samples for Socio-Economic Surveys in urban areas.
5.2 NSSO functions, with requisite autonomy in matters relating to data collection, processing and publication/dissemination of results/data based on its surveys, under overall guidance and supervision of National Statistical Commission (NSC) which appoints Working Groups/Technical Committees, comprising both official and non-official members, on different subjects for finalisation of survey instruments for its surveys. Director General (Survey) is responsible for overall coordination and supervision of all activities of NSSO who is assisted by four Additional Director Generals, each one being in-charge of a separate Division responsible for four distinct aspects of such large-scale surveys relating to their designing & planning, field work/ data collection, data processing and coordination between different Divisions of NSSO.
5.3 Divisions of NSSO:
• The Survey Design and Research Division (SDRD), located at Kolkata, is responsible for technical planning of surveys, formulation of sample design, designing of enquiry schedules, formulation of concepts and definitions, drawing of tabulation plan, analysis and presentation of results and preparation of survey reports.
• The Field Operations Division (FOD) with its headquarters at Delhi/Faridabad and a network of 6 Zonal Offices, 53 Regional Offices and 116 Sub-Regional Offices spread throughout the country, is responsible for the collection of primary data for the surveys undertaken by NSSO.

53
• The Data Processing Division (DPD) has its headquarters at Kolkata. It has six Data Processing Centers at Ahmedabad, Bangalore, Kolkata, Delhi, Giridih and Nagpur. It is responsible for sample selection, software development and processing tabulation of the data collected through surveys. It undertakes the job of software development for data entry, data verification, computer editing, other data validations, tabulation, etc. It also assists the States by providing IT solutions in all their data processing related activities as also through periodic training/workshop and other interactive methods. Industrial Statistics (IS) Wing also works under this Division. The main function of IS Wing is conceiving, designing, validating research regarding Annual Survey of Industries (ASI) which is the principal source of Industrial Statistics in India. The ASI data is collected and maintained through dedicated ASI Web Portal which leads to data accuracy and time saving. The vision is to deliver ASI data in a timely, transparent and reliable manner in a secured environment without any physical movement of the schedules.
• The Coordination and Publication Division (CPD) headquartered at Delhi coordinates all the activities of different Divisions. Besides, CPD is also responsible for organising National Seminars to discuss the survey results of various surveys conducted by the NSSO. It publishes the technical journal of NSSO, namely ‘Sarvekshana’ which includes research papers on various socio-economic surveys of NSSO.
Working Groups for recent rounds of NSS
5.4 Fourth meeting of the Working Group of NSS 74th round was held at New Delhi on 28th March 2019 to present the technical report of NSS 74th round and discussions thereof.
5.5 Third Working Group meeting of NSS 75th round was held at Hyderabad on 4th April 2018 to finalize the tabulation plan and estimation procedure of the survey on (i) Household Consumer Expenditure and (ii) Household Social Consumption on Health and Education.
5.6 Third meeting of the Working Group of NSS 76th round was held on 20th January 2018 at Kolkata to finalize the survey instruments for survey on (i) ‘Drinking Water, Sanitation, Hygiene and Housing Condition’ and (ii) ‘Persons with Disability’. Fourth meeting of the Working Group of NSS 76th round was held on 17th August 2018 at Kolkata to finalize the tabulation plan and estimation procedure for surveys of NSS 76th round.
5.7 The Working Group of NSS 77th round (January - December 2019) held its first and second meeting during 15th-16th June 2018 and 19th-20th July 2018 at New
54
Delhi and Kolkata respectively under the Chairmanship of Prof. P. S. Birthal, National Professor, National Institute of Agricultural Economics and Policy Research (NIAP), New Delhi to discuss survey instruments for survey on (i) ‘Land and Livestock holdings of the households and situation assessment of agricultural households’ and (ii) ‘Debt and investment’. Third meeting of the Working Group of NSS 77th round was held under the Chairmanship of Prof. P. S. Birthal on 10th August 2018 at New Delhi to finalize the survey instruments for surveys of NSS 77th round.
Standing Committee on Labour Force Statistics
5.8 Standing Committee on Labour Force Statistics (SCLFS) was constituted on 12th November 2014 under the Chairmanship of Dr S.P. Mukherjee, Emeritus Professor, University of Calcutta to oversee the conduct of surveys and system of collection, compilation and dissemination of Labour Force Statistics emanating from various surveys and census, besides suggesting mechanism for coordination and integration of Labour Force Surveys being conducted by the Central and State Governments.
5.9 During its meeting held on 23rd March 2017, the Standing Committee on Labour Force Statistics (SCLFS) recommended for constitution a Sub-Committee to identify the issues to be considered and resolved, before and during a Pilot Survey to study the feasibility of implementing some of the recommendations made by the 19th International Conference of Labour Statisticians (ICLS).
5.10 The report of the Sub-Committee to identify the recommendations of 19th
ICLS for conducting Pilot Study was discussed in detail in eighth meeting of SCLFS held on 16th August 2018. In the meeting a thorough review of the structure and content of the Schedule of Enquiry drafted in consultation with DG (Survey) was undertaken. In this meeting it was decided that the pilot survey will be carried out spreading over the whole country with States/UTs as stratum with the required sample size to provide reliable estimates only at the national level.
5.11 In 103rd meeting of the National Statistical Commission held on 7th
September 2018, a presentation was made to brief the Commission that based on the recommendations of 19th International Conference on Labour Statistics (ICLS), Methodology for Pilot Survey on Employment-Unemployment had been formulated. The Commission suggested that NSSO should prepare a concept note and also organize a seminar on employment & unemployment within the 19th ICLS framework inviting views of various stakeholders and academicians. Accordingly, decision on the proposal for Pilot Survey on Employment-Unemployment based on 19th ICLS was deferred.
55
Activities related to various other NSS Rounds of Socio-economic surveys
5.12 NSS 73rd round (July 2015-June 2016) was devoted to the subject of ‘Unincorporated Non-agricultural Enterprises (Excluding Construction)’. The NSS report number 581 titled 'Operational Characteristics of Unincorporated Non-agricultural Enterprises (Excluding Construction) in India' and NSS report number 582 titled 'Economic Characteristics of Unincorporated Non-agricultural Enterprises (Excluding Construction) in India' were released in March 2018 and July 2018 respectively.
5.13 NSS 74th round (July 2016 - June 2017) was devoted to ‘Survey of Services Sector’. It was a list frame based enterprise survey on the Services sector. The total number of central sample allocation in this survey from a combined frame of Ministry of Corporate Affairs (MCA), Economic Census (EC) and Business Registers (BR) was 63,659 enterprises. Data collection work has already been completed. A ‘Technical Report’ on the results of the survey is under finalisation.
5.14 NSS 75th round (July 2017 - June 2018) was devoted to survey on (i) Household Consumer Expenditure and (ii) Household Social Consumption on Health and Education. The data collection was completed in June 2018. The tabulation plan and estimation procedure corresponding to NSS 75th round has been finalised. Presently, the data validation job of this round is in progress. The key indicator reports and data of this round are expected to be released in June 2019.
5.15 The NSS 76th round of NSS (July-December 2018) was devoted to the subjects of (i) Disability and (ii) Drinking Water, Sanitation, Hygiene and House Condition. The All India Workshop of Trainers (AIWOT) for the NSS 76th round was held at Hyderabad during 5th - 6th April 2018. The survey commenced on 1st July 2018. Tabulation plan and estimation procedure corresponding to NSS 76th round has been finalized. The reports and data of this round are expected to be released in May 2019.
5.16 Data is being collected through e-schedule. Data files are received from field and validated at DPD. All India Data Processing Conference for NSS 76th Round was organized during 24th -25th July 2018. This was followed by a series of workshops at each of the individual data processing centers.
5.17 The 77th round of NSS (January - December 2019) is devoted to the subjects of (i) ‘Land and Livestock holdings of the households and situation assessment of agricultural households’ and (ii) ‘Debt and investment’. The All India Workshop of Trainers (AIWOT) for the NSS 77th round was held at Guwahati during 27th - 29th September 2018. The survey was launched on 1st January 2019. Preparation of Tabulation plan and Estimation procedure corresponding to NSS 77th round is in progress.
56
State Assistance for Socio-Economic Surveys
5.18 With an objective to generate sub-state level estimates for different socio-economic parameters, states also participate in NSS surveys. As such, there is need for development of capacity at state levels also in respect of data processing. DPD provides all kind of technical guidance to the states by supplying data processing instruments (including sample list, software for data entry, validation and tabulation) which helps in processing the state sample data and pooling of central and state sample data. Thereafter, state level reports on the pooled estimate are published by the states.
5.19 During 2018-19, DPD organized data processing workshops on NSS 76th round for processing of central sample data. During this period, DPD also organised Tabulation Workshop on NSS 73rd round and Pooling Workshop on central and state sample data of NSS 72nd round for the officials of Directorate of Economics and Statistics. In these workshops, theoretical and hands on trainings were also imparted. Specialized need-based training for states, have also been arranged by DPD as and when requested by the State DES, depending on the availability of officers to impart the training.
National Seminar on the results of NSS 71st and 72nd Rounds
5.20 NSS 71st round (January-June 2014) was dedicated to the subject on ‘Social Consumption: Health and Education’ and NSS 72nd round (July 2014-June 2015) was devoted to the subject ‘Domestic Tourism Expenditure’ & ‘Household Expenditure on Services and Durable Goods’. National Seminar based on the results of NSS 71st round and NSS 72nd round was held at Andhra University, Vishakhapatnam during 23rd -24th August 2018. During the seminar, a total of 17 technical papers including divisional papers on the above rounds were presented.
Agricultural Statistics
5.21 NSSO has the responsibility of guiding the states in developing suitable techniques for obtaining reliable and timely estimates of area and yield as also to ensure adoption of uniform concepts, definition and procedures in the collection of crop area and yield related statistics. It keeps a constant watch on the quality of Crop Statistics through the scheme of Improvement of Crop Statistics (ICS). Under the scheme, sample check on the primary field work relating to area enumeration in approximately 5000 villages in an agricultural season and supervision of about 16000 crop cutting experiments in each agricultural year are undertaken by the Field Operations Division (FOD) of NSSO. States are also participating in this programme of sample check on equal matching basis. The data collected through the supervision of crop cutting experiments at harvest stage are also utilized to compute 186 estimates of yield rate of specified crops under the ICS scheme.
57
Urban Frame Survey (UFS)
5.22 Urban Frame Survey (UFS) is a regular scheme being conducted in phased manner over a period of 5 years. The objective of the survey is formation and updation of UFS blocks for providing frame for selection of first stage sampling units in urban sector to conduct various Socio-Economic Surveys of NSSO.
5.23 A decision has been taken to undertake Urban Frame Survey (UFS) 2017-22 phase work on digital platform using mobile and portal based applications. The technology for the same is being developed by National Remote Sensing Centre (NRSC), Hyderabad. Final version of mobile application has been provided to field offices for field work. The beta version of web-portal has also been received and is being used by field offices. An improved version of portal is scheduled to be received in early April 2019 which will have, among other features, Quantum Geographic Information System (QGIS) plug-in as an integral part of portal, thereby further easing the work of field officials. Field officials have been given training in use of mobile application for capturing attribute data and QGIS software for editing the boundaries.
Periodic Labour Force Survey (PLFS)
5.24 The nationwide Labour Force Survey, namely, Periodic Labour Force Survey (PLFS) was launched from 1st April 2017. The main objective of the PLFS is to measure quarterly changes of various indicators of the labour market in urban areas as well as to generate the annual estimates of different labour force indicators both in rural and urban areas.
5.25 The data collection for PLFS in the field is being done through Computer Assisted Personnel Interviewing (CAPI) Solution. The CAPI Solution was developed by NSSO with technical assistance from World Bank for use in data collection for surveys conducted by NSSO by using hand held IT Devices in place of paper schedules. Process of upgradation of present CAPI Survey Solution version 5.19 to version 18.12 has been initiated for use from Quarter-9 (April 2019).
5.26 Till date, survey works for eight quarters of PLFS have been completed.
Computer Assisted Personal Interviewing (CAPI) Solution
5.27 NSSO has developed a Computer Assisted Personnel Interviewing (CAPI) Solution with technical assistance from the World Bank for use in data collection for surveys conducted by NSSO by using handheld IT device in place of paper schedule. NSSO is using Survey solution CAPI (Ver. 5.19) in PLFS from April 2017, changing its usual collection of data in paper schedule to direct data capturing in android based Tablets and uploading data on NIC server. Presently, NSSO is in the process of migrating to version 18.12 of CAPI Solutions.
58
Time Use Surveys (TUS)
5.28 The survey was started from 1st January 2019 for a period of one year. The primary objective of TUS is to measure participation of men, women and other groups of persons in paid and unpaid activities. About 10,000 First Stage Units (FSUs) will be surveyed for the TUS at all India level. It will help in monitoring the progress towards the achievement of some of the targets of Sustainable Development Goals (SDG).
Annual Survey of Industries (ASI)
5.29 The Annual Survey of Industries (ASI) is the principal source of industrial statistics in India. It provides statistical information to assess and evaluate, objectively and realistically, the changes in the growth, composition and structure of the organized manufacturing sector comprising activities related to manufacturing processes, repair services, generation, transmission, etc. of electricity, gas and water supply and cold storage. The survey is statutory in nature under the Collection of Statistics Act, 2008 (as amended in 2017) and the rules framed there under.
5.30 The ASI extends to the entire country. The survey covers all factories registered under sections 2m (i) and 2m (ii) of the Factories Act, 1948. The survey also covers bidi and cigar manufacturing establishments registered under the Bidi and Cigar Workers (Conditions of Employment) Act, 1966. All the electricity undertakings engaged in the generation, transmission and distribution of electricity registered with the Central Electricity Authority (CEA) were covered under ASI up to 1997-98 irrespective of their employment size. Certain services and activities like cold storage, water supply, repair of motor vehicles other consumer durables like watches, etc. are covered under the survey. Defence establishments, oil storage and distribution depots, restaurants, hotels, café and computer services and the technical training institutes are excluded from the purview of this survey. The electricity undertakings registered with the CEA are not being covered under ASI w.e.f. 1998-99. However, captive units not registered with CEA continue to be covered under ASI.
5.31 In addition to the above, now the coverage of ASI has been extended beyond the purview of the section 2m (i) and 2m (ii) of the Factories Act, 1948 and the Bidi & Cigar Workers (Conditions of Employment) Act, 1966 as recommended by the Sub-Group on Sampling Design of ASI. For this purpose, Business Register of Enterprises (BRE) prepared for the respective states and Directory of Establishments based on Sixth Economic Census would be used by Industrial Statistics Wing (IS Wing).
5.32 To start with the implementation of the augmented frame, units with 100 or more employees not registered under section 2m (i) and 2m (ii) of the Factories Act, 1948 but included in the BRE of the respective states would be included in ASI frame. For this, BRE of Andhra Pradesh (AP) was included in the frame of Andhra Pradesh
59
for ASI 2014-15 and BRE of Manipur, Chhattisgarh, Himachal Pradesh, Punjab, Uttar Pradesh, Tamil Nadu and Rajasthan were included in the frame of respective states for ASI 2015-16 after verification of such units by Field Operation Division (FOD). This is a significant departure from past practices and it is an improvement in coverage of registered manufacturing sector.
5.33 The data collected through ASI relates to capital, employment and emoluments, consumption of fuel and lubricants, raw materials and other input/output, value added, labour turnover and other characteristics of factories/industrial establishments. Fieldwork is carried out by the Field Operations Division of NSSO. The IS Wing processes the data and publishes the results.
State Participation in ASI
5.34 The State Directorates of Economics and Statistics (DESs) have been given necessary technical assistance and training for the purposes of participation in ASI. The participating states along with other desiring states have been provided with state sample list to take part in ASI survey work. IS Wing of DPD has provided all the survey and data processing instruments [sample list, schedule, instruction manual, data entry package (e-schedule), validation rules, validation software, pooling methodology, etc.] to the states. Central sample unit level data for respective states were also shared with the State DESs so as to enable them to generate district/micro level estimates, if necessary, by augmenting samples.
5.35 The major objectives of ASI in the present plan scheme named Capacity Development are:
• To improve the quality of ASI data processing. • Up-gradation of computer hardware and software of IS Wing, Kolkata
for ASI data processing and implementation of e-governance in phased manner as an extension of complete on line data processing.
• Assistance to state DESs for participating in ASI survey.
5.36 Over the last few decades, there has been a spurt in the growth of the number of registered factories and consequently in the number of units from which data are to be collected and analyzed annually. Considering operational constraint of NSSO (FOD), the sample sizes in ASI were kept at 65,972, 66,283, 70,943, 73,841 and 76,977 units during ASI 2012-13, ASI 2013-14, ASI 2014-15, ASI 2015-16 and ASI 2016-17 respectively. In ASI 2017-18, 76,613 units comprising of 51,569 census units and 25,044 sample units have been selected for the survey. The field work of ASI 2017-18 is in progress. All the schedules from ASI 2012-13 onwards have been canvassed through ASI web-portal.
5.37 An action plan has been drawn to reduce the time lag in releasing the ASI results. From ASI 1998-99, detailed results (in two volumes) are being released
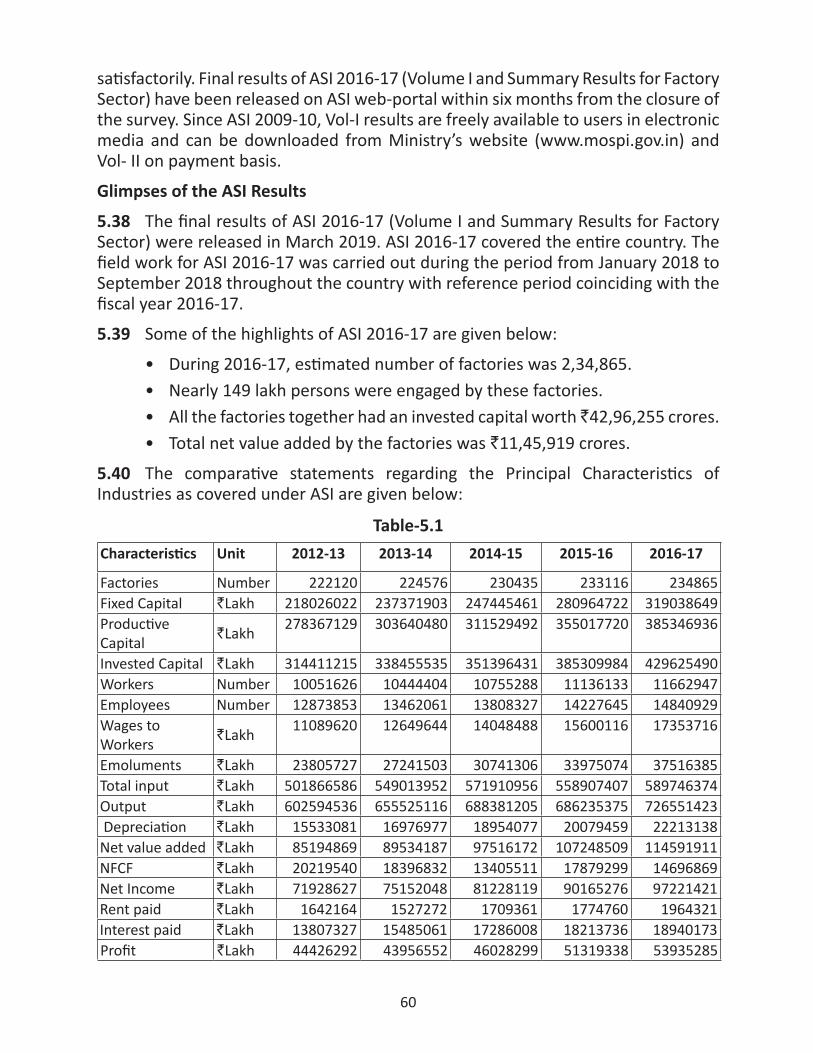
60
satisfactorily. Final results of ASI 2016-17 (Volume I and Summary Results for Factory Sector) have been released on ASI web-portal within six months from the closure of the survey. Since ASI 2009-10, Vol-I results are freely available to users in electronic media and can be downloaded from Ministry’s website (www.mospi.gov.in) and Vol- II on payment basis.
Glimpses of the ASI Results
5.38 The final results of ASI 2016-17 (Volume I and Summary Results for Factory Sector) were released in March 2019. ASI 2016-17 covered the entire country. The field work for ASI 2016-17 was carried out during the period from January 2018 to September 2018 throughout the country with reference period coinciding with the fiscal year 2016-17.
5.39 Some of the highlights of ASI 2016-17 are given below:
• During 2016-17, estimated number of factories was 2,34,865.• Nearly 149 lakh persons were engaged by these factories.• All the factories together had an invested capital worth ̀ 42,96,255 crores.• Total net value added by the factories was `11,45,919 crores.
5.40 The comparative statements regarding the Principal Characteristics of Industries as covered under ASI are given below:
Table-5.1
Characteristics Unit 2012-13 2013-14 2014-15 2015-16 2016-17
Factories Number 222120 224576 230435 233116 234865Fixed Capital `Lakh 218026022 237371903 247445461 280964722 319038649Productive Capital `Lakh 278367129 303640480 311529492 355017720 385346936
Invested Capital `Lakh 314411215 338455535 351396431 385309984 429625490Workers Number 10051626 10444404 10755288 11136133 11662947Employees Number 12873853 13462061 13808327 14227645 14840929Wages to Workers `Lakh 11089620 12649644 14048488 15600116 17353716
Emoluments `Lakh 23805727 27241503 30741306 33975074 37516385Total input `Lakh 501866586 549013952 571910956 558907407 589746374Output `Lakh 602594536 655525116 688381205 686235375 726551423 Depreciation `Lakh 15533081 16976977 18954077 20079459 22213138Net value added `Lakh 85194869 89534187 97516172 107248509 114591911NFCF `Lakh 20219540 18396832 13405511 17879299 14696869Net Income `Lakh 71928627 75152048 81228119 90165276 97221421Rent paid `Lakh 1642164 1527272 1709361 1774760 1964321Interest paid `Lakh 13807327 15485061 17286008 18213736 18940173Profit `Lakh 44426292 43956552 46028299 51319338 53935285
61
ASI Web-Portal
5.41 Annual Survey of Industries Web-Portal was developed by Industrial Statistical Wing, Kolkata, with the support of NIC for collection and compilation of ASI schedules. The main objective of the portal is collection of ASI data at the source with built-in validation which leads to data accuracy and time saving. The 24×7 availability in a secured environment is an added advantage. The vision is to deliver ASI data in a timely, transparent and reliable manner in a secured environment without any physical movement of the schedules. The ASI web-portal was successfully launched for frame updation, sample selection and e-compilation of ASI schedule from ASI 2012-13.
All India Training of Trainers (AITOT) on ASI for State Statistical Personnel
5.42 An All India Training of Trainers (AITOT) on ASI for the statistical personnel from the State DESs was organised during 6th-7th September 2018 at Sankhiyiki Bhawan, Delhi. The programme was inaugurated by DG (NSSO) and was attended by 38 participants from 20 states along with officers from NSSO. Concepts and definitions of ASI, recent changes in ASI schedule and related concepts, filling up of ASI return through e-schedule, pooling of central and state sample data, scrutiny and validation of ASI data using validation software and ASI frame related issues were discussed in the workshop.
5.43 National Seminar on Industrial Statistics
Ninth National Seminar on Industrial Statistics was organized on 14th December 2018 in Kolkata which was attended by senior officers of MoSPI, eminent economists, statisticians, researchers, and paper presenters from academia, industry, government and non-government organisations.
Price Data
5.44 Rural Retail Price Collection [RPC, 3.01(R)]: NSSO (FOD) collects regular monthly rural retail price data for the compilation of consumer price index (CPI) for Agricultural and Rural Labourers. Along with the price data, the daily wage rates of 12 major agricultural and 13 major non-agricultural occupations are also being collected in the Schedule-3.01 (R). Data on daily wage rates of important agricultural operations are reported by the State Governments on monthly basis. The Labour Bureau under Ministry of Labour and Employment compiles and publishes the index figures of CPI (AL/RL) which is released every month (20th or preceding working day of the following month) for each of the states as well at all India level. The current base year for RPC is 1986=100. Data for RPC is collected every month from 603 villages located across 26 States/UTs.
62
5.45 The RPC bulletin called the ‘Prices and Wages in Rural India’ which is published for each quarter, provides price data only at national level in respect of 260 commodities and wage data at national and state level for twenty five major states. The RPC bulletin till the quarter April-June 2018 has already been published and the data processing work of the bulletin for the quarter July-September 2018 was published in December 2018.
5.46 The market survey work for Base Year revision of CPI (AL/RL) has already been completed in April 2019. The regular price collection under the new series has started for approximately 793 villages spread throughout the country. The collection of retail prices under the existing base year 1986=100 will continue till December 2020.
5.47 Consumer Price Index (Urban): Consumer Price Indices (CPI) for Urban Areas measure the changes over time in general level of retail prices of goods and services for the purpose of consumption relevant to the entire urban population in the country that households acquire. The price collection of CPI (U) started from May 2008 by Field Operations Division (FOD) of NSSO on behalf of Central Statistics Office (CSO), Price Statistics Division (PSD). The current base year for CPI (U) is 2012=100. Price data collection is done for 1078 quotations per month from 310 towns across the country. Collection/transmission of monthly retail prices in the urban prices portal of CPI (U) is being done regularly by the NSSO (FOD).
5.48 Consumer Price Index (Rural): NSSO (FOD) has been entrusted with the work of CPI (Rural) from September 2018 after the handover of task from the Department of Posts (DoP). The base year of CPI (Rural) is same as that of CPI (Urban), i.e., 2012=100. Price data collection is being carried out from the markets located in 1181 villages across the country. To acquaint the staff with the markets and shops, joint price collection was carried out with assistance from DoP officials for a period of two months from September 2018 to October 2018. The price collection activity was carried out independently by the NSSO (FOD) from November 2018 onwards by engaging contractual staff.
5.49 The market survey work for Base Year revision of CPI (Urban) and CPI (Rural) has already been completed in April 2019. The regular price collection under the new series has started for approximately 1150 quotations in case of CPI (Urban) and approximately 1214 villages in case of CPI (Rural) spread throughout the country. The collection of retail prices under the existing base year 2012=100 will continue till December 2019.
63
5.50 Wholesale Price Index (WPI) (Ongoing): WPI is used as an important measure of inflation in India. Fiscal and Monetary policy changes are greatly influenced by changes in WPI. This survey is conducted by FOD on behalf of Office of Economic Adviser, DIPP.5.51 The base year for WPI is 2011-12=100. Data collection/transmission activities for 6765 quotations on monthly basis covering 5648 manufacturing units/factories from organized sector is performed regularly by engaging contractual manpower. Plan Scheme
5.52 NSSO is responsible for implementing one of the sub components of Ministry’s Plan Scheme ‘Capacity Development’, namely, ‘Strengthening of Survey Capabilities of NSSO’. Under this component, a total sum of `1039.09 lakh as Grant-in-Aid has been released to the North Eastern States of Arunachal Pradesh, Mizoram, Manipur, Tripura and Sikkim as first installment for undertaking NSS surveys during the year 2018-19.5.53 Under ‘Strengthening of Data Processing Capabilities of NSSO’, apart from building of infrastructure, technology up-gradation and human resources development, two Plan Centres, namely, DP Centre, Bangalore and DP Centre, Ahmadabad were established during the 10th Plan. These two DP Centres have contributed significantly in achieving timeliness of data processing and release of results and their continuation during 12th five year plan enabled NSSO to achieve the target of release of its results within one year of conduct of survey. 5.54 Purchase of land/construction of accommodation for field offices: The infrastructure in the field offices of the FOD was further developed and strengthened. Construction of office building of Regional Office Hubli and Sub Regional Office Mysuru has been completed and their inauguration done during 2018-19.5.55 Strengthening of Training facilities: NSSO organizes regular in-service training for its staff through its Zonal Training Centres (ZTCs) and AS Wing, Faridabad. During 2018-19 (April 2018 -March 2019), 1751 Officers/Officials were trained on various technical schemes like Socio-Economic Survey, ASI/ ASI Web Portal, Agriculture Statistics, UFS, etc., besides training on general administrative matters and ‘Right to Information Act’. 5.56 Publicity of NSSO: The following measures have been taken up in 2018-19 for creating a brand name for NSSO and for increasing co-operation from respondents with a view to improving the quality of data:
• Appeal seeking co-operation of people in the data collection work has been released in the national and regional newspapers.
• Telecast of video spot on Lok Sabha TV is going on.
64
Sarvekshana
5.57 Effective secretarial assistance was rendered to the Editorial Advisory Board of ‘Sarvekshana’, an in-house technical journal of NSSO to finalise the content of its different issues. The meeting of the Editorial Advisory Board (EAB) of ‘Sarvekshna’ a technical journal of NSSO was held on 18th March 2019 under the Chairmanship of Prof. U. Sankar to finalize the manuscript of 106th issue of the “Sarvekshna”.
5.58 104th issue of ‘Sarvekshana’ was published and also uploaded on the website of the Ministry during March 2018. 105th and 106th issues of ‘Sarvekshana’ have been uploaded on the website of the Ministry during September 2018 and March 2019, respectively.
Use of Modern Technology/New Initiatives
5.59 The subject coverage of NSS 76th Round is ‘Disability, Drinking Water, Sanitation and Hygiene & Housing Conditions’. The survey had been started in July 2018 and ended in December 2018. In this Round, while the data collection in the field was done with usual paper schedules, data entry is done in the field office itself using in-house developed MS Access based e-schedule. Field offices would e-mail the data files to the Data Processing Division for further processing. This could help to enhance quality of data by way of validation checks introduced in the e-schedule and obviate the need for data entry by Data Processing Centres thereby reducing the time lag in the release of reports.
5.60 Moving a step further, complete digitization of Socio-Economic Survey is envisaged from the 77th Round NSS, which started from 1st January 2019. This will entail digitization of paper schedules into digital schedules. Data in the field will be captured directly using tablets through web browser module developed by ISI. While improving the quality of field data, it will further reduce the time lag in the release of reports.
• SDRD has taken up the work of archiving old NSS reports and old issues of Sarvekshana. A total of 531 reports out of 536 old NSS reports (corresponding to NSS 1st round to 47th round) have been digitized and sent to CPD for uploading the same on website of MoSPI.
• Digitization of old issues of Sarvekshana has also been taken up. Out of 104 old issues 101 issues have been digitized and sent to CPD for uploading the same on website of MoSPI.
65
5.61 The next phase of UFS (2017-2022) has commenced in November 2017. This phase of UFS has been digitized. Different UFS operations will be carried out using mobile/web applications developed in collaboration with National Remote Sensing Centre (NRSC), Hyderabad. Boundaries of blocks/wards/Investigator units/towns will be drawn on satellite imagery obtained from ‘Bhuvan’ portal using Quantum Geographic Information System (QGIS) software. Geo-coordinates (latitudes and longitudes) of a given location, structure and associated attributes will be captured through the mobile application and embedded on satellite imagery. The maps drawn in this way alongwith associated attributes will be saved on Bhuvan portal for its ultimate use as sampling frame for conducting of Socio-Economic surveys.
5.62 Two new enterprise surveys viz. Annual Survey of Services Sector Enterprises (ASSSE) and Annual Survey of Unincorporated Sector Enterprises (ASUSE) are proposed to be launched in October 2019 and January 2020. A Standing Committee has been constituted under the chairmanship of Dr. Pronab Sen, Programme Director, International Growth Centre. First meeting of the Standing Committee was held on 24th October 2018. Till March 2019, three meetings of the Standing committee have been held to finalise the blueprint of the proposed surveys.
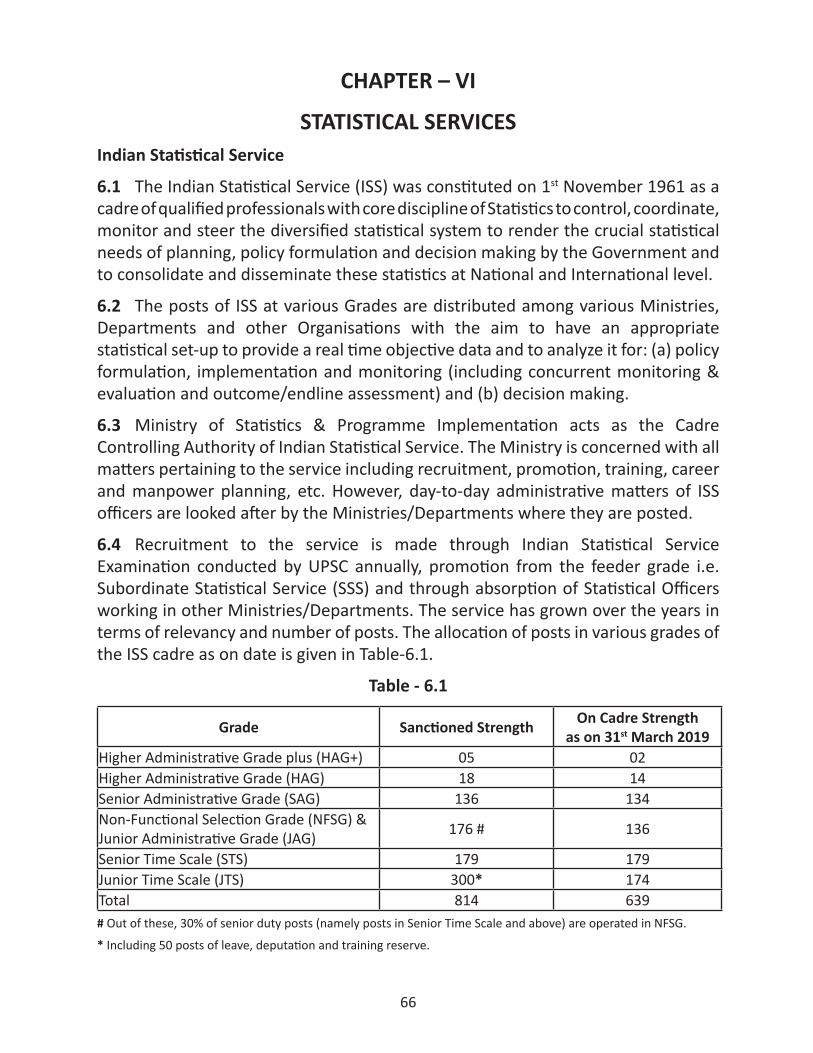
66
CHAPTER – VI
STATISTICAL SERVICESIndian Statistical Service
6.1 The Indian Statistical Service (ISS) was constituted on 1st November 1961 as a cadre of qualified professionals with core discipline of Statistics to control, coordinate, monitor and steer the diversified statistical system to render the crucial statistical needs of planning, policy formulation and decision making by the Government and to consolidate and disseminate these statistics at National and International level.
6.2 The posts of ISS at various Grades are distributed among various Ministries, Departments and other Organisations with the aim to have an appropriate statistical set-up to provide a real time objective data and to analyze it for: (a) policy formulation, implementation and monitoring (including concurrent monitoring & evaluation and outcome/endline assessment) and (b) decision making.
6.3 Ministry of Statistics & Programme Implementation acts as the Cadre Controlling Authority of Indian Statistical Service. The Ministry is concerned with all matters pertaining to the service including recruitment, promotion, training, career and manpower planning, etc. However, day-to-day administrative matters of ISS officers are looked after by the Ministries/Departments where they are posted.
6.4 Recruitment to the service is made through Indian Statistical Service Examination conducted by UPSC annually, promotion from the feeder grade i.e. Subordinate Statistical Service (SSS) and through absorption of Statistical Officers working in other Ministries/Departments. The service has grown over the years in terms of relevancy and number of posts. The allocation of posts in various grades of the ISS cadre as on date is given in Table-6.1.
Table - 6.1
Grade Sanctioned StrengthOn Cadre Strength
as on 31st March 2019Higher Administrative Grade plus (HAG+) 05 02Higher Administrative Grade (HAG) 18 14Senior Administrative Grade (SAG) 136 134Non-Functional Selection Grade (NFSG) &Junior Administrative Grade (JAG) 176 # 136
Senior Time Scale (STS) 179 179Junior Time Scale (JTS) 300* 174Total 814 639# Out of these, 30% of senior duty posts (namely posts in Senior Time Scale and above) are operated in NFSG.
* Including 50 posts of leave, deputation and training reserve.
67
6.5 The first examination for direct recruitment to the service was held in the year 1967 and the first batch of the service was appointed in the year 1968. Till date, 41 batches of direct recruits have joined the service. The latest batch of 29 officers has already joined in the month of February 2019.
6.6 The ISS Rules, 2016 provide for 50 per cent of the posts in JTS to be filled up by direct recruitment and 50 per cent by promotion from Subordinate Statistical Service (SSS) cadre. There is no direct recruitment at any other level of the service except in JTS. All the vacancies in other grades are filled up by promotion.
Subordinate Statistical Service
6.7 The Subordinate Statistical Service (SSS) was constituted on 12th February 2002 as a cadre of qualified personnel with core discipline of Statistics to assist in building crucial statistical database covering various aspects of Indian Economy for planning, policy formulation and decision making by the Government.
6.8 SSS is a Group-B Central Civil Service of statistical function posts which constitutes feeder cadre for ISS. It comprises Senior Statistical Officer (SSO) (Group-B Gazetted) having Grade Pay of `4600/- and Junior Statistical Officer (JSO) having Grade Pay of `4200/- in the Pay Band-2: `9300-34800/- in the pre-revised pay structure under the Sixth Central Pay Commission (6 CPC). As per 7th CPC, the Pay Scale of SSO corresponds to Level-7 and that of JSO corresponds to Level-6 in the Pay Matrix. The officers of the SSS cadre are posted in various Ministries/Departments/Organisations of the Government of India across the country.
6.9 Ministry of Statistics & Programme Implementation is also the Cadre Controlling Authority of Subordinate Statistical Service. The Ministry is concerned with all matters pertaining to the service including recruitment, promotion, training, career and manpower planning, etc. However, day-to-day administrative matters of SSS officers are taken care of by the respective Ministries/Departments/Organisations where they are posted.
6.10 The SSS Rules, 2013 provide for 90 per cent of the posts of JSO to be filled up by direct recruitment through open competitive examination viz. Combined Graduate Level Examination (CGLE) conducted by the Staff Selection Commission while 10 per cent by promotion from the feeder grade post holders. There is no direct recruitment at the level of SSO in the SSS cadre.
6.11 The sanctioned strength and number of incumbents in position as on 31st March 2019 are, as follows:
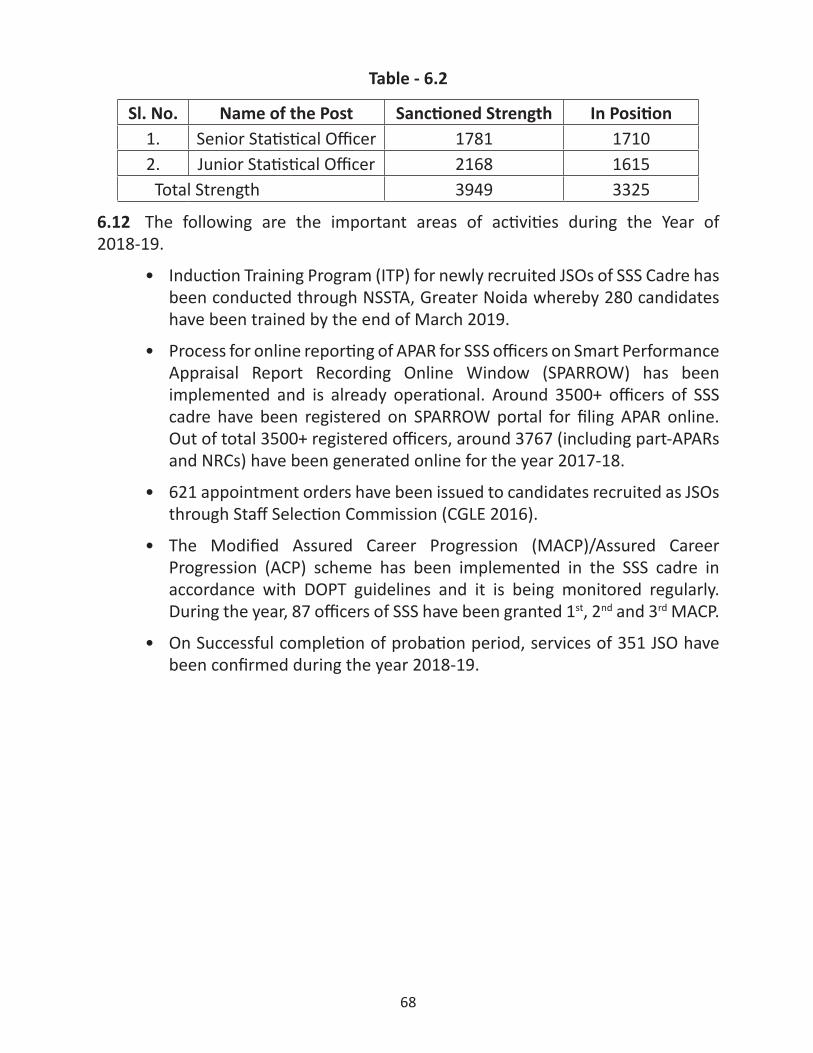
68
Table - 6.2
Sl. No. Name of the Post Sanctioned Strength In Position1. Senior Statistical Officer 1781 17102. Junior Statistical Officer 2168 1615
Total Strength 3949 3325
6.12 The following are the important areas of activities during the Year of 2018-19.
• Induction Training Program (ITP) for newly recruited JSOs of SSS Cadre has been conducted through NSSTA, Greater Noida whereby 280 candidates have been trained by the end of March 2019.
• Process for online reporting of APAR for SSS officers on Smart Performance Appraisal Report Recording Online Window (SPARROW) has been implemented and is already operational. Around 3500+ officers of SSS cadre have been registered on SPARROW portal for filing APAR online. Out of total 3500+ registered officers, around 3767 (including part-APARs and NRCs) have been generated online for the year 2017-18.
• 621 appointment orders have been issued to candidates recruited as JSOs through Staff Selection Commission (CGLE 2016).
• The Modified Assured Career Progression (MACP)/Assured Career Progression (ACP) scheme has been implemented in the SSS cadre in accordance with DOPT guidelines and it is being monitored regularly. During the year, 87 officers of SSS have been granted 1st, 2nd and 3rd MACP.
• On Successful completion of probation period, services of 351 JSO have been confirmed during the year 2018-19.
69
CHAPTER – VII
INDIAN STATISTICAL INSTITUTE
7.1 In the early thirties, realizing the necessity for advancement of theoretical and applied statistics in India, the Indian Statistical Institute (ISI) came into being following the pioneering initiative and efforts of Professor P.C. Mahalanobis. The Indian Statistical Institute was registered on 28th April 1932 as a non-profit distributing learned society under the West Bengal Societies Registration Act, XXI of 1860. From the beginning, the Institute started showing excellence in its own way. As the Institute expanded its research, teaching, training and project activities, it started earning national/international recognitions. The outstanding contributions made by the Institute in theoretical and applied statistical work culminated in the recognition of the Institute as an ‘Institution of National Importance’ by an Act of the Parliament, known as ‘Indian Statistical Institute Act of 1959’ (No. 57 of 1959), which conferred on the Institute the right to hold examinations and award degrees/diplomas in Statistics. Significantly, Pandit Jawaharlal Nehru, the then Prime Minister of India, himself piloted the bill in the Parliament in 1959.
7.2 As a result, degree courses leading to Bachelor of Statistics (B.Stat.) and Master of Statistics (M. Stat.) and Post Graduate Diplomas in Statistical Quality Control & Operations Research (SQC & OR) and Computer Science were started from June 1960. The Institute was also empowered to award the Ph.D. / D.Sc. Degree from the same year. Subsequently, Master of Technology (M. Tech) courses in Computer Science (CS) and in Quality, Reliability & Operations Research (QROR) were also introduced. Scope was further enlarged as the Institute was empowered to award degrees/diplomas not only in Statistics but also in Mathematics, Quantitative Economics, Computer Science and such other subjects related to Statistics by virtue of ‘Indian Statistical Institute (Amendment) Act, 1995’ (No. 38 of 1995) by the Parliament, which gave greater encouragement to research activities not only in Statistics/Mathematics but also in various branches of Computer and Communication Sciences, Natural and Social Sciences, Physics and Earth Sciences, Biological Sciences, SQC&OR, Library and Information Sciences in a broader way.
7.3 Over the years, the Institute has been playing a key role in the development of statistical theory and methods by promoting research and practical applications in different areas of natural and social sciences. ‘Sankhya–The Indian Journal of Statistics’, being published by the Institute since 1933, is still considered as one
70
of the leading statistical journals of the world. Pioneering research activities were carried out in many areas of statistical theory, especially in the core areas of multivariate analysis, sample surveys and design of experiments. Such activities were strengthened and new directions were opened up by Professor C.R. Rao and many others who joined the Institute in 1940s and the tradition continues. Research in economics was greatly stimulated when the then Prime Minister of India, Pandit Jawaharlal Nehru entrusted the preparation of the draft Second Five-Year-Plan of the country to Professor P.C. Mahalanobis and the Institute in the year 1954. The “Draft” submitted by the Institute under the leadership of Professor Mahalanobis with the planning models have since been regarded as major contributions to economic planning in India.
7.4 In the field of Computer Science, the Institute has a rich tradition. In 1953, a small analog computer was designed and built in the Institute. In 1956, the Institute acquired a HEC-2M machine from the U.K., which was the first digital computer in India. In early sixties, the Institute, in collaboration with the Jadavpur University, undertook the design, development and fabrication of a fully transistorized digital computer, called ISIJU-1, which was commissioned in 1966 by Shri M.C. Chagla, the then Minister of Education, Government of India. High quality research, publication and development in the different branches of computer sciences had been carried out by the internationally acclaimed computer scientists of the Institute over the last six decades and their concerted efforts have placed the Institute in the forefront in national and international scenario.
7.5 ISI also played a pioneering role in starting the Statistical Quality Control (SQC) movement in India by organizing a visit of Professor W.A. Shewhart, the father of SQC, to India in November 1947 and later by inviting other experts like Dr. W.E. Deming, Dr. Ellis R. Ott, Dr. H.C. Tippet and Mr. Genichi Taguchi for the same purpose. SQC promotional work of the Institute then gradually spread all over the industrial centres in India under a comprehensive programme covering education and training, applied research and consultancy services. The Institute also became a permanent member of ‘Quality Council of India’.
7.6 From the early days, the Institute has been interacting with many internationally reputed scientists in different disciplines from the world over. Some of these scientists have worked in the Institute for several months or even longer. Sir Ronald A. Fisher, a pioneer of modern statistics, was a regular visitor and lent considerable support to the Institute. Professor J.B.S. Haldane, a genecist of international repute, was a member of the faculty for several years beginning from 1957. The celebrated mathematician, Norbert Wiener visited the Institute
71
twice in 1954 and again in 1955-56. The other academic personalities whose longer visits influenced the development of the Institute include the Statisticians like Harold Hotelling, Frank Yates, Herman Wold, Edwin Harper (Jr.) and H. Cramer; the Mathematicians like A.N. Kolmogorov, Yu, V. Linnik, J.L. Doob and there after Vaughan F.R. Jones; Statistical Quality Control experts like Walter Shewhart and G. Taguchi; Economists like Simon Kuznets, Paul A. Baran, Joan Robinson, Jan Tinbergen, Nicholas Kaldor, R.M. Goodwin, David Cox, Ruth Glass and J.K. Galbraith; Geologist Pamela Robinson; Biochemists N.W. Pirie and Linguist D. Kostic and more recently Dr. Amartya K. Sen, Robert Aumann, Lotfi A. Zadeh, Joseph E. Stieglitz, James A. Mirrlees, Eric Stark Maskin, Ei-ichi Negishi, Ada Yonath; David Jonathan Gross, Meghnad Jagdishchandra Desai. All along the Institute has tried to live up to Ronald Fisher’s dictum that Statistics is a ‘Key Technology’ in view of its intimate relevance to all scientific endeavours, which involve experimentation, measurement and inference from sample to aggregate.
Teaching and Training Division
7.7 During the academic session 2018-2019, a total of 19166 candidates applied for admission and were called for written selection tests for various programmes offered by the Institute, viz., B. Stat. (Hons.), B. Math. (Hons.), M. Stat., M. Math., Master of Science (M.S.) in Quantitative Economics, Master of Science (M.S.) in Quality Management Science, Master of Science (M.S.) in Library and Information Science, M. Tech. in Computer Science, M. Tech. in Cryptology and Security, M. Tech. in Quality, Reliability and Operations Research, Post Graduate Diploma in Statistical Methods and Analytics, Post Graduate Diploma in Computer Applications, Research Fellowships in Statistics, Mathematics, Quantitative Economics, Computer Science, Quality, Reliability and Operations Research, Physics, Geology, Biological Science and Library and Information Science. Admission tests were conducted at 47 different centres. A total of 12289 candidates finally appeared for admission tests and a total of 1206 candidates qualified in the written tests and were called for interviews. Based on performance in the written tests, interview and the academic records, 360 candidates were offered admission to various courses during the academic session under review. The 2018-19 academic session commenced from July 2018. Fifty-third Annual Convocation of the Institute was held on 10th January 2019.
7.8 Till 7th January 2019, 170 trainees in Mathematics, Statistics, Engineering and Technology from various Universities/Institutions received four weeks/six weeks/two months/three months/four months and six months project training in different Units of the Institute, viz., Advanced Computing and Micro Electronics Unit (ACMU), Agricultural and Ecological Research Unit (AERU), Applied Statistics Unit (ASU), CSSC,
72
Computer Vision Pattern Recognition Unit (CVPRU), Electronic and Communication Science Unit (ECSU), Geological Study Unit (GSU), Human Genetics Unit (HGU), Machine Intelligence Unit (MIU), Physics and Applied Mathematics Unit (PAMU), PRU, Statistics and Mathematics Unit (SMU) Sampling and Official Statistics Unit (SOSU) and Statistical Quality Control (SQC) & Operations Research (OR) Unit under the guidance of different faculty members of the Institute.
International Statistical Education Centre (ISEC)
7.9 The International Statistical Education Centre (ISEC) was founded in 1950 at the initiative of Prof. P.C. Mahalanobis. The Centre opened at Kolkata through an agreement between the International Statistical Institute and the Indian Statistical Institute (ISI). At present, the Centre is run by the Indian Statistical Institute under the auspices of the Government of India. The Centre functions under a joint Board of Directors. In its history of more than 60 years, Prof. P.C. Mahalanobis was the Chairman of the Board of Directors since the inception of the Centre in 1950 until his death in 1972. Subsequently, Prof. C.R. Rao had been the Chairman of the Board till 2015. Currently, Prof. S.P. Mukherjee is the Chairman of the Board. The Centre aims to provide training in theoretical and applied statistics at various levels to selected participants from countries of Middle East, South and South-East Asia, Far-East and the Commonwealth countries of Africa. The primary training programme is a 10-month regular course in Statistics leading to a Statistical Training Diploma. In addition, tailor made special courses on Sample Survey and Demography have been organised for officers of the Statistical Bureau of Bhutan during the current year. The commencement date of the 72nd Term of the ISEC Regular Course (2018-2019) was 1st August 2018. This year 14 trainees attended from 11 different countries, namely Democratic Republic of Congo, Ethiopia, Fiji, Kenya, Liberia, Malawi, Niger, Sri Lanka, Tunisia, Tanzania, Tajikistan. 13 were supported by fellowships under the ITEC/SCAAP programme of the Government of India, while 1 trainee was supported by fellowships of the Central Bank of Sri Lanka,. They will be awarded the Statistical Training Diploma in the Convocation, tentatively scheduled on May 31, 2019. Till now, more than 1667 trainees from about 90 countries have received the Statistical Training Diploma from ISEC.
Research Work
7.10 The research activities of the Institute were grouped in the following Divisions:
Theoretical Statistics and Mathematics; Applied Statistics; Computer and Communication Sciences; Physics and Earth Sciences; Biological Sciences; Social Sciences; Statistical Quality Control & Operations Research; Library, Documentation & Information Sciences.
73
In addition, there are three centres i.e. Computer & Statistical Services Centre, Soft Computing Research and R.C. Bose Centre for Cryptology and Security. The Computer & Statistical Services Centre has the responsibilities of the management and IT infrastructure of in-house computer system of the Institute and providing computing and statistical services to scientific workers. The Centre for Soft Computing Research is functioning as an associated body of the Institute. R.C. Bose Centre for Cryptology and Security provides facility for teaching training and research activities on Cryptology and Data Security to the nation.
Externally Funded Projects
7.11 Apart from theoretical and experimental plan research, the Institute also undertook a variety of about one hundred and sixty nine externally funded projects from different Government and non-Government organizations like CAGE, Warwick University, UK; ESRC Grant, Manchester University; Foundation for Research Support of the State of Para - FAPESPA, Sao Paulo, Brazil; United Nations Development Programme; Goethe University, Germany; IBM; Intel Corporation, USA; Samsung Electronics, Korea; Google Arts & Culture; Reserve Bank of India; Bhabha Atomic Research Centre, Dept. of Atomic Energy, Govt. of India; Dept. of Science and Technology, Govt. of India; Dept. of Biotechnology, Govt. of India; Airport Authority of India; Bharat Electronics Limited; DGCI&S, Ministry of Commerce and Industry, Govt. of India; Indian Council of Agricultural Research; Indian National Science Academy; National Investigation Agency; National Board for Higher Mathematics; National Statistical Systems Training Academy, Ministry of Statistics and Programme Implementation, Govt. of India; Niti Ayog; Ministry of Agriculture, Govt. of India; Ministry of Human Resource and Development, Govt. of India; Ministry of Electronics and Information Technology, Govt. of India; Ministry of Coal, Govt. of India; Ministry of Tribal Affairs, Govt. of India; Ministry of Tourism, Govt. of India and many others.
Seminars, Workshops, Conferences, Symposiums
7.12 During the year, the Institute organized several seminars, workshops, conferences, symposiums with the participation of leading academicians/scientist from India and abroad. A few of them are mentioned below:
• Workshop on ‘Advance Tools and Techniques for Analysis Demographic and Health Statistics and Application of Computer Software’, Population Studies Unit, Kolkata, 18th-20th March 2018.
• School on ‘Programming with Python: Applications to Cosmology and Nonlinear Dynamics’, Physics and Applied Mathematics Unit, Kolkata, 18th-23rd March 2019.
74
• Seminar on ‘Executive Overreach by Minority Governments in India’, Economics and Planning Unit, Delhi, 27th April 2018.
• Summer School on ‘Mathematics and Statistics’ (for Women), Stat-Math Unit, Bangalore, 7th-18th May 2018.
• Seminar on A Multistate Time-to-event Model of Disease, Disability and Death of the Older Population: Estimates from the HRS data’, Population Studies Unit, Kolkata, 31st May 2018.
• Seminar on ‘Terms of Trade and Counterterrorism Externalities’, Economic Research Unit, Kolkata, 28th June 2018.
• Seminar on ‘Data Science in Quality Analytics in current Digital System’, Statistical Quality Control and Operations Research Unit, Coimbatore, 29th June 2018.
• Workshop on ‘Statistical Process Control’, Statistical Quality Control and Operations Research Unit, Mumbai, 29th-30th June 2018.
• National Workshop on ‘Mathematical and Statistical Software’, Sampling and Official Statistics Unit, Kolkata, 22nd-28th September 2018.
• Symposium on ‘Financial Inclusion and Digital Payment System in Jharkhand”, Sociological Research Unit, Giridih in collaboration with NABARD, Jharkhand, 3rd-4th October 2018.
• International Conferences on ‘Complex Dynamical Networks (IC2DN – 2018)’, Physics and Applies Mathematics Unit, Kolkata, 4th-5th October 2018.
• Workshop on ‘7th Delhi Macroeconomics Workshop’, Economics and Planning Unit, Delhi, 25th-26th October 2018.
• International Conference on ‘Computational Intelligence and Data Analytics’, Machine Intelligence Unit, Kolkata, 26th-27th October 2018.
• International School on ‘Deep Learning in SAR and Hyperspectral Remote Sensing’, Centre for Soft Computing Research, Kolkata 29th October-2nd November 2018.
• International Symposium on ‘Countries in Socio-economic Transition: Evidences from Auxology and Allied Disciplines’, Biological Anthropology Unit, Kolkata, 21st-24th November 2018.
• Workshop on ‘Reliability Theory and Survival Analysis’, Statistical Quality Control and Operations Research Unit, Bangalore, 28th-30th November 2018.
75
• Workshop on ‘Species Distribution Modelling with MaxEnt and R’, Agricultural and Ecological Research Unit, Kolkata, 3rd-9th December 2018.
• 4th Conference and Workshop on ‘Statistical methods in finance’, Applied Statistics Unit, Chennai, 17th-20th December 2018.
• International Conference on ‘Future of Libraries’, Library Division, ISI in collaboration with IIM, Bangalore, held at IIM, Bangalore 11th-14th January 2019.
• Winter School on ‘Research Methods in Biology/ Social Science and Application of Statistics’, Biological Anthropology Unit, Kolkata, 14th-18th January 2019.
• Workshop on ‘Data Anomaly in Official Statistics regarding Women Labour in India, Economic Analysis Unit, Bangalore, 25th-26th January 2019.
• Workshop on ‘Design and Analysis of Experiments’, Statistical Quality Control and Operations Research Unit, Kolkata, 28th January-2nd February 2019.
• International Conference on ‘India Biodiversity Meet-2019’ Agricultural and Ecological Research Unit, Kolkata 14th-16th February 2019.
• Workshop on ‘Winter School on Data Science’, Interdisciplinary Statistical Research Unit, Kolkata, 10th-15th March 2019.
Publication of the Institute
7.13 The internationally renowned journal Sankhya an official publication of the Indian Statistical Institute, was started by Prof. P.C. Mahalanobis in 1932 and began publication under his editorship. It is devoted to original research articles in Probability, Mathematical Statistics and Applied Statistics. Reviews and discussion articles on current research activity in the above areas are also published. A rigorous peer review process is followed for all articles submitted to Sankhya for publication. Many seminal articles in Probability, Theoretical Statistics and Applied Statistics have appeared in Sankhya. The journal is published in two separate series – Series A and Series B. Series A with two issues per year, one in February and the other in August, covers Probability and Theoretical Statistics, while Series B with two issues per year, one in May and the other in November, covers Applied and Interdisciplinary Statistics. Beginning on 2010, the Institute has been collaborating with Springer for printing and marketing the international edition of Sankhya, in both print and electronic editions. The editorial system is now electronic. The entire process starting from submission of articles to editorial processing ending in final
76
editorial decision for articles is now done online. The free access to the articles of every editions of Sankhya is available through the Sankhya website (sankhya.isical.ac.in).
Scientific Papers and Publication
7.14 During the year, 452 scientific papers were published in different national and international journals.
Scientific Assignments Abroad
7.15 Seventy-four scientists of the Institute visited a number of foreign countries either on invitation or under cultural exchange programme to attend international seminars and conferences. Most of them presented scientific papers and delivered lectures in those seminars and conferences. Countries visited by ISI faculty members were Australia, Austria, Bangladesh, Brazil, Belgium, Canada, China, Czech Republic, Finland, France, Germany, Greece, Italy, Israel, Japan, Malaysia, Mexico, Norway, Netherland, Nigeria, Poland, Republic of Korea, Sri Lanka, Singapore, South Korea, Slovenia, South Africa, Switzerland, Sweden, Spain, Thailand, Ukraine, UK, USA and Vietnam.
Visiting Scientists
7.16 197 scientists from Australia, Bangladesh, Belgium, China, Canada, France, Germany, Hungary, Italy, Iran, Israel, Japan, Mexico, Madrid, Namibia, Netherlands, Russia, Spain, Saudi Arabia, Singapore, Switzerland, Taiwan, Thailand, UK, USA and also from India visited the Institute to attend various Workshops, Conferences, Seminars as also to participate in collaborative research, teaching and other scientific activities of the Institute.
Recognition to ISI Scientists
7.17 In appreciation and recognition to the high standard of research and scientific excellence maintained by the researchers of the Institute, several faculty members received laurels in the forms of awards/ fellowships from organizations of national and international importance like Institute of Electrical and Electronics Engineers (IEEE), International Association for Mathematical Geosciences (IAMG), Indian Mathematical Society (IMS), Indian National Science Academy (INSA), Indian National Academy of Engineering (INAE), The World Academy of Sciences (TWAS), etc. Several faculty members served as visiting scientists/honorary professors/visiting professors in various universities in US and Europe; Indian Council of Social Sciences Research (ICSSR); Indian National Science Academy etc. Besides, many faculty members were invited by national and international Institutes/Organisations
77
to act as chairperson, members, chief editor, editor in their several committees/editorial boards, etc. Among those, some of the most notable recognitions earned by the faculty members are mentioned below:-
• Prof. Amartya Kumar Dutta has been awarded 1st Satish C. Bhatnagar Award for best publication in History of Mathematics in 2018 by Indian Mathematical Society (IMS) and INSA Teachers Award in 2018 by Indian National Science Academy (INSA).
• Prof. Sanghamitra Bandyopadhyay has been appointed as a Member of the Prime Minister’s; Science, Technology and Innovation Advisory Council (PM-STIAC) and awarded Plaque and Cash Award by The World Academy of Sciences (TWAS) in 2018.
• Dr. Malay Bhattacharyya has been awarded Young Engineer Award by Indian National Academy of Engineering in 2018.
• Prof. Debasis Mishra has been awarded Social Choice and Welfare Prize by Society for Social Choice and Welfare.
• Prof. Arunava Sen has been awarded the Siwei-Cheng Prize for 2018 by TWAS (The World Academy of Sciences).
• Prof. Satya R. Chakravarty has been selected as Member of the Expert Group, UNDP, New York.
• Dr. Abhik Ghosh has been selected New Researcher Travel Award by Institute of Mathematical Statistics (IMS), Sweden and Travel Award by International Biometric Society (IBS).
• Prof. Susmita Mitra has been awarded the Fulbright Nehru Academic and Professional Excellence Fellowship by United States-India Educational Foundation in 2018.
• Prof. B.S. Daya Sagar has been awarded Certificate of Appreciation by International Association for Mathematical Geosciences (IAMG) in 2018.
• Dr. Debdulal Dutta Roy has been awarded Research Activities to Worker Evaluation by Ministry of Labour and Employment.
• Dr. Niladri Sekhar Dash has been selected the Visiting Fellow by British Academy in 2018 and also selected as Lexicography Advisor by Oxford University Press, UK during February-September 2018.
• Dr. Parthanil Roy has been selected for Swarna Jayanti Fellowship, 2017-2018 by Dept. of Science & Technology and also selected as the Bernoulli Society Youth Representative.
78
• Prof. Bhargab B. Bhattacharya has been selected for Chair Professorship by Indian National Academy of Engineering (INAE).
• Prof. Sankar K. Pal has been selected for INSA Distinguished Professor Chair by Indian National Science Academy (INSA).
• Dr. Rituparna Sen has been elected Fellow of the International Statistical Institute in 2018.
• Prof. Madhura Swaminathan has been selected the Member of Executive Committee by Indian Society of Agricultural Economics and appointed Non-Official Director on the Board of Union Bank of India.
79
CHAPTER – VIII
TWENTY POINT PROGRAMME
8.1 The Twenty Point Programme (TPP) initiated in the year 1975 was restructured in the years 1982, 1986 and 2006. The thrust of the Programme restructured in 2006 is to eradicate poverty and improve the quality of life of the poor and the under-privileged people all over the country. The Programme covers various socio-economic aspects like poverty, employment, education, housing, agriculture, drinking water, afforestation and environment protection, energy to rural areas, welfare of weaker sections of the society, etc. The restructured Programme is called Twenty Point Programme (TPP)-2006 and its monitoring mechanism became operational with effect from 1st April 2007.
8.2 TPP-2006 has now completed more than ten years of its operationalisation. The Twenty Point Programme (TPP)-2006 originally contained 20 Points and 66 items monitored individually by different Central Nodal Ministries concerned. One of the 66 items viz. ‘Sampoorna Grameen Rojgar Yojana (SGRY)’ has since been subsumed into another item namely ‘National Rural Employment Guarantee Act’ with effect from 1st April 2008 and has been renamed as ‘Mahatma Gandhi National Rural Employment Generation Act’ w.e.f. 31st December 2009. Out of the remaining 65 items, 19 items are now being monitored on quarterly basis.
Monitoring Mechanism
8.3 The primary responsibility of implementation and monitoring of the programme (MoSPI) lies with the agencies entrusted with the execution of the programme, which in this case are the State Governments/UTs Administrations and the Central Nodal Ministries. The Ministry of Statistics and Programme Implementation monitors the programmes/schemes covered under TPP-2006 on the basis of performance reports received from State/UT Governments and Central Nodal Ministries. Ministry has developed a web based Management Information System to expeditiously collect information from the State Governments and the Central Nodal Ministries.
Monitoring Committees
8.4 The monitoring mechanism for TPP–2006 has now been widened by including Block level monitoring in addition to the existing Central, State and District level monitoring. Monitoring Committees at State, District and Block Level, for monitoring the progress of implementation of all schemes/items covered under the Twenty Point Programme - 2006, have been constituted by most of the States/UTs as per the provisions of TPP-2006 Guidelines.
80
The Management Information System for TPP-2006 consists of the following:
8.5 Quarterly Progress Report (QPR) with information on 19 items is prepared by this Ministry. The QPR provides information on the Annual Physical Targets, Cumulative Targets and Achievements for the period under report. Coverage is based on the data furnished by the State Governments/UT Administrations on their performance for 15 items and by the Central Nodal Ministries in respect of 4 items. A detailed analysis is made in the QPR to assess the relative performance of quarterly monitored items/parameters against the set targets. The QPR is sent to different users and to State/UT Governments and Nodal Ministries concerned for taking appropriate measures in the areas of concern.8.6 The Annual Report on TPP - 2006 covers information on all the items (except the items which are not yet operational) under the programme. The information on these items is provided by the respective Central Nodal Ministries and State/UT Governments.Monitoring and Impact Assessment of Twenty Point Programme-2006
8.7 The Ministry is mandated to undertake Monitoring and Impact Assessment Studies on selected programmes/schemes covered under TPP-2006. The Ministry has undertaken so far two Impact Assessment Studies. First relates to impact of MGNREGA in 3 selected districts of North Eastern States and the second on Rehabilitation of Disabled Persons under Deendayal Disability Rehabilitation Scheme (DDRS) in the States of Delhi, Karnataka, Madhya Pradesh and West Bengal. The concerned Nodal Ministries have been apprised of the findings of these studies. The Ministry has also undertaken the task of critically examining the reports of evaluations undertaken by the Central Nodal Ministries of the schemes implemented by them.National Review Meeting of Twenty Point Programme-2006
8.8 This Ministry has been organising National Review Meeting of TPP – 2006 on annual basis as part of its monitoring mechanism and also to have consultations with States/UT’s and Central Nodal Ministries, in order to improve the implementation of schemes/programmes covered under TPP by State/UT Governments, especially the schemes/programmes where the performance of States/UTs has been rather poor. So far, four annual review meetings have been held by this Ministry. The last meeting held on 18th March 2014 considered the status of action taken/ compliance of the earlier Review Meetings. A decision has been taken by the Ministry afterwards to keep National Review Meeting of TPP in abeyance.
81
Performance of quarterly monitored items under TPP-2006 during 2017-18
8.9 Based on the data received from the Central Nodal Ministries and State Governments/UT Administrations, an analysis of the overall performance of quarterly monitored items for the year 2017-18 is given in the following paragraphs and in Annexure IV. During 2017-18, 19 items were monitored on quarterly basis, out of which 13 items consisting of 19 parameters were monitored against targets fixed by concerned Nodal Ministries (for 2 parameters, namely ‘Food Security-TPDS - only AAY’ and ‘Food Security - TPDS - only BPL’, achievements have been not received for the all four quarters of 2017-18).8.10 The analysis for the period April 2017 – March 2018 shows that the performance under 15 items/parameters has been ‘Very Good’ (90% or above the targets). These items/parameters are:
• SC families assisted under Special Central Assistance (SCA) to Scheduled Caste Sub Plan (SCSP) & National Scheduled Caste Finance and Development Corporation NSFDC.
• Pumps sets energized• Rural Housing – Pradhan Mantri Awaas Yojana – Grameen (PMAY-G)• Area Covered under Plantation (Public and Forest Lands)• Number of Self Help Groups (SHGs) promoted (new and revived) during
the financial year National Rural Liveihood Mission (NRLM)• Seedlings planted (Public and Forest Lands)• Houses constructed – Economically Weaker Sections (EWS) / Low Income
Group (LIG)• Number of SHGs provided Revolving Fund (RF) during the financial year -
NRLM• Food Security – National Food Security Act (Tide Over)-NFSA• Integrated Child Development Service (ICDS) Blocks Operational (Cum.)• Electricity supplied• Food Security– Targeted Public Distribution System (TPDS)• Food Security– National Food Security Act (Normal)-NFSA• Anganwadis Functional (Cum.)• Road constructed – Pradhan Mantri Gram Sadak Yojna (PMGSY)
82
8.11 There are two items/parameters in the category of ‘Good’ (80% or above but less than 90%).
• Villages electrified - Deendayal Upadhyaya Gram Joyti Yojana (DDUGJY)
• Number of SHGs provided Community Investment Fund (CIF) during the financial year - NRLM
8.12 The performance of two items/parameters has been ‘Poor’ (below 80% of target). These items/parameters are:
• Coverage of quality affected habitations - National Rural Drinking Water Programme (NRDWP)
• Partially Covered Habitations – NRDWP
Specific Achievements under Quarterly Monitored Items/Parameters
Mahatma Gandhi National Rural Employment Guarantee Scheme (MGNREGS)
8.13 Providing gainful employment is the most important method of eradicating poverty in the country. Many employment generation programmes are being implemented in the rural areas. The National Rural Employment Guarantee Scheme (NREGS), now renamed as Mahatma Gandhi National Rural Employment Guarantee Scheme came into existence for the enhancement of livelihood security of the households in the rural areas of the country by providing at least one hundred days’ of guaranteed wage employment in every financial year to every household whose adult members volunteer to do unskilled manual work. During 2017-18, 301.15 lakh job cards were issued, 217 crore man days of employment was generated and `39190/- crore were paid as wages under the Scheme.
National Rural Livelihood Mission (NRLM)
8.14 From 2014-15 NRLM has replaced the scheme of Swarnajayanti Grameen Swarozgar Yojana (SGSY). NRLM is monitored under three parameters (i) Number of SHGs promoted (New and Revived) (ii) Number of SHGs provided Revolving Fund and (iii) Number of SHGs provided Community Investment Fund. During the period 2017-18, 7.92 lakh SHGs were promoted as against target of 6.92 lakh which is 114 % of the target and 4.84 lakh SHGs were provided Revolving Fund as against a target of 4.73 lakh which is 102 % of the target. The target for Number of SHGs provided Community Investment Fund (CIF) was 3.04 lakh and against it, 2.50 lakh SHGs were provided Community Investment Fund which is 82% of the target.
83
Distribution of waste land to landless
8.15 Agrarian reforms have been a core issue for rural reconstruction as a means of ensuring social justice to actual tillers and the landless rural poor. Increasing the access of landless rural poor to land is considered an important component of the effort aimed at poverty alleviation. The main objective of land reforms has been the re-ordering of agrarian relations in order to achieve an egalitarian social structure, elimination of exploitation in land relations, realizing the age old goal of land to the tiller, enlarging the land base of the rural poor, increasing agricultural productivity and infusing an element of equality in local institutions. During the year 2017-18, 3793 hectares of wasteland was developed and distributed among the landless.
Minimum Wages Enforcement (including Farm Labour)
8.16 In a labour surplus economy like India, fixation and enforcement of minimum wages can save labourers, particularly unorganised rural labourers, from exploitation. The Minimum Wages Act, 1948 empowers both the Central and the State Governments to fix, review, revise and enforce minimum wages in scheduled employments falling under their respective jurisdictions. The establishments violating the Minimum Wages Act, 1948 are prosecuted with fine or imprisonment or both. During the year 2017-18, 184660 inspections were carried out by the officials of Central and State Governments and 8051 irregularities were detected. The number of prosecution cases pending, filed and decided during the year 2016-17 were 4661, 877 and 721 respectively.
Food Security
Targeted Public Distribution System (TPDS)
8.17 Under the Targeted Public Distribution System (TPDS) each poor family is entitled for essential commodities at subsidised prices. The emphasis is on inclusion of only the really poor and vulnerable sections of society such as landless agricultural labourers, marginal farmers, artisans/craftsmen (potters, tappers, weavers, blacksmiths, carpenters, etc.) in the rural areas and slum dwellers and daily wagers in the informal sector (porters, rickshaw pullers and hand cart pullers, fruit and flower sellers on the pavements, etc.) in the urban areas. During the year 2017-18, the target was to allocate 552.86 lakh tonnes of food grains to States. However, the off-take by States against this allocation was 540.49 lakh tonnes of food grains which was 98% of the target.
84
National Food Security Act (Normal)
8.18 This parameter has been included in the quarterly monitored parameters since 2015-16. During 2017-18 as against the target allocation of 524.97 lakh tonnes of food grains, the actual off-take has been 512.20 lakh tonnes which was 98% of the target.
National Food Security Act (Tide Over)
8.19 This parameter has also been included in the quarterly monitored parameters since 2015-16. During 2017-18 as against the target allocation of 27.88 lakh tonnes of food grains, the actual off take has been 28.28 lakh tonnes which was 101% of the target.
Rural Housing-Indira Awaas Yojana (IAY)/ Pradhan Mantri Awaas Yojana (Gramin)
8.20 Indira Awaas Yojana (IAY) was a flagship scheme implemented by the Ministry of Rural Development. The scheme provided houses to the poor in rural areas. The objective of IAY scheme was primarily to help in construction/upgradation of dwelling units of members of Scheduled Castes/Scheduled Tribes, Freed Bonded Labourers, Minorities in the Below Poverty Line category and other below poverty line non-SC/ST rural households by providing them a lump sum financial assistance. Under the scheme, a shelter less BPL family was given assistance of `70000/- in plain areas and `75000/- in hilly/ difficult areas/ IAP districts for construction of dwelling. IAY, being a Centrally Sponsored Scheme, was funded on cost-sharing basis between the Government of India and the State Governments in the ratio of 75:25. However, in case of North-Eastern States and Sikkim, funding was shared between Government of India and these States in the ratio of 90:10 and in case of Union Territories, the entire funds under this scheme were provided by the Government of India. From 2016-17 Indira Awaas Yojana has been revamped to Pradhan Mantri Awaas Yojana (Gramin). Under the scheme PMAY, 3867343 houses were constructed during 2017-18 as against the target of construction of 3230293 houses which was 120% of the target.
EWS/LIG Houses in urban Areas
8.21 The Ministry of Housing and Urban Affairs (erstwhile Ministry of Housing and Urban Poverty Alleviation), Government of India has designed an interest subsidy scheme as an additional instrument for addressing the housing needs of the Economically Weaker Section/ Low Income Group segments in urban areas. The Scheme envisages the provision of interest subsidy to EWS and LIG segments to enable them to buy or construct houses. The Scheme will provide home loan with
85
Central Government subsidy to EWS/LIG persons for acquisition of house as also for construction of house to such beneficiary, who does not own a house in his/her name or in the name of his/her spouse or any dependent child. Such beneficiaries who own land in any urban area but do not have any pucca house in their name or in the name of their spouse or any dependent child will also be covered under the Scheme. As against the target of construction of 238024 EWS/LIG houses during 2017-18, 249155 houses were constructed and the achievement was 105% of the target.
National Rural Drinking Water Programme
8.22 A separate Ministry namely ‘M/o Drinking Water & Sanitation’ has been created in July 2011. The Accelerated Rural Water Supply Programme (ARWSP) scheme has also been changed as “National Rural Drinking Water Programme” (NRDWP), the monitoring parameters under TPP-2006 have also been changed to ‘Habitations covered (Partially covered)’ and ‘Coverage of water quality affected habitations’ with effect from April, 2011. During 2017-18, as against the target to cover 59770 habitations (Partially Covered) 17928 habitations have been covered under the programme. This was 30% of the target. Also, during this period as against the target to cover 9000 habitations with water quality problems, 5466 habitations have been addressed which was only 61% of the target.
Sanitation Programme in Rural Areas
8.23 Rural Sanitation is a State subject. The efforts of the States are supplemented by the Central Government through technical and financial assistance under the Central Rural Sanitation Programme (CRSP). The Programme was launched in the year 1986 with the objective of improving the quality of life of the rural people and providing privacy and dignity to women. The components of the Programme include construction of individual sanitary toilets for households below the poverty-line (BPL), conversion of dry latrines to flush toilets, construction of village sanitary complexes for women, setting up of sanitary marts and production centres, intensive campaign for creating awareness, health education, etc. School sanitation has been introduced as a major component to encourage wider acceptance of sanitation among the rural masses. During the year 2017-18, 30326535 individual household latrines have been constructed.
Institutional Delivery
8.24 The Hon’ble Prime Minister launched ‘Janani Suraksha Yojana’ under the National Rural Health Mission (NRHM) on 12th April 2005. The scheme has the dual
86
objectives of reducing maternal and infant mortality by promoting institutional delivery among poor women. Cash benefits are provided to the beneficiaries belonging to below poverty line (BPL) families and also to the village link worker/ASHA for coming to the institution for delivery, the cost of transportation, etc. Benefits are graded in nature and vary from high performing to low performing States and also from rural to urban areas. The scheme is 100% centrally sponsored. It is funded through the RCH flexi pool mechanism. Monitoring parameter under this scheme is number of deliveries that took place in specialised institutions. During the year 2017-18, 16625868 institutional deliveries were comes out all over the country.
Scheduled Caste Families Assisted
8.25 The SC (Scheduled Caste) population, according to 2011 Census, accounts for 16.6% of the country’s total population. The strategy evolved for their upliftment includes: (i) special component plan of the States and Central Ministries, (ii) special central assistance, and (iii) assistance through the Scheduled Castes Corporations in the States.
8.26 From 2015-16, the item “Scheduled Caste Families Assisted” is monitored under two parameters, namely (i) SC Families assisted under SCA to SCSP & NSFDC and (ii) SC Students assisted under Post-Matric Scholarship. During the period 2017-18, 1028663 SC Families were assisted under SCA to SCSP & NSFDC as against the target of 181000 which was 568 % of the target and 4201287 SC Students were assisted under Post-Matric Scholarship.
Universalisation of ICDS Scheme
8.27 Integrated Child Development Services (ICDS) was conceived as the most viable vehicle for achieving holistic development with a focus on mother and child. The intended development of women and children, as a national priority, is being guided and pursued through the National Policy for Children - 1974 and the National Plan of Action for Children. The target population includes pregnant women, nursing mothers, children upto 6 years of age and adolescent girls. Supplementary Nutrition, Pre-school Education, Immunization, Health Check-up, Referral Services and Nutrition & Health Education are the main intervention packages offered under the scheme. In addition, the scheme envisages effective convergence of inter-sectoral services in the Anganwadi centres. The beneficiaries under ICDS scheme are drawn from the poorest families. During the year 2017-18, as against the target of making 7075 ICDS Blocks (cumulative) operational, 7074 Block (cumulative) were made operational which was 100% of the target.
87
Functional Anganwadis
8.28 Under ICDS, Anganwadi is the primary unit which extends services such as supplementary feeding to bridge the calorie gap between the national recommended standards and average intake of children and women. In order to promote improved behavioural actions for the care of pregnant women and young children, Anganwadi also provides an important contact opportunity with pregnant women and mothers of infants, who are 4 to 6 months of age. Throughout the country, the Anganwadi Worker and Helper have been utilized for various programmes/ schemes related to health and family welfare. The target for the year 2017-18 was to make 14 lakh Anganwadis (cumulative) functional and the achievement against it was 13.43 lakh which was 96 % of the target.
Urban poor families assisted under seven point charter viz. land tenure, housing at affordable cost, water, sanitation, health, education and social security
8.29 Urban slums, particularly in the big cities of our country, are the picture of human misery and degradation. Urbanization is an inevitable phenomenon of modernization and economic development. Slums grow as a result of structural inequities in the development of the urban sector. Due to the high price of land and housing and low purchasing power, the urban poor are forced to join the existing slums for cheap shelter or to occupy any vacant land/areas wherever available in the city. With a view to paying particular attention to the needs of slum dwellers, urban poor families are assisted under the seven point charter viz. (i) land tenure, (ii) housing at affordable cost, (iii) water, (iv) sanitation, (v) health, (vi) education and (vii) social security. W.e.f April 2015 the parameter has become non-targetable. For the year 2017-18, 15.11 lakh poor families were assisted.
Afforestation:
(i) Area covered under plantation (Public & Forest Land)
(ii) Seedlings Planted (Public & Forest Land)
8.30 This programme has been conceived to increase the green cover of the country. Under this programme, two major items are being monitored on monthly basis i.e. (i) area covered under plantations in respect of public lands including forest lands and (ii) seedlings planted on public and forest lands. During the year 2017-18, as against the target to cover 14.73 lakh hectares of public and forest land under plantations, 16.89 lakh hectares of land was covered, showing 115% of achievement. Similarly, the target for seedling plantation during the year was to plant 9571.38 lakh seedlings on public and forest land and against it, the planting of 10731.01 lakh seedlings was achieved, which was 112% of the target.
88
Rural Roads – Pradhan Mantri Gram Sadak Yojana (PMGSY)
8.31 The President of India, in his address to Parliament on 25th February, 2005, announced a major plan for rebuilding rural India called ‘Bharat Nirman’. The Government has identified Rural Roads as one of the six components of Bharat Nirman and has set a goal to provide connectivity to all villages with a population of 1000 (500 in the case of hilly or tribal areas) with an all-weather road by 2009 through the Pradhan Mantri Gram Sadak Yojana (PMGSY). Grameen Sadak (Rural Roads) has been added to give highest priority to the development and expansion of Rural Roads as through connectivity, the fruits of development can reach the rural areas. The target for the year 2017-18 was for construction of 51000 Km of road in rural areas whereas the achievement was 48749 Km of road constructed, which was 96% of the target.
Deendayal Upadhyaya Gram Jyoti Yojana (DDUGJY)
8.32 This scheme of Rural Electricity Infrastructure and Household Electrification has been introduced in April, 2005 for achieving the National Common Minimum Programme objectives of providing access to electricity to all Rural Household in a period of four years. The Rural Electricity Corporation (REC) is the nodal agency for implementing the programme. The target for the year 2017-18 was electrification of 4492 villages and against it, 3736 villages were electrified which was 83% of the target.
Energization of Pump Sets
8.33 Electric power in rural areas is not only required for domestic and agricultural purposes but also for irrigation. Pumpsets are energized to provide irrigation facilities for agriculture. During the year 2017-18, 596134 pumpsets were energized against the target of energization of 432859 pumpsets which was 138% of the target.
Supply of Electricity
8.34 Government has notified the National Electricity Policy, which inter-alia aims at accelerated development of the power sector, providing supply of electricity to all areas and protecting interests of consumers and other stakeholders. The salient features of the policy are access to electricity and availability of power. During the year 2017-18, as against demand of 1192151 million units (MUs) of electricity, 1183666 MUs of electricity could be supplied which was 99% of the demand.
89
CHAPTER IX
INFRASTRUCTURE AND PROJECT MONITORING
9.1 The Infrastructure & Project Monitoring Division (IPMD) monitors the implementation status of Central Sector Infrastructure Projects costing more than `150 crore and above taken up by the respective Ministries/ Departments and their Central Public Sector Enterprises (CPSEs) in 16 infrastructure sectors. Successful Implementation of various projects and schemes constitutes the most significant conditions for development. Effective coordination judiciously matched with regular monitoring becomes an important element in ensuring their successful completion with improved efficiency at a greater speed and at a lesser cost.
Objectives of Project Monitoring
• To enhance effectiveness of project implementation;
• To facilitate information flow for effective decision making;
• To resolve outstanding implementation issues;
• To bring about system improvement; and
• To promote best management practices.
System of Monitoring:
9.2 The IPMD monitors the implementation of the Central Sector Projects above `150 crore through the mechanism of Online Computerized Monitoring System (OCMS).
• OCMS is an Oracle based Government-to-Government (G2G) application software with front end D2K.
• It provides linkages to Cabinet Secretariat, PMO, NITI Aayog and all Administrative Ministries to view the projects reports and query results.
• It enables the various project executing agencies to enter and view project progress data through a web-based interface on a periodic basis.
• The data submission process undergoes three-level authentication and authorization.
• Any number of milestones can be created and maintained in OCMS.
• Project agencies can select the reasons of delays from certain pre-
90
structured reasons or/additionally project agencies can write the new reasons of delay or their experience.
• The data submitted for a period is then analysed and published thereby providing a detailed overview of the latest status of the all ongoing Central Sector Infrastructure Projects.
• Any type of file (picture, map, excel sheets, pdf, PERT/CPM charts, etc.) can be uploaded on OCMS.
• It provides the monitoring of MoU targets/parameters.
• It also provides a communication channel between Administrative Ministry and the Project Implementing Agencies.
• Most of the Ministries like Power, Coal, Telecom, Petroleum, etc. have adopted the OCMS.
• The physical performances are measured in terms of milestones
• The constant persuasion of the IPMD has resulted in improved reporting and now majority of the Public Sector Enterprises are reporting on-line. However, data pertaining to milestones and the reasons for time and cost overruns are still not being reported to the fullest extent.
9.3 The IPMD has been making improvements in the OCMS as per the feedback received from the PSUs and also ironing out their difficulties through OCMS training and clarifications during interactions. The focus is now more on persuading the PSUs to forward the information online.
9.4 Facilitator in better implementation of Projects
One of the important contributions of the IPMD has been bringing in systemic improvements from time to time to facilitate better implementation of projects.
The IPMD, of this Ministry has been instrumental/facilitator in flagging/bringing out the projects lagging behind the schedule or facing cost overruns in the periodical review meetings of the projects by the concerned Administrative Ministries. This enables the Administrative Ministries in identifying the constraints for each project and take corrective measures for removal of such bottlenecks.
9.5 PROJECT IMPLEMENTATION STATUS DURING 2018-19
As on 1st February 2019, 1423 projects with an anticipated cost of `21,44,298.86 crore were on the monitor of the Ministry. For the purpose of monitoring, the projects have been grouped into two categories, viz (I) Mega
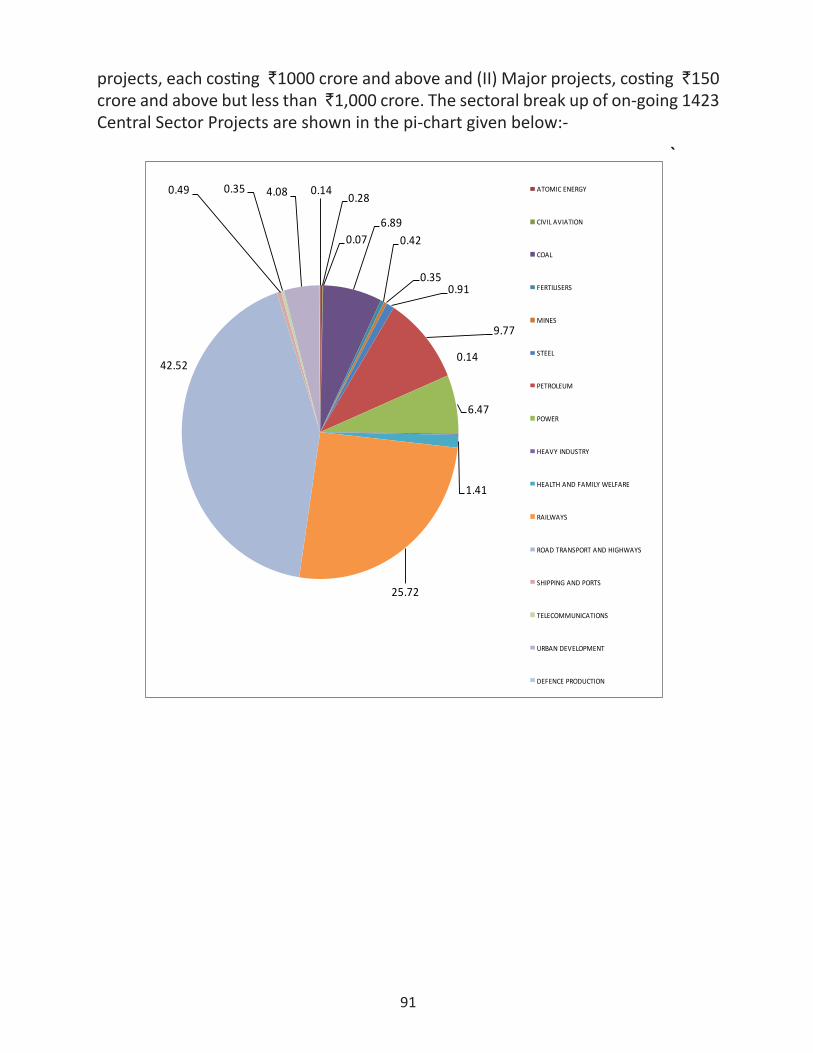
91
projects, each costing `1000 crore and above and (II) Major projects, costing `150 crore and above but less than `1,000 crore. The sectoral break up of on-going 1423 Central Sector Projects are shown in the pi-chart given below:-
0.28
0.076.89
0.42
0.350.91
9.77
6.47
0.14
1.41
25.72
42.52
0.49 0.35 4.08 0.14 ATOMIC ENERGY
CIVIL AVIATION
COAL
FERTILISERS
MINES
STEEL
PETROLEUM
POWER
HEAVY INDUSTRY
HEALTH AND FAMILY WELFARE
RAILWAYS
ROAD TRANSPORT AND HIGHWAYS
SHIPPING AND PORTS
TELECOMMUNICATIONS
URBAN DEVELOPMENT
DEFENCE PRODUCTION
`
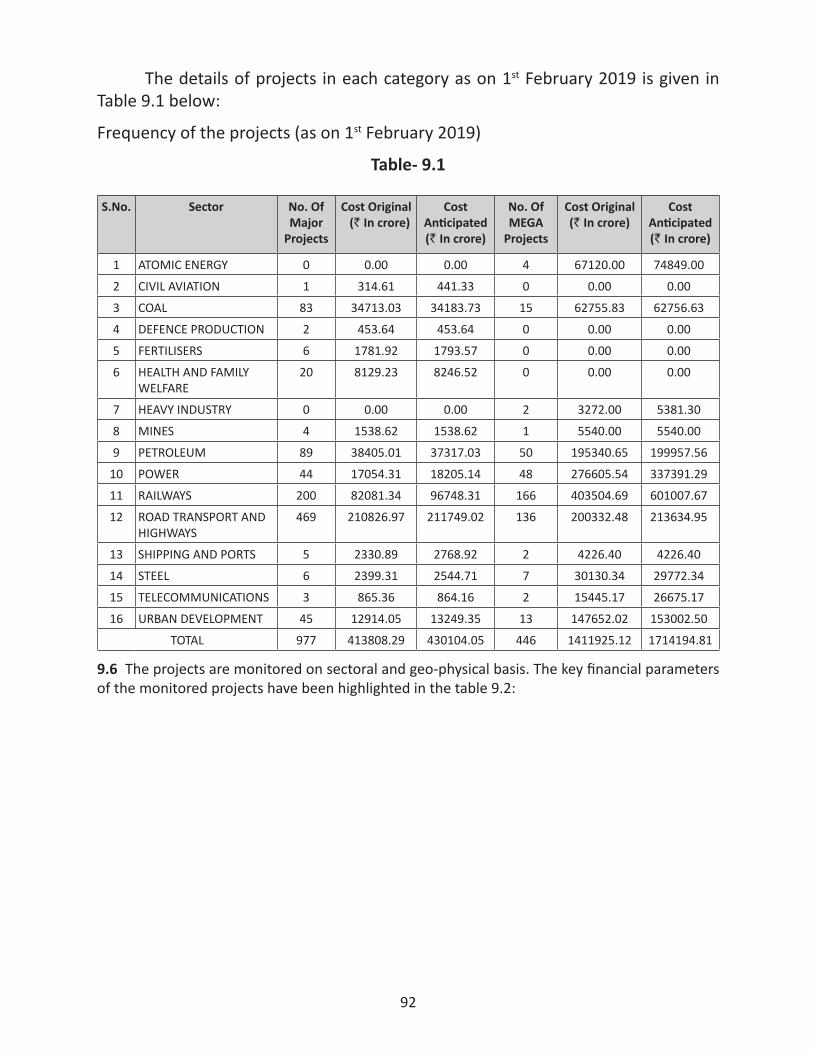
92
The details of projects in each category as on 1st February 2019 is given in Table 9.1 below:
Frequency of the projects (as on 1st February 2019)
Table- 9.1
S.No. Sector No. Of Major
Projects
Cost Original (` In crore)
Cost Anticipated (` In crore)
No. Of MEGA
Projects
Cost Original (` In crore)
Cost Anticipated (` In crore)
1 ATOMIC ENERGY 0 0.00 0.00 4 67120.00 74849.00
2 CIVIL AVIATION 1 314.61 441.33 0 0.00 0.00
3 COAL 83 34713.03 34183.73 15 62755.83 62756.63
4 DEFENCE PRODUCTION 2 453.64 453.64 0 0.00 0.00
5 FERTILISERS 6 1781.92 1793.57 0 0.00 0.00
6 HEALTH AND FAMILY WELFARE
20 8129.23 8246.52 0 0.00 0.00
7 HEAVY INDUSTRY 0 0.00 0.00 2 3272.00 5381.30
8 MINES 4 1538.62 1538.62 1 5540.00 5540.00
9 PETROLEUM 89 38405.01 37317.03 50 195340.65 199957.56
10 POWER 44 17054.31 18205.14 48 276605.54 337391.29
11 RAILWAYS 200 82081.34 96748.31 166 403504.69 601007.67
12 ROAD TRANSPORT AND HIGHWAYS
469 210826.97 211749.02 136 200332.48 213634.95
13 SHIPPING AND PORTS 5 2330.89 2768.92 2 4226.40 4226.40
14 STEEL 6 2399.31 2544.71 7 30130.34 29772.34
15 TELECOMMUNICATIONS 3 865.36 864.16 2 15445.17 26675.17
16 URBAN DEVELOPMENT 45 12914.05 13249.35 13 147652.02 153002.50
TOTAL 977 413808.29 430104.05 446 1411925.12 1714194.81
9.6 The projects are monitored on sectoral and geo-physical basis. The key financial parameters of the monitored projects have been highlighted in the table 9.2:
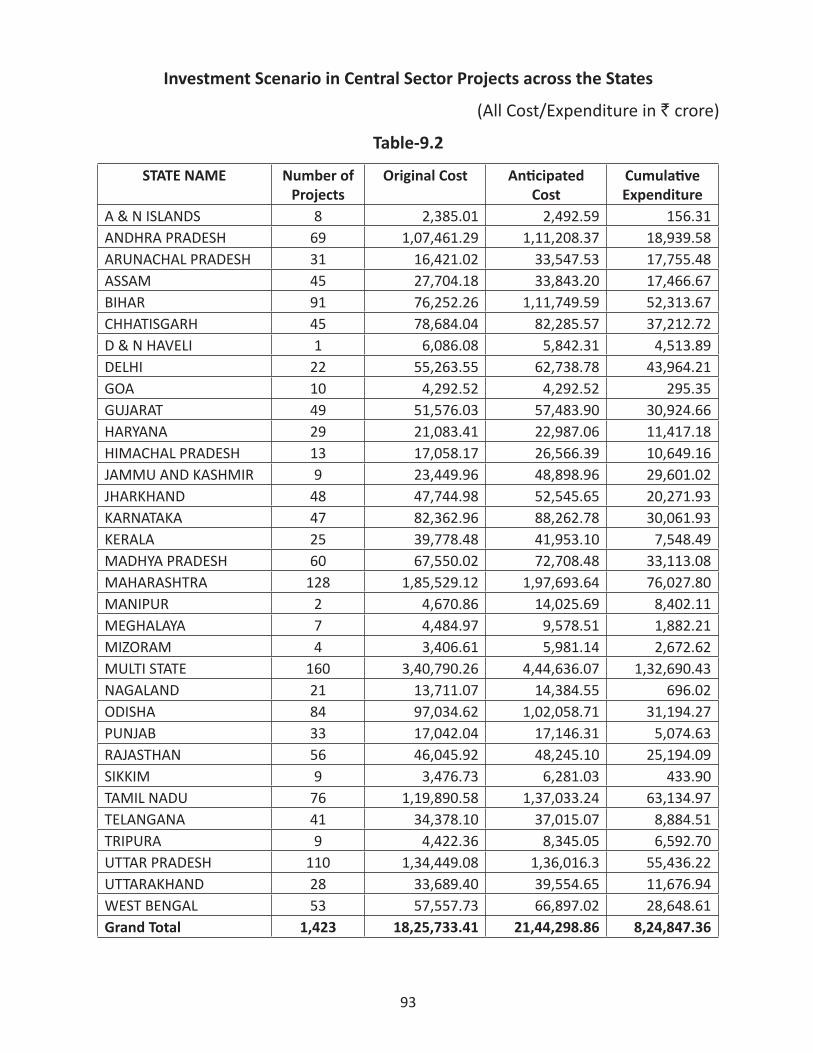
93
Investment Scenario in Central Sector Projects across the States
(All Cost/Expenditure in ` crore)
Table-9.2
STATE NAME Number of Projects
Original Cost Anticipated Cost
Cumulative Expenditure
A & N ISLANDS 8 2,385.01 2,492.59 156.31ANDHRA PRADESH 69 1,07,461.29 1,11,208.37 18,939.58ARUNACHAL PRADESH 31 16,421.02 33,547.53 17,755.48ASSAM 45 27,704.18 33,843.20 17,466.67BIHAR 91 76,252.26 1,11,749.59 52,313.67CHHATISGARH 45 78,684.04 82,285.57 37,212.72D & N HAVELI 1 6,086.08 5,842.31 4,513.89DELHI 22 55,263.55 62,738.78 43,964.21GOA 10 4,292.52 4,292.52 295.35GUJARAT 49 51,576.03 57,483.90 30,924.66HARYANA 29 21,083.41 22,987.06 11,417.18HIMACHAL PRADESH 13 17,058.17 26,566.39 10,649.16JAMMU AND KASHMIR 9 23,449.96 48,898.96 29,601.02JHARKHAND 48 47,744.98 52,545.65 20,271.93KARNATAKA 47 82,362.96 88,262.78 30,061.93KERALA 25 39,778.48 41,953.10 7,548.49MADHYA PRADESH 60 67,550.02 72,708.48 33,113.08MAHARASHTRA 128 1,85,529.12 1,97,693.64 76,027.80MANIPUR 2 4,670.86 14,025.69 8,402.11MEGHALAYA 7 4,484.97 9,578.51 1,882.21MIZORAM 4 3,406.61 5,981.14 2,672.62MULTI STATE 160 3,40,790.26 4,44,636.07 1,32,690.43NAGALAND 21 13,711.07 14,384.55 696.02ODISHA 84 97,034.62 1,02,058.71 31,194.27PUNJAB 33 17,042.04 17,146.31 5,074.63RAJASTHAN 56 46,045.92 48,245.10 25,194.09SIKKIM 9 3,476.73 6,281.03 433.90TAMIL NADU 76 1,19,890.58 1,37,033.24 63,134.97TELANGANA 41 34,378.10 37,015.07 8,884.51TRIPURA 9 4,422.36 8,345.05 6,592.70UTTAR PRADESH 110 1,34,449.08 1,36,016.3 55,436.22UTTARAKHAND 28 33,689.40 39,554.65 11,676.94WEST BENGAL 53 57,557.73 66,897.02 28,648.61Grand Total 1,423 18,25,733.41 21,44,298.86 8,24,847.36
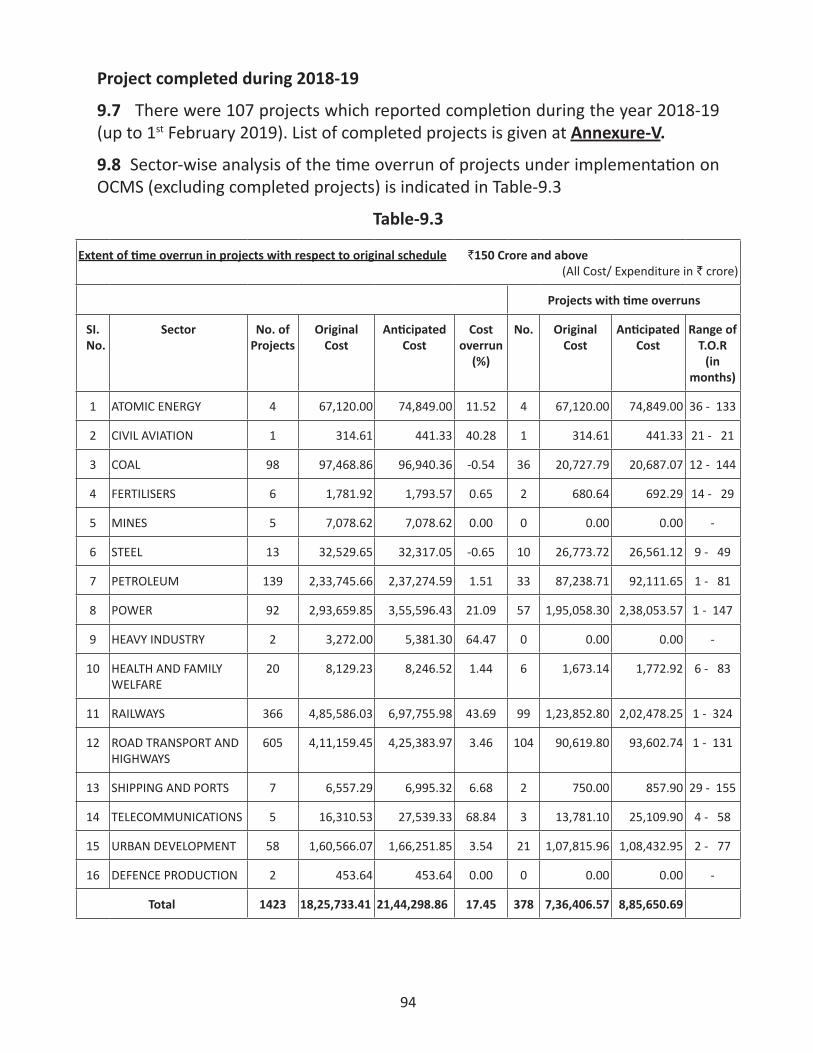
94
Project completed during 2018-19
9.7 There were 107 projects which reported completion during the year 2018-19 (up to 1st February 2019). List of completed projects is given at Annexure-V.
9.8 Sector-wise analysis of the time overrun of projects under implementation on OCMS (excluding completed projects) is indicated in Table-9.3
Table-9.3
Extent of time overrun in projects with respect to original schedule `150 Crore and above (All Cost/ Expenditure in ` crore)
Projects with time overruns
SI. No.
Sector No. ofProjects
OriginalCost
AnticipatedCost
Costoverrun
(%)
No. Original Cost
AnticipatedCost
Range of T.O.R
(in months)
1 ATOMIC ENERGY 4 67,120.00 74,849.00 11.52 4 67,120.00 74,849.00 36 - 133
2 CIVIL AVIATION 1 314.61 441.33 40.28 1 314.61 441.33 21 - 21
3 COAL 98 97,468.86 96,940.36 -0.54 36 20,727.79 20,687.07 12 - 144
4 FERTILISERS 6 1,781.92 1,793.57 0.65 2 680.64 692.29 14 - 29
5 MINES 5 7,078.62 7,078.62 0.00 0 0.00 0.00 -
6 STEEL 13 32,529.65 32,317.05 -0.65 10 26,773.72 26,561.12 9 - 49
7 PETROLEUM 139 2,33,745.66 2,37,274.59 1.51 33 87,238.71 92,111.65 1 - 81
8 POWER 92 2,93,659.85 3,55,596.43 21.09 57 1,95,058.30 2,38,053.57 1 - 147
9 HEAVY INDUSTRY 2 3,272.00 5,381.30 64.47 0 0.00 0.00 -
10 HEALTH AND FAMILY WELFARE
20 8,129.23 8,246.52 1.44 6 1,673.14 1,772.92 6 - 83
11 RAILWAYS 366 4,85,586.03 6,97,755.98 43.69 99 1,23,852.80 2,02,478.25 1 - 324
12 ROAD TRANSPORT AND HIGHWAYS
605 4,11,159.45 4,25,383.97 3.46 104 90,619.80 93,602.74 1 - 131
13 SHIPPING AND PORTS 7 6,557.29 6,995.32 6.68 2 750.00 857.90 29 - 155
14 TELECOMMUNICATIONS 5 16,310.53 27,539.33 68.84 3 13,781.10 25,109.90 4 - 58
15 URBAN DEVELOPMENT 58 1,60,566.07 1,66,251.85 3.54 21 1,07,815.96 1,08,432.95 2 - 77
16 DEFENCE PRODUCTION 2 453.64 453.64 0.00 0 0.00 0.00 -
Total 1423 18,25,733.41 21,44,298.86 17.45 378 7,36,406.57 8,85,650.69
95
9.9 Reasons for Time Overrun
(1) Issues with Union Ministries
(i) Environment, Forest and Wildlife Clearances(ii) Eco Sensitive Zone Clearance(iii) Tree Cutting Permission(iv) Grant of Working Permission(v) Approval for private railways siding construction(vi) Industrial License Permission(vii) Road Crossing of Pipelines/Transmission lines(viii) Grant of Right of Way(ix) Shifting of Utilities
(2) Issues with State Governments
(i) Land Acquisition issues(ii) Removal of encroachments(iii) Relief and Rehabilitation plan(iv) No Objection Certificate under Forest Rights Act(v) Power and Water supply(vi) Consent to establish and operate from State Pollution Control
Board.(vii) Transfer of Government Land(viii) Law and Order issues(ix) Right of Way permission(x) Diversion of forest land.
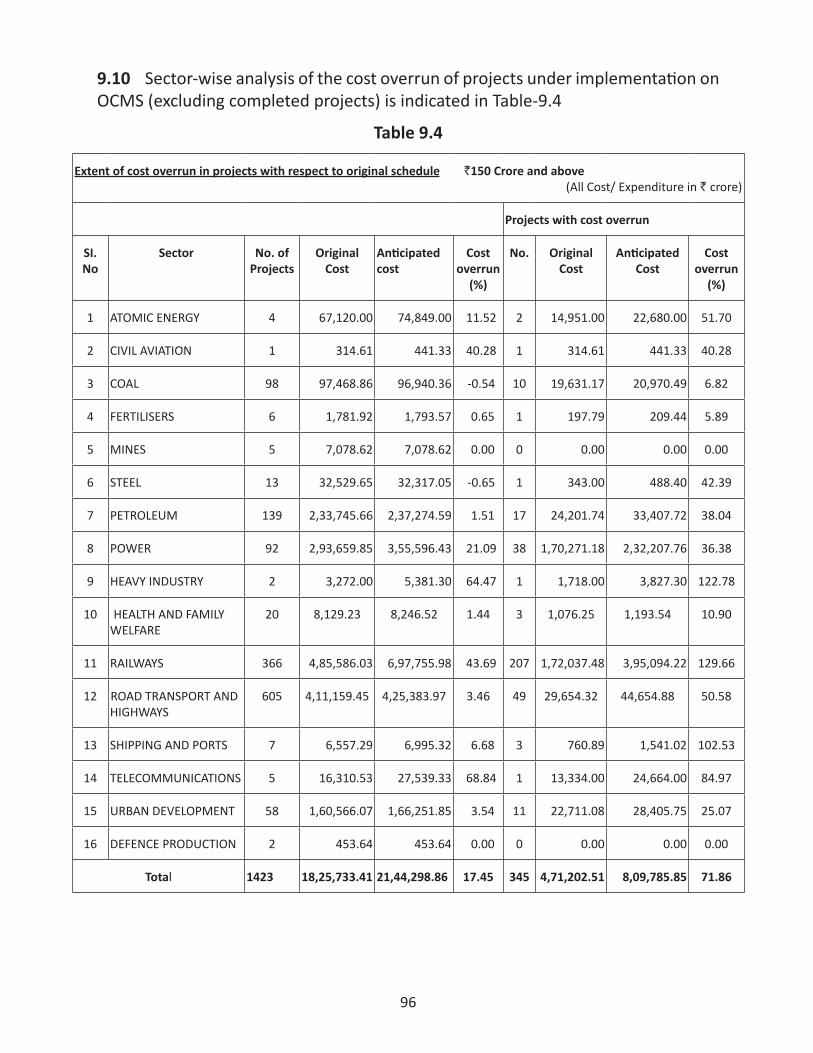
96
9.10 Sector-wise analysis of the cost overrun of projects under implementation on OCMS (excluding completed projects) is indicated in Table-9.4
Table 9.4
Extent of cost overrun in projects with respect to original schedule `150 Crore and above (All Cost/ Expenditure in ` crore)
Projects with cost overrun
SI. No
Sector No. ofProjects
OriginalCost
Anticipated cost
Costoverrun
(%)
No. Original Cost
AnticipatedCost
Cost overrun
(%)
1 ATOMIC ENERGY 4 67,120.00 74,849.00 11.52 2 14,951.00 22,680.00 51.70
2 CIVIL AVIATION 1 314.61 441.33 40.28 1 314.61 441.33 40.28
3 COAL 98 97,468.86 96,940.36 -0.54 10 19,631.17 20,970.49 6.82
4 FERTILISERS 6 1,781.92 1,793.57 0.65 1 197.79 209.44 5.89
5 MINES 5 7,078.62 7,078.62 0.00 0 0.00 0.00 0.00
6 STEEL 13 32,529.65 32,317.05 -0.65 1 343.00 488.40 42.39
7 PETROLEUM 139 2,33,745.66 2,37,274.59 1.51 17 24,201.74 33,407.72 38.04
8 POWER 92 2,93,659.85 3,55,596.43 21.09 38 1,70,271.18 2,32,207.76 36.38
9 HEAVY INDUSTRY 2 3,272.00 5,381.30 64.47 1 1,718.00 3,827.30 122.78
10 HEALTH AND FAMILY WELFARE
20 8,129.23 8,246.52 1.44 3 1,076.25 1,193.54 10.90
11 RAILWAYS 366 4,85,586.03 6,97,755.98 43.69 207 1,72,037.48 3,95,094.22 129.66
12 ROAD TRANSPORT AND HIGHWAYS
605 4,11,159.45 4,25,383.97 3.46 49 29,654.32 44,654.88 50.58
13 SHIPPING AND PORTS 7 6,557.29 6,995.32 6.68 3 760.89 1,541.02 102.53
14 TELECOMMUNICATIONS 5 16,310.53 27,539.33 68.84 1 13,334.00 24,664.00 84.97
15 URBAN DEVELOPMENT 58 1,60,566.07 1,66,251.85 3.54 11 22,711.08 28,405.75 25.07
16 DEFENCE PRODUCTION 2 453.64 453.64 0.00 0 0.00 0.00 0.00
Total 1423 18,25,733.41 21,44,298.86 17.45 345 4,71,202.51 8,09,785.85 71.86
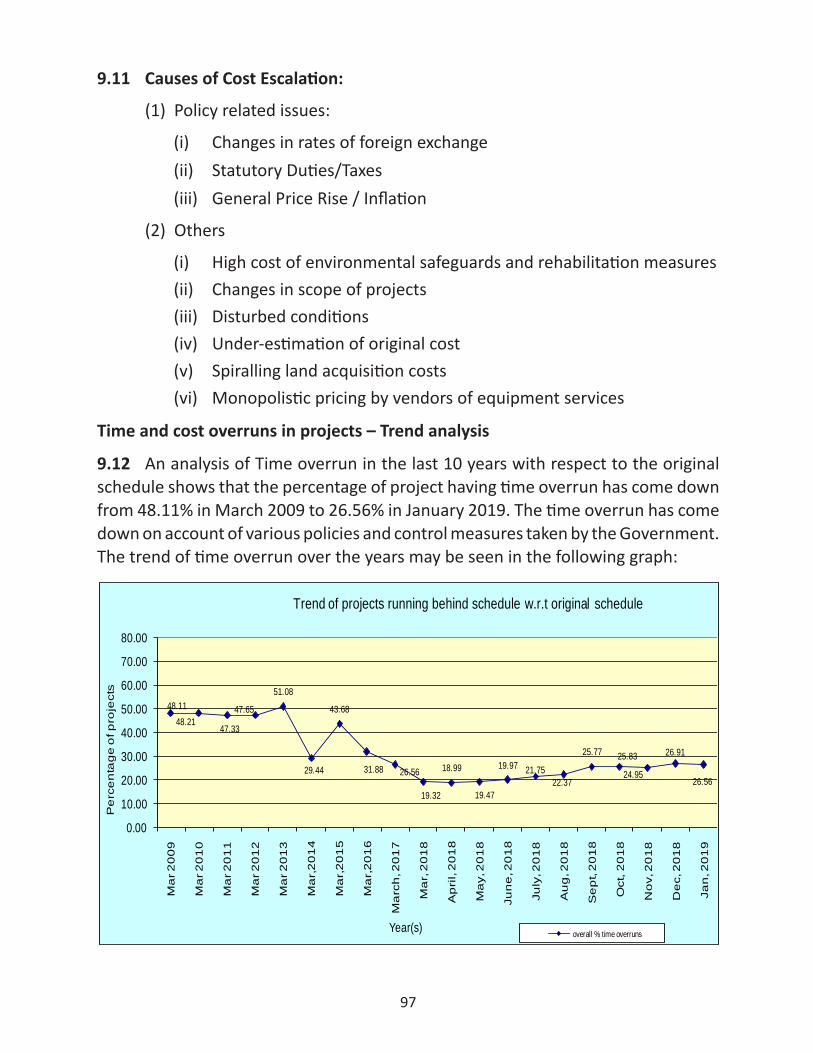
97
9.11 Causes of Cost Escalation:
(1) Policy related issues:
(i) Changes in rates of foreign exchange(ii) Statutory Duties/Taxes(iii) General Price Rise / Inflation
(2) Others
(i) High cost of environmental safeguards and rehabilitation measures(ii) Changes in scope of projects(iii) Disturbed conditions(iv) Under-estimation of original cost(v) Spiralling land acquisition costs(vi) Monopolistic pricing by vendors of equipment services
Time and cost overruns in projects – Trend analysis
9.12 An analysis of Time overrun in the last 10 years with respect to the original schedule shows that the percentage of project having time overrun has come down from 48.11% in March 2009 to 26.56% in January 2019. The time overrun has come down on account of various policies and control measures taken by the Government. The trend of time overrun over the years may be seen in the following graph:
48.1148.21
47.33
47.65
51.08
29.44
43.68
31.88 26.56
19.32
18.99
19.47
19.97 21.7522.37
25.77 25.83
24.95
26.91
26.56
0.00
10.00
20.00
30.00
40.00
50.00
60.00
70.00
80.00
Ma
r 20
09
Ma
r 20
10
Ma
r 20
11
Ma
r 20
12
Ma
r 20
13
Ma
r,2
01
4
Ma
r,2
01
5
Ma
r,2
01
6
Ma
rch
, 20
17
Ma
r, 2
01
8
Ap
ril,
20
18
Ma
y, 2
01
8
Jun
e, 2
01
8
July
, 20
18
Au
g, 2
01
8
Se
pt,
20
18
Oct
, 20
18
No
v, 2
01
8
De
c, 2
01
8
Jan
, 20
19
Pe
rce
nta
ge
of p
roje
cts
Year(s)
Trend of projects running behind schedule w.r.t original schedule
overall % time overruns
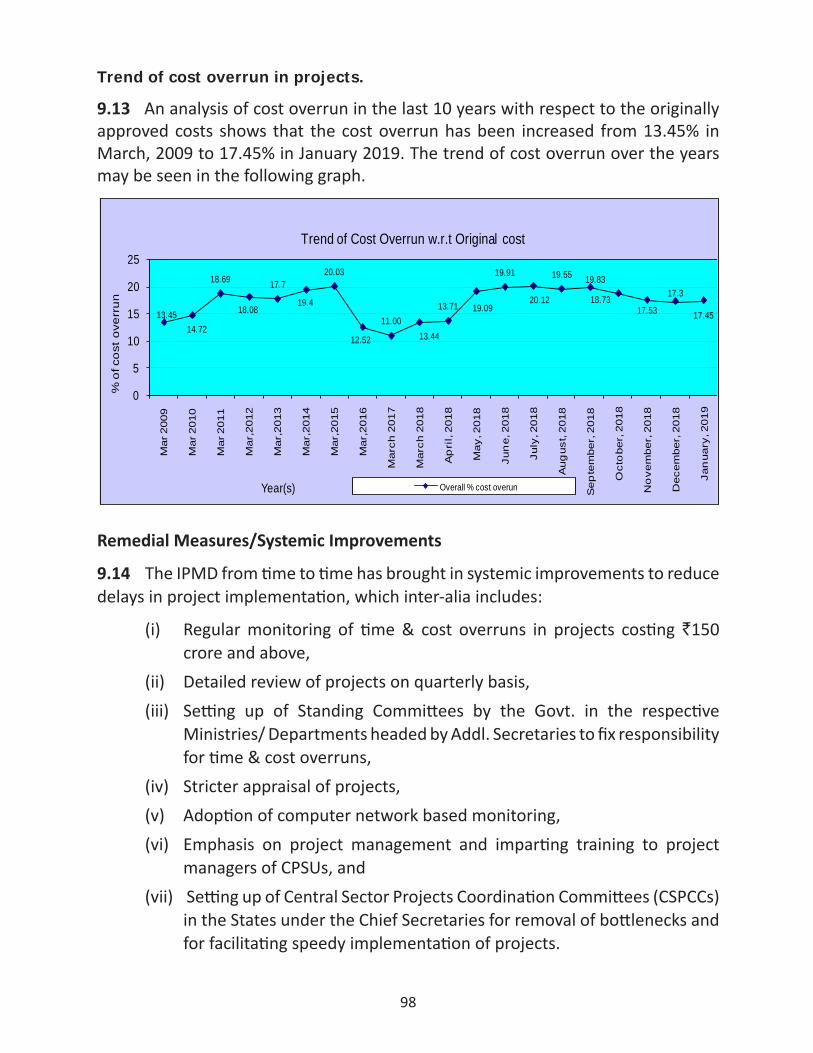
98
Trend of cost overrun in projects.
9.13 An analysis of cost overrun in the last 10 years with respect to the originally approved costs shows that the cost overrun has been increased from 13.45% in March, 2009 to 17.45% in January 2019. The trend of cost overrun over the years may be seen in the following graph.
13.4514.72
18.69
18.08
17.7
19.4
20.03
12.52
11.0013.44
13.71 19.09
19.91
20.12
19.55 19.83
18.7317.53
17.3
17.45
0
5
10
15
20
25
Mar
200
9
Mar
201
0
Mar
201
1
Mar
,201
2
Mar
,201
3
Mar
,201
4
Mar
,201
5
Mar
,201
6
Mar
ch 2
017
Mar
ch 2
018
Ap
ril,
2018
May
, 201
8
Jun
e, 2
018
July
, 201
8
Aug
ust,
2018
Sep
tem
ber,
201
8
Oct
obe
r, 2
018
No
vem
ber,
201
8
Dec
embe
r, 2
018
Jan
uary
, 201
9
% o
f co
st o
verr
un
Year(s)
Trend of Cost Overrun w.r.t Original cost
Overall % cost overun
Remedial Measures/Systemic Improvements
9.14 The IPMD from time to time has brought in systemic improvements to reduce delays in project implementation, which inter-alia includes:
(i) Regular monitoring of time & cost overruns in projects costing `150 crore and above,
(ii) Detailed review of projects on quarterly basis,(iii) Setting up of Standing Committees by the Govt. in the respective
Ministries/ Departments headed by Addl. Secretaries to fix responsibility for time & cost overruns,
(iv) Stricter appraisal of projects,(v) Adoption of computer network based monitoring, (vi) Emphasis on project management and imparting training to project
managers of CPSUs, and(vii) Setting up of Central Sector Projects Coordination Committees (CSPCCs)
in the States under the Chief Secretaries for removal of bottlenecks and for facilitating speedy implementation of projects.
99
Initiatives taken during the year
9.14.1 Central Sector Projects Coordination Committees (CSPCC): - The Ministry had advised all the State Governments to constitute a Central Sector Projects Coordination Committees (CSPCC) under the chairmanship of Chief Secretary to resolve project related issues faced by CPSUs in their States. So far, twenty-seven States have constituted such CSPCCs. The mechanism of CSPCC has been very effective in resolving issues related with the State Governments like land acquisition, shifting of utilities, resettlement & rehabilitation and law and order issues.
9.14.2 Taking up of issues with the concerned Ministries to review different sectors: - During the year the progress of implementation of projects in various sectors highlighting delayed projects were taken up at the different levels with the Ministry of Railways and Ministry of Road Transport & Highways.
9.14.3 Active participation in MOU/Review/EBR Meetings: - The IPMD is actively raising the issues of time & cost over runs in the project implementation item of the draft MOUs in the meetings of the MOU Task Forces conducted by the Department of Public Enterprises for assessing the performance of the CPSEs.
9.14.4 Re-designing and redevelopment of OCMS: - The Ministry is in the process of re-designing and redeveloping the OCMS. The existing OCMS is now being upgraded in .NET and SQL under the supervision of NIC to cater to the requirement of various stakeholders. The new software will be more user friendly and will have updated features like dashboards, graphics etc.
9.14.5.1 Development of Software for Infrastructure Performance: - The Ministry is in the process of developing the software for Infrastructure Performance with the support of ‘Digital India’ for better monitoring.
9.14.5.2 Study by IPMD, MoSPI: - PMI-KPMG has conducted a study on ‘Revamping Project Management Practices’ with the support of MoSPI.
Trainings under Project Management
9.15 During 2018-19 training has been conducted for Railways officers in various locations of Railways H.Q. The two days training programme includes training on Project Management for one day and training on OCMS software on second day wherein 50 participants from various Zonal Office of Railways participated.
Infrastructure Performance Monitoring
9.16 The monitoring of important infrastructure sectors in the country aims to provide an overview of the performance and highlight slippages, if any, before
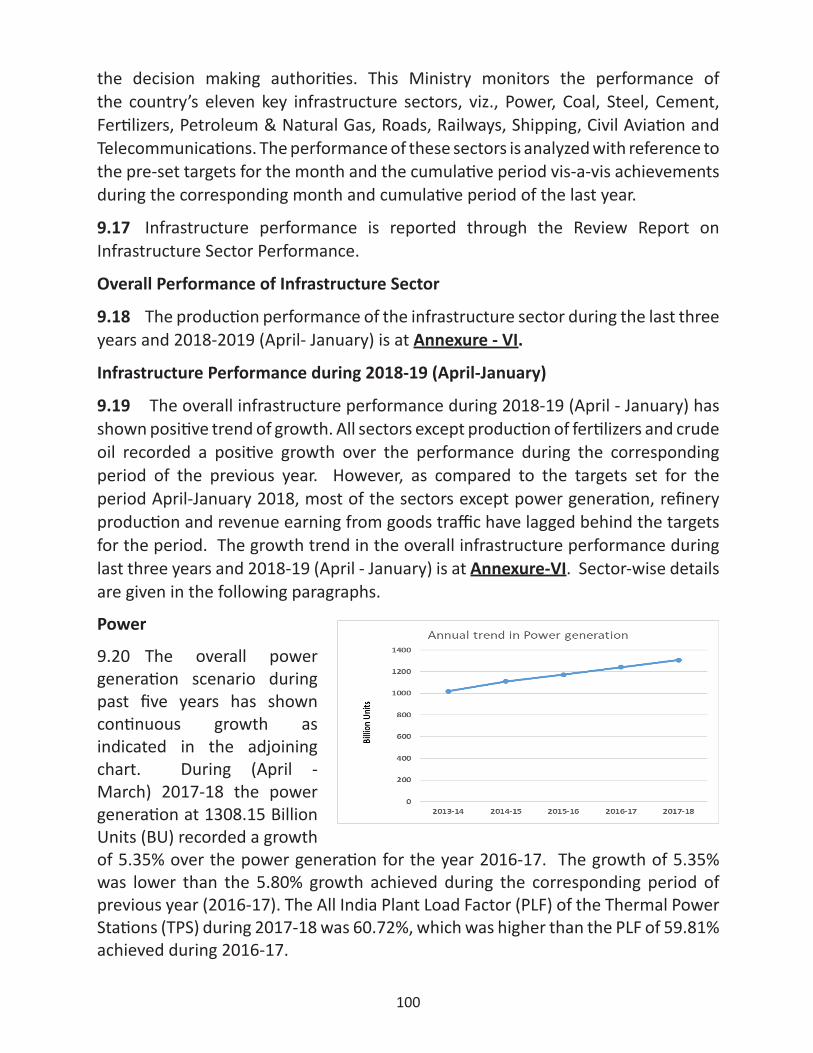
100
the decision making authorities. This Ministry monitors the performance of the country’s eleven key infrastructure sectors, viz., Power, Coal, Steel, Cement, Fertilizers, Petroleum & Natural Gas, Roads, Railways, Shipping, Civil Aviation and Telecommunications. The performance of these sectors is analyzed with reference to the pre-set targets for the month and the cumulative period vis-a-vis achievements during the corresponding month and cumulative period of the last year.
9.17 Infrastructure performance is reported through the Review Report on Infrastructure Sector Performance.
Overall Performance of Infrastructure Sector
9.18 The production performance of the infrastructure sector during the last three years and 2018-2019 (April- January) is at Annexure - VI.
Infrastructure Performance during 2018-19 (April-January)
9.19 The overall infrastructure performance during 2018-19 (April - January) has shown positive trend of growth. All sectors except production of fertilizers and crude oil recorded a positive growth over the performance during the corresponding period of the previous year. However, as compared to the targets set for the period April-January 2018, most of the sectors except power generation, refinery production and revenue earning from goods traffic have lagged behind the targets for the period. The growth trend in the overall infrastructure performance during last three years and 2018-19 (April - January) is at Annexure-VI. Sector-wise details are given in the following paragraphs.
Power
9.20 The overall power generation scenario during past five years has shown continuous growth as indicated in the adjoining chart. During (April - March) 2017-18 the power generation at 1308.15 Billion Units (BU) recorded a growth of 5.35% over the power generation for the year 2016-17. The growth of 5.35% was lower than the 5.80% growth achieved during the corresponding period of previous year (2016-17). The All India Plant Load Factor (PLF) of the Thermal Power Stations (TPS) during 2017-18 was 60.72%, which was higher than the PLF of 59.81% achieved during 2016-17.
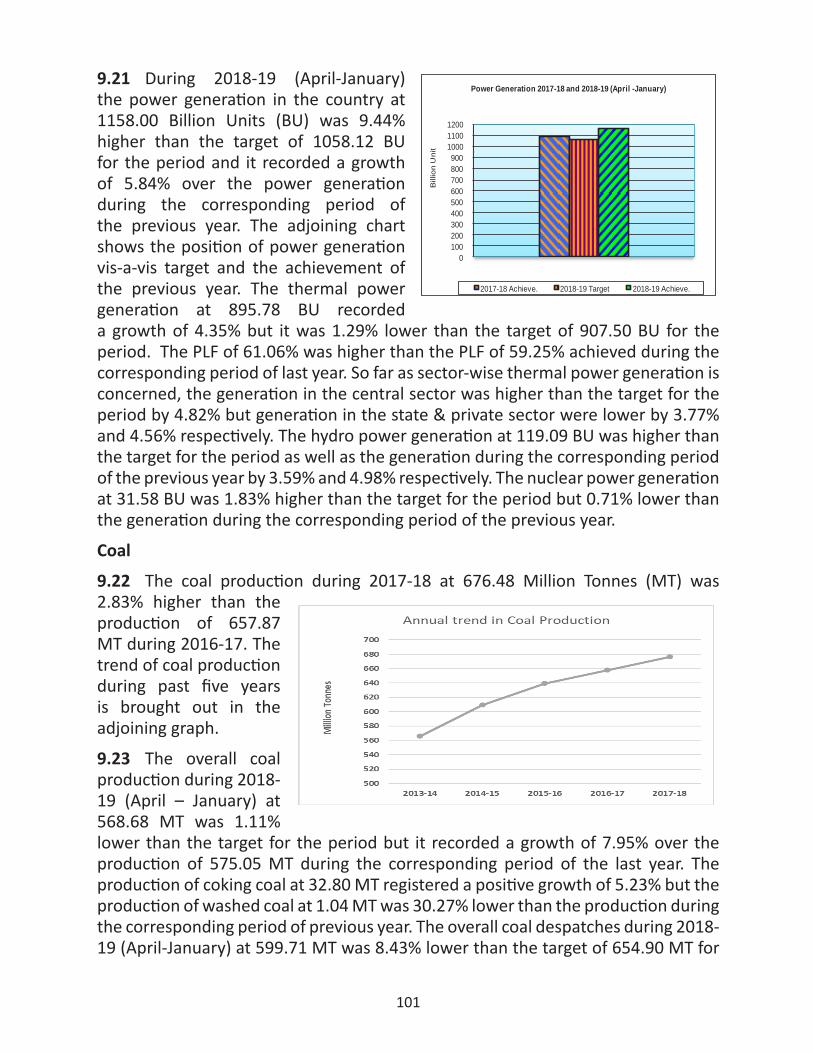
101
9.21 During 2018-19 (April-January) the power generation in the country at 1158.00 Billion Units (BU) was 9.44% higher than the target of 1058.12 BU for the period and it recorded a growth of 5.84% over the power generation during the corresponding period of the previous year. The adjoining chart shows the position of power generation vis-a-vis target and the achievement of the previous year. The thermal power generation at 895.78 BU recorded a growth of 4.35% but it was 1.29% lower than the target of 907.50 BU for the period. The PLF of 61.06% was higher than the PLF of 59.25% achieved during the corresponding period of last year. So far as sector-wise thermal power generation is concerned, the generation in the central sector was higher than the target for the period by 4.82% but generation in the state & private sector were lower by 3.77% and 4.56% respectively. The hydro power generation at 119.09 BU was higher than the target for the period as well as the generation during the corresponding period of the previous year by 3.59% and 4.98% respectively. The nuclear power generation at 31.58 BU was 1.83% higher than the target for the period but 0.71% lower than the generation during the corresponding period of the previous year.
Coal
9.22 The coal production during 2017-18 at 676.48 Million Tonnes (MT) was 2.83% higher than the production of 657.87 MT during 2016-17. The trend of coal production during past five years is brought out in the adjoining graph.
9.23 The overall coal production during 2018-19 (April – January) at 568.68 MT was 1.11% lower than the target for the period but it recorded a growth of 7.95% over the production of 575.05 MT during the corresponding period of the last year. The production of coking coal at 32.80 MT registered a positive growth of 5.23% but the production of washed coal at 1.04 MT was 30.27% lower than the production during the corresponding period of previous year. The overall coal despatches during 2018-19 (April-January) at 599.71 MT was 8.43% lower than the target of 654.90 MT for
0100200300400500600700800900
100011001200
Bill
ion
Uni
t
Power Generation 2017-18 and 2018-19 (April -January)
2017-18 Achieve. 2018-19 Target 2018-19 Achieve.
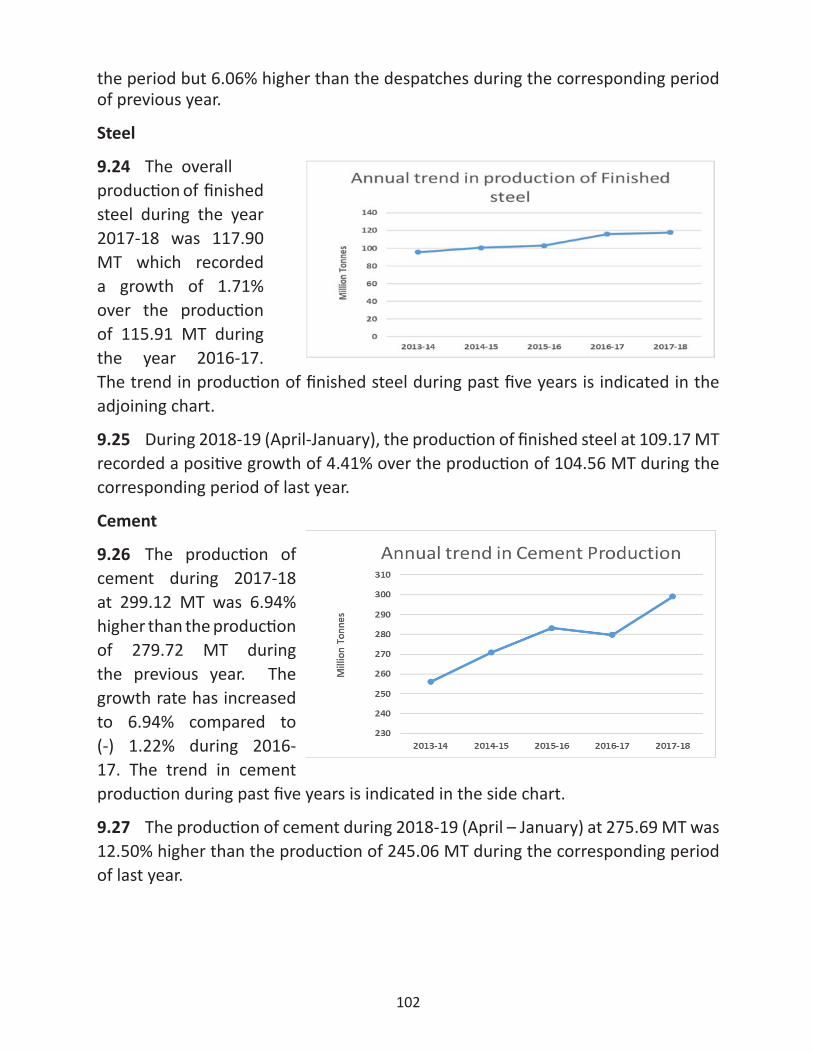
102
the period but 6.06% higher than the despatches during the corresponding period of previous year.
Steel
9.24 The overall production of finished steel during the year 2017-18 was 117.90 MT which recorded a growth of 1.71% over the production of 115.91 MT during the year 2016-17. The trend in production of finished steel during past five years is indicated in the adjoining chart.
9.25 During 2018-19 (April-January), the production of finished steel at 109.17 MT recorded a positive growth of 4.41% over the production of 104.56 MT during the corresponding period of last year.
Cement
9.26 The production of cement during 2017-18 at 299.12 MT was 6.94% higher than the production of 279.72 MT during the previous year. The growth rate has increased to 6.94% compared to (-) 1.22% during 2016-17. The trend in cement production during past five years is indicated in the side chart.
9.27 The production of cement during 2018-19 (April – January) at 275.69 MT was 12.50% higher than the production of 245.06 MT during the corresponding period of last year.
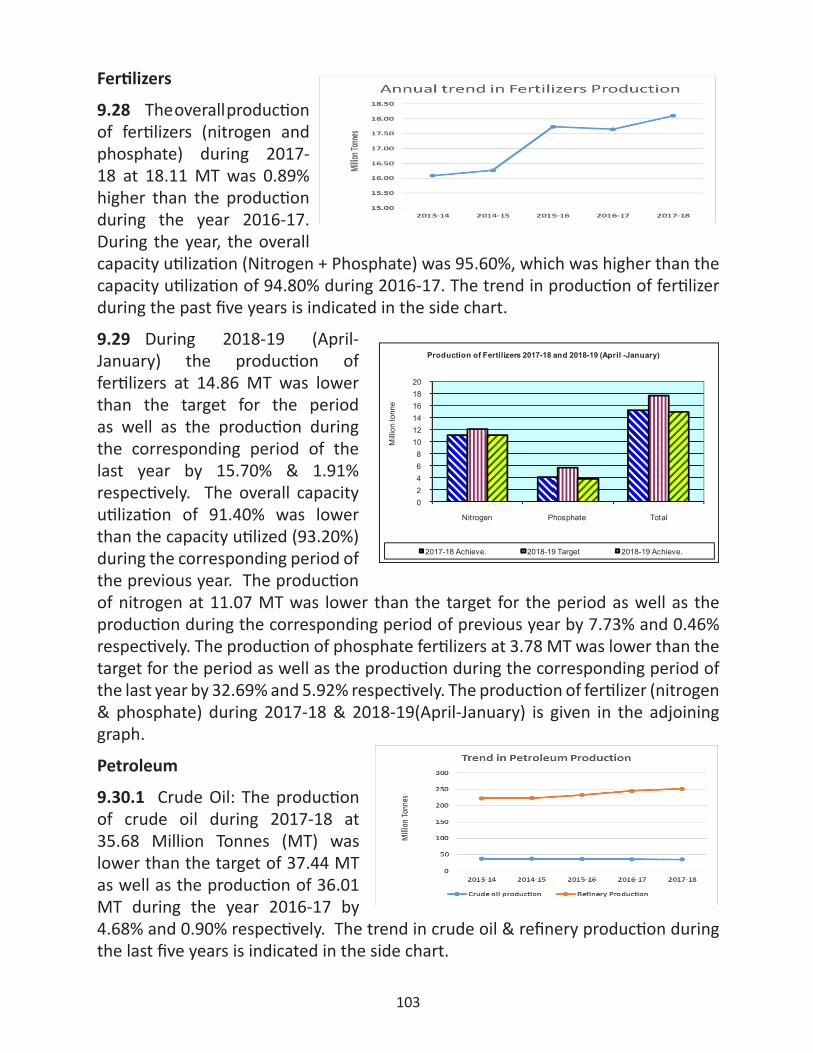
103
Fertilizers
9.28 The overall production of fertilizers (nitrogen and phosphate) during 2017-18 at 18.11 MT was 0.89% higher than the production during the year 2016-17. During the year, the overall capacity utilization (Nitrogen + Phosphate) was 95.60%, which was higher than the capacity utilization of 94.80% during 2016-17. The trend in production of fertilizer during the past five years is indicated in the side chart.
9.29 During 2018-19 (April-January) the production of fertilizers at 14.86 MT was lower than the target for the period as well as the production during the corresponding period of the last year by 15.70% & 1.91% respectively. The overall capacity utilization of 91.40% was lower than the capacity utilized (93.20%) during the corresponding period of the previous year. The production of nitrogen at 11.07 MT was lower than the target for the period as well as the production during the corresponding period of previous year by 7.73% and 0.46% respectively. The production of phosphate fertilizers at 3.78 MT was lower than the target for the period as well as the production during the corresponding period of the last year by 32.69% and 5.92% respectively. The production of fertilizer (nitrogen & phosphate) during 2017-18 & 2018-19(April-January) is given in the adjoining graph.
Petroleum
9.30.1 Crude Oil: The production of crude oil during 2017-18 at 35.68 Million Tonnes (MT) was lower than the target of 37.44 MT as well as the production of 36.01 MT during the year 2016-17 by 4.68% and 0.90% respectively. The trend in crude oil & refinery production during the last five years is indicated in the side chart.
02468
101214161820
Nitrogen Phosphate Total
Milli
on to
nne
Production of Fertilizers 2017-18 and 2018-19 (April -January)
2017-18 Achieve. 2018-19 Target 2018-19 Achieve.
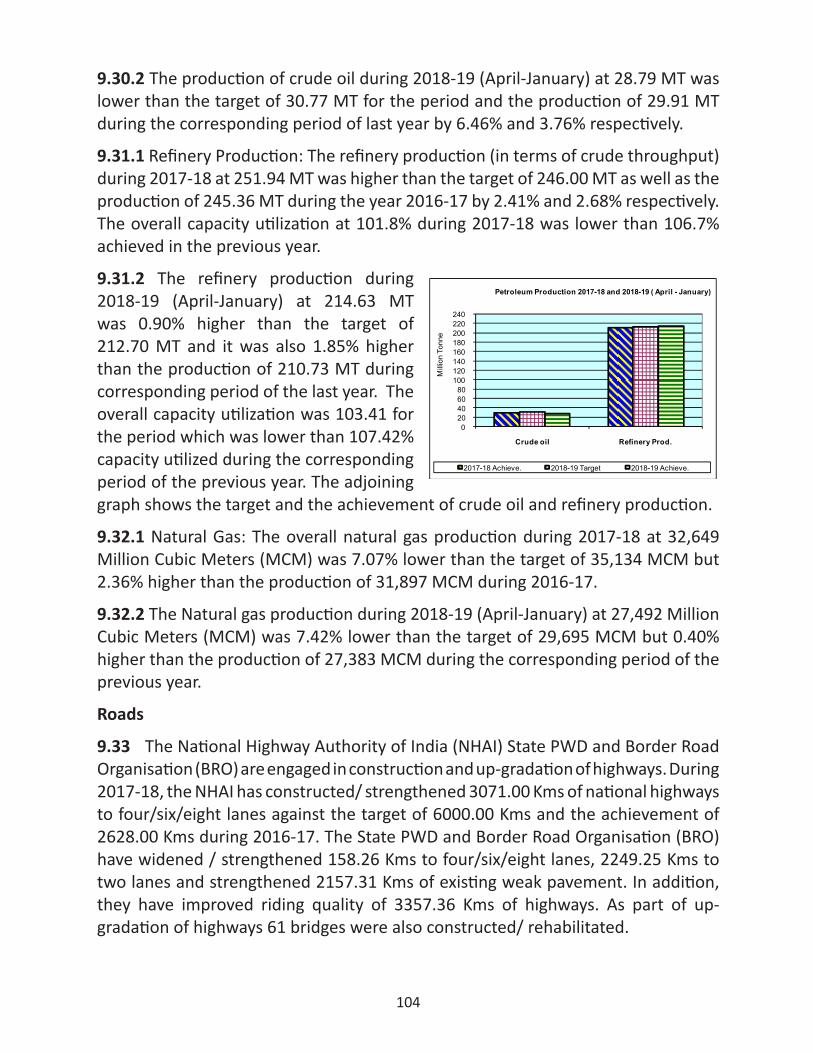
104
9.30.2 The production of crude oil during 2018-19 (April-January) at 28.79 MT was lower than the target of 30.77 MT for the period and the production of 29.91 MT during the corresponding period of last year by 6.46% and 3.76% respectively.
9.31.1 Refinery Production: The refinery production (in terms of crude throughput) during 2017-18 at 251.94 MT was higher than the target of 246.00 MT as well as the production of 245.36 MT during the year 2016-17 by 2.41% and 2.68% respectively. The overall capacity utilization at 101.8% during 2017-18 was lower than 106.7% achieved in the previous year.
9.31.2 The refinery production during 2018-19 (April-January) at 214.63 MT was 0.90% higher than the target of 212.70 MT and it was also 1.85% higher than the production of 210.73 MT during corresponding period of the last year. The overall capacity utilization was 103.41 for the period which was lower than 107.42% capacity utilized during the corresponding period of the previous year. The adjoining graph shows the target and the achievement of crude oil and refinery production.
9.32.1 Natural Gas: The overall natural gas production during 2017-18 at 32,649 Million Cubic Meters (MCM) was 7.07% lower than the target of 35,134 MCM but 2.36% higher than the production of 31,897 MCM during 2016-17.
9.32.2 The Natural gas production during 2018-19 (April-January) at 27,492 Million Cubic Meters (MCM) was 7.42% lower than the target of 29,695 MCM but 0.40% higher than the production of 27,383 MCM during the corresponding period of the previous year.
Roads
9.33 The National Highway Authority of India (NHAI) State PWD and Border Road Organisation (BRO) are engaged in construction and up-gradation of highways. During 2017-18, the NHAI has constructed/ strengthened 3071.00 Kms of national highways to four/six/eight lanes against the target of 6000.00 Kms and the achievement of 2628.00 Kms during 2016-17. The State PWD and Border Road Organisation (BRO) have widened / strengthened 158.26 Kms to four/six/eight lanes, 2249.25 Kms to two lanes and strengthened 2157.31 Kms of existing weak pavement. In addition, they have improved riding quality of 3357.36 Kms of highways. As part of up-gradation of highways 61 bridges were also constructed/ rehabilitated.
020406080
100120140160180200220240
Crude oil Refinery Prod.M
illion
Ton
ne
Petroleum Production 2017-18 and 2018-19 ( April - January)
2017-18 Achieve. 2018-19 Target 2018-19 Achieve.
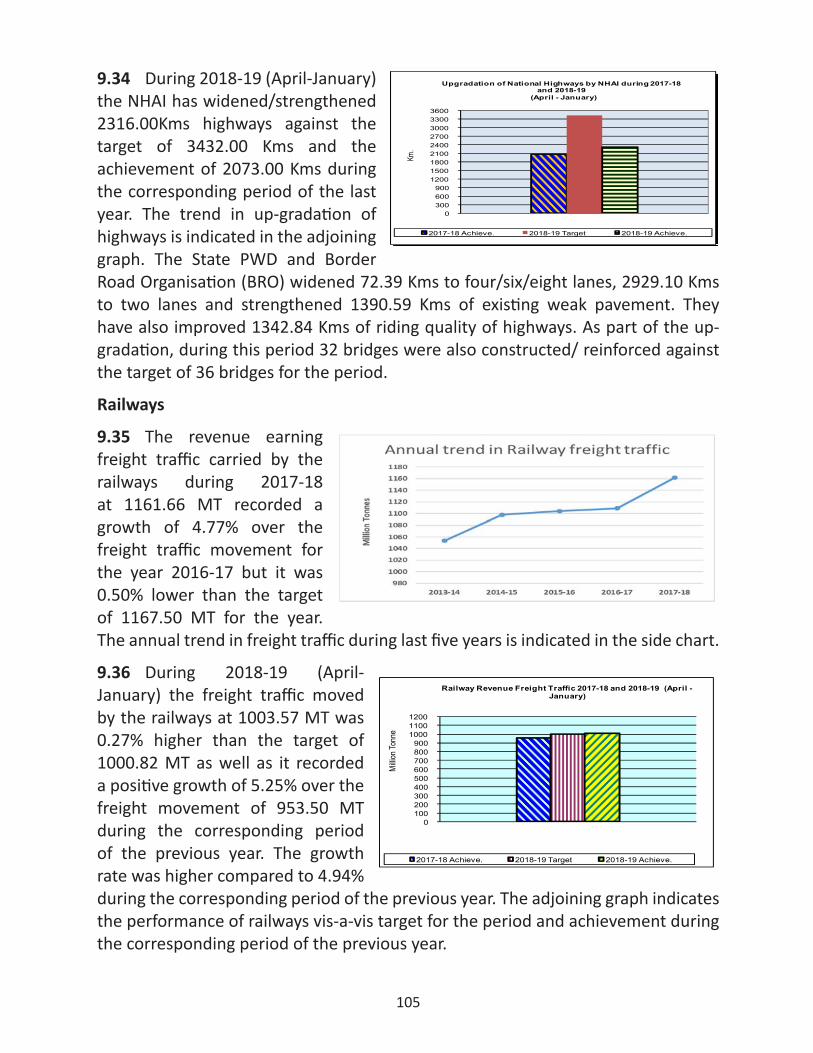
105
9.34 During 2018-19 (April-January) the NHAI has widened/strengthened 2316.00Kms highways against the target of 3432.00 Kms and the achievement of 2073.00 Kms during the corresponding period of the last year. The trend in up-gradation of highways is indicated in the adjoining graph. The State PWD and Border Road Organisation (BRO) widened 72.39 Kms to four/six/eight lanes, 2929.10 Kms to two lanes and strengthened 1390.59 Kms of existing weak pavement. They have also improved 1342.84 Kms of riding quality of highways. As part of the up-gradation, during this period 32 bridges were also constructed/ reinforced against the target of 36 bridges for the period.
Railways
9.35 The revenue earning freight traffic carried by the railways during 2017-18 at 1161.66 MT recorded a growth of 4.77% over the freight traffic movement for the year 2016-17 but it was 0.50% lower than the target of 1167.50 MT for the year. The annual trend in freight traffic during last five years is indicated in the side chart.
9.36 During 2018-19 (April-January) the freight traffic moved by the railways at 1003.57 MT was 0.27% higher than the target of 1000.82 MT as well as it recorded a positive growth of 5.25% over the freight movement of 953.50 MT during the corresponding period of the previous year. The growth rate was higher compared to 4.94% during the corresponding period of the previous year. The adjoining graph indicates the performance of railways vis-a-vis target for the period and achievement during the corresponding period of the previous year.
0300600900
120015001800210024002700300033003600
Km.
Upgradation of National Highways by NHAI during 2017-18 and 2018-19
(April - January)
2017-18 Achieve. 2018-19 Target 2018-19 Achieve.
0100200300400500600700800900
100011001200
Milli
on To
nne
Railway Revenue Freight Traffic 2017-18 and 2018-19 (April -January)
2017-18 Achieve. 2018-19 Target 2018-19 Achieve.
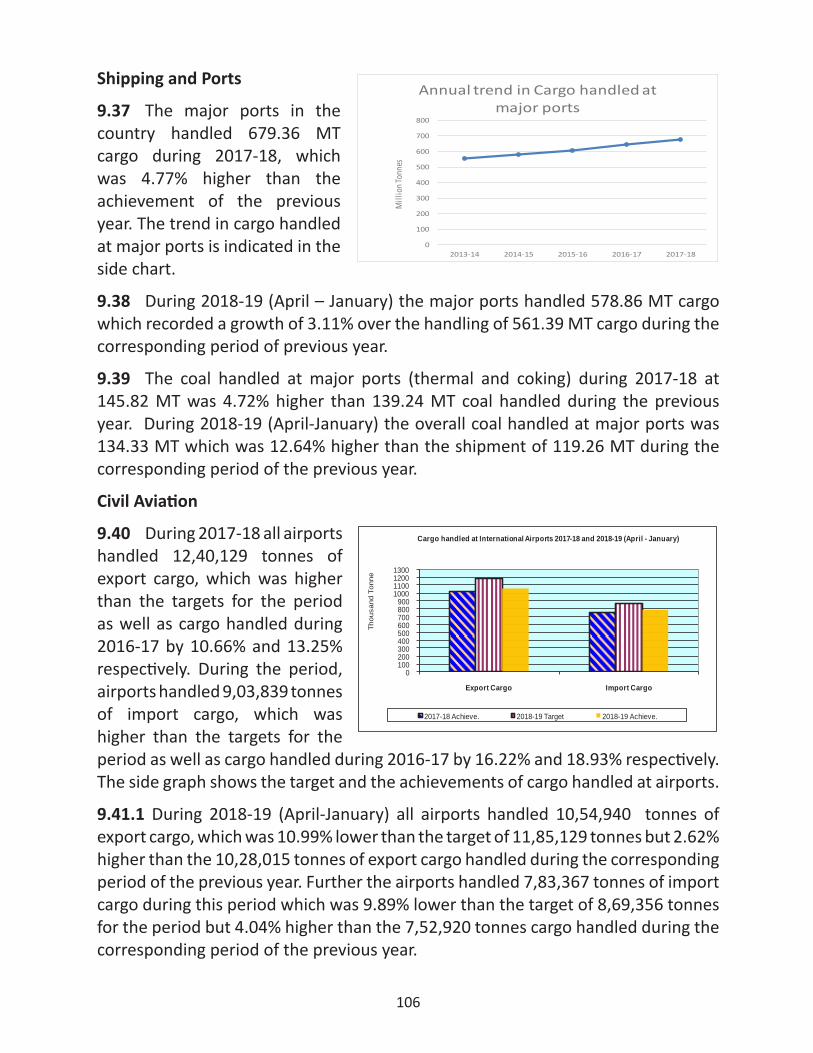
106
Shipping and Ports
9.37 The major ports in the country handled 679.36 MT cargo during 2017-18, which was 4.77% higher than the achievement of the previous year. The trend in cargo handled at major ports is indicated in the side chart.
9.38 During 2018-19 (April – January) the major ports handled 578.86 MT cargo which recorded a growth of 3.11% over the handling of 561.39 MT cargo during the corresponding period of previous year.
9.39 The coal handled at major ports (thermal and coking) during 2017-18 at 145.82 MT was 4.72% higher than 139.24 MT coal handled during the previous year. During 2018-19 (April-January) the overall coal handled at major ports was 134.33 MT which was 12.64% higher than the shipment of 119.26 MT during the corresponding period of the previous year.
Civil Aviation
9.40 During 2017-18 all airports handled 12,40,129 tonnes of export cargo, which was higher than the targets for the period as well as cargo handled during 2016-17 by 10.66% and 13.25% respectively. During the period, airports handled 9,03,839 tonnes of import cargo, which was higher than the targets for the period as well as cargo handled during 2016-17 by 16.22% and 18.93% respectively. The side graph shows the target and the achievements of cargo handled at airports.
9.41.1 During 2018-19 (April-January) all airports handled 10,54,940 tonnes of export cargo, which was 10.99% lower than the target of 11,85,129 tonnes but 2.62% higher than the 10,28,015 tonnes of export cargo handled during the corresponding period of the previous year. Further the airports handled 7,83,367 tonnes of import cargo during this period which was 9.89% lower than the target of 8,69,356 tonnes for the period but 4.04% higher than the 7,52,920 tonnes cargo handled during the corresponding period of the previous year.
0
100
200
300
400
500
600
700
800
2013-14 2014-15 2015-16 2016-17 2017-18
Mill
ion T
onne
s
Annual trend in Cargo handled at major ports
0100200300400500600700800900
1000110012001300
Export Cargo Import Cargo
Thou
sand
Ton
ne
Cargo handled at International Airports 2017-18 and 2018-19 (April - January)
2017-18 Achieve. 2018-19 Target 2018-19 Achieve.

107
9.41.2 During 2017-18 all airports handled 654.76 lakh passengers at international terminals, which was 2.28% lower than the target but 10.46% higher than the passengers handled during 2016-17. The domestic terminals of the airports handled 2432.78 lakh passengers during 2017-18, which was higher than the targets as well as the passengers handled during 2016-17 by 4.41% and 18.26% respectively.
9.42 During 2018-19 (April-January) the international terminals of the airports handled 579.85 lakh passengers which was 2.95% lower than the targets but 6.75% higher than the passengers handled during the corresponding period of the previous year. The domestic terminal of the airports handled 2310.01 lakh passengers which was 0.22% lower than the targets for the period but 15.75% higher than the passengers handled during the corresponding period of the last year. The side graph shows the target and the achievements of passengers handled at airports.
Telecommunications
9.43 During 2017-18, at the national level 40.55 lakh lines were added/connected to the switching capacity of telephone exchanges and 5147.504 lakh lines were also added/ connected during 2016-17. During 2017-18, private sectors provided 0.13 lakh new net fixed (wired) telephone connections and 2.91 lakh connections were also provided during 2016-17, while the public sector surrendered 15.37 lakh connections during 2017-18. During the year 2017-18, the public sector provided/connected 110.15 lakh new (net) cell phone (Mobile) connections and 146.43 lakh cell phone connections were also provided/connected during 2016-17. While the private sector provided/connected 73.83 lakh connections and 1218.36 lakh cell phone connections were also provided during 2016-17. Total 168.74 lakh connections (fixed + cell phones) were provided during 2017-18 and 1356.55 lakh phones connections were also provided during 2016-17. Annual trend in provision of landline and Cell phone connections during last five years is indicated in the above chart.
0200400600800
100012001400160018002000220024002600
International Domestic
Lakh
Num
ber
Passengers carried at major Airports 2017-18 and 2018-19 (April - January)
2017-18 Achieve. 2018-19 Target 2018-19 Achieve.
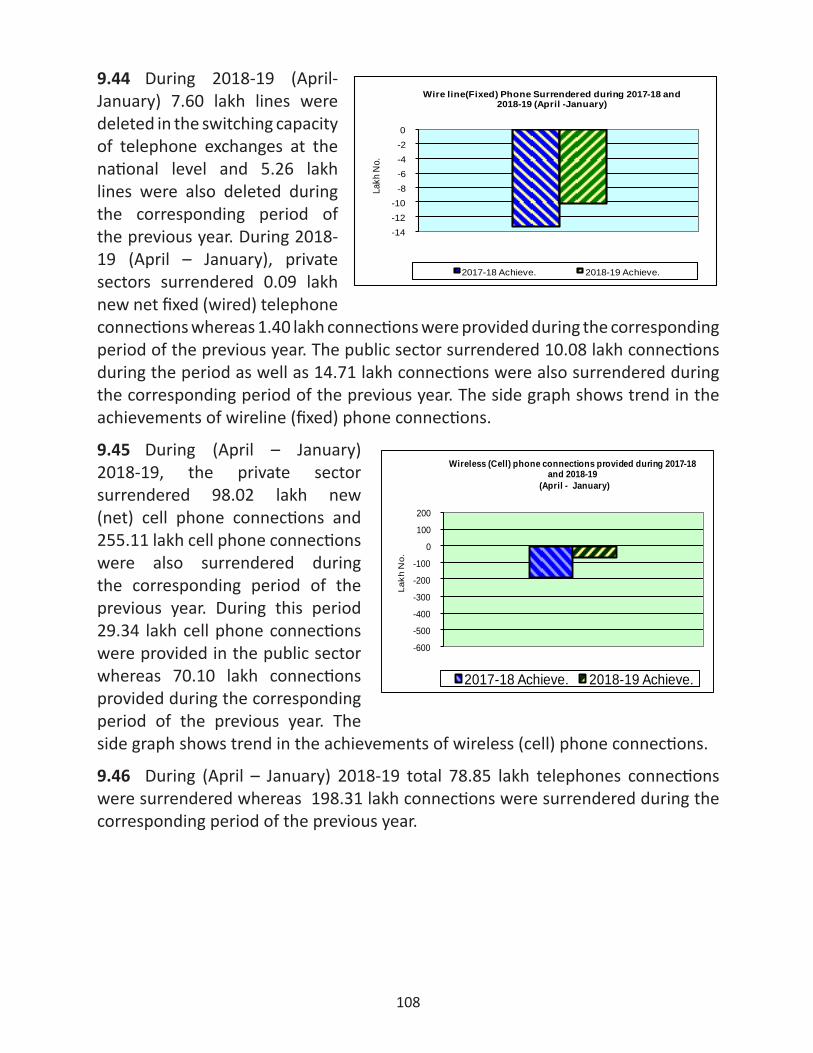
108
9.44 During 2018-19 (April-January) 7.60 lakh lines were deleted in the switching capacity of telephone exchanges at the national level and 5.26 lakh lines were also deleted during the corresponding period of the previous year. During 2018-19 (April – January), private sectors surrendered 0.09 lakh new net fixed (wired) telephone connections whereas 1.40 lakh connections were provided during the corresponding period of the previous year. The public sector surrendered 10.08 lakh connections during the period as well as 14.71 lakh connections were also surrendered during the corresponding period of the previous year. The side graph shows trend in the achievements of wireline (fixed) phone connections.
9.45 During (April – January) 2018-19, the private sector surrendered 98.02 lakh new (net) cell phone connections and 255.11 lakh cell phone connections were also surrendered during the corresponding period of the previous year. During this period 29.34 lakh cell phone connections were provided in the public sector whereas 70.10 lakh connections provided during the corresponding period of the previous year. The side graph shows trend in the achievements of wireless (cell) phone connections.
9.46 During (April – January) 2018-19 total 78.85 lakh telephones connections were surrendered whereas 198.31 lakh connections were surrendered during the corresponding period of the previous year.
-14-12-10
-8-6-4-20
Lakh
No.
Wire line(Fixed) Phone Surrendered during 2017-18 and 2018-19 (April -January)
2017-18 Achieve. 2018-19 Achieve.
-600
-500
-400
-300
-200
-100
0
100
200
Lakh
No.
Wireless (Cell) phone connections provided during 2017-18 and 2018-19
(April - January)
2017-18 Achieve. 2018-19 Achieve.
109
CHAPTER – X
MEMBERS OF PARLIAMENT LOCAL AREA DEVELOPMENT SCHEME
The Members of Parliament Local Area Development Scheme (MPLADS) was launched by the Government of India on 23rd December 1993 to provide a mechanism for Members of Parliament to recommend works of developmental nature for creation of durable community assets and for provision of basic facilities including community infrastructure, based on locally felt needs to be taken up in their Constituencies/States. Initially, the MPLADS was under the control of Ministry of Rural Development. The subject relating to the MPLADS was transferred to the Ministry of Statistics and Programme Implementation in October 1994. The scheme is governed by a set of Guidelines, which have been comprehensively revised from time to time. The present Guidelines were issued in June 2016.
10.1 The salient features of the MPLAD Scheme:
(a) MPLADS is a Central Scheme fully funded by the Government of India under which funds are released in the form of Grants-in-aid directly to the District Authorities.
(b) The funds released under the Scheme are non-lapsable, i.e. the entitlement of funds not released in a particular year is carried forward to the subsequent years, subject to eligibility. At present, the annual entitlement per MP/Constituency is `5 crore.
(c) Under MPLADS, the role of the Members of Parliament is limited to recommend works. Thereafter, it is the responsibility of the District Authority to sanction, execute and complete the works recommended by Members of Parliament within the stipulated time period.
(d) The elected Lok Sabha Members can recommend works in their respective constituencies. The elected members of the Rajya Sabha can recommend works anywhere in the State from which they are elected. Nominated Members of the Lok Sabha and Rajya Sabha can recommend works, anywhere in the country.
(e) There is no limit for works to be executed for the Government. However, for the works meant for trust/society there is a ceiling of `50 lakh for the lifetime of each trust/society. An MP can recommend funds only upto `100 lakh in all in a financial year, from MPLADS funds for works to trusts/societies.
110
(f) MPLADS works can be implemented in areas affected by natural calamities like flood, cyclone, hailstorm, avalanche, cloudburst, pest attack, landslides, tornado, earthquake, drought, tsunami, fire and biological, chemical, radiological hazards, etc. MPs from the non-affected areas of the State/UT can also recommend permissible works upto a maximum of `25 lakh per annum in the affected area(s) in that State/UT.
(g) In the event of ‘Calamity of severe nature’ (which is decided and declared by the Government of India) in any part of the country, an MP can recommend works up to a maximum of `1 crore for the affected district. The funds in this regard will be released by the Nodal District Authority of the MP concerned to the District Authority of the affected district to execute permissible works.
(h) In order to accord special attention to the development of areas inhabited by Scheduled Castes (SCs) and Scheduled Tribes (STs), 15% of MPLADS funds are to be utilized for areas inhabited by SC population and 7.5% for areas inhabited by ST population.
(i) If an elected Member of Parliament finds the need, to contribute MPLADS funds, to a place outside that State/UT or outside the constituency within the State or both, the MP can recommend eligible works, under these Guidelines upto a maximum of `25 lakh in a financial year. Such a gesture on the part of an MP will promote national unity, harmony, and fraternity among the people, at the grass roots level.
(j) The MP may recommend maximum of `20 lakh per year for giving assistance to Differently Abled Citizens for purchase of tri-cycles (including motorized tri-cycles), battery operated motorized wheel chair and artificial limbs; and aids for visually and hearing impaired.
(k) MPs may recommend their MPLADS funds to aided educational institutions which are receiving financial assistance from state government and are recognized by a State/UT/Central Board of Secondary Education in case of schools and by State/Central University in case of colleges and are not charging commercial fee from students. Such aided educational institutions are eligible for receiving MPLADS funds for all permissible items under the Guidelines with no ceiling. Both aided and un-aided educational institutions which are recognized by a Board of Secondary Education/University and are run by trusts/societies are eligible for receiving MPLADS funds for all permissible items under the Guidelines; the particular trust/society which runs the concerned educational institution will be governed by the maximum ceiling i.e. `50 lakh imposed on trusts/societies under the Guidelines.
111
(l) Energy efficient Community Gobar Gas plants, Crematoria and structures on burial/ cremation grounds and Non-conventional energy systems/devices for Community use are inter alia included in of the Guidelines.
(m) MPs may recommend MPLADS Funds for augmentation of funds for Scheme such as ‘Swachh Bharat Abhiyan’ which provides for construction of individual toilets, subject to provisions of the Guidelines on MPLADS.
(n) MPs may recommend MPLADS Funds for the installation of Wi-Fi system in educational institution, village and selected location.
(o) Funds released by the Government of India are deposited by the District Administrations in Nationalized Banks (including IDBI Banks)/Regional Rural Banks (Gramin Banks) which are on Core Banking Platform with the Nationalized Bank as their sponsor, for each MP for the purpose of MPLAD Scheme.
(p) The roles of Central Government, State Government, District Authorities and Implementing Agencies have been clearly defined in the Guidelines on MPLADS for implementation of MPLAD Scheme.
10.2 Impact
Since inception, the Scheme has benefited the local community by meeting various developmental needs such as drinking water facility, education, electricity, health and family welfare, irrigation, non-conventional energy, community centers, public libraries, bus stands/stops, roads, pathways and bridges, sports, etc. These works are sanctioned, executed and monitored as per the provisions of the MPLADS Guidelines.
10.3 Scheme Performance
10.3.1 Physical Performance
As compiled from reports received from the Districts, since inception of the scheme:-
• 23,47,456 works have been recommended since inception of the Scheme.
• 20,77,151 works have been sanctioned since inception of the Scheme.
• 18,50,228 works have been completed since inception of the Scheme.
• The percentage of works completed over sanctioned is 89.07 since inception of the Scheme.
112
• In the current financial year 1,42,313 works have been recommended, 1,27,740 works have been sanctioned (including works recommended during previous years) and 1,05,167 works have been completed (including works sanctioned during previous years).
10.3.2 Financial Performance
• `50462.25 crore has been released since inception of the Scheme.
• Expenditure of `48997.07crore has been incurred since inception of the Scheme
• The percentage of expenditure over release is 97.10 as on 31st March 2019 since inception of the Scheme.
• In 2018-19, allocated fund of `3950 crore has been released to its full extent which was last achieved in 2008-09. During this period, an expenditure of `5012.13 crore has been incurred (including brought forward unspent amounts of previous years).
10.3.3. The funds released year-wise under the scheme, since inception is furnished below:
Year Funds Released (In `Crore) Cumulative Release (In `Crore)
1993-1994 37.80 37.80
1994-1995 771.00 808.80
1995-1996 763.00 1571.80
1996-1997 778.00 2349.80
1997-1998 488.00 2837.80
1998-1999 789.50 3627.30
1999-2000 1390.50 5017.80
2000-2001 2080.00 7097.80
2001-2002 1800.00 8897.80
2002-2003 1600.00 10497.80
2003-2004 1682.00 12179.80
2004-2005 1310.00 13489.80
2005-2006 1433.90 14923.70
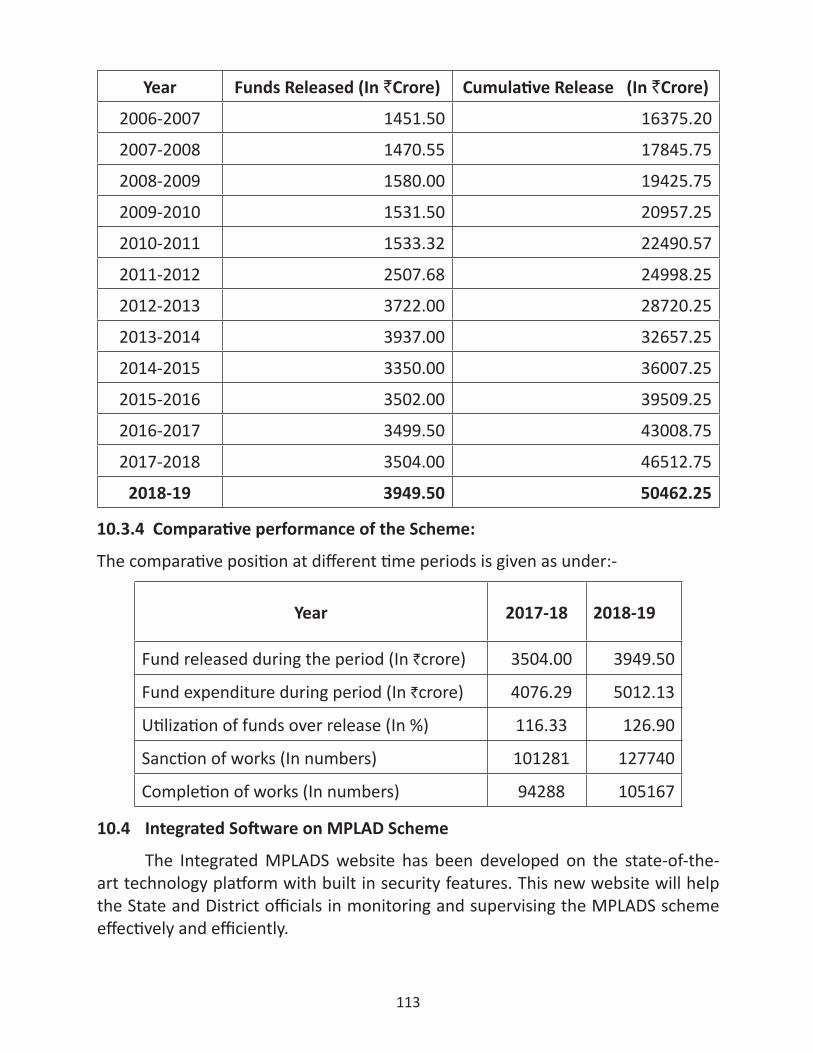
113
Year Funds Released (In `Crore) Cumulative Release (In `Crore)
2006-2007 1451.50 16375.20
2007-2008 1470.55 17845.75
2008-2009 1580.00 19425.75
2009-2010 1531.50 20957.25
2010-2011 1533.32 22490.57
2011-2012 2507.68 24998.25
2012-2013 3722.00 28720.25
2013-2014 3937.00 32657.25
2014-2015 3350.00 36007.25
2015-2016 3502.00 39509.25
2016-2017 3499.50 43008.75
2017-2018 3504.00 46512.75
2018-19 3949.50 50462.25
10.3.4 Comparative performance of the Scheme:
The comparative position at different time periods is given as under:-
Year
2017-18 2018-19
Fund released during the period (In `crore) 3504.00 3949.50
Fund expenditure during period (In `crore) 4076.29 5012.13
Utilization of funds over release (In %) 116.33 126.90
Sanction of works (In numbers) 101281 127740
Completion of works (In numbers) 94288 105167
10.4 Integrated Software on MPLAD Scheme
The Integrated MPLADS website has been developed on the state-of-the-art technology platform with built in security features. This new website will help the State and District officials in monitoring and supervising the MPLADS scheme effectively and efficiently.
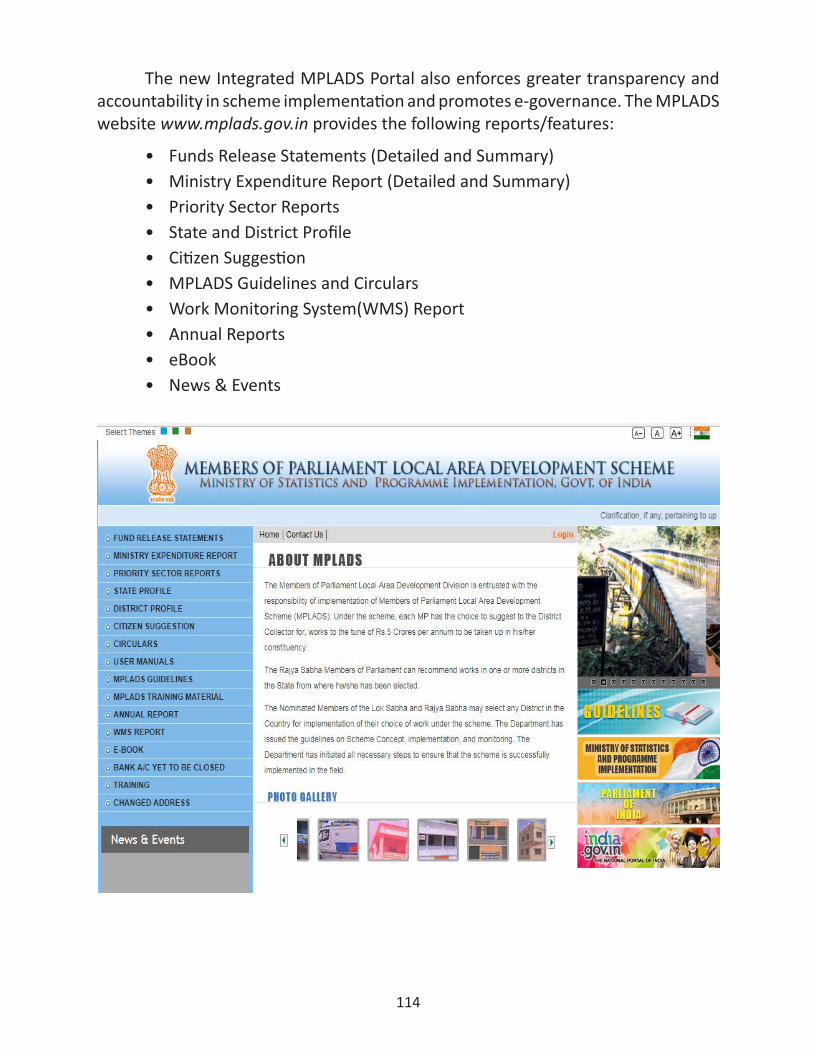
114
The new Integrated MPLADS Portal also enforces greater transparency and accountability in scheme implementation and promotes e-governance. The MPLADS website www.mplads.gov.in provides the following reports/features:
• Funds Release Statements (Detailed and Summary)• Ministry Expenditure Report (Detailed and Summary)• Priority Sector Reports• State and District Profile• Citizen Suggestion • MPLADS Guidelines and Circulars • Work Monitoring System(WMS) Report• Annual Reports• eBook• News & Events
115
New Integrated MPLADS Portal has following salient features:
• The Intergovernmental G2G solution ensures Micro / Macro (Works, Release and Expenditure) level reporting and monitoring for timely utilization of funds at Districts and Ministry including automatic incorporation of Member details from Lok Sabha and Rajya Sabha portal.
• The Citizen centric C2G solution provides transformation of public suggestions to on-line recommendations from Members of Parliament. It also provides messaging/blog, offline communication between Members and District Authorities.
• A single point of reference for all stakeholders – Members of Parliament, Districts, States, Ministry and Public.
• Captures the total available balances in Nodal Districts and Implementing Districts, thus resulting in timely monitoring of funds lying unutilized in the districts.
• Provides necessary alerts/ intimation through e-mails on all important milestones of any project such as project sanction, fund release, etc.
Through this portal, workflow system at Districts (Nodal Authorities) is established and integrated with the Government of India Release System. On regular updation on real time basis, the Sanction Order and MPR can be generated automatically. Further, on-line availability of MPR has facilitated timely release of funds subject to availability of other requisite eligible document(s).
10.5 Monitoring
• Implementation of MPLADS has improved due to intensive reviews and visits made by senior officers in the States.
• Annual Review Meetings with the Secretaries of State Nodal Departments are being regularly held to monitor release of funds and to take stock of the implementation of the scheme in the States/UTs.
• Technical assistance is also being provided to States/UTs to conduct training programmes for State/District officials to facilitate better implementation of the scheme. Ministry is providing training to the States/UTs for operationalising the newly developed integrated MPLADS website.
The physical monitoring by the external agencies has helped in bringing systemic changes for improved implementation of the Scheme. The overall improvement in the implementation of MPLAD Scheme is attributed to the synergy attained by the cooperation of different stakeholders and operational experience gained over years, community participation and close monitoring.
116
CHAPTER – XI
PROGRESSIVE USE OF OFFICIAL LANGUAGE/HINDI
11.1 In accordance with the Official Language Policy of the Union and in pursuance of the Annual Programme issued by the Department of Official Language, the Ministry of Statistics & Programme Implementation has been making continuous and concerted efforts for propagation and promotion of Hindi as official language in the Ministry and in its attached & subordinate offices. Official Language Section of the Ministry is responsible for monitoring and overseeing the implementation of various statutory provisions and policies as laid down in the Official Languages Act, 1963 and the Official Language Rules, 1976. As per information received from the Administration Division of the Ministry, as on 31.03.2019, all officers/employees are either proficient in Hindi or having its working knowledge. All the 12 Stenographers are trained in Hindi Shorthand/Typing. MTS officials are nominated regularly for the training programmes in Hindi typing.
Official Language Implementation Committee
11.2 An Official Language Implementation Committee under the Chairmanship of Joint Secretary (Admn.) undertakes quarterly review of the progressive use of Hindi as well as compliance of provisions of the Official Languages Act, 1963 & Official Languages Rules, 1976 in the Ministry and in its attached/subordinate offices. During the period under report, the meetings of the Committee were organized at regular intervals. Quarterly and Annual Reports regarding progressive use of Official Language in the Ministry are forwarded to the Department of Official Language, Ministry of Home Affairs regularly.
Inspections
11.3 The officers of the Ministry conduct inspections of the attached/subordinate offices as well as sections of the Ministry time and again to assess the position of progressive use of Hindi and give necessary instructions on the lapses found therein.
Inspections of following attached/subordinate offices of the Ministry have been carried out this year:
(i) Data Processing Centre, Giridih(ii) NSSO, FOD, Ajmer(iii) NSSO, FOD, Udaipur(iv) NSSO, FOD, Bhubaneswar
117
The divisions/sections of the Ministry inspected this year are as follows:-
(i) Coordination and Parliament Section(ii) National Account Division(iii) MPLADS Division
Awards and Incentives
11.4 As in the previous years, the incentive scheme for original noting/drafting in Hindi continued during this year also. In the month of September 2018, Hindi Month/Pakhwara was observed in the Ministry and in its attached and subordinate offices. In the Ministry, the period from 14th-28th September 2018 was observed as "Hindi Pakhwara". This Pakhwara was marked by greater participation of a large number of officers and officials in various competitions organized by Hindi Section of the Ministry. After evaluating the performances in these competitions, a total of 40 winner participants of the ministry were awarded cash prizes in different categories.
In order to promote use of Hindi in the ministry at all levels, various Hindi competitions were organized for Data Entry Operators as well as Daily Wages Employees this year also and 16 deserving participants were awarded cash prizes.
Hindi Training and Workshops
11.5 As per information received from Administration Wing of the Ministry, all the Stenographers/A.S.Os in the Ministry are trained in Hindi stenography/typing. So during the year 2018-19 none has been nominated under the Hindi Teaching Scheme of the Department of Official Language.
Inspections by Parliamentary Committee on Official Language
11.6 During the period under report, the 3rd Sub-committee of the Parliamentary Committee on Official Language carried out inspection of NSSO, FOD, Mysore on 19.06.2018.
11th World Hindi Conference
11.7 11th World Hindi Conference was organized by Ministry of External Affairs, Government of India in Mauritius from 18th -20th August 2018. In this connection, Ministry of External Affairs had issued a letter to almost all the Ministries/Departments of Government of India and other eligible Organizations requesting their participation in the said mega event. In response, Ministry of Statistics and Programme Implementation had nominated Joint Secretary (Admin.) and one Assistant Director (OL) to take part in this prestigious global event.
118
Publication of In-House Journal "Paridrishya"
11.8 During the reporting year, all the works related to publication of 9th issue of the in-house Hindi Journal of the Ministry "Paridrishya" have been completed and its printing process is underway.
119
CHAPTER XII
OTHER ACTIVITIES
12.1 The Vigilance Section in the Ministry, with the Joint Secretary & Chief Vigilance Officer as the Divisional head, deals with the following work:
• Vigilance cases i.e., cases of corruption, malpractices and lack of integrity in respect of Group ‘A’, ‘B’ and ‘C’ officers;
• Processing/issuing of vigilance clearance in respect of officers of various grades for various purposes;
• Implementation of Central Civil Service (Classification, Control and Appeal) Rules, 1964;
• Furnishing of monthly report of vigilance cases to the Department of Personnel & Training on Probity Portal.
12.2 Vigilance Section also handles the following activities:-
• Reviewing and streamlining of procedures, which appear to afford scope for corruption or misconduct and for initiating other measures for the prevention, detection of corruption and other malpractices and punishment to the corrupt in the Ministry as well as its attached and subordinate offices;
• Preparation of list of Officers of ‘Doubtful Integrity’ (ODI)/Agreed list and their postings to non-sensitive areas;
• Appointment of Vigilance Officers in the attached/subordinate offices.
12.3 The complaints received from individuals and organisations like CBI/CVC/PMO/Cabinet Secretariat/UPSC etc. are examined on the basis of the factual report obtained from the concerned Administrative Divisions, Attached and Subordinate Offices. The preliminary inquiries are made to look into the merit of the complaint and if the complaints have any substance then a regular departmental action is initiated.
12.4 During the year 2018-19 (April 2018-March 2019), 32 new complaints were received and examined for appropriate action. During the aforesaid period 20 disciplinary proceedings were also processed in the Vigilance Section of the Ministry which are at various stages of investigation/examination.
12.5 During the period (April 2018-March 2019), 2 Major and 1 Minor Penalty Charge Sheets have been issued.
120
12.6 In addition to the above, in consultation with UPSC/CVC, Major/Minor penalties were imposed in 4 disciplinary cases.
12.7 During the year 2018-2019, more than 1945 vigilance clearances were processed/ issued and 12 RTI Applications/5 First Appeals under the RTI Act, 2005 were received and disposed of within the stipulated time.
12.8 Vigilance Awareness Week was observed during the period 29th October 2018 to 3rd November 2018 to create awareness amongst officers and staff of the Ministry. It began with pledge taking ceremony. The theme of this year’s Vigilance Awareness Week was ‘Eradicate Corruption-Build a New India’ (Hkz‘kpkj feVkvks&u;k Hkkjr cukvks) Banners regarding observance of Vigilance Awareness Week were placed at vantage locations in the Ministry.
Redressal of Public Grievances
12.9 The Ministry of Statistics & Programme Implementation and its attached/subordinate offices do not have much public interaction with regard to delivery of services. However, a Grievance Redressal Machinery is functioning in this Ministry under the supervision of Nodal Officer (Public Grievances).
12.10 The grievances are received through P.G. Portal of the Ministry or through various Nodal Agencies such as Prime Minister's Office (PMO), President's Secretariat, Department of Administrative Reforms and Public Grievances (DARPG), Department of Pension & Pensioners’ Welfare (DOPPW) etc. The Public Grievances through P.G. Portal of the Ministry (CPGRAMS) and Department of Pension and Pensioners Welfare (CPENGRAMS) are regularly monitored by the Nodal Officer of the Ministry. There were 44 grievances pending as on 01st December 2017. During the period of 16 months starting from 1st December 2017 upto 31st March 2019, a total of 702 grievances were received and 719 grievances (including the pending grievance carried forward) were settled. All the Public Grievances cases are being monitored and followed up on priority basis by regularly reminding the concerned subordinate offices/divisions of the Ministry for early disposal. Monthly review meeting at JS level and quarterly review meeting at Secretary Level are also regularly held in Ministry.
12.11 The PIGR Cell of the Ministry has taken an initiative to provide the training opportunities for the staff in general and CPIOs/FAAs in particular at Zonal/Regional Level Offices under NSSO on the operation of On-line RTI Portal/PG Portal. This will help the Ministry to enforce the two very important tools of ‘Good Governance’ namely, ‘The RTI Act, 2005’ and (Public Grievance Redressal Mechanism’ in effective and efficient manner in the field offices of the Ministry. Accordingly, periodic Workshops/Training Programmes on On-line RTI Portal/PG Portal are being conducted by PIGR Cell of this Ministry in the field offices.
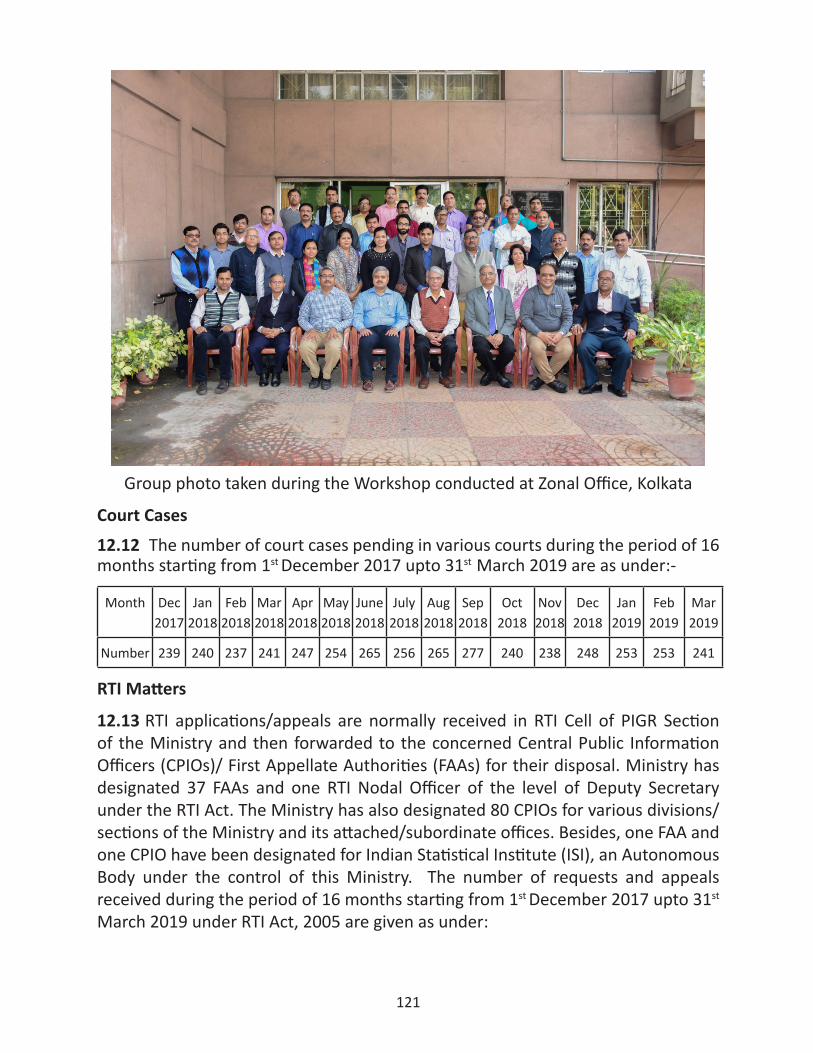
121
Group photo taken during the Workshop conducted at Zonal Office, Kolkata
Court Cases
12.12 The number of court cases pending in various courts during the period of 16 months starting from 1st December 2017 upto 31st March 2019 are as under:-
Month Dec2017
Jan2018
Feb2018
Mar2018
Apr2018
May2018
June2018
July2018
Aug2018
Sep2018
Oct2018
Nov2018
Dec2018
Jan2019
Feb2019
Mar2019
Number 239 240 237 241 247 254 265 256 265 277 240 238 248 253 253 241
RTI Matters
12.13 RTI applications/appeals are normally received in RTI Cell of PIGR Section of the Ministry and then forwarded to the concerned Central Public Information Officers (CPIOs)/ First Appellate Authorities (FAAs) for their disposal. Ministry has designated 37 FAAs and one RTI Nodal Officer of the level of Deputy Secretary under the RTI Act. The Ministry has also designated 80 CPIOs for various divisions/ sections of the Ministry and its attached/subordinate offices. Besides, one FAA and one CPIO have been designated for Indian Statistical Institute (ISI), an Autonomous Body under the control of this Ministry. The number of requests and appeals received during the period of 16 months starting from 1st December 2017 upto 31st
March 2019 under RTI Act, 2005 are given as under:
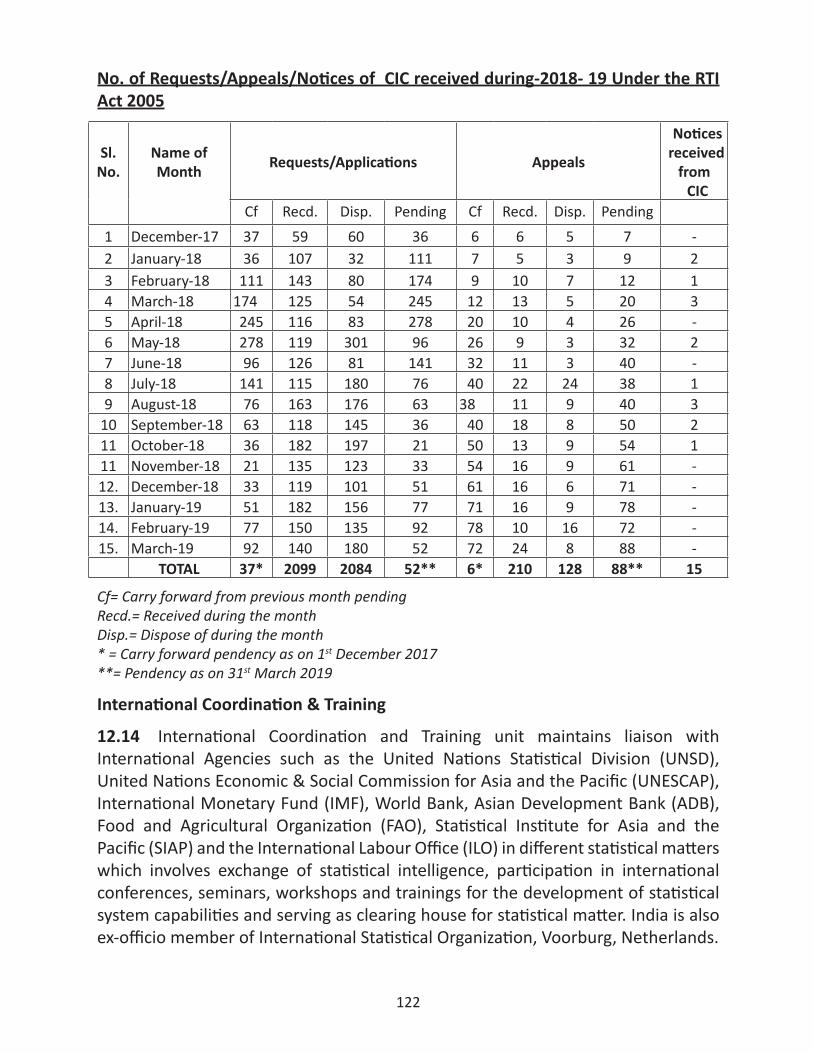
122
No. of Requests/Appeals/Notices of CIC received during-2018- 19 Under the RTI Act 2005
Sl. No.
Name of Month
Requests/Applications Appeals
Noticesreceived
fromCIC
Cf Recd. Disp. Pending Cf Recd. Disp. Pending1 December-17 37 59 60 36 6 6 5 7 -2 January-18 36 107 32 111 7 5 3 9 23 February-18 111 143 80 174 9 10 7 12 14 March-18 174 125 54 245 12 13 5 20 35 April-18 245 116 83 278 20 10 4 26 -6 May-18 278 119 301 96 26 9 3 32 27 June-18 96 126 81 141 32 11 3 40 -8 July-18 141 115 180 76 40 22 24 38 19 August-18 76 163 176 63 38 11 9 40 3
10 September-18 63 118 145 36 40 18 8 50 211 October-18 36 182 197 21 50 13 9 54 111 November-18 21 135 123 33 54 16 9 61 -12. December-18 33 119 101 51 61 16 6 71 -13. January-19 51 182 156 77 71 16 9 78 -14. February-19 77 150 135 92 78 10 16 72 -15. March-19 92 140 180 52 72 24 8 88 -
TOTAL 37* 2099 2084 52** 6* 210 128 88** 15
Cf= Carry forward from previous month pendingRecd.= Received during the monthDisp.= Dispose of during the month* = Carry forward pendency as on 1st December 2017**= Pendency as on 31st March 2019
International Coordination & Training
12.14 International Coordination and Training unit maintains liaison with International Agencies such as the United Nations Statistical Division (UNSD), United Nations Economic & Social Commission for Asia and the Pacific (UNESCAP), International Monetary Fund (IMF), World Bank, Asian Development Bank (ADB), Food and Agricultural Organization (FAO), Statistical Institute for Asia and the Pacific (SIAP) and the International Labour Office (ILO) in different statistical matters which involves exchange of statistical intelligence, participation in international conferences, seminars, workshops and trainings for the development of statistical system capabilities and serving as clearing house for statistical matter. India is also ex-officio member of International Statistical Organization, Voorburg, Netherlands.
123
12.15 45 Officers of this Ministry have attended 34 International Meetings/Conferences/Seminars and 35 Officers of this Ministry have participated in 31 International Workshops/Training Programmes/Courses during the period from 1st December 2017 to 31st March 2019.
12.16 Swachh Bharat Mission:-
(A) In true spirit of Swachh Bharat Mission and in order to achieve the vision of clean India, Ministry of Statistics and Programme Implementation (MoSPI) is making all out efforts and carrying out special cleanliness drives regularly.
(B) Following are the few major activities which are undertaken during these cleanliness drives:
• Regular up-keep and cleaning of the office premises, including the common areas like toilets, common corridors, stair, lifts etc.
• Upkeep and cleaning of the area around the office premises or the Office complex, including the parking areas, pathways etc.
• The regular and continuous cleanliness activities to ensure tidy workspaces.
• Ministry has nominated appropriate level officers to supervise and ensure the cleanliness activities in all its attached and subordinate offices.
• All out efforts have been made to weed out the old records and remove the scrap items from all the corridors and common spaces. Also, all the stair cases have been cleared of the obstructions. The Officers and staff are being regularly sensitized to keep their files and records in a neat and tidy manner in their rooms and keep the environment Spic and Span.
12.16 E-procurement:- The E-procurement and E-publishing mode of tender have been fully functional in the Ministry and all its attached/ subordinate offices.
12.18 Government E-Market Place:- The Ministry of Statistics & Programme Implementation has been registered under GeM portal for the procurement of products and services which are available under GeM. The procurement of products & services have been made fully operational and indenters, consignees, DDOs have been nominated for procurement of items available under GeM.
12.19 E-office project:- The e-Office project is one of the Mission Mode Project under the National e-Governance Plan to improve efficiency in Government process and service delivery mechanism. MoSPI has achieved the digitization of 60% of the physical files till the month of Dec. 2018 and it is envisaged to achieve the target of 80% by 30th June 2019.
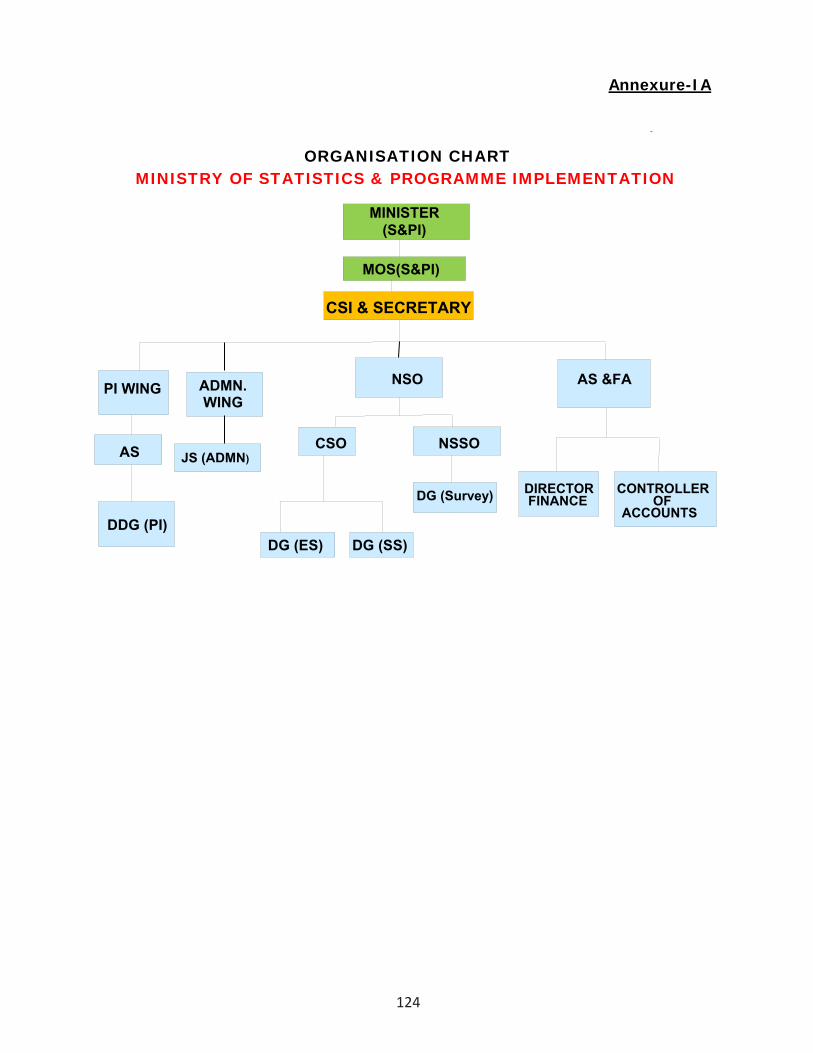
124
Annexure-IA
DDG (PI)
NSO
MINISTER (S&PI)
MINISTRY OF STATISTICS & PROGRAMME IMPLEMENTATIONORGANISATION CHART
CSI & SECRETARY
AS
CONTROLLEROF
ACCOUNTS
AS &FA
DIRECTOR FINANCEDG (Survey)
DG (ES)
PI WING
JS (ADMN)
ADMN. WING
‐
DG (SS)
MOS(S&PI)
CSO NSSO
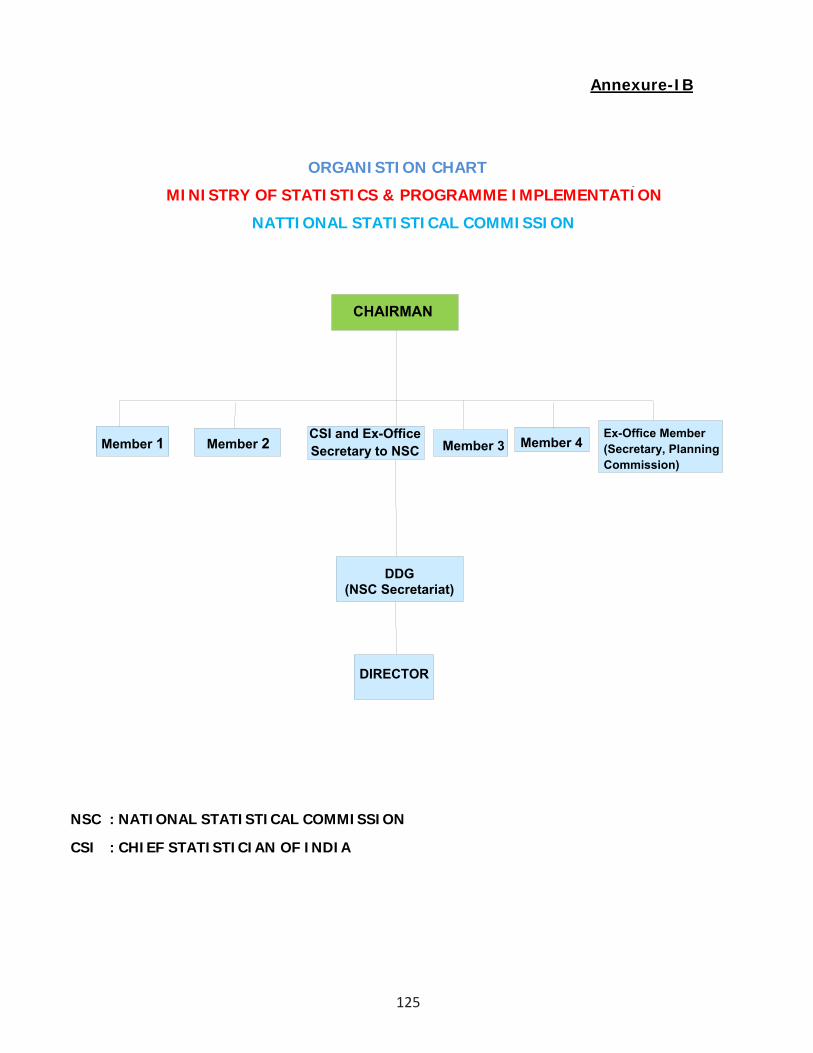
125
Annexure-IB
NSC : NATIONAL STATISTICAL COMMISSION
CSI : CHIEF STATISTICIAN OF INDIA
CHAIRMAN
Member 1
DIRECTOR
DDG (NSC Secretariat)
Member 3
‐
Member 4 Member 2 CSI and Ex-Office Secretary to NSC
Ex-Office Member (Secretary, Planning Commission)
MINISTRY OF STATISTICS & PROGRAMME IMPLEMENTATION
NATTIONAL STATISTICAL COMMISSION
ORGANISTION CHART
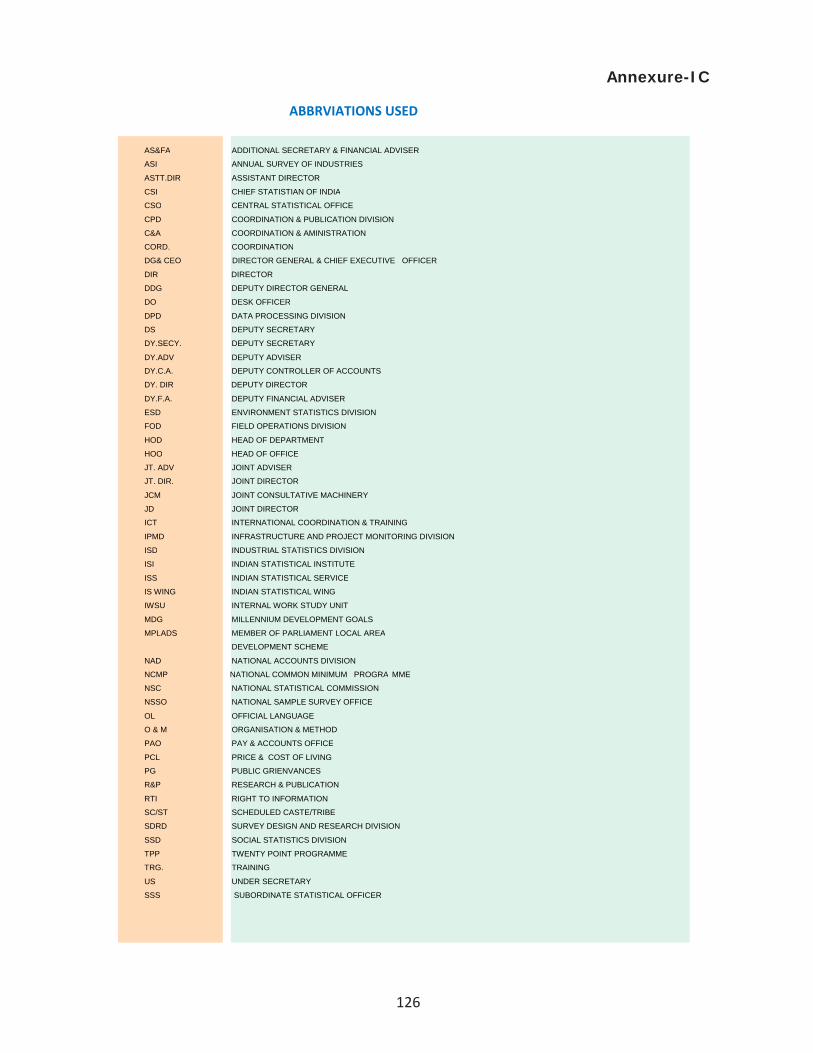
126
AS&FA ADDITIONAL SECRETARY & FINANCIAL ADVISER ASI ANNUAL SURVEY OF INDUSTRIES ASTT.DIR ASSISTANT DIRECTOR CSI CHIEF STATISTIAN OF INDIA CSO CENTRAL STATISTICAL OFFICE CPD COORDINATION & PUBLICATION DIVISION C&A COORDINATION & AMINISTRATION CORD. COORDINATION DG& CEO DIRECTOR GENERAL & CHIEF EXECUTIVE OFFICER DIR DIRECTOR DDG DEPUTY DIRECTOR GENERAL DO DESK OFFICER DPD DATA PROCESSING DIVISION DS DEPUTY SECRETARY DY.SECY. DEPUTY SECRETARY DY.ADV DEPUTY ADVISER DY.C.A. DEPUTY CONTROLLER OF ACCOUNTS DY. DIR DEPUTY DIRECTOR DY.F.A. DEPUTY FINANCIAL ADVISER ESD ENVIRONMENT STATISTICS DIVISION FOD FIELD OPERATIONS DIVISION HOD HEAD OF DEPARTMENT HOO HEAD OF OFFICE JT. ADV JOINT ADVISER JT. DIR. JOINT DIRECTOR JCM JOINT CONSULTATIVE MACHINERY JD JOINT DIRECTOR ICT INTERNATIONAL COORDINATION & TRAINING IPMD INFRASTRUCTURE AND PROJECT MONITORING DIVISION ISD INDUSTRIAL STATISTICS DIVISION ISI INDIAN STATISTICAL INSTITUTE ISS INDIAN STATISTICAL SERVICE IS WING INDIAN STATISTICAL WING IWSU INTERNAL WORK STUDY UNIT MDG MILLENNIUM DEVELOPMENT GOALS MPLADS MEMBER OF PARLIAMENT LOCAL AREA
DEVELOPMENT SCHEME NAD NATIONAL ACCOUNTS DIVISION NCMP NATIONAL COMMON MINIMUM PROGRA MME NSC NATIONAL STATISTICAL COMMISSION NSSO NATIONAL SAMPLE SURVEY OFFICE OL OFFICIAL LANGUAGE O & M ORGANISATION & METHOD PAO PAY & ACCOUNTS OFFICE PCL PRICE & COST OF LIVING PG PUBLIC GRIENVANCES R&P RESEARCH & PUBLICATION RTI RIGHT TO INFORMATION SC/ST SCHEDULED CASTE/TRIBE SDRD SURVEY DESIGN AND RESEARCH DIVISION SSD SOCIAL STATISTICS DIVISION TPP TWENTY POINT PROGRAMME TRG. TRAINING US UNDER SECRETARY SSS SUBORDINATE STATISTICAL OFFICER
ABBRVIATIONS USED
Annexure-IC
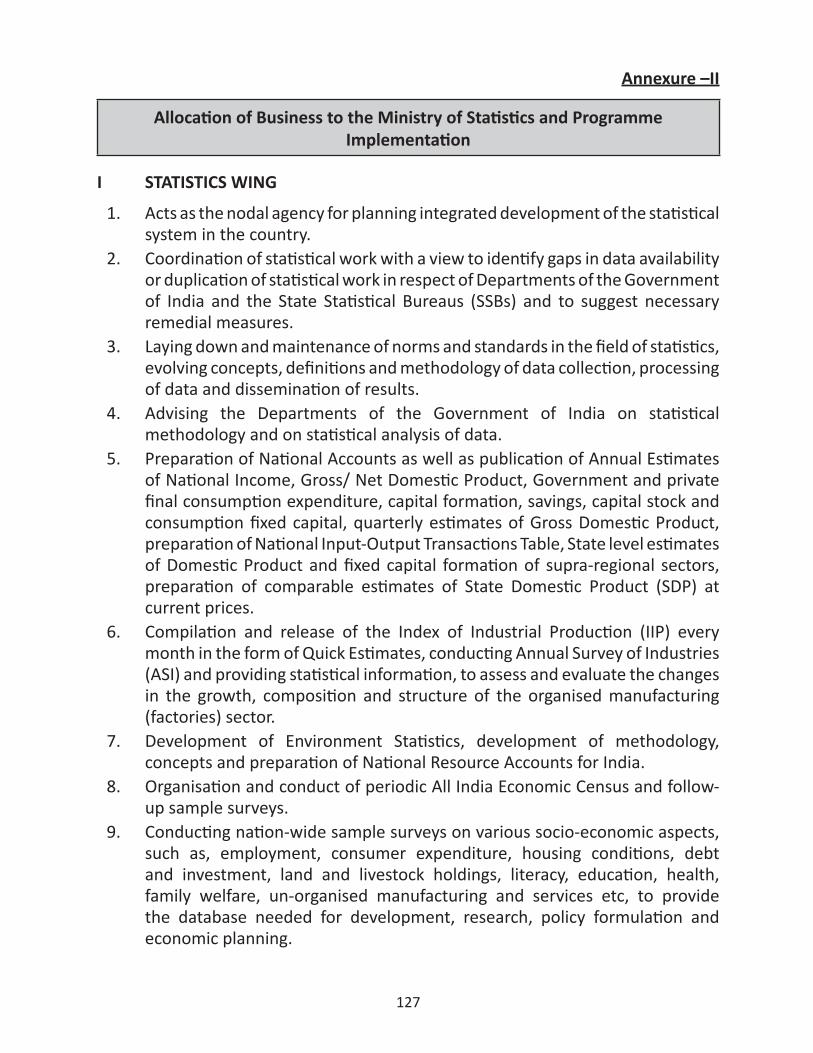
127
Annexure –II
Allocation of Business to the Ministry of Statistics and Programme Implementation
I STATISTICS WING
1. Acts as the nodal agency for planning integrated development of the statistical system in the country.
2. Coordination of statistical work with a view to identify gaps in data availability or duplication of statistical work in respect of Departments of the Government of India and the State Statistical Bureaus (SSBs) and to suggest necessary remedial measures.
3. Laying down and maintenance of norms and standards in the field of statistics, evolving concepts, definitions and methodology of data collection, processing of data and dissemination of results.
4. Advising the Departments of the Government of India on statistical methodology and on statistical analysis of data.
5. Preparation of National Accounts as well as publication of Annual Estimates of National Income, Gross/ Net Domestic Product, Government and private final consumption expenditure, capital formation, savings, capital stock and consumption fixed capital, quarterly estimates of Gross Domestic Product, preparation of National Input-Output Transactions Table, State level estimates of Domestic Product and fixed capital formation of supra-regional sectors, preparation of comparable estimates of State Domestic Product (SDP) at current prices.
6. Compilation and release of the Index of Industrial Production (IIP) every month in the form of Quick Estimates, conducting Annual Survey of Industries (ASI) and providing statistical information, to assess and evaluate the changes in the growth, composition and structure of the organised manufacturing (factories) sector.
7. Development of Environment Statistics, development of methodology, concepts and preparation of National Resource Accounts for India.
8. Organisation and conduct of periodic All India Economic Census and follow-up sample surveys.
9. Conducting nation-wide sample surveys on various socio-economic aspects, such as, employment, consumer expenditure, housing conditions, debt and investment, land and livestock holdings, literacy, education, health, family welfare, un-organised manufacturing and services etc, to provide the database needed for development, research, policy formulation and economic planning.
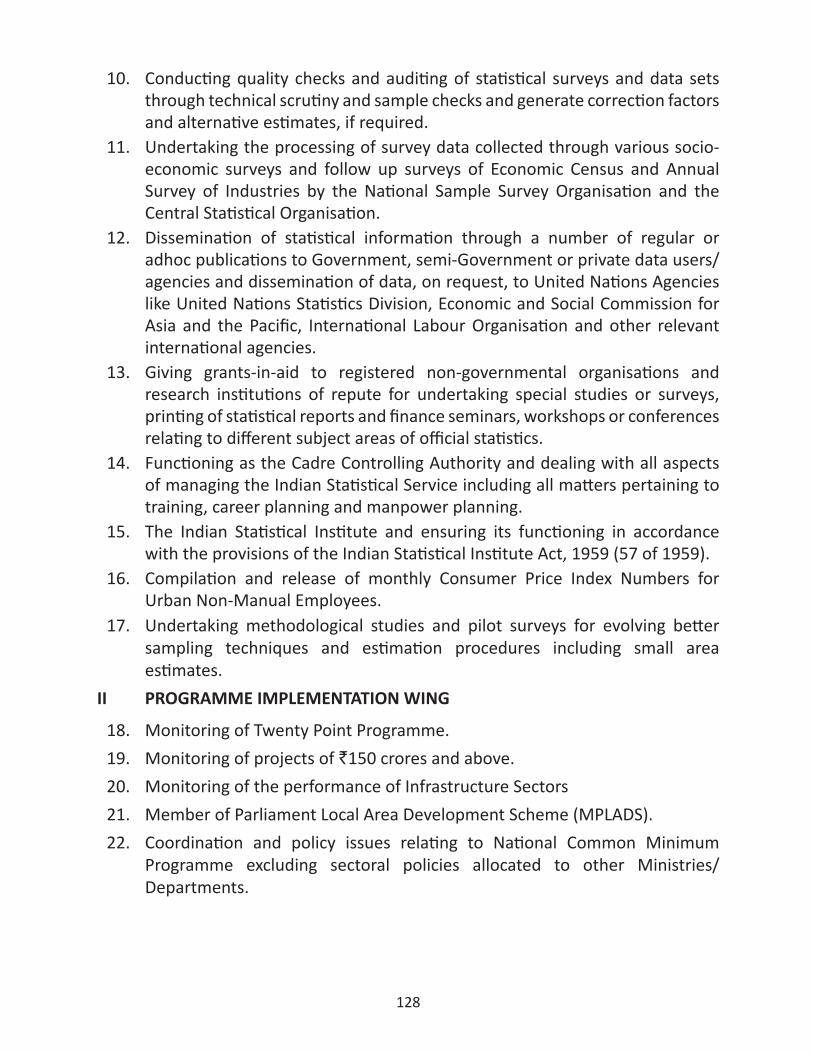
128
10. Conducting quality checks and auditing of statistical surveys and data sets through technical scrutiny and sample checks and generate correction factors and alternative estimates, if required.
11. Undertaking the processing of survey data collected through various socio-economic surveys and follow up surveys of Economic Census and Annual Survey of Industries by the National Sample Survey Organisation and the Central Statistical Organisation.
12. Dissemination of statistical information through a number of regular or adhoc publications to Government, semi-Government or private data users/agencies and dissemination of data, on request, to United Nations Agencies like United Nations Statistics Division, Economic and Social Commission for Asia and the Pacific, International Labour Organisation and other relevant international agencies.
13. Giving grants-in-aid to registered non-governmental organisations and research institutions of repute for undertaking special studies or surveys, printing of statistical reports and finance seminars, workshops or conferences relating to different subject areas of official statistics.
14. Functioning as the Cadre Controlling Authority and dealing with all aspects of managing the Indian Statistical Service including all matters pertaining to training, career planning and manpower planning.
15. The Indian Statistical Institute and ensuring its functioning in accordance with the provisions of the Indian Statistical Institute Act, 1959 (57 of 1959).
16. Compilation and release of monthly Consumer Price Index Numbers for Urban Non-Manual Employees.
17. Undertaking methodological studies and pilot surveys for evolving better sampling techniques and estimation procedures including small area estimates.
II PROGRAMME IMPLEMENTATION WING
18. Monitoring of Twenty Point Programme.19. Monitoring of projects of `150 crores and above.20. Monitoring of the performance of Infrastructure Sectors21. Member of Parliament Local Area Development Scheme (MPLADS).22. Coordination and policy issues relating to National Common Minimum
Programme excluding sectoral policies allocated to other Ministries/ Departments.
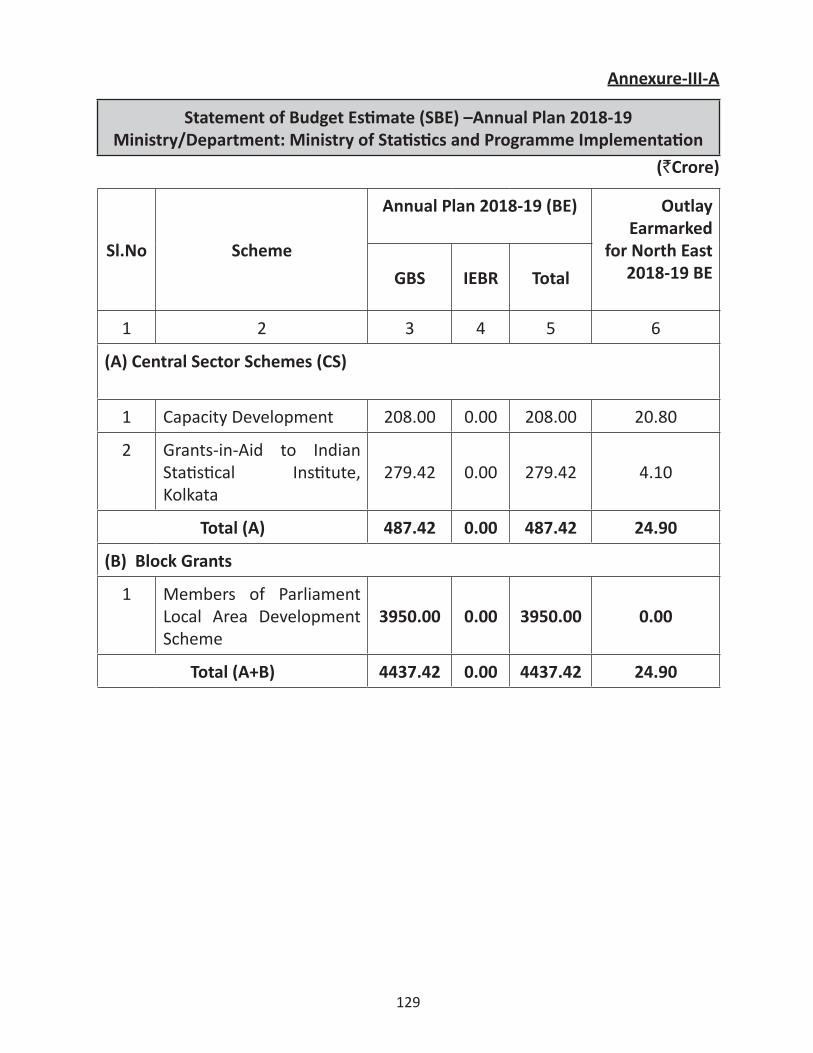
129
Annexure-III-A
Statement of Budget Estimate (SBE) –Annual Plan 2018-19Ministry/Department: Ministry of Statistics and Programme Implementation
(`Crore)
Sl.No Scheme
Annual Plan 2018-19 (BE) OutlayEarmarked
for North East 2018-19 BEGBS IEBR Total
1 2 3 4 5 6
(A) Central Sector Schemes (CS)
1 Capacity Development 208.00 0.00 208.00 20.80
2 Grants-in-Aid to Indian Statistical Institute, Kolkata
279.42 0.00 279.42 4.10
Total (A) 487.42 0.00 487.42 24.90
(B) Block Grants
1 Members of Parliament Local Area Development Scheme
3950.00 0.00 3950.00 0.00
Total (A+B) 4437.42 0.00 4437.42 24.90
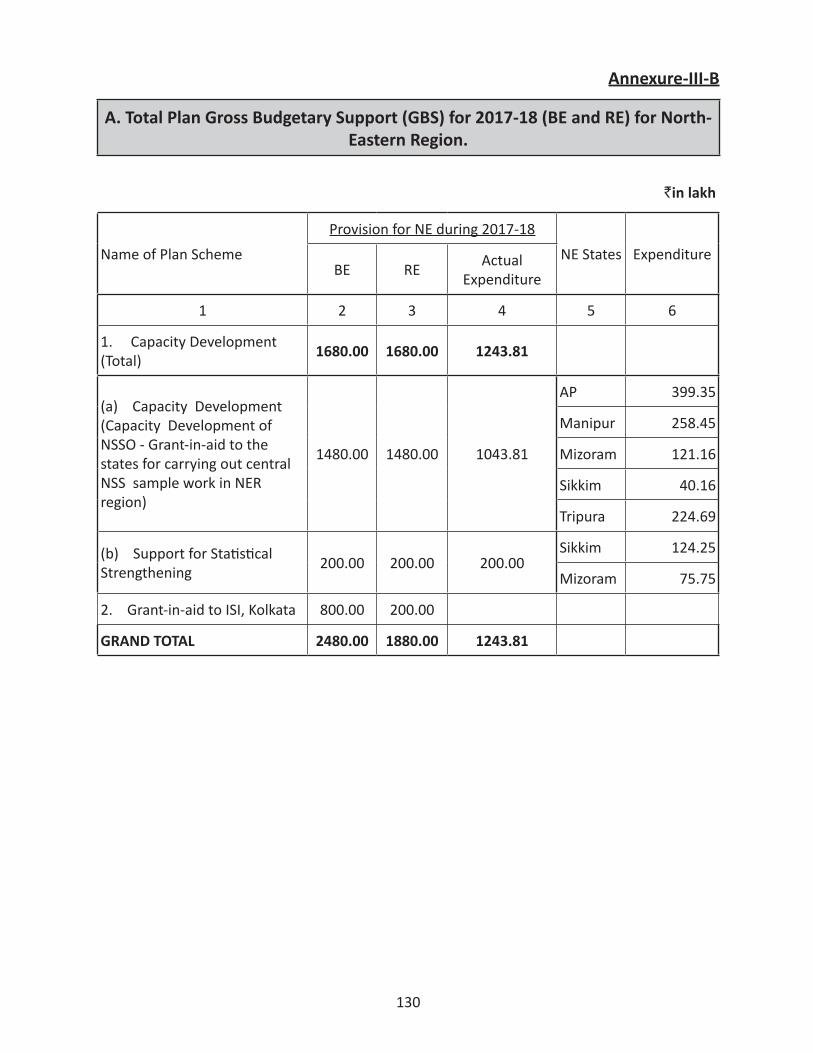
130
Annexure-III-B
A. Total Plan Gross Budgetary Support (GBS) for 2017-18 (BE and RE) for North-Eastern Region.
`in lakh
Name of Plan SchemeProvision for NE during 2017-18
NE States ExpenditureBE RE Actual
Expenditure
1 2 3 4 5 6
1. Capacity Development (Total) 1680.00 1680.00 1243.81
(a) Capacity Development (Capacity Development of NSSO - Grant-in-aid to the states for carrying out central NSS sample work in NER region)
1480.00 1480.00 1043.81
AP 399.35
Manipur 258.45
Mizoram 121.16
Sikkim 40.16
Tripura 224.69
(b) Support for Statistical Strengthening 200.00 200.00 200.00
Sikkim 124.25
Mizoram 75.75
2. Grant-in-aid to ISI, Kolkata 800.00 200.00
GRAND TOTAL 2480.00 1880.00 1243.81
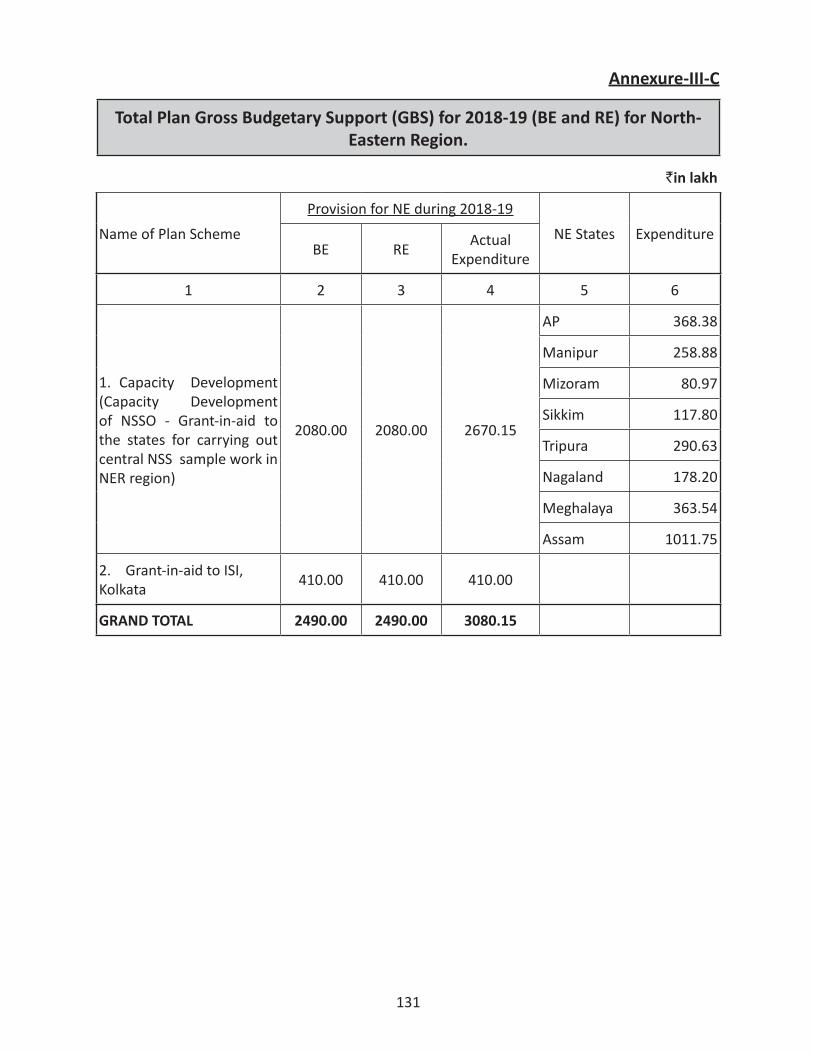
131
Annexure-III-C
Total Plan Gross Budgetary Support (GBS) for 2018-19 (BE and RE) for North-Eastern Region.
`in lakh
Name of Plan SchemeProvision for NE during 2018-19
NE States ExpenditureBE RE Actual
Expenditure
1 2 3 4 5 6
1. Capacity Development (Capacity Development of NSSO - Grant-in-aid to the states for carrying out central NSS sample work in NER region)
2080.00 2080.00 2670.15
AP 368.38
Manipur 258.88
Mizoram 80.97
Sikkim 117.80
Tripura 290.63
Nagaland 178.20
Meghalaya 363.54
Assam 1011.75
2. Grant-in-aid to ISI, Kolkata 410.00 410.00 410.00
GRAND TOTAL 2490.00 2490.00 3080.15
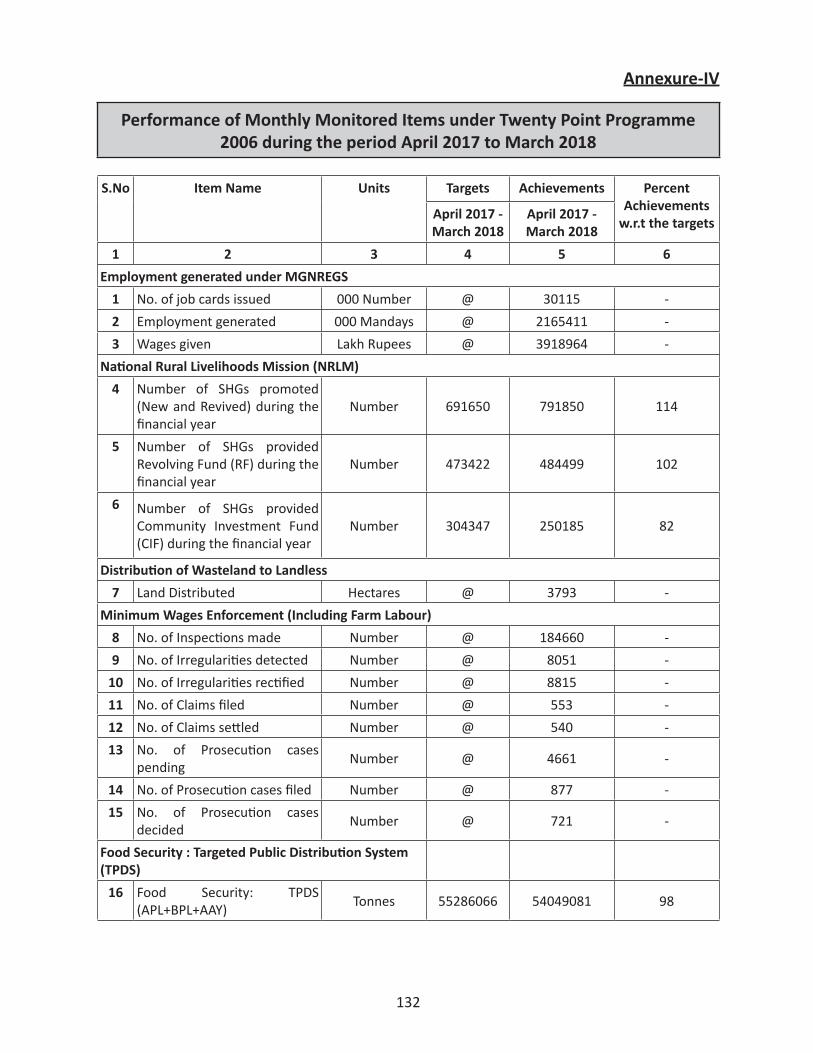
132
Annexure-IV
Performance of Monthly Monitored Items under Twenty Point Programme 2006 during the period April 2017 to March 2018
S.No Item Name Units Targets Achievements Percent Achievements
w.r.t the targetsApril 2017 - March 2018
April 2017 - March 2018
1 2 3 4 5 6
Employment generated under MGNREGS
1 No. of job cards issued 000 Number @ 30115 -2 Employment generated 000 Mandays @ 2165411 -3 Wages given Lakh Rupees @ 3918964 -
National Rural Livelihoods Mission (NRLM)
4 Number of SHGs promoted (New and Revived) during the financial year
Number 691650 791850 114
5 Number of SHGs provided Revolving Fund (RF) during the financial year
Number 473422 484499 102
6 Number of SHGs provided Community Investment Fund (CIF) during the financial year
Number 304347 250185 82
Distribution of Wasteland to Landless
7 Land Distributed Hectares @ 3793 -Minimum Wages Enforcement (Including Farm Labour)
8 No. of Inspections made Number @ 184660 -9 No. of Irregularities detected Number @ 8051 -
10 No. of Irregularities rectified Number @ 8815 -11 No. of Claims filed Number @ 553 -12 No. of Claims settled Number @ 540 -13 No. of Prosecution cases
pending Number @ 4661 -
14 No. of Prosecution cases filed Number @ 877 -15 No. of Prosecution cases
decided Number @ 721 -
Food Security : Targeted Public Distribution System (TPDS)
16 Food Security: TPDS (APL+BPL+AAY) Tonnes 55286066 54049081 98
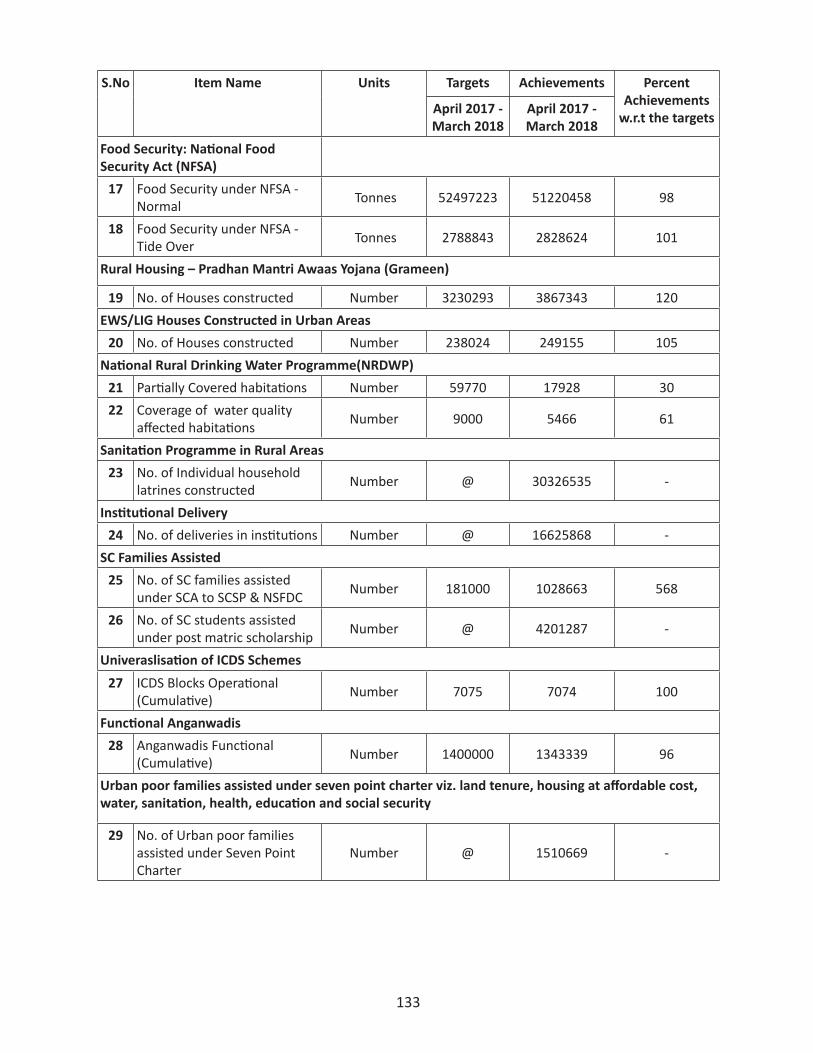
133
S.No Item Name Units Targets Achievements Percent Achievements
w.r.t the targetsApril 2017 - March 2018
April 2017 - March 2018
Food Security: National Food Security Act (NFSA)
17 Food Security under NFSA - Normal Tonnes 52497223 51220458 98
18 Food Security under NFSA - Tide Over Tonnes 2788843 2828624 101
Rural Housing – Pradhan Mantri Awaas Yojana (Grameen)
19 No. of Houses constructed Number 3230293 3867343 120EWS/LIG Houses Constructed in Urban Areas
20 No. of Houses constructed Number 238024 249155 105National Rural Drinking Water Programme(NRDWP)
21 Partially Covered habitations Number 59770 17928 3022 Coverage of water quality
affected habitations Number 9000 5466 61
Sanitation Programme in Rural Areas
23 No. of Individual household latrines constructed Number @ 30326535 -
Institutional Delivery
24 No. of deliveries in institutions Number @ 16625868 -SC Families Assisted
25 No. of SC families assisted under SCA to SCSP & NSFDC Number 181000 1028663 568
26 No. of SC students assisted under post matric scholarship Number @ 4201287 -
Univeraslisation of ICDS Schemes
27 ICDS Blocks Operational (Cumulative) Number 7075 7074 100
Functional Anganwadis
28 Anganwadis Functional (Cumulative) Number 1400000 1343339 96
Urban poor families assisted under seven point charter viz. land tenure, housing at affordable cost, water, sanitation, health, education and social security
29 No. of Urban poor families assisted under Seven Point Charter
Number @ 1510669 -
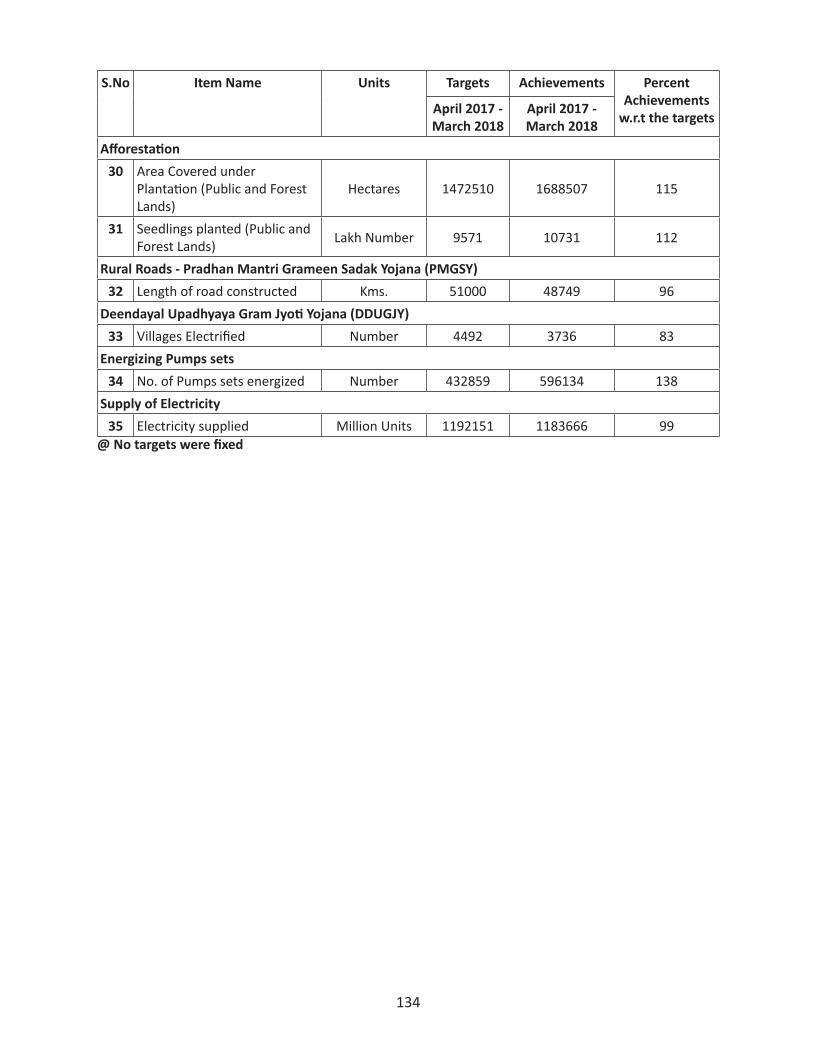
134
S.No Item Name Units Targets Achievements Percent Achievements
w.r.t the targetsApril 2017 - March 2018
April 2017 - March 2018
Afforestation
30 Area Covered under Plantation (Public and Forest Lands)
Hectares 1472510 1688507 115
31 Seedlings planted (Public and Forest Lands) Lakh Number 9571 10731 112
Rural Roads - Pradhan Mantri Grameen Sadak Yojana (PMGSY)
32 Length of road constructed Kms. 51000 48749 96Deendayal Upadhyaya Gram Jyoti Yojana (DDUGJY)
33 Villages Electrified Number 4492 3736 83Energizing Pumps sets
34 No. of Pumps sets energized Number 432859 596134 138Supply of Electricity
35 Electricity supplied Million Units 1192151 1183666 99@ No targets were fixed
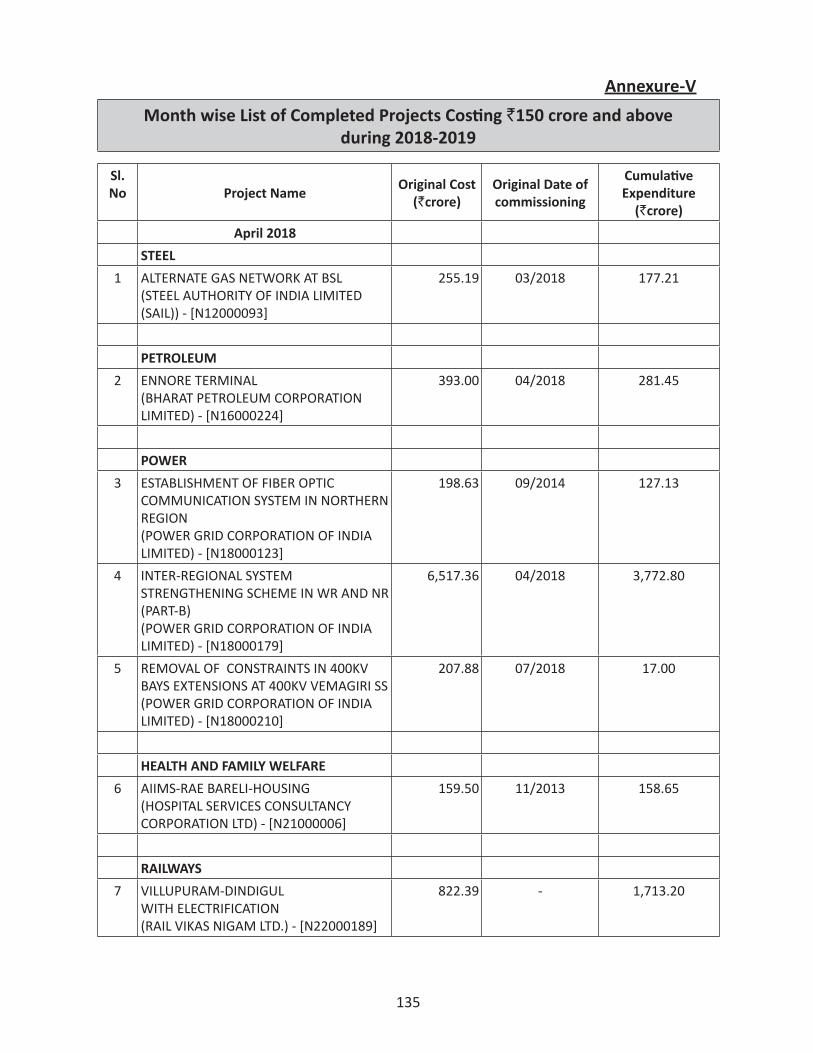
135
Sl. No Project Name
Original Cost(`crore)
Original Date of commissioning
Cumulative Expenditure
(`crore)
April 2018
STEEL
1 ALTERNATE GAS NETWORK AT BSL (STEEL AUTHORITY OF INDIA LIMITED (SAIL)) - [N12000093]
255.19 03/2018 177.21
PETROLEUM
2 ENNORE TERMINAL (BHARAT PETROLEUM CORPORATION LIMITED) - [N16000224]
393.00 04/2018 281.45
POWER
3 ESTABLISHMENT OF FIBER OPTIC COMMUNICATION SYSTEM IN NORTHERN REGION (POWER GRID CORPORATION OF INDIA LIMITED) - [N18000123]
198.63 09/2014 127.13
4 INTER-REGIONAL SYSTEM STRENGTHENING SCHEME IN WR AND NR (PART-B)(POWER GRID CORPORATION OF INDIA LIMITED) - [N18000179]
6,517.36 04/2018 3,772.80
5 REMOVAL OF CONSTRAINTS IN 400KV BAYS EXTENSIONS AT 400KV VEMAGIRI SS (POWER GRID CORPORATION OF INDIA LIMITED) - [N18000210]
207.88 07/2018 17.00
HEALTH AND FAMILY WELFARE
6 AIIMS-RAE BARELI-HOUSING (HOSPITAL SERVICES CONSULTANCY CORPORATION LTD) - [N21000006]
159.50 11/2013 158.65
RAILWAYS
7 VILLUPURAM-DINDIGUL WITH ELECTRIFICATION (RAIL VIKAS NIGAM LTD.) - [N22000189]
822.39 - 1,713.20
Annexure-V
Month wise List of Completed Projects Costing `150 crore and above during 2018-2019
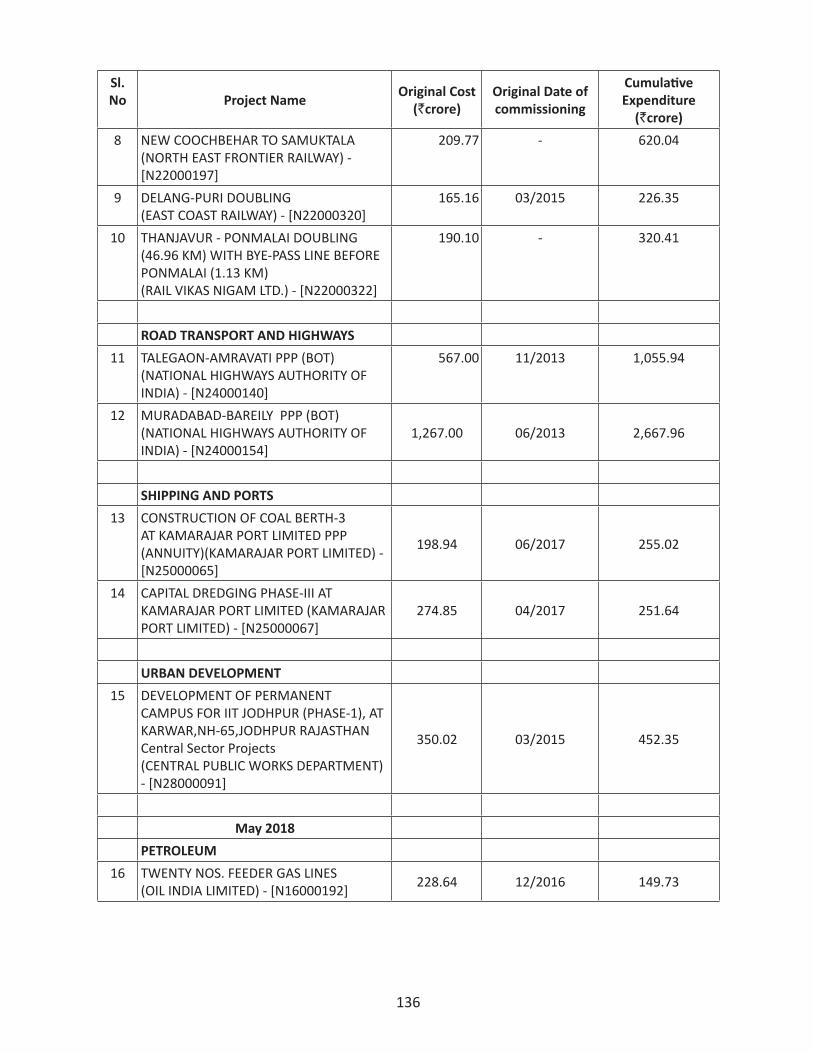
136
Sl. No Project Name
Original Cost(`crore)
Original Date of commissioning
Cumulative Expenditure
(`crore)
8 NEW COOCHBEHAR TO SAMUKTALA (NORTH EAST FRONTIER RAILWAY) - [N22000197]
209.77 - 620.04
9 DELANG-PURI DOUBLING (EAST COAST RAILWAY) - [N22000320]
165.16 03/2015 226.35
10 THANJAVUR - PONMALAI DOUBLING (46.96 KM) WITH BYE-PASS LINE BEFORE PONMALAI (1.13 KM) (RAIL VIKAS NIGAM LTD.) - [N22000322]
190.10 - 320.41
ROAD TRANSPORT AND HIGHWAYS
11 TALEGAON-AMRAVATI PPP (BOT)(NATIONAL HIGHWAYS AUTHORITY OF INDIA) - [N24000140]
567.00 11/2013 1,055.94
12 MURADABAD-BAREILY PPP (BOT)(NATIONAL HIGHWAYS AUTHORITY OF INDIA) - [N24000154]
1,267.00 06/2013 2,667.96
SHIPPING AND PORTS
13 CONSTRUCTION OF COAL BERTH-3 AT KAMARAJAR PORT LIMITED PPP (ANNUITY)(KAMARAJAR PORT LIMITED) - [N25000065]
198.94 06/2017 255.02
14 CAPITAL DREDGING PHASE-III AT KAMARAJAR PORT LIMITED (KAMARAJAR PORT LIMITED) - [N25000067]
274.85 04/2017 251.64
URBAN DEVELOPMENT
15 DEVELOPMENT OF PERMANENT CAMPUS FOR IIT JODHPUR (PHASE-1), AT KARWAR,NH-65,JODHPUR RAJASTHAN Central Sector Projects(CENTRAL PUBLIC WORKS DEPARTMENT) - [N28000091]
350.02 03/2015 452.35
May 2018
PETROLEUM
16 TWENTY NOS. FEEDER GAS LINES (OIL INDIA LIMITED) - [N16000192] 228.64 12/2016 149.73
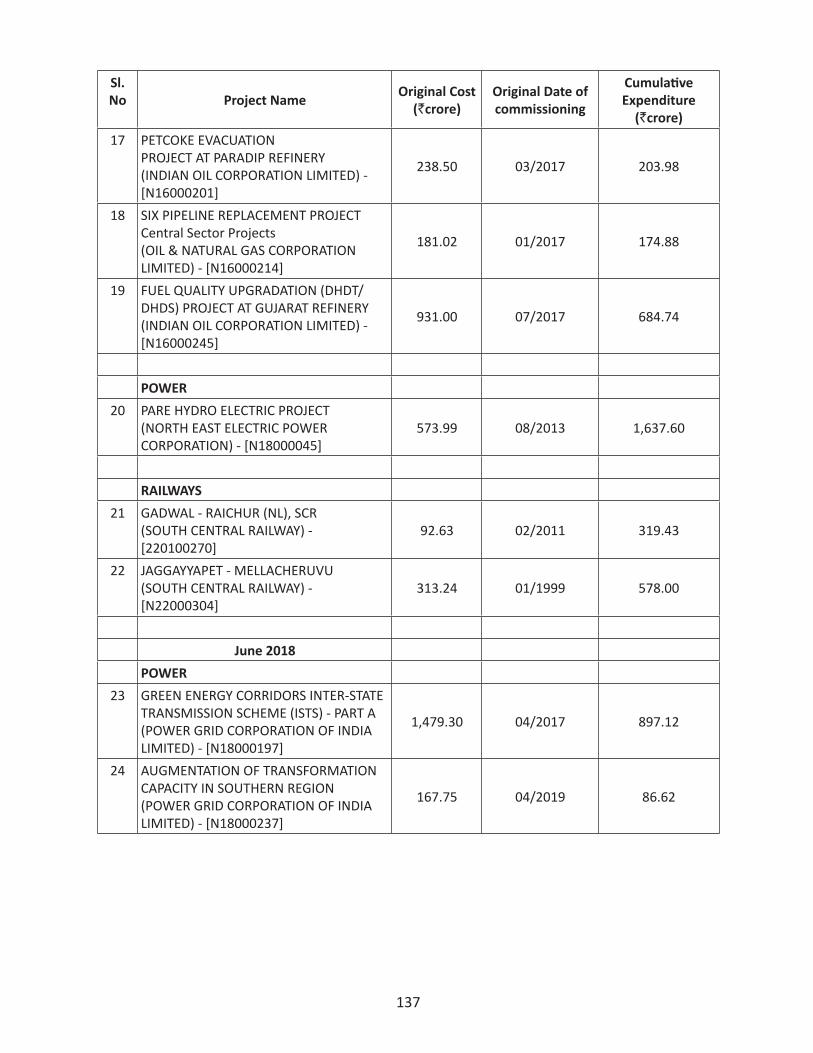
137
Sl. No Project Name
Original Cost(`crore)
Original Date of commissioning
Cumulative Expenditure
(`crore)
17 PETCOKE EVACUATION PROJECT AT PARADIP REFINERY (INDIAN OIL CORPORATION LIMITED) - [N16000201]
238.50 03/2017 203.98
18 SIX PIPELINE REPLACEMENT PROJECT Central Sector Projects (OIL & NATURAL GAS CORPORATION LIMITED) - [N16000214]
181.02 01/2017 174.88
19 FUEL QUALITY UPGRADATION (DHDT/DHDS) PROJECT AT GUJARAT REFINERY (INDIAN OIL CORPORATION LIMITED) - [N16000245]
931.00 07/2017 684.74
POWER
20 PARE HYDRO ELECTRIC PROJECT (NORTH EAST ELECTRIC POWER CORPORATION) - [N18000045]
573.99 08/2013 1,637.60
RAILWAYS
21 GADWAL - RAICHUR (NL), SCR (SOUTH CENTRAL RAILWAY) - [220100270]
92.63 02/2011 319.43
22 JAGGAYYAPET - MELLACHERUVU (SOUTH CENTRAL RAILWAY) - [N22000304]
313.24 01/1999 578.00
June 2018
POWER
23 GREEN ENERGY CORRIDORS INTER-STATE TRANSMISSION SCHEME (ISTS) - PART A(POWER GRID CORPORATION OF INDIA LIMITED) - [N18000197]
1,479.30 04/2017 897.12
24 AUGMENTATION OF TRANSFORMATION CAPACITY IN SOUTHERN REGION(POWER GRID CORPORATION OF INDIA LIMITED) - [N18000237]
167.75 04/2019 86.62
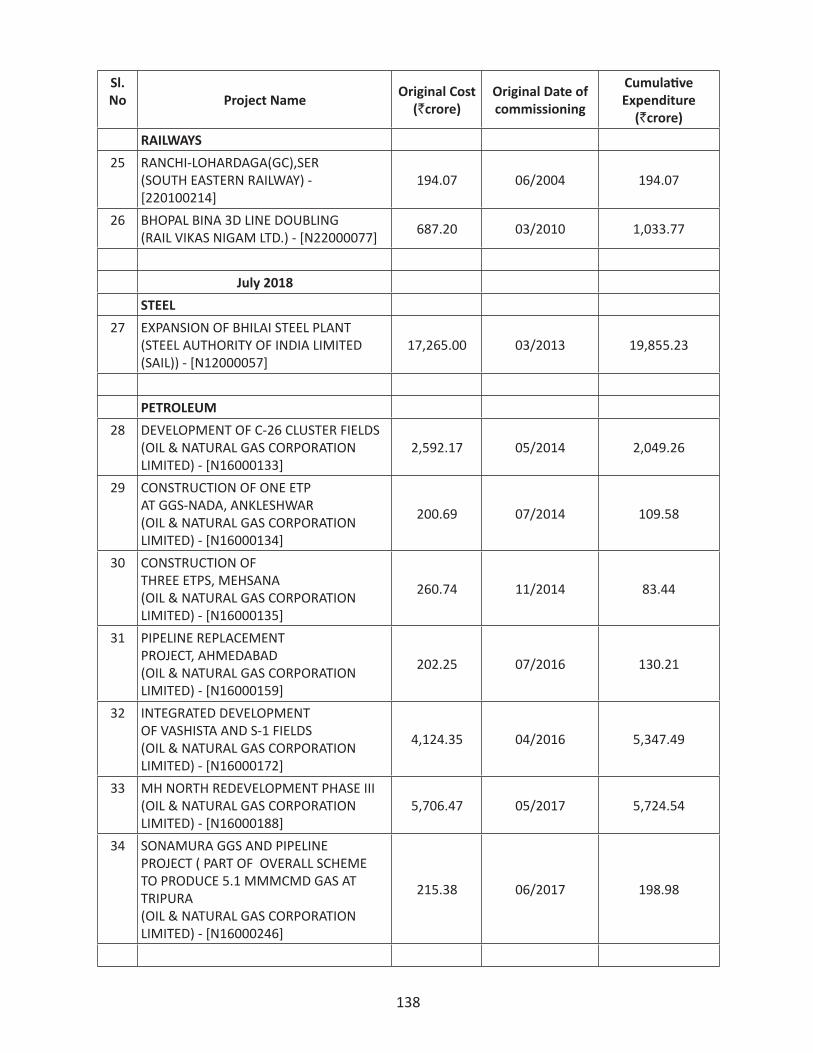
138
Sl. No Project Name
Original Cost(`crore)
Original Date of commissioning
Cumulative Expenditure
(`crore)
RAILWAYS
25 RANCHI-LOHARDAGA(GC),SER (SOUTH EASTERN RAILWAY) - [220100214]
194.07 06/2004 194.07
26 BHOPAL BINA 3D LINE DOUBLING (RAIL VIKAS NIGAM LTD.) - [N22000077] 687.20 03/2010 1,033.77
July 2018
STEEL
27 EXPANSION OF BHILAI STEEL PLANT (STEEL AUTHORITY OF INDIA LIMITED (SAIL)) - [N12000057]
17,265.00 03/2013 19,855.23
PETROLEUM
28 DEVELOPMENT OF C-26 CLUSTER FIELDS (OIL & NATURAL GAS CORPORATION LIMITED) - [N16000133]
2,592.17 05/2014 2,049.26
29 CONSTRUCTION OF ONE ETP AT GGS-NADA, ANKLESHWAR (OIL & NATURAL GAS CORPORATION LIMITED) - [N16000134]
200.69 07/2014 109.58
30 CONSTRUCTION OF THREE ETPS, MEHSANA (OIL & NATURAL GAS CORPORATION LIMITED) - [N16000135]
260.74 11/2014 83.44
31 PIPELINE REPLACEMENT PROJECT, AHMEDABAD (OIL & NATURAL GAS CORPORATION LIMITED) - [N16000159]
202.25 07/2016 130.21
32 INTEGRATED DEVELOPMENT OF VASHISTA AND S-1 FIELDS (OIL & NATURAL GAS CORPORATION LIMITED) - [N16000172]
4,124.35 04/2016 5,347.49
33 MH NORTH REDEVELOPMENT PHASE III (OIL & NATURAL GAS CORPORATION LIMITED) - [N16000188]
5,706.47 05/2017 5,724.54
34 SONAMURA GGS AND PIPELINE PROJECT ( PART OF OVERALL SCHEME TO PRODUCE 5.1 MMMCMD GAS AT TRIPURA (OIL & NATURAL GAS CORPORATION LIMITED) - [N16000246]
215.38 06/2017 198.98
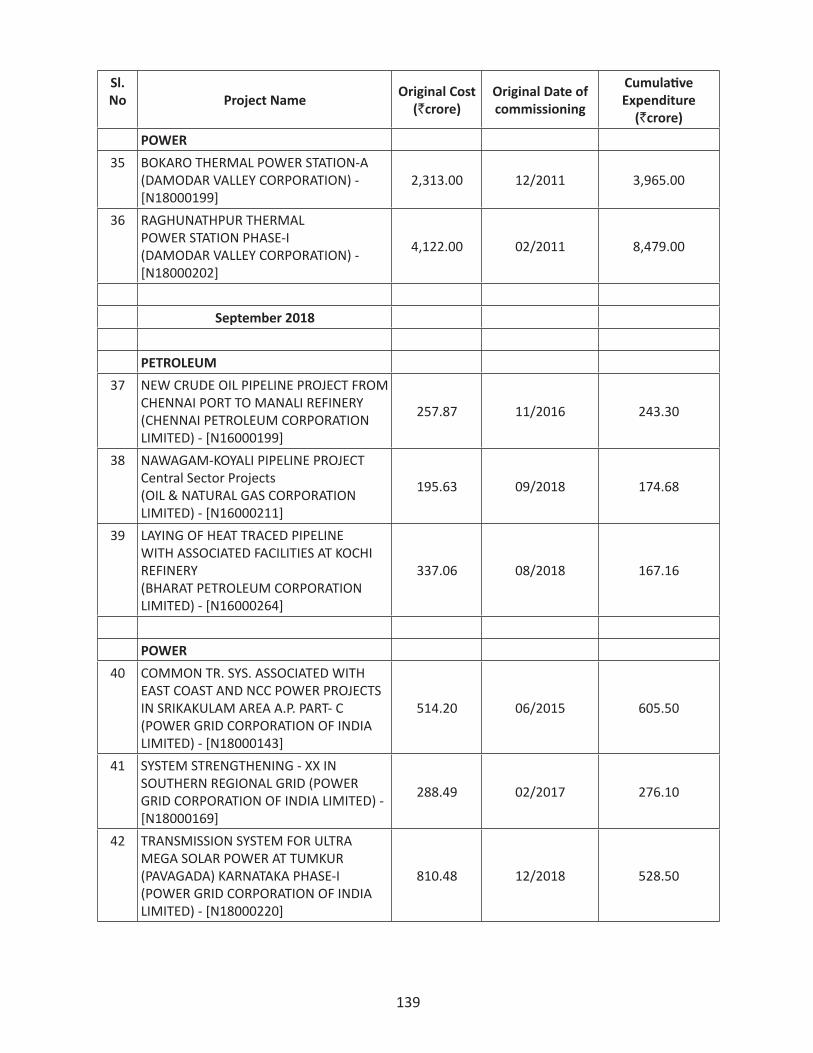
139
Sl. No Project Name
Original Cost(`crore)
Original Date of commissioning
Cumulative Expenditure
(`crore)
POWER
35 BOKARO THERMAL POWER STATION-A (DAMODAR VALLEY CORPORATION) - [N18000199]
2,313.00 12/2011 3,965.00
36 RAGHUNATHPUR THERMAL POWER STATION PHASE-I (DAMODAR VALLEY CORPORATION) - [N18000202]
4,122.00 02/2011 8,479.00
September 2018
PETROLEUM
37 NEW CRUDE OIL PIPELINE PROJECT FROM CHENNAI PORT TO MANALI REFINERY (CHENNAI PETROLEUM CORPORATION LIMITED) - [N16000199]
257.87 11/2016 243.30
38 NAWAGAM-KOYALI PIPELINE PROJECT Central Sector Projects(OIL & NATURAL GAS CORPORATION LIMITED) - [N16000211]
195.63 09/2018 174.68
39 LAYING OF HEAT TRACED PIPELINE WITH ASSOCIATED FACILITIES AT KOCHI REFINERY (BHARAT PETROLEUM CORPORATION LIMITED) - [N16000264]
337.06 08/2018 167.16
POWER
40 COMMON TR. SYS. ASSOCIATED WITH EAST COAST AND NCC POWER PROJECTS IN SRIKAKULAM AREA A.P. PART- C (POWER GRID CORPORATION OF INDIA LIMITED) - [N18000143]
514.20 06/2015 605.50
41 SYSTEM STRENGTHENING - XX IN SOUTHERN REGIONAL GRID (POWER GRID CORPORATION OF INDIA LIMITED) - [N18000169]
288.49 02/2017 276.10
42 TRANSMISSION SYSTEM FOR ULTRA MEGA SOLAR POWER AT TUMKUR (PAVAGADA) KARNATAKA PHASE-I (POWER GRID CORPORATION OF INDIA LIMITED) - [N18000220]
810.48 12/2018 528.50
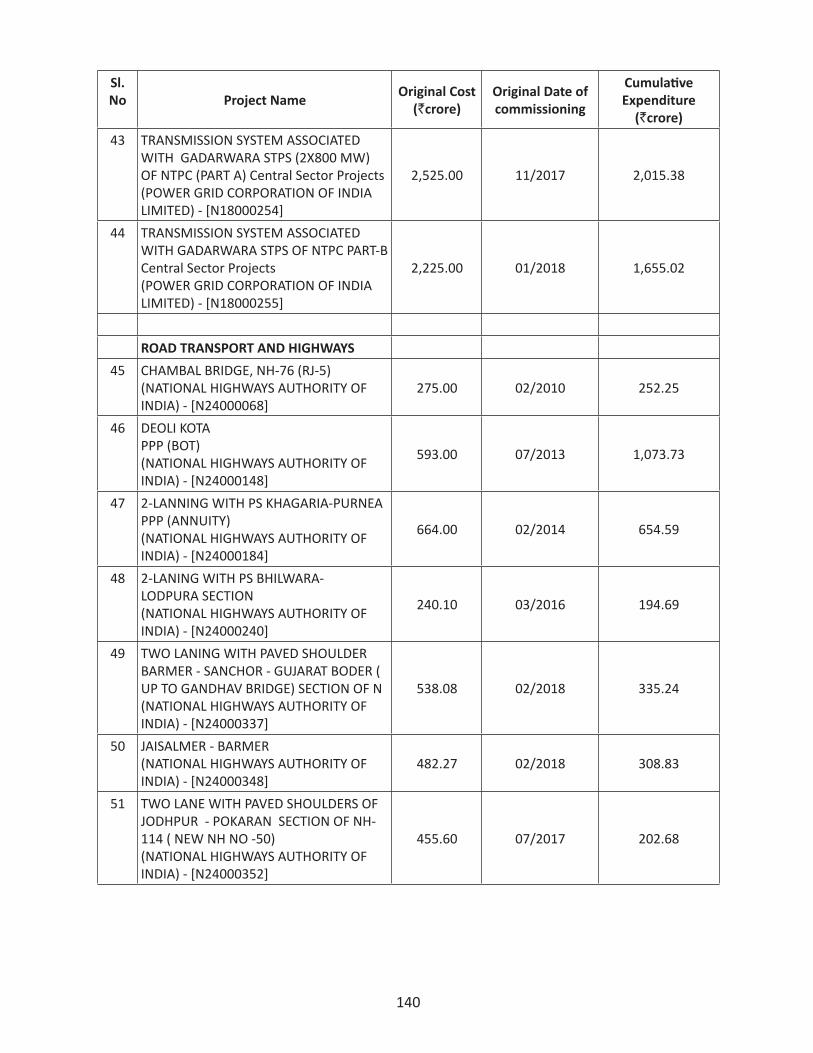
140
Sl. No Project Name
Original Cost(`crore)
Original Date of commissioning
Cumulative Expenditure
(`crore)
43 TRANSMISSION SYSTEM ASSOCIATED WITH GADARWARA STPS (2X800 MW) OF NTPC (PART A) Central Sector Projects(POWER GRID CORPORATION OF INDIA LIMITED) - [N18000254]
2,525.00 11/2017 2,015.38
44 TRANSMISSION SYSTEM ASSOCIATED WITH GADARWARA STPS OF NTPC PART-B Central Sector Projects(POWER GRID CORPORATION OF INDIA LIMITED) - [N18000255]
2,225.00 01/2018 1,655.02
ROAD TRANSPORT AND HIGHWAYS
45 CHAMBAL BRIDGE, NH-76 (RJ-5) (NATIONAL HIGHWAYS AUTHORITY OF INDIA) - [N24000068]
275.00 02/2010 252.25
46 DEOLI KOTA PPP (BOT)(NATIONAL HIGHWAYS AUTHORITY OF INDIA) - [N24000148]
593.00 07/2013 1,073.73
47 2-LANNING WITH PS KHAGARIA-PURNEA PPP (ANNUITY)(NATIONAL HIGHWAYS AUTHORITY OF INDIA) - [N24000184]
664.00 02/2014 654.59
48 2-LANING WITH PS BHILWARA-LODPURA SECTION (NATIONAL HIGHWAYS AUTHORITY OF INDIA) - [N24000240]
240.10 03/2016 194.69
49 TWO LANING WITH PAVED SHOULDER BARMER - SANCHOR - GUJARAT BODER ( UP TO GANDHAV BRIDGE) SECTION OF N (NATIONAL HIGHWAYS AUTHORITY OF INDIA) - [N24000337]
538.08 02/2018 335.24
50 JAISALMER - BARMER (NATIONAL HIGHWAYS AUTHORITY OF INDIA) - [N24000348]
482.27 02/2018 308.83
51 TWO LANE WITH PAVED SHOULDERS OF JODHPUR - POKARAN SECTION OF NH-114 ( NEW NH NO -50) (NATIONAL HIGHWAYS AUTHORITY OF INDIA) - [N24000352]
455.60 07/2017 202.68
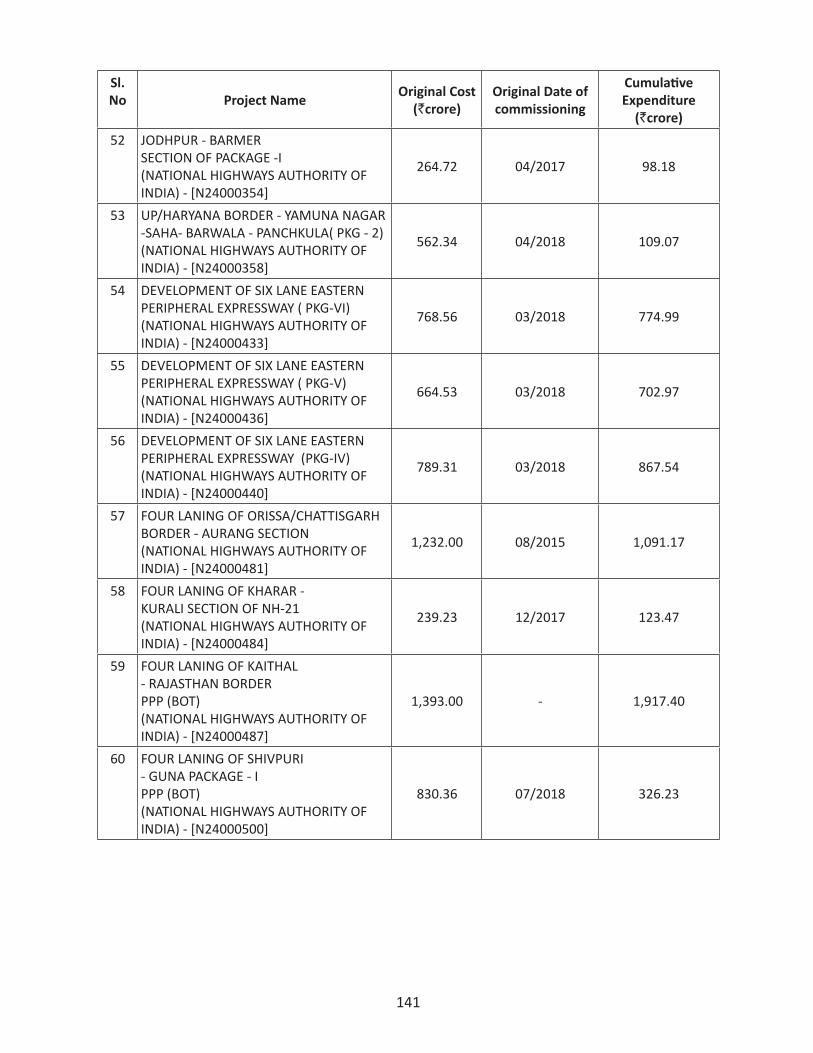
141
Sl. No Project Name
Original Cost(`crore)
Original Date of commissioning
Cumulative Expenditure
(`crore)
52 JODHPUR - BARMER SECTION OF PACKAGE -I (NATIONAL HIGHWAYS AUTHORITY OF INDIA) - [N24000354]
264.72 04/2017 98.18
53 UP/HARYANA BORDER - YAMUNA NAGAR -SAHA- BARWALA - PANCHKULA( PKG - 2) (NATIONAL HIGHWAYS AUTHORITY OF INDIA) - [N24000358]
562.34 04/2018 109.07
54 DEVELOPMENT OF SIX LANE EASTERN PERIPHERAL EXPRESSWAY ( PKG-VI) (NATIONAL HIGHWAYS AUTHORITY OF INDIA) - [N24000433]
768.56 03/2018 774.99
55 DEVELOPMENT OF SIX LANE EASTERN PERIPHERAL EXPRESSWAY ( PKG-V) (NATIONAL HIGHWAYS AUTHORITY OF INDIA) - [N24000436]
664.53 03/2018 702.97
56 DEVELOPMENT OF SIX LANE EASTERN PERIPHERAL EXPRESSWAY (PKG-IV) (NATIONAL HIGHWAYS AUTHORITY OF INDIA) - [N24000440]
789.31 03/2018 867.54
57 FOUR LANING OF ORISSA/CHATTISGARH BORDER - AURANG SECTION (NATIONAL HIGHWAYS AUTHORITY OF INDIA) - [N24000481]
1,232.00 08/2015 1,091.17
58 FOUR LANING OF KHARAR - KURALI SECTION OF NH-21 (NATIONAL HIGHWAYS AUTHORITY OF INDIA) - [N24000484]
239.23 12/2017 123.47
59 FOUR LANING OF KAITHAL - RAJASTHAN BORDER PPP (BOT)(NATIONAL HIGHWAYS AUTHORITY OF INDIA) - [N24000487]
1,393.00 - 1,917.40
60 FOUR LANING OF SHIVPURI - GUNA PACKAGE - I PPP (BOT)(NATIONAL HIGHWAYS AUTHORITY OF INDIA) - [N24000500]
830.36 07/2018 326.23
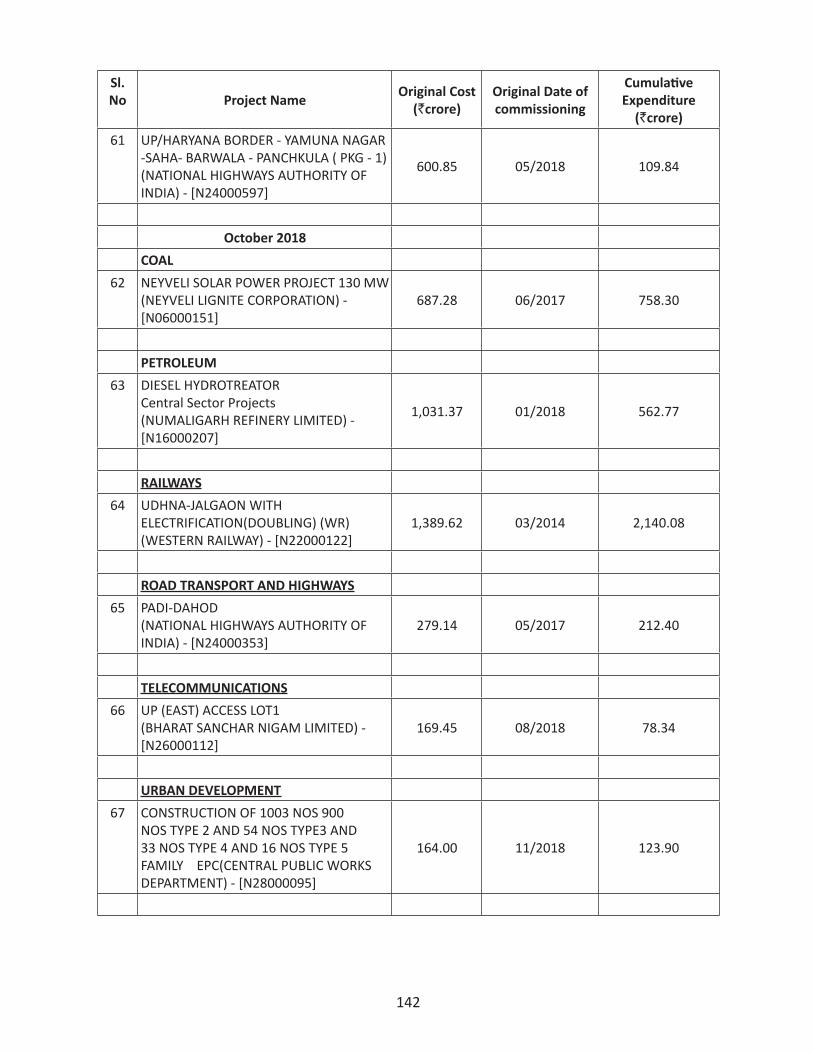
142
Sl. No Project Name
Original Cost(`crore)
Original Date of commissioning
Cumulative Expenditure
(`crore)
61 UP/HARYANA BORDER - YAMUNA NAGAR -SAHA- BARWALA - PANCHKULA ( PKG - 1) (NATIONAL HIGHWAYS AUTHORITY OF INDIA) - [N24000597]
600.85 05/2018 109.84
October 2018
COAL
62 NEYVELI SOLAR POWER PROJECT 130 MW (NEYVELI LIGNITE CORPORATION) - [N06000151]
687.28 06/2017 758.30
PETROLEUM
63 DIESEL HYDROTREATOR Central Sector Projects(NUMALIGARH REFINERY LIMITED) - [N16000207]
1,031.37 01/2018 562.77
RAILWAYS
64 UDHNA-JALGAON WITH ELECTRIFICATION(DOUBLING) (WR) (WESTERN RAILWAY) - [N22000122]
1,389.62 03/2014 2,140.08
ROAD TRANSPORT AND HIGHWAYS
65 PADI-DAHOD (NATIONAL HIGHWAYS AUTHORITY OF INDIA) - [N24000353]
279.14 05/2017 212.40
TELECOMMUNICATIONS
66 UP (EAST) ACCESS LOT1 (BHARAT SANCHAR NIGAM LIMITED) - [N26000112]
169.45 08/2018 78.34
URBAN DEVELOPMENT
67 CONSTRUCTION OF 1003 NOS 900 NOS TYPE 2 AND 54 NOS TYPE3 AND 33 NOS TYPE 4 AND 16 NOS TYPE 5 FAMILY EPC(CENTRAL PUBLIC WORKS DEPARTMENT) - [N28000095]
164.00 11/2018 123.90
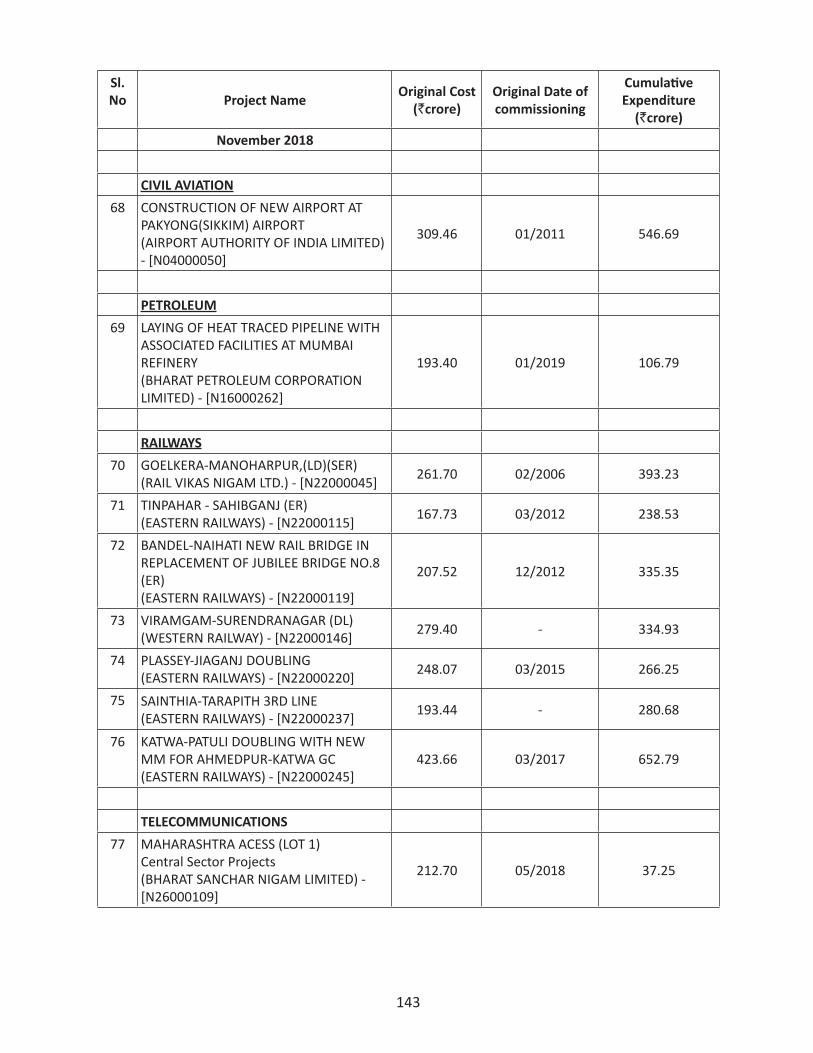
143
Sl. No Project Name
Original Cost(`crore)
Original Date of commissioning
Cumulative Expenditure
(`crore)
November 2018
CIVIL AVIATION
68 CONSTRUCTION OF NEW AIRPORT AT PAKYONG(SIKKIM) AIRPORT (AIRPORT AUTHORITY OF INDIA LIMITED) - [N04000050]
309.46 01/2011 546.69
PETROLEUM
69 LAYING OF HEAT TRACED PIPELINE WITH ASSOCIATED FACILITIES AT MUMBAI REFINERY (BHARAT PETROLEUM CORPORATION LIMITED) - [N16000262]
193.40 01/2019 106.79
RAILWAYS
70 GOELKERA-MANOHARPUR,(LD)(SER) (RAIL VIKAS NIGAM LTD.) - [N22000045] 261.70 02/2006 393.23
71 TINPAHAR - SAHIBGANJ (ER) (EASTERN RAILWAYS) - [N22000115] 167.73 03/2012 238.53
72 BANDEL-NAIHATI NEW RAIL BRIDGE IN REPLACEMENT OF JUBILEE BRIDGE NO.8 (ER) (EASTERN RAILWAYS) - [N22000119]
207.52 12/2012 335.35
73 VIRAMGAM-SURENDRANAGAR (DL) (WESTERN RAILWAY) - [N22000146] 279.40 - 334.93
74 PLASSEY-JIAGANJ DOUBLING (EASTERN RAILWAYS) - [N22000220] 248.07 03/2015 266.25
75 SAINTHIA-TARAPITH 3RD LINE (EASTERN RAILWAYS) - [N22000237] 193.44 - 280.68
76 KATWA-PATULI DOUBLING WITH NEW MM FOR AHMEDPUR-KATWA GC (EASTERN RAILWAYS) - [N22000245]
423.66 03/2017 652.79
TELECOMMUNICATIONS
77 MAHARASHTRA ACESS (LOT 1) Central Sector Projects(BHARAT SANCHAR NIGAM LIMITED) - [N26000109]
212.70 05/2018 37.25
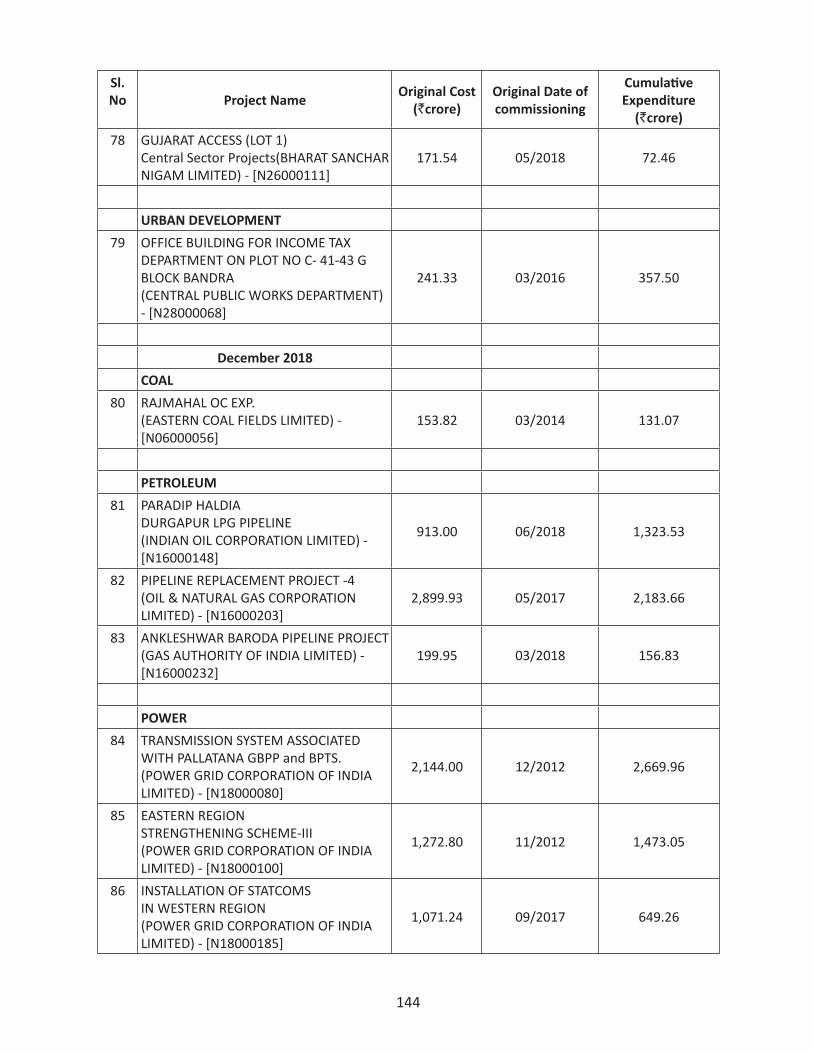
144
Sl. No Project Name
Original Cost(`crore)
Original Date of commissioning
Cumulative Expenditure
(`crore)
78 GUJARAT ACCESS (LOT 1) Central Sector Projects(BHARAT SANCHAR NIGAM LIMITED) - [N26000111]
171.54 05/2018 72.46
URBAN DEVELOPMENT
79 OFFICE BUILDING FOR INCOME TAX DEPARTMENT ON PLOT NO C- 41-43 G BLOCK BANDRA(CENTRAL PUBLIC WORKS DEPARTMENT) - [N28000068]
241.33 03/2016 357.50
December 2018
COAL
80 RAJMAHAL OC EXP. (EASTERN COAL FIELDS LIMITED) - [N06000056]
153.82 03/2014 131.07
PETROLEUM
81 PARADIP HALDIA DURGAPUR LPG PIPELINE (INDIAN OIL CORPORATION LIMITED) - [N16000148]
913.00 06/2018 1,323.53
82 PIPELINE REPLACEMENT PROJECT -4 (OIL & NATURAL GAS CORPORATION LIMITED) - [N16000203]
2,899.93 05/2017 2,183.66
83 ANKLESHWAR BARODA PIPELINE PROJECT (GAS AUTHORITY OF INDIA LIMITED) - [N16000232]
199.95 03/2018 156.83
POWER
84 TRANSMISSION SYSTEM ASSOCIATED WITH PALLATANA GBPP and BPTS. (POWER GRID CORPORATION OF INDIA LIMITED) - [N18000080]
2,144.00 12/2012 2,669.96
85 EASTERN REGION STRENGTHENING SCHEME-III (POWER GRID CORPORATION OF INDIA LIMITED) - [N18000100]
1,272.80 11/2012 1,473.05
86 INSTALLATION OF STATCOMS IN WESTERN REGION (POWER GRID CORPORATION OF INDIA LIMITED) - [N18000185]
1,071.24 09/2017 649.26
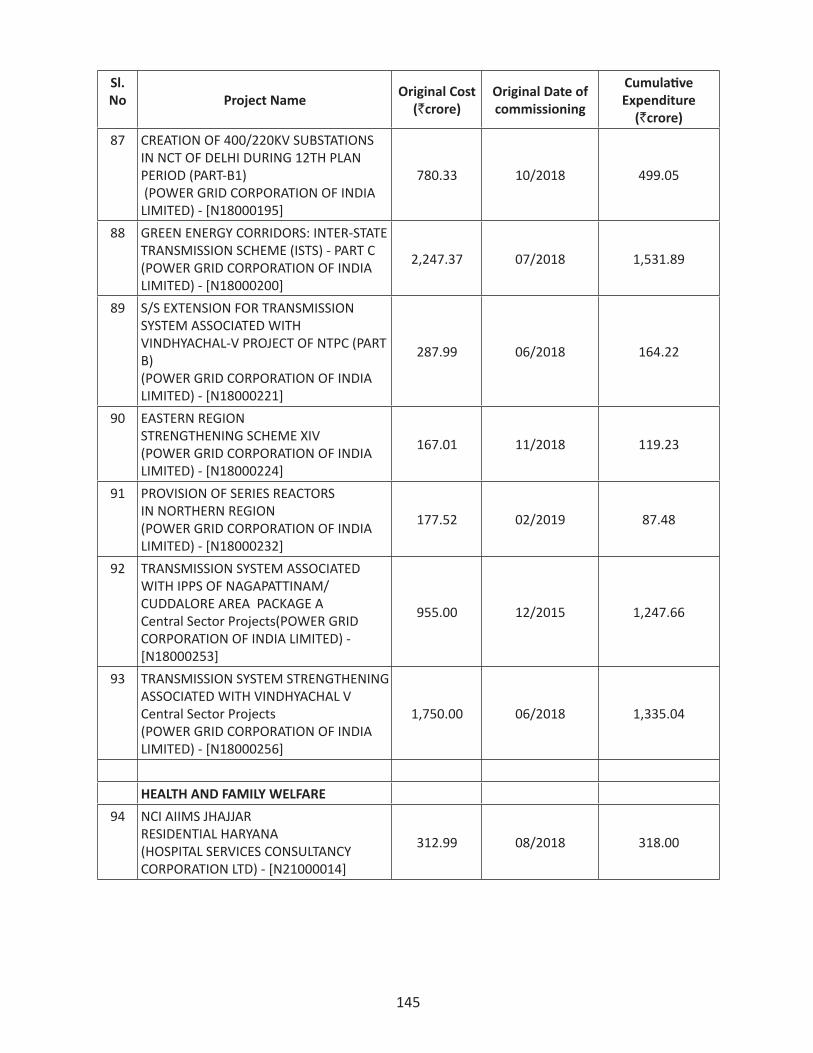
145
Sl. No Project Name
Original Cost(`crore)
Original Date of commissioning
Cumulative Expenditure
(`crore)
87 CREATION OF 400/220KV SUBSTATIONS IN NCT OF DELHI DURING 12TH PLAN PERIOD (PART-B1) (POWER GRID CORPORATION OF INDIA LIMITED) - [N18000195]
780.33 10/2018 499.05
88 GREEN ENERGY CORRIDORS: INTER-STATE TRANSMISSION SCHEME (ISTS) - PART C (POWER GRID CORPORATION OF INDIA LIMITED) - [N18000200]
2,247.37 07/2018 1,531.89
89 S/S EXTENSION FOR TRANSMISSION SYSTEM ASSOCIATED WITH VINDHYACHAL-V PROJECT OF NTPC (PART B) (POWER GRID CORPORATION OF INDIA LIMITED) - [N18000221]
287.99 06/2018 164.22
90 EASTERN REGION STRENGTHENING SCHEME XIV (POWER GRID CORPORATION OF INDIA LIMITED) - [N18000224]
167.01 11/2018 119.23
91 PROVISION OF SERIES REACTORS IN NORTHERN REGION (POWER GRID CORPORATION OF INDIA LIMITED) - [N18000232]
177.52 02/2019 87.48
92 TRANSMISSION SYSTEM ASSOCIATED WITH IPPS OF NAGAPATTINAM/ CUDDALORE AREA PACKAGE A Central Sector Projects(POWER GRID CORPORATION OF INDIA LIMITED) - [N18000253]
955.00 12/2015 1,247.66
93 TRANSMISSION SYSTEM STRENGTHENING ASSOCIATED WITH VINDHYACHAL V Central Sector Projects(POWER GRID CORPORATION OF INDIA LIMITED) - [N18000256]
1,750.00 06/2018 1,335.04
HEALTH AND FAMILY WELFARE
94 NCI AIIMS JHAJJAR RESIDENTIAL HARYANA (HOSPITAL SERVICES CONSULTANCY CORPORATION LTD) - [N21000014]
312.99 08/2018 318.00
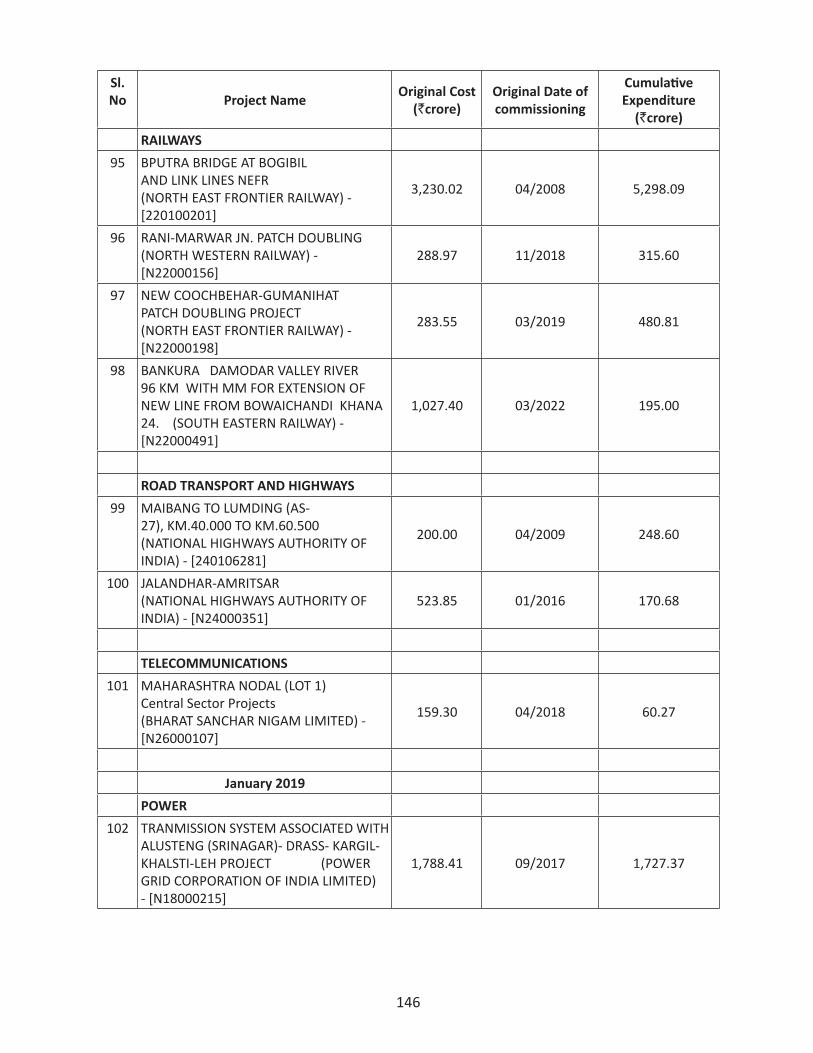
146
Sl. No Project Name
Original Cost(`crore)
Original Date of commissioning
Cumulative Expenditure
(`crore)
RAILWAYS
95 BPUTRA BRIDGE AT BOGIBIL AND LINK LINES NEFR (NORTH EAST FRONTIER RAILWAY) - [220100201]
3,230.02 04/2008 5,298.09
96 RANI-MARWAR JN. PATCH DOUBLING (NORTH WESTERN RAILWAY) - [N22000156]
288.97 11/2018 315.60
97 NEW COOCHBEHAR-GUMANIHAT PATCH DOUBLING PROJECT (NORTH EAST FRONTIER RAILWAY) - [N22000198]
283.55 03/2019 480.81
98 BANKURA DAMODAR VALLEY RIVER 96 KM WITH MM FOR EXTENSION OF NEW LINE FROM BOWAICHANDI KHANA 24. (SOUTH EASTERN RAILWAY) - [N22000491]
1,027.40 03/2022 195.00
ROAD TRANSPORT AND HIGHWAYS
99 MAIBANG TO LUMDING (AS-27), KM.40.000 TO KM.60.500 (NATIONAL HIGHWAYS AUTHORITY OF INDIA) - [240106281]
200.00 04/2009 248.60
100 JALANDHAR-AMRITSAR (NATIONAL HIGHWAYS AUTHORITY OF INDIA) - [N24000351]
523.85 01/2016 170.68
TELECOMMUNICATIONS
101 MAHARASHTRA NODAL (LOT 1) Central Sector Projects(BHARAT SANCHAR NIGAM LIMITED) - [N26000107]
159.30 04/2018 60.27
January 2019
POWER
102 TRANMISSION SYSTEM ASSOCIATED WITH ALUSTENG (SRINAGAR)- DRASS- KARGIL-KHALSTI-LEH PROJECT (POWER GRID CORPORATION OF INDIA LIMITED) - [N18000215]
1,788.41 09/2017 1,727.37
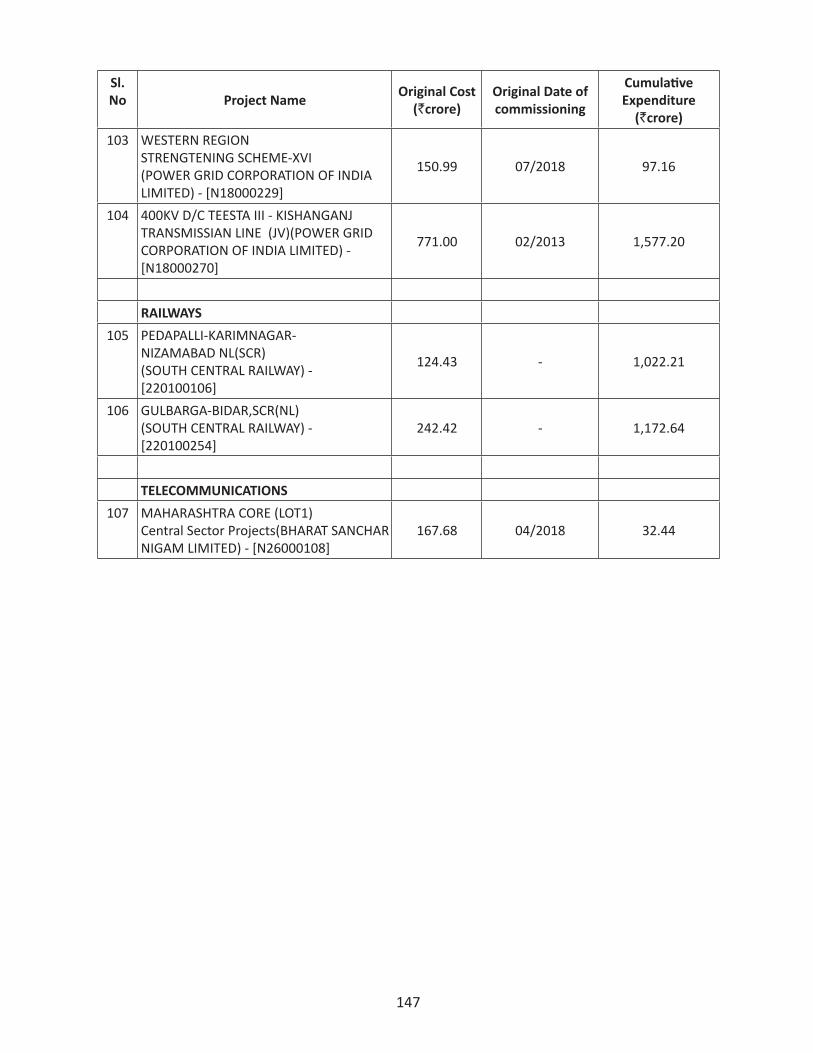
147
Sl. No Project Name
Original Cost(`crore)
Original Date of commissioning
Cumulative Expenditure
(`crore)
103 WESTERN REGION STRENGTENING SCHEME-XVI (POWER GRID CORPORATION OF INDIA LIMITED) - [N18000229]
150.99 07/2018 97.16
104 400KV D/C TEESTA III - KISHANGANJ TRANSMISSIAN LINE (JV)(POWER GRID CORPORATION OF INDIA LIMITED) - [N18000270]
771.00 02/2013 1,577.20
RAILWAYS
105 PEDAPALLI-KARIMNAGAR-NIZAMABAD NL(SCR) (SOUTH CENTRAL RAILWAY) - [220100106]
124.43 - 1,022.21
106 GULBARGA-BIDAR,SCR(NL) (SOUTH CENTRAL RAILWAY) - [220100254]
242.42 - 1,172.64
TELECOMMUNICATIONS
107 MAHARASHTRA CORE (LOT1) Central Sector Projects(BHARAT SANCHAR NIGAM LIMITED) - [N26000108]
167.68 04/2018 32.44
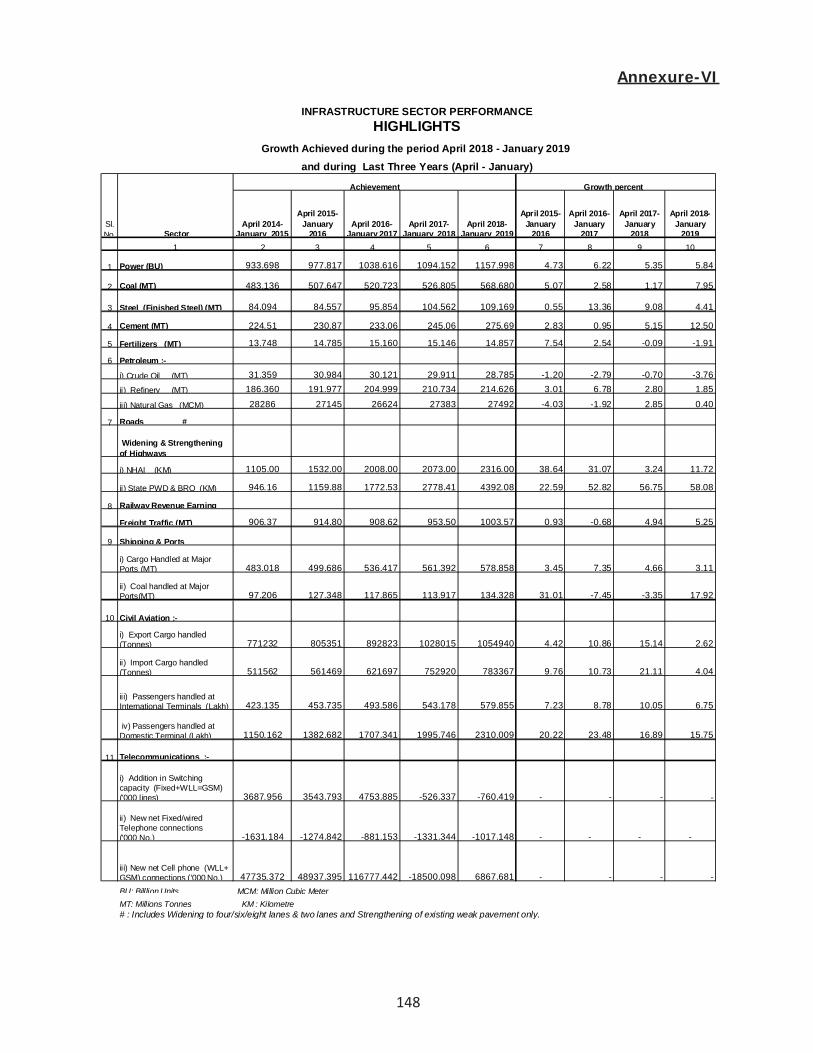
148
Annexure-VI
Sl.No. Sector
April 2014- January 2015
April 2015- January
2016April 2016-
January 2017April 2017-
January 2018April 2018-
January 2019
April 2015- January
2016
April 2016-January
2017
April 2017-January
2018
April 2018- January
20191 2 3 4 5 6 7 8 9 10
1 Power (BU) 933.698 977.817 1038.616 1094.152 1157.998 4.73 6.22 5.35 5.84
2 Coal (MT) 483.136 507.647 520.723 526.805 568.680 5.07 2.58 1.17 7.9519.64 19.64
3 Steel (Finished Steel) (MT) 84.094 84.557 95.854 104.562 109.169 0.55 13.36 9.08 4.41#DIV/0!
4 Cement (MT) 224.51 230.87 233.06 245.06 275.69 2.83 0.95 5.15 12.50
5 Fertilizers (MT) 13.748 14.785 15.160 15.146 14.857 7.54 2.54 -0.09 -1.91
6 Petroleum :-
i) Crude Oil (MT) 31.359 30.984 30.121 29.911 28.785 -1.20 -2.79 -0.70 -3.76ii) Refinery (MT) 186.360 191.977 204.999 210.734 214.626 3.01 6.78 2.80 1.85
iii) Natural Gas (MCM) 28286 27145 26624 27383 27492 -4.03 -1.92 2.85 0.40
7 Roads #
Widening & Strengthening of Highways
i) NHAI (KM) 1105.00 1532.00 2008.00 2073.00 2316.00 38.64 31.07 3.24 11.72
ii) State PWD & BRO (KM) 946.16 1159.88 1772.53 2778.41 4392.08 22.59 52.82 56.75 58.08
8 Railway Revenue Earning
Freight Traffic (MT) 906.37 914.80 908.62 953.50 1003.57 0.93 -0.68 4.94 5.25
9 Shipping & Ports
i) Cargo Handled at Major Ports (MT) 483.018 499.686 536.417 561.392 578.858 3.45 7.35 4.66 3.11
ii) Coal handled at Major Ports(MT) 97.206 127.348 117.865 113.917 134.328 31.01 -7.45 -3.35 17.92
10 Civil Aviation :-
i) Export Cargo handled (Tonnes) 771232 805351 892823 1028015 1054940 4.42 10.86 15.14 2.62
ii) Import Cargo handled (Tonnes) 511562 561469 621697 752920 783367 9.76 10.73 21.11 4.04
iii) Passengers handled at International Terminals (Lakh) 423.135 453.735 493.586 543.178 579.855 7.23 8.78 10.05 6.75
iv) Passengers handled at Domestic Terminal (Lakh) 1150.162 1382.682 1707.341 1995.746 2310.009 20.22 23.48 16.89 15.75
11 Telecommunications :-
i) Addition in Switching capacity (Fixed+WLL=GSM) ('000 lines) 3687.956 3543.793 4753.885 -526.337 -760.419 - - - -
ii) New net Fixed/wired Telephone connections ('000 No.) -1631.184 -1274.842 -881.153 -1331.344 -1017.148 - - - -
iii) New net Cell phone (WLL+ GSM) connections ('000 No.) 47735.372 48937.395 116777.442 -18500.098 6867.681 - - - -BU: Billlion UnitsMT: Millions Tonnes KM : Kilometre# : Includes Widening to four/six/eight lanes & two lanes and Strengthening of existing weak pavement only.
MCM: Million Cubic Meter
INFRASTRUCTURE SECTOR PERFORMANCE
and during Last Three Years (April - January)
Achievement Growth percent
HIGHLIGHTSGrowth Achieved during the period April 2018 - January 2019
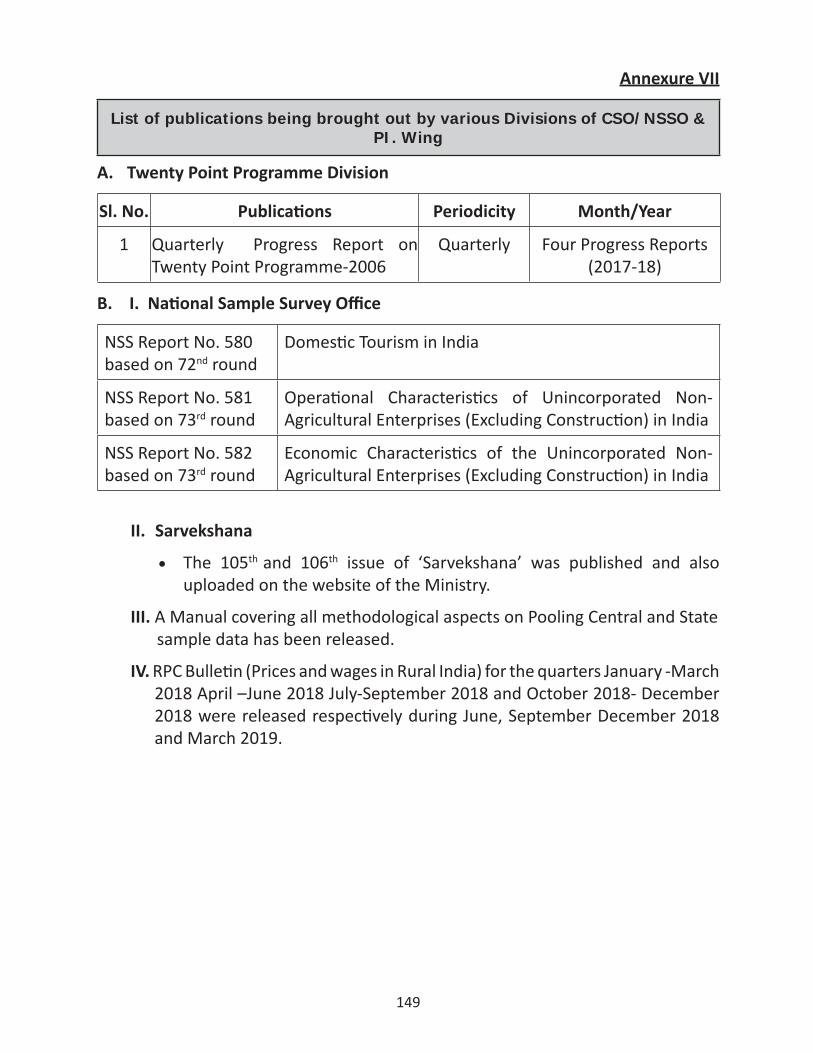
149
Annexure VII
List of publications being brought out by various Divisions of CSO/NSSO & PI. Wing
A. Twenty Point Programme Division
Sl. No. Publications Periodicity Month/Year
1 Quarterly Progress Report on Twenty Point Programme-2006
Quarterly Four Progress Reports(2017-18)
B. I. National Sample Survey Office
NSS Report No. 580 based on 72nd round
Domestic Tourism in India
NSS Report No. 581 based on 73rd round
Operational Characteristics of Unincorporated Non-Agricultural Enterprises (Excluding Construction) in India
NSS Report No. 582 based on 73rd round
Economic Characteristics of the Unincorporated Non-Agricultural Enterprises (Excluding Construction) in India
II. Sarvekshana
• The 105th and 106th issue of ‘Sarvekshana’ was published and also uploaded on the website of the Ministry.
III. A Manual covering all methodological aspects on Pooling Central and State sample data has been released.
IV. RPC Bulletin (Prices and wages in Rural India) for the quarters January -March 2018 April –June 2018 July-September 2018 and October 2018- December 2018 were released respectively during June, September December 2018 and March 2019.
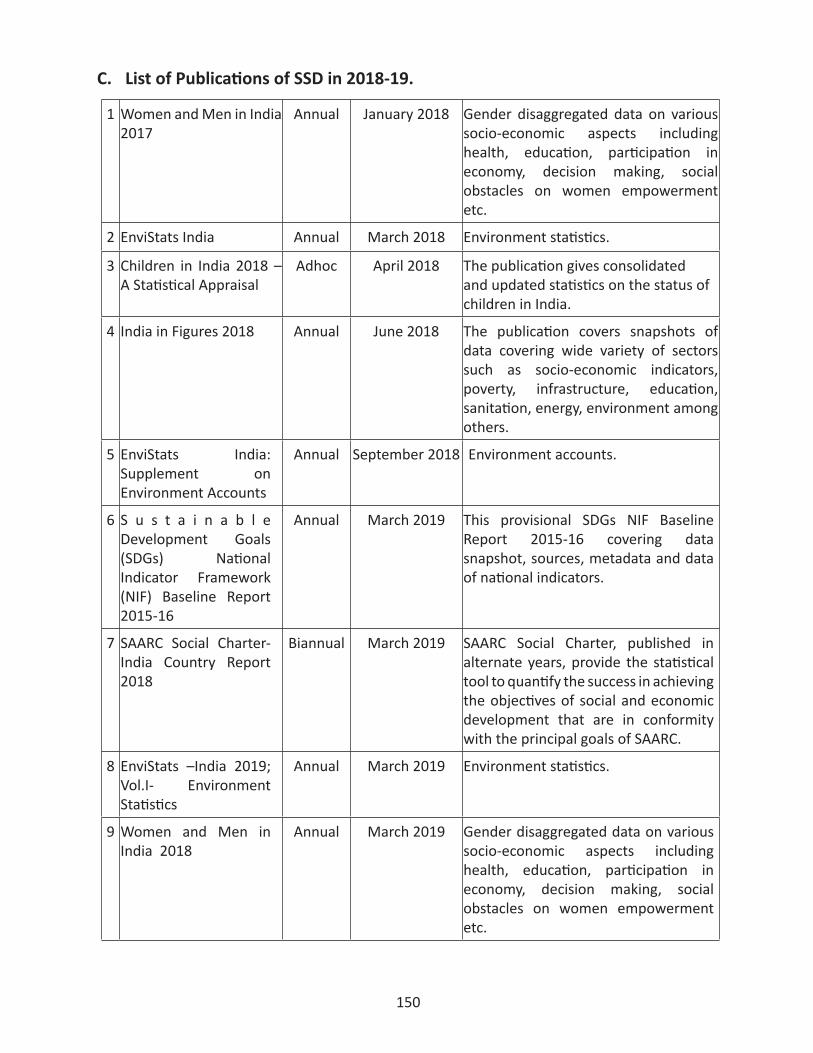
150
C. List of Publications of SSD in 2018-19.
1 Women and Men in India 2017
Annual January 2018 Gender disaggregated data on various socio-economic aspects including health, education, participation in economy, decision making, social obstacles on women empowerment etc.
2 EnviStats India Annual March 2018 Environment statistics.
3 Children in India 2018 – A Statistical Appraisal
Adhoc April 2018 The publication gives consolidated and updated statistics on the status of children in India.
4 India in Figures 2018 Annual June 2018 The publication covers snapshots of data covering wide variety of sectors such as socio-economic indicators, poverty, infrastructure, education, sanitation, energy, environment among others.
5 EnviStats India: Supplement on Environment Accounts
Annual September 2018 Environment accounts.
6 S u s t a i n a b l e Development Goals (SDGs) National Indicator Framework (NIF) Baseline Report 2015-16
Annual March 2019 This provisional SDGs NIF Baseline Report 2015-16 covering data snapshot, sources, metadata and data of national indicators.
7 SAARC Social Charter-India Country Report 2018
Biannual March 2019 SAARC Social Charter, published in alternate years, provide the statistical tool to quantify the success in achieving the objectives of social and economic development that are in conformity with the principal goals of SAARC.
8 EnviStats –India 2019; Vol.I- Environment Statistics
Annual March 2019 Environment statistics.
9 Women and Men in India 2018
Annual March 2019 Gender disaggregated data on various socio-economic aspects including health, education, participation in economy, decision making, social obstacles on women empowerment etc.
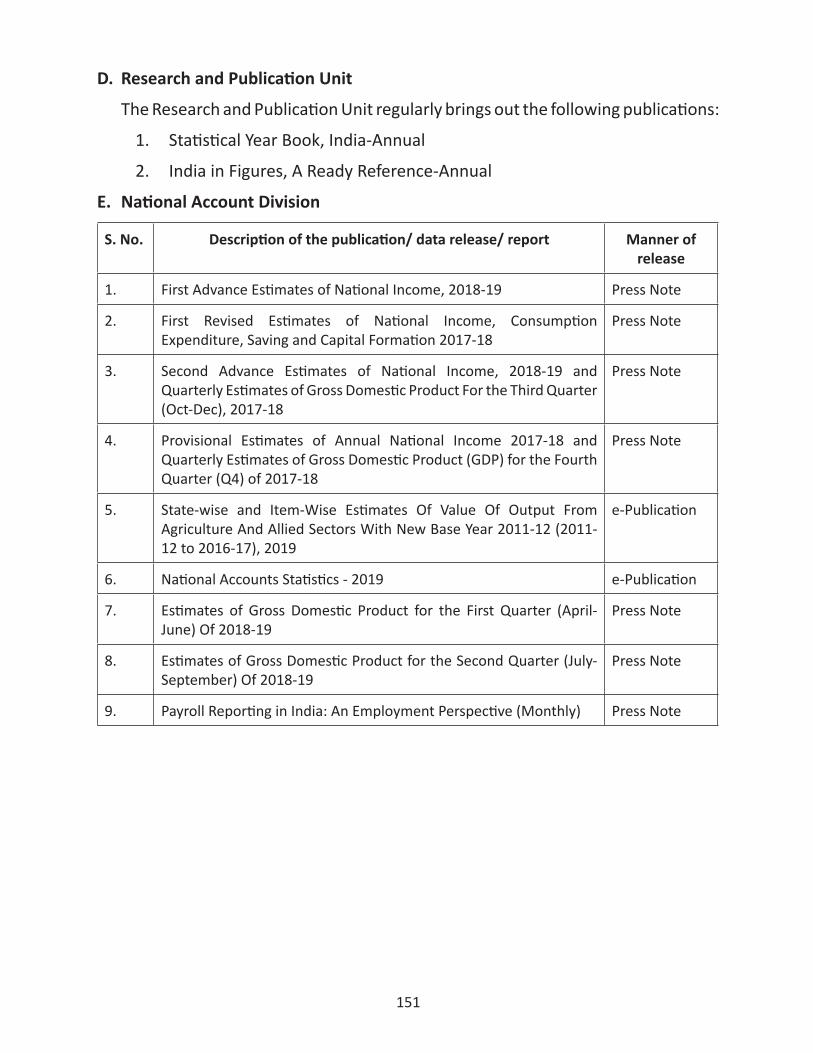
151
D. Research and Publication Unit
The Research and Publication Unit regularly brings out the following publications:
1. Statistical Year Book, India-Annual
2. India in Figures, A Ready Reference-Annual
E. National Account Division
S. No. Description of the publication/ data release/ report Manner of release
1. First Advance Estimates of National Income, 2018-19 Press Note
2. First Revised Estimates of National Income, Consumption Expenditure, Saving and Capital Formation 2017-18
Press Note
3. Second Advance Estimates of National Income, 2018-19 and Quarterly Estimates of Gross Domestic Product For the Third Quarter (Oct-Dec), 2017-18
Press Note
4. Provisional Estimates of Annual National Income 2017-18 and Quarterly Estimates of Gross Domestic Product (GDP) for the Fourth Quarter (Q4) of 2017-18
Press Note
5. State-wise and Item-Wise Estimates Of Value Of Output From Agriculture And Allied Sectors With New Base Year 2011-12 (2011-12 to 2016-17), 2019
e-Publication
6. National Accounts Statistics - 2019 e-Publication
7. Estimates of Gross Domestic Product for the First Quarter (April-June) Of 2018-19
Press Note
8. Estimates of Gross Domestic Product for the Second Quarter (July-September) Of 2018-19
Press Note
9. Payroll Reporting in India: An Employment Perspective (Monthly) Press Note
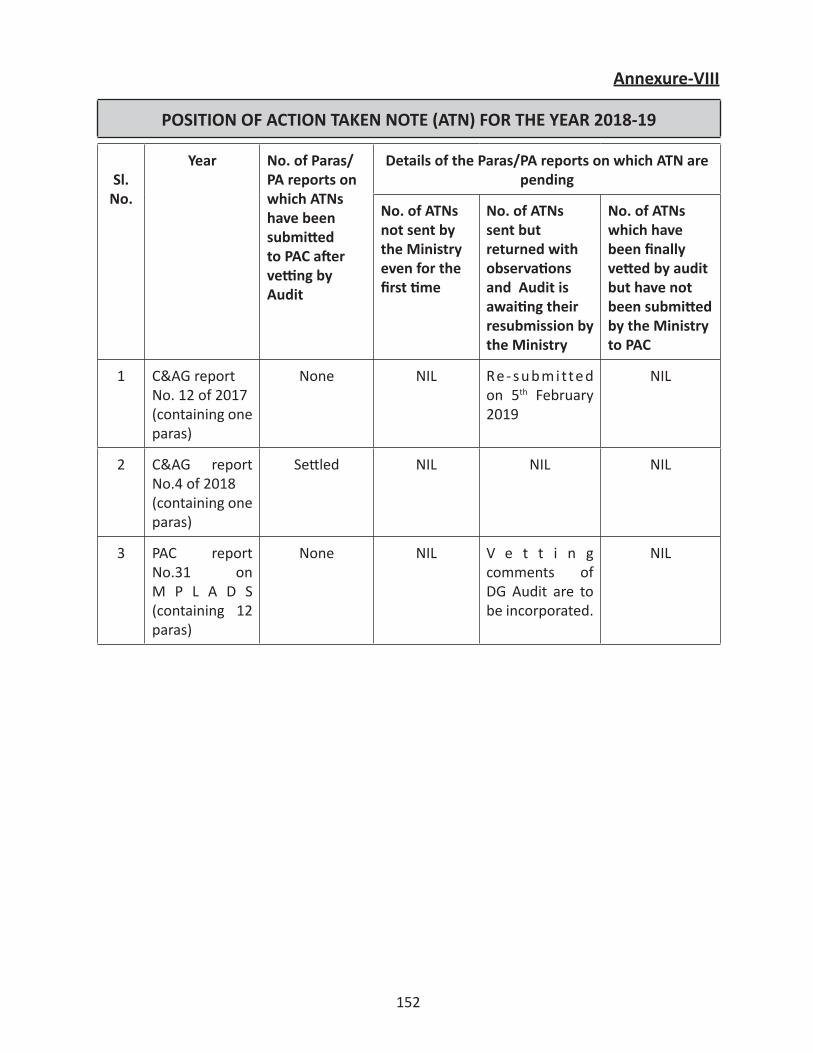
152
Annexure-VIII
POSITION OF ACTION TAKEN NOTE (ATN) FOR THE YEAR 2018-19
Sl.No.
Year No. of Paras/PA reports on which ATNs have been submitted to PAC after vetting by Audit
Details of the Paras/PA reports on which ATN are pending
No. of ATNs not sent by the Ministry even for the first time
No. of ATNs sent but returned with observations and Audit is awaiting their resubmission by the Ministry
No. of ATNs which have been finally vetted by audit but have not been submitted by the Ministry to PAC
1 C&AG report No. 12 of 2017(containing one paras)
None NIL Re - s u b m i tte d on 5th February 2019
NIL
2 C&AG report No.4 of 2018 (containing one paras)
Settled NIL NIL NIL
3 PAC report No.31 on M P L A D S (containing 12 paras)
None NIL V e t t i n g comments of DG Audit are to be incorporated.
NIL