Embed Size (px)
Citation preview
1
ANNUAL INNOVATION REPORT 2012
Innovation, Research and Growth
NOVEMBER 2012
Annual Innovation Report 2012
November 2012

Contents Contents .......................................................................................................................................... ii
Executive Summary........................................................................................................................ 1
Introduction ..................................................................................................................................... 6
Section 1: Evidence ........................................................................................................................ 7
1. Innovation in the macro economy......................................................................................... 8
1.1 Investment in research and development ......................................................................... 8
1.2 Investment in intangible assets ....................................................................................... 10
1.3 Impact on economic performance................................................................................... 12
2. Discovery and development ................................................................................................ 14
2.1 Investment in innovation.................................................................................................. 14
2.2 The UK’s research performance ..................................................................................... 16
2.3 Provision of skilled graduates.......................................................................................... 20
2.4 Bridging the gap between research and business .......................................................... 23
3. Innovative businesses.......................................................................................................... 24
3.1 Innovation activity............................................................................................................ 24
3.2 Investment in innovation.................................................................................................. 25
3.3 Innovation outputs ........................................................................................................... 29
4. International engagement .................................................................................................... 32
4.1 Attractiveness of the UK as a place to invest .................................................................. 32
4.2 Strengthening engagement in European programmes ................................................... 34
4.3 Access to international markets ...................................................................................... 35
5. Government as an enabler and lead customer for innovation ......................................... 38
5.1 Government investment in innovation ............................................................................. 38
ii
5.2 The publicly funded innovation infrastructure.................................................................. 41
5.3 Government as a lead customer ..................................................................................... 44
Section 2: Implementing the Innovation and Research Strategy for Growth.......................... 46
6. Discovery and development ................................................................................................ 47
6.1 Catapult centres .............................................................................................................. 47
6.2 Emerging technologies and industries ............................................................................ 50
6.3 Graphene ........................................................................................................................ 51
7. Innovative businesses.......................................................................................................... 52
7.1 R&D tax credits and other support for business R&D and innovation............................. 52
7.2 Innovation vouchers ........................................................................................................ 53
7.3 Venture capital ................................................................................................................ 54
7.4 Intellectual Property......................................................................................................... 55
7.5 Technology Strategy Board support for innovative business .......................................... 57
7.6 Design ............................................................................................................................. 58
8. Knowledge and innovation .................................................................................................. 59
8.1 UK Research Partnership Investment Fund – encouraging university partnerships with businesses and charities............................................................................................................. 59
8.2 Biomedical Catalyst......................................................................................................... 60
8.3 University-business interaction........................................................................................ 60
8.4 HEIF top-up..................................................................................................................... 61
8.5 Equipment sharing and cost sharing partnerships .......................................................... 61
8.6 Innovation ecosystem bodies .......................................................................................... 62
8.7 Innovation and Knowledge Centres (IKCs) ..................................................................... 62
8.8 E-infrastructure................................................................................................................ 63
9 Global collaboration ............................................................................................................. 64
iii

9.1 Supporting innovative UK businesses’ interests and trade overseas.............................. 64
9.2 Influencing the innovation landscape in Europe.............................................................. 65
9.3 Engagement with high growth economies....................................................................... 66
9.4 International Venture Capital........................................................................................... 69
10. New innovation challenges .............................................................................................. 71
10.1 Public Procurement ......................................................................................................... 71
10.2 Innovation inducement prizes......................................................................................... 73
10.3 Open data and transparency........................................................................................... 74
10.4 Data Strategy Board (DSB)............................................................................................. 74
10.5 Independent Shakespeare Review of Public Sector Information .................................... 74
10.6 Open access ................................................................................................................... 75
10.7 Research Councils’ Gateway to Research...................................................................... 75
10.8 Open Data Institute (ODI)................................................................................................ 76
11. Conclusion......................................................................................................................... 77
Annex A: Deliverables set out in the Innovation and Research Strategy for Growth ............ 78
iv
Foreword
Innovation has always been one of the UK's strengths and is a vital factor in ensuring our return to economic prosperity. It is instrumental in improving productivity, creating new goods and services, and expanding markets.
This fourth Annual Innovation Report provides the latest available evidence on our innovation performance and the contribution of business, government, higher education and research organisations to innovation activities in the UK.
It reveals a promising picture. The UK has one of the leading research bases, outstanding R&D capability, high levels of overseas investment and considerable international collaboration. According to the World Economic Forum, the UK ranks second in the world for university-industry collaboration, behind Switzerland but ahead of the US. In March 2012, the Government launched the new UK Research Partnership Investment Fund to incentivise and support large joint research ventures between universities, businesses and charities. We have now invested £300 million in this Fund, and with leveraged co-investment from the private and charitable sectors this will total over £1 billion for university research infrastructure and strategic research partnerships.
However the UK has not completely escaped the negative effects of the downturn, with business investment in R&D comparatively low and suffering a further contraction. We still have work to do to catch up with leading competitors such as Germany and the US.
This report comes a year after we released our Innovation and Research Strategy for Growth, explaining how we would put innovation and research at the heart of the Government’s growth agenda. We are also using these pages to set out the progress we have made in delivering that Strategy.
Working with the Technology Strategy Board, we have continued to develop the network of Catapult Centres to drive growth by commercialising innovation and research in key technology areas. We have created a new innovation voucher programme to help SMEs innovate by developing links with universities and other knowledge providers. The Technology Strategy Board has seen a fivefold increase in the number of applications for the re-launched Smart scheme and we have increased funding, which has now doubled to £40 million per annum, to meet this demand.
The government also directly supports innovation in a number of ways with more than 4,000 projects funded every year through the Technology Strategy Board. We are investing more in the Small Business Research Initiative, which continues to go from strength to strength. It has now awarded over £80 million of contracts to technology based SMEs. More public sector organisations than ever are now taking part in the programme,
v

allowing more SMEs to win Government contracts for innovative products and services. The new UK Centre for Challenge Prizes offers another way for businesses and the public to help solve innovation challenges.
On the international stage we have increased opportunities for the UK through new collaborations with both China and India, and we are working to extend this approach to Brazil. It is now easier for SMEs to access the information they need to export through UKTI’s new Open to Export web service. The IPO has introduced IP attachés to UK embassies in China, India and Brazil to help UK businesses better exploit their IP potential in those countries.
Moving forward, we will continue to measure our innovation performance and report the impact that the Strategy has had in driving innovation across the economy to secure growth.
DAVID WILLETTS
Minister of State for Universities and Science
November 2012
vi
Executive Summary
Introduction
Innovation is vital to a healthy, competitive economy and is one of the principal drivers of growth. Innovative economies are more productive and grow faster. Nesta’s latest Innovation Index shows that between 2000 and 2009, 27 per cent of UK labour productivity growth was directly attributable to private investment in innovation1. Estimates indicate that spillover benefits generated from Research & Development (R&D) generate a social return of a further 20-50 per cent2. If we are to return the UK to a path of sustainable economic growth, it is more important than ever that Government helps to facilitate, in partnership with business and research organisations, an environment that encourages investment in innovation.
Improving the innovation system will directly support two of the government’s priorities for growth, by helping to make the UK the best place in Europe to start or grow a business and encouraging investment and exports.
In December 2011 we published the Innovation and Research Strategy for Growth (IRS), with an accompanying economics paper; setting out Government’s priorities for improving the UK innovation and research landscape and performance.
We based our approach in the Strategy and our understanding of the current climate for innovation and research on the robust analysis set out in BIS Economics Paper 15 (2011).
The paper brought together fresh analytical thinking and evidence to inform policy. It emphasised the need to focus on facilitating collaboration between organisations, driving innovation across all sectors of the economy, maximising the effectiveness and connectivity of the innovation ecosystem and transforming the public sector into a major driver of innovation.
The IRS explained how we would take this agenda forward with policies that:
Support innovation and research in business;
Provide incentives for companies to invest in high-value business activities;
Create a more open and integrated innovation ecosystem; and
Remove barriers to innovation.
1 National Endowment for Science Technology and the Arts [now Nesta] (2009) UK innovation index: Productivity and Growth in the UK industries pp.5 2 BIS Economic Paper No.15 (2001) ‘Innovation and Research Strategy for Growth’ pp.21
1

Section 1: Evidence
This fourth Annual Innovation Report brings together the latest available evidence on the innovative activities in the UK and compares our performance against other leading economies. It gives a clear picture of the UK’s innovation performance during the recent recession, up to and including 2010.
The UK is still performing well in most key areas. We have clear and acknowledged strengths, such as the performance of our world leading research base, and compared to other countries the overall level of innovation investment in the UK remains strong. We are committed to building on these strengths. However, the UK has areas of relative underperformance where we need to improve to strengthen our competitive performance. The Strategy focused on those areas where we could further enhance our performance. This year’s analysis shows that in terms of innovation inputs:
In terms of traditional forms of innovation metrics, such as R&D as a proportion of GDP, the UK still trails behind most of our main competitors;
On the other hand the UK stands among the top performing countries when all intangible investment is taken into account. Despite a nominal fall in investment, investment as a share of value added in the UK private sector increased by 1.5 per cent; and
Spending on innovation held up reasonably well in the UK as we entered recession;
The UK provides a favourable environment for innovation:
The proportion of the UK labour force that is trained in science and technology has increased over time, and the UK has a high proportion of engineering and doctoral graduates in comparison to other countries; and
The UK is a highly attractive destination for foreign direct investment, with an exceptionally high share of UK business R&D funded from abroad.
Looking at outputs and efficiency we see a promising picture, with the UK proving to be a strong innovator with a healthy innovation ecosystem:
We have a particularly strong reputation for high quality research, with a 14 per cent share of the world's most highly-cited scientific papers;
The UK performs well on international collaboration and international investment measures, with the highest proportion of R&D funded from abroad amongst the OECD countries at 16 per cent of total R&D.
The UK is number one in the OECD’s ease of entrepreneurship index; and
UK innovative firms are far more likely to be active in foreign markets than their counterparts in France, Italy or Sweden.
2

The policies in the IRS were based on our analysis of the best available evidence at the time, covering the period up to 2009. The evidence we examine in this report brings us to 2010. The data therefore predates the Strategy’s publication. It shows that the picture has broadly not changed and we can be confident that the IRS is still supported by the evidence on which it was built.
Section 2: Implementing the Innovation and Research Strategy for Growth
We identified in the IRS that we needed to take action in five areas: discovery and development, innovative businesses, knowledge and innovation, global collaboration and new innovation challenges. We have made progress in all of these areas in the last year, through actions that underpin the core role of innovation and research in future UK growth. Examples of some of our most significant achievements are set out below, with further details in Section 2 of this report.
Discovery and development
The IRS recognised the importance of continuing to support curiosity driven research, and creating a favourable business environment in which to develop, commercialise and adopt new technologies.
Catapult Centres bridge the gap between academia and business to support the commercialisation of new technologies. The High Value Manufacturing Catapult is open for business, with six more Catapults aiming to be operational by April 2013.
Innovative businesses
Innovation in business across all sectors of the economy drives productivity and growth. In the IRS we identified the need for Government to continue to help innovative businesses to access finance and other forms of support, and we highlighted the importance of increasing levels of innovation in economically important sectors, where these are lower than in competitor countries.
We have worked with businesses and the Technology Strategy Board to launch a new innovation vouchers programme, focussing on areas and sectors with relatively low levels of private sector innovation and growth, in particular agrifood and the built environment. Start-up, micro and small and medium sized businesses can use the vouchers to access up to £5,000 worth of advice and expertise from universities, research organisations or other private sector knowledge suppliers, giving business better access to the knowledge base and an incentive to invest in further innovation activities.
Knowledge and innovation
The UK’s innovation ecosystem institutions have a worldwide reputation. The IRS emphasised our aim to maximise the value of the UK’s knowledge economy.
The Biomedical Catalyst has allocated a total of £49 million following the first round of applications, with 40 SMEs and 24 universities receiving awards. The Catalyst will provide a total of £180 million of funding over three years for innovative small and medium sized
3

companies and academics to develop solutions to healthcare challenges. These are the first steps towards turning bright ideas into products and services, accelerating the commercialisation of life science technologies and the speed with which they can be brought to market.
Recognising the vital importance of collaboration between universities, charities and industry, the £300 million UK Research Partnership Investment Fund (UKRPIF), set up earlier this year, supports large capital research projects in UK universities which secure or accelerate significant co-investment from business, charities or endowments. The Fund will secure £1 billion investment in university research infrastructure by attracting and accelerating private sector and charitable investment.
Global collaboration
In the IRS we set out how we would develop and support new forms of international partnership and collaboration, taking an active role in promoting UK strengths around the world.
We have strengthened our international engagement on innovation, establishing strong platforms for collaboration with China, India and developing another with Brazil. UKTI has launched its Open to Export web service, which alongside a refocused Science and Innovation Network, offers greater support for UK organisations looking for collaboration partners or trading and investment opportunities overseas.
New innovation challenges
Government can support, facilitate and drive innovation through its own day to day activities. The IRS showed how we would use procurement activities, open access to data and establish inducement prizes to stimulate and enable innovation across the economy.
Innovation inducement prizes galvanise innovation in areas where it would not otherwise happen, through providing an incentive for collaboration between individuals and organisations that would not usually work together. Since Nesta’s Centre for UK Challenge Prizes opened its doors in April 2012, supported by BIS, it has launched prizes in areas ranging from cycling to reducing waste. It has quickly established itself as a hub of expertise, advising businesses and Government Departments on how to run prizes and developing and providing expert advice on prizes to the European Commission.
The Open Data Institute will focus on innovation, commercialisation and the development of web standards to ensure that open data research is transformed into commercial advantage for the UK. Having announced the appointment of its Chief Executive and Technical Director, the Institute will be officially launched on 4th December 2012.
The Data Strategy Board has been established to create maximum value for companies and people across the UK from data held by the four Public Data Group Trading Funds – Ordnance Survey, the Met Office, the Land Registry and Companies House. The Board will also look across the wider public sector for data with the potential to unlock and expand the opportunities for growth and business.
4

Conclusion
As the UK faced the consequences of the 2008 financial crisis, the evidence on which we built our Innovation and Research Strategy for Growth still supports the priorities identified. Because of the time lags in the data, we are not yet able to use metrics to measure the impact that the Strategy has had. However, we have made clear progress against the actions we committed to deliver. We are taking action in a variety of key areas that will help to increase investment in innovation, improve collaboration across the innovation ecosystem, enhance incentives to innovate and maximise the impact of innovative activity. We are building a strong platform to drive future prosperity and growth.
5
Introduction The Department for Business, Innovation and Skills (BIS) published its Innovation and Research Strategy for Growth (IRS) and an accompanying Economics Paper in December 2011. Progress in implementing the IRS can be monitored according to a broad range of indicators. These relate to both the research and innovation performance of the UK, and also delivery against the performance measures set out in the IRS.
This is the fourth Annual Innovation Report that BIS has published, following a break in the series in 2011 due to the publication of the Strategy. It provides an overview of some of the key measures of innovation and research performance in the UK. This year it additionally serves as a benchmark against which progress against the IRS performance measures can be tracked.
This report considers five key perspectives of innovation and research: the macro view of overall innovation in the economy; the discovery of new ideas and their development through the innovation process; the role of businesses in commercialising those new ideas and bringing them to market; the increasingly global nature of innovation; and the role government plays in the innovation ecosystem.
Throughout the chapters that follow, evidence is presented around the key performance measures of the IRS as well as other important aspects of the innovation system.
As well as looking at UK innovation performance as measured through the most recent data, this report goes on to record the practical progress we have made in implementing the IRS. We set out what has been done to deliver the actions we committed to in the Strategy one year ago. The report highlights our achievements under all the areas of the Strategy which we identified for action: discovery and development, innovative businesses, knowledge and innovation, global collaboration and new innovation challenges, and offers case study examples of how some actions have been successfully implemented.
6

Section 1: Evidence Key points
The financial crisis of 2008 and the recession which followed in most economies across the globe had impacts on a range of innovation and research performance measures in most countries.
However, the UK has fared reasonably well in these difficult circumstances and, when compared to a group of key competitor countries, there are many signs that it remains a strong performer in science and innovation, particularly in terms of its efficiency. There is no room for complacency, as key competitor nations continue to invest in their science and innovation systems, but the UK has a strong base to build on as the Innovation and Research Strategy for Growth is implemented.
Headlines:
The UK continues to lag behind the lead countries on traditional measures such as investment in research and development as a percentage of GDP;
When accounting for wider measures of innovation investment including intangible assets, the UK is shown to perform strongly;
Spending on innovation held up reasonably well as the UK entered recession;
On output and efficiency measures, overall, the UK is a strong performer; and
The UK performs well on metrics relating to international collaboration and international investment.
The chapters in this section of the report provide a more detailed look at the evidence around the UK’s innovation performance.
7
1. Innovation in the macro economy Headlines:
Innovation is important for long-term productivity growth, although there is reason that the impact of innovation on productivity is difficult to reliably measure in a situation of subdued or negative economic growth.
The UK is amongst the leading countries in terms of innovation investment intensity, along with France and the US.
On the narrower measure of R&D investment, the UK is historically broadly in line with some of the comparator countries, such as Canada and France. The UK is behind the lead group of countries which includes Finland, Japan and Germany.
On measures of intangible investment the UK performs relatively strongly, although some countries have narrowed the gap with the UK in recent years.
Relatively low R&D investment compared to some countries is partially explained by the UK’s industrial structure, which includes a relatively high proportion of industries which are, by nature, of a lower R&D intensity.
Innovation’s central role in long-term economic growth is well documented in economic theory and evidenced in empirical research3. This chapter presents a range of key aggregate innovation performance measures. A more detailed analysis of firm engagement in different forms of innovation can be found in chapter 3. It starts with comparisons of the level of investment in R&D and other forms of innovative activity. It then considers the impact this has on productivity in the UK.
1.1 Investment in research and development
R&D is historically the most cited metric of innovation in an economy. It is an important input to many innovative processes and is relatively easy to compare across industries and countries. It is of particular importance in technology-intensive sectors but the technology developed through R&D is also of importance to low- and medium-tech industries.
Figure 1 presents the Gross Expenditure on R&D (GERD)4 intensity5 over the last two decades of available data. The UK has long been known to have relatively low R&D
3 For a full account of innovation in the economic growth literature see BIS (2011) Economics Paper No. 15 – Innovation and Research Strategy for Growth 4 Measures of investment intensity are calculated as the level of investment as a proportion of total GDP. 5 Investment intensity measures investment as a share of gross domestic product
8

intensity, sitting behind every country apart from Italy in 2010, with less than half the intensity of Finland.
Looking at the situation since 2008, with the exception of Japan and Canada there have not been notable falls in GERD intensity despite the economic circumstances. The UK is down slightly over the two years having seen a rise in intensity in 2009 before falling back down to 1.8 per cent in 2010.
However, much of the gap between the UK’s R&D intensity relative to comparator countries can be explained by the UK’s sectoral mix: this is investigated further in chapter 3.
Figure 1: Gross expenditure on R&D as a percentage of GDP, 1991 – 2010
0%
1%
2%
3%
4%
1991
1992
1993
1994
1995
1996
1997
1998
1999
2000
2001
2002
2003
2004
2005
2006
2007
2008
2009
2010
Canada Finland France Germany
Italy Japan UK USA (to 2009)
Source: OECD, Main Science and Technology Indicators (MSTI), August 2012
GERD is composed of R&D performed by businesses, government, higher education and private non-profit organisations. A breakdown of GERD by sector of performance is presented in figure 2. In all countries, the largest component is business enterprise R&D followed by R&D performed by higher education institutions.
In the UK in 2010, 61 per cent of all R&D was performed by businesses, with 27 per cent occurring in higher education, 9 per cent in government and the remainder in private non-profit organisations. Compared to 2008, this represents a small shift away from businesses towards higher education and government.
A more detailed analysis of the innovation performed in each of these sectors is provided in the following chapters of this report.
9
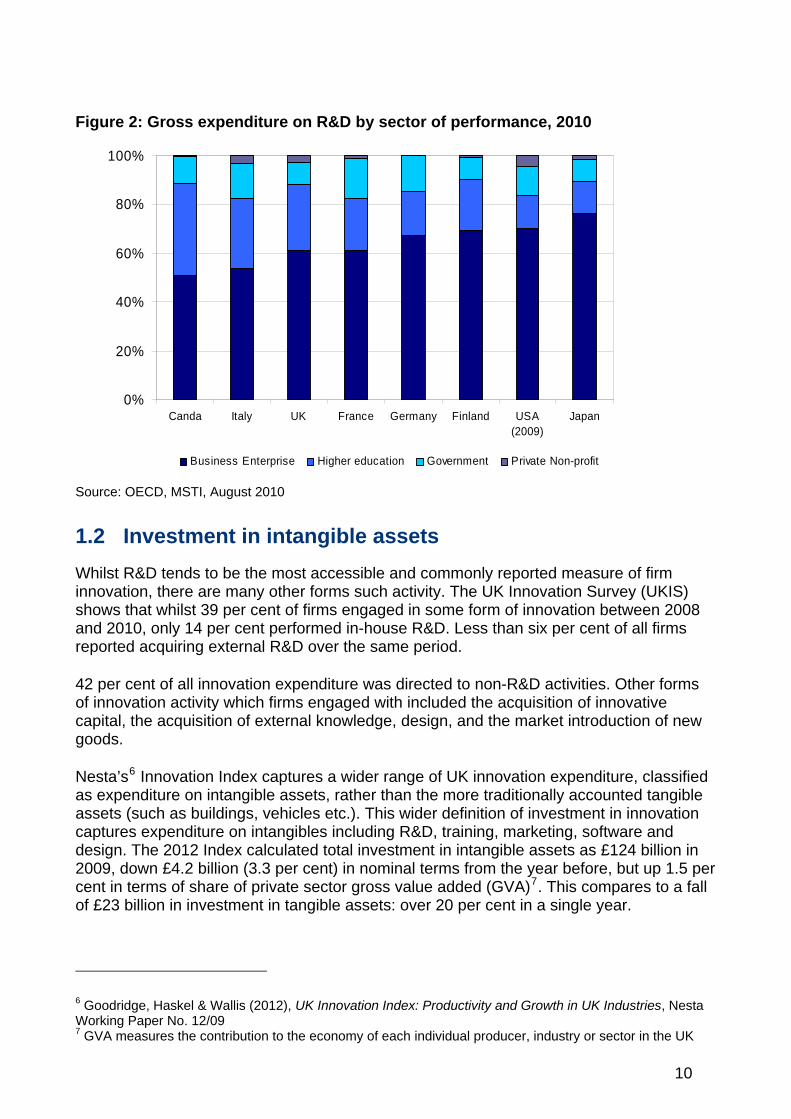
Figure 2: Gross expenditure on R&D by sector of performance, 2010
0%
20%
40%
60%
80%
100%
Canda Italy UK France Germany Finland USA(2009)
Japan
Business Enterprise Higher education Government Private Non-profit
Source: OECD, MSTI, August 2010
1.2 Investment in intangible assets
Whilst R&D tends to be the most accessible and commonly reported measure of firm innovation, there are many other forms such activity. The UK Innovation Survey (UKIS) shows that whilst 39 per cent of firms engaged in some form of innovation between 2008 and 2010, only 14 per cent performed in-house R&D. Less than six per cent of all firms reported acquiring external R&D over the same period.
42 per cent of all innovation expenditure was directed to non-R&D activities. Other forms of innovation activity which firms engaged with included the acquisition of innovative capital, the acquisition of external knowledge, design, and the market introduction of new goods.
Nesta’s6 Innovation Index captures a wider range of UK innovation expenditure, classified as expenditure on intangible assets, rather than the more traditionally accounted tangible assets (such as buildings, vehicles etc.). This wider definition of investment in innovation captures expenditure on intangibles including R&D, training, marketing, software and design. The 2012 Index calculated total investment in intangible assets as £124 billion in 2009, down £4.2 billion (3.3 per cent) in nominal terms from the year before, but up 1.5 per cent in terms of share of private sector gross value added (GVA)7. This compares to a fall of £23 billion in investment in tangible assets: over 20 per cent in a single year.
6 Goodridge, Haskel & Wallis (2012), UK Innovation Index: Productivity and Growth in UK Industries, Nesta Working Paper No. 12/09 7 GVA measures the contribution to the economy of each individual producer, industry or sector in the UK
10
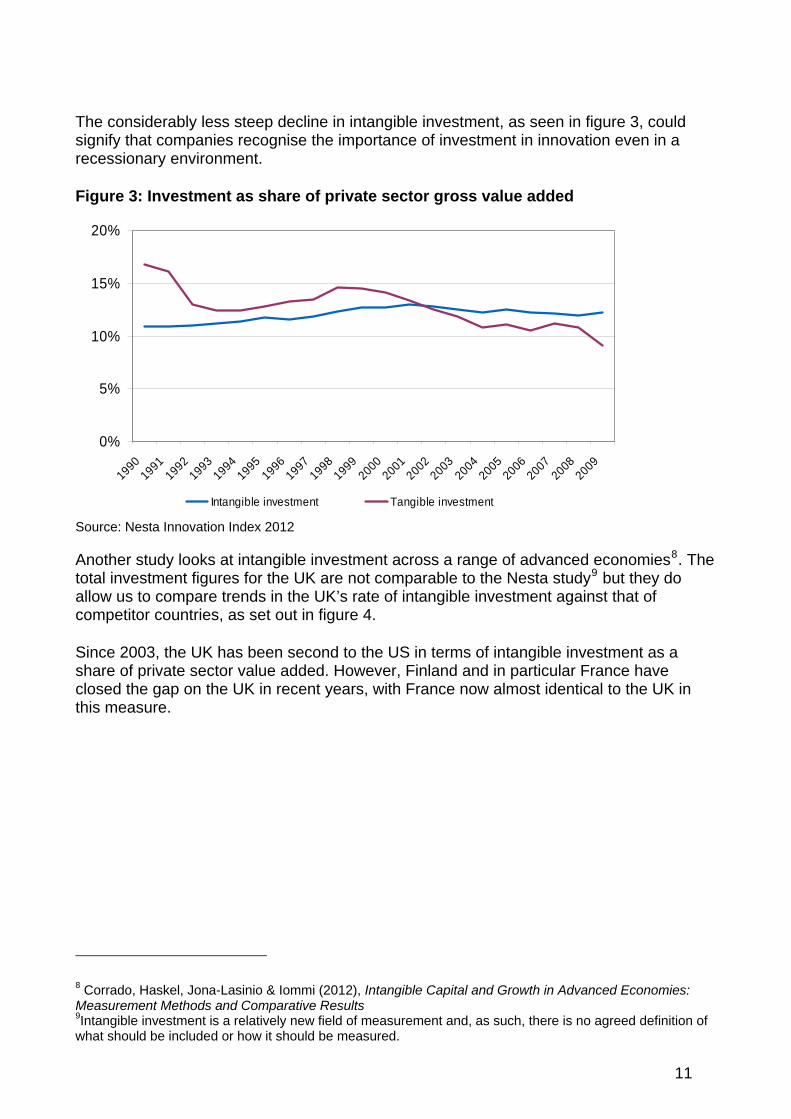
The considerably less steep decline in intangible investment, as seen in figure 3, could signify that companies recognise the importance of investment in innovation even in a recessionary environment.
Figure 3: Investment as share of private sector gross value added
0%
5%
10%
15%
20%
19901991
19921993
19941995
19961997
19981999
20002001
20022003
20042005
20062007
20082009
Intangible investment Tangible investment
Source: Nesta Innovation Index 2012
Another study looks at intangible investment across a range of advanced economies8. The total investment figures for the UK are not comparable to the Nesta study9 but they do allow us to compare trends in the UK’s rate of intangible investment against that of competitor countries, as set out in figure 4.
Since 2003, the UK has been second to the US in terms of intangible investment as a share of private sector value added. However, Finland and in particular France have closed the gap on the UK in recent years, with France now almost identical to the UK in this measure.
8 Corrado, Haskel, Jona-Lasinio & Iommi (2012), Intangible Capital and Growth in Advanced Economies: Measurement Methods and Comparative Results 9Intangible investment is a relatively new field of measurement and, as such, there is no agreed definition of what should be included or how it should be measured.
11
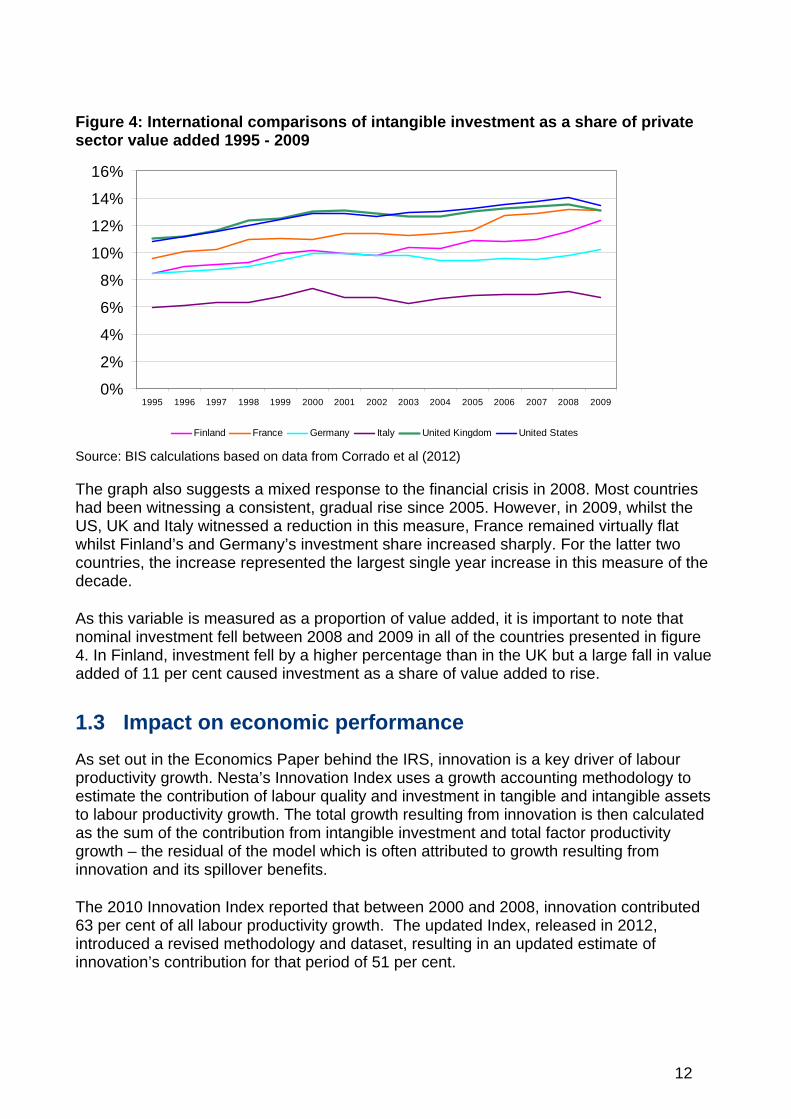
Figure 4: International comparisons of intangible investment as a share of private sector value added 1995 - 2009
0%
2%
4%
6%
8%
10%
12%
14%
16%
1995 1996 1997 1998 1999 2000 2001 2002 2003 2004 2005 2006 2007 2008 2009
Finland France Germany Italy United Kingdom United States
Source: BIS calculations based on data from Corrado et al (2012)
The graph also suggests a mixed response to the financial crisis in 2008. Most countries had been witnessing a consistent, gradual rise since 2005. However, in 2009, whilst the US, UK and Italy witnessed a reduction in this measure, France remained virtually flat whilst Finland’s and Germany’s investment share increased sharply. For the latter two countries, the increase represented the largest single year increase in this measure of the decade.
As this variable is measured as a proportion of value added, it is important to note that nominal investment fell between 2008 and 2009 in all of the countries presented in figure 4. In Finland, investment fell by a higher percentage than in the UK but a large fall in value added of 11 per cent caused investment as a share of value added to rise.
1.3 Impact on economic performance
As set out in the Economics Paper behind the IRS, innovation is a key driver of labour productivity growth. Nesta’s Innovation Index uses a growth accounting methodology to estimate the contribution of labour quality and investment in tangible and intangible assets to labour productivity growth. The total growth resulting from innovation is then calculated as the sum of the contribution from intangible investment and total factor productivity growth – the residual of the model which is often attributed to growth resulting from innovation and its spillover benefits.
The 2010 Innovation Index reported that between 2000 and 2008, innovation contributed 63 per cent of all labour productivity growth. The updated Index, released in 2012, introduced a revised methodology and dataset, resulting in an updated estimate of innovation’s contribution for that period of 51 per cent.
12

Of that, 19 per cent was from the direct contribution of the investment with an additional 32 per cent arising from total factor productivity growth: the indirect contribution of innovation investment.
The updated Index allows us to extend this analysis to include 2009. Figure 5 presents the different components which contributed to labour productivity growth over that period, compared to the previous Innovation Index.
Figure 5: Breakdown of components for UK average labour productivity growth, 2000-2008 and 2000 - 2009
2000 - 2008
Labour quality12%
Tangible invesmtent
37%
Intangible investment
19%
Total factor productivity
32%
Labour quality19%
Tangible investment
55%
Intangible investment
26%
Total factor productivity
0%
Source: BIS calculations based on data from Goodridge et al (2012), UK Innovation Index: Productivity and Growth in UK Industries, Nesta Working Paper No. 12/09
With strong negative labour productivity growth in 2009, we see a shift in composition towards labour quality and investment in tangible and intangible investments and a shift away, entirely, from total factor productivity (TFP).
It is likely that the dramatic change in the composition caused by the addition of a single year’s data can be attributed to the impact of the recession. This implies that TFP growth is not a reliable measure of the impact of innovation on economic growth in a recessionary environment with negative labour productivity growth. For instance, in a situation where labour is working below its full capacity, as is likely if product demand has fallen more than employment, increases in potential efficiency that could occur as a result of innovation may not manifest themselves in terms of increased measured efficiency. One may expect the positive contribution of the innovation to manifest itself in the longer run as demand for goods and, as such, labour, increases.
13

2. Discovery and development Headlines:
The UK research base is world-leading in its efficiency, measured in terms of number of citations and most-cited articles.
The UK ranks strongly in terms of international collaboration on scientific articles;
In terms of higher education R&D intensity, the UK is well behind the leaders in Finland and Canada, but reasonably well positioned in terms of the main group of comparator countries, in line with Germany and France; and
The UK remains a very attractive destination for inward R&D investment, being well ahead of all comparator countries on the proportion of research funding financed from abroad.
The proportion of the UK labour force that is trained in science and technology has increased over time.
The UK has a high proportion of engineering and doctoral graduates in comparison to other countries.
Science and Research activity in the UK is underpinned by a system of higher education institutions and Public Sector Research Establishments funded predominantly, but not exclusively, through the Science and Research Budget. It creates knowledge and builds capability, disseminates that knowledge to students and the wider public, charitable and private sectors, develops technologies, solves problems and, through all of this, creates and improves businesses. It delivers the skilled work force needed in the business sector to convert ideas into innovative, commercial products and processes. As such, the research base is a key source of knowledge, new ideas and skills.
This chapter considers the range of indicators around the UK’s research activities. It begins with funding and performance of R&D before considering the outputs achieved from that funding. It then focuses on the skilled graduates who come out of the higher education sector and the contribution they make to innovation before finally assessing the scale and impact of university-business interaction.
2.1 Investment in innovation
Chapter 2 shows that the higher education sector is an important performer of R&D in most countries. Figure 6 presents the intensity of Higher Education R&D (HERD) across a range of countries. Over the last decade, the UK has been towards the top of the main group of countries, although significantly behind the two leading countries of Finland and Canada.
14
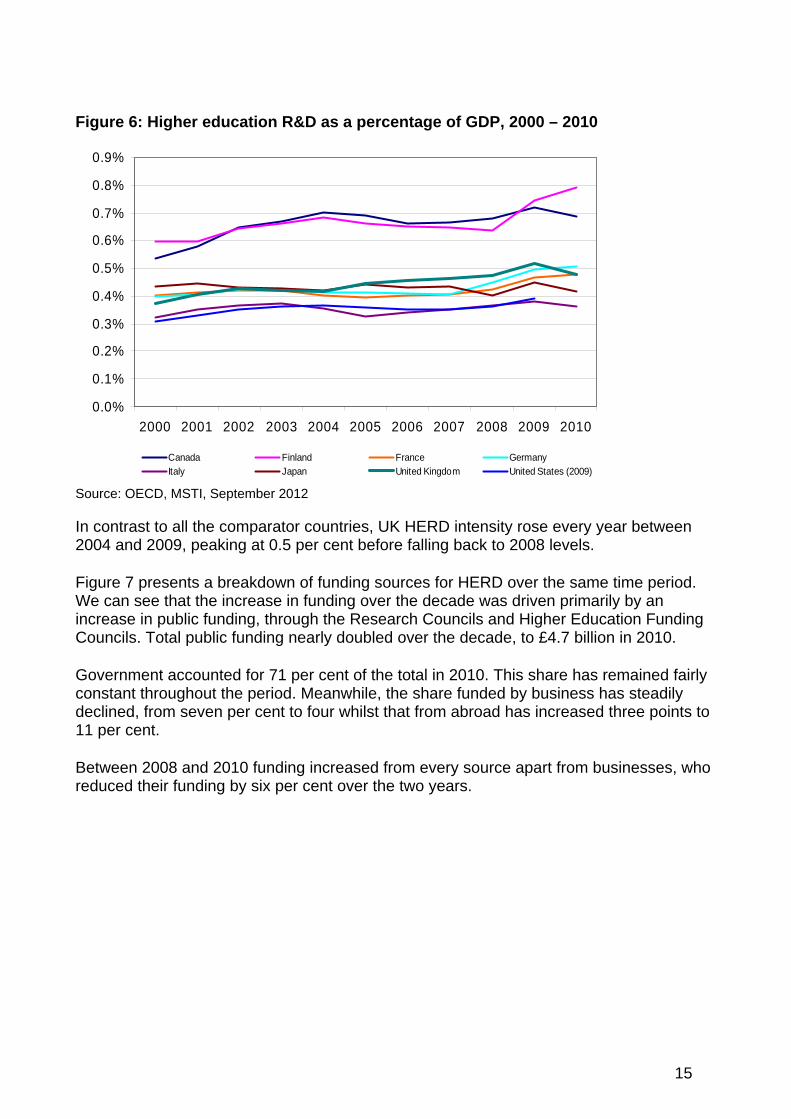
Figure 6: Higher education R&D as a percentage of GDP, 2000 – 2010
0.0%
0.1%
0.2%
0.3%
0.4%
0.5%
0.6%
0.7%
0.8%
0.9%
2000 2001 2002 2003 2004 2005 2006 2007 2008 2009 2010
Canada Finland France Germany
Italy Japan United Kingdom United States (2009)
Source: OECD, MSTI, September 2012
In contrast to all the comparator countries, UK HERD intensity rose every year between 2004 and 2009, peaking at 0.5 per cent before falling back to 2008 levels.
Figure 7 presents a breakdown of funding sources for HERD over the same time period. We can see that the increase in funding over the decade was driven primarily by an increase in public funding, through the Research Councils and Higher Education Funding Councils. Total public funding nearly doubled over the decade, to £4.7 billion in 2010.
Government accounted for 71 per cent of the total in 2010. This share has remained fairly constant throughout the period. Meanwhile, the share funded by business has steadily declined, from seven per cent to four whilst that from abroad has increased three points to 11 per cent.
Between 2008 and 2010 funding increased from every source apart from businesses, who reduced their funding by six per cent over the two years.
15
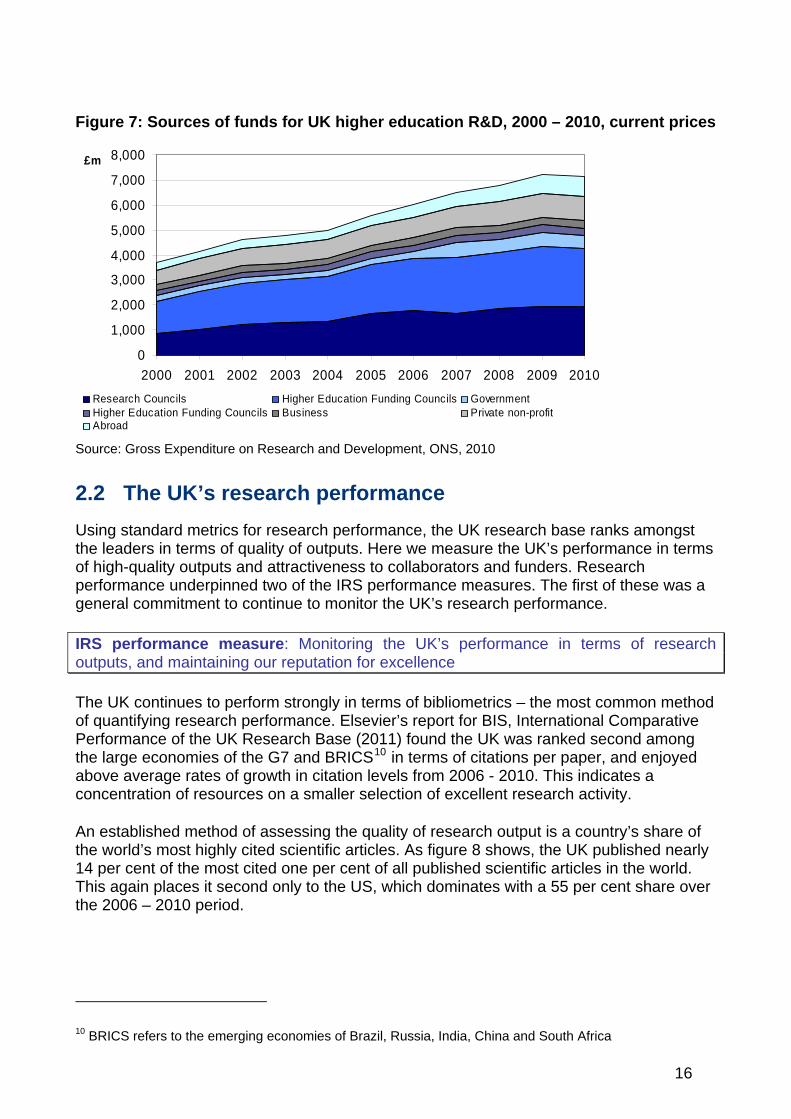
Figure 7: Sources of funds for UK higher education R&D, 2000 – 2010, current prices
0
1,000
2,000
3,000
4,000
5,000
6,000
7,000
8,000
2000 2001 2002 2003 2004 2005 2006 2007 2008 2009 2010
£m
Research Councils Higher Education Funding Councils GovernmentHigher Education Funding Councils Business Private non-profitAbroad
Source: Gross Expenditure on Research and Development, ONS, 2010
2.2 The UK’s research performance
Using standard metrics for research performance, the UK research base ranks amongst the leaders in terms of quality of outputs. Here we measure the UK’s performance in terms of high-quality outputs and attractiveness to collaborators and funders. Research performance underpinned two of the IRS performance measures. The first of these was a general commitment to continue to monitor the UK’s research performance.
IRS performance measure: Monitoring the UK’s performance in terms of research outputs, and maintaining our reputation for excellence
The UK continues to perform strongly in terms of bibliometrics – the most common method of quantifying research performance. Elsevier’s report for BIS, International Comparative Performance of the UK Research Base (2011) found the UK was ranked second among the large economies of the G7 and BRICS10 in terms of citations per paper, and enjoyed above average rates of growth in citation levels from 2006 - 2010. This indicates a concentration of resources on a smaller selection of excellent research activity.
An established method of assessing the quality of research output is a country’s share of the world’s most highly cited scientific articles. As figure 8 shows, the UK published nearly 14 per cent of the most cited one per cent of all published scientific articles in the world. This again places it second only to the US, which dominates with a 55 per cent share over the 2006 – 2010 period.
10 BRICS refers to the emerging economies of Brazil, Russia, India, China and South Africa
16
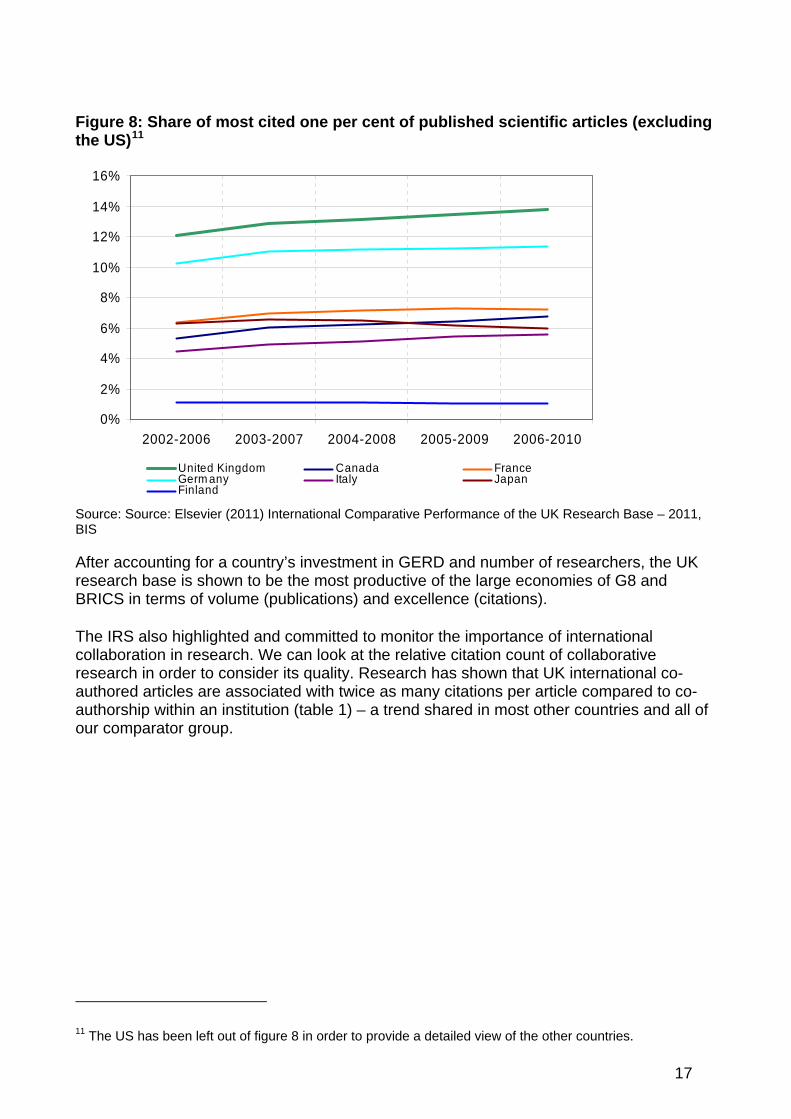
Figure 8: Share of most cited one per cent of published scientific articles (excluding the US)11
0%
2%
4%
6%
8%
10%
12%
14%
16%
2002-2006 2003-2007 2004-2008 2005-2009 2006-2010
United Kingdom Canada FranceGerm any Italy JapanFinland
Source: Source: Elsevier (2011) International Comparative Performance of the UK Research Base – 2011, BIS
After accounting for a country’s investment in GERD and number of researchers, the UK research base is shown to be the most productive of the large economies of G8 and BRICS in terms of volume (publications) and excellence (citations).
The IRS also highlighted and committed to monitor the importance of international collaboration in research. We can look at the relative citation count of collaborative research in order to consider its quality. Research has shown that UK international co-authored articles are associated with twice as many citations per article compared to co-authorship within an institution (table 1) – a trend shared in most other countries and all of our comparator group.
11 The US has been left out of figure 8 in order to provide a detailed view of the other countries.
17
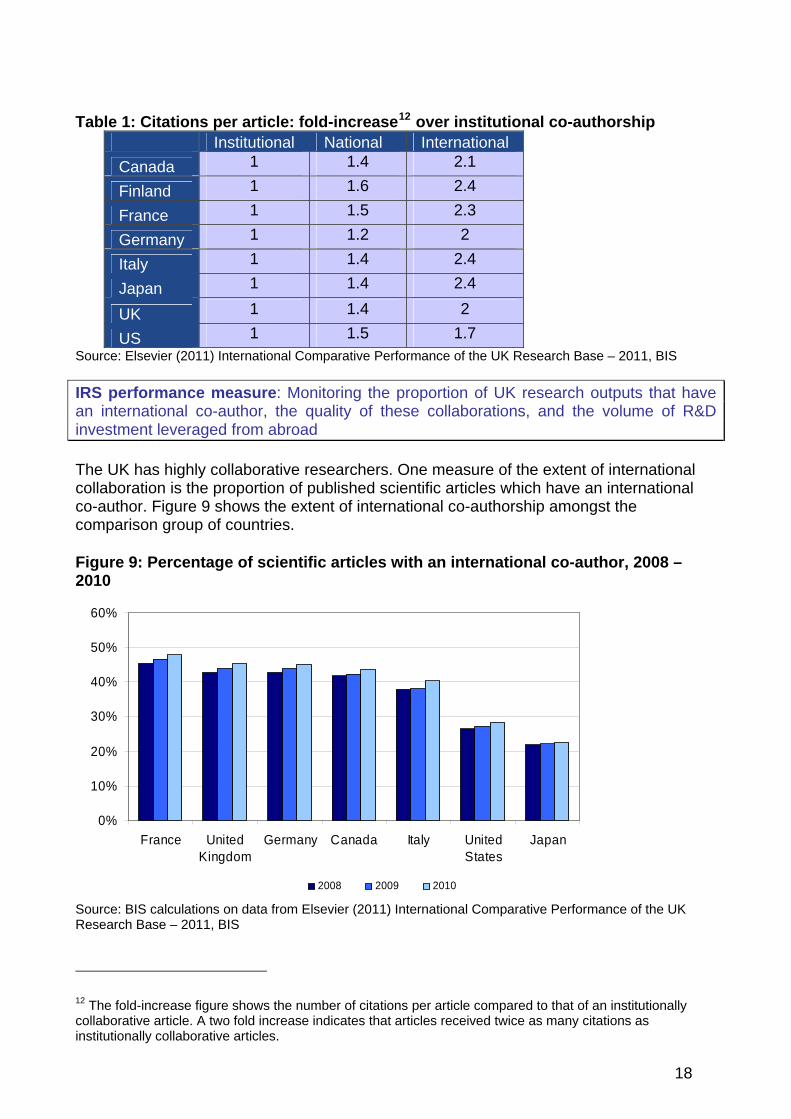
Table 1: Citations per article: fold-increase12 over institutional co-authorship Institutional National International
Canada 1 1.4 2.1
Finland 1 1.6 2.4
France 1 1.5 2.3
Germany 1 1.2 2
Italy 1 1.4 2.4
Japan 1 1.4 2.4
UK 1 1.4 2
US 1 1.5 1.7 Source: Elsevier (2011) International Comparative Performance of the UK Research Base – 2011, BIS
IRS performance measure: Monitoring the proportion of UK research outputs that have an international co-author, the quality of these collaborations, and the volume of R&D investment leveraged from abroad
The UK has highly collaborative researchers. One measure of the extent of international collaboration is the proportion of published scientific articles which have an international co-author. Figure 9 shows the extent of international co-authorship amongst the comparison group of countries.
Figure 9: Percentage of scientific articles with an international co-author, 2008 – 2010
0%
10%
20%
30%
40%
50%
60%
France UnitedKingdom
Germany Canada Italy UnitedStates
Japan
2008 2009 2010
Source: BIS calculations on data from Elsevier (2011) International Comparative Performance of the UK Research Base – 2011, BIS
12 The fold-increase figure shows the number of citations per article compared to that of an institutionally collaborative article. A two fold increase indicates that articles received twice as many citations as institutionally collaborative articles.
18
Between 2008 and 2010 all countries in the comparison group saw an increased share of international co-authorship amongst their publications. For the UK, the increase was over 14 per cent, faster than all other countries apart from the US and taking it from the fourth in 2006, to the second highest country in the group, behind France.
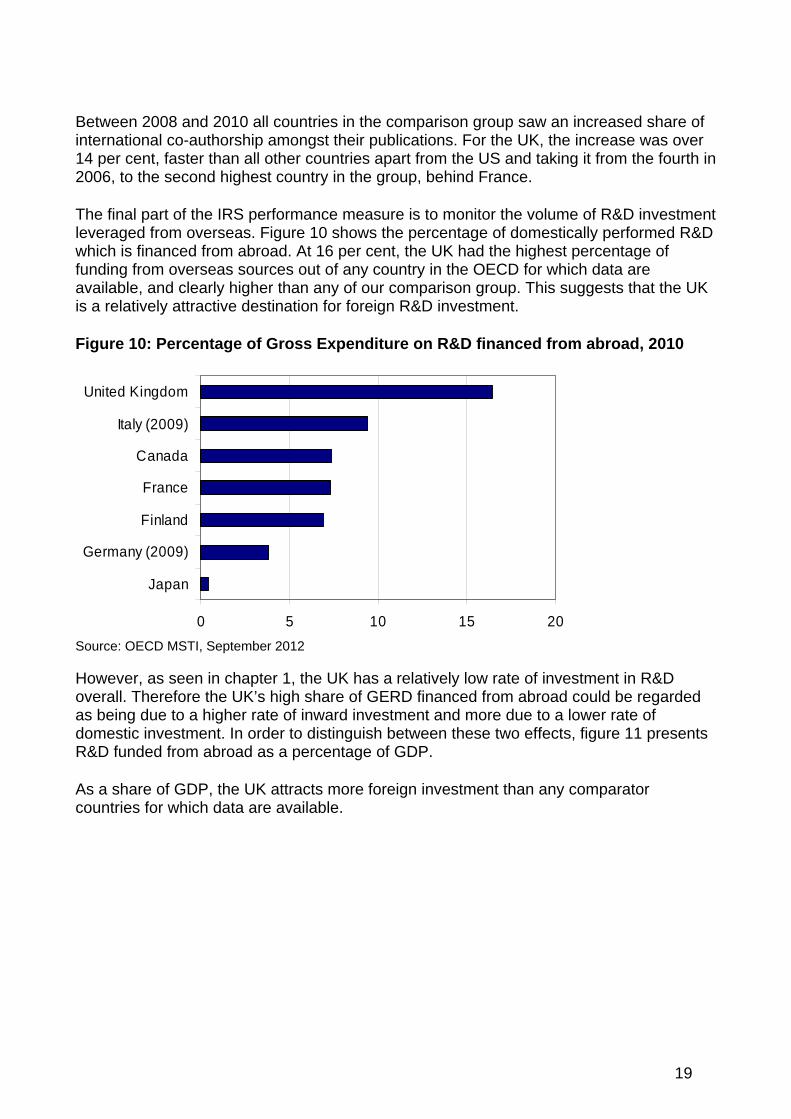
The final part of the IRS performance measure is to monitor the volume of R&D investment leveraged from overseas. Figure 10 shows the percentage of domestically performed R&D which is financed from abroad. At 16 per cent, the UK had the highest percentage of funding from overseas sources out of any country in the OECD for which data are available, and clearly higher than any of our comparison group. This suggests that the UK is a relatively attractive destination for foreign R&D investment.
Figure 10: Percentage of Gross Expenditure on R&D financed from abroad, 2010
0 5 10 15 20
Japan
Germany (2009)
Finland
France
Canada
Italy (2009)
United Kingdom
Source: OECD MSTI, September 2012 However, as seen in chapter 1, the UK has a relatively low rate of investment in R&D overall. Therefore the UK’s high share of GERD financed from abroad could be regarded as being due to a higher rate of inward investment and more due to a lower rate of domestic investment. In order to distinguish between these two effects, figure 11 presents R&D funded from abroad as a percentage of GDP.
As a share of GDP, the UK attracts more foreign investment than any comparator countries for which data are available.
19

Figure 11: R&D financed from abroad as a percentage of GDP, 2010
0 0.05 0.1 0.15 0.2 0.25 0.3 0.35
Japan
Germany (2009)
Italy (2009)
Canada
France
Finland
United Kingdom
Source: OECD MSTI, September 2012 The IRS performance measure above relates specifically to research and, as such, the relevant measure should similarly focus on investment leveraged as a result of research in the UK. Figure 7 showed the value and share of R&D performed by UK universities but financed from abroad has been increasing over the past decade. In 2010, overseas finance accounted for 11 per cent of total R&D performed in higher education in the UK. In terms of intensity, this equates to 0.05 per cent of GDP and represents the peak of an upward trend in this measure.
2.3 Provision of skilled graduates
In addition to directly engaging in research, UK universities play another important role in the innovation system; they provide highly skilled graduates and post-graduates to the labour force.
Figure 12 provides an overview of graduate employment across broad sectors, considering science and engineering degrees and all other disciplines. In total, across all sectors, around six per cent of employees are science graduates and over nine percent have some other degree. Employment of graduates is skewed towards innovative companies, in which eight per cent hold science degrees and over 11 per cent hold another degree.
The importance of graduates differs between sectors, with knowledge intensive services in particular having a high proportion of graduate employees. In every sector, firms which engage in any innovative activity employ more graduates of each category than non-innovative companies, suggesting highly skilled workers are important for innovation.
20
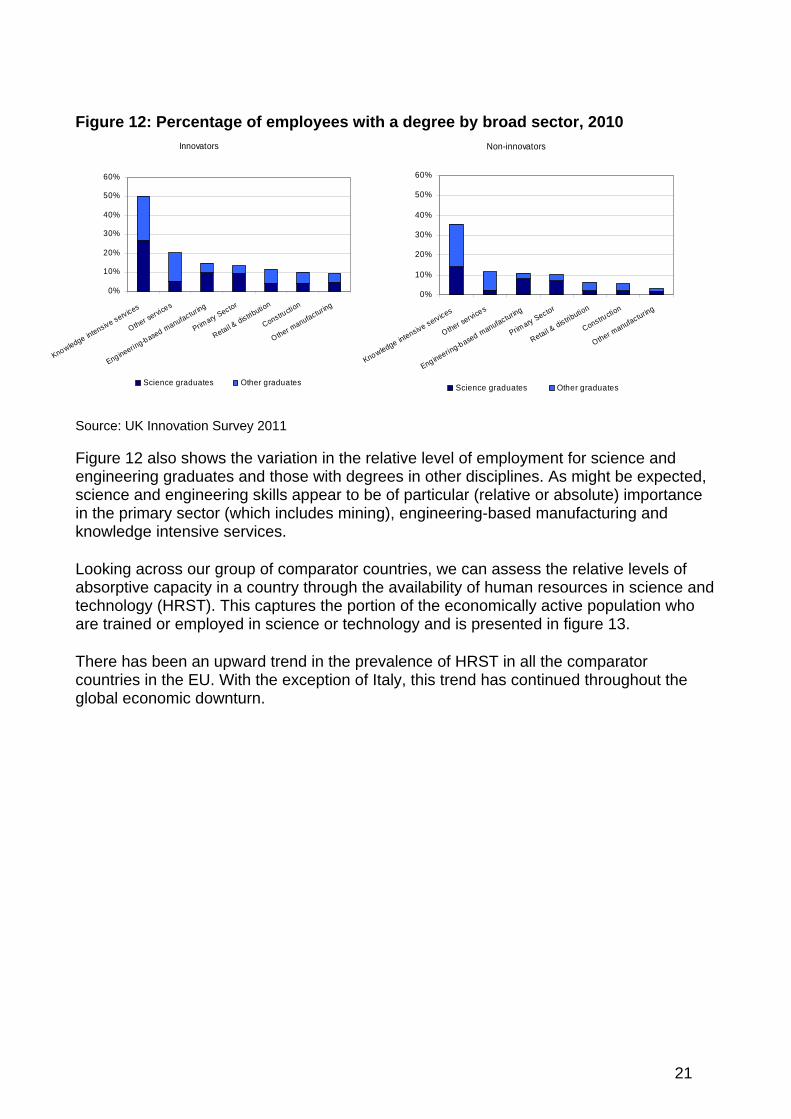
Figure 12: Percentage of employees with a degree by broad sector, 2010 Innovators
0%
10%
20%
30%
40%
50%
60%
Knowledge intensive services
Other services
Engineering-based m
anufacturing
Primary Sector
Retail & distrib
ution
Construction
Other manufacturing
Non-innovators
0%
10%
20%
30%
40%
50%
60%
Knowledge intensive services
Other services
Eng ineering-based m
anufacturing
Primary Sector
Retail & distrib
ution
Construction
Other manufacturing
Science graduates Other graduatesScience graduates Other graduates
Source: UK Innovation Survey 2011 Figure 12 also shows the variation in the relative level of employment for science and engineering graduates and those with degrees in other disciplines. As might be expected, science and engineering skills appear to be of particular (relative or absolute) importance in the primary sector (which includes mining), engineering-based manufacturing and knowledge intensive services.
Looking across our group of comparator countries, we can assess the relative levels of absorptive capacity in a country through the availability of human resources in science and technology (HRST). This captures the portion of the economically active population who are trained or employed in science or technology and is presented in figure 13.
There has been an upward trend in the prevalence of HRST in all the comparator countries in the EU. With the exception of Italy, this trend has continued throughout the global economic downturn.
21

Figure 13: Human resources in science and technology as a percentage of the labour force, 2002-2010
0%
10%
20%
30%
40%
50%
2002 2003 2004 2005 2006 2007 2008 2009 2010
European Union Germany France
Italy Finland United Kingdom
Source: Eurostat One of the key drivers of innovation capability is the very highly skilled. Such graduates underpin the future creative and absorptive capacity of the science and research system as well as businesses across the economy. Figure 14 presents the number of science and engineering doctoral graduates per 100,000 population across countries. The UK has the highest cumulative proportion of science and engineering doctoral graduates among the comparator countries with a similar proportion of science doctorals to Germany and France and second highest proportion of engineering students behind Finland.
Figure 14: Science and engineering doctoral graduates per 100,000 population, 2009
0 2 4 6 8 10 12 1
Japan
United States
Italy (2007)
Canada (2008)
France
Germany
Finland
United Kingdom
4
Science Engineering Source: OECD Science, Technology and Industry Scoreboard 2011 and OECD population data 2012
22

2.4 Bridging the gap between research and business
This chapter has outlined the importance of universities in producing high quality research and supplying the labour market with high-skilled graduates. Universities also create and supply problem solving capacity to business more directly, engaging in contracted research for specific activities.
Total income has grown in real terms year-on-year since 2003/04, reaching £3.3 billion in 2010/11. Figure 15 presents a breakdown of university income from knowledge exchange activities in 2010/11.
Figure 15: Breakdown of HEI knowledge exchange income by source, 2010/11
26%
33%
11%
4%
18%
6% 2%Collaborative research
Contract research
Consultancy
Facilities and equipment-relatedservices
CPD
Regeneration and developmentprogrammes
Intellectual property
Source: Higher Education – Business and Community Interaction Survey 2010-11
23

3. Innovative businesses Headlines:
Historically, UK Business Enterprise R&D investment intensity has been relatively low. However, investment intensity has held up well during the recession;
Much of the apparent intensity gap is explained by the UK’s industrial structure. Once this is accounted for, UK investment intensity is similar to that of Germany, Canada and Finland; and
The UK is among the leading countries in the EU in terms of venture capital investment as a share of GDP.
Businesses are key drivers of innovative activity. They provide finance, undertake R&D and deliver innovation to the market. Highly innovative businesses are found in all sectors of the economy and all regions of the country. This chapter presents evidence on the extent of innovation activity in the UK, the level and sources of investment for innovation, and the outputs that they achieve.
The IRS recognised the key role businesses play in an innovative economy and set out measures to increase investment and activity in the UK.
IRS performance measure: Increased levels of business investment in R&D and intangible assets, and an increase in the number of businesses in the UK that are actively innovating
3.1 Innovation activity
The first findings from the 2011 UK Innovation Survey (UKIS) were published this year. Due to a range of methodological changes, the results represent a break in the time series and can not be directly compared to previous waves of the survey13. The revised results show that a total of 37 per cent of firms were innovation active14 in the three year period from 2008 to 2010. International comparisons of the data were not available at the time of writing.
As noted in chapter 1, R&D represents just one of a range of innovation activities firms can engage in. Figure 16 presents the breakdown of activities carried out by firms between 2008 and 2010.
13 For full details of the changes, see BIS (2012) First findings from the UK Innovation Survey 2011 14 A firm is considered innovation active if it engaged in any of the following three activities: The introduction of new or significantly improved products or processes; engagement in innovation projects not yet complete or abandoned; new and significantly improved forms of organisation, business structure or practices and marketing concepts or strategies.
24

Figure 16: Percentage of firms engaged in specific innovation activities, 2008 - 2010
0 5 10 15 20 25
Acquisition of external knowledge
External R&D
Market research
Advanced machinery
Changes to product or service design
Launch advertising
All forms of design
Changes to marketing methods
Training for innovative activities
Internal R&D
Computer hardware
Computer software
Source: UK Innovation Survey 2011
3.2 Investment in innovation
Figure 17 presents a breakdown of 2010 expenditure across activities, taken from the UKIS. Whilst R&D is not the most common activity firms engage with, it is the largest category of expenditure, with internal R&D representing over a third of total expenditure. This is followed by the acquisition of capital (30 per cent) and the acquisition of external R&D, which more than doubled its share from 2008, to 24 per cent.
The total share of innovation investment on R&D activities stood at nearly 60 per cent in 2010, up from 43 per cent in 2008 (although, again, these figures are not directly comparable).
25
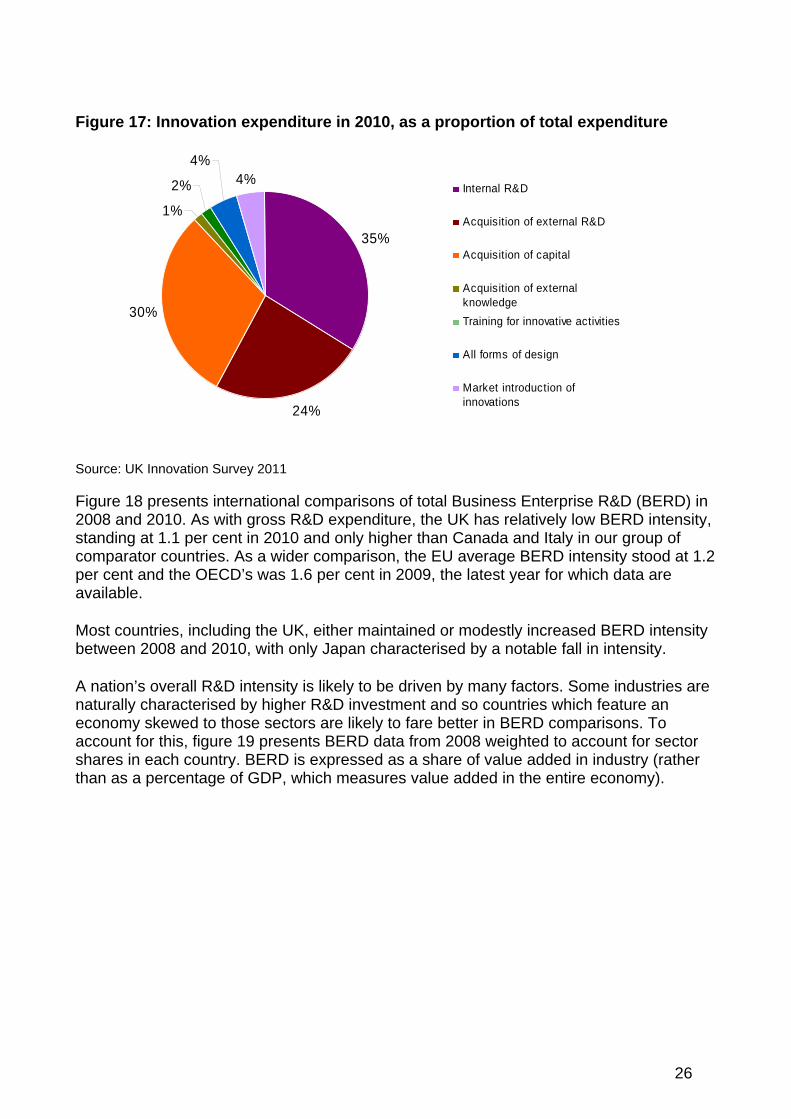
Figure 17: Innovation expenditure in 2010, as a proportion of total expenditure
35%
24%
30%
1%
2%
4%4%
Internal R&D
Acquisition of external R&D
Acquisition of capital
Acquisition of externalknowledge
Training for innovative activities
All forms of design
Market introduction ofinnovations
Source: UK Innovation Survey 2011
l comparisons of total Business Enterprise R&D (BERD) in 008 and 2010. As with gross R&D expenditure, the UK has relatively low BERD intensity,
tries, including the UK, either maintained or modestly increased BERD intensity between 2008 and 2010, with only Japan characterised by a notable fall in intensity.
are naturally characterised by higher R&D investment and so countries which feature an
tor her
Figure 18 presents internationa2standing at 1.1 per cent in 2010 and only higher than Canada and Italy in our group of comparator countries. As a wider comparison, the EU average BERD intensity stood at 1.2 per cent and the OECD’s was 1.6 per cent in 2009, the latest year for which data are available.
Most coun
A nation’s overall R&D intensity is likely to be driven by many factors. Some industries
economy skewed to those sectors are likely to fare better in BERD comparisons. To account for this, figure 19 presents BERD data from 2008 weighted to account for secshares in each country. BERD is expressed as a share of value added in industry (ratthan as a percentage of GDP, which measures value added in the entire economy).
26
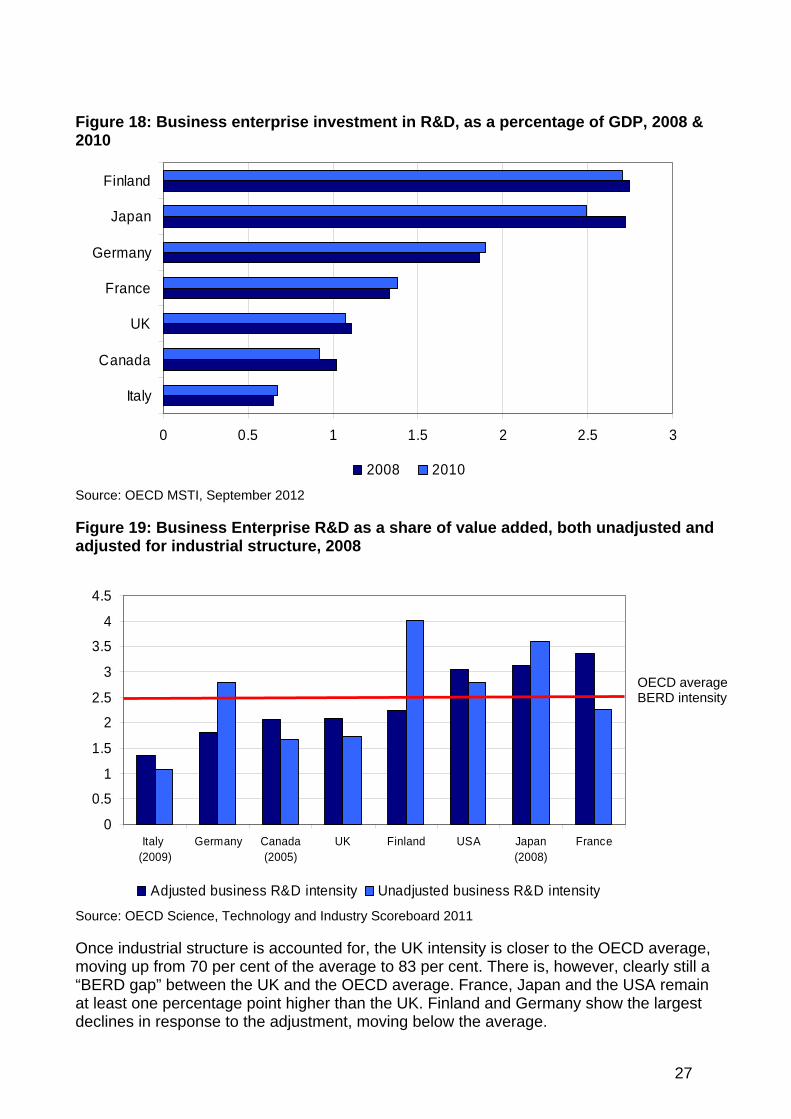
Figure 18: Business enterprise investment in R&D, as a percentage of GDP, 2008 & 2010
0 0.5 1 1.5 2 2.5 3
Italy
Canada
UK
France
Germany
Japan
Finland
2008 2010
Source: OECD MSTI, September 2012
R&D as a share of value added, both unadjusted and djusted for industrial structure, 2008
Figure 19: Business Enterprisea
0
0.5
1
1.5
2
2.5
3
3.5
4
4.5
Italy (2009)
Germany Canada(2005)
UK Finland USA Japan(2008)
France
Adjusted business R&D intensity Unadjusted business R&D intensity
Source: OECD Science, Technology and Industry Scoreboard 2011
is closer to the OECD average, oving up from 70 per cent of the average to 83 per cent. There is, however, clearly still a
OECD average BERD intensity
Once industrial structure is accounted for, the UK intensitym“BERD gap” between the UK and the OECD average. France, Japan and the USA remain at least one percentage point higher than the UK. Finland and Germany show the largest declines in response to the adjustment, moving below the average.
27
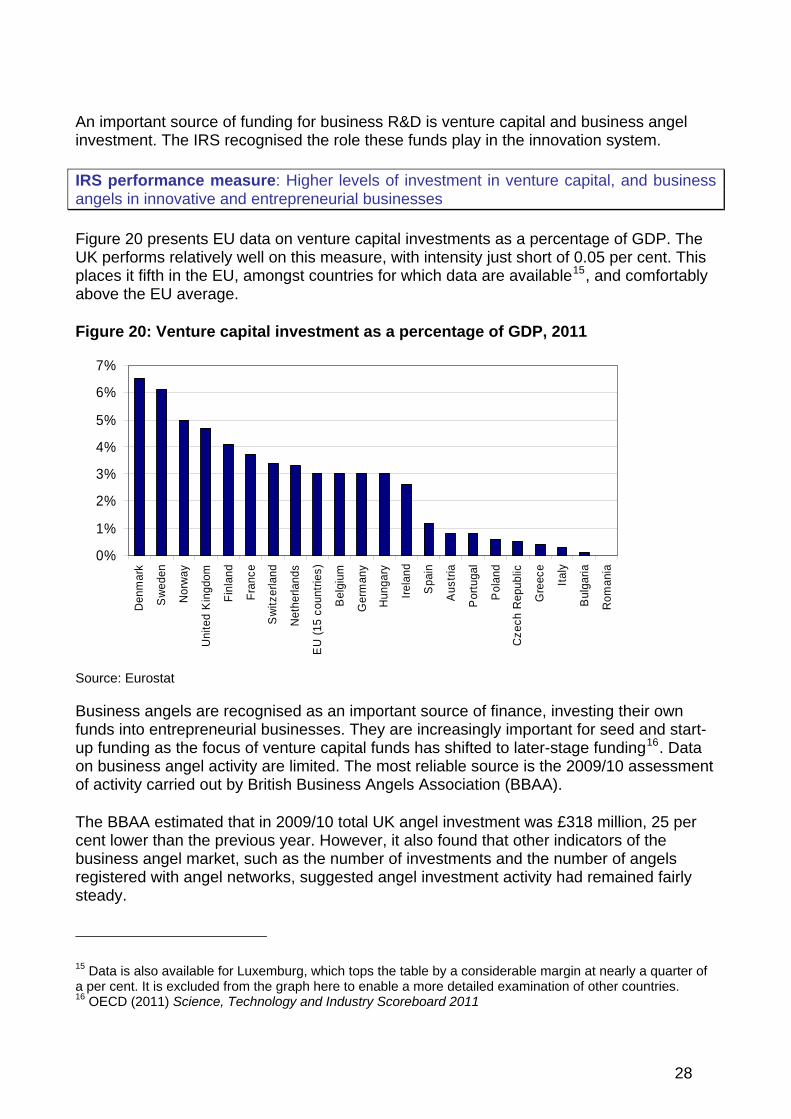
An important source of funding for business R&D is venture capital and business angel investment. The IRS recognised the role these funds play in the innovation system.
ss IRS performance measure: Higher levels of investment in venture capital, and busineangels in innovative and entrepreneurial businesses
Figure 20 presents EU data on venture capital investments as a percentage of GDP. The UK performs relatively well on this measure, with intensity just short of 0.05 per cent. This places it fifth in the EU, amongst countries for which data are available15, and comfortably above the EU average.
Figure 20: Venture capital investment as a percentage of GDP, 2011
0%
1%
2%
3%
4%
5%
6%
7%
Den
mar
k
Sw
eden
Nor
way
Uni
ted
Kin
gdom
Fin
land
Fra
nce
Sw
itzer
land
Net
herla
nds
EU
(15
cou
ntrie
s)
Bel
gium
Ger
man
y
Hun
gary
Irel
and
Spa
in
Aus
tria
Por
tuga
l
Pol
and
Cze
ch R
epub
lic
Gre
ece
Ital
y
Bul
garia
Rom
ania
Source: Eurostat
usiness angels are recognised as an important source of finance, investing their own preneurial businesses. They are increasingly important for seed and start-
up funding as the focus of venture capital funds has shifted to later-stage funding16. Data ent
icators of the business angel market, such as the number of investments and the number of angels
Bfunds into entre
on business angel activity are limited. The most reliable source is the 2009/10 assessmof activity carried out by British Business Angels Association (BBAA).
The BBAA estimated that in 2009/10 total UK angel investment was £318 million, 25 per cent lower than the previous year. However, it also found that other ind
registered with angel networks, suggested angel investment activity had remained fairly steady.
15 Data is also available for Luxemburg, which tops the table by a considerable margin at nearly a quarter of a per cent. It is excluded from the graph here to enable a more detailed examination of other countries. 16 OECD (2011) Science, Technology and Industry Scoreboard 2011
28
In a sign of the relative strength of the UK as a place for innovative businesses, the OECD’s Science, Technology and Industry Outlook 2012 ranked the UK at number 1 in its ease of entrepreneurship index.
The first two sections of this chapter consider the inputs to innovation: firms engaging in innovation. This section examines how these inputs
et innovations. This was down from 17 per cent in 2008. However, until internationally comparable data become available, it is not clear how much
st twelve months. The figures are largely in line with those reported in the 2010 Annual Innovation Report, which
ths, by size, 2007/08 & 2010
3.3 Innovation outputs
innovative activities and investment intranslate into innovative outputs.
The 2011 UK Innovation Survey found that in 2010, an average of 7 per cent of UK firms’ turnover derived from new to mark
of this fall was due to the differences between the two surveys.
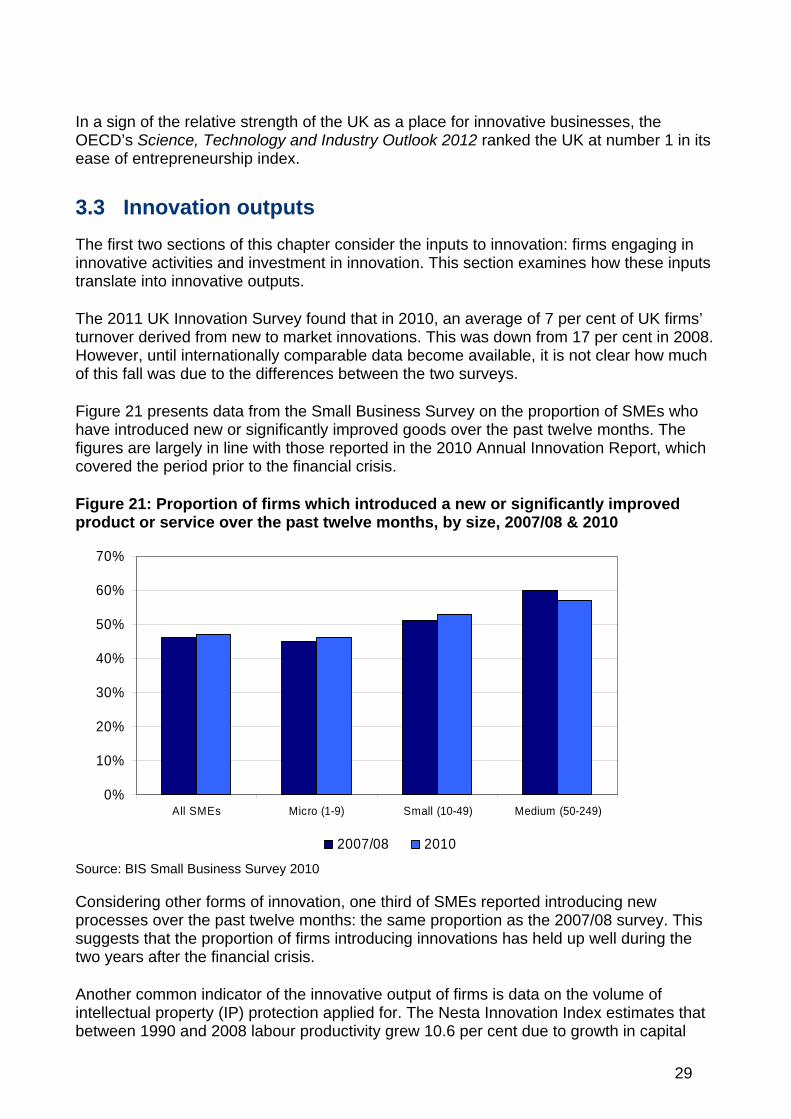
Figure 21 presents data from the Small Business Survey on the proportion of SMEs who have introduced new or significantly improved goods over the pa
covered the period prior to the financial crisis.
Figure 21: Proportion of firms which introduced a new or significantly improved product or service over the past twelve mon
0%
10%
20%
30%
40%
50%
60%
70%
All SMEs Micro (1-9) Small (10-49) Medium (50-249)
2007/08 2010
Source: BIS Small Business Survey 2010
onsidering other forms of innovation, one third of SMEs reported introducing new ths: the same proportion as the 2007/08 survey. This
suggests that the proportion of firms introducing innovations has held up well during the
applied for. The Nesta Innovation Index estimates that between 1990 and 2008 labour productivity grew 10.6 per cent due to growth in capital
Cprocesses over the past twelve mon
two years after the financial crisis.
Another common indicator of the innovative output of firms is data on the volume of intellectual property (IP) protection
29

deepening of IP protected assets1718. There is also an important role for design in theknowledge economy, with UK businesses investing up to £35 billion a year on design
nd 35 per cent of UK exports coming from industries that employ above-average proportions of designers20. When weighted by pay design accounts for 2
this
ent forms of IP protection. Table 2 presents this data from the latest wave of the survey.
19, allowing firms to develop more valuable products and services, and streamline their business processes.
The most up-to-date evidence also indicates that design-intensive sectors are highly export facing with arou
per cent of UK exports, much higher than its share of employment or output. Much of is directly exported rather than used in a supportive role in other industries’ exports.
IP can be protected in a number of ways, depending on what form the IP takes. The UK Innovation Survey collects information on the proportion of companies who use differ
Table 2: Percentages of firms reporting protection of innovation, by firm size
10–250 employees
250+ employees
All (10+ employees)
Apply for a patent 3 6 3
Register an industrial design 1 3 1
Register a trademark 4 9 4
Produce materials eligible for copyright
3 6 3
Use secrecy, including non-disclosure agreement
7 10 7
Use complexity of design 2 3 2
Use lead-advantage time on competitors
3 4 3
S 11
The evidence suggests that UK firms, given their investment in intangibl ets, make an those of US, Japan and other EU countries. It is worth
noting, however, that registered rights, patents trademarks and design rights have
ller her propensity for larger firms to innovate. The gap
between use amongst SMEs and larger firms is smaller for those forms of protection which
ource: UK Innovation Survey 20
e assless use of formal IP systems th
limitations as indicators of innovation.
Across all forms of protection, use is more prevalent amongst larger firms than smafirms. This is unsurprising given the hig
are relatively cheap to implement, such as secrecy. This could indicate that larger firms also have an advantage in being able to absorb the costs of formal IP protection more easily.
17 Haskel et al. (2011) UK Innovation Index: Productivity and growth in UK Industries, Nesta 18 Capital deepening refers to an increase in capital intensity. In this case, a higher investment intensity in IP protected assets. 19 Haskel & Pesole (2011) Design services, design rights and design life lengths in the UK, IPO 20 The Big Innovation Centre (2012) UK design as a global industry: International Trade and intellectual property, Intellectual Property Office
30
The data also reveals that by far the most common form of protection is secrecy. With eight per cent of firms reporting using secrecy to protect their IP, it is twice as common the mos
as t common formal protection, trademarks.
also apparent in the chemistry field, which includes pharmaceuticals and is the field with the most UK-based publications. This
ound
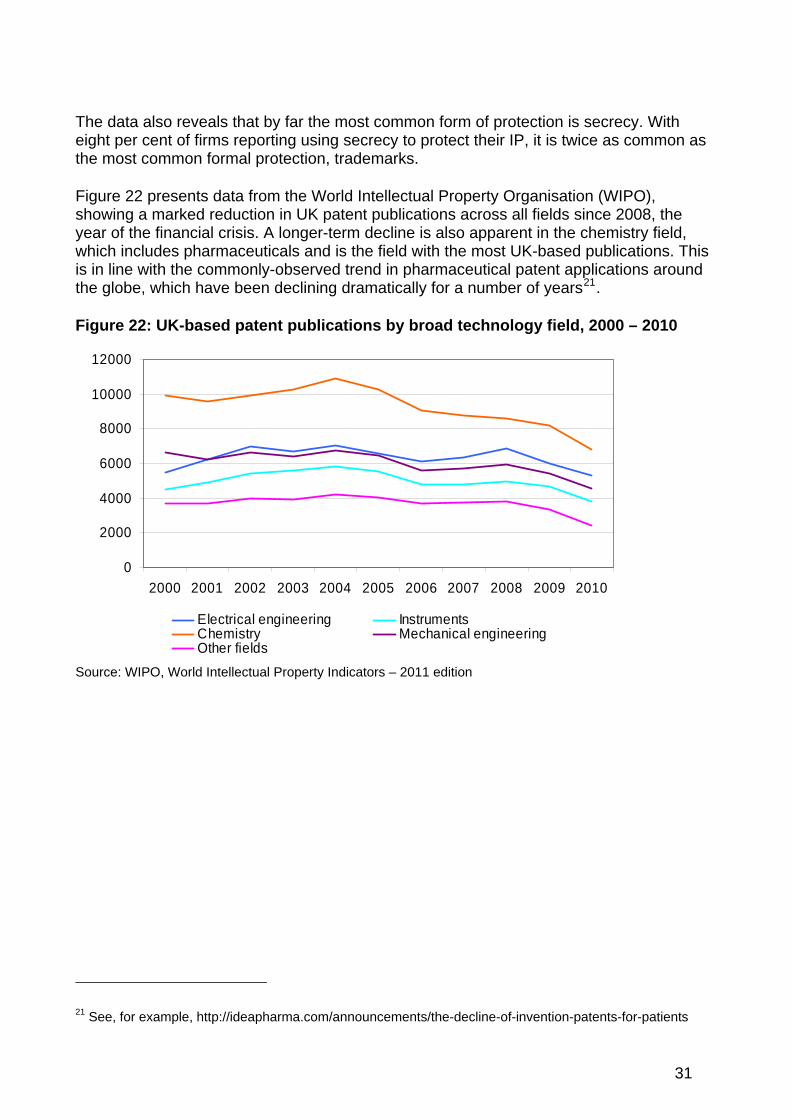
Figure 22 presents data from the World Intellectual Property Organisation (WIPO), showing a marked reduction in UK patent publications across all fields since 2008, the year of the financial crisis. A longer-term decline is
is in line with the commonly-observed trend in pharmaceutical patent applications arthe globe, which have been declining dramatically for a number of years21.
Figure 22: UK-based patent publications by broad technology field, 2000 – 2010
0
2000
4000
6000
8000
12000
10000
2000 2001 2002 2003 2004 2005 2006 2007 2008 2009 2010
Electrical engineering InstrumentsChemistry Mechanical engineeringOther fields
Source: WIPO, World Intellectual Property Indicators – 2011 edition
21 See, for example, http://ideapharma.com/announcements/the-decline-of-invention-patents-for-patients
31

4. International engagement Headlines:
The UK is a highly attractive destination for foreign direct investment.
An exceptionally high share of UK business R&D is funded from abroad;
UK innovative firms are far more likely to be active in foreign markets than their counterparts in France, Italy or Sweden;
The UK is a strong player in the EU Framework Programme, receiving nearly €4 billion so far from the 7th wave of the Programme; and
Whilst the UK performs relatively weakly in terms of international patents.
Innovation is an increasingly global endeavour, with companies and researchers partnering internationally. This enables them to share cost and risk, find complementary expertise and gain rapid access to different technologies and knowledge. We saw in chapter 3 that research involving international collaboration received twice the citations as those which kept collaboration within the same institution.
This chapter considers international engagement from a business perspective. It looks at the attractiveness of the UK as a place to invest before considering the UK’s own engagement with EU programmes and overseas markets.
4.1 Attractiveness of the UK as a place to invest
Attracting inward investment can lead to economic growth and job creation in the host country. UKTI estimate that in 2011/12, 1,400 inward investment projects in the UK led to over 110,000 jobs being created or safeguarded22. The IRS recognised the importance of inward investment as a source of growth and set out measures to support and promote the UK’s strengths in the skills base and R&D infrastructure – key reasons cited for choosing the UK as a location for investment.
IRS performance measure: Increasing the number of high quality inward investment projects from overseas
Although the number of inward investment projects decreased between 2010/11 and 2011/12, as shown in Figure 23, it is estimated that the number of new jobs created increased by 26 per cent over the same year. 12 per cent of all inward investment projects were directly related to R&D, down from 15 per cent in 2010/11.
22 UKTI Inward Investment Report 2011/12
32
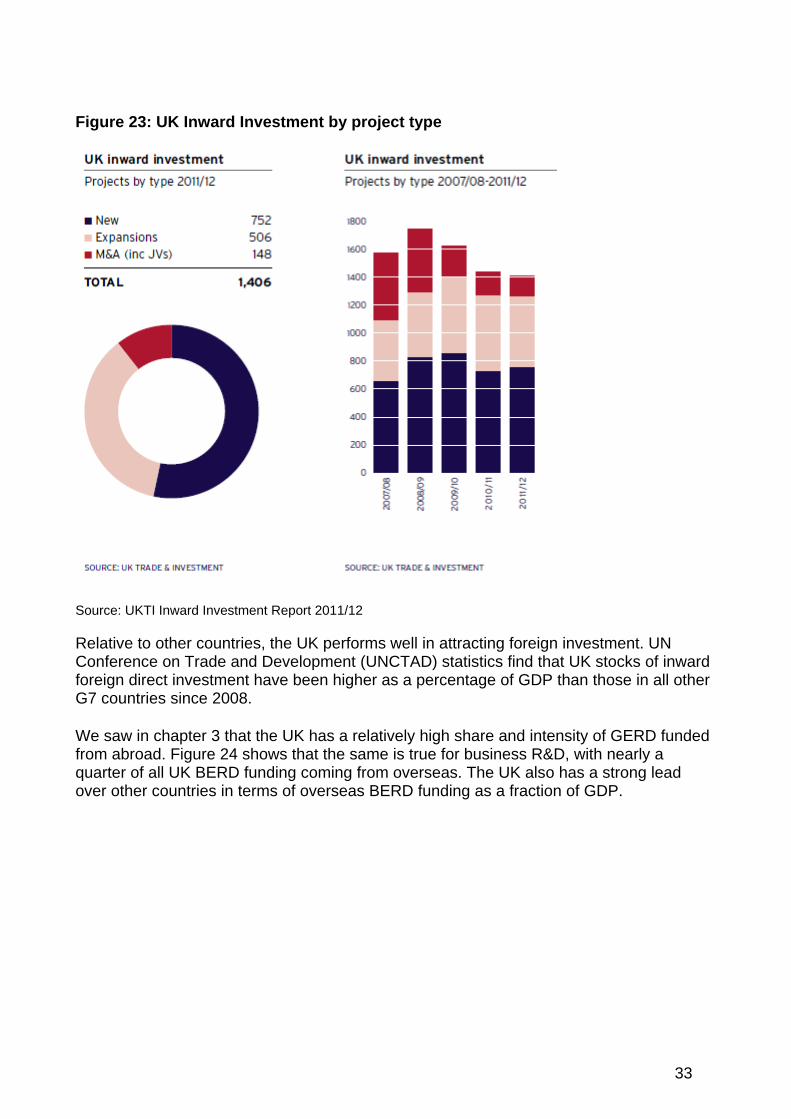
Figure 23: UK Inward Investment by project type
Source: UKTI Inward Investment Report 2011/12
v estment. UN
ng from overseas. The UK also has a strong lead
Relati e to other countries, the UK performs well in attracting foreign invConference on Trade and Development (UNCTAD) statistics find that UK stocks of inward foreign direct investment have been higher as a percentage of GDP than those in all other G7 countries since 2008.
We saw in chapter 3 that the UK has a relatively high share and intensity of GERD funded from abroad. Figure 24 shows that the same is true for business R&D, with nearly a quarter of all UK BERD funding comiover other countries in terms of overseas BERD funding as a fraction of GDP.
33
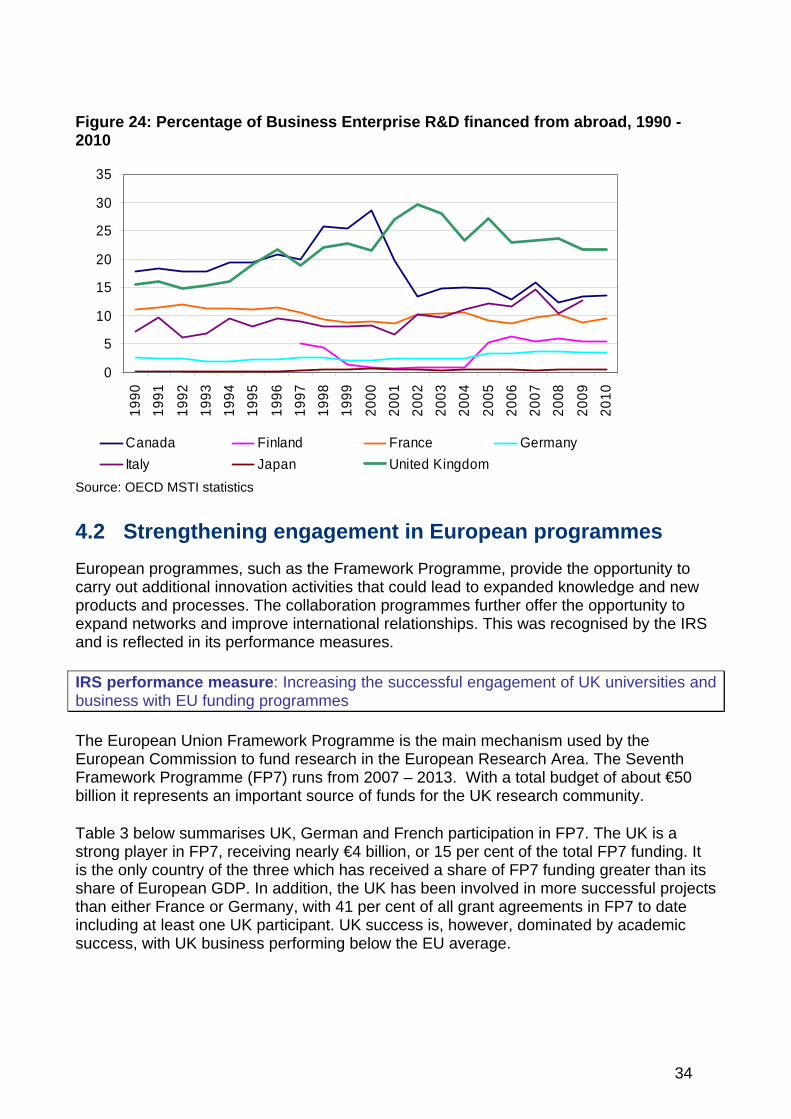
Figure 24: Percentage of Business Enterprise R&D financed from abroad, 1990 - 2010
0
5
10
15
20
25
30
35
19
90
19
91
19
92
19
93
19
94
19
95
19
96
19
97
19
98
19
99
20
00
20
01
20
02
20
03
20
04
20
05
20
06
20
07
20
08
20
09
20
10
Canada Finland France Germany
Italy Japan United Kingdom
Source: OECD MSTI statistics
4.2 Strengthening engagement in European programmes
European programmes, such as the Framework Programme, provide the opportunity to carry out additional innovation activities that could lead to expanded and new
programmes further offer the opportunity to expand networks and improve international relationships. This was recognised by the IRS
knowledgeproducts and processes. The collaboration
and is reflected in its performance measures.
IRS performance measure: Increasing the successful engagement of UK universities and business with EU funding programmes
The European Union Framework Programme is the main mechanism used by the European Commission to fund research in the European Research Area. The Seventh Framework Programme (FP7) runs from 2007 – 2013. With a total budget of about €50billion it represents an important source of funds for the UK research communit
y.
able 3 below summarises UK, German and French participation in FP7. The UK is a on, or 15 per cent of the total FP7 funding. It
the only country of the three which has received a share of FP7 funding greater than its been involved in more successful projects
an either France or Germany, with 41 per cent of all grant agreements in FP7 to date including at least one UK participant. UK success is, however, dominated by academic uccess, with UK business performing below the EU average.
Tstrong player in FP7, receiving nearly €4 billiisshare of European GDP. In addition, the UK hasth
s
34
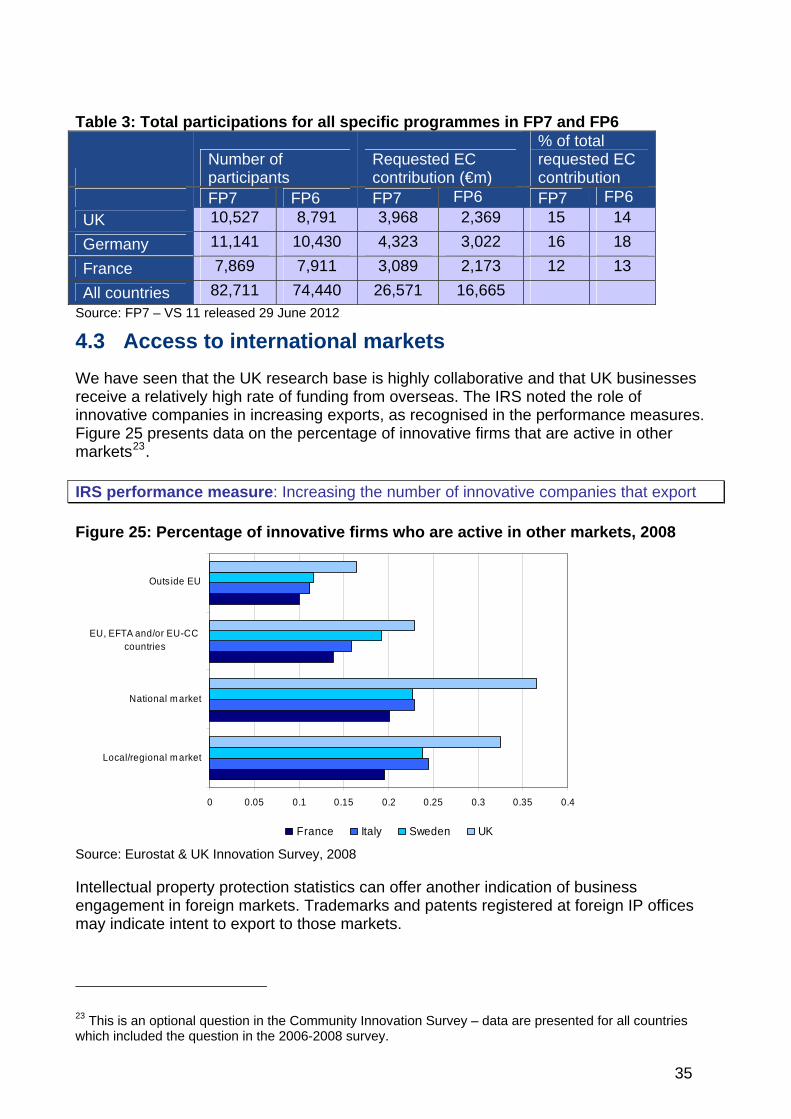
Table 3: Total participations for all specific programmes in FP7 and FP6
Number of participants
Requested EC contribution (€m)
% of total requested EC contribution
FP7 FP6 FP7 FP6 FP7 FP6
UK 10,527 8,791 3,968 2,369 15 14
Germany 11,141 10,430 4,323 3,022 16 18
France 7,869 7,911 3,089 2,173 12 13
All countries 82,711 74,440 26,571 16,665 Source: FP7 – VS 11 released 29 June 2012
4.3 Access to international markets
We have seen that the UK research base is highly collaborative and that UK businesses receive a relatively high rate of funding from overseas. The IRS noted the role of innovative companies in increasing exports, as recognised in the performance measures. Figure 25 presents data on the percentage of innovative firms that are active in other markets23.
e: Increasing the number of innovative companies that export IRS performance measur
Figure 25: Percentage of innovative firms who are active in other markets, 2008
EU, EFTA and/or EU-CC countries
Outs ide EU
National m arket
0 0.05 0.1 0.15 0.2 0.25 0.3 0.35 0.4
Local/regional m arket
France Italy Sweden UK
Source: Eurostat & UK Innovation Survey, 2008
Intellectual property protection statistics can offer another indication of business engagement in foreign markets. Trademarks and patents registered at foreign IP officesmay indicate intent to export to those markets.
This is an optional question in the Community Innovation Survey – data are presented for all countries which included the question in the 2006-2008 survey.
23
35
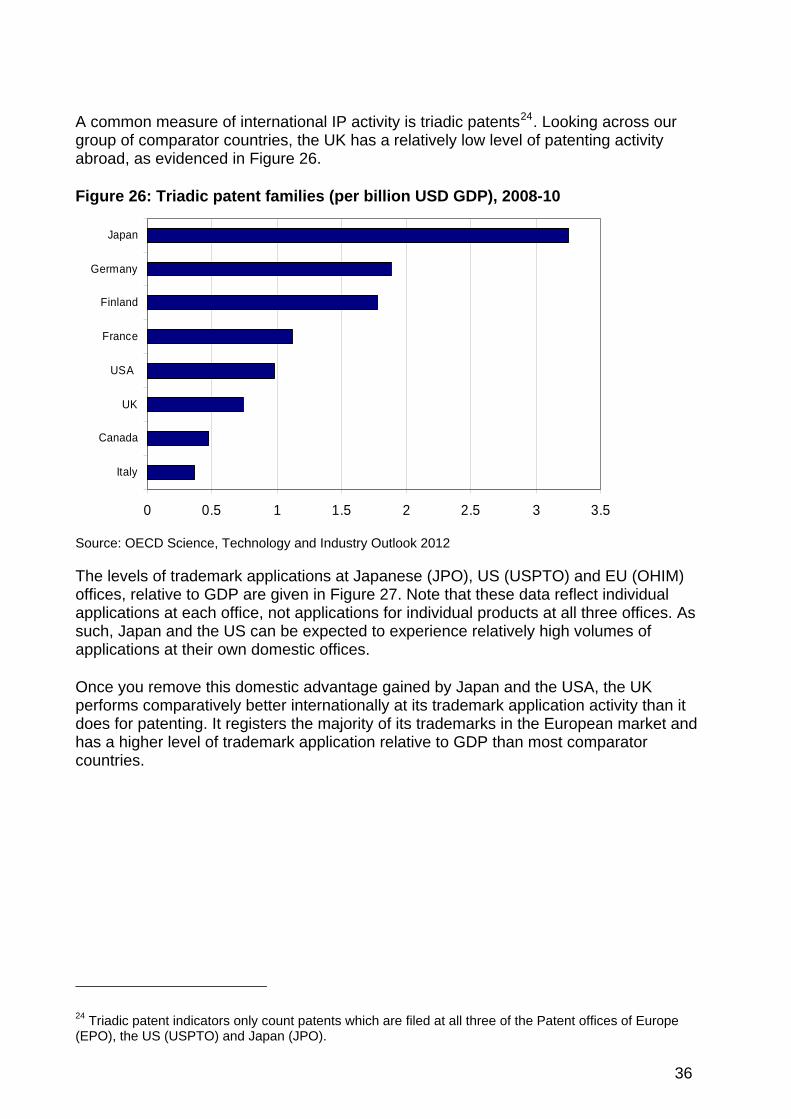
A common measure of international IP activity is triadic patents24. Looking across our group of comparator countries, the UK has a relatively low level of patenting activity abroad, as evidenc 26.
F gure 26: Triadic nt fam (per b USD , 2008
ed in Figure
i pate ilies illion GDP) -10
0 0.5 1 1.5 2 2.5 3 3.
Italy
Finland
Germany
Japan
5
a
The levels of trademark applications at Japanese (JPO), US (USPTO) and EU (OHIM) offices, relative to GDP are given in Figure 27. Note that these data reflect individual applications at each office, not applications for individual products at all three offices. As such, Japan and the US can be expected to experience relatively high volumes of applications at their own domestic offices.
Once you remove this domestic advantage gained by Japan and the USA, the UK performs comparatively better internationally at its trademark application activity than it does for patenting. It registers the majority of its trademarks in the European market and has a higher level of trademark application relative to GDP than most comparator countries.
Fr nce
Canada
UK
USA
Source: OECD Science, Technology and Industry Outlook 2012
24 Triadic patent indicators only count patents which are filed at all three of the Patent offices of Europe (EPO), the US (USPTO) and Japan (JPO).
36
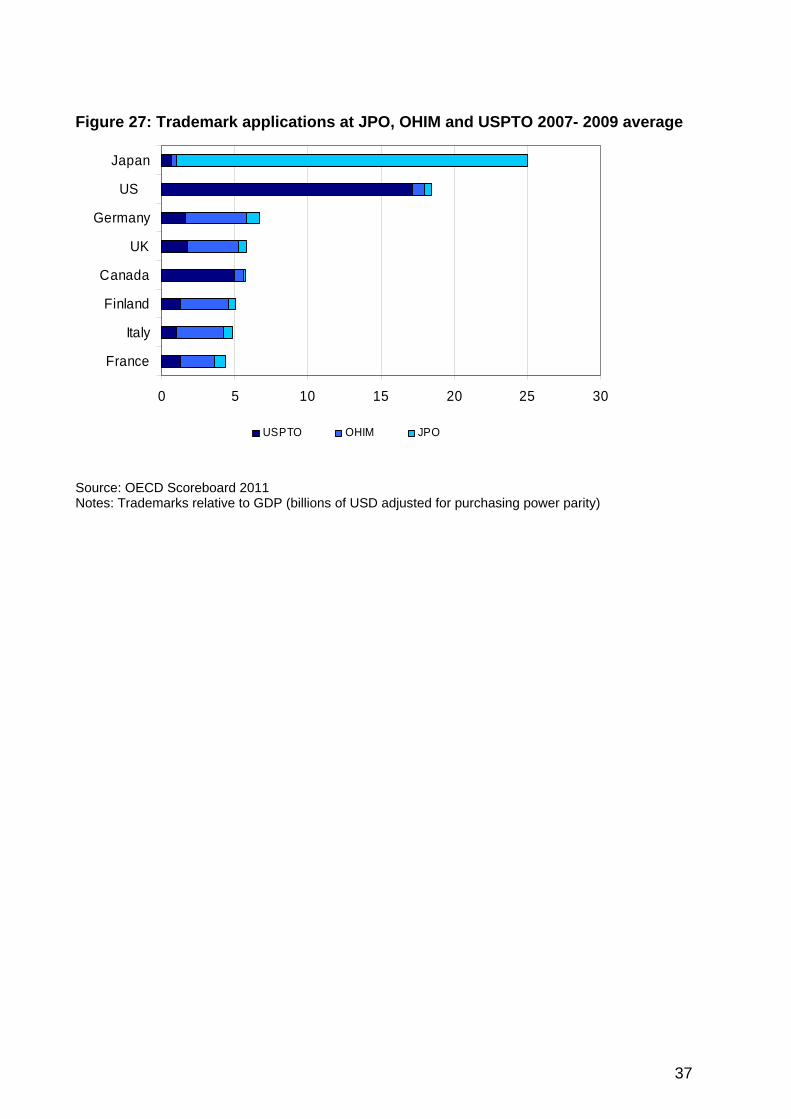
Figure 27: Trademark applications at JPO, OHIM and USPTO 2007- 2009 average
0 5 10 15 20 25 30
France
Italy
Finland
Canada
UK
Germany
Japan
US
USPTO OHIM JPO
Source: OECD Scoreboard 2011 Notes: Trademarks relative to GDP (billions of USD adjusted for purchasing power parity)
37

5. Government as an enabler and lead customer for innovation Headlines:
In terms of total funds committed by government for R&D the UK is not among the leading nations, but is broadly in line with the majority of countries in our comparator group.
UK government investment as a share of GDP has increased between 2007 and 2010; and
The number of firms claiming R&D Tax Credits has increased over time, with SMEs accounting for most of the increase in recent years. In 2010/11, claims were made against 72 per cent of all eligible business R&D.
The IRS recognised the fundamental role of government in fostering technological breakthroughs. Government has long played a central role in innovation. It acts as an
arch as well as directly into business innovation. It serves as rovides many
pects of the innovation infrastructure.
is chapter considers innovation from the perspective of the public sector. Starting with a more detailed look at public investment in R&D it then provides an overview of some key arts of the publically funded innovation infrastructure. Finally, it considers government’s
role as a lead customer for innovative goods.
.1 Government investment in innovation
overnment Budget Appropriations or Outlays for R&D (GBAORD) capture the total funds ommitted by government for R&D. As can be seen in figure 28, despite the austerity easures seen in most countries since the 2008 financial crisis, governments across our
omparator group have almost unanimously increased this measure.
he US leads this group, with investments primarily made towards defence R&D. This ew towards defence R&D is far more pronounced than for the other countries in the mparison group25. Finland and Germany also score highly on this measure. The UK nks in the middle of a group of countries with similar levels of GBAORD as a proportion
of GDP that lag the leaders, including France and Japan.
investor for science and resea large, and often lead, customer for innovative goods and services and it pas
Th
p
5
Gcmc
Tskcora
25 Full details of GBAORD by socio-economic objective can be found in the OECD STI Scoreboard 2011
38
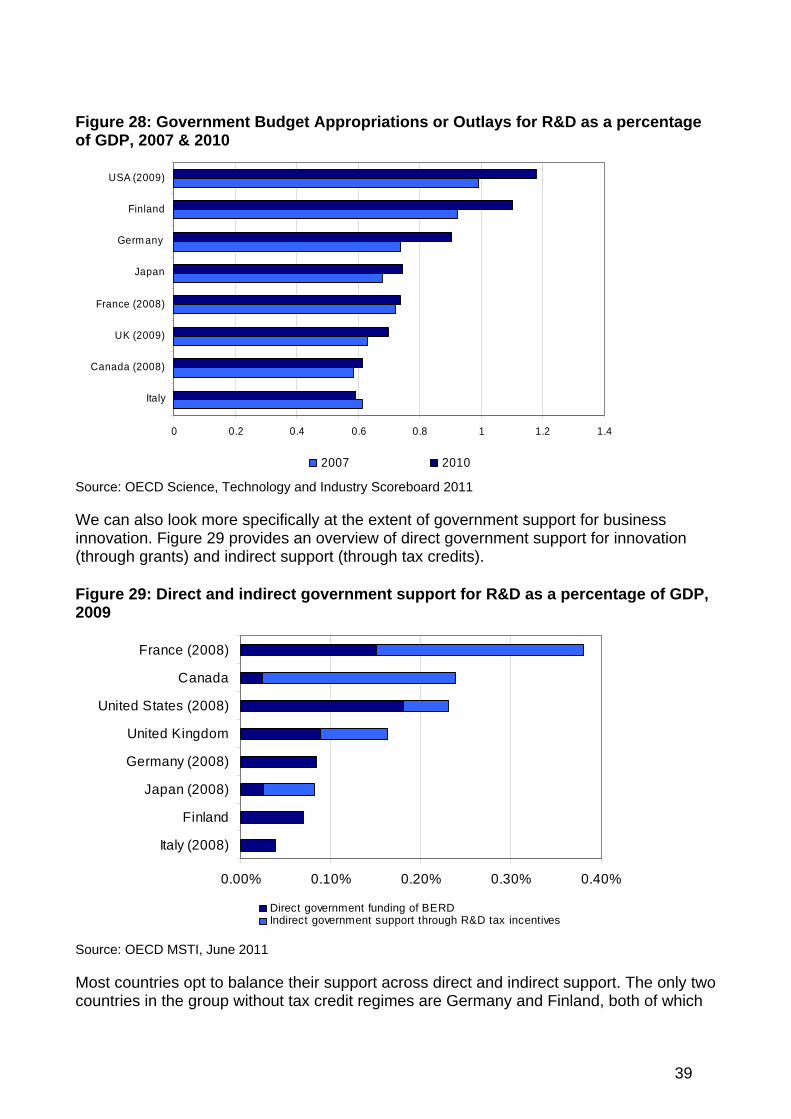
Figure 28: Government Budget Appropriations or Outlays for R&D as a percentaof GDP, 2007 & 2010
ge
0 0.2 0.4 0.6 0.8 1 1.2 1.4
USA (2009)
France (2008)
Finland
Germ any
Japan
UK (2009)
Italy
Canada (2008)
2007 2010
Source: OECD Science, Technology and Industry Scoreboard 2011
We can also look more specifically at the extent of government support for business innovation. Figure 29 provides an overview of direct government support for innovation
(through grants) and indirect support (through tax credits).
Figure 29: Direct and indirect government support for R&D as a percentage of GDP,2009
0.00% 0.10% 0.20%
Italy (2008)
Finland
Japan (2008)
0.30% 0.40%
France (2008)
Canada
Germany (2008)
United Kingdom
United States (2008)
Direct government funding of BERDIndirect government support through R&D tax incentives
Source: OECD MSTI, June 2011
Most countries opt to balance their support across direct and indirect support. The only two countries in the group without tax credit regimes are Germany and Finland, both of which
39

are planning to introduce a scheme. Italy does issue tax credits but data on their value is not available.
The chart suggests that the UK provides relatively high levels of support for business innovation, coming in fourth overall and third in terms of direct funding of BERD. It has a roughly 50:50 balance between direct and indirect support.
Tax credits for R&D projects offer a way for government to subsidise R&D activities whilst allowing market forces to determine which projects go ahead. The IRS recognised the importance of such incentives.
IRS performance measure: Increasing the number of businesses, particularly SMEs, claiming the R&D Tax Credit
HM Revenue and Customs (HMRC) publish data on the number of firms claiming R&D tax credits (RDTC). As figure 30 shows, the number of firms claiming RDTC has risen year-on-year since 2005/06 and that the rise has been particularly notable amongst SMEs. In 2010/11, SMEs represented over 80 per cent of all claims made, in terms of absolute numbers.
ype, 2000/01-2010/11 Figure 30: Number of claims for R&D tax credits, by firm t
0
2,000
4,000
6,000
10,000
12,000
8,000
2000-01
2001-02
2002-03
2003-04
2004-05
2005-06
2006-07
2007-08
2008-09
2009-10
2010-11
SMEs Large companies SME Subcontractors
Source: HMRC Research and Development Tax Credits Statistics, 2012
The total value of the R&D projects on which credits were claimed has also risen significantly since the regime was introduced. In 2010/11, RDTC were claimed on R&D projects worth a total of £11 billion. This represented nearly 68 per cent of total business
&D. R
40
5.2 The publicly funded innovation infrastructure
The UK’s innovation infrastructure plays an important role in supporting innovation and in
rty itish Standards Institution
(BSI) and the United Kingdom Accreditation Service (UKAS) all offer specialised but widely
e costs of innovation by enabling efficiency and reducing uncertainty for firms. These institutions offer problem solving services and contribute to
on
ng finance infrastructure supports innovation.
Since 2007, the Technology Strategy Board has been the prime channel through which the Government incentivises business-led technology innovation. It is a business focused organisation with a leadership role to stimulate and accelerate technology development and innovation in the areas which offer the greatest potential for boosting UK growth and productivity.
1. The Technology Strategy Board’s strategy has five key aims:
2. Accelerate the journey from concept to commercialisation;
3. Connect the innovation landscape;
4. Turn government action into business opportunity;
5. Invest in priority themed areas based on potential; and
6. Continuously improve Technology Strategy Board capability.
The Technology Strategy Board undertakes its role using a range of different approaches and
to
advancing innovation capabilities. The innovation infrastructure consists of institutions which support public goods information such as standards, measurement, accreditation and design concepts.
The interaction between firms and the innovation infrastructure is crucial for innovation outcomes in the UK. Innovation infrastructure institutions such as the Intellectual PropeOffice (IPO), the National Measurement System (NMS), the Br
accessible knowledge to the science infrastructure and businesses and to wider society. This information can reduce th
capacity building, and accelerating the transfer of new knowledge.
One of the main priorities of the IRS was to support a coherent and integrated knowledgeinfrastructure including by providing excellent measurement, standards and accreditatiand ensuri
Technology Strategy Board
and activities. It promotes innovation in many ways, including knowledge transfer support for R&D, to bringing people together to solve challenges and using procurementdrive innovation. Its anticipated expenditure across themes is set out in figure 31.
41

Figure 31: Anticipated Technology Strategy Board in-year expenditupriority area
re in 2014-15 by
Source: Technology Strategy Board Delivery Plan 2012-13
e
benefit from knowledge and ideas. It also provides expert advice on the use of IP in business.
Intellectual property rights (IPR) play an important role in the innovation system in clude patents, copyright
and design rights which protect new knowledge and creativity, and trademarks, used to mers.
Taylor Wessing Global Intellectual Property Index 2011, an assessment of 24 IP jurisdictions based on the views
L) hich develops and maintains the nation’s primary measurement standards, TUV NEL hich maintains and develops the UK’s national flow measurement standards and LGC
ent Institute for chemical and biochemical analysis. These stitutes ensure that fair and accurate measurement is available and used for transactions
Intellectual Property Office
The IPO is the government body responsible for Intellectual Property rights in the UK. ThIPO promotes innovation by providing an IP framework that enables creators, users and customers to
providing the legal protection to exploit intangible assets. They in
communicate product information to custo
The UK IP system was ranked second in the world by the
of IP owners and users.
National Measurement Institutes
The National Measurement Institutes are a network of laboratories and processes, which provide measurement standards and calibration testing facilities, which comprise the UK’s National Measurement System (NMS).
The National Measurement Institutes include the National Physical Laboratory (NPwwwhich is the National MeasuremInregulated by law.
42

Measurement plays a fundamental part in the innovation process. To develop new products and processes, companies need to measure quantity, quality and performance. The NMS supports innovation by demonstrating the compliance of new products and processes, reducing development times and making existing product improvements possible. Measurement standards underpin a wide range of public goods, including consumer protection, forensic science, environmental controls, medical treatment, and food safety regulation.
A number of studies26 have found that metrology and measurement make an important contribution to productivity growth. They support innovation in a number of ways, such as improving the effectiveness of the R&D process or by helping to reduce transaction costs and in limiting market failure.
Each year in the UK, £342 billion worth of goods are sold on the basis of the measurement of their quantity (£212 billion of this is controlled by weights and measures legislation, £130 billion by gas and electricity legislation). In addition to this, goods worth around £280 billion per annum are weighted or measured at the industrial, business-to-business level27.
Design
esign is an important part of the innovation process. The use of design can be ting product and process innovation, for
managing the innovation process itself and for the commercialisation of science, and the n is a UK strength yet there are parts of the economy that
oing through its Design Challenges, its championing of design and its
mentoring programmes to raise awareness and increase uptake of design in the public
as roducts, increasing productivity and
ng a range of measures
itation
BSI provides technical, managerial, environmental, design agreed codes of best practice operability and that facilitate trade. BSI also
e.
Dtransformative for companies in leading or suppor
delivery of public services. Desigare critical to future social and economic success where design awareness is low.
The Design Council has been tasked by Government to advise on design and to championdesign, which it is d
and private sectors.
The European Commission has also noted the important role of the wider use of design one of the key drivers for developing high value pimproving resource efficiency. In line with this, they are implementito raise awareness and use of design in innovation28.
Standards and accred
that improve safety, efficiency and interprovides expert advice on the use of standards. Standards reduce costs to businesses andconsumers by incorporating well defined codified information about the properties of goods, services or trading partners in a way that enables them to adopt products and processes or enter into trade with confidenc
26 Swann (2009) The economics of metrology and measurement, Frenz and Lamber (2012) Innovation Dynamics and the Role of Infrastructure 27 Analysis of the Economics of Weights and Measures Legislation, Deloitte June 2009. 28 A Stronger European Industry for Growth and Economic Recovery, European Commission
43

Accreditation is part of an overall system that assesses and ensures conformity withapplicable requirements. The UKAS reduces bureaucracy and increases efficiency by moderating the need for legislation through assessing and ensuring conformity with applicable standards and requirements, focusing on providing an independent evaluaof an organisation’s technical competence, thus maximising the value of standards.
Frenz & Lambert (2012)
tion
find that accreditation is associated with increased productivity and growth in the UK, suggesting that sound management structures and practices, tested
t figure in the UK was 6.5 per cent, which was higher than all other comparator except for France.
rise was driven primarily by relatively stable procurement levels whilst GDP was falling.
and approved to relevant standards, lay the foundation for good business performance and economic benefits.
5.3 Government as a lead customer
Government’s huge purchasing power means that it can play a lead role in incentivising the development of new products and technologies and accelerating the commercialisation of innovation. Figure 32 presents the scale of government as a customer with the value of public procurement ranging up to over seven per cent of GDP in France in 2010. The equivalencountries
The chart documents a large rise in UK public procurement as a percentage of GDP in 2009, followed by a smaller increase in 2010. It is important to note that this measure is affected both by the level of public procurement and the level of GDP. Given the timing of the sharp increase, aligning with the timing of the recession, it seems likely that the
Figure 32: Value of public procurement as a percentage of GDP, 2001-2010
8
5
6
7
4
3
0
1
2
2001 2002 2003 2004 2005 2006 2007 2008 2009 2010
EU (27 countries) Germany France Italy Finland United Kingdom
gy Strategy y-based
companies the opportunity to compete for contracts to develop products and services that
Source: Eurostat The Small Business Research Initiative (SBRI), managed by the TechnoloBoard, uses public procurement to drive innovation, through offering technolog
44

solve specific challenges faced by the public sector. The programme enables governmto engage with innovative businesses to procure new technologies with managed risk through a phased development programme.
There has been an increasing number of SBRI competitions involving an increasingly
ent
wide number of public sector organisations who are actively using SBRI as a means to procure
e
innovative solutions. Over 1,000 contracts have now been issued to businesses since threformatted scheme was launched in April 2009.
.
45
Section 2: Implementing the Innovation and Research Strategy for Growth
Key points
In December 2011 we published the Innovation and Research Strategy for Growth (IRS), setting out Government’s priorities for improving the UK innovation and research landscape and performance.
The IRS explained that we would deliver policies that support innovation and research in business; provide incentives for companies to invest in high-value activities; create a more open and integrated innovation ecosystem; and remove barriers to innovation.
We have made progress in all the five key areas in the last year, through actions that underpin the core role of innovation and research in future UK growth. Examples of some of our most significant achievements are:
The High Value Manufacturing Catapult is open for business, with six more Catapults aiming to be operational by April 2013;
We have launched a new innovation vouchers programme, focussing on areas and sectors with relatively low levels of private sector innovation and growth;
The Biomedical Catalyst has allocated a total of £49 million following the first round of applications with 40 SMEs and 24 universities receiving awards;
The £300 million UK Research Partnership Investment Fund (UKRPIF), set up earlier this year, will secure £1 billion investment in university research infrastructure;
We have established strong platforms for collaboration with China and India and UKTI has launched its Open to Export web service;
Nesta’s Centre for UK Challenge Prizes opened in April 2012, and has launched prizes in areas ranging from cycling to reducing waste;
The Open Data Institute will be officially launched on 4th December 2012; and
The Data Strategy Board has been established to create maximum value from public data for companies and people across the UK.
Section 2 of this report expands on these achievements and the progress we have made.
46
6. Discovery and developmeThe ability to develop, commercialise and adopt new technologies across the economy will define successful coharness its strengthand our expertise in
nt
untries in the 21st Century. To compete effectively, the UK must s in blue skies research, R&D, our favourable business environment areas such as design and behavioural science.
sserted the Government’s commitment to maintaining funding for esearch, while prioritising investment in emerging technologies in areas
o
k of Catapult centres and we have made considerable progress in supporting emerging
technologies and sectors where the UK stands to gain significant and sustainable gy
nt in the UK's innovation infrastructure and will make a major long-term contribution to UK economic
solve the challenges businesses are facing today, tomorrow and well into the next decade.
ti-disciplinary expertise;
”; and
business planning horizons.
By providing access to expertise and equipment the Catapult centres will make it easier for businesses to develop and commercialise innovative technologies. They will help to de-risk innovation in the UK and bring together world-leading capability in multi-disciplinary
In the IRS we reacuriosity driven rthat offer the greatest potential returns. We will back challenge-led innovation, driving inter-disciplinary collaboration and new business models, products and processes, and strengthen economically important technology-based sectors.
Throughout 2012 we have kept our innovation focus on our priority areas, and continued tdevelop technologies with identified strengths, opportunities and potential. The Technology Strategy Board has overseen the rapid establishment of the networ
technologies such as graphene and synthetic biology.
6.1 Catapult centres
The elite network of Catapult technology and innovation centres is focused on
economic advantage well into the future. These centres, in which the Technology StrateBoard will invest over £200 million by 2015, represent an important investme
growth. UK businesses are working closely with the Technology Strategy Board to ensure that the Catapult centres provide the future capability and expertise to
The Catapult centres will provide businesses with access to:
Specialist technical expertise and skills needed across the sector from SMEs, supply chains and tier one companies, particularly mul
High value capital equipment, facilities and infrastructure beyond the affordability of individual companies;
Technology and sector leadership and an independent “repository of knowledge
Long-term investment in technology platforms or demonstrators beyond the normal
47

teams. They will reach into the UK’s outstanding research base and focus theiraddressing major challenges. The Catapult centres being established are:
efforts on
Offshore Renewable Energy
Future Cities
Therapy and Offshore Renewable Energy Catapults have all appointed their CEOs and newly recruited leadership teams
the developing programme.
onsortium
High Value Manufacturing
Cell Therapy
Satellite Applications
Connected Digital Economy
Transport Systems
The Technology Strategy Board has made huge strides in establishing the Catapult network this year. The High Value Manufacturing, Cell
have increased the momentum of
The High Value Manufacturing Catapult is already fully operational, through a cof seven centres based across the UK. Between them they provide an integrated capability and embrace all forms of manufacturing from using metals and composites through to process manufacturing technologies and bio-processing. The Catapult is working with UK businesses, large and small; with Original Equipment Manufacturers (OEMs) and supply chains; and they are already starting to exploit synergies across the broad spectrum of their capabilities.
48

AMRC contributing to land speed record
The Advanced Manufacturing Research Centre, one of the seven centres of the High Value Manufacturing Catapult, is taking a hands-on role with the Bloodhound SSC project, to help break the land speed record and encourage a new generation of engineers.
Bloodhound SSC is an ambitious UK effort to regain the world land speed record in a purpose-built car capable of reaching over 1,000 miles per hour. The project is led by Richard Noble OBE, who took the land speed record in 1982 with Thrust 2 and led Thrust SSC, the world’s first supersonic car project, in the late 1990s.
The Bloodhound car is powered by a Eurojet EJ200 engine, as used in the Eurofighter Typhoon aircraft, plus a Falcon hybrid rocket. A Cosworth CA 2010 Formula 1 motor pumps fuel to the rocket and provides power to the car’s electrical and hydraulic systems.
The car’s body, chassis and control systems will meanwhile rely on a range of advanced design and manufacturing techniques.
As well as winning back the world land speed record, the Bloodhound team are aiming to enthuse a new generation about engineering, as the Thrust programme did a generation earlier.
“I was 13 years old when Richard Noble brought the land speed record back to the UK,” says Phil Spiers, head of the AMRC Advanced Structural Testing Centre. “When the Bloodhound project was formed, I was keen to be involved and trained as a STEM ambassador to help spread the message about the benefit of science, technology engineering and mathematics.”
Spiers offered the AMRC’s testing expertise and resources to the Bloodhound team, initially helping with spin testing of the car’s carbon brake discs alongside member company Vibrant NDT.
“When the team from Bloodhound came and saw the incredible resource available at the AMRC, we were asked if we could help with manufacturing some of the parts for the car,” Spiers says.
The AMRC’s machining-focused Process Technology Group is now producing a number of key parts for the car.
The final four Catapult centres - Satellite Applications, the Connected Digital Economy, Transport Systems and Future Cities - all aim to be operational by April 2013.
49
The Satellite Applications Catapult will help to increase the UK’s share of the growing space market and unlock the potential of UK businesses in developing satellite enabled products and services. Its expertise will be structured around satellite communications, navigation, Earth observations and unlocking new business models in space technologies.
T t will focus on the challenges and opportunities potential of the internet. It will ia and content; driving the
adoption of digital services into new sectors of the economy; and encouraging new
ices
ng
g the international activities undertaken by the
he Connected Digital Economy Catapulfacing UK businesses as they try to unlock the full economicbe focussing on new ways to create wealth from digital med
services based on the linking of the physical and virtual worlds.
The Future Cities Catapult will help UK businesses to create new products and servthat meet the needs of the world’s cities as they adapt to future demands. The four initial themes are: connecting city systems to enable integration and interoperability; increasidensity and population without congestion; transiting to resource-efficient; low-carbon cities; and resilient energy systems.
The Transport Systems Catapult will help businesses to develop new products and services that meet the needs of the worlds transport systems as they respond to ever stretching demands; selling UK capability on the global stage and using the UK as an exemplar test-bed.
IRS performance measure: TrackinCatapult Centres
The Catapult centres will need to be established for some time before we can monitor howthey are
delivering against this performance measure that was set out in the IRS. The
While Catapult centres focus on existing areas of UK strength, we also need to identify
y Efficient Computing, and Energy Harvesting, and has formed
egy Board is running feasibility study competitions in these areas to elp businesses to explore their options and build early stage demonstrators. Competitions
Technology Strategy Board is developing monitoring and evaluation plans for all Catapult centres and future reports will cover this measure when we have data available.
6.2 Emerging technologies and industries
opportunities in new technologies at an early stage and invest to exploit them. The Technology Strategy Board has identified three technologies for priority investment:Synthetic Biology, EnergSpecial Interest Groups (SIGs), operating across the Knowledge Transfer Networks, to build communities of practitioners in each of these emerging technologies. The Synthetic Biology SIG already has around 500 members.
To successfully accelerate these technologies to market, those with expertise in the science need to work closely with those nearer to market to develop commercial products. The Technology Strath
50

in Advancing the Industrial Application of Synthetic Biology; Energy Efficient Computing; and Energy Harvesting for Autonomous Sensing were all launched on 8 October 201229.
The Technology Strategy Board has been closely involved in the development of the UK Roadmap for Synthetic Biology, and will work with BBSRC and EPSRC to establish an
the University of Manchester, will act as
nd
hnologies and systems. Another £10 million will
The process to implement the Hub is already underway, with the intention that the first
Catapult
Innovation and Knowledge Centre (IKC) in Synthetic Biology in line with the roadmap recommendations. IKCs work to accelerate the commercialisation of world class science and emerging technologies into new products, processes or services. The new IKC willbenefit from the work done by the three partners to refine the model for IKCs.
6.3 Graphene
The UK is investing to create the Graphene Global Research & Technology Hub. The Hubis made up of four complementary strands of investment, to ensure that the UK maintains its position as a global leader in the exploitation of this novel material. The £45 million National Institute of Graphene Research, based at a resource for research and commercialisation activities for businesses and research groups across the UK. We are investing £20 million to support research into grapheneengineering, with an additional £10 million for research into manufacturing processes atechnologies linked to graphene. This investment will accelerate the development andgeneration of novel devices, application tecbe invested in equipment to complement existing activity in graphene and graphene-related science and engineering.
investments in research and equipment will be made in 2013, and the National Institute of Graphene Research becoming fully operational by 2016.
IRS performance measure: Delivering Government investment commitments incentres, High-Performance Computing and e-infrastructure and the Graphene Global Research and Technology Hub.
We will set out how we have delivered against this success measure in future reports, when information is available.
29 Co-funding for these competitions comes from BBSRC, DSTL, EPSRC and ESRC.
51
7. Innovative businesses Innovation in business in the UK drives productivity and growth. Our future economic growth depends on businesses being able to adopt technologies, and to invest in many other forms of innovation, like design, managerial and organisational competencies, human resources and intellectual property. It is also crucial that we raise the capability ofsome economically important sectors to innovate, both to increase innovation in those sectors and improve overall UK performance.
d that we need to continue to help innovative businesses to r forms of support to generate wealth and create new jobs, as well
ual
R&D Tax Credits are the single largest Government support for business investment in
&D expenditure.
competitive and to incentivise additional investment. HM reasury have been consulting business on the design of the scheme. Decisions about e design together with draft legislation are expected to be published in December 2012.
the IRS we identified the need to increase awareness about and take up of R&D tax redits by advanced manufacturing and other innovative SMEs with a capacity to grow. IS and HMRC are organising a series of workshops for around 900 SMEs and business
nd and Wales. Starting in December, the orkshops will promote other government support for business R&D and innovation, and
In the IRS we recogniseaccess finance and otheas acting to help them to develop and protect their innovations. We have taken action to deliver the commitments made in the Strategy. During the year we have implemented a number of these, including making the R&D tax credit scheme more generous, the introduction of an innovation vouchers programme, additional support to help companies access venture capital and to improve the intellectual property framework and IntellectProperty Office support for business.
7.1 R&D tax credits and other support for business R&D and innovation
R&D and continue to be a key driver of innovation following the IRS. In the year endingMarch 2011 claims totalled £1.1 billion on £10.9 billion of expenditure30. We believe that claims are now made for about two thirds of all business R
The rate of tax relief available through the SME R&D tax credit was raised to 225 per cent from April 2012, making it among the most competitive regimes in the world, which is likely to further incentivise companies to invest in R&D.
Last year the Chancellor announced that an ‘Above the Line’ (ATL) credit would be introduced in 2013 with the intention of making the R&D Tax Credit scheme for large companies more internationallyTth
IncBadvisers, to be held across England, Scotlaw
30 This expenditure compared with £15.11billion recorded in the Office for National Statistics (ONS) annual Business Enterprise Research and Development (BERD) survey of 400 of the largest R&D spenders and a sample of 4,600 other companies, and equates to about 72% of this total.
52

will involve HMRC, Technology Strategy Board, Intellectual ProperCouncil.
ty Office and the Design
ort
e
, –
012, as well as increasing the gross asset limit, employee limit and investment limit for both EIS and Venture Capital Trusts (VCTs),
ctors with relatively low levels of private sector innovation and growth. We launched the scheme on
ollaborate with knowledge based institutions in the public and private sectors, and can be an effective means of building
organisations or other private sector knowledge suppliers. They cover knowledge relating
Managing intellectual property.
ll
We also made a commitment to raise awareness of how R&D tax credits can help suppdesign-led R&D. We are scoping new case studies drawn from companies that have successfully claimed the R&D Tax Credits that will illustrate in clear terms how the schemworks, the benefits available, and the process of claiming. These case studies will also illustrate how the credits can support design-led R&D.
Enterprise tax changes
In April 2012, Government introduced the new Seed Enterprise Investment Scheme (SEIS) to encourage investment in new small companies. SEIS provides income tax relief of 50 per cent for individuals who invest in qualifying companies. To kick start the schemeGovernment also announced a capital gains tax (CGT) holiday on gains realised in 20122013 that are invested through SEIS in the same year.
Government increased the Enterprise Investment Scheme (EIS) annual investment limit for individuals to £1 million from April 2
removing some restrictions on qualifying shares and types of investor for EIS, and removing the £1 million limit on investment by a VCT in a single company.
7.2 Innovation vouchers
In the IRS we committed to work with businesses and the Technology Strategy Board to implement a new innovation vouchers programme, focussing in areas and se
24th September.
Innovation vouchers make it possible for SMEs to c
innovative capability in SMEs, through encouraging them to develop links with organisations that can support them to do this.
Start-up, micro and small and medium sized businesses can use the vouchers to access up to £5,000 worth of advice and expertise. This can come from universities, research
to all types of innovation, such as:
Ideas for new or improved products, processes and services;
Using design to improve ideas; and
Initially, to link with our work on strategically important sectors, the innovation vouchers wibe available to businesses that are working on ideas relevant to the agrifood and built environment sectors.
53

7.3 Venture capital
Government is committed to making the UK the best place in Europe to grow and finance
ll as
ment Fund (UKIIF), one of Europe’s largest technology funds, investing in life sciences, digital, advanced
h companies. The fund is proving to be highly successful.
e
e UK venture capital market by establishing a te the best US funds by making investments at all
d private
in England, and to support long-term, high quality jobs
a business. Venture capital is widely recognised as being a key factor in enabling entrepreneurial firms to enter the economy, which is essential for future growth, as weproviding crucial access to finance.
We have continued to support the UK Innovation Invest
manufacturing, and clean tecAn early assessment, which we published in May 201231 found that:
UKIIF is seen as effectively addressing the gap in the supply of equity finance in 2009 and is still required today, as few private sector UK institutions focus on VC market investment;
UKIIF has successfully encouraged additional private investment leverage and investment diversification; and
All surveyed UKIIF recipient businesses are currently developing highly innovativproducts or services.
UKIIF aims to mark a step change in thsubstantial fund of funds that will replicabusiness stages, with the market scale that can build companies with global reach. The UK Government has invested £150 million to cornerstone the creation of UKIIF, with the objective of matching private sector sources of funding. This has been exceeded with £180million raised from private investors, providing UKIIF with £330 million to invest at final closing.
We have also committed a further £200 million to Enterprise Capital Funds. The funds provide finance to SMEs with high growth potential that are seeking up to £2 million investment. More than £300 million has now been committed by Government aninvestors across 11 Enterprise Capital Funds.
The £50 million Business Angel Co-Investment Fund continues to support angel investments into high growth potential early stage SMEs, particularly in areas worst affected by public spending cuts. The fund has clear objectives to boost the quality and quantity of business angel investingin high growth companies.
31 Early Assessment of the UK Innovation Investment Fund, BIS, May 2012 http://www.bis.gov.uk/assets/BISCore/enterprise/docs/E/12-815-early-assessment-uk-innovation-investmfund.pdf
ent-
54
Case study:
Horizon Discovery Limited – Life Science
Horizon Discovery Limited is a Cambridge-based life science company that began trading in July 2007, providing leading edge research tools for decoding the human genome and accelerating discovery of personalised cancer medicines.
The company was founded to commercialise pioneering gene-editing technology invented by Professor David Russell at the University of Washington and developed by Horizon Discovery’s scientific co-founders at the John Hopkins University and the University of Torino Medical School. Seed funding was provided by Cambridge University and Cambridge University Alumni.
The business has expanded rapidly since UKIIF funding, adding 46 full-time staff in less than two years and now has 70 full-time staff. Sales have doubled to over £4.2 million and are forecast to increase by 100 per cent over the next twelve months, leading to profitability. The company was named Business Weekly’s Business of the Year in 2012, and received a Queen’s Award for Enterprise in International Trade. Within the next three years the business is expected to employ 130 and achieve sales in excess of £20 million, with exports representing over 90 per cent of trade.
“Through its investment in DFJ Esprit LLP, the UKIIF VC has played an invaluable role in the development of our company. Having succeeded in the implementation of Phase I of our business plan it was important to find an investor with a 10 year outlook on its funding strategy. DFJ Esprit has provided experience, diligence and management support to the senior executives and board of directors and, most importantly, has backed its aspiration to build a world-leading UK Life Science company.” Dr Darrin M Disley, CEO.
7.4 Intellectual Property
Intellectual Property (IP) is a significant growth factor for many companies: innovative companies that use intellectual property rights are associated with significantly better
erty d
fied the areas of business support to improve and has put measures in place to address them. Its paper ‘From ideas to growth: Helping SMEs get alue from their intellectual property’ addressed the concerns of the Hargreaves review
and found key difficulties for businesses around the complexity of advice offerings; a lack of strategic, business focused IP advice; and the cost of IP management.
chances of firm survival32 and company growth33. In the IRS the Intellectual PropOffice (IPO), committed to take forward a programme of work designed to improve anincrease the support available to business in this area.
This year the IPO has identi
v
h & Rogers (2007) The Value of Intellectual Property Rights to Firms, Economic Series Working Papers 319, University of Oxford
32 Helmers & Rogers (2008), Innovation and Survival of New Firms across British Regions, Economic Series Working Papers 416, University of Oxford, Department of Economics 33 Greenhalg
55

The IPO has set okey areas. It has i
ut how it intends address and gain maximum impact in each of these dentified new opportunities to:
ure that at an appropriate time and make decisions on the
management of IP that best fits their business. It will offer sufficient knowledge and
s s, products
r services. The IPO’s 2013 Fast Forward competition was launched on 22 October – a rize fund of £750,000 is available to award prizes to around a dozen projects which
improve the management of IP in knowledge exchange. The competition has awarded ,000 and £100,000 over the last two years to 23
Support awareness raising of IP amongst SMEs;
Improve access to commercially based IP advice;
Develop long term skills for entrepreneurs of the future; and
Take forward future work on dispute resolution.
To raise awareness of IP among SMEs the IPO is reviewing all its literature to ensit will help SMEs to seek advice
understanding of IP for SMEs to make an assessment of the value of their IP, identify potential opportunities for increasing its value and to minimise their risks regarding using other people’s IP or not adequately protecting their own assets.
This year the IPO will also fund 200 strategic IP audits, which will provide businesses with an understanding of the IP they own and how they can maximise its value.
IP Masterclass training will be available for 200 business advisors within publicly funded business support programs including GrowthAccelerator, the Technology Strategy Board Catapult centres and the Patent Library (PatLib) network to ensure that business advisors can identify potential IP issues and to advise their clients appropriately.
The knowledge exchange process of transferring university research to real world productand services is vital to economic growth through the creation of new companieop
£1.25 million in prizes of between £10winning projects.
56
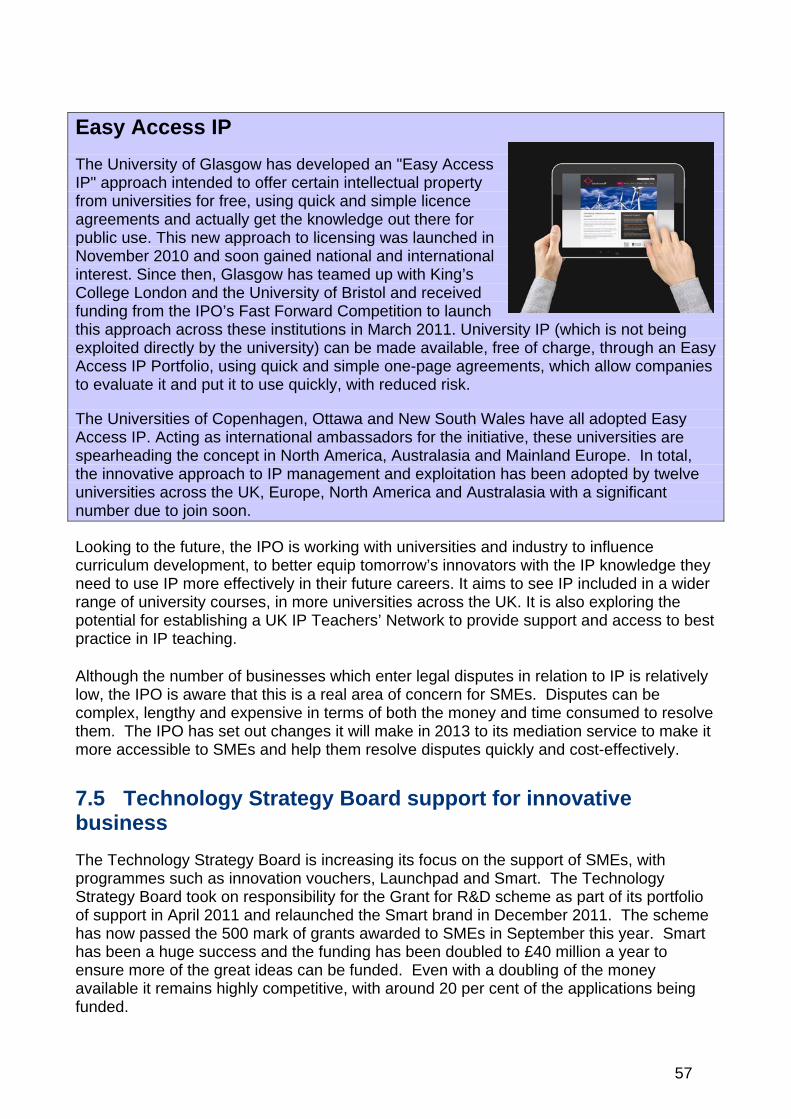
57
Easy Access IP
The University of Glasgow has developed an "Easy Access IP" approach intended to offer certain intellectual property from universities for free, using quick and simple licence agreements and actually get the knowledge out there for public use. This new approach to licensing was launched in November 2010 and soon gained national and international interest. Since then, Glasgow has teamed up with King’s College London and the University of Bristol and received funding from the IPO’s Fast Forward Competition to launch this approach across these institutions in March 2011. University IP (which is not being exploited directly by the university) can be made available, free of charge, through an Easy Access IP Portfolio, using quick and simple one-page agreements, which allow companies to evaluate it and put it to use quickly, with reduced risk.
The Universities of Copenhagen, Ottawa and New South Wales have all adopted Easy Access IP. Acting as international ambassadors for the initiative, these universities are spearheading the concept in North America, Australasia and Mainland Europe. In total, the innovative approach to IP management and exploitation has been adopted by twelve universities across the UK, Europe, North America and Australasia with a significant number due to join soon.
Looking to the future, the IPO is working with universities and industry to influence curriculum development, to better equip tomorrow’s innovators with the IP knowledge they need to use IP more effectively in their future careers. It aims to see IP included in a wider range of university courses, in more universities across the UK. It is also exploring the potential for establishing a UK IP Teachers’ Network to provide support and access to best practice in IP teaching.
Although the number of businesses which enter legal disputes in relation to IP is relativelow, the IPO is aware that this is a real area of concern for SMEs. Disputes can be complex, lengthy and expensive in terms of both the money and time consumed to resolve them. The IPO has set out changes it will make in
ly
2013 to its mediation service to make it ore accessible to SMEs and help them resolve disputes quickly and cost-effectively.
.5 Technology Strategy Board support for innovative usiness
he Technology Strategy Board is increasing its focus on the support of SMEs, with rogrammes such as innovation vouchers, Launchpad and Smart. The Technology trategy Board took on responsibility for the Grant for R&D scheme as part of its portfolio f support in April 2011 and relaunched the Smart brand in December 2011. The scheme as now passed the 500 mark of grants awarded to SMEs in September this year. Smart as been a huge success and the funding has been doubled to £40 million a year to
funded. Even with a doubling of the money vailable it remains highly competitive, with around 20 per cent of the applications being
m
7b
TpSohhensure more of the great ideas can be afunded.
Smart is encouraging awith the Technology Str
new cohort of early stage micro companies that have not worked ategy Board before to apply for funding. Some 70 per cent of the
mployees; 60 per cent are the Technology Strategy
chnology Strategy Board is vate investment community to
tor scheme for coaching and
34
t
nt of £3.75 in Net Value Added for every £1 of public money ses
companies applying are micro companies with less than 10 ehless than 5 years old; and, 70 per cent have not worked wit
Board before. To further support these companies, the Tecreating linkages to other forms of support such as the prihelp them raise additional finance and to the GrowthAcceleramentoring.
7.6 Design
The IRS recognised the role of design in supporting companies to innovate. We increased our funding for Designing Demand to £1.3 million in 2012/13 and expect over 100 SMEs to receive mentoring during the year from the Design Council-delivered programme.
A recent evaluation found strong returns to business, both actual and anticipated, fromthe programme: for every £1 businesses invest in design, they can expect over £20 in increased revenues, over £4 increase in net operating profit and over £5 in increased exports. Businesses also reported boosts to confidence, strategic thinking, brand and business identity, and the creation or safeguarding of 2,460 net FTE jobs as a direct resulof the programme. Based on actual and anticipated impact, the evaluation found a potential return on investmespent. Benefits to the design industry were also identified with a majority of businescommitted to ongoing investment in design as a core business function following participation in the programme.
34 Designing Demand National Evaluation 2007-2012, Eden Partners, May 2012
58

8. Knowledge and innovation The UK has an innovation ecosystem of institutions with a worldwide reputation. By collaborating with business and each other they can maximise the impact of their work. We re-stated, in the IRS, our commitment to maximise the value of the UK’s knowledge economy, to provide incentives to drive greater collaboration to remove barriers to cluster development and to strengthen essential parts of the network.
rch Partnership Investment Fund – encouraging
Partnership Investment Fund (UKRPIF), to add to £100 million provided in Budget 2012, to
ses
arts in
e call for
d in May 2012 to all higher education institutions across the UK. Some of the first projects to benefit include:
A £60 million partnership between the University of Birmingham and Rolls-Royce for a world-leading research centre for high temperature metallurgy and associated processes for components including turbine blades. This will ensure a more effective translation of fundamental research to production and train engineers from apprenticeships to postdoctoral fellows;
A £92 million partnership between the University of Warwick, Jaguar Land Rover (JLR) and Tata Motors European Technical Centre (TMETC) for a new National Automotive Innovation Campus. This will develop new technologies to reduce our dependency on fossil fuels. It will also address a shortage of skilled R&D staff in the automotive supply chain; and
A £138 million partnership of the University of Oxford and a consortium including Synergy Health, Cancer Research UK, Roche Diagnostics, GE Healthcare and the Oxford University Hospitals NHS Trust, to establish a new world-leading centre for targeted cancer research. This will take an all-encompassing approach to patients with early stage cancer, to develop, test and implement personalised minimally invasive treatments, combined with targeted diagnosis, imaging and therapy.
8.1 UK Reseauniversity partnerships with businesses and charities
In October, we announced additional funding of £200 million for the UK Research
enable universities to lever private sector and charity co-investment into long-term strategic research partnerships. This will further enhance our facilities for world class university research and help build strategic partnerships between universities, businesand charities across the UK, supporting long-term economic growth.
The Higher Education Funding Council for England (HEFCE), working with counterpthe Devolved Administrations, manages the Fund which is available for large capital research projects, providing between £10 million and £35 million to projects which securat least twice that amount in private or charitable co-investment. HEFCE issued a expressions of interest in the Fun
59

8.2 Biomedical Catalyst
The Biomedical Catalyst is a key feature of the UK Life Sciences Strategy and is making awards that represent the first step towards turning bright ideas into investable propositions in healthcare. It aims to accelerate the journey of life science products and services to market.
The Biomedical Catalyst’s goals are:
To deliver growth to the UK life sciences sector;
The deliver innovative life sciences products and service quicker and more einto healthcare; and
ffectively
l 2012. It will provide funding for innovative small- and medium-sized companies and academics to
lso be
h.
r of
To provide support to academically and commercially led R&D in a seamless, effective and efficient manner.
The three year £180 million programme, created by the Medical Research Council and Technology Strategy Board, opened for applications at the end of Apri
develop solutions to healthcare challenges.
The first feasibility funding awards were announced in August 2012. Just under £10 million was awarded to 18 SMEs and 14 academic institutions. The money will support academics and SMEs in evaluating and exploring the market potential of their early stage scientific ideas.
The conclusion of the first round of Early Stage Awards announced over £31 million of funding to support 17 business led projects and 10 academic led projects.
Five business led applications for late stage funding totalling £7.4 million will asupported.
8.3 University-business interaction
The UK’s universities are a key source of knowledge generation. In the IRS we emphasised their value as centres of dynamic local economies, employers and service providers to business.
Universities continue to engage with businesses on collaborative and contract researcThey provide continuous professional development training, and access to university based facilities expertise and infrastructure. They are generating an increasing numbenew companies: the number of successful IP based companies increased again in 2010/11, as did the number of those companies surviving for over three years. The
60

number of graduate start-ups also increturnover of nearly £275 million35.
ased to over 2,800 in 2010/11, with an estimated
nd ahead The World Economic Forum evaluation now ranks the UK second in the world, aof the US, for university-industry collaboration in R&D.
N8 Industry Innovation Forum
In January, in partnership with the Technology Strategy Board and HEFCE, the N8 Research Partnership launched the N8 Industry Innovation Forum (N8IIF). The N8IIF uses the “power of 8” universities working together to connect businesses of all sizes with academic partners. This is done on a cross sector basis to match industry needs with the latest research, science and technology solutions. The first N8IIF in the series was on Advanced Materials. This has resulted in a pipeline of 25 new industry-led ideas for translating new research and technology into commercially-viable products and services, with the objective of driving innovation, competitive advantage and growth.
8.4 HEIF top-up
Universities are stimulating economic growth and contributing to public services and society more than ever before. The latest Higher Education-Business and Community
n.
and building
8.5 Equipment sharing and cost sharing partnerships
ween themselves on a practical
challenges for sharing equipment, but also the wider benefits that
Interaction (HE-BCI) survey showed that the value of the services which UK universities provide to the economy and society increased by seven per cent in 2010/11 to £3.3 billioThis is an excellent achievement which is supported and underpinned by their strategies toinvest Higher Education Innovation Funding (HEIF).
In September, David Willetts announced an extra £6 million for HEIF would be provided to be shared equally between the top-performing HEIF funded universities. This will assistthem in further driving growth, creating and supporting innovative enterprisesstrategic relationships.
Our universities can also benefit from collaborating betlevel. In June, the N8 Research Partnership published the outcome of a study looking atnew and different ways to share investments in key research equipment across the N8 universities. This report ‘Sharing for Excellence and Growth’, funded by the EPSRC, highlights the costs andcan be realised, including developing state of the art new research equipment in partnership with manufacturers, recruiting and training talent, and enabling more ambitiousand novel research strategies. This has been shared with other regional university groups and others, to explore the opportunities for further integration of approaches, including opportunities to take advantage of the VAT Exemption on cost sharing services, introduced in the UK in July 2012.
35 Higher Education Business and Community Interaction Survey
61
8.6 Innovation ecosystem bodies
One of the key aims of the IRS was to establish a more interconnected and collaborative
taken opportunities to collaborate and join up their offer. This strengthened and broader network has already produced
ays to
The Design Council, Arts and Humanities Research Council (AHRC) and Economic and l (ESRC) are working together to shape design research of the RC and the Design Council published a scoping study on the
e in a y
) creates a fertile, knowledge-rich environment in which business can collaborate with academics and other businesses to create the next generation of
, and
s.
g
uct
mber.
UK innovation ecosystem which fully realised the value of its institutions. Since publishing the strategy our innovation partners have identified and
some examples of joint working:
The new release of Innovation Vouchers now covers a broader range of topics, including IP and design, providing a vital gateway to these services for innovative businesses;
Nesta’s upcoming innovation inducement prize on carbon data measurement is the result of joint working with NPL and aims to encourage the development of new whelp people monitor and manage greenhouse gas emissions and energy use; and
Social Research Councifuture. In August, the AHcurrent state of research on the value and impact of design. This was the first stagcollaboration between the two organisations to address the challenges being faced bthe design research community. While playing a key role in economic and social valuecreation, the community faces challenges in terms of measurement of the value of design, evidence-gathering and business and policy partnerships. Further research is being taken forward with the ESRC.
8.7 Innovation and Knowledge Centres (IKCs)
Collaboration is a key element of a successful innovation ecosystem. An Innovation and Knowledge Centre (IKC
technology as it emerges from the science base. Led by an academic institutionfunded for at least five years, IKCs are intended to accelerate the commercialisation of world class science and emerging technologies into new products, processes or serviceDesigned to foster collaboration and deliver competitive advantage to the businesses withwhom they interact, IKCs possess expert knowledge and understanding of core emerginscience and technology domains needed to make commercially viable systems work.
There are now six IKCs operational in the UK and the latest, the Sustainable ProdEngineering Centre for Innovative Functional Industrial Coatings (SPECIFIC) Production Facility, located at Port Talbot, was officially opened in October 2012.
Plans for a seventh IKC, focused on Synthetic Biology, were announced in Septe
62

8.8 E-infrastructure
In the IRS we recognised that we need to establish an e-infrastructure for the UK to take account of changes to scientific and innovation processes. We published our Strategic Vision for UK e-infrastructure in 2011.
We invested £165.5 million last year to renew, replace and/or introduce vital new capabilities. Areas benefitting from this investment include new supercomputers to support
st
he
he IBM ‘Blue Joule’ machine.
advanced or specialist research, improvements to high capacity networks, and the Daresbury Science and Innovation Campus which is supporting research into the lateproduct development software.
Collaboration between STFC and IBM at Daresbury laboratory has established one of tworld’s foremost centres in high performance computing and software development. The Hartree Centre at Daresbury is now home to the UK’s most powerful supercomputer, t
63
9 Global collaboration
RS showed how we would develop and support
find
Brazil. We are also offering greater support for UK
Innovation and research are increasingly international endeavours: most innovations noworiginate from multiple countries. The Inew forms of international partnership and collaboration, with Government taking an active role in promoting UK strengths around the world, allowing us to attract investment,partners for innovation collaboration and succeed in growing markets.
This year we have established strong platforms for collaboration with China, India and have begun to develop one withorganisations looking for collaboration partners or trading and investment opportunities overseas through UKTI’s new Opentoexport.com service where innovative companies can get support and advice to help grow their exports, and a refocused Science and InnovationNetwork.
A focus on innovation hotspots worldwide
The Science and Innovation Network (SIN - with around 90 posts in overseas locations - has been working alongside UKTI to build on the identification of key innovation hotspots around the globe. They aim to identify how they can find the opportunities and create the conditions for innovation collaboration to allow UK businesses to draw on the resources concentrated in these locations.
In partnership with BIS, the SIN, and the Technology Strategy Board, UKTI are building on this insight to develop a shared understanding of how international innovation hotspots relate to UK strengths, to enable more effective targeting and coordination of collaboration and trade activity.
9.1 Supporting innovative UK businesses’ interests and trade verseas
KTI and our UK innovation institutions have been working to increase the advice and support available to UK companies trading overseas and we are developing options for upport to UK organisations in accessing EU funding (focusing on the forthcoming Horizon
2020 programme). Chapter 5 of this report notes that whilst the UK is historically relatively uccessful in accessing such funds, this is driven by academia, with private enterprises
underperforming.
Research tells us that most SMEs feel that all the information they need to help them xport is "out there", but it is not all in one place (youGov February 2012).
OpentoExport.com is a new online service that meets this need. It launched on 29th ctober 2012, is supported by UKTI, and powered by digital services provider hibu. Open
to Export aggregates and organises quality content from service providers and xperienced exporters. Small businesses can ask questions of the export community.
They can receive and rate responses from government trade officers based in UK Embassies and High Commissions throughout the world and a range of organisations and private sector service providers.
o
U
s
s
e
O
e
64
During 2012 the Intellectual Property Office (IPO) has expandebusinesses to better exploit their IP potential in key global marattachés into China, India and Brazil, with more planned. They
d the help it offers UK kets having introduced IP are already establishing
ul “clean and cool” t, th
ill continue with at least a further two missions planned for 2013. The number of ies.
s xt major research and innovation Framework
Programme for 2014-2020.
ss
olutions to reach the market faster and making European standardisation more competitive globally. The Prime Minister’s EU growth strategy
We have led negotiations on the EU Regulation on European Standardisation, and
the IP management and protection risks that companies face in these markets, to develop a clear picture of what measures are most effective in minimising them.
The Technology Strategy Board and UKTI have collaborated to develop Entrepreneur Missions, taking groups of around 20 early-stage technology businesses to overseas markets to identify potential partners and investors. In 2012 a successfmission to San Francisco provided competition-winning cleantech SMEs with the insighconnections and opportunities to help accelerate their businesses, and the Future HealMission to Boston built on this successful collaboration, taking 20 of the UK’s most promising early stage healthcare technology businesses with high growth potential to explore commercial opportunities in the US. To date, these missions have secured more than US $200 million of contracts or investment for participating UK businesses. This joint working wmarkets targeted will also increase, with a focus on major developing econom
9.2 Influencing the innovation landscape in Europe
We continue to engage actively in the development of the EU innovation landscape working with the European Commission as it reviews the State Aid Regulations and buildits plans for Horizon 2020 – the ne
Effective Regulation on European Standardisation can improve European competitiveneby speeding up and modernising the standards-making process at European level, allowing innovative s
published in 2011 stated speeding up standard-setting for innovative new technologies should be a priority so that UK firms can make the most of new opportunities.
secured all the UK’s national objectives. The Regulation was adopted by the EuropeanParliament at its first reading. It will be agreed by the EPSCO Council in October and it will become law on 1st January.
65

International collaboration in the development of techniques for measuring the properties of nanoproducts
In order to take full advantage of the benefits of nanotechnology, it is becoming increasingly necessary to enable the safe and responsible development of nano-based products so that we can all use them with confidence. There is a pressing need for robust analytical methods and standards.
The UK has a leading reputation in measurements, metrology and standards at the nano level and the UK’s National Measurement Institute for chemical and biological analysis, LGC, has developed a leading capability.
LGC is leading the European Metrology Research Programme project, ‘Chemical and Optical Characterisation of Nanomaterials in biological systems’. In collaboration with leading measurement institutes in Germany, Hungary, Belgium and the UK, LGC is developing methods to characterise nanomaterials for their physical, chemical and optical properties in biological matrices. The combined expertise of the partners will enable the development of robust measurement techniques which can be used to directly characterise nanomaterials in biological matrices and can be further developed as underpinning standard techniques to support the wider nanotechnology industry.
9.3 Engagement with high growth economies
In the IRS we acknowledged that we need to recognise and exploit the opportunities
at nd the
ll .
CUK is building on a strong portfolio of collaborative research after 5 years of presence ent include in smart grids, energy storage
nd electric vehicles, sustainable materials for infrastructure, green economy, stem cells, oil security. The Research Councils UK (RCUK)/ Ministry of
cience and Technology (MoST) joint call in Health, Food Security and Energy has also
randum of Understanding (MoU) on innovation ollaboration with the Chinese Vice Minister of Science and Technology Wang Zhigang. his provides a platform for us to work with MoST on understanding and addressing the arriers to collaboration, and putting in place new collaboration opportunities. As a result ur dialogue with MoST and other key Chinese innovation bodies has increased
significantly and we have also signed an official level MoU to continue to increase the
created by the countries showing continuing strong economic growth such as China, India and Brazil. We expect the value of these opportunities to continue to increase, and are building collaboration with these counties to make the UK a partner of choice for innovation-related collaboration and trade.
RCUK and Technology Strategy Board are both developing International Frameworks thwill provide the basis for a more strategic approach to how Research Councils aTechnology Strategy Board focus their international collaboration activities. The RCUK Framework will be driven by research challenges that need to be tackled globally and wihelp to put these international research partnerships on a secure and sustainable footing
China
Rin China. New areas currently under developmasynthetic biology and sSjust selected projects for funding.
In April 2012 David Willetts signed a MemocTbo
66
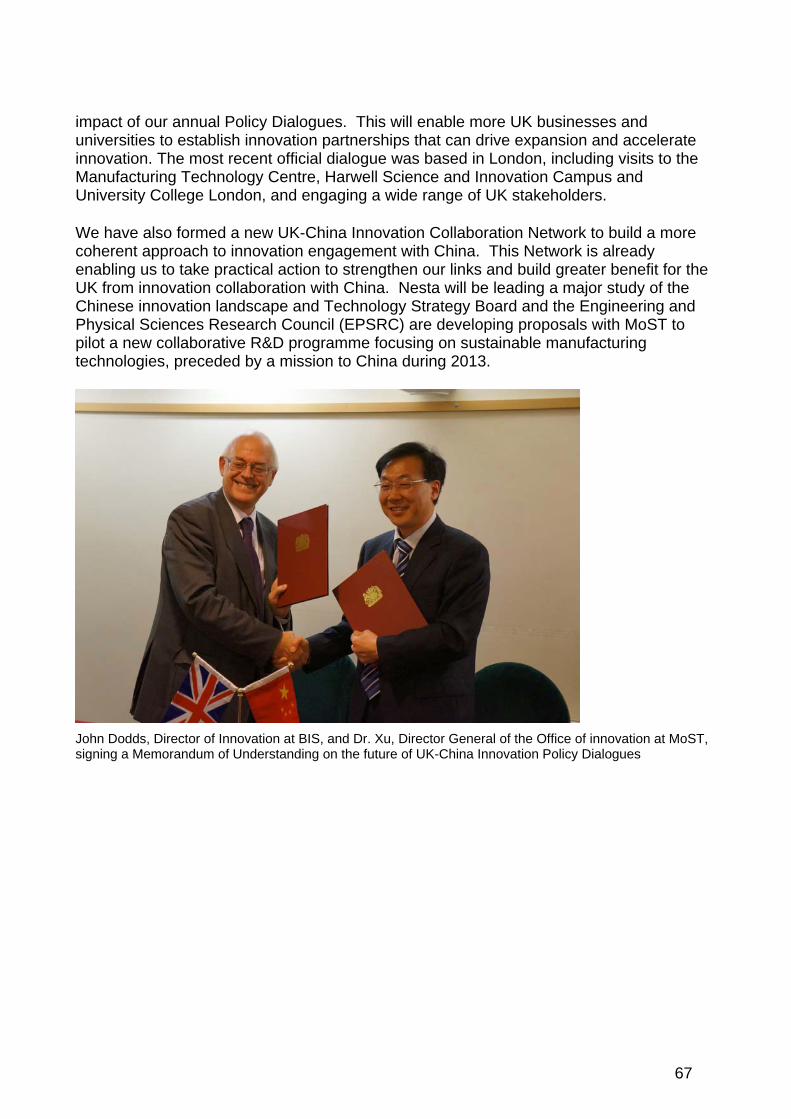
impact of our annual Policy Dialogues. This will enable more UK businesses and universities to establish innovation partnerships that can drive expansion and accelerateinnovation. The most recent official dialogue was based in London,
including visits to the
gagement with China. This Network is already
RC) are developing proposals with MoST to
Manufacturing Technology Centre, Harwell Science and Innovation Campus and University College London, and engaging a wide range of UK stakeholders.
We have also formed a new UK-China Innovation Collaboration Network to build a more coherent approach to innovation enenabling us to take practical action to strengthen our links and build greater benefit for theUK from innovation collaboration with China. Nesta will be leading a major study of the Chinese innovation landscape and Technology Strategy Board and the Engineering andPhysical Sciences Research Council (EPSpilot a new collaborative R&D programme focusing on sustainable manufacturing technologies, preceded by a mission to China during 2013.
John Dodds, Director of Innovation at BIS, and Dr. Xu, Director General of the Office of innovation at MoST, signing a Memorandum of Understanding on the future of UK-China Innovation Policy Dialogues
67

Dynex Semiconductor Ltd.
Dynex Semiconductor Ltd is a medium sized business, based in Lincoln. It is engaged in the research and development, design, sales and manufacture of high power semiconductor components used to control the flow of electrical energy in power electronic systems. In 2008, Zhuzhou CSR Times Electric Co. Ltd acquired approximately 75 per cent of Dynex Power Inc’s share capital and became the company’s immediate parent company. Zhuzhou CSR Times Electric is majority owned by the CSR Corporation, one of the world’s largest manufacturers of railway locomotives and metro systems. Both CSR Times Electric and the CSR Group are established in the People’s Republic of China and are quoted companies, although majority state owned.
This has given Dynex access to CSR technology and engineers, financial support from China, and preferential access as a supplier into the CSR corporation industrial supply chain. CSR has supported Dynex in updating and expanding its power semiconductor manufacturing facility at Lincoln, and support to expand its R&D activities through funding and transfer of engineers. In return Dynex is providing technical assistance to improve and expand the CSR Semiconductor Operations in China, and increase their access to the international market for power semiconductors. As its major shareholder, CSR is also becoming its major customer.
India
In January 2012, RCUK and the Indian Department for Science and Technology announced plans for a joint call in Advanced Manufacturing. A workshop bringing together academia, industry, policy makers and research funders explored themes in advanced manufacturing and how to maximise the value of outcomes of UK-India research collaboration for both countries. This led to the launch of a joint UK-India call for proposals in Advanced Manufacturing in July 2012. Proposals must include at least one industrial partner (UK/India/both) who should bring their own funding. Funding decisions will be announced by the end of March 2013.
In April 2012, David Willetts hosted the third biennial UK-India Science and Innovation Council, which recognised the importance of the UK’s substantial and long term
ect their novation approach and to look for ways to create more links between the UK and India at e level of SMEs and individual innovators.
SIN, British Council, RCUK joint research project mapping the Indian innovation opportunities for the UK, was launched in
eptember 2012.
echnology Strategy Board is building its links with India, with an Entrepreneur’s Mission eing planned with UKTI for February 2013 and we are looking for ways to build clearer
links between the research that RCUK funds and commercial opportunities for the UK. fID has built support for innovation into its support programmes in India and we are xploring how this can reinforce UK interests in the country.
relationship with India and agreed that innovation is a joint priority for partnership working over the next two years. We agreed to work with India to develop metrics that reflinth
Alandscape, as a first step to identifying S
Tb
De
68

UKTI is working alongside The Federatio(FICCI), and the UK Indian British Busine
n of Indian Chambers of Commerce and Industry ss Council (UKIBC) to develop and pilot
y
upp, in early 2013.
n 25th June 2012, with a remit to link up high
partnerships between established Indian companies and growing UK technology-focused SMEs which will:
Support Indian companies to access valuable technology and Intellectual Property;
Support UK companies to develop their technology and build their capacity to export into the Indian market with support from Indian companies; and
Support the development of globally focused trade partnerships between Indian and UKcompanies.
Brazil
Sir John Beddington signed an agreement with Brazilian Minister of Science, Technologand Innovation, Marco Antonio Raupp, at Rio+20 to explore the potential value of a UK-Brazil innovation collaboration platform. Following a visit from Professor Arbix, President of the Brazilian Innovation Agency, FINEP, in October, focussing on energy-related technologies, we are now working with Brazilian officials to develop a clear focus for thecollaboration platform. We hope to have a Round Table to discuss this between David Willetts and Marco Antonio Ra
9.4 International Venture Capital
Organised by BIS, UKTI, Technology Strategy Board, Nesta, the British Venture Capital and Share Equity Association (with the US National Venture Capital Association), Cambridge Enterprise and Tech City, our US-UK Financing Innovation Conference in July 2012 attracted a significant group of US delegates, including some of the leading Venture Capital fund managers and the head of the US Small Business Administration (SBA).
UKTI launched a Venture Capital Unit ogrowth and innovative SMEs with international sources of venture capital. The VentureCapital Unit has been developing the initial relationships established over the summer,which has resulted in a number of potential investments, and is developing its strategy around marketing the UK innovation ecosystem to the international investor community.
69

Building the Olympic Legacy
In addition to the US-UK Financing Innovation Conference, throughout the 2012 London Olympic Games, the British Business Embassy at Lancaster House welcomed over 4,000 business leaders and global figures to the Global Investment Conference and a series of Global Business Summits - the largest and most ambitious set of trade and investment events ever held in this country. The Summits showcased a range of creative and innovative UK activity such as advanced engineering, smart energy, ICT, Healthcare and Life Sciences over thirteen separate sector themed days, along with two country based days devoted to China and Brazil respectively.
Alongside this the British Business Club brought together over 6,000 companies into an on-line community to communicate details of networking events, business activities, news and potential partners around international sporting events, boosting the opportunities for UK companies to make valuable international business connections.
70
10. New innovation challenges
n ers and
innovative products and services. Public sector demand for innovation can give suppliers in the UK a leading
ge and potentially initiate further private demand. As public needs are similar in many her countries, innovation procurement can also trigger export opportunities. We have ken a range of procurement based actions to maximise our influence in this area.
all Business Research Initiative
overnment continues to invest more through the Small Business Research Initiative BRI) to support and grow technology-based SMEs, whilst sourcing new solutions to blic sector challenges. We are building on success to date and encouraging more blic sector bodies to engage in the programme, with 36 public sector bodies now
participating. So far during FY12/13, 27 competitions have been run, compared to 30 ring FY 2011/12; the scheme is growing in volume as well as value. The Technology rategy Board expects to issue £40 million of contracts this financial year, with around 2 million in contracts awarded to date.
novative ideas generated for the public sector through SBRI, include:
Technology developed by a British company that will offer people with dyslexia and visual impairments greater access to educational resources and more freedom to use the latest technology. The new service, developed by iansyst Ltd and its partners can convert digital information into accessible formats which could benefit thousands of learners.
Development and testing of a unique technology called Solaveil - a high tech material applied to glazing that stabilises and reduces solar energy transmission through the building fabric. The technology reduces a building’s solar heat gain, air conditioning needs and related energy costs. Solaveil is also inherently anti-microbial, creating a much healthier indoor environment. The anti-microbial properties are undergoing clinical trials at Warwick NHS and have enormous potential in the global healthcare sector.
Government can support, facilitate and drive innovation through its own day to day activities. In the IRS we explored how we would pull innovation into the economy and stimulate innovation in areas that would otherwise be neglected. We set out our ambitioto open up access in the UK to vast quantities of data to enable business, researchconsumers to realise its value and we explored what Government could do through its roleas a lead customer or as a supporter of innovation challenges.
10.1 Public Procurement
The IRS recognised the scale of the Government’s purchasing power and that it offers significant opportunities for the public sector to be a lead customer for
edotta
Sm
G(Spupu
duSt£2
In
71
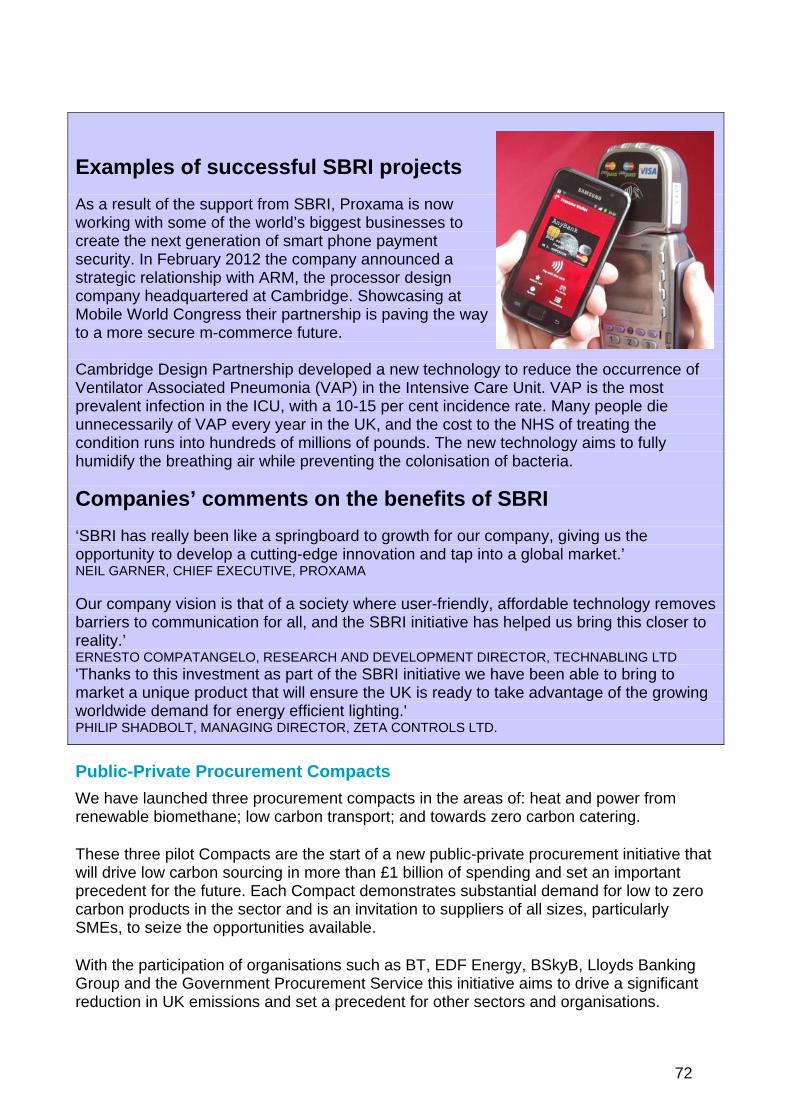
Examples of successful SBRI projects
As a result of the support from SBRI, Proxama is now working with some of the world’s biggest businesses to create the next generation of smart phone payment security. In February 2012 the company announced a strategic relationship with ARM, the processor design company headquartered at Cambridge. Showcasing at
72
Mobile World Congress their partnership is paving the way to a more secure m-commerce future. Cambridge Design Partnership developed a new technology to reduce the occurrence of Ventilator Associated Pneumonia (VAP) in the Intensive Care Unit. VAP is the most prevalent infection in the ICU, with a 10-15 per cent incidence rate. Many people die unnecessarily of VAP every year in the UK, and the cost to the NHS of treating the condition runs into hundreds of millions of pounds. The new technology aims to fully humidify the breathing air while preventing the colonisation of bacteria.
Companies’ comments on the benefits of SBRI
‘SBRI has really been like a springboard to growth for our company, giving us the opportunity to develop a cutting-edge innovation and tap into a global market.’ NEIL GARNER, CHIEF EXECUTIVE, PROXAMA
Our company vision is that of a society where user-friendly, affordable technology removes barriers to communication for all, and the SBRI initiative has helped us bring this closer to reality.’ ERNESTO COMPATANGELO, RESEARCH AND DEVELOPMENT DIRECTOR, TECHNABLING LTD 'Thanks to this investment as part of the SBRI initiative we have been able to bring to market a unique product that will ensure the UK is ready to take advantage of the growing worldwide demand for energy efficient lighting.' PHILIP SHADBOLT, MANAGING DIRECTOR, ZETA CONTROLS LTD.
Public-Private Procurement Compacts
We have launched three procurement compacts in the areas of: heat and power from renewable biomethane; low carbon transport; and towards zero carbon catering.
at
o
ith the participation of organisations such as BT, EDF Energy, BSkyB, Lloyds Banking roup and the Government Procurement Service this initiative aims to drive a significant
reduction in UK emissions and set a precedent for other sectors and organisations.
These three pilot Compacts are the start of a new public-private procurement initiative thwill drive low carbon sourcing in more than £1 billion of spending and set an important precedent for the future. Each Compact demonstrates substantial demand for low to zercarbon products in the sector and is an invitation to suppliers of all sizes, particularly SMEs, to seize the opportunities available.
WG
Lessons learnt from these pilot Compacts will contribute to possible development of further Compacts.
ad customer for innovative d knowledge gaps. Innovation
oven’ or ‘off the shelf' solutions. It , knowledge of sectors and their ts, and the ability to assess
are currently exploring possible rt advice the wider public
tion, ight
tre on Cycling.
Innovation Procurement Centre of Expertise
The Government’s capacity to strengthen its role as a leproducts and services is currently constrained by skills anprocurement is more demanding than purchasing ‘prrequires skills in handling outcome based specificationssupply chains, knowledge of technological developmensophisticated performance and quality specifications. Wemodels for a Centre of Expertise that would provide the expesector needs to grow the development of innovative products and services.
10.2 Innovation inducement prizes
The IRS identified the potential for innovation inducement prizes to galvanise innovaencourage new collaborations and solve multi-disciplinary problems in areas which motherwise be neglected. We have worked with Nesta to establish the UK Centre for Challenge Prizes, and have invested £350,000 in the UK Prize Fund so far.
The first two prizes with BIS support were launched in June and cen
"Hands Off my Bike" is a call for breakthrough innovations to make it more difficult to steal bikes. The winning innovation will be the one that requires the longest time to steal the bike within a minimum threshold of five minutes. The impact on the environment, cost and potential for commercialisation and/or implementation at scale will all be taken into account. The award will be made in June 2013.
The "Workplace Cycle Challenge Prize" is being run in collaboration with Challenge for Change and the Cycling Touring Club. Organisations of a minimum of 10 people are invited to design new ways of increasing the number of employees cycling to and from work. The winner will have achieved the highest percentage increase of trips to and from work by bike over the prize period and show the most potential for keeping that impact going. The award will be made in December 2013.
BIS will also support a Carbon Data Prize to be run through the Centre, in collaborationwith the Centre for Carbon Measurement at the National Physical Laboratory. Nesta haconsulted on the design of the prize with experts and through a public survey, and
s
is now
ing with inducement prizes. As well as
e
to share expertise and insights into challenge prizes.
developing the possible options with a view to launching the prize in late November.
Nesta has made progress in developing the Centre for Challenge Prizes as a hub of expertise. It advises businesses and Government Departments on how to run prizes and is already being sought out as a centre of knowledge and expertise to develop and disseminate new ideas and methods of worklaunching the prizes to be run with BIS support, Nesta has launched the Ageing Well and Waste Reduction Challenges with the Cabinet Office and is providing expert advice to theEuropean Commission on a prize to find the best social innovation solutions to help peoplmove towards new types of work. The Centre is also developing a practitioner group
73

IRS performance measure: Evaluating the impact of the UK innovation prize fund, and the impact that this has had in stimulating new innovations
The UK Prize Fund and Centre will need to be established for some time before we can n the
In June 2012 the Government announced in its Open Data White Paper that we would set oard will consider how transparency in ry while furthering the UK’s recognised
, into the sharing and disclosing of research data.
We also established the Administrative Data Taskforce, in December 2011. It will publish
data and services from those
ce ding
e
monitor how they are delivering against this performance measure that was set out iIRS. We will work with Nesta to evaluate their impact for future reports.
10.3 Open data and transparency
We have continued to work to harness the potential and collaborative opportunities offeredby wider use of open data.
up a Research Sector Transparency Board. The Bresearch can be a driver for innovation and discoveexcellence in science. It will advise Government transparency issues relating to the national research effort, and improved access for small and medium businesses to the research base. Amongst its first tasks will be to consider and address the recommendations of the Royal Society report, Science as an Open Enterprise
proposals for new mechanisms and collaborative agreements to enable and promote the wider use of administrative data for research and policy purposes, before the end of the year.
10.4 Data Strategy Board (DSB)
Following its announcement in the Autumn Statement 2011, we have set up the Data Strategy Board (DSB) to maximise the value of data from the four Public Data Group (PDG) Trading Funds (Met Office, Ordnance Survey, Companies House and Land Registry) for long-term economic and social benefit, including through the release of data free of charge at point of use. The DSB will act as an intelligent customer, advising Government on commissioning and purchasing key organisations.
The Board is chaired by Stephan Shakespeare (CEO of YouGov) and has a broad range of skills and expertise from the public and private sector, including from the open data community. As a result, open data users and re-users are now able to formally influenthe decisions on which new datasets are made available for free release from the TraFunds, as well as from elsewhere in the public sector.
10.5 Independent Shakespeare Review of Public Sector Information
Stephan Shakespeare will also lead the Government’s independent Review of Public Sector Information, which was launched on 22 October 2012. The review will consider th
74
full breadth of the public sector information market, both now and how it might develop in the future. It will examine the private sector, civil society and general public use and re-use of public information as well as the potential benefits for how the public sector uses
s (OA) and has accepted the ten main
help universities with the transition to open access. The investment will be made to 30
g
and re-uses its own data.
This Review will provide a robust evidence base and assessment of the market for public sector and open data, and will publish its recommendations in spring 2013.
10.6 Open access
Considerable progress has been made this year. Government has published its response to the Finch review of open accesrecommendations; this effectively sets Government policy on Open Access and we are now working with UK public research funders and other stakeholders to facilitate its practical implementation.
The UK public research funders (i.e., RCUK and the HE funding councils) support the Government’s position, and have set out how they will implement the policy.
In September 2012, BIS also provided a £10 million boost for open access, via RCUK, to
institutions for the establishment of institutional funds for payment of Article Processing Charges (APCs). The Research Councils have confirmed a further £37 million will be made available to over 100 institutions over the next two years for their block grant fundinmechanism for APCs.
Case study – Marblar
Marblar is a web-based platform that aims to open up the research and innovation process, using a global crowd of scientists, inventors, engineers and businesses to find new applications for existing ideas and technology. The Science and Technology Facilities Council (STFC) is using Marblar to highlight five inventions that need feedback regarding their future potential.
Marblar is being launched in phases – 200 participants are currently active on the site, enabling it to be fully tested, after which time a further 500 subscribers will be given access to the site. The microFTS, a novel compact and robust spectrometer (inventor: Hugh Mortimer, RAL Space, STFC) is the first technology to be put up on the website from STFC. A test group of participants have been leaving comments on applications for this spectrometer with some very exciting application ideas coming from people spanning a wide range of academic backgrounds.
10.7 Research Councils’ Gateway to Research
The Gateway to Research will provide a single point of access to Research Council information and related data. This will include a web based ‘Gateway to Research’ Portal.
75
The Research Councils are investing £2 million in this project and aim to have the portal ready by early 2014. Jimmy Wales (founder, Wikipedia) has been taken on as an advisoto the project. A beta version of the portal will be ready by the end of November 2012. Tportal interface and backgr
r he
ound dataset will then be improved iteratively, in consultation with users, until the launch of the final version. This is intended to be around late 2013 to
10.8 Open Data Institute (ODI)
s on innovation, commercialisation and the development
ved and the co-ks
The ODI team are currently defining a membership model for partner organisations and
sses required and the other focused on health-related data. The official ODI launch will take
n,
early 2014.
The Open Data Institute will focuof web standards to ensure that open data research is transformed into commercial advantage for the UK. The business plan for the Institute has been approdirectors have moved swiftly to secure premises in Shoreditch and to appoint Gavin Staras Chief Executive and Jeni Tennison as Technical Director.
have identified up to 40 potential founding members. They have held two hackathon events to date: one mainly to ensure the soundness of the systems and proce
place on 4th December 2012.
IRS performance measure: Reducing the number of regulations that restrict innovatioand increasing the availability of public data
We will report on the impact the ODI has had on this success measure in future reports, when the Institute has been operating for a sufficient amount of time.
76

11. Conclusion The latest available evidence on the UK’s innovation and research performance shows that the evidence on which we built our Innovation and Research Strategy for Growth still supports the priorities identified. The global economic downturn impacted innovation investment and output across the globe. However, the UK has fared relatively well, and is
as.
ality
s to re has
across the innovation .
still performing competitively in most key are
Compared to other leading economies, the overall level of innovation investment in the UKremains strong. Our research base is among the best in the world, producing high-quoutput with unmatched efficiency. The UK performs well on international collaboration andinward investment measures and is number one in the OECD’s ease of entrepreneurship index.
The policies in the IRS were based on our analysis of the best available evidence at the time, covering the period up to 2009. The evidence we examine in this report brings u2010. The data therefore predates the Strategy’s publication. It shows that the pictubroadly not changed and we can be confident that the IRS is still supported by the evidence on which it was built.
We have made clear progress against the actions we committed to deliver despite the unfavourable economic conditions. We are taking action in a variety of key areas that will help to increase investment in innovation, improve collaboration ecosystem, enhance incentives to innovate and maximise the impact of innovative activityWe are building a strong platform to drive future prosperity and growth.
77
Annex A: Deliverables set out in the Innovation and Research Strategy for
the Innovation and Research Strategy are detailed below.
Growth The outputs of the delivery plan that we set out in
Discovery and Development
Innovative Businesses
Action 1: We will invest over £200 million between 2011 and 2015 in establishing an elite national network of Catapult centres. We have announced the first three Catapults in High-value Manufacturing, Cell
ting and energy harvesting
Therapies and Offshore Renewable energy
Action 2: We will identify our priorities for investment in emerging technologies through the Technology Strategy Board, focusing on synthetic biology, energy efficient compu
Action 3: We will invest £50 million in the development of a Graphene Global Research and Technology Hub
Action 4: We will raise the rate of tax relief for the SME R&D Tax Credit to 225 per cent of qualifying expenditure. To increase usage of the R&D Tax Credit we will:
Work with HM Treasury, HM Revenue and Customs and the Devolved Administrations to increase the awareness and take-up of the SME scheme
Work with the Design sector to raise awareness of how the Scheme can help support research and development
Further simplify the scheme piloting a pre-approval scheme for smaller companies
We will introduce an ‘above the line’ tax credit to encourage research and development activity by larger companies
Action 5: We will increase our funding of Designing Demand to £1.3m enabling more businesses to benefit
Action 6: We will invest £25 million in enabling large-scale demonstrators in areas such as integrated systems for cities
78

79
Action 7: We will deliver a major conference in London 2012 around the Olympics with the British and US Venture Capital Associations and NESTA, to showcase and secure investment for some of the UK’s leading innovative companies
Action 8: We will establish a team based in the Technology Strategy Board that enables us to make maximum use of European Regional Development
aining courses for advisors into r range of business advisors. The IPO
will also develop an online business advisor training tool
Council to improve skill levels t and leadership skills ower distribution working with the Technology
Strategy Board and the knowledge base
ted support from the innovation infrastructure to ensure that agri-food and utilities businesses are able to access Government
Fund (ERDF) funding to support innovation investments
Action 9: The IPO will adapt Masterclass trmodules to make it accessible for a wide
Action 10: The IPO will consult businesses, business advisors and IP specialists on providing additional specific lower cost legal advice at a ‘paralegal’ level
Action 11: The IPO will redevelop its dispute resolution service to be more customer-focused
Action 12: We will work to increase innovation levels across economically important sectors starting with agri-food and utilities
Working with the Sector Skillsincluding managemen
Enable innovation in p
Help the UK water industry, working with the knowledge base, to innovate and so compete more effectively in overseas markets
Targe
support including raising awareness of support from the Technology Strategy Board and the R&D Tax Credit
K
nowledge and Innovation
Global Collaboration
Action 19: UKTI will deliver a package of measures to assist innovative UK Es to connect with overseas finance SM
Acbuthe
Action 21: UKTI will launch a collaborative online platform called “Open to Export”, enabling innovative companies and service providers to support one another
Action 22: We will undertake a review of the support system for potential UK proposers to EU funding programmes to ensure we have an effective system in place for Horizon 2020
Action 23: Establish an agreement with the Chinese Ministry of Science and Technology to fund bi-lateral research projects in key areas of mutual interest
tion 20: We will use the Olympic Games to provide a showcase of British siness and research capability in front of an international audience under GREAT brand
Action 13: We will invest £138 million to boost Britain’s e-infrastructure and make the UK a world leader in supercomputing research
Action 14: We will implement a new innovation voucher programme to support collaboration between SMEs and external knowledge providers
Action 15: Research Councils UK, working with the Funding Councils and in discussion with individual universities and consortia, will develop a principles-based Framework for treatment and submission of multi-institutional funding bids
Action 16: We will extend Launchpad to support new and emerging clusters in other parts of the UK
Action 17: We will introduce the EU VAT cost-sharing exemption to enable Universities and Charities to ensure that a VAT cost isn’t incurred when services are shared
Action 18: We will respond to Sir Tim Wilson’s forthcoming review of University-business collaboration
80

New Innovation Challenges
Action 24: We will consider and act on the recommendations of the Dame Janet Finch Publications Working Group
Action 25: We will consider and act on the recommendations of the Alan Langlands Administrative Data Task Force
Action 26: Research Councils will develop a web based publically searchable ‘Gateway to Research’
Action 27: An Open Data Institute will be developed, based in East London and co-directed by Professor Tim Berners-Lee and Professor Nigel Shadbolt
ll develop a new UK Prize Centre and Prize Fund to run inducement prizes in challenge areas where innovation is most needed
of Expertise for innovative products and services, in key areas with an initial focus on sustainability and healthcare
Private Procurement Compacts in the areas of catering; heat and power for buildings; and low carbon vehicles
cil will deliver a design-led commissioning toolkit departments and more widely across the public
k through the UK Alliance for Useful
Action 28: NESTA wi
Action 29: We will work with others across the public sector to develop Procurement Centres
Action 30: We will develop Public
Action 31: The Design Counfor adoption by government sector; and a coaching programme for senior civil servants
Action 32: NESTA and ESRC will worEvidence to advance the public sectors understanding of evidence and the case for backing what works
81

83
© Crown copyright 2012
ou may re-use this information (not including logos) free of charge in any format or medium, under the terms of the Open Government Licence.
isit www.nationalarchives.gov.uk/doc/open-government-licence
Y
V , write to the Information Policy Team, The National Archives, Kew, London TW9 4DU, or email: [email protected].
his publication is also available on our website at www.bis.gov.ukT
ny enquiries regarding this publication should be sent to:
epartment for Business, Innovation and Skills Victoria Street ondon SW1H 0ET el: 020 7215 5000
you require this publication in an alternative format, email [email protected]
A
D1LT If , or call 020 7215
000.
URN 12/P188
5