Embed Size (px)
Citation preview
(as successor issuer to Enerplus Resources Fund)
ANNUAL INFORMATION FORM
For the year ended December 31, 2010
March 11, 2011
GLOSSARY OF TERMS i Significant Factors or Uncertainties 36ABBREVIATIONS AND CONVERSIONS iii Proved and Probable Reserves Not on Production 36PRESENTATION OF ENERPLUS’ OIL AND GAS SUPPLEMENTAL OPERATIONAL INFORMATION 37
RESERVES, RESOURCES AND PRODUCTION Health, Safety and Environment 37INFORMATION iv Insurance 38Note to Reader Regarding Oil and Gas Information, Personnel 38
Definitions and National Instrument 51-101 iv DESCRIPTION OF CAPITAL STRUCTURE 39Disclosure of Reserves and Production Information iv Common Shares 39Barrels of Oil and Cubic Feet of Gas Equivalent v Preferred Shares 39Disclosure of Contingent Resources v Shareholder Rights Plan 39Interests in Reserves, Production, Wells and Senior Unsecured Notes 40
Properties v Bank Credit Facility 40Reserves Categories and Levels of Certainty for DIVIDENDS AND DISTRIBUTIONS 41
Reported Reserves viDividend Policy and History 41
Development and Production Status viDividend Reinvestment Plan 41
Description of Price and Cost Assumptions viiINDUSTRY CONDITIONS 42
PRESENTATION OF ENERPLUS’ FINANCIALOverview 42INFORMATION viiPricing and Marketing – Oil 42FORWARD-LOOKING STATEMENTS ANDPricing and Marketing – Natural Gas 42INFORMATION viiiThe North America Free Trade Agreement 43CORPORATE STRUCTURE 1Royalties and Incentives 43Enerplus Corporation 1Land Tenure 43Material Subsidiaries 1Environmental Regulation 44Organizational Structure 2Worker Safety 45Corporate Structure Prior to January 1, 2011 2
RISK FACTORS 46GENERAL DEVELOPMENT OF THE BUSINESS 3MARKET FOR SECURITIES 56Developments in the Past Three Years 3DIRECTORS AND OFFICERS 57Conversion from an Income Trust to a Corporation 4
Directors of the Corporation 57BUSINESS OF ENERPLUS 5Officers of the Corporation 58Overview 5Common Share Ownership 58Summary of Principal Production Locations 6Conflicts of Interest 59Capital Expenditures and Costs Incurred 7Audit & Risk Management Committee Disclosure 59Exploration and Development Activities 9
LEGAL PROCEEDINGS AND REGULATORY ACTIONS 59Oil and Natural Gas Wells and Unproved Properties 9INTEREST OF MANAGEMENT AND OTHERS INEnerplus’ Resource Play Types 10
MATERIAL TRANSACTIONS 59Equity Investments 14MATERIAL CONTRACTS AND DOCUMENTSQuarterly Production History 15
AFFECTING THE RIGHTS OF SECURITYHOLDERS 60Quarterly Netback History 16INTERESTS OF EXPERTS 60Abandonment and Reclamation Costs 17TRANSFER AGENT AND REGISTRAR 61Tax Horizon 18ADDITIONAL INFORMATION 61Marketing Arrangements and Forward Contracts 18APPENDIX A – REPORTS ON RESERVES DATA BYOIL AND NATURAL GAS RESERVES 20
INDEPENDENT QUALIFIED RESERVES EVALUATORSummary of Reserves 20 OR AUDITOR A-1Forecast Prices and Costs 27 APPENDIX B – REPORT ON RESERVES DATA BYConstant Prices and Costs 27 INDEPENDENT QUALIFIED RESERVES EVALUATORUndiscounted Future Net Revenue by Reserves OR AUDITOR B-1
Category 28 APPENDIX C – REPORT OF MANAGEMENT ANDNet Present Value of Future Net Revenue by Reserves DIRECTORS ON OIL AND GAS DISCLOSURE C-1
Category and Production Group 29 APPENDIX D – AUDIT & RISK MANAGEMENTEstimated Production for Gross Reserves Estimates 30 COMMITTEE DISCLOSURE PURSUANT TO NATIONALFuture Development Costs 31 INSTRUMENT 52-110 D-1Reconciliation of Reserves 31 APPENDIX E – SUPPLEMENTAL INFORMATION ABOUTUndeveloped Reserves 36 OIL AND GAS PRODUCING ACTIVITIES E-1
TABLE OF CONTENTS
Glossary of Terms
Unless the context otherwise requires, in this Annual Information Form, the following terms and abbreviations have the meanings set forth
below. Additional terms relating to oil and natural gas reserves, resources and operations have the meanings set forth under
‘‘Presentation of Enerplus’ Oil and Gas Reserves, Resources and Production Information’’.
‘‘ABCA’’ means the Business Corporations Act (Alberta), as amended;
‘‘AECO’’ means the physical storage and trading hub for natural gas on the TransCanada Alberta Transmission System (NOVA) which is the
delivery point for the various benchmark Alberta index prices;
‘‘Bank Credit Facility’’ means, as of December 31, 2010, Enerplus’ $1.0 billion unsecured, covenant-based revolving credit facility with a
syndicate of financial institutions: see ‘‘Material Contracts and Documents Affecting the Rights of Securityholders’’;
‘‘COGE Handbook’’ means the Canadian Oil and Gas Evaluation Handbook prepared jointly by The Society of Petroleum Evaluation Engineers
(Calgary Chapter) and the Canadian Institute of Mining, Metallurgy & Petroleum (Petroleum Society), as amended from time to time;
‘‘Common Shares’’ means the common shares in the capital of the Corporation;
‘‘Conversion’’ means the conversion of Enerplus’ business from an income trust structure (with the parent entity being the Fund) to a corporate
structure (with the parent entity being the Corporation) effective January 1, 2011 pursuant to a plan of arrangement under the ABCA;
‘‘Corporation’’ means Enerplus Corporation, a corporation amalgamated under the ABCA;
‘‘Credit Facilities’’ means, collectively, the Bank Credit Facility and the Senior Unsecured Notes: see ‘‘Material Contracts and Documents
Affecting the Rights of Securityholders’’.
‘‘CSA Notice 51-324’’ means Canadian Securities Administrators Staff Notice 51-324, Glossary to NI 51-101 Standards of Disclosure for Oil and
Gas Activities, issued by the Canadian securities regulatory authorities;
‘‘EELP’’ means Enerplus Exchangeable Limited Partnership, formerly a limited partnership established under the laws of Alberta and a subsidiary
of the Fund, which was dissolved on January 1, 2011 in connection with the Conversion;
‘‘Enerplus’’ means (i) on and after January 1, 2011, the Corporation and, where the context applies, its subsidiaries, taken as a whole, and
(ii) prior to January 1, 2011, the Fund and its subsidiaries, taken as a whole;
‘‘Enerplus USA’’ means Enerplus Resources (USA) Corporation, a corporation organized under the laws of Delaware and a wholly-owned
subsidiary of the Corporation;
‘‘Fund’’ means Enerplus Resources Fund, formerly a trust formed pursuant to the laws of Alberta that was dissolved on January 1, 2011 in
connection with the Conversion, and which was the predecessor issuer to the Corporation;
‘‘GAAP’’ means generally accepted accounting principles;
‘‘Haas’’ means Haas Petroleum Engineering Services Inc., independent petroleum consultants;
‘‘Haas Report’’ means the independent engineering evaluation of Enerplus’ oil, NGLs and natural gas reserves and contingent resources in the
Marcellus Properties prepared by Haas effective December 31, 2010, utilizing commodity price forecasts of McDaniel (for internal consistency in
Enerplus’ reserves reporting) as of January 1, 2011;
‘‘IFRS’’ means international financial reporting standards, being the standards adopted by the International Accounting Standards Board, as
amended from time to time;
‘‘Laricina’’ means Laricina Energy Ltd., a private corporation organized under the ABCA;
‘‘Marcellus Carry Amount’’ has the meaning assigned thereto under ‘‘General Development of the Business – Developments in the Past Three
Years – Developments in 2009 – Acquisition of Interests in the Marcellus Shale Gas Play’’;
‘‘Marcellus JDA’’ means the Joint Development Agreement dated September 1, 2009 among Enerplus USA and the vendors of the interests
acquired by Enerplus in the Marcellus shale gas resource play on September 1, 2009;
‘‘McDaniel’’ means McDaniel & Associates Consultants Limited, independent petroleum consultants;
E N E R P L U S 2010 ANNUAL INFORMATION FORM i
‘‘McDaniel Reports’’ means, collectively, the independent engineering evaluations of Enerplus’ oil, NGLs and natural gas reserves in Canada
and the western United States prepared by McDaniel effective December 31, 2010, utilizing commodity price forecasts of McDaniel as of
January 1, 2011;
‘‘MD&A’’ means management’s discussion and analysis;
‘‘NI 51-101’’ means National Instrument 51-101, Standards of Disclosure for Oil and Gas Activities, adopted by the Canadian securities
regulatory authorities;
‘‘NYSE’’ means the New York Stock Exchange;
‘‘SAGD’’ means steam assisted gravity drainage, an in situ production process used to recover bitumen from oil sands;
‘‘SEC’’ means the United States Securities and Exchange Commission;
‘‘Senior Unsecured Notes’’ means, as at December 31, 2010, the US$459 principal amount and Cdn$40 principal amount of senior unsecured
notes issued by Enerplus: see ‘‘Description of Capital Structure – Senior Unsecured Notes’’ and ‘‘Material Contracts and Documents Affecting
the Rights of Securityholders’’;
‘‘Shareholder Rights Plan’’ means the shareholder rights plan agreement between the Corporation and Computershare Trust Company of
Canada, as rights agent, dated effective January 1, 2011;
‘‘subsidiary’’ has the meaning assigned thereto in the Securities Act (Alberta);
‘‘Tax Act’’ means the Income Tax Act (Canada), R.S.C. 1985, c.1 (5th Supp.), as amended, including the regulations promulgated thereunder, as
amended from time to time;
‘‘Trust Units’’ means the former trust units of the Fund, each of which represented an equal undivided beneficial interest in the Fund and which
were exchanged on a one-for-one basis for Common Shares pursuant to the Conversion; and
‘‘TSX’’ means the Toronto Stock Exchange.
ii E N E R P L U S 2010 ANNUAL INFORMATION FORM
Abbreviations and Conversions
In this Annual Information Form, the following abbreviations have the meanings set forth below:
API American Petroleum Institute McfGE/day one thousand cubic feet of natural gas equivalent
bbls barrels, with each barrel representing per day
34.972 imperial gallons or 42 U.S. gallons MMbbls one million barrels
bbls/day barrels per day MMBOE(1) one million barrels of oil equivalent
Bcf billion cubic feet MMbtu one million British Thermal Units
Bcf/day billion cubic feet per day MMcf one million cubic feet
BcfGE(1) one billion cubic feet of natural gas equivalent MMcf/day one million cubic feet per day
BOE(1) barrels of oil equivalent NGLs natural gas liquids
BOE/day barrels of oil equivalent per day NYMEX the New York Mercantile Exchange
Mbbls one thousand barrels TcfGE(1) one trillion cubic feet of natural gas equivalent
MBOE(1) one thousand barrels of oil equivalent WTI West Texas Intermediate crude oil that serves as
Mcf one thousand cubic feet the benchmark crude oil for the NYMEX crude oil
Mcf/day one thousand cubic feet per day contract delivered in Cushing, Oklahoma
McfGE(1) one thousand cubic feet of natural gas equivalentNote:
(1) Enerplus has adopted the standard of 6 Mcf of natural gas: 1 bbl of oil when converting natural gas to BOEs, MBOEs and MMBOEs, and 1 bbl of oil and NGLs: 6 Mcf of natural gas whenconverting oil and NGLs to McfGEs, BcfGEs and TcfGEs. For further information, see ‘‘Presentation of Enerplus’ Oil and Gas Reserves, Resources and Production Information – Barrels of Oil andCubic Feet of Gas Equivalent’’.
In this Annual Information Form, unless otherwise indicated, all dollar amounts are in Canadian dollars and all references to ‘‘$’’ are to
Canadian dollars.
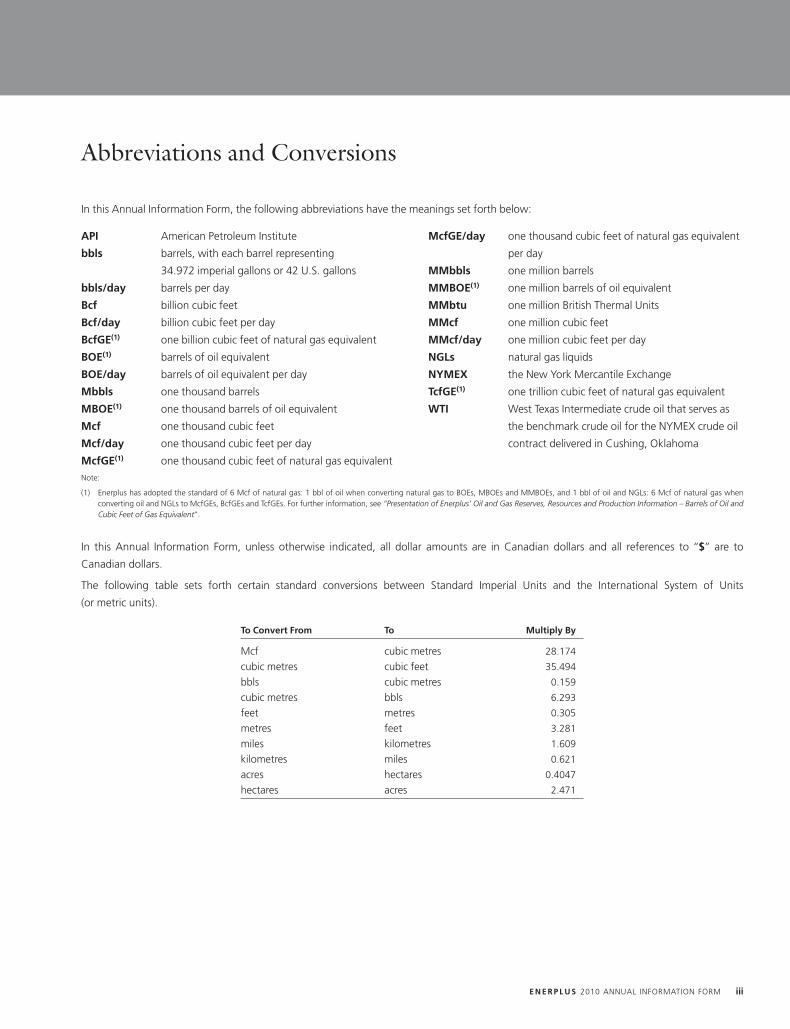
The following table sets forth certain standard conversions between Standard Imperial Units and the International System of Units
(or metric units).
To Convert From To Multiply By
Mcf cubic metres 28.174
cubic metres cubic feet 35.494
bbls cubic metres 0.159
cubic metres bbls 6.293
feet metres 0.305
metres feet 3.281
miles kilometres 1.609
kilometres miles 0.621
acres hectares 0.4047
hectares acres 2.471
E N E R P L U S 2010 ANNUAL INFORMATION FORM iii
Presentation of Enerplus’ Oil and Gas Reserves, Resources and
Production Information
NOTE TO READER REGARDING OIL AND GAS INFORMATION, DEFINITIONS AND NATIONAL INSTRUMENT 51-101
The oil and gas reserves and operational information of Enerplus contained in this Annual Information Form contains the information required to
be included in the Statement of Reserves Data and Other Oil and Gas Information pursuant to NI 51-101 adopted by the Canadian securities
regulatory authorities. Readers should also refer to the Reports on Reserves Data by McDaniel attached hereto as Appendix A, the Report on
Reserves Data by Haas attached as Appendix B and the Report of Management and Directors on Oil and Gas Disclosure attached hereto as
Appendix C. The effective date for the Statement of Reserves Data and Other Oil and Gas Information contained in this Annual Information
Form is December 31, 2010 and the preparation date for such information is March 11, 2011. This Annual Information Form also contains
certain supplemental operational and reserves information with respect to Enerplus not required to be disclosed under NI 51-101.
Certain of the following definitions and guidelines are contained in the Glossary to NI 51-101 contained in CSA Notice 51-324, which
incorporates certain definitions from the COGE Handbook. Readers should consult CSA Notice 51-324 and the COGE Handbook for additional
explanation and guidance.
DISCLOSURE OF RESERVES AND PRODUCTION INFORMATION
Presentation of Information
In this Annual Information Form, all estimates of oil and natural gas reserves and production are presented on a ‘‘company interest’’ basis
(as defined below), unless expressly indicated that they have been presented on a ‘‘gross’’ or ‘‘net’’ basis. ‘‘Company interest’’ is not a term
defined or recognized under NI 51-101 and does not have a standardized meaning under NI 51-101. Therefore, the ‘‘company interest’’ reserves
of Enerplus may not be comparable to similar measures presented by other issuers, and investors are cautioned that ‘‘company interest’’ reserves
should not be construed as an alternative to ‘‘gross’’ or ‘‘net’’ reserves calculated in accordance with NI 51-101.
Enerplus’ actual oil and natural gas reserves and future production may be greater than or less than the estimates provided in this Annual
Information Form. The estimated future net revenue from the production of such oil and natural gas reserves does not represent the fair market
value of such reserves. See ‘‘Oil and Natural Gas Reserves – Summary of Reserves’’ for additional information.
Notice to U.S. Readers
Data on oil and natural gas reserves contained in this Annual Information Form has generally been prepared in accordance with Canadian
disclosure standards, which are not comparable in all respects to United States or other foreign disclosure standards. For example, although the
SEC now generally permits oil and gas issuers, in their filings with the SEC, to disclose both proved reserves and probable reserves (each as
defined in the SEC rules), the SEC definitions of proved reserves and probable reserves may differ from the definitions of ‘‘proved reserves’’ and
‘‘probable reserves’’ under Canadian securities laws. In addition, under Canadian disclosure requirements and industry practice, reserves and
production are reported using gross (or, as noted above, ‘‘company interest’’) volumes, which are volumes prior to deduction of royalty and
similar payments. The practice in the United States is to report reserves and production using net volumes, after deduction of applicable royalties
and similar payments. Moreover, in accordance with Canadian disclosure requirements, Enerplus has determined and disclosed estimated future
net revenue from its reserves using forecast prices and costs, whereas the SEC now generally requires that reserve estimates be prepared using
an unweighted average of the closing prices for the applicable commodity on the first day of each of the twelve months preceding the
company’s fiscal year-end, with the option of also disclosing reserve estimates based upon future or other prices. Enerplus has also provided
certain supplemental information in this Annual Information Form (presented as ‘‘constant prices’’: see ‘‘– Description of Price and Cost
Assumptions’’ below) in accordance with the SEC’s pricing requirements. As a consequence of the foregoing, Enerplus’ reserve estimates and
production volumes may not be comparable to those made by companies utilizing United States reporting and disclosure standards.
Additionally, the SEC prohibits disclosure of oil and gas resources, including contingent resources, whereas Canadian issuers may disclose oil and
iv E N E R P L U S 2010 ANNUAL INFORMATION FORM
gas resources. Resources are different than, and should not be construed as, reserves. For a description of the definition of, and the risks and
uncertainties surrounding the disclosure of, contingent resources, see ‘‘– Disclosure of Contingent Resources’’ below.
Notwithstanding the above, Enerplus has included as Appendix E to this Annual Information Form certain disclosure relating to Enerplus’ oil and
gas reserves and operations in accordance with the Financial Accounting Standards Board’s Accounting Standards Update (ASU) No. 2010-03
‘‘Extractive Activities – Oil and Gas (Topic 932)’’, which disclosure complies with the SEC’s guidelines regarding disclosure of oil and gas reserves.
BARRELS OF OIL AND CUBIC FEET OF GAS EQUIVALENT
Enerplus has adopted the standard of 6 Mcf of natural gas: 1 bbl of oil when converting natural gas to BOEs, MBOEs and MMBOEs, and 1 bbl of
oil and NGLs: 6 Mcf of natural gas when converting oil and NGLs to McfGEs, BcfGEs and TcfGEs. BOEs, MBOEs, MMBOEs, McfGEs, MMcfGEs,
BcfGEs and TcfGEs may be misleading, particularly if used in isolation. The foregoing conversion ratios are based on an energy equivalency
conversion method primarily applicable at the burner tip and do not represent a value equivalency at the wellhead.
DISCLOSURE OF CONTINGENT RESOURCES
In this Annual Information Form, Enerplus has disclosed estimated volumes of ‘‘contingent resources’’ which relate to Enerplus’ interests in its
Bakken/Tight Oil, Marcellus and Crude Oil Waterflood resource plays.
‘‘Resources’’ are quantities of petroleum that are estimated to exist originally in naturally occurring accumulations, including the quantity of
petroleum that is estimated, as of a given date, to be contained in known accumulations, prior to production, plus those estimated quantities in
accumulations yet to be discovered.
‘‘Contingent resources’’ are defined as those quantities of hydrocarbons estimated, on a given date, to be potentially recoverable from known
accumulations using established technology or technology under development, but which are not currently considered to be commercially
recoverable due to one or more contingencies. Contingencies may include factors such as economic, legal, environmental, political and
regulatory matters or a lack of markets. It is also appropriate to classify as ‘‘contingent resources’’ the estimated discovered recoverable
quantities associated with a project in the early project stage.
The contingent resource estimates in this Annual Information Form are presented as the ‘‘best estimate’’ of the quantity that will actually be
recovered, meaning that it is equally likely that the actual remaining quantities recovered will be greater or less than the best estimate, and if
probabilistic methods are used, there should be at least a 50% probability that the quantities actually recovered will equal or exceed the best
estimate. The recovery and resource estimates provided herein are estimates only. Actual contingent resources (and any volumes that may be
reclassified as reserves) and future production from such contingent resources may be greater than or less than the estimates provided herein.
Resources and contingent resources do not constitute, and should not be confused with, reserves. See ‘‘Business of Enerplus – Enerplus’
Resource Play Types – Marcellus Shale Gas’’, ‘‘Business of Enerplus – Enerplus’ Resource Play Types – Bakken/Tight Oil’’, ‘‘Business of Enerplus –
Enerplus Resource Play Types – Crude Oil Waterflood’’ and ‘‘Risk Factors – Enerplus’ actual reserves and resources will vary from its reserve and
resource estimates, and those variations could be material’’.
INTERESTS IN RESERVES, PRODUCTION, WELLS AND PROPERTIES
In addition to the terms having defined meanings set forth in CSA Notice 51-324, the terms set forth below have the following meanings when
used in this Annual Information Form:
‘‘company interest’’ means, in relation to Enerplus’ interest in production or reserves, its working interest (operating or non-operating) share
before deduction of royalties, plus Enerplus’ royalty interests in production or reserves. See ‘‘ – Disclosure of Reserves and Production
Information’’ above.
‘‘gross’’ means:
(i) in relation to Enerplus’ interest in production or reserves, its working interest (operating or non-operating) share before deduction of
royalties and without including any royalty interests of Enerplus;
(ii) in relation to wells, the total number of wells in which Enerplus has an interest; and
(iii) in relation to properties, the total area in which Enerplus has an interest.
E N E R P L U S 2010 ANNUAL INFORMATION FORM v
‘‘net’’ means:
(i) in relation to Enerplus’ interest in production or reserves, its working interest (operating or non-operating) share after deduction of royalty
obligations, plus Enerplus’ royalty interests in production or reserves;
(ii) in relation to Enerplus’ interest in wells, the number of wells obtained by aggregating Enerplus’ working interest in each of its gross
wells; and
(iii) in relation to Enerplus’ interest in a property, the total area in which Enerplus has an interest multiplied by the working interest owned
by Enerplus.
‘‘working interest’’ means the percentage of undivided interest held by Enerplus in the oil and/or natural gas or mineral lease granted by the
mineral owner, Crown or freehold, which interest gives Enerplus the right to ‘‘work’’ the property (lease) to explore for, develop, produce and
market the leased substances.
RESERVES CATEGORIES AND LEVELS OF CERTAINTY FOR REPORTED RESERVES
In this Annual Information Form, the following terms have the meaning assigned thereto in CSA Notice 51-324 and the COGE Handbook:
‘‘reserves’’ are estimated remaining quantities of oil and natural gas and related substances anticipated to be recoverable from known
accumulations, as of a given date, based on: analysis of drilling, geological, geophysical and engineering data; the use of established
technology; and specified economic conditions, which are generally accepted as being reasonable, and shall be disclosed. Reserves may be
divided into proved and probable categories according to the degree of certainty associated with the estimates.
‘‘proved reserves’’ are those reserves that can be estimated with a high degree of certainty to be recoverable. It is likely that the actual
remaining quantities recovered will exceed the estimated proved reserves.
‘‘probable reserves’’ are those additional reserves that are less certain to be recovered than proved reserves. It is equally likely that the actual
remaining quantities recovered will be greater or less than the sum of the estimated proved plus probable reserves.
The qualitative certainty levels referred to in the definitions above are applicable to individual reserves entities (which refers to the lowest level at
which reserves calculations are performed) and to reported reserves (which refers to the highest-level sum of individual entity estimates for
which reserves estimates are presented). Reported reserves should target the following levels of certainty under a specific set of economic
conditions:
• at least a 90% probability that the quantities actually recovered will equal or exceed the estimated proved reserves; and
• at least a 50% probability that the quantities actually recovered will equal or exceed the sum of the estimated proved plus probable reserves.
DEVELOPMENT AND PRODUCTION STATUS
Each of the reserves categories reported by Enerplus (proved and probable) may be divided into developed and undeveloped categories:
‘‘developed reserves’’ are those reserves that are expected to be recovered from existing wells and installed facilities or, if facilities have not
been installed, that would involve a low expenditure (for example, when compared to the cost of drilling a well) to put the reserves on
production. The developed category may be subdivided into Producing and Non-Producing.
• ‘‘developed producing reserves’’ are those reserves that are expected to be recovered from completion intervals open at the time of the
estimate. These reserves may be currently producing or, if shut-in, they must have previously been on production, and the date of resumption
of production must be known with reasonable certainty.
• ‘‘developed non-producing reserves’’ are those reserves that either have not been on production, or have previously been on production,
but are shut-in, and the date of resumption of production is unknown.
‘‘undeveloped reserves’’ are those reserves expected to be recovered from known accumulations where a significant expenditure
(for example, when compared to the cost of drilling a well) is required to render them capable of production. They must fully meet the
requirements of the reserves classification (proved or probable) to which they are assigned.
vi E N E R P L U S 2010 ANNUAL INFORMATION FORM
DESCRIPTION OF PRICE AND COST ASSUMPTIONS
‘‘Forecast prices and costs’’ means future prices and costs that are:
(i) generally accepted as being a reasonable outlook of the future; and
(ii) if, and only to the extent that, there are fixed or presently determinable future prices or costs to which Enerplus is legally bound by a
contractual or other obligation to supply a physical product, including those for an extension period of a contract that is likely to be
extended, those prices or costs rather than the prices or costs referred to in paragraph (i).
‘‘Constant prices and costs’’ means, unless expressly noted otherwise, prices and costs used in an estimate that are the arithmetic average of
the first-day-of-the-month price of the applicable commodity for each of the twelve months in 2010, held constant throughout the estimated
lives of the properties to which the estimate applies.
Presentation of Enerplus’ Financial Information
The financial information included or referred to in this Annual Information Form has been prepared in accordance with Canadian GAAP.
Canadian GAAP differs in some significant respects from U.S. GAAP and therefore this financial information may not be comparable to the
financial information of U.S. companies. The principal differences as they apply to the Fund are summarized in Note 16 to Enerplus’ audited
consolidated financial statements for the year ended December 31, 2010, which are available on the Corporation’s SEDAR profile at
www.sedar.com, on the Corporation’s EDGAR profile at www.sec.gov as part of the annual report on Form 40-F filed by the Corporation with
the SEC together with this Annual Information Form, and on the Corporation’s website at www.enerplus.com.
In this Annual Information Form, unless otherwise indicated, all dollar amounts are in Canadian dollars and all references to ‘‘$’’ are to Canadian
dollars. On December 31, 2010, the exchange rate for one Canadian dollar, expressed in U.S. dollars and based upon the noon buying rate of
the Bank of Canada, was US$1.0054.
All references to ‘‘Enerplus’ audited consolidated financial statements for the year ended December 31, 2010’’ and ‘‘Enerplus’ MD&A for the
year ended December 31, 2010’’ refer to such documents as filed by the Corporation as successor issuer to the Fund as it existed at
December 31, 2010.
E N E R P L U S 2010 ANNUAL INFORMATION FORM vii

Forward-Looking Statements and Information
This Annual Information Form contains certain forward-looking statements and forward-looking information (collectively, ‘‘forward-looking
information’’) within the meaning of applicable securities laws which are based on Enerplus’ current internal expectations, estimates,
projections, assumptions and beliefs. The use of any of the words ‘‘anticipate’’, ‘‘continue’’, ‘‘estimate’’, ‘‘expect’’, ‘‘may’’, ‘‘will’’, ‘‘project’’,
‘‘plan’’, ‘‘intend’’, ‘‘guidance’’, ‘‘objective’’, ‘‘strategy’’, ‘‘should’’, ‘‘believe’’ and similar expressions are intended to identify forward-looking
statements and forward-looking information. These statements are not guarantees of future performance and involve known and unknown
risks, uncertainties and other factors that may cause actual results or events to differ materially from those anticipated in such forward-looking
information. Enerplus believes the expectations reflected in such forward-looking information are reasonable but no assurance can be given
that these expectations will prove to be correct, and such forward-looking information included in this Annual Information Form should not be
unduly relied upon. Such forward-looking information speaks only as of the date of this Annual Information Form and Enerplus does not
undertake any obligation to publicly update or revise any forward-looking information, except as required by applicable laws.
In particular, this Annual Information Form contains forward-looking information pertaining to the following:
• the quantity of, and future net revenues from, Enerplus’ reserves and/or contingent resources;
• crude oil, NGLs, natural gas and shale gas production levels;
• commodity prices, foreign currency exchange rates and interest rates;
• capital expenditure programs, drilling programs, development plans and other future expenditures, including the planned allocation of capital
expenditures among Enerplus’ resource plays;
• supply and demand for oil, NGLs and natural gas;
• Enerplus’ business strategy, including its asset and operational focus and transition from an income model to a growth and income-oriented
model;
• future acquisitions and dispositions and future growth potential;
• expectations regarding Enerplus’ ability to raise capital and to continually add to reserves and/or resources through acquisitions and
development;
• schedules for and timing of certain projects and Enerplus’ strategy for growth;
• Enerplus’ future operating and financial results;
• future abandonment and reclamation costs;
• future dividends that may be paid by Enerplus;
• Enerplus’ tax pools and the time at which Enerplus may incur certain income or other taxes; and
• treatment under governmental and other regulatory regimes and tax, environmental and other laws.
The forward-looking information contained in this Annual Information Form reflect several material factors and expectations and assumptions
made by Enerplus including, without limitation, that: Enerplus will have sufficient cash flow, debt or equity sources or other financial resources
required to fund its capital and operating expenditures and requirements as needed; Enerplus’ conduct and results of operations will be
consistent with its expectations; Enerplus and its industry partners will have the ability to develop Enerplus’ oil and gas properties in the manner
currently contemplated; current or, where applicable, proposed assumed industry conditions, laws and regulations will continue in effect or as
anticipated as described herein; the estimates of Enerplus’ reserves and resources volumes and the assumptions related thereto (including
commodity prices and development costs) are accurate in all material respects; there will be sufficient availability of services and labour to
conduct Enerplus’ operations as planned; and Enerplus’ commodity price and other cost assumptions will generally be accurate. Enerplus
believes the material factors, expectations and assumptions reflected in the forward-looking information are reasonable at this time but no
assurance can be given that these factors, expectations and assumptions will prove to be correct.
Enerplus’ actual results could differ materially from those anticipated in these forward-looking information as a result of both known and
unknown risks, including the risk factors set forth under ‘‘Risk Factors’’ in this Annual Information Form and risks relating to:
• volatility in market prices for oil, NGLs and natural gas, including changes in supply or demand for those products;
• actions by governmental or regulatory authorities including changes in income tax laws or changes in royalty regimes and incentive programs
relating to the oil and gas industry;
viii E N E R P L U S 2010 ANNUAL INFORMATION FORM
• unanticipated operating results including changes or fluctuations in oil, NGLs and natural gas production levels;
• changes in foreign currency exchange rates and interest rates;
• changes in development plans by Enerplus or third party operators;
• the ability of Enerplus to access required capital;
• changes in capital and other expenditure requirements and debt service requirements;
• liabilities and unexpected events inherent in oil and gas operations, including geological, technical, drilling and processing risks;
• actions of and reliance on industry partners;
• uncertainties associated with estimating reserves and resources;
• competition for, among other things, capital, acquisitions of reserves and resources, undeveloped lands, access to third party processing
capacity and skilled personnel;
• incorrect assessments of the value of acquisitions or the failure to complete dispositions;
• constraints on, or the unavailability of, adequate pipeline and transportation capacity to deliver Enerplus’ production to market;
• Enerplus’ success at the acquisition, exploitation and development of reserves and resources;
• changes in general economic, market (including credit market) and business conditions in Canada, North America and worldwide; and
• changes in tax, environmental, regulatory or other legislation applicable to Enerplus and its operations, and Enerplus’ ability to comply with
current and future environmental legislation and regulations and other laws and regulations.
Many of these risk factors and other specific risks and uncertainties are discussed in further detail throughout this Annual Information Form and
in Enerplus’ MD&A for the year ended December 31, 2010, which is available through the internet on the Corporation’s SEDAR profile at
www.sedar.com, on the Corporation’s EDGAR profile at www.sec.gov as part of the annual report on Form 40-F filed with the SEC together with
this Annual Information Form, and on the Corporation’s website at www.enerplus.com. Readers are also referred to the risk factors described in
this Annual Information Form under ‘‘Risk Factors’’ and in other documents the Corporation files from time to time with securities regulatory
authorities. Copies of these documents are available without charge from the Corporation or electronically on the internet on the Corporation’s
SEDAR profile at www.sedar.com, on the Corporation’s EDGAR profile at www.sec.gov and on the Corporation’s website at
www.enerplus.com.
E N E R P L U S 2010 ANNUAL INFORMATION FORM ix

ENERPLUS CORPORATION(as successor issuer to Enerplus Resources Fund)
Annual Information FormFor the year ended December 31, 2010
As described further under ‘‘General Development of the Business – Conversion from an Income Trust to a Corporation’’, on
January 1, 2011 Enerplus converted its business from an income trust structure, with the parent entity being the Fund, to a
corporate structure, with the parent entity being the Corporation, pursuant to the Conversion. The Fund was dissolved on
January 1, 2011 and the Corporation is the ‘‘successor issuer’’ of the Fund within the meaning of National Instrument 44-101
Short Form Prospectus Distributions of the Canadian Securities Administrators. Accordingly, where applicable and except as
otherwise noted, all information in this Annual Information Form is presented after giving effect to the Conversion.
Corporate Structure
ENERPLUS CORPORATION
The Corporation was incorporated on August 12, 2010 under the ABCA for the purposes of participating in the Conversion. As part of the plan
of arrangement under the ABCA pursuant to which the Conversion was effected, the Corporation was amalgamated with several other former
direct and indirect subsidiaries of the Fund on January 1, 2011 and continued as the Corporation. See ‘‘General Development of the Business –
Developments in the Past Three Years – Conversion from an Income Trust to a Corporation’’. The head, principal and registered office of the
Corporation is located at The Dome Tower, 3000, 333 - 7th Avenue S.W., Calgary, Alberta, T2P 2Z1. Enerplus also has a U.S. office located at
Wells Fargo Center, Suite 1300, 1700 Lincoln Street, Denver, Colorado, 80203. The Common Shares are currently traded on the TSX and the
NYSE under the symbol ‘‘ERF’’.
MATERIAL SUBSIDIARIES
As of January 1, 2011, the Corporation’s material subsidiaries were Enerplus Partnership and Enerplus USA.
Enerplus Partnership is a general partnership organized under the laws of Alberta and Enerplus USA is a corporation organized under the laws of
Delaware. All of the issued and outstanding securities of each of the Partnership and Enerplus USA are directly and indirectly owned by the
Corporation.
E N E R P L U S 2010 ANNUAL INFORMATION FORM 1
AIF
1MAR201109251351
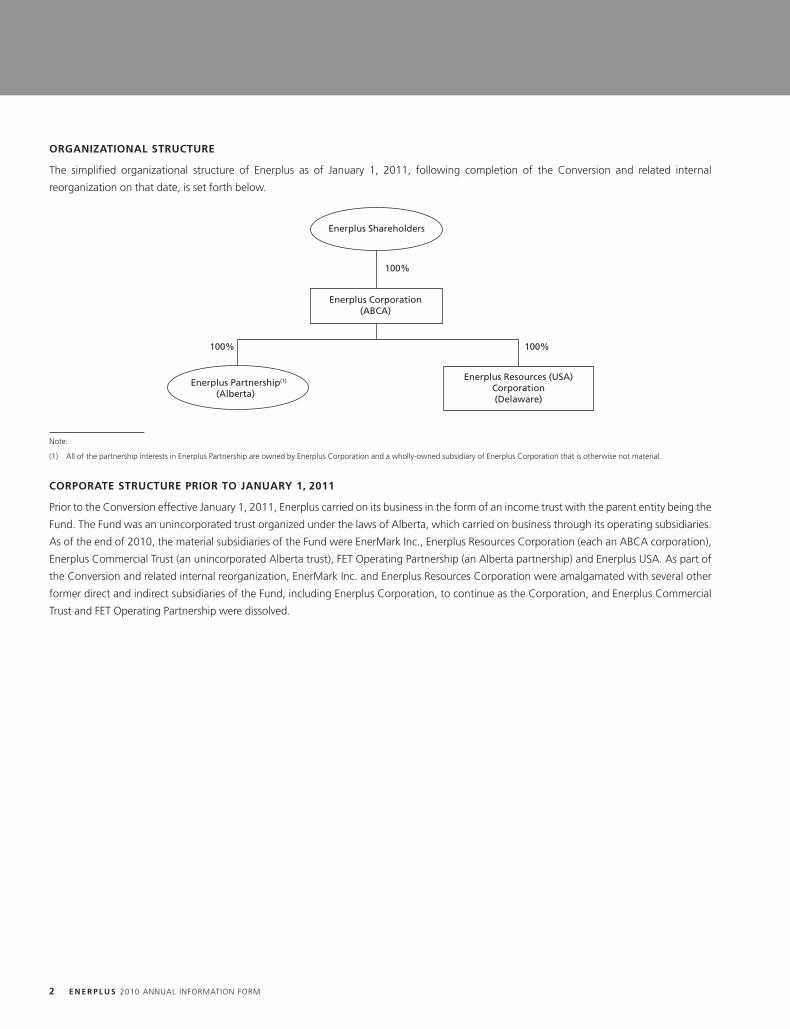
ORGANIZATIONAL STRUCTURE
The simplified organizational structure of Enerplus as of January 1, 2011, following completion of the Conversion and related internal
reorganization on that date, is set forth below.
Enerplus Shareholders
Enerplus Corporation(ABCA)
Enerplus Resources (USA)Corporation(Delaware)
Enerplus Partnership(Alberta)
100% 100%
100%
(1)
Note:
(1) All of the partnership interests in Enerplus Partnership are owned by Enerplus Corporation and a wholly-owned subsidiary of Enerplus Corporation that is otherwise not material.
CORPORATE STRUCTURE PRIOR TO JANUARY 1, 2011
Prior to the Conversion effective January 1, 2011, Enerplus carried on its business in the form of an income trust with the parent entity being the
Fund. The Fund was an unincorporated trust organized under the laws of Alberta, which carried on business through its operating subsidiaries.
As of the end of 2010, the material subsidiaries of the Fund were EnerMark Inc., Enerplus Resources Corporation (each an ABCA corporation),
Enerplus Commercial Trust (an unincorporated Alberta trust), FET Operating Partnership (an Alberta partnership) and Enerplus USA. As part of
the Conversion and related internal reorganization, EnerMark Inc. and Enerplus Resources Corporation were amalgamated with several other
former direct and indirect subsidiaries of the Fund, including Enerplus Corporation, to continue as the Corporation, and Enerplus Commercial
Trust and FET Operating Partnership were dissolved.
2 E N E R P L U S 2010 ANNUAL INFORMATION FORM
General Development of the Business
DEVELOPMENTS IN THE PAST THREE YEARS
Developments in 2008
Acquisition of Focus Energy Trust
On February 13, 2008, Enerplus completed its acquisition of Focus Energy Trust (‘‘Focus’’) pursuant to a plan of arrangement under the ABCA.
Pursuant to the arrangement, Enerplus acquired all of the assets and assumed all of the liabilities of Focus, Focus unitholders received 0.425 of a
Trust Unit for each Focus trust unit, and all of the trust units of Focus were redeemed. Enerplus issued an aggregate of 30,149,752 Trust Units to
former Focus unitholders in the 2008 transaction. Additionally, Enerplus assumed 9,087,000 exchangeable limited partnership units of
Focus Limited Partnership (a subsidiary of Focus, subsequently renamed EELP), which became exchangeable into 3,861,833 Trust Units as a
result of the transaction.
Disposition of Joslyn Oil Sands Lease
On July 31, 2008, Enerplus completed the sale of its 15% working interest in the Joslyn oil sands lease to Occidental Petroleum Corporation for
net proceeds of approximately $502 million, after adjustments and transaction costs. The proceeds of the sale were used to reduce bank debt.
The Joslyn oil sands lease, located in northeastern Alberta, is an oil sands project operated by Total E&P Canada Ltd., a wholly-owned subsidiary
of Total S.A. Enerplus had invested approximately $115 million in its 15% interest in the Joslyn oil sands lease from its inception in 2002 until
Enerplus sold its interest in 2008.
Developments in 2009
Acquisition of Interests in the Marcellus Shale Gas Play
On September 1, 2009, Enerplus (through the Fund’s indirect wholly-owned subsidiary, Enerplus USA) acquired an average 21.5% working
interest in approximately 540,000 gross acres within the Marcellus shale natural gas play in the northeastern United States, the majority of
which was located in Pennsylvania with certain interests in Maryland and West Virginia. Total consideration for the acquisition was
approximately US$411.0 million. The transaction had an effective date of May 1, 2009. The acquisition was structured as two components, with
one portion of the interests conveyed to Enerplus upon closing on September 1, 2009 and the remaining portion conveyed to Enerplus pursuant
to the Marcellus JDA, as described in further detail below.
At the September 1, 2009 closing, Enerplus acquired an approximate 8.6% working interest in the subject Marcellus properties for cash
consideration of US$164.4 million, which was paid at closing. Enerplus and the vendors of the interests also entered into the Marcellus JDA on
the closing date of the transaction, under which Enerplus acquired an additional approximate 12.9% working interest in the subject Marcellus
properties. Under the terms of the Marcellus JDA, the consideration of US$246.6 million (the ‘‘Marcellus Carry Amount’’) for these additional
working interests is paid over time as a ‘‘carry’’ and represents 50% of the vendors’ share of the future well drilling and completion costs on the
subject Marcellus properties until the Marcellus Carry Amount has been fully expended. As of December 31, 2010, the remaining Marcellus
Carry Amount was approximately US$147 million. Based on existing future drilling and completion plans, Enerplus anticipates the Marcellus
Carry Amount will be spent by 2012.
For a description of Enerplus’ interest in the Marcellus shale gas resource play, see ‘‘Business of Enerplus – Enerplus’ Resource Play Types –
Marcellus Shale Gas’’.
Additional Strategic Acquisitions and Dispositions
In 2009, Enerplus acquired additional Bakken land interests in southeast Saskatchewan and North Dakota for a purchase price of approximately
$55.0 million. Enerplus also disposed of $104.3 million of assets, almost all of which related to the sale of a non-core oil property in western
Canada, with production of approximately 200 BOE/day.
E N E R P L U S 2010 ANNUAL INFORMATION FORM 3
Developments in 2010
Acquisition of Additional Bakken Properties in North Dakota
On October 15, 2010, Enerplus acquired an additional 46,500 net acres (72 sections) of land in the Fort Berthold area of Dunn and McKenzie
counties in North Dakota. These lands were directly adjacent to Enerplus’ existing land holdings in this area and are prospective for light crude oil
in the Bakken and Three Forks formations. The purchase price was US$468.7 million (before closing adjustments) and was funded through
Enerplus’ Bank Credit Facility. Throughout 2010, Enerplus completed additional acquisitions in the Fort Berthold area, resulting in total
acquisitions in the Fort Berthold area in 2010 (including the October 15, 2010 acquisition described above) of 58,921 net acres, including
production of 1,900 BOE/day, for an aggregate purchase price of $588.0 million. For a description of Enerplus’ interest in the Bakken resource
play, see ‘‘Business of Enerplus – Enerplus’ Resource Play Types – Bakken/Tight Oil’’.
Acquisition of Additional Operated Marcellus Properties
On August 23, 2010, Enerplus purchased 58,500 net acres of undeveloped land in the Marcellus shale natural gas play in West Virginia and
Maryland. The acreage is predominantly located in Preston County in West Virginia and Garrett County in Maryland and created a new,
concentrated land position that Enerplus operates with an average 90% working interest. These new lands are in emerging areas with limited
existing development. In total, Enerplus spent $169.3 million on property acquisitions in the Marcellus shale gas play in 2010 (in addition to
expenditures of $92.3 million contributed towards the Marcellus Carry Amount), acquiring the two key operated areas described above and
acquiring a total of approximately 75,317 net acres of undeveloped land, of which 70,833 is operated by Enerplus.
Sale of Non-Core Conventional Assets and Additional Acquisitions
In 2010, Enerplus executed on its strategy to sell non-core conventional assets in order to improve its focus and operational efficiency. During
the year, Enerplus sold approximately 10,400 BOE/day of production for approximately $465.2 million. The proceeds from these sales were used
to retire outstanding debt under Enerplus’ Bank Credit Facility.
In addition to the acquisitions described above, in 2010 Enerplus purchased approximately 104,500 net acres of prospective land contiguous to
its existing holdings in the Freda Lake, Neptune and Oungre areas of the Saskatchewan Bakken play for $118.7 million. Enerplus also acquired
approximately 36,100 net acres of undeveloped land in the British Columbia Deep Basin for $25.9 million.
Sale of Kirby Oil Sands Lease
On October 1, 2010, Enerplus sold 100% of its Kirby SAGD oil sands lease for proceeds of $404.8 million. Enerplus acquired a 100% working
interest in the Kirby lease in 2007 for $203.1 million and since that time had invested an additional $58 million in the Kirby lease to further
delineate and identify the bitumen resource on the lease. Proceeds from the sale were used to retire outstanding debt under Enerplus’ Bank
Credit Facility.
CONVERSION FROM AN INCOME TRUST TO A CORPORATION
On October 31, 2006, the Canadian Federal Minister of Finance proposed to subject certain types of publicly traded mutual fund trusts, such as
the Fund, to tax at rates comparable to the combined federal and provincial corporate tax rates beginning in the 2011 tax year. The legislation
governing the tax on mutual fund trusts became law on June 22, 2007.
As a result, on January 1, 2011, Enerplus completed the Conversion pursuant to a plan of arrangement under the ABCA. The Conversion,
together with a related internal corporate reorganization, resulted in the business and structure of Enerplus being reorganized from an income
trust, with the parent entity being the Fund, into a corporate structure, with the parent entity being the Corporation. The plan of arrangement
was approved by the unitholders of the Fund and EELP on December 9, 2010. Pursuant to the plan of arrangement, holders of the Fund’s Trust
Units received one Common Share for each Trust Unit held, and holders of EELP exchangeable Class B limited partnership units received 0.425 of
a Common Share for each EELP unit held. As part of the Conversion and related reorganization transactions, the Fund and EELP were dissolved,
all of the outstanding Trust Units and EELP units were cancelled and the Corporation continued as the successor issuer to the Fund. The business,
directors and management of the Corporation following completion of the Conversion are the same as the business of the Fund and the
directors and management of the Fund (through its administrator, EnerMark Inc.) immediately before completion of the Conversion. As a result
of the Conversion, the Corporation is a reporting issuer in each of the provinces and territories of Canada and each of the Fund and EELP are no
longer reporting issuers in such jurisdictions.
4 E N E R P L U S 2010 ANNUAL INFORMATION FORM
Business of Enerplus
OVERVIEW
2010 was a transition year for Enerplus as it continued to move from an income model to a growth and income-oriented model in anticipation
of the Conversion. During this transition, Enerplus was focused on delivering operational results, repositioning its asset base and adding key
leadership and technical skills. Enerplus believes that it has made significant progress with respect to these strategies and that it is well
positioned for success as the new growth plays begin to contribute to its results during 2011.
Enerplus has realigned its asset base to include not only mature income-oriented assets but also early stage, growth-oriented assets. In 2010,
Enerplus acquired additional interests in the Marcellus shale gas play in the U.S., the Bakken play in both North Dakota and southeastern
Saskatchewan, and the Deep Basin region of Alberta and British Columbia. Enerplus believes that it has accumulated a meaningful portfolio of
prospects that will provide organic growth potential in the future. Enerplus also believes a greater concentration of assets will allow it to focus its
activities on a fewer number of high impact properties to create the greatest value for its investors. In 2010, Enerplus disposed of approximately
10,400 BOE/day of non-core conventional oil and gas production. In addition, Enerplus sold its Kirby SAGD oil sands property. See ‘‘General
Development of the Business – Developments in the Past Three Years – Developments in 2010’’ above.
Enerplus’ acquisition and development activities are generally focused on ‘‘resource plays’’, which are typically large and aerially extensive
accumulations of discovered oil and natural gas with limited geological risk. Resource plays typically require many wells to develop the play over
time. Resource plays generally exhibit lower production decline rates over the long term and a longer reserve life. Enerplus’ five resource play
types include: (i) Bakken/Tight Oil in Montana, North Dakota and southeastern Saskatchewan; (ii) Marcellus Shale Gas in the northeastern
United States; (iii) Tight Gas in northwestern Alberta and northeastern British Columbia; (iv) Crude Oil Waterfloods throughout western
Canada; and (v) Shallow Gas (which includes some shallow coalbed methane properties) in southeastern and central Alberta and southwestern
Saskatchewan. Additionally, Enerplus has interests in other conventional oil and natural gas properties throughout western Canada. Each of
these play types and property interests is described in detail under ‘‘ – Enerplus’ Resource Play Types’’ below.
Unless otherwise noted, (i) all production and operational information in this Annual Information Form is presented as at or, where applicable,
for the year ended, December 31, 2010, (ii) all production information represents Enerplus’ company interest in production from these
properties, which includes overriding royalty interests of Enerplus but is calculated before deduction of royalty interests owned by others, and
(iii) all references to reserve volumes represent Enerplus’ estimated company interest reserves using forecast prices and costs. See ‘‘Presentation
of Enerplus’ Oil and Gas Reserves, Resources and Production Information’’.
Enerplus’ oil and natural gas property interests are located primarily in western Canada in the provinces of Alberta, British Columbia,
Saskatchewan and Manitoba, and in the United States in the states of Montana, North Dakota, Maryland, Pennsylvania, West Virginia,
Wyoming and Utah. Enerplus’ major producing properties have related field production facilities and infrastructure to accommodate Enerplus’
production. Production volumes for the year ended December 31, 2010 from Enerplus’ properties consisted of approximately 42% crude oil and
NGLs and 58% natural gas, on a BOE basis. Enerplus’ 2010 average daily production was comprised of 31,135 bbls/day of crude oil,
3,889 bbls/day of NGLs and 288.7 MMcf/day of natural gas for a total of 83,139 BOE/day, a decrease of approximately 8,430 BOE/day
compared to 2009 average daily production of 32,984 bbls/day of crude oil, 4,157 bbls/day of NGLs and 326.6 MMcf/day of natural gas, for a
total of 91,569 BOE/day. The decline in average daily production in 2010 is largely attributable to lower capital spending in 2009 and the sale of
10,400 BOE/day of non-core production. Enerplus exited 2010 with average daily production of approximately 77,200 BOE/day. Approximately
72% of Enerplus’ 2010 production was operated by Enerplus and the remaining 28% was operated by industry partners. As at
December 31, 2010, the oil and natural gas property interests held by Enerplus were estimated to contain proved plus probable reserves of
110,893 Mbbls of light and medium crude oil, 38,960 Mbbls of heavy crude oil, 11,576 Mbbls of NGLs, 752,187 MMcf of natural gas and
116,662 MMcf of shale gas, for a total of 306,237 MBOE. Enerplus’ proved reserves represented approximately 72% of total proved plus
probable reserves, and approximately 53% of Enerplus’ proved plus probable reserves were weighted to crude oil and NGLs. See ‘‘Oil and
Natural Gas Reserves’’.
E N E R P L U S 2010 ANNUAL INFORMATION FORM 5
8MAR201117171870
SUMMARY OF PRINCIPAL PRODUCTION LOCATIONS
Crude Oil Waterfloods
Marcellus Shale Gas
Shallow Gas
Tight Gas
Bakken/Tight Oil
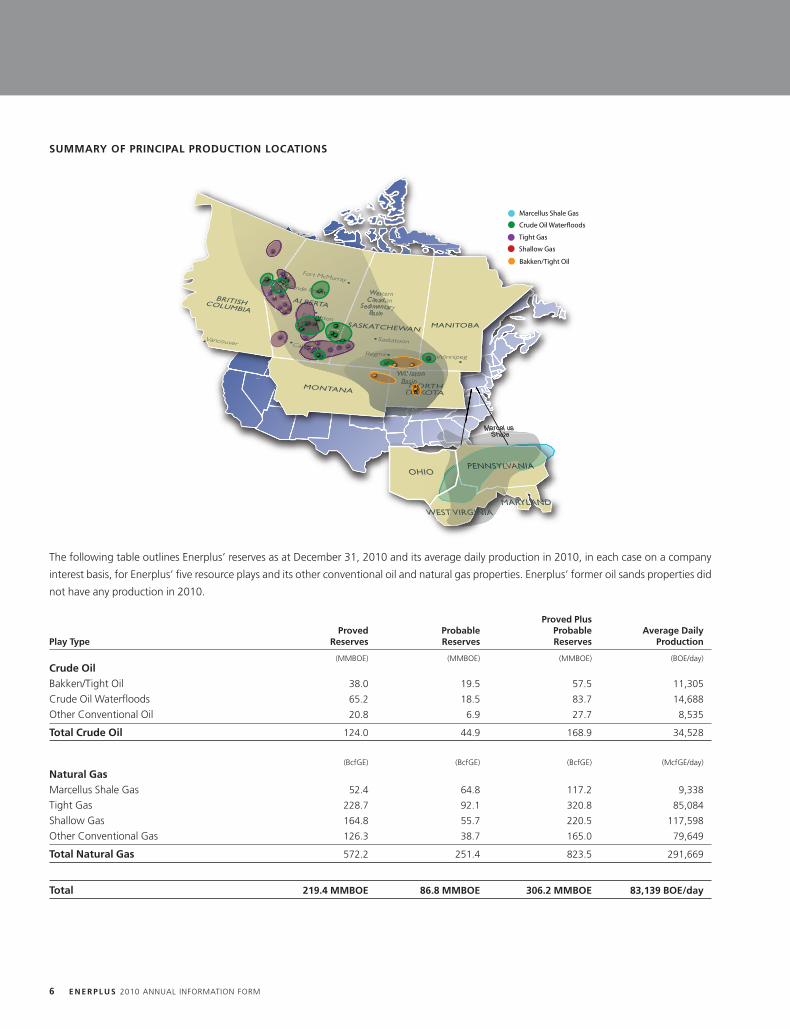
The following table outlines Enerplus’ reserves as at December 31, 2010 and its average daily production in 2010, in each case on a company
interest basis, for Enerplus’ five resource plays and its other conventional oil and natural gas properties. Enerplus’ former oil sands properties did
not have any production in 2010.
Proved PlusProved Probable Probable Average Daily
Play Type Reserves Reserves Reserves Production
(MMBOE) (MMBOE) (MMBOE) (BOE/day)Crude OilBakken/Tight Oil 38.0 19.5 57.5 11,305
Crude Oil Waterfloods 65.2 18.5 83.7 14,688
Other Conventional Oil 20.8 6.9 27.7 8,535
Total Crude Oil 124.0 44.9 168.9 34,528
(BcfGE) (BcfGE) (BcfGE) (McfGE/day)
Natural GasMarcellus Shale Gas 52.4 64.8 117.2 9,338
Tight Gas 228.7 92.1 320.8 85,084
Shallow Gas 164.8 55.7 220.5 117,598
Other Conventional Gas 126.3 38.7 165.0 79,649
Total Natural Gas 572.2 251.4 823.5 291,669
Total 219.4 MMBOE 86.8 MMBOE 306.2 MMBOE 83,139 BOE/day
6 E N E R P L U S 2010 ANNUAL INFORMATION FORM
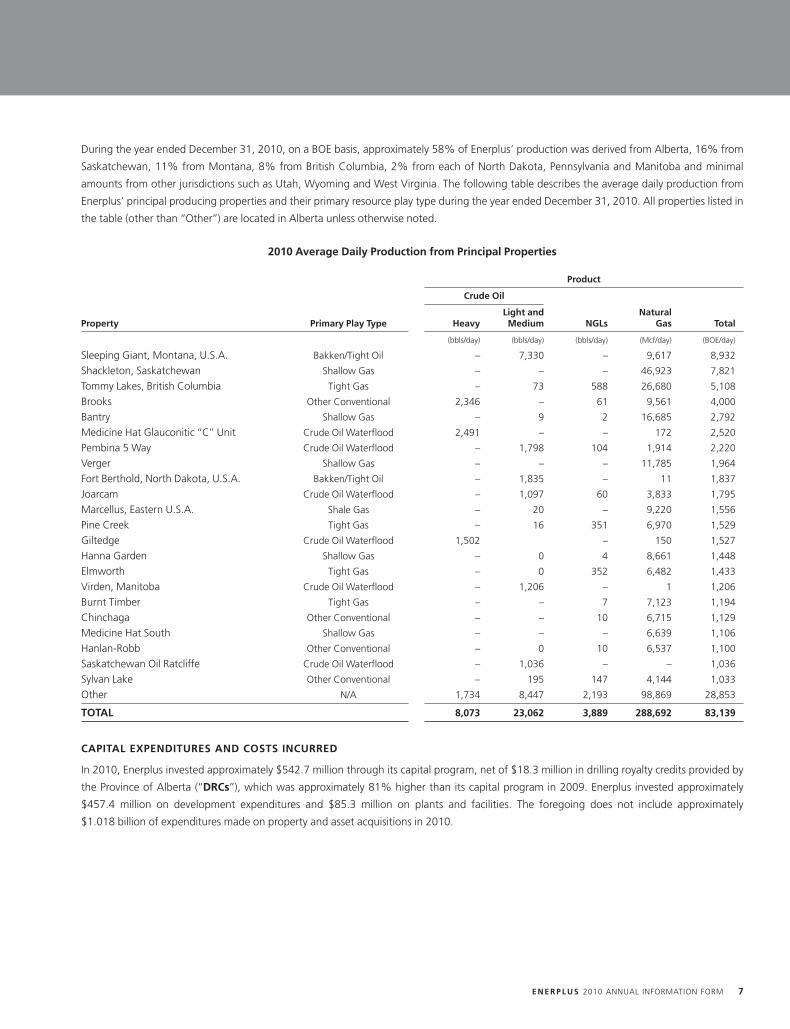
During the year ended December 31, 2010, on a BOE basis, approximately 58% of Enerplus’ production was derived from Alberta, 16% from
Saskatchewan, 11% from Montana, 8% from British Columbia, 2% from each of North Dakota, Pennsylvania and Manitoba and minimal
amounts from other jurisdictions such as Utah, Wyoming and West Virginia. The following table describes the average daily production from
Enerplus’ principal producing properties and their primary resource play type during the year ended December 31, 2010. All properties listed in
the table (other than ‘‘Other’’) are located in Alberta unless otherwise noted.
2010 Average Daily Production from Principal Properties
Product
Crude Oil
Light and NaturalProperty Primary Play Type Heavy Medium NGLs Gas Total
(bbls/day) (bbls/day) (bbls/day) (Mcf/day) (BOE/day)
Sleeping Giant, Montana, U.S.A. Bakken/Tight Oil – 7,330 – 9,617 8,932
Shackleton, Saskatchewan Shallow Gas – – – 46,923 7,821
Tommy Lakes, British Columbia Tight Gas – 73 588 26,680 5,108
Brooks Other Conventional 2,346 – 61 9,561 4,000
Bantry Shallow Gas – 9 2 16,685 2,792
Medicine Hat Glauconitic ‘‘C’’ Unit Crude Oil Waterflood 2,491 – – 172 2,520
Pembina 5 Way Crude Oil Waterflood – 1,798 104 1,914 2,220
Verger Shallow Gas – – – 11,785 1,964
Fort Berthold, North Dakota, U.S.A. Bakken/Tight Oil – 1,835 – 11 1,837
Joarcam Crude Oil Waterflood – 1,097 60 3,833 1,795
Marcellus, Eastern U.S.A. Shale Gas – 20 – 9,220 1,556
Pine Creek Tight Gas – 16 351 6,970 1,529
Giltedge Crude Oil Waterflood 1,502 – 150 1,527
Hanna Garden Shallow Gas – 0 4 8,661 1,448
Elmworth Tight Gas – 0 352 6,482 1,433
Virden, Manitoba Crude Oil Waterflood – 1,206 – 1 1,206
Burnt Timber Tight Gas – – 7 7,123 1,194
Chinchaga Other Conventional – – 10 6,715 1,129
Medicine Hat South Shallow Gas – – – 6,639 1,106
Hanlan-Robb Other Conventional – 0 10 6,537 1,100
Saskatchewan Oil Ratcliffe Crude Oil Waterflood – 1,036 – – 1,036
Sylvan Lake Other Conventional – 195 147 4,144 1,033
Other N/A 1,734 8,447 2,193 98,869 28,853
TOTAL 8,073 23,062 3,889 288,692 83,139
CAPITAL EXPENDITURES AND COSTS INCURRED
In 2010, Enerplus invested approximately $542.7 million through its capital program, net of $18.3 million in drilling royalty credits provided by
the Province of Alberta (‘‘DRCs’’), which was approximately 81% higher than its capital program in 2009. Enerplus invested approximately
$457.4 million on development expenditures and $85.3 million on plants and facilities. The foregoing does not include approximately
$1.018 billion of expenditures made on property and asset acquisitions in 2010.
E N E R P L U S 2010 ANNUAL INFORMATION FORM 7
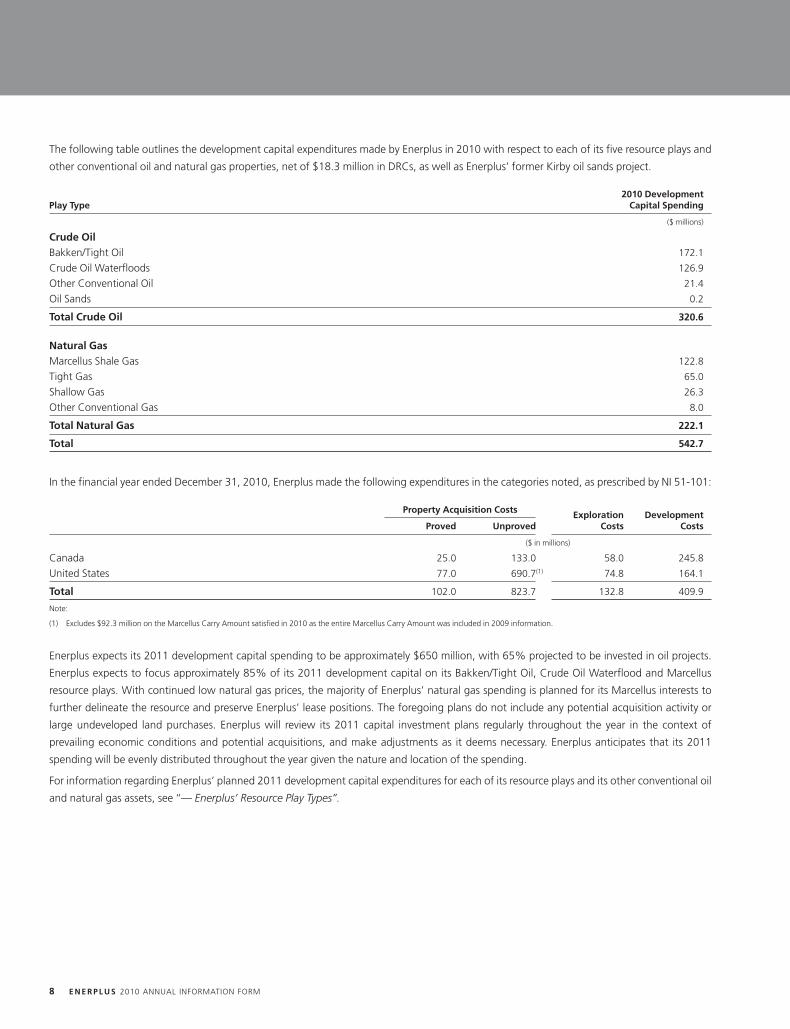
The following table outlines the development capital expenditures made by Enerplus in 2010 with respect to each of its five resource plays and
other conventional oil and natural gas properties, net of $18.3 million in DRCs, as well as Enerplus’ former Kirby oil sands project.
2010 DevelopmentPlay Type Capital Spending
($ millions)
Crude OilBakken/Tight Oil 172.1
Crude Oil Waterfloods 126.9
Other Conventional Oil 21.4
Oil Sands 0.2
Total Crude Oil 320.6
Natural GasMarcellus Shale Gas 122.8
Tight Gas 65.0
Shallow Gas 26.3
Other Conventional Gas 8.0
Total Natural Gas 222.1
Total 542.7
In the financial year ended December 31, 2010, Enerplus made the following expenditures in the categories noted, as prescribed by NI 51-101:
Property Acquisition Costs Exploration DevelopmentProved Unproved Costs Costs
($ in millions)
Canada 25.0 133.0 58.0 245.8
United States 77.0 690.7(1) 74.8 164.1
Total 102.0 823.7 132.8 409.9
Note:
(1) Excludes $92.3 million on the Marcellus Carry Amount satisfied in 2010 as the entire Marcellus Carry Amount was included in 2009 information.
Enerplus expects its 2011 development capital spending to be approximately $650 million, with 65% projected to be invested in oil projects.
Enerplus expects to focus approximately 85% of its 2011 development capital on its Bakken/Tight Oil, Crude Oil Waterflood and Marcellus
resource plays. With continued low natural gas prices, the majority of Enerplus’ natural gas spending is planned for its Marcellus interests to
further delineate the resource and preserve Enerplus’ lease positions. The foregoing plans do not include any potential acquisition activity or
large undeveloped land purchases. Enerplus will review its 2011 capital investment plans regularly throughout the year in the context of
prevailing economic conditions and potential acquisitions, and make adjustments as it deems necessary. Enerplus anticipates that its 2011
spending will be evenly distributed throughout the year given the nature and location of the spending.
For information regarding Enerplus’ planned 2011 development capital expenditures for each of its resource plays and its other conventional oil
and natural gas assets, see ‘‘— Enerplus’ Resource Play Types’’.
8 E N E R P L U S 2010 ANNUAL INFORMATION FORM
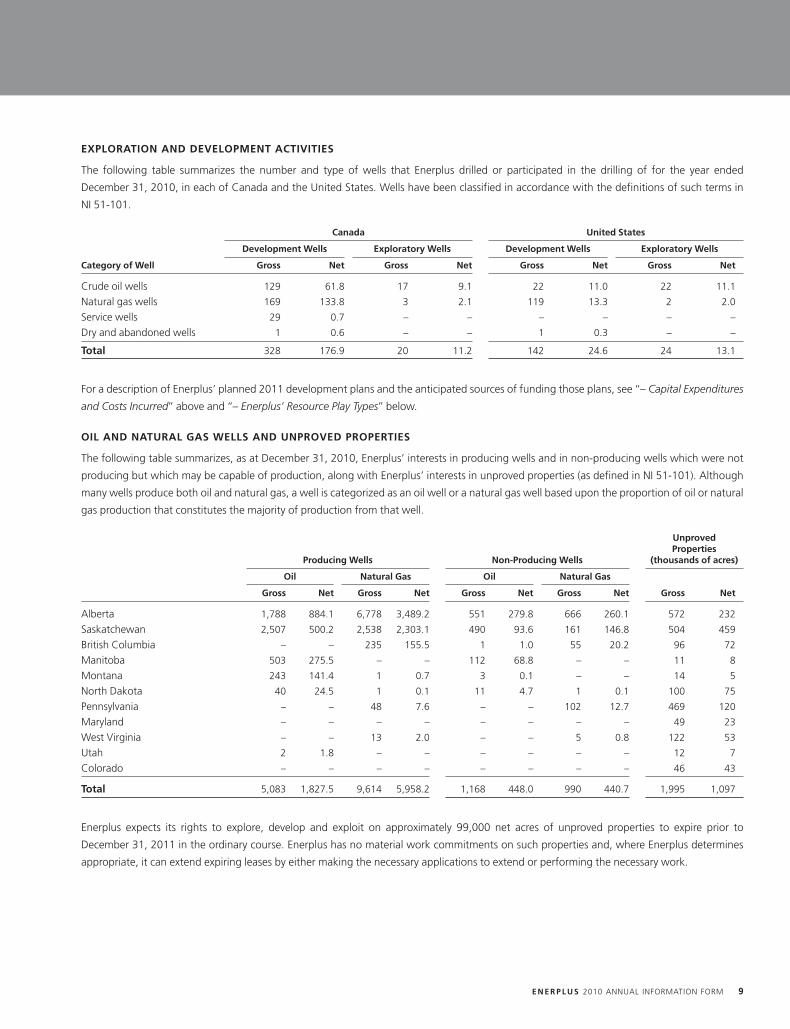
EXPLORATION AND DEVELOPMENT ACTIVITIES
The following table summarizes the number and type of wells that Enerplus drilled or participated in the drilling of for the year ended
December 31, 2010, in each of Canada and the United States. Wells have been classified in accordance with the definitions of such terms in
NI 51-101.
Canada United States
Development Wells Exploratory Wells Development Wells Exploratory Wells
Category of Well Gross Net Gross Net Gross Net Gross Net
Crude oil wells 129 61.8 17 9.1 22 11.0 22 11.1
Natural gas wells 169 133.8 3 2.1 119 13.3 2 2.0
Service wells 29 0.7 – – – – – –
Dry and abandoned wells 1 0.6 – – 1 0.3 – –
Total 328 176.9 20 11.2 142 24.6 24 13.1
For a description of Enerplus’ planned 2011 development plans and the anticipated sources of funding those plans, see ‘‘– Capital Expenditures
and Costs Incurred’’ above and ‘‘– Enerplus’ Resource Play Types’’ below.
OIL AND NATURAL GAS WELLS AND UNPROVED PROPERTIES
The following table summarizes, as at December 31, 2010, Enerplus’ interests in producing wells and in non-producing wells which were not
producing but which may be capable of production, along with Enerplus’ interests in unproved properties (as defined in NI 51-101). Although
many wells produce both oil and natural gas, a well is categorized as an oil well or a natural gas well based upon the proportion of oil or natural
gas production that constitutes the majority of production from that well.
UnprovedProperties
Producing Wells Non-Producing Wells (thousands of acres)
Oil Natural Gas Oil Natural Gas
Gross Net Gross Net Gross Net Gross Net Gross Net
Alberta 1,788 884.1 6,778 3,489.2 551 279.8 666 260.1 572 232
Saskatchewan 2,507 500.2 2,538 2,303.1 490 93.6 161 146.8 504 459
British Columbia – – 235 155.5 1 1.0 55 20.2 96 72
Manitoba 503 275.5 – – 112 68.8 – – 11 8
Montana 243 141.4 1 0.7 3 0.1 – – 14 5
North Dakota 40 24.5 1 0.1 11 4.7 1 0.1 100 75
Pennsylvania – – 48 7.6 – – 102 12.7 469 120
Maryland – – – – – – – – 49 23
West Virginia – – 13 2.0 – – 5 0.8 122 53
Utah 2 1.8 – – – – – – 12 7
Colorado – – – – – – – – 46 43
Total 5,083 1,827.5 9,614 5,958.2 1,168 448.0 990 440.7 1,995 1,097
Enerplus expects its rights to explore, develop and exploit on approximately 99,000 net acres of unproved properties to expire prior to
December 31, 2011 in the ordinary course. Enerplus has no material work commitments on such properties and, where Enerplus determines
appropriate, it can extend expiring leases by either making the necessary applications to extend or performing the necessary work.
E N E R P L U S 2010 ANNUAL INFORMATION FORM 9
ENERPLUS’ RESOURCE PLAY TYPES
Outlined below is a description of each of Enerplus’ five resource play types and its other conventional oil and natural gas properties.
Bakken/Tight Oil
Overview
Enerplus’ Bakken/Tight Oil resource play includes properties in Montana, North Dakota and southeastern Saskatchewan, including an
approximate 70% average working interest in certain producing wells in the Sleeping Giant Bakken oil field in Richland County, Montana, which
is one of Enerplus’ largest producing properties. Production from this resource play is primarily from the Middle Bakken dolomite formation at a
depth of approximately 10,000 feet and consists of light sweet crude oil (42� API) and some associated natural gas. Enerplus’ Bakken/Tight Oil
resource play represented approximately 14% of its 2010 average daily production on a BOE basis, with the majority of this production coming
from Enerplus’ U.S. Bakken properties. Approximately 19% of Enerplus’ proved plus probable reserves as at December 31, 2010 were
attributable to the Bakken/Tight Oil resource play. These properties are predominantly operated by Enerplus.
Enerplus’ Bakken/Tight Oil resource play grew significantly in 2010 through the acquisition of undeveloped acreage in North Dakota and
Saskatchewan. Enerplus added to its North Dakota Bakken position with the acquisition of 58,921 net acres for an aggregate purchase price of
$588 million, which also included production of 1,900 BOE/day. Enerplus also purchased 104,500 net acres of prospective land contiguous to its
existing holds in the Freda Lake, Neptune and Oungre areas of Saskatchewan for $118.7 million. Enerplus now holds over 220,000 net acres of
undeveloped land that is prospective for the Bakken and the Three Forks formations in certain areas. Total production from this resource play
grew by 12% year-over-year with the increase in production coming primarily from drilling activity in North Dakota.
In 2010, the majority of Enerplus’ drilling activity occurred in its U.S. Bakken assets where Enerplus drilled 6.4 net horizontal wells at the Sleeping
Giant field and another 14.8 net horizontal wells at the Fort Berthold, North Dakota property. Drilling results to date at the Fort Berthold area
have generally exceeded Enerplus’ expectations, and are the basis for the increase in capital spending planned for the area in 2011. Enerplus
also drilled a number of wells in Saskatchewan targeting the Bakken formation on both its operated leases and through its non-operated
working interest at Taylorton. The drilling results on Enerplus’ operated leases have been disappointing and while oil was discovered in this area,
the limited quantity does not meet current economic thresholds. Enerplus is continuing to evaluate seismic data from the area to assess the
potential of the Bakken and other zones.
Enerplus expects to spend approximately $300 million, representing approximately one-half of its 2011 capital budget, on its Bakken/Tight Oil
properties. Based upon the success of the drilling activities in Fort Berthold, approximately $230 million has been targeted for this area as
Enerplus moves into the development phase. Enerplus plans to drill 32 net operated wells at Fort Berthold with at least 75% of these wells
planned as long lateral horizontal wells. The primary target will be the Bakken formation, however Enerplus also plans to test the Three Forks
formation underlying the Bakken to evaluate the potential and future prospectivity of this zone. Enerplus has secured service agreements for
frac crews, proppant and a drilling rig to support the successful execution of its program. Enerplus is also working to have midstream
agreements in place by mid-year 2011 that will allow it to tie in its production and capture the associated natural gas. The remaining $70 million
planned to be spent on Bakken/Tight Oil properties is planned to be invested at Sleeping Giant in Montana and in Enerplus’ Canadian tight
oil properties.
Enerplus expects that production at Fort Berthold will more than double as Enerplus exits 2011, with total production from Enerplus’
Bakken/Tight Oil resource play growing by 50% throughout 2011, exiting in the range of 18,000 to 21,000 BOE/day. Given the high initial
productivity of the wells drilled on these properties and the competition for services in this region, exit production volumes and capital spending
could vary from guidance depending upon when new wells are drilled, completed and tied in.
Contingent Resource Estimate
An internal evaluation of Enerplus’ Bakken zone leases at the Fort Berthold, North Dakota property conducted by Enerplus and audited by
McDaniel has attributed a ‘‘best estimate’’ of 60 MMBOE of contingent resources attributable to the Bakken formation only, effective as of
December 31, 2010. This evaluation assumes and includes approximately 90 future drilling locations based upon a land utilization rate of 85%,
using a combination of short and long lateral wells with a range of recoveries from 250,000 to 800,000 bbls of crude oil from each well.
Enerplus expects that 65% of the wells drilled will be long lateral wells. This evaluation does not include any additional volumes that may be
recovered from the Three Forks formation, which Enerplus believes is prospective across its entire North Dakota acreage. For additional
10 E N E R P L U S 2010 ANNUAL INFORMATION FORM
information on the disclosure of contingent resources, including with respect to the presentation of the ‘‘best estimate’’ of contingent resources,
see ‘‘Presentation of Enerplus’ Oil and Gas Reserves, Resources and Production Information – Disclosure of Contingent Resources’’.
There is no certainty that it will be commercially viable to produce, or that Enerplus will produce, any portion of the volumes currently classified
as ‘‘contingent resources’’. The primary contingencies which currently prevent the classification of Enerplus’ disclosed contingent resources
associated with the Fort Berthold, North Dakota properties as reserves consist of additional delineation drilling to establish economic
productivity in the development areas and limitations to development based on adverse topography or other surface restrictions. Significant
positive factors related to the estimate include continued advancement of drilling and completion technology and early performance of
producing wells is above forecast. A significant negative factor related to the estimate is the limited performance history in the immediate area
of the contingent resource. There are a number of inherent risks and contingencies associated with the development of the acquired interests in
the property including commodity price fluctuations, project costs, Enerplus’ ability to make the necessary capital expenditures to develop the
properties, reliance on industry partners in project development, funding and provisions of services and those other risks and contingencies
described above and that apply generally to oil and gas operations as described above and under ‘‘Risk Factors’’ in this Annual Information Form.
Marcellus Shale Gas
Overview
Enerplus made its initial strategic investment in the Marcellus shale gas fairway in 2009, gaining entry into one of the largest shale gas plays in
North America. In 2010 Enerplus continued to add to its Marcellus interests through the acquisition of operated interests in Pennsylvania, West
Virginia and Maryland. Through four transactions totaling $169.3 million, Enerplus acquired 75,317 net acres of land, 70,833 of which it will
operate. For additional information, see ‘‘General Development of the Business – Developments in the Past Three Years’’. At
December 31, 2010, Enerplus had a 23% average working interest in 565,000 gross acres (approximately 130,000 net acres) in the Marcellus
play, as well as a 90% working interest representing approximately 70,000 net acres, taking Enerplus’ total interests in the Marcellus play to
approximately 200,000 net acres. The majority of Enerplus’ non-operated leases are concentrated in Pennsylvania with additional acreage
located in West Virginia and Maryland. The majority of Enerplus’ operated acreage is located in West Virginia and Maryland with additional
leases in Centre and Clinton Counties in Pennsylvania. Much of the non-operated acreage is contiguous and the majority of the leases allow
extensions of the primary term for an additional five years. Enerplus’ operated acreage has longer lease tenures of approximately seven years.
The majority of Enerplus’ activity in the Marcellus play in 2010 was with its primary operating partner, Chief Oil & Gas LLC, with whom Enerplus
participated in the drilling of 60 gross wells (11.7 net wells) during the year. Enerplus also participated in another 62 gross wells (1.9 net wells)
during 2010 with other operators. Enerplus planned to have 67 gross wells tied-in during 2010. However, due to the timing of pipeline
infrastructure and the availability of frac crews, only 38 gross wells were tied in during the year. Despite these delays, Enerplus exited 2010 on
track with average daily gross production of approximately 91 MMcf/day of natural gas (18 MMcf/day net to Enerplus), as well results exceeded
Enerplus’ original expectations. Enerplus estimates that there is currently 120 to 140 MMcf/day of natural gas production waiting on completion
or tie-in, of which Enerplus’ average working interest is approximately 20%. Enerplus also began drilling its first operated well in Centre County
in 2010. The well was completed in January 2011 but Enerplus does not expect tie-in until late 2011 due to current infrastructure and gathering
limitations.
Enerplus has planned for approximately $160 million of capital expenditures for the Marcellus play in 2011, plus an additional $116 million to be
expended as part of the Marcellus Carry Amount, with the majority of all expenditures being spent on Enerplus’ non-operated interests. With its
joint venture partners, Enerplus plans to have eight to ten rigs working throughout the play in 2011 and expects to drill 150 gross wells (22.4 net
wells). Enerplus also expects to complete approximately 121 wells and plans to have 94 new wells on stream by the end of the year. Enerplus also
plans to drill five gross operated delineation wells (four net wells) on its new Marcellus leases. Due to the timing of infrastructure, access to frac
crews and permitting, Enerplus estimates the cycle time from commencement of drilling to production tie-in is approximately nine months. As a
result of this timeframe, Enerplus anticipates that close to 75% of the wells that it plans to drill in 2011 will not be tied-in until 2012. As well,
with the high activity levels in this region, well costs could come under pressure throughout the year. Despite these delays, Enerplus expects
production in 2011 to grow by approximately 150% to approximately 45 MMcf/day of natural gas by year-end 2011.
As of December 31, 2010, Enerplus’ remaining commitment under the Marcellus Carry Amount was approximately US$147 million. Under the
terms of the Marcellus JDA, which only applies to the initial lands in which Enerplus acquired an interest in September 2009, until the full
Marcellus Carry Amount has been spent by Enerplus, the operators of the subject properties have the sole right to propose the drilling and
development of wells on these properties and Enerplus is required to participate in those operations (subject to certain exceptions, including
limitations on wells drilled subsequent to an initial well being drilled in an area or when the operator has failed to conduct sufficient drilling
E N E R P L U S 2010 ANNUAL INFORMATION FORM 11
activities as set out in the Marcellus JDA), and the operations on the subject properties will be conducted in accordance with a mutually
agreed-upon development plan. Subject to certain cure provisions, if Enerplus defaults in its obligations to pay the required portion of the
Marcellus Carry Amount on behalf of the operators, in addition to other remedies available to the operators, Enerplus will be required to
reassign to the operators all of its interests in the area where the proposed well was located, other than in respect of any existing wellbores
located in the area in which Enerplus owns an interest. Additionally, in such circumstances, the operators will have the right to suspend some or
all of their obligations to Enerplus under the Marcellus JDA, including with respect to the sharing of certain information and the requirement to
offer Enerplus its proportionate share of any subsequently acquired interests pursuant to certain area of mutual interest provisions, as described
below. Following Enerplus’ expenditure of the required Marcellus Carry Amount, either of Enerplus or the operator can propose well drilling and
development plans and the other party may elect whether or not it will participate in such drilling and development. If a party elects not to
participate, the provisions of the operating agreement with respect to the applicable area will govern the rights and remedies between
the parties.
The Marcellus JDA also includes area of mutual interest provisions with the vendors of Enerplus’ interests in the Marcellus properties acquired in
2009 that will provide Enerplus the opportunity to partner with the vendors in any follow-on acquisitions or swaps in the Marcellus region.
These provisions will provide Enerplus with the opportunity to jointly acquire more land under the current ownership structure, as well as the
potential to increase its working interest ownership on new lands and operate in certain new areas.
Enerplus has entered into long-term agreements for the gathering, dehydration, processing and compression of Enerplus’ share of production
from its Marcellus properties. These agreements are intended to provide Enerplus with cost certainty and direct ties to the northeastern
United States natural gas markets through connections with major interstate pipelines.
The independent Haas Report has assigned 52.4 BcfGE of proved reserves and 117.2 BcfGE of proved plus probable Reserves to Enerplus’
interests in its Marcellus properties as of December 31, 2010. This represents an increase of 370% from the independent estimate of the proved
plus probable reserves conducted by Haas at December 31, 2009.
Contingent Resource Estimate
Haas has also conducted an independent assessment of the contingent resources attributable to Enerplus’ interests in the Marcellus properties
and has provided a ‘‘best estimate’’ of natural gas contingent resources of approximately 3.9 TcfGE at December 31, 2010. This represents an
86% increase over the December 31, 2009 best estimate of contingent resources associated with the Marcellus of 2.1 TcfGE. This estimate
assumes a land utilization rate of 64% and that the average well would produce approximately 4 Bcf per well. Enerplus expects recoveries to
average approximately 30% with an average well density of four to eight wells per section. Enerplus continues to see upside in the percentage
of land that could be developed over time as delineation results continue to come in.
There is no certainty that it will be commercially viable to produce, or that Enerplus will produce, any portion of the volumes currently classified
as ‘‘contingent resources’’. The primary contingencies which currently prevent the classification of Enerplus’ disclosed contingent resources
associated with its Marcellus interests as reserves consist of: additional delineation drilling to establish economic productivity in the development
areas, limitations to development based on adverse topography or other surface restrictions, the uncertainty regarding marketing and
transportation of natural gas from development areas, the receipt of all required regulatory permits and approvals to develop the land, and
access to confidential information of other operators in the Marcellus formation. Significant negative factors related to the estimate include: the
pace of development, including drilling and infrastructure, is slower than the forecast, risk of adverse regulatory and tax changes, and other
issues related to gas development in populated areas. There are a number of inherent risks and contingencies associated with the development
of Enerplus’ interests in the Marcellus properties including commodity price fluctuations, project costs, Enerplus’ ability to make the necessary
capital expenditures to develop the properties, reliance on Enerplus’ industry partners in project development, acquisitions, funding and
provisions of services and those other risks and contingencies described above and that apply generally to oil and gas operations as described
above and under ‘‘Risk Factors’’ in this Annual Information Form.
For additional information on the disclosure of contingent resources, including with respect to the presentation of the ‘‘best estimate’’ of
contingent resources, see ‘‘Presentation of Enerplus’ Oil and Gas Reserves, Resources and Production Information – Disclosure of Contingent
Resources’’.
12 E N E R P L U S 2010 ANNUAL INFORMATION FORM
Crude Oil Waterfloods
Overview
Enerplus’ Crude Oil Waterflood assets are a core part of its business contributing low decline, stable production and cash flow to support
investment in Enerplus’ new growth plays. This portfolio includes a variety of properties producing from formations such as the Cardium, Viking,
Ratcliffe, Lloydminster and Glauconitic that offer new drilling opportunities, optimization and enhanced oil recovery potential. Through
horizontal drilling technology and reservoir depletion analysis, Enerplus has identified new opportunities in a number of these mature fields that
it believes will help offset declines and, in some areas, provide a modest level of growth.
In a waterflood, water is injected into the formation to supplement the original reservoir pressure and provide a drive mechanism to move
additional oil to producing wells. Pressure maintenance and the production of oil from water injection can result in a production profile with
more predictable and stable declines and higher recovery of reserves. Infill drilling and well/injector optimization are effective methods of
enhancing reserve recovery even further.
In 2010, Enerplus’ five largest Crude Oil Waterflood producing properties were Pembina 5 Way, Joarcam, Giltedge, the Medicine Hat Glauconitic
‘‘C’’ Unit and Virden, all of which are located in Alberta with the exception of Virden, which is in Manitoba. Enerplus operates over 85% of its
crude oil waterflood production. All of Enerplus’ major waterflood areas have associated crude oil production installations for emulsion treating
and injection or water disposal. In addition, the Joarcam property also has facilities for natural gas compression, dehydration and processing.
Approximately 18% of Enerplus’ production for the year ended December 31, 2010 and approximately 27% of Enerplus’ proved plus probable
reserves as at December 31, 2010 were related to its crude oil waterflood assets.
Enerplus’ activities in 2010 in this play were focused on drilling and recompletion activities and facility upgrades. Nine horizontal wells were
drilled into the Freda Ratcliffe unit and Enerplus expects that there are an additional 16 drilling locations in this unit. As a result of land
acquisitions completed in 2010, Enerplus will be reviewing the potential from other formations on these new lands on the Ratcliffe trend and
believes that there are significant additional development opportunities. Enerplus also began work on its first polymer pilot project at Giltedge,
which will continue through 2011. Approximately 53% of Enerplus’ Crude Oil Waterflood capital spending in 2010 was directed towards
drilling both producing and injector wells, including completion activities.
Enerplus expects to spend approximately $110 million on its Crude Oil Waterflood assets in 2011 and to maintain production volumes
throughout the year at approximately 14,000 BOE/day. Enerplus intends to also continue to advance the work on its enhanced oil recovery pilot
projects. A significant portion of this capital is being directed to activities that Enerplus believes will position it for future production and
reserve growth.
Contingent Resource Estimate
Enerplus has conducted an internal evaluation of the contingent resources associated with its Crude Oil Waterflood projects, which has resulted
in a ‘‘best estimate’’ of 60.5 MMBOE being classified as contingent resources effective as of December 31, 2010. Incremental oil recovery from
seven existing waterfloods through optimization work accounts for approximately 26.2 MMBOE of the total. The remaining 34.3 MMBOE is
attributable to enhanced oil recovery (‘‘EOR’’) projects in Enerplus’ Giltedge property and the Medicine Hat Glauconitic ‘‘C’’ Unit where projects
are underway. Although further EOR projects are being developed for other of Enerplus’ waterflood properties, these have not been thoroughly
evaluated and are not classified as contingent resources.
There is no certainty that it will be commercially viable to produce, or that Enerplus will produce, any portion of the volumes currently classified
as ‘‘contingent resources’’. Significant positive factors embedded in this estimate include well-established waterflood technology and a long
history of waterflood performance data. The EOR estimates are based on incremental recovery from higher displacement efficiency without any
improvement in areal sweep. A significant negative factor relevant to this estimate is the geological complexity and its effect on injector
producer connectivity. The contingency preventing these resources from being classified as reserves is the early stage of implementation to the
specific waterfloods. There are a number of inherent risks and contingencies associated with the development of these properties including
Enerplus’ ability to make the necessary capital expenditures to develop the properties, reliance on Enerplus’ industry partners in project
development, acquisitions, funding and provisions of services and those other risks and contingencies described above and that apply generally
to oil and gas operations as described above and under ‘‘Risk Factors’’ in this Annual Information Form.
For additional information on the disclosure of contingent resources, including with respect to the presentation of the ‘‘best estimate’’ of
contingent resources, see ‘‘Presentation of Enerplus’ Oil and Gas Reserves, Resources and Production Information – Disclosure of Contingent
Resources’’.
E N E R P L U S 2010 ANNUAL INFORMATION FORM 13
Tight Gas
Enerplus’ Tight Gas resource play represented 17% of Enerplus’ average daily production in 2010 and 17% of its proved plus probable reserves
as at December 31, 2010. Enerplus’ highest producing tight natural gas properties in 2010 were its Tommy Lakes property in northern British
Columbia, and Pine Creek, Elmworth and Burnt Timber, all of which are located in Alberta. This play type includes multi-zone tight natural gas
plays such as the Mannville, Nikannassin, Montney, Bluesky, Nordegg and Halfway zones, as well as others. Enerplus added to its land position in
the Deep Basin region of northwestern Alberta and northeastern British Columbia in 2010 and now has approximately 80,000 net acres of
undeveloped land which it believes is prospective for the Montney and Mannville formations.
Capital spending on Enerplus’ Tight Gas properties was reduced in 2010 to $65 million due to weakening natural gas prices and low economic
returns. Enerplus expects to spend approximately $60 million on its Tight Gas assets in 2011 and will focus on drilling four horizontal wells at
Tommy Lakes and a limited number of delineation wells in the Mannville zone in order to determine the future potential of its undeveloped
Mannville acreage.
Shallow Gas
Enerplus’ Shallow Gas resource play represented approximately 24% of Enerplus’ average daily production volumes in 2010 and approximately
12% of Enerplus’ proved plus probable reserves as at December 31, 2010. Approximately 85% of Enerplus’ shallow natural gas production is
operated by Enerplus. In 2010, Enerplus’ five largest Shallow Gas producing properties were the Shackleton field in southwest Saskatchewan
and the Bantry, Verger, Hanna Garden, and Medicine Hat South properties in Alberta. All of these properties have associated pipeline
infrastructure and compression facilities.
Due to weakening gas prices Enerplus dramatically reduced its capital spending on its Shallow Gas assets in 2010 investing $26 million, net of
approximately $18.3 million in Alberta drilling royalty credits. Most of the spending was at the Shackleton field in Saskatchewan and at Bantry,
Verger and Hanna Garden in Alberta. Drilling activity was focused on shallow natural gas properties in Alberta to take advantage of the Alberta
royalty drilling incentive program. In total, Enerplus drilled 103.7 net shallow natural gas wells, virtually all of which attracted drilling royalty
credits.
With the current natural gas price outlook, Enerplus’ projected shallow natural gas capital spending for 2011 has been reduced to
approximately $10 million. Activities will be focused on recompleting wells at Shackleton, Saskatchewan targeting multiple productive zones.
Other Conventional Oil and Gas Assets
In addition to the play types outlined above, Enerplus also owns other conventional oil and natural gas assets across western Canada. These
assets include a diversified portfolio of smaller working interests in both operated and non-operated crude oil and natural gas projects and
consist of various reservoir types. During 2010, Enerplus sold approximately 10,400 BOE/day of conventional oil and natural gas production in
order to better focus and improve its operations. Development capital expended on those properties in 2010 was reduced to approximately
$30 million, given Enerplus’ desire to concentrate its capital spending and efforts in its core resource play areas. Enerplus plans to spend
approximately $10 million of capital on its other conventional oil and gas properties in 2011.
Production from these other conventional oil and natural gas properties represented approximately 26% of Enerplus’ average daily production
in 2010 and declined to 20% of Enerplus’ 2010 December exit volumes as a result of asset sales during the year. These properties also accounted
for approximately 18% of Enerplus’ estimated total proved plus probable reserves as of December 31, 2010.
Major facilities included in Enerplus’ conventional oil and natural gas properties include a 100% interest in Brooks North and South oil batteries
and water disposal facilities, a 75% interest in the Colgate oil battery and an 8% interest in the Hanlan-Robb gas plant.
EQUITY INVESTMENTS
In 2005, Enerplus formed a joint venture with Laricina, a private oil sands company focused on SAGD development in the Athabasca oil sands
fairway. As part of this joint venture, Enerplus swapped a 1% working interest in the Joslyn oil sands lease for approximately 20% equity value in
Laricina. As at December 31, 2010, Enerplus owned approximately 4.3 million shares of Laricina, representing approximately 8% of the total
outstanding shares of Laricina. Included in the swap was an area of mutual interest agreement which was designed to allow Enerplus and
Laricina to jointly pursue additional in-situ oil sands ventures. Enerplus participated in four land acquisitions with Laricina since entering the
agreement, which has now expired.
Enerplus also has minor equity interests in several other resource focused entities with a book carrying value of approximately $26 million at
December 31, 2010.
14 E N E R P L U S 2010 ANNUAL INFORMATION FORM
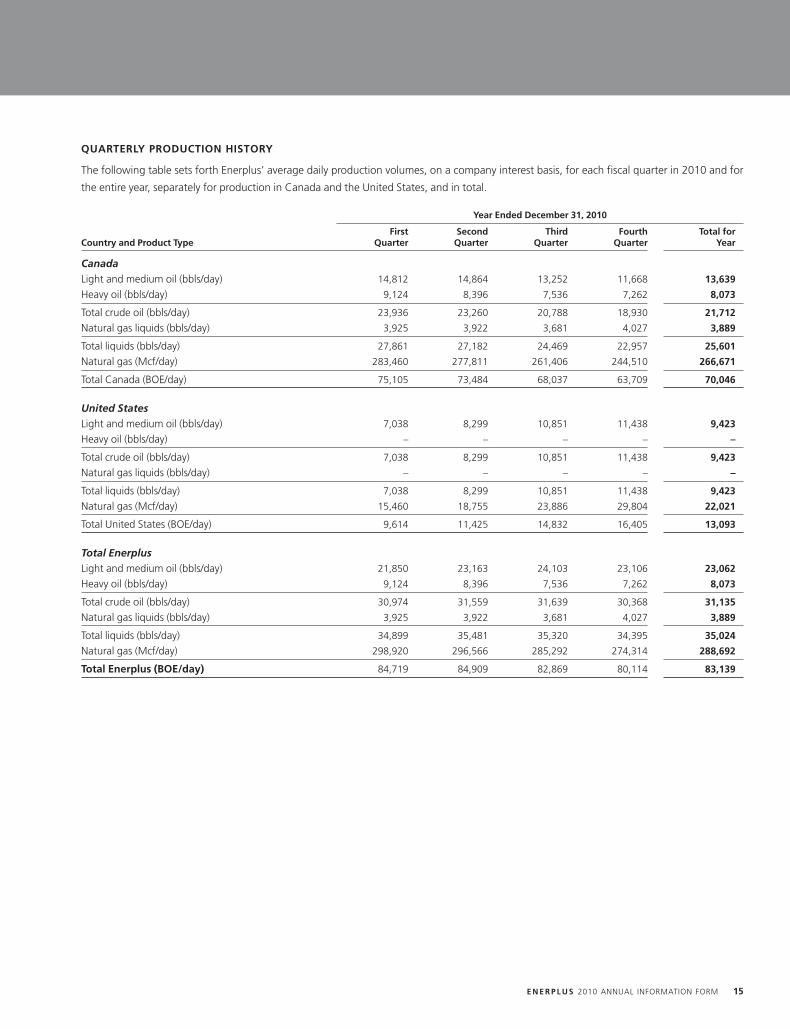
QUARTERLY PRODUCTION HISTORY
The following table sets forth Enerplus’ average daily production volumes, on a company interest basis, for each fiscal quarter in 2010 and for
the entire year, separately for production in Canada and the United States, and in total.
Year Ended December 31, 2010
First Second Third Fourth Total forCountry and Product Type Quarter Quarter Quarter Quarter Year
CanadaLight and medium oil (bbls/day) 14,812 14,864 13,252 11,668 13,639
Heavy oil (bbls/day) 9,124 8,396 7,536 7,262 8,073
Total crude oil (bbls/day) 23,936 23,260 20,788 18,930 21,712
Natural gas liquids (bbls/day) 3,925 3,922 3,681 4,027 3,889
Total liquids (bbls/day) 27,861 27,182 24,469 22,957 25,601
Natural gas (Mcf/day) 283,460 277,811 261,406 244,510 266,671
Total Canada (BOE/day) 75,105 73,484 68,037 63,709 70,046
United StatesLight and medium oil (bbls/day) 7,038 8,299 10,851 11,438 9,423
Heavy oil (bbls/day) – – – – –
Total crude oil (bbls/day) 7,038 8,299 10,851 11,438 9,423
Natural gas liquids (bbls/day) – – – – –
Total liquids (bbls/day) 7,038 8,299 10,851 11,438 9,423
Natural gas (Mcf/day) 15,460 18,755 23,886 29,804 22,021
Total United States (BOE/day) 9,614 11,425 14,832 16,405 13,093
Total EnerplusLight and medium oil (bbls/day) 21,850 23,163 24,103 23,106 23,062
Heavy oil (bbls/day) 9,124 8,396 7,536 7,262 8,073
Total crude oil (bbls/day) 30,974 31,559 31,639 30,368 31,135
Natural gas liquids (bbls/day) 3,925 3,922 3,681 4,027 3,889
Total liquids (bbls/day) 34,899 35,481 35,320 34,395 35,024
Natural gas (Mcf/day) 298,920 296,566 285,292 274,314 288,692
Total Enerplus (BOE/day) 84,719 84,909 82,869 80,114 83,139
E N E R P L U S 2010 ANNUAL INFORMATION FORM 15
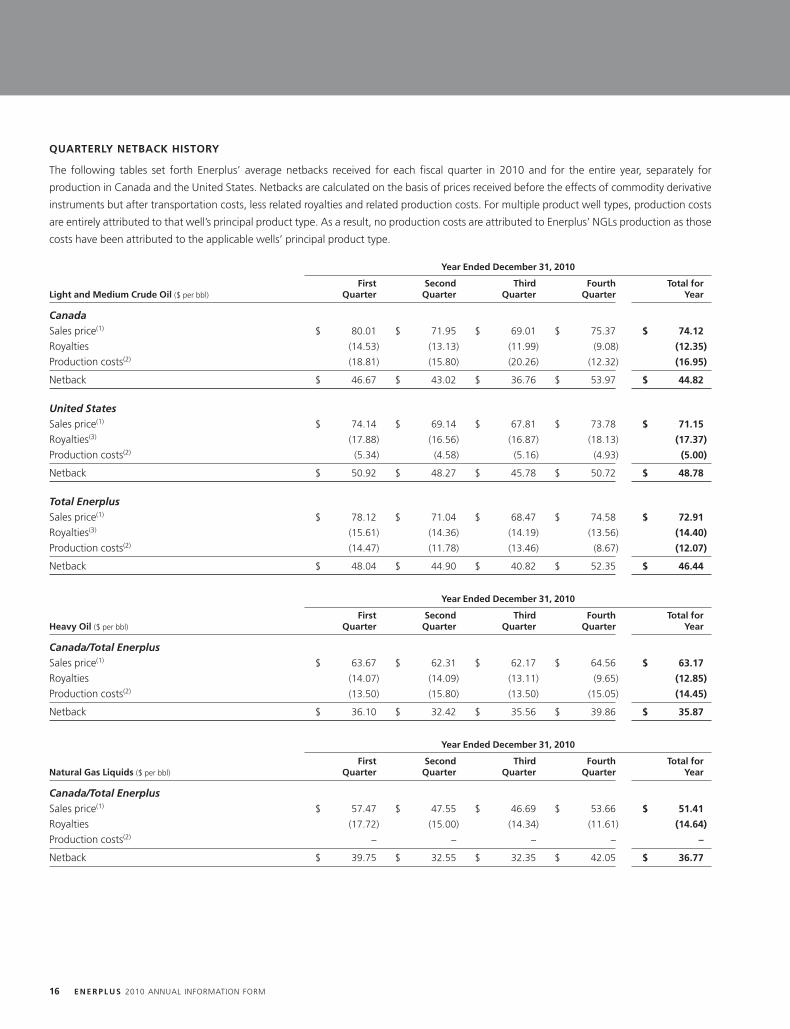
QUARTERLY NETBACK HISTORY
The following tables set forth Enerplus’ average netbacks received for each fiscal quarter in 2010 and for the entire year, separately for
production in Canada and the United States. Netbacks are calculated on the basis of prices received before the effects of commodity derivative
instruments but after transportation costs, less related royalties and related production costs. For multiple product well types, production costs
are entirely attributed to that well’s principal product type. As a result, no production costs are attributed to Enerplus’ NGLs production as those
costs have been attributed to the applicable wells’ principal product type.
Year Ended December 31, 2010
First Second Third Fourth Total forLight and Medium Crude Oil ($ per bbl) Quarter Quarter Quarter Quarter Year
CanadaSales price(1) $ 80.01 $ 71.95 $ 69.01 $ 75.37 $ 74.12
Royalties (14.53) (13.13) (11.99) (9.08) (12.35)
Production costs(2) (18.81) (15.80) (20.26) (12.32) (16.95)
Netback $ 46.67 $ 43.02 $ 36.76 $ 53.97 $ 44.82
United StatesSales price(1) $ 74.14 $ 69.14 $ 67.81 $ 73.78 $ 71.15
Royalties(3) (17.88) (16.56) (16.87) (18.13) (17.37)
Production costs(2) (5.34) (4.58) (5.16) (4.93) (5.00)
Netback $ 50.92 $ 48.27 $ 45.78 $ 50.72 $ 48.78
Total EnerplusSales price(1) $ 78.12 $ 71.04 $ 68.47 $ 74.58 $ 72.91
Royalties(3) (15.61) (14.36) (14.19) (13.56) (14.40)
Production costs(2) (14.47) (11.78) (13.46) (8.67) (12.07)
Netback $ 48.04 $ 44.90 $ 40.82 $ 52.35 $ 46.44
Year Ended December 31, 2010
First Second Third Fourth Total forHeavy Oil ($ per bbl) Quarter Quarter Quarter Quarter Year
Canada/Total EnerplusSales price(1) $ 63.67 $ 62.31 $ 62.17 $ 64.56 $ 63.17
Royalties (14.07) (14.09) (13.11) (9.65) (12.85)
Production costs(2) (13.50) (15.80) (13.50) (15.05) (14.45)
Netback $ 36.10 $ 32.42 $ 35.56 $ 39.86 $ 35.87
Year Ended December 31, 2010
First Second Third Fourth Total forNatural Gas Liquids ($ per bbl) Quarter Quarter Quarter Quarter Year
Canada/Total EnerplusSales price(1) $ 57.47 $ 47.55 $ 46.69 $ 53.66 $ 51.41
Royalties (17.72) (15.00) (14.34) (11.61) (14.64)
Production costs(2) – – – – –
Netback $ 39.75 $ 32.55 $ 32.35 $ 42.05 $ 36.77
16 E N E R P L U S 2010 ANNUAL INFORMATION FORM
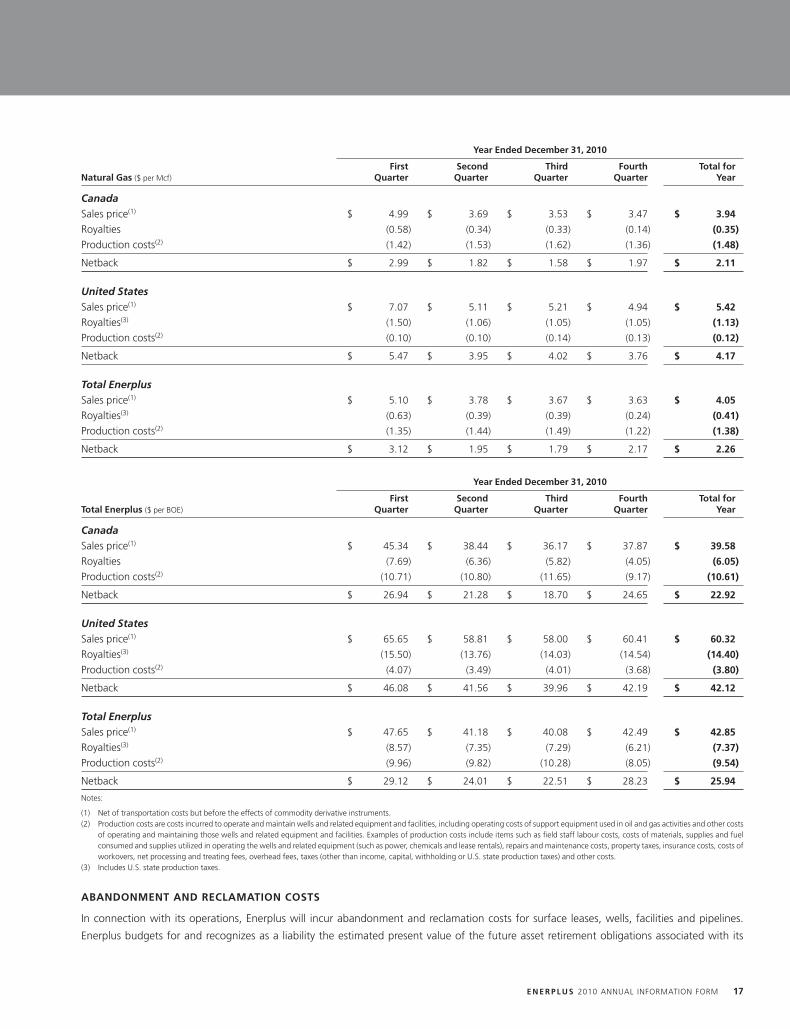
Year Ended December 31, 2010
First Second Third Fourth Total forNatural Gas ($ per Mcf) Quarter Quarter Quarter Quarter Year
CanadaSales price(1) $ 4.99 $ 3.69 $ 3.53 $ 3.47 $ 3.94
Royalties (0.58) (0.34) (0.33) (0.14) (0.35)
Production costs(2) (1.42) (1.53) (1.62) (1.36) (1.48)
Netback $ 2.99 $ 1.82 $ 1.58 $ 1.97 $ 2.11
United StatesSales price(1) $ 7.07 $ 5.11 $ 5.21 $ 4.94 $ 5.42
Royalties(3) (1.50) (1.06) (1.05) (1.05) (1.13)
Production costs(2) (0.10) (0.10) (0.14) (0.13) (0.12)
Netback $ 5.47 $ 3.95 $ 4.02 $ 3.76 $ 4.17
Total EnerplusSales price(1) $ 5.10 $ 3.78 $ 3.67 $ 3.63 $ 4.05
Royalties(3) (0.63) (0.39) (0.39) (0.24) (0.41)
Production costs(2) (1.35) (1.44) (1.49) (1.22) (1.38)
Netback $ 3.12 $ 1.95 $ 1.79 $ 2.17 $ 2.26
Year Ended December 31, 2010
First Second Third Fourth Total forTotal Enerplus ($ per BOE) Quarter Quarter Quarter Quarter Year
CanadaSales price(1) $ 45.34 $ 38.44 $ 36.17 $ 37.87 $ 39.58
Royalties (7.69) (6.36) (5.82) (4.05) (6.05)
Production costs(2) (10.71) (10.80) (11.65) (9.17) (10.61)
Netback $ 26.94 $ 21.28 $ 18.70 $ 24.65 $ 22.92
United StatesSales price(1) $ 65.65 $ 58.81 $ 58.00 $ 60.41 $ 60.32
Royalties(3) (15.50) (13.76) (14.03) (14.54) (14.40)
Production costs(2) (4.07) (3.49) (4.01) (3.68) (3.80)
Netback $ 46.08 $ 41.56 $ 39.96 $ 42.19 $ 42.12
Total EnerplusSales price(1) $ 47.65 $ 41.18 $ 40.08 $ 42.49 $ 42.85
Royalties(3) (8.57) (7.35) (7.29) (6.21) (7.37)
Production costs(2) (9.96) (9.82) (10.28) (8.05) (9.54)
Netback $ 29.12 $ 24.01 $ 22.51 $ 28.23 $ 25.94
Notes:
(1) Net of transportation costs but before the effects of commodity derivative instruments.(2) Production costs are costs incurred to operate and maintain wells and related equipment and facilities, including operating costs of support equipment used in oil and gas activities and other costs
of operating and maintaining those wells and related equipment and facilities. Examples of production costs include items such as field staff labour costs, costs of materials, supplies and fuelconsumed and supplies utilized in operating the wells and related equipment (such as power, chemicals and lease rentals), repairs and maintenance costs, property taxes, insurance costs, costs ofworkovers, net processing and treating fees, overhead fees, taxes (other than income, capital, withholding or U.S. state production taxes) and other costs.
(3) Includes U.S. state production taxes.
ABANDONMENT AND RECLAMATION COSTS
In connection with its operations, Enerplus will incur abandonment and reclamation costs for surface leases, wells, facilities and pipelines.
Enerplus budgets for and recognizes as a liability the estimated present value of the future asset retirement obligations associated with its
E N E R P L U S 2010 ANNUAL INFORMATION FORM 17
property, plant and equipment. Enerplus estimates such costs through a model that incorporates data from Enerplus’ operating history, industry
sources and cost formulas used by Alberta’s Energy Resources Conservation Board, together with other operating assumptions. Enerplus
expects all of its net wells to incur these costs. Enerplus anticipates the total amount of such costs, net of estimated salvage value for such
equipment, to be approximately $590 million on an undiscounted basis and $114 million discounted at 10%. The calculations of future net
revenue under ‘‘Oil and Natural Gas Reserves’’ in this Annual Information Form exclude approximately $238 million on an undiscounted basis
and $29 million discounted at 10% as these amounts represent costs for abandonment and reclamation of facilities and wells for which no
reserves have been attributed. In the next three financial years, Enerplus anticipates that a total of approximately $59 million on an
undiscounted basis and $52 million discounted at 10% will be incurred in respect of abandonment and reclamation costs.
TAX HORIZON
Under Enerplus’ previous structure as an income trust prior to the Conversion, taxable income of the Fund’s Canadian operating subsidiaries was
transferred through interest, royalty and other distribution payments to the Fund which, in turn, allocated all of its taxable income to its
unitholders. Accordingly, no material cash Canadian income taxes were paid by the Fund or its Canadian operating subsidiaries for the year
ended December 31, 2010.
As described in further detail under ‘‘General Development of the Business – Conversion from an Income Trust to a Corporation’’, effective
January 1, 2011, pursuant to the Conversion, Enerplus’ business was reorganized from an income trust structure to a Canadian corporate
structure and as a result Enerplus is subject to normal Canadian corporate income taxation. The most important variables that will determine the
level of cash taxes incurred by Enerplus post-Conversion will be the price of crude oil and natural gas, capital spending levels, the amount of tax
pools available and the tax laws governing the amount and timing of deductions.
Within the context of current commodity prices and capital spending plans, Enerplus generally does not expect to be taxable prior to 2013, with
nominal U.S. cash taxes anticipated to be paid in 2012. This estimate may vary depending on numerous factors, including fluctuations in
commodity prices and the nature and timing of Enerplus’ acquisitions and dispositions. Once it is taxable, Enerplus expects that its capital
spending will help shelter taxes and would expect cash taxes to average approximately 10% of cash flow. If crude oil and natural gas prices were
to strengthen beyond the levels anticipated by the current forward market, Enerplus’ tax pools would be utilized more quickly and it may
experience higher than expected cash taxes or payment of such taxes in an earlier time period. However, Enerplus emphasizes that it is difficult
to give guidance on future taxability as it operates within an industry that constantly changes given acquisitions, divestments, capital spending,
overall commodity prices and governing tax laws. See ‘‘Risk Factors – Changes in tax and other laws may adversely affect Enerplus and its
shareholders.’’
For additional information, see Notes 2(g) and 12 to Enerplus’ audited consolidated financial statements for the year ended December 31, 2010
and the information under the heading ‘‘Taxes’’ in Enerplus’ MD&A for the year ended December 31, 2010.
MARKETING ARRANGEMENTS AND FORWARD CONTRACTS
Crude Oil and NGLs
Enerplus’ crude oil and NGLs production is marketed to a diverse portfolio of intermediaries and end users on 30 day continuously renewing
contracts for crude oil and yearly contracts for NGLs whose terms fluctuate with monthly spot market prices. Enerplus received an average price
(net of transportation costs but before the effects of commodity derivative instruments) of $72.91/bbl for its light and medium crude oil,
$63.17/bbl for its heavy crude oil and $51.41/bbl for its NGLs for the year ended December 31, 2010, compared to $59.53/bbl for its light and
medium crude oil, $56.03/bbl for its heavy crude oil and $41.54/bbl for its NGLs for the year ended December 31, 2009. Enerplus has contracted
transportation for 1,000 bbls/day of its Bakken oil production beginning in May 2011 for five years, and an additional 5,000 bbls/day
commencing January 1, 2013 for five years.
18 E N E R P L U S 2010 ANNUAL INFORMATION FORM
Natural Gas
In marketing its natural gas production Enerplus tries to achieve a mix of contracts and customers. Within its sales portfolio of aggregator,
downstream and spot natural gas sales, Enerplus sold approximately 84% of its natural gas split evenly between the daily and monthly AECO
market indices and 16% against monthly U.S.-based indices.
Enerplus’ percentage of 2010 revenues attributable to natural gas (net of transportation costs but before the effects of commodity derivative
instruments) was 33% compared to 38% in 2009. The average price received by Enerplus (net of transportation costs but before the effects of
commodity derivative instruments) for its natural gas in 2010 was $4.05/Mcf compared to $3.91/Mcf for the year ended December 31, 2009.
Enerplus has contracted to transport approximately 200 MMcf/day of natural gas in Canada with contracts that range anywhere from
one month to five years. Enerplus has contracted gas gathering capacity for its Marcellus production of 6,000 MMbtu per day, which increases
to 13,650 MMbtu per day on June 1, 2011 until March 31, 2022. In addition, transportation for Enerplus’ Marcellus sales gas has been
contracted on Columbia Gas Transmission for 4,500 MMbtu per day until January 2014.
Future Commitments and Forward Contracts
Enerplus may use various types of derivative financial instruments and fixed price physical sales contracts to manage the risk related to
fluctuating commodity prices. Absent such hedging activities, all of the crude oil and NGLs and the majority of natural gas production of
Enerplus is sold into the open market at prevailing market prices, which exposes Enerplus to the risks associated with commodity price
fluctuations and foreign exchange rates. See ‘‘Risk Factors’’. Information regarding Enerplus’ financial instruments is contained in Note 13
to Enerplus’ audited consolidated financial statements for the year ended December 31, 2010 and under the headings ‘‘Results of Operations –
Pricing’’ and ‘‘Results of Operations – Price Risk Management’’ in Enerplus’ MD&A for the year ended December 31, 2010, each of which is
available through the internet on the Corporation’s website at www.enerplus.com, on the Corporation’s SEDAR profile at www.sedar.com and
on the Corporation’s EDGAR profile at www.sec.gov.
E N E R P L U S 2010 ANNUAL INFORMATION FORM 19
Oil and Natural Gas Reserves
SUMMARY OF RESERVES
All of Enerplus’ reserves, including its U.S. reserves, have been evaluated in accordance with NI 51-101. McDaniel, an independent petroleum
consulting firm based in Calgary, Alberta, has evaluated properties which comprise approximately 86% of the net present value (discounted at
10%, using forecast prices and costs) of Enerplus’ proved plus probable oil and natural gas reserves located in Canada and 96% of such value of
Enerplus’ reserves located in the western United States. Enerplus has evaluated the balance of these properties using similar evaluation
parameters, including the same forecast price, inflation and exchange rate assumptions utilized by McDaniel. McDaniel has reviewed Enerplus’
evaluation of these properties.
Haas, independent petroleum consultants based in Dallas, Texas, has evaluated all of Enerplus’ oil and natural gas reserves attributable to the
Marcellus shale gas assets located in the northeastern United States. For consistency in Enerplus’ reserves reporting, Haas used McDaniel’s
forecast prices and inflation rates to prepare their reports. Enerplus used McDaniel’s forecast exchange rates set forth below to convert
U.S. dollar amounts in the Haas Report to Canadian dollar amounts for presentation in this Annual Information Form.
The following sections and tables summarize, as at December 31, 2010, Enerplus’ oil, NGLs, natural gas and shale gas reserves and the
estimated net present values of future net revenues associated with such reserves, together with certain information, estimates and
assumptions associated with such reserve estimates. The data contained in the tables is a summary of the evaluations, and as a result the tables
may contain slightly different numbers than the evaluations themselves due to rounding. Additionally, the numbers in the tables may not add
due to rounding. For information relating to the changes in the volumes of Enerplus’ reserves from December 31, 2009 to December 31, 2010,
see ‘‘– Reconciliation of Reserves’’ below.
All estimates of future net revenues are stated prior to provision for interest and general and administrative expenses and after deduction of
royalties and estimated future capital expenditures, and both before and after income taxes. For additional information, see ‘‘Business of
Enerplus – Tax Horizon’’, ‘‘Industry Conditions’’ and ‘‘Risk Factors’’ in this Annual Information Form.
With respect to pricing information in the following reserves information, the wellhead oil prices were adjusted for quality and transportation
based on historical actual prices. The natural gas prices were adjusted, where necessary, based on historical pricing based on heating values and
the differing costs of service applied by various purchasers. The NGLs prices were adjusted to reflect historical average prices received.
It should not be assumed that the present worth of estimated future cash flows shown below is representative of the fair market
value of the reserves. There is no assurance that such price and cost assumptions will be attained and variances could be material.
The recovery and reserve estimates of Enerplus’ crude oil, NGLs and natural gas reserves provided herein are estimates only.
Actual reserves may be greater than or less than the estimates provided herein. Readers should review the definitions and
information contained in ‘‘Presentation of Enerplus’ Oil and Gas Reserves, Resources and Production Information’’ in conjunction
with the following tables and notes.
The following tables set forth the estimated volumes and net present value of future net revenue attributable to Enerplus’ reserves at
December 31, 2010, using both forecast and constant price and cost cases.
20 E N E R P L U S 2010 ANNUAL INFORMATION FORM
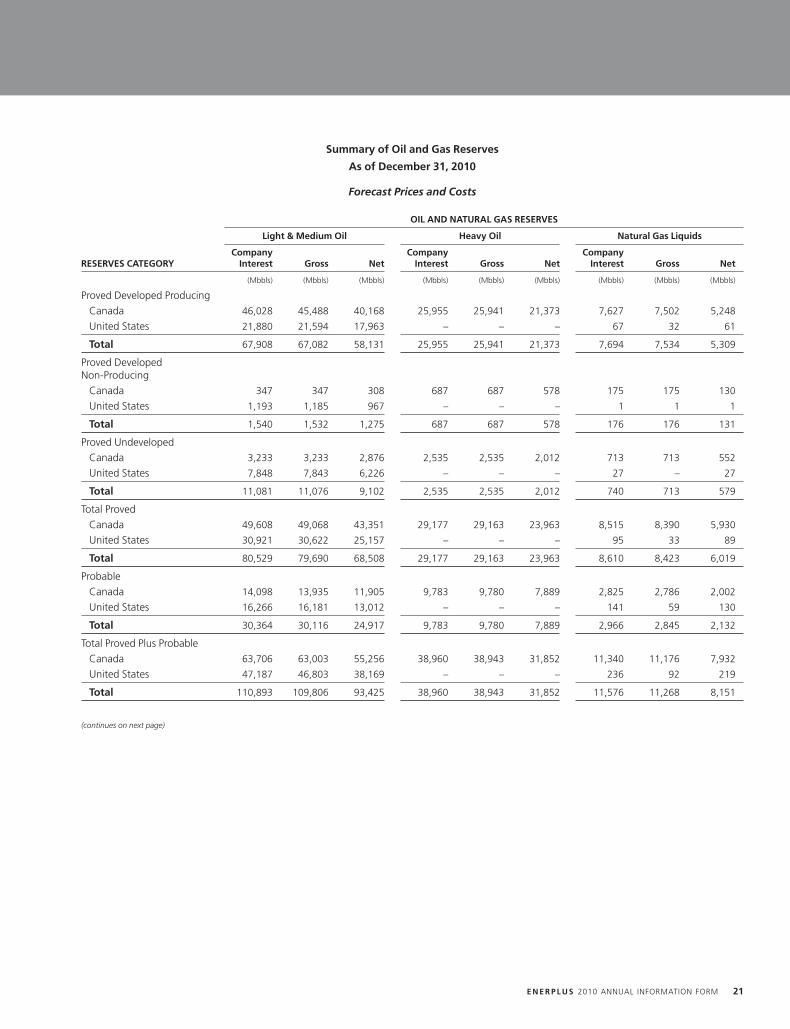
Summary of Oil and Gas Reserves
As of December 31, 2010
Forecast Prices and Costs
OIL AND NATURAL GAS RESERVES
Light & Medium Oil Heavy Oil Natural Gas Liquids
Company Company CompanyRESERVES CATEGORY Interest Gross Net Interest Gross Net Interest Gross Net
(Mbbls) (Mbbls) (Mbbls) (Mbbls) (Mbbls) (Mbbls) (Mbbls) (Mbbls) (Mbbls)
Proved Developed ProducingCanada 46,028 45,488 40,168 25,955 25,941 21,373 7,627 7,502 5,248
United States 21,880 21,594 17,963 – – – 67 32 61
Total 67,908 67,082 58,131 25,955 25,941 21,373 7,694 7,534 5,309
Proved DevelopedNon-Producing
Canada 347 347 308 687 687 578 175 175 130
United States 1,193 1,185 967 – – – 1 1 1
Total 1,540 1,532 1,275 687 687 578 176 176 131
Proved UndevelopedCanada 3,233 3,233 2,876 2,535 2,535 2,012 713 713 552
United States 7,848 7,843 6,226 – – – 27 – 27
Total 11,081 11,076 9,102 2,535 2,535 2,012 740 713 579
Total ProvedCanada 49,608 49,068 43,351 29,177 29,163 23,963 8,515 8,390 5,930
United States 30,921 30,622 25,157 – – – 95 33 89
Total 80,529 79,690 68,508 29,177 29,163 23,963 8,610 8,423 6,019
ProbableCanada 14,098 13,935 11,905 9,783 9,780 7,889 2,825 2,786 2,002
United States 16,266 16,181 13,012 – – – 141 59 130
Total 30,364 30,116 24,917 9,783 9,780 7,889 2,966 2,845 2,132
Total Proved Plus ProbableCanada 63,706 63,003 55,256 38,960 38,943 31,852 11,340 11,176 7,932
United States 47,187 46,803 38,169 – – – 236 92 219
Total 110,893 109,806 93,425 38,960 38,943 31,852 11,576 11,268 8,151
(continues on next page)
E N E R P L U S 2010 ANNUAL INFORMATION FORM 21

Summary of Oil and Gas Reserves
As of December 31, 2010
Forecast Prices and Costs
(continued)
OIL AND NATURAL GAS RESERVES
Natural Gas Shale Gas Total
Company Company CompanyRESERVES CATEGORY Interest Gross Net Interest Gross Net Interest Gross Net
(MMcf) (MMcf) (MMcf) (MMcf) (MMcf) (MMcf) (MBOE) (MBOE) (MBOE)
Proved Developed ProducingCanada 456,777 444,411 391,223 – – – 155,739 153,000 131,992
United States 34,566 30,436 29,121 32,014 32,014 25,593 33,044 32,035 27,143
Total 491,343 474,847 420,344 32,014 32,014 25,593 188,783 185,035 159,135
Proved DevelopedNon-Producing
Canada 12,883 12,859 11,188 – – – 3,357 3,352 2,881
United States 1,115 1,105 913 2,508 2,508 2,023 1,798 1,788 1,458
Total 13,998 13,964 12,101 2,508 2,508 2,023 5,155 5,140 4,339
Proved UndevelopedCanada 40,389 40,275 34,240 – – – 13,212 13,194 11,146
United States 8,360 5,786 7,211 17,703 17,703 14,199 12,219 11,758 9,822
Total 48,749 46,061 41,451 17,703 17,703 14,199 25,431 24,952 20,968
Total ProvedCanada 510,049 497,545 436,651 – – – 172,308 169,546 146,019
United States 44,041 37,327 37,245 52,225 52,225 41,815 47,061 45,581 38,423
Total 554,090 534,872 473,896 52,225 52,225 41,815 219,369 215,127 184,442
ProbableCanada 173,983 170,393 150,118 – – – 55,703 54,899 46,816
United States 24,114 15,910 21,067 64,437 64,437 51,553 31,165 29,631 25,245
Total 198,097 186,303 171,185 64,437 64,437 51,553 86,868 84,530 72,061
Total Proved Plus ProbableCanada 684,032 667,938 586,769 – – – 228,011 224,445 192,835
United States 68,155 53,237 58,312 116,662 116,662 93,368 78,226 75,212 63,668
Total 752,187 721,175 645,081 116,662 116,662 93,368 306,237 299,657 256,503
22 E N E R P L U S 2010 ANNUAL INFORMATION FORM
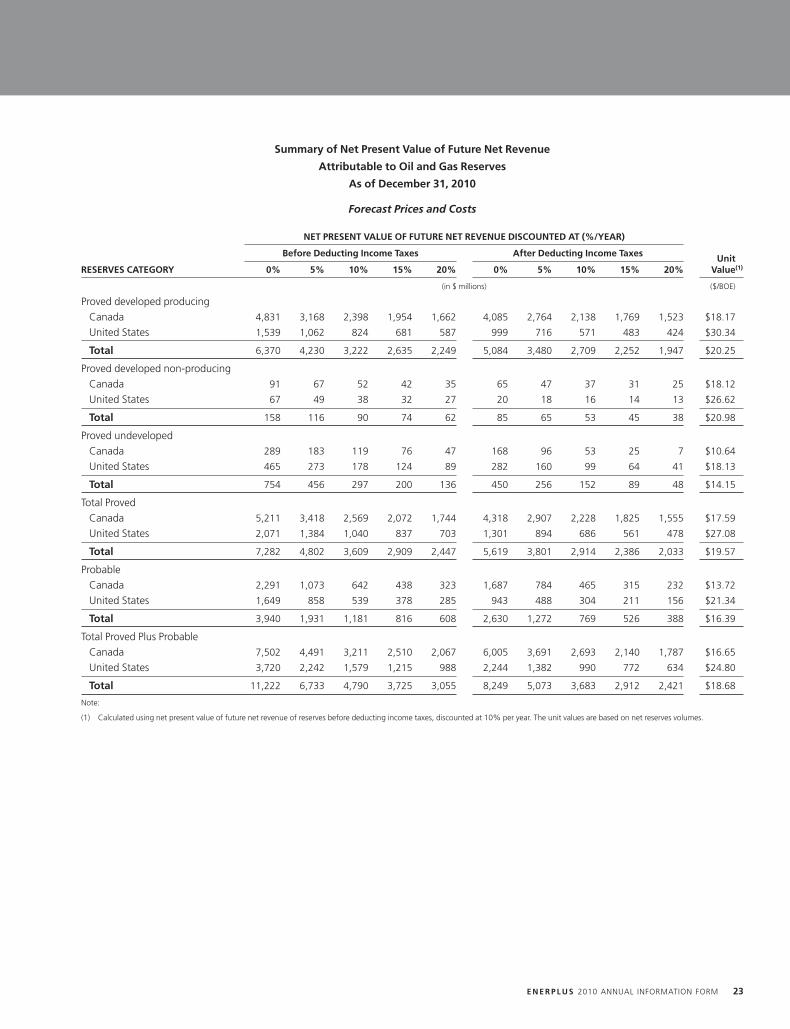
Summary of Net Present Value of Future Net Revenue
Attributable to Oil and Gas Reserves
As of December 31, 2010
Forecast Prices and Costs
NET PRESENT VALUE OF FUTURE NET REVENUE DISCOUNTED AT (%/YEAR)
Before Deducting Income Taxes After Deducting Income Taxes UnitRESERVES CATEGORY 0% 5% 10% 15% 20% 0% 5% 10% 15% 20% Value(1)
(in $ millions) ($/BOE)
Proved developed producingCanada 4,831 3,168 2,398 1,954 1,662 4,085 2,764 2,138 1,769 1,523 $18.17
United States 1,539 1,062 824 681 587 999 716 571 483 424 $30.34
Total 6,370 4,230 3,222 2,635 2,249 5,084 3,480 2,709 2,252 1,947 $20.25
Proved developed non-producingCanada 91 67 52 42 35 65 47 37 31 25 $18.12
United States 67 49 38 32 27 20 18 16 14 13 $26.62
Total 158 116 90 74 62 85 65 53 45 38 $20.98
Proved undevelopedCanada 289 183 119 76 47 168 96 53 25 7 $10.64
United States 465 273 178 124 89 282 160 99 64 41 $18.13
Total 754 456 297 200 136 450 256 152 89 48 $14.15
Total ProvedCanada 5,211 3,418 2,569 2,072 1,744 4,318 2,907 2,228 1,825 1,555 $17.59
United States 2,071 1,384 1,040 837 703 1,301 894 686 561 478 $27.08
Total 7,282 4,802 3,609 2,909 2,447 5,619 3,801 2,914 2,386 2,033 $19.57
ProbableCanada 2,291 1,073 642 438 323 1,687 784 465 315 232 $13.72
United States 1,649 858 539 378 285 943 488 304 211 156 $21.34
Total 3,940 1,931 1,181 816 608 2,630 1,272 769 526 388 $16.39
Total Proved Plus ProbableCanada 7,502 4,491 3,211 2,510 2,067 6,005 3,691 2,693 2,140 1,787 $16.65
United States 3,720 2,242 1,579 1,215 988 2,244 1,382 990 772 634 $24.80
Total 11,222 6,733 4,790 3,725 3,055 8,249 5,073 3,683 2,912 2,421 $18.68
Note:
(1) Calculated using net present value of future net revenue of reserves before deducting income taxes, discounted at 10% per year. The unit values are based on net reserves volumes.
E N E R P L U S 2010 ANNUAL INFORMATION FORM 23
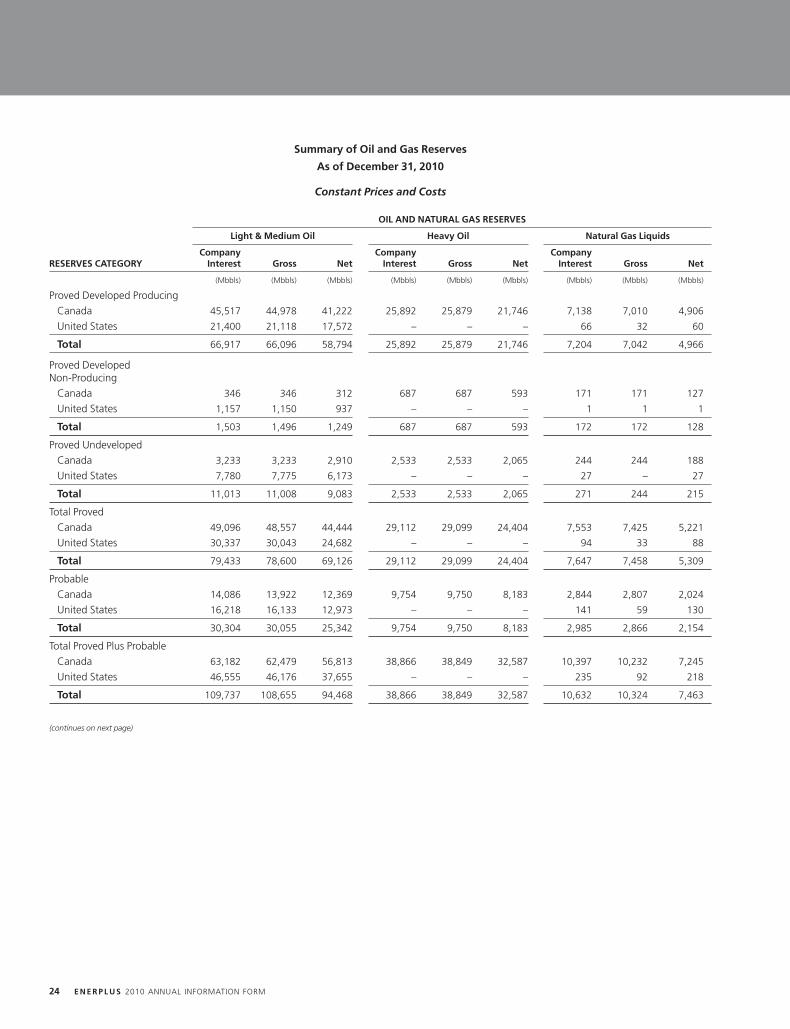
Summary of Oil and Gas Reserves
As of December 31, 2010
Constant Prices and Costs
OIL AND NATURAL GAS RESERVES
Light & Medium Oil Heavy Oil Natural Gas Liquids
Company Company CompanyRESERVES CATEGORY Interest Gross Net Interest Gross Net Interest Gross Net
(Mbbls) (Mbbls) (Mbbls) (Mbbls) (Mbbls) (Mbbls) (Mbbls) (Mbbls) (Mbbls)
Proved Developed ProducingCanada 45,517 44,978 41,222 25,892 25,879 21,746 7,138 7,010 4,906
United States 21,400 21,118 17,572 – – – 66 32 60
Total 66,917 66,096 58,794 25,892 25,879 21,746 7,204 7,042 4,966
Proved DevelopedNon-Producing
Canada 346 346 312 687 687 593 171 171 127
United States 1,157 1,150 937 – – – 1 1 1
Total 1,503 1,496 1,249 687 687 593 172 172 128
Proved UndevelopedCanada 3,233 3,233 2,910 2,533 2,533 2,065 244 244 188
United States 7,780 7,775 6,173 – – – 27 – 27
Total 11,013 11,008 9,083 2,533 2,533 2,065 271 244 215
Total ProvedCanada 49,096 48,557 44,444 29,112 29,099 24,404 7,553 7,425 5,221
United States 30,337 30,043 24,682 – – – 94 33 88
Total 79,433 78,600 69,126 29,112 29,099 24,404 7,647 7,458 5,309
ProbableCanada 14,086 13,922 12,369 9,754 9,750 8,183 2,844 2,807 2,024
United States 16,218 16,133 12,973 – – – 141 59 130
Total 30,304 30,055 25,342 9,754 9,750 8,183 2,985 2,866 2,154
Total Proved Plus ProbableCanada 63,182 62,479 56,813 38,866 38,849 32,587 10,397 10,232 7,245
United States 46,555 46,176 37,655 – – – 235 92 218
Total 109,737 108,655 94,468 38,866 38,849 32,587 10,632 10,324 7,463
(continues on next page)
24 E N E R P L U S 2010 ANNUAL INFORMATION FORM
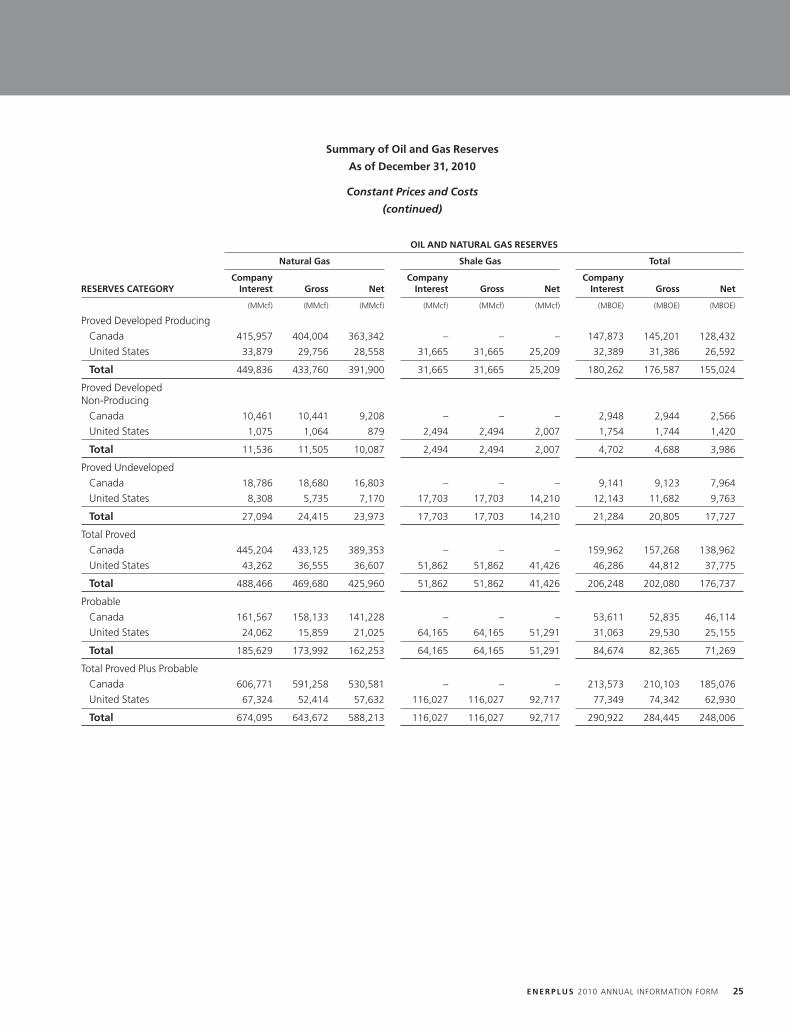
Summary of Oil and Gas Reserves
As of December 31, 2010
Constant Prices and Costs
(continued)
OIL AND NATURAL GAS RESERVES
Natural Gas Shale Gas Total
Company Company CompanyRESERVES CATEGORY Interest Gross Net Interest Gross Net Interest Gross Net
(MMcf) (MMcf) (MMcf) (MMcf) (MMcf) (MMcf) (MBOE) (MBOE) (MBOE)
Proved Developed ProducingCanada 415,957 404,004 363,342 – – – 147,873 145,201 128,432
United States 33,879 29,756 28,558 31,665 31,665 25,209 32,389 31,386 26,592
Total 449,836 433,760 391,900 31,665 31,665 25,209 180,262 176,587 155,024
Proved DevelopedNon-Producing
Canada 10,461 10,441 9,208 – – – 2,948 2,944 2,566
United States 1,075 1,064 879 2,494 2,494 2,007 1,754 1,744 1,420
Total 11,536 11,505 10,087 2,494 2,494 2,007 4,702 4,688 3,986
Proved UndevelopedCanada 18,786 18,680 16,803 – – – 9,141 9,123 7,964
United States 8,308 5,735 7,170 17,703 17,703 14,210 12,143 11,682 9,763
Total 27,094 24,415 23,973 17,703 17,703 14,210 21,284 20,805 17,727
Total ProvedCanada 445,204 433,125 389,353 – – – 159,962 157,268 138,962
United States 43,262 36,555 36,607 51,862 51,862 41,426 46,286 44,812 37,775
Total 488,466 469,680 425,960 51,862 51,862 41,426 206,248 202,080 176,737
ProbableCanada 161,567 158,133 141,228 – – – 53,611 52,835 46,114
United States 24,062 15,859 21,025 64,165 64,165 51,291 31,063 29,530 25,155
Total 185,629 173,992 162,253 64,165 64,165 51,291 84,674 82,365 71,269
Total Proved Plus ProbableCanada 606,771 591,258 530,581 – – – 213,573 210,103 185,076
United States 67,324 52,414 57,632 116,027 116,027 92,717 77,349 74,342 62,930
Total 674,095 643,672 588,213 116,027 116,027 92,717 290,922 284,445 248,006
E N E R P L U S 2010 ANNUAL INFORMATION FORM 25
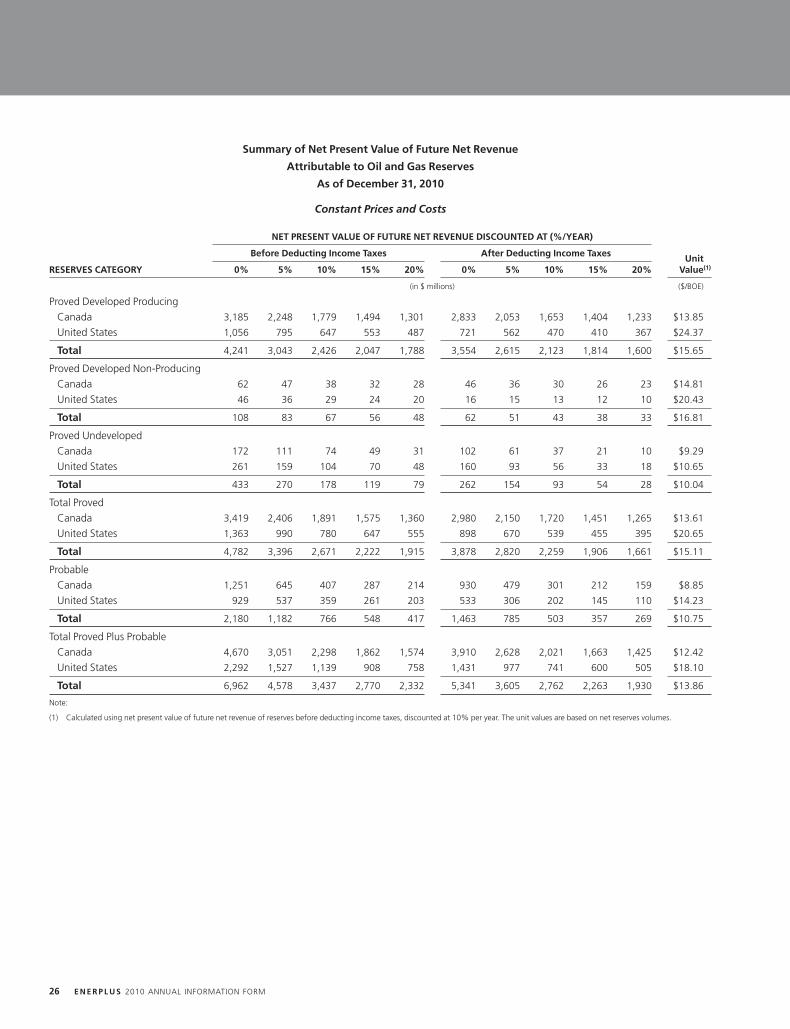
Summary of Net Present Value of Future Net Revenue
Attributable to Oil and Gas Reserves
As of December 31, 2010
Constant Prices and Costs
NET PRESENT VALUE OF FUTURE NET REVENUE DISCOUNTED AT (%/YEAR)
Before Deducting Income Taxes After Deducting Income Taxes UnitRESERVES CATEGORY 0% 5% 10% 15% 20% 0% 5% 10% 15% 20% Value(1)
(in $ millions) ($/BOE)
Proved Developed ProducingCanada 3,185 2,248 1,779 1,494 1,301 2,833 2,053 1,653 1,404 1,233 $13.85
United States 1,056 795 647 553 487 721 562 470 410 367 $24.37
Total 4,241 3,043 2,426 2,047 1,788 3,554 2,615 2,123 1,814 1,600 $15.65
Proved Developed Non-ProducingCanada 62 47 38 32 28 46 36 30 26 23 $14.81
United States 46 36 29 24 20 16 15 13 12 10 $20.43
Total 108 83 67 56 48 62 51 43 38 33 $16.81
Proved UndevelopedCanada 172 111 74 49 31 102 61 37 21 10 $9.29
United States 261 159 104 70 48 160 93 56 33 18 $10.65
Total 433 270 178 119 79 262 154 93 54 28 $10.04
Total ProvedCanada 3,419 2,406 1,891 1,575 1,360 2,980 2,150 1,720 1,451 1,265 $13.61
United States 1,363 990 780 647 555 898 670 539 455 395 $20.65
Total 4,782 3,396 2,671 2,222 1,915 3,878 2,820 2,259 1,906 1,661 $15.11
ProbableCanada 1,251 645 407 287 214 930 479 301 212 159 $8.85
United States 929 537 359 261 203 533 306 202 145 110 $14.23
Total 2,180 1,182 766 548 417 1,463 785 503 357 269 $10.75
Total Proved Plus ProbableCanada 4,670 3,051 2,298 1,862 1,574 3,910 2,628 2,021 1,663 1,425 $12.42
United States 2,292 1,527 1,139 908 758 1,431 977 741 600 505 $18.10
Total 6,962 4,578 3,437 2,770 2,332 5,341 3,605 2,762 2,263 1,930 $13.86
Note:
(1) Calculated using net present value of future net revenue of reserves before deducting income taxes, discounted at 10% per year. The unit values are based on net reserves volumes.
26 E N E R P L U S 2010 ANNUAL INFORMATION FORM
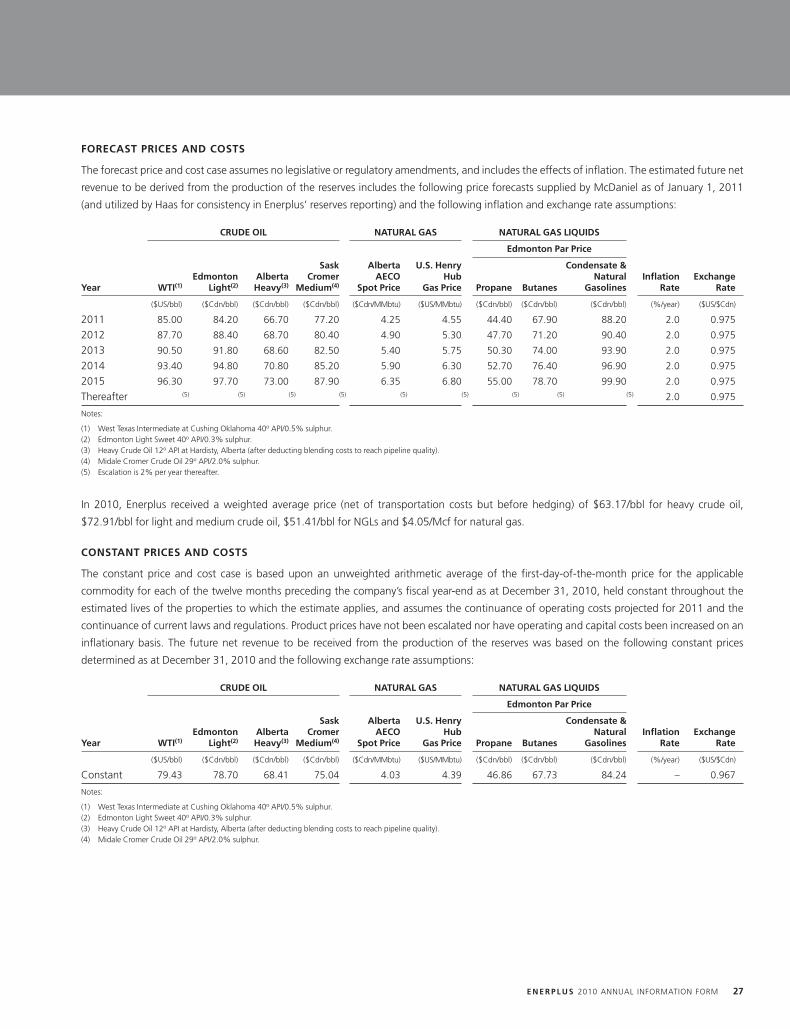
FORECAST PRICES AND COSTS
The forecast price and cost case assumes no legislative or regulatory amendments, and includes the effects of inflation. The estimated future net
revenue to be derived from the production of the reserves includes the following price forecasts supplied by McDaniel as of January 1, 2011
(and utilized by Haas for consistency in Enerplus’ reserves reporting) and the following inflation and exchange rate assumptions:
CRUDE OIL NATURAL GAS NATURAL GAS LIQUIDS
Edmonton Par Price
Sask Alberta U.S. Henry Condensate &Edmonton Alberta Cromer AECO Hub Natural Inflation Exchange
Year WTI(1) Light(2) Heavy(3) Medium(4) Spot Price Gas Price Propane Butanes Gasolines Rate Rate
($US/bbl) ($Cdn/bbl) ($Cdn/bbl) ($Cdn/bbl) ($Cdn/MMbtu) ($US/MMbtu) ($Cdn/bbl) ($Cdn/bbl) ($Cdn/bbl) (%/year) ($US/$Cdn)
2011 85.00 84.20 66.70 77.20 4.25 4.55 44.40 67.90 88.20 2.0 0.975
2012 87.70 88.40 68.70 80.40 4.90 5.30 47.70 71.20 90.40 2.0 0.975
2013 90.50 91.80 68.60 82.50 5.40 5.75 50.30 74.00 93.90 2.0 0.975
2014 93.40 94.80 70.80 85.20 5.90 6.30 52.70 76.40 96.90 2.0 0.975
2015 96.30 97.70 73.00 87.90 6.35 6.80 55.00 78.70 99.90 2.0 0.975
Thereafter (5) (5) (5) (5) (5) (5) (5) (5) (5) 2.0 0.975
Notes:
(1) West Texas Intermediate at Cushing Oklahoma 40o API/0.5% sulphur.(2) Edmonton Light Sweet 40o API/0.3% sulphur.(3) Heavy Crude Oil 12o API at Hardisty, Alberta (after deducting blending costs to reach pipeline quality).(4) Midale Cromer Crude Oil 29o API/2.0% sulphur.(5) Escalation is 2% per year thereafter.
In 2010, Enerplus received a weighted average price (net of transportation costs but before hedging) of $63.17/bbl for heavy crude oil,
$72.91/bbl for light and medium crude oil, $51.41/bbl for NGLs and $4.05/Mcf for natural gas.
CONSTANT PRICES AND COSTS
The constant price and cost case is based upon an unweighted arithmetic average of the first-day-of-the-month price for the applicable
commodity for each of the twelve months preceding the company’s fiscal year-end as at December 31, 2010, held constant throughout the
estimated lives of the properties to which the estimate applies, and assumes the continuance of operating costs projected for 2011 and the
continuance of current laws and regulations. Product prices have not been escalated nor have operating and capital costs been increased on an
inflationary basis. The future net revenue to be received from the production of the reserves was based on the following constant prices
determined as at December 31, 2010 and the following exchange rate assumptions:
CRUDE OIL NATURAL GAS NATURAL GAS LIQUIDS
Edmonton Par Price
Sask Alberta U.S. Henry Condensate &Edmonton Alberta Cromer AECO Hub Natural Inflation Exchange
Year WTI(1) Light(2) Heavy(3) Medium(4) Spot Price Gas Price Propane Butanes Gasolines Rate Rate
($US/bbl) ($Cdn/bbl) ($Cdn/bbl) ($Cdn/bbl) ($Cdn/MMbtu) ($US/MMbtu) ($Cdn/bbl) ($Cdn/bbl) ($Cdn/bbl) (%/year) ($US/$Cdn)
Constant 79.43 78.70 68.41 75.04 4.03 4.39 46.86 67.73 84.24 – 0.967
Notes:
(1) West Texas Intermediate at Cushing Oklahoma 40o API/0.5% sulphur.(2) Edmonton Light Sweet 40o API/0.3% sulphur.(3) Heavy Crude Oil 12o API at Hardisty, Alberta (after deducting blending costs to reach pipeline quality).(4) Midale Cromer Crude Oil 29o API/2.0% sulphur.
E N E R P L U S 2010 ANNUAL INFORMATION FORM 27
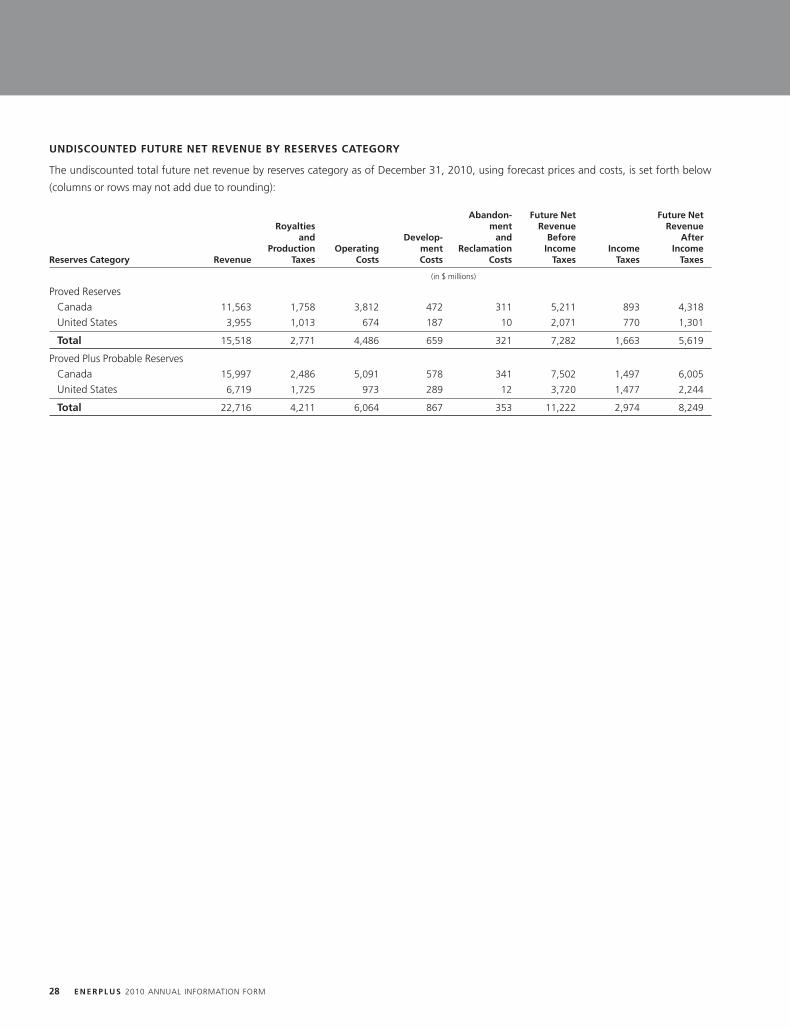
UNDISCOUNTED FUTURE NET REVENUE BY RESERVES CATEGORY
The undiscounted total future net revenue by reserves category as of December 31, 2010, using forecast prices and costs, is set forth below
(columns or rows may not add due to rounding):
Abandon- Future Net Future NetRoyalties ment Revenue Revenue
and Develop- and Before AfterProduction Operating ment Reclamation Income Income Income
Reserves Category Revenue Taxes Costs Costs Costs Taxes Taxes Taxes
(in $ millions)
Proved ReservesCanada 11,563 1,758 3,812 472 311 5,211 893 4,318
United States 3,955 1,013 674 187 10 2,071 770 1,301
Total 15,518 2,771 4,486 659 321 7,282 1,663 5,619
Proved Plus Probable ReservesCanada 15,997 2,486 5,091 578 341 7,502 1,497 6,005
United States 6,719 1,725 973 289 12 3,720 1,477 2,244
Total 22,716 4,211 6,064 867 353 11,222 2,974 8,249
28 E N E R P L U S 2010 ANNUAL INFORMATION FORM
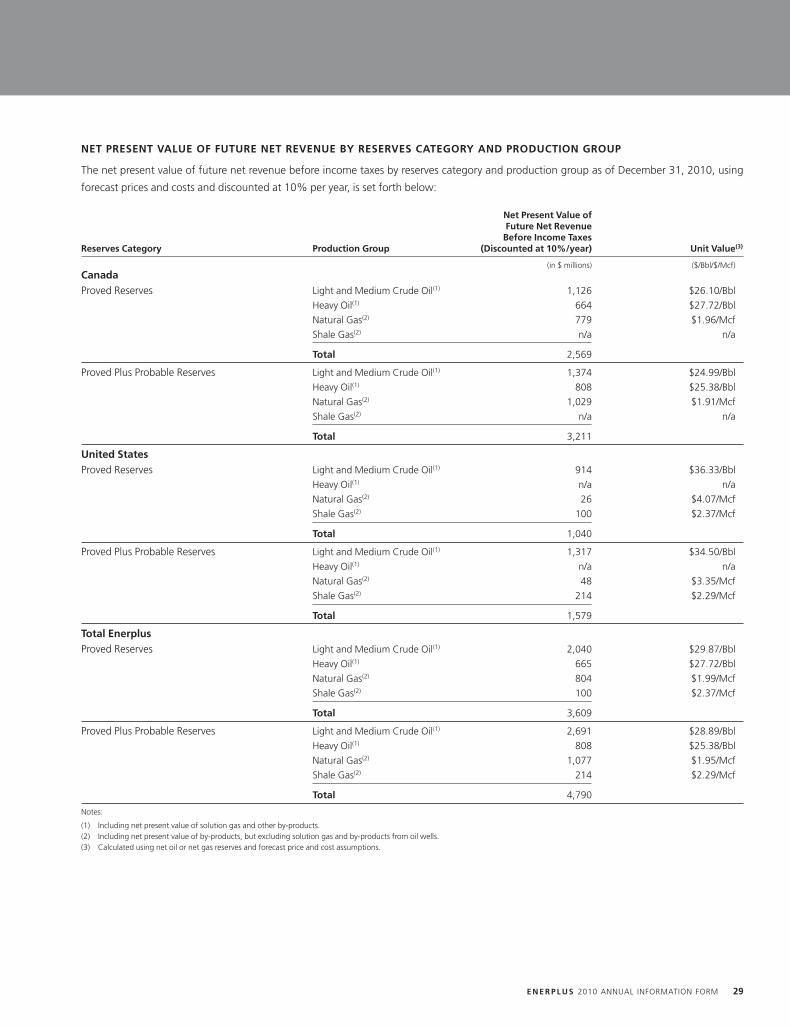
NET PRESENT VALUE OF FUTURE NET REVENUE BY RESERVES CATEGORY AND PRODUCTION GROUP
The net present value of future net revenue before income taxes by reserves category and production group as of December 31, 2010, using
forecast prices and costs and discounted at 10% per year, is set forth below:
Net Present Value ofFuture Net RevenueBefore Income Taxes
Reserves Category Production Group (Discounted at 10%/year) Unit Value(3)
(in $ millions) ($/Bbl/$/Mcf)CanadaProved Reserves Light and Medium Crude Oil(1) 1,126 $26.10/Bbl
Heavy Oil(1) 664 $27.72/Bbl
Natural Gas(2) 779 $1.96/Mcf
Shale Gas(2) n/a n/a
Total 2,569
Proved Plus Probable Reserves Light and Medium Crude Oil(1) 1,374 $24.99/Bbl
Heavy Oil(1) 808 $25.38/Bbl
Natural Gas(2) 1,029 $1.91/Mcf
Shale Gas(2) n/a n/a
Total 3,211
United StatesProved Reserves Light and Medium Crude Oil(1) 914 $36.33/Bbl
Heavy Oil(1) n/a n/a
Natural Gas(2) 26 $4.07/Mcf
Shale Gas(2) 100 $2.37/Mcf
Total 1,040
Proved Plus Probable Reserves Light and Medium Crude Oil(1) 1,317 $34.50/Bbl
Heavy Oil(1) n/a n/a
Natural Gas(2) 48 $3.35/Mcf
Shale Gas(2) 214 $2.29/Mcf
Total 1,579
Total EnerplusProved Reserves Light and Medium Crude Oil(1) 2,040 $29.87/Bbl
Heavy Oil(1) 665 $27.72/Bbl
Natural Gas(2) 804 $1.99/Mcf
Shale Gas(2) 100 $2.37/Mcf
Total 3,609
Proved Plus Probable Reserves Light and Medium Crude Oil(1) 2,691 $28.89/Bbl
Heavy Oil(1) 808 $25.38/Bbl
Natural Gas(2) 1,077 $1.95/Mcf
Shale Gas(2) 214 $2.29/Mcf
Total 4,790
Notes:
(1) Including net present value of solution gas and other by-products.(2) Including net present value of by-products, but excluding solution gas and by-products from oil wells.(3) Calculated using net oil or net gas reserves and forecast price and cost assumptions.
E N E R P L U S 2010 ANNUAL INFORMATION FORM 29
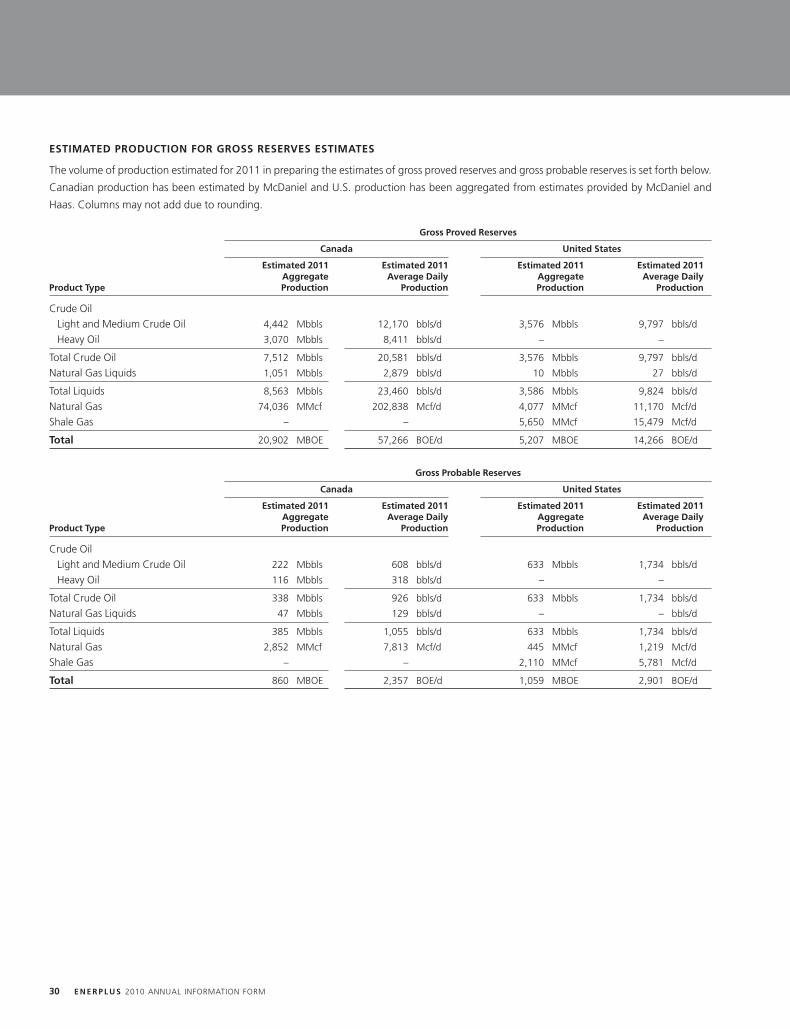
ESTIMATED PRODUCTION FOR GROSS RESERVES ESTIMATES
The volume of production estimated for 2011 in preparing the estimates of gross proved reserves and gross probable reserves is set forth below.
Canadian production has been estimated by McDaniel and U.S. production has been aggregated from estimates provided by McDaniel and
Haas. Columns may not add due to rounding.
Gross Proved Reserves
Canada United States
Estimated 2011 Estimated 2011 Estimated 2011 Estimated 2011Aggregate Average Daily Aggregate Average Daily
Product Type Production Production Production Production
Crude OilLight and Medium Crude Oil 4,442 Mbbls 12,170 bbls/d 3,576 Mbbls 9,797 bbls/d
Heavy Oil 3,070 Mbbls 8,411 bbls/d – –
Total Crude Oil 7,512 Mbbls 20,581 bbls/d 3,576 Mbbls 9,797 bbls/d
Natural Gas Liquids 1,051 Mbbls 2,879 bbls/d 10 Mbbls 27 bbls/d
Total Liquids 8,563 Mbbls 23,460 bbls/d 3,586 Mbbls 9,824 bbls/d
Natural Gas 74,036 MMcf 202,838 Mcf/d 4,077 MMcf 11,170 Mcf/d
Shale Gas – – 5,650 MMcf 15,479 Mcf/d
Total 20,902 MBOE 57,266 BOE/d 5,207 MBOE 14,266 BOE/d
Gross Probable Reserves
Canada United States
Estimated 2011 Estimated 2011 Estimated 2011 Estimated 2011Aggregate Average Daily Aggregate Average Daily
Product Type Production Production Production Production
Crude OilLight and Medium Crude Oil 222 Mbbls 608 bbls/d 633 Mbbls 1,734 bbls/d
Heavy Oil 116 Mbbls 318 bbls/d – –
Total Crude Oil 338 Mbbls 926 bbls/d 633 Mbbls 1,734 bbls/d
Natural Gas Liquids 47 Mbbls 129 bbls/d – – bbls/d
Total Liquids 385 Mbbls 1,055 bbls/d 633 Mbbls 1,734 bbls/d
Natural Gas 2,852 MMcf 7,813 Mcf/d 445 MMcf 1,219 Mcf/d
Shale Gas – – 2,110 MMcf 5,781 Mcf/d
Total 860 MBOE 2,357 BOE/d 1,059 MBOE 2,901 BOE/d
30 E N E R P L U S 2010 ANNUAL INFORMATION FORM
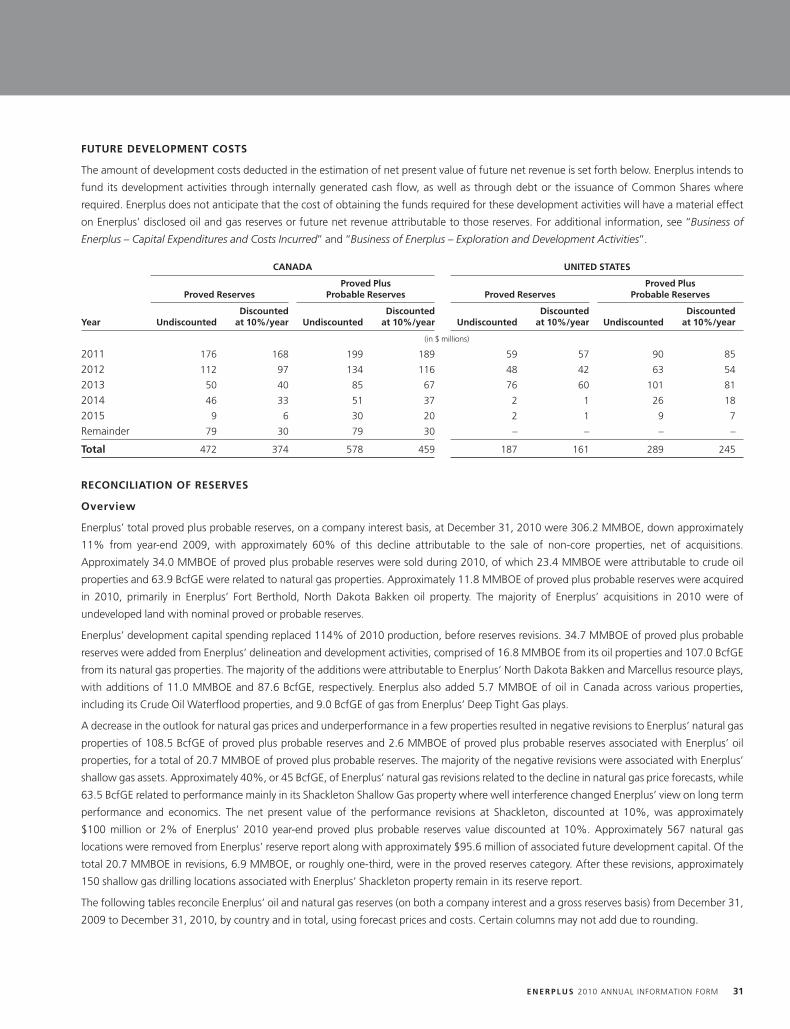
FUTURE DEVELOPMENT COSTS
The amount of development costs deducted in the estimation of net present value of future net revenue is set forth below. Enerplus intends to
fund its development activities through internally generated cash flow, as well as through debt or the issuance of Common Shares where
required. Enerplus does not anticipate that the cost of obtaining the funds required for these development activities will have a material effect
on Enerplus’ disclosed oil and gas reserves or future net revenue attributable to those reserves. For additional information, see ‘‘Business of
Enerplus – Capital Expenditures and Costs Incurred’’ and ‘‘Business of Enerplus – Exploration and Development Activities’’.
CANADA UNITED STATES
Proved Plus Proved PlusProved Reserves Probable Reserves Proved Reserves Probable Reserves
Discounted Discounted Discounted DiscountedYear Undiscounted at 10%/year Undiscounted at 10%/year Undiscounted at 10%/year Undiscounted at 10%/year
(in $ millions)
2011 176 168 199 189 59 57 90 85
2012 112 97 134 116 48 42 63 54
2013 50 40 85 67 76 60 101 81
2014 46 33 51 37 2 1 26 18
2015 9 6 30 20 2 1 9 7
Remainder 79 30 79 30 – – – –
Total 472 374 578 459 187 161 289 245
RECONCILIATION OF RESERVES
Overview
Enerplus’ total proved plus probable reserves, on a company interest basis, at December 31, 2010 were 306.2 MMBOE, down approximately
11% from year-end 2009, with approximately 60% of this decline attributable to the sale of non-core properties, net of acquisitions.
Approximately 34.0 MMBOE of proved plus probable reserves were sold during 2010, of which 23.4 MMBOE were attributable to crude oil
properties and 63.9 BcfGE were related to natural gas properties. Approximately 11.8 MMBOE of proved plus probable reserves were acquired
in 2010, primarily in Enerplus’ Fort Berthold, North Dakota Bakken oil property. The majority of Enerplus’ acquisitions in 2010 were of
undeveloped land with nominal proved or probable reserves.
Enerplus’ development capital spending replaced 114% of 2010 production, before reserves revisions. 34.7 MMBOE of proved plus probable
reserves were added from Enerplus’ delineation and development activities, comprised of 16.8 MMBOE from its oil properties and 107.0 BcfGE
from its natural gas properties. The majority of the additions were attributable to Enerplus’ North Dakota Bakken and Marcellus resource plays,
with additions of 11.0 MMBOE and 87.6 BcfGE, respectively. Enerplus also added 5.7 MMBOE of oil in Canada across various properties,
including its Crude Oil Waterflood properties, and 9.0 BcfGE of gas from Enerplus’ Deep Tight Gas plays.
A decrease in the outlook for natural gas prices and underperformance in a few properties resulted in negative revisions to Enerplus’ natural gas
properties of 108.5 BcfGE of proved plus probable reserves and 2.6 MMBOE of proved plus probable reserves associated with Enerplus’ oil
properties, for a total of 20.7 MMBOE of proved plus probable reserves. The majority of the negative revisions were associated with Enerplus’
shallow gas assets. Approximately 40%, or 45 BcfGE, of Enerplus’ natural gas revisions related to the decline in natural gas price forecasts, while
63.5 BcfGE related to performance mainly in its Shackleton Shallow Gas property where well interference changed Enerplus’ view on long term
performance and economics. The net present value of the performance revisions at Shackleton, discounted at 10%, was approximately
$100 million or 2% of Enerplus’ 2010 year-end proved plus probable reserves value discounted at 10%. Approximately 567 natural gas
locations were removed from Enerplus’ reserve report along with approximately $95.6 million of associated future development capital. Of the
total 20.7 MMBOE in revisions, 6.9 MMBOE, or roughly one-third, were in the proved reserves category. After these revisions, approximately
150 shallow gas drilling locations associated with Enerplus’ Shackleton property remain in its reserve report.
The following tables reconcile Enerplus’ oil and natural gas reserves (on both a company interest and a gross reserves basis) from December 31,
2009 to December 31, 2010, by country and in total, using forecast prices and costs. Certain columns may not add due to rounding.
E N E R P L U S 2010 ANNUAL INFORMATION FORM 31
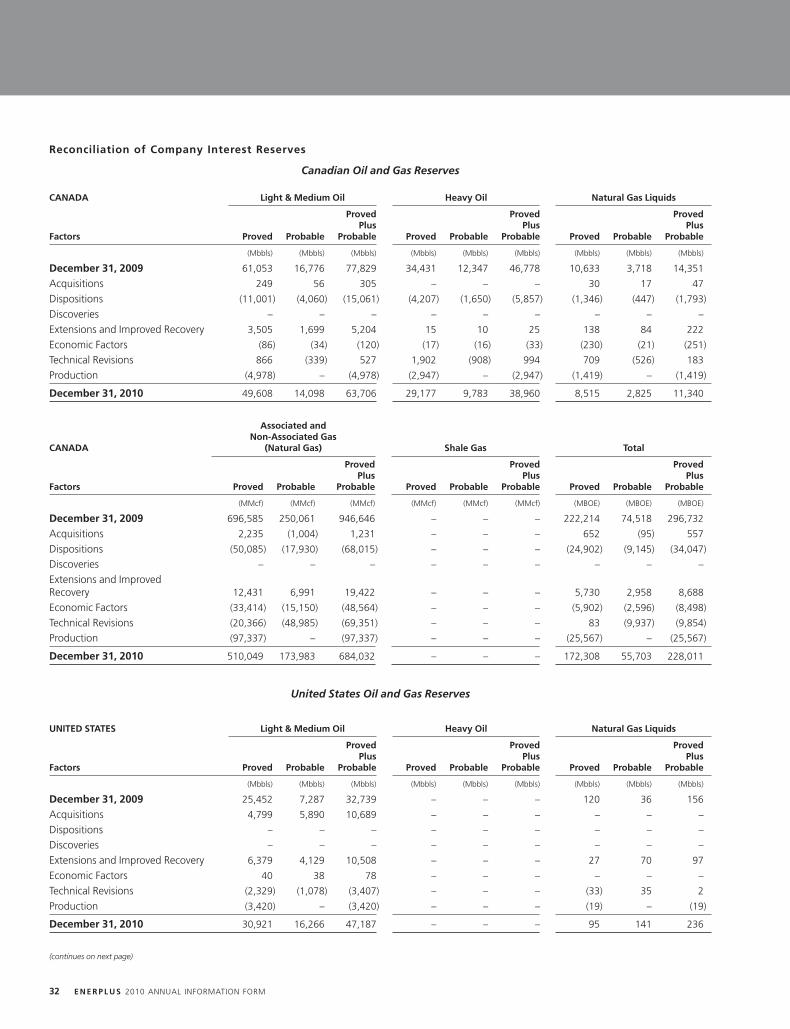
Reconciliation of Company Interest Reserves
Canadian Oil and Gas Reserves
CANADA Light & Medium Oil Heavy Oil Natural Gas Liquids
Proved Proved ProvedPlus Plus Plus
Factors Proved Probable Probable Proved Probable Probable Proved Probable Probable
(Mbbls) (Mbbls) (Mbbls) (Mbbls) (Mbbls) (Mbbls) (Mbbls) (Mbbls) (Mbbls)
December 31, 2009 61,053 16,776 77,829 34,431 12,347 46,778 10,633 3,718 14,351
Acquisitions 249 56 305 – – – 30 17 47
Dispositions (11,001) (4,060) (15,061) (4,207) (1,650) (5,857) (1,346) (447) (1,793)
Discoveries – – – – – – – – –
Extensions and Improved Recovery 3,505 1,699 5,204 15 10 25 138 84 222
Economic Factors (86) (34) (120) (17) (16) (33) (230) (21) (251)
Technical Revisions 866 (339) 527 1,902 (908) 994 709 (526) 183
Production (4,978) – (4,978) (2,947) – (2,947) (1,419) – (1,419)
December 31, 2010 49,608 14,098 63,706 29,177 9,783 38,960 8,515 2,825 11,340
Associated andNon-Associated Gas
CANADA (Natural Gas) Shale Gas Total
Proved Proved ProvedPlus Plus Plus
Factors Proved Probable Probable Proved Probable Probable Proved Probable Probable
(MMcf) (MMcf) (MMcf) (MMcf) (MMcf) (MMcf) (MBOE) (MBOE) (MBOE)
December 31, 2009 696,585 250,061 946,646 – – – 222,214 74,518 296,732
Acquisitions 2,235 (1,004) 1,231 – – – 652 (95) 557
Dispositions (50,085) (17,930) (68,015) – – – (24,902) (9,145) (34,047)
Discoveries – – – – – – – – –
Extensions and ImprovedRecovery 12,431 6,991 19,422 – – – 5,730 2,958 8,688
Economic Factors (33,414) (15,150) (48,564) – – – (5,902) (2,596) (8,498)
Technical Revisions (20,366) (48,985) (69,351) – – – 83 (9,937) (9,854)
Production (97,337) – (97,337) – – – (25,567) – (25,567)
December 31, 2010 510,049 173,983 684,032 – – – 172,308 55,703 228,011
United States Oil and Gas Reserves
UNITED STATES Light & Medium Oil Heavy Oil Natural Gas Liquids
Proved Proved ProvedPlus Plus Plus
Factors Proved Probable Probable Proved Probable Probable Proved Probable Probable
(Mbbls) (Mbbls) (Mbbls) (Mbbls) (Mbbls) (Mbbls) (Mbbls) (Mbbls) (Mbbls)
December 31, 2009 25,452 7,287 32,739 – – – 120 36 156
Acquisitions 4,799 5,890 10,689 – – – – – –
Dispositions – – – – – – – – –
Discoveries – – – – – – – – –
Extensions and Improved Recovery 6,379 4,129 10,508 – – – 27 70 97
Economic Factors 40 38 78 – – – – – –
Technical Revisions (2,329) (1,078) (3,407) – – – (33) 35 2
Production (3,420) – (3,420) – – – (19) – (19)
December 31, 2010 30,921 16,266 47,187 – – – 95 141 236
(continues on next page)
32 E N E R P L U S 2010 ANNUAL INFORMATION FORM
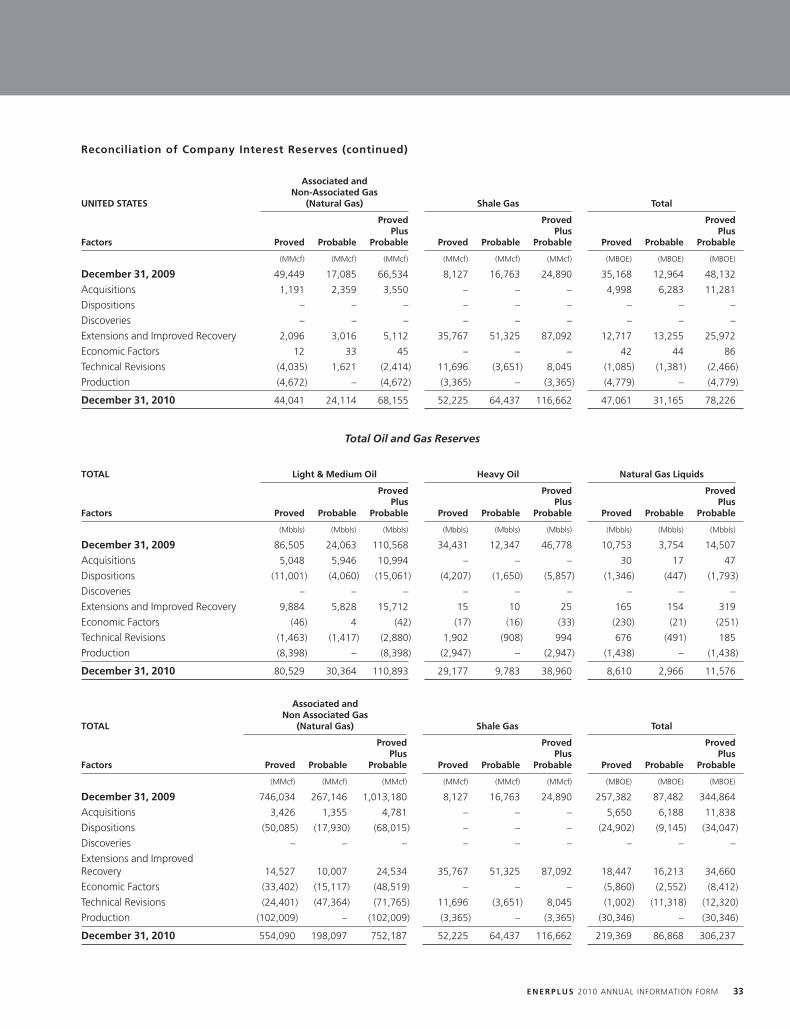
Reconciliation of Company Interest Reserves (continued)
Associated andNon-Associated Gas
UNITED STATES (Natural Gas) Shale Gas Total
Proved Proved ProvedPlus Plus Plus
Factors Proved Probable Probable Proved Probable Probable Proved Probable Probable
(MMcf) (MMcf) (MMcf) (MMcf) (MMcf) (MMcf) (MBOE) (MBOE) (MBOE)
December 31, 2009 49,449 17,085 66,534 8,127 16,763 24,890 35,168 12,964 48,132
Acquisitions 1,191 2,359 3,550 – – – 4,998 6,283 11,281
Dispositions – – – – – – – – –
Discoveries – – – – – – – – –
Extensions and Improved Recovery 2,096 3,016 5,112 35,767 51,325 87,092 12,717 13,255 25,972
Economic Factors 12 33 45 – – – 42 44 86
Technical Revisions (4,035) 1,621 (2,414) 11,696 (3,651) 8,045 (1,085) (1,381) (2,466)
Production (4,672) – (4,672) (3,365) – (3,365) (4,779) – (4,779)
December 31, 2010 44,041 24,114 68,155 52,225 64,437 116,662 47,061 31,165 78,226
Total Oil and Gas Reserves
TOTAL Light & Medium Oil Heavy Oil Natural Gas Liquids
Proved Proved ProvedPlus Plus Plus
Factors Proved Probable Probable Proved Probable Probable Proved Probable Probable
(Mbbls) (Mbbls) (Mbbls) (Mbbls) (Mbbls) (Mbbls) (Mbbls) (Mbbls) (Mbbls)
December 31, 2009 86,505 24,063 110,568 34,431 12,347 46,778 10,753 3,754 14,507
Acquisitions 5,048 5,946 10,994 – – – 30 17 47
Dispositions (11,001) (4,060) (15,061) (4,207) (1,650) (5,857) (1,346) (447) (1,793)
Discoveries – – – – – – – – –
Extensions and Improved Recovery 9,884 5,828 15,712 15 10 25 165 154 319
Economic Factors (46) 4 (42) (17) (16) (33) (230) (21) (251)
Technical Revisions (1,463) (1,417) (2,880) 1,902 (908) 994 676 (491) 185
Production (8,398) – (8,398) (2,947) – (2,947) (1,438) – (1,438)
December 31, 2010 80,529 30,364 110,893 29,177 9,783 38,960 8,610 2,966 11,576
Associated andNon Associated Gas
TOTAL (Natural Gas) Shale Gas Total
Proved Proved ProvedPlus Plus Plus
Factors Proved Probable Probable Proved Probable Probable Proved Probable Probable
(MMcf) (MMcf) (MMcf) (MMcf) (MMcf) (MMcf) (MBOE) (MBOE) (MBOE)
December 31, 2009 746,034 267,146 1,013,180 8,127 16,763 24,890 257,382 87,482 344,864
Acquisitions 3,426 1,355 4,781 – – – 5,650 6,188 11,838
Dispositions (50,085) (17,930) (68,015) – – – (24,902) (9,145) (34,047)
Discoveries – – – – – – – – –
Extensions and ImprovedRecovery 14,527 10,007 24,534 35,767 51,325 87,092 18,447 16,213 34,660
Economic Factors (33,402) (15,117) (48,519) – – – (5,860) (2,552) (8,412)
Technical Revisions (24,401) (47,364) (71,765) 11,696 (3,651) 8,045 (1,002) (11,318) (12,320)
Production (102,009) – (102,009) (3,365) – (3,365) (30,346) – (30,346)
December 31, 2010 554,090 198,097 752,187 52,225 64,437 116,662 219,369 86,868 306,237
E N E R P L U S 2010 ANNUAL INFORMATION FORM 33
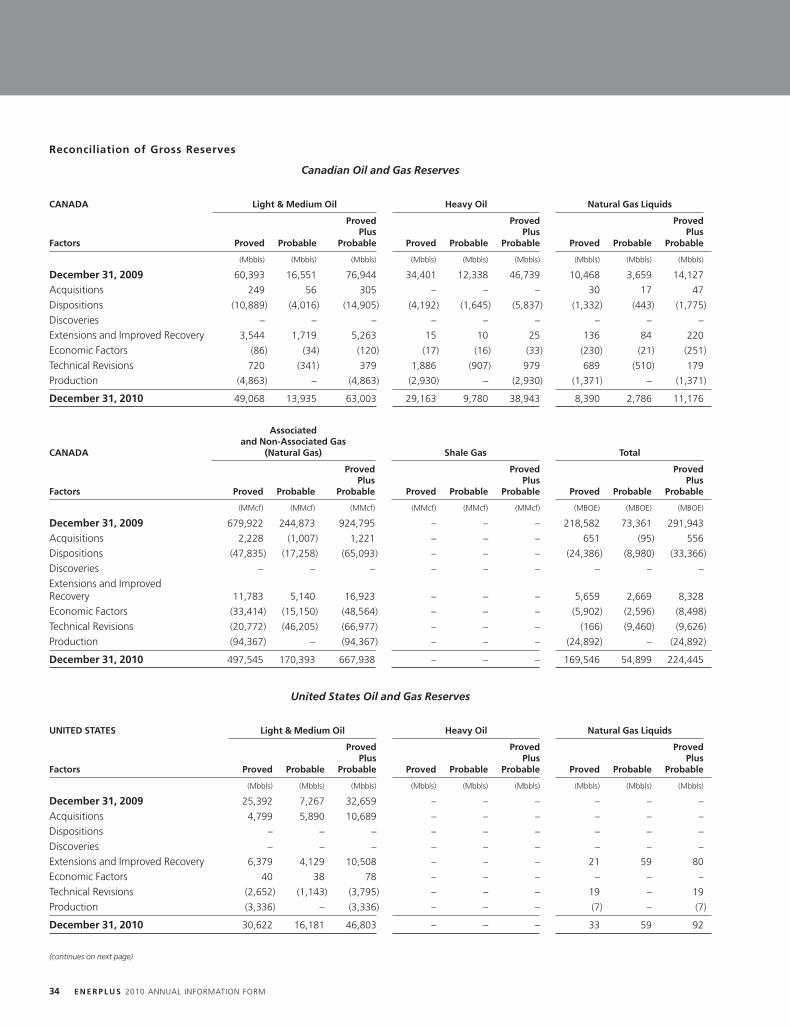
Reconciliation of Gross Reserves
Canadian Oil and Gas Reserves
CANADA Light & Medium Oil Heavy Oil Natural Gas Liquids
Proved Proved ProvedPlus Plus Plus
Factors Proved Probable Probable Proved Probable Probable Proved Probable Probable
(Mbbls) (Mbbls) (Mbbls) (Mbbls) (Mbbls) (Mbbls) (Mbbls) (Mbbls) (Mbbls)
December 31, 2009 60,393 16,551 76,944 34,401 12,338 46,739 10,468 3,659 14,127
Acquisitions 249 56 305 – – – 30 17 47
Dispositions (10,889) (4,016) (14,905) (4,192) (1,645) (5,837) (1,332) (443) (1,775)
Discoveries – – – – – – – – –
Extensions and Improved Recovery 3,544 1,719 5,263 15 10 25 136 84 220
Economic Factors (86) (34) (120) (17) (16) (33) (230) (21) (251)
Technical Revisions 720 (341) 379 1,886 (907) 979 689 (510) 179
Production (4,863) – (4,863) (2,930) – (2,930) (1,371) – (1,371)
December 31, 2010 49,068 13,935 63,003 29,163 9,780 38,943 8,390 2,786 11,176
Associatedand Non-Associated Gas
CANADA (Natural Gas) Shale Gas Total
Proved Proved ProvedPlus Plus Plus
Factors Proved Probable Probable Proved Probable Probable Proved Probable Probable
(MMcf) (MMcf) (MMcf) (MMcf) (MMcf) (MMcf) (MBOE) (MBOE) (MBOE)
December 31, 2009 679,922 244,873 924,795 – – – 218,582 73,361 291,943
Acquisitions 2,228 (1,007) 1,221 – – – 651 (95) 556
Dispositions (47,835) (17,258) (65,093) – – – (24,386) (8,980) (33,366)
Discoveries – – – – – – – – –
Extensions and ImprovedRecovery 11,783 5,140 16,923 – – – 5,659 2,669 8,328
Economic Factors (33,414) (15,150) (48,564) – – – (5,902) (2,596) (8,498)
Technical Revisions (20,772) (46,205) (66,977) – – – (166) (9,460) (9,626)
Production (94,367) – (94,367) – – – (24,892) – (24,892)
December 31, 2010 497,545 170,393 667,938 – – – 169,546 54,899 224,445
United States Oil and Gas Reserves
UNITED STATES Light & Medium Oil Heavy Oil Natural Gas Liquids
Proved Proved ProvedPlus Plus Plus
Factors Proved Probable Probable Proved Probable Probable Proved Probable Probable
(Mbbls) (Mbbls) (Mbbls) (Mbbls) (Mbbls) (Mbbls) (Mbbls) (Mbbls) (Mbbls)
December 31, 2009 25,392 7,267 32,659 – – – – – –
Acquisitions 4,799 5,890 10,689 – – – – – –
Dispositions – – – – – – – – –
Discoveries – – – – – – – – –
Extensions and Improved Recovery 6,379 4,129 10,508 – – – 21 59 80
Economic Factors 40 38 78 – – – – – –
Technical Revisions (2,652) (1,143) (3,795) – – – 19 – 19
Production (3,336) – (3,336) – – – (7) – (7)
December 31, 2010 30,622 16,181 46,803 – – – 33 59 92
(continues on next page)
34 E N E R P L U S 2010 ANNUAL INFORMATION FORM
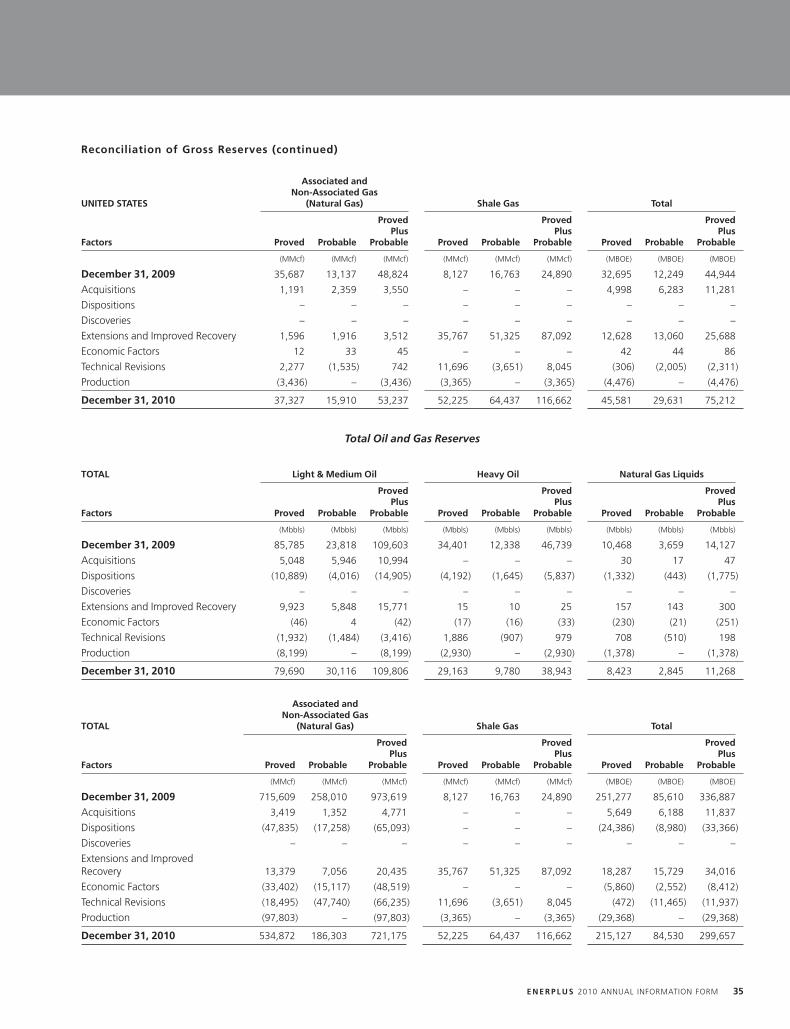
Reconciliation of Gross Reserves (continued)
Associated andNon-Associated Gas
UNITED STATES (Natural Gas) Shale Gas Total
Proved Proved ProvedPlus Plus Plus
Factors Proved Probable Probable Proved Probable Probable Proved Probable Probable
(MMcf) (MMcf) (MMcf) (MMcf) (MMcf) (MMcf) (MBOE) (MBOE) (MBOE)
December 31, 2009 35,687 13,137 48,824 8,127 16,763 24,890 32,695 12,249 44,944
Acquisitions 1,191 2,359 3,550 – – – 4,998 6,283 11,281
Dispositions – – – – – – – – –
Discoveries – – – – – – – – –
Extensions and Improved Recovery 1,596 1,916 3,512 35,767 51,325 87,092 12,628 13,060 25,688
Economic Factors 12 33 45 – – – 42 44 86
Technical Revisions 2,277 (1,535) 742 11,696 (3,651) 8,045 (306) (2,005) (2,311)
Production (3,436) – (3,436) (3,365) – (3,365) (4,476) – (4,476)
December 31, 2010 37,327 15,910 53,237 52,225 64,437 116,662 45,581 29,631 75,212
Total Oil and Gas Reserves
TOTAL Light & Medium Oil Heavy Oil Natural Gas Liquids
Proved Proved ProvedPlus Plus Plus
Factors Proved Probable Probable Proved Probable Probable Proved Probable Probable
(Mbbls) (Mbbls) (Mbbls) (Mbbls) (Mbbls) (Mbbls) (Mbbls) (Mbbls) (Mbbls)
December 31, 2009 85,785 23,818 109,603 34,401 12,338 46,739 10,468 3,659 14,127
Acquisitions 5,048 5,946 10,994 – – – 30 17 47
Dispositions (10,889) (4,016) (14,905) (4,192) (1,645) (5,837) (1,332) (443) (1,775)
Discoveries – – – – – – – – –
Extensions and Improved Recovery 9,923 5,848 15,771 15 10 25 157 143 300
Economic Factors (46) 4 (42) (17) (16) (33) (230) (21) (251)
Technical Revisions (1,932) (1,484) (3,416) 1,886 (907) 979 708 (510) 198
Production (8,199) – (8,199) (2,930) – (2,930) (1,378) – (1,378)
December 31, 2010 79,690 30,116 109,806 29,163 9,780 38,943 8,423 2,845 11,268
Associated andNon-Associated Gas
TOTAL (Natural Gas) Shale Gas Total
Proved Proved ProvedPlus Plus Plus
Factors Proved Probable Probable Proved Probable Probable Proved Probable Probable
(MMcf) (MMcf) (MMcf) (MMcf) (MMcf) (MMcf) (MBOE) (MBOE) (MBOE)
December 31, 2009 715,609 258,010 973,619 8,127 16,763 24,890 251,277 85,610 336,887
Acquisitions 3,419 1,352 4,771 – – – 5,649 6,188 11,837
Dispositions (47,835) (17,258) (65,093) – – – (24,386) (8,980) (33,366)
Discoveries – – – – – – – – –
Extensions and ImprovedRecovery 13,379 7,056 20,435 35,767 51,325 87,092 18,287 15,729 34,016
Economic Factors (33,402) (15,117) (48,519) – – – (5,860) (2,552) (8,412)
Technical Revisions (18,495) (47,740) (66,235) 11,696 (3,651) 8,045 (472) (11,465) (11,937)
Production (97,803) – (97,803) (3,365) – (3,365) (29,368) – (29,368)
December 31, 2010 534,872 186,303 721,175 52,225 64,437 116,662 215,127 84,530 299,657
E N E R P L U S 2010 ANNUAL INFORMATION FORM 35
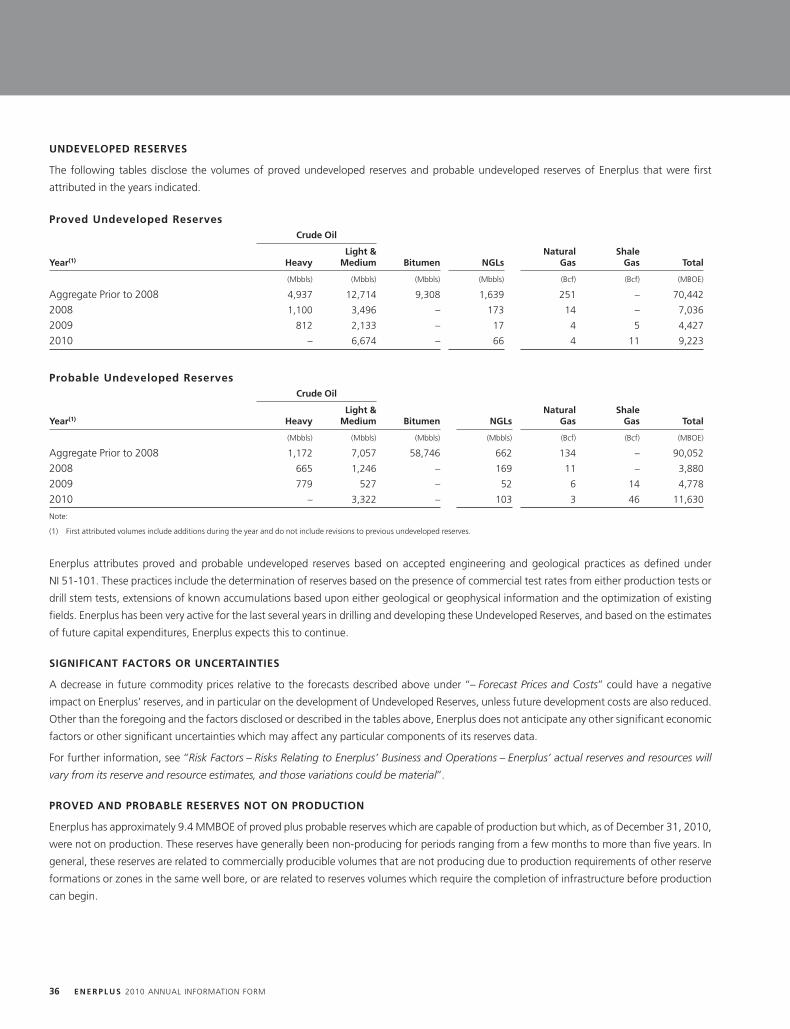
UNDEVELOPED RESERVES
The following tables disclose the volumes of proved undeveloped reserves and probable undeveloped reserves of Enerplus that were first
attributed in the years indicated.
Proved Undeveloped ReservesCrude Oil
Light & Natural ShaleYear(1) Heavy Medium Bitumen NGLs Gas Gas Total
(Mbbls) (Mbbls) (Mbbls) (Mbbls) (Bcf) (Bcf) (MBOE)
Aggregate Prior to 2008 4,937 12,714 9,308 1,639 251 – 70,442
2008 1,100 3,496 – 173 14 – 7,036
2009 812 2,133 – 17 4 5 4,427
2010 – 6,674 – 66 4 11 9,223
Probable Undeveloped ReservesCrude Oil
Light & Natural ShaleYear(1) Heavy Medium Bitumen NGLs Gas Gas Total
(Mbbls) (Mbbls) (Mbbls) (Mbbls) (Bcf) (Bcf) (MBOE)
Aggregate Prior to 2008 1,172 7,057 58,746 662 134 – 90,052
2008 665 1,246 – 169 11 – 3,880
2009 779 527 – 52 6 14 4,778
2010 – 3,322 – 103 3 46 11,630
Note:
(1) First attributed volumes include additions during the year and do not include revisions to previous undeveloped reserves.
Enerplus attributes proved and probable undeveloped reserves based on accepted engineering and geological practices as defined under
NI 51-101. These practices include the determination of reserves based on the presence of commercial test rates from either production tests or
drill stem tests, extensions of known accumulations based upon either geological or geophysical information and the optimization of existing
fields. Enerplus has been very active for the last several years in drilling and developing these Undeveloped Reserves, and based on the estimates
of future capital expenditures, Enerplus expects this to continue.
SIGNIFICANT FACTORS OR UNCERTAINTIES
A decrease in future commodity prices relative to the forecasts described above under ‘‘– Forecast Prices and Costs’’ could have a negative
impact on Enerplus’ reserves, and in particular on the development of Undeveloped Reserves, unless future development costs are also reduced.
Other than the foregoing and the factors disclosed or described in the tables above, Enerplus does not anticipate any other significant economic
factors or other significant uncertainties which may affect any particular components of its reserves data.
For further information, see ‘‘Risk Factors – Risks Relating to Enerplus’ Business and Operations – Enerplus’ actual reserves and resources will
vary from its reserve and resource estimates, and those variations could be material’’.
PROVED AND PROBABLE RESERVES NOT ON PRODUCTION
Enerplus has approximately 9.4 MMBOE of proved plus probable reserves which are capable of production but which, as of December 31, 2010,
were not on production. These reserves have generally been non-producing for periods ranging from a few months to more than five years. In
general, these reserves are related to commercially producible volumes that are not producing due to production requirements of other reserve
formations or zones in the same well bore, or are related to reserves volumes which require the completion of infrastructure before production
can begin.
36 E N E R P L U S 2010 ANNUAL INFORMATION FORM
Supplemental Operational Information
HEALTH, SAFETY AND ENVIRONMENT
Enerplus strives to develop and operate its oil and gas assets in a socially responsible manner and places a high priority on preserving the quality
of the environment and protecting the health and safety of its employees, contractors and the public in the communities in which it operates.
Enerplus actively participates in industry-recognized programs in an effort to support continuous improvement.
Health and Safety
In 2010, the number of Enerplus’ employee health and safety incidents increased slightly compared to 2009, and Enerplus’ 2010 employee
safety performance was below the Canadian Association of Petroleum Producers (‘‘CAPP’’) 2009 industry average. Enerplus’ 2010 employee
recordable injury frequency rate was 0.41 injuries per 200,000 man hours compared to 0.38 injuries per 200,000 man hours in 2009. Enerplus’
contractor total recordable injury frequency increased from 1.10 injuries per 200,000 man hours in 2009 to a rate of 1.72 injuries in 2010. An
employee of a drilling contractor was fatally injured at an Enerplus work site in 2010.
Health, safety and environmental (‘‘HSE’’) risks influence workplace practices, operating costs and the establishment of regulatory standards.
Enerplus maintains a comprehensive HSE management system designed to:
• increase emphasis on safety awareness and to promote continuous improvement and safety excellence;
• provide staff with the training and resources needed to complete work safely;
• incorporate hazard assessment and risk management as an integral part of everyday business; and
• monitor performance to ensure that its operations comply with all legal obligations and the internally-imposed standards.
Enerplus continues to develop and implement prevention measures and safety management program improvements that are designed to
support its focus and commitment for an injury-free workplace. Enerplus management maintains its commitment towards improved health and
safety performance by supporting a culture in which all employees and contractors embrace safety in their day-to-day activities.
Environment
Enerplus is committed to meeting its responsibilities to protect the environment through a variety of programs and actively monitors its
compliance with all regulations. In particular, Enerplus engages in the following activities:
• Enerplus supports and participates in the newly developed CAPP Responsible Canadian Energy program. Enerplus’ participation in this
program demonstrates its commitment to responsible resource development and to continuous improvement in environment, health and
safety and social performance;
• Site abandonment, remediation and reclamation expenditures for 2010 totalled $17.2 million. Enerplus received 83 reclamation certificates in
2010 by returning sites to that of equivalent land capability, which contributes to its overall reduction in liabilities;
• Enerplus experienced a decrease in pipeline failures with 40 such failures in 2010 versus 50 in 2009. The decrease was influenced by the
development and implementation of additional asset integrity functions under the corrosion risk management program. This included the
development and implementation of a new asset integrity software system which was designed to capture pipeline inventory data used to
inform integrity programs such as the chemical and pigging programs. Additionally, the data is used to identify potential failure sites, support
regulatory compliance and influence the development of new procedures for both operating and suspended steel pipelines. Enerplus
conducts annual property reviews in Canada with specific corrosion risk management goals designed to ensure compliance with HSE
legislation and regulations. 115 areas were reviewed in 2010. In addition, integrity inspections were completed at 50 sites in the Montana
Sleeping Giant field in 2010. The inspections included tanks, treaters and fuel gas scrubbers;
• In 2010, Enerplus expanded its internal facility inspection program to include inspections for health, safety, environment and regulatory
compliance at 149 major Canadian facilities. In addition, Enerplus developed an internal facility audit protocol and completed seven health,
safety, environment and regulatory compliance audits at facilities in Alberta and Saskatchewan; and
• Enerplus normally calculates its greenhouse gas emissions for the prior calendar year in the first and second quarter of the current year.
Therefore, results for 2010 are not yet available. Enerplus is currently working with a third party consultant to implement an emissions
E N E R P L U S 2010 ANNUAL INFORMATION FORM 37
software system to validate its baseline greenhouse gas emissions. In the interim, Enerplus has estimated its greenhouse gas emissions using
the CAPP methodology (CAPP Guide to Calculating Greenhouse Gas Emissions, 2003). Enerplus has estimated its 2009 direct and indirect
emissions to be approximately 700,000 carbon dioxide equivalent tonnes per year and 256,000 carbon dioxide equivalent tonnes per year,
respectively. The future adopted validation protocol, via the new emissions software system and with direction from the Canadian and
U.S. federal governments, may result in an adjustment to these estimates. In 2010 Enerplus completed a fugitive emissions camera survey to
detect losses from leaks and vents from 158 facilities across the three western provinces, and is working to repair identified leaks.
Specific greenhouse gas regulations have been enacted in Alberta and British Columbia. In Alberta, while Enerplus does not operate facilities
that qualify as large emitters, Enerplus is required to pay its share of the costs at non-operated large emitter facilities. In 2010, this cost was
approximately $130,000. In British Columbia, Enerplus is subject to the carbon tax introduced in mid-2008. The cost of this tax was
approximately $764,500 in 2010. In addition, Enerplus is required to report greenhouse gas emissions to the government of British Columbia by
March 31, 2011 under the Cap and Trade Act (British Columbia). Enerplus expects that the B.C. government will issue emission allowances to
emitters in 2012. Potential future costs are unknown until emission allowances are allocated, however Enerplus does not expect such
compliance costs to be material at its current hydrocarbon production levels. Moreover, until there is more certainty with respect to the federal
greenhouse gas regulations, Enerplus is unable to estimate the future potential compliance costs, although at this time Enerplus does not expect
such costs to be material given its current hydrocarbon production levels and at the current price of carbon offsets in the marketplace of
approximately $15 per tonne of carbon dioxide equivalent. In the U.S., the federal Environmental Protection Agency has issued a final
greenhouse gas tailoring rule that addresses greenhouse gas emissions from stationary sources under the Clean Air Act permitting programs,
however Enerplus does not expect this rule to affect its business at this time. Enerplus intends to continue to improve its energy efficiency
regardless of the ultimate regulations. See ‘‘Industry Conditions – Environmental Regulation’’ and ‘‘Risk Factors’’.
Enerplus endeavours to carry out its activities and operations in compliance with all relevant and applicable environmental regulations and good
industry practice. Enerplus carries insurance to cover a portion of its property losses, liability and business interruption. HSE and regulatory
updates and risks are reviewed regularly by the Safety & Social Responsibility Committee of the Corporation’s board of directors. At present,
Enerplus believes that it is, and intends to continue to be, in compliance with all material applicable environmental laws and regulations and has
included appropriate amounts in its capital expenditure budget to continue to meet its ongoing environmental obligations.
Overall, Enerplus strives to operate in a socially responsible manner and believes its HSE initiatives confirm its ongoing commitment to
environmental stewardship and the health and safety of its employees, contractors and the general public in the communities in which it
operates. Annually, Enerplus identifies key focus areas to support this commitment and sets forth strategic reduction targets. Enerplus believes
that by monitoring metrics, continuously identifying areas for improvement and implementing strategies, processes and procedures in those key
focus areas, Enerplus can reduce its environmental impact.
INSURANCE
Enerplus carries insurance coverage to protect its assets at or above the standards typical within the oil and natural gas industry. Insurance levels
are determined and acquired by Enerplus after considering the perceived risk of loss and appropriate coverage, together with the overall cost.
Enerplus currently purchases insurance to protect against third party liability, property damage, business interruption, pollution and well control.
In addition, liability coverage is also carried for the directors and officers of Enerplus.
PERSONNEL
As at December 31, 2010, Enerplus employed a total of 709 persons, including full-time benefit and payroll consultants.
38 E N E R P L U S 2010 ANNUAL INFORMATION FORM
Description of Capital Structure
The authorized capital of the Corporation consists of an unlimited number of Common Shares and a number of preferred shares, issuable in
series (‘‘Preferred Shares’’), which are limited to an amount equal to not more than one-quarter of the number of issued and outstanding
Common Shares at the time of the issuance of any such Preferred Shares. The following is a summary of the rights, privileges, restrictions and
conditions attaching to the Common Shares and the Preferred Shares. Copies of the Corporation’s articles of amalgamation and bylaws were
filed on the Corporation’s SEDAR profile at www.sedar.com on January 5, 2011 and on the Corporation’s EDGAR profile at www.sec.gov on
January 5, 2011.
COMMON SHARES
Holders of Common Shares are entitled to receive notice of and to attend all meetings of shareholders of the Corporation and to one vote at
such meetings for each Common Share held. The holders of the Common Shares are, at the discretion of the Corporation’s board of directors
and subject to applicable legal restrictions and subject to the rights, privileges, restrictions and conditions attaching to any other class or series of
shares of the Corporation, entitled to receive any dividends declared by the Corporation’s board of directors on the Common Shares and to
share in the remaining property of the Corporation upon liquidation, dissolution or winding-up.
PREFERRED SHARES
The Preferred Shares may be issued from time to time in one or more series with such rights, restrictions, privileges, conditions and designations
attached thereto as shall be fixed from time to time by the Corporation’s board of directors. Subject to the provisions of the ABCA, the Preferred
Shares of each series shall rank in parity with the Preferred Shares of every other series. The Preferred Shares shall be entitled to preference over
the Common Shares and any other shares of the Corporation ranking junior to the said Preferred Shares with respect to payment of dividends
and the distribution of assets in the event of liquidation, dissolution or winding-up of the Corporation, whether voluntary or involuntary, to the
extent fixed in the case of each respective series, and may also be given such other preferences over the Common Shares and any other shares of
the Corporation ranking junior to the said Preferred Shares as may be fixed in the case of each such series. There are no Preferred Shares
outstanding as of the date of this Annual Information Form.
SHAREHOLDER RIGHTS PLAN
Effective January 1, 2011, the Corporation adopted the Shareholder Rights Plan, which was approved by the Fund’s unitholders concurrently
with their approval of the Conversion on December 9, 2010. The Fund previously had in place a unitholder rights plan agreement that was
initially approved by unitholders on April 23, 1999 and was renewed for an additional three years by the Enerplus unitholders at each of the
2002, 2005 and 2008 annual general and special meetings of unitholders. The Shareholder Rights Plan must next be renewed and approved by
the Corporation’s shareholders at the annual general meeting to be held in 2013, failing which it will expire at such time. The Shareholder Rights
Plan, under which Computershare Trust Company of Canada acts as rights agent, generally provides that, following the acquisition by any
person or entity of 20% or more of the issued and outstanding Common Shares (except pursuant to certain permitted or excepted transactions)
and upon the occurrence of certain other events, each holder of Common Shares, other than such acquiring person or entity, shall be entitled to
acquire Common Shares at a discounted price. The Shareholder Rights Plan is similar to other shareholder rights plans adopted in the energy
sector. A copy of the Shareholder Rights Plan was filed as a ‘‘Security holder document’’ on January 5, 2011 on the Corporation’s SEDAR profile
at www.sedar.com, was filed on the Corporation’s EDGAR profile at www.sec.gov on January 5, 2011, and is available on the Corporation’s
website at www.enerplus.com under ‘‘Corporate Governance’’.
E N E R P L U S 2010 ANNUAL INFORMATION FORM 39
SENIOR UNSECURED NOTES
Enerplus has issued the Senior Unsecured Notes, of which US$459 million and Cdn$40 million principal amount were outstanding at
December 31, 2010. The Senior Unsecured Notes were originally issued in the amounts of (i) US$175 million on June 19, 2002 (of which
US$140 million principal amount remained outstanding at December 31, 2010), (ii) US$54 million on October 1, 2003, and (iii) US$225 million,
US$40 million and $40 million on June 18, 2009. Certain terms of the Senior Unsecured Notes are summarized below:
Original Remaining Coupon InterestIssue Date Principal Principal Rate Payment Dates Maturity Date Term
June 18, 2009 $40 million $40 million 6.37% June 18 and December 18 June 18, 2015 Bullet payment on maturity
June 18, 2009 US$40 million US$40 million 6.82% June 18 and December 18 June 18, 2015 Bullet payment on maturity
June 18, 2009 US$225 million US$225 million 7.97% June 18 and December 18 June 18, 2021 Principal payments required in 5 equalinstalments beginning June 18, 2017
October 1, 2003 US$54 million US$54 million 5.46% April 1 and October 1 October 1, 2015 Principal payments required in 5 equalinstalments beginning October 1, 2011
June 19, 2002 US$175 million US$140 million 6.62% June 19 and December 19 June 19, 2014 Principal payments required in equalinstalments on June 19, 2011 to 2014
For additional information regarding the Senior Unsecured Notes, see Note 8 to Enerplus’ audited consolidated financial statements for the year
ended December 31, 2010. See also ‘‘Material Contracts and Documents Affecting Securityholder Rights’’.
BANK CREDIT FACILITY
As of December 31, 2010, Enerplus had a $1.0 billion unsecured, covenant-based credit facility with a syndicate of financial institutions
maturing June 30, 2013. For a description of the Bank Credit Facility, see Note 8 to Enerplus’ audited consolidated financial statements for the
year ended December 31, 2010. See also ‘‘Material Contracts and Documents Affecting Securityholder Rights’’.
40 E N E R P L U S 2010 ANNUAL INFORMATION FORM
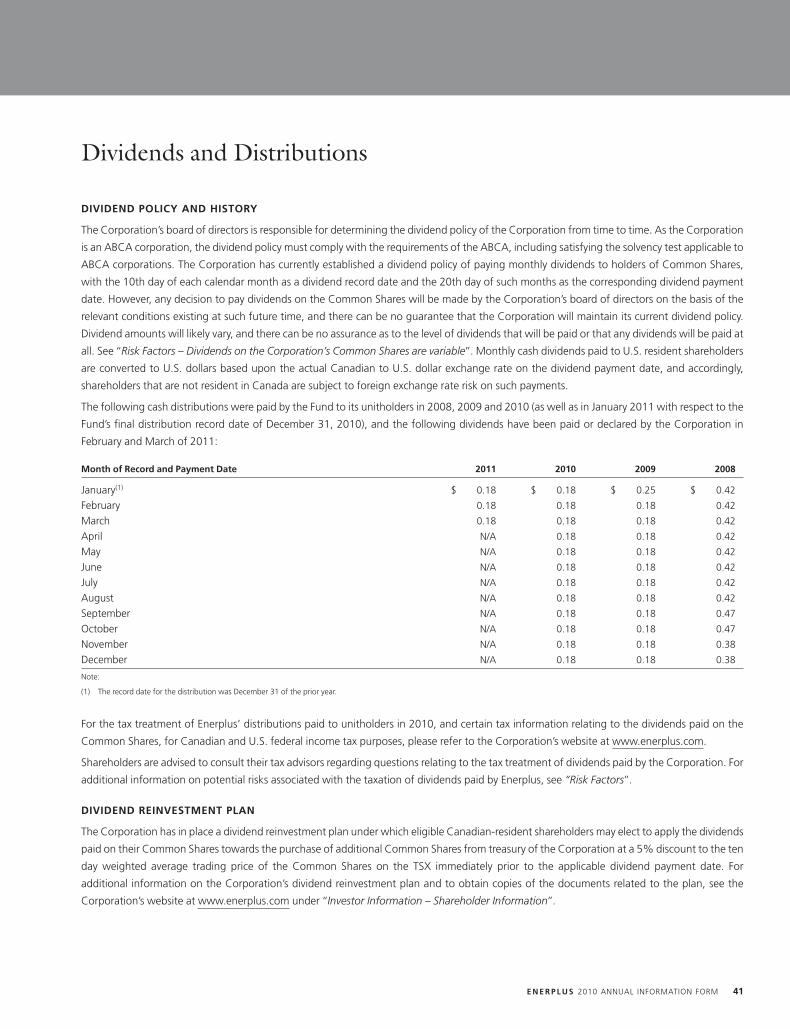
Dividends and Distributions
DIVIDEND POLICY AND HISTORY
The Corporation’s board of directors is responsible for determining the dividend policy of the Corporation from time to time. As the Corporation
is an ABCA corporation, the dividend policy must comply with the requirements of the ABCA, including satisfying the solvency test applicable to
ABCA corporations. The Corporation has currently established a dividend policy of paying monthly dividends to holders of Common Shares,
with the 10th day of each calendar month as a dividend record date and the 20th day of such months as the corresponding dividend payment
date. However, any decision to pay dividends on the Common Shares will be made by the Corporation’s board of directors on the basis of the
relevant conditions existing at such future time, and there can be no guarantee that the Corporation will maintain its current dividend policy.
Dividend amounts will likely vary, and there can be no assurance as to the level of dividends that will be paid or that any dividends will be paid at
all. See ‘‘Risk Factors – Dividends on the Corporation’s Common Shares are variable’’. Monthly cash dividends paid to U.S. resident shareholders
are converted to U.S. dollars based upon the actual Canadian to U.S. dollar exchange rate on the dividend payment date, and accordingly,
shareholders that are not resident in Canada are subject to foreign exchange rate risk on such payments.
The following cash distributions were paid by the Fund to its unitholders in 2008, 2009 and 2010 (as well as in January 2011 with respect to the
Fund’s final distribution record date of December 31, 2010), and the following dividends have been paid or declared by the Corporation in
February and March of 2011:
Month of Record and Payment Date 2011 2010 2009 2008
January(1) $ 0.18 $ 0.18 $ 0.25 $ 0.42
February 0.18 0.18 0.18 0.42
March 0.18 0.18 0.18 0.42
April N/A 0.18 0.18 0.42
May N/A 0.18 0.18 0.42
June N/A 0.18 0.18 0.42
July N/A 0.18 0.18 0.42
August N/A 0.18 0.18 0.42
September N/A 0.18 0.18 0.47
October N/A 0.18 0.18 0.47
November N/A 0.18 0.18 0.38
December N/A 0.18 0.18 0.38
Note:
(1) The record date for the distribution was December 31 of the prior year.
For the tax treatment of Enerplus’ distributions paid to unitholders in 2010, and certain tax information relating to the dividends paid on the
Common Shares, for Canadian and U.S. federal income tax purposes, please refer to the Corporation’s website at www.enerplus.com.
Shareholders are advised to consult their tax advisors regarding questions relating to the tax treatment of dividends paid by the Corporation. For
additional information on potential risks associated with the taxation of dividends paid by Enerplus, see ‘‘Risk Factors’’.
DIVIDEND REINVESTMENT PLAN
The Corporation has in place a dividend reinvestment plan under which eligible Canadian-resident shareholders may elect to apply the dividends
paid on their Common Shares towards the purchase of additional Common Shares from treasury of the Corporation at a 5% discount to the ten
day weighted average trading price of the Common Shares on the TSX immediately prior to the applicable dividend payment date. For
additional information on the Corporation’s dividend reinvestment plan and to obtain copies of the documents related to the plan, see the
Corporation’s website at www.enerplus.com under ‘‘Investor Information – Shareholder Information’’.
E N E R P L U S 2010 ANNUAL INFORMATION FORM 41
Industry Conditions
OVERVIEW
The oil and natural gas industry is subject to extensive controls and regulation governing its operations (including land tenure, exploration,
development, production, refining, transportation, marketing, remediation, abandonment and reclamation) imposed by legislation enacted by
various levels of government. The oil and natural gas industry is also subject to agreements among the various federal, provincial and state
governments with respect to pricing and taxation of oil and natural gas. Although it is not expected that any of these controls, regulations or
agreements will affect Enerplus’ operations in a manner materially different than they would affect other oil and gas issuers of similar size, the
controls, regulations and agreements should be considered carefully by investors in the oil and gas industry. All current legislation is a matter of
public record and Enerplus is unable to predict what additional legislation or amendments may be enacted. Outlined below are some of the
principal aspects of legislation, regulations and agreements governing the oil and gas industry.
The discussion below focuses on the Canadian oil and natural gas industry (and particularly Alberta, Saskatchewan and British Columbia, which
accounted for approximately 82% of Enerplus’ 2010 production). Enerplus also owns oil and natural gas properties and related assets in the
province of Manitoba and in Montana, North Dakota, Pennsylvania, West Virginia, Maryland, Wyoming and Utah in the United States. Enerplus’
U.S. oil and natural gas operations are regulated by administrative agencies under statutory provisions of the states where such operations are
conducted and by certain agencies of the federal government for operations on federal leases. These statutory provisions regulate matters such
as the exploration for and production of crude oil and natural gas, including provisions related to permits for the drilling of wells, bonding
requirements to drill or operate wells, the location of wells, the method of drilling and casing wells, the surface use and restoration of properties
upon which wells are drilled, and the abandonment of wells. Enerplus’ U.S. operations are also subject to various conservation laws and
regulations which regulate matters such as the size of drilling and spacing units or proration units, the number of wells which may be drilled in
an area, and the unitization or pooling of crude oil and natural gas properties. In addition, state conservation laws sometimes establish
maximum rates of production from crude oil and natural gas wells, generally prohibit the venting or flaring of natural gas, and impose certain
requirements regarding the rateability or fair apportionment of production from fields and individual wells.
PRICING AND MARKETING – OIL
Producers of oil negotiate sales contracts directly with oil purchasers, resulting in a market price for oil. The price depends, in part, on oil type
and quality, prices of competing fuels, distance to market, the value of refined products, the supply/demand balance and other contractual
terms, as well as the world price of oil. Crude oil exported from Canada is subject to regulation by the National Energy Board (the ‘‘NEB’’) and the
Government of Canada. Oil exports may be made pursuant to export contracts with terms not exceeding one year in the case of light crude oil,
and not exceeding two years in the case of heavy crude oil, provided that an order approving any such export has been obtained from the NEB.
Any oil export to be made pursuant to a contract of longer duration (to a maximum of 25 years) requires an exporter to obtain an export licence
from the NEB and the issuance of such a licence requires the approval of the Governor in Council.
PRICING AND MARKETING – NATURAL GAS
The price of natural gas sold in intraprovincial, interprovincial and international trade is determined by negotiation between buyers and sellers.
The price depends, in part, on natural gas quality, prices of competing natural gas and other fuels, distance to market, access to downstream
transportation, length of contract term, seasonal factors, weather conditions, the value of refined products, the supply/demand balance and
other contractual terms. Natural gas exported from Canada is subject to regulation by the NEB and the Government of Canada. Exporters are
free to negotiate prices and other terms with purchasers, provided that the export contracts must continue to meet certain criteria prescribed by
the NEB and the Government of Canada. Natural gas exports for a term of less than two years or for a term of two to 20 years (in quantities of
not more than 30,000 cubic metres per day), must be made pursuant to an NEB order. Any natural gas export to be made pursuant to a contract
of longer duration (to a maximum of 25 years) or a larger quantity requires an exporter to obtain an export licence from the NEB and the
issuance of such a licence requires the approval of the Governor in Council.
The governments in the Canadian provinces where Enerplus operates also regulate the volume of natural gas which may be removed from those
provinces for consumption elsewhere, based on such factors as reserve availability, transportation arrangements and market considerations.
42 E N E R P L U S 2010 ANNUAL INFORMATION FORM
THE NORTH AMERICA FREE TRADE AGREEMENT
On January 1, 1994, the North American Free Trade Agreement (‘‘NAFTA’’) became effective among the governments of Canada, the
United States of America and Mexico. In the context of energy resources, Canada continues to remain free to determine whether exports to the
United States or Mexico will be allowed, provided that any export restrictions do not: (i) reduce the proportion of energy resource exported
relative to domestic use (based upon the proportion prevailing in the most recent 36 month period); (ii) impose an export price higher than the
domestic price; and (iii) disrupt normal channels of supply. All three countries are generally prohibited from imposing minimum export or import
price requirements and, except as permitted in the enforcement of countervailing and anti-dumping orders and undertakings, minimum or
maximum import price requirements.
NAFTA contemplates the reduction of Mexican restrictive trade practices in the energy sector and prohibits discriminatory border restrictions and
export taxes. NAFTA also contemplates clearer disciplines on regulators to ensure fair implementation of any regulatory changes and to
minimize disruption of contractual arrangements, which is important for Canadian natural gas exports.
ROYALTIES AND INCENTIVES
In addition to federal regulations, each province in Canada and each U.S. state has legislation and regulations which govern oil and gas holdings
and land tenure, royalties, production rates, environmental protection and other matters. In all Canadian jurisdictions, producers of oil and
natural gas are required to pay annual rental payments in respect of Crown leases, and royalties and freehold production taxes in respect of oil
and natural gas produced from Crown and freehold lands, respectively. In all U.S. jurisdictions, producers of oil and natural gas are typically
required to pay annual rental payments in respect of federal, state and freehold leases until production begins and upon commencement of
production, royalties and production taxes are paid in respect of oil and natural gas produced from federal, state and freehold lands. The royalty
and production tax regime is a significant factor in the profitability of oil and natural gas production. Royalties payable on production from lands
other than Crown-owned lands in Canada and federal and state lands in the U.S. are determined by negotiations between the freehold mineral
owner and the lessee. Crown royalties in Canada and federal and state royalties and production taxes in the U.S. are determined by government
regulation and are generally calculated as a percentage of the value of the gross production. The rate of royalties payable generally depends in
part on prescribed reference prices, well productivity, geographical location, field discovery date and the type or quality of the petroleum
product produced. Other royalties and royalty-like interests are from time to time carved out of the working interest owner’s interest through
non-public transactions. These are often referred to as overriding royalties, gross overriding royalties or net profits or net carried interests.
From time to time, the federal and provincial governments in Canada and the federal and state governments in the U.S. have established
incentive programs which have included royalty rate or production tax reductions (including for specific wells), royalty holidays and tax credits for
the purpose of encouraging oil and natural gas exploration or enhanced planning projects. If applicable, oil and natural gas royalty holidays,
reductions and tax credits would effectively reduce the amount of royalties paid by oil and gas producers to the applicable governmental
entities.
LAND TENURE
Crude oil and natural gas located in the western Canadian provinces is owned predominantly by the respective provincial governments.
Provincial governments grant rights to explore for and produce oil and natural gas pursuant to leases, licences and permits for varying periods
and on conditions set forth in provincial legislation including requirements to perform specific work or make payments. Oil and natural gas
located in such provinces can also be privately owned and rights to explore for and produce such oil and natural gas are granted by lease on such
terms and conditions as may be negotiated.
Crude oil and natural gas located in the U.S. is predominantly owned by private owners. The Federal Government (Bureau of Land
Management), Bureau of Indian Affairs and the state in which the minerals are located also may hold ownership to such rights. These owners,
from governmental bodies to private individuals, grant rights to explore for and produce oil and gas pursuant to leases, licenses and permits for
varying periods and on conditions including requirements to perform specific work or make payments. As to those rights held by private owners,
all terms and conditions may be negotiated. For those rights held by governmental agencies, typically the terms and conditions of the oil and gas
lease have been predetermined by each governing or regulatory body. The majority (approximately 80%) of all leaseholds currently owned by
Enerplus in the U.S. have been granted through private individuals.
E N E R P L U S 2010 ANNUAL INFORMATION FORM 43
A lease may generally be continued after the initial term provided certain minimum levels of exploration or production have been achieved and
all lease rentals have been timely paid, subject to certain exceptions. To develop minerals, including oil and gas, it is necessary for the mineral
estate owner to have access to the surface estate. Under common law, the mineral estate is considered the ‘‘dominant’’ estate with the right to
extract minerals subject to reasonable use of the surface. Each state has developed and adopted their own statutes that operators must follow
both prior to drilling and following drilling including notification requirements and to provide compensation for lost land use and surface
damages. The surface rights required for pipelines and facilities are generally governed by leases, easements, rights-of-way, permits or licenses
granted by landowners or governmental authorities.
ENVIRONMENTAL REGULATION
The oil and natural gas industry is subject to environmental regulation pursuant to federal, provincial and state legislation. Environmental
legislation provides for restrictions and prohibitions on releases or emissions of various substances produced or utilized in association with
certain oil and gas industry operations. In addition, legislation requires that well, pipeline and facility sites be abandoned and reclaimed to the
satisfaction of the applicable authorities. As well, applicable environmental laws may impose remediation obligations with respect to a property
designated as a contaminated site upon certain responsible persons, which include persons responsible for the substance causing the
contamination, persons who caused release of the substance and any past or present owner, tenant or other person in possession of the site.
Compliance with such legislation can require significant expenditures. A breach of such legislation may result in the imposition of material fines
and penalties, the suspension or revocation of necessary licenses and authorizations, civil liability for pollution damage or the issuance of
clean-up orders.
In Alberta, environmental compliance is governed by the Environmental Protection and Enhancement Act (Alberta) (the ‘‘EPEA’’) and the Oil and
Gas Conservation Act (Alberta), both of which impose certain environmental responsibilities on oil and natural gas operators and working
interest holders in Alberta and impose penalties for violations. In certain instances, the EPEA imposes significant penalties for violations. In
Saskatchewan, environmental compliance is governed by the Environmental Management and Protection Act (Saskatchewan) and the Oil and
Gas Conservation Act (Saskatchewan). Oil and gas activities in Manitoba are regulated by the Oil and Gas Act (Manitoba). In British Columbia,
energy projects may be subject to review pursuant to the provisions of the Environmental Assessment Act (British Columbia), which rolls the
previous processes for the review of major energy projects into a single environmental assessment process that contemplates public
participation in the environmental review. Other environmental protection and management measures, including reclamation, are governed by
the Oil and Gas Activities Act (British Columbia) and the Environmental Management Act (British Columbia). Additionally, in 2008, the
Government of British Columbia instituted a carbon tax that applies to all fuel users in the province.
In 1994, the United Nations’ Framework Convention on Climate Change came into force and three years later led to the Kyoto Protocol which
requires participating countries, upon ratification, to reduce their emissions of carbon dioxide and other greenhouse gases. Canada ratified the
Kyoto Protocol in late 2002, and the Canadian federal government continues to evaluate other proposals and legislative measures that would
achieve similar objectives. The upstream Canadian oil and gas sector is in discussions with various federal and provincial levels of government
regarding the development of greenhouse gas regulations for the industry. The Alberta provincial government has instituted emission reduction
targets for large emitters (e.g., 100,000 tonnes of carbon dioxide per year at a single facility), which could result in increased capital
expenditures and operating costs. Currently, Enerplus does not operate any facility classed within this large emitter category. Additionally, in
2010 the Alberta provincial government and the Canadian federal government aligned in support of regulations that require the reporting of
greenhouse gas emissions at facilities that meet or exceed a 50,000 tonne per year carbon dioxide equivalent emissions threshold. Currently,
Enerplus does not operate any facility classed within this category. In late 2007 the Canadian federal government put forth an obligation for all
industries to submit 2006 emissions information (by May 31, 2008) on all facilities emitting greater than 1,000 tonnes of carbon dioxide per
year. Enerplus has complied with this requirement. It is believed this information will be used toward the forthcoming implementation plan. In
2008, the Province of British Columbia instituted a carbon tax and a ‘‘cap and trade’’ system for large emitters of greenhouse gases. See
‘‘Supplemental Operational Information – Health, Safety and Environment – Environment’’.
On March 10, 2008, the Canadian federal government proposed new regulations as part of its ‘‘Turning the Corner’’ plan that would require all
facilities emitting more than 3,000 tonnes of carbon dioxide per year to reduce emissions over time, and oil sands projects starting operations in
2012 and beyond to reduce greenhouse gas emissions, largely through carbon capture technology. The potential impact on both conventional
oil and gas and oil sands producers is currently unclear given the draft nature of the regulations and the fact that carbon capture technology has
44 E N E R P L U S 2010 ANNUAL INFORMATION FORM
not yet been proven on a large scale. Subsequent to the International Climate Change meeting in Copenhagen in December 2009 and,
regardless of the Cancun Conference of the Parties 2010 climate talks, the United States and Canada committed to a 17% reduction in
greenhouse gas emissions by 2020 relative to a 2005 baseline, but without further implementation details. Moreover, a recent report from the
National Roundtable on the Environment and Economy (2011) has recommended short-term actions for Canada to develop a national cap and
trade program and to eventually link with a North American cap and trade system if the U.S. eventually develops and implements its own cap
and trade system. However, as the Canadian federal government continues to seek to align its greenhouse gas regulations with those of the
United States, it is unclear whether the Canadian federal government will pursue any short-term action and therefore its regulations remain
pending. In addition to Alberta, certain other Canadian provincial governments (e.g., British Columbia and Saskatchewan) have also released
emission reduction targets. However, until implementation plans are developed, it is impossible to assess the impact on specific industries and
any individual businesses within an industry.
In the United States, environmental compliance is governed by federal legislation, including the Clean Air Act, Clean Water Act, Resource
Conservation and Recovery Act and Emergency Planning and Community Right-to-Know Act. Regulations promulgated under these statutes are
administered by the U.S. Environmental Protection Agency (the ‘‘EPA’’) at the federal level, or by various states whose programs have been
granted primacy by the EPA. Enerplus’ U.S. operations are currently subject to various regulations under respective oil and gas acts from the
Montana Board of Oil and Gas and Department of Environmental Quality, the North Dakota Department of Heath and Oil & Gas Division, and
the Utah Division of Oil, Gas, and Mining and the Division of Environmental Quality. Enerplus’ Marcellus shale gas operations are regulated by
Pennsylvania’s Department of Environmental Quality and in West Virginia by the Department of Environmental Protection.
In addition, the EPA announced on December 7, 2009 its findings that emissions of carbon dioxide, methane and other ‘‘greenhouse gases’’
present an endangerment to human health and the environment. These findings by the U.S. EPA may allow the agency to proceed with the
adoption and implementation of regulations that would restrict emissions of greenhouse gases under existing provisions of the federal Clean Air
Act. The EPA has also issued a final rule requiring the reporting of greenhouse gas emissions in the United States beginning in 2011 for emissions
occurring in 2010 from specified large greenhouse gas emission sources, fractionated natural gas liquids, and the production of naturally
occurring carbon dioxide, even when such production is not emitted to the atmosphere. The implementation of more stringent environmental
regulations on Enerplus’ U.S. operations could adversely affect Enerplus’ results from its U.S. operations.
See ‘‘Risk Factors – Enerplus’ operation of oil and natural gas wells could subject it to environmental costs, claims and liabilities’’ and ‘‘Risk
Factors – Government regulations and required regulatory approvals may adversely impact Enerplus’ operations and result in increased
operating and capital costs’’.
Enerplus believes that it is, and intends to continue to be, in material compliance with applicable environmental laws and regulations and is
committed to meeting its responsibilities to protect the environment wherever it operates or holds working interests. Enerplus anticipates that
this compliance may result in increased expenditures of both a capital and expense nature as a result of increasingly stringent laws relating to the
protection of the environment. Enerplus believes that it is reasonably likely that the trend in environmental legislation and regulation will
continue toward stricter standards.
WORKER SAFETY
Oilfield operations must be carried out in accordance with safe work procedures, rules and policies contained in applicable safety legislation.
Such legislation requires that every employer ensures the health and safety of all persons at any of its work sites and all workers engaged in the
work of that employer. The legislation, which provides for accident reporting procedures, also requires that every employer ensure that all of its
employees are aware of their duties and responsibilities under the applicable legislation. Penalties under applicable occupational health and
safety legislation include significant fines and incarceration.
E N E R P L U S 2010 ANNUAL INFORMATION FORM 45
Risk Factors
The following risk factors, together with other information contained in this Annual Information Form, should be carefully considered before
investing in the Common Shares. Each of these risks may negatively affect the trading price of the Common Shares or the amount of dividends
that may, from time to time and at the discretion of the Corporation’s board of directors, be declared and paid by the Corporation to its
shareholders.
Low or volatile oil and natural gas prices could have a material adverse effect on Enerplus’ results of operations andfinancial condition.
Enerplus’ results of operations and financial condition are dependent on the prices it receives for the oil and natural gas it produces and sells. Oil
and natural gas prices have fluctuated widely during recent years and may continue to be volatile in the future. Oil and natural gas prices may
fluctuate in response to a variety of factors beyond Enerplus’ control, including: (i) global energy supply, production and policies, including the
ability of OPEC to set and maintain production levels in order to seek to influence prices for oil; (ii) political conditions, including the risk of
hostilities in the Middle East and global terrorism; (iii) global and domestic economic conditions including currency fluctuations; (iv) the level of
consumer demand; (v) the production and storage levels of North American natural gas and the supply and price of imported oil and liquefied
natural gas; (vi) weather conditions; (vii) the proximity of reserves and resources to, and capacity of, transportation facilities and the availability
of refining capacity; (viii) the effect of world-wide energy conservation and greenhouse gas reduction measures and the price and availability of
alternative fuels; and (ix) government regulations.
Any decline in crude oil or natural gas prices may have a material adverse effect on Enerplus’ operations, financial condition, borrowing ability,
levels of reserves and resources and the level of expenditures for the development of Enerplus’ oil and natural gas reserves or resources. Certain
oil or natural gas wells may become or remain uneconomic to produce if commodity prices are low, thereby impacting Enerplus’ production
volumes.
Enerplus’ proposed strategy, including its proposed increased focus on growth-oriented projects and acquisitions, mayexpose Enerplus’ operations to increased risks.
As described under ‘‘General Development of the Business’’ and ‘‘Business of Enerplus’’, Enerplus is currently transitioning from an income
model to a growth and income-oriented model. This transition includes an increased emphasis on higher risk growth plays such as the
Bakken/Tight Oil, Marcellus Shale Gas and Canadian Deep Basin Tight Gas resource plays, which may expose Enerplus to additional risks in its
business and operations than has historically been the case, and there can be no assurance that the transition will be made successfully and will
not result in adverse financial or operational results to Enerplus. These types of resource plays are earlier stage development projects (and in
certain cases are more exploration-oriented in nature) than Enerplus has historically participated in and, as a result, there is more risk that
Enerplus’ expenditures on land, seismic and drilling may not provide economic returns. To the extent that Enerplus acquires properties or assets
with a higher risk exploration profile, the risk associated with such acquisitions and future development of such properties carries similar risks.
Additionally, Enerplus may face increased competition in its industry as other former income-oriented issuers also transition to a more growth-
oriented corporate model.
Dividends on the Corporation’s Common Shares are variable.
Although the Corporation currently intends to pay monthly cash dividends to its shareholders, these cash dividends may be reduced or
suspended. The amount of cash available to the Corporation to pay dividends can vary significantly from period to period for a number of
reasons, including among other things: (i) Enerplus’ operational and financial performance (including fluctuations in the quantity of Enerplus’
oil, NGLs and natural gas production and the sales price that Enerplus realizes for such production (after hedging contract receipts and
payments)); (ii) fluctuations in the costs to produce oil, NGLs and natural gas, including royalty burdens, and to administer and manage the
Corporation and its subsidiaries; (iii) the amount of cash required or retained for debt service or repayment; (iv) amounts required to fund capital
expenditures and working capital requirements; (v) access to equity markets; (vi) foreign currency exchange rates and interest rates; and (vii) the
risk factors set forth in this Annual Information Form. The decision whether or not to pay dividends and the amount of any such dividend is
subject to the discretion of the board of directors of the Corporation, which regularly evaluates the Corporation’s dividend policy and the
46 E N E R P L U S 2010 ANNUAL INFORMATION FORM
solvency test requirements of the ABCA. In addition, the level of dividends per Common Share will be affected by the number of outstanding
Common Shares and other securities that may be entitled to receive cash dividends or other payments. Dividends may be increased, reduced or
suspended entirely depending on Enerplus’ operations and the performance of its assets. The market value of the Common Shares may
deteriorate if the Corporation is unable to meet dividend expectations in the future, and that deterioration may be material.
To the extent that Enerplus uses internally-generated cash flow to finance acquisitions, development costs and other significant capital
expenditures, the amount of cash available to pay dividends to the Corporation’s shareholders may be reduced. To the extent that external
sources of capital, including debt or the issuance of additional Common Shares or other securities of the Corporation, become limited or
unavailable, Enerplus’ ability to make the necessary capital investments to maintain, develop or expand its oil and gas reserves and resources and
to invest in assets, as the case may be, will be impaired. To the extent that Enerplus is required to use cash flow to finance capital expenditures,
property acquisitions or asset acquisitions, as the case may be, the level of the Corporation’s cash dividend payments to its shareholders may be
reduced or even eliminated.
The board of directors of the Corporation has the discretion to determine the extent to which the Corporation’s cash flow will be allocated to the
payment of debt service charges as well as the repayment of outstanding debt. The payments of interest and principal with respect to Enerplus’
third party indebtedness, including the Credit Facilities, rank ahead of dividend payments that may be made by the Corporation to its
shareholders. An increase in the amount of funds used to pay debt service charges or reduce debt will reduce the amount of cash that may be
available for the Corporation to pay dividends to its shareholders. In addition, variations in interest rates and scheduled principal repayments, if
and as required under the terms of the Credit Facilities, could result in significant changes in the amount required to be applied to debt service.
Certain covenants in agreements with lenders may also limit payments of dividends.
Enerplus may require additional financing to maintain and expand its assets and operations.
In the normal course of making capital investments to maintain and expand Enerplus’ oil, NGLs and natural gas reserves and resources,
additional Common Shares or other securities of the Corporation may be issued which may result in a decline in production per share and
reserves and/or resources per share. Additionally, from time to time, the Corporation may issue Common Shares or other securities from treasury
in order to reduce debt, complete acquisitions and maintain a more optimal capital structure. Enerplus may also dispose of existing properties or
assets as a means of financing alternative projects or developments. Conversely, to the extent that external sources of capital, including the
availability of debt financing from banks or other creditors or the issuance of additional Common Shares or other securities, becomes limited,
unavailable or available on less favourable terms, Enerplus’ ability to make the necessary capital investments to maintain or expand its oil, NGLs
and natural gas reserves and resources will be impaired. To the extent that Enerplus is required to use additional cash flow to finance capital
expenditures or property acquisitions or to pay debt service charges or to reduce debt, the level of cash that may be available for the Corporation
to pay dividends to its shareholders may be reduced.
Enerplus’ Credit Facilities and any replacement credit facility may not provide sufficient liquidity.
Although Enerplus believes that its existing Credit Facilities are sufficient, there can be no assurance that the current amount will continue to be
available or will be adequate for the financial obligations of Enerplus or that additional funds can be obtained as required or on terms which are
economically advantageous to Enerplus. The amounts available under Enerplus’ Credit Facilities may not be sufficient for future operations, or
Enerplus may not be able to renew its Bank Credit Facilities or obtain additional financing on attractive economic terms, if at all. Enerplus’ Bank
Credit Facility is generally available on a three year term, extendable each year with a bullet payment required at the end of three years if the
facility is not renewed. Enerplus renewed the Bank Credit Facility in 2010, and accordingly it currently expires on June 30, 2013. There can be no
assurance that such a renewal will be available on favourable terms or that all of the current lenders under the facility will renew at their current
commitment levels. If this occurs, Enerplus may need to obtain alternate financing. Any failure of a member of the lending syndicate to fund its
obligations under the Bank Credit Facility or to renew its commitment in respect of such Bank Credit Facility, or failure of Enerplus to obtain
replacement financing or financing on favourable terms, may have a material adverse effect on Enerplus’ business, and dividends to
shareholders may be materially reduced or eliminated, as repayment of such debt has priority over dividend payments by the Corporation to its
shareholders. Additionally, in 2010 Enerplus began to repay the first of five annual principal instalments of approximately $53.7 million on
$268.3 million of Senior Unsecured Notes issued in 2002, and $11 million per year must be repaid on $55.1 million of Senior Unsecured Notes
issued in 2003 commencing October 1, 2011.
E N E R P L U S 2010 ANNUAL INFORMATION FORM 47
Enerplus’ commodity risk management activities could expose it to losses.
Enerplus may use financial derivative instruments and other hedging mechanisms to try to limit a portion of the adverse effects resulting from
volatility in natural gas and oil commodity prices. To the extent Enerplus hedges its commodity price exposure, it may forego the benefits it
would otherwise experience if commodity prices were to increase. In addition, Enerplus’ commodity hedging activities could expose it to losses.
These losses could occur under various circumstances, including if the other party to Enerplus’ hedge does not perform its obligations under the
hedge agreement.
Fluctuations in foreign currency exchange rates could adversely affect Enerplus’ business.
The price that Enerplus receives for a majority of its oil and natural gas is based on United States dollar denominated benchmarks, and therefore
the price that Enerplus receives in Canadian dollars is affected by the exchange rate between the two currencies. A material increase in the value
of the Canadian dollar relative to the United States dollar may negatively impact Enerplus’ net production revenue by decreasing the Canadian
dollars Enerplus receives for a given sale in United States dollars while offering limited relief to Enerplus’ cost structure, as a majority of its costs
are incurred in Canadian dollars. Enerplus conducts certain of its business and operations in the United States and is therefore exposed to
foreign currency risk on both revenues and costs to the extent the value of the Canadian dollar decreases relative to the United States dollar.
Enerplus currently has in place a cross-currency swap associated with the Senior Unsecured Notes issued by Enerplus in June 2002 and a foreign
exchange swap that effectively fixes the principal payments on its Senior Unsecured Notes issued in October 2003, each as described in Notes 8
and 13 to Enerplus’ audited consolidated financial statements for the year ended December 31, 2010.
Enerplus may be unable to add or develop additional reserves or resources.
Enerplus adds to its oil and natural gas reserves primarily through acquisitions and ongoing development of its existing reserves and resources,
together with certain exploration activities. As a result, the level of Enerplus’ future oil and natural gas reserves are highly dependent on its
success in developing and exploiting its reserve and resource base and acquiring additional reserves and/or resources through purchases or
exploration. Exploitation, exploration and development risks arise for Enerplus and, as a result, may affect the value of the Common Shares and
dividends to shareholders due to the uncertain results of searching for and producing oil and natural gas using imperfect scientific methods.
Additionally, if capital from external sources is not available or is not available on commercially advantageous terms, Enerplus’ ability to make the
necessary capital investments to maintain, develop or expand its oil and natural gas reserves and resources will be impaired. Even if the necessary
capital is available, Enerplus cannot assure that it will be successful in acquiring additional reserves or resources on terms that meet its
investment objectives. Without these additions, Enerplus’ reserves will deplete and, as a consequence, either its production or the average life of
its reserves will decline.
Enerplus’ actual reserves and resources will vary from its reserve and resource estimates, and those variations couldbe material.
The value of the Common Shares depends upon, among other things, the reserves and resources attributable to Enerplus’ properties. The actual
reserves and resources contained in Enerplus’ properties will vary from the estimates summarized in this Annual Information Form and those
variations could be material. Estimates of reserves and resources are by necessity projections, and thus are inherently uncertain. The process of
estimating reserves or resources requires interpretations and judgments on the part of petroleum engineers, resulting in imprecise
determinations, particularly with respect to new discoveries. Different engineers may make different estimates of reserve or resource quantities
and revenues attributable thereto based on the same data. Ultimately, actual reserves and resources attributable to Enerplus’ properties will vary
and be revised from current estimates, and those variations and revisions may be material. The reserve and resource information contained in
this Annual Information Form is only an estimate. A number of factors are considered and a number of assumptions are made when estimating
reserves and resources, such as, among other things; (i) historical production in the area compared with production rates from similar producing
areas; (ii) future commodity prices, production and development costs, royalties and capital expenditures; (iii) initial production rates and
production decline rates; (iv) ultimate recovery of reserves and resources and the success of future exploitation activities; (v) marketability of
production; and (vi) the effects of government regulation and other government royalties or levies that may be imposed over the producing life
of reserves and resources.
Reserve and resource estimates are based on the relevant factors, assumptions and prices on the date the evaluations were prepared. Many of
these factors are subject to change and are beyond Enerplus’ control. If these factors, assumptions and prices prove to be inaccurate, Enerplus’
48 E N E R P L U S 2010 ANNUAL INFORMATION FORM
actual reserves and resources could vary materially from its estimates. Additionally, all such estimates are, to some degree, uncertain, and
classifications of reserves and resources are only attempts to define the degree of uncertainty involved. For these reasons, estimates of the
economically recoverable quantities of oil and natural gas, the classification of such reserves and resources based on risk of recovery and
associated contingencies, and the estimates of future net revenues expected therefrom, prepared by different engineers or by the same
engineers at different times, may vary substantially.
Estimates with respect to reserves and resources that may be developed and produced in the future are often based upon volumetric or
probabilistic calculations and upon analogy to similar types of reserves or resources, rather than upon actual production history. Estimates based
on these methods generally are less reliable than those based on actual production history. Subsequent evaluation of the same reserves or
resources based upon production history may result in variations or revisions in the estimated reserves or resources, and any such variations or
revisions could be material.
Reserve and resource estimates may require revision based on actual production experience. Such figures have been determined based upon
assumed oil, natural gas and NGLs prices and operating costs. Market price fluctuations of commodity prices may render uneconomic the
recovery of certain categories of petroleum or natural gas. Moreover, short term factors may impair the economic viability of certain reserves or
resources in any particular period.
Enerplus may not realize the anticipated benefits of its acquisitions or dispositions.
From time to time, Enerplus may acquire additional oil and natural gas properties and related assets. Achieving the anticipated benefits of such
acquisitions will depend in part on successfully consolidating functions and integrating operations, procedures and personnel in a timely and
efficient manner, as well as Enerplus’ ability to realize the anticipated growth opportunities and synergies from combining and integrating the
acquired assets and properties into Enerplus’ existing business. These activities will require the dedication of substantial management effort,
time and capital and other resources which may divert management’s focus, capital and other resources from other strategic opportunities and
operational matters during this process. The integration process may result in the loss of key employees and the disruption of ongoing business,
customer and employee relationships that may adversely affect Enerplus’ ability to achieve the anticipated benefits of future acquisitions. The
risk factors set forth in this Annual Information Form relating to the oil and natural gas business and the operations, reserves and resources of
Enerplus apply equally in respect of any future properties or assets that Enerplus may acquire. Enerplus generally conducts certain due diligence
in connection with acquisitions, but there can be no assurance that Enerplus will identify all of the potential risks and liabilities related to the
subject properties.
When acquiring assets, Enerplus is subject to inherent risks associated with predicting the future performance of those assets. Enerplus makes
certain estimates and assumptions respecting the prospectivity and characteristics of the assets it acquires which may not be realized over time.
As such, assets acquired may not possess the value Enerplus attributed to them, which could adversely impact Enerplus’ cash flows. To the
extent that Enerplus makes acquisitions with higher growth potential, the higher risks often associated with such potential may result in
increased chances that actual results may vary from Enerplus’ initial estimates. An initial assessment of an acquisition may be based on a report
by engineers or firms of engineers that have different evaluation methods, approaches and assumptions than those of Enerplus’ engineers, and
these initial assessments may differ significantly from Enerplus’ subsequent assessments.
Furthermore, potential investors should be aware that certain acquisitions, and in particular acquisitions of higher risk/higher growth assets, and
the development of those acquired assets has required and will require significant capital expenditures from Enerplus, and Enerplus may not
receive cash flow from operations from these acquisitions for several years or may receive cash flow in an amount less than anticipated.
Accordingly, the timing and amount of capital expenditures may adversely affect Enerplus’ cash flow.
Enerplus may also from time to time dispose of properties and assets, as evidenced by its disposition of significant non-core properties in 2010 as
described under ‘‘General Development of the Business’’. These dispositions may consist of non-core properties or assets or may consist of assets
or properties that are being monetized in order to fund alternative projects or development by Enerplus. There can be no assurance that
Enerplus will be successful in such dispositions or realize the amount of desired proceeds from such dispositions, or that such dispositions will be
viewed positively by the financial markets, and such dispositions may negatively affect Enerplus’ results of operations or the trading price of the
Common Shares.
E N E R P L U S 2010 ANNUAL INFORMATION FORM 49
An increase in operating costs or a decline in Enerplus’ production level could have a material adverse effect on results ofoperations and financial condition.
Higher operating costs for Enerplus’ properties will directly decrease the amount of Enerplus’ cash flow. Electricity, chemicals, supplies, energy
services and labour costs are a few of Enerplus’ operating costs that are susceptible to material fluctuation. The level of production from
Enerplus’ existing properties may decline at rates greater than anticipated due to unforeseen circumstances, many of which are beyond
Enerplus’ control. Higher operating costs or a significant decline in production could result in materially lower cash flow and, therefore, could
adversely affect the trading price of the Common Shares and reduce the amount that may be available for dividend payments by the
Corporation to shareholders.
Since a portion of Enerplus’ properties are not operated by Enerplus, results of operations may be adversely affected bythe failure of third party operators.
The continuing production from a property, and to some extent the marketing of that production, is dependent upon the ability of the operators
of Enerplus’ properties. As of December 31, 2010, approximately 28% of Enerplus’ production is from properties operated by third parties. This
results in significant reliance on third party operators in both the operation and development of such properties and control over capital
expenditures relating thereto. The timing and amount of capital required to be spent by Enerplus may differ from Enerplus’ expectations and
planning, and may impact the ability and/or cost of Enerplus to finance such expenditures, as well as adversely affect other parts of Enerplus’
business and operations. To the extent a third party operator fails to perform these duties properly, faces capital or liquidity constraints or
becomes insolvent, Enerplus’ results of operations will be negatively impacted.
Further, the operating agreements governing the properties not operated by Enerplus typically require the operator to conduct operations in a
good and ‘‘workmanlike’’ manner. These operating agreements generally provide, however, that the operator has no liability to the other
non-operating working interest owners for losses sustained or liabilities incurred, except for liabilities that may result from gross negligence or
wilful misconduct.
Enerplus is subject to risk of default by the counterparties to Enerplus’ contracts.
Enerplus is subject to the risk that the counterparties to its risk management contracts, marketing arrangements and operating agreements and
other suppliers of products and services may default on their obligations under such agreements or arrangements, including as a result of
liquidity requirements or insolvency. Furthermore, low oil and natural gas prices increase the risk of bad debts related to Enerplus’ joint venture
and industry partners. A failure by such counterparties to make payments or perform their operational or other obligations to Enerplus may
adversely affect the results of operations, cash flows and financial position of Enerplus.
Delays in payment for business operations could adversely affect Enerplus.
In addition to the usual delays in payment by purchasers of oil and natural gas to Enerplus or to the operators of Enerplus’ properties (and the
delays of those operators in remitting payment to Enerplus), payments between any of these parties may also be delayed by, among other
things: (i) capital or liquidity constraints experienced by such parties, including restrictions imposed by lenders; (ii) accounting delays or
adjustments for prior periods; (iii) delays in the sale or delivery of products or delays in the connection of wells to a gathering system; (iv) weather
related delays such as freeze-offs, flooding and premature thawing; (v) blowouts or other accidents; or (vi) recovery by the operator of expenses
incurred in the operation of the properties or the establishment by the operator of reserves for these expenses.
Any of these delays could reduce the amount of Enerplus’ cash flow and the payment of cash dividends to its shareholders in a given period and
expose Enerplus to additional third party credit risks.
Enerplus’ operations are subject to certain risks and liabilities inherent in the oil and natural gas business, some of whichmay not be covered by insurance.
Enerplus’ business and operations, including the drilling of oil and natural gas wells and the production and transportation of oil and natural
gas, are subject to certain risks inherent in the oil and natural gas business. These risks and hazards include encountering unexpected formations
or pressures, blow-outs, craterings and fires. Enerplus’ operations may also subject it to the risk of vandalism or terrorist threats, including
eco-terrorism. The foregoing hazards could result in personal injury, loss of life, reduced production volumes or environmental and other
damage to Enerplus’ property and the property of others. Enerplus cannot fully protect against all of these risks, nor are all of these risks
insurable. Although Enerplus carries liability, business interruption and property insurance in respect of such matters, there can be no assurance
50 E N E R P L U S 2010 ANNUAL INFORMATION FORM
that insurance will be adequate to cover all losses resulting from such events or that the lost production will be restored in a timely manner.
Enerplus may become liable for damages arising from these events against which it cannot insure or against which it may elect not to insure
because of high premium costs or other reasons. While Enerplus has both safety and environmental policies in place to protect its operators and
employees and to meet regulatory requirements in areas where they operate, any costs incurred to repair damages or pay liabilities would
adversely affect Enerplus’ financial position, including the amount of funds that may be available for dividend payments to shareholders.
In addition, the Marcellus Shale Gas and the Bakken oil resource plays involve certain additional risks and uncertainties. The drilling and
completion of wells and operations in the Bakken and in shale gas plays, and in particular the Marcellus shale region, present certain challenges
that differ from conventional oil and gas operations. Wells in these plays generally must be drilled deeper than in many other areas, which makes
the wells more expensive to drill and complete. The wells may also be more susceptible to mechanical problems associated with the drilling and
completion of the wells, such as casing collapse and lost equipment in the wellbore. In addition, the fracturing of the Bakken and the Marcellus
shale may be more extensive and complicated than fracturing the geological formations in Enerplus’ other areas of operation and requires
greater volumes of water than conventional wells. The management of water and the treatment of produced water from these wells may be
more costly than the management of produced water from other geologic formations.
Unforeseen title defects or litigation may result in a loss of entitlement to production, reserves and resources.
From time to time, Enerplus conducts title reviews in accordance with industry practice prior to purchases of assets. However, if conducted,
these reviews do not guarantee that an unforeseen defect in the chain of title will not arise and defeat Enerplus’ title to the purchased assets. If
this type of defect were to occur, Enerplus’ entitlement to the production and reserves (and, if applicable, resources) from the purchased assets
could be jeopardized. Furthermore, from time to time, Enerplus may have disputes with industry partners as to ownership rights of certain
properties or resources.
If Enerplus expands beyond its current areas of operations or expands the scope of operations beyond oil and natural gasproduction, Enerplus may face new challenges and risks. If Enerplus is unsuccessful in managing these challenges andrisks, its results of operations and financial condition could be adversely affected.
Enerplus may acquire oil and natural gas properties and assets outside the geographic areas in which it has historically conducted its business
and operations. The expansion of Enerplus’ activities into new resource plays and locations may present challenges and risks that Enerplus has
not faced in the past, including operational and additional regulatory matters. Enerplus’ failure to manage these challenges and risks
successfully may adversely affect results of operations and financial condition. Prior to 2009, Enerplus’ operations and expertise historically were
focused on conventional oil and natural gas production and development in the Western Canadian Sedimentary Basin, the Williston Basin and
the northwest and central United States. The acquisition of the Marcellus Properties in the northeast United States in September 2009
represented a new focus by Enerplus on shale gas outside its traditional geographic areas. Although Enerplus will, in some cases, rely
significantly upon its partners with respect to ongoing development, operations and certain future expansions in the Marcellus shale gas region,
Enerplus has relatively limited experience in the drilling and development of shale gas properties, and in particular the Marcellus shale
gas region.
In addition, Enerplus’ activities are not limited to oil and natural gas production and development, and Enerplus could acquire other energy
related assets. Expansion of Enerplus’ activities into new areas may present challenges and risks that it has not faced in the past, including
dealing with additional regulatory matters. If Enerplus does not manage these challenges and risks successfully, its results of operations and
financial condition could be adversely affected.
A decline in Enerplus’ ability to market oil and natural gas production could have a material adverse effect on itsproduction levels or on the price that Enerplus receives for production.
Enerplus’ business depends in part upon the availability, proximity and capacity of oil and natural gas gathering systems, pipelines and
processing facilities to provide access to markets for its production. Canadian federal and provincial, as well as United States federal and state,
regulation of oil and gas production, processing and transportation, tax and energy policies, general economic conditions, and changes in
supply and demand could adversely affect Enerplus’ ability to produce and market oil and natural gas. New resource plays generally experience a
sharp increase in the amount of production being produced in the area which could exceed the existing capacity of the various gathering,
processing and pipeline infrastructure. For example, pipeline and transportation constraints experienced by oil producers in Montana, North
Dakota and southeast Saskatchewan have become more pronounced as a result of increased drilling and development activities in these
E N E R P L U S 2010 ANNUAL INFORMATION FORM 51
regions. Additionally, as exploration and drilling in the Marcellus shale gas play increases, the amount of natural gas and associated NGLs being
produced by Enerplus and others could exceed the capacity of the various gathering and intrastate or interstate transportation pipelines
currently available in these areas. If these constraints remain unresolved, Enerplus’ ability to transport its production in these regions may be
impaired and could adversely impact Enerplus’ production volumes or realized prices from these areas.
While the third party pipelines generally expand capacity to meet market needs, there can be differences in timing between the growth of
production and the growth of pipeline capacity, and unfavourable economic conditions or financing terms may defer or prevent the completion
of certain pipeline projects or gathering systems that are planned for such areas. There are also occasionally operational reasons, including as a
result of maintenance activities, for curtailing transportation capacity. Accordingly, there can be periods where transportation capacity is
insufficient to accommodate all of the production from a given region, causing added expense and/or volume curtailments for all shippers. In
such event, Enerplus may have to defer development of or shut in its wells awaiting a pipeline connection or capacity and/or sell its production at
lower prices than it would otherwise realize or than Enerplus currently projects, which would adversely affect Enerplus’ results of and cash flow
from operations.
Enerplus may be unable to compete successfully with other organizations in the oil and natural gas industry.
The oil and natural gas industry is highly competitive. Enerplus competes for capital, acquisitions of reserves and/or resources, undeveloped
lands, skilled personnel, access to drilling rigs, service rigs and other equipment, access to processing facilities, pipeline and refining capacity and
in many other respects with a substantial number of other organizations, many of which may have greater technical and financial resources than
Enerplus. Some of these organizations not only explore for, develop and produce oil and natural gas but also conduct refining operations and
market oil and other products on a world-wide basis. As a result of these complementary activities, some of Enerplus’ competitors may have
greater and more diverse competitive resources to draw upon.
Additionally, as Enerplus is subject to taxation as a Canadian corporation beginning in 2011 as a result of the Conversion from an income trust to
a corporation, Enerplus may be at a competitive disadvantage to other industry participants such as pension resource corporations,
U.S. flow-through entities such as master limited partnerships and limited liability companies, and U.S. or other foreign corporations that are
able to minimize Canadian tax through the use of inter-company debt and cross-border tax planning measures or who have access to lower cost
of capital.
Enerplus’ operation of oil and natural gas wells could subject it to environmental costs, claims and liabilities.
The oil and natural gas industry is subject to extensive environmental regulation pursuant to local, provincial and federal legislation in Canada
and federal and state laws and regulations in the United States. A breach of that legislation may result in the imposition of fines or the issuance
of ‘‘clean up’’ orders. Legislation regulating Enerplus’ industry may be changed to impose higher standards and potentially more costly
obligations, such as legislation that would require significant reductions in greenhouse gas emissions. See ‘‘Industry Conditions – Environmental
Regulation’’ for a summary of certain proposals. Although the actual form such legislation or regulation may take is largely unknown at this
time, the implementation of more stringent environmental legislation or regulatory requirements may result in additional costs for oil and
natural gas producers such as Enerplus, and such costs may be significant.
Enerplus is not fully insured against certain environmental risks, either because such insurance is not available or because of high premium costs.
In particular, insurance against risks from environmental pollution occurring over time (as opposed to sudden and catastrophic damages) is not
available on economically reasonable terms. Accordingly, Enerplus’ properties may be subject to liability due to hazards that cannot be insured
against, or that have not been insured against due to prohibitive premium costs or for other reasons.
Enerplus does not establish a separate reclamation fund for the purpose of funding its estimated future environmental and reclamation
obligations. Enerplus cannot assure investors that it will be able to satisfy its future environmental and reclamation obligations. Any site
reclamation or abandonment costs incurred in the ordinary course, in a specific period, will be funded out of cash flows and, therefore, will
reduce the amounts that may be available to pay as dividends to shareholders. Should Enerplus be unable to fully fund the cost of remedying an
environmental claim, Enerplus might be required to suspend operations or enter into interim compliance measures pending completion of the
required remedy.
Enerplus utilizes horizontal drilling, multi-stage hydraulic fracturing, specially formulated drilling fluids and other technologies in connection
with its drilling and completion activities. Recently there has been some public concern over the hydraulic fracturing process with regards to
shale gas formations in the United States and eastern Canada. Most of these concerns have raised questions regarding the drilling fluids used in
52 E N E R P L U S 2010 ANNUAL INFORMATION FORM
the fracturing process, their effect on fresh water aquifers, the use of water in connection with completion operations and the ability of such
water to be recycled. Certain government and regulatory agencies in Canada and the United States have begun investigating the potential risks
associated with the hydraulic fracturing process.
It is anticipated that federal, provincial and state regulatory frameworks to address concerns related to hydraulic fracturing will continue to
emerge. While Enerplus is unable to predict the impact of any potential regulations upon its business, the implementation of new regulations
with respect to water usage or hydraulic fracturing generally could increase Enerplus’ costs of compliance, operating costs, the risk of litigation
and environmental liability, or negatively impact the Corporation’s prospects, any of which may have a material adverse effect on Enerplus’
business, financial condition, results of operations.
Enerplus’ expanded scope of activities and enlarged shareholder base may attract increased criticism and costly litigation.
The expansion of Enerplus’ business activities, both geographically and with a new focus on exploration, may draw increased attention from
special interest groups opposed to development, which could have an adverse effect on market value. Higher visibility among investors may
expose the Corporation to greater risk of class action lawsuits related to, among other things, securities and environmental matters.
Changes in tax and other laws may adversely affect Enerplus and its shareholders.
Income tax laws, including tax laws that may affect the taxation of the Corporation or the Corporation’s dividends to its shareholders, or other
laws or government incentive programs relating to the oil and gas industry, may be changed or interpreted in a manner that adversely affects the
Corporation and its shareholders. Additionally, tax authorities having jurisdiction over Enerplus (whether as a result of Enerplus’ operations or
financing structures) or its securityholders may change or interpret applicable tax laws or treaties or administrative positions in a manner which is
detrimental to Enerplus or its securityholders, or may disagree with how Enerplus calculates its income for tax purposes.
Government regulations and required regulatory approvals may adversely impact Enerplus’ operations and result inincreased operating and capital costs.
The oil and gas industry operates under federal, provincial, state and municipal legislation and regulation governing such matters as royalties,
land tenure, prices, production rates, environmental protection controls, well and facility design and operation, income, the exportation of
crude oil, natural gas and other products, as well as other matters. The industry is also subject to regulation by governments in such matters as
the awarding or acquisition of exploration and production rights, the imposition of specific drilling obligations, control over the development
and abandonment of fields (including restrictions on production), and possibly expropriation or cancellation of contract rights. See ‘‘Industry
Conditions’’. To the extent that Enerplus fails to comply with applicable government regulations or regulatory approvals, Enerplus may be
subject to fines, enforcement proceedings (including ‘‘enforcement ladders’’ with varying penalties) and the restriction or complete revocation
of rights to conduct its business, or to apply for regulatory approvals necessary to conduct its business, in the ordinary course.
Government regulations may be changed from time to time in response to economic or political conditions. Additionally, Enerplus’ entry into
new jurisdictions and its adoption of new technology may attract additional regulatory oversight which could result in higher costs or require
changes to proposed operations. For example, U.S. federal and state governments have increased their scrutiny of the usage and disposal of
chemicals and water used in fracturing procedures in the Marcellus shale, while cities such as Philadelphia and New York have called for bans on
drilling in their local watersheds. The State of Maryland is currently reviewing its oil and gas drilling and development permitting process, which
could potentially include limiting or prohibiting certain types of oil and gas activities in the state. More activity by Enerplus on Indian land in
North Dakota also may increase compliance obligations under local or tribal rules. The exercise of discretion by governmental authorities under
existing regulations, the implementation of new regulations or the modification of existing regulations affecting the crude oil and natural gas
industry could negatively impact the development of oil and gas properties and assets, reduce demand for crude oil and natural gas or impose
increased costs on oil and gas companies, any of which could have a material adverse impact on Enerplus.
Additionally, various levels of Canadian and United States governments are considering legislation to reduce emissions of greenhouse gases. See
‘‘Industry Conditions – Environmental Regulation’’ for a description of these initiatives. Because Enerplus’ operations emit various types of
greenhouse gases, such new legislation or regulation could increase the costs related to operating and maintaining Enerplus’ facilities and could
require it to install new emission controls on its facilities, acquire allowances for its greenhouse gas emissions, pay taxes related to its greenhouse
gas emissions and administer and manage a greenhouse gas emissions program. Enerplus is not able at this time to estimate such increased
E N E R P L U S 2010 ANNUAL INFORMATION FORM 53
costs; however, they could be significant. Any of the foregoing could have adverse effects on Enerplus’ business, financial position, results of
operations and prospects.
In Alberta, the conversion of Enerplus’ business from an income trust to a corporation effective January 1, 2011 pursuant to the Conversion
included the amalgamation of different Energy Resources Conservation Board (‘‘ERCB’’) licensees into one. As part of the ERCB compliance
strategy, the Corporation’s compliance performance will be monitored for an unacceptable risk rate, ratio, percentage, or number of
non-compliance’s in either the same or different compliance categories that, prior to the amalgamation, were distributed amongst many license
holders. If more than two ERCB high risks are received in the same category, Enerplus could be put on ‘‘Monitoring’’ or ‘‘Persistent’’
non-compliance status, which could lead to enforcement consequences.
The Corporation’s adoption of IFRS may adversely impact the Corporation’s reported financial results.
The requirement for the Corporation to implement IFRS to replace Canadian GAAP effective January 1, 2011 may materially affect the
Corporation’s financial results as reported in its financial statements and its results of operations. For a detailed description of the impact of the
adoption of IFRS on Enerplus’ financial statements, see ‘‘Recent Canadian Accounting and Related Pronouncements – Convergence of Canadian
GAAP with International Financial Reporting Standards (‘‘IFRS’’)’’ in Enerplus’ MD&A for the year ended December 31, 2010. In addition,
following the adoption of IFRS, Enerplus will no longer be required to reconcile its financial statements to U.S. GAAP under certain U.S. SEC
requirements. IFRS may differ from U.S. GAAP in some significant respects, and therefore Enerplus’ financial information presented in
accordance with IFRS may not be directly comparable with financial information presented by U.S. companies in accordance with U.S. GAAP.
Lower oil and gas prices and higher costs increase the risk of write-downs of Enerplus’ oil and gas property assets andgoodwill.
Under IFRS, when indicators of impairment exist, the carrying value of the Exploration and Evaluation (‘‘E&E’’) assets as well as each Cash
Generating Unit (‘‘CGU’’), including goodwill attributed to the CGU, is compared to its recoverable amount. The recoverable amount is defined
as the higher of the fair value less cost to sell or value in use. A decline in oil and gas prices is an indicator of CGU impairment and may result in
the estimated recoverable amount of Enerplus’ developed oil and natural gas properties being less than their carrying value on the balance
sheet, resulting in a write-down of the CGU assets. All CGU write-downs are first recorded against the goodwill in the CGU, with the remainder
reducing the book value of the developed oil and gas assets in the CGU. E&E assets are tested for impairment prior to being transferred to a
CGU. Where the recoverable amount is less than the book value of E&E assets, the asset is reduced to the recoverable amount.
The offset for any goodwill, E&E or CGU impairment is recorded as a charge to net income. While these write-downs would not affect cash flow
from operations, the charge to earnings may be viewed unfavourably in the market. Impairments to goodwill and E&E assets are not reversed,
however should the conditions that caused the CGU asset impairment reverse in the future Enerplus would be required to reverse all, or a
portion of the impairment previously recorded.
The loss of Enerplus’ key management and other personnel could impact its business.
Shareholders are entirely dependent on the management of Enerplus with respect to the acquisition of oil and natural gas properties and assets,
the exploration for and development of additional reserves and resources and the management and administration of all matters relating to
Enerplus and its properties and assets. The loss of the services of key individuals could have a detrimental effect on the Corporation. Further,
Enerplus’ recent acquisitions and activities in various resource plays will require different skill sets than those needed in developing its traditional
asset base. There is no assurance that the Corporation will be able to attract and retain personnel with the technical expertise necessary to
develop such properties, which could adversely effect the Corporation’s exploration and development plans.
Conflicts of interest may arise between the Corporation and its directors and officers.
Circumstances may arise where directors and officers of the Corporation are directors or officers of corporations or other entities involved in the
oil and gas industry which are in competition to the interests of Enerplus. See ‘‘Directors and Officers – Conflicts of Interest’’. No assurances can
be given that opportunities identified by such persons will be provided to Enerplus.
Changes in market-based factors may adversely affect the trading price of the Common Shares.
The market price of the Common Shares is primarily a function of the value of the properties owned by Enerplus and anticipated dividends paid
to its shareholders. The market price of the Common Shares is therefore sensitive to a variety of market-based factors including, but not limited
54 E N E R P L U S 2010 ANNUAL INFORMATION FORM
to, interest rates and the comparability of the Common Shares to other yield-oriented securities. Any changes in these market-based factors
may adversely affect the trading price of the Common Shares.
United States and other non-resident shareholders may be subject to additional taxation.
The Tax Act and the tax treaties between Canada and other countries may impose additional withholding or other taxes on the cash dividends or
other property paid by the Corporation to shareholders who are not residents of Canada, and these taxes may change from time to time. In
addition, the country in which the shareholder is resident may impose local taxes on such dividends and these taxes may change from time to
time. For example, in the United States, the ‘‘qualified dividend’’ rate of 15% tax applied to the Corporation’s dividends under current
U.S. federal income tax laws was scheduled to expire at the end of 2010 but was extended through 2012, but there is no assurance that this
reduced tax rate will be extended beyond such date in its present form by the U.S. government.
Non-resident shareholders are subject to foreign exchange risk on the dividends that they may receive from theCorporation.
Any dividends that may be declared by the Corporation from time to time are declared in Canadian dollars and converted to foreign
denominated currencies at the spot exchange rate at the time of payment. As a consequence, investors are subject to foreign exchange risk. To
the extent that the Canadian dollar weakens with respect to their currency, the amount of the dividend will be reduced when converted to their
home currency.
The ability of United States and other non-resident shareholder investors to enforce civil remedies may be limited.
The Corporation is formed under the laws of Alberta, Canada, and its principal place of business is in Canada. Most of the directors and officers
of the Corporation are residents of Canada and some of the experts who provide services to the Corporation (such as its auditors and some of its
independent reserve engineers) are residents of Canada, and all or a substantial portion of their assets and the Corporation’s assets are located
within Canada. As a result, it may be difficult for investors in the United States or other non-Canadian jurisdictions (a ‘‘Foreign Jurisdiction’’) to
effect service of process within such Foreign Jurisdiction upon such directors, officers and representatives of experts who are not residents of the
Foreign Jurisdiction or to enforce against them judgments of courts of the applicable Foreign Jurisdiction based upon civil liability under the
securities laws of such Foreign Jurisdiction, including United States federal securities laws or the securities laws of any state within the
United States. In particular, there is doubt as to the enforceability in Canada against the Corporation or any of its directors, officers or
representatives of experts who are not residents of the United States, in original actions or in actions for enforcement of judgments of
United States courts of liabilities based solely upon the United States federal securities laws or the securities laws of any state within the
United States.
E N E R P L U S 2010 ANNUAL INFORMATION FORM 55
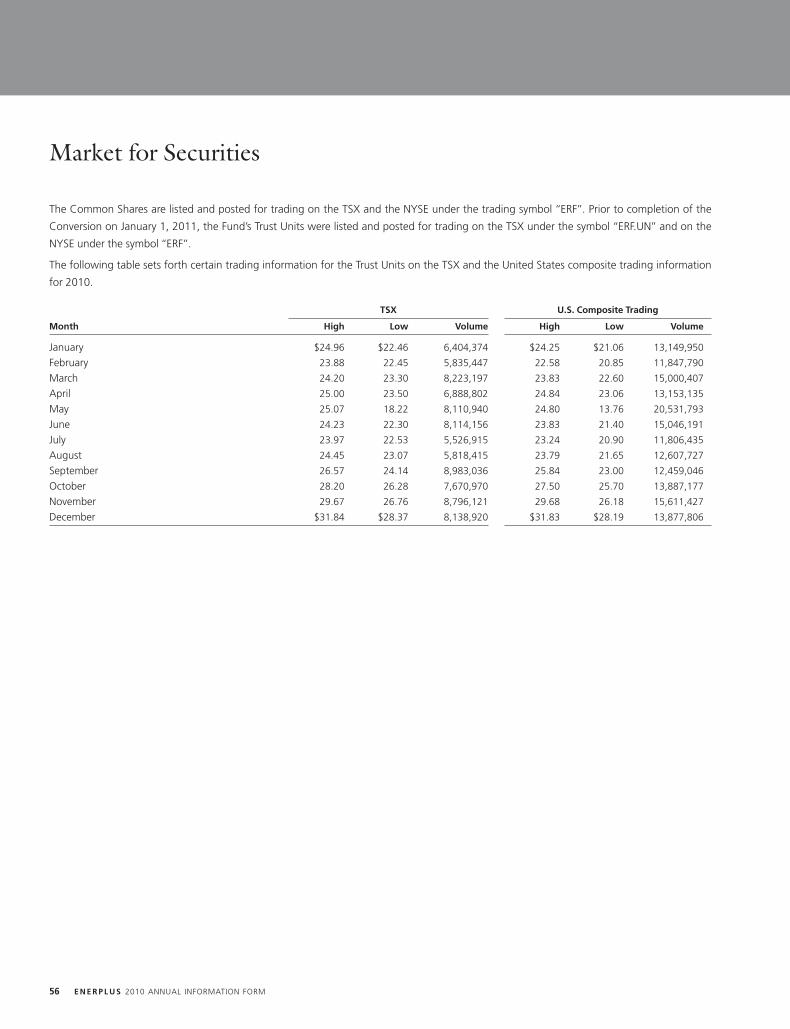
Market for Securities
The Common Shares are listed and posted for trading on the TSX and the NYSE under the trading symbol ‘‘ERF’’. Prior to completion of the
Conversion on January 1, 2011, the Fund’s Trust Units were listed and posted for trading on the TSX under the symbol ‘‘ERF.UN’’ and on the
NYSE under the symbol ‘‘ERF’’.
The following table sets forth certain trading information for the Trust Units on the TSX and the United States composite trading information
for 2010.
TSX U.S. Composite Trading
Month High Low Volume High Low Volume
January $24.96 $22.46 6,404,374 $24.25 $21.06 13,149,950
February 23.88 22.45 5,835,447 22.58 20.85 11,847,790
March 24.20 23.30 8,223,197 23.83 22.60 15,000,407
April 25.00 23.50 6,888,802 24.84 23.06 13,153,135
May 25.07 18.22 8,110,940 24.80 13.76 20,531,793
June 24.23 22.30 8,114,156 23.83 21.40 15,046,191
July 23.97 22.53 5,526,915 23.24 20.90 11,806,435
August 24.45 23.07 5,818,415 23.79 21.65 12,607,727
September 26.57 24.14 8,983,036 25.84 23.00 12,459,046
October 28.20 26.28 7,670,970 27.50 25.70 13,887,177
November 29.67 26.76 8,796,121 29.68 26.18 15,611,427
December $31.84 $28.37 8,138,920 $31.83 $28.19 13,877,806
56 E N E R P L U S 2010 ANNUAL INFORMATION FORM
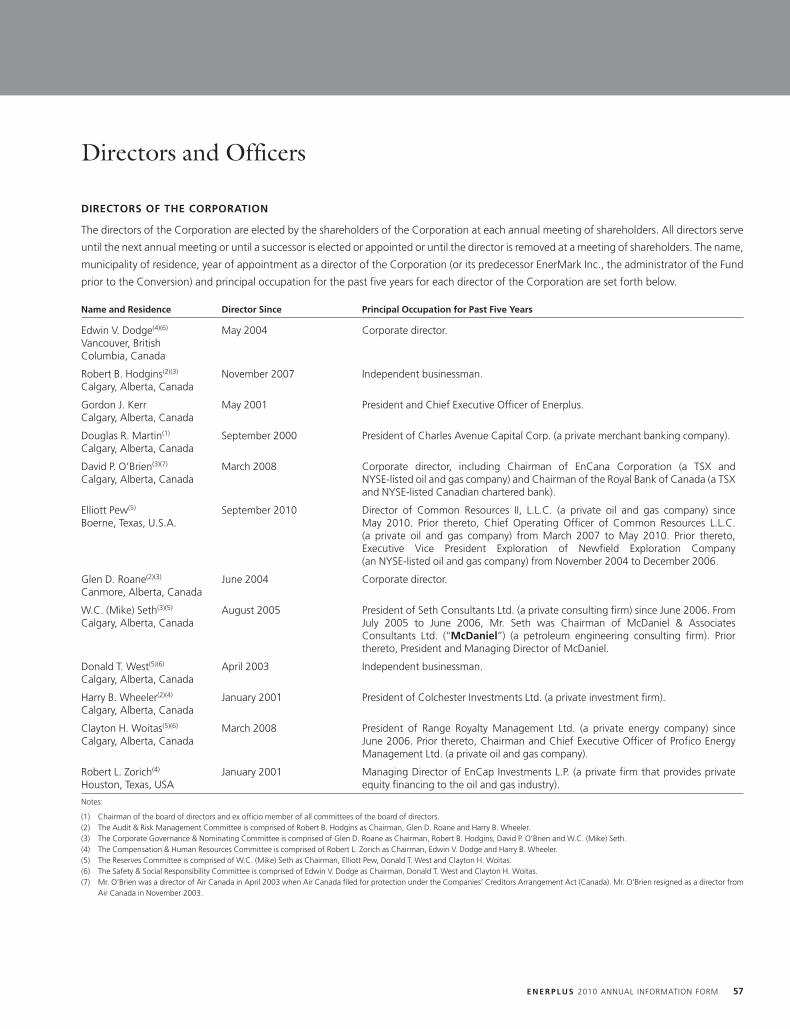
Directors and Officers
DIRECTORS OF THE CORPORATION
The directors of the Corporation are elected by the shareholders of the Corporation at each annual meeting of shareholders. All directors serve
until the next annual meeting or until a successor is elected or appointed or until the director is removed at a meeting of shareholders. The name,
municipality of residence, year of appointment as a director of the Corporation (or its predecessor EnerMark Inc., the administrator of the Fund
prior to the Conversion) and principal occupation for the past five years for each director of the Corporation are set forth below.
Name and Residence Director Since Principal Occupation for Past Five Years
Edwin V. Dodge(4)(6) May 2004 Corporate director.Vancouver, BritishColumbia, Canada
Robert B. Hodgins(2)(3) November 2007 Independent businessman.Calgary, Alberta, Canada
Gordon J. Kerr May 2001 President and Chief Executive Officer of Enerplus.Calgary, Alberta, Canada
Douglas R. Martin(1) September 2000 President of Charles Avenue Capital Corp. (a private merchant banking company).Calgary, Alberta, Canada
David P. O’Brien(3)(7) March 2008 Corporate director, including Chairman of EnCana Corporation (a TSX andCalgary, Alberta, Canada NYSE-listed oil and gas company) and Chairman of the Royal Bank of Canada (a TSX
and NYSE-listed Canadian chartered bank).
Elliott Pew(5) September 2010 Director of Common Resources II, L.L.C. (a private oil and gas company) sinceBoerne, Texas, U.S.A. May 2010. Prior thereto, Chief Operating Officer of Common Resources L.L.C.
(a private oil and gas company) from March 2007 to May 2010. Prior thereto,Executive Vice President Exploration of Newfield Exploration Company(an NYSE-listed oil and gas company) from November 2004 to December 2006.
Glen D. Roane(2)(3) June 2004 Corporate director.Canmore, Alberta, Canada
W.C. (Mike) Seth(3)(5) August 2005 President of Seth Consultants Ltd. (a private consulting firm) since June 2006. FromCalgary, Alberta, Canada July 2005 to June 2006, Mr. Seth was Chairman of McDaniel & Associates
Consultants Ltd. (‘‘McDaniel’’) (a petroleum engineering consulting firm). Priorthereto, President and Managing Director of McDaniel.
Donald T. West(5)(6) April 2003 Independent businessman.Calgary, Alberta, Canada
Harry B. Wheeler(2)(4) January 2001 President of Colchester Investments Ltd. (a private investment firm).Calgary, Alberta, Canada
Clayton H. Woitas(5)(6) March 2008 President of Range Royalty Management Ltd. (a private energy company) sinceCalgary, Alberta, Canada June 2006. Prior thereto, Chairman and Chief Executive Officer of Profico Energy
Management Ltd. (a private oil and gas company).
Robert L. Zorich(4) January 2001 Managing Director of EnCap Investments L.P. (a private firm that provides privateHouston, Texas, USA equity financing to the oil and gas industry).
Notes:
(1) Chairman of the board of directors and ex officio member of all committees of the board of directors.(2) The Audit & Risk Management Committee is comprised of Robert B. Hodgins as Chairman, Glen D. Roane and Harry B. Wheeler.(3) The Corporate Governance & Nominating Committee is comprised of Glen D. Roane as Chairman, Robert B. Hodgins, David P. O’Brien and W.C. (Mike) Seth.(4) The Compensation & Human Resources Committee is comprised of Robert L. Zorich as Chairman, Edwin V. Dodge and Harry B. Wheeler.(5) The Reserves Committee is comprised of W.C. (Mike) Seth as Chairman, Elliott Pew, Donald T. West and Clayton H. Woitas.(6) The Safety & Social Responsibility Committee is comprised of Edwin V. Dodge as Chairman, Donald T. West and Clayton H. Woitas.(7) Mr. O’Brien was a director of Air Canada in April 2003 when Air Canada filed for protection under the Companies’ Creditors Arrangement Act (Canada). Mr. O’Brien resigned as a director from
Air Canada in November 2003.
E N E R P L U S 2010 ANNUAL INFORMATION FORM 57
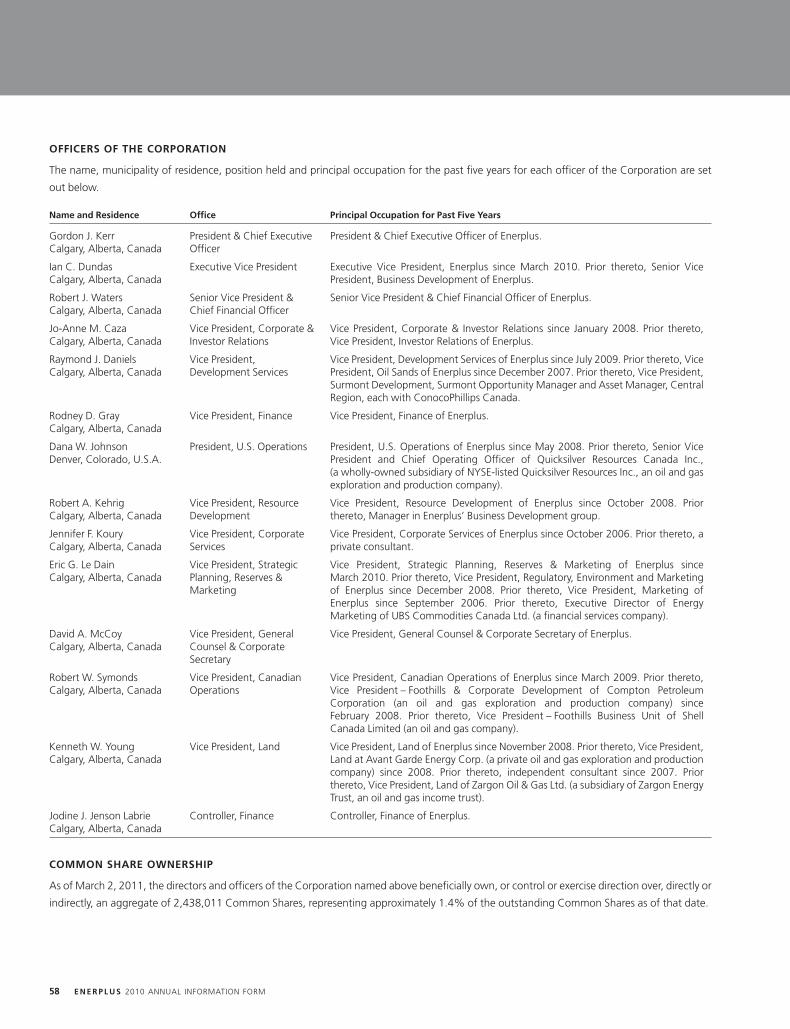
OFFICERS OF THE CORPORATION
The name, municipality of residence, position held and principal occupation for the past five years for each officer of the Corporation are set
out below.
Name and Residence Office Principal Occupation for Past Five Years
Gordon J. Kerr President & Chief Executive President & Chief Executive Officer of Enerplus.Calgary, Alberta, Canada Officer
Ian C. Dundas Executive Vice President Executive Vice President, Enerplus since March 2010. Prior thereto, Senior ViceCalgary, Alberta, Canada President, Business Development of Enerplus.
Robert J. Waters Senior Vice President & Senior Vice President & Chief Financial Officer of Enerplus.Calgary, Alberta, Canada Chief Financial Officer
Jo-Anne M. Caza Vice President, Corporate & Vice President, Corporate & Investor Relations since January 2008. Prior thereto,Calgary, Alberta, Canada Investor Relations Vice President, Investor Relations of Enerplus.
Raymond J. Daniels Vice President, Vice President, Development Services of Enerplus since July 2009. Prior thereto, ViceCalgary, Alberta, Canada Development Services President, Oil Sands of Enerplus since December 2007. Prior thereto, Vice President,
Surmont Development, Surmont Opportunity Manager and Asset Manager, CentralRegion, each with ConocoPhillips Canada.
Rodney D. Gray Vice President, Finance Vice President, Finance of Enerplus.Calgary, Alberta, Canada
Dana W. Johnson President, U.S. Operations President, U.S. Operations of Enerplus since May 2008. Prior thereto, Senior ViceDenver, Colorado, U.S.A. President and Chief Operating Officer of Quicksilver Resources Canada Inc.,
(a wholly-owned subsidiary of NYSE-listed Quicksilver Resources Inc., an oil and gasexploration and production company).
Robert A. Kehrig Vice President, Resource Vice President, Resource Development of Enerplus since October 2008. PriorCalgary, Alberta, Canada Development thereto, Manager in Enerplus’ Business Development group.
Jennifer F. Koury Vice President, Corporate Vice President, Corporate Services of Enerplus since October 2006. Prior thereto, aCalgary, Alberta, Canada Services private consultant.
Eric G. Le Dain Vice President, Strategic Vice President, Strategic Planning, Reserves & Marketing of Enerplus sinceCalgary, Alberta, Canada Planning, Reserves & March 2010. Prior thereto, Vice President, Regulatory, Environment and Marketing
Marketing of Enerplus since December 2008. Prior thereto, Vice President, Marketing ofEnerplus since September 2006. Prior thereto, Executive Director of EnergyMarketing of UBS Commodities Canada Ltd. (a financial services company).
David A. McCoy Vice President, General Vice President, General Counsel & Corporate Secretary of Enerplus.Calgary, Alberta, Canada Counsel & Corporate
Secretary
Robert W. Symonds Vice President, Canadian Vice President, Canadian Operations of Enerplus since March 2009. Prior thereto,Calgary, Alberta, Canada Operations Vice President – Foothills & Corporate Development of Compton Petroleum
Corporation (an oil and gas exploration and production company) sinceFebruary 2008. Prior thereto, Vice President – Foothills Business Unit of ShellCanada Limited (an oil and gas company).
Kenneth W. Young Vice President, Land Vice President, Land of Enerplus since November 2008. Prior thereto, Vice President,Calgary, Alberta, Canada Land at Avant Garde Energy Corp. (a private oil and gas exploration and production
company) since 2008. Prior thereto, independent consultant since 2007. Priorthereto, Vice President, Land of Zargon Oil & Gas Ltd. (a subsidiary of Zargon EnergyTrust, an oil and gas income trust).
Jodine J. Jenson Labrie Controller, Finance Controller, Finance of Enerplus.Calgary, Alberta, Canada
COMMON SHARE OWNERSHIP
As of March 2, 2011, the directors and officers of the Corporation named above beneficially own, or control or exercise direction over, directly or
indirectly, an aggregate of 2,438,011 Common Shares, representing approximately 1.4% of the outstanding Common Shares as of that date.
58 E N E R P L U S 2010 ANNUAL INFORMATION FORM
CONFLICTS OF INTEREST
Certain of the directors and officers named above may be directors or officers of issuers which are in competition with the Corporation, and as
such may encounter conflicts of interests in the administration of their duties with respect to the Corporation. In situations where conflicts of
interest arise, the Corporation expects the applicable director or officer to declare the conflict and, if a director of the Corporation, abstain from
voting in respect of such matters on behalf of the Corporation.
See ‘‘Risk Factors – Conflicts of interest may arise between the Corporation and its directors and officers’’.
AUDIT & RISK MANAGEMENT COMMITTEE DISCLOSURE
The disclosure regarding the Corporation’s Audit & Risk Management Committee required under National Instrument 52-110 adopted by
certain of the Canadian securities regulatory authorities is contained in Appendix D to this Annual Information Form.
Legal Proceedings and Regulatory Actions
Enerplus is involved in various claims and litigation arising in the normal course of business. While the outcome of these matters is uncertain and
there can be no assurance that such matters will be resolved in Enerplus’ favour, Enerplus does not currently believe that the outcome of any
pending or threatened proceedings related to these or other matters, or the amounts which Enerplus may be required to pay by reason thereof,
would have a material adverse impact on its financial position, results of operation or liquidity. Enerplus is not and was not during 2010 a party
to, and none of Enerplus’ property is or was during 2010 the subject of, any legal proceeding that involves a claim for damages (exclusive of
interest and costs) greater than 10% of its current assets as at December 31, 2010, and Enerplus has no knowledge of any such proceeding
being contemplated.
Interest of Management and Others in Material Transactions
To the knowledge of the directors and executive officers of the Corporation, none of the directors or executive officers of the Corporation and
no person or company that is the direct or indirect beneficial owner of, or who exercises control or direction over, more than 10% of any class or
series of the Corporation’s securities, nor any associate or affiliate of any of the foregoing, has had any material interest, direct or indirect, in any
transaction with Enerplus since January 1, 2008 or in any proposed transaction that has materially affected or is reasonably expected to
materially affect Enerplus.
E N E R P L U S 2010 ANNUAL INFORMATION FORM 59
Material Contracts and Documents Affecting theRights of Securityholders
Enerplus is not a party to any contracts material to its business or operations, other than contracts entered into in the normal course of business.
Copies of the following documents entered into the normal course of business and relating to the Credit Facilities have been filed on the Fund’s
SEDAR profile at www.sedar.com and on Form 6-K on the Fund’s EDGAR profile at www.sec.gov, as they were filed prior to the January 1, 2011
Conversion:
1. Bank Credit Facility, together with the First Amending Agreement, Second Amending Agreement, Third Amending Agreement and Fourth
Amending Agreement (March 18, 2008);
2. Fifth Amending Agreement to the Bank Credit Facility (July 21, 2010);
3. Form of the Note Purchase Agreement for the Senior Unsecured Notes issued in 2002, together with the First Amendment and Second
Amendment (March 18, 2008);
4. Third Amendment to the Note Purchase Agreement for the Senior Unsecured Notes issued in 2002 (SEDAR – November 10, 2010;
EDGAR – November 11, 2010);
5. Form of the Note Purchase Agreement for the Senior Unsecured Notes issued in 2003, together with the First Amendment
(March 18, 2008);
6. Second Amendment to the Note Purchase Agreement for the Senior Unsecured Notes issued in 2003 (SEDAR – November 10, 2010;
EDGAR – November 11, 2010); and
7. Form of the Note Purchase Agreement for the Senior Unsecured Notes issued in 2009 (SEDAR – June 23, 2009; EDGAR – June 25, 2009).
Copies of the following documents affecting the rights of securityholders have been filed on the Corporation’s SEDAR profile at www.sedar.com
and on Form 6-K on the Corporation’s EDGAR profile at www.sec.gov, as they were filed after the January 1, 2011 Conversion:
1. the Articles of Amalgamation and bylaws of the Corporation (January 5, 2011); and
2. the Shareholder Rights Plan, as described under ‘‘Description of Share Capital – Shareholder Rights Plan’’ (January 5, 2011).
Interests of Experts
McDaniel prepared the McDaniel Reports in respect of the reserves attributable to Enerplus’ oil and natural gas properties in Canada and the
western United States, a summary of which is contained in this Annual Information Form. McDaniel also audited the estimate of contingent
resources attributable to Enerplus’ interests in the Fort Berthold, North Dakota area, which is referred to in this Annual Information Form. As of
the dates of the McDaniel Reports, the ‘‘designated professionals’’ (as defined in Form 51-102F2 – Annual Information Form of the Canadian
securities regulatory authorities) of McDaniel, as a group, beneficially owned, directly or indirectly, less than 1% of the Corporation’s
outstanding Common Shares. Haas prepared the Haas Report in respect of the reserves and contingent resources attributable to Enerplus’
interests in the Marcellus Properties, a summary of which is contained in this Annual Information Form. As of the date of the Haas Report, the
designated professionals of Haas, as a group, beneficially owned, directly or indirectly, less than 1% of the Corporation’s outstanding
Common Shares.
The auditors of the Fund are Deloitte & Touche LLP, Independent Registered Chartered Accountants, Calgary, Alberta. Deloitte & Touche LLP has
confirmed that it is independent within the meaning of the Rules of Professional Conduct of the Institute of Chartered Accountants of Alberta,
the Securities Acts administered by the Securities and Exchange Commission and the requirements of the Independence Standards Board.
60 E N E R P L U S 2010 ANNUAL INFORMATION FORM
Transfer Agent and Registrar
The transfer agent and registrar for the Common Shares in Canada is Computershare Trust Company of Canada, at its principal offices in
Calgary, Alberta and Toronto, Ontario. Computershare Trust Company N.A. at its principal offices in Golden, Colorado is the transfer agent for
the Common Shares in the United States.
Additional Information
Additional information relating to the Corporation may be found on the Corporation’s profile on the SEDAR website at www.sedar.com, on the
EDGAR website at www.sec.gov and on the Corporation’s website at www.enerplus.com. Additional information, including directors’ and
officers’ remuneration and indebtedness, principal holders of the Corporation’s securities and securities authorized for issuance under equity
compensation plans, as applicable, is contained in the Corporation’s information circular and proxy statement dated March 11, 2011 for its
2011 annual general meeting of shareholders. Furthermore, additional financial information relating to the Corporation is provided in Enerplus’
audited consolidated financial statements and MD&A for the year ended December 31, 2010. Shareholders who wish to receive printed copies
of these documents free of charge should contact the Corporation’s Corporate & Investor Relations Department using the contact information
on the final page of this Annual Information Form.
E N E R P L U S 2010 ANNUAL INFORMATION FORM 61

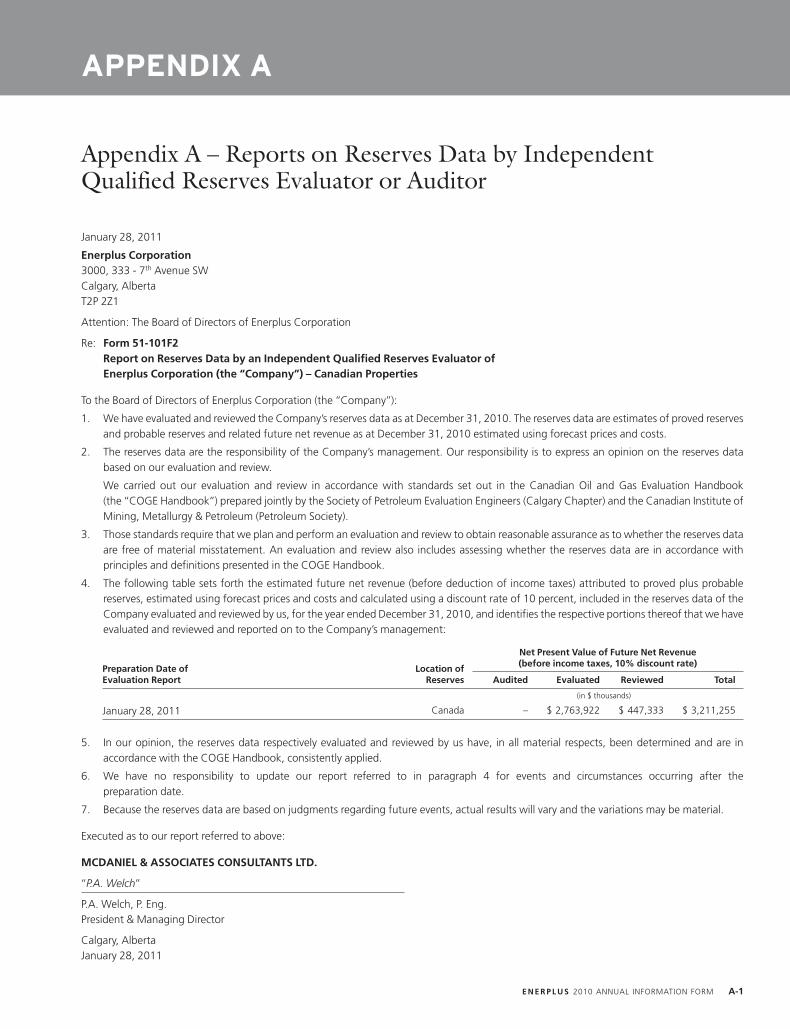
Appendix A – Reports on Reserves Data by IndependentQualified Reserves Evaluator or Auditor
January 28, 2011
Enerplus Corporation3000, 333 - 7th Avenue SWCalgary, AlbertaT2P 2Z1
Attention: The Board of Directors of Enerplus Corporation
Re: Form 51-101F2Report on Reserves Data by an Independent Qualified Reserves Evaluator ofEnerplus Corporation (the ‘‘Company’’) – Canadian Properties
To the Board of Directors of Enerplus Corporation (the ‘‘Company’’):
1. We have evaluated and reviewed the Company’s reserves data as at December 31, 2010. The reserves data are estimates of proved reservesand probable reserves and related future net revenue as at December 31, 2010 estimated using forecast prices and costs.
2. The reserves data are the responsibility of the Company’s management. Our responsibility is to express an opinion on the reserves databased on our evaluation and review.
We carried out our evaluation and review in accordance with standards set out in the Canadian Oil and Gas Evaluation Handbook(the ‘‘COGE Handbook’’) prepared jointly by the Society of Petroleum Evaluation Engineers (Calgary Chapter) and the Canadian Institute ofMining, Metallurgy & Petroleum (Petroleum Society).
3. Those standards require that we plan and perform an evaluation and review to obtain reasonable assurance as to whether the reserves dataare free of material misstatement. An evaluation and review also includes assessing whether the reserves data are in accordance withprinciples and definitions presented in the COGE Handbook.
4. The following table sets forth the estimated future net revenue (before deduction of income taxes) attributed to proved plus probablereserves, estimated using forecast prices and costs and calculated using a discount rate of 10 percent, included in the reserves data of theCompany evaluated and reviewed by us, for the year ended December 31, 2010, and identifies the respective portions thereof that we haveevaluated and reviewed and reported on to the Company’s management:
Net Present Value of Future Net Revenue(before income taxes, 10% discount rate)Preparation Date of Location of
Evaluation Report Reserves Audited Evaluated Reviewed Total
(in $ thousands)
Canada – $ 2,763,922 $ 447,333 $ 3,211,255January 28, 2011
5. In our opinion, the reserves data respectively evaluated and reviewed by us have, in all material respects, been determined and are inaccordance with the COGE Handbook, consistently applied.
6. We have no responsibility to update our report referred to in paragraph 4 for events and circumstances occurring after thepreparation date.
7. Because the reserves data are based on judgments regarding future events, actual results will vary and the variations may be material.
Executed as to our report referred to above:
MCDANIEL & ASSOCIATES CONSULTANTS LTD.
‘‘P.A. Welch’’
P.A. Welch, P. Eng.President & Managing Director
Calgary, AlbertaJanuary 28, 2011
E N E R P L U S 2010 ANNUAL INFORMATION FORM A-1
APPENDIX A
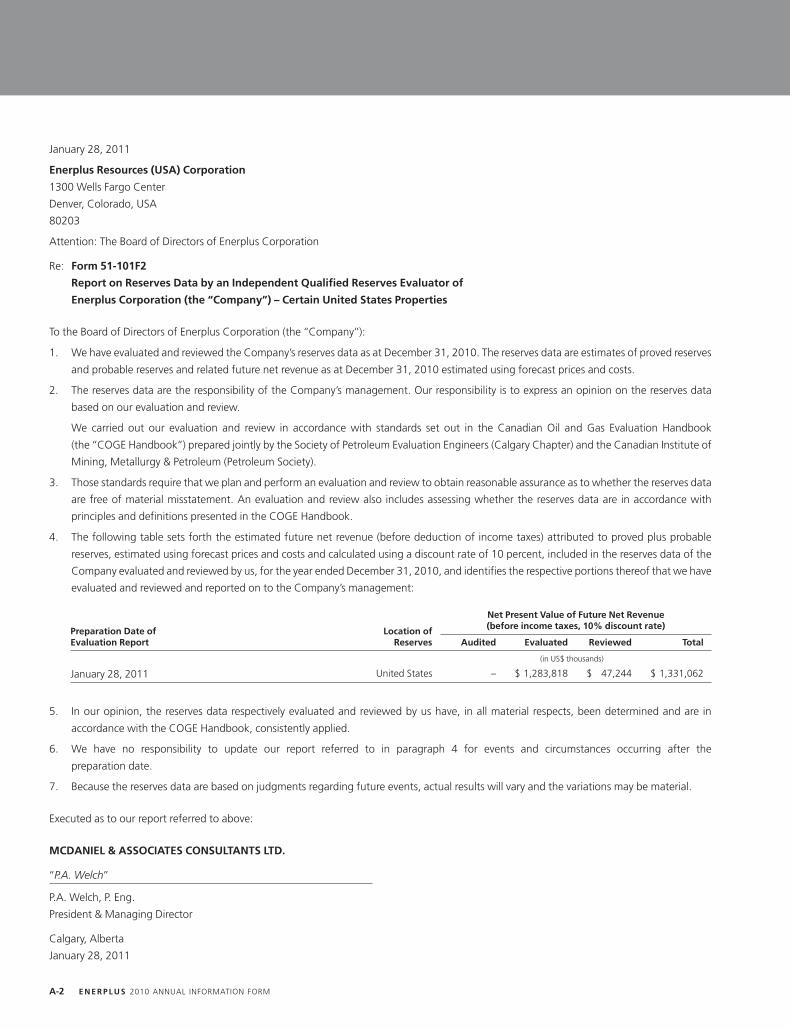
January 28, 2011
Enerplus Resources (USA) Corporation
1300 Wells Fargo Center
Denver, Colorado, USA
80203
Attention: The Board of Directors of Enerplus Corporation
Re: Form 51-101F2
Report on Reserves Data by an Independent Qualified Reserves Evaluator of
Enerplus Corporation (the ‘‘Company’’) – Certain United States Properties
To the Board of Directors of Enerplus Corporation (the ‘‘Company’’):
1. We have evaluated and reviewed the Company’s reserves data as at December 31, 2010. The reserves data are estimates of proved reserves
and probable reserves and related future net revenue as at December 31, 2010 estimated using forecast prices and costs.
2. The reserves data are the responsibility of the Company’s management. Our responsibility is to express an opinion on the reserves data
based on our evaluation and review.
We carried out our evaluation and review in accordance with standards set out in the Canadian Oil and Gas Evaluation Handbook
(the ‘‘COGE Handbook’’) prepared jointly by the Society of Petroleum Evaluation Engineers (Calgary Chapter) and the Canadian Institute of
Mining, Metallurgy & Petroleum (Petroleum Society).
3. Those standards require that we plan and perform an evaluation and review to obtain reasonable assurance as to whether the reserves data
are free of material misstatement. An evaluation and review also includes assessing whether the reserves data are in accordance with
principles and definitions presented in the COGE Handbook.
4. The following table sets forth the estimated future net revenue (before deduction of income taxes) attributed to proved plus probable
reserves, estimated using forecast prices and costs and calculated using a discount rate of 10 percent, included in the reserves data of the
Company evaluated and reviewed by us, for the year ended December 31, 2010, and identifies the respective portions thereof that we have
evaluated and reviewed and reported on to the Company’s management:
Net Present Value of Future Net Revenue(before income taxes, 10% discount rate)Preparation Date of Location of
Evaluation Report Reserves Audited Evaluated Reviewed Total
(in US$ thousands)
United States – $ 1,283,818 $ 47,244 $ 1,331,062January 28, 2011
5. In our opinion, the reserves data respectively evaluated and reviewed by us have, in all material respects, been determined and are in
accordance with the COGE Handbook, consistently applied.
6. We have no responsibility to update our report referred to in paragraph 4 for events and circumstances occurring after the
preparation date.
7. Because the reserves data are based on judgments regarding future events, actual results will vary and the variations may be material.
Executed as to our report referred to above:
MCDANIEL & ASSOCIATES CONSULTANTS LTD.
‘‘P.A. Welch’’
P.A. Welch, P. Eng.
President & Managing Director
Calgary, Alberta
January 28, 2011
A-2 E N E R P L U S 2010 ANNUAL INFORMATION FORM
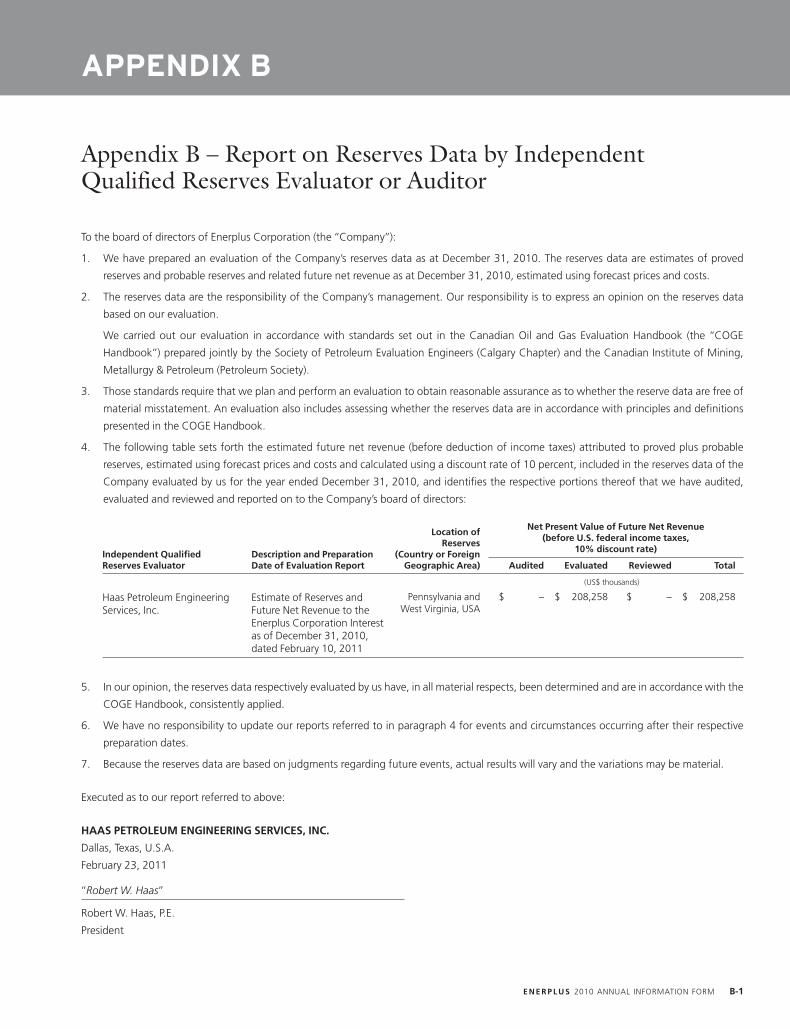
Appendix B – Report on Reserves Data by IndependentQualified Reserves Evaluator or Auditor
To the board of directors of Enerplus Corporation (the ‘‘Company’’):
1. We have prepared an evaluation of the Company’s reserves data as at December 31, 2010. The reserves data are estimates of proved
reserves and probable reserves and related future net revenue as at December 31, 2010, estimated using forecast prices and costs.
2. The reserves data are the responsibility of the Company’s management. Our responsibility is to express an opinion on the reserves data
based on our evaluation.
We carried out our evaluation in accordance with standards set out in the Canadian Oil and Gas Evaluation Handbook (the ‘‘COGE
Handbook’’) prepared jointly by the Society of Petroleum Evaluation Engineers (Calgary Chapter) and the Canadian Institute of Mining,
Metallurgy & Petroleum (Petroleum Society).
3. Those standards require that we plan and perform an evaluation to obtain reasonable assurance as to whether the reserve data are free of
material misstatement. An evaluation also includes assessing whether the reserves data are in accordance with principles and definitions
presented in the COGE Handbook.
4. The following table sets forth the estimated future net revenue (before deduction of income taxes) attributed to proved plus probable
reserves, estimated using forecast prices and costs and calculated using a discount rate of 10 percent, included in the reserves data of the
Company evaluated by us for the year ended December 31, 2010, and identifies the respective portions thereof that we have audited,
evaluated and reviewed and reported on to the Company’s board of directors:
Net Present Value of Future Net RevenueLocation of(before U.S. federal income taxes,Reserves
10% discount rate)Independent Qualified Description and Preparation (Country or ForeignReserves Evaluator Date of Evaluation Report Geographic Area) Audited Evaluated Reviewed Total
(US$ thousands)
Pennsylvania and $ – $ 208,258 $ – $ 208,258Haas Petroleum Engineering Estimate of Reserves andWest Virginia, USAServices, Inc. Future Net Revenue to the
Enerplus Corporation Interestas of December 31, 2010,dated February 10, 2011
5. In our opinion, the reserves data respectively evaluated by us have, in all material respects, been determined and are in accordance with the
COGE Handbook, consistently applied.
6. We have no responsibility to update our reports referred to in paragraph 4 for events and circumstances occurring after their respective
preparation dates.
7. Because the reserves data are based on judgments regarding future events, actual results will vary and the variations may be material.
Executed as to our report referred to above:
HAAS PETROLEUM ENGINEERING SERVICES, INC.
Dallas, Texas, U.S.A.
February 23, 2011
‘‘Robert W. Haas’’
Robert W. Haas, P.E.
President
E N E R P L U S 2010 ANNUAL INFORMATION FORM B-1
APPENDIX B

Appendix C – Report of Management and Directorson Oil and Gas Disclosure
Terms to which a meaning is described in CSA Staff Notice 51-324 – Glossary to NI 51-101 Standards of Disclosure for Oil and Gas Activities
have the same meaning herein.
Management of Enerplus Corporation (the ‘‘Company’’) are responsible for the preparation and disclosure of information with respect to the
Company’s oil and gas activities in accordance with securities regulatory requirements. This information includes reserves data, which are
estimates of proved reserves and probable reserves and related future net revenue as at December 31, 2010, estimated using forecast prices
and costs.
Independent qualified reserves evaluators have evaluated and reviewed the Company’s reserves data. The reports of the independent qualified
reserves evaluators are presented as Appendices A and B to this Annual Information Form.
The Reserves Committee of the board of directors of the Company has:
(a) reviewed the Company’s procedures for providing information to the independent qualified reserves evaluators;
(b) met with the independent qualified reserves evaluators to determine whether any restrictions affected the ability of the independent
qualified reserves evaluators to report without reservation and, with respect to the proposal to have McDaniel & Associates Consultants
Limited replace Netherland, Sewell & Associates, Inc. (‘‘NSAI’’) as the independent qualified reserves evaluator for the Company’s western
U.S. oil and gas reserves, to inquire whether there had been disputes between NSAI and management; and
(c) reviewed the reserves data with management and the independent qualified reserves evaluators.
The Reserves Committee of the board of directors of the Company has reviewed the Company’s procedures for assembling and reporting other
information associated with oil and gas activities and has reviewed that information with management. The board of directors of the Company
has, on the recommendation of the Reserves Committee, approved:
(a) the content and filing with securities regulatory authorities of Form 51-101F1 containing reserves data and other oil and gas information;
(b) the filing of Forms 51-101F2 which are the reports of the independent qualified reserves evaluators on the reserves data; and
(c) the content and filing of this report.
Because the reserves data are based on judgments regarding future events, actual results will vary and the variations may be material.
ENERPLUS CORPORATION
‘‘Gordon J. Kerr’’ ‘‘Ian C. Dundas’’
Gordon J. Kerr Ian C. Dundas
President & Chief Executive Officer Executive Vice President
‘‘W.C. (Mike) Seth’’ ‘‘Donald T. West’’
W.C. (Mike) Seth Donald T. West
Director Director
March 11, 2011
E N E R P L U S 2010 ANNUAL INFORMATION FORM C-1
APPENDIX C

Appendix D – Audit & Risk Management Committee DisclosurePursuant to National Instrument 52-110
A. THE AUDIT & RISK MANAGEMENT COMMITTEE’S CHARTER
The charter of the Audit & Risk Management Committee (the ‘‘Committee’’) of the board of directors of the Corporation is attached as
Schedule 1 to this Appendix D.
B. COMPOSITION OF THE AUDIT & RISK MANAGEMENT COMMITTEE
The current members of the Committee are Robert B. Hodgins (Chairman), Glen D. Roane and Harry B. Wheeler. Each member of the
Committee is independent and financially literate within the meaning of National Instrument 52-110.
C. RELEVANT EDUCATION AND EXPERIENCE
Name (Director Since) Principal Occupation and Biography
Robert B. Hodgins (Honors B.A. (Business), C.A.) Mr. Hodgins has been an independent businessman since November 2004. Prior
(Director since November 2007) to that, Mr. Hodgins served as the Chief Financial Officer of Pengrowth Energy
Trust (a TSX and NYSE-listed energy trust) from 2002 to 2004. Prior to that,
Other Public Directorships Mr. Hodgins held the position of Vice President and Treasurer of Canadian Pacific
Limited (a diversified energy, transportation and hotels company) from 1998 to• AltaGas Ltd. (energy midstream services)2002 and was Chief Financial Officer of TransCanada PipeLines Limited (a TSX and• Fairborne Energy Ltd. (oil and gas exploration andNYSE-listed energy transportation company) from 1993 to 1998. Mr. Hodginsproduction company)received an Honors Bachelor of Arts in Business from the Richard Ivey School of• MGM Energy Corp. (oil and gas exploration andBusiness at the University of Western Ontario in 1975 and received a Charteredproduction company)Accountant designation and was admitted as a member of the Institute of• Orion Oil & Gas Corporation (oil and gas explorationChartered Accountants of Ontario in 1977 and Alberta in 1991.and production company)
• Skope Energy Inc. (oil and gas exploration and
production company)
• MEG Energy Corp. (oil sands company)
Mr. Glen D. Roane (B.A., MBA) Mr. Roane is a corporate director and has served as a board member of many
(Director since June 2004) TSX-listed companies including (in addition to those public entities listed herewith
of which he currently serves as a director) UTS Energy Corporation, Repap
Other Public Directorships Enterprises Inc., Ranchero Energy Inc., Forte Resources Inc., Valiant Energy Inc.,
Maxx Petroleum Ltd. and NQL Energy Services Inc., since his retirement from TD• Badger Daylighting Ltd. (provider of non-destructiveAsset Management Inc., a subsidiary of The Toronto-Dominion Bank (a publiclyexcavation services)traded Canadian chartered bank) in 1997. In addition to serving as a director of• Logan International Inc. (oil and gas service business)the public entities listed herewith, Mr. Roane is a director of GBC North American• SilverBirch Energy Corporation (oil sands company)Fund Inc., a Canadian mutual fund corporation. Mr. Roane is also a member of
the Alberta Securities Commission. Mr. Roane holds a Bachelor of Arts and an
MBA from Queen’s University in Kingston, Ontario.
E N E R P L U S 2010 ANNUAL INFORMATION FORM D-1
APPENDIX D
Name (Director Since) Principal Occupation and Biography
Mr. Harry B. Wheeler (B.Sc. (Geology)) Mr. Wheeler has been the President of Colchester Investments Ltd., a private
(Director since January 2001) investment firm, since 2000. From 1962 to 1966, Mr. Wheeler worked with Mobil
Oil in Canada and Libya and from 1967 to 1972 was employed by International
Other Public Directorships Resources Ltd., in London, England and Denver, Colorado. He was a Director of
Quintette Coal Ltd., Vice President of Amalgamated Bonanza Petroleum Ltd. and• Niloperator of his private company before founding Cabre Exploration Ltd.
(‘‘Cabre’’), a public oil and gas company, in 1980. Mr. Wheeler was Chairman of
Cabre until it was acquired by EnerMark Income Fund (a predecessor of Enerplus)
in December 2000. Mr. Wheeler is currently a director of Magellan Resources Ltd.
and Knowledge Energy Inc., private oil and gas companies. Mr. Wheeler
graduated from the University of British Columbia in 1962 with a degree
in Geology.
D. PRE-APPROVAL POLICIES AND PROCEDURES
The Committee has implemented a policy restricting the services that may be provided by the Corporation’s auditors and the fees paid to the
Corporation’s auditors. Prior to the engagement of the Corporation’s auditors to perform both audit and non-audit services, the Committee
pre-approves the provision of the services. In making their determination regarding non-audit services, the Committee considers the compliance
with the policy and the provision of non-audit services in the context of avoiding impact on auditor independence. All audit and non-audit fees
paid to Deloitte & Touche LLP in 2010 and 2009 were pre-approved by the Committee. Based on the Committee’s discussions with management
and the independent auditors, the Committee is of the view that the provision of the non-audit services by Deloitte & Touche LLP described
above is compatible with maintaining that firm’s independence from the Corporation.
E. EXTERNAL AUDITOR SERVICE FEES
The aggregate fees paid by Enerplus to Deloitte & Touche LLP, Independent Registered Chartered Accountants, the auditors of Enerplus, for
professional services rendered in Enerplus’ last two fiscal years are as follows:
2010 2009
(in $ thousands)
Audit fees(1) $ 809.3 $ 790.2
Audit-related fees(2) – –
Tax fees(3) 212.1 367.3
All other fees(4) 57.0 –
$ 1,078.4 $ 1,157.3
Notes:
(1) Audit fees were for professional services rendered by Deloitte & Touche LLP for the audit of Enerplus’ annual financial statements and reviews of Enerplus’ quarterly financial statements, as well asservices provided in connection with statutory and regulatory filings or engagements.
(2) Audit-related fees are for assurance and related services reasonably related to the performance of the audit or review of Enerplus’ financial statements and not reported under ‘‘Audit fees’’ above.(3) Tax fees were for tax compliance, tax advice and tax planning. The fees were for services performed by Enerplus’ auditors’ tax division except those tax services related to the audit.(4) All other fees are fees for products and services provided by Enerplus’ auditors other than those described as ‘‘Audit fees’’, ‘‘Audit-related fees’’ and ‘‘Tax fees’’.
D-2 E N E R P L U S 2010 ANNUAL INFORMATION FORM
Audit & Risk Management Committee Charter
I. AUTHORITY
The Audit & Risk Management Committee (the ‘‘Committee’’) of the Board of Directors (the ‘‘Board’’) of Enerplus Corporation
(the ‘‘Corporation’’) shall be comprised of three or more Directors as determined from time to time by resolution of the Board. Consistent with
the appointment of other Board committees, the members of the Committee shall be elected by the Board at the first meeting of the Board
following each annual meeting of shareholders of the Corporation or at such other time as may be determined by the Board. The Chairman of
the Committee shall be designated by the Board, provided that if the Board does not so designate a Chairman, the members of the Committee,
by majority vote, may designate a Chairman. The presence in person or by telephone of a majority of the Committee’s members shall constitute
a quorum for any meeting of the Committee. All actions of the Committee will require the vote of a majority of its members present at a
meeting of the Committee at which a quorum is present.
Because of the Committee’s demanding role and responsibilities, the Corporate Governance & Nominating Committee reviews any invitation to
Committee members to join the audit committee of any other company or corporation. Where a member of the Committee simultaneously
serves on the audit committee of more than three (3) public companies, including the Committee, the Board determines whether such
simultaneous service impairs the ability of such member to serve effectively on the Committee.
Members of the Committee do not receive any compensation from the Corporation other than compensation as directors and committee
members. Prohibited compensation includes fees paid, directly or indirectly, for services as consultant or as legal or financial advisor, regardless
of the amount, but excludes any compensation approved by the Board and that is paid to the directors as members of the Board and
its committees.
II. PURPOSE OF THE COMMITTEE
The Committee’s mandate is to assist the Board in fulfilling its oversight responsibilities with respect to:
1. financial reporting and continuous disclosure of the Corporation;
2. the Corporation’s internal controls and policies, the certification process and compliance with regulatory requirements over financial
matters;
3. evaluating and monitoring the performance and independence of the Corporation’s external auditors; and
4. monitoring the manner in which the business risks of the Corporation are being identified and managed.
The Committee shall report to the Board on a regular basis with regard to such matters. The Committee has direct responsibility to recommend
the appointment of the external auditors and authority to fix their remuneration. The Committee may take such actions as it deems necessary to
satisfy itself that the Corporation’s auditors are independent of management. It is the objective of the Committee to maintain free and open
means of communications (including the annual proxy information circular) among the Board, the external auditors, and the financial senior
management of the Corporation.
III. COMPOSITION AND COMPETENCY OF THE COMMITTEE
Each member of the Committee shall be unrelated to the Corporation and, as such, shall be free from any relationship that may interfere with
the exercise of his or her independent judgment as a member of the Committee. All members of the Committee shall be financially literate and
at least one member of the Committee shall have accounting or related financial management expertise – ‘‘literate’’ or ‘‘literacy’’ and ‘‘expertise’’
as defined by applicable securities legislation. Members are encouraged to enhance their understanding of current issues through means of
their preference.
IV. MEETINGS OF THE COMMITTEE
The Committee shall meet with such frequency and at such intervals as it shall determine is necessary to carry out its duties and responsibilities.
As part of its purpose to foster open communications, the Committee shall meet at least quarterly with management and the Corporation’s
external auditors in separate executive sessions to discuss any matters that the Committee or each of these groups or persons believes should be
E N E R P L U S 2010 ANNUAL INFORMATION FORM D-3
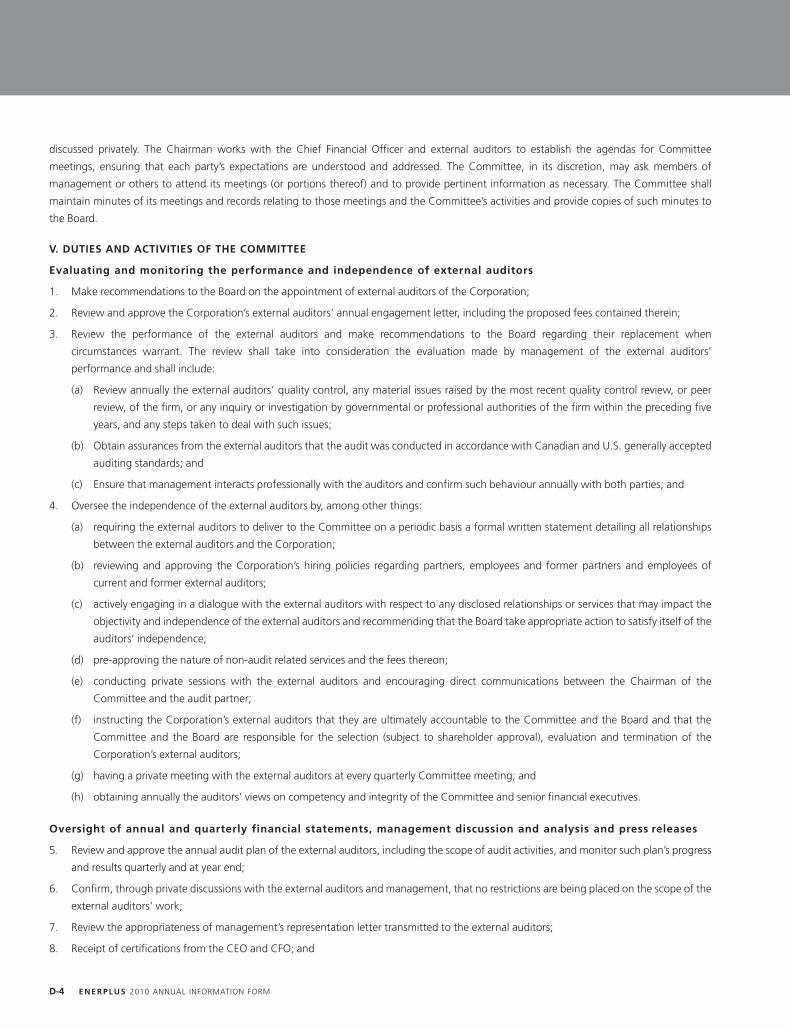
discussed privately. The Chairman works with the Chief Financial Officer and external auditors to establish the agendas for Committee
meetings, ensuring that each party’s expectations are understood and addressed. The Committee, in its discretion, may ask members of
management or others to attend its meetings (or portions thereof) and to provide pertinent information as necessary. The Committee shall
maintain minutes of its meetings and records relating to those meetings and the Committee’s activities and provide copies of such minutes to
the Board.
V. DUTIES AND ACTIVITIES OF THE COMMITTEE
Evaluating and monitoring the performance and independence of external auditors
1. Make recommendations to the Board on the appointment of external auditors of the Corporation;
2. Review and approve the Corporation’s external auditors’ annual engagement letter, including the proposed fees contained therein;
3. Review the performance of the external auditors and make recommendations to the Board regarding their replacement when
circumstances warrant. The review shall take into consideration the evaluation made by management of the external auditors’
performance and shall include:
(a) Review annually the external auditors’ quality control, any material issues raised by the most recent quality control review, or peer
review, of the firm, or any inquiry or investigation by governmental or professional authorities of the firm within the preceding five
years, and any steps taken to deal with such issues;
(b) Obtain assurances from the external auditors that the audit was conducted in accordance with Canadian and U.S. generally accepted
auditing standards; and
(c) Ensure that management interacts professionally with the auditors and confirm such behaviour annually with both parties; and
4. Oversee the independence of the external auditors by, among other things:
(a) requiring the external auditors to deliver to the Committee on a periodic basis a formal written statement detailing all relationships
between the external auditors and the Corporation;
(b) reviewing and approving the Corporation’s hiring policies regarding partners, employees and former partners and employees of
current and former external auditors;
(c) actively engaging in a dialogue with the external auditors with respect to any disclosed relationships or services that may impact the
objectivity and independence of the external auditors and recommending that the Board take appropriate action to satisfy itself of the
auditors’ independence;
(d) pre-approving the nature of non-audit related services and the fees thereon;
(e) conducting private sessions with the external auditors and encouraging direct communications between the Chairman of the
Committee and the audit partner;
(f) instructing the Corporation’s external auditors that they are ultimately accountable to the Committee and the Board and that the
Committee and the Board are responsible for the selection (subject to shareholder approval), evaluation and termination of the
Corporation’s external auditors;
(g) having a private meeting with the external auditors at every quarterly Committee meeting; and
(h) obtaining annually the auditors’ views on competency and integrity of the Committee and senior financial executives.
Oversight of annual and quarterly financial statements, management discussion and analysis and press releases
5. Review and approve the annual audit plan of the external auditors, including the scope of audit activities, and monitor such plan’s progress
and results quarterly and at year end;
6. Confirm, through private discussions with the external auditors and management, that no restrictions are being placed on the scope of the
external auditors’ work;
7. Review the appropriateness of management’s representation letter transmitted to the external auditors;
8. Receipt of certifications from the CEO and CFO; and
D-4 E N E R P L U S 2010 ANNUAL INFORMATION FORM
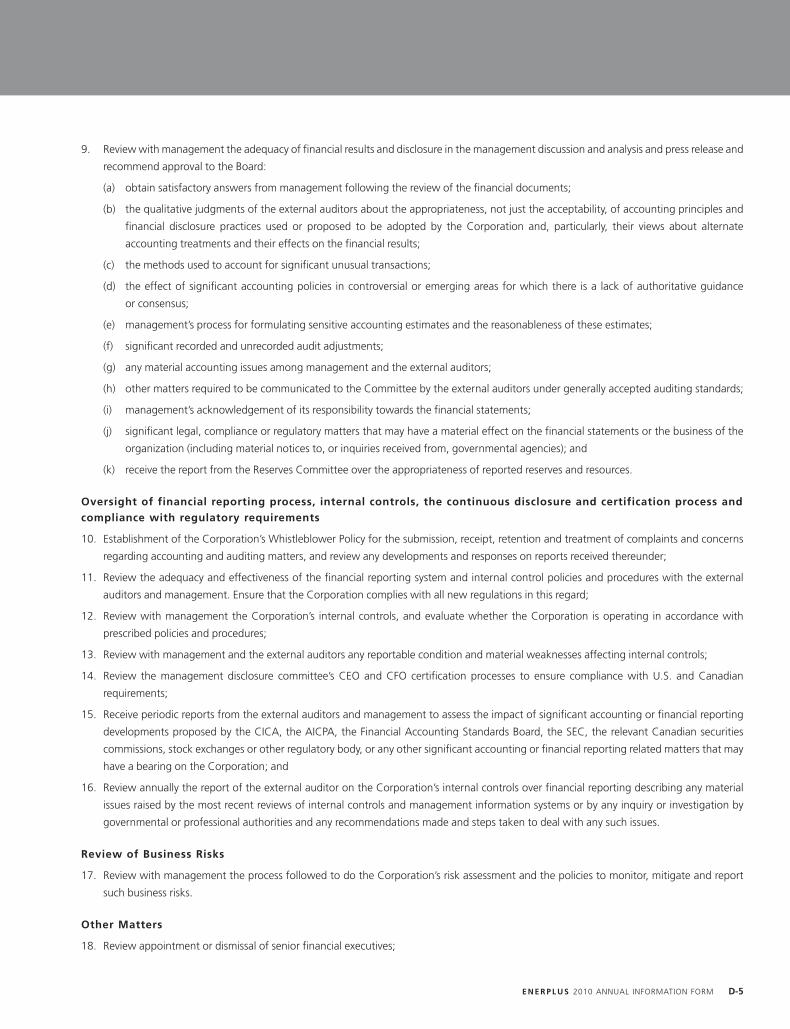
9. Review with management the adequacy of financial results and disclosure in the management discussion and analysis and press release and
recommend approval to the Board:
(a) obtain satisfactory answers from management following the review of the financial documents;
(b) the qualitative judgments of the external auditors about the appropriateness, not just the acceptability, of accounting principles and
financial disclosure practices used or proposed to be adopted by the Corporation and, particularly, their views about alternate
accounting treatments and their effects on the financial results;
(c) the methods used to account for significant unusual transactions;
(d) the effect of significant accounting policies in controversial or emerging areas for which there is a lack of authoritative guidance
or consensus;
(e) management’s process for formulating sensitive accounting estimates and the reasonableness of these estimates;
(f) significant recorded and unrecorded audit adjustments;
(g) any material accounting issues among management and the external auditors;
(h) other matters required to be communicated to the Committee by the external auditors under generally accepted auditing standards;
(i) management’s acknowledgement of its responsibility towards the financial statements;
(j) significant legal, compliance or regulatory matters that may have a material effect on the financial statements or the business of the
organization (including material notices to, or inquiries received from, governmental agencies); and
(k) receive the report from the Reserves Committee over the appropriateness of reported reserves and resources.
Oversight of financial reporting process, internal controls, the continuous disclosure and certification process andcompliance with regulatory requirements
10. Establishment of the Corporation’s Whistleblower Policy for the submission, receipt, retention and treatment of complaints and concerns
regarding accounting and auditing matters, and review any developments and responses on reports received thereunder;
11. Review the adequacy and effectiveness of the financial reporting system and internal control policies and procedures with the external
auditors and management. Ensure that the Corporation complies with all new regulations in this regard;
12. Review with management the Corporation’s internal controls, and evaluate whether the Corporation is operating in accordance with
prescribed policies and procedures;
13. Review with management and the external auditors any reportable condition and material weaknesses affecting internal controls;
14. Review the management disclosure committee’s CEO and CFO certification processes to ensure compliance with U.S. and Canadian
requirements;
15. Receive periodic reports from the external auditors and management to assess the impact of significant accounting or financial reporting
developments proposed by the CICA, the AICPA, the Financial Accounting Standards Board, the SEC, the relevant Canadian securities
commissions, stock exchanges or other regulatory body, or any other significant accounting or financial reporting related matters that may
have a bearing on the Corporation; and
16. Review annually the report of the external auditor on the Corporation’s internal controls over financial reporting describing any material
issues raised by the most recent reviews of internal controls and management information systems or by any inquiry or investigation by
governmental or professional authorities and any recommendations made and steps taken to deal with any such issues.
Review of Business Risks
17. Review with management the process followed to do the Corporation’s risk assessment and the policies to monitor, mitigate and report
such business risks.
Other Matters
18. Review appointment or dismissal of senior financial executives;
E N E R P L U S 2010 ANNUAL INFORMATION FORM D-5
19. Conduct or authorize investigations into any matters within the Committee’s scope of responsibilities, including retaining outside counsel
or other consultants or experts for this purpose;
20. Review the disclosure made in the Annual Report, Annual Information Form, Form 40-F and the Information Circular regarding the Audit &
Risk Management Committee;
21. Establish and maintain a free and open means of communication between the Board, the Committee, the external auditors,
and management;
22. Perform such additional activities, and consider such other matters, within the scope of its responsibilities, as the Committee or the Board
deems necessary or appropriate; and
23. Once a year, the Committee reviews the adequacy of its Charter and brings to the attention of the Board required changes, if any, for
approval. The Committee is also reviewed annually by the Corporate Governance & Nominating Committee, which reports its findings to
the Board.
While the Committee has the duties and responsibilities set forth in this Charter, the Committee is not responsible for planning or conducting
the audit or for determining whether the Corporation’s financial statements are complete and accurate and are in accordance with generally
accepted accounting principles. Similarly, it is not the responsibility of the Committee to resolve disagreements, if any, between management
and the external auditors. While it is acknowledged that the Committee is not legally obliged to ensure that the Corporation complies with all
laws and regulations, the spirit and intent of this Charter is that the Committee shall take reasonable steps to encourage the Corporation to act
in full compliance therewith.
D-6 E N E R P L U S 2010 ANNUAL INFORMATION FORM
Appendix E – Supplemental Information AboutOil and Gas Producing Activities
The following disclosures including proved reserves, future net cash flows, and costs incurred attributable to Enerplus’ conventional crude oil
and natural gas operations have been prepared in accordance with the provisions of the Financial Accounting Standards Board’s Accounting
Standards Update (ASU) No. 2010-03 ‘‘Extractive Activities – Oil and Gas (Topic 932) (the ‘‘ASU’’). This new guidance is primarily intended to
modernize and update oil and gas disclosure requirements and to align them with current practices and changes in technology. The new
standards also revised the definition of proved reserves and require the use of a 12 month average price to estimate proved reserves rather than
a period end spot price as required in prior periods. The 12 month average price is calculated as the unweighted arithmetic average of the spot
price on the first day of each month within the 12 month period prior to the end of the reporting period. The Corporation prospectively adopted
this guidance effective December 31, 2009 without prior period restatement.
A. PROVED OIL AND NATURAL GAS RESERVE QUANTITIES
Users of this information should be aware that the process of estimating quantities of ‘‘proved developed’’ and ‘‘proved undeveloped’’ crude oil,
natural gas, natural gas liquids and bitumen reserves is very complex, requiring significant subjective decisions in the evaluation of all available
geological, engineering and economic data for each reservoir. The data for a given reservoir may change substantially over time as a result of
numerous factors including, but not limited to, additional development activity, evolving production history, and continual reassessment of the
viability of production under varying economic conditions. Consequently, material revisions to existing reserve estimates occur from time to
time. Although every reasonable effort is made to ensure that reserve estimates reported represent the most accurate assessments possible, the
significance of the subjective decisions required and variances in available data for reservoirs make these estimates generally less precise than
other estimates presented in connection with financial statement disclosures. Future fluctuations in prices and costs, production rates, or
changes in political or regulatory environments could cause the Corporation’s reserves to be materially different from that presented.
Proved reserves, proved developed reserves and proved undeveloped reserves are defined under the ASU. Proved oil and gas reserves are those
quantities of oil and gas, which, by analysis of geoscience and engineering data, can be estimated with reasonable certainty to be economically
producible from a given date forward, from known reservoirs and under existing economic conditions, operating methods and government
regulation. Proved developed reserves are reserves that can be expected to be recovered through existing wells with existing equipment and
operating methods or in which the cost of the required equipment is relatively minor compared to the cost of a new well. Proved undeveloped
reserves are reserves that are expected to be recovered from new wells on undrilled acreage, or from existing wells where a relatively major
expenditure is required for recompletion. The proved reserves disclosed herein are determined according to the definition of ‘‘proved reserves’’
under NI 51-101 which may differ from the definition provided in the SEC rules, however the difference should not be material. See
‘‘Presentation of Enerplus’ Oil and Gas Reserves, Resources and Production Information’’ in this Annual Information Form. All cost information in
this section is stated in Canadian dollars and is calculated in accordance with United States of America Generally Accepted Accounting Principles
(‘‘U.S. GAAP’’).
Subsequent to December 31, 2010, no major discovery or other favourable or adverse event is believed to have caused a material change in the
estimates of proved reserves as of that date.
E N E R P L U S 2010 ANNUAL INFORMATION FORM E-1
APPENDIX E
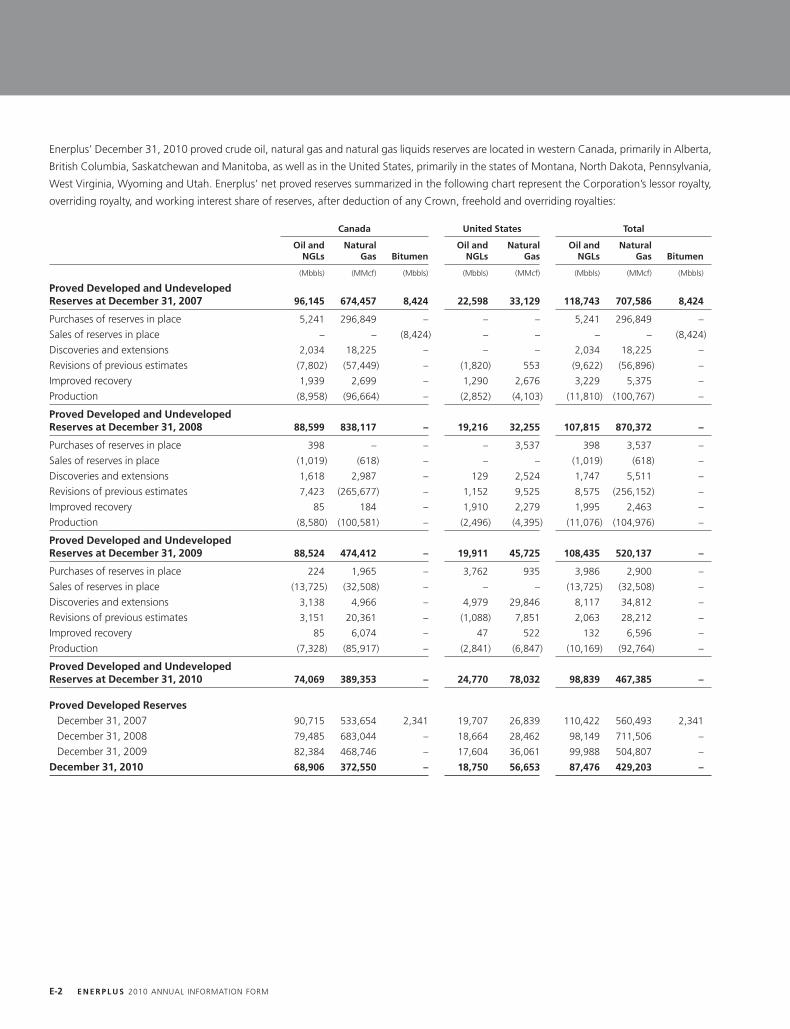
Enerplus’ December 31, 2010 proved crude oil, natural gas and natural gas liquids reserves are located in western Canada, primarily in Alberta,
British Columbia, Saskatchewan and Manitoba, as well as in the United States, primarily in the states of Montana, North Dakota, Pennsylvania,
West Virginia, Wyoming and Utah. Enerplus’ net proved reserves summarized in the following chart represent the Corporation’s lessor royalty,
overriding royalty, and working interest share of reserves, after deduction of any Crown, freehold and overriding royalties:
Canada United States Total
Oil and Natural Oil and Natural Oil and NaturalNGLs Gas Bitumen NGLs Gas NGLs Gas Bitumen
(Mbbls) (MMcf) (Mbbls) (Mbbls) (MMcf) (Mbbls) (MMcf) (Mbbls)
Proved Developed and UndevelopedReserves at December 31, 2007 96,145 674,457 8,424 22,598 33,129 118,743 707,586 8,424
Purchases of reserves in place 5,241 296,849 – – – 5,241 296,849 –
Sales of reserves in place – – (8,424) – – – – (8,424)
Discoveries and extensions 2,034 18,225 – – – 2,034 18,225 –
Revisions of previous estimates (7,802) (57,449) – (1,820) 553 (9,622) (56,896) –
Improved recovery 1,939 2,699 – 1,290 2,676 3,229 5,375 –
Production (8,958) (96,664) – (2,852) (4,103) (11,810) (100,767) –
Proved Developed and UndevelopedReserves at December 31, 2008 88,599 838,117 – 19,216 32,255 107,815 870,372 –
Purchases of reserves in place 398 – – – 3,537 398 3,537 –
Sales of reserves in place (1,019) (618) – – – (1,019) (618) –
Discoveries and extensions 1,618 2,987 – 129 2,524 1,747 5,511 –
Revisions of previous estimates 7,423 (265,677) – 1,152 9,525 8,575 (256,152) –
Improved recovery 85 184 – 1,910 2,279 1,995 2,463 –
Production (8,580) (100,581) – (2,496) (4,395) (11,076) (104,976) –
Proved Developed and UndevelopedReserves at December 31, 2009 88,524 474,412 – 19,911 45,725 108,435 520,137 –
Purchases of reserves in place 224 1,965 – 3,762 935 3,986 2,900 –
Sales of reserves in place (13,725) (32,508) – – – (13,725) (32,508) –
Discoveries and extensions 3,138 4,966 – 4,979 29,846 8,117 34,812 –
Revisions of previous estimates 3,151 20,361 – (1,088) 7,851 2,063 28,212 –
Improved recovery 85 6,074 – 47 522 132 6,596 –
Production (7,328) (85,917) – (2,841) (6,847) (10,169) (92,764) –
Proved Developed and UndevelopedReserves at December 31, 2010 74,069 389,353 – 24,770 78,032 98,839 467,385 –
Proved Developed ReservesDecember 31, 2007 90,715 533,654 2,341 19,707 26,839 110,422 560,493 2,341
December 31, 2008 79,485 683,044 – 18,664 28,462 98,149 711,506 –
December 31, 2009 82,384 468,746 – 17,604 36,061 99,988 504,807 –
December 31, 2010 68,906 372,550 – 18,750 56,653 87,476 429,203 –
E-2 E N E R P L U S 2010 ANNUAL INFORMATION FORM
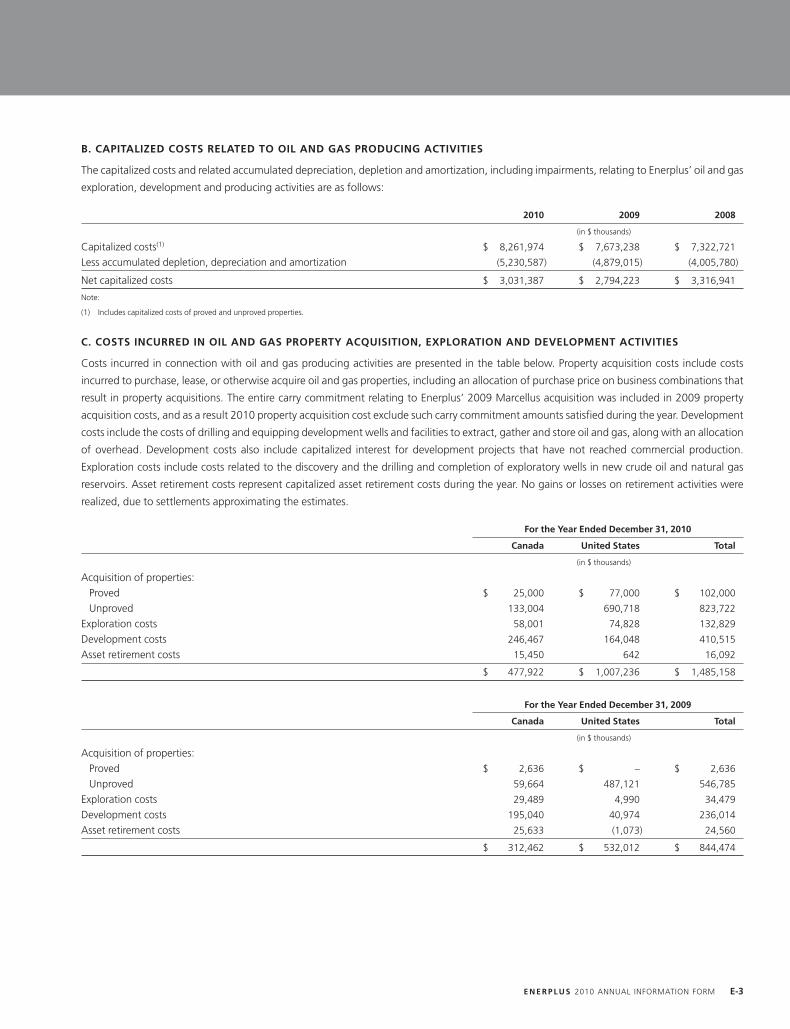
B. CAPITALIZED COSTS RELATED TO OIL AND GAS PRODUCING ACTIVITIES
The capitalized costs and related accumulated depreciation, depletion and amortization, including impairments, relating to Enerplus’ oil and gas
exploration, development and producing activities are as follows:
2010 2009 2008
(in $ thousands)
Capitalized costs(1) $ 8,261,974 $ 7,673,238 $ 7,322,721
Less accumulated depletion, depreciation and amortization (5,230,587) (4,879,015) (4,005,780)
Net capitalized costs $ 3,031,387 $ 2,794,223 $ 3,316,941
Note:
(1) Includes capitalized costs of proved and unproved properties.
C. COSTS INCURRED IN OIL AND GAS PROPERTY ACQUISITION, EXPLORATION AND DEVELOPMENT ACTIVITIES
Costs incurred in connection with oil and gas producing activities are presented in the table below. Property acquisition costs include costs
incurred to purchase, lease, or otherwise acquire oil and gas properties, including an allocation of purchase price on business combinations that
result in property acquisitions. The entire carry commitment relating to Enerplus’ 2009 Marcellus acquisition was included in 2009 property
acquisition costs, and as a result 2010 property acquisition cost exclude such carry commitment amounts satisfied during the year. Development
costs include the costs of drilling and equipping development wells and facilities to extract, gather and store oil and gas, along with an allocation
of overhead. Development costs also include capitalized interest for development projects that have not reached commercial production.
Exploration costs include costs related to the discovery and the drilling and completion of exploratory wells in new crude oil and natural gas
reservoirs. Asset retirement costs represent capitalized asset retirement costs during the year. No gains or losses on retirement activities were
realized, due to settlements approximating the estimates.
For the Year Ended December 31, 2010
Canada United States Total
(in $ thousands)
Acquisition of properties:Proved $ 25,000 $ 77,000 $ 102,000
Unproved 133,004 690,718 823,722
Exploration costs 58,001 74,828 132,829
Development costs 246,467 164,048 410,515
Asset retirement costs 15,450 642 16,092
$ 477,922 $ 1,007,236 $ 1,485,158
For the Year Ended December 31, 2009
Canada United States Total
(in $ thousands)
Acquisition of properties:Proved $ 2,636 $ – $ 2,636
Unproved 59,664 487,121 546,785
Exploration costs 29,489 4,990 34,479
Development costs 195,040 40,974 236,014
Asset retirement costs 25,633 (1,073) 24,560
$ 312,462 $ 532,012 $ 844,474
E N E R P L U S 2010 ANNUAL INFORMATION FORM E-3
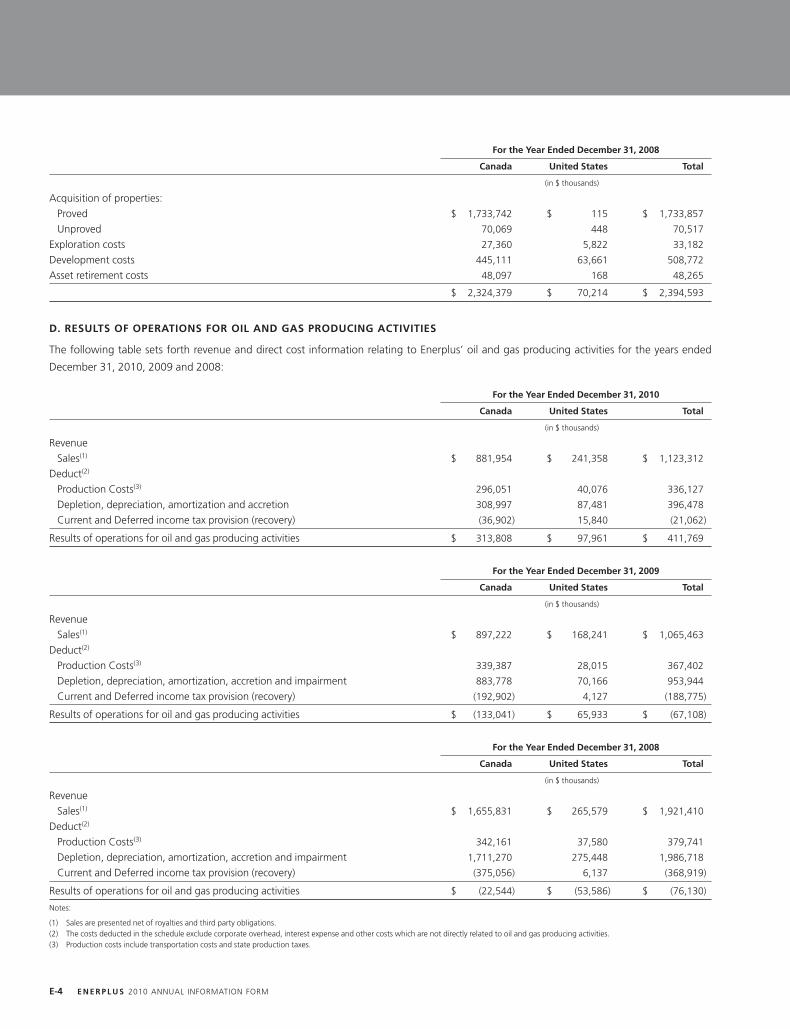
For the Year Ended December 31, 2008
Canada United States Total
(in $ thousands)
Acquisition of properties:Proved $ 1,733,742 $ 115 $ 1,733,857
Unproved 70,069 448 70,517
Exploration costs 27,360 5,822 33,182
Development costs 445,111 63,661 508,772
Asset retirement costs 48,097 168 48,265
$ 2,324,379 $ 70,214 $ 2,394,593
D. RESULTS OF OPERATIONS FOR OIL AND GAS PRODUCING ACTIVITIES
The following table sets forth revenue and direct cost information relating to Enerplus’ oil and gas producing activities for the years ended
December 31, 2010, 2009 and 2008:
For the Year Ended December 31, 2010
Canada United States Total
(in $ thousands)
RevenueSales(1) $ 881,954 $ 241,358 $ 1,123,312
Deduct(2)
Production Costs(3) 296,051 40,076 336,127
Depletion, depreciation, amortization and accretion 308,997 87,481 396,478
Current and Deferred income tax provision (recovery) (36,902) 15,840 (21,062)
Results of operations for oil and gas producing activities $ 313,808 $ 97,961 $ 411,769
For the Year Ended December 31, 2009
Canada United States Total
(in $ thousands)
RevenueSales(1) $ 897,222 $ 168,241 $ 1,065,463
Deduct(2)
Production Costs(3) 339,387 28,015 367,402
Depletion, depreciation, amortization, accretion and impairment 883,778 70,166 953,944
Current and Deferred income tax provision (recovery) (192,902) 4,127 (188,775)
Results of operations for oil and gas producing activities $ (133,041) $ 65,933 $ (67,108)
For the Year Ended December 31, 2008
Canada United States Total
(in $ thousands)
RevenueSales(1) $ 1,655,831 $ 265,579 $ 1,921,410
Deduct(2)
Production Costs(3) 342,161 37,580 379,741
Depletion, depreciation, amortization, accretion and impairment 1,711,270 275,448 1,986,718
Current and Deferred income tax provision (recovery) (375,056) 6,137 (368,919)
Results of operations for oil and gas producing activities $ (22,544) $ (53,586) $ (76,130)
Notes:
(1) Sales are presented net of royalties and third party obligations.(2) The costs deducted in the schedule exclude corporate overhead, interest expense and other costs which are not directly related to oil and gas producing activities.(3) Production costs include transportation costs and state production taxes.
E-4 E N E R P L U S 2010 ANNUAL INFORMATION FORM
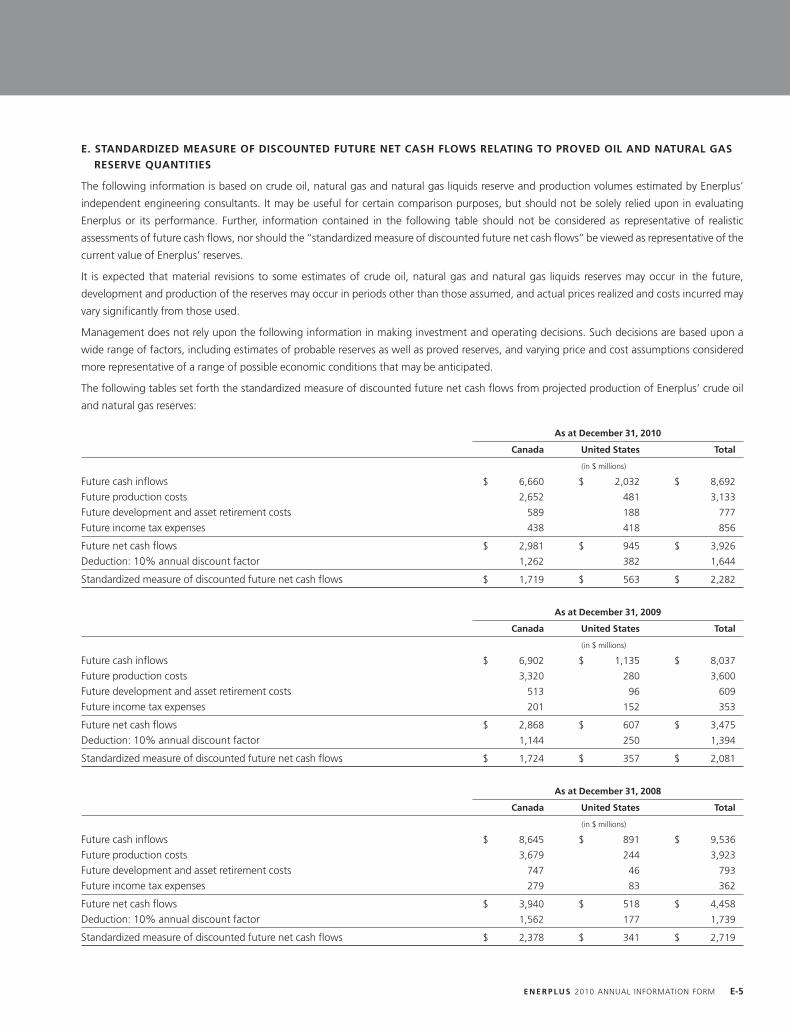
E. STANDARDIZED MEASURE OF DISCOUNTED FUTURE NET CASH FLOWS RELATING TO PROVED OIL AND NATURAL GAS
RESERVE QUANTITIES
The following information is based on crude oil, natural gas and natural gas liquids reserve and production volumes estimated by Enerplus’
independent engineering consultants. It may be useful for certain comparison purposes, but should not be solely relied upon in evaluating
Enerplus or its performance. Further, information contained in the following table should not be considered as representative of realistic
assessments of future cash flows, nor should the ‘‘standardized measure of discounted future net cash flows’’ be viewed as representative of the
current value of Enerplus’ reserves.
It is expected that material revisions to some estimates of crude oil, natural gas and natural gas liquids reserves may occur in the future,
development and production of the reserves may occur in periods other than those assumed, and actual prices realized and costs incurred may
vary significantly from those used.
Management does not rely upon the following information in making investment and operating decisions. Such decisions are based upon a
wide range of factors, including estimates of probable reserves as well as proved reserves, and varying price and cost assumptions considered
more representative of a range of possible economic conditions that may be anticipated.
The following tables set forth the standardized measure of discounted future net cash flows from projected production of Enerplus’ crude oil
and natural gas reserves:
As at December 31, 2010
Canada United States Total
(in $ millions)
Future cash inflows $ 6,660 $ 2,032 $ 8,692
Future production costs 2,652 481 3,133
Future development and asset retirement costs 589 188 777
Future income tax expenses 438 418 856
Future net cash flows $ 2,981 $ 945 $ 3,926
Deduction: 10% annual discount factor 1,262 382 1,644
Standardized measure of discounted future net cash flows $ 1,719 $ 563 $ 2,282
As at December 31, 2009
Canada United States Total
(in $ millions)
Future cash inflows $ 6,902 $ 1,135 $ 8,037
Future production costs 3,320 280 3,600
Future development and asset retirement costs 513 96 609
Future income tax expenses 201 152 353
Future net cash flows $ 2,868 $ 607 $ 3,475
Deduction: 10% annual discount factor 1,144 250 1,394
Standardized measure of discounted future net cash flows $ 1,724 $ 357 $ 2,081
As at December 31, 2008
Canada United States Total
(in $ millions)
Future cash inflows $ 8,645 $ 891 $ 9,536
Future production costs 3,679 244 3,923
Future development and asset retirement costs 747 46 793
Future income tax expenses 279 83 362
Future net cash flows $ 3,940 $ 518 $ 4,458
Deduction: 10% annual discount factor 1,562 177 1,739
Standardized measure of discounted future net cash flows $ 2,378 $ 341 $ 2,719
E N E R P L U S 2010 ANNUAL INFORMATION FORM E-5
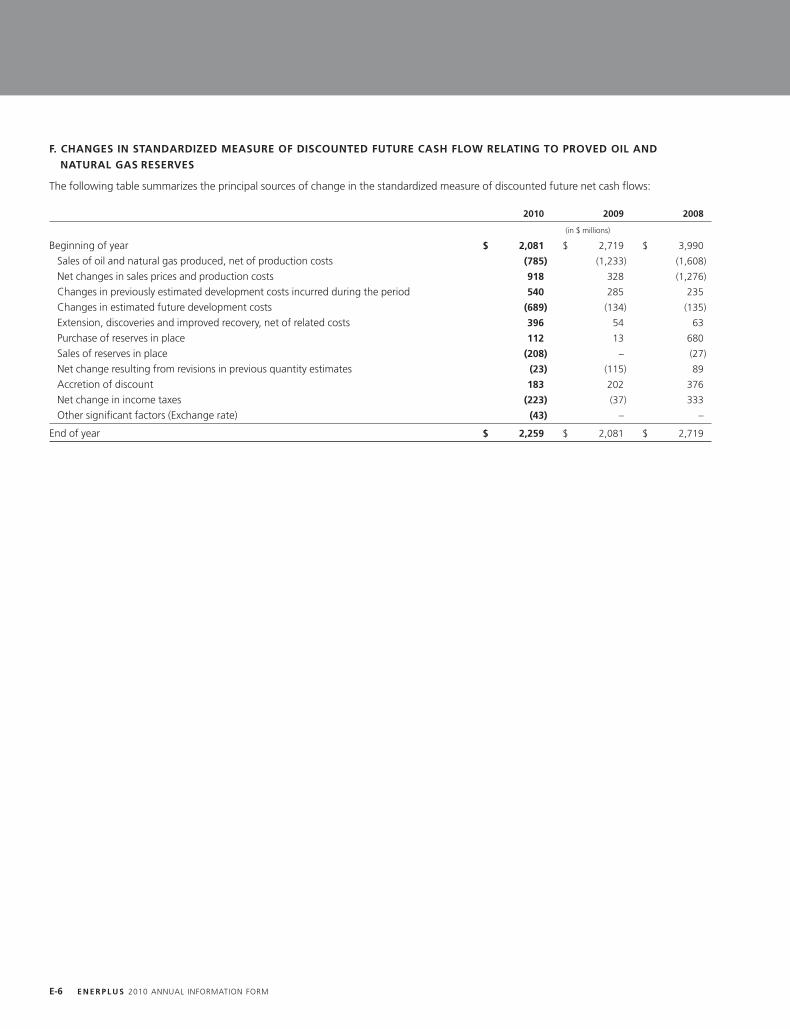
F. CHANGES IN STANDARDIZED MEASURE OF DISCOUNTED FUTURE CASH FLOW RELATING TO PROVED OIL AND
NATURAL GAS RESERVES
The following table summarizes the principal sources of change in the standardized measure of discounted future net cash flows:
2010 2009 2008
(in $ millions)
Beginning of year $ 2,081 $ 2,719 $ 3,990
Sales of oil and natural gas produced, net of production costs (785) (1,233) (1,608)
Net changes in sales prices and production costs 918 328 (1,276)
Changes in previously estimated development costs incurred during the period 540 285 235
Changes in estimated future development costs (689) (134) (135)
Extension, discoveries and improved recovery, net of related costs 396 54 63
Purchase of reserves in place 112 13 680
Sales of reserves in place (208) – (27)
Net change resulting from revisions in previous quantity estimates (23) (115) 89
Accretion of discount 183 202 376
Net change in income taxes (223) (37) 333
Other significant factors (Exchange rate) (43) – –
End of year $ 2,259 $ 2,081 $ 2,719
E-6 E N E R P L U S 2010 ANNUAL INFORMATION FORM
The following Supplemental Information About Oil and Gas Producing Activities required under United States generally accepted
accounting principles, as filed on March 23, 2011, modifies and supersedes the contents of the Supplemental Information About Oil and
Gas Producing Activities contained in Appendix E of Enerplus Corporation’s Annual Information Form for the year ended December 31,
2010 dated March 11, 2011 (the ‘‘AIF’’), which also forms part of Enerplus Corporation’s annual report on Form 40-F dated March 11,
2011 filed with the United States Securities and Exchange Commission. The only modifications to the information contained in
Appendix E of the AIF are immaterial changes to (i) the December 31, 2010 volume of United States oil and NGLs proved developed
reserves in Part A – Proved Oil and Natural Gas Reserve Quantities, and (ii) certain of the dollar values presented as at December 31, 2010
in Part E – Standardized Measure of Discounted Future Net Cash Flows Relating to Proved Oil and Gas Quantities. Capitalized terms and
abbreviations not otherwise defined herein have the meaning assigned to them in the AIF.
Supplemental Information AboutOil and Gas Producing Activities
The following disclosures including proved reserves, future net cash flows, and costs incurred attributable to the conventional crude oil and
natural gas operations of Enerplus Corporation (‘‘Enerplus’’ or the ‘‘Corporation’’) have been prepared in accordance with the provisions of
the Financial Accounting Standards Board’s Accounting Standards Update (ASU) No. 2010-03 ‘‘Extractive Activities – Oil and Gas (Topic 932)
(the ‘‘ASU’’). This new guidance is primarily intended to modernize and update oil and gas disclosure requirements and to align them with
current practices and changes in technology. The new standards also revised the definition of proved reserves and require the use of a 12 month
average price to estimate proved reserves rather than a period end spot price as required in prior periods. The 12 month average price is
calculated as the unweighted arithmetic average of the spot price on the first day of each month within the 12 month period prior to the end of
the reporting period. The Corporation prospectively adopted this guidance effective December 31, 2009 without prior period restatement.
A. PROVED OIL AND NATURAL GAS RESERVE QUANTITIES
Users of this information should be aware that the process of estimating quantities of ‘‘proved developed’’ and ‘‘proved undeveloped’’ crude oil,
natural gas, natural gas liquids and bitumen reserves is very complex, requiring significant subjective decisions in the evaluation of all available
geological, engineering and economic data for each reservoir. The data for a given reservoir may change substantially over time as a result of
numerous factors including, but not limited to, additional development activity, evolving production history, and continual reassessment of the
viability of production under varying economic conditions. Consequently, material revisions to existing reserve estimates occur from time to
time. Although every reasonable effort is made to ensure that reserve estimates reported represent the most accurate assessments possible, the
significance of the subjective decisions required and variances in available data for reservoirs make these estimates generally less precise than
other estimates presented in connection with financial statement disclosures. Future fluctuations in prices and costs, production rates, or
changes in political or regulatory environments could cause the Corporation’s reserves to be materially different from that presented.
Proved reserves, proved developed reserves and proved undeveloped reserves are defined under the ASU. Proved oil and gas reserves are those
quantities of oil and gas, which, by analysis of geoscience and engineering data, can be estimated with reasonable certainty to be economically
producible from a given date forward, from known reservoirs and under existing economic conditions, operating methods and government
regulation. Proved developed reserves are reserves that can be expected to be recovered through existing wells with existing equipment and
operating methods or in which the cost of the required equipment is relatively minor compared to the cost of a new well. Proved undeveloped
reserves are reserves that are expected to be recovered from new wells on undrilled acreage, or from existing wells where a relatively major
expenditure is required for recompletion. The proved reserves disclosed herein are determined according to the definition of ‘‘proved reserves’’
under NI 51-101 which may differ from the definition provided in the SEC rules, however the difference should not be material. See
‘‘Presentation of Enerplus’ Oil and Gas Reserves, Resources and Production Information’’ in the AIF. All cost information in this section is stated in
Canadian dollars and is calculated in accordance with United States generally accepted accounting principles.
Subsequent to December 31, 2010, no major discovery or other favourable or adverse event is believed to have caused a material change in the
estimates of proved reserves as of that date.
1
MARCH 23, 2011 – UPDATE
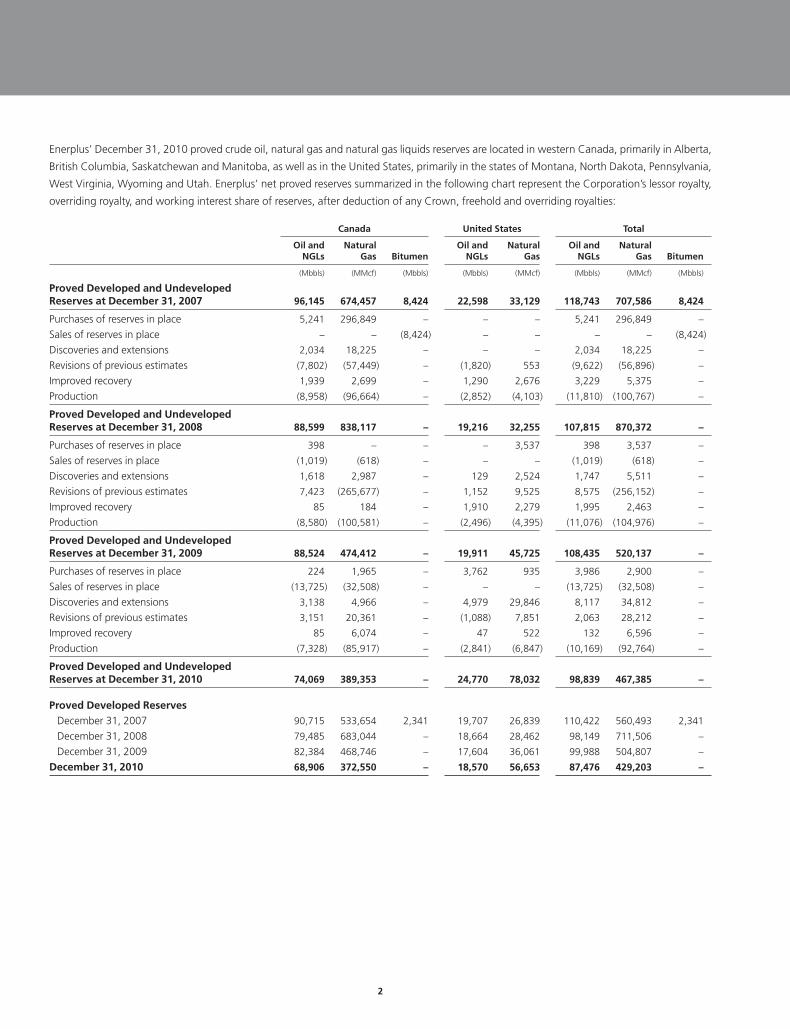
Enerplus’ December 31, 2010 proved crude oil, natural gas and natural gas liquids reserves are located in western Canada, primarily in Alberta,
British Columbia, Saskatchewan and Manitoba, as well as in the United States, primarily in the states of Montana, North Dakota, Pennsylvania,
West Virginia, Wyoming and Utah. Enerplus’ net proved reserves summarized in the following chart represent the Corporation’s lessor royalty,
overriding royalty, and working interest share of reserves, after deduction of any Crown, freehold and overriding royalties:
Canada United States Total
Oil and Natural Oil and Natural Oil and NaturalNGLs Gas Bitumen NGLs Gas NGLs Gas Bitumen
(Mbbls) (MMcf) (Mbbls) (Mbbls) (MMcf) (Mbbls) (MMcf) (Mbbls)
Proved Developed and UndevelopedReserves at December 31, 2007 96,145 674,457 8,424 22,598 33,129 118,743 707,586 8,424
Purchases of reserves in place 5,241 296,849 – – – 5,241 296,849 –
Sales of reserves in place – – (8,424) – – – – (8,424)
Discoveries and extensions 2,034 18,225 – – – 2,034 18,225 –
Revisions of previous estimates (7,802) (57,449) – (1,820) 553 (9,622) (56,896) –
Improved recovery 1,939 2,699 – 1,290 2,676 3,229 5,375 –
Production (8,958) (96,664) – (2,852) (4,103) (11,810) (100,767) –
Proved Developed and UndevelopedReserves at December 31, 2008 88,599 838,117 – 19,216 32,255 107,815 870,372 –
Purchases of reserves in place 398 – – – 3,537 398 3,537 –
Sales of reserves in place (1,019) (618) – – – (1,019) (618) –
Discoveries and extensions 1,618 2,987 – 129 2,524 1,747 5,511 –
Revisions of previous estimates 7,423 (265,677) – 1,152 9,525 8,575 (256,152) –
Improved recovery 85 184 – 1,910 2,279 1,995 2,463 –
Production (8,580) (100,581) – (2,496) (4,395) (11,076) (104,976) –
Proved Developed and UndevelopedReserves at December 31, 2009 88,524 474,412 – 19,911 45,725 108,435 520,137 –
Purchases of reserves in place 224 1,965 – 3,762 935 3,986 2,900 –
Sales of reserves in place (13,725) (32,508) – – – (13,725) (32,508) –
Discoveries and extensions 3,138 4,966 – 4,979 29,846 8,117 34,812 –
Revisions of previous estimates 3,151 20,361 – (1,088) 7,851 2,063 28,212 –
Improved recovery 85 6,074 – 47 522 132 6,596 –
Production (7,328) (85,917) – (2,841) (6,847) (10,169) (92,764) –
Proved Developed and UndevelopedReserves at December 31, 2010 74,069 389,353 – 24,770 78,032 98,839 467,385 –
Proved Developed ReservesDecember 31, 2007 90,715 533,654 2,341 19,707 26,839 110,422 560,493 2,341
December 31, 2008 79,485 683,044 – 18,664 28,462 98,149 711,506 –
December 31, 2009 82,384 468,746 – 17,604 36,061 99,988 504,807 –
December 31, 2010 68,906 372,550 – 18,570 56,653 87,476 429,203 –
2
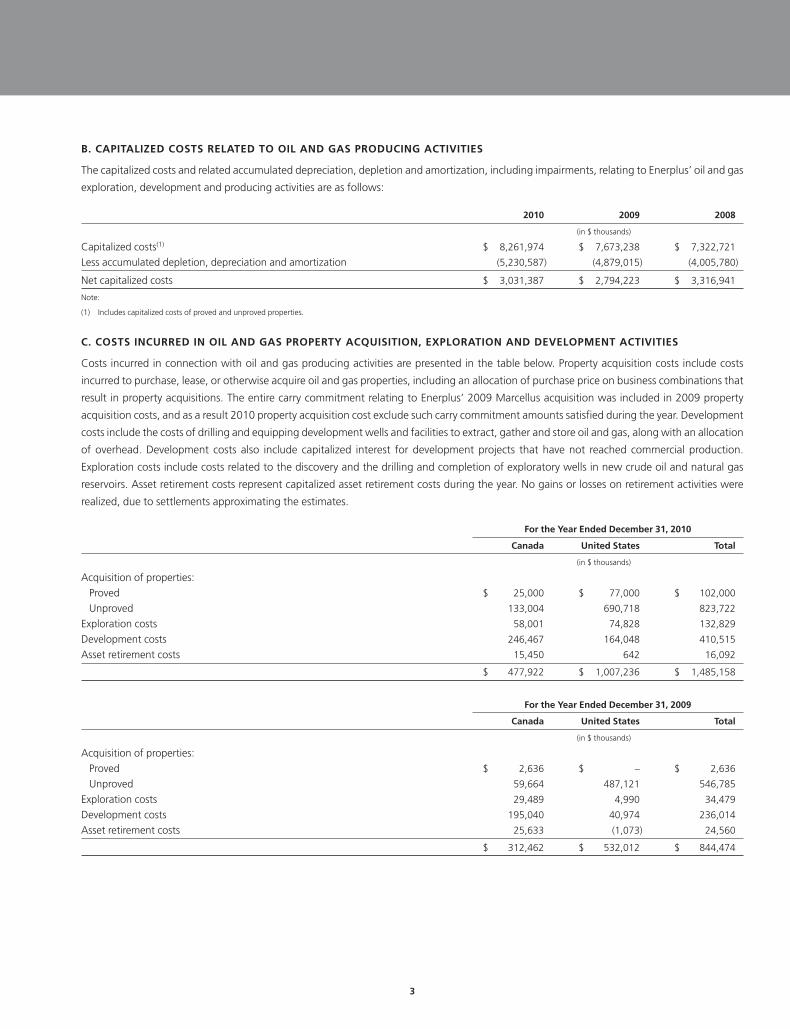
B. CAPITALIZED COSTS RELATED TO OIL AND GAS PRODUCING ACTIVITIES
The capitalized costs and related accumulated depreciation, depletion and amortization, including impairments, relating to Enerplus’ oil and gas
exploration, development and producing activities are as follows:
2010 2009 2008
(in $ thousands)
Capitalized costs(1) $ 8,261,974 $ 7,673,238 $ 7,322,721
Less accumulated depletion, depreciation and amortization (5,230,587) (4,879,015) (4,005,780)
Net capitalized costs $ 3,031,387 $ 2,794,223 $ 3,316,941
Note:
(1) Includes capitalized costs of proved and unproved properties.
C. COSTS INCURRED IN OIL AND GAS PROPERTY ACQUISITION, EXPLORATION AND DEVELOPMENT ACTIVITIES
Costs incurred in connection with oil and gas producing activities are presented in the table below. Property acquisition costs include costs
incurred to purchase, lease, or otherwise acquire oil and gas properties, including an allocation of purchase price on business combinations that
result in property acquisitions. The entire carry commitment relating to Enerplus’ 2009 Marcellus acquisition was included in 2009 property
acquisition costs, and as a result 2010 property acquisition cost exclude such carry commitment amounts satisfied during the year. Development
costs include the costs of drilling and equipping development wells and facilities to extract, gather and store oil and gas, along with an allocation
of overhead. Development costs also include capitalized interest for development projects that have not reached commercial production.
Exploration costs include costs related to the discovery and the drilling and completion of exploratory wells in new crude oil and natural gas
reservoirs. Asset retirement costs represent capitalized asset retirement costs during the year. No gains or losses on retirement activities were
realized, due to settlements approximating the estimates.
For the Year Ended December 31, 2010
Canada United States Total
(in $ thousands)
Acquisition of properties:Proved $ 25,000 $ 77,000 $ 102,000
Unproved 133,004 690,718 823,722
Exploration costs 58,001 74,828 132,829
Development costs 246,467 164,048 410,515
Asset retirement costs 15,450 642 16,092
$ 477,922 $ 1,007,236 $ 1,485,158
For the Year Ended December 31, 2009
Canada United States Total
(in $ thousands)
Acquisition of properties:Proved $ 2,636 $ – $ 2,636
Unproved 59,664 487,121 546,785
Exploration costs 29,489 4,990 34,479
Development costs 195,040 40,974 236,014
Asset retirement costs 25,633 (1,073) 24,560
$ 312,462 $ 532,012 $ 844,474
3
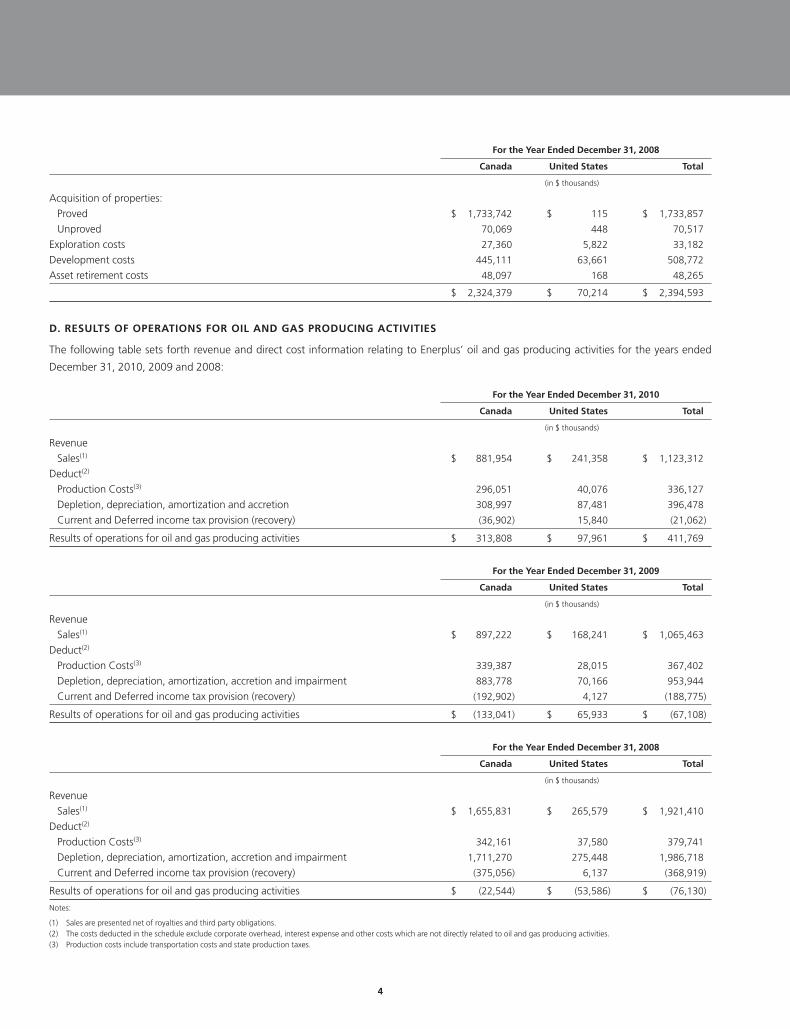
For the Year Ended December 31, 2008
Canada United States Total
(in $ thousands)
Acquisition of properties:Proved $ 1,733,742 $ 115 $ 1,733,857
Unproved 70,069 448 70,517
Exploration costs 27,360 5,822 33,182
Development costs 445,111 63,661 508,772
Asset retirement costs 48,097 168 48,265
$ 2,324,379 $ 70,214 $ 2,394,593
D. RESULTS OF OPERATIONS FOR OIL AND GAS PRODUCING ACTIVITIES
The following table sets forth revenue and direct cost information relating to Enerplus’ oil and gas producing activities for the years ended
December 31, 2010, 2009 and 2008:
For the Year Ended December 31, 2010
Canada United States Total
(in $ thousands)
RevenueSales(1) $ 881,954 $ 241,358 $ 1,123,312
Deduct(2)
Production Costs(3) 296,051 40,076 336,127
Depletion, depreciation, amortization and accretion 308,997 87,481 396,478
Current and Deferred income tax provision (recovery) (36,902) 15,840 (21,062)
Results of operations for oil and gas producing activities $ 313,808 $ 97,961 $ 411,769
For the Year Ended December 31, 2009
Canada United States Total
(in $ thousands)
RevenueSales(1) $ 897,222 $ 168,241 $ 1,065,463
Deduct(2)
Production Costs(3) 339,387 28,015 367,402
Depletion, depreciation, amortization, accretion and impairment 883,778 70,166 953,944
Current and Deferred income tax provision (recovery) (192,902) 4,127 (188,775)
Results of operations for oil and gas producing activities $ (133,041) $ 65,933 $ (67,108)
For the Year Ended December 31, 2008
Canada United States Total
(in $ thousands)
RevenueSales(1) $ 1,655,831 $ 265,579 $ 1,921,410
Deduct(2)
Production Costs(3) 342,161 37,580 379,741
Depletion, depreciation, amortization, accretion and impairment 1,711,270 275,448 1,986,718
Current and Deferred income tax provision (recovery) (375,056) 6,137 (368,919)
Results of operations for oil and gas producing activities $ (22,544) $ (53,586) $ (76,130)
Notes:
(1) Sales are presented net of royalties and third party obligations.(2) The costs deducted in the schedule exclude corporate overhead, interest expense and other costs which are not directly related to oil and gas producing activities.(3) Production costs include transportation costs and state production taxes.
4
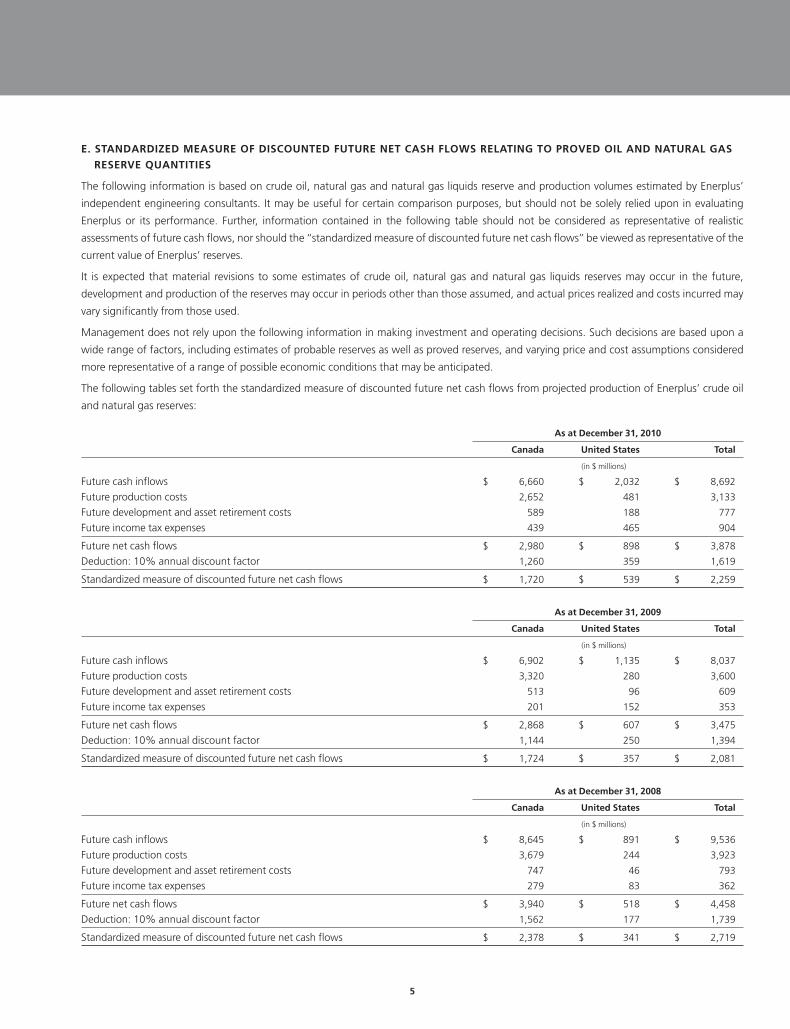
E. STANDARDIZED MEASURE OF DISCOUNTED FUTURE NET CASH FLOWS RELATING TO PROVED OIL AND NATURAL GAS
RESERVE QUANTITIES
The following information is based on crude oil, natural gas and natural gas liquids reserve and production volumes estimated by Enerplus’
independent engineering consultants. It may be useful for certain comparison purposes, but should not be solely relied upon in evaluating
Enerplus or its performance. Further, information contained in the following table should not be considered as representative of realistic
assessments of future cash flows, nor should the ‘‘standardized measure of discounted future net cash flows’’ be viewed as representative of the
current value of Enerplus’ reserves.
It is expected that material revisions to some estimates of crude oil, natural gas and natural gas liquids reserves may occur in the future,
development and production of the reserves may occur in periods other than those assumed, and actual prices realized and costs incurred may
vary significantly from those used.
Management does not rely upon the following information in making investment and operating decisions. Such decisions are based upon a
wide range of factors, including estimates of probable reserves as well as proved reserves, and varying price and cost assumptions considered
more representative of a range of possible economic conditions that may be anticipated.
The following tables set forth the standardized measure of discounted future net cash flows from projected production of Enerplus’ crude oil
and natural gas reserves:
As at December 31, 2010
Canada United States Total
(in $ millions)
Future cash inflows $ 6,660 $ 2,032 $ 8,692
Future production costs 2,652 481 3,133
Future development and asset retirement costs 589 188 777
Future income tax expenses 439 465 904
Future net cash flows $ 2,980 $ 898 $ 3,878
Deduction: 10% annual discount factor 1,260 359 1,619
Standardized measure of discounted future net cash flows $ 1,720 $ 539 $ 2,259
As at December 31, 2009
Canada United States Total
(in $ millions)
Future cash inflows $ 6,902 $ 1,135 $ 8,037
Future production costs 3,320 280 3,600
Future development and asset retirement costs 513 96 609
Future income tax expenses 201 152 353
Future net cash flows $ 2,868 $ 607 $ 3,475
Deduction: 10% annual discount factor 1,144 250 1,394
Standardized measure of discounted future net cash flows $ 1,724 $ 357 $ 2,081
As at December 31, 2008
Canada United States Total
(in $ millions)
Future cash inflows $ 8,645 $ 891 $ 9,536
Future production costs 3,679 244 3,923
Future development and asset retirement costs 747 46 793
Future income tax expenses 279 83 362
Future net cash flows $ 3,940 $ 518 $ 4,458
Deduction: 10% annual discount factor 1,562 177 1,739
Standardized measure of discounted future net cash flows $ 2,378 $ 341 $ 2,719
5
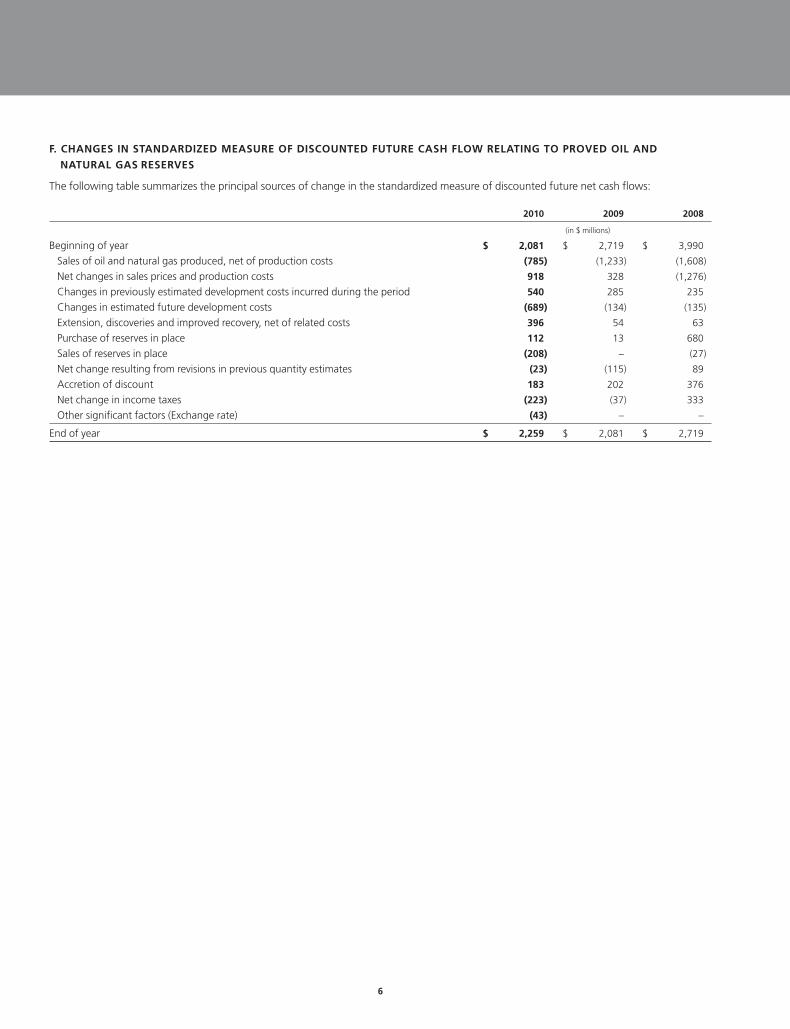
F. CHANGES IN STANDARDIZED MEASURE OF DISCOUNTED FUTURE CASH FLOW RELATING TO PROVED OIL AND
NATURAL GAS RESERVES
The following table summarizes the principal sources of change in the standardized measure of discounted future net cash flows:
2010 2009 2008
(in $ millions)
Beginning of year $ 2,081 $ 2,719 $ 3,990
Sales of oil and natural gas produced, net of production costs (785) (1,233) (1,608)
Net changes in sales prices and production costs 918 328 (1,276)
Changes in previously estimated development costs incurred during the period 540 285 235
Changes in estimated future development costs (689) (134) (135)
Extension, discoveries and improved recovery, net of related costs 396 54 63
Purchase of reserves in place 112 13 680
Sales of reserves in place (208) – (27)
Net change resulting from revisions in previous quantity estimates (23) (115) 89
Accretion of discount 183 202 376
Net change in income taxes (223) (37) 333
Other significant factors (Exchange rate) (43) – –
End of year $ 2,259 $ 2,081 $ 2,719
6

Enerplus CorporationThe Dome Tower
3000, 333 - 7th Avenue S.W.
Calgary, Alberta, Canada
T2P 2Z1
Telephone: 403.298.2200
Toll free: 1.800.319.6462
Fax: 403.298.2211
www.enerplus.com