Embed Size (px)
Citation preview

EN
ER
GIS
E
EV
OL
VE
UN
DE
RS
TA
ND
Annual General MeetingZoran Bogdanovic11 June 2018

Unless otherwise indicated, the condensed consolidated interim financial statements and the financial and operating data or other information included herein relate
to Coca-Cola HBC AG and its subsidiaries (“Coca-Cola HBC” or the “Company” or “we” or the “Group”).
This document contains forward-looking statements that involve risks and uncertainties. These statements may generally, but not always, be identified by the use of
words such as “believe”, “outlook”, “guidance”, “intend”, “expect”, “anticipate”, “plan”, “target” and similar expressions to identify forward-looking statements. All
statements other than statements of historical facts, including, among others, statements regarding our future financial position and results, our outlook for 2018 and
future years, business strategy and the effects of the global economic slowdown, the impact of the sovereign debt crisis, currency volatility, our recent acquisitions,
and restructuring initiatives on our business and financial condition, our future dealings with The Coca-Cola Company, budgets, projected levels of consumption and
production, projected raw material and other costs, estimates of capital expenditure, free cash flow, effective tax rates and plans and objectives of management for
future operations, are forward-looking statements. By their nature, forward-looking statements involve risk and uncertainty because they reflect our current
expectations and assumptions as to future events and circumstances that may not prove accurate. Our actual results and events could differ materially from those
anticipated in the forward-looking statements for many reasons, including the risks described in the 2017 Integrated Annual Report for Coca-Cola HBC AG and its
subsidiaries.
Although we believe that, as of the date of this document, the expectations reflected in the forward-looking statements are reasonable, we cannot assure you that
our future results, level of activity, performance or achievements will meet these expectations. Moreover, neither we, nor our directors, employees, advisors nor any
other person assumes responsibility for the accuracy and completeness of the forward-looking statements. After the date of the condensed consolidated interim
financial statements included in this document, unless we are required by law or the rules of the UK Financial Conduct Authority to update these forward-looking
statements, we will not necessarily update any of these forward-looking statements to conform them either to actual results or to changes in our expectations.
Forward-looking statements
22018 Annual General Meeting | June 2018

Exceptional year for Coca-Cola HBC
2018 Annual General Meeting | June 2018 3
Full-year highlights• FX-neutral net sales revenue up 5.9%,
achieved through a good balance of volume and FX-neutral revenue per case growth
• Strong FX-neutral revenue per case, up 3.6%
• Volume up by 2.2%, with positive performance in all segments
• Comparable EBIT margin up by 120bps to 9.5%
• Comparable EPS of €1.23, up 26.9%
• Free cash flow at €426m for the year, with higher capital expenditure

Exceptional year for Coca-Cola HBC
2018 Annual General Meeting | June 2018 4
Full-year highlights• FX-neutral net sales revenue up 5.9%,
achieved through a good balance of volume and FX-neutral revenue per case growth
• Strong FX-neutral revenue per case, up 3.6%
• Volume up by 2.2%, with positive performance in all segments
• Comparable EBIT margin up by 120bps to 9.5%
• Comparable EPS of €1.23, up 26.9%
• Free cash flow at €426m for the year, with higher capital expenditure

Accelerating growth
2018 Annual General Meeting | June 2018 5
Financial performance overview• FX-neutral net sales revenue up by
5.9%
• Volume up by 2.2%
• Pricing actions and mix improvements driving 3.6% growth in FX-neutral NSR per unit case
• Gross margin 90 bps higher
• Opex as % of revenue 30 bps better
FY '17 FY '16 change
Volume (m u.c.) 2,104.1 2,057.9 2.2%
Net sales revenue (€m) 6,522.0 6,219.0 4.9%
FX-neutral net sales revenue (€m) 6,522.0 6,157.2 5.9%
FX-neutral NSR per case (€) 3.10 2.99 3.6%
Comparable gross profit margin 37.5% 36.6% 90bps
Comparable OPEX as % of NSR 27.9% 28.2% -30bps
Financial indicators on a comparable basis exclude the recognition of restructuring costs, unrealised commodity hedging results and non-recurring items.Certain differences in calculations are due to rounding.

Accelerating growth
2018 Annual General Meeting | June 2018 6
Financial performance overview• Better price/mix and volume
leverage more than offset increase in input costs
• 120bps EBIT margin expansion
• Continued good growth in earnings per share
• Free cash flow generation consistently strong
FY '17 FY '16 change
Comparable EBIT (€m) 621.0 517.5 20.0%
Comparable EBIT margin 9.5% 8.3% 120pbs
Comparable net profit (€m) 448.3 352.1 27.3%
Comparable EPS (€) 1.233 0.972 26.9%
Free cash flow (€m) 425.9 431.2 -5.3
Financial indicators on a comparable basis exclude the recognition of restructuring costs, unrealised commodity hedging results and non-recurring items.Certain differences in calculations are due to rounding.

Delivering fasterrevenue growth
2018 Annual General Meeting | June 2018 7
Revenue growth from balancedvolume and price/mix growth
FY '17 vs. FY '16
Total CCH
Volume 2.2%
FX-neutral revenue per case 3.6%
Established markets
Volume 1.1%
FX-neutral revenue per case 0.7%
Developing markets
Volume 2.8%
FX-neutral revenue per case 2.7%
Emerging markets
Volume 2.7%
FX-neutral revenue per case 6.9%
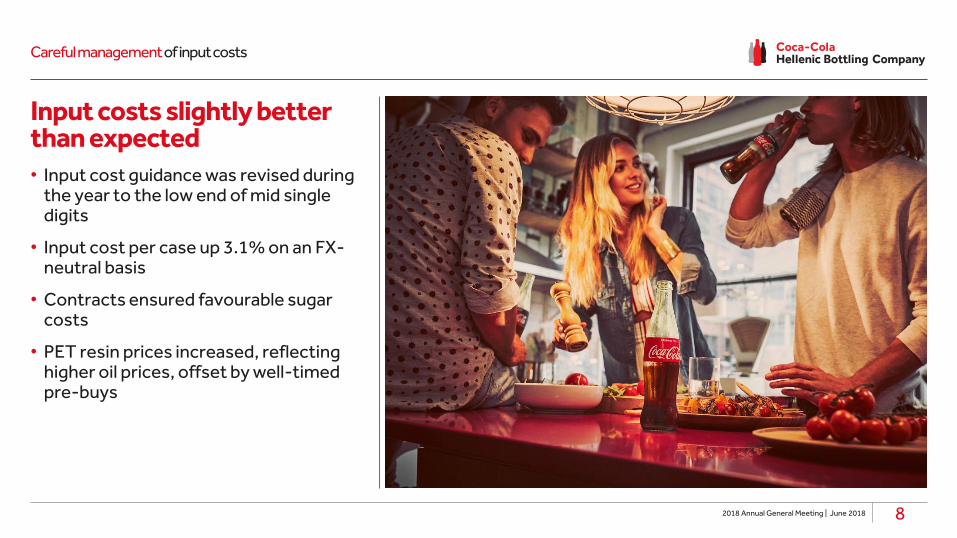
Careful management of input costs
2018 Annual General Meeting | June 2018 8
Input costs slightly better than expected • Input cost guidance was revised during
the year to the low end of mid single digits
• Input cost per case up 3.1% on an FX-neutral basis
• Contracts ensured favourable sugar costs
• PET resin prices increased, reflecting higher oil prices, offset by well-timed pre-buys
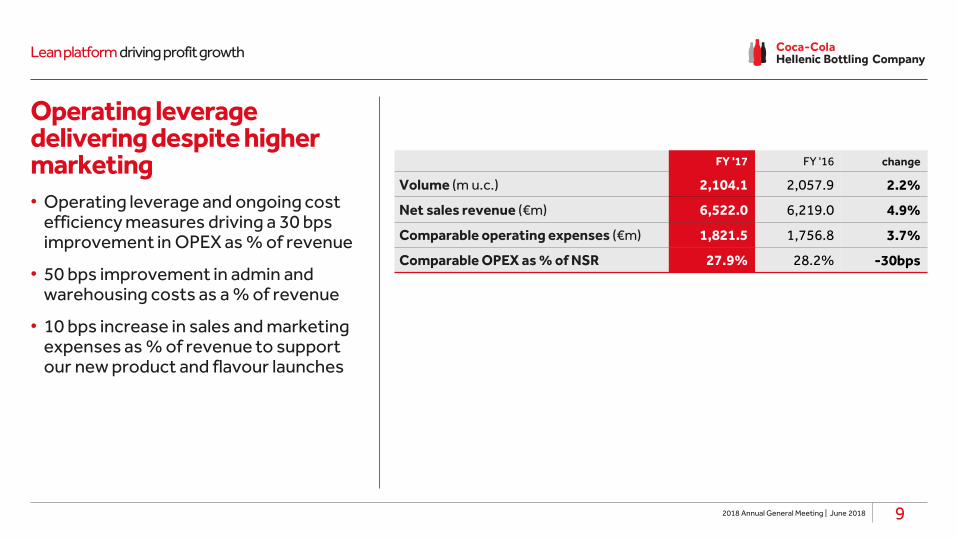
Lean platform driving profit growth
2018 Annual General Meeting | June 2018 9
Operating leverage delivering despite higher marketing• Operating leverage and ongoing cost
efficiency measures driving a 30 bps improvement in OPEX as % of revenue
• 50 bps improvement in admin and warehousing costs as a % of revenue
• 10 bps increase in sales and marketing expenses as % of revenue to support our new product and flavour launches
FY '17 FY '16 change
Volume (m u.c.) 2,104.1 2,057.9 2.2%
Net sales revenue (€m) 6,522.0 6,219.0 4.9%
Comparable operating expenses (€m) 1,821.5 1,756.8 3.7%
Comparable OPEX as % of NSR 27.9% 28.2% -30bps

Profit and margin growth
Emerging markets delivering profitability
2018 Annual General Meeting | June 2018 10
Comparable EBIT(€m)
Comparable EBIT margin
Financial indicators on a comparable basis exclude the recognition of restructuring costs, unrealised commodity hedging results and non-recurring items. Certain differences in calculations are due to rounding.
Emerging
Developing
Established
Total CCH
+8
-5
+100
+103
FY '17 FY '16
250.4 242.3
92.3 97.1
278.3 178.1
621.0 517.5
FY '17 change
10.3% 20bps
7.9% -100bps
9.6% 300bps
9.5% 120bps
Comparable EBIT(change €m)

Continuing to deliver balanced revenue growth
2018 Annual General Meeting | June 2018
First quarter highlights
11
• Revenue growth of 4.5% on a currency-neutral basis
• Revenue continues to be driven by balanced growth between volume and price/mix
• Volume growth of 2.3% in the quarter
• Good volume performances in the Established and Developing markets, as well as the medium-sized Emerging markets
• Sparkling drinks volume strong, up 2.8%

Building on our success
2018 Annual General Meeting | June 2018 12
Looking ahead
we expect another year of growth
Volume to grow in all segments
Improvement in FX-neutral net sales revenue per case
Input cost headwind in low single digits
FX headwind of c. €45m
Another good year of FX-neutral revenue growth and profit margin expansion

EN
ER
GIS
E
EV
OL
VE
UN
DE
RS
TA
ND
Q&A
For further information on Coca-Cola Hellenic please visit our website at: www.coca-colahellenic.com
Or contact our investor relations team [email protected]+30.210.6183 100