Embed Size (px)
Citation preview
ANNUAL GENERAL MEETINGTranslation of the Hungarian presentation
13 April 2018
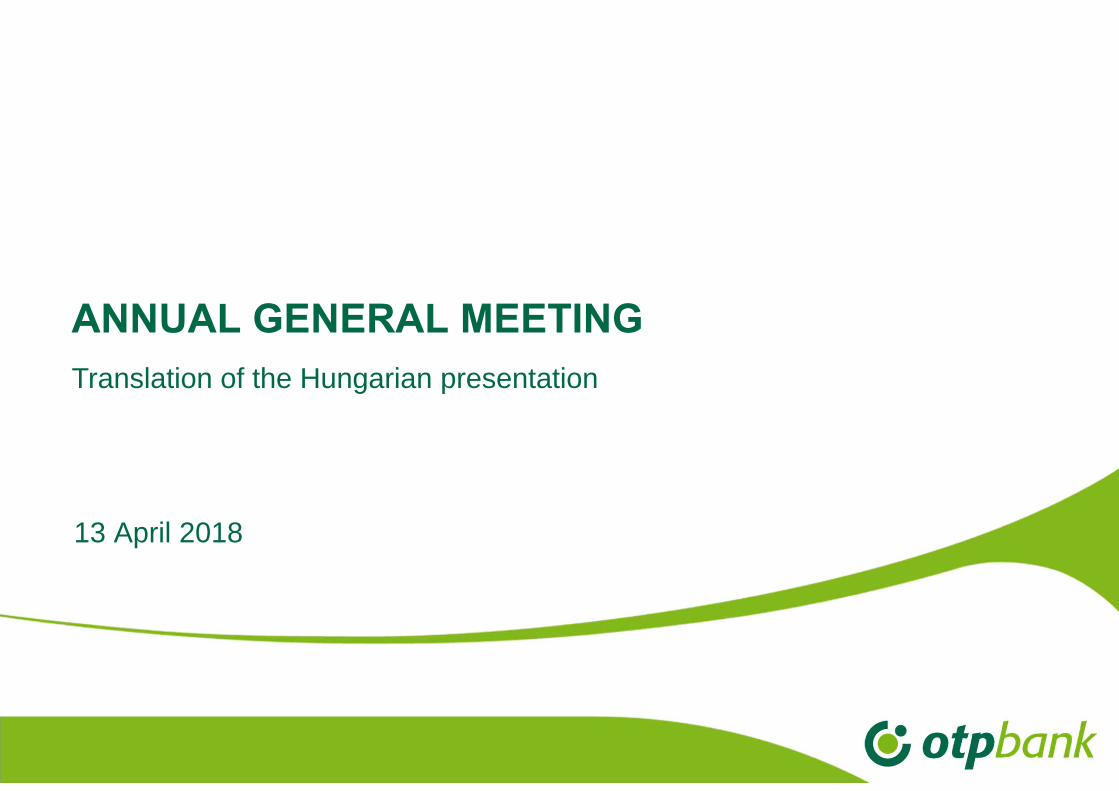
Agenda of the Annual General Meeting
1. The Company’s parent company’s financial statements and consolidated financial statements in accordance with International FinancialReporting Standards for the year ended 2017, as well as the proposal for the use of after-tax profit of the parent company: The report of the Board of Directors on the Company’s business operation in 2017; Proposal on the Company’s parent company’s financial statements in accordance with International Financial Reporting Standards for
the year ended 2017 (statement of financial position, statement of profit or loss, statement of comprehensive income, statement ofchanges in equity, statement of cash-flows, notes to the financial statements);
Proposal for the use of the after-tax profit of the parent company and for dividend payment; Proposal on the Company’s consolidated financial statements in accordance with International Financial Reporting Standards for the
year ended 2017 (statement of financial position, statement of profit or loss, statement of comprehensive income, statement ofchanges in equity, statement of cash-flows, notes to the financial statements);
Report of the Supervisory Board on the annual financial statements for 2017 and its proposal regarding the use of after-tax profit; Audit Committee’s report on the annual financial statement for 2017 and proposal for the use of the after-tax profit; Results of the Independent Auditor’s Report for the year ended 2017.
2. Approval of the Corporate Governance Report for Y20173. Evaluation of the activity of executive officers performed in the past business year, decision on the granting of discharge of liability4. Election of the Company’s audit firm, the determination of the audit remuneration, and determination of the substantive content of the
contract to be concluded with the auditor5. Proposal on the amendment of Article 5 Section 7, Article 6 Section 4, Article 8 Section 4, Article 13 Section 3, Article 13 Section 4,
Article 15 Section 2 of the OTP Bank Plc.'s Articles of Association6. Election of the member of the Supervisory Board7. Election of the member of the Audit Committee8. Proposal on the remuneration principles of OTP Bank Plc.9. Determination of the remuneration of members of the Board of Directors, the Supervisory Board and the Audit Committee10. Authorization of the Board of Directors to acquire the Company’s own shares
2Annual General Meeting – 13 April 2018
The report of the Board of Directors on the Company’s business operation in 2017
Item 1.a on the Agenda
Presented by: Dr. Sándor CsányiChairman of the Board of Directors & Chief Executive Officer
4
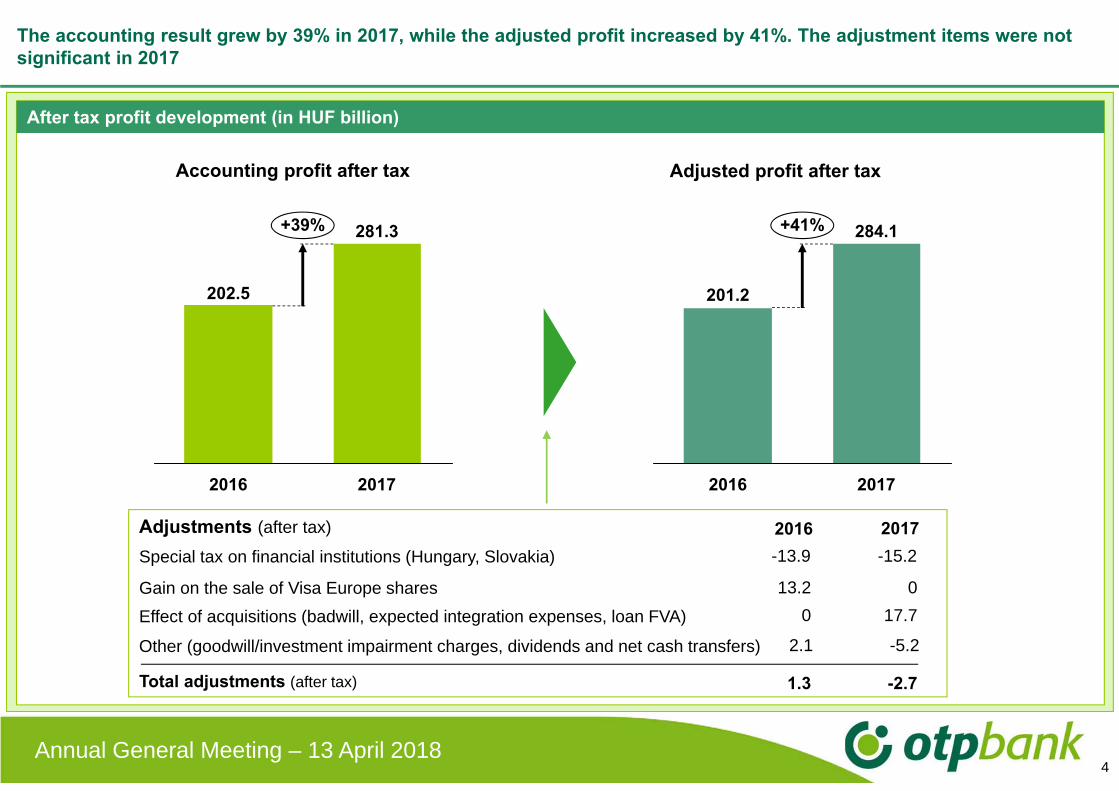
The accounting result grew by 39% in 2017, while the adjusted profit increased by 41%. The adjustment items were not significant in 2017
Accounting profit after tax
+39%
202.5
281.3
2016 2017
Adjusted profit after tax
2016
+41%
201.2
2017
284.1
(milliárd forintban)After tax profit development (in HUF billion)
Adjustments (after tax) 2016 2017Special tax on financial institutions (Hungary, Slovakia)
Gain on the sale of Visa Europe sharesEffect of acquisitions (badwill, expected integration expenses, loan FVA)
Total adjustments (after tax)
-13.9
13.20
1.3
-15.2
017.7
-2.7
Other (goodwill/investment impairment charges, dividends and net cash transfers) 2.1 -5.2
Annual General Meeting – 13 April 2018
5
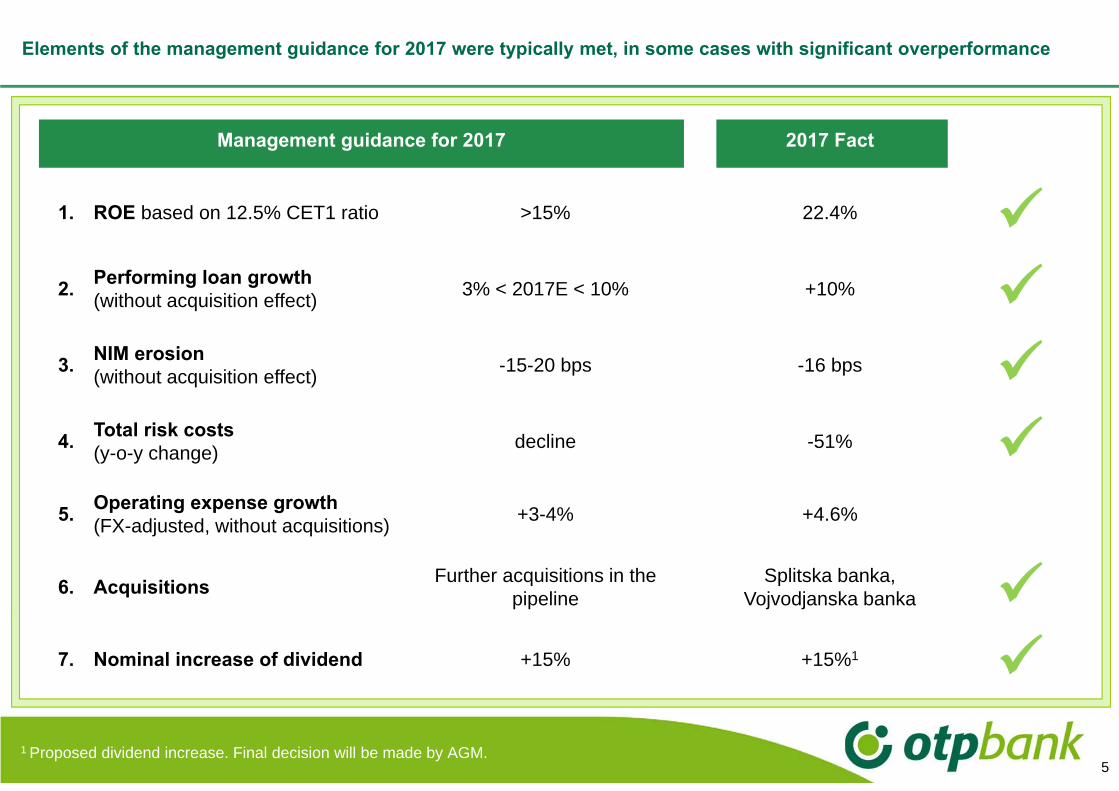
Elements of the management guidance for 2017 were typically met, in some cases with significant overperformance
Management guidance for 2017 2017 Fact
>15%1. ROE based on 12.5% CET1 ratio 22.4% 3% < 2017E < 10%2. Performing loan growth
(without acquisition effect) +10% -15-20 bps3. NIM erosion
(without acquisition effect) -16 bps decline4. Total risk costs
(y-o-y change) -51% +3-4%5. Operating expense growth
(FX-adjusted, without acquisitions) +4.6%
Further acquisitions in the pipeline6. Acquisitions Splitska banka,
Vojvodjanska banka +15%7. Nominal increase of dividend +15%1
1 Proposed dividend increase. Final decision will be made by AGM.
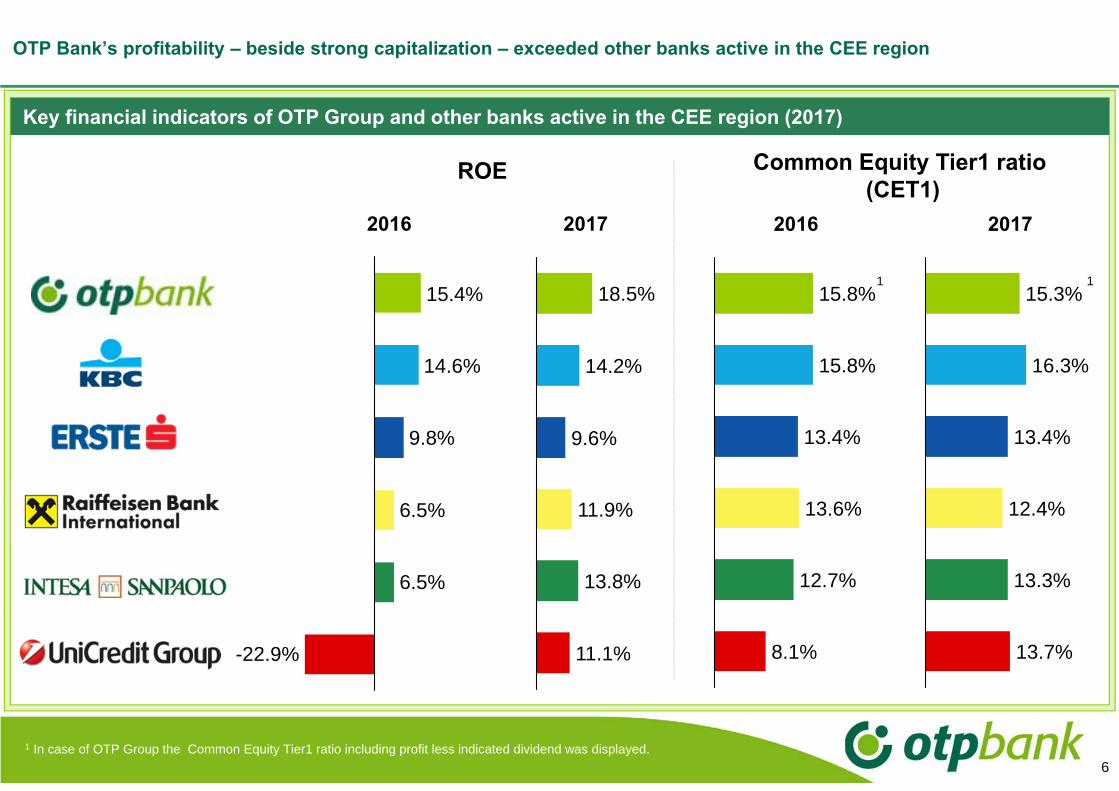
OTP Bank’s profitability – beside strong capitalization – exceeded other banks active in the CEE region
6
8.1%
13.4%
15.8%
12.7%
15.8%
13.6%
ROE Common Equity Tier1 ratio(CET1)
1 In case of OTP Group the Common Equity Tier1 ratio including profit less indicated dividend was displayed.
Key financial indicators of OTP Group and other banks active in the CEE region (2017)
6.5%
6.5%
9.8%
14.6%
-22.9%
15.4%1
14.2%
11.1%
18.5%
9.6%
11.9%
13.8%
2016 2017
13.7%
12.4%
13.3%
16.3%
13.4%
15.3%
2016 2017
1
7
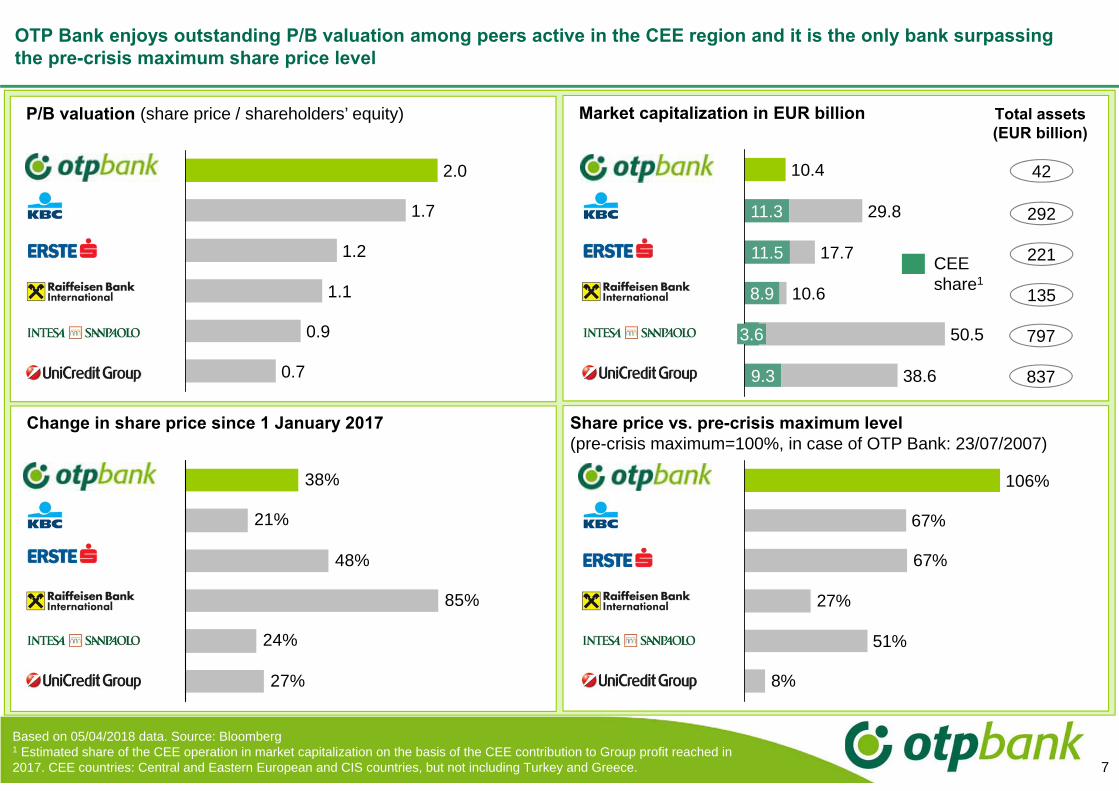
OTP Bank enjoys outstanding P/B valuation among peers active in the CEE region and it is the only bank surpassing the pre-crisis maximum share price level
P/B valuation (share price / shareholders’ equity) Market capitalization in EUR billion
Change in share price since 1 January 2017 Share price vs. pre-crisis maximum level(pre-crisis maximum=100%, in case of OTP Bank: 23/07/2007)
Based on 05/04/2018 data. Source: Bloomberg1 Estimated share of the CEE operation in market capitalization on the basis of the CEE contribution to Group profit reached in2017. CEE countries: Central and Eastern European and CIS countries, but not including Turkey and Greece.
0.9
1.1
0.7
1.2
1.7
2.0
27%
24%
85%
48%
21%
38%
8%
51%
27%
67%
67%
106%
42
292
221
135
797
837
Total assets (EUR billion)
9.3
11.3
38.6
3.6
8.9
50.5
10.6
17.711.5
29.8
10.4
CEEshare1
8
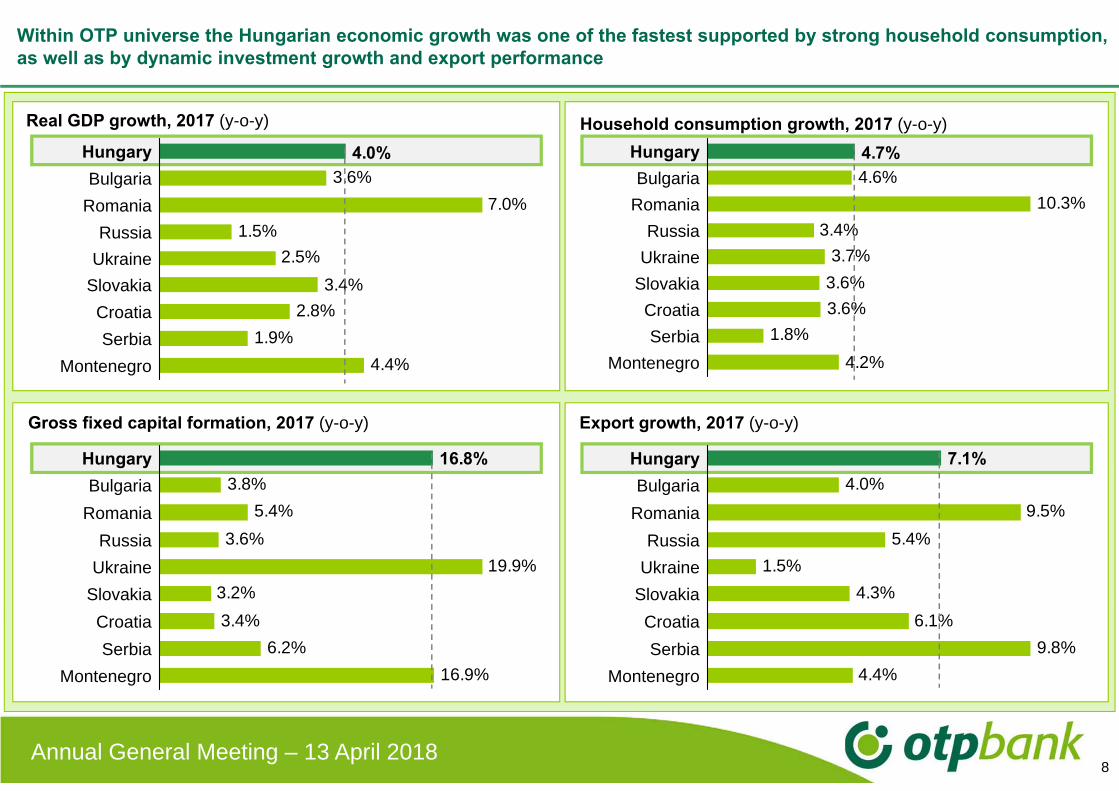
Within OTP universe the Hungarian economic growth was one of the fastest supported by strong household consumption, as well as by dynamic investment growth and export performance
Real GDP growth, 2017 (y-o-y) Household consumption growth, 2017 (y-o-y)
Export growth, 2017 (y-o-y)Gross fixed capital formation, 2017 (y-o-y)
4.4%1.9%
2.8%3.4%
2.5%1.5%
7.0%3.6%
4.0%
Slovakia
Bulgaria
RussiaRomania
Hungary
Ukraine
MontenegroSerbia
Croatia
4.2%1.8%
3.6%3.6%3.7%
3.4%10.3%
4.6%4.7%
Ukraine
Hungary
RussiaRomania
MontenegroSerbia
CroatiaSlovakia
Bulgaria
16.9%6.2%
3.4%3.2%
19.9%3.6%
5.4%3.8%
16.8%
Romania
Croatia
Bulgaria
Montenegro
Ukraine
Serbia
Slovakia
Russia
Hungary
4.4%9.8%
6.1%4.3%
1.5%5.4%
9.5%4.0%
7.1%
SerbiaCroatia
Ukraine
Montenegro
Slovakia
Russia
HungaryBulgaria
Romania
Annual General Meeting – 13 April 2018
9
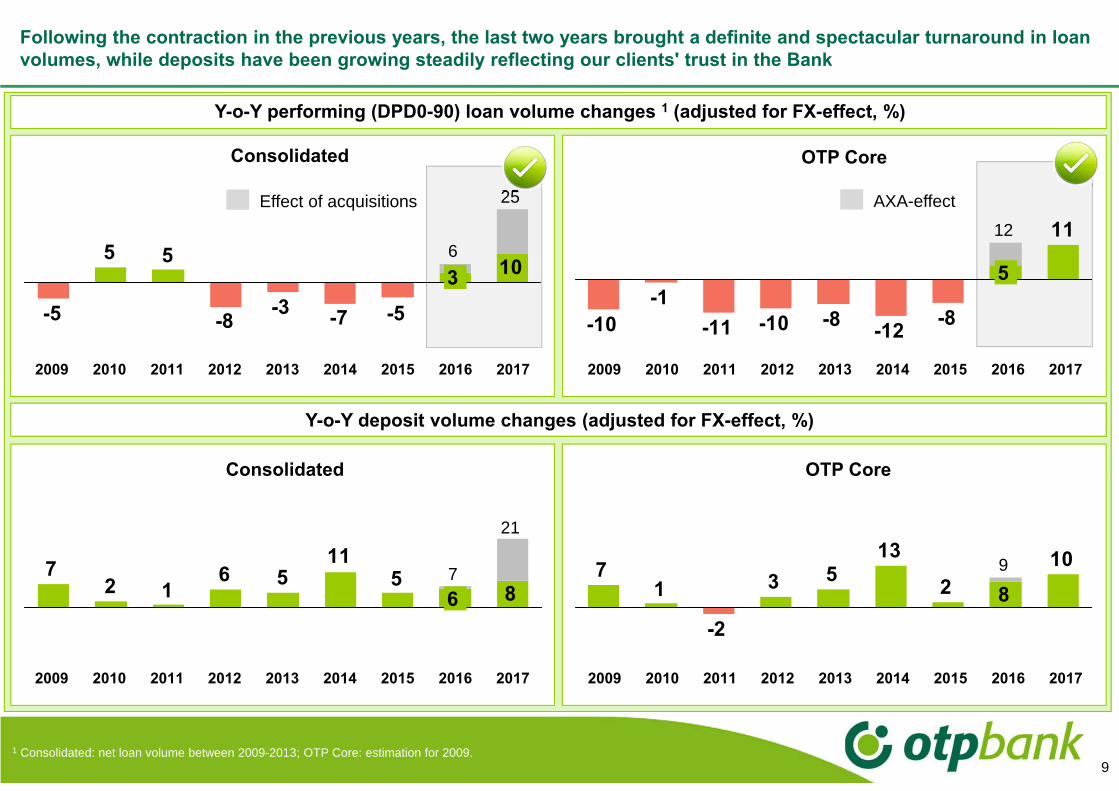
Following the contraction in the previous years, the last two years brought a definite and spectacular turnaround in loan volumes, while deposits have been growing steadily reflecting our clients' trust in the Bank
1 Consolidated: net loan volume between 2009-2013; OTP Core: estimation for 2009.
10
-5 -7 -3 -8
5 5
-5
25
63
Y-o-Y performing (DPD0-90) loan volume changes 1 (adjusted for FX-effect, %)
Effect of acquisitions
Consolidated OTP Core
11
-8 -12 -8 -10 -11 -1
-10
12
5
AXA-effect
A teljesítő (DPD0-90) hitelállomány éves változása (árfolyamszűrten, %)Y-o-Y deposit volume changes (adjusted for FX-effect, %)
Consolidated OTP Core
8 5
11 5 1 2
7 6
21
76
10 8 2
13 5 3
-2
1 7 9
2009 2010 2011 2012 2013 2014 2015 2016 2017 2009 2010 2011 2012 2013 2014 2015 2016 2017
2009 2010 2011 2012 2013 2014 2015 2016 2017 2009 2010 2011 2012 2013 2014 2015 2016 2017
10
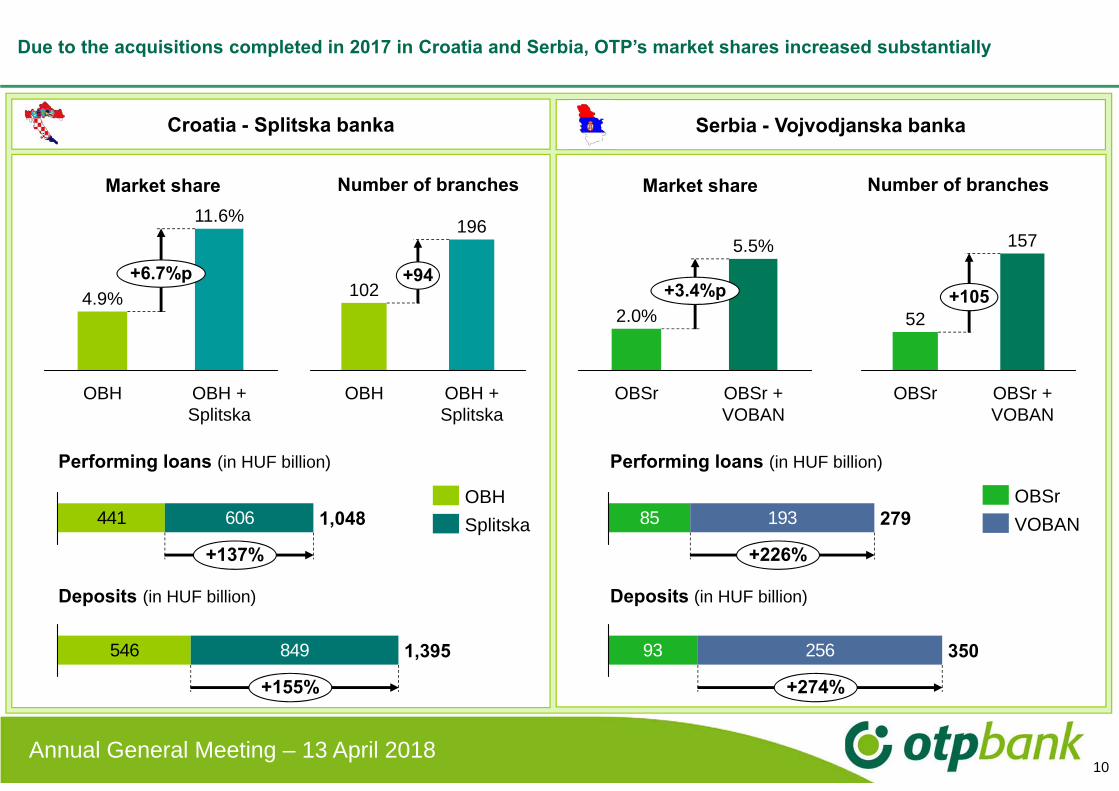
Due to the acquisitions completed in 2017 in Croatia and Serbia, OTP’s market shares increased substantially
OBSr + VOBAN
OBSr
2.0%+3.4%p
5.5%
+105
157
OBSr + VOBAN
OBSr
52
Number of branches
Croatia - Splitska banka Serbia - Vojvodjanska banka
Market share
OBH
11.6%
+6.7%p
OBH + Splitska
4.9%
OBH
102+94
OBH + Splitska
196
Market share Number of branches
441 606
+137%
1,048
546 849
+155%
1,395
Performing loans (in HUF billion)
Deposits (in HUF billion)
85 193 279
+226%
93 256
+274%
350
Performing loans (in HUF billion)
Deposits (in HUF billion)
SplitskaOBH OBSr
VOBAN
Annual General Meeting – 13 April 2018
11
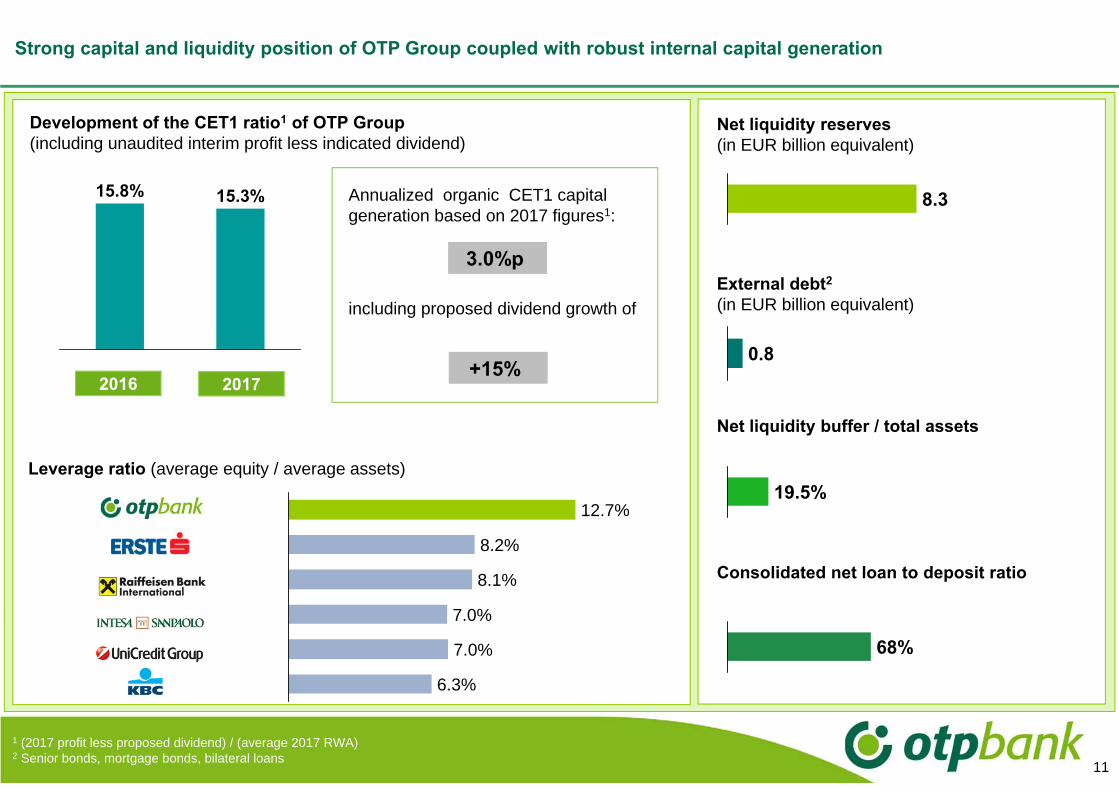
Strong capital and liquidity position of OTP Group coupled with robust internal capital generation
Development of the CET1 ratio1 of OTP Group(including unaudited interim profit less indicated dividend)
1 (2017 profit less proposed dividend) / (average 2017 RWA) 2 Senior bonds, mortgage bonds, bilateral loans
Leverage ratio (average equity / average assets)
Net liquidity buffer / total assets
Consolidated net loan to deposit ratio
Net liquidity reserves (in EUR billion equivalent)
External debt2
(in EUR billion equivalent)
12.7%
7.0%
7.0%
6.3%
8.1%
8.2%
15.8% 15.3%
20172016
8.3
0.8
19.5%
68%
Annualized organic CET1 capital generation based on 2017 figures1:
3.0%p
including proposed dividend growth of
+15%

12
9.2%
14.7%17.0%
19.3%19.8%
2013 2014 201720162015
The credit quality indicators kept further improving. The ratio of consolidated DPD90+ loans dropped below 10%
3173
212264263
2014 2017201620152013
0.4%1.1%
3.2%3.7%3.5%
2015 201620142013 2017
5177
133
253
190
20172014 201620152013
Annual General Meeting – 13 April 2018
Change in DPD90+ loan volumes (consolidated, adjusted for FX and sales and write-offs, in HUF billion)
Consolidated risk cost for possible loan losses (in HUF billion)
Consolidated DPD90+ ratio Consolidated risk cost rate
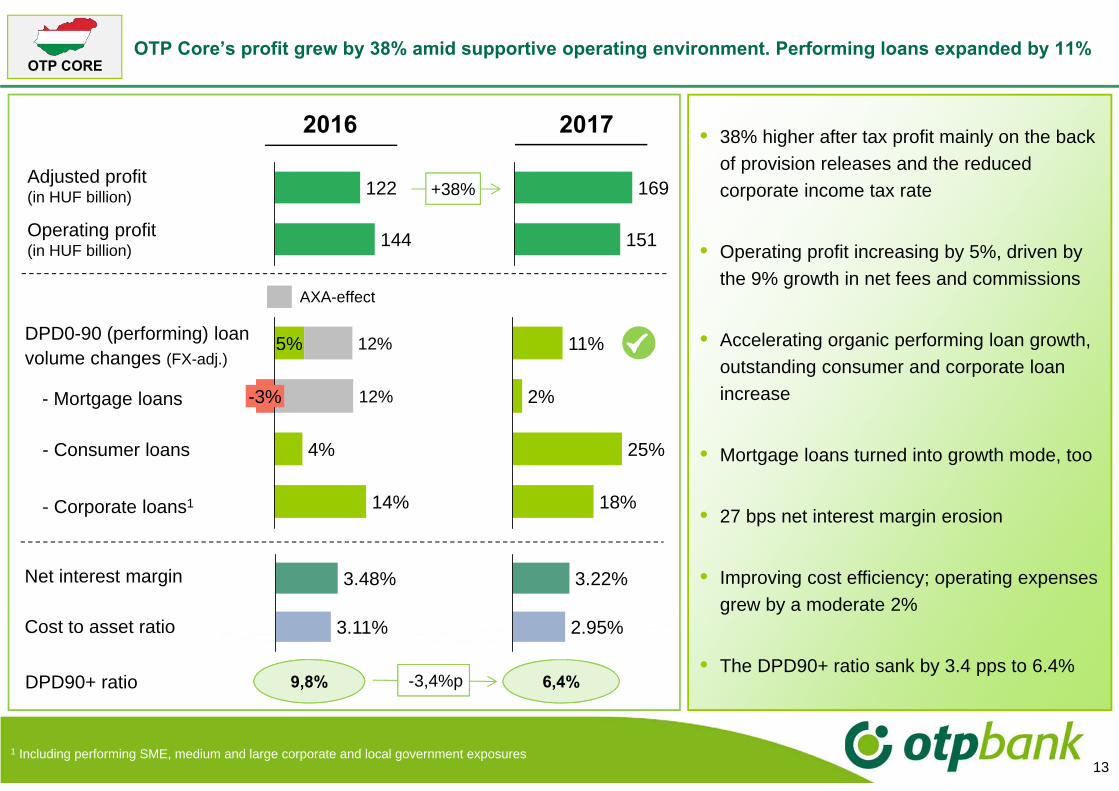
OTP Core’s profit grew by 38% amid supportive operating environment. Performing loans expanded by 11%
13
144
122Adjusted profit(in HUF billion)
Operating profit(in HUF billion)
2016 2017 • 38% higher after tax profit mainly on the back of provision releases and the reduced corporate income tax rate
• Operating profit increasing by 5%, driven by the 9% growth in net fees and commissions
• Accelerating organic performing loan growth, outstanding consumer and corporate loan increase
• Mortgage loans turned into growth mode, too
• 27 bps net interest margin erosion
• Improving cost efficiency; operating expenses grew by a moderate 2%
• The DPD90+ ratio sank by 3.4 pps to 6.4%
Net interest margin
Cost to asset ratio
169
151
3.11%
3.48% 3.22%
2.95%
OTP CORE
DPD0-90 (performing) loan volume changes (FX-adj.)
- Mortgage loans
- Consumer loans
- Corporate loans1
1 Including performing SME, medium and large corporate and local government exposures
18%
25%
11%
2%
5%
-3%
12%
12%
14%
4%
AXA-effect
+38%
9,8% 6,4%-3,4%p DPD90+ ratio
14
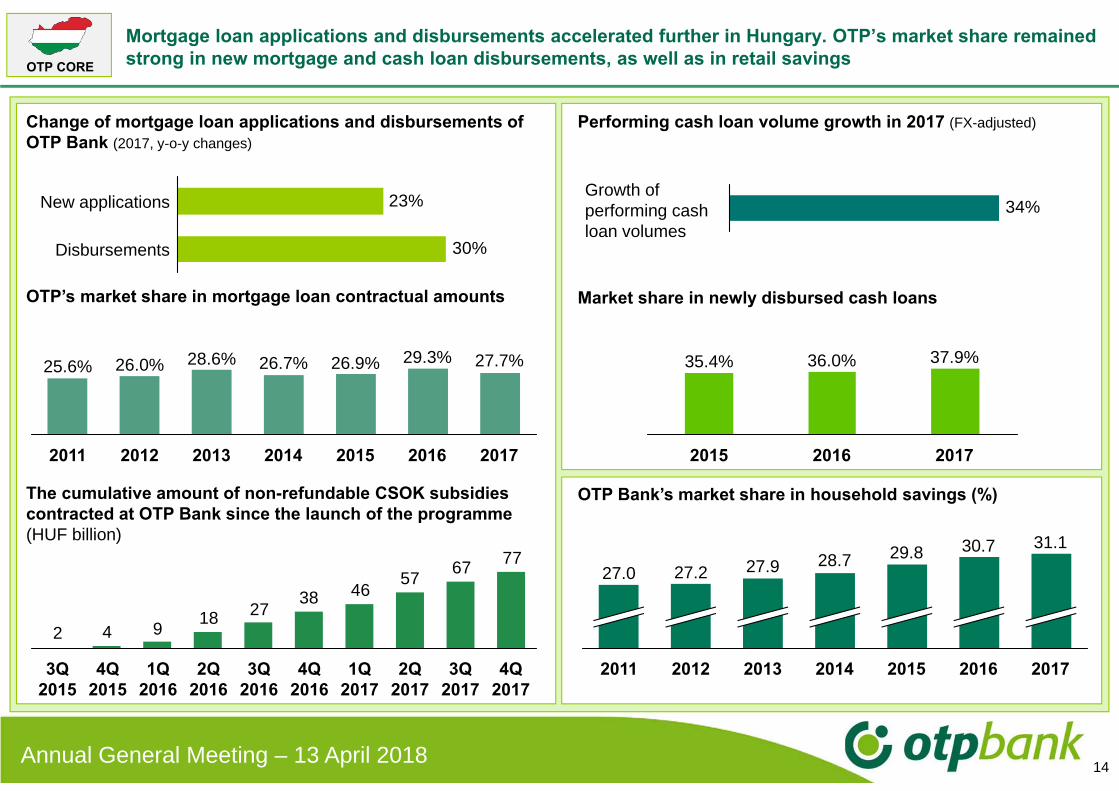
Mortgage loan applications and disbursements accelerated further in Hungary. OTP’s market share remained strong in new mortgage and cash loan disbursements, as well as in retail savingsOTP CORE
The cumulative amount of non-refundable CSOK subsidies contracted at OTP Bank since the launch of the programme(HUF billion)
7767574638
2718942
2Q 2016
4Q 2016
1Q 2016
3Q 2016
3Q 2015
4Q 2015
4Q 2017
3Q 2017
2Q 2017
1Q 2017
Change of mortgage loan applications and disbursements of OTP Bank (2017, y-o-y changes)
30%
23%New applications
Disbursements
OTP’s market share in mortgage loan contractual amounts
29.3%
20142013 2017
27.7%
2015 2016
26.9%26.7%28.6%
2012
26.0%
2011
25.6%
Market share in newly disbursed cash loans
20172015
35.4% 36.0%
2016
37.9%
OTP Bank’s market share in household savings (%)
2013
27.931.1
2017201620152014
30.729.828.7
2012
27.2
2011
27.0
Performing cash loan volume growth in 2017 (FX-adjusted)
34%Growth of performing cash loan volumes
Annual General Meeting – 13 April 2018
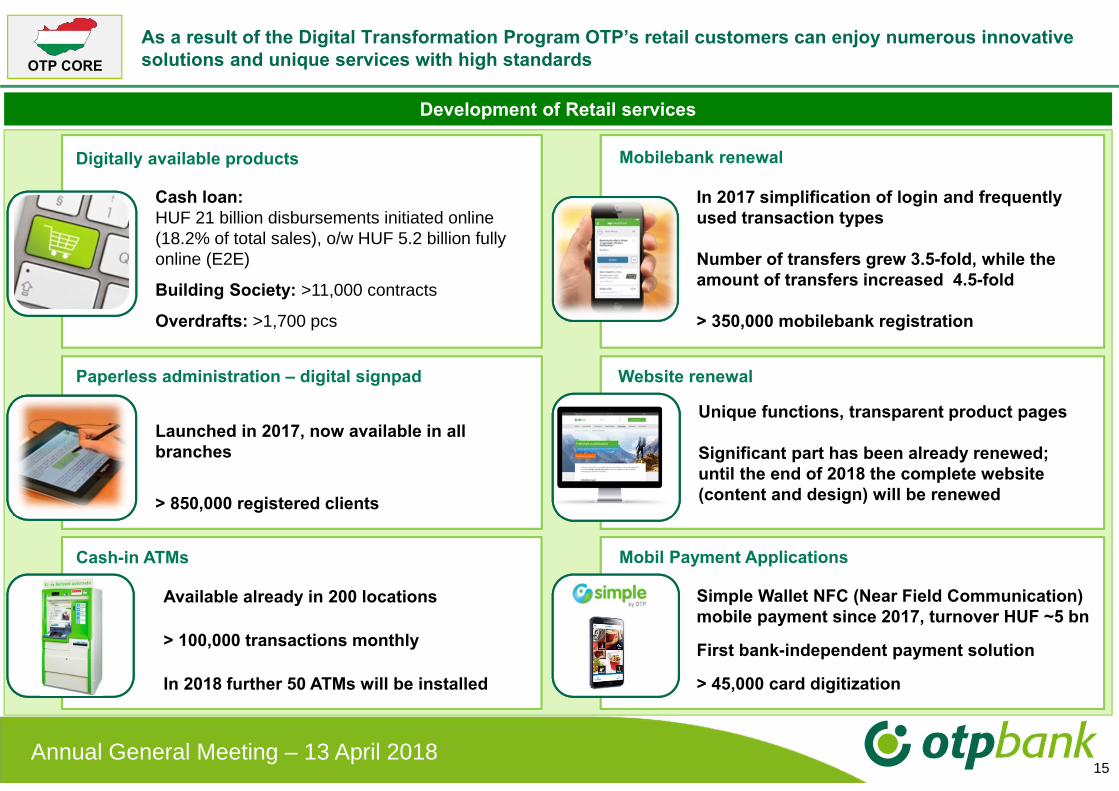
As a result of the Digital Transformation Program OTP’s retail customers can enjoy numerous innovative solutions and unique services with high standards
15
OTP CORE
Banking
Mobilebank renewal
Banking
Banking
Development of Retail services
Banking
Banking
Digitally available products
Cash loan:HUF 21 billion disbursements initiated online (18.2% of total sales), o/w HUF 5.2 billion fully online (E2E)
Building Society: >11,000 contracts
Overdrafts: >1,700 pcs
Banking
Paperless administration – digital signpad
Launched in 2017, now available in all branches
> 850,000 registered clients
Cash-in ATMs
Available already in 200 locations
> 100,000 transactions monthly
In 2018 further 50 ATMs will be installed
Mobil Payment Applications
Simple Wallet NFC (Near Field Communication) mobile payment since 2017, turnover HUF ~5 bn
First bank-independent payment solution
> 45,000 card digitization
Website renewal
In 2017 simplification of login and frequently used transaction types
Number of transfers grew 3.5-fold, while the amount of transfers increased 4.5-fold
> 350,000 mobilebank registration
Unique functions, transparent product pages
Significant part has been already renewed; until the end of 2018 the complete website (content and design) will be renewed
Annual General Meeting – 13 April 2018
16
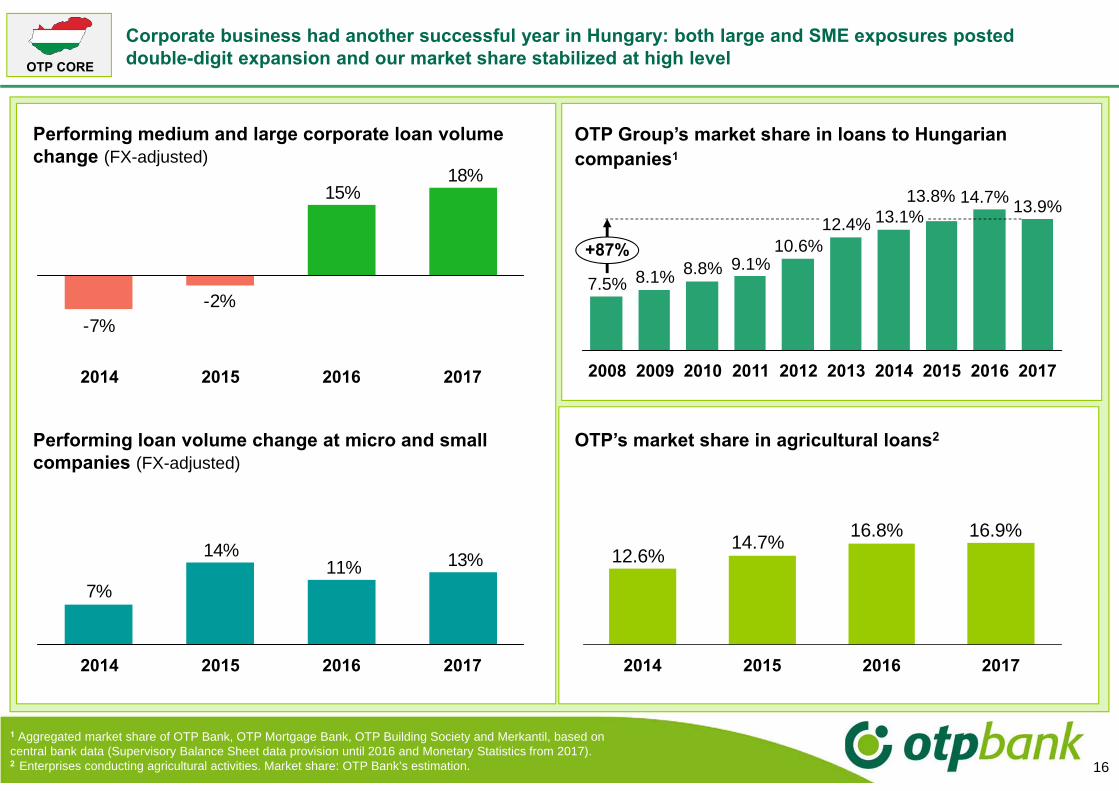
Corporate business had another successful year in Hungary: both large and SME exposures posted double-digit expansion and our market share stabilized at high level
OTP Group’s market share in loans to Hungarian companies1
1 Aggregated market share of OTP Bank, OTP Mortgage Bank, OTP Building Society and Merkantil, based on central bank data (Supervisory Balance Sheet data provision until 2016 and Monetary Statistics from 2017).2 Enterprises conducting agricultural activities. Market share: OTP Bank’s estimation.
13.1%
2013 2017
13.8%
2015
+87%
13.9%
2016
7.5%
14.7%
20142009
9.1%
2011
8.8%10.6%
12.4%
2012
8.1%
20102008
Performing loan volume change at micro and small companies (FX-adjusted)
13%11%14%
7%
20152014 2016 2017
18%15%
-2%-7%
2016 201720152014
Performing medium and large corporate loan volume change (FX-adjusted)
OTP’s market share in agricultural loans2
16.9%16.8%14.7%12.6%
2015 2016 20172014
OTP CORE
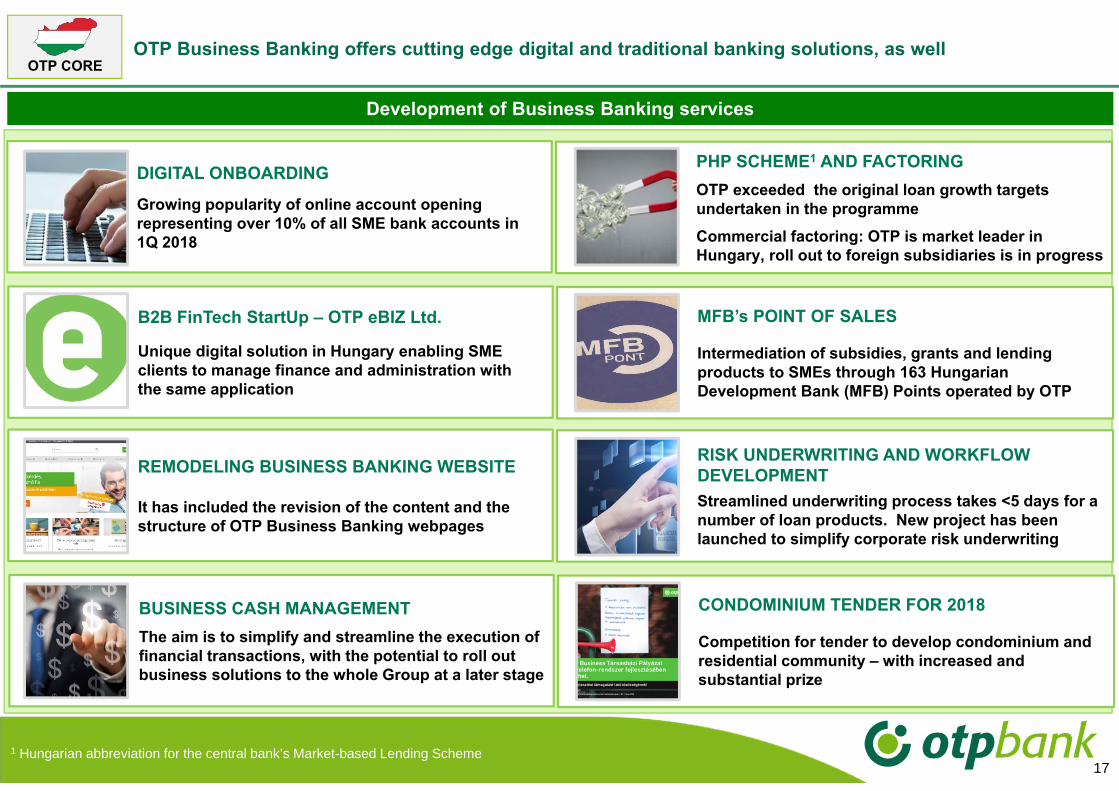
OTP Business Banking offers cutting edge digital and traditional banking solutions, as wellOTP CORE
Development of Business Banking services
DIGITAL ONBOARDING
Growing popularity of online account opening representing over 10% of all SME bank accounts in 1Q 2018
PHP SCHEME1 AND FACTORINGOTP exceeded the original loan growth targetsundertaken in the programmeCommercial factoring: OTP is market leader in Hungary, roll out to foreign subsidiaries is in progress
B2B FinTech StartUp – OTP eBIZ Ltd.
Unique digital solution in Hungary enabling SMEclients to manage finance and administration with the same application
MFB’s POINT OF SALES
Intermediation of subsidies, grants and lending products to SMEs through 163 Hungarian Development Bank (MFB) Points operated by OTP
REMODELING BUSINESS BANKING WEBSITE
It has included the revision of the content and the structure of OTP Business Banking webpages
RISK UNDERWRITING AND WORKFLOW DEVELOPMENTStreamlined underwriting process takes <5 days for a number of loan products. New project has been launched to simplify corporate risk underwriting
BUSINESS CASH MANAGEMENTThe aim is to simplify and streamline the execution of financial transactions, with the potential to roll out business solutions to the whole Group at a later stage
CONDOMINIUM TENDER FOR 2018
Competition for tender to develop condominium and residential community – with increased and substantial prize
171 Hungarian abbreviation for the central bank’s Market-based Lending Scheme
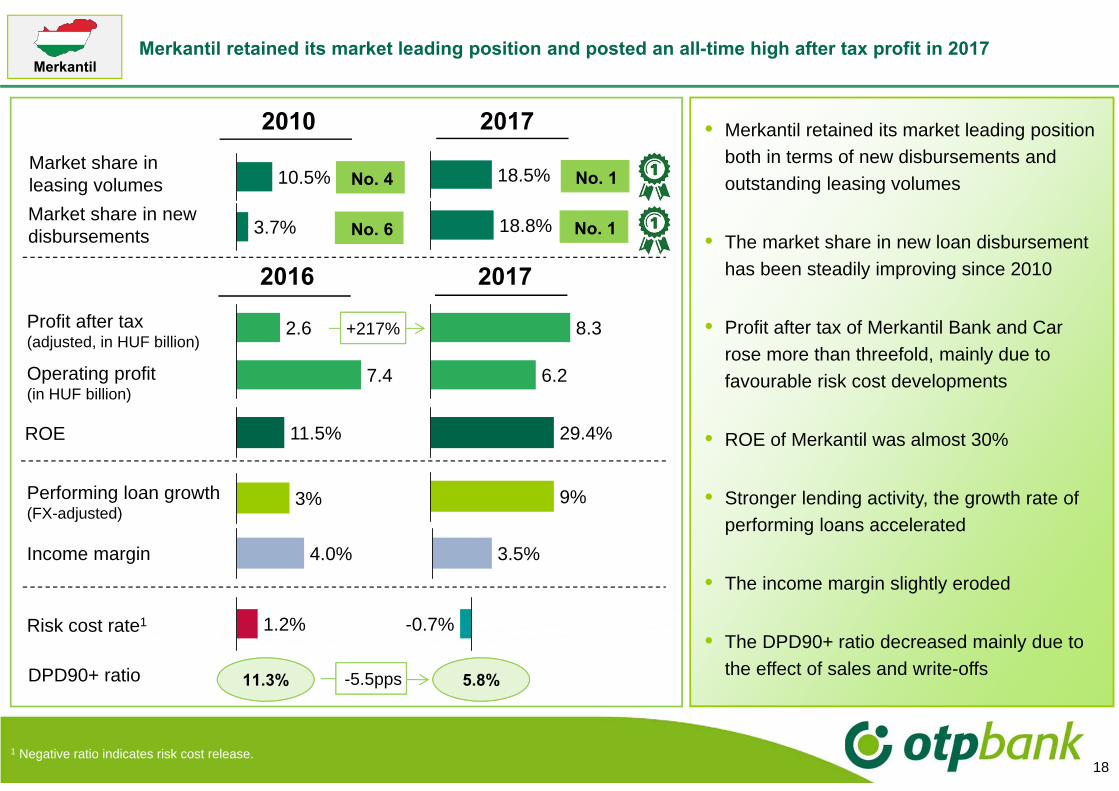
Merkantil retained its market leading position and posted an all-time high after tax profit in 2017
18
• Merkantil retained its market leading position both in terms of new disbursements and outstanding leasing volumes
• The market share in new loan disbursement has been steadily improving since 2010
• Profit after tax of Merkantil Bank and Car rose more than threefold, mainly due to favourable risk cost developments
• ROE of Merkantil was almost 30%
• Stronger lending activity, the growth rate of performing loans accelerated
• The income margin slightly eroded
• The DPD90+ ratio decreased mainly due to the effect of sales and write-offsDPD90+ ratio
Merkantil
1 Negative ratio indicates risk cost release.
7.4
2.6
2016 2017
Performing loan growth (FX-adjusted)
Income margin
8.3
6.2
3% 9%
1.2% -0.7%Risk cost rate1
Profit after tax(adjusted, in HUF billion)
Operating profit(in HUF billion)
10.5% 18.5%
11.3% 5.8%-5.5pps
No. 1No. 4 Market share in leasing volumes
4.0% 3.5%
2010 2017
Market share in new disbursements 3.7% 18.8% No. 1No. 6
+217%
11.5%ROE 29.4%
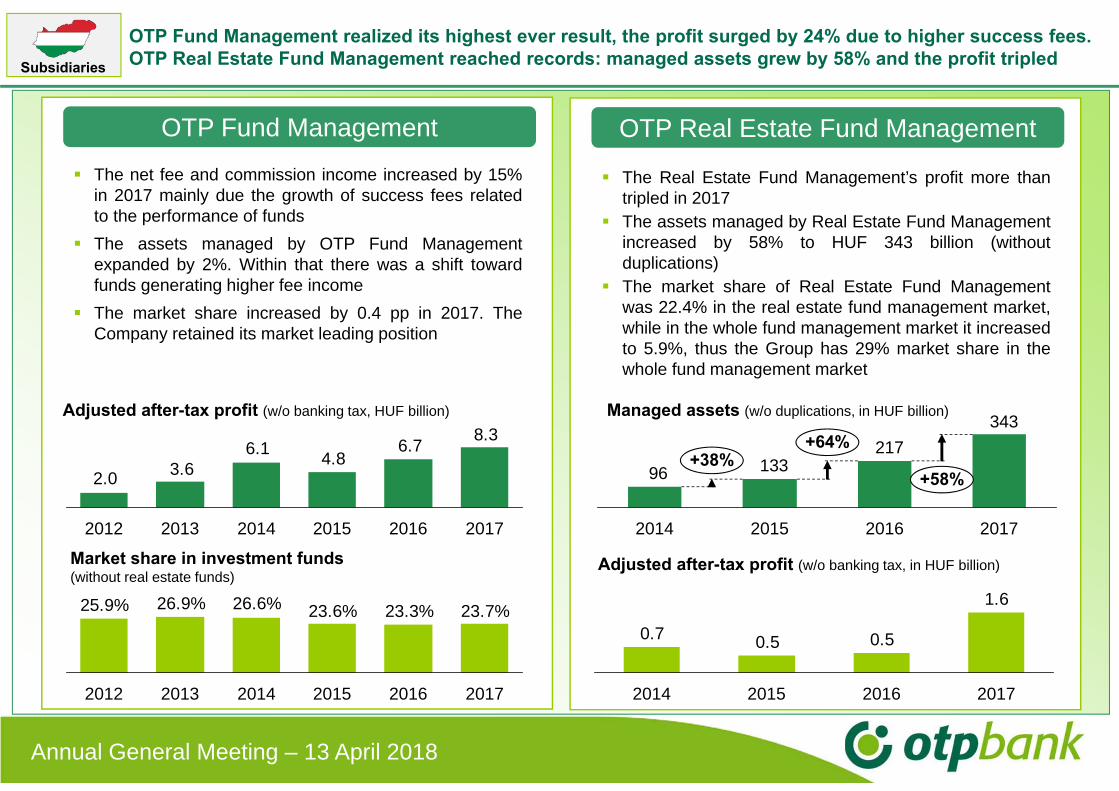
OTP Fund Management realized its highest ever result, the profit surged by 24% due to higher success fees. OTP Real Estate Fund Management reached records: managed assets grew by 58% and the profit tripled
OTP Fund Management
The net fee and commission income increased by 15%in 2017 mainly due the growth of success fees relatedto the performance of funds
The assets managed by OTP Fund Managementexpanded by 2%. Within that there was a shift towardfunds generating higher fee income
The market share increased by 0.4 pp in 2017. TheCompany retained its market leading position
Adjusted after-tax profit (w/o banking tax, HUF billion)
8.36.74.86.1
3.62.0
2013 2016 20172014 20152012
23.7%23.3%23.6%26.6%26.9%25.9%
2012 2015 201720162013 2014
Market share in investment funds(without real estate funds)
Subsidiaries
Annual General Meeting – 13 April 2018
OTP Real Estate Fund Management
The Real Estate Fund Management’s profit more thantripled in 2017
The assets managed by Real Estate Fund Managementincreased by 58% to HUF 343 billion (withoutduplications)
The market share of Real Estate Fund Managementwas 22.4% in the real estate fund management market,while in the whole fund management market it increasedto 5.9%, thus the Group has 29% market share in thewhole fund management market
Adjusted after-tax profit (w/o banking tax, in HUF billion)
1.6
0.50.50.7
2016 20172014 2015
343217
13396+38%
2014 2016
+58%
+64%
20172015
Managed assets (w/o duplications, in HUF billion)
20
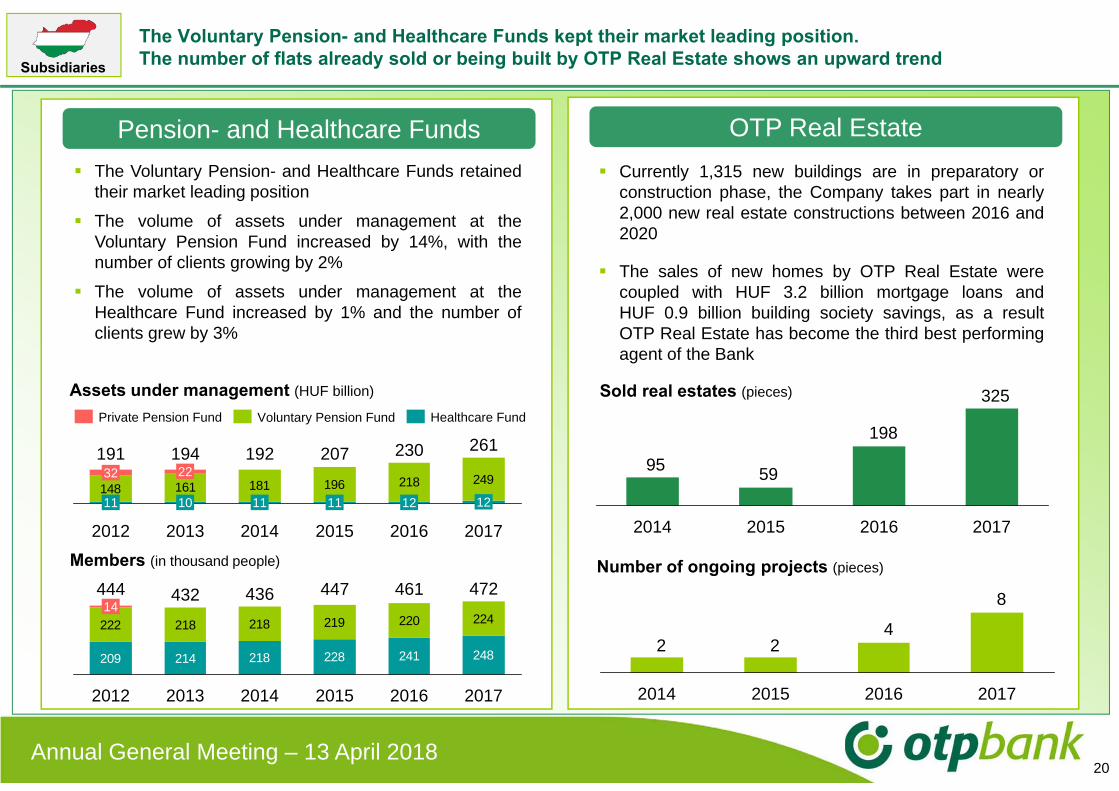
The Voluntary Pension- and Healthcare Funds kept their market leading position. The number of flats already sold or being built by OTP Real Estate shows an upward trend
OTP Real Estate Currently 1,315 new buildings are in preparatory or
construction phase, the Company takes part in nearly2,000 new real estate constructions between 2016 and2020
The sales of new homes by OTP Real Estate werecoupled with HUF 3.2 billion mortgage loans andHUF 0.9 billion building society savings, as a resultOTP Real Estate has become the third best performingagent of the Bank
Number of ongoing projects (pieces)
325
198
5995
201620152014 2017
Sold real estates (pieces)
8
422
20172015 20162014
Annual General Meeting – 13 April 2018
Pension- and Healthcare Funds The Voluntary Pension- and Healthcare Funds retained
their market leading position
The volume of assets under management at theVoluntary Pension Fund increased by 14%, with thenumber of clients growing by 2%
The volume of assets under management at theHealthcare Fund increased by 1% and the number ofclients grew by 3%
Members (in thousand people)
148 161 181 196 218 249
2013
194
1110
19222
2012
191
11
2014
32230
2016
12
2015
11
207
2017
261
12
Assets under management (HUF billion)
Private Pension Fund Healthcare FundVoluntary Pension Fund
209 214 218 228 241 248
222 218 218 219 220 224
2013
432
2012
43614
2014
444 447 461
2015 2016 2017
472
Subsidiaries
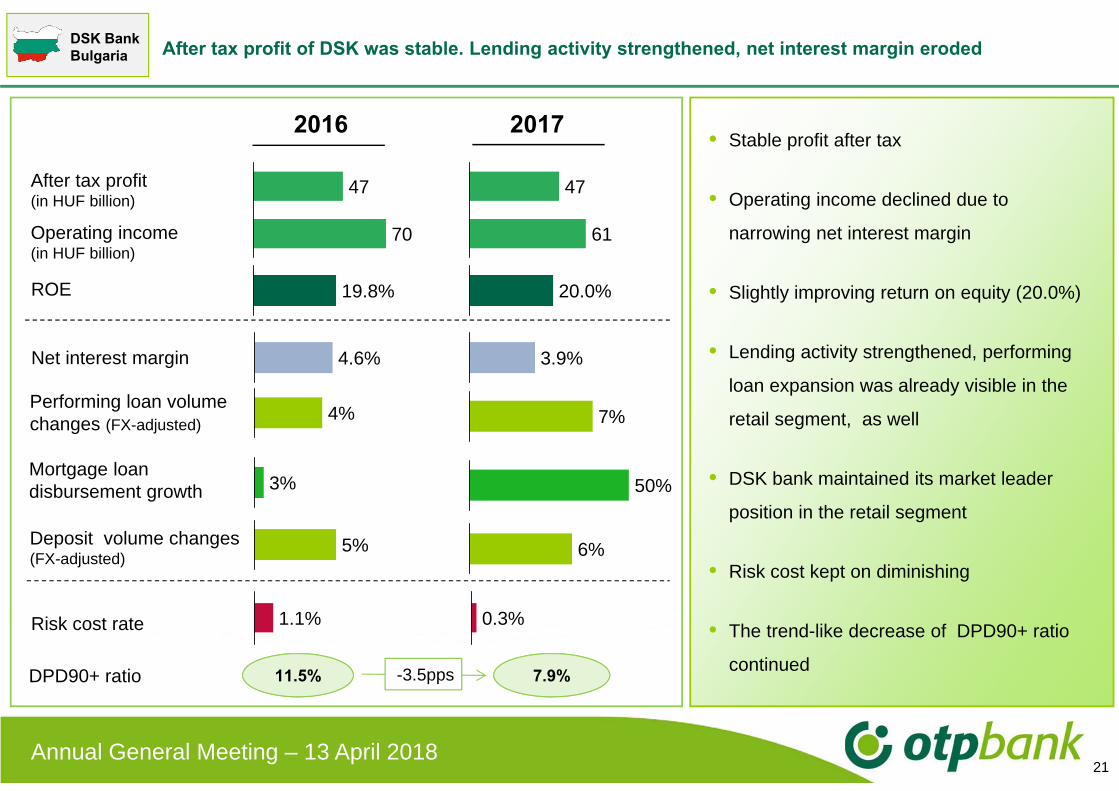
After tax profit of DSK was stable. Lending activity strengthened, net interest margin eroded
21
• Stable profit after tax
• Operating income declined due to
narrowing net interest margin
• Slightly improving return on equity (20.0%)
• Lending activity strengthened, performing
loan expansion was already visible in the
retail segment, as well
• DSK bank maintained its market leader
position in the retail segment
• Risk cost kept on diminishing
• The trend-like decrease of DPD90+ ratio
continued11.5% 7.9%-3.5pps
DSK Bank Bulgaria
Annual General Meeting – 13 April 2018
DPD90+ ratio
70
47
2016 2017
1.1% 0.3%
After tax profit(in HUF billion)
Operating income(in HUF billion)
4% 7%
4.6% 3.9%
61
47
5% 6%Deposit volume changes (FX-adjusted)
Net interest margin
Risk cost rate
Performing loan volume changes (FX-adjusted)
Mortgage loan disbursement growth 3% 50%
19.8%ROE 20.0%
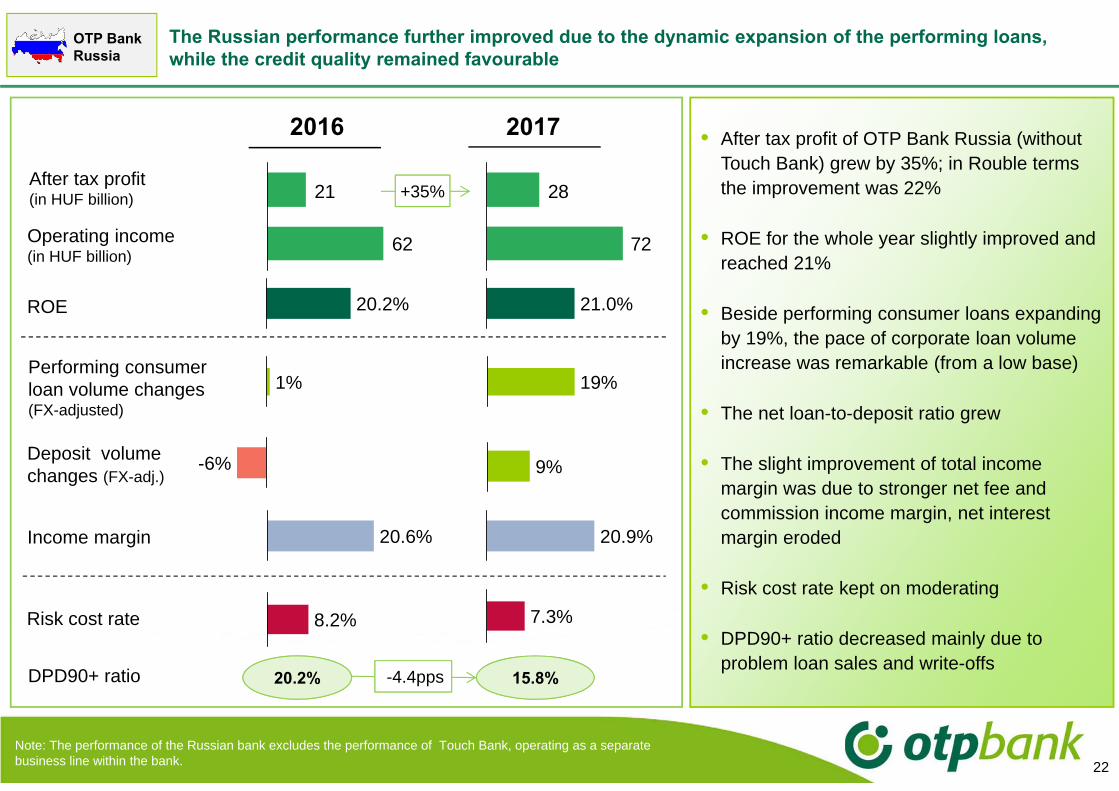
The Russian performance further improved due to the dynamic expansion of the performing loans, while the credit quality remained favourable
22
• After tax profit of OTP Bank Russia (without Touch Bank) grew by 35%; in Rouble terms the improvement was 22%
• ROE for the whole year slightly improved andreached 21%
• Beside performing consumer loans expanding by 19%, the pace of corporate loan volume increase was remarkable (from a low base)
• The net loan-to-deposit ratio grew
• The slight improvement of total income margin was due to stronger net fee and commission income margin, net interest margin eroded
• Risk cost rate kept on moderating
• DPD90+ ratio decreased mainly due to problem loan sales and write-offs
Note: The performance of the Russian bank excludes the performance of Touch Bank, operating as a separate business line within the bank.
OTP Bank Russia
2016 2017
8.2%Risk cost rate
20.2% 15.8%
62
21
72
28
-4.4pps
1% 19%
DPD90+ ratio
20.6% 20.9%
Performing consumer loan volume changes (FX-adjusted)
-6% 9%
Income margin
Deposit volume changes (FX-adj.)
Operating income(in HUF billion)
After tax profit(in HUF billion) +35%
20.2%ROE 21.0%
7.3%
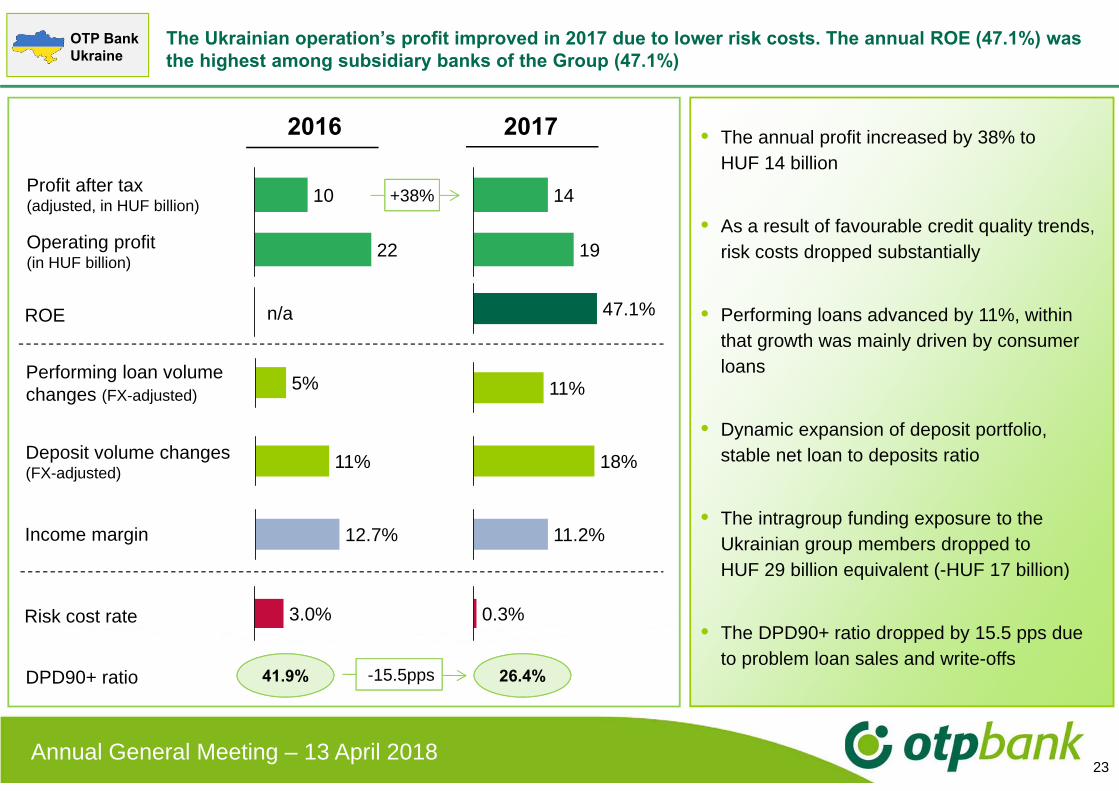
The Ukrainian operation’s profit improved in 2017 due to lower risk costs. The annual ROE (47.1%) was the highest among subsidiary banks of the Group (47.1%)
23
• The annual profit increased by 38% to HUF 14 billion
• As a result of favourable credit quality trends, risk costs dropped substantially
• Performing loans advanced by 11%, within that growth was mainly driven by consumer loans
• Dynamic expansion of deposit portfolio, stable net loan to deposits ratio
• The intragroup funding exposure to the Ukrainian group members dropped to HUF 29 billion equivalent (-HUF 17 billion)
• The DPD90+ ratio dropped by 15.5 pps due to problem loan sales and write-offs
OTP Bank Ukraine
Annual General Meeting – 13 April 2018
2016 2017
12.7% 11.2%
3.0% 0.3%Risk cost rate
22
10 14
19
Profit after tax(adjusted, in HUF billion)
Operating profit(in HUF billion)
41.9% 26.4%-15.5pps DPD90+ ratio
5% 11%
11% 18%
Income margin
Deposit volume changes (FX-adjusted)
Performing loan volume changes (FX-adjusted)
+38%
ROE n/a 47.1%
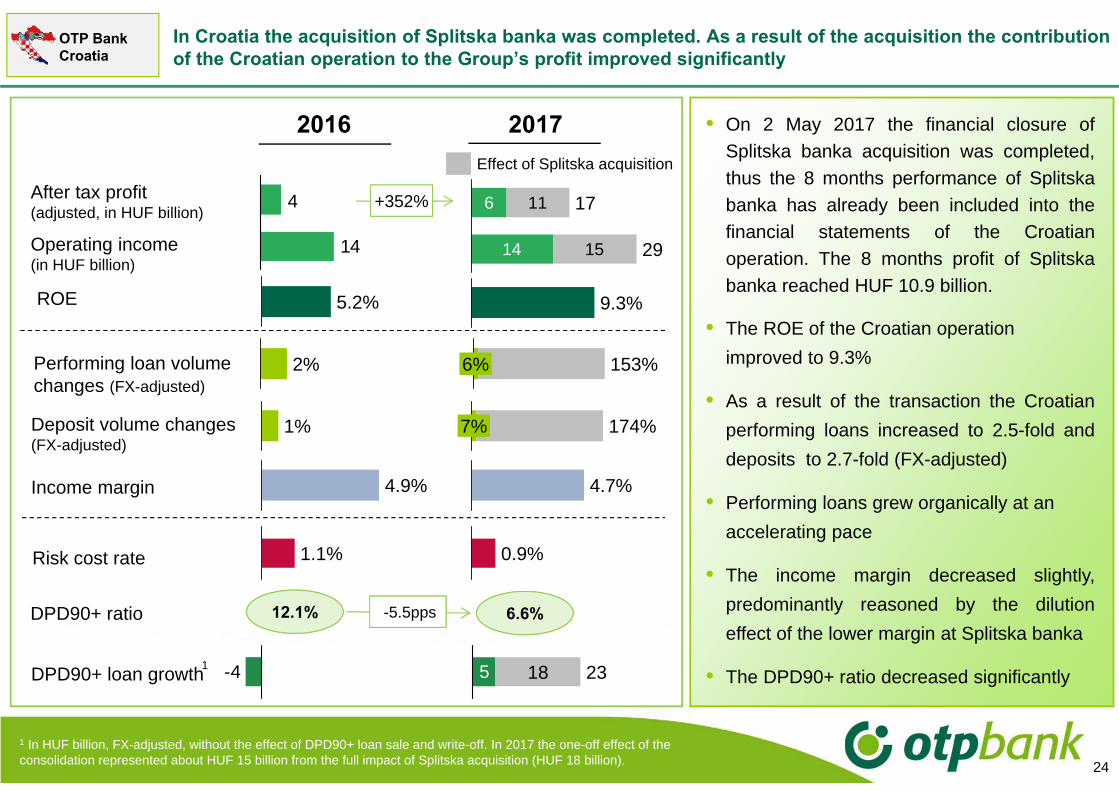
In Croatia the acquisition of Splitska banka was completed. As a result of the acquisition the contribution of the Croatian operation to the Group’s profit improved significantly
24
14
4
2016 2017 • On 2 May 2017 the financial closure ofSplitska banka acquisition was completed,thus the 8 months performance of Splitskabanka has already been included into thefinancial statements of the Croatianoperation. The 8 months profit of Splitskabanka reached HUF 10.9 billion.
• The ROE of the Croatian operationimproved to 9.3%
• As a result of the transaction the Croatianperforming loans increased to 2.5-fold anddeposits to 2.7-fold (FX-adjusted)
• Performing loans grew organically at an accelerating pace
• The income margin decreased slightly,predominantly reasoned by the dilutioneffect of the lower margin at Splitska banka
• The DPD90+ ratio decreased significantly
Deposit volume changes (FX-adjusted)
Income margin
6
14
11
15 29
17
4.9% 4.7%
1.1% 0.9%Risk cost rate
DPD90+ loan growth
12.1% 6.6%-5.5ppsDPD90+ ratio
OTP Bank Croatia
2% 153%6%
5 18 23-4
Effect of Splitska acquisition
Performing loan volume changes (FX-adjusted)
1% 7% 174%
1
1 In HUF billion, FX-adjusted, without the effect of DPD90+ loan sale and write-off. In 2017 the one-off effect of the consolidation represented about HUF 15 billion from the full impact of Splitska acquisition (HUF 18 billion).
After tax profit(adjusted, in HUF billion)
Operating income(in HUF billion)
ROE
+352%
5.2% 9.3%
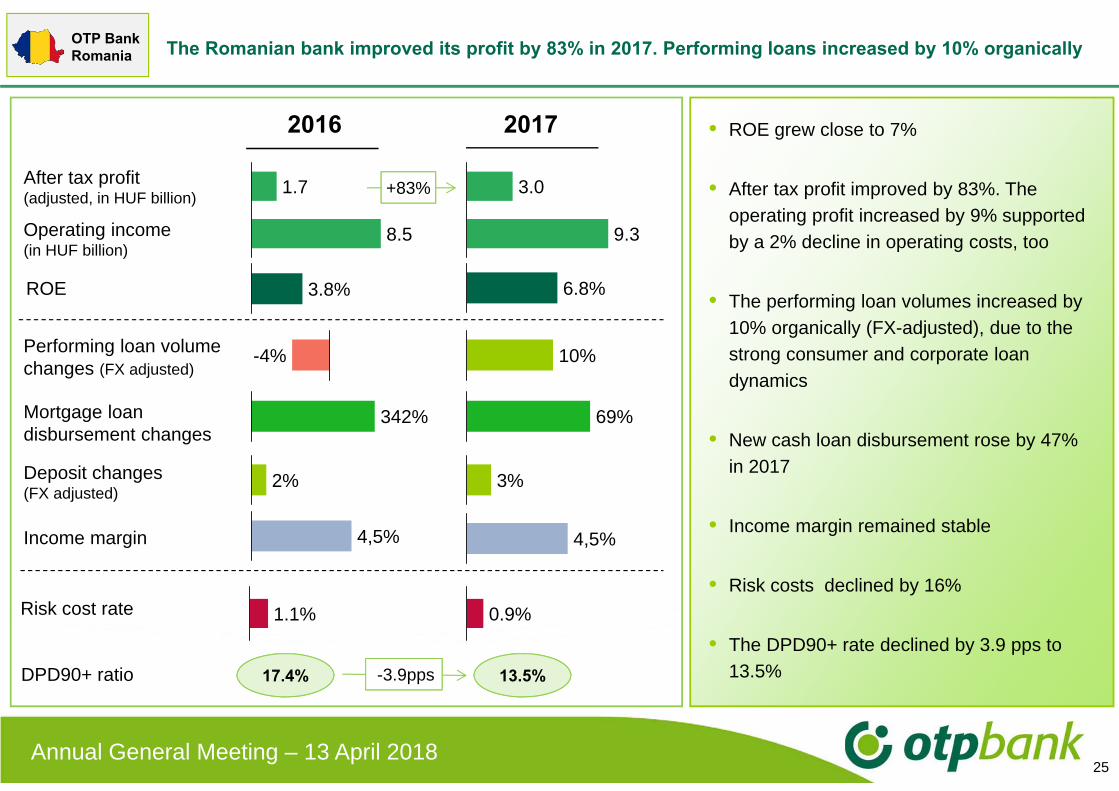
The Romanian bank improved its profit by 83% in 2017. Performing loans increased by 10% organically
25
• ROE grew close to 7%
• After tax profit improved by 83%. The operating profit increased by 9% supported by a 2% decline in operating costs, too
• The performing loan volumes increased by 10% organically (FX-adjusted), due to the strong consumer and corporate loan dynamics
• New cash loan disbursement rose by 47% in 2017
• Income margin remained stable
• Risk costs declined by 16%
• The DPD90+ rate declined by 3.9 pps to 13.5%
Performing loan volume changes (FX adjusted)
Mortgage loan disbursement changes
Deposit changes (FX adjusted)
Income margin
Risk cost rate
After tax profit (adjusted, in HUF billion)
Operating income(in HUF billion)
DPD90+ ratio
OTP Bank Romania
Annual General Meeting – 13 April 2018
9.3
3.0
2016 2017
8.5
1.7
4,5%4,5%
0.9%1.1%
17.4% 13.5%-3.9pps
10%-4%
3%2%
69%342%
3.8% 6.8%ROE
+83%
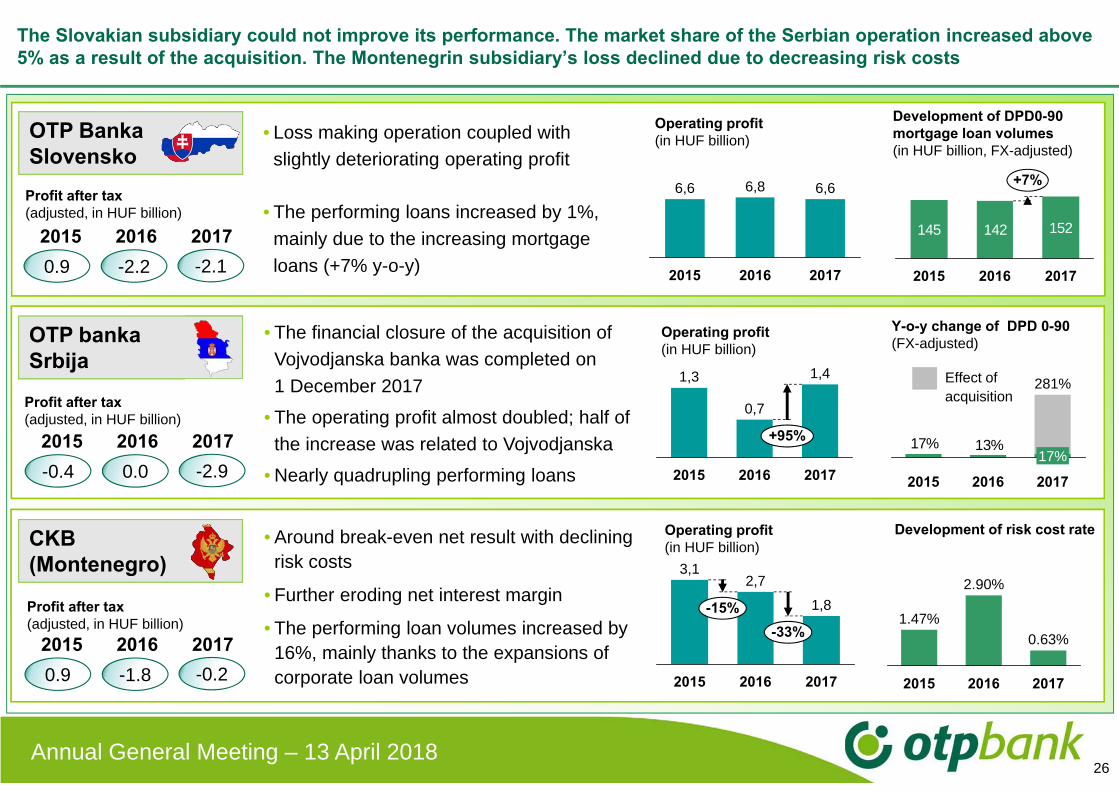
The Slovakian subsidiary could not improve its performance. The market share of the Serbian operation increased above 5% as a result of the acquisition. The Montenegrin subsidiary’s loss declined due to decreasing risk costs
26
• The financial closure of the acquisition of Vojvodjanska banka was completed on 1 December 2017
• The operating profit almost doubled; half of the increase was related to Vojvodjanska
• Nearly quadrupling performing loans
+95%
1,4
2016 2017
1,3
2015
0,7
• Around break-even net result with declining risk costs
• Further eroding net interest margin
• The performing loan volumes increased by 16%, mainly thanks to the expansions of corporate loan volumes 2017
0.63%
2.90%
2015 2016
1.47%
Development of risk cost rate
3,1
1,8
-33%
20172016
-15%
2,7
2015
OTP bankaSrbija
CKB(Montenegro)
2015 2016 20170.0-0.4 -2.9
2015 2016 2017-1.80.9 -0.2
13%17%
2017
281%
17%
20162015
Y-o-y change of DPD 0-90 (FX-adjusted)
• Loss making operation coupled with slightly deteriorating operating profit
• The performing loans increased by 1%, mainly due to the increasing mortgage loans (+7% y-o-y) 2015 2017
6,6
2016
6,86,6
OTP Banka SlovenskoProfit after tax(adjusted, in HUF billion)
Development of DPD0-90 mortgage loan volumes (in HUF billion, FX-adjusted)
2015 2016 2017-2.20.9 -2.1
145 142 152
2015 2017
+7%
2016
Operating profit(in HUF billion)
Annual General Meeting – 13 April 2018
Effect of acquisitionProfit after tax
(adjusted, in HUF billion)
Profit after tax(adjusted, in HUF billion)
Operating profit(in HUF billion)
Operating profit(in HUF billion)
27
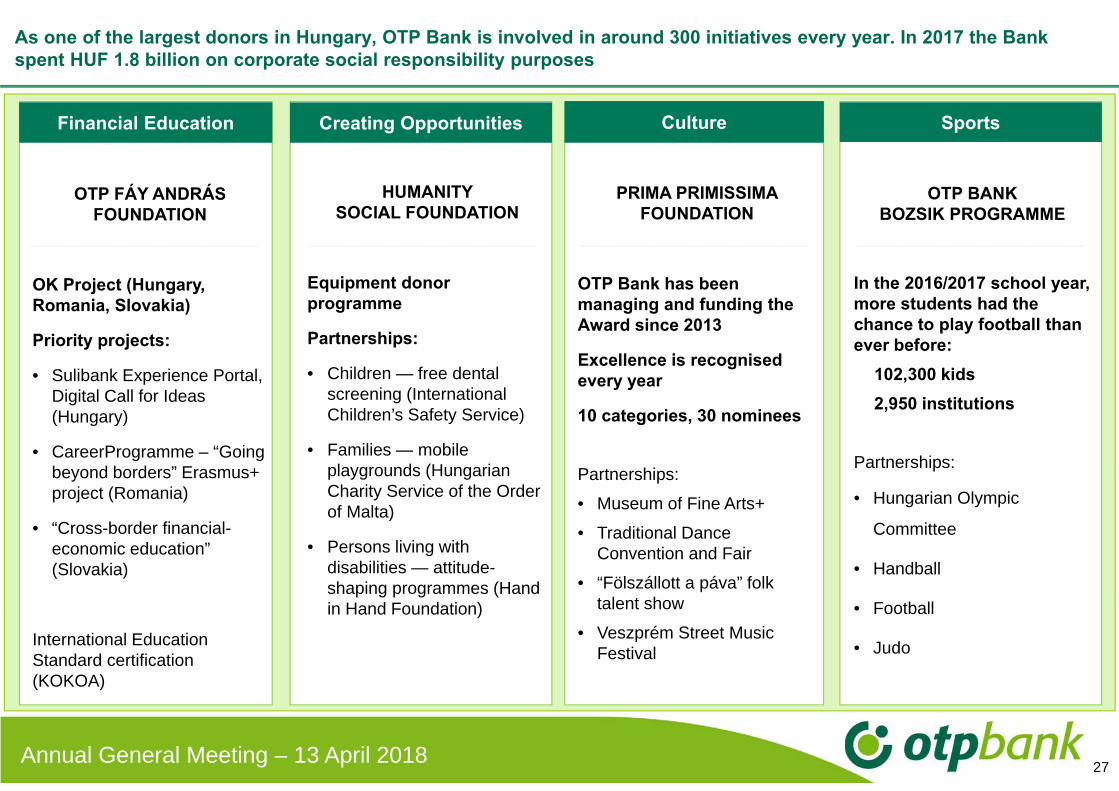
As one of the largest donors in Hungary, OTP Bank is involved in around 300 initiatives every year. In 2017 the Bank spent HUF 1.8 billion on corporate social responsibility purposes
Financial Education Creating Opportunities Culture Sports
OTP FÁY ANDRÁS FOUNDATION
OK Project (Hungary, Romania, Slovakia)
Priority projects:
• Sulibank Experience Portal, Digital Call for Ideas (Hungary)
• CareerProgramme – “Going beyond borders” Erasmus+ project (Romania)
• “Cross-border financial-economic education” (Slovakia)
International Education Standard certification (KOKOA)
HUMANITY SOCIAL FOUNDATION
Equipment donor programme
Partnerships:
• Children — free dental screening (International Children’s Safety Service)
• Families — mobile playgrounds (Hungarian Charity Service of the Order of Malta)
• Persons living with disabilities — attitude-shaping programmes (Hand in Hand Foundation)
PRIMA PRIMISSIMA FOUNDATION
OTP Bank has been managing and funding the Award since 2013
Excellence is recognised every year
10 categories, 30 nominees
Partnerships:
• Museum of Fine Arts+
• Traditional Dance Convention and Fair
• “Fölszállott a páva” folk talent show
• Veszprém Street Music Festival
OTP BANK BOZSIK PROGRAMME
In the 2016/2017 school year, more students had the chance to play football than ever before:
102,300 kids2,950 institutions
Partnerships:
• Hungarian Olympic
Committee
• Handball
• Football
• Judo
Annual General Meeting – 13 April 2018
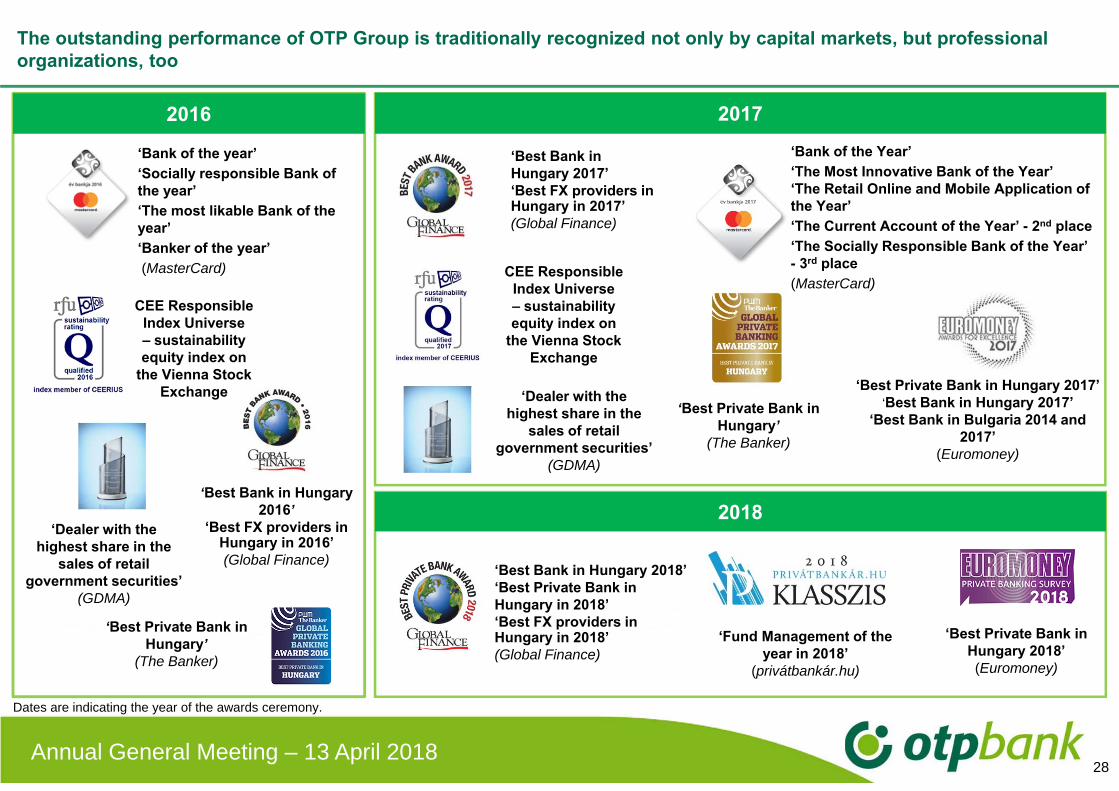
The outstanding performance of OTP Group is traditionally recognized not only by capital markets, but professional organizations, too
28
‘Best Bank in Hungary 2017’‘Best FX providers inHungary in 2017’(Global Finance)
20172016
‘Best Bank in Hungary 2016’
‘Best FX providers inHungary in 2016’(Global Finance)
‘Best Private Bank in Hungary 2017’‘Best Bank in Hungary 2017’
‘Best Bank in Bulgaria 2014 and 2017’
(Euromoney)
2018
‘Best Private Bank inHungary 2018’(Euromoney)
Annual General Meeting – 13 April 2018
‘Fund Management of theyear in 2018’
(privátbankár.hu)
‘Bank of the year’‘Socially responsible Bank of the year’‘The most likable Bank of theyear’‘Banker of the year’(MasterCard)
CEE Responsible Index Universe – sustainability equity index on
the Vienna Stock Exchange
‘Dealer with the highest share in the
sales of retail government securities’
(GDMA)
‘Best Private Bank in Hungary’
(The Banker)
‘Bank of the Year’‘The Most Innovative Bank of the Year’‘The Retail Online and Mobile Application of the Year’‘The Current Account of the Year’ - 2nd place‘The Socially Responsible Bank of the Year’- 3rd place(MasterCard)
CEE Responsible Index Universe – sustainability equity index on
the Vienna Stock Exchange
‘Best Private Bank in Hungary’
(The Banker)
‘Dealer with the highest share in the
sales of retail government securities’
(GDMA)
‘Best Bank in Hungary 2018’‘Best Private Bank in Hungary in 2018’‘Best FX providers inHungary in 2018’(Global Finance)
Dates are indicating the year of the awards ceremony.
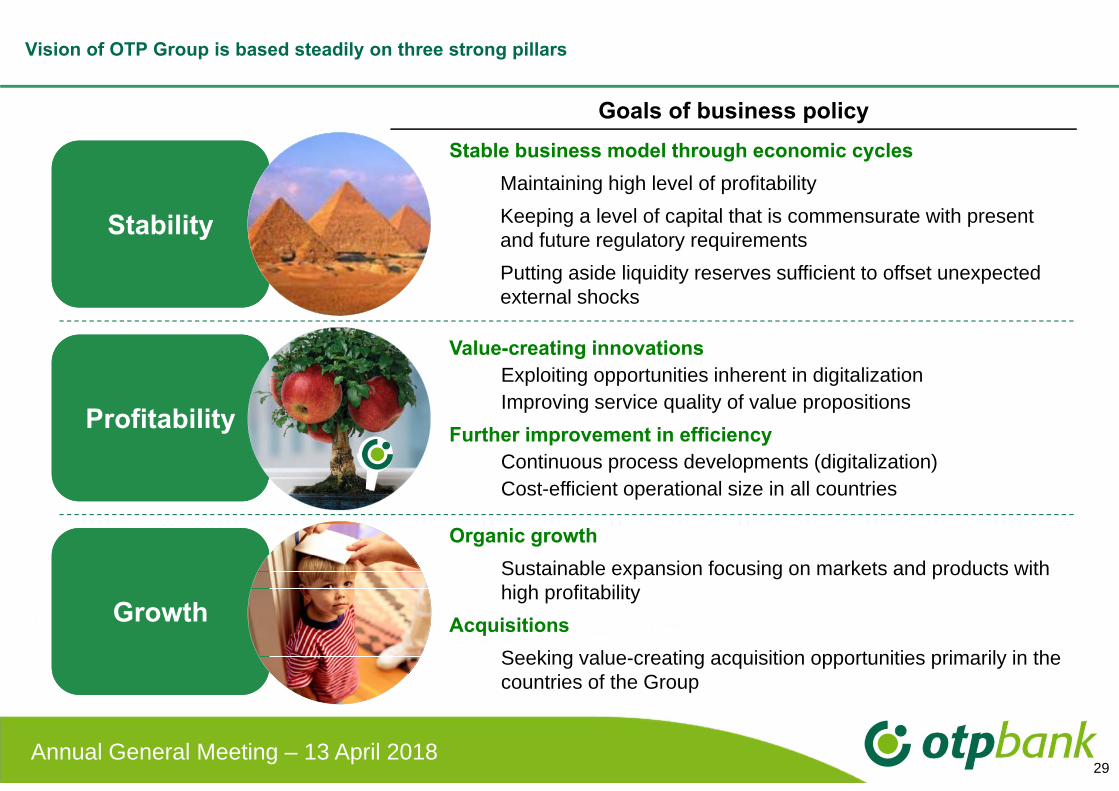
Vision of OTP Group is based steadily on three strong pillars
29
StabilityStability
ProfitabilityProfitability
GrowthGrowth
Goals of business policyStable business model through economic cycles
Maintaining high level of profitabilityKeeping a level of capital that is commensurate with present and future regulatory requirementsPutting aside liquidity reserves sufficient to offset unexpected external shocks
Organic growthSustainable expansion focusing on markets and products with high profitability
AcquisitionsSeeking value-creating acquisition opportunities primarily in the countries of the Group
Value-creating innovationsExploiting opportunities inherent in digitalization Improving service quality of value propositions
Further improvement in efficiencyContinuous process developments (digitalization)Cost-efficient operational size in all countries
Annual General Meeting – 13 April 2018
30
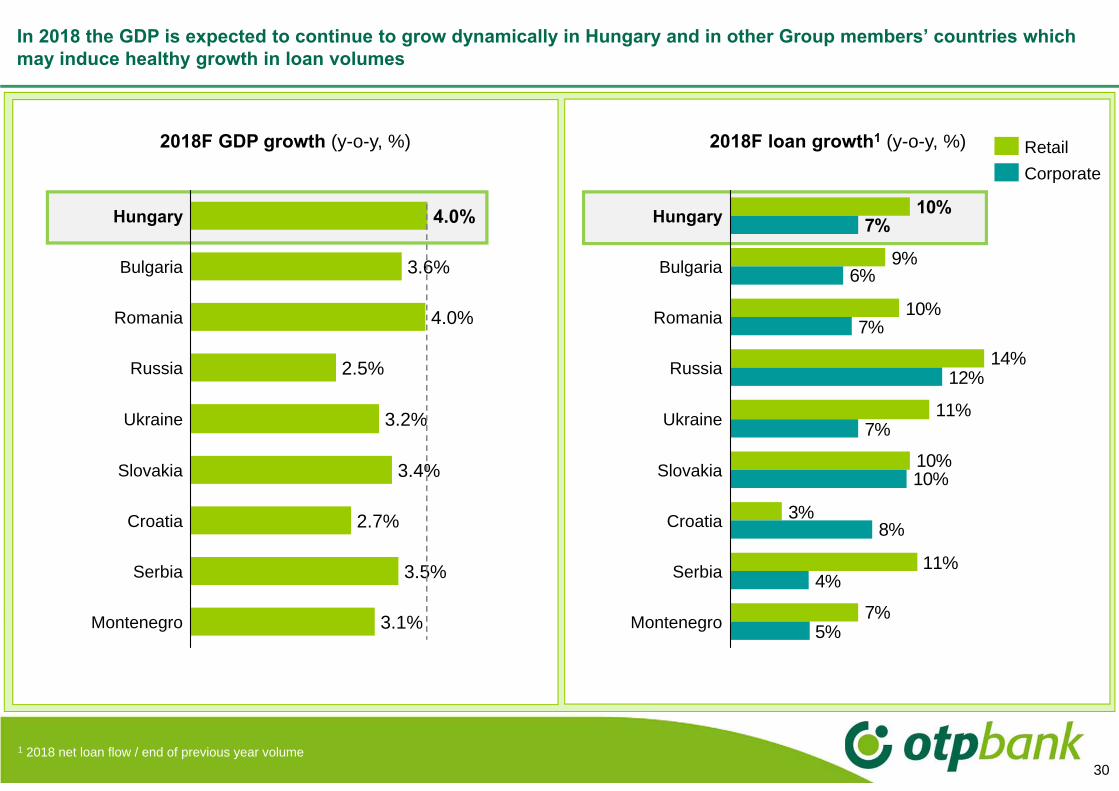
In 2018 the GDP is expected to continue to grow dynamically in Hungary and in other Group members’ countries which may induce healthy growth in loan volumes
2018F GDP growth (y-o-y, %) 2018F loan growth1 (y-o-y, %)
CorporateRetail
2.7%
Montenegro 3.1%
Serbia 3.5%
Croatia
Slovakia
2.5%
Bulgaria 3.6%
Romania
3.2%
Russia
Ukraine
4.0%
3.4%
Hungary 4.0%
7%
11%
3%
10%
11%
14%
10%
9%
10%
5%
4%
8%
10%
7%
12%
7%
6%
7%
Ukraine
Serbia
Montenegro
Slovakia
Croatia
Russia
Romania
Bulgaria
Hungary
1 2018 net loan flow / end of previous year volume
Strong growth is expected to continue in 2018 supported by organic and acquisition-generated business expansion
31
Management expectations for 2018 – 1.
Annual General Meeting – 13 April 2018
The ROE target of above 15% (assuming 12.5% Common Equity Tier1 ratio) announced at the 2015 Annual GeneralMeeting remains in place.
Apart from the negative impact of the Hungarian and Slovakian banking tax (HUF 15 billion after tax) furtheracquisitions may result in material adjustment items.
The FX-adjusted growth of performing loans – without the potential effect of further acquisitions – may be close to the2017 organic growth (+10%). Within that, the increase of household exposures may intensify, whereas the pace ofcorporate book expansion – following an outstandingly strong performance in 2016 and 2017 – may somewhatdecelerate.
The net interest margin erosion may continue, compared to the 4Q 2017 level (4.38%) the annual NIM may contract byaround another 10-15 bps. The forecast does incorporate the effect of acquisitions completed in 2017, howeverdoesn’t include the impact of further potential acquisitions.
Positive credit quality trends may continue with the DPD90+ ratio further declining, however total risk costs mayincrease as a result of higher loan volumes, the introduction of IFRS 9 and the presumably lower provision releasescompared to 2017.
The increase of FX-adjusted operating expenses without acquisition effect may exceed the 2017 dynamics and bearound 6% y-o-y as a result of wage inflation and on-going digital transformation.
The expected amount of proposed dividend to be paid after the 2018 financial year depends on the future acquisitions
32
Management expectations for 2018 – 2.
Beyond the capital required for organic growth the management intends to allocate significant part of the generatedexcess capital for further value-creating acquisitions:
o The dividend amount to be paid from 2018 earnings depends primarily on the impact of completed futureacquisitions. Subject to these deals, the final dividend proposal will be decided at the beginning of 2019.
o As for the indicated / deducted dividend amount presented among the financial data in the quarterly StockExchange Reports in 2018, the basis for the calculation will be the dividend proposal after the 2017 financial year(HUF 61.32 billion). However, the final dividend proposal can differ from this amount.
Annual General Meeting – 13 April 2018
33
Forward looking statements
This presentation contains certain forward-looking statements with respect to the financial
condition, results of operations, and businesses of OTP Bank. These statements and
forecasts involve risk and uncertainty because they relate to events and depend upon
circumstances that will occur in the future. There is a number of factors which could cause
actual results or developments to differ materially from those expressed or implied by
these forward looking statements and forecasts. The statements have been made with
reference to forecast price changes, economic conditions and the current regulatory
environment. Nothing in this announcement should be taken as an investment proposal.
Annual General Meeting – 13 April 2018
Proposal for the use of the after-tax profit of the parent company and for dividend payment
Item 1.c. on the Agenda

35
The management’s dividend proposal after the 2017 financial year is HUF 61.3 billion. The average dividend yield of OTP shares was 2 percentage points higher than the average 1 year government bond benchmark yield
Dividend amount (in HUF billion)
Dividend per share expected to be paid out based on the AGM’s Resolution on dividend1 (in HUF)
61.3
+15%
+14%
40.633.6 0%
53.246.2
+15%40.6
+21%
1 On shares eligible for dividend. In 2017 the calculation is based on the share count of 277,060,174 (the total number of common shares less the number of treasury shares on 5 April 2018).
2012 2013 2014 2015 2016 2017 proposal
Dividend per share in the Proposal on dividend payment for the Annual General Meeting (in HUF)
120 145 145 165 190
122 147 147 167 192
2 Difference between average 1Y govt bond benchmark yield and average OTP dividend yield. 3 Dividend per share expected to be paid out for the given financial year on shares eligible for dividend divided by the average closing share prices between 30 June of the given financial year and 30 June in the year of dividend pay-out (in case of 2017 average the closing share price on 5 April 2018 has been extrapolated until 30 June 2018).4 Average of benchmark yields between 30 June in the given year and 30 June of the following year (in case of 2016 average the yield on 5 April 2018 has been extrapolated until 30 June 2018).
Real dividend yield of OTP shares
2.0%2.0%1.8%
1.6%
0.1%
201620152014 20172013
2
Source: Bloomberg
Annual General Meeting – 13 April 2018
3.4% 3.3% 2.7% 2.4% 2.0%
Nominal dividend yield of OTP shares3
219
221
Benchmark yield of 1 year government securities4
3.2% 1.6% 0.9% 0.4% 0.0%
36
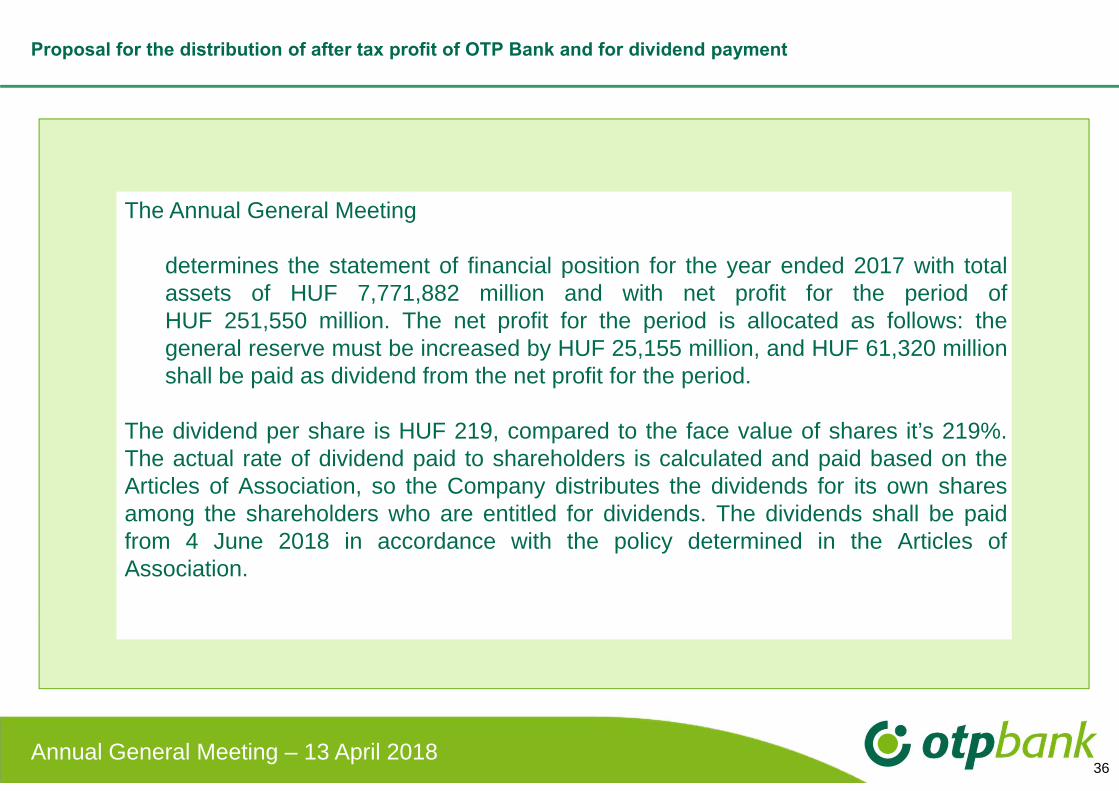
Proposal for the distribution of after tax profit of OTP Bank and for dividend payment
The Annual General Meeting
determines the statement of financial position for the year ended 2017 with totalassets of HUF 7,771,882 million and with net profit for the period ofHUF 251,550 million. The net profit for the period is allocated as follows: thegeneral reserve must be increased by HUF 25,155 million, and HUF 61,320 millionshall be paid as dividend from the net profit for the period.
The dividend per share is HUF 219, compared to the face value of shares it’s 219%.The actual rate of dividend paid to shareholders is calculated and paid based on theArticles of Association, so the Company distributes the dividends for its own sharesamong the shareholders who are entitled for dividends. The dividends shall be paidfrom 4 June 2018 in accordance with the policy determined in the Articles ofAssociation.
Annual General Meeting – 13 April 2018