Embed Size (px)
Citation preview

GR ENGINEERING SERVICES LIMITED
ANNUAL
FINANCIAL
REPORT
30 June 2016
ABN 12 121 542 738
For
per
sona
l use
onl
y

ANNUAL FINANCIAL REPORT
TABLE OF CONTENTS
CORPORATE DIRECTORY 3
DIRECTORS’ REPORT 4
AUDITOR’S INDEPENDENCE DECLARATION 22
CONSOLIDATED STATEMENT OF PROFIT OR LOSS AND OTHER
COMPREHENSIVE INCOME 23
CONSOLIDATED STATEMENT OF FINANCIAL POSITION 24
CONSOLIDATED STATEMENT OF CASH FLOWS 25
CONSOLIDATED STATEMENT OF CHANGES IN EQUITY 26
NOTES TO THE FINANCIAL STATEMENTS 27
DIRECTORS’ DECLARATION 66
INDEPENDENT AUDITOR’S REPORT 67
CORPORATE GOVERNANCE STATEMENT 69
ADDITIONAL ASX INFORMATION 77
CALENDAR
Final Dividend:
Ex-dividend Date 12 SEPTEMBER 2016
Record Date 14 SEPTEMBER 2016
Payment Date 28 SEPTEMBER 2016
Annual General Meeting 15 NOVEMBER 2016
2
For
per
sona
l use
onl
y

ANNUAL FINANCIAL REPORT
CORPORATE DIRECTORY
GR ENGINEERING SERVICES LIMITED
ACN 121 542 738
ABN 12 121 542 738
DIRECTORS
Geoff Jones (Managing Director)
Peter Hood (Non-Executive Chairman)
Tony Patrizi (Executive Director)
Barry Patterson (Non-Executive Director)
Terrence Strapp (Non-Executive Director)
COMPANY SECRETARY & CHIEF FINANCIAL OFFICER
Giuseppe (Joe) Totaro
REGISTERED OFFICE
179 Great Eastern Highway
BELMONT WA 6104
PRINCIPAL PLACE OF BUSINESS
179 Great Eastern Highway
BELMONT WA 6104
Telephone: (61 8) 6272 6000
Facsimile: (61 8) 6272 6001
Email: [email protected]
Website: www.gres.com.au
ASX CODE
GNG
AUDITOR
Deloitte Touche Tohmatsu
Tower 2, Brookfield Place, 123 St Georges Terrace
PERTH WA 6000
SOLICITORS TO THE COMPANY
Zafra Legal
Level 10, 105 St Georges Terrace
PERTH WA 6000
SHARE REGISTRY
Computershare Investor Services Pty Limited
Level 11, 172 St Georges Terrace
PERTH WA 6000
3
For
per
sona
l use
onl
y
ANNUAL FINANCIAL REPORT
DIRECTORS
COMPANY SECRETARY
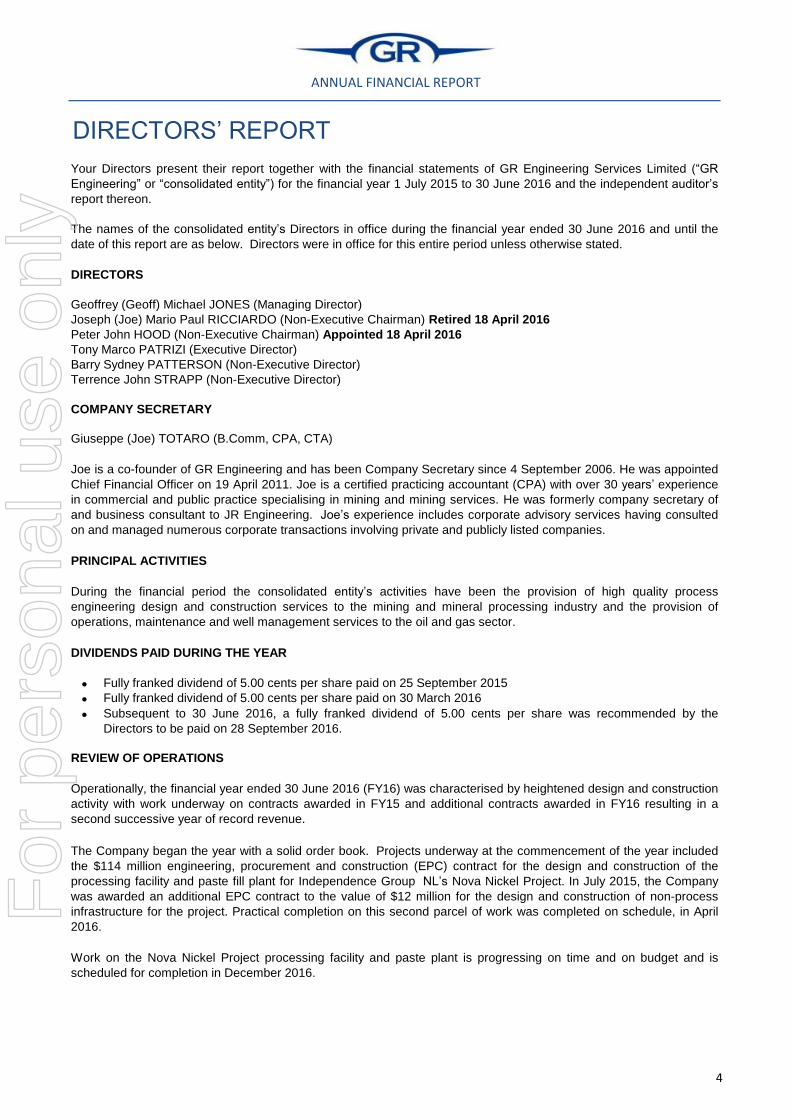
Fully franked dividend of 5.00 cents per share paid on 25 September 2015
Fully franked dividend of 5.00 cents per share paid on 30 March 2016
Barry Sydney PATTERSON (Non-Executive Director)
Terrence John STRAPP (Non-Executive Director)
Peter John HOOD (Non-Executive Chairman) Appointed 18 April 2016
Giuseppe (Joe) TOTARO (B.Comm, CPA, CTA)
Joe is a co-founder of GR Engineering and has been Company Secretary since 4 September 2006. He was appointed
Chief Financial Officer on 19 April 2011. Joe is a certified practicing accountant (CPA) with over 30 years’ experience
in commercial and public practice specialising in mining and mining services. He was formerly company secretary of
and business consultant to JR Engineering. Joe’s experience includes corporate advisory services having consulted
on and managed numerous corporate transactions involving private and publicly listed companies.
PRINCIPAL ACTIVITIES
DIRECTORS’ REPORT
Your Directors present their report together with the financial statements of GR Engineering Services Limited (“GR
Engineering” or “consolidated entity”) for the financial year 1 July 2015 to 30 June 2016 and the independent auditor’s
report thereon.
The names of the consolidated entity’s Directors in office during the financial year ended 30 June 2016 and until the
date of this report are as below. Directors were in office for this entire period unless otherwise stated.
Geoffrey (Geoff) Michael JONES (Managing Director)
Joseph (Joe) Mario Paul RICCIARDO (Non-Executive Chairman) Retired 18 April 2016
Tony Marco PATRIZI (Executive Director)
During the financial period the consolidated entity’s activities have been the provision of high quality process
engineering design and construction services to the mining and mineral processing industry and the provision of
operations, maintenance and well management services to the oil and gas sector.
DIVIDENDS PAID DURING THE YEAR
Subsequent to 30 June 2016, a fully franked dividend of 5.00 cents per share was recommended by the
Directors to be paid on 28 September 2016.
REVIEW OF OPERATIONS
Operationally, the financial year ended 30 June 2016 (FY16) was characterised by heightened design and construction
activity with work underway on contracts awarded in FY15 and additional contracts awarded in FY16 resulting in a
second successive year of record revenue.
The Company began the year with a solid order book. Projects underway at the commencement of the year included
the $114 million engineering, procurement and construction (EPC) contract for the design and construction of the
processing facility and paste fill plant for Independence Group NL’s Nova Nickel Project. In July 2015, the Company
was awarded an additional EPC contract to the value of $12 million for the design and construction of non-process
infrastructure for the project. Practical completion on this second parcel of work was completed on schedule, in April
2016.
Work on the Nova Nickel Project processing facility and paste plant is progressing on time and on budget and is
scheduled for completion in December 2016.
4
For
per
sona
l use
onl
y

ANNUAL FINANCIAL REPORT
DIRECTORS’ REPORT
During FY16 the Company engaged a team of personnel with strong process engineering experience in uranium. The
introduction of this new expertise enabled GR Engineering to more credibly bid for work involving this commodity with
the result that at year end, the Company was engaged on two uranium studies.
After a technical review conducted by GR Engineering in August 2015, work commenced on Phase II of Hellas Gold
SA’s (a subsidiary of Eldorado Gold Corporation of Canada) Olympias Project, located in Greece. This project involves
managing the decommissioning and demolition of existing plant and the design of a refurbished and expanded gold,
lead, zinc and silver processing facility and paste fill plant. This work is being undertaken under an EPCM contract and
works are expected to be completed during the March quarter of 2017.
In addition to the above projects, the Company was engaged on a number of smaller but nevertheless important
contracts including the EPC contract with Western Areas Limited for the Forrestania Mill Recovery Enhancement
Project and the Goldroom Upgrade Project at Newcrest Mining Limited’s Cadia Valley Operations in New South Wales.
Projects undertaken during FY16 relate to a broad range of base metals, precious metals and industrial minerals. This
broad cross section of commodities continues to be reflected in the Company’s study activity. During FY16 GR
Engineering completed 29 studies and as at year end, was engaged on a further 16 relating to projects across a broad
range of commodities and geographic locations.
Also in Australia and underway at the commencement of FY16, was the construction of the processing facilities for the
$55 million Keysbrook Leucoxene Project for MZI Resources Limited. Work on this project was carried out at two
locations, Keysbrook and Picton, separated by a distance of approximately 120 Kms. At Keysbrook, GR Engineering
constructed the wet concentrator facility to produce a heavy mineral product. Work at the Picton site involved an
expansion and upgrade of the existing plant, including the installation of additional mechanical equipment to process
the material received from Keysbrook. Being a brownfields project within an operating plant, this element of the project
brought with it additional challenges including the requirement to carry out the works with minimum impact on existing
operations. Notwithstanding these challenges this project was completed on time and on budget and was
commissioned in December 2015.
During the year GR Engineering was awarded the EPC contract for the design and construction of Doray Minerals
Limited’s Deflector Gold Project located near Gullewa in Western Australia. This plant was successfully commissioned
with the first gold poured from the gravity circuit and first copper-gold concentrate produced in May 2016. The design
and construction of the Deflector Gold Project was the second project successfully delivered for Doray Minerals and
provides another example of the Company’s capacity to win repeat work based on our track record of providing high
quality processing solutions on time and on budget.
Subsequent to year end, the Company was awarded the $36 million EPC contract for the design and construction of
completion works for the 500,000 tonne per annum Mungana zinc, lead, copper and gold concentrator facility located
at Chillagoe, Northern Queensland by Auctus Resources Pty Ltd (Auctus). Work on this project, which is being carried
out primarily through the Company’s Brisbane office, is expected to be completed in April 2017.
Overseas, construction of the Hemerdon tungsten/tin processing facility was approaching completion at the
commencement of FY16 and commissioning of this £75 million plant was completed in September 2015 at which time
operational control passed to the client, Wolf Minerals (UK) Limited (Wolf). Since that time Wolf and GR Engineering
have been working collaboratively to develop and implement operating practices to enable ramp up and fine tuning of
the facility.
Elsewhere overseas, the Company continued work on the engineering, procurement and construction management
(EPCM) contract for the Wetar Copper Project for PT Batutua Tembaga Raya, a subsidiary of Finders Resources
Limited. This contract was awarded in November 2014 and by 30 June 2016, Solvent Extraction and Electrowinning
works had been completed.
5
For
per
sona
l use
onl
y

ANNUAL FINANCIAL REPORT
DIRECTORS’ REPORT
FY16 was a year in which Upstream Production Solutions (Upstream PS) forged new relationships with oil and gas
producers and further cemented its credentials as a leading provider of operations and maintenance services to
Australia’s oil and gas industry.
In September 2015, Upstream PS was successful in securing a new two year contract with Empire Oil Company (WA)
Limited for the operation and maintenance of the Red Gully processing facility in the Perth Basin, Western Australia.
Upstream PS has been engaged on the Red Gully facility since it was commissioned in 2012. The award of the new
contract is a testament to Upstream PS’s ability to win repeat business based on its strong track record for safety and
its ability to achieve successful operational outcomes.
In addition, Upstream PS's WA/NT Region continued to provide operations and maintenance services to its long term
Perth Basin clients.
In May 2016, Upstream PS announced the award of a three year contract by Northern Oil and Gas Australia Pty Ltd
(NOGA) for the operation and maintenance of its Northern Endeavour floating production, storage and offloading
facility (FPSO) and associated infrastructure, located in the Laminaria-Corallina oil field in the Timor Sea.
At a steady state, this contract will involve approximately 50 personnel of which 39 will be based on the Northern
Endeavour FPSO. It is anticipated that services provided under the contract will generate revenue of approximately
$30 million per annum. This represents a significant step change to Upstream PS’s revenue profile and provides it
with an excellent opportunity to showcase its credentials and offshore operational capabilities as the Registered
Operator of significant oil and gas production assets.
In May 2016, Upstream PS was awarded a two year contract for the provision of wellsite and balance of plant facility
maintenance services and in the Surat Basin, south-west Queensland. Under this contract, Upstream PS is engaged to
complete scheduled and unscheduled maintenance and associated services for a minimum of 1500 wells, seven gas
processing facilities, nine water gathering systems, two water treatment facilities and one pre-treatment facility.
Revenue under this contract is expected to be approximately $50 million over the term of the contract.
Upstream PS’s presence in the Surat Basin was further increased by the award of additional parcels of work by
another leading Australian oil and gas producer in April 2016.
Together with the award of the NOGA contract, work won with Origin Energy has assisted in underpinning Upstream
PS’s recurrent revenue through FY17 and FY18 and further establishes Upstream PS as a leading provider of
operations and maintenance services in Australia’s oil and gas industry.
Looking ahead, GR Engineering enters FY17 with a solid order book dominated by Australian projects. As at the date
of this report, contracted revenue for the consolidated entity stood at approximately $115 million and the Company is
working diligently to more fully utilise its financial and operational capacity through the conversion of near term
opportunities both in Australia and overseas.
GR Engineering's operational success can only be fully measured within the overarching context of safety performance
and in particular the achievement of a zero harm objective. The consolidated entity achieved a Total Reportable Injury
Frequency Rate (TRIFR) of 5.89 in FY16. While this compares favourably to industry averages, management
continues to engender a culture and instil work practices to reflect the pre-eminence of safety in every task and on
every worksite.
6
For
per
sona
l use
onl
y

ANNUAL FINANCIAL REPORT
DIRECTORS’ REPORT
FINANCIAL POSITION
Seek to form strategic alliances and make strategic investments;
Develop and maintain strong client relationships;
Focus on securing larger scale projects;
Acquisition of complementary businesses;
Extend services to include Build, Own, Operate (BOO) and Build, Own, Operate, Transfer (BOOT) project
delivery and operations.
SIGNIFICANT CHANGES IN THE STATE OF AFFAIRS
The consolidated entity generated revenue of $255.3 million and net operating cash flow of $18.2 million for the year
ended 30 June 2016. During FY16, the consolidated entity paid dividends totalling $15.2 million and as at 30 June,
held cash totalling $64.9 million.
At the end of FY16, the consolidated entity held trade debtors of $29.9 million, trade creditors of $28.4 million and short
and long term debt of $0.9 million.
GROWTH STRATEGY
The consolidated entity’s growth strategy is based on the following key areas:
Extend geographic reach;
Extend and diversify commodities to which processing solutions are provided;
EVENTS AFTER BALANCE SHEET DATE
On 23 August 2016, the consolidated entity declared a fully franked dividend of 5.0 cents per share, an aggregate of
$7,643,565. The Record Date of the dividend is 14 September 2016 and the proposed payment date is 28 September
2016.
On 8 July 2016, GR Engineering entered into a $36 million contract with Auctus Resources Pty Ltd for the design and
construction of completion works associated with the 500,000 tonne per annum Mungana zinc, lead, copper and gold
concentrator facility located at Chillagoe, Northern Queensland.
FUTURE DEVELOPMENTS
Information regarding likely developments in the operations of the consolidated entity in future financial years is
referred to in the Review of Operations and Growth Strategy in above sections of this Directors' Report.
7
For
per
sona
l use
onl
y

ANNUAL FINANCIAL REPORT
DIRECTORS’ REPORT
In 1986 Joe led the founding of JR Engineering Services Pty Ltd (JR Engineering). As Managing Director, Joe
successfully grew JR Engineering into a leading engineering services provider before its sale to a major ASX listed
Mining Services Group in 2001.
BOARD OF DIRECTORS
Joseph (Joe) Mario Paul RICCIARDO – Non-Executive Chairman (Retired 18 April 2016).
BAppSc (Mech Eng)
Joe co-founded GR Engineering. He is a Mechanical Engineer with over 35 years’ experience in feasibility studies,
design, construction, maintenance and operation of mineral processing facilities.
- Non-Executive Chairman
Directorships in other listed entities in the last 3 years:
- Mineral Resources Limited (ASX:MIN) 2006 – 2016
- Non-Executive Chairman
Peter John HOOD – Non-Executive Chairman (Appointed 18 April 2016)
In 2006, Joe was instrumental in regrouping the former key executives from JR Engineering to establish GR
Engineering.
Joe was a Non-Executive Director of Mineral Resources Limited until his retirement on 18 April 2016.
Interests in ordinary shares in GR Engineering – 9,798,578
Interests in other securities in GR Engineering - None
Special Responsibilities:
Peter was appointed as a Non-Executive Director of the Company on 10 February 2016 and Non-Executive Chairman
on 18 April 2016.
BE(Chem), MAusIMM, FlChemE, FAICD
Peter is a Chemical Engineer and has over 40 years’ experience in the resource and energy sectors.
He was formerly the chief executive officer of Coogee Chemicals and then oil and gas operator, Coogee Resources.
Prior to that he served in senior management and project development roles for WMC Ltd in nickel and gold
production.
Peter has considerable board experience and is currently Chairman of Matrix Composites and Engineering Ltd,
Immediate Past President of the Australian Chamber of Commerce and Industry, Past President of the Chamber of
Commerce and Industry of Western Australia and former Chairman of Apollo Gas Ltd.
Interests in ordinary shares in GR Engineering – 500,000
Interests in other securities in GR Engineering - None
Special Responsibilities:
- Member of the Audit and Risk Committee
- Member of the Remuneration and Nominations Committee
Directorships in other listed entities in the last 3 years:
- Matrix Composites & Engineering Limited (ASX:MCE) 2011 - Present
8
For
per
sona
l use
onl
y

ANNUAL FINANCIAL REPORT
DIRECTORS’ REPORT
Geoffrey (Geoff) Michael JONES – Managing Director
BE (Civil), FIEAust, CPEng
Geoff is a Civil Engineer with over 30 years’ experience in construction, engineering, minerals processing and project
development in Australia and overseas. Geoff previously worked for Baulderstone Hornibrook, John Holland, Minproc
Engineers and Signet Engineering before serving over six years as Group Project Engineer for Resolute Mining
Limited.
- Azumah Resources Limited (ASX:AZM) 2009 – Present
- Energy Metals Limited (ASX:EME) 2008 – Present
Prior to joining GR Engineering Services Limited in 2011, Geoff was the General Manager of Sedgman Limited’s
metals engineering business and also responsible for the strategic development of the metals engineering division
internationally.
Interests in ordinary shares in GR Engineering – 940,253
Interests in other securities in GR Engineering :
- Share Appreciation Rights - 509,631
Special Responsibilities:
- Ausgold Limited (ASX:AUC) 29 July 2016 – Present
Tony Marco PATRIZI – Executive Director
BE (Mech Eng)
Tony co-founded GR Engineering. Tony is a Mechanical Engineer with over 30 years’ experience in the mining and
minerals processing industries as a company director, operations manager, and project manager and maintenance
engineer. Tony was previously the operations manager of JR Engineering which had over 300 personnel and provided
workshop, maintenance, engineering and construction services to mining and mineral processing projects in Western
Australia and interstate.
Interests in ordinary shares in GR Engineering – 9,795,000
Interests in other securities in GR Engineering - None
Directorships in other listed entities in the last 3 years:
- Primary Gold Limited (ASX:PGO) from 8 March 2016 - present
- Managing Director
Directorships in other listed entities in the last 3 years:
- Marindi Metals Limited (ASX:MZN) 2006 – Present
9
For
per
sona
l use
onl
y

ANNUAL FINANCIAL REPORT
DIRECTORS’ REPORT
Barry is a Mining Engineer with over 50 years’ experience in the mining industry and is a co-founder of GR
Engineering. He co-founded contract mining companies Eltin, Australian Mine Management and National Mine
Management. Barry was also a co-founder of JR Engineering.
Barry has served as a director of a number of public companies across a range of industries. He was formerly a non-
executive chairman of Sonic Healthcare Limited and Silex Systems Limited and is currently a Non-Executive Director
of Dacian Gold Limited.
Interests in ordinary shares in GR Engineering – 10,500,000
Interests in other securities in GR Engineering - None
Special Responsibilities:
- Chairman of the Audit and Risk Committee
- Member of the Remuneration and Nominations Committee
Directorships in other listed entities in the last 3 years:
- Ausdrill Limited (ASX:ASL) 2005 - Present
Terrence (Terry) John STRAPP – Non-Executive Director
CPA, SFFin., MAICD
Terry has extensive experience in banking, finance and corporate risk management and has over 30 years’ experience
in the mining and resource industry. He was formerly a non-executive director of The Mac Services Group Limited
(resigned 2010).
Terry is a non-executive director of Ausdrill Limited.
Interests in ordinary shares in GR Engineering – 380,000
Interests in other securities in GR Engineering - None
Special Responsibilities:
- Chairman of the Remuneration and Nominations Committee
- Member of the Audit and Risk Committee
Directorships in other listed entities in the last 3 years:
- Dacian Gold Limited (ASX:DCN) 2012 - Present
Barry Sydney PATTERSON – Non-Executive Director
ASMM, MIMM, FAICD
10
For
per
sona
l use
onl
y
ANNUAL FINANCIAL REPORT
DIRECTORS’ REPORT
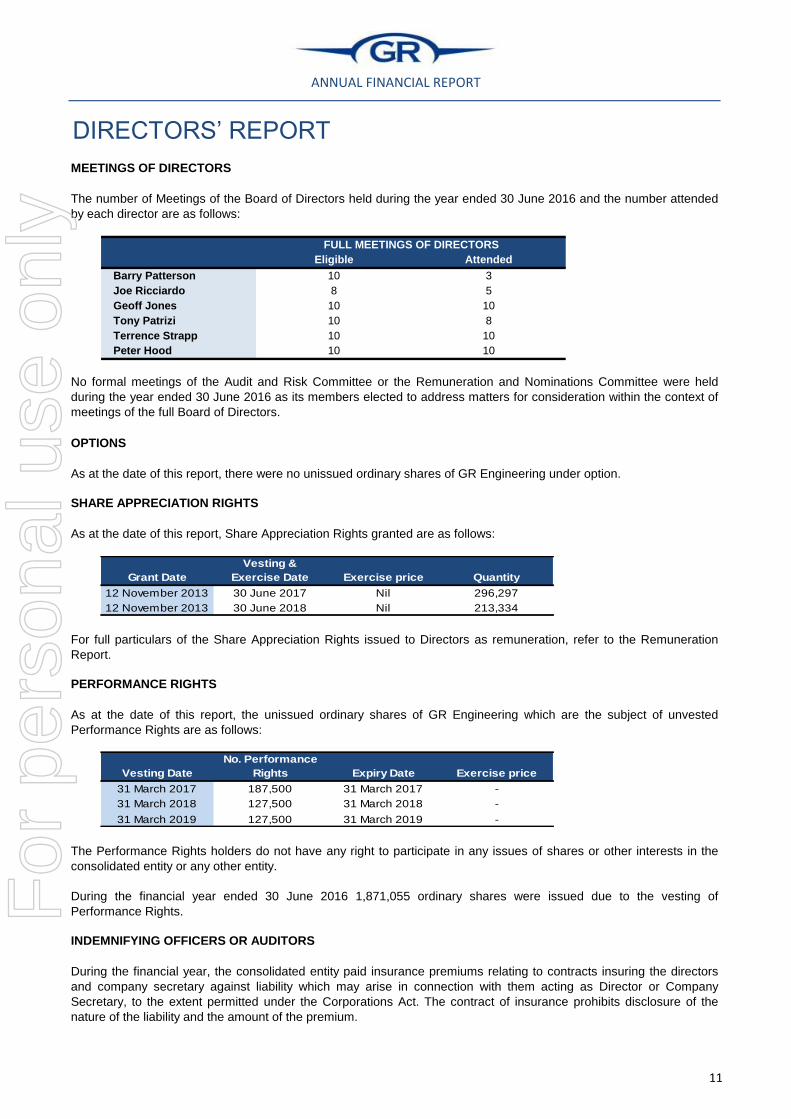
Eligible Attended
Barry Patterson 10 3
Joe Ricciardo 8 5
Geoff Jones 10 10
Tony Patrizi 10 8
Terrence Strapp 10 10
Peter Hood 10 10
SHARE APPRECIATION RIGHTS
As at the date of this report, Share Appreciation Rights granted are as follows:
The number of Meetings of the Board of Directors held during the year ended 30 June 2016 and the number attended
by each director are as follows:
FULL MEETINGS OF DIRECTORS
No formal meetings of the Audit and Risk Committee or the Remuneration and Nominations Committee were held
during the year ended 30 June 2016 as its members elected to address matters for consideration within the context of
meetings of the full Board of Directors.
OPTIONS
As at the date of this report, there were no unissued ordinary shares of GR Engineering under option.
MEETINGS OF DIRECTORS
During the financial year ended 30 June 2016 1,871,055 ordinary shares were issued due to the vesting of
Performance Rights.
INDEMNIFYING OFFICERS OR AUDITORS
During the financial year, the consolidated entity paid insurance premiums relating to contracts insuring the directors
and company secretary against liability which may arise in connection with them acting as Director or Company
Secretary, to the extent permitted under the Corporations Act. The contract of insurance prohibits disclosure of the
nature of the liability and the amount of the premium.
For full particulars of the Share Appreciation Rights issued to Directors as remuneration, refer to the Remuneration
Report.
PERFORMANCE RIGHTS
As at the date of this report, the unissued ordinary shares of GR Engineering which are the subject of unvested
Performance Rights are as follows:
The Performance Rights holders do not have any right to participate in any issues of shares or other interests in the
consolidated entity or any other entity.
Vesting Date
No. Performance
Rights Expiry Date Exercise price
31 March 2017 187,500 31 March 2017 -
31 March 2018 127,500 31 March 2018 -
31 March 2019 127,500 31 March 2019 -
Grant Date
Vesting &
Exercise Date Exercise price Quantity
12 November 2013 30 June 2017 Nil 296,297
12 November 2013 30 June 2018 Nil 213,334
11
For
per
sona
l use
onl
y

ANNUAL FINANCIAL REPORT
DIRECTORS’ REPORT
LEGAL PROCEEDINGS
No person has applied for leave of court to bring proceedings on behalf of the consolidated entity or intervene in any
proceedings to which the consolidated entity is a party for the purpose of taking responsibility on behalf of the
consolidated entity for all or any part of those proceedings.
NON AUDIT SERVICES
In conducting its business, the consolidated entity is required to obtain permits and licences from relevant state
environment protection authorities. It is of paramount importance to management and the Board of Directors that as
well as operating within its own Environmental Policies, the consolidated entity observes all relevant licences in good
standing. The consolidated entity has not been made aware of any areas of non-compliance in this regard.
The Board of Directors is satisfied that the provision of non-audit services during the year is consistent with the general
standard of independence imposed by the Corporations Act 2001.
Non-audit services were reviewed by the Board to ensure they do not compromise the objectivity of the Auditor and to
ensure the nature of services provided is not inconsistent with the principals of auditor independence. Set out in APES
110: Code of Ethics for Professional Accountants set by the Accounting Professional and Ethical Standards Board.
During the year ended 30 June 2016 fees amounting to $22,575 were paid to Deloitte Touche Tohmatsu for non-audit
services including taxation advice.
AUDITOR’S INDEPENDENCE DECLARATION
The Auditor’s Independence Declaration for the year ended 30 June 2016 has been reviewed and can be found at
page 22 of the annual financial report.
ENVIRONMENTAL ISSUES
12
For
per
sona
l use
onl
y

ANNUAL FINANCIAL REPORT
DIRECTORS’ REPORT
REMUNERATION REPORT – AUDITED
The remuneration report details the amount and nature of the remuneration for the consolidated entity’s key
management personnel.
Directors
Geoff Jones (Managing Director)
David Sala Tenna (General Manager - EPC)
Joe Totaro (Chief Financial Officer & Company Secretary)
Rodney Schier (Engineering Manager)
Paul Newling (General Manager – EPCM)
Unless otherwise stated the named persons held their current position for the whole financial year and since the end of
the financial year. At the consolidated entity’s 2015 Annual General Meeting, 99% of eligible shareholders voted in
favour of the remuneration report. No specific comments were made regarding the remuneration report at the meeting.
REMUNERATION POLICY
Joe Ricciardo (Non-Executive Chairman) - Retired 18 April 2016
Tony Patrizi (Executive Director)
Barry Patterson (Non-Executive Director)
Terrence Strapp (Non-Executive Director)
Peter Hood (Non-Executive Chairman) - Appointed 18 April 2016
Executives
The consolidated entity’s policy is to remunerate non-executive directors according to market rates and to reflect the
time dedicated to their position and special responsibilities involved.
GR Engineering’s Constitution provides that the Directors shall be paid out of the funds of the consolidated entity by
way of remuneration for services such sums as may from time to time be determined by the consolidated entity in
General Meeting, to be divided among the Directors in such proportions as they shall from time to time agree or in
default of agreement, equally.
Directors are encouraged to hold shares in the consolidated entity to align their personal objectives with the growth and
profitability of the consolidated entity.
The consolidated entity’s remuneration policy has been designed to attract and retain high calibre key employees
whose personal interests are aligned with success and growth of the consolidated entity and therefore shareholders.
This will be achieved by:
Staying abreast of labour market forces thereby ensuring remuneration offered by the consolidated entity is
competitive and remains so through a process of annual review.
Devising performance based remuneration programmes.
Utilising the consolidated entity’s Equity Incentive Plan and / or Employee Share Option Plan.
NON-EXECUTIVE DIRECTORS
13
For
per
sona
l use
onl
y
ANNUAL FINANCIAL REPORT
DIRECTORS’ REPORT
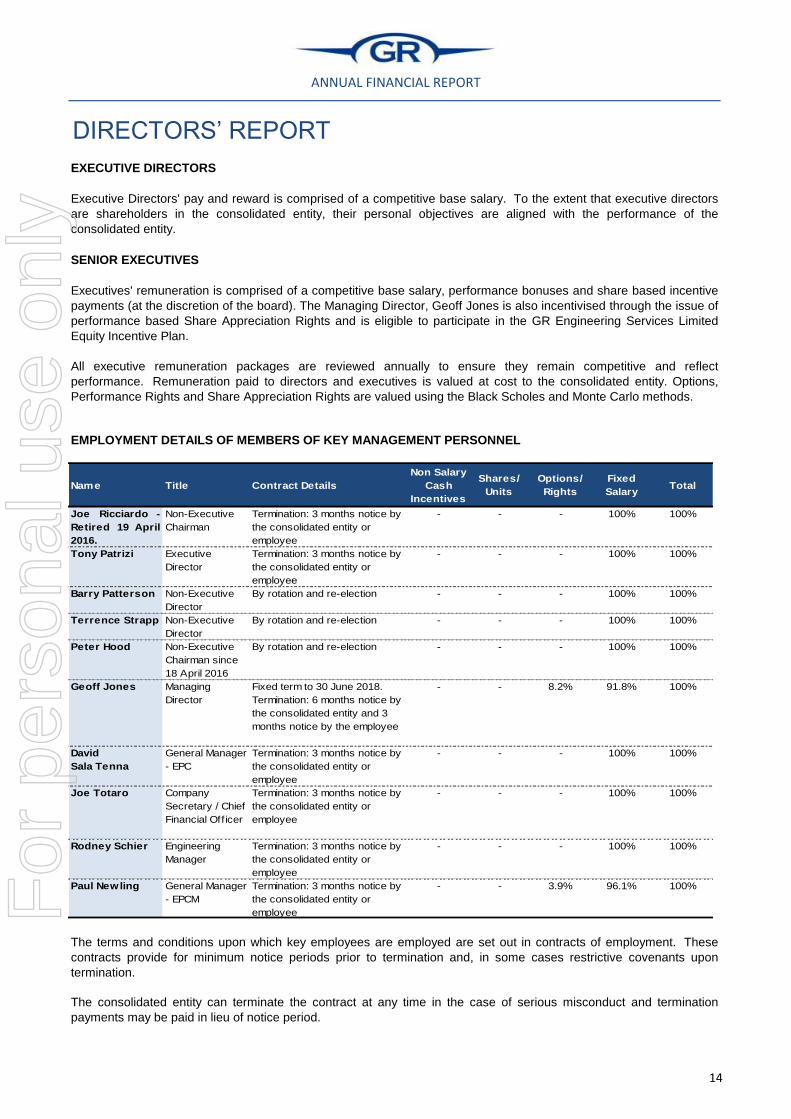
EXECUTIVE DIRECTORS
Executive Directors' pay and reward is comprised of a competitive base salary. To the extent that executive directors
are shareholders in the consolidated entity, their personal objectives are aligned with the performance of the
consolidated entity.
SENIOR EXECUTIVES
Executives' remuneration is comprised of a competitive base salary, performance bonuses and share based incentive
payments (at the discretion of the board). The Managing Director, Geoff Jones is also incentivised through the issue of
performance based Share Appreciation Rights and is eligible to participate in the GR Engineering Services Limited
Equity Incentive Plan.
All executive remuneration packages are reviewed annually to ensure they remain competitive and reflect
performance. Remuneration paid to directors and executives is valued at cost to the consolidated entity. Options,
Performance Rights and Share Appreciation Rights are valued using the Black Scholes and Monte Carlo methods.
EMPLOYMENT DETAILS OF MEMBERS OF KEY MANAGEMENT PERSONNEL
The terms and conditions upon which key employees are employed are set out in contracts of employment. These
contracts provide for minimum notice periods prior to termination and, in some cases restrictive covenants upon
termination.
The consolidated entity can terminate the contract at any time in the case of serious misconduct and termination
payments may be paid in lieu of notice period.
Name Title Contract Details
Non Salary
Cash
Incentives
Shares/
Units
Options/
Rights
Fixed
SalaryTotal
Joe Ricciardo -
Retired 19 April
2016.
Non-Executive
Chairman
Termination: 3 months notice by
the consolidated entity or
employee
- - - 100% 100%
Tony Patrizi Executive
Director
Termination: 3 months notice by
the consolidated entity or
employee
- - - 100% 100%
Barry Patterson Non-Executive
Director
By rotation and re-election - - - 100% 100%
Terrence Strapp Non-Executive
Director
By rotation and re-election - - - 100% 100%
Peter Hood Non-Executive
Chairman since
18 April 2016
By rotation and re-election - - - 100% 100%
Geoff Jones Managing
Director
Fixed term to 30 June 2018.
Termination: 6 months notice by
the consolidated entity and 3
months notice by the employee
- - 8.2% 91.8% 100%
David
Sala Tenna
General Manager
- EPC
Termination: 3 months notice by
the consolidated entity or
employee
- - - 100% 100%
Joe Totaro Company
Secretary / Chief
Financial Officer
Termination: 3 months notice by
the consolidated entity or
employee
- - - 100% 100%
Rodney Schier Engineering
Manager
Termination: 3 months notice by
the consolidated entity or
employee
- - - 100% 100%
Paul Newling General Manager
- EPCM
Termination: 3 months notice by
the consolidated entity or
employee
- - 3.9% 96.1% 100%
14
For
per
sona
l use
onl
y

ANNUAL FINANCIAL REPORT
DIRECTORS’ REPORT
** “Other” amounts relate to performance based bonus payments, as approved by the board
*** Reduction in benefits due to change in role to Non- Executive Chairman
**** Paid to SDG Nominees Pty Ltd, an entity controlled by Terrence Strapp
REMUNERATION DETAILS FOR THE YEAR ENDED 30 JUNE 2016 - BOARD OF DIRECTORS
* “Non-Cash payments” refer to reportable fringe benefits (fuel for personal vehicles and novated leases)
Post
Employment
Benefits
Cash Salary
& Fees
Non Cash
Payments
*
Other
** Sub Total
Super-
annuation Equity Options Total
%
Performance
Based
$ $ $ $ $ $ $ $
EXECUTIVE DIRECTORS
Tony Patrizi
2016 296,331 19,308 - 315,639 28,151 - - 343,790 0.0%
2015 287,213 13,809 - 301,022 27,285 - - 328,307 0.0%
Geoff Jones
2016 507,476 23,055 - 530,531 19,307 49,197 - 599,035 8.2%
2015 457,303 30,117 - 487,420 18,783 130,588 38,997 675,788 25.1%
NON-EXECUTIVE DIRECTORS
Joe Ricciardo ***
2016 50,148 5,418 - 55,566 4,764 - - 60,330 0.0%
2015 59,266 7,352 - 66,618 5,630 - - 72,248 0.0%
Barry Patterson
2016 57,000 - - 57,000 5,415 - - 62,415 0.0%
2015 57,000 - - 57,000 5,415 - - 62,415 0.0%
Terrence Strapp ****
2016 62,700 - - 62,700 5,415 - - 68,115 0.0%
2015 62,700 - - 62,700 5,415 - - 68,115 0.0%
Peter Hood
2016 57,000 - - 57,000 5,415 - - 62,415 0.0%
2015 57,000 - - 57,000 5,415 - - 62,415 0.0%
TOTAL DIRECTORS
2016 1,030,655 47,781 - 1,078,436 68,467 49,197 - 1,196,100 4.1%
2015 980,482 51,278 - 1,031,760 67,943 130,588 38,997 1,269,288 13.4%
Equity Based
PaymentsShort Term Benefits
15
For
per
sona
l use
onl
y

ANNUAL FINANCIAL REPORT
DIRECTORS’ REPORT
REMUNERATION DETAILS FOR THE YEAR ENDED 30 JUNE 2016 - EXECUTIVES
** “Other” amounts relate to performance based bonus payments, as approved by the board
* “Non-Cash payments” refer to reportable fringe benefits (fuel for personal vehicles and novated leases)
Post
Employment
Benefits
Cash Salary
& Fees
Non Cash
Payments
*
Other
** Sub Total
Super-
annuation Equity Options Total
%
Performance
Based
$ $ $ $ $ $ $ $
SENIOR EXECUTIVES
David Sala Tenna - General Manager - EPC
2016 331,193 5,037 5,479 341,709 31,984 - - 373,693 1.5%
2015 331,193 5,211 - 336,404 31,463 - - 367,867 0.0%
Joe Totaro – Company Secretary & Chief Financial Officer
2016 260,869 8,571 5,479 274,919 25,303 - - 300,222 1.8%
2015 260,869 9,459 - 270,328 24,782 - - 295,110 0.0%
Rodney Schier – Engineering Manager
2016 261,468 5,439 5,479 272,386 25,359 - - 297,745 1.8%
2015 261,468 5,121 - 266,589 24,839 - - 291,428 0.0%
Paul Newling – General Manager EPCM
2016 419,697 - 11,416 431,113 20,391 6,408 - 457,912 3.9%
2015 420,222 3,853 - 424,075 18,783 6,497 - 449,355 1.4%
TOTAL SENIOR EXECUTIVES
2016 1,273,227 19,047 27,853 1,320,127 103,037 6,408 - 1,429,572 2.4%
2015 1,273,752 23,644 - 1,297,396 99,867 6,497 - 1,403,760 0.5%
GRAND TOTAL
2016 2,303,882 66,828 27,853 2,398,563 171,504 55,605 - 2,625,672 3.2%
2015 2,254,234 74,922 - 2,329,156 167,810 137,085 38,997 2,673,048 6.6%
Equity Based
PaymentsShort Term Benefits
16
For
per
sona
l use
onl
y

ANNUAL FINANCIAL REPORT
DIRECTORS’ REPORT
Equity Incentive Plan
LONG TERM INCENTIVES
Employee Share Option Plan
The consolidated entity has established an employee share option plan (ESOP). The consolidated entity may offer
options to subscribe for shares in the consolidated entity to eligible persons subject to the ESOP rules. Options offered
under the ESOP are to be offered on such terms as the board determines and the offer must set out specified
information including the number of options, the period of the offer, calculation of the exercise price and any exercise
conditions.
The exercise price is to be determined by the Board in its absolute discretion and set out in the offer provided that the
exercise price is not less than the average market price on ASX on the five trading days prior to the day the Directors
resolve to grant the option(s).
The GR Engineering Services Limited 2015 Equity Incentive Plan (Plan) was adopted by the Board on 8 October 2015.
In accordance with the Listing Rules of the Australian Securities Exchange (ASX), shareholder approval of the Plan
was obtained at the consolidated entity’s Annual General Meeting held on 10 November 2015. Under the ASX Listing
Rules and Corporations Act 2001 (Cth), the issue of securities under the Plan to directors will be subject to separate
shareholder approval. Eligible participants in the Plan include those defined in ASIC Class Order 14/1000 (CO) or as
determined by the Board to be eligible to participate in the Plan from time to time.
The Plan is designed to align the interests of executives and employees with the interests of shareholders by providing
an opportunity to receive an equity interest in the consolidated entity and therefore direct participation in the benefits of
future consolidated entity performance over the medium to long term.
This is achieved by awarding both or either:
Performance Rights (PR), with each PR being a right to acquire one fully paid ordinary share of the consolidated
entity and vesting upon the satisfaction of certain performance conditions; and
Share Appreciation Rights (SARs), being rights to receive a future payment in shares, based on to the amount of
increase in market value of one share in the consolidated entity in a specified period between the grant of the
SAR and exercise of that SAR.
Securities issued under the Plan will be subject to vesting criteria as determined by the Board and have a term of 3
years (or such term as otherwise agreed by the Board).
During the year ended 30 June 2016 60,000 Performance Rights were issued in accordance with the terms and
conditions of the Plan. The consolidated entity also has 382,500 Performance Rights on issue pursuant to the 2012
Plan. A total of 442,500 Performance Rights were on issue as at 30 June 2016.
The Performance Rights issued or lapsed in the current financial year do not relate to key management personnel.
The GR Engineering Services Limited Equity Incentive Plan adopted in 2012 (2012 Plan) was superseded by the Plan,
but remains in place for the same purposes and on similar terms and conditions to the Plan to govern the unvested
securities issued under the 2012 Plan.
Grant Date Vesting Date Expiry Date Exercise Price Number Fair Value
30 Apr 2014 31 Mar 2017 31 Mar 2017 Nil 127,500 $0.511
30 Apr 2014 31 Mar 2018 31 Mar 2018 Nil 127,500 $0.458
30 Apr 2014 31 Mar 2019 31 Mar 2019 Nil 127,500 $0.410
31 Mar 2016 31 Mar 2017 31 Mar 2017 Nil 60,000 $0.824
17
For
per
sona
l use
onl
y

ANNUAL FINANCIAL REPORT
DIRECTORS’ REPORT
A total of 509,631 Share Appreciation Rights are on issue pursuant to the 2012 Plan.
The following share-based payment compensation relates to Share Appreciation Rights issued to directors and senior
management:
RELATIONSHIP BETWEEN COMPANY PERFORMANCE AND REMUNERATION POLICY
The table below sets out summary information about the consolidated entity’s earnings and movements in shareholder
wealth for the 5 years to 30 June 2016:
Tony Patrizi, a Non-Executive Director, two senior executives and four key employees hold significant shareholdings in
the consolidated entity. As a result the performance of the consolidated entity and the personal and financial interest of
its executive and management team are aligned.
The consolidated entity has issued Share Appreciation Rights to its Managing Director Geoff Jones which are
designed to incentivise the Managing Director and align his interests with those of all shareholders.
The ESOP and Plan have been adopted by the consolidated entity and will be implemented as the Nomination and
Remuneration Committee identify the need to remunerate either existing or future employees, key employees,
executives or executive directors on a performance basis.
2012 2013 2014 2015 2016
Revenue ($000's) 152,838 114,695 114,183 216,893 255,292
Net profit before tax ($000's) 19,858 11,476 16,787 17,196 25,406
Net profit after tax ($000's) 13,115 7,539 14,164 12,938 19,340
Share price at year end $0.90 $0.46 $0.70 $0.90 $0.99
Dividend ($000's) 12,000 9,000 9,000 12,785 15,158
EPS (cents) 8.74 5.03 9.44 8.60 12.71
Diluted EPS (cents) 8.74 4.97 9.26 8.42 12.64
Name Vesting Date
Date
Exercised
Number of
Shares Issued
on Vesting
Date
Exercise
Price
$ Quantity
Fair Value
$
% of
Compensation
for the Year
Consisting of
Share
Appreciation
Rights
Geoff 30 June 2014 30 June 2014 407,949 Nil 1,600,000 $0.1774 38.0%
Jones 30 June 2015 30 June 2015 324,582 Nil 727,273 $0.1827 19.3%
30 June 2016 30 June 2016 207,722 Nil 432,433 $0.1761 8.2%
30 June 2017 Nil 296,297 $0.1619
30 June 2018 Nil 213,334 $0.1508
Grant Date
12 November 2013
12 November 2013
12 November 2013
12 November 2013
12 November 2013
18
For
per
sona
l use
onl
y

ANNUAL FINANCIAL REPORT
DIRECTORS’ REPORT
SHAREHOLDING
The number of shares in the parent entity held during the financial year by each director and other members of key
management personnel of the consolidated entity, including their personally related parties, is set out below:
2016
Balance at the
start of the year
Received
as part of
remuneration
Additions /
other
Disposals /
other
Balance at the
end of the year
Ordinary shares
Joe Ricciardo * 9,798,578 - - - 9,798,578
Tony Patrizi 9,795,000 - - - 9,795,000
Barry Patterson 10,500,000 - - - 10,500,000
Terry Strapp 380,000 - - - 380,000
Peter Hood 500,000 - - - 500,000
Geoff Jones 1,182,531 207,722 - (450,000) 940,253
David Sala Tenna 13,825,000 - - - 13,825,000
Joe Totaro 9,500,000 - - - 9,500,000
Rodney Schier 8,100,000 - - - 8,100,000
Paul Newling - - - - -
63,581,109 207,722 - (450,000) 63,338,831
* Number of shares at date of retirement
2015
Balance at the
start of the year
Received
as part of
remuneration
Additions /
other
Disposals /
other
Balance at the
end of the year
Ordinary shares
Joe Ricciardo 9,798,578 - - - 9,798,578
Tony Patrizi 9,795,000 - - - 9,795,000
Barry Patterson 10,500,000 - - - 10,500,000
Terry Strapp 380,000 - - - 380,000
Peter Hood 500,000 - - - 500,000
Geoff Jones 857,949 324,582 - - 1,182,531
David Sala Tenna 13,825,000 - - - 13,825,000
Joe Totaro 9,500,000 - - - 9,500,000
Rodney Schier 8,100,000 - - - 8,100,000
Paul Newling - - - - -
63,256,527 324,582 - - 63,581,109
19
For
per
sona
l use
onl
y

ANNUAL FINANCIAL REPORT
DIRECTORS’ REPORT
OTHER TRANSACTIONS WITH KEY MANAGEMENT PERSONNEL
During the year ended 30 June 2016 the consolidated entity leased office space at 71-73 Daly Street from Ashguard
Pty Ltd. Directors of the consolidated entity, namely Joe Ricciardo, Tony Patrizi, and Barry Patterson, each have a non
controlling interest in Ashguard Pty Ltd. The total amount invoiced by Ashguard Pty Ltd in the year ended 30 June
2016 amounted to $314,019 including GST (2015: $314,263). The balance payable at 30 June 2016 is $46,860 (2015:
$46,054). During the year ended 30 June 2016 the consolidated entity procured items for Ashguard Pty Ltd. The total
amount invoiced to Ashguard Pty Ltd in the year ended 30 June 2016 was $1,225 including GST (2015: $10,998). The
balance outstanding at 30 June 2016 is nil (2015: nil).
During the year ended 30 June 2016 the consolidated entity procured items and hired equipment from PIHA Pty Ltd, a
subsidiary of Mineral Resources Limited, a company in which Joe Ricciardo was a non-executive director until his
retirement on 18 April 2016. The total amount invoiced by PIHA Pty Ltd in the year ended 30 June 2016 amounted to
$849,728 including GST (2015: $240,664). The balance payable at 30 June 2016 is $89,756 (2015: $237,936). In
previous years the consolidated entity provided engineering services and procurement of materials for PIHA Pty Ltd.
The total amount invoiced to PIHA Pty Ltd in the year ended 30 June 2016 was nil (2015: $41,083). The balance
outstanding at 30 June 2016 is nil (2015: nil).
In previous years the consolidated entity provided engineering services and procurement of materials for Crushing
Services International Pty Ltd (a subsidiary of Mineral Resources Limited), a company in which Joe Ricciardo was a
non-executive director until his retirement on 18 April 2016. The total amount invoiced to Crushing Services
International Pty Ltd in the year ended 30 June 2016 was nil (2015: $151,580). The balance outstanding at 30 June
2016 is nil (2015: nil).
During the year ended 30 June 2016 the consolidated entity provided engineering services and procurement of
materials for Azumah Resources Limited, a company in which Geoff Jones is a non-executive director. The total
amount invoiced to Azumah Resources Limited in the year ended 30 June 2016 was $29,760 including GST (2015:
$204,886). The balance outstanding at 30 June 2016 is nil (2015: nil).
During the year ended 30 June 2016 the consolidated entity was provided engineering services by Optiro Pty Ltd, a
company in which Joe Ricciardo and Tony Patrizi each hold non-controlling interests. The total amount invoiced by
Optiro Pty Ltd in the year ended 30 June 2016 was $11,253 including GST (2015: nil). The balance payable at 30 June
2016 is nil (2015: nil). In previous years the consolidated entity provided engineering services and procurement of
materials for Optiro Pty Ltd. The total amount invoiced to Optiro Pty Ltd in the year ended 30 June 2016 was nil (2015:
$9,680). The balance outstanding at 30 June 2016 is nil (2015: $9,680).
In previous years the consolidated entity provided engineering services and procurement of materials for Marindi
Metals Limited (previously Brumby Resources Limited), a company in which Geoff Jones is a non-executive director.
The total amount invoiced to Marindi Metals Limited in the year ended 30 June 2016 was nil (2015: $56,562). The
balance outstanding at 30 June 2016 is nil (2015: nil).
During the year ended 30 June 2016 the consolidated entity provided engineering services and procurement of
materials for Dacian Gold Limited, a company in which Barry Patterson is a non-executive director. The total amount
invoiced to Dacian Gold Limited in the year ended 30 June 2016 was $418,372 including GST (2015: $7,420). The
balance outstanding at 30 June 2016 is $302,581 (2015: nil).
The terms and conditions of the transactions and the associated agreements to which they relate (where applicable)
that have been set out above are at arms length and on normal commercial terms.
This marks the end of the remuneration report.
20
For
per
sona
l use
onl
y

ANNUAL FINANCIAL REPORT
DIRECTORS’ REPORT
Managing Director
Date : 23 August 2016
The Directors of the consolidated entity are committed to the highest standards of corporate governance in all
elements of the business of the consolidated entity including internal control, ethics, risk functions, policies and internal
and external audit.
The consolidated entity’s Board of Directors has adopted a comprehensive corporate governance policy and manual
based on ASX guidelines. The Board continually seeks to review and develop additional structures to be implemented
as the consolidated entity’s activities develop in size, nature and scope.
Please refer to the Corporate Governance Statement contained in this report.
This directors’ report is signed in accordance with a resolution of directors made pursuant to s.298(2) of the
Corporations Act 2001.
On behalf of the Directors
Geoff Jones
CORPORATE GOVERNANCE
21
For
per
sona
l use
onl
y

ANNUAL FINANCIAL REPORT
AUDITOR’S INDEPENDENCE DECLARATION
22
For
per
sona
l use
onl
y

ANNUAL FINANCIAL REPORT
FOR THE YEAR ENDED 30 JUNE 2016
Notes
2016 2015
$ $
Revenue 5 255,291,729 216,892,554
Other income 6 3,791,701 1,586,113
Expenses
Employee benefits expense 7 (69,120,391) (46,482,886)
Superannuation expense 7 (5,413,273) (4,218,975)
Depreciation and amortisation expense (1,789,325) (4,169,359)
Workers compensation expense (459,201) (324,568)
Equity based payments (394,651) (564,101)
Finance costs 7 (131,566) (58,869)
Direct materials and subcontractor costs (149,311,065) (137,893,008)
Accountancy & audit fees (317,935) (286,932)
Marketing (52,454) (34,930)
Bad debts 10 (9,900) (13,745)
Occupancy (2,480,489) (2,309,003)
Administration (4,197,463) (4,926,384)
Profit before income tax expense 25,405,717 17,195,907
Income tax expense 8 (6,065,734) (4,258,256)
Profit after income tax expense for the year attributable to the owners
of GR Engineering Services Limited 21 19,339,983 12,937,651
Other comprehensive income for the year, net of income tax
Items that may be reclassified subsequently to profit or loss :
Fair value gain/(loss) on available for sale financial assets 662,567 346,848
Exchange differences on translating foreign operations (1,970,215) 1,103,967
Other comprehensive income for the year, net of income tax (1,307,648) 1,450,815
Total comprehensive income for the year attributable to the owners
of GR Engineering Services Limited 18,032,335 14,388,466
Profit attributable to owners of the parent 19,339,983 12,937,651
18,032,335 14,388,466
Cents Cents
Basic earnings per share 31 12.71 8.60
Diluted earnings per share 31 12.64 8.42
CONSOLIDATED STATEMENT OF PROFIT OR LOSS
AND OTHER COMPREHENSIVE INCOME
Consolidated
Total comprehensive income attributable to the owners of the parent
The accompanying notes form part of these Financial Statements 23
For
per
sona
l use
onl
y

ANNUAL FINANCIAL REPORT
AS AT 30 JUNE 2016
Notes
2016 2015
$ $
Assets
Current assets
Cash and cash equivalents 9 64,923,175 64,582,994
Trade and other receivables 10 29,909,363 26,038,936
Inventories 11 4,409,364 2,821,512
Prepayments 503,561 652,458
Total current assets 99,745,463 94,095,900
Non-current assets
Property, plant and equipment 12 3,613,480 3,514,591
Financial assets 13 3,712,539 2,347,202
Intangible assets 14 34,765 552,656
Deferred tax 8 3,028,018 2,256,138
Total non-current assets 10,388,802 8,670,587
Total assets 110,134,265 102,766,487
Liabilities
Current liabilities
Trade and other payables 15 28,356,507 35,392,357
Borrowings 16 401,450 397,912
Income tax 8 643,876 2,055,333
Provisions 17 10,891,708 7,962,338
Unearned revenue 18 15,034,068 5,416,190
Total current liabilities 55,327,609 51,224,130
Non-current liabilities
Borrowings 16 522,418 706,432
Provisions 17 2,290,471 2,111,213
Total non-current liabilities 2,812,889 2,817,645
Total liabilities 58,140,498 54,041,775
Net assets 51,993,767 48,724,712
Equity
Issued capital 19 30,225,436 28,918,256
Reserves 20 332,768 2,552,945
Retained profits 21 21,435,563 17,253,511
Total equity 51,993,767 48,724,712
CONSOLIDATED STATEMENT OF FINANCIAL
POSITION
Consolidated
The accompanying notes form part of these Financial Statements 24
For
per
sona
l use
onl
y

ANNUAL FINANCIAL REPORT
FOR THE YEAR ENDED 30 JUNE 2016
Notes
2016 2015
$ $
Cash flows from operating activities
Receipts from customers 278,863,188 231,649,234
Payments to suppliers and employees (253,635,286) (184,485,238)
Income tax paid (8,249,071) (5,802,192)
Interest received 1,199,099 1,117,263
Net cash flows from operating activities 9 18,177,930 42,479,067
Cash flows from investing activities
Purchase of property, plant and equipment (944,184) (1,797,266)
(Investment)/divestment in term deposits for project security - 5,239,431
Investment in financial assets (1,248,595) (1,398,649)
Proceeds from sale of financial assets 1,964,235 -
Net cash flows (used in) / provided by investing activities (228,544) 2,043,516
Cash flows from financing activities
Payment of finance lease liabilities (606,614) (168,525)
Dividends paid (15,157,931) (12,784,676)
Net cash flows used in financing activities (15,764,545) (12,953,201)
Net increase in cash and cash equivalents 2,184,841 31,569,382
Cash and cash equivalents at beginning of period 64,582,994 32,193,955
Effects of exchange rate changes of balances of cash held in foreign
currencies (1,844,660) 819,657
Cash and cash equivalents at end of period 9 64,923,175 64,582,994
CONSOLIDATED STATEMENT OF CASH FLOWS
Consolidated
The accompanying notes form part of these Financial Statements 25
For
per
sona
l use
onl
y

ANNUAL FINANCIAL REPORT
FOR THE YEAR ENDED 30 JUNE 2016
Issued capitalShare Option
Reserve
Performance
Rights
Reserve
Share
Appreciation
Rights
Reserve
Foreign
Currency
Translation
Reserve
Investment
Revaluation
Reserve
Retained
EarningsTotal
$ $ $ $ $ $ $ $
Balance as at
30 June 2014 28,785,355 545,500 590,246 82,291 (404,255) (142,852) 17,100,536 46,556,821
Profit for the period - - - - - - 12,937,651 12,937,651
Other comprehensive
income for the period - - - - 1,103,967 346,848 - 1,450,815
Total comprehensive
income for the period - - - - 1,103,967 346,848 12,937,651 14,388,466
Dividends - - - - - - (12,784,676) (12,784,676)
Issue of shares 132,901 - - (132,901) - - - -
Share based payments - 38,997 394,516 130,588 - - - 564,101
Balance as at
30 June 2015 28,918,256 584,497 984,762 79,978 699,712 203,996 17,253,511 48,724,712
Profit for the period - - - - - - 19,339,983 19,339,983
Other comprehensive
income for the period - - - - (1,970,215) 662,567 - (1,307,648)
Total comprehensive
income for the period - - - - (1,970,215) 662,567 19,339,983 18,032,335
Dividends - - - - - - (15,157,931) (15,157,931)
Issue of shares 1,307,180 - (1,175,848) (76,132) - - - 55,200
Share based payments - - 290,257 49,194 - - - 339,451
Balance as at
30 June 2016 30,225,436 584,497 99,171 53,040 (1,270,503) 866,563 21,435,563 51,993,767
CONSOLIDATED STATEMENT OF CHANGES IN
EQUITY
The accompanying notes form part of these Financial Statements 26
For
per
sona
l use
onl
y
ANNUAL FINANCIAL REPORT
NOTES TO THE FINANCIAL STATEMENTSFOR THE YEAR ENDED 30 JUNE 2016
Note 2. Significant accounting policies
The principal accounting policies adopted in the preparation of the financial statements are set out below.
These policies have been consistently applied to all the years presented, unless otherwise stated.
New, revised or amending Accounting Standards and Interpretations adopted
Adoption of new and revised Accounting Standards
The consolidated entity has adopted all of the new and revised Standards and Interpretations issued by the
Australian Accounting Standards Board that are relevant to their operations and are effective for the current
financial reporting period, beginning 1 July 2015.
New and revised Standards and amendments thereof and Interpretations effective for the current year that
are relevant to the consolidated entity included:
Note 1. General information
The financial report covers GR Engineering Services Limited as a consolidated entity consisting of GR
Engineering Services Limited and the entities it controlled during the year. The financial report is presented in
Australian dollars, which is GR Engineering Services Limited's functional and presentation currency.
The financial report consists of the financial statements, notes to the financial statements and the directors'
declaration.
GR Engineering Services Limited is a listed public company limited by shares, incorporated and domiciled in
Australia. The registered office of GR Engineering Services Limited is located at 179 Great Eastern Highway,
Belmont, Western Australia. The principal place of business is located at 179 Great Eastern Highway,
Belmont, Western Australia.
A description of the nature of the consolidated entity's operations and its principal activities are included in the
directors' report, which is not part of the financial report.
The financial report was authorised for issue, in accordance with a resolution of directors, on 23 August 2016.
The directors have the power to amend and reissue the financial report.
The adoption of these standards and interpretations did not have a material impact on the consolidated entity.
AASB 2015-3 'Amendments to Australian Accounting Standards arising from the Withdrawal of AASB
1031 Materiality'
AASB 2015-4 ‘Amendments to Australian Accounting Standards – Financial Reporting Requirements for
Australian Groups with a Foreign Parent’
27
For
per
sona
l use
onl
y

ANNUAL FINANCIAL REPORT
NOTES TO THE FINANCIAL STATEMENTSFOR THE YEAR ENDED 30 JUNE 2016
Effective for annual
reporting periods
beginning on or after
Expected to be
initially applied in the
financial year ending
AASB 9 ‘Financial Instruments’, and the relevant amending
standards1 January 2018 30 June 2019
AASB 15 ‘Revenue from Contracts with Customers’, AASB 2014-5
‘Amendments to Australian Accounting Standards arising from
AASB 15’, AASB 2015-8 ‘Amendments to Australian Accounting
Standards – Effective Date of AASB 15’, and AASB 2016-3
‘Amendments to Australian Accounting Standards – Clarifications
to AASB 15’
1 January 2018 30 June 2019
AASB 16 ‘Leases’ 1 January 2019 30 June 2020
AASB 1057 ‘Application of Australian Accounting Standards’ and
AASB 2015-9 ‘Amendments to Australian Accounting Standards –
Scope and Application Paragraphs’
1 January 2016 30 June 2017
AASB 2014-3 ‘Amendments to Australian Accounting Standards –
Accounting for Acquisitions of Interests in Joint Operations’1 January 2016 30 June 2017
AASB 2014-4 ‘Amendments to Australian Accounting Standards –
Clarification of Acceptable Methods of Depreciation and
Amortisation’
1 January 2016 30 June 2017
AASB 2014-9 ‘Amendments to Australian Accounting Standards –
Equity Method in Separate Financial Statements’1 January 2016 30 June 2017
AASB 2014-10 ‘Amendments to Australian Accounting Standards –
Sale or Contribution of Assets between an Investor and its
Associate or Joint Venture’ and AASB 2015-10 ‘Amendments to
Australian Accounting Standards – Effective Date of Amendments
to AASB 10 and AASB 128’
1 January 2018 30 June 2019
AASB 2015-1 ‘Amendments to Australian Accounting Standards –
Annual Improvements to Australian Accounting Standards 2012-
2014 Cycle’
1 January 2016 30 June 2017
AASB 2015-2 ‘Amendments to Australian Accounting Standards –
Disclosure Initiative: Amendments to AASB 101’1 January 2016 30 June 2017
AASB 2015-5 ‘Amendments to Australian Accounting Standards –
Investment Entities: Applying the Consolidation Exception’1 January 2016 30 June 2017
AASB 2016-1 ‘Amendments to Australian Accounting Standards –
Recognition of Deferred Tax Assets for Unrealised Losses’1 January 2017 30 June 2018
AASB 2016-2 ‘Amendments to Australian Accounting Standards –
Disclosure Initiative: Amendments to AASB 107’1 January 2017 30 June 2018
New Accounting Standards and Interpretations not yet mandatory or early adopted
The following Australian Accounting Standards and Interpretations have recently been issued or amended but
are not yet effective and have not been adopted by the consolidated entity for the year ended 30 June 2016.
Standard/Interpretation
Note 2. Significant accounting policies (continued)
28
For
per
sona
l use
onl
y

ANNUAL FINANCIAL REPORT
NOTES TO THE FINANCIAL STATEMENTSFOR THE YEAR ENDED 30 JUNE 2016
Effective for annual
reporting periods
beginning on or after
Expected to be
initially applied in the
financial year ending
Classification and Measurement of Share-based Payment
Transactions (Amendment to IFRS 2)1 January 2018 30 June 2019
These financial statements are general purpose financial statements which have been prepared in
accordance with the Corporations Act 2001, Accounting Standards and Interpretations, and comply with other
requirements of the law.
The financial statements comprise the consolidated financial statements of the consolidated entity. For the
purposes of preparing the consolidated financial statements, the consolidated entity is a for-profit entity.
Accounting Standards include Australian Accounting Standards. Compliance with Australian Accounting
Standards ensures that the financial statements and notes of the company and the consolidated entity comply
with International Financial Reporting Standards (‘IFRS’).
Basis of preparation
The impact of these recently issued or amended standards and interpretations have not been determined as
yet by the consolidated entity.
Note 2. Significant accounting policies (continued)
Statement of compliance
At the date of authorisation of the financial statements, the following IASB Standards and IFRIC
Interpretations (for which Australian equivalent Standards and Interpretations have not yet been issued) were
in issue but not yet effective.
Standard/Interpretation
Level 1 inputs are quoted prices (unadjusted) in active markets for identical assets or liabilities that the
entity can access at the measurement date;
Level 2 inputs are inputs, other than quoted prices included within Level 1, that are observable for the
asset or liability, either directly or indirectly; and
Level 3 inputs are unobservable inputs for the asset or liability.
Historical cost convention
The consolidated financial statements have been prepared on the basis of historical cost, except for certain
non-current assets and financial instruments that are measured at revalued amounts or fair values, as
explained in the accounting policies below. Historical cost is generally based on the fair values of the
consideration given in exchange for assets. All amounts are presented in Australian dollars, unless otherwise
noted.
Fair value is the price that would be received to sell an asset or paid to transfer a liability in an orderly
transaction between market participants at the measurement date, regardless of whether that price is directly
observable or estimated using another valuation technique. In estimating the fair value of an asset or a
liability, the consolidated entity takes into account the characteristics of the asset or liability if market
participants would take those characteristics into account when pricing the asset or liability at the
measurement date. Fair value for measurement and/or disclosure purposes in these consolidated financial
statements is determined on such a basis, except for share-based payment transactions that are within the
scope of AASB 2, leasing transactions that are within the scope of AASB 117, and measurements that have
some similarities to fair value but are not fair value, such as net realisable value in AASB 2 or value in use in
AASB 136.
In addition, for financial reporting purposes, fair value measurements are categorised into Level 1, 2 or 3
based on the degree to which the inputs to the fair value measurements are observable and the significance
of the inputs to the fair value measurement in its entirety, which are described as follows:
29
For
per
sona
l use
onl
y

ANNUAL FINANCIAL REPORT
NOTES TO THE FINANCIAL STATEMENTSFOR THE YEAR ENDED 30 JUNE 2016
Critical accounting estimates
The preparation of the financial statements requires the use of certain critical accounting estimates. It also
requires management to exercise its judgement in the process of applying the consolidated entity's
accounting policies. The areas involving a higher degree of judgement or complexity, or areas where
assumptions and estimates are significant to the financial statements, are disclosed in note 3.
Note 2. Significant accounting policies (continued)
has power over the investee;
is exposed, or has rights, to variable returns from its involvement with the investee; and
has the ability to use its power to affect its returns.
The consolidated entity reassesses whether or not it controls an investee if facts and circumstances indicate
that there are changes to one or more of the three elements of control listed above.
When the consolidated entity has less than a majority of the voting rights of an investee, it has power over the
investee when the voting rights are sufficient to give it the practical ability to direct the relevant activities of the
investee unilaterally. The consolidated entity considers all relevant facts and circumstances in assessing
whether or not the consolidated entity's voting rights in an investee are sufficient to give it power, including:
the size of the consolidated entity's holding of voting rights relative to the size and dispersion of holdings
of the other vote holders;
Accounting for construction contracts
Where the outcome of a construction contract can be estimated reliably, revenue and costs are recognised by
reference to the stage of completion of the contract activity at the reporting date, measured based on the
proportion of contract costs incurred for work performed to date relative to the estimated total contract costs,
except where this would not be representative of the stage of completion. Variations in contract work, claims
and incentive payments are included to the extent that they have been agreed with the customer. Where the
outcome of a construction contract cannot be estimated reliably, contract revenue is recognised to the extent
of contract costs incurred that it is probable will be recoverable.
Contract costs are recognised as expenses in the period in which they are incurred. Where construction
contracts are still in the completion stage, they are included as work in progress.
When it is probable that total contract costs will exceed total contract revenue, the expected loss is
recognised as an expense immediately.
Principles of consolidation
The consolidated financial statements incorporate the financial statements of the consolidated entity and
entities (including structured entities) controlled by the consolidated entity and its subsidiaries. Control is
achieved when the consolidated entity:
potential voting rights held by the consolidated entity, other vote holders or other parties;
rights arising from other contractual arrangements; and
any additional facts and circumstances that indicate that the consolidated entity has, or does not have,
the current ability to direct the relevant activities at the time that decisions need to be made, including
voting patterns at previous shareholders' meetings.
30
For
per
sona
l use
onl
y
ANNUAL FINANCIAL REPORT
NOTES TO THE FINANCIAL STATEMENTSFOR THE YEAR ENDED 30 JUNE 2016
When necessary, adjustments are made to the financial statements of subsidiaries to bring their accounting
policies into line with the Group's accounting policies.
All intragroup assets and liabilities, equity, income, expenses and cash flows relating to transactions between
members of the Group are eliminated in full on consolidation.
Operating segments
Operating segments are reported in a manner consistent with the internal reporting provided to the chief
operating decision maker. The chief operating decision maker, who is responsible for allocating resources
and assessing performance of the operating segments, has been identified as the Managing Director of the
consolidated entity.
Foreign currency translation
The financial report is presented in Australian dollars, which is GR Engineering Services Limited's functional
and presentation currency.
Consolidation of a subsidiary begins when the consolidated entity obtains control over the subsidiary and
ceases when the consolidated entity loses control of the subsidiary. Specifically, income and expenses of a
subsidiary acquired or disposed of during the year are included in the consolidated statement of profit or loss
and other comprehensive income from the date the consolidated entity gains control until the date when the
consolidated entity ceases to control the subsidiary.
Note 2. Significant accounting policies (continued)
Profit or loss and each component of other comprehensive income are attributed to the owners of the
consolidated entity and to the non-controlling interests. Total comprehensive income of subsidiaries is
attributed to the owners of the consolidated entity and to the non-controlling interests even if this results in the
non-controlling interests having a deficit balance.
Non-monetary items that are measured in terms of historical cost in a foreign currency are translated using
the exchange rates as at the date of the initial transaction.
Foreign currency transactions
Foreign currency transactions are translated into Australian dollars using the exchange rates prevailing at the
dates of the transactions. Foreign exchange gains and losses resulting from the settlement of such
transactions and from the translation at financial year-end exchange rates of monetary assets and liabilities
denominated in foreign currencies are recognised in profit or loss.
Foreign operations
The assets and liabilities of foreign operations are translated into Australian dollars using the exchange rates
at the reporting date. The revenues and expenses of foreign operations are translated into Australian dollars
using the exchange rates prevailing at the dates of the transactions. All resulting foreign exchange differences
are recognised in other comprehensive income through the foreign currency reserve in equity.
The functional currency of GR Engineering Services (UK) Limited is Great British pounds. The functional
currency of Upstream Production Solutions Malaysia Sdn. Bhd. is Malaysian Ringgit. The functional currency
of GR Engineering Services (Greece) is Euro. The functional currency of other foreign subsidiaries of the
consolidated entity is United States dollars.
The foreign currency reserve is recognised in profit or loss when the foreign operation or net investment is
disposed of.
31
For
per
sona
l use
onl
y

ANNUAL FINANCIAL REPORT
NOTES TO THE FINANCIAL STATEMENTSFOR THE YEAR ENDED 30 JUNE 2016
Non-monetary items measured at fair value in a foreign currency are translated using the exchange rates at
the date when the fair value was determined.
Note 2. Significant accounting policies (continued)
Revenue recognition
Revenue is recognised to the extent that it is probable that the economic benefits will flow to the consolidated
entity and the revenue can be reliably measured.
Sales revenue
Income tax
The tax currently payable is based on taxable profit for the year. Taxable profit differs from profit as reported
in the statement of profit or loss because of items of income or expense that are taxable or deductible in other
years and items that are never taxable or deductible. The consolidated entity’s liability for current tax is
calculated using tax rates that have been enacted or substantively enacted by the end of the reporting period.
Deferred income tax is provided for on all temporary differences at the reporting date between the tax bases
of assets and liabilities and their carrying amounts for the financial reporting purposes.
Deferred income tax liabilities are recognised for all taxable temporary differences:
except where the deferred income tax liability arises from the initial recognition of an asset or liability in
a transaction that is not a business combination and, at the time of the transaction, affects neither the
accounting profit nor taxable profit or loss; and
in respect of taxable temporary differences associated with investments in subsidiaries, associates and
interests in joint ventures, except where the timing of the reversal of the temporary differences can be
controlled and it is probable that the temporary differences will not reverse in the foreseeable future.
Revenue from the sale of goods is recognised when the consolidated entity has transferred to the buyer the
significant risks and rewards of ownership of the goods.
Rendering of services
Revenue from a contract to provide services is recognised by reference to the stage of completion.
Where the contract outcome cannot be measured reliably, revenue is recognised only to the extent of the
expenses recognised that are recoverable.
Interest
Revenue is recognised as the interest accrues (using the effective interest method, which is the rate that
exactly discounts estimated future cash receipts through the expected life of the financial instrument) to the
net carrying amount of the financial asset.
32
For
per
sona
l use
onl
y

ANNUAL FINANCIAL REPORT
NOTES TO THE FINANCIAL STATEMENTSFOR THE YEAR ENDED 30 JUNE 2016
Income taxes relating to items recognised directly in equity are recognised in equity and not in the statement
of profit or loss and other comprehensive income.
Unearned income
Unearned income classified as a current liability consists of customer advances for construction work in
progress. The consolidated entity recognises a liability upon receipt of customer advances and then
subsequently recognised as revenue when earned.
Cash and cash equivalents
Cash and cash equivalents includes cash on hand, deposits held at call with financial institutions, other short-
term, highly liquid investments with original maturities of three months or less that are readily convertible to
known amounts of cash and which are subject to an insignificant risk of changes in value.
Trade and other receivables
Note 2. Significant accounting policies (continued)
Deferred income tax assets are recognised for all deductible temporary differences, carry-forward of unused
tax assets and unused tax losses, to the extent that it is probable that taxable profit will be available against
which the deductible temporary differences, and the carry-forward of unused tax assets and unused tax
losses can be utilised:
except where the deferred income tax asset relating to the deductible temporary differences arises from
the initial recognition of an asset or liability in a transaction that is not a business combination and, at
the time of the transaction, affects neither the accounting profit nor taxable profit or loss; and
in respect of deductible temporary differences associated with investments in subsidiaries, associates
and interests in joint ventures, deferred tax assets are only recognised to the extent that it is probable
that the temporary differences will reverse in the foreseeable future and taxable profit will be available
against which the temporary differences can be utilised.
The carrying amount of deferred income tax assets is reviewed at each reporting date and reduced to the
extent that it is no longer probable that sufficient taxable profit will be available to allow all or part of the
deferred income tax asset to be utilised.
Deferred income tax assets and liabilities are measured at the tax rates that are expected to apply to the year
when the asset is realised or the liability is settled, based on tax rates (and tax laws) that have been enacted
or substantively enacted at the reporting date.
Trade receivables, which generally have 30-90 day terms, are recognised and carried at original invoice
amount less an allowance for any uncollectible amounts.
An estimate for doubtful debts is made when collection of the full amount is no longer probable. Bad debts
are written off when identified.
Inventories
Inventories are valued at the lower of cost and net realisable value.
Net realisable value is the estimated selling price in the ordinary course of business, less estimated costs of
completion and the estimated costs necessary to make the sale.
33
For
per
sona
l use
onl
y

ANNUAL FINANCIAL REPORT
NOTES TO THE FINANCIAL STATEMENTSFOR THE YEAR ENDED 30 JUNE 2016
Investments and other financial assets
Investments and other financial assets are initially measured at fair value. Transaction costs are included as
part of the initial measurement, except for financial assets at fair value through profit or loss. They are
subsequently measured at either amortised cost or fair value depending on their classification. Classification
is determined based on the purpose of the acquisition and subsequent reclassification to other categories is
restricted. The fair values of quoted investments are based on current bid prices. For unlisted investments,
the consolidated entity establishes fair value by using valuation techniques. These include the use of recent
arm's length transactions, reference to other instruments that are substantially the same, discounted cash
flow analysis, and option pricing models.
Financial assets are derecognised when the rights to receive cash flows from the financial assets have
expired or have been transferred and the consolidated entity has transferred substantially all the risks and
rewards of ownership.
Loans and receivables
Loans and receivables are non-derivative financial assets with fixed or determinable payments that are not
quoted in an active market. They are carried at amortised cost using the effective interest rate method. Gains
and losses are recognised in profit or loss when the asset is derecognised or impaired.
Available for sale financial assets
Note 2. Significant accounting policies (continued)
Listed shares and listed redeemable notes held by the consolidated entity that are traded in an active market
are classified as available for sale and are stated at fair value.
Gains and losses arising from changes in fair value are recognised in other comprehensive income and
accumulated in the investments revaluation reserve, with the exception of impairment losses, interest
calculated using the effective interest method, and foreign exchange gains and losses on monetary assets,
which are recognised in profit or loss. Where the investment is disposed of or is determined to be impaired,
the cumulative gain or loss previously accumulated in the investments revaluation reserve is reclassified to
profit or loss.
Dividends on available for sale equity instruments are recognised in profit or loss when the consolidated
entity's right to receive the dividends is established.
Impairment of financial assets
The consolidated entity assesses at the end of each reporting period whether there is any objective evidence
that a financial asset or group of financial assets is impaired. Objective evidence includes significant financial
difficulty of the issuer or obligor; a breach of contract such as default or delinquency in payments; the lender
granting to a borrower concessions due to economic or legal reasons that the lender would not otherwise do;
it becomes probable that the borrower will enter bankruptcy or other financial reorganisation; the
disappearance of an active market for the financial asset; or observable data indicating that there is a
measurable decrease in estimated future cash flows.
When an available for sale financial asset is considered to be impaired, cumulative gains or losses previously
recognised in other comprehensive income are reclassified to profit or loss in the period.
34
For
per
sona
l use
onl
y

ANNUAL FINANCIAL REPORT
NOTES TO THE FINANCIAL STATEMENTSFOR THE YEAR ENDED 30 JUNE 2016
Note 2. Significant accounting policies (continued)
The amount of the impairment allowance for loans and receivables carried at amortised cost is the difference
between the asset’s carrying amount and the present value of estimated future cash flows, discounted at the
original effective interest rate. If there is a reversal of impairment, the reversal cannot exceed the amortised
cost that would have been recognised had the impairment not been made and is reversed to profit or loss.
Property, plant and equipment
Plant and equipment is stated at historical cost less accumulated depreciation and impairment. Historical cost
includes expenditure that is directly attributable to the acquisition of the items.
Depreciation is calculated on a straight-line basis over the estimated useful life of the asset as follows:
Property, plant and equipment - over 2.5 to 20 years
Leases
Finance leases, which transfer to the consolidated entity substantially all the risks and benefits incidental to
ownership of the leased item, are capitalised at the inception of the lease at the fair value of the leased
property or, if lower, at the present value of the minimum lease payments.
Lease payments are apportioned between the finance charges and reduction of the lease liability so as to
achieve a constant rate of interest on the remaining balance of the liability. Finance charges are charged
directly against income.
Capitalised leased assets are depreciated over the shorter of the estimated useful life of the asset or the
lease term.
The carrying values of plant and equipment are reviewed for impairment when events or changes in
circumstances indicate the carrying value may not be recoverable.
For an asset that does not generate largely independent cash inflows, the recoverable amount is determined
for the cash-generating unit to which the asset belongs. If any such indication exists and where the carrying
values exceed the estimated recoverable amount, the assets or cash-generating units are written down to
their recoverable amount.
The recoverable amount of plant and equipment is the greater of fair value less costs to sell and value in use.
In assessing value in use, the estimated future cash flows are discounted to their present value using a pre-
tax discount rate that reflects current market assessments of the time value of money and the risks specific to
the asset.
Impairment losses are recognised in the profit or loss in the cost of sales line item.
An item of property, plant and equipment is derecognised upon disposal or when no future economic benefits
are expected to arise from the continued used of the asset.
Any gain or loss arising on de-recognition of the asset (calculated as the difference between the net disposal
proceeds and the carrying amount of the item) is included in the statement of profit or loss in the period the
item is derecognised.
35
For
per
sona
l use
onl
y

ANNUAL FINANCIAL REPORT
NOTES TO THE FINANCIAL STATEMENTSFOR THE YEAR ENDED 30 JUNE 2016
Note 2. Significant accounting policies (continued)
Leases where the lessor retains substantially all the risks and benefits of ownership of the asset are classified
as operating leases. Initial direct costs incurred in negotiating an operating lease are added to the carrying
amount of the leased asset and recognised over the lease term on the same bases as the lease income.
These amounts represent liabilities for goods and services provided to the consolidated entity prior to the end
of the financial year and which are unpaid. Due to their short-term nature they are measured at amortised cost
and are not discounted. The amounts are unsecured and are usually paid within 30 days of recognition.
Borrowings
All loans and borrowings are initially recognised at cost, being the fair value of the consideration received net
of issue costs associated with the borrowing. After initial recognition, interest-bearing loans and borrowings
are subsequently measured at amortised cost using the effective interest method.
Gains and losses are recognised in the profit or loss when the liabilities are derecognised as well as through
the amortisation process.
Provisions
Provisions are recognised when the consolidated entity has a present obligation (legal or constructive) as a
result of a past event, it is probable that an outflow of resources embodying economic benefits will be required
to settle the obligation and a reliable estimate can be made of the amount of the obligation.
Operating lease payments are recognised as an expense in the statement of profit or loss on a straight-line
basis over the lease term.
Impairment of non-financial assets
At each reporting date, the consolidated entity assesses whether there is any indication that an asset may be
impaired. Where an indicator of impairment exists, the consolidated entity makes a formal estimate of
recoverable amount. Where the carrying amount of an asset exceeds its recoverable amount the asset is
considered impaired and is written down to its recoverable amount.
Recoverable amount is the greater of fair value less costs to sell and value in use. It is determined for an
individual asset, unless the asset’s value in use cannot be estimated to be close to its fair value less costs to
sell and it does not generate cash inflows that are largely independent of those from other assets or groups of
assets, in which case, the recoverable amount is determined for the cash-generating unit to which the asset
belongs.
In assessing value in use, the estimated future cash flows are discounted to their present value using a pre
tax discount rate that reflects current market assessments of the time value of money and the risks specific to
the asset.
Trade and other payables
Where the consolidated entity expects some or all of a provision to be reimbursed the reimbursement is
recognised as a separate asset but only when the reimbursement is virtually certain. The expense relating to
any provision is presented in the statement of profit or loss net of any reimbursement.
36
For
per
sona
l use
onl
y

ANNUAL FINANCIAL REPORT
NOTES TO THE FINANCIAL STATEMENTSFOR THE YEAR ENDED 30 JUNE 2016
A liability is recognised for benefits accruing to employees in respect of wages and salaries, annual leave and
sick leave in the period the related service is rendered.
Liabilities recognised in respect of short-term employee benefits, are measured at their nominal values using
the remuneration rate expected to apply at the time of settlement.
Liabilities recognised in respect of long term employee benefits are measured as the present value of the
estimated future cash outflows to be made by the consolidated entity in respect of services provided by
employees up to reporting date.
Defined contribution superannuation expense
Contributions to defined contribution superannuation plans are expensed in the period in which they are
incurred.
Share-based payments
Note 2. Significant accounting policies (continued)
If the effect of the time value of money is material, provisions are determined by discounting the expected
future cash flows at a pre-tax rate that reflects current market assessments of the time value of money and,
where appropriate, the risks specific to the liability.
Where discounting is used, the increase in the provision due to the passage of time is recognised as a
finance cost.
Employee benefits
Wages and salaries, annual leave and sick leave
Share based payments to employees and others providing similar services are measured at the fair value of
the equity instruments at the grant date.
The fair value determined at the grant date of the share based payments is expensed on a straight-line basis
over the vesting period, based on the consolidated entity’s estimate of equity instruments that will eventually
vest. At the end of each reporting period, the consolidated entity revises its estimate of the number of equity
instruments expected to vest. The impact of the revision of the original estimates, if any, is recognised in
profit or loss such that the cumulative expense reflects the revised estimate, with a corresponding adjustment
to the equity-settled employee benefits reserve.
Share based payment transactions with parties other than employees are measured at the fair value of the
goods or services received, except where that fair value cannot be estimated reliably, in which case they are
measured at the fair value of the equity instruments granted, measured at the date the entity obtains the
goods or the counterparty renders the service.
37
For
per
sona
l use
onl
y

ANNUAL FINANCIAL REPORT
NOTES TO THE FINANCIAL STATEMENTSFOR THE YEAR ENDED 30 JUNE 2016
If the entity reacquires its own equity instruments, for example as the result of a share buy back, those
instruments are deducted from equity and the associated shares are cancelled. No gain or loss is recognised
in profit or loss and the consideration paid including any directly attributable incremental costs (net of income
taxes) is recognised directly in equity.
Dividends
Dividends are recognised when declared during the financial year and no longer at the discretion of the
company.
Earnings per share
Basic earnings per share
Basic earnings per share is calculated by dividing the profit attributable to the owners of GR Engineering
Services Limited, excluding any costs of servicing equity other than ordinary shares, by the weighted average
number of ordinary shares outstanding during the financial year, adjusted for bonus elements in ordinary
shares issued during the financial year.
Note 2. Significant accounting policies (continued)
Issued capital
Ordinary shares are classified as equity. Incremental costs directly attributable to the issue of new shares are
shown in equity as a deduction, net of tax, from the proceeds. Incremental costs directly attributable to the
issue of new shares for the acquisition of a business are not included in the cost of the acquisition as part of
the purchase consideration.
The net amount of GST recoverable from, or payable to, the taxation authority is included as part of
receivables or payables in the statement of financial position.
Cash flows are included in the Statement of Cash Flows on a gross basis and the GST component of cash
flows arising from investing and financing activities, which is recoverable from, or payable to, the taxation
authority are classified as operating cash flows.
Commitments and contingencies are disclosed net of the amount of GST recoverable from, or payable to, the
taxation authority.
Diluted earnings per share
Diluted earnings per share adjusts the figures used in the determination of basic earnings per share to take
into account the after income tax effect of interest and other financing costs associated with dilutive potential
ordinary shares and the weighted average number of shares assumed to have been issued for no
consideration in relation to dilutive potential ordinary shares.
De-recognition of financial instruments
The de-recognition of a financial instrument takes place when the consolidated entity no longer controls the
contractual rights that comprise the financial instrument, which is normally the case when the instrument is
sold, or all the cash flows attributable to the instrument are passed through to an independent third party.
Goods and Services Tax ('GST') and other similar taxes
Revenues, expenses and assets are recognised net of the amount of GST except where the GST incurred on
a purchase of goods and services is not recoverable from the taxation authority, in which case the GST is
recognised as part of the cost of acquisition of the asset or as part of the expense item as applicable.
38
For
per
sona
l use
onl
y

ANNUAL FINANCIAL REPORT
NOTES TO THE FINANCIAL STATEMENTSFOR THE YEAR ENDED 30 JUNE 2016
Intangible assets
Note 2. Significant accounting policies (continued)
Contract costs are recognised as expenses in the period in which they are incurred. Where construction
contracts are still in the completion stage, they are included as work in progress.
When it is probable that total contract costs will exceed total contract revenue, the expected loss is
recognised as an expense immediately.
Because the consolidated entity predominantly undertakes projects on an Engineering, Procurement &
Construction (“EPC”) turnkey design and construction contract basis, all the risk associated with cost, time,
plant performance and plant warranty (defects period) rests with the consolidated entity. As such the
consolidated entity is responsible for the total “make-good” of any defects of underperformance.
The consolidated entity includes a project completion and close out provision (liability) in design and
construction project cost forecast reports of 3% of the project costs, or such other amount as assessed by
management having regard to specific project requirements.
Intangible assets acquired in a business combination
Intangible assets acquired in a business combination and recognised separately from goodwill are initially
recognised at their fair value at the acquisition date (which is regarded as their cost).
Subsequent to initial recognition, intangible assets acquired in a business combination are reported at cost
less accumulated amortisation and accumulated impairment losses. Amortisation is recognised on a straight-
line basis over their estimated useful lives. The estimated useful life and amortisation method are reviewed at
the end of each reporting period, with the effect of any changes in estimate being accounted for on a
prospective basis.
Note 3. Critical accounting judgements, estimates and assumptions
The preparation of the financial statements requires management to make judgements, estimates and
assumptions that affect the reported amounts in the financial statements. Management continually evaluates
its judgements and estimates in relation to assets, liabilities, contingent liabilities, revenue and expenses.
Management bases its judgements, estimates and assumptions on historical experience and on other various
factors, including expectations of future events, management believes to be reasonable under the
circumstances. The resulting accounting judgements and estimates will seldom equal the related actual
results. The judgements, estimates and assumptions that have a significant risk of causing a material
adjustment to the carrying amounts of assets and liabilities (refer to the respective notes) within the next
financial year are discussed below.
Where the outcome of a construction contract can be estimated reliably, revenue and costs are recognised by
reference to the stage of completion of the contract activity at the reporting date, measured based on the
proportion of contract costs incurred for work performed to date relative to the estimated total contract costs,
except where this would not be representative of the stage of completion. Variations in contract work, claims
and incentive payments are included to the extent that they have been agreed with the customer. Where the
outcome of a construction contract cannot be estimated reliably, contract revenue is recognised to the extent
of contract costs incurred that it is probable will be recoverable.
39
For
per
sona
l use
onl
y

ANNUAL FINANCIAL REPORT
Segment revenues and results
Segment revenue
2016 2015
$ $
Mineral processing 217,561,538 185,668,102
Oil and gas 37,730,191 31,224,452
Total revenue 255,291,729 216,892,554
Segment profit before tax
2016 2015
$ $
Mineral processing 22,339,174 18,815,506
Oil and gas 2,022,724 (1,619,599)
Corporate - gain on sale of securities 1,043,819 -
Total profit before tax 25,405,717 17,195,907
Segment assets and liabilities
Segment assets
2016 2015
$ $
Mineral processing 85,655,784 86,068,845
Oil and gas 20,765,942 14,350,441
Corporate - securities available for sale 3,712,539 2,347,202
Total assets 110,134,265 102,766,487
Depreciation and amortisation
2016 2015
$ $
Mineral processing 474,874 701,436
Oil and gas 1,314,451 3,467,923
Total depreciation and amortisation 1,789,325 4,169,359
Segment liabilities
2016 2015
$ $
Mineral processing 49,038,015 48,870,511
Oil and gas 9,102,483 5,171,264
Total liabilities 58,140,498 54,041,775
NOTES TO THE FINANCIAL STATEMENTSFOR THE YEAR ENDED 30 JUNE 2016
Note 4. Operating segments
Operating segments have been identified on the basis of internal reports of the consolidated entity that are regularly
reviewed by the chief operating decision maker in order to allocate resources to the segments and to assess their
performance. The chief operating decision maker has been identified as the Managing Director. On a regular basis, the
board receives financial information on a company basis similar to the financial statements presented in the financial report,
to manage and allocate their resources.
The Managing Director has chosen to classify the operations of the consolidated entity by reference to presence in an
industry. The segments identified on this basis are "mineral processing" and "oil and gas".
The following table shows the revenue and results of the consolidated entity summarised under these segments.
Segment revenue reported above represents revenue generated from external customers. There were no inter-segment
sales in the current year (2015: nil).
40
For
per
sona
l use
onl
y

ANNUAL FINANCIAL REPORT
NOTES TO THE FINANCIAL STATEMENTSFOR THE YEAR ENDED 30 JUNE 2016
Geographical information
Revenue
2016 2015
$ $
Australia 230,712,841 102,836,821
Overseas 24,578,888 114,055,733
Total revenue 255,291,729 216,892,554
Non-current assets
Information about major customers
Note 5. Revenue
2016 2015
$ $
Rendering of services - construction contracts 217,561,538 185,668,102
Rendering of services - operations and maintenance contracts 37,730,191 31,224,452
Total revenue 255,291,729 216,892,554
Note 6. Other income
2016 2015
$ $
Net foreign exchange gain/(loss) 1,240,673 436,480
Net gain/(loss) on disposal of property, plant and equipment - 13,284
Subsidies and grants 99,113 10,056
Interest revenue 1,199,099 1,117,263
Gain on sale of investment securities 1,043,819 -
Other revenue 208,997 9,030
Total other income 3,791,701 1,586,113
Note 4. Operating segments (continued)
The following table shows the revenue from external customers of the consolidated entity summarised by location.
All non-current assets of the consolidated entity are held in Australia.
During the financial year two customers individually provided more than 10% of total revenue each for the consolidated
entity (2015: 2 customers).
Consolidated
Consolidated
41
For
per
sona
l use
onl
y

ANNUAL FINANCIAL REPORT
NOTES TO THE FINANCIAL STATEMENTSFOR THE YEAR ENDED 30 JUNE 2016
Note 7. Expenses
2016 2015
$ $
Profit before income tax includes the following specific expenses:
Finance costs
Interest and leasing charges on finance leases 131,566 58,869
Employee benefits
Employee benefits expense excluding superannuation 69,120,391 46,482,886
Defined contribution superannuation expense 5,413,273 4,218,975
Total employee benefits 74,533,664 50,701,861
Note 8. Income tax expense
Major components of income tax expense for the years ended 30 June 2016 and 2015 are:
Income tax recognised in the Consolidated statement of profit or loss
2016 2015
$ $
Current income tax
Current income tax charge 8,804,963 6,894,707
Adjustments in respect of current income tax of previous years (1,683,392) (778,276)
Deferred income tax
Relating to origination and reversal of temporary differences (1,024,457) (1,818,250)
Adjustments in respect of previous deferred income tax (31,380) (39,925)
Income tax expense reported in statement of profit or loss 6,065,734 4,258,256
Income tax recognised in statement of changes in equity
Deferred income tax
Revaluation of shares 283,957 (148,649)
Income tax expense reported in equity 283,957 (148,649)
Accounting profit before income tax 25,405,717 17,195,907
At the statutory income tax rate of 30% (2015: 30%) 7,621,715 5,158,772
Add:
Non-deductible expenses 280,518 194,444
Adjustments in respect of previous current income tax (1,683,392) (818,201)
Impact to tax expense arising from foreign tax rate differential (283,532) (276,759)
Other 130,425 -
At effective income tax rate of 23.9% (2015: 24.8%) 6,065,734 4,258,256
Income tax expense reported in statement of profit or loss 6,065,734 4,258,256
Consolidated
Consolidated
A reconciliation of income tax expense applicable to accounting profit before income
tax at the statutory income tax rate to income tax expense at the consolidated entity’s
effective income tax rate for the years ended 30 June 2016 and 2015 is as follows:
42
For
per
sona
l use
onl
y

ANNUAL FINANCIAL REPORT
NOTES TO THE FINANCIAL STATEMENTSFOR THE YEAR ENDED 30 JUNE 2016
Note 8. Income tax expense (continued)
2016 2015
$ $
Deferred income tax
Deferred income tax at 30 June relates to the following:
Deferred income tax assets
Accrued employee entitlements 66,324 63,505
Accrued superannuation 17,322 14,073
Accrued audit fees 17,126 17,026
Leasing (74,520) (6,027)
Section 40/880 deduction 77 2,277
Provision for long service leave 94,686 93,181
Provision for warranty 2,322,493 1,534,549
Lease termination 96,331 61,452
Payables - Upstream Production Solutions subsidiary 94,806 94,806
Accrued employee entitlements - Upstream Production Solutions subsidiary 776,241 674,208
Shares in listed entity (371,384) (87,427)
Plant and equipment 50,725 -
3,090,227 2,461,623
Deferred income tax liabilities
Prepayments (3,555) (2,434)
Accrued interest (10,941) (17,173)
Other accrued income (4,081) (2,498)
Unrealised foreign exchange gain (23,184) (779)
Assets capitalised for tax - (1,554)
Prepayments - Upstream Production Solutions subsidiary - (222)
Customer contracts - Upstream Production Solutions subsidiary (10,429) (165,797)
Plant and equipment - Upstream Production Solutions subsidiary (10,019) (15,028)
(62,209) (205,485)
Net deferred tax asset 3,028,018 2,256,138
Current tax assets and liabilities
Current tax liabilities
Income tax payable 643,876 2,055,333
Consolidated
43
For
per
sona
l use
onl
y
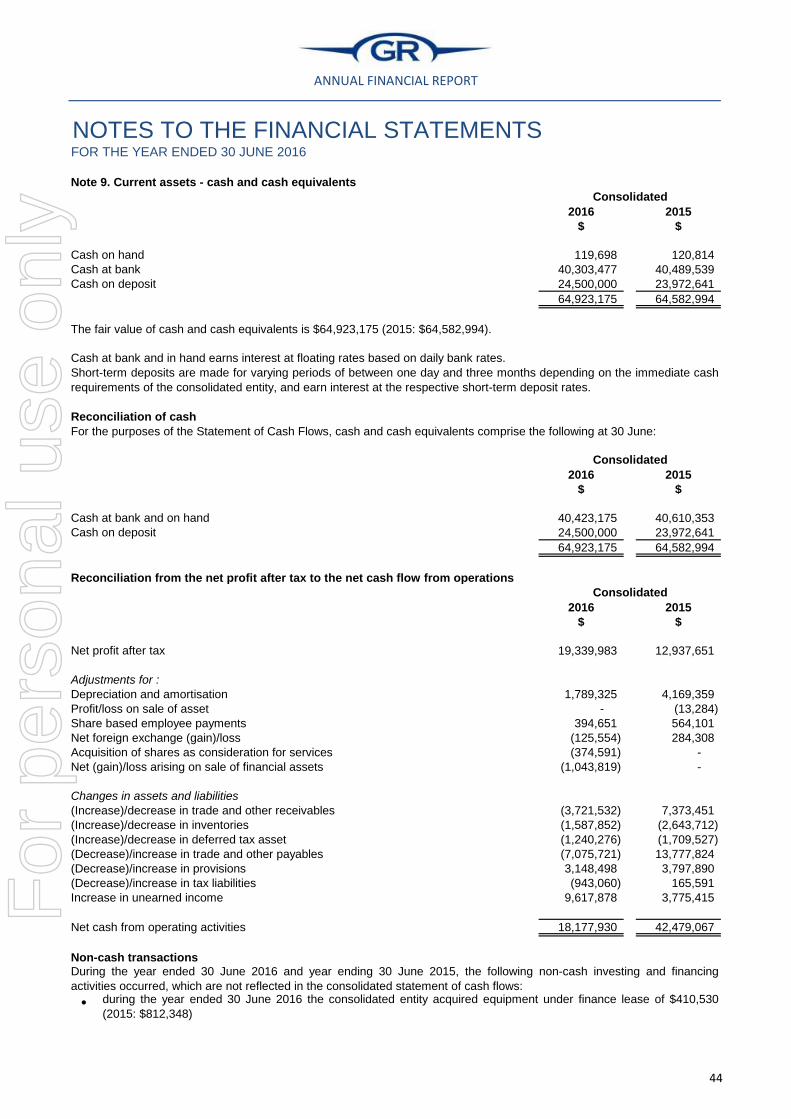
ANNUAL FINANCIAL REPORT
NOTES TO THE FINANCIAL STATEMENTSFOR THE YEAR ENDED 30 JUNE 2016
Note 9. Current assets - cash and cash equivalents
2016 2015
$ $
Cash on hand 119,698 120,814
Cash at bank 40,303,477 40,489,539
Cash on deposit 24,500,000 23,972,641
64,923,175 64,582,994
Reconciliation of cash
2016 2015
$ $
Cash at bank and on hand 40,423,175 40,610,353
Cash on deposit 24,500,000 23,972,641
64,923,175 64,582,994
Reconciliation from the net profit after tax to the net cash flow from operations
2016 2015
$ $
Net profit after tax 19,339,983 12,937,651
Adjustments for :
Depreciation and amortisation 1,789,325 4,169,359
Profit/loss on sale of asset - (13,284)
Share based employee payments 394,651 564,101
Net foreign exchange (gain)/loss (125,554) 284,308
Acquisition of shares as consideration for services (374,591) -
Net (gain)/loss arising on sale of financial assets (1,043,819) -
Changes in assets and liabilities
(Increase)/decrease in trade and other receivables (3,721,532) 7,373,451
(Increase)/decrease in inventories (1,587,852) (2,643,712)
(Increase)/decrease in deferred tax asset (1,240,276) (1,709,527)
(Decrease)/increase in trade and other payables (7,075,721) 13,777,824
(Decrease)/increase in provisions 3,148,498 3,797,890
(Decrease)/increase in tax liabilities (943,060) 165,591
Increase in unearned income 9,617,878 3,775,415
Net cash from operating activities 18,177,930 42,479,067
Non-cash transactions
For the purposes of the Statement of Cash Flows, cash and cash equivalents comprise the following at 30 June:
Consolidated
Consolidated
During the year ended 30 June 2016 and year ending 30 June 2015, the following non-cash investing and financing
activities occurred, which are not reflected in the consolidated statement of cash flows:during the year ended 30 June 2016 the consolidated entity acquired equipment under finance lease of $410,530
(2015: $812,348)
Consolidated
The fair value of cash and cash equivalents is $64,923,175 (2015: $64,582,994).
Cash at bank and in hand earns interest at floating rates based on daily bank rates.
Short-term deposits are made for varying periods of between one day and three months depending on the immediate cash
requirements of the consolidated entity, and earn interest at the respective short-term deposit rates.
44
For
per
sona
l use
onl
y

ANNUAL FINANCIAL REPORT
NOTES TO THE FINANCIAL STATEMENTSFOR THE YEAR ENDED 30 JUNE 2016
Note 10. Trade and other receivables
Current assets – trade and other receivables
2016 2015
$ $
Trade receivables 29,225,861 25,909,381
Less: Allowance for impairment of receivables - -
29,225,861 25,909,381
Other receivables 229,038 81,784
Accrued revenue 454,464 47,771
29,909,363 26,038,936
Trade receivables are non-interest bearing and are normally settled on 30 to 90 day terms.
Impairment of receivables
Movements in the allowance for impairment of receivables are as follows:
2016 2015
$ $
Opening balance - -
Receivables written off during the year as uncollectable - -
Closing balance - -
Bad debts written off during the year as uncollectable amount to $9,900 (2015: $13,745).
Past due but not impaired
The ageing of the past due but not impaired receivables are as follows:
2016 2015
$ $
0 to 3 months overdue 3,093,929 2,576,343
3 to 6 months overdue 274,265 17,288
Over 6 months overdue 5,318,947 -
8,687,141 2,593,631
In determining the recoverability of a trade receivable, the consolidated entity considers any change in the credit quality of
the trade receivable from the date credit was initially granted up to the end of the reporting period. The concentration of
credit risk is limited due to the fact that the customer base is large and unrelated.
Consolidated
Customers with balances past due but without allowance for impairment of receivables amount to $8,687,141 as at 30 June
2016 ($2,593,631 as at 30 June 2015).
Consolidated
Consolidated
45
For
per
sona
l use
onl
y

ANNUAL FINANCIAL REPORT
NOTES TO THE FINANCIAL STATEMENTSFOR THE YEAR ENDED 30 JUNE 2016
Note 11. Current assets - inventories
2016 2015
$ $
Consumables - at cost 643,800 643,800
Work in progress 3,765,564 2,177,712
4,409,364 2,821,512
Note 12. Non-current assets - property, plant and equipment
2016 2015
$ $
Plant and equipment - at cost 8,246,046 6,876,508
Less: Accumulated depreciation (4,925,395) (3,776,287)
3,320,651 3,100,221
Plant and equipment under lease 2,096,878 2,096,878
Less: Accumulated depreciation (1,804,049) (1,682,508)
292,829 414,370
3,613,480 3,514,591
Reconciliations
Plant &
Equipment
Under Lease
Plant &
Equipment Total
$ $ $
Balance at 30 June 2014 680,658 1,360,243 2,040,901
Additions 812,348 1,780,891 2,593,239
Disposals, Write off of assets - (45,197) (45,197)
Depreciation expense (267,666) (806,685) (1,074,351)
Balance at 30 June 2015 1,225,340 2,289,252 3,514,591
Additions 410,530 959,793 1,370,323
Disposals, Write off of assets - - -
Depreciation expense (367,103) (904,331) (1,271,434)
Balance at 30 June 2016 1,268,767 2,344,714 3,613,480
Consolidated
Consolidated
Reconciliations of the written down values at the beginning and end of the current and previous financial year are set out
below:
46
For
per
sona
l use
onl
y
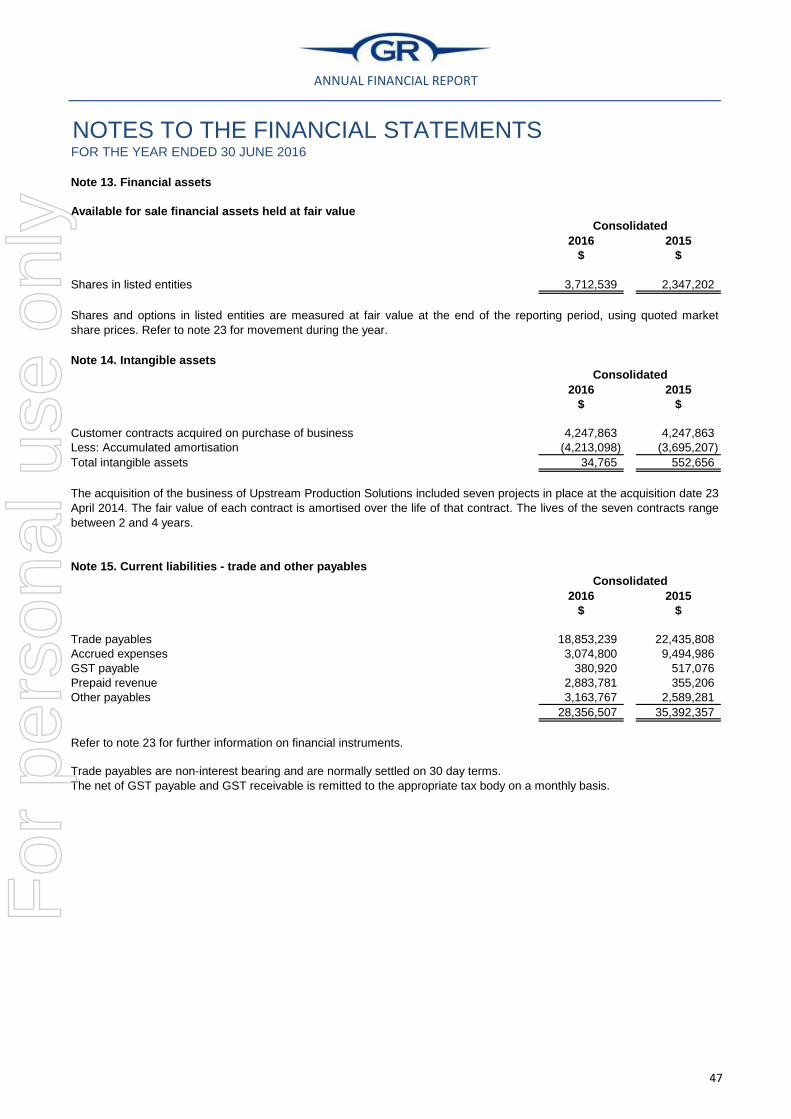
ANNUAL FINANCIAL REPORT
NOTES TO THE FINANCIAL STATEMENTSFOR THE YEAR ENDED 30 JUNE 2016
Note 13. Financial assets
Available for sale financial assets held at fair value
2016 2015
$ $
Shares in listed entities 3,712,539 2,347,202
Note 14. Intangible assets
2016 2015
$ $
Customer contracts acquired on purchase of business 4,247,863 4,247,863
Less: Accumulated amortisation (4,213,098) (3,695,207)
Total intangible assets 34,765 552,656
Note 15. Current liabilities - trade and other payables
2016 2015
$ $
Trade payables 18,853,239 22,435,808
Accrued expenses 3,074,800 9,494,986
GST payable 380,920 517,076
Prepaid revenue 2,883,781 355,206
Other payables 3,163,767 2,589,281
28,356,507 35,392,357
Refer to note 23 for further information on financial instruments.
Consolidated
Trade payables are non-interest bearing and are normally settled on 30 day terms.
The net of GST payable and GST receivable is remitted to the appropriate tax body on a monthly basis.
Shares and options in listed entities are measured at fair value at the end of the reporting period, using quoted market
share prices. Refer to note 23 for movement during the year.
Consolidated
The acquisition of the business of Upstream Production Solutions included seven projects in place at the acquisition date 23
April 2014. The fair value of each contract is amortised over the life of that contract. The lives of the seven contracts range
between 2 and 4 years.
Consolidated
47
For
per
sona
l use
onl
y
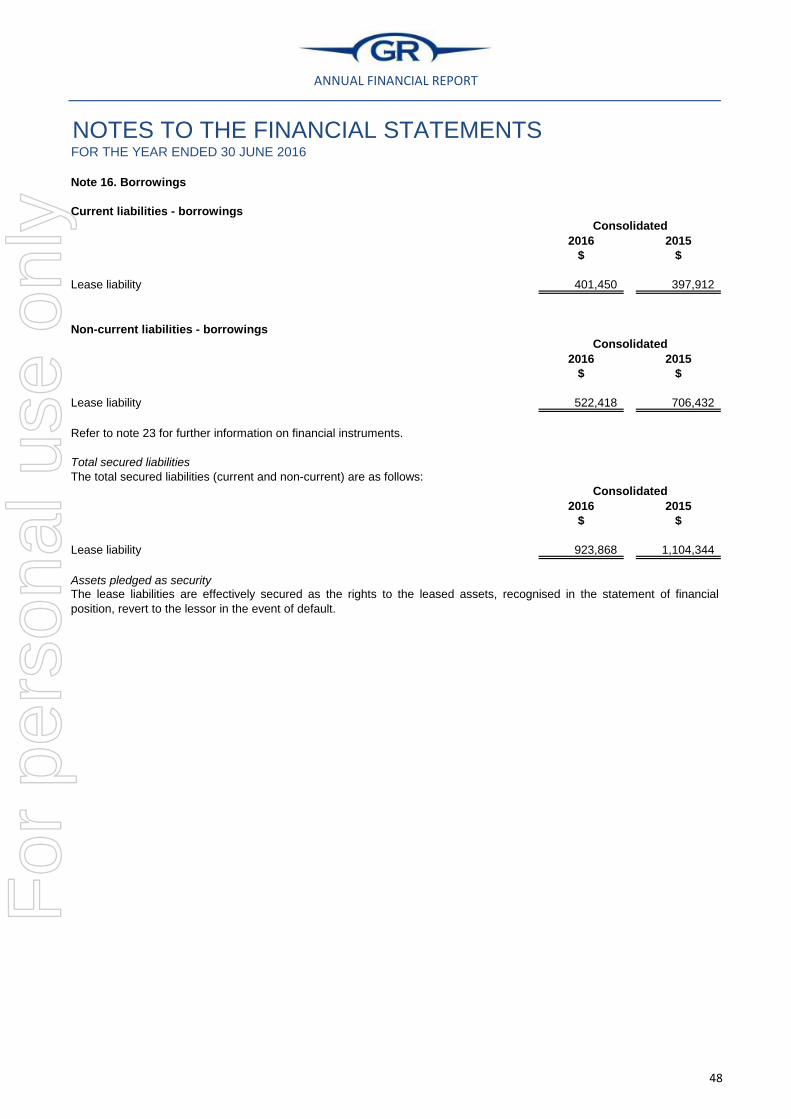
ANNUAL FINANCIAL REPORT
NOTES TO THE FINANCIAL STATEMENTSFOR THE YEAR ENDED 30 JUNE 2016
Note 16. Borrowings
Current liabilities - borrowings
2016 2015
$ $
Lease liability 401,450 397,912
Non-current liabilities - borrowings
2016 2015
$ $
Lease liability 522,418 706,432
Refer to note 23 for further information on financial instruments.
Total secured liabilities
The total secured liabilities (current and non-current) are as follows:
2016 2015
$ $
Lease liability 923,868 1,104,344
Assets pledged as security
Consolidated
Consolidated
Consolidated
The lease liabilities are effectively secured as the rights to the leased assets, recognised in the statement of financial
position, revert to the lessor in the event of default.
48
For
per
sona
l use
onl
y

ANNUAL FINANCIAL REPORT
NOTES TO THE FINANCIAL STATEMENTSFOR THE YEAR ENDED 30 JUNE 2016
Note 17. Provisions
Current liabilities - provisions
2016 2015
$ $
Annual leave 3,150,066 2,847,178
Warranties 7,741,642 5,115,160
10,891,708 7,962,338
Movement in provisions
2016 2015
$ $
Provision for annual leave
Balance at beginning of year 2,847,178 2,190,232
Additional provisions recognised 2,905,735 2,816,751
Amounts used (2,602,847) (2,159,805)
Balance at end of year 3,150,066 2,847,178
Provision for warranty and defects liability
Balance at beginning of year 5,115,160 2,683,227
Additional provisions/(reduction in provisions) recognised 6,241,778 2,431,933
Amounts used (3,615,296) -
Balance at end of year 7,741,642 5,115,160
Non-current liabilities - provisions
2016 2015
$ $
Long service leave 2,290,471 2,111,213
Movement in provisions
2016 2015
$ $
Provision for long service leave
Balance at beginning of year 2,111,213 1,407,585
Additional provisions recognised 376,044 757,204
Amounts used (196,786) (53,576)
Balance at end of year 2,290,471 2,111,213
Consolidated
Consolidated
Consolidated
Consolidated
49
For
per
sona
l use
onl
y

ANNUAL FINANCIAL REPORT
NOTES TO THE FINANCIAL STATEMENTSFOR THE YEAR ENDED 30 JUNE 2016
Note 18. Current liabilities - unearned revenue
2016 2015
$ $
Unearned revenue 15,034,068 5,416,190
Contracts in progress
2016 2015
$ $
Progress billings 404,854,458 216,482,839
Construction costs to date plus recognised profits 389,820,390 211,066,649
15,034,068 5,416,190
Note 19. Equity - issued capital
2016 2015 2016 2015
Shares Shares $ $
Ordinary shares - fully paid
Opening balance 150,732,531 150,407,949 28,918,256 28,785,355
Additional shares issued :
1,871,055 - 1,175,848 -
207,722 324,582 76,132 132,901
Services rendered 60,000 - 55,200 -
Ordinary shares - fully paid 152,871,308 150,732,531 30,225,436 28,918,256
Ordinary shares
Fully paid ordinary shares carry one vote per share and carry a right to dividends.
Share appreciation rights
Number of shares under
share appreciation rights Grant date Vesting date Exercise price
Performance
condition
share price
targets
296,297 12/11/2013 30/06/2017 $0.50 $1.04
213,334 12/11/2013 30/06/2018 $0.50 $1.24
Performance rights
Number of
performance rights Grant date Expiry date Exercise price
127,500 30/04/2014 31/03/2017 Nil
127,500 30/04/2014 31/03/2018 Nil
127,500 30/04/2014 31/03/2019 Nil
60,000 31/03/2016 31/03/2017 Nil
Changes to the Corporation Law abolished the authorised capital and par value concept in relation to share capital from 1
July 1998. Therefore, the consolidated entity does not have a limited amount of authorised capital and issued shares do not
have a par value.
As at 30 June 2016, the consolidated entity had on issue a total of 509,631 share appreciation rights to Geoff Jones,
Managing Director, as part of the consolidated entity's equity incentive plan (as at 30 June 2015: 942,064).
As at 30 June 2016, the consolidated entity had on issue a total of 442,500 performance rights (as at 30 June 2015:
2,295,000):
Consolidated
Consolidated
Consolidated Consolidated
Exercise of performance rights
Exercise of share appreciation rights
50
For
per
sona
l use
onl
y

ANNUAL FINANCIAL REPORT
NOTES TO THE FINANCIAL STATEMENTSFOR THE YEAR ENDED 30 JUNE 2016
Note 20. Equity - reserves
2016 2015
$ $
Foreign currency reserve (1,270,503) 699,712
Performance rights reserve 99,171 984,762
Share options reserve 584,497 584,497
Share appreciation rights reserve 53,040 79,978
Investment revaluation reserve 866,563 203,996
332,768 2,552,945
2016 2015
$ $
Foreign currency reserve
Balance at beginning of year 699,712 (404,255)
Additional amounts recognised (1,970,215) 1,103,967
Balance at end of year (1,270,503) 699,712
Performance rights reserve
Balance at beginning of year 984,762 590,246
Additional amounts recognised 290,257 394,516
Amount exercised (1,175,848) -
Balance at end of year 99,171 984,762
2016 2015
$ $
Share options reserve
Balance at beginning of year 584,497 545,500
Additional amounts recognised - 38,997
Balance at end of year 584,497 584,497
Share appreciation rights reserve
Balance at beginning of year 79,978 82,291
Additional amounts recognised 49,194 130,588
Amount exercised (76,132) (132,901)
Balance at end of year 53,040 79,978
Consolidated
Consolidated
The above foreign currency reserve represents foreign exchange differences resulting from translation of foreign currency
amounts held in subsidiaries of the consolidated entity.
The above performance rights reserve relates to performance rights granted and vested by the consolidated entity to its
employees under its equity incentive plan.
Consolidated
The above share options reserve relates to share options granted and vested by the consolidated entity to its employees
under its employee share option plan.
The above share appreciation rights reserve relates to share appreciation rights granted and vested by the consolidated
entity to its employees under its equity incentive plan.
51
For
per
sona
l use
onl
y
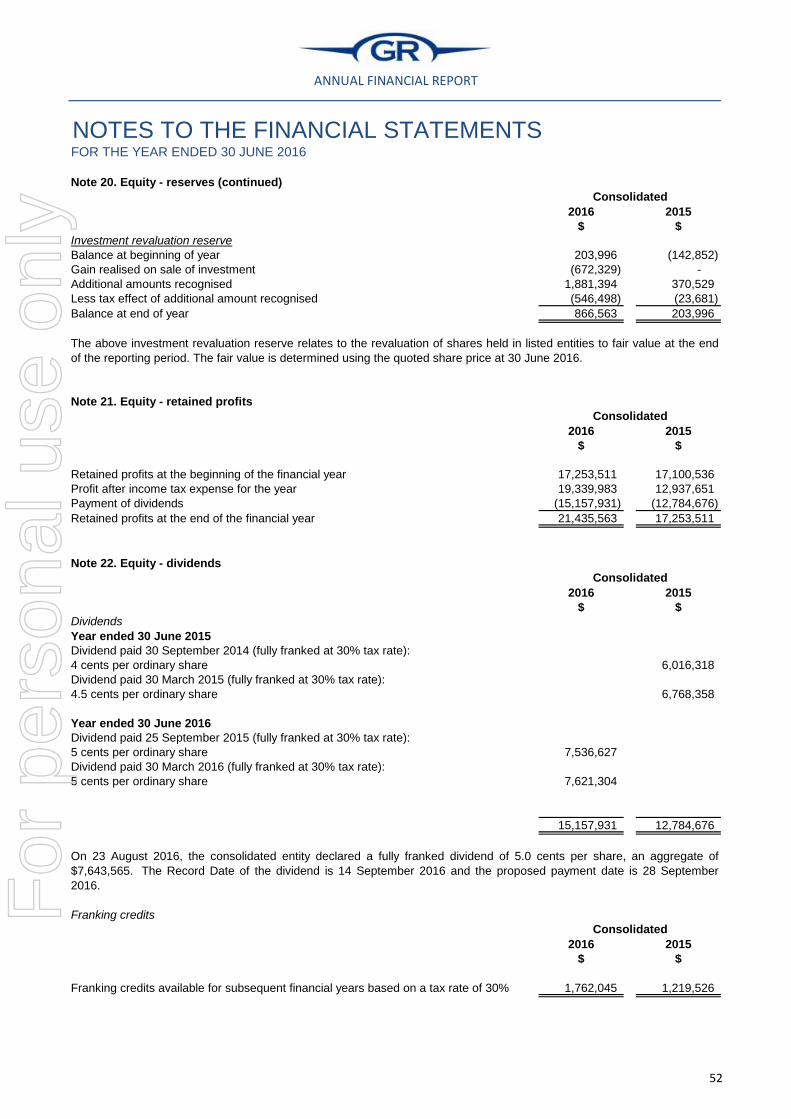
ANNUAL FINANCIAL REPORT
NOTES TO THE FINANCIAL STATEMENTSFOR THE YEAR ENDED 30 JUNE 2016
Note 20. Equity - reserves (continued)
2016 2015
$ $
Investment revaluation reserve
Balance at beginning of year 203,996 (142,852)
Gain realised on sale of investment (672,329) -
Additional amounts recognised 1,881,394 370,529
Less tax effect of additional amount recognised (546,498) (23,681)
Balance at end of year 866,563 203,996
Note 21. Equity - retained profits
2016 2015
$ $
Retained profits at the beginning of the financial year 17,253,511 17,100,536
Profit after income tax expense for the year 19,339,983 12,937,651
Payment of dividends (15,157,931) (12,784,676)
Retained profits at the end of the financial year 21,435,563 17,253,511
Note 22. Equity - dividends
2016 2015
$ $
Dividends
Year ended 30 June 2015
Dividend paid 30 September 2014 (fully franked at 30% tax rate):
4 cents per ordinary share 6,016,318
Dividend paid 30 March 2015 (fully franked at 30% tax rate):
4.5 cents per ordinary share 6,768,358
Year ended 30 June 2016
Dividend paid 25 September 2015 (fully franked at 30% tax rate):
5 cents per ordinary share 7,536,627
Dividend paid 30 March 2016 (fully franked at 30% tax rate):
5 cents per ordinary share 7,621,304
15,157,931 12,784,676
Franking credits
2016 2015
$ $
Franking credits available for subsequent financial years based on a tax rate of 30% 1,762,045 1,219,526
Consolidated
On 23 August 2016, the consolidated entity declared a fully franked dividend of 5.0 cents per share, an aggregate of
$7,643,565. The Record Date of the dividend is 14 September 2016 and the proposed payment date is 28 September
2016.
Consolidated
The above investment revaluation reserve relates to the revaluation of shares held in listed entities to fair value at the end
of the reporting period. The fair value is determined using the quoted share price at 30 June 2016.
Consolidated
Consolidated
52
For
per
sona
l use
onl
y

ANNUAL FINANCIAL REPORT
NOTES TO THE FINANCIAL STATEMENTSFOR THE YEAR ENDED 30 JUNE 2016
Note 23. Financial instruments
Financial risk management objectives
2016 2015
$ $
Financial assets
Cash and cash equivalents 64,923,175 64,582,994
Trade and other receivables 29,909,363 26,038,936
Available for sale securities 3,712,539 2,347,202
Total financial assets 98,545,077 92,969,132
Financial liabilities
Trade and other payables 28,356,507 35,392,357
Finance lease liabilities 923,868 1,104,344
Total financial liabilities 29,280,375 36,496,701
Capital management
Market risk
Foreign currency risk
2016 2015 2016 2015
AUD $ AUD $ AUD $ AUD $
United States Dollars 3,844,603 4,074,106 (45,189) (476,221)
Great British Pounds 3,629,317 18,570,958 (1,939,545) (9,946,829)
7,473,920 22,645,065 (1,984,734) (10,423,050)
The consolidated entity is exposed to risks in relation to its financial instruments. These risks include market risk
(consisting of foreign currency risk and interest rate risk), credit risk, liquidity risk and equity risk.
A summary of the consolidated entity’s financial instruments are as follows:
Consolidated
The consolidated entity holds balances in United States dollars, these balances are translated into Australian dollars at the
prevailing exchange rate at 30 June 2016 of AUD $1 = USD $0.74 (2015: AUD $1 = USD $0.77).
The consolidated entity holds balances in Great British pounds, these balances are translated into Australian dollars at the
prevailing exchange rate at 30 June 2016 of AUD $1 = GBP £0.55 (2015: AUD $1 = GBP £0.49).
The consolidated entity manages its capital to ensure the ability to continue as a going concern while maximising the return
to stakeholders. The capital structure of the consolidated entity consists of equity in the form of issued capital, reserves and
retained earnings. There is no requirement for borrowings at this stage, as there are sufficient reserves of cash balances.
The consolidated entity and the parent entity undertakes certain transactions denominated in foreign currency and are
exposed to foreign currency risk through foreign exchange rate fluctuations.
The carrying amounts in Australian dollars (AUD) of the consolidated entity’s foreign currency denominated monetary
assets and monetary liabilities at the end of the reporting period are as follows.
Assets Liabilities
Foreign exchange risk arises from future commercial transactions and recognised financial assets and financial liabilities
denominated in a currency that is not the entity’s functional currency. The risk is measured using sensitivity analysis and
cash flow forecasting.
53
For
per
sona
l use
onl
y

ANNUAL FINANCIAL REPORT
NOTES TO THE FINANCIAL STATEMENTSFOR THE YEAR ENDED 30 JUNE 2016
Note 23. Financial instruments (continued)
Interest rate risk
The following table details the consolidated entity’s sensitivity to a 10% increase and decrease in the value of the Australian
dollar against the currencies in which monetary assets are held:
The board has considered the consolidated entity’s exposure to interest rate risk by analysing the effect on profit and equity
of an interest rate increase or decrease of one percentage point in the following table:
2016
Effect on
profit
before tax
Effect on
equity
Effect on
profit
before tax
Effect on
equity
$ $ $ $
United States Dollars (345,349) (345,349) 422,221 422,221
Great British Pounds (153,616) (153,616) 187,753 187,753
(498,965) (498,965) 609,974 609,974
2015
Effect on
profit
before tax
Effect on
equity
Effect on
profit
before tax
Effect on
equity
$ $ $ $
United States Dollars (327,078) (327,078) 399,768 399,768
Great British Pounds (784,012) (784,012) 958,237 958,237
(1,111,090) (1,111,090) 1,358,005 1,358,005
Effect of 10% increase Effect of 10% decrease
in exchange rate in exchange rate
Effect of 10% increase Effect of 10% decrease
in exchange rate in exchange rate
Consolidated - 2016
Effect on
profit
before tax
Effect on
equity
Effect on
profit
before tax
Effect on
equity
$ $ $ $
Interest revenue 384,536 384,536 (384,536) (384,536)
Interest expense (3,577) (3,577) 3,543 3,543
380,959 380,959 (380,993) (380,993)
Consolidated - 2015
Effect on
profit
before tax
Effect on
equity
Effect on
profit
before tax
Effect on
equity
$ $ $ $
Interest revenue 334,487 334,487 (334,487) (334,487)
Interest expense (1,317) (1,317) 1,314 1,314
333,170 333,170 (333,173) (333,173)
Effect of 1% increase Effect of 1% decrease
in interest rate in interest rate
Effect of 1% increase Effect of 1% decrease
in interest rate in interest rate
54
For
per
sona
l use
onl
y
ANNUAL FINANCIAL REPORT
NOTES TO THE FINANCIAL STATEMENTSFOR THE YEAR ENDED 30 JUNE 2016
Note 23. Financial instruments (continued)
Equity price risk
Credit risk management
Liquidity risk management
Credit risk refers to the risk that a counterparty will default on its contractual obligations, resulting in financial loss to the
consolidated entity. The consolidated entity has adopted a policy of only dealing with creditworthy counterparties as a
means of mitigating the risk of financial loss from defaults. The consolidated entity uses independent rating agencies,
publicly available financial information and other trading records to rate its major customers. Legally binding contracts are
entered into to determine payment terms in relation to major projects.
The credit risk on liquid funds is limited because the counterparties are banks with high credit ratings assigned by
international credit rating agencies.
The consolidated entity does not have significant credit risk exposure to any single counterparty or group of counterparties.
Ultimate responsibility for liquidity risk management rests with the board of directors, which has established an appropriate
liquidity risk management framework for the management of the consolidated entity’s short-, medium- and long-term
funding and liquidity management requirements. The consolidated entity manages liquidity risk by maintaining adequate
reserves and banking facilities, by continuously monitoring forecast and actual cash flows, and by matching the maturity
profiles of financial assets and liabilities.
The consolidated entity is exposed to equity price risks arising from equity investments.
The sensitivity analysis below has been determined based on the exposure of the consolidated entity to a 5% increase or
decrease in equity prices at the end of the reporting period.
profit for the year ended 30 June 2016 would have been unaffected as the equity investments are classified as
available-for-sale; and
other comprehensive income for the year ended 30 June 2016 would increase by $185,627 (2015: $117,360) as a
result of an increase of 5% in equity prices, and decrease by $185,627 (2015: $117,360) as a result of a decrease of
5% in equity prices.
55
For
per
sona
l use
onl
y
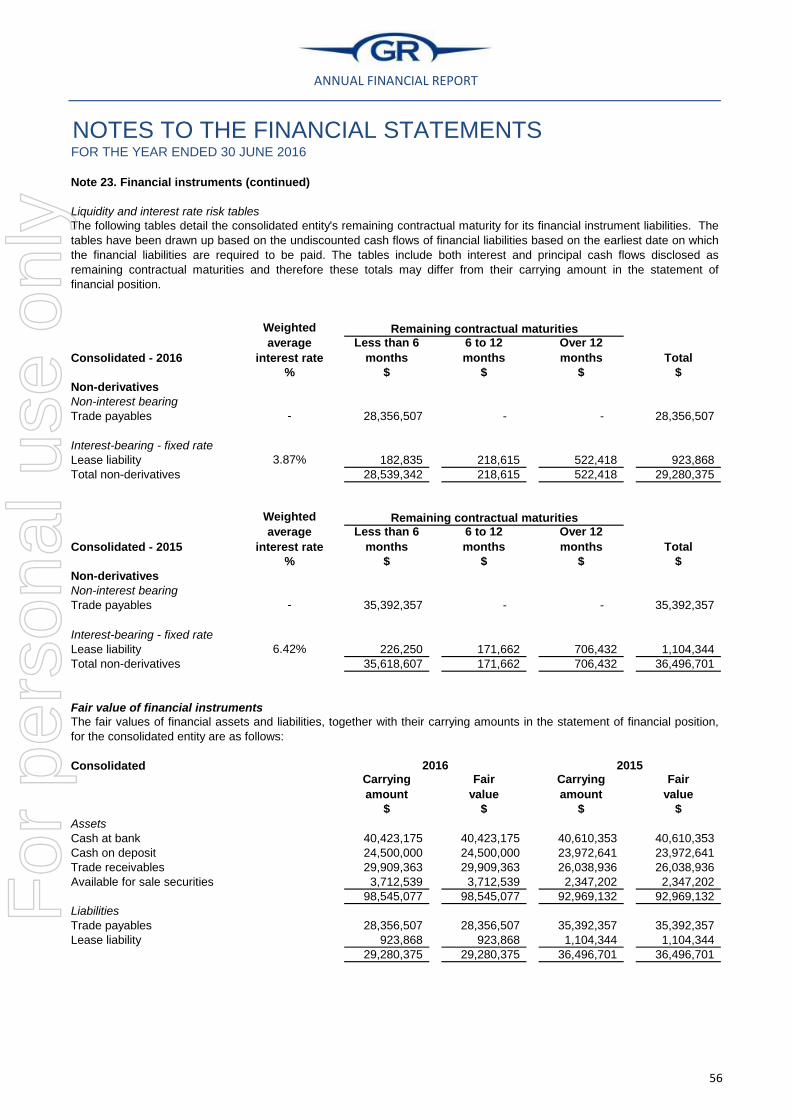
ANNUAL FINANCIAL REPORT
NOTES TO THE FINANCIAL STATEMENTSFOR THE YEAR ENDED 30 JUNE 2016
Note 23. Financial instruments (continued)
Liquidity and interest rate risk tables
Consolidated - 2016
Less than 6
months
6 to 12
months
Over 12
months Total
% $ $ $ $
Non-derivatives
Non-interest bearing
Trade payables - 28,356,507 - - 28,356,507
Interest-bearing - fixed rate
Lease liability 3.87% 182,835 218,615 522,418 923,868
Total non-derivatives 28,539,342 218,615 522,418 29,280,375
Consolidated - 2015
Less than 6
months
6 to 12
months
Over 12
months Total
% $ $ $ $
Non-derivatives
Non-interest bearing
Trade payables - 35,392,357 - - 35,392,357
Interest-bearing - fixed rate
Lease liability 6.42% 226,250 171,662 706,432 1,104,344
Total non-derivatives 35,618,607 171,662 706,432 36,496,701
Fair value of financial instruments
ConsolidatedCarrying
amount
Fair
value
Carrying
amount
Fair
value
$ $ $ $
Assets
Cash at bank 40,423,175 40,423,175 40,610,353 40,610,353
Cash on deposit 24,500,000 24,500,000 23,972,641 23,972,641
Trade receivables 29,909,363 29,909,363 26,038,936 26,038,936
Available for sale securities 3,712,539 3,712,539 2,347,202 2,347,202
98,545,077 98,545,077 92,969,132 92,969,132
Liabilities
Trade payables 28,356,507 28,356,507 35,392,357 35,392,357
Lease liability 923,868 923,868 1,104,344 1,104,344
29,280,375 29,280,375 36,496,701 36,496,701
The following tables detail the consolidated entity's remaining contractual maturity for its financial instrument liabilities. The
tables have been drawn up based on the undiscounted cash flows of financial liabilities based on the earliest date on which
the financial liabilities are required to be paid. The tables include both interest and principal cash flows disclosed as
remaining contractual maturities and therefore these totals may differ from their carrying amount in the statement of
financial position.
Weighted
average
interest rate
The fair values of financial assets and liabilities, together with their carrying amounts in the statement of financial position,
for the consolidated entity are as follows:
2016 2015
Remaining contractual maturities
Weighted
average
interest rate
Remaining contractual maturities
56
For
per
sona
l use
onl
y

ANNUAL FINANCIAL REPORT
NOTES TO THE FINANCIAL STATEMENTSFOR THE YEAR ENDED 30 JUNE 2016
Note 23. Financial instruments (continued)
Fair value hierarchy - 2016
Level 1 Level 2 Level 3 Total
$ $ $ $
Financial assets
Trade receivables - 29,909,363 - 29,909,363
Available for sale securities 3,712,539 - - 3,712,539
3,712,539 29,909,363 - 33,621,902
Financial liabilities
Trade payables - 28,356,507 - 28,356,507
Lease liability - 923,868 - 923,868
- 29,280,375 - 29,280,375
Fair value hierarchy - 2015
Level 1 Level 2 Level 3 Total
$ $ $ $
Financial assets
Trade receivables - 26,038,936 - 26,038,936
Available for sale securities 2,347,202 - - 2,347,202
2,347,202 26,038,936 - 28,386,138
Financial liabilities
Trade payables - 35,392,357 - 35,392,357
Lease liability - 1,104,344 - 1,104,344
- 36,496,701 - 36,496,701
2016 2015
$ $
Available for sale equity securities
Opening balance 2,347,202 601,704
Additions 1,339,228 1,250,000
Disposals (1,592,745) -
Net revaluations in other comprehensive income 1,618,854 495,498
Closing balance 3,712,539 2,347,202
For financial reporting purposes, fair value measurements are categorised into Level 1, 2 or 3 based on the degree to which
the inputs to the fair value measurements are observable and the significance of the inputs to the fair value measurement in
its entirety, which are described as follows:
Level 1 inputs are quoted prices (unadjusted) in active markets for identical assets or liabilities that the entity can
access at the measurement date;
Level 2 inputs are inputs, other than quoted prices included within Level 1, that are observable for the asset or liability,
either directly or indirectly; and
Level 3 inputs are unobservable inputs for the asset or liability.
The financial assets and liabilities of the consolidated entity are classified into these categories below:
The fair values of the financial assets and financial liabilities included in the level 2 and level 3 categories above have been
determined in accordance with generally accepted pricing models based on a discounted cash flow analysis, with the most
significant inputs being the discount rate that reflects the credit risk of counterparties.
Reconciliation of Level 1 fair value measurements:
Consolidated
57
For
per
sona
l use
onl
y

ANNUAL FINANCIAL REPORT
NOTES TO THE FINANCIAL STATEMENTSFOR THE YEAR ENDED 30 JUNE 2016
Note 24. Key management personnel disclosures
Directors
Executive directors
Joe Ricciardo
Peter Hood
Tony Patrizi
Geoff Jones
Non-executive directors
Barry Patterson
Terry Strapp
Peter Hood
Other key management personnel
Executives
David Sala Tenna
Paul Newling
Joe Totaro
Rodney Schier
Remuneration of key management personnel
2016 2015
$ $
Short term benefits 2,370,710 2,329,156
Post employment benefits 171,504 167,810
Share based payments 55,605 176,082
Other 27,853 -
2,625,672 2,673,048
Note 25. Remuneration of auditors
2016 2015
$ $
Audit services - Deloitte Touche Tohmatsu
Audit or review of the financial statements - Deloitte Touche Tohmatsu Australia 122,911 112,627
Audit or review of the financial statements - Deloitte Touche Tohmatsu UK 9,574 10,884
Other services - Deloitte Touche Tohmatsu
Tax compliance - Deloitte Touche Tohmatsu Australia 22,575 30,450
Other services - Deloitte Touche Tohmatsu Australia - 26,250
155,060 180,211
Executive Director
Managing Director
Non-Executive Director
Non-Executive Director
Non-Executive Director
The following persons also had the authority and responsibility for planning, directing and controlling the major activities of
the consolidated entity, directly or indirectly, during the financial year:
The following persons were directors of GR Engineering Services Limited during the financial year:
Non-Executive Chairman - Appointed 18 April 2016
Non-Executive Chairman - Retired 18 April 2016
Consolidated
During the financial year the following fees were paid or payable for services provided by Deloitte Touche Tohmatsu, the
auditor of the company, and its network firms:
Consolidated
General Manager EPC Division
General Manager EPCM Division
Chief Financial Officer and Company Secretary
Engineering Manager
Information on remuneration of key management personnel is set out in the Remuneration Report in the Directors Report.
The aggregate compensation made to key management personnel of the consolidated entity is set out below:
58
For
per
sona
l use
onl
y
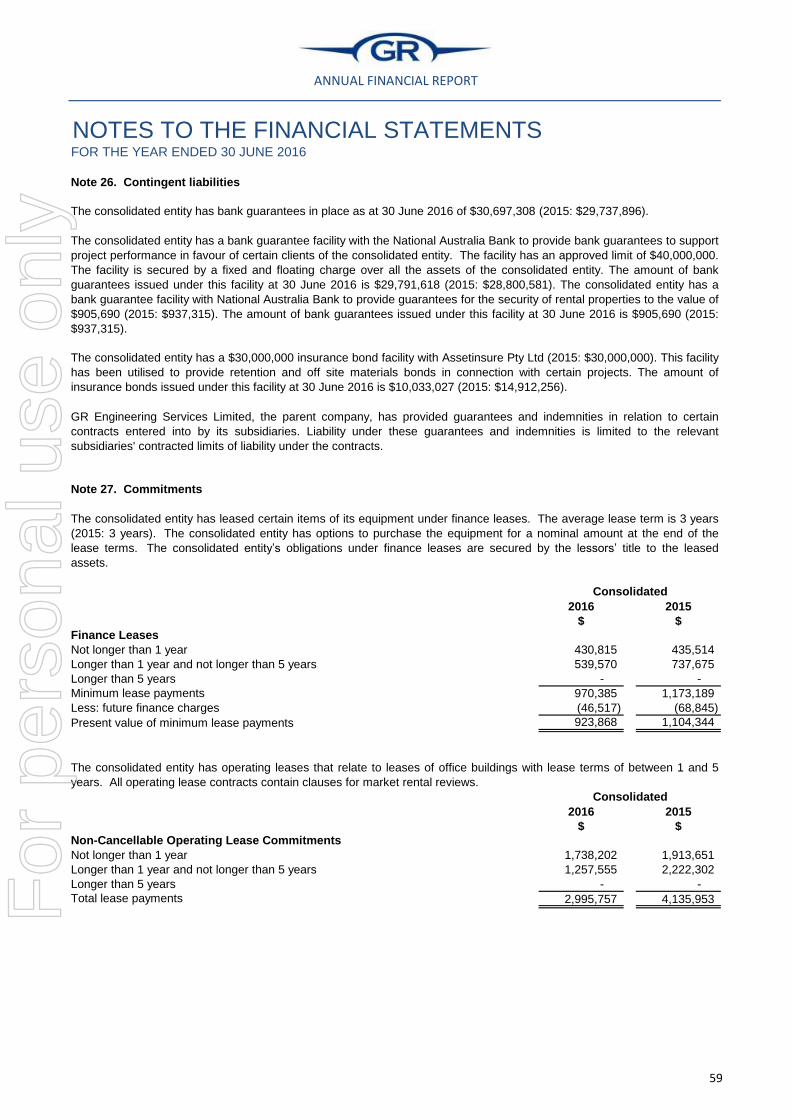
ANNUAL FINANCIAL REPORT
NOTES TO THE FINANCIAL STATEMENTSFOR THE YEAR ENDED 30 JUNE 2016
Note 26. Contingent liabilities
Note 27. Commitments
2016 2015
$ $
Finance Leases
Not longer than 1 year 430,815 435,514
Longer than 1 year and not longer than 5 years 539,570 737,675
Longer than 5 years - -
Minimum lease payments 970,385 1,173,189
Less: future finance charges (46,517) (68,845)
Present value of minimum lease payments 923,868 1,104,344
2016 2015
$ $
Non-Cancellable Operating Lease Commitments
Not longer than 1 year 1,738,202 1,913,651
Longer than 1 year and not longer than 5 years 1,257,555 2,222,302
Longer than 5 years - -
Total lease payments 2,995,757 4,135,953
The consolidated entity has bank guarantees in place as at 30 June 2016 of $30,697,308 (2015: $29,737,896).
The consolidated entity has a bank guarantee facility with the National Australia Bank to provide bank guarantees to support
project performance in favour of certain clients of the consolidated entity. The facility has an approved limit of $40,000,000.
The facility is secured by a fixed and floating charge over all the assets of the consolidated entity. The amount of bank
guarantees issued under this facility at 30 June 2016 is $29,791,618 (2015: $28,800,581). The consolidated entity has a
bank guarantee facility with National Australia Bank to provide guarantees for the security of rental properties to the value of
$905,690 (2015: $937,315). The amount of bank guarantees issued under this facility at 30 June 2016 is $905,690 (2015:
$937,315).
The consolidated entity has a $30,000,000 insurance bond facility with Assetinsure Pty Ltd (2015: $30,000,000). This facility
has been utilised to provide retention and off site materials bonds in connection with certain projects. The amount of
insurance bonds issued under this facility at 30 June 2016 is $10,033,027 (2015: $14,912,256).
GR Engineering Services Limited, the parent company, has provided guarantees and indemnities in relation to certain
contracts entered into by its subsidiaries. Liability under these guarantees and indemnities is limited to the relevant
subsidiaries' contracted limits of liability under the contracts.
The consolidated entity has leased certain items of its equipment under finance leases. The average lease term is 3 years
(2015: 3 years). The consolidated entity has options to purchase the equipment for a nominal amount at the end of the
lease terms. The consolidated entity’s obligations under finance leases are secured by the lessors’ title to the leased
assets.
Consolidated
The consolidated entity has operating leases that relate to leases of office buildings with lease terms of between 1 and 5
years. All operating lease contracts contain clauses for market rental reviews.
Consolidated
59
For
per
sona
l use
onl
y

ANNUAL FINANCIAL REPORT
NOTES TO THE FINANCIAL STATEMENTSFOR THE YEAR ENDED 30 JUNE 2016
Note 28. Related party transactions
During the year ended 30 June 2016 the consolidated entity procured items and hired equipment from PIHA Pty Ltd, a
subsidiary of Mineral Resources Limited, a company in which Joe Ricciardo was a non-executive director until his retirement
on 18 April 2016. The total amount invoiced by PIHA Pty Ltd in the year ended 30 June 2016 amounted to $849,728
including GST (2015: $240,664). The balance payable at 30 June 2016 is $89,756 (2015: $237,936). In previous years the
consolidated entity provided engineering services and procurement of materials for PIHA Pty Ltd. The total amount invoiced
to PIHA Pty Ltd in the year ended 30 June 2016 was nil (2015: $41,083). The balance outstanding at 30 June 2016 is nil
(2015: nil).
In previous years the consolidated entity provided engineering services and procurement of materials for Crushing Services
International Pty Ltd (a subsidiary of Mineral Resources Limited), a company in which Joe Ricciardo was a non-executive
director until his retirement on 18 April 2016. The total amount invoiced to Crushing Services International Pty Ltd in the
year ended 30 June 2016 was nil (2015: $151,580). The balance outstanding at 30 June 2016 is nil (2015: nil).
During the year ended 30 June 2016 the consolidated entity provided engineering services and procurement of materials for
Azumah Resources Limited, a company in which Geoff Jones is a non-executive director. The total amount invoiced to
Azumah Resources Limited in the year ended 30 June 2016 was $29,760 including GST (2015: $204,886). The balance
outstanding at 30 June 2016 is nil (2015: nil).
During the year ended 30 June 2016 the consolidated entity was provided engineering services by Optiro Pty Ltd, a
company in which Joe Ricciardo and Tony Patrizi each hold non-controlling interests. The total amount invoiced by Optiro
Pty Ltd in the year ended 30 June 2016 was $11,253 including GST (2015: nil). The balance payable at 30 June 2016 is nil
(2015: nil). In previous years the consolidated entity provided engineering services and procurement of materials for Optiro
Pty Ltd. The total amount invoiced to Optiro Pty Ltd in the year ended 30 June 2016 was nil (2015: $9,680). The balance
outstanding at 30 June 2016 is nil (2015: $9,680).
In previous years the consolidated entity provided engineering services and procurement of materials for Marindi Metals
Limited (previously Brumby Resources Limited), a company in which Geoff Jones is a non-executive director. The total
amount invoiced to Marindi Metals Limited in the year ended 30 June 2016 was nil (2015: $56,562). The balance
outstanding at 30 June 2016 is nil (2015: nil).
During the year ended 30 June 2016 the consolidated entity provided engineering services and procurement of materials for
Dacian Gold Limited, a company in which Barry Patterson is a non-executive director. The total amount invoiced to Dacian
Gold Limited in the year ended 30 June 2016 was $418,372 including GST (2015: $7,420). The balance outstanding at 30
June 2016 is $302,581 (2015: nil).
During the year ended 30 June 2016 the consolidated entity leased office space at 71-73 Daly Street from Ashguard Pty
Ltd. Directors of the consolidated entity, namely Joe Ricciardo, Tony Patrizi, and Barry Patterson, each have a non
controlling interest in Ashguard Pty Ltd. The total amount invoiced by Ashguard Pty Ltd in the year ended 30 June 2016
amounted to $314,019 including GST (2015: $314,263). The balance payable at 30 June 2016 is $46,860 (2015: $46,054).
During the year ended 30 June 2016 the consolidated entity procured items for Ashguard Pty Ltd. The total amount invoiced
to Ashguard Pty Ltd in the year ended 30 June 2016 was $1,225 including GST (2015: $10,998). The balance outstanding
at 30 June 2016 is nil (2015: nil).
The terms of these arrangements are at arms length and at normal commercial terms.
Other than transactions with parties related to key management personnel mentioned above and in the remuneration
report, there have been no other transactions with parties related to the consolidated entity in the financial year ending 30
June 2016.
60
For
per
sona
l use
onl
y
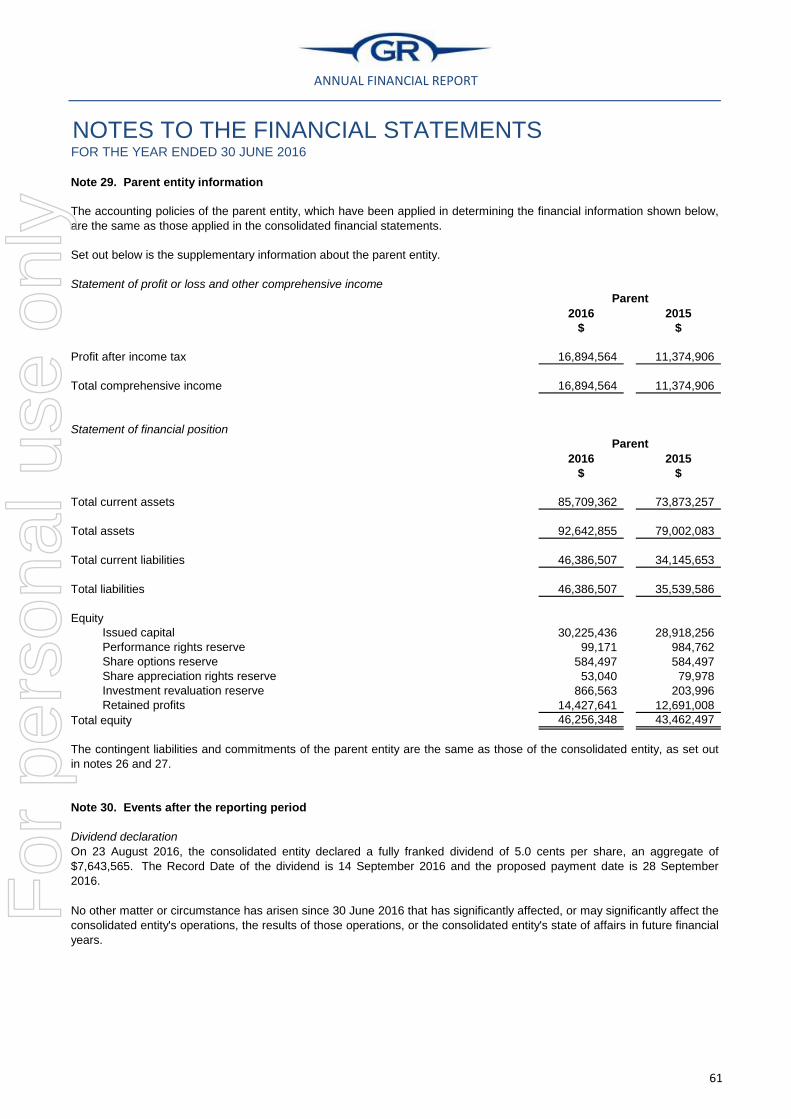
ANNUAL FINANCIAL REPORT
NOTES TO THE FINANCIAL STATEMENTSFOR THE YEAR ENDED 30 JUNE 2016
Note 29. Parent entity information
Statement of profit or loss and other comprehensive income
2016 2015
$ $
Profit after income tax 16,894,564 11,374,906
Total comprehensive income 16,894,564 11,374,906
Statement of financial position
2016 2015
$ $
Total current assets 85,709,362 73,873,257
Total assets 92,642,855 79,002,083
Total current liabilities 46,386,507 34,145,653
Total liabilities 46,386,507 35,539,586
Equity
Issued capital 30,225,436 28,918,256
Performance rights reserve 99,171 984,762
Share options reserve 584,497 584,497
Share appreciation rights reserve 53,040 79,978
Investment revaluation reserve 866,563 203,996
Retained profits 14,427,641 12,691,008
Total equity 46,256,348 43,462,497
Note 30. Events after the reporting period
Dividend declaration
The contingent liabilities and commitments of the parent entity are the same as those of the consolidated entity, as set out
in notes 26 and 27.
On 23 August 2016, the consolidated entity declared a fully franked dividend of 5.0 cents per share, an aggregate of
$7,643,565. The Record Date of the dividend is 14 September 2016 and the proposed payment date is 28 September
2016.
No other matter or circumstance has arisen since 30 June 2016 that has significantly affected, or may significantly affect the
consolidated entity's operations, the results of those operations, or the consolidated entity's state of affairs in future financial
years.
The accounting policies of the parent entity, which have been applied in determining the financial information shown below,
are the same as those applied in the consolidated financial statements.
Set out below is the supplementary information about the parent entity.
Parent
Parent
61
For
per
sona
l use
onl
y

ANNUAL FINANCIAL REPORT
NOTES TO THE FINANCIAL STATEMENTSFOR THE YEAR ENDED 30 JUNE 2016
Note 31. Earnings per share
2016 2015
$ $
19,339,983 12,937,651
Number Number
152,151,265 150,408,838
907,090 3,237,064
153,058,355 153,645,902
Cents Cents
Basic earnings per share 12.71 8.60
Diluted earnings per share 12.64 8.42
Note 32. Share-based payments
Consolidated
Profit after income tax attributable to the owners of GR Engineering Services Limited
Weighted average number of ordinary shares used in calculating basic earnings per
share
A further 50,000 rights were issued to two employees on 4 October 2012. A third tranche of 50,000 rights were issued to an
employee on 13 May 2013, these tranches of rights have a three year service term from the date of issue. On 30 April 2014
four further tranches of 127,500 rights each were issued to two employees. These tranches each have varying service
terms of 2, 3, 4 and 5 years from the date of issue. On 31 March 2016, a tranche of 60,000 rights were issued, with a
service term of 1 year.
Adjustments for calculation of diluted earnings per share:
Weighted average number of employee performance rights and share appreciation
rights issued
Weighted average number of ordinary shares used in calculating diluted earnings per
share
An Equity Incentive Plan was adopted by the consolidated entity on 28 March 2012, and was updated on 8 October 2015.
At the discretion of the Board, all eligible employees of the consolidated entity or eligible consultants may participate in the
Plan. Non-executive directors are not eligible to participate in the Plan.
The Plan is designed to align the interests of executives and employees with the interests of shareholders by providing an
opportunity to receive an equity interest in the consolidated entity and therefore direct participation in the benefits of future
consolidated entity performance over the medium to long term.
The consolidated entity issued a total of 2,215,000 performance rights on 11 September 2012 to a total of 86 employees
and long term contractors under an Equity Incentive Plan. Each right entitles the employee to acquire one fully paid share in
the consolidated entity for nil consideration, subject to the employees meeting a service term of three years from the date of
grant. These performance rights vested on 21 September 2015.
62
For
per
sona
l use
onl
y

ANNUAL FINANCIAL REPORT
NOTES TO THE FINANCIAL STATEMENTSFOR THE YEAR ENDED 30 JUNE 2016
Note 32. Share-based payments (continued)
Tranche 5 Tranche 6 Tranche 7 Tranche 8
Number issued 127,500 127,500 127,500 60,000
Number lapsed - - - -
Grant date 30 Apr 2014 30 Apr 2014 30 Apr 2014 31 Mar 2016
Exercise price Nil Nil Nil Nil
Vesting date 31 Mar 2017 31 Mar 2018 31 Mar 2019 31 Mar 2017
Expiry date 31 Mar 2017 31 Mar 2018 31 Mar 2019 31 Mar 2017
Vesting period (years) 3 4 5 1
Vesting conditions Nil Nil Nil Nil
Fair value $0.511 $0.458 $0.410 $0.824
Tranche 5 Tranche 6 Tranche 7 Tranche 8
Grant date share price $0.705 $0.705 $0.705 $0.920
Exercise price - - - -
Expected volatility 60% 60% 60% 60%
Term (years) 3 4 5 1
Dividend yield 11% 11% 11% 11%
Risk free interest rate 2.95% 3.33% 3.33% 1.89%
Movement in performance rights
Consolidated Number of Weighted Number of Weighted
performance average performance average
rights exercise rights exercise
price price
Balance at beginning of year 2,295,000 - 2,315,000 -
Granted during the year 60,000 - - -
Vested during the year (1,871,055) - - -
Forfeited during the year (41,445) - (20,000) -
Balance at end of year 442,500 - 2,295,000 -
A total of 571,445 performance rights have lapsed due to resignations and redundancies of entitled employees since the
date of issue of the first tranche of rights. Of this total, 41,445 have lapsed in the financial year ending 30 June 2016 (2015:
20,000).
A summary of performance rights on issue at 30 June 2016 follows:
The fair value of performance rights granted during the year was calculated using a Black-Scholes pricing model applying
inputs as follows:
2016 2015
The weighted average fair value of performance rights granted at 30 June 2016 is $0.51. The weighted average exercise
price of these performance rights at 30 June 2016 is nil. The weighted average remaining contractual life of performance
rights outstanding at 30 June 2016 is 590 days.
63
For
per
sona
l use
onl
y

ANNUAL FINANCIAL REPORT
NOTES TO THE FINANCIAL STATEMENTSFOR THE YEAR ENDED 30 JUNE 2016
Note 32. Share-based payments (continued)
Number of share
appreciation rights
Grant
date
Vesting
date Exercise price
Performance
condition
share price
targets
Fair value at
grant date
1,600,000 12 Nov 2013 30 Jun 2014 $0.50 $0.60 $0.18
727,273 12 Nov 2013 30 Jun 2015 $0.50 $0.72 $0.18
432,433 12 Nov 2013 30 Jun 2016 $0.50 $0.86 $0.18
296,297 12 Nov 2013 30 Jun 2017 $0.50 $1.04 $0.16
213,334 12 Nov 2013 30 Jun 2018 $0.50 $1.24 $0.15
Movement in share appreciation rights
Consolidated Number of Weighted Number of Weighted
share average share average
appreciation exercise appreciation exercise
rights price rights price
Balance at beginning of year 942,064 - 1,669,337 -
Granted during the year - - - -
Vested and exercised during the year (432,433) - (727,273) -
Balance at end of year 509,631 - 942,064 -
The weighted average fair value of share appreciation rights granted at 30 June 2016 is $0.16. The weighted average
exercise price of these share appreciation rights at 30 June 2016 is $0.50. The weighted average remaining contractual life
of share appreciation rights outstanding at 30 June 2016 is 518 days.
On 12 November 2013, the consolidated entity issued a total of 3,269,337 share appreciation rights to Geoff Jones,
Managing Director, as part of the consolidated entity's equity incentive plan. Of this total, 432,433 vested during the financial
year ending 30 June 2016 (2015: 727,273). The share appreciation rights are subject to vesting conditions, namely the
participant being employed by the consolidated entity as Managing Director and the share price being equal to or greater
than the exercise price at the vesting date.
The fair value of share appreciation rights granted during the year was calculated using a Monte Carlo pricing model
applying inputs as follows:
2016 2015
On the date of exercise of 432,433 of the above share appreciation rights, 30 June 2016, the closing share price was $0.99
per share.
Class A Class B Class C Class D Class E
Grant date share price $0.67 $0.67 $0.67 $0.67 $0.67
Exercise price $0.50 $0.50 $0.50 $0.50 $0.50
Expected volatility 60% 60% 60% 60% 60%
Vesting period (years) 0 1 2 3 4
Dividend yield 11% 11% 11% 11% 11%
Risk free interest rate 2.80% 2.80% 3.06% 3.06% 3.48%
64
For
per
sona
l use
onl
y

ANNUAL FINANCIAL REPORT
NOTES TO THE FINANCIAL STATEMENTSFOR THE YEAR ENDED 30 JUNE 2016
Note 33. Subsidiaries
The consolidated financial statements incorporate the following subsidiaries at the end of the reporting period.
Country of
Name of subsidiary incorporation 2016 2015
GR Engineering Services (Indonesia) Pty Limited Australia 100% 100%
GR Engineering Services (Argentina) Pty Limited Australia 100% 100%
PT GR Engineering Services Indonesia * Indonesia 100% 100%
GR Engineering Services (Africa) Mauritius 100% 100%
GR Engineering Services (UK) Limited United Kingdom 100% 100%
GR Engineering Services (Ghana) Limited ** Ghana 100% 100%
GR Engineering Services (Côte D’Ivoire) ** Côte D’Ivoire 100% 100%
GR Engineering Services (Mali) ** Mali 100% 100%
GR Engineering Services (Tengrela) *** Côte D’Ivoire 100% 100%
GR Engineering Services Peru S.A. + Peru 100% -
GR Engineering Services (Greece) ++ Greece 100% -
GR Engineering Services (Tanzania) Limited +++ Tanzania 100% -
Upstream Production Solutions Pty Ltd Australia 100% 100%
Upstream Production Solutions (Malaysia) Sdn. Bhd. Malaysia 100% 100%
*
**
***+
++
+++
Incorporation date 1 September 2015.
Incorporation date 2 May 2016
Equity holding
PT GR Engineering Services Indonesia is 90% owned by GR Engineering Services Limited and 10% owned by GR Engineering
Services (Indonesia) Pty Limited
GR Engineering Services (Ghana) Limited, GR Engineering Services (Côte D’Ivoire) and GR Engineering Services (Mali) are
100% owned by GR Engineering Services (Africa).
GR Engineering Services (Tengrela) is dormant.
GR Engineering Services (Greece) is 100% owned by GR Engineering Services (UK) Limited, and incorporation date is 13
January 2016
65
For
per
sona
l use
onl
y
ANNUAL FINANCIAL REPORT
DIRECTORS’ DECLARATION
The directors declare that:
(a) in the directors’ opinion, there are reasonable grounds to believe that the company will be able to pay its debts
as and when they become due and payable;
(b) in the directors’ opinion, the attached financial statements are in compliance with International Financial
Reporting Standards, as stated in note 2 to the financial statements;
(c) in the directors’ opinion, the attached financial statements and notes thereto are in accordance with the
Corporations Act 2001, including compliance with accounting standards and giving a true and fair view of the
financial position and performance of the consolidated entity; and
(d) the directors have been given the declarations required by s.295A of the Corporations Act 2001.
Signed in accordance with a resolution of the directors made pursuant to s.295(5) of the Corporations Act 2001.
On behalf of the Directors
Name: Geoff Jones
Managing Director
Date: 23 August 2016
66
For
per
sona
l use
onl
y
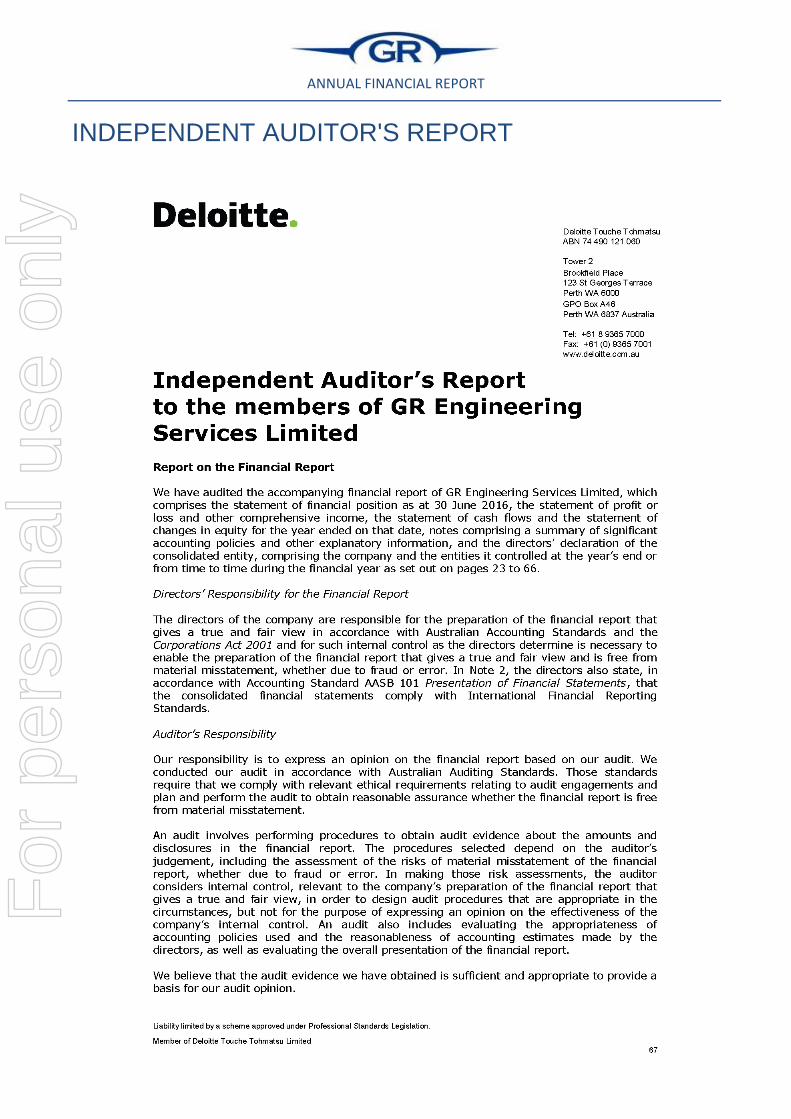
ANNUAL FINANCIAL REPORT
INDEPENDENT AUDITOR'S REPORT
67
For
per
sona
l use
onl
y

ANNUAL FINANCIAL REPORT
INDEPENDENT AUDITOR'S REPORT
68
For
per
sona
l use
onl
y

ANNUAL FINANCIAL REPORT
CORPORATE GOVERNANCE STATEMENT
Approach to Corporate Governance
GR Engineering Services Ltd ABN 12 121 542 738 (Company) has established a corporate governance
framework, the key features of which are set out in this statement. In establishing its corporate governance
framework, the Company has referred to the recommendations set out in the ASX Corporate Governance Council's
Corporate Governance Principles and Recommendations 3rd Edition (Principles & Recommendations).
The Company has followed each recommendation where the Board has considered the recommendation to be an
appropriate benchmark for its corporate governance practices. Where the Company's corporate governance
practices follow a recommendation, the Board has made appropriate statements reporting on the adoption of the
recommendation. In compliance with the "if not, why not" reporting regime, where, after due consideration, the
Company's corporate governance practices do not follow a recommendation, the Board has explained it reasons for
not following the recommendation and disclosed what, if any, alternative practices the Company has adopted
instead of those in the recommendation.
The following governance-related documents can be found on the Company's website at www.gres.com.au, under
the section marked "Corporate Governance":
Charters
Board
Audit and Risk Committee
Nomination and Remuneration Committee
Policies and Procedures
Process for Performance Evaluations
Policy and Procedure for the Selection and (Re)Appointment of Directors
Induction Program
Diversity Policy (summary)
Code of Conduct (summary)
Policy on Continuous Disclosure (summary)
Compliance Procedures (summary)
Shareholder Communication and Investor Relations Policy
Securities Trading Policy
The Company reports below on whether it has followed each of the recommendations during the 2015/2016
financial year (Reporting Period). The information in this statement is current at 23 August 2016. This statement
was approved by a resolution of the Board on 23 August 2016.
Cross-references to the Company’s Annual Financial Report in this statement are references to the Company’s
Annual Financial Report for the year ended 30 June 2016, which is disclosed on the Company’s website
www.gres.com.au, under the section marked "News”.
Principle 1 – Lay solid foundations for management and oversight
Recommendation 1.1
The Company has established the respective roles and responsibilities of its Board and management, and those
matters expressly reserved to the Board and those delegated to management and has documented this in its
Board Charter .
69
For
per
sona
l use
onl
y

ANNUAL FINANCIAL REPORT
CORPORATE GOVERNANCE STATEMENT
Recommendation 1.2
The Company undertakes appropriate checks before appointing a person or putting forward to shareholders a
candidate for election as a director and provides shareholders with all material information in its possession
relevant to a decision on whether or not to elect or re-elect a director.
The checks which are undertaken, and the information provided to shareholders are set out in the Company’s
Policy and Procedure for the Selection and (Re) Appointment of Directors .
Recommendation 1.3
The Company has a written agreement with each director and senior executive setting out the terms of their
appointment. The material terms of any employment, service or consultancy agreement the Company, or any of its
child entities, has entered into with its Managing Director, any of its directors, and any other person or entity who is
related party of the Managing Director or any of its directors has been disclosed in accordance with ASX Listing
Rule 3.16.4 (taking into consideration the exclusions from disclosure outlined in that rule).
Recommendation 1.4
The Company Secretary is accountable directly to the Board, through the Chair, on all matters to do with the proper
functioning of the Board as outlined in the Company’s Board Charter.
Recommendation 1.5
The Company has a Diversity Policy, which includes requirements for the Nomination and Remuneration
Committee to set measurable objectives for achieving gender diversity and to assess annually both the objectives
and the Company’s progress in achieving them. A summary of the Company’s Diversity Policy is disclosed on the
Company’s website.
The following measurable objective for achieving gender diversity has been set by the Nomination and
Remuneration Committee in accordance with the Diversity Policy:
“Subject to the identification of suitable qualified candidates, to increase the percentage of professional and senior
executive positions occupied by women to 15% by 30 June 2017.”
The Board continues to work towards meeting this objective and continues to foster a workplace environment and
recruitment policies designed to achieve greater female participation in the Company’s workforce.
The respective proportions of men and women on the Board, in senior executive positions and across the whole
organisation are set out in the following table. “Senior executive” for these purposes means a person who is a Key
Management Employee, a General Manager or a member of Senior Management as defined by the Workplace
Gender Equality Agency:
Proportion of women
Whole organisation 53 out of 344 (15%) (16% as at 30 June 2015)
Senior executive positions 22 out of 146 (15%) (10% as at 30 June 2015)
Board 0 out of 6 (0%) (0% as at 30 June 2015)
Proportion of women
Whole organisation 53 out of 344 (15%) (16% as at 30 June 2015)
Senior executive positions 22 out of 146 (15%) (10% as at 30 June 2015)
Board 0 out of 6 (0%) (0% as at 30 June 2015)
70
For
per
sona
l use
onl
y

ANNUAL FINANCIAL REPORT
CORPORATE GOVERNANCE STATEMENT
Recommendation 1.6
The Chair is responsible for evaluation of the Board and, when deemed appropriate, Board committees and
individual directors. The Chair is also responsible for evaluating the Managing Director.
The Chair evaluates the performance of the Managing Director and other Board members through a series of
discussions held throughout the year. These discussions include an assessment of the Company’s state of affairs,
the risks facing the Company and its economic objectives. The Chair evaluates the extent to which each director
has contributed to the efficient utilisation of resources, the identification of risk and the achievement of economic
objectives. During these discussions the Chair also elicits confidential feedback from each Director on their view of
the interpersonal dynamics between Board members and the quality of the Board’s decision making.
During the Reporting Period the Chair evaluated the performance of all Directors, including the Managing Director,
in accordance with the above process.
Recommendation 1.7
The Managing Director is responsible for evaluating the performance of senior executives in accordance with the
process disclosed in the Company’s Process for Performance Evaluations .
During the Reporting Period the Managing Director conducted performance evaluations of Senior Executives.
Where these evaluations resulted in the identification of areas where the Senior Executive’s technical or
interpersonal skills could be strengthened, appropriate training or remedial action was formulated and agreed.
Principle 2 – Structure the board to add value
Recommendation 2.1
The Board has established a Nomination and Remuneration Committee comprising Barry Patterson (Chair),
Terrence Strapp and Peter Hood. All members of the Nomination and Remuneration Committee are non-executive
directors and all members are independent directors. Accordingly, the Nomination and Remuneration Committee is
structured in accordance with Recommendation 2.1.
The Board has adopted a Nomination and Remuneration Committee Charter which describes the role, composition,
functions and responsibilities of the Nomination and Remuneration Committee and is disclosed on the Company’s
website.
The Nominations and Remuneration Committee held no separate meeting during the year electing instead to
address matters for its consideration within the context of meetings of the full Board of Directors.
Recommendation 2.2
The mix of skills and diversity that the Board currently has is a Board comprised of 4 qualified engineers and 1
qualified accountant. The matrix of skills held by the Board is weighted towards those skills which are required to
identify, assess, quantify and manage those risks which are most relevant to and prevalent in the Company’s
business and the industry in which it operates.
All of the Company’s directors hold, or have held, positions on the boards of other publicly listed companies and all
have extensive experience in the management of organisations across a range of industries.
When necessary, the Board engages the services of external experts and consultants to augment its capacity to
consider and assess matters which fall outside the domain of its collective expertise.
71
For
per
sona
l use
onl
y

ANNUAL FINANCIAL REPORT
CORPORATE GOVERNANCE STATEMENT
Recommendation 2.3
The Board considers the independence of directors having regard to the relationships listed in Box 2.3 of the
Principles & Recommendations. The independent directors of the Company are Messrs Patterson (deemed
independent), Strapp and Hood.
Mr Patterson is a substantial shareholder of the Company. Notwithstanding that he is a substantial shareholder the
Board considers Mr Patterson to be an independent director because he is not a member of management and is
otherwise free of any interest, position, association or relationship (including those listed in Box 2.3 of the Principles
& Recommendations) that might influence in a material respect, his capacity to bring an independent judgement to
bear on issues before the Board and to act in the best interests of the Company and its members generally.
Further, Mr Patterson’s interests as a substantial shareholder are considered by the Board to be in line with the
interests of all other shareholders.
The length of service of each director is set out in the Directors’ Report of the Company’s Annual Financial Report.
Recommendation 2.4
The Board has a majority of directors who are independent.
The Board is comprised of 5 directors three of whom are or are deemed to be independent. The two non-
independent directors are Tony Patrizi and Geoff Jones. Tony Patrizi is a founding shareholders of the Company
and Geoff Jones has been employed by the Company since 2011, initially as Chief Operating officer and since 01
July 2013, as Managing Director. Messrs Patrizi and Jones have thorough knowledge of the Company’s business
and extensive experience in managing the risks it faces. Their continued presence on the Board is therefore highly
valued.
The Board is of a size commensurate with the size and nature of the Company. Should the number of Board
members increase, it is the intention of the Company to appoint an additional independent director thereby creating
a majority of independent directors.
Recommendation 2.5
The Chair of the Board is Peter Hood. Mr Hood is an independent director and is not the Chief Executive Officer.
Recommendation 2.6
The Company has an induction program for new directors and senior executives. The goal of the program is to
assist new directors to participate fully and actively in Board decision-making at the earliest opportunity and to
assist senior executives to participate fully and actively in management decision-making at the earliest opportunity.
The Company’s Induction Program is disclosed on the Company’s website.
The Nomination and Remuneration Committee regularly reviews whether the directors as a group have the skills,
knowledge and familiarity with the Company and its operating environment required to fulfil their role on the Board
and the Board committees effectively using a Board skills matrix. Where any gaps are identified, the Nomination
and Remuneration Committee considers what training or development should be undertaken to fill those gaps. In
particular, the Nomination and Remuneration Committee ensures that any director who does not have specialist
accounting skills or knowledge has a sufficient understanding of accounting matters to fulfil his or her
responsibilities in relation to the Company’s financial statements. Directors also receive ongoing briefings from the
Company Secretary and Chief Financial Officer on developments in accounting standards.
72
For
per
sona
l use
onl
y

ANNUAL FINANCIAL REPORT
CORPORATE GOVERNANCE STATEMENT
Principle 3 – Act ethically and responsibly
Recommendation 3.1
The Company has established a Code of Conduct for its directors, senior executives and employees, which is
disclosed on the Company’s website.
Principle 4 – Safeguard integrity in corporate reporting
Recommendation 4.1
The Board has established an Audit and Risk Committee. The members of the Audit and Risk Committee are
Messrs Strapp (Chairman), Patterson and Hood. All members of the Audit and Risk Committee are independent
non-executive directors and the Audit and Risk Committee is chaired by Mr Strapp who is not also Chairman of the
Board. Accordingly, the Audit and Risk Committee is structured in compliance with Recommendation 4.1.
Terrence Strapp (CPA, FFin, MAICD) is a Certified Practicing Accountant and has extensive experience in
banking, finance and corporate risk management. Mr Strapp has extensive experience in the preparation and
interpretation of financial statements and information.
Peter Hood (BE (Chem), MAustIMM, FChemE, FAICD) is a Chemical Engineer and was formerly the Chief
Executive Officer of Coogee Chemicals and Coogee Resources. He is currently the Chairman of the Australian
Chamber of Commerce and Industry and Immediate Past President of the Chamber of Commerce and Industry
Western Australia. Peter is currently Chairman of Matrix Composites and Engineering Limited. His broad based
commercial experience includes the interpretation of financial statements and information.
Barry Patterson (ASMM, MIMM, FAICD) is a mining engineer with over 50 years’ experience in mining and mining
services. He was formerly non-executive Chairman of Sonic Healthcare Limited and Silex Systems Limited and is a
non-executive director of Dacian Gold Limited. His broad based commercial experience includes the interpretation
of financial statements and information.
The Company has also established a Procedure for the Selection, Appointment and Rotation of its External Auditor.
The Board is responsible for the initial appointment of the external auditor and the appointment of a new external
auditor when any vacancy arises. Candidates for the position of external auditor must demonstrate complete
independence from the Company through the engagement period. The Board may otherwise select an external
auditor based on criteria relevant to the Company's business and circumstances. The performance of the external
auditor is reviewed on an annual basis by the Board.
The Audit and Risk Committee held no separate meeting during the year electing instead to address matters for its
consideration within the context of meetings of the full Board of Directors.
The Board has adopted an Audit and Risk Committee Charter which describes the Audit and Risk Committee’s
role, composition, functions and responsibilities, which is disclosed on the Company’s website.
Recommendation 4.2
Before the Board approved the Company financial statements for the half year ended 31 December 2015 and the
full-year ended 30 June 2016, it received from the Managing Director and the Chief Financial Officer a declaration
that, in their opinion, the financial records of the Company for the relevant financial period have been properly
maintained and that the financial statements for the relevant financial period comply with the appropriate
accounting standards and give a true and fair view of the financial position and performance of the Company and
the consolidated entity and that the opinion has been formed on the basis of a sound system of risk management
and internal control which is operating effectively.
73
For
per
sona
l use
onl
y
ANNUAL FINANCIAL REPORT
CORPORATE GOVERNANCE STATEMENT
Recommendation 4.3
Under section 250RA of the Corporations Act, the Company’s auditor is required to attend the Company’s annual
general meeting at which the audit report is considered, and to be represented by a person who is a suitably
qualified member of the audit team that conducted the audit and is in a position to answer questions about the
audit. Each year, the Company writes to the Company’s auditor to inform them of the date of the Company’s
annual general meeting.
In accordance with section 250S of the Corporations Act, at the Company’s annual general meeting where the
Company’s auditor or their representative is at the meeting, the Chair allows a reasonable opportunity for the
members as a whole at the meeting to ask the auditor (or its representative) questions relevant to the conduct of
the audit; the preparation and content of the auditor’s report; the accounting policies adopted by the Company in
relation to the preparation of the financial statements; and the independence of the auditor in relation to the conduct
of the audit. The Chair also allows a reasonable opportunity for the auditor (or their representative) to answer
written questions submitted to the auditor under section 250PA of the Corporations Act.
A representative of the Company’s auditor, Deloitte Touche Tohmatsu attended the Company’s annual general
meeting held on 10 November 2015.
Principle 5 – Make timely and balanced disclosure
Recommendation 5.1
The Company has established written policies and procedures for complying with its continuous disclosure
obligations under the ASX Listing Rules. A summary of the Company’s Policy on Continuous Disclosure and
Compliance Procedures are disclosed on the Company’s website at www.gres.com.au.
Principle 6 – Respect the rights of security holders
Recommendation 6.1
The Company provides information about itself and its governance to investors via its website at www.gres.com.au
as set out in its Shareholder Communication and Investor Relations Policy .
Recommendation 6.2
The Company has designed and implemented an investor relations program to facilitate effective two-way
communication with investors. The program is set out in the Company’s Shareholder Communication and Investor
Relations Policy .
Recommendation 6.3
The Company has in place a Shareholder Communication and Investor Relations Policy which outlines the policies
and processes that it has in place to facilitate and encourage participation at meetings of shareholders.
Recommendation 6.4
Shareholders are given the option to receive communications from, and send communications to, the Company
and its share registry electronically. This is facilitated through the Company’s website which provides access to the
Company’s and its share registry’s full range of contact details, including email address.
74
For
per
sona
l use
onl
y

ANNUAL FINANCIAL REPORT
CORPORATE GOVERNANCE STATEMENT
Principle 7 – Recognise and manage risk
Recommendation 7.1
As noted above, the Board has established a combined Audit and Risk Committee. The Audit and Risk Committee
is structured in accordance with Recommendation 7.1. Please refer to the disclosure above in relation to
Recommendation 4.1 in relation to the Audit and Risk Committee.
Recommendation 7.2
The Audit and Risk Committee reviews the Company’s risk management framework annually to satisfy itself that it
continues to be sound, to determine whether there have been any changes in the material business risks the
Company faces and to ensure that the Company is operating within the risk appetite set by the Board.
Recommendation 7.3
The Company does not have an internal audit function. To evaluate and continually improve the effectiveness of
the Company’s risk management and internal control processes, the Board relies on ongoing reporting and
discussion of the management of material business risks as outlined in the Company’s Risk Management Policy .
Recommendation 7.4
The Company provides engineering and construction services to the mining industry and operations and
maintenance services to the oil and gas industry, including producers of coal seam gas. These activities expose the
Company, directly and indirectly to environmental, social and economic sustainability risks, which may materially
impact the Company’s ability to create or preserve value for shareholders over the short, medium or long term.
In relation to the provision of goods and services, these risks are mitigated by virtue of the Company entering a
project’s life cycle at a stage where all environmental, social and economic requirements of the relevant jurisdiction
have been met by the client. The Company does not provide goods and services in circumstances where this is not
the case and to that extent, the Company is in a position to continue its business activities in an environmentally,
socially and economically sustainable manner.
In relation to the Company’s suppliers, the Company takes due care to ensure that the goods and services required
for the conduct of its business are sourced from entities which act fairly and responsibly within the environments,
societies and economies in which they operate thereby mitigating sustainability risks in relation to these factors.
The Company aims to operate in a socially sustainable way by engaging with the local communities and wherever
possible providing employment and training opportunities to members of the local community. In doing so, the
Company operates within the framework of local norms and customs and endeavours to ensure that its clients do
likewise. The Company will not participate in any activity where it is likely to receive either directly or indirectly,
economic benefit through the exploitation of others.
75
For
per
sona
l use
onl
y

ANNUAL FINANCIAL REPORT
CORPORATE GOVERNANCE STATEMENT
Principle 8 – Remunerate fairly and responsibly
Recommendation 8.1
As noted above in relation to Recommendation 2.1, the Board has established a Nomination and Remuneration
Committee. The Nomination and Remuneration Committee is structured in compliance with Recommendation 8.1.
Please refer to the disclosure above in relation to Recommendation 2.1 in relation to the Nomination and
Remuneration Committee.
Recommendation 8.2
Details of remuneration, including the Company’s policy on remuneration, are contained in the “Remuneration
Report” which forms of part of the Directors’ Report in the Company’s Annual Financial Report. This disclosure
includes a summary of the Company’s policies regarding the deferral of performance-based remuneration and the
reduction, cancellation or clawback of the performance-based remuneration in the event of serious misconduct or a
material misstatement in the Company’s financial statements.
Under the terms of the GR Engineering Services Limited Equity Incentive Plan (Plan), if in the opinion of the Board
a participant acts fraudulently or dishonestly or wilfully breaches his or her duties to the Company, the Board may
in its absolute discretion determine that all unvested or unexercised performance rights or share appreciation rights
held by the participant will lapse.
In addition to the provisions under the Plan, the Board has adopted a clawback policy in relation to any cash
bonuses or shares issued pursuant to the Plan. Under this policy the Board reserves the right to take action to
reduce, recoup or otherwise adjust the employees performance based remuneration in circumstances where in the
opinion of the Board, an employee has acted fraudulently or dishonestly or has wilfully breached his or her duties to
the Company.
Recommendation 8.3
The Company's Remuneration Committee Charter includes a statement of the Company's policy on prohibiting
participants in the Plan entering into transactions (whether through the use of derivatives or otherwise) which limit
the economic risk of participating in the Plan.
76
For
per
sona
l use
onl
y

ANNUAL FINANCIAL REPORT
Distribution of securities
Total Units
% of shares
issued
155 100,696 0.07%
439 1,371,440 0.90%
247 2,065,229 1.35%
412 13,261,824 8.68%
36 11,593,650 7.58%
17 124,478,469 81.43%
1,306 152,871,308 100.00%
Equity security holders
Name
Number of
shares held
% of shares
issued
1. Citicorp Nominees Pty Ltd 15,261,308 9.98%
2. Mr David Joseph Sala Tenna + Ms Jane Frances Sala Tenna 13,825,000 9.04%
3. Joley Pty Ltd 12,000,000 7.85%
4. Polly Pty Ltd 10,500,000 6.87%
5. Paksian Pty Ltd 9,798,578 6.41%
6. Kingarth Pty Ltd 9,795,000 6.41%
7. Quintal Pty Ltd 9,500,000 6.21%
8. Mr Giuseppe Totaro 9,000,000 5.89%
9. Ms Beverley June Schier 8,100,000 5.30%
10. Ms Barbara Ann Woodhouse 6,085,022 3.98%
11. Ledgking Pty Ltd 6,000,000 3.92%
12. National Nominees Pty Ltd 4,994,626 3.27%
13. Mr Stephen Paul Kendrick 3,491,000 2.28%
14. J P Morgan Nominees Australia Ltd 2,209,694 1.45%
15. RBC Investor Services Australia Pty Ltd 2,000,000 1.31%
16. HSBC Custody Nominees (Australia) Limited 1,545,226 1.01%
17. Kendrick Investments Pty Ltd 1,384,000 0.91%
18. Mr Cono Antonino Angelo Ricciardo 980,000 0.64%
19. Pershing Australia Nominees Pty Ltd 895,000 0.59%
20. Bond Street Custodians Ltd 866,244 0.57%
128,230,698 83.88%
Substantial shareholders
Name
Number of
shares held
% of shares
issued
1. Commonwealth Bank of Australia (and its related bodies corporate) 15,208,984 9.95%
2. Mr David Joseph Sala Tenna + Ms Jane Frances Sala Tenna 13,825,000 9.04%
3. Joley Pty Ltd 12,000,000 7.85%
4. Polly Pty Ltd 10,500,000 6.87%
5. Paksian Pty Ltd 9,798,578 6.41%
6. Kingarth Pty Ltd 9,795,000 6.41%
7. Mr Giuseppe Totaro 9,500,000 6.21%
8. Quintal Pty Ltd 9,500,000 6.21%
9. Ms Beverley June Schier 8,100,000 5.30%
1,000,001 - 9,999,999,999
ADDITIONAL ASX INFORMATION
The shareholder information set out below was applicable as at 19 August 2016:
the twenty largest shareholders held 83.88% of the Ordinary Shares; and
there were 1,306 ordinary shareholders.
Analysis of number of equity security holders by size of holding:
Range
1 - 1,000
1,001 - 5,000
5,001 - 10,000
10,001 - 100,000
100,001 - 1,000,000
The number of shareholders holding less than a marketable parcel of ordinary shares is 29.
Top 20 Shareholders as at 19 August 2016
77
For
per
sona
l use
onl
y

ANNUAL FINANCIAL REPORT
ADDITIONAL ASX INFORMATION
Voting rights
Options on issue
Performance rights
Number Grant date Expiry date Exercise price
127,500 30 Apr 2014 31 Mar 2017 -
127,500 30 Apr 2014 31 Mar 2018 -
127,500 30 Apr 2014 31 Mar 2019 -
60,000 31 Mar 2016 31 Mar 2017 -
Share appreciation rights
Number Grant date Expiry date Exercise price
296,297 12 Nov 2013 30 Jun 2017 -
213,334 12 Nov 2013 30 Jun 2018 -
Company secretary
Registered office
Principal place of business
Share registry
On-market buyback
Restricted securities
There are no voting rights attached to Share Appreciation Rights over the consolidated entity’s shares.
The voting rights attached to ordinary shares are set out below:
Ordinary shares
On a show of hands every member present at a meeting in person or by proxy shall have one vote and upon a poll each
share shall have one vote.
Options over ordinary shares
There are no voting rights attached to Options over the consolidated entity’s shares.
Performance rights
There are no voting rights attached to Performance Rights over the consolidated entity’s shares.
Share appreciation rights
Facsimile: (61 8) 6272 6001
There are nil options on issue at 30 June 2016.
The following performance rights are on issue:
The following share appreciation rights are on issue:
Mr Giuseppe (Joe) Totaro
179 Great Eastern Highway
BELMONT WA 6104
179 Great Eastern Highway
BELMONT WA 6104
Telephone: (61 8) 6272 6000
Computershare Investor Services Pty Limited
Level 11, 172 St Georges Terrace
PERTH WA 6000
The consolidated entity has no current on-market buy back scheme.
There are no securities subject to any voluntary escrow or any transfer restrictions.
78
For
per
sona
l use
onl
y