Embed Size (px)
Citation preview
A N N U A L F I N A N C I A L R E P O R T
3 0 J U N E 2 0 1 4
ABN 40 009 245 210
INDO MINES LIMITED ANNUAL FINANCIAL REPORT 2014
Page 1
CONTENTS PAGE
CORPORATE DIRECTORY 2
DIRECTORS' REPORT 3
AUDITOR'S INDEPENDENCE DECLARATION 13
CONSOLIDATED STATEMENT OF PROFIT OR LOSS AND COMPREHENSIVE INCOME 14
CONSOLIDATED STATEMENT OF FINANCIAL POSITION 15
CONSOLIDATED STATEMENT OF CASH FLOWS 16
CONSOLIDATED STATEMENT OF CHANGES IN EQUITY 17
NOTES TO AND FORMING PART OF THE FINANCIAL STATEMENTS 19
DIRECTORS' DECLARATION 49
INDEPENDENT AUDIT REPORT 50
INDO MINES LIMITED ANNUAL FINANCIAL REPORT 2014
Page 2
CORPORATE DIRECTORY
Directors Mr Peter Chambers – Non-Executive Chairman
Mr Christopher Catlow – Non-Executive Director
Mr Darryl Harris – Non-Executive Director
Mr Darjoto Setyawan – Non-Executive Director
Mr Hendra Surya – Non-Executive Director
Ms Stacey Apostolou – Executive Director
Chief Executive Officer Mr Arran Marshall
Company Secretary Ms Stacey Apostolou
Registered and Principal Office 68 South Terrace
South Perth WA 6151
Telephone: +61 8 9474 7710
Facsimile: +61 8 9474 7771
Share Register Computershare Investor Services Pty Ltd
Level 2
45 St Georges Terrace
Perth WA 6000
Telephone: 1300 557 010
International: +61 8 9323 2000
Facsimile: +61 8 9323 2033
Stock Exchange Listing Australian Securities Exchange Limited
Home Branch – Perth
2 The Esplanade
Perth WA 6000
ASX Code IDO – Fully paid ordinary shares
Solicitors Hardy Bowen Lawyers – Australia
Hadiputranto, Hadinoto & Partners – Indonesia
Auditor
PricewaterhouseCoopers
Bankers National Australia Bank Ltd
INDO MINES LIMITED ANNUAL FINANCIAL REPORT 2014
DIRECTORS’ REPORT 30 JUNE 2014
Page 3
The Directors of Indo Mines Limited present their report on the Consolidated Entity consisting of Indo Mines Limited (“the Company” or “Indo Mines” or “Parent Entity”) and the entities it controlled at the end of, or during, the year ended 30 June 2014 (“Consolidated Entity” or “Group”). DIRECTORS The names of Directors in office at any time during the financial year or since the end of the financial year are:
Mr Peter Chambers Non-Executive Chairman Mr Martin Hacon Managing Director and Chief Executive Officer (resigned 31 January 2014) Mr Christopher Catlow Non-Executive Director Mr Darryl Harris Non-Executive Director Mr Darjoto Setyawan Non-Executive Director Mr Hendra Surya Non-Executive Director Ms Stacey Apostolou Executive Director – appointed 25 February 2014
Unless otherwise disclosed, Directors held their office from 1 July 2013 until the date of this report. CURRENT DIRECTORS AND OFFICERS Peter Chambers – Non-Executive Chairman Qualifications – B Comm
Mr Peter Chambers most recently held the position of Managing Director - Strategy and Governance with the Rajawali Group which he retired from at the end of June 2014. He served as a member of the Board of Directors of PT. Rajawali Corpora since 2005. Mr Chambers is a member of the Board of Commissioners and Chairman of the Audit Committee of Excelcomindo, Indonesia's third largest mobile telephone operator. He was one of the key persons when Rajawali established Excelcomindo in the late 1990s. He has more than 20 years' experience in the finance and telecommunications industries having been the Head of the South East Asia Communication Practice of Coopers and Lybrand (Hong Kong based). Mr Chambers has also held executive roles with various international companies over the years. Mr Chambers graduated from the Royal Melbourne Institute of Technology in Melbourne, Australia, with a degree in Finance and Accounting. Mr Chambers was appointed a Director of Indo Mines on 26 November 2012 and has not held a directorship in any other listed company in the past three years. Christopher Catlow – Non Executive Director Qualifications - B.Sc, FCA Mr Catlow is a highly experienced executive in the international resources industry, having worked on the development and operations of sand mining, hard rock and oil and gas projects over a 25 year career. He played a central role in the formation of Iluka Resources Limited and most recently was a senior executive of the ASX-listed iron ore mining company Fortescue Metals Group Limited, since shortly after its formation in 2003. During his seven years at Fortescue, initially as its inaugural Chief Financial Officer and then as its Investment and Business Development Director, the company financed and brought into production its major iron ore mining, processing, rail and port facility in Western Australia’s Pilbara region. The development established Fortescue as Australia's third largest iron ore producer behind Rio Tinto and BHP Billiton. Mr Catlow was appointed a Director of Indo Mines on 25 May 2010 and during the three year period to the end of the financial year, Mr Catlow has held directorships in Sirius Minerals Plc (April 2010 – present) and Allied Healthcare Group Limited (June 2011 - present).
INDO MINES LIMITED ANNUAL FINANCIAL REPORT 2014
DIRECTORS’ REPORT 30 JUNE 2014
Page 4
CURRENT DIRECTORS AND OFFICERS (continued) Darryl Harris – Non-Executive Director Qualifications - B.Sc. MAusIMM Mr Harris is an engineering metallurgist with over 20 years’ experience in the design and commissioning of mineral processing plants, across a range of different commodities. Mr Harris has had a long association with engineering companies including Nedpac, Signet Engineering, Lurgi WA, Outotec and Outokumpu Australia. He was involved in the development of various projects, including project coordinator for the An Feng-Kingstream Steel Project and other Australian ferrous projects. Mr Harris was appointed a Director of Indo Mines on 16 June 1987 and during the three year period to the end of the financial year, Mr Harris held directorships in Consolidated Tin Mines Limited (October 2010 – present) and Beacon Minerals Limited (July 2008 – March 2012). Darjoto Setyawan – Non-Executive Director Qualifications – BSc, Masters of Management Mr Darojoto Setyawan has been employed with the Rajawali Group since 1996 and has held the role of Managing Director - Mining & Resources since 2005. He was the President Director of the Bentoel Group, a subsidiary of Rajawali, from 1996 to 2006 and continued from 2006 - 2009 as the President Commissioner. Under his leadership, the Bentoel Group successfully negotiated with a syndicate of international banks as well as two leading State-Owned banks and restructured its loans. During the same period Bentoel underwent some structural changes including organization restructuring. The loan and organizational restructuring have paved the way for Bentoel to regain its position as one of the biggest cigarette manufacturers in Indonesia. In addition to being in charge of mining and resources, Mr Setyawan handles all matters related to external relations including those related to Government officials and agencies. He has also served as a member of the board on a number of companies where the Rajawali Group has an interest, including PT. Nusantara Infrastructure and the Semen Gresik Group. Mr Setyawan was appointed a Director of Indo Mines on 26 November 2012 and has not held a directorship in any other listed company in the past three years. Hendra Surya – Non-Executive Director Qualifications – BSc, Masters of International Management Mr Surya joined the Rajawali Group in 2005 and is currently the Deputy Managing Director - Mining and Resources. Since he joined with the Rajawali Group, Mr Surya has played a significant role in the on-going success of Rajawali’s business in Mining and Resources. His main contributions and deliverables include M&A, Corporate Finance, Project Development and Operation of Rajawali’s mining assets. He currently holds executive management positions in the several subsidiaries and affiliates of Rajawali Group and is President Director of PT Jogja Magasa Iron. Prior to his role with the Rajawali Group, Mr Surya spent eight years with PricewaterhouseCoopers where he was involved with a number of government related projects and a wide number of privatisations and major project financings. He holds a Masters Degree in International Business from the American Graduate School of International Management in Arizona. Mr Surya was appointed a Director of Indo Mines on 6 February 2012 and has not held a directorship in any other listed company in the past three years. Stacey Apostolou – Executive Director and Company Secretary (appointed as a Director on 25 February 2014) Qualifications – BBus CPA
Ms Apostolou was appointed to the position of Company Secretary on 14 October 2011. Ms Apostolou has previously acted as Finance Director to an ASX/AIM listed company, held company secretarial roles for publicly listed companies within the mining and exploration industry and has over 25 years relevant industry experience.
Ms Apostolou was appointed a Director of Indo Mines on 25 February 2014 and has not held a directorship in any other listed company in the past three years.
INDO MINES LIMITED ANNUAL FINANCIAL REPORT 2014
DIRECTORS’ REPORT 30 JUNE 2014
Page 5
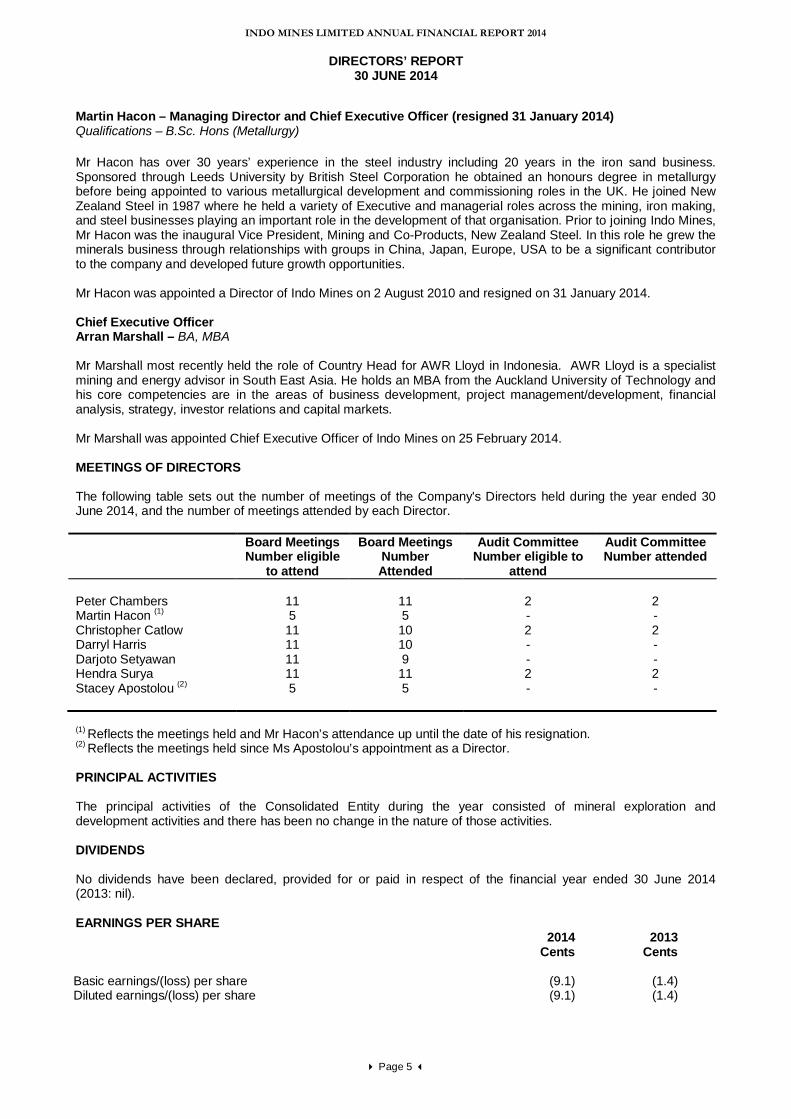
Martin Hacon – Managing Director and Chief Executive Officer (resigned 31 January 2014) Qualifications – B.Sc. Hons (Metallurgy) Mr Hacon has over 30 years’ experience in the steel industry including 20 years in the iron sand business. Sponsored through Leeds University by British Steel Corporation he obtained an honours degree in metallurgy before being appointed to various metallurgical development and commissioning roles in the UK. He joined New Zealand Steel in 1987 where he held a variety of Executive and managerial roles across the mining, iron making, and steel businesses playing an important role in the development of that organisation. Prior to joining Indo Mines, Mr Hacon was the inaugural Vice President, Mining and Co-Products, New Zealand Steel. In this role he grew the minerals business through relationships with groups in China, Japan, Europe, USA to be a significant contributor to the company and developed future growth opportunities. Mr Hacon was appointed a Director of Indo Mines on 2 August 2010 and resigned on 31 January 2014. Chief Executive Officer Arran Marshall – BA, MBA Mr Marshall most recently held the role of Country Head for AWR Lloyd in Indonesia. AWR Lloyd is a specialist mining and energy advisor in South East Asia. He holds an MBA from the Auckland University of Technology and his core competencies are in the areas of business development, project management/development, financial analysis, strategy, investor relations and capital markets. Mr Marshall was appointed Chief Executive Officer of Indo Mines on 25 February 2014. MEETINGS OF DIRECTORS The following table sets out the number of meetings of the Company's Directors held during the year ended 30 June 2014, and the number of meetings attended by each Director. Board Meetings
Number eligible to attend
Board Meetings Number Attended
Audit Committee Number eligible to
attend
Audit Committee Number attended
Peter Chambers 11 11 2 2 Martin Hacon (1) 5 5 - - Christopher Catlow 11 10 2 2 Darryl Harris 11 10 - - Darjoto Setyawan 11 9 - - Hendra Surya 11 11 2 2 Stacey Apostolou (2) 5 5 - - (1) Reflects the meetings held and Mr Hacon’s attendance up until the date of his resignation. (2) Reflects the meetings held since Ms Apostolou’s appointment as a Director. PRINCIPAL ACTIVITIES The principal activities of the Consolidated Entity during the year consisted of mineral exploration and development activities and there has been no change in the nature of those activities. DIVIDENDS No dividends have been declared, provided for or paid in respect of the financial year ended 30 June 2014 (2013: nil). EARNINGS PER SHARE 2014
Cents 2013
Cents Basic earnings/(loss) per share (9.1) (1.4) Diluted earnings/(loss) per share (9.1) (1.4)
INDO MINES LIMITED ANNUAL FINANCIAL REPORT 2014
DIRECTORS’ REPORT 30 JUNE 2014
Page 6
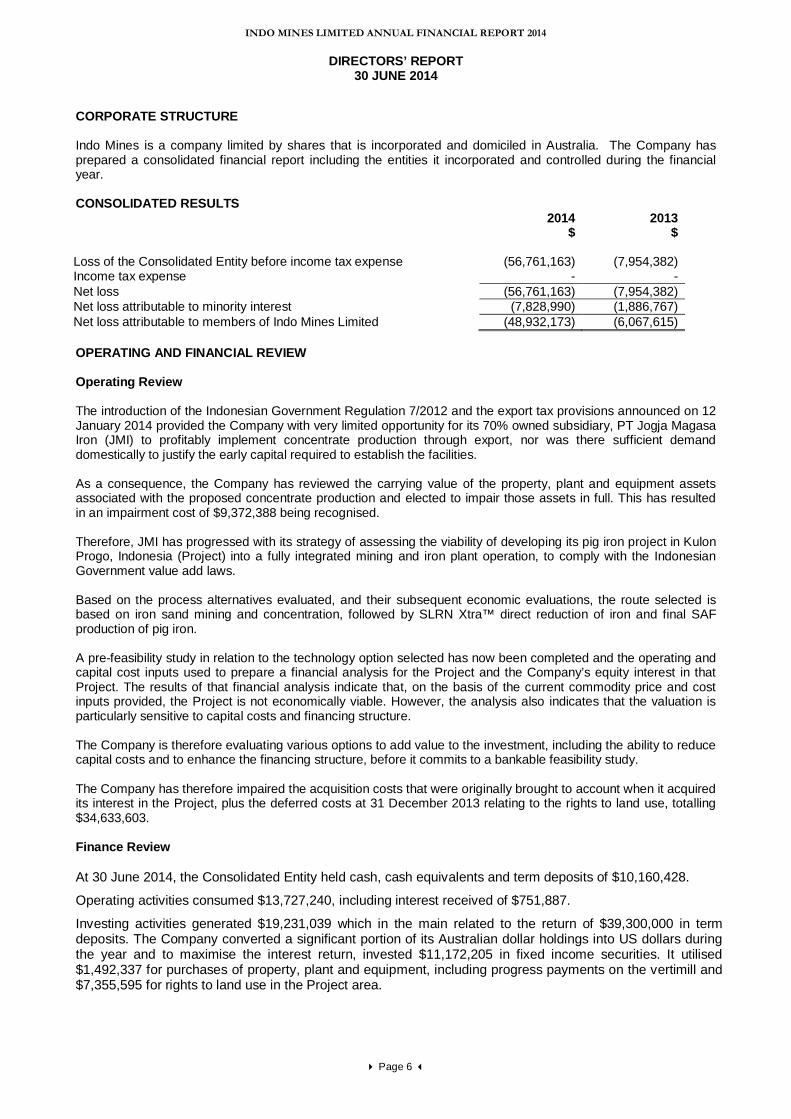
CORPORATE STRUCTURE Indo Mines is a company limited by shares that is incorporated and domiciled in Australia. The Company has prepared a consolidated financial report including the entities it incorporated and controlled during the financial year. CONSOLIDATED RESULTS 2014
$ 2013
$ Loss of the Consolidated Entity before income tax expense (56,761,163) (7,954,382) Income tax expense - - Net loss (56,761,163) (7,954,382) Net loss attributable to minority interest (7,828,990) (1,886,767) Net loss attributable to members of Indo Mines Limited (48,932,173) (6,067,615) OPERATING AND FINANCIAL REVIEW Operating Review The introduction of the Indonesian Government Regulation 7/2012 and the export tax provisions announced on 12 January 2014 provided the Company with very limited opportunity for its 70% owned subsidiary, PT Jogja Magasa Iron (JMI) to profitably implement concentrate production through export, nor was there sufficient demand domestically to justify the early capital required to establish the facilities. As a consequence, the Company has reviewed the carrying value of the property, plant and equipment assets associated with the proposed concentrate production and elected to impair those assets in full. This has resulted in an impairment cost of $9,372,388 being recognised. Therefore, JMI has progressed with its strategy of assessing the viability of developing its pig iron project in Kulon Progo, Indonesia (Project) into a fully integrated mining and iron plant operation, to comply with the Indonesian Government value add laws.
Based on the process alternatives evaluated, and their subsequent economic evaluations, the route selected is based on iron sand mining and concentration, followed by SLRN Xtra™ direct reduction of iron and final SAF production of pig iron. A pre-feasibility study in relation to the technology option selected has now been completed and the operating and capital cost inputs used to prepare a financial analysis for the Project and the Company’s equity interest in that Project. The results of that financial analysis indicate that, on the basis of the current commodity price and cost inputs provided, the Project is not economically viable. However, the analysis also indicates that the valuation is particularly sensitive to capital costs and financing structure. The Company is therefore evaluating various options to add value to the investment, including the ability to reduce capital costs and to enhance the financing structure, before it commits to a bankable feasibility study. The Company has therefore impaired the acquisition costs that were originally brought to account when it acquired its interest in the Project, plus the deferred costs at 31 December 2013 relating to the rights to land use, totalling $34,633,603. Finance Review At 30 June 2014, the Consolidated Entity held cash, cash equivalents and term deposits of $10,160,428.
Operating activities consumed $13,727,240, including interest received of $751,887.
Investing activities generated $19,231,039 which in the main related to the return of $39,300,000 in term deposits. The Company converted a significant portion of its Australian dollar holdings into US dollars during the year and to maximise the interest return, invested $11,172,205 in fixed income securities. It utilised $1,492,337 for purchases of property, plant and equipment, including progress payments on the vertimill and $7,355,595 for rights to land use in the Project area.
INDO MINES LIMITED ANNUAL FINANCIAL REPORT 2014
DIRECTORS’ REPORT 30 JUNE 2014
Page 7
SIGNIFICANT CHANGES IN THE STATE OF AFFAIRS There were no significant changes in the state of affairs of the Consolidated Entity during the year. SIGNIFICANT POST BALANCE DATE EVENTS A pre-feasibility study in relation to the technology option selected has now been completed and the operating and capital cost inputs used to prepare a financial analysis for the Project and the Company’s equity interest in that Project. The results of that financial analysis indicate that, on the basis of the current commodity price and cost inputs provided from the Study, the Project is not viable. However, the analysis indicates that the valuation is particularly sensitive to capital costs and financing structure. The results of that financial analysis indicate that, on the basis of the current commodity price and cost inputs provided from the Study, the Project is not economically viable. However, the analysis also indicates that the valuation is particularly sensitive to capital costs and financing structure. The Company is therefore evaluating various options to add value to the investment, including the ability to reduce capital costs and to enhance the financing structure, before it commits to a bankable feasibility study. It will also seek to reduce its operating expenses whilst it explores the various possibilities. In line with this initiative, the Company will also be streamlining the Board and consequently, Mr Chris Catlow and Ms Stacey Apostolou will be stepping down with effect from the date of this report. Ms Apostolou has also advised of her intention to resign as Company Secretary with effect from 31 October 2014. Other than the matters stated above, there are no matters or circumstances, which have arisen since 30 June 2014 that have significantly affected or may significantly affect:
(a) the operations, in financial years subsequent to 30 June 2014, of the Consolidated Entity; (b) the results of those operations, in financials years subsequent to 30 June 2014 of the
Consolidated Entity; or (c) the state of affairs, in financial years subsequent to 30 June 2014 of the Consolidated Entity.
ENVIRONMENTAL REGULATION AND PERFORMANCE The Consolidated Entity’s operations are subject to various environmental laws and regulations under the relevant government’s legislation. Full compliance with these laws and regulations is regarded as a minimum standard for all operations to achieve. Instances of environmental non-compliance by an operation are identified either by external compliance audits or inspections by relevant government authorities. There have been no significant known breaches by the Consolidated Entity during the financial year. LIKELY DEVELOPMENTS AND EXPECTED RESULTS During the coming year, the Company will finalise the pre-feasibility study for its pig iron project before committing to proceed with a bankable feasibility study. SHARE OPTIONS As at 30 June 2014 the following share options remain unexercised: • 1,500,000 vendor options exercisable at $0.20 each on or before 1 October 2014. During and since the year ended 30 June 2014, no further options over unissued ordinary shares have been granted, no shares have been issued as a result of the exercise of options and no options have expired.
INDO MINES LIMITED ANNUAL FINANCIAL REPORT 2014
DIRECTORS’ REPORT 30 JUNE 2014
Page 8
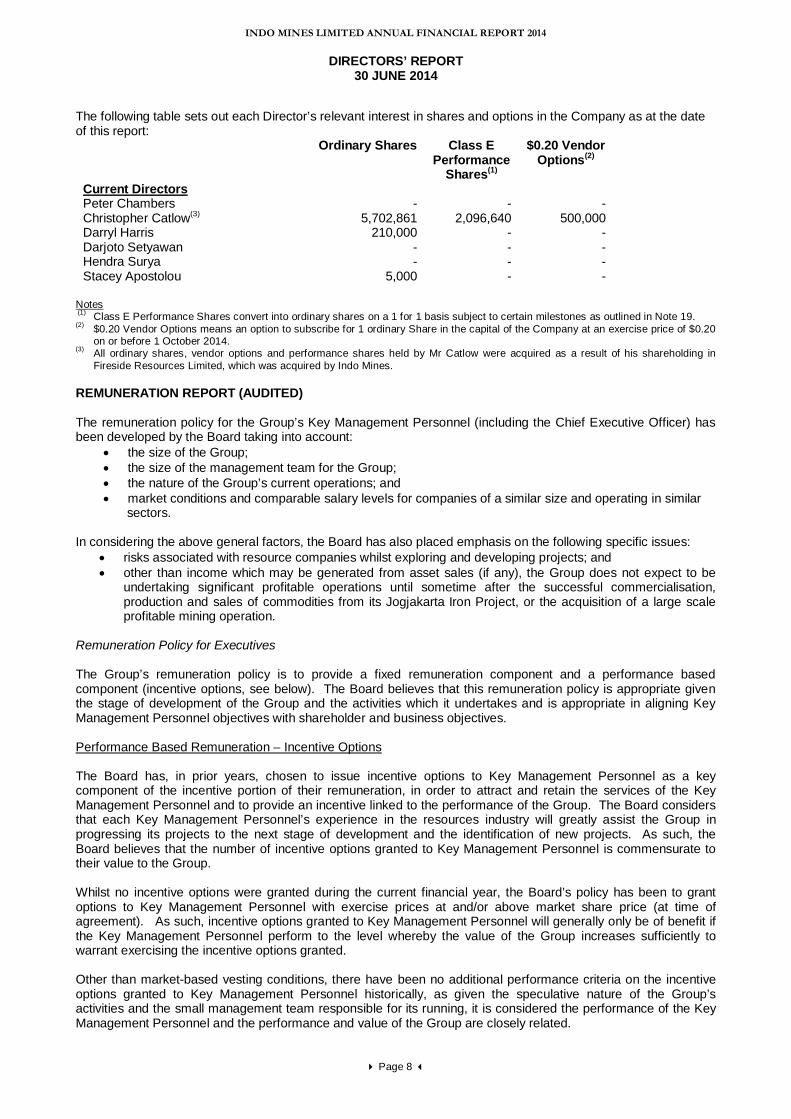
The following table sets out each Director’s relevant interest in shares and options in the Company as at the date of this report:
Ordinary Shares Class E Performance
Shares(1)
$0.20 Vendor Options(2)
Current Directors Peter Chambers - - - Christopher Catlow(3) 5,702,861 2,096,640 500,000 Darryl Harris 210,000 - - Darjoto Setyawan - - - Hendra Surya - - - Stacey Apostolou 5,000 - -
Notes (1) Class E Performance Shares convert into ordinary shares on a 1 for 1 basis subject to certain milestones as outlined in Note 19. (2) $0.20 Vendor Options means an option to subscribe for 1 ordinary Share in the capital of the Company at an exercise price of $0.20
on or before 1 October 2014. (3) All ordinary shares, vendor options and performance shares held by Mr Catlow were acquired as a result of his shareholding in
Fireside Resources Limited, which was acquired by Indo Mines. REMUNERATION REPORT (AUDITED)
The remuneration policy for the Group’s Key Management Personnel (including the Chief Executive Officer) has been developed by the Board taking into account:
• the size of the Group; • the size of the management team for the Group; • the nature of the Group’s current operations; and • market conditions and comparable salary levels for companies of a similar size and operating in similar sectors.
In considering the above general factors, the Board has also placed emphasis on the following specific issues:
• risks associated with resource companies whilst exploring and developing projects; and • other than income which may be generated from asset sales (if any), the Group does not expect to be
undertaking significant profitable operations until sometime after the successful commercialisation, production and sales of commodities from its Jogjakarta Iron Project, or the acquisition of a large scale profitable mining operation.
Remuneration Policy for Executives The Group’s remuneration policy is to provide a fixed remuneration component and a performance based component (incentive options, see below). The Board believes that this remuneration policy is appropriate given the stage of development of the Group and the activities which it undertakes and is appropriate in aligning Key Management Personnel objectives with shareholder and business objectives. Performance Based Remuneration – Incentive Options The Board has, in prior years, chosen to issue incentive options to Key Management Personnel as a key component of the incentive portion of their remuneration, in order to attract and retain the services of the Key Management Personnel and to provide an incentive linked to the performance of the Group. The Board considers that each Key Management Personnel’s experience in the resources industry will greatly assist the Group in progressing its projects to the next stage of development and the identification of new projects. As such, the Board believes that the number of incentive options granted to Key Management Personnel is commensurate to their value to the Group. Whilst no incentive options were granted during the current financial year, the Board’s policy has been to grant options to Key Management Personnel with exercise prices at and/or above market share price (at time of agreement). As such, incentive options granted to Key Management Personnel will generally only be of benefit if the Key Management Personnel perform to the level whereby the value of the Group increases sufficiently to warrant exercising the incentive options granted. Other than market-based vesting conditions, there have been no additional performance criteria on the incentive options granted to Key Management Personnel historically, as given the speculative nature of the Group’s activities and the small management team responsible for its running, it is considered the performance of the Key Management Personnel and the performance and value of the Group are closely related.
INDO MINES LIMITED ANNUAL FINANCIAL REPORT 2014
DIRECTORS’ REPORT 30 JUNE 2014
Page 9
REMUNERATION REPORT (AUDITED) (continued) Key Management Personnel are prohibited at all times from entering into margin lending or similar arrangements in respect to securities in the Company they hold or in which they have a relevant interest. Key Management Personnel are prohibited at all times from dealing in financial products issued or created over or in respect of the Company’s Securities. Impact of Shareholder Wealth on Key Management Personnel Remuneration The Board does not directly base remuneration levels on the Group’s share price or movement in the share price over the financial year. However, as noted above, a number of Key Management Personnel have in prior years received options which generally will only be of value should the Group’s shares increase sufficiently to warrant exercising the incentive options granted. As a result of the Group’s exploration and development activities, the Board anticipates that it will retain future earnings (if any) and other cash resources for the operation and development of its business. Accordingly the Group does not currently have a policy with respect to the payment of dividends, and as a result the remuneration policy does not take into account the level of dividends or other distributions to shareholders (e.g. return of capital). Impact of Earnings on Key Management Personnel Remuneration The Company does not expect to be undertaking significant profitable operations until sometime after the successful commercialisation, production and sales of commodities from its Jogjakarta Iron Project, or the acquisition of a large scale profitable mining operation. Accordingly the Board does not consider current or prior year earnings when assessing remuneration of Key Management Personnel. The compensation structures take into account the capability and experience of the key management personnel and their ability to assist Company performance. Fixed Compensation Fixed compensation consists of base compensation (which is calculated on a total cost basis and includes any FBT charges related to employee benefits including motor vehicles), as well as employer contributions to superannuation funds. Compensation levels are generally reviewed annually by the Remuneration Committee through a process that considers individual, segment and overall performance of the Group. In addition, where necessary, external consultants provide analysis and advice to ensure the Directors’ and senior executives’ compensation is competitive in the market place. A senior executive’s compensation is also reviewed on promotion. No external consultants were engaged during the year ended 30 June 2014.
Remuneration Policy for Non-Executive Directors The Board policy is to remunerate Non-Executive Directors at market rates for comparable companies for time, commitment and responsibilities. Given the current size, nature and risks of the Group, incentive options have previously been used to attract and retain Non-Executive Directors. The Board determines payments to the Non-Executive Directors and reviews their remuneration annually, based on market practice, duties and accountability. Independent external advice is sought when required. No external consultants were engaged during the year ended 30 June 2014. The maximum aggregate amount of fees that can be paid to Non-Executive Directors is subject to approval by shareholders at a General Meeting. Fees for Non-Executive Directors are not linked to the performance of the Group. However, to align Directors’ interests with shareholders’ interests, the Directors are encouraged to hold shares in the Company and certain Non-Executive Directors have, in prior years, received incentive options in order to secure their services. General Where required, Key Management Personnel receive superannuation contributions, which for the year ended 30 June 2014 was equal to 9.25% of salary, increasing to 9.5% from 1 July 2014. Key Management Personnel do not receive any other retirement benefit. From time to time, individuals have chosen to sacrifice part of their salary to increase payments towards superannuation.
INDO MINES LIMITED ANNUAL FINANCIAL REPORT 2014
DIRECTORS’ REPORT 30 JUNE 2014
Page 10
REMUNERATION REPORT (AUDITED) (continued) All remuneration paid to Key Management Personnel is valued at cost to the Company and expensed. Incentive options are valued using an appropriate option valuation methodology depending upon the terms of the options. The value of these incentive options is expensed over the vesting period. Employment Contracts with Key Management Personnel Ms Stacey Apostolou, Company Secretary and Chief Financial Officer of the Group, entered into a fixed term contract with effect from 1 March 2013 which initially expired on 31 December 2013, but was extended by mutual agreement until 31 December 2014. In the event that the Company terminates the contract prior to the end date, other than for gross misconduct or neglect of duty, then it will be required to pay out the remainder of the term. No amount is payable in the event of termination for gross misconduct or neglect of duty. Prior to Ms Apostolou’s appointment as a Director, she received a fixed remuneration component of $20,000 per month inclusive of superannuation. Subsequent to her appointment, this was increased to $23,333 per month (inclusive of superannuation). Mr Arran Marshall, Chief Executive Officer, entered into an executive services agreement with the Company with effect from 25 February 2014. Pursuant to that agreement, Mr Marshall is paid a base salary of A$275,000 per annum, a housing allowance of US$3,000 per month and a motor vehicle allowance of IDR12.5 million per month. In addition, Mr Marshall may be entitled to receive a bonus of up to A$370,000 subject to him achieving certain performance based milestones during the period to 31 December 2015. The Company may terminate Mr Marshall’s employment at any time upon three months' notice, where that termination is effected within twelve months of his commencement, and upon 6 months’ notice, where the termination is effected following the expiration of twelve months from commencement. In lieu of notice, the Company may pay Mr Marshall an amount calculated in proportion to his base salary for any period of short notice. Mr Marshall can resign by providing three months’ written notice. The Company can terminate the agreement without notice for serious misconduct. Mr Satya Graha, Executive Director of Operations Planning and Market Development of PT Jogja Magasa Iron who commenced on 18 July 2011, has a contract of employment with PT Jogja Magasa Iron which specifies the duties and obligations to be fulfilled by the Executive Director of Operations and Planning and Market Development. Mr Graha receives a fixed remuneration component of US$260,000 (including an additional month pay for Ramadan, pursuant to Indonesian law) per year net of applicable income tax and superannuation payments (Jamsostek in Indonesia). He also receives an allowance for his position of IDR180 million per annum. Mr Martin Hacon, Managing Director and Chief Executive Officer of the Group who resigned on 31 January 2014, had a contract of employment with Indo Mines which specified the duties and obligations to be fulfilled by the Managing Director and CEO. The contract could be terminated by either party by giving 3 months’ notice. Mr Hacon received a fixed remuneration component of $450,000 per annum inclusive of superannuation. Non-executive directors Total compensation for all Non-Executive Directors, last voted upon by shareholders at the 2011 AGM, is not to exceed $500,000 per annum and is set with reference to fees paid to other non-executive directors of comparable companies. With effect from 1 December 2012, fees payable for the independent Non-Executive Directors are $50,000 per annum inclusive of superannuation contributions. Directors appointed by the Rajawali Group do not receive any Directors’ fees. Mr Chambers retired from his executive role with the Rajawali Group on 30 June 2014. With effect from 1 July 2014, Mr Chambers receives a fee in his capacity as Chairman of $78,000 per annum inclusive of superannuation contributions. Non-Executive Directors did not receive any performance related compensation in 2014 (2013: Nil). Directors’ fees cover all main board activities and committee memberships. External consultants were not engaged in the preparation of the remuneration report.
INDO MINES LIMITED ANNUAL FINANCIAL REPORT 2014
DIRECTORS’ REPORT 30 JUNE 2014
Page 11
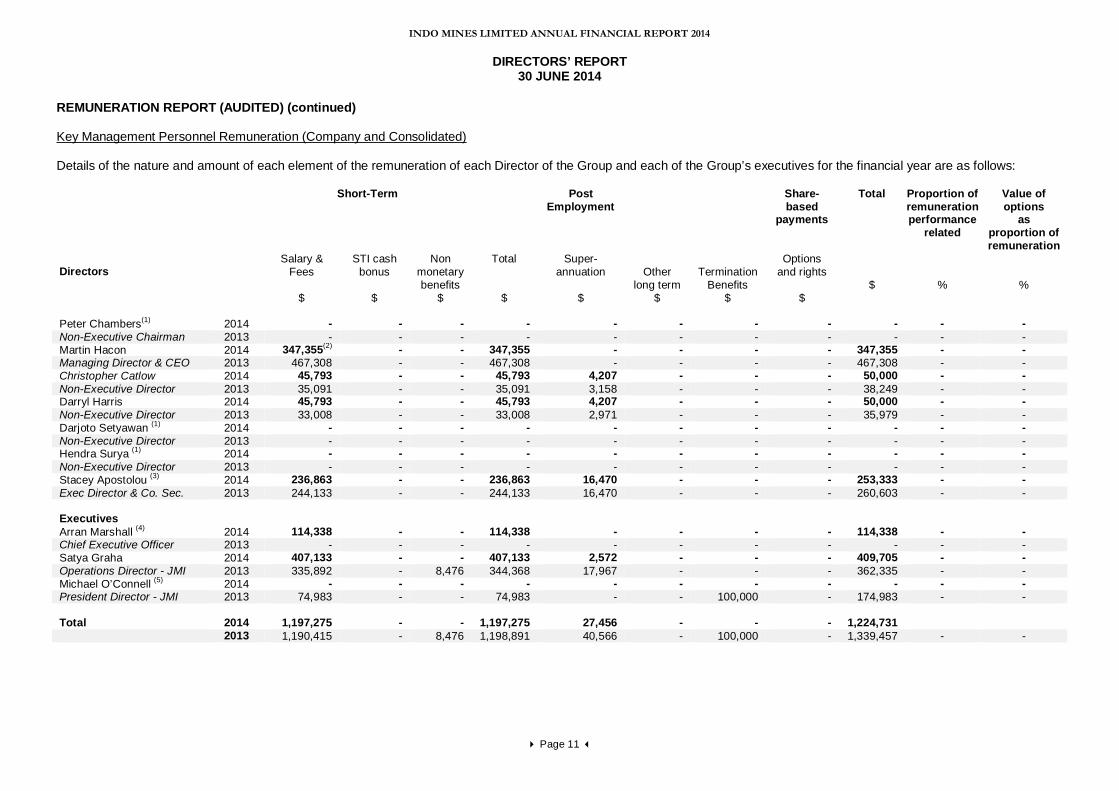
REMUNERATION REPORT (AUDITED) (continued) Key Management Personnel Remuneration (Company and Consolidated) Details of the nature and amount of each element of the remuneration of each Director of the Group and each of the Group’s executives for the financial year are as follows: Short-Term Post
Employment
Other long term
$
Termination Benefits
$
Share- based
payments
Total Proportion of remuneration performance
related
Value of options
as proportion of remuneration
Directors
Salary & Fees
$
STI cash bonus
$
Non monetary benefits
$
Total
$
Super- annuation
$
Options and rights
$
$
%
%
Peter Chambers(1) 2014 - - - - - - - - - - - Non-Executive Chairman 2013 - - - - - - - - - - - Martin Hacon 2014 347,355(2) - - 347,355 - - - - 347,355 - - Managing Director & CEO 2013 467,308 - - 467,308 - - - - 467,308 - - Christopher Catlow 2014 45,793 - - 45,793 4,207 - - - 50,000 - - Non-Executive Director 2013 35,091 - - 35,091 3,158 - - - 38,249 - - Darryl Harris 2014 45,793 - - 45,793 4,207 - - - 50,000 - - Non-Executive Director 2013 33,008 - - 33,008 2,971 - - - 35,979 - - Darjoto Setyawan (1) 2014 - - - - - - - - - - - Non-Executive Director 2013 - - - - - - - - - - - Hendra Surya (1) 2014 - - - - - - - - - - - Non-Executive Director 2013 - - - - - - - - - - - Stacey Apostolou (3) 2014 236,863 - - 236,863 16,470 - - - 253,333 - - Exec Director & Co. Sec. 2013 244,133 - - 244,133 16,470 - - - 260,603 - - Executives Arran Marshall (4) 2014 114,338 - - 114,338 - - - - 114,338 - - Chief Executive Officer 2013 - - - - - - - - - - - Satya Graha 2014 407,133 - - 407,133 2,572 - - - 409,705 - - Operations Director - JMI 2013 335,892 - 8,476 344,368 17,967 - - - 362,335 - - Michael O’Connell (5) 2014 - - - - - - - - - - - President Director - JMI 2013 74,983 - - 74,983 - - 100,000 - 174,983 - - Total 2014 1,197,275 - - 1,197,275 27,456 - - - 1,224,731 2013 1,190,415 - 8,476 1,198,891 40,566 - 100,000 - 1,339,457 - -
INDO MINES LIMITED ANNUAL FINANCIAL REPORT 2014
DIRECTORS’ REPORT 30 JUNE 2014
Page 12
REMUNERATION REPORT (AUDITED) (continued) Notes (1) No Directors Fees were payable to Messrs Chambers, Setyawan and Surya for the year ended 30 June
2014. (2) Includes the payment of $84,855 in annual leave paid out on termination. (3) Ms Apostolou commenced as a Director on 25 February 2014. The remuneration reflects amounts paid for
the full year. (4) Mr Marshall commenced employment on 25 February 2014. (5) Mr O'Connell resigned on 29 August 2012. Termination benefits of $100,000 consisted of a $75,000
termination payment for his three month notice period and a discretionary $25,000 as full and final satisfaction of any outstanding claims.
Options Granted to Key Management Personnel No options were granted, exercised or lapsed during the year. Chris Catlow has 500,000 options which vested in prior years. End of Remuneration Report INSURANCE OF OFFICERS AND AUDITORS Under the Constitution the Company is obliged, to the extent permitted by law, to indemnify an officer (including Directors) of the Company against liabilities incurred by the officer in that capacity, against costs and expenses incurred by the officer in successfully defending civil or criminal proceedings, and against any liability which arises out of conduct not involving a lack of good faith. The Company has in respect of any person who is or has been an officer of the Company or a related body corporate paid or agreed to pay a premium of $18,051 (2013: $17,606) in respect of a contract insuring against a liability incurred as an officer for the costs or expenses to defend legal proceedings. The Company has indemnified officers of the Company against a liability incurred as an officer including costs and expenses in successfully defending legal proceedings. The Company has not, during or since the end of the financial year, indemnified or agreed to indemnify an auditor of the Company or of any related body corporate against a liability incurred as such an auditor. NON-AUDIT SERVICES There were no non-audit services provided by the auditor (or by another person or firm on the auditor’s behalf) during the financial year. AUDITOR’S INDEPENDENCE DECLARATION The auditor’s independence declaration, which forms part of this Directors’ Report, for the year ended 30 June 2014 is on page 13. This report is made in accordance with a resolution of the Directors made pursuant to section 298(2) of the Corporations Act 2001. For and on behalf of the Directors PETER CHAMBERS Non-Executive Chairman Dated this 30th day of September 2014
INDO MINES LIMITED ANNUAL FINANCIAL REPORT 2014
Page 14
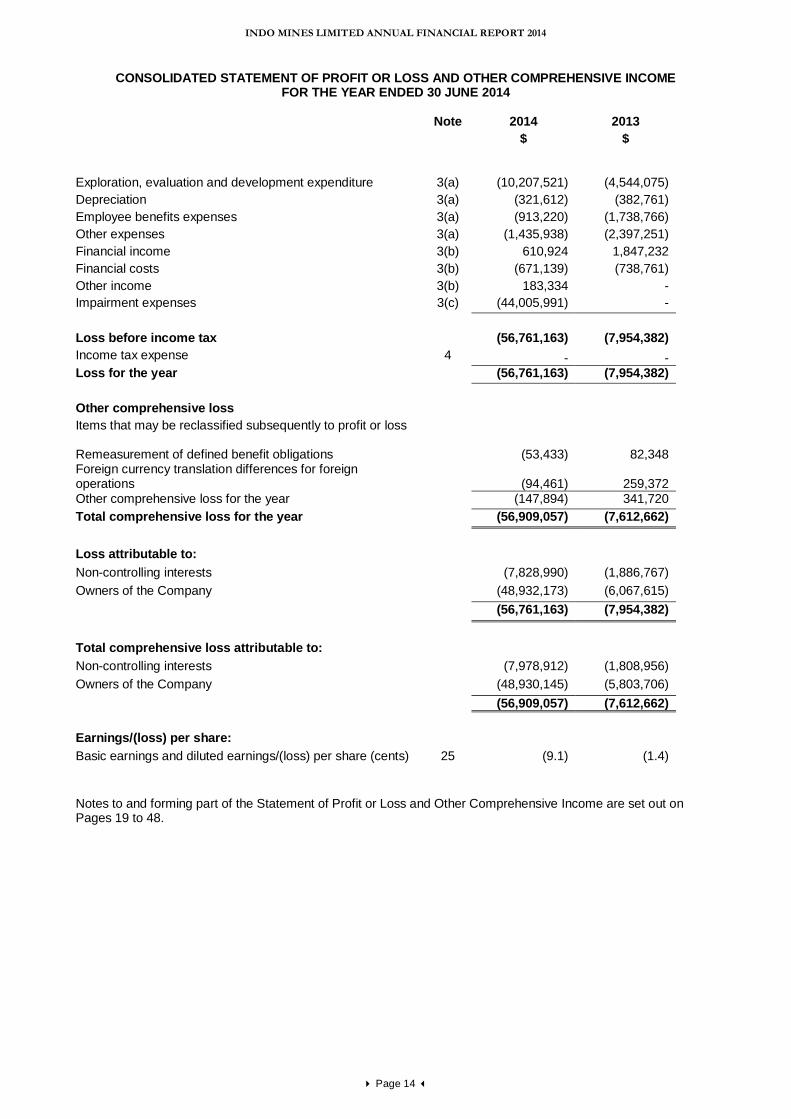
CONSOLIDATED STATEMENT OF PROFIT OR LOSS AND OTHER COMPREHENSIVE INCOME FOR THE YEAR ENDED 30 JUNE 2014
Note 2014 2013 $ $
Exploration, evaluation and development expenditure 3(a) (10,207,521) (4,544,075) Depreciation 3(a) (321,612) (382,761) Employee benefits expenses 3(a) (913,220) (1,738,766) Other expenses 3(a) (1,435,938) (2,397,251) Financial income 3(b) 610,924 1,847,232 Financial costs 3(b) (671,139) (738,761) Other income 3(b) 183,334 - Impairment expenses 3(c) (44,005,991) - Loss before income tax (56,761,163) (7,954,382) Income tax expense 4 - - Loss for the year (56,761,163) (7,954,382) Other comprehensive loss Items that may be reclassified subsequently to profit or loss Remeasurement of defined benefit obligations
(53,433) 82,348 Foreign currency translation differences for foreign operations
(94,461)
259,372
Other comprehensive loss for the year (147,894) 341,720 Total comprehensive loss for the year (56,909,057) (7,612,662)
Loss attributable to: Non-controlling interests (7,828,990) (1,886,767) Owners of the Company (48,932,173) (6,067,615) (56,761,163) (7,954,382) Total comprehensive loss attributable to: Non-controlling interests (7,978,912) (1,808,956) Owners of the Company (48,930,145) (5,803,706) (56,909,057) (7,612,662) Earnings/(loss) per share: Basic earnings and diluted earnings/(loss) per share (cents) 25 (9.1) (1.4)
Notes to and forming part of the Statement of Profit or Loss and Other Comprehensive Income are set out on Pages 19 to 48.
INDO MINES LIMITED ANNUAL FINANCIAL REPORT 2014
Page 15
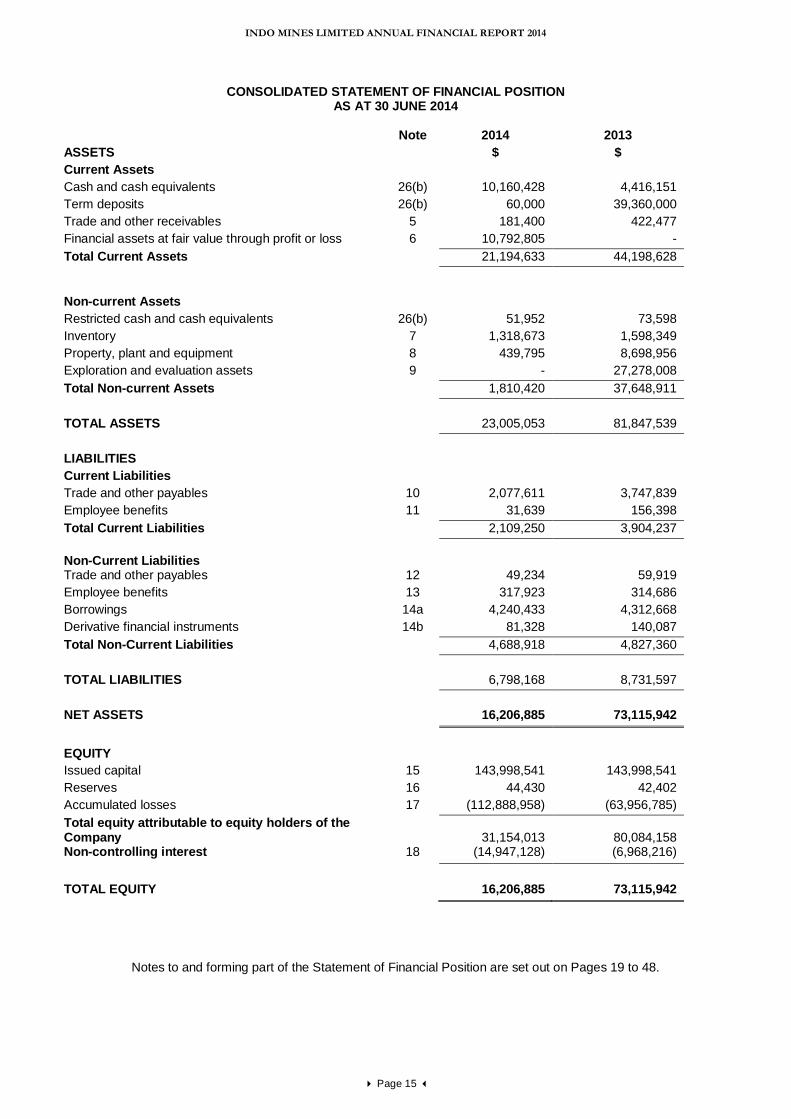
CONSOLIDATED STATEMENT OF FINANCIAL POSITION AS AT 30 JUNE 2014
Note 2014 2013
ASSETS $ $ Current Assets Cash and cash equivalents 26(b) 10,160,428 4,416,151 Term deposits 26(b) 60,000 39,360,000 Trade and other receivables 5 181,400 422,477 Financial assets at fair value through profit or loss 6 10,792,805 - Total Current Assets 21,194,633 44,198,628
Non-current Assets Restricted cash and cash equivalents 26(b) 51,952 73,598 Inventory 7 1,318,673 1,598,349 Property, plant and equipment 8 439,795 8,698,956 Exploration and evaluation assets 9 - 27,278,008 Total Non-current Assets 1,810,420 37,648,911
TOTAL ASSETS 23,005,053 81,847,539
LIABILITIES Current Liabilities Trade and other payables 10 2,077,611 3,747,839 Employee benefits 11 31,639 156,398 Total Current Liabilities 2,109,250 3,904,237 Non-Current Liabilities
Trade and other payables 12 49,234 59,919 Employee benefits 13 317,923 314,686 Borrowings 14a 4,240,433 4,312,668 Derivative financial instruments 14b 81,328 140,087 Total Non-Current Liabilities 4,688,918 4,827,360
TOTAL LIABILITIES 6,798,168 8,731,597
NET ASSETS 16,206,885 73,115,942
EQUITY Issued capital 15 143,998,541 143,998,541 Reserves 16 44,430 42,402 Accumulated losses 17 (112,888,958) (63,956,785) Total equity attributable to equity holders of the Company
31,154,013
80,084,158
Non-controlling interest 18 (14,947,128) (6,968,216) TOTAL EQUITY 16,206,885 73,115,942
Notes to and forming part of the Statement of Financial Position are set out on Pages 19 to 48.
INDO MINES LIMITED ANNUAL FINANCIAL REPORT 2014
Page 16
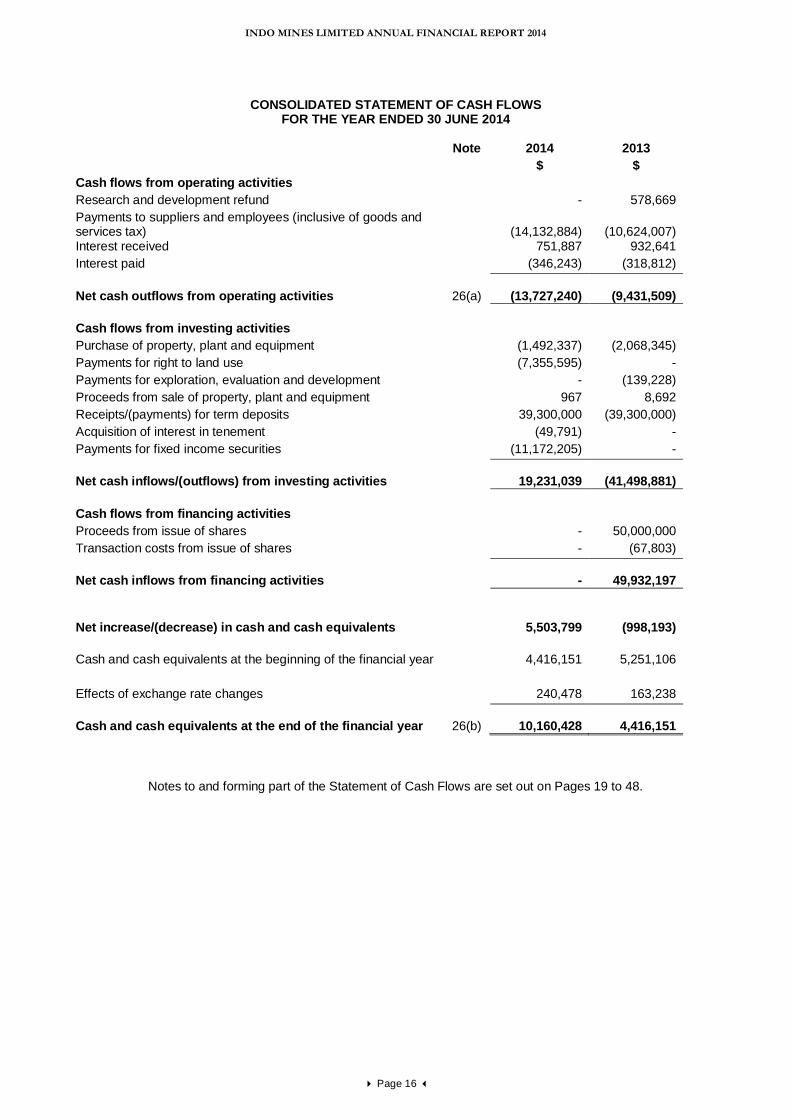
CONSOLIDATED STATEMENT OF CASH FLOWS FOR THE YEAR ENDED 30 JUNE 2014
Note 2014 2013
$ $ Cash flows from operating activities Research and development refund - 578,669 Payments to suppliers and employees (inclusive of goods and services tax)
(14,132,884)
(10,624,007)
Interest received 751,887 932,641 Interest paid (346,243) (318,812) Net cash outflows from operating activities
26(a)
(13,727,240)
(9,431,509)
Cash flows from investing activities Purchase of property, plant and equipment (1,492,337) (2,068,345) Payments for right to land use (7,355,595) - Payments for exploration, evaluation and development - (139,228) Proceeds from sale of property, plant and equipment 967 8,692 Receipts/(payments) for term deposits 39,300,000 (39,300,000) Acquisition of interest in tenement (49,791) - Payments for fixed income securities (11,172,205) - Net cash inflows/(outflows) from investing activities
19,231,039
(41,498,881)
Cash flows from financing activities Proceeds from issue of shares - 50,000,000 Transaction costs from issue of shares - (67,803) Net cash inflows from financing activities
-
49,932,197
Net increase/(decrease) in cash and cash equivalents
5,503,799
(998,193)
Cash and cash equivalents at the beginning of the financial year 4,416,151 5,251,106 Effects of exchange rate changes 240,478 163,238 Cash and cash equivalents at the end of the financial year
26(b)
10,160,428
4,416,151
Notes to and forming part of the Statement of Cash Flows are set out on Pages 19 to 48.
INDO MINES LIMITED ANNUAL FINANCIAL REPORT 2014
Page 17
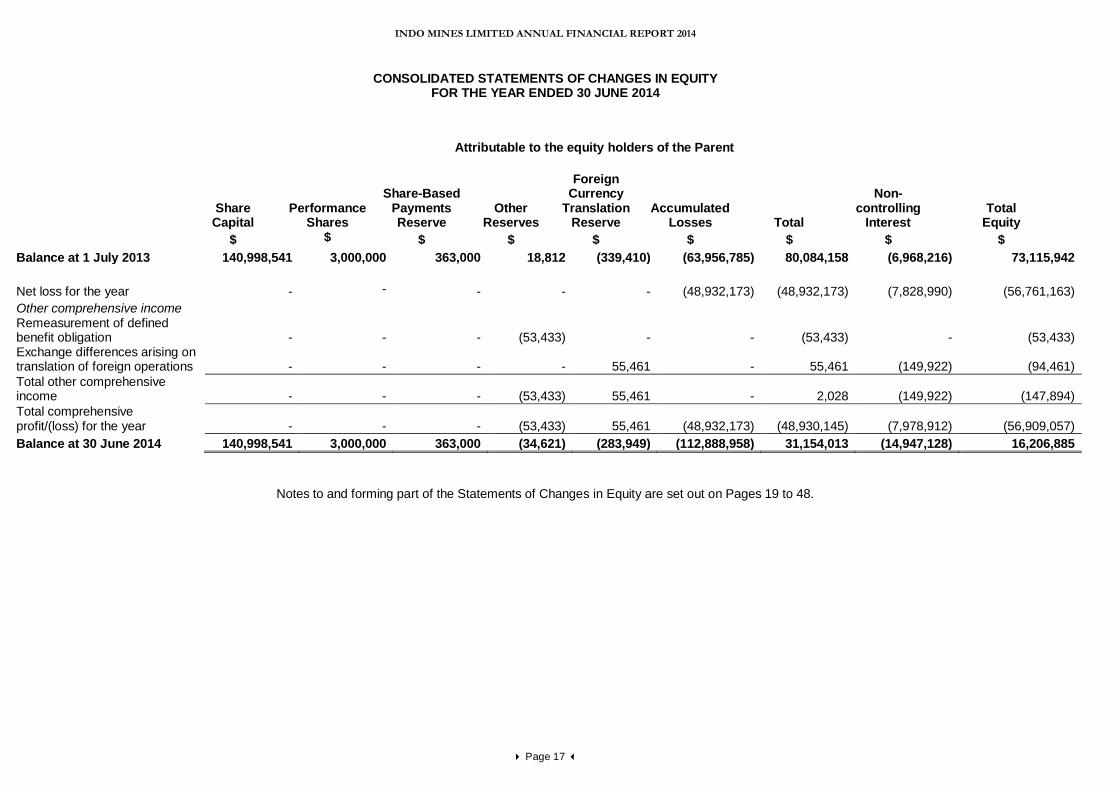
CONSOLIDATED STATEMENTS OF CHANGES IN EQUITY FOR THE YEAR ENDED 30 JUNE 2014
Notes to and forming part of the Statements of Changes in Equity are set out on Pages 19 to 48.
Attributable to the equity holders of the Parent
Share Capital
Performance Shares
Share-Based Payments Reserve
Other Reserves
Foreign Currency
TranslationReserve
Accumulated Losses
Total
Non-controlling
Interest Total
Equity $ $ $ $ $ $ $ $ $
Balance at 1 July 2013 140,998,541 3,000,000 363,000 18,812 (339,410) (63,956,785) 80,084,158 (6,968,216) 73,115,942 Net loss for the year - - - - - (48,932,173) (48,932,173) (7,828,990) (56,761,163) Other comprehensive income Remeasurement of defined benefit obligation -
- - (53,433) - - (53,433) - (53,433)
Exchange differences arising on translation of foreign operations -
- - - 55,461 - 55,461 (149,922) (94,461)
Total other comprehensive income -
- - (53,433) 55,461 - 2,028 (149,922) (147,894)
Total comprehensive profit/(loss) for the year -
- - (53,433) 55,461 (48,932,173) (48,930,145) (7,978,912) (56,909,057)
Balance at 30 June 2014 140,998,541 3,000,000 363,000 (34,621) (283,949) (112,888,958) 31,154,013 (14,947,128) 16,206,885
INDO MINES LIMITED ANNUAL FINANCIAL REPORT 2014
Page 18
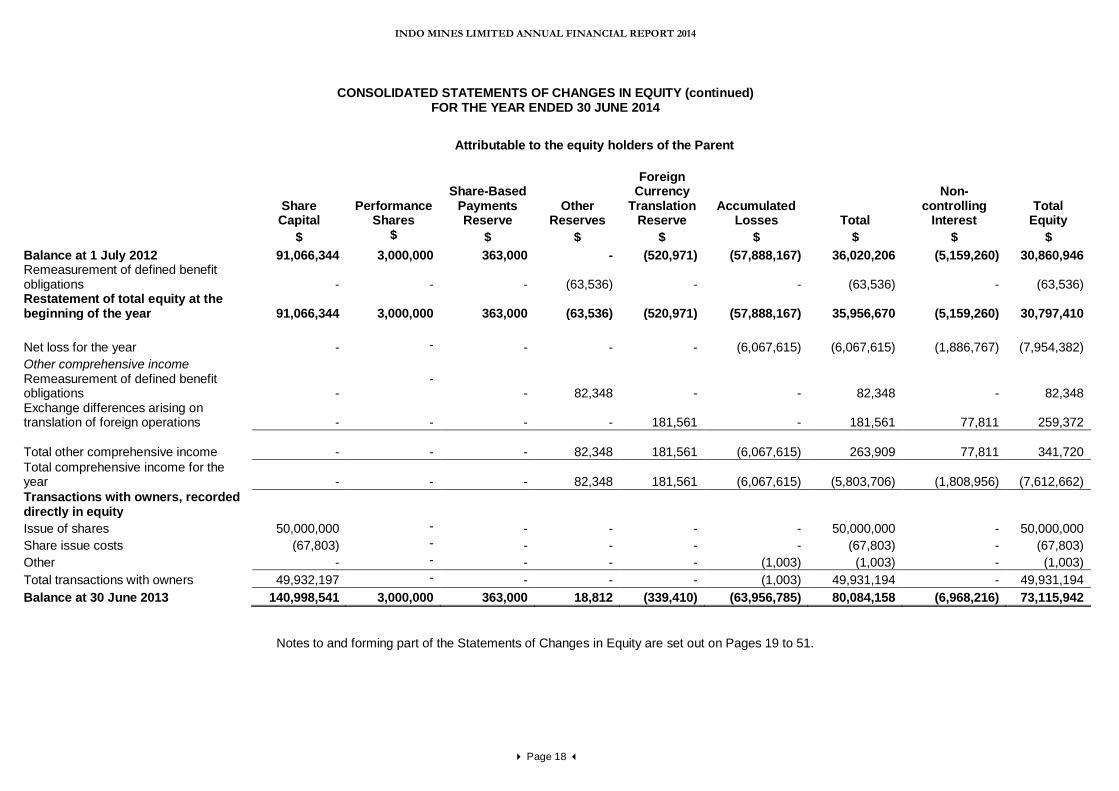
CONSOLIDATED STATEMENTS OF CHANGES IN EQUITY (continued)
FOR THE YEAR ENDED 30 JUNE 2014
Notes to and forming part of the Statements of Changes in Equity are set out on Pages 19 to 51.
Attributable to the equity holders of the Parent
Share Capital
Performance Shares
Share-Based Payments Reserve
Other Reserves
Foreign Currency
TranslationReserve
Accumulated Losses
Total
Non-controlling
Interest Total
Equity $ $ $ $ $ $ $ $ $
Balance at 1 July 2012 91,066,344 3,000,000 363,000 - (520,971) (57,888,167) 36,020,206 (5,159,260) 30,860,946 Remeasurement of defined benefit obligations -
- - (63,536) - - (63,536) - (63,536)
Restatement of total equity at the beginning of the year 91,066,344
3,000,000 363,000 (63,536) (520,971) (57,888,167) 35,956,670 (5,159,260) 30,797,410
Net loss for the year - - - - - (6,067,615) (6,067,615) (1,886,767) (7,954,382) Other comprehensive income Remeasurement of defined benefit obligations -
- - 82,348 - - 82,348 - 82,348
Exchange differences arising on translation of foreign operations -
- - - 181,561 - 181,561 77,811 259,372
Total other comprehensive income -
- - 82,348 181,561 (6,067,615) 263,909 77,811 341,720 Total comprehensive income for the year -
- - 82,348 181,561 (6,067,615) (5,803,706) (1,808,956) (7,612,662)
Transactions with owners, recorded directly in equity
Issue of shares 50,000,000 - - - - - 50,000,000 - 50,000,000 Share issue costs (67,803) - - - - - (67,803) - (67,803) Other - - - - - (1,003) (1,003) - (1,003) Total transactions with owners 49,932,197 - - - - (1,003) 49,931,194 - 49,931,194 Balance at 30 June 2013 140,998,541 3,000,000 363,000 18,812 (339,410) (63,956,785) 80,084,158 (6,968,216) 73,115,942
INDO MINES LIMITED ANNUAL FINANCIAL REPORT 2014
NOTES TO AND FORMING PART OF THE FINANCIAL STATEMENTS
Page 19
1. STATEMENT OF SIGNIFICANT ACCOUNTING POLICIES The principal accounting policies adopted in preparing the financial report of the Company, Indo Mines and its consolidated entities (“Consolidated Entity” or “Group”) for the year ended 30 June 2014 are stated to assist in a general understanding of the financial report. These policies have been consistently applied to all the years presented, except as described below. Indo Mines is domiciled in Australia and is a for-profit entity, limited by shares and these shares are publicly traded on the Australian Securities Exchange. The financial report of the Group for the year ended 30 June 2014 was authorised for issue in accordance with a resolution of the Directors on 30 September 2014. (a) Financial Position The Group incurred a loss for the year of $56,761,163 (2013: $7,954,382) whilst it continued with evaluation and studies for the development of the Jogjakarta Iron Project. The financial report has been prepared on a going concern basis which contemplates the continuation of business activity and the realisation of assets and settlement of liabilities in the ordinary course of business. (b) Basis of Preparation Statement of compliance The financial report is a general purpose financial report which has been prepared in accordance with Australian Accounting Standards (AASs) adopted by the Australian Accounting Standards Board (AASB) and the Corporations Act 2001. The consolidated financial report of the Group complies with International Financial Reporting Standards (IFRSs) adopted by the International Accounting Standards Board (IASB). Basis of measurement The consolidated financial statements have been prepared on the historical cost basis, as modified by the revaluation of financial assets and liabilities (including derivative instruments) at fair value through profit or loss.
New or revised accounting standards and interpretations The Group has applied the following standards and amendments for the first time for the annual reporting period commencing 1 July 2013: AASB 10 Consolidated Financial Statements, AASB 11 Joint Arrangements, AASB 12 Disclosure of Interests in Other Entities, revised AASB 127 Separate Financial Statements and AASB 128 Investments in Associates and Joint ventures and AASB 2011-7 Amendments to Australian Accounting Standards arising from the Consolidation and Joint Arrangements Standards. AASB 2012-10 Amendments to Australian Accounting Standards – Transition Guidance and Other Amendments which provides an exemption from the requirement to disclose the impact of the change in accounting policy on the current period. AASB 13 Fair Value Measurement and AASB 2011-8 Amendments to Australian Accounting Standards arising from AASB 13. AASB 119 Employee Benefits (September 2011) and AASB 2011-10 Amendments to Australian Accounting Standards arising from AASB 119 (September 2011). AASB 2012-5 Amendments to Australian Accounting Standards arising from Annual Improvements 2009-2011 cycle, and AASB 2012-2 Amendments to Australian Accounting Standards – Disclosures – Offsetting Financial Assets and Financial Liabilities. The adoption of AASB 13 and AASB 119 explained and summarised below. The other standards only affected the disclosures in the notes to the financial statements.
INDO MINES LIMITED ANNUAL FINANCIAL REPORT 2014
NOTES TO AND FORMING PART OF THE FINANCIAL STATEMENTS
Page 20
1. STATEMENT OF SIGNIFICANT ACCOUNTING POLICIES (continued) (b) Basis of Preparation (continued)
i. Fair value measurement AASB 13 Fair Value Measurement aims to provide consistency and reduce complexity by providing a precise definition of fair value and a single source of fair value measurement and disclosure requirements for use across Australian Accounting Standards. The standard does not extend the use of fair value accounting but provides guidance on how it should be applied where its use is already required or permitted by other Australian Accounting Standards. The standard defines fair value as the price that would be received to sell an asset or paid to transfer a liability in an orderly transaction between market participants at the measurement date. The adoption of this standard has resulted in additional disclosure in the notes to the financial statements, but has not had any material impact on the measurement of items in the financial statements.
ii. Employee benefits The adoption of the revised AASB 119 Employee Benefits changed the accounting for the group’s short- and long-term employee benefits, termination benefits and the accounting requirements for defined benefit obligations. Where the entity does not expect all annual leave to be taken within 12 months of the respective service being provided, annual leave obligations are now classified as long-term employee benefits in their entirety. This changes the measurement of these obligations, as the entire obligation is now measured on a discounted basis and no longer split into short term and long term portion. However, the impact of this change was immaterial since the majority of the leave is still expected to be taken within a short period after the end of the reporting period. One of the group entities has a defined benefit obligation plan under which all expenses were previously recorded in the income statements (no corridor approach). Under the revised AASB 19, these amounts are now required to be taken through Other Comprehensive Income. As the revised Standard must be adopted retrospectively, adjustments to the defined benefit obligation have been recognised at the beginning of the earliest period presented (being 1 July 2012) and the Statement of Profit or Loss and Other Comprehensive Income were restated for the comparative period and the impact is to increase Other Reserves and Accumulated Losses by $16,614.
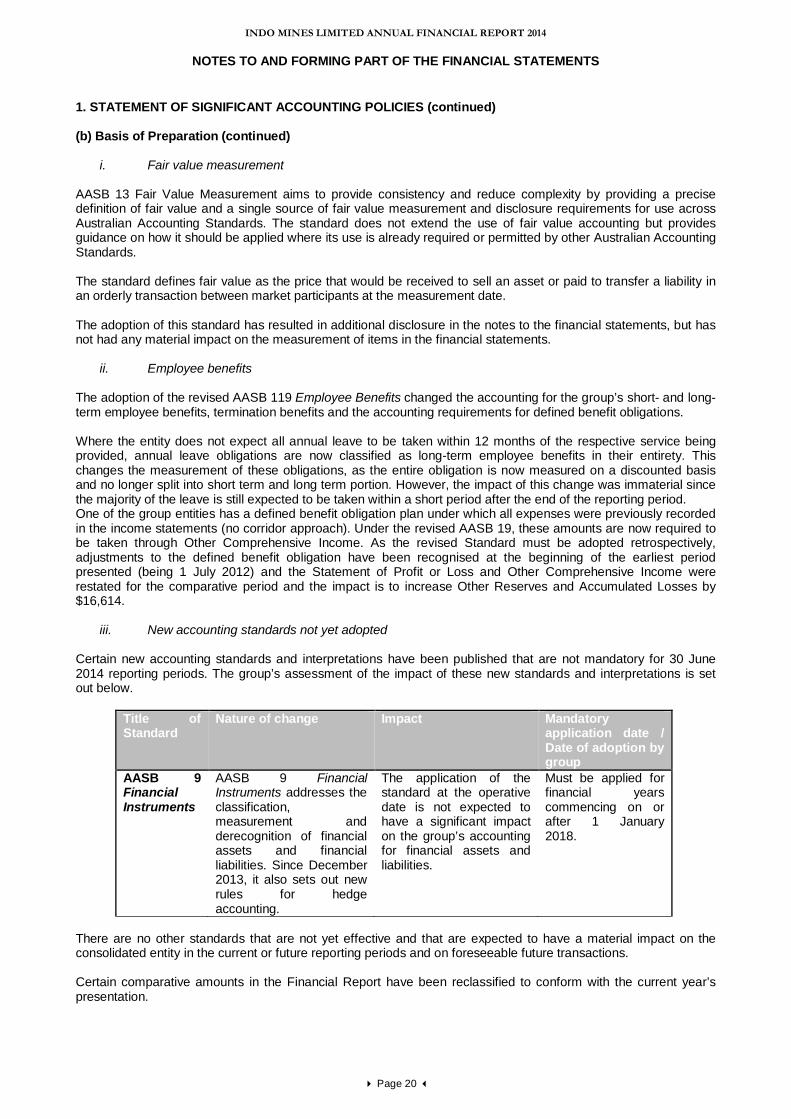
iii. New accounting standards not yet adopted Certain new accounting standards and interpretations have been published that are not mandatory for 30 June 2014 reporting periods. The group’s assessment of the impact of these new standards and interpretations is set out below.
Title of Standard
Nature of change Impact Mandatory application date / Date of adoption by group
AASB 9 Financial Instruments
AASB 9 Financial Instruments addresses the classification, measurement and derecognition of financial assets and financial liabilities. Since December 2013, it also sets out new rules for hedge accounting.
The application of the standard at the operative date is not expected to have a significant impact on the group’s accounting for financial assets and liabilities.
Must be applied for financial years commencing on or after 1 January 2018.
There are no other standards that are not yet effective and that are expected to have a material impact on the consolidated entity in the current or future reporting periods and on foreseeable future transactions. Certain comparative amounts in the Financial Report have been reclassified to conform with the current year’s presentation.
INDO MINES LIMITED ANNUAL FINANCIAL REPORT 2014
NOTES TO AND FORMING PART OF THE FINANCIAL STATEMENTS
Page 21
1. STATEMENT OF SIGNIFICANT ACCOUNTING POLICIES (continued) (c) Principles of Consolidation The consolidated financial statements incorporate the assets and liabilities of all subsidiaries of Indo Mines as at 30 June 2014 and the results of all subsidiaries for the year then ended. Indo Mines and its subsidiaries together are referred to as the Group or the Consolidated Entity. Subsidiaries are all those entities (including special purpose entities) over which the Group has the power to govern the financial and operating policies, generally accompanying a shareholding of more than one-half of the voting rights. The existence and potential effect of potential voting rights that are currently exercisable or convertible are considered when assessing whether the Group controls another entity. Subsidiaries are fully consolidated from the date on which control is transferred to the Group. They are de-consolidated from the date that control ceases. Intercompany transactions and balances, and unrealised gains on transactions between Group companies, are eliminated. Unrealised losses are also eliminated unless the transaction provides evidence of the impairment of the asset transferred. Accounting policies of subsidiaries have been changed where necessary to ensure consistency with the policies adopted by the Group. Non-controlling interest The Group measures any non-controlling interest at its proportionate interest in the identifiable net assets of the subsidiary.
(d) Discontinued operations
A discontinued operation is a component of the Group’s business that represents a separate major line of business or geographical area of operations that has been disposed of or is held for sale or distribution, or is a subsidiary acquired exclusively with a view to resale. Classification as a discontinued operation occurs upon disposal or when the operation meets the criteria to be classified as held for sale, if earlier. When an operation is classified as a discontinued operation, the comparative statement of comprehensive income is re-presented as if the operation had been discontinued from the start of the comparative year. (e) Exploration and evaluation expenditure Exploration and evaluation expenditure encompasses expenditures incurred by the Group in connection with the exploration for and evaluation of mineral resources before the technical feasibility and commercial viability of extracting a mineral resource are demonstrable. Exploration and evaluation expenditure incurred by the Group is accumulated for each area of interest and recorded as an asset if:
(i) the rights to tenure of the area of interest are current; and (ii) at least one of the following conditions is also met:
(1) the exploration and evaluation expenditures are expected to be recouped through successful development and exploitation of the area of interest, or alternatively, by its sale; and/or
(2) exploration and evaluation activities in the area of interest have not at the reporting date reached a stage which permits a reasonable assessment of the existence or otherwise of economically recoverable reserves, and active and significant operations in, or in relation to, the area of interest are continuing.
For each area of interest, expenditure incurred in the acquisition of rights to explore is capitalised and recognised as an exploration and evaluation asset. Exploration and evaluation assets are measured at cost at recognition. Capitalised exploration costs are reviewed each reporting date to establish whether an indication of impairment exists. If any such indication exists, the recoverable amount of the capitalised exploration costs is estimated to determine the extent of the impairment loss (if any).
INDO MINES LIMITED ANNUAL FINANCIAL REPORT 2014
NOTES TO AND FORMING PART OF THE FINANCIAL STATEMENTS
Page 22
1. STATEMENT OF SIGNIFICANT ACCOUNTING POLICIES (continued) (e) Exploration and evaluation (continued) Where a decision is made to proceed with development, accumulated expenditure is tested for impairment and transferred to development properties, and then amortised over the life of the reserves associated with the area of interest once mining operations have commenced.
Recoverability of the carrying amount of the exploration and evaluation assets is dependent on successful development and commercial exploitation, or alternatively, sale of the respective areas of interest. (f) Mining rights and amortisation Mining rights and other intangible assets that are acquired by the Group and have finite useful lives are measured at cost less accumulated amortisation and accumulated impairment losses.
Subsequent expenditure
Subsequent expenditure is capitalised only when it increases the future economic benefits embodied in the specific asset to which it relates. All other expenditure, including expenditure on internally generated goodwill and brands, is recognised in profit or loss as incurred.
Amortisation
Amortisation is calculated over the cost of the asset, or another amount substituted for cost, less its residual value. Amortisation is recognised in profit or loss on a straight-line basis over the estimated useful lives of intangible assets, other than goodwill, from the date that they are available for use, since this most closely reflects the expected pattern of consumption of the future economic benefits embodied in the asset.
Amortisation methods, useful lives and residual values are reviewed at each financial year-end and adjusted if appropriate. (g) Revenue Recognition Revenue from the sale of goods in the course of ordinary activities is measured at the fair value of the consideration received or receivable, net of returns, trade discounts and volume rebates. Revenue is recognised when persuasive evidence exists, usually in the form of an executed sales agreement, that the significant risks and rewards of ownership have been transferred to the customer, recovery of the consideration is probable, the associated costs and possible return of goods can be estimated reliably, there is no continuing management involvement with the goods, and the amount of revenue can be measured reliably. (h) Income Tax The income tax expense or revenue for the period is the tax payable on the current period’s taxable income based on the national income tax rate for each jurisdiction adjusted by changes in deferred tax assets and liabilities attributable to temporary differences between the tax bases of assets and liabilities and their carrying amounts in the financial statements, and to unused tax losses. Deferred tax assets and liabilities are recognised for temporary differences at the tax rates expected to apply when the assets are recovered or liabilities are settled, based on those tax rates which are enacted or substantively enacted for each jurisdiction. The relevant tax rates are applied to the cumulative amounts of deductible and taxable temporary differences to measure the deferred tax asset or liability. An exception is made for certain temporary differences arising from the initial recognition of an asset or a liability. No deferred tax asset or liability is recognised in relation to these temporary differences if they arose in a transaction, other than a business combination, that at the time of the transaction did not affect either accounting profit or taxable profit or loss. Deferred tax assets are recognised for deductible temporary differences and unused tax losses only if it is probable that future taxable amounts will be available to utilise those temporary differences and losses.
INDO MINES LIMITED ANNUAL FINANCIAL REPORT 2014
NOTES TO AND FORMING PART OF THE FINANCIAL STATEMENTS
Page 23
1. STATEMENT OF SIGNIFICANT ACCOUNTING POLICIES (continued) (h) Income Tax (continued) Deferred tax liabilities and assets are not recognised for temporary differences between the carrying amount and tax bases of investments in controlled entities where the parent entity is able to control the timing of the reversal of the temporary differences and it is probable that the differences will not reverse in the foreseeable future. Current and deferred tax balances attributable to amounts recognised directly in equity are also recognised directly in equity. Indo Mines and its wholly-owned Australian subsidiaries have formed an income tax consolidated group under the tax consolidation regime. Each entity in the group recognises its own current and deferred tax liabilities, except for any deferred tax assets resulting from unused tax losses and tax credits, which are immediately assumed by the Company. The current tax liability of each group entity is then subsequently assumed by the Company. The group notified the Australian Tax Office that it had formed an income tax consolidated group from 1 July 2008. (i) Impairment of Non-Financial Assets Assets that have an indefinite useful life are not subject to amortisation and are tested annually for impairment. Assets that are subject to amortisation are reviewed for impairment whenever events or changes in circumstances indicate that the carrying amount may not be recoverable. An impairment loss is recognised for the amount by which the asset’s carrying amount exceeds its recoverable amount. The recoverable amount is the higher of an asset’s fair value less costs to sell and value in use. For the purposes of assessing impairment, assets are grouped at the lowest levels for which there are separately identifiable cash flows (cash generating units). (j) Cash and Cash Equivalents Cash and cash equivalents includes cash on hand, deposits held at call with financial institutions and other short-term highly liquid investments that are readily convertible to known amounts of cash (maturities of three months or less) and which are subject to an insignificant risk of changes in value. Bank overdrafts are shown within borrowings in current liabilities on the balance sheet. Restricted cash and cash equivalents represents deposits held with financial institutions that are held as security and are not readily convertible to cash. (k) Trade Receivables Trade receivables are recognised initially at fair value and subsequently measured at amortised cost less an allowance for doubtful debts. Trade receivables are due for settlement no more than 30 days from the date of recognition. An estimate of doubtful debts is made when collection of the full amount is no longer probable. Bad debts are written off as incurred. (l) Inventories Inventories are measured at the lower of cost and net realisable value. The cost of inventories is based on the first-in first-out principle, and includes expenditure incurred in acquiring the inventories, production or conversion costs and other costs incurred in bringing them to their existing location and condition. Net realisable value is the estimated selling price in the ordinary course of business, less the estimated costs of completion and selling expenses. (m) Property, Plant and Equipment Plant and equipment is stated at historical cost less depreciation. Historical cost includes expenditure that is directly attributable to the acquisition of the items. Subsequent costs are included in the asset’s carrying amount or recognised as a separate asset, as appropriate, only when it is probable that future economic benefits associated with the item will flow to the Group and the cost of the item can be measured reliably. All other repairs and maintenance are charged to the income statement during the financial period in which they are incurred.
INDO MINES LIMITED ANNUAL FINANCIAL REPORT 2014
NOTES TO AND FORMING PART OF THE FINANCIAL STATEMENTS
Page 24
1. STATEMENT OF SIGNIFICANT ACCOUNTING POLICIES (continued) (m) Property, Plant and Equipment (continued) Plant and equipment are depreciated or amortised on a straight line basis at rates based upon their expected useful lives as follows:
Life (years)
Buildings Machinery Office equipment
4-10 8-16
4 The assets’ residual values and useful lives are reviewed, and adjusted if appropriate, at each balance sheet date. Gains and losses on disposals are determined by comparing proceeds with carrying amount. These are included in the income statement. (n) Fair value estimation The fair value of financial instruments traded in active markets (such as publicly traded derivatives, and trading and equity securities) is based on quoted market prices at the balance sheet date. The quoted market price used for financial assets held by the Group is the current bid price; the appropriate quoted market price for financial liabilities is the current ask price. The fair value of financial instruments that are not traded in an active market (for example, over the counter derivatives) is determined using valuation techniques. The Group uses a variety of methods and makes assumptions that are based on market conditions existing at each balance date. Quoted market prices or dealer quotes for similar instruments are used for long-term debt instruments held. Other techniques, such as discounted cash flows, are used to determine fair value for the remaining financial instruments. The fair value of interest-rate swaps is calculated as the present value of the estimated future cash flows. The fair value of forward exchange contracts is determined using forward exchange market rates at the balance sheet date. (o) Investments and Other Financial Assets The Group classifies its investments in the following categories: financial assets at fair value through profit or loss, loans and receivables, held-to-maturity investments, and available-for-sale financial assets. The classification depends on the purpose for which the investments were acquired. Management determines the classification of its investments at initial recognition and re-evaluates this designation at each reporting date. Financial assets at fair value through profit or loss are acquired for the purpose of selling in the short term with the intention of making a profit. Fair value movements are recognised in profit or loss. The fair values of quoted investments are based on current bid prices. If the market for a financial asset is not active (and for unlisted securities), the Group establishes fair value by using valuation techniques. These include reference to the fair values of recent arm’s length transactions, involving the same instruments or other instruments that are substantially the same, discounted cash flow analysis, and option pricing models. The Group assesses at each balance date whether there is objective evidence that a financial asset or group of financial assets is impaired. In the case of equity securities classified as available-for-sale, a significant or prolonged decline in the fair value of a security below its cost is considered in determining whether the security is impaired. If any such evidence exists for available-for-sale financial assets, the cumulative loss – measured as the difference between the acquisition cost and the current fair value, less any impairment loss on that financial asset previously recognised in profit and loss – is removed from equity and recognised in the income statement. Impairment losses recognised in the income statement on equity instruments are not reversed through the income statement. (p) Trade and Other Payables
Liabilities for trade creditors and other amounts are carried at cost which is the fair value of the consideration to be paid in the future for goods and services received, whether or not billed to the consolidated entity. The amounts are unsecured and are usually paid within 30 days. Payables to related parties are carried at the principal amount.
INDO MINES LIMITED ANNUAL FINANCIAL REPORT 2014
NOTES TO AND FORMING PART OF THE FINANCIAL STATEMENTS
Page 25
1. STATEMENT OF SIGNIFICANT ACCOUNTING POLICIES (continued) (q) Employee Benefits (i) Short term benefits Liabilities for wages and salaries, including non-monetary benefits and annual leave expected to be settled within twelve months of the reporting date are recognised in provisions in respect of employees’ services up to the reporting date and are measured at the amounts expected to be paid when the liabilities are settled. Liabilities for non-accumulating sick leave are recognised when the leave is taken and measured at the rates paid or payable. Employee benefits payable later than one year are measured at the present value of the estimated future cash flows to be made for those benefits. (ii) Defined contribution plans A defined contribution plan is a post-employment benefit plan under which an entity pays fixed contributions into a separate entity and will have no legal or constructive obligation to pay further amounts. Obligations for contributions to defined contribution plans are recognised as an employee benefit expense in profit or loss in the periods during which services are rendered by employees. Prepaid contributions are recognised as an asset to the extent that a cash refund or a reduction in future payments is available. Contributions to a defined contribution plan that are due more than 12 months after the end of the period in which the employees render the service are discounted to their present value. (iii) Defined benefit obligation The Indonesian subsidiary is required to provide minimum benefits as stipulated in government labour law regulations. Since the regulations establish the formula for determining the minimum amount of benefits, in substance the pension obligation under the regulations represent a defined benefit obligation. In determining the estimated employee benefit obligations, the subsidiary determines the present value of the defined benefit obligation, current service costs and past service cost using the ‘Project Unit Credit’ actuarial valuation method, with actuarial gains or losses recognised in other comprehensive income. (r) Issued Capital Ordinary shares are classified as equity. Issued and paid up capital is recognised at the fair value of the consideration received by the Company. Incremental costs directly attributable to the issue of new shares or options are shown in equity as a deduction, net of tax, from the proceeds. (s) Dividends Provision is made for the amount of any dividend declared on or before the end of the year but not distributed at balance date. (t) Earnings per Share Basic earnings per share is calculated by dividing the profit/loss attributable to equity holders of the Company, excluding any costs of servicing equity other than ordinary shares, by the weighted average number of ordinary shares outstanding during the year, adjusted for bonus elements in ordinary shares issued during the year. Diluted earnings per share adjusts the figures used in the determination of basic earnings/loss per share to take into account the after tax effect of interest and other financing costs associated with dilutive potential ordinary shares and the weighted average number of shares assumed to have been issued for no consideration in relation to dilutive potential ordinary shares.
INDO MINES LIMITED ANNUAL FINANCIAL REPORT 2014
NOTES TO AND FORMING PART OF THE FINANCIAL STATEMENTS
Page 26
1. STATEMENT OF SIGNIFICANT ACCOUNTING POLICIES (continued) (u) Share-Based Payments The grant date fair value of share-based payment awards granted to employees is recognised as an employee expense, with a corresponding increase in equity, over the period that the employees unconditionally become entitled to the awards. The amount recognised as an expense is adjusted to reflect the number of awards for which the related service and non-market vesting conditions are expected to be met, such that the amount ultimately recognised as an expense is based on the number of awards that do not meet the related service and non-market performance conditions at the vesting date. For share-based payment awards with non-vesting conditions, the grant date fair value of the share-based payment is measured to reflect such conditions and there is no true-up for differences between expected and actual outcomes. Share-based payment arrangements in which the Group receives goods or services as consideration for its own equity instruments are accounted for as equity-settled share-based payment transactions, regardless of how the equity instruments are obtained by the Group. (v) Goods and Services Tax
Revenues, expenses and assets are recognised net of the amount of GST except:
• where the GST incurred on a purchase of goods and services is not recoverable from the taxation authority, in which case the GST is recognised as part of the cost of acquisition of the asset or as part of the expense item as applicable; and
• receivables and payables are stated with the amount of GST included.
The net amount of GST recoverable from, or payable to, the taxation authority is included as part of receivables or payables in the balance sheet. Cash flows are included in the Cash Flow Statement on a gross basis and the GST component of cash flows arising from investing and financing activities, which is recoverable from, or payable to, the taxation authority are classified as operating cash flows. (w) Segment Reporting An operating segment is a component of the Group that engages in business activities from which it may earn revenues and incur expenses, including revenues and expenses that relate to transactions with any of the Group’s other components. All operating segments’ operating results are regularly reviewed by the chief operating decision maker to make decisions about resources to be allocated to the segment and assess its performance, and for which discrete financial information is available. Segment results that are reported include items directly attributable to a segment as well as those that can be allocated on a reasonable basis. Segment capital expenditure is the total cost incurred during the period to acquire property, plant and equipment, and intangible assets other than goodwill. (x) Finance income and finance costs Finance income comprises interest income on funds invested (including available-for-sale financial assets), dividend income, gains on the disposal of available-for-sale financial assets, changes in the fair value of financial assets and liabilities at fair value through profit or loss, and gains on hedging instruments that are recognised in profit or loss. Interest income is recognised as it accrues in profit or loss, using the effective interest method. Dividend income is recognised in profit or loss on the date that the Group’s right to receive payment is established, which in the case of quoted securities is the ex-dividend date. Finance costs comprise interest expense on borrowings, unwinding of the discount on provisions, dividends on preference shares classified as liabilities, changes in the fair value of financial assets at fair value through profit or loss, impairment losses recognised on financial assets, and losses on hedging instruments that are recognised in profit or loss. Borrowing costs that are not directly attributable to the acquisition, construction or production of a qualifying asset are recognised in profit or loss using the effective interest method.
INDO MINES LIMITED ANNUAL FINANCIAL REPORT 2014
NOTES TO AND FORMING PART OF THE FINANCIAL STATEMENTS
Page 27
1. STATEMENT OF SIGNIFICANT ACCOUNTING POLICIES (continued) (x) Finance income and finance costs (continued) Foreign currency gains and losses are reported on a net basis. (y) Foreign Currency Both the functional and presentation currency of Indo Mines at 30 June 2014 was Australian Dollars. The following table sets out the functional currency of the subsidiary (unless dormant) of the Group: Company Name Functional Currency PT Jogja Magasa Iron Indonesian Rupiah PT Kanlubang Bara Utama Indonesian Rupiah Each entity in the Group determines its own functional currency and items included in the financial statements of each entity are measured using that functional currency. Transactions in foreign currencies are initially recorded in the functional currency at the exchange rates ruling at the date of the transaction. Monetary assets and liabilities denominated in foreign currencies are retranslated at the rate of exchange ruling at the balance sheet date. All exchange differences in the consolidated financial report are taken to the income statement with the exception of differences in foreign currency borrowings that provide a hedge against a net investment in a foreign entity. These are taken directly to equity until the disposal of the net investment, at which time they are recognised in the income statement. Tax charges and tax credits attributable to exchange differences on those borrowings are also recognised in equity. Non-monetary items that are measured in terms of historical cost in a foreign currency are translated using the exchange rate as at the date of the initial transaction. Non-monetary items that are measured at fair value in a foreign currency are translated using the exchange rates at the date when the fair value was determined. Where the functional currency of a subsidiary of Indo Mines is not Australian Dollars the assets and liabilities of the subsidiary at reporting date are translated into the presentation currency of Indo Mines at the rate of exchange ruling at the balance sheet date and the income statements are translated by applying the average exchange rate for the year. Any exchange differences arising on this retranslation are taken directly to a separate component of equity. On disposal of a foreign entity, the deferred cumulative amount recognised in equity and relating to that particular foreign operation is recognised in the Statement of Comprehensive Income. (z) Impairment of financial assets (including receivables) A financial asset not carried at fair value through profit or loss is assessed at each reporting date to determine whether there is objective evidence that it is impaired. A financial asset is impaired if objective evidence indicates that a loss event has occurred after the initial recognition of the asset, and that the loss event had a negative effect on the estimated future cash flows of that asset that can be estimated reliably. Objective evidence that financial assets (including equity securities) are impaired can include default or delinquency by a debtor, restructuring of an amount due to the Group on terms that the Group would not consider otherwise, indications that a debtor or issuer will enter bankruptcy, the disappearance of an active market for a security. In addition, for an investment in an equity security, a significant or prolonged decline in its fair value below its cost is objective evidence of impairment. The Group considers evidence of impairment for receivables and held-to-maturity investment securities at both a specific asset and collective level. All individually significant receivables and held-to-maturity investment securities are assessed for specific impairment. All individually significant receivables and held-to-maturity investment securities found not to be specifically impaired are then collectively assessed for any impairment that has been incurred but not yet identified. Receivables and held-to-maturity investment securities that are not individually significant are collectively assessed for impairment by grouping together receivables and held-to-maturity investment securities with similar risk characteristics. In assessing collective impairment the Group uses historical trends of the probability of default, timing of recoveries and the amount of loss incurred, adjusted for management’s judgement as to whether current economic and credit conditions are such that the actual losses are likely to be greater or less than suggested by historical trends.
INDO MINES LIMITED ANNUAL FINANCIAL REPORT 2014
NOTES TO AND FORMING PART OF THE FINANCIAL STATEMENTS
Page 28
1. STATEMENT OF SIGNIFICANT ACCOUNTING POLICIES (continued) (z) Impairment of financial assets (including receivables) (continued) An impairment loss in respect of a financial asset measured at amortised cost is calculated as the difference between its carrying amount and the present value of the estimated future cash flows discounted at the asset’s original effective interest rate. Losses are recognised in profit or loss and reflected in an allowance account against receivables. Interest on the impaired asset continues to be recognised through the unwinding of the discount. When a subsequent event causes the amount of impairment loss to decrease, the decrease in impairment loss is reversed through profit or loss. Impairment losses on available-for-sale investment securities are recognised by transferring the cumulative loss that has been recognised in other comprehensive income, and presented in the fair value reserve in equity, to profit or loss. The cumulative loss that is removed from other comprehensive income and recognised in profit or loss is the difference between the acquisition cost, net of any principal repayment and amortisation, and the current fair value, less any impairment loss previously recognised in profit or loss. Changes in impairment provisions attributable to time value are reflected as a component of interest income. If, in a subsequent period, the fair value of an impaired available-for-sale debt security increases and the increase can be related objectively to an event occurring after the impairment loss was recognised in profit or loss, then the impairment loss is reversed, with the amount of the reversal recognised in profit or loss. However, any subsequent recovery in the fair value of an impaired available-for-sale equity security is recognised in other comprehensive income. (aa) Compound financial instruments Compound financial instruments issued by the Group comprise convertible notes that can be converted to share capital at the option of the holder, and the number of shares to be issued does not vary with changes in their fair value. The liability component of a compound financial instrument is recognised initially at the fair value of a similar liability that does not have an equity conversion option. The conversion component is recognised at fair value as a liability. Subsequent to initial recognition, the liability component of a compound financial instrument is measured at amortised cost using the effective interest method. The conversion component is measured at fair value through profit and loss. Interest, dividends, losses and gains relating to the financial liability are recognised in profit or loss. Distributions to the equity holders are recognised against equity, net of any tax benefit. 2. CRITICAL ACCOUNTING ESTIMATES AND JUDGEMENTS
Estimates and judgments are continually evaluated and are based on historical experience and other factors, including expectations of future events that are believed to be reasonable under the circumstances.
a) Uses of estimates and judgements The preparation of the consolidated financial statements in conformity with AASs requires management to make judgements, estimates and assumptions that affect the application of accounting policies and the reported amounts of assets, liabilities, income and expenses. Actual results may differ from these estimates. Estimates and underlying assumptions are reviewed on an ongoing basis. Revisions to accounting estimates are recognised in the period in which the estimates are revised and in any future periods affected. Information about critical judgements in applying accounting policies that have the most significant effect on the amounts recongised in the financial statements is included in the following notes:
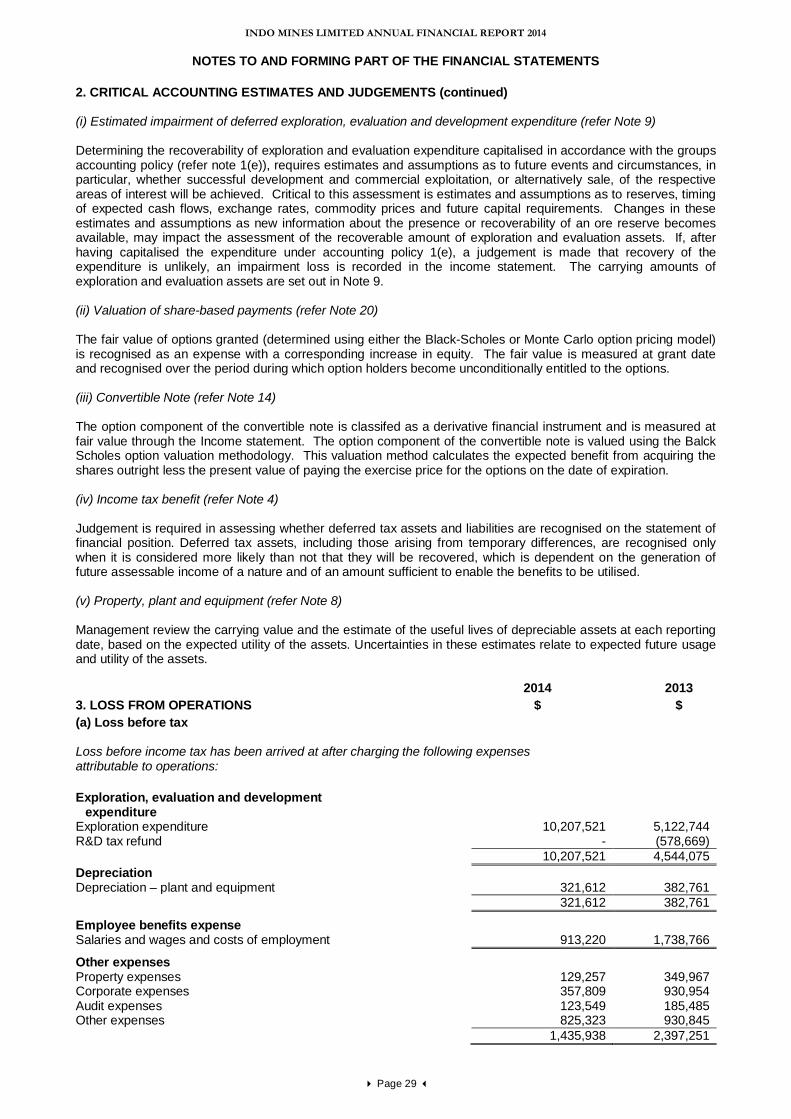
INDO MINES LIMITED ANNUAL FINANCIAL REPORT 2014
NOTES TO AND FORMING PART OF THE FINANCIAL STATEMENTS
Page 29
2. CRITICAL ACCOUNTING ESTIMATES AND JUDGEMENTS (continued) (i) Estimated impairment of deferred exploration, evaluation and development expenditure (refer Note 9) Determining the recoverability of exploration and evaluation expenditure capitalised in accordance with the groups accounting policy (refer note 1(e)), requires estimates and assumptions as to future events and circumstances, in particular, whether successful development and commercial exploitation, or alternatively sale, of the respective areas of interest will be achieved. Critical to this assessment is estimates and assumptions as to reserves, timing of expected cash flows, exchange rates, commodity prices and future capital requirements. Changes in these estimates and assumptions as new information about the presence or recoverability of an ore reserve becomes available, may impact the assessment of the recoverable amount of exploration and evaluation assets. If, after having capitalised the expenditure under accounting policy 1(e), a judgement is made that recovery of the expenditure is unlikely, an impairment loss is recorded in the income statement. The carrying amounts of exploration and evaluation assets are set out in Note 9. (ii) Valuation of share-based payments (refer Note 20) The fair value of options granted (determined using either the Black-Scholes or Monte Carlo option pricing model) is recognised as an expense with a corresponding increase in equity. The fair value is measured at grant date and recognised over the period during which option holders become unconditionally entitled to the options. (iii) Convertible Note (refer Note 14) The option component of the convertible note is classifed as a derivative financial instrument and is measured at fair value through the Income statement. The option component of the convertible note is valued using the Balck Scholes option valuation methodology. This valuation method calculates the expected benefit from acquiring the shares outright less the present value of paying the exercise price for the options on the date of expiration. (iv) Income tax benefit (refer Note 4) Judgement is required in assessing whether deferred tax assets and liabilities are recognised on the statement of financial position. Deferred tax assets, including those arising from temporary differences, are recognised only when it is considered more likely than not that they will be recovered, which is dependent on the generation of future assessable income of a nature and of an amount sufficient to enable the benefits to be utilised. (v) Property, plant and equipment (refer Note 8) Management review the carrying value and the estimate of the useful lives of depreciable assets at each reporting date, based on the expected utility of the assets. Uncertainties in these estimates relate to expected future usage and utility of the assets.
2014 2013 3. LOSS FROM OPERATIONS $ $ (a) Loss before tax Loss before income tax has been arrived at after charging the following expenses attributable to operations: Exploration, evaluation and development
expenditure
Exploration expenditure 10,207,521 5,122,744 R&D tax refund - (578,669) 10,207,521 4,544,075 Depreciation Depreciation – plant and equipment 321,612 382,761 321,612 382,761
Employee benefits expense Salaries and wages and costs of employment 913,220 1,738,766
Other expenses Property expenses 129,257 349,967 Corporate expenses 357,809 930,954 Audit expenses 123,549 185,485 Other expenses 825,323 930,845 1,435,938 2,397,251
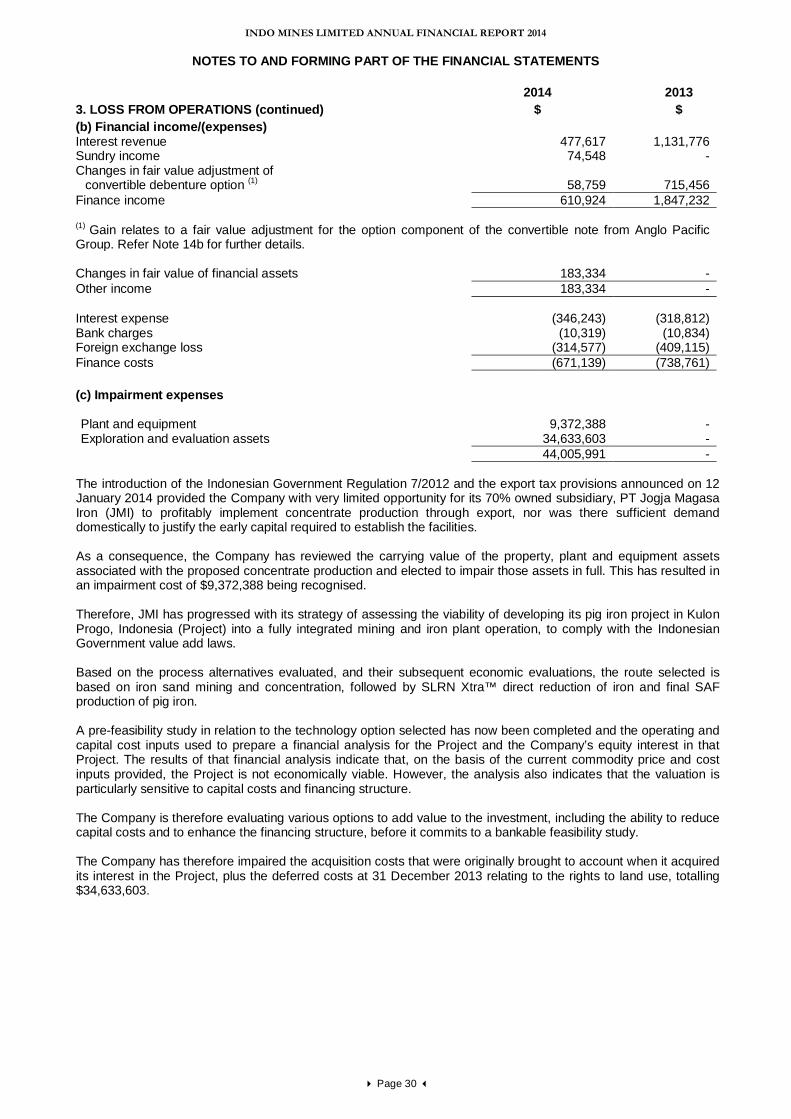
INDO MINES LIMITED ANNUAL FINANCIAL REPORT 2014
NOTES TO AND FORMING PART OF THE FINANCIAL STATEMENTS
Page 30
2014 2013 3. LOSS FROM OPERATIONS (continued) $ $ (b) Financial income/(expenses) Interest revenue 477,617 1,131,776 Sundry income 74,548 - Changes in fair value adjustment of
convertible debenture option (1) 58,759 715,456 Finance income 610,924 1,847,232 (1) Gain relates to a fair value adjustment for the option component of the convertible note from Anglo Pacific Group. Refer Note 14b for further details. Changes in fair value of financial assets 183,334 - Other income 183,334 - Interest expense (346,243) (318,812) Bank charges (10,319) (10,834) Foreign exchange loss (314,577) (409,115) Finance costs (671,139) (738,761) (c) Impairment expenses Plant and equipment 9,372,388 - Exploration and evaluation assets 34,633,603 - 44,005,991 -
The introduction of the Indonesian Government Regulation 7/2012 and the export tax provisions announced on 12 January 2014 provided the Company with very limited opportunity for its 70% owned subsidiary, PT Jogja Magasa Iron (JMI) to profitably implement concentrate production through export, nor was there sufficient demand domestically to justify the early capital required to establish the facilities. As a consequence, the Company has reviewed the carrying value of the property, plant and equipment assets associated with the proposed concentrate production and elected to impair those assets in full. This has resulted in an impairment cost of $9,372,388 being recognised. Therefore, JMI has progressed with its strategy of assessing the viability of developing its pig iron project in Kulon Progo, Indonesia (Project) into a fully integrated mining and iron plant operation, to comply with the Indonesian Government value add laws. Based on the process alternatives evaluated, and their subsequent economic evaluations, the route selected is based on iron sand mining and concentration, followed by SLRN Xtra™ direct reduction of iron and final SAF production of pig iron. A pre-feasibility study in relation to the technology option selected has now been completed and the operating and capital cost inputs used to prepare a financial analysis for the Project and the Company’s equity interest in that Project. The results of that financial analysis indicate that, on the basis of the current commodity price and cost inputs provided, the Project is not economically viable. However, the analysis also indicates that the valuation is particularly sensitive to capital costs and financing structure. The Company is therefore evaluating various options to add value to the investment, including the ability to reduce capital costs and to enhance the financing structure, before it commits to a bankable feasibility study. The Company has therefore impaired the acquisition costs that were originally brought to account when it acquired its interest in the Project, plus the deferred costs at 31 December 2013 relating to the rights to land use, totalling $34,633,603.
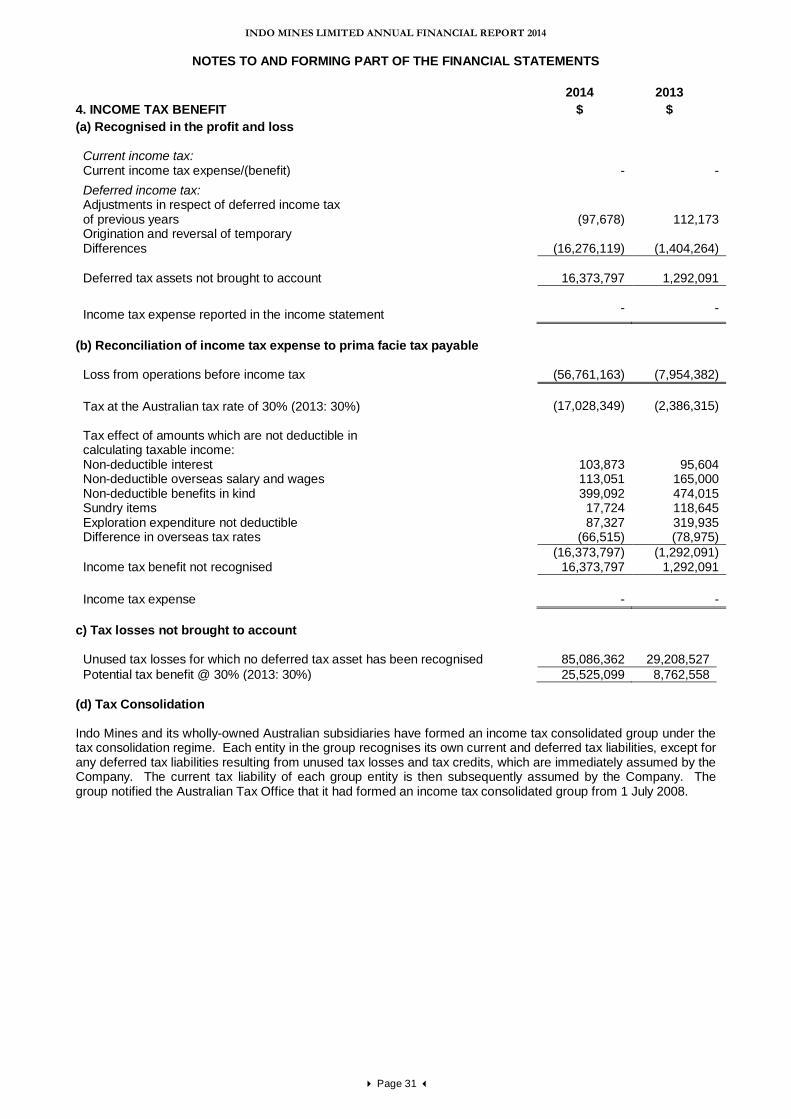
INDO MINES LIMITED ANNUAL FINANCIAL REPORT 2014
NOTES TO AND FORMING PART OF THE FINANCIAL STATEMENTS
Page 31
2014 2013 4. INCOME TAX BENEFIT $ $ (a) Recognised in the profit and loss
Current income tax: Current income tax expense/(benefit)
-
-
Deferred income tax: Adjustments in respect of deferred income tax of previous years
(97,678)
112,173
Origination and reversal of temporary Differences
(16,276,119)
(1,404,264)
Deferred tax assets not brought to account
16,373,797
1,292,091
Income tax expense reported in the income statement
-
-
(b) Reconciliation of income tax expense to prima facie tax payable
Loss from operations before income tax (56,761,163) (7,954,382)
Tax at the Australian tax rate of 30% (2013: 30%)
(17,028,349)
(2,386,315) Tax effect of amounts which are not deductible in calculating taxable income:
Non-deductible interest 103,873 95,604 Non-deductible overseas salary and wages 113,051 165,000 Non-deductible benefits in kind 399,092 474,015 Sundry items 17,724 118,645 Exploration expenditure not deductible 87,327 319,935 Difference in overseas tax rates (66,515) (78,975) (16,373,797) (1,292,091) Income tax benefit not recognised 16,373,797 1,292,091
Income tax expense - - c) Tax losses not brought to account
Unused tax losses for which no deferred tax asset has been recognised 85,086,362 29,208,527 Potential tax benefit @ 30% (2013: 30%) 25,525,099 8,762,558
(d) Tax Consolidation Indo Mines and its wholly-owned Australian subsidiaries have formed an income tax consolidated group under the tax consolidation regime. Each entity in the group recognises its own current and deferred tax liabilities, except for any deferred tax liabilities resulting from unused tax losses and tax credits, which are immediately assumed by the Company. The current tax liability of each group entity is then subsequently assumed by the Company. The group notified the Australian Tax Office that it had formed an income tax consolidated group from 1 July 2008.
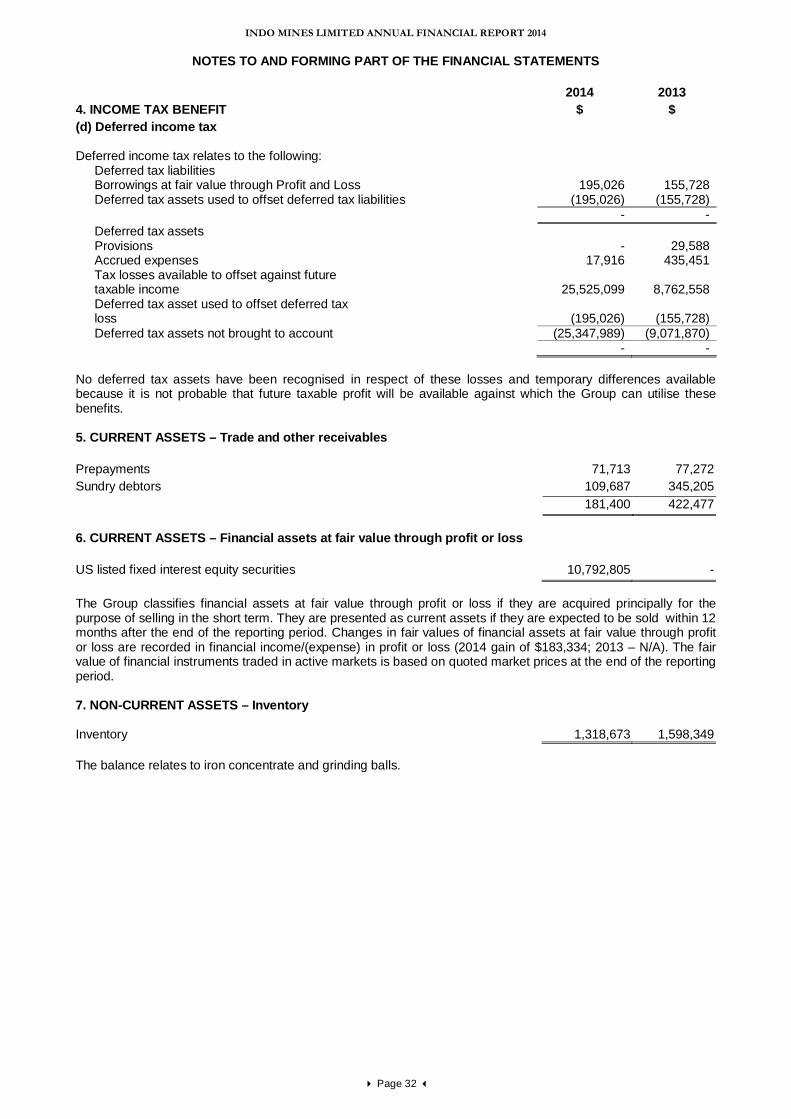
INDO MINES LIMITED ANNUAL FINANCIAL REPORT 2014
NOTES TO AND FORMING PART OF THE FINANCIAL STATEMENTS
Page 32
2014 2013 4. INCOME TAX BENEFIT $ $ (d) Deferred income tax
Deferred income tax relates to the following: Deferred tax liabilities Borrowings at fair value through Profit and Loss Deferred tax assets used to offset deferred tax liabilities
195,026 155,728 (195,026) (155,728)
- - Deferred tax assets Provisions - 29,588 Accrued expenses 17,916 435,451 Tax losses available to offset against future
taxable income 25,525,099 8,762,558 Deferred tax asset used to offset deferred tax
loss (195,026) (155,728) Deferred tax assets not brought to account (25,347,989) (9,071,870) - - No deferred tax assets have been recognised in respect of these losses and temporary differences available because it is not probable that future taxable profit will be available against which the Group can utilise these benefits. 5. CURRENT ASSETS – Trade and other receivables
Prepayments 71,713 77,272 Sundry debtors 109,687 345,205 181,400 422,477 6. CURRENT ASSETS – Financial assets at fair value through profit or loss
US listed fixed interest equity securities 10,792,805 - The Group classifies financial assets at fair value through profit or loss if they are acquired principally for the purpose of selling in the short term. They are presented as current assets if they are expected to be sold within 12 months after the end of the reporting period. Changes in fair values of financial assets at fair value through profit or loss are recorded in financial income/(expense) in profit or loss (2014 gain of $183,334; 2013 – N/A). The fair value of financial instruments traded in active markets is based on quoted market prices at the end of the reporting period. 7. NON-CURRENT ASSETS – Inventory
Inventory
1,318,673
1,598,349
The balance relates to iron concentrate and grinding balls.
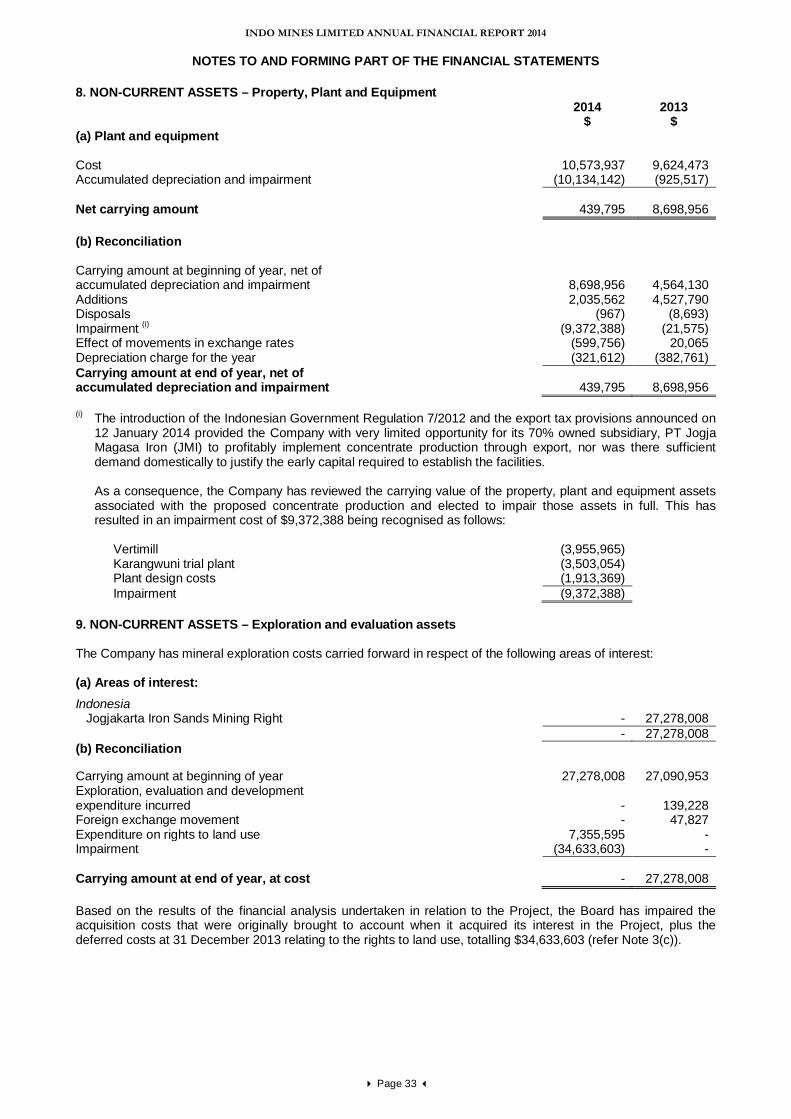
INDO MINES LIMITED ANNUAL FINANCIAL REPORT 2014
NOTES TO AND FORMING PART OF THE FINANCIAL STATEMENTS
Page 33
8. NON-CURRENT ASSETS – Property, Plant and Equipment 2014 2013 $ $ (a) Plant and equipment Cost
10,573,937
9,624,473
Accumulated depreciation and impairment (10,134,142) (925,517) Net carrying amount
439,795
8,698,956
(b) Reconciliation Carrying amount at beginning of year, net of accumulated depreciation and impairment
8,698,956
4,564,130 Additions 2,035,562 4,527,790 Disposals (967) (8,693) Impairment (i) (9,372,388) (21,575) Effect of movements in exchange rates (599,756) 20,065 Depreciation charge for the year (321,612) (382,761) Carrying amount at end of year, net of accumulated depreciation and impairment
439,795
8,698,956
(i) The introduction of the Indonesian Government Regulation 7/2012 and the export tax provisions announced on
12 January 2014 provided the Company with very limited opportunity for its 70% owned subsidiary, PT Jogja Magasa Iron (JMI) to profitably implement concentrate production through export, nor was there sufficient demand domestically to justify the early capital required to establish the facilities.
As a consequence, the Company has reviewed the carrying value of the property, plant and equipment assets associated with the proposed concentrate production and elected to impair those assets in full. This has resulted in an impairment cost of $9,372,388 being recognised as follows:
Vertimill (3,955,965) Karangwuni trial plant (3,503,054) Plant design costs (1,913,369) Impairment (9,372,388)
9. NON-CURRENT ASSETS – Exploration and evaluation assets The Company has mineral exploration costs carried forward in respect of the following areas of interest: (a) Areas of interest:
Indonesia Jogjakarta Iron Sands Mining Right - 27,278,008 - 27,278,008 (b) Reconciliation
Carrying amount at beginning of year 27,278,008 27,090,953 Exploration, evaluation and development expenditure incurred
-
139,228
Foreign exchange movement - 47,827 Expenditure on rights to land use 7,355,595 - Impairment (34,633,603) - Carrying amount at end of year, at cost
-
27,278,008
Based on the results of the financial analysis undertaken in relation to the Project, the Board has impaired the acquisition costs that were originally brought to account when it acquired its interest in the Project, plus the deferred costs at 31 December 2013 relating to the rights to land use, totalling $34,633,603 (refer Note 3(c)).
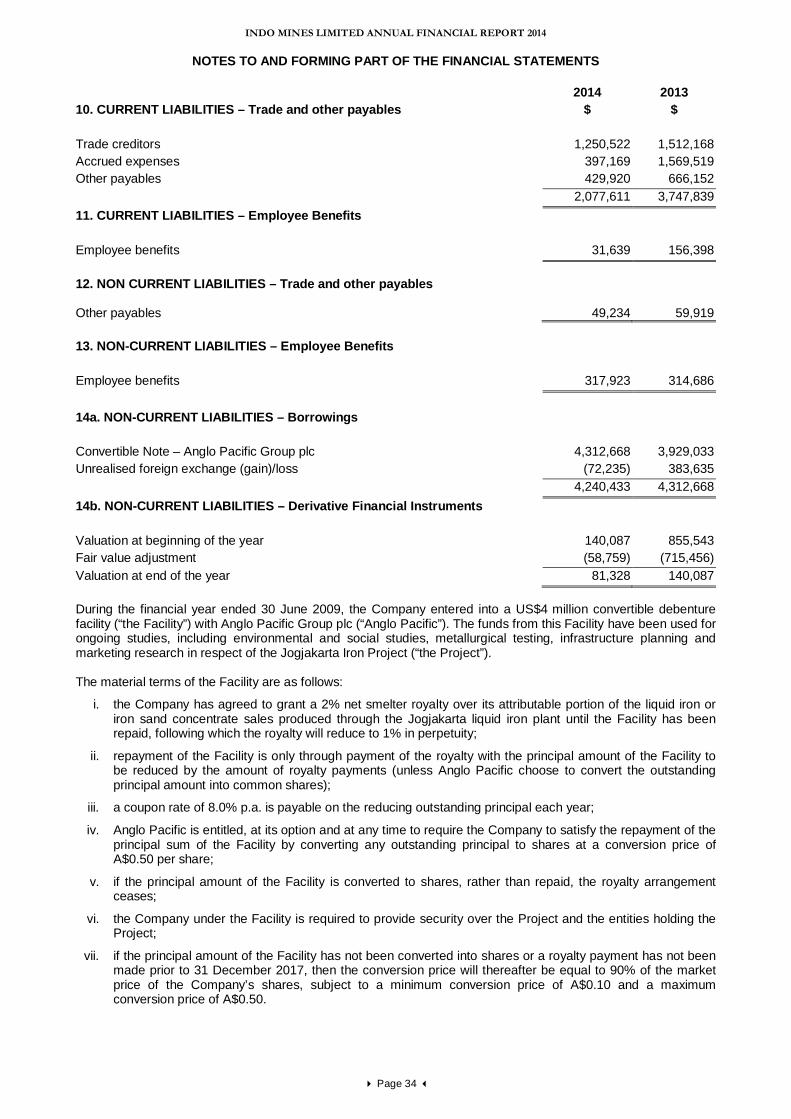
INDO MINES LIMITED ANNUAL FINANCIAL REPORT 2014
NOTES TO AND FORMING PART OF THE FINANCIAL STATEMENTS
Page 34
2014 2013 10. CURRENT LIABILITIES – Trade and other payables $ $ Trade creditors 1,250,522 1,512,168 Accrued expenses 397,169 1,569,519 Other payables 429,920 666,152 2,077,611 3,747,839 11. CURRENT LIABILITIES – Employee Benefits
Employee benefits 31,639 156,398 12. NON CURRENT LIABILITIES – Trade and other payables
Other payables
49,234
59,919
13. NON-CURRENT LIABILITIES – Employee Benefits
Employee benefits 317,923 314,686 14a. NON-CURRENT LIABILITIES – Borrowings
Convertible Note – Anglo Pacific Group plc 4,312,668 3,929,033 Unrealised foreign exchange (gain)/loss (72,235) 383,635 4,240,433 4,312,668 14b. NON-CURRENT LIABILITIES – Derivative Financial Instruments Valuation at beginning of the year 140,087 855,543 Fair value adjustment (58,759) (715,456) Valuation at end of the year 81,328 140,087 During the financial year ended 30 June 2009, the Company entered into a US$4 million convertible debenture facility (“the Facility”) with Anglo Pacific Group plc (“Anglo Pacific”). The funds from this Facility have been used for ongoing studies, including environmental and social studies, metallurgical testing, infrastructure planning and marketing research in respect of the Jogjakarta Iron Project (“the Project”). The material terms of the Facility are as follows:
i. the Company has agreed to grant a 2% net smelter royalty over its attributable portion of the liquid iron or iron sand concentrate sales produced through the Jogjakarta liquid iron plant until the Facility has been repaid, following which the royalty will reduce to 1% in perpetuity;
ii. repayment of the Facility is only through payment of the royalty with the principal amount of the Facility to be reduced by the amount of royalty payments (unless Anglo Pacific choose to convert the outstanding principal amount into common shares);
iii. a coupon rate of 8.0% p.a. is payable on the reducing outstanding principal each year;
iv. Anglo Pacific is entitled, at its option and at any time to require the Company to satisfy the repayment of the principal sum of the Facility by converting any outstanding principal to shares at a conversion price of A$0.50 per share;
v. if the principal amount of the Facility is converted to shares, rather than repaid, the royalty arrangement ceases;
vi. the Company under the Facility is required to provide security over the Project and the entities holding the Project;
vii. if the principal amount of the Facility has not been converted into shares or a royalty payment has not been made prior to 31 December 2017, then the conversion price will thereafter be equal to 90% of the market price of the Company’s shares, subject to a minimum conversion price of A$0.10 and a maximum conversion price of A$0.50.
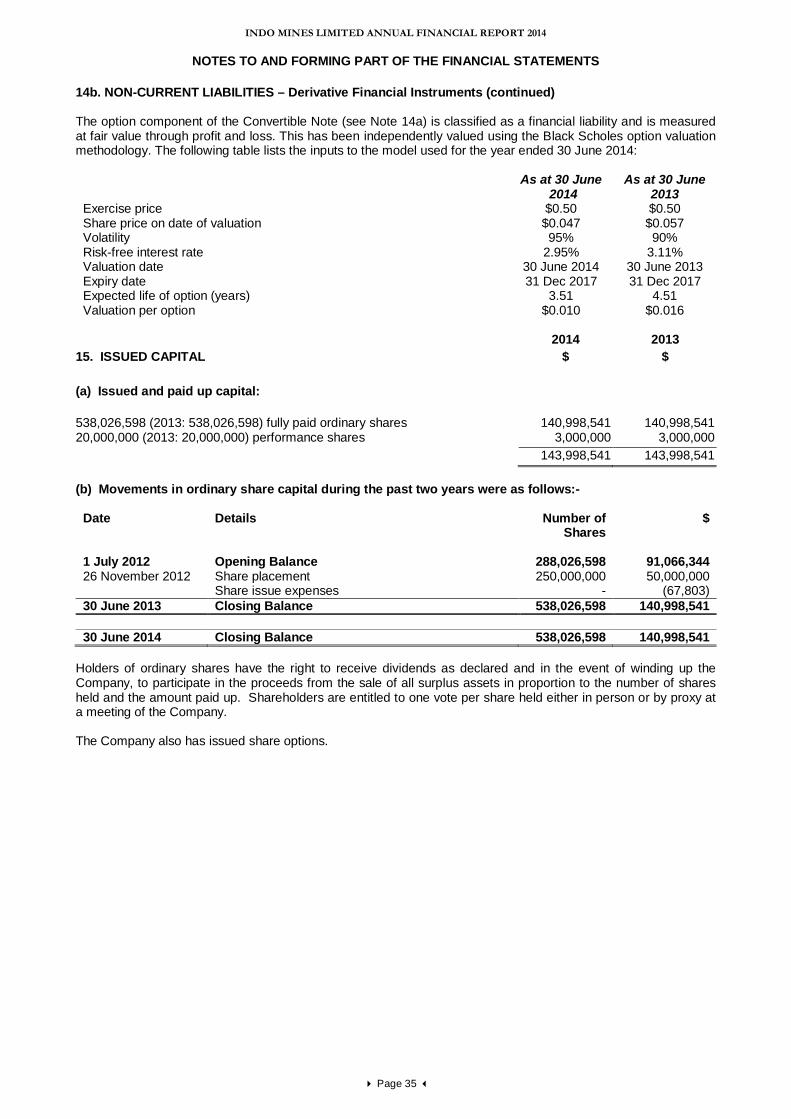
INDO MINES LIMITED ANNUAL FINANCIAL REPORT 2014
NOTES TO AND FORMING PART OF THE FINANCIAL STATEMENTS
Page 35
14b. NON-CURRENT LIABILITIES – Derivative Financial Instruments (continued) The option component of the Convertible Note (see Note 14a) is classified as a financial liability and is measured at fair value through profit and loss. This has been independently valued using the Black Scholes option valuation methodology. The following table lists the inputs to the model used for the year ended 30 June 2014:
As at 30 June 2014
As at 30 June 2013
Exercise price $0.50 $0.50 Share price on date of valuation $0.047 $0.057 Volatility 95% 90% Risk-free interest rate 2.95% 3.11% Valuation date 30 June 2014 30 June 2013 Expiry date 31 Dec 2017 31 Dec 2017 Expected life of option (years) 3.51 4.51 Valuation per option $0.010 $0.016
2014 2013 15. ISSUED CAPITAL $ $
(a) Issued and paid up capital: 538,026,598 (2013: 538,026,598) fully paid ordinary shares
140,998,541
140,998,541
20,000,000 (2013: 20,000,000) performance shares 3,000,000 3,000,000 143,998,541 143,998,541 (b) Movements in ordinary share capital during the past two years were as follows:-
Date Details Number of Shares
$
1 July 2012 Opening Balance 288,026,598 91,066,344 26 November 2012 Share placement 250,000,000 50,000,000 Share issue expenses - (67,803) 30 June 2013 Closing Balance 538,026,598 140,998,541 30 June 2014 Closing Balance 538,026,598 140,998,541
Holders of ordinary shares have the right to receive dividends as declared and in the event of winding up the Company, to participate in the proceeds from the sale of all surplus assets in proportion to the number of shares held and the amount paid up. Shareholders are entitled to one vote per share held either in person or by proxy at a meeting of the Company. The Company also has issued share options.
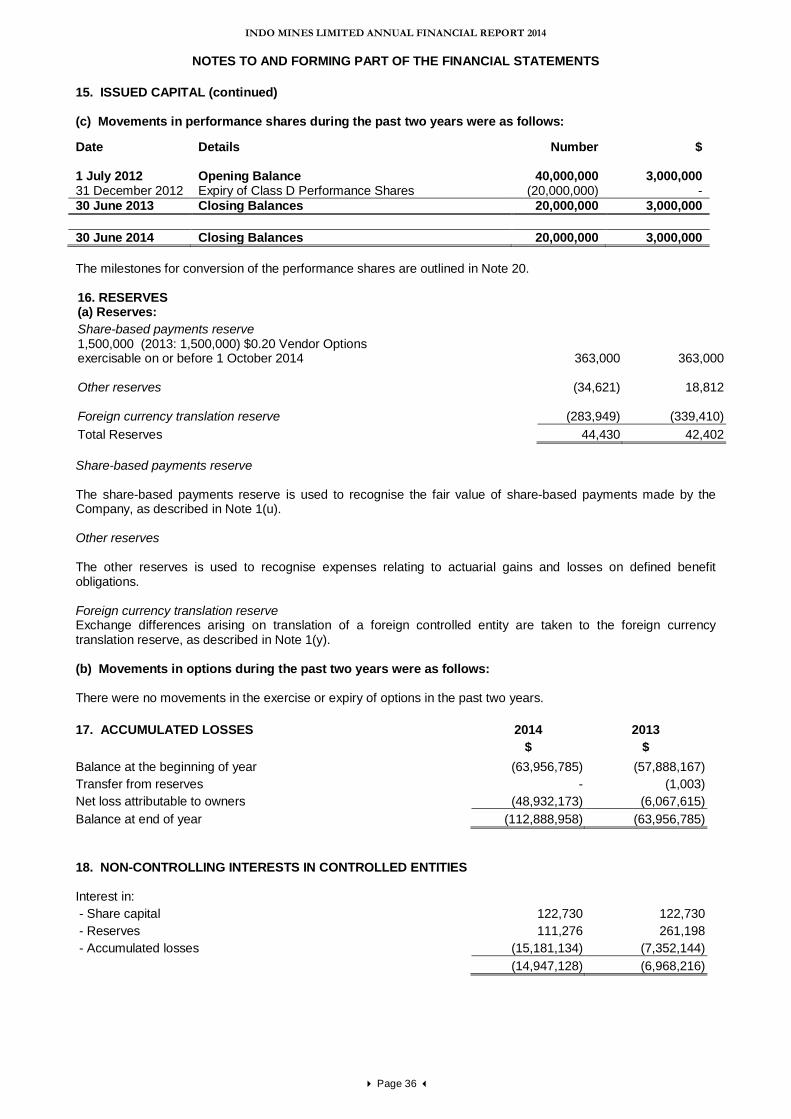
INDO MINES LIMITED ANNUAL FINANCIAL REPORT 2014
NOTES TO AND FORMING PART OF THE FINANCIAL STATEMENTS
Page 36
15. ISSUED CAPITAL (continued)
(c) Movements in performance shares during the past two years were as follows:
The milestones for conversion of the performance shares are outlined in Note 20. 16. RESERVES (a) Reserves:
Share-based payments reserve 1,500,000 (2013: 1,500,000) $0.20 Vendor Options exercisable on or before 1 October 2014 363,000 363,000 Other reserves (34,621) 18,812 Foreign currency translation reserve (283,949) (339,410) Total Reserves 44,430 42,402 Share-based payments reserve The share-based payments reserve is used to recognise the fair value of share-based payments made by the Company, as described in Note 1(u). Other reserves The other reserves is used to recognise expenses relating to actuarial gains and losses on defined benefit obligations. Foreign currency translation reserve Exchange differences arising on translation of a foreign controlled entity are taken to the foreign currency translation reserve, as described in Note 1(y). (b) Movements in options during the past two years were as follows: There were no movements in the exercise or expiry of options in the past two years. 17. ACCUMULATED LOSSES 2014 2013 $ $ Balance at the beginning of year (63,956,785) (57,888,167) Transfer from reserves - (1,003) Net loss attributable to owners (48,932,173) (6,067,615) Balance at end of year (112,888,958) (63,956,785) 18. NON-CONTROLLING INTERESTS IN CONTROLLED ENTITIES Interest in: - Share capital 122,730 122,730 - Reserves 111,276 261,198 - Accumulated losses (15,181,134) (7,352,144) (14,947,128) (6,968,216)
Date Details Number $ 1 July 2012 Opening Balance 40,000,000 3,000,000 31 December 2012 Expiry of Class D Performance Shares (20,000,000) - 30 June 2013 Closing Balances 20,000,000 3,000,000 30 June 2014 Closing Balances 20,000,000 3,000,000
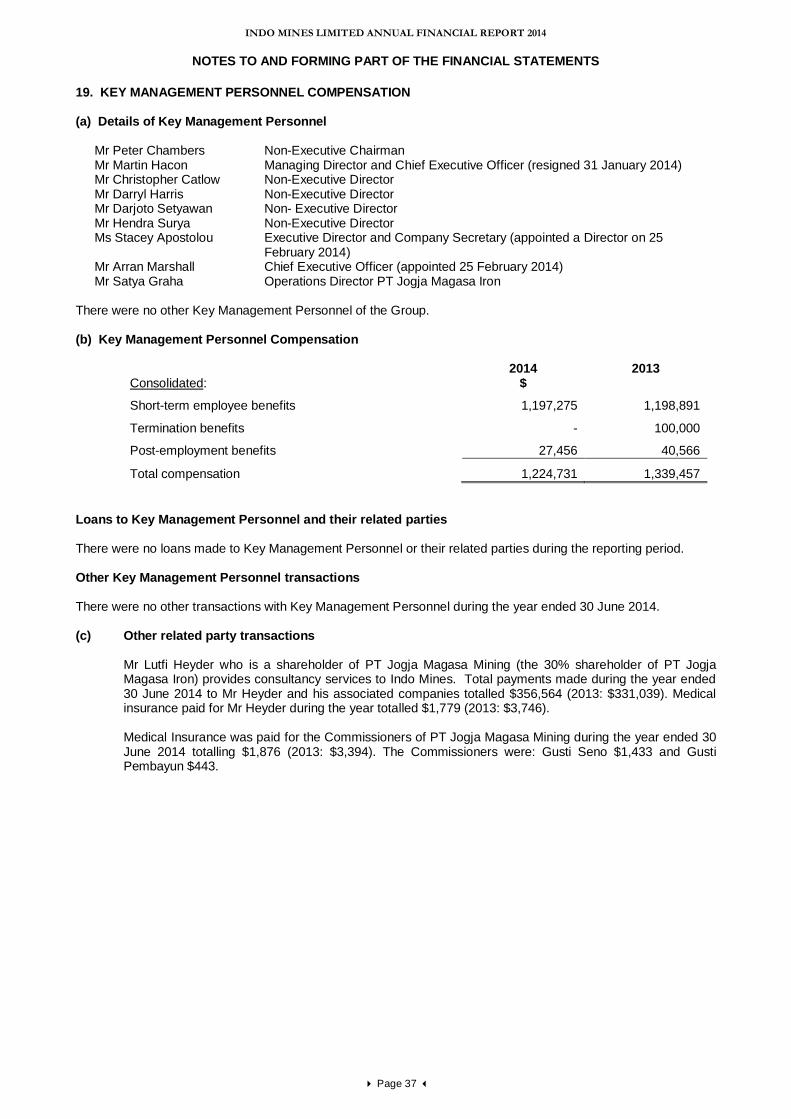
INDO MINES LIMITED ANNUAL FINANCIAL REPORT 2014
NOTES TO AND FORMING PART OF THE FINANCIAL STATEMENTS
Page 37
19. KEY MANAGEMENT PERSONNEL COMPENSATION (a) Details of Key Management Personnel
Mr Peter Chambers Non-Executive Chairman Mr Martin Hacon Managing Director and Chief Executive Officer (resigned 31 January 2014) Mr Christopher Catlow Non-Executive Director Mr Darryl Harris Non-Executive Director Mr Darjoto Setyawan Non- Executive Director Mr Hendra Surya Non-Executive Director Ms Stacey Apostolou Executive Director and Company Secretary (appointed a Director on 25
February 2014) Mr Arran Marshall Chief Executive Officer (appointed 25 February 2014) Mr Satya Graha Operations Director PT Jogja Magasa Iron
There were no other Key Management Personnel of the Group. (b) Key Management Personnel Compensation
Consolidated: 2014
$ 2013
Short-term employee benefits 1,197,275 1,198,891
Termination benefits - 100,000
Post-employment benefits 27,456 40,566
Total compensation 1,224,731 1,339,457 Loans to Key Management Personnel and their related parties There were no loans made to Key Management Personnel or their related parties during the reporting period. Other Key Management Personnel transactions There were no other transactions with Key Management Personnel during the year ended 30 June 2014. (c) Other related party transactions
Mr Lutfi Heyder who is a shareholder of PT Jogja Magasa Mining (the 30% shareholder of PT Jogja Magasa Iron) provides consultancy services to Indo Mines. Total payments made during the year ended 30 June 2014 to Mr Heyder and his associated companies totalled $356,564 (2013: $331,039). Medical insurance paid for Mr Heyder during the year totalled $1,779 (2013: $3,746). Medical Insurance was paid for the Commissioners of PT Jogja Magasa Mining during the year ended 30 June 2014 totalling $1,876 (2013: $3,394). The Commissioners were: Gusti Seno $1,433 and Gusti Pembayun $443.
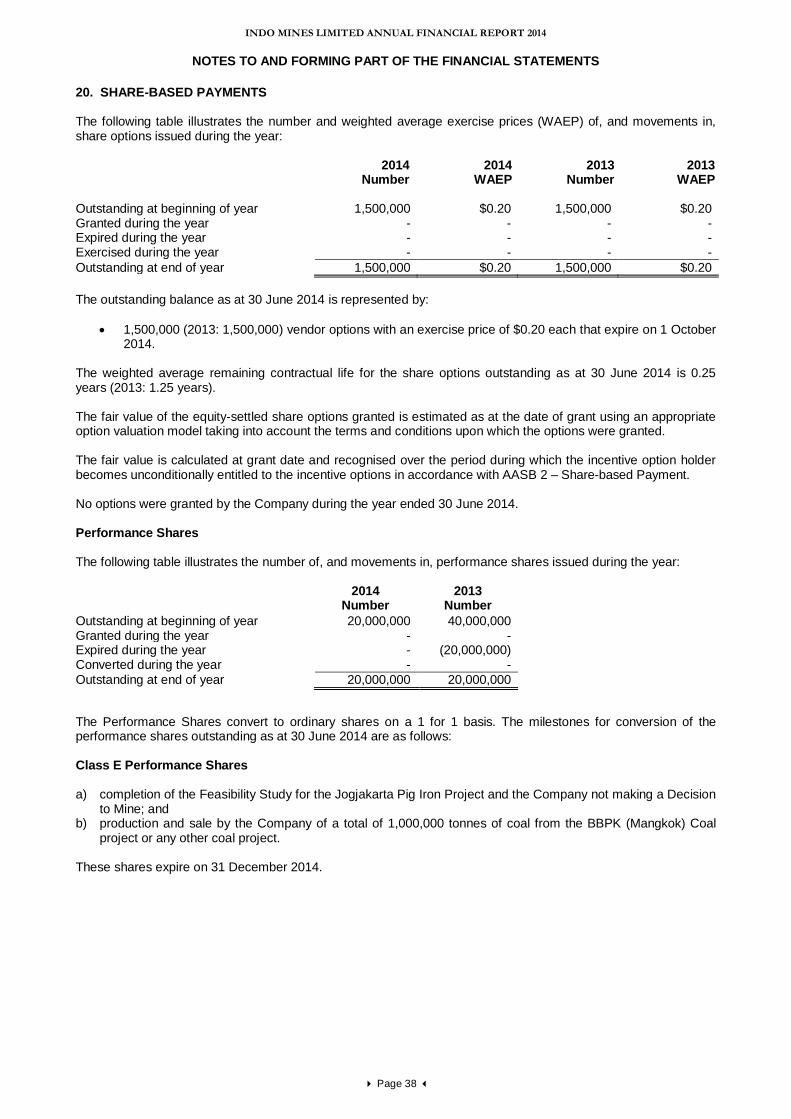
INDO MINES LIMITED ANNUAL FINANCIAL REPORT 2014
NOTES TO AND FORMING PART OF THE FINANCIAL STATEMENTS
Page 38
20. SHARE-BASED PAYMENTS The following table illustrates the number and weighted average exercise prices (WAEP) of, and movements in, share options issued during the year:
2014 2014 2013 2013 Number WAEP Number WAEP
Outstanding at beginning of year 1,500,000 $0.20 1,500,000 $0.20 Granted during the year - - - - Expired during the year - - - - Exercised during the year - - - - Outstanding at end of year 1,500,000 $0.20 1,500,000 $0.20 The outstanding balance as at 30 June 2014 is represented by:
• 1,500,000 (2013: 1,500,000) vendor options with an exercise price of $0.20 each that expire on 1 October 2014.
The weighted average remaining contractual life for the share options outstanding as at 30 June 2014 is 0.25 years (2013: 1.25 years). The fair value of the equity-settled share options granted is estimated as at the date of grant using an appropriate option valuation model taking into account the terms and conditions upon which the options were granted. The fair value is calculated at grant date and recognised over the period during which the incentive option holder becomes unconditionally entitled to the incentive options in accordance with AASB 2 – Share-based Payment. No options were granted by the Company during the year ended 30 June 2014. Performance Shares The following table illustrates the number of, and movements in, performance shares issued during the year:
2014 2013 Number Number
The Performance Shares convert to ordinary shares on a 1 for 1 basis. The milestones for conversion of the performance shares outstanding as at 30 June 2014 are as follows: Class E Performance Shares a) completion of the Feasibility Study for the Jogjakarta Pig Iron Project and the Company not making a Decision
to Mine; and b) production and sale by the Company of a total of 1,000,000 tonnes of coal from the BBPK (Mangkok) Coal
project or any other coal project. These shares expire on 31 December 2014.
Outstanding at beginning of year 20,000,000 40,000,000 Granted during the year - - Expired during the year - (20,000,000) Converted during the year - - Outstanding at end of year 20,000,000 20,000,000
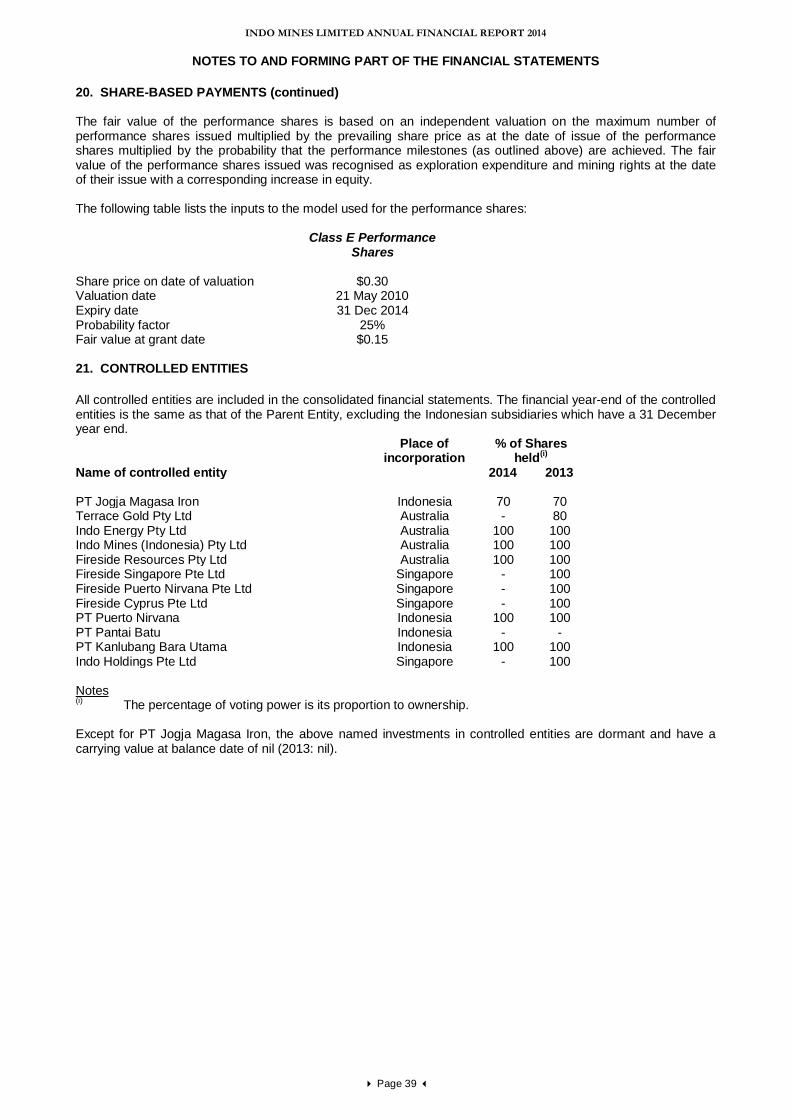
INDO MINES LIMITED ANNUAL FINANCIAL REPORT 2014
NOTES TO AND FORMING PART OF THE FINANCIAL STATEMENTS
Page 39
20. SHARE-BASED PAYMENTS (continued) The fair value of the performance shares is based on an independent valuation on the maximum number of performance shares issued multiplied by the prevailing share price as at the date of issue of the performance shares multiplied by the probability that the performance milestones (as outlined above) are achieved. The fair value of the performance shares issued was recognised as exploration expenditure and mining rights at the date of their issue with a corresponding increase in equity. The following table lists the inputs to the model used for the performance shares: Class E Performance
Shares
Share price on date of valuation $0.30 Valuation date 21 May 2010 Expiry date 31 Dec 2014 Probability factor 25% Fair value at grant date $0.15 21. CONTROLLED ENTITIES All controlled entities are included in the consolidated financial statements. The financial year-end of the controlled entities is the same as that of the Parent Entity, excluding the Indonesian subsidiaries which have a 31 December year end. Place of
incorporation % of Shares
held(i) Name of controlled entity 2014 2013 PT Jogja Magasa Iron Indonesia 70 70 Terrace Gold Pty Ltd Australia - 80 Indo Energy Pty Ltd Australia 100 100 Indo Mines (Indonesia) Pty Ltd Australia 100 100 Fireside Resources Pty Ltd Australia 100 100 Fireside Singapore Pte Ltd Singapore - 100 Fireside Puerto Nirvana Pte Ltd Singapore - 100 Fireside Cyprus Pte Ltd Singapore - 100 PT Puerto Nirvana Indonesia 100 100 PT Pantai Batu Indonesia - - PT Kanlubang Bara Utama Indonesia 100 100 Indo Holdings Pte Ltd Singapore - 100
Notes (i) The percentage of voting power is its proportion to ownership. Except for PT Jogja Magasa Iron, the above named investments in controlled entities are dormant and have a carrying value at balance date of nil (2013: nil).
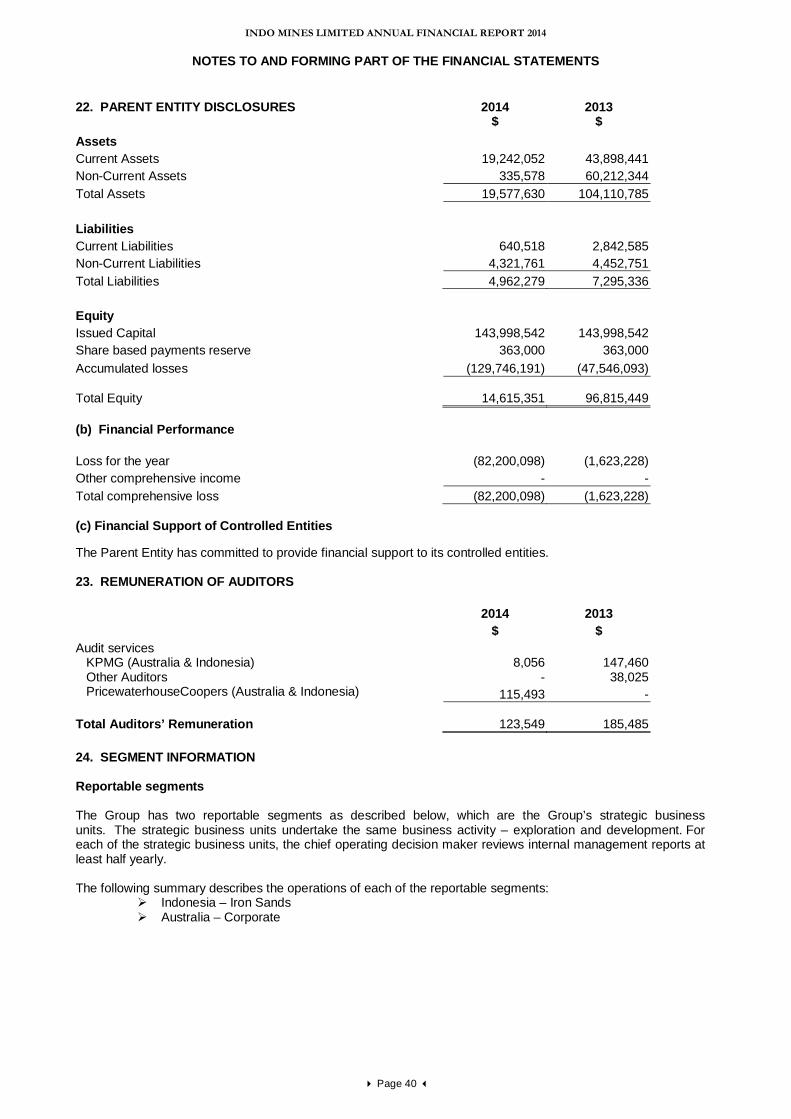
INDO MINES LIMITED ANNUAL FINANCIAL REPORT 2014
NOTES TO AND FORMING PART OF THE FINANCIAL STATEMENTS
Page 40
22. PARENT ENTITY DISCLOSURES
2014
2013
$ $ Assets Current Assets 19,242,052 43,898,441 Non-Current Assets 335,578 60,212,344 Total Assets 19,577,630 104,110,785 Liabilities Current Liabilities 640,518 2,842,585 Non-Current Liabilities 4,321,761 4,452,751 Total Liabilities 4,962,279 7,295,336 Equity Issued Capital 143,998,542 143,998,542 Share based payments reserve 363,000 363,000 Accumulated losses (129,746,191) (47,546,093) Total Equity 14,615,351 96,815,449 (b) Financial Performance Loss for the year (82,200,098) (1,623,228) Other comprehensive income - - Total comprehensive loss (82,200,098) (1,623,228) (c) Financial Support of Controlled Entities
The Parent Entity has committed to provide financial support to its controlled entities. 23. REMUNERATION OF AUDITORS
2014 2013
$ $ Audit services KPMG (Australia & Indonesia) Other Auditors
8,056
-
147,460 38,025
PricewaterhouseCoopers (Australia & Indonesia) 115,493 - Total Auditors’ Remuneration 123,549 185,485 24. SEGMENT INFORMATION
Reportable segments
The Group has two reportable segments as described below, which are the Group’s strategic business units. The strategic business units undertake the same business activity – exploration and development. For each of the strategic business units, the chief operating decision maker reviews internal management reports at least half yearly.
The following summary describes the operations of each of the reportable segments:
Indonesia – Iron Sands Australia – Corporate
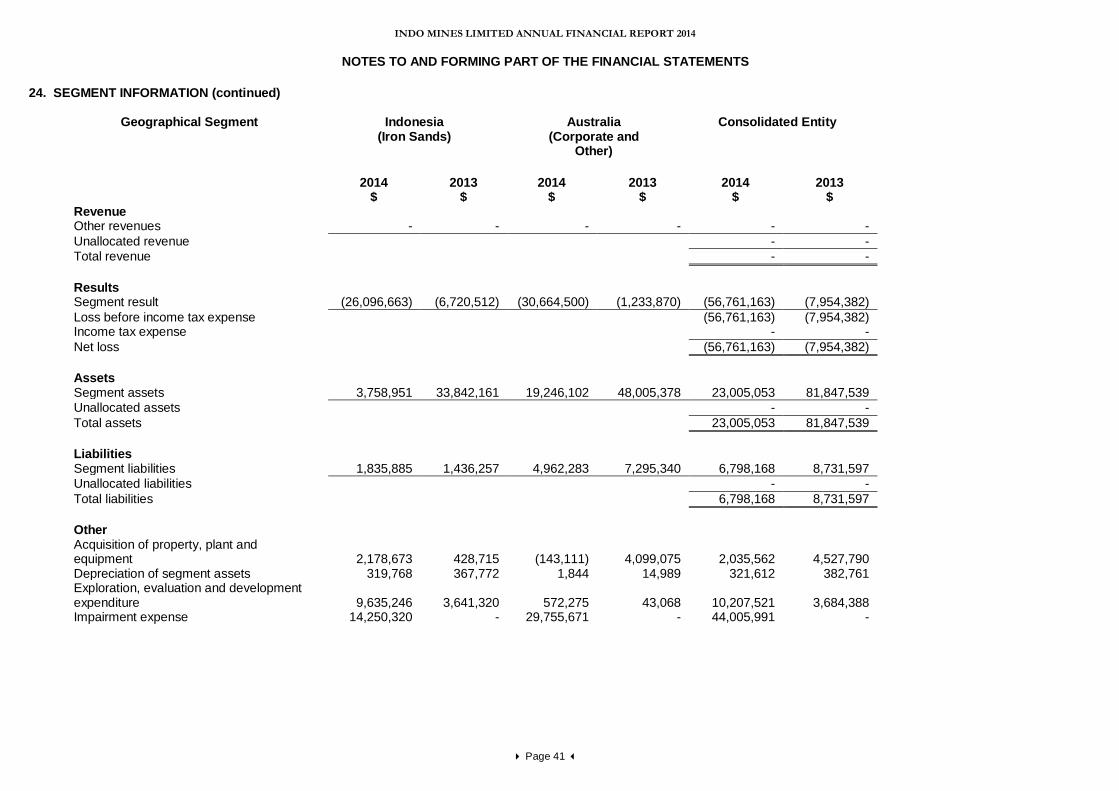
INDO MINES LIMITED ANNUAL FINANCIAL REPORT 2014
NOTES TO AND FORMING PART OF THE FINANCIAL STATEMENTS
Page 41
24. SEGMENT INFORMATION (continued)
Geographical Segment Indonesia (Iron Sands)
Australia (Corporate and
Other)
Consolidated Entity
2014 2013 2014 2013 2014 2013
$ $ $ $ $ $ Revenue Other revenues - - - - - - Unallocated revenue - - Total revenue - - Results Segment result (26,096,663) (6,720,512) (30,664,500) (1,233,870) (56,761,163) (7,954,382) Loss before income tax expense (56,761,163) (7,954,382) Income tax expense - - Net loss (56,761,163) (7,954,382) Assets Segment assets 3,758,951 33,842,161 19,246,102 48,005,378 23,005,053 81,847,539 Unallocated assets - - Total assets 23,005,053 81,847,539 Liabilities Segment liabilities 1,835,885 1,436,257 4,962,283 7,295,340 6,798,168 8,731,597 Unallocated liabilities - - Total liabilities 6,798,168 8,731,597 Other Acquisition of property, plant and equipment
2,178,673
428,715
(143,111)
4,099,075 2,035,562 4,527,790
Depreciation of segment assets 319,768 367,772 1,844 14,989 321,612 382,761 Exploration, evaluation and development expenditure
9,635,246
3,641,320
572,275
43,068
10,207,521 3,684,388
Impairment expense 14,250,320 - 29,755,671 - 44,005,991 -
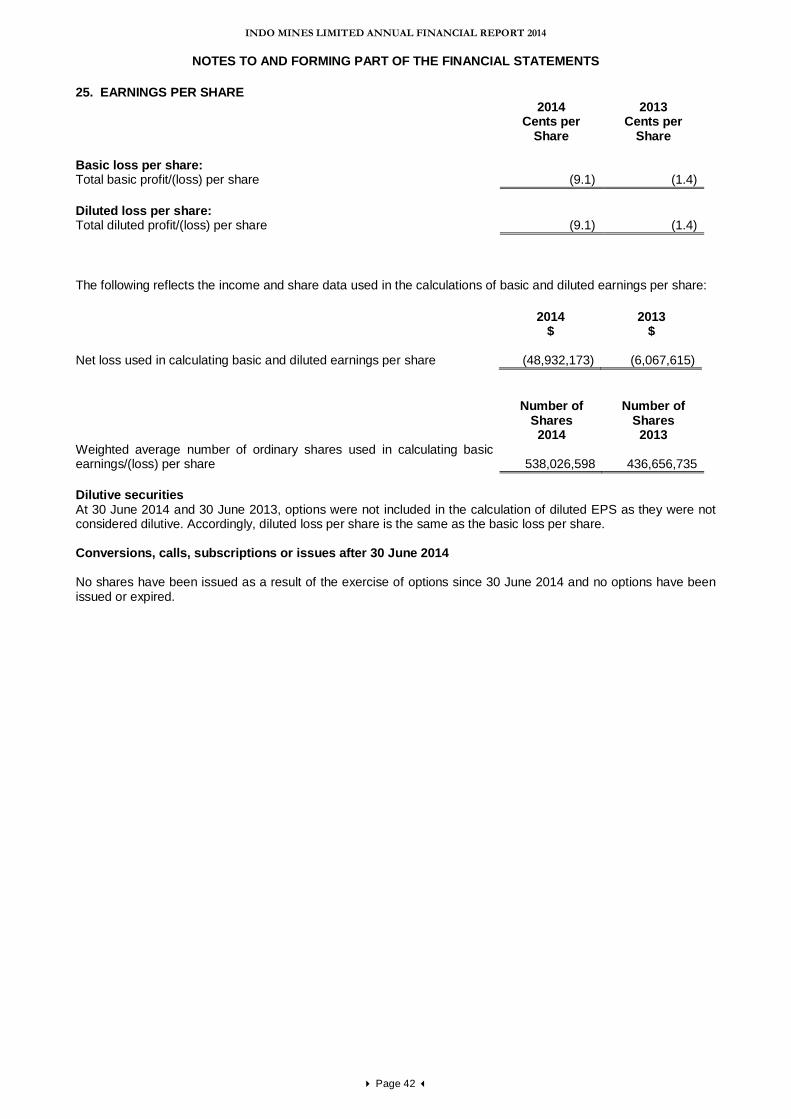
INDO MINES LIMITED ANNUAL FINANCIAL REPORT 2014
NOTES TO AND FORMING PART OF THE FINANCIAL STATEMENTS
Page 42
25. EARNINGS PER SHARE 2014
Cents per Share
2013 Cents per
Share Basic loss per share: Total basic profit/(loss) per share (9.1) (1.4) Diluted loss per share: Total diluted profit/(loss) per share (9.1) (1.4) The following reflects the income and share data used in the calculations of basic and diluted earnings per share: 2014 2013 $ $ Net loss used in calculating basic and diluted earnings per share
(48,932,173)
(6,067,615)
Number of Number of Shares Shares 2014 2013
Weighted average number of ordinary shares used in calculating basic earnings/(loss) per share
538,026,598
436,656,735
Dilutive securities At 30 June 2014 and 30 June 2013, options were not included in the calculation of diluted EPS as they were not considered dilutive. Accordingly, diluted loss per share is the same as the basic loss per share. Conversions, calls, subscriptions or issues after 30 June 2014 No shares have been issued as a result of the exercise of options since 30 June 2014 and no options have been issued or expired.
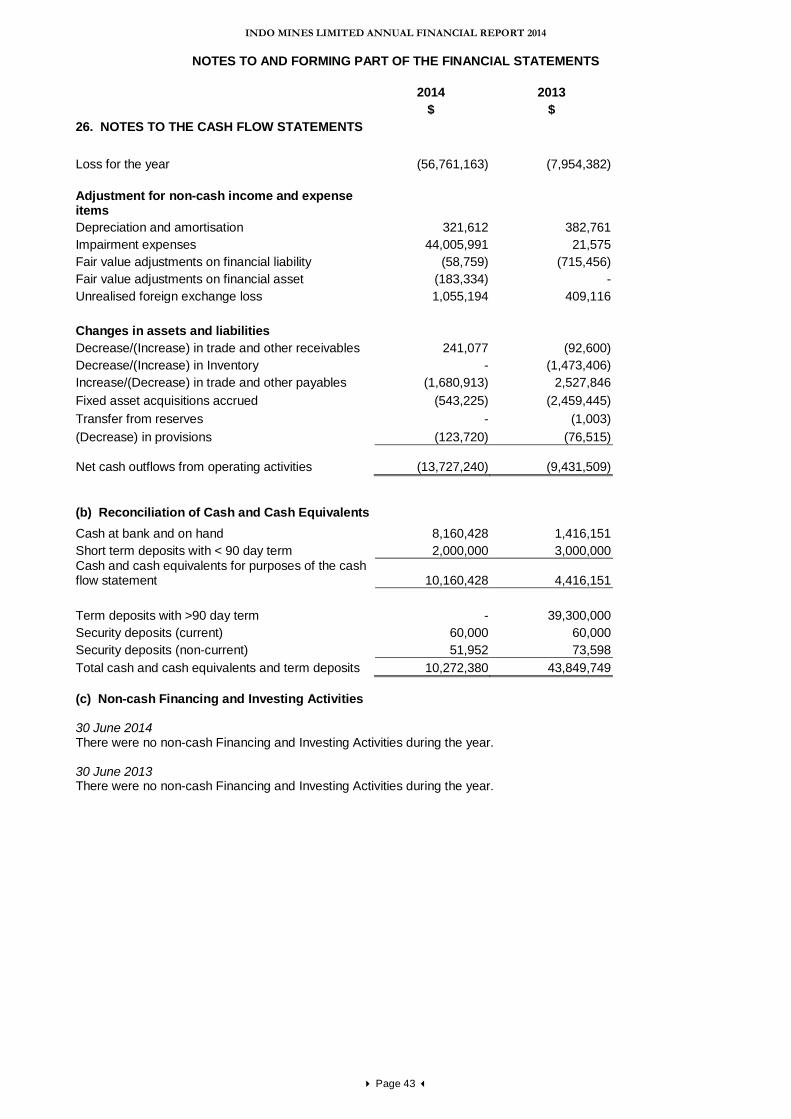
INDO MINES LIMITED ANNUAL FINANCIAL REPORT 2014
NOTES TO AND FORMING PART OF THE FINANCIAL STATEMENTS
Page 43
2014 2013 $ $ 26. NOTES TO THE CASH FLOW STATEMENTS
Loss for the year (56,761,163) (7,954,382) Adjustment for non-cash income and expense items Depreciation and amortisation 321,612 382,761 Impairment expenses 44,005,991 21,575 Fair value adjustments on financial liability (58,759) (715,456) Fair value adjustments on financial asset (183,334) - Unrealised foreign exchange loss 1,055,194 409,116 Changes in assets and liabilities Decrease/(Increase) in trade and other receivables 241,077 (92,600) Decrease/(Increase) in Inventory - (1,473,406) Increase/(Decrease) in trade and other payables (1,680,913) 2,527,846 Fixed asset acquisitions accrued (543,225) (2,459,445) Transfer from reserves - (1,003) (Decrease) in provisions (123,720) (76,515) Net cash outflows from operating activities (13,727,240) (9,431,509) (b) Reconciliation of Cash and Cash Equivalents Cash at bank and on hand 8,160,428 1,416,151 Short term deposits with < 90 day term 2,000,000 3,000,000 Cash and cash equivalents for purposes of the cash flow statement 10,160,428 4,416,151 Term deposits with >90 day term - 39,300,000 Security deposits (current) 60,000 60,000 Security deposits (non-current) 51,952 73,598 Total cash and cash equivalents and term deposits 10,272,380 43,849,749 (c) Non-cash Financing and Investing Activities 30 June 2014 There were no non-cash Financing and Investing Activities during the year. 30 June 2013 There were no non-cash Financing and Investing Activities during the year.
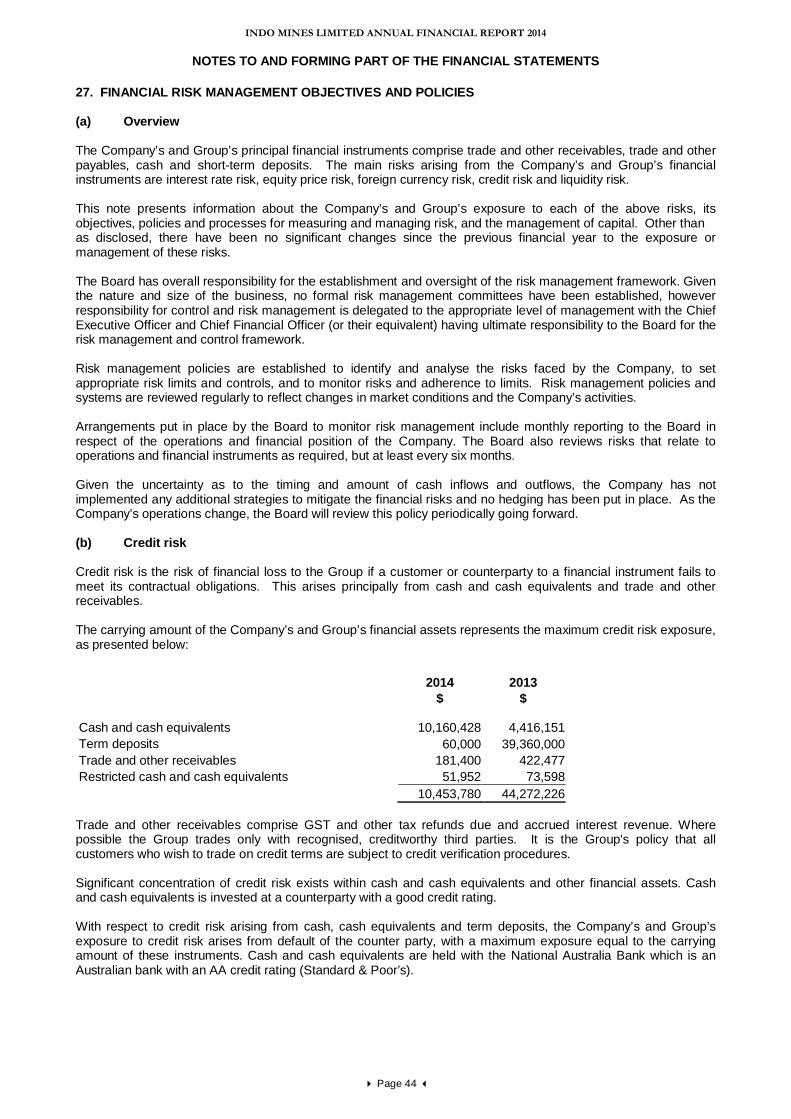
INDO MINES LIMITED ANNUAL FINANCIAL REPORT 2014
NOTES TO AND FORMING PART OF THE FINANCIAL STATEMENTS
Page 44
27. FINANCIAL RISK MANAGEMENT OBJECTIVES AND POLICIES (a) Overview The Company’s and Group’s principal financial instruments comprise trade and other receivables, trade and other payables, cash and short-term deposits. The main risks arising from the Company’s and Group’s financial instruments are interest rate risk, equity price risk, foreign currency risk, credit risk and liquidity risk. This note presents information about the Company’s and Group’s exposure to each of the above risks, its objectives, policies and processes for measuring and managing risk, and the management of capital. Other than as disclosed, there have been no significant changes since the previous financial year to the exposure or management of these risks. The Board has overall responsibility for the establishment and oversight of the risk management framework. Given the nature and size of the business, no formal risk management committees have been established, however responsibility for control and risk management is delegated to the appropriate level of management with the Chief Executive Officer and Chief Financial Officer (or their equivalent) having ultimate responsibility to the Board for the risk management and control framework. Risk management policies are established to identify and analyse the risks faced by the Company, to set appropriate risk limits and controls, and to monitor risks and adherence to limits. Risk management policies and systems are reviewed regularly to reflect changes in market conditions and the Company’s activities. Arrangements put in place by the Board to monitor risk management include monthly reporting to the Board in respect of the operations and financial position of the Company. The Board also reviews risks that relate to operations and financial instruments as required, but at least every six months. Given the uncertainty as to the timing and amount of cash inflows and outflows, the Company has not implemented any additional strategies to mitigate the financial risks and no hedging has been put in place. As the Company’s operations change, the Board will review this policy periodically going forward. (b) Credit risk Credit risk is the risk of financial loss to the Group if a customer or counterparty to a financial instrument fails to meet its contractual obligations. This arises principally from cash and cash equivalents and trade and other receivables. The carrying amount of the Company’s and Group’s financial assets represents the maximum credit risk exposure, as presented below: 2014 2013 $ $ Cash and cash equivalents 10,160,428 4,416,151 Term deposits 60,000 39,360,000 Trade and other receivables 181,400 422,477 Restricted cash and cash equivalents 51,952 73,598 10,453,780 44,272,226 Trade and other receivables comprise GST and other tax refunds due and accrued interest revenue. Where possible the Group trades only with recognised, creditworthy third parties. It is the Group's policy that all customers who wish to trade on credit terms are subject to credit verification procedures. Significant concentration of credit risk exists within cash and cash equivalents and other financial assets. Cash and cash equivalents is invested at a counterparty with a good credit rating. With respect to credit risk arising from cash, cash equivalents and term deposits, the Company’s and Group’s exposure to credit risk arises from default of the counter party, with a maximum exposure equal to the carrying amount of these instruments. Cash and cash equivalents are held with the National Australia Bank which is an Australian bank with an AA credit rating (Standard & Poor’s).
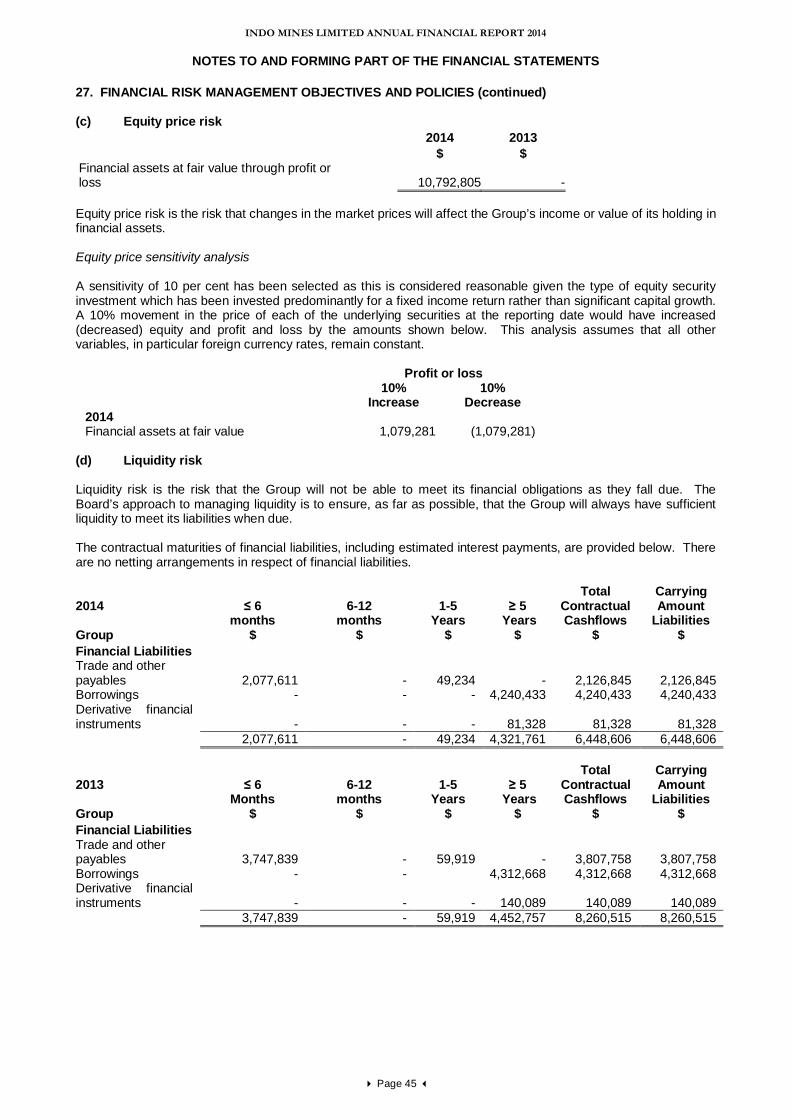
INDO MINES LIMITED ANNUAL FINANCIAL REPORT 2014
NOTES TO AND FORMING PART OF THE FINANCIAL STATEMENTS
Page 45
27. FINANCIAL RISK MANAGEMENT OBJECTIVES AND POLICIES (continued) (c) Equity price risk 2014 2013 $ $ Financial assets at fair value through profit or loss 10,792,805 - Equity price risk is the risk that changes in the market prices will affect the Group’s income or value of its holding in financial assets. Equity price sensitivity analysis A sensitivity of 10 per cent has been selected as this is considered reasonable given the type of equity security investment which has been invested predominantly for a fixed income return rather than significant capital growth. A 10% movement in the price of each of the underlying securities at the reporting date would have increased (decreased) equity and profit and loss by the amounts shown below. This analysis assumes that all other variables, in particular foreign currency rates, remain constant.
Profit or loss
10% Increase
10% Decrease
2014 Financial assets at fair value 1,079,281 (1,079,281)
(d) Liquidity risk Liquidity risk is the risk that the Group will not be able to meet its financial obligations as they fall due. The Board’s approach to managing liquidity is to ensure, as far as possible, that the Group will always have sufficient liquidity to meet its liabilities when due. The contractual maturities of financial liabilities, including estimated interest payments, are provided below. There are no netting arrangements in respect of financial liabilities. 2014
≤ 6
months
6-12
months
1-5
Years
≥ 5
Years
Total Contractual Cashflows
Carrying Amount
Liabilities Group $ $ $ $ $ $ Financial Liabilities Trade and other payables 2,077,611 - 49,234 - 2,126,845 2,126,845 Borrowings - - - 4,240,433 4,240,433 4,240,433 Derivative financial instruments - - - 81,328 81,328 81,328 2,077,611 - 49,234 4,321,761 6,448,606 6,448,606 2013
≤ 6 Months
6-12 months
1-5 Years
≥ 5 Years
Total
Contractual Cashflows
Carrying Amount
Liabilities Group $ $ $ $ $ $ Financial Liabilities Trade and other payables 3,747,839 - 59,919 - 3,807,758 3,807,758 Borrowings - - 4,312,668 4,312,668 4,312,668 Derivative financial instruments - - - 140,089 140,089 140,089 3,747,839 - 59,919 4,452,757 8,260,515 8,260,515
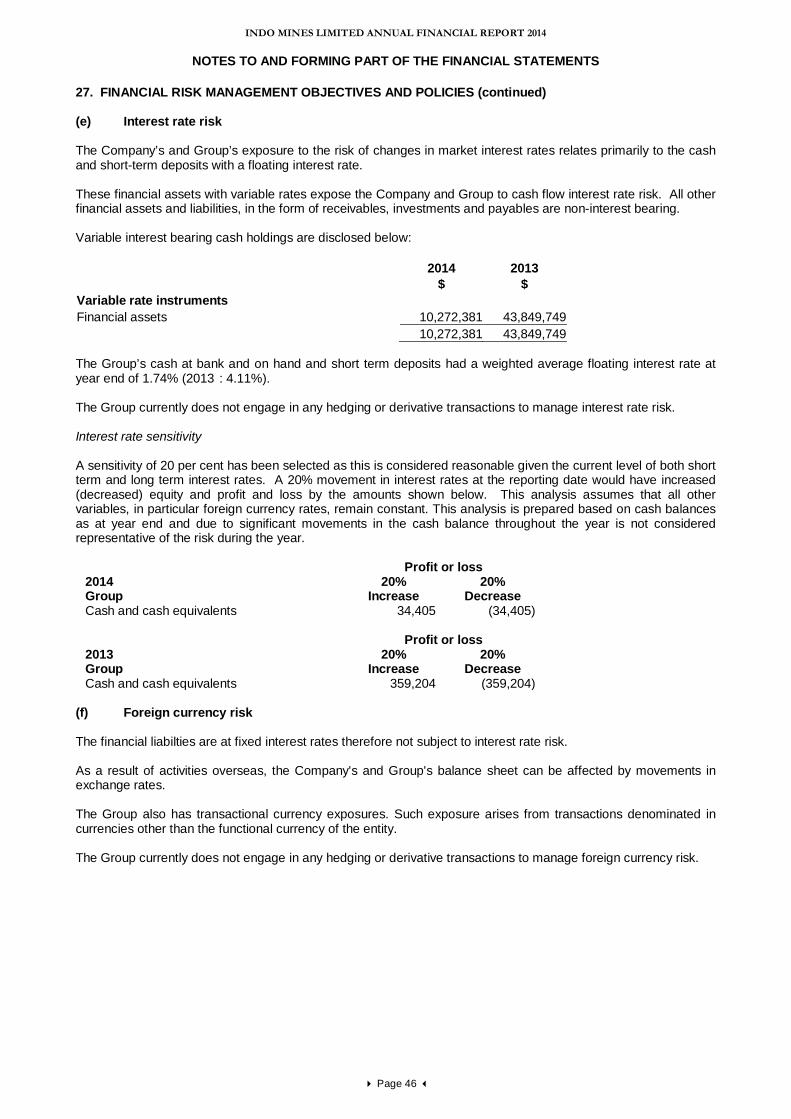
INDO MINES LIMITED ANNUAL FINANCIAL REPORT 2014
NOTES TO AND FORMING PART OF THE FINANCIAL STATEMENTS
Page 46
27. FINANCIAL RISK MANAGEMENT OBJECTIVES AND POLICIES (continued) (e) Interest rate risk The Company’s and Group’s exposure to the risk of changes in market interest rates relates primarily to the cash and short-term deposits with a floating interest rate. These financial assets with variable rates expose the Company and Group to cash flow interest rate risk. All other financial assets and liabilities, in the form of receivables, investments and payables are non-interest bearing. Variable interest bearing cash holdings are disclosed below: 2014 2013 $ $ Variable rate instruments Financial assets 10,272,381
43,849,749
10,272,381 43,849,749 The Group’s cash at bank and on hand and short term deposits had a weighted average floating interest rate at year end of 1.74% (2013 : 4.11%). The Group currently does not engage in any hedging or derivative transactions to manage interest rate risk. Interest rate sensitivity A sensitivity of 20 per cent has been selected as this is considered reasonable given the current level of both short term and long term interest rates. A 20% movement in interest rates at the reporting date would have increased (decreased) equity and profit and loss by the amounts shown below. This analysis assumes that all other variables, in particular foreign currency rates, remain constant. This analysis is prepared based on cash balances as at year end and due to significant movements in the cash balance throughout the year is not considered representative of the risk during the year.
Profit or loss 2014 Group
20% Increase
20% Decrease
Cash and cash equivalents 34,405 (34,405)
Profit or loss 2013 Group
20% Increase
20% Decrease
Cash and cash equivalents 359,204 (359,204) (f) Foreign currency risk The financial liabilties are at fixed interest rates therefore not subject to interest rate risk. As a result of activities overseas, the Company's and Group's balance sheet can be affected by movements in exchange rates. The Group also has transactional currency exposures. Such exposure arises from transactions denominated in currencies other than the functional currency of the entity. The Group currently does not engage in any hedging or derivative transactions to manage foreign currency risk.
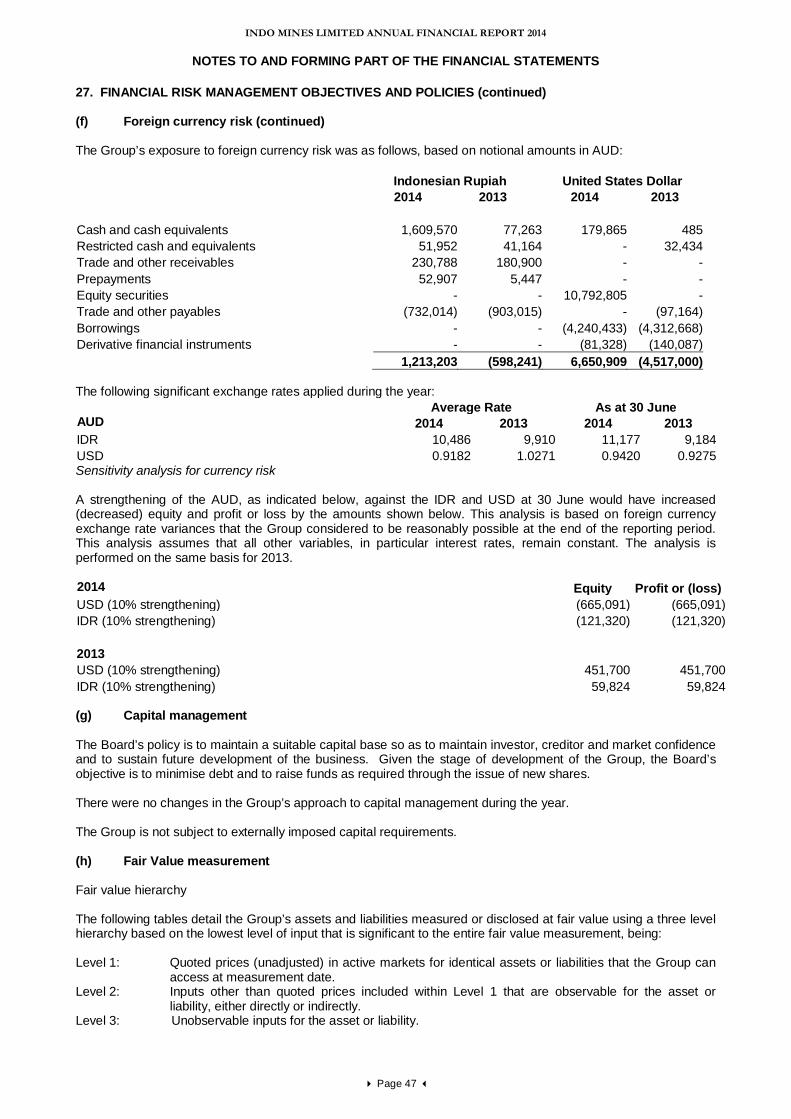
INDO MINES LIMITED ANNUAL FINANCIAL REPORT 2014
NOTES TO AND FORMING PART OF THE FINANCIAL STATEMENTS
Page 47
27. FINANCIAL RISK MANAGEMENT OBJECTIVES AND POLICIES (continued) (f) Foreign currency risk (continued) The Group’s exposure to foreign currency risk was as follows, based on notional amounts in AUD: Indonesian Rupiah United States Dollar 2014 2013 2014 2013 Cash and cash equivalents 1,609,570 77,263 179,865 485 Restricted cash and equivalents 51,952 41,164 - 32,434 Trade and other receivables 230,788 180,900 - - Prepayments 52,907 5,447 - - Equity securities - - 10,792,805 - Trade and other payables (732,014) (903,015) - (97,164) Borrowings - - (4,240,433) (4,312,668) Derivative financial instruments - - (81,328) (140,087) 1,213,203 (598,241) 6,650,909 (4,517,000) The following significant exchange rates applied during the year: Average Rate As at 30 June AUD 2014 2013 2014 2013 IDR 10,486 9,910 11,177 9,184 USD 0.9182 1.0271 0.9420 0.9275 Sensitivity analysis for currency risk A strengthening of the AUD, as indicated below, against the IDR and USD at 30 June would have increased (decreased) equity and profit or loss by the amounts shown below. This analysis is based on foreign currency exchange rate variances that the Group considered to be reasonably possible at the end of the reporting period. This analysis assumes that all other variables, in particular interest rates, remain constant. The analysis is performed on the same basis for 2013. 2014 Equity Profit or (loss) USD (10% strengthening) (665,091) (665,091) IDR (10% strengthening) (121,320) (121,320) 2013 USD (10% strengthening) 451,700 451,700 IDR (10% strengthening) 59,824 59,824 (g) Capital management The Board’s policy is to maintain a suitable capital base so as to maintain investor, creditor and market confidence and to sustain future development of the business. Given the stage of development of the Group, the Board’s objective is to minimise debt and to raise funds as required through the issue of new shares. There were no changes in the Group’s approach to capital management during the year. The Group is not subject to externally imposed capital requirements. (h) Fair Value measurement Fair value hierarchy The following tables detail the Group’s assets and liabilities measured or disclosed at fair value using a three level hierarchy based on the lowest level of input that is significant to the entire fair value measurement, being: Level 1: Quoted prices (unadjusted) in active markets for identical assets or liabilities that the Group can
access at measurement date. Level 2: Inputs other than quoted prices included within Level 1 that are observable for the asset or
liability, either directly or indirectly. Level 3: Unobservable inputs for the asset or liability.
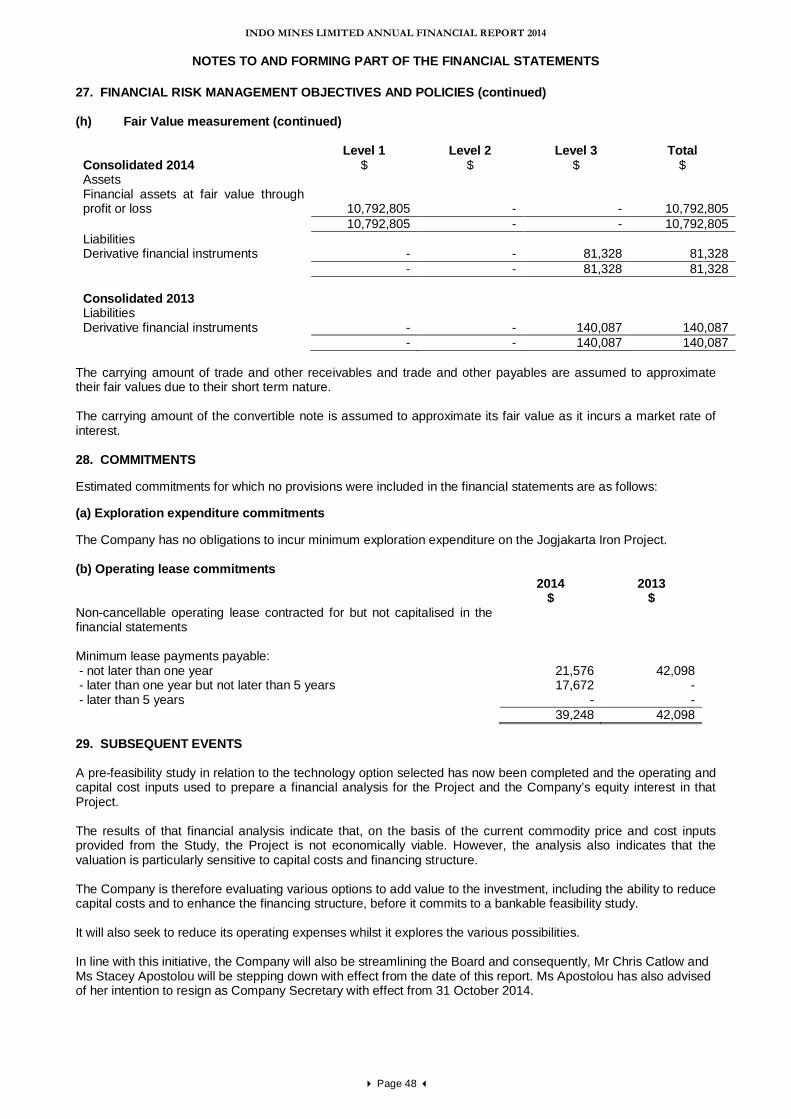
INDO MINES LIMITED ANNUAL FINANCIAL REPORT 2014
NOTES TO AND FORMING PART OF THE FINANCIAL STATEMENTS
Page 48
27. FINANCIAL RISK MANAGEMENT OBJECTIVES AND POLICIES (continued) (h) Fair Value measurement (continued)
Level 1 Level 2 Level 3 Total Consolidated 2014 $ $ $ $ Assets Financial assets at fair value through profit or loss
10,792,805
-
-
10,792,805
10,792,805 - - 10,792,805 Liabilities Derivative financial instruments - - 81,328 81,328 - - 81,328 81,328 Consolidated 2013
Liabilities Derivative financial instruments - - 140,087 140,087 - - 140,087 140,087
The carrying amount of trade and other receivables and trade and other payables are assumed to approximate their fair values due to their short term nature. The carrying amount of the convertible note is assumed to approximate its fair value as it incurs a market rate of interest. 28. COMMITMENTS Estimated commitments for which no provisions were included in the financial statements are as follows:
(a) Exploration expenditure commitments
The Company has no obligations to incur minimum exploration expenditure on the Jogjakarta Iron Project. (b) Operating lease commitments 2014 2013 $ $ Non-cancellable operating lease contracted for but not capitalised in the financial statements
Minimum lease payments payable: - not later than one year 21,576 42,098 - later than one year but not later than 5 years 17,672 - - later than 5 years - - 39,248 42,098
29. SUBSEQUENT EVENTS A pre-feasibility study in relation to the technology option selected has now been completed and the operating and capital cost inputs used to prepare a financial analysis for the Project and the Company’s equity interest in that Project. The results of that financial analysis indicate that, on the basis of the current commodity price and cost inputs provided from the Study, the Project is not economically viable. However, the analysis also indicates that the valuation is particularly sensitive to capital costs and financing structure. The Company is therefore evaluating various options to add value to the investment, including the ability to reduce capital costs and to enhance the financing structure, before it commits to a bankable feasibility study. It will also seek to reduce its operating expenses whilst it explores the various possibilities. In line with this initiative, the Company will also be streamlining the Board and consequently, Mr Chris Catlow and Ms Stacey Apostolou will be stepping down with effect from the date of this report. Ms Apostolou has also advised of her intention to resign as Company Secretary with effect from 31 October 2014.
INDO MINES LIMITED ANNUAL FINANCIAL REPORT 2014
NOTES TO AND FORMING PART OF THE FINANCIAL STATEMENTS
Page 49
DIRECTORS' DECLARATION In accordance with a resolution of the Directors of Indo Mines Limited, I state that: (1) In the opinion of the Directors:
(a) the financial statements and notes and the Remuneration Report in the directors' report set out on pages 8 to 12 are in accordance with the Corporations Act 2001 including:
(i) giving a true and fair view of the Group's financial position as at 30 June 2014 and of its
performance for the year ended on that date; and (ii) complying with Australian Accounting Standards (including the Australian Accounting
Interpretations) and the Corporations Regulations 2001;
(b) there are reasonable grounds to believe that the Company will be able to pay its debts as and when they become due and payable;
(c) the financial statements also comply with International Financial Reporting Standards as disclosed in
Note 1(b); and
(2) There are reasonable grounds to believe that the Company will be able to meet any obligations or liabilities when they become due and payable; and
(3) The Directors have been given the declarations required by Section 295A of the Corporations Act 2001
from the Chief Executive Officer and Chief Financial Officer for the financial year ended 30 June 2014. On behalf of the Board. PETER CHAMBERS Non-Executive Chairman Dated this 30th day of September 2014