Embed Size (px)
Citation preview

ANNUAL FINANCIAL REPORT 2015

Grand Valley State University
Financial Report
with Additional Information
June 30, 2015
Grand Valley State University
Contents
Report Letter 1-3
Administrative Officers 4
Management’s Discussion and Analysis - Unaudited 5-17
Financial Statements
Statement of Net Position 18 Statement of Revenue, Expenses, and Changes in Net Position 19 Statement of Cash Flows 20-21 Discretely Presented Component Unit - 38 Front Avenue 22 Statement of Fiduciary Net Position - Employee Benefit Plans 23 Statement of Changes in Fiduciary Net Position - Employee Benefit Plans 24 Notes to Financial Statements 25-60
Required Supplemental Information 61
Professional Support Staff Employees’ Retirement Plan:
Schedule of Changes in the Plan’s Net Pension Liability and Related Ratios 62 Schedule of Investment Returns 62 Schedule of Employer Contributions 63
Maintenance, Grounds, Service Employee’s Retirement Plan:
Schedule of Changes in the Plan’s Net Pension Liability and Related Ratios 64 Schedule of Investment Returns 64 Schedule of Employer Contributions 65
Other Post Employment Benefits - Schedule of Funding Progress 66 Other Supplemental Information 67
Schedule of Changes in Fiduciary Net Position By Employee Retirement Plan 68 Schedule of University and Foundation Endowments and Similar Funds 69-84
Schedule of Net Position by Fund 85-86
Schedule of Revenue, Expenses, and Changes in Net Position by Fund 87-88
Report on Internal Control Over Financial Reporting and on Compliance and Other Matters Based on an Audit of Financial Statements Performed in Accordance with Government Auditing Standards 89-90

Independent Auditor's Report
To the Board of TrusteesGrand Valley State University
Report on the Financial Statements
We have audited the accompanying financial statements of Grand Valley State University (the"University"), a component unit of the State of Michigan, its discretely presented componentunit, and its pension trust funds as of and for the years ended June 30, 2015 and 2014 and therelated notes to the financial statements, which collectively comprise Grand Valley StateUniversity's basic financial statements as listed in the table of contents.
Management's Responsibility for the Financial Statements
Management is responsible for the preparation and fair presentation of these financialstatements in accordance with accounting principles generally accepted in the United States ofAmerica; this includes the design, implementation, and maintenance of internal control relevantto the preparation and fair presentation of financial statements that are free from materialmisstatement, whether due to fraud or error.
Auditor's Responsibility
Our responsibility is to express an opinion on these financial statements based on our audits. Weconducted our audits in accordance with auditing standards generally accepted in the UnitedStates of America and the standards applicable to financial statement audits in GovernmentAuditing Standards, issued by the Comptroller General of the United States. Those standardsrequire that we plan and perform the audits to obtain reasonable assurance about whether thefinancial statements are free from material misstatement. The discretely presented componentunit was not audited under Government Auditing Standards.
An audit involves performing procedures to obtain audit evidence about the amounts anddisclosures in the financial statements. The procedures selected depend on the auditor'sjudgment, including the assessment of the risks of material misstatement of the financialstatements, whether due to fraud or error. In making those risk assessments, the auditorconsiders internal control relevant to the entity's preparation and fair presentation of thefinancial statements in order to design audit procedures that are appropriate in thecircumstances, but not for the purpose of expressing an opinion on the effectiveness of theentity's internal control. Accordingly, we express no such opinion. An audit also includesevaluating the appropriateness of accounting policies used and the reasonableness of significantaccounting estimates made by management, as well as evaluating the overall presentation of thefinancial statements.
We believe that the audit evidence we have obtained is sufficient and appropriate to provide abasis for our audit opinion.
1

To the Board of TrusteesGrand Valley State University
Opinion
In our opinion, the financial statements referred to above present fairly, in all material respects,the financial position of Grand Valley State University, its discretely presented component unit,and its pension trust funds as of June 30, 2015 and 2014 and the changes in its financial positionand its cash flows for the years then ended in accordance with accounting principles generallyaccepted in the United States of America.
Emphasis of Matter
As discussed in Note 1 to the financial statements, effective July 1, 2014, the University adoptednew accounting guidance under GASB Statement No. 68, Accounting and Financial Reporting forPensions. Statement No. 68 is an amendment to Statement No. 27. In accordance withStatement No. 68, the University is now recognizing its unfunded pension benefit obligation as aliability on the statement of net position for the first time. This statement also enhancesaccountability and transparency through revised note disclosures and required supplementalinformation (RSI). Our opinion is not modified with respect to this matter.
Other Matters
Required Supplemental Information
Accounting principles generally accepted in the United States of America require that themanagement's discussion and analysis, schedules of changes in the net pension liability andrelated ratios, investment returns, and employer contributions for each retirement plan, andschedule of other postemployment benefit plan funding progress as identified in the table ofcontents, be presented to supplement the basic financial statements. Such information, althoughnot a part of the basic financial statements, is required by the Governmental AccountingStandards Board, which considers it to be an essential part of financial reporting for placing thebasic financial statements in an appropriate operational, economic, or historical context. Wehave applied certain limited procedures to the required supplemental information in accordancewith auditing standards generally accepted in the United States of America, which consisted ofinquiries of management about the methods of preparing the information and comparing theinformation for consistency with management's responses to our inquiries, the basic financialstatements, and other knowledge we obtained during our audit of the basic financial statements.We do not express an opinion or provide any assurance on the information because the limitedprocedures do not provide us with sufficient evidence to express an opinion or provide anyassurance.
Other Information
Our audit was conducted for the purpose of forming an opinion on the financial statements thatcollectively comprise Grand Valley State University's basic financial statements. The othersupplemental information, as identified in the table of contents is presented for the purpose ofadditional analysis and is not a required part of the basic financial statements.
2

To the Board of TrusteesGrand Valley State University
The other supplemental information as identified in the table of contents is the responsibility ofmanagement and was derived from and relates directly to the underlying accounting and otherrecords used to prepare the basic financial statements. Such information has been subjected tothe auditing procedures applied in the audit of the basic financial statements and certainadditional procedures, including comparing and reconciling such information directly to theunderlying accounting and other records used to prepare the basic financial statements or to thebasic financial statements themselves, and other additional procedures in accordance withauditing standards generally accepted in the United States of America. In our opinion, the othersupplemental information as identified in the table of contents is fairly stated in all materialrespects in relation to the basic financial statements as a whole.
Other Reporting Required by Government Auditing Standards
In accordance with Government Auditing Standards, we have also issued our report datedNovember 6, 2015 on our consideration of Grand Valley State University's internal control overfinancial reporting and on our tests of its compliance with certain provisions of laws, regulations,contracts, grant agreements, and other matters. The purpose of that report is to describe thescope of our testing of internal control over financial reporting and compliance and the results ofthat testing, and not to provide an opinion on the internal control over financial reporting or oncompliance. That report is an integral part of an audit performed in accordance with GovernmentAuditing Standards in considering Grand Valley State University's internal control over financialreporting and compliance.
November 6, 2015
3
Grand Valley State University
4
Administrative Officers
Board of Trustees
David S. Hooker John C. Kennedy
Chair Vice Chair
Victor M Cardenas Mary L. Kramer
John G. Russell
Megan S. Sall
David L. Way
Kate Pew Wolters
Board of Trustees - Honorary Life Members
Donna K. Brooks
Dorothy A. Johnson
Executive and Board Officers
Thomas J. Haas President Gayle R. Davis Provost and Executive Vice President for Academic
and Student Affairs James D. Bachmeier Vice President for Finance and Administration and
Treasurer, Board of Trustees Jesse M. Bernal Vice President for Inclusion and Equity
Lynn M. Blue Vice President for Enrollment Development Thomas A. Butcher Vice President and General Counsel
Teri L. Losey Executive Associate to the President and Secretary, Board of Trustees
Karen M. Loth Vice President for Development Matthew E. McLogan Vice President for University Relations
Brian C. Copeland Associate Vice President for Business and Finance and Assistant Treasurer, Board of Trustees
Grand Valley State University
5
Management’s Discussion and Analysis - Unaudited
Financial and Enrollment Highlights for the Year Ended June 30, 2015
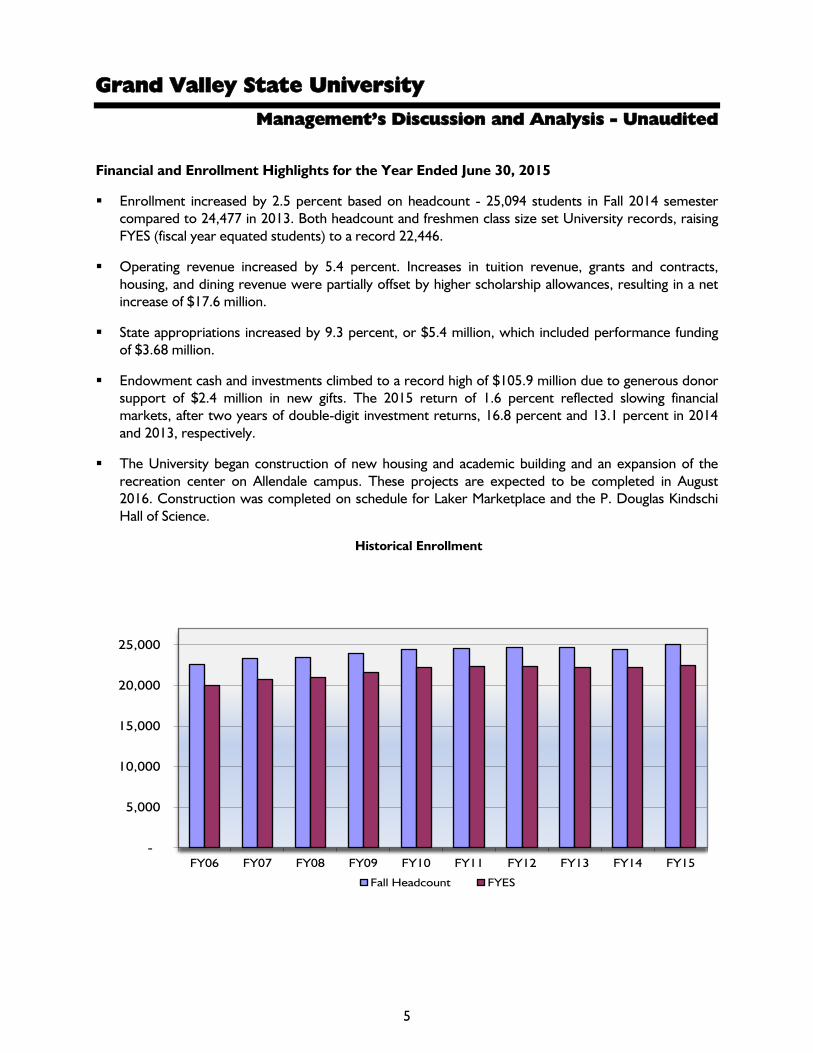
Enrollment increased by 2.5 percent based on headcount - 25,094 students in Fall 2014 semester compared to 24,477 in 2013. Both headcount and freshmen class size set University records, raising FYES (fiscal year equated students) to a record 22,446.
Operating revenue increased by 5.4 percent. Increases in tuition revenue, grants and contracts, housing, and dining revenue were partially offset by higher scholarship allowances, resulting in a net increase of $17.6 million.
State appropriations increased by 9.3 percent, or $5.4 million, which included performance funding of $3.68 million.
Endowment cash and investments climbed to a record high of $105.9 million due to generous donor support of $2.4 million in new gifts. The 2015 return of 1.6 percent reflected slowing financial markets, after two years of double-digit investment returns, 16.8 percent and 13.1 percent in 2014 and 2013, respectively.
The University began construction of new housing and academic building and an expansion of the recreation center on Allendale campus. These projects are expected to be completed in August 2016. Construction was completed on schedule for Laker Marketplace and the P. Douglas Kindschi Hall of Science.
Historical Enrollment
-
5,000
10,000
15,000
20,000
25,000
FY06 FY07 FY08 FY09 FY10 FY11 FY12 FY13 FY14 FY15
Fall Headcount FYES

Grand Valley State University
Management’s Discussion and Analysis - Unaudited (Continued)
6
The purpose of the annual report is to provide readers with financial information about the activities and financial condition of the University. The report consists of three basic financial statements that provide information on the University as a whole: the statement of net position, the statement of revenue, expenses, and changes in net position, and the statement of cash flows. These statements begin on page 18 and should be read in conjunction with the notes to the financial statements. The following summary and management’s discussion of the results are intended to provide the readers with an overview of the financial statements.
Effective for the year ended June 30, 2015, the University adopted Governmental Accounting Standards Board (GASB) Statement No. 68, Accounting and Financial Reporting for Pensions. No. 68 requires governments providing defined benefit pensions to recognize their unfunded pension benefit obligation as a liability for the first time, and to more comprehensively and comparably measure the annual costs of pension benefits. The University recorded a net pension liability of $11.5 million at July 1, 2014, which was offset by a $1.6 million liability recognized in prior years resulting in a $9.9 million decrease to unrestricted net position.
The Statement of Net Position
The statement of net position includes all assets and liabilities using the accrual basis of accounting, which is similar to the accounting used by most private sector institutions. Net position - assets and deferred outflows of resources offset by liabilities - is one way to measure the financial health of the University. Assets, deferred outflows of resources, and liabilities are generally measured using current values. Investments are stated at fair value, and capital assets are stated at historical cost less an allowance for depreciation. After the impact of GASB Statement No. 68, net position from 2013 to 2015 has increased by 10.8 percent from $617.3 million to $683.8 million.
Grand Valley State University
Management’s Discussion and Analysis - Unaudited (Continued)
7
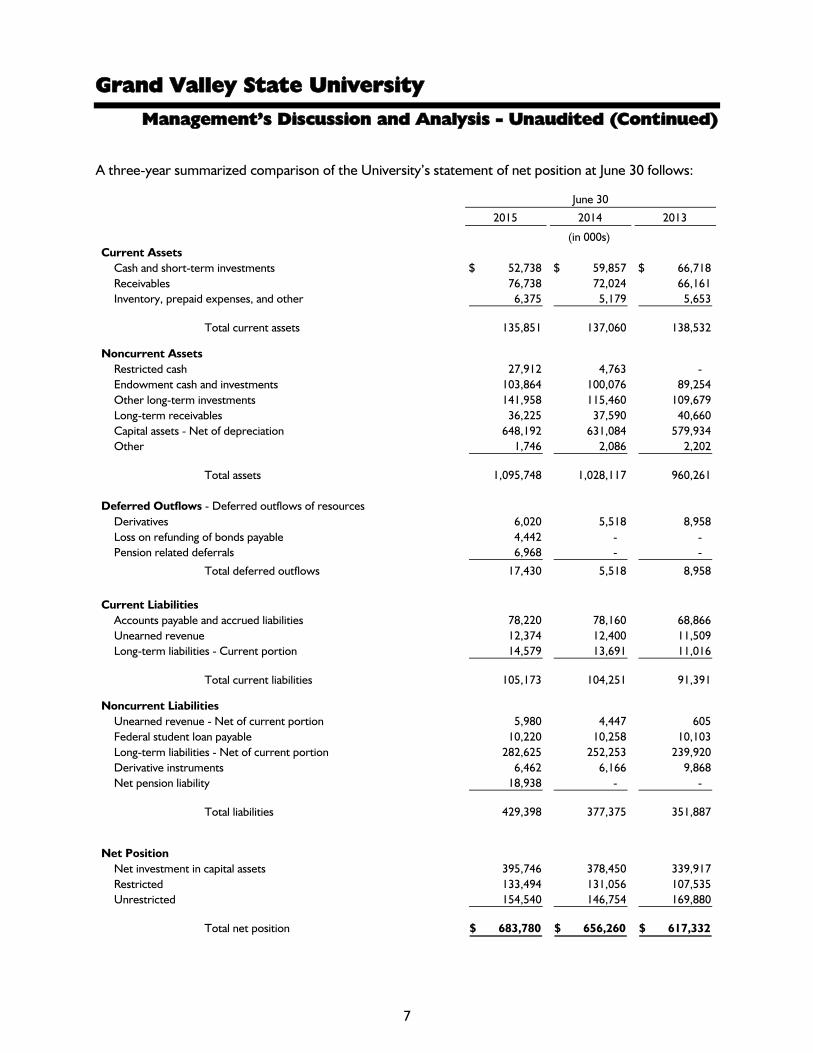
A three-year summarized comparison of the University’s statement of net position at June 30 follows:
June 30
2015 2014 2013
(in 000s) Current Assets
Cash and short-term investments 52,738$ 59,857$ 66,718$ Receivables 76,738 72,024 66,161 Inventory, prepaid expenses, and other 6,375 5,179 5,653
Total current assets 135,851 137,060 138,532
Noncurrent AssetsRestricted cash 27,912 4,763 - Endowment cash and investments 103,864 100,076 89,254 Other long-term investments 141,958 115,460 109,679 Long-term receivables 36,225 37,590 40,660 Capital assets - Net of depreciation 648,192 631,084 579,934 Other 1,746 2,086 2,202
Total assets 1,095,748 1,028,117 960,261
Deferred Outflows - Deferred outflows of resourcesDerivatives 6,020 5,518 8,958 Loss on refunding of bonds payable 4,442 - - Pension related deferrals 6,968 - -
Total deferred outflows 17,430 5,518 8,958
Current LiabilitiesAccounts payable and accrued liabilities 78,220 78,160 68,866 Unearned revenue 12,374 12,400 11,509 Long-term liabilities - Current portion 14,579 13,691 11,016
Total current liabilities 105,173 104,251 91,391
Noncurrent LiabilitiesUnearned revenue - Net of current portion 5,980 4,447 605 Federal student loan payable 10,220 10,258 10,103 Long-term liabilities - Net of current portion 282,625 252,253 239,920 Derivative instruments 6,462 6,166 9,868 Net pension liability 18,938 - -
Total liabilities 429,398 377,375 351,887
Net PositionNet investment in capital assets 395,746 378,450 339,917 Restricted 133,494 131,056 107,535 Unrestricted 154,540 146,754 169,880
Total net position 683,780$ 656,260$ 617,332$

Grand Valley State University
Management’s Discussion and Analysis - Unaudited (Continued)
8
Cash and short-term investments include unrestricted funds which are used for operating expenditures and are managed within the parameters of the University’s investment policy. Restricted cash consists of bond proceeds to construct housing and academic building on the Allendale campus and is classified as noncurrent assets due to the nature of these projects.
Current receivables, which include grants, state appropriations, capital appropriations, pledges, student notes, and various operating receivables that are expected to be collected within a year, increased by $10.6 million between 2013 and 2015. Current pledges receivable mainly reflect payments expected from the “Shaping Our Future” and the L. William Seidman Center capital campaigns, as collections drove the decline from $7.0 million outstanding in 2013 to $1.6 million in 2015. This $5.4 million decrease was offset by an increase in state appropriation receivable for charter schools and capital support for the P. Douglas Kindschi Hall of Science, which added $10.4 million and $6.7 million, respectively. The charter school appropriation receivable increased due to the opening of new schools, predominantly in the Detroit metropolitan area.
In 2015, financial markets slowed compared to 2014, when the S&P 500 recorded new highs and global markets performed strongly. Endowment investments generated a 1.6 percent return in 2015 compared to a 16.8 percent return in 2014 and a 13.1 percent return in 2013. The University (along with its investment advisory committee and outside consultants) continues to closely monitor endowment investment strategy and asset allocations.
Other long-term investments should be looked at in conjunction with cash and short-term investments. This combination of funds comprises the overall pool of cash and investments. There was an increase of $19.3 million of cash and investments between 2014 and 2015, after remaining steady between 2013 and 2014. The statement of cash flows on page 20 explains the sources and uses of cash.
Other current assets consist mainly of inventories and prepaid expenses. These assets fluctuate based on timing of inventory purchases and payments of vendor service agreements.
Long-term receivables, which include pledges, student notes, and a third-party notes receivable, declined by $4.4 million between 2013 and 2015. The decrease was mainly due to a drop in pledge receivables as a result of donor payment schedules. Long-term pledges are discounted to net present value for financial statement purposes.
Net capital assets increased by $17.1 million between 2014 and 2015 as a result of several construction projects on Allendale campus. Laker Marketplace opened in the spring. The most expansive project, the construction of the science laboratory building, opened for fall semester as the P. Douglas Kindschi Hall of Science. Construction began in the spring for new housing and academic building and an addition to the recreation center. These additions, totaling $38.9 million, were offset by depreciation expense of $21.8 million.
Net capital assets increased by $51.2 million between 2013 and 2014 due to the ongoing construction of the science laboratory building and Laker Marketplace, land purchases for future campus expansion and significant renovations to James H. Zumberge Hall, AuSable Hall, and Kleiner Dining Commons. These additions, totaling $74.4 million, were offset by depreciation expense of $23.2 million.

Grand Valley State University
Management’s Discussion and Analysis - Unaudited (Continued)
9
The L. William Seidman Center is capitalized on the 38 Front Avenue’s statement of net assets. Further detail regarding capital asset activity for both the University and 38 Front Avenue is presented in Note 3 on pages 36-37.
Deferred outflows of resources are funds expended by the University that are applicable to a future accounting period. The University continues to carry deferred outflows related to derivatives. Between 2014 and 2015, this balance remained steady after a decline of $3.4 million occurred between 2013 and 2014, mainly from a revaluation of the hybrid nature of one swap, which contained an embedded borrowing component. The balance is chiefly offset by derivative instruments, reflected in noncurrent liabilities. More detailed information regarding these swaps is presented in Note 5 to the financial statements.
With the issuance of bonds in September 2014, a deferred outflow was established from the portion of debt that continues to be held in escrow. This balance will be amortized over the life of the bonds. More detailed information regarding the debt transaction is presented in Note 4 to the financial statements.
Deferred outflows, related to pensions, of $7.0 million resulted from the implementation of GASB Statement No. 68. This balance includes $3.8 million resulting from changes in actuarial assumptions due to use of new mortality table (RP 2014) and $1.0 million from differences between actual and expected experience. These balances will be amortized over approximately 10 years. The remaining $2.2 million resulted from the shortfall between actual to projected investment earnings, which will be amortized over five years. More detailed information regarding the defined benefit pension plans is presented in Note 6 to the financial statements.
Accounts payable and accrued liabilities remained consistent between 2014 and 2015 after increasing by $9.3 million between 2013 and 2014. The increase was due to $3.8 million of new construction payables and $5.8 million of higher payables to public school academies. Six new public school academies were opened at the start of 2014.
Unearned revenue includes receipts from tuition, grants, and contracts that pertain to a future fiscal year, and remained steady between 2013 and 2015.
Current maturities in long-term debt increased by $3.5 million between 2013 and 2015. The increase includes $2.2 million that is attributable to principal payments on the 2013 bond issue.
Noncurrent liabilities include unearned revenue, federal student loan payable, derivative instruments, net pension liability, and the long-term portion of bonds payable. Unearned revenue increased by $5.3 million between 2013 and 2015 mainly due to upfront capital investments from the University’s food vendor in a new contract arrangement.
Long-term liabilities increased by $30.3 million between 2014 and 2015 due to the issuance of bonds for the new housing and classroom building construction. There was an increase of $12.3 million between 2013 and 2014 due to debt financing of the Laker Marketplace and a portion of the P. Douglas Kindschi Hall of Science, offset by principal retirement from current debt payments.

Grand Valley State University
Management’s Discussion and Analysis - Unaudited (Continued)
10
In 2015, the University received an A1 bond credit rating from Moody’s Investors Service, and its A+ rating from Standard & Poors remained unchanged. More detailed information about the University’s long-term debt is presented in Note 4 to the financial statements. Financing activity to construct the L. William Seidman Center is covered in the 38 Front Avenue financial reporting included in Note 4 to the financial statements.
Long-term liabilities also include the recognized portion of the liability for retiree medical benefits, as required by Governmental Accounting Standards Board (GASB) Statement No. 45, Accounting and Financial Reporting by Employers for Postemployment Benefits Other Than Pensions. As of July 1, 2015, the most recent actuarial valuation date, the actuarial accrued liability for benefits was $12.2 million, which included an assumption change to utilize the MP-2014 headcount weighted mortality table as published by the Society of Actuaries. Further information regarding the plan and funding status is detailed in Note 6.
As discussed previously, GASB Statement No. 68 requires that the net pension liability for the University’s sponsored defined benefit retirement plans be recognized on the University’s financial statements. In accordance with the statement, the University has reported a change in accounting principle adjustment to unrestricted net position of $9,948,539, which is the net of the net pension liability and related deferred outflows as of July 1, 2014. In addition to the detailed information provided in Note 6 concerning each defined benefit plan, there is a comprehensive analysis provided in the required supplemental information beginning on page 62.
The total net position of the University increased by $66.4 million between 2013 and 2015 mostly due to the investments in infrastructure on Allendale campus to support a growing student body as well as generous support from donors to endowments, and a combined endowment investment income return of 18.4 percent over the past two years. Further detail regarding the designation by the University of unrestricted net position for certain purposes is summarized in Note 1 to the financial statements.
Grand Valley State University
Management’s Discussion and Analysis - Unaudited (Continued)
11
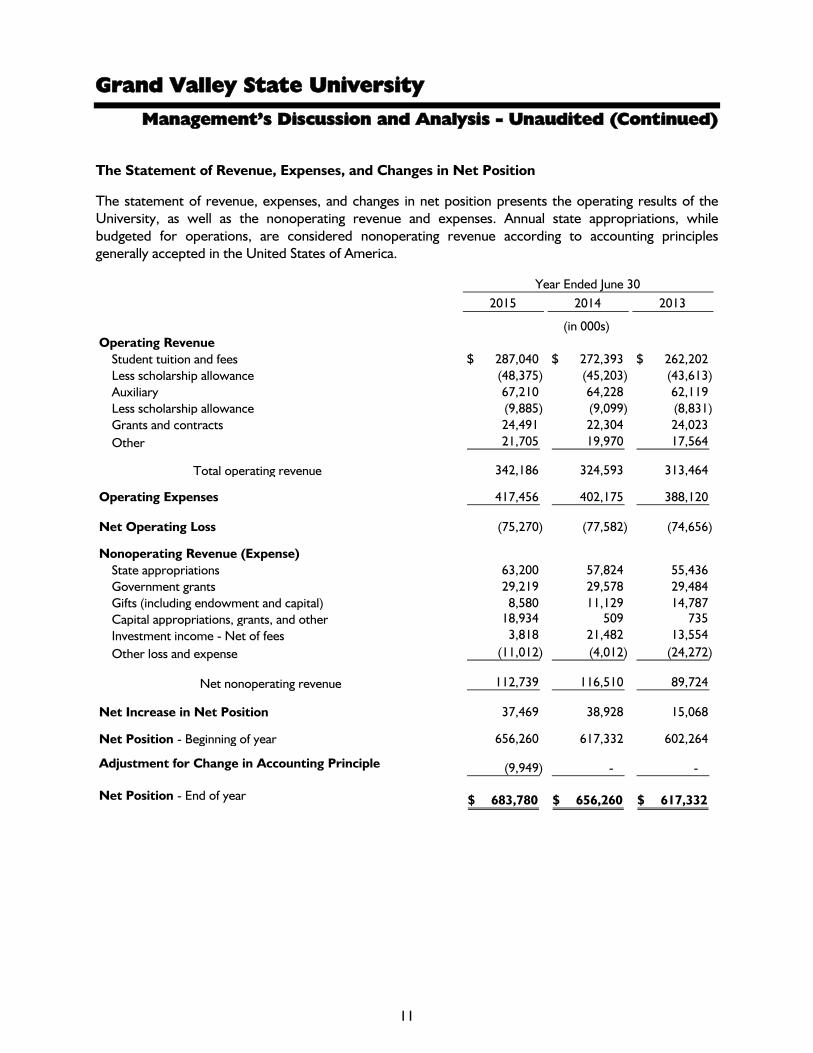
The Statement of Revenue, Expenses, and Changes in Net Position
The statement of revenue, expenses, and changes in net position presents the operating results of the University, as well as the nonoperating revenue and expenses. Annual state appropriations, while budgeted for operations, are considered nonoperating revenue according to accounting principles generally accepted in the United States of America.
2015 2014 2013
(in 000s) Operating Revenue
Student tuition and fees 287,040$ 272,393$ 262,202$ Less scholarship allowance (48,375) (45,203) (43,613) Auxiliary 67,210 64,228 62,119 Less scholarship allowance (9,885) (9,099) (8,831) Grants and contracts 24,491 22,304 24,023 Other 21,705 19,970 17,564
Total operating revenue 342,186 324,593 313,464
Operating Expenses 417,456 402,175 388,120
Net Operating Loss (75,270) (77,582) (74,656)
Nonoperating Revenue (Expense)State appropriations 63,200 57,824 55,436 Government grants 29,219 29,578 29,484 Gifts (including endowment and capital) 8,580 11,129 14,787 Capital appropriations, grants, and other 18,934 509 735 Investment income - Net of fees 3,818 21,482 13,554 Other loss and expense (11,012) (4,012) (24,272)
Net nonoperating revenue 112,739 116,510 89,724
Net Increase in Net Position 37,469 38,928 15,068
Net Position - Beginning of year 656,260 617,332 602,264
Adjustment for Change in Accounting Principle (9,949) - -
Net Position - End of year 683,780$ 656,260$ 617,332$
Year Ended June 30
Grand Valley State University
Management’s Discussion and Analysis - Unaudited (Continued)
12
Revenue generated by tuition and fees increased by 5.4 percent in 2015 and 3.9 percent in 2014. In 2015, the tuition rate increase averaged 3.0 percent and higher enrollment accounted for the remaining 2.4 percent increase. Between 2013 and 2014, the growth was mostly due to tuition rate increases.
Scholarship allowances as a percentage of tuition and fees slightly increased to 16.9 percent in 2015, after remaining at 16.6 percent in 2013 and 2014. The University continues to increase levels of scholarship support to mitigate the financial impact of tuition rate increases.
Auxiliary revenue consists of housing, dining, parking, bookstores, vending, golf course, health center, and conference fees from external customers. In 2015, auxiliary revenue increased by $3.0 million, of which housing and dining revenue added $1.75 million, with higher bookstore sales and parking accounting for the remaining increase. The increase in dining revenue of $1 million was mostly due to a 3.8 percent increase in meal plan participation. The slight increase in housing revenue was due to a combined 1.5 percent rate increase and uptick in occupancy. In 2014, housing and dining increased by $2.1 million, a result of an average 1.0 percent increase in housing rates and a 5.0 percent increase in meal plan participation, whereas housing occupancy remained unchanged from 2013 levels.
Grants and contracts revenue increased by $2.2 million between 2014 and 2015, mainly due to expanding grants and contracts awarded by the Michigan Economic Development Corporation (MEDC). Between 2013 and 2014, there was a decline of $1.7 million mainly due to the expiration of a few large federal grants.
Operating expenses increased by $15.3 million in 2015 and $14.1 million in 2014. Further analysis of this increase is provided beginning on page 14. Salaries, wages, and benefits comprise the largest operating expense, while instruction is the largest functional category.
State appropriations increased by 9.3 percent or $5.4 million between 2014 and 2015. For the second consecutive year, the University was awarded the highest percentage of one-time performance funding totaling $3.68 million by the State for its achievements of state metrics, which include number of degrees completed, level of graduation rates, and operational efficiencies. Between 2013 and 2014, the University received a 4.3 percent or $2.4 million increase. Appropriation per FYES as calculated by the State was $2,835 in 2015. However, the University still received the lowest level of funding per student from the State.
Nonoperating government grants consisting of Pell awards remained steady between 2013 and 2015.
Gifts, including capital and endowment gifts, declined from $14.8 million in 2013 to $8.6 million in 2015 mainly due to capital giving as the Shaping our Future, L. William Seidman Center, and Annis Water Resources Laboratory campaigns were completed.
Capital appropriations, grants, and other include awards and other capital income received for special purpose capital projects. In 2015, the State provided $18.4 million to construct the P. Douglas Kindschi Hall of Science on Allendale Campus.
Grand Valley State University
Management’s Discussion and Analysis - Unaudited (Continued)
13
Net investment income consists of realized income (interest, dividends, and realized gains on the sale of investments), unrealized gains/losses, and investment expenses (primarily bank fees). Returns on endowment investments fell to 1.6 percent in 2015 after gains of 16.8 percent and 13.1 percent in 2014 and 2013, respectively. Returns on operating investments remained steady. Other nonoperating expense includes interest expense, changes in the fair value of derivative instruments, gains or losses from disposal of assets, and transfers between the University and 38 Front Avenue. Expenses returned to standard levels in 2015, after the University received reimbursement of $7.2 million from the brownfield credits in 2014. In 2013, the University provided $13.1 million of support for the construction of the L. William Seidman Center.
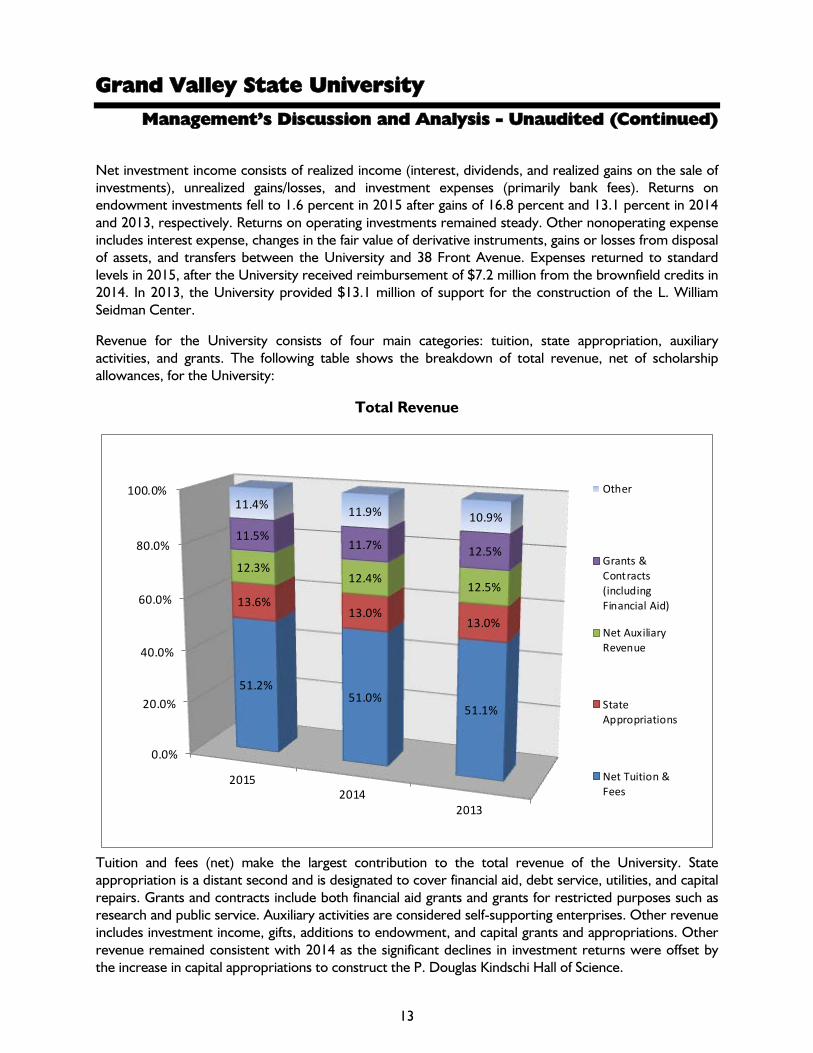
Revenue for the University consists of four main categories: tuition, state appropriation, auxiliary activities, and grants. The following table shows the breakdown of total revenue, net of scholarship allowances, for the University:
Total Revenue
0.0%
20.0%
40.0%
60.0%
80.0%
100.0%
20152014
2013
51.2%51.0%
51.1%
13.6%13.0%
13.0%
12.3%12.4%
12.5%
11.5%11.7% 12.5%
11.4% 11.9% 10.9%
Other
Grants &Contracts(includingFinancial Aid)
Net AuxiliaryRevenue
StateAppropriations
Net Tuition &Fees
Tuition and fees (net) make the largest contribution to the total revenue of the University. State appropriation is a distant second and is designated to cover financial aid, debt service, utilities, and capital repairs. Grants and contracts include both financial aid grants and grants for restricted purposes such as research and public service. Auxiliary activities are considered self-supporting enterprises. Other revenue includes investment income, gifts, additions to endowment, and capital grants and appropriations. Other revenue remained consistent with 2014 as the significant declines in investment returns were offset by the increase in capital appropriations to construct the P. Douglas Kindschi Hall of Science.
Grand Valley State University
Management’s Discussion and Analysis - Unaudited (Continued)
14
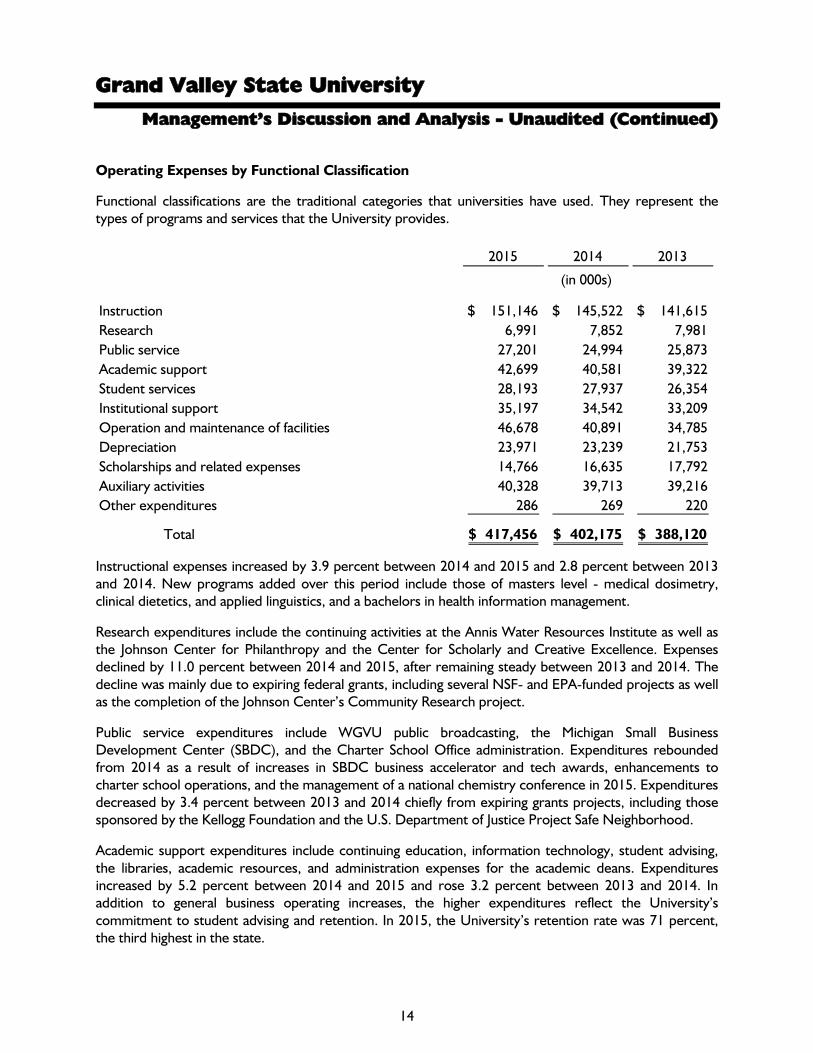
Operating Expenses by Functional Classification
Functional classifications are the traditional categories that universities have used. They represent the types of programs and services that the University provides.
2015 2014 2013
(in 000s)
Instruction 151,146$ 145,522$ 141,615$ Research 6,991 7,852 7,981 Public service 27,201 24,994 25,873 Academic support 42,699 40,581 39,322 Student services 28,193 27,937 26,354 Institutional support 35,197 34,542 33,209 Operation and maintenance of facilities 46,678 40,891 34,785 Depreciation 23,971 23,239 21,753 Scholarships and related expenses 14,766 16,635 17,792 Auxiliary activities 40,328 39,713 39,216 Other expenditures 286 269 220
Total 417,456$ 402,175$ 388,120$
Instructional expenses increased by 3.9 percent between 2014 and 2015 and 2.8 percent between 2013 and 2014. New programs added over this period include those of masters level - medical dosimetry, clinical dietetics, and applied linguistics, and a bachelors in health information management.
Research expenditures include the continuing activities at the Annis Water Resources Institute as well as the Johnson Center for Philanthropy and the Center for Scholarly and Creative Excellence. Expenses declined by 11.0 percent between 2014 and 2015, after remaining steady between 2013 and 2014. The decline was mainly due to expiring federal grants, including several NSF- and EPA-funded projects as well as the completion of the Johnson Center’s Community Research project.
Public service expenditures include WGVU public broadcasting, the Michigan Small Business Development Center (SBDC), and the Charter School Office administration. Expenditures rebounded from 2014 as a result of increases in SBDC business accelerator and tech awards, enhancements to charter school operations, and the management of a national chemistry conference in 2015. Expenditures decreased by 3.4 percent between 2013 and 2014 chiefly from expiring grants projects, including those sponsored by the Kellogg Foundation and the U.S. Department of Justice Project Safe Neighborhood.
Academic support expenditures include continuing education, information technology, student advising, the libraries, academic resources, and administration expenses for the academic deans. Expenditures increased by 5.2 percent between 2014 and 2015 and rose 3.2 percent between 2013 and 2014. In addition to general business operating increases, the higher expenditures reflect the University’s commitment to student advising and retention. In 2015, the University’s retention rate was 71 percent, the third highest in the state.
Grand Valley State University
Management’s Discussion and Analysis - Unaudited (Continued)
15
Student services expenditures represent student life programming, admissions, records, registration, financial aid, and intercollegiate athletics. Expenses remained steady after increasing by 6.0 percent between 2013 and 2014. This increase resulted from higher student recruitment and athletic activity and championships.
Institutional support expenditures include administration for the business operations, human resources, executive offices, marketing and communications, public safety, development, and alumni relations. Expenses remained steady after increasing by 4.0 percent between 2013 and 2014. This increase reflected the opening of new facilities and new software purchases to improve efficiencies.
Operation and maintenance of facilities increased by 14.1 percent between 2014 and 2015. The University continued to reconfigure existing facilities such as Kirkhof Center and Padnos Hall to prepare for changing use. In addition, there were significant housing and parking upgrades. Between 2013 and 2014, there was a 17.6 percent increase due to the following: noncapitalized housing, parking, and office space upgrades, full-year impact of the Seidman ground lease with 38 Front Avenue, and higher level of utility and maintenance costs with the full-year operations of the L. William Seidman Center and the Mary Pew Idema Library Learning and Information Commons.
Depreciation includes both academic and auxiliary buildings.
Scholarships and related expenses include work-study programs as well as the portion of financial aid that is not considered a scholarship allowance. To mitigate the impact of tuition increases on enrollment, the University continues to increase need-based scholarships. To look at the overall picture for scholarships and financial aid, it is important to also consider the scholarship allowance that is recorded net of tuition revenue and auxiliary revenue to identify that the total amount of scholarships awarded increased by 3.0 percent, from $70.9 million in 2014 to $73.0 million in 2015.
Auxiliary activities include housing, dining, parking, bookstores, vending, golf course, health center, and conference services. Debt service, depreciation, and repairs related to housing are included in the other categories of expense. Between 2013 and 2015, auxiliary expenditures remained steady.
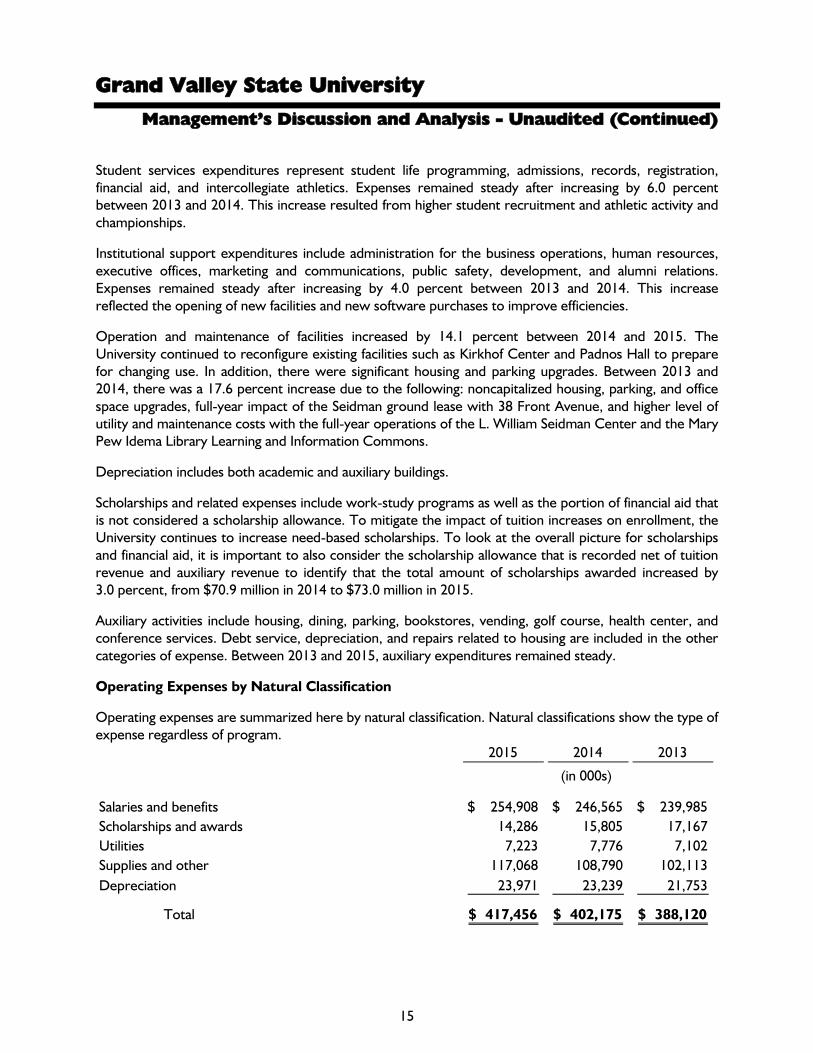
Operating Expenses by Natural Classification
Operating expenses are summarized here by natural classification. Natural classifications show the type of expense regardless of program.
2015 2014 2013
(in 000s)
Salaries and benefits 254,908$ 246,565$ 239,985$ Scholarships and awards 14,286 15,805 17,167 Utilities 7,223 7,776 7,102 Supplies and other 117,068 108,790 102,113 Depreciation 23,971 23,239 21,753
Total 417,456$ 402,175$ 388,120$

Grand Valley State University
Management’s Discussion and Analysis - Unaudited (Continued)
16
Salaries and benefit expenses, which represent 61.1 percent of total operating expenses in 2015, increased by 3.4 percent between 2014 and 2015 and 2.7 percent between 2013 and 2014. These increases mainly reflect the annual salary and benefit program and salary market adjustments.
Scholarships and awards represent financial aid expense less scholarship allowances and work-study wages. To obtain the overall financial aid picture, one must also consider the scholarship allowances.
Utilities declined by 7.1 percent between 2014 and 2015 due to a combination of lower number of heating and cooling days, lower natural gas prices, and water conservation. There was an increase of 9.5 percent between 2013 and 2014, which reflects the full-year operation of the new buildings on Allendale and Grand Rapids campuses, as well as a harsh winter.
Supplies and other expenses increased between 2013 and 2015 mostly due to a reconfiguring of existing space for new occupants, which occurred in Kirkhof Center, Padnos Hall, Lake Michigan Hall, DeVos Center, and Eberhard Center. Parking and housing also received upgrades during this period.
Depreciation continues to rise as a result of the recent significant capital additions. Depreciation includes both academic and auxiliary buildings.
The Statement of Cash Flows
The statement of cash flows provides information about the cash receipts and cash disbursements of the University during the year. This statement also helps users assess the University’s ability to generate net cash flows, its ability to meet its obligations as they come due, and its need for external financing.
2015 2014 2013
(in 000s)
Net Cash (Used in) Provided byOperating activities (49,358)$ (51,294)$ (52,429)$ Noncapital financing activities 99,567 96,242 95,056 Capital and related financing activities (7,598) (51,672) (77,351) Investing activities (13,612) 873 26,195
Net Increase (Decrease) in Cash and Cash Equivalents 28,999 (5,851) (8,529)
Cash and Cash Equivalents - Beginning of year 38,527 44,378 52,907
Cash and Cash Equivalents - End of year 67,526$ 38,527$ 44,378$
The primary cash receipts from operating activities consist of tuition and housing revenue. Cash outlays include payment of wages, benefits, supplies, utilities, and scholarships. From 2013 to 2015, net cash used in operating activities remained steady.
State appropriation is the primary source of noncapital financing. This source of revenue is categorized as nonoperating and accounts primarily for the higher level of receipts between 2013 and 2015. Other noncapital financing activity includes Pell grants, gifts, and grants for other than capital purposes.

Grand Valley State University
Management’s Discussion and Analysis - Unaudited (Continued)
17
Capital and related financing activities include debt proceeds to finance capital construction. In 2015, the University issued bonds to fund a new housing project, as well as refinance a prior debt issue. In 2014, bonds were issued to fund a portion of the construction of the P. Douglas Kindschi Hall of Science, Laker Marketplace, and AuSable Hall addition. In 2013, the University issued bonds for the purpose of refinancing a prior debt issue. In addition, receipts from pledge payments partially offset capital expenditures. Capital outlays declined between 2014 and 2015 with the near completion of the P. Douglas Kindschi Hall of Science and opening of Laker Marketplace.
Investing activities reflect purchases, sales, and interest income earned on investments. Investments identified in the cash flows statement include both restricted and unrestricted short- and long-term investments.
Economic Factors that Will Affect the Future
The economic position of the University is closely tied to that of the State of Michigan. The State of Michigan continues to include a performance component to its funding allocations, which includes number of degree completions, level of graduation rates, and operational efficiencies. For the third consecutive year, the University received the highest increase in performance funding due to its achievements in these areas. In total, the University will receive $65,035,200 or a 3.0 percent funding increase in 2016, following the 9.3 percent increase in 2015. Yet the University will continue to remain near bottom in state funding per student.
Enrollment is expected to remain steady for upcoming years based on the University’s strategic plan for controlled growth. As a student-centered institution, the University emphasizes teaching, learning, and connecting in pursuing its mission of educating students to shape their lives, their professions, and their societies.
Grand Valley State University
See Notes to Financial Statements. 18
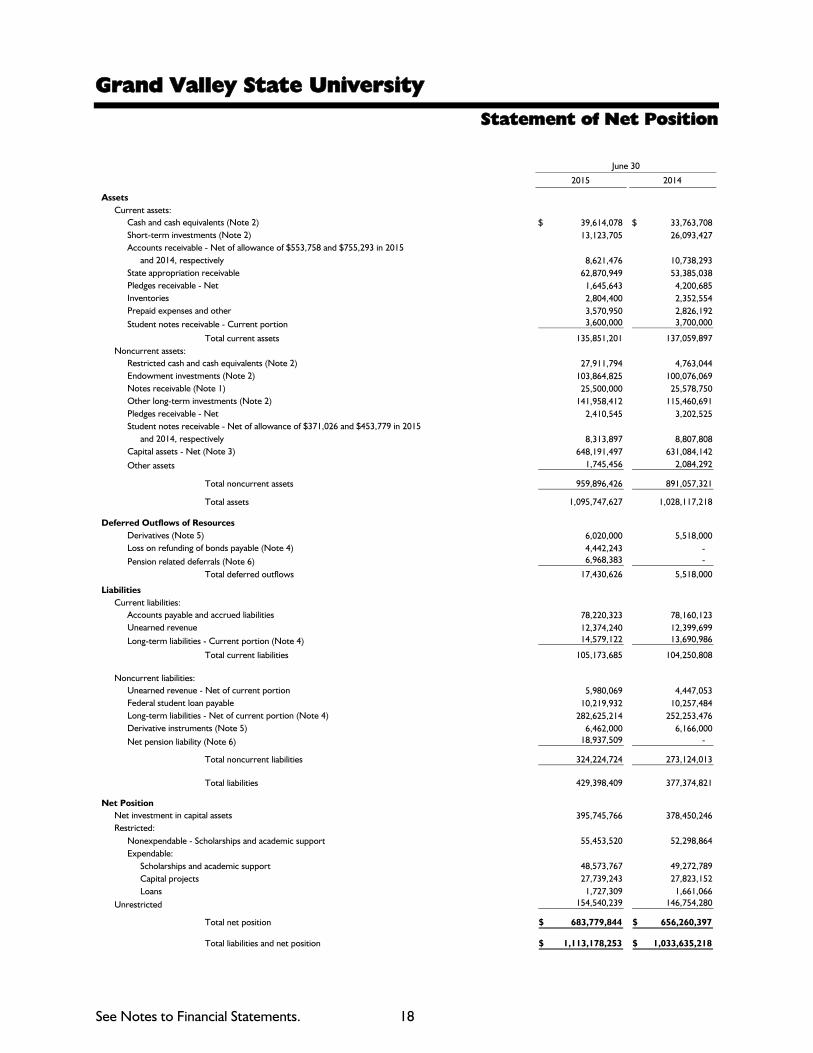
Statement of Net Position
June 30
2015 2014
AssetsCurrent assets:
Cash and cash equivalents (Note 2) 39,614,078$ 33,763,708$ Short-term investments (Note 2) 13,123,705 26,093,427 Accounts receivable - Net of allowance of $553,758 and $755,293 in 2015
and 2014, respectively 8,621,476 10,738,293 State appropriation receivable 62,870,949 53,385,038 Pledges receivable - Net 1,645,643 4,200,685 Inventories 2,804,400 2,352,554 Prepaid expenses and other 3,570,950 2,826,192 Student notes receivable - Current portion 3,600,000 3,700,000
Total current assets 135,851,201 137,059,897 Noncurrent assets:
Restricted cash and cash equivalents (Note 2) 27,911,794 4,763,044 Endowment investments (Note 2) 103,864,825 100,076,069 Notes receivable (Note 1) 25,500,000 25,578,750 Other long-term investments (Note 2) 141,958,412 115,460,691 Pledges receivable - Net 2,410,545 3,202,525 Student notes receivable - Net of allowance of $371,026 and $453,779 in 2015
and 2014, respectively 8,313,897 8,807,808 Capital assets - Net (Note 3) 648,191,497 631,084,142 Other assets 1,745,456 2,084,292
Total noncurrent assets 959,896,426 891,057,321
Total assets 1,095,747,627 1,028,117,218
Deferred Outflows of Resources Derivatives (Note 5) 6,020,000 5,518,000 Loss on refunding of bonds payable (Note 4) 4,442,243 - Pension related deferrals (Note 6) 6,968,383 -
Total deferred outflows 17,430,626 5,518,000
Liabilities Current liabilities:
Accounts payable and accrued liabilities 78,220,323 78,160,123 Unearned revenue 12,374,240 12,399,699 Long-term liabilities - Current portion (Note 4) 14,579,122 13,690,986
Total current liabilities 105,173,685 104,250,808
Noncurrent liabilities:Unearned revenue - Net of current portion 5,980,069 4,447,053 Federal student loan payable 10,219,932 10,257,484 Long-term liabilities - Net of current portion (Note 4) 282,625,214 252,253,476 Derivative instruments (Note 5) 6,462,000 6,166,000 Net pension liability (Note 6) 18,937,509 -
Total noncurrent liabilities 324,224,724 273,124,013
Total liabilities 429,398,409 377,374,821
Net PositionNet investment in capital assets 395,745,766 378,450,246 Restricted:
Nonexpendable - Scholarships and academic support 55,453,520 52,298,864 Expendable:
Scholarships and academic support 48,573,767 49,272,789 Capital projects 27,739,243 27,823,152 Loans 1,727,309 1,661,066
Unrestricted 154,540,239 146,754,280
Total net position 683,779,844$ 656,260,397$
Total liabilities and net position 1,113,178,253$ 1,033,635,218$

Grand Valley State University
See Notes to Financial Statements. 19
Statement of Revenue, Expenses, and Changes in Net Position
Year Ended June 30
2015 2014
Operating RevenueStudent tuition and fees 287,039,733$ 272,392,901$ Scholarship allowances (48,375,412) (45,203,110)
Net student tuition and fees 238,664,321 227,189,791
Government grants and contracts 22,580,853 21,391,375 Nongovernmental grants 1,909,588 913,290 Sales and services of educational activities 15,004,839 13,710,287 Auxiliary activities 67,210,403 64,227,453 Scholarship allowances (9,884,876) (9,099,081)
Net auxiliary activities 57,325,527 55,128,372
Other operating revenue 6,700,476 6,260,031
Total operating revenue 342,185,604 324,593,146
Operating Expenses - Education and generalInstruction 151,145,579 145,522,368 Research 6,991,086 7,852,408 Public service 27,201,376 24,993,763 Academic support 42,698,950 40,581,431 Student services 28,193,655 27,936,819 Institutional support 35,197,132 34,541,983 Operation and maintenance - Plant 46,678,380 40,890,938 Depreciation expense 23,971,364 23,239,162 Scholarships and related expenses 14,765,608 16,634,497 Auxiliary activities 40,327,710 39,712,963 Loan administrative fees and collection costs 285,722 268,594
Total operating expenses 417,456,562 402,174,926
Operating Loss (75,270,958) (77,581,780)
Nonoperating Revenue (Expense)State appropriations 63,200,000 57,823,500 Government grants 29,219,454 29,577,544 Gifts 5,992,840 5,760,021 Investment income:
Interest, dividends, and gains (loss) on investments - Net of investment expense of $1,264,390 and $1,154,578 in 2015 and 2014, respectively 3,818,423 21,481,851
Change in fair value of derivatives 206,000 262,000 Interest on capital asset - Related debt (9,884,448) (10,988,602) (Loss) gain on disposal of assets (1,334,573) 47,034
Net nonoperating revenue 91,217,696 103,963,348
Income - Before other revenues, expenses, gains, or losses 15,946,738 26,381,568
OtherCapital appropriations 18,406,140 - Capital grants and gifts 232,627 1,611,024 Other capital income 528,430 259,040 Additions to permanent endowments 2,354,051 4,008,365 Capital contributions from 38 Front Avenue - 6,668,184
Total other 21,521,248 12,546,613
Increase in Net Position 37,467,986 38,928,181
Net PositionBeginning of year 656,260,397 617,332,216 Adjustment for change in accounting principle (Note 1) (9,948,539) -
Net position - Beginning of year, as restated 646,311,858 617,332,216
End of year 683,779,844$ 656,260,397$

Grand Valley State University
See Notes to Financial Statements. 20
Statement of Cash Flows
Year Ended June 30
2015 2014
Cash Flows from Operating ActivitiesTuition and fees 238,800,294$ 226,765,165$ Grants and contracts 26,528,198 20,825,810 Payments to suppliers (120,378,562) (103,708,766) Payments for utilities (7,223,465) (7,776,019) Payments to employees (188,790,861) (183,869,470) Payments for benefits (63,736,779) (62,947,211) Payments for scholarships and fellowships (14,285,994) (15,804,805) Loans issued to students (34,282,963) (33,474,648) Collection of loans from students 34,876,874 32,930,431 Auxiliary enterprise charges:
Residence halls 42,619,257 41,097,903 Bookstore 8,836,569 8,329,045 Other 6,076,058 5,708,740
Sales and service of educational activities 14,772,982 13,687,253 Other receipts 6,830,297 6,942,538
Net cash used in operating activities (49,358,095) (51,294,034)
Cash Flows from Noncapital Financing ActivitiesState appropriations 62,234,090 57,389,411 Government grants 29,249,862 29,973,686 Gifts and grants for other than capital purposes 5,773,626 5,537,626 Private gifts for endowment purposes 2,354,051 4,008,365 Charitable annuities payments - Net (264,901) (264,903) Federal direct loan receipts 161,955,572 161,293,142 Federal direct loan lending disbursements (161,734,776) (161,695,133)
Net cash provided by noncapital financing activities 99,567,524 96,242,194
Cash Flows from Capital and Related Financing ActivitiesProceeds from capital debt 76,875,840 23,110,000 Capital appropriations 11,696,759 - Capital grants and gifts received 3,510,499 7,426,112 Other capital income 2,110,957 4,274,611 Proceeds from sale of capital assets 78,188 66,163 Capital contributions from 38 Front Avenue 992,376 7,663,033 Purchases of capital assets and construction (42,253,289) (73,413,217) Principal paid on capital debt (50,555,000) (10,045,000) Interest paid on capital debt (10,563,792) (11,263,618) Interest received from note receivable 510,000 510,000
Net cash used in capital and related financing activities (7,597,462) (51,671,916)
Cash Flows from Investing ActivitiesProceeds from sales and maturities of investments 27,831,142 13,574,660 Interest on investments 5,131,073 5,716,170 Purchase of investments (46,575,062) (18,418,480)
Net cash (used in) provided by investing activities (13,612,847) 872,350
Net Increase (Decrease) in Cash and Cash Equivalents 28,999,120 (5,851,406)
Cash and Cash Equivalents - Beginning of year 38,526,752 44,378,158
Cash and Cash Equivalents - End of year 67,525,872$ 38,526,752$
Grand Valley State University
See Notes to Financial Statements. 21
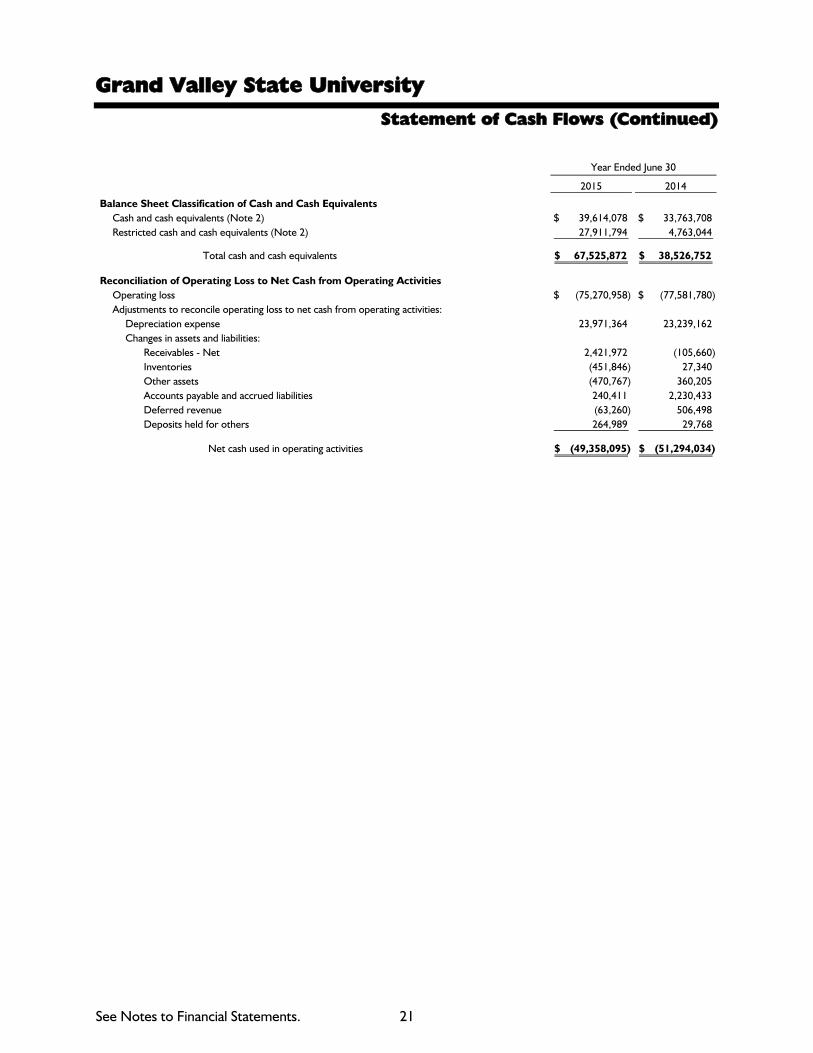
Statement of Cash Flows (Continued)
Year Ended June 30
2015 2014
Balance Sheet Classification of Cash and Cash EquivalentsCash and cash equivalents (Note 2) 39,614,078$ 33,763,708$ Restricted cash and cash equivalents (Note 2) 27,911,794 4,763,044
Total cash and cash equivalents 67,525,872$ 38,526,752$
Reconciliation of Operating Loss to Net Cash from Operating ActivitiesOperating loss (75,270,958)$ (77,581,780)$ Adjustments to reconcile operating loss to net cash from operating activities:
Depreciation expense 23,971,364 23,239,162 Changes in assets and liabilities:
Receivables - Net 2,421,972 (105,660) Inventories (451,846) 27,340 Other assets (470,767) 360,205 Accounts payable and accrued liabilities 240,411 2,230,433 Deferred revenue (63,260) 506,498 Deposits held for others 264,989 29,768
Net cash used in operating activities (49,358,095)$ (51,294,034)$

Grand Valley State University
See Notes to Financial Statements. 22
Discretely Presented Component Unit 38 Front Avenue
Statement of Net Assets June 30
2015 2014
AssetsCurrent assets 471,060$ 450,846$ Contribution receivable 1,891,279 1,897,846 Prepaid expenses 96,133 96,133 Capital assets - Net 38,135,815 39,185,336 Other assets 2,551,856 1,574,128
Total assets 43,146,143$ 43,204,289$
LiabilitiesCurrent liabilities 170,010$ 170,010$ Notes payable - QLICI (Note 4) 22,273,000 22,273,000 Notes payable - University (Note 4) 9,182,220 9,182,220
Total liabilities 31,625,230 31,625,230
Net AssetsUnrestricted 9,629,635 9,681,213 Temporarily restricted 1,891,278 1,897,846
Total net assets 11,520,913 11,579,059
Total liabilities and net assets (Note 4) 43,146,143$ 43,204,289$
Statement of Activities and Changes in Net Assets Year Ended June 30
2015 2014
RevenueCapital contributions from the University -$ 531,816$ Other contributions 1,739,183 1,739,313Other capital income - 7,200,000
Total revenue 1,739,183 9,471,129
Expenses
General and administrative 237,778 636,218Depreciation 1,049,521 1,049,521 Interest 510,030 510,030 Distribution to University - 7,200,000
Total expenses 1,797,329 9,395,769
(Decrease) Increase in Net Assets (58,146) 75,360
Net Assets - Beginning of year 11,579,059 11,503,699
Net Assets - End of year 11,520,913$ 11,579,059$

Grand Valley State University
See Notes to Financial Statements. 23
Statement of Fiduciary Net Position Employee Benefit Plans
June 30
2015 2014
AssetsMoney market funds 686,311$ 701,886$ Domestic equities 28,371,395 35,194,132 International equities 8,186,182 11,125,678 Domestic bonds 14,808,673 4,167,878 International bonds 1,447,203 979,078 Alternative assets 2,883,105 3,206,152
Total cash and cash equivalents and
investments 56,382,869 55,374,804
Accrued income 140,407 58,717
Net Position - Held in trust for pension benefits 56,523,276$ 55,433,521$

Grand Valley State University
See Notes to Financial Statements. 24
Statement of Changes in Fiduciary Net Position Employee Benefit Plans
Year Ended June 30
2015 2014
AdditionsInvestment income:
Interest and dividend income 1,464,334$ 1,099,723$ Net (depreciation) appreciation in fair value of investments (393,420) 8,424,696
Total investment income 1,070,914 9,524,419
Employer contributions 2,256,628 2,298,849 Other income 434,363 344,818
Total additions 3,761,905 12,168,086
DeductionsBenefit payments 2,462,367 2,199,067 Administrative expense 209,783 119,717
Total deductions 2,672,150 2,318,784
Net Increase 1,089,755 9,849,302
Net Position Held in Trust for Pension BenefitsBeginning of year 55,433,521 45,584,219
End of year 56,523,276$ 55,433,521$

Grand Valley State University
Notes to Financial Statements June 30, 2015 and 2014
25
Note 1 - Summary of Significant Accounting Policies
Reporting Entity - Grand Valley State University (the “University”) is an institution of higher education created by the Michigan Constitution of 1963 and is considered to be a component unit of the State of Michigan (the “State”). Its board of trustees is appointed by the governor of the State. Accordingly, the University is included in the State’s financial statements as a discrete component unit. Transactions with the State relate primarily to appropriations for operations and capital improvements and grants from various state agencies.
The University has five affiliated organizations that were evaluated in accordance with Governmental Accounting Standards Board (GASB) Statement No. 61, The Financial Reporting Entity: Omnibus, which the University adopted on July 1, 2011. Each organization is described below, with additional information provided regarding the impact to the University’s financial statements and accompanying condensed financial statements.
Grand Valley University Foundation (GVUF) is a Michigan nonprofit corporation established to solicit, collect, receive, and administer funds to advance the mission and goals of the University. In accordance with the provisions of GASB Statement No. 61, GVUF is blended into the University’s financial statements because the University has operational responsibility for GVUF and GVUF provides services entirely for the benefit of the University. GVUF obtains an annual financial audit as required by the Michigan Department of Attorney General. The June 30, 2015 audited financial statements for GVUF are located at the University’s Business and Finance Office.
University Properties, Inc. (UPI) is a Michigan nonprofit corporation established for the purpose of holding, administering, and further improving real property held by the University. In accordance with the provisions of GASB Statement No. 61, UPI is blended into the University’s financial statements because the University has operational responsibility for UPI and services are provided entirely for the benefit of the University.
Grand Valley Research Corporation (GVRC) is a Michigan nonprofit corporation established for educational and scientific purposes to provide support solely to the University. In accordance with the provisions of GASB Statement No. 61, GVRC is considered to be a component unit of the University and the blending method is the appropriate method for inclusion in the University’s financial statements because a financial benefit and burden relationship exists between the University and GVRC. In April 2013, GVRC became the sole member owner of Lafayette-Hastings LLC, a Michigan limited liability company that was formed in 2011 for the purpose of real estate management on behalf of the University. In September 2014, GVRC transferred its membership to the University. Both entities are blended into the University’s financial statements.
38 Front Avenue is a Michigan nonprofit corporation formed in 2011. It was formed for the purpose of advancing the expansion of the L. Seidman College of Business into a new facility. The University has operational responsibility for it as it operates entirely on behalf of the University. Any outstanding debt will be repaid with resources generated by the University.

Grand Valley State University
Notes to Financial Statements June 30, 2015 and 2014
26
Note 1 - Summary of Significant Accounting Policies (Continued)
In accordance with GASB Statement No. 61, 38 Front Avenue is reported as a discrete component unit. 38 Front Avenue obtains an annual financial audit as required by its financing agreements and the June 30, 2015 report can be accessed at the University’s business and finance office.
Financial statements for each entity blended in the University’s financial reporting follow:
Condensed Statement of Net Position
Grand Valley
Research
Lafayette
Hastings, LLC
Grand Valley
Research and
Lafayette
Hastings, LLC
2015 2014 2015 2014 2015 2015 2014
AssetsCurrent assets 310$ 310$ 130,117$ 110,378$ 232,478$ 156,949$ 491,098$ Capital assets (net) - - 4,958 4,958 - - - Other assets 1,322,333 1,217,428 559 3,544 469,421 - 266,189
Total assets 1,322,643$ 1,217,738$ 135,634$ 118,880$ 701,899$ 156,949$ 757,287$
Liabilities - Current liabilities -$ -$ -$ 143$ -$ 211,939$ 166,721$
Net PositionNet investment in capital assets - - 4,958 4,958 - - - Restricted:
Nonexpendable 1,124,163 1,036,448 - - - - - Expendable 198,480 181,290 - - - - -
Unrestricted - - 130,676 113,779 701,899 (54,990) 590,566
Total net position 1,322,643 1,217,738 135,634 118,737 701,899 (54,990) 590,566
Total liabilities and net position 1,322,643$ 1,217,738$ 135,634$ 118,880$ 701,899$ 156,949$ 757,287$
Grand Valley University Foundation University Properties, Inc.
Condensed Statement of Revenue, Expenses,
and Changes in Net Position
Grand Valley
Research
Lafayette
Hastings, LLC
Grand Valley
Research and
Lafayette
Hastings, LLC
2015 2014 2015 2014 2015 2015 2014
Operating RevenueSales and services of educational activities -$ -$ -$ -$ 153,583$ 569,000$ 597,137$ Auxiliary enterprises - - 80,624 70,781 - - - Other 22,491 31,670 - - - - -
Total operating revenue 22,491 31,670 80,624 70,781 153,583 569,000 597,137
Operating ExpensePersonnel costs 39,725 1,061 - - - - - Supplies and other 549,612 976,479 63,727 59,608 255,063 788,364 411,432 Depreciation - - - - - - 24,065
Total operating expense 589,337 977,540 63,727 59,608 255,063 788,364 435,497
Nonoperating Revenue (Expense)Gifts and additions to endowments 572,676 1,540,675 - - - - - Investment income (loss) 26,706 111,514 - - 2,186 - (394) Other 72,369 - - (1,683) 210,627 164,374 (4,312,052)
Total nonoperating revenue (expense) 671,751 1,652,189 - (1,683) 212,813 164,374 (4,312,446)
Increase (Decrease) in Net Position 104,905 706,319 16,897 9,490 111,333 (54,990) (4,150,806)
Net Position - Beginning of year 1,217,738 511,419 118,737 109,247 590,566 - 4,741,372
Net Position - End of year 1,322,643$ 1,217,738$ 135,634$ 118,737$ 701,899$ (54,990)$ 590,566$
University Properties, Inc. Grand Valley University Foundation
Grand Valley State University
Notes to Financial Statements June 30, 2015 and 2014
27
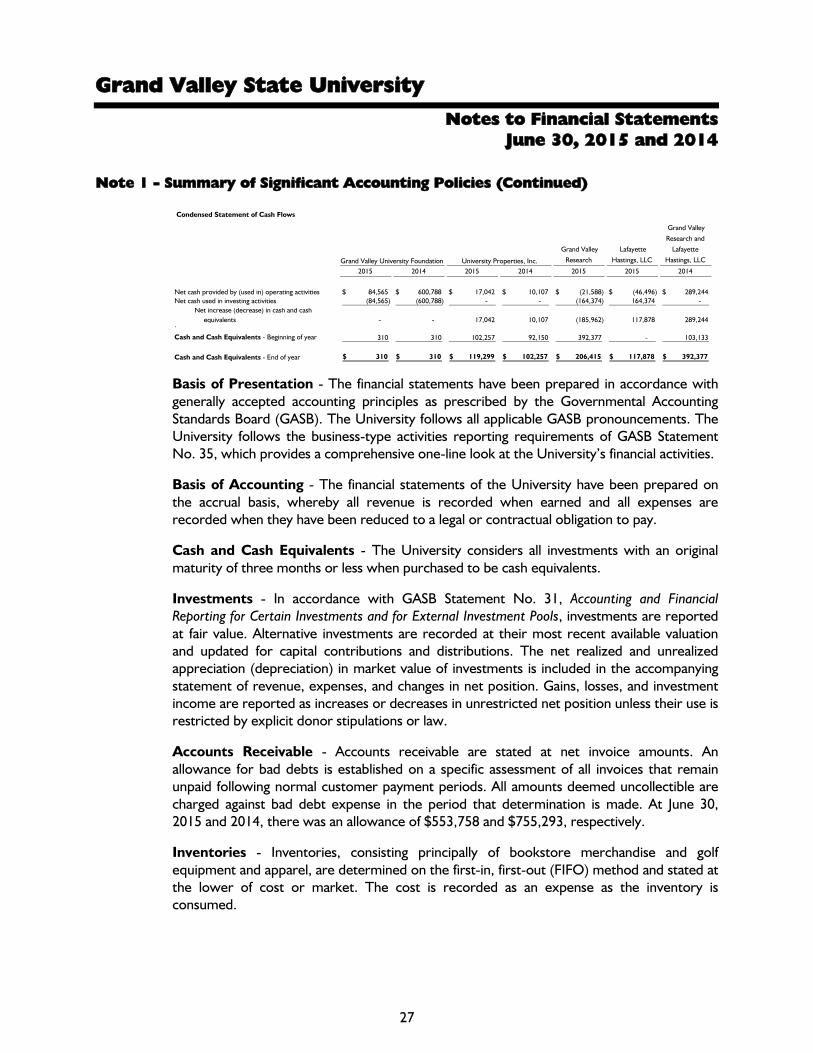
Note 1 - Summary of Significant Accounting Policies (Continued)
Condensed Statement of Cash Flows
Grand Valley
Research
Lafayette
Hastings, LLC
Grand Valley
Research and
Lafayette
Hastings, LLC
2015 2014 2015 2014 2015 2015 2014
Net cash provided by (used in) operating activities 84,565$ 600,788$ 17,042$ 10,107$ (21,588)$ (46,496)$ 289,244$ Net cash used in investing activities (84,565) (600,788) - - (164,374) 164,374 -
Net increase (decrease) in cash and cash equivalents - - 17,042 10,107 (185,962) 117,878 289,244
.
Cash and Cash Equivalents - Beginning of year 310 310 102,257 92,150 392,377 - 103,133
Cash and Cash Equivalents - End of year 310$ 310$ 119,299$ 102,257$ 206,415$ 117,878$ 392,377$
Grand Valley University Foundation University Properties, Inc.
Basis of Presentation - The financial statements have been prepared in accordance with generally accepted accounting principles as prescribed by the Governmental Accounting Standards Board (GASB). The University follows all applicable GASB pronouncements. The University follows the business-type activities reporting requirements of GASB Statement No. 35, which provides a comprehensive one-line look at the University’s financial activities.
Basis of Accounting - The financial statements of the University have been prepared on the accrual basis, whereby all revenue is recorded when earned and all expenses are recorded when they have been reduced to a legal or contractual obligation to pay.
Cash and Cash Equivalents - The University considers all investments with an original maturity of three months or less when purchased to be cash equivalents.
Investments - In accordance with GASB Statement No. 31, Accounting and Financial Reporting for Certain Investments and for External Investment Pools, investments are reported at fair value. Alternative investments are recorded at their most recent available valuation and updated for capital contributions and distributions. The net realized and unrealized appreciation (depreciation) in market value of investments is included in the accompanying statement of revenue, expenses, and changes in net position. Gains, losses, and investment income are reported as increases or decreases in unrestricted net position unless their use is restricted by explicit donor stipulations or law.
Accounts Receivable - Accounts receivable are stated at net invoice amounts. An allowance for bad debts is established on a specific assessment of all invoices that remain unpaid following normal customer payment periods. All amounts deemed uncollectible are charged against bad debt expense in the period that determination is made. At June 30, 2015 and 2014, there was an allowance of $553,758 and $755,293, respectively.
Inventories - Inventories, consisting principally of bookstore merchandise and golf equipment and apparel, are determined on the first-in, first-out (FIFO) method and stated at the lower of cost or market. The cost is recorded as an expense as the inventory is consumed.

Grand Valley State University
Notes to Financial Statements June 30, 2015 and 2014
28
Note 1 - Summary of Significant Accounting Policies (Continued)
Pledges Receivable - The carrying amount of pledges receivable represents recorded promises to contribute, measured at fair value, net of estimated uncollectible promises. Pledges receivable are recorded at their net present value using a discount rate of 4.72 percent for the years ended June 30, 2015 and 2014. Included in pledges receivable are an unamortized discount of $545,755 and $658,775 at June 30, 2015 and 2014, respectively, and an allowance of $6,638 and $9,311 at June 30, 2015 and 2014, respectively.
Note Receivable - During the year ended June 30, 2012, a leveraged loan of $16,317,780 was provided to Grand Valley Investment Fund, an unrelated entity, for the purpose of financing the construction of the L. William Seidman Center. Interest accrues at 2 percent per annum. In 2019, the payment schedule shifts from interest-only payments to addition of principal, with annual receipts due of $892,062. The note will be retired in 2041. The note is reviewed annually and is considered fully collectible at June 30, 2015.
During the year ended June 30, 2013, a loan of $9,182,220 was provided by the University to 38 Front Avenue for the purpose of financing the construction of the L. William Seidman Center. Interest accrues at 2 percent per annum. In 2020, the payment schedule shifts from interest-only payments to also including principal, with annual receipts due of $501,974. The note will be retired in 2042. The note is reviewed annually and is considered fully collectible at June 30, 2015.
Physical Properties - Capital assets with a unit cost of over $5,000 and all library books are recorded at cost at the date of acquisition or, if donated, at fair market value at the date of donation. Infrastructure assets are included in the financial statements and are depreciated. Depreciation is computed using the straight-line method over the estimated useful life of the asset and is not allocated to the functional expenditure categories. Expenditures for construction in progress are capitalized as incurred. Interest expense relating to construction is capitalized net of interest income earned on resources set aside for this purpose. Net capitalized interest included in construction in progress totaled approximately $169,041 and $33,200 at June 30, 2015 and 2014, respectively. Certain maintenance and replacement reserves have been established to fund costs relating to residences and other auxiliary activity facilities.
Derivative Instruments - Derivative instruments consist primarily of interest rate swap agreements associated with the University’s outstanding long-term debt obligations. Derivative instruments are stated at fair value as established by major securities markets.
Unearned Tuition and Fee Revenue - Tuition and fee revenue received and related to the period after June 30 has been deferred.
Provision for Unemployment Compensation - The University has elected to establish a provision for unemployment compensation under the terms of the Michigan Employment Security Act. Under this provision, the State of Michigan is reimbursed by the University for claims paid to former employees.
Compensated Absences - Compensated absence costs are accrued when earned by employees.

Grand Valley State University
Notes to Financial Statements June 30, 2015 and 2014
29
Note 1 - Summary of Significant Accounting Policies (Continued)
Operating Revenue - All revenue from programmatic sources is considered to be operating revenue. Included in nonoperating revenue are state appropriations, investment income, Pell grant revenue, and gifts. Gifts (pledges) that are received on an installment basis are recorded at net present value.
Scholarship Allowances and Student Aid - Financial aid to students is reported in the financial statements under the alternative method as prescribed by the National Association of College and University Business Officers (NACUBO). Certain aid, such as loans, funds provided to students as awarded by third parties, and federal direct lending, is accounted for as a third-party payment (credited to the student’s account as if the student made the payment). All other aid is reflected in the financial statements as operating expenses or scholarship allowances, which reduce revenue. The amount reported as operating expense represents the portion of aid that was provided to the student in the form of cash. Scholarship allowances represent the portion of aid provided to the student in the form of reduced tuition. Under the alternative method, these amounts are computed on a university basis by allocating the cash payments to students, excluding payments for services, on the ratio of total aid to the aid not considered to be third-party aid.
Federal Financial Assistance Programs - The University participates in federally funded Pell Grants, SEOG Grants, Federal Work-Study, Federal Direct Lending, and Perkins Loans programs. Federal programs are audited in accordance with the Single Audit Act amendments of 1996, the U.S. Office of Management and Budget Revised Circular A-133, Audit of States, Local Governments, and Non-Profit Organizations, and the compliance supplement.
During 2015 and 2014, the University distributed $161,734,776 and $161,695,133, respectively, for direct lending through the U.S. Department of Education, which is not included as revenue and expenditures on the accompanying financial statements.
Encumbrances - The University maintains an encumbrance system for tracking outstanding purchase orders and other commitments for materials or services not received during the year. Encumbrances totaled approximately $52,108,500, which represents the estimated amount of expenses ultimately to result if unperformed contracts in progress at June 30, 2015 are completed. Approximately $41,330,800 of the total is committed for capital projects.
Encumbrances outstanding do not constitute expenses or liabilities and are not reflected in the financial statements.
Fiduciary Fund - The fiduciary fund consists of funds held in a trust and accounts for the activities of the employees’ retirement system, which accumulates resources for pension benefit payments to qualified employees.

Grand Valley State University
Notes to Financial Statements June 30, 2015 and 2014
30
Note 1 - Summary of Significant Accounting Policies (Continued)
Net Position - Net position is classified according to external donor restrictions or availability of assets for satisfaction of University obligations. Nonexpendable restricted net position is gifts that have been received for endowment purposes, the corpus of which cannot be expended. Expendable restricted net position represents funds that have been gifted for specific purposes and funds held in federal loan programs.
The unrestricted net position balance at June 30, 2015 includes $9,301,420 of funds functioning as endowment, $14,369,800 of capital projects in progress, $16,678,079 of housing and auxiliary repair and maintenance funds, $23,845,952 of debt service funds, $28,939,695 for academic initiatives and technology, $42,419,374 for future capital projects and debt service, and $18,985,919 for reserves for operations and cash flow.
The unrestricted net position balance at June 30, 2014 includes $9,492,975 of funds functioning as endowment, $9,636,925 of capital projects in progress, $18,919,471 of housing and auxiliary repair and maintenance funds, $20,104,822 of debt service funds, $29,157,087 for academic initiatives and technology, $36,730,721 for future capital projects and debt service, and $22,712,279 for reserves for operations and cash flow.
It is the University’s policy to apply restricted resources first when an expense is incurred for purposes for which both restricted and unrestricted net position are available.
Net investment in capital assets consists of capital assets, net of accumulated depreciation, unspent bond proceeds, components of debt structuring, and outstanding principal balances of debt attributable to the acquisition, construction, or improvement of those assets.
Use of Estimates - The preparation of financial statements in conformity with generally accepted accounting principles requires management to make estimates and assumptions that affect the reported amounts of assets and liabilities and disclosure of contingent assets and liabilities at the date of the financial statements and the reported amounts of revenue and expenses during the reporting period. Actual results could differ from those estimates. Certain estimates are more susceptible to change based on the potential changes in estimates and assumptions, including estimates such as the allowance for doubtful accounts and self-insurance healthcare claims.
Pensions - For the purpose of measuring the net pension liability, deferred outflows of resources, deferred inflows of resources related to pensions, and pension expense, information about the fiduciary net position of the Grand Valley State University defined benefit plans was calculated by a certified actuary. Contribution revenue is recorded as contributions are made by the University to the plan. Benefit payments (including refunds of employee contributions) are recognized as expense when due and payable in accordance with the benefit terms. Related plan investments are reported at fair value.

Grand Valley State University
Notes to Financial Statements June 30, 2015 and 2014
31
Note 1 - Summary of Significant Accounting Policies (Continued)
Deferred Outflows of Resources - In addition to assets, the statement of net position reports a separate section for deferred outflows of resources. This separate financial statement element represents a consumption of net position that applies to a future periods and so will not be recognized as an outflow of resources (expense) until then. The deferred outflows of resources related to the net pension liability and components of long term obligations. See Notes 4 through 6 for more information.
Deferred Inflows of Resources - In addition to liabilities, the statement of net position reports a separate section for deferred inflows of resources. This separate financial statement element represents an acquisition of net position that applies to a future period and so will not be recognized as an inflow of resources (revenue) until that time. There were no deferred inflows of resources as of June 30, 2015 and 2014.
Adoption of New Standard - The GASB issued Statement No. 68, Accounting and Financial Reporting for Pensions, and GASB Statement No. 71, Pension Transition for Contributions Made Subsequent to the Measurement Date. Statement No. 68 requires governments providing defined benefit pensions to recognize their unfunded pension benefit obligation as a liability for the first time, and to more comprehensively and comparably measure the annual costs of pension benefits. GASB Statement No. 71 is a clarification to GASB Statement No. 68 requiring a government to recognize a beginning deferred outflow of resources for its pension contributions, if any, made subsequent to the measurement date of the beginning net pension liability. The statements also enhance accountability and transparency through revised note disclosures and required supplemental information (RSI). In accordance with the statement, the University has reported a net pension liability of $11,552,568, which was offset by a long-term liability of $1,604,029 recognized in prior years. Therefore, the decrease to unrestricted net position as of July 1, 2014 was $9,948,539 as a result of the change in accounting principle.
Note 2 - Cash and Investments
The operating portfolio is invested in accordance with University policy.
Cash and Short-term Investments - Investment policies for cash and short-term investments, as set forth by the board of trustees, authorize the University to invest in interest-bearing time deposits, short-term cash funds, money market funds, intermediate cash funds, U.S. government-backed obligations, and commercial paper. All investments must be held by financial institutions organized under federal or state law.

Grand Valley State University
Notes to Financial Statements June 30, 2015 and 2014
32
Note 2 - Cash and Investments (Continued)
Investments - Investment policies, as set forth by the board of trustees, also authorize the University to invest in equity securities, bonds, or similar securities and real estate investments for production of rental income. The board of trustees has authorized the treasurer or assistant treasurer of the board of trustees to make the University’s investment decisions, subject to review, with the members of the appropriate board committee. In accordance with policies set forth by the board of trustees, complete discretion in selecting individual investments of endowment assets is assigned to two or more money managers who are chosen at the discretion of the University’s treasurer. The University’s treasurer and the appropriate board committee monitor the money managers’ performance.
The board of trustees has established an investment policy with the objectives of protecting the principal of these funds and maximizing total investment return without assuming extraordinary risks. Additionally, for endowment investments, the foremost objective is to maintain a spending rate that provides a proper balance between preservation of corpus and enhancement of the purchasing power of investment earnings. For the years ended June 30, 2015 and 2014, the endowed spending rate was 4.75 percent.
As of June 30, 2015, the University has remaining commitments of $6,989,690 in alternative asset investments. As of June 30, 2015 and 2014, the University had approximately $32.2 million and $29.5 million, respectively, invested in alternative asset investments.
The University’s cash and investments are included in the statement of net position under the following classifications:
2015 2014
Cash and cash equivalents 39,614,078$ 33,763,708$ Short-term investments 13,123,705 26,093,427 Restricted cash and cash equivalents 27,911,794 4,763,044 Endowment investments 103,864,825 100,076,069 Other long-term investments 141,958,412 115,460,691
Total cash and investments 326,472,814$ 280,156,939$ The University’s cash and investments consist of the following:
2015 2014
Money markets 67,525,872$ 38,526,752$ Time deposits 1,008,123 1,004,184 Fixed-income securities - 12,993,240 Equity security investments 64,760,222 63,900,962 Mutual bond funds 159,001,201 132,373,350 Other 34,177,396 31,358,451
Total cash and investments 326,472,814$ 280,156,939$

Grand Valley State University
Notes to Financial Statements June 30, 2015 and 2014
33
Note 2 - Cash and Investments (Continued)
As of June 30, 2015, the University had the following investments and maturities:
Fair
Market Value
Less Than
One Year 1-5 Years 6-10 Years
More Than
10 Years
Money markets 67,525,872$ 67,525,872$ - $ - $ - $ Time deposits 1,008,123 1,008,123 - - - Mutual bond funds 159,001,201 - 97,477,925 46,150,967 15,372,309 Mutual equity funds 36,798,772 - 7,367,632 - 29,431,140 Mutual international equity funds 27,961,450 - 1,420,229 - 26,541,221 Real estate 1,812,376 - - - 1,812,376 Venture capital 7,834,699 - - - 7,834,699
Other investments 24,530,321 - 1,120,224 - 23,410,097
Total investments and maturities 326,472,814$ 68,533,995$ 107,386,010$ 46,150,967$ 104,401,842$
As of June 30, 2014, the University had the following investments and maturities:
Fair
Market Value
Less Than
One Year 1-5 Years 6-10 Years
More Than
10 Years
Money markets 38,526,752$ 38,526,752$ - $ - $ - $ Time deposits 1,004,184 1,004,184 - - - Mutual bond funds 132,373,350 - 71,283,551 46,510,029 14,579,770 Mutual equity funds 35,241,311 - 6,901,996 - 28,339,315 Mutual international equity funds 28,659,651 - 1,198,102 - 27,461,549 U.S. governmental agencies 12,993,240 12,993,240 - - - Real estate 1,720,913 - - - 1,720,913 Venture capital 6,621,164 - - - 6,621,164
Other investments 23,016,374 - 1,333,761 - 21,682,613
Total investments and maturities 280,156,939$ 52,524,176$ 80,717,410$ 46,510,029$ 100,405,324$
Concentration of Credit Risk - The University’s investment strategy, like that of most other institutions, incorporates certain financial instruments that involve, to varying degrees, elements of market risk and credit risk. Market risk is the potential for changes in the value of financial instruments due to market changes. Market risk is directly impacted by the volatility and liquidity of the markets in which the underlying assets are traded. Credit risk is the possibility that a loss may occur due to the failure of a counterparty to perform according to the terms of the contract. Risk of loss in the event of a counterparty default is typically limited to the amounts recognized in the statement of revenue, expenses, and changes in net position.
Investments are presented above based on the segmented time distribution maturity. Mutual equity funds are considered to be long-term funds and therefore are presented as investments with a maturity over one year, whereas the mutual bond funds as of June 30, 2015 have average maturities between 2.2 years and 8.8 years and are presented as an investment with a maturity over one year. Mutual bond funds as of June 30, 2014 have average maturities between 0.9 years and 8.6 years. Market risks (including interest rate risk and liquidity risk) and credit risks are managed by board policies.
Grand Valley State University
Notes to Financial Statements June 30, 2015 and 2014
34
Note 2 - Cash and Investments (Continued)
Interest Rate Risk - As a means of limiting its exposure to fair value losses arising from rising interest rates, the University’s operating investment policy limits the amount of the University’s operating portfolio that can be invested in securities with maturities of more than one year. Operating investment maturities are limited as follows:
Less than one year 10%-100%One to five years 0%-90%More than five years 0%-30%
Investments held by the endowment funds are invested based on the policy that they are held to maturity; therefore, the interest rate risk is not considered in the University’s decisions.
Custodial Credit Risk - Custodial credit risk is the risk that in the event of a bank failure, the University’s deposits may not be available or returned. The University does not have a deposit policy for custodial credit risk. At June 30, 2015 and 2014, the carrying amount of the University’s deposits was $67,525,872 and $38,526,752, respectively. Of the cash balances in the bank, $1,524,290 and $1,509,378, respectively, was insured.
The remaining cash balances in the bank of $69,149,284 and $39,460,798 at June 30, 2015 and 2014, respectively, were uninsured and uncollateralized. The University does not require deposits to be insured or collateralized. It is precluded by state law from collateralizing its deposits.
38 Front Avenue maintains cash balances at one bank and as part of the University’s pooled operating cash and investments. Accounts are insured by the Federal Deposit Insurance Corporation up to $250,000. As of June 30, 2015 and 2014, the Company had uninsured deposits totaling $221,000 and $200,846, respectively.
Credit Risk - The University’s operating investment policy limits its short-term operating investments to .5 percent of total bank assets or to investment vehicles that possess the highest ratings available by two national services.
The University’s operating investment policy limits its longer-term investments to investment grade or better securities.
The endowment funds are invested based on the policy that they are held permanently. Therefore, it is possible to invest in alternative investments that have a higher credit risk, but over the long term have the opportunity to yield higher rates of return.

Grand Valley State University
Notes to Financial Statements June 30, 2015 and 2014
35
Note 2 - Cash and Investments (Continued)
The University held the following types of fixed-income investments and credit ratings at June 30, 2015 and 2014:
Market Value 2015 Rating* Market Value 2014 Rating*
PNC UltraShort 12,115,581$ 3 star 12,096,003$ 3 starVanguard Short Term Investment Grade 27,764,631 4 star 12,771,551 4 starDoubleline Low Duration 24,950,690 4 star - Western Asset Intermediate 30,425,964 3 star 30,591,023 3 starLoomis Sayles Multisector Full Discretion 3,210,938 4 star 3,639,844 5 starJPMorgan Core Bond 14,943,394 4 star 14,597,152 4 starRidgeworth Seix Floating Rate High Income 7,138,852 4 star 7,011,723 2 starVanguard TIPS Inflation Protected Security 6,189,263 4 star 6,394,984 4 starFranklin Templeton 3,837,024 3 star 4,382,640 5 starDoubleline Total Return 10,831,496 5 star 10,483,686 5 starPIMCO Low Duration 192,902 4 star 14,956,823 4 starDodge & Cox Income Fund 1,172,878 4 star 263,083 4 stariShares Core Total 460,140 3 star 344,610 3 starOppenheimer International 96,981 4 star 53,915 3 starVanguard Intermediate Term 298,158 4 star - PIMCO Total Return - 206,543 3 starU.S. government agencies - 12,993,240 AA+
Total 143,628,892$ 130,786,820$
* Star ratings obtained from Morningstar, AA+ and A2 ratings obtained from S&P. Custodial Credit Risk - Custodial risk is the risk that, in the event of failure of the counterparty, the University will not be able to recover the value of its investments or collateral securities that are in the possession of an outside party. The University does not have a policy for custodial credit risk. The University’s investments are held by a custody agent.
Foreign Credit Risk - The University holds investments in some international mutual funds that invest in international equity funds and debt. These funds are invested in various countries throughout the world and therefore expose the University to foreign credit risk. The international equity and debt investments represent approximately 15 percent and 18 percent of total cash and investments at June 30, 2015 and 2014, respectively. Investments in these funds were approximately $49.4 million and $51.8 million for the years ended June 30, 2015 and 2014, respectively.
Alternative Assets - The other investments and venture capital are comprised of investments in alternative assets. As referenced above, alternative assets consist of investments that seek absolute-based return in hedge markets, investments in the private equity class investing in various ventures, or investments in a pool of assets invested in the following subclasses: global natural resources, commodities, global real estate, and global inflation-linked bonds.

Grand Valley State University
Notes to Financial Statements June 30, 2015 and 2014
36
Note 3 - Capital Assets
Capital asset activity for the University for the year ended June 30, 2015 was as follows:
Beginning
Balance Additions Reductions
Ending
Balance
Land 62,110,551$ 4,306,731$ 2,735,668$ 63,681,614$ Nondepreciable artwork and
historical treasures 5,869,167 135,192 - 6,004,359
Nondepreciable land improvements 1,722,820 - - 1,722,820 Construction in progress - Net 36,228,319 11,741,330 - 47,969,649
Total cost of nondepreciable capital assets 105,930,857 16,183,253 2,735,668 119,378,442
Land improvements and infrastructure 97,591,930 2,007,137 - 99,599,067
Buildings 622,012,114 24,000,879 1,273,572 644,739,421 Equipment 60,187,520 1,556,993 1,219,900 60,524,613 Library books 15,748,140 817,217 432,837 16,132,520
Total cost of depreciablecapital assets 795,539,704 28,382,226 2,926,309 820,995,621
Total cost of capital assets 901,470,561 44,565,479$ 5,661,977$ 940,374,063
Less accumulated depreciation for:Land improvements and infrastructure 45,198,118 4,761,686$ - $ 49,959,804 Buildings 168,206,810 14,589,871 625,978 182,170,703 Equipment 45,020,941 3,740,209 1,116,402 47,644,748 Library books 11,960,550 879,598 432,837 12,407,311
Total accumulated depreciation 270,386,419 23,971,364$ 2,175,217$ 292,182,566
Capital assets - Net 631,084,142$ 648,191,497$
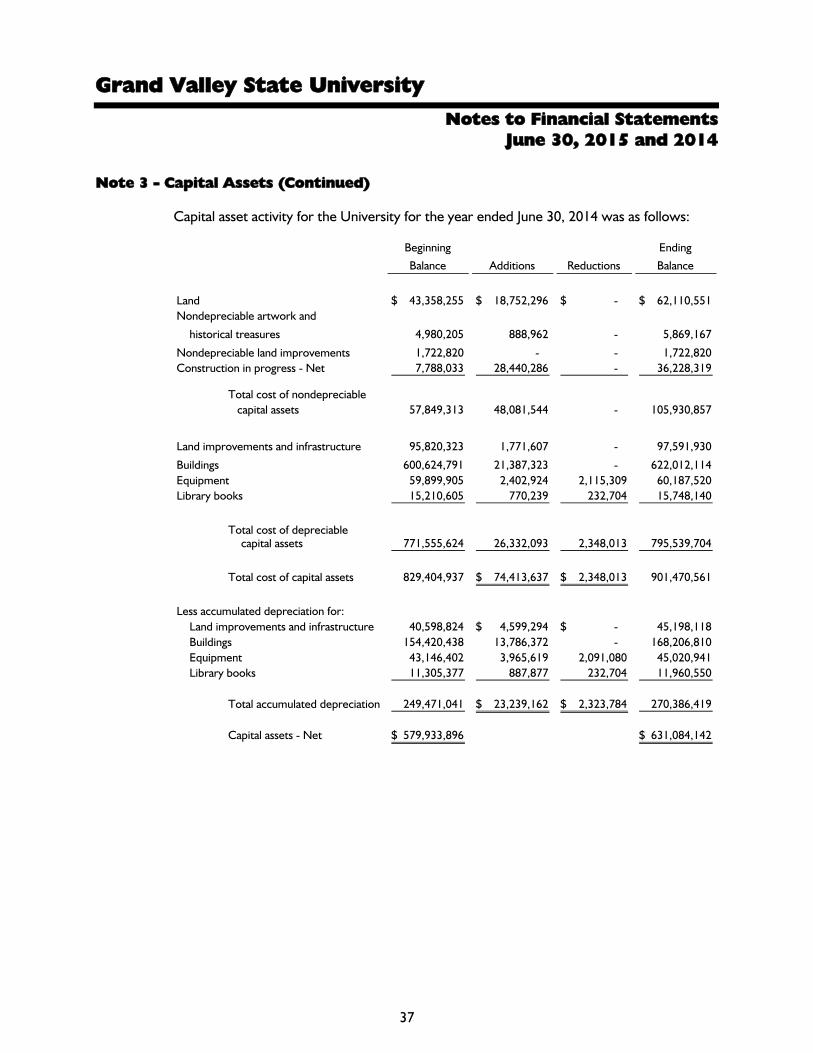
Grand Valley State University
Notes to Financial Statements June 30, 2015 and 2014
37
Note 3 - Capital Assets (Continued)
Capital asset activity for the University for the year ended June 30, 2014 was as follows:
Beginning
Balance Additions Reductions
Ending
Balance
Land 43,358,255$ 18,752,296$ - $ 62,110,551$ Nondepreciable artwork and
historical treasures 4,980,205 888,962 - 5,869,167
Nondepreciable land improvements 1,722,820 - - 1,722,820 Construction in progress - Net 7,788,033 28,440,286 - 36,228,319
Total cost of nondepreciable capital assets 57,849,313 48,081,544 - 105,930,857
Land improvements and infrastructure 95,820,323 1,771,607 - 97,591,930
Buildings 600,624,791 21,387,323 - 622,012,114 Equipment 59,899,905 2,402,924 2,115,309 60,187,520 Library books 15,210,605 770,239 232,704 15,748,140
Total cost of depreciablecapital assets 771,555,624 26,332,093 2,348,013 795,539,704
Total cost of capital assets 829,404,937 74,413,637$ 2,348,013$ 901,470,561
Less accumulated depreciation for:Land improvements and infrastructure 40,598,824 4,599,294$ - $ 45,198,118 Buildings 154,420,438 13,786,372 - 168,206,810 Equipment 43,146,402 3,965,619 2,091,080 45,020,941 Library books 11,305,377 887,877 232,704 11,960,550
Total accumulated depreciation 249,471,041 23,239,162$ 2,323,784$ 270,386,419
Capital assets - Net 579,933,896$ 631,084,142$

Grand Valley State University
Notes to Financial Statements June 30, 2015 and 2014
38
Note 3 - Capital Assets (Continued)
Capital asset activity for 38 Front Avenue for the year ended June 30, 2015 was as follows:
Beginning
Balance Additions Reductions
Ending
Balance
Land improvements and infrastructure 1,746,000$ - $ - $ 1,746,000$ Buildings 38,488,857 - - 38,488,857
Total cost of capital assets 40,234,857 - $ - $ 40,234,857
Less accumulated depreciation for:
Land improvements and infrastructure 87,300 87,300$ - $ 174,600 Buildings 962,221 962,221 - 1,924,442
Total accumulated depreciation 1,049,521 1,049,521$ - $ 2,099,042
Capital assets - Net 39,185,336$ 38,135,815$
Capital asset activity for 38 Front Avenue for the year ended June 30, 2014 was as follows:
Beginning
Balance Additions Reductions
Ending
Balance
Land improvements and infrastructure 1,746,000$ - $ - $ 1,746,000$ Buildings 38,211,775 277,082 - 38,488,857
Total cost of capital assets 39,957,775 277,082$ - $ 40,234,857
Less accumulated depreciation for:
Land improvements and infrastructure - 87,300$ - $ 87,300 Buildings - 962,221 - 962,221
Total accumulated depreciation - 1,049,521$ - $ 1,049,521
Capital assets - Net 39,957,775$ 39,185,336$
The following estimated useful lives are used to compute depreciation: Land improvements and infrastructure 20 yearsBuildings 40-50 yearsEquipment 3-25 yearsLibrary books 10 years

Grand Valley State University
Notes to Financial Statements June 30, 2015 and 2014
39
Note 4 - Long-term Liabilities
Long-term liabilities of the University consist of bonds payable, net other postemployment benefits, charitable gift annuities payable, and notes payable.
The changes in long-term liabilities for the year ended June 30, 2015 are as shown below:
Beginning
Balance Additions Reductions
GASB 68
Reclassification
Ending
Balance
Due Within
One Year
General Revenue Bonds, Series 1998 5,580,000$ - $ 1,285,000$ - $ 4,295,000$ 1,355,000$ General Revenue Bonds,
Series 2007A 8,165,000 - 725,000 - 7,440,000 745,000 General Revenue Refunding Bonds,
Series 2008A 85,245,000 - 2,840,000 - 82,405,000 3,090,000 General Revenue Refunding Variable
Rate Demand Bonds, Series 2008B 36,770,000 - 1,675,000 - 35,095,000 1,700,000 General Revenue Bonds, Series 2009 46,425,000 - 39,195,000 - 7,230,000 1,335,000 General Revenue Bonds, Series 2011 17,475,000 - 2,155,000 - 15,320,000 2,260,000 General Revenue Refunding
Bonds, Series 2013A 28,630,000 - 2,680,000 - 25,950,000 2,770,000 General Revenue Bonds, Series 2014A 23,110,000 9,010,000 - - 32,120,000 - General Revenue Refunding Bonds,
Series 2014B - 36,940,000 - - 36,940,000 - General Revenue Bonds, Series 2015A - 27,430,000 - - 27,430,000 -
Total bonds payable 251,400,000 73,380,000 50,555,000 - 274,225,000 13,255,000
Unamortized bond premiums 1,929,245 7,938,083 501,912 - 9,365,416 637,520 Net other postemployment
benefits (see Note 6) 6,986,428 1,841,914 414,635 - 8,413,707 415,000 Defined benefit retirement payable 1,604,029 - - 1,604,029 - - Charitable gift annuities payable 1,125,627 447,979 264,902 - 1,308,704 264,902 Ground lease payable to 38 Front 1,897,847 - 6,568 - 1,891,279 6,700 Building lease payable to 38 Front 1,001,286 998,944 - - 2,000,230 - Interest rate swap contract (see Note 5) 2,837,000 - 538,000 - 2,299,000 484,000 Deferred charge refunding (see Note 5) (2,837,000) - (538,000) - (2,299,000) (484,000)
Total 265,944,462 84,606,920$ 51,743,017$ 1,604,029$ 297,204,336 14,579,122$
Due within one year 13,690,986 14,579,122
Total long-term liabilities 252,253,476$ 282,625,214$
The changes in long-term liability for 38 Front Avenue for the year ended June 30, 2015 are as follows:
Beginning
Balance Additions Reductions
Ending
Balance
Due Within
One Year
Loans payable to University 9,182,220$ - $ - $ 9,182,220$ - $ Loans payable to QLICI 22,273,000 - - 22,273,000 -
Total loans payable 31,455,220$ - $ - $ 31,455,220$ - $
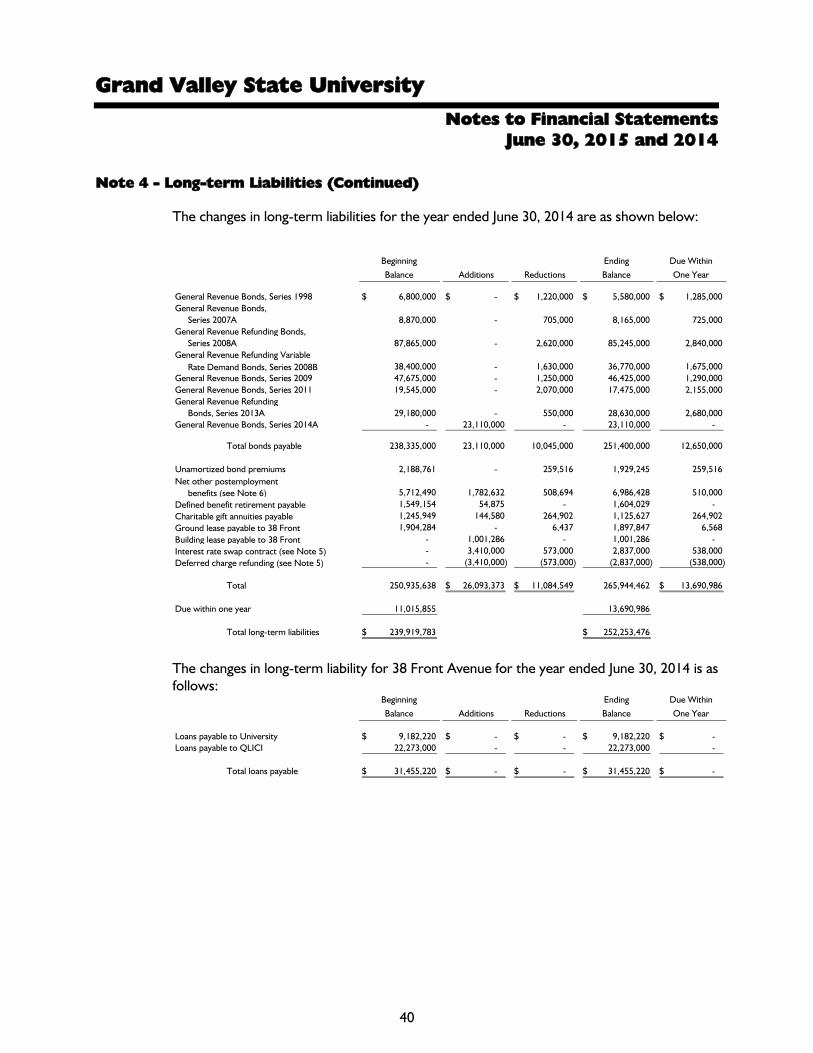
Grand Valley State University
Notes to Financial Statements June 30, 2015 and 2014
40
Note 4 - Long-term Liabilities (Continued)
The changes in long-term liabilities for the year ended June 30, 2014 are as shown below:
Beginning
Balance Additions Reductions
Ending
Balance
Due Within
One Year
General Revenue Bonds, Series 1998 6,800,000$ - $ 1,220,000$ 5,580,000$ 1,285,000$ General Revenue Bonds,
Series 2007A 8,870,000 - 705,000 8,165,000 725,000 General Revenue Refunding Bonds,
Series 2008A 87,865,000 - 2,620,000 85,245,000 2,840,000 General Revenue Refunding Variable
Rate Demand Bonds, Series 2008B 38,400,000 - 1,630,000 36,770,000 1,675,000 General Revenue Bonds, Series 2009 47,675,000 - 1,250,000 46,425,000 1,290,000 General Revenue Bonds, Series 2011 19,545,000 - 2,070,000 17,475,000 2,155,000 General Revenue Refunding
Bonds, Series 2013A 29,180,000 - 550,000 28,630,000 2,680,000 General Revenue Bonds, Series 2014A - 23,110,000 - 23,110,000 -
Total bonds payable 238,335,000 23,110,000 10,045,000 251,400,000 12,650,000
Unamortized bond premiums 2,188,761 - 259,516 1,929,245 259,516 Net other postemployment
benefits (see Note 6) 5,712,490 1,782,632 508,694 6,986,428 510,000 Defined benefit retirement payable 1,549,154 54,875 - 1,604,029 - Charitable gift annuities payable 1,245,949 144,580 264,902 1,125,627 264,902 Ground lease payable to 38 Front 1,904,284 - 6,437 1,897,847 6,568 Building lease payable to 38 Front - 1,001,286 - 1,001,286 - Interest rate swap contract (see Note 5) - 3,410,000 573,000 2,837,000 538,000 Deferred charge refunding (see Note 5) - (3,410,000) (573,000) (2,837,000) (538,000)
Total 250,935,638 26,093,373$ 11,084,549$ 265,944,462 13,690,986$
Due within one year 11,015,855 13,690,986
Total long-term liabilities 239,919,783$ 252,253,476$
The changes in long-term liability for 38 Front Avenue for the year ended June 30, 2014 is as follows:
Beginning
Balance Additions Reductions
Ending
Balance
Due Within
One Year
Loans payable to University 9,182,220$ - $ - $ 9,182,220$ - $ Loans payable to QLICI 22,273,000 - - 22,273,000 -
Total loans payable 31,455,220$ - $ - $ 31,455,220$ - $
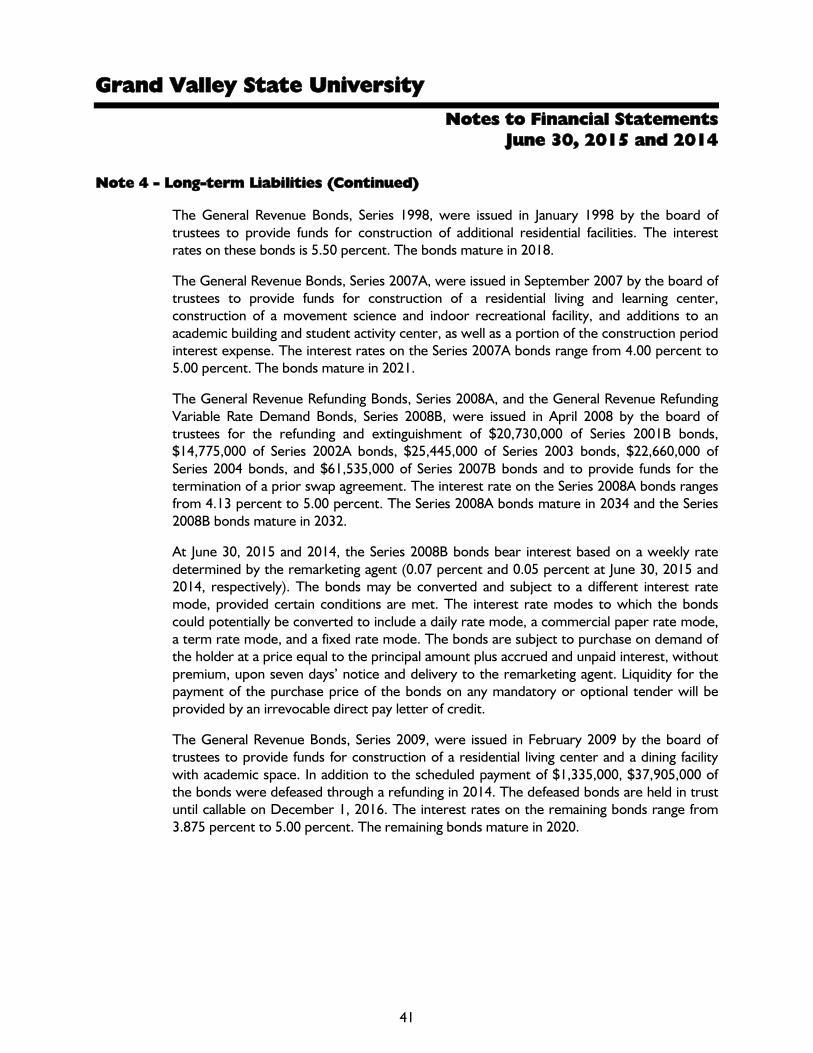
Grand Valley State University
Notes to Financial Statements June 30, 2015 and 2014
41
Note 4 - Long-term Liabilities (Continued)
The General Revenue Bonds, Series 1998, were issued in January 1998 by the board of trustees to provide funds for construction of additional residential facilities. The interest rates on these bonds is 5.50 percent. The bonds mature in 2018.
The General Revenue Bonds, Series 2007A, were issued in September 2007 by the board of trustees to provide funds for construction of a residential living and learning center, construction of a movement science and indoor recreational facility, and additions to an academic building and student activity center, as well as a portion of the construction period interest expense. The interest rates on the Series 2007A bonds range from 4.00 percent to 5.00 percent. The bonds mature in 2021.
The General Revenue Refunding Bonds, Series 2008A, and the General Revenue Refunding Variable Rate Demand Bonds, Series 2008B, were issued in April 2008 by the board of trustees for the refunding and extinguishment of $20,730,000 of Series 2001B bonds, $14,775,000 of Series 2002A bonds, $25,445,000 of Series 2003 bonds, $22,660,000 of Series 2004 bonds, and $61,535,000 of Series 2007B bonds and to provide funds for the termination of a prior swap agreement. The interest rate on the Series 2008A bonds ranges from 4.13 percent to 5.00 percent. The Series 2008A bonds mature in 2034 and the Series 2008B bonds mature in 2032.
At June 30, 2015 and 2014, the Series 2008B bonds bear interest based on a weekly rate determined by the remarketing agent (0.07 percent and 0.05 percent at June 30, 2015 and 2014, respectively). The bonds may be converted and subject to a different interest rate mode, provided certain conditions are met. The interest rate modes to which the bonds could potentially be converted to include a daily rate mode, a commercial paper rate mode, a term rate mode, and a fixed rate mode. The bonds are subject to purchase on demand of the holder at a price equal to the principal amount plus accrued and unpaid interest, without premium, upon seven days’ notice and delivery to the remarketing agent. Liquidity for the payment of the purchase price of the bonds on any mandatory or optional tender will be provided by an irrevocable direct pay letter of credit.
The General Revenue Bonds, Series 2009, were issued in February 2009 by the board of trustees to provide funds for construction of a residential living center and a dining facility with academic space. In addition to the scheduled payment of $1,335,000, $37,905,000 of the bonds were defeased through a refunding in 2014. The defeased bonds are held in trust until callable on December 1, 2016. The interest rates on the remaining bonds range from 3.875 percent to 5.00 percent. The remaining bonds mature in 2020.
Grand Valley State University
Notes to Financial Statements June 30, 2015 and 2014
42
Note 4 - Long-term Liabilities (Continued)
The General Revenue Bonds, Series 2011, were issued in May 2011 by the board of trustees to provide a portion of the funds needed to construct, furnish, and equip the Mary Idema Pew Library Learning and Information Commons. The interest rates on these bonds range from 4.00 percent to 5.00 percent. The bonds mature in 2021.
The General Revenue Refunding Bonds, Series 2013A, were issued in June 2013 by the board of trustees for the current refunding of $29,180,000 of Series 2005 bonds.
At June 30, 2015 and 2014, the Series 2013A bonds bear interest of 0.68 percent and 0.66 percent, respectively, based on a reset rate calculated as a factor of LIBOR plus an applicable spread. The bonds may be converted and subject to a different interest rate mode, provided certain conditions are met. The interest rate modes to which the bonds could potentially be converted include a daily rate mode, a weekly rate mode, a term rate mode, a bank rate mode, and a fixed rate mode. The bonds mature in 2025.
The General Revenue Bonds, Series 2014A, were issued in February 2014 by the board of trustees to provide a portion of the funds needed to construct, furnish, and equip a classroom and laboratory building on the Allendale Campus and a building for the relocation of the University’s bookstore and printing activities, as well as an addition to Au Sable Hall. This is a draw-down bond in which a portion was drawn during fiscal year 2014 and the remainder in fiscal year 2015.
At June 30, 2015 and 2014, the Series 2014A bonds bear interest of 0.65 percent and 0.63 percent, respectively, based on a reset rate calculated as a factor of LIBOR plus an applicable spread. The bonds may be converted and subject to a different interest rate mode, provided certain conditions are met. The interest rate modes to which the bonds could potentially be converted include a daily-rate mode, a weekly-rate mode, a term-rate mode, a bank-rate mode, and a fixed-rate mode. The bonds mature in 2040.
The General Revenue Refunding Bonds, Series 2014B, were issued in September 2014 by the board of trustees for the advance refunding of $37,905,000 of Series 2009 bonds. The interest rates on these bonds range from 3.50 percent to 5.00 percent. The bonds mature in 2035. The advance refunding resulted in a loss of $4,664,356, which is recorded as a deferred outflow and is amortized over the life of the original debt.
The General Revenue Bonds, Series 2015A, were issued in June 2015 by the board of trustees to provide a portion of the funds needed to construct, furnish, and equip a student housing and academic building on the Allendale Campus. The interest rates on these bonds range from 4.00 percent to 5.00 percent. The bonds mature in 2036.

Grand Valley State University
Notes to Financial Statements June 30, 2015 and 2014
43
Note 4 - Long-term Liabilities (Continued)
Scheduled maturities of long-term liabilities are as follows:
Fiscal Year Revenue Bonds
Annuities
Payable Total Interest
2016 13,255,000$ 264,902$ 13,519,902$ 8,999,930$ 2017 13,950,000 264,902 14,214,902 8,628,836 2018 14,690,000 264,902 14,954,902 8,133,488 2019 14,885,000 264,902 15,149,902 7,597,632 2020 15,120,000 249,096 15,369,096 7,107,949
2021-2025 62,445,000 - 62,445,000 28,963,384 2026-2030 71,370,000 - 71,370,000 17,674,117 2031-2035 55,760,000 - 55,760,000 5,096,833 2036-2040 12,750,000 - 12,750,000 214,379
Total 274,225,000$ 1,308,704$ 275,533,704$ 92,416,548$
38 Front Avenue Loans Payable
QLICI loans payable of $22,273,000 were issued in 2012 to provide partial funding for construction for the L. William Seidman Center as required by New Market Tax Credits. The interest rate on these loans ranges from 1.43 percent to 1.50 percent. The loans mature in 2041.
A loan payable of $9,182,220 was issued by the University to 38 Front Avenue in 2013 to provide partial funding for construction for the L. William Seidman Center. The interest rate on this loan is 2 percent. The loan matures in 2042.
The scheduled maturities of the 38 Front Avenue loans payable are as follows:
Fiscal Year Loans Payable Interest
2016 - $ 510,033$ 2017 - 510,033
2018 152,000 509,260
2019 815,779 503,702
2020 1,146,060 491,691
2021-2025 6,013,888 2,173,947 2026-2030 6,516,210 1,670,005 2031-2035 7,060,916 1,123,557 2036-2040 7,652,577 530,022 2041-2042 2,097,790 40,218
Total 31,455,220$ 8,062,468$

Grand Valley State University
Notes to Financial Statements June 30, 2015 and 2014
44
Note 5 - Derivative Instruments
The University is party to derivative financial instruments (interest rate swaps) that are reported at fair value on the statement of net position at June 30, 2015 and 2014. The fair value is calculated by the counterparty to the transactions and approximates the termination value of the interest rate swaps.
The fair value balances and notional amounts of the derivative instruments outstanding at June 30, 2015, classified by type and the change in fair value of such derivative instruments for the year ended as reported in the 2015 financial statements, are as follows:
Type Classification Amount Classification Amount Notional
Hedging DerivativesCash flow hedges:
Pay fixed-interest rate swap
Deferred outflow of resources/Interest rate swap contract $ (105,000) Liability $ (235,000) $ 25,950,000
Pay fixed interest rate swap
Deferred outflow of resources (397,000) Liability (5,785,000) 27,940,000
Total (502,000) Total (6,020,000)
Pay fixed-interest rate swap
Change in fair value of derivative instruments 206,000 Liability (442,000) 7,155,000
Total (6,462,000)$
Changes in Fair Value Fair Value at June 30, 2015
Investment Derivative -
The fair value balances and notional amounts of the derivative instruments outstanding at June 30, 2014, classified by type, and the change in fair value of such derivative instruments for the year ended as reported in the 2014 financial statements are as follows:
Type Classification Amount Classification Amount Notional
Hedging DerivativesCash flow hedges:
Pay fixed-interest rate swap
Deferred outflow of resources/Interest rate swap contract $ 3,400,000 Liability $ (130,000) $ 28,630,000
Pay fixed-interest rate swap
Deferred outflow of resources 40,000 Liability (5,388,000) 27,940,000
Total 3,440,000 Total (5,518,000)
Pay fixed-interest rate swap
Change in fair value of derivative instruments 262,000 Liability (648,000) 8,840,000
Total (6,166,000)$
Changes in Fair Value Fair Value at June 30, 2014
Investment Derivative -

Grand Valley State University
Notes to Financial Statements June 30, 2015 and 2014
45
Note 5 - Derivative Instruments (Continued)
As of the balance sheet date, the swap agreements can be summarized as follows:
Effective Notional Pay Receive Maturity CounterpartyDate Type Objective Amount Terms Terms Date Credit Rating
9/24/2003 Pay fixed, Receive variable
Cash flow hedge for Series 2008B bonds 7,155,000$ 3.299% Fixed
70% of one-month LIBOR 6/1/2019 A3/A-
3/3/2005 Pay fixed, Receive variable
Cash flow hedge for Series 20013A bonds 25,950,000 3.501% Fixed
70% of one-month LIBOR 12/1/2025 A3/A-
9/6/2007 Pay fixed, Receive variable
Cash flow hedge for Series 2008B bonds 27,940,000 3.691% Fixed
70% of one-month LIBOR 12/1/2031 A3/A-
The University currently holds three derivative instruments that are pay-fixed, receive-variable interest rate swaps. The notional amounts of the swaps match the principal amount of the associated debt and the swap agreements contain scheduled reductions to outstanding notional amounts that follow scheduled reductions in the associated “bonds payable” category; the intent of entering into these swap agreements was to create a synthetic fixed-rate debt, at an interest rate that is lower than if fixed-rate debt were to have been issued directly. Two of the swap agreements are effective cash flow hedges and one is not. The one not considered effective is classified as an investment derivative.
In fiscal year 2014, one of the University’s hedging relationships was designated into a new relationship due to a refunding of the original debt. In accordance with GASB Statement No. 53, this swap is now considered a hybrid instrument consisting of a financing element and an embedded derivative. The at-market amount of the swap at the time of the new hedging relationship is designated as a hedging instrument with a current mark-to-market value of $235,000 and $130,000 at June 30, 2015 and 2014, respectively. The above-market amount, which equals $2,837,000 and $2,299,000 at June 30, 2015 and 2014, respectively, is considered a borrowing and included in long-term debt as an interest rate swap contract and is offset by deferred charge on refunding.
The fair values of the interest rate swaps were calculated by an independent consultant as of June 30, 2015 and 2014. The fair values represent the future net settlement payments or receipts required by the swap, assuming that the current forward rates implied by the yield curve correctly anticipate future spot interest rates.
The interest rate swaps are subject to the following risks:
Credit Risk - The University is exposed to credit risk on hedging derivative instruments that are in asset positions. The terms of the swap agreement require collateralization of the fair value of hedging derivative instruments in asset positions based on a scale that evaluates both the market value of the swap and the counterparty’s credit rating. The University has never needed to access collateral from the counterparty.

Grand Valley State University
Notes to Financial Statements June 30, 2015 and 2014
46
Note 5 - Derivative Instruments (Continued)
It is the University’s policy to enter into netting arrangements whenever it has entered into more than one derivative instrument transaction with a counterparty. Under the terms of these arrangements, should one party become insolvent or otherwise default on its obligations, close-out netting provisions permit the nondefaulting party to accelerate and terminate all outstanding transactions and net the transactions' fair values so that a single sum will be owed by, or owed to, the nondefaulting party.
The aggregate fair value of hedging derivative instruments in asset positions at June 30, 2015 and 2014 was $0. This represents the maximum loss that would be recognized at the reporting date if all counterparties failed to perform as contracted. This maximum exposure is reduced by $0 of collateral held and $8,761,000 and $9,003,000 at June 30, 2015 and 2014, respectively, of liabilities included in netting arrangements with those counterparties, resulting in a net exposure to credit risk of $0.
All of the contracts are held with one counterparty. That counterparty is rated A3/A- at June 30, 2015.
Interest Rate Risk - The University is exposed to interest rate risk on its interest rate swaps. On its pay-fixed, receive-variable interest rate swap, as LIBOR rates decrease, the University’s net payment on the swap increases.
Basis Risk - The University is exposed to basis risk on its LIBOR-based interest rate swaps due to variable-rate payments received by the University on these instruments based on a rate or index other than interest rates the University pays on its variable-rate debt, which is remarketed every seven days. As of June 30, 2015 and 2014, the weighted average interest rate on the University’s hedged variable-rate debt is .33 percent and .32 percent, respectively, while 70 percent of LIBOR is .13 percent and .11 percent, respectively.
Termination Risk - The University or its counterparties may terminate a derivative instrument if the other party fails to perform under the terms of the contract.
Hedging Derivative Instrument Payments and Hedged Debt
As of June 30, 2015, aggregate debt service requirements of the University’s debt (fixed-rate and variable-rate) and net receipts/payments on associated hedging derivative instruments are as follows. These amounts assume that current interest rates on variable-rate bonds and the current reference rates of hedging derivative instruments will remain the same for their term. As these rates vary, interest payments on variable-rate bonds and net receipts/ payments on the hedging derivative instruments will vary.

Grand Valley State University
Notes to Financial Statements June 30, 2015 and 2014
47
Note 5 - Derivative Instruments (Continued)
Fiscal Year Principal InterestInterest Rate Swaps - Net Total
2016 2,770,000$ 176,587$ 1,398,343$ 4,344,930$ 2017 2,870,000 165,589 1,720,049 4,755,638 2018 2,990,000 145,634 1,620,958 4,756,592 2019 3,100,000 124,904 1,518,017 4,742,921 2020 3,225,000 103,368 1,411,075 4,739,443
2021-2025 18,825,000 241,897 5,120,813 24,187,710 2026-2030 14,045,000 46,808 2,263,502 16,355,310 2031-2032 6,065,000 3,946 200,734 6,269,680
Total 53,890,000$ 1,008,733$ 15,253,491$ 70,152,224$
Associated with Swap Agreements
Note 6 - Retirement Plans
Defined Contribution Plans
The executive, administrative, and professional staff and faculty are covered under a defined contribution retirement plan through TIAA-CREF (Teachers Insurance and Annuity Association of America - College Retirement Equities Fund) or Fidelity Investments. Employees may contribute an amount not to exceed the Internal Revenue Service’s designated maximum. Participants become fully vested upon completion of two years of employment. Discretionary university contributions equal to 12 percent of participants’ base salaries were made in each year.
The total expense under this discretionary plan was approximately $15,239,800 and $14,481,400 for the years ended June 30, 2015 and 2014, respectively. Total payroll covered under this plan was approximately $127,166,000 in 2015 and $120,895,700 in 2014.
Maintenance, grounds, and service staff hired after October 8, 2004 and professional support staff hired on or after February 2, 2006 participate in a defined contribution plan with University contributions equal to 8 percent of wages. Effective January 1, 2015, the University will also match the employees’ contribution up to an additional 1.0 percent of wages. Participants become fully vested upon completion of two years of employment. Total expenses under this plan were approximately $769,600 in 2015 and $678,500 in 2014. Total payroll covered under this plan was approximately $9,619,600 in 2015 and $8,481,100 in 2014.

Grand Valley State University
Notes to Financial Statements June 30, 2015 and 2014
48
Note 6 - Retirement Plans (Continued)
Defined Benefit Plans
GVSU Professional Support Staff Employees’ Retirement Plan Description
Plan administration. Grand Valley State University (GVSU) administers the GVSU Professional Support Staff Employees’ Retirement Plan - a single-employer defined benefit pension plan that provides pensions for all professional support staff of the University hired before February 2, 2006. Management of the plan is vested in the treasurer of the board. Benefit terms have been established by contractual agreements between the University and the various employee union representation; amendments are subject to the same process. The financial statements of the plan are included in these financial statements as an employee benefit plan trust fund (a fiduciary fund).
At July 1, 2014, retirement plan membership consisted of the following:
Inactive plan members receiving benefits 134Inactive members entitled to, not yet receiving benefits 91Active plan members 264
Total participants 489
Benefits provided. The plan provides retirement and death benefits. Retirement benefits for plan members are calculated as 1.9 percent of the member’s calendar year salary for the highest five years out of the last 10 years multiplied by the member’s years of service. Plan members with 10 years of continuous service are eligible to retire at age 65, or with reduced benefits, as early as age 55. Death benefits are equal to the present value of accrued benefits. A plan member who leaves the University with less than 10 years of continuous service may withdraw his or her contributions. The plan does not provide cost of living adjustments.
Contributions. Article 9, Section 24 of the Regulations of the State of Michigan constitution requires the financial benefits arising on account of service rendered each year be funded during that year. The University retains an actuary to determine the estimated amount necessary to finance the costs of benefits earned by plan members during the year, with an additional amount to finance any unfunded accrued liability. In addition, active members also contribute to the plan. Beginning January 1, 2015, the active member’s contribution rate changed from 2.0 percent to 3.0 percent. The University’s contribution rate of annual payroll was 15.1 percent and 14.6 percent for the year ended June 30, 2015 and 2014, respectively.

Grand Valley State University
Notes to Financial Statements June 30, 2015 and 2014
49
Note 6 - Retirement Plans (Continued)
Investments
Investment policy. The retirement plan’s policy in regard to the allocation of invested assets is established and may be amended by the treasurer of the board in consultation with the GVSU Pension Plans Investment Committee. It is the policy of the treasurer of the board to pursue an investment strategy that is long term and primarily equity-based. The retirement plan’s investment policy discourages the use of cash equivalents, except for liquidity purposes, and aims to refrain from dramatically shifting asset class allocations over short time spans. The following was the asset allocation policy as of June 30, 2015:
Asset ClassTarget
Allocation
Domestic equities 57%International equities 15%Fixed income 20%Cash 0%Real estate 3%Commodities 5%
Concentrations. The retirement plan held no investment in any one organization that represents 5 percent or more of the retirement plan’s fiduciary net position.
Rate of return. The annual money-weighted rate of return on retirement plan investments, net of retirement plan investment expense, was 2.9 percent and 20.2 percent for the years ended June 30, 2015 and 2014, respectively. The money-weighted rate of return expresses investment performance, net of investment expense.

Grand Valley State University
Notes to Financial Statements June 30, 2015 and 2014
50
Note 6 - Retirement Plans (Continued)
Net Pension Liability of the University
The University’s net pension liability was measured as of June 30, 2015 and the total pension liability used to calculate the net pension liability was determined by an actuarial valuation as of July 1, 2014, which used update procedures to roll forward the estimated liability to June 30, 2015.
Changes in the net pension liability during the measurement year were as follows:
Total Pension Liability
Plan Net Position
Net Pension Liability
Balance at June 30, 2014 47,511,566$ 40,492,321$ 7,019,245$ Changes for the Year
Service cost - Beginning of year 869,998 - 869,998 Interest on average adjusted TPL 3,170,993 - 3,170,993 Changes in assumptions 3,014,969 - 3,014,969 Benefits payments, including refunds of member contributions (1,683,752) - (1,683,752) Contributions - Employer - 1,645,094 (1,645,094) Contributions - Member - 280,975 (280,975) Net investment income - 610,806 (610,806) Benefit payments, including refunds of member contributions - (1,683,752) 1,683,752
Net Changes 5,372,208 853,123 4,519,085
Balance at June 30, 2015 52,883,774$ 41,345,444$ 11,538,330$
Pension Expense and Deferred Outflows of Resources and Deferred Inflows of Resources Related to Pensions
For the years ended June 30, 2015 and 2014, the University recognized pension expense of $1,767,781 and $1,681,352, respectively. At June 30, 2015, the University reported deferred outflows of resources related to pensions from the following sources:
Deferred Outflows of Resources
Difference between expected and actual experience 603,627$ Changes in assumptions 2,122,081 Net difference between projected and actual earnings on
plan investments 1,670,690 Total 4,396,398$

Grand Valley State University
Notes to Financial Statements June 30, 2015 and 2014
51
Note 6 - Retirement Plans (Continued) Amounts reported as deferred outflows of resources related to pension will be recognized in pension expense as follows:
Years Ended June 30 Amount
2016 706,934$ 2017 706,934 2018 706,934 2019 706,934 2020 289,261
Actuarial assumptions. The actuarial valuation as of July 1, 2014 was prepared by updating procedures and including the following actuarial assumptions, applied to all periods included in the measurement: Salary increases including inflation 2.50%Investment rate of return 7.06%, net of pension plan investment expense
Mortality rates were updated to the Mortality Table RP-2014 with Projection Table MP-2014 from the 1983 Group Annuity Mortality Table for Males or Females, as appropriate Discount rate. The discount rate used to measure the total pension liability at June 30, 2015 was 6.80 percent, whereas the prior rate used at June 30, 2014 was 6.82 percent. The projection of cash flows used to determine the discount rate assumed that plan member contributions will be made at the current contribution rate and that University contributions will be made at rates equal to the difference between actuarially determined contribution rates and the member rate. Based on those assumptions, the retirement plan’s fiduciary net position was not projected to be available to make all projected future benefit payments of active and inactive plan members. Therefore, the discount rate incorporates a municipal bond rate of 3.05 percent. The source of that bond rate was the AA Rated 20 year bond rate as published by FMS Bonds, Inc. The long-term expected rate of return from plan investments was applied to projected benefit payments from 2015 through 2074 and the municipal bond rate was applied to the remaining periods. The long-term expected rate of return on pension plan investments was determined using a model in which best-estimate ranges of expected future real rates of return (expected returns, net of retirement plan investment expense and inflation) are developed for each major asset class. These ranges are combined to produce the long-term expected rate of return by weighting the expected future real rates of return by the target asset allocation percentage and by adding expected inflation. The target allocation and best estimates of arithmetic real rates of return as of June 30, 2015, the measurement date, for each major asset class are summarized in the table on the following page.

Grand Valley State University
Notes to Financial Statements June 30, 2015 and 2014
52
Note 6 - Retirement Plans (Continued)
Asset ClassTarget
AllocationLong-term Expected Real
Rate of Return
Domestic equities 57% 7.89%International equities 15% 8.73%Fixed income 20% 4.33%Cash 0% 0.50%Real estate 3% 7.98%Commodities 5% 2.91%
The sum of the target allocations times the long-term expected rates is 7.06 percent.
Sensitivity of the net pension liability to changes in the discount rate. The following presents the net pension liability (NPL) of the University, calculated using the discount rate of 6.80 percent, as well as what the University’s net pension liability would be if it were calculated using a discount rate that is one percentage point lower (5.80 percent) or one percentage point higher (7.80 percent) than the current rate:
1% Decrease(5.80%)
Current Discount Rate
(6.80%)1% Increase
(7.80%)
Net pension liability 18,688,641$ 11,538,330$ 5,596,792$ GVSU Maintenance, Grounds, Service Employees’ Retirement Plan Description Plan administration. Grand Valley State University (GVSU) administers the GVSU Maintenance, Grounds, Service Employees’ Retirement Plan - a single-employer defined benefit pension plan that provides pensions for all permanent full-time maintenance, grounds, and service employees of the University hired before October 9, 2004. Management of the plan is vested in the treasurer of the board. Benefit terms have been established by contractual agreements between the University and the various employee union representation; amendments are subject to the same process. The financial statements of the plan are included in these financial statements as an employee benefit plan trust fund (a fiduciary fund). At July 1, 2014, retirement plan membership consisted of the following:
Inactive plan members receiving benefits 61Inactive members entitled to, not yet receiving benefits 5
Active plan members 92
Total participants 158
Grand Valley State University
Notes to Financial Statements June 30, 2015 and 2014
53
Note 6 - Retirement Plans (Continued)
Benefits provided. The plan provides retirement and death benefits. Retirement benefits for plan members are calculated as 1.9 percent of the member’s calendar year salary for the highest five years out of the last 10 years multiplied by the member’s years of service. Plan members with 10 years of continuous service are eligible to retire at age 65, or with reduced benefits, as early as age 55. Death benefits are equal to the present value of accrued benefits. A plan member who leaves the University with less than 10 years of continuous service may withdraw his or her contributions. The plan does not provide cost of living adjustments.
Contributions. Article 9, Section 24 of the Regulations of the State of Michigan Constitution requires the financial benefits arising on account of service rendered each year be funded during that year. The University retains an independent actuary to determine the estimated amount necessary to finance the costs of benefits earned by plan members during the year, with an additional amount to finance any unfunded accrued liability. In addition, active members also contribute to the plan. Beginning May 1, 2015, the active member’s contribution rate changed to 4.10 percent from 4.25 percent. The University’s contribution rate of annual payroll was 16.4 percent and 14.8 percent for the years ended June 30, 2015 and 2014, respectively.
Investments
Investment policy. The retirement plan’s policy in regard to the allocation of invested assets is established and may be amended by the treasurer of the board in consultation with the GVSU Pension Plans Investment Committee. It is the policy of the treasurer of the board to pursue an investment strategy that is long term and primarily equity-based. The retirement plan’s investment policy discourages the use of cash equivalents, except for liquidity purposes, and aims to refrain from dramatically shifting asset class allocations over short time spans. The following was the asset allocation policy as of June 30, 2015:
Asset ClassTarget
Allocation
Domestic equities 57%International equities 15%Fixed income 20%Cash 0%Real estate 3%Commodities 5%
Concentrations. The retirement plan held no investment in any one organization that represents 5 percent or more of the retirement plan’s fiduciary net position.
Rate of return. The annual money-weighted rate of return on retirement plan investments, net of retirement plan investment expense, was 2.9 percent and 20.2 percent for the years ended June 30, 2015 and June 30, 2014, respectively. The money-weighted rate of return expresses investment performance, net of investment expense.

Grand Valley State University
Notes to Financial Statements June 30, 2015 and 2014
54
Note 6 - Retirement Plans (Continued) Net Pension Liability The University’s net pension liability was measured as of June 30, 2015 and the total pension liability used to calculate the net pension liability was determined by an actuarial valuation as of July 1, 2014, which used update procedures to roll forward the estimated liability to June 30, 2015.
Changes in the net pension liability during the measurement year were as follows:
Total Pension Liability
Plan Net Position
Net Pension Liability
Balance at June 30, 2014 19,474,523$ 14,941,200$ 4,533,323$ Changes for the Year
Service cost - Beginning of year 373,413 - 373,413 Interest on average adjusted TPL 1,227,012 - 1,227,012 Changes in assumptions 2,280,678 - 2,280,678 Benefits payments, including refunds of member contributions (778,615) - (778,615) Contributions - Employer - 611,534 (611,534) Contributions - Member - 165,723 (165,723) Net investment income - 237,990 (237,990) Benefit payments, including refunds of member contributions - (778,615) 778,615
Net Changes 3,102,488 236,632 2,865,856
Balance at June 30, 2015 22,577,011$ 15,177,832$ 7,399,179$
Pension Expense and Deferred Outflows of Resources and Deferred Inflows of Resources Related to Pensions For the years ended June 30, 2015 and 2014, the University recognized pension expense of $905,405 and $617,498, respectively. At June 30, 2015, the University reported deferred outflows of resources related to pensions from the following sources:
Deferred Outflows of Resources
Difference between expected and actual experience 372,677$ Changes in assumptions 1,668,459 Net difference between projected and actual earnings on plan investments 530,849
Total 2,571,985$
Grand Valley State University
Notes to Financial Statements June 30, 2015 and 2014
55
Note 6 - Retirement Plans (Continued)
Amounts reported as deferred outflows of resources related to pension will be recognized in pension expense as follows:
Amortization of Deferred Outflows Amount
2016 372,254$ 2017 372,254 2018 372,254 2019 372,255 2020 239,542
Thereafter 843,426
Actuarial assumptions. The total pension liability was determined by an actuarial valuation as of July 1, 2014, using updating procedures and the following actuarial assumptions, applied to all periods included in the measurement: Salary increases including inflation 2.50%Investment rate of return 7.06%, net of pension plan investment expense
Mortality rates were updated to the Mortality Table RP-2014 with Projection Table MP-2014 from the 1983 Group Annuity Mortality Table for Males or Females, as appropriate. Discount rate. The discount rate used to measure the total pension liability was 5.90 percent. The projection of cash flows used to determine the discount rate assumed that plan member contributions will be made at the current contribution rate and that University contributions will be made at rates equal to the difference between actuarially determined contribution rates and the member rate. The discount rate declined from 6.42 percent at June 30, 2014 mainly as a result of use of the new mortality tables. Based on those assumptions, the retirement plan’s fiduciary net position was not projected to be available to make all projected future benefit payments of current active and inactive plan members. Therefore, the discount rate incorporates a municipal bond rate of 3.05 percent. The source of that bond rate was the AA Rated 20-year bond rate as published by FMS Bonds, Inc. The long-term expected rate of return from plan investments was applied to projected benefit payments from 2015 through 2050 and the municipal bond rate was applied to the remaining periods. The long-term expected rate of return on retirement plan investments was determined using a building-block method in which best-estimate ranges of expected future real rates of return (expected returns, net of retirement plan investment expense and inflation) are developed for each major asset class. These ranges are combined to produce the long-term expected rate of return by weighting the expected future real rates of return by the target asset allocation percentage and by adding expected inflation. Best estimates of arithmetic real rates of return for each major asset class included in the retirement plan’s target asset allocation as of June 30, 2015 (see the discussion of the retirement plan’s investment policy) are summarized in the table on the next page.

Grand Valley State University
Notes to Financial Statements June 30, 2015 and 2014
56
Note 6 - Retirement Plans (Continued)
Asset ClassTarget
AllocationLong-term Expected Real
Rate of Return
Domestic equities 57% 7.89%International equities 15% 8.73%Fixed income 20% 4.33%Cash 0% 0.00%Real estate 3% 7.98%Commodities 5% 2.91%
The sum of the target allocations times the long-term expected rates is 7.06 percent. Sensitivity of the net pension liability to changes in the discount rate. The following presents the net pension liability (NPL) of the University, calculated using the discount rate of 5.90 percent, as well as what the University’s net pension liability would be if it were calculated using a discount rate that is one percentage point lower (4.90 percent) or one percentage point higher (6.90 percent) than the current rate:
1% Decrease(4.90%)
Current Discount Rate
(5.90%)1% Increase
(6.90%)
Net pension liability 10,309,746$ 7,399,179$ 4,954,212$
Other Postemployment Benefits
The University has a single-employer defined benefit plan that provides certain healthcare benefits for retired faculty and staff. The plan covers 2,471 members as of July 1, 2015 and currently does not require active members to contribute to the plan. At January 1, 2014, the plan was closed to new participants.
Plan Description - Substantially all of the University’s employees hired prior to January 1, 2014 may become eligible for certain healthcare benefits if they reach retirement age while working for the University, are vested in a University-sponsored retirement plan, and their years of University service and age total a minimum of 75.
Funding Policy - The plan requirements are established and may be amended by the University’s board of trustees.

Grand Valley State University
Notes to Financial Statements June 30, 2015 and 2014
57
Note 6 - Retirement Plans (Continued) Annual OPEB Cost and Net OPEB Obligation - The University’s annual other postemployment benefit (OPEB) cost (expense) is calculated based on the annual required contribution of the employer (ARC), an amount actuarially determined in accordance with the parameters of GASB Statement No. 45. The ARC represents a level of funding that, if paid on an ongoing basis, is projected to cover normal cost each year and amortize any unfunded actuarial liabilities over a period not to exceed 15 years. The required supplemental information shows the components of the University’s annual OPEB cost for the year, the amount actually contributed to the plan, and changes in the University’s OPEB obligation. Funded Status and Funding Progress - As of July 1, 2015, the most recent actuarial valuation date, the plan was 0 percent funded. The actuarial accrued liability for benefits was $12,178,970, and the actuarial value of assets was $0, resulting in an unfunded actuarial accrued liability (UAAL) of $12,178,970. An investment fund was established for the purpose of prefunding retiree benefits, with a market value of $12,052,353 and $10,460,491 at June 30, 2015 and 2014, respectively. However, because the funds are not irrevocable, these contributions do not constitute contributions for GASB Statement No. 45 purposes. The covered payroll (annual payroll of active employees covered by the plan) was $142,719,060 and $145,002,900 for 2015 and 2014, respectively, and the ratio of all UAAL to covered payroll was 8.53 percent and 8.41 percent for 2015 and 2014, respectively. Actuarial valuations of an ongoing plan involve estimates of the value of reported amounts and assumptions about the probability of occurrence of events far into the future. Examples include assumptions about future employment and mortality. Amounts determined regarding the funded status of the plan and the annual required contributions of the employer are subject to continual revision as actual results are compared with past expectations and new estimates are made about the future.
Actuarial Methods and Assumptions - Projections of benefits for financial reporting purposes are based on the substantive plan and include the types of benefits provided at the time of each valuation. The actuarial methods and assumptions used include techniques that are designed to reduce the effects of short-term volatility in actuarial accrued liabilities and the actuarial value of assets, consistent with the long-term perspective of the calculations.
In the July 1, 2015 actuarial valuation, the projected unit cost actuarial method was used. The actuarial assumptions included a 7.0 percent investment rate of return (net of administrative expenses) based on the expected long-term investment returns on plan assets. There was a change in assumptions to update the mortality to the RP-2014 table. The UAAL is being amortized as a projected unit credit level dollar, closed on a 15-year basis. The remaining amortization period at June 30, 2015 was seven years. Benefits valued are fixed dollar amounts.
Grand Valley State University
Notes to Financial Statements June 30, 2015 and 2014
58
Note 7 - Commitments
The University has an arrangement with the State of Michigan and State Building Authority (the “SBA”) to finance a large portion of the Padnos College of Engineering and Computing and the Graduate School of Business and Graduate Library Building located on the Pew Campus in downtown Grand Rapids. The arrangement is based upon a lease agreement that is signed by the University. It stipulates that the SBA will hold title to the buildings and the State will make all lease payments to the SBA on behalf of the University, and the University will pay all operating and maintenance costs. At the expiration of the lease, the SBA has agreed to sell each building to the University for $1. A similar arrangement will be executed for the P. Douglas Kinschi Hall of Science in the upcoming fiscal year.
Beginning on January 1, 2011, the University leased lab space to a private company for a five-year term. The tenant has the option of extending the lease for five additional periods of five years each. At June 30, 2015, the base rent is $136,135 per year.
The University has agreed to lease the Michigan Alternative and Renewable Energy Facility from the City of Muskegon at no cost through June 30, 2025. Ownership of the building will revert to the University at lease termination for $1.
The University has agreed to lease office space from Bicycle Factory, LLC, beginning in the fiscal year ended June 30, 2009 for 90 months. As of June 30, 2015, the University has $113,143 as a put deposit. In the event the lessor elects to sell individual units (floors) therein, the University has the ability to purchase it for $3.47 million.
Note 8 - Contingencies
The University is self-funded for coverage under portions of its hospital/medical benefits and for all unemployment compensation and workers’ compensation. The University also offers one HMO plan to employees. Stop-loss coverage has been purchased by the University for the self-funded hospital/medical benefits and workers’ compensation claims. The stop-loss insurance limits the claims for hospital/medical benefits to $250,000 per individual, with no lifetime limit. The workers’ compensation stop-loss insurance limits its liability for claims paid per individual to $500,000 in 2015 and 2014. Current liabilities for estimated claims retained by the University under self-insurance programs have been established at $1,738,702 and $1,662,493 as of June 30, 2015 and 2014, respectively.
2015 2014
Balance - Beginning of year 1,662,493$ 2,130,760$ Claims incurred and changes in estimates 29,611,203 27,813,816 Claim payments (29,534,994) (28,282,083)
Balance - End of year 1,738,702$ 1,662,493$
To secure payment for a utility agreement, the University requested a $450,000 letter of credit during August 2007, which has been extended through March 31, 2017.

Grand Valley State University
Notes to Financial Statements June 30, 2015 and 2014
59
Note 8 - Contingencies (Continued)
The University is a participant in the Michigan Universities Self-Insurance Corporation (MUSIC). This organization provides insurance coverage for errors and omissions liability, comprehensive general liability, and all risk property insurance. In fiscal year 2015, there are 11 universities that participate in MUSIC. Each participating university is responsible for a first tier of losses up to a level that has been actuarially determined. MUSIC is financially responsible for a second tier of losses. For comprehensive general liability errors and omissions and all risk property insurance, MUSIC has purchased excess insurance coverage with commercial insurance carriers to cover a third tier of losses. However, in the event the insurance reserves established by MUSIC are insufficient to meet its second tier obligations, each of the participating universities share this obligation by agreements with MUSIC.
In the normal course of its activities, the University has been a party in various legal actions. Historically, the University has not experienced significant losses from such actions. After taking into consideration legal counsel’s evaluation of pending actions, the University is of the opinion that the outcome thereof will not have a material effect on its financial statements.
Pursuant to State of Michigan Public Act 362 of 1993, as amended, the University has previously authorized 71 public school academies. All 71 of these public school academies can operate schools funded by the State School Aid Act. The University, as fiscal agent, provides guidance in and review of compliance with state requirements and forwards the state payment to the public school academies. Public funding is provided by the State of Michigan on a per-pupil basis. Funding of $246,497,213 and $234,925,984 was appropriated by the State in 2015 and 2014, respectively, to be allocated to the public school academies, net of approximately a 3 percent administrative fee retained by the University. At June 30, 2015, $44,682,292 was outstanding as a receivable from the State, of which $43,437,255 will be subsequently forwarded to support the public school academies. At June 30, 2014, $42,871,672 was outstanding as a receivable from the State, of which $41,677,380 was subsequently forwarded to support the public school academies. This activity is treated as an agency transaction.
The L. William Seidman Center opened on May 1, 2013, and an operating lease between the University and 38 Front Avenue commenced. It is a 30-year triple net operating lease paid by the University for exclusive use of the center. Rental payments are due annually, in advance. In addition, the University entered into a 99-year triple-net ground lease with 38 Front Avenue for the land upon which the center is constructed. Lease payments of $1 are due annually, in advance. The fair market value of the ground lease has been recognized as a capital related expense by the University.
38 Front Avenue was financed in part by proceeds from loans received from investors participating in the New Markets Tax Credit program administered by the Community Development Financial Institutions Fund of the U.S. Department of Treasury.

Grand Valley State University
Notes to Financial Statements June 30, 2015 and 2014
60
Note 8 - Contingencies (Continued)
Under the program as part of the loan agreement, 38 Front Avenue has committed to maintaining its status as a qualified active low-income community business (QALICB) as defined in IRC Section 45D. The QALICB is a Michigan nonprofit corporation with Grand Valley State University as the only member. The purpose of the QALICB is to acquire, own, and construct a new, multi-story 124,000 square foot LEED Silver building for the expansion of the Seidman College of Business and various community and business outreach services.
Note 9 - Upcoming Pronouncements
In February 2015, the GASB issued Statement No. 72, Fair Value Measurement and Application. GASB Statement No. 72 addresses accounting and financial reporting issues related to fair value measurement. The statement provides guidance for determining a fair value measurement for financial reporting purposes. This statement also provides guidance for applying fair value to certain investments and disclosures related to all fair value measurements. The University is currently evaluating the impact this standard will have on the financial statements when adopted. The provisions of this statement are effective for financial statements for periods beginning after June 15, 2015.
In June 2015, the GASB issued Statement No. 75, Accounting and Financial Reporting for Postemployment Benefits Other Than Pensions, which addresses reporting by governments that provide postemployment benefits other than pensions (OPEB) to their employees and for governments that finance OPEB for employees of other governments. This OPEB standard will require the University to recognize on the face of the financial statements its full net OPEB liability. The statement also enhances accountability and transparency through revised note disclosures and required supplemental information (RSI). The University is currently evaluating the impact this standard will have on the financial statements when adopted. The provisions of this statement are effective for financial statements for periods beginning after June 15, 2017.
61
Required Supplemental Information

Grand Valley State University
62
Required Supplemental Information Professional Support Staff Employees’ Retirement Plan
Schedule of Changes in the Plan’s Net Pension Liability and
Related Ratios
June 30, 2015 June 30, 2014Total Pension Liability (TPL)
Service cost - Beginning of year 869,998$ 884,731$ Interest on average adjusted TPL 3,170,993 3,026,543 Changes in benefit terms - - Differences between expected and actual experience - - Changes in assumptions 3,014,969 - Benefits payments, including refunds of member contributions (1,683,752) (1,554,355)
Net change in total pension liability 5,372,208 2,356,919
Total pension liability - Beginning of year 47,511,566 45,154,647
Total pension liability - End of year 52,883,774$ 47,511,566$
Plan Fiduciary Net PositionContributions - Employer 1,645,094$ 1,681,351$ Contributions - Member 280,975 161,147 Net investment income 781,423 6,959,448 Administrative expenses (160,112) (77,694) Benefit payments, including refunds of member contributions (1,683,752) (1,554,355) Other (10,505) 1,534
Net change in plan fiduciary net position 853,123 7,171,431
Plan fiduciary net position - Beginning of year 40,492,321 33,320,890
Plan fiduciary net position - End of year 41,345,444$ 40,492,321$
Net pension liability - End of year 11,538,330$ 7,019,245$
Plan fiduciary net position as a percentage of total pension liability 78.2% 85.2%
Covered employee payroll 10,858,867$ 11,544,380$ Net pension liability as a percentage of covered employee payroll 106.3% 60.8%
Schedule of Investment Returns
June 30, 2015 June 30, 2014
Annual money-weighted rate of return, net of investment expense 2.9% 20.2%

Grand Valley State University
63
Required Supplemental Information Professional Support Staff Employees’ Retirement Plan
Schedule of Employer Contributions
June 30, 2015 June 30, 2014
Actuarially determined contribution offset by employee contributions 1,482,594$ 1,741,333$ Actual contributions by University 1,645,094$ 1,681,352$ Contribution deficiency (excess) (162,500)$ 59,981$ Covered employee payroll 10,858,868$ 11,544,380$ Actual contributions as a percentage of covered employee payroll 15.1% 14.6% Notes to Schedule of Contributions Actuarial valuation information relative to the determination of contributions:
Valuation Date July 1, 2014
Actuarial MethodsActuarial cost method Entry age normalAmortization method Level dollar amount, closedRemaining amortization period 26 years, declining based on average future serviceAsset valuation method Four-year moving market value average recognizing 25% of gains
and losses per year
Actuarial Assumptions
Retirement age 65 with 10 years of vesting service
Salary increases 2.50%/year
Investment rate of return:
Total pension liability 7.06%/year
Funding 7.00%/year
Mortality RP-2014 with Projection Table MP-2014
Data CollectionDate and form of data All personnel and asset data was prepared by the plan sponsor or
representative and was generally relied upon as being correct and complete without audit
Changes Since Prior Valuation The nonelective employee contribution rate increased from to 3.00% effective January 2015.
Change in mortality table from 1983 GAM to RP-2014.
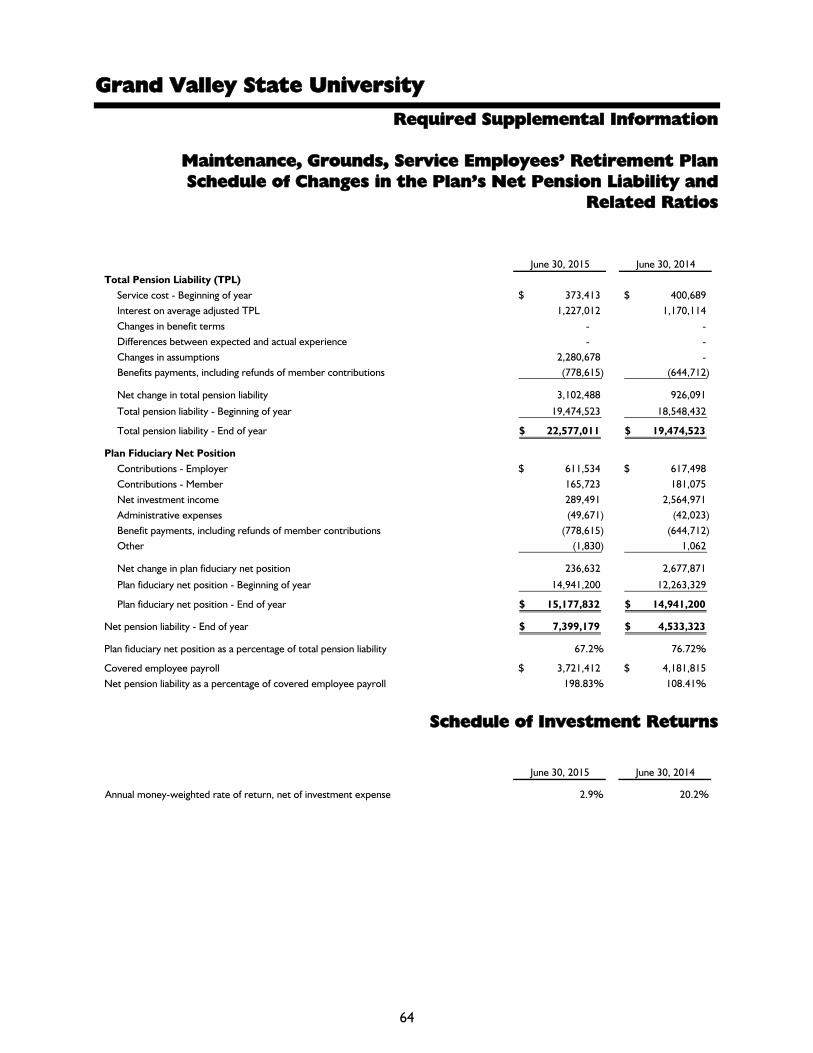
Grand Valley State University
64
Required Supplemental Information
Maintenance, Grounds, Service Employees’ Retirement Plan Schedule of Changes in the Plan’s Net Pension Liability and
Related Ratios
June 30, 2015 June 30, 2014
Total Pension Liability (TPL)Service cost - Beginning of year 373,413$ 400,689$ Interest on average adjusted TPL 1,227,012 1,170,114 Changes in benefit terms - - Differences between expected and actual experience - - Changes in assumptions 2,280,678 - Benefits payments, including refunds of member contributions (778,615) (644,712)
Net change in total pension liability 3,102,488 926,091
Total pension liability - Beginning of year 19,474,523 18,548,432
Total pension liability - End of year 22,577,011$ 19,474,523$
Plan Fiduciary Net PositionContributions - Employer 611,534$ 617,498$ Contributions - Member 165,723 181,075 Net investment income 289,491 2,564,971 Administrative expenses (49,671) (42,023) Benefit payments, including refunds of member contributions (778,615) (644,712) Other (1,830) 1,062
Net change in plan fiduciary net position 236,632 2,677,871
Plan fiduciary net position - Beginning of year 14,941,200 12,263,329
Plan fiduciary net position - End of year 15,177,832$ 14,941,200$
Net pension liability - End of year 7,399,179$ 4,533,323$
Plan fiduciary net position as a percentage of total pension liability 67.2% 76.72%
Covered employee payroll 3,721,412$ 4,181,815$ Net pension liability as a percentage of covered employee payroll 198.83% 108.41%
Schedule of Investment Returns
June 30, 2015 June 30, 2014
Annual money-weighted rate of return, net of investment expense 2.9% 20.2%

Grand Valley State University
65
Required Supplemental Information Schedules Maintenance, Grounds, Service Employees’ Retirement Plan
Schedule of Employer Contributions
June 30, 2015 June 30, 2014
Actuarially determined contribution offset by employee contributions 618,150$ 612,391$ Actual contributions by University 611,534$ 617,498$ Contribution deficiency (excess) (6,616)$ (5,107)$ Covered employee payroll 3,721,412$ 4,181,815$ Actual contributions as a percentage of covered employee payroll 16.43% 14.77%
Notes to Schedule of Contributions Actuarial valuation information relative to the determination of contributions: Valuation Date July 1, 2014
Actuarial MethodsActuarial cost method Entry age normalAmortization method Level dollar amount, closedRemaining amortization period 26 years, declining based on average future serviceAsset valuation method Four-year moving market value average recognizing 25% of gains
and losses per year
Actuarial Assumptions
Retirement age 65 with 10 years of vesting service
Salary increases 2.50%/year
Investment rate of return:
Total pension liability 7.06%/year
Funding 7.00%/year
Mortality RP-2014 with Projection Table MP-2014
Data CollectionDate and form of data All personnel and asset data was prepared by the plan sponsor or
representative and was generally relied upon as being correct and complete without audit
Changes Since Prior Valuation The nonelective employee contribution rate decreased from 4.25% to 4.10%
Change in mortality table from 1983 GAM to RP-2014.

Grand Valley State University
66
Required Supplemental Information Other Post Employment Benefits
The schedule of funding progress for the OPEB plan is as follows:
Actuarial
Valuation Date
Actuarial Value
of Assets
Actuarial
Accrued Liability
(AAL)
Unfunded AAL
(UAAL)
Funded
Ratio Covered Payroll
UAAL as a
Percentage of
Covered
Payroll
7/1/2015 $ - $ 12,178,970 (12,178,970)$ - % 151,365,900$ 8.0% 7/1/2013 - 12,196,088 (12,196,088) - % 138,717,600 8.8% 7/1/2011 - 10,451,148 (10,451,148) - % 124,441,600 8.4% 7/1/2009 - 9,475,238 (9,475,238) - % 111,775,600 8.5%
Funded Status of Plan

67
Other Supplemental Information

Grand Valley State University
68
Schedule of Changes in Fiduciary Net Position By Employee Retirement Plan
Activity for the Maintenance, Grounds, and Service Employees’ Retirement Plan and the Professional Support Staff Employees’ Retirement Plan, formerly the Clerical, Office, and Technical Employees’ Retirement Plan, for the years ended June 30, 2015 and 2014 is as follows:
Year Ended June 30 Year Ended June 30
2015 2014 2015 2014
AdditionsInvestment income (loss):
Interest and dividends 391,296$ 296,008$ 1,073,038$ 803,714$ Net (depreciation) appreciation in fair value of investments (978,002) 1,302,631 (3,000,720) 3,450,849 Income on sale of investments 876,197 966,332 2,709,105 2,704,885
Total investment income 289,491 2,564,971 781,423 6,959,448
Employer contributions 611,534 617,498 1,645,094 1,681,351 Other income 163,893 182,137 270,470 162,681
Total additions - Net 1,064,918 3,364,606 2,696,987 8,803,480
DeductionsBenefit payments 778,615 644,712 1,683,752 1,554,355 Administrative expense 49,671 42,023 160,112 77,694
Total deductions 828,286 686,735 1,843,864 1,632,049
Net Increase 236,632 2,677,871 853,123 7,171,431
Net Assets Held in Trust for Pension Benefits
Beginning of year 14,941,200 12,263,329 40,492,321 33,320,890
End of year 15,177,832$ 14,941,200$ 41,345,444$ 40,492,321$
Maintenance, Grounds, and Service
Employees'
Retirement Plan
Professional Support Staff Employees'
Retirement Plan

Grand Valley State University
69
Schedule of University and Foundation Endowments and Similar Funds June 30, 2015
BalanceJune 30, 2014
Gifts and Additions
Investment Income and Deductions
Distribution Beneficiary
FundsIntrafund
DistributionBalance
June 30, 2015
Retained Investment
IncomePrincipal Balance
June 30, 2015Endowment Funds
School of Accounting Faculty Endowed Scholarship 37,570$ 5,830$ 810$ 1,676$ 4,360$ 46,894$ 6,198$ 40,696$ Kathy A. Agard Endowed Fellowship in Community
Philanthropy 142,667 150 2,929 5,919 50 139,877 31,213 108,664 Alayont Undergraduate Research Fellowship
in Mathematics - 18,000 190 - 13,000 31,190 190 31,000 John Allegrina Nontraditional Student Endowed
Memorial Scholarship 15,121 304 314 - 201 15,940 3,325 12,615 Mathias J. Alten Endowment Fund 45,340 10,468 1,056 2,195 2,245 56,914 7,932 48,982 Alumni Heritage Scholarship Fund 929,355 49,914 19,373 39,404 2,674 961,912 228,537 733,375 WGVU - AM Radio Endowment 4,969 1,589 110 - - 6,668 908 5,760 Eric A. Andres Live, Laugh, Love, Learn Scholarship 44,559 498 919 1,855 211 44,332 9,431 34,901 David G. and Mary L. Annis Education Scholarship 120,567 2,188 2,498 5,068 25 120,210 32,251 87,959 R.B. Annis Educational Foundation and Outreach
Program Endowment 174,032 660 3,581 7,234 460 171,499 42,739 128,760 Anonymous Endowed Graduate Fellowship - 2,410 10 - - 2,420 10 2,410 Anonymous Endowed Scholarship 94981 - 100 2 - 100 202 2 200 Anonymous Margin of Excellence for Science
Endowment - 152,172 (1,359) - 25,000 175,813 (1,359) 177,172 Joseph E. Appelt P.E. Engineering Scholarship Fund 52,708 - 1,082 2,186 - 51,604 15,662 35,942 APICS Scholarship Fund 46,296 25 951 1,921 25 45,376 40,151 5,225 Carl and Delores Arendsen Golf Scholarship 46,666 641 967 1,953 391 46,712 11,117 35,595 ARAMARK Student Excellence Endowed Scholarship 37,607 - 772 1,560 - 36,819 6,819 30,000 Bachmeier Disability Support Services Endowment 39,660 2,503 841 1,705 1,758 43,057 9,933 33,124 Carl and Claudia Bajema Grand Rapids Urban
Schools Endowed Scholarship 53,976 3,229 1,165 2,337 3,004 59,037 9,004 50,033 Baker-Hall Physics Fund 90,364 6,118 1,927 3,880 908 95,437 32,773 62,664 Baldwin Foundation Scholarship Endowment Fund 37,957 10,000 896 1,788 - 47,065 7,065 40,000 John T. Batchelder Political Science Scholarship 45,141 255 928 1,876 - 44,448 10,518 33,930 William C. Baum Endowment 104,333 2,175 2,166 4,370 - 104,304 29,005 75,299 Nancy H. Baum Endowment in Dance 49,687 250 1,023 2,066 20 48,914 23,474 25,440 Beckering Family Carillon Endowment 34,959 75 719 1,452 - 34,301 10,766 23,535 Fred A. Bell Business Scholarship Endowment 49,195 85 1,011 2,042 15 48,264 16,563 31,701 David Alan Bergsma Scholarship Fund 67,923 - 1,395 2,817 - 66,501 55,866 10,635

Grand Valley State University
70
Schedule of University and Foundation Endowments and Similar Funds (Continued) June 30, 2015
BalanceJune 30, 2014
Gifts and Additions
Investment Income and Deductions
Distribution Beneficiary
FundsIntrafund
DistributionBalance
June 30, 2015
Retained Investment
IncomePrincipal Balance
June 30, 2015Endowment Funds (Continued)
Hyman H. & Greta M. Berkowitz Scholarship Fund 513,003$ 135$ 10,533$ 21,277$ 6$ 502,400$ 235,180$ 267,220$ Biology Field and Laboratory Enhancement Fund 201,804 12,733 4,238 8,518 594 210,851 50,607 160,244 The Biomedical/Health Science Fund 44,621 1,642 924 1,873 150 45,464 14,020 31,444 The Rev. Darld and Joyce Black Doctor of Physical
Therapy Scholarship in Memory of Robert Klein 41,949 525 872 1,758 625 42,213 11,647 30,566 Blinkhorn/Donk First Generation Scholars
Endowed Scholarship - 2,340 17 - 980 3,337 17 3,320 Edith I. Blodgett Endowed Music Scholarship Fund 75,426 212 1,551 3,134 212 74,267 37,759 36,508 Archie A. Blood, Jr. '79, '83 Endowed PATHWAYS
Scholarship 10,347 5,094 165 - - 15,606 470 15,136 Joan Boand Athletic Scholarship Fund 84,956 1,825 1,770 3,571 1,145 86,125 25,066 61,059 Boand & Rowe Endowment for Advancement of
Women in Sport & Physical Activity 28,286 7,060 664 - 3,181 39,191 4,118 35,073 Clarke and Nancy Borgeson Science, Technology,
and Mathematics Endowed Scholarship 6,451 6,194 199 - - 12,844 531 12,313 Ira Brad Memorial Scholarship 184,243 5,950 3,855 7,773 450 186,725 41,146 145,579 William J. & Margaret G. Branstrom Fund 139,641 - 2,867 5,791 - 136,717 88,030 48,687 George and Georgia Breur Scholarship 16,184 - 335 - - 16,519 6,519 10,000 Brooks College Endowed Scholarship for Study Abroad 20,159 6,327 500 - 6,580 33,566 2,464 31,102 The Donna K. Brooks Presidential Scholarship 388,206 120 7,972 16,102 - 380,196 119,332 260,864 Paul Brian and Margaret Susan Brooks Endowed
Memorial Scholarship 46,593 3,320 974 1,976 - 48,911 5,538 43,373 The Brooks Family Minority Scholarship 377,418 - 7,749 15,653 - 369,514 117,464 252,050 Johnny C. Burton Memorial Scholarship 92,862 - 1,907 3,851 - 90,918 36,250 54,668 Thomas A. & Cheryl L. '91, '98 Butcher Endowed
Nontraditional Student Scholarship 8,944 16,200 298 - 3,650 29,092 742 28,350 Greg Cadaret Baseball Fund 92,434 1,734 1,925 3,885 1,525 93,733 43,357 50,376 Dr. Johnine and Dr. Orel Callahan Honors Senior
Research Program Endowment 1,325 300 33 - 300 1,958 198 1,760 Carlton Radiologic and Imaging Sciences Undergraduate
Scholarship 7,941 - 165 - - 8,106 2,506 5,600 Ara Cary Lectureship Fund 62,649 400 1,284 2,599 - 61,734 20,014 41,720 Barry Castro Business Ethics Scholarship 114,852 940 2,369 4,787 740 114,114 26,649 87,465 Bernard & Camille Cebelak Scholarship Fund 411,105 - 8,441 17,050 - 402,496 102,236 300,260

Grand Valley State University
71
Schedule of University and Foundation Endowments and Similar Funds (Continued) June 30, 2015
BalanceJune 30, 2014
Gifts and Additions
Investment Income and Deductions
Distribution Beneficiary
FundsIntrafund
DistributionBalance
June 30, 2015
Retained Investment
IncomePrincipal Balance
June 30, 2015Endowment Funds (Continued)
Endowment for the Center for Scholarly and Creative Excellence 447$ -$ 9$ -$ -$ 456$ 156$ 300$
Collegiate Entrepreneurs' Organization (CEO) Endowment 108,554 - 2,229 4,502 - 106,281 31,570 74,711 Robert L. Chamberlain Scholarship Fund 74,120 765 1,524 3,088 350 73,671 37,373 36,298 Ruth Chamberlain Global Issues Scholarship
Endowment 129,125 6,000 2,722 5,484 50 132,413 19,313 113,100 Frederick A. Chapman Endowed Memorial Public
Relations Scholarship 23,200 300 484 - - 23,984 3,384 20,600 Hong Chen Memorial Endowment 31,024 - 637 1,287 - 30,374 9,203 21,171 Children's Enrichment Center Student Parent
Scholarship 22,774 981 483 - 1,085 25,323 5,656 19,667 Douglas K. and Ellen Chung Asian Social Work
Graduate Scholarship 42,510 - 873 1,763 - 41,620 10,928 30,692 CLAS Margin of Excellence for Science Endowment - 127,981 222 - - 128,203 222 127,981 Class of 1968 Endowed Scholarship 34,699 8,995 756 - 120 44,570 2,870 41,700 Helen Claytor Minority Scholarship 1,516,992 - 31,146 62,913 - 1,485,225 500,822 984,403 College of Liberal Arts and Sciences Endowed Scholarship 21,909 10,435 510 - 5,458 38,312 1,799 36,513 Colliers International Endowed Scholarship 19,006 14,400 546 - - 33,952 3,952 30,000 School of Communications Scholarship Fund 61,345 735 1,267 2,561 470 61,256 17,512 43,744 Community Foundation for Muskegon County
Interfaith Dialogue Fund* 423,407 - 8,693 17,560 - 414,540 93,191 321,349 GVU Foundation Community Leadership Endowment* 231,036 29,158 4,794 9,889 1,278 256,377 35,842 220,535 College of Education Future Teacher Scholarship 77,595 8,333 1,670 3,416 8,347 92,529 13,877 78,652 Computing and Information Systems Scholarship Fund 169,383 3,359 3,514 7,095 1,534 170,695 54,723 115,972 Cook Leadership Fellows of Hauenstein Center
for Presidential Studies 1,417,222 1,662 29,122 58,825 2,262 1,391,443 352,710 1,038,733 The Coopersville Scholarship 1,274,517 250,870 29,095 58,214 170 1,496,438 229,262 1,267,176 Professional Support Staff (PSS) Scholarship
Endowment Fund 163,618 2,542 3,389 6,851 2,415 165,113 43,722 121,391 David Daniels Memorial Scholarship 93,813 7,348 1,990 4,085 743 99,809 39,985 59,824 Gilbert R. and Patricia K. Davis Endowed Merit Scholarship
for Part/full-time Junior and Senior English Majors 124,248 750 2,553 5,167 375 122,759 45,878 76,881 Gilbert R. and Patricia K. Davis Davis Theatre Endowed
Scholarship: Remembering Shakespeare - 25,204 178 - - 25,382 178 25,204 Greta & Arthur Delong Perpetual Scholarship Fund 94,972 - 1,950 3,939 - 92,983 39,123 53,860
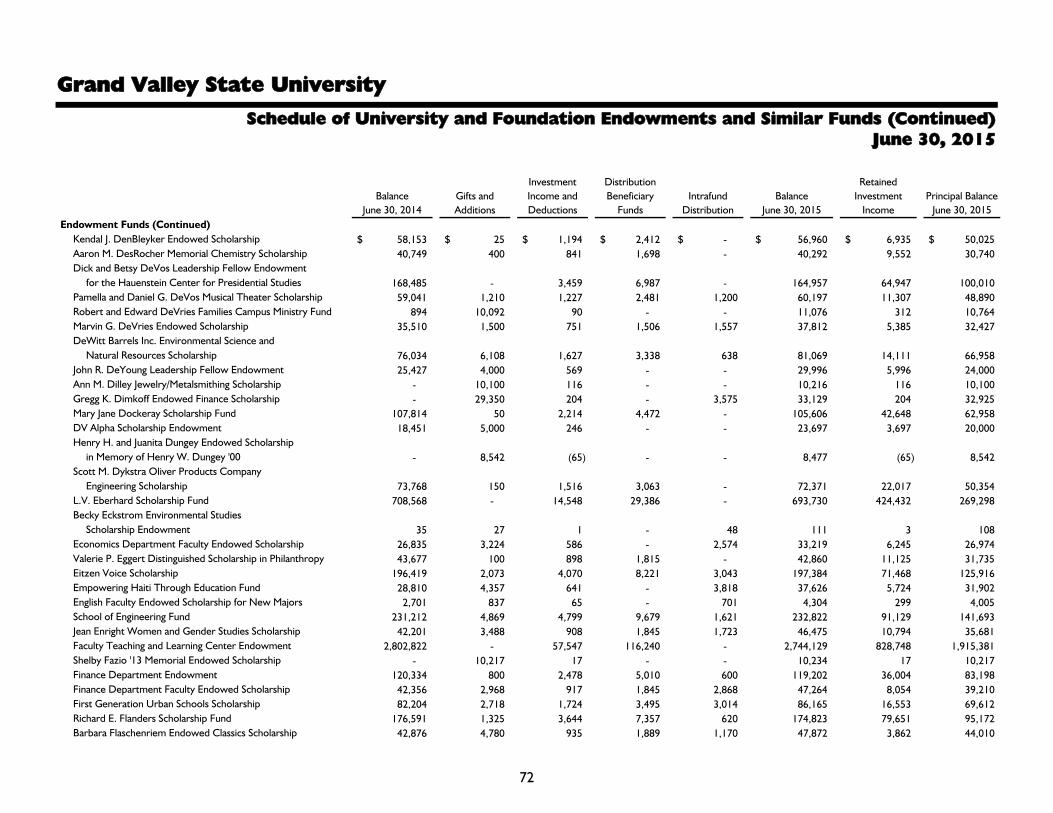
Grand Valley State University
72
Schedule of University and Foundation Endowments and Similar Funds (Continued) June 30, 2015
BalanceJune 30, 2014
Gifts and Additions
Investment Income and Deductions
Distribution Beneficiary
FundsIntrafund
DistributionBalance
June 30, 2015
Retained Investment
IncomePrincipal Balance
June 30, 2015Endowment Funds (Continued)
Kendal J. DenBleyker Endowed Scholarship 58,153$ 25$ 1,194$ 2,412$ -$ 56,960$ 6,935$ 50,025$ Aaron M. DesRocher Memorial Chemistry Scholarship 40,749 400 841 1,698 - 40,292 9,552 30,740 Dick and Betsy DeVos Leadership Fellow Endowment
for the Hauenstein Center for Presidential Studies 168,485 - 3,459 6,987 - 164,957 64,947 100,010 Pamella and Daniel G. DeVos Musical Theater Scholarship 59,041 1,210 1,227 2,481 1,200 60,197 11,307 48,890 Robert and Edward DeVries Families Campus Ministry Fund 894 10,092 90 - - 11,076 312 10,764 Marvin G. DeVries Endowed Scholarship 35,510 1,500 751 1,506 1,557 37,812 5,385 32,427 DeWitt Barrels Inc. Environmental Science and
Natural Resources Scholarship 76,034 6,108 1,627 3,338 638 81,069 14,111 66,958 John R. DeYoung Leadership Fellow Endowment 25,427 4,000 569 - - 29,996 5,996 24,000 Ann M. Dilley Jewelry/Metalsmithing Scholarship - 10,100 116 - - 10,216 116 10,100 Gregg K. Dimkoff Endowed Finance Scholarship - 29,350 204 - 3,575 33,129 204 32,925 Mary Jane Dockeray Scholarship Fund 107,814 50 2,214 4,472 - 105,606 42,648 62,958 DV Alpha Scholarship Endowment 18,451 5,000 246 - - 23,697 3,697 20,000 Henry H. and Juanita Dungey Endowed Scholarship
in Memory of Henry W. Dungey '00 - 8,542 (65) - - 8,477 (65) 8,542 Scott M. Dykstra Oliver Products Company
Engineering Scholarship 73,768 150 1,516 3,063 - 72,371 22,017 50,354 L.V. Eberhard Scholarship Fund 708,568 - 14,548 29,386 - 693,730 424,432 269,298 Becky Eckstrom Environmental Studies
Scholarship Endowment 35 27 1 - 48 111 3 108 Economics Department Faculty Endowed Scholarship 26,835 3,224 586 - 2,574 33,219 6,245 26,974 Valerie P. Eggert Distinguished Scholarship in Philanthropy 43,677 100 898 1,815 - 42,860 11,125 31,735 Eitzen Voice Scholarship 196,419 2,073 4,070 8,221 3,043 197,384 71,468 125,916 Empowering Haiti Through Education Fund 28,810 4,357 641 - 3,818 37,626 5,724 31,902 English Faculty Endowed Scholarship for New Majors 2,701 837 65 - 701 4,304 299 4,005 School of Engineering Fund 231,212 4,869 4,799 9,679 1,621 232,822 91,129 141,693 Jean Enright Women and Gender Studies Scholarship 42,201 3,488 908 1,845 1,723 46,475 10,794 35,681 Faculty Teaching and Learning Center Endowment 2,802,822 - 57,547 116,240 - 2,744,129 828,748 1,915,381 Shelby Fazio '13 Memorial Endowed Scholarship - 10,217 17 - - 10,234 17 10,217 Finance Department Endowment 120,334 800 2,478 5,010 600 119,202 36,004 83,198 Finance Department Faculty Endowed Scholarship 42,356 2,968 917 1,845 2,868 47,264 8,054 39,210 First Generation Urban Schools Scholarship 82,204 2,718 1,724 3,495 3,014 86,165 16,553 69,612 Richard E. Flanders Scholarship Fund 176,591 1,325 3,644 7,357 620 174,823 79,651 95,172 Barbara Flaschenriem Endowed Classics Scholarship 42,876 4,780 935 1,889 1,170 47,872 3,862 44,010

Grand Valley State University
73
Schedule of University and Foundation Endowments and Similar Funds (Continued) June 30, 2015
BalanceJune 30, 2014
Gifts and Additions
Investment Income and Deductions
Distribution Beneficiary
FundsIntrafund
DistributionBalance
June 30, 2015
Retained Investment
IncomePrincipal Balance
June 30, 2015Endowment Funds (Continued)
Robert W. Fletcher Memorial Endowment 152,731$ 6,969$ 3,168$ 6,464$ 6,535$ 162,939$ 29,640$ 133,299$ Football Alumni Endowment Fund 174,493 14,897 3,664 7,462 3,540 189,132 42,780 146,352 Milton E. Ford LGBT Resource Center Endowment 16,062 11,664 481 - 6,571 34,778 3,769 31,009 Fraternity and Sorority Laker Leaders Scholarship - 489 (5) - - 484 (5) 489 Frey Foundation Chair for Family Foundations
and Philanthropy 1,892,056 100 38,846 78,468 34 1,852,568 352,278 1,500,290 Kenneth and Irene Fridsma Endowed Special
Education Scholarship - 15,000 280 - 15,000 30,280 280 30,000 The General Dynamics Land Systems
Engineering Scholarship 49,881 - 1,024 2,069 - 48,836 16,836 32,000 Geology Development Fund 152,558 1,200 3,144 6,349 100 150,653 77,601 73,052 Geology Student Field Camp Endowment 67,832 1,792 1,419 2,862 983 69,164 19,453 49,711 Norman Gibson Geology Field Study Scholarship 78,627 11,187 1,637 3,383 800 88,868 13,346 75,522 Charlotte A. Gierst & Salome C. Egeler Trust Fund 91,793 45 1,886 3,809 105 90,020 42,840 47,180 Richard Giles Memorial Scholarship Fund 451,488 2,800 9,296 18,778 - 444,806 275,996 168,810 Eric Jon Gillette Memorial Scholarship 39,976 - 821 1,658 - 39,139 9,039 30,100 George and Barbara Gordon Endowment for
the Gordon Gallery 358,723 50,200 7,726 15,426 100 401,323 50,883 350,440 John and Barbara Gracki Football Degree Completion
Scholarship Fund 55,647 1,050 1,161 2,340 1,000 56,518 9,468 47,050 The Graduate Teacher Certification Scholarship 103,616 782 2,141 4,321 864 103,082 28,742 74,340 Grand Valley Grand Forum Endowment 298,690 4,465 6,177 12,465 458 297,325 112,764 184,561 GV in DC Endowed Scholarship - 910 (4) - - 906 (4) 910 The Grand Valley Lanthorn Merit Scholarship 45,525 375 941 1,900 375 45,316 14,426 30,890 Grand Valley State University Athletic Fund 346,254 13,859 7,155 14,558 3,020 355,730 101,480 254,250 GVSU Founders Endowed Scholarship - 2,950 9 - - 2,959 9 2,950 Grand Valley State University Fund 5,940,427 433,024 139,785 265,765 (433,024) 5,814,447 3,629,037 2,185,410 GVSU Interprofessional Education Initiative
Endowment Fund 10,483 1,281 226 - 204 12,194 2,755 9,439 GVSU LGBT Scholarship Endowment 154,177 2,364 3,195 6,460 2,423 155,699 35,952 119,747 Grand Valley State University Symphony Orchestra
Endowed Scholarship 13,955 1,868 311 - 490 16,624 3,665 12,959 Women's Center Non-Traditional Student Scholarship 104,478 1,871 2,163 4,367 806 104,951 28,602 76,349 Tom and Marcia Haas & Family Laker Marching
Band Scholarship 69,970 810 1,474 2,971 4,125 73,408 12,047 61,361

Grand Valley State University
74
Schedule of University and Foundation Endowments and Similar Funds (Continued) June 30, 2015
BalanceJune 30, 2014
Gifts and Additions
Investment Income and Deductions
Distribution Beneficiary
FundsIntrafund
DistributionBalance
June 30, 2015
Retained Investment
IncomePrincipal Balance
June 30, 2015Endowment Funds (Continued)
Rick K. Hamlin Endowed Memorial Scholarship 23,539$ 10,020$ 604$ -$ -$ 34,163$ 4,043$ 30,120$ Earl Harper Scholarship Fund 78,813 - 1,618 3,268 - 77,163 39,068 38,095 Hauenstein Center for Presidential Studies Endowment 1,808,738 40,343 37,466 75,803 2,904 1,813,648 302,142 1,511,506 Center for Health Sciences Simulation Endowment 44,867 2,425 913 - 264 48,469 18,628 29,841 Joyce Hecht Distinguished Scholarship in Philanthropy 176,506 100 3,625 7,322 - 172,909 51,094 121,815 William Hegarty Endowment Fund 39,090 - 803 1,621 - 38,272 12,288 25,984 Arthur C. Hills Music Scholarship Fund 104,677 447 2,154 4,355 243 103,166 50,546 52,620 Hispanic Scholarship Fund 83,387 - 1,712 3,458 - 81,641 32,455 49,186 Dr. James D. Hoffman Scholarship 113,251 - 2,325 4,697 - 110,879 37,828 73,051 The Hilda C. Holder Endowed Scholarship for Women
in Business Fund 50,086 - 1,028 2,077 - 49,037 13,937 35,100 Honors Program Enrichment 41,425 364 860 1,738 1,008 41,919 12,580 29,339 Hosford Family Excellence in Academics and Athletics
Endowed Scholarship 78,410 37,677 2,046 - 12,490 130,623 4,733 125,890 Hospitality and Tourism Management Department
Endowment 56,357 1,890 1,176 2,379 1,057 58,101 13,147 44,954 J. C. Huizenga Business Scholarship 74,864 1,300 1,553 3,138 200 74,779 16,639 58,140 The Professor Paul A. Huizenga Biology Education
Scholarship 165,210 7,500 3,437 7,000 2,000 171,147 39,483 131,664 Innovation Connection Endowment - 420,147 4,435 - - 424,582 4,435 420,147 W.G. Jackson Fund 276,509 259 5,679 11,472 123 271,098 113,537 157,561 Nathan M. Hurwitz Endowed Memorial Scholarship 38,514 6,190 863 1,738 1,275 45,104 4,769 40,335 Todd Jager Memorial Graduate Athletic Training
Student Award 88,300 3,717 1,786 3,670 - 90,133 17,929 72,204 Michael and Susan Jandernoa Scholarship Endowment 261,226 - 5,363 10,834 - 255,755 54,714 201,041 The Dorothy A. Johnson Center for Philanthropy
Library Endowment 837,139 503 17,194 34,729 34 820,141 312,964 507,177 The Dorothy A. Johnson Center for Philanthropy
Operations Endowment 5,062,905 51,335 104,479 211,564 808 5,007,963 1,340,315 3,667,648 Johnson Leadership Scholarship Endowment 39,625 - 814 1,643 - 38,796 7,796 31,000 Jurries Family Scholarship 44,293 2 910 1,837 2 43,370 13,325 30,045 Justice and Society Endowed Scholarship 50,736 100 1,042 2,105 25 49,798 9,603 40,195 Dr. Sara Kane-Smart Endowed Scholarship in Honor
of Children's Advocacy Center in Holland - 1,013 19 - 1,000 2,032 19 2,013 Sylvia and Richard Kaufman Interfaith Institute Endowment 827,728 8,759 17,057 34,533 1,434 820,445 168,640 651,805
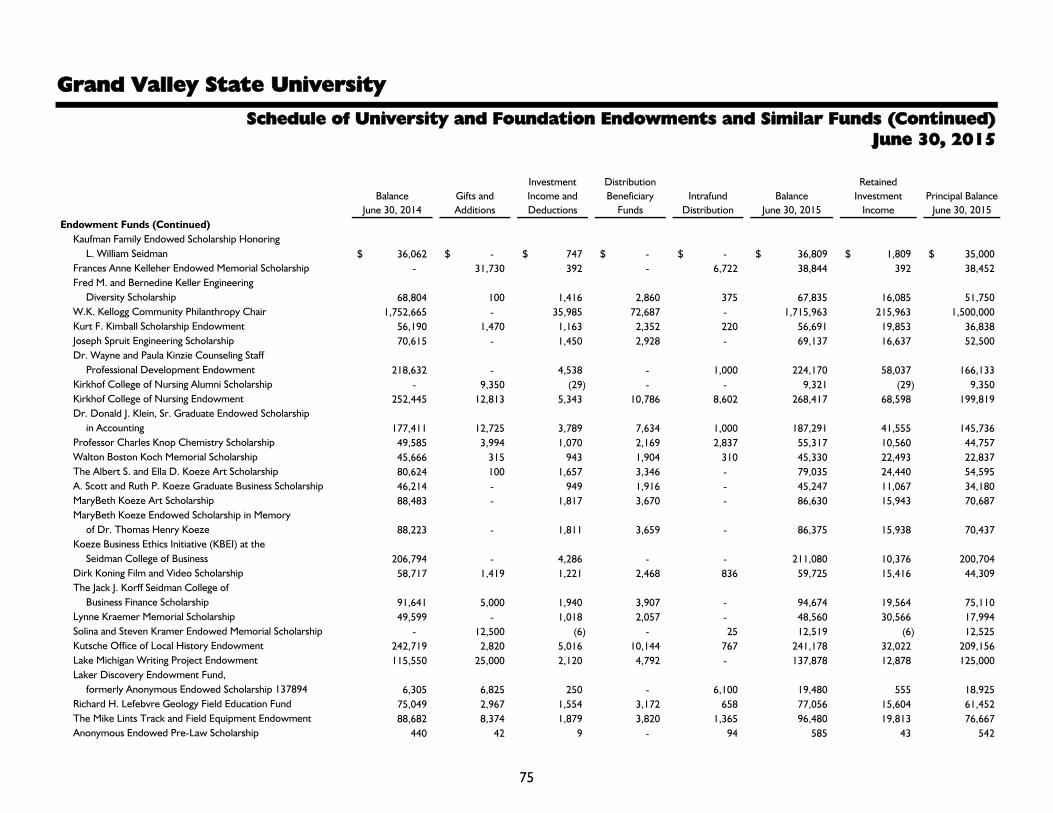
Grand Valley State University
75
Schedule of University and Foundation Endowments and Similar Funds (Continued) June 30, 2015
BalanceJune 30, 2014
Gifts and Additions
Investment Income and Deductions
Distribution Beneficiary
FundsIntrafund
DistributionBalance
June 30, 2015
Retained Investment
IncomePrincipal Balance
June 30, 2015Endowment Funds (Continued)
Kaufman Family Endowed Scholarship HonoringL. William Seidman 36,062$ -$ 747$ -$ -$ 36,809$ 1,809$ 35,000$
Frances Anne Kelleher Endowed Memorial Scholarship - 31,730 392 - 6,722 38,844 392 38,452 Fred M. and Bernedine Keller Engineering
Diversity Scholarship 68,804 100 1,416 2,860 375 67,835 16,085 51,750 W.K. Kellogg Community Philanthropy Chair 1,752,665 - 35,985 72,687 - 1,715,963 215,963 1,500,000 Kurt F. Kimball Scholarship Endowment 56,190 1,470 1,163 2,352 220 56,691 19,853 36,838 Joseph Spruit Engineering Scholarship 70,615 - 1,450 2,928 - 69,137 16,637 52,500 Dr. Wayne and Paula Kinzie Counseling Staff
Professional Development Endowment 218,632 - 4,538 - 1,000 224,170 58,037 166,133 Kirkhof College of Nursing Alumni Scholarship - 9,350 (29) - - 9,321 (29) 9,350 Kirkhof College of Nursing Endowment 252,445 12,813 5,343 10,786 8,602 268,417 68,598 199,819 Dr. Donald J. Klein, Sr. Graduate Endowed Scholarship
in Accounting 177,411 12,725 3,789 7,634 1,000 187,291 41,555 145,736 Professor Charles Knop Chemistry Scholarship 49,585 3,994 1,070 2,169 2,837 55,317 10,560 44,757 Walton Boston Koch Memorial Scholarship 45,666 315 943 1,904 310 45,330 22,493 22,837 The Albert S. and Ella D. Koeze Art Scholarship 80,624 100 1,657 3,346 - 79,035 24,440 54,595 A. Scott and Ruth P. Koeze Graduate Business Scholarship 46,214 - 949 1,916 - 45,247 11,067 34,180 MaryBeth Koeze Art Scholarship 88,483 - 1,817 3,670 - 86,630 15,943 70,687 MaryBeth Koeze Endowed Scholarship in Memory
of Dr. Thomas Henry Koeze 88,223 - 1,811 3,659 - 86,375 15,938 70,437 Koeze Business Ethics Initiative (KBEI) at the
Seidman College of Business 206,794 - 4,286 - - 211,080 10,376 200,704 Dirk Koning Film and Video Scholarship 58,717 1,419 1,221 2,468 836 59,725 15,416 44,309 The Jack J. Korff Seidman College of
Business Finance Scholarship 91,641 5,000 1,940 3,907 - 94,674 19,564 75,110 Lynne Kraemer Memorial Scholarship 49,599 - 1,018 2,057 - 48,560 30,566 17,994 Solina and Steven Kramer Endowed Memorial Scholarship - 12,500 (6) - 25 12,519 (6) 12,525 Kutsche Office of Local History Endowment 242,719 2,820 5,016 10,144 767 241,178 32,022 209,156 Lake Michigan Writing Project Endowment 115,550 25,000 2,120 4,792 - 137,878 12,878 125,000 Laker Discovery Endowment Fund,
formerly Anonymous Endowed Scholarship 137894 6,305 6,825 250 - 6,100 19,480 555 18,925 Richard H. Lefebvre Geology Field Education Fund 75,049 2,967 1,554 3,172 658 77,056 15,604 61,452 The Mike Lints Track and Field Equipment Endowment 88,682 8,374 1,879 3,820 1,365 96,480 19,813 76,667 Anonymous Endowed Pre-Law Scholarship 440 42 9 - 94 585 43 542

Grand Valley State University
76
Schedule of University and Foundation Endowments and Similar Funds (Continued) June 30, 2015
BalanceJune 30, 2014
Gifts and Additions
Investment Income and Deductions
Distribution Beneficiary
FundsIntrafund
DistributionBalance
June 30, 2015
Retained Investment
IncomePrincipal Balance
June 30, 2015Endowment Funds (Continued)
Logie Fellowship Endowment 190,830$ 100$ 3,919$ 7,915$ -$ 186,934$ 54,299$ 132,635$ Loutit Foundation Fund 286,441 46 (21,354) - 46 265,179 50,168 215,011 Bucky Love WGVU TV Music Program Endowment 44,319 - 910 1,838 - 43,391 3,391 40,000 Arend D. and Nancy Lubbers Honors College Scholarship 929,787 402 19,094 38,568 125 910,840 293,756 617,084 Marney (Houseman) MacAdam Endowed Voice Scholarship - 24,292 (217) - 667 24,742 (217) 24,959 McFadden Picciuca International Child Welfare Scholarship 22,611 668 481 - 818 24,578 8,762 15,816 T.J. Maciak Give Life Endowed Scholarship 11,189 1,578 266 - 2,705 15,738 1,509 14,229 Mack-Jackson African American Teacher Scholarship 92,051 12 1,890 3,818 12 90,147 39,158 50,989 Dr. Nancy K. Mack & Katherine Klemit Mack
Endowed Memorial Scholarship 15,455 30,000 638 - 15,000 61,093 1,093 60,000 Eric I. Maino Community Technology Award Endowment 44,688 450 918 1,859 - 44,197 10,109 34,088 Teri Linn (Houghton) Marsh Endowed Memorial
Nursing Scholarship 73,112 3,680 1,559 3,144 3,050 78,257 6,802 71,455 Jean E. Martin Doctor of Nursing Practice Scholarship 302,454 10,360 6,403 12,875 10,260 316,602 89,374 227,228 Mathematics Endowment Fund 262,932 2,870 5,434 10,975 1,720 261,981 120,862 141,119 Regional Math and Science Center Endowment 214,153 241 4,403 8,892 406 210,311 81,673 128,638 Russell G. Mawby Fellowship in Philanthropic Studies 188,456 100 3,868 7,816 - 184,608 48,801 135,807 Coach Jim Meerman Memorial Endowed Scholarship - 21,817 122 - - 21,939 122 21,817 GVUF Fred Meijer Diversity Scholarship* 47,814 - 991 - - 48,805 23,805 25,000 Frederik Meijer Endowed Honors Chair
in Entrepreneurship and Innovation 1,900,457 - 39,020 78,817 - 1,860,660 360,660 1,500,000 Frederik Meijer First Generation Honors College
Student Scholarship Endowment 3,220,298 531 66,126 133,569 537 3,153,923 650,973 2,502,950 Frederik Meijer Honors College Service-Learning
Endowment 5,570 769 109 - - 6,448 629 5,819 Frederik Meijer Lecture Series Endowment 504,273 - 10,354 20,913 - 493,714 193,714 300,000 GVUF Meijer Scholarship* 515,171 - 10,677 - - 525,848 25,848 500,000 Corky Meinecke Scholarship Endowment Fund 79,641 8,175 1,557 3,309 50 86,114 24,175 61,939 Memorial Garden Endowment 6,954 1,498 145 - - 8,597 3,439 5,158 Mercantile Bank of Michigan Upward Bound (TRiO)
Program Endowment 48,762 163 1,012 - - 49,937 9,774 40,163 Paul C. and Florence Miller Mineral
Collection Endowment 63,800 75 1,311 2,648 75 62,613 21,513 41,100 Paul C. Miller Scholarship Fund 207,773 - 4,266 8,617 - 203,422 103,099 100,323
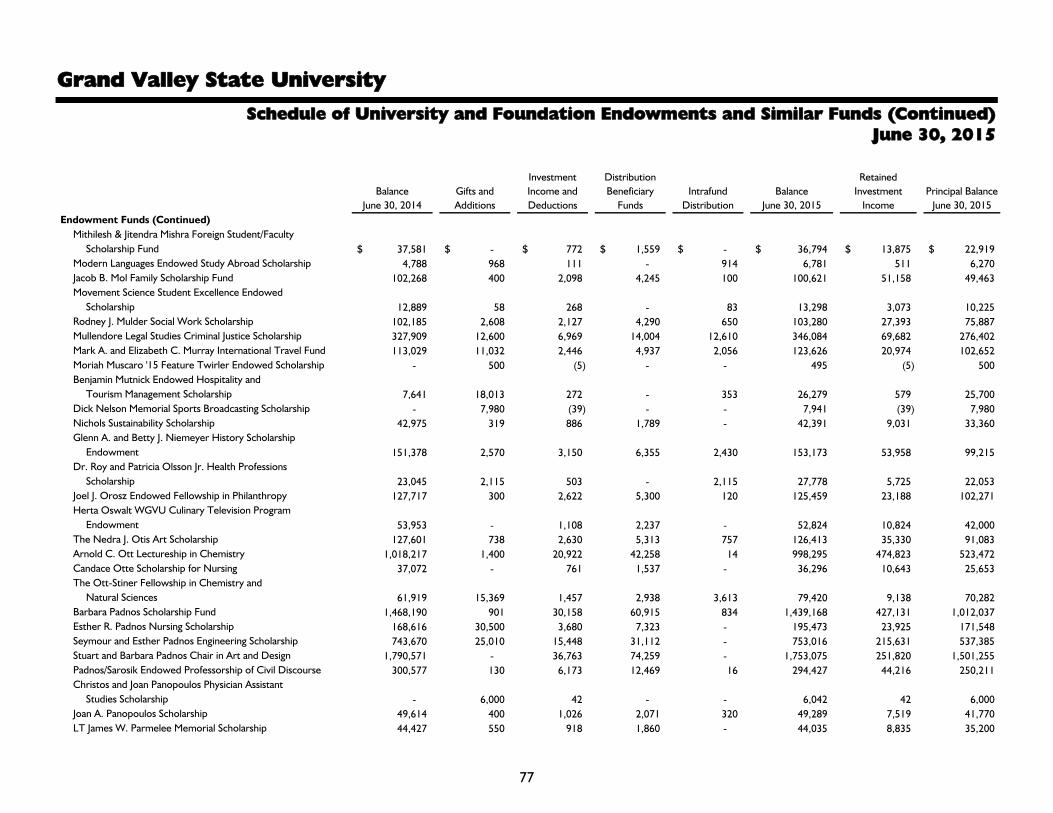
Grand Valley State University
77
Schedule of University and Foundation Endowments and Similar Funds (Continued) June 30, 2015
BalanceJune 30, 2014
Gifts and Additions
Investment Income and Deductions
Distribution Beneficiary
FundsIntrafund
DistributionBalance
June 30, 2015
Retained Investment
IncomePrincipal Balance
June 30, 2015Endowment Funds (Continued)
Mithilesh & Jitendra Mishra Foreign Student/Faculty Scholarship Fund 37,581$ -$ 772$ 1,559$ -$ 36,794$ 13,875$ 22,919$
Modern Languages Endowed Study Abroad Scholarship 4,788 968 111 - 914 6,781 511 6,270 Jacob B. Mol Family Scholarship Fund 102,268 400 2,098 4,245 100 100,621 51,158 49,463 Movement Science Student Excellence Endowed
Scholarship 12,889 58 268 - 83 13,298 3,073 10,225 Rodney J. Mulder Social Work Scholarship 102,185 2,608 2,127 4,290 650 103,280 27,393 75,887 Mullendore Legal Studies Criminal Justice Scholarship 327,909 12,600 6,969 14,004 12,610 346,084 69,682 276,402 Mark A. and Elizabeth C. Murray International Travel Fund 113,029 11,032 2,446 4,937 2,056 123,626 20,974 102,652 Moriah Muscaro '15 Feature Twirler Endowed Scholarship - 500 (5) - - 495 (5) 500 Benjamin Mutnick Endowed Hospitality and
Tourism Management Scholarship 7,641 18,013 272 - 353 26,279 579 25,700 Dick Nelson Memorial Sports Broadcasting Scholarship - 7,980 (39) - - 7,941 (39) 7,980 Nichols Sustainability Scholarship 42,975 319 886 1,789 - 42,391 9,031 33,360 Glenn A. and Betty J. Niemeyer History Scholarship
Endowment 151,378 2,570 3,150 6,355 2,430 153,173 53,958 99,215 Dr. Roy and Patricia Olsson Jr. Health Professions
Scholarship 23,045 2,115 503 - 2,115 27,778 5,725 22,053 Joel J. Orosz Endowed Fellowship in Philanthropy 127,717 300 2,622 5,300 120 125,459 23,188 102,271 Herta Oswalt WGVU Culinary Television Program
Endowment 53,953 - 1,108 2,237 - 52,824 10,824 42,000 The Nedra J. Otis Art Scholarship 127,601 738 2,630 5,313 757 126,413 35,330 91,083 Arnold C. Ott Lectureship in Chemistry 1,018,217 1,400 20,922 42,258 14 998,295 474,823 523,472 Candace Otte Scholarship for Nursing 37,072 - 761 1,537 - 36,296 10,643 25,653 The Ott-Stiner Fellowship in Chemistry and
Natural Sciences 61,919 15,369 1,457 2,938 3,613 79,420 9,138 70,282 Barbara Padnos Scholarship Fund 1,468,190 901 30,158 60,915 834 1,439,168 427,131 1,012,037 Esther R. Padnos Nursing Scholarship 168,616 30,500 3,680 7,323 - 195,473 23,925 171,548 Seymour and Esther Padnos Engineering Scholarship 743,670 25,010 15,448 31,112 - 753,016 215,631 537,385 Stuart and Barbara Padnos Chair in Art and Design 1,790,571 - 36,763 74,259 - 1,753,075 251,820 1,501,255 Padnos/Sarosik Endowed Professorship of Civil Discourse 300,577 130 6,173 12,469 16 294,427 44,216 250,211 Christos and Joan Panopoulos Physician Assistant
Studies Scholarship - 6,000 42 - - 6,042 42 6,000 Joan A. Panopoulos Scholarship 49,614 400 1,026 2,071 320 49,289 7,519 41,770 LT James W. Parmelee Memorial Scholarship 44,427 550 918 1,860 - 44,035 8,835 35,200

Grand Valley State University
78
Schedule of University and Foundation Endowments and Similar Funds (Continued) June 30, 2015
BalanceJune 30, 2014
Gifts and Additions
Investment Income and Deductions
Distribution Beneficiary
FundsIntrafund
DistributionBalance
June 30, 2015
Retained Investment
IncomePrincipal Balance
June 30, 2015Endowment Funds (Continued)
Paton Family Entrepreneurial Fund -$ 10,100$ (102)$ -$ -$ 9,998$ (102)$ 10,100$ Paton Family Entrepreneur Scholarship Endowment 38,530 750 799 1,619 - 38,460 8,810 29,650 Eugene and Lillian Pawl Scholarship 4,207 4,125 132 - 1,500 9,964 1,239 8,725 Peace and Justice Activist Scholarship 70,840 513 1,458 2,948 250 70,113 32,275 37,838 Ross W. Perry Bachelor of Science Scholarships 316,857 - 6,507 13,143 200 310,421 104,706 205,715 Physical Therapy Department Fund 89,887 1,345 1,845 3,763 1,138 90,452 27,803 62,649 Physical Therapy Urban Schools Endowed Scholarship - 8,417 44 - - 8,461 44 8,417 William F. Pickard Fund 101,230 - 2,078 4,198 - 99,110 68,195 30,915 Pioneer Class of 1967 Endowed Scholarship 44,404 3,270 951 - - 48,625 8,144 40,481 Plant Service Personnel Descendants Scholarship Fund 719,397 10,443 14,900 30,120 10,661 725,281 217,703 507,578 PNC Early Childhood Education Scholarship Endowment 168,506 - 3,460 6,988 - 164,978 28,796 136,182 Positive Black Women Endowment Fund 76,251 1,298 1,580 3,195 1,104 77,038 20,707 56,331 Paul W. Potter and Margaret E. Potter Scholarship 64,126 - 1,317 2,659 - 62,784 11,684 51,100 The Judith S. Pratt Non-Traditional Nursing Scholarship 96,014 1,950 1,994 4,030 1,370 97,298 26,041 71,257 Berthold Price Scholarship Fund 190,838 - 3,918 7,914 - 186,842 90,207 96,635 Price Heneveld Engineering Scholarship 212,808 - 4,369 8,826 - 208,351 58,033 150,318 Margaret Proctor School of Communications Scholarship 54,317 833 1,126 2,273 460 54,463 18,233 36,230 Orgulloso de Ser 'Proud to Be' Scholarship Endowment 216 371 6 - 21 614 12 602 Dr. George I. and Helen Z. Quimby Scholarship 44,438 3,055 952 1,914 525 47,056 14,387 32,669 Dr. George I. Quimby Memorial Anthropology
Endowment 44,787 3,100 959 1,930 600 47,516 10,535 36,981 Rauch Family Leadership Endowed Scholarship for
Portage Schools 53,684 - 1,102 2,226 - 52,560 7,260 45,300 Recreation Leadership Endowed Scholarship - 114 (1) - - 113 (1) 114 Redfield Financial Group Business and Baseball
Endowed Scholarship 37,478 - 769 1,554 - 36,693 6,233 30,460 John W. and Virginia M. Reifel Economics Scholarship 180,910 6,766 3,838 7,716 6,574 190,372 36,907 153,465 Reister Family Scholarship Endowment 117,320 1,194 2,417 4,890 25 116,066 33,423 82,643 Reverend Dennis and E. Jean (Lackey) McMurray Academic Achievement Scholarship 214 - 4 - - 218 94 124 Peter P. and Patricia R. Renucci Medical Lab Sciences
Scholarship Endowment 45,840 519 947 1,914 522 45,914 10,309 35,605 Peter P. Renucci Family Medical Lab Sciences
Scholarship Endowment 43,788 480 905 1,830 555 43,898 9,990 33,908
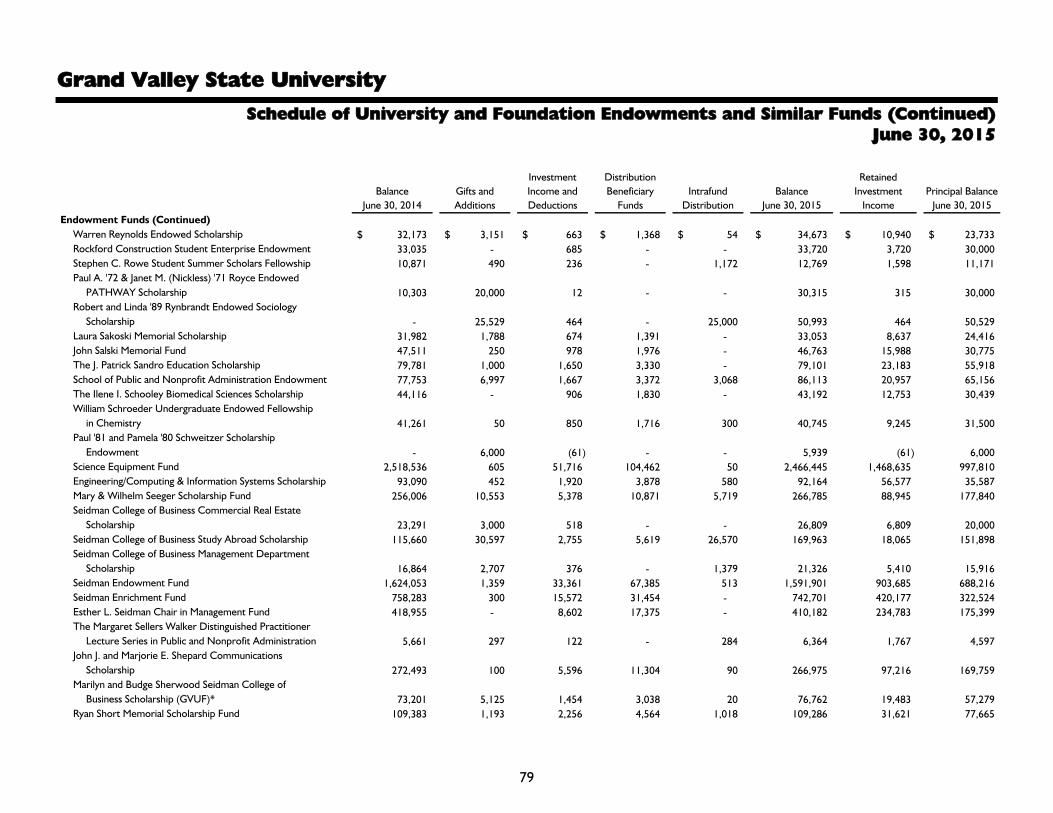
Grand Valley State University
79
Schedule of University and Foundation Endowments and Similar Funds (Continued) June 30, 2015
BalanceJune 30, 2014
Gifts and Additions
Investment Income and Deductions
Distribution Beneficiary
FundsIntrafund
DistributionBalance
June 30, 2015
Retained Investment
IncomePrincipal Balance
June 30, 2015Endowment Funds (Continued)
Warren Reynolds Endowed Scholarship 32,173$ 3,151$ 663$ 1,368$ 54$ 34,673$ 10,940$ 23,733$ Rockford Construction Student Enterprise Endowment 33,035 - 685 - - 33,720 3,720 30,000 Stephen C. Rowe Student Summer Scholars Fellowship 10,871 490 236 - 1,172 12,769 1,598 11,171 Paul A. '72 & Janet M. (Nickless) '71 Royce Endowed
PATHWAY Scholarship 10,303 20,000 12 - - 30,315 315 30,000 Robert and Linda '89 Rynbrandt Endowed Sociology
Scholarship - 25,529 464 - 25,000 50,993 464 50,529 Laura Sakoski Memorial Scholarship 31,982 1,788 674 1,391 - 33,053 8,637 24,416 John Salski Memorial Fund 47,511 250 978 1,976 - 46,763 15,988 30,775 The J. Patrick Sandro Education Scholarship 79,781 1,000 1,650 3,330 - 79,101 23,183 55,918 School of Public and Nonprofit Administration Endowment 77,753 6,997 1,667 3,372 3,068 86,113 20,957 65,156 The Ilene I. Schooley Biomedical Sciences Scholarship 44,116 - 906 1,830 - 43,192 12,753 30,439 William Schroeder Undergraduate Endowed Fellowship
in Chemistry 41,261 50 850 1,716 300 40,745 9,245 31,500 Paul '81 and Pamela '80 Schweitzer Scholarship
Endowment - 6,000 (61) - - 5,939 (61) 6,000 Science Equipment Fund 2,518,536 605 51,716 104,462 50 2,466,445 1,468,635 997,810 Engineering/Computing & Information Systems Scholarship 93,090 452 1,920 3,878 580 92,164 56,577 35,587 Mary & Wilhelm Seeger Scholarship Fund 256,006 10,553 5,378 10,871 5,719 266,785 88,945 177,840 Seidman College of Business Commercial Real Estate
Scholarship 23,291 3,000 518 - - 26,809 6,809 20,000 Seidman College of Business Study Abroad Scholarship 115,660 30,597 2,755 5,619 26,570 169,963 18,065 151,898 Seidman College of Business Management Department
Scholarship 16,864 2,707 376 - 1,379 21,326 5,410 15,916 Seidman Endowment Fund 1,624,053 1,359 33,361 67,385 513 1,591,901 903,685 688,216 Seidman Enrichment Fund 758,283 300 15,572 31,454 - 742,701 420,177 322,524 Esther L. Seidman Chair in Management Fund 418,955 - 8,602 17,375 - 410,182 234,783 175,399 The Margaret Sellers Walker Distinguished Practitioner
Lecture Series in Public and Nonprofit Administration 5,661 297 122 - 284 6,364 1,767 4,597 John J. and Marjorie E. Shepard Communications
Scholarship 272,493 100 5,596 11,304 90 266,975 97,216 169,759 Marilyn and Budge Sherwood Seidman College of
Business Scholarship (GVUF)* 73,201 5,125 1,454 3,038 20 76,762 19,483 57,279 Ryan Short Memorial Scholarship Fund 109,383 1,193 2,256 4,564 1,018 109,286 31,621 77,665

Grand Valley State University
80
Schedule of University and Foundation Endowments and Similar Funds (Continued) June 30, 2015
BalanceJune 30, 2014
Gifts and Additions
Investment Income and Deductions
Distribution Beneficiary
FundsIntrafund
DistributionBalance
June 30, 2015
Retained Investment
IncomePrincipal Balance
June 30, 2015Endowment Funds (Continued)
Frederick S. Singer Memorial Veteran's Endowed Scholarship 34,322$ 634$ 711$ 1,438$ 439$ 34,668$ 3,035$ 31,633$
Ram and Usha Singh Social Work Scholarship 42,560 - 874 1,765 - 41,669 13,174 28,495 Small Family Endowed Scholarship - 2,410 6 - 710 3,126 6 3,120 Drs. Esther and Enrico Sobong Scholarship 45,124 214 929 1,876 106 44,497 13,051 31,446 Social Work Faculty Development Fund 47,862 - 983 1,985 - 46,860 24,685 22,175 The Social Work Minority Scholarship 49,840 - 1,023 2,067 - 48,796 15,363 33,433 Social Work Scholarship Fund 48,889 883 1,009 2,043 436 49,174 15,891 33,283 Spectrum Health Diversity Scholarship 107,148 - 2,200 4,444 - 104,904 29,613 75,291 Spectrum Industries, Inc. Endowed Scholarship - 40,000 465 - - 40,465 465 40,000 Paul Springer Crew Scholarship 21,569 1,770 463 - - 23,802 5,915 17,887 Statistics Endowment Fund 68,414 1,174 1,419 2,868 962 69,101 16,686 52,415 Steelcase Inc. Seidman College of Business Diversity
Scholarship 146,128 - 3,000 6,060 - 143,068 42,533 100,535 The Howard and Rose Stein Endowed Biology Scholarship 72,347 1,344 1,491 3,026 194 72,350 21,044 51,306 George and Marianne Stein Endowed Memorial
Scholarship 55,400 50,000 1,676 - - 107,076 7,076 100,000 Joseph Stevens Freedom Fund 149,587 1,770 3,086 6,239 646 148,850 63,721 85,129 Les and Jackie (Ott) Stiner Fellowship in Historical
and Humanistic Studies - 1,700 16 - - 1,716 16 1,700 Esther Rehm Stotz Scholarship Fund 173,707 50 3,567 7,206 50 170,168 98,730 71,438 The Subar Family - Model Coverall Service Scholarship 52,215 - 1,072 2,166 - 51,121 15,661 35,460 SCB Student Portfolio Endowment - 166,250 1,129 - - 167,379 1,129 166,250 Student Sustainability Endowment Fund 18,054 1,016 391 - 1,060 20,521 5,041 15,480 Duke Tanaka Jr. Anatomy Scholarship 45,084 1,389 915 1,874 100 45,614 11,177 34,437 Tax Program Fund 171,893 1,350 3,551 - - 176,794 105,964 70,830 AT&T Pioneers Michigan Chapter Scholarship 83,515 - 1,715 3,464 - 81,766 38,791 42,975 Charles L. Toot Endowed Memorial Golf Scholarship 26,490 6,560 654 - 5,167 38,871 5,753 33,118 Edward Tremba Geology Scholarship Fund 103,247 1,315 2,132 4,309 100 102,485 49,413 53,072 Office of Undergraduate Research and Scholarship
(OURS) Endowment 5,692 961 137 - 1,731 8,521 963 7,558 Kathleen Underwood Endowed S3 Fellowship for the
Study of Social Issues of Inequality in History or Contemporary Society - 1,071 (7) - - 1,064 (7) 1,071

Grand Valley State University
81
Schedule of University and Foundation Endowments and Similar Funds (Continued) June 30, 2015
BalanceJune 30, 2014
Gifts and Additions
Investment Income and Deductions
Distribution Beneficiary
FundsIntrafund
DistributionBalance
June 30, 2015
Retained Investment
IncomePrincipal Balance
June 30, 2015Endowment Funds (Continued)
University Library Fund 399,281$ 8,943$ 8,299$ 16,789$ 8,105$ 407,839$ 191,817$ 216,022$ Stephanie Urbanawiz Physician Assistant Endowed
Scholarship - 11,536 10 - - 11,546 10 11,536 David and Carol Van Andel Leadership Fellow Endowment
for the Hauenstein Center for Presidential Studies 144,268 1,000 2,974 6,005 - 142,237 41,237 101,000 The Donald and Barbara VanderJagt Mathematics
and Athletic Scholarship 85,060 2,150 1,770 3,578 - 85,402 21,840 63,562 VanSteeland Campus Beautification Fund 162,027 918 3,331 6,737 942 160,481 86,184 74,297 Richard E. Veazey Graduate Academic Scholarship
in Accounting 388,186 100 7,971 16,101 - 380,156 74,774 305,382 Kenneth Venderbush Endowment Fund 35,668 - 732 1,479 - 34,921 14,746 20,175 P. and J. Versluis Endowed Scholarship 121,880 - 2,502 5,055 - 119,327 9,327 110,000 Veteran's History Project Endowment 53,120 12,832 1,242 2,480 385 65,099 10,939 54,160 Volkhardt Family Scholarship 175,560 350 3,611 7,292 350 172,579 51,372 121,207 The Waddell/Treanor Native Plant Endowment 899,623 50 18,472 37,312 50 880,883 174,226 706,657 Anonymous Endowed Math and Science Scholarship 10,508 10,000 334 - - 20,842 842 20,000 Florence Cowan Ward Scholarship for Nursing 195,182 2,100 4,030 8,160 - 193,152 54,238 138,914 Margaret F. Ward Art and Design Scholarship 41,272 90 848 1,713 - 40,497 10,331 30,166 Margaret Ward Music Scholarship 41,581 326 858 1,734 343 41,374 11,589 29,785 Margaret Ward WGVU Symphony and Art Programming
Endowment Fund 67,042 - 1,376 2,780 - 65,638 22,247 43,391 The John D. Wardrop Leadership Fellow Endowment 47,884 595 993 2,010 690 48,152 12,922 35,230 Maribeth Wardrop Leaders in Philanthropy Scholarship 83,040 801 1,705 3,454 351 82,443 15,931 66,512 WGVU Engineering Student Co-op Endowment 2,828 - 59 - - 2,887 1,787 1,100 WRI Equipment Fund 2,718,338 97 55,814 112,739 142 2,661,652 1,500,849 1,160,803 WGVU - FM Radio Program Endowment Fund 75,236 5,108 1,565 3,196 - 78,713 17,744 60,969 WGVU-TV Program Fund 129,480 27,438 2,802 5,810 712 154,622 27,593 127,029 WGVU LZ Michigan Scholarship Endowment 36,875 417 762 1,541 328 36,841 4,208 32,633 WGVU-TV Scholarship Fund 465,329 209 9,556 19,303 24 455,815 249,720 206,095 Weldon Memorial Chemistry Fund 242,381 1,878 4,992 10,091 459 239,619 105,065 134,554 Bonnie Wesorick Center for Health Care Transformation
Endowment 1,027,490 22,652 21,572 - 6,518 1,078,232 313,589 764,643 West Side Service Projects Endowment 37,843 3 777 1,569 10 37,064 7,908 29,156 West Shore AWARE Scholarship 78,428 - 1,610 3,253 - 76,785 16,660 60,125
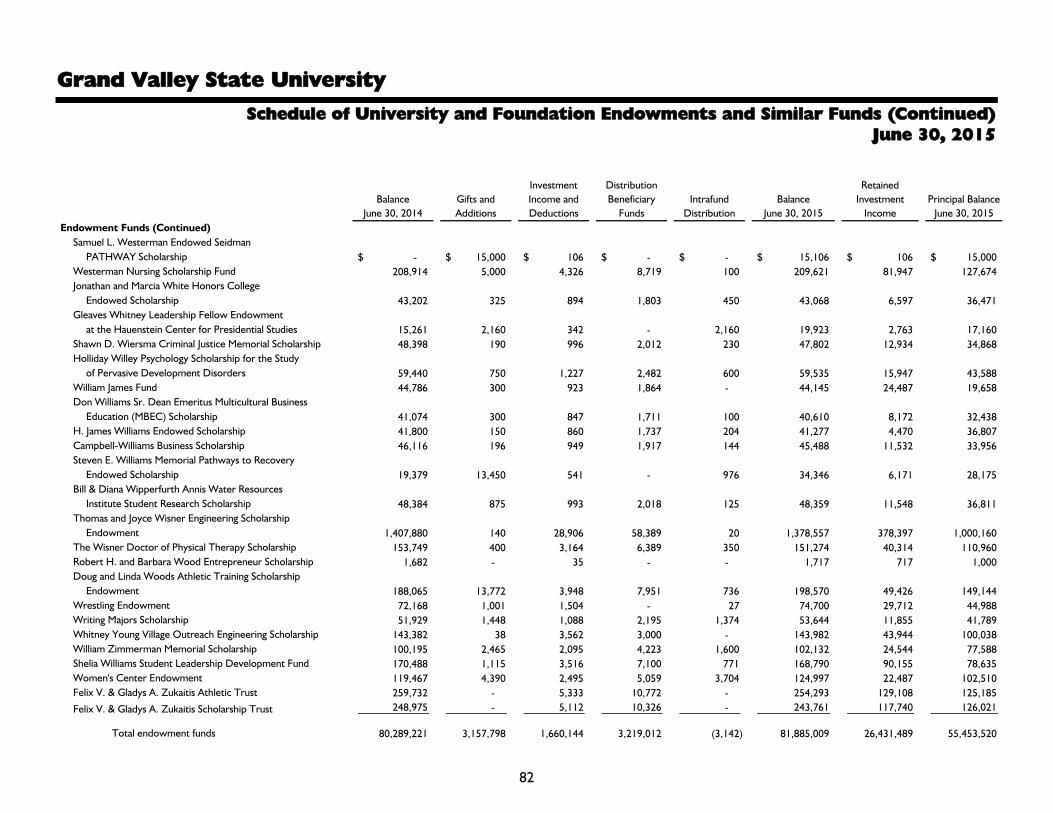
Grand Valley State University
82
Schedule of University and Foundation Endowments and Similar Funds (Continued) June 30, 2015
BalanceJune 30, 2014
Gifts and Additions
Investment Income and Deductions
Distribution Beneficiary
FundsIntrafund
DistributionBalance
June 30, 2015
Retained Investment
IncomePrincipal Balance
June 30, 2015Endowment Funds (Continued)
Samuel L. Westerman Endowed Seidman PATHWAY Scholarship -$ 15,000$ 106$ -$ -$ 15,106$ 106$ 15,000$
Westerman Nursing Scholarship Fund 208,914 5,000 4,326 8,719 100 209,621 81,947 127,674 Jonathan and Marcia White Honors College
Endowed Scholarship 43,202 325 894 1,803 450 43,068 6,597 36,471 Gleaves Whitney Leadership Fellow Endowment
at the Hauenstein Center for Presidential Studies 15,261 2,160 342 - 2,160 19,923 2,763 17,160 Shawn D. Wiersma Criminal Justice Memorial Scholarship 48,398 190 996 2,012 230 47,802 12,934 34,868 Holliday Willey Psychology Scholarship for the Study
of Pervasive Development Disorders 59,440 750 1,227 2,482 600 59,535 15,947 43,588 William James Fund 44,786 300 923 1,864 - 44,145 24,487 19,658 Don Williams Sr. Dean Emeritus Multicultural Business
Education (MBEC) Scholarship 41,074 300 847 1,711 100 40,610 8,172 32,438 H. James Williams Endowed Scholarship 41,800 150 860 1,737 204 41,277 4,470 36,807 Campbell-Williams Business Scholarship 46,116 196 949 1,917 144 45,488 11,532 33,956 Steven E. Williams Memorial Pathways to Recovery
Endowed Scholarship 19,379 13,450 541 - 976 34,346 6,171 28,175 Bill & Diana Wipperfurth Annis Water Resources
Institute Student Research Scholarship 48,384 875 993 2,018 125 48,359 11,548 36,811 Thomas and Joyce Wisner Engineering Scholarship
Endowment 1,407,880 140 28,906 58,389 20 1,378,557 378,397 1,000,160 The Wisner Doctor of Physical Therapy Scholarship 153,749 400 3,164 6,389 350 151,274 40,314 110,960 Robert H. and Barbara Wood Entrepreneur Scholarship 1,682 - 35 - - 1,717 717 1,000 Doug and Linda Woods Athletic Training Scholarship
Endowment 188,065 13,772 3,948 7,951 736 198,570 49,426 149,144 Wrestling Endowment 72,168 1,001 1,504 - 27 74,700 29,712 44,988 Writing Majors Scholarship 51,929 1,448 1,088 2,195 1,374 53,644 11,855 41,789 Whitney Young Village Outreach Engineering Scholarship 143,382 38 3,562 3,000 - 143,982 43,944 100,038 William Zimmerman Memorial Scholarship 100,195 2,465 2,095 4,223 1,600 102,132 24,544 77,588 Shelia Williams Student Leadership Development Fund 170,488 1,115 3,516 7,100 771 168,790 90,155 78,635 Women's Center Endowment 119,467 4,390 2,495 5,059 3,704 124,997 22,487 102,510 Felix V. & Gladys A. Zukaitis Athletic Trust 259,732 - 5,333 10,772 - 254,293 129,108 125,185
Felix V. & Gladys A. Zukaitis Scholarship Trust 248,975 - 5,112 10,326 - 243,761 117,740 126,021
Total endowment funds 80,289,221 3,157,798 1,660,144 3,219,012 (3,142) 81,885,009 26,431,489 55,453,520

Grand Valley State University
83
Schedule of University and Foundation Endowments and Similar Funds (Continued) June 30, 2015
BalanceJune 30, 2014
Gifts and Additions
Investment Income and Deductions
Distribution Beneficiary
FundsIntrafund
DistributionBalance
June 30, 2015
Retained Investment
IncomePrincipal Balance
June 30, 2015Funds Functioning as Endowments
Accounting Scholarship Fund 556,489$ 11,220$ 11,546$ 23,323$ 400$ 556,332$ 269,839$ 286,493$ Alumni Scholarship Fund 970,178 196 19,922 40,241 196 950,251 452,069 498,182 Owen F. Bieber Scholarship Trust 756,824 - 15,539 31,387 - 740,976 427,446 313,530 Alexander Calder Honors Scholarship 182,827 20 3,756 7,586 385 179,402 39,925 139,477 Charles & Florence Irwin Scholarship Endowment Fund 287,158 4,912 5,926 11,989 887 286,894 109,898 176,996 Joe E. Reid Memorial Scholarship Fund 104,086 220 2,138 4,320 - 102,124 48,182 53,942 SPX Corporation Engineering Scholarship Fund 159,189 - 3,268 6,602 - 155,855 105,745 50,110 Robert C. Trotter Scholarship Fund 609,599 - 12,516 25,281 - 596,834 448,967 147,867 Angus Fund 1,800,154 766 36,967 74,672 166 1,763,381 906,701 856,680 R.B. Annis WRI Endowment 1,960,420 12,820 40,396 81,578 1,037 1,933,095 801,681 1,131,414 James R. Sebastian Endowed Chair in Engineering
Cooperative Education and Educational Development 2,014,542 - 41,362 83,548 - 1,972,356 1,430,994 541,362 Richard M. and Helen DeVos Center for
Entrepreneurship & Innovation Endowment 1,891,833 1,244 38,834 78,463 50 1,853,498 624,030 1,229,468 Science Religion Project 250,767 - 5,149 10,400 - 245,516 84,179 161,337 VanderMey Endowment 188,578 - 3,872 7,821 - 184,629 70,202 114,427 Grand Rapids Continuing Education 1,953,975 - 40,495 - - 1,994,470 1,620,488 373,982 Leon W. Hall Trust Fund 897,283 - 18,423 37,212 - 878,494 544,082 334,412 Russel H. Kirkhof Fund 2,818,692 - 57,873 116,898 - 2,759,667 1,752,368 1,007,299 Seymour & Esther Padnos School of Engineering 2,872,518 15 58,978 119,131 21 2,812,401 1,297,942 1,514,459 Padnos Fund 1,902,845 - 39,069 78,915 - 1,862,999 862,974 1,000,025 Charles C. Saur Fund 57,820 - 344 - - 58,164 (53,413) 111,577
Undistributed Income Fund 628,390 - 12,398 - - 640,788 640,788 -
Total funds functioning as endowments 22,864,167 31,413 468,771 839,367 3,142 22,528,126 12,485,087 10,043,039

Grand Valley State University
84
Schedule of University and Foundation Endowments and Similar Funds (Continued) June 30, 2015
BalanceJune 30, 2014
Gifts and Additions
Investment Income and Deductions
Distribution Beneficiary
FundsIntrafund
DistributionBalance
June 30, 2015
Retained Investment
IncomePrincipal Balance
June 30, 2015Annuity Funds
John and Shirley Batchelder Charitable Gift Annuity 63,520$ -$ (19,697)$ -$ -$ 43,823$ 25,000$ 18,823$ John and Nancy Batts Charitable Gift Annuity 367,245 - (98,493) - - 268,752 (103,560) 372,312 Darld T. and Joyce M. Black Charitable Gift Annuity 13,128 - (2,441) - - 10,687 4,135 6,552 Robert F. and Jean A. Blossfeld Charitable Gift Annuity 3,965 - (896) - - 3,069 916 2,153 George C. and Margaret T. Cope Charitable Gift Annuity 8,602 - (1,803) - - 6,799 (1,284) 8,083 Dr. Gilbert R. and Patricia Davis Charitable Gift Annuities 45,438 - (17,252) - - 28,186 8,170 20,016 Ralph and Grace Hauenstein Charitable Gift Annuities (121,776) - (141,676) - - (263,452) (726,431) 462,979 John and Janice Heerspink Charitable Gift Annuity 1,140 - (1,572) - - (432) (2,067) 1,635 Harvey E. Lemmen Charitable Gift Annuities 138,982 - (120,720) - - 18,262 (70,600) 88,862 John F. and Mae D. Shipley Charitable Gift Annuity 4,839 - (1,677) - - 3,162 (1,735) 4,897 Jacquelyn L. and Lester L. Stiner Charitable Gift Annuity 4,910 - (2,343) - - 2,567 1,061 1,506 John T. Tevebaugh Charitable Gift Annuities 17,218 - (2,847) - - 14,371 4,431 9,940
Peter Merrick Turner Charitable Gift Annuity 10,866 - (4,171) - - 6,695 (4,871) 11,566
Total annuity funds 558,077 - (415,588) - - 142,489 (866,835) 1,009,324
Total endowment and similar funds 103,711,465$ 3,189,211$ 1,713,327$ 4,058,379$ -$ 104,555,624$ 38,049,741$ 66,505,883$
* Funds held by Grand Valley University Foundation

Grand Valley State University
85
Schedule of Net Position by Fund Year Ended June 30, 2015
Auxiliary Expendable Total
General Designated Activities Restricted Current Loan Endowment Plant Agency Retirement/ Retirement/ BlendedFund Fund Fund Fund Funds Fund Fund Fund Fund Pension Health Components 2015 2014
AssetsCurrent assets:
Cash and cash equivalents 12,071,971$ 11,349,753$ (1,527,232)$ 4,200,501$ 26,094,993$ 652,684$ - $ 13,386,055$ (1,193,361)$ - $ 287,969$ 385,738$ 39,614,078$ 33,763,708$ Short-term investments 3,757,135 3,549,927 - 1,324,599 8,631,661 204,342 - 4,197,405 - - 90,297 - 13,123,705 26,093,427 Accounts receivable 865,408 750,708 1,105,627 4,635,338 7,357,081 - - 3,000 1,222,324 - - 39,071 8,621,476 10,738,293 State appropriation receivable 11,479,276 - - 11,479,276 - - 6,709,381 44,682,292 - - - 62,870,949 53,385,038 Pledges receivable 8,333 - - 1,643,949 1,652,282 - - - - - - - 1,652,282 4,209,996 Less allowance for uncollectible accounts - - - (6,639) (6,639) - - - - - - - (6,639) (9,311)
Net pledges receivable 8,333 - - 1,637,310 1,645,643 - - - - - 1,645,643 4,200,685
Inventory - 89,784 2,703,798 2,793,582 - - - - - - 10,818 2,804,400 2,352,554 Prepaid expenses and other 2,085,008 573,107 26,345 61,878 2,746,338 215,194 - 609,418 - - - - 3,570,950 2,826,192 Student notes receivable -
Current portion 527,200 - - - 527,200 3,072,800 - - - - - - 3,600,000 3,700,000
Total current assets 30,794,331 16,313,279 2,308,538 11,859,626 61,275,774 4,145,020 - 24,905,259 44,711,255 - 378,266 435,627 135,851,201 137,059,897
Noncurrent assets:Restricted cash and cash equivalents - - - - - - 677,171 25,912,290 - - - 1,322,333 27,911,794 4,763,044 Endowment investments - - - - - - 103,864,825 - - - - - 103,864,825 100,076,069 Note receivable - - - - - - - 25,500,000 - - - - 25,500,000 25,578,750 Other long-term investments 76,790 59,243,367 - 67,595 59,387,752 - - 70,048,885 - - 12,052,353 469,422 141,958,412 115,460,691 Pledges receivable - - - 2,956,300 2,956,300 - - - - - - - 2,956,300 3,861,300 Less discount to present value - - - (545,755) (545,755) - - - - - - - (545,755) (658,775)
Net pledges receivable - - - 2,410,545 2,410,545 - - - - - - - 2,410,545 3,202,525
Student notes receivable - Net - - - - - 8,313,897 - - - - - - 8,313,897 8,807,808 Capital assets - Net - - - - - - - 648,186,539 - - - 4,958 648,191,497 631,084,142 Other assets - 273,248 - - 273,248 - - 1,445,587 - - - 26,621 1,745,456 2,084,292
Total noncurrent assets 76,790 59,516,615 - 2,478,140 62,071,545 8,313,897 104,541,996 771,093,301 - - 12,052,353 1,823,334 959,896,426 891,057,321
Total assets 30,871,121 75,829,894 2,308,538 14,337,766 123,347,319 12,458,917 104,541,996 795,998,560 44,711,255 - 12,430,619 2,258,961 1,095,747,627 1,028,117,218
Deferred Outflows of ResourcesDerivatives - - - - - - - 6,020,000 - - - - 6,020,000 5,518,000 Loss on refunding of bonds payable - - - - - - - 4,442,243 - - - - 4,442,243 - Pension related deferrals - - - - - - - - - 6,968,383 - - 6,968,383 -
Consolidated Total
Current Funds
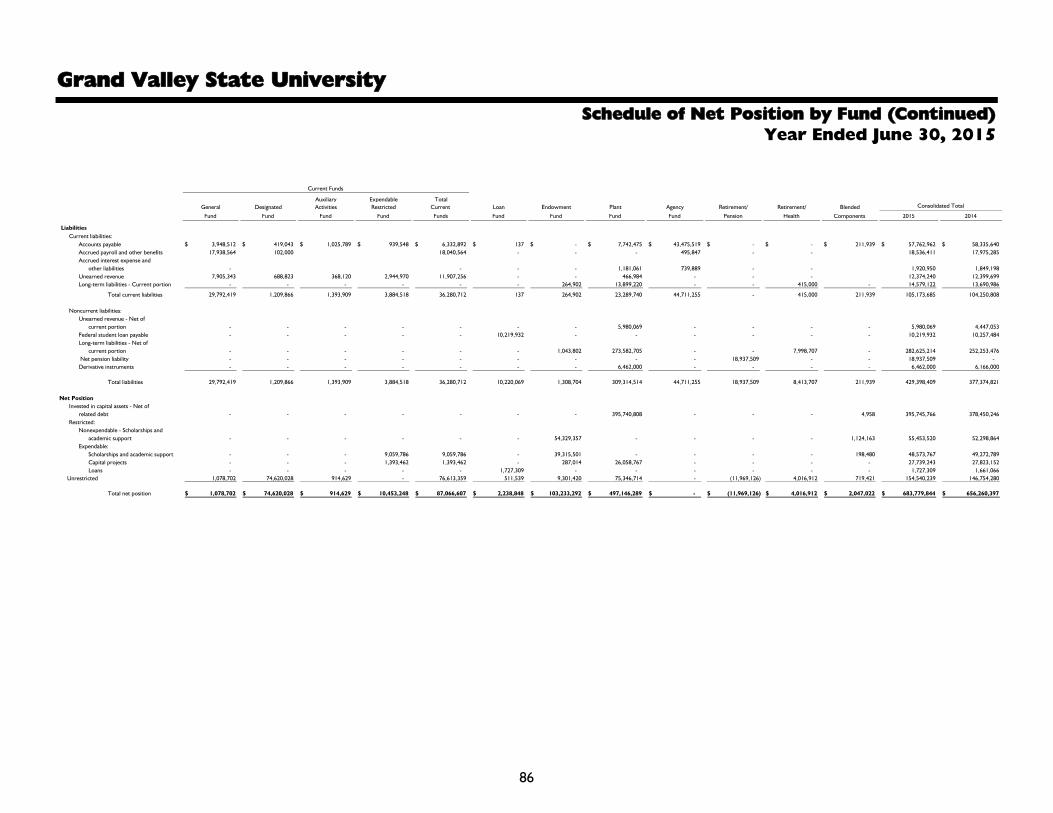
Grand Valley State University
86
Schedule of Net Position by Fund (Continued) Year Ended June 30, 2015
Auxiliary Expendable TotalGeneral Designated Activities Restricted Current Loan Endowment Plant Agency Retirement/ Retirement/ Blended Consolidated Total
Fund Fund Fund Fund Funds Fund Fund Fund Fund Pension Health Components 2015 2014
Liabilities Current liabilities:
Accounts payable 3,948,512$ 419,043$ 1,025,789$ 939,548$ 6,332,892$ 137$ - $ 7,742,475$ 43,475,519$ - $ - $ 211,939$ 57,762,962$ 58,335,640$ Accrued payroll and other benefits 17,938,564 102,000 18,040,564 - - - 495,847 - - 18,536,411 17,975,285 Accrued interest expense and
other liabilities - - - - 1,181,061 739,889 - - 1,920,950 1,849,198 Unearned revenue 7,905,343 688,823 368,120 2,944,970 11,907,256 - - 466,984 - - - 12,374,240 12,399,699 Long-term liabilities - Current portion - - - - - - 264,902 13,899,220 - - 415,000 - 14,579,122 13,690,986
Total current liabilities 29,792,419 1,209,866 1,393,909 3,884,518 36,280,712 137 264,902 23,289,740 44,711,255 - 415,000 211,939 105,173,685 104,250,808
Noncurrent liabilities:Unearned revenue - Net of
current portion - - - - - - - 5,980,069 - - - - 5,980,069 4,447,053 Federal student loan payable - - - - - 10,219,932 - - - - - - 10,219,932 10,257,484 Long-term liabilities - Net of
current portion - - - - - - 1,043,802 273,582,705 - - 7,998,707 - 282,625,214 252,253,476 Net pension liability - - - - - - - - - 18,937,509 - - 18,937,509 - Derivative instruments - - - - - - - 6,462,000 - - - - 6,462,000 6,166,000
Total liabilities 29,792,419 1,209,866 1,393,909 3,884,518 36,280,712 10,220,069 1,308,704 309,314,514 44,711,255 18,937,509 8,413,707 211,939 429,398,409 377,374,821
Net PositionInvested in capital assets - Net of
related debt - - - - - - - 395,740,808 - - - 4,958 395,745,766 378,450,246 Restricted:
Nonexpendable - Scholarships andacademic support - - - - - - 54,329,357 - - - - 1,124,163 55,453,520 52,298,864
Expendable:Scholarships and academic support - - - 9,059,786 9,059,786 - 39,315,501 - - - - 198,480 48,573,767 49,272,789 Capital projects - - - 1,393,462 1,393,462 - 287,014 26,058,767 - - - - 27,739,243 27,823,152 Loans - - - - - 1,727,309 - - - - - - 1,727,309 1,661,066
Unrestricted 1,078,702 74,620,028 914,629 - 76,613,359 511,539 9,301,420 75,346,714 - (11,969,126) 4,016,912 719,421 154,540,239 146,754,280
Total net position 1,078,702$ 74,620,028$ 914,629$ 10,453,248$ 87,066,607$ 2,238,848$ 103,233,292$ 497,146,289$ - $ (11,969,126)$ 4,016,912$ 2,047,022$ 683,779,844$ 656,260,397$
Current Funds

Grand Valley State University
87
Schedule of Revenue, Expenses, and Changes in Net Position by Fund Year Ended June 30, 2015
Auxiliary Expendable Total StudentGeneral Designated Activities Restricted Current Loan Endowment Plant Retirement/Pension Retirement/Health Blended
Fund Fund Fund Fund Funds Fund Fund Fund Fund Fund Components Eliminations 2015 2014
Operating RevenueStudent tuition and fees 286,353,824$ 685,909$ - $ - $ 287,039,733$ - $ - $ - $ - $ - $ - $ - $ 287,039,733$ 272,392,901$ Less scholarship allowances - - - - - - - - - - - (48,375,412) (48,375,412) (45,203,110)
Net student tuition and fees 286,353,824 685,909 - - 287,039,733 - - - - - - (48,375,412) 238,664,321 227,189,791
Government grants and contracts:Federal - - - 14,656,318 14,656,318 - - - - - - - 14,656,318 14,760,076 State - - - 6,923,276 6,923,276 - - - - - - - 6,923,276 5,844,160 Local - 100,853 - 900,406 1,001,259 - - - - - - - 1,001,259 787,139
Nongovernmental grants - 539,815 - 1,369,773 1,909,588 - - - - - - - 1,909,588 913,290 Sales and services of educational activities 911,553 13,174,845 - 195,858 14,282,256 - - - - - 722,583 - 15,004,839 13,710,287 Auxiliary activities - - 67,159,779 - 67,159,779 - - - - - 50,624 - 67,210,403 64,227,453 Less scholarship allowances - - - - - - - - - - - (9,884,876) (9,884,876) (9,099,081)
Net auxiliary activities - - 67,159,779 - 67,159,779 - - - - - 50,624 (9,884,876) 57,325,527 55,128,372
Indirect cost recoveries 1,515,039 (59,213) - (1,455,826) - - - - - - - - - - Other sources 1,865,618 4,264,276 - 244,458 6,374,352 326,124 - - - - - - 6,700,476 6,260,031 Endowment income 246,107 541,122 - 3,271,150 4,058,379 - (4,028,628) - - - (29,751) - - -
Total operating revenue 290,892,141 19,247,607 67,159,779 26,105,413 403,404,940 326,124 (4,028,628) - - - 743,456 (58,260,288) 342,185,604 324,593,146
Operating ExpensesInstruction 148,141,477 298,187 - 2,705,915 151,145,579 - - - - - - - 151,145,579 145,522,368 Research 3,487,354 1,074,957 - 2,369,074 6,931,385 - - - - - 59,701 - 6,991,086 7,852,408 Public service 2,215,450 11,590,524 - 13,395,402 27,201,376 - - - - - - - 27,201,376 24,993,763 Academic support 38,649,243 730,644 - 3,319,063 42,698,950 - - - - - - - 42,698,950 40,581,431 Student services 26,607,475 1,422,338 - 163,842 28,193,655 - - - - - - - 28,193,655 27,936,819 Institutional support 35,370,022 (195,005) - 22,115 35,197,132 - - - - - - - 35,197,132 34,541,983 Operation and maintenance - Plant 39,517,446 307,583 - 161,976 39,987,005 - - 5,649,488 - - 1,041,887 - 46,678,380 40,890,938 Depreciation expense - - - - - - - 23,971,364 - - - - 23,971,364 23,239,162 Scholarships and related expenses 38,108,160 209,536 - 34,708,200 73,025,896 - - - - - - (58,260,288) 14,765,608 16,634,497 Auxiliary activities - - 40,293,983 - 40,293,983 - - - - - 33,727 - 40,327,710 39,712,963 Transfer to (from) blended component - 375,000 - - 375,000 - 72,368 - - - (447,368) - - - Loan administrative fees and collection costs - - - - - 285,722 - - - - - - 285,722 268,594
Total operating expenses 332,096,627 15,813,764 40,293,983 56,845,587 445,049,961 285,722 72,368 29,620,852 - - 687,947 (58,260,288) 417,456,562 402,174,926
Operating (Loss) Income (41,204,486) 3,433,843 26,865,796 (30,740,174) (41,645,021) 40,402 (4,100,996) (29,620,852) - - 55,509 - (75,270,958) (77,581,780)
Current Funds
Consolidated Total

Grand Valley State University
88
Schedule of Revenue, Expenses, and Changes in Net Position by Fund (Continued) Year Ended June 30, 2015
Auxiliary Expendable Total StudentGeneral Designated Activities Restricted Current Loan Endowment Plant Retirement/Pension Retirement/Health Blended
Fund Fund Fund Fund Funds Fund Fund Fund Fund Fund Components Eliminations 2015 2014
Nonoperating Revenue (Expenses)State appropriations 63,200,000$ - $ - $ - $ 63,200,000$ - $ - $ - $ - $ - $ - $ - $ 63,200,000$ 57,823,500$ Government grants - - - 29,219,454 29,219,454 - - - - - - - 29,219,454 29,577,544 Gifts 337,724 3,038,569 575 2,559,558 5,936,426 25,000 31,414 - - - - - 5,992,840 5,760,021 Investment income: -
Interest, dividends, gains (losses) - Net of investment expense 1,076,325 (260,419) - 4,529 820,435 2,087 1,686,621 869,988 - 410,400 28,892 - 3,818,423 21,481,851
Change in fair value of derivatives - - - - - - - 206,000 - - - - 206,000 262,000 Interest on capital asset - Related debt - - - - - - - (9,884,448) - - - - (9,884,448) (10,988,602) Gain (loss) on disposal of capital assets 7,500 - - 144 7,644 - - (1,342,217) - - - - (1,334,573) 47,034
Net nonoperating revenue (expenses) 64,621,549 2,778,150 575 31,783,685 99,183,959 27,087 1,718,035 (10,150,677) - 410,400 28,892 - 91,217,696 103,963,348
Income (Loss) - Before other revenue, expenses, gains, and losses 23,417,063 6,211,993 26,866,371 1,043,511 57,538,938 67,489 (2,382,961) (39,771,529) - 410,400 84,401 - 15,946,738 26,381,568
Other Revenue, Expenses, Gains, and LossesCapital gifts - - - 47,785 47,785 - - 69,150 - - - - 116,935 1,002,234 Add discount adjustment - - - 115,692 115,692 - - - - - - - 115,692 358,790
Net capital gifts - - - 163,477 163,477 - - 69,150 - - - - 232,627 1,361,024
Capital appropriations - - - - - - - 18,406,140 - - - - 18,406,140 -
Capital grants - - - - - - - - - - - - - 250,000 Other capital income - - - - - - - 528,430 - - - - 528,430 259,040 Capital additions (1,908,725) 21,608 - (85,635) (1,972,752) - - 1,972,752 - - - - - - Additions to permanent endowments - - - - - - 2,318,469 - - - 35,582 - 2,354,051 4,008,365 Capital contributions from 38 Front Avenue - - - - - - - - - - - - - 6,668,184
Total other revenue, expenses, gains, and losses (1,908,725) 21,608 - 77,842 (1,809,275) - 2,318,469 20,976,472 - - 35,582 - 21,521,248 12,546,613
Transfers Out (In)Mandatory transfers 7,676,175 16,847 18,597,035 324,397 26,614,454 (23,887) (420,197) (26,170,370) - - - - - - Nonmandatory transfers 13,332,614 3,159,712 8,183,832 (519,442) 24,156,716 - (383,550) (25,793,753) 2,020,587 - - - - -
Total transfers 21,008,789 3,176,559 26,780,867 (195,045) 50,771,170 (23,887) (803,747) (51,964,123) 2,020,587 - - - - -
Increase (Decrease) in Net Position 499,549 3,057,042 85,504 1,316,398 4,958,493 91,376 739,255 33,169,066 (2,020,587) 410,400 119,983 - 37,467,986 38,928,181
Net Position - Beginning of year 579,153 71,562,986 829,125 9,136,850 82,108,114 2,147,472 102,494,037 463,977,223 - 3,606,512 1,927,039 - 656,260,397 617,332,216
Adjustment for Change in Accounting Principle - - - - - - - - (9,948,539) - - - (9,948,539) -
Net Position - End of year 1,078,702$ 74,620,028$ 914,629$ 10,453,248$ 87,066,607$ 2,238,848$ 103,233,292$ 497,146,289$ (11,969,126)$ 4,016,912$ 2,047,022$ - $ 683,779,844$ 656,260,397$
Consolidated Total
Current Funds
Report on Internal Control Over Financial Reporting and on Complianceand Other Matters Based on an Audit of Financial Statements Performed in Accordance with Government Auditing Standards
Independent Auditor's Report
To Management and the Board of TrusteesGrand Valley State University
We have audited, in accordance with auditing standards generally accepted in the United Statesof America and the standards applicable to financial audits contained in Government AuditingStandards issued by the Comptroller General of the United States, the financial statements ofGrand Valley State University (the "University"), a component unity of the State of Michigan, itsdiscretely presented component unit, and its pension trust funds as of and for the year endedJune 30, 2015 and the related notes to the financial statements, and have issued our reportthereon dated November 6, 2015. The financial statements of 38 Front Avenue were notaudited in accordance with Government Auditing Standards.
Internal Control Over Financial Reporting
In planning and performing our audit of the financial statements, we considered Grand ValleyState University's internal control over financial reporting (internal control) to determine theaudit procedures that are appropriate in the circumstances for the purpose of expressing ouropinion on the financial statements, but not for the purpose of expressing an opinion on theeffectiveness of the University's internal control. Accordingly, we do not express an opinion onthe effectiveness of the University's internal control.
A deficiency in internal control exists when the design or operation of a control does not allowmanagement or employees, in the normal course of performing their assigned functions, toprevent, or detect and correct, misstatements on a timely basis. A material weakness is adeficiency, or a combination of deficiencies, in internal control such that there is a reasonablepossibility that a material misstatement of the University's financial statements will not beprevented, or detected and corrected, on a timely basis. A significant deficiency is a deficiency,or a combination of deficiencies, in internal control that is less severe than a material weakness,yet important enough to merit attention by those charged with governance.
Our consideration of internal control was for the limited purpose described in the firstparagraph of this section and was not designed to identify all deficiencies in internal control thatmight be material weaknesses or significant deficiencies. Given these limitations, during our auditwe did not identify any deficiencies in internal control that we consider to be materialweaknesses. However, material weaknesses may exist that have not been identified.
89
To Management and the Board of TrusteesGrand Valley State University
Compliance and Other Matters
As part of obtaining reasonable assurance about whether Grand Valley State University's financialstatements are free from material misstatement, we performed tests of its compliance withcertain provisions of laws, regulations, contracts, and grant agreements, noncompliance withwhich could have a direct and material effect on the determination of financial statementamounts. However, providing an opinion on compliance with those provisions was not anobjective of our audit and, accordingly, we do not express such an opinion. The results of ourtests disclosed no instances of noncompliance or other matters that are required to be reportedunder Government Auditing Standards.
Purpose of this Report
The purpose of this report is solely to describe the scope of our testing of internal control andcompliance and the results of that testing, and not to provide an opinion on the effectiveness ofthe University's internal control or on compliance. This report is an integral part of an auditperformed in accordance with Government Auditing Standards in considering the University'sinternal control and compliance. Accordingly, this communication is not suitable for any otherpurpose.
November 6, 2015
90


![Table of Contents - MJC · 5 | P a g e [To Top] HIGHLIGHTS Enrollment Trends STUDENT HEADCOUNT, CREDIT-COURSE ENROLLMENT, FULL-TIME PROPORTIONS Annual unduplicated student headcount](https://img.pdfslide.us/doc/110x75/6036871153493575042dc0e2/table-of-contents-mjc-5-p-a-g-e-to-top-highlights-enrollment-trends-student.jpg)