Embed Size (px)
Citation preview
Annual Course of Matric Potential in Differently Used Savanna Oxisols in BrazilJuliane Lilienfein,* Wolfgang Wilcke, Miguel Angelo Ayarza, Samuel do Carmo Lima,
Lourival Vilela, and Wolfgang Zech
ABSTRACTSustainable land use in periodically dry Brazilian savannas requires
a water-saving management. We hypothesized that the annual courseof matric potentials («|<M) in very-fine, isohyperthermic Anionic Acrus-toxes of Pinus plantations (PI), degraded (DP) and productive pas-tures (PP), no-till (NT) and conventional tillage (CT) cropping, andnatural savanna (Cerrado, CE) differed significantly. On three plotsin each of these land-use systems water input and i|»M at the 0.15-,0.30-, 0.80-, 1.2-, and 2.0-m depths was measured with tensiometersweekly between 27 Mar. 1997 and 28 Apr. 1998. Precipitation between29 Apr. 1997 and 28 Apr. 1998 was 1562 mm, with only 210 mm inMay to September, when iK, at the 0.15- and 0.30-m depths decreasedto less than -80 kPa in all systems; the lowest I|IM at 2-in depth was-57 kPa. During the monitored period, the PI soils had lower average<Ji,, at the 0.8- to 2-m depths (-60 kPa) than those in CE (-46),indicating higher rainfall interception losses and higher transpiration.In CT, average i|»M values at the 0.8- to 2-m depths (-29) were higherthan in NT (-51) because of different crops and different soil manage-ment. Between June and November, «]»M at the 2-m depth in CEdecreased to a lower value (—42) than in vegetation-free CT (—22)and NT (-27). In DP and PP soils, I|IMS were similar to those in CEsoils at all depths. The estimated average water storage in the upper2 m during the monitored period was: 565 mm (CT) > 553 (PP) >541 (DP) > 537 (CE) > 526 (NT) > 479 (PI). Our results show thatmainly the vegetation type and tillage practices control the annualcourse of matric potential in differently used savanna Oxisols.
IN THE LAST 30 YR, intensive agriculture developed onthe nutrient-poor soils of the Brazilian savanna re-
gion (the Cerrados). Large parts of natural Cerradowere cleared and afforested or transformed to pastureand cropping systems (Goedert, 1983). Agriculture inthis region is water-limited. In soils under native vegeta-tion, matric potentials at 0.5-m soil depth decrease be-low the permanent wilting point, that is, the matric po-tential at which plants wilt, only one month after theend of the rainy season (Franco et al., 1996). If dryperiods occur during critical stages of crop growth, suchas flowering, water stress may result in severe yieldlosses (Goedert, 1983). Land-use practices which resultin changed water budgets may therefore affect cropyields and, in the long run, may also have impacts onthe ground water level and storage.
The soil water content is influenced by the waterconsumption of plants and by soil management (McGo-wan and Williams, 1980a, 1980b; Azooz et al., 1996). In
Juliane Lilienfein, Wolfgang Wilcke, and Wolfgang Zech, Inst. of SoilScience and Soil Geography, Univ. of Bayreuth, D-95440 Bayreuth,Germany; Miguel Angelo Ayarza, CIAT-Laderas, Apartado 1410,Tegucigalpa, Honduras; Samuel do Carmo Lima, Federal Univ. ofUberlandia, 38406-210 Uberlandia-MG, Brazil; Lourival Vilela, EM-BRAPA-Cerrado, Caixa Postal 08223, Planaltina-DF, Brazil. Re-ceived 24 Sept. 1998. *Corresponding author (julia.lilienfein®uni-bayreuth.de).
Published in Soil Sci. Soc. Am. J. 63:1778-1785 (1999).
Great Britain, McGowan and Williams (1980a, 1980b)found decreasing evapotranspiration along the line:woodland > pasture > barley. Because forests generallyconsume more water and have a greater interceptioncapacity resulting in higher evaporation losses, lowersoil water contents are often found in soils under forestthan under cropping systems or pastures (Blume andZimmermann, 1975; Hodnett et al., 1995). In a studyby Lima (1983), conducted in the state of Sao Paulo,Brazil, the water content of the uppermost 2 m of soilsunder different Pinus species was significantly lowerthan under natural Cerrado vegetation. Pinus forestsuse up to 93% of the annual precipitation for transpira-tion (Schiller and Cohen, 1998). Lima et al. (1990) re-ported a higher annual evapotranspiration of 5-yr-oldPinus caribaea Morelet plantations (716 mm yr"1) thanof native Cerrado vegetation (576 mm yr"1) in Brazil.Hodnett et al. (1995) compared evapotranspiration ratesof Amazonian rain forest and pasture and found similarevapotranspiration rates of=4 mm d"1 at high soil watercontents. At low soil water contents, evapotranspirationrates in pasture were substantially reduced to a mini-mum of 1.2 mm d"1, while those of the forest remainedabove 3.5 mm d"1. In cropping systems transpirationrates depend on crop species and yield. The economi-cally most important crops cultivated in the study regionare corn (Zea mays L.) and soybean [Glycine max (L.)Merr.]. The transpiration coefficient (i.e., the ratio be-tween dry biomass and transpiration water loss) of soy-bean is almost two times (>700 kg H2O kg"1 dry bio-mass) that of corn (300-400 kg kg'1; Geisler, 1980).
In CT soils, pore continuity is reduced compared withNT soils, resulting in reduced evaporation (Lal et al.,1980; Logsdon et al., 1990; Azooz et al., 1996). Azoozand Arshad (1996) reported higher infiltration rates anda higher saturated hydraulic conductivity in NT than inCT soils. While the volume of macropores (>14 |xm)in the study of Azooz and Arshad (1996) was not signifi-cantly different between NT and CT soils, Hill (1990)found a higher macropore volume (>15 uin) in CT thanin NT soils and, in contrast to the conclusions of Azoozand Arshad (1996), inferred faster drainage in the for-mer than in the latter. Furthermore, the pore space forplant-available water was greater in CT than in NT soils(Hill, 1990). The effects of tillage practices also dependon climatic conditions. For example, during humid win-ters in Great Britain, Goss et al. (1978) found no differ-ence in water content between the tillage variants,whereas in dry winters more water was stored in NTsystems than in the tilled ones.
Abbreviations: A10, oxalate-extractable Al; CE, Cerrado; CT, conven-tional tillage; DP, degraded pasture; Fed, dithionite-citrate-extractableFe; NT, no-till; PI, Pinus caribaea plantation; PP, productive pasture;4<M! matric potential.
1778
LILIENFEIN ET AL.: ANNUAL COURSE OF MATRIC POTENTIAL IN SAVANNA OXISOLS IN BRAZIL 1779
The objective of this work was to compare the annualcourse of matric potentials in differently used Braziliansavanna Oxisols and to evaluate the systems with regardto water availability for plants and water storage in therooting zone.
MATERIALS AND METHODSStudy Sites
The study area is located southeast of Uberlandia (Stateof Minas Gerais) =400 km south of Brasilia (Fig. 1). Withinan area of =100 km2, three plots of each of the following sixland-use and natural systems were selected: (i) Pinus planta-tions (PI), (ii) degraded (DP) and (iii) productive pastures(PP), (iv) no-till (NT) and (v) conventional tillage (CT) crop-ping, and (vi) natural savanna (Cerrado, CE). We consideredthese land-use systems the most important ones in the studyregion. To allow for statistical evaluation with variance analy-sis we aimed at selecting independent replicates of each sys-tem. As our objective was to conduct an on-farm experiment,we had to select the experimental plots in existing land-usesystems. Thus, an entirely randomized plot selection was notpossible. However, we only chose replicate plots of each land-use and natural system which were separated from each otherby a distance of at least 300 m and, except for PI, by an areawhich was differently used between the replicate plots. ThePI forest covered a large area without intermixed plots withdifferent land-use. We assume that the prerequisites for vari-ance analysis have been met by this experimental design.
The PI system consisted of P. caribaea planted in 1977which received an initial fertilization of 25 kg P ha"1 (80 gsuperphosphate per plant). In both, DP and PP Brachiariadecumbens Stapf, an imported grass species from Africa, wasplanted as a monoculture in 1985. The DP had vegetation-free spots and some invaded Cerrado plants, while PP was apure grass pasture with a closed vegetation cover. Both pas-tures were fertilized with 40 kg P ha"1, 65 kg K ha"1, 32 kgN ha"1, and 11 dolomite ha"1 when established; PP was furtherfertilized with 17 kg P ha"1 and 33 kg K ha"1 in 1996-1997.There were additional fertilizer applications to PP at unknownrates and application times prior to 1996. The CT soils havebeen plowed or loosened with a disk harrow two to threetimes per year for 12 yr and used for corn-soybean rotation.In 1996, soybean was harvested at the end of March, thencorn was planted on 11 Nov. 1997 and harvested on 1 Apr.1998. The NT systems had been established only between 1and 3 yr prior to the beginning of our experiment in 1997after the plots had been used as CT in the way describedabove for 9 to 11 yr. In the 1996-1997 rainy season, after theharvest of soybean in the end of March, corn was planted on10 Feb. 1997 and harvested on 15 June 1997; then soybeanwas planted on 28 Nov. 1997 and harvested on 16 Apr. 1998.In 1998 the soil moisture did not support a second crop becauseof an unusual dryness due to the "El Nino" effect. Both crop-ping systems (CT, NT) were fertilized with an annual averageof -70 kg N ha"1, 100 kg P ha"1, and 160 kg K ha"1. TheCerrado vegetation was characterized by an open grasslandwith a 15 to 40% cover of 3- to 5-m-high trees and may beconsidered as typical (Sarmiento, 1984). The dominant treespecies are Pouteria torta (Mart.) Radlk., Kielmeyera coriacea(Spreng.) Mart., Caryocar brasiliense Camb., Ouratea hex-asperma (St. Hil.) Benth., and Miconia albicans (Sw.) Triana.
All study sites had slopes below 1°; they have been continu-ously used for the same purposes for 12 (DP, PP, NT, CT) or20 (PI) yr and passed directly from natural vegetation to thecurrent land-use system except for the NT soils. All study soils
Fig. 1. Locations of the study sites (CE, native Cerrado; PI, Pinus;NT, no-till cropping; CT, conventional tillage; DP, degraded pas-ture; and PP, productive pasture).
developed from fine limnic sediments of the lower Tertiary.The soils were homogeneously weathered to a depth of sev-eral meters.
Equipment and MeasurementsOn each of the 18 plots a 10 by 10 m area was fenced and
equipped with five replicate tensiometers at each of 0.15-, 0.3-,0.8-, 1.2-, and 2-m depths. All plots were equipped with fiverain collectors consisting of a sampling bottle and a funnelwith a diameter of 115 mm at 0.3-m height above the soilsurface to measure soil water input. Each sampling bottle wasprotected against larger particles and small animals with apolyethylene net (0.5-mm mesh width). A table-tennis ball wasused to reduce evaporation. Tensiometers and rain collectorswere placed within and between the crop rows in the croppingsystems and near and between the trees in CE and PI. Duringthe rainy season (March-April 1997 and October 1997-April1998) and during the dry season (May-October 1997), il/Mswere read and precipitation measured every 7 and 14 d, respec-tively. The soils in CT were hoed manually instead of plowingon 9 October and 21 Nov. 1997 within the fenced plots astensiometers could not be removed. Weed in NT was con-trolled by the application of 1.2 kg ha"1 glyphosate [W-(phos-phonomethyl)glycine; Roundup, Monsanto, St. Louis, MO]on 27 Nov. 1997.
Meteorological DataPrecipitation data, and daily maximum and minimum tem-
peratures were provided by the Fazenda Pinusplan, a commer-cial farm producing mainly corn, soybean, and Pinus. Themeteorological station of the farm is located near Plot CE2and CT2 (Fig. 1) in the study area.
1780 SOIL SCI. SOC. AM. J., VOL. 63, NOVEMBER-DECEMBER 1999
Soil Physical CharacterizationParticle-size distribution was determined in the 0- to 0.15-,
0.15- to 0.3-, 0.3- to 0.8-, 0.8- to 1.2-, 1.2- to 2-m layers afterremoval of the oxides with Na-dithionite and of organic matterwith H2O2 at 90°C, following dispersion with hexametaphos-phate. Coarse and fine sand were sieved to 250 to 2000 and50 to 250 (j,m, respectively. Silt and clay concentrations weredetermined with the pipette method (Gee and Bauder, 1986).Soil density was determined gravimetrically by taking fiveundisturbed 100-mL soil cores.
To determine soil water characteristic curves, five undis-turbed soil samples were taken from the 0- to 0.15-, 0.15- to0.3-, 0.3- to 0.8-, 0.8- to 1.2-, 1.2- to 2-m soil layers with 100-mL steel rings from one selected soil in each of CE and NT(CE1 and CT2 in Fig. 1). The five replicate cores per layerwere taken from various depths to account for the heterogene-ity within one layer. The gravimetrical soil water content wasdetermined at i|<Ms of -0.316, -1.0, -3.16, -10.0, and -31.6kPa after equilibrating on ceramic plates. Water content at-1584.8 kPa was determined in a pressure pot using disturbedsamples (Klute, 1986).
Soil Chemical CharacterizationSoil organic carbon (SOC) was determined with a CHNS-
analyzer (Vario EL, Elementar Analysensysteme GmbH, Ha-nau, Germany). Aluminum in poorly ordered Fe oxides wasextracted with the oxalate-buffer method (A10; Schwertmann,1964), crystalline Fe oxides with the cold dithionite-citrate-buffer (DCB) method (Fed; Holmgren, 1967). Aluminum andFe were measured with flame atomic absorption spectropho-tometry (Varian AA 400, Varian, Mulgrave, Australia).
Calculations and Statistical EvaluationTo fit soil water characteristic curves to the measured val-
ues, the Soil Hydraulic Properties Fitting (SHYPFIT) program(Durner, 1994) was used. The soil water characteristic curvesobtained for a specific layer of one soil in each of CE and NTwere averaged to estimate water storage in the soil layers.Estimates were calculated for the dry season (May-October1997) and the rainy season (November 1997-April 1998) sepa-rately:
. WSsl = psl/slesl [1]where WSsi is the water storage in the soil layer (mm), psl thesoil bulk density (Mg m~3), /sl the depth of the soil layer (m),and 9S| average water content in the soil layer (g kg"1).
Water storages of the soil layers were summed to get thewater storage of the uppermost 2 m:
WS = WS(M,.15 + WSo.15 .̂3 + WSo.3 ,̂.8
+ WSL2_2.0 [2]Main and interactive means of the soil water characteristiccurves, Fed and A10 concentrations, texture, and the calculatedwater contents were tested with Tukey's honestly significantdifference (HSD) mean separation test (Hartung and Elpelt,1989). Mean V)JMS were tested with the Wilcoxon matched pairstest. Significance was set at P < 0.05. Statistical analyses wereperformed with STATISTICA for Windows 5.1 (StatSoft,1995, Hamburg, Germany).
RESULTS AND DISCUSSIONComparability of the Soils
Differences in I|JMS between land-use systems can onlybe interpreted as caused by land-use practices if the
soils were similar prior to the beginning of land use. Totest this prerequisite, we compared soil characteristicsthat are not or only little influenced by land use. Suchcharacteristics include the soil classification, the parti-cle-size distribution, and the mineralogical composition.As indicators of the mineralogical composition, we de-termined the concentration of Fed, which is a measurefor the concentration of Fe oxides formed after therelease of Fe from primary minerals (Mehra and Jack-son, 1960). Additionally, we used the concentration ofA10 as a measure for the concentration of the Al thatisomorphously substitutes for Fe in Fe oxides (Parfittand Childs, 1988).
All studied soils were very-fine isohyperthermic An-ionic Acrustoxes (Soil Survey Staff, 1997) with high clayconcentrations (615-885 g kg"1). There was no signifi-cant change in clay content with increasing soil depthin any individual soil (data not shown). Clay, silt, coarse,and fine sand concentrations were not significantly dif-ferent between the land-use systems within any individ-ual soil layer (Table 1). The A10 and Fed concentrationsof the same depth layer were not significantly differentbetween any of the studied soils of all land-use systems.Additionally, the average standard deviations of the A10and Fed concentrations between the replicate plots ofone system (Fed: 9.1 g kg"1, A10:0.27 g kg^1) were similarto those between all soils (Fed: 9.2, A10: 0.33). Thus, weassume that the soils had similar properties prior to landuse, and differences in V|JM and water storage can beinterpreted as the result of land-use practices, whichalso are the reason for small but significant differencesin SOC concentrations.
Climate and Soil Water InputBetween 29 Apr. 1997 and 28 Apr. 1998, the average
maximum temperature was 29°C and the average mini-mum temperature was 16°C, with only small variationsduring the year. Total precipitation during that time was1562 mm; 1342 mm fell between October 1997 and April1998 and only 220 mm during the dry season betweenthe end of April and September 1997 (Fig. 2). The cumu-lative precipitation between 29 Apr. 1997 and 28 Apr.1998 is comparable with the mean annual precipitationbetween 1981 and 1990 of 1550 mm (Rosa et al., 1991).However, due to the El Nino effect, precipitation duringthe dry season in 1997 was higher (220 mm) comparedwith the average of 130 mm between 1981 and 1990.
The land-use systems with a noncontinuous canopy(CE, DP) received higher soil water inputs than theother land-use systems because of the smaller loss dueto the evaporation of intercepted water (Table 2). Re-duced soil water input on the PI plots are related toevaporation of water intercepted by the needles, whichhas been reported to be equivalent to =25 to 30% ofabove-canopy precipitation in evergreen coniferous for-ests (Baumler and Zech, 1997; Parfitt et al., 1997). Small-est inputs were measured for CT where corn was plantedin the 1997-1998 rainy season. Ellies and Huber (1991)showed that the proportion of stemflow in corn culturescan reach values of up to 50% of the precipitation. As
LILIENFEIN ET AL.: ANNUAL COURSE OF MATRIC POTENTIAL IN SAVANNA OXISOLS IN BRAZIL 1781
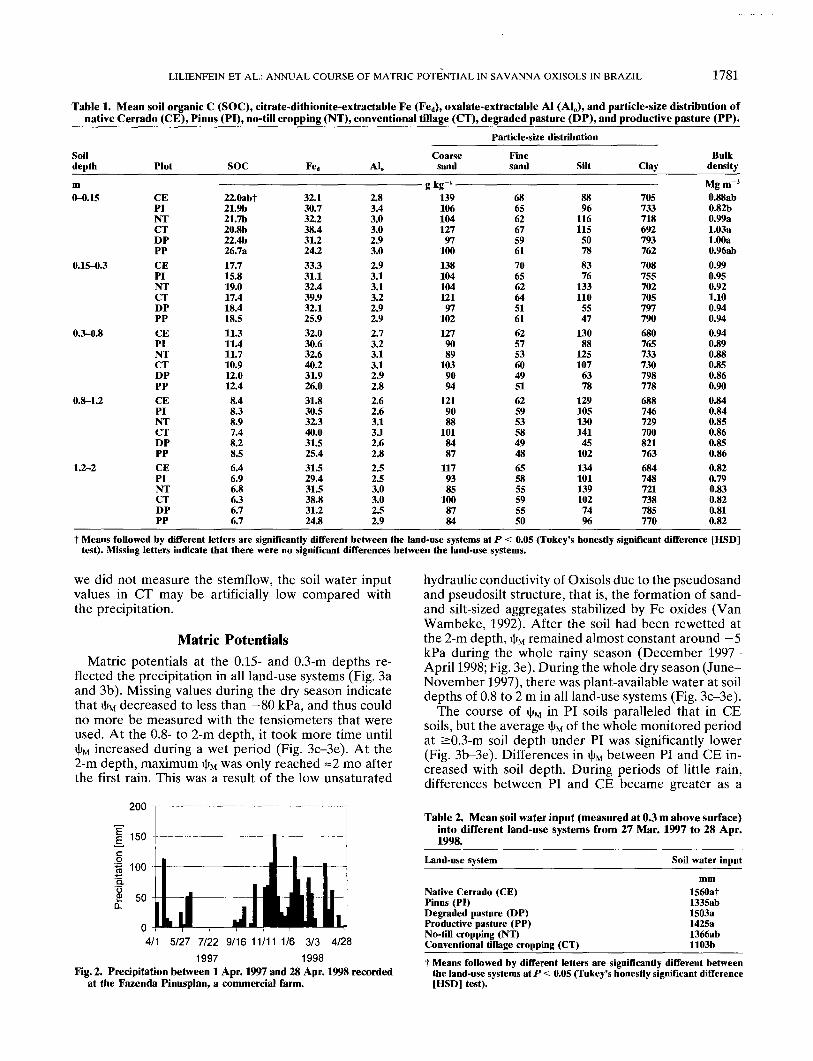
Table 1. Mean soil organic C (SOC), citrate-dithionite-extractable Fe (Fed), oxalate-extractable Al (A10), and particle-size distribution ofnative Cerrado (CE), Pinus (PI), no-till cropping (NT), conventional tillage (CT), degraded pasture (DP), and productive pasture (PP).
Particle-size distribution
Soildepth
m0-0.15
0.15-0.3
0.3-0.8
0.8-1.2
1.2-2
Plot
CEPINTCTDPPPCEPINTCTDPPPCEPINTCTDPPPCEPINTCTDPPPCEPINTCTDPPP
SOC
22.0abt21.9b21.7b20.8b22.4b26.7a17.715.819.017.418.418.511.311.411.710.912.012.48.48.38.97.48.28.56.46.96.86.36.76.7
Fed
32.130.732.238.431.224.233.331.132.439.932.125.932.030.632.640.231.926.031.830.532.340.031.525.431.529.431.538.831.224.8
A10
2.83.43.03.02.93.02.93.13.13.22.92.92.73.23.13.12.92.82.62.63.13.12.62.82.52.53.03.02.52.9
Coarsesand
—— g kg"1 ———13910610412797
10013810410412197
1021279089
1039094
1219088
1018487
1179385
1008784
Finesand
686562675961706562645161625753604951625953584948655855595550
Silt
8896
11611550788376
1331105547
13088
1251076378
12910513014145
1021341011391027496
Clay
705733718692793762708755702705797790680765733730798778688746729700821763684748721738785770
Bulkdensity
Mgm 3
0.88ab0.82b0.99a1.03al.OOa0.96ab0.990.950.921.100.940.940.940.890.880.850.860.900.840.840.850.860.850.860.820.790.830.820.810.82
t Means followed by different letters are significantly different between the land-use systems at P < 0.05 (Tukey's honestly significant difference [HSD]test). Missing letters indicate that there were no significant differences between the land-use systems.
we did not measure the stemflow, the soil water inputvalues in CT may be artificially low compared withthe precipitation.
Matric PotentialsMatric potentials at the 0.15- and 0.3-m depths re-
flected the precipitation in all land-use systems (Fig. 3aand 3b). Missing values during the dry season indicatethat I(JM decreased to less than -80 kPa, and thus couldno more be measured with the tensiometers that wereused. At the 0.8- to 2-m depth, it took more time until4<M increased during a wet period (Fig. 3c-3e). At the2-m depth, maximum i|/M was only reached ~2 mo afterthe first rain. This was a result of the low unsaturated
200
4/281997 1998
Fig. 2. Precipitation between 1 Apr. 1997 and 28 Apr. 1998 recordedat the Fazenda Pinusplan, a commercial farm.
hydraulic conductivity of Oxisols due to the pseudosandand pseudosilt structure, that is, the formation of sand-and silt-sized aggregates stabilized by Fe oxides (VanWambeke, 1992). After the soil had been rewetted atthe 2-m depth, \\IM remained almost constant around -5kPa during the whole rainy season (December 1997-April 1998; Fig. 3e). During the whole dry season (June-November 1997), there was plant-available water at soildepths of 0.8 to 2 m in all land-use systems (Fig. 3c-3e).
The course of I|JM in PI soils paralleled that in CEsoils, but the average I|JM of the whole monitored periodat ^0.3-m soil depth under PI was significantly lower(Fig. 3b-3e). Differences in i|*M between PI and CE in-creased with soil depth. During periods of little rain,differences between PI and CE became greater as a
Table 2. Mean soil water input (measured at 0.3 m above surface)into different land-use systems from 27 Mar. 1997 to 28 Apr.1998.
Land-use system Soil water input
Native Cerrado (CE)Pinus (PI)Degraded pasture (DP)Productive pasture (PP)No-till cropping (NT)Conventional tillage cropping (CT)
1560at1335ab1503a1425a1366ab1103b
t Means followed by different letters are significantly different betweenthe land-use systems at P < 0.05 (Tukey's honestly significant difference[HSD] test).
1782 SOIL SCI. SOC. AM. J., VOL. 63, NOVEMBER-DECEMBER 1999
a 1997 1998 ° 1997 1998 ° 1997 19983/25 6/17 9/9 12/2 2/24 3/25 6/17 9/9 12/2 2/24 3/25 6/17 9/9 12/2 2/24
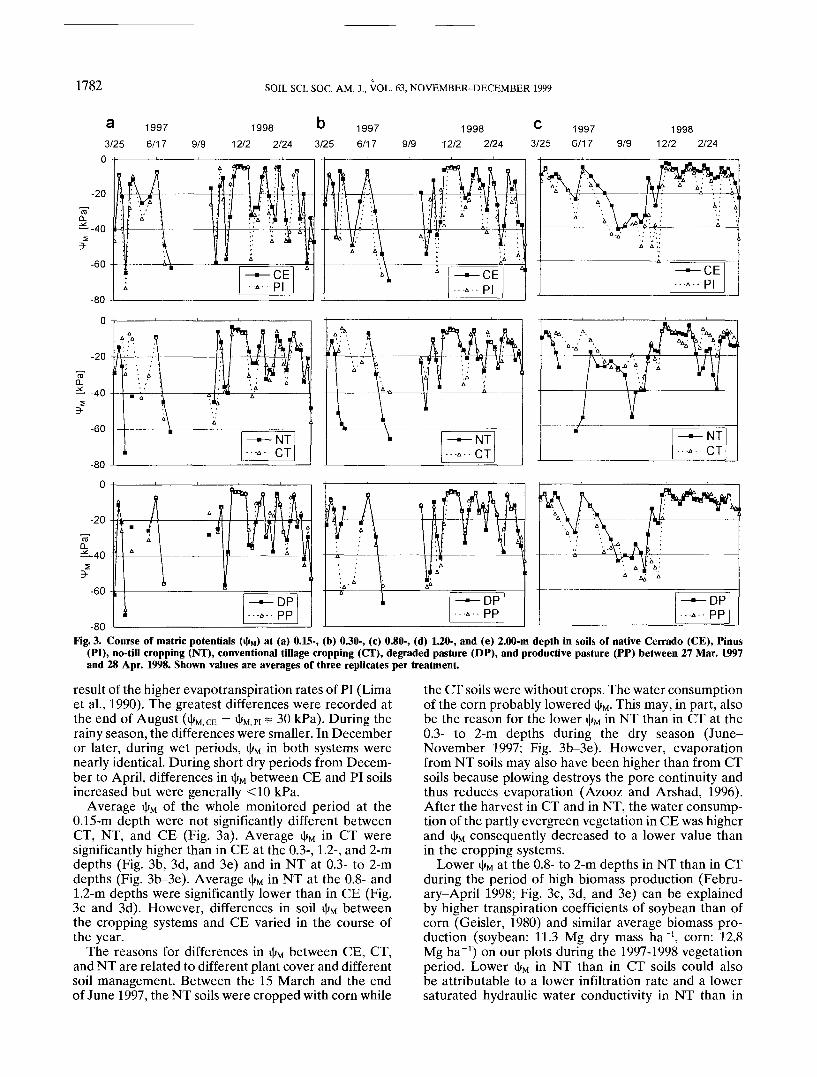
Fig. 3. Course of matric potentials (i[%) at (a) 0.15-, (b) 0.30-, (c) 0.80-, (d) 1.20-, and (e) 2.00-m depth in soils of native Cerrado (CE), Pinus(PI), no-till cropping (NT), conventional tillage cropping (CT), degraded pasture (DP), and productive pasture (PP) between 27 Mar. 1997and 28 Apr. 1998. Shown values are averages of three replicates per treatment.
result of the higher evapotranspiration rates of PI (Limaet al., 1990). The greatest differences were recorded atthe end of August (^M,CE ~ <|*M,PI == 30 kPa). During therainy season, the differences were smaller. In Decemberor later, during wet periods, I|JM in both systems werenearly identical. During short dry periods from Decem-ber to April, differences in \\>M between CE and PI soilsincreased but were generally <10 kPa.
Average iJ/M of the whole monitored period at the0.15-m depth were not significantly different betweenCT, NT, and CE (Fig. 3a). Average i|»M in CT weresignificantly higher than in CE at the 0.3-, 1.2-, and 2-mdepths (Fig. 3b, 3d, and 3e) and in NT at 0.3- to 2-mdepths (Fig. 3b-3e). Average I|/M in NT at the 0.8- and1.2-m depths were significantly lower than in CE (Fig.3c and 3d). However, differences in soil iJ*M betweenthe cropping systems and CE varied in the course ofthe year.
The reasons for differences in iJjM between CE, CT,and NT are related to different plant cover and differentsoil management. Between the 15 March and the endof June 1997, the NT soils were cropped with corn while
the CT soils were without crops. The water consumptionof the corn probably lowered iJjM. This may, in part, alsobe the reason for the lower vJ/M in NT than in CT at the0.3- to 2-m depths during the dry season (June-November 1997; Fig. 3b-3e). However, evaporationfrom NT soils may also have been higher than from CTsoils because plowing destroys the pore continuity andthus reduces evaporation (Azooz and Arshad, 1996).After the harvest in CT and in NT, the water consump-tion of the partly evergreen vegetation in CE was higherand »|/M consequently decreased to a lower value thanin the cropping systems.
Lower <|)M at the 0.8- to 2-m depths in NT than in CTduring the period of high biomass production (Febru-ary-April 1998; Fig. 3c, 3d, and 3e) can be explainedby higher transpiration coefficients of soybean than ofcorn (Geisler, 1980) and similar average biomass pro-duction (soybean: 11.3 Mg dry mass ha"1, corn: 12.8Mg ha"1) on our plots during the 1997-1998 vegetationperiod. Lower \\>M in NT than in CT soils could alsobe attributable to a lower infiltration rate and a lowersaturated hydraulic water conductivity in NT than in
LILIENFEIN ET AL.: ANNUAL COURSE OF MATRIC POTENTIAL IN SAVANNA OXISOLS IN BRAZIL 1783
U 1997 1998 6 1997 19983/25 6/17 9/9 12/2 2/24 3/25 6/17 9/9 12/2 2/240
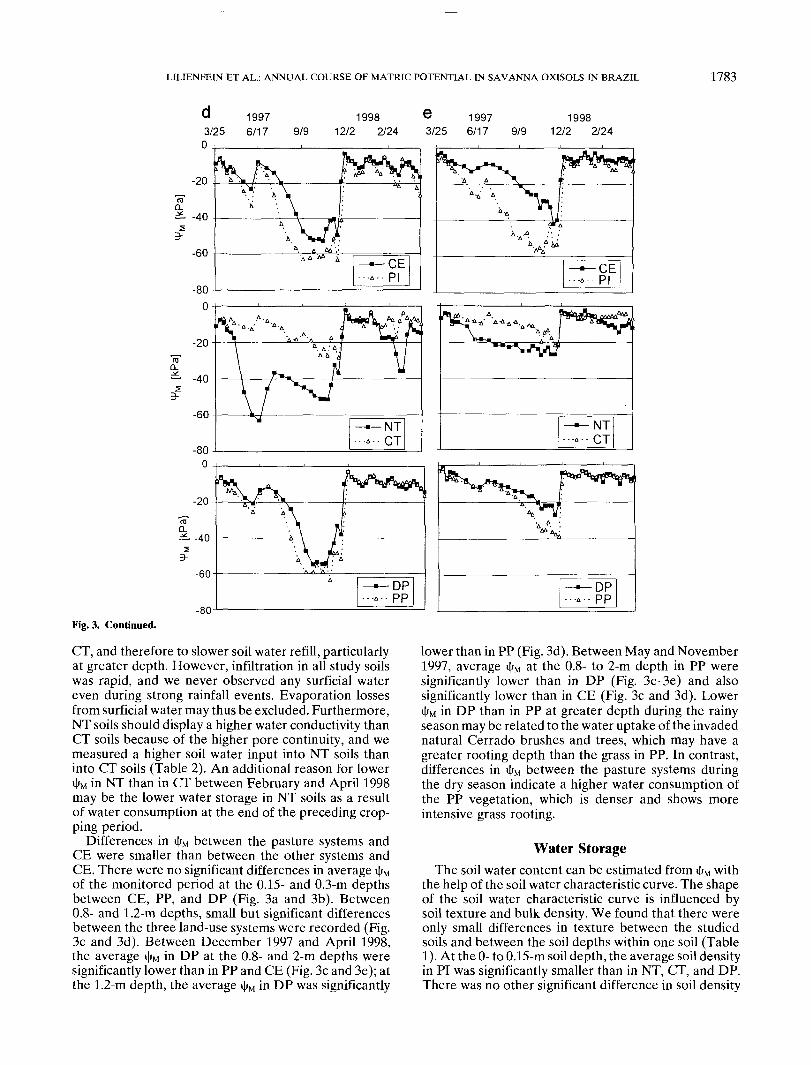
-80Fig. 3. Continued.
CT, and therefore to slower soil water refill, particularlyat greater depth. However, infiltration in all study soilswas rapid, and we never observed any surficial watereven during strong rainfall events. Evaporation lossesfrom surficial water may thus be excluded. Furthermore,NT soils should display a higher water conductivity thanCT soils because of the higher pore continuity, and wemeasured a higher soil water input into NT soils thaninto CT soils (Table 2). An additional reason for lowerV|»M in NT than in CT between February and April 1998may be the lower water storage in NT soils as a resultof water consumption at the end of the preceding crop-ping period.
Differences in 4>M between the pasture systems andCE were smaller than between the other systems andCE. There were no significant differences in average i|;Mof the monitored period at the 0.15- and 0.3-m depthsbetween CE, PP, and DP (Fig. 3a and 3b). Between0.8- and 1.2-m depths, small but significant differencesbetween the three land-use systems were recorded (Fig.3c and 3d). Between December 1997 and April 1998,the average i|/M in DP at the 0.8- and 2-m depths weresignificantly lower than in PP and CE (Fig. 3c and 3e); atthe 1.2-m depth, the average v[/M in DP was significantly
lower than in PP (Fig. 3d). Between May and November1997, average i|% at the 0.8- to 2-m depth in PP weresignificantly lower than in DP (Fig. 3c-3e) and alsosignificantly lower than in CE (Fig. 3c and 3d). Lowerv|;M in DP than in PP at greater depth during the rainyseason may be related to the water uptake of the invadednatural Cerrado brushes and trees, which may have agreater rooting depth than the grass in PP. In contrast,differences in 4»M between the pasture systems duringthe dry season indicate a higher water consumption ofthe PP vegetation, which is denser and shows moreintensive grass rooting.
Water StorageThe soil water content can be estimated from if/M with
the help of the soil water characteristic curve. The shapeof the soil water characteristic curve is influenced bysoil texture and bulk density. We found that there wereonly small differences in texture between the studiedsoils and between the soil depths within one soil (Table1). At the 0- to 0.15-m soil depth, the average soil densityin PI was significantly smaller than in NT, CT, and DP.There was no other significant difference in soil density
1784 SOIL SCI. SOC. AM. J., VOL. 63, NOVEMBER-DECEMBER 1999
600
500
'CO
CO
400oo
300
200
. CE1, 0-0.15 mo CT2, 0-0.15 m-CE1, 0.15-0.3m-CT2, 0.15-0.3m• CE1, 0.3-0.8ma CT2, 0.3 - 0.8 mACE1.0.8- 1.2ma CT2, 0.8- 1.2m*CE1, 1 .2 -2m+ CT2, 1.2-2 m
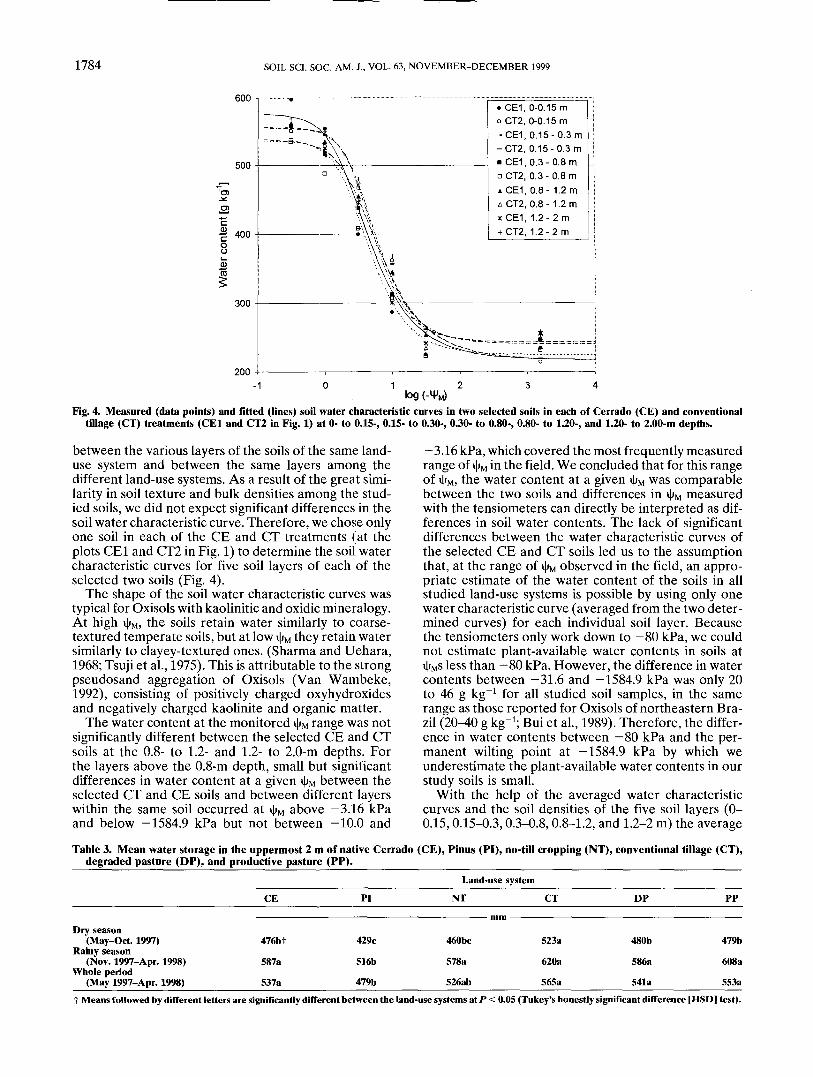
Fig. 4. Measured (data points) and fitted (lines) soil water characteristic curves in two selected soils in each of Cerrado (CE) and conventionaltillage (CT) treatments (CE1 and CT2 in Fig. 1) at 0- to 0.1S-, 0.15- to 0.30-, 0.30- to 0.80-, 0.80- to 1.20-, and 1.20- to 2.00-m depths.
between the various layers of the soils of the same land-use system and between the same layers among thedifferent land-use systems. As a result of the great simi-larity in soil texture and bulk densities among the stud-ied soils, we did not expect significant differences in thesoil water characteristic curve. Therefore, we chose onlyone soil in each of the CE and CT treatments (at theplots CE1 and CT2 in Fig. 1) to determine the soil watercharacteristic curves for five soil layers of each of theselected two soils (Fig. 4).
The shape of the soil water characteristic curves wastypical for Oxisols with kaolinitic and oxidic mineralogy.At high v|%, the soils retain water similarly to coarse-textured temperate soils, but at low \\IM they retain watersimilarly to clayey-textured ones. (Sharma and Uehara,1968; Tsuji et al., 1975). This is attributable to the strongpseudosand aggregation of Oxisols (Van Wambeke,1992), consisting of positively charged oxyhydroxidesand negatively charged kaolinite and organic matter.
The water content at the monitored i|»M range was notsignificantly different between the selected CE and CTsoils at the 0.8- to 1.2- and 1.2- to 2.0-m depths. Forthe layers above the 0.8-m depth, small but significantdifferences in water content at a given v[>M between theselected CT and CE soils and between different layerswithin the same soil occurred at \\IM above -3.16 kPaand below -1584.9 kPa but not between -10.0 and
-3.16 kPa, which covered the most frequently measuredrange of v|»M in the field. We concluded that for this rangeof I|/M, the water content at a given I|JM was comparablebetween the two soils and differences in i|;M measuredwith the tensiometers can directly be interpreted as dif-ferences in soil water contents. The lack of significantdifferences between the water characteristic curves ofthe selected CE and CT soils led us to the assumptionthat, at the range of I|JM observed in the field, an appro-priate estimate of the water content of the soils in allstudied land-use systems is possible by using only onewater characteristic curve (averaged from the two deter-mined curves) for each individual soil layer. Becausethe tensiometers only work down to -80 kPa, we couldnot estimate plant-available water contents in soils at4*Ms less than -80 kPa. However, the difference in watercontents between -31.6 and -1584.9 kPa was only 20to 46 g kg"1 for all studied soil samples, in the samerange as those reported for Oxisols of northeastern Bra-zil (20-40 g kg"1; Bui et al., 1989). Therefore, the differ-ence in water contents between -80 kPa and the per-manent wilting point at -1584.9 kPa by which weunderestimate the plant-available water contents in ourstudy soils is small.
With the help of the averaged water characteristiccurves and the soil densities of the five soil layers (0-0.15,0.15-0.3,0.3-0.8,0.8-1.2, and 1.2-2 m) the average
Table 3. Mean water storage in the uppermost 2 m of native Cerrado (CE), Pinus (PI), no-till cropping (NT), conventional tillage (CT),degraded pasture (DP), and productive pasture (PP)._____________________________________________
Land-use systemCE PI NT CT DP PP
Dry season(May-Oct. 1997)
Rainy season(Nov. 1997-Apr. 1998)
Whole period(May 1997-Apr. 1998)
476bt
587a
S37a
429c
516b
479b
460bc
578a
526ab
523a
620a
565a
480b
586a
541a
479b
608a
S53at Means followed by different letters are significantly different between the land-use systems at P < 0.05 (Tukey's honestly significant difference [HSD] test).
LILIENFEIN ET AL.: ANNUAL COURSE OF MATRIC POTENTIAL IN SAVANNA OXISOLS IN BRAZIL 1785
water storage of each system in the uppermost 2 m wasestimated using Eq. [1] and [2]. During the rainy season,the average water storages were not significantly differ-ent among all studied land-use systems, except for PIwhere the average water storage in the uppermost 2 mwas significantly smaller than in all other land-use sys-tems (Table 3). During the dry season differences weremore pronounced; the water storage decreased alongthe line: CT > DP = PP > CE > NT > PI.
CONCLUSIONSOur results indicate that it is mainly the type of vege-
tation that controls the annual course of ipM in differentlyused savanna Oxisols because it influences evapotrans-piration, interception, and stemflow. In CT, plowingprobably additionally results in reduced evaporationand thus increased ij»M because the pore continuity isdestroyed. Both pasture systems showed similar annualcourses of i|»M in soil as CE, indicating that the soil waterbudget under pasture is close to that of the naturalsystem. In PI and NT soils, 4/M was decreased and theaverage annual water storage was reduced comparedwith CE.
ACKNOWLEDGMENTSWe gratefully acknowledge the funding of the German Re-
search Foundation (DFG Ze 154/36-1: CE, PI, NT, CT) andthe MAS (Managing Acid Soils) program (DP, PP) convenedby CIAT (Centre Internacional de la Agricultura Tropical,Cali, Colombia). We thank C. Benicke, P.H. da Costa, A.C.Frascoli, T. Glotzmann, A. Schill, and U. Schwantag for theirsupport. We also thank H.L.A. Bessa and C.R. Cage (FazendaPlanalto Hirofume), R. Domicio (Fazenda Brasmix), J. Fon-seca (Fazenda Rancharia alegre), H. Fuzaro (Fazenda Passa-rinho), G. Guimaraes (Fazenda Bomjardim), H. Guimaraes(Fazenda Luzia), A. Mauro (Fazenda Pinusplan), W. Ribeirada Sa (Fazenda Beija Flor), and A.F. Santes (Fazenda EstanciaRecanto das Flores).


![MATRIC-L5 [OFFICE ]...MATRIC-L5 [OFFICE ] MATRIC-S1/U1 108 MATRIC-W1 168 MATRIC-P4 278 MATRIC-A3 362 MATRIC-L1 428 DE Matric-L5 I Einbau-Lichtlinie rein direktstrahlend • Montage](https://img.pdfslide.us/doc/110x75/5f0518737e708231d4113d85/matric-l5-office-matric-l5-office-matric-s1u1-108-matric-w1-168-matric-p4.jpg)