Embed Size (px)
Citation preview

1. Introduction
Southwestern Pennsylvania Annual Compensation and Benefits Study
© 2010 Pittsburgh Technology Council. All rights reserved.
Page 1 – 1
OverviewThe Pittsburgh Technology Council is pleased to present the 2010 - 2011 Southwestern Pennsylvania Annual Compensation and Benefits Study. This report includes data for 69 companies that matched 10,103 employees located within the 13-county southwestern Pennsylvania region to 130+ unique jobs. The survey is organized as follows: PPage No.
1 Introduction 1-3
2 Participation Survey Participants 2-3
Participant Demographics Participant Contact List
2-4 2-5
3 Compensation Data Data Collection Overview 3-1 Page References to Individual Job Compensation Data 3-2 Definition and Terms 3-5 Overall Compensation Summary for All Jobs 3-7 Individual Job Compensation Data Sheets 3-10
4 Policies and Practices Strategic Initiatives 4-2 2011 Pay Increase Budgets 4-4
2011 Pay Range and Structure Adjustments Performance Management Programs
4-6 4-7
Incentive Plans 4-9 Pay Premiums and Shift Differentials 4-13 Healthcare, Welfare and Voluntary Benefit Plans 4-16 Retirement Plans 4-26 401(k) Plans 4-27 403(b) Plans 4-31 Holiday, Vacation and Other Paid Time Off Practices 4-34 Referral Bonuses 4-42 Signing Bonuses 4-43 Tuition Assistance, Professional Development and Staff Development 4-44

1. Introduction
Southwestern Pennsylvania Annual Compensation and Benefits Study
© 2010 Pittsburgh Technology Council. All rights reserved.
Page 1 – 2
Recognition and Achievement Awards Work/Life Policies and Programs
4-46 4-48
Perquisites and Fringe Benefits Employment Practices Severance Practices and Programs
4-51 4-54 4-55
5 Methodology
Definitions and Terms 5-1
Data Analysis Methodology Job Descriptions
5-1 5-2
About 3C 5-40 About the Pittsburgh Technology Council 5-41

1. Introduction
Southwestern Pennsylvania Annual Compensation and Benefits Study
© 2010 Pittsburgh Technology Council. All rights reserved.
Page 1 – 3
About the SurveyThe 2010 - 2011 Southwestern Pennsylvania Annual Compensation and Benefits Study identifies trends and practices related to cash compensation, benefit programs and other human resource policies of companies located within the following 13-counties of southwestern Pennsylvania:
Allegheny Armstrong Beaver Bedford
Butler Cambria Fayette Greene
Indiana Lawrence Somerset Washington
Westmoreland
Compensation Consulting Consortium, LLC – “3C,” a compensation consulting firm, and its office located in Pittsburgh, Pa., again partnered with the Pittsburgh Technology Council to conduct this year’s survey. The Pittsburgh Human Resources Association (PHRA) again assisted in this year’s survey marketing and questionnaire distribution processes. In July 2010, the Pittsburgh Technology Council, Pittsburgh Human Resources Association and 3C e-mailed and faxed survey questionnaires to approximately 500 companies regarding base salary and bonus/incentive practices applicable to 130+ key jobs, general pay administration policies, benefit program design features and other human resource policies applicable to the companies’ broad-based work force located within southwestern Pennsylvania. For this year’s survey, 69 organizations responded and provided actual compensation practices for approximately 10,103 employees. Careful attention has been paid to ensure the statistical validity of the results presented. Questionable data submitted have been reviewed, revised and/or omitted based on discussions with survey participants. Given the significant change in number and types of survey participants, we advise the users of this survey to exercise caution in conducting year-over-year comparison analyses. Data are effective as of July 1, 2010.

1. Introduction
Southwestern Pennsylvania Annual Compensation and Benefits Study
© 2010 Pittsburgh Technology Council. All rights reserved.
Page 1 – 4
ConfidentialityThis survey is designed to provide meaningful statistical analyses without compromising data supplied in confidence by participants. Accordingly, the analyses included within this report have been prepared according to 3C’s standards for data presentation which include the following:
A minimum of two organizations must be included for any type of data to be displayed. A minimum of three incumbents across at least two organizations must be included to display the 50th percentile and average practices for all compensation-related data. A minimum of five incumbents across at least two organizations must be included to display all percentiles (25th, 50th and 75th) for compensation-related data.
The analysis of compensation and related information is displayed for each of the survey positions where sufficient data were collected. Two hyphens are displayed when there are insufficient data.
Survey Definitions A description of the methodology used in analyzing the participants’ data and definitions for statistics and all compensation elements is included throughout the report and a general summary also is listed within the Methodology section. The descriptions of the surveyed jobs as well as an alphabetical listing of the surveyed jobs by job title also are included within the Methodology section.
QuestionsQuestions regarding any information included within this report can be directed to Dawn Cumpston or Jennifer Gligonic at 412. 816.1670 or via e-mail at [email protected] or [email protected].

2. Participation
Southwestern Pennsylvania Annual Compensation and Benefits Study © 2010 Pittsburgh Technology Council. All rights reserved.
Page 2 – 1
The 69 participating employers are categorized by the following industry, employee size and annual revenue groupings.
Industries
The definitions of the seven industry groupings for which results are presented are noted below.
Manufacturing Design and manufacturing of equipment, machinery and systems in which electronics are a primary component, including computer hardware. Manufacturing and research of primary and specialty metals, ceramics, plastics and synthetics; chemical research and manufacturing; and, environmental and earth sciences. All other manufacturing. Software, Computer and Technology Design and development of computer software and systems; networking and systems integration products; electronic media content; wireless, satellite, and land-based telecommunication products; and, engineered and science-based products. Software, computer and technology-related consulting services, including customization of products and services developed and owned by other organizations. Consulting related to design, installation and operation of computer software and systems; networking, systems integrations, and related services. Consulting related to operations and services of internet service providers; electronic media content providers; wireless, satellite, and land-based telecommunication products; and, engineered and science-based products. Life-Sciences/Biotech/Medical Devices Companies and organizations engaged in research, development, commercialization and/or manufacturing of biological, pharmaceutical, therapeutic or medical materials, equipment, devices, supplies or technologies. Not-for-Profit Organizations that qualify for exemption status from federal and state income taxation. Typically serve the public interest in areas such as charity, education, science, religion, advocacy or literacy. May receive contributions or funding from various sources such as the general public, corporations, private foundations, governmental agencies or other public charities. Also includes governmental agencies.

2. Participation
Southwestern Pennsylvania Annual Compensation and Benefits Study © 2010 Pittsburgh Technology Council. All rights reserved.
Page 2 – 2
All Other Employers Consulting, law, accounting, auditing, architecture, and design firms or other type of professional or business service organization. Includes organizations offering a primary product or service not described by any other category.

2. Participation
Southwestern Pennsylvania Annual Compensation and Benefits Study © 2010 Pittsburgh Technology Council. All rights reserved.
Page 2 – 3
Manufacturing Not-for-Profit
Acutronic USA, Inc. * Allegheny Conference for Community Development *Aerotech, Inc * Carnegie Library of Pittsburgh *Alcoa Inc. Carnegie Mellon University *AMETEK/Process & Analytical Instruments Division Cranberry TownshipBucyrus America Inc. Excela Health *CMR USA, LLC Innovation Works, Inc. *FS-Elliott Co., LLC Pennsylvania One Call System IncGENCO Port Authority of Allegheny CountyKoppers, Inc. * The Heinz Endowments *LaBarge, Inc. * The Pittsburgh Technology Council *Matric, Ltd. * VisitPittsburgh *Mitsubishi Electric Power Products, Inc. *NOVA Chemicals LLife-Sciences/Biotech/Medical DevicesPBM Valve Solutions *Pressure Chemical Co. * Alung Technologies, Inc. *Sauereisen Inc. Circadiance LLCUniversal Electric Corporation * Invivodata, Inc. *
McKesson Automation, Inc. *All Other Employers Phillips Respironics *
Pittsburgh Life Sciences Greenhouse *American Eagle Outfitters, Inc. * Precision Therapeutics, Inc. *Buchanan Ingersoll & Rooney PCCONSOL Energy, Inc. * SSoftware, Computer and Technology Cowden AssociatesDaedalus, Inc. * Compunetix, Inc.Development Dimensions International, Inc. Confluence *Duquesne Light Holdings * Emerson Process Management Power & Water Solutions, Inc.Education Management Corporation * Inmedius, IncFederal Home Loan Bank of Pittsburgh Lucas Systems Inc. *FedEx Ground Management Science Associates, Inc. *Giant Eagle, Inc. Matrix Operations Company, LLC DBA Matrix Solutions*Highmark * Newton Consulting *MARC USA, Inc. * Resilient Cognitive Solutions *MAYA Design, Inc. * Rhiza Labs, LLCMultiscope, Inc. SDLC Partners L.P. *Penn Line Service, Inc. Simio LLC *Reed Smith, LLP * TeleTracking Technologies, Inc. *Software Engineering Institute True Commerce, Inc.Technosystems Service Corporation *The Duggan Rhodes Group
Survey Participants The table below lists this year’s survey participants within the major industry groupings. An asterisk “*” identifies organizations who also participated in the 2009 survey.

2. Participation
Southwestern Pennsylvania Annual Compensation and Benefits Study © 2010 Pittsburgh Technology Council. All rights reserved.
Page 2 – 4
Participant Demographics The tables below provide a profile of the survey’s participants in terms of annual revenue and total number of full-time equivalent employees.
Industry
No. of Orgs.
% of Participants Organized by Annual Revenue ($ Millions)
Less than $7.5 $7.5 to $25 $26 to $150 More than $150 Software, Computer & Technology 14 29% 43% 14% 14%
Manufacturing 17 18% 18% 29% 35%
Life-Sciences/Biotech/Medical Devices
7 42% 29% 0% 29%
Not-for-Profit 11 18% 27% 37% 18%
All Other Employers 20 25% 10% 5% 60%
All Combined 69 25% 23% 17% 35%
Industry
No. of Orgs.
% of Participants Organized by No. of Full-Time Equivalent Employees
Less than 50 50 - 150 151 - 500 More than 500 Software, Computer & Technology 14 43% 29% 14% 14%
Manufacturing 17 24% 18% 34% 24%
Life-Sciences/Biotech/Medical Devices
7 43% 14% 14% 29%
Not-for-Profit 11 36% 18% 18% 28%
All Other Employers 20 20% 15% 5% 60%
All Combined 69 30% 19% 18% 33%
Note: Number of full-time equivalent employees equals sum of full-time employees plus part-time employees converted to a full-time equivalent basis.

2. Participation
Southwestern Pennsylvania Annual Compensation and Benefits Study © 2010 Pittsburgh Technology Council. All rights reserved.
Page 2 – 5
Alcoa Inc. CONSOL Energy, Inc.Theresa Garfold Janelle FriedlineSr. Compensation Consultant Compensation Coordinator412.553.2821 724.485.4119
Alung Technologies, Inc. Cranberry TownshipLinda Allen Richard CibellaHR Consultant Director, Human Resources/Labor Relations412.697.3370 724.776.4806 x1130
American Eagle Outfitters Daedalus Excel, Inc.Kourtney Karleski Cheryl Casciola Manager, Compensation Operations Manager412.432.3415 412.687.7000 X 10
Development Dimensions International, Inc.Sharon Hicks Kerrie L. Lutz, CCP, PHRHuman Resources Manager Compensation Manager412-826-2401 412.220.3534
Buchanan Ingersoll & Rooney PC Duquesne Light HoldingsDina Vickers Jeff D. CypherManager - Human Resources Operations Manager, HR Programs and Services412.562.8822 412.393.1582
Bucyrus America Inc. Education Management CorporationCasandra Mickle Jaclyn MitchellHR Generalist Compensation Analyst724.743.1375 412.995.7611
Circadiance LLCKathy Groll Sharon MarshallHR Manager Manager, Compensation and Pensions724.387.9184 412.963.3607
CMR USA, LLC Excela HealthJennifer Ream Ginger FritzVP, Finance and Administration Compensation Analyst724.452.2200 x11 724.689.1942
Confluence Federal Home Loan Bank of PittsburghJason M. Laura Jennifer BeighleyDirector of Human Resources Sr. Compensation & Benefits Analyst412.697.4364 412.288.2867
AMETEK/Process & Analytical Instruments Division
Emerson Process Management Power & Water Solutions, Inc.
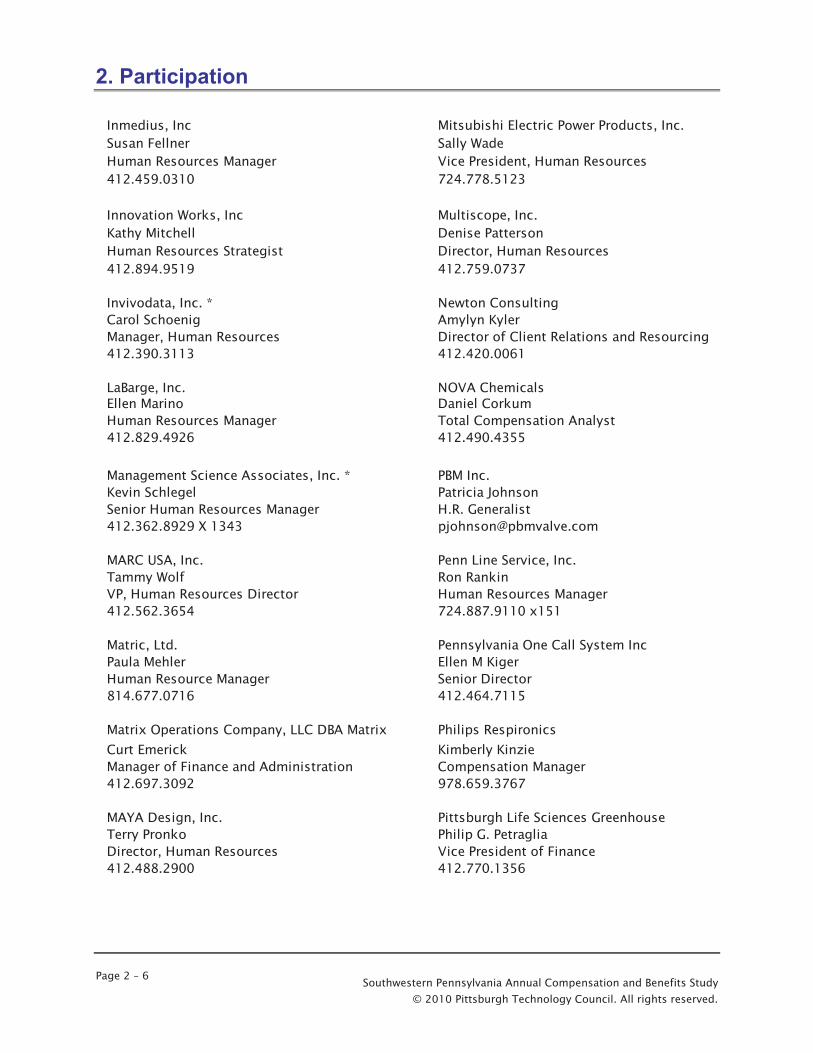
Participant Contact List Permission was given by the following participants to be reported in the contact list. This does not represent a full participant listing. An asterisk “*” identifies members of the survey Advisory Board Committee.
2. Participation
Southwestern Pennsylvania Annual Compensation and Benefits Study © 2010 Pittsburgh Technology Council. All rights reserved.
Page 2 – 6
Inmedius, Inc Mitsubishi Electric Power Products, Inc.Susan Fellner Sally WadeHuman Resources Manager Vice President, Human Resources412.459.0310 724.778.5123
Innovation Works, Inc Multiscope, Inc.Kathy Mitchell Denise PattersonHuman Resources Strategist Director, Human Resources412.894.9519 412.759.0737
Invivodata, Inc. * Newton ConsultingCarol Schoenig Amylyn KylerManager, Human Resources Director of Client Relations and Resourcing412.390.3113 412.420.0061
LaBarge, Inc. NOVA ChemicalsEllen Marino Daniel CorkumHuman Resources Manager Total Compensation Analyst412.829.4926 412.490.4355
Management Science Associates, Inc. * PBM Inc.Kevin Schlegel Patricia JohnsonSenior Human Resources Manager H.R. Generalist412.362.8929 X 1343 [email protected]
MARC USA, Inc. Penn Line Service, Inc.Tammy Wolf Ron RankinVP, Human Resources Director Human Resources Manager412.562.3654 724.887.9110 x151
Matric, Ltd. Pennsylvania One Call System IncPaula Mehler Ellen M KigerHuman Resource Manager Senior Director814.677.0716 412.464.7115
Philips RespironicsCurt Emerick Kimberly KinzieManager of Finance and Administration Compensation Manager412.697.3092 978.659.3767
MAYA Design, Inc. Pittsburgh Life Sciences GreenhouseTerry Pronko Philip G. PetragliaDirector, Human Resources Vice President of Finance412.488.2900 412.770.1356
Matrix Operations Company, LLC DBA Matrix

2. Participation
Southwestern Pennsylvania Annual Compensation and Benefits Study © 2010 Pittsburgh Technology Council. All rights reserved.
Page 2 – 7
McKesson Automation, Inc. Rhiza Labs, LLCAmanda Brewer Terry PronkoHuman Resource Manager Director, HR724.741.8339 412.488.0600
Pittsburgh Technology Council * Sauereisen Inc.Justin Driscoll Patti KenzieDirector, STEM Talent Acquisition HR Generalist412.918.4281 412.963.0303 x225Joan KennedyVice President, Human Resources SDLC Partners L.P412.918.4233 Chris Simchick
Principal PartnerPort Authority of Allegheny County 412.373.1950Stephanie HerriotHuman Resource Information Associate TeleTracking Technologies *412.566.5342 Beverly McGrath
Vice President, Human ResourcesPrecision Therapeutics, Inc. * 412.391.6394Sarah FanksManager, Administrative Operations The Duggan Rhodes Group412.432.1553 Chris Jones
Director of OperationsPressure Chemical Co. 412.227.3884Holly DreibholdHuman Resources Administrator The Heinz Endowments412.682.5882 x 112 Stuart Redshaw
Director, Human ResourcesReed Smith LLP 412.338.2616Liz McKeeHuman Resources Specialist True Commerce, Inc.412.288.4138 Becky Sherwin
Human Resources GeneralistResilient Cognitive Solutions 724.940.5520 x401Fedora PhillipsOffice Administrator, HR VisitPittsburgh412.904.1664 x24 Mary Grasha Houpt
Director, Human Resources412.325.0303

3. Compensation Data
Southwestern Pennsylvania Annual Compensation and Benefits Study © 2010 Pittsburgh Technology Council. All rights reserved.
Page 3 – 1
Data Collection Overview Jobs in the 2010 - 2011 Southwestern Pennsylvania Annual Compensation and Benefits Study are organized into the following job families:
Management & Administration Accounting, Finance & Purchasing Engineering & Field Services Documentation & Publication Laboratory Science & Chemistry
Information Systems Customer Services & Support Marketing & Sales Manufacturing & Warehousing
There are two full pages of information for each job, breaking out compensation data by industry and employer size measured in terms of full-time equivalent (FTE) employees and annual organizational revenue. Survey participants submitted compensation data for every full-time employee matched to a survey job. Average and median rates of pay and 25th and 75th percentiles were then calculated from the individual pay rates submitted. When matching survey jobs, survey participants were instructed to compare the duties and responsibilities of their organizations’ jobs with the survey descriptors and ensure major responsibilities of their jobs were comparable to the survey jobs. As part of the survey, data were combined to create several “All Level” jobs in cases where multiple levels for the same job exist. For example, incumbent pay data submitted by participants for Engineer I, II and III were combined into a new job called Engineer – All Levels. Combining the job-level pay practices provide the survey user with additional insights into the full range of market pay practices for a particular set of job skills and responsibilities. The following pages identify the specific page number to use in locating compensation data for each surveyed job as well as the “All Level” jobs. A summary of the job descriptions is included in the Methodology section of this report.

3. Compensation Data
Southwestern Pennsylvania Annual Compensation and Benefits Study © 2010 Pittsburgh Technology Council. All rights reserved.
Page 3 – 2
Job Number / Job TitlePage
NumberM anagement and Administration
101 RECEPTIONIST 10106 ADM INISTRATIVE ASSISTANT 12108 EXECUTIVE ASSISTANT/SR ADM INISTRATIVE ASSISTANT 14112 GENERAL CLERK - INTERM EDIATE 16117 BILLING CLERK 18126 HUM AN RESOURCES M ANAGER 20129 HUM AN RESOURCES GENERALIST 22130 EM PLOYEE TRAINING SPECIALIST 24135 TECHNICAL RECRUITER 26140 OFFICE M ANAGER 28152 CONTRACT ADM INISTRATOR 30
Accounting, Finance and Purchasing201 ACCOUNTING CLERK - ALL LEVELS 32202 ACCOUNTING CLERK - INTERM EDIATE 34203 ACCOUNTING CLERK – SENIOR 36204 PAYROLL CLERK 38231 ACCOUNTANT - ALL LEVELS 40232 ACCOUNTANT 42233 SENIOR ACCOUNTANT 44245 ACCOUNTING M ANAGER 46246 FINANCIAL ANALYST 48252 BUYER/PLANNER - ALL LEVELS 50253 BUYER/PLANNER 52254 SENIOR BUYER/PLANNER 54255 PURCHASING M ANAGER 56
Engineering and Field Services310 FIELD SERVICE TECHNICIAN - ALL LEVELS 58311 FIELD SERVICE TECHNICIAN 60312 SENIOR FIELD SERVICE TECHNICIAN 62321 DRAFTER/DESIGNER (CAD) - ALL LEVELS 64322 DRAFTER/DESIGNER (CAD) 66323 DRAFTER/DESIGNER (CAD) SENIOR 68330 ELECTRONICS TECHNICAN - ALL LEVELS 70331 ELECTRONICS TECHNICIAN I 72332 ELECTRONICS TECHNICIAN II 74333 ELECTRONICS TECHNICIAN III 76340 SYSTEM S/ELECTRONICS ENGINNER - ALL LEVELS 78341 SYSTEM S/ELECTRONICS ENGINEER I 80343 SYSTEM S/ELECTRONICS ENGINEER II 82345 SYSTEM S/ELECTRONICS ENGINEER III 84350 M ECHANICAL ENGINEER - ALL LEVELS 86351 M ECHANICAL ENGINEER I 88353 M ECHANICAL ENGINEER II 90355 M ECHANICAL ENGINEER III 92381 ELECTRICAL ENGINEER - ALL LEVELS 94382 ELECTRICAL ENGINEER I 96383 ELECTRICAL ENGINEER II 98384 ELECTRICAL ENGINEER III 100388 INDUSTRIAL ENGINEER - ALL LEVELS 102385 INDUSTRIAL ENGINEER I 104386 INDUSTRIAL ENGINEER II 106387 INDUSTRIAL ENGINEER III 108380 ENGINEERING M ANAGER 110
Page References to Individual Job Compensation

3. Compensation Data
Southwestern Pennsylvania Annual Compensation and Benefits Study © 2010 Pittsburgh Technology Council. All rights reserved.
Page 3 – 3
Job Number / Job TitlePage
NumberDocumentation and Publication
401 ENGINEERING DOCUM ENTATION COORDINATOR 112431 TECHNICAL WRITER 114441 GRAPHIC ILLUSTRATOR/DESIGNER 116
Laboratory Science and Chemistry570 LABORATORY ASSISTANT 118572 LABORATORY TECHNICIAN 120577 RESEARCH ASSOCIATE 122580 RESEARCH SCIENTIST - ALL LEVELS 124581 RESEARCH SCIENTIST 126589 SENIOR RESEARCH SCIENTIST 128590 RESEARCH AND DEVELOPM ENT M ANAGER (Non-M D) N/A **592 CLINICAL RESEARCH ASSOCIATE 130583 DOCUM ENT CONTROL SPECIALIST 132591 CLINICAL LAB M ANAGER 134594 M EDICAL RECORDS SPECIALIST N/A **595 M EDICAL RECORDS COORDINATOR N/A **596 QUALITY ASSURANCE/QUALITY CONTROL INSPECTOR 136598 BIOSTATISTICIAN/STATISTICIAN 138599 REGULATORY AFFAIRS SPECIALIST N/A **582 REGULATORY AFFAIRS M ANAGER N/A **
Information Technology651 ANALYST/PROGRAM M ER - ALL LEVELS 140652 ANALYST/PROGRAM M ER I 142653 ANALYST/PROGRAM M ER II 144654 ANALYST/PROGRAM M ER III 146601 SOFTWARE DEVELOPER - ALL LEVELS 148602 SOFTWARE DEVELOPER I 150603 SOFTWARE DEVELOPER II 152605 SOFTWARE DEVELOPER III 154607 SOFTWARE DEVELOPM ENT M ANAGER 156608 SOFTWARE QUALITY ASSURANCE ANALYST 158620 BUSINESS ANALYST - ALL LEVELS 160621 BUSINESS ANALYST 162622 SENIOR BUSINESS ANALYST 164624 INTERNET APPLICATIONS DEVELOPER 166609 PROJECT M ANAGER - ALL LEVELS 168610 PROJECT M ANAGER 170625 SENIOR PROJECT M ANAGER 172623 TECHNICAL CONSULTANT (BILLABLE) - ALL LEVELS 174626 TECHNICAL CONSULTANT (BILLABLE) 176627 SENIOR TECHNICAL CONSULTANT (BILLABLE) 178628 INSTRUCTIONAL DESIGNER 180629 INFORM ATION SYSTEM S TRAINING SPECIALIST 182630 DATA WAREHOUSE ARCHITECT 184631 DATA WAREHOUSE ANALYST 186632 DATA ANALYST 188635 DATABASE REPORT WRITER 190735 APPLICATIONS SYSTEM S ANALYST 192736 SYSTEM S ADM INISTRATOR 194733 INFORM ATION SYSTEM S ENGINEER 196738 IS/IT M ANAGER 198742 WEBSITE DEVELOPER 200744 DATABASE ADM INISTRATOR 202750 NETWORK ANALYST - ALL LEVELS 204751 NETWORK ANALYST 206752 SENIOR NETWORK ANALYST 208755 NETWORK ENGINEER - ALL LEVELS 210753 NETWORK ENGINEER 212754 SENIOR NETWORK ENGINEER 214760 PC SUPPORT SPECIALIST 216

3. Compensation Data
Southwestern Pennsylvania Annual Compensation and Benefits Study © 2010 Pittsburgh Technology Council. All rights reserved.
Page 3 – 4
Job Number / Job TitlePage
NumberCustomer Services and Support
810 CUSTOM ER SERVICE REPRESENTATIVE - ALL LEVELS 218811 CUSTOM ER SERVICE REPRESENTATIVE 220813 SENIOR CUSTOM ER SERVICE REPRESENTATIVE 222815 CUSTOM ER SERVICE SUPERVISOR 224817 CUSTOM ER SERVICE M ANAGER 226825 PRODUCT SUPPORT SPECIALIST - ALL LEVELS 228826 PRODUCT SUPPORT SPECIALIST I 230827 PRODUCT SUPPORT SPECIALIST II 232828 PRODUCT SUPPORT SPECIALIST III 234840 PRODUCT SUPPORT M ANAGER 236
M arketing and Sales843 SALES REPRESENTATIVE - ALL LEVELS 238841 SALES REPRESENTATIVE 240842 SENIOR SALES REPRESENTATIVE 242846 INSIDE SALES REPRESENTATIVE/TELEM ARKETER 244847 ACCOUNT M ANAGER 246848 SALES SUPPORT ASSISTANT 248850 WRITER–M ARKETING/COM M UNICATIONS 250860 PRODUCT M ARKETING SPECIALIST 252865 PRODUCT M ANAGER 254871 M ARKETING M ANAGER 256
M anufacturing and Warehousing901 FORKLIFT OPERATOR 258905 STOCK CLERK 260910 SHIPPING CLERK 262915 SHIPPING/WAREHOUSE SUPERVISOR 264916 SHIPPING/WAREHOUSE M ANAGER 266919 M ACHINE OPERATOR 268920 NUM ERICAL CONTROL M ACHINE OPERATOR 270922 M ACHINIST 272921 SENIOR M ACHINIST (JOURNEYM AN LEVEL) 274926 ASSEM BLER - ALL LEVELS 276927 ASSEM BLER 278928 SENIOR ASSEM BLER 280929 GENERAL M AINTENANCE WORKER 282931 M AINTENANCE M ECHANIC 284935 M AINTENANCE AND FACILITIES SUPERVISOR 286942 WELDER 288945 SALES ESTIM ATOR N/A **951 QUALITY ASSURANCE INSPECTOR 290955 QUALITY ASSURANCE SUPERVISOR 292956 QUALITY ASSURANCE ENGINEER 294959 M ANUFACTURING ENGINEER 296960 PRODUCTION TEST TECHNICIAN - All Levels 298961 PRODUCTION TEST TECHNICIAN 300962 SENIOR PRODUCTION TEST TECHNICIAN 302963 PRODUCTION PLANNER/SCHEDULER 304964 SIX SIGM A SPECIALIST N/A **965 PRODUCTION SUPERVISOR 306970 PRODUCTION M ANAGER 308
** Insufficient Data

3. Compensation Data
Southwestern Pennsylvania Annual Compensation and Benefits Study © 2010 Pittsburgh Technology Council. All rights reserved.
Page 3 – 5
The following definitions describe the survey data displayed on the individual job data sheets included within this section.
Definitions and Terms
Statistics Percentiles show the dispersion of the market data above and below a measure of central tendency. They provide information about the data without listing all of the actual data points. To compute a percentile, the data are ranked from lowest to highest. The resulting percentile value is the actual or interpolated data point that a percent of the observations are less than. The percentiles used in this survey include:
25th Percentile (also known as the first quartile): The value below which lies 25% of the sample. 50th Percentile (also known as the median): The value below which lies 50% of the sample. The median is also the exact middle point of the data when the values are ranked from lowest to highest. It is less affected by extremely high or low values than the average. 75th Percentile (also known as the third quartile): The value below which lies 75% of the sample. Average: The value that represents the sum of all data reported divided by the number of data points.
Survey Elements The following provides a brief definition of the terms and data displayed on the individual job compensation sheets.
Descriptor: The survey job number and title, followed by the job descriptor. Participants referred to these descriptors in matching jobs. Participation instructions advised respondents to match the jobs of full-time employees whose major duties and responsibilities were compatible to the duties and responsibilities of the surveyed job, regardless of title. Job Match Comparability: Identifies the match comparability between the participating organization's position and the survey position. Employers Reporting: The number of survey participants that reported one or more active full-time employees in a particular job.

3. Compensation Data
Southwestern Pennsylvania Annual Compensation and Benefits Study © 2010 Pittsburgh Technology Council. All rights reserved.
Page 3 – 6
Employees Reported: The number of active full-time employees whose individual rates of pay were reported. Employers Reporting: The number of survey participants that reported one or more active full-time employees in a particular job. Employees Reported: The number of active full-time employees whose individual rates of pay were reported. Annual Base Pay: Base salary as of July 1, 2010, with statistics calculated using individual pay rates reported for each incumbent across all organizations. % Incentive Eligible: Identifies the average percent of individuals in the position eligible for a short-term incentive or bonus. Incentive Pay: Actual cash incentives paid for the most recently completed year. Statistics include only those individuals actually receiving a short-term incentive or bonus payment. Total Cash Compensation: Annual base pay plus incentive pay for all incumbents, including those not receiving or eligible for incentive pay. Most Recent New Hire: Pay data reflect base salary practices specific to employees hired within the past six months.

3. Compensation Data
Page 3 – 7 Southwestern Pennsylvania Annual Compensation and Benefits Study
© 2010 Pittsburgh Technology Council. All rights reserved.
25th %ile 50th %ile 75th %ile Average 25th %ile 50th %ile 75th %ile Average101 RECEPTIONIST 34 50 $26.6 $29.5 $35.0 $31.5 $27.1 $30.6 $37.0 $32.1106 ADMINISTRATIVE ASSISTANT 45 484 $34.6 $40.0 $48.6 $41.2 $35.0 $40.9 $49.7 $42.1108 EXECUTIVE ASSISTANT/SR ADMINISTRATIVE ASSISTANT 37 233 $45.0 $51.0 $61.5 $55.0 $45.9 $53.9 $63.5 $56.7112 GENERAL CLERK - INTERMEDIATE 17 255 $23.9 $27.0 $30.5 $29.8 $24.1 $27.6 $31.3 $30.6117 BILLING CLERK 15 66 $32.5 $39.5 $44.5 $39.5 $34.1 $40.4 $46.1 $40.8126 HUMAN RESOURCES MANAGER 37 62 $70.0 $85.0 $102.7 $90.5 $70.0 $90.4 $115.9 $98.7129 HUMAN RESOURCES GENERALIST 32 54 $46.0 $54.1 $65.0 $56.0 $46.5 $55.0 $67.2 $58.0130 EMPLOYEE TRAINING SPECIALIST 11 23 $54.6 $68.6 $73.2 $65.8 $54.6 $71.7 $79.2 $68.6135 TECHNICAL RECRUITER 5 6 $46.8 $50.2 $56.1 $50.4 $47.4 $51.5 $56.2 $53.2140 OFFICE MANAGER 23 194 $35.1 $37.5 $42.5 $39.9 $35.1 $37.5 $42.6 $40.3152 CONTRACT ADMINISTRATOR 12 28 $51.8 $72.2 $82.8 $70.5 $51.8 $75.0 $87.8 $75.2201 ACCOUNTING CLERK - ALL LEVELS 39 200 $30.9 $34.5 $39.5 $36.0 $31.1 $34.9 $40.6 $36.9202 ACCOUNTING CLERK - INTERMEDIATE 32 138 $29.9 $33.6 $37.0 $34.4 $30.9 $34.5 $38.4 $35.4203 ACCOUNTING CLERK – SENIOR 20 62 $32.3 $36.5 $45.9 $39.5 $32.3 $37.0 $47.9 $40.2204 PAYROLL CLERK 25 57 $32.5 $35.3 $39.9 $37.5 $33.7 $36.1 $39.9 $38.4231 ACCOUNTANT - ALL LEVELS 47 277 $43.0 $51.8 $60.0 $52.0 $43.4 $52.2 $61.2 $53.5232 ACCOUNTANT 32 137 $40.0 $46.8 $56.0 $48.8 $41.0 $47.0 $57.7 $50.1233 SENIOR ACCOUNTANT 32 140 $47.5 $54.3 $62.1 $55.1 $49.1 $56.8 $64.4 $56.8245 ACCOUNTING MANAGER 35 72 $68.2 $87.6 $99.9 $87.8 $69.9 $89.7 $114.0 $95.9246 FINANCIAL ANALYST 15 58 $58.6 $68.0 $76.9 $66.5 $59.8 $68.4 $79.8 $68.6252 BUYER/PLANNER - ALL LEVELS 31 142 $46.2 $52.1 $60.3 $54.5 $46.5 $53.7 $62.3 $56.4253 BUYER/PLANNER 27 89 $42.7 $47.7 $52.9 $48.5 $43.0 $49.2 $55.3 $50.4254 SENIOR BUYER/PLANNER 17 53 $55.8 $59.9 $68.7 $64.7 $55.8 $61.0 $70.6 $66.4255 PURCHASING MANAGER 23 33 $72.9 $92.3 $106.0 $90.6 $75.5 $99.4 $121.2 $98.8310 FIELD SERVICE TECHNICIAN - ALL LEVELS 12 160 $41.1 $53.2 $63.0 $52.5 $42.8 $54.1 $65.5 $54.0311 FIELD SERVICE TECHNICIAN 11 92 $36.6 $45.8 $55.1 $46.9 $37.8 $46.4 $55.2 $48.2312 SENIOR FIELD SERVICE TECHNICIAN 10 68 $51.2 $62.3 $66.6 $60.1 $51.2 $64.1 $66.6 $61.8321 DRAFTER/DESIGNER (CAD) - ALL LEVELS 21 126 $47.4 $55.2 $62.0 $55.3 $48.5 $57.4 $63.0 $56.8322 DRAFTER/DESIGNER (CAD) 15 62 $42.1 $47.7 $54.1 $47.9 $42.3 $50.0 $56.8 $49.3323 DRAFTER/DESIGNER (CAD) SENIOR 15 64 $55.9 $62.0 $68.2 $62.5 $58.6 $62.0 $73.0 $64.2330 ELECTRONICS TECHNICIAN - ALL LEVELS 12 133 $30.8 $36.4 $48.8 $41.9 $30.8 $36.4 $51.0 $42.1331 ELECTRONICS TECHNICIAN I 6 48 $26.3 $29.0 $32.4 $30.1 $26.3 $29.0 $32.4 $30.1332 ELECTRONICS TECHNICIAN II 11 69 $35.5 $40.2 $47.9 $43.2 $35.5 $40.5 $48.8 $43.5333 ELECTRONICS TECHNICIAN III 4 16 $73.1 $76.4 $76.4 $71.1 $74.1 $76.4 $76.4 $71.6340 SYSTEMS/ELECTRONICS ENGINEER - ALL LEVELS 15 76 $59.5 $74.7 $88.2 $75.4 $60.5 $76.9 $88.4 $76.7341 SYSTEMS/ELECTRONICS ENGINEER I 6 14 $42.1 $52.8 $59.4 $54.1 $42.1 $52.8 $60.6 $54.2343 SYSTEMS/ELECTRONICS ENGINEER II 11 35 $60.5 $70.6 $77.8 $68.7 $60.9 $70.6 $79.1 $69.7345 SYSTEMS/ELECTRONICS ENGINEER III 11 27 $83.5 $94.1 $103.4 $95.2 $83.5 $96.2 $105.5 $97.4350 MECHANICAL ENGINEER - ALL LEVELS 13 102 $61.2 $71.6 $86.6 $74.2 $61.9 $73.4 $88.7 $76.1351 MECHANICAL ENGINEER I 9 21 $54.0 $58.7 $61.0 $57.8 $54.0 $60.0 $61.7 $58.8353 MECHANICAL ENGINEER II 7 36 $59.6 $65.0 $71.1 $66.5 $60.4 $66.2 $74.3 $68.1355 MECHANICAL ENGINEER III 13 46 $77.8 $87.7 $97.6 $87.2 $78.9 $89.0 $102.0 $90.0381 ELECTRICAL ENGINEER - ALL LEVELS 13 87 $61.6 $78.6 $88.7 $78.3 $62.3 $80.9 $90.9 $81.1382 ELECTRICAL ENGINEER I 6 19 $55.2 $57.8 $59.9 $57.8 $57.3 $57.8 $62.0 $58.5383 ELECTRICAL ENGINEER II 9 28 $61.0 $76.8 $85.3 $71.9 $63.5 $78.9 $85.3 $72.9384 ELECTRICAL ENGINEER III 12 40 $79.9 $89.0 $95.1 $92.5 $82.6 $91.9 $99.1 $97.6388 INDUSTRIAL ENGINEER - ALL LEVELS 9 29 $55.6 $62.1 $74.8 $67.1 $55.6 $66.7 $75.6 $69.1385 INDUSTRIAL ENGINEER I 6 16 $54.0 $56.0 $60.3 $58.3 $54.0 $56.0 $60.3 $58.5386 INDUSTRIAL ENGINEER II 4 10 $63.6 $70.6 $78.4 $70.9 $67.1 $72.2 $81.9 $73.6387 INDUSTRIAL ENGINEER III 2 3 -- $107.9 -- $101.5 -- $120.0 -- $110.7380 ENGINEERING MANAGER 14 33 $106.1 $117.5 $123.7 $113.9 $108.4 $124.3 $141.0 $124.6401 ENGINEERING DOCUMENTATION COORDINATOR 3 17 $32.8 $37.5 $39.2 $36.7 $32.8 $38.6 $40.4 $37.4431 TECHNICAL WRITER 11 35 $46.6 $52.7 $62.0 $52.6 $46.6 $52.7 $62.9 $53.2441 GRAPHIC ILLUSTRATOR/DESIGNER 18 49 $38.6 $45.3 $58.0 $50.7 $38.6 $47.2 $58.0 $51.6
Annual Base Pay Total Cash Compensation$ in thousands
Job Code
Employers Reported
Employees ReportedJob Title
The tables below and on the following pages identify the range of base pay and total cash compensation for each job across all organizations.

3. Compensation Data
Page 3 – 8 Southwestern Pennsylvania Annual Compensation and Benefits Study
© 2010 Pittsburgh Technology Council. All rights reserved.
25th %ile 50th %ile 75th %ile Average 25th %ile 50th %ile 75th %ile Average570 LABORATORY ASSISTANT 2 10 $25.1 $25.9 $34.4 $28.9 $25.1 $25.9 $34.4 $28.9572 LABORATORY TECHNICIAN 7 86 $34.0 $35.4 $44.1 $40.2 $35.2 $38.2 $45.6 $41.9577 RESEARCH ASSOCIATE 3 47 $28.0 $32.0 $41.6 $36.8 $28.0 $32.0 $41.6 $37.3580 RESEARCH SCIENTIST - ALL LEVELS 10 44 $76.0 $88.3 $98.4 $88.9 $79.1 $91.4 $109.1 $94.0581 RESEARCH SCIENTIST 9 23 $71.0 $79.2 $83.7 $75.6 $71.0 $83.3 $85.6 $79.1589 SENIOR RESEARCH SCIENTIST 7 22 $90.7 $98.6 $108.3 $102.1 $95.2 $107.9 $113.9 $108.8592 CLINICAL RESEARCH ASSOCIATE 2 16 $60.0 $65.6 $71.3 $64.0 $64.3 $71.0 $80.5 $69.5583 DOCUMENT CONTROL SPECIALIST 4 4 -- $40.2 -- $42.7 -- $40.2 -- $42.7591 CLINICAL LAB MANAGER 2 6 $66.3 $71.7 $83.3 $85.1 $66.6 $76.3 $85.2 $86.6596 QUALITY ASSURANCE/QUALITY CONTROL INSPECTOR 8 16 $41.4 $47.7 $54.2 $50.8 $42.6 $50.7 $54.2 $52.1598 BIOSTATISTICIAN/STATISTICIAN 2 3 -- $90.3 -- $83.3 -- $98.9 -- $87.7651 ANALYST/PROGRAMMER - ALL LEVELS 20 701 $66.3 $73.1 $79.7 $72.6 $70.1 $78.3 $85.7 $77.4652 ANALYST/PROGRAMMER I 10 78 $49.1 $55.1 $67.7 $58.8 $51.9 $57.1 $69.4 $60.7653 ANALYST/PROGRAMMER II 16 245 $62.9 $66.7 $71.8 $67.4 $65.9 $71.1 $74.8 $71.3654 ANALYST/PROGRAMMER III 9 378 $74.0 $78.7 $82.1 $78.8 $79.6 $84.4 $88.4 $84.8601 SOFTWARE DEVELOPER - ALL LEVELS 25 571 $62.4 $77.0 $89.0 $77.7 $62.5 $78.0 $92.0 $79.0602 SOFTWARE DEVELOPER I 11 115 $48.0 $52.5 $61.5 $55.5 $48.1 $52.8 $61.5 $55.7603 SOFTWARE DEVELOPER II 20 194 $61.4 $67.2 $75.6 $68.6 $62.0 $68.3 $78.0 $69.6605 SOFTWARE DEVELOPER III 23 262 $82.5 $90.4 $100.3 $94.2 $85.0 $92.5 $102.6 $96.2607 SOFTWARE DEVELOPMENT MANAGER 13 90 $97.1 $112.6 $129.6 $113.4 $97.1 $113.8 $130.3 $114.8608 SOFTWARE QUALITY ASSURANCE ANALYST 13 73 $47.7 $55.0 $62.8 $55.7 $47.7 $55.8 $62.8 $56.2620 BUSINESS ANALYST - ALL LEVELS 13 64 $55.7 $71.0 $79.5 $71.2 $56.7 $72.0 $79.5 $72.4621 BUSINESS ANALYST 10 40 $49.5 $62.0 $74.6 $65.3 $51.7 $64.4 $75.1 $66.4622 SENIOR BUSINESS ANALYST 8 24 $71.2 $78.5 $90.2 $81.2 $71.6 $78.6 $90.3 $82.3624 INTERNET APPLICATIONS DEVELOPER 3 7 $50.3 $60.0 $80.0 $65.9 $50.3 $60.0 $80.0 $65.9609 PROJECT MANAGER - ALL LEVELS 31 225 $74.5 $84.1 $95.7 $86.3 $77.8 $88.7 $104.3 $92.0610 PROJECT MANAGER 26 126 $69.7 $78.5 $86.7 $78.2 $72.6 $81.5 $91.5 $81.6625 SENIOR PROJECT MANAGER 20 99 $83.4 $95.5 $103.5 $96.6 $88.0 $105.4 $115.2 $105.3623 TECHNICAL CONSULTANT (BILLABLE) - ALL LEVELS 8 117 $60.0 $70.0 $80.0 $70.3 $60.0 $70.0 $80.6 $71.4626 TECHNICAL CONSULTANT (BILLABLE) 6 102 $57.3 $64.1 $74.5 $65.7 $57.5 $66.5 $75.5 $66.5627 SENIOR TECHNICAL CONSULTANT (BILLABLE) 5 15 $85.0 $100.0 $112.7 $102.1 $91.5 $100.9 $112.9 $104.9628 INSTRUCTIONAL DESIGNER 6 6 $52.4 $62.1 $68.2 $60.7 $52.4 $62.1 $68.2 $61.0629 INFORMATION SYSTEMS TRAINING SPECIALIST 7 16 $56.0 $64.3 $77.0 $66.3 $56.0 $64.3 $77.0 $67.1630 DATA WAREHOUSE ARCHITECT 5 9 $92.1 $100.7 $102.5 $99.1 $102.5 $105.4 $107.6 $104.1631 DATA WAREHOUSE ANALYST 4 40 $47.7 $51.6 $59.2 $53.4 $47.7 $51.6 $59.2 $53.5632 DATA ANALYST 4 11 $44.5 $49.4 $62.8 $55.7 $44.5 $49.4 $62.8 $56.6635 DATABASE REPORT WRITER - New Job 2010 4 63 $37.3 $40.2 $43.3 $41.4 $37.3 $40.2 $43.3 $41.4735 APPLICATIONS SYSTEMS ANALYST 14 86 $53.8 $62.3 $75.5 $64.8 $55.3 $64.6 $78.6 $67.0736 SYSTEMS ADMINISTRATOR 15 51 $49.3 $63.2 $70.4 $61.6 $50.1 $64.0 $72.6 $63.8733 INFORMATION SYSTEMS ENGINEER 3 15 $69.5 $79.1 $83.1 $77.5 $74.0 $82.0 $85.9 $80.6738 IS/IT MANAGER 33 179 $93.5 $107.8 $114.8 $105.3 $98.8 $121.6 $132.8 $118.9742 WEBSITE DEVELOPER 16 41 $52.4 $62.0 $69.4 $63.2 $57.1 $62.9 $70.0 $65.1744 DATABASE ADMINISTRATOR 18 52 $67.9 $79.9 $93.8 $81.2 $68.3 $83.0 $95.2 $84.1750 NETWORK ANALYST - ALL LEVELS 24 73 $53.9 $63.7 $74.2 $64.8 $55.6 $63.8 $80.0 $66.5751 NETWORK ANALYST 17 35 $45.9 $53.9 $60.3 $56.2 $45.9 $55.6 $63.7 $57.9752 SENIOR NETWORK ANALYST 14 38 $63.7 $72.3 $80.0 $72.7 $63.7 $73.2 $82.3 $74.5755 NETWORK ENGINEER - ALL LEVELS 16 41 $73.2 $83.4 $98.3 $84.4 $76.3 $86.3 $102.2 $89.0753 NETWORK ENGINEER 9 15 $66.7 $73.7 $88.3 $76.1 $72.1 $76.3 $88.3 $79.2754 SENIOR NETWORK ENGINEER 11 26 $78.1 $87.4 $103.8 $89.1 $81.2 $94.5 $105.1 $94.6760 PC SUPPORT SPECIALIST 29 145 $34.8 $40.0 $46.8 $41.2 $34.9 $40.8 $49.1 $42.4
Annual Base Pay Total Cash Compensation$ in thousands
Job Code
Employers Reported
Employees ReportedJob Title

3. Compensation Data
Page 3 – 9 Southwestern Pennsylvania Annual Compensation and Benefits Study
© 2010 Pittsburgh Technology Council. All rights reserved.
25th %ile 50th %ile 75th %ile Average 25th %ile 50th %ile 75th %ile Average810 CUSTOMER SERVICE REPRESENTATIVE - ALL LEVELS 33 767 $28.6 $32.6 $38.2 $35.8 $30.1 $34.1 $39.9 $37.2811 CUSTOMER SERVICE REPRESENTATIVE 28 671 $28.3 $31.8 $36.4 $34.9 $29.9 $33.3 $38.3 $36.3813 SENIOR CUSTOMER SERVICE REPRESENTATIVE 21 96 $34.9 $39.5 $45.4 $42.0 $36.2 $41.3 $47.0 $43.5815 CUSTOMER SERVICE SUPERVISOR 9 13 $57.1 $63.0 $71.4 $63.5 $57.1 $68.4 $74.9 $66.3817 CUSTOMER SERVICE MANAGER 9 15 $74.8 $77.4 $105.7 $90.0 $78.5 $82.3 $121.1 $98.4825 PRODUCT SUPPORT SPECIALIST - ALL LEVELS 12 212 $40.0 $48.1 $55.6 $49.8 $40.1 $49.7 $56.8 $50.6826 PRODUCT SUPPORT SPECIALIST I 10 109 $38.2 $41.4 $48.1 $43.2 $38.2 $41.5 $50.3 $44.1827 PRODUCT SUPPORT SPECIALIST II 10 66 $45.3 $53.4 $60.0 $53.6 $45.3 $53.9 $63.1 $54.3828 PRODUCT SUPPORT SPECIALIST III 7 37 $54.1 $58.6 $67.9 $62.5 $54.1 $60.3 $67.9 $63.2840 PRODUCT SUPPORT MANAGER 5 13 $65.2 $72.0 $83.8 $75.1 $67.0 $72.0 $83.8 $76.9843 SALES REPRESENTATIVE - ALL LEVELS 27 417 $51.3 $58.8 $69.1 $62.1 $62.6 $72.5 $82.4 $74.0841 SALES REPRESENTATIVE 19 315 $51.0 $55.0 $64.0 $58.4 $60.0 $69.7 $78.6 $70.4842 SENIOR SALES REPRESENTATIVE 18 102 $59.9 $71.7 $85.0 $73.6 $72.2 $80.0 $89.7 $85.2846 INSIDE SALES REPRESENTATIVE/TELEMARKETER 12 61 $40.0 $42.9 $46.2 $44.1 $44.2 $48.2 $55.7 $52.0847 ACCOUNT MANAGER 11 42 $76.7 $88.8 $108.2 $89.7 $77.1 $88.8 $121.0 $97.7848 SALES SUPPORT ASSISTANT 12 13 $33.4 $39.5 $41.6 $38.9 $34.3 $40.0 $42.3 $39.8850 WRITER–MARKETING/COMMUNICATIONS 12 24 $44.9 $61.2 $69.4 $58.1 $45.4 $65.9 $72.1 $60.2860 PRODUCT MARKETING SPECIALIST 12 84 $46.4 $54.5 $67.0 $56.9 $47.0 $54.6 $67.2 $57.4865 PRODUCT MANAGER 15 66 $84.1 $98.4 $121.3 $100.7 $87.8 $107.7 $129.9 $111.9871 MARKETING MANAGER 21 52 $65.4 $83.6 $103.6 $83.8 $69.8 $89.4 $106.9 $89.3901 FORKLIFT OPERATOR 5 100 $28.1 $42.2 $42.6 $36.4 $29.7 $42.2 $42.6 $36.6905 STOCK CLERK 18 292 $21.3 $25.2 $31.8 $26.9 $21.3 $25.4 $32.5 $27.2910 SHIPPING CLERK 22 218 $23.6 $27.4 $32.4 $29.0 $24.0 $28.4 $33.7 $29.7915 SHIPPING/WAREHOUSE SUPERVISOR 16 39 $42.4 $50.2 $57.2 $50.3 $45.0 $54.1 $59.4 $53.1916 SHIPPING/WAREHOUSE MANAGER 10 17 $64.2 $75.6 $95.9 $77.4 $65.0 $79.8 $114.2 $85.1919 MACHINE OPERATOR 10 74 $28.1 $33.0 $40.2 $34.2 $28.2 $33.5 $41.6 $34.5920 NUMERICAL CONTROL MACHINE OPERATOR 4 31 $31.5 $35.0 $39.4 $35.3 $31.5 $35.0 $39.4 $35.3922 MACHINIST 8 38 $37.5 $41.8 $44.0 $41.7 $37.5 $41.8 $45.2 $42.3921 SENIOR MACHINIST (JOURNEYMAN LEVEL) 10 28 $41.0 $43.9 $49.2 $45.3 $41.6 $44.2 $50.2 $46.2926 ASSEMBLER - ALL LEVELS 16 912 $27.0 $32.4 $35.1 $31.2 $28.1 $33.4 $36.2 $32.2927 ASSEMBLER 16 444 $22.4 $27.4 $31.3 $27.2 $22.4 $29.0 $32.6 $28.0928 SENIOR ASSEMBLER 13 468 $32.4 $35.1 $35.1 $35.0 $33.4 $36.1 $36.2 $36.1929 GENERAL MAINTENANCE WORKER 17 42 $31.5 $35.8 $42.3 $37.2 $31.5 $37.3 $43.5 $37.8931 MAINTENANCE MECHANIC 12 90 $37.1 $43.3 $44.8 $42.9 $37.4 $44.0 $46.1 $43.4935 MAINTENANCE AND FACILITIES SUPERVISOR 15 28 $50.3 $61.4 $77.2 $61.9 $50.3 $62.5 $78.0 $64.1942 WELDER 9 48 $37.5 $39.9 $45.0 $42.8 $37.5 $39.9 $45.0 $42.9951 QUALITY ASSURANCE INSPECTOR 10 94 $32.4 $35.1 $39.8 $36.4 $33.0 $36.3 $42.3 $37.7955 QUALITY ASSURANCE SUPERVISOR 9 13 $52.4 $56.9 $68.9 $62.3 $57.3 $60.5 $73.1 $66.1956 QUALITY ASSURANCE ENGINEER 6 25 $58.2 $69.3 $78.5 $69.0 $62.6 $71.0 $83.2 $72.1959 MANUFACTURING ENGINEER 9 24 $61.5 $68.6 $79.9 $70.1 $62.0 $69.3 $81.9 $72.0960 PRODUCTION TEST TECHNICIAN - ALL LEVELS 6 49 $30.6 $37.4 $43.4 $37.7 $31.3 $39.0 $44.8 $38.7961 PRODUCTION TEST TECHNICIAN 6 30 $26.8 $34.6 $38.4 $34.4 $26.8 $35.2 $40.0 $35.4962 SENIOR PRODUCTION TEST TECHNICIAN 3 19 $38.1 $42.1 $46.3 $42.9 $39.1 $42.2 $47.8 $44.1963 PRODUCTION PLANNER/SCHEDULER 5 14 $46.9 $49.2 $52.3 $49.1 $46.9 $49.2 $52.3 $49.1965 PRODUCTION SUPERVISOR 14 53 $52.8 $59.9 $69.0 $61.7 $54.0 $63.9 $69.2 $65.1970 PRODUCTION MANAGER 15 16 $74.6 $85.7 $105.8 $89.8 $74.6 $90.9 $114.5 $94.3
Annual Base Pay Total Cash Compensation$ in thousands
Job Code
Employers Reported
Employees ReportedJob Title

Job Code 101 RECEPTIONIST
Description
0.0% Less Complex92.0% Comparable8.0% More Complex
All Organizations
Software, Computer and
Technology Manufacturing
Life-Sciences/ Biotech/
Medical Devices Not-for-ProfitAll Other
EmployersAnnual Base Pay
Employers Reported 34 4 11 3 7 9Employees Reported 50 5 11 5 9 2025th Percentile ($000's) 26.6 26.0 27.8 31.0 26.6 26.550th Percentile ($000's) 29.5 27.0 29.4 34.2 29.1 30.475th Percentile ($000's) 35.0 29.2 31.2 41.9 35.0 37.8Average ($000's) 31.5 27.7 30.5 33.4 31.3 32.6
Incentive Pay% Incentive Eligible 60% 40% 64% 80% 22% 75%25th Percentile ($000's) 1.1 -- 2.0 -- -- 0.850th Percentile ($000's) 1.5 -- 2.3 1.4 -- 1.475th Percentile ($000's) 2.2 -- 3.0 -- -- 1.9Average ($000's) 1.7 -- 2.7 1.3 -- 1.5
25th Percentile ($000's) 27.1 26.0 27.8 32.2 27.5 26.550th Percentile ($000's) 30.6 27.9 29.4 35.6 29.1 31.375th Percentile ($000's) 37.0 29.2 32.4 43.3 35.0 37.9Average ($000's) 32.1 28.3 31.5 34.2 31.6 33.1
Most Recent New HireEmployers Reported 4 0 1 1 1 1
Median ($000's) 28.2 -- -- -- -- --Average ($000's) 26.8 -- -- -- -- --
Greets and screens visitors. Provides general information. Refers visitors to appropriate persons. Receives telephone calls; assists withplacement of outgoing calls; sorts and distributes mail. May perform other administrative and clerical duties.
Industry - Type of Employer
Total Cash CompensationBase Plus Incentive Pay
Job Match Comparability
Page 3-10Southwestern Pennsylvania Annual Compensation and Benefits Study
© 2010 Pittsburgh Technology Council. All rights reserved.

Job Code 101 RECEPTIONIST
Description
Less than 50 50 - 150 151 - 500 More than 500Less than
$7.5M$7.5M to
$25M$26M to $150M
More than $150M
Annual Base PayEmployers Reported 7 7 7 13 6 6 8 14Employees Reported 7 7 7 29 6 6 8 30
25th Percentile ($000's) 28.7 25.8 28.3 26.7 26.0 26.0 29.4 26.350th Percentile ($000's) 35.0 26.6 29.2 31.0 27.0 28.5 31.4 29.375th Percentile ($000's) 39.5 30.0 30.3 35.7 35.6 35.6 33.5 35.4Average ($000's) 33.1 28.0 29.2 32.5 29.7 30.3 31.5 32.0
Incentive Pay% Incentive Eligible 57% 43% 43% 69% 50% 50% 38% 70%
25th Percentile ($000's) -- -- -- 0.9 -- -- -- 1.050th Percentile ($000's) 1.4 1.8 1.9 1.4 1.4 1.4 3.5 1.475th Percentile ($000's) -- -- -- 2.2 -- -- -- 2.1Average ($000's) 1.4 2.5 1.9 1.6 1.4 1.4 3.5 1.6
25th Percentile ($000's) 28.7 26.2 28.3 26.7 26.0 27.6 29.4 26.850th Percentile ($000's) 35.0 27.5 29.2 31.4 27.0 29.0 32.5 31.275th Percentile ($000's) 40.2 32.7 30.3 37.6 36.6 35.6 34.9 37.1Average ($000's) 33.3 29.1 29.7 33.2 29.9 30.7 32.4 32.8
Most Recent New HireEmployers Reported 2 0 1 1 1 0 2 1
Median ($000's) -- -- -- -- -- -- -- --Average ($000's) -- -- -- -- -- -- -- --
Greets and screens visitors. Provides general information. Refers visitors to appropriate persons. Receives telephone calls; assists withplacement of outgoing calls; sorts and distributes mail. May perform other administrative and clerical duties.
Organizational FTE's Organizational Revenue ($ Millions)
Total Cash CompensationBase Plus Incentive Pay
Page 3-11Southwestern Pennsylvania Annual Compensation and Benefits Study
© 2010 Pittsburgh Technology Council. All rights reserved.

Job Code 106 ADMINISTRATIVE ASSISTANT
Description
0.6% Less Complex83.7% Comparable15.7% More Complex
All Organizations
Software, Computer and
Technology Manufacturing
Life-Sciences/ Biotech/
Medical Devices Not-for-ProfitAll Other
EmployersAnnual Base Pay
Employers Reported 45 8 10 2 9 16Employees Reported 484 15 63 24 68 31425th Percentile ($000's) 34.6 31.2 36.8 35.0 34.0 35.050th Percentile ($000's) 40.0 32.6 44.8 41.1 35.8 41.075th Percentile ($000's) 48.6 34.8 49.5 46.0 41.6 49.4Average ($000's) 41.2 32.9 43.6 41.9 37.5 41.9
Incentive Pay% Incentive Eligible 56% 33% 86% 71% 4% 61%25th Percentile ($000's) 1.4 1.0 2.0 1.3 -- 1.350th Percentile ($000's) 2.0 1.1 2.6 1.4 2.2 1.875th Percentile ($000's) 2.8 1.8 3.2 1.6 -- 2.8Average ($000's) 2.2 1.7 2.7 1.5 1.9 2.1
25th Percentile ($000's) 35.0 31.4 38.8 35.9 34.1 35.450th Percentile ($000's) 40.9 32.8 46.6 42.7 35.9 41.475th Percentile ($000's) 49.7 35.1 52.7 47.1 41.6 50.1Average ($000's) 42.1 33.4 45.7 42.9 37.5 42.7
Most Recent New HireEmployers Reported 11 2 1 1 1 6
Median ($000's) 35.0 -- -- -- -- 36.0Average ($000's) 36.7 -- -- -- -- 38.1
Job Match Comparability
Composes letters and memos from notes and verbal instructions. Maintains schedules. Plans meetings. Records and prepares minutes ofmeetings and conferences. Proficient with MS Office. Normally requires 2 or more years related experience.
Industry - Type of Employer
Total Cash CompensationBase Plus Incentive Pay
Page 3-12Southwestern Pennsylvania Annual Compensation and Benefits Study
© 2010 Pittsburgh Technology Council. All rights reserved.

Job Code 106 ADMINISTRATIVE ASSISTANT
Description
Less than 50 50 - 150 151 - 500 More than 500Less than
$7.5M$7.5M to
$25M$26M to $150M
More than $150M
Annual Base PayEmployers Reported 7 9 7 22 6 8 8 23Employees Reported 17 15 35 417 9 12 36 427
25th Percentile ($000's) 36.0 26.5 27.1 35.0 27.0 26.7 26.9 35.250th Percentile ($000's) 42.4 27.0 34.6 41.0 31.7 31.7 34.6 41.075th Percentile ($000's) 48.9 34.7 38.4 49.3 35.4 36.0 41.9 49.2Average ($000's) 42.7 29.6 33.3 42.3 32.4 30.8 35.2 42.2
Incentive Pay% Incentive Eligible 29% 53% 40% 59% 44% 58% 31% 58%
25th Percentile ($000's) 1.0 1.1 0.7 1.5 -- 1.0 2.9 1.550th Percentile ($000's) 2.4 2.2 0.9 2.0 3.9 1.1 5.0 2.075th Percentile ($000's) 3.9 3.8 2.0 2.8 -- 1.9 5.2 2.8Average ($000's) 2.4 2.6 1.3 2.2 2.9 1.5 3.7 2.2
25th Percentile ($000's) 37.1 26.5 27.1 35.5 27.0 27.4 26.9 35.750th Percentile ($000's) 42.4 27.9 34.6 41.8 31.7 32.7 34.6 41.675th Percentile ($000's) 48.9 35.8 39.4 50.3 39.2 36.1 42.7 50.2Average ($000's) 43.3 30.8 33.7 43.1 33.4 31.5 35.6 43.1
Most Recent New HireEmployers Reported 2 1 1 7 0 2 2 7
Median ($000's) -- -- -- 35.5 -- -- -- 35.5Average ($000's) -- -- -- 37.9 -- -- -- 37.9
Total Cash CompensationBase Plus Incentive Pay
Composes letters and memos from notes and verbal instructions. Maintains schedules. Plans meetings. Records and prepares minutes ofmeetings and conferences. Proficient with MS Office. Normally requires 2 or more years related experience.
Organizational FTE's Organizational Revenue ($ Millions)
Page 3-13Southwestern Pennsylvania Annual Compensation and Benefits Study
© 2010 Pittsburgh Technology Council. All rights reserved.

Job Code 108 EXECUTIVE ASSISTANT / SENIOR ADMINISTRATIVE ASSISTANT
Description
3.4% Less Complex76.8% Comparable19.7% More Complex
All Organizations
Software, Computer and
Technology Manufacturing
Life-Sciences/ Biotech/
Medical Devices Not-for-ProfitAll Other
EmployersAnnual Base Pay
Employers Reported 37 4 8 2 9 14Employees Reported 233 14 27 12 20 16025th Percentile ($000's) 45.0 40.0 45.1 46.6 41.5 45.450th Percentile ($000's) 51.0 49.3 49.8 55.2 48.2 53.775th Percentile ($000's) 61.5 53.1 53.7 59.8 49.8 65.1Average ($000's) 55.0 47.9 50.7 53.2 47.1 57.4
Incentive Pay% Incentive Eligible 67% 36% 67% 92% 40% 71%25th Percentile ($000's) 1.7 2.0 3.7 1.7 1.9 1.550th Percentile ($000's) 2.8 2.1 4.0 1.9 3.2 2.875th Percentile ($000's) 4.5 2.1 4.4 2.3 4.4 4.8Average ($000's) 3.5 2.3 4.0 2.0 3.4 3.8
25th Percentile ($000's) 45.9 40.0 47.7 48.4 42.5 46.050th Percentile ($000's) 53.9 49.9 50.7 56.9 48.6 56.375th Percentile ($000's) 63.5 56.0 57.0 61.8 52.9 67.4Average ($000's) 56.7 48.7 52.6 55.0 48.4 59.2
Most Recent New HireEmployers Reported 4 1 0 0 1 2
Median ($000's) 68.0 -- -- -- -- --Average ($000's) 68.2 -- -- -- -- --
Job Match Comparability
Performs administrative duties for a senior executive, including the chief executive. Responsibilities require discretion, judgment, tact,and poise. Incumbent has considerable latitude and flexibility in carrying out assigned tasks. May supervise lower level administrativestaff. Typically is classified as exempt.
Industry - Type of Employer
Total Cash CompensationBase Plus Incentive Pay
Page 3-14Southwestern Pennsylvania Annual Compensation and Benefits Study
© 2010 Pittsburgh Technology Council. All rights reserved.

Job Code 108 EXECUTIVE ASSISTANT / SENIOR ADMINISTRATIVE ASSISTANT
Description
Less than 50 50 - 150 151 - 500 More than 500Less than
$7.5M$7.5M to
$25M$26M to $150M
More than $150M
Annual Base PayEmployers Reported 5 5 8 19 5 6 5 21Employees Reported 9 12 11 201 6 16 5 206
25th Percentile ($000's) 41.0 48.7 49.3 45.0 41.8 48.0 48.3 45.050th Percentile ($000's) 46.9 56.6 53.3 51.0 46.7 53.5 51.4 51.075th Percentile ($000's) 48.6 61.5 61.2 62.2 54.6 57.8 53.3 63.0Average ($000's) 45.7 57.4 54.3 55.3 47.3 54.6 50.5 55.3
Incentive Pay% Incentive Eligible 78% 67% 64% 67% 67% 69% 40% 67%
25th Percentile ($000's) 1.6 2.0 1.1 1.8 -- 2.0 -- 1.750th Percentile ($000's) 2.6 2.1 2.6 2.8 2.1 2.5 -- 2.875th Percentile ($000's) 5.4 3.2 4.2 4.6 -- 3.8 -- 4.6Average ($000's) 3.4 2.6 2.7 3.7 2.3 3.2 -- 3.6
25th Percentile ($000's) 42.0 51.8 49.3 45.5 42.9 50.4 48.3 45.550th Percentile ($000's) 49.0 57.9 56.7 53.9 47.8 55.9 51.4 54.175th Percentile ($000's) 53.0 62.1 61.5 64.3 57.6 58.6 55.1 64.4Average ($000's) 48.0 59.0 55.3 57.0 48.4 56.6 51.2 57.1
Most Recent New HireEmployers Reported 0 2 0 2 1 1 0 2
Median ($000's) -- -- -- -- -- -- -- --Average ($000's) -- -- -- -- -- -- -- --
Total Cash CompensationBase Plus Incentive Pay
Performs administrative duties for a senior executive, including the chief executive. Responsibilities require discretion, judgment, tact,and poise. Incumbent has considerable latitude and flexibility in carrying out assigned tasks. May supervise lower level administrativestaff. Typically is classified as exempt.
Organizational FTE's Organizational Revenue ($ Millions)
Page 3-15Southwestern Pennsylvania Annual Compensation and Benefits Study
© 2010 Pittsburgh Technology Council. All rights reserved.

Job Code 112 GENERAL CLERK - INTERMEDIATE
Description
4.3% Less Complex88.6% Comparable7.1% More Complex
All Organizations
Software, Computer and
Technology Manufacturing
Life-Sciences/ Biotech/
Medical Devices Not-for-ProfitAll Other
EmployersAnnual Base Pay
Employers Reported 17 2 5 1 2 7Employees Reported 255 8 13 1 130 10325th Percentile ($000's) 23.9 24.9 27.4 -- 22.8 28.150th Percentile ($000's) 27.0 27.6 28.7 -- 24.3 31.275th Percentile ($000's) 30.5 31.7 29.5 -- 26.9 39.3Average ($000's) 29.8 29.0 28.2 -- 25.0 35.9
Incentive Pay% Incentive Eligible 40% 0% 62% 100% 0% 91%25th Percentile ($000's) 1.4 -- 2.1 -- -- 1.450th Percentile ($000's) 1.8 -- 2.2 -- -- 1.775th Percentile ($000's) 2.2 -- 2.3 -- -- 2.0Average ($000's) 2.2 -- 2.1 -- -- 2.3
25th Percentile ($000's) 24.1 24.9 27.5 -- 22.8 29.350th Percentile ($000's) 27.6 27.6 29.5 -- 24.3 33.275th Percentile ($000's) 31.3 31.7 31.5 -- 26.9 42.1Average ($000's) 30.6 29.0 29.3 -- 25.0 37.8
Most Recent New HireEmployers Reported 4 0 0 0 1 3
Median ($000's) 28.0 -- -- -- -- 30.0Average ($000's) 33.3 -- -- -- -- 35.0
Performs a variety of clerical and administrative tasks. Typically requires typing skills sufficient to complete computer-based records andprepare reports, letters, and other materials in which terms are clear and formats follow a standard pattern. Routinely uses a PC to carryout assigned activities. Works under general direction. Requires high school graduation or the equivalent and 2 or more years relatedexperience.
Industry - Type of Employer
Total Cash CompensationBase Plus Incentive Pay
Job Match Comparability
Page 3-16Southwestern Pennsylvania Annual Compensation and Benefits Study
© 2010 Pittsburgh Technology Council. All rights reserved.
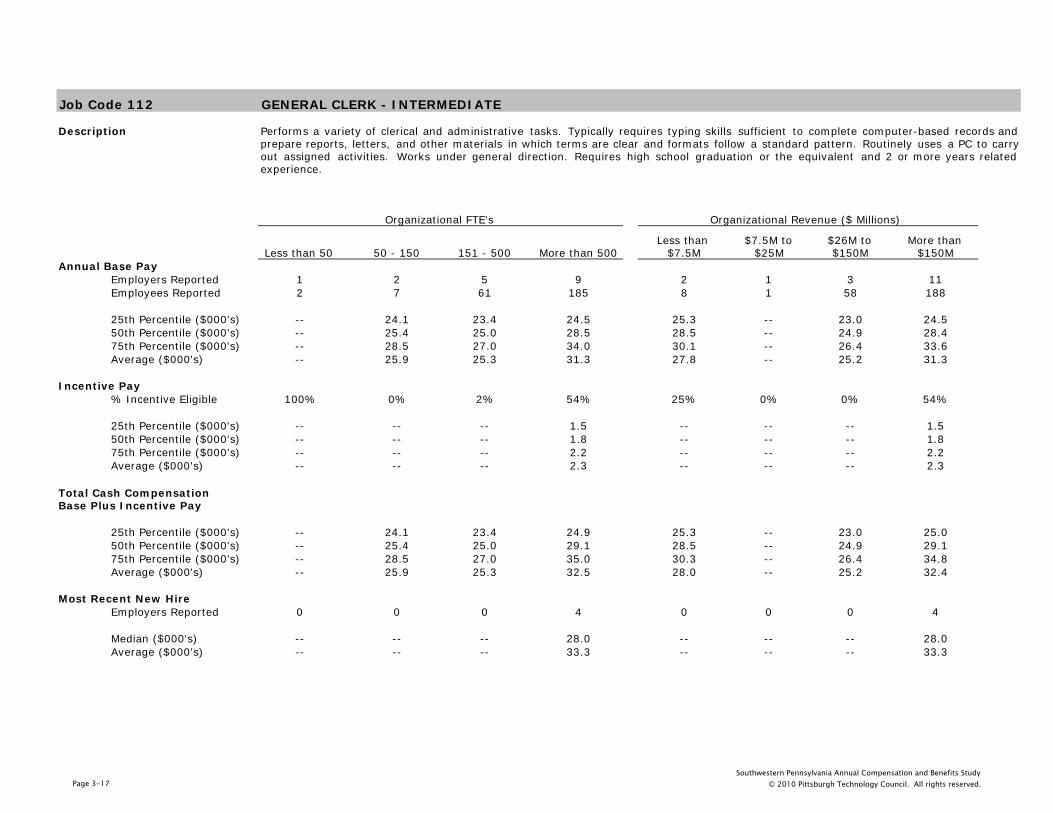
Job Code 112 GENERAL CLERK - INTERMEDIATE
Description
Less than 50 50 - 150 151 - 500 More than 500Less than
$7.5M$7.5M to
$25M$26M to $150M
More than $150M
Annual Base PayEmployers Reported 1 2 5 9 2 1 3 11Employees Reported 2 7 61 185 8 1 58 188
25th Percentile ($000's) -- 24.1 23.4 24.5 25.3 -- 23.0 24.550th Percentile ($000's) -- 25.4 25.0 28.5 28.5 -- 24.9 28.475th Percentile ($000's) -- 28.5 27.0 34.0 30.1 -- 26.4 33.6Average ($000's) -- 25.9 25.3 31.3 27.8 -- 25.2 31.3
Incentive Pay% Incentive Eligible 100% 0% 2% 54% 25% 0% 0% 54%
25th Percentile ($000's) -- -- -- 1.5 -- -- -- 1.550th Percentile ($000's) -- -- -- 1.8 -- -- -- 1.875th Percentile ($000's) -- -- -- 2.2 -- -- -- 2.2Average ($000's) -- -- -- 2.3 -- -- -- 2.3
25th Percentile ($000's) -- 24.1 23.4 24.9 25.3 -- 23.0 25.050th Percentile ($000's) -- 25.4 25.0 29.1 28.5 -- 24.9 29.175th Percentile ($000's) -- 28.5 27.0 35.0 30.3 -- 26.4 34.8Average ($000's) -- 25.9 25.3 32.5 28.0 -- 25.2 32.4
Most Recent New HireEmployers Reported 0 0 0 4 0 0 0 4
Median ($000's) -- -- -- 28.0 -- -- -- 28.0Average ($000's) -- -- -- 33.3 -- -- -- 33.3
Total Cash CompensationBase Plus Incentive Pay
Performs a variety of clerical and administrative tasks. Typically requires typing skills sufficient to complete computer-based records andprepare reports, letters, and other materials in which terms are clear and formats follow a standard pattern. Routinely uses a PC to carryout assigned activities. Works under general direction. Requires high school graduation or the equivalent and 2 or more years relatedexperience.
Organizational FTE's Organizational Revenue ($ Millions)
Page 3-17Southwestern Pennsylvania Annual Compensation and Benefits Study
© 2010 Pittsburgh Technology Council. All rights reserved.

Job Code 117 BILLING CLERK
Description
0.0% Less Complex92.4% Comparable7.6% More Complex
All Organizations
Software, Computer and
Technology Manufacturing
Life-Sciences/ Biotech/
Medical Devices Not-for-ProfitAll Other
EmployersAnnual Base Pay
Employers Reported 15 1 4 2 2 6Employees Reported 66 2 7 27 2 2825th Percentile ($000's) 32.5 -- 30.1 35.6 -- 32.850th Percentile ($000's) 39.5 -- 31.3 39.9 -- 39.575th Percentile ($000's) 44.5 -- 36.5 46.2 -- 44.7Average ($000's) 39.5 -- 33.4 41.4 -- 39.3
Incentive Pay% Incentive Eligible 85% 100% 71% 100% 0% 79%25th Percentile ($000's) 1.3 -- -- 1.5 -- 1.050th Percentile ($000's) 1.7 -- -- 2.1 -- 1.375th Percentile ($000's) 2.6 -- -- 2.9 -- 1.9Average ($000's) 1.9 -- -- 2.2 -- 1.5
25th Percentile ($000's) 34.1 -- 30.1 37.2 -- 34.250th Percentile ($000's) 40.4 -- 31.3 41.5 -- 39.575th Percentile ($000's) 46.1 -- 36.5 48.8 -- 45.2Average ($000's) 40.8 -- 33.4 43.6 -- 40.3
Most Recent New HireEmployers Reported 5 1 0 2 0 2
Median ($000's) 32.8 -- -- -- -- --Average ($000's) 32.5 -- -- -- -- --
Compiles data and prepares invoices including amounts due, items sold and/or services delivered and terms of credit. Posts paymentsand adjustments consistent with contracts and company policies. Balances payments posted daily with system reports. Updatesdepartmental logs on payment trends. Responds to customer billing questions. Typically requires 2 years previous experience.
Industry - Type of Employer
Total Cash CompensationBase Plus Incentive Pay
Job Match Comparability
Page 3-18Southwestern Pennsylvania Annual Compensation and Benefits Study
© 2010 Pittsburgh Technology Council. All rights reserved.

Job Code 117 BILLING CLERK
Description
Less than 50 50 - 150 151 - 500 More than 500Less than
$7.5M$7.5M to
$25M$26M to $150M
More than $150M
Annual Base PayEmployers Reported 1 1 5 8 1 2 5 7Employees Reported 1 1 13 51 1 6 6 53
25th Percentile ($000's) -- -- 32.0 35.6 -- 32.4 32.6 33.350th Percentile ($000's) -- -- 32.8 39.6 -- 34.1 37.1 39.575th Percentile ($000's) -- -- 37.0 46.2 -- 36.6 40.4 44.9Average ($000's) -- -- 34.3 41.2 -- 34.4 37.0 40.6
Incentive Pay% Incentive Eligible 100% 0% 85% 86% 100% 83% 50% 89%
25th Percentile ($000's) -- -- 2.5 1.2 -- 2.5 -- 1.350th Percentile ($000's) -- -- 2.7 1.6 -- 2.5 1.9 1.675th Percentile ($000's) -- -- 3.3 2.5 -- 3.5 -- 2.5Average ($000's) -- -- 2.7 1.8 -- 2.7 1.9 1.8
25th Percentile ($000's) -- -- 32.0 36.7 -- 34.9 32.6 34.250th Percentile ($000's) -- -- 34.7 41.1 -- 36.1 37.6 40.575th Percentile ($000's) -- -- 40.5 47.5 -- 39.6 42.1 46.8Average ($000's) -- -- 35.6 42.6 -- 36.7 37.6 41.9
Most Recent New HireEmployers Reported 0 1 2 2 0 2 1 2
Median ($000's) -- -- -- -- -- -- -- --Average ($000's) -- -- -- -- -- -- -- --
Total Cash CompensationBase Plus Incentive Pay
Compiles data and prepares invoices including amounts due, items sold and/or services delivered and terms of credit. Posts paymentsand adjustments consistent with contracts and company policies. Balances payments posted daily with system reports. Updatesdepartmental logs on payment trends. Responds to customer billing questions. Typically requires 2 years previous experience.
Organizational FTE's Organizational Revenue ($ Millions)
Page 3-19Southwestern Pennsylvania Annual Compensation and Benefits Study
© 2010 Pittsburgh Technology Council. All rights reserved.

Job Code 126 HUMAN RESOURCES MANAGER
Description
0.0% Less Complex69.4% Comparable30.6% More Complex
All Organizations
Software, Computer and
Technology Manufacturing
Life-Sciences/ Biotech/
Medical Devices Not-for-ProfitAll Other
EmployersAnnual Base Pay
Employers Reported 37 6 8 4 5 14Employees Reported 62 7 9 8 5 3325th Percentile ($000's) 70.0 67.6 80.0 76.7 67.7 70.050th Percentile ($000's) 85.0 69.7 91.6 123.2 78.4 84.075th Percentile ($000's) 102.7 87.3 102.0 145.9 84.2 103.0Average ($000's) 90.5 76.2 92.0 113.7 76.7 89.6
Incentive Pay% Incentive Eligible 76% 86% 100% 100% 40% 67%25th Percentile ($000's) 4.9 2.8 6.9 25.3 -- 2.550th Percentile ($000's) 9.1 4.4 11.3 25.5 -- 7.775th Percentile ($000's) 19.6 6.2 14.5 36.8 -- 15.6Average ($000's) 14.1 4.7 12.4 29.0 -- 12.4
25th Percentile ($000's) 70.0 69.1 85.5 85.0 67.7 70.050th Percentile ($000's) 90.4 74.8 91.6 148.7 78.4 86.375th Percentile ($000's) 115.9 92.6 114.9 176.4 96.7 116.3Average ($000's) 98.7 78.9 100.3 135.5 80.4 96.4
Most Recent New HireEmployers Reported 3 1 0 0 0 2
Median ($000's) 70.0 -- -- -- -- --Average ($000's) 71.5 -- -- -- -- --
Manages and administers policies and programs covering several functional areas such as employment, personnel administration, wageand salary administration, training, safety, employee benefits, and labor relations. May supervise department staff. Typically requires adegree and 5 years HR experience. This position is not considered senior management.
Industry - Type of Employer
Total Cash CompensationBase Plus Incentive Pay
Job Match Comparability
Page 3-20Southwestern Pennsylvania Annual Compensation and Benefits Study
© 2010 Pittsburgh Technology Council. All rights reserved.

Job Code 126 HUMAN RESOURCES MANAGER
Description
Less than 50 50 - 150 151 - 500 More than 500Less than
$7.5M$7.5M to
$25M$26M to $150M
More than $150M
Annual Base PayEmployers Reported 5 9 8 15 4 10 8 15Employees Reported 5 10 8 39 4 11 8 39
25th Percentile ($000's) 84.2 63.4 67.9 70.9 -- 64.3 66.4 73.450th Percentile ($000's) 88.5 77.0 81.7 90.0 86.8 84.2 74.0 94.875th Percentile ($000's) 88.5 93.7 87.0 110.9 -- 88.9 84.4 110.9Average ($000's) 78.6 76.9 80.2 97.7 75.5 76.6 76.4 98.9
Incentive Pay% Incentive Eligible 100% 80% 75% 72% 75% 91% 63% 74%
25th Percentile ($000's) 7.0 3.0 11.2 4.4 -- 4.0 19.2 4.450th Percentile ($000's) 7.7 5.8 11.3 15.0 7.7 5.8 25.4 11.675th Percentile ($000's) 9.1 9.6 11.5 25.3 -- 10.3 31.6 25.3Average ($000's) 8.4 6.7 11.3 16.8 7.7 7.1 25.4 15.7
25th Percentile ($000's) 96.2 63.9 67.9 73.7 -- 65.5 66.4 75.350th Percentile ($000's) 96.2 79.9 82.0 94.8 90.6 89.1 74.0 94.875th Percentile ($000's) 96.7 95.9 92.7 125.1 -- 97.1 92.9 125.1Average ($000's) 85.3 80.3 83.1 108.4 79.3 81.2 82.8 109.0
Most Recent New HireEmployers Reported 0 1 0 2 0 1 0 2
Median ($000's) -- -- -- -- -- -- -- --Average ($000's) -- -- -- -- -- -- -- --
Manages and administers policies and programs covering several functional areas such as employment, personnel administration, wageand salary administration, training, safety, employee benefits, and labor relations. May supervise department staff. Typically requires adegree and 5 years HR experience. This position is not considered senior management.
Organizational FTE's Organizational Revenue ($ Millions)
Total Cash CompensationBase Plus Incentive Pay
Page 3-21Southwestern Pennsylvania Annual Compensation and Benefits Study
© 2010 Pittsburgh Technology Council. All rights reserved.

Job Code 129 HUMAN RESOURCES GENERALIST
Description
0.0% Less Complex87.0% Comparable13.0% More Complex
All Organizations
Software, Computer and
Technology Manufacturing
Life-Sciences/ Biotech/
Medical Devices Not-for-ProfitAll Other
EmployersAnnual Base Pay
Employers Reported 32 6 10 1 3 12Employees Reported 54 6 11 5 3 2925th Percentile ($000's) 46.0 42.8 49.5 -- -- 45.050th Percentile ($000's) 54.1 47.1 51.4 -- 53.5 53.375th Percentile ($000's) 65.0 53.7 65.6 -- -- 62.0Average ($000's) 56.0 47.9 57.9 -- 49.2 54.2
Incentive Pay% Incentive Eligible 61% 33% 73% 100% 0% 62%25th Percentile ($000's) 2.8 -- 2.3 -- -- 1.750th Percentile ($000's) 3.8 -- 3.4 -- -- 3.775th Percentile ($000's) 5.7 -- 3.5 -- -- 5.7Average ($000's) 4.2 -- 3.2 -- -- 4.0
25th Percentile ($000's) 46.5 42.8 50.3 -- -- 45.050th Percentile ($000's) 55.0 47.1 51.4 -- 53.5 55.075th Percentile ($000's) 67.2 53.7 67.3 -- -- 65.0Average ($000's) 58.0 48.6 59.6 -- 49.2 56.0
Most Recent New HireEmployers Reported 3 1 1 0 0 1
Median ($000's) 50.0 -- -- -- -- --Average ($000's) 53.2 -- -- -- -- --
Performs a variety of HR activities such as employment, compensation, EEO, training, and employee relations. In smaller organizations,incumbent may be the only human resource professional. Typically requires a degree and 3–5 years experience.
Industry - Type of Employer
Total Cash CompensationBase Plus Incentive Pay
Job Match Comparability
Page 3-22Southwestern Pennsylvania Annual Compensation and Benefits Study
© 2010 Pittsburgh Technology Council. All rights reserved.

Job Code 129 HUMAN RESOURCES GENERALIST
Description
Less than 50 50 - 150 151 - 500 More than 500Less than
$7.5M$7.5M to
$25M$26M to $150M
More than $150M
Annual Base PayEmployers Reported 4 5 6 17 3 6 5 18Employees Reported 4 5 6 39 3 6 5 40
25th Percentile ($000's) -- 45.0 51.9 46.0 -- 48.5 51.0 46.050th Percentile ($000's) 49.8 48.0 56.0 55.0 39.7 52.6 53.5 55.075th Percentile ($000's) -- 66.3 58.4 69.2 -- 63.5 58.4 68.3Average ($000's) 48.1 53.1 53.4 57.6 42.3 55.2 52.3 57.7
Incentive Pay% Incentive Eligible 50% 20% 50% 69% 33% 33% 40% 70%
25th Percentile ($000's) -- -- -- 3.4 -- -- -- 2.950th Percentile ($000's) -- -- 3.5 4.1 -- -- -- 3.875th Percentile ($000's) -- -- -- 5.7 -- -- -- 5.6Average ($000's) -- -- 3.5 4.4 -- -- -- 4.2
25th Percentile ($000's) -- 45.0 51.9 47.6 -- 48.5 53.5 48.450th Percentile ($000's) 50.3 48.0 56.4 55.7 39.7 52.6 58.7 55.375th Percentile ($000's) -- 66.3 60.7 71.6 -- 63.5 59.3 71.4Average ($000's) 48.3 53.1 54.5 60.1 42.6 55.2 54.6 60.0
Most Recent New HireEmployers Reported 2 0 0 1 1 1 0 1
Median ($000's) -- -- -- -- -- -- -- --Average ($000's) -- -- -- -- -- -- -- --
Total Cash CompensationBase Plus Incentive Pay
Performs a variety of HR activities such as employment, compensation, EEO, training, and employee relations. In smaller organizations,incumbent may be the only human resource professional. Typically requires a degree and 3–5 years experience.
Organizational FTE's Organizational Revenue ($ Millions)
Page 3-23Southwestern Pennsylvania Annual Compensation and Benefits Study
© 2010 Pittsburgh Technology Council. All rights reserved.

Job Code 130 EMPLOYEE TRAINING SPECIALIST
Description
0.0% Less Complex78.3% Comparable21.7% More Complex
All Organizations
Software, Computer and
Technology Manufacturing
Life-Sciences/ Biotech/
Medical Devices Not-for-ProfitAll Other
EmployersAnnual Base Pay
Employers Reported 11 1 2 1 1 6Employees Reported 23 2 3 5 1 1225th Percentile ($000's) 54.6 -- -- -- -- 54.350th Percentile ($000's) 68.6 -- 67.0 -- -- 68.275th Percentile ($000's) 73.2 -- -- -- -- 71.3Average ($000's) 65.8 -- 62.9 -- -- 62.7
Incentive Pay% Incentive Eligible 78% 0% 100% 100% 0% 83%25th Percentile ($000's) 3.9 -- -- -- -- 1.550th Percentile ($000's) 4.8 -- 6.1 -- -- 4.475th Percentile ($000's) 7.1 -- -- -- -- 7.9Average ($000's) 5.4 -- 6.1 -- -- 5.0
25th Percentile ($000's) 54.6 -- -- -- -- 55.450th Percentile ($000's) 71.7 -- 72.4 -- -- 69.275th Percentile ($000's) 79.2 -- -- -- -- 73.0Average ($000's) 68.6 -- 66.9 -- -- 64.8
Most Recent New HireEmployers Reported 0 0 0 0 0 0
Median ($000's) -- -- -- -- -- --Average ($000's) -- -- -- -- -- --
Job Match Comparability
Organizes, administers and facilitates educational and training programs for the organization’s employees. May develop in-houseprograms. Maintains records of all training activities including employee progress and effectiveness. May provide on-the-job training andorientation of new employees. Typically requires a bachelor's degree and 3 years of previous experience. This position is responsible forproviding training not related to information systems. Incumbents responsible for providing information systems-related training shouldbe reported under job 629.
Industry - Type of Employer
Total Cash CompensationBase Plus Incentive Pay
Page 3-24Southwestern Pennsylvania Annual Compensation and Benefits Study
© 2010 Pittsburgh Technology Council. All rights reserved.

Job Code 130 EMPLOYEE TRAINING SPECIALIST
Description
Less than 50 50 - 150 151 - 500 More than 500Less than
$7.5M$7.5M to
$25M$26M to $150M
More than $150M
Annual Base PayEmployers Reported 0 0 1 10 0 0 3 8Employees Reported 0 0 1 22 0 0 3 20
25th Percentile ($000's) -- -- -- 55.1 -- -- -- 55.450th Percentile ($000's) -- -- -- 68.8 -- -- 54.9 69.775th Percentile ($000's) -- -- -- 73.4 -- -- -- 73.8Average ($000's) -- -- -- 67.0 -- -- 54.1 67.5
Incentive Pay% Incentive Eligible -- -- 100% 77% -- -- 67% 80%
25th Percentile ($000's) -- -- -- 3.9 -- -- -- 3.750th Percentile ($000's) -- -- -- 4.8 -- -- -- 4.475th Percentile ($000's) -- -- -- 7.1 -- -- -- 6.1Average ($000's) -- -- -- 5.4 -- -- -- 4.9
25th Percentile ($000's) -- -- -- 55.1 -- -- -- 55.450th Percentile ($000's) -- -- -- 72.0 -- -- 54.9 72.075th Percentile ($000's) -- -- -- 79.2 -- -- -- 79.3Average ($000's) -- -- -- 69.9 -- -- 57.5 70.2
Most Recent New HireEmployers Reported 0 0 0 0 0 0 0 0
Median ($000's) -- -- -- -- -- -- -- --Average ($000's) -- -- -- -- -- -- -- --
Total Cash CompensationBase Plus Incentive Pay
Organizes, administers and facilitates educational and training programs for the organization’s employees. May develop in-houseprograms. Maintains records of all training activities including employee progress and effectiveness. May provide on-the-job training andorientation of new employees. Typically requires a bachelor's degree and 3 years of previous experience. This position is responsible forproviding training not related to information systems. Incumbents responsible for providing information systems-related training shouldbe reported under job 629.
Organizational FTE's Organizational Revenue ($ Millions)
Page 3-25Southwestern Pennsylvania Annual Compensation and Benefits Study
© 2010 Pittsburgh Technology Council. All rights reserved.

Job Code 135 TECHNICAL RECRUITER
Description
0.0% Less Complex50.0% Comparable50.0% More Complex
All Organizations
Software, Computer and
Technology Manufacturing
Life-Sciences/ Biotech/
Medical Devices Not-for-ProfitAll Other
EmployersAnnual Base Pay
Employers Reported 5 2 1 0 0 2Employees Reported 6 3 1 0 0 225th Percentile ($000's) 46.8 -- -- -- -- --50th Percentile ($000's) 50.2 46.0 -- -- -- --75th Percentile ($000's) 56.1 -- -- -- -- --Average ($000's) 50.4 45.6 -- -- -- --
Incentive Pay% Incentive Eligible 67% 33% 100% -- -- 100%
-- -- -- -- -- --50th Percentile ($000's) 2.5 -- -- -- -- --75th Percentile ($000's) -- -- -- -- -- --Average ($000's) 5.7 -- -- -- -- --
25th Percentile ($000's) 47.4 -- -- -- -- --50th Percentile ($000's) 51.5 46.0 -- -- -- --75th Percentile ($000's) 56.2 -- -- -- -- --Average ($000's) 53.2 49.9 -- -- -- --
Most Recent New HireEmployers Reported 1 1 0 0 0 0
Median ($000's) -- -- -- -- -- --Average ($000's) -- -- -- -- -- --
Job Match Comparability
Industry - Type of Employer
Total Cash CompensationBase Plus Incentive Pay
Responsible for the hiring of employees for technical positions within the organization. Interviews candidates against current open jobrequisitions. Determines the best avenue for methods of recruiting such as advertising, employment agencies, employee referrals, etc.Administers pre-employment tests, checks references and conducts exit interviews. Typically requires a Bachelor's degree and 2 yearsof prior experience.
Page 3-26Southwestern Pennsylvania Annual Compensation and Benefits Study
© 2010 Pittsburgh Technology Council. All rights reserved.

Job Code 135 TECHNICAL RECRUITER
Description
Less than 50 50 - 150 151 - 500 More than 500Less than
$7.5M$7.5M to
$25M$26M to $150M
More than $150M
Annual Base PayEmployers Reported 0 1 2 2 0 1 1 3Employees Reported 0 1 3 2 0 1 2 3
25th Percentile ($000's) -- -- -- -- -- -- -- --50th Percentile ($000's) -- -- 51.4 -- -- -- -- 51.475th Percentile ($000's) -- -- -- -- -- -- -- --Average ($000's) -- -- 51.7 -- -- -- -- 55.2
Incentive Pay% Incentive Eligible -- 100% 33% 100% -- 100% 0% 100%
25th Percentile ($000's) -- -- -- -- -- -- -- --50th Percentile ($000's) -- -- -- -- -- -- -- 2.075th Percentile ($000's) -- -- -- -- -- -- -- --Average ($000's) -- -- -- -- -- -- -- 2.0
25th Percentile ($000's) -- -- -- -- -- -- -- --50th Percentile ($000's) -- -- 51.4 -- -- -- -- 51.675th Percentile ($000's) -- -- -- -- -- -- -- --Average ($000's) -- -- 51.7 -- -- -- -- 56.5
Most Recent New HireEmployers Reported 0 0 1 0 0 0 1 0
Median ($000's) -- -- -- -- -- -- -- --Average ($000's) -- -- -- -- -- -- -- --
Responsible for the hiring of employees for technical positions within the organization. Interviews candidates against current open jobrequisitions. Determines the best avenue for methods of recruiting such as advertising, employment agencies, employee referrals, etc.Administers pre-employment tests, checks references and conducts exit interviews. Typically requires a Bachelor's degree and 2 yearsof prior experience.
Organizational FTE's Organizational Revenue ($ Millions)
Total Cash CompensationBase Plus Incentive Pay
Page 3-27Southwestern Pennsylvania Annual Compensation and Benefits Study
© 2010 Pittsburgh Technology Council. All rights reserved.

Job Code 140 OFFICE MANAGER
Description
84.0% Less Complex9.3% Comparable6.7% More Complex
All Organizations
Software, Computer and
Technology Manufacturing
Life-Sciences/ Biotech/
Medical Devices Not-for-ProfitAll Other
EmployersAnnual Base Pay
Employers Reported 23 6 4 2 2 9Employees Reported 194 6 5 2 162 1925th Percentile ($000's) 35.1 42.4 43.6 -- 34.0 42.250th Percentile ($000's) 37.5 49.5 46.5 -- 37.3 55.075th Percentile ($000's) 42.5 62.8 47.3 -- 40.3 60.3Average ($000's) 39.9 54.8 50.5 -- 37.2 54.5
Incentive Pay% Incentive Eligible 10% 100% 40% 50% 0% 53%25th Percentile ($000's) 1.5 1.8 -- -- -- 0.750th Percentile ($000's) 4.0 4.0 -- -- -- 2.775th Percentile ($000's) 8.5 7.0 -- -- -- 4.6Average ($000's) 5.5 4.5 -- -- -- 5.1
25th Percentile ($000's) 35.1 43.9 46.5 -- 34.0 42.250th Percentile ($000's) 37.5 52.4 47.3 -- 37.3 55.075th Percentile ($000's) 42.6 69.1 52.2 -- 40.3 60.5Average ($000's) 40.3 58.6 54.2 -- 37.2 56.1
Most Recent New HireEmployers Reported 0 0 0 0 0 0
Median ($000's) -- -- -- -- -- --Average ($000's) -- -- -- -- -- --
Manages administrative activities such as office services, telephone services, central files and facilities. Schedules and coordinatesprojects and special assignments. May purchase office supplies and equipment. May supervise clerical and administrative staff. Requires5 years experience.
Industry - Type of Employer
Total Cash CompensationBase Plus Incentive Pay
Job Match Comparability
Page 3-28Southwestern Pennsylvania Annual Compensation and Benefits Study
© 2010 Pittsburgh Technology Council. All rights reserved.
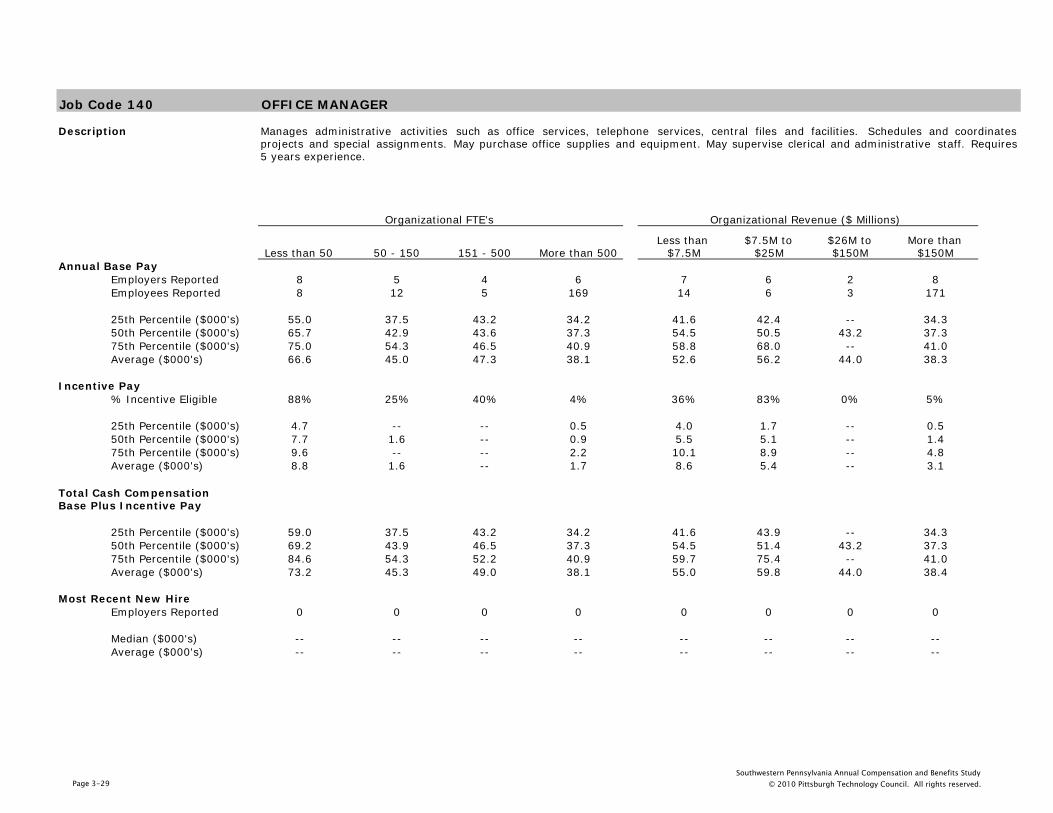
Job Code 140 OFFICE MANAGER
Description
Less than 50 50 - 150 151 - 500 More than 500Less than
$7.5M$7.5M to
$25M$26M to $150M
More than $150M
Annual Base PayEmployers Reported 8 5 4 6 7 6 2 8Employees Reported 8 12 5 169 14 6 3 171
25th Percentile ($000's) 55.0 37.5 43.2 34.2 41.6 42.4 -- 34.350th Percentile ($000's) 65.7 42.9 43.6 37.3 54.5 50.5 43.2 37.375th Percentile ($000's) 75.0 54.3 46.5 40.9 58.8 68.0 -- 41.0Average ($000's) 66.6 45.0 47.3 38.1 52.6 56.2 44.0 38.3
Incentive Pay% Incentive Eligible 88% 25% 40% 4% 36% 83% 0% 5%
25th Percentile ($000's) 4.7 -- -- 0.5 4.0 1.7 -- 0.550th Percentile ($000's) 7.7 1.6 -- 0.9 5.5 5.1 -- 1.475th Percentile ($000's) 9.6 -- -- 2.2 10.1 8.9 -- 4.8Average ($000's) 8.8 1.6 -- 1.7 8.6 5.4 -- 3.1
25th Percentile ($000's) 59.0 37.5 43.2 34.2 41.6 43.9 -- 34.350th Percentile ($000's) 69.2 43.9 46.5 37.3 54.5 51.4 43.2 37.375th Percentile ($000's) 84.6 54.3 52.2 40.9 59.7 75.4 -- 41.0Average ($000's) 73.2 45.3 49.0 38.1 55.0 59.8 44.0 38.4
Most Recent New HireEmployers Reported 0 0 0 0 0 0 0 0
Median ($000's) -- -- -- -- -- -- -- --Average ($000's) -- -- -- -- -- -- -- --
Total Cash CompensationBase Plus Incentive Pay
Manages administrative activities such as office services, telephone services, central files and facilities. Schedules and coordinatesprojects and special assignments. May purchase office supplies and equipment. May supervise clerical and administrative staff. Requires5 years experience.
Organizational FTE's Organizational Revenue ($ Millions)
Page 3-29Southwestern Pennsylvania Annual Compensation and Benefits Study
© 2010 Pittsburgh Technology Council. All rights reserved.

Job Code 152 CONTRACT ADMINISTRATORDescription
3.6% Less Complex89.3% Comparable7.1% More Complex
All Organizations
Software, Computer and
Technology Manufacturing
Life-Sciences/ Biotech/
Medical Devices Not-for-ProfitAll Other
EmployersAnnual Base Pay
Employers Reported 12 2 4 0 3 3Employees Reported 28 2 4 0 3 1925th Percentile ($000's) 51.8 -- -- -- -- 55.750th Percentile ($000's) 72.2 -- 62.1 -- 52.0 72.375th Percentile ($000's) 82.8 -- -- -- -- 83.2Average ($000's) 70.5 -- 68.0 -- 58.4 71.9
Incentive Pay% Incentive Eligible 64% 50% 50% -- 33% 74%25th Percentile ($000's) 4.5 -- -- -- -- 4.650th Percentile ($000's) 7.4 -- -- -- -- 7.375th Percentile ($000's) 9.8 -- -- -- -- 8.2Average ($000's) 7.7 -- -- -- -- 7.5
25th Percentile ($000's) 51.8 -- -- -- -- 58.050th Percentile ($000's) 75.0 -- 63.3 -- 52.0 78.975th Percentile ($000's) 87.8 -- -- -- -- 90.5Average ($000's) 75.2 -- 72.3 -- 61.7 77.4
Most Recent New HireEmployers Reported 0 0 0 0 0 0
Median ($000's) -- -- -- -- -- --Average ($000's) -- -- -- -- -- --
Negotiates and administers contracts from proposal to close-out. Reviews, coordinates, and controls all organization activities onassigned contracts including proposal development, customer negotiations, and overall contract administration. Serves as liaison withcustomers and clients. Communicates appropriate contract information to internal department heads. Monitors critical administrativetasks associated with major contracts.
Industry - Type of Employer
Total Cash CompensationBase Plus Incentive Pay
Job Match Comparability
Page 3-30Southwestern Pennsylvania Annual Compensation and Benefits Study
© 2010 Pittsburgh Technology Council. All rights reserved.

Job Code 152 CONTRACT ADMINISTRATOR
Description
Less than 50 50 - 150 151 - 500 More than 500Less than
$7.5M$7.5M to
$25M$26M to $150M
More than $150M
Annual Base PayEmployers Reported 1 0 4 7 0 1 4 7Employees Reported 1 0 4 23 0 1 4 23
25th Percentile ($000's) -- -- -- 51.6 -- -- -- 56.250th Percentile ($000's) -- -- 62.1 72.3 -- -- 52.1 72.375th Percentile ($000's) -- -- -- 83.2 -- -- -- 83.2Average ($000's) -- -- 64.1 71.3 -- -- 59.1 72.2
Incentive Pay% Incentive Eligible 100% -- 50% 65% -- 100% 50% 65%
25th Percentile ($000's) -- -- -- 4.6 -- -- -- 4.550th Percentile ($000's) -- -- -- 7.4 -- -- -- 7.375th Percentile ($000's) -- -- -- 10.6 -- -- -- 9.5Average ($000's) -- -- -- 7.9 -- -- -- 7.6
25th Percentile ($000's) -- -- -- 51.6 -- -- -- 58.550th Percentile ($000's) -- -- 63.3 76.1 -- -- 52.1 76.175th Percentile ($000's) -- -- -- 90.5 -- -- -- 90.5Average ($000's) -- -- 64.7 76.5 -- -- 59.1 77.5
Most Recent New HireEmployers Reported 0 0 0 0 0 0 0 0
Median ($000's) -- -- -- -- -- -- -- --Average ($000's) -- -- -- -- -- -- -- --
Total Cash CompensationBase Plus Incentive Pay
Negotiates and administers contracts from proposal to close-out. Reviews, coordinates, and controls all organization activities onassigned contracts including proposal development, customer negotiations, and overall contract administration. Serves as liaison withcustomers and clients. Communicates appropriate contract information to internal department heads. Monitors critical administrativetasks associated with major contracts.
Organizational FTE's Organizational Revenue ($ Millions)
Page 3-31Southwestern Pennsylvania Annual Compensation and Benefits Study
© 2010 Pittsburgh Technology Council. All rights reserved.

Job Code 201 ACCOUNTING CLERK - ALL LEVELS
Description
1.0% Less Complex93.0% Comparable6.0% More Complex
All Organizations
Software, Computer and
Technology Manufacturing
Life-Sciences/ Biotech/
Medical Devices Not-for-ProfitAll Other
EmployersAnnual Base Pay
Employers Reported 39 4 13 2 6 14Employees Reported 200 8 47 3 26 11625th Percentile ($000's) 30.9 32.4 30.0 -- 31.8 29.850th Percentile ($000's) 34.5 35.8 34.5 31.2 33.1 35.175th Percentile ($000's) 39.5 40.6 45.3 -- 34.8 39.1Average ($000's) 36.0 36.4 37.0 33.8 33.7 36.1
Incentive Pay% Incentive Eligible 58% 50% 49% 100% 0% 73%25th Percentile ($000's) 1.3 -- 1.5 -- -- 1.350th Percentile ($000's) 2.2 2.4 2.5 -- -- 1.875th Percentile ($000's) 2.6 -- 2.7 -- -- 2.6Average ($000's) 2.3 2.4 2.4 -- -- 2.3
25th Percentile ($000's) 31.1 34.2 31.2 -- 31.8 31.150th Percentile ($000's) 34.9 37.0 35.7 31.2 33.1 35.375th Percentile ($000's) 40.6 41.6 45.3 -- 34.8 41.0Average ($000's) 36.9 37.6 38.2 33.8 33.7 37.2
Most Recent New HireEmployers Reported 9 0 4 2 0 3
Median ($000's) 34.0 -- 38.3 -- -- 36.0Average ($000's) 35.7 -- 38.2 -- -- 33.8
The data for this position is a combination of the data reported by participants for 202 Accounting Clerk - Intermediate and 203Accounting Clerk - Senior
Industry - Type of Employer
Total Cash CompensationBase Plus Incentive Pay
Job Match Comparability
Page 3-32Southwestern Pennsylvania Annual Compensation and Benefits Study
© 2010 Pittsburgh Technology Council. All rights reserved.

Job Code 201 ACCOUNTING CLERK - ALL LEVELS
Description
Less than 50 50 - 150 151 - 500 More than 500Less than
$7.5M$7.5M to
$25M$26M to $150M
More than $150M
Annual Base PayEmployers Reported 1 8 11 19 3 6 9 21Employees Reported 1 15 33 151 8 7 21 164
25th Percentile ($000's) -- 34.3 28.5 31.2 32.1 35.4 29.1 30.550th Percentile ($000's) -- 36.4 32.1 34.7 35.8 39.5 32.8 34.675th Percentile ($000's) -- 39.8 36.0 39.5 39.5 40.4 35.5 39.3Average ($000's) -- 38.7 32.7 36.4 37.0 41.1 33.3 36.1
Incentive Pay% Incentive Eligible 100% 27% 33% 66% 13% 43% 43% 62%
25th Percentile ($000's) -- -- 1.0 1.3 -- -- 2.4 1.350th Percentile ($000's) -- 3.1 1.0 2.2 -- 1.4 2.9 2.175th Percentile ($000's) -- -- 2.5 2.7 -- -- 3.8 2.6Average ($000's) -- 3.1 1.7 2.4 -- 1.4 3.3 2.3
25th Percentile ($000's) -- 34.3 28.5 31.5 32.1 35.4 29.1 31.150th Percentile ($000's) -- 37.1 32.1 35.0 35.8 39.5 33.3 34.975th Percentile ($000's) -- 40.6 37.4 41.6 39.5 41.1 36.7 40.9Average ($000's) -- 39.1 33.5 37.5 37.0 41.3 33.9 37.1
Most Recent New HireEmployers Reported 0 0 4 5 0 1 3 5
Median ($000's) -- -- 29.1 36.5 -- -- 29.0 36.5Average ($000's) -- -- 31.5 37.3 -- -- 28.9 37.3
Total Cash CompensationBase Plus Incentive Pay
The data for this position is a combination of the data reported by participants for 202 Accounting Clerk - Intermediate and 203Accounting Clerk - Senior
Organizational FTE's Organizational Revenue ($ Millions)
Page 3-33Southwestern Pennsylvania Annual Compensation and Benefits Study
© 2010 Pittsburgh Technology Council. All rights reserved.

Job Code 202 ACCOUNTING CLERK - INTERMEDIATE
Description
1.4% Less Complex93.5% Comparable5.1% More Complex
All Organizations
Software, Computer and
Technology Manufacturing
Life-Sciences/ Biotech/
Medical Devices Not-for-ProfitAll Other
EmployersAnnual Base Pay
Employers Reported 32 3 9 2 5 13Employees Reported 138 6 33 3 12 8425th Percentile ($000's) 29.9 31.4 28.5 -- 31.6 29.850th Percentile ($000's) 33.6 33.5 33.2 31.2 32.3 34.475th Percentile ($000's) 37.0 36.6 36.2 -- 34.9 37.1Average ($000's) 34.4 34.0 34.3 33.8 33.5 34.6
Incentive Pay% Incentive Eligible 58% 50% 48% 100% 0% 69%25th Percentile ($000's) 1.3 -- 1.0 -- -- 1.350th Percentile ($000's) 2.1 2.4 2.4 -- -- 1.875th Percentile ($000's) 2.5 -- 2.6 -- -- 2.4Average ($000's) 2.2 2.1 2.2 -- -- 2.2
25th Percentile ($000's) 30.9 32.0 28.9 -- 31.6 31.150th Percentile ($000's) 34.5 36.0 34.5 31.2 32.3 34.775th Percentile ($000's) 38.4 37.2 38.4 -- 34.9 39.2Average ($000's) 35.4 35.0 35.7 33.8 33.5 35.7
Most Recent New HireEmployers Reported 8 0 3 2 0 3
Median ($000's) 36.0 -- 47.5 -- -- 36.0Average ($000's) 36.2 -- 40.0 -- -- 33.8
Performs clerical duties in support of accounting functions. Requires thorough knowledge of assigned responsibilities and proficiency withspreadsheet applications. Works relatively independent but may require supervision for non-routine procedures. Normally requires 2years experience.
Industry - Type of Employer
Total Cash CompensationBase Plus Incentive Pay
Job Match Comparability
Page 3-34Southwestern Pennsylvania Annual Compensation and Benefits Study
© 2010 Pittsburgh Technology Council. All rights reserved.

Job Code 202 ACCOUNTING CLERK - INTERMEDIATE
Description
Less than 50 50 - 150 151 - 500 More than 500Less than
$7.5M$7.5M to
$25M$26M to $150M
More than $150M
Annual Base PayEmployers Reported 1 5 9 17 3 4 7 18Employees Reported 1 9 26 102 7 4 13 114
25th Percentile ($000's) -- 32.2 26.7 31.1 32.0 -- 28.5 29.950th Percentile ($000's) -- 36.4 30.2 34.3 34.5 37.9 31.0 33.675th Percentile ($000's) -- 39.4 34.9 37.2 38.2 -- 34.2 37.0Average ($000's) -- 35.8 31.2 35.1 35.1 37.6 31.4 34.6
Incentive Pay% Incentive Eligible 100% 22% 27% 69% 14% 75% 31% 63%
25th Percentile ($000's) -- -- 1.0 1.3 -- -- -- 1.350th Percentile ($000's) -- -- 1.0 2.2 -- 1.4 2.4 2.075th Percentile ($000's) -- -- 2.4 2.6 -- -- -- 2.5Average ($000's) -- -- 1.6 2.3 -- 1.4 2.4 2.2
25th Percentile ($000's) -- 32.2 28.2 31.4 32.0 -- 28.5 30.950th Percentile ($000's) -- 36.4 31.0 34.9 34.5 37.9 31.0 34.575th Percentile ($000's) -- 39.4 36.4 39.6 38.2 -- 35.2 39.0Average ($000's) -- 35.9 32.0 36.3 35.1 37.9 31.8 35.8
Most Recent New HireEmployers Reported 0 0 3 5 0 1 2 5
Median ($000's) -- -- 29.0 36.5 -- -- -- 36.5Average ($000's) -- -- 32.3 37.3 -- -- -- 37.3
Total Cash CompensationBase Plus Incentive Pay
Performs clerical duties in support of accounting functions. Requires thorough knowledge of assigned responsibilities and proficiency withspreadsheet applications. Works relatively independent but may require supervision for non-routine procedures. Normally requires 2years experience.
Organizational FTE's Organizational Revenue ($ Millions)
Page 3-35Southwestern Pennsylvania Annual Compensation and Benefits Study
© 2010 Pittsburgh Technology Council. All rights reserved.

Job Code 203 ACCOUNTING CLERK - SENIOR
Description
0.0% Less Complex91.9% Comparable8.1% More Complex
All Organizations
Software, Computer and
Technology Manufacturing
Life-Sciences/ Biotech/
Medical Devices Not-for-ProfitAll Other
EmployersAnnual Base Pay
Employers Reported 20 2 8 0 2 8Employees Reported 62 2 14 0 14 3225th Percentile ($000's) 32.3 -- 34.8 -- 32.0 30.550th Percentile ($000's) 36.5 -- 42.7 -- 33.4 37.175th Percentile ($000's) 45.9 -- 49.7 -- 34.7 47.1Average ($000's) 39.5 -- 43.3 -- 33.9 40.0
Incentive Pay% Incentive Eligible 56% 50% 50% -- 0% 84%25th Percentile ($000's) 1.7 -- 3.3 -- -- 1.350th Percentile ($000's) 2.8 -- 4.4 -- -- 2.575th Percentile ($000's) 3.9 -- 4.6 -- -- 3.2Average ($000's) 3.0 -- 3.8 -- -- 2.7
25th Percentile ($000's) 32.3 -- 34.9 -- 32.0 30.850th Percentile ($000's) 37.0 -- 42.7 -- 33.4 37.175th Percentile ($000's) 47.9 -- 49.7 -- 34.7 50.7Average ($000's) 40.2 -- 44.1 -- 33.9 40.9
Most Recent New HireEmployers Reported 1 0 1 0 0 0
Median ($000's) -- -- -- -- -- --Average ($000's) -- -- -- -- -- --
Performs complex accounting clerical duties. Assists with trial balances, analyzes financial documents, investigates questionable data,and prepares reports. Requires independent judgment when procedures are not well defined. May typically require 4-5 years accountingclerical experience.
Industry - Type of Employer
Total Cash CompensationBase Plus Incentive Pay
Job Match Comparability
Page 3-36Southwestern Pennsylvania Annual Compensation and Benefits Study
© 2010 Pittsburgh Technology Council. All rights reserved.

Job Code 203 ACCOUNTING CLERK - SENIOR
Description
Less than 50 50 - 150 151 - 500 More than 500Less than
$7.5M$7.5M to
$25M$26M to $150M
More than $150M
Annual Base PayEmployers Reported 0 4 5 11 1 2 5 12Employees Reported 0 6 7 49 1 3 8 50
25th Percentile ($000's) -- 34.8 32.7 31.9 -- -- 33.0 31.950th Percentile ($000's) -- 38.2 36.0 36.9 -- 40.9 35.0 37.075th Percentile ($000's) -- 48.0 44.7 46.2 -- -- 38.1 46.6Average ($000's) -- 43.0 38.5 39.2 -- 45.9 36.3 39.4
Incentive Pay% Incentive Eligible -- 33% 57% 59% 0% 0% 63% 60%
25th Percentile ($000's) -- -- -- 1.6 -- -- 3.8 1.650th Percentile ($000's) -- -- 3.4 2.5 -- -- 4.1 2.575th Percentile ($000's) -- -- -- 3.4 -- -- 4.4 3.4Average ($000's) -- -- 3.4 2.8 -- -- 4.1 2.8
25th Percentile ($000's) -- 35.9 32.7 31.9 -- -- 33.0 31.950th Percentile ($000's) -- 40.6 36.0 36.9 -- 40.9 35.3 37.075th Percentile ($000's) -- 48.0 46.4 46.3 -- -- 41.3 47.9Average ($000's) -- 43.8 39.0 39.9 -- 45.9 37.3 40.1
Most Recent New HireEmployers Reported 0 0 1 0 0 0 1 0
Median ($000's) -- -- -- -- -- -- -- --Average ($000's) -- -- -- -- -- -- -- --
Total Cash CompensationBase Plus Incentive Pay
Performs complex accounting clerical duties. Assists with trial balances, analyzes financial documents, investigates questionable data,and prepares reports. Requires independent judgment when procedures are not well defined. May typically require 4-5 years accountingclerical experience.
Organizational FTE's Organizational Revenue ($ Millions)
Page 3-37Southwestern Pennsylvania Annual Compensation and Benefits Study
© 2010 Pittsburgh Technology Council. All rights reserved.

Job Code 204 PAYROLL CLERK
Description
0.0% Less Complex86.0% Comparable14.0% More Complex
All Organizations
Software, Computer and
Technology Manufacturing
Life-Sciences/ Biotech/
Medical Devices Not-for-ProfitAll Other
EmployersAnnual Base Pay
Employers Reported 25 2 7 0 6 10Employees Reported 57 2 9 0 6 4025th Percentile ($000's) 32.5 -- 34.0 -- 33.9 31.750th Percentile ($000's) 35.3 -- 36.0 -- 36.5 35.175th Percentile ($000's) 39.9 -- 39.9 -- 41.4 38.1Average ($000's) 37.5 -- 39.0 -- 37.9 36.6
Incentive Pay% Incentive Eligible 63% 0% 78% -- 0% 73%25th Percentile ($000's) 1.6 -- 1.6 -- -- 1.650th Percentile ($000's) 1.9 -- 2.1 -- -- 1.975th Percentile ($000's) 2.2 -- 3.0 -- -- 2.1Average ($000's) 2.3 -- 2.6 -- -- 2.2
25th Percentile ($000's) 33.7 -- 34.0 -- 33.9 33.250th Percentile ($000's) 36.1 -- 36.0 -- 36.5 35.775th Percentile ($000's) 39.9 -- 39.9 -- 41.4 39.2Average ($000's) 38.4 -- 40.1 -- 37.9 37.7
Most Recent New HireEmployers Reported 3 0 1 0 0 2
Median ($000's) 31.2 -- -- -- -- --Average ($000's) 33.8 -- -- -- -- --
Maintains payroll records and processes the payroll. Processes time records and adjusts records for changes in wage rates, benefits, ordeductions. Checks listings against source documents and traces and corrects errors in listings. Assists in the preparation of summarypayroll reports. May compute wages for non-computerized systems.
Industry - Type of Employer
Total Cash CompensationBase Plus Incentive Pay
Job Match Comparability
Page 3-38Southwestern Pennsylvania Annual Compensation and Benefits Study
© 2010 Pittsburgh Technology Council. All rights reserved.

Job Code 204 PAYROLL CLERK
Description
Less than 50 50 - 150 151 - 500 More than 500Less than
$7.5M$7.5M to
$25M$26M to $150M
More than $150M
Annual Base PayEmployers Reported 2 0 5 18 1 1 6 17Employees Reported 2 0 5 50 1 1 6 49
25th Percentile ($000's) -- -- 34.3 31.9 -- -- 33.0 32.150th Percentile ($000's) -- -- 36.0 35.3 -- -- 35.1 35.375th Percentile ($000's) -- -- 38.6 40.5 -- -- 37.9 39.9Average ($000's) -- -- 36.0 37.5 -- -- 35.7 37.6
Incentive Pay% Incentive Eligible 50% -- 40% 66% 100% 0% 33% 67%
25th Percentile ($000's) -- -- -- 1.6 -- -- -- 1.750th Percentile ($000's) -- -- -- 1.9 -- -- -- 1.975th Percentile ($000's) -- -- -- 2.2 -- -- -- 2.2Average ($000's) -- -- -- 2.3 -- -- -- 2.4
25th Percentile ($000's) -- -- 34.3 33.4 -- -- 33.0 33.750th Percentile ($000's) -- -- 36.0 36.3 -- -- 35.1 36.475th Percentile ($000's) -- -- 38.6 40.9 -- -- 37.9 39.9Average ($000's) -- -- 36.0 38.6 -- -- 35.9 38.7
Most Recent New HireEmployers Reported 0 0 1 2 0 0 1 2
Median ($000's) -- -- -- -- -- -- -- --Average ($000's) -- -- -- -- -- -- -- --
Total Cash CompensationBase Plus Incentive Pay
Maintains payroll records and processes the payroll. Processes time records and adjusts records for changes in wage rates, benefits, ordeductions. Checks listings against source documents and traces and corrects errors in listings. Assists in the preparation of summarypayroll reports. May compute wages for non-computerized systems.
Organizational FTE's Organizational Revenue ($ Millions)
Page 3-39Southwestern Pennsylvania Annual Compensation and Benefits Study
© 2010 Pittsburgh Technology Council. All rights reserved.

Job Code 231 ACCOUNTANT - ALL LEVELS
Description
14.8% Less Complex73.3% Comparable11.9% More Complex
All Organizations
Software, Computer and
Technology Manufacturing
Life-Sciences/ Biotech/
Medical Devices Not-for-ProfitAll Other
EmployersAnnual Base Pay
Employers Reported 47 8 13 4 7 15Employees Reported 277 20 49 20 60 12825th Percentile ($000's) 43.0 41.7 48.5 52.5 40.8 43.050th Percentile ($000's) 51.8 52.3 54.1 55.5 44.1 53.475th Percentile ($000's) 60.0 64.2 62.0 64.9 49.0 60.7Average ($000's) 52.0 52.4 55.1 58.0 46.1 52.5
Incentive Pay% Incentive Eligible 47% 45% 69% 50% 5% 58%25th Percentile ($000's) 3.6 2.5 3.8 2.2 -- 4.250th Percentile ($000's) 4.5 5.2 4.3 3.2 6.3 4.775th Percentile ($000's) 5.3 5.9 4.8 4.2 -- 5.3Average ($000's) 4.7 4.2 4.9 3.5 6.7 4.7
25th Percentile ($000's) 43.4 41.7 51.9 52.5 41.3 43.050th Percentile ($000's) 52.2 52.3 58.0 56.5 44.3 54.075th Percentile ($000's) 61.2 69.5 65.4 66.0 49.0 62.2Average ($000's) 53.5 53.5 58.8 59.4 46.5 53.9
Most Recent New HireEmployers Reported 8 1 1 1 0 5
Median ($000's) 59.9 -- -- -- -- 60.0Average ($000's) 53.6 -- -- -- -- 54.7
The data for this position is a combination of the data reported by participants for 232 Accountant and 233 Senior Accountant
Industry - Type of Employer
Total Cash CompensationBase Plus Incentive Pay
Job Match Comparability
Page 3-40Southwestern Pennsylvania Annual Compensation and Benefits Study
© 2010 Pittsburgh Technology Council. All rights reserved.

Job Code 231 ACCOUNTANT - ALL LEVELS
Description
Less than 50 50 - 150 151 - 500 More than 500Less than
$7.5M$7.5M to
$25M$26M to $150M
More than $150M
Annual Base PayEmployers Reported 7 9 9 22 2 13 9 23Employees Reported 9 14 27 227 2 18 15 242
25th Percentile ($000's) 51.2 47.5 50.2 42.8 -- 49.2 46.7 43.050th Percentile ($000's) 64.6 53.5 55.8 49.8 -- 55.4 52.7 50.675th Percentile ($000's) 66.9 57.0 61.5 58.9 -- 63.5 56.0 59.8Average ($000's) 59.6 54.6 55.4 51.1 -- 56.8 51.2 51.6
Incentive Pay% Incentive Eligible 44% 71% 52% 45% 100% 56% 73% 44%
25th Percentile ($000's) -- 4.4 1.5 3.9 -- 2.4 6.1 3.750th Percentile ($000's) 4.4 6.4 2.5 4.5 -- 3.6 6.7 4.475th Percentile ($000's) -- 7.2 5.5 5.0 -- 5.9 7.3 4.9Average ($000's) 4.1 5.9 5.2 4.5 -- 4.6 6.9 4.5
25th Percentile ($000's) 51.2 52.4 51.4 42.9 -- 50.9 49.3 43.050th Percentile ($000's) 64.6 55.4 57.7 50.9 -- 55.4 53.4 51.875th Percentile ($000's) 72.1 60.7 64.6 60.5 -- 67.2 59.3 60.7Average ($000's) 61.4 57.5 58.1 52.4 -- 58.6 53.9 52.9
Most Recent New HireEmployers Reported 0 2 1 5 0 2 1 5
Median ($000's) -- -- -- 60.0 -- -- -- 60.0Average ($000's) -- -- -- 55.1 -- -- -- 55.1
Total Cash CompensationBase Plus Incentive Pay
The data for this position is a combination of the data reported by participants for 232 Accountant and 233 Senior Accountant
Organizational FTE's Organizational Revenue ($ Millions)
Page 3-41Southwestern Pennsylvania Annual Compensation and Benefits Study
© 2010 Pittsburgh Technology Council. All rights reserved.

Job Code 232 ACCOUNTANT
Description
3.6% Less Complex92.7% Comparable3.6% More Complex
All Organizations
Software, Computer and
Technology Manufacturing
Life-Sciences/ Biotech/
Medical Devices Not-for-ProfitAll Other
EmployersAnnual Base Pay
Employers Reported 32 3 10 3 6 10Employees Reported 137 8 17 15 33 6425th Percentile ($000's) 40.0 39.5 43.8 51.3 38.1 39.150th Percentile ($000's) 46.8 43.3 51.9 54.9 42.7 46.975th Percentile ($000's) 56.0 53.1 64.2 56.4 45.0 60.0Average ($000's) 48.8 44.8 52.5 54.8 42.8 50.0
Incentive Pay% Incentive Eligible 53% 50% 88% 47% 6% 69%25th Percentile ($000's) 3.6 -- 3.9 1.8 -- 4.250th Percentile ($000's) 4.4 1.5 4.5 2.6 -- 4.875th Percentile ($000's) 5.0 -- 4.6 3.4 -- 5.3Average ($000's) 4.2 1.5 4.4 2.6 -- 4.7
25th Percentile ($000's) 41.0 39.5 47.0 52.0 38.5 39.350th Percentile ($000's) 47.0 44.1 52.0 55.1 43.0 47.875th Percentile ($000's) 57.7 53.1 68.3 56.7 46.3 60.8Average ($000's) 50.1 45.0 55.1 55.9 43.1 51.7
Most Recent New HireEmployers Reported 5 1 1 0 0 3
Median ($000's) 50.0 -- -- -- -- 56.9Average ($000's) 50.2 -- -- -- -- 52.0
Performs accounting functions such as maintaining general and subsidiary ledgers and preparing operating and financial statements.Examines financial statements for completeness, internal accuracy, and conformity with standard practice. Prepares trial balances,statements, exhibits, and reports. Normally requires a four year degree in accounting and 1–3 years experience.
Industry - Type of Employer
Total Cash CompensationBase Plus Incentive Pay
Job Match Comparability
Page 3-42Southwestern Pennsylvania Annual Compensation and Benefits Study
© 2010 Pittsburgh Technology Council. All rights reserved.

Job Code 232 ACCOUNTANT
Description
Less than 50 50 - 150 151 - 500 More than 500Less than
$7.5M$7.5M to
$25M$26M to $150M
More than $150M
Annual Base PayEmployers Reported 4 6 5 17 0 8 6 18Employees Reported 5 6 10 116 0 9 9 119
25th Percentile ($000's) 48.5 39.5 43.6 39.6 -- 42.7 42.5 39.850th Percentile ($000's) 51.2 46.6 52.3 46.0 -- 48.5 52.7 46.275th Percentile ($000's) 53.4 51.3 54.3 56.5 -- 52.0 54.4 56.4Average ($000's) 52.1 45.8 49.0 48.8 -- 48.1 48.6 48.9
Incentive Pay% Incentive Eligible 40% 67% 90% 49% -- 56% 78% 50%
25th Percentile ($000's) -- -- 1.1 3.7 -- 2.1 7.4 3.750th Percentile ($000's) -- 6.3 1.1 4.5 -- 2.9 7.8 4.475th Percentile ($000's) -- -- 1.1 4.9 -- 4.3 8.3 4.9Average ($000's) -- 4.9 1.1 4.3 -- 3.4 7.8 4.1
25th Percentile ($000's) 50.8 43.7 43.6 39.9 -- 45.7 42.5 40.150th Percentile ($000's) 51.2 48.8 52.3 46.7 -- 50.8 53.4 46.875th Percentile ($000's) 53.4 54.3 54.3 59.8 -- 52.0 56.1 59.7Average ($000's) 53.2 48.3 49.1 50.2 -- 49.6 50.3 50.1
Most Recent New HireEmployers Reported 0 1 1 3 0 1 1 3
Median ($000's) -- -- -- 56.9 -- -- -- 56.9Average ($000's) -- -- -- 52.0 -- -- -- 52.0
Total Cash CompensationBase Plus Incentive Pay
Performs accounting functions such as maintaining general and subsidiary ledgers and preparing operating and financial statements.Examines financial statements for completeness, internal accuracy, and conformity with standard practice. Prepares trial balances,statements, exhibits, and reports. Normally requires a four year degree in accounting and 1–3 years experience.
Organizational FTE's Organizational Revenue ($ Millions)
Page 3-43Southwestern Pennsylvania Annual Compensation and Benefits Study
© 2010 Pittsburgh Technology Council. All rights reserved.

Job Code 233 SENIOR ACCOUNTANT
Description
25.7% Less Complex54.3% Comparable20.0% More Complex
All Organizations
Software, Computer and
Technology Manufacturing
Life-Sciences/ Biotech/
Medical Devices Not-for-ProfitAll Other
EmployersAnnual Base Pay
Employers Reported 32 7 7 3 4 11Employees Reported 140 12 32 5 27 6425th Percentile ($000's) 47.5 48.0 51.8 65.0 43.7 49.550th Percentile ($000's) 54.3 58.4 54.4 65.1 47.4 55.575th Percentile ($000's) 62.1 68.4 59.8 73.5 54.2 62.2Average ($000's) 55.1 57.5 56.5 67.6 50.2 55.0
Incentive Pay% Incentive Eligible 41% 42% 59% 60% 4% 47%25th Percentile ($000's) 3.9 4.5 3.1 -- -- 4.050th Percentile ($000's) 4.6 5.6 4.2 6.3 -- 4.575th Percentile ($000's) 5.4 5.9 4.9 -- -- 5.3Average ($000's) 5.1 4.9 5.0 6.3 -- 4.6
25th Percentile ($000's) 49.1 48.0 54.0 65.1 43.7 49.550th Percentile ($000's) 56.8 61.4 58.6 65.6 47.4 55.875th Percentile ($000's) 64.4 72.1 62.1 74.3 54.2 63.9Average ($000's) 56.8 59.2 60.7 70.1 50.6 56.0
Most Recent New HireEmployers Reported 4 0 0 1 0 3
Median ($000's) 63.8 -- -- -- -- 62.5Average ($000's) 63.9 -- -- -- -- 63.5
Analyzes accounting systems to determine need for new accounts, revisions in accounts structure, and new types of ledgers, revisions inreporting systems, and new classifications and definitions. Determines accounting treatment of financial transactions. Recommendssolutions to complex accounting problems. May provide work direction to lower-level accountants. Normally requires a four year degreein accounting and 4 or more years experience.
Industry - Type of Employer
Total Cash CompensationBase Plus Incentive Pay
Job Match Comparability
Page 3-44Southwestern Pennsylvania Annual Compensation and Benefits Study
© 2010 Pittsburgh Technology Council. All rights reserved.

Job Code 233 SENIOR ACCOUNTANT
Description
Less than 50 50 - 150 151 - 500 More than 500Less than
$7.5M$7.5M to
$25M$26M to $150M
More than $150M
Annual Base PayEmployers Reported 3 7 5 17 2 8 4 18Employees Reported 4 8 17 111 2 9 6 123
25th Percentile ($000's) -- 53.5 54.3 46.1 -- 57.4 48.3 46.950th Percentile ($000's) 68.5 56.6 59.7 52.8 -- 60.0 52.9 54.075th Percentile ($000's) -- 62.5 66.0 60.0 -- 70.2 60.9 61.0Average ($000's) 69.0 61.1 59.2 53.5 -- 65.6 55.1 54.1
Incentive Pay% Incentive Eligible 50% 75% 29% 41% 100% 56% 67% 38%
25th Percentile ($000's) -- 5.4 1.5 4.1 -- 4.0 -- 3.350th Percentile ($000's) -- 6.9 2.5 4.6 -- 5.6 6.2 4.375th Percentile ($000's) -- 8.1 5.6 5.0 -- 8.0 -- 4.9Average ($000's) -- 6.7 5.5 4.6 -- 6.1 6.4 4.9
25th Percentile ($000's) -- 55.2 56.8 46.3 -- 60.0 52.5 47.450th Percentile ($000's) 72.1 60.5 61.7 54.2 -- 67.7 57.2 55.275th Percentile ($000's) -- 68.9 69.3 61.7 -- 72.1 67.2 62.3Average ($000's) 71.6 64.4 63.4 54.7 -- 67.6 59.4 55.7
Most Recent New HireEmployers Reported 0 1 0 3 0 1 0 3
Median ($000's) -- -- -- 65.0 -- -- -- 65.0Average ($000's) -- -- -- 65.2 -- -- -- 65.2
Total Cash CompensationBase Plus Incentive Pay
Analyzes accounting systems to determine need for new accounts, revisions in accounts structure, and new types of ledgers, revisions inreporting systems, and new classifications and definitions. Determines accounting treatment of financial transactions. Recommendssolutions to complex accounting problems. May provide work direction to lower-level accountants. Normally requires a four year degreein accounting and 4 or more years experience.
Organizational FTE's Organizational Revenue ($ Millions)
Page 3-45Southwestern Pennsylvania Annual Compensation and Benefits Study
© 2010 Pittsburgh Technology Council. All rights reserved.

Job Code 245 ACCOUNTING MANAGER
Description
0.0% Less Complex80.6% Comparable19.4% More Complex
All Organizations
Software, Computer and
Technology Manufacturing
Life-Sciences/ Biotech/
Medical Devices Not-for-ProfitAll Other
EmployersAnnual Base Pay
Employers Reported 35 7 8 1 5 14Employees Reported 72 8 17 7 6 3425th Percentile ($000's) 68.2 60.7 71.0 -- 58.6 68.950th Percentile ($000's) 87.6 71.8 91.2 -- 66.9 87.675th Percentile ($000's) 99.9 85.0 99.2 -- 72.0 99.0Average ($000's) 87.8 73.5 89.6 -- 65.5 86.9
Incentive Pay% Incentive Eligible 65% 50% 82% 100% 17% 62%25th Percentile ($000's) 2.4 -- 8.6 -- -- 1.450th Percentile ($000's) 8.9 8.1 19.2 -- -- 2.575th Percentile ($000's) 22.7 -- 24.4 -- -- 8.4Average ($000's) 13.9 7.3 16.9 -- -- 8.0
25th Percentile ($000's) 69.9 61.7 83.5 -- 58.6 69.150th Percentile ($000's) 89.7 75.6 109.8 -- 66.9 89.075th Percentile ($000's) 114.0 91.1 116.5 -- 72.0 105.8Average ($000's) 95.9 76.2 102.6 -- 65.9 91.1
Most Recent New HireEmployers Reported 3 0 1 0 0 2
Median ($000's) 90.0 -- -- -- -- --Average ($000's) 90.7 -- -- -- -- --
Manages a major accounting function directly or through subordinate supervisors. Typical responsibilities include maintaining general andsubsidiary ledgers, preparing operating and financial statements, reconciling bank statements, fixed asset control and depreciation, andtax report preparation. Requires a degree in accounting and 6 or more years experience.
Industry - Type of Employer
Total Cash CompensationBase Plus Incentive Pay
Job Match Comparability
Page 3-46Southwestern Pennsylvania Annual Compensation and Benefits Study
© 2010 Pittsburgh Technology Council. All rights reserved.

Job Code 245 ACCOUNTING MANAGER
Description
Less than 50 50 - 150 151 - 500 More than 500Less than
$7.5M$7.5M to
$25M$26M to $150M
More than $150M
Annual Base PayEmployers Reported 5 6 8 16 6 4 8 17Employees Reported 5 7 12 48 6 4 10 52
25th Percentile ($000's) 55.0 66.8 67.4 73.0 58.3 -- 64.2 73.050th Percentile ($000's) 68.0 68.3 81.9 89.7 70.2 73.7 69.5 90.375th Percentile ($000's) 81.4 82.8 92.8 105.1 88.3 -- 82.1 104.4Average ($000's) 69.8 74.5 79.8 93.6 72.5 74.9 74.1 93.2
Incentive Pay% Incentive Eligible 40% 57% 50% 73% 17% 75% 50% 73%
25th Percentile ($000's) -- -- 7.3 2.3 -- -- 8.5 2.350th Percentile ($000's) -- 8.9 7.8 14.2 -- 3.3 8.9 11.775th Percentile ($000's) -- -- 8.1 24.5 -- -- 16.7 23.2Average ($000's) -- 7.9 7.3 16.1 -- 5.3 16.3 14.4
25th Percentile ($000's) 55.0 70.9 67.4 74.3 58.3 -- 65.0 78.650th Percentile ($000's) 68.0 76.7 86.8 96.4 70.2 76.4 76.8 95.775th Percentile ($000's) 83.4 85.9 98.2 120.7 88.3 -- 88.1 117.6Average ($000's) 70.2 79.0 82.9 104.3 72.5 78.9 80.6 102.9
Most Recent New HireEmployers Reported 0 0 1 2 0 0 0 3
Median ($000's) -- -- -- -- -- -- -- 90.0Average ($000's) -- -- -- -- -- -- -- 90.7
Total Cash CompensationBase Plus Incentive Pay
Manages a major accounting function directly or through subordinate supervisors. Typical responsibilities include maintaining general andsubsidiary ledgers, preparing operating and financial statements, reconciling bank statements, fixed asset control and depreciation, andtax report preparation. Requires a degree in accounting and 6 or more years experience.
Organizational FTE's Organizational Revenue ($ Millions)
Page 3-47Southwestern Pennsylvania Annual Compensation and Benefits Study
© 2010 Pittsburgh Technology Council. All rights reserved.

Job Code 246 FINANCIAL ANALYST
Description
1.7% Less Complex62.1% Comparable36.2% More Complex
All Organizations
Software, Computer and
Technology Manufacturing
Life-Sciences/ Biotech/
Medical Devices Not-for-ProfitAll Other
EmployersAnnual Base Pay
Employers Reported 15 2 3 1 3 6Employees Reported 58 6 9 13 6 2425th Percentile ($000's) 58.6 65.3 75.2 -- 58.3 53.250th Percentile ($000's) 68.0 74.4 80.0 -- 59.7 59.475th Percentile ($000's) 76.9 82.0 80.0 -- 61.4 69.5Average ($000's) 66.5 73.9 75.3 -- 60.5 60.0
Incentive Pay% Incentive Eligible 69% 0% 100% 100% 0% 75%25th Percentile ($000's) 3.3 -- 5.4 -- -- 1.650th Percentile ($000's) 4.6 -- 5.7 -- -- 4.075th Percentile ($000's) 5.6 -- 6.5 -- -- 5.5Average ($000's) 4.4 -- 5.9 -- -- 3.7
25th Percentile ($000's) 59.8 65.3 81.4 -- 58.3 54.850th Percentile ($000's) 68.4 74.4 85.3 -- 59.7 63.075th Percentile ($000's) 79.8 82.0 86.3 -- 61.4 72.5Average ($000's) 68.6 73.9 81.1 -- 60.5 61.5
Most Recent New HireEmployers Reported 3 0 0 1 0 2
Median ($000's) 75.8 -- -- -- -- --Average ($000's) 71.9 -- -- -- -- --
Gathers financial-related information, assembles spreadsheets, write reports and present results to senior management. Usesspreadsheets and statistical software packages to analyze financial data, spot trends and develop forecasts. May be responsible forbudget analysis and providing analyses to measure the financial risks associated with making a particular investment decision. Requiresa degree in finance and accounting and 3 years of prior experience.
Industry - Type of Employer
Total Cash CompensationBase Plus Incentive Pay
Job Match Comparability
Page 3-48Southwestern Pennsylvania Annual Compensation and Benefits Study
© 2010 Pittsburgh Technology Council. All rights reserved.

Job Code 246 FINANCIAL ANALYST
Description
Less than 50 50 - 150 151 - 500 More than 500Less than
$7.5M$7.5M to
$25M$26M to $150M
More than $150M
Annual Base PayEmployers Reported 0 0 0 15 0 0 1 14Employees Reported 0 0 0 58 0 0 1 57
25th Percentile ($000's) -- -- -- 58.6 -- -- -- 58.650th Percentile ($000's) -- -- -- 68.0 -- -- -- 69.175th Percentile ($000's) -- -- -- 76.9 -- -- -- 77.3Average ($000's) -- -- -- 66.5 -- -- -- 66.6
Incentive Pay% Incentive Eligible -- -- -- 69% -- -- 0% 70%
25th Percentile ($000's) -- -- -- 3.3 -- -- -- 3.350th Percentile ($000's) -- -- -- 4.6 -- -- -- 4.675th Percentile ($000's) -- -- -- 5.6 -- -- -- 5.6Average ($000's) -- -- -- 4.4 -- -- -- 4.4
25th Percentile ($000's) -- -- -- 59.8 -- -- -- 59.750th Percentile ($000's) -- -- -- 68.4 -- -- -- 69.175th Percentile ($000's) -- -- -- 79.8 -- -- -- 80.0Average ($000's) -- -- -- 68.6 -- -- -- 68.7
Most Recent New HireEmployers Reported 0 0 0 3 0 0 0 3
Median ($000's) -- -- -- 75.8 -- -- -- 75.8Average ($000's) -- -- -- 71.9 -- -- -- 71.9
Total Cash CompensationBase Plus Incentive Pay
Gathers financial-related information, assembles spreadsheets, write reports and present results to senior management. Usesspreadsheets and statistical software packages to analyze financial data, spot trends and develop forecasts. May be responsible forbudget analysis and providing analyses to measure the financial risks associated with making a particular investment decision. Requiresa degree in finance and accounting and 3 years of prior experience.
Organizational FTE's Organizational Revenue ($ Millions)
Page 3-49Southwestern Pennsylvania Annual Compensation and Benefits Study
© 2010 Pittsburgh Technology Council. All rights reserved.

Job Code 252 BUYER/PLANNER - ALL LEVELS
Description
5.6% Less Complex91.5% Comparable2.8% More Complex
All Organizations
Software, Computer and
Technology Manufacturing
Life-Sciences/ Biotech/
Medical Devices Not-for-ProfitAll Other
EmployersAnnual Base Pay
Employers Reported 31 3 13 4 2 9Employees Reported 142 10 65 21 5 4125th Percentile ($000's) 46.2 46.4 46.4 46.8 32.5 47.750th Percentile ($000's) 52.1 49.7 52.9 57.4 32.5 51.275th Percentile ($000's) 60.3 56.1 57.8 66.5 35.0 62.0Average ($000's) 54.5 50.7 53.4 56.3 34.8 58.8
Incentive Pay% Incentive Eligible 83% 70% 89% 76% 0% 90%25th Percentile ($000's) 2.7 3.2 4.0 2.3 -- 3.650th Percentile ($000's) 4.2 3.2 4.4 2.6 -- 4.375th Percentile ($000's) 5.0 3.2 5.3 2.8 -- 6.5Average ($000's) 4.5 3.2 4.6 2.6 -- 6.4
25th Percentile ($000's) 46.5 46.4 47.5 49.4 32.5 47.950th Percentile ($000's) 53.7 49.7 54.0 58.3 32.5 52.275th Percentile ($000's) 62.3 56.1 61.4 68.7 35.0 67.3Average ($000's) 56.4 51.0 55.5 58.1 34.8 60.9
Most Recent New HireEmployers Reported 8 1 2 2 0 3
Median ($000's) 46.2 -- -- -- -- 47.5Average ($000's) 48.3 -- -- -- -- 54.9
The data for this position is a combination of the data reported by participants for 253 Buyer/Planner and 254 Senior Buyer/Planner
Industry - Type of Employer
Total Cash CompensationBase Plus Incentive Pay
Job Match Comparability
Page 3-50Southwestern Pennsylvania Annual Compensation and Benefits Study
© 2010 Pittsburgh Technology Council. All rights reserved.

Job Code 252 BUYER/PLANNER - ALL LEVELS
Description
Less than 50 50 - 150 151 - 500 More than 500Less than
$7.5M$7.5M to
$25M$26M to $150M
More than $150M
Annual Base PayEmployers Reported 5 3 7 16 5 3 7 16Employees Reported 6 5 37 94 5 4 31 102
25th Percentile ($000's) 46.9 41.8 41.4 47.5 45.0 -- 40.7 47.550th Percentile ($000's) 53.7 46.6 49.9 54.9 49.8 46.3 49.5 54.975th Percentile ($000's) 63.9 52.9 55.4 63.2 66.1 -- 53.9 62.1Average ($000's) 55.1 50.7 48.7 57.0 53.8 48.3 48.4 56.7
Incentive Pay% Incentive Eligible 100% 60% 84% 83% 80% 75% 77% 85%
25th Percentile ($000's) 2.7 -- 3.3 2.6 -- -- 6.1 2.650th Percentile ($000's) 3.2 7.5 3.3 4.2 3.2 4.8 7.5 4.275th Percentile ($000's) 4.0 -- 3.3 4.9 -- -- 8.8 4.9Average ($000's) 3.5 7.4 3.3 4.4 2.5 4.8 7.4 4.4
25th Percentile ($000's) 51.2 41.8 41.4 48.0 45.0 -- 41.4 48.350th Percentile ($000's) 54.9 46.6 49.9 55.8 50.8 49.4 49.5 55.675th Percentile ($000's) 66.4 60.4 55.4 68.2 69.3 -- 55.1 67.1Average ($000's) 57.4 55.2 48.8 59.4 55.3 50.7 49.1 58.9
Most Recent New HireEmployers Reported 1 0 2 5 1 0 2 5
Median ($000's) -- -- -- 47.5 -- -- -- 47.5Average ($000's) -- -- -- 52.1 -- -- -- 52.1
Total Cash CompensationBase Plus Incentive Pay
The data for this position is a combination of the data reported by participants for 253 Buyer/Planner and 254 Senior Buyer/Planner
Organizational FTE's Organizational Revenue ($ Millions)
Page 3-51Southwestern Pennsylvania Annual Compensation and Benefits Study
© 2010 Pittsburgh Technology Council. All rights reserved.

Job Code 253 BUYER/PLANNER
Description
9.0% Less Complex86.5% Comparable4.5% More Complex
All Organizations
Software, Computer and
Technology Manufacturing
Life-Sciences/ Biotech/
Medical Devices Not-for-ProfitAll Other
EmployersAnnual Base Pay
Employers Reported 27 3 13 2 2 7Employees Reported 89 6 43 9 5 2625th Percentile ($000's) 42.7 42.4 43.5 43.0 32.5 45.050th Percentile ($000's) 47.7 49.7 47.5 46.8 32.5 47.975th Percentile ($000's) 52.9 51.2 55.6 52.9 35.0 50.6Average ($000's) 48.5 49.5 49.3 48.3 34.8 49.6
Incentive Pay% Incentive Eligible 82% 83% 84% 100% 0% 88%25th Percentile ($000's) 2.7 3.2 3.5 1.9 -- 3.450th Percentile ($000's) 4.1 3.2 4.3 2.5 -- 4.275th Percentile ($000's) 4.6 3.2 4.8 2.9 -- 5.7Average ($000's) 4.0 3.2 4.3 2.5 -- 4.5
25th Percentile ($000's) 43.0 42.4 43.5 44.9 32.5 45.450th Percentile ($000's) 49.2 49.7 50.8 49.4 32.5 48.475th Percentile ($000's) 55.3 51.2 59.5 55.7 35.0 54.8Average ($000's) 50.4 50.1 51.6 50.6 34.8 51.5
Most Recent New HireEmployers Reported 6 1 2 1 0 2
Median ($000's) 46.2 -- -- -- -- --Average ($000's) 44.6 -- -- -- -- --
Determines material needs, timing, and sourcing. Forecasts future demand for materials and products and plans purchases. Preparesand places orders for standard and nonstandard materials, products, and services based on demand forecast. Evaluates materialshortages and determines appropriate inventory levels. Negotiates contracts within specified limits. Negotiates returns of defectivematerials. Identifies sources and vendors. Controls, monitors, and analyzes vendor quality. Typically requires a degree and 2–4 yearsexperience.
Industry - Type of Employer
Total Cash CompensationBase Plus Incentive Pay
Job Match Comparability
Page 3-52Southwestern Pennsylvania Annual Compensation and Benefits Study
© 2010 Pittsburgh Technology Council. All rights reserved.

Job Code 253 BUYER/PLANNER
Description
Less than 50 50 - 150 151 - 500 More than 500Less than
$7.5M$7.5M to
$25M$26M to $150M
More than $150M
Annual Base PayEmployers Reported 4 3 7 13 4 3 7 13Employees Reported 4 5 22 58 4 3 23 59
25th Percentile ($000's) -- 41.8 39.4 45.0 -- -- 38.7 44.750th Percentile ($000's) 58.0 46.6 43.1 48.0 58.0 46.0 44.1 48.075th Percentile ($000's) -- 52.9 48.7 55.9 -- -- 49.7 55.7Average ($000's) 57.0 50.7 43.1 49.8 56.0 45.2 45.0 49.5
Incentive Pay% Incentive Eligible 100% 60% 73% 86% 75% 67% 70% 88%
25th Percentile ($000's) -- -- 3.3 2.5 -- -- 6.1 2.550th Percentile ($000's) 3.2 7.5 3.3 4.1 3.2 -- 7.5 4.175th Percentile ($000's) -- -- 3.3 4.4 -- -- 8.8 4.4Average ($000's) 3.5 7.4 3.3 3.8 2.5 -- 7.4 3.8
25th Percentile ($000's) -- 41.8 39.4 45.4 -- -- 40.0 45.150th Percentile ($000's) 60.8 46.6 43.5 49.9 60.1 46.6 44.1 49.975th Percentile ($000's) -- 60.4 48.8 59.5 -- -- 49.7 59.4Average ($000's) 60.5 55.2 43.3 52.1 57.8 48.5 45.9 51.8
Most Recent New HireEmployers Reported 0 0 2 4 0 0 2 4
Median ($000's) -- -- -- 47.5 -- -- -- 47.5Average ($000's) -- -- -- 47.3 -- -- -- 47.3
Total Cash CompensationBase Plus Incentive Pay
Determines material needs, timing, and sourcing. Forecasts future demand for materials and products and plans purchases. Preparesand places orders for standard and nonstandard materials, products, and services based on demand forecast. Evaluates materialshortages and determines appropriate inventory levels. Negotiates contracts within specified limits. Negotiates returns of defectivematerials. Identifies sources and vendors. Controls, monitors, and analyzes vendor quality. Typically requires a degree and 2–4 yearsexperience.
Organizational FTE's Organizational Revenue ($ Millions)
Page 3-53Southwestern Pennsylvania Annual Compensation and Benefits Study
© 2010 Pittsburgh Technology Council. All rights reserved.

Job Code 254 SENIOR BUYER/PLANNER
Description
0.0% Less Complex100.0% Comparable0.0% More Complex
All Organizations
Software, Computer and
Technology Manufacturing
Life-Sciences/ Biotech/
Medical Devices Not-for-ProfitAll Other
EmployersAnnual Base Pay
Employers Reported 17 2 6 3 0 6Employees Reported 53 4 22 12 0 1525th Percentile ($000's) 55.8 -- 55.5 59.3 -- 57.150th Percentile ($000's) 59.9 52.4 57.5 64.3 -- 78.075th Percentile ($000's) 68.7 -- 65.3 68.1 -- 91.5Average ($000's) 64.7 52.5 61.3 62.4 -- 74.7
Incentive Pay% Incentive Eligible 85% 50% 100% 58% -- 93%25th Percentile ($000's) 2.7 -- 5.0 2.6 -- 11.050th Percentile ($000's) 4.9 -- 5.3 2.6 -- 17.075th Percentile ($000's) 5.4 -- 5.6 2.7 -- 23.1Average ($000's) 5.8 -- 5.3 2.7 -- 17.0
25th Percentile ($000's) 55.8 -- 55.5 59.5 -- 57.150th Percentile ($000's) 61.0 52.4 59.3 65.9 -- 80.675th Percentile ($000's) 70.6 -- 67.2 69.1 -- 91.5Average ($000's) 66.4 52.5 63.2 63.7 -- 77.0
Most Recent New HireEmployers Reported 2 0 0 1 0 1
Median ($000's) -- -- -- -- -- --Average ($000's) -- -- -- -- -- --
Determines material needs, timing, and sourcing. Prepares and places orders for nonstandard, complex and specialty materials, products,and services based on demand forecast. Evaluates material shortages and determines appropriate inventory levels. Also providesguidance and mentoring to lower level staff. Negotiates contracts within specified limits. Negotiates returns of defective materials. Identifies sources and vendors. Controls, monitors, and analyzes vendor quality. Typically requires a degree and 5 or more yearsexperience.
Industry - Type of Employer
Total Cash CompensationBase Plus Incentive Pay
Job Match Comparability
Page 3-54Southwestern Pennsylvania Annual Compensation and Benefits Study
© 2010 Pittsburgh Technology Council. All rights reserved.

Job Code 254 SENIOR BUYER/PLANNER
Description
Less than 50 50 - 150 151 - 500 More than 500Less than
$7.5M$7.5M to
$25M$26M to $150M
More than $150M
Annual Base PayEmployers Reported 2 0 3 12 1 1 2 13Employees Reported 2 0 15 36 1 1 8 43
25th Percentile ($000's) -- -- 53.9 57.8 -- -- 55.7 55.950th Percentile ($000's) -- -- 56.3 66.0 -- -- 57.6 61.875th Percentile ($000's) -- -- 58.2 80.0 -- -- 59.4 74.0Average ($000's) -- -- 57.0 68.6 -- -- 58.3 66.5
Incentive Pay% Incentive Eligible 100% -- 100% 78% 100% 100% 100% 81%
25th Percentile ($000's) -- -- -- 2.7 -- -- -- 2.750th Percentile ($000's) -- -- -- 4.9 -- -- -- 4.975th Percentile ($000's) -- -- -- 5.4 -- -- -- 5.4Average ($000's) -- -- -- 5.8 -- -- -- 5.8
25th Percentile ($000's) -- -- 53.9 59.7 -- -- 55.7 56.250th Percentile ($000's) -- -- 56.3 68.6 -- -- 57.6 63.375th Percentile ($000's) -- -- 58.2 83.3 -- -- 59.4 77.7Average ($000's) -- -- 57.0 71.2 -- -- 58.3 68.6
Most Recent New HireEmployers Reported 1 0 0 1 1 0 0 1
Median ($000's) -- -- -- -- -- -- -- --Average ($000's) -- -- -- -- -- -- -- --
Total Cash CompensationBase Plus Incentive Pay
Determines material needs, timing, and sourcing. Prepares and places orders for nonstandard, complex and specialty materials, products,and services based on demand forecast. Evaluates material shortages and determines appropriate inventory levels. Also providesguidance and mentoring to lower level staff. Negotiates contracts within specified limits. Negotiates returns of defective materials. Identifies sources and vendors. Controls, monitors, and analyzes vendor quality. Typically requires a degree and 5 or more yearsexperience.
Organizational FTE's Organizational Revenue ($ Millions)
Page 3-55Southwestern Pennsylvania Annual Compensation and Benefits Study
© 2010 Pittsburgh Technology Council. All rights reserved.

Job Code 255 PURCHASING MANAGER
Description
6.1% Less Complex54.5% Comparable39.4% More Complex
All Organizations
Software, Computer and
Technology Manufacturing
Life-Sciences/ Biotech/
Medical Devices Not-for-ProfitAll Other
EmployersAnnual Base Pay
Employers Reported 23 2 12 3 1 5Employees Reported 33 2 14 8 1 825th Percentile ($000's) 72.9 -- 69.9 84.2 -- 99.050th Percentile ($000's) 92.3 -- 79.1 105.4 -- 101.675th Percentile ($000's) 106.0 -- 99.5 114.7 -- 107.1Average ($000's) 90.6 -- 84.7 98.0 -- 99.9
Incentive Pay% Incentive Eligible 79% 50% 71% 88% 0% 100%25th Percentile ($000's) 9.6 -- 6.3 13.6 -- 13.350th Percentile ($000's) 14.6 -- 7.0 15.1 -- 15.675th Percentile ($000's) 16.7 -- 11.6 16.7 -- 17.5Average ($000's) 14.2 -- 12.6 14.1 -- 16.0
25th Percentile ($000's) 75.5 -- 70.7 93.4 -- 104.250th Percentile ($000's) 99.4 -- 82.0 120.4 -- 114.975th Percentile ($000's) 121.2 -- 102.4 131.4 -- 124.2Average ($000's) 98.8 -- 90.1 110.3 -- 111.8
Most Recent New HireEmployers Reported 0 0 0 0 0 0
Median ($000's) -- -- -- -- -- --Average ($000's) -- -- -- -- -- --
Manages forecasting and purchasing functions. Supervises purchasing and planning staff. Coordinates forecasts, procurement, andinventory requirements. Sets planning priorities. Determines and establishes procurement procedures. Maintains relationships withvendors and monitors performance. Meets with vendors to control backorders, improve or maintain on-time delivery, prevent or solveproblems, and share forecasts. Reviews alternative suppliers. May manage inventories and records. Typically requires a degree and 5 ormore years experience.
Industry - Type of Employer
Total Cash CompensationBase Plus Incentive Pay
Job Match Comparability
Page 3-56Southwestern Pennsylvania Annual Compensation and Benefits Study
© 2010 Pittsburgh Technology Council. All rights reserved.

Job Code 255 PURCHASING MANAGER
Description
Less than 50 50 - 150 151 - 500 More than 500Less than
$7.5M$7.5M to
$25M$26M to $150M
More than $150M
Annual Base PayEmployers Reported 2 2 8 11 2 2 6 13Employees Reported 2 2 9 20 2 2 6 23
25th Percentile ($000's) -- -- 68.9 85.5 -- -- 72.7 79.150th Percentile ($000's) -- -- 77.3 103.3 -- -- 88.4 101.475th Percentile ($000's) -- -- 91.7 114.1 -- -- 99.7 113.5Average ($000's) -- -- 77.9 100.2 -- -- 86.3 96.9
Incentive Pay% Incentive Eligible 50% 50% 78% 85% 50% 50% 67% 87%
25th Percentile ($000's) -- -- 4.7 12.3 -- -- -- 12.250th Percentile ($000's) -- -- 4.9 15.0 -- -- 13.2 14.975th Percentile ($000's) -- -- 5.0 17.0 -- -- -- 16.8Average ($000's) -- -- 4.9 15.4 -- -- 13.2 14.8
25th Percentile ($000's) -- -- 68.9 96.3 -- -- 72.7 83.450th Percentile ($000's) -- -- 77.3 118.0 -- -- 88.4 113.475th Percentile ($000's) -- -- 91.7 131.7 -- -- 102.6 131.5Average ($000's) -- -- 79.0 112.5 -- -- 88.5 107.9
Most Recent New HireEmployers Reported 0 0 0 0 0 0 0 0
Median ($000's) -- -- -- -- -- -- -- --Average ($000's) -- -- -- -- -- -- -- --
Total Cash CompensationBase Plus Incentive Pay
Manages forecasting and purchasing functions. Supervises purchasing and planning staff. Coordinates forecasts, procurement, andinventory requirements. Sets planning priorities. Determines and establishes procurement procedures. Maintains relationships withvendors and monitors performance. Meets with vendors to control backorders, improve or maintain on-time delivery, prevent or solveproblems, and share forecasts. Reviews alternative suppliers. May manage inventories and records. Typically requires a degree and 5 ormore years experience.
Organizational FTE's Organizational Revenue ($ Millions)
Page 3-57Southwestern Pennsylvania Annual Compensation and Benefits Study
© 2010 Pittsburgh Technology Council. All rights reserved.

Job Code 310 FIELD SERVICE TECHNICIAN - ALL LEVELS
Description
0.0% Less Complex76.9% Comparable23.1% More Complex
All Organizations
Software, Computer and
Technology Manufacturing
Life-Sciences/ Biotech/
Medical Devices Not-for-ProfitAll Other
EmployersAnnual Base Pay
Employers Reported 12 3 4 2 0 3Employees Reported 160 17 29 75 0 3925th Percentile ($000's) 41.1 43.3 44.7 36.4 -- 55.150th Percentile ($000's) 53.2 46.4 56.1 45.6 -- 57.775th Percentile ($000's) 63.0 54.1 63.3 57.8 -- 66.6Average ($000's) 52.5 50.7 56.2 48.0 -- 59.1
Incentive Pay% Incentive Eligible 63% 0% 97% 91% -- 10%25th Percentile ($000's) 1.4 -- 4.1 1.3 -- --50th Percentile ($000's) 1.9 -- 4.7 1.7 -- --75th Percentile ($000's) 3.4 -- 5.4 2.3 -- --Average ($000's) 2.6 -- 5.1 1.8 -- --
25th Percentile ($000's) 42.8 43.3 50.0 37.7 -- 55.150th Percentile ($000's) 54.1 46.4 59.0 47.2 -- 57.775th Percentile ($000's) 65.5 54.1 68.0 58.9 -- 66.6Average ($000's) 54.0 50.7 60.5 49.6 -- 59.1
Most Recent New HireEmployers Reported 3 1 1 0 0 1
Median ($000's) 45.0 -- -- -- -- --Average ($000's) 44.5 -- -- -- -- --
The data for this position is a combination of the data reported by participants for 311 Field Service Technician and 312 Senior FieldService Technician
Industry - Type of Employer
Total Cash CompensationBase Plus Incentive Pay
Job Match Comparability
Page 3-58Southwestern Pennsylvania Annual Compensation and Benefits Study
© 2010 Pittsburgh Technology Council. All rights reserved.
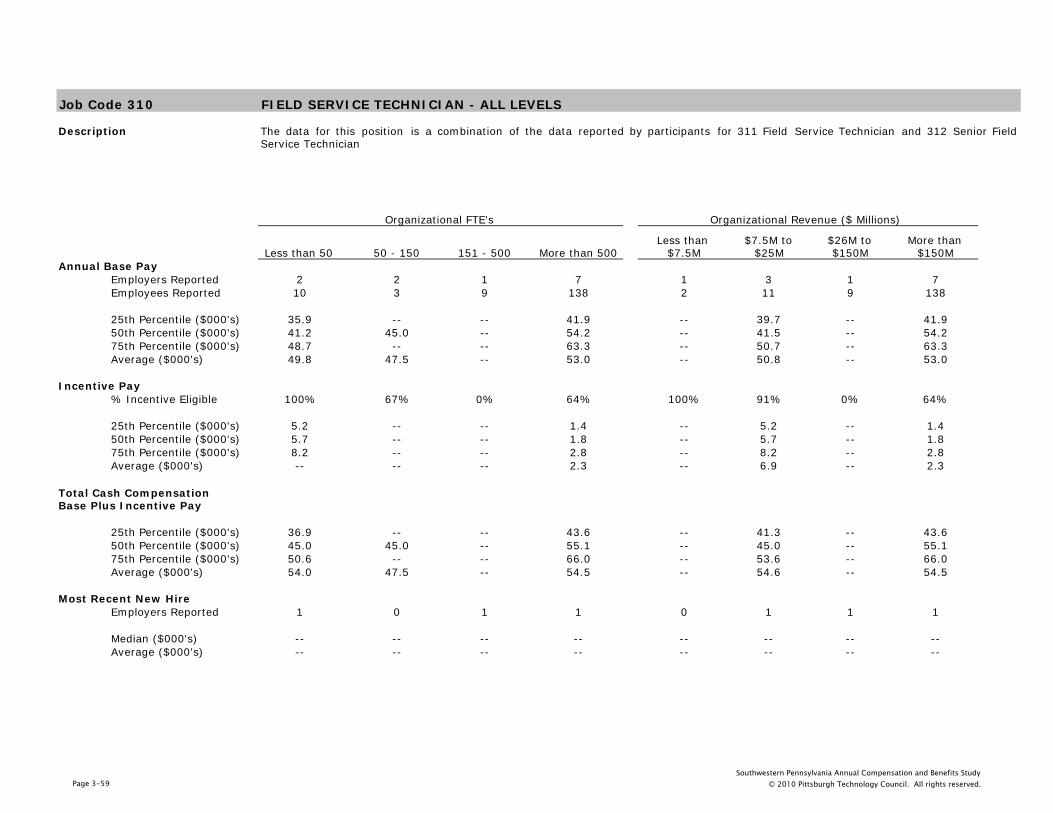
Job Code 310 FIELD SERVICE TECHNICIAN - ALL LEVELS
Description
Less than 50 50 - 150 151 - 500 More than 500Less than
$7.5M$7.5M to
$25M$26M to $150M
More than $150M
Annual Base PayEmployers Reported 2 2 1 7 1 3 1 7Employees Reported 10 3 9 138 2 11 9 138
25th Percentile ($000's) 35.9 -- -- 41.9 -- 39.7 -- 41.950th Percentile ($000's) 41.2 45.0 -- 54.2 -- 41.5 -- 54.275th Percentile ($000's) 48.7 -- -- 63.3 -- 50.7 -- 63.3Average ($000's) 49.8 47.5 -- 53.0 -- 50.8 -- 53.0
Incentive Pay% Incentive Eligible 100% 67% 0% 64% 100% 91% 0% 64%
25th Percentile ($000's) 5.2 -- -- 1.4 -- 5.2 -- 1.450th Percentile ($000's) 5.7 -- -- 1.8 -- 5.7 -- 1.875th Percentile ($000's) 8.2 -- -- 2.8 -- 8.2 -- 2.8Average ($000's) -- -- -- 2.3 -- 6.9 -- 2.3
25th Percentile ($000's) 36.9 -- -- 43.6 -- 41.3 -- 43.650th Percentile ($000's) 45.0 45.0 -- 55.1 -- 45.0 -- 55.175th Percentile ($000's) 50.6 -- -- 66.0 -- 53.6 -- 66.0Average ($000's) 54.0 47.5 -- 54.5 -- 54.6 -- 54.5
Most Recent New HireEmployers Reported 1 0 1 1 0 1 1 1
Median ($000's) -- -- -- -- -- -- -- --Average ($000's) -- -- -- -- -- -- -- --
Total Cash CompensationBase Plus Incentive Pay
The data for this position is a combination of the data reported by participants for 311 Field Service Technician and 312 Senior FieldService Technician
Organizational FTE's Organizational Revenue ($ Millions)
Page 3-59Southwestern Pennsylvania Annual Compensation and Benefits Study
© 2010 Pittsburgh Technology Council. All rights reserved.
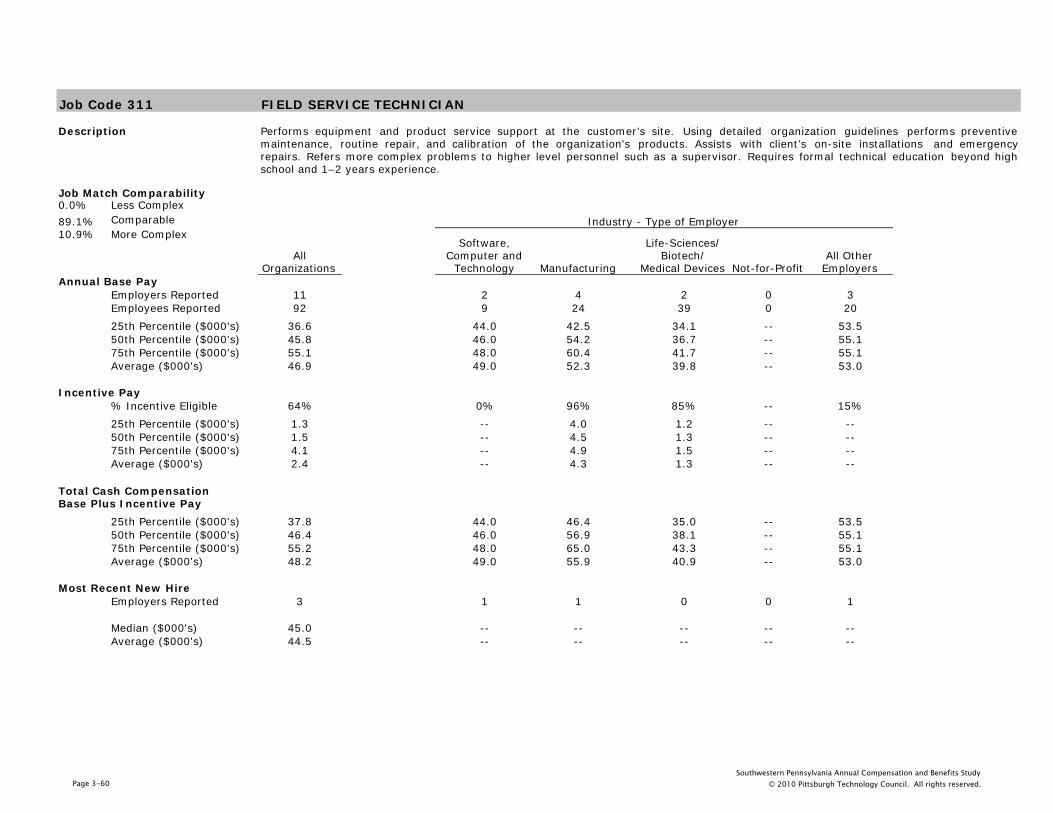
Job Code 311 FIELD SERVICE TECHNICIAN
Description
0.0% Less Complex89.1% Comparable10.9% More Complex
All Organizations
Software, Computer and
Technology Manufacturing
Life-Sciences/ Biotech/
Medical Devices Not-for-ProfitAll Other
EmployersAnnual Base Pay
Employers Reported 11 2 4 2 0 3Employees Reported 92 9 24 39 0 2025th Percentile ($000's) 36.6 44.0 42.5 34.1 -- 53.550th Percentile ($000's) 45.8 46.0 54.2 36.7 -- 55.175th Percentile ($000's) 55.1 48.0 60.4 41.7 -- 55.1Average ($000's) 46.9 49.0 52.3 39.8 -- 53.0
Incentive Pay% Incentive Eligible 64% 0% 96% 85% -- 15%25th Percentile ($000's) 1.3 -- 4.0 1.2 -- --50th Percentile ($000's) 1.5 -- 4.5 1.3 -- --75th Percentile ($000's) 4.1 -- 4.9 1.5 -- --Average ($000's) 2.4 -- 4.3 1.3 -- --
25th Percentile ($000's) 37.8 44.0 46.4 35.0 -- 53.550th Percentile ($000's) 46.4 46.0 56.9 38.1 -- 55.175th Percentile ($000's) 55.2 48.0 65.0 43.3 -- 55.1Average ($000's) 48.2 49.0 55.9 40.9 -- 53.0
Most Recent New HireEmployers Reported 3 1 1 0 0 1
Median ($000's) 45.0 -- -- -- -- --Average ($000's) 44.5 -- -- -- -- --
Performs equipment and product service support at the customer’s site. Using detailed organization guidelines performs preventivemaintenance, routine repair, and calibration of the organization's products. Assists with client’s on-site installations and emergencyrepairs. Refers more complex problems to higher level personnel such as a supervisor. Requires formal technical education beyond highschool and 1–2 years experience.
Industry - Type of Employer
Total Cash CompensationBase Plus Incentive Pay
Job Match Comparability
Page 3-60Southwestern Pennsylvania Annual Compensation and Benefits Study
© 2010 Pittsburgh Technology Council. All rights reserved.

Job Code 311 FIELD SERVICE TECHNICIAN
Description
Less than 50 50 - 150 151 - 500 More than 500Less than
$7.5M$7.5M to
$25M$26M to $150M
More than $150M
Annual Base PayEmployers Reported 2 2 1 6 1 3 1 6Employees Reported 7 3 8 74 1 9 8 74
25th Percentile ($000's) 35.0 -- -- 36.0 -- 38.4 -- 36.050th Percentile ($000's) 38.4 45.0 -- 51.9 -- 41.2 -- 51.975th Percentile ($000's) 41.2 -- -- 55.1 -- 44.7 -- 55.1Average ($000's) 38.2 47.5 -- 47.6 -- 42.0 -- 47.6
Incentive Pay% Incentive Eligible 100% 67% 0% 68% 100% 89% 0% 68%
25th Percentile ($000's) 3.9 -- -- 1.3 -- 3.9 -- 1.350th Percentile ($000's) 5.3 -- -- 1.5 -- 5.3 -- 1.575th Percentile ($000's) 5.6 -- -- 3.9 -- 5.6 -- 3.9Average ($000's) 4.2 -- -- 2.3 -- 4.2 -- 2.3
25th Percentile ($000's) 35.2 -- -- 37.3 -- 41.2 -- 37.350th Percentile ($000's) 41.5 45.0 -- 52.7 -- 43.5 -- 52.775th Percentile ($000's) 45.0 -- -- 55.8 -- 46.5 -- 55.8Average ($000's) 40.7 47.5 -- 49.1 -- 43.9 -- 49.1
Most Recent New HireEmployers Reported 1 0 1 1 0 1 1 1
Median ($000's) -- -- -- -- -- -- -- --Average ($000's) -- -- -- -- -- -- -- --
Total Cash CompensationBase Plus Incentive Pay
Performs equipment and product service support at the customer’s site. Using detailed organization guidelines performs preventivemaintenance, routine repair, and calibration of the organization's products. Assists with client’s on-site installations and emergencyrepairs. Refers more complex problems to higher level personnel such as a supervisor. Requires formal technical education beyond highschool and 1–2 years experience.
Organizational FTE's Organizational Revenue ($ Millions)
Page 3-61Southwestern Pennsylvania Annual Compensation and Benefits Study
© 2010 Pittsburgh Technology Council. All rights reserved.

Job Code 312 SENIOR FIELD SERVICE TECHNICIAN
Description
0.0% Less Complex60.3% Comparable39.7% More Complex
All Organizations
Software, Computer and
Technology Manufacturing
Life-Sciences/ Biotech/
Medical Devices Not-for-ProfitAll Other
EmployersAnnual Base Pay
Employers Reported 10 3 3 2 0 2Employees Reported 68 8 5 36 0 1925th Percentile ($000's) 51.2 38.4 70.0 46.0 -- 66.650th Percentile ($000's) 62.3 51.6 71.4 56.6 -- 66.675th Percentile ($000's) 66.6 56.9 74.5 63.2 -- 66.6Average ($000's) 60.1 52.6 75.3 56.8 -- 65.5
Incentive Pay% Incentive Eligible 60% 0% 100% 97% -- 5%25th Percentile ($000's) 1.8 -- 5.5 1.7 -- --50th Percentile ($000's) 2.3 -- 7.3 2.3 -- --75th Percentile ($000's) 2.7 -- 10.6 2.6 -- --Average ($000's) 2.9 -- 8.9 2.2 -- --
25th Percentile ($000's) 51.2 38.4 76.8 47.7 -- 66.650th Percentile ($000's) 64.1 51.6 79.0 58.9 -- 66.675th Percentile ($000's) 66.6 56.9 80.1 65.9 -- 66.6Average ($000's) 61.8 52.6 82.4 59.0 -- 65.5
Most Recent New HireEmployers Reported 0 0 0 0 0 0
Median ($000's) -- -- -- -- -- --Average ($000's) -- -- -- -- -- --
Performs equipment and product service support at the customer’s sites. Using established organization guidelines performs installation,preventive maintenance, routine repair, and calibration of organization's products and equipment. Serves as customer contact ontechnical and service related problems. May assist lower level technicians. Refers more complex problems to higher level personnel.Requires formal technical training beyond high school and 3 or more years field service technician experience.
Industry - Type of Employer
Total Cash CompensationBase Plus Incentive Pay
Job Match Comparability
Page 3-62Southwestern Pennsylvania Annual Compensation and Benefits Study
© 2010 Pittsburgh Technology Council. All rights reserved.

Job Code 312 SENIOR FIELD SERVICE TECHNICIAN
Description
Less than 50 50 - 150 151 - 500 More than 500Less than
$7.5M$7.5M to
$25M$26M to $150M
More than $150M
Annual Base PayEmployers Reported 2 0 1 7 1 1 1 7Employees Reported 3 0 1 64 1 2 1 64
25th Percentile ($000's) -- -- -- 50.7 -- -- -- 50.750th Percentile ($000's) 70.0 -- -- 61.5 -- -- -- 61.575th Percentile ($000's) -- -- -- 66.6 -- -- -- 66.6Average ($000's) 76.8 -- -- 59.2 -- -- -- 59.2
Incentive Pay% Incentive Eligible 100% -- 0% 59% 100% 100% 0% 59%
25th Percentile ($000's) -- -- -- 1.7 -- -- -- 1.750th Percentile ($000's) 12.3 -- -- 2.3 -- -- -- 2.375th Percentile ($000's) -- -- -- 2.6 -- -- -- 2.6Average ($000's) -- -- -- 2.4 -- -- -- 2.4
25th Percentile ($000's) -- -- -- 51.1 -- -- -- 51.150th Percentile ($000's) 79.0 -- -- 63.6 -- -- -- 63.675th Percentile ($000's) -- -- -- 66.6 -- -- -- 66.6Average ($000's) 85.0 -- -- 60.6 -- -- -- 60.6
Most Recent New HireEmployers Reported 0 0 0 0 0 0 0 0
Median ($000's) -- -- -- -- -- -- -- --Average ($000's) -- -- -- -- -- -- -- --
Total Cash CompensationBase Plus Incentive Pay
Performs equipment and product service support at the customer’s sites. Using established organization guidelines performs installation,preventive maintenance, routine repair, and calibration of organization's products and equipment. Serves as customer contact ontechnical and service related problems. May assist lower level technicians. Refers more complex problems to higher level personnel.Requires formal technical training beyond high school and 3 or more years field service technician experience.
Organizational FTE's Organizational Revenue ($ Millions)
Page 3-63Southwestern Pennsylvania Annual Compensation and Benefits Study
© 2010 Pittsburgh Technology Council. All rights reserved.

Job Code 321 DRAFTER/DESIGNER (CAD) - ALL LEVELS
Description
0.8% Less Complex88.9% Comparable10.3% More Complex
All Organizations
Software, Computer and
Technology Manufacturing
Life-Sciences/ Biotech/
Medical Devices Not-for-ProfitAll Other
EmployersAnnual Base Pay
Employers Reported 21 3 10 2 1 5Employees Reported 126 5 78 4 1 3825th Percentile ($000's) 47.4 42.8 47.5 -- -- 45.050th Percentile ($000's) 55.2 57.4 54.1 65.1 -- 57.575th Percentile ($000's) 62.0 63.4 58.7 -- -- 62.3Average ($000's) 55.3 53.5 54.1 64.4 -- 57.0
Incentive Pay% Incentive Eligible 63% 20% 78% 25% 0% 45%25th Percentile ($000's) 3.6 -- 3.6 -- -- 3.450th Percentile ($000's) 4.0 -- 4.0 -- -- 4.175th Percentile ($000's) 4.8 -- 4.8 -- -- 4.7Average ($000's) 4.2 -- 4.4 -- -- 3.8
25th Percentile ($000's) 48.5 42.8 48.6 -- -- 45.850th Percentile ($000's) 57.4 57.4 56.6 65.1 -- 59.375th Percentile ($000's) 63.0 63.4 62.1 -- -- 64.2Average ($000's) 56.8 53.5 56.1 64.4 -- 58.0
Most Recent New HireEmployers Reported 2 0 2 0 0 0
Median ($000's) -- -- -- -- -- --Average ($000's) -- -- -- -- -- --
The data for this position is a combination of the data reported by participants for 322 Drafter/Designer (CAD) and 323 Drafter/Designer(CAD) - Senior
Industry - Type of Employer
Total Cash CompensationBase Plus Incentive Pay
Job Match Comparability
Page 3-64Southwestern Pennsylvania Annual Compensation and Benefits Study
© 2010 Pittsburgh Technology Council. All rights reserved.

Job Code 321 DRAFTER/DESIGNER (CAD) - ALL LEVELS
Description
Less than 50 50 - 150 151 - 500 More than 500Less than
$7.5M$7.5M to
$25M$26M to $150M
More than $150M
Annual Base PayEmployers Reported 3 3 5 10 1 4 6 10Employees Reported 7 3 41 75 1 8 20 97
25th Percentile ($000's) 57.4 -- 44.3 51.1 -- 53.1 42.2 50.050th Percentile ($000's) 65.6 49.6 51.6 56.2 -- 60.3 48.4 56.275th Percentile ($000's) 67.8 -- 57.3 62.2 -- 65.9 54.6 62.0Average ($000's) 60.0 52.0 52.0 56.8 -- 57.2 48.5 56.4
Incentive Pay% Incentive Eligible 86% 33% 61% 64% 100% 63% 20% 72%
25th Percentile ($000's) 6.3 -- -- 3.5 -- 6.3 -- 3.550th Percentile ($000's) 8.2 -- -- 4.0 -- 8.2 7.0 4.075th Percentile ($000's) 8.9 -- -- 4.4 -- 8.9 -- 4.4Average ($000's) 7.0 -- -- 3.9 -- 7.0 7.0 3.9
25th Percentile ($000's) 61.2 -- 44.3 53.4 -- 53.1 42.2 51.050th Percentile ($000's) 68.6 56.6 51.6 58.9 -- 64.2 48.4 58.275th Percentile ($000's) 71.9 -- 57.3 63.6 -- 70.8 55.4 63.4Average ($000's) 64.0 54.3 52.0 58.9 -- 60.7 48.8 58.0
Most Recent New HireEmployers Reported 0 0 1 1 0 0 0 2
Median ($000's) -- -- -- -- -- -- -- --Average ($000's) -- -- -- -- -- -- -- --
Total Cash CompensationBase Plus Incentive Pay
The data for this position is a combination of the data reported by participants for 322 Drafter/Designer (CAD) and 323 Drafter/Designer(CAD) - Senior
Organizational FTE's Organizational Revenue ($ Millions)
Page 3-65Southwestern Pennsylvania Annual Compensation and Benefits Study
© 2010 Pittsburgh Technology Council. All rights reserved.

Job Code 322 DRAFTER/DESIGNER (CAD)
Description
1.6% Less Complex80.6% Comparable17.7% More Complex
All Organizations
Software, Computer and
Technology Manufacturing
Life-Sciences/ Biotech/
Medical Devices Not-for-ProfitAll Other
EmployersAnnual Base Pay
Employers Reported 15 2 8 0 1 4Employees Reported 62 2 44 0 1 1525th Percentile ($000's) 42.1 -- 43.9 -- -- 41.350th Percentile ($000's) 47.7 -- 50.0 -- -- 42.975th Percentile ($000's) 54.1 -- 54.3 -- -- 49.5Average ($000's) 47.9 -- 48.8 -- -- 46.0
Incentive Pay% Incentive Eligible 77% 0% 86% -- 0% 67%25th Percentile ($000's) 3.3 -- 3.6 -- -- 1.350th Percentile ($000's) 3.9 -- 4.0 -- -- 1.775th Percentile ($000's) 4.1 -- 4.1 -- -- 2.5Average ($000's) 3.7 -- 3.9 -- -- 2.0
25th Percentile ($000's) 42.3 -- 44.4 -- -- 41.350th Percentile ($000's) 50.0 -- 51.8 -- -- 42.975th Percentile ($000's) 56.8 -- 56.9 -- -- 51.1Average ($000's) 49.3 -- 50.6 -- -- 46.4
Most Recent New HireEmployers Reported 1 0 1 0 0 0
Median ($000's) -- -- -- -- -- --Average ($000's) -- -- -- -- -- --
Prepares working plans and drafts detailed drawings manually and using computer aided design systems (CAD). Makes engineeringcomputations and writes specifications. Prepares and creates geometric displays for complex detail assemblies working from layouts,sketches, drawings, and verbal instructions. Verifies completed work, checking dimensions, materials to be used, and quantities. Mayprovide technical direction to lower level drafters. Requires technical training and 1–5 years experience. Not a trainee.
Industry - Type of Employer
Total Cash CompensationBase Plus Incentive Pay
Job Match Comparability
Page 3-66Southwestern Pennsylvania Annual Compensation and Benefits Study
© 2010 Pittsburgh Technology Council. All rights reserved.

Job Code 322 DRAFTER/DESIGNER (CAD)
Description
Less than 50 50 - 150 151 - 500 More than 500Less than
$7.5M$7.5M to
$25M$26M to $150M
More than $150M
Annual Base PayEmployers Reported 1 2 5 7 0 2 6 7Employees Reported 1 2 24 35 0 2 9 51
25th Percentile ($000's) -- -- 39.9 42.9 -- -- 36.6 42.950th Percentile ($000's) -- -- 47.1 49.0 -- -- 39.4 50.075th Percentile ($000's) -- -- 55.1 54.1 -- -- 47.0 55.4Average ($000's) -- -- 46.8 49.1 -- -- 41.3 49.4
Incentive Pay% Incentive Eligible 100% 50% 75% 80% -- 50% 33% 86%
25th Percentile ($000's) -- -- -- 3.4 -- -- -- 3.450th Percentile ($000's) -- -- -- 3.9 -- -- 7.0 3.975th Percentile ($000's) -- -- -- 4.1 -- -- -- 4.1Average ($000's) -- -- -- 3.6 -- -- 7.0 3.6
25th Percentile ($000's) -- -- 39.9 43.4 -- -- 36.6 43.450th Percentile ($000's) -- -- 47.1 52.7 -- -- 39.4 51.675th Percentile ($000's) -- -- 55.1 58.1 -- -- 47.0 57.2Average ($000's) -- -- 46.8 51.2 -- -- 42.1 50.9
Most Recent New HireEmployers Reported 0 0 1 0 0 0 0 1
Median ($000's) -- -- -- -- -- -- -- --Average ($000's) -- -- -- -- -- -- -- --
Total Cash CompensationBase Plus Incentive Pay
Prepares working plans and drafts detailed drawings manually and using computer aided design systems (CAD). Makes engineeringcomputations and writes specifications. Prepares and creates geometric displays for complex detail assemblies working from layouts,sketches, drawings, and verbal instructions. Verifies completed work, checking dimensions, materials to be used, and quantities. Mayprovide technical direction to lower level drafters. Requires technical training and 1–5 years experience. Not a trainee.
Organizational FTE's Organizational Revenue ($ Millions)
Page 3-67Southwestern Pennsylvania Annual Compensation and Benefits Study
© 2010 Pittsburgh Technology Council. All rights reserved.

Job Code 323 DRAFTER/DESIGNER (CAD) SENIOR
Description
0.0% Less Complex96.9% Comparable3.1% More Complex
All Organizations
Software, Computer and
Technology Manufacturing
Life-Sciences/ Biotech/
Medical Devices Not-for-ProfitAll Other
EmployersAnnual Base Pay
Employers Reported 15 3 7 2 0 3Employees Reported 64 3 34 4 0 2325th Percentile ($000's) 55.9 -- 54.4 -- -- 56.650th Percentile ($000's) 62.0 63.4 60.0 65.1 -- 62.075th Percentile ($000's) 68.2 -- 67.7 -- -- 72.4Average ($000's) 62.5 63.5 61.0 64.4 -- 64.3
Incentive Pay% Incentive Eligible 50% 33% 68% 25% -- 30%25th Percentile ($000's) 4.0 -- 3.3 -- -- 4.150th Percentile ($000's) 4.6 -- 5.1 -- -- 4.475th Percentile ($000's) 5.3 -- 5.5 -- -- 5.0Average ($000's) 4.8 -- 5.0 -- -- 4.5
25th Percentile ($000's) 58.6 -- 56.3 -- -- 60.150th Percentile ($000's) 62.0 63.4 62.0 65.1 -- 62.075th Percentile ($000's) 73.0 -- 73.0 -- -- 75.0Average ($000's) 64.2 63.5 63.2 64.4 -- 65.6
Most Recent New HireEmployers Reported 1 0 1 0 0 0
Median ($000's) -- -- -- -- -- --Average ($000's) -- -- -- -- -- --
Works at the highest technical level. Assignments include engineering design, require proficiency with CAD systems, and considerableinterface with engineers. Provides technical direction to lower level drafters. This is the senior non-supervisory position and normallyrequires 5 or more years experience.
Industry - Type of Employer
Total Cash CompensationBase Plus Incentive Pay
Job Match Comparability
Page 3-68Southwestern Pennsylvania Annual Compensation and Benefits Study
© 2010 Pittsburgh Technology Council. All rights reserved.

Job Code 323 DRAFTER/DESIGNER (CAD) SENIOR
Description
Less than 50 50 - 150 151 - 500 More than 500Less than
$7.5M$7.5M to
$25M$26M to $150M
More than $150M
Annual Base PayEmployers Reported 3 1 4 7 1 3 3 8Employees Reported 6 1 17 40 1 6 11 46
25th Percentile ($000's) 60.4 -- 51.6 56.7 -- 59.5 48.4 57.250th Percentile ($000's) 66.3 -- 57.4 62.0 -- 63.8 54.3 62.275th Percentile ($000's) 68.2 -- 66.8 68.2 -- 66.6 58.0 70.1Average ($000's) 64.3 -- 59.3 63.6 -- 63.1 54.3 64.2
Incentive Pay% Incentive Eligible 83% 0% 41% 50% 100% 67% 9% 57%
25th Percentile ($000's) 8.2 -- -- 3.9 -- -- -- 3.950th Percentile ($000's) 8.6 -- -- 4.3 -- 8.6 -- 4.375th Percentile ($000's) 9.1 -- -- 5.1 -- -- -- 5.1Average ($000's) 8.6 -- -- 4.2 -- 8.6 -- 4.2
25th Percentile ($000's) 67.0 -- 51.6 59.3 -- 63.0 48.4 59.750th Percentile ($000's) 69.1 -- 57.4 62.0 -- 68.0 54.3 63.675th Percentile ($000's) 73.1 -- 66.8 73.4 -- 73.1 58.0 73.5Average ($000's) 68.6 -- 59.3 65.6 -- 67.4 54.3 66.0
Most Recent New HireEmployers Reported 0 0 0 1 0 0 0 1
Median ($000's) -- -- -- -- -- -- -- --Average ($000's) -- -- -- -- -- -- -- --
Total Cash CompensationBase Plus Incentive Pay
Works at the highest technical level. Assignments include engineering design, require proficiency with CAD systems, and considerableinterface with engineers. Provides technical direction to lower level drafters. This is the senior non-supervisory position and normallyrequires 5 or more years experience.
Organizational FTE's Organizational Revenue ($ Millions)
Page 3-69Southwestern Pennsylvania Annual Compensation and Benefits Study
© 2010 Pittsburgh Technology Council. All rights reserved.

Job Code 330 ELECTRONICS TECHNICIAN - ALL LEVELS
Description
0.0% Less Complex100.0% Comparable0.0% More Complex
All Organizations
Software, Computer and
Technology Manufacturing
Life-Sciences/ Biotech/
Medical Devices Not-for-ProfitAll Other
EmployersAnnual Base Pay
Employers Reported 12 1 7 2 1 1Employees Reported 133 22 82 10 1 1825th Percentile ($000's) 30.8 -- 28.6 40.8 -- --50th Percentile ($000's) 36.4 -- 33.0 44.3 -- --75th Percentile ($000's) 48.8 -- 39.0 48.4 -- --Average ($000's) 41.9 -- 35.7 44.7 -- --
Incentive Pay% Incentive Eligible 51% 0% 71% 100% 0% 0%25th Percentile ($000's) 1.4 -- 2.6 1.4 -- --50th Percentile ($000's) 1.6 -- 2.6 1.5 -- --75th Percentile ($000's) 2.5 -- 3.1 1.6 -- --Average ($000's) 2.0 -- 2.8 1.5 -- --
25th Percentile ($000's) 30.8 -- 28.6 42.4 -- --50th Percentile ($000's) 36.4 -- 33.0 45.8 -- --75th Percentile ($000's) 51.0 -- 39.0 49.7 -- --Average ($000's) 42.1 -- 35.9 46.0 -- --
Most Recent New HireEmployers Reported 2 0 2 0 0 0
Median ($000's) -- -- -- -- -- --Average ($000's) -- -- -- -- -- --
The data for this position is a combination of the data reported by participants for 331 Electronics Technician I, 332 ElectronicsTechnician II and 333 Electronics Technician III
Industry - Type of Employer
Total Cash CompensationBase Plus Incentive Pay
Job Match Comparability
Page 3-70Southwestern Pennsylvania Annual Compensation and Benefits Study
© 2010 Pittsburgh Technology Council. All rights reserved.

Job Code 330 ELECTRONICS TECHNICIAN - ALL LEVELS
Description
Less than 50 50 - 150 151 - 500 More than 500Less than
$7.5M$7.5M to
$25M$26M to $150M
More than $150M
Annual Base PayEmployers Reported 1 1 5 5 1 1 5 5Employees Reported 1 1 92 39 1 1 90 41
25th Percentile ($000's) -- -- 28.8 50.5 -- -- 28.8 48.650th Percentile ($000's) -- -- 32.7 58.0 -- -- 32.7 58.075th Percentile ($000's) -- -- 36.9 76.4 -- -- 36.5 76.4Average ($000's) -- -- 33.7 61.0 -- -- 33.7 59.7
Incentive Pay% Incentive Eligible 100% 0% 58% 36% 100% 0% 56% 41%
25th Percentile ($000's) -- -- -- 1.4 -- -- -- 1.450th Percentile ($000's) -- -- -- 1.6 -- -- -- 1.675th Percentile ($000's) -- -- -- 2.5 -- -- -- 2.5Average ($000's) -- -- -- 2.0 -- -- -- 2.0
25th Percentile ($000's) -- -- 28.8 51.9 -- -- 28.8 50.350th Percentile ($000's) -- -- 32.7 58.0 -- -- 32.7 58.075th Percentile ($000's) -- -- 36.9 76.4 -- -- 36.5 76.4Average ($000's) -- -- 33.7 61.7 -- -- 33.7 60.4
Most Recent New HireEmployers Reported 0 0 2 0 0 0 2 0
Median ($000's) -- -- -- -- -- -- -- --Average ($000's) -- -- -- -- -- -- -- --
Total Cash CompensationBase Plus Incentive Pay
The data for this position is a combination of the data reported by participants for 331 Electronics Technician I, 332 ElectronicsTechnician II and 333 Electronics Technician III
Organizational FTE's Organizational Revenue ($ Millions)
Page 3-71Southwestern Pennsylvania Annual Compensation and Benefits Study
© 2010 Pittsburgh Technology Council. All rights reserved.

Job Code 331 ELECTRONICS TECHNICIAN I
Description
0.0% Less Complex100.0% Comparable0.0% More Complex
All Organizations
Software, Computer and
Technology Manufacturing
Life-Sciences/ Biotech/
Medical Devices Not-for-ProfitAll Other
EmployersAnnual Base Pay
Employers Reported 6 1 3 0 1 1Employees Reported 48 4 42 0 1 125th Percentile ($000's) 26.3 -- 25.2 -- -- --50th Percentile ($000's) 29.0 -- 28.7 -- -- --75th Percentile ($000's) 32.4 -- 30.8 -- -- --Average ($000's) 30.1 -- 28.8 -- -- --
Incentive Pay% Incentive Eligible 81% 0% 93% -- 0% 0%25th Percentile ($000's) -- -- -- -- -- --50th Percentile ($000's) -- -- -- -- -- --75th Percentile ($000's) -- -- -- -- -- --Average ($000's) -- -- -- -- -- --
25th Percentile ($000's) 26.3 -- 25.2 -- -- --50th Percentile ($000's) 29.0 -- 28.7 -- -- --75th Percentile ($000's) 32.4 -- 30.8 -- -- --Average ($000's) 30.1 -- 28.8 -- -- --
Most Recent New HireEmployers Reported 2 0 2 0 0 0
Median ($000's) -- -- -- -- -- --Average ($000's) -- -- -- -- -- --
Inspects, modifies, tests, and repairs electronic circuits and components. Calibrates equipment and records data. Assists in developmentand fabrication of prototypes, subassemblies, components, parts, equipment, and systems. Requires 2 years formal technical training orassociate degree. Entry level.
Industry - Type of Employer
Total Cash CompensationBase Plus Incentive Pay
Job Match Comparability
Page 3-72Southwestern Pennsylvania Annual Compensation and Benefits Study
© 2010 Pittsburgh Technology Council. All rights reserved.
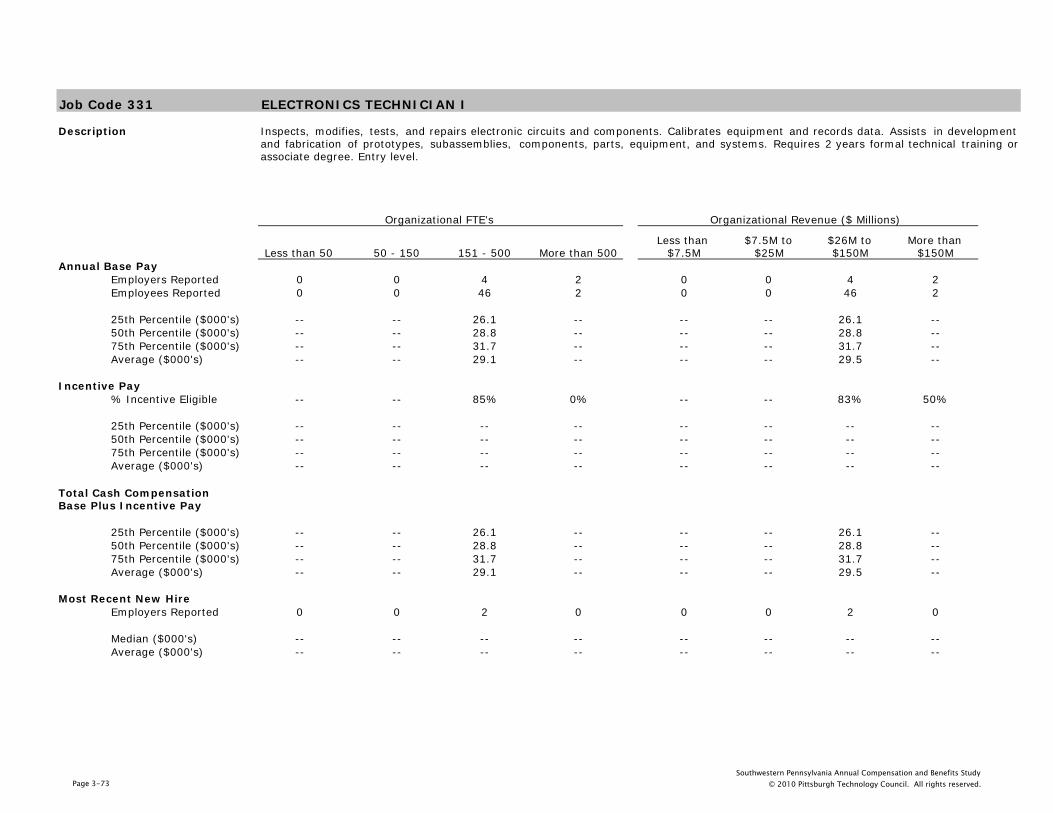
Job Code 331 ELECTRONICS TECHNICIAN I
Description
Less than 50 50 - 150 151 - 500 More than 500Less than
$7.5M$7.5M to
$25M$26M to $150M
More than $150M
Annual Base PayEmployers Reported 0 0 4 2 0 0 4 2Employees Reported 0 0 46 2 0 0 46 2
25th Percentile ($000's) -- -- 26.1 -- -- -- 26.1 --50th Percentile ($000's) -- -- 28.8 -- -- -- 28.8 --75th Percentile ($000's) -- -- 31.7 -- -- -- 31.7 --Average ($000's) -- -- 29.1 -- -- -- 29.5 --
Incentive Pay% Incentive Eligible -- -- 85% 0% -- -- 83% 50%
25th Percentile ($000's) -- -- -- -- -- -- -- --50th Percentile ($000's) -- -- -- -- -- -- -- --75th Percentile ($000's) -- -- -- -- -- -- -- --Average ($000's) -- -- -- -- -- -- -- --
25th Percentile ($000's) -- -- 26.1 -- -- -- 26.1 --50th Percentile ($000's) -- -- 28.8 -- -- -- 28.8 --75th Percentile ($000's) -- -- 31.7 -- -- -- 31.7 --Average ($000's) -- -- 29.1 -- -- -- 29.5 --
Most Recent New HireEmployers Reported 0 0 2 0 0 0 2 0
Median ($000's) -- -- -- -- -- -- -- --Average ($000's) -- -- -- -- -- -- -- --
Total Cash CompensationBase Plus Incentive Pay
Inspects, modifies, tests, and repairs electronic circuits and components. Calibrates equipment and records data. Assists in developmentand fabrication of prototypes, subassemblies, components, parts, equipment, and systems. Requires 2 years formal technical training orassociate degree. Entry level.
Organizational FTE's Organizational Revenue ($ Millions)
Page 3-73Southwestern Pennsylvania Annual Compensation and Benefits Study
© 2010 Pittsburgh Technology Council. All rights reserved.

Job Code 332 ELECTRONICS TECHNICIAN II
Description
0.0% Less Complex100.0% Comparable0.0% More Complex
All Organizations
Software, Computer and
Technology Manufacturing
Life-Sciences/ Biotech/
Medical Devices Not-for-ProfitAll Other
EmployersAnnual Base Pay
Employers Reported 11 1 7 2 0 1Employees Reported 69 17 39 8 0 525th Percentile ($000's) 35.5 -- 34.0 39.3 -- --50th Percentile ($000's) 40.2 -- 39.1 43.7 -- --75th Percentile ($000's) 47.9 -- 50.0 45.7 -- --Average ($000's) 43.2 -- 42.3 43.1 -- --
Incentive Pay% Incentive Eligible 38% 0% 46% 100% -- 0%25th Percentile ($000's) 1.4 -- 2.5 1.3 -- --50th Percentile ($000's) 1.6 -- 2.6 1.4 -- --75th Percentile ($000's) 2.4 -- 2.7 1.6 -- --Average ($000's) 1.9 -- 2.6 1.4 -- --
25th Percentile ($000's) 35.5 -- 34.0 40.8 -- --50th Percentile ($000's) 40.5 -- 39.1 45.1 -- --75th Percentile ($000's) 48.8 -- 51.4 46.7 -- --Average ($000's) 43.5 -- 42.5 44.3 -- --
Most Recent New HireEmployers Reported 0 0 0 0 0 0
Median ($000's) -- -- -- -- -- --Average ($000's) -- -- -- -- -- --
Lays out and builds developmental and production electronic equipment and systems. Analyzes and troubleshoots; conducts tests toestablish operating data. Prepares schematics, mechanical drawings, and parts lists. Discusses layouts, procedures, and problems withengineers. Requires 2–5 years experience.
Industry - Type of Employer
Total Cash CompensationBase Plus Incentive Pay
Job Match Comparability
Page 3-74Southwestern Pennsylvania Annual Compensation and Benefits Study
© 2010 Pittsburgh Technology Council. All rights reserved.

Job Code 332 ELECTRONICS TECHNICIAN II
Description
Less than 50 50 - 150 151 - 500 More than 500Less than
$7.5M$7.5M to
$25M$26M to $150M
More than $150M
Annual Base PayEmployers Reported 1 1 5 4 1 1 4 5Employees Reported 1 1 45 22 1 1 43 24
25th Percentile ($000's) -- -- 32.9 45.3 -- -- 32.9 43.750th Percentile ($000's) -- -- 36.2 56.0 -- -- 36.1 52.675th Percentile ($000's) -- -- 40.6 58.0 -- -- 40.5 58.0Average ($000's) -- -- 38.0 53.9 -- -- 37.8 53.0
Incentive Pay% Incentive Eligible 100% 0% 31% 50% 100% 0% 28% 54%
25th Percentile ($000's) -- -- -- 1.4 -- -- -- 1.450th Percentile ($000's) -- -- -- 1.6 -- -- -- 1.675th Percentile ($000's) -- -- -- 2.4 -- -- -- 2.4Average ($000's) -- -- -- 1.9 -- -- -- 1.9
25th Percentile ($000's) -- -- 32.9 47.0 -- -- 32.9 45.150th Percentile ($000's) -- -- 36.2 57.3 -- -- 36.1 55.475th Percentile ($000's) -- -- 40.6 58.0 -- -- 40.5 58.0Average ($000's) -- -- 38.0 54.8 -- -- 37.8 53.8
Most Recent New HireEmployers Reported 0 0 0 0 0 0 0 0
Median ($000's) -- -- -- -- -- -- -- --Average ($000's) -- -- -- -- -- -- -- --
Total Cash CompensationBase Plus Incentive Pay
Lays out and builds developmental and production electronic equipment and systems. Analyzes and troubleshoots; conducts tests toestablish operating data. Prepares schematics, mechanical drawings, and parts lists. Discusses layouts, procedures, and problems withengineers. Requires 2–5 years experience.
Organizational FTE's Organizational Revenue ($ Millions)
Page 3-75Southwestern Pennsylvania Annual Compensation and Benefits Study
© 2010 Pittsburgh Technology Council. All rights reserved.

Job Code 333 ELECTRONICS TECHNICIAN III
Description
0.0% Less Complex100.0% Comparable0.0% More Complex
All Organizations
Software, Computer and
Technology Manufacturing
Life-Sciences/ Biotech/
Medical Devices Not-for-ProfitAll Other
EmployersAnnual Base Pay
Employers Reported 4 1 1 1 0 1Employees Reported 16 1 1 2 0 12
25th Percentile ($000's) 73.1 -- -- -- -- --50th Percentile ($000's) 76.4 -- -- -- -- --75th Percentile ($000's) 76.4 -- -- -- -- --Average ($000's) 71.1 -- -- -- -- --
Incentive Pay% Incentive Eligible 19% 0% 100% 100% -- 0%25th Percentile ($000's) -- -- -- -- -- --50th Percentile ($000's) 1.7 -- -- -- -- --75th Percentile ($000's) -- -- -- -- -- --Average ($000's) 2.3 -- -- -- -- --
25th Percentile ($000's) 74.1 -- -- -- -- --50th Percentile ($000's) 76.4 -- -- -- -- --75th Percentile ($000's) 76.4 -- -- -- -- --Average ($000's) 71.6 -- -- -- -- --
Most Recent New HireEmployers Reported 0 0 0 0 0 0
Median ($000's) -- -- -- -- -- --Average ($000's) -- -- -- -- -- --
Carries out complex and unique assignments applying principles and theories of electronics, electrical circuitry, engineering mathematics,electronic and electrical testing, and physics. Develops new test procedures and defines standards. May oversee work of lower leveltechnicians. Typically requires 5–7 years experience.
Industry - Type of Employer
Total Cash CompensationBase Plus Incentive Pay
Job Match Comparability
Page 3-76Southwestern Pennsylvania Annual Compensation and Benefits Study
© 2010 Pittsburgh Technology Council. All rights reserved.

Job Code 333 ELECTRONICS TECHNICIAN III
Description
Less than 50 50 - 150 151 - 500 More than 500Less than
$7.5M$7.5M to
$25M$26M to $150M
More than $150M
Annual Base PayEmployers Reported 0 0 1 3 0 0 1 3Employees Reported 0 0 1 15 0 0 1 15
25th Percentile ($000's) -- -- -- 75.3 -- -- -- 75.350th Percentile ($000's) -- -- -- 76.4 -- -- -- 76.475th Percentile ($000's) -- -- -- 76.4 -- -- -- 76.4Average ($000's) -- -- -- 72.5 -- -- -- 72.5
Incentive Pay% Incentive Eligible -- -- 0% 20% -- -- 0% 20%
25th Percentile ($000's) -- -- -- -- -- -- -- --50th Percentile ($000's) -- -- -- 1.7 -- -- -- 1.775th Percentile ($000's) -- -- -- -- -- -- -- --Average ($000's) -- -- -- 2.3 -- -- -- 2.3
25th Percentile ($000's) -- -- -- 75.3 -- -- -- 75.350th Percentile ($000's) -- -- -- 76.4 -- -- -- 76.475th Percentile ($000's) -- -- -- 76.4 -- -- -- 76.4Average ($000's) -- -- -- 72.9 -- -- -- 72.9
Most Recent New HireEmployers Reported 0 0 0 0 0 0 0 0
Median ($000's) -- -- -- -- -- -- -- --Average ($000's) -- -- -- -- -- -- -- --
Total Cash CompensationBase Plus Incentive Pay
Carries out complex and unique assignments applying principles and theories of electronics, electrical circuitry, engineering mathematics,electronic and electrical testing, and physics. Develops new test procedures and defines standards. May oversee work of lower leveltechnicians. Typically requires 5–7 years experience.
Organizational FTE's Organizational Revenue ($ Millions)
Page 3-77Southwestern Pennsylvania Annual Compensation and Benefits Study
© 2010 Pittsburgh Technology Council. All rights reserved.
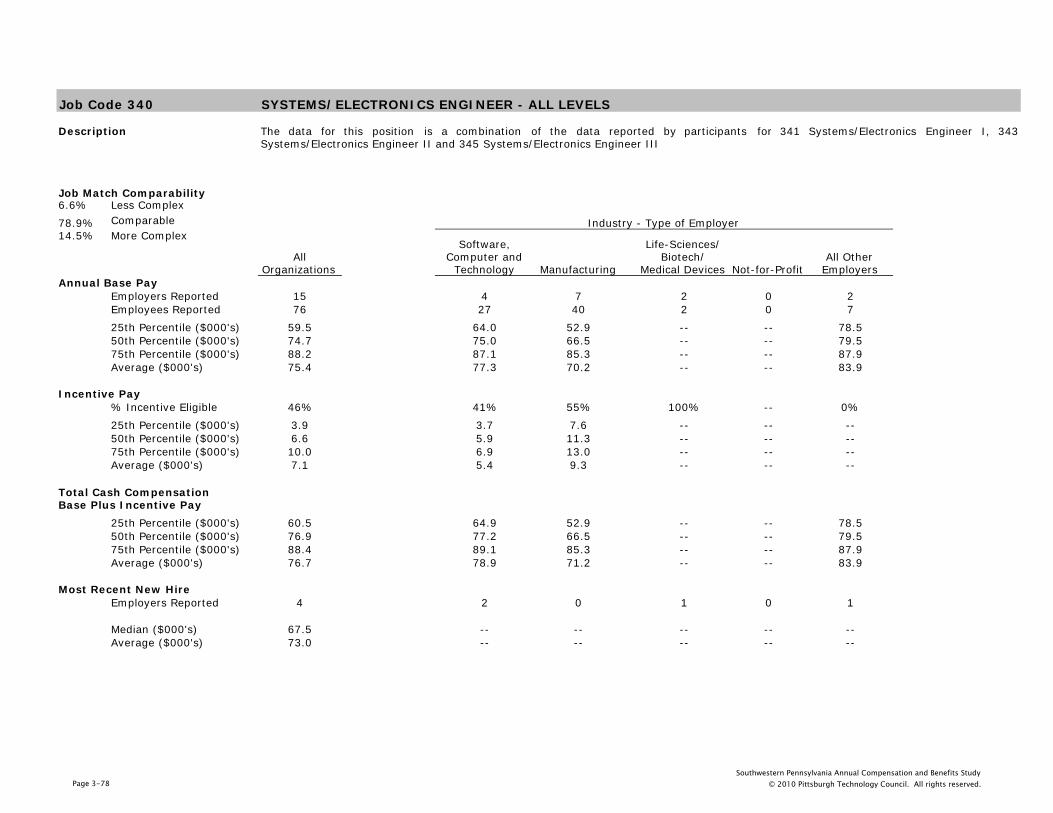
Job Code 340 SYSTEMS/ELECTRONICS ENGINEER - ALL LEVELS
Description
6.6% Less Complex78.9% Comparable14.5% More Complex
All Organizations
Software, Computer and
Technology Manufacturing
Life-Sciences/ Biotech/
Medical Devices Not-for-ProfitAll Other
EmployersAnnual Base Pay
Employers Reported 15 4 7 2 0 2Employees Reported 76 27 40 2 0 725th Percentile ($000's) 59.5 64.0 52.9 -- -- 78.550th Percentile ($000's) 74.7 75.0 66.5 -- -- 79.575th Percentile ($000's) 88.2 87.1 85.3 -- -- 87.9Average ($000's) 75.4 77.3 70.2 -- -- 83.9
Incentive Pay% Incentive Eligible 46% 41% 55% 100% -- 0%25th Percentile ($000's) 3.9 3.7 7.6 -- -- --50th Percentile ($000's) 6.6 5.9 11.3 -- -- --75th Percentile ($000's) 10.0 6.9 13.0 -- -- --Average ($000's) 7.1 5.4 9.3 -- -- --
25th Percentile ($000's) 60.5 64.9 52.9 -- -- 78.550th Percentile ($000's) 76.9 77.2 66.5 -- -- 79.575th Percentile ($000's) 88.4 89.1 85.3 -- -- 87.9Average ($000's) 76.7 78.9 71.2 -- -- 83.9
Most Recent New HireEmployers Reported 4 2 0 1 0 1
Median ($000's) 67.5 -- -- -- -- --Average ($000's) 73.0 -- -- -- -- --
The data for this position is a combination of the data reported by participants for 341 Systems/Electronics Engineer I, 343Systems/Electronics Engineer II and 345 Systems/Electronics Engineer III
Industry - Type of Employer
Total Cash CompensationBase Plus Incentive Pay
Job Match Comparability
Page 3-78Southwestern Pennsylvania Annual Compensation and Benefits Study
© 2010 Pittsburgh Technology Council. All rights reserved.

Job Code 340 SYSTEMS/ELECTRONICS ENGINEER - ALL LEVELS
Description
Less than 50 50 - 150 151 - 500 More than 500Less than
$7.5M$7.5M to
$25M$26M to $150M
More than $150M
Annual Base PayEmployers Reported 4 1 6 4 3 3 4 5Employees Reported 14 1 37 24 12 4 34 26
25th Percentile ($000's) 70.3 -- 52.4 73.7 67.3 -- 50.1 73.150th Percentile ($000's) 87.2 -- 64.5 79.4 81.8 93.4 62.5 79.075th Percentile ($000's) 101.1 -- 78.7 90.4 100.4 -- 77.9 88.3Average ($000's) 85.7 -- 68.8 80.1 84.4 98.9 66.4 79.4
Incentive Pay% Incentive Eligible 86% 0% 54% 13% 83% 75% 50% 19%
25th Percentile ($000's) 3.9 -- 12.5 -- 3.7 -- -- 5.350th Percentile ($000's) 6.4 -- 12.5 10.0 5.9 13.3 -- 10.075th Percentile ($000's) 7.7 -- 12.5 -- 6.9 -- -- 11.3Average ($000's) 6.3 -- 12.5 7.7 5.4 13.3 -- 7.7
25th Percentile ($000's) 77.0 -- 52.4 73.7 72.8 -- 50.1 73.150th Percentile ($000's) 88.3 -- 64.5 79.4 87.1 100.4 62.5 79.075th Percentile ($000's) 104.4 -- 78.7 90.8 103.3 -- 77.9 88.7Average ($000's) 89.8 -- 69.2 81.0 88.0 105.5 66.4 80.3
Most Recent New HireEmployers Reported 2 0 0 2 2 0 0 2
Median ($000's) -- -- -- -- -- -- -- --Average ($000's) -- -- -- -- -- -- -- --
Total Cash CompensationBase Plus Incentive Pay
The data for this position is a combination of the data reported by participants for 341 Systems/Electronics Engineer I, 343Systems/Electronics Engineer II and 345 Systems/Electronics Engineer III
Organizational FTE's Organizational Revenue ($ Millions)
Page 3-79Southwestern Pennsylvania Annual Compensation and Benefits Study
© 2010 Pittsburgh Technology Council. All rights reserved.
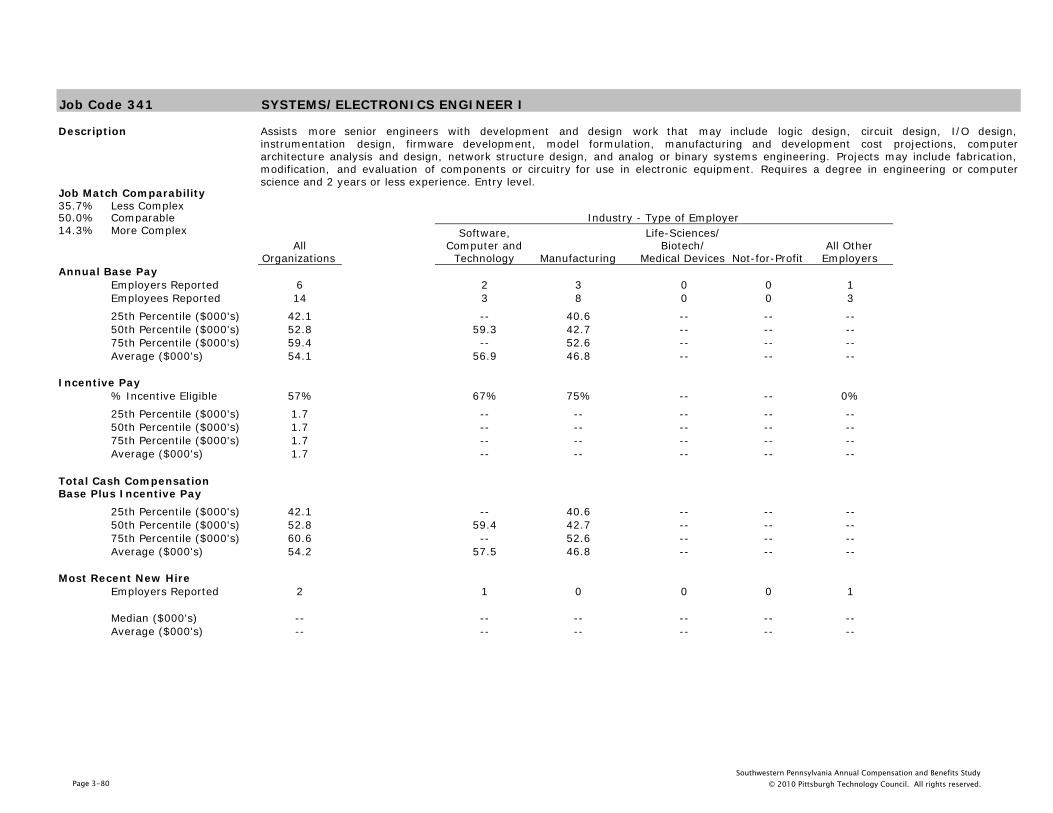
Job Code 341 SYSTEMS/ELECTRONICS ENGINEER I
Description
35.7% Less Complex50.0% Comparable14.3% More Complex
All Organizations
Software, Computer and
Technology Manufacturing
Life-Sciences/ Biotech/
Medical Devices Not-for-ProfitAll Other
EmployersAnnual Base Pay
Employers Reported 6 2 3 0 0 1Employees Reported 14 3 8 0 0 325th Percentile ($000's) 42.1 -- 40.6 -- -- --50th Percentile ($000's) 52.8 59.3 42.7 -- -- --75th Percentile ($000's) 59.4 -- 52.6 -- -- --Average ($000's) 54.1 56.9 46.8 -- -- --
Incentive Pay% Incentive Eligible 57% 67% 75% -- -- 0%25th Percentile ($000's) 1.7 -- -- -- -- --50th Percentile ($000's) 1.7 -- -- -- -- --75th Percentile ($000's) 1.7 -- -- -- -- --Average ($000's) 1.7 -- -- -- -- --
25th Percentile ($000's) 42.1 -- 40.6 -- -- --50th Percentile ($000's) 52.8 59.4 42.7 -- -- --75th Percentile ($000's) 60.6 -- 52.6 -- -- --Average ($000's) 54.2 57.5 46.8 -- -- --
Most Recent New HireEmployers Reported 2 1 0 0 0 1
Median ($000's) -- -- -- -- -- --Average ($000's) -- -- -- -- -- --
Assists more senior engineers with development and design work that may include logic design, circuit design, I/O design,instrumentation design, firmware development, model formulation, manufacturing and development cost projections, computerarchitecture analysis and design, network structure design, and analog or binary systems engineering. Projects may include fabrication,modification, and evaluation of components or circuitry for use in electronic equipment. Requires a degree in engineering or computerscience and 2 years or less experience. Entry level.
Industry - Type of Employer
Total Cash CompensationBase Plus Incentive Pay
Job Match Comparability
Page 3-80Southwestern Pennsylvania Annual Compensation and Benefits Study
© 2010 Pittsburgh Technology Council. All rights reserved.

Job Code 341 SYSTEMS/ELECTRONICS ENGINEER I
Description
Less than 50 50 - 150 151 - 500 More than 500Less than
$7.5M$7.5M to
$25M$26M to $150M
More than $150M
Annual Base PayEmployers Reported 1 0 3 2 1 0 2 3Employees Reported 2 0 8 4 2 0 7 5
25th Percentile ($000's) -- -- 40.6 -- -- -- 40.2 59.450th Percentile ($000's) -- -- 42.7 68.5 -- -- 41.6 65.075th Percentile ($000's) -- -- 52.6 -- -- -- 48.1 77.7Average ($000's) -- -- 46.8 67.8 -- -- 44.2 67.3
Incentive Pay% Incentive Eligible 100% -- 75% 0% 100% -- 71% 20%
25th Percentile ($000's) -- -- -- -- -- -- -- --50th Percentile ($000's) -- -- -- -- -- -- -- --75th Percentile ($000's) -- -- -- -- -- -- -- --Average ($000's) -- -- -- -- -- -- -- --
25th Percentile ($000's) -- -- 40.6 -- -- -- 40.2 59.450th Percentile ($000's) -- -- 42.7 68.5 -- -- 41.6 65.075th Percentile ($000's) -- -- 52.6 -- -- -- 48.1 77.7Average ($000's) -- -- 46.8 67.8 -- -- 44.2 67.3
Most Recent New HireEmployers Reported 1 0 0 1 1 0 0 1
Median ($000's) -- -- -- -- -- -- -- --Average ($000's) -- -- -- -- -- -- -- --
Total Cash CompensationBase Plus Incentive Pay
Assists more senior engineers with development and design work that may include logic design, circuit design, I/O design,instrumentation design, firmware development, model formulation, manufacturing and development cost projections, computerarchitecture analysis and design, network structure design, and analog or binary systems engineering. Projects may include fabrication,modification, and evaluation of components or circuitry for use in electronic equipment. Requires a degree in engineering or computerscience and 2 years or less experience. Entry level.
Organizational FTE's Organizational Revenue ($ Millions)
Page 3-81Southwestern Pennsylvania Annual Compensation and Benefits Study
© 2010 Pittsburgh Technology Council. All rights reserved.

Job Code 343 SYSTEMS/ELECTRONICS ENGINEER II
Description
0.0% Less Complex82.9% Comparable17.1% More Complex
All Organizations
Software, Computer and
Technology Manufacturing
Life-Sciences/ Biotech/
Medical Devices Not-for-ProfitAll Other
EmployersAnnual Base Pay
Employers Reported 11 4 6 0 0 1Employees Reported 35 12 21 0 0 225th Percentile ($000's) 60.5 65.1 55.7 -- -- --50th Percentile ($000's) 70.6 72.5 64.7 -- -- --75th Percentile ($000's) 77.8 76.9 77.3 -- -- --Average ($000's) 68.7 71.7 65.8 -- -- --
Incentive Pay% Incentive Eligible 49% 58% 48% -- -- 0%25th Percentile ($000's) 6.4 6.4 -- -- -- --50th Percentile ($000's) 6.6 6.6 -- -- -- --75th Percentile ($000's) 7.7 7.7 -- -- -- --Average ($000's) 6.4 6.4 -- -- -- --
25th Percentile ($000's) 60.9 65.7 55.7 -- -- --50th Percentile ($000's) 70.6 76.2 64.7 -- -- --75th Percentile ($000's) 79.1 80.3 77.3 -- -- --Average ($000's) 69.7 74.3 65.8 -- -- --
Most Recent New HireEmployers Reported 2 0 2 0 0 0
Median ($000's) -- -- -- -- -- --Average ($000's) -- -- -- -- -- --
Performs non-standard engineering development and design work that requires considerable engineering skill, creative ability, andindependent judgment. May provide technical supervision to lower level engineers and technical staff. Requires a degree in engineeringor computer science and 3–5 years related experience.
Industry - Type of Employer
Total Cash CompensationBase Plus Incentive Pay
Job Match Comparability
Page 3-82Southwestern Pennsylvania Annual Compensation and Benefits Study
© 2010 Pittsburgh Technology Council. All rights reserved.

Job Code 343 SYSTEMS/ELECTRONICS ENGINEER II
Description
Less than 50 50 - 150 151 - 500 More than 500Less than
$7.5M$7.5M to
$25M$26M to $150M
More than $150M
Annual Base PayEmployers Reported 2 1 5 3 1 2 4 4Employees Reported 6 1 21 7 5 2 20 8
25th Percentile ($000's) 70.3 -- 55.7 69.7 -- -- 55.2 71.250th Percentile ($000's) 73.3 -- 64.5 76.5 -- -- 64.3 77.675th Percentile ($000's) 82.3 -- 77.3 80.4 -- -- 72.6 79.9Average ($000's) 75.1 -- 65.2 74.5 -- -- 64.5 75.1
Incentive Pay% Incentive Eligible 100% 0% 52% 0% 100% 50% 50% 13%
25th Percentile ($000's) 6.4 -- -- -- -- -- -- --50th Percentile ($000's) 6.6 -- -- -- -- -- -- --75th Percentile ($000's) 7.7 -- -- -- -- -- -- --Average ($000's) 6.4 -- -- -- -- -- -- --
25th Percentile ($000's) 77.0 -- 55.7 69.7 -- -- 55.2 71.250th Percentile ($000's) 81.3 -- 64.5 76.5 -- -- 64.3 77.675th Percentile ($000's) 84.4 -- 77.3 80.4 -- -- 72.6 79.9Average ($000's) 80.5 -- 65.2 74.5 -- -- 64.5 75.1
Most Recent New HireEmployers Reported 0 0 0 0 0 0 0 0
Median ($000's) -- -- -- -- -- -- -- --Average ($000's) -- -- -- -- -- -- -- --
Total Cash CompensationBase Plus Incentive Pay
Performs non-standard engineering development and design work that requires considerable engineering skill, creative ability, andindependent judgment. May provide technical supervision to lower level engineers and technical staff. Requires a degree in engineeringor computer science and 3–5 years related experience.
Organizational FTE's Organizational Revenue ($ Millions)
Page 3-83Southwestern Pennsylvania Annual Compensation and Benefits Study
© 2010 Pittsburgh Technology Council. All rights reserved.

Job Code 345 SYSTEMS/ELECTRONICS ENGINEER III
Description
0.0% Less Complex88.9% Comparable11.1% More Complex
All Organizations
Software, Computer and
Technology Manufacturing
Life-Sciences/ Biotech/
Medical Devices Not-for-ProfitAll Other
EmployersAnnual Base Pay
Employers Reported 11 3 5 2 0 1Employees Reported 27 12 11 2 0 225th Percentile ($000's) 83.5 76.7 87.8 -- -- --50th Percentile ($000's) 94.1 89.1 99.5 -- -- --75th Percentile ($000's) 103.4 96.9 103.9 -- -- --Average ($000's) 95.2 88.0 95.7 -- -- --
Incentive Pay% Incentive Eligible 37% 17% 55% 100% -- 0%25th Percentile ($000's) 4.6 -- 7.6 -- -- --50th Percentile ($000's) 10.0 -- 11.3 -- -- --75th Percentile ($000's) 12.6 -- 13.0 -- -- --Average ($000's) 8.4 -- 9.3 -- -- --
25th Percentile ($000's) 83.5 76.7 88.1 -- -- --50th Percentile ($000's) 96.2 89.1 100.8 -- -- --75th Percentile ($000's) 105.5 97.4 110.9 -- -- --Average ($000's) 97.4 88.8 99.1 -- -- --
Most Recent New HireEmployers Reported 2 1 0 1 0 0
Median ($000's) -- -- -- -- -- --Average ($000's) -- -- -- -- -- --
Performs engineering work in the research, development, and design of products and systems. Interacts at the highest levels with clientengineers and customers. Work requires the highest degree of creative ability, engineering and programming skills, and independentjudgment. Incumbent may coordinate and technically lead projects and subordinate engineers. Requires an advanced engineering, math,physics, computer science, or related degree and 6 or more years related experience. This is normally the senior nonsupervisoryengineering level. May be titled Senior Principal Engineer.
Industry - Type of Employer
Total Cash CompensationBase Plus Incentive Pay
Job Match Comparability
Page 3-84Southwestern Pennsylvania Annual Compensation and Benefits Study
© 2010 Pittsburgh Technology Council. All rights reserved.

Job Code 345 SYSTEMS/ELECTRONICS ENGINEER III
Description
Less than 50 50 - 150 151 - 500 More than 500Less than
$7.5M$7.5M to
$25M$26M to $150M
More than $150M
Annual Base PayEmployers Reported 4 0 4 3 3 2 3 3Employees Reported 6 0 8 13 5 2 7 13
25th Percentile ($000's) 99.6 -- 85.2 77.2 98.9 -- 84.2 77.250th Percentile ($000's) 103.4 -- 100.2 89.4 105.0 -- 99.5 89.475th Percentile ($000's) 116.3 -- 110.7 94.1 120.0 -- 103.4 94.1Average ($000's) 106.3 -- 100.4 86.8 107.2 -- 94.2 86.8
Incentive Pay% Incentive Eligible 67% -- 38% 23% 60% 100% 29% 23%
25th Percentile ($000's) -- -- -- -- -- -- -- --50th Percentile ($000's) 5.4 -- 12.5 10.0 4.6 -- -- 10.075th Percentile ($000's) -- -- -- -- -- -- -- --Average ($000's) 7.8 -- 12.5 7.7 4.6 -- -- 7.7
25th Percentile ($000's) 103.3 -- 85.2 77.2 102.7 -- 84.2 77.250th Percentile ($000's) 110.4 -- 100.2 90.0 105.0 -- 99.5 90.075th Percentile ($000's) 119.0 -- 110.7 96.2 120.0 -- 103.4 96.2Average ($000's) 110.2 -- 102.0 88.6 109.1 -- 94.2 88.6
Most Recent New HireEmployers Reported 1 0 0 1 1 0 0 1
Median ($000's) -- -- -- -- -- -- -- --Average ($000's) -- -- -- -- -- -- -- --
Total Cash CompensationBase Plus Incentive Pay
Performs engineering work in the research, development, and design of products and systems. Interacts at the highest levels with clientengineers and customers. Work requires the highest degree of creative ability, engineering and programming skills, and independentjudgment. Incumbent may coordinate and technically lead projects and subordinate engineers. Requires an advanced engineering, math,physics, computer science, or related degree and 6 or more years related experience. This is normally the senior nonsupervisoryengineering level. May be titled Senior Principal Engineer.
Organizational FTE's Organizational Revenue ($ Millions)
Page 3-85Southwestern Pennsylvania Annual Compensation and Benefits Study
© 2010 Pittsburgh Technology Council. All rights reserved.

Job Code 350 MECHANICAL ENGINEER - ALL LEVELS
Description
0.0% Less Complex81.4% Comparable18.6% More Complex
All Organizations
Software, Computer and
Technology Manufacturing
Life-Sciences/ Biotech/
Medical Devices Not-for-ProfitAll Other
EmployersAnnual Base Pay
Employers Reported 13 0 9 3 0 1Employees Reported 102 0 50 49 0 325th Percentile ($000's) 61.2 -- 60.0 63.3 -- --50th Percentile ($000's) 71.6 -- 69.3 71.8 -- --75th Percentile ($000's) 86.6 -- 86.3 89.6 -- --Average ($000's) 74.2 -- 73.4 75.0 -- --
Incentive Pay% Incentive Eligible 60% -- 46% 78% -- 0%25th Percentile ($000's) 3.0 -- 2.9 3.1 -- --50th Percentile ($000's) 3.7 -- 5.1 3.6 -- --75th Percentile ($000's) 4.5 -- 10.5 4.4 -- --Average ($000's) 4.4 -- 6.3 3.7 -- --
25th Percentile ($000's) 61.9 -- 60.0 64.4 -- --50th Percentile ($000's) 73.4 -- 70.3 75.0 -- --75th Percentile ($000's) 88.7 -- 86.6 89.6 -- --Average ($000's) 76.1 -- 74.9 77.4 -- --
Most Recent New HireEmployers Reported 4 0 2 2 0 0
Median ($000's) 66.0 -- -- -- -- --Average ($000's) 64.7 -- -- -- -- --
The data for this position is a combination of the data reported by participants for 351 Mechanical Engineer I, 353 Mechanical Engineer IIand 355 Mechanical Engineer III
Industry - Type of Employer
Total Cash CompensationBase Plus Incentive Pay
Job Match Comparability
Page 3-86Southwestern Pennsylvania Annual Compensation and Benefits Study
© 2010 Pittsburgh Technology Council. All rights reserved.

Job Code 350 MECHANICAL ENGINEER - ALL LEVELS
Description
Less than 50 50 - 150 151 - 500 More than 500Less than
$7.5M$7.5M to
$25M$26M to $150M
More than $150M
Annual Base PayEmployers Reported 3 3 3 4 2 3 3 5Employees Reported 7 6 33 56 5 5 27 65
25th Percentile ($000's) 61.2 64.8 59.3 63.9 62.4 60.1 58.9 63.350th Percentile ($000's) 66.1 75.0 64.2 77.8 66.1 77.0 64.8 75.075th Percentile ($000's) 77.9 77.6 81.5 90.3 77.7 91.8 79.6 89.6Average ($000's) 69.1 73.6 70.1 77.3 64.8 77.7 70.0 76.4
Incentive Pay% Incentive Eligible 57% 50% 27% 80% 40% 40% 11% 83%
25th Percentile ($000's) -- -- -- 2.9 -- -- -- 2.950th Percentile ($000's) 12.3 8.5 -- 3.6 -- -- 8.5 3.675th Percentile ($000's) -- -- -- 4.5 -- -- -- 4.5Average ($000's) 12.3 8.5 -- 4.0 -- -- 8.5 4.0
25th Percentile ($000's) 61.2 69.3 59.3 66.2 62.4 60.1 58.9 64.450th Percentile ($000's) 66.1 75.0 64.2 80.8 66.1 77.0 68.0 78.075th Percentile ($000's) 77.9 85.8 81.5 93.2 77.7 91.8 81.5 91.0Average ($000's) 70.9 76.4 70.1 80.3 64.8 80.1 70.6 78.9
Most Recent New HireEmployers Reported 1 1 1 1 1 0 2 1
Median ($000's) -- -- -- -- -- -- -- --Average ($000's) -- -- -- -- -- -- -- --
Total Cash CompensationBase Plus Incentive Pay
The data for this position is a combination of the data reported by participants for 351 Mechanical Engineer I, 353 Mechanical Engineer IIand 355 Mechanical Engineer III
Organizational FTE's Organizational Revenue ($ Millions)
Page 3-87Southwestern Pennsylvania Annual Compensation and Benefits Study
© 2010 Pittsburgh Technology Council. All rights reserved.

Job Code 351 MECHANICAL ENGINEER I
Description
0.0% Less Complex100.0% Comparable0.0% More Complex
All Organizations
Software, Computer and
Technology Manufacturing
Life-Sciences/ Biotech/
Medical Devices Not-for-ProfitAll Other
EmployersAnnual Base Pay
Employers Reported 9 0 6 3 0 0Employees Reported 21 0 14 7 0 025th Percentile ($000's) 54.0 -- 57.0 46.6 -- --50th Percentile ($000's) 58.7 -- 60.0 47.2 -- --75th Percentile ($000's) 61.0 -- 61.8 58.8 -- --Average ($000's) 57.8 -- 60.8 51.8 -- --
Incentive Pay% Incentive Eligible 57% -- 64% 43% -- --25th Percentile ($000's) 4.4 -- 5.5 -- -- --50th Percentile ($000's) 5.5 -- 6.0 2.7 -- --
75th Percentile ($000's) 6.3 -- 6.6 -- -- --Average ($000's) 5.2 -- 6.1 2.7 -- --
25th Percentile ($000's) 54.0 -- 58.2 46.6 -- --50th Percentile ($000's) 60.0 -- 60.0 47.2 -- --75th Percentile ($000's) 61.7 -- 62.2 60.2 -- --Average ($000's) 58.8 -- 62.1 52.1 -- --
Most Recent New HireEmployers Reported 2 0 0 2 0 0
Median ($000's) -- -- -- -- -- --Average ($000's) -- -- -- -- -- --
Performs standard design, layout, testing, and evaluation of mechanical and electromechanical devices and systems. Performs productdevelopment activities including layout and interpretation of specifications and documentation requirements. Entry level. Requires adegree in mechanical engineering and 2 years or less experience.
Industry - Type of Employer
Total Cash CompensationBase Plus Incentive Pay
Job Match Comparability
Page 3-88Southwestern Pennsylvania Annual Compensation and Benefits Study
© 2010 Pittsburgh Technology Council. All rights reserved.

Job Code 351 MECHANICAL ENGINEER I
Description
Less than 50 50 - 150 151 - 500 More than 500Less than
$7.5M$7.5M to
$25M$26M to $150M
More than $150M
Annual Base PayEmployers Reported 2 1 3 3 1 1 3 4Employees Reported 3 1 10 7 1 2 6 12
25th Percentile ($000's) -- -- 57.0 46.9 -- -- 54.7 55.850th Percentile ($000's) 54.5 -- 59.3 58.7 -- -- 57.4 59.575th Percentile ($000's) -- -- 60.8 61.6 -- -- 60.3 62.8Average ($000's) 51.5 -- 58.8 58.5 -- -- 57.5 59.6
Incentive Pay% Incentive Eligible 100% 100% 50% 43% 100% 100% 17% 67%
25th Percentile ($000's) -- -- -- -- -- -- -- 3.350th Percentile ($000's) 7.2 -- -- 3.8 -- -- -- 3.875th Percentile ($000's) -- -- -- -- -- -- -- 4.4Average ($000's) 7.2 -- -- 3.8 -- -- -- 3.8
25th Percentile ($000's) -- -- 57.0 46.9 -- -- 54.7 55.850th Percentile ($000's) 60.0 -- 59.3 59.0 -- -- 57.4 60.075th Percentile ($000's) -- -- 60.8 62.7 -- -- 60.3 62.8Average ($000's) 53.9 -- 58.8 59.6 -- -- 58.5 60.2
Most Recent New HireEmployers Reported 1 0 0 1 1 0 0 1
Median ($000's) -- -- -- -- -- -- -- --Average ($000's) -- -- -- -- -- -- -- --
Total Cash CompensationBase Plus Incentive Pay
Performs standard design, layout, testing, and evaluation of mechanical and electromechanical devices and systems. Performs productdevelopment activities including layout and interpretation of specifications and documentation requirements. Entry level. Requires adegree in mechanical engineering and 2 years or less experience.
Organizational FTE's Organizational Revenue ($ Millions)
Page 3-89Southwestern Pennsylvania Annual Compensation and Benefits Study
© 2010 Pittsburgh Technology Council. All rights reserved.

Job Code 353 MECHANICAL ENGINEER II
Description
0.0% Less Complex86.1% Comparable13.9% More Complex
All Organizations
Software, Computer and
Technology Manufacturing
Life-Sciences/ Biotech/
Medical Devices Not-for-ProfitAll Other
EmployersAnnual Base Pay
Employers Reported 7 0 4 2 0 1Employees Reported 36 0 13 22 0 125th Percentile ($000's) 59.6 -- 59.0 63.3 -- --50th Percentile ($000's) 65.0 -- 60.1 67.4 -- --75th Percentile ($000's) 71.1 -- 68.2 75.7 -- --Average ($000's) 66.5 -- 63.2 68.5 -- --
Incentive Pay% Incentive Eligible 58% -- 23% 82% -- 0%25th Percentile ($000's) 2.8 -- -- 2.9 -- --50th Percentile ($000's) 3.0 -- 2.5 3.1 -- --75th Percentile ($000's) 3.4 -- -- 3.4 -- --Average ($000's) 3.0 -- 2.3 3.1 -- --
25th Percentile ($000's) 60.4 -- 59.3 65.1 -- --50th Percentile ($000's) 66.2 -- 60.5 69.7 -- --75th Percentile ($000's) 74.3 -- 68.2 77.3 -- --Average ($000's) 68.1 -- 63.8 70.7 -- --
Most Recent New HireEmployers Reported 1 0 0 1 0 0
Median ($000's) -- -- -- -- -- --Average ($000's) -- -- -- -- -- --
Performs nonstandard design, layout, testing, and evaluation of mechanical and electromechanical devices and systems. Assignmentsare complex and require initiative and judgment. Requires an engineering degree and 3–5 years experience.
Industry - Type of Employer
Total Cash CompensationBase Plus Incentive Pay
Job Match Comparability
Page 3-90Southwestern Pennsylvania Annual Compensation and Benefits Study
© 2010 Pittsburgh Technology Council. All rights reserved.

Job Code 353 MECHANICAL ENGINEER II
Description
Less than 50 50 - 150 151 - 500 More than 500Less than
$7.5M$7.5M to
$25M$26M to $150M
More than $150M
Annual Base PayEmployers Reported 1 1 2 3 1 1 2 3Employees Reported 1 1 9 25 1 1 9 25
25th Percentile ($000's) -- -- 58.5 63.3 -- -- 58.5 63.350th Percentile ($000's) -- -- 59.4 67.7 -- -- 59.4 67.775th Percentile ($000's) -- -- 63.5 77.0 -- -- 63.5 77.0Average ($000's) -- -- 61.5 68.6 -- -- 61.5 68.6
Incentive Pay% Incentive Eligible 0% 0% 0% 84% 0% 0% 0% 84%
25th Percentile ($000's) -- -- -- 2.8 -- -- -- 2.850th Percentile ($000's) -- -- -- 3.0 -- -- -- 3.075th Percentile ($000's) -- -- -- 3.4 -- -- -- 3.4Average ($000's) -- -- -- 3.0 -- -- -- 3.0
25th Percentile ($000's) -- -- 58.5 64.7 -- -- 58.5 64.750th Percentile ($000's) -- -- 59.4 70.0 -- -- 59.4 70.075th Percentile ($000's) -- -- 63.5 78.0 -- -- 63.5 78.0Average ($000's) -- -- 61.5 70.9 -- -- 61.5 70.9
Most Recent New HireEmployers Reported 0 0 0 1 0 0 0 1
Median ($000's) -- -- -- -- -- -- -- --Average ($000's) -- -- -- -- -- -- -- --
Total Cash CompensationBase Plus Incentive Pay
Performs nonstandard design, layout, testing, and evaluation of mechanical and electromechanical devices and systems. Assignmentsare complex and require initiative and judgment. Requires an engineering degree and 3–5 years experience.
Organizational FTE's Organizational Revenue ($ Millions)
Page 3-91Southwestern Pennsylvania Annual Compensation and Benefits Study
© 2010 Pittsburgh Technology Council. All rights reserved.

Job Code 355 MECHANICAL ENGINEER III
Description
0.0% Less Complex69.6% Comparable30.4% More Complex
All Organizations
Software, Computer and
Technology Manufacturing
Life-Sciences/ Biotech/
Medical Devices Not-for-ProfitAll Other
EmployersAnnual Base Pay
Employers Reported 13 0 9 3 0 1Employees Reported 46 0 24 20 0 225th Percentile ($000's) 77.8 -- 76.5 84.8 -- --50th Percentile ($000's) 87.7 -- 86.1 92.3 -- --75th Percentile ($000's) 97.6 -- 95.5 98.4 -- --Average ($000's) 87.2 -- 85.5 90.2 -- --
Incentive Pay% Incentive Eligible 63% -- 50% 85% -- 0%25th Percentile ($000's) 4.2 -- 4.7 4.1 -- --50th Percentile ($000's) 4.5 -- 10.3 4.4 -- --75th Percentile ($000's) 5.2 -- 11.6 4.5 -- --Average ($000's) 5.5 -- 8.2 4.4 -- --
25th Percentile ($000's) 78.9 -- 76.5 88.3 -- --50th Percentile ($000's) 89.0 -- 86.5 96.5 -- --75th Percentile ($000's) 102.0 -- 100.4 104.0 -- --Average ($000's) 90.0 -- 87.9 93.7 -- --
Most Recent New HireEmployers Reported 2 0 2 0 0 0
Median ($000's) -- -- -- -- -- --Average ($000's) -- -- -- -- -- --
Performs design, layout, testing, and evaluation of highly complex mechanical and electromechanical devices or systems. Performsextensive product development activities, including layout, interpretation, and implementation of customer specifications. Participates inproduct and production planning. Provides technical direction to lower level engineers. Typically requires advanced engineering degreeand 6 or more years experience.
Industry - Type of Employer
Total Cash CompensationBase Plus Incentive Pay
Job Match Comparability
Page 3-92Southwestern Pennsylvania Annual Compensation and Benefits Study
© 2010 Pittsburgh Technology Council. All rights reserved.

Job Code 355 MECHANICAL ENGINEER III
Description
Less than 50 50 - 150 151 - 500 More than 500Less than
$7.5M$7.5M to
$25M$26M to $150M
More than $150M
Annual Base PayEmployers Reported 3 3 3 4 2 3 3 5Employees Reported 4 4 14 24 3 3 12 28
25th Percentile ($000's) -- -- 74.0 86.4 -- -- 73.5 84.950th Percentile ($000's) 77.9 77.4 83.7 94.1 77.7 91.8 81.5 92.375th Percentile ($000's) -- -- 88.4 98.4 -- -- 87.2 98.4Average ($000's) 79.4 79.9 83.6 91.8 72.7 89.4 82.6 90.5
Incentive Pay% Incentive Eligible 50% 50% 29% 88% 33% 33% 17% 89%
25th Percentile ($000's) -- -- -- 4.2 -- -- -- 4.250th Percentile ($000's) -- -- -- 4.4 -- -- -- 4.475th Percentile ($000's) -- -- -- 4.8 -- -- -- 4.8Average ($000's) -- -- -- 4.9 -- -- -- 4.9
25th Percentile ($000's) -- -- 74.0 89.0 -- -- 73.5 87.150th Percentile ($000's) 77.9 82.9 83.7 99.0 77.7 91.8 83.7 96.575th Percentile ($000's) -- -- 88.4 104.3 -- -- 88.8 104.1Average ($000's) 82.5 82.6 83.6 96.1 72.7 93.5 83.6 94.2
Most Recent New HireEmployers Reported 0 1 1 0 0 0 2 0
Median ($000's) -- -- -- -- -- -- -- --Average ($000's) -- -- -- -- -- -- -- --
Total Cash CompensationBase Plus Incentive Pay
Performs design, layout, testing, and evaluation of highly complex mechanical and electromechanical devices or systems. Performsextensive product development activities, including layout, interpretation, and implementation of customer specifications. Participates inproduct and production planning. Provides technical direction to lower level engineers. Typically requires advanced engineering degreeand 6 or more years experience.
Organizational FTE's Organizational Revenue ($ Millions)
Page 3-93Southwestern Pennsylvania Annual Compensation and Benefits Study
© 2010 Pittsburgh Technology Council. All rights reserved.

Job Code 381 ELECTRICAL ENGINEER - ALL LEVELS
Description
0.0% Less Complex92.0% Comparable8.0% More Complex
All Organizations
Software, Computer and
Technology Manufacturing
Life-Sciences/ Biotech/
Medical Devices Not-for-ProfitAll Other
EmployersAnnual Base Pay
Employers Reported 13 1 8 2 0 2Employees Reported 87 12 23 27 0 2525th Percentile ($000's) 61.6 -- 59.3 72.4 -- 62.050th Percentile ($000's) 78.6 -- 71.4 80.0 -- 85.375th Percentile ($000's) 88.7 -- 86.5 88.7 -- 93.0Average ($000's) 78.3 -- 72.2 81.5 -- 84.6
Incentive Pay% Incentive Eligible 55% 50% 70% 78% -- 20%25th Percentile ($000's) 3.4 -- 3.5 3.4 -- 17.250th Percentile ($000's) 4.2 -- 5.7 3.7 -- 19.475th Percentile ($000's) 8.6 -- 9.2 4.3 -- 26.8Average ($000's) 7.1 -- 6.3 4.1 -- 20.8
25th Percentile ($000's) 62.3 -- 63.1 76.5 -- 62.050th Percentile ($000's) 80.9 -- 80.5 82.4 -- 85.375th Percentile ($000's) 90.9 -- 86.7 88.7 -- 93.0Average ($000's) 81.1 -- 75.0 84.6 -- 88.8
Most Recent New HireEmployers Reported 3 1 1 1 0 0
Median ($000's) 78.0 -- -- -- -- --Average ($000's) 75.8 -- -- -- -- --
The data for this position is a combination of the data reported by participants for 382 Electrical Engineer I, 383 Electrical Engineer IIand 384 Electrical Engineer III
Industry - Type of Employer
Total Cash CompensationBase Plus Incentive Pay
Job Match Comparability
Page 3-94Southwestern Pennsylvania Annual Compensation and Benefits Study
© 2010 Pittsburgh Technology Council. All rights reserved.

Job Code 381 ELECTRICAL ENGINEER - ALL LEVELS
Description
Less than 50 50 - 150 151 - 500 More than 500Less than
$7.5M$7.5M to
$25M$26M to $150M
More than $150M
Annual Base PayEmployers Reported 2 2 4 5 1 2 4 6Employees Reported 7 3 21 56 1 7 18 61
25th Percentile ($000's) 55.5 -- 52.0 68.5 -- 55.5 51.2 68.650th Percentile ($000's) 64.0 93.0 68.6 80.4 -- 71.3 62.9 80.775th Percentile ($000's) 71.3 -- 85.3 92.6 -- 83.2 83.4 89.7Average ($000's) 66.8 83.9 69.5 82.7 -- 72.1 67.2 82.5
Incentive Pay% Incentive Eligible 86% 67% 48% 54% 0% 86% 44% 56%
25th Percentile ($000's) 6.0 -- -- 3.4 -- 6.0 8.4 3.450th Percentile ($000's) 8.7 -- -- 4.1 -- 8.7 9.7 4.175th Percentile ($000's) 9.8 -- -- 5.1 -- 9.8 10.9 5.1Average ($000's) 7.2 -- -- 6.9 -- 7.2 9.7 6.9
25th Percentile ($000's) 59.9 -- 52.0 68.6 -- 59.9 51.2 68.750th Percentile ($000's) 64.0 101.4 68.6 83.3 -- 81.1 64.1 83.775th Percentile ($000's) 81.2 -- 85.3 92.7 -- 88.1 83.4 92.6Average ($000's) 70.9 90.4 69.5 86.3 -- 76.2 68.2 85.8
Most Recent New HireEmployers Reported 0 0 2 1 0 0 1 2
Median ($000's) -- -- -- -- -- -- -- --Average ($000's) -- -- -- -- -- -- -- --
Total Cash CompensationBase Plus Incentive Pay
The data for this position is a combination of the data reported by participants for 382 Electrical Engineer I, 383 Electrical Engineer IIand 384 Electrical Engineer III
Organizational FTE's Organizational Revenue ($ Millions)
Page 3-95Southwestern Pennsylvania Annual Compensation and Benefits Study
© 2010 Pittsburgh Technology Council. All rights reserved.

Job Code 382 ELECTRICAL ENGINEER I
Description
0.0% Less Complex100.0% Comparable0.0% More Complex
All Organizations
Software, Computer and
Technology Manufacturing
Life-Sciences/ Biotech/
Medical Devices Not-for-ProfitAll Other
EmployersAnnual Base Pay
Employers Reported 6 0 3 2 0 1Employees Reported 19 0 5 4 0 1025th Percentile ($000's) 55.2 -- 54.9 -- -- --50th Percentile ($000's) 57.8 -- 55.0 55.2 -- --75th Percentile ($000's) 59.9 -- 56.0 -- -- --Average ($000's) 57.8 -- 54.7 54.3 -- --
Incentive Pay% Incentive Eligible 26% -- 60% 50% -- 0%25th Percentile ($000's) 2.2 -- -- -- -- --50th Percentile ($000's) 2.5 -- 4.5 -- -- --75th Percentile ($000's) 3.8 -- -- -- -- --Average ($000's) 3.5 -- 4.5 -- -- --
25th Percentile ($000's) 57.3 -- 55.0 -- -- --50th Percentile ($000's) 57.8 -- 57.3 56.7 -- --75th Percentile ($000's) 62.0 -- 62.5 -- -- --Average ($000's) 58.5 -- 56.5 55.5 -- --
Most Recent New HireEmployers Reported 1 0 1 0 0 0
Median ($000's) -- -- -- -- -- --Average ($000's) -- -- -- -- -- --
Performs standard design, layout, testing, and evaluation of electrical apparatus, components, equipment and machinery. Performsproduct development activities including layout and interpretation of specifications and documentation requirements related to systems,machinery and equipment used for generation, transmission and distribution of energy. Entry level. Requires a degree in electricalengineering and 2 years or less experience.
Industry - Type of Employer
Total Cash CompensationBase Plus Incentive Pay
Job Match Comparability
Page 3-96Southwestern Pennsylvania Annual Compensation and Benefits Study
© 2010 Pittsburgh Technology Council. All rights reserved.

Job Code 382 ELECTRICAL ENGINEER I
Description
Less than 50 50 - 150 151 - 500 More than 500Less than
$7.5M$7.5M to
$25M$26M to $150M
More than $150M
Annual Base PayEmployers Reported 1 0 2 3 0 1 1 4Employees Reported 3 0 2 14 0 3 1 15
25th Percentile ($000's) -- -- -- 56.1 -- -- -- 56.550th Percentile ($000's) -- -- -- 57.8 -- -- -- 57.875th Percentile ($000's) -- -- -- 60.9 -- -- -- 62.0Average ($000's) -- -- -- 58.9 -- -- -- 59.1
Incentive Pay% Incentive Eligible 100% -- 0% 14% -- 100% 0% 13%
25th Percentile ($000's) -- -- -- -- -- -- -- --50th Percentile ($000's) -- -- -- -- -- -- -- --75th Percentile ($000's) -- -- -- -- -- -- -- --Average ($000's) -- -- -- -- -- -- -- --
25th Percentile ($000's) -- -- -- 57.7 -- -- -- 57.750th Percentile ($000's) -- -- -- 57.8 -- -- -- 57.875th Percentile ($000's) -- -- -- 61.0 -- -- -- 62.0Average ($000's) -- -- -- 59.2 -- -- -- 59.5
Most Recent New HireEmployers Reported 0 0 1 0 0 0 0 1
Median ($000's) -- -- -- -- -- -- -- --Average ($000's) -- -- -- -- -- -- -- --
Total Cash CompensationBase Plus Incentive Pay
Performs standard design, layout, testing, and evaluation of electrical apparatus, components, equipment and machinery. Performsproduct development activities including layout and interpretation of specifications and documentation requirements related to systems,machinery and equipment used for generation, transmission and distribution of energy. Entry level. Requires a degree in electricalengineering and 2 years or less experience.
Organizational FTE's Organizational Revenue ($ Millions)
Page 3-97Southwestern Pennsylvania Annual Compensation and Benefits Study
© 2010 Pittsburgh Technology Council. All rights reserved.

Job Code 383 ELECTRICAL ENGINEER II
Description
0.0% Less Complex96.4% Comparable3.6% More Complex
All Organizations
Software, Computer and
Technology Manufacturing
Life-Sciences/ Biotech/
Medical Devices Not-for-ProfitAll Other
EmployersAnnual Base Pay
Employers Reported 9 1 5 2 0 1Employees Reported 28 10 7 7 0 425th Percentile ($000's) 61.0 -- 59.3 73.7 -- --50th Percentile ($000's) 76.8 -- 64.0 76.8 -- --75th Percentile ($000's) 85.3 -- 82.5 82.2 -- --Average ($000's) 71.9 -- 68.4 78.1 -- --
Incentive Pay% Incentive Eligible 50% 40% 71% 71% -- 0%25th Percentile ($000's) 3.2 -- 4.1 3.4 -- --50th Percentile ($000's) 3.5 -- 5.1 3.5 -- --75th Percentile ($000's) 3.9 -- 6.2 3.6 -- --Average ($000's) 4.0 -- 5.1 3.6 -- --
25th Percentile ($000's) 63.5 -- 64.1 77.6 -- --50th Percentile ($000's) 78.9 -- 64.5 80.3 -- --75th Percentile ($000's) 85.3 -- 82.5 84.0 -- --Average ($000's) 72.9 -- 69.9 80.6 -- --
Most Recent New HireEmployers Reported 1 1 0 0 0 0
Median ($000's) -- -- -- -- -- --Average ($000's) -- -- -- -- -- --
Performs nonstandard design, layout, testing, and evaluation of electrical apparatus, components, equipment and machinery. Performsnonstandard product development activities including layout and interpretation of specifications and documentation requirements relatedto systems, machinery and equipment used for generation, transmission and distribution of energy. Assignments are complex andrequire initiative and judgment. Requires an engineering degree and 3–5 years experience.
Industry - Type of Employer
Total Cash CompensationBase Plus Incentive Pay
Job Match Comparability
Page 3-98Southwestern Pennsylvania Annual Compensation and Benefits Study
© 2010 Pittsburgh Technology Council. All rights reserved.

Job Code 383 ELECTRICAL ENGINEER II
Description
Less than 50 50 - 150 151 - 500 More than 500Less than
$7.5M$7.5M to
$25M$26M to $150M
More than $150M
Annual Base PayEmployers Reported 1 1 3 4 1 0 3 5Employees Reported 1 1 14 12 1 0 12 15
25th Percentile ($000's) -- -- 51.2 75.2 -- -- 49.8 76.850th Percentile ($000's) -- -- 65.4 79.8 -- -- 58.8 80.975th Percentile ($000's) -- -- 83.5 85.4 -- -- 70.9 85.5Average ($000's) -- -- 67.5 78.9 -- -- 62.5 79.9
Incentive Pay% Incentive Eligible 0% 100% 50% 50% 0% -- 42% 60%
25th Percentile ($000's) -- -- -- 3.2 -- -- 7.2 3.250th Percentile ($000's) -- -- -- 3.4 -- -- 7.2 3.475th Percentile ($000's) -- -- -- 3.6 -- -- 7.2 3.6Average ($000's) -- -- -- 3.5 -- -- 7.2 3.5
25th Percentile ($000's) -- -- 51.2 78.8 -- -- 49.8 80.250th Percentile ($000's) -- -- 65.4 81.6 -- -- 61.2 82.475th Percentile ($000's) -- -- 83.5 85.4 -- -- 70.9 85.5Average ($000's) -- -- 67.5 80.6 -- -- 63.1 81.3
Most Recent New HireEmployers Reported 0 0 1 0 0 0 1 0
Median ($000's) -- -- -- -- -- -- -- --Average ($000's) -- -- -- -- -- -- -- --
Total Cash CompensationBase Plus Incentive Pay
Performs nonstandard design, layout, testing, and evaluation of electrical apparatus, components, equipment and machinery. Performsnonstandard product development activities including layout and interpretation of specifications and documentation requirements relatedto systems, machinery and equipment used for generation, transmission and distribution of energy. Assignments are complex andrequire initiative and judgment. Requires an engineering degree and 3–5 years experience.
Organizational FTE's Organizational Revenue ($ Millions)
Page 3-99Southwestern Pennsylvania Annual Compensation and Benefits Study
© 2010 Pittsburgh Technology Council. All rights reserved.

Job Code 384 ELECTRICAL ENGINEER III
Description
0.0% Less Complex85.0% Comparable15.0% More Complex
All Organizations
Software, Computer and
Technology Manufacturing
Life-Sciences/ Biotech/
Medical Devices Not-for-ProfitAll Other
EmployersAnnual Base Pay
Employers Reported 12 1 7 2 0 2Employees Reported 40 2 11 16 0 1125th Percentile ($000's) 79.9 -- 72.3 79.6 -- 92.850th Percentile ($000's) 89.0 -- 86.5 83.3 -- 93.075th Percentile ($000's) 95.1 -- 90.0 93.2 -- 117.2Average ($000's) 92.5 -- 82.6 89.8 -- 106.2
Incentive Pay% Incentive Eligible 73% 100% 73% 88% -- 45%25th Percentile ($000's) 4.0 -- 4.2 3.7 -- 17.250th Percentile ($000's) 4.5 -- 7.0 4.1 -- 19.475th Percentile ($000's) 10.5 -- 9.9 4.8 -- 26.8Average ($000's) 8.6 -- 7.2 4.5 -- 20.8
25th Percentile ($000's) 82.6 -- 81.2 81.5 -- 92.850th Percentile ($000's) 91.9 -- 87.0 87.6 -- 93.075th Percentile ($000's) 99.1 -- 93.1 97.7 -- 135.5Average ($000's) 97.6 -- 86.6 93.5 -- 115.7
Most Recent New HireEmployers Reported 1 0 0 1 0 0
Median ($000's) -- -- -- -- -- --Average ($000's) -- -- -- -- -- --
Performs design, layout, testing, and evaluation of highly complex electrical apparatus, components, equipment and machinery. Performsextensive product development activities, including layout, interpretation, and implementation of customer specifications related tosystems, machinery and equipment used for generation, transition and distribution of energy. Participates in product and productionplanning. Provides technical direction to lower level engineers. Typically requires advanced engineering degree and 6 or more yearsexperience.
Industry - Type of Employer
Total Cash CompensationBase Plus Incentive Pay
Job Match Comparability
Page 3-100Southwestern Pennsylvania Annual Compensation and Benefits Study
© 2010 Pittsburgh Technology Council. All rights reserved.

Job Code 384 ELECTRICAL ENGINEER III
Description
Less than 50 50 - 150 151 - 500 More than 500Less than
$7.5M$7.5M to
$25M$26M to $150M
More than $150M
Annual Base PayEmployers Reported 1 2 4 5 0 2 4 6Employees Reported 3 2 5 30 0 4 5 31
25th Percentile ($000's) -- -- 73.2 80.3 -- -- 73.2 80.450th Percentile ($000's) -- -- 85.3 91.2 -- 83.2 85.3 89.775th Percentile ($000's) -- -- 87.0 95.0 -- -- 93.0 94.4Average ($000's) -- -- 81.5 95.3 -- 84.8 82.7 95.0
Incentive Pay% Incentive Eligible 100% 50% 60% 73% -- 75% 60% 74%
25th Percentile ($000's) -- -- -- 3.8 -- -- -- 3.850th Percentile ($000's) -- -- -- 4.2 -- 9.9 12.2 4.275th Percentile ($000's) -- -- -- 9.5 -- -- -- 9.5Average ($000's) -- -- -- 8.3 -- 9.9 12.2 8.3
25th Percentile ($000's) -- -- 73.2 83.9 -- -- 73.2 84.050th Percentile ($000's) -- -- 85.3 92.6 -- 88.1 85.3 92.675th Percentile ($000's) -- -- 87.0 99.6 -- -- 98.2 99.4Average ($000's) -- -- 81.5 101.1 -- 89.7 85.1 100.7
Most Recent New HireEmployers Reported 0 0 0 1 0 0 0 1
Median ($000's) -- -- -- -- -- -- -- --Average ($000's) -- -- -- -- -- -- -- --
Total Cash CompensationBase Plus Incentive Pay
Performs design, layout, testing, and evaluation of highly complex electrical apparatus, components, equipment and machinery. Performsextensive product development activities, including layout, interpretation, and implementation of customer specifications related tosystems, machinery and equipment used for generation, transition and distribution of energy. Participates in product and productionplanning. Provides technical direction to lower level engineers. Typically requires advanced engineering degree and 6 or more yearsexperience.
Organizational FTE's Organizational Revenue ($ Millions)
Page 3-101Southwestern Pennsylvania Annual Compensation and Benefits Study
© 2010 Pittsburgh Technology Council. All rights reserved.

Job Code 388 INDUSTRIAL ENGINEER - ALL LEVELS
Description
0.0% Less Complex100.0% Comparable0.0% More Complex
All Organizations
Software, Computer and
Technology Manufacturing
Life-Sciences/ Biotech/
Medical Devices Not-for-ProfitAll Other
EmployersAnnual Base Pay
Employers Reported 9 0 4 2 0 3Employees Reported 29 0 10 8 0 1125th Percentile ($000's) 55.6 -- 56.0 68.2 -- 55.350th Percentile ($000's) 62.1 -- 68.0 74.4 -- 56.075th Percentile ($000's) 74.8 -- 81.1 81.8 -- 57.8Average ($000's) 67.1 -- 72.1 73.3 -- 58.0
Incentive Pay% Incentive Eligible 93% -- 100% 88% -- 91%25th Percentile ($000's) 3.3 -- 6.0 2.7 -- 4.550th Percentile ($000's) 3.9 -- 9.3 3.3 -- 4.575th Percentile ($000's) 5.6 -- 12.4 3.5 -- 4.5Average ($000's) 5.4 -- 9.1 3.2 -- 4.5
25th Percentile ($000's) 55.6 -- 57.2 70.3 -- 55.350th Percentile ($000's) 66.7 -- 68.0 76.3 -- 56.075th Percentile ($000's) 75.6 -- 85.9 85.2 -- 57.8Average ($000's) 69.1 -- 75.7 75.7 -- 58.4
Most Recent New HireEmployers Reported 4 0 1 1 0 2
Median ($000's) 56.3 -- -- -- -- --Average ($000's) 57.7 -- -- -- -- --
The data for this position is a combination of the data reported by participants for 385 Industrial Engineer I, 386 Industrial Engineer IIand 387 Industrial Engineer III
Industry - Type of Employer
Total Cash CompensationBase Plus Incentive Pay
Job Match Comparability
Page 3-102Southwestern Pennsylvania Annual Compensation and Benefits Study
© 2010 Pittsburgh Technology Council. All rights reserved.

Job Code 388 INDUSTRIAL ENGINEER - ALL LEVELS
Description
Less than 50 50 - 150 151 - 500 More than 500Less than
$7.5M$7.5M to
$25M$26M to $150M
More than $150M
Annual Base PayEmployers Reported 1 0 2 6 1 0 1 7Employees Reported 1 0 6 22 1 0 3 25
25th Percentile ($000's) -- -- 52.3 56.1 -- -- -- 56.050th Percentile ($000's) -- -- 61.0 64.5 -- -- -- 62.175th Percentile ($000's) -- -- 68.0 78.6 -- -- -- 75.6Average ($000's) -- -- 59.7 70.0 -- -- -- 68.3
Incentive Pay% Incentive Eligible 100% -- 100% 91% 100% -- 100% 92%
25th Percentile ($000's) -- -- -- 3.3 -- -- -- 3.350th Percentile ($000's) -- -- -- 3.8 -- -- -- 3.875th Percentile ($000's) -- -- -- 6.0 -- -- -- 6.0Average ($000's) -- -- -- 5.5 -- -- -- 5.5
25th Percentile ($000's) -- -- 52.3 56.1 -- -- -- 56.050th Percentile ($000's) -- -- 61.0 66.9 -- -- -- 66.775th Percentile ($000's) -- -- 68.0 81.9 -- -- -- 78.2Average ($000's) -- -- 59.7 72.5 -- -- -- 70.5
Most Recent New HireEmployers Reported 0 0 1 3 0 0 1 3
Median ($000's) -- -- -- 56.5 -- -- -- 56.5Average ($000's) -- -- -- 58.2 -- -- -- 58.2
Total Cash CompensationBase Plus Incentive Pay
The data for this position is a combination of the data reported by participants for 385 Industrial Engineer I, 386 Industrial Engineer IIand 387 Industrial Engineer III
Organizational FTE's Organizational Revenue ($ Millions)
Page 3-103Southwestern Pennsylvania Annual Compensation and Benefits Study
© 2010 Pittsburgh Technology Council. All rights reserved.

Job Code 385 INDUSTRIAL ENGINEER I
Description
0.0% Less Complex100.0% Comparable0.0% More Complex
All Organizations
Software, Computer and
Technology Manufacturing
Life-Sciences/ Biotech/
Medical Devices Not-for-ProfitAll Other
EmployersAnnual Base Pay
Employers Reported 6 0 2 1 0 3Employees Reported 16 0 4 1 0 1125th Percentile ($000's) 54.0 -- -- -- -- 55.350th Percentile ($000's) 56.0 -- 52.9 -- -- 56.075th Percentile ($000's) 60.3 -- -- -- -- 57.8Average ($000's) 58.3 -- 55.1 -- -- 58.0
Incentive Pay% Incentive Eligible 88% -- 100% 0% -- 91%25th Percentile ($000's) 4.5 -- -- -- -- 4.550th Percentile ($000's) 4.5 -- -- -- -- 4.575th Percentile ($000's) 4.5 -- -- -- -- 4.5Average ($000's) 4.5 -- -- -- -- 4.5
25th Percentile ($000's) 54.0 -- -- -- -- 55.350th Percentile ($000's) 56.0 -- 52.9 -- -- 56.075th Percentile ($000's) 60.3 -- -- -- -- 57.8Average ($000's) 58.5 -- 55.1 -- -- 58.4
Most Recent New HireEmployers Reported 3 0 1 0 0 2
Median ($000's) 56.0 -- -- -- -- --Average ($000's) 57.5 -- -- -- -- --
Studies and evaluates work flow and operating processes and makes recommendations to increase production, efficiency, quality andvolume. Completes planning activities for equipment layouts in production facilities and offices. May estimate costs for assignedprojects. Entry level. Requires a degree in industrial engineering and 2 years or less experience.
Industry - Type of Employer
Total Cash CompensationBase Plus Incentive Pay
Job Match Comparability
Page 3-104Southwestern Pennsylvania Annual Compensation and Benefits Study
© 2010 Pittsburgh Technology Council. All rights reserved.

Job Code 385 INDUSTRIAL ENGINEER I
Description
Less than 50 50 - 150 151 - 500 More than 500Less than
$7.5M$7.5M to
$25M$26M to $150M
More than $150M
Annual Base PayEmployers Reported 1 0 2 3 1 0 1 4Employees Reported 1 0 4 11 1 0 1 14
25th Percentile ($000's) -- -- -- 55.8 -- -- -- 55.150th Percentile ($000's) -- -- 52.9 56.5 -- -- -- 56.375th Percentile ($000's) -- -- -- 62.5 -- -- -- 64.8Average ($000's) -- -- 55.1 60.5 -- -- -- 59.4
Incentive Pay% Incentive Eligible 100% -- 100% 82% 100% -- 100% 86%
25th Percentile ($000's) -- -- -- -- -- -- -- --50th Percentile ($000's) -- -- -- -- -- -- -- --75th Percentile ($000's) -- -- -- -- -- -- -- --Average ($000's) -- -- -- -- -- -- -- --
25th Percentile ($000's) -- -- -- 55.8 -- -- -- 55.150th Percentile ($000's) -- -- 52.9 56.5 -- -- -- 56.375th Percentile ($000's) -- -- -- 62.5 -- -- -- 64.8Average ($000's) -- -- 55.1 60.5 -- -- -- 59.4
Most Recent New HireEmployers Reported 0 0 1 2 0 0 1 2
Median ($000's) -- -- -- -- -- -- -- --Average ($000's) -- -- -- -- -- -- -- --
Total Cash CompensationBase Plus Incentive Pay
Studies and evaluates work flow and operating processes and makes recommendations to increase production, efficiency, quality andvolume. Completes planning activities for equipment layouts in production facilities and offices. May estimate costs for assignedprojects. Entry level. Requires a degree in industrial engineering and 2 years or less experience.
Organizational FTE's Organizational Revenue ($ Millions)
Page 3-105Southwestern Pennsylvania Annual Compensation and Benefits Study
© 2010 Pittsburgh Technology Council. All rights reserved.

Job Code 386 INDUSTRIAL ENGINEER II
Description
0.0% Less Complex100.0% Comparable0.0% More Complex
All Organizations
Software, Computer and
Technology Manufacturing
Life-Sciences/ Biotech/
Medical Devices Not-for-ProfitAll Other
EmployersAnnual Base Pay
Employers Reported 4 0 3 1 0 0Employees Reported 10 0 4 6 0 025th Percentile ($000's) 63.6 -- -- -- -- --50th Percentile ($000's) 70.6 -- 69.0 -- -- --75th Percentile ($000's) 78.4 -- -- -- -- --Average ($000's) 70.9 -- 71.2 -- -- --
Incentive Pay% Incentive Eligible 100% -- 100% 100% -- --25th Percentile ($000's) 3.3 -- -- -- -- --50th Percentile ($000's) 3.6 -- 5.6 -- -- --75th Percentile ($000's) 4.3 -- -- -- -- --Average ($000's) 3.9 -- 5.6 -- -- --
25th Percentile ($000's) 67.1 -- -- -- -- --50th Percentile ($000's) 72.2 -- 69.0 -- -- --75th Percentile ($000's) 81.9 -- -- -- -- --Average ($000's) 73.6 -- 74.0 -- -- --
Most Recent New HireEmployers Reported 1 0 0 1 0 0
Median ($000's) -- -- -- -- -- --Average ($000's) -- -- -- -- -- --
Conducts moderately complex studies and evaluations of work flow and operating processes and makes recommendations to increaseproduction, efficiency, quality and volume. Completes moderately complex planning for equipment layouts in production facilities andoffices. Estimates costs for assigned projects and evaluates cost factors. May provide direction and training to lower level professionalemployees. Assignments are moderately complex and require initiative and judgment. Requires an industrial engineering degree and3–5 years experience.
Industry - Type of Employer
Total Cash CompensationBase Plus Incentive Pay
Job Match Comparability
Page 3-106Southwestern Pennsylvania Annual Compensation and Benefits Study
© 2010 Pittsburgh Technology Council. All rights reserved.

Job Code 386 INDUSTRIAL ENGINEER II
Description
Less than 50 50 - 150 151 - 500 More than 500Less than
$7.5M$7.5M to
$25M$26M to $150M
More than $150M
Annual Base PayEmployers Reported 0 0 1 3 0 0 1 3Employees Reported 0 0 2 8 0 0 2 8
25th Percentile ($000's) -- -- -- 61.3 -- -- -- 61.350th Percentile ($000's) -- -- -- 73.0 -- -- -- 73.075th Percentile ($000's) -- -- -- 80.9 -- -- -- 80.9Average ($000's) -- -- -- 71.3 -- -- -- 71.3
Incentive Pay% Incentive Eligible -- -- 100% 100% -- -- 100% 100%
25th Percentile ($000's) -- -- -- 3.3 -- -- -- 3.350th Percentile ($000's) -- -- -- 3.6 -- -- -- 3.675th Percentile ($000's) -- -- -- 4.3 -- -- -- 4.3Average ($000's) -- -- -- 3.9 -- -- -- 3.9
25th Percentile ($000's) -- -- -- 64.8 -- -- -- 64.850th Percentile ($000's) -- -- -- 76.3 -- -- -- 76.375th Percentile ($000's) -- -- -- 85.2 -- -- -- 85.2Average ($000's) -- -- -- 74.8 -- -- -- 74.8
Most Recent New HireEmployers Reported 0 0 0 1 0 0 0 1
Median ($000's) -- -- -- -- -- -- -- --Average ($000's) -- -- -- -- -- -- -- --
Total Cash CompensationBase Plus Incentive Pay
Conducts moderately complex studies and evaluations of work flow and operating processes and makes recommendations to increaseproduction, efficiency, quality and volume. Completes moderately complex planning for equipment layouts in production facilities andoffices. Estimates costs for assigned projects and evaluates cost factors. May provide direction and training to lower level professionalemployees. Assignments are moderately complex and require initiative and judgment. Requires an industrial engineering degree and3–5 years experience.
Organizational FTE's Organizational Revenue ($ Millions)
Page 3-107Southwestern Pennsylvania Annual Compensation and Benefits Study
© 2010 Pittsburgh Technology Council. All rights reserved.

Job Code 387 INDUSTRIAL ENGINEER III
Description
0.0% Less Complex100.0% Comparable0.0% More Complex
All Organizations
Software, Computer and
Technology Manufacturing
Life-Sciences/ Biotech/
Medical Devices Not-for-ProfitAll Other
EmployersAnnual Base Pay
Employers Reported 2 0 1 1 0 0Employees Reported 3 0 2 1 0 025th Percentile ($000's) -- -- -- -- -- --50th Percentile ($000's) 107.9 -- -- -- -- --75th Percentile ($000's) -- -- -- -- -- --Average ($000's) 101.5 -- -- -- -- --
Incentive Pay% Incentive Eligible 100% -- 100% 100% -- --25th Percentile ($000's) -- -- -- -- -- --50th Percentile ($000's) 12.2 -- -- -- -- --75th Percentile ($000's) -- -- -- -- -- --Average ($000's) 9.3 -- -- -- -- --
25th Percentile ($000's) -- -- -- -- -- --50th Percentile ($000's) 120.0 -- -- -- -- --75th Percentile ($000's) -- -- -- -- -- --Average ($000's) 110.7 -- -- -- -- --
Most Recent New HireEmployers Reported 0 0 0 0 0 0
Median ($000's) -- -- -- -- -- --Average ($000's) -- -- -- -- -- --
Conducts complex studies and evaluations of work flow and operating processes and makes recommendations to increase production,efficiency, quality and volume. Completes complex planning for equipment layouts in production facilities and offices. Estimates costsfor proposed projects and evaluates cost factors. Provides direction and training to lower level professional employees. Assigns work todrafters and technicians. Assignments are complex and require initiative and judgment. Requires an industrial engineering degree and 6or more years experience.
Industry - Type of Employer
Total Cash CompensationBase Plus Incentive Pay
Job Match Comparability
Page 3-108Southwestern Pennsylvania Annual Compensation and Benefits Study
© 2010 Pittsburgh Technology Council. All rights reserved.

Job Code 387 INDUSTRIAL ENGINEER III
Description
Less than 50 50 - 150 151 - 500 More than 500Less than
$7.5M$7.5M to
$25M$26M to $150M
More than $150M
Annual Base PayEmployers Reported 0 0 0 2 0 0 0 2Employees Reported 0 0 0 3 0 0 0 3
25th Percentile ($000's) -- -- -- -- -- -- -- --50th Percentile ($000's) -- -- -- 107.9 -- -- -- 107.975th Percentile ($000's) -- -- -- -- -- -- -- --Average ($000's) -- -- -- 101.5 -- -- -- 101.5
Incentive Pay% Incentive Eligible -- -- -- 100% -- -- -- 100%
25th Percentile ($000's) -- -- -- -- -- -- -- --50th Percentile ($000's) -- -- -- 12.2 -- -- -- 12.275th Percentile ($000's) -- -- -- -- -- -- -- --Average ($000's) -- -- -- 9.3 -- -- -- 9.3
25th Percentile ($000's) -- -- -- -- -- -- -- --50th Percentile ($000's) -- -- -- 120.0 -- -- -- 120.075th Percentile ($000's) -- -- -- -- -- -- -- --Average ($000's) -- -- -- 110.7 -- -- -- 110.7
Most Recent New HireEmployers Reported 0 0 0 0 0 0 0 0
Median ($000's) -- -- -- -- -- -- -- --Average ($000's) -- -- -- -- -- -- -- --
Total Cash CompensationBase Plus Incentive Pay
Conducts complex studies and evaluations of work flow and operating processes and makes recommendations to increase production,efficiency, quality and volume. Completes complex planning for equipment layouts in production facilities and offices. Estimates costsfor proposed projects and evaluates cost factors. Provides direction and training to lower level professional employees. Assigns work todrafters and technicians. Assignments are complex and require initiative and judgment. Requires an industrial engineering degree and 6or more years experience.
Organizational FTE's Organizational Revenue ($ Millions)
Page 3-109Southwestern Pennsylvania Annual Compensation and Benefits Study
© 2010 Pittsburgh Technology Council. All rights reserved.

Job Code 380 ENGINEERING MANAGER
Description
0.0% Less Complex57.6% Comparable42.4% More Complex
All Organizations
Software, Computer and
Technology Manufacturing
Life-Sciences/ Biotech/
Medical Devices Not-for-ProfitAll Other
EmployersAnnual Base Pay
Employers Reported 14 0 8 2 1 3Employees Reported 33 0 12 16 1 425th Percentile ($000's) 106.1 -- 99.3 116.7 -- --50th Percentile ($000's) 117.5 -- 113.0 122.5 -- 105.775th Percentile ($000's) 123.7 -- 123.2 124.9 -- --Average ($000's) 113.9 -- 112.1 120.1 -- 102.6
Incentive Pay% Incentive Eligible 88% -- 92% 100% 0% 50%25th Percentile ($000's) 10.4 -- 7.2 13.4 -- --50th Percentile ($000's) 13.8 -- 8.9 14.4 -- --75th Percentile ($000's) 16.0 -- 13.9 16.4 -- --Average ($000's) 14.2 -- 13.2 14.7 -- --
25th Percentile ($000's) 108.4 -- 103.5 130.1 -- --50th Percentile ($000's) 124.3 -- 114.7 136.9 -- 108.475th Percentile ($000's) 141.0 -- 142.4 142.6 -- --Average ($000's) 124.6 -- 120.9 134.8 -- 106.1
Most Recent New HireEmployers Reported 0 0 0 0 0 0
Median ($000's) -- -- -- -- -- --Average ($000's) -- -- -- -- -- --
Manages the formulation of engineering strategies, policies and plans. Ensures engineering standards of quality, cost, safety, timeliness and performance. Contributes to research and development projects. Interprets plans, drawings and specifications to provide advice onengineering methods and procedures. Provides technical oversight and assistance to other departments as required. Manages personnelactivities of the department, such as recruitment, hiring, performance evaluations, and salary adjustments. May oversee field testing ofproducts and systems performed by field staff. Typically requires a Master's degree and 6-10 years of experience.
Industry - Type of Employer
Total Cash CompensationBase Plus Incentive Pay
Job Match Comparability
Page 3-110Southwestern Pennsylvania Annual Compensation and Benefits Study
© 2010 Pittsburgh Technology Council. All rights reserved.

Job Code 380 ENGINEERING MANAGER
Description
Less than 50 50 - 150 151 - 500 More than 500Less than
$7.5M$7.5M to
$25M$26M to $150M
More than $150M
Annual Base PayEmployers Reported 1 1 4 8 1 2 3 8Employees Reported 2 1 4 26 2 2 3 26
25th Percentile ($000's) -- -- -- 103.7 -- -- -- 106.350th Percentile ($000's) -- -- 114.7 118.8 -- -- 100.2 118.875th Percentile ($000's) -- -- -- 124.4 -- -- -- 124.4Average ($000's) -- -- 118.4 113.8 -- -- 99.6 115.0
Incentive Pay% Incentive Eligible 0% 0% 100% 96% 0% 50% 67% 100%
25th Percentile ($000's) -- -- -- 10.3 -- -- -- 10.350th Percentile ($000's) -- -- 20.6 13.8 -- -- -- 13.875th Percentile ($000's) -- -- -- 15.2 -- -- -- 15.2Average ($000's) -- -- 20.6 13.9 -- -- -- 13.9
25th Percentile ($000's) -- -- -- 117.2 -- -- -- 117.250th Percentile ($000's) -- -- 114.7 134.4 -- -- 100.2 134.475th Percentile ($000's) -- -- -- 142.1 -- -- -- 142.1Average ($000's) -- -- 123.5 126.7 -- -- 99.6 127.9
Most Recent New HireEmployers Reported 0 0 0 0 0 0 0 0
Median ($000's) -- -- -- -- -- -- -- --Average ($000's) -- -- -- -- -- -- -- --
Total Cash CompensationBase Plus Incentive Pay
Manages the formulation of engineering strategies, policies and plans. Ensures engineering standards of quality, cost, safety, timeliness and performance. Contributes to research and development projects. Interprets plans, drawings and specifications to provide advice onengineering methods and procedures. Provides technical oversight and assistance to other departments as required. Manages personnelactivities of the department, such as recruitment, hiring, performance evaluations, and salary adjustments. May oversee field testing ofproducts and systems performed by field staff. Typically requires a Master's degree and 6-10 years of experience.
Organizational FTE's Organizational Revenue ($ Millions)
Page 3-111Southwestern Pennsylvania Annual Compensation and Benefits Study
© 2010 Pittsburgh Technology Council. All rights reserved.

Job Code 401 ENGINEERING DOCUMENTATION COORDINATOR
Description
0.0% Less Complex70.6% Comparable29.4% More Complex
All Organizations
Software, Computer and
Technology Manufacturing
Life-Sciences/ Biotech/
Medical Devices Not-for-ProfitAll Other
EmployersAnnual Base Pay
Employers Reported 3 0 1 1 1 0Employees Reported 17 0 4 12 1 025th Percentile ($000's) 32.8 -- -- -- -- --50th Percentile ($000's) 37.5 -- -- -- -- --75th Percentile ($000's) 39.2 -- -- -- -- --Average ($000's) 36.7 -- -- -- -- --
Incentive Pay% Incentive Eligible 94% -- 100% 100% 0% --25th Percentile ($000's) 1.0 -- -- -- -- --50th Percentile ($000's) 1.2 -- -- -- -- --75th Percentile ($000's) 1.2 -- -- -- -- --Average ($000's) 1.1 -- -- -- -- --
25th Percentile ($000's) 32.8 -- -- -- -- --50th Percentile ($000's) 38.6 -- -- -- -- --75th Percentile ($000's) 40.4 -- -- -- -- --Average ($000's) 37.4 -- -- -- -- --
Most Recent New HireEmployers Reported 1 0 0 1 0 0
Median ($000's) -- -- -- -- -- --Average ($000's) -- -- -- -- -- --
Records engineering and product changes. Keeps logs and records of change notices. Maintains files of engineering drawings. Makesdrawing and document copies. Requires high school education, additional vocational or on-the-job training, and 1 year experience.
Industry - Type of Employer
Total Cash CompensationBase Plus Incentive Pay
Job Match Comparability
Page 3-112Southwestern Pennsylvania Annual Compensation and Benefits Study
© 2010 Pittsburgh Technology Council. All rights reserved.

Job Code 401 ENGINEERING DOCUMENTATION COORDINATOR
Description
Less than 50 50 - 150 151 - 500 More than 500Less than
$7.5M$7.5M to
$25M$26M to $150M
More than $150M
Annual Base PayEmployers Reported 0 0 2 1 0 0 2 1Employees Reported 0 0 5 12 0 0 5 12
25th Percentile ($000's) -- -- 27.7 -- -- -- 27.7 --50th Percentile ($000's) -- -- 32.7 -- -- -- 32.7 --75th Percentile ($000's) -- -- 32.8 -- -- -- 32.8 --Average ($000's) -- -- 32.1 -- -- -- 32.1 --
Incentive Pay% Incentive Eligible -- -- 80% 100% -- -- 80% 100%
25th Percentile ($000's) -- -- -- -- -- -- -- --50th Percentile ($000's) -- -- -- -- -- -- -- --75th Percentile ($000's) -- -- -- -- -- -- -- --Average ($000's) -- -- -- -- -- -- -- --
25th Percentile ($000's) -- -- 27.7 -- -- -- 27.7 --50th Percentile ($000's) -- -- 32.7 -- -- -- 32.7 --75th Percentile ($000's) -- -- 32.8 -- -- -- 32.8 --Average ($000's) -- -- 32.1 -- -- -- 32.1 --
Most Recent New HireEmployers Reported 0 0 0 1 0 0 0 1
Median ($000's) -- -- -- -- -- -- -- --Average ($000's) -- -- -- -- -- -- -- --
Total Cash CompensationBase Plus Incentive Pay
Records engineering and product changes. Keeps logs and records of change notices. Maintains files of engineering drawings. Makesdrawing and document copies. Requires high school education, additional vocational or on-the-job training, and 1 year experience.
Organizational FTE's Organizational Revenue ($ Millions)
Page 3-113Southwestern Pennsylvania Annual Compensation and Benefits Study
© 2010 Pittsburgh Technology Council. All rights reserved.

Job Code 431 TECHNICAL WRITER
Description
11.4% Less Complex48.6% Comparable40.0% More Complex
All Organizations
Software, Computer and
Technology Manufacturing
Life-Sciences/ Biotech/
Medical Devices Not-for-ProfitAll Other
EmployersAnnual Base Pay
Employers Reported 11 2 3 2 0 4Employees Reported 35 8 5 10 0 1225th Percentile ($000's) 46.6 45.5 39.5 59.6 -- 41.950th Percentile ($000's) 52.7 48.8 47.3 62.9 -- 50.475th Percentile ($000's) 62.0 52.0 48.6 66.2 -- 62.7Average ($000's) 52.6 49.4 44.3 62.8 -- 49.8
Incentive Pay% Incentive Eligible 29% 38% 20% 50% -- 8%25th Percentile ($000's) 3.1 -- -- 3.0 -- --50th Percentile ($000's) 3.3 -- -- 3.3 -- --75th Percentile ($000's) 3.7 -- -- 3.3 -- --Average ($000's) 3.3 -- -- 3.2 -- --
25th Percentile ($000's) 46.6 45.5 39.5 62.0 -- 41.950th Percentile ($000's) 52.7 48.8 47.3 64.0 -- 50.475th Percentile ($000's) 62.9 52.0 48.6 66.4 -- 63.1Average ($000's) 53.2 49.4 44.3 64.4 -- 50.1
Most Recent New HireEmployers Reported 1 0 1 0 0 0
Median ($000's) -- -- -- -- -- --Average ($000's) -- -- -- -- -- --
Prepares standard operations and maintenance manuals and technical publications. Gathers technical information, writes and coordinateslayout and organization. Researches engineering information such as drawings, design reports, equipment, and test specifications, andby interviewing engineers and technicians. Requires a degree and 1–2 years experience. Not a trainee.
Industry - Type of Employer
Total Cash CompensationBase Plus Incentive Pay
Job Match Comparability
Page 3-114Southwestern Pennsylvania Annual Compensation and Benefits Study
© 2010 Pittsburgh Technology Council. All rights reserved.

Job Code 431 TECHNICAL WRITER
Description
Less than 50 50 - 150 151 - 500 More than 500Less than
$7.5M$7.5M to
$25M$26M to $150M
More than $150M
Annual Base PayEmployers Reported 0 1 4 6 1 0 3 7Employees Reported 0 2 8 25 2 0 7 26
25th Percentile ($000's) -- -- 41.1 50.0 -- -- 40.6 50.450th Percentile ($000's) -- -- 45.8 58.0 -- -- 44.2 58.075th Percentile ($000's) -- -- 48.6 64.1 -- -- 48.0 64.0Average ($000's) -- -- 44.5 57.2 -- -- 43.0 57.1
Incentive Pay% Incentive Eligible -- 0% 50% 24% 0% -- 43% 27%
25th Percentile ($000's) -- -- -- 3.1 -- -- -- 3.150th Percentile ($000's) -- -- -- 3.3 -- -- -- 3.375th Percentile ($000's) -- -- -- 3.7 -- -- -- 3.7Average ($000's) -- -- -- 3.3 -- -- -- 3.3
25th Percentile ($000's) -- -- 41.1 50.0 -- -- 40.6 50.450th Percentile ($000's) -- -- 45.8 58.7 -- -- 44.2 58.475th Percentile ($000's) -- -- 48.6 64.7 -- -- 48.0 64.5Average ($000's) -- -- 44.5 58.0 -- -- 43.0 57.9
Most Recent New HireEmployers Reported 0 0 1 0 0 0 0 1
Median ($000's) -- -- -- -- -- -- -- --Average ($000's) -- -- -- -- -- -- -- --
Total Cash CompensationBase Plus Incentive Pay
Prepares standard operations and maintenance manuals and technical publications. Gathers technical information, writes and coordinateslayout and organization. Researches engineering information such as drawings, design reports, equipment, and test specifications, andby interviewing engineers and technicians. Requires a degree and 1–2 years experience. Not a trainee.
Organizational FTE's Organizational Revenue ($ Millions)
Page 3-115Southwestern Pennsylvania Annual Compensation and Benefits Study
© 2010 Pittsburgh Technology Council. All rights reserved.

Job Code 441 GRAPHIC ILLUSTRTOR/DESIGNER
Description
2.0% Less Complex63.3% Comparable34.7% More Complex
All Organizations
Software, Computer and
Technology Manufacturing
Life-Sciences/ Biotech/
Medical Devices Not-for-ProfitAll Other
EmployersAnnual Base Pay
Employers Reported 18 1 2 0 5 10Employees Reported 49 3 4 0 9 3325th Percentile ($000's) 38.6 -- -- -- 39.4 38.550th Percentile ($000's) 45.3 -- 38.8 -- 52.4 45.075th Percentile ($000's) 58.0 -- -- -- 58.0 61.8Average ($000's) 50.7 -- 40.1 -- 51.1 51.5
Incentive Pay% Incentive Eligible 49% 0% 75% -- 22% 58%25th Percentile ($000's) 2.3 -- -- -- -- 3.550th Percentile ($000's) 4.3 -- -- -- -- 5.075th Percentile ($000's) 6.1 -- -- -- -- 6.4Average ($000's) 4.5 -- -- -- -- 5.1
25th Percentile ($000's) 38.6 -- -- -- 39.4 38.550th Percentile ($000's) 47.2 -- 38.8 -- 52.4 47.275th Percentile ($000's) 58.0 -- -- -- 58.0 61.8Average ($000's) 51.6 -- 40.1 -- 51.5 52.7
Most Recent New HireEmployers Reported 1 0 0 0 0 1
Median ($000's) -- -- -- -- -- --Average ($000's) -- -- -- -- -- --
Produces finished artwork, ready for reproduction, by scanning drawings and redrawing using computer-based drawing and illustrationprograms. Creates drawings, designs, and illustrations by using icons in database or by drawing routine icons, for use in catalogs,manuals, sales flyers, or other printed materials. Performs drawing requirements of 1 and 2 point perspective. Creates illustration bestsuited for nature of assignment and produces desired visual effect to conform to printing method specified. Requires associate's degreein commercial art and 1–2 years experience in commercial art and/or technical illustration.
Industry - Type of Employer
Total Cash CompensationBase Plus Incentive Pay
Job Match Comparability
Page 3-116Southwestern Pennsylvania Annual Compensation and Benefits Study
© 2010 Pittsburgh Technology Council. All rights reserved.

Job Code 441 GRAPHIC ILLUSTRTOR/DESIGNER
Description
Less than 50 50 - 150 151 - 500 More than 500Less than
$7.5M$7.5M to
$25M$26M to $150M
More than $150M
Annual Base PayEmployers Reported 5 3 4 6 5 3 3 7Employees Reported 14 11 6 18 16 9 3 21
25th Percentile ($000's) 45.0 37.1 37.3 44.3 36.7 37.6 -- 43.050th Percentile ($000's) 63.1 38.5 38.8 50.0 53.4 38.6 39.0 50.075th Percentile ($000's) 68.7 41.2 47.6 55.5 67.6 43.8 -- 56.3Average ($000's) 62.2 38.3 46.4 50.7 57.4 41.4 42.7 50.6
Incentive Pay% Incentive Eligible 57% 45% 67% 39% 44% 67% 0% 52%
25th Percentile ($000's) 2.6 -- -- 2.1 3.8 1.0 -- 2.550th Percentile ($000's) 5.0 -- 4.0 2.1 5.5 1.0 -- 3.075th Percentile ($000's) 6.4 -- -- 2.1 6.5 1.0 -- 3.5Average ($000's) 4.8 -- 4.0 2.1 5.4 1.0 -- 3.0
25th Percentile ($000's) 46.3 37.1 37.3 44.3 36.8 37.6 -- 43.050th Percentile ($000's) 63.1 38.5 38.8 50.0 56.1 38.6 39.0 50.075th Percentile ($000's) 73.1 41.2 47.6 55.5 72.6 43.8 -- 56.3Average ($000's) 64.9 38.3 47.0 50.8 59.8 41.5 42.7 50.9
Most Recent New HireEmployers Reported 0 0 0 1 0 0 0 1
Median ($000's) -- -- -- -- -- -- -- --Average ($000's) -- -- -- -- -- -- -- --
Total Cash CompensationBase Plus Incentive Pay
Produces finished artwork, ready for reproduction, by scanning drawings and redrawing using computer-based drawing and illustrationprograms. Creates drawings, designs, and illustrations by using icons in database or by drawing routine icons, for use in catalogs,manuals, sales flyers, or other printed materials. Performs drawing requirements of 1 and 2 point perspective. Creates illustration bestsuited for nature of assignment and produces desired visual effect to conform to printing method specified. Requires associate's degreein commercial art and 1–2 years experience in commercial art and/or technical illustration.
Organizational FTE's Organizational Revenue ($ Millions)
Page 3-117Southwestern Pennsylvania Annual Compensation and Benefits Study
© 2010 Pittsburgh Technology Council. All rights reserved.

Job Code 570 LABORATORY ASSISTANT
Description
0.0% Less Complex100.0% Comparable0.0% More Complex
All Organizations
Software, Computer and
Technology Manufacturing
Life-Sciences/ Biotech/
Medical Devices Not-for-ProfitAll Other
EmployersAnnual Base Pay
Employers Reported 2 0 1 0 1 0Employees Reported 10 0 1 0 9 025th Percentile ($000's) 25.1 -- -- -- -- --50th Percentile ($000's) 25.9 -- -- -- -- --75th Percentile ($000's) 34.4 -- -- -- -- --Average ($000's) 28.9 -- -- -- -- --
Incentive Pay% Incentive Eligible 0% -- 0% -- 0% --25th Percentile ($000's) -- -- -- -- -- --50th Percentile ($000's) -- -- -- -- -- --75th Percentile ($000's) -- -- -- -- -- --Average ($000's) -- -- -- -- -- --
25th Percentile ($000's) 25.1 -- -- -- -- --50th Percentile ($000's) 25.9 -- -- -- -- --75th Percentile ($000's) 34.4 -- -- -- -- --Average ($000's) 28.9 -- -- -- -- --
Most Recent New HireEmployers Reported 0 0 0 0 0 0
Median ($000's) -- -- -- -- -- --Average ($000's) -- -- -- -- -- --
Sets up laboratory and field equipment to assist research workers. Cleans, sterilizes and maintains laboratory equipment and workareas. Prepares samples for testing and analysis. Operates common laboratory equipment such as microscopes, spectrophotometersand auto analyzers. Weighs, analyzes and measures ingredients used in testing. Records and compiles test results. Prepares charts,graphs, spreadsheets and reports using a variety of software.
Industry - Type of Employer
Total Cash CompensationBase Plus Incentive Pay
Job Match Comparability
Page 3-118Southwestern Pennsylvania Annual Compensation and Benefits Study
© 2010 Pittsburgh Technology Council. All rights reserved.

Job Code 570 LABORATORY ASSISTANT
Description
Less than 50 50 - 150 151 - 500 More than 500Less than
$7.5M$7.5M to
$25M$26M to $150M
More than $150M
Annual Base PayEmployers Reported 0 0 0 2 0 0 0 2Employees Reported 0 0 0 10 0 0 0 10
25th Percentile ($000's) -- -- -- 25.1 -- -- -- 25.150th Percentile ($000's) -- -- -- 25.9 -- -- -- 25.975th Percentile ($000's) -- -- -- 34.4 -- -- -- 34.4Average ($000's) -- -- -- 28.9 -- -- -- 28.9
Incentive Pay% Incentive Eligible -- -- -- 0% -- -- -- 0%
25th Percentile ($000's) -- -- -- -- -- -- -- --50th Percentile ($000's) -- -- -- -- -- -- -- --75th Percentile ($000's) -- -- -- -- -- -- -- --Average ($000's) -- -- -- -- -- -- -- --
25th Percentile ($000's) -- -- -- 25.1 -- -- -- 25.150th Percentile ($000's) -- -- -- 25.9 -- -- -- 25.975th Percentile ($000's) -- -- -- 34.4 -- -- -- 34.4Average ($000's) -- -- -- 28.9 -- -- -- 28.9
Most Recent New HireEmployers Reported 0 0 0 0 0 0 0 0
Median ($000's) -- -- -- -- -- -- -- --Average ($000's) -- -- -- -- -- -- -- --
Total Cash CompensationBase Plus Incentive Pay
Sets up laboratory and field equipment to assist research workers. Cleans, sterilizes and maintains laboratory equipment and workareas. Prepares samples for testing and analysis. Operates common laboratory equipment such as microscopes, spectrophotometersand auto analyzers. Weighs, analyzes and measures ingredients used in testing. Records and compiles test results. Prepares charts,graphs, spreadsheets and reports using a variety of software.
Organizational FTE's Organizational Revenue ($ Millions)
Page 3-119Southwestern Pennsylvania Annual Compensation and Benefits Study
© 2010 Pittsburgh Technology Council. All rights reserved.

Job Code 572 LABORATORY TECHNICIAN
Description
0.0% Less Complex94.2% Comparable5.8% More Complex
All Organizations
Software, Computer and
Technology Manufacturing
Life-Sciences/ Biotech/
Medical Devices Not-for-ProfitAll Other
EmployersAnnual Base Pay
Employers Reported 7 0 4 1 1 1Employees Reported 86 0 20 59 1 6
25th Percentile ($000's) 34.0 -- 43.6 -- -- --50th Percentile ($000's) 35.4 -- 52.0 -- -- --75th Percentile ($000's) 44.1 -- 57.3 -- -- --Average ($000's) 40.2 -- 50.6 -- -- --
Incentive Pay% Incentive Eligible 73% -- 75% 81% 0% 0%25th Percentile ($000's) 1.7 -- 1.8 -- -- --50th Percentile ($000's) 2.4 -- 2.3 -- -- --75th Percentile ($000's) 2.8 -- 2.4 -- -- --Average ($000's) 2.3 -- 2.1 -- -- --
25th Percentile ($000's) 35.2 -- 45.6 -- -- --50th Percentile ($000's) 38.2 -- 52.0 -- -- --75th Percentile ($000's) 45.6 -- 59.6 -- -- --Average ($000's) 41.9 -- 52.2 -- -- --
Most Recent New HireEmployers Reported 2 0 0 1 0 1
Median ($000's) -- -- -- -- -- --Average ($000's) -- -- -- -- -- --
Performs testing required to characterize product performance. Performs required documentation and ensures that all documentationfulfills Good Manufacturing Practice (GMP) requirements. Identifies and recommends improvements that may increase efficiency ofworkload or process and improve quality of products. Calibrates and maintains equipment and prepares reagents. Maintains anunderstanding of technological principles and clinical applications of the organization's products. Maintains skills necessary to interpretdata. Requires a degree in a laboratory science or equivalent technical training and 3 years or less experience.
Industry - Type of Employer
Total Cash CompensationBase Plus Incentive Pay
Job Match Comparability
Page 3-120Southwestern Pennsylvania Annual Compensation and Benefits Study
© 2010 Pittsburgh Technology Council. All rights reserved.
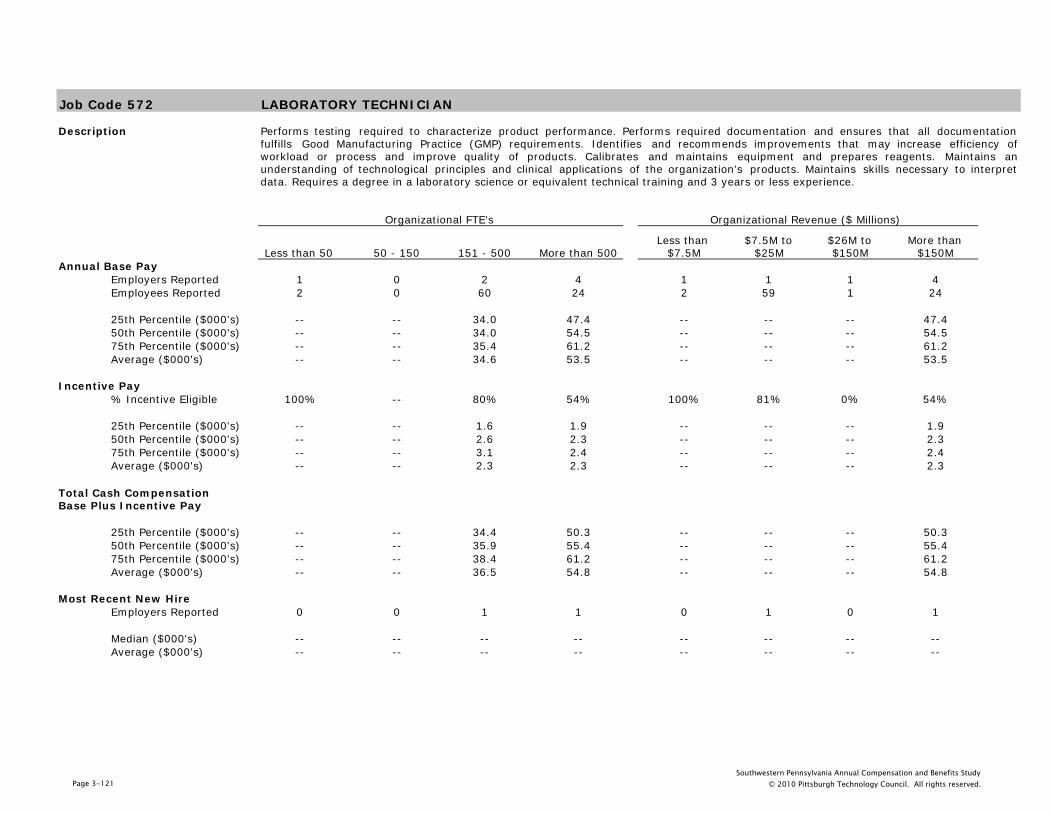
Job Code 572 LABORATORY TECHNICIAN
Description
Less than 50 50 - 150 151 - 500 More than 500Less than
$7.5M$7.5M to
$25M$26M to $150M
More than $150M
Annual Base PayEmployers Reported 1 0 2 4 1 1 1 4Employees Reported 2 0 60 24 2 59 1 24
25th Percentile ($000's) -- -- 34.0 47.4 -- -- -- 47.450th Percentile ($000's) -- -- 34.0 54.5 -- -- -- 54.575th Percentile ($000's) -- -- 35.4 61.2 -- -- -- 61.2Average ($000's) -- -- 34.6 53.5 -- -- -- 53.5
Incentive Pay% Incentive Eligible 100% -- 80% 54% 100% 81% 0% 54%
25th Percentile ($000's) -- -- 1.6 1.9 -- -- -- 1.950th Percentile ($000's) -- -- 2.6 2.3 -- -- -- 2.375th Percentile ($000's) -- -- 3.1 2.4 -- -- -- 2.4Average ($000's) -- -- 2.3 2.3 -- -- -- 2.3
25th Percentile ($000's) -- -- 34.4 50.3 -- -- -- 50.350th Percentile ($000's) -- -- 35.9 55.4 -- -- -- 55.475th Percentile ($000's) -- -- 38.4 61.2 -- -- -- 61.2Average ($000's) -- -- 36.5 54.8 -- -- -- 54.8
Most Recent New HireEmployers Reported 0 0 1 1 0 1 0 1
Median ($000's) -- -- -- -- -- -- -- --Average ($000's) -- -- -- -- -- -- -- --
Total Cash CompensationBase Plus Incentive Pay
Performs testing required to characterize product performance. Performs required documentation and ensures that all documentationfulfills Good Manufacturing Practice (GMP) requirements. Identifies and recommends improvements that may increase efficiency ofworkload or process and improve quality of products. Calibrates and maintains equipment and prepares reagents. Maintains anunderstanding of technological principles and clinical applications of the organization's products. Maintains skills necessary to interpretdata. Requires a degree in a laboratory science or equivalent technical training and 3 years or less experience.
Organizational FTE's Organizational Revenue ($ Millions)
Page 3-121Southwestern Pennsylvania Annual Compensation and Benefits Study
© 2010 Pittsburgh Technology Council. All rights reserved.

Job Code 577 RESEARCH ASSOCIATE
Description
0.0% Less Complex100.0% Comparable0.0% More Complex
All Organizations
Software, Computer and
Technology Manufacturing
Life-Sciences/ Biotech/
Medical Devices Not-for-ProfitAll Other
EmployersAnnual Base Pay
Employers Reported 3 0 0 1 1 1Employees Reported 47 0 0 7 38 225th Percentile ($000's) 28.0 -- -- -- -- --50th Percentile ($000's) 32.0 -- -- -- -- --75th Percentile ($000's) 41.6 -- -- -- -- --Average ($000's) 36.8 -- -- -- -- --
Incentive Pay% Incentive Eligible 15% -- -- 71% 0% 100%25th Percentile ($000's) 2.1 -- -- -- -- --50th Percentile ($000's) 3.9 -- -- -- -- --75th Percentile ($000's) 4.1 -- -- -- -- --Average ($000's) 3.5 -- -- -- -- --
25th Percentile ($000's) 28.0 -- -- -- -- --50th Percentile ($000's) 32.0 -- -- -- -- --75th Percentile ($000's) 41.6 -- -- -- -- --Average ($000's) 37.3 -- -- -- -- --
Most Recent New HireEmployers Reported 0 0 0 0 0 0
Median ($000's) -- -- -- -- -- --Average ($000's) -- -- -- -- -- --
Conducts laboratory or clinical experiments according to prescribed protocols. Assists in development of procedures and design ofexperiments. Verifies experimental results, evaluates complex data, and reports results internally. Evaluation of data may includestatistical analyses. May be involved in product research and development and/or clinical trials. Typically requires a degree in chemistry,biology, biochemistry, or a related laboratory science and 1 or more years experience.
Industry - Type of Employer
Total Cash CompensationBase Plus Incentive Pay
Job Match Comparability
Page 3-122Southwestern Pennsylvania Annual Compensation and Benefits Study
© 2010 Pittsburgh Technology Council. All rights reserved.

Job Code 577 RESEARCH ASSOCIATE
Description
Less than 50 50 - 150 151 - 500 More than 500Less than
$7.5M$7.5M to
$25M$26M to $150M
More than $150M
Annual Base PayEmployers Reported 0 0 1 2 0 1 0 2Employees Reported 0 0 7 40 0 7 0 40
25th Percentile ($000's) -- -- -- 26.9 -- -- -- 26.950th Percentile ($000's) -- -- -- 31.7 -- -- -- 31.775th Percentile ($000's) -- -- -- 38.5 -- -- -- 38.5Average ($000's) -- -- -- 35.0 -- -- -- 35.0
Incentive Pay% Incentive Eligible -- -- 71% 5% -- 71% -- 5%
25th Percentile ($000's) -- -- -- -- -- -- -- --50th Percentile ($000's) -- -- -- -- -- -- -- --75th Percentile ($000's) -- -- -- -- -- -- -- --Average ($000's) -- -- -- -- -- -- -- --
25th Percentile ($000's) -- -- -- 26.9 -- -- -- 26.950th Percentile ($000's) -- -- -- 31.7 -- -- -- 31.775th Percentile ($000's) -- -- -- 38.5 -- -- -- 38.5Average ($000's) -- -- -- 35.2 -- -- -- 35.2
Most Recent New HireEmployers Reported 0 0 0 0 0 0 0 0
Median ($000's) -- -- -- -- -- -- -- --Average ($000's) -- -- -- -- -- -- -- --
Total Cash CompensationBase Plus Incentive Pay
Conducts laboratory or clinical experiments according to prescribed protocols. Assists in development of procedures and design ofexperiments. Verifies experimental results, evaluates complex data, and reports results internally. Evaluation of data may includestatistical analyses. May be involved in product research and development and/or clinical trials. Typically requires a degree in chemistry,biology, biochemistry, or a related laboratory science and 1 or more years experience.
Organizational FTE's Organizational Revenue ($ Millions)
Page 3-123Southwestern Pennsylvania Annual Compensation and Benefits Study
© 2010 Pittsburgh Technology Council. All rights reserved.

Job Code 580 RESEARCH SCIENTIST - ALL LEVELS
Description
2.3% Less Complex90.9% Comparable6.8% More Complex
All Organizations
Software, Computer and
Technology Manufacturing
Life-Sciences/ Biotech/
Medical Devices Not-for-ProfitAll Other
EmployersAnnual Base Pay
Employers Reported 10 0 5 2 0 3Employees Reported 44 0 28 12 0 425th Percentile ($000's) 76.0 -- 76.0 87.3 -- --50th Percentile ($000's) 88.3 -- 84.9 99.0 -- 77.075th Percentile ($000's) 98.4 -- 94.3 117.1 -- --Average ($000's) 88.9 -- 82.6 102.9 -- 91.0
Incentive Pay% Incentive Eligible 95% -- 100% 92% -- 75%25th Percentile ($000's) 2.9 -- 3.0 4.0 -- --50th Percentile ($000's) 4.2 -- 4.0 7.5 -- 13.275th Percentile ($000's) 10.9 -- 10.6 10.8 -- --Average ($000's) 7.0 -- 5.8 7.3 -- 17.3
25th Percentile ($000's) 79.1 -- 79.1 92.3 -- --50th Percentile ($000's) 91.4 -- 88.2 104.5 -- 85.075th Percentile ($000's) 109.1 -- 103.9 117.1 -- --Average ($000's) 94.0 -- 88.0 104.7 -- 104.0
Most Recent New HireEmployers Reported 2 0 2 0 0 0
Median ($000's) -- -- -- -- -- --Average ($000's) -- -- -- -- -- --
The data for this position is a combination of the data reported by participants for 581 Research Scientist and 589 Senior ResearchScientist
Industry - Type of Employer
Total Cash CompensationBase Plus Incentive Pay
Job Match Comparability
Page 3-124Southwestern Pennsylvania Annual Compensation and Benefits Study
© 2010 Pittsburgh Technology Council. All rights reserved.

Job Code 580 RESEARCH SCIENTIST - ALL LEVELS
Description
Less than 50 50 - 150 151 - 500 More than 500Less than
$7.5M$7.5M to
$25M$26M to $150M
More than $150M
Annual Base PayEmployers Reported 4 1 1 4 4 2 0 4Employees Reported 8 8 4 24 8 12 0 24
25th Percentile ($000's) 50.2 -- -- 80.3 50.2 87.3 -- 80.350th Percentile ($000's) 56.0 -- -- 89.1 56.0 99.0 -- 89.175th Percentile ($000's) 70.9 -- -- 96.5 70.9 117.1 -- 96.5Average ($000's) 60.8 -- -- 91.3 60.8 102.9 -- 91.3
Incentive Pay% Incentive Eligible 88% 100% 75% 100% 88% 92% -- 100%
25th Percentile ($000's) 1.0 -- -- 3.5 1.0 4.0 -- 3.550th Percentile ($000's) 1.0 -- -- 4.3 1.0 7.5 -- 4.375th Percentile ($000's) 1.0 -- -- 10.9 1.0 10.8 -- 10.9Average ($000's) 1.4 -- -- 8.2 1.4 7.3 -- 8.2
25th Percentile ($000's) 50.2 -- -- 84.1 50.2 92.3 -- 84.150th Percentile ($000's) 57.9 -- -- 93.3 57.9 104.5 -- 93.375th Percentile ($000's) 71.2 -- -- 109.1 71.2 117.1 -- 109.1Average ($000's) 61.7 -- -- 99.5 61.7 104.7 -- 99.5
Most Recent New HireEmployers Reported 2 0 0 0 2 0 0 0
Median ($000's) -- -- -- -- -- -- -- --Average ($000's) -- -- -- -- -- -- -- --
Total Cash CompensationBase Plus Incentive Pay
The data for this position is a combination of the data reported by participants for 581 Research Scientist and 589 Senior ResearchScientist
Organizational FTE's Organizational Revenue ($ Millions)
Page 3-125Southwestern Pennsylvania Annual Compensation and Benefits Study
© 2010 Pittsburgh Technology Council. All rights reserved.

Job Code 581 RESEARCH SCIENTIST
Description
0.0% Less Complex87.0% Comparable13.0% More Complex
All Organizations
Software, Computer and
Technology Manufacturing
Life-Sciences/ Biotech/
Medical Devices Not-for-ProfitAll Other
EmployersAnnual Base Pay
Employers Reported 9 0 4 2 0 3Employees Reported 23 0 16 4 0 325th Percentile ($000's) 71.0 -- 72.3 -- -- --50th Percentile ($000's) 79.2 -- 79.3 78.7 -- 58.075th Percentile ($000's) 83.7 -- 82.0 -- -- --Average ($000's) 75.6 -- 76.0 80.4 -- 67.2
Incentive Pay% Incentive Eligible 91% -- 100% 75% -- 67%25th Percentile ($000's) 2.9 -- 3.0 -- -- --50th Percentile ($000's) 3.5 -- 3.5 7.3 -- --75th Percentile ($000's) 4.2 -- 4.1 -- -- --Average ($000's) 4.4 -- 3.5 7.3 -- --
25th Percentile ($000's) 71.0 -- 73.5 -- -- --50th Percentile ($000's) 83.3 -- 83.3 79.0 -- 60.975th Percentile ($000's) 85.6 -- 85.0 -- -- --Average ($000's) 79.1 -- 79.1 84.0 -- 72.5
Most Recent New HireEmployers Reported 2 0 2 0 0 0
Median ($000's) -- -- -- -- -- --Average ($000's) -- -- -- -- -- --
Leads research and completes projects in one or more research areas. Suggests research projects to management. Schedules projectsand allots personnel, time, and equipment. Prepares internal research reports. May prepare manuscripts for publication and presentfindings at scientific meetings. Coaches and counsels lower level research staff. Generally requires a Masters degree, expertise in theareas researched, and 3 or more years experience.
Industry - Type of Employer
Total Cash CompensationBase Plus Incentive Pay
Job Match Comparability
Page 3-126Southwestern Pennsylvania Annual Compensation and Benefits Study
© 2010 Pittsburgh Technology Council. All rights reserved.

Job Code 581 RESEARCH SCIENTIST
Description
Less than 50 50 - 150 151 - 500 More than 500Less than
$7.5M$7.5M to
$25M$26M to $150M
More than $150M
Annual Base PayEmployers Reported 4 1 1 3 4 2 0 3Employees Reported 6 1 3 13 6 4 0 13
25th Percentile ($000's) 51.8 -- -- 79.2 51.8 -- -- 79.250th Percentile ($000's) 56.0 -- -- 80.3 56.0 78.7 -- 80.375th Percentile ($000's) 67.0 -- -- 86.3 67.0 -- -- 86.3Average ($000's) 59.0 -- -- 81.8 59.0 80.4 -- 81.8
Incentive Pay% Incentive Eligible 83% 100% 67% 100% 83% 75% -- 100%
25th Percentile ($000's) 1.0 -- -- 3.3 1.0 -- -- 3.350th Percentile ($000's) 1.0 -- -- 3.5 1.0 7.3 -- 3.575th Percentile ($000's) 1.9 -- -- 4.3 1.9 -- -- 4.3Average ($000's) 1.6 -- -- 4.7 1.6 -- -- 4.7
25th Percentile ($000's) 52.0 -- -- 83.3 52.0 -- -- 83.350th Percentile ($000's) 57.9 -- -- 84.2 57.9 79.0 -- 84.275th Percentile ($000's) 67.7 -- -- 89.9 67.7 -- -- 89.9Average ($000's) 59.9 -- -- 86.5 59.9 84.0 -- 86.5
Most Recent New HireEmployers Reported 2 0 0 0 2 0 0 0
Median ($000's) -- -- -- -- -- -- -- --Average ($000's) -- -- -- -- -- -- -- --
Total Cash CompensationBase Plus Incentive Pay
Leads research and completes projects in one or more research areas. Suggests research projects to management. Schedules projectsand allots personnel, time, and equipment. Prepares internal research reports. May prepare manuscripts for publication and presentfindings at scientific meetings. Coaches and counsels lower level research staff. Generally requires a Masters degree, expertise in theareas researched, and 3 or more years experience.
Organizational FTE's Organizational Revenue ($ Millions)
Page 3-127Southwestern Pennsylvania Annual Compensation and Benefits Study
© 2010 Pittsburgh Technology Council. All rights reserved.

Job Code 589 SENIOR RESEARCH SCIENTIST
Description
4.5% Less Complex95.5% Comparable0.0% More Complex
All Organizations
Software, Computer and
Technology Manufacturing
Life-Sciences/ Biotech/
Medical Devices Not-for-ProfitAll Other
EmployersAnnual Base Pay
Employers Reported 7 0 4 2 0 1Employees Reported 22 0 13 8 0 125th Percentile ($000's) 90.7 -- 88.7 101.0 -- --50th Percentile ($000's) 98.6 -- 94.9 112.1 -- --75th Percentile ($000's) 108.3 -- 98.8 128.6 -- --Average ($000's) 102.1 -- 90.1 114.1 -- --
Incentive Pay% Incentive Eligible 100% -- 100% 100% -- 100%25th Percentile ($000's) 3.4 -- 2.7 7.5 -- --50th Percentile ($000's) 10.7 -- 10.7 7.5 -- --75th Percentile ($000's) 11.3 -- 11.0 7.5 -- --Average ($000's) 9.7 -- 7.9 7.5 -- --
25th Percentile ($000's) 95.2 -- 90.4 101.2 -- --50th Percentile ($000's) 107.9 -- 105.4 112.1 -- --75th Percentile ($000's) 113.9 -- 112.6 128.6 -- --Average ($000's) 108.8 -- 98.0 115.1 -- --
Most Recent New HireEmployers Reported 0 0 0 0 0 0
Median ($000's) -- -- -- -- -- --Average ($000's) -- -- -- -- -- --
Directs independent research activities, including laboratory and field research, project development, technical support, and managementand evaluation of subordinates. Coordinates design, development, and modification of research products and related activities. Maydevelop research criteria and provide expert advice on new products, concepts, and projects. May have budget and financial responsibilityfor all related activities. Typically requires a Ph.D. and 5 or more years of scientific research experience in a recognized field or area ofinquiry.
Industry - Type of Employer
Total Cash CompensationBase Plus Incentive Pay
Job Match Comparability
Page 3-128Southwestern Pennsylvania Annual Compensation and Benefits Study
© 2010 Pittsburgh Technology Council. All rights reserved.

Job Code 589 SENIOR RESEARCH SCIENTIST
Description
Less than 50 50 - 150 151 - 500 More than 500Less than
$7.5M$7.5M to
$25M$26M to $150M
More than $150M
Annual Base PayEmployers Reported 1 1 1 4 1 2 0 4Employees Reported 3 7 1 11 3 8 0 11
25th Percentile ($000's) -- -- -- 93.8 -- 101.0 -- 93.850th Percentile ($000's) -- -- -- 98.3 -- 112.1 -- 98.375th Percentile ($000's) -- -- -- 102.0 -- 128.6 -- 102.0Average ($000's) -- -- -- 102.5 -- 114.1 -- 102.5
Incentive Pay% Incentive Eligible 100% 100% 100% 100% 100% 100% -- 100%
25th Percentile ($000's) -- -- -- 10.6 -- 7.5 -- 10.650th Percentile ($000's) -- -- -- 10.9 -- 7.5 -- 10.975th Percentile ($000's) -- -- -- 12.5 -- 7.5 -- 12.5Average ($000's) -- -- -- 12.3 -- 7.5 -- 12.3
25th Percentile ($000's) -- -- -- 104.4 -- 101.2 -- 104.450th Percentile ($000's) -- -- -- 109.2 -- 112.1 -- 109.275th Percentile ($000's) -- -- -- 113.3 -- 128.6 -- 113.3Average ($000's) -- -- -- 114.8 -- 115.1 -- 114.8
Most Recent New HireEmployers Reported 0 0 0 0 0 0 0 0
Median ($000's) -- -- -- -- -- -- -- --Average ($000's) -- -- -- -- -- -- -- --
Total Cash CompensationBase Plus Incentive Pay
Directs independent research activities, including laboratory and field research, project development, technical support, and managementand evaluation of subordinates. Coordinates design, development, and modification of research products and related activities. Maydevelop research criteria and provide expert advice on new products, concepts, and projects. May have budget and financial responsibilityfor all related activities. Typically requires a Ph.D. and 5 or more years of scientific research experience in a recognized field or area ofinquiry.
Organizational FTE's Organizational Revenue ($ Millions)
Page 3-129Southwestern Pennsylvania Annual Compensation and Benefits Study
© 2010 Pittsburgh Technology Council. All rights reserved.

Job Code 592 CLINICAL RESEARCH ASSOCIATE
Description
0.0% Less Complex100.0% Comparable0.0% More Complex
All Organizations
Software, Computer and
Technology Manufacturing
Life-Sciences/ Biotech/
Medical Devices Not-for-ProfitAll Other
EmployersAnnual Base Pay
Employers Reported 2 0 0 2 0 0Employees Reported 16 0 0 16 0 025th Percentile ($000's) 60.0 -- -- 60.0 -- --50th Percentile ($000's) 65.6 -- -- 65.6 -- --75th Percentile ($000's) 71.3 -- -- 71.3 -- --Average ($000's) 64.0 -- -- 64.0 -- --
Incentive Pay% Incentive Eligible 100% -- -- 100% -- --25th Percentile ($000's) 2.7 -- -- 2.7 -- --50th Percentile ($000's) 3.2 -- -- 3.2 -- --75th Percentile ($000's) 3.6 -- -- 3.6 -- --Average ($000's) 6.3 -- -- 6.3 -- --
25th Percentile ($000's) 64.3 -- -- 64.3 -- --50th Percentile ($000's) 71.0 -- -- 71.0 -- --75th Percentile ($000's) 80.5 -- -- 80.5 -- --Average ($000's) 69.5 -- -- 69.5 -- --
Most Recent New HireEmployers Reported 2 0 0 2 0 0
Median ($000's) -- -- -- -- -- --Average ($000's) -- -- -- -- -- --
Prepares clinical study reports, protocols, regulatory documents and amendments. Monitors and tracks patient enrollment and studyprogress. Also collects, organizes, and analyzes project data and the accuracy and efficiency of data entry procedures and projectdeadlines. Assists with the distribution, collection, and tracking of medical reports and regulatory documents. Requires a degree and 2years of clinical/scientific research, nursing or medical devices/pharmaceutical clinical trials.
Job Match Comparability
Industry - Type of Employer
Total Cash CompensationBase Plus Incentive Pay
Page 3-130Southwestern Pennsylvania Annual Compensation and Benefits Study
© 2010 Pittsburgh Technology Council. All rights reserved.

Job Code 592 CLINICAL RESEARCH ASSOCIATE
Description
Organizational FTE's Organizational Revenue ($ Millions)
Less than 50 50 - 150 151 - 500 More than 500Less than
$7.5M$7.5M to
$25M$26M to $150M
More than $150M
Annual Base PayEmployers Reported 0 0 1 1 0 1 0 1Employees Reported 0 0 7 9 0 7 0 9
25th Percentile ($000's) -- -- -- -- -- -- -- --50th Percentile ($000's) -- -- -- -- -- -- -- --75th Percentile ($000's) -- -- -- -- -- -- -- --Average ($000's) -- -- -- -- -- -- -- --
Incentive Pay% Incentive Eligible -- -- 100% 100% -- 100% -- 100%
25th Percentile ($000's) -- -- -- -- -- -- -- --50th Percentile ($000's) -- -- -- -- -- -- -- --75th Percentile ($000's) -- -- -- -- -- -- -- --Average ($000's) -- -- -- -- -- -- -- --
25th Percentile ($000's) -- -- -- -- -- -- -- --50th Percentile ($000's) -- -- -- -- -- -- -- --75th Percentile ($000's) -- -- -- -- -- -- -- --Average ($000's) -- -- -- -- -- -- -- --
Most Recent New HireEmployers Reported 0 0 1 1 0 1 0 1
Median ($000's) -- -- -- -- -- -- -- --Average ($000's) -- -- -- -- -- -- -- --
Prepares clinical study reports, protocols, regulatory documents and amendments. Monitors and tracks patient enrollment and studyprogress. Also collects, organizes, and analyzes project data and the accuracy and efficiency of data entry procedures and projectdeadlines. Assists with the distribution, collection, and tracking of medical reports and regulatory documents. Requires a degree and 2years of clinical/scientific research, nursing or medical devices/pharmaceutical clinical trials.
Total Cash CompensationBase Plus Incentive Pay
Page 3-131Southwestern Pennsylvania Annual Compensation and Benefits Study
© 2010 Pittsburgh Technology Council. All rights reserved.

Job Code 583 DOCUMENT CONTROL SPECIALIST
Description
25.0% Less Complex75.0% Comparable0.0% More Complex
All Organizations
Software, Computer and
Technology Manufacturing
Life-Sciences/ Biotech/
Medical Devices Not-for-ProfitAll Other
EmployersAnnual Base Pay
Employers Reported 4 0 1 1 1 1Employees Reported 4 0 1 1 1 125th Percentile ($000's) -- -- -- -- -- --50th Percentile ($000's) 40.2 -- -- -- -- --75th Percentile ($000's) -- -- -- -- -- --Average ($000's) 42.7 -- -- -- -- --
Incentive Pay% Incentive Eligible 0% -- 0% 0% 0% 0%25th Percentile ($000's) -- -- -- -- -- --50th Percentile ($000's) -- -- -- -- -- --75th Percentile ($000's) -- -- -- -- -- --Average ($000's) -- -- -- -- -- --
25th Percentile ($000's) -- -- -- -- -- --50th Percentile ($000's) 40.2 -- -- -- -- --75th Percentile ($000's) -- -- -- -- -- --Average ($000's) 42.7 -- -- -- -- --
Most Recent New HireEmployers Reported 1 0 0 0 1 0
Median ($000's) -- -- -- -- -- --Average ($000's) -- -- -- -- -- --
Supports the document management needs of the company including all revision controlled documents, regulatory files, marketingliterature, manuals, etc. Assures that all controlled documents are maintained and changed through established processes and withproper approvals. Manages the repository of all controlled documents. Typically requires an Associate’s Degree and 5 years relatedexperience.
Industry - Type of Employer
Total Cash CompensationBase Plus Incentive Pay
Job Match Comparability
Page 3-132Southwestern Pennsylvania Annual Compensation and Benefits Study
© 2010 Pittsburgh Technology Council. All rights reserved.

Job Code 583 DOCUMENT CONTROL SPECIALIST
Description
Less than 50 50 - 150 151 - 500 More than 500Less than
$7.5M$7.5M to
$25M$26M to $150M
More than $150M
Annual Base PayEmployers Reported 0 0 2 2 0 1 2 1Employees Reported 0 0 2 2 0 1 2 1
25th Percentile ($000's) -- -- -- -- -- -- -- --50th Percentile ($000's) -- -- -- -- -- -- -- --75th Percentile ($000's) -- -- -- -- -- -- -- --Average ($000's) -- -- -- -- -- -- -- --
Incentive Pay% Incentive Eligible -- -- 0% 0% -- 0% 0% 0%
25th Percentile ($000's) -- -- -- -- -- -- -- --50th Percentile ($000's) -- -- -- -- -- -- -- --75th Percentile ($000's) -- -- -- -- -- -- -- --Average ($000's) -- -- -- -- -- -- -- --
25th Percentile ($000's) -- -- -- -- -- -- -- --50th Percentile ($000's) -- -- -- -- -- -- -- --75th Percentile ($000's) -- -- -- -- -- -- -- --Average ($000's) -- -- -- -- -- -- -- --
Most Recent New HireEmployers Reported 0 0 0 1 0 0 1 0
Median ($000's) -- -- -- -- -- -- -- --Average ($000's) -- -- -- -- -- -- -- --
Total Cash CompensationBase Plus Incentive Pay
Supports the document management needs of the company including all revision controlled documents, regulatory files, marketingliterature, manuals, etc. Assures that all controlled documents are maintained and changed through established processes and withproper approvals. Manages the repository of all controlled documents. Typically requires an Associate’s Degree and 5 years relatedexperience.
Organizational FTE's Organizational Revenue ($ Millions)
Page 3-133Southwestern Pennsylvania Annual Compensation and Benefits Study
© 2010 Pittsburgh Technology Council. All rights reserved.

Job Code 591 CLINICAL LAB MANAGER
Description
0.0% Less Complex83.3% Comparable16.7% More Complex
All Organizations
Software, Computer and
Technology Manufacturing
Life-Sciences/ Biotech/
Medical Devices Not-for-ProfitAll Other
EmployersAnnual Base Pay
Employers Reported 2 0 0 1 1 0Employees Reported 6 0 0 4 2 025th Percentile ($000's) 66.3 -- -- -- -- --50th Percentile ($000's) 71.7 -- -- -- -- --75th Percentile ($000's) 83.3 -- -- -- -- --Average ($000's) 85.1 -- -- -- -- --
Incentive Pay% Incentive Eligible 33% -- -- 50% 0% --25th Percentile ($000's) -- -- -- -- -- --50th Percentile ($000's) -- -- -- -- -- --75th Percentile ($000's) -- -- -- -- -- --Average ($000's) -- -- -- -- -- --
25th Percentile ($000's) 66.6 -- -- -- -- --50th Percentile ($000's) 76.3 -- -- -- -- --75th Percentile ($000's) 85.2 -- -- -- -- --Average ($000's) 86.6 -- -- -- -- --
Most Recent New HireEmployers Reported 1 0 0 1 0 0
Median ($000's) -- -- -- -- -- --Average ($000's) -- -- -- -- -- --
Directly or indirectly manages the financial and technical operations of a clinical laboratory department. Develops, implements andmonitors policies and procedures for the clinical laboratory. Ensures the provision of the accurate and timely determination of testresults. Maintains compliance with all governmental accreditation and regulatory agency requirements. Directs quality assurance,education and training programs for laboratory staff. Typically requires a Bachelor's Degree and 7 years experience in medical technology or related field.
Industry - Type of Employer
Total Cash CompensationBase Plus Incentive Pay
Job Match Comparability
Page 3-134Southwestern Pennsylvania Annual Compensation and Benefits Study
© 2010 Pittsburgh Technology Council. All rights reserved.

Job Code 591 CLINICAL LAB MANAGER
Description
Less than 50 50 - 150 151 - 500 More than 500Less than
$7.5M$7.5M to
$25M$26M to $150M
More than $150M
Annual Base PayEmployers Reported 0 0 1 1 0 1 0 1Employees Reported 0 0 4 2 0 4 0 2
25th Percentile ($000's) -- -- -- -- -- -- -- --50th Percentile ($000's) -- -- -- -- -- -- -- --75th Percentile ($000's) -- -- -- -- -- -- -- --Average ($000's) -- -- -- -- -- -- -- --
Incentive Pay% Incentive Eligible -- -- 50% 0% -- 50% -- 0%
25th Percentile ($000's) -- -- -- -- -- -- -- --50th Percentile ($000's) -- -- -- -- -- -- -- --75th Percentile ($000's) -- -- -- -- -- -- -- --Average ($000's) -- -- -- -- -- -- -- --
25th Percentile ($000's) -- -- -- -- -- -- -- --50th Percentile ($000's) -- -- -- -- -- -- -- --75th Percentile ($000's) -- -- -- -- -- -- -- --Average ($000's) -- -- -- -- -- -- -- --
Most Recent New HireEmployers Reported 0 0 1 0 0 1 0 0
Median ($000's) -- -- -- -- -- -- -- --Average ($000's) -- -- -- -- -- -- -- --
Total Cash CompensationBase Plus Incentive Pay
Directly or indirectly manages the financial and technical operations of a clinical laboratory department. Develops, implements andmonitors policies and procedures for the clinical laboratory. Ensures the provision of the accurate and timely determination of testresults. Maintains compliance with all governmental accreditation and regulatory agency requirements. Directs quality assurance,education and training programs for laboratory staff. Typically requires a Bachelor's Degree and 7 years experience in medical technology or related field.
Organizational FTE's Organizational Revenue ($ Millions)
Page 3-135Southwestern Pennsylvania Annual Compensation and Benefits Study
© 2010 Pittsburgh Technology Council. All rights reserved.

Job Code 596 QUALITY ASSURANCE/QUALITY CONTROL INSPECTOR
Description
6.3% Less Complex87.5% Comparable6.3% More Complex
All Organizations
Software, Computer and
Technology Manufacturing
Life-Sciences/ Biotech/
Medical Devices Not-for-ProfitAll Other
EmployersAnnual Base Pay
Employers Reported 8 1 5 2 0 0Employees Reported 16 1 7 8 0 025th Percentile ($000's) 41.4 -- 48.9 38.8 -- --50th Percentile ($000's) 47.7 -- 52.8 43.0 -- --75th Percentile ($000's) 54.2 -- 58.9 47.3 -- --Average ($000's) 50.8 -- 55.7 45.6 -- --
Incentive Pay% Incentive Eligible 63% 0% 71% 63% -- --25th Percentile ($000's) 3.1 -- 5.3 3.0 -- --50th Percentile ($000's) 4.4 -- 5.3 3.8 -- --75th Percentile ($000's) 4.5 -- 5.3 4.5 -- --Average ($000's) 4.0 -- 5.3 3.7 -- --
25th Percentile ($000's) 42.6 -- 48.9 41.2 -- --50th Percentile ($000's) 50.7 -- 52.8 43.4 -- --75th Percentile ($000's) 54.2 -- 58.9 51.7 -- --Average ($000's) 52.1 -- 56.5 47.4 -- --
Most Recent New HireEmployers Reported 2 0 0 2 0 0
Median ($000's) -- -- -- -- -- --Average ($000's) -- -- -- -- -- --
Assures the integrity of the company’s products through verification and validation testing and inspection and control of material. Assistsengineers in the verification of new product development designs to assure compliance with product requirements, safety standards, andrisk management countermeasures. Also responsible for the inspection function in quality assurance, including incoming inspection, inprocess inspection, manages delivery holds; controls inventory locations for pre-released products and quarantined product, releasingproducts for distribution, addressing non-conforming materials from the inspection functions, and controlling quality records. Typicallyrequires an Associates Degree with 3 years related experience.
Industry - Type of Employer
Total Cash CompensationBase Plus Incentive Pay
Job Match Comparability
Page 3-136Southwestern Pennsylvania Annual Compensation and Benefits Study
© 2010 Pittsburgh Technology Council. All rights reserved.
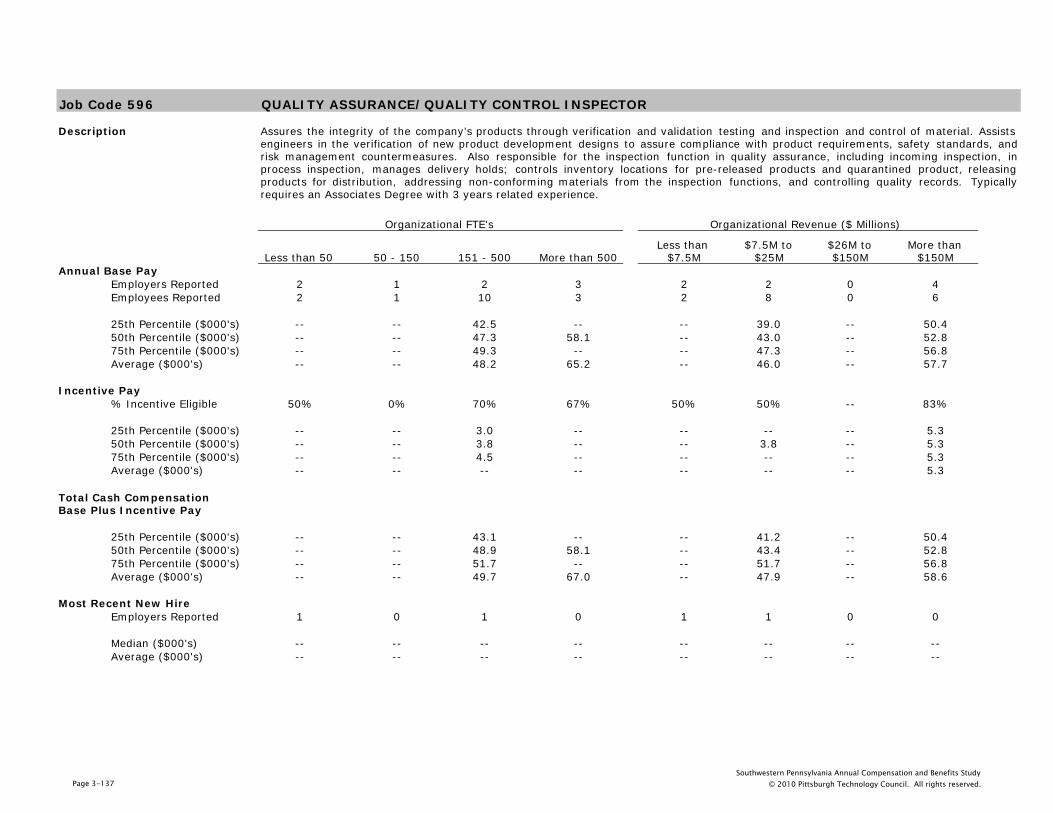
Job Code 596 QUALITY ASSURANCE/QUALITY CONTROL INSPECTOR
Description
Less than 50 50 - 150 151 - 500 More than 500Less than
$7.5M$7.5M to
$25M$26M to $150M
More than $150M
Annual Base PayEmployers Reported 2 1 2 3 2 2 0 4Employees Reported 2 1 10 3 2 8 0 6
25th Percentile ($000's) -- -- 42.5 -- -- 39.0 -- 50.450th Percentile ($000's) -- -- 47.3 58.1 -- 43.0 -- 52.875th Percentile ($000's) -- -- 49.3 -- -- 47.3 -- 56.8Average ($000's) -- -- 48.2 65.2 -- 46.0 -- 57.7
Incentive Pay% Incentive Eligible 50% 0% 70% 67% 50% 50% -- 83%
25th Percentile ($000's) -- -- 3.0 -- -- -- -- 5.350th Percentile ($000's) -- -- 3.8 -- -- 3.8 -- 5.375th Percentile ($000's) -- -- 4.5 -- -- -- -- 5.3Average ($000's) -- -- -- -- -- -- -- 5.3
25th Percentile ($000's) -- -- 43.1 -- -- 41.2 -- 50.450th Percentile ($000's) -- -- 48.9 58.1 -- 43.4 -- 52.875th Percentile ($000's) -- -- 51.7 -- -- 51.7 -- 56.8Average ($000's) -- -- 49.7 67.0 -- 47.9 -- 58.6
Most Recent New HireEmployers Reported 1 0 1 0 1 1 0 0
Median ($000's) -- -- -- -- -- -- -- --Average ($000's) -- -- -- -- -- -- -- --
Total Cash CompensationBase Plus Incentive Pay
Assures the integrity of the company’s products through verification and validation testing and inspection and control of material. Assistsengineers in the verification of new product development designs to assure compliance with product requirements, safety standards, andrisk management countermeasures. Also responsible for the inspection function in quality assurance, including incoming inspection, inprocess inspection, manages delivery holds; controls inventory locations for pre-released products and quarantined product, releasingproducts for distribution, addressing non-conforming materials from the inspection functions, and controlling quality records. Typicallyrequires an Associates Degree with 3 years related experience.
Organizational FTE's Organizational Revenue ($ Millions)
Page 3-137Southwestern Pennsylvania Annual Compensation and Benefits Study
© 2010 Pittsburgh Technology Council. All rights reserved.

Job Code 598 BIOSTATISTICIAN/STATISTICIAN
Description
0.0% Less Complex100.0% Comparable0.0% More Complex
All Organizations
Software, Computer and
Technology Manufacturing
Life-Sciences/ Biotech/
Medical Devices Not-for-ProfitAll Other
EmployersAnnual Base Pay
Employers Reported 2 0 0 1 1 0Employees Reported 3 0 0 2 1 025th Percentile ($000's) -- -- -- -- -- --50th Percentile ($000's) 90.3 -- -- -- -- --75th Percentile ($000's) -- -- -- -- -- --Average ($000's) 83.3 -- -- -- -- --
Incentive Pay% Incentive Eligible 67% -- -- 50% 100% --25th Percentile ($000's) -- -- -- -- -- --50th Percentile ($000's) -- -- -- -- -- --75th Percentile ($000's) -- -- -- -- -- --Average ($000's) -- -- -- -- -- --
25th Percentile ($000's) -- -- -- -- -- --50th Percentile ($000's) 98.9 -- -- -- -- --75th Percentile ($000's) -- -- -- -- -- --Average ($000's) 87.7 -- -- -- -- --
Most Recent New HireEmployers Reported 1 0 0 1 0 0
Median ($000's) -- -- -- -- -- --Average ($000's) -- -- -- -- -- --
Performs statistical design, modeling, and analyses on research data, typically to support product development. Interacts and consultswith physicians, scientists and engineers to ensure proper use of statistical methodology and interpretation of results. May respond toquestions from regulatory authorities on statistical issues. Typically has an advanced degree with a focus in statistics, bioinformaticsand/or machine learning techniques along with 4 - 5 years of related experience.
Job Match Comparability
Industry - Type of Employer
Total Cash CompensationBase Plus Incentive Pay
Page 3-138Southwestern Pennsylvania Annual Compensation and Benefits Study
© 2010 Pittsburgh Technology Council. All rights reserved.

Job Code 598 BIOSTATISTICIAN/STATISTICIAN
Description
Less than 50 50 - 150 151 - 500 More than 500Less than
$7.5M$7.5M to
$25M$26M to $150M
More than $150M
Annual Base PayEmployers Reported 0 1 1 0 0 2 0 0Employees Reported 0 1 2 0 0 3 0 0
25th Percentile ($000's) -- -- -- -- -- -- -- --50th Percentile ($000's) -- -- -- -- -- 90.3 -- --75th Percentile ($000's) -- -- -- -- -- -- -- --Average ($000's) -- -- -- -- -- 83.3 -- --
Incentive Pay% Incentive Eligible -- 100% 50% -- -- 67% -- --
25th Percentile ($000's) -- -- -- -- -- -- -- --50th Percentile ($000's) -- -- -- -- -- -- -- --75th Percentile ($000's) -- -- -- -- -- -- -- --Average ($000's) -- -- -- -- -- -- -- --
25th Percentile ($000's) -- -- -- -- -- -- -- --50th Percentile ($000's) -- -- -- -- -- 98.9 -- --75th Percentile ($000's) -- -- -- -- -- -- -- --Average ($000's) -- -- -- -- -- 87.7 -- --
Most Recent New HireEmployers Reported 0 0 1 0 0 1 0 0
Median ($000's) -- -- -- -- -- -- -- --Average ($000's) -- -- -- -- -- -- -- --
Performs statistical design, modeling, and analyses on research data, typically to support product development. Interacts and consultswith physicians, scientists and engineers to ensure proper use of statistical methodology and interpretation of results. May respond toquestions from regulatory authorities on statistical issues. Typically has an advanced degree with a focus in statistics, bioinformaticsand/or machine learning techniques along with 4 - 5 years of related experience.
Organizational FTE's Organizational Revenue ($ Millions)
Total Cash CompensationBase Plus Incentive Pay
Page 3-139Southwestern Pennsylvania Annual Compensation and Benefits Study
© 2010 Pittsburgh Technology Council. All rights reserved.

Job Code 651 ANALYST/PROGRAMMER - ALL LEVELS
Description
1.1% Less Complex98.3% Comparable0.6% More Complex
All Organizations
Software, Computer and
Technology Manufacturing
Life-Sciences/ Biotech/
Medical Devices Not-for-ProfitAll Other
EmployersAnnual Base Pay
Employers Reported 20 3 4 0 2 11Employees Reported 701 13 9 0 26 65325th Percentile ($000's) 66.3 53.8 64.0 -- 57.4 66.950th Percentile ($000's) 73.1 62.5 79.5 -- 63.4 73.775th Percentile ($000's) 79.7 72.8 88.8 -- 67.9 79.8Average ($000's) 72.6 67.6 72.0 -- 63.8 73.1
Incentive Pay% Incentive Eligible 92% 85% 89% -- 4% 95%25th Percentile ($000's) 4.8 2.0 6.1 -- -- 4.850th Percentile ($000's) 6.0 2.2 6.9 -- -- 6.075th Percentile ($000's) 7.0 2.5 11.8 -- -- 7.0Average ($000's) 5.8 4.1 8.6 -- -- 5.8
25th Percentile ($000's) 70.1 55.7 64.0 -- 58.9 71.150th Percentile ($000's) 78.3 64.7 85.5 -- 63.9 78.875th Percentile ($000's) 85.7 75.3 95.5 -- 67.9 85.7Average ($000's) 77.4 71.0 77.7 -- 64.2 78.1
Most Recent New HireEmployers Reported 6 1 0 0 0 5
Median ($000's) 68.8 -- -- -- -- 70.5Average ($000's) 70.0 -- -- -- -- 71.3
The data for this position is a combination of the data reported by participants for 652 Analyst/Programmer I; 653 Analyst/ProgrammerII, and 654 Analyst/Programmer III
Industry - Type of Employer
Total Cash CompensationBase Plus Incentive Pay
Job Match Comparability
Page 3-140Southwestern Pennsylvania Annual Compensation and Benefits Study
© 2010 Pittsburgh Technology Council. All rights reserved.

Job Code 651 ANALYST/PROGRAMMER - ALL LEVELS
Description
Less than 50 50 - 150 151 - 500 More than 500Less than
$7.5M$7.5M to
$25M$26M to $150M
More than $150M
Annual Base PayEmployers Reported 0 5 3 12 1 4 2 13Employees Reported 0 14 4 683 1 13 3 684
25th Percentile ($000's) -- 56.8 -- 66.6 -- 55.7 -- 66.550th Percentile ($000's) -- 62.5 51.8 73.4 -- 62.5 40.1 73.475th Percentile ($000's) -- 72.5 -- 79.7 -- 72.8 -- 79.7Average ($000's) -- 67.2 51.9 72.8 -- 67.7 48.0 72.8
Incentive Pay% Incentive Eligible -- 86% 75% 92% 0% 92% 67% 92%
25th Percentile ($000's) -- 2.1 -- 4.8 -- 2.1 -- 4.850th Percentile ($000's) -- 2.3 2.3 6.1 -- 2.3 -- 6.175th Percentile ($000's) -- 2.7 -- 7.0 -- 2.7 -- 7.0Average ($000's) -- 4.5 2.3 5.8 -- 4.5 -- 5.8
25th Percentile ($000's) -- 61.0 -- 70.5 -- 64.1 -- 70.550th Percentile ($000's) -- 65.2 52.0 78.4 -- 65.8 40.1 78.475th Percentile ($000's) -- 75.1 -- 85.7 -- 75.3 -- 85.7Average ($000's) -- 71.1 52.5 77.7 -- 71.9 48.0 77.7
Most Recent New HireEmployers Reported 0 1 0 5 0 1 0 5
Median ($000's) -- -- -- 70.5 -- -- -- 70.5Average ($000's) -- -- -- 71.3 -- -- -- 71.3
Total Cash CompensationBase Plus Incentive Pay
The data for this position is a combination of the data reported by participants for 652 Analyst/Programmer I; 653 Analyst/ProgrammerII, and 654 Analyst/Programmer III
Organizational FTE's Organizational Revenue ($ Millions)
Page 3-141Southwestern Pennsylvania Annual Compensation and Benefits Study
© 2010 Pittsburgh Technology Council. All rights reserved.

Job Code 652 ANALYST/PROGRAMMER I
Description
10.3% Less Complex85.9% Comparable3.8% More Complex
All Organizations
Software, Computer and
Technology Manufacturing
Life-Sciences/ Biotech/
Medical Devices Not-for-ProfitAll Other
EmployersAnnual Base Pay
Employers Reported 10 1 2 0 1 6Employees Reported 78 1 3 0 9 6525th Percentile ($000's) 49.1 -- -- -- -- 49.050th Percentile ($000's) 55.1 -- 40.1 -- -- 55.175th Percentile ($000's) 67.7 -- -- -- -- 68.2Average ($000's) 58.8 -- 48.0 -- -- 59.4
Incentive Pay% Incentive Eligible 72% 0% 67% -- 0% 83%25th Percentile ($000's) 2.2 -- -- -- -- 2.250th Percentile ($000's) 2.9 -- -- -- -- 2.975th Percentile ($000's) 3.6 -- -- -- -- 3.6Average ($000's) 3.0 -- -- -- -- 3.0
25th Percentile ($000's) 51.9 -- -- -- -- 51.950th Percentile ($000's) 57.1 -- 40.1 -- -- 57.475th Percentile ($000's) 69.4 -- -- -- -- 69.9Average ($000's) 60.7 -- 48.0 -- -- 61.6
Most Recent New HireEmployers Reported 2 0 0 0 0 2
Median ($000's) -- -- -- -- -- --Average ($000's) -- -- -- -- -- --
Plans, develops, tests, and documents mainframe-resident and client/ server computer applications programs, generally working fromsource data provided by senior analyst/programmers. May review system capabilities and scheduling limitations to determine ifrequested application or modification is possible within existing system. Applies standard programming procedures, including graphicaluser interface (GUI) development, and a detailed knowledge of the application being programmed. Prepares program documentation andmaterials for users. Normally requires a relevant degree, proficiency in a language such as C, C++, Visual Basic, or JAVA, and 2–4 yearsprogramming experience.
Industry - Type of Employer
Total Cash CompensationBase Plus Incentive Pay
Job Match Comparability
Page 3-142Southwestern Pennsylvania Annual Compensation and Benefits Study
© 2010 Pittsburgh Technology Council. All rights reserved.

Job Code 652 ANALYST/PROGRAMMER I
Description
Less than 50 50 - 150 151 - 500 More than 500Less than
$7.5M$7.5M to
$25M$26M to $150M
More than $150M
Annual Base PayEmployers Reported 0 0 2 8 0 0 2 8Employees Reported 0 0 3 75 0 0 3 75
25th Percentile ($000's) -- -- -- 49.4 -- -- -- 49.450th Percentile ($000's) -- -- 40.1 55.1 -- -- 40.1 55.175th Percentile ($000's) -- -- -- 67.9 -- -- -- 67.9Average ($000's) -- -- 48.0 59.3 -- -- 48.0 59.3
Incentive Pay% Incentive Eligible -- -- 67% 72% -- -- 67% 72%
25th Percentile ($000's) -- -- -- 2.2 -- -- -- 2.250th Percentile ($000's) -- -- -- 2.9 -- -- -- 2.975th Percentile ($000's) -- -- -- 3.6 -- -- -- 3.6Average ($000's) -- -- -- 3.0 -- -- -- 3.0
25th Percentile ($000's) -- -- -- 52.0 -- -- -- 52.050th Percentile ($000's) -- -- 40.1 57.3 -- -- 40.1 57.375th Percentile ($000's) -- -- -- 69.6 -- -- -- 69.6Average ($000's) -- -- 48.0 61.2 -- -- 48.0 61.2
Most Recent New HireEmployers Reported 0 0 0 2 0 0 0 2
Median ($000's) -- -- -- -- -- -- -- --Average ($000's) -- -- -- -- -- -- -- --
Total Cash CompensationBase Plus Incentive Pay
Plans, develops, tests, and documents mainframe-resident and client/ server computer applications programs, generally working fromsource data provided by senior analyst/programmers. May review system capabilities and scheduling limitations to determine ifrequested application or modification is possible within existing system. Applies standard programming procedures, including graphicaluser interface (GUI) development, and a detailed knowledge of the application being programmed. Prepares program documentation andmaterials for users. Normally requires a relevant degree, proficiency in a language such as C, C++, Visual Basic, or JAVA, and 2–4 yearsprogramming experience.
Organizational FTE's Organizational Revenue ($ Millions)
Page 3-143Southwestern Pennsylvania Annual Compensation and Benefits Study
© 2010 Pittsburgh Technology Council. All rights reserved.

Job Code 653 ANALYST/PROGRAMMER II
Description
0.0% Less Complex100.0% Comparable0.0% More Complex
All Organizations
Software, Computer and
Technology Manufacturing
Life-Sciences/ Biotech/
Medical Devices Not-for-ProfitAll Other
EmployersAnnual Base Pay
Employers Reported 16 2 2 0 2 10Employees Reported 245 11 2 0 10 22225th Percentile ($000's) 62.9 57.9 -- -- 60.6 63.150th Percentile ($000's) 66.7 62.5 -- -- 64.1 66.875th Percentile ($000's) 71.8 72.3 -- -- 67.2 71.9Average ($000's) 67.4 66.4 -- -- 63.9 67.6
Incentive Pay% Incentive Eligible 89% 91% 100% -- 10% 92%25th Percentile ($000's) 4.4 2.0 -- -- -- 4.450th Percentile ($000's) 4.9 2.2 -- -- -- 4.975th Percentile ($000's) 5.2 2.5 -- -- -- 5.2Average ($000's) 4.8 2.3 -- -- -- 4.9
25th Percentile ($000's) 65.9 59.9 -- -- 63.3 66.750th Percentile ($000's) 71.1 64.7 -- -- 64.8 71.475th Percentile ($000's) 74.8 74.8 -- -- 67.4 75.1Average ($000's) 71.3 68.5 -- -- 64.9 71.7
Most Recent New HireEmployers Reported 5 1 0 0 0 4
Median ($000's) 67.7 -- -- -- -- 69.5Average ($000's) 67.1 -- -- -- -- 68.3
Designs, prototypes, develop, and maintain complex business, accounting, and management information systems in both centralized andnetworked environments. Typically works on more complex assignments that require non-standard programming techniques and/orextensive knowledge of advanced development languages. Evaluates user requests for new or modified programs to determinefeasibility, cost, and time requirements, and compatibility with existing systems and capabilities. Determines programmingspecifications. Provides assistance to lower level analyst/ programmers. Typically requires a degree in computer science, managementinformation systems, or business, proficiency in two or more programming languages, and 5–7 years related experience. Job Match Comparability
Industry - Type of Employer
Total Cash CompensationBase Plus Incentive Pay
Page 3-144Southwestern Pennsylvania Annual Compensation and Benefits Study
© 2010 Pittsburgh Technology Council. All rights reserved.

Job Code 653 ANALYST/PROGRAMMER II
Description
Less than 50 50 - 150 151 - 500 More than 500Less than
$7.5M$7.5M to
$25M$26M to $150M
More than $150M
Annual Base PayEmployers Reported 0 4 1 11 1 3 0 12Employees Reported 0 13 1 231 1 12 0 232
25th Percentile ($000's) -- 55.7 -- 63.1 -- 55.3 -- 63.150th Percentile ($000's) -- 62.5 -- 66.8 -- 62.5 -- 66.875th Percentile ($000's) -- 71.8 -- 71.9 -- 72.0 -- 71.8Average ($000's) -- 64.9 -- 67.6 -- 65.3 -- 67.6
Incentive Pay% Incentive Eligible -- 85% 100% 89% 0% 92% -- 89%
25th Percentile ($000's) -- 2.0 -- 4.4 -- 2.0 -- 4.450th Percentile ($000's) -- 2.2 -- 4.9 -- 2.2 -- 4.975th Percentile ($000's) -- 2.5 -- 5.2 -- 2.5 -- 5.2Average ($000's) -- 3.0 -- 4.9 -- 3.0 -- 4.9
25th Percentile ($000's) -- 60.0 -- 66.6 -- 62.0 -- 66.550th Percentile ($000's) -- 64.7 -- 71.2 -- 65.2 -- 71.275th Percentile ($000's) -- 74.3 -- 74.9 -- 74.5 -- 74.8Average ($000's) -- 67.4 -- 71.6 -- 68.0 -- 71.5
Most Recent New HireEmployers Reported 0 1 0 4 0 1 0 4
Median ($000's) -- -- -- 69.5 -- -- -- 69.5Average ($000's) -- -- -- 68.3 -- -- -- 68.3
Designs, prototypes, develop, and maintain complex business, accounting, and management information systems in both centralized andnetworked environments. Typically works on more complex assignments that require non-standard programming techniques and/orextensive knowledge of advanced development languages. Evaluates user requests for new or modified programs to determinefeasibility, cost, and time requirements, and compatibility with existing systems and capabilities. Determines programmingspecifications. Provides assistance to lower level analyst/ programmers. Typically requires a degree in computer science, managementinformation systems, or business, proficiency in two or more programming languages, and 5–7 years related experience.
Organizational FTE's Organizational Revenue ($ Millions)
Total Cash CompensationBase Plus Incentive Pay
Page 3-145Southwestern Pennsylvania Annual Compensation and Benefits Study
© 2010 Pittsburgh Technology Council. All rights reserved.

Job Code 654 ANALYST/PROGRAMMER III
Description
0.0% Less Complex99.7% Comparable0.3% More Complex
All Organizations
Software, Computer and
Technology Manufacturing
Life-Sciences/ Biotech/
Medical Devices Not-for-ProfitAll Other
EmployersAnnual Base Pay
Employers Reported 9 1 2 0 1 5Employees Reported 378 1 4 0 7 366
25th Percentile ($000's) 74.0 -- -- -- -- 74.150th Percentile ($000's) 78.7 -- 91.5 -- -- 78.775th Percentile ($000's) 82.1 -- -- -- -- 82.0Average ($000's) 78.8 -- 89.2 -- -- 78.8
Incentive Pay% Incentive Eligible 98% 100% 100% -- 0% 100%25th Percentile ($000's) 6.2 -- -- -- -- 6.250th Percentile ($000's) 6.8 -- 10.0 -- -- 6.875th Percentile ($000's) 7.2 -- -- -- -- 7.2Average ($000's) 6.8 -- 9.9 -- -- 6.8
25th Percentile ($000's) 79.6 -- -- -- -- 79.850th Percentile ($000's) 84.4 -- 101.5 -- -- 84.675th Percentile ($000's) 88.4 -- -- -- -- 88.3Average ($000's) 84.8 -- 99.0 -- -- 84.9
Most Recent New HireEmployers Reported 2 0 0 0 0 2
Median ($000's) -- -- -- -- -- --Average ($000's) -- -- -- -- -- --
Works with users to establish and validate requests for new programs; outlines steps required for program development, includingdiagrams and charts; determines feasibility, cost, and time requirements; and compatibility with existing systems and capabilities.Provides advanced technical guidance to and may oversee work of lower level analyst/programmers. Writes program documentation anduser operations guidelines. Requires comprehensive knowledge of programming techniques and multiple programming languages ofnetworked and centralized operating systems, and the capabilities of enterprise database products and development suites. Typicallyrequires a related degree and 8+ years related experience.
Industry - Type of Employer
Total Cash CompensationBase Plus Incentive Pay
Job Match Comparability
Page 3-146Southwestern Pennsylvania Annual Compensation and Benefits Study
© 2010 Pittsburgh Technology Council. All rights reserved.

Job Code 654 ANALYST/PROGRAMMER III
Description
Less than 50 50 - 150 151 - 500 More than 500Less than
$7.5M$7.5M to
$25M$26M to $150M
More than $150M
Annual Base PayEmployers Reported 0 1 0 8 0 1 0 8Employees Reported 0 1 0 377 0 1 0 377
25th Percentile ($000's) -- -- -- 74.0 -- -- -- 74.050th Percentile ($000's) -- -- -- 78.7 -- -- -- 78.775th Percentile ($000's) -- -- -- 82.0 -- -- -- 82.0Average ($000's) -- -- -- 78.7 -- -- -- 78.7
Incentive Pay% Incentive Eligible -- 100% -- 98% -- 100% -- 98%
25th Percentile ($000's) -- -- -- 6.2 -- -- -- 6.250th Percentile ($000's) -- -- -- 6.8 -- -- -- 6.875th Percentile ($000's) -- -- -- 7.2 -- -- -- 7.2Average ($000's) -- -- -- 6.8 -- -- -- 6.8
25th Percentile ($000's) -- -- -- 79.6 -- -- -- 79.650th Percentile ($000's) -- -- -- 84.4 -- -- -- 84.475th Percentile ($000's) -- -- -- 88.3 -- -- -- 88.3Average ($000's) -- -- -- 84.7 -- -- -- 84.7
Most Recent New HireEmployers Reported 0 0 0 2 0 0 0 2
Median ($000's) -- -- -- -- -- -- -- --Average ($000's) -- -- -- -- -- -- -- --
Total Cash CompensationBase Plus Incentive Pay
Works with users to establish and validate requests for new programs; outlines steps required for program development, includingdiagrams and charts; determines feasibility, cost, and time requirements; and compatibility with existing systems and capabilities.Provides advanced technical guidance to and may oversee work of lower level analyst/programmers. Writes program documentation anduser operations guidelines. Requires comprehensive knowledge of programming techniques and multiple programming languages ofnetworked and centralized operating systems, and the capabilities of enterprise database products and development suites. Typicallyrequires a related degree and 8+ years related experience.
Organizational FTE's Organizational Revenue ($ Millions)
Page 3-147Southwestern Pennsylvania Annual Compensation and Benefits Study
© 2010 Pittsburgh Technology Council. All rights reserved.

Job Code 601 SOFTWARE DEVELOPER - ALL LEVELS
Description
2.8% Less Complex77.1% Comparable20.1% More Complex
All Organizations
Software, Computer and
Technology Manufacturing
Life-Sciences/ Biotech/
Medical Devices Not-for-ProfitAll Other
EmployersAnnual Base Pay
Employers Reported 25 11 3 4 1 6Employees Reported 571 216 14 186 1 15425th Percentile ($000's) 62.4 64.4 56.5 55.1 -- 75.350th Percentile ($000's) 77.0 77.3 61.8 65.0 -- 86.575th Percentile ($000's) 89.0 86.5 80.9 82.3 -- 101.8Average ($000's) 77.7 75.4 70.5 70.1 -- 90.9
Incentive Pay% Incentive Eligible 35% 50% 21% 32% 0% 20%25th Percentile ($000's) 3.1 3.0 -- 3.4 -- 6.050th Percentile ($000's) 4.6 3.5 12.2 4.2 -- 8.075th Percentile ($000's) 6.8 5.9 -- 4.8 -- 8.8Average ($000's) 5.5 5.5 12.2 4.2 -- 7.1
25th Percentile ($000's) 62.5 65.0 57.3 55.1 -- 78.050th Percentile ($000's) 78.0 78.0 63.6 65.4 -- 89.075th Percentile ($000's) 92.0 88.3 80.9 82.6 -- 102.2Average ($000's) 79.0 76.7 72.2 71.0 -- 92.4
Most Recent New HireEmployers Reported 12 9 1 1 0 1
Median ($000's) 73.4 67.5 -- -- -- --Average ($000's) 71.7 68.0 -- -- -- --
The data for this position is a combination of the data reported by participants for 602 Software Developer I, 603 Software Developer IIand 605 Software Developer III
Industry - Type of Employer
Total Cash CompensationBase Plus Incentive Pay
Job Match Comparability
Page 3-148Southwestern Pennsylvania Annual Compensation and Benefits Study
© 2010 Pittsburgh Technology Council. All rights reserved.

Job Code 601 SOFTWARE DEVELOPER - ALL LEVELS
Description
Less than 50 50 - 150 151 - 500 More than 500Less than
$7.5M$7.5M to
$25M$26M to $150M
More than $150M
Annual Base PayEmployers Reported 7 6 4 8 6 8 3 8Employees Reported 36 55 76 404 21 71 75 404
25th Percentile ($000's) 62.6 64.8 60.9 62.3 69.0 64.0 60.9 62.350th Percentile ($000's) 80.2 81.0 75.1 75.8 82.0 81.0 75.1 75.875th Percentile ($000's) 90.9 87.8 85.2 90.0 89.0 89.0 85.1 90.0Average ($000's) 79.7 80.3 72.3 78.2 81.3 79.9 72.0 78.2
Incentive Pay% Incentive Eligible 47% 96% 71% 19% 62% 80% 72% 19%
25th Percentile ($000's) 3.1 2.9 3.7 4.0 3.1 2.9 3.7 4.050th Percentile ($000's) 5.0 3.2 5.6 4.9 4.0 3.2 5.6 4.975th Percentile ($000's) 6.3 5.6 6.6 7.5 5.7 6.3 6.6 7.5Average ($000's) 5.6 5.6 5.1 5.6 4.3 6.0 5.1 5.6
25th Percentile ($000's) 64.9 70.8 60.9 62.4 71.8 64.9 60.9 62.450th Percentile ($000's) 80.2 82.8 75.1 77.3 82.0 82.3 75.1 77.375th Percentile ($000's) 90.9 93.2 86.6 93.1 89.6 92.5 85.9 93.1Average ($000's) 81.6 84.2 73.2 79.1 83.3 83.2 72.9 79.1
Most Recent New HireEmployers Reported 4 2 3 3 4 2 3 3
Median ($000's) 74.8 -- 57.1 80.0 74.8 -- 57.1 80.0Average ($000's) 72.9 -- 61.1 80.9 72.9 -- 61.1 80.9
Total Cash CompensationBase Plus Incentive Pay
The data for this position is a combination of the data reported by participants for 602 Software Developer I, 603 Software Developer IIand 605 Software Developer III
Organizational FTE's Organizational Revenue ($ Millions)
Page 3-149Southwestern Pennsylvania Annual Compensation and Benefits Study
© 2010 Pittsburgh Technology Council. All rights reserved.

Job Code 602 SOFTWARE DEVELOPER I
Description
12.2% Less Complex84.3% Comparable3.5% More Complex
All Organizations
Software, Computer and
Technology Manufacturing
Life-Sciences/ Biotech/
Medical Devices Not-for-ProfitAll Other
EmployersAnnual Base Pay
Employers Reported 11 5 1 3 0 2Employees Reported 115 54 3 38 0 2025th Percentile ($000's) 48.0 48.0 -- 45.5 -- 59.250th Percentile ($000's) 52.5 55.3 -- 49.6 -- 70.375th Percentile ($000's) 61.5 63.2 -- 50.7 -- 72.0Average ($000's) 55.5 56.0 -- 48.7 -- 66.9
Incentive Pay% Incentive Eligible 17% 24% 0% 13% -- 5%25th Percentile ($000's) 1.5 2.8 -- 1.4 -- --50th Percentile ($000's) 2.8 3.1 -- 1.4 -- --75th Percentile ($000's) 4.1 5.0 -- 1.4 -- --Average ($000's) 3.4 4.3 -- 1.4 -- --
25th Percentile ($000's) 48.1 48.1 -- 45.5 -- 59.250th Percentile ($000's) 52.8 55.8 -- 49.6 -- 70.375th Percentile ($000's) 61.5 63.2 -- 50.7 -- 72.0Average ($000's) 55.7 56.4 -- 48.7 -- 66.9
Most Recent New HireEmployers Reported 5 3 1 1 0 0
Median ($000's) 52.3 50.0 -- -- -- --Average ($000's) 51.1 50.4 -- -- -- --
Assists in the design and coding of software products. Conducts system tests. Identifies and debugs relatively simple problems andrecommends fixes. Codes enhancements and supports features. Participates in writing product and user documentation. Requiresextensive knowledge of one or more platforms and operating systems, and of programming languages such as Visual Basic, C, C++,JAVA, .Net, Websphere, J2EE, etc. Requires a degree in computer science, electrical/electronics engineering, math, physics, or anequivalent discipline, and 2–3 years software development experience. May be titled Software Engineer.
Industry - Type of Employer
Total Cash CompensationBase Plus Incentive Pay
Job Match Comparability
Page 3-150Southwestern Pennsylvania Annual Compensation and Benefits Study
© 2010 Pittsburgh Technology Council. All rights reserved.

Job Code 602 SOFTWARE DEVELOPER I
Description
Less than 50 50 - 150 151 - 500 More than 500Less than
$7.5M$7.5M to
$25M$26M to $150M
More than $150M
Annual Base PayEmployers Reported 3 2 2 4 2 3 2 4Employees Reported 8 9 17 81 2 15 17 81
25th Percentile ($000's) 59.3 45.0 43.8 49.3 -- 46.8 43.8 49.350th Percentile ($000's) 61.0 47.5 48.0 51.6 -- 60.0 48.0 51.675th Percentile ($000's) 62.7 58.5 55.1 63.5 -- 61.5 55.1 63.5Average ($000's) 62.6 50.3 50.2 56.4 -- 56.2 50.2 56.4
Incentive Pay% Incentive Eligible 13% 100% 41% 2% 50% 60% 41% 2%
25th Percentile ($000's) -- 2.8 -- -- -- 2.8 -- --50th Percentile ($000's) -- 3.1 -- -- -- 3.1 -- --75th Percentile ($000's) -- 5.0 -- -- -- 5.0 -- --Average ($000's) -- 4.3 -- -- -- 4.3 -- --
25th Percentile ($000's) 59.3 45.0 43.8 49.3 -- 48.9 43.8 49.350th Percentile ($000's) 61.0 50.3 48.0 52.5 -- 60.0 48.0 52.575th Percentile ($000's) 62.7 58.5 55.1 63.5 -- 61.5 55.1 63.5Average ($000's) 62.7 52.7 50.2 56.4 -- 57.6 50.2 56.4
Most Recent New HireEmployers Reported 1 1 2 1 1 1 2 1
Median ($000's) -- -- -- -- -- -- -- --Average ($000's) -- -- -- -- -- -- -- --
Total Cash CompensationBase Plus Incentive Pay
Assists in the design and coding of software products. Conducts system tests. Identifies and debugs relatively simple problems andrecommends fixes. Codes enhancements and supports features. Participates in writing product and user documentation. Requiresextensive knowledge of one or more platforms and operating systems, and of programming languages such as Visual Basic, C, C++,JAVA, .Net, Websphere, J2EE, etc. Requires a degree in computer science, electrical/electronics engineering, math, physics, or anequivalent discipline, and 2–3 years software development experience. May be titled Software Engineer.
Organizational FTE's Organizational Revenue ($ Millions)
Page 3-151Southwestern Pennsylvania Annual Compensation and Benefits Study
© 2010 Pittsburgh Technology Council. All rights reserved.

Job Code 603 SOFTWARE DEVELOPER II
Description
0.0% Less Complex60.8% Comparable39.2% More Complex
All Organizations
Software, Computer and
Technology Manufacturing
Life-Sciences/ Biotech/
Medical Devices Not-for-ProfitAll Other
EmployersAnnual Base Pay
Employers Reported 20 9 2 3 0 6Employees Reported 194 71 6 91 0 2625th Percentile ($000's) 61.4 67.2 58.3 57.2 -- 69.850th Percentile ($000's) 67.2 74.0 60.9 63.0 -- 75.175th Percentile ($000's) 75.6 79.4 62.2 68.2 -- 79.1Average ($000's) 68.6 73.7 60.4 63.8 -- 73.3
Incentive Pay% Incentive Eligible 35% 55% 33% 16% -- 42%25th Percentile ($000's) 2.9 2.7 -- 2.9 -- 5.850th Percentile ($000's) 3.4 3.0 -- 3.3 -- 6.775th Percentile ($000's) 5.8 5.3 -- 3.4 -- 7.0Average ($000's) 4.3 3.7 -- 3.3 -- 6.2
25th Percentile ($000's) 62.0 67.4 60.8 57.4 -- 72.050th Percentile ($000's) 68.3 74.0 61.8 63.0 -- 78.375th Percentile ($000's) 78.0 80.7 64.0 69.3 -- 81.6Average ($000's) 69.6 74.8 61.6 64.2 -- 75.9
Most Recent New HireEmployers Reported 2 1 1 0 0 1
Median ($000's) -- -- -- -- -- --Average ($000's) -- -- -- -- -- --
Designs and codes software components, units, and modules that meet product specification and development schedules. Tests anddebugs assigned components and units. Adheres to product build and release schedules and strategies. Acts as a technical resource forlower level developers. Requires comprehensive knowledge of one or more platforms and operating systems, and of languages such asVisual Basic, C, C++, JAVA, .Net, Websphere, J2EE, etc. Requires a degree in computer science, electrical engineering, math, or anequivalent field, and 4–6 years software development experience. May be titled Senior Software Engineer.
Industry - Type of Employer
Total Cash CompensationBase Plus Incentive Pay
Job Match Comparability
Page 3-152Southwestern Pennsylvania Annual Compensation and Benefits Study
© 2010 Pittsburgh Technology Council. All rights reserved.

Job Code 603 SOFTWARE DEVELOPER II
Description
Less than 50 50 - 150 151 - 500 More than 500Less than
$7.5M$7.5M to
$25M$26M to $150M
More than $150M
Annual Base PayEmployers Reported 5 4 3 8 3 6 3 8Employees Reported 13 18 25 138 8 23 25 138
25th Percentile ($000's) 62.7 67.9 63.0 60.0 68.6 64.0 63.0 60.050th Percentile ($000's) 69.0 79.4 67.0 66.3 70.3 77.5 67.0 66.375th Percentile ($000's) 85.0 85.4 75.2 74.0 86.0 85.2 75.2 74.0Average ($000's) 72.6 76.4 68.8 67.2 76.8 74.2 68.8 67.2
Incentive Pay% Incentive Eligible 77% 100% 68% 16% 100% 87% 68% 16%
25th Percentile ($000's) 3.1 2.7 4.9 3.3 3.1 2.7 4.9 3.350th Percentile ($000's) 3.3 3.0 5.5 4.2 3.1 3.0 5.5 4.275th Percentile ($000's) 5.2 3.0 5.7 6.7 3.5 3.1 5.7 6.7Average ($000's) 3.9 3.5 5.1 4.9 3.2 3.7 5.1 4.9
25th Percentile ($000's) 65.9 70.3 63.0 60.0 70.5 65.5 63.0 60.050th Percentile ($000's) 71.5 82.0 67.0 66.7 72.1 80.2 67.0 66.775th Percentile ($000's) 85.0 88.4 76.9 74.9 86.1 87.8 76.9 74.9Average ($000's) 74.4 79.1 69.6 67.8 78.8 76.6 69.6 67.8
Most Recent New HireEmployers Reported 2 2 1 2 2 2 1 2
Median ($000's) -- -- -- -- -- -- -- --Average ($000's) -- -- -- -- -- -- -- --
Total Cash CompensationBase Plus Incentive Pay
Designs and codes software components, units, and modules that meet product specification and development schedules. Tests anddebugs assigned components and units. Adheres to product build and release schedules and strategies. Acts as a technical resource forlower level developers. Requires comprehensive knowledge of one or more platforms and operating systems, and of languages such asVisual Basic, C, C++, JAVA, .Net, Websphere, J2EE, etc. Requires a degree in computer science, electrical engineering, math, or anequivalent field, and 4–6 years software development experience. May be titled Senior Software Engineer.
Organizational FTE's Organizational Revenue ($ Millions)
Page 3-153Southwestern Pennsylvania Annual Compensation and Benefits Study
© 2010 Pittsburgh Technology Council. All rights reserved.

Job Code 605 SOFTWARE DEVELOPER III
Description
0.8% Less Complex85.9% Comparable13.4% More Complex
All Organizations
Software, Computer and
Technology Manufacturing
Life-Sciences/ Biotech/
Medical Devices Not-for-ProfitAll Other
EmployersAnnual Base Pay
Employers Reported 23 10 3 4 1 5Employees Reported 262 91 5 57 1 10825th Percentile ($000's) 82.5 81.0 84.1 83.1 -- 84.950th Percentile ($000's) 90.4 87.4 87.0 93.3 -- 95.075th Percentile ($000's) 100.3 92.7 91.6 100.8 -- 110.0Average ($000's) 94.2 88.1 91.5 94.4 -- 99.6
Incentive Pay% Incentive Eligible 44% 60% 20% 70% 0% 18%25th Percentile ($000's) 4.1 3.2 -- 4.1 -- 8.050th Percentile ($000's) 5.4 5.5 -- 4.4 -- 8.675th Percentile ($000's) 8.2 7.0 -- 5.0 -- 9.0Average ($000's) 6.4 6.9 -- 4.5 -- 8.0
25th Percentile ($000's) 85.0 82.0 84.1 84.2 -- 87.450th Percentile ($000's) 92.5 88.8 87.0 97.3 -- 96.175th Percentile ($000's) 102.6 94.5 91.6 105.3 -- 110.6Average ($000's) 96.2 90.3 94.9 96.9 -- 101.0
Most Recent New HireEmployers Reported 6 5 0 1 0 0
Median ($000's) 85.0 82.0 -- -- -- --Average ($000's) 88.5 85.7 -- -- -- --
Oversees technical design, development, and implementation of large projects and/or major software products and systems. Assists indefining architecture requirements and establishing standards for design and development. Consults with management and customersregarding product feasibility and viability of product plans and designs. Serves as primary technical resource to development team.Provides product demonstrations and participates in trade shows, seminars, industry panels, and user group meetings. Interacts withcustomers regarding strategies, requirements, problem solving, and support. This is normally the senior non-management developerlevel. Requires comprehensive knowledge of one or more platforms and operating systems, and of programming languages such as Visual Basic, C and C++. Typically requires 8 or more years of software product development experience and expert knowledge of specificproducts, systems, and lines of business.
Industry - Type of Employer
Total Cash CompensationBase Plus Incentive Pay
Job Match Comparability
Page 3-154Southwestern Pennsylvania Annual Compensation and Benefits Study
© 2010 Pittsburgh Technology Council. All rights reserved.

Job Code 605 SOFTWARE DEVELOPER III
Description
Less than 50 50 - 150 151 - 500 More than 500Less than
$7.5M$7.5M to
$25M$26M to $150M
More than $150M
Annual Base PayEmployers Reported 6 6 4 7 5 8 3 7Employees Reported 15 28 34 185 11 33 33 185
25th Percentile ($000's) 82.6 81.0 80.9 83.5 80.8 82.0 80.8 83.550th Percentile ($000's) 92.0 86.9 86.3 92.5 83.2 89.0 85.3 92.575th Percentile ($000's) 104.0 93.5 92.7 105.0 91.6 98.7 92.7 105.0Average ($000's) 95.0 92.4 85.8 96.0 89.2 94.7 85.7 96.0
Incentive Pay% Incentive Eligible 40% 93% 88% 29% 36% 85% 91% 29%
25th Percentile ($000's) 5.5 3.2 3.7 4.2 -- 3.2 3.7 4.250th Percentile ($000's) 6.0 5.4 5.9 5.0 5.8 5.4 5.9 5.075th Percentile ($000's) 9.7 8.5 6.8 8.3 -- 8.9 6.8 8.3Average ($000's) 8.6 7.6 5.2 5.9 6.4 8.1 5.2 5.9
25th Percentile ($000's) 84.8 81.8 81.1 85.6 80.8 82.9 80.8 85.650th Percentile ($000's) 92.0 92.3 87.8 94.3 87.5 92.5 87.4 94.375th Percentile ($000's) 104.0 101.7 93.5 105.5 91.6 103.9 93.8 105.5Average ($000's) 97.9 97.6 87.2 97.5 91.6 99.6 87.1 97.5
Most Recent New HireEmployers Reported 1 2 1 2 1 2 1 2
Median ($000's) -- -- -- -- -- -- -- --Average ($000's) -- -- -- -- -- -- -- --
Total Cash CompensationBase Plus Incentive Pay
Oversees technical design, development, and implementation of large projects and/or major software products and systems. Assists indefining architecture requirements and establishing standards for design and development. Consults with management and customersregarding product feasibility and viability of product plans and designs. Serves as primary technical resource to development team.Provides product demonstrations and participates in trade shows, seminars, industry panels, and user group meetings. Interacts withcustomers regarding strategies, requirements, problem solving, and support. This is normally the senior non-management developerlevel. Requires comprehensive knowledge of one or more platforms and operating systems, and of programming languages such as Visual Basic, C and C++. Typically requires 8 or more years of software product development experience and expert knowledge of specificproducts, systems, and lines of business.
Organizational FTE's Organizational Revenue ($ Millions)
Page 3-155Southwestern Pennsylvania Annual Compensation and Benefits Study
© 2010 Pittsburgh Technology Council. All rights reserved.

Job Code 607 SOFTWARE DEVELOPMENT MANAGER
Description
16.7% Less Complex70.0% Comparable13.3% More Complex
All Organizations
Software, Computer and
Technology Manufacturing
Life-Sciences/ Biotech/
Medical Devices Not-for-ProfitAll Other
EmployersAnnual Base Pay
Employers Reported 13 7 0 1 0 5Employees Reported 90 32 0 8 0 5025th Percentile ($000's) 97.1 87.9 -- -- -- 114.050th Percentile ($000's) 112.6 96.7 -- -- -- 127.675th Percentile ($000's) 129.6 104.6 -- -- -- 137.8Average ($000's) 113.4 97.7 -- -- -- 126.5
Incentive Pay% Incentive Eligible 16% 22% -- 0% -- 14%25th Percentile ($000's) 5.3 3.4 -- -- -- 13.050th Percentile ($000's) 10.3 3.9 -- -- -- 16.375th Percentile ($000's) 16.4 4.7 -- -- -- 17.2Average ($000's) 10.9 4.2 -- -- -- 14.7
25th Percentile ($000's) 97.1 87.9 -- -- -- 114.650th Percentile ($000's) 113.8 96.7 -- -- -- 128.075th Percentile ($000's) 130.3 106.1 -- -- -- 140.7Average ($000's) 114.8 98.3 -- -- -- 128.5
Most Recent New HireEmployers Reported 0 0 0 0 0 0
Median ($000's) -- -- -- -- -- --Average ($000's) -- -- -- -- -- --
Manages software design teams of moderate to large size and complexity. Evaluates progress and results of development efforts.Provide senior engineering leadership to hire and direct the software release and quality assurance teams. Responsible for hiring, firing,performance appraisals, and pay reviews of software developers. Ensures corporate software security utilizing software developmentmethods and best practices to protect against possible programming errors and security breaches. Typically requires 10+ years technicalexperience in software development with 1-3 years of project leadership experience.
Industry - Type of Employer
Total Cash CompensationBase Plus Incentive Pay
Job Match Comparability
Page 3-156Southwestern Pennsylvania Annual Compensation and Benefits Study
© 2010 Pittsburgh Technology Council. All rights reserved.

Job Code 607 SOFTWARE DEVELOPMENT MANAGER
Description
Less than 50 50 - 150 151 - 500 More than 500Less than
$7.5M$7.5M to
$25M$26M to $150M
More than $150M
Annual Base PayEmployers Reported 5 1 2 5 4 2 1 6Employees Reported 5 3 4 78 4 4 3 79
25th Percentile ($000's) 105.0 -- -- 96.3 -- -- -- 96.350th Percentile ($000's) 115.9 -- 115.8 112.6 110.4 111.5 -- 113.275th Percentile ($000's) 125.0 -- -- 130.3 -- -- -- 130.8Average ($000's) 114.7 -- 118.4 113.6 112.2 107.2 -- 113.9
Incentive Pay% Incentive Eligible 40% 100% 100% 6% 25% 100% 100% 8%
25th Percentile ($000's) -- -- -- 16.3 -- -- -- 15.950th Percentile ($000's) -- -- 15.8 16.4 -- 3.9 -- 16.475th Percentile ($000's) -- -- -- 18.0 -- -- -- 17.6Average ($000's) -- -- 15.8 15.4 -- 4.2 -- 15.5
25th Percentile ($000's) 115.3 -- -- 96.3 -- -- -- 96.350th Percentile ($000's) 115.9 -- 115.8 113.4 115.6 115.4 -- 113.675th Percentile ($000's) 130.0 -- -- 131.0 -- -- -- 131.4Average ($000's) 118.1 -- 122.4 114.6 114.7 111.4 -- 115.1
Most Recent New HireEmployers Reported 0 0 0 0 0 0 0 0
Median ($000's) -- -- -- -- -- -- -- --Average ($000's) -- -- -- -- -- -- -- --
Total Cash CompensationBase Plus Incentive Pay
Manages software design teams of moderate to large size and complexity. Evaluates progress and results of development efforts.Provide senior engineering leadership to hire and direct the software release and quality assurance teams. Responsible for hiring, firing,performance appraisals, and pay reviews of software developers. Ensures corporate software security utilizing software developmentmethods and best practices to protect against possible programming errors and security breaches. Typically requires 10+ years technicalexperience in software development with 1-3 years of project leadership experience.
Organizational FTE's Organizational Revenue ($ Millions)
Page 3-157Southwestern Pennsylvania Annual Compensation and Benefits Study
© 2010 Pittsburgh Technology Council. All rights reserved.

Job Code 608 SOFTWARE QUALITY ASSURANCE ANALYST
Description
13.7% Less Complex61.6% Comparable24.7% More Complex
All Organizations
Software, Computer and
Technology Manufacturing
Life-Sciences/ Biotech/
Medical Devices Not-for-ProfitAll Other
EmployersAnnual Base Pay
Employers Reported 13 7 0 1 1 4Employees Reported 73 56 0 6 1 1025th Percentile ($000's) 47.7 47.8 -- -- -- 52.550th Percentile ($000's) 55.0 54.0 -- -- -- 64.075th Percentile ($000's) 62.8 60.0 -- -- -- 70.0Average ($000's) 55.7 54.6 -- -- -- 60.2
Incentive Pay% Incentive Eligible 36% 39% -- 0% 0% 40%25th Percentile ($000's) 1.6 1.9 -- -- -- --50th Percentile ($000's) 2.1 2.3 -- -- -- 1.075th Percentile ($000's) 3.0 3.2 -- -- -- --Average ($000's) 2.3 2.5 -- -- -- 1.0
25th Percentile ($000's) 47.7 47.8 -- -- -- 52.550th Percentile ($000's) 55.8 54.7 -- -- -- 64.075th Percentile ($000's) 62.8 60.4 -- -- -- 70.0Average ($000's) 56.2 55.2 -- -- -- 60.4
Most Recent New HireEmployers Reported 6 3 0 0 0 3
Median ($000's) 56.5 46.5 -- -- -- 64.0Average ($000's) 56.0 49.0 -- -- -- 63.0
Tests employer's software products to increase the quality of product and system delivered to the customer. Develops and implementstesting procedures to simulate customer use. Ensures that product meets user requirements and performs to standards. May develop andimplement testing procedures on customer premises, using installed systems. Typically requires a degree, detailed and comprehensiveknowledge of employer's software products, and 1–3 years experience.
Industry - Type of Employer
Total Cash CompensationBase Plus Incentive Pay
Job Match Comparability
Page 3-158Southwestern Pennsylvania Annual Compensation and Benefits Study
© 2010 Pittsburgh Technology Council. All rights reserved.

Job Code 608 SOFTWARE QUALITY ASSURANCE ANALYST
Description
Less than 50 50 - 150 151 - 500 More than 500Less than
$7.5M$7.5M to
$25M$26M to $150M
More than $150M
Annual Base PayEmployers Reported 1 4 2 6 2 3 2 6Employees Reported 2 14 11 46 3 13 11 46
25th Percentile ($000's) -- 48.0 48.3 46.8 -- 48.0 48.3 46.850th Percentile ($000's) -- 54.5 51.5 56.4 52.9 54.5 51.5 56.475th Percentile ($000's) -- 59.6 55.0 65.8 -- 60.0 55.0 65.8Average ($000's) -- 56.7 53.7 55.7 56.2 57.4 53.7 55.7
Incentive Pay% Incentive Eligible 0% 93% 82% 9% 0% 100% 82% 9%
25th Percentile ($000's) -- 1.8 3.4 -- -- 1.8 3.4 --50th Percentile ($000's) -- 2.0 3.5 1.0 -- 2.0 3.5 1.075th Percentile ($000's) -- 2.5 3.6 -- -- 2.5 3.6 --Average ($000's) -- 2.2 3.5 1.0 -- 2.2 3.5 1.0
25th Percentile ($000's) -- 48.4 51.6 46.8 -- 49.7 51.6 46.850th Percentile ($000's) -- 55.6 52.4 56.4 52.9 56.4 52.4 56.475th Percentile ($000's) -- 62.5 55.0 65.8 -- 62.6 55.0 65.8Average ($000's) -- 58.4 54.6 55.7 56.2 59.3 54.6 55.7
Most Recent New HireEmployers Reported 0 1 1 4 0 1 1 4
Median ($000's) -- -- -- 60.0 -- -- -- 60.0Average ($000's) -- -- -- 60.4 -- -- -- 60.4
Total Cash CompensationBase Plus Incentive Pay
Tests employer's software products to increase the quality of product and system delivered to the customer. Develops and implementstesting procedures to simulate customer use. Ensures that product meets user requirements and performs to standards. May develop andimplement testing procedures on customer premises, using installed systems. Typically requires a degree, detailed and comprehensiveknowledge of employer's software products, and 1–3 years experience.
Organizational FTE's Organizational Revenue ($ Millions)
Page 3-159Southwestern Pennsylvania Annual Compensation and Benefits Study
© 2010 Pittsburgh Technology Council. All rights reserved.

Job Code 620 BUSINESS ANALYST - ALL LEVELS
Description
9.4% Less Complex67.2% Comparable23.4% More Complex
All Organizations
Software, Computer and
Technology Manufacturing
Life-Sciences/ Biotech/
Medical Devices Not-for-ProfitAll Other
EmployersAnnual Base Pay
Employers Reported 13 5 1 2 0 5Employees Reported 64 25 7 10 0 2225th Percentile ($000's) 55.7 46.0 -- 55.3 -- 62.050th Percentile ($000's) 71.0 64.0 -- 70.7 -- 77.275th Percentile ($000's) 79.5 74.8 -- 76.7 -- 89.6Average ($000's) 71.2 66.1 -- 67.4 -- 76.7
Incentive Pay% Incentive Eligible 39% 28% 100% 20% -- 41%25th Percentile ($000's) 2.6 2.2 -- -- -- 4.350th Percentile ($000's) 3.5 2.6 -- -- -- 4.875th Percentile ($000's) 5.2 2.6 -- -- -- 6.1Average ($000's) 4.3 3.7 -- -- -- 5.0
25th Percentile ($000's) 56.7 46.0 -- 55.3 -- 66.250th Percentile ($000's) 72.0 64.9 -- 70.7 -- 77.475th Percentile ($000's) 79.5 76.7 -- 76.7 -- 92.8Average ($000's) 72.4 67.0 -- 68.0 -- 78.8
Most Recent New HireEmployers Reported 5 2 1 0 0 1
Median ($000's) 75.7 -- -- -- -- --Average ($000's) 95.6 -- -- -- -- --
The data for this position is a combination of the data reported by participants for 621 Business Analyst and 622 Senior Business Analyst
Industry - Type of Employer
Total Cash CompensationBase Plus Incentive Pay
Job Match Comparability
Page 3-160Southwestern Pennsylvania Annual Compensation and Benefits Study
© 2010 Pittsburgh Technology Council. All rights reserved.

Job Code 620 BUSINESS ANALYST - ALL LEVELS
Description
Less than 50 50 - 150 151 - 500 More than 500Less than
$7.5M$7.5M to
$25M$26M to $150M
More than $150M
Annual Base PayEmployers Reported 3 2 2 6 2 3 0 8Employees Reported 8 6 8 42 7 7 0 50
25th Percentile ($000's) 61.1 60.1 71.4 53.5 60.1 60.3 -- 55.050th Percentile ($000's) 64.8 66.3 77.8 69.8 62.0 72.1 -- 72.075th Percentile ($000's) 102.4 74.1 92.8 79.3 83.7 75.4 -- 79.7Average ($000's) 88.4 66.9 79.5 67.0 72.8 85.6 -- 69.0
Incentive Pay% Incentive Eligible 88% 100% 100% 10% 86% 100% -- 24%
25th Percentile ($000's) 3.9 2.2 4.3 -- 3.9 2.2 -- 2.850th Percentile ($000's) 5.7 2.6 4.3 3.6 5.7 2.6 -- 4.375th Percentile ($000's) 7.0 2.6 4.3 -- 7.0 2.6 -- 4.3Average ($000's) 5.3 3.7 4.3 3.7 5.3 3.7 -- 3.8
25th Percentile ($000's) 63.7 64.2 71.4 55.0 61.9 66.3 -- 55.150th Percentile ($000's) 71.5 72.6 77.8 69.8 68.1 74.6 -- 72.075th Percentile ($000's) 108.2 76.7 96.1 79.3 89.9 78.0 -- 79.7Average ($000's) 92.4 70.6 80.1 67.4 77.3 88.7 -- 69.4
Most Recent New HireEmployers Reported 1 1 1 2 0 2 0 3
Median ($000's) -- -- -- -- -- -- -- 75.7Average ($000's) -- -- -- -- -- -- -- 79.9
Total Cash CompensationBase Plus Incentive Pay
The data for this position is a combination of the data reported by participants for 621 Business Analyst and 622 Senior Business Analyst
Organizational FTE's Organizational Revenue ($ Millions)
Page 3-161Southwestern Pennsylvania Annual Compensation and Benefits Study
© 2010 Pittsburgh Technology Council. All rights reserved.

Job Code 621 BUSINESS ANALYST
Description
15.0% Less Complex55.0% Comparable30.0% More Complex
All Organizations
Software, Computer and
Technology Manufacturing
Life-Sciences/ Biotech/
Medical Devices Not-for-ProfitAll Other
EmployersAnnual Base Pay
Employers Reported 10 3 1 2 0 4Employees Reported 40 13 2 10 0 1525th Percentile ($000's) 49.5 42.0 -- 55.3 -- 55.150th Percentile ($000's) 62.0 46.0 -- 70.7 -- 67.675th Percentile ($000's) 74.6 64.9 -- 76.7 -- 77.2Average ($000's) 65.3 63.1 -- 67.4 -- 67.5
Incentive Pay% Incentive Eligible 38% 31% 100% 20% -- 47%25th Percentile ($000's) 2.6 -- -- -- -- 3.950th Percentile ($000's) 3.2 2.5 -- -- -- 4.375th Percentile ($000's) 4.4 -- -- -- -- 5.5Average ($000's) 3.8 2.4 -- -- -- 4.6
25th Percentile ($000's) 51.7 42.0 -- 55.3 -- 56.550th Percentile ($000's) 64.4 46.0 -- 70.7 -- 70.075th Percentile ($000's) 75.1 64.9 -- 76.7 -- 77.4Average ($000's) 66.4 63.7 -- 68.0 -- 69.6
Most Recent New HireEmployers Reported 3 2 0 0 0 1
Median ($000's) 83.6 -- -- -- -- --Average ($000's) 108.7 -- -- -- -- --
Analyzes client and customer business needs. Researches and proposes products, systems, and solutions as appropriate. Providesproduct development and implementation support. Assists teams in implementations at client and customer worksites. Performs orassists in customer and client training. Significant amount of time is spent on the road. Typically requires a degree in business systems,computer science, or engineering and 2 - 4 years experience.
Industry - Type of Employer
Total Cash CompensationBase Plus Incentive Pay
Job Match Comparability
Page 3-162Southwestern Pennsylvania Annual Compensation and Benefits Study
© 2010 Pittsburgh Technology Council. All rights reserved.

Job Code 621 BUSINESS ANALYST
Description
Less than 50 50 - 150 151 - 500 More than 500Less than
$7.5M$7.5M to
$25M$26M to $150M
More than $150M
Annual Base PayEmployers Reported 2 1 2 5 1 2 0 7Employees Reported 5 3 3 29 4 4 0 32
25th Percentile ($000's) 62.0 -- -- 46.0 -- -- -- 46.050th Percentile ($000's) 62.0 -- 58.6 55.9 -- 73.5 -- 57.375th Percentile ($000's) 67.6 -- -- 74.5 -- -- -- 74.8Average ($000's) 87.8 -- 65.0 61.1 -- 100.6 -- 61.5
Incentive Pay% Incentive Eligible 100% 100% 100% 14% 100% 100% -- 22%
25th Percentile ($000's) 3.1 -- -- -- -- -- -- 2.850th Percentile ($000's) 4.8 -- 4.3 3.6 -- 2.5 -- 4.375th Percentile ($000's) 6.4 -- -- -- -- -- -- 4.3Average ($000's) 4.7 -- 4.3 3.7 -- 2.4 -- 3.8
25th Percentile ($000's) 65.5 -- -- 49.7 -- -- -- 48.750th Percentile ($000's) 68.1 -- 58.6 57.8 -- 76.0 -- 58.275th Percentile ($000's) 74.8 -- -- 74.5 -- -- -- 74.8Average ($000's) 91.6 -- 66.4 61.6 -- 102.4 -- 62.1
Most Recent New HireEmployers Reported 1 1 0 1 0 2 0 1
Median ($000's) -- -- -- -- -- -- -- --Average ($000's) -- -- -- -- -- -- -- --
Total Cash CompensationBase Plus Incentive Pay
Analyzes client and customer business needs. Researches and proposes products, systems, and solutions as appropriate. Providesproduct development and implementation support. Assists teams in implementations at client and customer worksites. Performs orassists in customer and client training. Significant amount of time is spent on the road. Typically requires a degree in business systems,computer science, or engineering and 2 - 4 years experience.
Organizational FTE's Organizational Revenue ($ Millions)
Page 3-163Southwestern Pennsylvania Annual Compensation and Benefits Study
© 2010 Pittsburgh Technology Council. All rights reserved.

Job Code 622 SENIOR BUSINESS ANALYST
Description
0.0% Less Complex87.5% Comparable12.5% More Complex
All Organizations
Software, Computer and
Technology Manufacturing
Life-Sciences/ Biotech/
Medical Devices Not-for-ProfitAll Other
EmployersAnnual Base Pay
Employers Reported 8 4 1 0 0 3Employees Reported 24 12 5 0 0 725th Percentile ($000's) 71.2 60.4 -- -- -- 85.850th Percentile ($000's) 78.5 70.3 -- -- -- 99.875th Percentile ($000's) 90.2 77.2 -- -- -- 107.0Average ($000's) 81.2 69.3 -- -- -- 96.5
Incentive Pay% Incentive Eligible 42% 25% 100% -- -- 29%25th Percentile ($000's) 2.7 -- -- -- -- --50th Percentile ($000's) 5.2 2.7 -- -- -- --75th Percentile ($000's) 7.6 -- -- -- -- --Average ($000's) 5.5 4.9 -- -- -- --
25th Percentile ($000's) 71.6 64.3 -- -- -- 85.850th Percentile ($000's) 78.6 71.2 -- -- -- 105.075th Percentile ($000's) 90.3 78.6 -- -- -- 107.0Average ($000's) 82.3 70.5 -- -- -- 98.3
Most Recent New HireEmployers Reported 3 1 1 0 0 1
Median ($000's) 75.7 -- -- -- -- --Average ($000's) 78.2 -- -- -- -- --
Builds relationships with clients and customers, including technical and financial buyers. Performs functional consultation for customersand clients. Prepares complex recommendations and proposals. Leads technical teams in implementations at client and customer worksites. Designs and presents customer-client orientation and training. Requires a thorough knowledge of employer's products andsolutions. Majority of time is spent on the road. Typically requires a degree in business systems, computer science, or engineering and 5 or more years’ experience.
Industry - Type of Employer
Total Cash CompensationBase Plus Incentive Pay
Job Match Comparability
Page 3-164Southwestern Pennsylvania Annual Compensation and Benefits Study
© 2010 Pittsburgh Technology Council. All rights reserved.

Job Code 622 SENIOR BUSINESS ANALYST
Description
Less than 50 50 - 150 151 - 500 More than 500Less than
$7.5M$7.5M to
$25M$26M to $150M
More than $150M
Annual Base PayEmployers Reported 2 2 1 3 2 2 0 4Employees Reported 3 3 5 13 3 3 0 18
25th Percentile ($000's) -- -- -- 72.0 -- -- -- 76.050th Percentile ($000's) 99.8 60.5 -- 79.1 99.8 60.5 -- 78.875th Percentile ($000's) -- -- -- 84.6 -- -- -- 86.4Average ($000's) 89.4 65.5 -- 80.1 89.4 65.5 -- 82.4
Incentive Pay% Incentive Eligible 67% 100% 100% 0% 67% 100% -- 28%
25th Percentile ($000's) -- -- -- -- -- -- -- --50th Percentile ($000's) -- 2.7 -- -- -- 2.7 -- --75th Percentile ($000's) -- -- -- -- -- -- -- --Average ($000's) -- 4.9 -- -- -- 4.9 -- --
25th Percentile ($000's) -- -- -- 72.0 -- -- -- 76.050th Percentile ($000's) 105.0 70.5 -- 79.1 105.0 70.5 -- 78.875th Percentile ($000's) -- -- -- 84.6 -- -- -- 86.4Average ($000's) 93.6 70.4 -- 80.1 93.6 70.4 -- 82.4
Most Recent New HireEmployers Reported 0 0 1 2 0 0 0 3
Median ($000's) -- -- -- -- -- -- -- 75.7Average ($000's) -- -- -- -- -- -- -- 78.2
Total Cash CompensationBase Plus Incentive Pay
Builds relationships with clients and customers, including technical and financial buyers. Performs functional consultation for customersand clients. Prepares complex recommendations and proposals. Leads technical teams in implementations at client and customer worksites. Designs and presents customer-client orientation and training. Requires a thorough knowledge of employer's products andsolutions. Majority of time is spent on the road. Typically requires a degree in business systems, computer science, or engineering and 5 or more years’ experience.
Organizational FTE's Organizational Revenue ($ Millions)
Page 3-165Southwestern Pennsylvania Annual Compensation and Benefits Study
© 2010 Pittsburgh Technology Council. All rights reserved.

Job Code 624 INTERNET APPLICATIONS DEVELOPER
Description
28.6% Less Complex71.4% Comparable0.0% More Complex
All Organizations
Software, Computer and
Technology Manufacturing
Life-Sciences/ Biotech/
Medical Devices Not-for-ProfitAll Other
EmployersAnnual Base Pay
Employers Reported 3 1 0 0 0 2Employees Reported 7 1 0 0 0 625th Percentile ($000's) 50.3 -- -- -- -- 49.250th Percentile ($000's) 60.0 -- -- -- -- 61.375th Percentile ($000's) 80.0 -- -- -- -- 85.0Average ($000's) 65.9 -- -- -- -- 66.8
Incentive Pay% Incentive Eligible 0% 0% -- -- -- 0%25th Percentile ($000's) -- -- -- -- -- --50th Percentile ($000's) -- -- -- -- -- --75th Percentile ($000's) -- -- -- -- -- --Average ($000's) -- -- -- -- -- --
25th Percentile ($000's) 50.3 -- -- -- -- 49.250th Percentile ($000's) 60.0 -- -- -- -- 61.375th Percentile ($000's) 80.0 -- -- -- -- 85.0Average ($000's) 65.9 -- -- -- -- 66.8
Most Recent New HireEmployers Reported 1 0 0 0 0 1
Median ($000's) -- -- -- -- -- --Average ($000's) -- -- -- -- -- --
Participates as a team member in developing external large scale network based applications (Internet/Intranet) for clients andcustomers. Applications are typically interactive, crash resistant and secure, and capable of handling hundreds to millions ofsimultaneous interactions. Specifies functionality and creates proto types. Implements middleware and supporting packages. Integratessystems. Creates documentation. May assist with site maintenance. Competencies typically include C/C++, Java, Visual Basic, CGI,HTML, Perl, and a working knowledge of client server architectures and relational database systems and applications. Normally requires acomputer science or engineering degree and 2+ years web developer experience.
Industry - Type of Employer
Total Cash CompensationBase Plus Incentive Pay
Job Match Comparability
Page 3-166Southwestern Pennsylvania Annual Compensation and Benefits Study
© 2010 Pittsburgh Technology Council. All rights reserved.

Job Code 624 INTERNET APPLICATIONS DEVELOPER
Description
Less than 50 50 - 150 151 - 500 More than 500Less than
$7.5M$7.5M to
$25M$26M to $150M
More than $150M
Annual Base PayEmployers Reported 1 1 0 1 1 1 0 1Employees Reported 1 5 0 1 1 5 0 1
25th Percentile ($000's) -- -- -- -- -- -- -- --50th Percentile ($000's) -- -- -- -- -- -- -- --75th Percentile ($000's) -- -- -- -- -- -- -- --Average ($000's) -- -- -- -- -- -- -- --
Incentive Pay% Incentive Eligible 0% 0% -- 0% 0% 0% -- 0%
25th Percentile ($000's) -- -- -- -- -- -- -- --50th Percentile ($000's) -- -- -- -- -- -- -- --75th Percentile ($000's) -- -- -- -- -- -- -- --Average ($000's) -- -- -- -- -- -- -- --
25th Percentile ($000's) -- -- -- -- -- -- -- --50th Percentile ($000's) -- -- -- -- -- -- -- --75th Percentile ($000's) -- -- -- -- -- -- -- --Average ($000's) -- -- -- -- -- -- -- --
Most Recent New HireEmployers Reported 0 1 0 0 0 1 0 0
Median ($000's) -- -- -- -- -- -- -- --Average ($000's) -- -- -- -- -- -- -- --
Total Cash CompensationBase Plus Incentive Pay
Participates as a team member in developing external large scale network based applications (Internet/Intranet) for clients andcustomers. Applications are typically interactive, crash resistant and secure, and capable of handling hundreds to millions ofsimultaneous interactions. Specifies functionality and creates proto types. Implements middleware and supporting packages. Integratessystems. Creates documentation. May assist with site maintenance. Competencies typically include C/C++, Java, Visual Basic, CGI,HTML, Perl, and a working knowledge of client server architectures and relational database systems and applications. Normally requires acomputer science or engineering degree and 2+ years web developer experience.
Organizational FTE's Organizational Revenue ($ Millions)
Page 3-167Southwestern Pennsylvania Annual Compensation and Benefits Study
© 2010 Pittsburgh Technology Council. All rights reserved.

Job Code 609 PROJECT MANAGER - All Levels
Description
1.8% Less Complex94.7% Comparable3.6% More Complex
All Organizations
Software, Computer and
Technology Manufacturing
Life-Sciences/ Biotech/
Medical Devices Not-for-ProfitAll Other
EmployersAnnual Base Pay
Employers Reported 31 6 6 1 3 15Employees Reported 225 33 98 18 5 7125th Percentile ($000's) 74.5 68.0 79.7 -- 84.9 75.150th Percentile ($000's) 84.1 82.0 86.6 -- 110.0 86.775th Percentile ($000's) 95.7 91.0 94.5 -- 110.0 101.6Average ($000's) 86.3 83.8 86.3 -- 101.8 90.3
Incentive Pay% Incentive Eligible 74% 67% 96% 0% 60% 66%25th Percentile ($000's) 6.0 2.7 6.7 -- -- 3.250th Percentile ($000's) 7.5 3.4 7.8 -- 6.6 6.975th Percentile ($000's) 14.1 6.5 14.6 -- -- 22.8Average ($000's) 9.8 7.6 9.9 -- 7.7 11.8
25th Percentile ($000's) 77.8 68.8 85.1 -- 84.9 77.250th Percentile ($000's) 88.7 82.9 95.1 -- 116.5 88.075th Percentile ($000's) 104.3 94.2 106.0 -- 116.6 103.7Average ($000's) 92.0 87.9 95.4 -- 106.4 93.6
Most Recent New HireEmployers Reported 6 3 0 0 0 3
Median ($000's) 84.0 83.0 -- -- -- 90.0Average ($000's) 82.8 79.3 -- -- -- 86.2
The data for this position is a combination of the data reported by participants for 610 Project Manager and 625 Senior Project Manager
Industry - Type of Employer
Total Cash CompensationBase Plus Incentive Pay
Job Match Comparability
Page 3-168Southwestern Pennsylvania Annual Compensation and Benefits Study
© 2010 Pittsburgh Technology Council. All rights reserved.

Job Code 609 PROJECT MANAGER - All Levels
Description
Less than 50 50 - 150 151 - 500 More than 500Less than
$7.5M$7.5M to
$25M$26M to $150M
More than $150M
Annual Base PayEmployers Reported 4 5 4 18 3 6 3 19Employees Reported 9 21 22 173 6 24 8 187
25th Percentile ($000's) 97.8 64.1 72.2 75.0 83.8 64.0 66.7 75.150th Percentile ($000's) 110.0 79.2 83.3 84.2 103.1 81.1 73.0 84.775th Percentile ($000's) 125.0 91.0 95.9 94.5 120.9 104.8 79.0 95.2Average ($000's) 106.3 81.4 83.6 86.2 106.9 84.4 72.7 86.5
Incentive Pay% Incentive Eligible 89% 76% 82% 72% 67% 83% 88% 72%
25th Percentile ($000's) 6.6 2.5 4.5 6.6 -- 2.7 5.9 6.350th Percentile ($000's) 6.9 3.0 5.8 7.9 12.1 3.4 6.7 7.775th Percentile ($000's) 11.0 4.2 7.2 14.8 -- 6.8 7.4 14.6Average ($000's) 10.5 7.9 5.8 10.5 14.5 7.8 9.5 10.0
25th Percentile ($000's) 108.4 66.3 72.2 79.1 90.7 65.7 68.6 79.150th Percentile ($000's) 116.6 80.7 85.0 90.3 115.6 82.5 78.7 90.075th Percentile ($000's) 125.0 94.2 100.4 103.6 124.4 116.5 86.2 103.7Average ($000's) 114.4 86.7 86.8 92.1 114.1 90.3 78.7 92.1
Most Recent New HireEmployers Reported 1 2 1 2 1 2 1 2
Median ($000's) -- -- -- -- -- -- -- --Average ($000's) -- -- -- -- -- -- -- --
Total Cash CompensationBase Plus Incentive Pay
The data for this position is a combination of the data reported by participants for 610 Project Manager and 625 Senior Project Manager
Organizational FTE's Organizational Revenue ($ Millions)
Page 3-169Southwestern Pennsylvania Annual Compensation and Benefits Study
© 2010 Pittsburgh Technology Council. All rights reserved.

Job Code 610 PROJECT MANAGER
Description
3.2% Less Complex96.0% Comparable0.8% More Complex
All Organizations
Software, Computer and
Technology Manufacturing
Life-Sciences/ Biotech/
Medical Devices Not-for-ProfitAll Other
EmployersAnnual Base Pay
Employers Reported 26 4 6 1 2 13Employees Reported 126 12 58 10 2 4425th Percentile ($000's) 69.7 62.2 73.9 -- -- 73.250th Percentile ($000's) 78.5 64.7 83.7 -- -- 77.975th Percentile ($000's) 86.7 71.7 87.9 -- -- 86.7Average ($000's) 78.2 68.3 82.3 -- -- 78.4
Incentive Pay% Incentive Eligible 71% 75% 93% 0% 0% 61%25th Percentile ($000's) 5.8 2.2 6.3 -- -- 2.550th Percentile ($000's) 7.0 2.4 7.2 -- -- 4.275th Percentile ($000's) 7.8 3.2 7.8 -- -- 10.0Average ($000's) 6.7 3.0 7.1 -- -- 7.5
25th Percentile ($000's) 72.6 64.4 79.6 -- -- 73.750th Percentile ($000's) 81.5 67.3 88.4 -- -- 79.975th Percentile ($000's) 91.5 73.5 95.6 -- -- 88.5Average ($000's) 81.6 70.1 88.4 -- -- 79.6
Most Recent New HireEmployers Reported 3 1 0 0 0 2
Median ($000's) 73.0 -- -- -- -- --Average ($000's) 68.0 -- -- -- -- --
Manages a small account or portions of larger accounts, including planning, scheduling, budgeting, and staffing. Is responsible forkeeping project on schedule and within budget. Manages client relationships for a team of consultants, developers, engineers, analysts,and other professionals assigned to project and client/customer work sites. Is responsible for client satisfaction. Manages project’stechnical aspects by instructing, directing, and checking the work of other team members. Networks with business partners, vendors, andindependent consultants to stay current with industry and technology developments. May represent employer at trade shows andconferences. Typically requires a degree in business, computer science, or engineering—and 5-7 years related experience.
Industry - Type of Employer
Total Cash CompensationBase Plus Incentive Pay
Job Match Comparability
Page 3-170Southwestern Pennsylvania Annual Compensation and Benefits Study
© 2010 Pittsburgh Technology Council. All rights reserved.

Job Code 610 PROJECT MANAGER
Description
Less than 50 50 - 150 151 - 500 More than 500Less than
$7.5M$7.5M to
$25M$26M to $150M
More than $150M
Annual Base PayEmployers Reported 2 4 4 16 2 4 3 17Employees Reported 2 12 15 97 2 12 4 108
25th Percentile ($000's) -- 58.3 70.0 72.7 -- 51.3 -- 72.550th Percentile ($000's) -- 64.2 84.2 79.9 -- 64.0 70.8 80.075th Percentile ($000's) -- 78.3 91.9 86.8 -- 71.1 -- 87.3Average ($000's) -- 66.3 83.6 79.2 -- 63.8 72.3 80.0
Incentive Pay% Incentive Eligible 100% 58% 73% 72% 50% 67% 75% 72%
25th Percentile ($000's) -- 2.2 4.1 6.3 -- 2.2 -- 6.050th Percentile ($000's) -- 2.3 4.6 7.4 -- 2.4 14.0 7.275th Percentile ($000's) -- 3.0 5.7 7.9 -- 3.2 -- 7.8Average ($000's) -- 2.6 5.1 7.3 -- 3.2 14.0 6.8
25th Percentile ($000's) -- 59.8 70.4 74.5 -- 55.1 -- 74.350th Percentile ($000's) -- 66.4 84.2 83.2 -- 65.2 76.8 83.375th Percentile ($000's) -- 78.3 94.0 91.7 -- 72.9 -- 92.1Average ($000's) -- 67.6 85.6 82.9 -- 65.7 79.3 83.4
Most Recent New HireEmployers Reported 0 1 1 1 0 1 1 1
Median ($000's) -- -- -- -- -- -- -- --Average ($000's) -- -- -- -- -- -- -- --
Total Cash CompensationBase Plus Incentive Pay
Manages a small account or portions of larger accounts, including planning, scheduling, budgeting, and staffing. Is responsible forkeeping project on schedule and within budget. Manages client relationships for a team of consultants, developers, engineers, analysts,and other professionals assigned to project and client/customer work sites. Is responsible for client satisfaction. Manages project’stechnical aspects by instructing, directing, and checking the work of other team members. Networks with business partners, vendors, andindependent consultants to stay current with industry and technology developments. May represent employer at trade shows andconferences. Typically requires a degree in business, computer science, or engineering—and 5-7 years related experience.
Organizational FTE's Organizational Revenue ($ Millions)
Page 3-171Southwestern Pennsylvania Annual Compensation and Benefits Study
© 2010 Pittsburgh Technology Council. All rights reserved.

Job Code 625 SENIOR PROJECT MANAGER
Description
0.0% Less Complex92.9% Comparable7.1% More Complex
All Organizations
Software, Computer and
Technology Manufacturing
Life-Sciences/ Biotech/
Medical Devices Not-for-ProfitAll Other
EmployersAnnual Base Pay
Employers Reported 20 6 2 1 1 10Employees Reported 99 21 40 8 3 2725th Percentile ($000's) 83.4 80.1 86.5 -- -- 98.950th Percentile ($000's) 95.5 85.0 92.7 -- -- 104.075th Percentile ($000's) 103.5 102.3 98.5 -- -- 116.7Average ($000's) 96.6 92.6 92.1 -- -- 109.8
Incentive Pay% Incentive Eligible 77% 62% 100% 0% 100% 74%25th Percentile ($000's) 6.5 3.3 12.7 -- -- 4.650th Percentile ($000's) 13.8 5.6 14.8 -- -- 7.275th Percentile ($000's) 15.8 12.0 15.7 -- -- 25.7Average ($000's) 12.8 10.5 13.3 -- -- 14.1
25th Percentile ($000's) 88.0 82.0 98.9 -- -- 103.250th Percentile ($000's) 105.4 88.0 106.9 -- -- 106.975th Percentile ($000's) 115.2 107.6 112.2 -- -- 120.5Average ($000's) 105.3 98.1 105.4 -- -- 116.6
Most Recent New HireEmployers Reported 5 3 0 0 0 2
Median ($000's) 86.5 84.0 -- -- -- --Average ($000's) 92.6 82.1 -- -- -- --
Manages a major account or multiple smaller accounts, including planning, scheduling, budgeting, and staffing. Is responsible forkeeping project on schedule and within budget. Manages client relationships for a team of consultants, developers, engineers, analysts,and other professionals assigned to project and client/customer work sites. Is responsible for client satisfaction. Manages project’stechnical aspects by instructing, directing, and checking the work of other team members. Networks with business partners, vendors, andindependent consultants to stay current with industry and technology developments. May represent employer at trade shows andconferences. Typically requires a degree in business, computer science, or engineering—advanced degree or MBA preferred—and 7–10years related experience.
Industry - Type of Employer
Total Cash CompensationBase Plus Incentive Pay
Job Match Comparability
Page 3-172Southwestern Pennsylvania Annual Compensation and Benefits Study
© 2010 Pittsburgh Technology Council. All rights reserved.

Job Code 625 SENIOR PROJECT MANAGER
Description
Less than 50 50 - 150 151 - 500 More than 500Less than
$7.5M$7.5M to
$25M$26M to $150M
More than $150M
Annual Base PayEmployers Reported 3 3 2 12 2 4 1 13Employees Reported 7 9 7 76 4 12 4 79
25th Percentile ($000's) 109.2 82.0 75.2 84.0 -- 82.8 -- 84.150th Percentile ($000's) 110.0 101.8 82.3 93.8 116.7 105.5 -- 94.575th Percentile ($000's) 125.0 107.0 96.0 102.3 -- 113.8 -- 102.1Average ($000's) 119.2 101.6 83.8 95.1 122.3 105.0 -- 95.3
Incentive Pay% Incentive Eligible 86% 100% 100% 71% 75% 100% 100% 72%
25th Percentile ($000's) 6.5 2.9 5.9 10.5 -- 3.3 -- 7.450th Percentile ($000's) 6.6 4.0 6.9 14.8 15.8 6.5 -- 14.675th Percentile ($000's) 10.0 18.2 7.3 15.9 -- 13.4 -- 15.8Average ($000's) 10.9 12.0 6.5 13.9 15.8 10.8 -- 13.4
25th Percentile ($000's) 116.6 82.9 78.9 88.2 -- 85.2 -- 89.150th Percentile ($000's) 122.8 107.6 89.0 105.2 123.9 116.6 -- 105.275th Percentile ($000's) 130.0 129.5 101.9 111.6 -- 130.0 -- 110.8Average ($000's) 127.0 112.2 89.3 103.9 130.2 114.9 -- 103.9
Most Recent New HireEmployers Reported 1 1 1 2 1 1 1 2
Median ($000's) -- -- -- -- -- -- -- --Average ($000's) -- -- -- -- -- -- -- --
Total Cash CompensationBase Plus Incentive Pay
Manages a major account or multiple smaller accounts, including planning, scheduling, budgeting, and staffing. Is responsible forkeeping project on schedule and within budget. Manages client relationships for a team of consultants, developers, engineers, analysts,and other professionals assigned to project and client/customer work sites. Is responsible for client satisfaction. Manages project’stechnical aspects by instructing, directing, and checking the work of other team members. Networks with business partners, vendors, andindependent consultants to stay current with industry and technology developments. May represent employer at trade shows andconferences. Typically requires a degree in business, computer science, or engineering—advanced degree or MBA preferred—and 7–10years related experience.
Organizational FTE's Organizational Revenue ($ Millions)
Page 3-173Southwestern Pennsylvania Annual Compensation and Benefits Study
© 2010 Pittsburgh Technology Council. All rights reserved.

Job Code 623 TECHNICAL CONSULTANT (BILLABLE) - ALL LEVELS
Description
5.1% Less Complex76.1% Comparable18.8% More Complex
All Organizations
Software, Computer and
Technology Manufacturing
Life-Sciences/ Biotech/
Medical Devices Not-for-ProfitAll Other
EmployersAnnual Base Pay
Employers Reported 8 4 2 0 0 2Employees Reported 117 99 3 0 0 1525th Percentile ($000's) 60.0 60.0 -- -- -- 48.350th Percentile ($000's) 70.0 70.7 81.7 -- -- 59.575th Percentile ($000's) 80.0 80.0 -- -- -- 64.1Average ($000's) 70.3 71.8 80.7 -- -- 58.7
Incentive Pay% Incentive Eligible 100% 100% 100% -- -- 100%25th Percentile ($000's) 1.0 0.6 -- -- -- 2.550th Percentile ($000's) 2.5 1.5 5.0 -- -- 2.875th Percentile ($000's) 2.9 2.5 -- -- -- 3.7Average ($000's) 2.6 2.2 5.2 -- -- 3.0
25th Percentile ($000's) 60.0 60.0 -- -- -- 49.750th Percentile ($000's) 70.0 70.9 86.7 -- -- 62.375th Percentile ($000's) 80.6 80.3 -- -- -- 68.6Average ($000's) 71.4 72.5 85.9 -- -- 61.3
Most Recent New HireEmployers Reported 5 4 0 0 0 1
Median ($000's) 70.0 70.0 -- -- -- --Average ($000's) 72.1 72.8 -- -- -- --
The data for this position is a combination of the data reported by participants for 626 Technical Consultant (Billable) and 627 SeniorTechnical Consultant (Billable)
Industry - Type of Employer
Total Cash CompensationBase Plus Incentive Pay
Job Match Comparability
Page 3-174Southwestern Pennsylvania Annual Compensation and Benefits Study
© 2010 Pittsburgh Technology Council. All rights reserved.

Job Code 623 TECHNICAL CONSULTANT (BILLABLE) - ALL LEVELS
Description
Less than 50 50 - 150 151 - 500 More than 500Less than
$7.5M$7.5M to
$25M$26M to $150M
More than $150M
Annual Base PayEmployers Reported 2 3 0 3 1 4 0 3Employees Reported 12 97 0 8 10 99 0 8
25th Percentile ($000's) 51.1 60.0 -- 64.5 -- 60.0 -- 64.550th Percentile ($000's) 58.8 70.7 -- 77.8 -- 70.7 -- 77.875th Percentile ($000's) 63.8 80.0 -- 82.1 -- 80.0 -- 82.1Average ($000's) 62.3 71.2 -- 71.3 -- 71.8 -- 71.3
Incentive Pay% Incentive Eligible 100% 100% -- 100% 100% 100% -- 100%
25th Percentile ($000's) 2.5 0.6 -- 2.5 -- 0.6 -- 2.550th Percentile ($000's) 2.8 1.5 -- 3.6 -- 1.5 -- 3.675th Percentile ($000's) 3.9 2.5 -- 4.9 -- 2.5 -- 4.9Average ($000's) -- 2.2 -- 3.7 -- 2.2 -- 3.7
25th Percentile ($000's) 51.1 60.0 -- 66.7 -- 60.0 -- 66.750th Percentile ($000's) 61.5 70.9 -- 82.0 -- 70.9 -- 82.075th Percentile ($000's) 67.7 80.0 -- 87.1 -- 80.3 -- 87.1Average ($000's) 64.4 71.9 -- 75.0 -- 72.5 -- 75.0
Most Recent New HireEmployers Reported 2 3 0 0 1 4 0 0
Median ($000's) -- 70.0 -- -- -- 70.0 -- --Average ($000's) -- 70.9 -- -- -- 72.8 -- --
Total Cash CompensationBase Plus Incentive Pay
The data for this position is a combination of the data reported by participants for 626 Technical Consultant (Billable) and 627 SeniorTechnical Consultant (Billable)
Organizational FTE's Organizational Revenue ($ Millions)
Page 3-175Southwestern Pennsylvania Annual Compensation and Benefits Study
© 2010 Pittsburgh Technology Council. All rights reserved.

Job Code 626 TECHNICAL CONSULTANT (BILLABLE)
Description
5.9% Less Complex82.4% Comparable11.8% More Complex
All Organizations
Software, Computer and
Technology Manufacturing
Life-Sciences/ Biotech/
Medical Devices Not-for-ProfitAll Other
EmployersAnnual Base Pay
Employers Reported 6 3 1 0 0 2Employees Reported 102 87 1 0 0 1425th Percentile ($000's) 57.3 60.0 -- -- -- 46.650th Percentile ($000's) 64.1 67.0 -- -- -- 58.875th Percentile ($000's) 74.5 75.2 -- -- -- 63.8Average ($000's) 65.7 67.0 -- -- -- 56.6
Incentive Pay% Incentive Eligible 100% 100% 100% -- -- 100%25th Percentile ($000's) 1.0 0.9 -- -- -- 2.550th Percentile ($000's) 2.5 1.5 -- -- -- 2.675th Percentile ($000's) 2.8 2.5 -- -- -- 3.1Average ($000's) 2.2 1.6 -- -- -- 2.9
25th Percentile ($000's) 57.5 60.0 -- -- -- 48.850th Percentile ($000's) 66.5 67.3 -- -- -- 61.575th Percentile ($000's) 75.5 75.7 -- -- -- 68.3Average ($000's) 66.5 67.5 -- -- -- 59.1
Most Recent New HireEmployers Reported 4 3 0 0 0 1
Median ($000's) 61.5 62.0 -- -- -- --Average ($000's) 62.4 62.9 -- -- -- --
Provides for-fee IT project-related or staff augmentation services related to implementation, enhancement, or integration of proprietarysoftware products, new products or customization of existing products. Duties are performed at the customer’s site and usually involvesingle products or single platforms. Requires a bachelor’s degree and 2 or more years of experience in software development, technicalsupport or consulting.
Industry - Type of Employer
Total Cash CompensationBase Plus Incentive Pay
Job Match Comparability
Page 3-176Southwestern Pennsylvania Annual Compensation and Benefits Study
© 2010 Pittsburgh Technology Council. All rights reserved.

Job Code 626 TECHNICAL CONSULTANT (BILLABLE)
Description
Less than 50 50 - 150 151 - 500 More than 500Less than
$7.5M$7.5M to
$25M$26M to $150M
More than $150M
Annual Base PayEmployers Reported 2 2 0 2 1 3 0 2Employees Reported 11 86 0 5 10 87 0 5
25th Percentile ($000's) 50.8 60.0 -- 45.0 -- 60.0 -- 45.050th Percentile ($000's) 58.1 67.0 -- 71.0 -- 67.0 -- 71.075th Percentile ($000's) 62.2 75.3 -- 76.9 -- 75.2 -- 76.9Average ($000's) 54.8 67.2 -- 63.3 -- 67.0 -- 63.3
Incentive Pay% Incentive Eligible 100% 100% -- 100% 100% 100% -- 100%
25th Percentile ($000's) 2.5 0.9 -- 2.5 -- 0.9 -- 2.550th Percentile ($000's) 2.8 1.5 -- 2.5 -- 1.5 -- 2.575th Percentile ($000's) 3.9 2.5 -- 2.8 -- 2.5 -- 2.8Average ($000's) 3.1 1.6 -- 3.1 -- 1.6 -- 3.1
25th Percentile ($000's) 50.8 60.0 -- 47.8 -- 60.0 -- 47.850th Percentile ($000's) 60.6 67.4 -- 73.0 -- 67.3 -- 73.075th Percentile ($000's) 65.5 75.7 -- 81.3 -- 75.7 -- 81.3Average ($000's) 57.1 67.7 -- 66.4 -- 67.5 -- 66.4
Most Recent New HireEmployers Reported 2 2 0 0 1 3 0 0
Median ($000's) -- -- -- -- -- 62.0 -- --Average ($000's) -- -- -- -- -- 62.9 -- --
Total Cash CompensationBase Plus Incentive Pay
Provides for-fee IT project-related or staff augmentation services related to implementation, enhancement, or integration of proprietarysoftware products, new products or customization of existing products. Duties are performed at the customer’s site and usually involvesingle products or single platforms. Requires a bachelor’s degree and 2 or more years of experience in software development, technicalsupport or consulting.
Organizational FTE's Organizational Revenue ($ Millions)
Page 3-177Southwestern Pennsylvania Annual Compensation and Benefits Study
© 2010 Pittsburgh Technology Council. All rights reserved.

Job Code 627 SENIOR TECHNICAL CONSULTANT (BILLABLE)
Description
0.0% Less Complex33.3% Comparable66.7% More Complex
All Organizations
Software, Computer and
Technology Manufacturing
Life-Sciences/ Biotech/
Medical Devices Not-for-ProfitAll Other
EmployersAnnual Base Pay
Employers Reported 5 3 1 0 0 1Employees Reported 15 12 2 0 0 125th Percentile ($000's) 85.0 91.7 -- -- -- --50th Percentile ($000's) 100.0 102.7 -- -- -- --75th Percentile ($000's) 112.7 118.3 -- -- -- --Average ($000's) 102.1 106.4 -- -- -- --
Incentive Pay% Incentive Eligible 100% 100% 100% -- -- 100%25th Percentile ($000's) 0.8 0.5 -- -- -- --50th Percentile ($000's) 2.9 1.5 -- -- -- --75th Percentile ($000's) 5.0 3.4 -- -- -- --Average ($000's) 4.3 4.1 -- -- -- --
25th Percentile ($000's) 91.5 99.2 -- -- -- --50th Percentile ($000's) 100.9 104.5 -- -- -- --75th Percentile ($000's) 112.9 118.6 -- -- -- --Average ($000's) 104.9 108.8 -- -- -- --
Most Recent New HireEmployers Reported 3 3 0 0 0 0
Median ($000's) 127.0 127.0 -- -- -- --Average ($000's) 118.5 118.5 -- -- -- --
Provides for-fee IT project-related or staff augmentation services related to implementation, enhancement, integration or audits ofcomplex proprietary software products, new products or customization of existing products. Duties are performed at the customer’s siteand usually involve multiple products or multiple platforms. Requires a bachelor’s degree and 5 or more years of experience in softwaredevelopment, technical support or consulting.
Industry - Type of Employer
Total Cash CompensationBase Plus Incentive Pay
Job Match Comparability
Page 3-178Southwestern Pennsylvania Annual Compensation and Benefits Study
© 2010 Pittsburgh Technology Council. All rights reserved.

Job Code 627 SENIOR TECHNICAL CONSULTANT (BILLABLE)
Description
Less than 50 50 - 150 151 - 500 More than 500Less than
$7.5M$7.5M to
$25M$26M to $150M
More than $150M
Annual Base PayEmployers Reported 1 2 0 2 0 3 0 2Employees Reported 1 11 0 3 0 12 0 3
25th Percentile ($000's) -- 89.5 -- -- -- 91.7 -- --50th Percentile ($000's) -- 100.4 -- 83.5 -- 102.7 -- 83.575th Percentile ($000's) -- 112.7 -- -- -- 118.3 -- --Average ($000's) -- 102.9 -- 84.5 -- 106.4 -- 84.5
Incentive Pay% Incentive Eligible 100% 100% -- 100% -- 100% -- 100%
25th Percentile ($000's) -- 0.5 -- -- -- 0.5 -- --50th Percentile ($000's) -- 1.5 -- 4.9 -- 1.5 -- 4.975th Percentile ($000's) -- 3.4 -- -- -- 3.4 -- --Average ($000's) -- 4.1 -- 4.7 -- 4.1 -- 4.7
25th Percentile ($000's) -- 98.0 -- -- -- 99.2 -- --50th Percentile ($000's) -- 104.0 -- 88.4 -- 104.5 -- 88.475th Percentile ($000's) -- 112.9 -- -- -- 118.6 -- --Average ($000's) -- 105.5 -- 89.3 -- 108.8 -- 89.3
Most Recent New HireEmployers Reported 1 2 0 0 0 3 0 0
Median ($000's) -- -- -- -- -- 127.0 -- --Average ($000's) -- -- -- -- -- 118.5 -- --
Total Cash CompensationBase Plus Incentive Pay
Provides for-fee IT project-related or staff augmentation services related to implementation, enhancement, integration or audits ofcomplex proprietary software products, new products or customization of existing products. Duties are performed at the customer’s siteand usually involve multiple products or multiple platforms. Requires a bachelor’s degree and 5 or more years of experience in softwaredevelopment, technical support or consulting.
Organizational FTE's Organizational Revenue ($ Millions)
Page 3-179Southwestern Pennsylvania Annual Compensation and Benefits Study
© 2010 Pittsburgh Technology Council. All rights reserved.

Job Code 628 INSTRUCTIONAL DESIGNER
Description
16.7% Less Complex83.3% Comparable0.0% More Complex
All Organizations
Software, Computer and
Technology Manufacturing
Life-Sciences/ Biotech/
Medical Devices Not-for-ProfitAll Other
EmployersAnnual Base Pay
Employers Reported 6 1 1 0 1 3Employees Reported 6 1 1 0 1 325th Percentile ($000's) 52.4 -- -- -- -- --50th Percentile ($000's) 62.1 -- -- -- -- 67.975th Percentile ($000's) 68.2 -- -- -- -- --Average ($000's) 60.7 -- -- -- -- 59.6
Incentive Pay% Incentive Eligible 67% 0% 100% -- 0% 100%25th Percentile ($000's) -- -- -- -- -- --50th Percentile ($000's) 2.1 -- -- -- -- 2.175th Percentile ($000's) -- -- -- -- -- --Average ($000's) 2.1 -- -- -- -- 2.1
25th Percentile ($000's) 52.4 -- -- -- -- --50th Percentile ($000's) 62.1 -- -- -- -- 67.975th Percentile ($000's) 68.2 -- -- -- -- --Average ($000's) 61.0 -- -- -- -- 60.3
Most Recent New HireEmployers Reported 1 0 1 0 0 0
Median ($000's) -- -- -- -- -- --Average ($000's) -- -- -- -- -- --
Plans, develops and organizes information systems-related training program and materials specific to the customer’s product, systemsand/or needs. Analyzes the learning needs of the customer and makes recommendations for course content. Provides guidance totraining personnel. Tracks training program progress by analyzing learner's satisfaction, job performance and proficiency testing. Mayalso facilitate complex training courses. Typically requires a bachelor's degree and 5 or more years of prior curriculum design anddevelopment experience.
Industry - Type of Employer
Total Cash CompensationBase Plus Incentive Pay
Job Match Comparability
Page 3-180Southwestern Pennsylvania Annual Compensation and Benefits Study
© 2010 Pittsburgh Technology Council. All rights reserved.

Job Code 628 INSTRUCTIONAL DESIGNER
Description
Less than 50 50 - 150 151 - 500 More than 500Less than
$7.5M$7.5M to
$25M$26M to $150M
More than $150M
Annual Base PayEmployers Reported 0 0 1 5 0 0 0 6Employees Reported 0 0 1 5 0 0 0 6
25th Percentile ($000's) -- -- -- 51.2 -- -- -- 52.450th Percentile ($000's) -- -- -- 56.3 -- -- -- 62.175th Percentile ($000's) -- -- -- 67.9 -- -- -- 68.2Average ($000's) -- -- -- 57.2 -- -- -- 60.7
Incentive Pay% Incentive Eligible -- -- 100% 60% -- -- -- 67%
25th Percentile ($000's) -- -- -- -- -- -- -- --50th Percentile ($000's) -- -- -- 2.1 -- -- -- 2.175th Percentile ($000's) -- -- -- -- -- -- -- --Average ($000's) -- -- -- 2.1 -- -- -- 2.1
25th Percentile ($000's) -- -- -- 51.2 -- -- -- 52.450th Percentile ($000's) -- -- -- 56.3 -- -- -- 62.175th Percentile ($000's) -- -- -- 67.9 -- -- -- 68.2Average ($000's) -- -- -- 57.7 -- -- -- 61.0
Most Recent New HireEmployers Reported 0 0 1 0 0 0 0 1
Median ($000's) -- -- -- -- -- -- -- --Average ($000's) -- -- -- -- -- -- -- --
Total Cash CompensationBase Plus Incentive Pay
Plans, develops and organizes information systems-related training program and materials specific to the customer’s product, systemsand/or needs. Analyzes the learning needs of the customer and makes recommendations for course content. Provides guidance totraining personnel. Tracks training program progress by analyzing learner's satisfaction, job performance and proficiency testing. Mayalso facilitate complex training courses. Typically requires a bachelor's degree and 5 or more years of prior curriculum design anddevelopment experience.
Organizational FTE's Organizational Revenue ($ Millions)
Page 3-181Southwestern Pennsylvania Annual Compensation and Benefits Study
© 2010 Pittsburgh Technology Council. All rights reserved.

Job Code 629 INFORMATION SYSTEMS TRAINING SPECIALIST
Description
6.3% Less Complex81.3% Comparable12.5% More Complex
All Organizations
Software, Computer and
Technology Manufacturing
Life-Sciences/ Biotech/
Medical Devices Not-for-ProfitAll Other
EmployersAnnual Base Pay
Employers Reported 7 4 1 1 0 1Employees Reported 16 4 1 9 0 225th Percentile ($000's) 56.0 -- -- -- -- --50th Percentile ($000's) 64.3 76.6 -- -- -- --75th Percentile ($000's) 77.0 -- -- -- -- --Average ($000's) 66.3 75.6 -- -- -- --
Incentive Pay% Incentive Eligible 13% 25% 100% 0% -- 0%25th Percentile ($000's) -- -- -- -- -- --50th Percentile ($000's) -- -- -- -- -- --75th Percentile ($000's) -- -- -- -- -- --Average ($000's) -- -- -- -- -- --
25th Percentile ($000's) 56.0 -- -- -- -- --50th Percentile ($000's) 64.3 76.6 -- -- -- --75th Percentile ($000's) 77.0 -- -- -- -- --Average ($000's) 67.1 77.7 -- -- -- --
Most Recent New HireEmployers Reported 0 0 0 0 0 0
Median ($000's) -- -- -- -- -- --Average ($000's) -- -- -- -- -- --
Organizes, prepares and facilitates information systems-related educational and training programs for the customer’s users and/orinternal information system personnel. May design and develop in-house programs. Maintains records of all training activities andeffectiveness evaluations. Typically requires a bachelor's degree and 3 years of previous experience. Individuals responsible for trainingthat is not related to information systems should be reported under job code 130.
Industry - Type of Employer
Total Cash CompensationBase Plus Incentive Pay
Job Match Comparability
Page 3-182Southwestern Pennsylvania Annual Compensation and Benefits Study
© 2010 Pittsburgh Technology Council. All rights reserved.

Job Code 629 INFORMATION SYSTEMS TRAINING SPECIALIST
Description
Less than 50 50 - 150 151 - 500 More than 500Less than
$7.5M$7.5M to
$25M$26M to $150M
More than $150M
Annual Base PayEmployers Reported 2 0 1 4 1 1 1 4Employees Reported 2 0 1 13 1 1 1 13
25th Percentile ($000's) -- -- -- 55.7 -- -- -- 55.750th Percentile ($000's) -- -- -- 62.3 -- -- -- 62.375th Percentile ($000's) -- -- -- 76.7 -- -- -- 76.7Average ($000's) -- -- -- 64.3 -- -- -- 64.3
Incentive Pay% Incentive Eligible 0% -- 100% 8% 0% 0% 100% 8%
25th Percentile ($000's) -- -- -- -- -- -- -- --50th Percentile ($000's) -- -- -- -- -- -- -- --75th Percentile ($000's) -- -- -- -- -- -- -- --Average ($000's) -- -- -- -- -- -- -- --
25th Percentile ($000's) -- -- -- 55.7 -- -- -- 55.750th Percentile ($000's) -- -- -- 62.7 -- -- -- 62.775th Percentile ($000's) -- -- -- 76.7 -- -- -- 76.7Average ($000's) -- -- -- 64.7 -- -- -- 64.7
Most Recent New HireEmployers Reported 0 0 0 0 0 0 0 0
Median ($000's) -- -- -- -- -- -- -- --Average ($000's) -- -- -- -- -- -- -- --
Total Cash CompensationBase Plus Incentive Pay
Organizes, prepares and facilitates information systems-related educational and training programs for the customer’s users and/orinternal information system personnel. May design and develop in-house programs. Maintains records of all training activities andeffectiveness evaluations. Typically requires a bachelor's degree and 3 years of previous experience. Individuals responsible for trainingthat is not related to information systems should be reported under job code 130.
Organizational FTE's Organizational Revenue ($ Millions)
Page 3-183Southwestern Pennsylvania Annual Compensation and Benefits Study
© 2010 Pittsburgh Technology Council. All rights reserved.

Job Code 630 DATA WAREHOUSE ARCHITECT
Description
11.1% Less Complex77.8% Comparable11.1% More Complex
All Organizations
Software, Computer and
Technology Manufacturing
Life-Sciences/ Biotech/
Medical Devices Not-for-ProfitAll Other
EmployersAnnual Base Pay
Employers Reported 5 1 0 0 0 4Employees Reported 9 1 0 0 0 825th Percentile ($000's) 92.1 -- -- -- -- 91.550th Percentile ($000's) 100.7 -- -- -- -- 98.175th Percentile ($000's) 102.5 -- -- -- -- 103.1Average ($000's) 99.1 -- -- -- -- 98.8
Incentive Pay% Incentive Eligible 56% 100% -- -- -- 50%25th Percentile ($000's) 7.3 -- -- -- -- --50th Percentile ($000's) 7.6 -- -- -- -- 9.275th Percentile ($000's) 10.9 -- -- -- -- --Average ($000's) 9.0 -- -- -- -- 9.4
25th Percentile ($000's) 102.5 -- -- -- -- 99.450th Percentile ($000's) 105.4 -- -- -- -- 105.275th Percentile ($000's) 107.6 -- -- -- -- 106.0Average ($000's) 104.1 -- -- -- -- 103.6
Most Recent New HireEmployers Reported 1 0 0 0 0 1
Median ($000's) -- -- -- -- -- --Average ($000's) -- -- -- -- -- --
Responsible for overall architecture creation, design, development and implementation of Data Warehouse and Business Intelligencesolutions for customers. Develops data warehousing requirements and design specifications, evaluates software and hardware platforms,and integrates systems. Defines, designs and builds dimensional databases. Designs, implements and tunes the ETL processes.Performs detailed data analysis and dimensional data modeling; also identifies and promotes best practices and patterns for datamodeling. Provides direction and oversight for all activities related to data cleansing, data quality, and data consolidation usingstandard data modeling methodologies and processes. Assists in post-implementation continuous improvement efforts in enhancingperformance and providing increased functionality. Requires bachelor’s degree in business, computer science, engineering or relateddiscipline and 7 or more years related experience.
Industry - Type of Employer
Total Cash CompensationBase Plus Incentive Pay
Job Match Comparability
Page 3-184Southwestern Pennsylvania Annual Compensation and Benefits Study
© 2010 Pittsburgh Technology Council. All rights reserved.

Job Code 630 DATA WAREHOUSE ARCHITECT
Description
Less than 50 50 - 150 151 - 500 More than 500Less than
$7.5M$7.5M to
$25M$26M to $150M
More than $150M
Annual Base PayEmployers Reported 0 0 2 3 0 0 1 4Employees Reported 0 0 2 7 0 0 1 8
25th Percentile ($000's) -- -- -- 91.0 -- -- -- 91.550th Percentile ($000's) -- -- -- 94.6 -- -- -- 98.175th Percentile ($000's) -- -- -- 103.8 -- -- -- 103.1Average ($000's) -- -- -- 98.5 -- -- -- 98.8
Incentive Pay% Incentive Eligible -- -- 100% 43% -- -- 100% 50%
25th Percentile ($000's) -- -- -- -- -- -- -- --50th Percentile ($000's) -- -- -- 10.9 -- -- -- 9.275th Percentile ($000's) -- -- -- -- -- -- -- --Average ($000's) -- -- -- 10.6 -- -- -- 9.4
25th Percentile ($000's) -- -- -- 96.3 -- -- -- 99.450th Percentile ($000's) -- -- -- 105.0 -- -- -- 105.275th Percentile ($000's) -- -- -- 105.4 -- -- -- 106.0Average ($000's) -- -- -- 103.0 -- -- -- 103.6
Most Recent New HireEmployers Reported 0 0 0 1 0 0 0 1
Median ($000's) -- -- -- -- -- -- -- --Average ($000's) -- -- -- -- -- -- -- --
Total Cash CompensationBase Plus Incentive Pay
Responsible for overall architecture creation, design, development and implementation of Data Warehouse and Business Intelligencesolutions for customers. Develops data warehousing requirements and design specifications, evaluates software and hardware platforms,and integrates systems. Defines, designs and builds dimensional databases. Designs, implements and tunes the ETL processes.Performs detailed data analysis and dimensional data modeling; also identifies and promotes best practices and patterns for datamodeling. Provides direction and oversight for all activities related to data cleansing, data quality, and data consolidation usingstandard data modeling methodologies and processes. Assists in post-implementation continuous improvement efforts in enhancingperformance and providing increased functionality. Requires bachelor’s degree in business, computer science, engineering or relateddiscipline and 7 or more years related experience.
Organizational FTE's Organizational Revenue ($ Millions)
Page 3-185Southwestern Pennsylvania Annual Compensation and Benefits Study
© 2010 Pittsburgh Technology Council. All rights reserved.

Job Code 631 DATA WAREHOUSE ANALYST
Description
0.0% Less Complex97.5% Comparable2.5% More Complex
All Organizations
Software, Computer and
Technology Manufacturing
Life-Sciences/ Biotech/
Medical Devices Not-for-ProfitAll Other
EmployersAnnual Base Pay
Employers Reported 4 2 1 0 0 1Employees Reported 40 37 2 0 0 125th Percentile ($000's) 47.7 48.0 -- -- -- --50th Percentile ($000's) 51.6 51.3 -- -- -- --75th Percentile ($000's) 59.2 56.9 -- -- -- --Average ($000's) 53.4 52.5 -- -- -- --
Incentive Pay% Incentive Eligible 10% 3% 100% -- -- 100%25th Percentile ($000's) -- -- -- -- -- --50th Percentile ($000's) 3.8 -- -- -- -- --75th Percentile ($000's) -- -- -- -- -- --Average ($000's) 3.8 -- -- -- -- --
25th Percentile ($000's) 47.7 48.0 -- -- -- --50th Percentile ($000's) 51.6 51.3 -- -- -- --75th Percentile ($000's) 59.2 56.9 -- -- -- --Average ($000's) 53.5 52.6 -- -- -- --
Most Recent New HireEmployers Reported 1 0 0 0 0 1
Median ($000's) -- -- -- -- -- --Average ($000's) -- -- -- -- -- --
Performs database analysis and design in solving complex problems. Defines architecture, including database structures and metadata,and develops and maintains best practices for data extraction, data loading, and data transformation into and out of a data warehouseor data mart. Develops metadata definitions from business rules and has an intimate familiarity with data modeling, CASE, and datadesign tools. Establishes the data management framework that improves the data quality and standards for both database structuresand repository. Serves as a technical leader and consultant for the extraction, transformation, and load (ETL) between data sources,data warehouses, and data marts. Typically requires a bachelor’s degree and two to four years of related experience includingapplications development.
Industry - Type of Employer
Total Cash CompensationBase Plus Incentive Pay
Job Match Comparability
Page 3-186Southwestern Pennsylvania Annual Compensation and Benefits Study
© 2010 Pittsburgh Technology Council. All rights reserved.

Job Code 631 DATA WAREHOUSE ANALYST
Description
Less than 50 50 - 150 151 - 500 More than 500Less than
$7.5M$7.5M to
$25M$26M to $150M
More than $150M
Annual Base PayEmployers Reported 0 1 2 1 0 1 0 3Employees Reported 0 1 3 36 0 1 0 39
25th Percentile ($000's) -- -- -- -- -- -- -- 47.450th Percentile ($000's) -- -- 65.3 -- -- -- -- 51.375th Percentile ($000's) -- -- -- -- -- -- -- 58.0Average ($000's) -- -- 65.7 -- -- -- -- 52.5
Incentive Pay% Incentive Eligible -- 100% 100% 0% -- 100% -- 8%
25th Percentile ($000's) -- -- -- -- -- -- -- --50th Percentile ($000's) -- -- -- -- -- -- -- --75th Percentile ($000's) -- -- -- -- -- -- -- --Average ($000's) -- -- -- -- -- -- -- --
25th Percentile ($000's) -- -- -- -- -- -- -- 47.450th Percentile ($000's) -- -- 65.3 -- -- -- -- 51.375th Percentile ($000's) -- -- -- -- -- -- -- 58.0Average ($000's) -- -- 65.7 -- -- -- -- 52.5
Most Recent New HireEmployers Reported 0 0 1 0 0 0 0 1
Median ($000's) -- -- -- -- -- -- -- --Average ($000's) -- -- -- -- -- -- -- --
Total Cash CompensationBase Plus Incentive Pay
Performs database analysis and design in solving complex problems. Defines architecture, including database structures and metadata,and develops and maintains best practices for data extraction, data loading, and data transformation into and out of a data warehouseor data mart. Develops metadata definitions from business rules and has an intimate familiarity with data modeling, CASE, and datadesign tools. Establishes the data management framework that improves the data quality and standards for both database structuresand repository. Serves as a technical leader and consultant for the extraction, transformation, and load (ETL) between data sources,data warehouses, and data marts. Typically requires a bachelor’s degree and two to four years of related experience includingapplications development.
Organizational FTE's Organizational Revenue ($ Millions)
Page 3-187Southwestern Pennsylvania Annual Compensation and Benefits Study
© 2010 Pittsburgh Technology Council. All rights reserved.
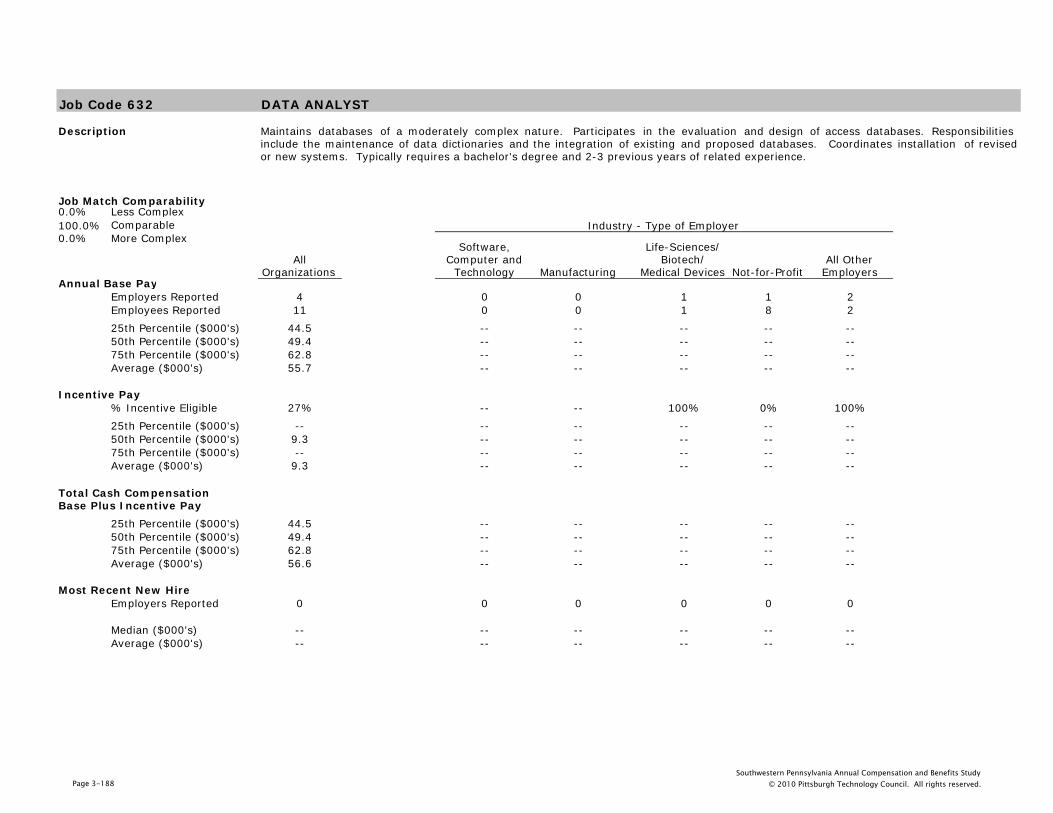
Job Code 632 DATA ANALYST
Description
0.0% Less Complex100.0% Comparable0.0% More Complex
All Organizations
Software, Computer and
Technology Manufacturing
Life-Sciences/ Biotech/
Medical Devices Not-for-ProfitAll Other
EmployersAnnual Base Pay
Employers Reported 4 0 0 1 1 2Employees Reported 11 0 0 1 8 225th Percentile ($000's) 44.5 -- -- -- -- --50th Percentile ($000's) 49.4 -- -- -- -- --75th Percentile ($000's) 62.8 -- -- -- -- --Average ($000's) 55.7 -- -- -- -- --
Incentive Pay% Incentive Eligible 27% -- -- 100% 0% 100%25th Percentile ($000's) -- -- -- -- -- --50th Percentile ($000's) 9.3 -- -- -- -- --75th Percentile ($000's) -- -- -- -- -- --Average ($000's) 9.3 -- -- -- -- --
25th Percentile ($000's) 44.5 -- -- -- -- --50th Percentile ($000's) 49.4 -- -- -- -- --75th Percentile ($000's) 62.8 -- -- -- -- --Average ($000's) 56.6 -- -- -- -- --
Most Recent New HireEmployers Reported 0 0 0 0 0 0
Median ($000's) -- -- -- -- -- --Average ($000's) -- -- -- -- -- --
Maintains databases of a moderately complex nature. Participates in the evaluation and design of access databases. Responsibilitiesinclude the maintenance of data dictionaries and the integration of existing and proposed databases. Coordinates installation of revisedor new systems. Typically requires a bachelor's degree and 2-3 previous years of related experience.
Industry - Type of Employer
Total Cash CompensationBase Plus Incentive Pay
Job Match Comparability
Page 3-188Southwestern Pennsylvania Annual Compensation and Benefits Study
© 2010 Pittsburgh Technology Council. All rights reserved.

Job Code 632 DATA ANALYST
Description
Less than 50 50 - 150 151 - 500 More than 500Less than
$7.5M$7.5M to
$25M$26M to $150M
More than $150M
Annual Base PayEmployers Reported 0 0 1 3 0 1 0 3Employees Reported 0 0 1 10 0 1 0 10
25th Percentile ($000's) -- -- -- 44.3 -- -- -- 44.350th Percentile ($000's) -- -- -- 47.5 -- -- -- 47.575th Percentile ($000's) -- -- -- 58.4 -- -- -- 58.4Average ($000's) -- -- -- 54.7 -- -- -- 54.7
Incentive Pay% Incentive Eligible -- -- 100% 20% -- 100% -- 20%
25th Percentile ($000's) -- -- -- -- -- -- -- --50th Percentile ($000's) -- -- -- -- -- -- -- --75th Percentile ($000's) -- -- -- -- -- -- -- --Average ($000's) -- -- -- -- -- -- -- --
25th Percentile ($000's) -- -- -- 44.3 -- -- -- 44.350th Percentile ($000's) -- -- -- 47.5 -- -- -- 47.575th Percentile ($000's) -- -- -- 58.4 -- -- -- 58.4Average ($000's) -- -- -- 54.7 -- -- -- 54.7
Most Recent New HireEmployers Reported 0 0 0 0 0 0 0 0
Median ($000's) -- -- -- -- -- -- -- --Average ($000's) -- -- -- -- -- -- -- --
Total Cash CompensationBase Plus Incentive Pay
Maintains databases of a moderately complex nature. Participates in the evaluation and design of access databases. Responsibilitiesinclude the maintenance of data dictionaries and the integration of existing and proposed databases. Coordinates installation of revisedor new systems. Typically requires a bachelor's degree and 2-3 previous years of related experience.
Organizational FTE's Organizational Revenue ($ Millions)
Page 3-189Southwestern Pennsylvania Annual Compensation and Benefits Study
© 2010 Pittsburgh Technology Council. All rights reserved.
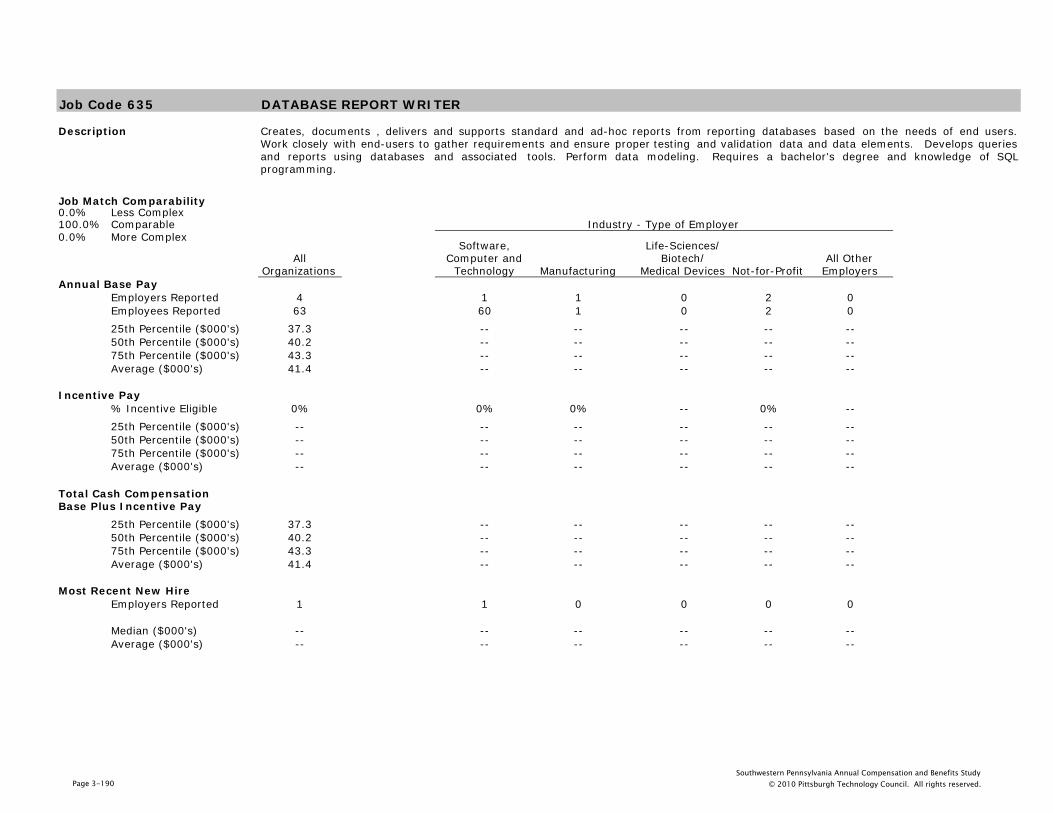
Job Code 635 DATABASE REPORT WRITER
Description
0.0% Less Complex100.0% Comparable0.0% More Complex
All Organizations
Software, Computer and
Technology Manufacturing
Life-Sciences/ Biotech/
Medical Devices Not-for-ProfitAll Other
EmployersAnnual Base Pay
Employers Reported 4 1 1 0 2 0Employees Reported 63 60 1 0 2 025th Percentile ($000's) 37.3 -- -- -- -- --50th Percentile ($000's) 40.2 -- -- -- -- --75th Percentile ($000's) 43.3 -- -- -- -- --Average ($000's) 41.4 -- -- -- -- --
Incentive Pay% Incentive Eligible 0% 0% 0% -- 0% --25th Percentile ($000's) -- -- -- -- -- --50th Percentile ($000's) -- -- -- -- -- --75th Percentile ($000's) -- -- -- -- -- --Average ($000's) -- -- -- -- -- --
25th Percentile ($000's) 37.3 -- -- -- -- --50th Percentile ($000's) 40.2 -- -- -- -- --75th Percentile ($000's) 43.3 -- -- -- -- --Average ($000's) 41.4 -- -- -- -- --
Most Recent New HireEmployers Reported 1 1 0 0 0 0
Median ($000's) -- -- -- -- -- --Average ($000's) -- -- -- -- -- --
Creates, documents , delivers and supports standard and ad-hoc reports from reporting databases based on the needs of end users.Work closely with end-users to gather requirements and ensure proper testing and validation data and data elements. Develops queriesand reports using databases and associated tools. Perform data modeling. Requires a bachelor's degree and knowledge of SQLprogramming.
Industry - Type of Employer
Total Cash CompensationBase Plus Incentive Pay
Job Match Comparability
Page 3-190Southwestern Pennsylvania Annual Compensation and Benefits Study
© 2010 Pittsburgh Technology Council. All rights reserved.

Job Code 635 DATABASE REPORT WRITER
Description
Less than 50 50 - 150 151 - 500 More than 500Less than
$7.5M$7.5M to
$25M$26M to $150M
More than $150M
Annual Base PayEmployers Reported 0 0 1 3 0 0 2 2Employees Reported 0 0 1 62 0 0 2 61
25th Percentile ($000's) -- -- -- 37.2 -- -- -- 37.150th Percentile ($000's) -- -- -- 40.2 -- -- -- 40.175th Percentile ($000's) -- -- -- 42.7 -- -- -- 42.7Average ($000's) -- -- -- 40.9 -- -- -- 40.4
Incentive Pay% Incentive Eligible -- -- 0% 0% -- -- 0% 0%
25th Percentile ($000's) -- -- -- -- -- -- -- --50th Percentile ($000's) -- -- -- -- -- -- -- --75th Percentile ($000's) -- -- -- -- -- -- -- --Average ($000's) -- -- -- -- -- -- -- --
25th Percentile ($000's) -- -- -- 37.2 -- -- -- 37.150th Percentile ($000's) -- -- -- 40.2 -- -- -- 40.175th Percentile ($000's) -- -- -- 42.7 -- -- -- 42.7Average ($000's) -- -- -- 40.9 -- -- -- 40.4
Most Recent New HireEmployers Reported 0 0 0 1 0 0 0 1
Median ($000's) -- -- -- -- -- -- -- --Average ($000's) -- -- -- -- -- -- -- --
Total Cash CompensationBase Plus Incentive Pay
Creates, documents , delivers and supports standard and ad-hoc reports from reporting databases based on the needs of end users.Work closely with end-users to gather requirements and ensure proper testing and validation data and data elements. Develops queriesand reports using databases and associated tools. Perform data modeling. Requires a bachelor's degree and knowledge of SQLprogramming.
Organizational FTE's Organizational Revenue ($ Millions)
Page 3-191Southwestern Pennsylvania Annual Compensation and Benefits Study
© 2010 Pittsburgh Technology Council. All rights reserved.

Job Code 735 APPLICATIONS SYSTEMS ANALYST
Description
3.5% Less Complex72.1% Comparable24.4% More Complex
All Organizations
Software, Computer and
Technology Manufacturing
Life-Sciences/ Biotech/
Medical Devices Not-for-ProfitAll Other
EmployersAnnual Base Pay
Employers Reported 14 0 4 0 4 6Employees Reported 86 0 26 0 12 4825th Percentile ($000's) 53.8 -- 53.3 -- 42.8 60.350th Percentile ($000's) 62.3 -- 60.2 -- 44.6 70.775th Percentile ($000's) 75.5 -- 72.2 -- 52.3 78.9Average ($000's) 64.8 -- 63.1 -- 47.7 69.9
Incentive Pay% Incentive Eligible 47% -- 96% -- 0% 31%25th Percentile ($000's) 4.4 -- 4.7 -- -- 2.550th Percentile ($000's) 5.6 -- 5.8 -- -- 5.175th Percentile ($000's) 6.6 -- 6.5 -- -- 7.0Average ($000's) 5.4 -- 5.8 -- -- 4.9
25th Percentile ($000's) 55.3 -- 55.3 -- 42.8 60.350th Percentile ($000's) 64.6 -- 64.6 -- 44.6 70.875th Percentile ($000's) 78.6 -- 78.5 -- 52.3 79.6Average ($000's) 67.0 -- 67.8 -- 47.7 71.5
Most Recent New HireEmployers Reported 0 0 0 0 0 0
Median ($000's) -- -- -- -- -- --Average ($000's) -- -- -- -- -- --
Evaluates user needs and requests for new or modified programs and/or systems to determine scope, feasibility, cost, time requirementsand compatibility with existing systems and capabilities. Defines programming specifications. Typically requires a degree in computerscience, management information systems, or business, and 3–5 years related experience.
Industry - Type of Employer
Total Cash CompensationBase Plus Incentive Pay
Job Match Comparability
Page 3-192Southwestern Pennsylvania Annual Compensation and Benefits Study
© 2010 Pittsburgh Technology Council. All rights reserved.

Job Code 735 APPLICATIONS SYSTEMS ANALYST
Description
Less than 50 50 - 150 151 - 500 More than 500Less than
$7.5M$7.5M to
$25M$26M to $150M
More than $150M
Annual Base PayEmployers Reported 0 1 3 10 1 0 3 10Employees Reported 0 1 6 79 1 0 3 82
25th Percentile ($000's) -- -- 52.2 55.8 -- -- -- 54.550th Percentile ($000's) -- -- 53.9 65.0 -- -- 56.6 63.575th Percentile ($000's) -- -- 55.7 77.0 -- -- -- 75.9Average ($000's) -- -- 53.5 65.8 -- -- 53.9 65.3
Incentive Pay% Incentive Eligible -- 0% 67% 46% 0% -- 0% 49%
25th Percentile ($000's) -- -- -- 4.4 -- -- -- 4.450th Percentile ($000's) -- -- -- 5.6 -- -- -- 5.675th Percentile ($000's) -- -- -- 6.6 -- -- -- 6.6Average ($000's) -- -- -- 5.4 -- -- -- 5.4
25th Percentile ($000's) -- -- 52.2 56.8 -- -- -- 56.150th Percentile ($000's) -- -- 53.9 67.9 -- -- 56.6 67.275th Percentile ($000's) -- -- 55.7 79.1 -- -- -- 79.0Average ($000's) -- -- 53.5 68.3 -- -- 53.9 67.7
Most Recent New HireEmployers Reported 0 0 0 0 0 0 0 0
Median ($000's) -- -- -- -- -- -- -- --Average ($000's) -- -- -- -- -- -- -- --
Evaluates user needs and requests for new or modified programs and/or systems to determine scope, feasibility, cost, time requirementsand compatibility with existing systems and capabilities. Defines programming specifications. Typically requires a degree in computerscience, management information systems, or business, and 3–5 years related experience.
Organizational FTE's Organizational Revenue ($ Millions)
Total Cash CompensationBase Plus Incentive Pay
Page 3-193Southwestern Pennsylvania Annual Compensation and Benefits Study
© 2010 Pittsburgh Technology Council. All rights reserved.

Job Code 736 SYSTEMS ADMINISTRATOR
Description
0.0% Less Complex76.5% Comparable23.5% More Complex
All Organizations
Software, Computer and
Technology Manufacturing
Life-Sciences/ Biotech/
Medical Devices Not-for-ProfitAll Other
EmployersAnnual Base Pay
Employers Reported 15 3 2 1 3 6Employees Reported 51 16 3 1 3 2825th Percentile ($000's) 49.3 37.6 -- -- -- 62.750th Percentile ($000's) 63.2 41.0 70.0 -- 65.0 69.675th Percentile ($000's) 70.4 48.3 -- -- -- 73.8Average ($000's) 61.6 43.5 78.9 -- 61.7 70.0
Incentive Pay% Incentive Eligible 47% 13% 100% 100% 33% 61%25th Percentile ($000's) 4.3 -- -- -- -- 5.250th Percentile ($000's) 6.2 -- 15.1 -- -- 6.675th Percentile ($000's) 9.3 -- -- -- -- 9.8Average ($000's) 6.8 -- 15.1 -- -- 7.1
25th Percentile ($000's) 50.1 37.6 -- -- -- 63.250th Percentile ($000's) 64.0 41.0 70.0 -- 66.0 71.075th Percentile ($000's) 72.6 48.3 -- -- -- 75.1Average ($000's) 63.8 44.1 83.9 -- 62.1 73.0
Most Recent New HireEmployers Reported 1 0 0 1 0 0
Median ($000's) -- -- -- -- -- --Average ($000's) -- -- -- -- -- --
Monitors systems configurations including software and hardware and recommends modifications as needed to ensure optimumperformance and reliability. Administers servers including administration and setup of the workstations connected to a LAN or WAN.Schedules and performs software installations and upgrades to operating systems and layered software packages according toestablished policies and procedures. Also schedules and performs system backups and database archives. Ensures data integrity. Alsomay provide technical support to system users. Typically requires a degree in computer science and 3 or less years of relatedexperience.
Industry - Type of Employer
Total Cash CompensationBase Plus Incentive Pay
Job Match Comparability
Page 3-194Southwestern Pennsylvania Annual Compensation and Benefits Study
© 2010 Pittsburgh Technology Council. All rights reserved.

Job Code 736 SYSTEMS ADMINISTRATOR
Description
Less than 50 50 - 150 151 - 500 More than 500Less than
$7.5M$7.5M to
$25M$26M to $150M
More than $150M
Annual Base PayEmployers Reported 3 1 4 7 2 3 2 8Employees Reported 3 1 5 42 2 3 2 44
25th Percentile ($000's) -- -- 58.8 44.4 -- -- -- 46.350th Percentile ($000's) 55.5 -- 62.5 65.0 -- 62.5 -- 65.075th Percentile ($000's) -- -- 63.7 72.4 -- -- -- 71.6Average ($000's) 58.7 -- 61.3 62.1 -- 58.7 -- 62.2
Incentive Pay% Incentive Eligible 100% 0% 80% 40% 100% 67% 50% 43%
25th Percentile ($000's) -- -- -- 6.0 -- -- -- 6.050th Percentile ($000's) 3.9 -- 5.2 6.9 -- -- -- 6.975th Percentile ($000's) -- -- -- 11.2 -- -- -- 11.2Average ($000's) 3.0 -- 5.2 8.0 -- -- -- 8.0
25th Percentile ($000's) -- -- 58.8 44.4 -- -- -- 46.350th Percentile ($000's) 59.5 -- 68.3 65.5 -- 66.0 -- 65.575th Percentile ($000's) -- -- 68.4 73.8 -- -- -- 73.8Average ($000's) 61.7 -- 63.4 64.4 -- 61.0 -- 64.4
Most Recent New HireEmployers Reported 0 0 1 0 0 1 0 0
Median ($000's) -- -- -- -- -- -- -- --Average ($000's) -- -- -- -- -- -- -- --
Total Cash CompensationBase Plus Incentive Pay
Monitors systems configurations including software and hardware and recommends modifications as needed to ensure optimumperformance and reliability. Administers servers including administration and setup of the workstations connected to a LAN or WAN.Schedules and performs software installations and upgrades to operating systems and layered software packages according toestablished policies and procedures. Also schedules and performs system backups and database archives. Ensures data integrity. Alsomay provide technical support to system users. Typically requires a degree in computer science and 3 or less years of relatedexperience.
Organizational FTE's Organizational Revenue ($ Millions)
Page 3-195Southwestern Pennsylvania Annual Compensation and Benefits Study
© 2010 Pittsburgh Technology Council. All rights reserved.

Job Code 733 INFORMATION SYSTEMS ENGINEER
Description
0.0% Less Complex80.0% Comparable20.0% More Complex
All Organizations
Software, Computer and
Technology Manufacturing
Life-Sciences/ Biotech/
Medical Devices Not-for-ProfitAll Other
EmployersAnnual Base Pay
Employers Reported 3 0 0 0 0 3Employees Reported 15 0 0 0 0 1525th Percentile ($000's) 69.5 -- -- -- -- 69.550th Percentile ($000's) 79.1 -- -- -- -- 79.175th Percentile ($000's) 83.1 -- -- -- -- 83.1Average ($000's) 77.5 -- -- -- -- 77.5
Incentive Pay% Incentive Eligible 100% -- -- -- -- 100%25th Percentile ($000's) 1.8 -- -- -- -- 1.850th Percentile ($000's) 3.2 -- -- -- -- 3.275th Percentile ($000's) 4.6 -- -- -- -- 4.6Average ($000's) 3.6 -- -- -- -- 3.6
25th Percentile ($000's) 74.0 -- -- -- -- 74.050th Percentile ($000's) 82.0 -- -- -- -- 82.075th Percentile ($000's) 85.9 -- -- -- -- 85.9Average ($000's) 80.6 -- -- -- -- 80.6
Most Recent New HireEmployers Reported 1 0 0 0 0 1
Median ($000's) -- -- -- -- -- --Average ($000's) -- -- -- -- -- --
Configures software and hardware to meet user requirements. Performs integration of diverse and dispersed systems. Makesenhancements to existing systems according to specifications. Troubleshoots problems of a non-routine nature. Analyzes systemsperformance, stability and design. Typically requires a degree in computer science and 3-5 years of related experience.
Industry - Type of Employer
Total Cash CompensationBase Plus Incentive Pay
Job Match Comparability
Page 3-196Southwestern Pennsylvania Annual Compensation and Benefits Study
© 2010 Pittsburgh Technology Council. All rights reserved.

Job Code 733 INFORMATION SYSTEMS ENGINEER
Description
Less than 50 50 - 150 151 - 500 More than 500Less than
$7.5M$7.5M to
$25M$26M to $150M
More than $150M
Annual Base PayEmployers Reported 0 0 1 2 0 0 0 3Employees Reported 0 0 3 12 0 0 0 15
25th Percentile ($000's) -- -- -- 64.2 -- -- -- 69.550th Percentile ($000's) -- -- -- 79.0 -- -- -- 79.175th Percentile ($000's) -- -- -- 81.2 -- -- -- 83.1Average ($000's) -- -- -- 75.5 -- -- -- 77.5
Incentive Pay% Incentive Eligible -- -- 100% 100% -- -- -- 100%
25th Percentile ($000's) -- -- -- 1.4 -- -- -- 1.850th Percentile ($000's) -- -- -- 2.4 -- -- -- 3.275th Percentile ($000's) -- -- -- 5.2 -- -- -- 4.6Average ($000's) -- -- -- 3.5 -- -- -- 3.6
25th Percentile ($000's) -- -- -- 71.1 -- -- -- 74.050th Percentile ($000's) -- -- -- 79.4 -- -- -- 82.075th Percentile ($000's) -- -- -- 82.5 -- -- -- 85.9Average ($000's) -- -- -- 78.4 -- -- -- 80.6
Most Recent New HireEmployers Reported 0 0 0 1 0 0 0 1
Median ($000's) -- -- -- -- -- -- -- --Average ($000's) -- -- -- -- -- -- -- --
Total Cash CompensationBase Plus Incentive Pay
Configures software and hardware to meet user requirements. Performs integration of diverse and dispersed systems. Makesenhancements to existing systems according to specifications. Troubleshoots problems of a non-routine nature. Analyzes systemsperformance, stability and design. Typically requires a degree in computer science and 3-5 years of related experience.
Organizational FTE's Organizational Revenue ($ Millions)
Page 3-197Southwestern Pennsylvania Annual Compensation and Benefits Study
© 2010 Pittsburgh Technology Council. All rights reserved.

Job Code 738 IS/IT MANAGER
Description
4.5% Less Complex88.3% Comparable7.3% More Complex
All Organizations
Software, Computer and
Technology Manufacturing
Life-Sciences/ Biotech/
Medical Devices Not-for-ProfitAll Other
EmployersAnnual Base Pay
Employers Reported 33 6 10 3 5 9Employees Reported 179 10 36 4 7 12225th Percentile ($000's) 93.5 77.8 95.4 -- 76.1 99.350th Percentile ($000's) 107.8 81.4 106.1 92.8 79.9 109.275th Percentile ($000's) 114.8 108.4 112.6 -- 93.8 116.3Average ($000's) 105.3 92.6 102.8 92.9 84.2 108.7
Incentive Pay% Incentive Eligible 91% 60% 89% 50% 14% 99%25th Percentile ($000's) 10.5 8.4 24.5 -- -- 8.950th Percentile ($000's) 16.1 15.0 28.1 -- -- 15.275th Percentile ($000's) 18.0 20.6 31.1 -- -- 16.7Average ($000's) 16.3 14.0 27.9 -- -- 13.6
25th Percentile ($000's) 98.8 78.9 104.0 -- 78.2 106.550th Percentile ($000's) 121.6 83.3 132.0 94.1 85.4 122.775th Percentile ($000's) 132.8 109.2 143.1 -- 93.8 130.8Average ($000's) 118.9 98.2 124.5 95.4 86.0 121.7
Most Recent New HireEmployers Reported 1 0 1 0 0 0
Median ($000's) -- -- -- -- -- --Average ($000's) -- -- -- -- -- --
Manages the work of internally-focused systems analysts, computer programmers, support specialists, and other computer relatedworkers. Plans, directs, or coordinates internal IT/IS activities such as installation and upgrading of hardware and software, developmentof computer networks, systems design and computer programming. Develops computer information resources, providing for data securityand control, strategic computing, and disaster recovery. Reports to senior management on information systems plans, projects, andperformance. Manages operational budget and expenditures. Requires a Bachelor’s Degree in Computer Science and 5-7 years relatedexperience.
Industry - Type of Employer
Total Cash CompensationBase Plus Incentive Pay
Job Match Comparability
Page 3-198Southwestern Pennsylvania Annual Compensation and Benefits Study
© 2010 Pittsburgh Technology Council. All rights reserved.

Job Code 738 IS/IT MANAGER
Description
Less than 50 50 - 150 151 - 500 More than 500Less than
$7.5M$7.5M to
$25M$26M to $150M
More than $150M
Annual Base PayEmployers Reported 2 8 9 14 3 7 10 13Employees Reported 2 9 9 159 3 8 10 158
25th Percentile ($000's) -- 78.5 76.6 96.5 -- 77.0 76.8 96.650th Percentile ($000's) -- 97.1 81.1 108.6 70.2 99.6 79.4 108.675th Percentile ($000's) -- 104.5 99.4 115.7 -- 111.4 83.3 115.7Average ($000's) -- 96.6 87.1 107.3 80.9 98.8 83.9 107.4
Incentive Pay% Incentive Eligible 100% 67% 67% 93% 67% 75% 60% 94%
25th Percentile ($000's) -- 12.3 9.9 11.1 -- 12.2 10.2 11.050th Percentile ($000's) -- 16.5 9.9 16.2 -- 16.5 10.4 16.275th Percentile ($000's) -- 20.6 10.0 18.0 -- 20.6 24.1 17.9Average ($000's) -- 16.5 9.9 16.5 -- 16.3 19.4 16.4
25th Percentile ($000's) -- 85.4 76.6 104.9 -- 83.7 77.4 104.950th Percentile ($000's) -- 97.1 85.2 124.0 73.8 100.8 84.3 124.075th Percentile ($000's) -- 104.5 99.4 133.5 -- 121.9 96.9 133.6Average ($000's) -- 103.9 89.3 122.0 83.3 107.0 89.8 122.1
Most Recent New HireEmployers Reported 0 0 0 1 0 0 0 1
Median ($000's) -- -- -- -- -- -- -- --Average ($000's) -- -- -- -- -- -- -- --
Manages the work of internally-focused systems analysts, computer programmers, support specialists, and other computer relatedworkers. Plans, directs, or coordinates internal IT/IS activities such as installation and upgrading of hardware and software, developmentof computer networks, systems design and computer programming. Develops computer information resources, providing for data securityand control, strategic computing, and disaster recovery. Reports to senior management on information systems plans, projects, andperformance. Manages operational budget and expenditures. Requires a Bachelor’s Degree in Computer Science and 5-7 years relatedexperience.
Organizational FTE's Organizational Revenue ($ Millions)
Total Cash CompensationBase Plus Incentive Pay
Page 3-199Southwestern Pennsylvania Annual Compensation and Benefits Study
© 2010 Pittsburgh Technology Council. All rights reserved.

Job Code 742 WEBSITE DEVELOPER
Description
2.4% Less Complex78.0% Comparable19.5% More Complex
All Organizations
Software, Computer and
Technology Manufacturing
Life-Sciences/ Biotech/
Medical Devices Not-for-ProfitAll Other
EmployersAnnual Base Pay
Employers Reported 16 2 3 1 5 5Employees Reported 41 3 3 1 5 2925th Percentile ($000's) 52.4 -- -- -- 50.9 54.050th Percentile ($000's) 62.0 57.1 62.9 -- 60.8 63.075th Percentile ($000's) 69.4 -- -- -- 60.9 70.0Average ($000's) 63.2 55.2 69.8 -- 59.0 63.8
Incentive Pay% Incentive Eligible 61% 33% 67% 100% 40% 66%25th Percentile ($000's) 4.7 -- -- -- -- 5.050th Percentile ($000's) 5.5 -- -- -- -- 5.575th Percentile ($000's) 7.2 -- -- -- -- 6.8Average ($000's) 6.2 -- -- -- -- 6.4
25th Percentile ($000's) 57.1 -- -- -- 58.1 59.250th Percentile ($000's) 62.9 57.1 62.9 -- 60.8 65.075th Percentile ($000's) 70.0 -- -- -- 60.9 70.0Average ($000's) 65.1 56.7 74.2 -- 60.5 65.6
Most Recent New HireEmployers Reported 3 0 0 0 0 3
Median ($000's) 60.0 -- -- -- -- 60.0Average ($000's) 61.4 -- -- -- -- 61.4
Designs and develops organization’s website based on employer’s Internet strategies and objectives. Customizes web based interactivefeatures, builds database gateways, and implements electronic commerce services. Requires experience with HTML, CGI, and World WideWeb browsers, technical knowledge of servers and operating systems, a working knowledge of database query languages, developmentskills with one or more authoring tools, and the ability to develop programs/write scripts in one or more languages such as JAVA Script,Visual Basic Script, DreamWeaver, Apache, Tomcat, etc. Typically requires a related degree and 1–2 years related experience.
Industry - Type of Employer
Total Cash CompensationBase Plus Incentive Pay
Job Match Comparability
Page 3-200Southwestern Pennsylvania Annual Compensation and Benefits Study
© 2010 Pittsburgh Technology Council. All rights reserved.

Job Code 742 WEBSITE DEVELOPER
Description
Less than 50 50 - 150 151 - 500 More than 500Less than
$7.5M$7.5M to
$25M$26M to $150M
More than $150M
Annual Base PayEmployers Reported 1 2 3 10 0 3 4 9Employees Reported 1 3 3 34 0 4 4 33
25th Percentile ($000's) -- -- -- 51.9 -- -- -- 51.250th Percentile ($000's) -- 70.0 62.9 61.1 -- 72.9 61.9 61.475th Percentile ($000's) -- -- -- 68.9 -- -- -- 69.0Average ($000's) -- 70.3 59.7 62.5 -- 71.6 60.0 62.5
Incentive Pay% Incentive Eligible 100% 33% 67% 62% -- 50% 50% 64%
25th Percentile ($000's) -- -- -- 4.8 -- -- -- 4.850th Percentile ($000's) -- -- -- 5.5 -- -- -- 5.575th Percentile ($000's) -- -- -- 7.2 -- -- -- 7.2Average ($000's) -- -- -- 6.8 -- -- -- 6.8
25th Percentile ($000's) -- -- -- 52.7 -- -- -- 51.250th Percentile ($000's) -- 70.0 62.9 62.6 -- 73.1 61.9 62.775th Percentile ($000's) -- -- -- 69.3 -- -- -- 69.4Average ($000's) -- 72.7 61.3 64.5 -- 73.6 61.2 64.6
Most Recent New HireEmployers Reported 0 1 0 2 0 1 0 2
Median ($000's) -- -- -- -- -- -- -- --Average ($000's) -- -- -- -- -- -- -- --
Total Cash CompensationBase Plus Incentive Pay
Designs and develops organization’s website based on employer’s Internet strategies and objectives. Customizes web based interactivefeatures, builds database gateways, and implements electronic commerce services. Requires experience with HTML, CGI, and World WideWeb browsers, technical knowledge of servers and operating systems, a working knowledge of database query languages, developmentskills with one or more authoring tools, and the ability to develop programs/write scripts in one or more languages such as JAVA Script,Visual Basic Script, DreamWeaver, Apache, Tomcat, etc. Typically requires a related degree and 1–2 years related experience.
Organizational FTE's Organizational Revenue ($ Millions)
Page 3-201Southwestern Pennsylvania Annual Compensation and Benefits Study
© 2010 Pittsburgh Technology Council. All rights reserved.

Job Code 744 DATABASE ADMINISTRATOR
Description
9.6% Less Complex51.9% Comparable38.5% More Complex
All Organizations
Software, Computer and
Technology Manufacturing
Life-Sciences/ Biotech/
Medical Devices Not-for-ProfitAll Other
EmployersAnnual Base Pay
Employers Reported 18 5 2 0 3 8Employees Reported 52 21 3 0 4 2425th Percentile ($000's) 67.9 68.5 -- -- -- 71.750th Percentile ($000's) 79.9 90.1 74.1 -- 70.9 79.675th Percentile ($000's) 93.8 95.7 -- -- -- 86.0Average ($000's) 81.2 84.4 76.2 -- 71.5 80.7
Incentive Pay% Incentive Eligible 60% 33% 100% -- 0% 88%25th Percentile ($000's) 3.0 3.5 -- -- -- 2.650th Percentile ($000's) 5.1 3.7 14.7 -- -- 5.375th Percentile ($000's) 7.2 5.1 -- -- -- 7.3Average ($000's) 6.4 4.5 14.7 -- -- 6.5
25th Percentile ($000's) 68.3 68.5 -- -- -- 74.250th Percentile ($000's) 83.0 90.8 74.1 -- 70.9 81.275th Percentile ($000's) 95.2 97.0 -- -- -- 87.4Average ($000's) 84.1 85.5 81.1 -- 71.5 85.3
Most Recent New HireEmployers Reported 4 2 0 0 0 2
Median ($000's) 86.0 -- -- -- -- --Average ($000's) 87.8 -- -- -- -- --
Plans and coordinates administration of one or more large, centralized databases. Reviews database design and integration of hostsystems and makes recommendations for enhancements and improvements. Ensures accurate, appropriate, and effective use of data,including database structure, documentation, and operational guidelines. Performs audits to ensure accuracy and proper use of data intables, applications, and supporting dictionaries. Serves as liaison between users and technical staff. Trains users and responds torequests for assistance. Monitors utilization and transaction activity. Prepares and/or reviews activity and performance reports. Mayestablish and maintain security and integrity controls. Typically requires a degree and 3–5 years related experience.
Industry - Type of Employer
Total Cash CompensationBase Plus Incentive Pay
Job Match Comparability
Page 3-202Southwestern Pennsylvania Annual Compensation and Benefits Study
© 2010 Pittsburgh Technology Council. All rights reserved.

Job Code 744 DATABASE ADMINISTRATOR
Description
Less than 50 50 - 150 151 - 500 More than 500Less than
$7.5M$7.5M to
$25M$26M to $150M
More than $150M
Annual Base PayEmployers Reported 1 2 4 11 0 3 2 13Employees Reported 1 4 7 40 0 5 3 44
25th Percentile ($000's) -- -- 69.5 65.9 -- 87.7 -- 65.950th Percentile ($000's) -- 93.9 93.7 79.6 -- 100.0 93.7 79.675th Percentile ($000's) -- -- 95.4 87.0 -- 105.0 -- 90.5Average ($000's) -- 90.3 81.2 77.9 -- 107.6 85.8 77.9
Incentive Pay% Incentive Eligible 100% 100% 86% 50% -- 100% 67% 55%
25th Percentile ($000's) -- -- 6.6 2.6 -- 3.3 -- 2.750th Percentile ($000's) -- 3.5 7.2 4.4 -- 3.5 -- 5.575th Percentile ($000's) -- -- 7.2 9.8 -- 3.6 -- 8.2Average ($000's) -- -- 6.7 6.9 -- 3.4 -- 6.9
25th Percentile ($000's) -- -- 69.5 67.4 -- 90.8 -- 67.450th Percentile ($000's) -- 97.1 98.8 80.0 -- 103.5 98.8 80.075th Percentile ($000's) -- -- 102.6 90.2 -- 108.7 -- 90.8Average ($000's) -- 92.9 85.1 80.7 -- 109.6 89.8 80.8
Most Recent New HireEmployers Reported 1 1 0 2 0 2 0 2
Median ($000's) -- -- -- -- -- -- -- --Average ($000's) -- -- -- -- -- -- -- --
Total Cash CompensationBase Plus Incentive Pay
Plans and coordinates administration of one or more large, centralized databases. Reviews database design and integration of hostsystems and makes recommendations for enhancements and improvements. Ensures accurate, appropriate, and effective use of data,including database structure, documentation, and operational guidelines. Performs audits to ensure accuracy and proper use of data intables, applications, and supporting dictionaries. Serves as liaison between users and technical staff. Trains users and responds torequests for assistance. Monitors utilization and transaction activity. Prepares and/or reviews activity and performance reports. Mayestablish and maintain security and integrity controls. Typically requires a degree and 3–5 years related experience.
Organizational FTE's Organizational Revenue ($ Millions)
Page 3-203Southwestern Pennsylvania Annual Compensation and Benefits Study
© 2010 Pittsburgh Technology Council. All rights reserved.

Job Code 750 NETWORK ANALYST - ALL LEVELS
Description
0.0% Less Complex95.9% Comparable4.1% More Complex
All Organizations
Software, Computer and
Technology Manufacturing
Life-Sciences/ Biotech/
Medical Devices Not-for-ProfitAll Other
EmployersAnnual Base Pay
Employers Reported 24 4 5 0 5 10Employees Reported 73 20 6 0 10 3725th Percentile ($000's) 53.9 53.8 57.5 -- 52.1 61.450th Percentile ($000's) 63.7 58.2 60.4 -- 56.4 72.675th Percentile ($000's) 74.2 65.6 73.9 -- 60.8 80.9Average ($000's) 64.8 59.1 67.3 -- 57.0 69.6
Incentive Pay% Incentive Eligible 37% 5% 67% -- 0% 59%25th Percentile ($000's) 2.7 -- -- -- -- 2.550th Percentile ($000's) 6.5 -- 7.0 -- -- 6.575th Percentile ($000's) 7.1 -- -- -- -- 7.1Average ($000's) 5.7 -- 8.9 -- -- 5.4
25th Percentile ($000's) 55.6 53.8 57.9 -- 52.1 61.450th Percentile ($000's) 63.8 58.2 62.6 -- 56.4 77.975th Percentile ($000's) 80.0 65.6 79.8 -- 60.8 86.1Average ($000's) 66.5 59.2 71.7 -- 57.0 72.2
Most Recent New HireEmployers Reported 2 0 0 0 0 2
Median ($000's) -- -- -- -- -- --Average ($000's) -- -- -- -- -- --
The data for this position is a combination of the data reported by participants for 751 Network Analyst and 752 Senior Network Analyst
Industry - Type of Employer
Total Cash CompensationBase Plus Incentive Pay
Job Match Comparability
Page 3-204Southwestern Pennsylvania Annual Compensation and Benefits Study
© 2010 Pittsburgh Technology Council. All rights reserved.

Job Code 750 NETWORK ANALYST - ALL LEVELS
Description
Less than 50 50 - 150 151 - 500 More than 500Less than
$7.5M$7.5M to
$25M$26M to $150M
More than $150M
Annual Base PayEmployers Reported 0 4 4 16 2 2 5 15Employees Reported 0 5 6 62 3 2 8 60
25th Percentile ($000's) -- 45.0 43.1 56.5 -- -- 49.3 56.650th Percentile ($000's) -- 61.0 54.0 65.8 45.0 -- 55.8 65.875th Percentile ($000's) -- 63.8 56.5 75.0 -- -- 57.9 75.7Average ($000's) -- 58.6 51.0 66.6 50.4 -- 54.3 66.7
Incentive Pay% Incentive Eligible -- 20% 17% 40% 0% 50% 13% 42%
25th Percentile ($000's) -- -- -- 3.9 -- -- -- 3.950th Percentile ($000's) -- -- -- 6.6 -- -- -- 6.675th Percentile ($000's) -- -- -- 7.2 -- -- -- 7.2Average ($000's) -- -- -- 5.9 -- -- -- 5.9
25th Percentile ($000's) -- 45.0 43.1 56.5 -- -- 49.3 56.650th Percentile ($000's) -- 63.3 54.0 65.8 45.0 -- 55.8 65.875th Percentile ($000's) -- 63.8 56.5 80.6 -- -- 57.9 81.1Average ($000's) -- 59.1 51.0 68.6 50.4 -- 54.3 68.8
Most Recent New HireEmployers Reported 0 0 0 2 0 0 0 2
Median ($000's) -- -- -- -- -- -- -- --Average ($000's) -- -- -- -- -- -- -- --
Total Cash CompensationBase Plus Incentive Pay
The data for this position is a combination of the data reported by participants for 751 Network Analyst and 752 Senior Network Analyst
Organizational FTE's Organizational Revenue ($ Millions)
Page 3-205Southwestern Pennsylvania Annual Compensation and Benefits Study
© 2010 Pittsburgh Technology Council. All rights reserved.

Job Code 751 NETWORK ANALYST
Description
0.0% Less Complex94.3% Comparable5.7% More Complex
All Organizations
Software, Computer and
Technology Manufacturing
Life-Sciences/ Biotech/
Medical Devices Not-for-ProfitAll Other
EmployersAnnual Base Pay
Employers Reported 17 4 4 0 4 5Employees Reported 35 10 4 0 7 1425th Percentile ($000's) 45.9 49.1 -- -- 50.6 44.750th Percentile ($000's) 53.9 53.6 58.2 -- 55.6 50.075th Percentile ($000's) 60.3 57.5 -- -- 57.4 69.1Average ($000's) 56.2 52.9 58.6 -- 55.5 58.3
Incentive Pay% Incentive Eligible 37% 10% 75% -- 0% 64%25th Percentile ($000's) 4.5 -- -- -- -- 5.650th Percentile ($000's) 7.0 -- 5.7 -- -- 8.275th Percentile ($000's) 8.2 -- -- -- -- 8.7Average ($000's) 6.4 -- 5.7 -- -- 7.3
25th Percentile ($000's) 45.9 49.1 -- -- 50.6 44.750th Percentile ($000's) 55.6 53.6 60.4 -- 55.6 52.475th Percentile ($000's) 63.7 57.5 -- -- 57.4 76.2Average ($000's) 57.9 53.1 61.5 -- 55.5 61.5
Most Recent New HireEmployers Reported 1 0 0 0 0 1
Median ($000's) -- -- -- -- -- --Average ($000's) -- -- -- -- -- --
Provides technical support in the installation and maintenance of the Local Area Network (LAN). Assists in the evaluation of hardwareand software, including peripheral, output, and telecommunications equipment. Installs network hardware and software, includingnetwork operating systems. Monitors data communications to ensure that network is available to all users. Ensures security procedures,provides and resets passwords, and backs up network. Troubleshoots and resolves routine problems. Generally responsible formaintaining a simple network of 25 or fewer nodes, or for a section of a larger network. Requires 1 or more years experience. May requirea degree.
Industry - Type of Employer
Total Cash CompensationBase Plus Incentive Pay
Job Match Comparability
Page 3-206Southwestern Pennsylvania Annual Compensation and Benefits Study
© 2010 Pittsburgh Technology Council. All rights reserved.

Job Code 751 NETWORK ANALYST
Description
Less than 50 50 - 150 151 - 500 More than 500Less than
$7.5M$7.5M to
$25M$26M to $150M
More than $150M
Annual Base PayEmployers Reported 0 2 4 11 1 1 5 10Employees Reported 0 3 5 27 2 1 6 26
25th Percentile ($000's) -- -- 40.0 48.3 -- -- 43.1 48.150th Percentile ($000's) -- 45.0 52.4 56.7 -- -- 54.0 55.375th Percentile ($000's) -- -- 55.6 66.0 -- -- 56.5 63.7Average ($000's) -- 49.5 49.0 58.3 -- -- 52.9 57.8
Incentive Pay% Incentive Eligible -- 33% 20% 41% 0% 100% 17% 42%
25th Percentile ($000's) -- -- -- 4.7 -- -- -- 4.750th Percentile ($000's) -- -- -- 7.6 -- -- -- 7.675th Percentile ($000's) -- -- -- 8.4 -- -- -- 8.4Average ($000's) -- -- -- 6.9 -- -- -- 6.9
25th Percentile ($000's) -- -- 40.0 48.3 -- -- 43.1 48.150th Percentile ($000's) -- 45.0 52.4 56.7 -- -- 54.0 56.575th Percentile ($000's) -- -- 55.6 68.0 -- -- 56.5 64.8Average ($000's) -- 50.3 49.0 60.4 -- -- 52.9 59.9
Most Recent New HireEmployers Reported 0 0 0 1 0 0 0 1
Median ($000's) -- -- -- -- -- -- -- --Average ($000's) -- -- -- -- -- -- -- --
Total Cash CompensationBase Plus Incentive Pay
Provides technical support in the installation and maintenance of the Local Area Network (LAN). Assists in the evaluation of hardwareand software, including peripheral, output, and telecommunications equipment. Installs network hardware and software, includingnetwork operating systems. Monitors data communications to ensure that network is available to all users. Ensures security procedures,provides and resets passwords, and backs up network. Troubleshoots and resolves routine problems. Generally responsible formaintaining a simple network of 25 or fewer nodes, or for a section of a larger network. Requires 1 or more years experience. May requirea degree.
Organizational FTE's Organizational Revenue ($ Millions)
Page 3-207Southwestern Pennsylvania Annual Compensation and Benefits Study
© 2010 Pittsburgh Technology Council. All rights reserved.

Job Code 752 SENIOR NETWORK ANALYST
Description
0.0% Less Complex97.4% Comparable2.6% More Complex
All Organizations
Software, Computer and
Technology Manufacturing
Life-Sciences/ Biotech/
Medical Devices Not-for-ProfitAll Other
EmployersAnnual Base Pay
Employers Reported 14 2 2 0 3 7Employees Reported 38 10 2 0 3 2325th Percentile ($000's) 63.7 61.1 -- -- -- 72.350th Percentile ($000's) 72.3 65.8 -- -- 61.7 75.175th Percentile ($000's) 80.0 69.9 -- -- -- 83.7Average ($000's) 72.7 65.3 -- -- 60.5 76.4
Incentive Pay% Incentive Eligible 37% 0% 50% -- 0% 57%25th Percentile ($000's) 2.0 -- -- -- -- 1.950th Percentile ($000's) 6.4 -- -- -- -- 6.375th Percentile ($000's) 6.7 -- -- -- -- 6.6Average ($000's) 5.3 -- -- -- -- 4.4
25th Percentile ($000's) 63.7 61.1 -- -- -- 73.250th Percentile ($000's) 73.2 65.8 -- -- 61.7 80.875th Percentile ($000's) 82.3 69.9 -- -- -- 87.1Average ($000's) 74.5 65.3 -- -- 60.5 78.8
Most Recent New HireEmployers Reported 1 0 0 0 0 1
Median ($000's) -- -- -- -- -- --Average ($000's) -- -- -- -- -- --
Designs, installs, maintains, and coordinates the use of the Local Area or Wide Area Network (LAN/WAN). Evaluates hardware andsoftware, including peripheral, output, and telecommunications equipment. Enforces security procedures, installs network software, andmanages network performance. Troubleshoots and resolves complex problems. Implements and coordinates network policies,procedures, and standards. Trains users. Generally responsible for maintaining moderately complex networks of 25 to 100 nodes.Typically requires a degree and 3–5 years experience. May require certification as a network analyst or engineer.
Industry - Type of Employer
Total Cash CompensationBase Plus Incentive Pay
Job Match Comparability
Page 3-208Southwestern Pennsylvania Annual Compensation and Benefits Study
© 2010 Pittsburgh Technology Council. All rights reserved.

Job Code 752 SENIOR NETWORK ANALYST
Description
Less than 50 50 - 150 151 - 500 More than 500Less than
$7.5M$7.5M to
$25M$26M to $150M
More than $150M
Annual Base PayEmployers Reported 0 2 1 11 1 1 2 10Employees Reported 0 2 1 35 1 1 2 34
25th Percentile ($000's) -- -- -- 64.1 -- -- -- 64.750th Percentile ($000's) -- -- -- 72.4 -- -- -- 72.575th Percentile ($000's) -- -- -- 80.0 -- -- -- 80.0Average ($000's) -- -- -- 73.0 -- -- -- 73.5
Incentive Pay% Incentive Eligible -- 0% 0% 40% 0% 0% 0% 41%
25th Percentile ($000's) -- -- -- 2.0 -- -- -- 2.050th Percentile ($000's) -- -- -- 6.4 -- -- -- 6.475th Percentile ($000's) -- -- -- 6.7 -- -- -- 6.7Average ($000's) -- -- -- 5.3 -- -- -- 5.3
25th Percentile ($000's) -- -- -- 64.1 -- -- -- 64.750th Percentile ($000's) -- -- -- 73.7 -- -- -- 74.175th Percentile ($000's) -- -- -- 84.0 -- -- -- 84.7Average ($000's) -- -- -- 75.0 -- -- -- 75.5
Most Recent New HireEmployers Reported 0 0 0 1 0 0 0 1
Median ($000's) -- -- -- -- -- -- -- --Average ($000's) -- -- -- -- -- -- -- --
Total Cash CompensationBase Plus Incentive Pay
Designs, installs, maintains, and coordinates the use of the Local Area or Wide Area Network (LAN/WAN). Evaluates hardware andsoftware, including peripheral, output, and telecommunications equipment. Enforces security procedures, installs network software, andmanages network performance. Troubleshoots and resolves complex problems. Implements and coordinates network policies,procedures, and standards. Trains users. Generally responsible for maintaining moderately complex networks of 25 to 100 nodes.Typically requires a degree and 3–5 years experience. May require certification as a network analyst or engineer.
Organizational FTE's Organizational Revenue ($ Millions)
Page 3-209Southwestern Pennsylvania Annual Compensation and Benefits Study
© 2010 Pittsburgh Technology Council. All rights reserved.

Job Code 755 NETWORK ENGINEER - ALL LEVELS
Description
2.4% Less Complex92.7% Comparable4.9% More Complex
All Organizations
Software, Computer and
Technology Manufacturing
Life-Sciences/ Biotech/
Medical Devices Not-for-ProfitAll Other
EmployersAnnual Base Pay
Employers Reported 16 4 1 1 2 8Employees Reported 41 7 3 1 3 2725th Percentile ($000's) 73.2 55.2 -- -- -- 81.550th Percentile ($000's) 83.4 73.7 -- -- 75.0 90.275th Percentile ($000's) 98.3 75.7 -- -- -- 103.3Average ($000's) 84.4 66.0 -- -- 73.2 89.8
Incentive Pay% Incentive Eligible 78% 86% 100% 100% 0% 81%25th Percentile ($000's) 2.7 2.2 -- -- -- 3.250th Percentile ($000's) 5.3 2.6 -- -- -- 8.675th Percentile ($000's) 10.9 2.7 -- -- -- 12.4Average ($000's) 6.5 2.9 -- -- -- 7.6
25th Percentile ($000's) 76.3 56.3 -- -- -- 84.150th Percentile ($000's) 86.3 76.3 -- -- 75.0 95.175th Percentile ($000's) 102.2 79.7 -- -- -- 104.9Average ($000's) 89.0 68.0 -- -- 73.2 95.4
Most Recent New HireEmployers Reported 1 0 0 0 0 1
Median ($000's) -- -- -- -- -- --Average ($000's) -- -- -- -- -- --
The data for this position is a combination of the data reported by participants for 753 Network Engineer and 754 Senior NetworkEngineer
Industry - Type of Employer
Total Cash CompensationBase Plus Incentive Pay
Job Match Comparability
Page 3-210Southwestern Pennsylvania Annual Compensation and Benefits Study
© 2010 Pittsburgh Technology Council. All rights reserved.

Job Code 755 NETWORK ENGINEER - ALL LEVELS
Description
Less than 50 50 - 150 151 - 500 More than 500Less than
$7.5M$7.5M to
$25M$26M to $150M
More than $150M
Annual Base PayEmployers Reported 1 3 2 10 1 4 2 9Employees Reported 1 6 2 32 1 7 2 31
25th Percentile ($000's) -- 51.4 -- 80.0 -- 55.2 -- 81.550th Percentile ($000's) -- 62.1 -- 89.3 -- 71.4 -- 90.275th Percentile ($000's) -- 70.9 -- 102.7 -- 75.1 -- 103.3Average ($000's) -- 61.2 -- 89.5 -- 65.5 -- 90.3
Incentive Pay% Incentive Eligible 0% 83% 100% 78% 0% 86% 100% 77%
25th Percentile ($000's) -- 2.0 -- 3.2 -- 2.2 -- 3.250th Percentile ($000's) -- 2.4 -- 7.3 -- 2.6 -- 6.375th Percentile ($000's) -- 2.6 -- 12.1 -- 2.7 -- 12.2Average ($000's) -- 2.3 -- 7.3 -- 3.1 -- 7.2
25th Percentile ($000's) -- 51.4 -- 81.8 -- 56.3 -- 82.550th Percentile ($000's) -- 63.1 -- 94.5 -- 76.3 -- 95.175th Percentile ($000's) -- 73.4 -- 104.6 -- 78.6 -- 104.9Average ($000's) -- 62.7 -- 94.8 -- 67.7 -- 95.4
Most Recent New HireEmployers Reported 0 0 0 1 0 0 0 1
Median ($000's) -- -- -- -- -- -- -- --Average ($000's) -- -- -- -- -- -- -- --
Total Cash CompensationBase Plus Incentive Pay
The data for this position is a combination of the data reported by participants for 753 Network Engineer and 754 Senior NetworkEngineer
Organizational FTE's Organizational Revenue ($ Millions)
Page 3-211Southwestern Pennsylvania Annual Compensation and Benefits Study
© 2010 Pittsburgh Technology Council. All rights reserved.

Job Code 753 NETWORK ENGINEER
Description
6.7% Less Complex86.7% Comparable6.7% More Complex
All Organizations
Software, Computer and
Technology Manufacturing
Life-Sciences/ Biotech/
Medical Devices Not-for-ProfitAll Other
EmployersAnnual Base Pay
Employers Reported 9 2 0 0 0 7Employees Reported 15 5 0 0 0 1025th Percentile ($000's) 66.7 48.0 -- -- -- 69.350th Percentile ($000's) 73.7 62.5 -- -- -- 84.275th Percentile ($000's) 88.3 73.7 -- -- -- 95.7Average ($000's) 76.1 61.1 -- -- -- 83.6
Incentive Pay% Incentive Eligible 73% 100% -- -- -- 60%25th Percentile ($000's) 2.2 2.0 -- -- -- 3.250th Percentile ($000's) 2.7 2.4 -- -- -- 7.375th Percentile ($000's) 7.3 2.6 -- -- -- 9.9Average ($000's) 5.2 2.3 -- -- -- 7.5
25th Percentile ($000's) 72.1 48.0 -- -- -- 76.050th Percentile ($000's) 76.3 64.7 -- -- -- 84.275th Percentile ($000's) 88.3 76.3 -- -- -- 95.7Average ($000's) 79.2 62.9 -- -- -- 87.4
Most Recent New HireEmployers Reported 0 0 0 0 0 0
Median ($000's) -- -- -- -- -- --Average ($000's) -- -- -- -- -- --
Designs, installs, and maintains complex networks typically consisting of 100 or more nodes that link numerous computing platforms,operating systems, and topologies across widely dispersed geographic areas. Evaluates hardware and software suitable for large,complex networks. Designs, tests, and implements interface programs. Develops security procedures. Manages network performance.Troubleshoots and resolves complex problems to ensure no disruption of mission-critical applications. Designs and maintains fault-tolerant systems and manages system backups. May have supervisory responsibility for subordinate network analysts. May requireextensive expertise across hardware and systems supplied by multiple vendors. Normally requires an engineering or related degree,certification as a network engineer, and 3–5 years experience.
Industry - Type of Employer
Total Cash CompensationBase Plus Incentive Pay
Job Match Comparability
Page 3-212Southwestern Pennsylvania Annual Compensation and Benefits Study
© 2010 Pittsburgh Technology Council. All rights reserved.

Job Code 753 NETWORK ENGINEER
Description
Less than 50 50 - 150 151 - 500 More than 500Less than
$7.5M$7.5M to
$25M$26M to $150M
More than $150M
Annual Base PayEmployers Reported 0 2 0 7 0 2 1 6Employees Reported 0 5 0 10 0 5 1 9
25th Percentile ($000's) -- 48.0 -- 69.3 -- 48.0 -- 73.250th Percentile ($000's) -- 62.5 -- 84.2 -- 62.5 -- 86.375th Percentile ($000's) -- 73.7 -- 95.7 -- 73.7 -- 97.5Average ($000's) -- 61.1 -- 83.6 -- 61.1 -- 85.6
Incentive Pay% Incentive Eligible -- 100% -- 60% -- 100% 100% 56%
25th Percentile ($000's) -- 2.0 -- 3.2 -- 2.0 -- 2.750th Percentile ($000's) -- 2.4 -- 7.3 -- 2.4 -- 5.275th Percentile ($000's) -- 2.6 -- 9.9 -- 2.6 -- 9.3Average ($000's) -- 2.3 -- 7.5 -- 2.3 -- 6.9
25th Percentile ($000's) -- 48.0 -- 76.0 -- 48.0 -- 76.350th Percentile ($000's) -- 64.7 -- 84.2 -- 64.7 -- 86.375th Percentile ($000's) -- 76.3 -- 95.7 -- 76.3 -- 97.5Average ($000's) -- 62.9 -- 87.4 -- 62.9 -- 88.6
Most Recent New HireEmployers Reported 0 0 0 0 0 0 0 0
Median ($000's) -- -- -- -- -- -- -- --Average ($000's) -- -- -- -- -- -- -- --
Total Cash CompensationBase Plus Incentive Pay
Designs, installs, and maintains complex networks typically consisting of 100 or more nodes that link numerous computing platforms,operating systems, and topologies across widely dispersed geographic areas. Evaluates hardware and software suitable for large,complex networks. Designs, tests, and implements interface programs. Develops security procedures. Manages network performance.Troubleshoots and resolves complex problems to ensure no disruption of mission-critical applications. Designs and maintains fault-tolerant systems and manages system backups. May have supervisory responsibility for subordinate network analysts. May requireextensive expertise across hardware and systems supplied by multiple vendors. Normally requires an engineering or related degree,certification as a network engineer, and 3–5 years experience.
Organizational FTE's Organizational Revenue ($ Millions)
Page 3-213Southwestern Pennsylvania Annual Compensation and Benefits Study
© 2010 Pittsburgh Technology Council. All rights reserved.

Job Code 754 SENIOR NETWORK ENGINEER
Description
0.0% Less Complex96.2% Comparable3.8% More Complex
All Organizations
Software, Computer and
Technology Manufacturing
Life-Sciences/ Biotech/
Medical Devices Not-for-ProfitAll Other
EmployersAnnual Base Pay
Employers Reported 11 2 1 1 2 5Employees Reported 26 2 3 1 3 1725th Percentile ($000's) 78.1 -- -- -- -- 85.050th Percentile ($000's) 87.4 -- -- -- 75.0 92.075th Percentile ($000's) 103.8 -- -- -- -- 105.7Average ($000's) 89.1 -- -- -- 73.2 93.4
Incentive Pay% Incentive Eligible 81% 50% 100% 100% 0% 94%25th Percentile ($000's) 3.7 -- -- -- -- 3.250th Percentile ($000's) 6.0 -- -- -- -- 10.175th Percentile ($000's) 11.9 -- -- -- -- 12.4Average ($000's) 7.2 -- -- -- -- 7.7
25th Percentile ($000's) 81.2 -- -- -- -- 92.250th Percentile ($000's) 94.5 -- -- -- 75.0 101.975th Percentile ($000's) 105.1 -- -- -- -- 118.1Average ($000's) 94.6 -- -- -- 73.2 100.1
Most Recent New HireEmployers Reported 1 0 0 0 0 1
Median ($000's) -- -- -- -- -- --Average ($000's) -- -- -- -- -- --
Designs more complex communications networks. Employs expert knowledge of data, voice, fax, and video transport facilities, protocols,operating systems, and standards and regulations for public and private data networks. Projects usage and required capacities based onanalysis of existing and emerging products and services. Locates, evaluates, and specifies products, services, and vendors. Works withvendors to evaluate new products and resolve equipment design problems. Prepares reports as necessary to inform and advise seniortechnical staff and management. Requires a degree in engineering or computer science or equivalent experience and education. Typicallyrequires 5-7 years network design and engineering experience.
Industry - Type of Employer
Total Cash CompensationBase Plus Incentive Pay
Job Match Comparability
Page 3-214Southwestern Pennsylvania Annual Compensation and Benefits Study
© 2010 Pittsburgh Technology Council. All rights reserved.

Job Code 754 SENIOR NETWORK ENGINEER
Description
Less than 50 50 - 150 151 - 500 More than 500Less than
$7.5M$7.5M to
$25M$26M to $150M
More than $150M
Annual Base PayEmployers Reported 1 1 2 7 1 2 1 7Employees Reported 1 1 2 22 1 2 1 22
25th Percentile ($000's) -- -- -- 83.1 -- -- -- 83.150th Percentile ($000's) -- -- -- 91.4 -- -- -- 91.475th Percentile ($000's) -- -- -- 105.4 -- -- -- 105.4Average ($000's) -- -- -- 92.2 -- -- -- 92.2
Incentive Pay% Incentive Eligible 0% 0% 100% 86% 0% 50% 100% 86%
25th Percentile ($000's) -- -- -- 3.3 -- -- -- 3.350th Percentile ($000's) -- -- -- 6.9 -- -- -- 6.975th Percentile ($000's) -- -- -- 12.2 -- -- -- 12.2Average ($000's) -- -- -- 7.3 -- -- -- 7.3
25th Percentile ($000's) -- -- -- 86.4 -- -- -- 86.450th Percentile ($000's) -- -- -- 99.3 -- -- -- 99.375th Percentile ($000's) -- -- -- 113.1 -- -- -- 113.1Average ($000's) -- -- -- 98.2 -- -- -- 98.2
Most Recent New HireEmployers Reported 0 0 0 1 0 0 0 1
Median ($000's) -- -- -- -- -- -- -- --Average ($000's) -- -- -- -- -- -- -- --
Total Cash CompensationBase Plus Incentive Pay
Designs more complex communications networks. Employs expert knowledge of data, voice, fax, and video transport facilities, protocols,operating systems, and standards and regulations for public and private data networks. Projects usage and required capacities based onanalysis of existing and emerging products and services. Locates, evaluates, and specifies products, services, and vendors. Works withvendors to evaluate new products and resolve equipment design problems. Prepares reports as necessary to inform and advise seniortechnical staff and management. Requires a degree in engineering or computer science or equivalent experience and education. Typicallyrequires 5-7 years network design and engineering experience.
Organizational FTE's Organizational Revenue ($ Millions)
Page 3-215Southwestern Pennsylvania Annual Compensation and Benefits Study
© 2010 Pittsburgh Technology Council. All rights reserved.

Job Code 760 PC SUPPORT SPECIALIST
Description
7.6% Less Complex84.8% Comparable7.6% More Complex
All Organizations
Software, Computer and
Technology Manufacturing
Life-Sciences/ Biotech/
Medical Devices Not-for-ProfitAll Other
EmployersAnnual Base Pay
Employers Reported 29 6 7 3 5 8Employees Reported 145 26 9 6 16 8825th Percentile ($000's) 34.8 25.0 34.0 35.9 34.9 37.050th Percentile ($000's) 40.0 27.9 36.4 37.4 37.3 43.875th Percentile ($000's) 46.8 30.9 54.1 44.8 40.0 51.4Average ($000's) 41.2 29.9 42.7 40.0 37.6 45.1
Incentive Pay% Incentive Eligible 63% 15% 89% 100% 0% 83%25th Percentile ($000's) 1.5 -- 2.4 1.5 -- 1.550th Percentile ($000's) 2.0 3.1 3.4 1.6 -- 1.975th Percentile ($000's) 3.1 -- 4.4 4.5 -- 2.9Average ($000's) 2.4 2.7 3.4 3.3 -- 2.3
25th Percentile ($000's) 34.9 25.0 34.0 37.0 34.9 38.150th Percentile ($000's) 40.8 27.9 39.1 38.9 37.3 45.375th Percentile ($000's) 49.1 30.9 55.6 48.5 40.0 53.3Average ($000's) 42.4 30.3 44.2 42.7 37.6 46.7
Most Recent New HireEmployers Reported 10 0 2 0 2 6
Median ($000's) 35.0 -- -- -- -- 37.6Average ($000's) 37.2 -- -- -- -- 38.7
Provides technical assistance and training to PC users. Staffs a helpdesk or information center. Responds to users' requests forassistance by phone and in person. Installs and modifies hardware and software. Diagnoses hardware, software, and operator problemsand takes remedial actions or recommends procedural changes. May install and configure peripheral equipment such as monitors,keyboards, printers, and disk drives. May load and configure software such as operating systems and environments, and applicationssuch as word processing, database, and spreadsheet programs. Requires comprehensive knowledge of the employer's PC equipment andsoftware. Generally requires comprehensive knowledge of one or more operating systems and environments and 1–2 years experience.May require a degree.
Industry - Type of Employer
Total Cash CompensationBase Plus Incentive Pay
Job Match Comparability
Page 3-216Southwestern Pennsylvania Annual Compensation and Benefits Study
© 2010 Pittsburgh Technology Council. All rights reserved.

Job Code 760 PC SUPPORT SPECIALIST
Description
Less than 50 50 - 150 151 - 500 More than 500Less than
$7.5M$7.5M to
$25M$26M to $150M
More than $150M
Annual Base PayEmployers Reported 0 5 8 16 0 6 7 16Employees Reported 0 5 13 127 0 7 10 128
25th Percentile ($000's) -- 36.0 30.0 34.9 -- 40.2 30.9 34.850th Percentile ($000's) -- 44.4 35.4 40.0 -- 45.0 36.0 39.775th Percentile ($000's) -- 45.0 42.7 47.9 -- 46.8 42.5 47.9Average ($000's) -- 41.7 36.6 41.6 -- 43.2 36.4 41.4
Incentive Pay% Incentive Eligible -- 80% 54% 63% -- 86% 30% 64%
25th Percentile ($000's) -- -- 3.8 1.5 -- 3.3 -- 1.550th Percentile ($000's) -- 2.5 4.5 1.9 -- 4.2 3.1 1.975th Percentile ($000's) -- -- 6.1 3.0 -- 5.3 -- 3.0Average ($000's) -- 2.5 5.1 2.3 -- 4.3 3.1 2.3
25th Percentile ($000's) -- 36.0 30.0 34.9 -- 40.5 30.9 34.950th Percentile ($000's) -- 45.0 35.4 40.8 -- 48.4 36.0 40.675th Percentile ($000's) -- 48.4 42.7 49.6 -- 51.6 42.5 49.4Average ($000's) -- 42.7 37.8 42.9 -- 45.6 36.7 42.7
Most Recent New HireEmployers Reported 0 0 3 7 0 0 2 8
Median ($000's) -- -- 35.4 34.9 -- -- -- 34.9Average ($000's) -- -- 35.4 37.7 -- -- -- 37.0
Total Cash CompensationBase Plus Incentive Pay
Provides technical assistance and training to PC users. Staffs a helpdesk or information center. Responds to users' requests forassistance by phone and in person. Installs and modifies hardware and software. Diagnoses hardware, software, and operator problemsand takes remedial actions or recommends procedural changes. May install and configure peripheral equipment such as monitors,keyboards, printers, and disk drives. May load and configure software such as operating systems and environments, and applicationssuch as word processing, database, and spreadsheet programs. Requires comprehensive knowledge of the employer's PC equipment andsoftware. Generally requires comprehensive knowledge of one or more operating systems and environments and 1–2 years experience.May require a degree.
Organizational FTE's Organizational Revenue ($ Millions)
Page 3-217Southwestern Pennsylvania Annual Compensation and Benefits Study
© 2010 Pittsburgh Technology Council. All rights reserved.

Job Code 810 CUSTOMER SERVICE REPRESENTATIVE - ALL LEVELS
Description
0.4% Less Complex97.9% Comparable1.7% More Complex
All Organizations
Software, Computer and
Technology Manufacturing
Life-Sciences/ Biotech/
Medical Devices Not-for-ProfitAll Other
EmployersAnnual Base Pay
Employers Reported 33 4 12 4 6 7Employees Reported 767 35 35 73 45 57925th Percentile ($000's) 28.6 29.0 32.5 32.5 28.5 28.250th Percentile ($000's) 32.6 33.8 47.5 35.3 33.3 31.675th Percentile ($000's) 38.2 41.8 55.5 40.5 36.3 36.8Average ($000's) 35.8 37.4 45.7 37.5 33.8 35.1
Incentive Pay% Incentive Eligible 79% 26% 63% 100% 9% 86%25th Percentile ($000's) 1.6 1.5 1.9 1.3 -- 1.750th Percentile ($000's) 1.8 1.7 2.5 1.5 2.1 1.875th Percentile ($000's) 2.1 1.9 3.0 1.9 -- 2.1Average ($000's) 1.8 1.8 2.8 1.7 1.8 1.8
25th Percentile ($000's) 30.1 29.0 34.5 33.8 28.5 29.950th Percentile ($000's) 34.1 33.8 47.5 36.7 33.3 33.575th Percentile ($000's) 39.9 43.3 57.5 42.2 36.3 38.9Average ($000's) 37.2 37.9 47.3 39.0 34.0 36.6
Most Recent New HireEmployers Reported 6 1 2 2 0 1
Median ($000's) 28.2 -- -- -- -- --Average ($000's) 30.2 -- -- -- -- --
The data for this position is a combination of the data reported by participants for 811 Customer Service Representative and 813 SeniorCustomer Service Representative
Industry - Type of Employer
Total Cash CompensationBase Plus Incentive Pay
Job Match Comparability
Page 3-218Southwestern Pennsylvania Annual Compensation and Benefits Study
© 2010 Pittsburgh Technology Council. All rights reserved.

Job Code 810 CUSTOMER SERVICE REPRESENTATIVE - ALL LEVELS
Description
Less than 50 50 - 150 151 - 500 More than 500Less than
$7.5M$7.5M to
$25M$26M to $150M
More than $150M
Annual Base PayEmployers Reported 7 7 7 12 8 7 6 12Employees Reported 11 61 27 668 52 30 13 672
25th Percentile ($000's) 36.5 28.6 31.0 28.5 28.5 31.5 30.2 28.550th Percentile ($000's) 38.6 34.3 33.0 32.4 33.5 39.1 35.1 32.475th Percentile ($000's) 45.3 40.1 38.0 37.6 38.4 42.9 41.6 37.6Average ($000's) 39.9 36.6 35.3 35.7 34.6 40.6 36.8 35.7
Incentive Pay% Incentive Eligible 64% 30% 52% 85% 13% 93% 31% 85%
25th Percentile ($000's) 0.9 1.6 2.0 1.6 0.9 1.9 -- 1.650th Percentile ($000's) 0.9 1.9 2.0 1.8 0.9 2.0 -- 1.875th Percentile ($000's) 1.0 2.1 3.7 2.1 1.0 2.9 -- 2.1Average ($000's) 0.9 1.9 3.0 1.8 0.9 2.5 -- 1.8
25th Percentile ($000's) 36.5 29.1 33.0 30.0 28.5 34.0 30.2 30.150th Percentile ($000's) 38.6 34.3 35.0 34.0 33.5 41.3 35.1 34.075th Percentile ($000's) 45.3 40.1 41.6 39.6 38.4 46.8 41.6 39.5Average ($000's) 40.1 37.0 36.9 37.2 34.7 42.4 36.8 37.2
Most Recent New HireEmployers Reported 0 0 3 3 0 1 2 3
Median ($000's) -- -- 29.7 28.1 -- -- -- 28.1Average ($000's) -- -- 28.5 30.6 -- -- -- 30.6
Total Cash CompensationBase Plus Incentive Pay
The data for this position is a combination of the data reported by participants for 811 Customer Service Representative and 813 SeniorCustomer Service Representative
Organizational FTE's Organizational Revenue ($ Millions)
Page 3-219Southwestern Pennsylvania Annual Compensation and Benefits Study
© 2010 Pittsburgh Technology Council. All rights reserved.

Job Code 811 CUSTOMER SERVICE REPRESENTATIVE
Description
0.3% Less Complex99.3% Comparable0.4% More Complex
All Organizations
Software, Computer and
Technology Manufacturing
Life-Sciences/ Biotech/
Medical Devices Not-for-ProfitAll Other
EmployersAnnual Base Pay
Employers Reported 28 4 8 3 6 7Employees Reported 671 26 24 47 36 53825th Percentile ($000's) 28.3 28.3 32.0 32.4 28.5 28.150th Percentile ($000's) 31.8 30.5 46.0 33.3 31.5 31.175th Percentile ($000's) 36.4 41.8 56.3 35.4 34.6 36.2Average ($000's) 34.9 37.4 44.3 34.6 31.8 34.7
Incentive Pay% Incentive Eligible 80% 35% 54% 100% 8% 87%25th Percentile ($000's) 1.5 1.5 2.0 1.3 -- 1.650th Percentile ($000's) 1.8 1.7 2.4 1.4 2.1 1.875th Percentile ($000's) 2.1 1.9 2.7 1.5 -- 2.1Average ($000's) 1.8 1.8 2.5 1.4 1.7 1.8
25th Percentile ($000's) 29.9 28.3 34.0 33.0 28.5 29.850th Percentile ($000's) 33.3 30.5 47.3 34.6 31.8 32.775th Percentile ($000's) 38.3 43.3 58.1 36.8 34.6 38.2Average ($000's) 36.3 38.0 46.0 35.8 32.0 36.2
Most Recent New HireEmployers Reported 5 1 1 2 0 1
Median ($000's) 28.1 -- -- -- -- --Average ($000's) 28.7 -- -- -- -- --
Handles service inquiries and problems presented by external customers. Examines warranty claims, handles customer returns andexchanges. Follows established guidelines on servicing and repairs/returns. May provide product and pricing information. Promotes andmaintains positive customer relations. Maintains logs, records, and files. Requires comprehensive working knowledge of employer’sproducts and policies. Typically requires 1–3 years experience or an equivalent combination of education and experience.
Industry - Type of Employer
Total Cash CompensationBase Plus Incentive Pay
Job Match Comparability
Page 3-220Southwestern Pennsylvania Annual Compensation and Benefits Study
© 2010 Pittsburgh Technology Council. All rights reserved.

Job Code 811 CUSTOMER SERVICE REPRESENTATIVE
Description
Less than 50 50 - 150 151 - 500 More than 500Less than
$7.5M$7.5M to
$25M$26M to $150M
More than $150M
Annual Base PayEmployers Reported 5 6 5 12 6 6 4 12Employees Reported 5 48 16 602 36 21 7 607
25th Percentile ($000's) 32.0 28.5 31.0 28.2 28.4 31.0 28.7 28.250th Percentile ($000's) 37.9 33.1 31.6 31.7 30.3 40.4 33.3 31.875th Percentile ($000's) 38.6 40.0 34.0 36.3 33.7 46.4 39.8 36.2Average ($000's) 35.2 35.4 33.2 35.0 31.1 41.8 34.2 34.9
Incentive Pay% Incentive Eligible 60% 31% 25% 86% 8% 90% 0% 85%
25th Percentile ($000's) -- 1.5 -- 1.5 -- 1.6 -- 1.550th Percentile ($000's) 0.9 1.9 2.0 1.8 0.9 2.0 -- 1.875th Percentile ($000's) -- 2.2 -- 2.1 -- 2.0 -- 2.1Average ($000's) 0.9 1.9 2.3 1.8 0.9 1.9 -- 1.8
25th Percentile ($000's) 32.0 28.5 32.5 29.9 28.4 33.0 28.7 29.950th Percentile ($000's) 37.9 33.4 33.1 33.2 30.3 41.2 33.3 33.375th Percentile ($000's) 38.6 40.0 35.8 38.2 33.7 48.0 39.8 38.2Average ($000's) 35.4 35.8 34.5 36.4 31.2 43.2 34.2 36.4
Most Recent New HireEmployers Reported 0 0 2 3 0 1 1 3
Median ($000's) -- -- -- 28.1 -- -- -- 28.1Average ($000's) -- -- -- 29.1 -- -- -- 29.1
Total Cash CompensationBase Plus Incentive Pay
Handles service inquiries and problems presented by external customers. Examines warranty claims, handles customer returns andexchanges. Follows established guidelines on servicing and repairs/returns. May provide product and pricing information. Promotes andmaintains positive customer relations. Maintains logs, records, and files. Requires comprehensive working knowledge of employer’sproducts and policies. Typically requires 1–3 years experience or an equivalent combination of education and experience.
Organizational FTE's Organizational Revenue ($ Millions)
Page 3-221Southwestern Pennsylvania Annual Compensation and Benefits Study
© 2010 Pittsburgh Technology Council. All rights reserved.

Job Code 813 SENIOR CUSTOMER SERVICE REPRESENTATIVE
Description
1.0% Less Complex88.5% Comparable10.4% More Complex
All Organizations
Software, Computer and
Technology Manufacturing
Life-Sciences/ Biotech/
Medical Devices Not-for-ProfitAll Other
EmployersAnnual Base Pay
Employers Reported 21 2 7 4 3 5Employees Reported 96 9 11 26 9 4125th Percentile ($000's) 34.9 33.8 35.5 37.9 39.3 34.150th Percentile ($000's) 39.5 35.5 49.3 42.9 39.9 38.475th Percentile ($000's) 45.4 38.0 51.8 47.4 41.6 41.6Average ($000's) 42.0 37.5 48.8 42.9 41.8 40.7
Incentive Pay% Incentive Eligible 72% 0% 82% 100% 11% 80%25th Percentile ($000's) 1.9 -- 3.7 1.8 -- 2.050th Percentile ($000's) 2.1 -- 6.3 1.9 -- 2.175th Percentile ($000's) 2.5 -- 6.3 3.1 -- 2.5Average ($000's) 2.4 -- 4.5 2.4 -- 2.2
25th Percentile ($000's) 36.2 33.8 35.5 41.2 39.3 35.850th Percentile ($000's) 41.3 35.5 49.3 44.2 39.9 40.775th Percentile ($000's) 47.0 38.0 52.3 49.4 41.6 44.4Average ($000's) 43.5 37.5 50.0 44.9 42.0 42.5
Most Recent New HireEmployers Reported 3 0 1 2 0 0
Median ($000's) 36.3 -- -- -- -- --Average ($000's) 35.8 -- -- -- -- --
Performs nonroutine support activities in the customer service function. Responds to external customer inquiries requiring research toaddress status of order, repair, return, or field servicing. Promotes and maintains positive customer relations in stressful and potentiallyadversarial situations. Interacts with other departments to ensure timely delivery or service, or resolution of compliant. May providedirection to lower-level representatives in the successful delivery of complex support or service. Requires comprehensive workingknowledge of employer’s products and policies. Normally requires 3-5 years of experience.
Industry - Type of Employer
Total Cash CompensationBase Plus Incentive Pay
Job Match Comparability
Page 3-222Southwestern Pennsylvania Annual Compensation and Benefits Study
© 2010 Pittsburgh Technology Council. All rights reserved.

Job Code 813 SENIOR CUSTOMER SERVICE REPRESENTATIVE
Description
Less than 50 50 - 150 151 - 500 More than 500Less than
$7.5M$7.5M to
$25M$26M to $150M
More than $150M
Annual Base PayEmployers Reported 5 4 4 8 7 3 4 7Employees Reported 6 13 11 66 16 9 6 65
25th Percentile ($000's) 38.6 37.1 33.0 34.6 38.0 33.0 32.0 34.450th Percentile ($000's) 45.3 39.7 37.8 39.5 40.0 37.8 38.4 39.575th Percentile ($000's) 48.9 46.8 40.7 44.5 47.7 38.2 47.3 44.6Average ($000's) 43.8 41.1 38.3 42.6 42.6 37.7 39.9 42.7
Incentive Pay% Incentive Eligible 67% 23% 91% 79% 25% 100% 67% 80%
25th Percentile ($000's) -- -- 3.3 1.9 -- 3.1 -- 1.950th Percentile ($000's) 1.0 2.1 3.7 2.1 1.0 3.6 -- 2.175th Percentile ($000's) -- -- 4.7 2.4 -- 4.4 -- 2.4Average ($000's) 1.0 2.1 4.0 2.3 1.0 3.8 -- 2.3
25th Percentile ($000's) 38.6 37.1 35.6 36.3 38.0 36.2 32.0 36.350th Percentile ($000's) 45.3 39.7 41.4 41.6 40.0 41.4 38.4 41.575th Percentile ($000's) 48.9 46.8 45.9 46.1 47.7 42.8 47.3 46.3Average ($000's) 44.0 41.3 40.5 44.4 42.6 40.7 39.9 44.4
Most Recent New HireEmployers Reported 0 0 2 1 0 1 1 1
Median ($000's) -- -- -- -- -- -- -- --Average ($000's) -- -- -- -- -- -- -- --
Total Cash CompensationBase Plus Incentive Pay
Performs nonroutine support activities in the customer service function. Responds to external customer inquiries requiring research toaddress status of order, repair, return, or field servicing. Promotes and maintains positive customer relations in stressful and potentiallyadversarial situations. Interacts with other departments to ensure timely delivery or service, or resolution of compliant. May providedirection to lower-level representatives in the successful delivery of complex support or service. Requires comprehensive workingknowledge of employer’s products and policies. Normally requires 3-5 years of experience.
Organizational FTE's Organizational Revenue ($ Millions)
Page 3-223Southwestern Pennsylvania Annual Compensation and Benefits Study
© 2010 Pittsburgh Technology Council. All rights reserved.

Job Code 815 CUSTOMER SERVICE SUPERVISOR
Description
7.7% Less Complex92.3% Comparable0.0% More Complex
All Organizations
Software, Computer and
Technology Manufacturing
Life-Sciences/ Biotech/
Medical Devices Not-for-ProfitAll Other
EmployersAnnual Base Pay
Employers Reported 9 0 3 2 2 2Employees Reported 13 0 3 3 2 525th Percentile ($000's) 57.1 -- -- -- -- 69.750th Percentile ($000's) 63.0 -- 58.3 66.9 -- 72.075th Percentile ($000's) 71.4 -- -- -- -- 74.9Average ($000's) 63.5 -- 57.2 60.8 -- 71.8
Incentive Pay% Incentive Eligible 54% -- 67% 100% 0% 40%25th Percentile ($000's) 5.1 -- -- -- -- --50th Percentile ($000's) 5.3 -- -- 5.0 -- --75th Percentile ($000's) 7.2 -- -- -- -- --Average ($000's) 6.0 -- -- 4.8 -- --
25th Percentile ($000's) 57.1 -- -- -- -- 72.050th Percentile ($000's) 68.4 -- 62.5 71.9 -- 74.975th Percentile ($000's) 74.9 -- -- -- -- 77.5Average ($000's) 66.3 -- 59.9 65.6 -- 74.5
Most Recent New HireEmployers Reported 2 0 0 1 0 1
Median ($000's) -- -- -- -- -- --Average ($000's) -- -- -- -- -- --
Supervises customer service representatives who are responsible for processing orders, corresponding with customers, and coordinatinginternally with units such as purchasing, production, engineering, or shipping. May supervise fulfillment. May oversee distribution oforganization's products. May have responsibility for warehousing products and maintaining inventory. Normally requires education beyondhigh school and 4–6 years related experience.
Industry - Type of Employer
Total Cash CompensationBase Plus Incentive Pay
Job Match Comparability
Page 3-224Southwestern Pennsylvania Annual Compensation and Benefits Study
© 2010 Pittsburgh Technology Council. All rights reserved.

Job Code 815 CUSTOMER SERVICE SUPERVISOR
Description
Less than 50 50 - 150 151 - 500 More than 500Less than
$7.5M$7.5M to
$25M$26M to $150M
More than $150M
Annual Base PayEmployers Reported 0 1 4 4 0 1 4 4Employees Reported 0 1 4 8 0 1 4 8
25th Percentile ($000's) -- -- -- 65.9 -- -- -- 65.950th Percentile ($000's) -- -- 54.0 70.5 -- -- 56.4 70.575th Percentile ($000's) -- -- -- 72.7 -- -- -- 72.7Average ($000's) -- -- 53.6 69.1 -- -- 55.5 70.0
Incentive Pay% Incentive Eligible -- 100% 50% 50% -- 100% 50% 50%
25th Percentile ($000's) -- -- -- -- -- -- -- --50th Percentile ($000's) -- -- -- 5.3 -- -- -- 5.375th Percentile ($000's) -- -- -- -- -- -- -- --Average ($000's) -- -- -- 5.9 -- -- -- 5.9
25th Percentile ($000's) -- -- -- 71.0 -- -- -- 71.050th Percentile ($000's) -- -- 54.0 73.4 -- -- 56.4 73.475th Percentile ($000's) -- -- -- 76.9 -- -- -- 76.9Average ($000's) -- -- 54.7 72.1 -- -- 57.5 72.9
Most Recent New HireEmployers Reported 0 0 1 1 0 1 0 1
Median ($000's) -- -- -- -- -- -- -- --Average ($000's) -- -- -- -- -- -- -- --
Total Cash CompensationBase Plus Incentive Pay
Supervises customer service representatives who are responsible for processing orders, corresponding with customers, and coordinatinginternally with units such as purchasing, production, engineering, or shipping. May supervise fulfillment. May oversee distribution oforganization's products. May have responsibility for warehousing products and maintaining inventory. Normally requires education beyondhigh school and 4–6 years related experience.
Organizational FTE's Organizational Revenue ($ Millions)
Page 3-225Southwestern Pennsylvania Annual Compensation and Benefits Study
© 2010 Pittsburgh Technology Council. All rights reserved.

Job Code 817 CUSTOMER SERVICE MANAGER
Description
0.0% Less Complex93.3% Comparable6.7% More Complex
All Organizations
Software, Computer and
Technology Manufacturing
Life-Sciences/ Biotech/
Medical Devices Not-for-ProfitAll Other
EmployersAnnual Base Pay
Employers Reported 9 1 2 1 2 3Employees Reported 15 1 2 5 2 525th Percentile ($000's) 74.8 -- -- -- -- 72.550th Percentile ($000's) 77.4 -- -- -- -- 84.875th Percentile ($000's) 105.7 -- -- -- -- 106.9Average ($000's) 90.0 -- -- -- -- 87.5
Incentive Pay% Incentive Eligible 80% 100% 50% 100% 0% 100%25th Percentile ($000's) 5.7 -- -- -- -- 4.750th Percentile ($000's) 8.2 -- -- -- -- 8.275th Percentile ($000's) 15.4 -- -- -- -- 15.4Average ($000's) 11.5 -- -- -- -- 10.9
25th Percentile ($000's) 78.5 -- -- -- -- 80.750th Percentile ($000's) 82.3 -- -- -- -- 88.375th Percentile ($000's) 121.1 -- -- -- -- 122.3Average ($000's) 98.4 -- -- -- -- 98.4
Most Recent New HireEmployers Reported 1 1 0 0 0 0
Median ($000's) -- -- -- -- -- --Average ($000's) -- -- -- -- -- --
Manages the activities of the customer service staff. Ensures that the volume of work meets performance measures relating to customersatisfaction. Develops operating policies and procedures. Develops the business plan for the unit including budget development.Approves personnel activities concerning hiring, training and evaluation of staff performance. Typically requires 5-7 years of relatedexperience.
Industry - Type of Employer
Total Cash CompensationBase Plus Incentive Pay
Job Match Comparability
Page 3-226Southwestern Pennsylvania Annual Compensation and Benefits Study
© 2010 Pittsburgh Technology Council. All rights reserved.

Job Code 817 CUSTOMER SERVICE MANAGER
Description
Less than 50 50 - 150 151 - 500 More than 500Less than
$7.5M$7.5M to
$25M$26M to $150M
More than $150M
Annual Base PayEmployers Reported 1 1 1 6 2 0 1 6Employees Reported 1 1 1 12 2 0 1 12
25th Percentile ($000's) -- -- -- 73.7 -- -- -- 73.750th Percentile ($000's) -- -- -- 80.6 -- -- -- 80.675th Percentile ($000's) -- -- -- 105.2 -- -- -- 105.2Average ($000's) -- -- -- 88.9 -- -- -- 88.9
Incentive Pay% Incentive Eligible 100% 0% 0% 92% 50% -- 0% 92%
25th Percentile ($000's) -- -- -- 5.7 -- -- -- 5.750th Percentile ($000's) -- -- -- 8.2 -- -- -- 8.275th Percentile ($000's) -- -- -- 15.4 -- -- -- 15.4Average ($000's) -- -- -- 11.5 -- -- -- 11.5
25th Percentile ($000's) -- -- -- 80.4 -- -- -- 80.450th Percentile ($000's) -- -- -- 85.3 -- -- -- 85.375th Percentile ($000's) -- -- -- 120.5 -- -- -- 120.5Average ($000's) -- -- -- 99.4 -- -- -- 99.4
Most Recent New HireEmployers Reported 1 0 0 0 1 0 0 0
Median ($000's) -- -- -- -- -- -- -- --Average ($000's) -- -- -- -- -- -- -- --
Total Cash CompensationBase Plus Incentive Pay
Manages the activities of the customer service staff. Ensures that the volume of work meets performance measures relating to customersatisfaction. Develops operating policies and procedures. Develops the business plan for the unit including budget development.Approves personnel activities concerning hiring, training and evaluation of staff performance. Typically requires 5-7 years of relatedexperience.
Organizational FTE's Organizational Revenue ($ Millions)
Page 3-227Southwestern Pennsylvania Annual Compensation and Benefits Study
© 2010 Pittsburgh Technology Council. All rights reserved.

Job Code 825 PRODUCT SUPPORT SPECIALIST - ALL LEVELS
Description
38.2% Less Complex59.9% Comparable1.9% More Complex
All Organizations
Software, Computer and
Technology Manufacturing
Life-Sciences/ Biotech/
Medical Devices Not-for-ProfitAll Other
EmployersAnnual Base Pay
Employers Reported 12 6 3 2 0 1Employees Reported 212 74 9 125 0 425th Percentile ($000's) 40.0 39.1 63.0 40.4 -- --50th Percentile ($000's) 48.1 47.2 65.0 47.4 -- --75th Percentile ($000's) 55.6 57.8 67.9 53.9 -- --Average ($000's) 49.8 50.6 63.7 47.9 -- --
Incentive Pay% Incentive Eligible 38% 49% 89% 26% -- 100%25th Percentile ($000's) 2.7 2.3 -- 2.7 -- --50th Percentile ($000's) 3.0 3.6 -- 2.9 -- --75th Percentile ($000's) 3.5 4.1 -- 3.2 -- --Average ($000's) 3.0 3.4 -- 2.8 -- --
25th Percentile ($000's) 40.1 40.0 63.0 40.4 -- --50th Percentile ($000's) 49.7 47.8 65.0 49.4 -- --75th Percentile ($000's) 56.8 59.9 67.9 54.7 -- --Average ($000's) 50.6 51.8 63.7 48.6 -- --
Most Recent New HireEmployers Reported 4 3 0 1 0 0
Median ($000's) 42.0 41.0 -- -- -- --Average ($000's) 46.6 48.7 -- -- -- --
The data for this position is a combination of the data reported by participants for 826 Product Support Specialist I, 827 Product SupportSpecialist II and 828 Product Support Specialist III
Industry - Type of Employer
Total Cash CompensationBase Plus Incentive Pay
Job Match Comparability
Page 3-228Southwestern Pennsylvania Annual Compensation and Benefits Study
© 2010 Pittsburgh Technology Council. All rights reserved.

Job Code 825 PRODUCT SUPPORT SPECIALIST - ALL LEVELS
Description
Less than 50 50 - 150 151 - 500 More than 500Less than
$7.5M$7.5M to
$25M$26M to $150M
More than $150M
Annual Base PayEmployers Reported 1 4 3 4 1 4 2 5Employees Reported 3 22 23 164 3 22 16 171
25th Percentile ($000's) -- 39.0 53.8 40.0 -- 39.0 53.1 40.150th Percentile ($000's) -- 42.0 60.0 47.4 -- 42.0 54.8 47.475th Percentile ($000's) -- 61.8 64.8 54.6 -- 61.8 60.7 55.2Average ($000's) -- 49.9 60.9 48.3 -- 49.9 57.9 49.1
Incentive Pay% Incentive Eligible 0% 95% 100% 22% 0% 95% 100% 25%
25th Percentile ($000's) -- 2.0 3.7 2.7 -- 2.0 3.7 2.750th Percentile ($000's) -- 2.2 4.0 2.9 -- 2.2 4.0 2.975th Percentile ($000's) -- 2.9 4.2 3.2 -- 2.9 4.2 3.2Average ($000's) -- 2.4 4.2 2.8 -- 2.4 4.2 2.8
25th Percentile ($000's) -- 39.3 57.1 40.0 -- 39.3 56.8 40.150th Percentile ($000's) -- 42.8 63.0 47.7 -- 42.8 58.8 49.375th Percentile ($000's) -- 64.0 67.6 55.3 -- 64.0 64.9 55.7Average ($000's) -- 51.2 63.5 48.8 -- 51.2 61.6 49.6
Most Recent New HireEmployers Reported 0 1 1 2 0 1 1 2
Median ($000's) -- -- -- -- -- -- -- --Average ($000's) -- -- -- -- -- -- -- --
Total Cash CompensationBase Plus Incentive Pay
The data for this position is a combination of the data reported by participants for 826 Product Support Specialist I, 827 Product SupportSpecialist II and 828 Product Support Specialist III
Organizational FTE's Organizational Revenue ($ Millions)
Page 3-229Southwestern Pennsylvania Annual Compensation and Benefits Study
© 2010 Pittsburgh Technology Council. All rights reserved.
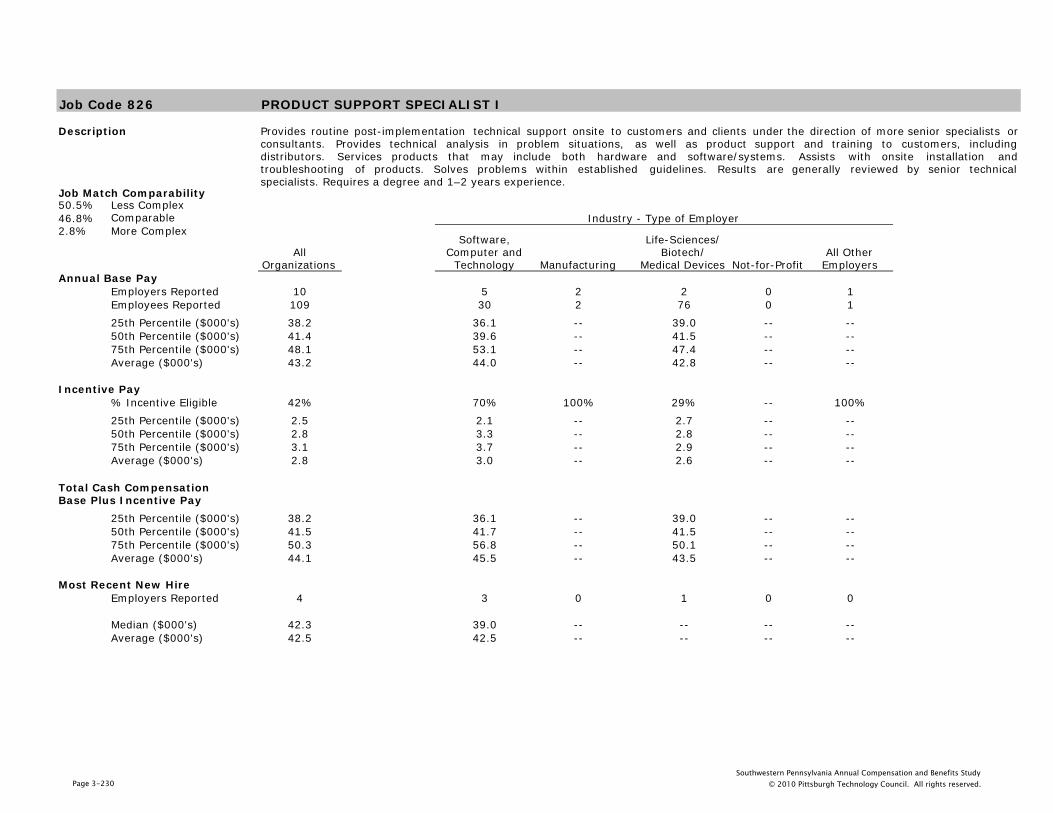
Job Code 826 PRODUCT SUPPORT SPECIALIST I
Description
50.5% Less Complex46.8% Comparable2.8% More Complex
All Organizations
Software, Computer and
Technology Manufacturing
Life-Sciences/ Biotech/
Medical Devices Not-for-ProfitAll Other
EmployersAnnual Base Pay
Employers Reported 10 5 2 2 0 1Employees Reported 109 30 2 76 0 125th Percentile ($000's) 38.2 36.1 -- 39.0 -- --50th Percentile ($000's) 41.4 39.6 -- 41.5 -- --75th Percentile ($000's) 48.1 53.1 -- 47.4 -- --Average ($000's) 43.2 44.0 -- 42.8 -- --
Incentive Pay% Incentive Eligible 42% 70% 100% 29% -- 100%25th Percentile ($000's) 2.5 2.1 -- 2.7 -- --50th Percentile ($000's) 2.8 3.3 -- 2.8 -- --75th Percentile ($000's) 3.1 3.7 -- 2.9 -- --Average ($000's) 2.8 3.0 -- 2.6 -- --
25th Percentile ($000's) 38.2 36.1 -- 39.0 -- --50th Percentile ($000's) 41.5 41.7 -- 41.5 -- --75th Percentile ($000's) 50.3 56.8 -- 50.1 -- --Average ($000's) 44.1 45.5 -- 43.5 -- --
Most Recent New HireEmployers Reported 4 3 0 1 0 0
Median ($000's) 42.3 39.0 -- -- -- --Average ($000's) 42.5 42.5 -- -- -- --
Provides routine post-implementation technical support onsite to customers and clients under the direction of more senior specialists orconsultants. Provides technical analysis in problem situations, as well as product support and training to customers, includingdistributors. Services products that may include both hardware and software/systems. Assists with onsite installation andtroubleshooting of products. Solves problems within established guidelines. Results are generally reviewed by senior technicalspecialists. Requires a degree and 1–2 years experience.
Industry - Type of Employer
Total Cash CompensationBase Plus Incentive Pay
Job Match Comparability
Page 3-230Southwestern Pennsylvania Annual Compensation and Benefits Study
© 2010 Pittsburgh Technology Council. All rights reserved.

Job Code 826 PRODUCT SUPPORT SPECIALIST I
Description
Less than 50 50 - 150 151 - 500 More than 500Less than
$7.5M$7.5M to
$25M$26M to $150M
More than $150M
Annual Base PayEmployers Reported 0 3 3 4 0 3 2 5Employees Reported 0 12 11 86 0 12 10 87
25th Percentile ($000's) -- 37.5 52.5 38.1 -- 37.5 52.2 38.150th Percentile ($000's) -- 39.6 53.6 40.9 -- 39.6 53.3 41.175th Percentile ($000's) -- 48.0 54.6 46.8 -- 48.0 54.1 47.1Average ($000's) -- 43.3 52.0 42.1 -- 43.3 51.7 42.2
Incentive Pay% Incentive Eligible -- 100% 100% 27% -- 100% 100% 28%
25th Percentile ($000's) -- 1.7 3.7 2.7 -- 1.7 3.7 2.750th Percentile ($000's) -- 2.1 3.7 2.8 -- 2.1 3.7 2.875th Percentile ($000's) -- 2.2 3.9 2.9 -- 2.2 3.9 2.9Average ($000's) -- 2.0 3.8 2.6 -- 2.0 3.8 2.6
25th Percentile ($000's) -- 37.5 55.3 38.1 -- 37.5 55.9 38.150th Percentile ($000's) -- 41.7 56.8 40.9 -- 41.7 57.1 41.175th Percentile ($000's) -- 49.7 57.6 46.8 -- 49.7 57.7 47.4Average ($000's) -- 44.5 54.7 42.6 -- 44.5 54.7 42.8
Most Recent New HireEmployers Reported 0 1 1 2 0 1 1 2
Median ($000's) -- -- -- -- -- -- -- --Average ($000's) -- -- -- -- -- -- -- --
Total Cash CompensationBase Plus Incentive Pay
Provides routine post-implementation technical support onsite to customers and clients under the direction of more senior specialists orconsultants. Provides technical analysis in problem situations, as well as product support and training to customers, includingdistributors. Services products that may include both hardware and software/systems. Assists with onsite installation andtroubleshooting of products. Solves problems within established guidelines. Results are generally reviewed by senior technicalspecialists. Requires a degree and 1–2 years experience.
Organizational FTE's Organizational Revenue ($ Millions)
Page 3-231Southwestern Pennsylvania Annual Compensation and Benefits Study
© 2010 Pittsburgh Technology Council. All rights reserved.

Job Code 827 PRODUCT SUPPORT SPECIALIST II
Description
39.4% Less Complex60.6% Comparable0.0% More Complex
All Organizations
Software, Computer and
Technology Manufacturing
Life-Sciences/ Biotech/
Medical Devices Not-for-ProfitAll Other
EmployersAnnual Base Pay
Employers Reported 10 5 2 2 0 1Employees Reported 66 27 5 31 0 325th Percentile ($000's) 45.3 40.1 63.8 50.2 -- --50th Percentile ($000's) 53.4 45.3 65.0 53.6 -- --75th Percentile ($000's) 60.0 60.0 65.5 55.6 -- --Average ($000's) 53.6 50.1 65.0 53.4 -- --
Incentive Pay% Incentive Eligible 33% 37% 80% 16% -- 100%25th Percentile ($000's) 2.9 3.5 -- 3.0 -- --50th Percentile ($000's) 3.3 4.2 -- 3.2 -- --75th Percentile ($000's) 4.2 4.8 -- 3.3 -- --Average ($000's) 3.6 4.2 -- 3.2 -- --
25th Percentile ($000's) 45.3 40.1 63.8 50.2 -- --50th Percentile ($000's) 53.9 45.3 65.0 53.9 -- --75th Percentile ($000's) 63.1 64.2 65.5 56.0 -- --Average ($000's) 54.3 51.3 65.0 53.9 -- --
Most Recent New HireEmployers Reported 1 1 0 0 0 0
Median ($000's) -- -- -- -- -- --Average ($000's) -- -- -- -- -- --
Provides post-implementation technical support to customers and clients under the direction of a manager and technical analysis inproblem situations. Provides support and training on products. Assists with on-site installation and troubleshooting of products. Servicesproducts that may include both hardware and software/systems. Makes decisions and recommends solutions to problems withinestablished guidelines. Results may be reviewed by senior consultants or technical specialists. Requires a degree, comprehensiveknowledge of the employer's products, and 3–5 years experience.
Industry - Type of Employer
Total Cash CompensationBase Plus Incentive Pay
Job Match Comparability
Page 3-232Southwestern Pennsylvania Annual Compensation and Benefits Study
© 2010 Pittsburgh Technology Council. All rights reserved.

Job Code 827 PRODUCT SUPPORT SPECIALIST II
Description
Less than 50 50 - 150 151 - 500 More than 500Less than
$7.5M$7.5M to
$25M$26M to $150M
More than $150M
Annual Base PayEmployers Reported 1 3 2 4 1 3 1 5Employees Reported 3 5 10 48 3 5 6 52
25th Percentile ($000's) -- 40.0 62.8 44.9 -- 40.0 -- 45.350th Percentile ($000's) -- 62.4 64.2 51.4 -- 62.4 -- 52.975th Percentile ($000's) -- 65.5 67.2 55.4 -- 65.5 -- 56.0Average ($000's) -- 55.1 66.9 51.2 -- 55.1 -- 52.3
Incentive Pay% Incentive Eligible 0% 80% 100% 17% 0% 80% 100% 23%
25th Percentile ($000's) -- -- 4.2 2.9 -- -- -- 2.950th Percentile ($000's) -- 2.3 4.3 3.1 -- 2.3 -- 3.175th Percentile ($000's) -- -- 5.5 3.3 -- -- -- 3.3Average ($000's) -- 2.3 4.8 2.8 -- 2.3 -- 2.8
25th Percentile ($000's) -- 40.0 64.2 44.9 -- 40.0 -- 45.350th Percentile ($000's) -- 64.6 66.1 52.1 -- 64.6 -- 53.475th Percentile ($000's) -- 65.5 68.4 55.8 -- 65.5 -- 56.3Average ($000's) -- 56.0 69.8 51.6 -- 56.0 -- 52.6
Most Recent New HireEmployers Reported 0 0 0 1 0 0 0 1
Median ($000's) -- -- -- -- -- -- -- --Average ($000's) -- -- -- -- -- -- -- --
Total Cash CompensationBase Plus Incentive Pay
Provides post-implementation technical support to customers and clients under the direction of a manager and technical analysis inproblem situations. Provides support and training on products. Assists with on-site installation and troubleshooting of products. Servicesproducts that may include both hardware and software/systems. Makes decisions and recommends solutions to problems withinestablished guidelines. Results may be reviewed by senior consultants or technical specialists. Requires a degree, comprehensiveknowledge of the employer's products, and 3–5 years experience.
Organizational FTE's Organizational Revenue ($ Millions)
Page 3-233Southwestern Pennsylvania Annual Compensation and Benefits Study
© 2010 Pittsburgh Technology Council. All rights reserved.

Job Code 828 PRODUCT SUPPORT SPECIALIST III
Description
0.0% Less Complex97.3% Comparable2.7% More Complex
All Organizations
Software, Computer and
Technology Manufacturing
Life-Sciences/ Biotech/
Medical Devices Not-for-ProfitAll Other
EmployersAnnual Base Pay
Employers Reported 7 4 1 2 0 0Employees Reported 37 17 2 18 0 025th Percentile ($000's) 54.1 51.4 -- 55.8 -- --50th Percentile ($000's) 58.6 56.3 -- 58.4 -- --75th Percentile ($000's) 67.9 80.3 -- 64.1 -- --Average ($000's) 62.5 63.2 -- 59.9 -- --
Incentive Pay% Incentive Eligible 32% 29% 100% 28% -- --25th Percentile ($000's) 3.2 3.0 -- 3.3 -- --50th Percentile ($000's) 3.3 3.2 -- 3.3 -- --75th Percentile ($000's) 3.4 3.4 -- 3.4 -- --Average ($000's) 3.3 3.2 -- 3.3 -- --
25th Percentile ($000's) 54.1 52.5 -- 55.9 -- --50th Percentile ($000's) 60.3 56.3 -- 60.9 -- --75th Percentile ($000's) 67.9 82.5 -- 65.0 -- --Average ($000's) 63.2 63.8 -- 60.8 -- --
Most Recent New HireEmployers Reported 1 1 0 0 0 0
Median ($000's) -- -- -- -- -- --Average ($000's) -- -- -- -- -- --
Provides post-implementation technical support to customers and clients under the direction of a manager and technical analysts inproblem situations. Provides support and training on products to customers. Provides on-site troubleshooting of products. Is a technicalexpert on products that may include both hardware and software/systems. Normally requires a degree and 5 or more years experience.
Industry - Type of Employer
Total Cash CompensationBase Plus Incentive Pay
Job Match Comparability
Page 3-234Southwestern Pennsylvania Annual Compensation and Benefits Study
© 2010 Pittsburgh Technology Council. All rights reserved.
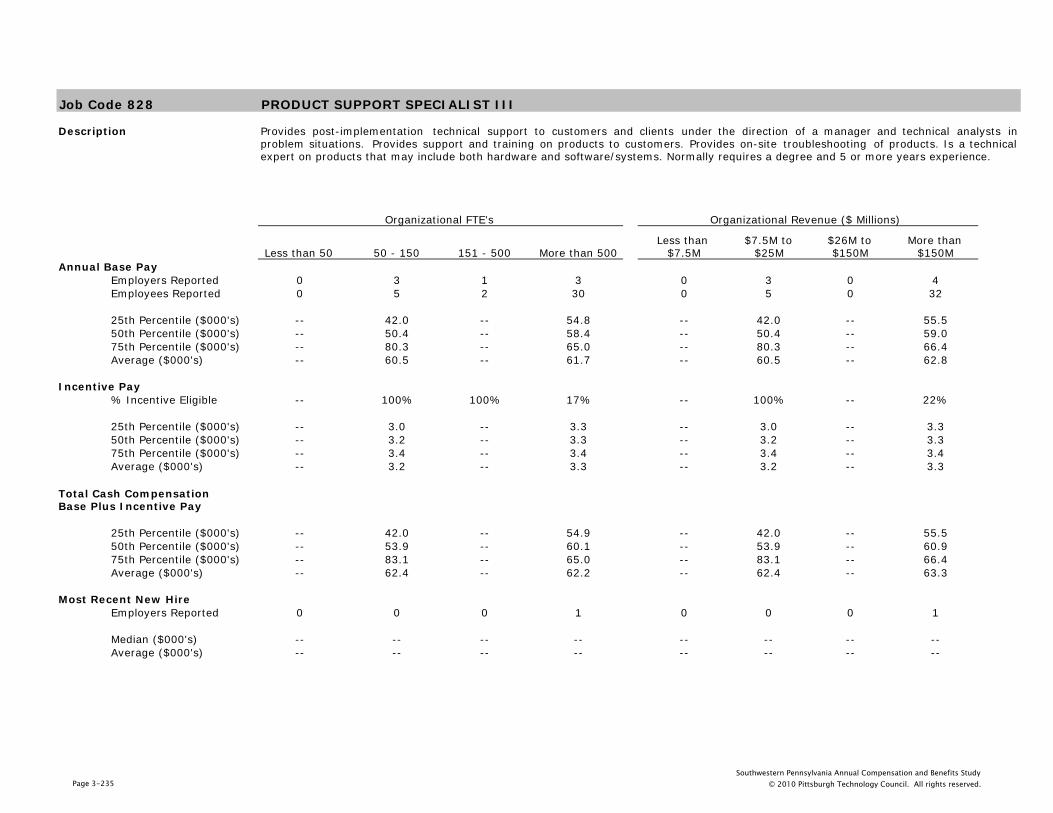
Job Code 828 PRODUCT SUPPORT SPECIALIST III
Description
Less than 50 50 - 150 151 - 500 More than 500Less than
$7.5M$7.5M to
$25M$26M to $150M
More than $150M
Annual Base PayEmployers Reported 0 3 1 3 0 3 0 4Employees Reported 0 5 2 30 0 5 0 32
25th Percentile ($000's) -- 42.0 -- 54.8 -- 42.0 -- 55.550th Percentile ($000's) -- 50.4 -- 58.4 -- 50.4 -- 59.075th Percentile ($000's) -- 80.3 -- 65.0 -- 80.3 -- 66.4Average ($000's) -- 60.5 -- 61.7 -- 60.5 -- 62.8
Incentive Pay% Incentive Eligible -- 100% 100% 17% -- 100% -- 22%
25th Percentile ($000's) -- 3.0 -- 3.3 -- 3.0 -- 3.350th Percentile ($000's) -- 3.2 -- 3.3 -- 3.2 -- 3.375th Percentile ($000's) -- 3.4 -- 3.4 -- 3.4 -- 3.4Average ($000's) -- 3.2 -- 3.3 -- 3.2 -- 3.3
25th Percentile ($000's) -- 42.0 -- 54.9 -- 42.0 -- 55.550th Percentile ($000's) -- 53.9 -- 60.1 -- 53.9 -- 60.975th Percentile ($000's) -- 83.1 -- 65.0 -- 83.1 -- 66.4Average ($000's) -- 62.4 -- 62.2 -- 62.4 -- 63.3
Most Recent New HireEmployers Reported 0 0 0 1 0 0 0 1
Median ($000's) -- -- -- -- -- -- -- --Average ($000's) -- -- -- -- -- -- -- --
Total Cash CompensationBase Plus Incentive Pay
Provides post-implementation technical support to customers and clients under the direction of a manager and technical analysts inproblem situations. Provides support and training on products to customers. Provides on-site troubleshooting of products. Is a technicalexpert on products that may include both hardware and software/systems. Normally requires a degree and 5 or more years experience.
Organizational FTE's Organizational Revenue ($ Millions)
Page 3-235Southwestern Pennsylvania Annual Compensation and Benefits Study
© 2010 Pittsburgh Technology Council. All rights reserved.

Job Code 840 PRODUCT SUPPORT MANAGER
Description
0.0% Less Complex84.6% Comparable15.4% More Complex
All Organizations
Software, Computer and
Technology Manufacturing
Life-Sciences/ Biotech/
Medical Devices Not-for-ProfitAll Other
EmployersAnnual Base Pay
Employers Reported 5 3 1 1 0 0Employees Reported 13 11 1 1 0 025th Percentile ($000's) 65.2 64.0 -- -- -- --50th Percentile ($000's) 72.0 67.1 -- -- -- --75th Percentile ($000's) 83.8 75.3 -- -- -- --Average ($000's) 75.1 70.4 -- -- -- --
Incentive Pay% Incentive Eligible 23% 18% 0% 100% -- --25th Percentile ($000's) -- -- -- -- -- --50th Percentile ($000's) 11.2 -- -- -- -- --75th Percentile ($000's) -- -- -- -- -- --Average ($000's) 11.2 -- -- -- -- --
25th Percentile ($000's) 67.0 66.1 -- -- -- --50th Percentile ($000's) 72.0 67.1 -- -- -- --75th Percentile ($000's) 83.8 75.3 -- -- -- --Average ($000's) 76.9 71.0 -- -- -- --
Most Recent New HireEmployers Reported 0 0 0 0 0 0
Median ($000's) -- -- -- -- -- --Average ($000's) -- -- -- -- -- --
Manages technical support, including product support specialists and technical consultant staff. Resolves product/system technicalproblems. Monitors customer's business, training, and product support needs. Supports customer modification, enhancement, integration,and testing of installed products/systems. Supports related customer training. Typically requires a degree in business or a closely relatedfield, detailed knowledge of employer's products/systems and of customers' information systems, and 5–7 years experience.
Industry - Type of Employer
Total Cash CompensationBase Plus Incentive Pay
Job Match Comparability
Page 3-236Southwestern Pennsylvania Annual Compensation and Benefits Study
© 2010 Pittsburgh Technology Council. All rights reserved.

Job Code 840 PRODUCT SUPPORT MANAGER
Description
Less than 50 50 - 150 151 - 500 More than 500Less than
$7.5M$7.5M to
$25M$26M to $150M
More than $150M
Annual Base PayEmployers Reported 0 3 0 2 0 3 0 2Employees Reported 0 3 0 10 0 3 0 10
25th Percentile ($000's) -- -- -- 65.7 -- -- -- 65.750th Percentile ($000's) -- 85.0 -- 69.6 -- 85.0 -- 69.675th Percentile ($000's) -- -- -- 75.9 -- -- -- 75.9Average ($000's) -- 80.5 -- 73.5 -- 80.5 -- 73.5
Incentive Pay% Incentive Eligible -- 67% -- 10% -- 67% -- 10%
25th Percentile ($000's) -- -- -- -- -- -- -- --50th Percentile ($000's) -- -- -- -- -- -- -- --75th Percentile ($000's) -- -- -- -- -- -- -- --Average ($000's) -- -- -- -- -- -- -- --
25th Percentile ($000's) -- -- -- 65.7 -- -- -- 65.750th Percentile ($000's) -- 85.0 -- 69.6 -- 85.0 -- 69.675th Percentile ($000's) -- -- -- 75.9 -- -- -- 75.9Average ($000's) -- 82.9 -- 75.1 -- 82.9 -- 75.1
Most Recent New HireEmployers Reported 0 0 0 0 0 0 0 0
Median ($000's) -- -- -- -- -- -- -- --Average ($000's) -- -- -- -- -- -- -- --
Total Cash CompensationBase Plus Incentive Pay
Manages technical support, including product support specialists and technical consultant staff. Resolves product/system technicalproblems. Monitors customer's business, training, and product support needs. Supports customer modification, enhancement, integration,and testing of installed products/systems. Supports related customer training. Typically requires a degree in business or a closely relatedfield, detailed knowledge of employer's products/systems and of customers' information systems, and 5–7 years experience.
Organizational FTE's Organizational Revenue ($ Millions)
Page 3-237Southwestern Pennsylvania Annual Compensation and Benefits Study
© 2010 Pittsburgh Technology Council. All rights reserved.

Job Code 843 SALES REPRESENTATIVE - ALL LEVELS
Description
0.5% Less Complex94.5% Comparable5.0% More Complex
All Organizations
Software, Computer and
Technology Manufacturing
Life-Sciences/ Biotech/
Medical Devices Not-for-ProfitAll Other
EmployersAnnual Base Pay
Employers Reported 27 5 9 2 5 6Employees Reported 417 25 35 306 23 2825th Percentile ($000's) 51.3 70.0 62.7 51.0 53.8 38.850th Percentile ($000's) 58.8 75.0 74.3 56.2 62.4 49.475th Percentile ($000's) 69.1 80.0 84.1 65.0 72.9 83.6Average ($000's) 62.1 75.0 75.8 59.9 62.5 57.3
Incentive Pay% Incentive Eligible 91% 48% 97% 100% 57% 54%25th Percentile ($000's) 7.3 2.5 2.5 9.3 1.0 12.550th Percentile ($000's) 13.3 2.6 4.0 14.5 6.2 21.475th Percentile ($000's) 20.2 2.9 10.3 20.3 10.3 65.4Average ($000's) 15.5 7.4 11.6 15.4 6.4 44.2
25th Percentile ($000's) 62.6 70.0 65.2 62.9 55.3 38.850th Percentile ($000's) 72.5 75.1 76.5 72.4 66.5 75.575th Percentile ($000's) 82.4 82.8 87.1 80.0 73.7 88.0Average ($000's) 74.0 77.1 83.4 73.3 66.2 73.1
Most Recent New HireEmployers Reported 5 1 0 2 1 1
Median ($000's) 51.0 -- -- -- -- --Average ($000's) 54.3 -- -- -- -- --
The data for this position is a combination of the data reported by participants for 841 Sales Representative and 842 Senior SalesRepresentative
Industry - Type of Employer
Total Cash CompensationBase Plus Incentive Pay
Job Match Comparability
Page 3-238Southwestern Pennsylvania Annual Compensation and Benefits Study
© 2010 Pittsburgh Technology Council. All rights reserved.

Job Code 843 SALES REPRESENTATIVE - ALL LEVELS
Description
Less than 50 50 - 150 151 - 500 More than 500Less than
$7.5M$7.5M to
$25M$26M to $150M
More than $150M
Annual Base PayEmployers Reported 9 7 4 7 9 7 5 6Employees Reported 23 36 25 333 24 35 26 332
25th Percentile ($000's) 55.7 40.0 65.6 51.0 35.0 52.7 66.2 51.050th Percentile ($000's) 71.9 60.6 71.5 57.0 60.8 63.5 73.3 57.075th Percentile ($000's) 84.7 75.5 80.0 66.3 74.9 78.6 80.5 66.3Average ($000's) 69.7 59.1 72.6 61.2 60.0 63.5 74.4 61.2
Incentive Pay% Incentive Eligible 74% 69% 52% 98% 46% 89% 50% 98%
25th Percentile ($000's) 0.9 2.9 3.5 8.8 0.9 2.7 21.1 8.850th Percentile ($000's) 3.1 10.0 4.6 14.1 1.0 6.9 21.8 14.175th Percentile ($000's) 6.3 15.1 11.6 20.3 4.0 11.0 72.8 20.3Average ($000's) 4.1 21.2 8.5 15.6 2.3 12.2 55.3 15.6
25th Percentile ($000's) 58.5 49.7 66.1 62.9 35.8 57.3 66.2 63.250th Percentile ($000's) 74.3 69.2 71.6 72.9 62.9 72.5 73.3 72.975th Percentile ($000's) 86.7 82.9 80.0 82.2 74.9 87.7 83.0 82.2Average ($000's) 71.7 70.9 73.7 74.5 60.5 72.5 80.7 74.6
Most Recent New HireEmployers Reported 1 1 2 1 1 2 1 1
Median ($000's) -- -- -- -- -- -- -- --Average ($000's) -- -- -- -- -- -- -- --
Total Cash CompensationBase Plus Incentive Pay
The data for this position is a combination of the data reported by participants for 841 Sales Representative and 842 Senior SalesRepresentative
Organizational FTE's Organizational Revenue ($ Millions)
Page 3-239Southwestern Pennsylvania Annual Compensation and Benefits Study
© 2010 Pittsburgh Technology Council. All rights reserved.

Job Code 841 SALES REPRESENTATIVE
Description
0.6% Less Complex97.8% Comparable1.6% More Complex
All Organizations
Software, Computer and
Technology Manufacturing
Life-Sciences/ Biotech/
Medical Devices Not-for-ProfitAll Other
EmployersAnnual Base Pay
Employers Reported 19 3 6 2 5 3Employees Reported 315 3 14 262 19 1725th Percentile ($000's) 51.0 -- 59.6 51.0 53.0 30.050th Percentile ($000's) 55.0 53.0 67.7 55.0 58.6 40.075th Percentile ($000's) 64.0 -- 80.5 64.6 63.6 45.0Average ($000's) 58.4 55.5 70.6 59.1 57.5 39.8
Incentive Pay% Incentive Eligible 96% 67% 93% 100% 58% 76%25th Percentile ($000's) 7.1 -- 2.5 8.4 0.9 14.850th Percentile ($000's) 13.0 -- 6.2 13.3 6.2 21.475th Percentile ($000's) 19.8 -- 9.3 19.9 10.0 54.2Average ($000's) 14.7 -- 16.3 14.3 6.2 38.2
25th Percentile ($000's) 60.0 -- 62.8 61.9 53.2 30.050th Percentile ($000's) 69.7 54.9 73.6 71.0 63.1 45.075th Percentile ($000's) 78.6 -- 86.3 78.7 70.3 71.0Average ($000's) 70.4 56.1 85.7 71.2 61.0 57.8
Most Recent New HireEmployers Reported 4 0 0 2 1 1
Median ($000's) 51.0 -- -- -- -- --Average ($000's) 53.0 -- -- -- -- --
Sells and promotes employer’s business-to-business products in face-to-face meetings with potential clients and customers. Contactspotential clients and customers via telephone and other appropriate media. Represents employer at trade shows and other promotionalvenues. Develops and maintains sufficient knowledge of employer’s products to conduct effective demonstrations. Travels within adesignated territory, or more widely to visit assigned prospects and customers. May participate in team sales efforts. Provides marketfeedback to employer about the needs of customers and clients and about its products and competitor products. May initiate processingof orders. Documents sales efforts and successes and prepares reports for sales management. May mentor and support sales associates.Typically requires a marketing or related degree and 2 or more years direct sales experience.
Industry - Type of Employer
Total Cash CompensationBase Plus Incentive Pay
Job Match Comparability
Page 3-240Southwestern Pennsylvania Annual Compensation and Benefits Study
© 2010 Pittsburgh Technology Council. All rights reserved.

Job Code 841 SALES REPRESENTATIVE
Description
Less than 50 50 - 150 151 - 500 More than 500Less than
$7.5M$7.5M to
$25M$26M to $150M
More than $150M
Annual Base PayEmployers Reported 5 7 2 5 5 7 3 4Employees Reported 10 29 4 272 14 25 5 271
25th Percentile ($000's) 40.6 40.0 -- 51.0 30.0 41.6 61.1 51.050th Percentile ($000's) 53.4 54.0 63.1 55.0 44.5 54.4 80.7 55.075th Percentile ($000's) 59.3 63.7 -- 64.0 59.7 65.0 88.8 64.0Average ($000's) 51.7 54.9 66.0 58.9 45.2 56.2 76.3 59.0
Incentive Pay% Incentive Eligible 70% 66% 100% 100% 21% 92% 80% 100%
25th Percentile ($000's) 0.8 9.1 -- 8.2 -- 4.9 -- 8.250th Percentile ($000's) 1.0 10.9 4.6 13.2 0.9 9.1 21.8 13.275th Percentile ($000's) 6.3 21.5 -- 19.9 -- 11.0 -- 19.9Average ($000's) 3.6 28.4 8.5 14.3 2.2 15.3 55.3 14.3
25th Percentile ($000's) 41.3 40.0 -- 61.8 30.0 52.9 61.1 61.950th Percentile ($000's) 55.0 63.1 72.4 70.8 45.0 66.5 102.4 70.875th Percentile ($000's) 64.2 72.7 -- 78.7 62.0 79.8 125.1 78.7Average ($000's) 54.2 68.6 72.4 71.1 45.7 67.2 109.5 71.2
Most Recent New HireEmployers Reported 1 1 1 1 1 2 0 1
Median ($000's) -- -- -- -- -- -- -- --Average ($000's) -- -- -- -- -- -- -- --
Total Cash CompensationBase Plus Incentive Pay
Sells and promotes employer’s business-to-business products in face-to-face meetings with potential clients and customers. Contactspotential clients and customers via telephone and other appropriate media. Represents employer at trade shows and other promotionalvenues. Develops and maintains sufficient knowledge of employer’s products to conduct effective demonstrations. Travels within adesignated territory, or more widely to visit assigned prospects and customers. May participate in team sales efforts. Provides marketfeedback to employer about the needs of customers and clients and about its products and competitor products. May initiate processingof orders. Documents sales efforts and successes and prepares reports for sales management. May mentor and support sales associates.Typically requires a marketing or related degree and 2 or more years direct sales experience.
Organizational FTE's Organizational Revenue ($ Millions)
Page 3-241Southwestern Pennsylvania Annual Compensation and Benefits Study
© 2010 Pittsburgh Technology Council. All rights reserved.

Job Code 842 SENIOR SALES REPRESENTATIVE
Description
0.0% Less Complex84.3% Comparable15.7% More Complex
All Organizations
Software, Computer and
Technology Manufacturing
Life-Sciences/ Biotech/
Medical Devices Not-for-ProfitAll Other
EmployersAnnual Base Pay
Employers Reported 18 4 6 1 2 5Employees Reported 102 22 21 44 4 1125th Percentile ($000's) 59.9 70.4 65.5 -- -- 82.750th Percentile ($000's) 71.7 75.1 76.5 -- 89.0 87.675th Percentile ($000's) 85.0 83.0 85.5 -- -- 88.4Average ($000's) 73.6 77.7 79.2 -- 86.6 84.3
Incentive Pay% Incentive Eligible 77% 45% 100% 100% 50% 18%25th Percentile ($000's) 11.9 2.5 2.5 -- -- --50th Percentile ($000's) 17.1 2.7 3.0 -- -- --75th Percentile ($000's) 22.6 2.9 9.6 -- -- --Average ($000's) 18.7 8.3 5.5 -- -- --
25th Percentile ($000's) 72.2 71.8 65.6 -- -- 85.650th Percentile ($000's) 80.0 76.4 76.5 -- 90.4 87.675th Percentile ($000's) 89.7 83.7 87.8 -- -- 89.4Average ($000's) 85.2 79.9 81.9 -- 90.5 96.7
Most Recent New HireEmployers Reported 1 1 0 0 0 0
Median ($000's) -- -- -- -- -- --Average ($000's) -- -- -- -- -- --
Sells and promotes employer’s products in face-to-face meetings with potential clients and customers. Maintains extensive and detailedknowledge of employer’s products and competing products. Develops sales presentations and tactics. Leads efforts of sales teams todemonstrate and sell complex business-to-business products and services. Develops product demonstrations and represents employer attrade shows and other promotional venues. Documents sales efforts and successes and prepares reports covering assigned products,territories, and sales targets. Guides and supports assigned sales representatives. Typically requires a degree and 5 or more years directsales experience.
Industry - Type of Employer
Total Cash CompensationBase Plus Incentive Pay
Job Match Comparability
Page 3-242Southwestern Pennsylvania Annual Compensation and Benefits Study
© 2010 Pittsburgh Technology Council. All rights reserved.

Job Code 842 SENIOR SALES REPRESENTATIVE
Description
Less than 50 50 - 150 151 - 500 More than 500Less than
$7.5M$7.5M to
$25M$26M to $150M
More than $150M
Annual Base PayEmployers Reported 6 3 3 6 5 4 3 6Employees Reported 13 7 21 61 10 10 21 61
25th Percentile ($000's) 74.3 72.5 66.5 56.8 72.5 75.5 66.5 56.850th Percentile ($000's) 83.8 77.1 71.6 63.4 76.8 82.5 71.6 63.475th Percentile ($000's) 90.0 80.0 80.0 87.6 82.9 89.5 80.0 87.6Average ($000's) 83.5 76.7 73.9 71.0 80.7 81.6 73.9 71.0
Incentive Pay% Incentive Eligible 77% 86% 43% 89% 80% 80% 43% 89%
25th Percentile ($000's) 2.6 2.5 -- 13.2 1.8 2.6 -- 13.250th Percentile ($000's) 3.6 2.7 -- 19.2 2.5 2.9 -- 19.275th Percentile ($000's) 6.1 2.9 -- 24.1 3.3 5.4 -- 24.1Average ($000's) 5.1 4.3 -- 21.2 2.5 5.2 -- 21.2
25th Percentile ($000's) 74.3 75.0 66.5 75.2 72.5 78.9 66.5 75.250th Percentile ($000's) 85.5 80.0 71.6 84.1 76.8 88.0 71.6 84.175th Percentile ($000's) 91.1 85.4 80.0 95.2 84.1 90.8 80.0 95.2Average ($000's) 85.1 80.4 73.9 89.7 81.2 85.8 73.9 89.7
Most Recent New HireEmployers Reported 0 0 1 0 0 0 1 0
Median ($000's) -- -- -- -- -- -- -- --Average ($000's) -- -- -- -- -- -- -- --
Total Cash CompensationBase Plus Incentive Pay
Sells and promotes employer’s products in face-to-face meetings with potential clients and customers. Maintains extensive and detailedknowledge of employer’s products and competing products. Develops sales presentations and tactics. Leads efforts of sales teams todemonstrate and sell complex business-to-business products and services. Develops product demonstrations and represents employer attrade shows and other promotional venues. Documents sales efforts and successes and prepares reports covering assigned products,territories, and sales targets. Guides and supports assigned sales representatives. Typically requires a degree and 5 or more years directsales experience.
Organizational FTE's Organizational Revenue ($ Millions)
Page 3-243Southwestern Pennsylvania Annual Compensation and Benefits Study
© 2010 Pittsburgh Technology Council. All rights reserved.

Job Code 846 INSIDE SALES REPRESENTATIVE/TELEMARKETER
Description
0.0% Less Complex29.5% Comparable70.5% More Complex
All Organizations
Software, Computer and
Technology Manufacturing
Life-Sciences/ Biotech/
Medical Devices Not-for-ProfitAll Other
EmployersAnnual Base Pay
Employers Reported 12 5 4 1 1 1Employees Reported 61 11 13 26 2 925th Percentile ($000's) 40.0 42.0 37.1 -- -- --50th Percentile ($000's) 42.9 45.0 41.0 -- -- --75th Percentile ($000's) 46.2 47.6 46.1 -- -- --Average ($000's) 44.1 46.3 45.9 -- -- --
Incentive Pay% Incentive Eligible 80% 73% 46% 100% 0% 100%25th Percentile ($000's) 4.5 57.7 3.8 -- -- --50th Percentile ($000's) 5.3 57.7 4.6 -- -- --75th Percentile ($000's) 7.7 57.7 5.3 -- -- --Average ($000's) 11.0 57.7 4.5 -- -- --
25th Percentile ($000's) 44.2 42.0 41.0 -- -- --50th Percentile ($000's) 48.2 45.0 44.2 -- -- --75th Percentile ($000's) 55.7 47.6 49.1 -- -- --Average ($000's) 52.0 51.6 48.7 -- -- --
Most Recent New HireEmployers Reported 4 2 1 0 1 0
Median ($000's) 42.0 -- -- -- -- --Average ($000's) 40.1 -- -- -- -- --
Makes routine telephone sales calls following established procedures and guidelines. Promotes, sells, or confirms sales of products andservices. Refers non-routine requests or issues to senior telemarketer or supervisor. Uses computer based system to gather and provideinformation and track history. Requires a working knowledge of products and services. Normally requires high school graduation and 0–2years related experience.
Industry - Type of Employer
Total Cash CompensationBase Plus Incentive Pay
Job Match Comparability
Page 3-244Southwestern Pennsylvania Annual Compensation and Benefits Study
© 2010 Pittsburgh Technology Council. All rights reserved.

Job Code 846 INSIDE SALES REPRESENTATIVE/TELEMARKETER
Description
Less than 50 50 - 150 151 - 500 More than 500Less than
$7.5M$7.5M to
$25M$26M to $150M
More than $150M
Annual Base PayEmployers Reported 2 5 2 3 3 3 2 4Employees Reported 2 18 5 36 4 11 7 39
25th Percentile ($000's) -- 38.4 36.0 40.8 -- 42.0 37.6 40.450th Percentile ($000's) -- 41.8 46.1 43.6 39.5 45.0 39.5 43.175th Percentile ($000's) -- 45.0 47.0 46.3 -- 53.5 44.3 46.2Average ($000's) -- 45.0 41.9 43.7 41.9 50.1 40.7 43.2
Incentive Pay% Incentive Eligible 50% 67% 0% 100% 25% 64% 71% 92%
25th Percentile ($000's) -- 4.2 -- 4.8 -- -- 4.2 4.750th Percentile ($000's) -- 5.3 -- 5.5 -- -- 5.3 5.475th Percentile ($000's) -- 5.4 -- 10.2 -- -- 5.4 9.4Average ($000's) -- 4.9 -- 12.5 -- -- -- 11.8
25th Percentile ($000's) -- 40.5 41.0 47.5 -- 42.0 42.2 47.050th Percentile ($000's) -- 43.3 47.0 51.5 39.5 45.0 44.9 50.575th Percentile ($000's) -- 45.0 48.2 56.8 -- 53.5 47.2 56.5Average ($000's) -- 46.3 44.2 56.1 41.9 50.1 44.2 55.0
Most Recent New HireEmployers Reported 0 4 0 0 1 2 1 0
Median ($000's) -- 42.0 -- -- -- -- -- --Average ($000's) -- 40.1 -- -- -- -- -- --
Total Cash CompensationBase Plus Incentive Pay
Makes routine telephone sales calls following established procedures and guidelines. Promotes, sells, or confirms sales of products andservices. Refers non-routine requests or issues to senior telemarketer or supervisor. Uses computer based system to gather and provideinformation and track history. Requires a working knowledge of products and services. Normally requires high school graduation and 0–2years related experience.
Organizational FTE's Organizational Revenue ($ Millions)
Page 3-245Southwestern Pennsylvania Annual Compensation and Benefits Study
© 2010 Pittsburgh Technology Council. All rights reserved.

Job Code 847 ACCOUNT MANAGER
Description
7.1% Less Complex35.7% Comparable57.1% More Complex
All Organizations
Software, Computer and
Technology Manufacturing
Life-Sciences/ Biotech/
Medical Devices Not-for-ProfitAll Other
EmployersAnnual Base Pay
Employers Reported 11 5 2 2 0 2Employees Reported 42 19 4 13 0 625th Percentile ($000's) 76.7 75.0 -- 107.3 -- 84.650th Percentile ($000's) 88.8 81.4 76.8 108.5 -- 91.775th Percentile ($000's) 108.2 90.9 -- 112.8 -- 93.4Average ($000's) 89.7 83.5 75.7 103.4 -- 89.0
Incentive Pay% Incentive Eligible 50% 32% 50% 100% -- 0%25th Percentile ($000's) 15.6 36.3 -- 17.1 -- --50th Percentile ($000's) 21.9 57.5 -- 21.9 -- --75th Percentile ($000's) 22.9 78.8 -- 22.7 -- --Average ($000's) 26.0 57.5 -- 20.3 -- --
25th Percentile ($000's) 77.1 75.0 -- 121.3 -- 84.650th Percentile ($000's) 88.8 81.4 76.8 128.4 -- 91.775th Percentile ($000's) 121.0 90.9 -- 136.4 -- 93.4Average ($000's) 97.7 89.5 75.7 120.5 -- 89.0
Most Recent New HireEmployers Reported 3 3 0 0 0 0
Median ($000's) 115.0 115.0 -- -- -- --Average ($000's) 91.7 91.7 -- -- -- --
Prepares proposals, marketing plans, and forecast/report sales activity for assigned region or key accounts. Develops programs toachieve maximum sales volume consistent with sales forecasts/projections. Gathers detailed information about accounts, identifiesdecision-makers, understands strategic business challenges and priorities, and leads team in analyzing information and prioritizingopportunities critical to accounts. Functions as primary interface between company and account personnel; also resolves any complaintsor concerns. Requires extensive knowledge of products and services. Normally requires 5 or more years of related experience.
Industry - Type of Employer
Total Cash CompensationBase Plus Incentive Pay
Job Match Comparability
Page 3-246Southwestern Pennsylvania Annual Compensation and Benefits Study
© 2010 Pittsburgh Technology Council. All rights reserved.

Job Code 847 ACCOUNT MANAGER
Description
Less than 50 50 - 150 151 - 500 More than 500Less than
$7.5M$7.5M to
$25M$26M to $150M
More than $150M
Annual Base PayEmployers Reported 1 4 3 3 1 4 1 5Employees Reported 1 8 8 25 1 8 4 29
25th Percentile ($000's) -- 66.8 74.3 82.8 -- 66.8 -- 78.250th Percentile ($000's) -- 93.1 76.8 93.4 -- 93.1 -- 92.675th Percentile ($000's) -- 116.3 78.1 108.5 -- 116.3 -- 108.3Average ($000's) -- 87.5 76.5 95.8 -- 87.5 -- 93.0
Incentive Pay% Incentive Eligible 100% 75% 25% 48% 100% 75% 0% 48%
25th Percentile ($000's) -- 36.3 -- 17.1 -- 36.3 -- 17.150th Percentile ($000's) -- 57.5 -- 21.9 -- 57.5 -- 21.975th Percentile ($000's) -- 78.8 -- 22.7 -- 78.8 -- 22.7Average ($000's) -- 57.5 -- 20.3 -- 57.5 -- 20.3
25th Percentile ($000's) -- 66.8 74.3 82.8 -- 66.8 -- 79.650th Percentile ($000's) -- 100.6 76.8 93.4 -- 100.6 -- 92.675th Percentile ($000's) -- 116.3 78.1 128.4 -- 116.3 -- 127.9Average ($000's) -- 101.9 76.5 104.7 -- 101.9 -- 100.7
Most Recent New HireEmployers Reported 0 3 0 0 0 3 0 0
Median ($000's) -- 115.0 -- -- -- 115.0 -- --Average ($000's) -- 91.7 -- -- -- 91.7 -- --
Total Cash CompensationBase Plus Incentive Pay
Prepares proposals, marketing plans, and forecast/report sales activity for assigned region or key accounts. Develops programs toachieve maximum sales volume consistent with sales forecasts/projections. Gathers detailed information about accounts, identifiesdecision-makers, understands strategic business challenges and priorities, and leads team in analyzing information and prioritizingopportunities critical to accounts. Functions as primary interface between company and account personnel; also resolves any complaintsor concerns. Requires extensive knowledge of products and services. Normally requires 5 or more years of related experience.
Organizational FTE's Organizational Revenue ($ Millions)
Page 3-247Southwestern Pennsylvania Annual Compensation and Benefits Study
© 2010 Pittsburgh Technology Council. All rights reserved.

Job Code 848 SALES SUPPORT ASSISTANT
Description
7.7% Less Complex84.6% Comparable7.7% More Complex
All Organizations
Software, Computer and
Technology Manufacturing
Life-Sciences/ Biotech/
Medical Devices Not-for-ProfitAll Other
EmployersAnnual Base Pay
Employers Reported 12 4 3 0 3 2Employees Reported 13 4 3 0 3 325th Percentile ($000's) 33.4 -- -- -- -- --50th Percentile ($000's) 39.5 39.6 42.0 -- 33.4 39.575th Percentile ($000's) 41.6 -- -- -- -- --Average ($000's) 38.9 38.0 41.4 -- 37.1 39.4
Incentive Pay% Incentive Eligible 54% 25% 33% -- 67% 100%25th Percentile ($000's) 2.2 -- -- -- -- --50th Percentile ($000's) 3.0 -- -- -- -- 3.875th Percentile ($000's) 3.8 -- -- -- -- --Average ($000's) 2.9 -- -- -- -- 3.8
25th Percentile ($000's) 34.3 -- -- -- -- --50th Percentile ($000's) 40.0 39.6 42.0 -- 34.3 42.375th Percentile ($000's) 42.3 -- -- -- -- --Average ($000's) 39.8 38.0 41.4 -- 38.5 41.9
Most Recent New HireEmployers Reported 3 1 0 0 1 1
Median ($000's) 33.4 -- -- -- -- --Average ($000's) 34.9 -- -- -- -- --
Provides administrative support to sales representatives, account managers and the overall sales function by processing data,generating routine reports regarding sales results and sales force earnings, preparing presentations, coordinating mailings, andmaintaining files and records. Updates and adds records to computer databases and coordinates communications with appropriate staffregarding status of leads and sales materials. May answer questions about the organization’s products and/or services. May also assistin customer service or order processing functions.
Industry - Type of Employer
Total Cash CompensationBase Plus Incentive Pay
Job Match Comparability
Page 3-248Southwestern Pennsylvania Annual Compensation and Benefits Study
© 2010 Pittsburgh Technology Council. All rights reserved.

Job Code 848 SALES SUPPORT ASSISTANT
Description
Less than 50 50 - 150 151 - 500 More than 500Less than
$7.5M$7.5M to
$25M$26M to $150M
More than $150M
Annual Base PayEmployers Reported 4 4 2 2 4 4 2 2Employees Reported 4 4 2 3 4 4 2 3
25th Percentile ($000's) -- -- -- -- -- -- -- --50th Percentile ($000's) 35.2 36.7 -- 39.5 32.3 39.6 -- 39.575th Percentile ($000's) -- -- -- -- -- -- -- --Average ($000's) 36.5 39.5 -- 39.4 35.0 41.0 -- 39.4
Incentive Pay% Incentive Eligible 50% 50% 0% 100% 50% 50% 0% 100%
25th Percentile ($000's) -- -- -- -- -- -- -- --50th Percentile ($000's) -- -- -- 3.8 -- -- -- 3.875th Percentile ($000's) -- -- -- -- -- -- -- --Average ($000's) -- -- -- 3.8 -- -- -- 3.8
25th Percentile ($000's) -- -- -- -- -- -- -- --50th Percentile ($000's) 35.2 37.2 -- 42.3 32.3 39.6 -- 42.375th Percentile ($000's) -- -- -- -- -- -- -- --Average ($000's) 36.9 40.1 -- 41.9 35.4 41.6 -- 41.9
Most Recent New HireEmployers Reported 1 1 0 1 2 0 0 1
Median ($000's) -- -- -- -- -- -- -- --Average ($000's) -- -- -- -- -- -- -- --
Total Cash CompensationBase Plus Incentive Pay
Provides administrative support to sales representatives, account managers and the overall sales function by processing data,generating routine reports regarding sales results and sales force earnings, preparing presentations, coordinating mailings, andmaintaining files and records. Updates and adds records to computer databases and coordinates communications with appropriate staffregarding status of leads and sales materials. May answer questions about the organization’s products and/or services. May also assistin customer service or order processing functions.
Organizational FTE's Organizational Revenue ($ Millions)
Page 3-249Southwestern Pennsylvania Annual Compensation and Benefits Study
© 2010 Pittsburgh Technology Council. All rights reserved.

Job Code 850 WRITER - MARKETING/COMMUNICATIONS
Description
0.0% Less Complex62.5% Comparable37.5% More Complex
All Organizations
Software, Computer and
Technology Manufacturing
Life-Sciences/ Biotech/
Medical Devices Not-for-ProfitAll Other
EmployersAnnual Base Pay
Employers Reported 12 3 0 3 3 3Employees Reported 24 3 0 9 4 825th Percentile ($000's) 44.9 -- -- 66.8 -- 41.450th Percentile ($000's) 61.2 40.0 -- 69.4 52.6 49.475th Percentile ($000's) 69.4 -- -- 74.9 -- 60.6Average ($000's) 58.1 53.0 -- 69.4 51.6 50.4
Incentive Pay% Incentive Eligible 58% 67% -- 78% 50% 38%25th Percentile ($000's) 3.3 -- -- 3.8 -- --50th Percentile ($000's) 3.9 -- -- 3.9 -- 4.175th Percentile ($000's) 4.6 -- -- 4.1 -- --Average ($000's) 4.2 -- -- 4.0 -- 4.1
25th Percentile ($000's) 45.4 -- -- 70.6 -- 42.850th Percentile ($000's) 65.9 40.0 -- 73.4 57.6 49.475th Percentile ($000's) 72.1 -- -- 76.2 -- 60.6Average ($000's) 60.2 55.3 -- 72.1 54.6 51.4
Most Recent New HireEmployers Reported 1 0 0 0 0 1
Median ($000's) -- -- -- -- -- --Average ($000's) -- -- -- -- -- --
Composes non-technical articles, leaflets, pamphlets, brochures, and related materials designed to educate and inform customers,clients, and the public. Works with various departments to collect background information and to obtain copy approval. Works undergeneral supervision. Requires a degree in communications, English, or related field, and 2–4 years experience writing in a businessenvironment required. May be titled Marketing/Communications Specialist.
Industry - Type of Employer
Total Cash CompensationBase Plus Incentive Pay
Job Match Comparability
Page 3-250Southwestern Pennsylvania Annual Compensation and Benefits Study
© 2010 Pittsburgh Technology Council. All rights reserved.
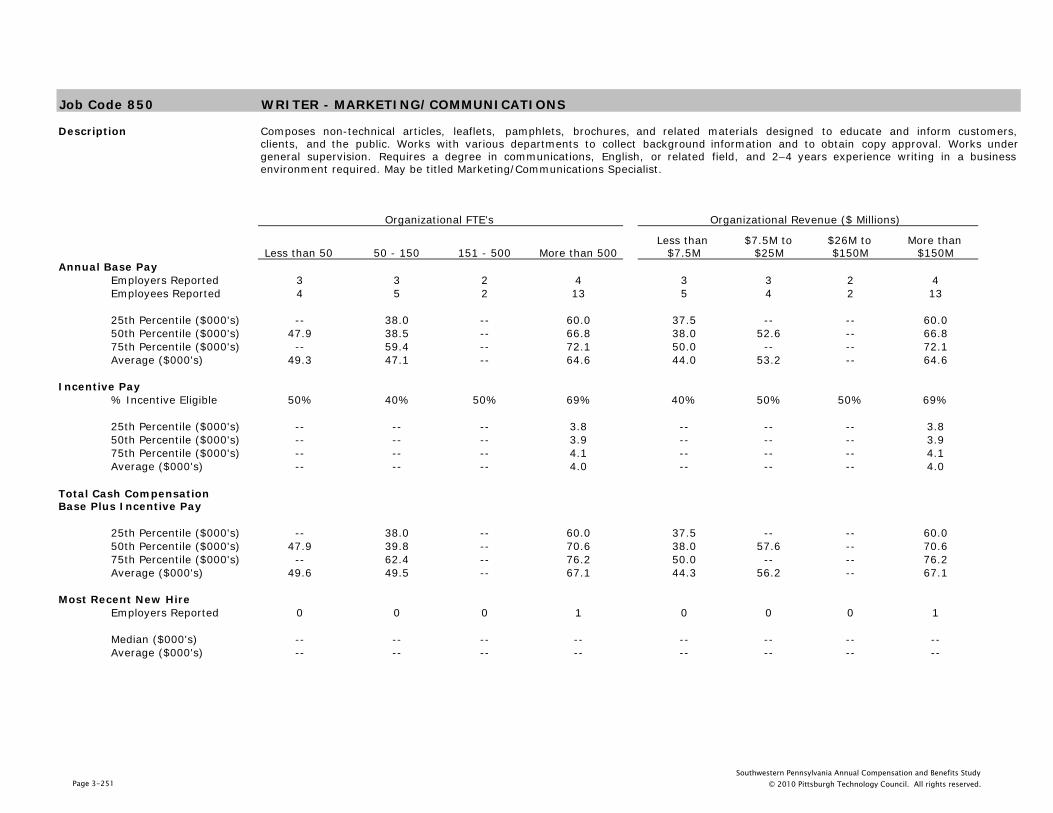
Job Code 850 WRITER - MARKETING/COMMUNICATIONS
Description
Less than 50 50 - 150 151 - 500 More than 500Less than
$7.5M$7.5M to
$25M$26M to $150M
More than $150M
Annual Base PayEmployers Reported 3 3 2 4 3 3 2 4Employees Reported 4 5 2 13 5 4 2 13
25th Percentile ($000's) -- 38.0 -- 60.0 37.5 -- -- 60.050th Percentile ($000's) 47.9 38.5 -- 66.8 38.0 52.6 -- 66.875th Percentile ($000's) -- 59.4 -- 72.1 50.0 -- -- 72.1Average ($000's) 49.3 47.1 -- 64.6 44.0 53.2 -- 64.6
Incentive Pay% Incentive Eligible 50% 40% 50% 69% 40% 50% 50% 69%
25th Percentile ($000's) -- -- -- 3.8 -- -- -- 3.850th Percentile ($000's) -- -- -- 3.9 -- -- -- 3.975th Percentile ($000's) -- -- -- 4.1 -- -- -- 4.1Average ($000's) -- -- -- 4.0 -- -- -- 4.0
25th Percentile ($000's) -- 38.0 -- 60.0 37.5 -- -- 60.050th Percentile ($000's) 47.9 39.8 -- 70.6 38.0 57.6 -- 70.675th Percentile ($000's) -- 62.4 -- 76.2 50.0 -- -- 76.2Average ($000's) 49.6 49.5 -- 67.1 44.3 56.2 -- 67.1
Most Recent New HireEmployers Reported 0 0 0 1 0 0 0 1
Median ($000's) -- -- -- -- -- -- -- --Average ($000's) -- -- -- -- -- -- -- --
Total Cash CompensationBase Plus Incentive Pay
Composes non-technical articles, leaflets, pamphlets, brochures, and related materials designed to educate and inform customers,clients, and the public. Works with various departments to collect background information and to obtain copy approval. Works undergeneral supervision. Requires a degree in communications, English, or related field, and 2–4 years experience writing in a businessenvironment required. May be titled Marketing/Communications Specialist.
Organizational FTE's Organizational Revenue ($ Millions)
Page 3-251Southwestern Pennsylvania Annual Compensation and Benefits Study
© 2010 Pittsburgh Technology Council. All rights reserved.

Job Code 860 PRODUCT MARKETING SPECIALIST
Description
4.8% Less Complex94.0% Comparable1.2% More Complex
All Organizations
Software, Computer and
Technology Manufacturing
Life-Sciences/ Biotech/
Medical Devices Not-for-ProfitAll Other
EmployersAnnual Base Pay
Employers Reported 12 3 3 0 1 5Employees Reported 84 3 3 0 1 7725th Percentile ($000's) 46.4 -- -- -- -- 46.650th Percentile ($000's) 54.5 75.0 48.0 -- -- 54.175th Percentile ($000's) 67.0 -- -- -- -- 64.7Average ($000's) 56.9 66.0 50.6 -- -- 56.7
Incentive Pay% Incentive Eligible 24% 67% 100% -- 0% 19%25th Percentile ($000's) 1.5 -- -- -- -- 2.050th Percentile ($000's) 3.0 -- 3.4 -- -- 3.075th Percentile ($000's) 4.5 -- -- -- -- 4.4Average ($000's) 3.2 -- 3.4 -- -- 3.1
25th Percentile ($000's) 47.0 -- -- -- -- 46.850th Percentile ($000's) 54.6 75.0 48.1 -- -- 54.375th Percentile ($000's) 67.2 -- -- -- -- 67.0Average ($000's) 57.4 66.0 52.9 -- -- 57.1
Most Recent New HireEmployers Reported 2 1 0 0 0 1
Median ($000's) -- -- -- -- -- --Average ($000's) -- -- -- -- -- --
Plans, directs, and administers the marketing activity for a product or product line. Sets objectives, develops marketing strategy, andmonitors the administration of marketing services including proposals, quotations, pricing, scheduling, and shipping of the product.Coordinates promotional activities, including advertising, literature, and trade show participation, to achieve marketing objectives.Requires a degree in business administration or marketing and 3–5 years relevant experience.
Industry - Type of Employer
Total Cash CompensationBase Plus Incentive Pay
Job Match Comparability
Page 3-252Southwestern Pennsylvania Annual Compensation and Benefits Study
© 2010 Pittsburgh Technology Council. All rights reserved.

Job Code 860 PRODUCT MARKETING SPECIALIST
Description
Less than 50 50 - 150 151 - 500 More than 500Less than
$7.5M$7.5M to
$25M$26M to $150M
More than $150M
Annual Base PayEmployers Reported 1 3 2 6 2 1 2 7Employees Reported 1 3 2 78 2 1 2 79
25th Percentile ($000's) -- -- -- 46.7 -- -- -- 46.750th Percentile ($000's) -- 44.0 -- 54.5 -- -- -- 54.175th Percentile ($000's) -- -- -- 66.4 -- -- -- 65.8Average ($000's) -- 51.6 -- 57.0 -- -- -- 56.9
Incentive Pay% Incentive Eligible 100% 67% 100% 19% 50% 100% 100% 20%
25th Percentile ($000's) -- -- -- 2.0 -- -- -- 2.050th Percentile ($000's) -- -- -- 3.0 -- -- -- 3.075th Percentile ($000's) -- -- -- 4.4 -- -- -- 4.4Average ($000's) -- -- -- 3.1 -- -- -- 3.1
25th Percentile ($000's) -- -- -- 46.9 -- -- -- 46.950th Percentile ($000's) -- 48.1 -- 54.6 -- -- -- 54.375th Percentile ($000's) -- -- -- 67.1 -- -- -- 67.1Average ($000's) -- 53.5 -- 57.3 -- -- -- 57.2
Most Recent New HireEmployers Reported 0 0 1 1 0 0 1 1
Median ($000's) -- -- -- -- -- -- -- --Average ($000's) -- -- -- -- -- -- -- --
Total Cash CompensationBase Plus Incentive Pay
Plans, directs, and administers the marketing activity for a product or product line. Sets objectives, develops marketing strategy, andmonitors the administration of marketing services including proposals, quotations, pricing, scheduling, and shipping of the product.Coordinates promotional activities, including advertising, literature, and trade show participation, to achieve marketing objectives.Requires a degree in business administration or marketing and 3–5 years relevant experience.
Organizational FTE's Organizational Revenue ($ Millions)
Page 3-253Southwestern Pennsylvania Annual Compensation and Benefits Study
© 2010 Pittsburgh Technology Council. All rights reserved.

Job Code 865 PRODUCT MANAGER
Description
12.1% Less Complex59.1% Comparable28.8% More Complex
All Organizations
Software, Computer and
Technology Manufacturing
Life-Sciences/ Biotech/
Medical Devices Not-for-ProfitAll Other
EmployersAnnual Base Pay
Employers Reported 15 5 6 1 1 2Employees Reported 66 7 21 28 4 625th Percentile ($000's) 84.1 67.3 88.0 -- -- 94.550th Percentile ($000's) 98.4 88.2 122.5 -- -- 95.575th Percentile ($000's) 121.3 90.0 125.0 -- -- 97.4Average ($000's) 100.7 81.4 114.2 -- -- 94.8
Incentive Pay% Incentive Eligible 91% 86% 81% 100% 100% 83%25th Percentile ($000's) 7.4 5.1 17.0 -- -- 8.450th Percentile ($000's) 16.1 7.1 20.0 -- -- 9.975th Percentile ($000's) 21.5 7.8 28.7 -- -- 9.9Average ($000's) 16.4 6.2 24.7 -- -- 8.9
25th Percentile ($000's) 87.8 70.8 88.6 -- -- 95.250th Percentile ($000's) 107.7 90.0 131.4 -- -- 99.475th Percentile ($000's) 129.9 94.9 144.0 -- -- 104.1Average ($000's) 111.9 84.1 128.3 -- -- 99.2
Most Recent New HireEmployers Reported 3 1 0 1 1 0
Median ($000's) 80.0 -- -- -- -- --Average ($000's) 83.2 -- -- -- -- --
Manages a line of business. Develops a strategic concept and plan for the product or line of business. Directs the development ofrefinements to products or brands. In conjunction with department managers, manages product engineering, manufacturing, financialplanning and control, business development, and technical sales support to ensure achievement of product development and/ormarketing goals.
Industry - Type of Employer
Total Cash CompensationBase Plus Incentive Pay
Job Match Comparability
Page 3-254Southwestern Pennsylvania Annual Compensation and Benefits Study
© 2010 Pittsburgh Technology Council. All rights reserved.

Job Code 865 PRODUCT MANAGER
Description
Less than 50 50 - 150 151 - 500 More than 500Less than
$7.5M$7.5M to
$25M$26M to $150M
More than $150M
Annual Base PayEmployers Reported 4 3 4 4 4 3 3 5Employees Reported 7 4 10 45 7 4 5 50
25th Percentile ($000's) 61.3 -- 81.0 95.3 61.3 -- 88.2 88.350th Percentile ($000's) 86.2 73.5 87.6 107.7 86.2 73.5 125.0 105.175th Percentile ($000's) 88.8 -- 118.5 122.5 88.8 -- 129.3 122.2Average ($000's) 78.5 74.0 97.0 107.4 78.5 74.0 109.9 105.0
Incentive Pay% Incentive Eligible 86% 75% 70% 98% 86% 75% 40% 98%
25th Percentile ($000's) 1.0 -- 7.4 11.6 1.0 -- -- 11.650th Percentile ($000's) 2.2 3.1 7.8 16.9 2.2 3.1 -- 16.975th Percentile ($000's) 2.4 -- 8.2 22.4 2.4 -- -- 22.4Average ($000's) 2.1 3.1 7.8 19.1 2.1 3.1 -- 19.1
25th Percentile ($000's) 62.9 -- 82.7 99.9 62.9 -- 96.7 95.050th Percentile ($000's) 88.6 73.5 91.8 122.8 88.6 73.5 125.0 116.675th Percentile ($000's) 90.0 -- 118.5 140.2 90.0 -- 129.3 139.4Average ($000's) 80.0 74.8 98.6 123.1 80.0 74.8 113.0 119.2
Most Recent New HireEmployers Reported 1 1 0 1 1 1 0 1
Median ($000's) -- -- -- -- -- -- -- --Average ($000's) -- -- -- -- -- -- -- --
Total Cash CompensationBase Plus Incentive Pay
Manages a line of business. Develops a strategic concept and plan for the product or line of business. Directs the development ofrefinements to products or brands. In conjunction with department managers, manages product engineering, manufacturing, financialplanning and control, business development, and technical sales support to ensure achievement of product development and/ormarketing goals.
Organizational FTE's Organizational Revenue ($ Millions)
Page 3-255Southwestern Pennsylvania Annual Compensation and Benefits Study
© 2010 Pittsburgh Technology Council. All rights reserved.

Job Code 871 MARKETING MANAGER
Description
13.5% Less Complex59.6% Comparable26.9% More Complex
All Organizations
Software, Computer and
Technology Manufacturing
Life-Sciences/ Biotech/
Medical Devices Not-for-ProfitAll Other
EmployersAnnual Base Pay
Employers Reported 21 5 2 2 3 9Employees Reported 52 6 2 8 4 3225th Percentile ($000's) 65.4 72.9 -- 93.2 -- 63.450th Percentile ($000's) 83.6 82.0 -- 107.2 61.2 81.075th Percentile ($000's) 103.6 99.8 -- 109.2 -- 92.3Average ($000's) 83.8 81.9 -- 101.3 59.2 81.1
Incentive Pay% Incentive Eligible 69% 67% 100% 100% 75% 59%25th Percentile ($000's) 6.6 -- -- 15.8 -- 6.250th Percentile ($000's) 9.9 6.3 -- 16.0 5.4 8.875th Percentile ($000's) 15.6 -- -- 19.8 -- 10.3Average ($000's) 11.4 6.3 -- 17.8 5.4 9.7
25th Percentile ($000's) 69.8 75.6 -- 103.3 -- 66.350th Percentile ($000's) 89.4 87.6 -- 124.3 64.9 83.375th Percentile ($000's) 106.9 101.0 -- 130.1 -- 98.5Average ($000's) 89.3 84.0 -- 116.9 62.0 85.0
Most Recent New HireEmployers Reported 4 2 0 0 0 2
Median ($000's) 95.0 -- -- -- -- --Average ($000's) 92.2 -- -- -- -- --
Responsible for managing the marketing and promotion of the organization's products and services. Manages, monitors and evaluatesmarket research programs and expenditures. Allocates funds and determines project direction. Develops policies, programs, andobjectives for all product and service marketing activities including E- Commerce for the organization. Typically requires a Bachelor'sdegree in marketing, business or related area and 5 or more years of experience.
Industry - Type of Employer
Total Cash CompensationBase Plus Incentive Pay
Job Match Comparability
Page 3-256Southwestern Pennsylvania Annual Compensation and Benefits Study
© 2010 Pittsburgh Technology Council. All rights reserved.

Job Code 871 MARKETING MANAGER
Description
Less than 50 50 - 150 151 - 500 More than 500Less than
$7.5M$7.5M to
$25M$26M to $150M
More than $150M
Annual Base PayEmployers Reported 4 6 2 9 4 5 4 8Employees Reported 6 10 2 34 8 7 4 33
25th Percentile ($000's) 47.1 61.5 -- 72.7 53.0 53.9 -- 75.050th Percentile ($000's) 68.1 69.8 -- 87.3 64.7 72.5 96.5 88.875th Percentile ($000's) 74.0 108.7 -- 105.1 78.9 92.0 -- 106.8Average ($000's) 64.4 79.6 -- 87.7 69.1 74.9 88.7 88.7
Incentive Pay% Incentive Eligible 67% 50% 100% 74% 25% 86% 75% 76%
25th Percentile ($000's) -- 7.6 -- 7.4 -- 6.5 -- 7.450th Percentile ($000's) 7.2 7.8 -- 10.3 -- 7.6 4.8 10.375th Percentile ($000's) -- 9.9 -- 16.0 -- 8.8 -- 16.0Average ($000's) 7.2 9.1 -- 12.6 -- 7.7 4.8 12.6
25th Percentile ($000's) 49.8 61.8 -- 76.1 53.0 57.6 -- 79.350th Percentile ($000's) 73.6 76.8 -- 93.2 70.2 77.4 98.9 93.675th Percentile ($000's) 76.5 108.7 -- 109.5 78.9 95.2 -- 109.8Average ($000's) 66.8 82.3 -- 94.8 70.5 79.2 89.9 95.9
Most Recent New HireEmployers Reported 1 1 0 2 1 1 0 2
Median ($000's) -- -- -- -- -- -- -- --Average ($000's) -- -- -- -- -- -- -- --
Total Cash CompensationBase Plus Incentive Pay
Responsible for managing the marketing and promotion of the organization's products and services. Manages, monitors and evaluatesmarket research programs and expenditures. Allocates funds and determines project direction. Develops policies, programs, andobjectives for all product and service marketing activities including E- Commerce for the organization. Typically requires a Bachelor'sdegree in marketing, business or related area and 5 or more years of experience.
Organizational FTE's Organizational Revenue ($ Millions)
Page 3-257Southwestern Pennsylvania Annual Compensation and Benefits Study
© 2010 Pittsburgh Technology Council. All rights reserved.

Job Code 901 FORKLIFT OPERATOR
Description
0.0% Less Complex100.0% Comparable0.0% More Complex
All Organizations
Software, Computer and
Technology Manufacturing
Life-Sciences/ Biotech/
Medical Devices Not-for-ProfitAll Other
EmployersAnnual Base Pay
Employers Reported 5 0 3 0 0 2Employees Reported 100 0 17 0 0 8325th Percentile ($000's) 28.1 -- 27.7 -- -- 33.950th Percentile ($000's) 42.2 -- 28.2 -- -- 42.275th Percentile ($000's) 42.6 -- 30.3 -- -- 42.6Average ($000's) 36.4 -- 29.5 -- -- 37.8
Incentive Pay% Incentive Eligible 40% -- 76% -- -- 33%25th Percentile ($000's) 0.4 -- 0.4 -- -- 0.450th Percentile ($000's) 0.5 -- 2.1 -- -- 0.575th Percentile ($000's) 0.5 -- 2.3 -- -- 0.5Average ($000's) 0.7 -- 1.5 -- -- 0.4
25th Percentile ($000's) 29.7 -- 28.0 -- -- 34.150th Percentile ($000's) 42.2 -- 30.3 -- -- 42.275th Percentile ($000's) 42.6 -- 32.5 -- -- 42.6Average ($000's) 36.6 -- 30.4 -- -- 37.9
Most Recent New HireEmployers Reported 1 0 0 0 0 1
Median ($000's) -- -- -- -- -- --Average ($000's) -- -- -- -- -- --
Responsible for operating a forklift in warehouses and factories for the purpose of moving, locating, relocating, stacking, and countingmerchandise and parts. Loads and unloads delivery trucks. Accountable for the safe and efficient operation of the vehicle and may alsobe required to perform Order Filler and Checker duties in addition to his or her own. Maintains accurate records of materials moved.Requires the ability to lift up to 50 lbs frequently. Typically requires a high school education or equivalent and less than six months ofexperience.
Job Match Comparability
Industry - Type of Employer
Total Cash CompensationBase Plus Incentive Pay
Page 3-258Southwestern Pennsylvania Annual Compensation and Benefits Study
© 2010 Pittsburgh Technology Council. All rights reserved.

Job Code 901 FORKLIFT OPERATOR
Description
Less than 50 50 - 150 151 - 500 More than 500Less than
$7.5M$7.5M to
$25M$26M to $150M
More than $150M
Annual Base PayEmployers Reported 0 0 2 3 0 0 0 5Employees Reported 0 0 11 89 0 0 0 100
25th Percentile ($000's) -- -- 26.8 30.3 -- -- -- 28.150th Percentile ($000's) -- -- 28.0 42.2 -- -- -- 42.275th Percentile ($000's) -- -- 31.6 42.6 -- -- -- 42.6Average ($000's) -- -- 29.4 37.3 -- -- -- 36.4
Incentive Pay% Incentive Eligible -- -- 64% 37% -- -- -- 40%
25th Percentile ($000's) -- -- 0.3 0.4 -- -- -- 0.450th Percentile ($000's) -- -- 0.3 0.5 -- -- -- 0.575th Percentile ($000's) -- -- 0.4 0.5 -- -- -- 0.5Average ($000's) -- -- 0.3 0.8 -- -- -- 0.7
25th Percentile ($000's) -- -- 26.9 32.5 -- -- -- 29.750th Percentile ($000's) -- -- 28.0 42.2 -- -- -- 42.275th Percentile ($000's) -- -- 31.6 42.6 -- -- -- 42.6Average ($000's) -- -- 29.5 37.5 -- -- -- 36.6
Most Recent New HireEmployers Reported 0 0 0 1 0 0 0 1
Median ($000's) -- -- -- -- -- -- -- --Average ($000's) -- -- -- -- -- -- -- --
Responsible for operating a forklift in warehouses and factories for the purpose of moving, locating, relocating, stacking, and countingmerchandise and parts. Loads and unloads delivery trucks. Accountable for the safe and efficient operation of the vehicle and may alsobe required to perform Order Filler and Checker duties in addition to his or her own. Maintains accurate records of materials moved.Requires the ability to lift up to 50 lbs frequently. Typically requires a high school education or equivalent and less than six months ofexperience.
Organizational FTE's Organizational Revenue ($ Millions)
Total Cash CompensationBase Plus Incentive Pay
Page 3-259Southwestern Pennsylvania Annual Compensation and Benefits Study
© 2010 Pittsburgh Technology Council. All rights reserved.

Job Code 905 STOCK CLERK
Description
0.0% Less Complex89.0% Comparable11.0% More Complex
All Organizations
Software, Computer and
Technology Manufacturing
Life-Sciences/ Biotech/
Medical Devices Not-for-ProfitAll Other
EmployersAnnual Base Pay
Employers Reported 18 2 9 1 2 4Employees Reported 292 12 79 36 8 15725th Percentile ($000's) 21.3 22.8 26.5 -- 19.5 21.350th Percentile ($000's) 25.2 24.3 29.6 -- 20.1 22.075th Percentile ($000's) 31.8 26.9 32.9 -- 23.8 27.6Average ($000's) 26.9 25.2 28.8 -- 24.9 24.9
Incentive Pay% Incentive Eligible 72% 0% 33% 100% 0% 94%25th Percentile ($000's) 0.4 -- 0.5 -- -- 0.350th Percentile ($000's) 0.5 -- 0.8 -- -- 0.475th Percentile ($000's) 0.9 -- 0.9 -- -- 0.5Average ($000's) 0.6 -- 0.8 -- -- 0.4
25th Percentile ($000's) 21.3 22.8 26.5 -- 19.5 21.350th Percentile ($000's) 25.4 24.3 30.2 -- 20.1 22.275th Percentile ($000's) 32.5 26.9 33.7 -- 23.8 28.0Average ($000's) 27.2 25.2 29.3 -- 24.9 25.0
Most Recent New HireEmployers Reported 4 0 3 0 0 1
Median ($000's) 21.3 -- 18.7 -- -- --Average ($000's) 20.8 -- 19.8 -- -- --
Receives, unpacks, and issues materials and supplies in a stockroom or warehouse. Checks goods received against bills of lading,purchase orders, or other documents. Places materials and supplies on shelves, racks, or in specified floor locations. Sorts, counts, andchecks raw materials, finished and semi finished parts. Fills orders from requisitions and maintains the necessary clerical records.Normally requires high school diploma or equivalent reading, writing, and math ability and 1 year experience.
Industry - Type of Employer
Total Cash CompensationBase Plus Incentive Pay
Job Match Comparability
Page 3-260Southwestern Pennsylvania Annual Compensation and Benefits Study
© 2010 Pittsburgh Technology Council. All rights reserved.

Job Code 905 STOCK CLERK
Description
Less than 50 50 - 150 151 - 500 More than 500Less than
$7.5M$7.5M to
$25M$26M to $150M
More than $150M
Annual Base PayEmployers Reported 1 0 8 9 1 0 8 9Employees Reported 1 0 90 201 1 0 45 246
25th Percentile ($000's) -- -- 22.0 21.3 -- -- 19.6 21.350th Percentile ($000's) -- -- 28.0 22.0 -- -- 21.7 27.975th Percentile ($000's) -- -- 32.9 31.2 -- -- 25.9 32.4Average ($000's) -- -- 27.4 26.7 -- -- 23.5 27.5
Incentive Pay% Incentive Eligible 0% -- 26% 93% 0% -- 49% 76%
25th Percentile ($000's) -- -- 0.5 0.4 -- -- 0.8 0.450th Percentile ($000's) -- -- 0.7 0.5 -- -- 0.8 0.575th Percentile ($000's) -- -- 0.8 1.0 -- -- 0.8 0.9Average ($000's) -- -- 0.7 0.6 -- -- 0.8 0.6
25th Percentile ($000's) -- -- 22.0 21.3 -- -- 19.6 21.350th Percentile ($000's) -- -- 28.4 22.5 -- -- 21.7 28.275th Percentile ($000's) -- -- 33.6 31.7 -- -- 25.9 33.3Average ($000's) -- -- 27.7 27.0 -- -- 23.5 27.9
Most Recent New HireEmployers Reported 0 0 3 1 0 0 3 1
Median ($000's) -- -- 18.7 -- -- -- 18.7 --Average ($000's) -- -- 19.8 -- -- -- 19.8 --
Total Cash CompensationBase Plus Incentive Pay
Receives, unpacks, and issues materials and supplies in a stockroom or warehouse. Checks goods received against bills of lading,purchase orders, or other documents. Places materials and supplies on shelves, racks, or in specified floor locations. Sorts, counts, andchecks raw materials, finished and semi finished parts. Fills orders from requisitions and maintains the necessary clerical records.Normally requires high school diploma or equivalent reading, writing, and math ability and 1 year experience.
Organizational FTE's Organizational Revenue ($ Millions)
Page 3-261Southwestern Pennsylvania Annual Compensation and Benefits Study
© 2010 Pittsburgh Technology Council. All rights reserved.

Job Code 910 SHIPPING CLERK
Description
0.0% Less Complex86.7% Comparable13.3% More Complex
All Organizations
Software, Computer and
Technology Manufacturing
Life-Sciences/ Biotech/
Medical Devices Not-for-ProfitAll Other
EmployersAnnual Base Pay
Employers Reported 22 3 10 3 1 5Employees Reported 218 7 42 95 1 7325th Percentile ($000's) 23.6 22.9 26.6 25.4 -- 22.950th Percentile ($000's) 27.4 23.6 31.1 30.0 -- 23.675th Percentile ($000's) 32.4 34.8 34.3 32.4 -- 24.5Average ($000's) 29.0 29.2 30.9 29.2 -- 27.5
Incentive Pay% Incentive Eligible 86% 14% 90% 91% 0% 85%25th Percentile ($000's) 0.5 -- 2.2 1.0 -- 0.350th Percentile ($000's) 1.1 -- 2.4 1.2 -- 0.475th Percentile ($000's) 1.3 -- 3.1 1.3 -- 0.5Average ($000's) 1.1 -- 2.5 1.1 -- 0.4
25th Percentile ($000's) 24.0 22.9 27.6 26.5 -- 22.950th Percentile ($000's) 28.4 23.6 31.9 31.2 -- 24.075th Percentile ($000's) 33.7 34.8 35.5 33.7 -- 24.9Average ($000's) 29.7 29.7 31.8 30.1 -- 27.7
Most Recent New HireEmployers Reported 5 0 3 1 0 1
Median ($000's) 22.9 -- 25.0 -- -- --Average ($000's) 23.2 -- 25.2 -- -- --
Performs tasks associated with the shipment of materials, supplies, and equipment. Prepares records of goods shipped and bills oflading. Posts weights and shipping charges and maintains shipping record files. May operate forklift and prepare goods for finalshipment. Typically requires high school diploma or equivalent reading, writing, and math ability and 1 year experience.
Industry - Type of Employer
Total Cash CompensationBase Plus Incentive Pay
Job Match Comparability
Page 3-262Southwestern Pennsylvania Annual Compensation and Benefits Study
© 2010 Pittsburgh Technology Council. All rights reserved.

Job Code 910 SHIPPING CLERK
Description
Less than 50 50 - 150 151 - 500 More than 500Less than
$7.5M$7.5M to
$25M$26M to $150M
More than $150M
Annual Base PayEmployers Reported 4 5 5 8 4 4 6 8Employees Reported 5 14 27 172 5 5 20 188
25th Percentile ($000's) 32.0 25.5 24.9 23.5 27.6 25.3 23.6 23.650th Percentile ($000's) 32.9 27.4 27.9 27.4 32.9 32.0 25.9 27.475th Percentile ($000's) 34.6 30.9 35.0 32.4 34.6 38.2 28.2 32.4Average ($000's) 30.8 29.1 29.8 28.9 29.9 32.4 27.6 29.1
Incentive Pay% Incentive Eligible 100% 71% 78% 88% 80% 40% 65% 89%
25th Percentile ($000's) 1.0 2.3 3.3 0.4 -- -- 2.4 0.450th Percentile ($000's) 1.0 3.3 3.3 1.0 1.0 -- 3.3 1.075th Percentile ($000's) 1.0 3.5 3.3 1.2 -- -- 3.4 1.2Average ($000's) 1.0 3.0 3.3 0.9 1.0 -- 3.0 0.9
25th Percentile ($000's) 32.0 27.3 24.9 23.7 27.6 25.3 23.6 24.050th Percentile ($000's) 33.9 29.4 27.9 28.2 33.9 32.0 26.9 28.475th Percentile ($000's) 34.6 33.3 35.0 33.5 34.6 38.2 30.9 33.7Average ($000's) 31.2 30.6 29.9 29.5 30.3 32.4 28.9 29.7
Most Recent New HireEmployers Reported 1 0 2 2 0 1 1 3
Median ($000's) -- -- -- -- -- -- -- 22.9Average ($000's) -- -- -- -- -- -- -- 23.0
Total Cash CompensationBase Plus Incentive Pay
Performs tasks associated with the shipment of materials, supplies, and equipment. Prepares records of goods shipped and bills oflading. Posts weights and shipping charges and maintains shipping record files. May operate forklift and prepare goods for finalshipment. Typically requires high school diploma or equivalent reading, writing, and math ability and 1 year experience.
Organizational FTE's Organizational Revenue ($ Millions)
Page 3-263Southwestern Pennsylvania Annual Compensation and Benefits Study
© 2010 Pittsburgh Technology Council. All rights reserved.

Job Code 915 SHIPPING/WAREHOUSE SUPERVISOR
Description
0.0% Less Complex97.4% Comparable2.6% More Complex
All Organizations
Software, Computer and
Technology Manufacturing
Life-Sciences/ Biotech/
Medical Devices Not-for-ProfitAll Other
EmployersAnnual Base Pay
Employers Reported 16 1 6 2 2 5Employees Reported 39 1 15 7 2 1425th Percentile ($000's) 42.4 -- 41.2 55.0 -- 42.450th Percentile ($000's) 50.2 -- 53.1 57.3 -- 45.075th Percentile ($000's) 57.2 -- 57.3 58.5 -- 48.7Average ($000's) 50.3 -- 52.8 57.8 -- 45.1
Incentive Pay% Incentive Eligible 79% 100% 93% 86% 0% 71%25th Percentile ($000's) 2.0 -- 4.7 3.8 -- 0.950th Percentile ($000's) 3.8 -- 5.8 4.0 -- 1.575th Percentile ($000's) 5.8 -- 6.6 4.3 -- 1.9Average ($000's) 4.1 -- 5.8 4.0 -- 1.6
25th Percentile ($000's) 45.0 -- 47.3 58.2 -- 42.650th Percentile ($000's) 54.1 -- 57.1 60.5 -- 45.675th Percentile ($000's) 59.4 -- 60.2 61.8 -- 50.2Average ($000's) 53.1 -- 57.4 61.2 -- 46.0
Most Recent New HireEmployers Reported 0 0 0 0 0 0
Median ($000's) -- -- -- -- -- --Average ($000's) -- -- -- -- -- --
Supervises receiving and stocking equipment and supplies. Ensures that all items are logged, tagged, and properly stored. Supervisesfulfillment of orders for equipment and supplies. Schedules activities of stock and shipping clerks. Trains employees who receivematerials for storage and fulfill requisitions and orders. Prepares reports for management. Normally requires high school diploma withgood mathematical and analytical skills and 3–5 years warehouse and/or distribution center experience.
Industry - Type of Employer
Total Cash CompensationBase Plus Incentive Pay
Job Match Comparability
Page 3-264Southwestern Pennsylvania Annual Compensation and Benefits Study
© 2010 Pittsburgh Technology Council. All rights reserved.

Job Code 915 SHIPPING/WAREHOUSE SUPERVISOR
Description
Less than 50 50 - 150 151 - 500 More than 500Less than
$7.5M$7.5M to
$25M$26M to $150M
More than $150M
Annual Base PayEmployers Reported 0 2 6 8 1 0 6 9Employees Reported 0 3 13 23 1 0 7 31
25th Percentile ($000's) -- -- 39.1 45.0 -- -- 38.9 45.050th Percentile ($000's) -- 42.4 51.4 52.9 -- -- 42.6 51.475th Percentile ($000's) -- -- 54.3 57.3 -- -- 60.3 56.1Average ($000's) -- 41.2 51.8 50.7 -- -- 48.9 50.9
Incentive Pay% Incentive Eligible -- 67% 85% 78% 0% -- 57% 87%
25th Percentile ($000's) -- -- 5.6 1.5 -- -- -- 1.950th Percentile ($000's) -- -- 6.2 2.3 -- -- 6.1 3.875th Percentile ($000's) -- -- 7.2 3.8 -- -- -- 5.2Average ($000's) -- -- 6.6 2.6 -- -- 6.1 3.9
25th Percentile ($000's) -- -- 45.1 45.6 -- -- 41.7 45.550th Percentile ($000's) -- 44.3 54.6 55.1 -- -- 49.0 54.675th Percentile ($000's) -- -- 60.9 59.4 -- -- 60.3 59.4Average ($000's) -- 45.3 55.9 52.5 -- -- 50.7 54.0
Most Recent New HireEmployers Reported 0 0 0 0 0 0 0 0
Median ($000's) -- -- -- -- -- -- -- --Average ($000's) -- -- -- -- -- -- -- --
Total Cash CompensationBase Plus Incentive Pay
Supervises receiving and stocking equipment and supplies. Ensures that all items are logged, tagged, and properly stored. Supervisesfulfillment of orders for equipment and supplies. Schedules activities of stock and shipping clerks. Trains employees who receivematerials for storage and fulfill requisitions and orders. Prepares reports for management. Normally requires high school diploma withgood mathematical and analytical skills and 3–5 years warehouse and/or distribution center experience.
Organizational FTE's Organizational Revenue ($ Millions)
Page 3-265Southwestern Pennsylvania Annual Compensation and Benefits Study
© 2010 Pittsburgh Technology Council. All rights reserved.

Job Code 916 SHIPPING/WAREHOUSE MANAGER
Description
0.0% Less Complex88.2% Comparable11.8% More Complex
All Organizations
Software, Computer and
Technology Manufacturing
Life-Sciences/ Biotech/
Medical Devices Not-for-ProfitAll Other
EmployersAnnual Base Pay
Employers Reported 10 0 5 1 1 3Employees Reported 17 0 7 1 1 825th Percentile ($000's) 64.2 -- 74.4 -- -- 61.150th Percentile ($000's) 75.6 -- 80.0 -- -- 70.575th Percentile ($000's) 95.9 -- 101.9 -- -- 78.4Average ($000's) 77.4 -- 83.9 -- -- 70.5
Incentive Pay% Incentive Eligible 82% -- 86% 100% 0% 88%25th Percentile ($000's) 4.4 -- 12.8 -- -- 4.050th Percentile ($000's) 10.2 -- 14.1 -- -- 4.475th Percentile ($000's) 14.6 -- 21.3 -- -- 5.6Average ($000's) 12.0 -- 20.0 -- -- 6.2
25th Percentile ($000's) 65.0 -- 79.5 -- -- 63.550th Percentile ($000's) 79.8 -- 80.0 -- -- 74.675th Percentile ($000's) 114.2 -- 121.9 -- -- 83.4Average ($000's) 85.1 -- 95.3 -- -- 75.2
Most Recent New HireEmployers Reported 0 0 0 0 0 0
Median ($000's) -- -- -- -- -- --Average ($000's) -- -- -- -- -- --
Directs, coordinates and plans the warehouse storage and distribution of products and materials. Schedules employees and drivers,arranges pick-ups and drop-offs, manages deliveries and schedules loading dock machine operators. Ensures all activities followapproved regulations related to personal safety and safety of inventory. Verifies shipping records and addresses concerns of shippingshortages or overages. Typically requires a Bachelor's degree and 3-5 years of warehouse and/or distribution center experience.
Job Match Comparability
Industry - Type of Employer
Total Cash CompensationBase Plus Incentive Pay
Page 3-266Southwestern Pennsylvania Annual Compensation and Benefits Study
© 2010 Pittsburgh Technology Council. All rights reserved.

Job Code 916 SHIPPING/WAREHOUSE MANAGER
Description
Less than 50 50 - 150 151 - 500 More than 500Less than
$7.5M$7.5M to
$25M$26M to $150M
More than $150M
Annual Base PayEmployers Reported 0 1 4 5 0 1 3 6Employees Reported 0 1 5 11 0 1 3 13
25th Percentile ($000's) -- -- 69.6 66.8 -- -- -- 69.650th Percentile ($000's) -- -- 79.2 75.6 -- -- 64.2 80.075th Percentile ($000's) -- -- 80.0 103.3 -- -- -- 99.4Average ($000's) -- -- 74.3 82.8 -- -- 63.4 84.0
Incentive Pay% Incentive Eligible -- 100% 80% 82% -- 100% 33% 92%
25th Percentile ($000's) -- -- -- 4.2 -- -- -- 4.450th Percentile ($000's) -- -- 26.0 6.0 -- -- -- 10.275th Percentile ($000's) -- -- -- 14.5 -- -- -- 14.6Average ($000's) -- -- 26.0 8.9 -- -- -- 12.0
25th Percentile ($000's) -- -- 79.2 69.1 -- -- -- 75.850th Percentile ($000's) -- -- 79.8 80.2 -- -- 64.2 80.275th Percentile ($000's) -- -- 80.0 117.8 -- -- -- 121.5Average ($000's) -- -- 84.7 90.1 -- -- 63.4 94.2
Most Recent New HireEmployers Reported 0 0 0 0 0 0 0 0
Median ($000's) -- -- -- -- -- -- -- --Average ($000's) -- -- -- -- -- -- -- --
Directs, coordinates and plans the warehouse storage and distribution of products and materials. Schedules employees and drivers,arranges pick-ups and drop-offs, manages deliveries and schedules loading dock machine operators. Ensures all activities followapproved regulations related to personal safety and safety of inventory. Verifies shipping records and addresses concerns of shippingshortages or overages. Typically requires a Bachelor's degree and 3-5 years of warehouse and/or distribution center experience.
Organizational FTE's Organizational Revenue ($ Millions)
Total Cash CompensationBase Plus Incentive Pay
Page 3-267Southwestern Pennsylvania Annual Compensation and Benefits Study
© 2010 Pittsburgh Technology Council. All rights reserved.

Job Code 919 MACHINE OPERATOR
Description
0.0% Less Complex90.5% Comparable9.5% More Complex
All Organizations
Software, Computer and
Technology Manufacturing
Life-Sciences/ Biotech/
Medical Devices Not-for-ProfitAll Other
EmployersAnnual Base Pay
Employers Reported 10 1 7 0 0 2Employees Reported 74 6 43 0 0 2525th Percentile ($000's) 28.1 -- 28.1 -- -- 29.350th Percentile ($000's) 33.0 -- 33.8 -- -- 31.875th Percentile ($000's) 40.2 -- 43.2 -- -- 38.6Average ($000's) 34.2 -- 35.2 -- -- 34.1
Incentive Pay% Incentive Eligible 53% 0% 42% -- -- 84%25th Percentile ($000's) 1.9 -- 1.9 -- -- --50th Percentile ($000's) 2.8 -- 2.8 -- -- --75th Percentile ($000's) 3.9 -- 3.9 -- -- --Average ($000's) 3.2 -- 3.2 -- -- --
25th Percentile ($000's) 28.2 -- 28.5 -- -- 29.350th Percentile ($000's) 33.5 -- 34.3 -- -- 31.875th Percentile ($000's) 41.6 -- 43.7 -- -- 38.6Average ($000's) 34.5 -- 35.8 -- -- 34.1
Most Recent New HireEmployers Reported 1 0 1 0 0 0
Median ($000's) -- -- -- -- -- --Average ($000's) -- -- -- -- -- --
Operates machine tools such as milling machines and lathes, boring machines and presses, cutters, and grinders. Follows clearlydetailed specifications and shop orders to perform relatively simple operations. May operate and monitor equipment working undernumerical control. Requires training to read job orders and engineering specifications, and experience in setting up and operating specificmachine tools. Typically requires 6 months to 1 year formal training or qualifying experience.
Industry - Type of Employer
Total Cash CompensationBase Plus Incentive Pay
Job Match Comparability
Page 3-268Southwestern Pennsylvania Annual Compensation and Benefits Study
© 2010 Pittsburgh Technology Council. All rights reserved.

Job Code 919 MACHINE OPERATOR
Description
Less than 50 50 - 150 151 - 500 More than 500Less than
$7.5M$7.5M to
$25M$26M to $150M
More than $150M
Annual Base PayEmployers Reported 1 4 4 1 2 2 4 2Employees Reported 6 47 17 4 10 37 21 6
25th Percentile ($000's) -- 29.2 24.1 -- 27.6 30.1 24.1 34.750th Percentile ($000's) -- 36.0 26.6 -- 31.9 38.6 27.0 37.975th Percentile ($000's) -- 43.2 31.2 -- 33.8 44.0 29.2 43.4Average ($000's) -- 36.0 28.0 -- 30.6 37.9 27.8 39.4
Incentive Pay% Incentive Eligible 100% 57% 12% 100% 60% 57% 29% 100%
25th Percentile ($000's) -- 3.8 -- -- -- -- 3.8 1.750th Percentile ($000's) -- 3.9 -- -- -- -- 3.9 1.975th Percentile ($000's) -- 4.6 -- -- -- -- 4.6 2.1Average ($000's) -- 4.5 -- -- -- -- 4.5 1.9
25th Percentile ($000's) -- 29.5 24.1 -- 27.6 30.1 24.1 35.350th Percentile ($000's) -- 36.0 26.6 -- 31.9 38.6 27.0 38.775th Percentile ($000's) -- 43.7 31.2 -- 33.8 44.0 32.1 45.4Average ($000's) -- 36.4 28.0 -- 30.6 37.9 28.6 40.7
Most Recent New HireEmployers Reported 0 0 1 0 0 0 1 0
Median ($000's) -- -- -- -- -- -- -- --Average ($000's) -- -- -- -- -- -- -- --
Total Cash CompensationBase Plus Incentive Pay
Operates machine tools such as milling machines and lathes, boring machines and presses, cutters, and grinders. Follows clearlydetailed specifications and shop orders to perform relatively simple operations. May operate and monitor equipment working undernumerical control. Requires training to read job orders and engineering specifications, and experience in setting up and operating specificmachine tools. Typically requires 6 months to 1 year formal training or qualifying experience.
Organizational FTE's Organizational Revenue ($ Millions)
Page 3-269Southwestern Pennsylvania Annual Compensation and Benefits Study
© 2010 Pittsburgh Technology Council. All rights reserved.

Job Code 920 NUMERICAL CONTROL MACHINE OPERATOR
Description
0.0% Less Complex100.0% Comparable0.0% More Complex
All Organizations
Software, Computer and
Technology Manufacturing
Life-Sciences/ Biotech/
Medical Devices Not-for-ProfitAll Other
EmployersAnnual Base Pay
Employers Reported 4 0 4 0 0 0Employees Reported 31 0 31 0 0 025th Percentile ($000's) 31.5 -- 31.5 -- -- --50th Percentile ($000's) 35.0 -- 35.0 -- -- --75th Percentile ($000's) 39.4 -- 39.4 -- -- --Average ($000's) 35.3 -- 35.3 -- -- --
Incentive Pay% Incentive Eligible 26% -- 26% -- -- --25th Percentile ($000's) -- -- -- -- -- --50th Percentile ($000's) -- -- -- -- -- --75th Percentile ($000's) -- -- -- -- -- --Average ($000's) -- -- -- -- -- --
25th Percentile ($000's) 31.5 -- 31.5 -- -- --50th Percentile ($000's) 35.0 -- 35.0 -- -- --75th Percentile ($000's) 39.4 -- 39.4 -- -- --Average ($000's) 35.3 -- 35.3 -- -- --
Most Recent New HireEmployers Reported 1 0 1 0 0 0
Median ($000's) -- -- -- -- -- --Average ($000's) -- -- -- -- -- --
Sets up and operates numerically controlled machines to cut, shape, and form metal, plastic, and composite work pieces. Reviewsspecifications to determine setup procedure and machining sequence. Selects and attaches fixtures, work pieces, and cutting tools.Loads control media. Changes work piece location and cutting tools as necessary during machining. Although machining processesrequire little or no deviation from routine procedures, may occasionally make adjustments to overcome faulty programming or machinemalfunctions. Measures work piece for conformity to specifications. Normally requires 2–3 years experience. May be titled NumericalControl Machine Operator or Machinist.
Industry - Type of Employer
Total Cash CompensationBase Plus Incentive Pay
Job Match Comparability
Page 3-270Southwestern Pennsylvania Annual Compensation and Benefits Study
© 2010 Pittsburgh Technology Council. All rights reserved.

Job Code 920 NUMERICAL CONTROL MACHINE OPERATOR
Description
Less than 50 50 - 150 151 - 500 More than 500Less than
$7.5M$7.5M to
$25M$26M to $150M
More than $150M
Annual Base PayEmployers Reported 0 1 3 0 0 0 3 1Employees Reported 0 1 30 0 0 0 24 7
25th Percentile ($000's) -- -- 31.9 -- -- -- 31.1 --50th Percentile ($000's) -- -- 35.0 -- -- -- 33.6 --75th Percentile ($000's) -- -- 39.7 -- -- -- 36.5 --Average ($000's) -- -- 35.7 -- -- -- 34.3 --
Incentive Pay% Incentive Eligible -- 100% 23% -- -- -- 4% 100%
25th Percentile ($000's) -- -- -- -- -- -- -- --50th Percentile ($000's) -- -- -- -- -- -- -- --75th Percentile ($000's) -- -- -- -- -- -- -- --Average ($000's) -- -- -- -- -- -- -- --
25th Percentile ($000's) -- -- 31.9 -- -- -- 31.1 --50th Percentile ($000's) -- -- 35.0 -- -- -- 33.6 --75th Percentile ($000's) -- -- 39.7 -- -- -- 36.5 --Average ($000's) -- -- 35.7 -- -- -- 34.3 --
Most Recent New HireEmployers Reported 0 0 1 0 0 0 1 0
Median ($000's) -- -- -- -- -- -- -- --Average ($000's) -- -- -- -- -- -- -- --
Total Cash CompensationBase Plus Incentive Pay
Sets up and operates numerically controlled machines to cut, shape, and form metal, plastic, and composite work pieces. Reviewsspecifications to determine setup procedure and machining sequence. Selects and attaches fixtures, work pieces, and cutting tools.Loads control media. Changes work piece location and cutting tools as necessary during machining. Although machining processesrequire little or no deviation from routine procedures, may occasionally make adjustments to overcome faulty programming or machinemalfunctions. Measures work piece for conformity to specifications. Normally requires 2–3 years experience. May be titled NumericalControl Machine Operator or Machinist.
Organizational FTE's Organizational Revenue ($ Millions)
Page 3-271Southwestern Pennsylvania Annual Compensation and Benefits Study
© 2010 Pittsburgh Technology Council. All rights reserved.

Job Code 922 MACHINIST
Description
0.0% Less Complex42.1% Comparable57.9% More Complex
All Organizations
Software, Computer and
Technology Manufacturing
Life-Sciences/ Biotech/
Medical Devices Not-for-ProfitAll Other
EmployersAnnual Base Pay
Employers Reported 8 0 5 1 1 1Employees Reported 38 0 30 6 1 125th Percentile ($000's) 37.5 -- 36.6 -- -- --50th Percentile ($000's) 41.8 -- 39.0 -- -- --75th Percentile ($000's) 44.0 -- 43.6 -- -- --Average ($000's) 41.7 -- 39.2 -- -- --
Incentive Pay% Incentive Eligible 92% -- 97% 100% 0% 0%25th Percentile ($000's) 1.7 -- 2.1 -- -- --50th Percentile ($000's) 1.9 -- 2.2 -- -- --75th Percentile ($000's) 2.1 -- 2.8 -- -- --Average ($000's) 2.1 -- 2.7 -- -- --
25th Percentile ($000's) 37.5 -- 37.5 -- -- --50th Percentile ($000's) 41.8 -- 39.3 -- -- --75th Percentile ($000's) 45.2 -- 43.6 -- -- --Average ($000's) 42.3 -- 39.5 -- -- --
Most Recent New HireEmployers Reported 1 0 0 0 0 1
Median ($000's) -- -- -- -- -- --Average ($000's) -- -- -- -- -- --
Sets up and operates conventional, special-purpose, and numerical control machines and machining centers. Studies blueprints,specifications, sketches, and manuals to determine dimensions and tolerances, setup requirements, and sequence of operations.Conducts trial runs and verifies accuracy of machine settings and programmed control data. Confers with engineers, programmers, andproduction personnel to resolve machining and assembly problems. Requires expertise in setup and operation of all machine tools and3–5 years qualifying experience.
Industry - Type of Employer
Total Cash CompensationBase Plus Incentive Pay
Job Match Comparability
Page 3-272Southwestern Pennsylvania Annual Compensation and Benefits Study
© 2010 Pittsburgh Technology Council. All rights reserved.

Job Code 922 MACHINIST
Description
Less than 50 50 - 150 151 - 500 More than 500Less than
$7.5M$7.5M to
$25M$26M to $150M
More than $150M
Annual Base PayEmployers Reported 0 1 3 4 0 0 4 4Employees Reported 0 1 26 11 0 0 6 32
25th Percentile ($000's) -- -- 36.6 46.4 -- -- 29.9 37.550th Percentile ($000's) -- -- 37.5 49.2 -- -- 32.3 42.775th Percentile ($000's) -- -- 43.2 54.4 -- -- 33.1 44.3Average ($000's) -- -- 38.7 49.8 -- -- 33.8 43.2
Incentive Pay% Incentive Eligible -- 100% 96% 82% -- -- 67% 97%
25th Percentile ($000's) -- -- -- 1.7 -- -- -- 1.750th Percentile ($000's) -- -- -- 1.8 -- -- 4.6 1.875th Percentile ($000's) -- -- -- 2.0 -- -- -- 2.0Average ($000's) -- -- -- 1.8 -- -- 4.6 1.8
25th Percentile ($000's) -- -- 36.6 47.5 -- -- 29.9 37.550th Percentile ($000's) -- -- 37.5 51.4 -- -- 32.3 42.975th Percentile ($000's) -- -- 43.2 55.4 -- -- 36.6 45.5Average ($000's) -- -- 38.7 51.3 -- -- 34.5 43.7
Most Recent New HireEmployers Reported 0 0 0 1 0 0 0 1
Median ($000's) -- -- -- -- -- -- -- --Average ($000's) -- -- -- -- -- -- -- --
Total Cash CompensationBase Plus Incentive Pay
Sets up and operates conventional, special-purpose, and numerical control machines and machining centers. Studies blueprints,specifications, sketches, and manuals to determine dimensions and tolerances, setup requirements, and sequence of operations.Conducts trial runs and verifies accuracy of machine settings and programmed control data. Confers with engineers, programmers, andproduction personnel to resolve machining and assembly problems. Requires expertise in setup and operation of all machine tools and3–5 years qualifying experience.
Organizational FTE's Organizational Revenue ($ Millions)
Page 3-273Southwestern Pennsylvania Annual Compensation and Benefits Study
© 2010 Pittsburgh Technology Council. All rights reserved.

Job Code 921 SENIOR MACHINIST (JOURNEYMAN LEVEL)
Description
0.0% Less Complex100.0% Comparable0.0% More Complex
All Organizations
Software, Computer and
Technology Manufacturing
Life-Sciences/ Biotech/
Medical Devices Not-for-ProfitAll Other
EmployersAnnual Base Pay
Employers Reported 10 0 8 1 0 1Employees Reported 28 0 26 1 0 125th Percentile ($000's) 41.0 -- 40.7 -- -- --50th Percentile ($000's) 43.9 -- 43.9 -- -- --75th Percentile ($000's) 49.2 -- 48.3 -- -- --Average ($000's) 45.3 -- 44.3 -- -- --
Incentive Pay% Incentive Eligible 54% -- 54% 100% -- 0%25th Percentile ($000's) 2.4 -- 2.6 -- -- --50th Percentile ($000's) 2.9 -- 3.0 -- -- --75th Percentile ($000's) 4.1 -- 4.6 -- -- --Average ($000's) 3.5 -- 3.9 -- -- --
25th Percentile ($000's) 41.6 -- 41.3 -- -- --50th Percentile ($000's) 44.2 -- 44.2 -- -- --75th Percentile ($000's) 50.2 -- 50.0 -- -- --Average ($000's) 46.2 -- 45.2 -- -- --
Most Recent New HireEmployers Reported 0 0 0 0 0 0
Median ($000's) -- -- -- -- -- --Average ($000's) -- -- -- -- -- --
Sets up and operates conventional, special-purpose, and numerical control machines and machining centers. Studies blueprints,specifications, sketches, and manuals to determine dimensions and tolerances, setup requirements, and sequence of operations.Conducts trial runs and verifies accuracy of machine settings and programmed control data. Confers with engineers, programmers, andproduction personnel to resolve machining and assembly problems. Requires expertise in setup and operation of all machine tools and3–5 years qualifying experience. Requires journeyman papers.
Industry - Type of Employer
Total Cash CompensationBase Plus Incentive Pay
Job Match Comparability
Page 3-274Southwestern Pennsylvania Annual Compensation and Benefits Study
© 2010 Pittsburgh Technology Council. All rights reserved.

Job Code 921 SENIOR MACHINIST (JOURNEYMAN LEVEL)
Description
Less than 50 50 - 150 151 - 500 More than 500Less than
$7.5M$7.5M to
$25M$26M to $150M
More than $150M
Annual Base PayEmployers Reported 0 3 4 3 0 2 4 4Employees Reported 0 4 18 6 0 2 19 7
25th Percentile ($000's) -- -- 40.4 49.3 -- -- 39.9 46.350th Percentile ($000's) -- 44.2 42.8 50.3 -- -- 42.8 50.175th Percentile ($000's) -- -- 45.2 52.5 -- -- 44.9 51.8Average ($000's) -- 44.4 42.9 53.2 -- -- 42.6 51.8
Incentive Pay% Incentive Eligible -- 50% 44% 83% -- 0% 47% 86%
25th Percentile ($000's) -- -- -- 2.4 -- -- 5.7 2.450th Percentile ($000's) -- -- -- 2.4 -- -- 6.2 2.475th Percentile ($000's) -- -- -- 2.9 -- -- 6.7 2.9Average ($000's) -- -- -- 2.5 -- -- 6.2 2.5
25th Percentile ($000's) -- -- 40.4 51.8 -- -- 40.4 47.750th Percentile ($000's) -- 47.8 42.8 53.1 -- -- 42.8 52.975th Percentile ($000's) -- -- 45.2 55.4 -- -- 45.7 54.7Average ($000's) -- 47.5 42.9 55.2 -- -- 43.2 53.5
Most Recent New HireEmployers Reported 0 0 0 0 0 0 0 0
Median ($000's) -- -- -- -- -- -- -- --Average ($000's) -- -- -- -- -- -- -- --
Total Cash CompensationBase Plus Incentive Pay
Sets up and operates conventional, special-purpose, and numerical control machines and machining centers. Studies blueprints,specifications, sketches, and manuals to determine dimensions and tolerances, setup requirements, and sequence of operations.Conducts trial runs and verifies accuracy of machine settings and programmed control data. Confers with engineers, programmers, andproduction personnel to resolve machining and assembly problems. Requires expertise in setup and operation of all machine tools and3–5 years qualifying experience. Requires journeyman papers.
Organizational FTE's Organizational Revenue ($ Millions)
Page 3-275Southwestern Pennsylvania Annual Compensation and Benefits Study
© 2010 Pittsburgh Technology Council. All rights reserved.

Job Code 926 ASSEMBLER - ALL LEVELS
Description
0.1% Less Complex95.6% Comparable4.3% More Complex
All Organizations
Software, Computer and
Technology Manufacturing
Life-Sciences/ Biotech/
Medical Devices Not-for-ProfitAll Other
EmployersAnnual Base Pay
Employers Reported 16 2 11 3 0 0Employees Reported 912 68 434 410 0 025th Percentile ($000's) 27.0 23.5 22.9 32.4 -- --50th Percentile ($000's) 32.4 26.7 28.2 35.1 -- --75th Percentile ($000's) 35.1 30.8 35.0 35.1 -- --Average ($000's) 31.2 27.7 29.4 33.7 -- --
Incentive Pay% Incentive Eligible 82% 0% 84% 92% -- --25th Percentile ($000's) 1.0 -- 2.3 1.0 -- --50th Percentile ($000's) 1.1 -- 2.7 1.0 -- --75th Percentile ($000's) 2.2 -- 3.3 1.1 -- --Average ($000's) 1.6 -- 3.1 1.0 -- --
25th Percentile ($000's) 28.1 23.5 22.9 33.4 -- --50th Percentile ($000's) 33.4 26.7 30.0 36.1 -- --75th Percentile ($000's) 36.2 30.8 36.5 36.2 -- --Average ($000's) 32.2 27.7 30.5 34.7 -- --
Most Recent New HireEmployers Reported 6 0 5 1 0 0
Median ($000's) 16.6 -- 16.6 -- -- --Average ($000's) 20.8 -- 20.4 -- -- --
The data for this position is a combination of the data reported by participants for 927 Assembler and 928 Senior Assembler
Industry - Type of Employer
Total Cash CompensationBase Plus Incentive Pay
Job Match Comparability
Page 3-276Southwestern Pennsylvania Annual Compensation and Benefits Study
© 2010 Pittsburgh Technology Council. All rights reserved.

Job Code 926 ASSEMBLER - ALL LEVELS
Description
Less than 50 50 - 150 151 - 500 More than 500Less than
$7.5M$7.5M to
$25M$26M to $150M
More than $150M
Annual Base PayEmployers Reported 3 3 6 4 2 3 6 5Employees Reported 11 79 306 516 6 18 332 556
25th Percentile ($000's) 26.6 25.8 20.8 32.4 26.3 31.8 21.1 32.450th Percentile ($000's) 31.7 29.1 24.5 35.1 30.2 36.5 24.7 35.175th Percentile ($000's) 34.1 35.0 32.6 35.1 33.3 39.9 29.1 35.1Average ($000's) 33.0 30.5 26.8 33.9 29.9 36.4 25.7 34.4
Incentive Pay% Incentive Eligible 64% 84% 61% 94% 33% 28% 64% 94%
25th Percentile ($000's) 3.9 3.2 -- 1.0 -- 3.9 3.2 1.050th Percentile ($000's) 5.6 4.0 -- 1.1 -- 5.6 4.0 1.175th Percentile ($000's) 6.6 4.8 -- 1.2 -- 6.6 4.8 1.2Average ($000's) 5.1 4.0 -- 1.4 -- 5.1 4.0 1.4
25th Percentile ($000's) 26.6 28.0 20.8 33.3 26.3 32.5 21.1 33.350th Percentile ($000's) 33.3 31.2 24.5 36.1 30.2 36.5 25.0 36.175th Percentile ($000's) 34.4 37.2 32.6 36.2 33.3 40.3 30.2 36.2Average ($000's) 34.4 32.9 26.8 35.2 29.9 37.3 26.2 35.6
Most Recent New HireEmployers Reported 1 1 4 0 1 0 4 1
Median ($000's) -- -- 16.6 -- -- -- 16.6 --Average ($000's) -- -- 19.2 -- -- -- 20.0 --
Total Cash CompensationBase Plus Incentive Pay
The data for this position is a combination of the data reported by participants for 927 Assembler and 928 Senior Assembler
Organizational FTE's Organizational Revenue ($ Millions)
Page 3-277Southwestern Pennsylvania Annual Compensation and Benefits Study
© 2010 Pittsburgh Technology Council. All rights reserved.

Job Code 927 ASSEMBLER
Description
0.0% Less Complex92.6% Comparable7.4% More Complex
All Organizations
Software, Computer and
Technology Manufacturing
Life-Sciences/ Biotech/
Medical Devices Not-for-ProfitAll Other
EmployersAnnual Base Pay
Employers Reported 16 2 11 3 0 0Employees Reported 444 41 323 80 0 025th Percentile ($000's) 22.4 21.5 21.6 29.7 -- --50th Percentile ($000's) 27.4 24.1 26.0 30.0 -- --75th Percentile ($000's) 31.3 26.7 30.3 33.9 -- --Average ($000's) 27.2 25.0 26.4 31.4 -- --
Incentive Pay% Incentive Eligible 80% 0% 94% 61% -- --25th Percentile ($000's) 1.3 -- 2.2 0.9 -- --50th Percentile ($000's) 2.3 -- 2.5 1.1 -- --75th Percentile ($000's) 2.7 -- 3.0 1.2 -- --Average ($000's) 2.3 -- 2.8 1.1 -- --
25th Percentile ($000's) 22.4 21.5 21.6 29.7 -- --50th Percentile ($000's) 29.0 24.1 27.2 31.2 -- --75th Percentile ($000's) 32.6 26.7 32.5 34.2 -- --Average ($000's) 28.0 25.0 27.4 32.0 -- --
Most Recent New HireEmployers Reported 6 0 5 1 0 0
Median ($000's) 16.6 -- 16.6 -- -- --Average ($000's) 20.5 -- 20.2 -- -- --
Performs assemblies of standardized products or sub-assemblies at bench or conveyor. Assembles, modifies, reworks, and repairsmechanical and electro-mechanical assemblies. Works from assembly drawings, operation sheets, engineering specifications, sketches,and running sheets of average complexity to perform operations on assemblies, banks, cabinets, chassis, and panels. Typically requiresa high school diploma or the equivalent and less than 1 year experience. Vocational training is preferred.
Industry - Type of Employer
Total Cash CompensationBase Plus Incentive Pay
Job Match Comparability
Page 3-278Southwestern Pennsylvania Annual Compensation and Benefits Study
© 2010 Pittsburgh Technology Council. All rights reserved.

Job Code 927 ASSEMBLER
Description
Less than 50 50 - 150 151 - 500 More than 500Less than
$7.5M$7.5M to
$25M$26M to $150M
More than $150M
Annual Base PayEmployers Reported 3 3 6 4 2 3 6 5Employees Reported 10 59 221 154 6 7 245 186
25th Percentile ($000's) 26.3 25.0 18.7 29.3 26.3 28.1 19.8 29.750th Percentile ($000's) 31.5 27.5 22.4 30.3 30.2 31.7 22.9 31.775th Percentile ($000's) 33.3 29.6 25.7 34.2 33.3 33.9 25.7 35.0Average ($000's) 30.8 27.8 24.0 31.3 29.9 31.4 23.0 32.5
Incentive Pay% Incentive Eligible 60% 95% 76% 79% 33% 57% 79% 83%
25th Percentile ($000's) 3.1 3.0 -- 1.2 -- -- 3.0 1.250th Percentile ($000's) 3.9 3.5 -- 2.1 -- 3.9 3.5 2.175th Percentile ($000's) 4.7 4.1 -- 2.3 -- -- 4.1 2.3Average ($000's) 3.9 3.6 -- 1.8 -- 3.9 3.6 1.8
25th Percentile ($000's) 26.3 27.0 18.7 30.3 26.3 28.1 19.8 30.950th Percentile ($000's) 32.3 29.5 22.4 32.5 30.2 32.0 22.9 32.575th Percentile ($000's) 33.7 32.6 25.7 35.4 33.3 34.9 26.7 36.4Average ($000's) 31.6 30.1 24.0 32.7 29.9 32.6 23.5 33.7
Most Recent New HireEmployers Reported 1 1 4 0 1 0 4 1
Median ($000's) -- -- 16.6 -- -- -- 16.6 --Average ($000's) -- -- 18.9 -- -- -- 19.8 --
Total Cash CompensationBase Plus Incentive Pay
Performs assemblies of standardized products or sub-assemblies at bench or conveyor. Assembles, modifies, reworks, and repairsmechanical and electro-mechanical assemblies. Works from assembly drawings, operation sheets, engineering specifications, sketches,and running sheets of average complexity to perform operations on assemblies, banks, cabinets, chassis, and panels. Typically requiresa high school diploma or the equivalent and less than 1 year experience. Vocational training is preferred.
Organizational FTE's Organizational Revenue ($ Millions)
Page 3-279Southwestern Pennsylvania Annual Compensation and Benefits Study
© 2010 Pittsburgh Technology Council. All rights reserved.

Job Code 928 SENIOR ASSEMBLER
Description
0.2% Less Complex98.5% Comparable1.3% More Complex
All Organizations
Software, Computer and
Technology Manufacturing
Life-Sciences/ Biotech/
Medical Devices Not-for-ProfitAll Other
EmployersAnnual Base Pay
Employers Reported 13 2 10 1 0 0Employees Reported 468 27 111 330 0 025th Percentile ($000's) 32.4 28.9 32.8 -- -- --50th Percentile ($000's) 35.1 31.2 39.2 -- -- --75th Percentile ($000's) 35.1 33.6 43.5 -- -- --Average ($000's) 35.0 31.8 37.9 -- -- --
Incentive Pay% Incentive Eligible 84% 0% 55% 100% -- --25th Percentile ($000's) 1.0 -- 3.0 -- -- --50th Percentile ($000's) 1.0 -- 3.3 -- -- --75th Percentile ($000's) 1.1 -- 3.3 -- -- --Average ($000's) 1.4 -- 3.9 -- -- --
25th Percentile ($000's) 33.4 28.9 32.8 -- -- --50th Percentile ($000's) 36.1 31.2 42.9 -- -- --75th Percentile ($000's) 36.2 33.6 46.7 -- -- --Average ($000's) 36.1 31.8 39.4 -- -- --
Most Recent New HireEmployers Reported 1 0 1 0 0 0
Median ($000's) -- -- -- -- -- --Average ($000's) -- -- -- -- -- --
Assembles, modifies, reworks, repairs and tests mechanical, electronic, and electromechanical assemblies. Works from interrelatedwiring and assembly drawings, operation sheets, engineering specifications, sketches, and running sheets to perform complete wiringand assembly operations on chassis, panels, assemblies, banks, and cabinets. Performs delicate adjustments of interrelated parts (forexample, spring tensions). Assembles to extremely close tolerances components and parts that may have unusual or nonstandardshapes. Requires high school diploma, vocational training preferred, and 3–5 years experience.
Industry - Type of Employer
Total Cash CompensationBase Plus Incentive Pay
Job Match Comparability
Page 3-280Southwestern Pennsylvania Annual Compensation and Benefits Study
© 2010 Pittsburgh Technology Council. All rights reserved.

Job Code 928 SENIOR ASSEMBLER
Description
Less than 50 50 - 150 151 - 500 More than 500Less than
$7.5M$7.5M to
$25M$26M to $150M
More than $150M
Annual Base PayEmployers Reported 1 3 6 3 0 3 6 4Employees Reported 1 20 85 362 0 11 87 370
25th Percentile ($000's) -- 36.0 28.4 32.4 -- 36.0 28.4 32.450th Percentile ($000's) -- 38.6 32.8 35.1 -- 38.1 32.8 35.175th Percentile ($000's) -- 40.6 35.0 35.1 -- 42.8 35.0 35.1Average ($000's) -- 38.4 34.0 35.0 -- 39.6 33.3 35.3
Incentive Pay% Incentive Eligible 100% 50% 22% 100% -- 9% 24% 100%
25th Percentile ($000's) -- 5.4 -- 1.0 -- -- 5.4 1.050th Percentile ($000's) -- 5.6 -- 1.0 -- -- 5.6 1.075th Percentile ($000's) -- 6.4 -- 1.1 -- -- 6.4 1.1Average ($000's) -- 5.9 -- 1.2 -- -- 5.9 1.2
25th Percentile ($000's) -- 37.8 28.4 33.4 -- 36.0 28.4 33.450th Percentile ($000's) -- 41.3 32.8 36.1 -- 38.1 32.8 36.175th Percentile ($000's) -- 45.1 35.0 36.2 -- 42.8 35.2 36.2Average ($000's) -- 41.1 34.0 36.2 -- 40.3 33.9 36.5
Most Recent New HireEmployers Reported 0 0 1 0 0 0 1 0
Median ($000's) -- -- -- -- -- -- -- --Average ($000's) -- -- -- -- -- -- -- --
Total Cash CompensationBase Plus Incentive Pay
Assembles, modifies, reworks, repairs and tests mechanical, electronic, and electromechanical assemblies. Works from interrelatedwiring and assembly drawings, operation sheets, engineering specifications, sketches, and running sheets to perform complete wiringand assembly operations on chassis, panels, assemblies, banks, and cabinets. Performs delicate adjustments of interrelated parts (forexample, spring tensions). Assembles to extremely close tolerances components and parts that may have unusual or nonstandardshapes. Requires high school diploma, vocational training preferred, and 3–5 years experience.
Organizational FTE's Organizational Revenue ($ Millions)
Page 3-281Southwestern Pennsylvania Annual Compensation and Benefits Study
© 2010 Pittsburgh Technology Council. All rights reserved.

Job Code 929 GENERAL MAINTENANCE WORKER
Description
2.4% Less Complex92.9% Comparable4.8% More Complex
All Organizations
Software, Computer and
Technology Manufacturing
Life-Sciences/ Biotech/
Medical Devices Not-for-ProfitAll Other
EmployersAnnual Base Pay
Employers Reported 17 1 7 1 3 5Employees Reported 42 1 13 6 5 1725th Percentile ($000's) 31.5 -- 27.5 -- 31.7 31.050th Percentile ($000's) 35.8 -- 35.8 -- 33.3 33.875th Percentile ($000's) 42.3 -- 39.7 -- 40.9 37.5Average ($000's) 37.2 -- 34.2 -- 37.4 36.5
Incentive Pay% Incentive Eligible 43% 0% 62% 100% 0% 24%25th Percentile ($000's) 1.4 -- 2.1 -- -- --50th Percentile ($000's) 1.9 -- 2.6 -- -- 1.975th Percentile ($000's) 2.6 -- 2.7 -- -- --Average ($000's) 1.9 -- 2.2 -- -- 1.9
25th Percentile ($000's) 31.5 -- 28.1 -- 31.7 31.050th Percentile ($000's) 37.3 -- 37.8 -- 33.3 33.875th Percentile ($000's) 43.5 -- 40.2 -- 40.9 37.5Average ($000's) 37.8 -- 35.2 -- 37.4 36.7
Most Recent New HireEmployers Reported 0 0 0 0 0 0
Median ($000's) -- -- -- -- -- --Average ($000's) -- -- -- -- -- --
Performs a wide variety of building maintenance and repair work involving carpentry, electrical, masonry, painting, plumbing, heating,ventilation, air-conditioning or other mechanical and maintenance skills. Incumbents are required to utilize functional skills in all ofthese areas. Requires Knowledge of basic construction, repair maintenance and procedures and ability to operate hand and power tools.
Industry - Type of Employer
Total Cash CompensationBase Plus Incentive Pay
Job Match Comparability
Page 3-282Southwestern Pennsylvania Annual Compensation and Benefits Study
© 2010 Pittsburgh Technology Council. All rights reserved.

Job Code 929 GENERAL MAINTENANCE WORKER
Description
Less than 50 50 - 150 151 - 500 More than 500Less than
$7.5M$7.5M to
$25M$26M to $150M
More than $150M
Annual Base PayEmployers Reported 0 3 5 9 1 2 4 10Employees Reported 0 8 6 28 5 3 4 30
25th Percentile ($000's) -- 32.7 30.0 31.7 -- -- -- 32.050th Percentile ($000's) -- 36.4 38.9 35.8 -- 29.9 34.2 35.875th Percentile ($000's) -- 45.3 40.7 41.5 -- -- -- 41.1Average ($000's) -- 38.2 35.7 37.2 -- 33.3 35.2 37.2
Incentive Pay% Incentive Eligible -- 0% 50% 54% 0% 0% 25% 57%
25th Percentile ($000's) -- -- -- 1.5 -- -- -- 1.450th Percentile ($000's) -- -- 0.3 1.9 -- -- -- 1.975th Percentile ($000's) -- -- -- 2.6 -- -- -- 2.6Average ($000's) -- -- 0.3 2.0 -- -- -- 1.9
25th Percentile ($000's) -- 32.7 30.1 31.7 -- -- -- 32.050th Percentile ($000's) -- 36.4 39.0 36.8 -- 29.9 34.2 37.475th Percentile ($000's) -- 45.3 40.7 43.0 -- -- -- 42.7Average ($000's) -- 38.2 35.7 38.2 -- 33.3 35.2 38.1
Most Recent New HireEmployers Reported 0 0 0 0 0 0 0 0
Median ($000's) -- -- -- -- -- -- -- --Average ($000's) -- -- -- -- -- -- -- --
Total Cash CompensationBase Plus Incentive Pay
Performs a wide variety of building maintenance and repair work involving carpentry, electrical, masonry, painting, plumbing, heating,ventilation, air-conditioning or other mechanical and maintenance skills. Incumbents are required to utilize functional skills in all ofthese areas. Requires Knowledge of basic construction, repair maintenance and procedures and ability to operate hand and power tools.
Organizational FTE's Organizational Revenue ($ Millions)
Page 3-283Southwestern Pennsylvania Annual Compensation and Benefits Study
© 2010 Pittsburgh Technology Council. All rights reserved.

Job Code 931 MAINTENANCE MECHANIC
Description
1.1% Less Complex91.1% Comparable7.8% More Complex
All Organizations
Software, Computer and
Technology Manufacturing
Life-Sciences/ Biotech/
Medical Devices Not-for-ProfitAll Other
EmployersAnnual Base Pay
Employers Reported 12 0 7 1 1 3Employees Reported 90 0 28 18 14 3025th Percentile ($000's) 37.1 -- 37.9 -- -- 44.050th Percentile ($000's) 43.3 -- 43.5 -- -- 44.475th Percentile ($000's) 44.8 -- 46.7 -- -- 55.7Average ($000's) 42.9 -- 41.8 -- -- 47.8
Incentive Pay% Incentive Eligible 60% -- 93% 100% 0% 33%25th Percentile ($000's) 1.1 -- 1.5 -- -- --50th Percentile ($000's) 1.4 -- 2.0 -- -- --75th Percentile ($000's) 1.8 -- 2.2 -- -- --Average ($000's) 1.5 -- 1.9 -- -- --
25th Percentile ($000's) 37.4 -- 37.9 -- -- 44.050th Percentile ($000's) 44.0 -- 45.0 -- -- 44.475th Percentile ($000's) 46.1 -- 49.3 -- -- 55.7Average ($000's) 43.4 -- 42.6 -- -- 47.8
Most Recent New HireEmployers Reported 2 0 1 0 0 1
Median ($000's) -- -- -- -- -- --Average ($000's) -- -- -- -- -- --
Maintains production equipment. Configures and calibrates equipment as necessary to support production needs. Troubleshoots commonequipment failures and repairs equipment on the production floor. Assists in the construction of new production equipment, includingmechanical assemblies and electrical circuits. Requires formal technical training beyond high school and 1–2 years experience, includingproficiency on machine shop equipment.
Industry - Type of Employer
Total Cash CompensationBase Plus Incentive Pay
Job Match Comparability
Page 3-284Southwestern Pennsylvania Annual Compensation and Benefits Study
© 2010 Pittsburgh Technology Council. All rights reserved.

Job Code 931 MAINTENANCE MECHANIC
Description
Less than 50 50 - 150 151 - 500 More than 500Less than
$7.5M$7.5M to
$25M$26M to $150M
More than $150M
Annual Base PayEmployers Reported 1 0 4 7 1 0 3 8Employees Reported 3 0 15 72 3 0 8 79
25th Percentile ($000's) -- -- 30.0 39.5 -- -- 24.2 39.550th Percentile ($000's) -- -- 38.4 43.8 -- -- 30.0 43.575th Percentile ($000's) -- -- 40.2 44.8 -- -- 33.3 44.8Average ($000's) -- -- 35.6 44.0 -- -- 29.8 43.8
Incentive Pay% Incentive Eligible 100% -- 93% 51% 100% -- 88% 56%
25th Percentile ($000's) -- -- -- 1.1 -- -- -- 1.150th Percentile ($000's) -- -- -- 1.4 -- -- -- 1.475th Percentile ($000's) -- -- -- 1.9 -- -- -- 1.9Average ($000's) -- -- -- 1.5 -- -- -- 1.5
25th Percentile ($000's) -- -- 30.0 39.5 -- -- 24.2 39.550th Percentile ($000's) -- -- 38.4 44.2 -- -- 30.0 44.075th Percentile ($000's) -- -- 40.2 46.2 -- -- 33.3 46.1Average ($000's) -- -- 35.6 44.5 -- -- 29.8 44.3
Most Recent New HireEmployers Reported 0 0 1 1 0 0 1 1
Median ($000's) -- -- -- -- -- -- -- --Average ($000's) -- -- -- -- -- -- -- --
Total Cash CompensationBase Plus Incentive Pay
Maintains production equipment. Configures and calibrates equipment as necessary to support production needs. Troubleshoots commonequipment failures and repairs equipment on the production floor. Assists in the construction of new production equipment, includingmechanical assemblies and electrical circuits. Requires formal technical training beyond high school and 1–2 years experience, includingproficiency on machine shop equipment.
Organizational FTE's Organizational Revenue ($ Millions)
Page 3-285Southwestern Pennsylvania Annual Compensation and Benefits Study
© 2010 Pittsburgh Technology Council. All rights reserved.

Job Code 935 MAINTENANCE AND FACILITIES SUPERVISOR
Description
0.0% Less Complex89.3% Comparable10.7% More Complex
All Organizations
Software, Computer and
Technology Manufacturing
Life-Sciences/ Biotech/
Medical Devices Not-for-ProfitAll Other
EmployersAnnual Base Pay
Employers Reported 15 1 4 0 3 7Employees Reported 28 1 4 0 7 1625th Percentile ($000's) 50.3 -- -- -- 44.4 56.450th Percentile ($000's) 61.4 -- 73.3 -- 50.3 71.375th Percentile ($000's) 77.2 -- -- -- 55.6 77.3Average ($000's) 61.9 -- 65.5 -- 49.9 67.5
Incentive Pay% Incentive Eligible 46% 0% 75% -- 0% 63%25th Percentile ($000's) 3.7 -- -- -- -- 4.350th Percentile ($000's) 5.3 -- 4.2 -- -- 6.475th Percentile ($000's) 6.6 -- -- -- -- 7.0Average ($000's) 5.2 -- 3.4 -- -- 5.7
25th Percentile ($000's) 50.3 -- -- -- 44.4 58.050th Percentile ($000's) 62.5 -- 73.8 -- 50.3 76.475th Percentile ($000's) 78.0 -- -- -- 55.6 81.7Average ($000's) 64.1 -- 68.1 -- 49.9 70.7
Most Recent New HireEmployers Reported 0 0 0 0 0 0
Median ($000's) -- -- -- -- -- --Average ($000's) -- -- -- -- -- --
Supervises maintenance of production equipment and facilities. Supervises construction and implementation of new and upgradedequipment. Manages production support including utilities, equipment spare parts and supplies, and janitorial services. Responsibilitiestypically include preventive maintenance programs for all equipment and facilities, including HVAC, lighting and fixtures, and buildingmaintenance. Requires 2 years formal technical training or the equivalent, 5 years related hands-on experience, and 1–2 yearssupervisory experience.
Industry - Type of Employer
Total Cash CompensationBase Plus Incentive Pay
Job Match Comparability
Page 3-286Southwestern Pennsylvania Annual Compensation and Benefits Study
© 2010 Pittsburgh Technology Council. All rights reserved.

Job Code 935 MAINTENANCE AND FACILITIES SUPERVISOR
Description
Less than 50 50 - 150 151 - 500 More than 500Less than
$7.5M$7.5M to
$25M$26M to $150M
More than $150M
Annual Base PayEmployers Reported 1 2 4 8 2 0 4 9Employees Reported 1 2 4 21 2 0 4 22
25th Percentile ($000's) -- -- -- 50.3 -- -- -- 50.350th Percentile ($000's) -- -- 69.0 62.0 -- -- 49.7 62.675th Percentile ($000's) -- -- -- 77.3 -- -- -- 77.3Average ($000's) -- -- 65.8 62.4 -- -- 52.9 63.5
Incentive Pay% Incentive Eligible 100% 50% 25% 48% 50% -- 25% 50%
25th Percentile ($000's) -- -- -- 4.2 -- -- -- 4.250th Percentile ($000's) -- -- -- 6.4 -- -- -- 6.075th Percentile ($000's) -- -- -- 7.0 -- -- -- 6.9Average ($000's) -- -- -- 5.7 -- -- -- 5.6
25th Percentile ($000's) -- -- -- 50.3 -- -- -- 50.350th Percentile ($000's) -- -- 69.0 63.0 -- -- 50.4 63.075th Percentile ($000's) -- -- -- 80.1 -- -- -- 81.1Average ($000's) -- -- 66.9 64.9 -- -- 54.2 66.1
Most Recent New HireEmployers Reported 0 0 0 0 0 0 0 0
Median ($000's) -- -- -- -- -- -- -- --Average ($000's) -- -- -- -- -- -- -- --
Total Cash CompensationBase Plus Incentive Pay
Supervises maintenance of production equipment and facilities. Supervises construction and implementation of new and upgradedequipment. Manages production support including utilities, equipment spare parts and supplies, and janitorial services. Responsibilitiestypically include preventive maintenance programs for all equipment and facilities, including HVAC, lighting and fixtures, and buildingmaintenance. Requires 2 years formal technical training or the equivalent, 5 years related hands-on experience, and 1–2 yearssupervisory experience.
Organizational FTE's Organizational Revenue ($ Millions)
Page 3-287Southwestern Pennsylvania Annual Compensation and Benefits Study
© 2010 Pittsburgh Technology Council. All rights reserved.

Job Code 942 WELDER
Description
0.0% Less Complex95.8% Comparable4.2% More Complex
All Organizations
Software, Computer and
Technology Manufacturing
Life-Sciences/ Biotech/
Medical Devices Not-for-ProfitAll Other
EmployersAnnual Base Pay
Employers Reported 9 0 7 0 1 1Employees Reported 48 0 42 0 1 525th Percentile ($000's) 37.5 -- 37.5 -- -- --50th Percentile ($000's) 39.9 -- 38.8 -- -- --75th Percentile ($000's) 45.0 -- 42.9 -- -- --Average ($000's) 42.8 -- 40.3 -- -- --
Incentive Pay% Incentive Eligible 79% -- 90% -- 0% 0%25th Percentile ($000's) 3.1 -- 3.1 -- -- --50th Percentile ($000's) 4.2 -- 4.2 -- -- --75th Percentile ($000's) 5.3 -- 5.3 -- -- --Average ($000's) 4.2 -- 4.2 -- -- --
25th Percentile ($000's) 37.5 -- 37.5 -- -- --50th Percentile ($000's) 39.9 -- 38.8 -- -- --75th Percentile ($000's) 45.0 -- 42.9 -- -- --Average ($000's) 42.9 -- 40.5 -- -- --
Most Recent New HireEmployers Reported 0 0 0 0 0 0
Median ($000's) -- -- -- -- -- --Average ($000's) -- -- -- -- -- --
Welds metal parts or components together using brazing, gas, or arc welding equipment. Repairs broken or cracked parts, fills holes andincreases size of metal parts using welding equipment. Reviews layouts, blueprints, work orders, or diagrams in preparation for weldingor cutting metal components. May position pieces to be welded into jigs, holding fixtures, guides and steps using measuringinstruments and hand tools. May inspect completed work for conformance to specifications. Requires 2-5 years of experience in positionor specialization.
Industry - Type of Employer
Total Cash CompensationBase Plus Incentive Pay
Job Match Comparability
Page 3-288Southwestern Pennsylvania Annual Compensation and Benefits Study
© 2010 Pittsburgh Technology Council. All rights reserved.

Job Code 942 WELDER
Description
Less than 50 50 - 150 151 - 500 More than 500Less than
$7.5M$7.5M to
$25M$26M to $150M
More than $150M
Annual Base PayEmployers Reported 0 3 2 4 0 2 3 4Employees Reported 0 3 37 8 0 2 3 43
25th Percentile ($000's) -- -- 37.5 52.2 -- -- -- 37.550th Percentile ($000's) -- 45.8 37.5 58.9 -- -- 45.8 39.075th Percentile ($000's) -- -- 40.2 62.8 -- -- -- 43.9Average ($000's) -- 45.9 39.5 56.9 -- -- 46.0 42.4
Incentive Pay% Incentive Eligible -- 33% 97% 13% -- 0% 33% 86%
25th Percentile ($000's) -- -- -- -- -- -- -- 2.050th Percentile ($000's) -- -- -- -- -- -- -- 2.075th Percentile ($000's) -- -- -- -- -- -- -- 2.0Average ($000's) -- -- -- -- -- -- -- 2.0
25th Percentile ($000's) -- -- 37.5 52.2 -- -- -- 37.550th Percentile ($000's) -- 49.8 37.5 58.9 -- -- 52.2 39.075th Percentile ($000's) -- -- 40.2 62.8 -- -- -- 43.9Average ($000's) -- 48.0 39.5 57.2 -- -- 48.1 42.4
Most Recent New HireEmployers Reported 0 0 0 0 0 0 0 0
Median ($000's) -- -- -- -- -- -- -- --Average ($000's) -- -- -- -- -- -- -- --
Total Cash CompensationBase Plus Incentive Pay
Welds metal parts or components together using brazing, gas, or arc welding equipment. Repairs broken or cracked parts, fills holes andincreases size of metal parts using welding equipment. Reviews layouts, blueprints, work orders, or diagrams in preparation for weldingor cutting metal components. May position pieces to be welded into jigs, holding fixtures, guides and steps using measuringinstruments and hand tools. May inspect completed work for conformance to specifications. Requires 2-5 years of experience in positionor specialization.
Organizational FTE's Organizational Revenue ($ Millions)
Page 3-289Southwestern Pennsylvania Annual Compensation and Benefits Study
© 2010 Pittsburgh Technology Council. All rights reserved.

Job Code 951 QUALITY ASSURANCE INSPECTOR
Description
0.0% Less Complex100.0% Comparable0.0% More Complex
All Organizations
Software, Computer and
Technology Manufacturing
Life-Sciences/ Biotech/
Medical Devices Not-for-ProfitAll Other
EmployersAnnual Base Pay
Employers Reported 10 2 6 1 0 1Employees Reported 94 12 33 39 0 1025th Percentile ($000's) 32.4 28.7 38.0 -- -- --50th Percentile ($000's) 35.1 32.0 42.1 -- -- --75th Percentile ($000's) 39.8 33.8 44.0 -- -- --Average ($000's) 36.4 32.9 40.8 -- -- --
Incentive Pay% Incentive Eligible 83% 0% 88% 100% -- 100%25th Percentile ($000's) 1.1 -- 3.2 -- -- --50th Percentile ($000's) 1.2 -- 3.3 -- -- --75th Percentile ($000's) 3.3 -- 3.5 -- -- --Average ($000's) 2.0 -- 3.4 -- -- --
25th Percentile ($000's) 33.0 28.7 38.7 -- -- --50th Percentile ($000's) 36.3 32.0 44.5 -- -- --75th Percentile ($000's) 42.3 33.8 47.3 -- -- --Average ($000's) 37.7 32.9 43.1 -- -- --
Most Recent New HireEmployers Reported 1 0 1 0 0 0
Median ($000's) -- -- -- -- -- --Average ($000's) -- -- -- -- -- --
Inspects parts and products; performs less complex and/or repetitive testing to ensure fabrication conforms to established standards,parts lists, assembly drawings, wiring diagrams, and other associated documentation. May use basic tests or measurements and maywrite inspection reports listing discrepancies. Generally requires high school diploma, vocational training, and 1 year or less experience.
Industry - Type of Employer
Total Cash CompensationBase Plus Incentive Pay
Job Match Comparability
Page 3-290Southwestern Pennsylvania Annual Compensation and Benefits Study
© 2010 Pittsburgh Technology Council. All rights reserved.

Job Code 951 QUALITY ASSURANCE INSPECTOR
Description
Less than 50 50 - 150 151 - 500 More than 500Less than
$7.5M$7.5M to
$25M$26M to $150M
More than $150M
Annual Base PayEmployers Reported 0 2 3 5 0 1 3 6Employees Reported 0 5 18 71 0 4 17 73
25th Percentile ($000's) -- 34.6 28.4 33.1 -- -- 28.4 33.150th Percentile ($000's) -- 38.0 32.0 35.2 -- -- 31.4 35.375th Percentile ($000's) -- 38.1 33.7 43.5 -- -- 33.5 43.5Average ($000's) -- 37.7 31.4 37.5 -- -- 30.5 37.6
Incentive Pay% Incentive Eligible -- 20% 39% 99% -- 0% 35% 99%
25th Percentile ($000's) -- -- -- 1.1 -- -- 4.9 1.150th Percentile ($000's) -- -- -- 1.2 -- -- 4.9 1.275th Percentile ($000's) -- -- -- 3.2 -- -- 4.9 3.2Average ($000's) -- -- -- 1.9 -- -- 4.9 1.9
25th Percentile ($000's) -- 38.0 28.4 33.7 -- -- 28.4 34.050th Percentile ($000's) -- 38.1 32.0 36.4 -- -- 31.4 36.575th Percentile ($000's) -- 39.6 33.7 46.3 -- -- 33.5 45.8Average ($000's) -- 38.7 31.4 39.2 -- -- 30.8 39.2
Most Recent New HireEmployers Reported 0 0 1 0 0 0 1 0
Median ($000's) -- -- -- -- -- -- -- --Average ($000's) -- -- -- -- -- -- -- --
Total Cash CompensationBase Plus Incentive Pay
Inspects parts and products; performs less complex and/or repetitive testing to ensure fabrication conforms to established standards,parts lists, assembly drawings, wiring diagrams, and other associated documentation. May use basic tests or measurements and maywrite inspection reports listing discrepancies. Generally requires high school diploma, vocational training, and 1 year or less experience.
Organizational FTE's Organizational Revenue ($ Millions)
Page 3-291Southwestern Pennsylvania Annual Compensation and Benefits Study
© 2010 Pittsburgh Technology Council. All rights reserved.

Job Code 955 QUALITY ASSURANCE SUPERVISOR
Description
0.0% Less Complex84.6% Comparable15.4% More Complex
All Organizations
Software, Computer and
Technology Manufacturing
Life-Sciences/ Biotech/
Medical Devices Not-for-ProfitAll Other
EmployersAnnual Base Pay
Employers Reported 9 0 6 2 0 1Employees Reported 13 0 7 3 0 325th Percentile ($000's) 52.4 -- 59.7 -- -- --50th Percentile ($000's) 56.9 -- 66.0 56.9 -- --75th Percentile ($000's) 68.9 -- 77.8 -- -- --Average ($000's) 62.3 -- 68.4 57.9 -- --
Incentive Pay% Incentive Eligible 92% -- 86% 100% -- 100%25th Percentile ($000's) 4.3 -- 4.7 -- -- --50th Percentile ($000's) 4.9 -- 6.4 3.9 -- --75th Percentile ($000's) 5.0 -- 8.7 -- -- --Average ($000's) 5.6 -- 6.9 3.9 -- --
25th Percentile ($000's) 57.3 -- 62.2 -- -- --50th Percentile ($000's) 60.5 -- 69.9 60.5 -- --75th Percentile ($000's) 73.1 -- 83.1 -- -- --Average ($000's) 66.1 -- 72.3 60.5 -- --
Most Recent New HireEmployers Reported 0 0 0 0 0 0
Median ($000's) -- -- -- -- -- --Average ($000's) -- -- -- -- -- --
Supervises subordinates engaged in inspecting and testing parts and products to ensure adherence to established quality assurancestandards, procedures, and controls. Provides assistance to management in scheduling and controlling inspection activities. Reviewsinspection reports to resolve questions and provide recommendations for development and revisions of quality assurance standards andprocedures. Requires 3–5 years experience. May be titled Quality Control Supervisor.
Industry - Type of Employer
Total Cash CompensationBase Plus Incentive Pay
Job Match Comparability
Page 3-292Southwestern Pennsylvania Annual Compensation and Benefits Study
© 2010 Pittsburgh Technology Council. All rights reserved.

Job Code 955 QUALITY ASSURANCE SUPERVISOR
Description
Less than 50 50 - 150 151 - 500 More than 500Less than
$7.5M$7.5M to
$25M$26M to $150M
More than $150M
Annual Base PayEmployers Reported 2 2 1 4 2 1 1 5Employees Reported 2 2 1 8 2 1 1 9
25th Percentile ($000's) -- -- -- 52.5 -- -- -- 52.550th Percentile ($000's) -- -- -- 55.6 -- -- -- 56.975th Percentile ($000's) -- -- -- 66.0 -- -- -- 66.0Average ($000's) -- -- -- 61.9 -- -- -- 62.4
Incentive Pay% Incentive Eligible 100% 50% 100% 100% 100% 0% 100% 100%
25th Percentile ($000's) -- -- -- 4.2 -- -- -- 4.250th Percentile ($000's) -- -- -- 4.9 -- -- -- 4.975th Percentile ($000's) -- -- -- 5.0 -- -- -- 5.0Average ($000's) -- -- -- 5.0 -- -- -- 5.0
25th Percentile ($000's) -- -- -- 57.4 -- -- -- 57.450th Percentile ($000's) -- -- -- 59.4 -- -- -- 60.575th Percentile ($000's) -- -- -- 70.7 -- -- -- 69.9Average ($000's) -- -- -- 66.9 -- -- -- 66.8
Most Recent New HireEmployers Reported 0 0 0 0 0 0 0 0
Median ($000's) -- -- -- -- -- -- -- --Average ($000's) -- -- -- -- -- -- -- --
Total Cash CompensationBase Plus Incentive Pay
Supervises subordinates engaged in inspecting and testing parts and products to ensure adherence to established quality assurancestandards, procedures, and controls. Provides assistance to management in scheduling and controlling inspection activities. Reviewsinspection reports to resolve questions and provide recommendations for development and revisions of quality assurance standards andprocedures. Requires 3–5 years experience. May be titled Quality Control Supervisor.
Organizational FTE's Organizational Revenue ($ Millions)
Page 3-293Southwestern Pennsylvania Annual Compensation and Benefits Study
© 2010 Pittsburgh Technology Council. All rights reserved.

Job Code 956 QUALITY ASSURANCE ENGINEER
Description
0.0% Less Complex32.0% Comparable68.0% More Complex
All Organizations
Software, Computer and
Technology Manufacturing
Life-Sciences/ Biotech/
Medical Devices Not-for-ProfitAll Other
EmployersAnnual Base Pay
Employers Reported 6 0 5 1 0 0Employees Reported 25 0 12 13 0 025th Percentile ($000's) 58.2 -- 56.8 -- -- --50th Percentile ($000's) 69.3 -- 66.8 -- -- --75th Percentile ($000's) 78.5 -- 69.8 -- -- --Average ($000's) 69.0 -- 64.1 -- -- --
Incentive Pay% Incentive Eligible 96% -- 92% 100% -- --25th Percentile ($000's) 3.5 -- 4.6 -- -- --50th Percentile ($000's) 4.4 -- 5.2 -- -- --75th Percentile ($000's) 5.1 -- 5.3 -- -- --Average ($000's) 4.3 -- 5.0 -- -- --
25th Percentile ($000's) 62.6 -- 59.6 -- -- --50th Percentile ($000's) 71.0 -- 66.8 -- -- --75th Percentile ($000's) 83.2 -- 74.5 -- -- --Average ($000's) 72.1 -- 66.6 -- -- --
Most Recent New HireEmployers Reported 3 0 2 1 0 0
Median ($000's) 57.0 -- -- -- -- --Average ($000's) 61.9 -- -- -- -- --
Performs a variety of moderately complex tasks related to the inspection and testing of finished goods. Utilizes existing systems andparticipates in the development of new systems to identify project failure trends and to verify consistency of various design standards.Analyzes reports and returned products, and recommends corrective action for procedural, product, or process deficiencies. Works undergeneral supervision. Normally requires a degree in a technical discipline and 1–2 years experience.
Industry - Type of Employer
Total Cash CompensationBase Plus Incentive Pay
Job Match Comparability
Page 3-294Southwestern Pennsylvania Annual Compensation and Benefits Study
© 2010 Pittsburgh Technology Council. All rights reserved.

Job Code 956 QUALITY ASSURANCE ENGINEER
Description
Less than 50 50 - 150 151 - 500 More than 500Less than
$7.5M$7.5M to
$25M$26M to $150M
More than $150M
Annual Base PayEmployers Reported 0 0 4 2 0 0 3 3Employees Reported 0 0 6 19 0 0 5 20
25th Percentile ($000's) -- -- 54.6 64.3 -- -- 53.8 64.450th Percentile ($000's) -- -- 61.6 71.8 -- -- 57.0 70.675th Percentile ($000's) -- -- 67.2 79.4 -- -- 67.5 79.1Average ($000's) -- -- 60.9 71.6 -- -- 59.9 71.3
Incentive Pay% Incentive Eligible -- -- 83% 100% -- -- 80% 100%
25th Percentile ($000's) -- -- -- 3.5 -- -- -- 3.550th Percentile ($000's) -- -- -- 4.4 -- -- -- 4.475th Percentile ($000's) -- -- -- 5.1 -- -- -- 5.1Average ($000's) -- -- -- 4.3 -- -- -- 4.3
25th Percentile ($000's) -- -- 54.6 67.6 -- -- 53.8 67.150th Percentile ($000's) -- -- 61.6 75.0 -- -- 57.0 74.875th Percentile ($000's) -- -- 67.2 84.4 -- -- 67.5 84.4Average ($000's) -- -- 60.9 75.6 -- -- 59.9 75.2
Most Recent New HireEmployers Reported 0 0 2 1 0 0 2 1
Median ($000's) -- -- -- -- -- -- -- --Average ($000's) -- -- -- -- -- -- -- --
Total Cash CompensationBase Plus Incentive Pay
Performs a variety of moderately complex tasks related to the inspection and testing of finished goods. Utilizes existing systems andparticipates in the development of new systems to identify project failure trends and to verify consistency of various design standards.Analyzes reports and returned products, and recommends corrective action for procedural, product, or process deficiencies. Works undergeneral supervision. Normally requires a degree in a technical discipline and 1–2 years experience.
Organizational FTE's Organizational Revenue ($ Millions)
Page 3-295Southwestern Pennsylvania Annual Compensation and Benefits Study
© 2010 Pittsburgh Technology Council. All rights reserved.

Job Code 959 MANUFACTURING ENGINEER
Description
4.2% Less Complex83.3% Comparable12.5% More Complex
All Organizations
Software, Computer and
Technology Manufacturing
Life-Sciences/ Biotech/
Medical Devices Not-for-ProfitAll Other
EmployersAnnual Base Pay
Employers Reported 9 0 6 3 0 0Employees Reported 24 0 12 12 0 025th Percentile ($000's) 61.5 -- 56.7 65.1 -- --50th Percentile ($000's) 68.6 -- 63.6 72.2 -- --75th Percentile ($000's) 79.9 -- 73.0 83.4 -- --Average ($000's) 70.1 -- 65.6 74.6 -- --
Incentive Pay% Incentive Eligible 88% -- 92% 83% -- --25th Percentile ($000's) 2.8 -- 3.8 2.8 -- --50th Percentile ($000's) 3.4 -- 4.7 2.9 -- --75th Percentile ($000's) 4.2 -- 4.9 3.8 -- --Average ($000's) 3.5 -- 4.1 3.3 -- --
25th Percentile ($000's) 62.0 -- 56.7 67.9 -- --50th Percentile ($000's) 69.3 -- 65.8 74.7 -- --75th Percentile ($000's) 81.9 -- 75.6 85.4 -- --Average ($000's) 72.0 -- 67.0 77.0 -- --
Most Recent New HireEmployers Reported 2 0 1 1 0 0
Median ($000's) -- -- -- -- -- --Average ($000's) -- -- -- -- -- --
Provides manufacturing advice and guidance to engineering and manufacturing departments regarding product fabrication. Providestimely and effective development of manufacturing standards and process specifications to assure achievement of manufacturing andcost objectives. Acquires information and prepares feasibility studies or justifies purchase or building of equipment required for newmanufacturing methods. Provides expertise in areas such as setups, machine tool capabilities, machining methods, and tooling andfixturing. Normally requires a degree in manufacturing engineering or a related discipline and 2 years experience.
Industry - Type of Employer
Total Cash CompensationBase Plus Incentive Pay
Job Match Comparability
Page 3-296Southwestern Pennsylvania Annual Compensation and Benefits Study
© 2010 Pittsburgh Technology Council. All rights reserved.

Job Code 959 MANUFACTURING ENGINEER
Description
Less than 50 50 - 150 151 - 500 More than 500Less than
$7.5M$7.5M to
$25M$26M to $150M
More than $150M
Annual Base PayEmployers Reported 1 2 3 3 1 1 3 4Employees Reported 1 2 7 14 1 1 7 15
25th Percentile ($000's) -- -- 53.4 66.5 -- -- 53.4 67.150th Percentile ($000's) -- -- 57.2 73.5 -- -- 57.2 75.075th Percentile ($000's) -- -- 63.1 79.9 -- -- 61.0 81.4Average ($000's) -- -- 61.8 74.1 -- -- 57.9 75.3
Incentive Pay% Incentive Eligible 100% 50% 100% 86% 100% 0% 100% 87%
25th Percentile ($000's) -- -- -- 2.8 -- -- 4.5 2.850th Percentile ($000's) -- -- -- 3.1 -- -- 4.5 3.175th Percentile ($000's) -- -- -- 4.2 -- -- 4.5 4.2Average ($000's) -- -- -- 3.4 -- -- 4.5 3.4
25th Percentile ($000's) -- -- 53.4 68.9 -- -- 53.4 69.050th Percentile ($000's) -- -- 57.2 76.1 -- -- 57.2 78.475th Percentile ($000's) -- -- 63.1 84.0 -- -- 63.1 85.8Average ($000's) -- -- 61.8 77.1 -- -- 58.6 78.0
Most Recent New HireEmployers Reported 1 0 1 0 1 0 1 0
Median ($000's) -- -- -- -- -- -- -- --Average ($000's) -- -- -- -- -- -- -- --
Total Cash CompensationBase Plus Incentive Pay
Provides manufacturing advice and guidance to engineering and manufacturing departments regarding product fabrication. Providestimely and effective development of manufacturing standards and process specifications to assure achievement of manufacturing andcost objectives. Acquires information and prepares feasibility studies or justifies purchase or building of equipment required for newmanufacturing methods. Provides expertise in areas such as setups, machine tool capabilities, machining methods, and tooling andfixturing. Normally requires a degree in manufacturing engineering or a related discipline and 2 years experience.
Organizational FTE's Organizational Revenue ($ Millions)
Page 3-297Southwestern Pennsylvania Annual Compensation and Benefits Study
© 2010 Pittsburgh Technology Council. All rights reserved.

Job Code 960 PRODUCTION TEST TECHNICIAN - ALL LEVELS
Description
16.3% Less Complex83.7% Comparable0.0% More Complex
All Organizations
Software, Computer and
Technology Manufacturing
Life-Sciences/ Biotech/
Medical Devices Not-for-ProfitAll Other
EmployersAnnual Base Pay
Employers Reported 6 1 4 1 0 0Employees Reported 49 1 22 26 0 025th Percentile ($000's) 30.6 -- 24.8 -- -- --50th Percentile ($000's) 37.4 -- 30.9 -- -- --75th Percentile ($000's) 43.4 -- 36.9 -- -- --Average ($000's) 37.7 -- 30.9 -- -- --
Incentive Pay% Incentive Eligible 96% 0% 95% 100% -- --25th Percentile ($000's) 1.2 -- 4.4 -- -- --50th Percentile ($000's) 1.4 -- 4.9 -- -- --75th Percentile ($000's) 1.7 -- 4.9 -- -- --Average ($000's) 1.8 -- 4.6 -- -- --
25th Percentile ($000's) 31.3 -- 24.8 -- -- --50th Percentile ($000's) 39.0 -- 31.9 -- -- --75th Percentile ($000's) 44.8 -- 38.8 -- -- --Average ($000's) 38.7 -- 31.6 -- -- --
Most Recent New HireEmployers Reported 0 0 0 0 0 0
Median ($000's) -- -- -- -- -- --Average ($000's) -- -- -- -- -- --
The data for this position is a combination of the data reported by participants for 961 Production Test Technician and 962 SeniorProduction Test Technician
Industry - Type of Employer
Total Cash CompensationBase Plus Incentive Pay
Job Match Comparability
Page 3-298Southwestern Pennsylvania Annual Compensation and Benefits Study
© 2010 Pittsburgh Technology Council. All rights reserved.

Job Code 960 PRODUCTION TEST TECHNICIAN - ALL LEVELS
Description
Less than 50 50 - 150 151 - 500 More than 500Less than
$7.5M$7.5M to
$25M$26M to $150M
More than $150M
Annual Base PayEmployers Reported 1 1 2 2 0 2 2 2Employees Reported 3 1 18 27 0 4 18 27
25th Percentile ($000's) -- -- 24.2 37.2 -- -- 24.2 37.250th Percentile ($000's) -- -- 28.9 42.7 -- 36.4 28.9 42.775th Percentile ($000's) -- -- 34.5 47.7 -- -- 34.5 47.7Average ($000's) -- -- 29.9 43.2 -- 35.6 29.9 43.2
Incentive Pay% Incentive Eligible 100% 0% 100% 96% -- 75% 100% 96%
25th Percentile ($000's) -- -- -- 1.2 -- -- -- 1.250th Percentile ($000's) -- -- -- 1.4 -- 4.9 -- 1.475th Percentile ($000's) -- -- -- 1.6 -- -- -- 1.6Average ($000's) -- -- -- 1.5 -- 4.6 -- 1.5
25th Percentile ($000's) -- -- 24.2 38.5 -- -- 24.2 38.550th Percentile ($000's) -- -- 28.9 44.0 -- 40.2 28.9 44.075th Percentile ($000's) -- -- 34.5 49.3 -- -- 34.5 49.3Average ($000's) -- -- 29.9 44.6 -- 39.0 29.9 44.6
Most Recent New HireEmployers Reported 0 0 0 0 0 0 0 0
Median ($000's) -- -- -- -- -- -- -- --Average ($000's) -- -- -- -- -- -- -- --
Total Cash CompensationBase Plus Incentive Pay
The data for this position is a combination of the data reported by participants for 961 Production Test Technician and 962 SeniorProduction Test Technician
Organizational FTE's Organizational Revenue ($ Millions)
Page 3-299Southwestern Pennsylvania Annual Compensation and Benefits Study
© 2010 Pittsburgh Technology Council. All rights reserved.

Job Code 961 PRODUCTION TEST TECHNICIAN
Description
26.7% Less Complex73.3% Comparable0.0% More Complex
All Organizations
Software, Computer and
Technology Manufacturing
Life-Sciences/ Biotech/
Medical Devices Not-for-ProfitAll Other
EmployersAnnual Base Pay
Employers Reported 6 1 4 1 0 0Employees Reported 30 1 14 15 0 025th Percentile ($000's) 26.8 -- 22.8 -- -- --50th Percentile ($000's) 34.6 -- 26.6 -- -- --75th Percentile ($000's) 38.4 -- 31.8 -- -- --Average ($000's) 34.4 -- 27.7 -- -- --
Incentive Pay% Incentive Eligible 93% 0% 93% 100% -- --25th Percentile ($000's) 1.2 -- 4.2 -- -- --50th Percentile ($000's) 1.3 -- 4.4 -- -- --75th Percentile ($000's) 1.6 -- 4.7 -- -- --Average ($000's) 1.7 -- 4.4 -- -- --
25th Percentile ($000's) 26.8 -- 22.8 -- -- --50th Percentile ($000's) 35.2 -- 26.6 -- -- --75th Percentile ($000's) 40.0 -- 33.3 -- -- --Average ($000's) 35.4 -- 28.3 -- -- --
Most Recent New HireEmployers Reported 0 0 0 0 0 0
Median ($000's) -- -- -- -- -- --Average ($000's) -- -- -- -- -- --
Assists engineers in analyzing and testing devices, components, and subassemblies to ensure product quality. Performs standardizedtest procedures. Processes test data and may prepare preliminary analysis and information for inclusion in reports. Generally requireshigh school diploma, vocational training preferred, and 1 year experience. May also be titled Quality Control Tester.
Industry - Type of Employer
Total Cash CompensationBase Plus Incentive Pay
Job Match Comparability
Page 3-300Southwestern Pennsylvania Annual Compensation and Benefits Study
© 2010 Pittsburgh Technology Council. All rights reserved.

Job Code 961 PRODUCTION TEST TECHNICIAN
Description
Less than 50 50 - 150 151 - 500 More than 500Less than
$7.5M$7.5M to
$25M$26M to $150M
More than $150M
Annual Base PayEmployers Reported 1 1 2 2 0 2 2 2Employees Reported 2 1 11 16 0 3 11 16
25th Percentile ($000's) -- -- 22.3 36.2 -- -- 22.3 36.250th Percentile ($000's) -- -- 24.2 37.6 -- 35.6 24.2 37.675th Percentile ($000's) -- -- 26.9 43.3 -- -- 26.9 43.3Average ($000's) -- -- 25.6 40.3 -- 35.1 25.6 40.3
Incentive Pay% Incentive Eligible 100% 0% 100% 94% -- 67% 100% 94%
25th Percentile ($000's) -- -- -- 1.1 -- -- -- 1.150th Percentile ($000's) -- -- -- 1.2 -- -- -- 1.275th Percentile ($000's) -- -- -- 1.5 -- -- -- 1.5Average ($000's) -- -- -- 1.3 -- -- -- 1.5
25th Percentile ($000's) -- -- 22.3 37.4 -- -- 22.3 37.450th Percentile ($000's) -- -- 24.2 38.8 -- 40.0 24.2 38.875th Percentile ($000's) -- -- 26.9 44.7 -- -- 26.9 44.7Average ($000's) -- -- 25.6 41.5 -- 38.0 25.6 41.5
Most Recent New HireEmployers Reported 0 0 0 0 0 0 0 0
Median ($000's) -- -- -- -- -- -- -- --Average ($000's) -- -- -- -- -- -- -- --
Total Cash CompensationBase Plus Incentive Pay
Assists engineers in analyzing and testing devices, components, and subassemblies to ensure product quality. Performs standardizedtest procedures. Processes test data and may prepare preliminary analysis and information for inclusion in reports. Generally requireshigh school diploma, vocational training preferred, and 1 year experience. May also be titled Quality Control Tester.
Organizational FTE's Organizational Revenue ($ Millions)
Page 3-301Southwestern Pennsylvania Annual Compensation and Benefits Study
© 2010 Pittsburgh Technology Council. All rights reserved.

Job Code 962 SENIOR PRODUCTION TEST TECHNICIAN
Description
0.0% Less Complex100.0% Comparable0.0% More Complex
All Organizations
Software, Computer and
Technology Manufacturing
Life-Sciences/ Biotech/
Medical Devices Not-for-ProfitAll Other
EmployersAnnual Base Pay
Employers Reported 3 0 2 1 0 0Employees Reported 19 0 8 11 0 025th Percentile ($000's) 38.1 -- 33.6 -- -- --50th Percentile ($000's) 42.1 -- 37.7 -- -- --75th Percentile ($000's) 46.3 -- 39.5 -- -- --Average ($000's) 42.9 -- 36.7 -- -- --
Incentive Pay% Incentive Eligible 100% -- 100% 100% -- --25th Percentile ($000's) 1.4 -- 4.9 -- -- --50th Percentile ($000's) 1.5 -- 4.9 -- -- --75th Percentile ($000's) 1.8 -- 4.9 -- -- --Average ($000's) 1.9 -- 4.9 -- -- --
25th Percentile ($000's) 39.1 -- 33.6 -- -- --50th Percentile ($000's) 42.2 -- 38.6 -- -- --75th Percentile ($000's) 47.8 -- 41.2 -- -- --Average ($000's) 44.1 -- 37.3 -- -- --
Most Recent New HireEmployers Reported 0 0 0 0 0 0
Median ($000's) -- -- -- -- -- --Average ($000's) -- -- -- -- -- --
Assists engineers in analyzing and testing devices, components, and subassemblies to ensure product quality. Performs complex andnonroutine test procedures. Records and analyzes test data and prepares reports with minimal supervision. Requires high schooldiploma, vocational training preferred, and 5 years experience. May also be titled Quality Control Tester.
Industry - Type of Employer
Total Cash CompensationBase Plus Incentive Pay
Job Match Comparability
Page 3-302Southwestern Pennsylvania Annual Compensation and Benefits Study
© 2010 Pittsburgh Technology Council. All rights reserved.

Job Code 962 SENIOR PRODUCTION TEST TECHNICIAN
Description
Less than 50 50 - 150 151 - 500 More than 500Less than
$7.5M$7.5M to
$25M$26M to $150M
More than $150M
Annual Base PayEmployers Reported 1 0 1 1 0 1 1 1Employees Reported 1 0 7 11 0 1 7 11
25th Percentile ($000's) -- -- -- -- -- -- -- --50th Percentile ($000's) -- -- -- -- -- -- -- --75th Percentile ($000's) -- -- -- -- -- -- -- --Average ($000's) -- -- -- -- -- -- -- --
Incentive Pay% Incentive Eligible 100% -- 100% 100% -- 100% 100% 100%
25th Percentile ($000's) -- -- -- -- -- -- -- --50th Percentile ($000's) -- -- -- -- -- -- -- --75th Percentile ($000's) -- -- -- -- -- -- -- --Average ($000's) -- -- -- -- -- -- -- --
25th Percentile ($000's) -- -- -- -- -- -- -- --50th Percentile ($000's) -- -- -- -- -- -- -- --75th Percentile ($000's) -- -- -- -- -- -- -- --Average ($000's) -- -- -- -- -- -- -- --
Most Recent New HireEmployers Reported 0 0 0 0 0 0 0 0
Median ($000's) -- -- -- -- -- -- -- --Average ($000's) -- -- -- -- -- -- -- --
Total Cash CompensationBase Plus Incentive Pay
Assists engineers in analyzing and testing devices, components, and subassemblies to ensure product quality. Performs complex andnonroutine test procedures. Records and analyzes test data and prepares reports with minimal supervision. Requires high schooldiploma, vocational training preferred, and 5 years experience. May also be titled Quality Control Tester.
Organizational FTE's Organizational Revenue ($ Millions)
Page 3-303Southwestern Pennsylvania Annual Compensation and Benefits Study
© 2010 Pittsburgh Technology Council. All rights reserved.

Job Code 963 PRODUCTION PLANNER/SCHEDULER
Description
21.4% Less Complex57.1% Comparable21.4% More Complex
All Organizations
Software, Computer and
Technology Manufacturing
Life-Sciences/ Biotech/
Medical Devices Not-for-ProfitAll Other
EmployersAnnual Base Pay
Employers Reported 5 1 3 1 0 0Employees Reported 14 5 8 1 0 025th Percentile ($000's) 46.9 -- 45.2 -- -- --50th Percentile ($000's) 49.2 -- 51.1 -- -- --75th Percentile ($000's) 52.3 -- 58.2 -- -- --Average ($000's) 49.1 -- 50.7 -- -- --
Incentive Pay% Incentive Eligible 86% 100% 88% 0% -- --25th Percentile ($000's) -- -- -- -- -- --50th Percentile ($000's) -- -- -- -- -- --75th Percentile ($000's) -- -- -- -- -- --Average ($000's) -- -- -- -- -- --
25th Percentile ($000's) 46.9 -- 45.2 -- -- --50th Percentile ($000's) 49.2 -- 51.1 -- -- --75th Percentile ($000's) 52.3 -- 58.2 -- -- --Average ($000's) 49.1 -- 50.7 -- -- --
Most Recent New HireEmployers Reported 1 0 1 0 0 0
Median ($000's) -- -- -- -- -- --Average ($000's) -- -- -- -- -- --
Plans and prepares production schedules for manufacturing products. Ensures products are made efficiently and timely. Draws up masterschedules that establish time limits and sequences of manufacturing operations. Establishes monthly production commitments includingwork-in-process to meet shipment dates. May provide instructions and authorization before production can begin. Works with the sales,cost accounting, and purchasing and manufacturing department staffs to develop sales forecasts, which are used to estimate how manyitems must be manufactured. May also prepare purchase orders. Typically requires a bachelor’s degree and 3 years prior inventory andproduction control experience, particularly in a process controlled manufacturing operation.
Industry - Type of Employer
Total Cash CompensationBase Plus Incentive Pay
Job Match Comparability
Page 3-304Southwestern Pennsylvania Annual Compensation and Benefits Study
© 2010 Pittsburgh Technology Council. All rights reserved.

Job Code 963 PRODUCTION PLANNER/SCHEDULER
Description
Less than 50 50 - 150 151 - 500 More than 500Less than
$7.5M$7.5M to
$25M$26M to $150M
More than $150M
Annual Base PayEmployers Reported 0 0 4 1 0 0 3 2Employees Reported 0 0 13 1 0 0 9 5
25th Percentile ($000's) -- -- 46.8 -- -- -- 38.0 49.850th Percentile ($000's) -- -- 48.8 -- -- -- 47.3 56.775th Percentile ($000's) -- -- 52.5 -- -- -- 48.8 62.6Average ($000's) -- -- 49.0 -- -- -- 44.4 57.6
Incentive Pay% Incentive Eligible -- -- 92% 0% -- -- 89% 80%
25th Percentile ($000's) -- -- -- -- -- -- -- --50th Percentile ($000's) -- -- -- -- -- -- -- --75th Percentile ($000's) -- -- -- -- -- -- -- --Average ($000's) -- -- -- -- -- -- -- --
25th Percentile ($000's) -- -- 46.8 -- -- -- 38.0 49.850th Percentile ($000's) -- -- 48.8 -- -- -- 47.3 56.775th Percentile ($000's) -- -- 52.5 -- -- -- 48.8 62.6Average ($000's) -- -- 49.0 -- -- -- 44.4 57.6
Most Recent New HireEmployers Reported 0 0 1 0 0 0 1 0
Median ($000's) -- -- -- -- -- -- -- --Average ($000's) -- -- -- -- -- -- -- --
Total Cash CompensationBase Plus Incentive Pay
Plans and prepares production schedules for manufacturing products. Ensures products are made efficiently and timely. Draws up masterschedules that establish time limits and sequences of manufacturing operations. Establishes monthly production commitments includingwork-in-process to meet shipment dates. May provide instructions and authorization before production can begin. Works with the sales,cost accounting, and purchasing and manufacturing department staffs to develop sales forecasts, which are used to estimate how manyitems must be manufactured. May also prepare purchase orders. Typically requires a bachelor’s degree and 3 years prior inventory andproduction control experience, particularly in a process controlled manufacturing operation.
Organizational FTE's Organizational Revenue ($ Millions)
Page 3-305Southwestern Pennsylvania Annual Compensation and Benefits Study
© 2010 Pittsburgh Technology Council. All rights reserved.

Job Code 965 PRODUCTION SUPERVISOR
Description
20.8% Less Complex73.6% Comparable5.7% More Complex
All Organizations
Software, Computer and
Technology Manufacturing
Life-Sciences/ Biotech/
Medical Devices Not-for-ProfitAll Other
EmployersAnnual Base Pay
Employers Reported 14 1 10 2 0 1Employees Reported 53 1 38 13 0 125th Percentile ($000's) 52.8 -- 52.8 51.9 -- --50th Percentile ($000's) 59.9 -- 58.9 61.6 -- --75th Percentile ($000's) 69.0 -- 67.1 64.0 -- --Average ($000's) 61.7 -- 62.5 58.0 -- --
Incentive Pay% Incentive Eligible 83% 100% 84% 77% -- 100%25th Percentile ($000's) 3.9 -- 4.4 1.3 -- --50th Percentile ($000's) 4.5 -- 4.5 3.3 -- --75th Percentile ($000's) 6.3 -- 7.4 3.8 -- --Average ($000's) 6.0 -- 6.1 2.8 -- --
25th Percentile ($000's) 54.0 -- 54.6 51.9 -- --50th Percentile ($000's) 63.9 -- 63.3 63.7 -- --75th Percentile ($000's) 69.2 -- 68.5 66.5 -- --Average ($000's) 65.1 -- 65.8 59.9 -- --
Most Recent New HireEmployers Reported 1 0 0 1 0 0
Median ($000's) -- -- -- -- -- --Average ($000's) -- -- -- -- -- --
Supervises employees engaged in the processing, fabrication, assembly, installation, or testing of organization products. Schedules,assigns, and monitors work to meet production schedules. Responsible for preventive maintenance and repair of equipment. Preparesproduction reports of group activities. Responsible for training, selection, assignment, review, and appraisal of subordinates.Recommends personnel actions. Requires high school diploma or equivalent education and 5 or more years experience.
Industry - Type of Employer
Total Cash CompensationBase Plus Incentive Pay
Job Match Comparability
Page 3-306Southwestern Pennsylvania Annual Compensation and Benefits Study
© 2010 Pittsburgh Technology Council. All rights reserved.

Job Code 965 PRODUCTION SUPERVISOR
Description
Less than 50 50 - 150 151 - 500 More than 500Less than
$7.5M$7.5M to
$25M$26M to $150M
More than $150M
Annual Base PayEmployers Reported 1 3 5 5 1 2 6 5Employees Reported 2 4 15 32 2 2 11 38
25th Percentile ($000's) -- -- 50.8 57.6 -- -- 54.9 52.850th Percentile ($000's) -- 64.4 54.0 60.6 -- -- 64.5 59.775th Percentile ($000's) -- -- 66.8 69.7 -- -- 70.1 63.9Average ($000's) -- 66.6 59.1 63.8 -- -- 63.3 61.9
Incentive Pay% Incentive Eligible 100% 50% 73% 91% 100% 0% 64% 92%
25th Percentile ($000's) -- -- -- 3.9 -- -- 11.8 3.950th Percentile ($000's) -- -- -- 4.4 -- -- 12.4 4.475th Percentile ($000's) -- -- -- 4.6 -- -- 22.2 4.6Average ($000's) -- -- -- 5.6 -- -- 18.5 4.6
25th Percentile ($000's) -- -- 50.8 61.9 -- -- 55.8 56.550th Percentile ($000's) -- 73.7 54.0 64.5 -- -- 67.1 63.875th Percentile ($000's) -- -- 66.8 70.6 -- -- 80.4 66.4Average ($000's) -- 72.5 59.1 68.7 -- -- 68.4 65.2
Most Recent New HireEmployers Reported 0 0 0 1 0 0 0 1
Median ($000's) -- -- -- -- -- -- -- --Average ($000's) -- -- -- -- -- -- -- --
Total Cash CompensationBase Plus Incentive Pay
Supervises employees engaged in the processing, fabrication, assembly, installation, or testing of organization products. Schedules,assigns, and monitors work to meet production schedules. Responsible for preventive maintenance and repair of equipment. Preparesproduction reports of group activities. Responsible for training, selection, assignment, review, and appraisal of subordinates.Recommends personnel actions. Requires high school diploma or equivalent education and 5 or more years experience.
Organizational FTE's Organizational Revenue ($ Millions)
Page 3-307Southwestern Pennsylvania Annual Compensation and Benefits Study
© 2010 Pittsburgh Technology Council. All rights reserved.

Job Code 970 PRODUCTION MANAGER
Description
0.0% Less Complex87.5% Comparable12.5% More Complex
All Organizations
Software, Computer and
Technology Manufacturing
Life-Sciences/ Biotech/
Medical Devices Not-for-ProfitAll Other
EmployersAnnual Base Pay
Employers Reported 15 1 10 3 0 1Employees Reported 16 1 11 3 0 125th Percentile ($000's) 74.6 -- 74.0 -- -- --50th Percentile ($000's) 85.7 -- 88.5 82.9 -- --75th Percentile ($000's) 105.8 -- 110.5 -- -- --Average ($000's) 89.8 -- 92.3 88.4 -- --
Incentive Pay% Incentive Eligible 81% 100% 82% 67% -- 100%25th Percentile ($000's) 7.2 -- 6.6 -- -- --50th Percentile ($000's) 9.5 -- 9.7 -- -- --75th Percentile ($000's) 12.7 -- 13.5 -- -- --Average ($000's) 10.2 -- 10.4 -- -- --
25th Percentile ($000's) 74.6 -- 74.0 -- -- --50th Percentile ($000's) 90.9 -- 89.5 92.4 -- --75th Percentile ($000's) 114.5 -- 118.0 -- -- --Average ($000's) 94.3 -- 98.0 91.6 -- --
Most Recent New HireEmployers Reported 0 0 0 0 0 0
Median ($000's) -- -- -- -- -- --Average ($000's) -- -- -- -- -- --
Manages fabrication and/or assembly operation through first-line supervisors. Responsible for monitoring of automated productionprocesses; meeting production schedules, standards, and profitability; and implementing safety programs. Degree preferred. Requires4–6 years experience as production supervisor or assistant manager.
Industry - Type of Employer
Total Cash CompensationBase Plus Incentive Pay
Job Match Comparability
Page 3-308Southwestern Pennsylvania Annual Compensation and Benefits Study
© 2010 Pittsburgh Technology Council. All rights reserved.

Job Code 970 PRODUCTION MANAGER
Description
Less than 50 50 - 150 151 - 500 More than 500Less than
$7.5M$7.5M to
$25M$26M to $150M
More than $150M
Annual Base PayEmployers Reported 3 3 5 4 3 2 5 5Employees Reported 3 3 5 5 3 2 5 6
25th Percentile ($000's) -- -- 73.0 82.9 -- -- 75.1 81.150th Percentile ($000's) 78.0 103.0 75.1 104.3 78.0 -- 103.0 93.675th Percentile ($000's) -- -- 104.0 110.4 -- -- 104.0 108.9Average ($000's) 77.8 88.7 87.4 100.1 77.8 -- 93.7 95.3
Incentive Pay% Incentive Eligible 100% 100% 60% 80% 100% 100% 60% 83%
25th Percentile ($000's) -- -- -- -- -- -- -- 7.750th Percentile ($000's) 1.0 12.7 -- 8.9 1.0 -- 14.3 8.975th Percentile ($000's) -- -- -- -- -- -- -- 12.5Average ($000's) 1.0 12.7 -- 11.3 1.0 -- 14.3 11.3
25th Percentile ($000's) -- -- 73.0 92.4 -- -- 75.1 88.050th Percentile ($000's) 78.0 117.3 75.1 104.3 78.0 -- 104.0 98.375th Percentile ($000's) -- -- 104.0 118.7 -- -- 113.5 115.1Average ($000's) 78.2 97.2 87.4 109.2 78.2 -- 96.6 102.9
Most Recent New HireEmployers Reported 0 0 0 0 0 0 0 0
Median ($000's) -- -- -- -- -- -- -- --Average ($000's) -- -- -- -- -- -- -- --
Total Cash CompensationBase Plus Incentive Pay
Manages fabrication and/or assembly operation through first-line supervisors. Responsible for monitoring of automated productionprocesses; meeting production schedules, standards, and profitability; and implementing safety programs. Degree preferred. Requires4–6 years experience as production supervisor or assistant manager.
Organizational FTE's Organizational Revenue ($ Millions)
Page 3-309Southwestern Pennsylvania Annual Compensation and Benefits Study
© 2010 Pittsburgh Technology Council. All rights reserved.

4. Policies and Practices
Southwestern Pennsylvania Annual Compensation and Benefits Study
© 2010 Pittsburgh Technology Council. All rights reserved.
Page 4 – 1
In addition to compensation practice data, this survey provides prevalence and trend data pertaining to the following programs and policies: Program/Policy Page No.
Strategic Initiatives 2011 Pay Increase Budgets
4–24-4
2011 Pay Range and Structure Adjustments 4–6Performance Management Programs 4-7
Incentive Plans Pay Premiums and Shift Differentials Healthcare, Welfare and Voluntary Benefit Plans
4-94-134-16
Retirement Plans 401(k) Plans
4–264-27
403(b) Plans 4–31Holiday, Vacation and Other Paid Time Off Practices 4–34
Referral Bonuses 4–42Signing Bonuses 4-43Tuition Assistance, Professional Development and Staff Training 4–44
Recognition and Achievement Awards Work/Life Policies and Programs Perquisites and Fringe Benefits Employment Practices Severance Practices and Programs
4–464-484-514-544-55
Percentages listed throughout these analyses are based on 69 total survey responses unless otherwise noted. The number of employers included typically appears at the top of each table and may change within the table as appropriate. Column percentages may not total 100% due to non-response or multiple responses (when appropriate). Non-responses that do not contribute to understanding a policy or practice may be omitted.

4. Policies and Practices
Southwestern Pennsylvania Annual Compensation and Benefits Study
© 2010 Pittsburgh Technology Council. All rights reserved.
Page 4 – 2
Strategic Initatives
Total Less than 50 50 to 150 151 to 500More than
500 Manufacturing
Software, Computer and
Technology Life Sciences Not For ProfitAll Other
Employers
Total Employers Reported 69 20 13 12 24 17 14 7 11 20
Staff Layoffs/FurloughsImplemented in 2010
Employers Reporting 23 6 6 3 8 8 3 0 4 8Percent to Total 33% 30% 46% 25% 33% 47% 21% 0% 36% 40%
Projected for 2011Employers Reporting 3 1 0 0 2 0 1 0 1 1Percent to Total 4% 5% 0% 0% 8% 0% 7% 0% 9% 5%
Reduced WorkweekImplemented in 2010
Employers Reporting 3 2 1 0 0 1 1 0 0 1Percent to Total 4% 10% 8% 0% 0% 6% 7% 0% 0% 5%
Projected for 2011Employers Reporting 1 1 0 0 0 0 0 0 1 0Percent to Total 1% 5% 0% 0% 0% 0% 0% 0% 9% 0%
Voluntary or Mandatory Unpaid Time OffImplemented in 2010
Employers Reporting 3 0 2 1 0 2 0 1 0 0Percent to Total 4% 0% 15% 8% 0% 12% 0% 14% 0% 0%
Projected for 2011Employers Reporting 0 0 0 0 0 0 0 0 0 0Percent to Total 0% 0% 0% 0% 0% 0% 0% 0% 0% 0%
FULLTIME EMPLOYEES TYPE OF EMPLOYER
STRATEGIES TO ADDRESS THE ECONOMIC SITUATION
Strategic Initiatives Local participants were asked to identify initiatives implemented in 2010 or projected for 2011 in response to economic and/or financial pressures.
One-third of participants implemented staff layoffs or furloughs in 2010. Only 4% are planning to do so in 2011. 43% of all employers reduced their 2010 pay increase budget and/or average increase amount. For organizations granting increases in 2010, increases are limited to 70% of eligible staff, on average. Prevalence of other cost-cutting initiatives implemented in 2010 include: 27% increasing employee’s contributions toward benefit costs or reduced benefit levels; 19% decreasing or eliminating bonus opportunities; 19% reducing, suspending, freezing or terminating retirement benefits; and, 9% reducing employees' base salary. For 2011, 10% of employers continue to expect reduced pay increases; 10% expect to increase employee's contributions toward benefit costs or reduce benefit levels.

4. Policies and Practices
Southwestern Pennsylvania Annual Compensation and Benefits Study
© 2010 Pittsburgh Technology Council. All rights reserved.
Page 4 – 3
Strategic Initatives
Total Less than 50 50 to 150 151 to 500More than
500 Manufacturing
Software, Computer and
Technology Life Sciences Not For ProfitAll Other
Employers
Total Employers Reported 69 20 13 12 24 17 14 7 11 20
Reduced Pay IncreasesImplemented in 2010
Employers Reporting 30 7 4 3 16 4 5 1 4 16Percent to Total 43% 35% 31% 25% 67% 24% 36% 14% 36% 80%
Projected for 2011Employers Reporting 7 1 0 1 5 1 0 0 0 6Percent to Total 10% 5% 0% 8% 21% 6% 0% 0% 0% 30%
Cut/Reduced Employee's Base SalaryImplemented in 2010
Employers Reporting 6 2 1 1 2 2 2 0 0 2Percent to Total 9% 10% 8% 8% 8% 12% 14% 0% 0% 10%
Projected for 2011Employers Reporting 0 0 0 0 0 0 0 0 0 0Percent to Total 0% 0% 0% 0% 0% 0% 0% 0% 0% 0%
Decreased/Eliminated Bonus OpportunitiesImplemented in 2010
Employers Reporting 13 4 2 2 5 2 4 1 0 6Percent to Total 19% 20% 15% 17% 21% 12% 29% 14% 0% 30%
Projected for 2011Employers Reporting 5 0 0 1 4 0 1 0 0 4Percent to Total 7% 0% 0% 8% 17% 0% 7% 0% 0% 20%
Increased Employee's Contributions Towards Benefit CostsImplemented in 2010
Employers Reporting 14 2 4 1 7 1 2 1 4 6Percent to Total 20% 10% 31% 8% 29% 6% 14% 14% 36% 30%
Projected for 2011Employers Reporting 5 2 0 1 2 1 1 0 2 1Percent to Total 7% 10% 0% 8% 8% 6% 7% 0% 18% 5%
Reduced Level of BenefitsImplemented in 2010
Employers Reporting 5 2 1 0 2 1 1 0 1 2Percent to Total 7% 10% 8% 0% 8% 6% 7% 0% 9% 10%
Projected for 2011Employers Reporting 2 2 0 0 0 1 0 0 1 0Percent to Total 3% 10% 0% 0% 0% 6% 0% 0% 9% 0%
Reduced/Temporarily Withdrawn Retirement BenefitsImplemented in 2010
Employers Reporting 8 4 0 2 2 2 3 0 1 2Percent to Total 12% 20% 0% 17% 8% 12% 21% 0% 9% 10%
Projected for 2011Employers Reporting 0 0 0 0 0 0 0 0 0 0Percent to Total 0% 0% 0% 0% 0% 0% 0% 0% 0% 0%
Permanently Froze or Terminated Pension PlanImplemented in 2010
Employers Reporting 5 2 1 0 2 2 0 0 1 2Percent to Total 7% 10% 8% 0% 8% 12% 0% 0% 9% 10%
Projected for 2011Employers Reporting 2 1 0 0 1 2 0 0 0 0Percent to Total 3% 5% 0% 0% 4% 12% 0% 0% 0% 0%
Percent of employers - Yes 7% 25% 0% 0% 0% 12% 0% 29% 9% 0%Percent of employers - No 93% 75% 100% 100% 100% 88% 100% 71% 91% 100%
Percent of employers - Yes 1% 0% 0% 0% 4% 0% 0% 0% 0% 5%Percent of employers - No 99% 100% 100% 100% 96% 100% 100% 100% 100% 95%
2010 SALARY FREEZE PLANNED
2010 SALARY REDUCTION PLANNED
FULLTIME EMPLOYEES TYPE OF EMPLOYER
STRATEGIES TO ADDRESS THE ECONOMIC SITUATION

4. Policies and Practices
Southwestern Pennsylvania Annual Compensation and Benefits Study
© 2010 Pittsburgh Technology Council. All rights reserved.
Page 4 – 4
2011 Pay Increase Budgets
Total Less than 50 50 to 150 151 to 500More than
500 Manufacturing
Software, Computer and
Technology Life Sciences Not For ProfitAll Other
Employers
Total Employers Reported 69 20 13 12 24 17 14 7 11 20
2011 TOTAL PAY INCREASE BUDGETNonexempt Staff
Employers Reporting 19 5 3 3 8 4 3 3 4 5
25th Percentile 3.0% 2.0% -- -- 3.0% -- -- -- -- 3.0%50th Percentile 3.0% 3.0% 4.0% 3.0% 3.0% 3.0% 3.5% 3.5% 3.0% 3.0%75th Percentile 3.5% 3.5% -- -- 3.0% -- -- -- -- 3.0%Average 3.2% 2.8% 3.7% 3.5% 3.1% 3.1% 3.5% 3.5% 2.8% 3.2%
Exempt StaffEmployers Reporting 18 5 3 3 7 4 2 3 4 5
25th Percentile 3.0% 3.0% -- -- 3.0% -- -- -- -- 3.0%50th Percentile 3.0% 3.0% 3.5% 3.0% 3.0% 3.0% -- 3.5% 3.0% 3.0%75th Percentile 3.5% 3.5% -- -- 3.0% -- -- -- -- 3.0%Average 3.2% 3.0% 3.5% 3.5% 3.1% 3.0% 3.8% 3.8% 2.8% 3.2%
No Budget Set at This TimeEmployers Reporting 47 14 9 9 15 11 11 3 7 15Employers Without Budgets 68% 70% 69% 75% 63% 65% 79% 43% 64% 75%
Additional note, percentiles represent only employers reporting planned budgets at this time.
FULLTIME EMPLOYEES TYPE OF EMPLOYER
2011 Pay Increase Budgets Pay increase budgets are the funds an organization allocates to be used for base salary increases within the budget year. Some increase budgets include only merit funds, while other budgets include monies for some combination of merit, cost-of-living and market adjustment increases.
Only 32% of the survey participants had 2011 pay increase and pay structure budget estimates completed at the time the survey questionnaires were submitted.
o Of these organizations, the median 2011 total pay increase budget is 3.0% of base salary for each employee group – non-exempt and exempt staff.
For organizations that budget a combination of increases, the median 2011 merit increase is projected at 3.2% of base salary for both non-exempt and exempt staff. A small number of employers were able to provide 2011 budget data for cost-of-living adjustments and market adjustments yielding median adjustments of 3.3% of base salary and 0.2% of base salary, respectively. For organizations granting increases in 2011, an estimated 100% of all employees are being budgeted to receive an increase.

4. Policies and Practices
Southwestern Pennsylvania Annual Compensation and Benefits Study
© 2010 Pittsburgh Technology Council. All rights reserved.
Page 4 – 5
2011 Pay Increase Budgets
Total Less than 50 50 to 150 151 to 500More than
500 Manufacturing
Software, Computer and
Technology Life Sciences Not For ProfitAll Other
Employers
Total Employers Reported 69 20 13 12 24 17 14 7 11 20
Percent of employers - Yes 51% 45% 54% 58% 50% 41% 57% 29% 64% 55%Percent of employers - No 49% 55% 46% 42% 50% 59% 43% 71% 36% 45%
Nonexempt StaffMERIT
Employers Reporting 4 0 1 1 2 1 0 1 0 2Average 3.3% -- -- -- 3.2% -- -- -- -- 3.2%Median 3.2% -- -- -- -- -- -- -- -- --
COST OF LIVINGEmployers Reporting 4 2 1 0 1 2 1 1 0 0
Average 4.4% 3.3% -- -- -- 5.5% -- -- -- --Median 3.3% -- -- -- -- -- -- -- -- --
MARKET ADJUSTMENTEmployers Reporting 3 0 0 0 3 1 0 0 0 2
Average 0.9% -- -- -- 0.9% -- -- -- -- 0.1%Median 0.2% -- -- -- 0.2% -- -- -- -- --
Exempt StaffMERIT
Employers Reporting 4 0 1 1 2 1 0 1 0 2Average 3.1% -- -- -- 3.2% -- -- -- -- 3.2%Median 3.2% -- -- -- -- -- -- -- -- --
COST OF LIVINGEmployers Reporting 2 2 0 0 0 1 0 1 0 0
Average 3.3% 3.3% -- -- -- -- -- -- -- --Median -- -- -- -- -- -- -- -- -- --
MARKET ADJUSTMENTEmployers Reporting 3 0 0 0 3 1 0 0 0 2
Average 0.9% -- -- -- 0.9% -- -- -- -- 0.1%Median 0.2% -- -- -- 0.2% -- -- -- -- --
Employers Reporting 53 12 11 11 19 15 11 3 7 17Average 70% 61% 59% 75% 78% 52% 65% 70% 89% 80%Median 95% 75% 96% 95% 95% 40% 90% 100% 100% 95%
Employers Reporting 43 10 8 8 17 10 8 3 6 16Average 91% 90% 88% 86% 95% 75% 96% 100% 100% 94%Median 100% 100% 100% 100% 100% 95% 100% 100% 100% 100%
COMBINATION OF INCREASE BUDGETS
COMBINATION OF INCREASE BUDGETS
TOTAL PAY INCREASE BUDGET EQUALS MERIT BUDGET
FULLTIME EMPLOYEES TYPE OF EMPLOYER
PERCENTAGE OF STAFF BUDGETED TO RECEIVE AN INCREASE IN 2011
AVERAGE PERCENT RECEIVING INCREASE IN PRIOR YEAR

4. Policies and Practices
Southwestern Pennsylvania Annual Compensation and Benefits Study
© 2010 Pittsburgh Technology Council. All rights reserved.
Page 4 – 6
Pay Ranges - Structure Adjustments
Total Less than 50 50 to 150 151 to 500More than
500 Manufacturing
Software, Computer and
Technology Life Sciences Not For ProfitAll Other
Employers
Total Employers Reported 69 20 13 12 24 17 14 7 11 20
FORMAL PAY STRUCTURES USED
Percent of employers - Yes 57% 25% 38% 67% 88% 53% 29% 29% 100% 65%Percent of employers - No 43% 75% 62% 33% 13% 47% 71% 71% 0% 35%
Nonexempt StaffEmployers Reporting 18 1 0 4 13 4 2 1 4 7
Average 2.6% -- -- 2.8% 2.5% 2.3% 2.8% -- 2.1% 2.7%Median 2.5% -- -- 2.3% 2.5% 2.5% -- -- 2.0% 2.5%
Exempt StaffEmployers Reporting 16 1 0 4 11 4 1 1 4 6
Average 2.7% -- -- 2.8% 2.6% 2.7% -- -- 2.1% 2.6%Median 2.3% -- -- 2.3% 2.0% 3.0% -- -- 2.0% 2.3%
No Budget Set at This TimeEmployers Reporting 4 1 1 0 2 0 1 1 0 2Employers Without Budgets 10% 20% 20% 0% 10% 0% 25% 50% 0% 15%
Total Employers Reported 46 9 6 8 23 10 6 2 11 17
ANNUALEmployers Reporting 37 7 3 7 20 9 3 2 7 16
Percent to total 80% 78% 50% 88% 87% 90% 50% 100% 64% 94%
SEMI-ANNUALEmployers Reporting 1 1 0 0 0 0 0 0 1 0
Percent to total 2% 11% 0% 0% 0% 0% 0% 0% 9% 0%
NO SET TIMEEmployers Reporting 4 1 2 0 1 0 2 0 2 0
Percent to total 9% 11% 33% 0% 4% 0% 33% 0% 18% 0%
OTHEREmployers Reporting 4 0 1 1 2 1 1 0 1 1
Percent to total 9% 0% 17% 13% 9% 10% 17% 0% 9% 6%
TYPE OF EMPLOYER
Additional note, responses include employers having informal pay ranges.
FULLTIME EMPLOYEES
FREQUENCY OF PAY STRUCTURE ADJUSTMENT
PROJECTED 2010 RANGE MIDPOINT INCREASE
2011 Pay Range and Structure Adjustments Slightly over one-half (57%) of survey participants utilize formal pay structures or ranges and the majority report adjusting these ranges on an annual basis. For employers who have formal pay ranges and have estimated an adjustment for 2011, the median 2011 projected adjustments to pay range midpoints are 2.5% and 2.3% for non-exempt and exempt jobs, respectively.

4. Policies and Practices
Southwestern Pennsylvania Annual Compensation and Benefits Study
© 2010 Pittsburgh Technology Council. All rights reserved.
Page 4 – 7
Performance Management Programs
Total Less than 50 50 to 150 151 to 500More than
500 Manufacturing
Software, Computer and
Technology Life Sciences Not For ProfitAll Other
Employers
Total Employers Reported 69 20 13 12 24 17 14 7 11 20
Percent of employers - Yes 94% 95% 92% 100% 92% 94% 100% 86% 91% 95%Percent of employers - No 6% 5% 8% 0% 8% 6% 0% 14% 9% 5%
Total Employers Reported 65 19 12 11 23 15 14 6 11 19
ANNUALEmployers Reporting 54 15 11 9 19 13 11 6 10 14
Percent to total 83% 79% 92% 82% 83% 87% 79% 100% 91% 74%
SEMI-ANNUALEmployers Reporting 8 3 0 1 4 1 1 0 1 5
Percent to total 12% 16% 0% 9% 17% 7% 7% 0% 9% 26%
QUARTERLYEmployers Reporting 2 0 1 1 0 1 1 0 0 0
Percent to total 3% 0% 8% 9% 0% 7% 7% 0% 0% 0%
NO SET TIMEEmployers Reporting 1 1 0 0 0 0 1 0 0 0
Percent to total 2% 5% 0% 0% 0% 0% 7% 0% 0% 0%
FULLTIME EMPLOYEES TYPE OF EMPLOYER
COMPANY HAS FORMAL PROCESS USED TO REVIEW EMPLOYEE PERFORMANCE
FREQUENCY OF FORMAL EMPLOYEE PERFORMANCE REVIEW
Performance Management Programs As a new topic to this year's survey, participants were asked to provide data regarding programs used to manage employee performance.
The majority of participating organizations (94%) have a formal process for reviewing employee performance.
o Of these organizations, 83% report formally reviewing employees' performance once a year on an annual basis.
The five most common elements included within the performance management program are: 1) individual goals (92%); 2) competencies (72%); 3) personal development objectives (69%); 4) self appraisal (63%); and, 5) competency goals (57%). Slightly less than half (45%) link individual performance ratings to base salary increases.

4. Policies and Practices
Southwestern Pennsylvania Annual Compensation and Benefits Study
© 2010 Pittsburgh Technology Council. All rights reserved.
Page 4 – 8
Performance Management Programs
Total Less than 50 50 to 150 151 to 500More than
500 Manufacturing
Software, Computer and
Technology Life Sciences Not For ProfitAll Other
Employers
Total Employers Reported 69 20 13 12 24 17 14 7 11 20
INDIVIDUAL GOALSEmployers Reporting 60 17 11 10 22 14 12 5 10 19
Percent to total 92% 89% 92% 91% 96% 93% 86% 83% 91% 100%
TEAM GOALSEmployers Reporting 25 11 3 5 6 6 8 2 3 6
Percent to total 38% 58% 25% 45% 26% 40% 57% 33% 27% 32%
COMPETENCY GOALSEmployers Reporting 37 14 7 6 10 10 9 5 3 10
Percent to total 57% 74% 58% 55% 43% 67% 64% 83% 27% 53%
COMPETENCIESEmployers Reporting 47 14 9 3 21 10 10 3 7 17
Percent to total 72% 74% 75% 27% 91% 67% 71% 50% 64% 89%
PERSONAL DEVELOPMENT OBJECTIVESEmployers Reporting 45 12 9 5 19 9 9 4 7 16
Percent to total 69% 63% 75% 45% 83% 60% 64% 67% 64% 84%
SELF APPRAISALEmployers Reporting 41 12 9 4 16 7 7 3 8 16
Percent to total 63% 63% 75% 36% 70% 47% 50% 50% 73% 84%
MULTI-RATER / 360Employers Reporting 15 4 4 0 7 3 3 0 1 8
Percent to total 23% 21% 33% 0% 30% 20% 21% 0% 9% 42%
FORMAL PERFORMANCE RATING SCALEEmployers Reporting 33 7 5 5 16 8 4 2 7 12
Percent to total 51% 37% 42% 45% 70% 53% 29% 33% 64% 63%
LINKAGE OF BASE SALARY INCREASE TO PERFORMANCE RATINGEmployers Reporting 29 5 8 4 12 8 6 2 6 7
Percent to total 45% 26% 67% 36% 52% 53% 43% 33% 55% 37%
FULLTIME EMPLOYEES TYPE OF EMPLOYER
ELEMENTS INCLUDED WITHIN PERFORMANCE MANAGEMENT PROGRAM
Note, employers may have multiple elements, percentages may not add up to 100%.

4. Policies and Practices
Southwestern Pennsylvania Annual Compensation and Benefits Study
© 2010 Pittsburgh Technology Council. All rights reserved.
Page 4 – 9
Incentive Plan Design
Total Less than 50 50 to 150 151 to 500More than
500 Manufacturing
Software, Computer and
Technology Life Sciences Not For ProfitAll Other
Employers
Total Employers Reported 69 20 13 12 24 17 14 7 11 20
Managers 48 13 9 9 17 14 12 4 4 14Percentage of Total 70% 65% 69% 75% 71% 82% 86% 57% 36% 70%
Exempt Staff 44 11 8 9 16 13 11 4 3 13Percentage of Total 64% 55% 62% 75% 67% 76% 79% 57% 27% 65%
NE Technical Staff 35 10 5 8 12 13 7 2 3 10Percentage of Total 51% 50% 38% 67% 50% 76% 50% 29% 27% 50%
NE Clerical 34 10 5 8 11 12 7 2 3 10Percentage of Total 49% 50% 38% 67% 46% 71% 50% 29% 27% 50%
Managers 42 13 7 6 16 11 10 5 3 13Percentage of Total 61% 65% 54% 50% 67% 65% 71% 71% 27% 65%
Exempt Staff 37 11 6 5 15 10 9 4 2 12Percentage of Total 54% 55% 46% 42% 63% 59% 64% 57% 18% 60%
NE Technical Staff 28 9 3 4 12 10 5 1 2 10Percentage of Total 41% 45% 23% 33% 50% 59% 36% 14% 18% 50%
NE Clerical 27 9 3 4 11 9 5 1 2 10Percentage of Total 39% 45% 23% 33% 46% 53% 36% 14% 18% 50%
TYPE OF EMPLOYERFULLTIME EMPLOYEES
2010 INCENTIVE, CASH BONUS PLAN ELIGIBILITY
2011 INCENTIVE, CASH BONUS PLAN ELIGIBILITY
Incentive Plans Participants were asked to provide data regarding incentive and bonus plan eligibility, typical payments and maximum reward opportunities, types of formal cash-based incentive plans currently in use, and the typical performance components used to calculate incentive and bonus payments.
Incentive and Bonus Plan Eligibility For organizations offering some type of formal incentive or bonus plan in 2010, two-thirds or more classify managers and exempt staff as incentive eligible while approximately one-half (49% - 51%) classify non-exempt staff as incentive eligible. For 2011, approximately a 10% decrease in eligibility for incentives is projected across all employee groups.

4. Policies and Practices
Southwestern Pennsylvania Annual Compensation and Benefits Study
© 2010 Pittsburgh Technology Council. All rights reserved.
Page 4 – 10
Incentive Plan Design
Total Less than 50 50 to 150 151 to 500More than
500 Manufacturing
Software, Computer and
Technology Life Sciences Not For ProfitAll Other
Employers
Total Employers Reported 69 20 13 12 24 17 14 7 11 20
MANAGERSAverage 15.5% 16.1% 12.2% 9.7% 19.5% 14.7% 12.2% 13.6% 21.3% 17.3%Median 13.0% 18.0% 10.0% 10.0% 15.0% 11.0% 10.0% 10.0% 20.0% 15.0%
EXEMPT STAFFAverage 11.6% 13.2% 11.0% 7.6% 12.8% 12.1% 8.6% 9.1% 16.9% 12.7%Median 10.0% 12.0% 9.0% 7.8% 12.0% 12.0% 7.3% 10.0% 18.8% 10.0%
NONEXEMPT TECHNICAL STAFFAverage 8.0% 11.6% 7.9% 7.6% 5.6% 8.8% 6.9% 7.5% 10.8% 6.4%Median 7.5% 10.5% 8.3% 7.8% 4.5% 9.5% 6.3% 7.5% 10.0% 4.0%
NONEXEMPT CLERICAL STAFFAverage 8.0% 11.7% 7.9% 7.6% 5.7% 8.9% 6.9% 7.5% 10.8% 6.4%Median 7.5% 10.0% 8.3% 7.8% 4.3% 9.5% 6.3% 7.5% 10.0% 4.0%
FULLTIME EMPLOYEES TYPE OF EMPLOYER
INCENTIVE OPPORTUNITY - MAXIMUM
Incentive Plan Design
Total Less than 50 50 to 150 151 to 500More than
500 Manufacturing
Software, Computer and
Technology Life Sciences Not For ProfitAll Other
Employers
Total Employers Reported 69 20 13 12 24 17 14 7 11 20
Total Employers Reported 22 5 4 4 9 8 3 1 1 9 Average 7.8% 10.0% 6.1% 8.3% 7.2% 7.3% 5.9% -- -- 7.5%Median 7.3% 8.2% 6.3% 9.0% 5.9% 7.0% 6.5% -- -- 6.5%
FULLTIME EMPLOYEES TYPE OF EMPLOYER
INCENTIVES PAID AS % OF ELIGIBLE BASE SALARIES (excludes sales commissions)
Aggregate Incentive and Bonus Plan Payments Total incentive and bonus payments, excluding sales commissions, for the prior year equaled approximately 7.3% of eligible base salaries, at median, and 7.8% of eligible base salaries on average.
Maximum Incentive Opportunities
Median maximum incentive opportunities are 13% of base salaries for managers, 10% for exempt, 7.5% for non-exempt technical and clerical staff.

4. Policies and Practices
Southwestern Pennsylvania Annual Compensation and Benefits Study
© 2010 Pittsburgh Technology Council. All rights reserved.
Page 4 – 11
Incentive Plan Design
Total Less than 50 50 to 150 151 to 500More than
500 Manufacturing
Software, Computer and
Technology Life Sciences Not For ProfitAll Other
Employers
Total Employers Reported 69 20 13 12 24 17 14 7 11 20
Management IncentivePlan Currently In Use 28% 15% 31% 25% 38% 35% 29% 43% 0% 30%
Plan Currently In Use 39% 35% 46% 58% 29% 53% 43% 43% 18% 35%Department Specific Incentive
Plan Currently In Use 16% 10% 15% 17% 21% 12% 21% 14% 9% 20%Project Based Incentive
Plan Currently In Use 10% 5% 15% 17% 8% 12% 7% 14% 9% 10%
Individual IncentivesPlan Currently In Use 36% 40% 31% 25% 42% 24% 43% 14% 36% 50%
FULLTIME EMPLOYEES TYPE OF EMPLOYER
INCENTIVE PLAN TYPE PREVALENCE
Organization-wide Goal Sharing/Gain Sharing
Incentive Plan Design
Total Less than 50 50 to 150 151 to 500More than
500 Manufacturing
Software, Computer and
Technology Life Sciences Not For ProfitAll Other
Employers
Total Employers Reported 69 20 13 12 24 17 14 7 11 20
Overall Organization PerformanceManager 65% 65% 62% 67% 67% 76% 71% 71% 36% 65%Exempt Staff 57% 55% 54% 58% 58% 71% 71% 57% 27% 50%Nonexempt Technical Staff 41% 35% 31% 50% 46% 71% 36% 14% 27% 35%Nonexempt Clerical Staff 38% 30% 31% 50% 42% 59% 36% 14% 27% 35%
Business Unit/Department PerformanceManager 26% 30% 15% 17% 33% 29% 21% 57% 0% 30%Exempt Staff 22% 30% 8% 8% 29% 24% 21% 43% 0% 25%Nonexempt Technical Staff 12% 20% 0% 8% 13% 18% 7% 29% 0% 10%Nonexempt Clerical Staff 9% 15% 0% 8% 8% 12% 7% 29% 0% 5%
Individual PerformanceManager 52% 60% 54% 42% 50% 53% 64% 57% 36% 50%Exempt Staff 43% 50% 46% 33% 42% 35% 71% 57% 27% 35%Nonexempt Technical Staff 28% 40% 15% 33% 21% 24% 36% 29% 27% 25%Nonexempt Clerical Staff 25% 35% 15% 33% 17% 12% 36% 29% 27% 25%
DiscretionaryManager 25% 40% 15% 33% 13% 29% 21% 29% 18% 25%Exempt Staff 22% 40% 8% 33% 8% 24% 21% 29% 18% 20%Nonexempt Technical Staff 20% 40% 0% 33% 8% 24% 14% 29% 18% 20%Nonexempt Clerical Staff 19% 35% 8% 33% 4% 12% 21% 29% 18% 20%
BY GROUP
FULLTIME EMPLOYEES TYPE OF EMPLOYER
PERFORMANCE METRIC PREVALENCE
Types of Incentive Plans Organization-wide goal sharing/gain sharing (39%) and individual-based incentive plans (36%) continue to be the most prevalent types of plans offered by survey participants.
Management-only incentive plans are in place at 28% of participating companies.
Performance Components
Across all job levels, the most prevalent performance measures for incentive plans are overall organizational performance and individual performance.

4. Policies and Practices
Southwestern Pennsylvania Annual Compensation and Benefits Study
© 2010 Pittsburgh Technology Council. All rights reserved.
Page 4 – 12
Incentive Plan Design
Total Less than 50 50 to 150 151 to 500More than
500 Manufacturing
Software, Computer and
Technology Life Sciences Not For ProfitAll Other
Employers
Total Employers Reported 69 20 13 12 24 17 14 7 11 20
Reduce Reward Opportunities 3% 10% 0% 0% 0% 6% 0% 0% 9% 0%
6% 10% 0% 17% 0% 6% 7% 14% 0% 5%
1% 0% 0% 0% 4% 6% 0% 0% 0% 0%
1% 0% 0% 8% 0% 6% 0% 0% 0% 0%
14% 20% 8% 17% 13% 12% 7% 14% 9% 25%
Increase Number of Plan Participants
Change the Performance Goals and Measures
FULLTIME EMPLOYEES TYPE OF EMPLOYER
Reduce Number of Plan Participants
EXPECTED CHANGES TO INCENTIVE PLAN IN 2011
Increase Reward Opportunities
Expected Changes to Incentive Plans for 2011 Participants were asked to identify expected changes to their organization’s incentive plan for 2011.
14% expect to change performance goals and measures in 2011. And, as mentioned previously, a slight decrease in eligibility for incentives is projected across all employee groups in 2011.

4. Policies and Practices
Southwestern Pennsylvania Annual Compensation and Benefits Study
© 2010 Pittsburgh Technology Council. All rights reserved.
Page 4 – 13
Pay Premiums & Shift Differentials
Total Less than 50 50 to 150 151 to 500More than
500 Manufacturing
Software, Computer and
Technology Life Sciences Not For ProfitAll Other
Employers
Total Employers Reported 69 20 13 12 24 17 14 7 11 20
Total Employers Reported 3 0 0 1 2 0 0 0 0 3Exempt Eligible 4% 0% 0% 8% 8% 0% 0% 0% 0% 15%Exempt Not Eligible 96% 100% 100% 92% 92% 100% 100% 100% 100% 85%
Total Employers Reported 20 1 0 6 13 7 4 2 2 5Nonexempt Personnel Eligible 29% 5% 0% 50% 54% 41% 29% 29% 18% 25%Nonexempt Personnel Not Eligible 71% 95% 100% 50% 46% 59% 71% 71% 82% 75%
Employers Reporting 18 1 0 6 11 7 3 2 2 4
$0.86 -- -- $1.04 $0.77 $0.77 $0.92 $1.33 $0.38 $0.98
$0.78 -- -- $1.00 $0.75 $0.75 $1.00 -- -- $0.88
Employers Reporting 18 1 0 5 12 7 4 1 2 4
$0.94 -- -- $1.15 $0.87 $0.92 $1.09 -- $0.40 $1.05
$0.93 -- -- $1.00 $0.93 $0.85 $0.88 -- -- $1.00
Employers Reporting 16 1 0 5 10 7 3 1 2 3
$0.83 -- -- $0.95 $0.77 $0.77 $0.92 -- $0.38 $1.06
$0.78 -- -- $1.00 $0.73 $0.75 $1.00 -- -- $1.00
Employers Reporting 16 1 0 5 10 7 3 1 2 3
$0.97 -- -- $1.15 $0.90 $0.92 $1.25 -- $0.50 $1.06
$0.93 -- -- $1.00 $0.93 $0.85 $1.00 -- -- $1.00
FULLTIME EMPLOYEES
Median Weekday Night11 p.m. - 7 a.m.
Average Weekend Evening3 p.m. - 11 p.m.Median Weekend Evening3 p.m. - 11 p.m.
Median Weekday Evening3 p.m. - 11 p.m.
EVENING AND NIGHT SHIFT DIFFERENTIAL ELIGIBILITY
Average Weekday Evening3 p.m. - 11 p.m.
TYPE OF EMPLOYER
Average Weekend Night11 p.m. - 7 a.m.Median Weekend Night11 p.m. - 7 a.m.
Average Weekday Night11 p.m. - 7 a.m.
Pay Premiums & Shift Differentials Participants were asked to provide data regarding shift differentials, holiday pay differentials, exempt overtime payments and pay premiums for hard-to-find skills. Shift Differentials
Slightly less than one-third (29%) of participants have non-exempt employees eligible for evening and night shift pay differentials.
o A small percentage of participants (4%) have exempt employees also eligible for these pay differentials.
For all organizations, the median weekday and weekend evening differential (3 p.m. to 11 p.m.) is $0.78 per hour. The median weekday and weekend night differential (11 p.m. to 7 a.m.) is $0.93 per hour.
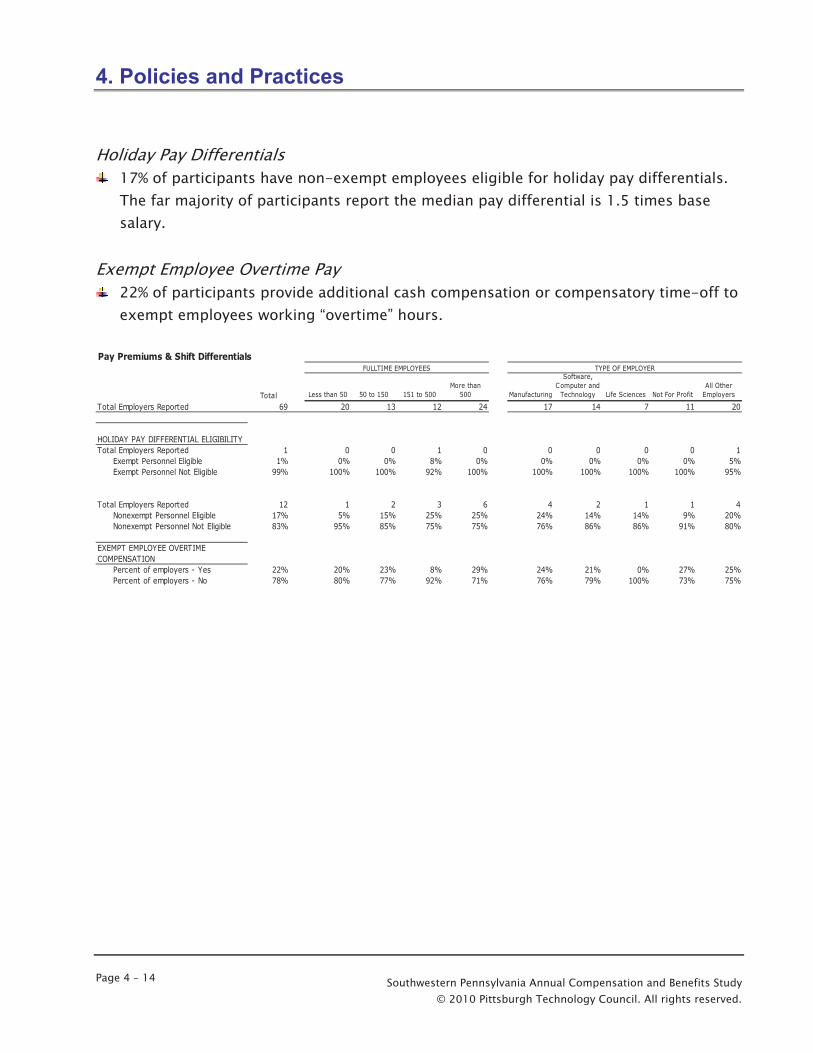
4. Policies and Practices
Southwestern Pennsylvania Annual Compensation and Benefits Study
© 2010 Pittsburgh Technology Council. All rights reserved.
Page 4 – 14
Pay Premiums & Shift Differentials
Total Less than 50 50 to 150 151 to 500More than
500 Manufacturing
Software, Computer and
Technology Life Sciences Not For ProfitAll Other
Employers
Total Employers Reported 69 20 13 12 24 17 14 7 11 20
Total Employers Reported 1 0 0 1 0 0 0 0 0 1Exempt Personnel Eligible 1% 0% 0% 8% 0% 0% 0% 0% 0% 5%Exempt Personnel Not Eligible 99% 100% 100% 92% 100% 100% 100% 100% 100% 95%
Total Employers Reported 12 1 2 3 6 4 2 1 1 4Nonexempt Personnel Eligible 17% 5% 15% 25% 25% 24% 14% 14% 9% 20%Nonexempt Personnel Not Eligible 83% 95% 85% 75% 75% 76% 86% 86% 91% 80%
Percent of employers - Yes 22% 20% 23% 8% 29% 24% 21% 0% 27% 25%Percent of employers - No 78% 80% 77% 92% 71% 76% 79% 100% 73% 75%
FULLTIME EMPLOYEES TYPE OF EMPLOYER
HOLIDAY PAY DIFFERENTIAL ELIGIBILITY
EXEMPT EMPLOYEE OVERTIME COMPENSATION
Holiday Pay Differentials
17% of participants have non-exempt employees eligible for holiday pay differentials. The far majority of participants report the median pay differential is 1.5 times base salary.
Exempt Employee Overtime Pay
22% of participants provide additional cash compensation or compensatory time-off to exempt employees working “overtime” hours.

4. Policies and Practices
Southwestern Pennsylvania Annual Compensation and Benefits Study
© 2010 Pittsburgh Technology Council. All rights reserved.
Page 4 – 15
Pay Premiums & Shift Differentials
Total Less than 50 50 to 150 151 to 500More than
500 Manufacturing
Software, Computer and
Technology Life Sciences Not For ProfitAll Other
Employers
Total Employers Reported 69 20 13 12 24 17 14 7 11 20
Total Employers Reported 5 1 0 2 2 0 2 0 1 2
JAVAEmployers Reporting 1 0 0 0 1 0 0 0 0 1
Percent to total 20% 0% 0% 0% 50% 0% 0% 0% 0% 50%
Average Extra Salary Paid -- -- -- -- -- -- -- -- -- --Median Extra Salary Paid -- -- -- -- -- -- -- -- -- --
.NET TECHNOLOGIESEmployers Reporting 3 0 0 1 2 0 1 0 1 1
Percent to total 60% 0% 0% 50% 100% 0% 50% 0% 100% 50%
Average Extra Salary Paid 5.0% -- -- -- 5.0% -- -- -- -- --Median Extra Salary Paid 5.0% -- -- -- -- -- -- -- -- --
PL/SQLEmployers Reporting 3 0 0 1 2 0 1 0 1 1
Percent to total 60% 0% 0% 50% 100% 0% 50% 0% 100% 50%
Average Extra Salary Paid 5.0% -- -- -- 5.0% -- -- -- -- --Median Extra Salary Paid 5.0% -- -- -- -- -- -- -- -- --
FULLTIME EMPLOYEES TYPE OF EMPLOYER
EMPLOYER COMPENSATES FOR DIFFICULT TO FIND SKILLS
BY SKILL
Additional note, employers may have multiple answers, percentages may not add up to 100%.
Additional Compensation for Hard-To-Find Skills
Five participants report paying higher compensation to employees possessing difficult-to-find skills.
o Of these organizations, approximately 60% pay additional compensation for .Net Technologies and PL/SQL.
All organizations report paying the extra compensation in a higher salary. The median amount paid for this extra compensation is 5% of base salary.

4. Policies and Practices
Southwestern Pennsylvania Annual Compensation and Benefits Study
© 2010 Pittsburgh Technology Council. All rights reserved.
Page 4 – 16
Healthcare Benefit Plans
Total Less than 50 50 to 150 151 to 500More than
500 Manufacturing
Software, Computer and
Technology Life Sciences Not For ProfitAll Other
Employers
Total Employers Reported 69 20 13 12 24 17 14 7 11 20
HMOEmployers Reporting 8 0 1 0 7 1 1 1 2 3
Percent to total 12% 0% 8% 0% 29% 6% 7% 14% 18% 15%
PPOEmployers Reporting 63 20 11 11 21 15 13 5 11 19
Percent to total 91% 100% 85% 92% 88% 88% 93% 71% 100% 95%
POSEmployers Reporting 1 0 0 1 0 0 0 0 1 0
Percent to total 1% 0% 0% 8% 0% 0% 0% 0% 9% 0%
CONSUMER DRIVEN HEALTH PLANEmployers Reporting 11 0 3 0 8 2 2 1 1 5
Percent to total 16% 0% 23% 0% 33% 12% 14% 14% 9% 25%
OTHER PLANEmployers Reporting 1 1 0 0 0 1 0 0 0 0
Percent to total 1% 5% 0% 0% 0% 6% 0% 0% 0% 0%
TYPES OF HEALTHCARE BENEFIT PLANS OFFERED
FULLTIME EMPLOYEES
Other Programs include: EPO - Exclusive Provider Organization
Additional note, employers may have multiple plans, percentages may not add up to 100%.
TYPE OF EMPLOYER
Healthcare, Welfare and Voluntary Benefit Plans This section summarizes responses relative to healthcare, dental, vision and medical insurance plan prevalence, program eligibility criteria and cost sharing arrangements.
The majority of all participating companies (91%) provide healthcare benefits through a PPO. Slightly more than one-half of all participants (54%) allow new employees to participate in the healthcare plan on the first day of the month after the employee’s first day of work.
o Approximately one-quarter (23%) of participating organizations allow new employees to participate in the healthcare plan on the first day of employment.
Median employer contributions toward healthcare premiums are 80% and 76% of the premiums for individual and family coverage, respectively; employees are required to pay the remaining 20% and 24% of the premiums. Approximately 72% of employers use the same cost sharing arrangements and premium amounts for all employees regardless of income or level. Across all participants, approximately one-third of employers (30%) self insure their medical plan. However, for the larger employers (those with over 500 full-time employees), approximately 63% self insure their medical plan. 84% of all participants allow their employees to “opt-out” of medical insurance.
o Of these employers, 39% provide cash compensation to the employees opting-out of medical insurance and the median monthly cash reimbursement paid for individual coverage is $93.
Nearly three-quarters of participants offer a qualified cafeteria program, (i.e., a Section 125 program). The most prevalent cafeteria benefit programs include Healthcare Flexible Spending Account and Dependent Care Assistance Program.

4. Policies and Practices
Southwestern Pennsylvania Annual Compensation and Benefits Study
© 2010 Pittsburgh Technology Council. All rights reserved.
Page 4 – 17
Healthcare Benefit Plans
Total Less than 50 50 to 150 151 to 500More than
500 Manufacturing
Software, Computer and
Technology Life Sciences Not For ProfitAll Other
Employers
Total Employers Reported 69 20 13 12 24 17 14 7 11 20
Employers Self Insuring 30% 5% 15% 25% 63% 35% 14% 0% 9% 60%Employers Not Self Insuring 70% 95% 85% 75% 38% 65% 86% 100% 91% 40%
Employers With Opt-Out 84% 90% 69% 92% 83% 88% 93% 71% 91% 75%Employers Without Opt-Out 16% 10% 31% 8% 17% 12% 7% 29% 9% 25%
Employers Provide Cash 39% 28% 44% 50% 40% 33% 23% 60% 50% 44%Employers Do Not Provide Cash 61% 72% 56% 50% 60% 67% 77% 40% 50% 56%
Average Reimbursement $125 $165 $160 $120 $86 $162 $104 $142 $173 $67Median Reimbursement $93 $127 $75 $83 $80 $100 $104 $75 $127 $65
Employers With Opt-Out 43% 50% 46% 25% 46% 47% 43% 14% 45% 50%Employers Without Opt-Out 57% 50% 54% 75% 54% 53% 57% 86% 55% 50%
Employers Charge Fees 19% 15% 33% 17% 18% 27% 0% 0% 17% 30%Employers Do Not Charge Fees 81% 85% 67% 83% 82% 73% 100% 100% 83% 70%
Average Amount Collected $205 $275 $216 -- $200 $125 -- -- -- $222Median Amount Collected $200 -- -- -- -- $50 -- -- -- $200
Employers Offer Plan 45% 55% 15% 50% 50% 29% 21% 71% 45% 65%Employers Do Not Offer Plan 55% 45% 85% 50% 50% 71% 79% 29% 55% 35%
Employers with Program 74% 65% 77% 75% 79% 71% 71% 57% 73% 85%Employers Without Program 26% 35% 23% 25% 21% 29% 29% 43% 27% 15%
FULL FLEXIBLE BENEFITSEmployers Reporting 11 3 2 2 4 4 2 1 1 3
Percent to total 22% 23% 20% 22% 21% 33% 20% 25% 13% 18%
Employers Reporting 38 8 5 7 18 9 5 3 6 15Percent to total 75% 62% 50% 78% 95% 75% 50% 75% 75% 88%
Employers Reporting 30 6 4 7 13 9 4 0 5 12Percent to total 59% 46% 40% 78% 68% 75% 40% 0% 63% 71%
Employers Reporting 20 10 4 2 4 4 7 3 3 3Percent to total 39% 77% 40% 22% 21% 33% 70% 75% 38% 18%
Employers Reporting 6 1 1 0 4 1 0 1 0 4Percent to total 12% 8% 10% 0% 21% 8% 0% 25% 0% 24%
OPT-OUT PROVISION FOR SPOUSE MEDICAL PLAN
EMPLOYEE CHARGED ADDITIONAL COST FOR SPOUSE OPTING OUT
DEPENDENT CARE ASSISTANCE PROGRAM"DCAP"
OPT-OUT PROVISION FOR EMPLOYEE MEDICAL PLAN
CASH COMPENSATION TO EMPLOYEES WHO OPT OUT
FULLTIME EMPLOYEES TYPE OF EMPLOYER
ADOPTIONS ASSISTANCE BENEFITS
CAFETERIA PROGRAM QUALIFIED UNDER SECTION 125
PREMIUM ONLY PLAN "POP"
SELF INSURE MEDICAL PLAN WITH HIGHEST ENROLLMENT
MEDICAL PLAN OFFERED FOR DOMESTIC PARTNERS
HEALTH CARE FLEXIBLE SPENDING ARRANGEMENT "HEALTH FSA"
CAFETERIA PROGRAMS INCLUDED

4. Policies and Practices
Southwestern Pennsylvania Annual Compensation and Benefits Study
© 2010 Pittsburgh Technology Council. All rights reserved.
Page 4 – 18
Healthcare Benefit Plans
Total Less than 50 50 to 150 151 to 500More than
500 Manufacturing
Software, Computer and
Technology Life Sciences Not For ProfitAll Other
Employers
Total Employers Reported 69 20 13 12 24 17 14 7 11 20
COMPANY SHARE
Individual coverage Company/IndividualAverage 81%/19% 82%/18% 84%/16% 85%/15% 83%/17% 82%/18% 79%/21% 87%/13% 91%/09% 80%/20%Median 80%/20% 82%/18% 84%/16% 81%/19% 80%/20% 80%/20% 78%/22% 90%/10% 90%/10% 80%/20%
Average Monthly Premiums $393 $419 $358 $337 $418 $503 $346 $326 $476 $334Median Monthly Premiums $366 $337 $343 $366 $424 $373 $340 $319 $393 $377
Family coverage Company/IndividualAverage 76%/24% 75%/25% 76%/24% 80%/20% 78%/22% 78%/22% 74%/26% 82%/18% 81%/19% 72%/28%Median 80%/20% 78%/22% 80%/20% 80%/20% 80%/20% 80%/20% 73%/27% 80%/20% 82%/18% 73%/27%
Average Monthly Premiums $1,019 $1,018 $1,009 $990 $1,047 $945 $1,000 $970 $1,190 $974Median Monthly Premiums $1,014 $998 $931 $1,014 $1,233 $1,020 $997 $956 $1,188 $1,091
Employers With Same Costs 72% 80% 92% 67% 58% 65% 100% 71% 55% 70%Employers With Different Costs 28% 20% 8% 33% 42% 35% 0% 29% 45% 30%
FIRST DAY OF WORKEmployers Reporting 16 6 1 2 7 2 5 0 1 8
Percent to total 23% 30% 8% 17% 29% 12% 36% 0% 9% 40%
Employers Reporting 37 11 6 9 11 10 6 5 9 7Percent to total 54% 55% 46% 75% 46% 59% 43% 71% 82% 35%
Employers Reporting 8 1 5 0 2 3 3 0 1 1Percent to total 12% 5% 38% 0% 8% 18% 21% 0% 9% 5%
Employers Reporting 3 1 0 0 2 0 0 1 0 2Percent to total 4% 5% 0% 0% 8% 0% 0% 14% 0% 10%
Employers Reporting 2 1 0 1 0 2 0 0 0 0Percent to total 3% 5% 0% 8% 0% 12% 0% 0% 0% 0%
Employers Reporting 0 0 0 0 0 0 0 0 0 0Percent to total 0% 0% 0% 0% 0% 0% 0% 0% 0% 0%
Employers Reporting 2 0 1 0 1 0 0 0 0 2Percent to total 3% 0% 8% 0% 4% 0% 0% 0% 0% 10%
FULLTIME EMPLOYEES TYPE OF EMPLOYER
Company/IndividualCompany/Individual
FIRST OF MONTH FOLLOWING EMPLOYMENT DATE
FIRST OF MONTH AFTER 1 MONTH OF SERVICE
FIRST OF MONTH AFTER 6 MONTHS OF SERVICE
OTHER
FIRST OF MONTH AFTER 2 MONTHS OF SERVICE
MONTHLY COSTS SAME FOR EMPLOYEES AT ALL LEVELS
EMPLOYEE PLAN ELIGIBILITY
FIRST OF MONTH AFTER 3 MONTHS OF SERVICE
LARGEST HEALTHCARE PLAN ANNUAL PREMIUM COST SHARING ARRANGEMENT

4. Policies and Practices
Southwestern Pennsylvania Annual Compensation and Benefits Study
© 2010 Pittsburgh Technology Council. All rights reserved.
Page 4 – 19
Healthcare Benefit Plans
Total Less than 50 50 to 150 151 to 500More than
500 Manufacturing
Software, Computer and
Technology Life Sciences Not For ProfitAll Other
Employers
Total Employers Reported 69 20 13 12 24 17 14 7 11 20
Employers with Dental Plan 96% 90% 100% 100% 96% 94% 100% 86% 100% 95%Employers without Dental Plan 4% 10% 0% 0% 4% 6% 0% 14% 0% 5%
Employers with Costs Integrated 10% 15% 8% 25% 0% 18% 7% 0% 18% 5%
90% 85% 92% 75% 100% 82% 93% 100% 82% 95%
COMPANY SHARE
Individual coverage Company/IndividualAverage 79%/21% 82%/18% 89%/11% 88%/12% 71%/29% 87%/13% 82%/18% 84%/16% 72%/28% 74%/26%Median 81%/19% 81%/19% 90%/10% 89%/11% 76%/24% 91%/09% 81%/19% 85%/15% 80%/20% 78%/22%
Average Monthly Premiums $30.45 $29.91 $24.93 $26.24 $36.43 $29.16 $25.47 $25.08 $48.01 $26.33Median Monthly Premiums $25.55 $30.80 $25.24 $25.10 $23.58 $23.00 $26.22 $27.40 $28.91 $24.26
Family coverage Company/IndividualAverage 75%/25% 79%/21% 78%/22% 80%/20% 68%/32% 87%/13% 78%/22% 84%/16% 62%/38% 68%/32%Median 80%/20% 76%/24% 80%/20% 82%/18% 72%/28% 91%/09% 74%/26% 85%/15% 66%/34% 76%/24%
Average Monthly Premiums $101.33 $128.78 $84.60 $84.35 $93.45 $183.21 $81.12 $74.06 $117.38 $79.22Median Monthly Premiums $80.87 $92.35 $77.31 $85.90 $73.26 $70.00 $85.16 $81.24 $86.10 $80.00
FULLTIME EMPLOYEES TYPE OF EMPLOYER
Company/Individual Company/Individual
Employers with Costs Not Integrated
ANNUAL PREMIUM COST SHARING ARRANGEMENT PERCENTAGES FOR DENTAL PLAN
DENTAL PLAN COSTS INTEGRATED WITH HEALTHCARE PREMIUM
DENTAL PLAN PREVALENCE
Dental Plan Benefits 96% of participants provide dental plan benefits to employees. Nearly all of these organizations (90%) do not integrate the dental plan costs with the healthcare plan costs. Median employer contributions toward dental premiums are 81% and 80% of the premiums for individual or family coverage, respectively. Employees are required to pay the remaining 19% to 20% of the premiums.
o The employer-paid portions of the premiums paid by large employers are less (76% and 72% for individual and family, respectively) than the portions paid by smaller employers (81% and 76%) and the median monthly premiums are also lower at the larger organizations.

4. Policies and Practices
Southwestern Pennsylvania Annual Compensation and Benefits Study
© 2010 Pittsburgh Technology Council. All rights reserved.
Page 4 – 20
Healthcare Benefit Plans
Total Less than 50 50 to 150 151 to 500 More than 500 Manufacturing
Software, Computer and
TechnologyLife Sciences Not For Profit All Other
Employers
Total Employers Reported 69 20 13 12 24 17 14 7 11 20
Employers with Optical Plan 87% 75% 92% 100% 88% 82% 93% 86% 100% 80%Employers without Optical Plan 13% 25% 8% 0% 13% 18% 7% 14% 0% 20%
Employers with Costs Integrated 17% 25% 8% 25% 13% 18% 14% 14% 18% 20%
83% 75% 92% 75% 88% 82% 86% 86% 82% 80%
COMPANY SHARE
Individual coverage Company/IndividualAverage 80%/20% 88%/12% 82%/18% 89%/11% 71%/29% 87%/13% 84%/16% 85%/15% 85%/15% 67%/33%Median 80%/20% 95%/05% 79%/21% 90%/10% 75%/25% 100%/0% 80%/20% 83%/17% 95%/05% 73%/27%
Average Monthly Premiums $5.22 $6.60 $4.54 $5.07 $4.71 $6.37 $4.53 $4.23 $5.10 $5.86Median Monthly Premiums $4.71 $5.12 $4.32 $5.05 $4.58 $4.38 $4.28 $4.70 $4.94 $5.56
Family coverage Company/IndividualAverage 72%/28% 76%/24% 75%/25% 89%/11% 62%/38% 84%/16% 80%/20% 85%/15% 58%/42% 61%/39%Median 75%/25% 83%/17% 74%/26% 90%/10% 69%/31% 90%/10% 80%/20% 82%/18% 50%/50% 70%/30%
Average Monthly Premiums $13.05 $13.64 $13.10 $12.37 $12.83 $12.34 $12.39 $9.87 $13.05 $16.03Median Monthly Premiums $12.64 $13.47 $12.51 $12.41 $14.12 $12.85 $10.69 $11.55 $12.52 $15.00
ANNUAL PREMIUM COST SHARING ARRANGEMENT PERCENTAGES FOR OPTICAL PLAN
OPTICAL PLAN COSTS INTEGRATED WITHHEALTHCARE PREMIUM
OPTICAL PLAN PREVALENCE
Company/IndividualCompany/Individual
Employers with Costs Not Integrated
FULLTIME EMPLOYEES TYPE OF EMPLOYER
Optical Plan Benefits 87% of participants provide vision benefits to employees.
Again, the clear majority of these organizations (83%) do not integrate the vision plan costs with the healthcare benefit plan costs. Median employer contributions toward vision premiums are 80% and 75% for individual and family coverage, respectively.
o Larger employers’ portion of the individual and family premiums (75% and 69%, respectively) is less than smaller employers (95% and 83%) and, again, the median monthly premiums are generally lower at the larger organizations.

4. Policies and Practices
Southwestern Pennsylvania Annual Compensation and Benefits Study
© 2010 Pittsburgh Technology Council. All rights reserved.
Page 4 – 21
Healthcare Benefit Plans
Total Less than 50 50 to 150 151 to 500More than
500 Manufacturing
Software, Computer and
Technology Life Sciences Not For ProfitAll Other
Employers
Total Employers Reported 69 20 13 12 24 17 14 7 11 20
Employers With H S A 19% 10% 8% 17% 33% 29% 7% 0% 0% 35%Employers Without H S A 81% 90% 92% 83% 67% 71% 93% 100% 100% 65%
IndividualAverage Deductible $1,554 $1,250 -- $2,500 $1,519 $1,663 -- -- -- $1,536Median Deductible $1,500 -- -- -- $1,500 $1,500 -- -- -- $1,500
FamilyAverage Deductible $3,067 $2,500 -- $5,000 $2,975 $3,200 -- -- -- $3,071Median Deductible $2,750 -- -- -- $2,750 $2,750 -- -- -- $3,000
IndividualAverage Contribution $475 -- -- -- $475 -- -- -- -- $500Median Contribution $450 -- -- -- $450 -- -- -- -- $500
FamilyAverage Contribution $950 -- -- -- $950 -- -- -- -- $1,000Median Contribution $900 -- -- -- $900 -- -- -- -- $1,000
Employers With HRAs 20% 20% 23% 33% 13% 29% 14% 29% 18% 15%Employers Without HRAs 80% 80% 77% 67% 88% 71% 86% 71% 82% 85%
IndividualAverage Contribution $740 $844 $1,000 $375 $583 $875 $917 $1,000 $250 $625Median Contribution $750 $813 $1,000 -- $750 -- $1,000 -- -- $625
FamilyAverage Contribution $1,617 $2,188 $2,000 $1,250 $717 $2,075 $1,833 $2,000 $1,000 $1,250Median Contribution $1,500 $1,875 $2,000 -- $500 -- $2,000 -- -- $1,250
FULLTIME EMPLOYEES TYPE OF EMPLOYER
HEALTH SAVINGS ACCOUNT PREVALENCE
EMPLOYER HSA ANNUAL CONTRIBUTION DEDUCTIBLE OFFSET
HSA ANNUAL INSURANCE DEDUCTIBLE
EMPLOYER HRA ANNUAL CONTRIBUTION
HEALTH REIMBURSEMENT ARRANGEMENT PREVALENCE
Health Savings Accounts (HSA) and Health Reimbursement Arrangements (HRA) Less than one-quarter (19%) of participating companies currently offer Health Savings Accounts (HSA) to their employees. Of these companies, the median insurance plan deductibles are $1,500 and $2,750 for individual and family coverage, respectively.
o These companies provide a median annual contribution to the HSA of $450 to $900 for individual and family coverage, respectively, in an attempt to help offset the high insurance plan deductibles.
20% of participating companies offer Health Reimbursement Arrangements (HRAs) to their employees with a median employer contribution of $750 and $1,500 for individual and family coverage, respectively.

4. Policies and Practices
Southwestern Pennsylvania Annual Compensation and Benefits Study
© 2010 Pittsburgh Technology Council. All rights reserved.
Page 4 – 22
Healthcare Benefit Plans
Total Less than 50 50 to 150 151 to 500More than
500 Manufacturing
Software, Computer and
Technology Life Sciences Not For ProfitAll Other
Employers
Total Employers Reported 69 20 13 12 24 17 14 7 11 20
AD & DEmployers Reporting 61 17 13 12 19 15 14 5 10 17
Percent to total 88% 85% 100% 100% 79% 88% 100% 71% 91% 85%
LIFE INSURANCEEmployers Reporting 63 18 12 12 21 16 14 5 10 18
Percent to total 91% 90% 92% 100% 88% 94% 100% 71% 91% 90%
SHORT TERM DISABILITYEmployers Reporting 53 16 9 10 18 14 10 5 9 15
Percent to total 77% 80% 69% 83% 75% 82% 71% 71% 82% 75%
LONG TERM DISABILITYEmployers Reporting 50 17 10 10 13 14 10 4 9 13
Percent to total 72% 85% 77% 83% 54% 82% 71% 57% 82% 65%
OTHEREmployers Reporting 8 1 2 1 4 1 4 0 1 2
Percent to total 12% 5% 15% 8% 17% 6% 29% 0% 9% 10%
Other Programs include: Dependant life insurance, long term care, business travel/accident.
FULLTIME EMPLOYEES TYPE OF EMPLOYER
OTHER EMPLOYER PAID BENEFIT PROGRAM PREVALENCE
Other Employer-Paid Benefit Program Prevalence The clear majority of survey participants (72% and above) provide employees with accidental death and dismemberment (AD&D) insurance, life insurance, short-term disability and long-term disability at no cost to the employee for premiums.

4. Policies and Practices
Southwestern Pennsylvania Annual Compensation and Benefits Study
© 2010 Pittsburgh Technology Council. All rights reserved.
Page 4 – 23
Healthcare Benefit Plans
Total Less than 50 50 to 150 151 to 500More than
500 Manufacturing
Software, Computer and
Technology Life Sciences Not For ProfitAll Other
Employers
Total Employers Reported 69 20 13 12 24 17 14 7 11 20
HEALTH SCREENINGSEmployers Reporting 21 2 5 1 13 6 3 2 4 6
Percent to total 30% 10% 38% 8% 54% 35% 21% 29% 36% 30%
Employers Reporting 25 6 3 1 15 5 3 2 7 8Percent to total 36% 30% 23% 8% 63% 29% 21% 29% 64% 40%
Employers Reporting 25 5 4 1 15 5 5 1 6 8Percent to total 36% 25% 31% 8% 63% 29% 36% 14% 55% 40%
Employers Reporting 15 2 1 0 12 3 0 1 3 8Percent to total 22% 10% 8% 0% 50% 18% 0% 14% 27% 40%
Employers Reporting 13 2 3 2 6 3 4 0 2 4Percent to total 19% 10% 23% 17% 25% 18% 29% 0% 18% 20%
Employers Reporting 27 5 5 2 15 6 7 1 3 10Percent to total 39% 25% 38% 17% 63% 35% 50% 14% 27% 50%
Employers Reporting 17 5 3 2 7 1 5 2 3 6Percent to total 25% 25% 23% 17% 29% 6% 36% 29% 27% 30%
Employers Reporting 15 2 3 0 10 4 2 1 3 5Percent to total 22% 10% 23% 0% 42% 24% 14% 14% 27% 25%
Employers Reporting 17 1 3 2 11 5 2 1 3 6Percent to total 25% 5% 23% 17% 46% 29% 14% 14% 27% 30%
Employers Reporting 13 1 3 1 8 4 1 1 3 4Percent to total 19% 5% 23% 8% 33% 24% 7% 14% 27% 20%
Employers Reporting 7 0 2 0 5 1 2 1 2 1Percent to total 10% 0% 15% 0% 21% 6% 14% 14% 18% 5%
Employers Reporting 13 1 4 2 6 3 2 2 2 4Percent to total 19% 5% 31% 17% 25% 18% 14% 29% 18% 20%
Other Programs include: Reimbursement of health equipment, time off for participating in health screenings, non smoking discounts, company provided flu shots
FULLTIME EMPLOYEES TYPE OF EMPLOYER
PARTIAL REIMBURSEMENT FOR OFF-SITE FITNESS FACILITY
ON-SITE FITNESS FACILITY
PHYSICAL ACTIVITY PROGRAMS
NUTRITIONAL PROGRAMS
NEWSLETTERS
TOBACCO USE PROGRAMS
EMPLOYER PROVIDED TYPES OF WELLNESS OR SERVICES
CASH INCENTIVES FOR HEALTHIER LIFESTYLE CHANGES
EDUCATIONAL WORKSHOPS
BIKE RACKS IN PARKING AREAS
HEALTHY FOODS IN CAFETERIA/VENDING MACHINES
Wellness Program Prevalence The most prevalent types of wellness programs or services provided to employees to promote a healthy life style include: 1) healthy foods in cafeteria/vending machines (39%); 2 and 3) educational workshops and newsletters (36%); 4) health screenings (30%); and, 5 and 6) bike racks in parking areas and physical activity programs (25%). Approximately 19% of participants provide cash-based incentives for participating in healthier lifestyle changes and programs.

4. Policies and Practices
Southwestern Pennsylvania Annual Compensation and Benefits Study
© 2010 Pittsburgh Technology Council. All rights reserved.
Page 4 – 24
Healthcare Benefit Plans
Total Less than 50 50 to 150 151 to 500More than
500 Manufacturing
Software, Computer and
Technology Life Sciences Not For ProfitAll Other
Employers
Total Employers Reported 69 20 13 12 24 17 14 7 11 20
Employers with Program 28% 15% 23% 25% 42% 12% 29% 0% 27% 50%Employers Without Program 72% 85% 77% 75% 58% 88% 71% 100% 73% 50%
CANCER INSURANCEEmployers Reporting 14 4 4 3 3 4 5 0 3 2
Percent to total 20% 20% 31% 25% 13% 24% 36% 0% 27% 10%
Employers Reporting 18 3 4 3 8 4 4 1 3 6Percent to total 26% 15% 31% 25% 33% 24% 29% 14% 27% 30%
Employers Reporting 6 3 1 1 1 3 1 1 1 0Percent to total 9% 15% 8% 8% 4% 18% 7% 14% 9% 0%
SUPPLEMENTAL LIFE INSURANCEEmployers Reporting 45 8 8 8 21 13 10 1 6 15
Percent to total 65% 40% 62% 67% 88% 76% 71% 14% 55% 75%
Employers Reporting 35 4 8 7 16 11 7 1 4 12Percent to total 51% 20% 62% 58% 67% 65% 50% 14% 36% 60%
Employers Reporting 29 6 8 3 12 8 6 1 7 7Percent to total 42% 30% 62% 25% 50% 47% 43% 14% 64% 35%
PRE-PAID LEGAL INSURANCEEmployers Reporting 12 1 3 2 6 2 3 1 2 4
Percent to total 17% 5% 23% 17% 25% 12% 21% 14% 18% 20%
Employers Reporting 8 0 0 1 7 2 0 2 0 4Percent to total 12% 0% 0% 8% 29% 12% 0% 29% 0% 20%
Employers Reporting 8 0 0 1 7 2 0 2 0 4Percent to total 12% 0% 0% 8% 29% 12% 0% 29% 0% 20%
Employers Reporting 6 0 1 0 5 1 1 1 0 3Percent to total 9% 0% 8% 0% 21% 6% 7% 14% 0% 15%
Employers Reporting 7 1 1 1 4 2 1 1 0 3Percent to total 10% 5% 8% 8% 17% 12% 7% 14% 0% 15%
FULLTIME EMPLOYEES TYPE OF EMPLOYER
QUALIFIED TRANSPORTATION EXPENSE BENEFIT OFFERED (IRC SECTION 132)
VOLUNTARY BENEFITS MADE AVAILABLE TO EMPLOYEES
Other Benefits include: STD and LTD, critical illness and accident coverage
SUPPLEMENTAL MEDICAL INSURANCE
LONG TERM CARE INSURANCE
PET INSURANCE
IDENTITY THEFT INSURANCE
HOME OWNERS INSURANCE
DEPENDENT LIFE INSURANCE
AD&D INSURANCE
AUTOMOBILE INSURANCE
Qualified Transportation Expense Benefit and Voluntary Benefit Program Prevalence
28% of participants offer a qualified transportation expense benefit.
The top five types of voluntary benefit programs made available to employees include: 1) supplemental life insurance (65%); 2) dependent life insurance (51%); 3) accidental death and dismemberment insurance (42%); 4) long-term care insurance (26%); and, 5) cancer insurance (20%).

4. Policies and Practices
Southwestern Pennsylvania Annual Compensation and Benefits Study
© 2010 Pittsburgh Technology Council. All rights reserved.
Page 4 – 25
Healthcare Benefit Plans
Total Less than 50 50 to 150 151 to 500More than
500 Manufacturing
Software, Computer and
Technology Life Sciences Not For ProfitAll Other
Employers
Total Employers Reported 69 20 13 12 24 17 14 7 11 20
INCREASED EMPLOYEE PREMIUMSEmployers Reporting 17 4 5 3 5 2 3 2 4 6
Percent to total 25% 20% 38% 25% 21% 12% 21% 29% 36% 30%
Employers Reporting 9 6 2 0 1 2 3 1 1 2Percent to total 13% 30% 15% 0% 4% 12% 21% 14% 9% 10%
Employers Reporting 1 1 0 0 0 1 0 0 0 0Percent to total 1% 5% 0% 0% 0% 6% 0% 0% 0% 0%
INCREASE DEDUCTIBLESEmployers Reporting 12 4 4 1 3 2 2 1 2 5
Percent to total 17% 20% 31% 8% 13% 12% 14% 14% 18% 25%
Employers Reporting 2 0 1 0 1 0 0 0 1 1Percent to total 3% 0% 8% 0% 4% 0% 0% 0% 9% 5%
Employers Reporting 2 0 0 1 1 1 0 1 0 0Percent to total 3% 0% 0% 8% 4% 6% 0% 14% 0% 0%
Employers Reporting 15 6 3 1 5 2 5 1 1 6Percent to total 22% 30% 23% 8% 21% 12% 36% 14% 9% 30%
INCREASE USE OF WELLNESS PROGRAMSEmployers Reporting 27 9 4 5 9 5 3 2 8 9
Percent to total 39% 45% 31% 42% 38% 29% 21% 29% 73% 45%
FULLTIME EMPLOYEES TYPE OF EMPLOYER
Other approaches include: Reduce number of plans
CHANGE PLAN DESIGN
CHANGE INSURANCE CARRIER
INCREASE EMPLOYEECO-INSURANCE
BECOME SELF INSURED
2011 PLANS TO CONTROL OR REDUCE HEALTHCARE COSTS
REDUCE BENEFITS
Top Healthcare Cost Control ApproachesSurvey participants report the use of wellness programs (39%) as the most prevalent approach being taken to control or reduce healthcare costs for 2011.
Other approaches include:
Increase employee premiums (25%);
Change plan design (22%)
Increase deductibles (17%); and,
Change insurance carriers (13%).

4. Policies and Practices
Southwestern Pennsylvania Annual Compensation and Benefits Study
© 2010 Pittsburgh Technology Council. All rights reserved.
Page 4 – 26
Retirement Plans
Total Less than 50 50 to 150 151 to 500More than
500 Manufacturing
Software, Computer and
Technology Life Sciences Not For ProfitAll Other
Employers
Total Employers Reported 69 20 13 12 24 17 14 7 11 20
401(k) PLANEmployers Reporting 56 16 12 9 19 16 12 5 4 19
Percent to total 81% 80% 92% 75% 79% 94% 86% 71% 36% 95%
Employers Reporting 7 3 0 1 3 0 0 0 6 1Percent to total 10% 15% 0% 8% 13% 0% 0% 0% 55% 5%
Employers Reporting 9 2 0 1 6 2 0 0 3 4Percent to total 13% 10% 0% 8% 25% 12% 0% 0% 27% 20%
DEFINED CONTRIBUTION PLANEmployers Reporting 14 3 2 3 6 3 4 0 3 4
Percent to total 20% 15% 15% 25% 25% 18% 29% 0% 27% 20%
Employers Reporting 4 0 1 1 2 1 0 0 0 3Percent to total 6% 0% 8% 8% 8% 6% 0% 0% 0% 15%
Employers Reporting 15 3 2 3 7 4 3 1 0 7Percent to total 22% 15% 15% 25% 29% 24% 21% 14% 0% 35%
THRIFT SAVINGS PLANEmployers Reporting 1 0 0 0 1 0 0 0 0 1
Percent to total 1% 0% 0% 0% 4% 0% 0% 0% 0% 5%
Employers Reporting 3 1 0 0 2 0 0 0 1 2Percent to total 4% 5% 0% 0% 8% 0% 0% 0% 9% 10%
Employers Reporting 4 1 0 0 3 0 0 2 0 2Percent to total 6% 5% 0% 0% 13% 0% 0% 29% 0% 10%
Other plans include:
Employers Reporting 60 17 12 11 20 12 14 6 9 19Percent to total 87% 85% 92% 92% 83% 71% 100% 86% 82% 95%
Employers Reporting 4 2 1 0 1 3 0 0 0 1Percent to total 6% 10% 8% 0% 4% 18% 0% 0% 0% 5%
Employers Reporting 1 1 0 0 0 0 0 0 1 0Percent to total 1% 5% 0% 0% 0% 0% 0% 0% 9% 0%
Employers Reporting 2 0 0 0 2 1 0 0 1 0Percent to total 3% 0% 0% 0% 8% 6% 0% 0% 9% 0%
FREEZE OR TERMINATION OF SOME OR ALL PENSION BENEFITS
2011 RETIREMENT PLAN EXPECTATIONS
ENHANCEMENT OF BENEFITS FROM 2010 LEVEL
REDUCTION OF BENEFITS FROM 2010 LEVEL
MAINTAIN BENEFITS AT SAME LEVELS AS 2010 BENEFIT
FULLTIME EMPLOYEES TYPE OF EMPLOYER
ESOP, portable pension, simple IRA
RETIREMENT PLANS AVAILABLE TO NON-EXECUTIVE EMPLOYEES
403(b) PLAN
DEFINED BENEFIT PLAN
CASH-BALANCE PLAN
PROFIT SHARING PLAN
MONEY PURCHASE PLAN
STOCK PURCHASE PLAN
Retirement Plans More than one-half of participants currently have more than one type of retirement plan available to their non-executive employees. The most prevalent types of retirement plans offered are: 1) 401(k) (81%); 2) profit sharing plan (22%); and, 3) a defined contribution plan (20%).For 2011, 87% of employers expect 2011 retirement benefits to be maintained at the same level as 2010 benefits.

4. Policies and Practices
Southwestern Pennsylvania Annual Compensation and Benefits Study
© 2010 Pittsburgh Technology Council. All rights reserved.
Page 4 – 27
401(k) Plans
Total Less than 50 50 to 150 151 to 500More than
500 Manufacturing
Software, Computer and
Technology Life Sciences Not For ProfitAll Other
Employers
Total Employers Reported 69 20 13 12 24 17 14 7 11 20
Employers with 401(k) 81% 80% 92% 75% 79% 94% 86% 71% 36% 95%Employers without 401(k) 19% 20% 8% 25% 21% 6% 14% 29% 64% 5%
Average Participation 73% 73% 75% 66% 75% 73% 68% 83% 97% 68%Median Participation 82% 84% 83% 80% 80% 84% 80% 80% 99% 78%
401(k) PLAN PREVALENCE
PERCENTAGE OF ELIGIBLE EMPLOYEES PARTICIPATING
TYPE OF EMPLOYERFULLTIME EMPLOYEES
401(k) Plans 91% of all survey participants provide either a 401(k) or 403(b) plan. Approximately 32% of employers are currently offering a Roth 401(k) plan. From a 401(k) plan perspective, the plans enjoy very strong participation with a median participation rate of approximately 82% of eligible employees across all employers. Nearly two-thirds of participants (65%) reported that they do not automatically enroll employees in the plan.
o 48% provide immediate eligibility for plan participation at hire. o An additional 32% provide plan eligibility at three or less months of service.
The majority of these plans are funded jointly by employees and employers, with the employer contributing amounts corresponding to employees’ contributions.
o Approximately 71% of participants provide a company match. o The median maximum amount of employee contributions eligible for an employer match
remains consistent with 2009 and is 6% of the employee’s base pay. o 71% of employers allow employees to become eligible for the match with three months
or less of service. Approximately one-third (34%) of participants provide a discretionary contribution with the median contribution equal to 3% of base salary.
o Approximately 49% provide immediate, full vesting of the employer’s contribution; however, approximately 34% require two to five years of service to receive 100% of the employer’s contribution.
The median maximum employer contribution in 2009 to the 401(k) was 5% of base salary. Approximately two-thirds (71%) of organizations use the current plan provider to deliver employee investment education. 46% of the participating companies use an outside independent retirement consultant to assist in managing the retirement plan.

4. Policies and Practices
Southwestern Pennsylvania Annual Compensation and Benefits Study
© 2010 Pittsburgh Technology Council. All rights reserved.
Page 4 – 28
401(k) Plans
Total Less than 50 50 to 150 151 to 500More than
500 Manufacturing
Software, Computer and
Technology Life Sciences Not For ProfitAll Other
Employers
Total Employers Reported 69 20 13 12 24 17 14 7 11 20
Employers Do Enroll 35% 15% 38% 33% 50% 47% 29% 29% 18% 40%Employers Do Not Enroll 65% 85% 62% 67% 50% 53% 71% 71% 82% 60%
NONE 27 8 3 5 11 11 7 2 0 7Percent to total 48% 50% 25% 56% 58% 69% 58% 40% 0% 37%
3 MONTHS OR LESS 18 3 4 3 8 4 3 3 1 7Percent to total 32% 19% 33% 33% 42% 25% 25% 60% 25% 37%
4-6 MONTHS 8 3 4 1 0 1 1 0 2 4Percent to total 14% 19% 33% 11% 0% 6% 8% 0% 50% 21%
7-11 MONTHS 0 0 0 0 0 0 0 0 0 0Percent to total 0% 0% 0% 0% 0% 0% 0% 0% 0% 0%
1 YEAR 3 2 1 0 0 0 1 0 1 1Percent to total 5% 13% 8% 0% 0% 0% 8% 0% 25% 5%
MORE THAN 1 YEAR 0 0 0 0 0 0 0 0 0 0Percent to total 0% 0% 0% 0% 0% 0% 0% 0% 0% 0%
40 11 6 7 16 12 10 3 2 13Employer Provides Match 71% 69% 50% 78% 84% 75% 83% 60% 50% 68%Employer Does Not Provide Match 29% 31% 50% 22% 16% 25% 17% 40% 50% 32%
Average Contribution 5.6% 6.1% 4.8% 5.4% 5.6% 5.6% 5.5% 6.3% 6.0% 5.4%Median Contribution 6.0% 6.0% 4.5% 6.0% 6.0% 6.0% 5.5% 6.0% -- 6.0%
NONE 19 4 3 3 9 8 6 0 1 4Percent to total 48% 36% 50% 43% 56% 67% 60% 0% 50% 31%
3 MONTHS OR LESS 9 2 0 2 5 1 1 3 1 3Percent to total 23% 18% 0% 29% 31% 8% 10% 100% 50% 23%
4-6 MONTHS 2 0 1 0 1 0 0 0 0 2Percent to total 5% 0% 17% 0% 6% 0% 0% 0% 0% 15%
7-11 MONTHS 0 0 0 0 0 0 0 0 0 0Percent to total 0% 0% 0% 0% 0% 0% 0% 0% 0% 0%
1 YEAR 10 5 2 2 1 3 3 0 0 4Percent to total 25% 45% 33% 29% 6% 25% 30% 0% 0% 31%
MORE THAN 1 YEAR 0 0 0 0 0 0 0 0 0 0Percent to total 0% 0% 0% 0% 0% 0% 0% 0% 0% 0%
SERVICE REQUIREMENTS FOR EMPLOYER MATCH
Employer provides Match
FULLTIME EMPLOYEES
SERVICE REQUIREMENTS FOR PLAN PARTICIPATION
EMPLOYER AUTOMATICALLY ENROLLS EMPLOYEE IN PLAN
EMPLOYER MATCH PREVALENCE
MAXIMUM EMPLOYEE CONTRIBUTION ELIGIBLE FOR MATCH
TYPE OF EMPLOYER
Additional note, percentiles represent only employers reporting requirements, percentages may not add up to 100%.

4. Policies and Practices
Southwestern Pennsylvania Annual Compensation and Benefits Study
© 2010 Pittsburgh Technology Council. All rights reserved.
Page 4 – 29
401(k) Plans
Total Less than 50 50 to 150 151 to 500More than
500 Manufacturing
Software, Computer and
Technology Life Sciences Not For ProfitAll Other
Employers
Total Employers Reported 69 20 13 12 24 17 14 7 11 20
16 5 6 2 3 4 2 2 2 6Percent to Total 28.6% 31.3% 50.0% 22.2% 15.8% 25.0% 16.7% 40.0% 50.0% 31.6%
Average 0.9% 1.1% 0.8% 0.5% 0.8% 0.8% 0.7% 0.8% 1.0% 1.0%Median 1.0% 1.0% 1.0% 0.4% 1.0% 1.0% 0.8% 1.0% -- 1.0%
Average 1.6% 1.8% 1.4% 1.9% 1.5% 2.1% 1.4% 1.4% 1.7% 1.5%Median 2.0% 2.0% 1.0% 1.3% 2.0% 2.0% 1.5% 2.0% -- 1.5%
Percent to total 2.3% 2.6% 2.0% 1.7% 2.4% 2.4% 2.1% 2.1% 2.3% 2.3%3.0% 3.0% 1.5% 1.5% 3.0% 3.0% 2.3% 3.0% -- 2.8%
Average 2.8% 3.3% 2.6% 2.1% 2.8% 3.1% 2.7% 2.6% 3.0% 2.7%Median 3.5% 4.0% 2.0% 2.0% 2.0% 3.5% 2.8% 3.5% -- 2.0%
Average 3.3% 4.0% 2.7% 2.4% 3.5% 3.5% 3.1% 3.1% 3.7% 3.3%Median 3.5% 5.0% 2.5% 2.5% 2.5% 4.0% 3.3% 4.0% -- 2.5%
Average 3.7% 4.4% 2.7% 1.6% 4.1% 3.7% 3.3% 3.1% 4.3% 3.8%Median 3.0% 5.0% 2.5% 1.5% 3.0% 3.5% 3.0% 3.1% -- 3.0%
Average 4.1% 4.5% 2.8% 1.5% 4.9% 4.3% 3.4% 6.0% 4.3% 4.4%Median 4.0% 5.0% 3.0% 1.5% 6.0% 4.0% 3.0% 6.0% -- 4.5%
Average 4.2% 4.7% 2.8% 1.5% 4.9% 4.3% 3.6% 6.0% 4.3% 4.4%Median 4.3% 5.0% 3.0% 1.5% 6.0% 4.0% 3.5% 6.0% -- 4.5%
OTHER 4 2 2 0 0 1 1 0 1 1Percent to total 11.4% 22.2% 50.0% 0.0% 0.0% 10.0% 12.5% 0.0% 50.0% 8.3%
Employer Provides 34% 31% 33% 11% 47% 31% 33% 0% 25% 47%Employer Does Not Provide 66% 69% 67% 89% 53% 69% 67% 100% 75% 53%
Average 2.9% 1.8% 3.5% -- 3.4% 2.6% 2.5% -- -- 3.3%Median 3.0% 2.0% -- -- 3.0% 3.0% -- -- -- 3.0%
Average Contribution 5.1% 4.2% 5.6% 4.3% 6.0% 5.7% 4.1% 6.8% 6.5% 4.2%Median Contribution 5.0% 4.0% 4.0% 6.0% 5.5% 5.5% 5.0% -- -- 3.8%
MATCH PER EMPLOYEE CONTRIBUTION OF 11+%
AVERAGE DISCRETIONARY AMOUNT AS A PERCENT OF BASE SALARY
MATCH PER EMPLOYEE CONTRIBUTION OF 5%
MATCH PER EMPLOYEE CONTRIBUTION OF 6%
MATCH PER EMPLOYEE CONTRIBUTION OF 4%
PRIOR YEAR'S MAXIMUM EMPLOYER CONTRIBUTION AS A PERCENT of BASE SALARY
MATCH PER EMPLOYEE CONTRIBUTION OF 7% - 10%
NO MATCH PER PERCENT CONTRIBUTED
MATCH PER EMPLOYEE CONTRIBUTION OF 1%
DISCRETIONARY EMPLOYER CONTRIBUTIONS
MATCH PER EMPLOYEE CONTRIBUTION OF 2%
MATCH PER EMPLOYEE CONTRIBUTION OF 3%
EMPLOYER MATCH FOR EACH EMPLOYEE PERCENT CONTRIBUTED
TYPE OF EMPLOYER
Other consists of: Matching $1.00 for $1.00 for first 3% contributed, then $0.25 to $0.75 for each $1.00 on next 2%-5% contributed; 3% Safe Harbor, 33.3% match up to 6%, and match based on company annual earnings
Additional note, percentiles represent only employers reporting contributions, percentages may not add up to 100%.
FULLTIME EMPLOYEES

4. Policies and Practices
Southwestern Pennsylvania Annual Compensation and Benefits Study
© 2010 Pittsburgh Technology Council. All rights reserved.
Page 4 – 30
401(k) Plans
Total Less than 50 50 to 150 151 to 500More than
500 Manufacturing
Software, Computer and
Technology Life Sciences Not For ProfitAll Other
Employers
Total Employers Reported 69 20 13 12 24 17 14 7 11 20
VESTING IS IMMEDIATE 26 9 3 3 11 7 8 2 0 9Percent to total 49% 56% 27% 38% 61% 47% 67% 50% 0% 50%
6-18 MONTHS 3 1 1 0 1 1 0 1 0 1Percent to total 6% 6% 9% 0% 6% 7% 0% 25% 0% 6%
2-4 YEARS 11 2 1 3 5 4 1 1 2 3Percent to total 21% 13% 9% 38% 28% 27% 8% 25% 50% 17%
5 YEARS 7 1 4 1 1 1 1 0 1 4Percent to total 13% 6% 36% 13% 6% 7% 8% 0% 25% 22%
MORE THAN 5 YEARS 2 1 1 0 0 0 0 0 1 1Percent to total 4% 6% 9% 0% 0% 0% 0% 0% 25% 6%
NOT APPLICABLE 4 2 1 1 0 2 2 0 0 0Percent to total 8% 13% 9% 13% 0% 13% 17% 0% 0% 0%
Employers Offering 32% 40% 23% 50% 21% 35% 36% 29% 9% 40%Employers Not Offering 68% 60% 77% 50% 79% 65% 64% 71% 91% 60%
CURRENT PLAN PROVIDER 40 11 7 6 16 12 6 5 3 14Percent to total 71% 69% 58% 67% 84% 75% 50% 100% 75% 74%
3RD PARTY INDEPENDENT 19 7 5 3 4 4 6 0 2 7Percent to total 34% 44% 42% 33% 21% 25% 50% 0% 50% 37%
NONE CURRENTLY PROVIDED 1 0 1 0 0 0 0 0 0 1Percent to total 2% 0% 8% 0% 0% 0% 0% 0% 0% 5%
OTHER 1 0 0 0 1 1 0 0 0 0Percent to total 2% 0% 0% 0% 5% 6% 0% 0% 0% 0%
Employers Using 46% 40% 69% 17% 54% 41% 50% 14% 36% 65%Employers Not Using 54% 60% 31% 83% 46% 59% 50% 86% 64% 35%
TYPE OF EMPLOYER
SERVICE REQUIREMENTS FOR 100% VESTING IN EMPLOYER CONTRIBUTION
EMPLOYEE INVESTMENT EDUCATION PROVIDER
ROTH IRA
FULLTIME EMPLOYEES
OUTSIDE CONSULTANT USED ALONG WITH RETIREMENT PLAN VENDOR

4. Policies and Practices
Southwestern Pennsylvania Annual Compensation and Benefits Study
© 2010 Pittsburgh Technology Council. All rights reserved.
Page 4 – 31
403(b) Plans Eight participating organizations reported having a 403(b) plan.
o Within these organizations, plans report a median employee participation rate of 70% of eligible employees.
One-half of these participants provide a match and only two of these employers provide a discretionary contribution.
o The median maximum amount of employee contributions eligible for an employer match is 3.5% of base pay.
The median maximum employer contribution in 2009 to the 403(b) was 7% of base salary. 57% of organizations offering a 403(b) plan use an independent outside retirement consultant to assist with managing the retirement plan.
403(b) Plans
Total Less than 50 50 to 150 151 to 500More than
500 Manufacturing
Software, Computer and
Technology Life Sciences Not For ProfitAll Other
Employers
Total Employers Reported 69 20 13 12 24 17 14 7 11 20
403(b) PLAN PREVALENCEEmployers Reporting 8 3 1 1 3 1 0 0 6 1Employers With 403(b) 12% 15% 8% 8% 13% 6% 0% 0% 55% 5%Employers Without 403(b) 88% 85% 92% 92% 88% 94% 100% 100% 45% 95%
Average Participation 68% 55% -- -- 85% -- -- -- 68% --Median Participation 70% -- -- -- -- -- -- -- 70% --
Employers Do Enroll 6% 0% 8% 0% 13% 6% 0% 0% 18% 5%Employers Do Not Enroll 94% 100% 92% 100% 88% 94% 100% 100% 82% 95%
NONE 6 3 0 1 2 0 0 0 6 0Percent to total 75% 100% -- 100% 67% -- -- -- 100% --
3 MONTHS OR LESS 1 0 1 0 0 1 0 0 0 0Percent to total 13% -- 100% -- -- 100% -- -- -- --
4-6 MONTHS 0 0 0 0 0 0 0 0 0 0Percent to total -- -- -- -- -- -- -- -- -- --
7-11 MONTHS 0 0 0 0 0 0 0 0 0 0Percent to total -- -- -- -- -- -- -- -- -- --
1 YEAR 1 0 0 0 1 0 0 0 0 1Percent to total 13% -- -- -- 33% -- -- -- -- 100%
MORE THAN 1 YEAR 0 0 0 0 0 0 0 0 0 0Percent to total -- -- -- -- -- -- -- -- -- --
Employer Provides Match 50% 67% 0% 100% 33% 0% 0% 0% 67% 0%Employer Does Not Provide Match 50% 33% 100% 0% 67% 100% 0% 0% 33% 100%
Employers Reporting 4 2 0 1 1 0 0 0 4 0Average Contribution 3.5% 3.0% -- -- -- -- -- -- 3.5% --Median Contribution 3.5% -- -- -- -- -- -- -- 3.5% --
SERVICE REQUIREMENTS FOR PLAN PARTICIPATION
EMPLOYER MATCH PREVALENCE
EMPLOYER AUTOMATICALLY ENROLLS EMPLOYEE IN PLAN
MAXIMUM EMPLOYEE CONTRIBUTION ELIGIBLE FOR MATCH
FULLTIME EMPLOYEES TYPE OF EMPLOYER
PERCENTAGE OF ELIGIBLE EMPLOYEES PARTICIPATING

4. Policies and Practices
Southwestern Pennsylvania Annual Compensation and Benefits Study
© 2010 Pittsburgh Technology Council. All rights reserved.
Page 4 – 32
403(b) Plans
Total Less than 50 50 to 150 151 to 500More than
500 Manufacturing
Software, Computer and
Technology Life Sciences Not For ProfitAll Other
Employers
Total Employers Reported 69 20 13 12 24 17 14 7 11 20
NONE 0 0 0 0 0 0 0 0 0 0Percent to total -- -- -- -- -- -- -- -- -- --
3 MONTHS OR LESS 0 0 0 0 0 0 0 0 0 0Percent to total -- -- -- -- -- -- -- -- -- --
4-6 MONTHS 1 1 0 0 0 0 0 0 1 0Percent to total 25% 50% -- -- -- -- -- -- 25% --
7-11 MONTHS 0 0 0 0 0 0 0 0 0 0Percent to total -- -- -- -- -- -- -- -- -- --
1 YEAR 3 1 0 1 1 0 0 0 3 0Percent to total 75% 50% -- 100% 100% -- -- -- 75% --
MORE THAN 1 YEAR 0 0 0 0 0 0 0 0 0 0Percent to total -- -- -- -- -- -- -- -- -- --
4 1 1 0 2 1 0 0 2 1Average 50.0% 33.3% 100.0% 0.0% 66.7% 100.0% -- -- 33.3% 100.0%
Average 0.8% 1.0% -- -- -- -- -- -- 0.8% --Median 1.0% -- -- -- -- -- -- -- 1.0% --
Average 1.7% 2.0% -- -- -- -- -- -- 1.7% --Median 2.0% -- -- -- -- -- -- -- 2.0% --
Percent to total 2.6% 3.0% -- -- -- -- -- -- 2.6% --3.0% -- -- -- -- -- -- -- 3.0% --
Average 3.3% 4.0% -- -- -- -- -- -- 3.3% --Median 4.0% -- -- -- -- -- -- -- 4.0% --
Average 4.6% 5.0% -- -- -- -- -- -- 4.6% --Median 5.0% -- -- -- -- -- -- -- 5.0% --
Average 5.3% 6.0% -- -- -- -- -- -- 5.3% --Median 6.0% -- -- -- -- -- -- -- 6.0% --
Average 9.0% 12.0% -- -- -- -- -- -- 9.0% --Median 9.0% -- -- -- -- -- -- -- 9.0% --
Average 9.0% 12.0% -- -- -- -- -- -- 9.0% --Median 9.0% -- -- -- -- -- -- -- 9.0% --
NO MATCH PER PERCENT CONTRIBUTED
MATCH PER EMPLOYEE CONTRIBUTION OF 2%
MATCH PER EMPLOYEE CONTRIBUTION OF 3%
MATCH PER EMPLOYEE CONTRIBUTION OF 4%
MATCH PER EMPLOYEE CONTRIBUTION OF 5%
MATCH PER EMPLOYEE CONTRIBUTION OF 6%
MATCH PER EMPLOYEE CONTRIBUTION OF 7% - 10%
MATCH PER EMPLOYEE CONTRIBUTION OF 11+%
MATCH PER EMPLOYEE CONTRIBUTION OF 1%
EMPLOYER MATCH FOR EACH EMPLOYEE PERCENT CONTRIBUTED
SERVICE REQUIREMENTS FOR EMPLOYER MATCH
FULLTIME EMPLOYEES TYPE OF EMPLOYER

4. Policies and Practices
Southwestern Pennsylvania Annual Compensation and Benefits Study
© 2010 Pittsburgh Technology Council. All rights reserved.
Page 4 – 33
403(b) Plans
Total Less than 50 50 to 150 151 to 500More than
500 Manufacturing
Software, Computer and
Technology Life Sciences Not For ProfitAll Other
Employers
Total Employers Reported 69 20 13 12 24 17 14 7 11 20
Employer Provides 25% 33% 0% 0% 33% 0% 0% 0% 17% 100%Employer Does Not Provide 75% 67% 0% 100% 67% 0% 0% 0% 83% 0%
Employers Reporting 2 1 0 0 1 0 0 0 1 1Average Contribution 8.0% -- -- -- -- -- -- -- -- --Median Contribution -- -- -- -- -- -- -- -- -- --
Employers Reporting 6 2 0 1 3 0 0 0 5 1Average Contribution 7.0% 7.0% -- -- 7.3% -- -- -- 6.8% --Median Contribution 7.0% -- -- -- 8.0% -- -- -- 6.0% --
VESTING IS IMMEDIATE 3 1 0 1 1 0 0 0 3 0Percent to total 38% 33% -- 100% 25% -- -- -- 43% --
6-18 MONTHS 1 1 0 0 0 0 0 0 1 0Percent to total 13% 33% -- -- -- -- -- -- 14% --
2-4 YEARS 2 0 0 0 2 0 0 0 1 1Percent to total 25% -- -- -- 50% -- -- -- 14% 100%
5 YEARS 0 0 0 0 0 0 0 0 0 0Percent to total -- -- -- -- -- -- -- -- -- --
MORE THAN 5 YEARS 1 0 0 0 1 0 0 0 1 0Percent to total 13% -- -- -- 25% -- -- -- 14% --
NOT APPLICABLE 1 1 0 0 0 0 0 0 1 0Percent to total 13% 33% -- -- -- -- -- -- 14% --
CURRENT PLAN PROVIDER 4 1 0 1 2 0 0 0 3 1Percent to total 57% 33% -- 100% 67% -- -- -- 50% 100%
3RD PARTY INDEPENDENT 0 0 0 0 0 0 0 0 0 0Percent to total -- -- -- -- -- -- -- -- -- --
NONE CURRENTLY PROVIDED 3 2 0 0 1 0 0 0 3 0Percent to total 43% 67% -- -- 33% -- -- -- 50% --
OTHER 0 0 0 0 0 0 0 0 0 0Percent to total -- -- -- -- -- -- -- -- -- --
Employers Using 38% 0% 0% 100% 100% 0% 0% 0% 50% 100%Employers Not Using 63% -- -- 0% 0% -- -- -- 50% 0%
FULLTIME EMPLOYEES TYPE OF EMPLOYER
EMPLOYEE INVESTMENT EDUCATION PROVIDER
OUTSIDE CONSULTANT USED ALONG WITH RETIREMENT PLAN VENDOR
DISCRETIONARY EMPLOYER CONTRIBUTIONS
AVERAGE DISCRETIONARY AMOUNT AS A PERCENT OF BASE SALARY
PRIOR YEAR'S MAXIMUM EMPLOYER CONTRIBUTION AS A PERCENT of BASE SALARY
SERVICE REQUIREMENTS FOR 100% VESTING IN EMPLOYER CONTRIBUTION

4. Policies and Practices
Southwestern Pennsylvania Annual Compensation and Benefits Study
© 2010 Pittsburgh Technology Council. All rights reserved.
Page 4 – 34
Total Less than 50 50 to 150 151 to 500More than
500 Manufacturing
Software, Computer and
Technology Life Sciences Not For ProfitAll Other
Employers
Total Employers Reported 69 20 13 12 24 17 14 7 11 20
Employers Reporting 67 19 13 12 23 16 14 6 11 20Average No. of Days 9 10 10 10 9 10 10 9 10 9Median No. of Days 10 10 10 10 9 10 10 9 11 9
TYPE OF EMPLOYERFULLTIME EMPLOYEES
Holiday, Vacation, and Other PaidTime Off Practices
PAID HOLIDAYS FOR FULL TIME EMPLOYEES
Holiday, Vacation and Other Paid Time Off Practices Participants provided details into their holiday, vacation, sick time and other paid time off (PTO) practices. Separate analyses of these practices are provided for organizations having an integrated paid time off program (i.e., a bank or pool of paid time off days) versus those that do not.
The median number of annual paid holidays awarded to full-time employees is ten. Several organizations report providing one to two paid floating holidays per year as part of the ten paid holidays awarded each year. The majority of participants provide the following as paid holidays: New Year’s Day, Memorial Day, Independence Day, Labor Day, Thanksgiving Day and Christmas Day. Less than one-half (41%) of participants use an integrated PTO program inclusive of a bank of paid time off versus those using the traditional approach inclusive of separate vacation, personal and sick day allotments (59%). Regardless of paid time off approach, the majority of organizations appear to use the same vacation schedule for exempt and non-exempt employees. Consistent with last year's results, for those having an integrated PTO program, 15 is the median number of annual paid days off provided to full-time employees upon hire. For those not having an integrated PTO program, employers typically provide 10 vacation days and three personal days on an annual basis to full-time employees upon hire. The majority of organizations without an integrated PTO program (72%) do not provide a specified number of paid sick days per year to full-time employees. For those that do, median practices suggest five paid sick days per year are provided to full-time employees. Approximately 35% of organizations allow carryover of unused paid time off days. Approximately three-quarters of all organizations allow employees to take time off without pay; 6% allow employees to purchase additional paid time off. 90% of all participants expect to maintain the same amount of paid time off in 2011 as offered in 2010.

4. Policies and Practices
Southwestern Pennsylvania Annual Compensation and Benefits Study
© 2010 Pittsburgh Technology Council. All rights reserved.
Page 4 – 35
Total Less than 50 50 to 150 151 to 500More than
500 Manufacturing
Software, Computer and
Technology Life Sciences Not For ProfitAll Other
Employers
Total Employers Reported 69 20 13 12 24 17 14 7 11 20
PAID HOLIDAYS RECOGNIZEDNEW YEARS EVE
Employers Reporting 20 9 2 3 6 6 6 1 2 5Percent to total 30% 47% 15% 25% 26% 38% 43% 17% 18% 25%
NEW YEARS DAYEmployers Reporting 66 19 12 12 23 15 14 6 11 20
Percent to total 99% 100% 92% 100% 100% 94% 100% 100% 100% 100%
MARTIN LUTHER KING JR. DAYEmployers Reporting 17 4 4 3 6 1 3 1 6 6
Percent to total 25% 21% 31% 25% 26% 6% 21% 17% 55% 30%
PRESIDENTS DAYEmployers Reporting 7 2 2 1 2 0 2 1 2 2
Percent to total 10% 11% 15% 8% 9% 0% 14% 17% 18% 10%
GOOD FRIDAYEmployers Reporting 32 8 6 8 10 14 7 2 4 5
Percent to total 48% 42% 46% 67% 43% 88% 50% 33% 36% 25%
MEMORIAL DAYEmployers Reporting 66 19 13 12 22 16 14 6 11 19
Percent to total 99% 100% 100% 100% 96% 100% 100% 100% 100% 95%
INDEPENDENCE DAYEmployers Reporting 67 19 13 12 23 16 14 6 11 20
Percent to total 100% 100% 100% 100% 100% 100% 100% 100% 100% 100%
LABOR DAYEmployers Reporting 67 19 13 12 23 16 14 6 11 20
Percent to total 100% 100% 100% 100% 100% 100% 100% 100% 100% 100%
THANKSGIVING DAYEmployers Reporting 67 19 13 12 23 16 14 6 11 20
Percent to total 100% 100% 100% 100% 100% 100% 100% 100% 100% 100%
DAY AFTER THANKSGIVINGEmployers Reporting 52 17 10 9 16 16 11 5 7 13
Percent to total 78% 89% 77% 75% 70% 100% 79% 83% 64% 65%
CHRISTMAS EVE DAYEmployers Reporting 38 13 7 6 12 13 10 1 5 9
Percent to total 57% 68% 54% 50% 52% 81% 71% 17% 45% 45%
CHRISTMAS DAYEmployers Reporting 66 18 13 12 23 16 14 6 10 20
Percent to total 99% 95% 100% 100% 100% 100% 100% 100% 91% 100%
JOB ANNIVERSARY DAYEmployers Reporting 0 0 0 0 0 0 0 0 0 0
Percent to total 0% 0% 0% 0% 0% 0% 0% 0% 0% 0%
EMPLOYEE BIRTHDAYEmployers Reporting 2 0 2 0 0 0 0 1 1 0
Percent to total 3% 0% 15% 0% 0% 0% 0% 17% 9% 0%
FLOATING HOLIDAYEmployers Reporting 30 6 6 7 11 10 6 2 5 7
Percent to total 45% 32% 46% 58% 48% 63% 43% 33% 45% 35%
OTHEREmployers Reporting 9 5 1 1 2 4 2 0 2 1
Percent to total 13% 26% 8% 8% 9% 25% 14% 0% 18% 5%
Other includes: Veteran's Day and Columbus Day. A few organizations provide 1 to 2 floating holidays and up to 4 extra days during Christmas or July 4 week.
TYPE OF EMPLOYERFULLTIME EMPLOYEES
Holiday, Vacation, and Other PaidTime Off Practices

4. Policies and Practices
Southwestern Pennsylvania Annual Compensation and Benefits Study
© 2010 Pittsburgh Technology Council. All rights reserved.
Page 4 – 36
Total Less than 50 50 to 150 151 to 500More than
500 Manufacturing
Software, Computer and
Technology Life Sciences Not For ProfitAll Other
Employers
Total Employers Reported 69 20 13 12 24 17 14 7 11 20
28 11 4 5 8 4 8 4 6 6Employer Uses Integrated PTO 41% 55% 31% 42% 33% 24% 57% 57% 55% 30%
59% 45% 69% 58% 67% 76% 43% 43% 45% 70%
VACATION DAYSVacation Days Included 89% 82% 75% 100% 100% 75% 100% 100% 67% 100%Vacation Days Not Included 11% 18% 25% 0% 0% 25% 0% 0% 33% 0%
PERSONAL DAYSPersonal Days Included 86% 73% 100% 80% 100% 75% 88% 100% 83% 83%Personal Days Not Included 14% 27% 0% 20% 0% 25% 13% 0% 17% 17%
SICK DAYSSick Days Included 89% 82% 100% 80% 100% 75% 88% 100% 83% 100%Sick Days Not Included 11% 18% 0% 20% 0% 25% 13% 0% 17% 0%
COMPANY-PAID HOLIDAYSCompany-Paid Holidays Included 4% 0% 0% 0% 13% 0% 0% 0% 17% 0%
96% 100% 100% 100% 88% 100% 100% 100% 83% 100%
OTHERYes 7% 9% 0% 0% 13% 0% 0% 0% 0% 33%No 93% 91% 100% 100% 88% 100% 100% 100% 100% 67%
NonexemptUPON HIRE
Employers Reporting 16 8 1 4 3 4 4 2 2 4Average Number of Days 15 16 -- 13 16 12 15 21 14 16Median Number of Days 15 15 -- 15 17 15 15 -- -- 16
AFTER 1 YEAR OF SERVICEEmployers Reporting 20 9 1 3 7 3 4 2 6 5
Average Number of Days 17 17 -- 14 18 13 16 20 17 18Median Number of Days 17 16 -- 15 18 14 15 -- 18 18
AFTER 5 YEARS OF SERVICEEmployers Reporting 24 10 2 6 6 5 6 3 6 4
Average Number of Days 20 20 16 18 22 15 20 25 21 21Median Number of Days 20 20 -- 19 23 15 20 23 21 22
AFTER 10 YEARS OF SERVICEEmployers Reporting 24 9 2 6 7 5 6 2 6 5
Average Number of Days 23 22 19 21 27 18 23 27 23 26Median Number of Days 25 24 -- 20 25 15 24 -- 25 25
AFTER 15 YEARS OF SERVICEEmployers Reporting 17 7 1 3 6 3 3 1 6 4
Average Number of Days 24 23 -- 20 28 17 22 -- 25 27Median Number of Days 25 25 -- 18 28 18 24 -- 25 27
AFTER 20 YEARS OF SERVICEEmployers Reporting 18 7 1 4 6 4 3 1 6 4
Average Number of Days 25 24 -- 21 30 20 22 -- 26 28Median Number of Days 25 25 -- 20 30 20 24 -- 28 29
AFTER 25 YEARS OF SERVICEEmployers Reporting 17 7 1 3 6 3 3 1 6 4
Average Number of Days 25 24 -- 23 30 21 23 -- 26 28Median Number of Days 25 25 -- 25 30 25 25 -- 28 29
Holiday, Vacation, and Other PaidTime Off Practices FULLTIME EMPLOYEES TYPE OF EMPLOYER
Other includes: Doctor excused absences, bereavement, requested LOA days.
Employer Does Not Use Integrated PTO
INTEGRATED PAID TIME OFF PROGRAM
Employers with Integrated Program
NUMBER OF INTEGRATED PTO DAYS BASED ON SPECIFIED YEARS OF SERVICE
Company-Paid Holidays Not Included
DAYS INCLUDED IN INTEGRATED PAID TIME OFF PROGRAM

4. Policies and Practices
Southwestern Pennsylvania Annual Compensation and Benefits Study
© 2010 Pittsburgh Technology Council. All rights reserved.
Page 4 – 37
Total Less than 50 50 to 150 151 to 500More than
500 Manufacturing
Software, Computer and
Technology Life Sciences Not For ProfitAll Other
Employers
Total Employers Reported 69 20 13 12 24 17 14 7 11 20
ExemptUPON HIRE
Employers Reporting 20 9 3 4 4 4 6 3 2 5Average Number of Days 15 16 14 13 14 12 15 19 14 14Median Number of Days 15 15 15 15 14 15 15 18 -- 15
AFTER 1 YEAR OF SERVICEEmployers Reporting 24 10 3 3 8 3 6 3 6 6
Average Number of Days 17 17 13 14 19 13 15 18 17 19Median Number of Days 16 16 13 15 18 14 15 16 18 18
AFTER 5 YEARS OF SERVICEEmployers Reporting 30 11 4 6 9 5 9 4 6 6
Average Number of Days 20 20 19 18 21 16 18 24 21 22Median Number of Days 20 20 20 19 23 15 20 23 21 22
AFTER 10 YEARS OF SERVICEEmployers Reporting 28 10 3 6 9 5 8 3 6 6
Average Number of Days 22 21 20 21 25 18 20 26 23 26Median Number of Days 25 23 23 20 25 15 20 25 25 25
AFTER 15 YEARS OF SERVICEEmployers Reporting 22 8 3 3 8 3 6 2 6 5
Average Number of Days 23 22 21 20 27 17 21 27 25 26Median Number of Days 25 21 23 18 26 18 22 -- 25 25
AFTER 20 YEARS OF SERVICEEmployers Reporting 23 8 3 4 8 4 6 2 6 5
Average Number of Days 24 22 21 21 29 20 21 27 26 27Median Number of Days 25 23 23 20 28 20 22 -- 28 27
AFTER 25 YEARS OF SERVICEEmployers Reporting 22 8 3 3 8 3 6 2 6 5
Average Number of Days 25 22 21 23 30 21 23 27 26 27Median Number of Days 25 23 23 25 29 25 22 -- 28 27
NUMBER OF INTEGRATED PTO DAYS BASED ON SPECIFIED YEARS OF SERVICE
Holiday, Vacation, and Other PaidTime Off Practices FULLTIME EMPLOYEES TYPE OF EMPLOYER

4. Policies and Practices
Southwestern Pennsylvania Annual Compensation and Benefits Study
© 2010 Pittsburgh Technology Council. All rights reserved.
Page 4 – 38
Total Less than 50 50 to 150 151 to 500More than
500 Manufacturing
Software, Computer and
Technology Life Sciences Not For ProfitAll Other
Employers
Total Employers Reported 69 20 13 12 24 17 14 7 11 20
NonexemptUPON HIRE
Employers Reporting 20 6 3 6 5 8 5 1 2 4Average Number of Days 10 16 8 8 7 9 13 -- 8 11Median Number of Days 10 18 10 10 10 10 11 -- -- 10
AFTER 1 YEAR OF SERVICEEmployers Reporting 36 8 9 5 14 12 5 0 7 12
Average Number of Days 12 14 9 24 9 16 14 -- 8 10Median Number of Days 10 13 10 10 10 10 15 -- 10 10
AFTER 5 YEARS OF SERVICEEmployers Reporting 38 9 9 6 14 13 5 1 7 12
Average Number of Days 16 16 14 27 13 19 18 -- 13 15Median Number of Days 15 15 15 15 15 15 20 -- 15 15
AFTER 10 YEARS OF SERVICEEmployers Reporting 36 8 9 5 14 11 5 1 7 12
Average Number of Days 20 19 18 38 17 26 19 -- 16 18Median Number of Days 20 20 20 20 19 20 20 -- 20 20
AFTER 15 YEARS OF SERVICEEmployers Reporting 35 8 8 5 14 12 5 0 7 11
Average Number of Days 23 20 19 47 19 31 20 -- 18 19Median Number of Days 20 20 20 20 20 20 20 -- 20 20
AFTER 20 YEARS OF SERVICEEmployers Reporting 31 6 7 5 13 11 4 0 6 10
Average Number of Days 25 20 20 49 20 33 20 -- 21 20Median Number of Days 20 20 20 20 20 20 20 -- 25 20
AFTER 25 YEARS OF SERVICEEmployers Reporting 30 6 7 5 12 12 4 0 5 9
Average Number of Days 26 21 21 50 21 34 20 -- 21 21Median Number of Days 21 23 20 25 23 25 20 -- 25 20
ExemptUPON HIRE
Employers Reporting 22 7 4 6 5 8 5 3 2 4Average Number of Days 11 16 8 11 7 9 13 13 10 13Median Number of Days 10 15 10 13 10 10 11 13 -- 13
AFTER 1 YEAR OF SERVICEEmployers Reporting 39 10 11 5 13 13 5 2 6 13
Average Number of Days 13 14 9 25 9 15 14 14 10 10Median Number of Days 10 15 10 10 10 10 15 -- 10 10
AFTER 5 YEARS OF SERVICEEmployers Reporting 40 11 10 6 13 13 5 3 6 13
Average Number of Days 16 17 14 27 13 19 18 18 13 15Median Number of Days 15 20 15 15 15 15 20 20 15 15
AFTER 10 YEARS OF SERVICEEmployers Reporting 37 8 11 5 13 12 5 1 6 13
Average Number of Days 20 18 17 39 17 25 19 -- 17 18Median Number of Days 20 20 16 20 20 18 20 -- 20 20
AFTER 15 YEARS OF SERVICEEmployers Reporting 37 9 10 5 13 13 5 1 6 12
Average Number of Days 23 20 18 48 19 30 20 -- 18 19Median Number of Days 20 20 20 20 20 20 20 -- 20 20
AFTER 20 YEARS OF SERVICEEmployers Reporting 33 7 9 5 12 12 4 1 5 11
Average Number of Days 24 20 19 49 20 32 20 -- 20 20Median Number of Days 20 20 20 20 20 20 20 -- 25 20
AFTER 25 YEARS OF SERVICEEmployers Reporting 33 7 9 5 12 13 4 1 5 10
Average Number of Days 25 20 20 51 21 33 20 -- 22 21Median Number of Days 21 20 20 25 23 25 20 -- 25 20
Holiday, Vacation, and Other PaidTime Off Practices FULLTIME EMPLOYEES TYPE OF EMPLOYER
VACATION DAYS BASED ON SPECIFIED YEARS OF SERVICE (NOT PART OF PTO)

4. Policies and Practices
Southwestern Pennsylvania Annual Compensation and Benefits Study
© 2010 Pittsburgh Technology Council. All rights reserved.
Page 4 – 39
Total Less than 50 50 to 150 151 to 500More than
500 Manufacturing
Software, Computer and
Technology Life Sciences Not For ProfitAll Other
Employers
Total Employers Reported 69 20 13 12 24 17 14 7 11 20
NonexemptEmployers Reporting 21 3 5 4 9 8 1 1 2 9
Average Number of Days 3 3 3 4 3 4 -- -- 3 3Median Number of Days 3 2 3 5 3 3 -- -- -- 3
ExemptEmployers Reporting 19 3 4 4 8 6 1 1 2 9
Average Number of Days 3 3 4 4 3 4 -- -- 3 3Median Number of Days 3 2 3 5 3 3 -- -- -- 3
NonexemptEmployers Specify 28% 20% 31% 25% 33% 29% 21% 14% 36% 30%Employers Do Not Specify 72% 80% 69% 75% 67% 71% 79% 86% 64% 70%
ExemptEmployers Specify 19% 15% 23% 25% 17% 12% 14% 14% 36% 20%Employers Do Not Specify 81% 85% 77% 75% 83% 88% 86% 86% 64% 80%
NonexemptUPON HIRE
Employers Reporting 12 4 2 2 4 4 3 1 1 3Average Number of Days 6 8 5 4 5 4 4 -- -- 5Median Number of Days 5 7 -- -- 5 4 3 -- -- 5
AFTER 1 YEAR OF SERVICEEmployers Reporting 17 3 4 3 7 4 3 0 4 6
Average Number of Days 5 7 5 6 4 4 4 -- 8 5Median Number of Days 5 3 5 5 5 4 3 -- 8 5
AFTER 5 YEARS OF SERVICEEmployers Reporting 17 3 4 3 7 4 3 0 4 6
Average Number of Days 6 7 5 6 6 4 4 -- 10 5Median Number of Days 5 3 5 5 5 4 3 -- 10 5
AFTER 10 YEARS OF SERVICEEmployers Reporting 17 3 4 3 7 4 3 0 4 6
Average Number of Days 6 7 5 6 6 4 4 -- 10 5Median Number of Days 5 3 5 5 5 4 3 -- 10 5
AFTER 15 YEARS OF SERVICEEmployers Reporting 17 3 4 3 7 4 3 0 4 6
Average Number of Days 6 7 5 6 6 4 4 -- 10 5Median Number of Days 5 3 5 5 5 4 3 -- 10 5
AFTER 20 YEARS OF SERVICEEmployers Reporting 17 3 4 3 7 4 3 0 4 6
Average Number of Days 6 7 5 6 6 4 4 -- 10 5Median Number of Days 5 3 5 5 5 4 3 -- 10 5
AFTER 25 YEARS OF SERVICEEmployers Reporting 17 3 4 3 7 4 3 0 4 6
Average Number of Days 6 7 5 6 6 4 4 -- 10 5Median Number of Days 5 3 5 5 5 4 3 -- 10 5
Holiday, Vacation, and Other PaidTime Off Practices FULLTIME EMPLOYEES TYPE OF EMPLOYER
PAID PERSONAL DAYS PER YEAR
SPECIFIC NUMBER OF PAID SICK DAYS PROVIDED
NUMBER OF SICK DAYS BASED ON SPECIFIED YEARS OF SERVICE

4. Policies and Practices
Southwestern Pennsylvania Annual Compensation and Benefits Study
© 2010 Pittsburgh Technology Council. All rights reserved.
Page 4 – 40
Total Less than 50 50 to 150 151 to 500More than
500 Manufacturing
Software, Computer and
Technology Life Sciences Not For ProfitAll Other
Employers
Total Employers Reported 69 20 13 12 24 17 14 7 11 20
ExemptUPON HIRE
Employers Reporting 8 3 1 2 2 2 2 1 1 2Average Number of Days 7 9 -- 4 6 4 4 -- -- 6Median Number of Days 5 10 -- -- -- -- -- -- -- --
AFTER 1 YEAR OF SERVICEEmployers Reporting 11 2 3 3 3 2 2 0 3 4
Average Number of Days 6 9 5 6 5 4 4 -- 10 5Median Number of Days 5 -- 5 5 5 -- -- -- 10 5
AFTER 5 YEARS OF SERVICEEmployers Reporting 11 2 3 3 3 2 2 0 3 4
Average Number of Days 6 9 5 6 5 4 4 -- 10 5Median Number of Days 5 -- 5 5 5 -- -- -- 10 5
AFTER 10 YEARS OF SERVICEEmployers Reporting 11 2 3 3 3 2 2 0 3 4
Average Number of Days 6 9 5 6 5 4 4 -- 10 5Median Number of Days 5 -- 5 5 5 -- -- -- 10 5
AFTER 15 YEARS OF SERVICEEmployers Reporting 11 2 3 3 3 2 2 0 3 4
Average Number of Days 6 9 5 6 5 4 4 -- 10 5Median Number of Days 5 -- 5 5 5 -- -- -- 10 5
AFTER 20 YEARS OF SERVICEEmployers Reporting 11 2 3 3 3 2 2 0 3 4
Average Number of Days 6 9 5 6 5 4 4 -- 10 5Median Number of Days 5 -- 5 5 5 -- -- -- 10 5
AFTER 25 YEARS OF SERVICEEmployers Reporting 11 2 3 3 3 2 2 0 3 4
Average Number of Days 6 9 5 6 5 4 4 -- 10 5Median Number of Days 5 -- 5 5 5 -- -- -- 10 5
VACATIONEmployers Reporting 24 7 3 6 8 11 3 1 4 5
Average Number of Days 18 24 5 25 10 21 25 -- 15 9Median Number of Days 10 20 5 20 8 5 25 -- 15 5
PERSONALEmployers Reporting 3 0 1 1 1 2 0 0 0 1
Average Number of Days 4 -- -- -- -- 6 -- -- -- --Median Number of Days 5 -- -- -- -- -- -- -- -- --
SICKEmployers Reporting 7 1 2 2 2 0 1 0 5 1
Average Number of Days 13 -- 5 15 19 -- -- -- 18 --Median Number of Days 11 -- -- -- -- -- -- -- 15 --
INTEGRATED PTOEmployers Reporting 19 7 3 3 6 2 7 2 3 5
Average Number of Days 18 15 21 10 24 60 9 28 22 14Median Number of Days 10 5 10 10 20 -- 10 -- 5 8
NUMBER OF SICK DAYS BASED ON SPECIFIED YEARS OF SERVICE
ALLOW CARRYOVER OF UNUSED PAID TIME OFF DAYS
Holiday, Vacation, and Other PaidTime Off Practices FULLTIME EMPLOYEES TYPE OF EMPLOYER

4. Policies and Practices
Southwestern Pennsylvania Annual Compensation and Benefits Study
© 2010 Pittsburgh Technology Council. All rights reserved.
Page 4 – 41
Total Less than 50 50 to 150 151 to 500More than
500 Manufacturing
Software, Computer and
Technology Life Sciences Not For ProfitAll Other
Employers
Total Employers Reported 69 20 13 12 24 17 14 7 11 20
Employers Allow 75% 95% 54% 67% 75% 76% 79% 57% 82% 75%Employers Do Not Allow 25% 5% 46% 33% 25% 24% 21% 43% 18% 25%
Maximum days per yearMedian 32 17 25 23 55 50 -- 28 5 13Average 5 5 20 5 18 20 -- -- -- 5
Employees May Purchase 6% 5% 8% 0% 8% 0% 14% 0% 0% 10%Employees May Not Purchase 94% 95% 92% 100% 92% 100% 86% 100% 100% 90%
REDUCE THE AMOUNT OF PAID TIME OFF VERSUS 2010Employers Reporting 0 0 0 0 0 0 0 0 0 0
Percent to total 0% 0% 0% 0% 0% 0% 0% 0% 0% 0%
MAINTAIN THE SAME AMOUNT OF PAID TIME OFF VERSUS 2010Employers Reporting 62 18 12 11 21 15 14 4 10 19
Percent to total 90% 90% 92% 92% 88% 88% 100% 57% 91% 95%
ENHANCE THE AMOUNT OF PAID TIME OFF VERSUS 2010Employers Reporting 1 1 0 0 0 0 0 1 0 0
Percent to total 1% 5% 0% 0% 0% 0% 0% 14% 0% 0%
Holiday, Vacation, and Other PaidTime Off Practices FULLTIME EMPLOYEES TYPE OF EMPLOYER
EMPLOYEES MAY PURCHASE ADDITIONAL PAID TIME OFF
2011 EXPECTED CHANGES TO PAID TIME OFF PROGRAMS
ALLOW TIME OFF WITHOUT PAY

4. Policies and Practices
Southwestern Pennsylvania Annual Compensation and Benefits Study
© 2010 Pittsburgh Technology Council. All rights reserved.
Page 4 – 42
Referral Bonuses
Total Less than 50 50 to 150 151 to 500More than
500 Manufacturing
Software, Computer and
Technology Life Sciences Not For ProfitAll Other
Employers
Total Employers Reported 69 20 13 12 24 17 14 7 11 20
Employer Provides 43% 25% 62% 58% 42% 41% 71% 43% 9% 45%Employer Does Not Provide 57% 75% 38% 42% 58% 59% 29% 57% 91% 55%
Total Employers Reported 30 5 8 7 10 7 10 3 1 9
5 0 0 1 4 3 1 0 0 1Percent to total 17% 0% 0% 14% 40% 43% 10% 0% 0% 11%
2 0 1 0 1 0 1 1 0 0Percent to total 7% 0% 13% 0% 10% 0% 10% 33% 0% 0%
20 4 6 6 4 3 7 2 1 7Percent to total 67% 80% 75% 86% 40% 43% 70% 67% 100% 78%
OTHER 3 1 1 0 1 1 1 0 0 1Percent to total 10% 20% 13% 0% 10% 14% 10% 0% 0% 11%
Employers Reporting 2 0 1 0 1 0 1 1 0 0Average % Paid 41.7% -- -- -- -- -- -- -- -- --Median % Paid -- -- -- -- -- -- -- -- -- --
12% 5% 15% 8% 17% 6% 7% 14% 0% 25%
88% 95% 85% 92% 83% 94% 93% 86% 100% 75%
NONEXEMPT JOBEmployers Reporting 26 5 7 5 9 5 10 2 1 8
Average Paid $1,058 $880 $907 $600 $1,528 $1,100 $1,090 $3,000 -- $606Median Paid $625 $500 $500 $500 $1,000 $1,000 $625 -- -- $500
EXEMPT JOBEmployers Reporting 29 5 8 6 10 6 10 3 1 9
Average Paid $1,290 $930 $1,000 $1,000 $1,875 $1,250 $1,240 $1,000 -- $1,583Median Paid $1,000 $500 $875 $750 $1,000 $1,250 $875 $1,000 -- $1,000
MANAGEMENT JOBEmployers Reporting 26 5 7 5 9 5 10 3 1 7
Average Paid $1,448 $1,030 $1,179 $900 $2,194 $1,200 $1,240 $1,667 -- $2,000Median Paid $1,000 $1,000 $1,000 $500 $1,000 $1,000 $875 $1,000 -- $1,000
Employers Using Different Bonus Amounts by Job Level
PORTION AT HIRE AND BALANCE AFTER REQUIRED SERVICE IS COMPLETED
100% PAYABLE AFTER REQUIRED SERVICE IS COMPLETED
SPLIT BONUS PAYMENT:PERCENT PAID AT HIRE
Employers Using the Same Bonus Amounts for all Job Levels
FULLTIME EMPLOYEES
BONUS AMOUNTS:VARY BY JOB LEVEL
TYPICAL BONUS AMOUNT BY JOB LEVEL
100% WHEN NEW EMPLOYEE BEGINS WORK
REFERRAL BONUS PAYMENT
REFERRAL BONUS PREVALENCE
Other includes: 50% paid after 3 months and 50% after 6 months
TYPE OF EMPLOYER
Referral Bonuses 43% of all participants use employee referral bonuses. The median bonus paid in 2009 was $625 for non-exempt jobs and $1,000 for exempt and management jobs.
o The majority of participants (88%) report that they do not vary bonus amounts by job level.

4. Policies and Practices
Southwestern Pennsylvania Annual Compensation and Benefits Study
© 2010 Pittsburgh Technology Council. All rights reserved.
Page 4 – 43
Signing Bonuses
Total Less than 50 50 to 150 151 to 500More than
500 Manufacturing
Software, Computer and
Technology Life Sciences Not For ProfitAll Other
Employers
Total Employers Reported 69 20 13 12 24 17 14 7 11 20
NONEXEMPT JOBEmployers Reporting 4 1 0 1 2 3 0 0 0 1
Percent to Total 6% 5% -- 8% 8% 18% -- -- -- 5%
EXEMPT JOBEmployers Reporting 13 2 0 3 8 3 3 1 0 6
Percent to Total 19% 10% -- 25% 33% 18% 21% 14% -- 30%
MANAGEMENT JOBEmployers Reporting 17 3 2 2 10 5 1 3 0 8
Percent to Total 25% 15% 15% 17% 42% 29% 7% 43% -- 40%
NONEXEMPT JOBEmployers Reporting 2 2 0 0 0 0 1 0 0 1
Average Paid $1,000 $1,000 -- -- -- -- -- -- -- --Median Paid -- -- -- -- -- -- -- -- -- --
EXEMPT JOBEmployers Reporting 10 3 0 1 6 0 4 1 0 5
Average Paid $2,900 $1,833 -- -- $3,583 -- $1,875 -- -- $3,700Median Paid $2,250 $1,500 -- -- $4,000 -- $1,750 -- -- $5,000
MANAGEMENT JOBEmployers Reporting 11 4 2 0 5 1 2 3 0 5
Average Paid $5,773 $2,750 $6,250 -- $8,000 -- $3,750 $5,833 -- $7,400Median Paid $5,000 $2,250 -- -- $10,000 -- -- $5,000 -- $10,000
SIGNING BONUS PREVALENCE BY JOB LEVEL
FULLTIME EMPLOYEES TYPE OF EMPLOYER
TYPICAL BONUS AMOUNT BY JOB LEVEL
Signing Bonuses 25% of all participants offer signing bonuses, primarily for exempt and management staff. Signing bonus payments in 2009 ranged from $1,500 to $5,000 for exempt jobs and $2,250 to $10,000 for management jobs. The majority of organizations pay the entire bonus at the time of hire.

4. Policies and Practices
Southwestern Pennsylvania Annual Compensation and Benefits Study
© 2010 Pittsburgh Technology Council. All rights reserved.
Page 4 – 44
Total Less than 50 50 to 150 151 to 500More than
500 Manufacturing
Software, Computer and
Technology Life Sciences Not For ProfitAll Other
Employers
Total Employers Reported 69 20 13 12 24 17 14 7 11 20
ALL EMPLOYEESEmployers Reporting 34 8 5 6 15 13 6 0 5 10
Percent to total 60% 47% 42% 60% 83% 87% 43% -- 71% 59%
EXEMPT STAFF ONLYEmployers Reporting 2 1 0 0 1 0 0 0 0 2
Percent to total 4% 6% -- -- 6% -- -- -- -- 12%
NON-EXEMPT STAFF ONLYEmployers Reporting 0 0 0 0 0 0 0 0 0 0
Percent to total -- -- -- -- -- -- -- -- -- --
NO ASSISTANCE PROVIDEDEmployers Reporting 21 8 7 4 2 2 8 4 2 5
Percent to total 37% 47% 58% 40% 11% 13% 57% 100% 29% 29%
BOOKSPercent to total 47% 78% 20% 67% 31% 54% 67% 0% 20% 42%
LAB FEESPercent to total 44% 56% 40% 50% 38% 46% 50% 0% 40% 42%
TRANSPORTATIONPercent to total 3% 11% 0% 0% 0% 0% 17% 0% 0% 0%
GRADUATION FEESPercent to total 17% 11% 20% 17% 19% 15% 17% 0% 20% 8%
OTHER EXPENSES REIMBURSEDPercent to total 11% 0% 20% 17% 13% 8% 17% 0% 0% 17%
OTHER COMPANY REIMBURSED TUITION RELATED EXPENSE PREVALENCE
TUITION REIMBURSEMENT / ASSISTANCE PREVALENCE
Tuition Assistance, Professional Development and Staff Training
Other includes: Application, activity and registration fees, parking, certifications, and supplies.
TYPE OF EMPLOYERFULLTIME EMPLOYEES
Tuition Assistance, Professional Development and Staff Training 60% of participating companies provide tuition reimbursement or tuition assistance to their entire work force. 47% and 44% provide reimbursement for books and lab fees, respectively. Of the organizations providing tuition reimbursement or tuition assistance, 58% require a service commitment from the employee following receipt of tuition assistance. In these organizations, the majority require one year or more of service to avoid tuition assistance repayment. The majority of participants (82%) budget for staff development. Of these organizations, the median annual amount budgeted per full-time employee was $1,000 in 2009.

4. Policies and Practices
Southwestern Pennsylvania Annual Compensation and Benefits Study
© 2010 Pittsburgh Technology Council. All rights reserved.
Page 4 – 45
Total Less than 50 50 to 150 151 to 500More than
500 Manufacturing
Software, Computer and
Technology Life Sciences Not For ProfitAll Other
Employers
Total Employers Reported 69 20 13 12 24 17 14 7 11 20
No Service Requirement 40% 40% 20% 14% 57% 36% 79% 0% 71% 36%3 Months or Less 0% 0% 0% 0% 0% 0% 0% 0% 0% 0%4 - 6 Months 5% 10% 0% 0% 5% 7% 0% 0% 7% 0%7 - 10 Months 2% 0% 0% 14% 0% 7% 0% 0% 0% 0%1 Year 28% 50% 20% 14% 24% 21% 14% 0% 7% 43%More than 1 Year 23% 0% 60% 57% 14% 29% 7% 0% 14% 21%
Full amount 24% 0% 0% 57% 20% 25% 0% 0% 33% 20%Partial / pro-rated 68% 80% 0% 29% 80% 50% 0% 0% 67% 80%Discretionary 8% 20% 0% 14% 0% 25% 0% 0% 0% 0%
Employers With Budget 82% 69% 88% 75% 90% 71% 78% 100% 100% 82%Employers Without Budget 18% 31% 13% 25% 10% 29% 22% 0% 0% 18%
PREVIOUS FISCAL YEAR'S BUDGETAS HOURS PER FTE
Employers Reporting 6 1 1 0 4 0 3 0 0 3Average Hours 37 -- -- -- 20 -- 60 -- -- 13Median Hours 30 -- -- -- 18 -- 40 -- -- 16
AS DOLLARS PER FTEEmployers Reporting 11 5 4 0 2 2 2 0 3 4
Average Dollars $1,672 $1,141 $2,523 -- $1,300 $400 $1,828 -- $3,400 $935Median Dollars $1,000 $1,000 $725 -- -- -- -- -- $1,000 $800
TUITION REPAYMENT AMOUNT
EMPLOYEE TRAINING AND DEVELOPMENT BUDGET PREVALENCE
TUITION ASSISTANCE REPAYMENT
Tuition Assistance, Professional Development and Staff Training FULLTIME EMPLOYEES TYPE OF EMPLOYER

4. Policies and Practices
Southwestern Pennsylvania Annual Compensation and Benefits Study
© 2010 Pittsburgh Technology Council. All rights reserved.
Page 4 – 46
Total Less than 50 50 to 150 151 to 500More than
500 Manufacturing
Software, Computer and
Technology Life Sciences Not For ProfitAll Other
Employers
Total Employers Reported 69 20 13 12 24 17 14 7 11 20
Employers Provide 75% 60% 85% 75% 83% 71% 93% 43% 82% 75%Employers Do Not Provide 25% 40% 15% 25% 17% 29% 7% 57% 18% 25%
SERVICE/ANNIVERSARYEmployers Reporting 40 8 7 7 18 8 10 2 9 11
Percent to total 77% 67% 64% 78% 90% 67% 77% 67% 100% 73%
SUGGESTION/INNOVATIONEmployers Reporting 8 1 2 1 4 2 1 1 2 2
Percent to total 15% 8% 18% 11% 20% 17% 8% 33% 22% 13%
EMPLOYEE PERFORMANCEEmployers Reporting 16 3 3 4 6 4 7 0 1 4
Percent to total 31% 25% 27% 44% 30% 33% 54% -- 11% 27%
FORMAL EDUCATION ACHIEVEMENTEmployers Reporting 2 0 0 0 2 2 0 0 0 0
Percent to total 4% -- -- -- 10% 17% -- -- -- --
CERTIFICATION ACHIEVEMENTEmployers Reporting 2 1 0 0 1 1 1 0 0 0
Percent to total 4% 8% -- -- 5% 8% 8% -- -- --
PROJECT COMPLETIONEmployers Reporting 6 1 2 1 2 1 2 0 1 2
Percent to total 12% 8% 18% 11% 10% 8% 15% -- 11% 13%
SAFETYEmployers Reporting 10 1 1 2 6 6 0 1 1 2
Percent to total 19% 8% 9% 22% 30% 50% -- 33% 11% 13%
SPOT/IMMEDIATE RECOGNITIONEmployers Reporting 19 8 2 1 8 5 2 3 3 6
Percent to total 37% 67% 18% 11% 40% 42% 15% 100% 33% 40%
FORMAL RECOGNITION AWARD PROGRAM PREVALENCE
FULLTIME EMPLOYEES TYPE OF EMPLOYER
Additional note, employers may have multiple answers, percentages may not add up to 100%.
RECOGNITION AWARD PROGRAM TYPE
Recognition and Achievement Awards Approximately three-quarters (75%) of participants have formal recognition award programs. The most prevalent programs include service/anniversary (77%), spot/immediate recognition (37%) and employee performance (31%). Merchandise (35%) and cash awards (32%) were the most prevalent recognition award vehicles among participants with the median award values at $175 and $375, respectively.

4. Policies and Practices
Southwestern Pennsylvania Annual Compensation and Benefits Study
© 2010 Pittsburgh Technology Council. All rights reserved.
Page 4 – 47
Recognition Awards
Total Less than 50 50 to 150 151 to 500More than
500 Manufacturing
Software, Computer and
Technology Life Sciences Not For ProfitAll Other
Employers
Total Employers Reported 69 20 13 12 24 17 14 7 11 20
CASH AWARDEmployers Reporting 22 6 3 4 9 5 4 2 4 7
Percent to total 32% 30% 23% 33% 38% 29% 29% 29% 36% 35%
Average Paid $467 $700 $375 $133 $425 $75 $563 $750 $483 $425Median Paid $375 $500 $375 $100 $250 $75 $500 -- $500 $250
MERCHANDISE AWARDEmployers Reporting 24 4 6 4 10 4 6 0 5 9
Percent to total 35% 20% 46% 33% 42% 24% 43% 0% 45% 45%
Average Paid $222 $294 $215 $233 $166 $250 $283 -- $100 $233Median Paid $175 $325 $125 $300 $150 $250 $275 -- $38 $175
PAID TIME OFFEmployers Reporting 8 4 2 1 1 1 3 0 2 2 Percent to Total 12% 20% 15% 8% 4% 6% 21% 0% 18% 10%
GIFT CARDEmployers Reporting 20 5 5 3 7 5 5 2 4 4
Percent to total 29% 25% 38% 25% 29% 29% 36% 29% 36% 20%
Average Paid $88 $170 $55 $83 $40 $88 $169 $38 $63 $56Median Paid $50 $100 $50 $100 $50 $100 $75 -- $50 $50
DINNEREmployers Reporting 5 1 0 2 2 3 1 1 0 0
Percent to total 7% 5% 0% 17% 8% 18% 7% 14% 0% 0%
Average Paid $53 -- -- $10 $50 $10 -- -- -- --Median Paid $50 -- -- -- -- $10 -- -- -- --
SPECIAL TRIPEmployers Reporting 5 1 2 0 2 1 1 1 1 1
Percent to total 7% 5% 15% 0% 8% 6% 7% 14% 9% 5%
Average Paid $1,867 -- $1,300 -- $3,000 -- -- -- -- --Median Paid $2,000 -- -- -- -- -- -- -- -- --
TROPHY/PLAQUEEmployers Reporting 10 3 0 0 7 3 0 2 1 4
Percent to total 14% 15% 0% 0% 29% 18% 0% 29% 9% 20%
Average Paid $42 $28 -- -- $52 $35 -- $60 -- $28Median Paid $30 $28 -- -- $30 $35 -- -- -- $28
OTHER AWARDSEmployers Reporting 7 2 4 1 0 0 4 0 1 2 Percent to Total 10% 10% 31% 8% 0% 0% 29% 0% 9% 10%
RECOGNITION AWARD PREVALENCE
Other Includes: Certificate of achievement, recognition at company parties, savings bonds, catered lunch, anniversary gift and tickets to sporting events.
FULLTIME EMPLOYEES TYPE OF EMPLOYER
Additional note, employers may have multiple answers, percentages may not add up to 100%.

4. Policies and Practices
Southwestern Pennsylvania Annual Compensation and Benefits Study
© 2010 Pittsburgh Technology Council. All rights reserved.
Page 4 – 48
Work/Life Policies & Programs
Total Less than 50 50 to 150 151 to 500More than
500 Manufacturing
Software, Computer and
Technology Life Sciences Not For ProfitAll Other
Employers
Total Employers Reported 69 20 13 12 24 17 14 7 11 20
PROGRAM CURRENTLY PROVIDED
Employers Reporting 13 1 2 3 7 4 0 0 3 6Percent to total 19% 5% 15% 25% 29% 24% 0% 0% 27% 30%
Employers Reporting 5 0 0 1 4 2 0 0 1 2Percent to total 7% 0% 0% 8% 17% 12% 0% 0% 9% 10%
Employers Reporting 41 15 7 6 13 13 6 3 7 12Percent to total 59% 75% 54% 50% 54% 76% 43% 43% 64% 60%
Employers Reporting 24 9 3 3 9 5 7 4 4 4Percent to total 35% 45% 23% 25% 38% 29% 50% 57% 36% 20%
Employers Reporting 4 1 0 0 3 0 0 0 1 3Percent to total 6% 5% 0% 0% 13% 0% 0% 0% 9% 15%
Employers Reporting 9 5 0 0 4 2 1 0 3 3Percent to total 13% 25% 0% 0% 17% 12% 7% 0% 27% 15%
Employers Reporting 6 1 0 0 5 2 0 0 1 3Percent to total 9% 5% 0% 0% 21% 12% 0% 0% 9% 15%
Employers Reporting 31 4 4 7 16 8 5 2 6 10Percent to total 45% 20% 31% 58% 67% 47% 36% 29% 55% 50%
Employers Reporting 22 0 4 5 13 5 5 1 3 8Percent to total 32% 0% 31% 42% 54% 29% 36% 14% 27% 40%
Employers Reporting 43 8 7 7 21 12 8 3 7 13Percent to total 62% 40% 54% 58% 88% 71% 57% 43% 64% 65%
TELECOMMUTING ON REGULAR BASIS
TYPE OF EMPLOYER
WORK/LIFE POLICY PROGRAMS EMPLOYERS PROVIDE OR CONSIDERING
FULLTIME EMPLOYEES
FLEXTIME
SABBATICAL LEAVE
PAID LEAVE FOR ADOPTION
COLLEGE TUITION ASSISTANCE FOR CHILDREN
COMPUTER PURCHASE DISCOUNT
EMPLOYEE ASSISTANCE PROGRAM
CELL PHONE DISCOUNT
COMPRESSED WORKWEEK
JOB SHARING
Work/Life Policies and Programs The most prevalent work/life programs currently offered by participants include: 1) employee assistance programs (62%); 2) flextime (59%); 3) cell phone discount (45%); 4) telecommuting on a regular basis (35%); and, 5) computer purchase discount (32%). Participants’ responses suggest there will be minimal changes in the near term relative to the prevalence of new work/life programs. Less than 6% of participating organizations are expecting to make changes to these programs in 2011.

4. Policies and Practices
Southwestern Pennsylvania Annual Compensation and Benefits Study
© 2010 Pittsburgh Technology Council. All rights reserved.
Page 4 – 49
Work/Life Policies & Programs
Total Less than 50 50 to 150 151 to 500More than
500 Manufacturing
Software, Computer and
Technology Life Sciences Not For ProfitAll Other
Employers
Total Employers Reported 69 20 13 12 24 17 14 7 11 20
Employers Reporting 20 1 5 2 12 4 3 0 5 8Percent to total 29% 5% 38% 17% 50% 24% 21% 0% 45% 40%
Employers Reporting 16 5 3 0 8 5 2 1 4 4Percent to total 23% 25% 23% 0% 33% 29% 14% 14% 36% 20%
Employers Reporting 2 0 0 0 2 1 0 0 1 0Percent to total 3% 0% 0% 0% 8% 6% 0% 0% 9% 0%
Employers Reporting 3 1 0 1 1 2 0 0 1 0Percent to total 4% 5% 0% 8% 4% 12% 0% 0% 9% 0%
Employers Reporting 8 1 0 0 7 1 2 1 1 3Percent to total 12% 5% 0% 0% 29% 6% 14% 14% 9% 15%
Employers Reporting 6 1 1 1 3 2 0 0 1 3Percent to total 9% 5% 8% 8% 13% 12% 0% 0% 9% 15%
Employers Reporting 37 14 8 7 8 11 11 3 3 9Percent to total 54% 70% 62% 58% 33% 65% 79% 43% 27% 45%
Employers Reporting 23 5 5 5 8 7 3 1 6 6Percent to total 33% 25% 38% 42% 33% 41% 21% 14% 55% 30%
PHASED RETIREMENT
FULLTIME EMPLOYEES TYPE OF EMPLOYER
FRIDAY CASUAL DRESS
FREE OR SUBSIDIZED MEALS
DISCOUNTS FOR MAJOR PURCHASES (AFFINITY PROGRAMS)
DRY CLEANING
EVERY DAY CASUAL DRESS
PRE-RETIREMENT COUNSELING
FITNESS CENTER DISCOUNTS
Additional note, employers may have multiple answers, percentages may not add up to 100%.
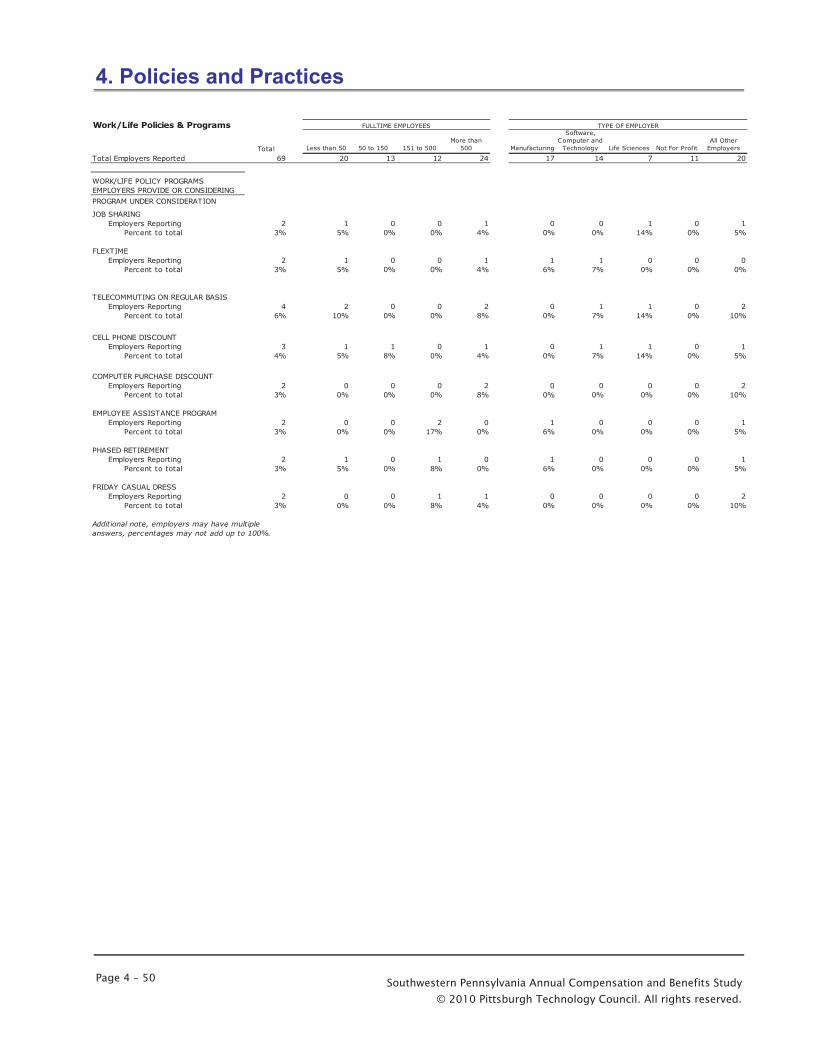
4. Policies and Practices
Southwestern Pennsylvania Annual Compensation and Benefits Study
© 2010 Pittsburgh Technology Council. All rights reserved.
Page 4 – 50
Work/Life Policies & Programs
Total Less than 50 50 to 150 151 to 500More than
500 Manufacturing
Software, Computer and
Technology Life Sciences Not For ProfitAll Other
Employers
Total Employers Reported 69 20 13 12 24 17 14 7 11 20
PROGRAM UNDER CONSIDERATION
Employers Reporting 2 1 0 0 1 0 0 1 0 1Percent to total 3% 5% 0% 0% 4% 0% 0% 14% 0% 5%
Employers Reporting 2 1 0 0 1 1 1 0 0 0Percent to total 3% 5% 0% 0% 4% 6% 7% 0% 0% 0%
Employers Reporting 4 2 0 0 2 0 1 1 0 2Percent to total 6% 10% 0% 0% 8% 0% 7% 14% 0% 10%
Employers Reporting 3 1 1 0 1 0 1 1 0 1Percent to total 4% 5% 8% 0% 4% 0% 7% 14% 0% 5%
Employers Reporting 2 0 0 0 2 0 0 0 0 2Percent to total 3% 0% 0% 0% 8% 0% 0% 0% 0% 10%
Employers Reporting 2 0 0 2 0 1 0 0 0 1Percent to total 3% 0% 0% 17% 0% 6% 0% 0% 0% 5%
Employers Reporting 2 1 0 1 0 1 0 0 0 1Percent to total 3% 5% 0% 8% 0% 6% 0% 0% 0% 5%
Employers Reporting 2 0 0 1 1 0 0 0 0 2Percent to total 3% 0% 0% 8% 4% 0% 0% 0% 0% 10%
FULLTIME EMPLOYEES TYPE OF EMPLOYER
WORK/LIFE POLICY PROGRAMS EMPLOYERS PROVIDE OR CONSIDERING
CELL PHONE DISCOUNT
FLEXTIME
FRIDAY CASUAL DRESS
Additional note, employers may have multiple answers, percentages may not add up to 100%.
TELECOMMUTING ON REGULAR BASIS
PHASED RETIREMENT
COMPUTER PURCHASE DISCOUNT
EMPLOYEE ASSISTANCE PROGRAM
JOB SHARING

4. Policies and Practices
Southwestern Pennsylvania Annual Compensation and Benefits Study
© 2010 Pittsburgh Technology Council. All rights reserved.
Page 4 – 51
Perquisites and Fringe Benefits
Total Less than 50 50 to 150 151 to 500More than
500 Manufacturing
Software, Computer and
Technology Life Sciences Not For ProfitAll Other
Employers
Total Employers Reported 69 20 13 12 24 17 14 7 11 20
Senior Management
Employers Reporting 7 5 1 0 1 1 1 1 1 3Percent to total 10% 25% 8% 0% 4% 6% 7% 14% 9% 15%
Employers Reporting 12 4 2 0 6 3 3 1 1 4Percent to total 17% 20% 15% 0% 25% 18% 21% 14% 9% 20%
Employers Reporting 26 9 3 3 11 5 4 2 4 11Percent to total 38% 45% 23% 25% 46% 29% 29% 29% 36% 55%
Employers Reporting 7 1 0 1 5 2 2 0 0 3Percent to total 10% 5% 0% 8% 21% 12% 14% 0% 0% 15%
Employers Reporting 5 1 0 0 4 3 0 0 0 2Percent to total 7% 5% 0% 0% 17% 18% 0% 0% 0% 10%
Employers Reporting 15 5 3 1 6 2 3 2 0 8Percent to total 22% 25% 23% 8% 25% 12% 21% 29% 0% 40%
Employers Reporting 9 0 0 0 9 1 2 0 2 4Percent to total 13% 0% 0% 0% 38% 6% 14% 0% 18% 20%
Employers Reporting 21 1 4 3 13 5 1 1 3 11Percent to total 30% 5% 31% 25% 54% 29% 7% 14% 27% 55%
Employers Reporting 8 1 1 0 6 3 0 1 1 3Percent to total 12% 5% 8% 0% 25% 18% 0% 14% 9% 15%
Employers Reporting 7 2 0 1 4 1 0 0 2 4Percent to total 10% 10% 0% 8% 17% 6% 0% 0% 18% 20%
FREE DRINKS
SUPPLEMENTAL LIFE INSURANCE
BENEFITS EMPLOYERS PROVIDE FREE OR AT REDUCED COSTS
AUTOMOBILE ALLOWANCE
SUPPLEMENTAL DISABILITY INSURANCE
SUPPLEMENTAL RETIREMENT BENEFITS
VOLUNTARY DEFERRED COMPENSATOIN
SPORTING EVENT TICKETS
FULLTIME EMPLOYEES TYPE OF EMPLOYER
HOME INTERNET CONNECTION
FINANCIAL COUNSELING
RESERVED/PAID PARKING
Perquisites and Fringe Benefits Participants were asked to provide data regarding the perquisites and fringe benefits provided to employees.
Senior Management - The most prevalent perquisites and fringe benefits provided to senior management include: 1) reserved/paid parking (38%); 2) supplemental life insurance (30%); 3) free drinks (22%); 4) financial counseling (17%); and, 5) voluntary deferred compensation opportunity (13%). Consistent with prior year results, the prevalence of perquisites and fringe benefits tends to increase with organizational size.

4. Policies and Practices
Southwestern Pennsylvania Annual Compensation and Benefits Study
© 2010 Pittsburgh Technology Council. All rights reserved.
Page 4 – 52
Perquisites and Fringe Benefits
Total Less than 50 50 to 150 151 to 500More than
500 Manufacturing
Software, Computer and
Technology Life Sciences Not For ProfitAll Other
Employers
Total Employers Reported 69 20 13 12 24 17 14 7 11 20
All Management Team
Employers Reporting 3 2 0 0 1 0 1 0 1 1Percent to total 4% 10% 0% 0% 4% 0% 7% 0% 9% 5%
Employers Reporting 10 4 2 0 4 2 3 1 1 3Percent to total 14% 20% 15% 0% 17% 12% 21% 14% 9% 15%
Employers Reporting 11 5 0 1 5 2 2 2 1 4Percent to total 16% 25% 0% 8% 21% 12% 14% 29% 9% 20%
Employers Reporting 1 0 0 0 1 0 0 0 0 1Percent to total 1% 0% 0% 0% 4% 0% 0% 0% 0% 5%
Employers Reporting 4 2 0 0 2 2 0 0 1 1Percent to total 6% 10% 0% 0% 8% 12% 0% 0% 9% 5%
Employers Reporting 15 5 3 1 6 2 3 2 0 8Percent to total 22% 25% 23% 8% 25% 12% 21% 29% 0% 40%
Employers Reporting 2 0 0 0 2 1 1 0 0 0Percent to total 3% 0% 0% 0% 8% 6% 7% 0% 0% 0%
Employers Reporting 17 1 2 3 11 5 1 1 2 8Percent to total 25% 5% 15% 25% 46% 29% 7% 14% 18% 40%
Employers Reporting 7 1 1 0 5 3 0 1 1 2Percent to total 10% 5% 8% 0% 21% 18% 0% 14% 9% 10%
Employers Reporting 3 1 0 0 2 1 0 0 1 1Percent to total 4% 5% 0% 0% 8% 6% 0% 0% 9% 5%
AUTOMOBILE ALLOWANCE
BENEFITS EMPLOYERS PROVIDE FREE OR AT REDUCED COSTS
HOME INTERNET CONNECTION
SPORTING EVENT TICKETS
FREE DRINKS
RESERVED/PAID PARKING
VOLUNATARY DEFERRED COMPENSATION
SUPPLEMENTAL LIFE INSURANCE
SUPPLEMENTAL DISABILITY INSURANCE
FULLTIME EMPLOYEES
FINANCIAL COUNSELING
TYPE OF EMPLOYER
SUPPLEMENTAL RETIREMENT BENEFITS
Management Team -- The most prevalent perquisites and fringe benefits provided to all of the management team include: 1) supplemental life insurance (25%); 2) free drinks (22%); and, 3) reserved/paid parking (16%).

4. Policies and Practices
Southwestern Pennsylvania Annual Compensation and Benefits Study
© 2010 Pittsburgh Technology Council. All rights reserved.
Page 4 – 53
Perquisites and Fringe Benefits
Total Less than 50 50 to 150 151 to 500More than
500 Manufacturing
Software, Computer and
Technology Life Sciences Not For ProfitAll Other
Employers
Total Employers Reported 69 20 13 12 24 17 14 7 11 20
Key Performers
Employers Reporting 5 2 1 1 1 0 1 1 2 1Percent to total 7% 10% 8% 8% 4% 0% 7% 14% 18% 5%
Employers Reporting 7 5 0 1 1 1 2 2 0 2Percent to total 10% 25% 0% 8% 4% 6% 14% 29% 0% 10%
Employers Reporting 2 0 1 1 0 0 0 1 1 0Percent to total 3% 0% 8% 8% 0% 0% 0% 14% 9% 0%
Employers Reporting 3 1 1 0 1 2 0 0 1 0Percent to total 4% 5% 8% 0% 4% 12% 0% 0% 9% 0%
Employers Reporting 15 5 3 1 6 2 3 2 0 8Percent to total 22% 25% 23% 8% 25% 12% 21% 29% 0% 40%
Employers Reporting 1 0 0 0 1 0 1 0 0 0Percent to total 1% 0% 0% 0% 4% 0% 7% 0% 0% 0%
Employers Reporting 13 1 2 2 8 4 1 1 1 6Percent to total 19% 5% 15% 17% 33% 24% 7% 14% 9% 30%
Employers Reporting 6 1 1 0 4 2 0 1 1 2Percent to total 9% 5% 8% 0% 17% 12% 0% 14% 9% 10%
Employers Reporting 3 1 0 0 2 1 0 0 1 1Percent to total 4% 5% 0% 0% 8% 6% 0% 0% 9% 5%
Employers Reporting 1 0 1 0 0 0 1 0 0 0Percent to total 1% 0% 8% 0% 0% 0% 7% 0% 0% 0%
FREE DRINKS
VOLUNTARY DEFERRED COMPENSATION
SUPPLEMENTAL LIFE INSURANCE
SUPPLEMENTAL DISABILITY INSURANCE
SUPPLEMENTAL RETIREMENT BENEFITS
SPORTING EVENT TICKETS
OTHER
AUTOMOBILE ALLOWANCE
FULLTIME EMPLOYEES TYPE OF EMPLOYER
HOME INTERNET CONNECTION
RESERVED/PAID PARKING
Key Performers -- The most prevalent perquisites and fringe benefits provided to key performers include: 1) free drinks (22%); 2) supplemental life insurance (19%); and, 3) reserved/paid parking (10%).
Exempt and Non-exempt Staff -- The most prevalent perquisites and fringe benefits provided to exempt and non-exempt staff also include free drinks, reserved/paid parking and supplemental life insurance.

4. Policies and Practices
Southwestern Pennsylvania Annual Compensation and Benefits Study
© 2010 Pittsburgh Technology Council. All rights reserved.
Page 4 – 54
Employment Practices
Total Less than 50 50 to 150 151 to 500More than
500 Manufacturing
Software, Computer and
Technology Life Sciences Not For ProfitAll Other
Employers
Total Employers Reported 69 20 13 12 24 17 14 7 11 20
Percent of employers - Yes 49% 20% 38% 58% 74% 47% 50% 50% 36% 55%Percent of employers - No 51% 80% 62% 42% 26% 53% 50% 50% 64% 45%
Percent of employers - Yes 78% 67% 67% 71% 88% 88% 86% 100% 33% 73%Percent of employers - No 22% 33% 33% 29% 13% 13% 14% 0% 67% 27%
Percent of employers - Yes 77% 75% 67% 83% 80% 88% 86% 33% 33% 90%Percent of employers - No 23% 25% 33% 17% 20% 13% 14% 67% 67% 10%
Average Maximum Paid $6,111 $4,000 $8,333 $5,000 $5,333 $4,500 $7,250 -- -- $5,500Median Maximum Paid $5,000 $4,000 $10,000 $5,000 $5,000 $4,500 $7,500 -- -- $5,500
Percent of employers - Yes 36% 11% 25% 36% 61% 44% 29% 20% 27% 44%Percent of employers - No 64% 89% 75% 64% 39% 56% 71% 80% 73% 56%
EMPLOYER HAS FORMAL RELOCATION POLICY
EMPLOYER PROVIDES FINANCIAL ASSISTANCE FOR VISAS OR GREEN CARDS
EMPLOYER PROVIDES FOREIGN NATIONALSPONSORSHIPS
FULLTIME EMPLOYEES TYPE OF EMPLOYER
EMPLOY FOREIGN NATIONALS
Employment Practices Participants were asked to provide data regarding general employment policies and practices.
Approximately one-half (49%) of participating organizations employ foreign nationals.
o Of these organizations, 78% provide sponsorships and approximately three-quarters (77%) provide financial assistance for visas or green cards. The median maximum financial assistance amount is $5,000.
64% of organizations do not have a formal relocation policy; however, more than one-half of all large organizations (61%) do have a formal policy.

4. Policies and Practices
Southwestern Pennsylvania Annual Compensation and Benefits Study
© 2010 Pittsburgh Technology Council. All rights reserved.
Page 4 – 55
Severance Benefits
Total Less than 50 50 to 150 151 to 500More than
500 Manufacturing
Software, Computer and
Technology Life Sciences Not For ProfitAll Other
Employers
Total Employers Reported 69 20 13 12 24 17 14 7 11 20
Percent of employers - Yes 42% 20% 38% 33% 67% 47% 36% 14% 27% 60%Percent of employers - No 58% 80% 62% 67% 33% 53% 64% 86% 73% 40%
Employers Reporting 11 2 0 1 8 4 1 0 1 5Percent to total 38% 50% 0% 25% 50% 50% 20% 0% 33% 42%
Employers Reporting 23 4 5 4 10 6 4 1 3 9Percent to total 79% 100% 100% 100% 63% 75% 80% 100% 100% 75%
Employers Reporting 21 2 5 3 11 4 4 1 3 9Percent to total 72% 50% 100% 75% 69% 50% 80% 100% 100% 75%
Employers Reporting 17 1 3 3 10 4 2 1 3 7Percent to total 59% 25% 60% 75% 63% 50% 40% 100% 100% 58%
Employers Reporting 10 0 2 0 8 1 0 1 1 7Percent to total 34% 0% 40% 0% 267% 13% 0% 100% 33% 58%
BENEFITS INCLUDED IN THE STANDARD SEVERANCE PACKAGE
COMPANY HAS A FORMAL SEVERANCE POLICY OR PROGRAM
Career Counseling/Job Training
Employee Assistance Program
Additional note, employers may have multiple answers, percentages may not add up to 100%.
Salary Continuation
Company Paid Benefits Continuation
Lump Sum Cash Payment
FULLTIME EMPLOYEES TYPE OF EMPLOYER
Severance Practices and Programs Participants were asked to provide data applicable to their organization’s severance policies.
Slightly less than one-half of participants (42%) have a formal severance policy that provides salary continuation or lump sum payments to displaced or terminated employees. The most prevalent benefits included in the standard severance package include salary continuation (79%), company paid benefits continuation (72%) and career counseling/job training (59%). The far majority of organizations (78%) do not provide severance for voluntary terminations due to company restructuring. The typical median amount of severance provided for exempt and non-exempt staff having five or less years of service is two to four weeks of salary; staff having five to ten years of service receive five to nine weeks of salary; and, staff having 10 or more years of service receive ten weeks of salary. For the largest organizations, the maximum amount of severance is 38 weeks of base salary.

4. Policies and Practices
Southwestern Pennsylvania Annual Compensation and Benefits Study
© 2010 Pittsburgh Technology Council. All rights reserved.
Page 4 – 56
Severance Benefits
Total Less than 50 50 to 150 151 to 500More than
500 Manufacturing
Software, Computer and
Technology Life Sciences Not For ProfitAll Other
Employers
Total Employers Reported 69 20 13 12 24 17 14 7 11 20
Employer Provides 22% 20% 15% 8% 33% 35% 7% 14% 9% 30%Employer Does Not Provide 78% 80% 85% 92% 67% 65% 93% 86% 91% 70%
Exempt Staff
Less than 1 YearEmployers Reporting 20 4 3 3 10 7 2 2 2 7
Average Number of Weeks 3 2 2 3 3 3 2 2 2 3Median Number of Weeks 2 2 2 3 2 2 -- -- -- 2
1 - Less than 2 Years Employers Reporting 30 7 5 5 13 10 3 2 4 11
Average Number of Weeks 3 2 2 4 4 3 3 2 2 3Median Number of Weeks 2 2 2 4 2 2 2 -- 2 2
2 - Less than 3 YearsEmployers Reporting 32 7 5 5 15 11 4 2 4 11
Average Number of Weeks 3 2 3 4 4 3 3 3 2 4Median Number of Weeks 3 2 4 4 3 3 3 -- 2 3
3 - Less than 4 YearsEmployers Reporting 32 7 5 5 15 11 4 2 4 11
Average Number of Weeks 4 3 4 5 5 4 4 4 3 5Median Number of Weeks 4 3 4 4 4 4 4 -- 3 4
4 - Less than 5 YearsEmployers Reporting 33 7 5 5 16 11 4 2 4 12
Average Number of Weeks 5 3 5 6 6 5 5 5 4 7Median Number of Weeks 5 4 5 5 5 4 5 -- 4 7
5 - Less than 6 YearsEmployers Reporting 33 7 5 5 16 11 4 2 4 12
Average Number of Weeks 6 4 6 7 7 5 5 6 4 8Median Number of Weeks 6 4 6 6 6 5 6 -- 5 7
6 - Less than 10 YearsEmployers Reporting 33 7 5 5 16 11 4 2 4 12
Average Number of Weeks 9 5 8 10 11 8 8 10 6 11Median Number of Weeks 9 4 9 9 10 7 8 -- 7 10
Greater than 10 YearsEmployers Reporting 33 7 5 5 16 11 4 2 4 12
Average Number of Weeks 11 6 9 13 14 8 9 10 8 16Median Number of Weeks 10 4 10 10 10 7 10 -- 10 11
FULLTIME EMPLOYEES TYPE OF EMPLOYER
COMPANY PROVIDES SEVERANCE ON VOLUNTARY TERMINATTIONS DUE TO RESTRUCTURING
TYPICAL NUMBER OF WEEKS OF PAID SEVERANCE PROVIDED BASED ON YEARS OF SERVICE

4. Policies and Practices
Southwestern Pennsylvania Annual Compensation and Benefits Study
© 2010 Pittsburgh Technology Council. All rights reserved.
Page 4 – 57
Severance Benefits
Total Less than 50 50 to 150 151 to 500More than
500 Manufacturing
Software, Computer and
Technology Life Sciences Not For ProfitAll Other
Employers
Total Employers Reported 69 20 13 12 24 17 14 7 11 20
Nonexempt Staff
Less than 1 YearEmployers Reporting 17 4 1 3 9 7 1 1 2 6
Average Number of Weeks 3 2 -- 3 3 2 -- -- 2 4Median Number of Weeks 2 2 -- 2 2 2 -- -- -- 2
1 - Less than 2 Years Employers Reporting 27 7 4 5 11 10 3 1 4 9
Average Number of Weeks 3 2 2 3 4 3 3 -- 2 3Median Number of Weeks 2 2 2 2 2 2 2 -- 2 2
2 - Less than 3 YearsEmployers Reporting 29 7 4 5 13 11 4 1 4 9
Average Number of Weeks 3 2 3 3 4 3 3 -- 2 4Median Number of Weeks 2 2 3 3 2 3 3 -- 2 2
3 - Less than 4 YearsEmployers Reporting 29 7 4 5 13 11 4 1 4 9
Average Number of Weeks 4 3 4 4 5 4 4 -- 3 5Median Number of Weeks 3 3 4 4 3 4 4 -- 3 3
4 - Less than 5 YearsEmployers Reporting 29 7 4 5 13 11 4 1 4 9
Average Number of Weeks 5 3 4 5 6 5 5 -- 4 6Median Number of Weeks 4 4 4 5 4 4 5 -- 4 4
5 - Less than 6 YearsEmployers Reporting 29 7 4 5 13 11 4 1 4 9
Average Number of Weeks 6 4 5 6 7 5 5 -- 4 7Median Number of Weeks 5 4 5 6 5 5 6 -- 5 5
6 - Less than 10 YearsEmployers Reporting 29 7 4 5 13 11 4 1 4 9
Average Number of Weeks 8 5 7 8 10 7 8 -- 6 9Median Number of Weeks 7 4 7 9 10 7 8 -- 7 6
Greater than 10 YearsEmployers Reporting 29 7 4 5 13 11 4 1 4 9
Average Number of Weeks 10 5 7 8 13 8 9 -- 8 13Median Number of Weeks 10 4 7 10 10 7 10 -- 10 10
Exempt Staff
Minimum Number of WeeksEmployers Reporting 34 7 5 6 16 10 4 3 4 13
Average Number of Weeks 3 1 2 3 4 3 2 2 1 4Median Number of Weeks 2 1 2 3 2 2 2 2 1 2
Maximum Number of WeeksEmployers Reporting 34 8 5 7 14 11 4 3 4 12
Average Number of Weeks 20 5 9 12 36 15 18 25 9 27Median Number of Weeks 11 3 10 10 38 7 10 12 12 25
Nonexempt Staff
Minimum Number of WeeksEmployers Reporting 29 6 3 6 14 10 3 2 3 11
Average Number of Weeks 3 1 2 3 4 2 2 2 1 4Median Number of Weeks 2 1 1 2 3 2 2 -- 1 2
Maximum Number of WeeksEmployers Reporting 33 8 4 7 14 11 4 2 4 12
Average Number of Weeks 19 5 7 7 35 15 18 28 9 24Median Number of Weeks 12 4 7 7 38 7 10 -- 12 13
MINIMUM AND MAXIMUM AMOUNT OF SEVERANCE PROVIDED
TYPICAL NUMBER OF WEEKS OF PAID SEVERANCE PROVIDED BASED ON YEARS OF SERVICE
FULLTIME EMPLOYEES TYPE OF EMPLOYER

5. Methodology
Southwestern Pennsylvania Annual Compensation and Benefits Study
© 2010 Pittsburgh Technology Council. All rights reserved.
Page 5 – 1
The following definitions describe information and data included within this report.
Definitions and Terms
Statistics Percentiles show the dispersion of the market data above and below a measure of central tendency. They provide information about the data without listing all of the actual data points. To compute a percentile, the data are ranked from lowest to highest. The resulting percentile value is the actual or interpolated data point that a percent of the observations are less than. Common percentiles used in compensation surveys include:
25th Percentile (also known as the first quartile): The value below which lies 25% of the sample. 50th Percentile (also known as the median): The value below which lies 50% of the sample. The median is also the exact middle point of the data when the values are ranked from lowest to highest. It is less affected by extremely high or low values than the average. 75th Percentile (also known as the third quartile): The value below which lies 75% of the sample. Average: The value that represents the sum of all data reported divided by the number of data points.
Data Analysis Methodology This survey is designed to provide meaningful statistical analysis without compromising data supplied in confidence by participants. Accordingly, the analyses included within this report have been prepared according to 3C’s standards for data presentation which include the following:
A minimum of two organizations must be included for any type of data to be displayed. A minimum of three incumbents across at least two organizations must be included to display the 50th percentile and average practices for all compensation- related data. A minimum of five incumbents across at least two organizations must be included to display all percentiles (25th, 50th, 75th) for compensation-related data.

5. Methodology
Southwestern Pennsylvania Annual Compensation and Benefits Study
© 2010 Pittsburgh Technology Council. All rights reserved.
Page 5 – 2
The analysis of compensation and related information collected is displayed for each of the survey positions where sufficient data was collected. Two hyphens are displayed when there are insufficient data.
Job Descriptions MANAGEMENT AND ADMINISTRATION 101. RECEPTIONIST
Greets and screens visitors. Provides general information. Refers visitors to appropriate persons. Receives telephone calls; assists with placement of outgoing calls; sorts and distributes mail. May perform other administrative and clerical duties.
106. ADMINISTRATIVE ASSISTANT
Composes letters and memos from notes and verbal instructions. Maintains schedules. Plans meetings. Records and prepares minutes of meetings and conferences. Proficient with MS Office. Normally requires 2 or more years related experience.
108. EXECUTIVE ASSISTANT/SR ADMINISTRATIVE ASSISTANT
Performs administrative duties for a senior executive, including the chief executive. Responsibilities require discretion, judgment, tact, and poise. Incumbent has considerable latitude and flexibility in carrying out assigned tasks. May supervise lower level administrative staff. Typically is classified as exempt.
112. GENERAL CLERK - INTERMEDIATE
Performs a variety of clerical and administrative tasks. Typically requires typing skills sufficient to complete computer-based records and prepare reports, letters, and other materials in which terms are clear and formats follow a standard pattern. Routinely uses a PC to carry out assigned activities. Works under general direction. Requires high school graduation or the equivalent and 2 or more years related experience.
117. BILLING CLERK
Compiles data and prepares invoices including amounts due, items sold and/or services delivered and terms of credit. Posts payments and adjustments consistent with contracts and company policies. Balances payments posted daily with system

5. Methodology
Southwestern Pennsylvania Annual Compensation and Benefits Study
© 2010 Pittsburgh Technology Council. All rights reserved.
Page 5 – 3
reports. Updates departmental logs on payment trends. Responds to customer billing questions. Typically requires 2 years previous experience.
126. HUMAN RESOURCES MANAGER
Manages and administers policies and programs covering several functional areas such as employment, personnel administration, wage and salary administration, training, safety, employee benefits, and labor relations. May supervise department staff. Typically requires a degree and 5 years HR experience. This position is not considered senior management.
129. HUMAN RESOURCES GENERALIST
Performs a variety of HR activities such as employment, compensation, EEO, training, and employee relations. In smaller organizations, incumbent may be the only human resource professional. Typically requires a degree and 3–5 years experience.
130. EMPLOYEE TRAINING SPECIALIST
Organizes, administers and facilitates educational and training programs for the organization’s employees. May develop in-house programs. Maintains records of all training activities including employee progress and effectiveness. May provide on-the-job training and orientation of new employees. Typically requires a Bachelor's degree and 3 years of previous experience. This position is responsible for providing training not related to information systems. Incumbents responsible for providing information systems-related training should be reported under job 629.
135. TECHNICAL RECRUITER
Responsible for the hiring of employees for technical positions within the organization. Interviews candidates against current open job requisitions. Determines the best avenue for methods of recruiting such as advertising, employment agencies, employee referrals, etc. Administers pre-employment tests, checks references and conducts exit interviews. Typically requires a Bachelor's degree and 2 years of prior experience.

5. Methodology
Southwestern Pennsylvania Annual Compensation and Benefits Study
© 2010 Pittsburgh Technology Council. All rights reserved.
Page 5 – 4
140. OFFICE MANAGER
Manages administrative activities such as office services, telephone services, central files and facilities. Schedules and coordinates projects and special assignments. May purchase office supplies and equipment. May supervise clerical and administrative staff. Requires 5 years experience.
152. CONTRACT ADMINISTRATOR
Negotiates and administers contracts from proposal to close-out. Reviews, coordinates, and controls all organization activities on assigned contracts including proposal development, customer negotiations, and overall contract administration. Serves as liaison with customers and clients. Communicates appropriate contract information to internal department heads. Monitors critical administrative tasks associated with major contracts.
ACCOUNTING, FINANCE & PURCHASING 201. ACCOUNTING CLERK – ALL LEVELS
The data for this position is a combination of the data reported by participants for 202 Accounting Clerk - Intermediate and 203 Accounting Clerk – Senior.
202. ACCOUNTING CLERK - INTERMEDIATE
Performs clerical duties in support of accounting functions. Requires thorough knowledge of assigned responsibilities and proficiency with spreadsheet applications. Works relatively independent but may require supervision for non-routine procedures. Normally requires 2 years experience.
203. ACCOUNTING CLERK – SENIOR
Performs complex clerical accounting duties. Assists with trial balances, analyzes financial documents, investigates questionable data, and prepares reports. Requires independent judgment when procedures are not well defined. May typically require 4-5 years accounting clerical experience.
204. PAYROLL CLERK
Maintains payroll records and processes the payroll. Processes time records and adjusts records for changes in wage rates, benefits, or deductions. Checks listings

5. Methodology
Southwestern Pennsylvania Annual Compensation and Benefits Study
© 2010 Pittsburgh Technology Council. All rights reserved.
Page 5 – 5
against source documents and traces and corrects errors in listings. Assists in the preparation of summary payroll reports. May compute wages for non-computerized systems.
231. ACCOUNTANT – ALL LEVELS
The data for this position is a combination of the data reported by participants for 232 Accountant and 233 Senior Accountant.
232. ACCOUNTANT
Performs accounting functions such as maintaining general and subsidiary ledgers and preparing operating and financial statements. Examines financial statements for completeness, internal accuracy, and conformity with standard practice. Prepares trial balances, statements, exhibits, and reports. Normally requires a four year degree in accounting and 1–3 years experience.
233. SENIOR ACCOUNTANT
Analyzes accounting systems to determine need for new accounts, revisions in accounts structure, and new types of ledgers, revisions in reporting systems, and new classifications and definitions. Determines accounting treatment of financial transactions. Recommends solutions to complex accounting problems. May provide work direction to lower-level accountants. Normally requires a four year degree in accounting and 4 or more years’ experience.
245. ACCOUNTING MANAGER
Manages a major accounting function directly or through subordinate supervisors. Typical responsibilities include maintaining general and subsidiary ledgers, preparing operating and financial statements, reconciling bank statements, fixed asset control and depreciation, and tax report preparation. Requires a degree in accounting and 6 or more years experience.
246. FINANCIAL ANALYST
Gathers financial-related information, assembles spreadsheets, write reports and present results to senior management. Uses spreadsheets and statistical software packages to analyze financial data, spot trends and develop forecasts. May be

5. Methodology
Southwestern Pennsylvania Annual Compensation and Benefits Study
© 2010 Pittsburgh Technology Council. All rights reserved.
Page 5 – 6
responsible for budget analysis and providing analyses to measure the financial risks associated with making a particular investment decision. Requires a degree in finance and accounting and 3 years of prior experience.
252. BUYER/PLANNER – ALL LEVELS
The data for this position is a combination of the data reported by participants for 253 Buyer/Planner and 254 Senior Buyer/Planner.
253. BUYER/PLANNER
Determines material needs, timing, and sourcing. Forecasts future demand for materials and products and plans purchases. Prepares and places orders for standard and nonstandard materials, products, and services based on demand forecast. Evaluates material shortages and determines appropriate inventory levels. Negotiates contracts within specified limits. Negotiates returns of defective materials. Identifies sources and vendors. Controls, monitors, and analyzes vendor quality. Typically requires a degree and 2–4 years experience.
254. SENIOR BUYER/PLANNER
Determines material needs, timing and sourcing. Prepares and places orders for nonstandard, complex and specialty materials, products, and services. Also provides guidance and mentoring to lower level staff. Forecasts future demand for same materials and products and plans purchases. Negotiates returns of defective materials. Identifies sources and vendors. Negotiates contracts within specified limits. Controls, monitors, and analyzes vendor quality. Evaluates material shortages and determines appropriate inventory levels. Typically requires a degree and 5 or more years experience.
255. PURCHASING MANAGER
Manages forecasting and purchasing functions and staff. Coordinates forecasts, procurement, and inventory requirements. Sets planning priorities. Determines and establishes procurement procedures. Maintains relationships with vendors and monitors performance. Meets with vendors to control backorders, improve or maintain on-time delivery, prevent or solve problems, and share forecasts. Reviews alternative suppliers. May manage inventories and records. Typically requires a degree and 5 or more years experience.

5. Methodology
Southwestern Pennsylvania Annual Compensation and Benefits Study
© 2010 Pittsburgh Technology Council. All rights reserved.
Page 5 – 7
ENGINEERING & FIELD SERVICES
310. FIELD SERVICE TECHNICIAN – ALL LEVELS
The data for this position is a combination of the data reported by participants for 311 Field Service Technician and 312 Senior Field Service Technician.
311. FIELD SERVICE TECHNICIAN
Performs equipment and product service support at the customer’s site. Using detailed organization guidelines performs preventive maintenance, routine repair, and calibration of the organization's products. Assists with client’s on-site installations and emergency repairs. Refers more complex problems to higher level personnel such as a supervisor. Requires formal technical education beyond high school and 1–2 years experience.
312. SENIOR FIELD SERVICE TECHNICIAN
Performs equipment and product service support at the customer’s sites. Using established organization guidelines performs installation, preventive maintenance, routine repair, and calibration of organization's products and equipment. Serves as customer contact on technical and service related problems. May assist lower level technicians. Refers more complex problems to higher level personnel. Requires formal technical training beyond high school and 3 or more years field service technician experience.
321. DRAFTER/DESIGNER (CAD) – ALL LEVELS
The data for this position is a combination of the data reported by participants for
322 Drafter/Designer (CAD) and 323 Drafter/Designer (CAD) – Senior.
322. DRAFTER/DESIGNER (CAD)
Prepares working plans and drafts detailed drawings manually and using computer aided design systems (CAD). Makes engineering computations and writes specifications. Prepares and creates geometric displays for complex detail assemblies working from layouts, sketches, drawings, and verbal instructions. Verifies completed work, checking dimensions, materials to be used, and quantities. May provide

5. Methodology
Southwestern Pennsylvania Annual Compensation and Benefits Study
© 2010 Pittsburgh Technology Council. All rights reserved.
Page 5 – 8
technical direction to lower level drafters. Requires technical training and 1–5 years experience. Not a trainee.
323. DRAFTER/DESIGNER (CAD) SENIOR
Works at the highest technical level. Assignments include engineering design, require proficiency with CAD systems, and considerable interface with engineers. Provides technical direction to lower level drafters. This is the senior non-supervisory position and normally requires 5 or more years experience.
330. ELECTRONICS TECHNICIAN – ALL LEVELS
The data for this position is a combination of the data reported by participants for 331 Electronics Technician I, 332 Electronics Technician II and 333 Electronics Technician III.
331. ELECTRONICS TECHNICIAN I
Inspects, modifies, tests, and repairs electronic circuits and components. Calibrates equipment and records data. Assists in development and fabrication of prototypes, subassemblies, components, parts, equipment, and systems. Requires 2 years formal technical training or associate degree. Entry level.
332. ELECTRONICS TECHNICIAN II
Lays out and builds developmental and production electronic equipment and systems. Analyzes and troubleshoots; conducts tests to establish operating data. Prepares schematics, mechanical drawings, and parts lists. Discusses layouts, procedures, and problems with engineers. Requires 2–5 years experience.
333. ELECTRONICS TECHNICIAN III
Carries out complex and unique assignments applying principles and theories of electronics, electrical circuitry, engineering mathematics, electronic and electrical testing, and physics. Develops new test procedures and defines standards. May oversee work of lower level technicians. Typically requires 5–7 years experience.

5. Methodology
Southwestern Pennsylvania Annual Compensation and Benefits Study
© 2010 Pittsburgh Technology Council. All rights reserved.
Page 5 – 9
When matching jobs in this group, compare Software Developer jobs, beginning with job #602, and Analyst/Programmer jobs, beginning with job #652.
340. SYSTEMS/ELECTRONICS ENGINEER – ALL LEVELS
The data for this position is a combination of the data reported by participants for 341 Systems/Electronics Engineer I, 343 Systems/Electronics Engineer II and 345 Systems/Electronics Engineer III.
341. SYSTEMS/ELECTRONICS ENGINEER I
Assists more senior engineers with development and design work that may include logic design, circuit design, I/O design, instrumentation design, firmware development, model formulation, manufacturing and development cost projections, computer architecture analysis and design, network structure design, and analog or binary systems engineering. Projects may include fabrication, modification, and evaluation of components or circuitry for use in electronic equipment. Requires a degree in engineering or computer science and 2 years or less experience. Entry level.
343. SYSTEMS/ELECTRONICS ENGINEER II
Performs non- standard engineering development and design work that requires considerable engineering skill, creative ability, and independent judgment. May provide technical supervision to lower level engineers and technical staff. Requires a degree in engineering or computer science and 3–5 years related experience.
345. SYSTEMS/ELECTRONICS ENGINEER III
Performs engineering work in the research, development, and design of products and systems. Interacts at the highest levels with client engineers and customers. Work requires the highest degree of creative ability, engineering and programming skills, and independent judgment. Incumbent may coordinate and technically lead projects and subordinate engineers. Requires an advanced engineering, math, physics, computer science, or related degree and 6 or more years related experience. This is normally the senior nonsupervisory engineering level.

5. Methodology
Southwestern Pennsylvania Annual Compensation and Benefits Study
© 2010 Pittsburgh Technology Council. All rights reserved.
Page 5 – 10
350. MECHANICAL ENGINEER – ALL LEVELS
The data for this position is a combination of the data reported by participants for 351 Mechanical Engineer I, 353 Mechanical Engineer II and 355 Mechanical Engineer III.
351. MECHANICAL ENGINEER I
Performs standard design, layout, testing, and evaluation of mechanical and electromechanical devices and systems. Performs product development activities including layout and interpretation of specifications and documentation requirements. Entry level. Requires a degree in mechanical engineering and 2 years or less experience.
353. MECHANICAL ENGINEER II
Performs nonstandard design, layout, testing, and evaluation of mechanical and electromechanical devices and systems. Assignments are complex and require initiative and judgment. Requires an engineering degree and 3–5 years experience.
355. MECHANICAL ENGINEER III
Performs design, layout, testing, and evaluation of highly complex mechanical and electromechanical devices or systems. Performs extensive product development activities, including layout, interpretation, and implementation of customer specifications. Participates in product and production planning. Provides technical direction to lower level engineers. Typically requires advanced engineering degree and 6 or more years experience.
381. ELECTRICAL ENGINEER – ALL LEVELS
The data for this position is a combination of the data reported by participants for 382 Electrical Engineer I, 383 Electrical Engineer II and 384 Electrical Engineer III.
382. ELECTRICAL ENGINEER I
Performs standard design, layout, testing, and evaluation of electrical apparatus, components, equipment and machinery. Performs product development activities including layout and interpretation of specifications and documentation requirements related to systems, machinery and equipment used for generation, transmission and

5. Methodology
Southwestern Pennsylvania Annual Compensation and Benefits Study
© 2010 Pittsburgh Technology Council. All rights reserved.
Page 5 – 11
distribution of energy. Entry level. Requires a degree in electrical engineering and 2 years or less experience.
383. ELECTRICAL ENGINEER II
Performs nonstandard design, layout, testing, and evaluation of electrical apparatus, components, equipment and machinery. Performs nonstandard product development activities including layout and interpretation of specifications and documentation requirements related to systems, machinery and equipment used for generation, transmission and distribution of energy. Assignments are complex and require initiative and judgment. Requires an engineering degree and 3–5 years experience.
384. ELECTRICAL ENGINEER III
Performs design, layout, testing, and evaluation of highly complex electrical apparatus, components, equipment and machinery. Performs extensive product development activities, including layout, interpretation, and implementation of customer specifications related to systems, machinery and equipment used for generation, transition and distribution of energy. Participates in product and production planning. Provides technical direction to lower level engineers. Typically requires advanced engineering degree and 6 or more years experience.
388. INDUSTRIAL ENGINEER – ALL LEVELS
The data for this position is a combination of the data reported by participants for 385 Industrial Engineer I, 386 Industrial Engineer II and 387 Industrial Engineer III.
385. INDUSTRIAL ENGINEER I
Studies and evaluates work flow and operating processes and makes recommendations to increase production, efficiency, quality and volume. Completes planning activities for equipment layouts in production facilities and offices. May estimate costs for assigned projects. Entry level. Requires a degree in industrial engineering and 2 years or less experience.
386. INDUSTRIAL ENGINEER II
Conducts moderately complex studies and evaluations of work flow and operating processes and makes recommendations to increase production, efficiency, quality and

5. Methodology
Southwestern Pennsylvania Annual Compensation and Benefits Study
© 2010 Pittsburgh Technology Council. All rights reserved.
Page 5 – 12
volume. Completes moderately complex planning for equipment layouts in production facilities and offices. Estimates costs for assigned projects and evaluates cost factors. May provide direction and training to lower level professional employees. Assignments are moderately complex and require initiative and judgment. Requires an industrial engineering degree and 3–5 years experience.
387. INDUSTRIAL ENGINEER III
Conducts complex studies and evaluations of work flow and operating processes and makes recommendations to increase production, efficiency, quality and volume. Completes complex planning for equipment layouts in production facilities and offices. Estimates costs for proposed projects and evaluates cost factors. Provides direction and training to lower level professional employees. Assigns work to drafters and technicians. Assignments are complex and require initiative and judgment. Requires an industrial engineering degree and 6 or more years experience.
380. ENGINEERING MANAGER
Manages the formulation of engineering strategies, policies and plans. Ensures engineering standards of quality, cost, safety, timeliness and performance. Contributes to research and development projects. Interprets plans, drawings and specifications to provide advice on engineering methods and procedures. Provides technical oversight and assistance to other departments as required. Manages personnel activities of the department, such as recruitment, hiring, performance evaluations, and salary adjustments. May oversee field testing of products and systems performed by field staff. Typically requires a Master's degree and 6-10 years of experience.
DOCUMENTATION & PUBLICATION 401. ENGINEERING DOCUMENTATION COORDINATOR
Records engineering and product changes. Keeps logs and records of change notices. Maintains files of engineering drawings. Makes drawing and document copies. Requires high school education, additional vocational or on-the-job training, and 1 year experience.
431. TECHNICAL WRITER
Prepares standard operations and maintenance manuals and technical publications. Gathers technical information, writes and coordinates layout and organization.

5. Methodology
Southwestern Pennsylvania Annual Compensation and Benefits Study
© 2010 Pittsburgh Technology Council. All rights reserved.
Page 5 – 13
Researches engineering information such as drawings, design reports, equipment, and test specifications, and by interviewing engineers and technicians. Requires a degree and 1–2 years experience. Not a trainee.
441. GRAPHIC ILLUSTRATOR/DESIGNER
Produces finished artwork, ready for reproduction, by scanning drawings and redrawing using computer-based drawing and illustration programs. Creates drawings, designs, and illustrations by using icons in database or by drawing routine icons, for use in catalogs, manuals, sales flyers, or other printed materials. Performs drawing requirements of 1 and 2 point perspective. Creates illustration best suited for nature of assignment and produces desired visual effect to conform to printing method specified. Requires Associate's degree in commercial art and 1–2 years experience in commercial art and/or technical illustration.
LABORATORY SCIENCE & CHEMISTRY
570. LABORATORY ASSISTANT
Sets up laboratory and field equipment to assist research workers. Cleans, sterilizes and maintains laboratory equipment and work areas. Prepares samples for testing and analysis. Operates common laboratory equipment such as microscopes, spectrophotometers and auto analyzers. Weighs, analyzes and measures ingredients used in testing. Records and compiles test results. Prepares charts, graphs, spreadsheets and reports using a variety of software.
572. LABORATORY TECHNICIAN
Performs testing required to characterize product performance. Performs required documentation and ensures that all documentation fulfills Good Manufacturing Practice (GMP) requirements. Identifies and recommends improvements that may increase efficiency of workload or process and improve quality of products. Calibrates and maintains equipment and prepares reagents. Maintains an understanding of technological principles and clinical applications of the organization's products. Maintains skills necessary to interpret data. Requires a degree in a laboratory science or equivalent technical training and 3 years or less experience.

5. Methodology
Southwestern Pennsylvania Annual Compensation and Benefits Study
© 2010 Pittsburgh Technology Council. All rights reserved.
Page 5 – 14
577. RESEARCH ASSOCIATE
Conducts laboratory or clinical experiments according to prescribed protocols. Assists in development of procedures and design of experiments. Verifies experimental results, evaluates complex data, and reports results internally. Evaluation of data may include statistical analyses. May be involved in product research and development and/or clinical trials. Typically requires a degree in chemistry, biology, biochemistry, or a related laboratory science and 1 or more years experience.
580. RESEARCH SCIENTIST – ALL LEVELS
The data for this position is a combination of the data reported by participants for 581 Research Scientist and 589 Senior Research Scientist.
581. RESEARCH SCIENTIST
Leads research and completes projects in one or more research areas. Suggests research projects to management. Schedules projects and allots personnel, time, and equipment. Prepares internal research reports. May prepare manuscripts for publication and present findings at scientific meetings. Coaches and counsels lower level research staff. Generally requires a Masters degree, expertise in the areas researched, and 3 or more years experience.
589. SENIOR RESEARCH SCIENTIST
Directs independent research activities, including laboratory and field research, project development, technical support, and management and evaluation of subordinates. Coordinates design, development, and modification of research products and related activities. May develop research criteria and provide expert advice on new products, concepts, and projects. May have budget and financial responsibility for all related activities. Typically requires a Ph.D. and 5 or more years of scientific research experience in a recognized field or area of inquiry.
590. RESEARCH AND DEVELOPMENT MANAGER (Non-MD)
Directs the research operations including coordination, monitoring, interviewing, and patient services. Develops and implements research strategies, policies, and
procedures. Also manages financial and staff resources. Requires a PhD and a

5. Methodology
Southwestern Pennsylvania Annual Compensation and Benefits Study
© 2010 Pittsburgh Technology Council. All rights reserved.
Page 5 – 15
minimum of 10 years of clinical research experience with at least 5 years of supervisory or management experience.
592. CLINICAL RESEARCH ASSOCIATE
Prepares clinical study reports, protocols, regulatory documents and amendments. Monitors and tracks patient enrollment and study progress. Also collects, organizes, and analyzes project data and the accuracy and efficiency of data entry procedures and project deadlines. Assists with the distribution, collection, and tracking of medical reports and regulatory documents. Requires a degree and 2 years of clinical/scientific research, nursing or medical devices/pharmaceutical clinical trials.
583. DOCUMENT CONTROL SPECIALIST
Supports the document management needs of the company including all revision controlled documents, regulatory files, marketing literature, manuals, etc. Assures that all controlled documents are maintained and changed through established processes and with proper approvals. Manages the repository of all controlled documents. Typically requires an Associate’s Degree and 5 years related experience.
591. CLINICAL LAB MANAGER
Directly or indirectly manages the financial and technical operations of a clinical laboratory department. Develops, implements and monitors policies and procedures for the clinical laboratory. Ensures the provision of the accurate and timely determination of test results. Maintains compliance with all governmental accreditation and regulatory agency requirements. Directs quality assurance, education and training programs for laboratory staff. Typically requires a Bachelor's Degree and 7 years experience in medical technology or related field.
594. MEDICAL RECORDS SPECIALIST
Responsibilities include the daily collection and confirmation of paperwork and filing in appropriate patient charts and the verification that all information is complete and accurate. Verifies the data integrity in the laboratory information system against paperwork received. Works in conjunction with client services and billing departments to improve interdepartmental processes and communications. Other responsibilities include the verification and transmission of patient reports and the management and

5. Methodology
Southwestern Pennsylvania Annual Compensation and Benefits Study
© 2010 Pittsburgh Technology Council. All rights reserved.
Page 5 – 16
tracking of patient chart requests from the medical records departments. Typically requires an Associate's Degree or Technical School Degree in healthcare.
595. MEDICAL RECORDS COORDINATOR
Verifies information in the specimen medical record and electronic database and performs ICD-9 coding. Also conducts the quality control assessment of test results and confirms information relating to correlation of test results and final report. Prepares, proofs and releases test results to physicians. Identifies and implements process improvements to streamline workflow and improve quality control measures. Requires a familiarity with medical transcription, medical records, tumor registry, production of patient reports for physicians, ICD-9 coding and one year of related experience and/or training.
596. QUALITY ASSURANCE/QUALITY CONTROL INSPECTOR
Assures the integrity of the company’s products through verification and validation testing and inspection and control of material. Assists engineers in the verification of new product development designs to assure compliance with product requirements, safety standards, and risk management countermeasures. Also responsible for the inspection function in quality assurance, including incoming inspection, in process inspection, manages delivery holds; controls inventory locations for pre-released products and quarantined product, releasing products for distribution, addressing non-conforming materials from the inspection functions, and controlling quality records. Associates Degree with 3 years experience.
597. CLINICAL LAB QUALITY ASSURANCE/QUALITY CONTROL SUPERVISOR
Ensures that the clinical laboratory consistently provides accurate and timely information to the physician. Oversees a small staff. Validates and releases testing of new or existing materials used by the clinical lab; sets up incoming inspections and specifications of materials; updates and maintains Standard Operating Procedures related to the performance of the laboratory and regulatory requirements. Provides technical expertise and leadership in quality systems design and implementation, auditing, proficiency testing and corrective action management. Manages internal and external audits to ensure compliance with regulatory requirements. Requires a degree with a major in a natural science, at least 2 years working in a CLIA or FDA regulated environment and prior supervisory experience.

5. Methodology
Southwestern Pennsylvania Annual Compensation and Benefits Study
© 2010 Pittsburgh Technology Council. All rights reserved.
Page 5 – 17
598. BIOSTATISTICIAN/STATISTICIAN
Performs statistical design, modeling, and analyses on research data, typically to support product development. Interacts and consults with physicians, scientists and engineers to ensure proper use of statistical methodology and interpretation of results. May respond to questions from regulatory authorities on statistical issues. Typically has an advanced degree with a focus in statistics, bioinformatics and/or machine learning techniques along with 4-5 years of related experience.
599. REGULATORY AFFAIRS SPECIALIST
Conducts research and reviews laws and regulations that affect the organization’s operations and scientific and medical documentation and compares them to current policies and practices. Assists operating areas in developing and revising affected policies, procedures and forms to ensure compliance with applicable requirements. Provides related management and staff training and education to ensure compliance. Requires a degree and 3 years of related experience.
582. REGULATORY AFFAIRS MANAGER
Provides the frame work for the planning and preparation of all regulatory submissions (510(k), IDE, Device License etc.) for product approvals to the FDA and Health Canada, including requisite post-market approval reports. Assists in the development of strategies for marketing, commercial operations and Engineering to ensure the most efficient and effective paths to market. Manages the preparation and maintenance of technical files and documentation in support of the Medical Device Directive. Provides regulatory training, perspective and information to the company. Acts as the liaison between the business and regulatory agencies. Bachelor’s Degree in engineering with 10 years experience.
INFORMATION SYSTEMS 651. ANALYST/PROGRAMMER – ALL LEVELS
The data for this position is a combination of the data reported by participants for 652 Analyst/Programmer I, 653 Analyst/Programmer II and 654 Analyst/Programmer III.

5. Methodology
Southwestern Pennsylvania Annual Compensation and Benefits Study
© 2010 Pittsburgh Technology Council. All rights reserved.
Page 5 – 18
652. ANALYST/PROGRAMMER I
Plans, develops, tests, and documents mainframe-resident and client/ server computer applications programs, generally working from source data provided by senior analyst/programmers. May review system capabilities and scheduling limitations to determine if requested application or modification is possible within existing system. Applies standard programming procedures, including graphical user interface (GUI) development, and a detailed knowledge of the application being programmed. Prepares program documentation and materials for users. Normally requires a relevant degree, proficiency in a language such as C, C++, Visual Basic, or JAVA, and 2–4 years programming experience.
653. ANALYST/PROGRAMMER II
Designs, prototypes, develop, and maintain complex business, accounting, and management information systems in both centralized and networked environments. Typically works on more complex assignments that require non-standard programming techniques and/or extensive knowledge of advanced development languages. Evaluates user requests for new or modified programs to determine feasibility, cost, and time requirements, and compatibility with existing systems and capabilities. Determines programming specifications. Provides assistance to lower level analyst/ programmers. Typically requires a degree in computer science, management information systems, or business, proficiency in two or more programming languages, and 5–7 years related experience.
654. ANALYST/PROGRAMMER III
Works with users to establish and validate requests for new programs; outlines steps required for program development, including diagrams and charts; determines feasibility, cost, and time requirements; and compatibility with existing systems and capabilities. Provides advanced technical guidance to and may oversee work of lower level analyst/programmers. Writes program documentation and user operations guidelines. Requires comprehensive knowledge of programming techniques and multiple programming languages of networked and centralized operating systems, and the capabilities of enterprise database products and development suites. Typically requires a related degree and 8+ years related experience.

5. Methodology
Southwestern Pennsylvania Annual Compensation and Benefits Study
© 2010 Pittsburgh Technology Council. All rights reserved.
Page 5 – 19
601. SOFTWARE DEVELOPER – ALL LEVELS
The data for this position is a combination of the data reported by participants for 602 Software Developer I, 603 Software Developer II and 605 Software Developer III.
602. SOFTWARE DEVELOPER I
Assists in the design and coding of software products. Conducts system tests. Identifies and debugs relatively simple problems and recommends fixes. Codes enhancements and supports features. Participates in writing product and user documentation. Requires extensive knowledge of one or more platforms and operating systems, and of programming languages such as Visual Basic, C and C++. Requires a degree in computer science, electrical/electronics engineering, math, physics, or an equivalent discipline, and 2–3 years software development experience.
603. SOFTWARE DEVELOPER II
Designs and codes software components, units, and modules that meet product specification and development schedules. Tests and debugs assigned components and units. Adheres to product build and release schedules and strategies. Acts as a technical resource for lower level developers. Requires comprehensive knowledge of one or more platforms and operating systems, and of languages such as Visual Basic, C and C++. Requires a degree in computer science, electrical engineering, math, or an equivalent field, and 4–6 years software development experience.
605. SOFTWARE DEVELOPER III
Oversees technical design, development, and implementation of large projects and/or major software products and systems. Assists in defining architecture requirements and establishing standards for design and development. Consults with management and customers regarding product feasibility and viability of product plans and designs. Serves as primary technical resource to development team. Provides product demonstrations and participates in trade shows, seminars, industry panels, and user group meetings. Interacts with customers regarding strategies, requirements, problem solving, and support. This is normally the senior non-management developer level. Requires comprehensive knowledge of one or more platforms and operating systems, and of programming languages such as Visual Basic, C and C++. Typically requires 8

5. Methodology
Southwestern Pennsylvania Annual Compensation and Benefits Study
© 2010 Pittsburgh Technology Council. All rights reserved.
Page 5 – 20
or more years of software product development experience and expert knowledge of specific products, systems, and lines of business.
607. SOFTWARE DEVELOPMENT MANAGER
Manages software design teams of moderate to large size and complexity. Evaluates progress and results of development efforts. Provide senior engineering leadership to hire and direct the software release and quality assurance teams. Responsible for hiring, firing, performance appraisals, and pay reviews of software developers. Ensures corporate software security utilizing software development methods and best practices to protect against possible programming errors and security breaches. Typically requires 10+ years technical experience in software development with 1-3 years of project leadership experience.
608. SOFTWARE QUALITY ASSURANCE ANALYST
Tests employer's software products to increase the quality of product and system delivered to the customer. Develops and implements testing procedures to simulate customer use. Ensures that product meets user requirements and performs to standards. May develop and implement testing procedures on customer premises, using installed systems. Typically requires a degree, detailed and comprehensive knowledge of employer's software products, and 1–3 years experience.
620. BUSINESS ANALYST – ALL LEVELS
The data for this position is a combination of the data reported by participants for 621 Business Analyst and 622 Senior Business Analyst.
621. BUSINESS ANALYST
Analyzes client and customer business needs. Researches and proposes products, systems, and solutions as appropriate. Provides product development and implementation support. Assists teams in implementations at client and customer worksites and may include customer and client training. Significant amount of time is spent on the road. Typically requires a degree in business systems, computer science, or engineering and 2 - 4 years experience.

5. Methodology
Southwestern Pennsylvania Annual Compensation and Benefits Study
© 2010 Pittsburgh Technology Council. All rights reserved.
Page 5 – 21
622. SENIOR BUSINESS ANALYST
Builds relationships with clients and customers, including technical and financial buyers. Performs functional consultation for customers and clients. Prepares complex recommendations and proposals. Leads technical teams in implementations at client and customer work sites and may design and deliver customer-client orientation and training. Requires a thorough knowledge of employer's products and solutions. Majority of time is spent on the road. Typically requires a degree in business systems, computer science, or engineering and 5 or more years experience.
624. INTERNET APPLICATIONS DEVELOPER
Participates as a team member in developing external large scale network based applications (Internet/Intranet) for clients and customers. Applications are typically interactive, crash resistant and secure, and capable of handling hundreds to millions of simultaneous interactions. Specifies functionality and creates proto types. Implements middleware and supporting packages. Integrates systems. Creates documentation. May assist with site maintenance. Competencies typically include C/C++, Java, Visual Basic, CGI, HTML, Perl, and a working knowledge of client server architectures and relational database systems and applications. Normally requires a computer science or engineering degree and 2+ years web developer experience.
609. PROJECT MANAGER - All Levels The data for this position is a combination of the data reported by participants for 610 Project Manager and 625 Senior Project Manager
610. PROJECT MANAGER
Manages a small account or portions of larger accounts, including planning, scheduling, budgeting, and staffing. Is responsible for keeping project on schedule and within budget. Manages client relationships for a team of consultants, developers, engineers, analysts, and other professionals assigned to project and client/customer work sites. Is responsible for client satisfaction. Manages project’s technical aspects by instructing, directing, and checking the work of other team members. Networks with business partners, vendors, and independent consultants to stay current with industry and technology developments. May represent employer at trade shows and conferences. Typically requires a degree in business, computer science, or engineering—and 5-7 years related experience.

5. Methodology
Southwestern Pennsylvania Annual Compensation and Benefits Study
© 2010 Pittsburgh Technology Council. All rights reserved.
Page 5 – 22
625. SENIOR PROJECT MANAGER
Manages a major account or multiple smaller accounts, including planning, scheduling, budgeting, and staffing. Is responsible for keeping project on schedule and within budget. Manages client relationships for a team of consultants, developers, engineers, analysts, and other professionals assigned to project and client/customer work sites. Is responsible for client satisfaction. Manages project’s technical aspects by instructing, directing, and checking the work of other team members. Networks with business partners, vendors, and independent consultants to stay current with industry and technology developments. May represent employer at trade shows and conferences. Typically requires a degree in business, computer science, or engineering—advanced degree or MBA preferred—and 7+ years related experience.
623. TECHNICAL CONSULTANT (BILLABLE) – ALL LEVELS
The data for this position is a combination of the data reported by participants for 626 Technical Consultant (Billable) and 627 Senior Technical Consultant (Billable).
626. TECHNICAL CONSULTANT (BILLABLE)
Provides for-fee IT project-related or staff augmentation services related to implementation, enhancement, or integration of proprietary software products, new products or customization of existing products. Duties are performed at the customer’s site and usually involve single products or single platforms. Requires a Bachelor’s degree and 2 or more years of experience in software development, technical support or consulting.
627. SENIOR TECHNICAL CONSULTANT (BILLABLE)
Provides for-fee IT project-related or staff augmentation services related to implementation, enhancement, integration or audits of complex proprietary software products, new products or customization of existing products. Duties are performed at the customer’s site and usually involve multiple products or multiple platforms. Requires a Bachelor’s degree and 5 or more years of experience in software development, technical support or consulting.
628. INSTRUCTIONAL DESIGNER
Plans, develops and organizes information systems-related training program and materials specific to the customer’s product, systems and/or needs. Analyzes the

5. Methodology
Southwestern Pennsylvania Annual Compensation and Benefits Study
© 2010 Pittsburgh Technology Council. All rights reserved.
Page 5 – 23
learning needs of the customer and makes recommendations for course content. Provides guidance to training personnel. Tracks training program progress by analyzing learner's satisfaction, job performance and proficiency testing. May also facilitate complex training courses. Typically requires a Bachelor's degree and 5 or more years of prior curriculum design and development experience.
629. INFORMATION SYSTEMS TRAINING SPECIALIST
Organizes, prepares and facilitates information systems-related educational and training programs for the customer’s users and/or internal information system personnel. May design and develop in-house programs. Maintains records of all training activities and effectiveness evaluations. Typically requires a Bachelor's degree and 3 years of previous experience. Individuals responsible for training that is not related to information systems should be reported under job code 130.
630. DATA WAREHOUSE ARCHITECT
Responsible for overall architecture creation, design, development and implementation of Data Warehouse and Business Intelligence solutions for customers. Develops data warehousing requirements and design specifications, evaluates software and hardware platforms, and integrates systems. Defines, designs and builds dimensional databases. Designs, implements and tunes the ETL processes. Performs detailed data analysis and dimensional data modeling; also identifies and promotes best practices and patterns for data modeling. Provides direction and oversight for all activities related to data cleansing, data quality, and data consolidation using standard data modeling methodologies and processes. Assists in post-implementation continuous improvement efforts in enhancing performance and providing increased functionality. Requires Bachelor’s degree in business, computer science, engineering or related discipline and 7 or more years related experience.
631. DATA WAREHOUSE ANALYST
Performs database analysis and design in solving complex problems. Defines architecture, including database structures and metadata, and develops and maintains best practices for data extraction, data loading, and data transformation into and out of a data warehouse or data mart. Develops metadata definitions from business rules and has an intimate familiarity with data modeling, CASE, and data design tools. Establishes the data management framework that improves the data quality and standards for both database structures and repository. Serves as a technical leader
5. Methodology
Southwestern Pennsylvania Annual Compensation and Benefits Study
© 2010 Pittsburgh Technology Council. All rights reserved.
Page 5 – 24
and consultant for the extraction, transformation, and load (ETL) between data sources, data warehouses, and data marts. Typically requires a Bachelor’s degree and 2-4 years of related experience including applications development.
632. DATA ANALYST Maintains databases of a moderately complex nature. Participates in the evaluation and design of databases. Provides ongoing reporting that supports information-based decision making and identifies opportunities for the improvement of existing processes. Manipulates, extracts and integrates data from a variety of database sources. Maintains data dictionaries. Coordinates the installation of revised or new systems. Typically requires a Bachelor’s degree and 2-3 previous years of related experience. 635. DATABASE REPORT WRITER Creates, documents , delivers and supports standard and ad-hoc reports from reporting databases based on the needs of end users. Work closely with end-users to gather requirements and ensure proper testing and validation data and data elements. Develops queries and reports using databases and associated tools. Perform data modeling. Requires a Bachelor's degree and knowledge of SQL programming.
735. APPLICATIONS SYSTEMS ANALYST
Evaluates user needs and requests for new or modified programs and/or systems to determine scope, feasibility, cost, time requirements and compatibility with existing systems and capabilities. Defines programming specifications. Typically requires a degree in computer science, management information systems, or business, and 3–5 years related experience.
736. SYSTEMS ADMINISTRATOR
Monitors systems configurations including software and hardware and recommends modifications as needed to ensure optimum performance and reliability. Administers servers including administration and setup of the workstations connected to a LAN or WAN. Schedules and performs software installations and upgrades to operating systems and layered software packages according to established policies and procedures. Also schedules and performs system backups and database archives. Ensures data integrity. Also may provide technical support to system users. Typically requires a degree in computer science and 3 or less years of related experience.

5. Methodology
Southwestern Pennsylvania Annual Compensation and Benefits Study
© 2010 Pittsburgh Technology Council. All rights reserved.
Page 5 – 25
733. INFORMATION SYSTEMS ENGINEER Configures software and hardware to meet user requirements. Performs integration of diverse and dispersed systems. Makes enhancements to existing systems according to specifications. Troubleshoots problems of a non-routine nature. Analyzes systems performance, stability and design. Typically requires a degree in computer science and 3-5 years of related experience. 738. IS/IT MANAGER Manages the work of internally-focused systems analysts, computer programmers, support specialists, and other computer related staff. Plans, directs, or coordinates internal IT/IS activities such as installation and upgrading of hardware and software, development of computer networks, systems design and computer programming. Develops computer information resources, providing for data security and control, strategic computing, and disaster recovery. Reports to senior management on information systems plans, projects, and performance. Manages operational budget and expenditures. Requires a Bachelor’s Degree in Computer Science and 5-7 years related experience. 742. WEBSITE DEVELOPER Designs and develops organization’s website based on employer’s Internet strategies and objectives. Customizes web based interactive features, builds database gateways, and implements electronic commerce services. Requires experience with HTML, CGI, and World Wide Web browsers, technical knowledge of servers and operating systems, a working knowledge of database query languages, development skills with one or more authoring tools, and the ability to develop programs/write scripts in one or more languages such as JAVA Script, Visual Basic Script, DreamWeaver, Apache, Tomcat, etc. Typically requires a related degree and 1–2 years related experience.
744. DATABASE ADMINISTRATOR
Plans and coordinates administration of one or more large, centralized databases. Reviews database design and integration of host systems and makes recommendations for enhancements and improvements. Ensures accurate, appropriate, and effective use of data, including database structure, documentation, and operational guidelines. Performs audits to ensure accuracy and proper use of data in tables, applications, and supporting dictionaries. Serves as liaison between users and technical staff. Trains users and responds to requests for assistance. Monitors utilization and transaction

5. Methodology
Southwestern Pennsylvania Annual Compensation and Benefits Study
© 2010 Pittsburgh Technology Council. All rights reserved.
Page 5 – 26
activity. Prepares and/or reviews activity and performance reports. May establish and
maintain security and integrity controls. Typically requires a degree and 3–5 years related experience.
750 – NETWORK ANALYST – ALL LEVELS
The data for this position is a combination of the data reported by participants for 751 Network Analyst and 752 Senior Network Analyst.
751. NETWORK ANALYST
Provides technical support in the installation and maintenance of the Local Area Network (LAN). Assists in the evaluation of hardware and software, including peripheral, output, and telecommunications equipment. Installs network hardware and software, including network operating systems. Monitors data communications to ensure that network is available to all users. Ensures security procedures, provides and resets passwords, and backs up network. Troubleshoots and resolves routine problems. Generally responsible for maintaining a simple network of 25 or fewer nodes, or for a section of a larger network. Requires 1 or more years experience. May require a degree.
752. SENIOR NETWORK ANALYST
Designs, installs, maintains, and coordinates the use of the Local Area or Wide Area Network (LAN/WAN). Evaluates hardware and software, including peripheral, output, and telecommunications equipment. Enforces security procedures, installs network software, and manages network performance. Troubleshoots and resolves complex problems. Implements and coordinates network policies, procedures, and standards. Trains users. Generally responsible for maintaining moderately complex networks of 25 to 100 nodes. Typically requires a degree and 3–5 years experience. May require certification as a network analyst or engineer.
755. NETWORK ENGINEER – ALL LEVELS
The data for this position is a combination of the data reported by participants for 753 Network Engineer and 754 Senior Network Engineer.

5. Methodology
Southwestern Pennsylvania Annual Compensation and Benefits Study
© 2010 Pittsburgh Technology Council. All rights reserved.
Page 5 – 27
753. NETWORK ENGINEER
Designs, installs, and maintains complex networks typically consisting of 100 or more nodes that link numerous computing platforms, operating systems, and topologies across widely dispersed geographic areas. Evaluates hardware and software suitable for large, complex networks. Designs, tests, and implements interface programs. Develops security procedures. Manages network performance. Troubleshoots and resolves complex problems to ensure no disruption of mission-critical applications. Designs and maintains fault-tolerant systems and manages system backups. May have supervisory responsibility for subordinate network analysts. May require extensive expertise across hardware and systems supplied by multiple vendors. Normally requires an engineering or related degree, certification as a network engineer, and 3–5 years experience.
754. SENIOR NETWORK ENGINEER
Designs more complex communications networks. Employs expert knowledge of data, voice, fax, and video transport facilities, protocols, operating systems, and standards and regulations for public and private data networks. Projects usage and required capacities based on analysis of existing and emerging products and services. Locates, evaluates, and specifies products, services, and vendors. Works with vendors to evaluate new products and resolve equipment design problems. Prepares reports as necessary to inform and advise senior technical staff and management. Requires a degree in engineering or computer science or equivalent experience and education. Typically requires 5-7 years network design and engineering experience.
760. PC SUPPORT SPECIALIST
Provides technical assistance and training to PC users. Staffs a helpdesk or information center. Responds to users' requests for assistance by phone and in person. Installs and modifies hardware and software. Diagnoses hardware, software, and operator problems and takes remedial actions or recommends procedural changes. May install and configure peripheral equipment such as monitors, keyboards, printers, and disk drives. May load and configure software such as operating systems and environments, and applications such as word processing, database, and spreadsheet programs. Requires comprehensive knowledge of the employer's PC equipment and software. Generally requires comprehensive knowledge of one or more operating systems and environments and 1–2 years experience. May require a degree.

5. Methodology
Southwestern Pennsylvania Annual Compensation and Benefits Study
© 2010 Pittsburgh Technology Council. All rights reserved.
Page 5 – 28
CUSTOMER SERVICES & SUPPORT
810. CUSTOMER SERVICE REPRESENTATIVE – ALL LEVELS
The data for this position is a combination of the data reported by participants for 811 Customer Service Representative and 813 Senior Customer Service Representative.
811. CUSTOMER SERVICE REPRESENTATIVE
Handles service inquiries and problems presented by external customers. Examines warranty claims, handles customer returns and exchanges. Follows established guidelines on servicing and repairs/returns. May provide product and pricing information. Promotes and maintains positive customer relations. Maintains logs, records, and files. Requires comprehensive working knowledge of employer’s products and policies. Typically requires 1–3 years experience or an equivalent combination of education and experience.
813. SENIOR CUSTOMER SERVICE REPRESENTATIVE
Performs non-routine support activities in the external customer service function. Responds to external customer inquiries requiring research to address status of order, repair, return, or field servicing. Promotes and maintains positive customer relations in stressful and potentially adversarial situations. Interacts with other departments to ensure timely delivery or service, or resolution of compliant. May provide direction to lower-level representatives in the successful delivery of complex support or service. Requires comprehensive working knowledge of employer’s products and policies. Normally requires 3-5 years of experience.
815. CUSTOMER SERVICE SUPERVISOR
Supervises customer service representatives who are responsible for processing orders, corresponding with customers, and coordinating internally with units such as purchasing, production, engineering, or shipping. May supervise fulfillment. May oversee distribution of organization's products. May have responsibility for warehousing products and maintaining inventory. Normally requires education beyond high school and 4–6 years related experience.

5. Methodology
Southwestern Pennsylvania Annual Compensation and Benefits Study
© 2010 Pittsburgh Technology Council. All rights reserved.
Page 5 – 29
817. CUSTOMER SERVICE MANAGER Manages the activities of the customer service staff. Ensures that the volume of work meets performance measures relating to customer satisfaction. Develops operating policies and procedures. Develops the business plan for the unit including budget development. Approves personnel activities concerning hiring, training and evaluation of staff performance. Typically requires 5-7 years of related experience.
825. PRODUCT SUPPORT SPECIALIST – ALL LEVELS
The data for this position is a combination of the data reported by participants for 826 Product Support Specialist I, 827 Product Support Specialist II and 828 Product Support Specialist III.
826. PRODUCT SUPPORT SPECIALIST I
Provides routine post-implementation technical support onsite to customers and clients under the direction of more senior specialists or consultants. Provides technical analysis in problem situations, as well as product support and training to customers, including distributors. Services products that may include both hardware and software/systems. Assists with onsite installation and troubleshooting of products. Solves problems within established guidelines. Results are generally reviewed by senior technical specialists. Requires a degree and 1–2 years experience.
827. PRODUCT SUPPORT SPECIALIST II
Provides post-implementation technical support to customers and clients under the direction of a manager and technical analysts in problem situations. Provides support and training on products. Assists with on-site installation and troubleshooting of products. Services products that may include both hardware and software/systems. Makes decisions and recommends solutions to problems within established guidelines. Results may be reviewed by senior consultants or technical specialists. Requires a degree, comprehensive knowledge of the employer's products, and 3–5 years experience.
828. PRODUCT SUPPORT SPECIALIST III
Provides post-implementation technical support to customers and clients under the direction of a manager and technical analysts in problem situations. Provides support and training on products to customers. Provides on-site troubleshooting of products.

5. Methodology
Southwestern Pennsylvania Annual Compensation and Benefits Study
© 2010 Pittsburgh Technology Council. All rights reserved.
Page 5 – 30
Is a technical expert on products that may include both hardware and software/systems. Normally requires a degree and 5 or more years experience.
840. PRODUCT SUPPORT MANAGER
Manages technical support, including product support specialists and technical consultant staff. Resolves product/system technical problems. Monitors customer's business, training, and product support needs. Supports customer modification, enhancement, integration, and testing of installed products/systems. Supports related customer training. Typically requires a degree in business or a closely related field, detailed knowledge of employer's products/systems and of customers' information systems, and 5–7 years experience.
MARKETING & SALES
843. SALES REPRESENTATIVE – ALL LEVELS
The data for this position is a combination of the data reported by participants for 841 Sales Representative and 842 Senior Sales Representative.
841. SALES REPRESENTATIVE
Sells and promotes employer’s business-to-business products in face-to-face meetings with potential clients and customers. Contacts potential clients and customers via telephone and other appropriate media. Represents employer at trade shows and other promotional venues. Develops and maintains sufficient knowledge of employer’s products to conduct effective demonstrations. Travels within a designated territory, or more widely to visit assigned prospects and customers. May participate in team sales efforts. Provides market feedback to employer about the needs of customers and clients and about its products and competitor products. May initiate processing of orders. Documents sales efforts and successes and prepares reports for sales management. May mentor and support sales associates. Typically requires a marketing or related degree and 2 or more years direct sales experience.
842. SENIOR SALES REPRESENTATIVE
Sells and promotes employer’s products in face-to-face meetings with potential clients and customers. Maintains extensive and detailed knowledge of employer’s products

5. Methodology
Southwestern Pennsylvania Annual Compensation and Benefits Study
© 2010 Pittsburgh Technology Council. All rights reserved.
Page 5 – 31
and competing products. Develops sales presentations and tactics. Leads efforts of sales teams to demonstrate and sell complex business-to-business products and services. Develops product demonstrations and represents employer at trade shows and other promotional venues. Documents sales efforts and successes and prepares reports covering assigned products, territories, and sales targets. Guides and supports assigned sales representatives. Typically requires a degree and 5 or more years direct sales experience.
846. INSIDE SALES REPRESENTATIVE/TELEMARKETER
Makes routine telephone sales calls following established procedures and guidelines. Promotes, sells, or confirms sales of products and services. Refers non-routine requests or issues to senior telemarketer or supervisor. Uses computer based system to gather and provide information and track history. Requires a working knowledge of products and services. Normally requires high school graduation and 0–2 years related experience.
847. ACCOUNT MANAGER
Prepares proposals, marketing plans, and forecast/report sales activity for assigned region or key accounts. Develops programs to achieve maximum sales volume consistent with sales forecasts/projections. Gathers detailed information about accounts, identifies decision-makers, understands strategic business challenges and priorities, and leads team in analyzing information and prioritizing opportunities critical to accounts. Functions as primary interface between company and account personnel; also resolves any complaints or concerns. Requires extensive knowledge of products and services. Normally requires 5 or more years of related experience.
848. SALES SUPPORT ASSISTANT
Provides administrative support to sales representatives, account managers and the overall sales function by processing data, generating routine reports regarding sales results and sales force earnings, preparing presentations, coordinating mailings, and maintaining files and records. Updates and adds records to computer databases and coordinates communications with appropriate staff regarding status of leads and sales materials. May answer questions about the organization’s products and/or services. May also assist in customer service or order processing functions.

5. Methodology
Southwestern Pennsylvania Annual Compensation and Benefits Study
© 2010 Pittsburgh Technology Council. All rights reserved.
Page 5 – 32
850. WRITER–MARKETING/COMMUNICATIONS
Composes non-technical articles, leaflets, pamphlets, brochures, and related materials designed to educate and inform customers, clients, and the public. Works with various departments to collect background information and to obtain copy approval. Works under general supervision. Requires a degree in communications, English, or related field, and 2–4 years experience writing in a business environment required.
860. PRODUCT MARKETING SPECIALIST
Plans, directs, and administers the marketing activity for a product or product line. Sets objectives, develops marketing strategy, and monitors the administration of marketing services including proposals, quotations, pricing, scheduling, and shipping of the product. Coordinates promotional activities, including advertising, literature, and trade show participation, to achieve marketing objectives. Requires a degree in business administration or marketing and 3–5 years relevant experience.
865. PRODUCT MANAGER
Manages a line of business. Develops a strategic concept and plan for the product or line of business. Directs the development of refinements to products or brands. In conjunction with department managers, manages product engineering, manufacturing, financial planning and control, business development, and technical sales support to ensure achievement of product development and/or marketing goals.
871. MARKETING MANAGER
Responsible for managing the marketing and promotion of the organization's products and services. Manages, monitors and evaluates market research programs and expenditures. Allocates funds and determines project direction. Develops policies, programs, and objectives for all product and service marketing activities including E- Commerce for the organization. Typically requires a Bachelor's degree in marketing, business or related area and 5 or more years of experience.
MANUFACTURING & WAREHOUSING 901. FORKLIFT OPERATOR
Responsible for operating a forklift in warehouses and factories for the purpose of moving, locating, relocating, stacking, and counting merchandise and parts. Loads

5. Methodology
Southwestern Pennsylvania Annual Compensation and Benefits Study
© 2010 Pittsburgh Technology Council. All rights reserved.
Page 5 – 33
and unloads delivery trucks. Accountable for the safe and efficient operation of the vehicle and may also be required to perform Order Filler and Checker duties in addition to his or her own. Maintains accurate records of materials moved. Requires the ability to lift up to 50 lbs frequently. Typically requires a high school education or equivalent and less than six months of experience.
905. STOCK CLERK
Receives, unpacks, and issues materials and supplies in a stockroom or warehouse. Checks goods received against bills of lading, purchase orders, or other documents. Places materials and supplies on shelves, racks, or in specified floor locations. Sorts, counts, and checks raw materials, finished and semi finished parts. Fills orders from requisitions and maintains the necessary clerical records. Normally requires high school diploma or equivalent reading, writing, and math ability and 1 year experience.
910. SHIPPING CLERK
Performs tasks associated with the shipment of materials, supplies, and equipment. Prepares records of goods shipped and bill of lading. Posts weights and shipping charges and maintains shipping record files. May operate forklift and prepare goods for final shipment. Typically requires high school diploma or equivalent reading, writing, and math ability and 1 year experience.
915. SHIPPING/WAREHOUSE SUPERVISOR
Supervises receiving and stocking equipment and supplies. Ensures that all items are logged, tagged, and properly stored. Supervises fulfillment of orders for equipment and supplies. Schedules activities of stock and shipping clerks. Trains employees who receive materials for storage and fulfill requisitions and orders. Prepares reports for management. Normally requires high school diploma with good mathematical and analytical skills and 3–5 years warehouse and/or distribution center experience.
916. SHIPPING/WAREHOUSE MANAGER Directs, coordinates and plans the warehouse storage and distribution of products and materials. Schedules employees and drivers, arranges pick-ups and drop-offs, manages deliveries and schedules loading dock machine operators. Ensures all activities follow approved regulations related to personal safety and safety of inventory. Verifies shipping records and addresses concerns of shipping shortages or

5. Methodology
Southwestern Pennsylvania Annual Compensation and Benefits Study
© 2010 Pittsburgh Technology Council. All rights reserved.
Page 5 – 34
overages. Typically requires a Bachelor's degree and 3-5 years of warehouse and/or distribution center experience.
919. MACHINE OPERATOR
Operates machine tools such as milling machines and lathes, boring machines and presses, cutters, and grinders. Follows clearly detailed specifications and shop orders to perform relatively simple operations. May operate and monitor equipment working under numerical control. Requires training to read job orders and engineering specifications, and experience in setting up and operating specific machine tools. Typically requires 6 months to 1 year formal training or qualifying experience.
920. NUMERICAL CONTROL MACHINE OPERATOR
Sets up and operates numerically controlled machines to cut, shape, and form metal, plastic, and composite work pieces. Reviews specifications to determine setup procedure and machining sequence. Selects and attaches fixtures, work pieces, and cutting tools. Loads control media. Changes work piece location and cutting tools as necessary during machining. Although machining processes require little or no deviation from routine procedures, may occasionally make adjustments to overcome faulty programming or machine malfunctions. Measures work piece for conformity to specifications. Normally requires 2–3 years experience.
922. MACHINIST
Sets up and operates conventional, special-purpose, and numerical control machines and machining centers. Studies blueprints, specifications, sketches, and manuals to determine dimensions and tolerances, setup requirements, and sequence of operations. Conducts trial runs and verifies accuracy of machine settings and programmed control data. Confers with engineers, programmers, and production personnel to resolve machining and assembly problems. Requires expertise in setup and operation of all machine tools and 3–5 years qualifying experience.
921. SENIOR MACHINIST (JOURNEYMAN LEVEL)
Sets up and operates conventional, special-purpose, and numerical control machines and machining centers. Studies blueprints, specifications, sketches, and manuals to determine dimensions and tolerances, setup requirements, and sequence of operations. Conducts trial runs and verifies accuracy of machine settings and
5. Methodology
Southwestern Pennsylvania Annual Compensation and Benefits Study
© 2010 Pittsburgh Technology Council. All rights reserved.
Page 5 – 35
programmed control data. Confers with engineers, programmers, and production personnel to resolve machining and assembly problems. Requires expertise in setup and operation of all machine tools and 3–5 years qualifying experience. Requires journeyman papers.
926. ASSEMBLER – ALL LEVELS
The data for this position is a combination of the data reported by participants for 927 Assembler and 928 Senior Assembler.
927. ASSEMBLER
Performs assemblies of standardized products or sub-assemblies at bench or conveyor. Assembles, modifies, reworks, and repairs mechanical and electro-mechanical assemblies. Works from assembly drawings, operation sheets, engineering specifications, sketches, and running sheets of average complexity to perform operations on assemblies, banks, cabinets, chassis, and panels. Typically requires a high school diploma or the equivalent and less than 1 year experience. Vocational training is preferred.
928. SENIOR ASSEMBLER
Assembles, modifies, reworks, repairs and tests mechanical, electronic, and electromechanical assemblies. Works from interrelated wiring and assembly drawings, operation sheets, engineering specifications, sketches, and running sheets to perform complete wiring and assembly operations on chassis, panels, assemblies, banks, and cabinets. Performs delicate adjustments of interrelated parts (for example, spring tensions). Assembles to extremely close tolerances components and parts that may have unusual or nonstandard shapes. Requires high school diploma, vocational training preferred, and 3–5 years experience.
929. GENERAL MAINTENANCE WORKER
Performs a wide variety of building maintenance and repair work involving carpentry, electrical, masonry, painting, plumbing or other mechanical and maintenance skills. Incumbents are required to utilize functional skills in all of these areas. Requires knowledge of basic construction, repair maintenance and procedures and ability to operate hand and power tools.

5. Methodology
Southwestern Pennsylvania Annual Compensation and Benefits Study
© 2010 Pittsburgh Technology Council. All rights reserved.
Page 5 – 36
931. MAINTENANCE MECHANIC
Maintains production equipment. Configures and calibrates equipment as necessary to support production needs. Troubleshoots common equipment failures and repairs equipment on the production floor. Assists in the construction of new production equipment, including mechanical assemblies and electrical circuits. Requires formal technical training beyond high school and 1–2 years experience, including proficiency on machine shop equipment.
935. MAINTENANCE AND FACILITIES SUPERVISOR
Supervises maintenance of production equipment and facilities. Supervises construction and implementation of new and upgraded equipment. Manages production support including utilities, equipment spare parts and supplies, and janitorial services. Responsibilities typically include preventive maintenance programs for all equipment and facilities, including HVAC, lighting and fixtures, and building maintenance. Requires 2 years formal technical training or the equivalent, 5 years related hands-on experience, and 1–2 years supervisory experience.
942. WELDER
Welds metal parts or components together using brazing, gas, or arc welding equipment. Repairs broken or cracked parts, fills holes and increases size of metal parts using welding equipment. Reviews layouts, blueprints, work orders, or diagrams in preparation for welding or cutting metal components. May position pieces to be welded into jigs, holding fixtures, guides and steps using measuring instruments and hand tools. May inspect completed work for conformance to specifications. Requires 2-5 years of experience in position or specialization.
945. SALES ESTIMATOR
Works with outside sales representatives and customer service representatives to prepare cost estimates for company business and projects. Itemizes equipment to be produced by the organization or to be purchased from outside vendors. Computes profit percentages and adds to cost estimates to obtain price. The estimator must understand the customer requirements and the cost of meeting those requirements within the company capabilities. Requires an Associates Degree in Accounting or Business Administration and 1 -2 years related experience.

5. Methodology
Southwestern Pennsylvania Annual Compensation and Benefits Study
© 2010 Pittsburgh Technology Council. All rights reserved.
Page 5 – 37
951. QUALITY ASSURANCE INSPECTOR Inspects parts and products; performs less complex and/or repetitive testing to ensure fabrication conforms to established standards, parts lists, assembly drawings, wiring diagrams, and other associated documentation. May use basic tests or measurements and may write inspection reports listing discrepancies. Generally requires high school diploma, vocational training, and 1 year or less experience. 955. QUALITY ASSURANCE SUPERVISOR Supervises subordinates engaged in inspecting and testing parts and products to ensure adherence to established quality assurance standards, procedures, and controls. Provides assistance to management in scheduling and controlling inspection activities. Reviews inspection reports to resolve questions and provide recommendations for development and revisions of quality assurance standards and procedures. Requires 3–5 years experience. 956. QUALITY ASSURANCE ENGINEER Performs a variety of moderately complex tasks related to the inspection and testing of finished goods. Utilizes existing systems and participates in the development of new systems to identify project failure trends and to verify consistency of various design standards. Analyzes reports and returned products, and recommends corrective action for procedural, product, or process deficiencies. Works under general supervision. Normally requires a degree in a technical discipline and 1–2 years experience.
959. MANUFACTURING ENGINEER
Provides manufacturing advice and guidance to engineering and manufacturing departments regarding product fabrication. Provides timely and effective development of manufacturing standards and process specifications to assure achievement of manufacturing and cost objectives. Acquires information and prepares feasibility studies or justifies purchase or building of equipment required for new manufacturing methods. Provides expertise in areas such as setups, machine tool capabilities, machining methods, and tooling and fixturing. Normally requires a degree in manufacturing engineering or a related discipline and 2 years experience.

5. Methodology
Southwestern Pennsylvania Annual Compensation and Benefits Study
© 2010 Pittsburgh Technology Council. All rights reserved.
Page 5 – 38
960. PRODUCTION TEST TECHNICIAN – ALL LEVELS
The data for this position is a combination of the data reported by participants for 961 Production Test Technician and 962 Senior Production Test Technician
961. PRODUCTION TEST TECHNICIAN
Assists engineers in analyzing and testing devices, components, and subassemblies to ensure product quality. Performs standardized test procedures. Processes test data and may prepare preliminary analysis and information for inclusion in reports. Generally requires high school diploma, vocational training preferred, and 1 year experience. May also be titled Quality Control Tester.
962. SENIOR PRODUCTION TEST TECHNICIAN
Assists engineers in analyzing and testing devices, components, and subassemblies to ensure product quality. Performs complex and nonroutine test procedures. Records and analyzes test data and prepares reports with minimal supervision. Requires high school diploma, vocational training preferred, and 5 years experience. May also be titled Quality Control Tester.
963. PRODUCTION PLANNER/SCHEDULER
Plans and prepares production schedules for manufacturing products. Ensures products are made efficiently and timely. Draws up master schedules that establish time limits and sequences of manufacturing operations. Establishes monthly production commitments including work-in-process to meet shipment dates. May provide instructions and authorization before production can begin. Works with the sales, cost accounting, and purchasing and manufacturing department staffs to develop sales forecasts, which are used to estimate how many items must be manufactured. May also prepare purchase orders. Typically requires a Bachelor’s degree and 3 years prior inventory and production control experience, particularly in a process controlled manufacturing operation.
964. SIX SIGMA SPECIALIST Partners with business unit leaders to develop continuous improvement projects aligned with the strategic goals and objectives of the organization. Builds organizational sustainability using process improvement knowledge and strategies. Manage financial aspects of projects and project delivery. Requires a Bachelor's

5. Methodology
Southwestern Pennsylvania Annual Compensation and Benefits Study
© 2010 Pittsburgh Technology Council. All rights reserved.
Page 5 – 39
Degree in Economics or Industrial Engineering. Also requires Six-Sigma Certification and the use of DMAIC project methodology. 965. PRODUCTION SUPERVISOR
Supervises employees engaged in the processing, fabrication, assembly, installation, or testing of organization products. Schedules, assigns, and monitors work to meet production schedules. Responsible for preventive maintenance and repair of equipment. Prepares production reports of group activities. Responsible for training, selection, assignment, review, and appraisal of subordinates. Recommends personnel actions. Requires high school diploma or equivalent education and 5 or more years experience.
970. PRODUCTION MANAGER
Manages fabrication and/or assembly operation through first-line supervisors. Responsible for monitoring of automated production processes; meeting production schedules, standards, and profitability; and implementing safety programs. Degree preferred. Requires 4–6 years experience as production supervisor or assistant manager.

5. Methodology
Southwestern Pennsylvania Annual Compensation and Benefits Study
© 2010 Pittsburgh Technology Council. All rights reserved.
Page 5 – 40
About 3C 3C – Compensation Consulting Consortium – is a full-service, client-focused compensation consulting firm dedicated to establishing effective total reward programs to enhance the value of your business. We are compensation professionals whose interactive approach to client consulting is based on a wealth of compensation experience in corporate and consulting environments. 3C is owned by its employees and completely independent. We believe that this gives us the freedom and objectivity to deliver advice without the conflicts of interest that may exist in other firms that provide many services and products. Each project is led by a 3C partner so that a client’s primary contact is the individual accountable for the project’s success. In tandem with our consulting services, we have developed a Human Resources Institute (HRi). HRi offers workshops in which we share our knowledge base with our clients and show them how to design and develop their own unique solutions. These workshops can be integrated into the consulting arrangement. HRi reflects our commitment to developing and continually enhancing 3C’s body of knowledge and to transferring this crucial asset to our clients. Visit our Web site – www.3Ccomp.com – for additional information about our services and capabilities.

5. Methodology
Southwestern Pennsylvania Annual Compensation and Benefits Study
© 2010 Pittsburgh Technology Council. All rights reserved.
Page 5 – 41
About the Pittsburgh Technology Council Since 1983, the Pittsburgh Technology Council has been the principal point of connection for companies from four primary clusters of the technology industry that are represented by a critical mass of businesses in southwestern Pennsylvania including, the Advanced Manufacturing / Materials, Green Technology, Information Technology and Life Sciences sectors.
What is the Pittsburgh Technology Council? The Pittsburgh Technology Council (PTC or Council) goes beyond your ordinary trade association. We have a vested interest in your business success because, when our members succeed, we succeed. It’s how we measure our impact and how we build our programs and services. We work hard to foster the development of the technology industry within the 13-county region of southwestern Pennsylvania. By engaging companies in the tech sector, as well as companies who utilize technology, the PTC builds value for all members.
How Does it Work? When you become a member of the Council, you join our tech community – a connection of individuals in over 1,300 companies dedicated to our region’s success through technology. PTC members have access to the Council’s wide range of products and services that are carefully chosen to help you make, raise and save money. Whether you are looking to establish new sales channels, boost your workforce, provide cost-effective health care solutions or simply add bottom line savings, the Council can deliver proven results.
Who Should Join? Entrepreneurs. Fortune 500 companies. Growing organizations. Anyone! If your company or organization has an interest in saving money, building connections and establishing your presence in the region, you will find value in Council membership. Our list of benefits keeps growing to ensure that your membership with us is maximized.
For more information or membership opportunities, please contact Brian Lang at 412.918.4249 or visit www.pghtech.org.