Embed Size (px)
Citation preview

ANNUAL CLIMATOLOGICAL
REPORT 2016

Table of Contents
1. Introduction ....................................................................................................................... 1
2. Climate of Singapore ......................................................................................................... 1
3. Meteorological Stations ..................................................................................................... 2
3.1. Upper Air Observatory ................................................................................................ 3
3.2. Manned Meteorological Stations ................................................................................. 3
3.3. Automatic Weather Stations ....................................................................................... 4
4. Monthly Records of Changi Climate Station ...................................................................... 8
5. Daily Records of Changi Climate Station ......................................................................... 14
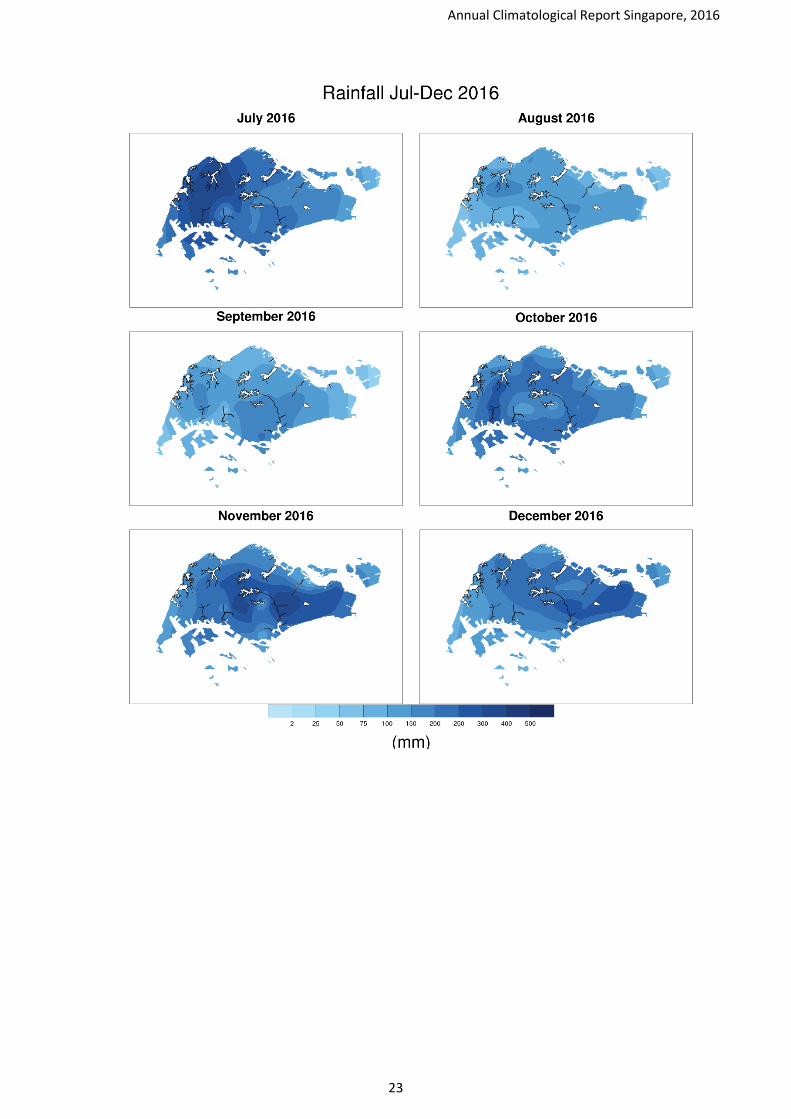
6. Isohyets .......................................................................................................................... 21
7. Monthly Observation of Weather Parameters .................................................................. 26
8. Weather Parameter Observation by Months.................................................................... 35
8.1. Jan to Apr ................................................................................................................. 36
8.2. May to Aug ............................................................................................................... 41
8.3. Sep to Dec ................................................................................................................ 46
9. Weather Statistics for Manned Meteorological Station .................................................... 51
9.1. Monthly Observation ................................................................................................. 52
9.2. Hourly Observation ................................................................................................... 58
10. Weather Statistics for Automatic Weather Station ......................................................... 69
10.1. Monthly Observation ............................................................................................... 70
10.2. Hourly Observation ................................................................................................. 89
11. Wind Rose .................................................................................................................. 126
11.1. Annual Wind Rose of All Stations ......................................................................... 127
11.2. Monthly Wind Rose of Changi Climate Station ...................................................... 132
12. Upper Air Data ............................................................................................................ 135
13. Soil Data ..................................................................................................................... 144
Annex 1 Instruments of the Manned Meteorological Station .............................................. 146
Annex 2 Instruments of the Manual Rainfall Station .......................................................... 148
Annex 3 Instruments of the Automatic Weather Station .................................................... 151

Annual Climatological Report Singapore, 2016
1
1. Introduction
The annual climatological report of the Meteorological Service Singapore (MSS) contains climate statistics for
57 automatic weather stations (AWSs), 5 manned meteorological stations and 1 upper air observatory (UAO).
Among these AWSs island-wide, there are 40 rainfall-only stations and 18 full-stations, recording rainfall,
temperature, relative humidity, wind and pressure.
The meteorological station that is located in the aerodrome of the Changi International Airport also serves as
the climate station for Singapore. According to World Meteorological Organization guidelines, a climate station
monitors the climate over a long term period to provide data that enables detection of climate change signals at
the national level. It should minimally have 30 years of rainfall and minimum/maximum temperature data and
be located relatively far from large urban centres. Changi climate station meets these requirements with 33 years
of meteorological records spanning 1984 to 2016.
Singapore’s climate station has been located at 8 different sites (twice to Kallang) in the past 140 years.(see
Table 1). Some of these stations have been decommissioned at various points in the past due to changes of local
land use in the vicinity of the site.
Period of service Location
1 Jan 1869 – Dec 1874 Convict Prison (Outram)
2 Jan 1875 – Dec 1928 Kandang Kerbau Hospital
3 Jan 1929 – May 1934 Mount Faber
4 Jun 1934 – Dec 1941 Kallang
5 Jan 1942 – Dec 1947 Botanic Gardens
6 Jan 1948 – Aug 1955 Kallang
7 Sep 1955 – Dec 1983 Paya Lebar
8 Jan 1984 – present Changi
Table 1: Period of service and the location of the Climate Station of Singapore
Prior to the installing of the AWSs, MSS had been operating 30 manual rainfall gauges with some dating back
as early as 1960s, see Annex 2. With the completion of the AWSs in 2011, these manual instruments have all
been replaced with electronic tipping bucket rain gauges.
2. Climate of Singapore
In general, the climate of Singapore is relatively uniform throughout the year and large variations in seasonal
weather do not occur. The main features of Singapore’s climate are uniform temperature, high humidity and
abundant rainfall throughout the year due to maritime influence and the island’s close proximity to the Equator.
The diurnal temperature variation is small, with highs of 31°C to 33°C during the day and lows of 23°C to 25°C
during the night. Based on climate station records from 1929, the highest temperature observed is 36.0°C,
recorded in 1998 and the lowest is 19.4°C, recorded in 1934.
The relative humidity is high all year round and varies daily from more than 90% in the morning just before
sunrise and falling to around 60% in the afternoon on days when there is no rain. Relative humidity reaches
100% frequently during periods of rain. The average annual relative humidity is 84% and the lowest relative
humidity observed is 33%, recorded in 1966.

Annual Climatological Report Singapore, 2016
2
Although there are seasonal variations in the amount of rainfall, there are no distinct wet or dry seasons as rain
falls every month of the year, giving a long term annual average rainfall of 2,329 mm. Based on climate station
records from 1869, the maximum monthly rainfall is 818.6 mm, recorded in Jan 1893 and the minimum is 0.2
mm recorded in Feb 2014. The highest rainfall recorded in a day is 512.4 mm, recorded in Dec 1978.
Monsoon seasons are defined by the prevailing winds dominant at the time of the year. The two main seasons
are the Northeast Monsoon which lasts from Dec to Mar and the Southwest Monsoon from Jun to Sep. The
Northeast Monsoon season is wetter and accounts for about half of the annual rainfall while the Southwest
Monsoon season is relatively drier and accounts for about a third.
The Northeast Monsoon season can be divided into a wet and a dry phase. The wet phase of the Northeast
Monsoon usually occurs in Dec and Jan while the later part of the season is in the dry phase where days are
generally fair and occasionally windy with little or no rain. The Northeast Monsoon winds are generally cooler
and constant in direction; and spells of wet weather associated with surges in the monsoon flow may persist for
several days at a time. The wet spells are more frequent during the first two months of the northeast monsoon
season. Dry spells occur during the second half of the northeast monsoon season.
The main feature of the Southwest Monsoon season is the incidence of morning squalls which develop over
Sumatra and move eastwards towards Singapore. These squalls can bring gusts which are occasionally strong,
and are often accompanied by heavy rain and thunder with associated drops in temperature. More intense
features of the storm seldom last for more than 1 hour. Sumatra squalls occur on an average of 3 to 4 times a
month throughout the season.
During the Inter-Monsoon periods of Apr to May and Oct to Nov, when the winds are generally light and
variable in direction, sea breeze induced thunderstorms are common. The sea breeze carries humidity inland
and mixes with the rising warm land air and, in unstable conditions, form rain clouds in the afternoon. In the
Inter-Monsoon periods, afternoon and evening thunderstorms and convective showers are thus more frequent.
3. Meteorological Stations
MSS currently operates 1 upper air station, 5 manned meteorological stations, and 57 automatic weather
stations. The locations of these stations are shown in Figure 1.

Annual Climatological Report Singapore, 2016
3
Figure 1: Locations of UAO, Manned Meteorological Stations and AWSs
3.1. Upper Air Observatory
The UAO, which has been operational since the 1950s, gathers meteorological observations of the atmosphere
that are essential for weather monitoring and forecasting. It is part of a global network of about 1,300 upper-air
stations world-wide.
Twice daily measurements are carried out at the UAO through the release of balloon-borne meteorological
sensors which measure temperature, humidity, wind and pressure up to heights of 30 km. The upper air station
is equipped with a sounding system and an automated sliding hatch in the roof enabling the weather balloon to
be released from within the observatory. Helium gas is used to ensure safety in the balloon-filling operations.
In addition to the twice daily soundings using radiosondes, vertical profile measurements of ozone concentration
are carried out once a month. This is done through attaching an ozonesonde together with the radiosonde to the
weather balloon.
3.2. Manned Meteorological Stations
Since 1984, the meteorological station serving the Changi International Airport has been designated as the
climate station of Singapore. The locations of the other 4 other manned meteorological stations are at Paya
Lebar, Tengah, Seletar, and Sembawang.

Annual Climatological Report Singapore, 2016
4
The Changi station operates 24 hours a day, while the other 4 meteorological stations perform manual
observations only from 5 am to 11 pm. The locations of these stations, given in decimal degree, are listed in
Table 2, and the details of their instruments and starting operational dates are given in Table 3. A more detailed
listing of the instruments can be found in the Annex 1.
Station
Position Elevation above mean sea-level (m) ID Lat. (N) Long. (E)
24 Changi Climate Station 1.3678 103.9826 15
06 Paya Lebar Meteorological Station 1.3524 103.9007 34
23 Tengah Meteorological Station 1.3858 103.7114 17
25 Seletar Meteorological Station 1.4166 103.8654 17
80 Sembawang Meteorological Station 1.4252 103.8202 26
Table 2: Locations of the manned stations
ID
Sta
tio
n
Hel
lman
n R
ain
Gau
ge
Th
erm
om
eter
Hyg
rom
eter
Bar
om
eter
Su
nsh
ine
Rec
ord
er
So
il T
her
mo
met
er
Eva
po
rati
on
Tan
k
Op
erat
ion
al D
ate
24 Changi Climate Station 1 1 1 1 1 1 1 01/01/1972
06 Paya Lebar Meteorological Station 1 1 1 1 01/08/1955
23 Tengah Meteorological Station 1 1 1 1 01/01/1950
25 Seletar Meteorological Station 1 1 1 1 01/04/1970
80 Sembawang Meteorological Station 1 1 1 1 01/04/1986
Table 3: Types and numbers of instruments at the manned stations
3.3. Automatic Weather Stations
The network of 57 automatic weather stations, are distributed across the island to measure rain, temperature,
relative humidity, wind and pressure. All these measured meteorological readings are transmitted in real time
to the Central Forecast Office located at the terminal building of the Changi International Airport. The locations
of the AWSs are given in Table 5, and the instruments and operational start dates are listed in Table 6.
ID Station
Position Elevation above mean sea-level (m) Lat. (N) Long. (E)
07 Macritchie Reservoir 1.3417 103.8338 25
08 Lower Peirce Reservoir 1.3701 103.8271 9
11 Choa Chu Kang (West) 1.3746 103.6938 22
24 Changi Climate Station 1.3678 103.9826 15
29 Pasir Ris (West) 1.3863 103.9412 10
31 Kampong Bahru 1.2745 103.8280 35
33 Jurong Pier 1.3081 103.7100 6
35 Ulu Pandan 1.3329 103.7556 13
36 Serangoon 1.3382 103.8657 9
40 Mandai 1.4036 103.7898 38
43 Tai Seng 1.3399 103.8878 36
44 Jurong (West) 1.3455 103.6806 84

Annual Climatological Report Singapore, 2016
5
ID Station
Position Elevation above mean sea-level (m) Lat. (N) Long. (E)
46 Upper Thomson 1.3416 103.8106 34
50 Clementi 1.3337 103.7768 69
55 Buangkok 1.3837 103.8860 29
60 Sentosa Island 1.2500 103.8279 37
61 Chai Chee 1.3277 103.9203 24
63 Boon Lay (West) 1.3275 103.7042 11
64 Bukit Panjang 1.3824 103.7603 32
66 Kranji Reservoir 1.4387 103.7363 9
69 Upper Peirce Reservoir 1.3700 103.8050 45
71 Kent Ridge 1.2923 103.7815 72
77 Queenstown 1.2937 103.8125 24
78 Tanjong Katong 1.3070 103.8907 6
79 Somerset (Road) 1.3004 103.8372 67
81 Punggol 1.4029 103.9092 25
82 Tuas West 1.3247 103.6351 45
84 Simei 1.3437 103.9444 19
86 Boon Lay (East) 1.3302 103.7205 42
88 Toa Payoh 1.3415 103.8519 29
89 Tuas 1.3199 103.6616 25
90 Bukit Timah 1.3191 103.8191 21
91 Yishun 1.4301 103.8308 43
92 Buona Vista 1.2841 103.7886 38
94 Pasir Ris (Central) 1.3679 103.9489 23
101 Jurong (North) 1.3505 103.7134 18
102 Semakau Island 1.1890 103.7680 6
104 Admiralty 1.4439 103.7854 27
105 Admiralty West 1.4582 103.7953 28
106 Pulau Ubin 1.4168 103.9673 27
107 East Coast Parkway 1.3134 103.9619 9
108 Marina Barrage 1.2799 103.8703 15
109 Ang Mo Kio 1.3764 103.8492 53
110 Serangoon North 1.3606 103.8697 57
111 Newton 1.3106 103.8365 115
112 Lim Chu Kang 1.4385 103.7013 6
113 Marine Parade 1.3065 103.9107 25
114 Choa Chu Kang (Central) 1.3819 103.7386 25
115 Tuas South 1.2938 103.6184 6
116 Pasir Panjang 1.2810 103.7540 26
117 Jurong Island 1.2542 103.6741 22
118 Dhoby Ghaut 1.2994 103.8461 21
119 Nicoll Highway 1.3011 103.8666 26
120 Botanic Garden 1.3087 103.8180 39
121 Choa Chu Kang (South) 1.3729 103.7224 38
122 Khatib 1.4173 103.8249 26
123 Whampoa 1.3214 103.8577 31
Table 4: Locations of the AWSs

Annual Climatological Report Singapore, 2016
6
ID
Sta
tio
n
Win
d S
enso
r (1
0m)
Win
d S
enso
r (5
m)
Win
d S
enso
r (2
m)
Tip
pin
g B
uck
et
Th
erm
om
eter
Hyg
rom
eter
Bar
om
eter
So
lar
Rad
iati
on
Bro
adb
and
UV
To
tal U
V
So
il T
her
mo
met
er
Cei
lom
eter
Vis
ibili
ty S
enso
r
Eva
po
rati
on
Tan
k
Do
pp
ler
Rai
n s
enso
r
Op
erat
ion
al D
ate
07 Macritchie Reservoir 2 12/02/2009
08 Lower Peirce Reservoir 2 29/01/2010
11 Choa Chu Kang (West) 2 05/03/2009
24 Changi Climate Station 1 1 1 1 1 1 1 1 1 1 1 1 1 28/05/2009
29 Pasir Ris (West) 2 05/05/2010
31 Kampong Bahru 2 28/04/2010
33 Jurong Pier 2 03/02/2010
35 Ulu Pandan 2 27/02/2009
36 Serangoon 2 09/07/2009
40 Mandai 2 11/12/2009
43 Tai Seng 1 2 1 1 1 28/04/2011
44 Jurong (West) 1 2 1 1 17/03/2009
46 Upper Thomson 2 21/01/2010
50 Clementi 1 2 1 1 14/04/2010
55 Buangkok 2 06/11/2008
60 Sentosa Island 1 2 1 1 1 1 04/03/2010
61 Chai Chee 2 15/12/2009
63 Boon Lay (West) 2 24/03/2009
64 Bukit Panjang 2 07/12/2009
66 Kranji Reservoir 2 23/10/2008
69 Upper Peirce Reservoir 2 04/02/2010
71 Kent Ridge 2 24/03/2009
77 Queenstown 2 23/11/2009
78 Tanjong Katong 2 24/09/2008
79 Somerset (Road) 1 24/03/2011
81 Punggol 2 04/06/2009
82 Tuas West 2 03/03/2009
84 Simei 2 15/06/2009
86 Boon Lay (East) 1 2 1 1 1 30/11/2009
88 Toa Payoh 2 16/03/2010
89 Tuas 2 02/10/2008
90 Bukit Timah 2 03/03/2009
91 Yishun 2 19/05/2009
92 Buona Vista 2 02/03/2009
94 Pasir Ris (Central) 2 18/03/2010
101 Jurong (North) 2 10/09/2008
102 Semakau Island 1 2 1 1 1 1 31/10/2008
104 Admiralty 1 2 1 1 16/10/2008
105 Admiralty West 2 11/09/2008
106 Pulau Ubin 1 2 1 1 1 05/01/2009
107 East Coast Parkway 1 2 1 1 1 10/06/2009
108 Marina Barrage 1 2 1 1 1 08/07/2010
109 Ang Mo Kio 1 2 1 1 1 02/09/2009
110 Serangoon North 2 03/06/2009
111 Newton 1 2 1 1 15/10/2009

Annual Climatological Report Singapore, 2016
7
ID
Sta
tio
n
Win
d S
enso
r (1
0m)
Win
d S
enso
r (5
m)
Win
d S
enso
r (2
m)
Tip
pin
g B
uck
et
Th
erm
om
eter
Hyg
rom
eter
Bar
om
eter
So
lar
Rad
iati
on
Bro
adb
and
UV
To
tal U
V
So
il T
her
mo
met
er
Cei
lom
eter
Vis
ibili
ty S
enso
r
Eva
po
rati
on
Tan
k
Do
pp
ler
Rai
n s
enso
r
Op
erat
ion
al D
ate
112 Lim Chu Kang 2 29/01/2010
113 Marine Parade 2 13/05/2009
114 Choa Chu Kang (Central) 2 15/12/2009
115 Tuas South 1 2 1 1 1 30/03/2011
116 Pasir Panjang 1 2 1 1 1 24/02/2010
117 Jurong Island 1 2 1 1 1 05/08/2011
118 Dhoby Ghaut 2 03/09/2010
119 Nicoll Highway 2 17/09/2010
120 Botanic Garden 2 23/09/2010
121 Choa Chu Kang (South) 1 2 1 1 1 1 08/03/2011
122 Khatib 1 2 1 1 1 1 1 11/10/2010
123 Whampoa 2 09/09/2011
Table 5: Types and numbers of instruments at the AWSs

Annual Climatological Report Singapore, 2016
8
4. Monthly Records of Changi Climate Station

Annual Climatological Report Singapore, 2016
9
Climate Statistics of Changi Climate Station for 2016
Jan Feb Mar Apr May Jun Jul Aug Sep Oct Nov Dec
Rai
nfal
l (m
m)
Monthly Total
2016 126.6 186.0 6.2 89.8 193.8 162.8 168.6 139.2 118.9 181.0 290.2 292.6
1981-
2010
Average
234.6 112.8 170.3 154.8 171.2 130.7 154.4 148.9 156.5 154.6 258.5 318.6
Raindays
2016 15 10 6 14 12 13 20 15 15 16 20 23
1981-
2010
Average
13 8 13 14 14 12 14 14 13 15 18 18
Tem
pera
ture
(°C
)
Monthly
Average of
Daily
Maximum1
2016 31.8 31.1 33.1 33.4 33.0 31.6 31.7 31.8 32.0 32.1 30.7 31.6
1981-
2010
Average
30.4 31.7 32.0 32.3 32.2 32.0 31.3 31.4 31.4 31.7 31.1 30.2
Monthly
Average of
Daily
Minimum2
2016 26.0 25.6 26.6 26.7 26.5 26.1 25.8 26.2 25.1 25.2 24.9 24.7
1981-
2010
Average
23.9 24.3 24.6 25.0 25.4 25.4 25.0 25.0 24.8 24.7 24.3 24.0
Monthly
24-hr
Average
2016 28.3 27.8 29.0 29.4 29.3 28.5 28.4 28.9 28.3 28.3 27.4 27.4
1981-
2010
Average
26.5 27.1 27.5 28.0 28.3 28.3 27.9 27.9 27.6 27.6 27.0 26.4
Rel
ativ
e H
umid
ity
(%
)
Monthly
Average of
Daily
Maximum
2016 92 90 88 90 92 91 90 89 90 89 92 91
1981-
2010
Average
95 95 96 97 96 95 95 94 96 96 97 96
Monthly
Average of
Daily
Minimum
2016 63 64 57 57 59 62 61 58 55 54 58 49
1981-
2010
Average
67 62 63 63 65 64 65 64 64 63 66 69
Monthly
24-hr
Average
2016 80 79 75 76 77 78 77 74 74 72 78 73
1981-
2010
Average
84 82 83 84 84 82 82 82 83 83 86 87
Win
d (m
/s)
Monthly
24-hr
Average
2016 2.8 3.3 3.2 2.3 2.1 2.0 2.2 2.3 1.9 1.8 1.7 2.0
1981-
2010
Average
2.9 3.0 2.3 1.6 1.7 2.0 2.4 2.5 2.0 1.6 1.5 2.2
1 Average of all daily maximum values over a month 2 Average of all daily minimum values over a month

Annual Climatological Report Singapore, 2016
10
0.0
50.0
100.0
150.0
200.0
250.0
300.0
350.0
Jan Feb Mar Apr May Jun Jul Aug Sep Oct Nov Dec
Rai
nfa
ll (m
m)
Rainfall Amount at Changi Climate Station
2016 1981-2010 Average
26.0
26.5
27.0
27.5
28.0
28.5
29.0
29.5
30.0
Jan Feb Mar Apr May Jun Jul Aug Sep Oct Nov Dec
Tem
pe
ratu
re (
°C)
Monthly Average Temperature at Changi Climate Station
2016 1981-2010 Average

Annual Climatological Report Singapore, 2016
11
29.0
29.5
30.0
30.5
31.0
31.5
32.0
32.5
33.0
33.5
34.0
Jan Feb Mar Apr May Jun Jul Aug Sep Oct Nov Dec
Tem
pe
ratu
re (
°C)
Monthly Average of Daily Maximum Temperature at Changi Climate Station
2016 1981-2010 Average
23.0
23.5
24.0
24.5
25.0
25.5
26.0
26.5
27.0
Jan Feb Mar Apr May Jun Jul Aug Sep Oct Nov Dec
Tem
pe
ratu
re (
°C)
Monthly Average of Daily Minimum Temperature at Changi Climate Station
2016 1981-2010 Average

Annual Climatological Report Singapore, 2016
12
50
55
60
65
70
75
80
85
90
95
100
Jan Feb Mar Apr May Jun Jul Aug Sep Oct Nov Dec
Re
lati
ve H
um
idit
y (%
)Monthly Average Relative Humidity
at Changi Climate Station
2016 1981-2010 Average
50
55
60
65
70
75
80
85
90
95
100
Jan Feb Mar Apr May Jun Jul Aug Sep Oct Nov Dec
Re
lati
ve H
um
idit
y (%
)
Monthly Average of Daily Minimum Relative Humidity at Changi Climate Station
2016 1981-2010 Average

Annual Climatological Report Singapore, 2016
13
50
55
60
65
70
75
80
85
90
95
100
Jan Feb Mar Apr May Jun Jul Aug Sep Oct Nov Dec
Re
lati
ve H
um
idit
y (%
)Monthly Average of Daily Maximum Relative
Humidity at Changi Climate Station
2016 1981-2010 Average
0.0
0.5
1.0
1.5
2.0
2.5
3.0
3.5
Jan Feb Mar Apr May Jun Jul Aug Sep Oct Nov Dec
Me
an W
ind
Sp
ee
d (
m/s
)
Monthly Average Wind Speed at Changi Climate Station
2016 1981-2010 Average

Annual Climatological Report Singapore, 2016
14
5. Daily Records3 of Changi Climate Station
3 All daily records are defined as records from midnight to midnight Singapore local time, on that calendar date

Annual Climatological Report Singapore, 2016
15
Daily Total Rainfall (mm), Changi, Singapore 2016
Jan Feb Mar Apr May Jun Jul Aug Sep Oct Nov Dec
1 2.0 0.0 0.0 0.0 0.0 0.8 0.0 22.2 3.6 0.0 35.0 18.4
2 39.6 10.6 0.0 0.0 0.0 0.0 0.0 0.0 0.0 0.0 1.0 1.2
3 16.6 0.0 0.0 7.6 0.0 0.0 0.0 7.0 0.0 75.4 19.2 1.0
4 0.0 0.2 0.4 6.2 0.0 3.8 0.0 0.0 1.8 0.0 0.0 18.6
5 0.0 0.0 0.0 0.0 0.6 0.0 0.0 0.2 12.6 0.0 4.4 0.8
6 0.0 1.8 0.0 0.0 0.0 0.0 1.2 4.6 1.0 0.4 0.0 21.6
7 0.0 26.4 0.0 0.0 0.0 0.0 0.8 0.0 5.0 22.2 1.2 33.4
8 0.0 0.0 0.6 0.0 0.0 3.8 4.4 0.0 0.0 0.0 0.0 0.0
9 1.8 0.0 0.0 1.2 0.0 0.6 0.0 0.0 6.6 0.0 64.4 23.4
10 0.0 0.0 1.6 0.0 0.0 0.0 0.0 0.0 2.8 0.0 11.0 2.0
11 0.0 0.4 0.0 0.0 8.0 16.2 1.4 3.6 0.2 0.0 5.6 7.6
12 0.0 0.6 0.0 9.4 0.0 0.0 0.0 3.4 3.4 0.2 8.8 0.0
13 0.0 0.0 2.4 0.0 0.8 7.2 1.2 0.0 0.0 0.0 0.0 0.0
14 0.2 1.2 0.0 9.6 16.4 0.0 0.8 0.2 34.0 1.6 65.6 0.2
15 5.6 0.0 0.0 4.8 0.0 34.6 0.4 0.0 0.0 0.0 0.0 0.0
16 12.2 0.0 0.0 0.0 31.6 6.4 1.6 0.0 15.2 5.0 30.2 2.4
17 33.2 0.0 0.0 0.0 0.0 18.4 0.4 2.2 0.0 0.0 29.4 29.6
18 2.6 0.0 0.0 0.0 54.8 0.2 44.0 0.0 7.2 0.0 1.0 2.4
19 2.0 70.4 0.0 0.2 0.0 0.0 0.4 11.2 15.8 22.4 0.8 6.0
20 0.8 2.6 0.0 0.4 2.8 0.0 11.8 0.0 0.0 0.0 1.8 0.0
21 0.6 0.0 0.2 0.0 10.6 0.0 59.4 30.6 2.5 1.0 0.0 3.0
22 0.0 0.0 1.0 0.0 25.6 2.2 28.8 0.2 0.0 4.2 1.4 12.2
23 0.0 0.0 0.0 0.0 1.8 0.0 4.8 18.2 0.0 0.8 1.2 19.6
24 0.0 71.8 0.0 13.8 0.0 67.8 0.8 13.4 0.0 7.0 0.0 73.0
25 2.4 0.0 0.0 18.2 0.0 0.0 0.2 0.0 0.0 15.0 2.8 10.4
26 6.0 0.0 0.0 7.6 0.0 0.8 1.6 0.0 0.0 1.6 4.6 0.0
27 1.0 0.0 0.0 4.2 0.0 0.0 0.0 0.0 0.0 14.6 0.0 0.6
28 0.0 0.0 0.0 6.2 29.8 0.0 0.0 0.0 0.0 0.0 0.0 3.8
29 0.0 0.0 0.0 0.4 0.0 0.0 0.0 10.6 0.0 9.2 0.8 0.0
30 0.0 0.0 0.0 11.0 0.0 0.6 11.6 7.2 0.4 0.0 1.4
31 0.0 0.0 0.0 4.0 0.0 0.0 0.0
Monthly Average
4.1 6.4 0.2 3.0 6.3 5.4 5.4 4.5 4.0 5.8 9.7 9.4
▪ No Data
— Defective Data

Annual Climatological Report Singapore, 2016
16
Daily Average Temperature (°C), Changi, Singapore 2016
Jan Feb Mar Apr May Jun Jul Aug Sep Oct Nov Dec
1 27.5 28.8 28.6 29.6 29.6 28.0 29.8 27.4 27.1 27.9 26.7 25.7
2 25.7 27.7 28.2 29.8 29.4 28.7 29.9 29.1 28.5 30.0 27.4 27.4
3 25.4 28.5 28.5 28.8 30.0 28.7 30.1 27.5 29.1 27.8 27.4 27.3
4 27.8 28.2 28.4 29.2 30.7 26.9 30.1 28.4 28.7 28.3 28.3 28.6
5 28.6 28.3 28.5 29.0 29.5 28.7 30.1 29.5 27.9 28.5 26.9 28.7
6 28.5 28.7 29.0 29.4 29.8 29.7 29.3 28.3 28.8 27.9 28.8 27.7
7 28.7 27.0 28.5 29.3 29.8 29.9 29.4 29.4 27.5 25.9 26.8 27.8
8 28.6 27.7 28.4 29.7 29.7 28.0 29.1 29.6 29.2 28.6 28.7 28.5
9 28.5 26.8 29.2 28.8 30.0 28.5 29.8 29.0 27.8 28.5 27.0 27.0
10 28.7 26.7 29.0 29.7 30.7 28.7 29.6 29.7 27.0 29.7 27.3 27.5
11 28.8 27.4 29.4 29.8 29.3 28.1 28.1 29.2 28.5 30.1 26.9 26.5
12 29.0 27.6 28.9 29.9 29.7 28.6 29.8 29.0 26.3 29.9 27.5 28.5
13 29.0 28.6 29.0 29.6 28.8 28.7 28.2 29.4 28.9 29.5 27.8 28.4
14 28.7 28.5 29.2 29.4 27.7 28.4 27.6 28.7 26.5 28.9 25.5 28.0
15 27.9 28.9 29.2 28.9 28.8 28.5 27.4 29.3 28.7 30.0 27.6 28.7
16 28.0 28.7 28.6 29.9 28.5 28.4 28.4 29.6 28.1 28.6 26.4 28.2
17 27.4 28.1 29.0 30.1 29.2 26.4 27.7 29.3 28.9 29.2 27.0 26.8
18 28.6 27.9 28.8 30.3 28.5 26.9 27.3 30.2 28.3 29.6 27.4 26.9
19 28.5 25.1 28.9 30.5 28.6 27.7 28.0 28.3 28.3 27.6 27.9 28.0
20 28.3 26.7 29.3 29.4 29.6 29.0 27.1 29.6 28.7 29.0 28.0 28.6
21 28.3 27.5 29.1 30.4 28.9 28.9 27.1 27.8 28.1 29.0 28.6 28.5
22 28.5 28.2 28.3 29.7 28.1 27.3 26.0 29.2 28.3 28.3 27.4 26.7
23 28.7 28.0 28.8 29.8 29.1 29.2 27.1 29.2 28.4 28.2 27.6 27.0
24 28.8 25.9 29.5 29.2 29.9 26.7 27.4 27.7 28.5 26.8 27.6 26.3
25 28.3 27.8 29.0 28.7 30.0 29.1 27.5 29.2 28.7 26.9 27.7 26.6
26 27.9 28.4 29.5 28.9 28.6 28.8 26.5 29.4 28.3 27.2 27.4 26.5
27 28.8 28.3 29.6 28.9 30.0 28.9 28.4 29.4 28.1 25.9 27.3 26.3
28 29.0 28.5 29.6 28.9 29.0 29.5 28.6 28.8 29.7 27.4 27.6 25.7
29 28.6 28.7 29.3 29.0 29.7 30.3 28.7 28.9 29.6 27.1 26.4 27.6
30 28.8 29.4 28.6 27.9 30.0 28.9 27.4 28.1 27.3 28.1 27.0
31 28.8 29.6 28.8 27.6 28.3 28.8 26.6
Monthly Average
28.3 27.8 29.0 29.4 29.3 28.5 28.4 28.9 28.3 28.3 27.4 27.4
▪ No Data
— Defective Data

Annual Climatological Report Singapore, 2016
17
Daily Maximum Temperature (°C), Changi, Singapore 2016
Jan Feb Mar Apr May Jun Jul Aug Sep Oct Nov Dec
1 29.8 32.7 31.9 34.2 33.1 32.2 32.7 30.8 31.6 31.4 28.7 27.2
2 28.0 31.7 31.2 34.4 33.3 32.0 32.2 32.4 31.6 33.9 31.4 32.2
3 26.8 32.5 32.0 31.9 33.6 32.5 33.4 30.1 32.3 31.2 31.7 29.8
4 31.9 31.7 31.6 32.3 34.3 27.8 33.0 30.4 33.0 32.9 31.7 32.9
5 32.1 31.6 32.2 31.7 33.8 31.9 33.2 32.7 31.3 31.9 28.7 32.8
6 31.5 32.4 32.7 33.8 34.6 32.5 31.9 32.1 31.8 30.2 32.5 32.6
7 31.9 28.4 32.6 33.7 33.4 32.7 32.1 32.0 28.5 27.9 28.7 33.1
8 32.4 29.7 32.4 34.4 32.9 31.0 31.8 32.7 31.8 32.9 32.6 32.7
9 32.1 28.6 33.2 33.3 34.1 32.0 32.9 32.2 32.2 31.8 30.0 31.2
10 32.3 28.6 33.4 35.0 34.5 32.2 32.7 32.8 29.8 34.2 32.1 30.6
11 32.5 30.2 33.8 33.5 34.0 32.0 30.2 31.1 32.1 34.6 30.3 29.8
12 32.3 32.1 32.3 34.5 33.2 31.6 33.0 31.1 28.6 34.3 32.0 32.4
13 32.6 32.1 33.6 33.2 31.8 32.0 31.2 32.1 32.3 32.0 30.8 33.1
14 32.1 32.0 32.9 33.6 32.8 32.1 30.4 32.9 30.5 32.6 27.6 33.6
15 32.1 32.4 32.9 30.7 32.8 30.9 30.9 32.3 32.2 34.2 31.4 33.0
16 32.8 31.9 33.4 33.5 34.3 31.2 33.4 32.3 32.3 32.3 29.1 31.8
17 31.8 31.4 33.8 34.1 32.5 30.6 33.2 32.7 32.0 32.1 31.6 31.3
18 32.5 31.5 33.3 34.1 33.3 29.4 32.5 32.7 32.9 32.9 31.7 31.6
19 32.0 28.2 33.2 34.6 32.8 30.4 33.3 31.4 31.9 30.7 31.5 32.5
20 31.5 29.9 33.4 33.8 32.4 32.9 30.1 31.9 32.8 32.7 31.3 33.0
21 31.8 31.0 34.1 34.8 31.3 31.3 30.5 29.1 33.6 32.6 32.2 33.4
22 31.6 31.9 33.5 33.7 32.1 31.4 30.0 31.7 32.4 32.0 28.9 31.8
23 32.5 31.8 33.2 33.1 33.2 32.1 30.8 32.4 32.3 32.4 29.8 30.5
24 32.5 29.5 33.5 31.6 31.9 29.2 31.0 30.7 32.1 30.7 31.5 32.5
25 32.2 31.1 33.7 32.6 33.1 32.0 28.8 32.2 32.6 32.4 32.0 31.8
26 30.4 31.6 33.4 32.6 31.3 31.6 29.4 33.8 33.3 31.2 31.2 30.6
27 32.2 31.9 33.6 33.6 32.8 30.6 31.9 33.3 30.3 31.0 29.5 30.2
28 32.8 31.9 34.0 32.7 31.9 32.1 31.0 31.9 34.1 31.8 30.0 28.3
29 32.3 32.0 33.7 32.8 32.2 33.4 31.9 32.0 34.4 30.1 28.1 31.2
30 32.5 33.5 33.8 31.9 33.1 31.0 29.2 34.3 30.0 31.8 32.0
31 32.6 33.8 32.5 31.8 32.0 33.0 29.1
Monthly Average
31.8 31.1 33.1 33.4 33.0 31.6 31.7 31.8 32.0 32.1 30.7 31.6
▪ No Data
— Defective Data
Annual Climatological Report Singapore, 2016
18
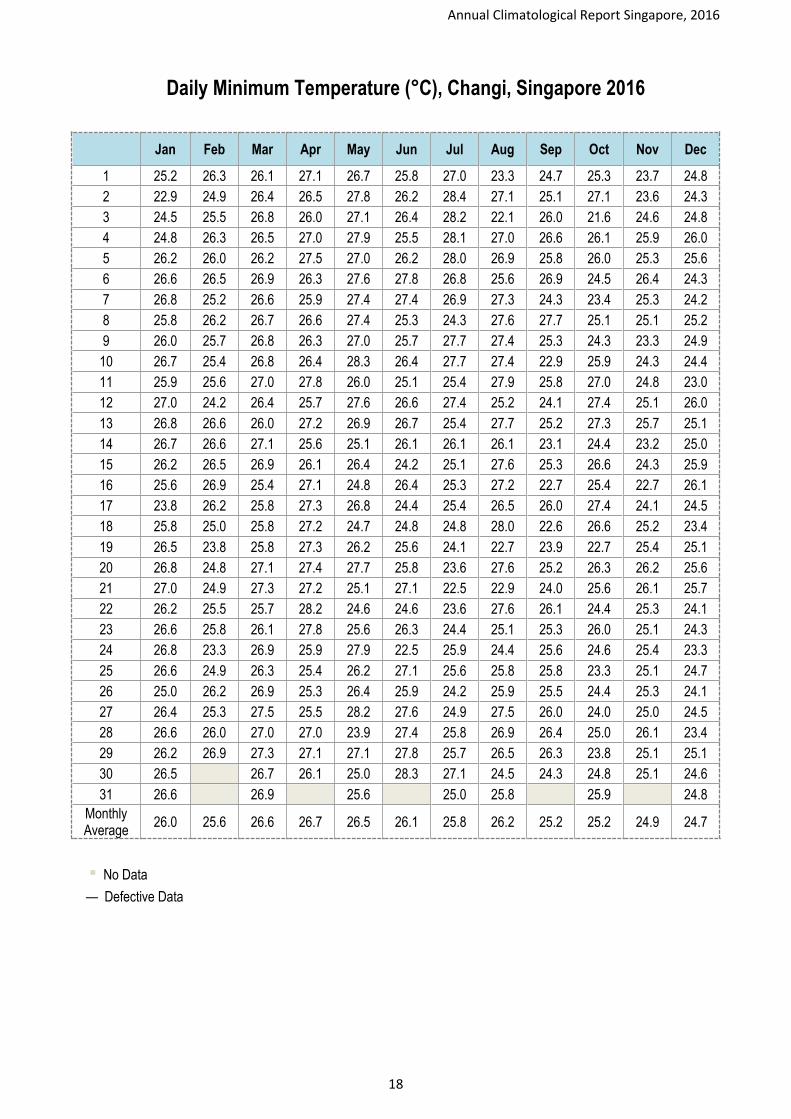
Daily Minimum Temperature (°C), Changi, Singapore 2016
Jan Feb Mar Apr May Jun Jul Aug Sep Oct Nov Dec
1 25.2 26.3 26.1 27.1 26.7 25.8 27.0 23.3 24.7 25.3 23.7 24.8
2 22.9 24.9 26.4 26.5 27.8 26.2 28.4 27.1 25.1 27.1 23.6 24.3
3 24.5 25.5 26.8 26.0 27.1 26.4 28.2 22.1 26.0 21.6 24.6 24.8
4 24.8 26.3 26.5 27.0 27.9 25.5 28.1 27.0 26.6 26.1 25.9 26.0
5 26.2 26.0 26.2 27.5 27.0 26.2 28.0 26.9 25.8 26.0 25.3 25.6
6 26.6 26.5 26.9 26.3 27.6 27.8 26.8 25.6 26.9 24.5 26.4 24.3
7 26.8 25.2 26.6 25.9 27.4 27.4 26.9 27.3 24.3 23.4 25.3 24.2
8 25.8 26.2 26.7 26.6 27.4 25.3 24.3 27.6 27.7 25.1 25.1 25.2
9 26.0 25.7 26.8 26.3 27.0 25.7 27.7 27.4 25.3 24.3 23.3 24.9
10 26.7 25.4 26.8 26.4 28.3 26.4 27.7 27.4 22.9 25.9 24.3 24.4
11 25.9 25.6 27.0 27.8 26.0 25.1 25.4 27.9 25.8 27.0 24.8 23.0
12 27.0 24.2 26.4 25.7 27.6 26.6 27.4 25.2 24.1 27.4 25.1 26.0
13 26.8 26.6 26.0 27.2 26.9 26.7 25.4 27.7 25.2 27.3 25.7 25.1
14 26.7 26.6 27.1 25.6 25.1 26.1 26.1 26.1 23.1 24.4 23.2 25.0
15 26.2 26.5 26.9 26.1 26.4 24.2 25.1 27.6 25.3 26.6 24.3 25.9
16 25.6 26.9 25.4 27.1 24.8 26.4 25.3 27.2 22.7 25.4 22.7 26.1
17 23.8 26.2 25.8 27.3 26.8 24.4 25.4 26.5 26.0 27.4 24.1 24.5
18 25.8 25.0 25.8 27.2 24.7 24.8 24.8 28.0 22.6 26.6 25.2 23.4
19 26.5 23.8 25.8 27.3 26.2 25.6 24.1 22.7 23.9 22.7 25.4 25.1
20 26.8 24.8 27.1 27.4 27.7 25.8 23.6 27.6 25.2 26.3 26.2 25.6
21 27.0 24.9 27.3 27.2 25.1 27.1 22.5 22.9 24.0 25.6 26.1 25.7
22 26.2 25.5 25.7 28.2 24.6 24.6 23.6 27.6 26.1 24.4 25.3 24.1
23 26.6 25.8 26.1 27.8 25.6 26.3 24.4 25.1 25.3 26.0 25.1 24.3
24 26.8 23.3 26.9 25.9 27.9 22.5 25.9 24.4 25.6 24.6 25.4 23.3
25 26.6 24.9 26.3 25.4 26.2 27.1 25.6 25.8 25.8 23.3 25.1 24.7
26 25.0 26.2 26.9 25.3 26.4 25.9 24.2 25.9 25.5 24.4 25.3 24.1
27 26.4 25.3 27.5 25.5 28.2 27.6 24.9 27.5 26.0 24.0 25.0 24.5
28 26.6 26.0 27.0 27.0 23.9 27.4 25.8 26.9 26.4 25.0 26.1 23.4
29 26.2 26.9 27.3 27.1 27.1 27.8 25.7 26.5 26.3 23.8 25.1 25.1
30 26.5 26.7 26.1 25.0 28.3 27.1 24.5 24.3 24.8 25.1 24.6
31 26.6 26.9 25.6 25.0 25.8 25.9 24.8
Monthly Average
26.0 25.6 26.6 26.7 26.5 26.1 25.8 26.2 25.2 25.2 24.9 24.7
▪ No Data
— Defective Data

Annual Climatological Report Singapore, 2016
19
Daily Average Relative Humidity (%), Changi, Singapore 2016
Jan Feb Mar Apr May Jun Jul Aug Sep Oct Nov Dec
1 84.1 73.4 73.9 69.8 74.2 80.8 75.7 79.5 82.5 70.6 85.8 87.9
2 90.3 78.9 75.3 70.9 75.9 78.9 75.0 69.1 70.5 65.2 76.0 73.5
3 92.6 75.4 75.9 78.4 72.8 76.2 73.0 77.3 71.2 72.1 78.5 77.1
4 82.7 79.1 76.8 78.1 70.3 83.8 72.2 72.3 76.0 70.7 70.4 71.3
5 78.7 80.9 78.8 78.8 77.8 81.2 71.8 69.6 78.7 72.7 83.2 70.8
6 80.0 80.8 77.3 73.6 76.6 74.8 74.8 78.8 72.0 73.6 69.8 81.1
7 75.8 84.3 80.4 71.2 76.5 72.8 74.3 74.7 78.1 87.5 88.1 82.2
8 76.7 73.8 80.3 71.2 75.5 81.8 72.9 70.5 73.4 65.5 71.1 70.7
9 78.0 78.2 77.0 78.8 73.7 81.0 69.9 77.0 79.1 64.8 83.8 79.5
10 77.3 81.6 78.5 75.7 70.5 79.0 71.5 70.5 81.9 61.8 82.4 72.4
11 77.1 84.4 76.0 75.0 78.9 82.6 80.8 73.2 74.8 62.8 81.7 73.3
12 75.5 81.8 75.0 74.4 77.9 77.4 73.6 72.7 86.2 63.0 77.2 57.2
13 76.4 80.9 77.1 74.2 80.2 78.0 79.0 71.6 73.8 66.7 76.8 62.3
14 79.2 80.8 77.2 76.5 86.4 79.5 81.4 70.7 85.4 67.1 91.7 62.8
15 81.7 79.5 72.6 78.2 79.6 77.2 81.2 71.5 76.2 61.3 76.5 60.8
16 83.9 75.1 71.4 74.4 81.2 79.1 75.0 70.6 71.4 70.7 80.7 67.2
17 86.3 69.0 72.5 74.0 80.0 87.0 78.8 76.1 67.8 64.8 81.8 81.5
18 81.2 76.4 72.3 71.5 83.7 83.3 84.0 71.3 75.2 67.6 81.1 74.4
19 78.9 94.2 72.1 71.9 82.7 76.0 75.1 77.2 75.5 73.6 78.7 64.8
20 78.3 85.9 74.0 76.5 79.0 68.8 83.9 71.6 66.0 68.9 80.0 54.9
21 76.2 77.2 78.1 69.0 76.9 74.5 — 81.4 73.9 70.5 70.4 54.8
22 79.8 72.8 81.1 75.7 83.8 82.0 89.0 73.0 75.8 72.5 78.2 78.0
23 77.5 77.8 79.5 73.5 77.8 76.8 81.8 74.8 69.0 78.0 72.8 78.4
24 76.8 88.9 74.1 78.8 74.5 — 79.8 80.1 70.9 86.8 69.1 84.9
25 76.9 75.7 72.3 79.0 76.8 74.5 76.6 68.1 68.8 83.1 76.2 82.3
26 80.3 72.3 67.6 79.2 75.5 78.1 82.3 66.2 69.8 79.0 85.2 75.3
27 78.1 76.2 71.4 80.1 74.9 73.3 77.8 71.9 72.2 83.5 76.9 71.2
28 77.1 76.1 69.2 81.6 76.9 70.0 73.6 71.2 66.0 74.8 69.2 75.8
29 78.9 74.8 70.2 77.5 73.7 67.3 73.5 79.0 59.5 82.6 71.2 63.8
30 76.6 70.1 79.3 81.3 73.4 74.7 83.5 75.3 78.4 62.4 82.0
31 75.4 69.1 73.8 80.7 78.8 71.4 85.0
Monthly Average
79.6 78.8 74.7 75.6 77.4 77.6 77.1 74.0 73.9 72.0 77.6 72.8
▪ No Data
— Defective Data
Annual Climatological Report Singapore, 2016
20
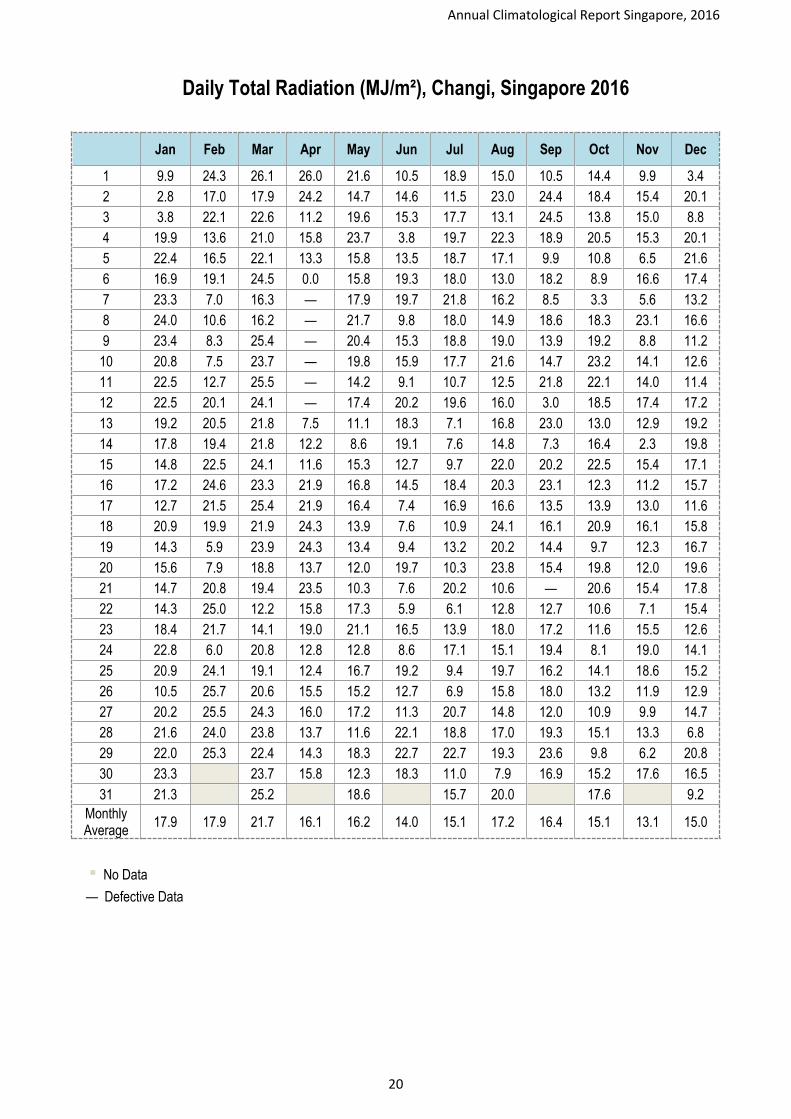
Daily Total Radiation (MJ/m²), Changi, Singapore 2016
Jan Feb Mar Apr May Jun Jul Aug Sep Oct Nov Dec
1 9.9 24.3 26.1 26.0 21.6 10.5 18.9 15.0 10.5 14.4 9.9 3.4
2 2.8 17.0 17.9 24.2 14.7 14.6 11.5 23.0 24.4 18.4 15.4 20.1
3 3.8 22.1 22.6 11.2 19.6 15.3 17.7 13.1 24.5 13.8 15.0 8.8
4 19.9 13.6 21.0 15.8 23.7 3.8 19.7 22.3 18.9 20.5 15.3 20.1
5 22.4 16.5 22.1 13.3 15.8 13.5 18.7 17.1 9.9 10.8 6.5 21.6
6 16.9 19.1 24.5 0.0 15.8 19.3 18.0 13.0 18.2 8.9 16.6 17.4
7 23.3 7.0 16.3 — 17.9 19.7 21.8 16.2 8.5 3.3 5.6 13.2
8 24.0 10.6 16.2 — 21.7 9.8 18.0 14.9 18.6 18.3 23.1 16.6
9 23.4 8.3 25.4 — 20.4 15.3 18.8 19.0 13.9 19.2 8.8 11.2
10 20.8 7.5 23.7 — 19.8 15.9 17.7 21.6 14.7 23.2 14.1 12.6
11 22.5 12.7 25.5 — 14.2 9.1 10.7 12.5 21.8 22.1 14.0 11.4
12 22.5 20.1 24.1 — 17.4 20.2 19.6 16.0 3.0 18.5 17.4 17.2
13 19.2 20.5 21.8 7.5 11.1 18.3 7.1 16.8 23.0 13.0 12.9 19.2
14 17.8 19.4 21.8 12.2 8.6 19.1 7.6 14.8 7.3 16.4 2.3 19.8
15 14.8 22.5 24.1 11.6 15.3 12.7 9.7 22.0 20.2 22.5 15.4 17.1
16 17.2 24.6 23.3 21.9 16.8 14.5 18.4 20.3 23.1 12.3 11.2 15.7
17 12.7 21.5 25.4 21.9 16.4 7.4 16.9 16.6 13.5 13.9 13.0 11.6
18 20.9 19.9 21.9 24.3 13.9 7.6 10.9 24.1 16.1 20.9 16.1 15.8
19 14.3 5.9 23.9 24.3 13.4 9.4 13.2 20.2 14.4 9.7 12.3 16.7
20 15.6 7.9 18.8 13.7 12.0 19.7 10.3 23.8 15.4 19.8 12.0 19.6
21 14.7 20.8 19.4 23.5 10.3 7.6 20.2 10.6 — 20.6 15.4 17.8
22 14.3 25.0 12.2 15.8 17.3 5.9 6.1 12.8 12.7 10.6 7.1 15.4
23 18.4 21.7 14.1 19.0 21.1 16.5 13.9 18.0 17.2 11.6 15.5 12.6
24 22.8 6.0 20.8 12.8 12.8 8.6 17.1 15.1 19.4 8.1 19.0 14.1
25 20.9 24.1 19.1 12.4 16.7 19.2 9.4 19.7 16.2 14.1 18.6 15.2
26 10.5 25.7 20.6 15.5 15.2 12.7 6.9 15.8 18.0 13.2 11.9 12.9
27 20.2 25.5 24.3 16.0 17.2 11.3 20.7 14.8 12.0 10.9 9.9 14.7
28 21.6 24.0 23.8 13.7 11.6 22.1 18.8 17.0 19.3 15.1 13.3 6.8
29 22.0 25.3 22.4 14.3 18.3 22.7 22.7 19.3 23.6 9.8 6.2 20.8
30 23.3 23.7 15.8 12.3 18.3 11.0 7.9 16.9 15.2 17.6 16.5
31 21.3 25.2 18.6 15.7 20.0 17.6 9.2
Monthly Average
17.9 17.9 21.7 16.1 16.2 14.0 15.1 17.2 16.4 15.1 13.1 15.0
▪ No Data
— Defective Data

Annual Climatological Report Singapore, 2016
21
6. Isohyets

Annual Climatological Report Singapore, 2016
22
Annual Climatological Report Singapore, 2016
23

Annual Climatological Report Singapore, 2016
24

Annual Climatological Report Singapore, 2016
25

Annual Climatological Report Singapore, 2016
26
7. Monthly Observation of Weather Parameters

Annual Climatological Report Singapore, 2016
27
7.1. 2016 Monthly Average Temperature (°C)
Jan Feb Mar Apr May Jun Jul Aug Sep Oct Nov Dec
Manned Meteorological Stations
Changi 28.3 27.8 29.0 29.4 29.3 28.5 28.4 28.9 28.3 28.3 27.4 27.4
Paya Lebar — — — — — — — — — — — —
Tengah 27.5 27.1 28.4 28.5 28.3 27.2 27.7 28.3 28.0 28.0 27.1 27.3
Seletar 28.4 28.0 29.1 29.7 29.6 28.7 28.7 29.7 28.9 28.8 27.9 27.9
Sembawang 27.9 27.6 28.6 28.8 28.4 27.5 27.8 28.4 27.8 27.7 27.0 27.2
Automatic Meteorological Stations
Tai Seng 28.5 28.0 29.0 29.7 29.8 29.2 28.9 29.5 29.0 28.9 27.9 27.9
Jurong (West) 27.3 27.1 28.2 28.7 28.5 27.9 27.9 28.6 27.9 27.7 26.9 27.0
Clementi 27.6 27.3 28.3 28.8 28.9 28.1 28.0 28.7 28.2 27.8 27.1 27.3
Sentosa Island 28.3 — 29.0 29.3 29.3 28.6 28.3 28.8 28.5 28.4 27.7 —
Boon Lay (East) 28.1 — — — — — — — — — — —
Semakau Island 28.0 27.8 28.8 29.5 29.5 29.0 28.7 29.0 28.8 28.5 27.6 27.9
Admiralty 27.7 27.3 28.4 29.1 28.8 28.1 28.2 28.8 28.2 28.1 27.2 27.2
Pulau Ubin 27.6 27.3 28.1 28.7 28.5 27.6 27.7 28.2 27.5 27.5 26.8 26.8
East Coast Parkway 28.4 28.0 28.8 29.4 29.4 29.0 28.8 29.1 28.6 28.5 27.8 27.8
Marina Barrage 28.6 28.2 29.3 30.0 30.0 29.2 29.0 29.5 29.0 28.8 28.0 28.2
Ang Mo Kio 27.8 27.4 28.5 29.1 29.2 28.4 28.3 29.1 28.4 28.3 27.4 27.4
Newton 27.7 27.3 28.4 28.9 28.8 28.1 27.9 28.4 — — — 27.1
Tuas South 27.9 27.8 29.0 29.7 29.5 28.7 28.0 29.3 28.8 28.7 27.9 27.9
Pasir Panjang 28.3 28.1 29.1 29.7 29.7 29.1 28.9 29.3 28.9 28.7 27.9 28.0
Jurong Island 28.1 28.0 29.1 29.7 29.7 29.1 29.0 29.1 28.7 28.8 27.9 28.4
Choa Chu Kang (South) 27.5 27.4 28.6 28.7 28.7 27.9 28.0 28.8 28.2 28.1 27.2 27.4
Khatib 28.1 27.8 28.9 28.9 28.6 27.7 27.9 28.5 28.0 27.9 27.2 27.3
Monthly Average 28.0 27.6 28.7 29.2 29.1 28.4 28.3 28.9 28.4 28.3 27.5 27.6
▪ No Data
— Defective Data

Annual Climatological Report Singapore, 2016
28
7.2. 2016 Monthly Maximum Temperature (°C)
Jan Feb Mar Apr May Jun Jul Aug Sep Oct Nov Dec
Manned Meteorological Stations
Changi 32.8 32.7 34.1 35.0 34.6 33.4 33.4 33.8 34.4 34.6 32.6 33.6
Paya Lebar 34.5 34.1 35.5 36.5 36.5 35.4 34.1 34.2 36.3 35.5 34.2 35.6
Tengah 34.8 34.0 35.3 36.2 36.1 34.9 35.2 34.2 35.3 34.9 34.7 35.4
Seletar 34.4 33.5 34.9 36.7 36.1 35.7 36.0 35.4 36.8 35.5 35.4 35.9
Sembawang 33.7 33.3 34.1 35.1 35.3 34.5 34.6 33.8 35.3 34.5 34.1 34.8
Automatic Meteorological Stations
Tai Seng 33.0 32.8 33.7 35.4 35.5 34.9 34.3 33.6 35.4 34.5 33.8 34.3
Jurong (West) 33.6 33.0 34.6 35.1 35.4 33.7 33.7 32.9 33.2 32.5 33.4 34.1
Clementi 33.4 33.4 35.0 36.4 35.9 34.2 34.3 33.4 34.9 34.1 33.4 34.7
Sentosa Island 33.8 27.8 34.2 35.3 35.3 33.3 33.7 33.3 33.7 33.7 32.8 —
Boon Lay (East) 33.6 — — — — — — — — — — —
Semakau Island 31.2 31.6 32.1 33.5 34.0 32.4 32.5 31.5 31.6 31.0 30.4 32.3
Admiralty 34.4 32.6 35.0 36.3 35.5 34.3 34.7 33.7 34.5 33.8 34.0 34.2
Pulau Ubin 33.3 32.6 34.1 36.6 35.7 34.7 34.2 34.2 34.9 35.5 34.4 34.0
East Coast Parkway 32.4 32.2 33.2 33.6 33.2 31.7 32.0 31.9 33.7 33.4 31.9 32.7
Marina Barrage 34.5 34.2 34.7 36.0 35.9 34.4 35.6 34.5 35.2 34.6 34.1 34.3
Ang Mo Kio 34.0 32.8 34.7 35.8 35.6 34.5 34.6 34.1 35.2 34.4 34.3 34.7
Newton 33.5 32.6 34.2 34.4 34.5 33.8 33.2 32.2 — — — 34.0
Tuas South 34.1 33.4 34.8 35.6 34.4 33.5 34.1 33.1 33.1 32.8 32.3 33.3
Pasir Panjang 33.7 33.3 33.9 35.3 34.2 33.2 33.6 32.8 33.0 33.0 32.1 33.2
Jurong Island 33.9 33.9 34.8 35.6 34.1 33.8 33.5 33.1 33.8 33.5 32.5 34.2
Choa Chu Kang (South) 33.9 33.1 34.8 35.7 35.7 34.6 34.5 33.7 34.3 33.9 34.8 34.9
Khatib 34.3 34.0 34.9 35.7 35.5 34.9 34.7 33.9 35.8 34.6 34.1 34.7
Monthly Average 33.7 32.9 34.4 35.5 35.2 34.1 34.2 33.5 34.5 34.0 33.5 34.3
▪ No Data
— Defective Data

Annual Climatological Report Singapore, 2016
29
7.3. 2016 Monthly Average Relative Humidity (%)
Jan Feb Mar Apr May Jun Jul Aug Sep Oct Nov Dec
Manned Meteorological Stations
Changi 79.6 78.8 74.7 75.6 77.4 77.6 77.1 74.0 73.9 72.0 77.6 72.8
Paya Lebar — — — — — — — — — — — —
Tengah 83.6 81.2 77.6 80.7 82.2 84.7 82.6 78.8 79.3 80.4 85.0 82.4
Seletar 77.6 76.2 72.3 73.3 76.2 78.0 76.7 70.7 72.9 73.8 79.6 77.1
Sembawang 82.5 81.3 78.6 81.2 83.5 84.2 82.1 79.6 80.1 82.8 87.2 83.2
Automatic Meteorological Stations
Tai Seng 78.5 77.8 74.9 74.9 75.9 75.8 76.6 73.0 72.8 73.9 81.2 79.0
Jurong (West) 85.2 80.7 72.3 69.8 73.2 68.4 69.4 69.8 69.0 70.9 — 72.5
Clementi 83.3 81.7 78.8 79.7 80.2 80.9 81.4 77.0 77.7 80.3 84.7 82.7
Sentosa Island 76.5 — 68.0 71.4 73.2 74.0 75.4 71.7 71.1 71.6 78.8 —
Boon Lay (East) 82.5 — — — — — — — — — — —
Semakau Island 78.8 76.6 76.0 76.5 76.5 76.4 78.1 77.0 76.3 78.1 80.9 80.8
Admiralty 89.6 88.4 85.2 84.9 87.0 87.4 84.9 80.4 82.6 82.9 90.8 87.8
Pulau Ubin 89.9 88.5 86.2 86.3 88.8 91.4 90.6 87.4 87.3 87.4 92.3 90.5
East Coast Parkway 81.4 80.8 79.0 80.2 80.5 80.0 80.5 78.7 78.6 78.9 84.3 82.2
Marina Barrage 78.6 77.6 74.0 75.3 76.2 77.2 77.2 74.4 73.6 75.2 81.7 78.2
Ang Mo Kio 80.1 79.2 74.7 75.5 76.4 76.6 76.4 70.9 72.8 74.2 82.1 79.8
Newton 76.2 74.2 73.9 74.8 74.0 74.9 75.5 72.9 — — — 74.1
Tuas South 80.4 77.6 74.5 74.8 76.3 76.8 79.4 73.9 74.6 76.4 79.8 77.9
Pasir Panjang 84.9 82.6 80.2 81.2 82.4 82.8 83.7 80.8 80.2 81.8 86.9 84.3
Jurong Island 78.5 74.0 71.5 73.1 73.5 74.1 75.1 73.6 72.9 73.7 78.4 74.3
Choa Chu Kang (South) 91.1 88.1 88.2 85.1 84.0 86.3 78.2 74.6 74.7 78.8 93.0 78.3
Khatib 79.7 77.1 74.5 70.9 — — — — — — — —
Monthly Average 81.9 80.2 76.9 77.3 78.9 79.4 79.1 75.8 76.3 77.7 84.2 80.3
▪ No Data
— Defective Data

Annual Climatological Report Singapore, 2016
30
7.4. 2016 Monthly Minimum Relative Humidity (%)
Jan Feb Mar Apr May Jun Jul Aug Sep Oct Nov Dec
Manned Meteorological Stations
Changi 55.0 55.0 47.0 46.0 48.0 45.0 48.0 41.0 33.0 38.0 46.0 34.0
Paya Lebar — — — — — — — — — — — —
Tengah — — — — — — — — — — — —
Seletar — — — — — — — — — — — —
Sembawang — — — — — — — — — — — —
Automatic Meteorological Stations
Tai Seng 52.6 46.3 46.9 40.1 40.3 39.9 45.7 40.9 36.7 39.7 43.5 42.8
Jurong (West) 45.3 44.7 39.0 37.7 40.9 41.6 43.4 44.3 40.6 49.3 55.4 49.1
Clementi 50.2 52.3 49.9 46.7 44.2 46.2 50.0 48.0 40.4 44.0 50.5 46.7
Sentosa Island 40.2 74.0 34.4 37.0 38.5 40.6 39.3 39.8 30.8 39.0 42.7 —
Boon Lay (East) 47.3 — — — — — — — — — — —
Semakau Island 56.1 48.6 51.2 40.4 46.9 54.1 57.8 55.4 55.8 53.6 56.5 50.6
Admiralty 53.3 50.9 47.1 44.7 44.0 42.2 46.9 44.2 42.9 45.1 45.3 41.2
Pulau Ubin 61.3 58.2 55.9 49.8 54.2 49.3 58.5 52.1 43.0 51.4 47.0 52.0
East Coast Parkway 58.4 57.0 54.2 50.8 55.2 58.3 54.1 58.7 42.8 51.6 60.1 51.8
Marina Barrage 46.5 41.5 43.6 40.7 43.9 46.4 46.8 43.3 33.4 42.2 48.5 42.6
Ang Mo Kio 45.9 45.6 40.1 39.3 39.8 37.0 40.4 38.5 34.0 40.8 39.1 38.2
Newton 50.8 48.0 47.1 43.7 40.5 42.0 48.0 45.5 — — — 46.0
Tuas South 47.9 46.8 40.3 40.5 49.6 52.0 45.0 50.6 50.5 53.8 55.7 47.4
Pasir Panjang 47.3 48.0 46.5 44.1 45.8 52.1 54.7 51.6 46.7 43.3 58.8 47.2
Jurong Island 41.3 38.8 35.3 42.2 37.6 42.9 47.4 45.5 42.8 46.7 48.1 39.8
Choa Chu Kang (South) 54.9 52.7 49.7 49.8 44.9 39.4 46.5 44.4 41.2 46.6 81.8 45.6
Khatib 50.4 47.2 45.7 45.0 — — — 45.4 57.0 47.9 77.2 51.5
Monthly Average 50.0 50.0 45.4 43.3 44.4 45.6 48.3 46.8 42.6 46.3 54.0 46.2
▪ No Data
— Defective Data

Annual Climatological Report Singapore, 2016
31
7.5. 2016 Monthly Average Wind Speed (m/s)
Jan Feb Mar Apr May Jun Jul Aug Sep Oct Nov Dec
Manned Meteorological Stations
Changi 2.8 3.3 3.2 2.3 2.1 2.0 2.2 2.3 1.9 1.8 1.7 2.0
Paya Lebar 3.9 4.9 4.2 2.7 2.3 2.3 2.6 3.1 2.7 2.6 2.3 2.8
Tengah 2.9 3.6 3.2 2.2 1.9 1.9 2.1 2.5 2.3 2.3 2.1 2.5
Seletar 3.8 4.7 4.3 2.9 2.3 2.3 2.5 2.9 2.5 2.3 2.2 2.5
Sembawang 2.8 3.3 3.4 2.0 2.0 1.9 2.1 2.3 2.2 2.5 2.4 2.5
Automatic Meteorological Stations
Tai Seng 2.6 3.3 3.0 1.8 1.5 1.5 1.5 2.0 1.7 1.6 1.5 1.9
Jurong (West) 1.9 2.4 2.1 1.8 1.8 1.8 1.9 2.2 2.1 2.2 1.8 2.2
Clementi 1.7 2.1 2.0 1.5 1.2 1.4 1.6 1.5 1.9 2.2 2.7 3.0
Sentosa Island 2.0 1.7 2.2 2.0 1.9 1.8 1.7 2.2 1.6 1.6 1.7 —
Boon Lay (East) 1.7 — — — — — — — — — — —
Semakau Island 4.3 5.1 4.8 5.0 5.4 5.6 5.4 6.2 6.9 7.6 6.0 6.5
Admiralty 2.9 3.5 3.3 2.3 1.8 1.6 1.8 2.0 2.0 2.2 2.0 2.5
Pulau Ubin 2.8 3.1 2.9 2.6 2.6 2.4 2.4 2.4 2.3 2.3 2.3 2.2
East Coast Parkway 2.4 3.1 2.9 2.5 2.7 3.0 3.1 4.1 3.1 2.9 2.2 2.2
Marina Barrage 2.3 3.2 2.7 1.7 1.8 2.1 2.5 2.8 3.7 3.9 4.2 4.8
Ang Mo Kio 1.8 2.1 2.0 1.5 1.4 1.3 1.5 1.7 1.5 1.6 1.3 1.6
Newton 1.7 2.0 2.0 1.8 1.8 1.8 2.0 2.3 — — — 1.9
Tuas South 1.4 1.8 1.5 1.4 1.6 1.6 1.6 2.0 2.1 2.3 1.8 1.9
Pasir Panjang 2.8 3.4 3.0 2.4 2.5 2.5 2.6 2.8 3.0 3.4 2.7 3.3
Jurong Island 1.5 1.7 1.9 2.2 2.3 2.3 2.5 3.0 2.1 1.9 1.8 1.8
Choa Chu Kang (South) 1.9 2.6 2.2 1.4 1.2 1.2 1.3 1.4 1.3 1.3 1.2 1.6
Khatib 1.5 1.8 1.7 1.2 1.0 1.0 1.1 1.3 1.2 1.1 1.0 1.3
Monthly Average 2.4 3.0 2.8 2.1 2.1 2.1 2.2 2.5 2.4 2.5 2.3 2.6
▪ No Data
— Defective Data

Annual Climatological Report Singapore, 2016
32
7.6. 2016 Monthly Maximum Gust (m/s)
Jan Feb Mar Apr May Jun Jul Aug Sep Oct Nov Dec
Manned Meteorological Stations
Changi 18.0 12.7 12.4 12.7 14.9 14.1 14.6 18.1 15.0 14.2 12.7 13.1
Paya Lebar 15.4 15.9 14.4 11.3 15.4 13.4 12.9 17.0 15.9 15.4 13.4 16.5
Tengah 12.9 15.4 14.4 14.4 15.4 13.9 15.9 18.0 14.9 14.9 13.4 16.5
Seletar 17.5 19.0 15.4 13.4 17.5 15.4 17.5 19.0 20.1 17.5 14.4 14.9
Sembawang 14.4 13.9 12.3 13.9 16.5 15.4 19.0 18.5 17.0 18.5 15.4 13.9
Automatic Meteorological Stations
Tai Seng 14.0 15.2 13.1 10.6 12.6 13.9 22.8 19.7 22.0 13.5 20.1 13.2
Jurong (West) 12.7 13.0 25.2 14.9 20.4 17.5 17.3 19.5 18.9 18.3 16.5 16.7
Clementi 12.0 14.2 11.7 10.4 12.8 10.6 10.5 11.5 12.5 11.8 12.4 11.6
Sentosa Island 12.6 11.2 12.6 11.0 13.2 12.2 12.4 18.0 13.0 13.3 11.8 —
Boon Lay (East) 22.2 — — — — — — — — — — —
Semakau Island 22.7 23.3 17.3 18.5 23.7 26.1 25.8 27.1 28.6 31.9 28.7 23.1
Admiralty 17.9 16.1 14.7 12.1 16.1 15.0 14.3 18.1 16.6 15.7 16.1 13.0
Pulau Ubin 12.0 12.4 11.0 17.5 12.0 13.9 12.4 12.1 12.0 11.7 12.4 10.5
East Coast Parkway 14.4 14.6 14.4 12.7 14.9 27.9 15.8 18.7 19.4 18.2 18.3 13.1
Marina Barrage 20.5 12.6 12.6 10.3 14.6 13.3 20.4 17.5 17.3 16.2 16.4 14.3
Ang Mo Kio 13.4 14.4 11.1 18.6 17.9 14.8 18.2 19.0 13.7 14.2 17.7 11.7
Newton 13.7 14.6 12.9 13.3 15.1 13.4 15.1 14.3 — — — 12.7
Tuas South 15.7 12.1 12.0 17.7 15.0 18.4 15.1 18.0 17.8 20.2 14.8 15.5
Pasir Panjang 16.5 14.1 16.4 17.1 23.5 23.0 18.5 23.9 22.2 23.5 20.7 19.8
Jurong Island 14.3 13.6 11.5 14.9 16.9 16.0 12.8 15.2 15.4 15.9 14.1 12.4
Choa Chu Kang (South) 26.2 15.2 12.0 13.1 12.9 27.0 28.4 15.5 12.1 14.8 24.7 21.7
Khatib 13.5 11.6 10.3 10.2 11.2 10.3 11.1 11.4 13.0 10.9 9.6 11.2
Monthly Average 15.9 14.6 13.8 13.8 15.9 16.6 16.8 17.6 17.0 16.7 16.4 14.9
▪ No Data
— Defective Data

Annual Climatological Report Singapore, 2016
33
7.7. 2016 Monthly Total Rainfall (mm)
Jan Feb Mar Apr May Jun Jul Aug Sep Oct Nov Dec Yearly Total
Manned Meteorological Stations
Changi 126.6 186.0 6.2 89.8 193.8 162.8 168.6 139.2 118.9 181.0 290.2 292.6 1955.7
Paya Lebar 86.0 201.1 — 175.8 186.8 165.8 194.7 115.1 194.9 240.4 355.7 235.9 —
Tengah 209.1 231.1 86.7 193.3 247.1 330.8 426.0 213.0 148.9 289.1 231.6 196.8 2803.5
Seletar 119.3 181.2 39.2 100.0 308.2 332.4 260.8 95.6 107.2 215.4 169.6 255.2 2184.1
Sembawang 146.4 181.6 132.9 190.1 234.1 268.8 205.8 131.8 93.5 201.5 206.7 220.3 2213.5
Automatic Meteorological Stations
Tai Seng 116.2 183.4 55.4 108.2 200.4 148.6 209.6 172.8 180.4 192.8 413.2 268.2 2249.2
Jurong (West) 224.8 193.4 109.2 225.2 346.6 330.6 322.4 85.6 140.0 214.2 169.6 120.4 2482.0
Clementi 234.8 170.8 76.0 203.8 164.8 206.8 275.6 97.4 182.0 — 394.0 205.0 —
Sentosa Island — — 69.8 110.8 173.4 253.0 220.0 111.6 187.2 196.0 — — —
Boon Lay (East) — — — — — — — — — — — — —
Semakau Island 216.8 121.2 66.4 58.8 92.0 153.4 199.7 106.6 203.4 258.0 317.2 — —
Admiralty 174.4 189.4 54.8 116.4 211.0 115.8 256.6 163.4 93.8 245.8 160.6 186.0 1968.0
Pulau Ubin 107.8 186.6 29.8 39.0 145.4 235.6 — — 118.8 182.2 272.2 231.2 —
East Coast Parkway 99.2 147.4 21.6 128.6 152.2 75.0 158.6 112.2 172.4 167.6 187.8 223.4 1646.0
Marina Barrage — — 27.8 66.0 207.2 145.8 207.0 97.0 212.0 255.8 244.4 184.8 —
Ang Mo Kio 136.6 196.8 39.4 280.6 225.6 182.4 179.2 133.6 142.6 220.0 266.2 190.4 2193.4
Newton 190.2 214.4 119.0 161.0 156.4 152.2 165.4 — — — — 177.4 —
Tuas South 281.6 213.0 102.6 101.0 187.4 281.6 288.8 145.8 133.0 202.2 200.0 108.2 2245.2
Pasir Panjang 192.0 157.4 85.4 182.6 116.6 253.2 271.0 79.0 143.0 219.4 197.4 134.0 2031.0
Jurong Island 361.4 — 106.6 125.8 121.4 249.8 — 115.4 156.0 137.8 326.6 100.8 —
Choa Chu Kang (South) 199.4 — 49.6 187.2 238.4 358.6 431.6 192.2 148.6 221.0 239.4 187.2 —
Khatib 119.2 184.4 114.8 241.2 257.0 261.0 181.2 92.0 103.4 184.0 201.4 193.0 2132.6
Monthly Average 178.6 184.6 73.0 149.8 198.6 225.1 247.4 125.6 150.6 213.5 253.0 189.9 2189.6
▪ No Data
— Defective Data

Annual Climatological Report Singapore, 2016
34
7.7. 2016 Monthly Total Rainfall (mm)
Jan Feb Mar Apr May Jun Jul Aug Sep Oct Nov Dec Yearly Total
Precipitation Stations
Macritchie Reservoir 173.2 215.4 99.2 165.8 232.0 157.4 209.2 143.6 182.6 — — 254.4 —
Lower Peirce Reservoir 188.8 253.0 48.4 302.9 231.2 247.2 — — — — — 241.6 —
Choa Chu Kang (West) — 183.6 101.2 170.4 235.6 359.8 323.2 165.8 174.0 205.0 213.0 182.5 —
Pasir Ris (West) 98.2 197.6 12.4 98.4 149.4 — — — — — — 225.6 —
Kampong Bahru 202.6 185.6 85.7 157.6 178.8 308.2 244.8 104.8 216.4 218.4 — — —
Jurong Pier 322.4 221.2 115.1 312.4 260.2 374.2 328.2 107.8 — 273.6 262.2 172.2 —
Ulu Pandan 210.2 188.2 50.2 221.2 204.2 277.5 — — — — — 193.8 —
Serangoon — 201.8 74.4 176.2 285.2 156.4 204.6 158.8 156.0 223.3 413.4 297.9 —
Mandai — 208.4 84.4 204.4 267.8 233.6 259.8 113.4 86.8 225.8 266.4 206.4 —
Upper Thomson 174.4 198.6 113.0 154.6 207.8 213.6 184.6 117.6 156.8 188.8 285.8 215.6 2211.2
Buangkok 88.0 177.2 19.2 109.4 245.6 172.8 146.6 118.0 128.8 189.6 243.2 170.6 1809.0
Chai Chee 149.0 160.8 56.4 108.4 153.8 99.2 124.0 — — — 247.6 267.6 —
Boon Lay (West) — 219.8 112.4 319.8 336.4 339.6 382.7 — 199.2 328.0 247.2 158.6 —
Bukit Panjang 186.2 174.8 57.0 208.8 304.8 291.8 362.0 171.4 121.6 226.4 278.2 251.8 2634.8
Kranji Reservoir 199.0 177.0 84.4 174.2 228.2 144.4 324.6 — — — 165.6 234.8 —
Upp Peirce Reservoir 136.0 — 61.0 317.6 227.0 172.0 246.0 126.0 110.0 — 261.6 219.0 —
Kent Ridge 268.4 181.8 97.2 232.8 195.4 309.6 267.8 100.4 212.6 299.6 228.4 167.2 2561.2
Queenstown 234.2 212.6 133.6 217.0 206.4 229.6 190.0 100.6 185.6 259.0 234.2 175.2 2378.0
Tanjong Katong 113.6 170.4 37.2 86.8 191.0 131.0 210.0 115.2 154.8 218.4 271.4 250.0 1949.8
Somerset (Road) 184.0 209.0 106.0 144.0 153.6 150.6 196.6 71.2 149.2 255.4 252.2 152.4 2024.2
Punggol — 177.0 39.0 106.0 211.4 212.8 226.2 156.0 143.6 207.8 237.6 224.4 —
Simei 86.4 146.2 28.6 113.6 147.2 — — — — — 241.8 233.4 —
Toa Payoh 159.0 192.0 53.2 184.4 247.8 138.4 193.0 155.8 149.6 186.4 314.0 246.2 2219.8
Tuas 276.2 147.2 147.4 285.4 291.4 345.2 293.0 95.4 130.0 265.6 186.2 118.6 2581.6
Bukit Timah 230.8 163.8 128.8 208.0 198.2 212.8 179.4 121.6 225.6 224.0 261.0 194.2 2348.2
Yishun 150.0 174.8 71.2 194.6 285.2 256.2 205.5 129.4 120.8 205.6 177.2 223.2 2193.7
Buona Vista 262.0 194.0 108.8 164.5 203.7 307.0 237.6 123.6 197.0 308.0 199.5 179.6 2485.3
Pasir Ris (Central) 132.2 191.0 7.2 100.0 147.0 136.2 — — — — 279.6 199.6 —
Jurong (North) — — — 289.4 262.0 337.0 434.4 172.8 148.0 310.6 262.6 188.4 —
Admiralty West 174.4 189.4 54.8 116.4 211.0 115.8 256.6 163.4 93.8 245.8 160.6 186.0 1968.0
Serangoon North 159.4 183.6 35.2 243.4 155.3 — — 129.2 — — 312.8 209.2 —
Lim Chu Kang 237.4 175.2 153.8 318.4 206.8 103.0 304.5 146.9 108.8 196.6 — 179.0 —
Marine Parade 84.4 150.2 32.0 76.8 136.2 82.6 126.8 — — 207.8 194.0 266.0 —
Choa Chu Kang (Central) 175.6 158.0 48.0 212.4 279.8 276.4 418.0 162.0 114.2 232.6 215.4 213.8 2506.2
Dhoby Ghaut 230.0 207.2 109.8 142.6 172.8 159.6 197.0 — — — 274.4 165.8 —
Nicoll Highway 174.2 179.4 53.8 87.6 187.1 153.1 199.2 111.2 217.0 287.4 309.8 177.4 2137.2
Botanic Garden 259.6 180.2 141.0 231.2 236.0 250.1 212.6 114.6 232.8 256.6 275.4 202.4 2592.5
Whampoa 139.8 189.4 103.0 119.4 205.4 130.6 224.8 145.8 122.6 205.8 322.4 231.6 2140.6
Monthly Average 184.5 187.0 76.7 188.0 218.2 219.3 248.0 129.5 158.3 240.2 250.7 206.8 2307.3
Macritchie Reservoir 173.2 215.4 99.2 165.8 232.0 157.4 209.2 143.6 182.6 — — 254.4 —
Lower Peirce Reservoir 188.8 253.0 48.4 302.9 231.2 247.2 — — — — — 241.6 —
▪ No Data
— Defective Data

Annual Climatological Report Singapore, 2016
35
8. Weather Parameter Observation by Months
Annual Climatological Report Singapore, 2016
36
8.1. Jan to Apr

Annual Climatological Report Singapore, 2016
37

Annual Climatological Report Singapore, 2016
38
January 2016
Station
Rain Air Temperature RH Wind Pressure
Total Min Average Max Average Max Average Prevailing Average
mm °C °C °C % m/s m/s Direction hPa
Manned Meteorological Stations
Changi 126.6 22.9 28.3 32.8 79.6 18.0 2.8 NE 1011.7
Paya Lebar 86.0 23.3 34.5 15.4 3.9 NE 1011.3
Tengah 209.1 23.5 27.5 34.8 83.6 12.9 2.9 NNE 1011.2
Seletar 119.3 23.6 28.4 34.4 77.6 17.5 3.8 N 1011.3
Sembawang 146.4 23.2 27.9 33.7 82.5 14.4 2.8 NE 1011.3
Automatic Meteorological Stations
Tai Seng 116.2 23.4 28.5 33.0 78.5 14.0 2.6 ENE 1012.2
Jurong (West) 224.8 23.3 27.3 33.6 85.2 12.7 1.9 N
Clementi 234.8 23.0 27.6 33.4 83.3 12.0 1.7 NE
Sentosa Island — 22.7 28.3 33.8 76.5 12.6 2.0 ENE 1012.3
Boon Lay (East) — 23.6 28.1 33.6 82.5 22.2 1.7 ENE 1012.3
Semakau Island 216.8 22.9 28.0 31.2 78.8 22.7 4.3 N 1011.6
Admiralty 174.4 23.1 27.7 34.4 89.6 17.9 2.9 N
Pulau Ubin 107.8 22.8 27.6 33.3 89.9 12.0 2.8 NNW 1012.2
East Coast Parkway 99.2 23.4 28.4 32.4 81.4 14.4 2.4 NNE 1012.2
Marina Barrage — 23.6 28.6 34.5 78.6 20.5 2.3 NE 1012.0
Ang Mo Kio 136.6 22.9 27.8 34.0 80.1 13.4 1.8 NE 1012.3
Newton 190.2 22.8 27.7 33.5 76.2 13.7 1.7 N
Tuas South 281.6 24.2 27.9 34.1 80.4 15.7 1.4 NE 1012.2
Pasir Panjang 192.0 24.1 28.3 33.7 84.9 16.5 2.8 NE 1011.9
Jurong Island 361.4 22.8 28.1 33.9 78.5 14.3 1.5 N 1011.9
Choa Chu Kang (South) 199.4 23.2 27.5 33.9 91.1 26.2 1.9 NNE 1012.1
Khatib 119.2 23.2 28.1 34.3 79.7 13.5 1.5 NE 1012.4
▪ No Data
— Defective Data

Annual Climatological Report Singapore, 2016
39
February 2016
Station
Rain Air Temperature RH Wind Pressure
Total Min Average Max Average Max Average Prevailing Average
mm °C °C °C % m/s m/s Direction hPa
Manned Meteorological Stations
Changi 186.0 23.3 27.8 32.7 78.8 12.7 3.3 NE 1012.0
Paya Lebar 201.1 23.8 34.1 15.9 4.9 NE 1011.6
Tengah 231.1 22.3 27.1 34.0 81.2 15.4 3.6 NNE 1011.4
Seletar 181.2 22.2 28.0 33.5 76.2 19.0 4.7 NNE 1011.6
Sembawang 181.6 22.6 27.6 33.3 81.3 13.9 3.3 NNE 1011.5
Automatic Meteorological Stations
Tai Seng 183.4 23.8 28.0 32.8 77.8 15.2 3.3 ENE 1012.4
Jurong (West) 193.4 23.2 27.1 33.0 80.7 13.0 2.4 NNE
Clementi 170.8 22.9 27.3 33.4 81.7 14.2 2.1 NE
Sentosa Island — 23.3 — 27.8 — 11.2 1.7 N 1013.6
Boon Lay (East) — — — — — — — — —
Semakau Island 121.2 23.7 27.8 31.6 76.6 23.3 5.1 N 1011.7
Admiralty 189.4 23.5 27.3 32.6 88.4 16.1 3.5 N
Pulau Ubin 186.6 22.2 27.3 32.6 88.5 12.4 3.1 NNW 1012.4
East Coast Parkway 147.4 23.7 28.0 32.2 80.8 14.6 3.1 NNE 1012.4
Marina Barrage — 22.7 28.2 34.2 77.6 12.6 3.2 NNE 1012.2
Ang Mo Kio 196.8 21.5 27.4 32.8 79.2 14.4 2.1 NE 1012.5
Newton 214.4 22.4 27.3 32.6 74.2 14.6 2.0 N
Tuas South 213.0 23.4 27.8 33.4 77.6 12.1 1.8 NE 1012.3
Pasir Panjang 157.4 23.8 28.1 33.3 82.6 14.1 3.4 NE 1012.0
Jurong Island — 23.7 28.0 33.9 74.0 13.6 1.7 N 1012.3
Choa Chu Kang (South) — 23.4 27.4 33.1 88.1 15.2 2.6 NNE 1012.5
Khatib 184.4 22.2 27.8 34.0 77.1 11.6 1.8 NNE 1012.7
▪ No Data
— Defective Data

Annual Climatological Report Singapore, 2016
40
March 2016
Station
Rain Air Temperature RH Wind Pressure
Total Min Average Max Average Max Average Prevailing Average
mm °C °C °C % m/s m/s Direction hPa
Manned Meteorological Stations
Changi 6.2 25.4 29.0 34.1 74.7 12.4 3.2 NE 1011.6
Paya Lebar — 25.1 35.5 14.4 4.2 NE 1011.1
Tengah 86.7 23.9 28.4 35.3 77.6 14.4 3.2 NNE 1011.0
Seletar 39.2 25.1 29.1 34.9 72.3 15.4 4.3 NNE 1011.2
Sembawang 132.9 23.8 28.6 34.1 78.6 12.3 3.4 NE 1011.1
Automatic Meteorological Stations
Tai Seng 55.4 25.4 29.0 33.7 74.9 13.1 3.0 ENE 1012.1
Jurong (West) 109.2 23.7 28.2 34.6 72.3 25.2 2.1 NE
Clementi 76.0 24.4 28.3 35.0 78.8 11.7 2.0 NE
Sentosa Island 69.8 23.0 29.0 34.2 68.0 12.6 2.2 NNE 1012.1
Boon Lay (East) — — — — — — — — —
Semakau Island 66.4 23.5 28.8 32.1 76.0 17.3 4.8 N 1011.4
Admiralty 54.8 24.3 28.4 35.0 85.2 14.7 3.3 NE
Pulau Ubin 29.8 23.2 28.1 34.1 86.2 11.0 2.9 NNW 1012.1
East Coast Parkway 21.6 26.2 28.8 33.2 79.0 14.4 2.9 NNE 1012.1
Marina Barrage 27.8 24.8 29.3 34.7 74.0 12.6 2.7 NNE 1011.9
Ang Mo Kio 39.4 24.3 28.5 34.7 74.7 11.1 2.0 NE 1012.1
Newton 119.0 24.1 28.4 34.2 73.9 12.9 2.0 E
Tuas South 102.6 24.2 29.0 34.8 74.5 12.0 1.5 NE 1011.9
Pasir Panjang 85.4 23.2 29.1 33.9 80.2 16.4 3.0 NE 1011.7
Jurong Island 106.6 23.9 29.1 34.8 71.5 11.5 1.9 N 1011.5
Choa Chu Kang (South) 49.6 25.1 28.6 34.8 88.2 12.0 2.2 NNE 1011.9
Khatib 114.8 23.4 28.9 34.9 74.5 10.3 1.7 NE 1012.3
▪ No Data
— Defective Data

Annual Climatological Report Singapore, 2016
41
April 2016
Station
Rain Air Temperature RH Wind Pressure
Total Min Average Max Average Max Average Prevailing Average
mm °C °C °C % m/s m/s Direction hPa
Manned Meteorological Stations
Changi 89.8 25.3 29.4 35.0 75.6 12.7 2.3 NE 1010.0
Paya Lebar 175.8 24.2 36.5 11.3 2.7 NE 1009.6
Tengah 193.3 24.0 28.5 36.2 80.7 14.4 2.2 N 1009.4
Seletar 100.0 25.4 29.7 36.7 73.3 13.4 2.9 NE 1009.6
Sembawang 190.1 23.5 28.8 35.1 81.2 13.9 2.0 NE 1009.5
Automatic Meteorological Stations
Tai Seng 108.2 25.3 29.7 35.4 74.9 10.6 1.8 ENE 1010.5
Jurong (West) 225.2 23.7 28.7 35.1 69.8 14.9 1.8 ENE
Clementi 203.8 23.4 28.8 36.4 79.7 10.4 1.5 NE
Sentosa Island 110.8 23.8 29.3 35.3 71.4 11.0 2.0 E 1010.6
Boon Lay (East) — — — — — — — — —
Semakau Island 58.8 25.4 29.5 33.5 76.5 18.5 5.0 N 1009.9
Admiralty 116.4 24.0 29.1 36.3 84.9 12.1 2.3 NE
Pulau Ubin 39.0 23.9 28.7 36.6 86.3 17.5 2.6 NW 1010.5
East Coast Parkway 128.6 24.9 29.4 33.6 80.2 12.7 2.5 NNE 1010.6
Marina Barrage 66.0 25.5 30.0 36.0 75.3 10.3 1.7 NE 1010.3
Ang Mo Kio 280.6 24.0 29.1 35.8 75.5 18.6 1.5 ENE 1010.5
Newton 161.0 24.5 28.9 34.4 74.8 13.3 1.8 E
Tuas South 101.0 23.8 29.7 35.6 74.8 17.7 1.4 NE 1010.4
Pasir Panjang 182.6 23.5 29.7 35.3 81.2 17.1 2.4 NE 1010.1
Jurong Island 125.8 24.2 29.7 35.6 73.1 14.9 2.2 NE 1010.0
Choa Chu Kang (South) 187.2 24.4 28.7 35.7 85.1 13.1 1.4 N 1010.4
Khatib 241.2 23.7 28.9 35.7 70.9 10.2 1.2 NE 1010.7
▪ No Data
— Defective Data

Annual Climatological Report Singapore, 2016
42
8.2. May to Aug

Annual Climatological Report Singapore, 2016
43

Annual Climatological Report Singapore, 2016
44
May 2016
Station
Rain Air Temperature RH Wind Pressure
Total Min Average Max Average Max Average Prevailing Average
mm °C °C °C % m/s m/s Direction hPa
Manned Meteorological Stations
Changi 193.8 23.9 29.3 34.6 77.4 14.9 2.1 SSW 1009.4
Paya Lebar 186.8 25.0 36.5 15.4 2.3 S 1009.0
Tengah 247.1 24.2 28.3 36.1 82.2 15.4 1.9 N 1008.9
Seletar 308.2 24.3 29.6 36.1 76.2 17.5 2.3 E 1009.0
Sembawang 234.1 22.1 28.4 35.3 83.5 16.5 2.0 W 1009.0
Automatic Meteorological Stations
Tai Seng 200.4 24.7 29.8 35.5 75.9 12.6 1.5 SSW 1009.9
Jurong (West) 346.6 23.2 28.5 35.4 73.2 20.4 1.8 N
Clementi 164.8 23.7 28.9 35.9 80.2 12.8 1.2 NE
Sentosa Island 173.4 24.0 29.3 35.3 73.2 13.2 1.9 E 1010.0
Boon Lay (East) — — — — — — — — —
Semakau Island 92.0 24.7 29.5 34.0 76.5 23.7 5.4 S 1009.3
Admiralty 211.0 23.7 28.8 35.5 87.0 16.1 1.8 N
Pulau Ubin 145.4 23.7 28.5 35.7 88.8 12.0 2.6 NW 1009.8
East Coast Parkway 152.2 24.4 29.4 33.2 80.5 14.9 2.7 ESE 1010.0
Marina Barrage 207.2 24.7 30.0 35.9 76.2 14.6 1.8 ESE 1009.8
Ang Mo Kio 225.6 24.1 29.2 35.6 76.4 17.9 1.4 W 1009.9
Newton 156.4 24.0 28.8 34.5 74.0 15.1 1.8 ESE
Tuas South 187.4 23.7 29.5 34.4 76.3 15.0 1.6 SSW 1009.9
Pasir Panjang 116.6 24.1 29.7 34.2 82.4 23.5 2.5 NE 1009.6
Jurong Island 121.4 23.7 29.7 34.1 73.5 16.9 2.3 WSW 1009.5
Choa Chu Kang (South) 238.4 24.2 28.7 35.7 84.0 12.9 1.2 N 1009.8
Khatib 257.0 23.7 28.6 35.5 — 11.2 1.0 NW 1010.1
▪ No Data
— Defective Data
Annual Climatological Report Singapore, 2016
45
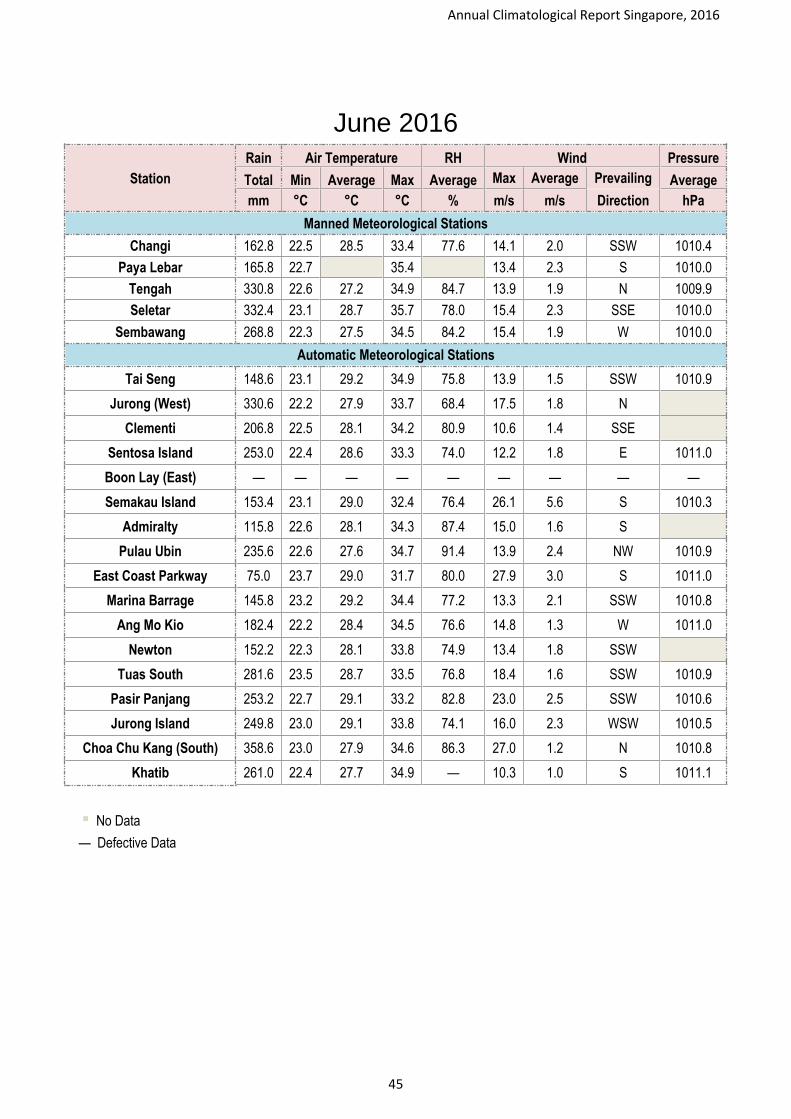
June 2016
Station
Rain Air Temperature RH Wind Pressure
Total Min Average Max Average Max Average Prevailing Average
mm °C °C °C % m/s m/s Direction hPa
Manned Meteorological Stations
Changi 162.8 22.5 28.5 33.4 77.6 14.1 2.0 SSW 1010.4
Paya Lebar 165.8 22.7 35.4 13.4 2.3 S 1010.0
Tengah 330.8 22.6 27.2 34.9 84.7 13.9 1.9 N 1009.9
Seletar 332.4 23.1 28.7 35.7 78.0 15.4 2.3 SSE 1010.0
Sembawang 268.8 22.3 27.5 34.5 84.2 15.4 1.9 W 1010.0
Automatic Meteorological Stations
Tai Seng 148.6 23.1 29.2 34.9 75.8 13.9 1.5 SSW 1010.9
Jurong (West) 330.6 22.2 27.9 33.7 68.4 17.5 1.8 N
Clementi 206.8 22.5 28.1 34.2 80.9 10.6 1.4 SSE
Sentosa Island 253.0 22.4 28.6 33.3 74.0 12.2 1.8 E 1011.0
Boon Lay (East) — — — — — — — — —
Semakau Island 153.4 23.1 29.0 32.4 76.4 26.1 5.6 S 1010.3
Admiralty 115.8 22.6 28.1 34.3 87.4 15.0 1.6 S
Pulau Ubin 235.6 22.6 27.6 34.7 91.4 13.9 2.4 NW 1010.9
East Coast Parkway 75.0 23.7 29.0 31.7 80.0 27.9 3.0 S 1011.0
Marina Barrage 145.8 23.2 29.2 34.4 77.2 13.3 2.1 SSW 1010.8
Ang Mo Kio 182.4 22.2 28.4 34.5 76.6 14.8 1.3 W 1011.0
Newton 152.2 22.3 28.1 33.8 74.9 13.4 1.8 SSW
Tuas South 281.6 23.5 28.7 33.5 76.8 18.4 1.6 SSW 1010.9
Pasir Panjang 253.2 22.7 29.1 33.2 82.8 23.0 2.5 SSW 1010.6
Jurong Island 249.8 23.0 29.1 33.8 74.1 16.0 2.3 WSW 1010.5
Choa Chu Kang (South) 358.6 23.0 27.9 34.6 86.3 27.0 1.2 N 1010.8
Khatib 261.0 22.4 27.7 34.9 — 10.3 1.0 S 1011.1
▪ No Data
— Defective Data

Annual Climatological Report Singapore, 2016
46
July 2016
Station
Rain Air Temperature RH Wind Pressure
Total Min Average Max Average Max Average Prevailing Average
mm °C °C °C % m/s m/s Direction hPa
Manned Meteorological Stations
Changi 168.6 22.5 28.4 33.4 77.1 14.6 2.2 S 1009.8
Paya Lebar 194.7 23.2 34.1 12.9 2.6 S 1009.4
Tengah 426.0 22.3 27.7 35.2 82.6 15.9 2.1 N 1009.3
Seletar 260.8 22.2 28.7 36.0 76.7 17.5 2.5 S 1009.3
Sembawang 205.8 22.3 27.8 34.6 82.1 19.0 2.1 S 1009.4
Automatic Meteorological Stations
Tai Seng 209.6 23.3 28.9 34.3 76.6 22.8 1.5 SSW 1010.3
Jurong (West) 322.4 22.2 27.9 33.7 69.4 17.3 1.9 SE
Clementi 275.6 21.3 28.0 34.3 81.4 10.5 1.6 NNW
Sentosa Island 220.0 23.4 28.3 33.7 75.4 12.4 1.7 ESE 1010.5
Boon Lay (East) — — — — — — — — —
Semakau Island 199.7 23.6 28.7 32.5 78.1 25.8 5.4 S 1009.8
Admiralty 256.6 22.2 28.2 34.7 84.9 14.3 1.8 S
Pulau Ubin — 22.7 27.7 34.2 90.6 12.4 2.4 NW 1010.3
East Coast Parkway 158.6 23.0 28.8 32.0 80.5 15.8 3.1 SE 1010.4
Marina Barrage 207.0 23.2 29.0 35.6 77.2 20.4 2.5 NNW 1010.2
Ang Mo Kio 179.2 21.2 28.3 34.6 76.4 18.2 1.5 E 1010.4
Newton 165.4 22.2 27.9 33.2 75.5 15.1 2.0 ESE
Tuas South 288.8 23.6 28.0 34.1 79.4 15.1 1.6 SSW 1010.3
Pasir Panjang 271.0 22.3 28.9 33.6 83.7 18.5 2.6 ESE 1010.0
Jurong Island — 21.9 29.0 33.5 75.1 12.8 2.5 ESE 1009.9
Choa Chu Kang (South) 431.6 22.5 28.0 34.5 78.2 28.4 1.3 N 1010.2
Khatib 181.2 22.2 27.9 34.7 — 11.1 1.1 S 1010.5
▪ No Data
— Defective Data

Annual Climatological Report Singapore, 2016
47
August 2016
Station
Rain Air Temperature RH Wind Pressure
Total Min Average Max Average Max Average Prevailing Average
mm °C °C °C % m/s m/s Direction hPa
Manned Meteorological Stations
Changi 139.2 22.1 28.9 33.8 74.0 18.1 2.3 SSW 1009.4
Paya Lebar 115.1 22.4 34.2 17.0 3.1 S 1009.0
Tengah 213.0 21.5 28.3 34.2 78.8 18.0 2.5 S 1008.9
Seletar 95.6 22.9 29.7 35.4 70.7 19.0 2.9 S 1008.9
Sembawang 131.8 21.6 28.4 33.8 79.6 18.5 2.3 S 1009.0
Automatic Meteorological Stations
Tai Seng 172.8 22.3 29.5 33.6 73.0 19.7 2.0 SSW 1009.9
Jurong (West) 85.6 22.1 28.6 32.9 69.8 19.5 2.2 S
Clementi 97.4 22.2 28.7 33.4 77.0 11.5 1.5 SE
Sentosa Island 111.6 22.1 28.8 33.3 71.7 18.0 2.2 SSW 1010.1
Boon Lay (East) — — — — — — — — —
Semakau Island 106.6 23.7 29.0 31.5 77.0 27.1 6.2 S 1009.4
Admiralty 163.4 21.9 28.8 33.7 80.4 18.1 2.0 S
Pulau Ubin — 22.2 28.2 34.2 87.4 12.1 2.4 W 1010.0
East Coast Parkway 112.2 22.6 29.1 31.9 78.7 18.7 4.1 SSW 1010.0
Marina Barrage 97.0 22.9 29.5 34.5 74.4 17.5 2.8 SSW 1009.8
Ang Mo Kio 133.6 22.3 29.1 34.1 70.9 19.0 1.7 SW 1009.9
Newton — 21.6 28.4 32.2 72.9 14.3 2.3 SSW
Tuas South 145.8 23.0 29.3 33.1 73.9 18.0 2.0 SSW 1009.9
Pasir Panjang 79.0 22.6 29.3 32.8 80.8 23.9 2.8 ESE 1009.6
Jurong Island 115.4 23.0 29.1 33.1 73.6 15.2 3.0 SSE 1009.5
Choa Chu Kang (South) 192.2 22.1 28.8 33.7 74.6 15.5 1.4 SSE 1009.8
Khatib 92.0 22.1 28.5 33.9 — 11.4 1.3 S 1010.1
▪ No Data
— Defective Data

Annual Climatological Report Singapore, 2016
48
8.3. Sep to Dec

Annual Climatological Report Singapore, 2016
49
September 2016
Station
Rain Air Temperature RH Wind Pressure
Total Min Average Max Average Max Average Prevailing Average
mm °C °C °C % m/s m/s Direction hPa
Manned Meteorological Stations
Changi 118.9 22.6 28.3 34.4 73.9 15.0 1.9 SSW 1010.0
Paya Lebar 194.9 22.2 36.3 15.9 2.7 W 1009.6
Tengah 148.9 21.8 28.0 35.3 79.3 14.9 2.3 WSW 1009.5
Seletar 107.2 23.0 28.9 36.8 72.9 20.1 2.5 WSW 1009.5
Sembawang 93.5 22.4 27.8 35.3 80.1 17.0 2.2 S 1009.5
Automatic Meteorological Stations
Tai Seng 180.4 22.9 29.0 35.4 72.8 22.0 1.7 SSW 1010.5
Jurong (West) 140.0 22.2 27.9 33.2 69.0 18.9 2.1 WNW
Clementi 182.0 21.8 28.2 34.9 77.7 12.5 1.9 NNW
Sentosa Island 187.2 22.0 28.5 33.7 71.1 13.0 1.6 S 1010.6
Boon Lay (East) — — — — — — — — —
Semakau Island 203.4 23.1 28.8 31.6 76.3 28.6 6.9 W 1009.9
Admiralty 93.8 22.7 28.2 34.5 82.6 16.6 2.0 S
Pulau Ubin 118.8 22.2 27.5 34.9 87.3 12.0 2.3 WNW 1010.4
East Coast Parkway 172.4 22.4 28.6 33.7 78.6 19.4 3.1 S 1010.5
Marina Barrage 212.0 22.1 29.0 35.2 73.6 17.3 3.7 NNW 1010.3
Ang Mo Kio 142.6 22.8 28.4 35.2 72.8 13.7 1.5 W 1010.5
Newton — — — — — — — —
Tuas South 133.0 24.0 28.8 33.1 74.6 17.8 2.1 SSW 1010.5
Pasir Panjang 143.0 21.8 28.9 33.0 80.2 22.2 3.0 SSW 1010.2
Jurong Island 156.0 22.7 28.7 33.8 72.9 15.4 2.1 WSW 1010.1
Choa Chu Kang (South) 148.6 22.6 28.2 34.3 74.7 12.1 1.3 N 1010.4
Khatib 103.4 22.4 28.0 35.8 — 13.0 1.2 S 1010.7
▪ No Data
— Defective Data

Annual Climatological Report Singapore, 2016
50
October 2016
Station
Rain Air Temperature RH Wind Pressure
Total Min Average Max Average Max Average Prevailing Average
mm °C °C °C % m/s m/s Direction hPa
Manned Meteorological Stations
Changi 181.0 21.6 28.3 34.6 72.0 14.2 1.8 W 1009.4
Paya Lebar 240.4 22.7 35.5 15.4 2.6 W 1009.1
Tengah 289.1 22.3 28.0 34.9 80.4 14.9 2.3 SW 1009.0
Seletar 215.4 23.3 28.8 35.5 73.8 17.5 2.3 WSW 1009.0
Sembawang 201.5 22.0 27.7 34.5 82.8 18.5 2.5 W 1009.0
Automatic Meteorological Stations
Tai Seng 192.8 23.0 28.9 34.5 73.9 13.5 1.6 WNW 1009.9
Jurong (West) 214.2 21.7 27.7 32.5 70.9 18.3 2.2 WNW
Clementi — 22.5 27.8 34.1 80.3 11.8 2.2 NNW
Sentosa Island 196.0 23.2 28.4 33.7 71.6 13.3 1.6 WNW 1010.1
Boon Lay (East) — — — — — — — — —
Semakau Island 258.0 23.0 28.5 31.0 78.1 31.9 7.6 W 1009.4
Admiralty 245.8 22.2 28.1 33.8 82.9 15.7 2.2 WSW
Pulau Ubin 182.2 21.9 27.5 35.5 87.4 11.7 2.3 WNW 1009.9
East Coast Parkway 167.6 23.3 28.5 33.4 78.9 18.2 2.9 SW 1010.0
Marina Barrage 255.8 23.0 28.8 34.6 75.2 16.2 3.9 NNW 1009.8
Ang Mo Kio 220.0 22.4 28.3 34.4 74.2 14.2 1.6 WSW 1010.0
Newton — — — — — — — —
Tuas South 202.2 23.0 28.7 32.8 76.4 20.2 2.3 WNW 1010.0
Pasir Panjang 219.4 21.9 28.7 33.0 81.8 23.5 3.4 NE 1009.6
Jurong Island 137.8 22.5 28.8 33.5 73.7 15.9 1.9 WSW 1009.6
Choa Chu Kang (South) 221.0 22.6 28.1 33.9 78.8 14.8 1.3 W 1009.9
Khatib 184.0 22.8 27.9 34.6 — 10.9 1.1 W 1010.2
▪ No Data
— Defective Data

Annual Climatological Report Singapore, 2016
51
November 2016
Station
Rain Air Temperature RH Wind Pressure
Total Min Average Max Average Max Average Prevailing Average
mm °C °C °C % m/s m/s Direction hPa
Manned Meteorological Stations
Changi 290.2 22.7 27.4 32.6 77.6 12.7 1.7 NNW 1009.7
Paya Lebar 355.7 22.3 34.2 13.4 2.3 W 1009.4
Tengah 231.6 22.4 27.1 34.7 85.0 13.4 2.1 N 1009.3
Seletar 169.6 23.0 27.9 35.4 79.6 14.4 2.2 N 1009.3
Sembawang 206.7 21.9 27.0 34.1 87.2 15.4 2.4 N 1009.3
Automatic Meteorological Stations
Tai Seng 413.2 23.2 27.9 33.8 81.2 20.1 1.5 E 1010.2
Jurong (West) 169.6 22.6 26.9 33.4 — 16.5 1.8 N
Clementi 394.0 22.7 27.1 33.4 84.7 12.4 2.7 NNW
Sentosa Island — 23.0 27.7 32.8 78.8 11.8 1.7 SSW 1010.4
Boon Lay (East) — — — — — — — — —
Semakau Island 317.2 22.4 27.6 30.4 80.9 28.7 6.0 W 1009.7
Admiralty 160.6 22.1 27.2 34.0 90.8 16.1 2.0 N
Pulau Ubin 272.2 22.1 26.8 34.4 92.3 12.4 2.3 NE 1010.2
East Coast Parkway 187.8 23.6 27.8 31.9 84.3 18.3 2.2 N 1010.3
Marina Barrage 244.4 22.9 28.0 34.1 81.7 16.4 4.2 N 1010.1
Ang Mo Kio 266.2 22.8 27.4 34.3 82.1 17.7 1.3 W 1010.3
Newton — — — — — — — —
Tuas South 200.0 23.7 27.9 32.3 79.8 14.8 1.8 NNE 1010.2
Pasir Panjang 197.4 23.3 27.9 32.1 86.9 20.7 2.7 NE 1009.9
Jurong Island 326.6 22.7 27.9 32.5 78.4 14.1 1.8 WSW 1009.8
Choa Chu Kang (South) 239.4 23.1 27.2 34.8 93.0 24.7 1.2 N 1010.2
Khatib 201.4 22.2 27.2 34.1 — 9.6 1.0 NW 1010.5
▪ No Data
— Defective Data

Annual Climatological Report Singapore, 2016
52
December 2016
Station
Rain Air Temperature RH Wind Pressure
Total Min Average Max Average Max Average Prevailing Average
mm °C °C °C % m/s m/s Direction hPa
Manned Meteorological Stations
Changi 292.6 23.0 27.4 33.6 72.8 13.1 2.0 NNW 1009.5
Paya Lebar 235.9 23.1 35.6 16.5 2.8 N 1009.1
Tengah 196.8 22.3 27.3 35.4 82.4 16.5 2.5 N 1009.0
Seletar 255.2 23.6 27.9 35.9 77.1 14.9 2.5 NNW 1009.0
Sembawang 220.3 22.3 27.2 34.8 83.2 13.9 2.5 W 1009.1
Automatic Meteorological Stations
Tai Seng 268.2 23.3 27.9 34.3 79.0 13.2 1.9 NNE 1010.0
Jurong (West) 120.4 22.7 27.0 34.1 72.5 16.7 2.2 N
Clementi 205.0 22.8 27.3 34.7 82.7 11.6 3.0 NW
Sentosa Island — — — — — — — — —
Boon Lay (East) — — — — — — — — —
Semakau Island — 23.4 27.9 32.3 80.8 23.1 6.5 W 1009.4
Admiralty 186.0 22.8 27.2 34.2 87.8 13.0 2.5 N
Pulau Ubin 231.2 22.7 26.8 34.0 90.5 10.5 2.2 N 1010.0
East Coast Parkway 223.4 23.7 27.8 32.7 82.2 13.1 2.2 N 1010.1
Marina Barrage 184.8 23.5 28.2 34.3 78.2 14.3 4.8 NNW 1009.8
Ang Mo Kio 190.4 23.0 27.4 34.7 79.8 11.7 1.6 W 1010.1
Newton 177.4 22.6 27.1 34.0 74.1 12.7 1.9 NW
Tuas South 108.2 23.9 27.9 33.3 77.9 15.5 1.9 NNE 1010.0
Pasir Panjang 134.0 23.3 28.0 33.2 84.3 19.8 3.3 NE 1009.7
Jurong Island 100.8 23.3 28.4 34.2 74.3 12.4 1.8 NNW 1009.6
Choa Chu Kang (South) 187.2 23.1 27.4 34.9 78.3 21.7 1.6 N 1009.9
Khatib 193.0 22.8 27.3 34.7 — 11.2 1.3 NNW 1010.2
▪ No Data
— Defective Data

Annual Climatological Report Singapore, 2015
51
9. Weather Statistics for Manned Meteorological Station

Annual Climatological Report Singapore, 2015
52
9.1. Monthly Observation

Annual Climatological Report Singapore, 2015
53
S06 Paya Lebar 2016
Month Jan Feb Mar Apr May Jun Jul Aug Sep Oct Nov Dec
Min Temperature (°C) 23.3 23.8 25.1 24.2 25.0 22.7 23.2 22.4 22.2 22.7 22.3 23.1
Average Daily Min
Temperature (°C) 26.1 25.5 26.5 26.8 26.6 26.2 25.8 26.2 25.3 25.3 25.0 25.1
Average Temperature (°C) — — — — — — — — — — — —
Average Daily Max
Temperature (°C) 32.7 31.9 33.8 34.5 33.9 32.4 32.2 32.9 32.9 32.8 31.8 32.6
Max Temperature 34.5 34.1 35.5 36.5 36.5 35.4 34.1 34.2 36.3 35.5 34.2 35.6
Average Dew Point
Temperature (°C) — — — — — — — — — — — —
Min Relative Humidity (%) — — — — — — — — — — — —
Average Relative Humidity
(%) — — — — — — — — — — — —
Average Wind Speed (m/s) 3.9 4.9 4.2 2.7 2.3 2.3 2.6 3.1 2.7 2.6 2.3 2.8
Prevailing Wind Direction NE NE NE NE S S S S W W W N
Maximum Gust (m/s) 15.4 15.9 14.4 11.3 15.4 13.4 12.9 17.0 15.9 15.4 13.4 16.5
Total Rainfall (mm) 86.0 201.1 — 175.8 186.8 165.8 194.7 115.1 194.9 240.4 355.7 235.9
Highest Daily Rainfall (mm) 32.4 102.4 22.9 44.9 43.8 74.0 64.1 17.4 95.6 71.9 54.2 73.4
Average Temperature Paya Lebar 2015 Rainfall Paya Lebar 2015
▪ No Data
— Defective Data
0
50
100
150
200
250
300
350
400
Jan Feb Mar Apr May Jun Jul Aug Sep Oct Nov Dec
Rai
nfa
ll (m
m)
Month
Rainfall Paya Lebar 2016

Annual Climatological Report Singapore, 2015
54
S23 Tengah 2016
Month Jan Feb Mar Apr May Jun Jul Aug Sep Oct Nov Dec
Min Temperature (°C) 23.5 22.3 23.9 24.0 24.2 22.6 22.3 21.5 21.8 22.3 22.4 22.3
Average Daily Min
Temperature (°C) 24.4 23.9 24.9 25.0 24.9 24.2 24.0 24.2 23.7 24.0 23.0 23.8
Average Temperature (°C) 27.5 27.1 28.4 28.5 28.3 27.2 27.7 28.3 28.0 28.0 27.1 27.3
Average Daily Max
Temperature (°C) 32.5 31.8 34.0 34.5 34.0 32.0 32.1 32.8 32.6 32.3 31.9 32.6
Max Temperature 34.8 34.0 35.3 36.2 36.1 34.9 35.2 34.2 35.3 34.9 34.7 35.4
Average Dew Point
Temperature (°C) 24.3 23.4 23.8 24.6 24.8 24.2 24.3 24.1 23.8 24.0 24.2 23.8
Min Relative Humidity (%) — — — — — — — — — — — —
Average Relative Humidity
(%) 83.6 81.2 77.6 80.7 82.2 84.7 82.6 78.8 79.3 80.4 85.0 82.4
Average Wind Speed (m/s) 2.9 3.6 3.2 2.2 1.9 1.9 2.1 2.5 2.3 2.3 2.1 2.5
Prevailing Wind Direction NNE NNE NNE N N N N S WSW SW N N
Maximum Gust (m/s) 12.9 15.4 14.4 14.4 15.4 13.9 15.9 18.0 14.9 14.9 13.4 16.5
Total Rainfall (mm) 209.1 231.1 86.7 193.3 247.1 330.8 426.0 213.0 148.9 289.1 231.6 196.8
Highest Daily Rainfall (mm) 37.3 83.0 32.2 49.3 45.1 57.5 62.5 65.8 58.8 63.2 51.2 39.9
Average Temperature Tengah 2015 Rainfall Tengah 2015
▪ No Data
— Defective Data
24.0
25.0
26.0
27.0
28.0
29.0
Jan Feb Mar Apr May Jun Jul Aug Sep Oct Nov Dec
Tem
pe
ratu
re (
°C)
Month
Average Temperature Tengah2016
0
50
100
150
200
250
300
350
400
450
Jan Feb Mar Apr May Jun Jul Aug Sep Oct Nov Dec
Rai
nfa
ll (m
m)
Month
Rainfall Tengah 2016

Annual Climatological Report Singapore, 2015
55
S24 Changi 2016
Month Jan Feb Mar Apr May Jun Jul Aug Sep Oct Nov Dec
Min Temperature (°C) 22.9 23.3 25.4 25.3 23.9 22.5 22.5 22.1 22.6 21.6 22.7 23.0
Average Daily Min
Temperature (°C) 26.0 25.6 26.6 26.7 26.5 26.1 25.8 26.2 25.1 25.2 24.9 24.7
Average Temperature (°C) 28.3 27.8 29.0 29.4 29.3 28.5 28.4 28.9 28.3 28.3 27.4 27.4
Average Daily Max
Temperature (°C) 31.8 31.1 33.1 33.4 33.0 31.6 31.7 31.8 32.0 32.1 30.7 31.6
Max Temperature 32.8 32.7 34.1 35.0 34.6 33.4 33.4 33.8 34.4 34.6 32.6 33.6
Average Dew Point
Temperature (°C) 24.3 23.7 23.9 24.5 24.7 24.1 23.9 23.6 22.9 22.5 22.9 21.7
Min Relative Humidity (%) 55.0 55.0 47.0 46.0 48.0 45.0 48.0 41.0 33.0 38.0 46.0 34.0
Average Relative Humidity
(%) 79.6 78.8 74.7 75.6 77.4 77.6 77.1 74.0 73.9 72.0 77.6 72.8
Average Wind Speed (m/s) 2.8 3.3 3.2 2.3 2.1 2.0 2.2 2.3 1.9 1.8 1.7 2.0
Prevailing Wind Direction NE NE NE NE SSW SSW S SSW SSW W NNW NNW
Maximum Gust (m/s) 18.0 12.7 12.4 12.7 14.9 14.1 14.6 18.1 15.0 14.2 12.7 13.1
Total Rainfall (mm) 126.6 186.0 6.2 89.8 193.8 162.8 168.6 139.2 118.9 181.0 290.2 292.6
Highest Daily Rainfall (mm) 39.6 71.8 2.4 18.2 54.8 67.8 59.4 30.6 34.0 75.4 65.6 73.0
Average Temperature Changi 2015 Rainfall Changi 2015
▪ No Data
— Defective Data
24.0
25.0
26.0
27.0
28.0
29.0
30.0
Jan Feb Mar Apr May Jun Jul Aug Sep Oct Nov Dec
Tem
pe
ratu
re (
°C)
Month
Average Temperature Changi 2016
0
50
100
150
200
250
300
350
Jan Feb Mar Apr May Jun Jul Aug Sep Oct Nov Dec
Rai
nfa
ll (m
m)
Month
Rainfall Changi 2016

Annual Climatological Report Singapore, 2015
56
S25 Seletar 2016
Month Jan Feb Mar Apr May Jun Jul Aug Sep Oct Nov Dec
Min Temperature (°C) 23.6 22.2 25.1 25.4 24.3 23.1 22.2 22.9 23.0 23.3 23.0 23.6
Average Daily Min
Temperature (°C) 26.0 25.5 26.4 26.8 26.4 25.9 25.5 26.3 25.3 25.6 25.1 25.1
Average Temperature (°C) 28.4 28.0 29.1 29.7 29.6 28.7 28.7 29.7 28.9 28.8 27.9 27.9
Average Daily Max
Temperature (°C) 32.3 31.5 33.7 34.8 34.3 32.8 33.1 33.9 33.7 33.1 31.9 32.6
Max Temperature 34.4 33.5 34.9 36.7 36.1 35.7 36.0 35.4 36.8 35.5 35.4 35.9
Average Dew Point
Temperature (°C) 23.9 23.3 23.3 24.1 24.7 24.2 24.0 23.5 23.2 23.3 23.8 23.3
Min Relative Humidity (%) — — — — — — — — — — — —
Average Relative Humidity
(%) 77.6 76.2 72.3 73.3 76.2 78.0 76.7 70.7 72.9 73.8 79.6 77.1
Average Wind Speed (m/s) 3.8 4.7 4.3 2.9 2.3 2.3 2.5 2.9 2.5 2.3 2.2 2.5
Prevailing Wind Direction N NNE NNE NE E SSE S S WSW WSW N NNW
Maximum Gust (m/s) 17.5 19.0 15.4 13.4 17.5 15.4 17.5 19.0 20.1 17.5 14.4 14.9
Total Rainfall (mm) 119.3 181.2 39.2 100.0 308.2 332.4 260.8 95.6 107.2 215.4 169.6 255.2
Highest Daily Rainfall (mm) 43.0 77.8 26.4 17.0 62.2 86.6 54.6 38.2 18.0 53.8 20.4 52.6
Average Temperature Seletar 2015 Rainfall Seletar 2015
▪ No Data
— Defective Data
24.0
25.0
26.0
27.0
28.0
29.0
30.0
Jan Feb Mar Apr May Jun Jul Aug Sep Oct Nov Dec
Tem
pe
ratu
re (
°C)
Month
Average Temperature Seletar2016
0
50
100
150
200
250
300
350
Jan Feb Mar Apr May Jun Jul Aug Sep Oct Nov Dec
Rai
nfa
ll (m
m)
Month
Rainfall Seletar 2016

Annual Climatological Report Singapore, 2015
57
S80 Sembawang 2016
Month Jan Feb Mar Apr May Jun Jul Aug Sep Oct Nov Dec
Min Temperature (°C) 23.2 22.6 23.8 23.5 22.1 22.3 22.3 21.6 22.4 22.0 21.9 22.3
Average Daily Min
Temperature (°C) 24.9 24.5 25.3 25.1 24.7 24.1 24.1 24.4 23.7 24.1 23.9 24.0
Average Temperature (°C) 27.9 27.6 28.6 28.8 28.4 27.5 27.8 28.4 27.8 27.7 27.0 27.2
Average Daily Max
Temperature (°C) 32.0 31.5 33.1 33.9 33.6 31.8 32.1 32.7 32.6 32.3 31.4 32.0
Max Temperature 33.7 33.3 34.1 35.1 35.3 34.5 34.6 33.8 35.3 34.5 34.1 34.8
Average Dew Point
Temperature (°C) 24.5 23.9 24.4 25.0 25.2 24.4 24.2 24.2 23.7 24.2 24.6 23.9
Min Relative Humidity (%) — — — — — — — — — — — —
Average Relative Humidity
(%) 82.5 81.3 78.6 81.2 83.5 84.2 82.1 79.6 80.1 82.8 87.2 83.2
Average Wind Speed (m/s) 2.8 3.3 3.4 2.0 2.0 1.9 2.1 2.3 2.2 2.5 2.4 2.5
Prevailing Wind Direction NE NNE NE NE W W S S S W N W
Maximum Gust (m/s) 14.4 13.9 12.3 13.9 16.5 15.4 19.0 18.5 17.0 18.5 15.4 13.9
Total Rainfall (mm) 146.4 181.6 132.9 190.1 234.1 268.8 205.8 131.8 93.5 201.5 206.7 220.3
Highest Daily Rainfall (mm) 35.0 88.1 46.6 35.5 83.0 75.1 43.2 47.5 19.4 85.0 28.0 46.0
Average Temperature Sembawang
2015
Rainfall Sembawang 2015
▪ No Data
— Defective Data
24.0
25.0
26.0
27.0
28.0
29.0
30.0
Jan Feb Mar Apr May Jun Jul Aug Sep Oct Nov Dec
Tem
pe
ratu
re (
°C)
Month
Average Temperature Sembawang 2016
0
50
100
150
200
250
300
Jan Feb Mar Apr May Jun Jul Aug Sep Oct Nov Dec
Rai
nfa
ll (m
m)
Month
Rainfall Sembawang 2016

Annual Climatological Report Singapore, 2016
58
9.2. Hourly Observation

Annual Climatological Report Singapore, 2016
59
S06 Paya Lebar 2016
Hours 1 2 3 4 5 6 7 8 9 10 11 12
Min Dry Bulb
Temperature (°C) 23.3 23.1 23.3 23.3 23.9 24.3 23.7 24.0
Max Dry Bulb
Temperature (°C) 29.8 29.8 29.5 29.8 31.2 32.0 33.4 35.0
Average Dry Bulb
Temperature (°C) 27.3 27.1 27.0 27.3 28.2 29.3 30.2 31.0
Average Dew Point
Temperature (°C) 24.7 24.6 24.5 24.6 24.6 24.5 24.3 24.2
Average Relative
Humidity (%) 85.6 86.0 86.5 85.3 81.0 75.8 71.3 67.9
Average Wind Speed
(m/s) 2.0 2.0 2.0 2.1 2.6 3.1 3.5 3.6
Max Gust (m/s) 13.4 15.9 17.0 14.4 12.3 10.8 13.4 13.9
Rainfall (mm) 129.7 169.8 154.2 84.1 75.4 55.5 84.3 120.2
Average Temperature Paya Lebar 2015
▪ No Data
— Defective Data
23
24
25
26
27
28
29
30
31
32
0 1 2 3 4 5 6 7 8 9 10 11 12 13 14 15 16 17 18 19 20 21 22 23 24
Tem
per
atu
re [
°C]
Hour
Average Temperature Paya Lebar 2016

Annual Climatological Report Singapore, 2016
60
S06 Paya Lebar 2016
Hours 13 14 15 16 17 18 19 20 21 22 23 24
Min Dry Bulb Temperature (°C)
24.6 23.9 24.3 24.7 25.1 24.7 24.0 24.5 24.3 24.7 24.9
Max Dry Bulb Temperature (°C)
35.1 36.0 36.3 36.1 35.8 34.4 33.4 32.7 31.9 31.7 31.3
Average Dry Bulb Temperature (°C)
31.4 31.6 31.5 31.3 30.9 30.3 29.6 29.1 28.7 28.5 28.3
Average Dew Point Temperature (°C)
24.1 24.1 24.0 24.0 23.9 24.0 24.1 24.2 24.4 24.6 24.6
Average Relative Humidity (%)
66.0 65.3 65.6 66.6 67.7 69.8 72.8 75.9 78.1 79.7 80.9
Average Wind Speed (m/s)
3.8 4.0 4.1 4.0 3.8 3.5 3.2 2.8 2.5 2.2 2.1
Max Gust (m/s) 15.9 13.4 14.4 15.4 15.9 16.5 13.4 15.4 13.9 9.8 12.3
Rainfall (mm) 130.3 173.0 110.4 127.8 159.0 205.4 69.8 50.7 77.8 21.1 9.5
Rainfall Paya Lebar 2015
▪ No Data
— Defective Data
0
50
100
150
200
250
1 2 3 4 5 6 7 8 9 10 11 12 13 14 15 16 17 18 19 20 21 22 23 24
Rai
nfa
ll [
mm
]
Hour
Rainfall Paya Lebar 2016

Annual Climatological Report Singapore, 2016
61
S23 Tengah 2016
Hours 1 2 3 4 5 6 7 8 9 10 11 12
Min Dry Bulb
Temperature (°C) 22.9 23.4 23.6 23.4 23.1 22.7 22.1 22.5 23.0 23.6 23.2 23.5
Max Dry Bulb
Temperature (°C) 28.6 28.5 28.0 28.1 28.4 28.2 27.6 27.9 29.9 31.2 32.8 34.0
Average Dry Bulb
Temperature (°C) 26.3 26.1 25.9 25.7 25.5 25.3 25.2 25.3 26.8 28.2 29.4 30.3
Average Dew Point
Temperature (°C) 24.3 24.2 24.2 24.1 23.8 23.8 23.7 24.0 24.6 24.6 24.5 24.4
Average Relative
Humidity (%) 88.9 89.6 90.4 90.9 90.8 91.3 91.7 92.4 88.2 81.0 75.4 71.3
Average Wind Speed
(m/s) — — — — 1.4 1.5 1.4 1.4 1.9 2.6 2.9 3.1
Max Gust (m/s) — — — — 16.5 18.0 14.9 15.4 9.8 11.3 12.3 14.4
Rainfall (mm) 101.9 32.5 26.7 82.8 91.9 133.9 112.8 105.5 44.8 88.6 245.1 152.5
Average Temperature Tengah 2015
▪ No Data
— Defective Data
23.0
24.0
25.0
26.0
27.0
28.0
29.0
30.0
31.0
32.0
0 1 2 3 4 5 6 7 8 9 10 11 12 13 14 15 16 17 18 19 20 21 22 23 24
Tem
per
atu
re [
°C]
Hour
Average Temperature Tengah 2016
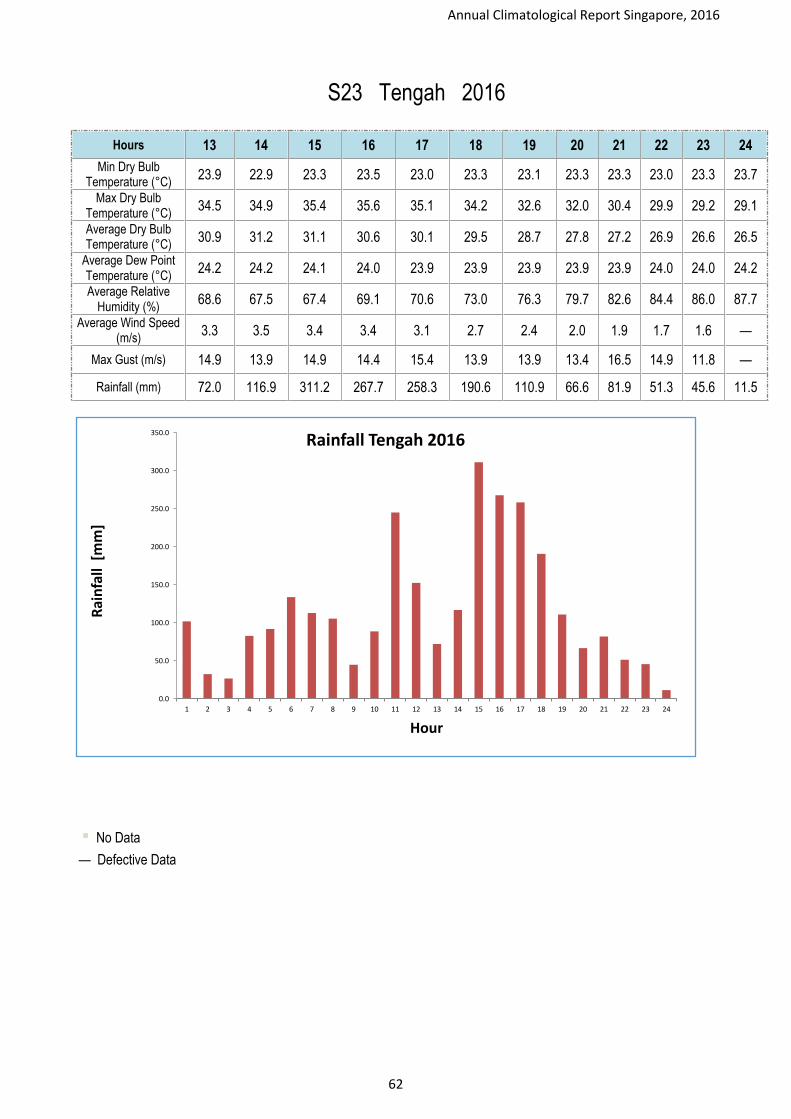
Annual Climatological Report Singapore, 2016
62
S23 Tengah 2016
Hours 13 14 15 16 17 18 19 20 21 22 23 24
Min Dry Bulb Temperature (°C)
23.9 22.9 23.3 23.5 23.0 23.3 23.1 23.3 23.3 23.0 23.3 23.7
Max Dry Bulb Temperature (°C)
34.5 34.9 35.4 35.6 35.1 34.2 32.6 32.0 30.4 29.9 29.2 29.1
Average Dry Bulb Temperature (°C)
30.9 31.2 31.1 30.6 30.1 29.5 28.7 27.8 27.2 26.9 26.6 26.5
Average Dew Point Temperature (°C)
24.2 24.2 24.1 24.0 23.9 23.9 23.9 23.9 23.9 24.0 24.0 24.2
Average Relative Humidity (%)
68.6 67.5 67.4 69.1 70.6 73.0 76.3 79.7 82.6 84.4 86.0 87.7
Average Wind Speed (m/s)
3.3 3.5 3.4 3.4 3.1 2.7 2.4 2.0 1.9 1.7 1.6 —
Max Gust (m/s) 14.9 13.9 14.9 14.4 15.4 13.9 13.9 13.4 16.5 14.9 11.8 —
Rainfall (mm) 72.0 116.9 311.2 267.7 258.3 190.6 110.9 66.6 81.9 51.3 45.6 11.5
Rainfall Tengah 2015
▪ No Data
— Defective Data
0.0
50.0
100.0
150.0
200.0
250.0
300.0
350.0
1 2 3 4 5 6 7 8 9 10 11 12 13 14 15 16 17 18 19 20 21 22 23 24
Rai
nfa
ll [
mm
]
Hour
Rainfall Tengah 2016

Annual Climatological Report Singapore, 2016
63
S24 Changi 2016
Hours 1 2 3 4 5 6 7 8 9 10 11 12
Min Dry Bulb
Temperature (°C) 24.7 23.6 23.9 22.5 22.8 21.8 22.5 22.9 23.2 24.4 23.9 23.3
Max Dry Bulb
Temperature (°C) 29.9 29.7 29.5 29.3 29.2 29.1 29.3 30.1 31.3 32.4 33.3 33.5
Average Dry Bulb
Temperature (°C) 27.4 27.3 27.1 26.9 26.8 26.7 26.6 27.1 28.2 29.1 29.8 30.3
Average Dew Point
Temperature (°C) 23.9 24.0 24.1 24.1 24.1 24.0 24.0 24.2 24.1 23.8 23.5 23.2
Average Relative
Humidity (%) 81.6 82.7 83.8 84.8 85.4 85.9 86.1 84.3 78.9 73.7 69.7 66.3
Average Wind Speed
(m/s) 1.7 1.7 1.6 1.5 1.5 1.5 1.5 1.7 2.1 2.6 2.8 3.0
Max Gust (m/s) 13.0 13.1 11.5 10.6 15.0 14.2 18.1 14.2 12.4 12.5 18.0 14.6
Rainfall (mm) 19.2 51.0 44.4 73.0 100.0 117.0 151.4 74.8 96.0 69.6 85.0 77.0
Average Temperature Changi 2015
▪ No Data
— Defective Data
23.0
24.0
25.0
26.0
27.0
28.0
29.0
30.0
31.0
32.0
0 1 2 3 4 5 6 7 8 9 10 11 12 13 14 15 16 17 18 19 20 21 22 23 24
Tem
per
atu
re [
°C]
Hour
Average Temperature Changi 2016
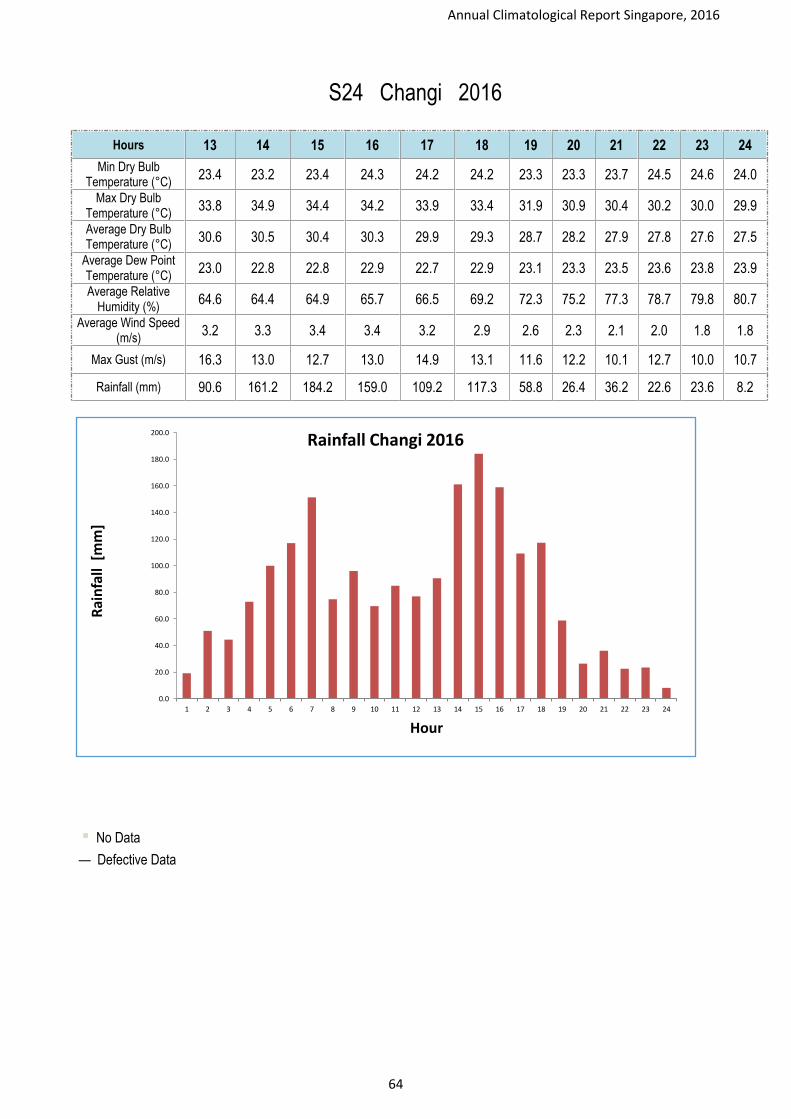
Annual Climatological Report Singapore, 2016
64
S24 Changi 2016
Hours 13 14 15 16 17 18 19 20 21 22 23 24
Min Dry Bulb Temperature (°C)
23.4 23.2 23.4 24.3 24.2 24.2 23.3 23.3 23.7 24.5 24.6 24.0
Max Dry Bulb Temperature (°C)
33.8 34.9 34.4 34.2 33.9 33.4 31.9 30.9 30.4 30.2 30.0 29.9
Average Dry Bulb Temperature (°C)
30.6 30.5 30.4 30.3 29.9 29.3 28.7 28.2 27.9 27.8 27.6 27.5
Average Dew Point Temperature (°C)
23.0 22.8 22.8 22.9 22.7 22.9 23.1 23.3 23.5 23.6 23.8 23.9
Average Relative Humidity (%)
64.6 64.4 64.9 65.7 66.5 69.2 72.3 75.2 77.3 78.7 79.8 80.7
Average Wind Speed (m/s)
3.2 3.3 3.4 3.4 3.2 2.9 2.6 2.3 2.1 2.0 1.8 1.8
Max Gust (m/s) 16.3 13.0 12.7 13.0 14.9 13.1 11.6 12.2 10.1 12.7 10.0 10.7
Rainfall (mm) 90.6 161.2 184.2 159.0 109.2 117.3 58.8 26.4 36.2 22.6 23.6 8.2
Rainfall Changi 2015
▪ No Data
— Defective Data
0.0
20.0
40.0
60.0
80.0
100.0
120.0
140.0
160.0
180.0
200.0
1 2 3 4 5 6 7 8 9 10 11 12 13 14 15 16 17 18 19 20 21 22 23 24
Rai
nfa
ll [
mm
]
Hour
Rainfall Changi 2016
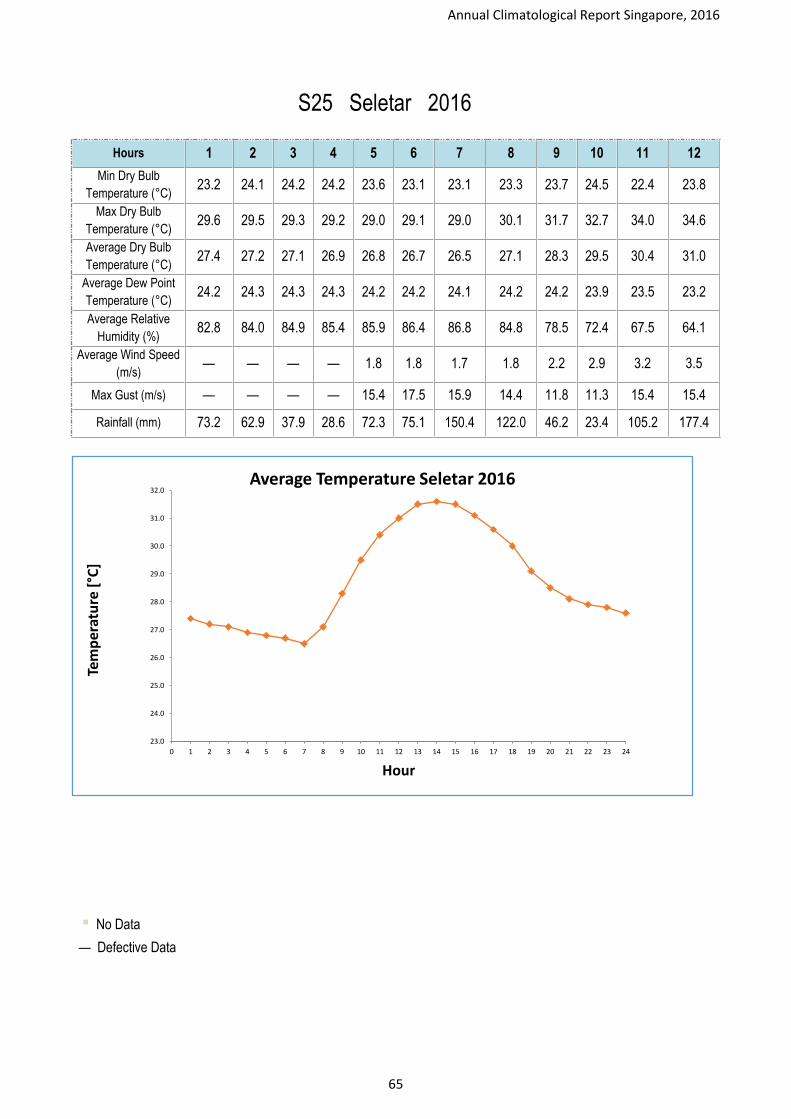
Annual Climatological Report Singapore, 2016
65
S25 Seletar 2016
Hours 1 2 3 4 5 6 7 8 9 10 11 12
Min Dry Bulb
Temperature (°C) 23.2 24.1 24.2 24.2 23.6 23.1 23.1 23.3 23.7 24.5 22.4 23.8
Max Dry Bulb
Temperature (°C) 29.6 29.5 29.3 29.2 29.0 29.1 29.0 30.1 31.7 32.7 34.0 34.6
Average Dry Bulb
Temperature (°C) 27.4 27.2 27.1 26.9 26.8 26.7 26.5 27.1 28.3 29.5 30.4 31.0
Average Dew Point
Temperature (°C) 24.2 24.3 24.3 24.3 24.2 24.2 24.1 24.2 24.2 23.9 23.5 23.2
Average Relative
Humidity (%) 82.8 84.0 84.9 85.4 85.9 86.4 86.8 84.8 78.5 72.4 67.5 64.1
Average Wind Speed
(m/s) — — — — 1.8 1.8 1.7 1.8 2.2 2.9 3.2 3.5
Max Gust (m/s) — — — — 15.4 17.5 15.9 14.4 11.8 11.3 15.4 15.4
Rainfall (mm) 73.2 62.9 37.9 28.6 72.3 75.1 150.4 122.0 46.2 23.4 105.2 177.4
Average Temperature Seletar 2015
▪ No Data
— Defective Data
23.0
24.0
25.0
26.0
27.0
28.0
29.0
30.0
31.0
32.0
0 1 2 3 4 5 6 7 8 9 10 11 12 13 14 15 16 17 18 19 20 21 22 23 24
Tem
per
atu
re [
°C]
Hour
Average Temperature Seletar 2016

Annual Climatological Report Singapore, 2016
66
S25 Seletar 2016
Hours 13 14 15 16 17 18 19 20 21 22 23 24
Min Dry Bulb Temperature (°C)
23.8 23.7 24.1 24.0 24.3 22.4 23.3 23.7 23.9 24.0 24.6 24.8
Max Dry Bulb Temperature (°C)
35.1 36.1 35.5 35.2 35.0 34.4 33.2 31.8 31.0 30.8 30.2 29.8
Average Dry Bulb Temperature (°C)
31.5 31.6 31.5 31.1 30.6 30.0 29.1 28.5 28.1 27.9 27.8 27.6
Average Dew Point Temperature (°C)
22.9 22.9 22.9 22.9 23.0 23.1 23.3 23.6 23.8 23.9 24.1 24.2
Average Relative Humidity (%)
61.5 60.9 61.7 63.4 65.0 67.8 71.7 75.4 77.6 79.3 80.6 81.9
Average Wind Speed (m/s)
3.5 3.8 4.0 3.9 3.8 3.5 3.2 3.0 2.7 2.4 2.2 —
Max Gust (m/s) 17.0 14.9 14.9 17.5 19.5 15.4 13.9 14.4 11.8 14.9 14.4 —
Rainfall (mm) 111.2 122.9 296.6 173.6 114.4 179.8 50.6 60.8 59.0 18.6 16.0 6.0
Rainfall Seletar 2015
▪ No Data
— Defective Data
0.0
50.0
100.0
150.0
200.0
250.0
300.0
350.0
1 2 3 4 5 6 7 8 9 10 11 12 13 14 15 16 17 18 19 20 21 22 23 24
Rai
nfa
ll [
mm
]
Hour
Rainfall Seletar 2016
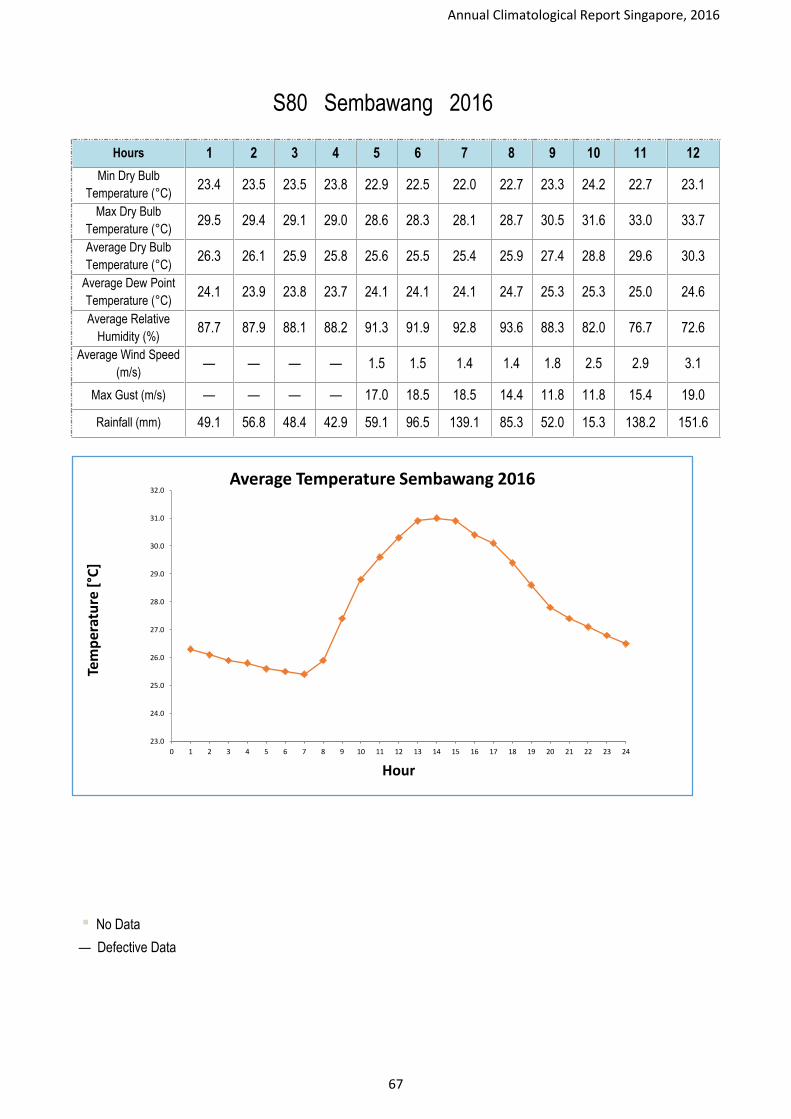
Annual Climatological Report Singapore, 2016
67
S80 Sembawang 2016
Hours 1 2 3 4 5 6 7 8 9 10 11 12
Min Dry Bulb
Temperature (°C) 23.4 23.5 23.5 23.8 22.9 22.5 22.0 22.7 23.3 24.2 22.7 23.1
Max Dry Bulb
Temperature (°C) 29.5 29.4 29.1 29.0 28.6 28.3 28.1 28.7 30.5 31.6 33.0 33.7
Average Dry Bulb
Temperature (°C) 26.3 26.1 25.9 25.8 25.6 25.5 25.4 25.9 27.4 28.8 29.6 30.3
Average Dew Point
Temperature (°C) 24.1 23.9 23.8 23.7 24.1 24.1 24.1 24.7 25.3 25.3 25.0 24.6
Average Relative
Humidity (%) 87.7 87.9 88.1 88.2 91.3 91.9 92.8 93.6 88.3 82.0 76.7 72.6
Average Wind Speed
(m/s) — — — — 1.5 1.5 1.4 1.4 1.8 2.5 2.9 3.1
Max Gust (m/s) — — — — 17.0 18.5 18.5 14.4 11.8 11.8 15.4 19.0
Rainfall (mm) 49.1 56.8 48.4 42.9 59.1 96.5 139.1 85.3 52.0 15.3 138.2 151.6
Average Temperature Sembawang 2015
▪ No Data
— Defective Data
23.0
24.0
25.0
26.0
27.0
28.0
29.0
30.0
31.0
32.0
0 1 2 3 4 5 6 7 8 9 10 11 12 13 14 15 16 17 18 19 20 21 22 23 24
Tem
per
atu
re [
°C]
Hour
Average Temperature Sembawang 2016

Annual Climatological Report Singapore, 2016
68
S80 Sembawang 2016
Hours 13 14 15 16 17 18 19 20 21 22 23 24
Min Dry Bulb Temperature (°C)
23.7 23.4 23.7 24.0 24.3 23.6 23.0 23.6 23.8 23.3 23.3 23.3
Max Dry Bulb Temperature (°C)
34.5 34.7 35.0 34.7 34.8 33.7 32.5 31.0 30.3 29.9 29.8 29.5
Average Dry Bulb Temperature (°C)
30.9 31.0 30.9 30.4 30.1 29.4 28.6 27.8 27.4 27.1 26.8 26.5
Average Dew Point Temperature (°C)
24.3 24.1 24.0 23.9 24.1 24.1 24.3 24.6 24.6 24.7 24.7 24.3
Average Relative Humidity (%)
69.3 67.8 68.2 69.6 71.8 74.1 78.8 83.1 85.5 87.1 89.1 87.6
Average Wind Speed (m/s)
3.2 3.4 3.6 3.5 3.2 2.9 2.4 2.1 1.9 1.6 1.5 —
Max Gust (m/s) 14.9 14.4 15.9 17.0 17.0 13.9 14.4 16.5 16.5 17.0 10.8 —
Rainfall (mm) 65.8 152.8 190.6 315.7 173.3 144.3 74.4 70.8 57.8 14.3 14.7 4.7
Rainfall Sembawang 2015
▪ No Data
— Defective Data
0.0
50.0
100.0
150.0
200.0
250.0
300.0
350.0
1 2 3 4 5 6 7 8 9 10 11 12 13 14 15 16 17 18 19 20 21 22 23 24
Rai
nfa
ll [
mm
]
Hour
Rainfall Sembawang 2016

Annual Climatological Report Singapore, 2016
69
10. Weather Statistics for Automatic Weather Station
Annual Climatological Report Singapore, 2016
70
10.1. Monthly Observation

Annual Climatological Report Singapore, 2016
71
S24 Changi 2016
Month Jan Feb Mar Apr May Jun Jul Aug Sep Oct Nov Dec
Min Temperature (°C) 22.9 23.3 25.4 25.3 23.9 22.5 22.5 22.1 22.6 21.6 22.7 23.0
Average Daily Min
Temperature (°C) 26.0 25.6 26.6 26.7 26.5 26.1 25.8 26.2 25.1 25.2 24.9 24.7
Average Temperature (°C) 28.3 27.8 29.0 29.4 29.3 28.5 28.4 28.9 28.3 28.3 27.4 27.4
Average Daily Max
Temperature (°C) 31.8 31.1 33.1 33.4 33.0 31.6 31.7 31.8 32.0 32.1 30.7 31.6
Max Temperature 32.8 32.7 34.1 35.0 34.6 33.4 33.4 33.8 34.4 34.6 32.6 33.6
Average Dew Point
Temperature (°C) 24.3 23.7 23.9 24.5 24.7 24.1 23.9 23.6 22.9 22.5 22.9 21.7
Min Relative Humidity (%) 55.0 55.0 47.0 46.0 48.0 45.0 48.0 41.0 33.0 38.0 46.0 34.0
Average Relative Humidity
(%) 79.6 78.8 74.7 75.6 77.4 77.6 77.1 74.0 73.9 72.0 77.6 72.8
Average Wind Speed (m/s) 2.8 3.3 3.2 2.3 2.1 2.0 2.2 2.3 1.9 1.8 1.7 2.0
Prevailing Wind Direction NE NE NE NE SSW SSW S SSW SSW W NNW NNW
Maximum Gust (m/s) 18.0 12.7 12.4 12.7 14.9 14.1 14.6 18.1 15.0 14.2 12.7 13.1
Total Rainfall (mm) 126.6 186.0 6.2 89.8 193.8 162.8 168.6 139.2 118.9 181.0 290.2 292.6
Highest Daily Rainfall (mm) 39.6 71.8 2.4 18.2 54.8 67.8 59.4 30.6 34.0 75.4 65.6 73.0
Average Temperature Changi 2015 Rainfall Changi 2015
▪ No Data
— Defective Data
24.0
25.0
26.0
27.0
28.0
29.0
30.0
Jan Feb Mar Apr May Jun Jul Aug Sep Oct Nov Dec
Tem
pe
ratu
re (
°C)
Month
Average Temperature Changi 2016
0
50
100
150
200
250
300
350
Jan Feb Mar Apr May Jun Jul Aug Sep Oct Nov Dec
Rai
nfa
ll (m
m)
Month
Rainfall Changi 2016

Annual Climatological Report Singapore, 2016
72
S43 Tai Seng 2016
Month Jan Feb Mar Apr May Jun Jul Aug Sep Oct Nov Dec
Min Temperature (°C) 23.4 23.8 25.4 25.3 24.7 23.1 23.3 22.3 22.9 23.0 23.2 23.3
Average Daily Min
Temperature (°C) 26.4 26.0 26.9 27.2 27.0 26.8 26.0 26.7 25.8 25.9 25.2 25.4
Average Temperature (°C) 28.5 28.0 29.0 29.7 29.8 29.2 28.9 29.5 29.0 28.9 27.9 27.9
Average Daily Max
Temperature (°C) 31.6 31.0 32.7 33.7 33.6 32.4 32.1 32.6 32.5 32.3 31.1 31.8
Max Temperature 33.0 32.8 33.7 35.4 35.5 34.9 34.3 33.6 35.4 34.5 33.8 34.3
Average Dew Point
Temperature (°C) 24.2 23.6 23.9 24.6 24.9 24.3 24.3 24.0 23.4 23.5 24.3 23.7
Min Relative Humidity (%) 52.6 46.3 46.9 40.1 40.3 39.9 45.7 40.9 36.7 39.7 43.5 42.8
Average Relative Humidity
(%) 78.5 77.8 74.9 74.9 75.9 75.8 76.6 73.0 72.8 73.9 81.2 79.0
Average Wind Speed (m/s) 2.6 3.3 3.0 1.8 1.5 1.5 1.5 2.0 1.7 1.6 1.5 1.9
Prevailing Wind Direction ENE ENE ENE ENE SSW SSW SSW SSW SSW WNW E NNE
Maximum Gust (m/s) 14.0 15.2 13.1 10.6 12.6 13.9 22.8 19.7 22.0 13.5 20.1 13.2
Total Rainfall (mm) 116.2 183.4 55.4 108.2 200.4 148.6 209.6 172.8 180.4 192.8 413.2 268.2
Highest Daily Rainfall (mm) 29.0 94.6 18.4 60.8 43.6 52.0 44.0 36.6 86.6 50.4 68.0 86.0
Average Temperature Tai Seng 2015 Rainfall Tai Seng 2015
▪ No Data
— Defective Data
24.0
25.0
26.0
27.0
28.0
29.0
30.0
31.0
Jan Feb Mar Apr May Jun Jul Aug Sep Oct Nov Dec
Tem
pe
ratu
re (
°C)
Month
Average Temperature Tai Seng2016
0
50
100
150
200
250
300
350
400
450
Jan Feb Mar Apr May Jun Jul Aug Sep Oct Nov Dec
Rai
nfa
ll (m
m)
Month
Rainfall Tai Seng 2016

Annual Climatological Report Singapore, 2016
73
S44 Jurong (West) 2016
Month Jan Feb Mar Apr May Jun Jul Aug Sep Oct Nov Dec
Min Temperature (°C) 23.3 23.2 23.7 23.7 23.2 22.2 22.2 22.1 22.2 21.7 22.6 22.7
Average Daily Min
Temperature (°C) 25.0 24.7 25.5 25.7 25.3 25.3 24.9 25.8 24.6 24.7 24.3 24.4
Average Temperature (°C) 27.3 27.1 28.2 28.7 28.5 27.9 27.9 28.6 27.9 27.7 26.9 27.0
Average Daily Max
Temperature (°C) 31.6 31.1 33.1 33.4 33.0 31.0 31.0 31.5 31.2 30.7 30.6 31.1
Max Temperature 33.6 33.0 34.6 35.1 35.4 33.7 33.7 32.9 33.2 32.5 33.4 34.1
Average Dew Point
Temperature (°C) 24.3 23.4 22.7 23.2 23.7 22.7 23.5 22.7 22.1 22.4 — 22.3
Min Relative Humidity (%) 45.3 44.7 39.0 37.7 40.9 41.6 43.4 44.3 40.6 49.3 55.4 49.1
Average Relative Humidity
(%) 85.2 80.7 72.3 69.8 73.2 68.4 69.4 69.8 69.0 70.9 — 72.5
Average Wind Speed (m/s) 1.9 2.4 2.1 1.8 1.8 1.8 1.9 2.2 2.1 2.2 1.8 2.2
Prevailing Wind Direction N NNE NE ENE N N SE S WNW WNW N N
Maximum Gust (m/s) 12.7 13.0 25.2 14.9 20.4 17.5 17.3 19.5 18.9 18.3 16.5 16.7
Total Rainfall (mm) 224.8 193.4 109.2 225.2 346.6 330.6 322.4 85.6 140.0 214.2 169.6 120.4
Highest Daily Rainfall (mm) 40.4 79.4 30.6 67.2 69.2 150.6 51.4 39.0 47.4 49.2 33.8 36.0
Average Temperature Jurong (West) 2015 Rainfall Jurong (West) 2015
▪ No Data
— Defective Data
24.0
25.0
26.0
27.0
28.0
29.0
Jan Feb Mar Apr May Jun Jul Aug Sep Oct Nov Dec
Tem
pe
ratu
re (
°C)
Month
Average Temperature Jurong (West) 2016
0
50
100
150
200
250
300
350
400
Jan Feb Mar Apr May Jun Jul Aug Sep Oct Nov Dec
Rai
nfa
ll (m
m)
Month
Rainfall Jurong (West) 2016

Annual Climatological Report Singapore, 2016
74
S50 Clementi 2016
Month Jan Feb Mar Apr May Jun Jul Aug Sep Oct Nov Dec
Min Temperature (°C) 23.0 22.9 24.4 23.4 23.7 22.5 21.3 22.2 21.8 22.5 22.7 22.8
Average Daily Min
Temperature (°C) 25.3 24.9 25.8 25.9 26.0 25.4 25.0 26.0 24.8 24.8 24.3 24.7
Average Temperature (°C) 27.6 27.3 28.3 28.8 28.9 28.1 28.0 28.7 28.2 27.8 27.1 27.3
Average Daily Max
Temperature (°C) 31.6 31.0 32.9 33.5 33.4 31.7 31.7 32.1 32.2 31.4 30.9 31.7
Max Temperature 33.4 33.4 35.0 36.4 35.9 34.2 34.3 33.4 34.9 34.1 33.4 34.7
Average Dew Point
Temperature (°C) 24.3 23.7 24.1 24.8 25.0 24.4 24.3 24.1 23.7 23.9 24.1 23.9
Min Relative Humidity (%) 50.2 52.3 49.9 46.7 44.2 46.2 50.0 48.0 40.4 44.0 50.5 46.7
Average Relative Humidity
(%) 83.3 81.7 78.8 79.7 80.2 80.9 81.4 77.0 77.7 80.3 84.7 82.7
Average Wind Speed (m/s) 1.7 2.1 2.0 1.5 1.2 1.4 1.6 1.5 1.9 2.2 2.7 3.0
Prevailing Wind Direction NE NE NE NE NE SSE NNW SE NNW NNW NNW NW
Maximum Gust (m/s) 12.0 14.2 11.7 10.4 12.8 10.6 10.5 11.5 12.5 11.8 12.4 11.6
Total Rainfall (mm) 234.8 170.8 76.0 203.8 164.8 206.8 275.6 97.4 182.0 — 394.0 205.0
Highest Daily Rainfall (mm) 50.4 86.8 20.2 39.4 41.4 51.4 72.8 34.2 33.8 48.0 69.4 34.8
Average Temperature Clementi 2015 Rainfall Clementi 2015
▪ No Data
— Defective Data
24.0
25.0
26.0
27.0
28.0
29.0
30.0
Jan Feb Mar Apr May Jun Jul Aug Sep Oct Nov Dec
Tem
pe
ratu
re (
°C)
Month
Average Temperature Clementi2016
0
50
100
150
200
250
300
350
400
450
Jan Feb Mar Apr May Jun Jul Aug Sep Oct Nov Dec
Rai
nfa
ll (m
m)
Month
Rainfall Clementi 2016

Annual Climatological Report Singapore, 2016
75
S60 Sentosa Island 2016
Month Jan Feb Mar Apr May Jun Jul Aug Sep Oct Nov Dec
Min Temperature (°C) 22.7 23.3 23.0 23.8 24.0 22.4 23.4 22.1 22.0 23.2 23.0
Average Daily Min
Temperature (°C) 25.8 23.3 26.8 26.9 26.6 26.1 25.8 26.5 25.4 25.5 25.2
Average Temperature (°C) 28.3 — 29.0 29.3 29.3 28.6 28.3 28.8 28.5 28.4 27.7
Average Daily Max
Temperature (°C) 31.8 27.8 32.7 32.7 32.6 31.4 31.3 31.6 31.5 31.4 30.5
Max Temperature 33.8 27.8 34.2 35.3 35.3 33.3 33.7 33.3 33.7 33.7 32.8
Average Dew Point
Temperature (°C) 23.6 — 22.2 23.3 23.8 23.4 23.4 23.0 22.4 22.5 23.6
Min Relative Humidity (%) 40.2 74.0 34.4 37.0 38.5 40.6 39.3 39.8 30.8 39.0 42.7
Average Relative Humidity
(%) 76.5 — 68.0 71.4 73.2 74.0 75.4 71.7 71.1 71.6 78.8
Average Wind Speed (m/s) 2.0 1.7 2.2 2.0 1.9 1.8 1.7 2.2 1.6 1.6 1.7
Prevailing Wind Direction ENE N NNE E E E ESE SSW S WNW SSW
Maximum Gust (m/s) 12.6 11.2 12.6 11.0 13.2 12.2 12.4 18.0 13.0 13.3 11.8
Total Rainfall (mm) — — 69.8 110.8 173.4 253.0 220.0 111.6 187.2 196.0 —
Highest Daily Rainfall (mm) 35.8 94.6 40.0 35.4 45.2 134.6 45.6 44.0 51.6 41.8 58.0
Average Temperature Sentosa Island 2015 Rainfall Sentosa Island 2015
▪ No Data
— Defective Data
24.0
25.0
26.0
27.0
28.0
29.0
30.0
Jan Feb Mar Apr May Jun Jul Aug Sep Oct Nov Dec
Tem
pe
ratu
re (
°C)
Month
Average Temperature Sentosa Island 2016
0
50
100
150
200
250
300
Jan Feb Mar Apr May Jun Jul Aug Sep Oct Nov Dec
Rai
nfa
ll (m
m)
Month
Rainfall Sentosa Island 2016

Annual Climatological Report Singapore, 2016
76
S86 Boon Lay (East) 2016
Month Jan Feb Mar Apr May Jun Jul Aug Sep Oct Nov Dec
Min Temperature (°C) 23.6
Average Daily Min
Temperature (°C) 26.0
Average Temperature (°C) 28.1
Average Daily Max
Temperature (°C) 31.6
Max Temperature 33.6
Average Dew Point
Temperature (°C) 24.6
Min Relative Humidity (%) 47.3
Average Relative Humidity
(%) 82.5
Average Wind Speed (m/s) 1.7
Prevailing Wind Direction ENE
Maximum Gust (m/s) 22.2
Total Rainfall (mm) —
Highest Daily Rainfall (mm) 19.4
Average Temperature Boon Lay (East) 2015 Rainfall Boon Lay (East) 2015
▪ No Data
— Defective Data
24.0
25.0
26.0
27.0
28.0
29.0
Jan Feb Mar Apr May Jun Jul Aug Sep Oct Nov Dec
Tem
pe
ratu
re (
°C)
Month
Average Temperature Boon Lay (East) 2016
0
0
0
1
1
1
Jan Feb Mar Apr May Jun Jul Aug Sep Oct Nov Dec
Rai
nfa
ll (m
m)
Month
Rainfall Boon Lay (East) 2016

Annual Climatological Report Singapore, 2016
77
S102 Semakau Island 2016
Month Jan Feb Mar Apr May Jun Jul Aug Sep Oct Nov Dec
Min Temperature (°C) 22.9 23.7 23.5 25.4 24.7 23.1 23.6 23.7 23.1 23.0 22.4 23.4
Average Daily Min
Temperature (°C) 26.0 26.2 27.2 27.9 27.6 27.0 26.5 27.1 26.1 25.9 25.5 26.0
Average Temperature (°C) 28.0 27.8 28.8 29.5 29.5 29.0 28.7 29.0 28.8 28.5 27.6 27.9
Average Daily Max
Temperature (°C) 30.0 29.8 30.9 31.5 31.5 30.5 30.4 30.4 30.3 29.9 29.1 30.1
Max Temperature 31.2 31.6 32.1 33.5 34.0 32.4 32.5 31.5 31.6 31.0 30.4 32.3
Average Dew Point
Temperature (°C) 23.9 23.3 24.1 24.9 24.9 24.4 24.4 24.5 24.1 24.3 23.9 24.3
Min Relative Humidity (%) 56.1 48.6 51.2 40.4 46.9 54.1 57.8 55.4 55.8 53.6 56.5 50.6
Average Relative Humidity
(%) 78.8 76.6 76.0 76.5 76.5 76.4 78.1 77.0 76.3 78.1 80.9 80.8
Average Wind Speed (m/s) 4.3 5.1 4.8 5.0 5.4 5.6 5.4 6.2 6.9 7.6 6.0 6.5
Prevailing Wind Direction N N N N S S S S W W W W
Maximum Gust (m/s) 22.7 23.3 17.3 18.5 23.7 26.1 25.8 27.1 28.6 31.9 28.7 23.1
Total Rainfall (mm) 216.8 121.2 66.4 58.8 92.0 153.4 199.7 106.6 203.4 258.0 317.2 —
Highest Daily Rainfall (mm) 34.4 82.2 39.4 30.8 14.6 68.6 35.8 37.4 44.8 45.6 128.0 33.6
Average Temperature Semakau Island 2015 Rainfall Semakau Island 2015
▪ No Data
— Defective Data
24.0
25.0
26.0
27.0
28.0
29.0
30.0
Jan Feb Mar Apr May Jun Jul Aug Sep Oct Nov Dec
Tem
pe
ratu
re (
°C)
Month
Average Temperature Semakau Island 2016
0
50
100
150
200
250
300
350
Jan Feb Mar Apr May Jun Jul Aug Sep Oct Nov Dec
Rai
nfa
ll (m
m)
Month
Rainfall Semakau Island 2016

Annual Climatological Report Singapore, 2016
78
S104 Admiralty 2016
Month Jan Feb Mar Apr May Jun Jul Aug Sep Oct Nov Dec
Min Temperature (°C) 23.1 23.5 24.3 24.0 23.7 22.6 22.2 21.9 22.7 22.2 22.1 22.8
Average Daily Min
Temperature (°C) 25.5 25.1 25.9 26.2 25.8 25.6 25.2 25.7 24.9 25.1 24.8 24.6
Average Temperature (°C) 27.7 27.3 28.4 29.1 28.8 28.1 28.2 28.8 28.2 28.1 27.2 27.2
Average Daily Max
Temperature (°C) 31.4 30.6 32.8 33.9 33.4 31.6 32.1 32.1 32.3 31.6 31.0 31.3
Max Temperature 34.4 32.6 35.0 36.3 35.5 34.3 34.7 33.7 34.5 33.8 34.0 34.2
Average Dew Point
Temperature (°C) 25.7 25.0 25.4 26.0 26.2 25.6 25.4 24.9 24.7 24.9 25.4 24.9
Min Relative Humidity (%) 53.3 50.9 47.1 44.7 44.0 42.2 46.9 44.2 42.9 45.1 45.3 41.2
Average Relative Humidity
(%) 89.6 88.4 85.2 84.9 87.0 87.4 84.9 80.4 82.6 82.9 90.8 87.8
Average Wind Speed (m/s) 2.9 3.5 3.3 2.3 1.8 1.6 1.8 2.0 2.0 2.2 2.0 2.5
Prevailing Wind Direction N N NE NE N S S S S WSW N N
Maximum Gust (m/s) 17.9 16.1 14.7 12.1 16.1 15.0 14.3 18.1 16.6 15.7 16.1 13.0
Total Rainfall (mm) 174.4 189.4 54.8 116.4 211.0 115.8 256.6 163.4 93.8 245.8 160.6 186.0
Highest Daily Rainfall (mm) 33.8 69.0 16.0 28.0 51.0 28.8 76.4 27.2 20.8 67.8 32.2 50.0
Average Temperature Admiralty 2015 Rainfall Admiralty 2015
▪ No Data
— Defective Data
24.0
25.0
26.0
27.0
28.0
29.0
30.0
Jan Feb Mar Apr May Jun Jul Aug Sep Oct Nov Dec
Tem
pe
ratu
re (
°C)
Month
Average Temperature Admiralty2016
0
50
100
150
200
250
300
Jan Feb Mar Apr May Jun Jul Aug Sep Oct Nov Dec
Rai
nfa
ll (m
m)
Month
Rainfall Admiralty 2016

Annual Climatological Report Singapore, 2016
79
S106 Pulau Ubin 2016
Month Jan Feb Mar Apr May Jun Jul Aug Sep Oct Nov Dec
Min Temperature (°C) 22.8 22.2 23.2 23.9 23.7 22.6 22.7 22.2 22.2 21.9 22.1 22.7
Average Daily Min
Temperature (°C) 24.9 24.7 25.1 25.6 25.4 24.9 24.6 25.0 24.1 24.2 24.2 24.1
Average Temperature (°C) 27.6 27.3 28.1 28.7 28.5 27.6 27.7 28.2 27.5 27.5 26.8 26.8
Average Daily Max
Temperature (°C) 31.7 30.8 32.6 34.2 33.9 32.4 32.4 33.0 32.8 32.1 31.0 31.4
Max Temperature 33.3 32.6 34.1 36.6 35.7 34.7 34.2 34.2 34.9 35.5 34.4 34.0
Average Dew Point
Temperature (°C) 25.6 25.0 25.4 25.9 26.3 25.9 25.9 25.7 25.0 25.0 25.3 24.9
Min Relative Humidity (%) 61.3 58.2 55.9 49.8 54.2 49.3 58.5 52.1 43.0 51.4 47.0 52.0
Average Relative Humidity
(%) 89.9 88.5 86.2 86.3 88.8 91.4 90.6 87.4 87.3 87.4 92.3 90.5
Average Wind Speed (m/s) 2.8 3.1 2.9 2.6 2.6 2.4 2.4 2.4 2.3 2.3 2.3 2.2
Prevailing Wind Direction NNW NNW NNW NW NW NW NW W WNW WNW NE N
Maximum Gust (m/s) 12.0 12.4 11.0 17.5 12.0 13.9 12.4 12.1 12.0 11.7 12.4 10.5
Total Rainfall (mm) 107.8 186.6 29.8 39.0 145.4 235.6 — — 118.8 182.2 272.2 231.2
Highest Daily Rainfall (mm) 36.2 70.4 16.0 18.6 34.8 76.4 44.0 40.2 28.2 50.0 45.8 36.2
Average Temperature Pulau Ubin 2015 Rainfall Pulau Ubin 2015
▪ No Data
— Defective Data
24.0
25.0
26.0
27.0
28.0
29.0
Jan Feb Mar Apr May Jun Jul Aug Sep Oct Nov Dec
Tem
pe
ratu
re (
°C)
Month
Average Temperature Pulau Ubin 2016
0
50
100
150
200
250
300
Jan Feb Mar Apr May Jun Jul Aug Sep Oct Nov Dec
Rai
nfa
ll (m
m)
Month
Rainfall Pulau Ubin 2016

Annual Climatological Report Singapore, 2016
80
S107 East Coast Parkway 2016
Month Jan Feb Mar Apr May Jun Jul Aug Sep Oct Nov Dec
Min Temperature (°C) 23.4 23.7 26.2 24.9 24.4 23.7 23.0 22.6 22.4 23.3 23.6 23.7
Average Daily Min
Temperature (°C) 26.5 26.2 27.0 27.1 27.1 27.0 26.6 26.8 25.8 25.8 25.7 25.5
Average Temperature (°C) 28.4 28.0 28.8 29.4 29.4 29.0 28.8 29.1 28.6 28.5 27.8 27.8
Average Daily Max
Temperature (°C) 31.0 30.4 31.6 31.5 31.4 30.5 30.5 30.5 30.7 30.6 29.9 30.9
Max Temperature 32.4 32.2 33.2 33.6 33.2 31.7 32.0 31.9 33.7 33.4 31.9 32.7
Average Dew Point
Temperature (°C) 24.8 24.3 24.7 25.5 25.7 25.1 25.0 25.0 24.4 24.4 24.8 24.4
Min Relative Humidity (%) 58.4 57.0 54.2 50.8 55.2 58.3 54.1 58.7 42.8 51.6 60.1 51.8
Average Relative Humidity
(%) 81.4 80.8 79.0 80.2 80.5 80.0 80.5 78.7 78.6 78.9 84.3 82.2
Average Wind Speed (m/s) 2.4 3.1 2.9 2.5 2.7 3.0 3.1 4.1 3.1 2.9 2.2 2.2
Prevailing Wind Direction NNE NNE NNE NNE ESE S SE SSW S SW N N
Maximum Gust (m/s) 14.4 14.6 14.4 12.7 14.9 27.9 15.8 18.7 19.4 18.2 18.3 13.1
Total Rainfall (mm) 99.2 147.4 21.6 128.6 152.2 75.0 158.6 112.2 172.4 167.6 187.8 223.4
Highest Daily Rainfall (mm) 37.8 61.6 16.6 42.8 37.4 23.0 96.8 21.2 68.4 33.8 46.0 62.0
Average Temperature East Coast Parkway
2015
Rainfall East Coast Parkway 2015
▪ No Data
— Defective Data
24.0
25.0
26.0
27.0
28.0
29.0
30.0
Jan Feb Mar Apr May Jun Jul Aug Sep Oct Nov Dec
Tem
pe
ratu
re (
°C)
Month
Average Temperature East Coast Parkway 2016
0
50
100
150
200
250
Jan Feb Mar Apr May Jun Jul Aug Sep Oct Nov Dec
Rai
nfa
ll (m
m)
Month
Rainfall East Coast Parkway2016

Annual Climatological Report Singapore, 2016
81
S108 Marina Barrage 2016
Month Jan Feb Mar Apr May Jun Jul Aug Sep Oct Nov Dec
Min Temperature (°C) 23.6 22.7 24.8 25.5 24.7 23.2 23.2 22.9 22.1 23.0 22.9 23.5
Average Daily Min
Temperature (°C) 26.4 25.9 27.1 27.4 26.9 26.6 26.2 26.9 25.8 25.7 25.3 25.6
Average Temperature (°C) 28.6 28.2 29.3 30.0 30.0 29.2 29.0 29.5 29.0 28.8 28.0 28.2
Average Daily Max
Temperature (°C) 32.4 31.5 33.1 34.0 33.8 32.4 32.6 32.7 32.5 32.1 31.4 32.3
Max Temperature 34.5 34.2 34.7 36.0 35.9 34.4 35.6 34.5 35.2 34.6 34.1 34.3
Average Dew Point
Temperature (°C) 24.4 23.7 24.0 25.0 25.2 24.6 24.5 24.3 23.6 23.8 24.5 23.8
Min Relative Humidity (%) 46.5 41.5 43.6 40.7 43.9 46.4 46.8 43.3 33.4 42.2 48.5 42.6
Average Relative Humidity
(%) 78.6 77.6 74.0 75.3 76.2 77.2 77.2 74.4 73.6 75.2 81.7 78.2
Average Wind Speed (m/s) 2.3 3.2 2.7 1.7 1.8 2.1 2.5 2.8 3.7 3.9 4.2 4.8
Prevailing Wind Direction NE NNE NNE NE ESE SSW NNW SSW NNW NNW N NNW
Maximum Gust (m/s) 20.5 12.6 12.6 10.3 14.6 13.3 20.4 17.5 17.3 16.2 16.4 14.3
Total Rainfall (mm) — — 27.8 66.0 207.2 145.8 207.0 97.0 212.0 255.8 244.4 184.8
Highest Daily Rainfall (mm) 18.2 80.8 22.2 21.2 40.4 45.2 91.6 26.8 54.4 49.8 43.8 50.4
Average Temperature Marina Barrage 2015 Rainfall Marina Barrage 2015
▪ No Data
— Defective Data
24.0
25.0
26.0
27.0
28.0
29.0
30.0
31.0
Jan Feb Mar Apr May Jun Jul Aug Sep Oct Nov Dec
Tem
pe
ratu
re (
°C)
Month
Average Temperature Marina Barrage 2016
0
50
100
150
200
250
300
Jan Feb Mar Apr May Jun Jul Aug Sep Oct Nov Dec
Rai
nfa
ll (m
m)
Month
Rainfall Marina Barrage 2016
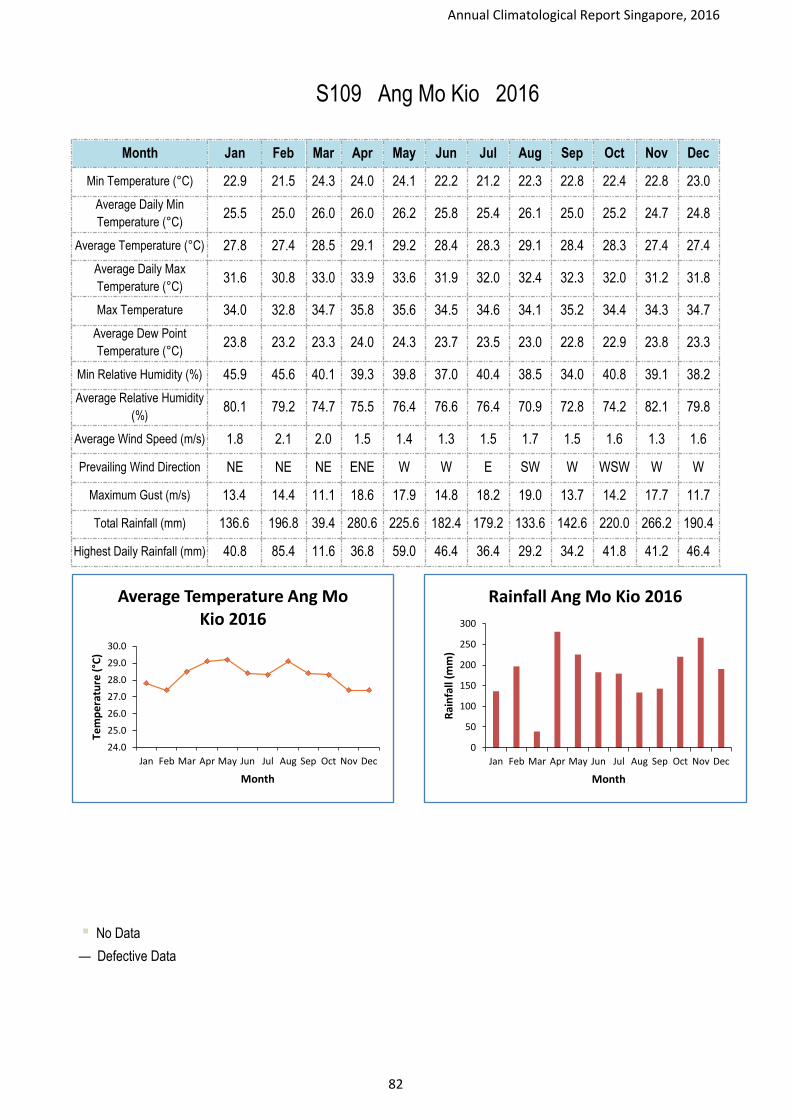
Annual Climatological Report Singapore, 2016
82
S109 Ang Mo Kio 2016
Month Jan Feb Mar Apr May Jun Jul Aug Sep Oct Nov Dec
Min Temperature (°C) 22.9 21.5 24.3 24.0 24.1 22.2 21.2 22.3 22.8 22.4 22.8 23.0
Average Daily Min
Temperature (°C) 25.5 25.0 26.0 26.0 26.2 25.8 25.4 26.1 25.0 25.2 24.7 24.8
Average Temperature (°C) 27.8 27.4 28.5 29.1 29.2 28.4 28.3 29.1 28.4 28.3 27.4 27.4
Average Daily Max
Temperature (°C) 31.6 30.8 33.0 33.9 33.6 31.9 32.0 32.4 32.3 32.0 31.2 31.8
Max Temperature 34.0 32.8 34.7 35.8 35.6 34.5 34.6 34.1 35.2 34.4 34.3 34.7
Average Dew Point
Temperature (°C) 23.8 23.2 23.3 24.0 24.3 23.7 23.5 23.0 22.8 22.9 23.8 23.3
Min Relative Humidity (%) 45.9 45.6 40.1 39.3 39.8 37.0 40.4 38.5 34.0 40.8 39.1 38.2
Average Relative Humidity
(%) 80.1 79.2 74.7 75.5 76.4 76.6 76.4 70.9 72.8 74.2 82.1 79.8
Average Wind Speed (m/s) 1.8 2.1 2.0 1.5 1.4 1.3 1.5 1.7 1.5 1.6 1.3 1.6
Prevailing Wind Direction NE NE NE ENE W W E SW W WSW W W
Maximum Gust (m/s) 13.4 14.4 11.1 18.6 17.9 14.8 18.2 19.0 13.7 14.2 17.7 11.7
Total Rainfall (mm) 136.6 196.8 39.4 280.6 225.6 182.4 179.2 133.6 142.6 220.0 266.2 190.4
Highest Daily Rainfall (mm) 40.8 85.4 11.6 36.8 59.0 46.4 36.4 29.2 34.2 41.8 41.2 46.4
Average Temperature Ang Mo Kio
2015
Rainfall Ang Mo Kio 2015
▪ No Data
— Defective Data
24.0
25.0
26.0
27.0
28.0
29.0
30.0
Jan Feb Mar Apr May Jun Jul Aug Sep Oct Nov Dec
Tem
pe
ratu
re (
°C)
Month
Average Temperature Ang Mo Kio 2016
0
50
100
150
200
250
300
Jan Feb Mar Apr May Jun Jul Aug Sep Oct Nov Dec
Rai
nfa
ll (m
m)
Month
Rainfall Ang Mo Kio 2016

Annual Climatological Report Singapore, 2016
83
S111 Newton 2016
Month Jan Feb Mar Apr May Jun Jul Aug Sep Oct Nov Dec
Min Temperature (°C) 22.8 22.4 24.1 24.5 24.0 22.3 22.2 21.6
Average Daily Min
Temperature (°C) 25.6 25.0 26.2 26.3 26.2 25.8 25.3 26.2
Average Temperature (°C) 27.7 27.3 28.4 28.9 28.8 28.1 27.9 28.4
Average Daily Max
Temperature (°C) 31.4 30.5 32.3 32.7 32.6 31.3 31.0 31.2
Max Temperature 33.5 32.6 34.2 34.4 34.5 33.8 33.2 32.2
Average Dew Point
Temperature (°C) 23.5 22.4 23.1 23.9 24.1 23.6 23.7 23.1
Min Relative Humidity (%) 50.8 48.0 47.1 43.7 40.5 42.0 48.0 45.5
Average Relative Humidity
(%) 76.2 74.2 73.9 74.8 74.0 74.9 75.5 72.9
Average Wind Speed (m/s) 1.7 2.0 2.0 1.8 1.8 1.8 2.0 2.3
Prevailing Wind Direction N N E E ESE SSW ESE SSW
Maximum Gust (m/s) 13.7 14.6 12.9 13.3 15.1 13.4 15.1 14.3
Total Rainfall (mm) 190.2 214.4 119.0 161.0 156.4 152.2 165.4 —
Highest Daily Rainfall (mm) 22.8 92.0 51.6 40.0 40.2 43.4 40.0 11.8
Average Temperature Newton 2015 Rainfall Newton 2015
▪ No Data
— Defective Data
24.0
25.0
26.0
27.0
28.0
29.0
30.0
Jan Feb Mar Apr May Jun Jul Aug Sep Oct Nov Dec
Tem
pe
ratu
re (
°C)
Month
Average Temperature Newton2016
0
50
100
150
200
250
Jan Feb Mar Apr May Jun Jul Aug Sep Oct Nov Dec
Rai
nfa
ll (m
m)
Month
Rainfall Newton 2016

Annual Climatological Report Singapore, 2016
84
S115 Tuas South 2016
Month Jan Feb Mar Apr May Jun Jul Aug Sep Oct Nov Dec
Min Temperature (°C) 24.2 23.4 24.2 23.8 23.7 23.5 23.6 23.0 24.0 23.0 23.7 23.9
Average Daily Min
Temperature (°C) 25.7 25.6 26.6 27.0 26.6 26.7 26.1 26.9 25.8 25.9 25.5 25.7
Average Temperature (°C) 27.9 27.8 29.0 29.7 29.5 28.7 28.0 29.3 28.8 28.7 27.9 27.9
Average Daily Max
Temperature (°C) 31.3 31.6 32.8 33.0 32.6 31.3 31.3 31.6 31.3 30.8 30.5 31.2
Max Temperature 34.1 33.4 34.8 35.6 34.4 33.5 34.1 33.1 33.1 32.8 32.3 33.3
Average Dew Point
Temperature (°C) 24.1 23.4 23.8 24.6 24.8 24.2 24.1 24.0 23.7 24.0 24.0 23.6
Min Relative Humidity (%) 47.9 46.8 40.3 40.5 49.6 52.0 45.0 50.6 50.5 53.8 55.7 47.4
Average Relative Humidity
(%) 80.4 77.6 74.5 74.8 76.3 76.8 79.4 73.9 74.6 76.4 79.8 77.9
Average Wind Speed (m/s) 1.4 1.8 1.5 1.4 1.6 1.6 1.6 2.0 2.1 2.3 1.8 1.9
Prevailing Wind Direction NE NE NE NE SSW SSW SSW SSW SSW WNW NNE NNE
Maximum Gust (m/s) 15.7 12.1 12.0 17.7 15.0 18.4 15.1 18.0 17.8 20.2 14.8 15.5
Total Rainfall (mm) 281.6 213.0 102.6 101.0 187.4 281.6 288.8 145.8 133.0 202.2 200.0 108.2
Highest Daily Rainfall (mm) 43.0 69.0 55.8 23.2 54.2 208.2 53.0 48.4 23.4 37.6 46.0 45.4
Average Temperature Tuas South
2015
Rainfall Tuas South 2015
▪ No Data
— Defective Data
24.0
25.0
26.0
27.0
28.0
29.0
30.0
Jan Feb Mar Apr May Jun Jul Aug Sep Oct Nov Dec
Tem
pe
ratu
re (
°C)
Month
Average Temperature Tuas South 2016
0
50
100
150
200
250
300
350
Jan Feb Mar Apr May Jun Jul Aug Sep Oct Nov Dec
Rai
nfa
ll (m
m)
Month
Rainfall Tuas South 2016
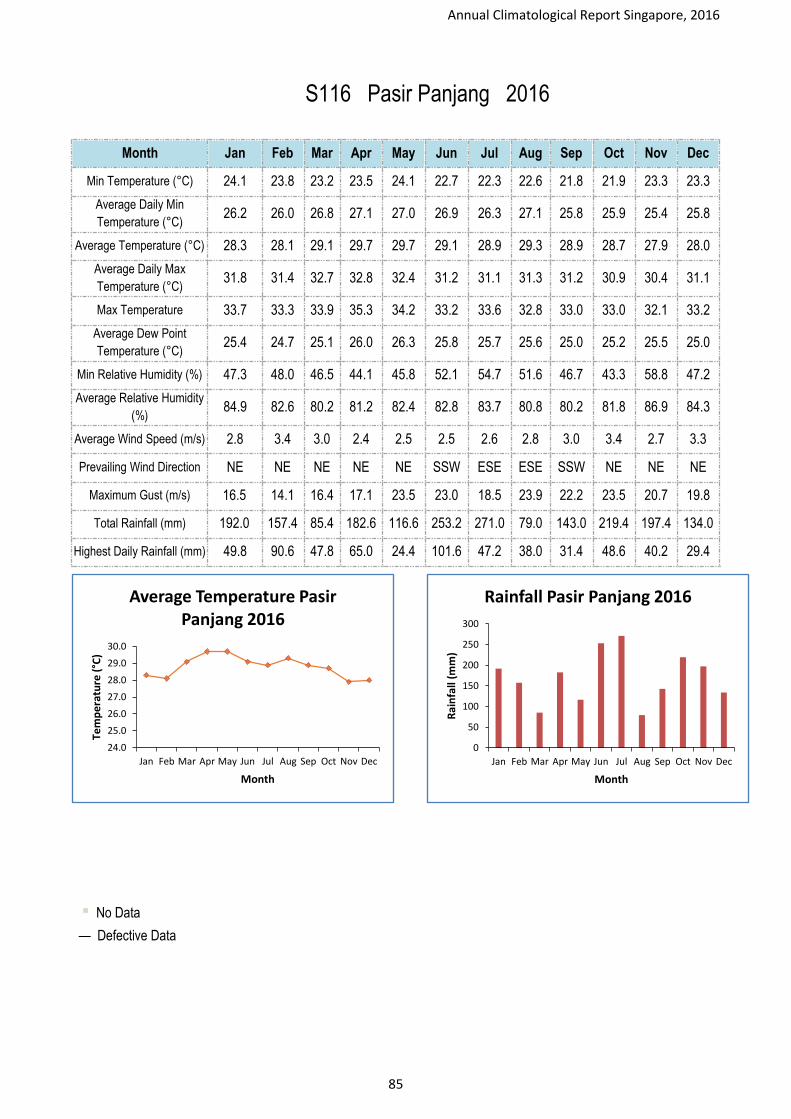
Annual Climatological Report Singapore, 2016
85
S116 Pasir Panjang 2016
Month Jan Feb Mar Apr May Jun Jul Aug Sep Oct Nov Dec
Min Temperature (°C) 24.1 23.8 23.2 23.5 24.1 22.7 22.3 22.6 21.8 21.9 23.3 23.3
Average Daily Min
Temperature (°C) 26.2 26.0 26.8 27.1 27.0 26.9 26.3 27.1 25.8 25.9 25.4 25.8
Average Temperature (°C) 28.3 28.1 29.1 29.7 29.7 29.1 28.9 29.3 28.9 28.7 27.9 28.0
Average Daily Max
Temperature (°C) 31.8 31.4 32.7 32.8 32.4 31.2 31.1 31.3 31.2 30.9 30.4 31.1
Max Temperature 33.7 33.3 33.9 35.3 34.2 33.2 33.6 32.8 33.0 33.0 32.1 33.2
Average Dew Point
Temperature (°C) 25.4 24.7 25.1 26.0 26.3 25.8 25.7 25.6 25.0 25.2 25.5 25.0
Min Relative Humidity (%) 47.3 48.0 46.5 44.1 45.8 52.1 54.7 51.6 46.7 43.3 58.8 47.2
Average Relative Humidity
(%) 84.9 82.6 80.2 81.2 82.4 82.8 83.7 80.8 80.2 81.8 86.9 84.3
Average Wind Speed (m/s) 2.8 3.4 3.0 2.4 2.5 2.5 2.6 2.8 3.0 3.4 2.7 3.3
Prevailing Wind Direction NE NE NE NE NE SSW ESE ESE SSW NE NE NE
Maximum Gust (m/s) 16.5 14.1 16.4 17.1 23.5 23.0 18.5 23.9 22.2 23.5 20.7 19.8
Total Rainfall (mm) 192.0 157.4 85.4 182.6 116.6 253.2 271.0 79.0 143.0 219.4 197.4 134.0
Highest Daily Rainfall (mm) 49.8 90.6 47.8 65.0 24.4 101.6 47.2 38.0 31.4 48.6 40.2 29.4
Average Temperature Pasir Panjang 2015 Rainfall Pasir Panjang 2015
▪ No Data
— Defective Data
24.0
25.0
26.0
27.0
28.0
29.0
30.0
Jan Feb Mar Apr May Jun Jul Aug Sep Oct Nov Dec
Tem
pe
ratu
re (
°C)
Month
Average Temperature Pasir Panjang 2016
0
50
100
150
200
250
300
Jan Feb Mar Apr May Jun Jul Aug Sep Oct Nov Dec
Rai
nfa
ll (m
m)
Month
Rainfall Pasir Panjang 2016

Annual Climatological Report Singapore, 2016
86
S117 Jurong Island 2016
Month Jan Feb Mar Apr May Jun Jul Aug Sep Oct Nov Dec
Min Temperature (°C) 22.8 23.7 23.9 24.2 23.7 23.0 21.9 23.0 22.7 22.5 22.7 23.3
Average Daily Min
Temperature (°C) 25.5 25.7 26.8 27.1 26.8 26.7 25.9 26.8 25.5 25.6 24.9 25.7
Average Temperature (°C) 28.1 28.0 29.1 29.7 29.7 29.1 29.0 29.1 28.7 28.8 27.9 28.4
Average Daily Max
Temperature (°C) 31.5 32.0 32.8 33.0 32.7 31.6 31.3 31.8 31.6 31.4 30.7 31.7
Max Temperature 33.9 33.9 34.8 35.6 34.1 33.8 33.5 33.1 33.8 33.5 32.5 34.2
Average Dew Point
Temperature (°C) 23.9 22.7 23.2 24.1 24.3 23.9 24.0 23.7 23.2 23.5 23.6 23.2
Min Relative Humidity (%) 41.3 38.8 35.3 42.2 37.6 42.9 47.4 45.5 42.8 46.7 48.1 39.8
Average Relative Humidity
(%) 78.5 74.0 71.5 73.1 73.5 74.1 75.1 73.6 72.9 73.7 78.4 74.3
Average Wind Speed (m/s) 1.5 1.7 1.9 2.2 2.3 2.3 2.5 3.0 2.1 1.9 1.8 1.8
Prevailing Wind Direction N N N NE WSW WSW ESE SSE WSW WSW WSW NNW
Maximum Gust (m/s) 14.3 13.6 11.5 14.9 16.9 16.0 12.8 15.2 15.4 15.9 14.1 12.4
Total Rainfall (mm) 361.4 — 106.6 125.8 121.4 249.8 — 115.4 156.0 137.8 326.6 100.8
Highest Daily Rainfall (mm) 56.6 71.6 56.6 30.2 43.6 109.6 37.6 69.2 31.4 28.4 42.0 31.4
Average Temperature Jurong Island 2015 Rainfall Jurong Island 2015
▪ No Data
— Defective Data
24.0
25.0
26.0
27.0
28.0
29.0
30.0
Jan Feb Mar Apr May Jun Jul Aug Sep Oct Nov Dec
Tem
pe
ratu
re (
°C)
Month
Average Temperature Jurong Island 2016
0
50
100
150
200
250
300
350
400
Jan Feb Mar Apr May Jun Jul Aug Sep Oct Nov Dec
Rai
nfa
ll (m
m)
Month
Rainfall Jurong Island 2016

Annual Climatological Report Singapore, 2016
87
S121 Choa Chu Kang (South) 2016
Month Jan Feb Mar Apr May Jun Jul Aug Sep Oct Nov Dec
Min Temperature (°C) 23.2 23.4 25.1 24.4 24.2 23.0 22.5 22.1 22.6 22.6 23.1 23.1
Average Daily Min
Temperature (°C) 25.1 24.9 25.9 25.7 25.6 25.2 24.9 25.7 24.8 24.9 24.6 24.8
Average Temperature (°C) 27.5 27.4 28.6 28.7 28.7 27.9 28.0 28.8 28.2 28.1 27.2 27.4
Average Daily Max
Temperature (°C) 31.7 31.2 33.1 33.7 33.6 31.7 31.8 32.3 32.1 31.7 31.1 31.7
Max Temperature 33.9 33.1 34.8 35.7 35.7 34.6 34.5 33.7 34.3 33.9 34.8 34.9
Average Dew Point
Temperature (°C) 25.7 25.4 26.3 26.4 25.4 25.3 25.0 24.0 23.8 24.4 25.1 24.3
Min Relative Humidity (%) 54.9 52.7 49.7 49.8 44.9 39.4 46.5 44.4 41.2 46.6 81.8 45.6
Average Relative Humidity
(%) 91.1 88.1 88.2 85.1 84.0 86.3 78.2 74.6 74.7 78.8 93.0 78.3
Average Wind Speed (m/s) 1.9 2.6 2.2 1.4 1.2 1.2 1.3 1.4 1.3 1.3 1.2 1.6
Prevailing Wind Direction NNE NNE NNE N N N N SSE N W N N
Maximum Gust (m/s) 26.2 15.2 12.0 13.1 12.9 27.0 28.4 15.5 12.1 14.8 24.7 21.7
Total Rainfall (mm) 199.4 — 49.6 187.2 238.4 358.6 431.6 192.2 148.6 221.0 239.4 187.2
Highest Daily Rainfall (mm) 21.4 78.0 19.2 56.6 47.6 70.0 51.6 65.6 48.0 55.6 61.8 39.0
Average Temperature Choa Chu Kang (South) 2015 Rainfall Choa Chu Kang (South) 2015
▪ No Data
— Defective Data
24.0
25.0
26.0
27.0
28.0
29.0
30.0
Jan Feb Mar Apr May Jun Jul Aug Sep Oct Nov Dec
Tem
pe
ratu
re (
°C)
Month
Average Temperature Choa Chu Kang (South) 2016
0
100
200
300
400
500
Jan Feb Mar Apr May Jun Jul Aug Sep Oct Nov Dec
Rai
nfa
ll (m
m)
Month
Rainfall Choa Chu Kang (South)2016

Annual Climatological Report Singapore, 2016
88
S122 Khatib 2016
Month Jan Feb Mar Apr May Jun Jul Aug Sep Oct Nov Dec
Min Temperature (°C) 23.2 22.2 23.4 23.7 23.7 22.4 22.2 22.1 22.4 22.8 22.2 22.8
Average Daily Min
Temperature (°C) 25.5 25.1 25.9 25.7 25.4 24.9 24.7 25.2 24.3 24.7 24.4 24.4
Average Temperature (°C) 28.1 27.8 28.9 28.9 28.6 27.7 27.9 28.5 28.0 27.9 27.2 27.3
Average Daily Max
Temperature (°C) 32.6 31.9 33.7 34.5 33.9 32.2 32.4 32.8 32.7 32.4 31.6 32.3
Max Temperature 34.3 34.0 34.9 35.7 35.5 34.9 34.7 33.9 35.8 34.6 34.1 34.7
Average Dew Point
Temperature (°C) 24.6 23.1 23.8 24.4 — — — — — — — —
Min Relative Humidity (%) 50.4 47.2 45.7 45.0 — — — 45.4 57.0 47.9 77.2 51.5
Average Relative Humidity
(%) 79.7 77.1 74.5 70.9 — — — — — — — —
Average Wind Speed (m/s) 1.5 1.8 1.7 1.2 1.0 1.0 1.1 1.3 1.2 1.1 1.0 1.3
Prevailing Wind Direction NE NNE NE NE NW S S S S W NW NNW
Maximum Gust (m/s) 13.5 11.6 10.3 10.2 11.2 10.3 11.1 11.4 13.0 10.9 9.6 11.2
Total Rainfall (mm) 119.2 184.4 114.8 241.2 257.0 261.0 181.2 92.0 103.4 184.0 201.4 193.0
Highest Daily Rainfall (mm) 26.4 91.0 44.2 39.6 81.2 56.2 42.4 33.0 20.6 69.6 29.8 32.6
Average Temperature Khatib 2015
Rainfall K 2015
▪ No Data
— Defective Data
24.0
25.0
26.0
27.0
28.0
29.0
30.0
Jan Feb Mar Apr May Jun Jul Aug Sep Oct Nov Dec
Tem
pe
ratu
re (
°C)
Month
Average Temperature Khatib2016
0
50
100
150
200
250
300
Jan Feb Mar Apr May Jun Jul Aug Sep Oct Nov Dec
Rai
nfa
ll (m
m)
Month
Rainfall Khatib 2016

Annual Climatological Report Singapore, 2016
89
10.2. Hourly Observation

Annual Climatological Report Singapore, 2016
90
S24 Changi 2016
Hours 1 2 3 4 5 6 7 8 9 10 11 12
Min Dry Bulb
Temperature (°C) 24.7 23.6 23.9 22.5 22.8 21.8 22.5 22.9 23.2 24.4 23.9 23.3
Max Dry Bulb
Temperature (°C) 29.9 29.7 29.5 29.3 29.2 29.1 29.3 30.1 31.3 32.4 33.3 33.5
Average Dry Bulb
Temperature (°C) 27.4 27.3 27.1 26.9 26.8 26.7 26.6 27.1 28.2 29.1 29.8 30.3
Average Dew Point
Temperature (°C) 23.9 24.0 24.1 24.1 24.1 24.0 24.0 24.2 24.1 23.8 23.5 23.2
Average Relative
Humidity (%) 81.6 82.7 83.8 84.8 85.4 85.9 86.1 84.3 78.9 73.7 69.7 66.3
Average Wind Speed
(m/s) 1.7 1.7 1.6 1.5 1.5 1.5 1.5 1.7 2.1 2.6 2.8 3.0
Max Gust (m/s) 13.0 13.1 11.5 10.6 15.0 14.2 18.1 14.2 12.4 12.5 18.0 14.6
Rainfall (mm) 19.2 51.0 44.4 73.0 100.0 117.0 151.4 74.8 96.0 69.6 85.0 77.0
Average Temperature Changi 2015
▪ No Data
— Defective Data
23.0
24.0
25.0
26.0
27.0
28.0
29.0
30.0
31.0
32.0
0 1 2 3 4 5 6 7 8 9 10 11 12 13 14 15 16 17 18 19 20 21 22 23 24
Tem
per
atu
re [
°C]
Hour
Average Temperature Changi 2016

Annual Climatological Report Singapore, 2016
91
S24 Changi 2016
Hours 13 14 15 16 17 18 19 20 21 22 23 24
Min Dry Bulb Temperature (°C)
23.4 23.2 23.4 24.3 24.2 24.2 23.3 23.3 23.7 24.5 24.6 24.0
Max Dry Bulb Temperature (°C)
33.8 34.9 34.4 34.2 33.9 33.4 31.9 30.9 30.4 30.2 30.0 29.9
Average Dry Bulb Temperature (°C)
30.6 30.5 30.4 30.3 29.9 29.3 28.7 28.2 27.9 27.8 27.6 27.5
Average Dew Point Temperature (°C)
23.0 22.8 22.8 22.9 22.7 22.9 23.1 23.3 23.5 23.6 23.8 23.9
Average Relative Humidity (%)
64.6 64.4 64.9 65.7 66.5 69.2 72.3 75.2 77.3 78.7 79.8 80.7
Average Wind Speed (m/s)
3.2 3.3 3.4 3.4 3.2 2.9 2.6 2.3 2.1 2.0 1.8 1.8
Max Gust (m/s) 16.3 13.0 12.7 13.0 14.9 13.1 11.6 12.2 10.1 12.7 10.0 10.7
Rainfall (mm) 90.6 161.2 184.2 159.0 109.2 117.3 58.8 26.4 36.2 22.6 23.6 8.2
Rainfall Changi 2015
▪ No Data
— Defective Data
0.0
20.0
40.0
60.0
80.0
100.0
120.0
140.0
160.0
180.0
200.0
1 2 3 4 5 6 7 8 9 10 11 12 13 14 15 16 17 18 19 20 21 22 23 24
Rai
nfa
ll [
mm
]
Hour
Rainfall Changi 2016

Annual Climatological Report Singapore, 2016
92
S43 Tai Seng 2016
Hours 1 2 3 4 5 6 7 8 9 10 11 12
Min Dry Bulb
Temperature (°C) 24.5 24.1 24.4 23.4 23.0 22.3 22.5 23.2 23.3 24.1 23.3 23.6
Max Dry Bulb
Temperature (°C) 30.3 30.1 30.1 30.0 30.0 29.9 29.9 30.1 31.7 32.6 33.6 34.3
Average Dry Bulb
Temperature (°C) 28.0 27.8 27.7 27.5 27.4 27.2 27.1 27.5 28.3 29.2 29.9 30.4
Average Dew Point
Temperature (°C) 24.6 24.6 24.6 24.6 24.6 24.5 24.5 24.5 24.5 24.2 23.9 23.6
Average Relative
Humidity (%) 82.0 82.9 83.7 84.4 84.9 85.3 85.7 84.0 79.8 75.0 70.5 67.6
Average Wind Speed
(m/s) 1.4 1.4 1.4 1.3 1.4 1.4 1.4 1.6 2.0 2.3 2.5 2.6
Max Gust (m/s) 10.9 10.2 19.7 11.8 13.9 14.2 14.9 14.2 16.1 10.9 12.7 14.5
Rainfall (mm) 33.6 45.6 68.6 47.2 114.0 161.2 115.6 100.0 93.6 25.4 106.2 144.6
Average Temperature Tai Seng 2015
▪ No Data
— Defective Data
23.0
24.0
25.0
26.0
27.0
28.0
29.0
30.0
31.0
32.0
0 1 2 3 4 5 6 7 8 9 10 11 12 13 14 15 16 17 18 19 20 21 22 23 24
Tem
per
atu
re [
°C]
Hour
Average Temperature Tai Seng 2016

Annual Climatological Report Singapore, 2016
93
S43 Tai Seng 2016
Hours 13 14 15 16 17 18 19 20 21 22 23 24
Min Dry Bulb Temperature (°C)
23.7 23.4 23.6 24.3 24.0 23.5 23.3 23.8 24.3 24.0 24.6 24.6
Max Dry Bulb Temperature (°C)
34.6 35.2 35.4 35.5 35.2 34.6 34.2 33.0 32.5 31.8 31.2 30.6
Average Dry Bulb Temperature (°C)
30.8 30.9 30.9 30.6 30.3 29.9 29.3 28.8 28.5 28.4 28.3 28.1
Average Dew Point Temperature (°C)
23.4 23.3 23.3 23.4 23.3 23.4 23.6 23.9 24.1 24.3 24.4 24.5
Average Relative Humidity (%)
65.7 64.8 65.1 66.3 67.2 69.1 72.2 75.3 77.5 78.9 79.8 81.0
Average Wind Speed (m/s)
2.7 2.8 2.8 2.8 2.6 2.5 2.3 2.0 1.8 1.7 1.6 1.5
Max Gust (m/s) 15.2 22.0 13.3 14.0 13.5 13.2 20.1 13.2 11.4 22.8 10.6 9.9
Rainfall (mm) 144.2 189.0 106.8 150.8 167.0 186.2 107.4 47.8 45.4 16.8 12.6 19.6
Rainfall Tai Seng 2015
▪ No Data
— Defective Data
0.0
20.0
40.0
60.0
80.0
100.0
120.0
140.0
160.0
180.0
200.0
1 2 3 4 5 6 7 8 9 10 11 12 13 14 15 16 17 18 19 20 21 22 23 24
Rai
nfa
ll [
mm
]
Hour
Rainfall Tai Seng 2016
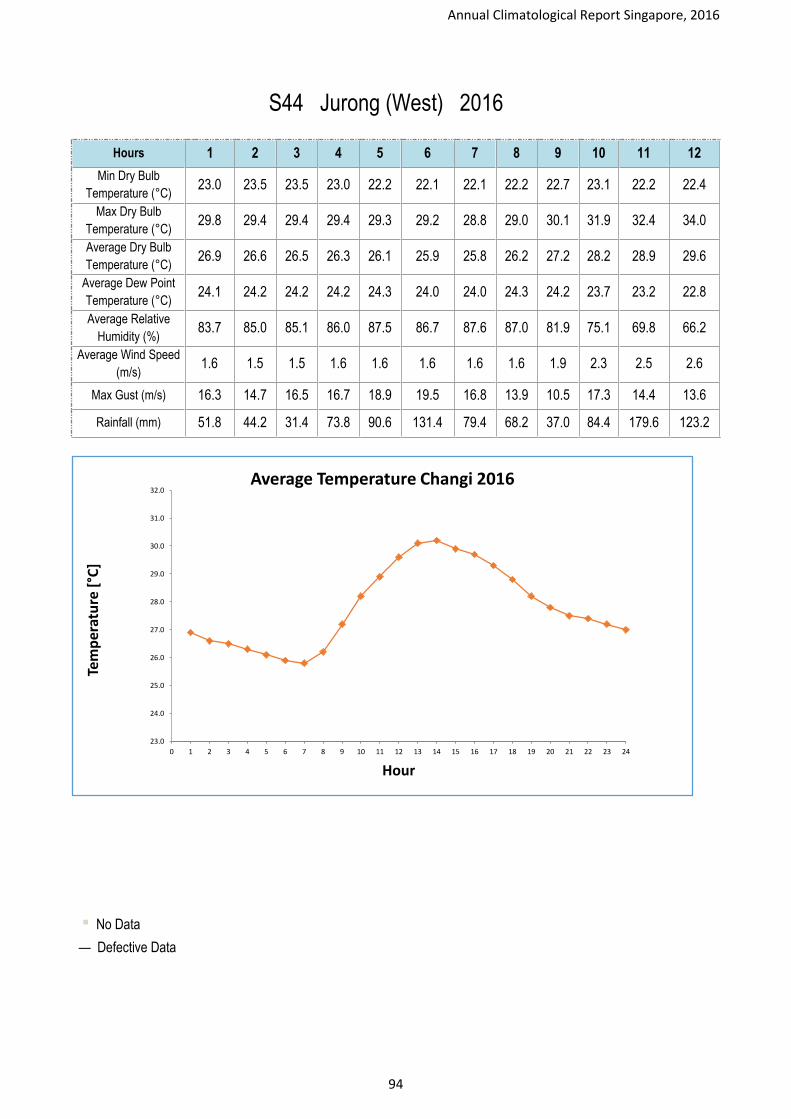
Annual Climatological Report Singapore, 2016
94
S44 Jurong (West) 2016
Hours 1 2 3 4 5 6 7 8 9 10 11 12
Min Dry Bulb
Temperature (°C) 23.0 23.5 23.5 23.0 22.2 22.1 22.1 22.2 22.7 23.1 22.2 22.4
Max Dry Bulb
Temperature (°C) 29.8 29.4 29.4 29.4 29.3 29.2 28.8 29.0 30.1 31.9 32.4 34.0
Average Dry Bulb
Temperature (°C) 26.9 26.6 26.5 26.3 26.1 25.9 25.8 26.2 27.2 28.2 28.9 29.6
Average Dew Point
Temperature (°C) 24.1 24.2 24.2 24.2 24.3 24.0 24.0 24.3 24.2 23.7 23.2 22.8
Average Relative
Humidity (%) 83.7 85.0 85.1 86.0 87.5 86.7 87.6 87.0 81.9 75.1 69.8 66.2
Average Wind Speed
(m/s) 1.6 1.5 1.5 1.6 1.6 1.6 1.6 1.6 1.9 2.3 2.5 2.6
Max Gust (m/s) 16.3 14.7 16.5 16.7 18.9 19.5 16.8 13.9 10.5 17.3 14.4 13.6
Rainfall (mm) 51.8 44.2 31.4 73.8 90.6 131.4 79.4 68.2 37.0 84.4 179.6 123.2
Average Temperature Jurong (West) 2015
▪ No Data
— Defective Data
23.0
24.0
25.0
26.0
27.0
28.0
29.0
30.0
31.0
32.0
0 1 2 3 4 5 6 7 8 9 10 11 12 13 14 15 16 17 18 19 20 21 22 23 24
Tem
per
atu
re [
°C]
Hour
Average Temperature Changi 2016

Annual Climatological Report Singapore, 2016
95
S44 Jurong (West) 2016
Hours 13 14 15 16 17 18 19 20 21 22 23 24
Min Dry Bulb Temperature (°C)
22.7 23.0 22.6 22.2 22.2 23.1 21.9 21.7 22.7 22.5 23.7 23.6
Max Dry Bulb Temperature (°C)
34.4 34.9 35.4 35.1 34.4 34.6 33.4 31.9 30.9 30.6 30.5 30.2
Average Dry Bulb Temperature (°C)
30.1 30.2 29.9 29.7 29.3 28.8 28.2 27.8 27.5 27.4 27.2 27.0
Average Dew Point Temperature (°C)
22.6 22.4 22.5 22.5 22.6 22.8 23.0 23.3 23.5 23.6 23.9 24.0
Average Relative Humidity (%)
64.0 63.2 63.9 64.7 66.8 69.0 72.5 75.9 77.7 79.3 81.1 82.5
Average Wind Speed (m/s)
2.7 2.8 2.8 2.7 2.5 2.2 2.0 1.8 1.8 1.7 1.6 1.6
Max Gust (m/s) 13.4 13.8 14.9 17.5 13.1 14.7 25.2 11.4 14.8 20.4 9.3 19.0
Rainfall (mm) 57.0 153.2 300.0 193.0 262.6 180.0 160.8 27.2 54.8 51.8 36.6 10.0
Rainfall Jurong (West) 2015
▪ No Data
— Defective Data
0.0
50.0
100.0
150.0
200.0
250.0
300.0
350.0
1 2 3 4 5 6 7 8 9 10 11 12 13 14 15 16 17 18 19 20 21 22 23 24
Rai
nfa
ll [
mm
]
Hour
Rainfall Changi 2016

Annual Climatological Report Singapore, 2016
96
S50 Clementi 2016
Hours 1 2 3 4 5 6 7 8 9 10 11 12
Min Dry Bulb
Temperature (°C) 23.4 23.1 23.0 23.4 21.8 22.0 22.4 22.3 21.9 22.8 21.3 21.7
Max Dry Bulb
Temperature (°C) 29.5 29.3 29.2 29.1 29.0 28.8 28.7 28.9 31.1 32.0 33.3 34.4
Average Dry Bulb
Temperature (°C) 26.9 26.7 26.6 26.4 26.3 26.1 26.0 26.5 27.7 28.6 29.4 29.9
Average Dew Point
Temperature (°C) 24.4 24.4 24.4 24.4 24.3 24.3 24.3 24.4 24.5 24.4 24.3 24.1
Average Relative
Humidity (%) 86.4 87.3 88.0 88.7 89.2 89.8 90.1 88.5 83.3 78.5 74.4 71.7
Average Wind Speed
(m/s) 2.0 2.0 2.0 2.0 2.1 2.0 2.0 1.7 1.6 1.7 1.7 1.8
Max Gust (m/s) 12.8 12.4 9.7 10.6 10.4 11.7 11.8 12.5 9.6 10.5 11.4 14.2
Rainfall (mm) 48.8 80.1 94.7 75.0 105.1 177.0 167.4 67.3 75.8 33.8 103.8 132.0
Average Temperature Clementi 2015
▪ No Data
— Defective Data
23.0
24.0
25.0
26.0
27.0
28.0
29.0
30.0
31.0
32.0
0 1 2 3 4 5 6 7 8 9 10 11 12 13 14 15 16 17 18 19 20 21 22 23 24
Tem
per
atu
re [
°C]
Hour
Average Temperature Clementi 2016

Annual Climatological Report Singapore, 2016
97
S50 Clementi 2016
Hours 13 14 15 16 17 18 19 20 21 22 23 24
Min Dry Bulb Temperature (°C)
23.2 23.1 23.0 23.4 22.6 22.6 22.7 22.6 23.1 23.6 23.7 23.9
Max Dry Bulb Temperature (°C)
35.6 35.7 36.4 35.9 34.2 34.1 33.1 31.9 31.6 30.8 30.3 29.9
Average Dry Bulb Temperature (°C)
30.3 30.4 30.2 30.0 29.6 29.1 28.4 27.9 27.6 27.4 27.2 27.1
Average Dew Point Temperature (°C)
24.0 23.9 24.0 23.9 23.9 23.9 24.0 24.1 24.2 24.3 24.3 24.4
Average Relative Humidity (%)
69.7 69.4 70.0 71.0 72.3 74.5 77.6 80.1 82.1 83.4 84.4 85.4
Average Wind Speed (m/s)
1.8 1.9 1.9 1.9 1.9 1.9 2.0 2.0 1.9 1.9 1.9 2.0
Max Gust (m/s) 12.2 14.0 12.8 12.0 12.2 13.0 11.8 10.5 10.5 10.8 9.4 10.8
Rainfall (mm) 74.0 127.8 175.6 141.6 271.0 143.4 121.6 54.6 63.2 33.0 21.6 8.8
Rainfall Clementi 2015
▪ No Data
— Defective Data
0.0
50.0
100.0
150.0
200.0
250.0
300.0
1 2 3 4 5 6 7 8 9 10 11 12 13 14 15 16 17 18 19 20 21 22 23 24
Rai
nfa
ll [
mm
]
Hour
Rainfall Clementi 2016

Annual Climatological Report Singapore, 2016
98
S60 Sentosa Island 2016
Hours 1 2 3 4 5 6 7 8 9 10 11 12
Min Dry Bulb
Temperature (°C) 24.0 23.7 23.6 24.1 22.0 22.6 22.1 22.7 22.5 23.2 23.7 23.4
Max Dry Bulb
Temperature (°C) 29.7 29.5 29.6 29.6 29.4 29.3 29.3 29.9 31.4 31.9 33.0 33.4
Average Dry Bulb
Temperature (°C) 27.7 27.6 27.4 27.3 27.2 27.1 27.0 27.4 28.2 28.9 29.4 29.8
Average Dew Point
Temperature (°C) 23.7 23.8 24.0 24.1 24.1 24.1 24.1 24.0 23.6 23.1 22.7 22.3
Average Relative
Humidity (%) 79.1 80.6 82.3 83.2 83.9 84.4 85.1 82.6 76.7 72.0 68.8 65.5
Average Wind Speed
(m/s) 1.4 1.5 1.5 1.5 1.6 1.6 1.6 1.7 1.9 2.2 2.5 2.6
Max Gust (m/s) 13.3 12.4 12.0 12.0 12.8 13.3 18.0 12.6 11.2 9.5 12.4 10.3
Rainfall (mm) 43.0 56.6 69.0 63.2 122.0 124.0 72.6 96.6 60.4 95.8 40.8 99.4
Average Temperature Sentosa Island 2015
▪ No Data
— Defective Data
23.0
24.0
25.0
26.0
27.0
28.0
29.0
30.0
31.0
32.0
0 1 2 3 4 5 6 7 8 9 10 11 12 13 14 15 16 17 18 19 20 21 22 23 24
Tem
per
atu
re [
°C]
Hour
Average Temperature Sentosa Island 2016

Annual Climatological Report Singapore, 2016
99
S60 Sentosa Island 2016
Hours 13 14 15 16 17 18 19 20 21 22 23 24
Min Dry Bulb Temperature (°C)
23.6 22.7 23.5 23.6 22.5 22.5 23.7 23.3 23.4 23.8 23.2 23.6
Max Dry Bulb Temperature (°C)
34.3 35.3 35.3 34.2 34.3 33.6 33.1 31.7 31.1 30.7 30.4 30.2
Average Dry Bulb Temperature (°C)
30.1 30.1 30.1 30.1 29.9 29.5 29.0 28.6 28.3 28.1 28.0 27.9
Average Dew Point Temperature (°C)
22.1 22.0 21.9 21.9 21.8 21.9 22.1 22.5 22.8 23.1 23.4 23.6
Average Relative Humidity (%)
63.8 63.0 63.0 63.5 63.5 65.0 67.8 70.5 72.8 74.8 76.4 77.9
Average Wind Speed (m/s)
2.7 2.7 2.6 2.5 2.3 2.0 1.7 1.6 1.6 1.5 1.5 1.5
Max Gust (m/s) 12.6 11.9 11.8 11.8 11.3 9.9 9.9 10.3 8.6 8.9 13.2 8.8
Rainfall (mm) 61.0 77.8 151.4 95.2 179.8 79.0 89.0 42.0 27.8 20.2 35.6 6.0
Rainfall Sentosa Island 2015
▪ No Data
— Defective Data
0.0
20.0
40.0
60.0
80.0
100.0
120.0
140.0
160.0
180.0
200.0
1 2 3 4 5 6 7 8 9 10 11 12 13 14 15 16 17 18 19 20 21 22 23 24
Rai
nfa
ll [
mm
]
Hour
Rainfall Sentosa Island 2016

Annual Climatological Report Singapore, 2016
100
S86 Boon Lay (East) 2016
Hours 1 2 3 4 5 6 7 8 9 10 11 12
Min Dry Bulb
Temperature (°C) 25.8 25.5 25.6 25.0 24.9 24.9 24.9 25.3 24.4 24.9 25.7 26.4
Max Dry Bulb
Temperature (°C) 28.1 28.1 27.9 27.8 27.7 27.4 27.4 27.6 28.7 29.9 30.6 31.7
Average Dry Bulb
Temperature (°C) 27.3 27.1 26.9 26.7 26.7 26.6 26.5 26.7 27.6 28.6 29.4 30.3
Average Dew Point
Temperature (°C) 25.3 25.3 25.4 25.3 25.4 25.4 25.4 25.4 25.4 24.9 24.3 23.4
Average Relative
Humidity (%) 89.0 89.9 91.1 92.2 93.1 93.2 93.5 92.9 88.1 80.9 74.9 67.6
Average Wind Speed
(m/s) 1.3 1.3 1.4 1.3 1.3 1.4 1.4 1.5 1.7 2.0 2.0 2.1
Max Gust (m/s) 5.1 5.0 6.2 5.2 5.7 5.5 5.8 5.3 6.8 7.5 7.1 7.8
Rainfall (mm) 0.0 0.0 0.4 1.0 0.0 0.0 0.0 0.0 10.0 0.2 0.4 0.0
Average Temperature Boon Lay (East) 2015
▪ No Data
— Defective Data
23.0
24.0
25.0
26.0
27.0
28.0
29.0
30.0
31.0
32.0
0 1 2 3 4 5 6 7 8 9 10 11 12 13 14 15 16 17 18 19 20 21 22 23 24
Tem
per
atu
re [
°C]
Hour
Average Temperature Boon Lay (East) 2016

Annual Climatological Report Singapore, 2016
101
S86 Boon Lay (East) 2016
Hours 13 14 15 16 17 18 19 20 21 22 23 24
Min Dry Bulb Temperature (°C)
25.5 23.6 23.8 24.5 25.0 25.6 25.6 25.7 25.7 25.5 25.4 25.5
Max Dry Bulb Temperature (°C)
32.4 33.1 33.6 33.1 32.6 31.9 31.1 30.0 29.2 28.7 28.4 28.2
Average Dry Bulb Temperature (°C)
30.2 29.8 29.8 29.3 28.9 28.8 28.3 28.1 27.9 27.7 27.6 27.5
Average Dew Point Temperature (°C)
23.4 23.4 23.5 23.8 24.2 24.2 24.2 24.3 24.3 24.6 25.0 25.1
Average Relative Humidity (%)
68.6 70.4 70.6 73.9 77.2 77.3 79.2 80.6 81.2 83.5 85.8 87.1
Average Wind Speed (m/s)
2.3 2.3 2.1 2.2 2.0 2.0 1.9 1.7 1.5 1.5 1.6 1.5
Max Gust (m/s) 8.5 9.5 8.5 22.2 8.0 10.9 8.4 8.1 7.0 7.3 7.0 5.8
Rainfall (mm) 10.2 20.4 11.4 8.4 4.8 6.2 2.4 0.0 0.0 0.0 0.0 0.0
Rainfall Boon Lay (East) 2015
▪ No Data
— Defective Data
0.0
5.0
10.0
15.0
20.0
25.0
1 2 3 4 5 6 7 8 9 10 11 12 13 14 15 16 17 18 19 20 21 22 23 24
Rai
nfa
ll [
mm
]
Hour
Rainfall Boon Lay (East) 2016

Annual Climatological Report Singapore, 2016
102
S102 Semakau Island 2016
Hours 1 2 3 4 5 6 7 8 9 10 11 12
Min Dry Bulb
Temperature (°C) 23.6 24.3 24.0 24.3 23.1 23.4 22.7 22.4 23.8 23.9 23.6 23.7
Max Dry Bulb
Temperature (°C) 30.4 30.4 30.4 30.3 30.2 30.1 30.0 30.3 30.7 31.2 31.8 32.3
Average Dry Bulb
Temperature (°C) 28.4 28.3 28.2 28.1 27.9 27.8 27.7 27.8 28.1 28.5 28.8 29.0
Average Dew Point
Temperature (°C) 24.5 24.5 24.5 24.5 24.5 24.4 24.4 24.4 24.3 24.2 24.1 24.1
Average Relative
Humidity (%) 79.6 80.3 80.9 81.4 81.6 82.2 82.5 82.0 80.1 77.9 76.2 75.1
Average Wind Speed
(m/s) 4.6 4.8 5.0 5.1 5.1 5.2 5.3 5.3 5.6 6.0 6.4 6.7
Max Gust (m/s) 25.6 23.7 26.6 26.1 24.5 28.6 31.9 25.7 21.7 23.3 25.8 21.5
Rainfall (mm) 26.6 36.8 81.8 63.8 87.6 160.0 166.0 130.4 67.4 64.8 80.6 91.9
Average Temperature Semakau Island 2015
▪ No Data
— Defective Data
23.0
24.0
25.0
26.0
27.0
28.0
29.0
30.0
31.0
32.0
0 1 2 3 4 5 6 7 8 9 10 11 12 13 14 15 16 17 18 19 20 21 22 23 24
Tem
per
atu
re [
°C]
Hour
Average Temperature Semakau Island 2016

Annual Climatological Report Singapore, 2016
103
S102 Semakau Island 2016
Hours 13 14 15 16 17 18 19 20 21 22 23 24
Min Dry Bulb Temperature (°C)
23.4 23.2 24.2 24.7 22.9 23.0 24.0 23.0 23.2 24.2 23.2 23.6
Max Dry Bulb Temperature (°C)
32.9 33.3 34.0 33.5 32.5 32.4 31.9 31.2 31.1 31.0 30.8 30.7
Average Dry Bulb Temperature (°C)
29.2 29.3 29.3 29.3 29.2 29.2 29.0 28.9 28.8 28.6 28.6 28.5
Average Dew Point Temperature (°C)
24.1 24.0 24.0 24.0 24.0 23.9 24.0 24.1 24.2 24.3 24.5 24.5
Average Relative Humidity (%)
74.1 73.9 73.7 73.6 73.8 73.9 74.8 75.5 76.4 77.7 78.6 79.2
Average Wind Speed (m/s)
7.1 7.4 7.5 7.3 6.8 6.3 5.8 5.4 5.0 4.8 4.7 4.6
Max Gust (m/s) 19.7 20.3 22.7 19.8 18.8 20.8 21.4 20.1 20.3 24.4 23.4 24.7
Rainfall (mm) 108.6 64.4 38.4 70.2 136.0 86.2 100.6 74.4 47.0 38.4 62.8 29.8
Rainfall Semakau Island 2015
▪ No Data
— Defective Data
0.0
20.0
40.0
60.0
80.0
100.0
120.0
140.0
160.0
180.0
1 2 3 4 5 6 7 8 9 10 11 12 13 14 15 16 17 18 19 20 21 22 23 24
Rai
nfa
ll [
mm
]
Hour
Rainfall Semakau Island 2016

Annual Climatological Report Singapore, 2016
104
S104 Admiralty 2016
Hours 1 2 3 4 5 6 7 8 9 10 11 12
Min Dry Bulb
Temperature (°C) 23.2 23.3 23.6 23.6 22.7 22.1 21.9 22.2 22.7 22.3 23.0 22.2
Max Dry Bulb
Temperature (°C) 29.6 29.4 29.3 28.9 28.9 28.9 28.7 29.2 31.3 31.9 32.8 33.3
Average Dry Bulb
Temperature (°C) 27.1 26.9 26.7 26.6 26.3 26.3 26.1 26.5 27.5 28.5 29.2 29.8
Average Dew Point
Temperature (°C) 26.0 26.0 26.0 26.0 25.9 25.8 25.7 25.8 25.9 25.7 25.3 24.8
Average Relative
Humidity (%) 93.9 94.9 95.9 96.5 97.2 97.3 97.3 96.0 91.2 85.6 79.5 75.1
Average Wind Speed
(m/s) 1.9 1.9 1.8 1.8 1.8 1.8 1.8 1.7 2.0 2.4 2.6 2.8
Max Gust (m/s) 15.7 15.4 11.6 15.0 16.6 18.1 16.1 14.7 10.4 13.6 16.1 14.9
Rainfall (mm) 13.6 29.8 35.2 36.4 63.2 86.0 150.2 54.4 46.2 49.4 107.8 176.8
Average Temperature Admiralty 2015
▪ No Data
— Defective Data
23.0
24.0
25.0
26.0
27.0
28.0
29.0
30.0
31.0
32.0
0 1 2 3 4 5 6 7 8 9 10 11 12 13 14 15 16 17 18 19 20 21 22 23 24
Tem
per
atu
re [
°C]
Hour
Average Temperature Admiralty 2016

Annual Climatological Report Singapore, 2016
105
S104 Admiralty 2016
Hours 13 14 15 16 17 18 19 20 21 22 23 24
Min Dry Bulb Temperature (°C)
22.6 22.7 22.7 23.2 23.0 23.5 22.3 22.7 22.8 22.8 23.6 23.3
Max Dry Bulb Temperature (°C)
34.5 36.1 36.3 35.3 35.2 34.5 33.9 32.5 31.3 30.9 31.0 30.8
Average Dry Bulb Temperature (°C)
30.4 30.6 30.4 29.9 29.6 29.1 28.5 28.1 27.8 27.6 27.4 27.3
Average Dew Point Temperature (°C)
24.5 24.2 24.1 24.3 24.4 24.6 24.9 25.3 25.6 25.8 25.9 26.0
Average Relative Humidity (%)
71.6 70.1 70.6 73.4 75.3 77.8 81.9 85.6 88.5 90.4 91.6 92.7
Average Wind Speed (m/s)
2.9 3.0 3.1 3.2 3.0 2.8 2.6 2.4 2.3 2.1 2.0 2.0
Max Gust (m/s) 16.1 16.0 15.4 15.6 17.9 14.4 13.6 16.1 14.8 14.8 12.3 10.1
Rainfall (mm) 121.2 115.4 149.4 187.8 135.0 123.6 119.8 67.0 56.0 17.0 15.2 11.6
Rainfall Admiralty 2015
▪ No Data
— Defective Data
0.0
20.0
40.0
60.0
80.0
100.0
120.0
140.0
160.0
180.0
200.0
1 2 3 4 5 6 7 8 9 10 11 12 13 14 15 16 17 18 19 20 21 22 23 24
Rai
nfa
ll [
mm
]
Hour
Rainfall Admiralty 2016

Annual Climatological Report Singapore, 2016
106
S106 Pulau Ubin 2016
Hours 1 2 3 4 5 6 7 8 9 10 11 12
Min Dry Bulb
Temperature (°C) 23.3 22.7 23.1 23.2 22.6 22.2 21.9 22.1 22.2 22.7 24.0 23.1
Max Dry Bulb
Temperature (°C) 28.7 28.4 28.5 28.2 28.1 28.0 28.1 29.1 31.0 32.6 34.7 34.3
Average Dry Bulb
Temperature (°C) 26.1 25.9 25.9 25.8 25.7 25.5 25.4 26.0 27.7 28.9 29.8 30.4
Average Dew Point
Temperature (°C) 25.6 25.6 25.6 25.5 25.4 25.3 25.2 25.7 26.0 25.9 25.7 25.5
Average Relative
Humidity (%) 97.4 98.0 98.4 98.6 98.8 98.7 98.8 98.1 91.1 84.6 79.4 76.0
Average Wind Speed
(m/s) 2.0 2.1 2.0 2.1 2.1 2.1 2.1 2.2 2.7 3.0 3.2 3.3
Max Gust (m/s) 11.3 12.4 11.8 10.9 13.9 12.4 11.5 11.1 10.1 10.9 10.4 11.9
Rainfall (mm) 18.8 76.4 49.8 66.2 85.0 107.8 113.4 143.6 63.4 22.2 99.6 76.8
Average Temperature Pulau Ubin 2015
▪ No Data
— Defective Data
23.0
24.0
25.0
26.0
27.0
28.0
29.0
30.0
31.0
32.0
0 1 2 3 4 5 6 7 8 9 10 11 12 13 14 15 16 17 18 19 20 21 22 23 24
Tem
per
atu
re [
°C]
Hour
Average Temperature Pulau Ubin 2016

Annual Climatological Report Singapore, 2016
107
S106 Pulau Ubin 2016
Hours 13 14 15 16 17 18 19 20 21 22 23 24
Min Dry Bulb Temperature (°C)
23.2 22.8 23.0 22.2 22.5 22.9 22.2 22.3 22.9 22.7 23.3 23.3
Max Dry Bulb Temperature (°C)
35.1 36.4 36.6 36.0 35.4 34.6 33.1 31.1 29.7 29.1 28.9 28.9
Average Dry Bulb Temperature (°C)
30.7 30.8 30.5 30.2 29.6 28.8 27.8 27.1 26.8 26.5 26.4 26.2
Average Dew Point Temperature (°C)
25.5 25.4 25.4 25.4 25.2 25.2 25.2 25.3 25.4 25.5 25.6 25.6
Average Relative Humidity (%)
74.6 74.2 75.2 76.5 78.4 81.7 86.2 90.1 92.4 94.3 95.5 96.6
Average Wind Speed (m/s)
3.3 3.3 3.2 3.1 3.0 2.8 2.5 2.3 2.2 2.1 2.0 2.0
Max Gust (m/s) 11.1 11.6 12.0 12.1 12.4 11.8 11.4 10.1 11.7 16.7 17.5 8.7
Rainfall (mm) 89.6 161.0 156.2 152.2 125.0 106.6 36.2 88.6 53.0 25.6 9.2 8.0
Rainfall Pulau Ubin 2015
▪ No Data
— Defective Data
0.0
20.0
40.0
60.0
80.0
100.0
120.0
140.0
160.0
180.0
1 2 3 4 5 6 7 8 9 10 11 12 13 14 15 16 17 18 19 20 21 22 23 24
Rai
nfa
ll [
mm
]
Hour
Rainfall Pulau Ubin 2016

Annual Climatological Report Singapore, 2016
108
S107 East Coast Parkway 2016
Hours 1 2 3 4 5 6 7 8 9 10 11 12
Min Dry Bulb
Temperature (°C) 25.1 24.2 24.6 23.0 23.1 22.4 22.6 23.6 23.7 23.6 24.4 23.6
Max Dry Bulb
Temperature (°C) 30.6 30.7 30.7 30.5 30.3 30.2 30.2 30.5 30.9 31.4 32.4 33.0
Average Dry Bulb
Temperature (°C) 28.2 28.0 27.9 27.8 27.6 27.5 27.4 27.7 28.3 28.8 29.1 29.4
Average Dew Point
Temperature (°C) 25.1 25.1 25.2 25.2 25.1 25.1 25.0 25.0 24.9 24.8 24.7 24.7
Average Relative
Humidity (%) 83.7 84.9 85.5 86.0 86.4 86.6 86.7 85.3 82.0 79.6 77.3 76.0
Average Wind Speed
(m/s) 2.1 2.0 2.1 2.1 2.2 2.3 2.2 2.3 2.6 3.0 3.3 3.7
Max Gust (m/s) 14.9 27.9 24.0 14.6 19.4 18.3 18.7 19.4 13.8 12.2 14.3 15.4
Rainfall (mm) 16.0 43.4 80.2 63.0 90.6 125.2 93.2 51.8 93.4 55.4 56.2 48.2
Average Temperature East Coast Parkway 2015
▪ No Data
— Defective Data
23.0
24.0
25.0
26.0
27.0
28.0
29.0
30.0
31.0
32.0
0 1 2 3 4 5 6 7 8 9 10 11 12 13 14 15 16 17 18 19 20 21 22 23 24
Tem
per
atu
re [
°C]
Hour
Average Temperature East Coast Parkway 2016

Annual Climatological Report Singapore, 2016
109
S107 East Coast Parkway 2016
Hours 13 14 15 16 17 18 19 20 21 22 23 24
Min Dry Bulb Temperature (°C)
23.6 23.4 23.4 23.7 24.5 24.3 23.7 23.9 24.3 24.5 24.7 24.0
Max Dry Bulb Temperature (°C)
33.3 33.3 33.6 33.6 33.7 33.6 32.7 31.8 31.6 31.0 30.9 30.8
Average Dry Bulb Temperature (°C)
29.6 29.7 29.7 29.7 29.6 29.5 29.2 28.9 28.6 28.5 28.4 28.3
Average Dew Point Temperature (°C)
24.6 24.6 24.6 24.6 24.5 24.5 24.6 24.7 24.8 24.9 25.0 25.1
Average Relative Humidity (%)
75.0 74.6 74.5 74.6 74.7 75.0 76.7 78.4 80.2 81.2 82.2 83.0
Average Wind Speed (m/s)
4.0 4.2 4.3 4.1 3.8 3.4 3.0 2.7 2.5 2.3 2.2 2.1
Max Gust (m/s) 14.4 14.9 15.2 14.0 16.4 14.3 13.5 12.5 12.7 12.3 16.5 15.8
Rainfall (mm) 123.2 128.8 94.2 104.8 107.2 113.2 45.8 36.2 38.8 7.4 14.4 15.4
Rainfall East Coast Parkway 2015
▪ No Data
— Defective Data
0.0
20.0
40.0
60.0
80.0
100.0
120.0
140.0
1 2 3 4 5 6 7 8 9 10 11 12 13 14 15 16 17 18 19 20 21 22 23 24
Rai
nfa
ll [
mm
]
Hour
Rainfall East Coast Parkway 2016
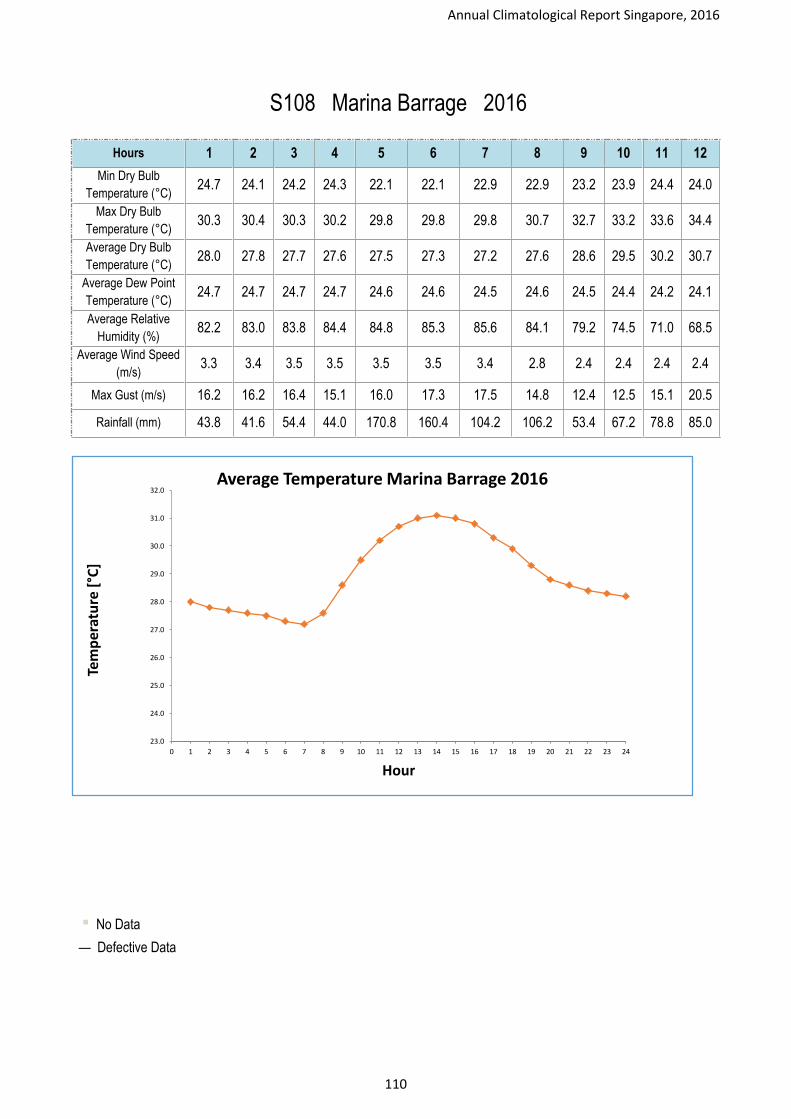
Annual Climatological Report Singapore, 2016
110
S108 Marina Barrage 2016
Hours 1 2 3 4 5 6 7 8 9 10 11 12
Min Dry Bulb
Temperature (°C) 24.7 24.1 24.2 24.3 22.1 22.1 22.9 22.9 23.2 23.9 24.4 24.0
Max Dry Bulb
Temperature (°C) 30.3 30.4 30.3 30.2 29.8 29.8 29.8 30.7 32.7 33.2 33.6 34.4
Average Dry Bulb
Temperature (°C) 28.0 27.8 27.7 27.6 27.5 27.3 27.2 27.6 28.6 29.5 30.2 30.7
Average Dew Point
Temperature (°C) 24.7 24.7 24.7 24.7 24.6 24.6 24.5 24.6 24.5 24.4 24.2 24.1
Average Relative
Humidity (%) 82.2 83.0 83.8 84.4 84.8 85.3 85.6 84.1 79.2 74.5 71.0 68.5
Average Wind Speed
(m/s) 3.3 3.4 3.5 3.5 3.5 3.5 3.4 2.8 2.4 2.4 2.4 2.4
Max Gust (m/s) 16.2 16.2 16.4 15.1 16.0 17.3 17.5 14.8 12.4 12.5 15.1 20.5
Rainfall (mm) 43.8 41.6 54.4 44.0 170.8 160.4 104.2 106.2 53.4 67.2 78.8 85.0
Average Temperature Marina Barrage 2015
▪ No Data
— Defective Data
23.0
24.0
25.0
26.0
27.0
28.0
29.0
30.0
31.0
32.0
0 1 2 3 4 5 6 7 8 9 10 11 12 13 14 15 16 17 18 19 20 21 22 23 24
Tem
per
atu
re [
°C]
Hour
Average Temperature Marina Barrage 2016

Annual Climatological Report Singapore, 2016
111
S108 Marina Barrage 2016
Hours 13 14 15 16 17 18 19 20 21 22 23 24
Min Dry Bulb Temperature (°C)
23.9 23.6 23.9 24.4 23.3 22.7 22.7 23.6 23.5 23.6 23.6 23.6
Max Dry Bulb Temperature (°C)
35.1 36.0 35.8 35.9 34.9 34.2 33.5 32.0 31.2 31.0 30.6 30.6
Average Dry Bulb Temperature (°C)
31.0 31.1 31.0 30.8 30.3 29.9 29.3 28.8 28.6 28.4 28.3 28.2
Average Dew Point Temperature (°C)
24.0 23.9 23.8 23.8 23.7 23.7 23.8 24.0 24.3 24.4 24.5 24.6
Average Relative Humidity (%)
66.8 65.9 66.4 67.3 68.6 70.3 73.1 75.8 77.8 79.1 80.1 81.1
Average Wind Speed (m/s)
2.4 2.5 2.5 2.6 2.6 2.7 3.1 3.2 3.3 3.3 3.3 3.3
Max Gust (m/s) 12.6 13.9 14.2 20.4 15.4 13.8 14.0 14.3 13.2 14.2 13.4 12.6
Rainfall (mm) 74.4 62.6 97.2 121.8 179.2 133.6 87.8 69.8 34.2 12.4 41.8 35.0
Rainfall Marina Barrage 2015
▪ No Data
— Defective Data
0.0
20.0
40.0
60.0
80.0
100.0
120.0
140.0
160.0
180.0
200.0
1 2 3 4 5 6 7 8 9 10 11 12 13 14 15 16 17 18 19 20 21 22 23 24
Rai
nfa
ll [
mm
]
Hour
Rainfall Marina Barrage 2016

Annual Climatological Report Singapore, 2016
112
S109 Ang Mo Kio 2016
Hours 1 2 3 4 5 6 7 8 9 10 11 12
Min Dry Bulb
Temperature (°C) 22.9 22.9 23.3 23.8 22.8 22.3 22.4 22.8 22.8 23.3 21.2 22.0
Max Dry Bulb
Temperature (°C) 29.8 29.6 29.4 29.4 29.3 29.1 29.3 29.5 31.8 32.3 33.0 33.8
Average Dry Bulb
Temperature (°C) 27.2 27.0 26.8 26.7 26.5 26.3 26.2 26.7 27.8 28.7 29.5 30.1
Average Dew Point
Temperature (°C) 24.1 24.2 24.2 24.2 24.2 24.2 24.2 24.2 24.0 23.6 23.1 22.7
Average Relative
Humidity (%) 83.7 85.0 86.0 86.8 87.7 88.2 89.0 86.4 80.3 74.4 69.5 65.8
Average Wind Speed
(m/s) 1.2 1.2 1.2 1.1 1.2 1.2 1.1 1.2 1.5 1.8 2.0 2.1
Max Gust (m/s) 11.6 12.5 11.0 14.8 17.4 17.9 16.0 11.4 9.9 18.2 14.3 19.0
Rainfall (mm) 55.6 39.0 37.0 42.8 90.6 101.0 151.6 81.6 40.8 40.0 85.6 150.4
Average Temperature Ang Mo Kio 2015
▪ No Data
— Defective Data
23.0
24.0
25.0
26.0
27.0
28.0
29.0
30.0
31.0
32.0
0 1 2 3 4 5 6 7 8 9 10 11 12 13 14 15 16 17 18 19 20 21 22 23 24
Tem
per
atu
re [
°C]
Hour
Average Temperature Ang Mo Kio 2016

Annual Climatological Report Singapore, 2016
113
S109 Ang Mo Kio 2016
Hours 13 14 15 16 17 18 19 20 21 22 23 24
Min Dry Bulb Temperature (°C)
22.2 22.9 23.0 23.4 23.4 21.5 21.7 22.7 23.2 23.3 23.8 24.3
Max Dry Bulb Temperature (°C)
34.5 35.4 35.8 35.5 35.1 34.2 33.9 32.9 32.3 32.1 31.1 30.1
Average Dry Bulb Temperature (°C)
30.6 30.7 30.6 30.3 29.9 29.4 28.7 28.2 27.9 27.7 27.6 27.4
Average Dew Point Temperature (°C)
22.4 22.3 22.4 22.5 22.5 22.7 22.9 23.3 23.6 23.8 23.9 24.0
Average Relative Humidity (%)
63.0 62.3 63.0 64.5 65.9 68.6 71.9 75.4 77.8 79.5 80.9 82.2
Average Wind Speed (m/s)
2.2 2.3 2.4 2.4 2.2 2.0 1.8 1.6 1.5 1.3 1.3 1.2
Max Gust (m/s) 13.2 14.4 12.1 13.3 12.9 18.6 11.8 10.2 14.0 11.6 10.3 9.2
Rainfall (mm) 113.0 145.8 196.8 214.0 198.2 184.4 75.6 50.0 64.0 16.0 11.0 8.6
Rainfall Ang Mo Kio 2015
▪ No Data
— Defective Data
0.0
50.0
100.0
150.0
200.0
250.0
1 2 3 4 5 6 7 8 9 10 11 12 13 14 15 16 17 18 19 20 21 22 23 24
Rai
nfa
ll [
mm
]
Hour
Rainfall Ang Mo Kio 2016

Annual Climatological Report Singapore, 2016
114
S111 Newton 2016
Hours 1 2 3 4 5 6 7 8 9 10 11 12
Min Dry Bulb
Temperature (°C) 23.7 23.3 23.5 22.7 22.6 22.3 21.6 22.6 23.1 23.3 22.2 22.2
Max Dry Bulb
Temperature (°C) 29.3 29.1 29.0 29.0 28.9 28.9 28.9 29.2 31.1 32.3 33.5 33.4
Average Dry Bulb
Temperature (°C) 27.2 27.1 27.0 26.8 26.7 26.6 26.5 26.8 27.6 28.4 29.0 29.5
Average Dew Point
Temperature (°C) 24.4 24.5 24.5 24.6 24.6 24.7 24.7 24.6 24.4 23.8 23.3 22.9
Average Relative
Humidity (%) 83.8 85.1 86.1 87.0 87.9 88.3 89.0 86.5 82.1 75.8 70.6 67.2
Average Wind Speed
(m/s) 1.7 1.6 1.6 1.5 1.6 1.6 1.5 1.6 1.7 1.9 2.1 2.2
Max Gust (m/s) 15.1 13.5 11.3 11.2 11.2 14.3 13.0 11.6 10.7 12.0 13.5 15.1
Rainfall (mm) 46.2 24.8 43.2 28.6 45.2 40.4 37.4 41.6 26.6 19.0 46.8 58.4
Average Temperature Newton 2015
▪ No Data
— Defective Data
23.0
24.0
25.0
26.0
27.0
28.0
29.0
30.0
31.0
32.0
0 1 2 3 4 5 6 7 8 9 10 11 12 13 14 15 16 17 18 19 20 21 22 23 24
Tem
per
atu
re [
°C]
Hour
Average Temperature Newton 2016

Annual Climatological Report Singapore, 2016
115
S111 Newton 2016
Hours 13 14 15 16 17 18 19 20 21 22 23 24
Min Dry Bulb Temperature (°C)
23.3 22.8 22.9 23.9 22.5 22.4 23.1 23.7 23.2 23.4 23.7 23.8
Max Dry Bulb Temperature (°C)
33.9 33.9 34.4 34.5 33.9 33.5 32.8 31.7 31.3 31.1 30.4 29.9
Average Dry Bulb Temperature (°C)
29.8 29.9 29.9 29.6 29.4 28.9 28.4 28.0 27.8 27.7 27.5 27.4
Average Dew Point Temperature (°C)
22.8 22.8 22.7 22.7 22.7 22.8 23.1 23.3 23.6 23.9 24.1 24.2
Average Relative Humidity (%)
65.7 65.4 65.0 66.1 67.0 69.1 72.5 75.4 77.9 79.7 81.2 82.4
Average Wind Speed (m/s)
2.4 2.4 2.4 2.5 2.4 2.2 2.1 1.9 1.8 1.8 1.7 1.7
Max Gust (m/s) 13.4 14.1 13.3 13.0 13.1 12.9 13.7 12.3 11.8 10.5 13.4 10.6
Rainfall (mm) 61.2 89.8 120.0 147.8 147.8 151.2 38.2 67.4 38.6 10.8 7.8 16.2
Rainfall Newton 2015
▪ No Data
— Defective Data
0.0
20.0
40.0
60.0
80.0
100.0
120.0
140.0
160.0
1 2 3 4 5 6 7 8 9 10 11 12 13 14 15 16 17 18 19 20 21 22 23 24
Rai
nfa
ll [
mm
]
Hour
Rainfall Newton 2016

Annual Climatological Report Singapore, 2016
116
S115 Tuas South 2016
Hours 1 2 3 4 5 6 7 8 9 10 11 12
Min Dry Bulb
Temperature (°C) 24.8 23.7 23.8 24.6 23.5 23.8 23.7 23.0 23.6 23.7 23.7 23.6
Max Dry Bulb
Temperature (°C) 30.6 30.4 30.2 30.2 30.4 30.2 29.9 29.9 31.0 32.9 33.7 33.9
Average Dry Bulb
Temperature (°C) 27.9 27.8 27.6 27.5 27.4 27.1 27.1 27.2 27.9 28.7 29.3 29.9
Average Dew Point
Temperature (°C) 24.2 24.2 24.2 24.2 24.2 24.1 24.1 24.2 24.4 24.3 24.2 24.1
Average Relative
Humidity (%) 80.3 81.2 81.8 82.2 83.0 83.6 84.0 83.7 81.4 77.7 74.3 71.6
Average Wind Speed
(m/s) 1.2 1.3 1.3 1.4 1.5 1.6 1.5 1.6 1.8 1.9 2.2 2.5
Max Gust (m/s) 16.9 15.0 15.4 17.9 17.8 20.2 16.4 14.6 10.7 15.7 14.5 13.3
Rainfall (mm) 20.2 68.8 43.4 51.2 115.6 169.0 76.6 126.0 46.8 68.4 136.0 127.8
Average Temperature Tuas South 2015
▪ No Data
— Defective Data
23.0
24.0
25.0
26.0
27.0
28.0
29.0
30.0
31.0
32.0
0 1 2 3 4 5 6 7 8 9 10 11 12 13 14 15 16 17 18 19 20 21 22 23 24
Tem
per
atu
re [
°C]
Hour
Average Temperature Tuas South 2016

Annual Climatological Report Singapore, 2016
117
S115 Tuas South 2016
Hours 13 14 15 16 17 18 19 20 21 22 23 24
Min Dry Bulb Temperature (°C)
23.7 23.9 24.2 23.4 24.0 23.7 23.3 23.0 23.7 24.0 24.0 24.3
Max Dry Bulb Temperature (°C)
34.9 34.2 35.1 34.8 35.6 35.0 34.2 32.9 31.8 31.4 31.1 30.7
Average Dry Bulb Temperature (°C)
30.3 30.4 30.3 30.2 30.0 29.7 29.2 28.8 28.6 28.4 28.2 28.1
Average Dew Point Temperature (°C)
24.0 24.0 23.9 23.9 23.8 23.8 23.8 23.8 23.9 23.9 24.0 24.1
Average Relative Humidity (%)
69.8 69.2 69.2 69.6 70.0 71.0 73.0 74.9 76.0 76.9 78.2 79.3
Average Wind Speed (m/s)
2.7 2.8 2.7 2.5 2.2 1.8 1.5 1.3 1.2 1.2 1.2 1.1
Max Gust (m/s) 12.4 12.1 12.9 12.1 11.0 12.5 17.7 11.8 15.9 15.1 11.4 14.1
Rainfall (mm) 100.0 123.0 192.2 181.0 224.4 131.0 85.0 35.6 36.0 51.2 9.8 26.2
Rainfall Tuas South 2015
▪ No Data
— Defective Data
0.0
50.0
100.0
150.0
200.0
250.0
1 2 3 4 5 6 7 8 9 10 11 12 13 14 15 16 17 18 19 20 21 22 23 24
Rai
nfa
ll [
mm
]
Hour
Rainfall Tuas South 2016

Annual Climatological Report Singapore, 2016
118
S116 Pasir Panjang 2016
Hours 1 2 3 4 5 6 7 8 9 10 11 12
Min Dry Bulb
Temperature (°C) 24.1 24.3 23.8 23.5 21.8 21.9 22.6 23.1 23.6 23.8 22.3 22.8
Max Dry Bulb
Temperature (°C) 30.5 30.5 30.5 30.4 30.3 30.2 29.8 30.4 31.0 32.1 33.1 33.6
Average Dry Bulb
Temperature (°C) 28.3 28.1 27.9 27.8 27.7 27.5 27.4 27.6 28.2 28.9 29.4 29.8
Average Dew Point
Temperature (°C) 25.9 25.9 25.8 25.9 25.8 25.7 25.7 25.7 25.7 25.6 25.3 25.2
Average Relative
Humidity (%) 87.0 87.9 88.6 89.3 89.8 90.2 90.4 89.7 86.4 82.6 79.2 76.8
Average Wind Speed
(m/s) 2.3 2.4 2.4 2.5 2.6 2.6 2.6 2.5 2.8 3.1 3.3 3.4
Max Gust (m/s) 23.0 21.4 19.4 23.0 21.5 23.9 23.5 18.5 15.4 16.9 20.8 15.6
Rainfall (mm) 16.2 40.4 52.0 66.6 111.0 193.4 76.6 58.0 45.8 75.6 126.0 100.0
Average Temperature Pasir Panjang 2015
▪ No Data
— Defective Data
23.0
24.0
25.0
26.0
27.0
28.0
29.0
30.0
31.0
32.0
0 1 2 3 4 5 6 7 8 9 10 11 12 13 14 15 16 17 18 19 20 21 22 23 24
Tem
per
atu
re [
°C]
Hour
Average Temperature Pasir Panjang 2016

Annual Climatological Report Singapore, 2016
119
S116 Pasir Panjang 2016
Hours 13 14 15 16 17 18 19 20 21 22 23 24
Min Dry Bulb Temperature (°C)
24.4 24.1 23.5 23.2 22.7 23.1 23.3 23.3 23.3 23.9 24.4 24.7
Max Dry Bulb Temperature (°C)
34.5 34.4 34.8 35.0 35.3 34.3 33.7 32.5 32.0 31.8 31.3 31.0
Average Dry Bulb Temperature (°C)
30.1 30.1 30.2 30.1 29.9 29.7 29.3 29.0 28.8 28.7 28.5 28.4
Average Dew Point Temperature (°C)
25.1 25.0 24.9 24.9 24.8 24.8 25.0 25.3 25.4 25.6 25.7 25.8
Average Relative Humidity (%)
75.2 74.6 74.3 74.6 75.3 75.9 78.3 80.6 82.3 83.7 85.1 86.1
Average Wind Speed (m/s)
3.6 3.8 3.8 3.6 3.4 3.1 2.9 2.6 2.5 2.5 2.3 2.3
Max Gust (m/s) 15.9 17.8 15.6 16.4 16.5 19.8 17.4 15.6 13.9 17.1 19.4 23.5
Rainfall (mm) 65.6 123.4 175.2 130.4 162.4 143.8 113.4 41.2 50.8 15.4 33.2 14.6
Rainfall Pasir Panjang 2015
▪ No Data
— Defective Data
0.0
50.0
100.0
150.0
200.0
250.0
1 2 3 4 5 6 7 8 9 10 11 12 13 14 15 16 17 18 19 20 21 22 23 24
Rai
nfa
ll [
mm
]
Hour
Rainfall Pasir Panjang 2016

Annual Climatological Report Singapore, 2016
120
S117 Jurong Island 2016
Hours 1 2 3 4 5 6 7 8 9 10 11 12
Min Dry Bulb
Temperature (°C) 24.1 23.5 23.3 23.6 22.8 22.5 22.7 22.7 23.6 22.5 21.9 22.7
Max Dry Bulb
Temperature (°C) 30.1 30.1 30.0 29.9 29.9 29.7 29.6 30.3 31.0 31.7 32.7 33.4
Average Dry Bulb
Temperature (°C) 28.0 27.9 27.7 27.6 27.4 27.2 27.1 27.5 28.2 28.9 29.5 30.0
Average Dew Point
Temperature (°C) 24.0 24.0 24.0 24.1 24.0 24.0 23.9 24.1 23.9 23.6 23.4 23.2
Average Relative
Humidity (%) 78.9 80.0 80.8 81.4 82.0 82.8 82.9 82.2 77.7 73.5 70.4 67.5
Average Wind Speed
(m/s) 1.7 1.7 1.8 1.7 1.8 1.7 1.7 1.7 2.0 2.2 2.4 2.6
Max Gust (m/s) 15.6 13.8 14.1 15.6 15.2 15.9 15.1 14.3 11.7 12.1 13.5 16.0
Rainfall (mm) 17.0 73.0 67.0 58.8 101.6 170.8 87.8 94.6 70.6 105.8 126.2 117.6
Average Temperature Jurong Island 2015
▪ No Data
— Defective Data
23.0
24.0
25.0
26.0
27.0
28.0
29.0
30.0
31.0
32.0
0 1 2 3 4 5 6 7 8 9 10 11 12 13 14 15 16 17 18 19 20 21 22 23 24
Tem
per
atu
re [
°C]
Hour
Average Temperature Jurong Island 2016

Annual Climatological Report Singapore, 2016
121
S117 Jurong Island 2016
Hours 13 14 15 16 17 18 19 20 21 22 23 24
Min Dry Bulb Temperature (°C)
23.3 23.0 23.8 23.9 22.8 23.3 23.0 22.5 23.8 24.0 23.7 24.4
Max Dry Bulb Temperature (°C)
34.4 35.6 34.4 34.8 35.4 34.9 34.3 32.8 31.6 31.5 30.8 30.6
Average Dry Bulb Temperature (°C)
30.4 30.5 30.4 30.3 30.0 29.7 29.1 28.8 28.6 28.5 28.3 28.2
Average Dew Point Temperature (°C)
23.1 23.0 23.0 23.0 23.0 23.0 23.1 23.3 23.5 23.7 23.8 23.9
Average Relative Humidity (%)
66.2 65.2 66.0 66.2 67.0 68.4 70.7 72.6 74.0 75.4 76.8 78.0
Average Wind Speed (m/s)
2.8 2.9 2.9 2.7 2.5 2.3 2.0 1.9 1.9 1.8 1.8 1.8
Max Gust (m/s) 13.1 14.3 16.9 12.8 14.0 13.9 11.2 10.3 12.5 11.4 14.9 12.2
Rainfall (mm) 54.8 104.8 223.2 205.8 147.6 144.0 107.6 45.4 25.6 31.4 26.4 10.0
Rainfall Jurong Island 2015
▪ No Data
— Defective Data
0.0
50.0
100.0
150.0
200.0
250.0
1 2 3 4 5 6 7 8 9 10 11 12 13 14 15 16 17 18 19 20 21 22 23 24
Rai
nfa
ll [
mm
]
Hour
Rainfall Jurong Island 2016

Annual Climatological Report Singapore, 2016
122
S121 Choa Chu Kang (South) 2016
Hours 1 2 3 4 5 6 7 8 9 10 11 12
Min Dry Bulb
Temperature (°C) 22.8 23.1 23.7 23.5 22.8 22.5 22.1 22.4 22.6 23.2 22.7 22.5
Max Dry Bulb
Temperature (°C) 29.6 29.1 28.9 29.1 29.1 29.0 28.6 29.0 30.4 31.9 32.7 34.0
Average Dry Bulb
Temperature (°C) 26.8 26.6 26.4 26.2 26.1 25.9 25.8 26.3 27.5 28.5 29.4 30.1
Average Dew Point
Temperature (°C) 26.2 26.2 26.1 26.0 25.9 25.8 25.8 26.1 26.5 26.0 25.4 24.8
Average Relative
Humidity (%) 95.0 96.1 96.8 97.0 97.3 97.6 97.8 96.9 92.8 85.6 79.1 73.5
Average Wind Speed
(m/s) 1.0 1.0 1.0 1.0 1.0 1.0 1.0 1.1 1.6 2.0 2.2 2.3
Max Gust (m/s) 24.5 14.3 9.7 12.4 14.6 14.8 14.4 11.3 15.5 28.4 11.4 14.5
Rainfall (mm) 73.8 42.4 28.4 63.2 76.6 128.6 122.8 83.4 91.8 105.2 213.2 203.0
Average Temperature Choa Chu Kang (South) 2015
▪ No Data
— Defective Data
23.0
24.0
25.0
26.0
27.0
28.0
29.0
30.0
31.0
32.0
0 1 2 3 4 5 6 7 8 9 10 11 12 13 14 15 16 17 18 19 20 21 22 23 24
Tem
per
atu
re [
°C]
Hour
Average Temperature Choa Chu Kang (South) 2016

Annual Climatological Report Singapore, 2016
123
S121 Choa Chu Kang (South) 2016
Hours 13 14 15 16 17 18 19 20 21 22 23 24
Min Dry Bulb Temperature (°C)
23.6 23.1 22.8 23.3 21.7 21.7 22.7 22.6 23.2 23.1 23.3 23.9
Max Dry Bulb Temperature (°C)
34.9 35.1 35.7 35.7 35.2 34.9 33.7 32.3 31.3 30.5 30.1 29.7
Average Dry Bulb Temperature (°C)
30.6 30.7 30.6 30.3 29.8 29.4 28.6 28.1 27.7 27.4 27.2 27.0
Average Dew Point Temperature (°C)
24.5 24.3 24.3 24.5 24.5 24.6 24.9 25.3 25.6 25.9 26.1 26.1
Average Relative Humidity (%)
70.6 69.1 68.9 71.6 73.2 75.7 80.5 84.3 87.7 90.4 92.3 93.7
Average Wind Speed (m/s)
2.3 2.4 2.4 2.3 2.2 1.9 1.7 1.4 1.3 1.2 1.1 1.1
Max Gust (m/s) 14.3 24.7 13.1 18.2 14.3 26.2 13.5 27.0 21.7 12.1 10.4 9.9
Rainfall (mm) 82.0 160.4 214.4 236.8 199.8 146.8 125.4 65.6 71.0 31.6 57.8 13.6
Rainfall Choa Chu Kang (South) 2015
▪ No Data
— Defective Data
0.0
50.0
100.0
150.0
200.0
250.0
1 2 3 4 5 6 7 8 9 10 11 12 13 14 15 16 17 18 19 20 21 22 23 24
Rai
nfa
ll [
mm
]
Hour
Rainfall Choa Chu Kang (South) 2016
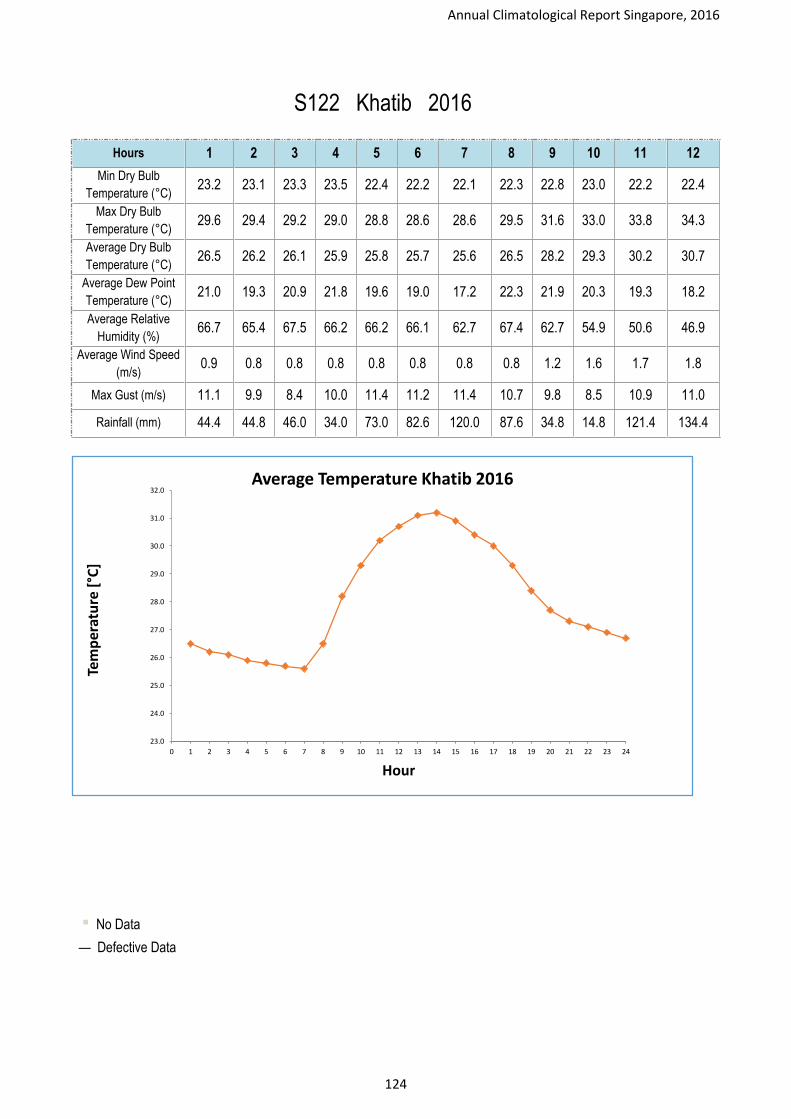
Annual Climatological Report Singapore, 2016
124
S122 Khatib 2016
Hours 1 2 3 4 5 6 7 8 9 10 11 12
Min Dry Bulb
Temperature (°C) 23.2 23.1 23.3 23.5 22.4 22.2 22.1 22.3 22.8 23.0 22.2 22.4
Max Dry Bulb
Temperature (°C) 29.6 29.4 29.2 29.0 28.8 28.6 28.6 29.5 31.6 33.0 33.8 34.3
Average Dry Bulb
Temperature (°C) 26.5 26.2 26.1 25.9 25.8 25.7 25.6 26.5 28.2 29.3 30.2 30.7
Average Dew Point
Temperature (°C) 21.0 19.3 20.9 21.8 19.6 19.0 17.2 22.3 21.9 20.3 19.3 18.2
Average Relative
Humidity (%) 66.7 65.4 67.5 66.2 66.2 66.1 62.7 67.4 62.7 54.9 50.6 46.9
Average Wind Speed
(m/s) 0.9 0.8 0.8 0.8 0.8 0.8 0.8 0.8 1.2 1.6 1.7 1.8
Max Gust (m/s) 11.1 9.9 8.4 10.0 11.4 11.2 11.4 10.7 9.8 8.5 10.9 11.0
Rainfall (mm) 44.4 44.8 46.0 34.0 73.0 82.6 120.0 87.6 34.8 14.8 121.4 134.4
Average Temperature Khatib 2015
▪ No Data
— Defective Data
23.0
24.0
25.0
26.0
27.0
28.0
29.0
30.0
31.0
32.0
0 1 2 3 4 5 6 7 8 9 10 11 12 13 14 15 16 17 18 19 20 21 22 23 24
Tem
per
atu
re [
°C]
Hour
Average Temperature Khatib 2016

Annual Climatological Report Singapore, 2016
125
S122 Khatib 2016
Hours 13 14 15 16 17 18 19 20 21 22 23 24
Min Dry Bulb Temperature (°C)
22.4 23.2 23.3 23.6 23.4 22.2 22.4 22.9 23.2 22.8 23.4 23.8
Max Dry Bulb Temperature (°C)
35.0 35.5 35.8 35.7 35.1 34.7 33.7 31.9 30.6 30.2 29.7 29.6
Average Dry Bulb Temperature (°C)
31.1 31.2 30.9 30.4 30.0 29.3 28.4 27.7 27.3 27.1 26.9 26.7
Average Dew Point Temperature (°C)
17.5 17.7 16.8 16.6 17.0 16.7 17.5 18.6 19.2 19.6 20.0 20.6
Average Relative Humidity (%)
44.2 44.2 43.3 44.4 47.1 48.9 53.2 57.1 60.4 62.1 63.6 65.6
Average Wind Speed (m/s)
2.0 2.0 2.0 2.0 1.8 1.6 1.3 1.2 1.1 1.0 0.9 0.9
Max Gust (m/s) 10.1 11.6 10.3 12.4 13.5 10.5 10.3 8.9 9.2 10.0 7.6 6.8
Rainfall (mm) 82.4 152.8 221.4 319.8 179.6 126.2 73.4 52.4 57.8 10.0 14.8 4.2
Rainfall Khatib 2015
▪ No Data
— Defective Data
0.0
50.0
100.0
150.0
200.0
250.0
300.0
350.0
1 2 3 4 5 6 7 8 9 10 11 12 13 14 15 16 17 18 19 20 21 22 23 24
Rai
nfa
ll [
mm
]
Hour
Rainfall Khatib 2016

Annual Climatological Report Singapore, 2016
126
11. Wind Rose

Annual Climatological Report Singapore, 2016
127
11.1. Annual Wind Rose of All Stations

Annual Climatological Report Singapore, 2016
128

Annual Climatological Report Singapore, 2016
129
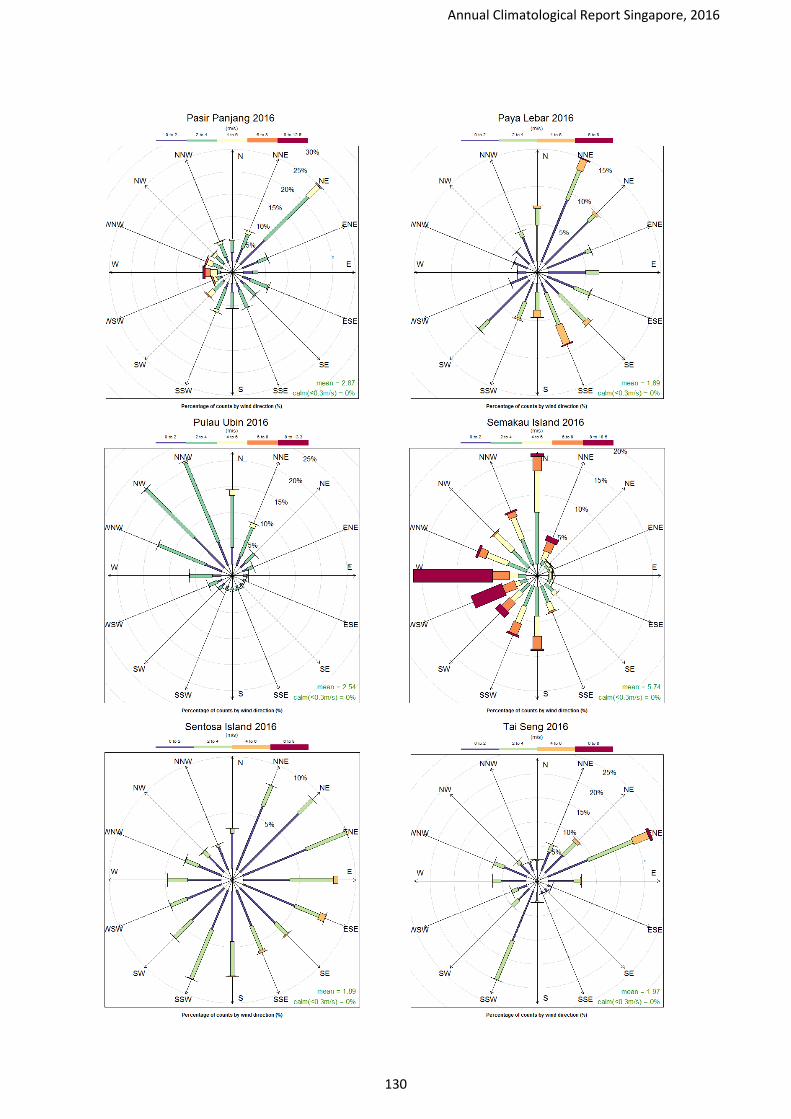
Annual Climatological Report Singapore, 2016
130

Annual Climatological Report Singapore, 2016
131

Annual Climatological Report Singapore, 2016
132
11.2. Monthly Wind Rose of Changi Climate Station

Annual Climatological Report Singapore, 2016
133

Annual Climatological Report Singapore, 2016
134

Annual Climatological Report Singapore, 2016
134
12. Upper Air Data

Annual Climatological Report Singapore, 2016
135
Temperature (°C) at 00 UTC and 12 UTC
Singapore, 2016
Pressure Time Jan Feb Mar Apr May Jun Jul Aug Sep Oct Nov Dec
1000 00 UTC 26.3 25.7 26.5 27.5 27.5 27.3 27.0 27.4 26.5 26.4 25.7 25.7
12 UTC 28.2 27.8 28.6 29.4 29.7 28.9 28.8 29.4 29.0 28.9 27.7 27.8
925 00 UTC 22.1 21.6 22.6 23.4 23.5 23.3 23.0 23.1 23.1 22.8 22.4 22.4
12 UTC 22.7 22.2 22.9 23.9 24.3 23.5 23.4 23.7 23.9 23.7 23.0 22.9
850 00 UTC 18.5 18.4 19.1 19.5 19.6 18.9 18.9 18.7 18.8 18.9 18.4 18.1
12 UTC 18.6 18.2 19.3 19.9 20.1 19.4 19.1 19.4 19.2 19.3 19.0 18.5
700 00 UTC 10.4 10.0 10.5 10.7 10.7 9.7 9.6 9.7 9.1 10.1 9.5 9.7
12 UTC 10.6 10.3 11.1 11.4 11.2 10.3 10.2 10.6 10.1 10.2 10.3 10.0
600 00 UTC 3.7 3.3 3.5 3.7 3.8 2.6 2.5 2.4 2.1 3.3 2.8 2.6
12 UTC 3.9 3.7 4.2 4.4 4.2 2.9 3.0 3.3 3.0 3.2 3.4 3.1
500 00 UTC -4.9 -4.8 -4.7 -3.9 -4.1 -5.2 -5.5 -5.2 -5.4 -4.5 -4.8 -5.1
12 UTC -4.3 -4.0 -3.9 -3.6 -3.5 -5.1 -5.1 -4.9 -5.3 -4.6 -4.1 -4.4
400 00 UTC -14.5 -14.1 -14.0 -14.2 -13.6 -15.3 -15.6 -15.5 -15.3 -14.6 -14.7 -15.1
12 UTC -14.1 -13.9 -13.6 -13.8 -13.4 -14.7 -14.8 -15.1 -15.2 -14.6 -14.2 -14.9
300 00 UTC -29.6 -28.9 -29.0 -28.8 -28.3 -29.9 -30.5 -30.4 -30.4 -29.3 -29.4 -30.0
12 UTC -29.4 -28.7 -28.6 -28.4 -27.8 -29.5 -29.8 -30.0 -29.8 -29.4 -29.1 -29.6
250 00 UTC -40.0 -39.4 -38.9 -39.0 -38.3 -40.2 -40.6 -40.7 -40.7 -39.8 -39.8 -40.5
12 UTC -39.6 -39.0 -38.8 -38.6 -37.9 -39.7 -40.1 -40.2 -40.1 -39.7 -39.4 -39.8
200 00 UTC -52.1 -52.1 -51.3 -51.3 -50.9 -52.8 -53.0 -52.9 -53.4 -53.0 -52.7 -53.3
12 UTC -51.8 -51.7 -51.2 -50.9 -50.3 -52.3 -52.7 -52.5 -52.8 -52.4 -52.1 -52.8
150 00 UTC -66.1 -67.2 -66.0 -66.1 -66.4 -67.8 -67.8 -67.4 -68.3 -68.7 -68.2 -68.7
12 UTC -66.1 -67.0 -65.8 -65.7 -66.0 -67.6 -67.6 -66.7 -67.7 -68.1 -67.8 -68.3
100 00 UTC -80.8 -79.3 -81.5 -80.6 -82.9 -78.9 -79.6 -78.7 -80.5 -82.0 -85.3 -82.4
12 UTC -80.9 -79.1 -80.8 -81.0 -82.3 -79.5 -80.0 -79.9 -79.7 -81.6 -84.8 -82.5
70 00 UTC -75.7 -76.2 -78.9 -79.4 -78.5 -74.7 -73.5 -72.8 -72.5 -71.8 -75.4 -76.1
12 UTC -76.8 -77.4 -79.3 -78.3 -80.3 -76.5 -74.2 -73.3 -73.7 -75.0 -76.8 -78.5
50 00 UTC -69.8 -71.5 -72.4 -72.6 -71.5 -67.8 -62.4 -61.3 -62.8 -64.6 -65.2 -66.0
12 UTC -69.8 -71.9 -73.3 -74.0 -71.7 -69.2 -63.6 -63.5 -63.9 -65.8 -66.5 -66.3
30 00 UTC -59.6 -58.8 -59.7 -56.7 -55.8 -55.9 -56.5 -57.8 -57.4 -56.6 -57.8 -58.7
12 UTC -59.7 -59.2 -59.2 -56.7 -55.5 -55.3 -55.9 -55.6 -58.1 -57.4 -58.3 -60.5
20 00 UTC -55.0 -55.5 -54.0 -51.2 -51.3 -51.7 -52.2 -53.0 -51.9 -52.1 -52.4 -54.1
12 UTC -56.4 -55.2 -54.3 -51.4 -51.0 -50.2 -51.3 -51.4 -52.0 -51.8 -53.0 -53.9
10 00 UTC -49.1 -49.9 -47.8 -44.6 -44.7 -45.0 -44.4 -47.2 -44.7 -44.3 -46.0 -48.0
12 UTC -47.5 -46.5 -46.3 -43.5 -40.8 -42.9 -44.1 -46.1 -43.4 -41.4 -42.4 -45.0

Annual Climatological Report Singapore, 2016
136
Dew Point (°C) at 00 UTC and 12 UTC
Singapore, 2016
Pressure Time Jan Feb Mar Apr May Jun Jul Aug Sep Oct Nov Dec
1000 00 UTC 24.0 23.4 23.8 24.6 24.6 24.2 24.1 23.8 23.2 23.3 23.4 23.0
12 UTC 23.3 22.7 23.1 23.6 24.1 23.6 23.5 23.1 22.3 22.4 23.5 23.0
925 00 UTC 19.8 19.5 19.0 20.0 20.2 19.0 19.0 19.5 18.6 19.2 19.2 19.0
12 UTC 20.2 19.7 20.8 21.2 21.2 20.2 19.5 19.8 19.0 18.8 19.8 19.9
850 00 UTC 15.6 14.1 14.4 15.0 15.5 14.8 14.4 15.0 14.5 14.8 15.6 15.0
12 UTC 16.2 14.7 15.8 16.5 16.1 14.6 14.6 14.4 14.2 14.3 15.5 15.0
700 00 UTC 5.8 5.8 4.6 4.6 7.0 5.1 4.8 4.5 5.5 6.1 6.9 6.2
12 UTC 6.4 6.1 5.0 5.1 6.7 5.5 4.3 4.3 4.9 5.0 6.8 6.3
600 00 UTC -3.6 -1.8 -2.5 -1.1 0.5 -0.5 -2.2 -1.8 -0.7 0.7 0.9 -0.5
12 UTC -3.6 -2.3 -2.4 -1.2 0.2 -0.2 -1.6 -2.7 -1.0 -0.3 0.8 -0.4
500 00 UTC -11.1 -8.4 -10.5 -11.6 -8.2 -8.3 -10.3 -10.0 -9.1 -7.3 -7.6 -8.2
12 UTC -11.3 -8.3 -10.5 -10.9 -8.4 -7.9 -9.4 -9.9 -8.4 -7.9 -7.2 -8.3
400 00 UTC -24.1 -22.5 -23.4 -21.3 -20.7 -20.2 -21.4 -21.7 -20.9 -18.2 -18.8 -19.5
12 UTC -23.7 -21.0 -23.5 -20.1 -19.1 -19.5 -21.6 -20.9 -19.6 -18.2 -18.0 -17.9
300 00 UTC -39.7 -37.6 -39.4 -37.5 -36.1 -37.4 -38.0 -37.7 -36.9 -35.1 -35.4 -36.0
12 UTC -38.5 -35.3 -38.0 -37.1 -34.8 -35.9 -36.5 -36.9 -35.6 -34.5 -34.4 -34.6
250 00 UTC -48.2 -46.8 -49.7 -46.7 -46.2 -48.0 -49.2 -46.8 -47.7 -45.9 -45.4 -46.4
12 UTC -48.1 -46.1 -48.5 -45.9 -44.9 -46.9 -46.6 -46.6 -47.5 -45.8 -44.5 -45.4
200 00 UTC -59.8 -59.0 -60.1 -59.1 -58.1 -59.7 -60.6 -59.1 -59.7 -58.8 -58.4 -58.8
12 UTC -59.5 -58.7 -60.8 -57.0 -55.8 -59.4 -59.6 -58.2 -59.5 -58.8 -58.0 -58.5
150 00 UTC -72.9 -73.7 -73.2 -72.2 -71.6 -74.1 -74.3 -73.4 -74.0 -73.9 -73.7 -73.9
12 UTC -74.3 -73.4 -73.4 -72.2 -71.7 -73.8 -74.5 -72.6 -74.2 -73.8 -74.1 -73.2
100 00 UTC -86.7 -87.1 -87.0 -86.3 -87.8 -86.5 -86.2 -86.6 -86.4 -88.1 -89.8 -88.8
12 UTC -86.6 -87.1 -87.0 -86.6 -87.6 -86.9 -86.6 -86.9 -86.7 -88.1 -90.1 -88.9
70 00 UTC -88.1 -88.5 -89.3 -89.2 -89.3 -89.3 -88.9 -89.1 -88.1 -87.5 -87.4 -88.8
12 UTC -87.5 -88.7 -89.4 -89.1 -89.4 -88.7 -88.8 -88.7 -87.3 -87.5 -88.2 -89.3
50 00 UTC -89.8 -89.9 -89.6 -89.8 -91.1 -89.8 -88.0 -87.2 -88.3 -89.6 -87.8 -88.4
12 UTC -88.5 -89.2 -89.5 -90.1 -90.0 -90.9 -88.9 -88.8 -89.1 -88.3 -91.0 -88.6
30 00 UTC -85.9 -85.3 -86.0 -87.8 -87.2 -87.2 -87.7 -88.6 -88.3 -87.7 -88.6 -85.3
12 UTC -86.0 -85.6 -89.5 -87.8 -87.0 -86.8 -87.2 -87.0 -88.8 -88.3 -88.9 -90.4
20 00 UTC -86.6 -87.0 -85.9 -84.0 -84.1 -84.3 -84.7 -85.2 -84.5 -84.6 -84.8 -86.0
12 UTC -83.6 -86.8 -86.1 -84.1 -83.9 -83.3 -84.1 -84.1 -84.6 -84.4 -85.2 -85.9
10 00 UTC -82.6 -83.1 -81.7 -79.5 -79.6 -79.8 -79.4 -81.3 -79.6 -79.3 -80.4 -81.8
12 UTC -81.5 -80.8 -80.6 -78.7 -76.9 -78.3 -79.2 -80.5 -78.7 -77.3 -78.0 -79.8

Annual Climatological Report Singapore, 2016
137

Annual Climatological Report Singapore, 2016
138

Annual Climatological Report Singapore, 2016
139

Annual Climatological Report Singapore, 2016
140
Wind Speed (m/s) at 00 UTC and 12 UTC
Singapore, 2016
Pressure Time Jan Feb Mar Apr May Jun Jul Aug Sep Oct Nov Dec
1000 00 UTC 3.9 4.3 4.3 2.7 2.1 1.9 2.4 2.9 2.5 2.5 2.9 3.3
12 UTC 4.9 6.0 5.7 3.5 2.3 2.5 2.7 3.1 3.0 2.9 3.0 3.2
925 00 UTC 7.9 10.3 6.6 4.5 4.5 5.0 5.4 7.5 7.2 7.7 6.2 8.0
12 UTC 7.9 9.5 6.9 4.7 4.0 4.4 4.1 5.8 5.9 5.5 4.9 7.6
850 00 UTC 5.2 6.6 4.8 3.6 4.1 6.4 5.8 8.8 7.1 8.5 5.9 9.1
12 UTC 5.8 7.3 4.4 3.4 3.9 5.9 4.6 8.5 6.8 7.6 5.7 8.9
700 00 UTC 5.0 5.0 4.1 3.3 5.6 5.9 4.9 7.3 6.8 8.1 5.3 10.0
12 UTC 4.7 5.0 3.8 4.0 5.8 6.3 5.3 7.5 7.7 8.4 4.9 9.0
600 00 UTC 5.5 6.2 5.0 5.2 5.6 6.1 4.7 5.6 5.5 7.1 4.6 7.7
12 UTC 5.6 5.6 4.9 4.5 5.3 6.1 4.2 6.1 6.2 7.3 4.8 7.8
500 00 UTC 6.3 7.0 9.5 6.4 5.6 5.3 5.2 5.5 4.9 4.9 5.0 5.6
12 UTC 5.8 6.3 8.7 6.0 5.4 5.6 5.0 5.1 4.4 4.9 5.1 6.2
400 00 UTC 9.6 9.3 9.1 7.1 6.5 7.7 8.3 8.9 8.9 6.2 5.3 5.4
12 UTC 8.7 9.0 8.9 7.5 5.8 8.7 8.6 9.4 7.9 6.1 4.6 5.5
300 00 UTC 9.1 10.3 10.5 7.9 7.3 11.3 11.0 13.4 11.4 10.6 5.6 9.6
12 UTC 8.9 9.3 9.3 8.2 8.1 11.6 12.1 14.8 12.7 10.1 5.0 8.6
250 00 UTC 9.4 10.6 10.8 9.0 8.8 14.5 14.3 16.4 15.3 13.5 7.1 12.5
12 UTC 9.3 10.0 10.0 9.1 9.2 15.1 13.8 17.3 14.4 12.7 6.1 12.6
200 00 UTC 13.0 12.7 10.1 9.2 10.6 17.7 17.7 23.6 20.8 17.7 8.6 18.5
12 UTC 12.7 12.2 9.7 8.8 10.5 18.0 16.7 22.9 20.1 16.5 8.3 16.9
150 00 UTC 12.0 15.5 9.5 9.4 11.8 21.3 18.1 32.3 27.8 22.7 13.2 25.2
12 UTC 13.6 14.6 10.3 9.8 12.0 21.1 18.3 33.8 27.7 23.1 12.6 23.2
100 00 UTC 8.6 10.1 9.4 10.4 13.5 11.5 16.7 22.1 18.0 22.4 18.4 18.6
12 UTC 8.1 9.9 10.7 9.6 12.1 15.8 16.3 24.0 20.8 24.3 18.1 20.4
70 00 UTC 9.5 10.1 9.4 9.6 6.6 8.5 10.4 13.3 12.9 10.9 7.5 8.9
12 UTC 8.1 8.4 10.2 9.5 5.1 8.6 8.8 12.9 11.5 9.7 5.2 6.8
50 00 UTC 7.9 8.7 8.0 8.6 19.0 23.1 16.8 7.9 7.1 9.0 9.6 12.1
12 UTC 6.5 8.5 7.7 8.2 13.8 21.1 17.5 8.6 7.3 8.8 8.5 8.6
30 00 UTC 11.5 11.6 8.0 6.6 8.0 11.2 12.1 16.7 16.2 15.0 16.8 18.0
12 UTC 10.1 8.1 6.7 6.7 11.2 9.9 10.8 15.8 15.3 13.7 14.4 16.7
20 00 UTC 11.4 14.1 12.7 13.0 10.2 10.2 10.0 12.4 11.6 14.5 15.8 17.8
12 UTC 11.9 15.1 14.2 11.4 11.5 9.3 12.0 13.6 12.8 15.0 17.4 15.6
10 00 UTC 24.1 20.8 16.8 6.4 7.8 6.8 6.7 7.0 6.6 8.1 7.0 8.1
12 UTC 21.5 20.1 14.5 4.5 8.5 7.4 6.0 6.9 5.8 7.8 8.6 8.5

Annual Climatological Report Singapore, 2016
141

Annual Climatological Report Singapore, 2016
142

Annual Climatological Report Singapore, 2016
144
13. Soil Data

Annual Climatological Report Singapore, 2016
145
20.0
22.0
24.0
26.0
28.0
30.0
32.0
34.0
36.0
38.0
40.0
1 2 3 4 5 6 7 8 9 10 11 12 13 14 15 16 17 18 19 20 21 22 23 24
Tem
pe
ratu
re (
°C)
Hour
Changi Hourly Soil Temperature
Mean_GRASST Mean_SOILT_0CM Mean_SOILT_5CM
Mean_SOILT_10CM Mean_SOILT_20CM Mean_SOILT_30CM
Mean_SOILT_100CM
25.0
26.0
27.0
28.0
29.0
30.0
31.0
32.0
Jan Feb Mar Apr May Jun Jul Aug Sep Oct Nov Dec
Tem
pe
ratu
re (
°C)
Month
Changi Monthly Soil Temperature
Mean_GRASST Mean_SOILT_0CM Mean_SOILT_5CM
Mean_SOILT_10CM Mean_SOILT_20CM Mean_SOILT_30CM
Mean_SOILT_100CM

Annual Climatological Report Singapore, 2015
146
Annex 1 Instruments of the Manned Meteorological Station
Since 1984, the manned meteorological station serving the Changi International Airport has been designated
as the Climate Station of Singapore. The locations of the other 4 manned stations are at Paya Lebar, Tengah,
Seletar, and Sembawang. The Paya Lebar station is the longest serving meteorological station, which has been
operational since the 1950s. The Changi station operates 24 hours every day while the other 4 meteorological
stations record observations only from 4 am to 11 pm.
ID Station Parameters Operational Period Instruments Location
24
Cha
ngi C
limat
e S
tatio
n
Pressure 1 Jun, 1981 to 1 Nov, 2010 WilhLambrecht4 Indoor
1 Nov, 2010 to Present Vaisala5 Outdoor
Temperature 1 Jun, 1981 to 1 Aug, 2011 Zeal/Casella (Mercury)6 Outdoor
1 Aug, 2011 to Present Vaisala Outdoor
Humidity 1 Jun, 1981 to 1 Aug, 2011 Zeal/Casella (Mercury) Outdoor
1 Aug, 2011 to Present Vaisala Outdoor
Surface Wind 1 Jun, 1981 to 1 Aug, 2011 Munro Pressure Tube7 Outdoor
1 Aug, 2011 to Present Vaisala Outdoor
Rainfall 1 Jun, 1981 to 1 Nov, 2010 Munro Rain Gauges7 Outdoor
1 Nov, 2010 to Present Vaisala Outdoor
Evaporation 1 Jun, 1981 to 1 Nov, 2010 A Class Evap Pan Outdoor
1 Nov, 2010 to Present Vaisala Outdoor
Sunshine 1 Jun, 1981 to Present Campbell-stokes recorder Outdoor
06
Pay
a Le
bar
Met
eoro
logi
cal S
tatio
n Pressure
1 Aug, 1955 to 1 Jan, 1982 F Darton& Company8 Indoor
1 Jan, 1982 to Present Negretti and Zambra9 Outdoor
Temperature 1 Aug, 1955 to 1 Aug, 1981 Zeal/Casella (Mercury) Outdoor
1 Aug, 1981 to Present Casella Roof top
Humidity 1 Aug, 1955 to 1 Aug, 1981 Zeal/Casella (Mercury) Outdoor
1 Aug, 1981 to Present Casella Roof top
Rainfall 1 Aug, 1955 to 1 Aug, 1981 Munro Rain Gauges Outdoor
1 Aug, 1981 to Present Munro Rain Gauges Roof top
23
Ten
gah
Met
eoro
logi
cal
Sta
tion
Pressure 1 Jan, 1950 to 1 Oct, 2003 THIES Clima Indoor
1 Oct, 2003 to Present Sutron Corp Indoor
Temperature 1 Jan, 1950 to 1 Oct, 2003 Zeal/Casella (Mercury) Outdoor
1 Oct, 2003 to Present Sutron Corp Outdoor
Humidity 1 Jan, 1950 to 1 Oct, 2003 Zeal/Casella (Mercury) Outdoor
1 Oct, 2003 to Present Sutron Corp Outdoor
Rainfall 1 Jan, 1950 to Present Munro Rain Gauges Outdoor
25
Sel
etar
Met
eoro
logi
cal
Sta
tion
Pressure 1 May, 1970 to 31 May, 2005 THIES Clima10 Indoor
1 Jun, 2005 to Present ALMOS/ Vaisala Outdoor
Temperature 1 May, 1970 to 31 May, 2005 Zeal/Casella (Mercury) Outdoor
1 Jun, 2005 to Present ALMOS/ Vaisala Outdoor
Humidity 1 May, 1970 to 31 May, 2005 Zeal/Casella (Mercury) Outdoor
1 Jun, 2005 to Present ALMOS/ Vaisala Outdoor
Rainfall 1 May, 1970 to Present Munro Rain Gauges Outdoor
4www.lambrecht.net 5www.vaisala.com 6www.zeal.co.uk and www.casellameasurement.com/cl_ne_manual.htm 7www.munroinstruments.com 8www.russell-scientific.co.uk 9www.negrettiandzambra.co.uk 10www.thiesclima.com/air-pressure.html

Annual Climatological Report Singapore, 2015
147
ID Station Parameters Operational Period Instruments Location
80
Sem
baw
ang
Met
eoro
logi
cal
Sta
tion
Pressure 1 Apr, 1986 to 30 Sep, 2003 WilhLambrecht Indoor
1 Oct, 2003 to Present Sutron Corp11 Indoor
Temperature 1 Apr, 1986 to 30 Sep, 2003 Zeal/Casella (Mercury) Outdoor
1 Oct, 2003 to Present Sutron Corp Outdoor
Humidity 1 Apr, 1986 to 30 Sep, 2003 Zeal/Casella (Mercury) Outdoor
1 Oct, 2003 to Present Sutron Corp Outdoor
Rainfall 1 Apr, 1986 to Present Munro Rain Gauges Outdoor
Table 6: Instruments and their operational dates at the Manned Meteorological Stations
11www.sutron.com

Annual Climatological Report Singapore, 2015
148
Annex 2 Instruments of the Manual Rainfall Station
Before the AWSs system, there were a number of manual rain gauges in operation in Singapore. Rainfall was
recorded on continuous strips of paper rolls, and operators had to visit the stations once a week to collect and
replace them. Among the rain gauges used in the past were the natural siphon rain gauge, the tilting siphon
rain gauge and the Hellmann rain gauge.
The tilting siphon rain gauge, produces an autographic record of rainfall accumulation from a pen attached to
a float in the rainfall chamber of the instrument. The chamber tilts and empties when the pen reaches the top
of the chart at 25mm rainfall. Siphoning starts when the chamber tilts.
The natural siphon rain gauge works in a similar mechanism as the tilting siphon rain gauge except the way in
which it siphons. It consists of two coaxial tubes to the sides of the float container. The annular gap between
the inner and outer tubes is so small that siphoning can start abruptly when water reaches the top of the tube
without any mechanical trigger.
The Hellman rain gauge is an autographic rain gauge with 200cm² circular collecting area. Measuring 453mm
tall, it consists of a protective housing, tunnel, built-in measuring vessel with float and siphoning device, and
records on a clockwork driven drum with nominal recording period of 7 days.
Station Number Location Operational Period Instruments Lat.(N) Long. (E)
07
Macritchie Reservoir 1 Jan, 1953 26 May, 1982 Natural 1°20.51 103°50.03
Macritchie Reservoir 27 May, 1982 7 May, 1987 Tilting 1°20.51 103°50.03
Macritchie Reservoir 8 May, 1987 Present Hellmann 1°20.51 103°50.03
Macritchie Reservoir 12 Feb, 2009 Present Vaisala 1°20.51 103°50.03
11
Ama Keng Police Station 1 Feb, 1954 26 Nov, 1984 Tilting 1°24.00 103°42.00
Ama Keng Police Station 27 Nov, 1984 30 Jun, 1988 Hellmann 1°24.00 103°42.00
Ama Keng Telephone Exchange 1 Jul, 1988 31 Oct, 2003 Hellmann - -
Choa Chu Kang Cemetery Office 1 Nov, 2003 30 Sep, 2009 Hellmann 1°22.47 103°41.63
Choa Chu Kang Cemetery Office 5 Mar, 2009 Present Vaisala 1°22.46 103°41.62
29
Serangoon Sewage Treament Work 1 Jan, 1949 20 Mar, 1975 - 1°23.15 103°55.41
Serangoon Sewage Treament Work 21 Mar, 1975 29 Apr, 1977 Natural 1°23.15 103°55.41
Serangoon Sewage Treament Work 30 Apr, 1977 30 Apr, 1987 Tilting 1°23.15 103°55.41
Serangoon Sewage Treament Work 1 May, 1987 30 Jun, 2010 Hellmann 1°23.15 103°55.41
Pasir Ris Home Team Chalets 5 May, 2010 Present Vaisala 1°23.19 103°56.48
31
Singapore Harbour Board Gate 9 1 Mar, 1948 30 Sep, 1976 Tilting 1°16.00 103°49.00
Saint James Complex 1 Jun, 1976 15 Apr, 1986 Tilting 1°15.93 103°49.47
Saint James Complex 16 Apr, 1986 31 Mar, 2010 Hellmann 1°15.93 103°49.47
CHIJ (Kellock) Primary School 28 Apr, 2010 Present Vaisala 1°16.46 103°49.69
33
Tanjong Kling Police Station 01 Jan, 1953 31 Dec, 1969 Tilting 1°18.50 103°43.00
Tanjong Kling Police Station 01 Jan, 1973 25 Sep, 1977 Hellmann 1°18.50 103°43.00
Marine Police Station Jurong Pier 26 Sep, 1977 31 Aug, 1999 Hellmann - -
Jurong Pier Road 1 Sep, 1999 30 Apr, 2010 Hellmann 1°18.49 103°42.60
Jurong Pier Road 3 Feb, 2010 Present Vaisala 1°18.49 103°42.59
Ulu Pandan Sewage Treatment Work 19 Jun, 1975 30 Nov, 1981 Tilting 1°19.97 103°45.34
35 Ulu Pandan Sewage Treatment Work 1 Dec, 1981 1 Mar, 2010 Hellmann 1°19.97 103°45.34
Ulu Pandan Sewage Treatment Work 27 Feb, 2009 Present Vaisala 1°19.95 103°45.30
36 Woodleigh Filter 1 Dec, 2000 Mar, 2010 Hellmann 1°20.29 103°51.94
Woodleigh Filter 19 Jul, 2009 Present Vaisala 1°20.26 103°51.97
40 Singapore Orchid’s 16 Oct, 1965 7 May, 1987 Tilting 1°24.40 103°47.00

Annual Climatological Report Singapore, 2015
149
Station Number Location Operational Period Instruments Lat.(N) Long. (E)
Singapore Orchid’s 8 May, 1987 31 Mar, 2010 Hellmann 1°24.40 103°47.00
Singapore Orchid’s 11 Dec, 2009 Present Vaisala 1°24.40 103°46.99
43 Upper Air Observatory 1 Apr, 1962 31 Dec, 2011 Tilting 1°20.44 103°53.29
Upper Air Observatory 28 Apr, 2011 Present Vaisala 1°20.44 103°53.29
44
Nanyang Technical University 1 Apr, 1967 31 Dec, 1971 Tilting 1°20.71 103°41.00
Nanyang Technical University 1 Jan, 1972 31 Aug, 2009 Hellmann 1°20.71 103°41.00
Nanyang Technological University 17 Mar, 2009 Present Vaisala 1°20.71 103°41.00
46
Singapore Golf Club 1 Sep, 1967 3 Mar, 1978 Natural 1°20.50 103°48.64
Singapore Golf Club 4 Mar, 1978 31 Mar, 2010 Hellmann 1°20.50 103°48.64
Singapore Golf Club 21 Jan, 2010 Present Vaisala 1°20.49 103°48.65
50
Singapore Boy’s Home 1 Nov, 1968 31 Aug, 1973 Tilting - -
Singapore Boy’s Home 1 Sep, 1973 31 Oct, 1994 Hellmann - -
Ngee Ann Polytechnic 1 Nov, 1994 30 Jun, 2010 Hellmann 1°19.91 103°46.57
Ngee Ann Polytechnic 14 Apr, 2010 Present Vaisala 1°19.91 103°46.57
55
Trafalgar Station 12 Apr, 1973 30 Aug, 1979 Tilting 1°23.00 103°54.00
Trafalgar Station 31 Aug, 1979 24 Mar, 1997 Hellmann 1°23.00 103°54.00
Woodbridge Hospital 25 Mar, 1997 3 Jan, 2010 Hellmann 1°23.01 103°53.16
Woodbridge Hospital 6 Nov, 2008 Present Vaisala 1°23.02 103°53.16
60
Sentosa Telecom Station 1 May, 1972 15 Jan, 1976 - 1°14.87 103°50.18
Sentosa Telecom Station 16 Jan, 1976 31 Dec, 1980 Tilting 1°14.87 103°50.18
Sentosa Telecom Station 1 Jan, 1981 1 Apr, 2010 Hellmann 1°14.87 103°50.18
Sentosa 4 Mar, 2010 Present Vaisala 1°15.02 103°49.65
61
Opera Estate 1 Jan, 1976 31 Dec, 1981 Tilting 1°19.00 103°55.00
Chai Chee Pumping Station 1 Jan, 1982 21 Oct, 1987 Hellmann - -
Chai Chee Complex 22 Oct, 1987 4 Apr, 2010 Hellmann 1°19.38 103°55.30
Ping Yi Secondary School 15 Dec, 2009 Present Vaisala 1°19.63 103°55.24
63
International Road Pumping Station 1 Nov, 1976 17 Aug, 1982 Tilting 1°19.65 103°42.25
International Road Pumping Station 18 Aug, 1982 3 Nov, 2009 Hellmann 1°19.65 103°42.25
International Road Pumping Station 24 Mar, 2009 Present Vaisala 1°19.65 103°42.25
64
Bukit Panjang Sewage Treatment Work 28 Nov, 1977 30 Nov, 1984 Tilting - -
Bukit Panjang Telephone Exchange 1 Dec, 1984 31 Mar, 2010 Hellmann 1°22.94 103°45.64
Bukit Panjang Telecom 7 Dec, 2009 Present Vaisala 1°22.94 103°45.64
66 Kranji Reservoir 1 Jan, 1978 2 Nov, 2009 Hellmann 1°26.32 103°44.16
Kranji Reservoir 23 Oct, 2008 Present Vaisala 1°26.32 103°44.16
71
Kent Ridge Met. Station 1 Oct, 1980 11 Apr, 1984 Tilting 1°18.10 103°46.42
Kent Ridge Road 12 Apr, 1984 3 Jan, 2010 Hellmann 1°17.54 103°46.89
Kent Ridge Road, CRISP 24 Mar, 2009 Present Vaisala 1°17.54 103°46.89
72 Prince Edward Road 1 Jul, 1982 Present Hellmann 1°16.43 103°50.89
Prince Edward Road 27 Jan, 2010 Present Vaisala 1°16.43 103°50.89
77
Clarence Lane Pumping Station 1 Jan, 1980 23 Apr, 1990 Tilting 1°17.40 103°48.90
Clarence Lane Pumping Station 24 Apr, 1990 14 Dec, 1998 Hellmann 1°17.40 103°48.90
MOE Kay Siang Road 15 Dec, 1998 1 Apr, 2010 Hellmann 1°17.10 103°48.80
Queenstown Secondary School 23 Nov, 2009 Present Vaisala 1°17.62 103°48.76
78
Poole Road 1Jul, 1977 24 Aug, 1984 Tilting 1°18.42 103°53.44
Poole Road 25 Aug, 1984 4 Jan, 2010 Hellmann 1°18.42 103°53.44
Poole Road Pumping Station 24 Sep, 2008 Present Vaisala 1°18.42 103°53.44
79 Power Building Somerset/ Triple One 1 Sep, 1984 Present Hellmann 1°18.02 103°50.23
Triple One Somerset Building 24 Mar, 2011 Present Vaisala 1°18.02 103°50.23
81
Punggol Port Road 1 Jun, 1986 31 Dec, 2002 Hellmann 1°24.40 103°55.10
Punggol 17th Ave 1 Jan, 2003 28 Feb, 2010 Hellmann 1°25.00 103°54.32
Punggol Secondary School 4 Jun, 2009 Present Vaisala 1°24.17 103°54.57
82 Tuas Incinerator 1 Aug, 1986 1 Jul, 2010 Hellmann 1°19.48 103°38.11

Annual Climatological Report Singapore, 2015
150
Station Number Location Operational Period Instruments Lat.(N) Long. (E)
Tuas Incinerator 3 Mar, 2009 Present Vaisala 1°19.49 103°38.11
89 Tuas Fire Station 1 Jan, 1999 14 Sep, 2010 Hellmann 1°19.19 103°39.68
Tuas Fire Station 2 Oct, 2008 Present Vaisala 1°19.19 103°39.68
90 CCAB Bukit Timah Road 1 Jun, 1995 2 Nov, 2009 Hellmann 1°19.15 103°49.16
CCAB Bukit Timah Road 3 Mar, 2009 Present Vaisala 1°19.15 103°49.16
91 Yishun Ave 5 1 Jul, 1995 1 Oct, 2009 Hellmann 1°25.80 103°49.84
Yishun Ave 5 19 May, 2009 Present Vaisala 1°25.80 103°49.84
92 NACLI, South Buona Vista 1 Sep, 1995 Present Hellmann 1°17.05 103°47.33
NACLI, South Buona Vista 2 Mar, 2009 Present Vaisala 1°17.05 103°47.33
94 Pasir Ris Street 51 1 Feb, 1999 1 Jul, 2010 Hellmann 1°21.97 103°57.17
Coral Secondary School 18 Mar, 2010 Present Vaisala 1°22.08 103°56.94
Table 7: Locations and instruments of the Manual Rainfall Stations

Annual Climatological Report Singapore, 2015
151
Annex 3 Instruments of the Automatic Weather Station
MSS employs an array of sensors and instruments that measures and records different meteorological
parameters. These include radiation shield sensor, ultrasonic wind sensor, temperature and humidity sensor,
electronic tipping bucket rain gauge, and pressure sensor. Information recorded by these sensors is transmitted
wirelessly to the Main Meteorological Office located at terminal building of the Changi International Airport.
Instruments General Specifications Reference Picture
Vaisala Rain Gauge RG13
Contact closure every 0.2 mm
Constant flow rate from siphoning device at base of funnel
Area of aperture 400 cm²
Vaisala HMP45A and HMP45D Relative Humidity and Temperature Probes, Vaisala HUMICAP® Sensor
Measurement range from -39.2 to 60 °C and 0.8 to 100% RH
Output scale from -40 to 60 °C and 0 to 100 % RH
Uncertainty at 20 °C is ± 0.2 °C, ± 2% RH for 0 to 90 % RH and ± 3% RH for 90 to 100 % RH
Vaisala DTR503 Radiation Shield
12 plate plastic shield to house humidity and temperature sensors
White outer surface, black inner surface
Vaisala WMT50 Ultrasonic Wind Sensor
Measuring range from 0 to 60 m/s
Response time 0.25 s
Accuracy (0 to 35 m/s) ± 0.3 m/s or ± 3%, whichever is greater
Accuracy (35 to 60 m/s) ± 5%
Accuracy (wind direction) ± 3%
Vaisala PMT16A Pressure Sensor
Measurement range from 600 to 1100 hPa
Total uncertainty ± 0.3 hPa

Annual Climatological Report Singapore, 2015
152
Kipp & Zonen CNR 1 Net Radiometer
Measures short and long-wave radiation
Response time less than 18 seconds
Daily uncertainty ± 10%
Kipp & Zonen CUV 4 Broadband UV Radiometer
Spectral range 305 to 385 nm
Response time less than 1 second
Maximum irradiance 100 W/m²
Middleton Solar UVR1-B Narrow-band UV-B global spectral radiometer
Spectral range 280 to 315 nm
Response time less than 0.5 second
Vaisala CL31 Celiometer
Measurement range from 0 to 7.5 km
Measurement cycle adjustable between 2 and 120 seconds
Reporting resolution in 5 m
Vaisala FD12 Visibility Meter
Measurement range from 10 to 50000 m
Instrument uncertainty ± 4%
Nova Lynx Model 255-100 Analog Output Evaporation Gauge
Measurement range from 0 to 10 inches
Reporting resolution in 0.01 inches
Uncertainty ± 0.25%
Table 8: Current list of instruments in use in MSS