Embed Size (px)
Citation preview

Statistical Release 23 September 2014
Annual Bus Statistics:England 2013/14
Passenger journeys on local buses in England increased 2% in the year to March 2014, with overall mileage run continuing the slow decline of recent years.
FURTHER INFORMATION:
Matthew Tranter 020 7944 3076
In this publicationSummary p2
Passenger journeys p4
Mileage and services p8
Fleet and staff p13
Financial p15
Background p17
About this releaseThis release presents the latest annual statistics on the local bus sector. Local bus services use public service vehicles (PSVs) to carry passengers paying separate fares over short distances. The latest figures usually relate to the 2013/14 financial year. Most of the data are derived from the department’s main annual survey of bus operators.
This document presents the figures for England, in line with the coverage of DfT bus policy. However the statistical tables cover the whole of Great Britain
The 4.7 billion passenger journeys on buses in England in 2013/14 is the highest figure since the mid-1980s.
Passenger numbers in London, which have doubled over this period, increased 3% in the latest year
Passenger numbers also grew outside London, by 1.5%, the first such increase since 2008/09 which was the first year of free national bus travel for older people. This increase was largely due to an increase in fare paying passengers.
Bus service mileage in England is estimated to have fallen 0.3% in the latest year, continuing a gradual decline from 2008/09.
As in the last two years, his was largely due to reductions in mileage on local authority supported services outside London which fell an estimated 7%, though mileage on commercial services is estimated to have increased.
At March 2014, 84% of the 36 thousand buses in England had the accessibility certificate required for all buses on local services by 2017 at the latest, with the upward trend of recent years continuing.
A list of data tables accompanying this publication is available on the gov.uk website
RESPONSIBLE STATISTICIAN:
Media: 020 7944 3066 Public: 020 7944 3076 Email: [email protected]
Back Forward

Annual Bus Statistics 2013/14 - Page 2
London51%
Outside London, growth from 04/05 largely in concessionary passengers, but in 13/14 growth due to fare paying passengers
Passenger journeys increased in and outside London
Bus mileage falling with bigger reductions in supported services
Bus fleet continues to become more accessible
Further information: www.gov.uk/government/collections/bus-statistics
Journeys 2013/14 Recent trend (04/05 =100)concessionary journeys 34%
4.7 billion
Since 12/13
3.0%
0.4%
2.3%
1.5%100
130
04/05 08/09 13/14
London
England
OutsideLondon
Mileage 2013/14 Recent trend (05/06 =100)
local authority supported19%
Since 12/13 Outside London:
London23%
1.3 billion
95
100
105
05/06 08/09 13/14
London
EnglandOutsideLondon
Since 09/10 less supported mileage, partially offset by more commercial:
0.3%
0%
average bus age in years7.7
92%
82%86%
automatic vehicle location
CCTV
ITSO smart equipped (outside London)
Buses 2013/14
London26%
35,800 79%
84%
98%13/14 level% Buses with accessibility certificate
20
40
60
80
100
04/05 13/14
LondonEnglandOutsideLondon
In recent years bus use falling in North, but growing in South
Supported down 59m (23%)
Commercial up 33m (4%)
Fare inflation low relative to recent years:
3.1%
6.0%
Fare inflation year to March 2014
Average annual inflation 2008 to 2013
North and West
South and East (outside London)
2.6% 2.6%
0.8%9.4% since 08/09
since 12/13
since 08/09
since 12/13
Annual Bus Statistics year to March 2014: Summary for England
ForwardBackHome

Annual Bus Statistics 2013/14 - Page 3
These are the main annual national statistics on the local bus sector in England, providing key information for monitoring trends in usage and provision for a mode of transport used for around two-thirds of public transport journeys.
► Within Department for Transport (DfT) figures are used as background to policy development, and to monitor industry progress, for example in relation to low floor buses. They contribute to two DfT business plan indicators.
► These statistics may also be used by local authorities for comparison purposes and by academics, researchers and others with an interest in public transport.
Most figures relates to local bus services. These are timetabled services using public service vehicles to carry passengers over relatively short distances, and usually eligible for Bus Service Operators Grant. This excludes long distance coach services, private hire work and closed contracts but includes school services accessible to the general public.
Bus services in England. The majority of bus services in England are provided by private companies, which has been the case outside London since deregulation of the industry in 1986. Services can be operated on a purely commercial basis, or with financial support from transport authorities (‘supported services’). London services are operated by private companies but regulated by Transport for London (TfL).
Area classification. Figures for England in these statistics are often disaggregated by broad area type into London, metropolitan areas (which are the six former metropolitan counties of Greater Manchester, Merseyside, South Yorkshire, Tyne and Wear, West Midlands and West Yorkshire) and non-metropolitan areas (the rest of England, covering shire counties and unitary authorities).
Concessionary travel. Bus travel for older and disabled people has been free anywhere in England since April 2008. The Transport Act 2000 required all local authorities to provide a minimum standard of a half fare for travel by older and disabled people on buses. From April 2006, statutory free bus travel in the local area was introduced, and from April 2008 this was extended to free travel by bus anywhere in England.
Local authorities can, at their own discretion, offer extensions to the statutory scheme or concessionary travel for young people. The number of concessionary journeys has been collected as part of these statistics from 2007/08. More detailed concessionary travel statistics are published separately by DfT.
Photo: Graeme Hall Snaps/Alamy
Introduction
ForwardBackHome

Annual Bus Statistics 2013/14 - Page 4
About the dataThese statistics count each boarding of a bus as one journey, and are based on estimates supplied by bus operators.
Passenger typesTotals are split into concessionary and non-concessionary (fare paying) passengers. Concessionary passengers are either older or disabled passengers travelling free under the English National Concessionary Travel Scheme (ENCTS), or young people whose travel is subsidised by a local authority (in areas where such schemes exist).
Bus passenger journeys
Growth in the number of journeys in London over the last two decades (and decline elsewhere) means that over half of bus journeys in England are now made in London.
Over a third of the total bus passenger journeys made in England were by those holding a concessionary travel pass, though the type of concession differs within and outside London (see below) - journeys made free by under 16s in London represent around 1 in every 11 bus journeys in England.
Further information on the characteristics of bus passengers can be found in the National Travel Survey statistics.
Bus passenger journeys in 2013/14 [data tables bus01 ]
► 4.7 billion journeys made by bus in England in 2013/14, over half in London.
► An increase of 2% compared with the previous year, largely due to more fare-paying passengers - though outside London totals remain below the level of two years ago.
► Larger increase in the south and east regions of England than the north and west, a broad continuation of recent trends
Bus passenger journeys by area and type of passenger: England 2013/14
London 2.4 billion
Metropolitanareas 1.0 billion
Non-Metropolitan areas1.3 billion
Nonconcessionary 1,600m
Nonconcessionary 650m
Nonconcessionary 850m
Outside London 2.3 billion
Older and disabled concessions340m
Older and disabled 430m
Older and disabled 280m
Youth concessions450m
Youth 90m
Youth 30m
ForwardBackHome

Annual Bus Statistics 2013/14 - Page 5
Trends in passenger journeys
90
100
110
120
130
140
04/05 06/07 08/09 13/14
London
Non-met areas
Met areas
Statutory free local concessionary travel, free nationally in 08/09
Change 13/14on previous year
3.0%
Index 2004/05 = 100
1.7%
1.3%
England 2.3%
0.0
0.5
1.0
1.5
2.0
2.5
86/87 94/95 04/05 08/09 13/14
London
Non-met areas
Met areas
De-regulationoutside London
London Buses sold off
Statutory free concessionary travel (local 06/07, national 08/09)
Change on 86/87
105%
Billion journeys
17%
44%
Note: Break in time series outside London in 04/05 due to change in estimation method
Overall, bus passenger journeys increased 2% in 2013/14 compared to the previous year.
In London, there was a resumption of the upward trend of recent years following a fall in 2012/13 which was attributed to cold weather and the timing of Easter. Bus use in London is now double the level of the mid-1980s, with rapid growth from the mid-1990s (when service mileage grew and fares rose relatively slowly) now slowing, with journeys growing broadly in line with population.
Outside London, passenger numbers increased for the first time since 2008/09, which was the first full year of free national concessionary travel for older and disabled people. Over the longer term, bus use outside London has been declining, particularly in the metropolitan areas, with increasing car ownership likely to be an important factor.
Growth outside LondonExcept over the period when free concessionary travel was introduced, overall bus use outside London has only increased year-on-year 3 times - including in 2013/14
Buses in contextAlthough overall the bus accounts for only 6% of trips made, nearly two-thirds of journeys on public transport in Great Britain are made by bus - see Transport Statistics Great Britain.
There are over 3 times more bus journeys than rail journeys annually (and around 6 times as many in England outside London)
Related informationThese statistics relate to passengers on local bus services. The main source of information on non-local bus use (e.g. longer distance coach services) is the National Travel Survey.
Change in bus passenger journeys since 2004/05
Number of bus passenger journeys since 1985/86
ForwardBackHome

Annual Bus Statistics 2013/14 - Page 6
5%
-1%
13%
-4% -3%
2%
2%
-2%-4%
2%
-1%
3%
Year-on-year % change in journeys by type of passenger, since 2008/09
Metropolitan areas
Non-metropolitan areas
Concessionary passengers
Non-concessionary passengers
London
The introduction of free concessionary travel, locally in 2006/07 and then nationally in 2008/09, is likely to have been the main factor explaining the growth in passenger journeys over this period. Since 2008/09, the decline has resumed, most notably in metropolitan areas.
There are a number of factors which are known to impact on bus use (see box to the right).
These are likely to vary greatly within local areas so it is difficult to interpret trends at national level with any degree of certainty, particularly over the relatively short term.
In addition, changes in how operators record figures can have an impact. Whilst we believe that this rarely affects national trends, there can be an impact on statistics for smaller areas.
However some broad patterns can be seen. For example, at local authority level (the most disaggregate level for which these statistics are produced) average bus use is relatively well correlated with the proportion of no-car households in the area. Note that this does not demonstrate a causal relationship – in some areas good public transport may mean people choose not to own a car.
Factors affecting bus use in an area include:
► Levels of car ownership
► Demographics - population structure and density
► Availability, quality and cost of bus services
► Wider economic conditions
► Weather conditions
Factors affecting bus use
In fact, 2013/14 is only the third year since the mid-1980s (other than between 2006/07 and 2008/09) to show a year-on-year increase in overall bus use outside London, although the number of passengers remains below the 2011/12 level.
This increase is largely due to more fare paying (non-concessionary) passengers in 2013/14, which grew for the first time since first recorded separately in 2008/09.
However, currently there is insufficient information to assess whether this represents a change of trend (possibly associated with wider economic conditions, relatively low fare increases and milder winter weather) or a fluctuation.

Annual Bus Statistics 2013/14 - Page 7
81
72
6764
69
65
76
63
4745
3032
3541
3439
2004/05 2013/14
North East
West Midlands
Yorkshire/Humber
North West
East Midlands
South EastSouth West
North West
East
-11%
-7%-5%-17%
+5%+16%+17%-3%
Relationship between bus use and car ownership at local authority level
As is evident above, levels of bus use vary considerably across the country, with differing levels of car ownership an important factor. Bus use is generally higher in the north and west regions of England (where there are more no-car households), compared to the south and east.
Over the last decade, the areas of higher bus use have shown a greater decline, measured by journeys per head. Over this period the proportion of no-car households has fallen more in the north and west.
Variation across the country
Change in bus use per head by region from 2004/05North and South% change in bus journeys per head:
Since 2004/05
North and West -9.5%
South and East +9.3%
Since 2008/09
North and West -11.2%
South and East -1.3%
Latest year (since 12/13)
North and West +0.4%
South and East +1.8%
North and West 1.35 bn bus journeys 20.7m population 65 bus journeys per head
South and East 970m bus journeys 24.7m population 39 bus journeys per head
0 10 20 30 40 50
050
100
150
% Households with no car (2011 Census)
Bus Journeys per head, 13/14
MetropolitanPredominantly urbanSignificant ruralPredominantly rural
Size of square proportional to number of bus journeys authority
Colour denotes type of area
= 45 million journeys
Brighton
Nottingham
Oxfordshire has the highest bus use per head among the most rural authorities
Brighton and Nottingham have the highest levels of bus use outside London
Bus use is generally higher in areas with a higher proportion of no-car households
The metropolitan areas have relatively high bus use, and the highest number of total journeys (due to their large populations)
ForwardBackHome
Annual Bus Statistics 2013/14 - Page 8
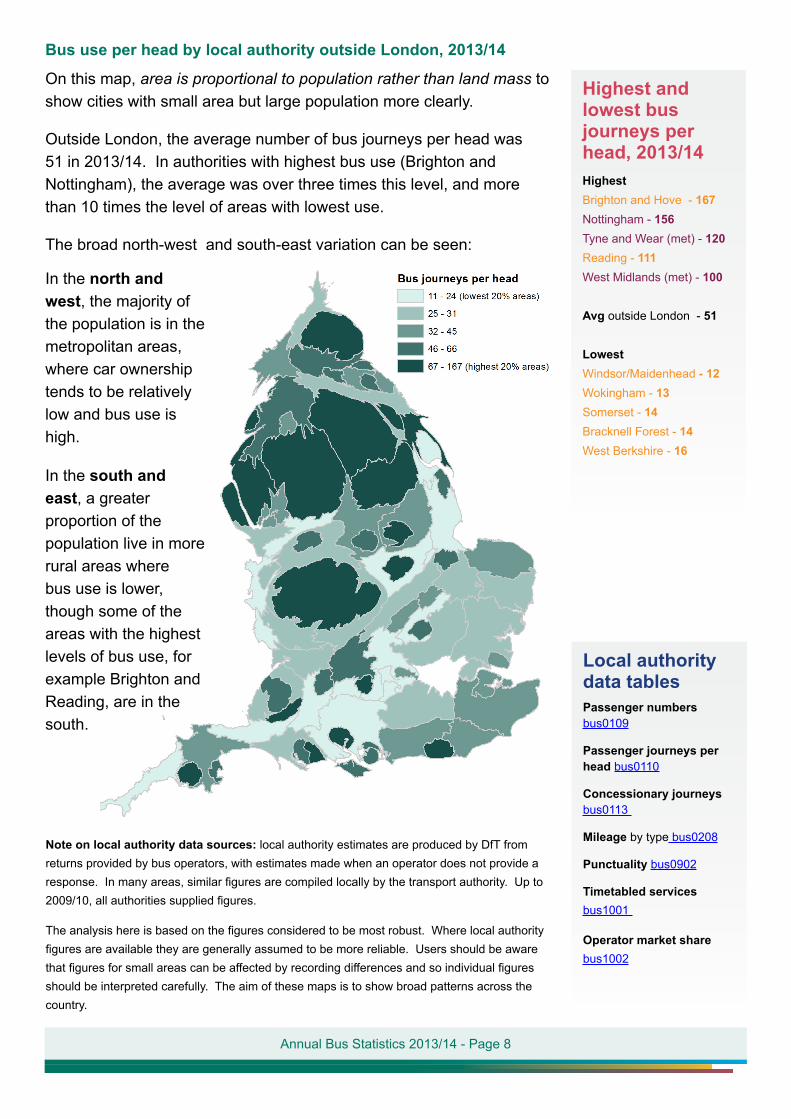
Highest and lowest bus journeys per head, 2013/14Highest Brighton and Hove - 167Nottingham - 156Tyne and Wear (met) - 120Reading - 111West Midlands (met) - 100
Avg outside London - 51
LowestWindsor/Maidenhead - 12Wokingham - 13Somerset - 14Bracknell Forest - 14West Berkshire - 16
Bus use per head by local authority outside London, 2013/14
Local authority data tablesPassenger numbers bus0109
Passenger journeys per head bus0110
Concessionary journeys bus0113
Mileage by type bus0208
Punctuality bus0902
Timetabled services bus1001
Operator market share bus1002
On this map, area is proportional to population rather than land mass to show cities with small area but large population more clearly.
Outside London, the average number of bus journeys per head was 51 in 2013/14. In authorities with highest bus use (Brighton and Nottingham), the average was over three times this level, and more than 10 times the level of areas with lowest use.
The broad north-west and south-east variation can be seen:
Note on local authority data sources: local authority estimates are produced by DfT from returns provided by bus operators, with estimates made when an operator does not provide a response. In many areas, similar figures are compiled locally by the transport authority. Up to 2009/10, all authorities supplied figures.
The analysis here is based on the figures considered to be most robust. Where local authority figures are available they are generally assumed to be more reliable. Users should be aware that figures for small areas can be affected by recording differences and so individual figures should be interpreted carefully. The aim of these maps is to show broad patterns across the country.
In the south and east, a greater proportion of the population live in more rural areas where bus use is lower, though some of the areas with the highest levels of bus use, for example Brighton and Reading, are in the south.
In the north and west, the majority of the population is in the metropolitan areas, where car ownership tends to be relatively low and bus use is high.

Annual Bus Statistics 2013/14 - Page 9
Change in bus journeys per head by local authority outside London since 2004/05
Biggest % change in bus use per head since 2004/05*Biggest increaseBournemouth +74%Poole +72%Thurrock +59%East Sussex +44%West Sussex +38%
Avg outside London -3%
Biggest decreaseDarlington -35%Leicester -30%Stockton-on-Tees -26%Hartlepool -26%Redcar and Cleveland -26%
*Excluding those where trend believed to be affected by known data issues. These figures compare the earliest and latest years for which data are available as this is generally the most reliable comparison. At this level, year on year figures should be treated with caution.
Again, on this map, area is proportional to population rather than land mass to show cities with small area but large population more clearly. This map shows the broad north-west and south-pattern in the change in bus use.
Factors affecting the pattern shown are likely to include changes in car ownership, the introduction of free national concessionary travel and the impact of the economic downturn from 2008/09, all of which may have affected different areas in different ways. However, there are also likely to be a wide range of factors specific to particular areas, for example changes in service cost and quality implemented by different operators.
The map shows change in bus use per head. Comparing 2013/14 with 2004/05, overall there were 37 million more bus journeys outside London but a fall in journeys per head of 3% as population grew proportionally more.
Areas with missing data (due to local authority boundary changes over this period) are unshaded
ForwardBackHome

Annual Bus Statistics 2013/14 - Page 10
About the dataThese statistics relate to mileage run by buses in service (i.e. whilst carrying passengers) , and exclude ‘dead running’ (for example mileage between the start and end of routes and the depot)
Supported servicesThese are services for which the bus operator receives payment from a local transport authority for running the service. They are usually services considered socially necessary, but not commercially viable - authorities have a duty under the Transport Act 1985 (section 63) to secure provision of services considered appropriate to meet passenger transport requirements in their area where these would not otherwise be met
Bus mileage and services
Around 1.3 billion miles were operated on bus services in 2013/14, with mileage in London accounting for around a quarter of the total.
Outside London, the majority of mileage - an estimated 81% overall - is run on a purely commercial basis, with the remainder on services financially supported by local authorities. The proportion of mileage supported is higher on average in more rural authorities.
Bus service mileage in 2013/14 [data tables bus02 ]
► 1.3 billion bus service miles run, around a quarter in London
► An estimated 19% of mileage outside London on services financially supported by local authorities
► Overall mileage in England reduced slightly in 2013/14, continuing the slow downward trend of recent years, largely due to reduction in supported service mileage.
Larger bus operators (PLC-owned or having fleets of over 100 buses) provide virtually all London services and over 80% of total mileage run outside London, but smaller operators account for over 40% of supported service milage. Around half the local bus mileage operated by the smaller operators is on supported services.
Proportion of mileage by operator size, 2013/14
Bus mileage operated by area and type: England 2013/14
London 300 million
Metropolitan areas340 million; 13% supported
Non-metropolitan areas650 million; 22% supported
London
Outside London - commercial
Outside London - supported
Large operators 99%
Large operators 90%
Large operators 57%
ForwardBackHome

Annual Bus Statistics 2013/14 - Page 11
0
100
200
300
400
500
600
700
800
86/87 94/95 04/05 13/14
London
Non-met areas
Met areas
De-regulationoutside London
London Buses sold off
Change on 86/87
75%
Million miles
13%
2%
Note: Break in time series outside London in 04/05 due to change in estimation method
Trends in mileage
Change in bus service mileage since 2005/06
In London mileage remained unchanged in the latest year, but over the last two decades has grown steadily, notably in the early 2000s – a period of rapid growth in public funding for London buses. In recent years growth has slowed, whilst funding has fallen in real terms after peaking in 2008/09.
Outside London, overall mileage fell 0.4% in 2013/14 and is 4% below the 2008/09 level, and at the lowest level since the year of industry de-regulation (1986/87). Mileage grew sharply after de-regulation, and then more slowly over the following decade to 1999/00, driven by growth in commercial services. However, by 2004/05 it had fallen back to the level of the late 1980s, with increases in supported mileage offset by bigger reductions in commercial services.
Bus service mileage since 1985/86
90
95
100
105
110
05/06 08/09 13/14
London
Non-met areas
Met areas
Change 13/14on previous year
0.0%
Index 2005/06 = 100
0.0%
1.3%
England 0.3%
Related informationThese statistics relate to mileage on local bus services. DfT road traffic statistics provide an estimate of overall bus and coach mileage.
Local bus service mileage in England estimated to have fallen slightly in 2013/14, continuing the gradual decline since the start of the economic downturn in 2008/09.
Factors affecting mileageSupply of bus services is likely to be affected by broadly similar factors affecting demand such as population demographics. Bus operating costs and availability of public funding for supported services are also likely to be important.
ForwardBackHome

Annual Bus Statistics 2013/14 - Page 12
Recent reductions in mileage outside London have been due to decline of supported mileage, which fell 7% in 2013/14 and is now 24% lower than the 2009/10 peak.
020406080
100120140160180200
87/88 98/99 08/09 13/14
Non-met areas
Met areas
Funding for support to bus operators begins to increase
Change in 13/14:Million miles
10% on previous year
Funding peaks in real terms
Earliest year of data
23% on 09/10 level
5% on previous year
24% on 09/10 level
-4
-23 -18 -13
410 11 9
-30
-20
-10
0
10
20
10/11 11/12 12/13 13/14
Million miles
Reduction in supported mileage
Increase in commercial mileage
Overall, supported mileage is estimated to be nearly 60 million miles lower than in 2009/10. Around half of the reduction has been offset by increased mileage on commercial services in non-metropolitan areas.
Change in supported and commercial miles in last 4 years
Related infomation Local authority revenue expenditure statistics provide information on spending by local authorities, including support to bus operators (which is the spend line shown on the chart)
At the aggregate level, trends in supported mileage have broadly followed trends in public funding support to bus operators, increasing through the 2000s but falling in the years following the 2010 spending review, which reduced central government grants to local authorities.
Supported service mileage since 1987/88
Supported service spend and mileage trend since 1998/99
Data noteAlthough the new and lost mileage may be in different areas, in part this pattern will be due to some operators continuing to operate some services commercially once subsidy has been removed. However changes in the classification of services by some operators also affect the trends and we estimate this to affect at least 8 million miles
19% of mileage supportedin 2013/14, compared to:
24% in 2008/09
16% in 1998/99
17% in 1987/88
90
100
110
120
130
140
98/99 08/09 13/14
Index 1998/99 = 100
Supported mileage
Spend on supported services (real terms)
2008/09 levels around 40% higher than a decade earlier
Sharp fall from peak but remaining above 98/99 level

Annual Bus Statistics 2013/14 - Page 13
Variations across the countryLevels of bus mileage (supply) are clearly associated with levels of bus use (demand), with areas of higher bus use generally having more service mileage per head of population. This is illustrated below at the local authority level.
Relationship between bus mileage and bus use per head at local authority level, 2013/14
0
10
20
30
40
50
0 20 40 60 80 100 120 140 160 180
Miles per head of population
Bus journeys per head of population
For a given level of demand,generally higher levels of mileage in more rural areas
Met areas generally have relatively more passengers per bus mile
Nottingham and Brighton have levels of demand out of line with mileage
Size of circle proportional to total annual mileage
Key to colours:Met areas Predominatly urban areasSignificantlyrural areasPredominantly rural areas
Conversely, the proportion of mileage that is supported tends to be higher in areas where bus use is lowest, which is likely to reflect the fact that in these areas fewer bus services are commercially viable. However, the proportion of mileage supported (at the local authority level measured here) can still vary for areas with broadly the same level of bus use.
Relationship between % mileage supported and bus use per head by local authority, 2013/14
0
10
20
30
40
50
60
70
0 20 40 60 80 100 120 140 160 180
% mileage supported
Bus journeys per head of population
In areas with lowest bus demand, these figures suggest up to half of all mileage may be supported
Met areas have low proportions of supported mileage but account for around a quarter of supported miles due to their size
Size of circle proportional to total supported mileage
Key to colours:Met areas Predominatly urban areasSignificantlyrural areasPredominantly rural areasMore rural areas tend to have
higher proportions of supported mileage

Annual Bus Statistics 2013/14 - Page 14
Bus service patterns [data tables bus10 ]Timetable dataprovides more detailed inflormation on when and where bus services run, and who operates them than the other sources in this publication. The statistics given here are based on a snapshot for one week in October 2013. Users should be aware that as the data are derived from a system used for administrative purposes, there can be data quality issues which particularly affect figures for small areas.
This publication provides a brief overview to illustrate the type of statistics that can be derived from this data. We welcome any feedback from users on whether they are useful.
Here, a service essentially relates to one line in a timetable.
Rural and urban classifications are based on location of stops. Services are classified according to the proportion of stops in each area type.
There are approximately 2.7 million timetabled bus services per week in England, on around 14,000 distinct routes, operated by around 830 operators.
Overall, over a quarter of services run in London; outside London nearly 90% of services are in urban areas. The number of services in noticeably lower on Sunday, though the reduction is smaller in London and greater for rural services. On Sundays, over 40% of services run are in London.
The change in overall mileage in recent years shows an association with change in passenger journeys, at the regional level, with some growth in the regions in the South of England and greatest decline in the the North
-15%
0%
15%
-15% 0% 15%
Change in passenger journeys
Change in bus mileage
Passengers and mileage growing in some regions in the South
Largestreductions in passengers and mileage in the North
London
% change in bus mileage and passengers since 2008/09, by region
0 100 200 300 400 500
LondonUrban RuralOutside London
Average weekday:440,000 services
Saturday:350,000 services
Sunday:180,000 services
Timetabled bus services by day of week, October 2013
Timetabled bus services by time of day, October 2013
0
8000
6am Mid-day 6pm
Weekday
Sunday
Saturday
London
0
27000
6am Mid-day 6pm
Weekday
Sunday
Saturday
Outside London

Annual Bus Statistics 2013/14 - Page 15
Bus service punctuality [data tables bus09 ] Punctuality dataBus punctuality statistics provide one measure of the performance of local bus services, based on data reported by local authorities who monitor punctuality using manual surveys or data from electronic systems. There are different measures of punctuality for frequent and non-frequent services (a frequent service is one which has 6 or more buses per hour), though many areas have no frequent services.
In 2013/14, an estimated 83% of non-frequent services in England ran on time (defined as between 1 minute early and 5 minutes 59 seconds late), an increase from 79% in 2008/09.
► At regional level between 82% and 86% of buses were on time, except in the West Midlands (79%). There was greater variation at local authority level, ranging from 64% up to 97% in some areas.
► 53 local authorities had a higher proportion of non-frequent buses on time in 2013/14 than 2008/09, with 20 showing a decrease.
% non-frequent bus services on time, England up to 2013/14
75
80
85
08/09 13/14
London 84.0%England 83.4%
Note: axis trucated to show trend more clearly
Outside London
83.1%
Percentage 'on time'
0 5 10 15 20
61 - 65%
66 - 70%
71 - 75%
76 - 80%
81 - 85%
86 - 90%
91 - 95%
Over 95%
Number of authoritiesPercentage 'on time'
Bus operator market share of services, October 2013
0% 5% 10% 15% 20% 25%
Other operators
Other big operators
National Express
Go Ahead Group
First
Arriva
Stagecoach
Outside London London20%
12%
22%
5%
13%
17%
13%
'Big 5'67%
Overall, the five largest operators - the ‘big 5’ account for over two-thirds of services in England.
London has relatively more early morning and evening services on weekdays than the rest of the country. Saturday and Sunday services start later, both inside and outside London.
Related informationStatistics on the number of registered bus routes are published in Traffic Commissioner annual reports.
Further information on timetable data can be found via the Traveline National Data Set.
ForwardBackHome

Annual Bus Statistics 2013/14 - Page 16
PSVAR certificatesAll buses used on local services will soon be required to have a certificate under the Public Service Vehicles Accessibiliy Regulations (PSVAR) which set minimum standards for low floor vehicles. Level step free access and space for at least one wheelchair are among the items specified.
Small single deck vehicles must have certificates by January 2015, larger single deck buses by 2016 and double deckers by 2017.
See https://www.gov.uk/government/publications/bus-coach-accessibility-faq for further information.
Automatic vehicle locationAVL devices are used to track vehicle location and can be used for real time passenger information systems.
ITSO smart enabledITSO is an organisation which sets a common technical standard for smart ticketing. See www.itso.org.uk/ for further details. These statistics count buses fitted with ticket machines able to accept ITSO smart tickets.
Vehicles and staff
At the end of March 2014, local bus operators in England owned around 36 thousand buses in total, with around a quarter of these in London.
The London fleet has a lower average age and has a higher proportion of buses fitted with CCTV or Automatic Vehicle Location devices.
Overall, 84% of buses in England have the PSVAR accessibility certificate which will be required for all buses on local services by 2017 at the latest, with virtually all London buses accessible compared with 79% outside London.
Bus fleet in 2013/14 [data tables bus06 ]
► Around 36 thousand buses in England at end March 2014, a quarter of these in London
► 84% have accessibility certificates, up from 78% in the previous year, continuing the steady upward trend.
► Local bus operators employ over 100 thousand staff
5.9 years average age
Bus fleet by area type: England 2013/14
99% with AVL
98% with CCTV
7.8 years average age
95% with AVL
89% with CCTV
92% ITSO smart-enabled
8.5 years average age
85% with AVL
70% with CCTV
82% ITSO smart-enabled
London9,200 buses98% with accessibility certificate
Metropolitan areas9,700 buses83% with accessibility certificate
Non-metropolitan areas16,700 buses77% with accessibility certificate
ForwardBackHome

Annual Bus Statistics 2013/14 - Page 17
51%
82%
47%
92%
25%
86%
Bus fleet trends
Staff employed [data tables bus07 ]
Local bus operators in England employed an estimated 105 thousand full time equivalent staff at end March 2014, with the majority being drivers.
Figures are only available on a consistent basis from 2004/05, since when the numbers have been broadly flat though staff numbers for London-based operators have increased to reach around 30% of the total, whilst numbers outside London have fallen slightly over this period.
Data from the Office for National Statistics shows that full-time bus and coach drivers work longer hours and have lower weekly wages than the average across all occupations, though the gap has narrowed slightly over the past decade.
The total fleet size has varied little in recent years, but the proportion of accessible buses has increased steadily.
At March 2014, an estimated 5,600 buses in England were estimated to not have the certificate:
Accessible or low floor buses: England from 2004/05
Percentage of buses fitted: England
600 buses not used on local services
1,000 small single deckers
2,000 large single deckers
1,900 double deckers
The proportion of buses fitted with other equipment also continues to increase. Bus operators have been able to claim an uplift to Bus Service Operators Grant (BSOG) payments for buses fitted with AVL and ITSO smart readers since April 2010, which may have contributed to some of the increase seen.
2007/08 2010/11 2013/14
Bus and coach driver wages and hours worked compared to all occupations, 2013
0
5
10
15
20
25
30
35
05/06 07/08 09/10 11/12 13/14
Withaccessibility certificate
Not low floorLow floor access but no certificate
Bus and coach drivers
All occupations
£444
Median weekly wage, 2013 (13/14 prices)
2003 201312% in real terms since '03
£518 3%
Median weekly hours worked, 2013
Bus and coach drivers
All occupations 1%
41.5hours
8%since '03
37.5hours
ForwardBackHome

Annual Bus Statistics 2013/14 - Page 18
Operator revenue and costs
► Annual bus operator revenue is estimated to be around £5.6 billion, of which 58% is from fare receipts
► Bus fare inflation in the year to March 2014 was 3%; low compared to previous years, but still above inflation
► Net Government support for buses was an estimated £2.2 billion in 2013/14, down 19% from the 2008/09 peak in real terms
Bus operator revenue related to local bus services was an estimated £5.6 billion in 2013/14.
Overall 58% of this revenue is estimated to come from fare receipts, with the remainder from central or local Government. However, nearly half of the non-fare revenue relates to concessionary fare reimbursement - adding this would bring the total to 77%.
Operating revenue in 2013/14 [data tables bus04 ]
About the dataEstimates of operator revenue are compiled from data on fare receipts collected via the annual survey of bus operators, and non-fare sources from DfT and local authority finance records.
The bus fares index is compiled quarterly and measures the estimated impact of fare receipts which would result from fare changes, assuming no change in passenger behaviour.
Operating costs are collected via survey of operators
Bus operator revenue by type and area: England 2013/14
Met areas £1.3 billion
Non-met£2.2 billion
London£2.1 billion
Fares£3.3 billion (58%)
Government£2.3 billion (42%)
Fares£1260m (60%)
Conc.£230m
Support £130m
Support to operators£560m
Fares£1220m (55%)
Fares£790m (60%)
Support £330m
Concessionary reimbursement £500m
Conc. reimb£300m
BSOG £170m
BSOG £90m
BSOG £40m
Types of revenueFare receipts represent money received by operators through on and off bus fares.
Support to operators covers payments from local authorities, mostly for running supported services.
Concessionary reimbursement is payment to operators from local authorities for carrying concessionary passengers.
Bus Service Operators Grant (BSOG) is a fuel duty rebate paid to operators by DfT.
Other sources of operator income (e.g. for non-local services)are excluded here.
ForwardBackHome

Annual Bus Statistics 2013/14 - Page 19
Bus fares index [data table bus0405 ]
Bus fares increased by an average 3% in the year to March 2014, with similar rates of increase in London and in the rest of England. This is lower than in recent years.
In London, fares fell in real terms during the early 2000s (a period of increasing public funding) but have since increased at above the rate of inflation, except in 2008.
Outside London fares have increased at a lower rate in only two of the last 20 years (with one of these, the fall in 2007, being affected by the introduction of concessionary travel (which made lots of previously paid-for journeys free)
Annual change in bus fares index from 1996
-5%
0%
5%
10%
15%
1996 2000 2005 2010 2014
Outside London
-5%
0%
5%
10%
15%
1996 2000 2005 2010 2014
Annual % change (yr to March) London
Retail Price Index
Government support [data tables bus05 ] Total net government support for buses in 2013/14 was an estimated £2.2 billion (in 13/14 prices); this includes £1 billion for concessionary travel reimbursement (which is effectively a subsidy to concessionary passengers) and £1.2 billion subsidy to bus operators through payments for supported services and BSOG.
Total support grew steadily in real terms from the early 2000s to a peak in 2008/09, due to increased public funding in London and the introduction of free national concessionary travel. Since 2008/09, the total has fallen 19% as support to operators has reduced and concessionary travel reimbursement has broadly levelled off.
Net Government support for buses by area type, from 1996/97
BSOG per passenger journeyis a DfT business plan indicator, measuring central government support for buses.
See www.gov.uk/government/publications/bus-subsidy-per-passenger-journey
0
500
1000
1500
2000
2500
3000
96/97 00/01 04/05 08/09 13/14
London£823m (38%)
Non-met areas£864m (39%)
Met areas£514m (23%)
£ million (13/14 prices) In 2013/14
ForwardBackHome

Annual Bus Statistics 2013/14 - Page 20
Government support for buses and concessionary travel by type and area, from 1996/97
Support to bus operators
England LondonMetropolitan areas
Non-metropolitan areas
0200400600800
10001200
96/97 13/14
BSOG closelyrelated to mileage so highest spend in non-met areas where most bus mileage is run. Cut by 20% in April 2012 and not paid to London operators from October 2013.
0200400600800
10001200
96/97 13/14
Rapid growth from 04/05 to 08/09, especially in non-met areas, due to introduction of statutory free concessionary travel for older/disabled. Smaller increases in London and met areas where free travel more widely available prior to 04/05
0200400600800
10001200
96/97 13/14
Rapid growth in London from the early 2000s and smaller rise in non-met areas, both peaking in 08/09 and falling since then. Much flatter trend in met areas
£m, 13/14 prices
Concessionary travel
Bus service operators grant (BSOG)
Bus operating costs [data tables bus04 ]
These statistics record bus operator costs for local bus services outside London from 2004/05. Over this period costs have increased by an estimated 14% in real terms, with relatively high cost inflation to 2008/09 followed by a broad levelling off (costs in 13/14 are 1% below the 2008/09 level in real terms). Changes in real bus and coach driver earnings over the same period show a similar trend. As staff costs form a large proportion of the total, the slower growth in wages since the start of the economic downturn could explain the reducing operator cost inflation.
Change in local bus operating costs and bus/coach driver earnings, in real terms, from 2004/05 Related
informationA more detailed index of bus industry cost inflation is compiled by the Confederation of Passenger Transport, and published as the CPT cost index.
Further sources of relevant information include published accounts of large bus operating companies and groups.
95
100
105
110
115
120
04/05 (costs)2004 (earnings)
08/092008
13/142013
Index 2004/05 = 100 (costs), 2004 = 100 (earnings)
Operatingcosts
Bus and coach driver weekly earnings

Annual Bus Statistics 2013/14 - Page 21
Background information
Users and uses of these statistics
These statistics provide key information on trends in the bus sector. Within the Department for Transport they are used for:
► ministerial briefing and to answer public enquiries;
► as background to policy development;
► monitoring trends in the bus sector, for example in relation to accessible buses;
► the bus punctuality figures are used to monitor progress for the DfT business plan indicator related to the proportion of buses running on time (www.gov.uk/government/publications/input-and-impact-indicators); and
► by economists in modelling policy options (for example related to reform of bus subsidy).
Outside DfT known uses include:
► passenger journeys figures are used as a measure of the overall health/state of the industry, for example by private research organisations, and are occasionally reported in the trade press;
► local authorities may use these statistics to compare trends in their area with the national picture;
► these statistics have also provided background information for recent reports by the Transport Select Committee and Competition Commission;
► bus fares data are used by the Office for National Statistics in calculating the Retail and Consumer Price Indices and in the National Accounts.
Strengths and weaknesses of the data
These statistics are derived from a number of sources, with the main source being the DfT annual Public Service Vehicle (PSV) survey of over 500 local bus operators which provides data on passenger journeys, vehicle miles, revenue and costs, and vehicles and staff. However, certain statistics (for example annual statistics on bus fares) are derived from smaller surveys of the larger bus operators, or from local authorities. Information on passenger journeys and bus mileage for London is provided by Transport for London.
User feedbackWe welcome any feedback on any aspect of these statistics which can be provided by email to [email protected] or by completing a short online feedback form.
National StatisticsNational Statistics are produced to high professional standards set out in the National Statistics Code of Practice. They undergo regular quality assurance reviews to ensure they meet customer needs: www.statisticsauthority.gov.uk/assessment/code-of-practice/index.html
For details of ministers and officials who receive pre-release access to these statistics up to 24 hours before release: www.gov.uk/government/organisations/department-for-transport/series/bus-statistics

Annual Bus Statistics 2013/14 - Page 22
Many of these statistics have been collected on a broadly comparable basis from operators for many years. However, following revisions to the methodology used to compile the published figures, 2004/05 is the earliest year for which figures are comparable on exactly the same basis.
The PSV survey uses imputation techniques to derive key figures for operators who were either not selected in the sample for that year, or who did not respond. On occasion, imputations for earlier years can be improved using directly-reported data for later years. Minor revisions to back-data can occur as a result, although trends are rarely affected substantively.
For the key indicators (passenger journeys and vehicle miles operated) the data provided by operators covers around, or above, 90% of the total figure, with the remainder imputed.
Comparison with other sources suggests that, at aggregate (national) level, the statistics are likely to provide a reasonably robust measure of levels and broad trends. However, figures representing smaller groups of operators and single year on year changes should be treated with caution as these are more susceptible to measurement errors (for example, an inaccurate return by an operator, or a change in an operator’s method of producing the figures) which are more likely to even out at the national level. Regional, and particularly local authority, level figures should be interpreted with caution.
Further details of the full range of data sources and methods used in the production of these statistics can be found in the notes and definitions document available via: www.gov.uk/government/statistics/buses-statistics-guidance
Background information
Next releaseThe next Quarterly Bus Statistics release will be published in December 2014, and will contain estimates for 2014 Q3 (July to September) together with annual figures for costs, revenue and Government support for buses and concessionary travel. The next Annual Bus Statistics will be published in Autumn 2014.
ForwardBackHome