Embed Size (px)
Citation preview
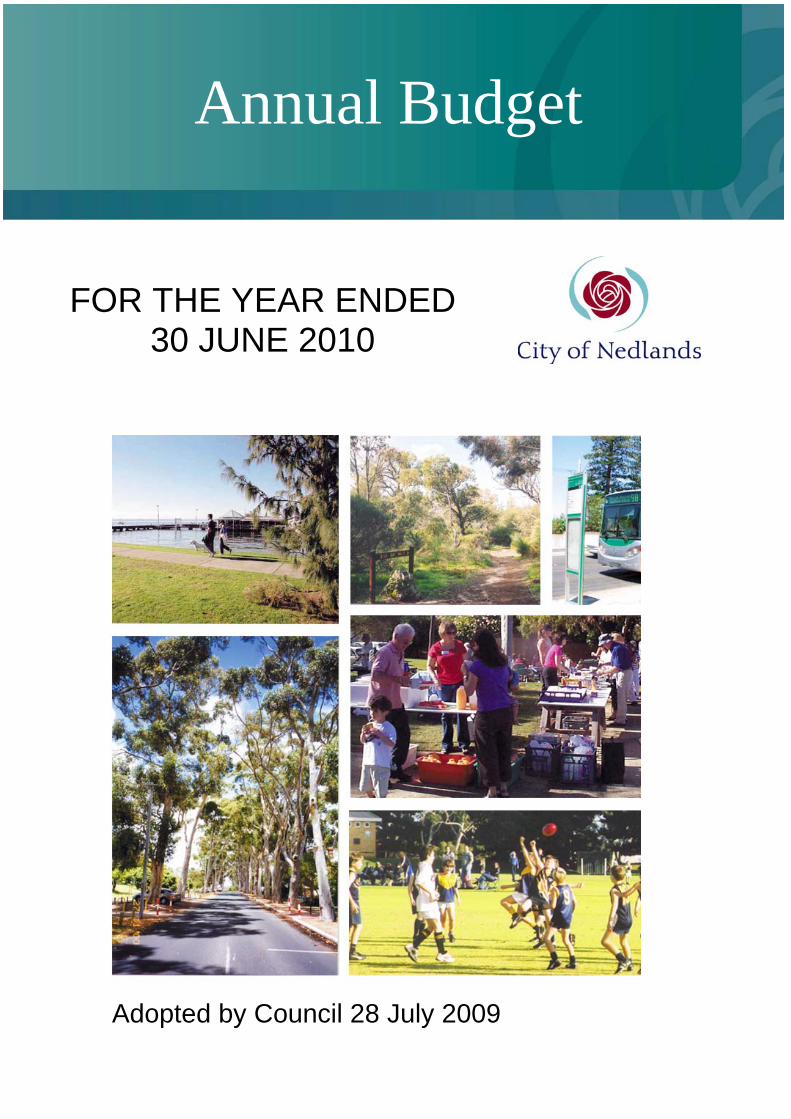
Annual Budget
FOR THE YEAR ENDED30 JUNE 2010
Adopted by Council 28 July 2009
Message from the Chief Executive Officer The 2009/10 Annual Budget was adopted by the City of Nedlands at its Special Council Meeting held on Tuesday 28 July, and represents the culmination of a great deal of work and effort by the Elected Members and officers alike. This budget seeks to continue to address the cumulative effect of minimal rate rises over recent years that have lead to the deferral of planned infrastructure capital works projects. To continue to address the infrastructure backlog at Nedlands, this budget is based on an average rate increase of 5.0%, being 3% to meet the increase in ongoing expenditure as a result of CPI plus an additional 2% to be applied to funding infrastructure. Another key component of the Budget is the borrowing of $2.0 million to fund infrastructure works. In discussions leading up to the adoption of the Budget, Councillors were mindful of the current state of the economy and the impact any increase would have on ratepayers. However, the City is not immune to increases in costs passed on to it by the State Government with substantial increases in the cost of electricity and land fill levies for waste disposal. I wish to record my appreciation to Her Worship the Mayor, Councillors and staff who helped to formulate this budget and the philosophy behind it. It engendered a great deal of healthy debate and that was conducted in a respectful and well meaning manner, mindful of the interests of the current and future citizens of this city.
GRAHAM FOSTER CHIEF EXECUTIVE OFFICER
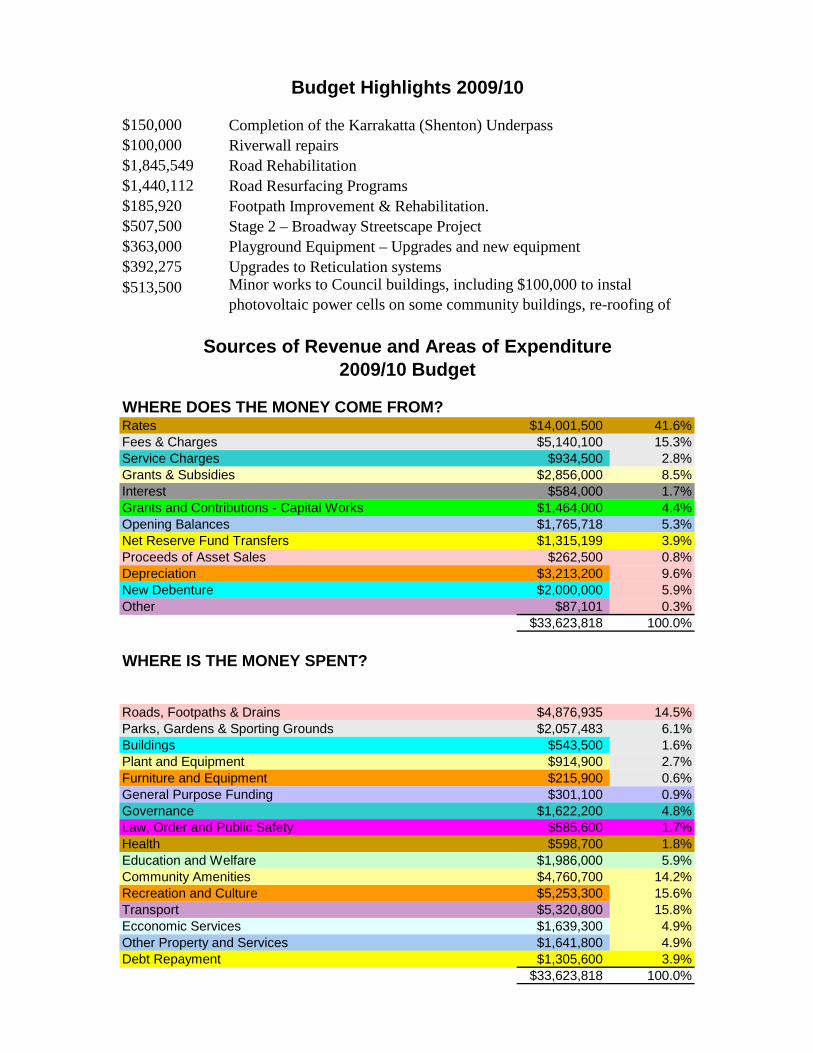
$150,000$100,000$1,845,549$1,440,112$185,920$507,500$363,000$392,275$513,500 Minor works to Council buildings, including $100,000 to instal
photovoltaic power cells on some community buildings, re-roofing of
Upgrades to Reticulation systemsPlayground Equipment – Upgrades and new equipmentStage 2 – Broadway Streetscape Project
Riverwall repairs
Footpath Improvement & Rehabilitation.Road Resurfacing ProgramsRoad Rehabilitation
Budget Highlights 2009/10
Completion of the Karrakatta (Shenton) Underpass
WHERE DOES THE MONEY COME FROM?Rates $14,001,500 41.6%Fees & Charges $5,140,100 15.3%Service Charges $934,500 2.8%Grants & Subsidies $2,856,000 8.5%Interest $584,000 1.7%Grants and Contributions - Capital Works $1,464,000 4.4%Opening Balances $1,765,718 5.3%Net Reserve Fund Transfers $1,315,199 3.9%Proceeds of Asset Sales $262,500 0.8%Depreciation $3,213,200 9.6%New Debenture $2,000,000 5.9%Other $87,101 0.3%
$33,623,818 100.0%
Sources of Revenue and Areas of Expenditure2009/10 Budget
WHERE IS THE MONEY SPENT?
Roads, Footpaths & Drains $4,876,935 14.5%Parks, Gardens & Sporting Grounds $2,057,483 6.1%Buildings $543,500 1.6%Plant and Equipment $914,900 2.7%Furniture and Equipment $215,900 0.6%General Purpose Funding $301,100 0.9%Governance $1,622,200 4.8%Law, Order and Public Safety $585,600 1.7%Health $598,700 1.8%Education and Welfare $1,986,000 5.9%Community Amenities $4,760,700 14.2%Recreation and Culture $5,253,300 15.6%Transport $5,320,800 15.8%Ecconomic Services $1,639,300 4.9%Other Property and Services $1,641,800 4.9%Debt Repayment $1,305,600 3.9%
$33,623,818 100.0%
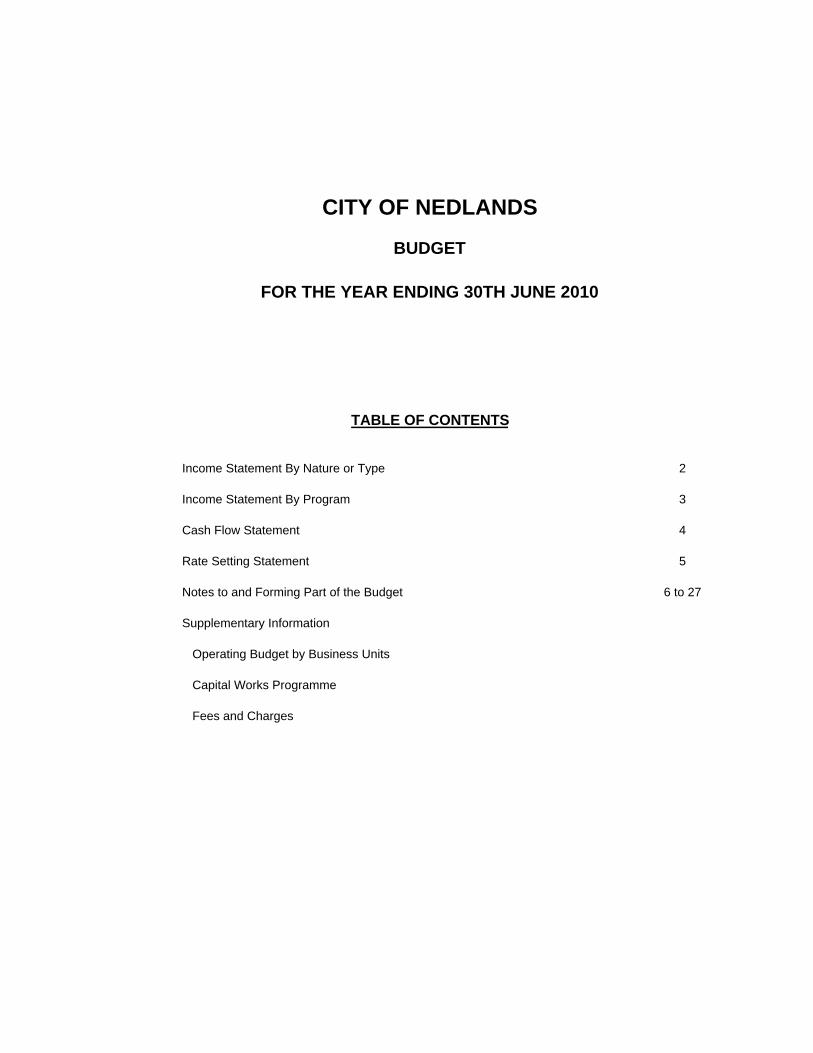
CITY OF NEDLANDS
BUDGET
FOR THE YEAR ENDING 30TH JUNE 2010
TABLE OF CONTENTS
Income Statement By Nature or Type 2
Income Statement By Program 3
Cash Flow Statement 4
Rate Setting Statement 5
Notes to and Forming Part of the Budget 6 to 27
Supplementary Information
Operating Budget by Business Units
Capital Works Programme Fees and Charges
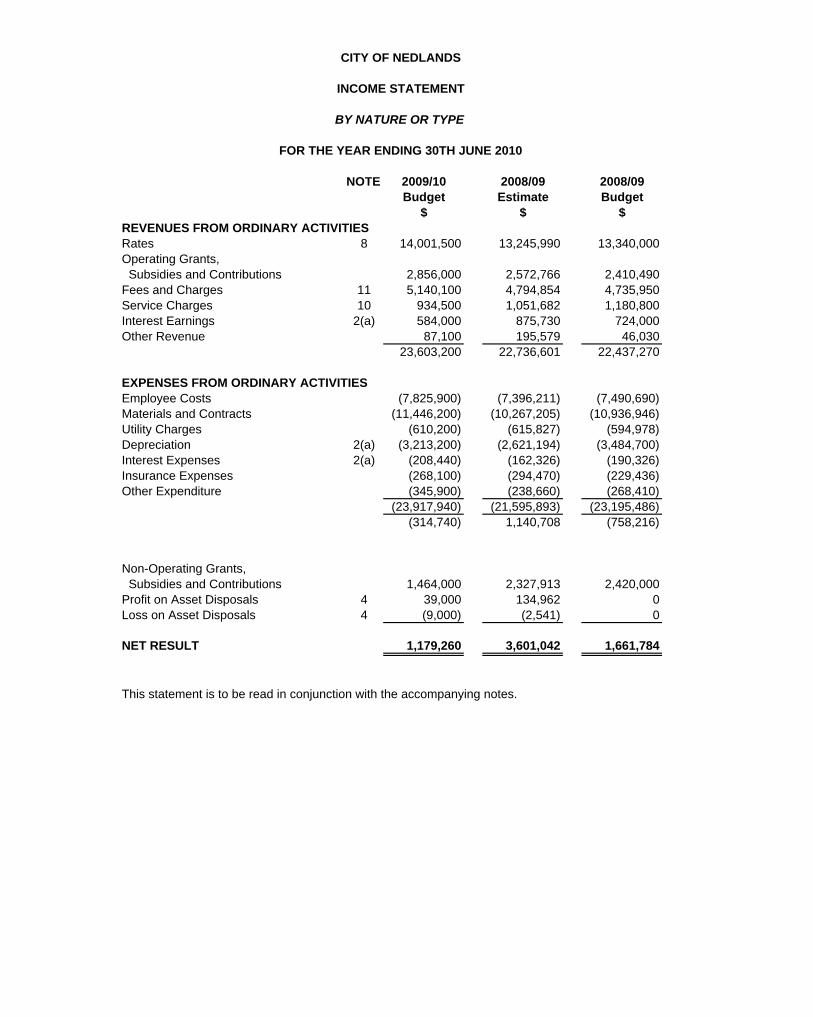
CITY OF NEDLANDS
INCOME STATEMENT
BY NATURE OR TYPE
FOR THE YEAR ENDING 30TH JUNE 2010
NOTE 2009/10 2008/09 2008/09Budget Estimate Budget
$ $ $REVENUES FROM ORDINARY ACTIVITIESRates 8 14,001,500 13,245,990 13,340,000Operating Grants, Subsidies and Contributions 2,856,000 2,572,766 2,410,490Fees and Charges 11 5,140,100 4,794,854 4,735,950Service Charges 10 934,500 1,051,682 1,180,800Interest Earnings 2(a) 584,000 875,730 724,000Other Revenue 87,100 195,579 46,030
23,603,200 22,736,601 22,437,270
EXPENSES FROM ORDINARY ACTIVITIESEmployee Costs (7,825,900) (7,396,211) (7,490,690)Materials and Contracts (11,446,200) (10,267,205) (10,936,946)Utility Charges (610,200) (615,827) (594,978)Depreciation 2(a) (3,213,200) (2,621,194) (3,484,700)Interest Expenses 2(a) (208,440) (162,326) (190,326)Insurance Expenses (268,100) (294,470) (229,436)Other Expenditure (345,900) (238,660) (268,410)
(23,917,940) (21,595,893) (23,195,486)(314,740) 1,140,708 (758,216)
Non-Operating Grants, Subsidies and Contributions 1,464,000 2,327,913 2,420,000Profit on Asset Disposals 4 39,000 134,962 0Loss on Asset Disposals 4 (9,000) (2,541) 0
NET RESULT 1,179,260 3,601,042 1,661,784
This statement is to be read in conjunction with the accompanying notes.
Page 2
CITY OF NEDLANDSINCOME STATEMENT
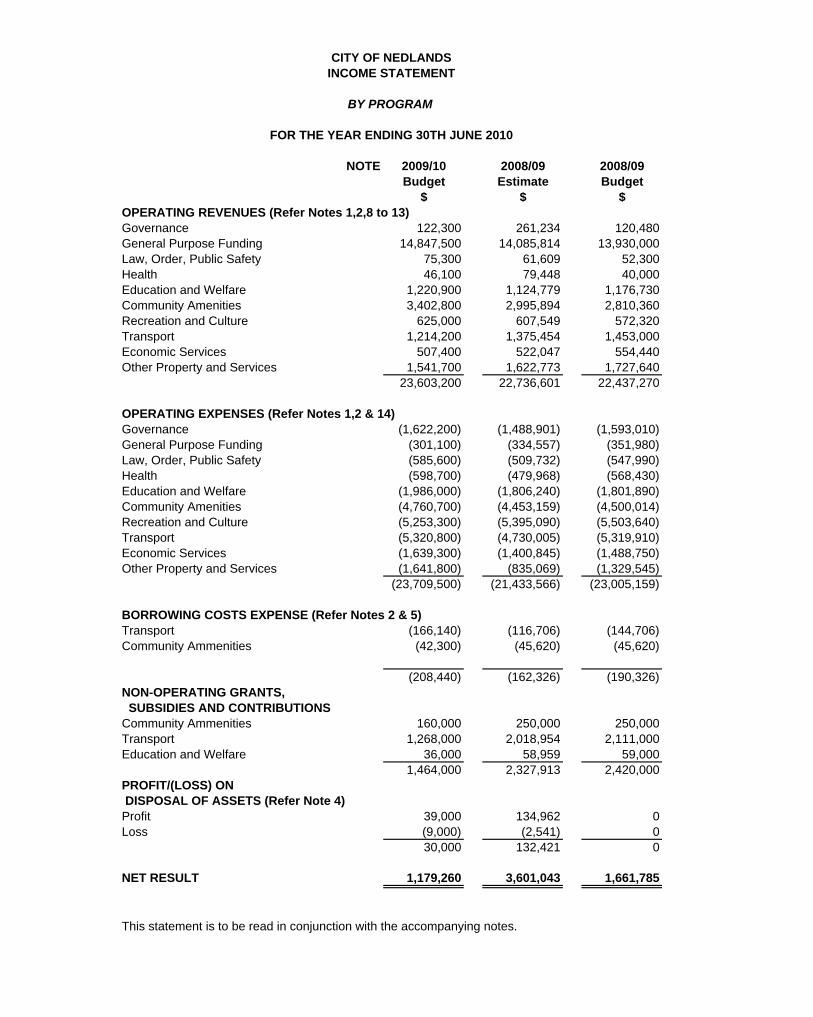
BY PROGRAM
FOR THE YEAR ENDING 30TH JUNE 2010
NOTE 2009/10 2008/09 2008/09Budget Estimate Budget
$ $ $OPERATING REVENUES (Refer Notes 1,2,8 to 13)Governance 122,300 261,234 120,480General Purpose Funding 14,847,500 14,085,814 13,930,000Law, Order, Public Safety 75,300 61,609 52,300Health 46,100 79,448 40,000Education and Welfare 1,220,900 1,124,779 1,176,730Community Amenities 3,402,800 2,995,894 2,810,360Recreation and Culture 625,000 607,549 572,320Transport 1,214,200 1,375,454 1,453,000Economic Services 507,400 522,047 554,440Other Property and Services 1,541,700 1,622,773 1,727,640
23,603,200 22,736,601 22,437,270
OPERATING EXPENSES (Refer Notes 1,2 & 14)Governance (1,622,200) (1,488,901) (1,593,010)General Purpose Funding (301,100) (334,557) (351,980)Law, Order, Public Safety (585,600) (509,732) (547,990)Health (598,700) (479,968) (568,430)Education and Welfare (1,986,000) (1,806,240) (1,801,890)Community Amenities (4,760,700) (4,453,159) (4,500,014)Recreation and Culture (5,253,300) (5,395,090) (5,503,640)Transport (5,320,800) (4,730,005) (5,319,910)Economic Services (1,639,300) (1,400,845) (1,488,750)Other Property and Services (1,641,800) (835,069) (1,329,545)
(23,709,500) (21,433,566) (23,005,159)
BORROWING COSTS EXPENSE (Refer Notes 2 & 5)Transport (166,140) (116,706) (144,706)Community Ammenities (42,300) (45,620) (45,620)
(208,440) (162,326) (190,326)NON-OPERATING GRANTS, SUBSIDIES AND CONTRIBUTIONSCommunity Ammenities 160,000 250,000 250,000Transport 1,268,000 2,018,954 2,111,000Education and Welfare 36,000 58,959 59,000
1,464,000 2,327,913 2,420,000PROFIT/(LOSS) ON DISPOSAL OF ASSETS (Refer Note 4)Profit 39,000 134,962 0Loss (9,000) (2,541) 0
30,000 132,421 0
NET RESULT 1,179,260 3,601,043 1,661,785
This statement is to be read in conjunction with the accompanying notes.
Page 3
CITY OF NEDLANDS
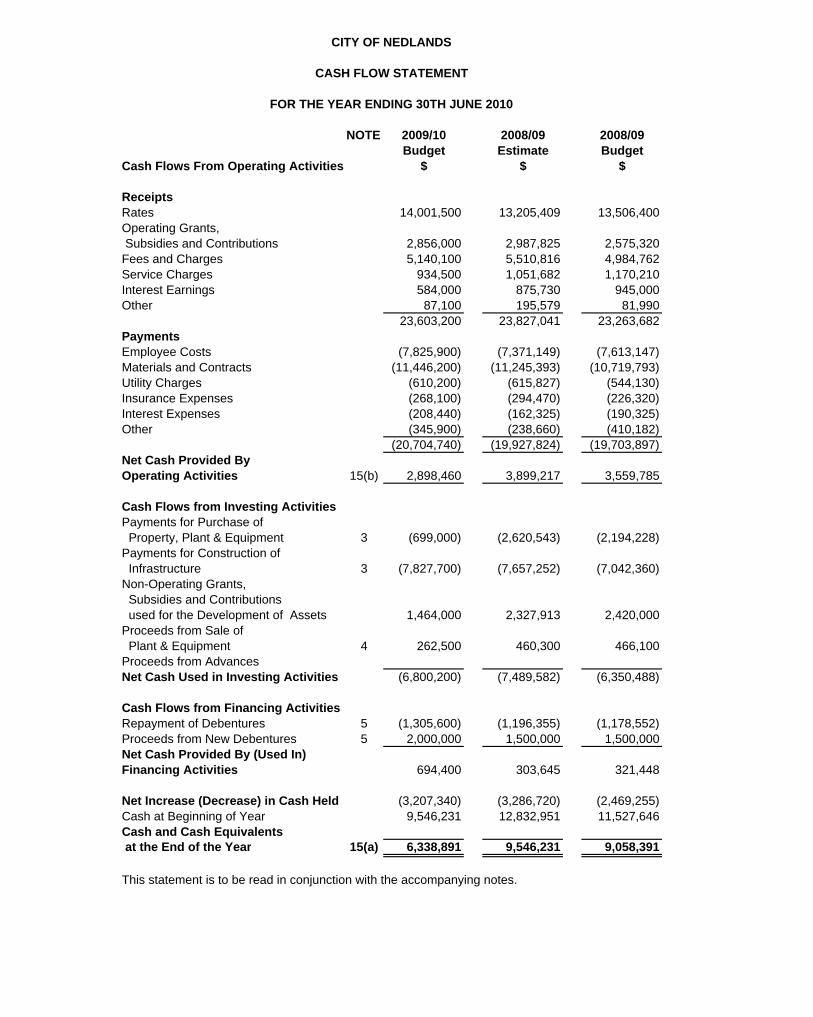
CASH FLOW STATEMENT
FOR THE YEAR ENDING 30TH JUNE 2010
NOTE 2009/10 2008/09 2008/09Budget Estimate Budget
Cash Flows From Operating Activities $ $ $
ReceiptsRates 14,001,500 13,205,409 13,506,400Operating Grants, Subsidies and Contributions 2,856,000 2,987,825 2,575,320Fees and Charges 5,140,100 5,510,816 4,984,762Service Charges 934,500 1,051,682 1,170,210Interest Earnings 584,000 875,730 945,000Other 87,100 195,579 81,990
23,603,200 23,827,041 23,263,682PaymentsEmployee Costs (7,825,900) (7,371,149) (7,613,147)Materials and Contracts (11,446,200) (11,245,393) (10,719,793)Utility Charges (610,200) (615,827) (544,130)Insurance Expenses (268,100) (294,470) (226,320)Interest Expenses (208,440) (162,325) (190,325)Other (345,900) (238,660) (410,182)
(20,704,740) (19,927,824) (19,703,897)Net Cash Provided ByOperating Activities 15(b) 2,898,460 3,899,217 3,559,785
Cash Flows from Investing ActivitiesPayments for Purchase of Property, Plant & Equipment 3 (699,000) (2,620,543) (2,194,228)Payments for Construction of Infrastructure 3 (7,827,700) (7,657,252) (7,042,360)Non-Operating Grants, Subsidies and Contributions used for the Development of Assets 1,464,000 2,327,913 2,420,000Proceeds from Sale of Plant & Equipment 4 262,500 460,300 466,100Proceeds from AdvancesNet Cash Used in Investing Activities (6,800,200) (7,489,582) (6,350,488)
Cash Flows from Financing ActivitiesRepayment of Debentures 5 (1,305,600) (1,196,355) (1,178,552)Proceeds from New Debentures 5 2,000,000 1,500,000 1,500,000Net Cash Provided By (Used In)Financing Activities 694,400 303,645 321,448
Net Increase (Decrease) in Cash Held (3,207,340) (3,286,720) (2,469,255)Cash at Beginning of Year 9,546,231 12,832,951 11,527,646Cash and Cash Equivalents at the End of the Year 15(a) 6,338,891 9,546,231 9,058,391
This statement is to be read in conjunction with the accompanying notes.
Page 4
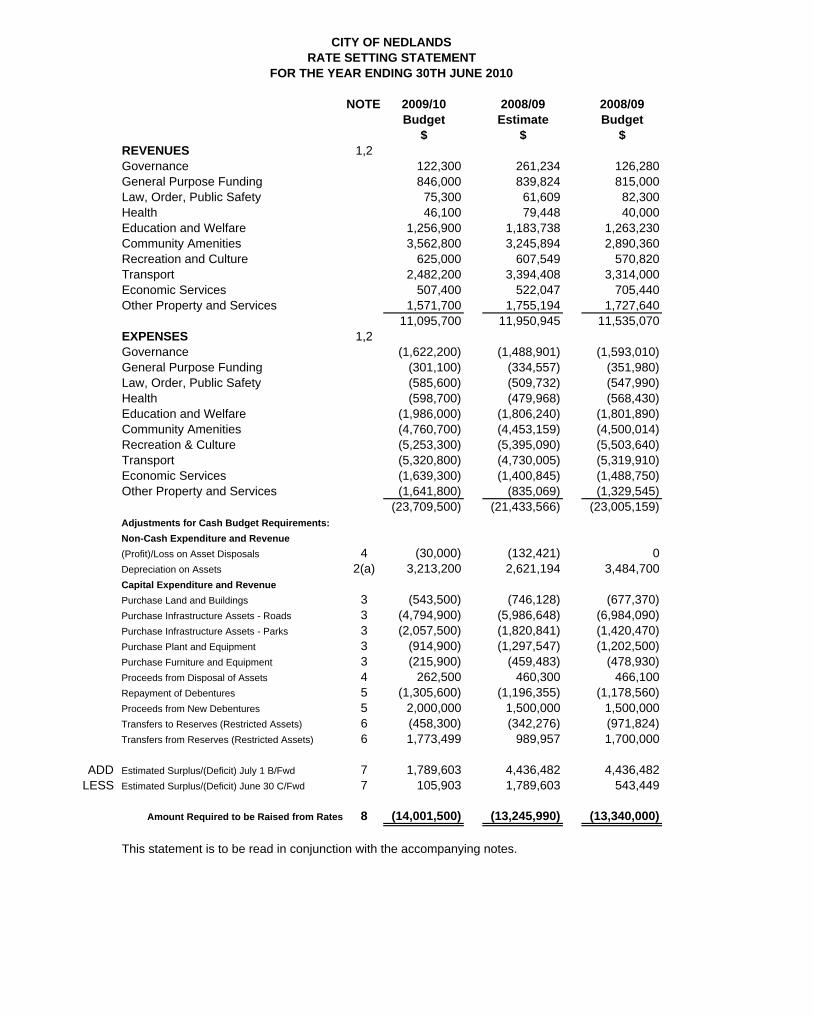
CITY OF NEDLANDSRATE SETTING STATEMENT
FOR THE YEAR ENDING 30TH JUNE 2010
NOTE 2009/10 2008/09 2008/09Budget Estimate Budget
$ $ $REVENUES 1,2Governance 122,300 261,234 126,280General Purpose Funding 846,000 839,824 815,000Law, Order, Public Safety 75,300 61,609 82,300Health 46,100 79,448 40,000Education and Welfare 1,256,900 1,183,738 1,263,230Community Amenities 3,562,800 3,245,894 2,890,360Recreation and Culture 625,000 607,549 570,820Transport 2,482,200 3,394,408 3,314,000Economic Services 507,400 522,047 705,440Other Property and Services 1,571,700 1,755,194 1,727,640
11,095,700 11,950,945 11,535,070EXPENSES 1,2Governance (1,622,200) (1,488,901) (1,593,010)General Purpose Funding (301,100) (334,557) (351,980)Law, Order, Public Safety (585,600) (509,732) (547,990)Health (598,700) (479,968) (568,430)Education and Welfare (1,986,000) (1,806,240) (1,801,890)Community Amenities (4,760,700) (4,453,159) (4,500,014)Recreation & Culture (5,253,300) (5,395,090) (5,503,640)Transport (5,320,800) (4,730,005) (5,319,910)Economic Services (1,639,300) (1,400,845) (1,488,750)Other Property and Services (1,641,800) (835,069) (1,329,545)
(23,709,500) (21,433,566) (23,005,159)Adjustments for Cash Budget Requirements:Non-Cash Expenditure and Revenue(Profit)/Loss on Asset Disposals 4 (30,000) (132,421) 0Depreciation on Assets 2(a) 3,213,200 2,621,194 3,484,700Capital Expenditure and RevenuePurchase Land and Buildings 3 (543,500) (746,128) (677,370)Purchase Infrastructure Assets - Roads 3 (4,794,900) (5,986,648) (6,984,090)Purchase Infrastructure Assets - Parks 3 (2,057,500) (1,820,841) (1,420,470)Purchase Plant and Equipment 3 (914,900) (1,297,547) (1,202,500)Purchase Furniture and Equipment 3 (215,900) (459,483) (478,930)Proceeds from Disposal of Assets 4 262,500 460,300 466,100Repayment of Debentures 5 (1,305,600) (1,196,355) (1,178,560)Proceeds from New Debentures 5 2,000,000 1,500,000 1,500,000Transfers to Reserves (Restricted Assets) 6 (458,300) (342,276) (971,824)Transfers from Reserves (Restricted Assets) 6 1,773,499 989,957 1,700,000
ADD Estimated Surplus/(Deficit) July 1 B/Fwd 7 1,789,603 4,436,482 4,436,482LESS Estimated Surplus/(Deficit) June 30 C/Fwd 7 105,903 1,789,603 543,449
Amount Required to be Raised from Rates 8 (14,001,500) (13,245,990) (13,340,000)
This statement is to be read in conjunction with the accompanying notes.
Page 5
CITY OF NEDLANDSNOTES TO AND FORMING PART OF THE BUDGET
FOR THE YEAR ENDING 30TH JUNE 2010
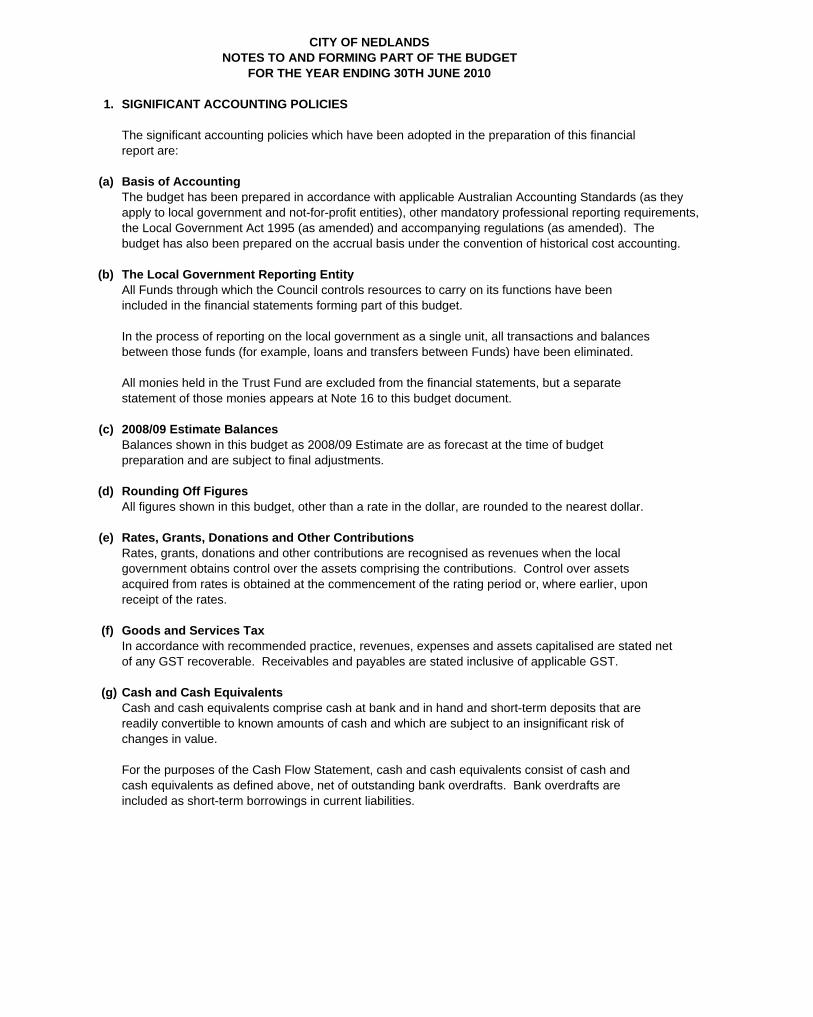
1. SIGNIFICANT ACCOUNTING POLICIES
The significant accounting policies which have been adopted in the preparation of this financialreport are:
(a) Basis of AccountingThe budget has been prepared in accordance with applicable Australian Accounting Standards (as theyapply to local government and not-for-profit entities), other mandatory professional reporting requirements,the Local Government Act 1995 (as amended) and accompanying regulations (as amended). Thebudget has also been prepared on the accrual basis under the convention of historical cost accounting.
(b) The Local Government Reporting EntityAll Funds through which the Council controls resources to carry on its functions have beenincluded in the financial statements forming part of this budget.
In the process of reporting on the local government as a single unit, all transactions and balancesbetween those funds (for example, loans and transfers between Funds) have been eliminated.
All monies held in the Trust Fund are excluded from the financial statements, but a separatestatement of those monies appears at Note 16 to this budget document.
(c) 2008/09 Estimate BalancesBalances shown in this budget as 2008/09 Estimate are as forecast at the time of budgetpreparation and are subject to final adjustments.
(d) Rounding Off FiguresAll figures shown in this budget, other than a rate in the dollar, are rounded to the nearest dollar.
(e) Rates, Grants, Donations and Other ContributionsRates, grants, donations and other contributions are recognised as revenues when the localgovernment obtains control over the assets comprising the contributions. Control over assetsacquired from rates is obtained at the commencement of the rating period or, where earlier, uponreceipt of the rates.
(f) Goods and Services TaxIn accordance with recommended practice, revenues, expenses and assets capitalised are stated netof any GST recoverable. Receivables and payables are stated inclusive of applicable GST.
(g) Cash and Cash EquivalentsCash and cash equivalents comprise cash at bank and in hand and short-term deposits that arereadily convertible to known amounts of cash and which are subject to an insignificant risk ofchanges in value.
For the purposes of the Cash Flow Statement, cash and cash equivalents consist of cash andcash equivalents as defined above, net of outstanding bank overdrafts. Bank overdrafts areincluded as short-term borrowings in current liabilities.
Page 6

CITY OF NEDLANDSNOTES TO AND FORMING PART OF THE BUDGET
FOR THE YEAR ENDING 30TH JUNE 2010
1. SIGNIFICANT ACCOUNTING POLICIES (Continued)
(h) Trade and Other Receivables
(i) Inventories
(j) Fixed Assets
Initial RecognitionAll assets are initially recognised at cost. Cost is determined as the fair value of the assets given asconsideration plus costs incidental to the acquisition. For assets acquired at no cost or for nominalconsideration, cost is determined as fair value at the date of acquisition. The cost of non-current assetsconstructed includes the cost of all materials, direct labour and variable and fixed overheads.
RevaluationCertain asset classes may be revalued on a regular basis such that the carying values are not materiallydifferent from fair value. For infrastructure and other asset classes where no active market exists, fairvalue is determined to be the current replacement cost of an asset less, where applicable, accumulateddepreciation calculated on a basis to reflect the already consumed or expired future economic benefits.
Those assets carried at a revalued amount, being their fair value at the date of revaluation less anysubsequent accumulated depreciation and accumulated impairment losses, are to be revalued withsufficient regularity to ensure the carrying amount does not differ materially from that determined usingfair value at reporting date.
Land Under RoadsLand under roads is excluded from infrastructure in accordance with the transitional arrangements availableunder AASB 1045 and in accordance with legislative requirements.
Trade receivables, which generally have 30 - 90 day terms, are recognised initially at fair value and subsequently measured at amortised cost using the effective interest rate method, less any allowance for uncollectible amounts.
Collectibility of trade receivables is reviewed on an ongoing basis. Debts that are known to be uncollectible are written off when identified. An allowance for doubtful debts is raised when there is objective evidence that they will not be collectible.
General Inventories are valued at the lower of cost and net realisable value. Net realisablevalue is the estimated selling price in the ordinary course of business less the estimated costs of completion and the estimated costs necessary to make the sale. Inventories held from trading are classified as current even if not expected to be realised in the next 12 months.
Land Held for ResaleLand purchased for development and/or resale is valued at the lower of cost and net realisable value. Cost includes the cost of acquisition, development and interest incurred on the financing of that land during its development. Interest and holding charges incurred after development is complete are recognised as expenses.
Revenue arising from the sale of property is recognised in the operating statement as at the time of signing a binding contract of sale.
Land held for resale is classified as current except where it is held as non-current based on Council’s intentions to release for sale.
Page 7

CITY OF NEDLANDSNOTES TO AND FORMING PART OF THE BUDGET
FOR THE YEAR ENDING 30TH JUNE 2010
1. SIGNIFICANT ACCOUNTING POLICIES (Continued)
(j) Fixed Assets (Continued)
Land Under RoadsIn Western Australia, all land under roads is Crown Land, the responsibility for managing which, is vestedin the local government.
Effective as at 1 July 2008, Council elected not to recognise any value for land under roads acquired on orbefore 30 June 2008. This accords with the treatment available in Australian Accounting StandardAASB 1051 Land Under Roads and the fact Local Government (Financial Management) Regulation 16(a)(i)prohibits local governments from recognising such land as an asset.
In respect of land under roads acquired on or after 1 July 2008, as detailed above, Local Government(Financial Management) Regulation 16(a)(i) prohibits local governments from recognising such land as anasset.
Whilst this treatment is inconsistent with the requirements of AASB 1051, Local Government (FinancialManagement) Regulation 4(2) provides, in the event of such an inconsistency, the Local Government(Financial Management) Regulations prevail.
Consequently, any land under roads acquired on or after 1 July 2008 is not included as an asset of theCouncil.
(k) Depreciation of Non-Current AssetsAll non-current assets having a limited useful life are separately and systematically depreciated overtheir useful lives in a manner which reflects the consumption of the future economic benefits embodiedin those assets. Assets are depreciated from the date of acquisition or, in respect of internallyconstructed assets, from the time the asset is completed and held ready for use.
Depreciation is recognised on a straight-line basis, using rates which are reviewed each reportingperiod. Major depreciation periods are:
Buildings 50 yearsFurniture and Equipment 4 to 10 yearsPlant and Equipment 5 to 15 yearsSealed roads and streets construction/road base 50 years original surfacing and major re-surfacing - bituminous seals 20 years - asphalt surfaces 25 years gravel sheet 12 yearsFootpaths - slab 40 yearsSewerage piping 50 yearsdrainage systems 75 years
Page 8
CITY OF NEDLANDS
NOTES TO AND FORMING PART OF THE BUDGET
FOR THE YEAR ENDING 30TH JUNE 2010
1. SIGNIFICANT ACCOUNTING POLICIES (Continued)
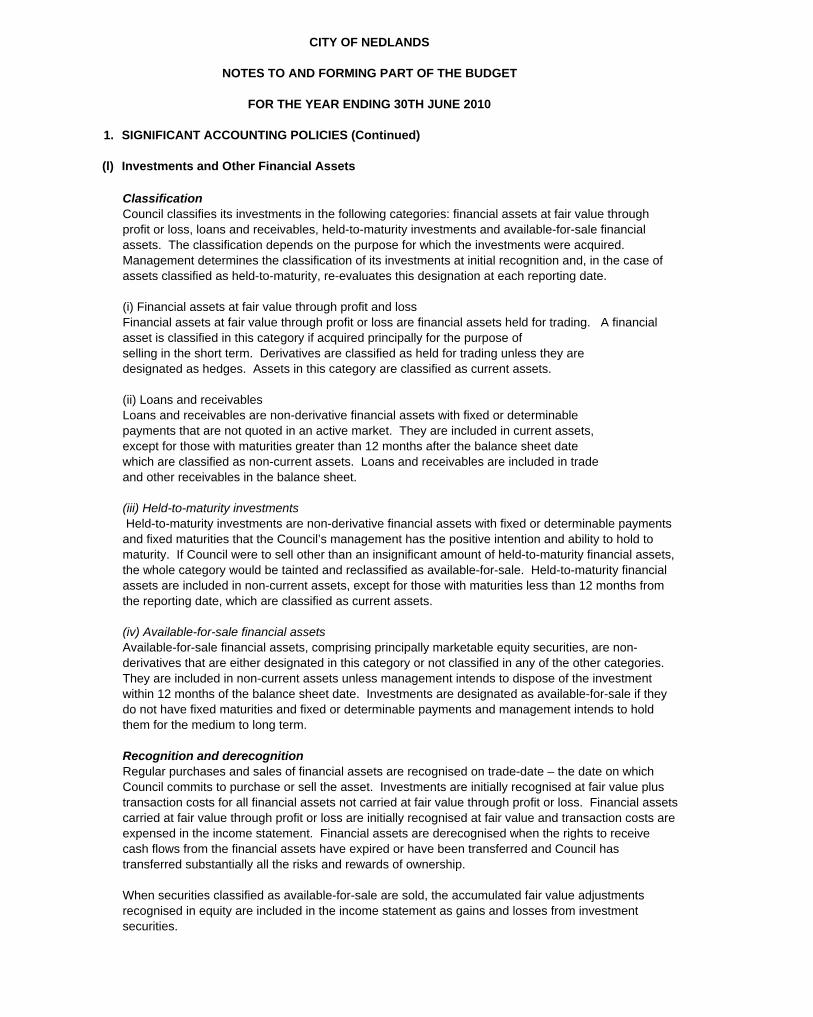
(l) Investments and Other Financial Assets
ClassificationCouncil classifies its investments in the following categories: financial assets at fair value through profit or loss, loans and receivables, held-to-maturity investments and available-for-sale financial assets. The classification depends on the purpose for which the investments were acquired. Management determines the classification of its investments at initial recognition and, in the case of assets classified as held-to-maturity, re-evaluates this designation at each reporting date.
(i) Financial assets at fair value through profit and lossFinancial assets at fair value through profit or loss are financial assets held for trading. A financial asset is classified in this category if acquired principally for the purpose of selling in the short term. Derivatives are classified as held for trading unless they are designated as hedges. Assets in this category are classified as current assets.
(ii) Loans and receivables Loans and receivables are non-derivative financial assets with fixed or determinable payments that are not quoted in an active market. They are included in current assets, except for those with maturities greater than 12 months after the balance sheet date which are classified as non-current assets. Loans and receivables are included in trade and other receivables in the balance sheet.
(iii) Held-to-maturity investments Held-to-maturity investments are non-derivative financial assets with fixed or determinable payments and fixed maturities that the Council’s management has the positive intention and ability to hold to maturity. If Council were to sell other than an insignificant amount of held-to-maturity financial assets, the whole category would be tainted and reclassified as available-for-sale. Held-to-maturity financial assets are included in non-current assets, except for those with maturities less than 12 months from the reporting date, which are classified as current assets. (iv) Available-for-sale financial assetsAvailable-for-sale financial assets, comprising principally marketable equity securities, are non-derivatives that are either designated in this category or not classified in any of the other categories. They are included in non-current assets unless management intends to dispose of the investment within 12 months of the balance sheet date. Investments are designated as available-for-sale if they do not have fixed maturities and fixed or determinable payments and management intends to hold them for the medium to long term.
Recognition and derecognitionRegular purchases and sales of financial assets are recognised on trade-date – the date on which Council commits to purchase or sell the asset. Investments are initially recognised at fair value plus transaction costs for all financial assets not carried at fair value through profit or loss. Financial assets carried at fair value through profit or loss are initially recognised at fair value and transaction costs are expensed in the income statement. Financial assets are derecognised when the rights to receive cash flows from the financial assets have expired or have been transferred and Council has transferred substantially all the risks and rewards of ownership.
When securities classified as available-for-sale are sold, the accumulated fair value adjustments recognised in equity are included in the income statement as gains and losses from investment securities.
Page 9

CITY OF NEDLANDS
NOTES TO AND FORMING PART OF THE BUDGET
FOR THE YEAR ENDING 30TH JUNE 2010
1. SIGNIFICANT ACCOUNTING POLICIES (Continued)
(l) Investments and Other Financial Assets (Continued)
Subsequent measurementLoans and receivables and held-to-maturity investments are carried at amortised cost using theeffective interest method.
Available-for-sale financial assets and financial assets at fair value through profit and loss are subsequentlycarried at fair value. Gains and losses arising from changes in the fair value of the financial assets atfair value category are presented in the income statement within other income or other expenses in theperiod in which they arise. Dividend income from financial assets at fair value through profit and loss isrecognised in the income statement as part of revenue from continuing operations when the Council'sright to receive payments is established. Changes in the fair value of other monetary and non-monetarysecurities classified as available-for-sale are recognised in equity.
ImpairmentCouncil assesses at each balance date whether there is objective evidence that a financial asset or groupof assets is impaired. In the case of equity securities classified as available-for-sale, a significant orprolonged decline in the fair value of a security below its cost is considered as an indicator that thesecurities are impaired. If any such evidence exists for available-for-sale financial assets, the cumulativeloss - measured as the difference between the acquisition cost and the current fair value, less anyimpairment loss on that financial asset previously recognised in profit or loss - is removed from equity andrecognised in the income statement. Impairment losses recognised in the income statement on equityinstruments classified as available-for-sale are not reversed through the income statement.
(m) Estimation of Fair ValueThe fair value of financial assets and financial liabilities must be estimated for recognition and measurement or for disclosure purposes.
The fair value of financial instruments traded in active markets is based on quoted market prices at the balance sheet date.
The fair value of financial instruments that are not traded in an active market is determined using valuation techniques. Council uses a variety of methods and makes assumptions that are based on market conditions existing at each balance date. These include the use of recent arm’s length transactions, reference to other instruments that are substantially the same, discounted cash flow analysis, and option pricing models making maximum use of market inputs and relying as little as possible on entity-specific inputs.
Quoted market prices or dealer quotes for similar instruments are used for long-term debt instruments held. Other techniques, such as estimated discounted cash flows, are used to determine fair value for the remaining financial instruments.
The nominal value less estimated credit adjustments of trade receivables and payables are assumed to approximate their fair values. The fair value of financial liabilities for disclosure purposes is estimated by discounting the future contractual cash flows at the current market interest rate that is available to the Council for similar financial instruments.
Page 10
CITY OF NEDLANDS
NOTES TO AND FORMING PART OF THE BUDGET
FOR THE YEAR ENDING 30TH JUNE 2010
1. SIGNIFICANT ACCOUNTING POLICIES (Continued)
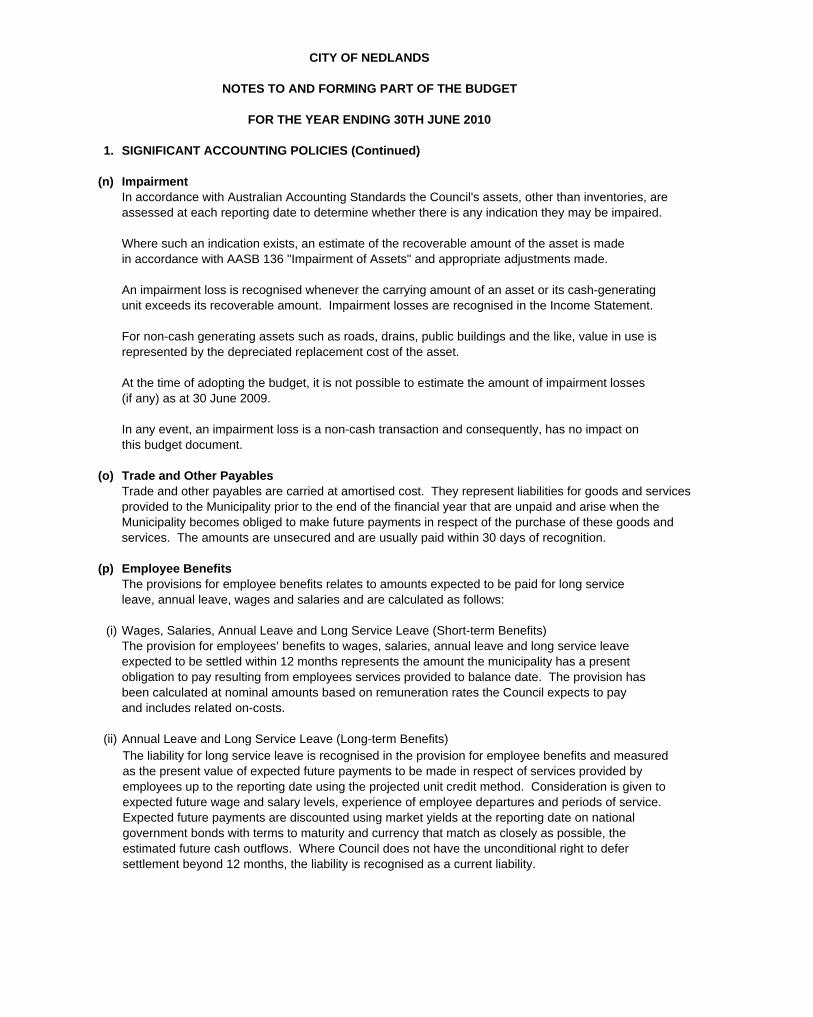
(n) ImpairmentIn accordance with Australian Accounting Standards the Council's assets, other than inventories, areassessed at each reporting date to determine whether there is any indication they may be impaired.
Where such an indication exists, an estimate of the recoverable amount of the asset is madein accordance with AASB 136 "Impairment of Assets" and appropriate adjustments made.
An impairment loss is recognised whenever the carrying amount of an asset or its cash-generatingunit exceeds its recoverable amount. Impairment losses are recognised in the Income Statement.
For non-cash generating assets such as roads, drains, public buildings and the like, value in use isrepresented by the depreciated replacement cost of the asset.
At the time of adopting the budget, it is not possible to estimate the amount of impairment losses(if any) as at 30 June 2009.
In any event, an impairment loss is a non-cash transaction and consequently, has no impact onthis budget document.
(o) Trade and Other PayablesTrade and other payables are carried at amortised cost. They represent liabilities for goods and servicesprovided to the Municipality prior to the end of the financial year that are unpaid and arise when theMunicipality becomes obliged to make future payments in respect of the purchase of these goods andservices. The amounts are unsecured and are usually paid within 30 days of recognition.
(p) Employee BenefitsThe provisions for employee benefits relates to amounts expected to be paid for long serviceleave, annual leave, wages and salaries and are calculated as follows:
(i) Wages, Salaries, Annual Leave and Long Service Leave (Short-term Benefits)The provision for employees’ benefits to wages, salaries, annual leave and long service leaveexpected to be settled within 12 months represents the amount the municipality has a presentobligation to pay resulting from employees services provided to balance date. The provision hasbeen calculated at nominal amounts based on remuneration rates the Council expects to payand includes related on-costs.
(ii) Annual Leave and Long Service Leave (Long-term Benefits)The liability for long service leave is recognised in the provision for employee benefits and measured as the present value of expected future payments to be made in respect of services provided by employees up to the reporting date using the projected unit credit method. Consideration is given to expected future wage and salary levels, experience of employee departures and periods of service. Expected future payments are discounted using market yields at the reporting date on national government bonds with terms to maturity and currency that match as closely as possible, the estimated future cash outflows. Where Council does not have the unconditional right to defer settlement beyond 12 months, the liability is recognised as a current liability.
Page 11
CITY OF NEDLANDS
NOTES TO AND FORMING PART OF THE BUDGET
FOR THE YEAR ENDING 30TH JUNE 2010
1. SIGNIFICANT ACCOUNTING POLICIES (Continued)
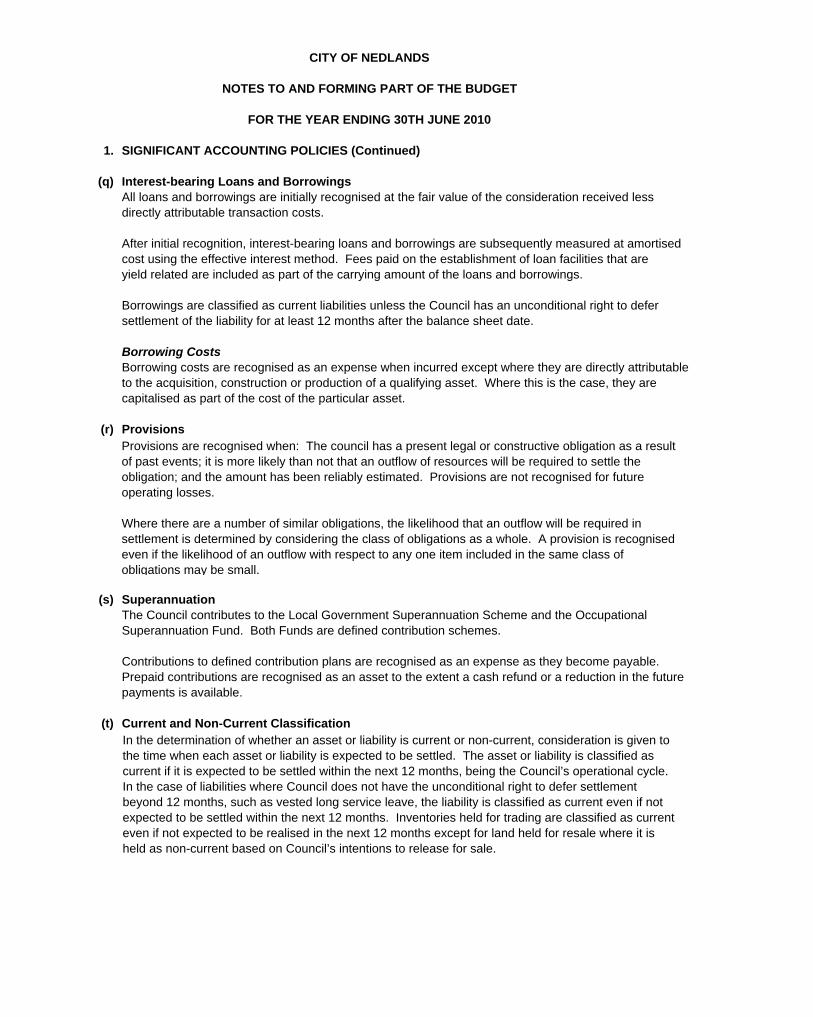
(q) Interest-bearing Loans and BorrowingsAll loans and borrowings are initially recognised at the fair value of the consideration received lessdirectly attributable transaction costs.
After initial recognition, interest-bearing loans and borrowings are subsequently measured at amortisedcost using the effective interest method. Fees paid on the establishment of loan facilities that areyield related are included as part of the carrying amount of the loans and borrowings.
Borrowings are classified as current liabilities unless the Council has an unconditional right to defersettlement of the liability for at least 12 months after the balance sheet date.
Borrowing CostsBorrowing costs are recognised as an expense when incurred except where they are directly attributableto the acquisition, construction or production of a qualifying asset. Where this is the case, they arecapitalised as part of the cost of the particular asset.
(r) Provisions
(s) SuperannuationThe Council contributes to the Local Government Superannuation Scheme and the OccupationalSuperannuation Fund. Both Funds are defined contribution schemes.
Contributions to defined contribution plans are recognised as an expense as they become payable.Prepaid contributions are recognised as an asset to the extent a cash refund or a reduction in the futurepayments is available.
(t) Current and Non-Current Classification
Provisions are recognised when: The council has a present legal or constructive obligation as a result of past events; it is more likely than not that an outflow of resources will be required to settle the obligation; and the amount has been reliably estimated. Provisions are not recognised for future operating losses.
Where there are a number of similar obligations, the likelihood that an outflow will be required in settlement is determined by considering the class of obligations as a whole. A provision is recognised even if the likelihood of an outflow with respect to any one item included in the same class of obligations may be small.
In the determination of whether an asset or liability is current or non-current, consideration is given to the time when each asset or liability is expected to be settled. The asset or liability is classified as current if it is expected to be settled within the next 12 months, being the Council’s operational cycle. In the case of liabilities where Council does not have the unconditional right to defer settlement beyond 12 months, such as vested long service leave, the liability is classified as current even if not expected to be settled within the next 12 months. Inventories held for trading are classified as current even if not expected to be realised in the next 12 months except for land held for resale where it is held as non-current based on Council’s intentions to release for sale.
Page 12
CITY OF NEDLANDS
NOTES TO AND FORMING PART OF THE BUDGET
FOR THE YEAR ENDING 30TH JUNE 2010
2009/10 2008/09 2008/09Budget Estimate Budget
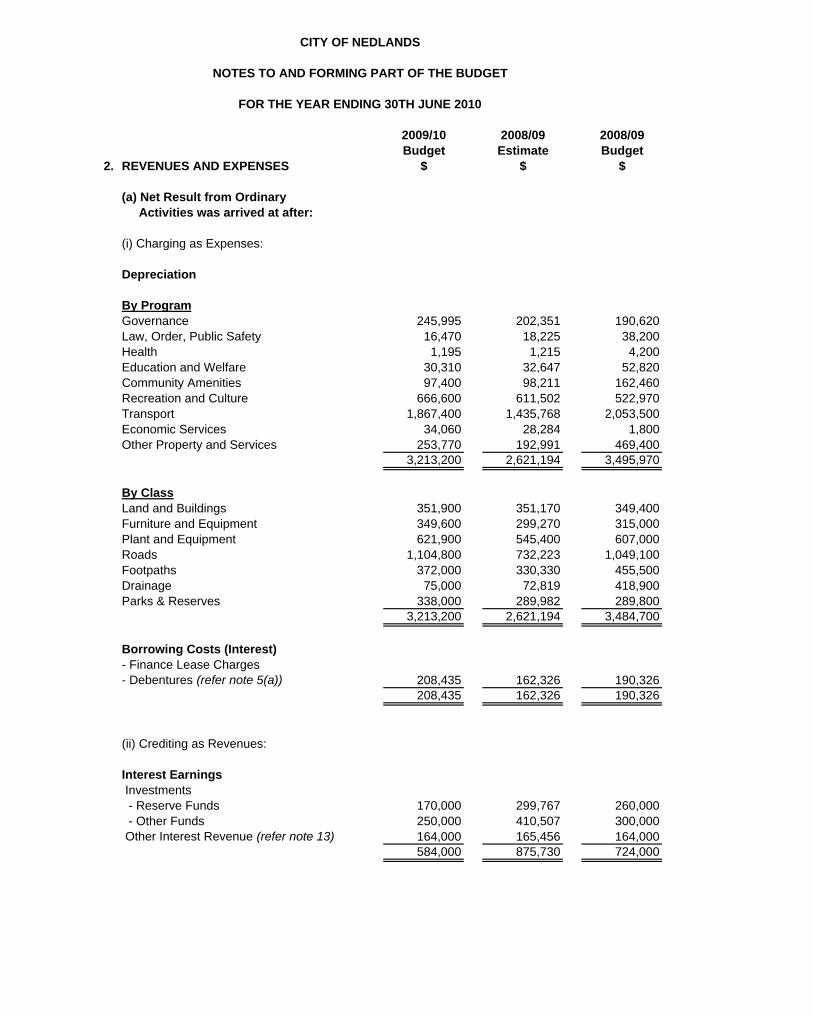
2. REVENUES AND EXPENSES $ $ $
(a) Net Result from Ordinary Activities was arrived at after:
(i) Charging as Expenses:
Depreciation
By ProgramGovernance 245,995 202,351 190,620Law, Order, Public Safety 16,470 18,225 38,200Health 1,195 1,215 4,200Education and Welfare 30,310 32,647 52,820Community Amenities 97,400 98,211 162,460Recreation and Culture 666,600 611,502 522,970Transport 1,867,400 1,435,768 2,053,500Economic Services 34,060 28,284 1,800Other Property and Services 253,770 192,991 469,400
3,213,200 2,621,194 3,495,970
By ClassLand and Buildings 351,900 351,170 349,400Furniture and Equipment 349,600 299,270 315,000Plant and Equipment 621,900 545,400 607,000Roads 1,104,800 732,223 1,049,100Footpaths 372,000 330,330 455,500Drainage 75,000 72,819 418,900Parks & Reserves 338,000 289,982 289,800
3,213,200 2,621,194 3,484,700
Borrowing Costs (Interest)- Finance Lease Charges- Debentures (refer note 5(a)) 208,435 162,326 190,326
208,435 162,326 190,326
(ii) Crediting as Revenues:
Interest Earnings Investments - Reserve Funds 170,000 299,767 260,000 - Other Funds 250,000 410,507 300,000 Other Interest Revenue (refer note 13) 164,000 165,456 164,000
584,000 875,730 724,000
Page 13
CITY OF NEDLANDS
NOTES TO AND FORMING PART OF THE BUDGET
FOR THE YEAR ENDING 30TH JUNE 2010
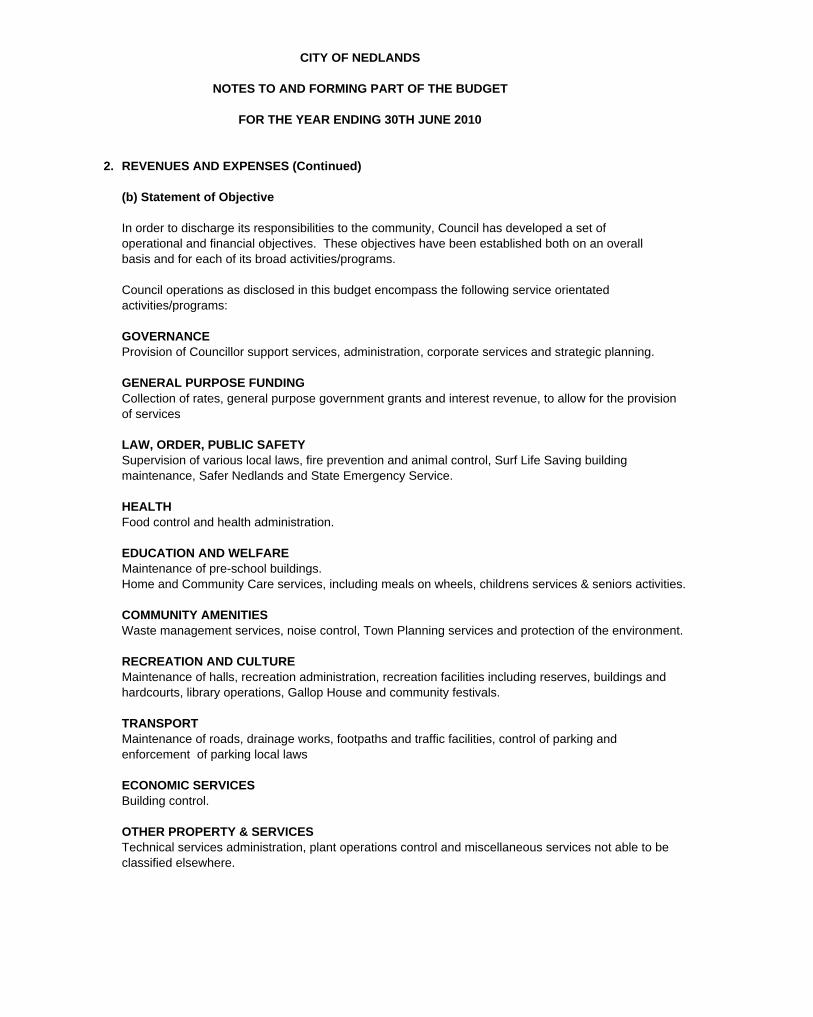
2. REVENUES AND EXPENSES (Continued)
(b) Statement of Objective
In order to discharge its responsibilities to the community, Council has developed a set ofoperational and financial objectives. These objectives have been established both on an overallbasis and for each of its broad activities/programs.
Council operations as disclosed in this budget encompass the following service orientatedactivities/programs:
GOVERNANCEProvision of Councillor support services, administration, corporate services and strategic planning.
GENERAL PURPOSE FUNDING
LAW, ORDER, PUBLIC SAFETY
HEALTHFood control and health administration.
EDUCATION AND WELFAREMaintenance of pre-school buildings.Home and Community Care services, including meals on wheels, childrens services & seniors activities.
COMMUNITY AMENITIESWaste management services, noise control, Town Planning services and protection of the environment.
RECREATION AND CULTUREMaintenance of halls, recreation administration, recreation facilities including reserves, buildings andhardcourts, library operations, Gallop House and community festivals.
TRANSPORT
ECONOMIC SERVICESBuilding control.
OTHER PROPERTY & SERVICESTechnical services administration, plant operations control and miscellaneous services not able to be classified elsewhere.
Collection of rates, general purpose government grants and interest revenue, to allow for the provision of services
Supervision of various local laws, fire prevention and animal control, Surf Life Saving building maintenance, Safer Nedlands and State Emergency Service.
Maintenance of roads, drainage works, footpaths and traffic facilities, control of parking and enforcement of parking local laws
Page 14
CITY OF NEDLANDSNOTES TO AND FORMING PART OF THE BUDGET
FOR THE YEAR ENDING 30TH JUNE 2010
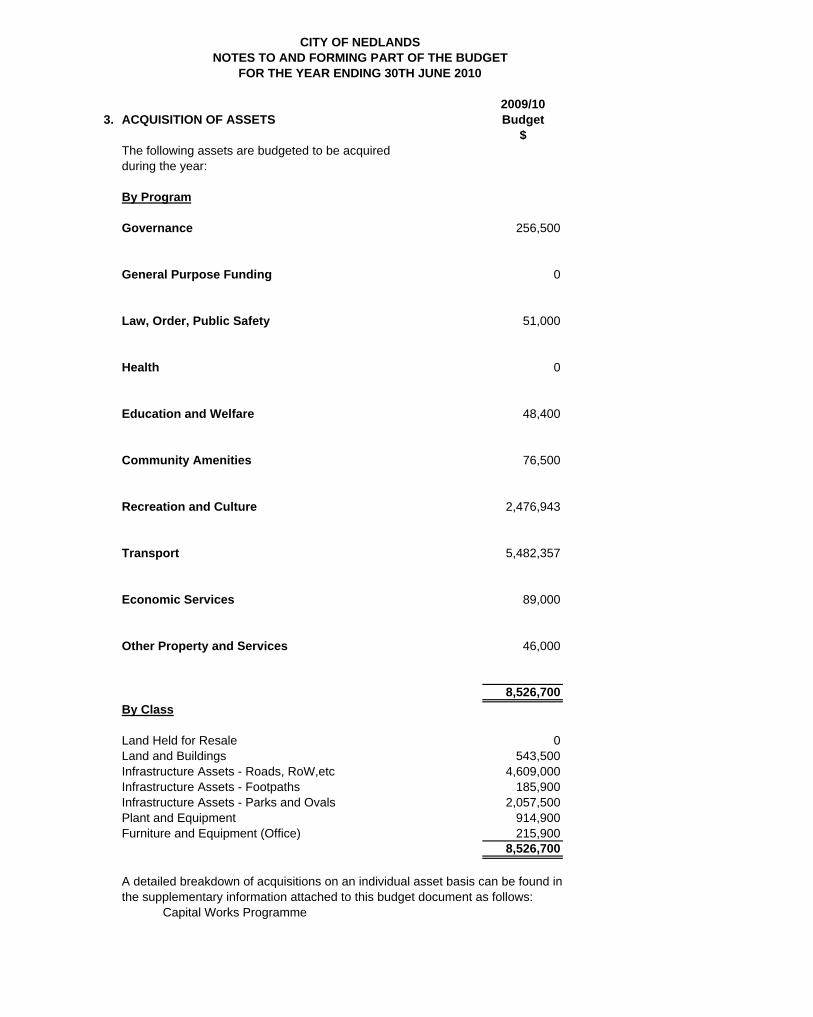
2009/103. ACQUISITION OF ASSETS Budget
$The following assets are budgeted to be acquiredduring the year:
By Program
Governance 256,500
General Purpose Funding 0
Law, Order, Public Safety 51,000
Health 0
Education and Welfare 48,400
Community Amenities 76,500
Recreation and Culture 2,476,943
Transport 5,482,357
Economic Services 89,000
Other Property and Services 46,000
8,526,700By Class
Land Held for Resale 0Land and Buildings 543,500Infrastructure Assets - Roads, RoW,etc 4,609,000Infrastructure Assets - Footpaths 185,900Infrastructure Assets - Parks and Ovals 2,057,500Plant and Equipment 914,900Furniture and Equipment (Office) 215,900
8,526,700
A detailed breakdown of acquisitions on an individual asset basis can be found inthe supplementary information attached to this budget document as follows: Capital Works Programme
Page 15

CITY OF NEDLANDS
NOTES TO AND FORMING PART OF THE BUDGET
FOR THE YEAR ENDING 30TH JUNE 2010
4. DISPOSALS OF ASSETS
The following assets are budgeted to be disposed of during the year.
Net Book Value Sale Proceeds Profit(Loss)
By Program 2009/10 2009/10 2009/10BUDGET BUDGET BUDGET
$ $ $
Other Property and Services 223,500 262,500 39,000
Governance 9,000 0 (9,000)
232,500 262,500 30,000
Net Book Value Sale Proceeds Profit(Loss)
By Class 2009/10 2009/10 2009/10BUDGET BUDGET BUDGET
$ $ $
Plant & Equipment 223,500 262,500 39,000
Furniture & Equipment 9,000 0 (9,000)
232,500 262,500 30,000
2009/10Summary BUDGET
$
Profit on Asset Disposals 39,000Loss on Asset Disposals (9,000)
30,000
Page 16
CITY OF NEDLANDSNOTES TO AND FORMING PART OF THE BUDGET
FOR THE YEAR ENDING 30TH JUNE 2010
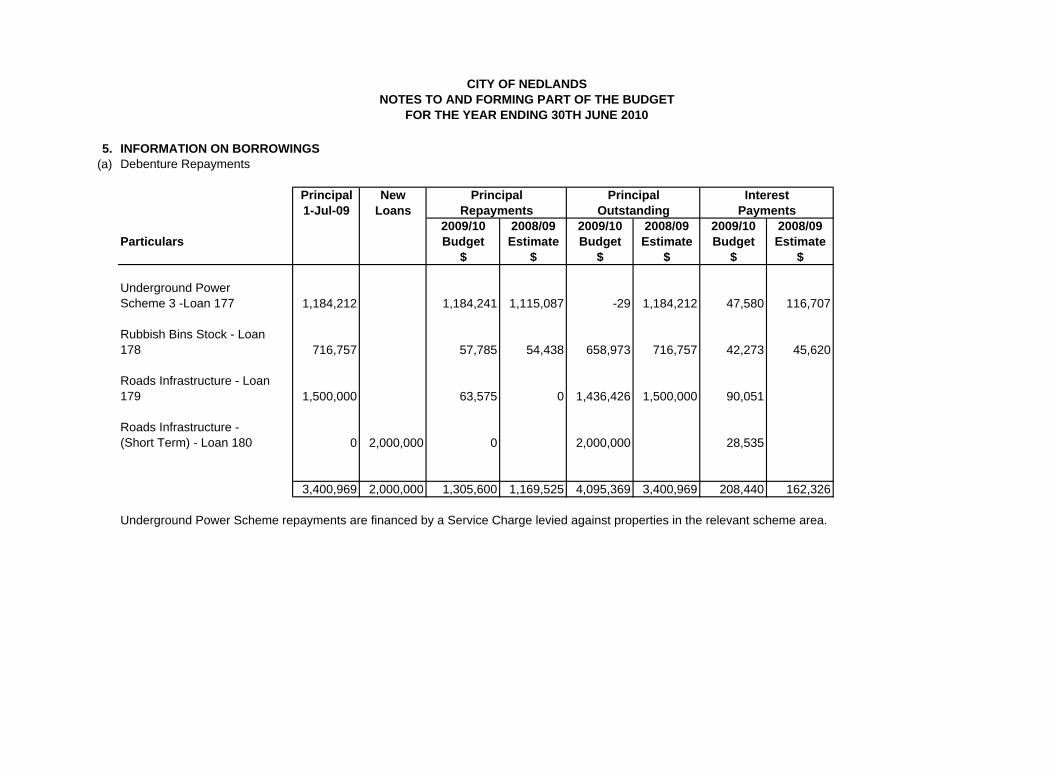
5. (a) Debenture Repayments
Principal New Principal Principal Interest1-Jul-09 Loans Repayments Outstanding Payments
2009/10 2008/09 2009/10 2008/09 2009/10 2008/09Particulars Budget Estimate Budget Estimate Budget Estimate
$ $ $ $ $ $
Underground Power Scheme 3 -Loan 177 1,184,212 1,184,241 1,115,087 -29 1,184,212 47,580 116,707
Rubbish Bins Stock - Loan 178 716,757 57,785 54,438 658,973 716,757 42,273 45,620
Roads Infrastructure - Loan 179 1,500,000 63,575 0 1,436,426 1,500,000 90,051
Roads Infrastructure - (Short Term) - Loan 180 0 2,000,000 0 2,000,000 28,535
3,400,969 2,000,000 1,305,600 1,169,525 4,095,369 3,400,969 208,440 162,326
INFORMATION ON BORROWINGS
Underground Power Scheme repayments are financed by a Service Charge levied against properties in the relevant scheme area.
Page 17
CITY OF NEDLANDS
NOTES TO AND FORMING PART OF THE BUDGET
FOR THE YEAR ENDING 30TH JUNE 2010
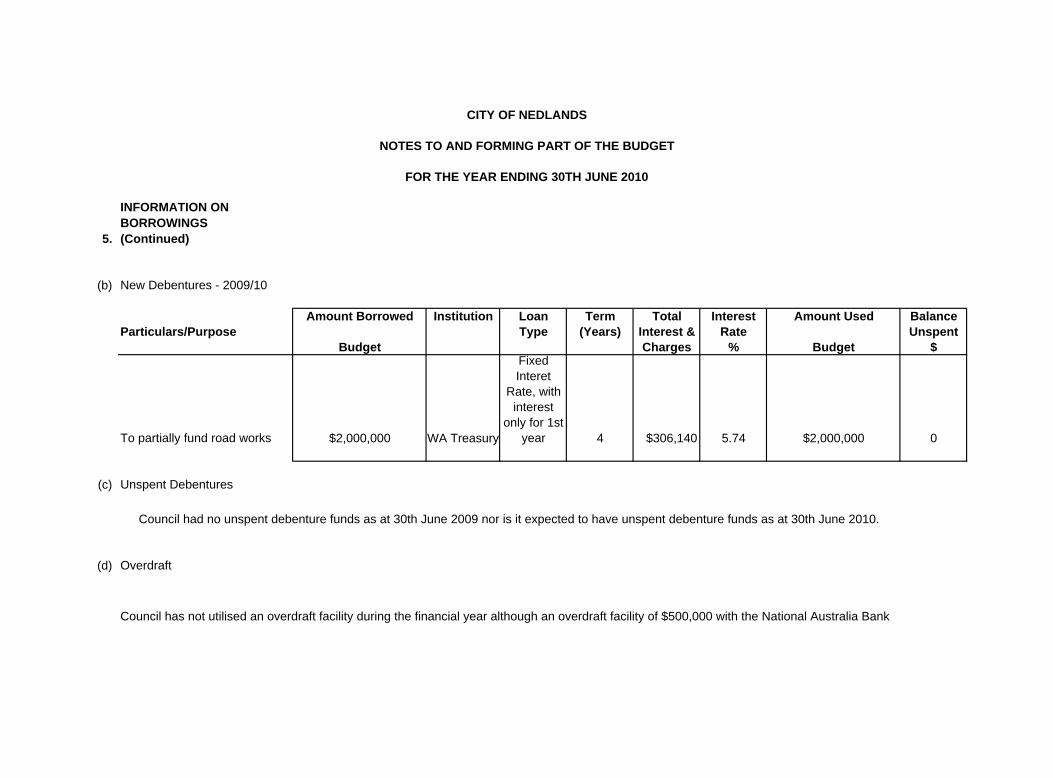
5.
INFORMATION ON BORROWINGS (Continued)
(b) New Debentures - 2009/10
Amount Borrowed Institution Loan Term Total Interest Amount Used Balance Particulars/Purpose Type (Years) Interest & Rate Unspent
Budget Charges % Budget $
To partially fund road works WA Treasury
Fixed Interet
Rate, with interest
only for 1st year 4 $306,140 5.74 $2,000,000 0
(c) Unspent Debentures
(d) Overdraft
Council has not utilised an overdraft facility during the financial year although an overdraft facility of $500,000 with the National Australia Bank
$2,000,000
Council had no unspent debenture funds as at 30th June 2009 nor is it expected to have unspent debenture funds as at 30th June 2010.
Page 18
CITY OF NEDLANDS
NOTES TO AND FORMING PART OF THE BUDGET
FOR THE YEAR ENDING 30TH JUNE 2010
2009/10 2008/09 2008/09Budget Estimate Budget
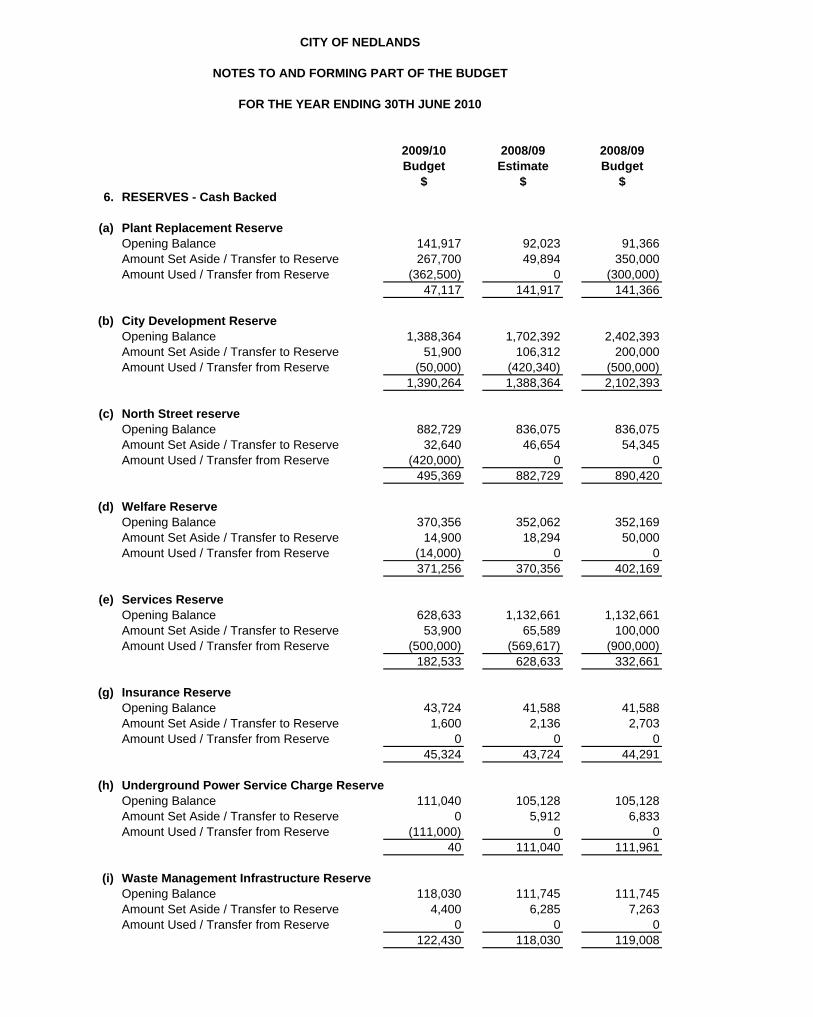
$ $ $6. RESERVES - Cash Backed
(a) Plant Replacement ReserveOpening Balance 141,917 92,023 91,366Amount Set Aside / Transfer to Reserve 267,700 49,894 350,000Amount Used / Transfer from Reserve (362,500) 0 (300,000)
47,117 141,917 141,366
(b) City Development ReserveOpening Balance 1,388,364 1,702,392 2,402,393Amount Set Aside / Transfer to Reserve 51,900 106,312 200,000Amount Used / Transfer from Reserve (50,000) (420,340) (500,000)
1,390,264 1,388,364 2,102,393
(c) North Street reserveOpening Balance 882,729 836,075 836,075Amount Set Aside / Transfer to Reserve 32,640 46,654 54,345Amount Used / Transfer from Reserve (420,000) 0 0
495,369 882,729 890,420
(d) Welfare ReserveOpening Balance 370,356 352,062 352,169Amount Set Aside / Transfer to Reserve 14,900 18,294 50,000Amount Used / Transfer from Reserve (14,000) 0 0
371,256 370,356 402,169
(e) Services ReserveOpening Balance 628,633 1,132,661 1,132,661Amount Set Aside / Transfer to Reserve 53,900 65,589 100,000Amount Used / Transfer from Reserve (500,000) (569,617) (900,000)
182,533 628,633 332,661
(g) Insurance ReserveOpening Balance 43,724 41,588 41,588Amount Set Aside / Transfer to Reserve 1,600 2,136 2,703Amount Used / Transfer from Reserve 0 0 0
45,324 43,724 44,291
(h) Underground Power Service Charge ReserveOpening Balance 111,040 105,128 105,128Amount Set Aside / Transfer to Reserve 0 5,912 6,833Amount Used / Transfer from Reserve (111,000) 0 0
40 111,040 111,961
(i) Waste Management Infrastructure ReserveOpening Balance 118,030 111,745 111,745Amount Set Aside / Transfer to Reserve 4,400 6,285 7,263Amount Used / Transfer from Reserve 0 0 0
122,430 118,030 119,008
Page 19

CITY OF NEDLANDS
NOTES TO AND FORMING PART OF THE BUDGET
FOR THE YEAR ENDING 30TH JUNE 2010
2009/10 2008/09 2008/09Budget Estimate Budget
6. RESERVES (Continued) $ $ $
(j) Building Replacement ReserveOpening Balance 675,135 634,472 634,472Amount Set Aside / Transfer to Reserve 30,860 40,663 200,000Amount Used / Transfer from Reserve (304,600) 0 0
401,395 675,135 834,472
(k) Tresillian ReserveOpening Balance 10,999 10,462 10,462Amount Set Aside / Transfer to Reserve 400 537 680Amount Used / Transfer from Reserve (11,399) 0 0
0 10,999 11,142
TOTAL CASH BACKED RESERVES 3,055,728 4,370,927 4,989,883
All of the cash backed reserve accounts are supported by money held in financial institutions andmatch the amount shown as restricted cash in Note 3 to this financial report.
Summary of TransfersTo Cash Backed Reserves
Transfers to ReservesPlant Replacement Reserve 267,700 49,894 350,000City Development Reserve 51,900 106,312 200,000Lot 195 North Street Reserve 32,640 46,654 54,345Welfare Reserve 14,900 18,294 50,000Services Reserve 53,900 65,589 100,000Insurance Reserve 1,600 2,136 2,703Underground Power Service Charge Reserve 0 5,912 6,833Waste Management Infrastructure Reserve 4,400 6,285 7,263Building Replacment Reserve 30,860 40,663 200,000Tresillian Reserve 400 537 680
458,300 342,276 971,824Transfers from ReservesPlant Replacement Reserve (362,500) 0 (300,000)City Development Reserve (50,000) (420,340) (500,000)Lot 195 North Street Reserve (420,000) 0 0Welfare Reserve (14,000) 0 0Services Reserve (500,000) (569,617) (900,000)Insurance Reserve 0 0 0Underground Power Service Charge Reserve (111,000) 0 0Waste Management Infrastructure Reserve 0 0 0Building Replacment Reserve (304,600) 0 0Tresillian Reserve (11,399) 0 0
(1,773,499) (989,957) (1,700,000)
Total Transfer to/(from) Reserves (1,315,199) (647,681) (728,176)
Page 20

CITY OF NEDLANDS
NOTES TO AND FORMING PART OF THE BUDGET
FOR THE YEAR ENDING 30TH JUNE 2010
In accordance with Council resolution in relation to each reserve account, the purpose for whichthe reserves are set aside are as follows:
In accordance with council resolutions in relation to each reserve account, the purpose for whichthe reserves are set aside are as follows:
Plant Replacement ReserveTo provide for the replacement of Council's plant and equipment so that the cost is spreadover a number of years. The use of funds in this reserve is ongoing
City Development ReserveTo fund the improvement of Property, Plant and Equipment. The use of funds in this reserveis ongoing
Lot 195 North Street ReserveTo fund the operational and capital costs of community facilities in Mt Claremont,community and recreation facilities in Swanbourne and infrastructure generally.Use of this reserve is ongoing
Welfare ReserveTo fund the operational and capital costs of welfare services. The use of funds in thisreserve is ongoing.
Services ReserveTo provide funds for the purchase of land for parking areas, streets, depots etc. town planningschemes, valuation and legal expenses, items of works of an urgent nature such as drainage,street works, provision of street lighting and buildings maintenance. The use of funds in this reserve is ongoing
Insurance ReserveTo cover any excess that may arise from having a performance based workers compensationpremium
Underground Power Service Charge ReserveTo set aside surplus underground power (Scheme 2) funds received from Western Power tobe refunded to rate payers as a reduction in the final installment in 2007.
Waste Management Infrastructure ReserveTo provide for the replacement of Council's Rubbish Bin stock so that the cost isspread over a number of years. The use of funds in this reserve is ongoing.
Building Replacment ReserveTo fund the upgrade and/or replacement of Council's buildings. The use of this reserve is ongoing
Tresillian ReserveTo fund the operational and capital costs of the Tresillian Community Centre.The use of funds in this reserve is ongoing.
Page 21
CITY OF NEDLANDS
NOTES TO AND FORMING PART OF THE BUDGET
FOR THE YEAR ENDING 30TH JUNE 2010
2009/10 2008/09Budget Estimate
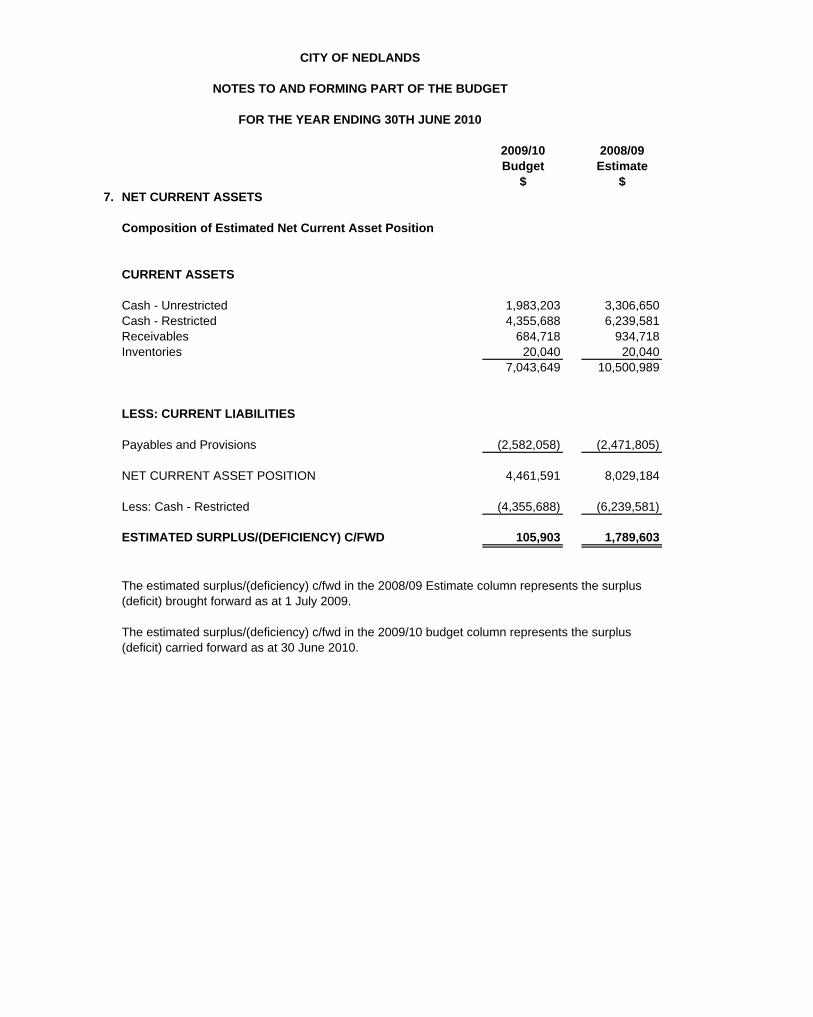
$ $7. NET CURRENT ASSETS
Composition of Estimated Net Current Asset Position
CURRENT ASSETS
Cash - Unrestricted 1,983,203 3,306,650Cash - Restricted 4,355,688 6,239,581Receivables 684,718 934,718Inventories 20,040 20,040
7,043,649 10,500,989
LESS: CURRENT LIABILITIES
Payables and Provisions (2,582,058) (2,471,805)
NET CURRENT ASSET POSITION 4,461,591 8,029,184
Less: Cash - Restricted (4,355,688) (6,239,581)
ESTIMATED SURPLUS/(DEFICIENCY) C/FWD 105,903 1,789,603
The estimated surplus/(deficiency) c/fwd in the 2008/09 Estimate column represents the surplus(deficit) brought forward as at 1 July 2009.
The estimated surplus/(deficiency) c/fwd in the 2009/10 budget column represents the surplus(deficit) carried forward as at 30 June 2010.
Page 22

CITY OF NEDLANDSNOTES TO AND FORMING PART OF THE BUDGET
FOR THE YEAR ENDING 30TH JUNE 2010
8. RATING INFORMATION - 2009/10 FINANCIAL YEAR
Rate in Number Rateable 2009/10 2009/10 2009/10 2009/10 2008/09RATE TYPE of Value Budgeted Budgeted Budgeted Budgeted Estimate
Properties $ Rate Interim Back Total $Revenue Rates Rates Revenue
$ $ $ $Differential General Rate
GRV - Residential 5.0541 5,602 196,586,169 9,935,662 (20,000) 9,915,662 9,324,679GRV - Non-Residential 7.0339 300 25,466,139 1,791,263 1,791,263 1,696,253
Sub-Totals 5,902 222,052,308 11,726,925 (20,000) 0 11,706,925 11,020,932Minimum
Minimum Rates $GRV - Residential 928 2,273 31,732,822 2,109,344 2,109,344 2,043,062GRV - Non-Residential 1,260 147 1,594,276 185,220 185,220 181,996
Sub-Totals 2,420 33,327,098 2,294,564 0 0 2,294,564 2,225,05814,001,489 13,245,990
Totals 14,001,500 13,245,990
All land except exempt land in the City of Nedlands is rated according to its Gross Rental Value (GRV).
Council has adopted a differential rating approach, according to the predominant purpose for which the land is used, to ensure that rate revenueis collected on an equitable basis.
The differential general rates detailed above for the 2009/10 financial year have been determined by Council on the basis of raising the revenue required to meetthe deficiency between the total estimated expenditure proposed in the budget and the estimated revenue to be received from all sources other than rates, andalso considering the extent of any increase in rating over the level adopted in the previous year.
Difference from the values advertised in the local public notice given of proposed differential and minimum ratesThe advertised minimum rates have been revised to reflect the requirement for total rates revenue in 2009/10 to be 5 % more than those for 2008/09; the minimum rates for Residential properties is now $ 928 and for other properties $1,260. For the same reason, the rate in the dollar for Residential properties has been changed to5.0541 cents and for non-residential properties to 7.0339 cents.
cents per dollar
Page 23
CITY OF NEDLANDS
NOTES TO AND FORMING PART OF THE BUDGET
FOR THE YEAR ENDING 30TH JUNE 2010
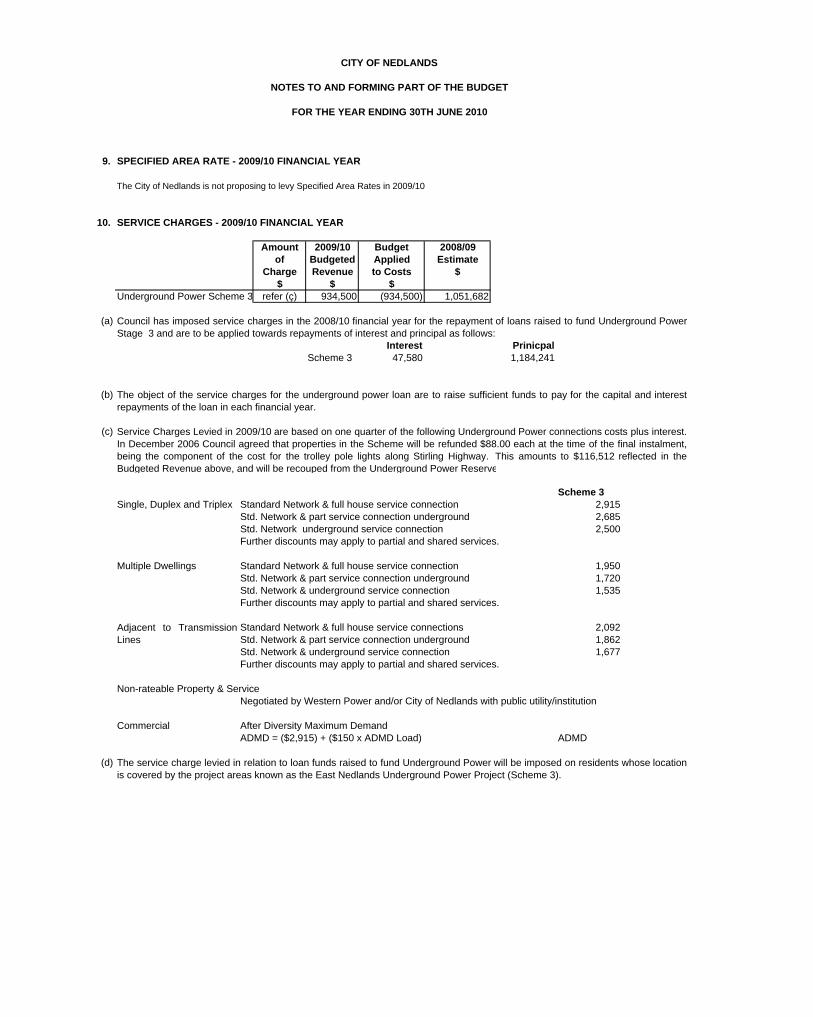
9. SPECIFIED AREA RATE - 2009/10 FINANCIAL YEAR
The City of Nedlands is not proposing to levy Specified Area Rates in 2009/10
10. SERVICE CHARGES - 2009/10 FINANCIAL YEAR
Amount 2009/10 Budget 2008/09of Budgeted Applied Estimate
Charge Revenue to Costs $ $ $ $
Underground Power Scheme 3 refer (ç) 934,500 (934,500) 1,051,682
(a)
Interest PrinicpalScheme 3 47,580 1,184,241
(b)
(c)
Scheme 3Single, Duplex and Triplex Standard Network & full house service connection 2,915
Std. Network & part service connection underground 2,685Std. Network underground service connection 2,500Further discounts may apply to partial and shared services.
Multiple Dwellings Standard Network & full house service connection 1,950Std. Network & part service connection underground 1,720Std. Network & underground service connection 1,535Further discounts may apply to partial and shared services.
Standard Network & full house service connections 2,092Std. Network & part service connection underground 1,862Std. Network & underground service connection 1,677Further discounts may apply to partial and shared services.
Non-rateable Property & ServiceNegotiated by Western Power and/or City of Nedlands with public utility/institution
Commercial After Diversity Maximum Demand ADMD = ($2,915) + ($150 x ADMD Load) ADMD
(d) The service charge levied in relation to loan funds raised to fund Underground Power will be imposed on residents whose locationis covered by the project areas known as the East Nedlands Underground Power Project (Scheme 3).
Council has imposed service charges in the 2008/10 financial year for the repayment of loans raised to fund Underground PowerStage 3 and are to be applied towards repayments of interest and principal as follows:
The object of the service charges for the underground power loan are to raise sufficient funds to pay for the capital and interestrepayments of the loan in each financial year.
Service Charges Levied in 2009/10 are based on one quarter of the following Underground Power connections costs plus interest.In December 2006 Council agreed that properties in the Scheme will be refunded $88.00 each at the time of the final instalment,being the component of the cost for the trolley pole lights along Stirling Highway. This amounts to $116,512 reflected in theBudgeted Revenue above, and will be recouped from the Underground Power Reserve
Adjacent to TransmissionLines
Page 24
CITY OF NEDLANDS
NOTES TO AND FORMING PART OF THE BUDGET
FOR THE YEAR ENDING 30TH JUNE 2010
2009/10 2008/09Budget Estimate
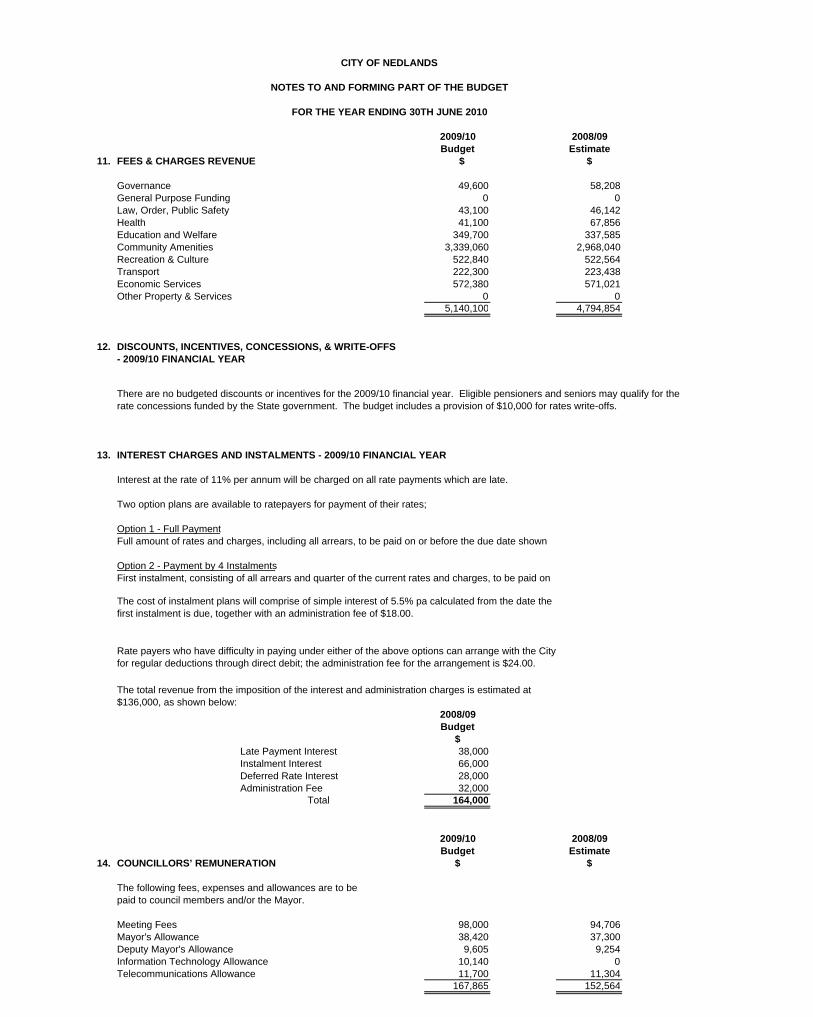
11. FEES & CHARGES REVENUE $ $
Governance 49,600 58,208General Purpose Funding 0 0Law, Order, Public Safety 43,100 46,142Health 41,100 67,856Education and Welfare 349,700 337,585Community Amenities 3,339,060 2,968,040Recreation & Culture 522,840 522,564Transport 222,300 223,438Economic Services 572,380 571,021Other Property & Services 0 0
5,140,100 4,794,854
12. DISCOUNTS, INCENTIVES, CONCESSIONS, & WRITE-OFFS- 2009/10 FINANCIAL YEAR
13. INTEREST CHARGES AND INSTALMENTS - 2009/10 FINANCIAL YEAR
Interest at the rate of 11% per annum will be charged on all rate payments which are late.
Two option plans are available to ratepayers for payment of their rates;
Option 1 - Full Payment
Option 2 - Payment by 4 Instalments
2008/09Budget
$ Late Payment Interest 38,000
Instalment Interest 66,000Deferred Rate Interest 28,000Administration Fee 32,000
Total 164,000
2009/10 2008/09Budget Estimate
14. COUNCILLORS’ REMUNERATION $ $
The following fees, expenses and allowances are to bepaid to council members and/or the Mayor.
Meeting Fees 98,000 94,706Mayor's Allowance 38,420 37,300Deputy Mayor's Allowance 9,605 9,254Information Technology Allowance 10,140 0Telecommunications Allowance 11,700 11,304
167,865 152,564
The total revenue from the imposition of the interest and administration charges is estimated at $136,000, as shown below:
There are no budgeted discounts or incentives for the 2009/10 financial year. Eligible pensioners and seniors may qualify for the rate concessions funded by the State government. The budget includes a provision of $10,000 for rates write-offs.
Rate payers who have difficulty in paying under either of the above options can arrange with the City for regular deductions through direct debit; the administration fee for the arrangement is $24.00.
Full amount of rates and charges, including all arrears, to be paid on or before the due date shown
First instalment, consisting of all arrears and quarter of the current rates and charges, to be paid on
The cost of instalment plans will comprise of simple interest of 5.5% pa calculated from the date thefirst instalment is due, together with an administration fee of $18.00.
Page 25
CITY OF NEDLANDS
NOTES TO AND FORMING PART OF THE BUDGET
FOR THE YEAR ENDING 30TH JUNE 2010
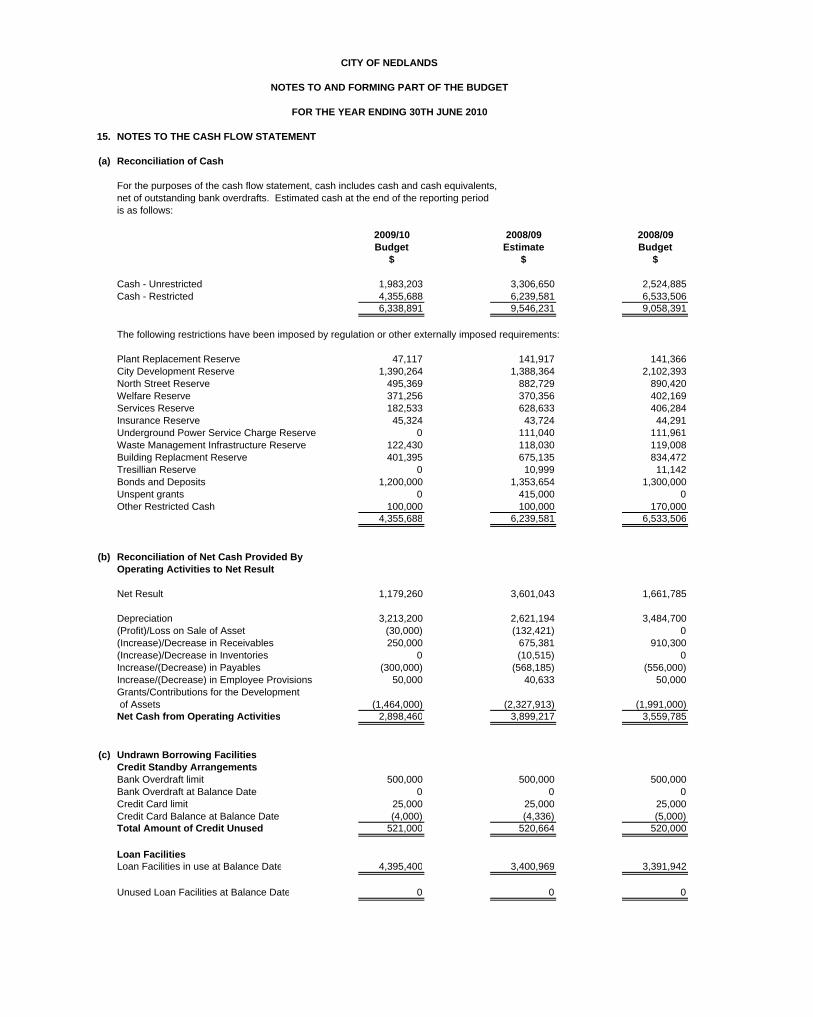
15. NOTES TO THE CASH FLOW STATEMENT
(a) Reconciliation of Cash
For the purposes of the cash flow statement, cash includes cash and cash equivalents,net of outstanding bank overdrafts. Estimated cash at the end of the reporting periodis as follows:
2009/10 2008/09 2008/09Budget Estimate Budget
$ $ $
Cash - Unrestricted 1,983,203 3,306,650 2,524,885Cash - Restricted 4,355,688 6,239,581 6,533,506
6,338,891 9,546,231 9,058,391
The following restrictions have been imposed by regulation or other externally imposed requirements:
Plant Replacement Reserve 47,117 141,917 141,366City Development Reserve 1,390,264 1,388,364 2,102,393North Street Reserve 495,369 882,729 890,420Welfare Reserve 371,256 370,356 402,169Services Reserve 182,533 628,633 406,284Insurance Reserve 45,324 43,724 44,291Underground Power Service Charge Reserve 0 111,040 111,961Waste Management Infrastructure Reserve 122,430 118,030 119,008Building Replacment Reserve 401,395 675,135 834,472Tresillian Reserve 0 10,999 11,142Bonds and Deposits 1,200,000 1,353,654 1,300,000Unspent grants 0 415,000 0Other Restricted Cash 100,000 100,000 170,000
4,355,688 6,239,581 6,533,506
(b) Reconciliation of Net Cash Provided ByOperating Activities to Net Result
Net Result 1,179,260 3,601,043 1,661,785
Depreciation 3,213,200 2,621,194 3,484,700(Profit)/Loss on Sale of Asset (30,000) (132,421) 0(Increase)/Decrease in Receivables 250,000 675,381 910,300(Increase)/Decrease in Inventories 0 (10,515) 0Increase/(Decrease) in Payables (300,000) (568,185) (556,000)Increase/(Decrease) in Employee Provisions 50,000 40,633 50,000Grants/Contributions for the Development of Assets (1,464,000) (2,327,913) (1,991,000)Net Cash from Operating Activities 2,898,460 3,899,217 3,559,785
(c) Undrawn Borrowing FacilitiesCredit Standby ArrangementsBank Overdraft limit 500,000 500,000 500,000Bank Overdraft at Balance Date 0 0 0Credit Card limit 25,000 25,000 25,000Credit Card Balance at Balance Date (4,000) (4,336) (5,000)Total Amount of Credit Unused 521,000 520,664 520,000
Loan FacilitiesLoan Facilities in use at Balance Date 4,395,400 3,400,969 3,391,942
Unused Loan Facilities at Balance Date 0 0 0
Page 27

CITY OF NEDLANDS
NOTES TO AND FORMING PART OF THE BUDGET
FOR THE YEAR ENDING 30TH JUNE 2010
16. TRUST FUNDS
Funds held at balance date over which the Municipality has no control and which are not included inthe financial statements are as follows:
Balance Amounts Amounts BalanceDetail 1-Jul-09 Received Paid 30-Jun-10
$ $ ($) $
Housing Bonds 1,000 1,000Unclaimed Moneys 18,776 18,776Charities Fund 636 -636 0
20,412 19,776
17. MAJOR LAND TRANSACTIONS
It is not anticipated that any major land transactions will occur in 2009/10
18. TRADING UNDERTAKINGS AND MAJOR TRADING UNDERTAKINGS
It is not anticipated any trading undertakings or major trading undertakings will occur in 2009/10.
Page 28

Operating Budget by Business Unit

AUTHORITYPrint Date: 40,017
0
2008/09 2008/09 2009/10Estimate Budget Budget
11024 -19,95011025 -24011030 -3911035 -10,45911040 -16,18311048 -54,176
-101,047
01300 463,61801305 4,40001306 001310 61,35701315 8,30001320 6,78401325 5,57201335 38901340 11,396
01350 35,11301355 17,38301360 51,76401365 24,82201370 46,84101375 3,104
01380 8,59601385 40,39201390 57,47601391 9,14401395 38,26401400 94501405 181,29001410 19,14201415 90801425 1101440 22,75201445 8,86501451 0
(500)(21,000)
(200)(16,500)(11,000)
(100)
5,50013,000
8,80039,500
10,00050,00029,000
(49,300)
4,0004,500
449,000
Corporate Services
9,000
3,30047,80025,00065,00018,00036,500
13,5000
Finance
Operating Expenditure NetFinance - Revenue
Finance RevenueEmergency Services Levy Administration Fee (21,000)Sale of Electoral Rolls (200)Sale of Photocopies (120)Ownership enquiries - rates (13,000)Commissions (16,200)Sundry Income (1,500)
32,000175,000
1,50040,000
StaffSalaries 444,550
Total Finance - Revenue (52,020)
Finance - Expenditure
Long Service Leave 4,590Salaries - Relief 9,700Superannuation 45,820Workers Compensation Premium 9,200Training 12,800Conference Expenses 5,000
BuildingOffice Maintenance 36,450
Fringe Benefits Tax 0Allowances 14,100
Depreciation - Finance 16,950Cleaning 67,000
Insurance Premium 10,000
Office Expenses
Gardening 30,500Utility Charges 41,600
Advertising 9,000Printing & Stationery 26,500Photocopying - Lease & Maintenance 66,030Photocopier Stationery 10,000Telephone 44,800Equipment 1,500Depreciation - Furniture & Equipment 170,580Bank Charges 36,400Subscriptions 2,600Couriers 200Postage 24,000Other 3,200
2,500
Insurance 400 02,410
23,0000
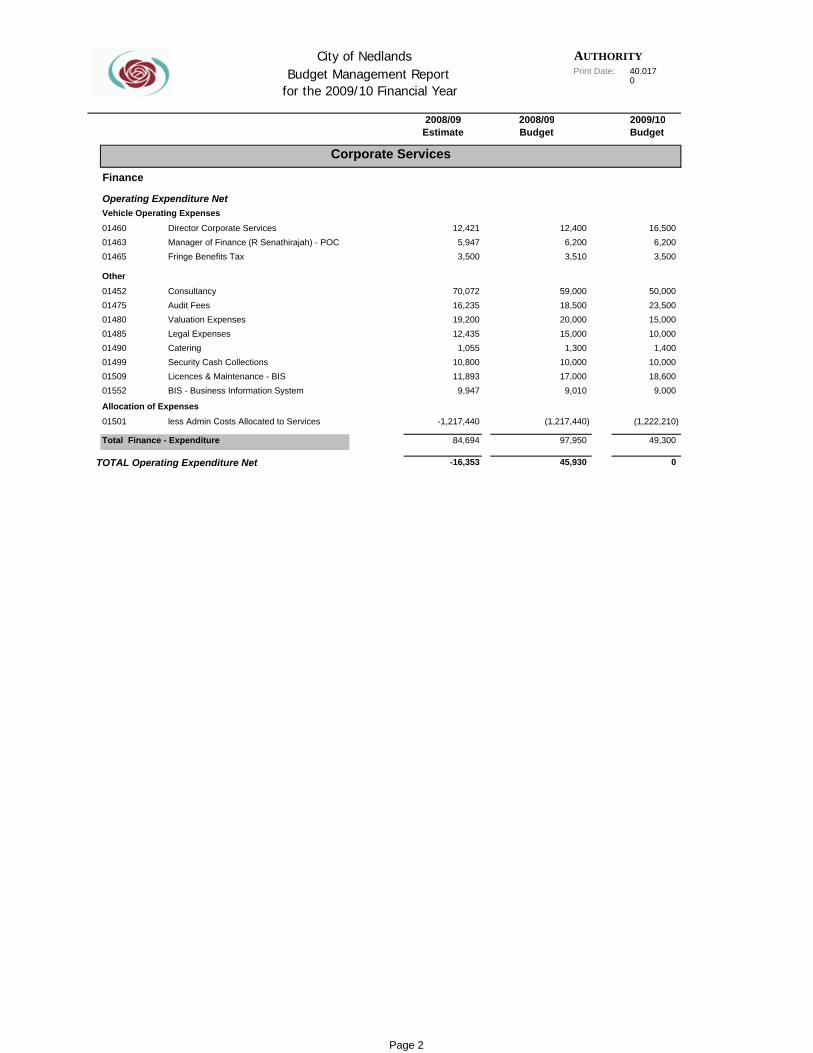
City of Nedlands Budget Management Report
for the 2009/10 Financial Year
Finance
Operating Expenditure Net
Page 1
AUTHORITYPrint Date: 40,017
0
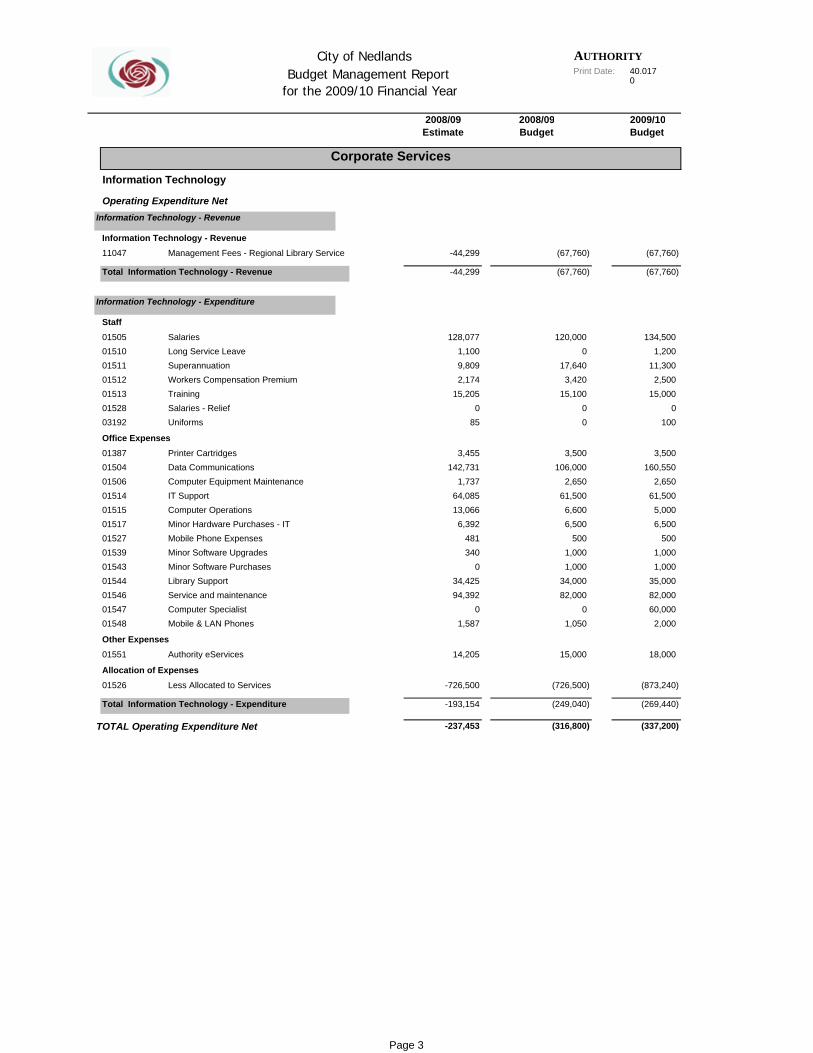
City of Nedlands Budget Management Report
for the 2009/10 Financial Year
2008/09 2008/09 2009/10Estimate Budget Budget
01460 12,42101463 5,94701465 3,500
01452 70,07201475 16,23501480 19,20001485 12,43501490 1,05501499 10,80001509 11,89301552 9,947
01501 -1,217,440
84,694
-16,353
Vehicle Operating ExpensesOperating Expenditure Net
Fringe Benefits Tax 3,510 3,500
Director Corporate Services 12,400Manager of Finance (R Senathirajah) - POC 6,200
23,50050,000
6,20016,500
10,0001,400
10,00015,000
49,300
(1,222,210)
9,00018,600
59,000Audit Fees 18,500
OtherConsultancy
Valuation Expenses 20,000Legal Expenses 15,000Catering 1,300Security Cash Collections 10,000
Allocation of Expensesless Admin Costs Allocated to Services (1,217,440)
Licences & Maintenance - BIS 17,000BIS - Business Information System 9,010
Total Finance - Expenditure 97,950
TOTAL Operating Expenditure Net 45,930 0
Corporate Services
Finance
Page 2
AUTHORITYPrint Date: 40,017
0
City of Nedlands Budget Management Report
for the 2009/10 Financial Year
2008/09 2008/09 2009/10Estimate Budget Budget
11047 -44,299
-44,299
01505 128,07701510 1,10001511 9,80901512 2,17401513 15,20501528 003192 85
01387 3,45501504 142,73101506 1,73701514 64,08501515 13,06601517 6,39201527 48101539 34001543 001544 34,42501546 94,39201547 001548 1,587
01551 14,205
01526 -726,500
-193,154
-237,453
134,500
(67,760)
(67,760)
15,0002,500
11,3001,200
160,5503,500
1000
6,5005,000
61,5002,650
35,0001,0001,000
500
Information Technology - RevenueManagement Fees - Regional Library Service (67,760)
Corporate Services
Information Technology
Operating Expenditure NetInformation Technology - Revenue
StaffSalaries 120,000
Total Information Technology - Revenue (67,760)
Information Technology - Expenditure
Long Service Leave 0Superannuation 17,640Workers Compensation Premium 3,420Training 15,100
Office ExpensesPrinter Cartridges 3,500
Salaries - Relief 0Uniforms 0
Data Communications 106,000Computer Equipment Maintenance 2,650IT Support 61,500Computer Operations 6,600Minor Hardware Purchases - IT 6,500Mobile Phone Expenses 500Minor Software Upgrades 1,000Minor Software Purchases 1,000
Mobile & LAN Phones 1,050
Library Support 34,000Service and maintenance 82,000
TOTAL Operating Expenditure Net (316,800)
Allocation of ExpensesLess Allocated to Services (726,500)
2,00060,00082,000
Total Information Technology - Expenditure (249,040)
Other ExpensesAuthority eServices 15,000
Computer Specialist 0
(337,200)
(269,440)
(873,240)
18,000
Page 3
AUTHORITYPrint Date: 40,017
0
City of Nedlands Budget Management Report
for the 2009/10 Financial Year
2008/09 2008/09 2009/10Estimate Budget Budget
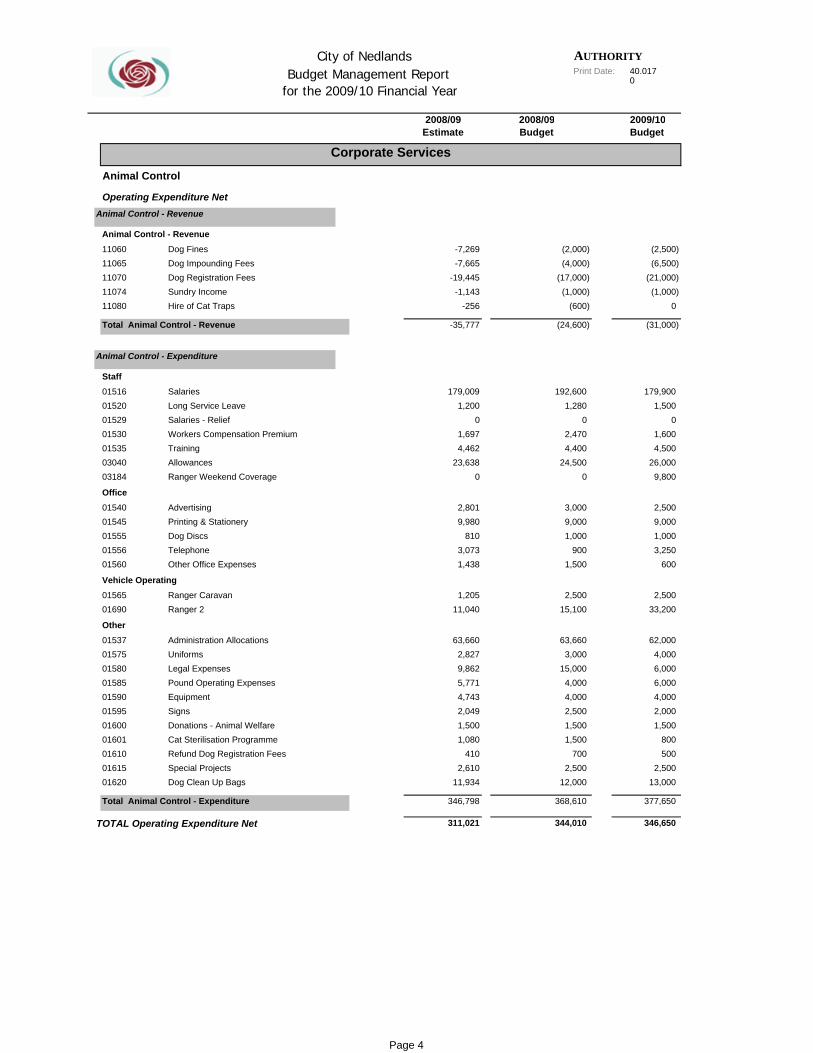
11060 -7,26911065 -7,66511070 -19,44511074 -1,14311080 -256
-35,777
01516 179,00901520 1,20001529 001530 1,69701535 4,46203040 23,63803184 0
01540 2,80101545 9,98001555 81001556 3,07301560 1,438
01565 1,20501690 11,040
01537 63,66001575 2,82701580 9,86201585 5,77101590 4,74301595 2,04901600 1,50001601 1,08001610 41001615 2,61001620 11,934
346,798
311,021
0(1,000)
(21,000)(6,500)
01,500
179,900
(31,000)
9,80026,000
4,5001,600
3,2501,0009,0002,500
Animal Control - RevenueDog Fines (2,000)
Corporate Services
Animal Control
Operating Expenditure NetAnimal Control - Revenue
(2,500)Dog Impounding Fees (4,000)Dog Registration Fees (17,000)Sundry Income (1,000)Hire of Cat Traps (600)
StaffSalaries 192,600
Total Animal Control - Revenue (24,600)
Animal Control - Expenditure
Long Service Leave 1,280Salaries - Relief 0Workers Compensation Premium 2,470Training 4,400
OfficeAdvertising 3,000
Allowances 24,500Ranger Weekend Coverage 0
Printing & Stationery 9,000Dog Discs 1,000Telephone 900Other Office Expenses 1,500
Ranger 2 15,100
Other
Vehicle OperatingRanger Caravan 2,500
Administration Allocations 63,660Uniforms 3,000Legal Expenses 15,000Pound Operating Expenses 4,000
1,500Cat Sterilisation Programme 1,500
Equipment 4,000Signs 2,500
600
Dog Clean Up Bags 12,000
Total Animal Control - Expenditure 368,610
Refund Dog Registration Fees 700Special Projects 2,500
Donations - Animal Welfare
4,00062,000
33,2002,500
2,0004,0006,0006,000
2,500500800
1,500
377,650
13,000
TOTAL Operating Expenditure Net 344,010 346,650
Page 4
AUTHORITYPrint Date: 40,017
0
City of Nedlands Budget Management Report
for the 2009/10 Financial Year
2008/09 2008/09 2009/10Estimate Budget Budget
11085 -171,36811090 -1,49511100 -2,06411105 -90011116 -1,273
-177,099
01625 160,55801630 1,40001635 30,34301640 6,88201645 1,681
01650 1,60901655 2,87501660 4,62001670 1,04401675 3,176
01680 001681 001685 15,125
01647 82,13001700 18,22501705 3,41901710 -4,53301720 4,59901725 2,01501730 13401733 11,71603196 23,68203198 1,94608905 6,502
379,145
202,046
(1,500)(165,500)
Corporate Services
(171,200)
(1,400)(1,000)(1,800)
P 7 f 73
3,6201,0002,5002,5002,000
3,3004,500
30,100
94,000
16,90018,50015,500
2,50013,000
5,000500
2,0007,0008,0004,000
16,470
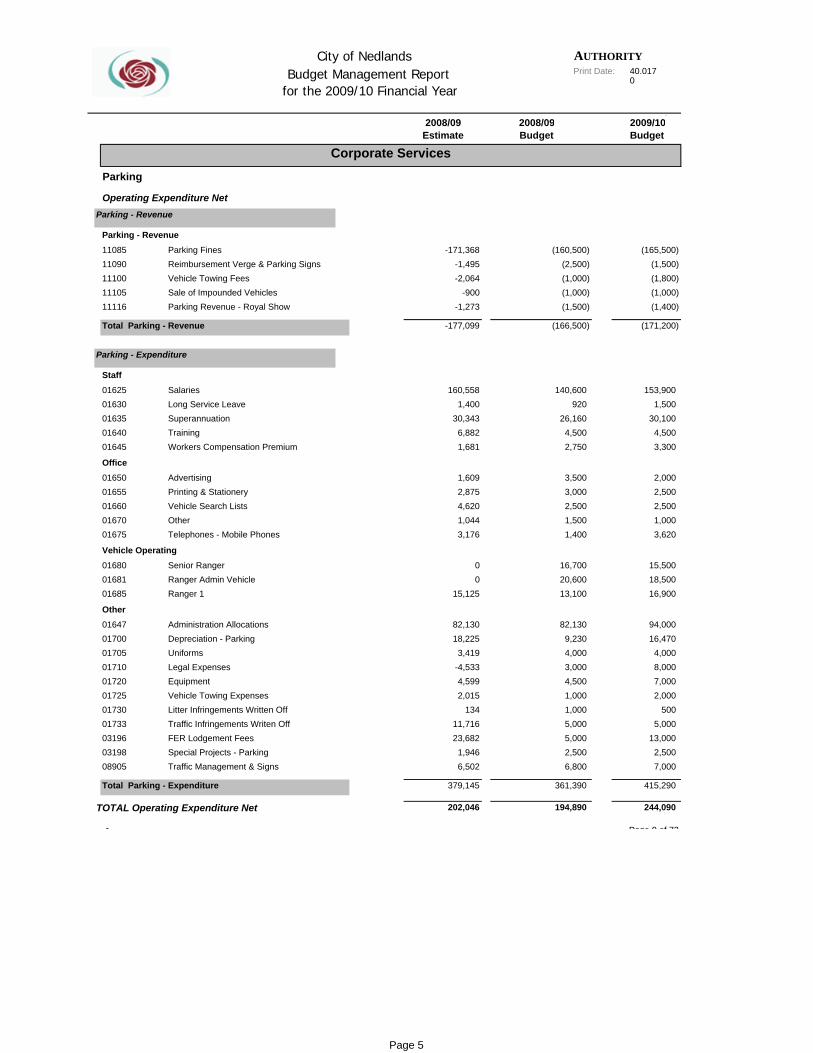
Parking
Operating Expenditure NetParking - Revenue
Parking - RevenueParking Fines (160,500)Reimbursement Verge & Parking Signs (2,500)Vehicle Towing Fees (1,000)Sale of Impounded Vehicles (1,000)Parking Revenue - Royal Show (1,500)
Total Parking - Revenue (166,500)
Parking - Expenditure
StaffSalaries 140,600 153,900Long Service Leave 920 1,500
Workers Compensation Premium 2,750
Office
Superannuation 26,160Training 4,500
Advertising 3,500Printing & Stationery 3,000
Telephones - Mobile Phones 1,400
Vehicle Operating
Vehicle Search Lists 2,500Other 1,500
Ranger 1 13,100
Other
Senior Ranger 16,700Ranger Admin Vehicle 20,600
Administration Allocations 82,130Depreciation - Parking 9,230Uniforms 4,000Legal Expenses 3,000Equipment 4,500Vehicle Towing Expenses 1,000Litter Infringements Written Off 1,000Traffic Infringements Writen Off 5,000FER Lodgement Fees 5,000Special Projects - Parking 2,500
7,000Traffic Management & Signs 6,800
Total Parking - Expenditure 361,390 415,290
TOTAL Operating Expenditure Net 194,890 244,090
A Page 9 of 73
Page 5
AUTHORITYPrint Date: 40,017
0
City of Nedlands Budget Management Report
for the 2009/10 Financial Year
2008/09 2008/09 2009/10Estimate Budget Budget
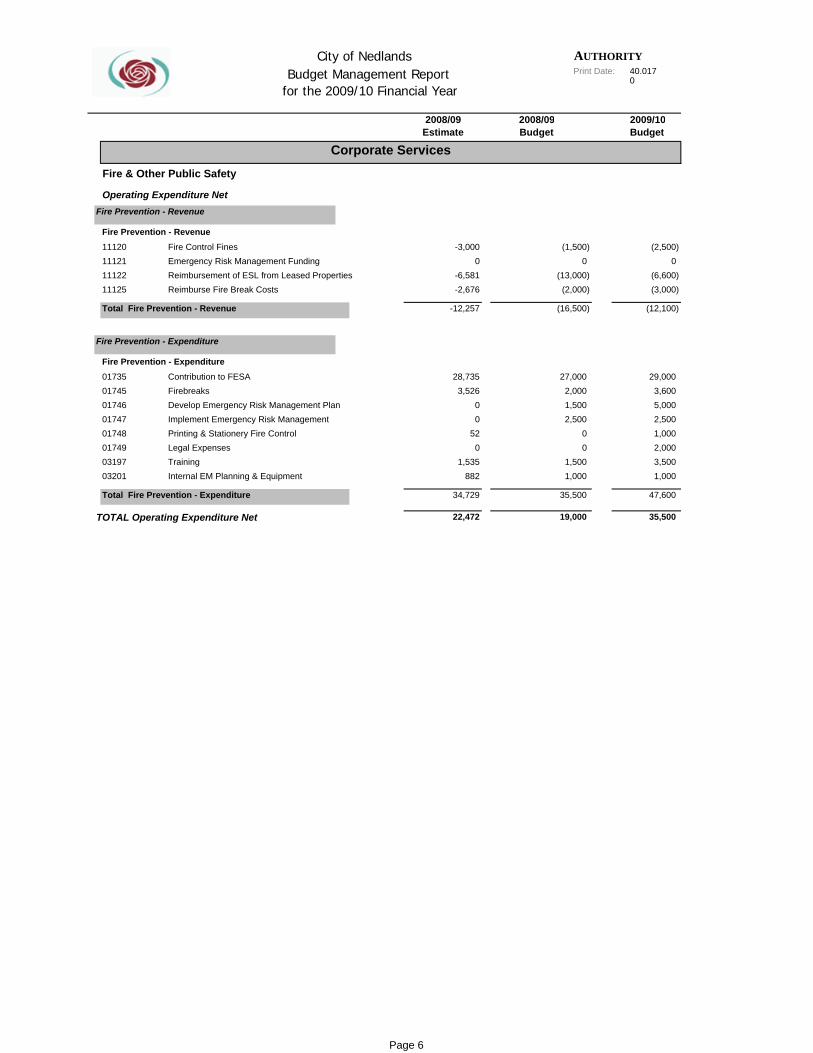
11120 -3,00011121 011122 -6,58111125 -2,676
-12,257
01735 28,73501745 3,52601746 001747 001748 5201749 003197 1,53503201 882
34,729
22,472
(3,000)(6,600)
0(2,500)
Fire Prevention - Revenue
1,0002,5005,000
(12,100)
29,000
47,600
1,0003,5002,000
35,500
Fire Control Fines (1,500)
Corporate Services
Fire & Other Public Safety
Operating Expenditure NetFire Prevention - Revenue
Emergency Risk Management Funding 0Reimbursement of ESL from Leased Properties (13,000)Reimburse Fire Break Costs (2,000)
Total Fire Prevention - Revenue (16,500)
Fire Prevention - Expenditure
Fire Prevention - ExpenditureContribution to FESA 27,000Firebreaks 2,000 3,600Develop Emergency Risk Management Plan 1,500Implement Emergency Risk Management 2,500Printing & Stationery Fire Control 0Legal Expenses 0Training 1,500Internal EM Planning & Equipment 1,000
Total Fire Prevention - Expenditure 35,500
TOTAL Operating Expenditure Net 19,000
Page 6
AUTHORITYPrint Date: 40,017
0
City of Nedlands Budget Management Report
for the 2009/10 Financial Year
2008/09 2008/09 2009/10Estimate Budget Budget
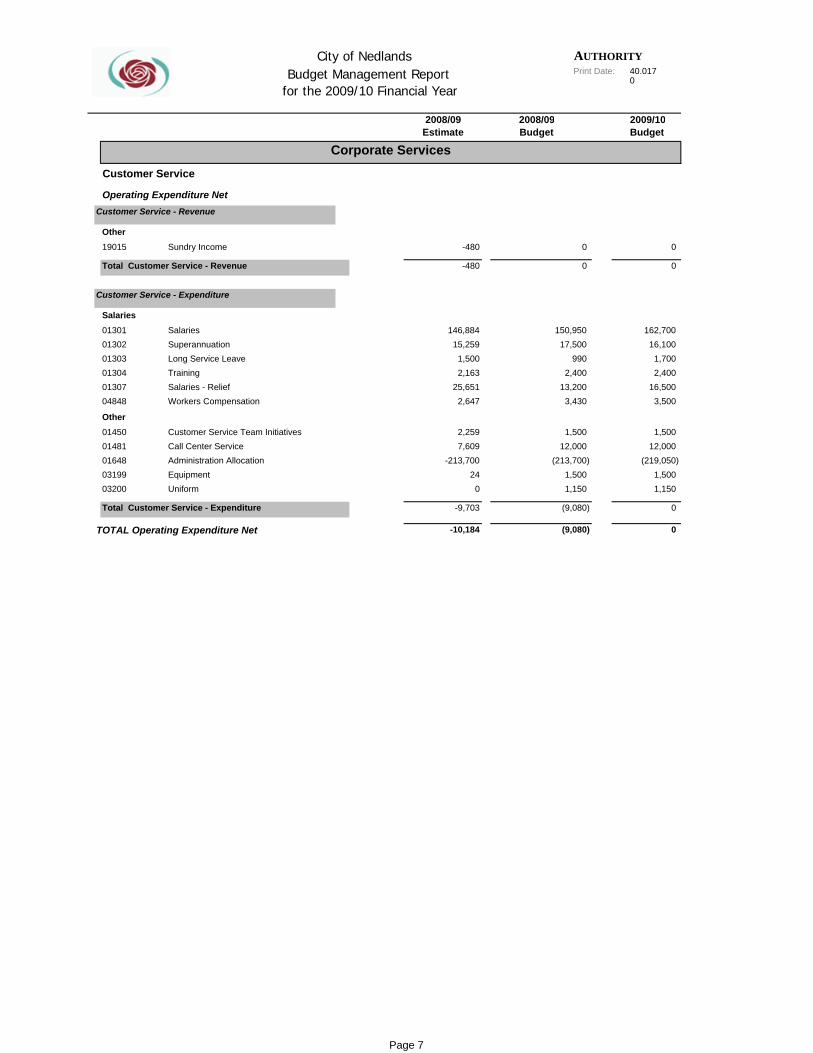
19015 -480
-480
01301 146,88401302 15,25901303 1,50001304 2,16301307 25,65104848 2,647
01450 2,25901481 7,60901648 -213,70003199 2403200 0
-9,703
-10,184
162,700
0
0
16,5002,4001,700
16,100
(219,050)12,000
1,500
3,500
0
0
1,1501,500
OtherSundry Income 0
Corporate Services
Customer Service
Operating Expenditure NetCustomer Service - Revenue
SalariesSalaries 150,950
Total Customer Service - Revenue 0
Customer Service - Expenditure
Superannuation 17,500Long Service Leave 990
Workers Compensation 3,430
Other
Training 2,400Salaries - Relief 13,200
Customer Service Team Initiatives 1,500Call Center Service 12,000Administration Allocation (213,700)Equipment 1,500Uniform 1,150
Total Customer Service - Expenditure (9,080)
TOTAL Operating Expenditure Net (9,080)
Page 7
AUTHORITYPrint Date: 40,017
0
City of Nedlands Budget Management Report
for the 2009/10 Financial Year
2008/09 2008/09 2009/10Estimate Budget Budget
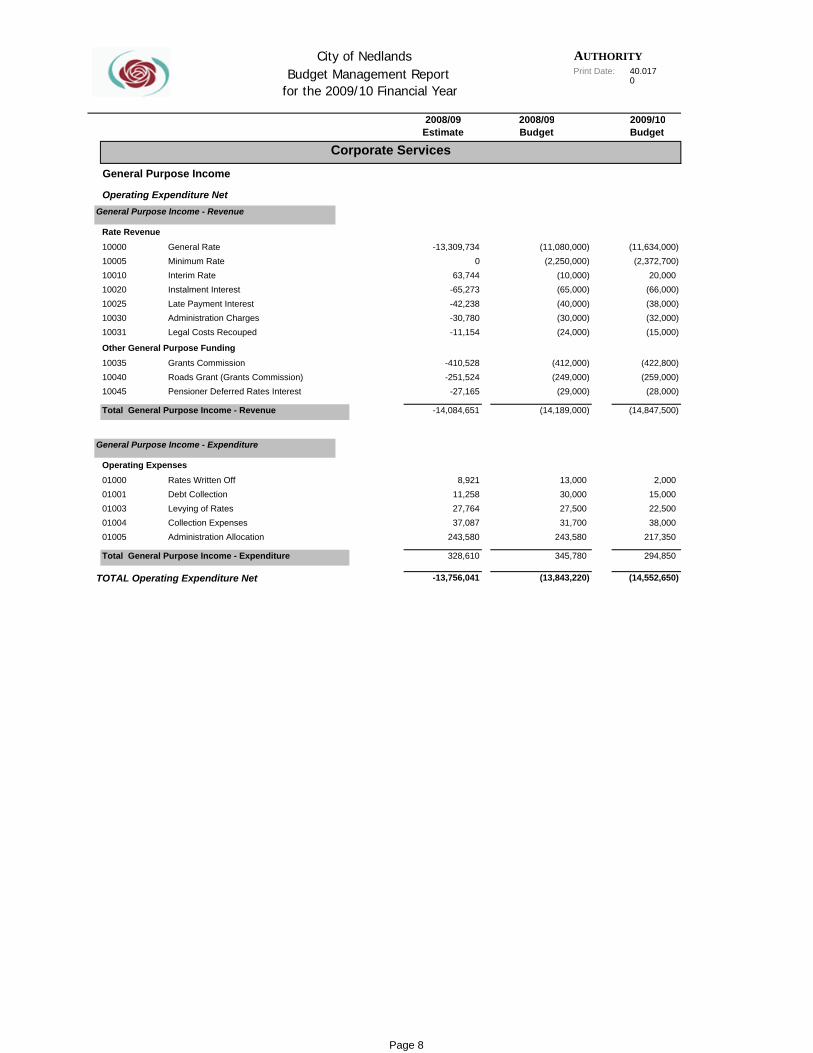
10000 -13,309,73410005 010010 63,74410020 -65,27310025 -42,23810030 -30,78010031 -11,154
10035 -410,52810040 -251,52410045 -27,165
-14,084,651
01000 8,92101001 11,25801003 27,76401004 37,08701005 243,580
328,610
-13,756,041
(66,000)20,000
(2,372,700)(11,634,000)
(28,000)(259,000)(422,800)
(15,000)(32,000)(38,000)
22,50015,000
2,000
(14,847,500)
(14,552,650)
294,850
217,35038,000
Rate RevenueGeneral Rate (11,080,000)
Corporate Services
General Purpose Income
Operating Expenditure NetGeneral Purpose Income - Revenue
Minimum Rate (2,250,000)Interim Rate (10,000)Instalment Interest (65,000)Late Payment Interest (40,000)
Other General Purpose FundingGrants Commission (412,000)
Administration Charges (30,000)Legal Costs Recouped (24,000)
Roads Grant (Grants Commission) (249,000)Pensioner Deferred Rates Interest (29,000)
Operating ExpensesRates Written Off 13,000
Total General Purpose Income - Revenue (14,189,000)
General Purpose Income - Expenditure
Debt Collection 30,000Levying of Rates 27,500Collection Expenses 31,700Administration Allocation 243,580
Total General Purpose Income - Expenditure 345,780
TOTAL Operating Expenditure Net (13,843,220)
Page 8

AUTHORITYPrint Date: 40,017
0
City of Nedlands Budget Management Report
for the 2009/10 Financial Year
2008/09 2008/09 2009/10Estimate Budget Budget
11175 -1,163
11016 -67,13511185 -19411187 -40018065 -1,051,090
11140 -1,710
11195 -410,50711200 -299,767
-1,831,965
01221 99201795 001800 939
01775 7,222,12301780 -7,222,12301785 24,261
01825 156,439
182,631
-1,649,334
0(50,000)
0
(250,000)
0
(1,051,000)0
5,00000
4,000
(1,521,000)
(170,000)
185,100
176,100
Corporate Services
Rates 0
Other
Unclassified
Operating Expenditure NetUnclassifed - Revenue
Contra Items
Insurance Claim Reimbursement (38,400)Sundry Income 0Litter Fines (120)Residential Project - Contribution - Residents (1,180,800)
Interest ReceivedInterest Earnings - Municipal (300,000)
Salaries & WagesReimbursement - Workers Compensation 0
Interest Earnings - Reserves (260,000)
Total Unclassifed - Revenue (1,779,320)
Unclassifed - Expenditure
GeneralFringe Benefits Tax 3,690
Insurance Claim Excess 4,000
Salaries & Wages
0Sundry 500 0
Workers Compensation Claims 15,000
Interest Paid
Gross Total Salaries for Year 0Salaries & Wages Allocated 0
Interest on Loans (Council) 163,000
Total Unclassifed - Expenditure 186,190
TOTAL Operating Expenditure Net (1,593,130) (1,335,900)
P 13 f 73
Page 9

AUTHORITYPrint Date: 40,017
0
City of Nedlands Budget Management Report
for the 2009/10 Financial Year
2008/09 2008/09 2009/10Estimate Budget Budget
11061 1,892
1,892
01233 62,67301236 60001237 001238 98301239 2,155
04965 9,46904970 9,524
01549 133,07501895 28,11106251 24,00006468 34,80008900 68008903 17,59308906 19,421
343,083
344,975
0
0
1,3009,300
063,200
26,000300
35,00025,00012,000
124,200
6,00012,400
2,500
337,200
337,200
20,000
Corporate Services - Sundry RevenueProfit/Loss on Sale of Assets 0
Corporate Services
Corporate Services
Corporate Services - Revenue
StaffSalaries 60,000
Total Corporate Services - Revenue 0
Corporate Services - Expenses
Long Service Leave 290Superannuation 8,510Workers Compensation 1,380Training 2,500
Fringe Benefits Tax 5,910
Other Expenses
Vehicle ExpensesManager Corporate Services 9,100
Authority Corporate Management System 124,000Performance Management System 18,000Electronic Services Strategy 25,000Knowledge Management Strategic Project Impleme 35,000Printing & Stationery 300Internet / Intranet Support & Maintenance 26,000
TOTAL Operating Expenditure Net 335,990
Risk Management Training & Awareness 20,000
Total Corporate Services - Expenses 335,990
P 14 f 73
Page 10
AUTHORITYPrint Date: 40,017
0
City of Nedlands Budget Management Report
for the 2009/10 Financial Year
2008/09 2008/09 2009/10Estimate Budget Budget
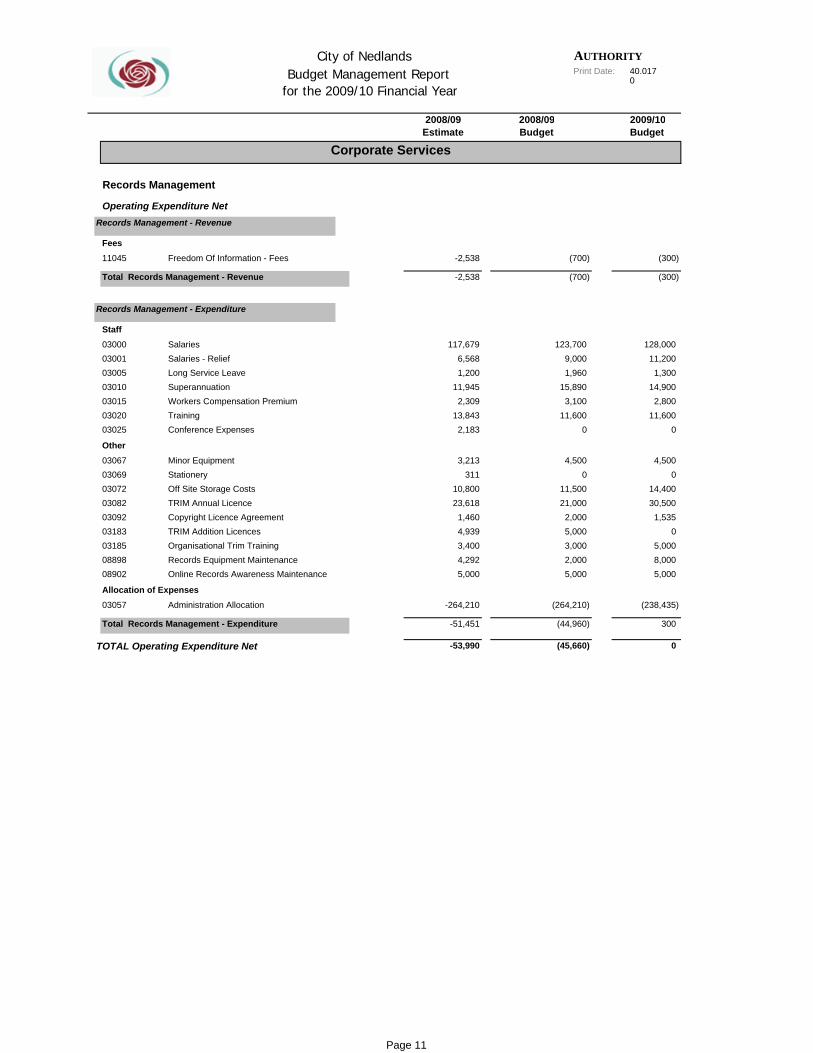
11045 -2,538
-2,538
03000 117,67903001 6,56803005 1,20003010 11,94503015 2,30903020 13,84303025 2,183
03067 3,21303069 31103072 10,80003082 23,61803092 1,46003183 4,93903185 3,40008898 4,29208902 5,000
03057 -264,210
-51,451
-53,990
11,200128,000
(300)
(300)
11,6002,800
14,9001,300
14,4000
4,500
0
5,0000
1,53530,500
300
(238,435)
5,0008,000
0
FeesFreedom Of Information - Fees (700)
Corporate Services
Records Management
Operating Expenditure NetRecords Management - Revenue
StaffSalaries 123,700
Total Records Management - Revenue (700)
Records Management - Expenditure
Salaries - Relief 9,000Long Service Leave 1,960Superannuation 15,890Workers Compensation Premium 3,100
OtherMinor Equipment 4,500
Training 11,600Conference Expenses 0
Stationery 0Off Site Storage Costs 11,500TRIM Annual Licence 21,000Copyright Licence Agreement 2,000TRIM Addition Licences 5,000Organisational Trim Training 3,000
Allocation of ExpensesAdministration Allocation (264,210)
Records Equipment Maintenance 2,000Online Records Awareness Maintenance 5,000
Total Records Management - Expenditure (44,960)
TOTAL Operating Expenditure Net (45,660)
Page 11
AUTHORITYPrint Date: 40,017
0
City of Nedlands Budget Management Report
for the 2009/10 Financial Year
2008/09 2008/09 2009/10Estimate Budget Budget
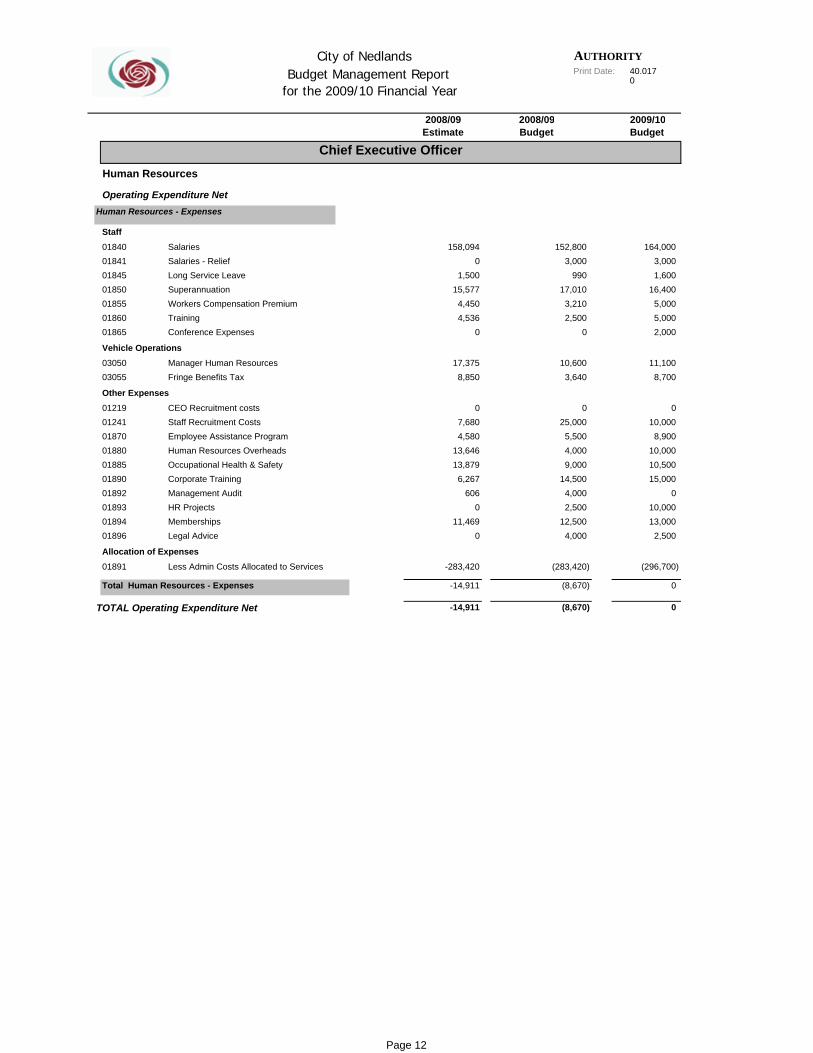
01840 158,09401841 001845 1,50001850 15,57701855 4,45001860 4,53601865 0
03050 17,37503055 8,850
01219 001241 7,68001870 4,58001880 13,64601885 13,87901890 6,26701892 60601893 001894 11,46901896 0
01891 -283,420
-14,911
-14,911
2,0005,0005,000
16,4001,6003,000
164,000
10,0000
8,70011,100
0
(296,700)
2,50013,00010,000
015,00010,50010,000
8,900
Chief Executive Officer
Human Resources
Operating Expenditure NetHuman Resources - Expenses
StaffSalaries 152,800Salaries - Relief 3,000Long Service Leave 990Superannuation 17,010
Conference Expenses 0
Vehicle Operations
Workers Compensation Premium 3,210Training 2,500
Other ExpensesCEO Recruitment costs 0
Manager Human Resources 10,600Fringe Benefits Tax 3,640
Staff Recruitment Costs 25,000Employee Assistance Program 5,500Human Resources Overheads 4,000Occupational Health & Safety 9,000Corporate Training 14,500Management Audit 4,000
Legal Advice 4,000
Allocation of Expenses
HR Projects 2,500Memberships 12,500
Less Admin Costs Allocated to Services (283,420)
Total Human Resources - Expenses (8,670)
TOTAL Operating Expenditure Net (8,670) 0
Page 12
AUTHORITYPrint Date: 40,017
0
City of Nedlands Budget Management Report
for the 2009/10 Financial Year
2008/09 2008/09 2009/10Estimate Budget Budget
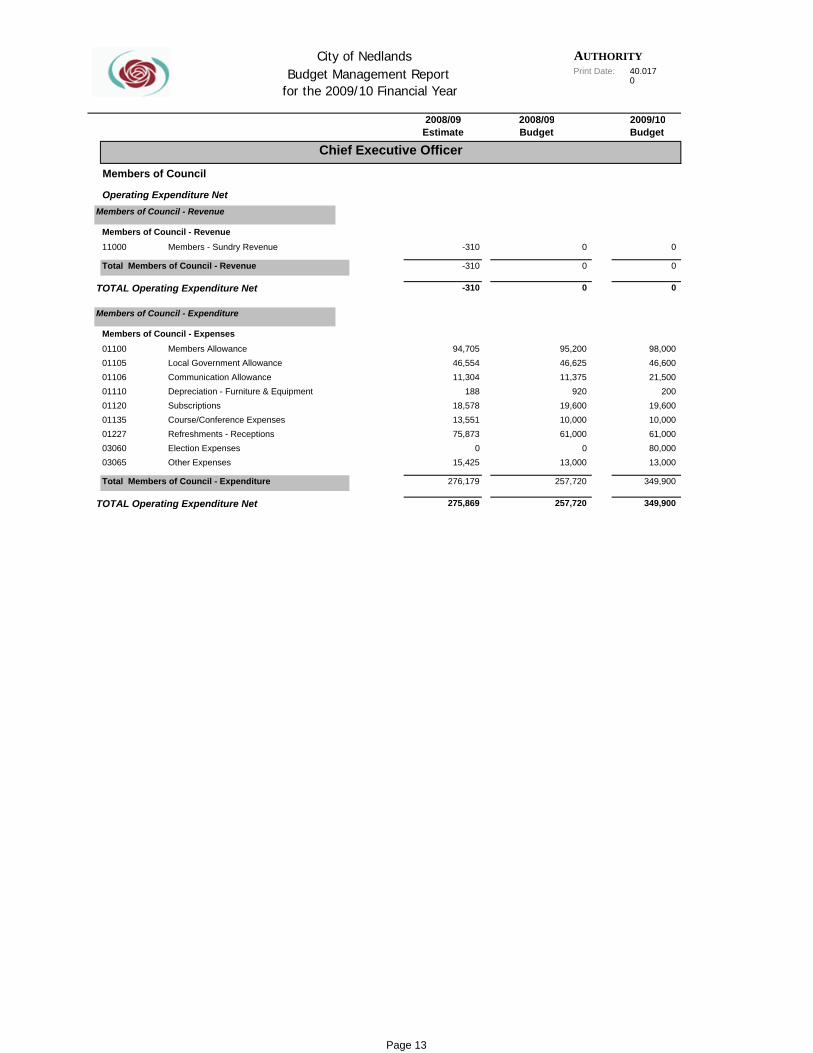
11000 -310
-310
-310
01100 94,70501105 46,55401106 11,30401110 18801120 18,57801135 13,55101227 75,87303060 003065 15,425
276,179
275,869
Total Members of Council - Revenue 0
TOTAL Operating Expenditure Net 0
Members of Council - RevenueMembers - Sundry Revenue 0
Chief Executive Officer
Members of Council
Operating Expenditure NetMembers of Council - Revenue
0
0
10,00019,600
20021,50046,60098,000
0
13,00080,00061,000
349,900
349,900
Members of Council - ExpensesMembers Allowance 95,200
Members of Council - Expenditure
Local Government Allowance 46,625Communication Allowance 11,375Depreciation - Furniture & Equipment 920Subscriptions 19,600Course/Conference Expenses 10,000Refreshments - Receptions 61,000Election Expenses 0Other Expenses 13,000
Total Members of Council - Expenditure 257,720
TOTAL Operating Expenditure Net 257,720
Page 13
AUTHORITYPrint Date: 40,017
0
City of Nedlands Budget Management Report
for the 2009/10 Financial Year
2008/09 2008/09 2009/10Estimate Budget Budget
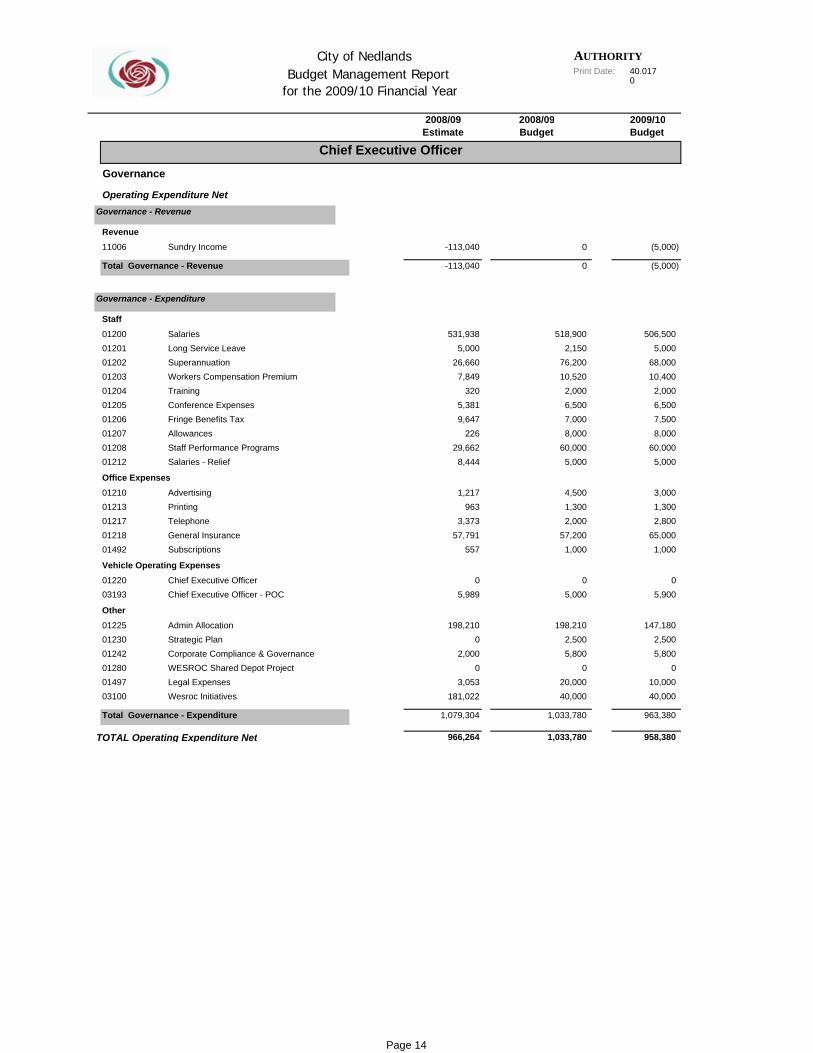
11006 -113,040
-113,040
01200 531,93801201 5,00001202 26,66001203 7,84901204 32001205 5,38101206 9,64701207 22601208 29,66201212 8,444
01210 1,21701213 96301217 3,37301218 57,79101492 557
01220 003193 5,989
01225 198,21001230 001242 2,00001280 001497 3,05303100 181,022
1,079,304
966,264
(5,000)
(5,000)
Chief Executive Officer
6,5002,000
10,40068,000
5,00060,000
8,0007,500
10,0000
5,8002,500
147,180
5,9000
1,00065,000
958,380
963,380
40,000
2,8001,3003,000
Governance
Operating Expenditure NetGovernance - Revenue
RevenueSundry Income 0
Total Governance - Revenue 0
Governance - Expenditure
StaffSalaries 518,900 506,500Long Service Leave 2,150 5,000Superannuation 76,200Workers Compensation Premium 10,520Training 2,000Conference Expenses 6,500Fringe Benefits Tax 7,000Allowances 8,000
Office ExpensesAdvertising 4,500
Staff Performance Programs 60,000Salaries - Relief 5,000
Printing 1,300Telephone 2,000General Insurance 57,200Subscriptions 1,000
Chief Executive Officer - POC 5,000
Other
Vehicle Operating ExpensesChief Executive Officer 0
Admin Allocation 198,210Strategic Plan 2,500Corporate Compliance & Governance 5,800WESROC Shared Depot Project 0Legal Expenses 20,000Wesroc Initiatives 40,000
Total Governance - Expenditure 1,033,780
TOTAL Operating Expenditure Net 1,033,780
Page 14

AUTHORITYPrint Date: 40,017
0
City of Nedlands Budget Management Report
for the 2009/10 Financial Year
2008/09 2008/09 2009/10Estimate Budget Budget
14000 -3,56314005 -20,41014010 -23,87314015 -12,82114020 -16,62214025 -2,75414026 -57,228
14445 -64814450 -32414455 -6,30014462 -2,02514465 -1,54014475 -3,10614495 -11,156
14056 1,910
-160,459
04000 10,94004005 13,95704010 2,41904015 56004016 34504020 4,31504025 180
04030 12,12904035 17,61604040 2,37604045 1,37904047 15404050 7,17004055 5604060 7,746
04065 10,42504070 20,93704075 2,16704080 52504085 3,59004090 222
04095 4,65404100 15,45904105 4,054
(55,600)(2,500)
(16,100)0
(22,700)(20,400)
(8,300)
0(10,000)
0(1,700)
0
(10,900)(3,800)(2,500)
0600
2,750
(154,500)
17,450
20,0009,700
1804,320
4,3600
1,000
3,590600
2,25020,50011,850
8,30060
7,18080
1,5002,375
Community Services
Community Facilities
Operating Expenditure NetPublic Halls - Revenue
Hall HireAllen Park Pavilion (3,070)Dalkeith Hall (19,600)Drabble House (18,700)Hackett Hall (16,360)
Mt Claremont Community Centre (57,000)
Rents & Reimbursements
John Leckie Music Centre (11,650)J.C. Smith Pavilion (9,970)
Hackett Playgroup (1,950)Nedlands Child Health Clinic 0Strickland Street (9,800)Sundry Income 0
Reimbursements - General (7,630)
Other Revenue
College Park Family Centre (1,300)Mt. Claremont (2,500)
Retention of Bonds & Fees for Damages 0
Total Public Halls - Revenue (159,530)
Public Halls - Expenses
Allen Park PavilionBuilding Maintenance 16,850Cleaning 14,000 13,700Utility Charges 1,000Insurance 1,300
Depreciation - Furniture & Equipment 180
Dalkeith Hall
Refunds - Hall Hire 0Depreciation - Buildings 4,320
Building Maintenance 11,900Cleaning 20,500Utility Charges 1,850Insurance 3,170APRA licence fees 80Depreciation - Building 7,180
Drabble HouseBuilding Maintenance 12,800
Depreciation - Furniture & Equipment 90Garden maintenance 10,740
Cleaning 20,000Utility Charges 2,450Insurance 1,200Depreciation - Building 3,590Depreciation - Furniture & Equipment 540 225
5,740Cleaning 16,500
Hackett HallBuilding Maintenance
Utility Charges 3,890
Page 15
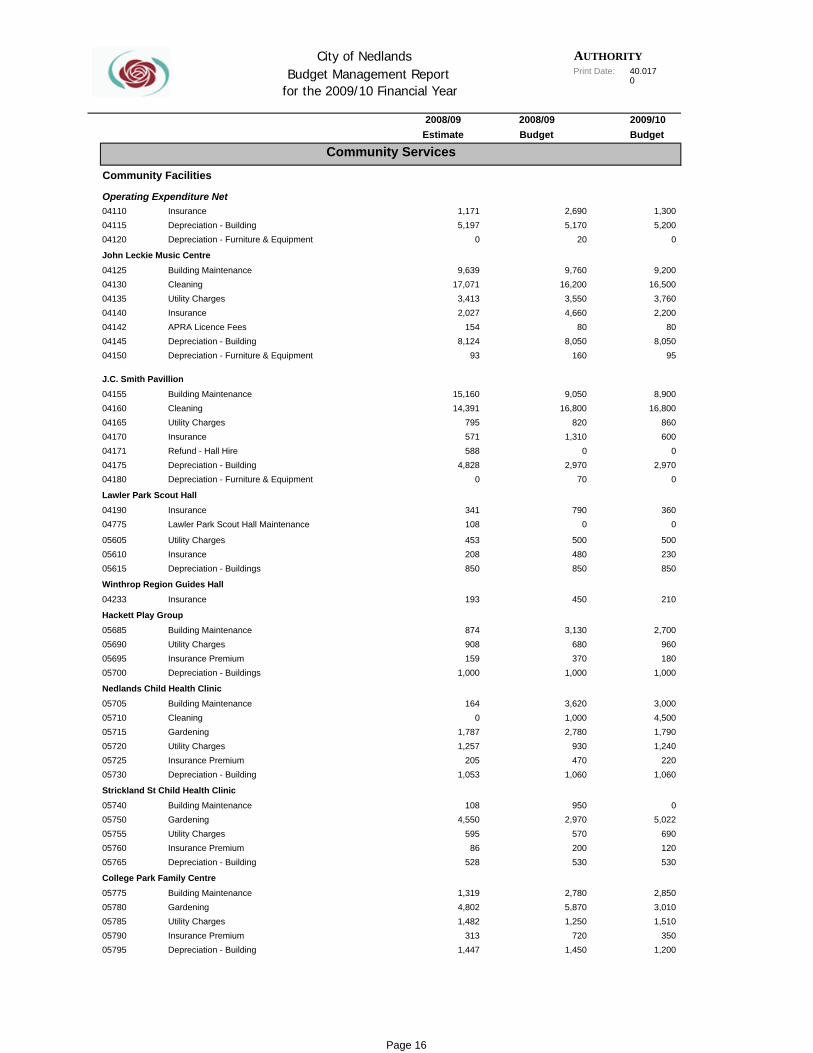
AUTHORITYPrint Date: 40,017
0
City of Nedlands Budget Management Report
for the 2009/10 Financial Year
2008/09 2008/09 2009/10Estimate Budget Budget
04110 1,17104115 5,19704120 0
04125 9,63904130 17,07104135 3,41304140 2,02704142 15404145 8,12404150 93
04155 15,16004160 14,39104165 79504170 57104171 58804175 4,82804180 0
04190 34104775 108
05605 45305610 20805615 850
04233 193
05685 87405690 90805695 15905700 1,000
05705 16405710 005715 1,78705720 1,25705725 20505730 1,053
05740 10805750 4,55005755 59505760 8605765 528
05775 1,31905780 4,80205785 1,48205790 31305795 1,447
1,300
16,5009,200
05,200
8,05080
2,2003,760
86016,800
8,900
95
02,970
0600
4,5003,000
1,000180960
2,700
210
850230
2201,2401,790
500
0360
3,0102,850
530120690
5,0220
1,200350
1,510
Insurance 2,690Operating Expenditure Net
John Leckie Music CentreBuilding Maintenance 9,760
Depreciation - Building 5,170Depreciation - Furniture & Equipment 20
Cleaning 16,200Utility Charges 3,550Insurance 4,660APRA Licence Fees 80
J.C. Smith PavillionBuilding Maintenance 9,050
Depreciation - Building 8,050Depreciation - Furniture & Equipment 160
Cleaning 16,800Utility Charges 820Insurance 1,310Refund - Hall Hire 0Depreciation - Building 2,970Depreciation - Furniture & Equipment 70
Lawler Park Scout Hall Maintenance 0
Lawler Park Scout HallInsurance 790
Utility Charges 500Insurance 480
Insurance 450
Hackett Play Group
Depreciation - Buildings 850
Winthrop Region Guides Hall
Building Maintenance 3,130Utility Charges 680
Nedlands Child Health ClinicBuilding Maintenance 3,620
Insurance Premium 370Depreciation - Buildings 1,000
Cleaning 1,000Gardening 2,780Utility Charges 930Insurance Premium 470Depreciation - Building 1,060 1,060
950Gardening 2,970
Strickland St Child Health ClinicBuilding Maintenance
Depreciation - Building 530
College Park Family Centre
Utility Charges 570Insurance Premium 200
Building Maintenance 2,780Gardening 5,870
Depreciation - Building 1,450
Utility Charges 1,250Insurance Premium 720
Community Services
Community Facilities
Page 16
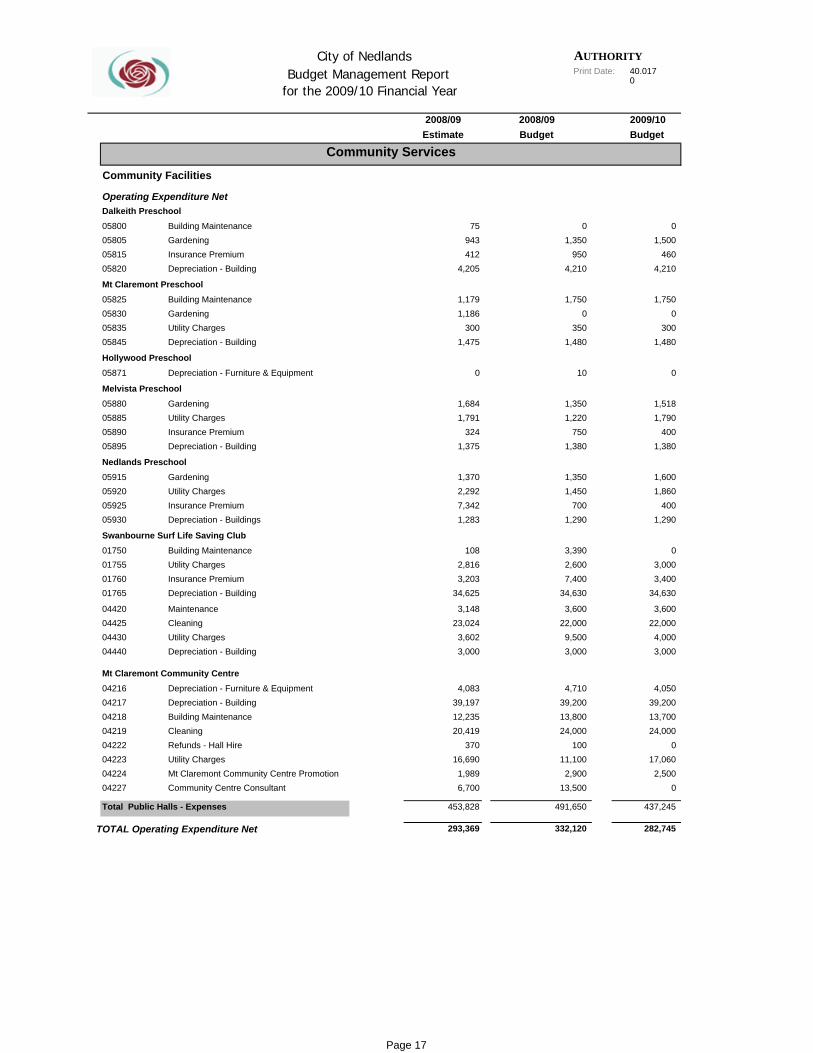
AUTHORITYPrint Date: 40,017
0
City of Nedlands Budget Management Report
for the 2009/10 Financial Year
2008/09 2008/09 2009/10Estimate Budget Budget
05800 7505805 94305815 41205820 4,205
05825 1,17905830 1,18605835 30005845 1,475
05871 0
05880 1,68405885 1,79105890 32405895 1,375
05915 1,37005920 2,29205925 7,34205930 1,283
01750 10801755 2,81601760 3,20301765 34,625
04420 3,14804425 23,02404430 3,60204440 3,000
04216 4,08304217 39,19704218 12,23504219 20,41904222 37004223 16,69004224 1,98904227 6,700
453,828
293,369
0
1,750
4,210460
1,500
1,7901,518
0
1,480300
0
0
1,290400
1,8601,600
1,380400
3,600
34,6303,4003,000
39,2004,050
4,00022,000
17,0600
24,00013,700
Dalkeith Preschool
Community Services
Community Facilities
Operating Expenditure Net
Building Maintenance 0Gardening 1,350
Mt Claremont PreschoolBuilding Maintenance 1,750
Insurance Premium 950Depreciation - Building 4,210
Gardening 0Utility Charges 350
Depreciation - Furniture & Equipment 10
Melvista Preschool
Depreciation - Building 1,480
Hollywood Preschool
Gardening 1,350Utility Charges 1,220
Nedlands PreschoolGardening 1,350
Insurance Premium 750Depreciation - Building 1,380
Depreciation - Buildings 1,290
Swanbourne Surf Life Saving Club
Utility Charges 1,450Insurance Premium 700
Building Maintenance 3,390Utility Charges 2,600
Maintenance 3,600
Insurance Premium 7,400Depreciation - Building 34,630
282,745
Cleaning 22,000Utility Charges 9,500
437,245
02,500
Depreciation - Building 3,000 3,000
4,710Depreciation - Building 39,200
Mt Claremont Community CentreDepreciation - Furniture & Equipment
Building Maintenance 13,800Cleaning 24,000Refunds - Hall Hire 100Utility Charges 11,100Mt Claremont Community Centre Promotion 2,900Community Centre Consultant 13,500
Total Public Halls - Expenses 491,650
TOTAL Operating Expenditure Net 332,120
Page 17
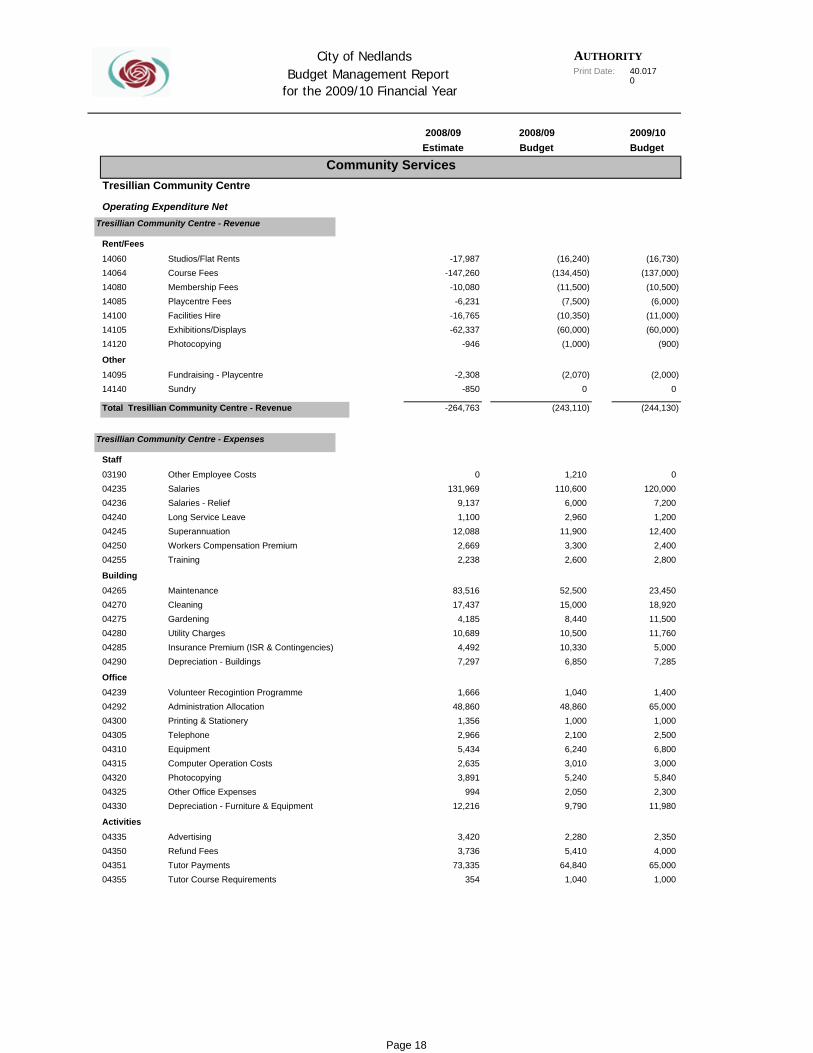
AUTHORITYPrint Date: 40,017
0
City of Nedlands Budget Management Report
for the 2009/10 Financial Year
2008/09 2008/09 2009/10Estimate Budget Budget
14060 -17,98714064 -147,26014080 -10,08014085 -6,23114100 -16,76514105 -62,33714120 -946
14095 -2,30814140 -850
-264,763
03190 004235 131,96904236 9,13704240 1,10004245 12,08804250 2,66904255 2,238
04265 83,51604270 17,43704275 4,18504280 10,68904285 4,49204290 7,297
04239 1,66604292 48,86004300 1,35604305 2,96604310 5,43404315 2,63504320 3,89104325 99404330 12,216
04335 3,42004350 3,73604351 73,33504355 354
(137,000)(16,730)
0(2,000)
(900)(60,000)(11,000)
(6,000)(10,500)
12,4001,2007,200
(244,130)
0
18,92023,450
2,8002,400
65,0001,400
7,2855,000
11,76011,500
3,0006,8002,5001,000
2,350
11,9802,3005,840
65,0004,000
P 22 f 73
Rent/FeesStudios/Flat Rents (16,240)
Tresillian Community Centre
Operating Expenditure NetTresillian Community Centre - Revenue
Course Fees (134,450)Membership Fees (11,500)Playcentre Fees (7,500)Facilities Hire (10,350)
OtherFundraising - Playcentre (2,070)
Exhibitions/Displays (60,000)Photocopying (1,000)
Sundry 0
Total Tresillian Community Centre - Revenue (243,110)
Tresillian Community Centre - Expenses
StaffOther Employee Costs 1,210Salaries 110,600 120,000Salaries - Relief 6,000Long Service Leave 2,960
Training 2,600
Building
Superannuation 11,900Workers Compensation Premium 3,300
Maintenance 52,500Cleaning 15,000Gardening 8,440Utility Charges 10,500
OfficeVolunteer Recogintion Programme 1,040
Insurance Premium (ISR & Contingencies) 10,330Depreciation - Buildings 6,850
Administration Allocation 48,860Printing & Stationery 1,000Telephone 2,100Equipment 6,240Computer Operation Costs 3,010Photocopying 5,240
ActivitiesAdvertising 2,280
Other Office Expenses 2,050Depreciation - Furniture & Equipment 9,790
Refund Fees 5,410Tutor Payments 64,840Tutor Course Requirements 1,040 1,000
Community Services
Page 18
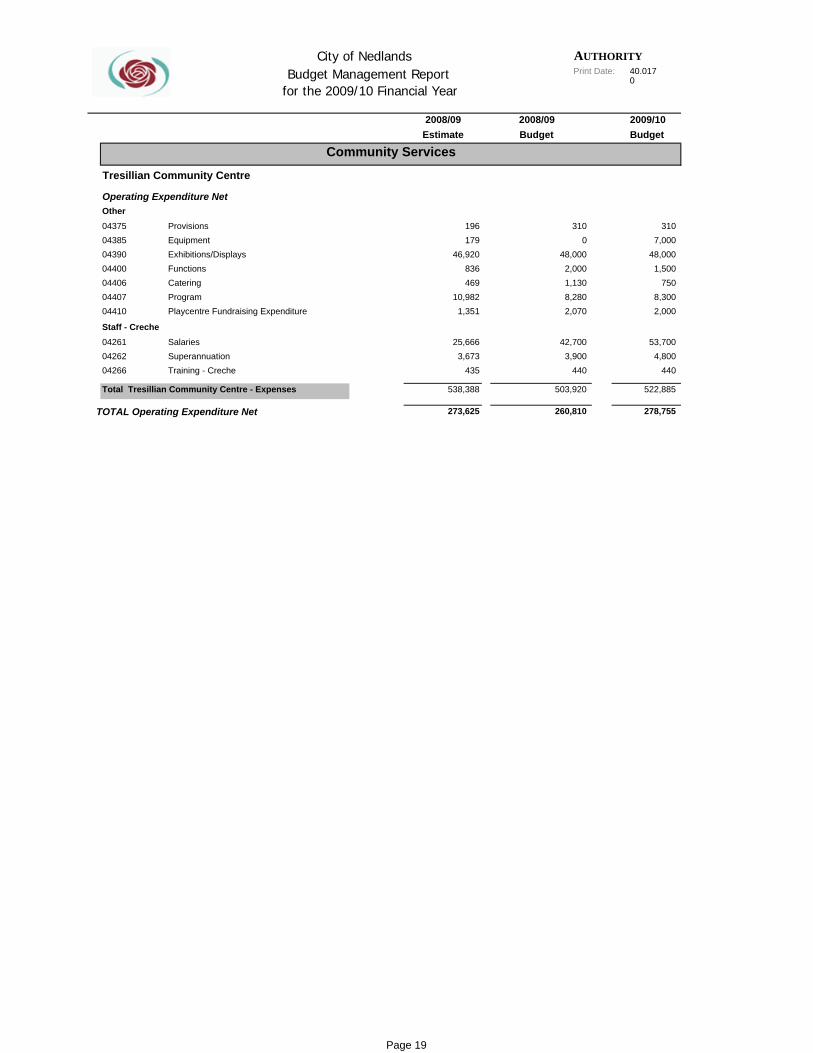
AUTHORITYPrint Date: 40,017
0
City of Nedlands Budget Management Report
for the 2009/10 Financial Year
2008/09 2008/09 2009/10Estimate Budget Budget
04375 19604385 17904390 46,92004400 83604406 46904407 10,98204410 1,351
04261 25,66604262 3,67304266 435
538,388
273,625
2,0008,300
7501,500
48,0007,000
310
522,885
4404,800
53,700
310Equipment 0
OtherProvisions
Exhibitions/Displays 48,000Functions 2,000
Playcentre Fundraising Expenditure 2,070
Staff - Creche
Catering 1,130Program 8,280
Salaries 42,700Superannuation 3,900Training - Creche 440
Total Tresillian Community Centre - Expenses 503,920
TOTAL Operating Expenditure Net 260,810 278,755
P 24 f 73
Community Services
Tresillian Community Centre
Operating Expenditure Net
Page 19
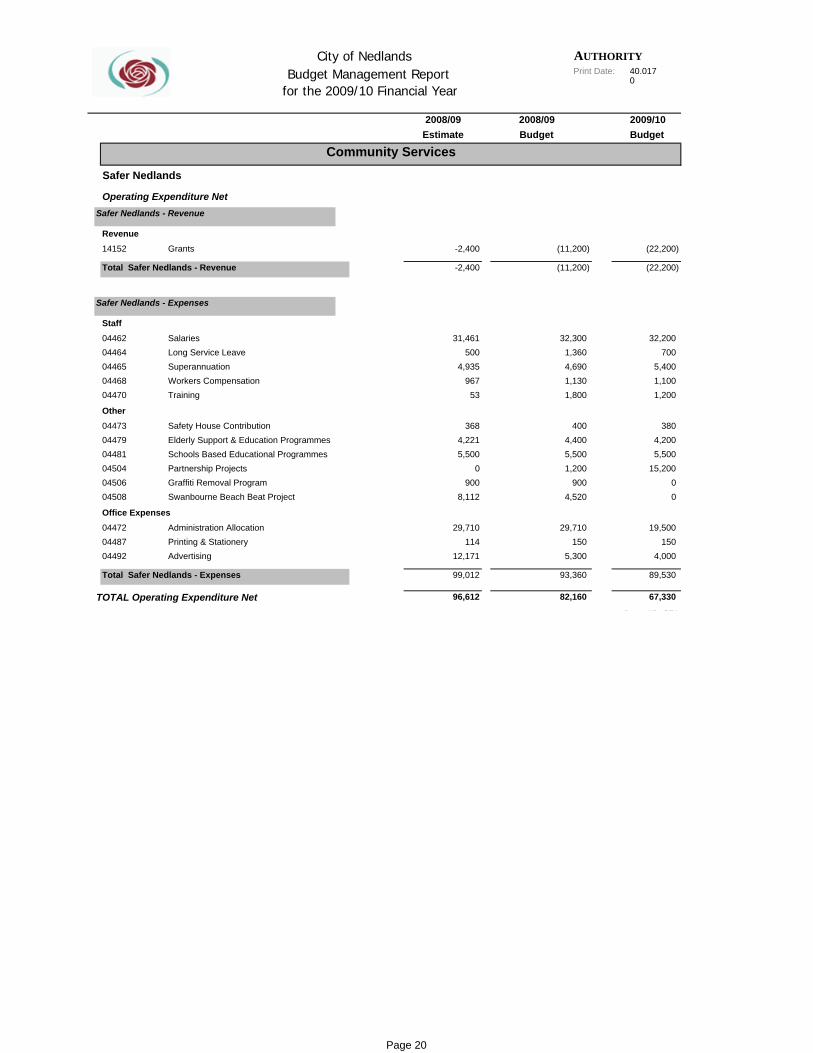
AUTHORITYPrint Date: 40,017
0
City of Nedlands Budget Management Report
for the 2009/10 Financial Year
2008/09 2008/09 2009/10Estimate Budget Budget
14152 -2,400
-2,400
04462 31,46104464 50004465 4,93504468 96704470 53
04473 36804479 4,22104481 5,50004504 004506 90004508 8,112
04472 29,71004487 11404492 12,171
99,012
96,612
70032,200
(22,200)
(22,200)
5,5004,200
380
1,2001,1005,400
89,530
4,000150
19,500
00
15,200
67,330
RevenueGrants (11,200)
Community Services
Safer Nedlands
Operating Expenditure NetSafer Nedlands - Revenue
StaffSalaries 32,300
Total Safer Nedlands - Revenue (11,200)
Safer Nedlands - Expenses
Long Service Leave 1,360Superannuation 4,690
OtherSafety House Contribution 400
Workers Compensation 1,130Training 1,800
Elderly Support & Education Programmes 4,400Schools Based Educational Programmes 5,500
Swanbourne Beach Beat Project 4,520
Office Expenses
Partnership Projects 1,200Graffiti Removal Program 900
Administration Allocation 29,710Printing & Stationery 150
TOTAL Operating Expenditure Net 82,160
Advertising 5,300
Total Safer Nedlands - Expenses 93,360
P 25 f 73
Page 20
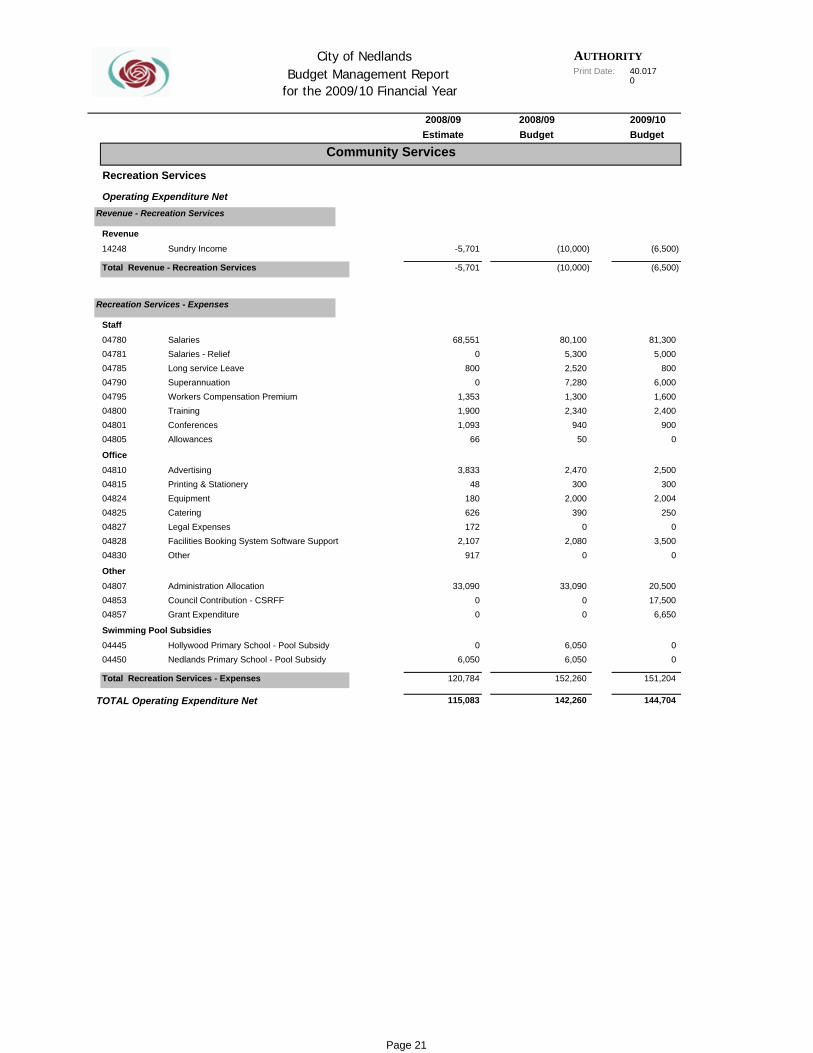
AUTHORITYPrint Date: 40,017
0
City of Nedlands Budget Management Report
for the 2009/10 Financial Year
2008/09 2008/09 2009/10Estimate Budget Budget
14248 -5,701
-5,701
04780 68,55104781 004785 80004790 004795 1,35304800 1,90004801 1,09304805 66
04810 3,83304815 4804824 18004825 62604827 17204828 2,10704830 917
04807 33,09004853 004857 0
04445 004450 6,050
120,784
115,083
81,300
(6,500)
(6,500)
1,6006,000
8005,000
2,004300
2,500
0900
2,400
6,65017,50020,500
03,500
0250
144,704
151,204
00
RevenueSundry Income (10,000)
Community Services
Recreation Services
Operating Expenditure NetRevenue - Recreation Services
StaffSalaries 80,100
Total Revenue - Recreation Services (10,000)
Recreation Services - Expenses
Salaries - Relief 5,300Long service Leave 2,520Superannuation 7,280Workers Compensation Premium 1,300
Allowances 50
Office
Training 2,340Conferences 940
Advertising 2,470Printing & Stationery 300Equipment 2,000Catering 390
Other 0
Other
Legal Expenses 0Facilities Booking System Software Support 2,080
Grant Expenditure 0
Swimming Pool Subsidies
Administration Allocation 33,090Council Contribution - CSRFF 0
Hollywood Primary School - Pool Subsidy 6,050Nedlands Primary School - Pool Subsidy 6,050
Total Recreation Services - Expenses 152,260
TOTAL Operating Expenditure Net 142,260
Page 21
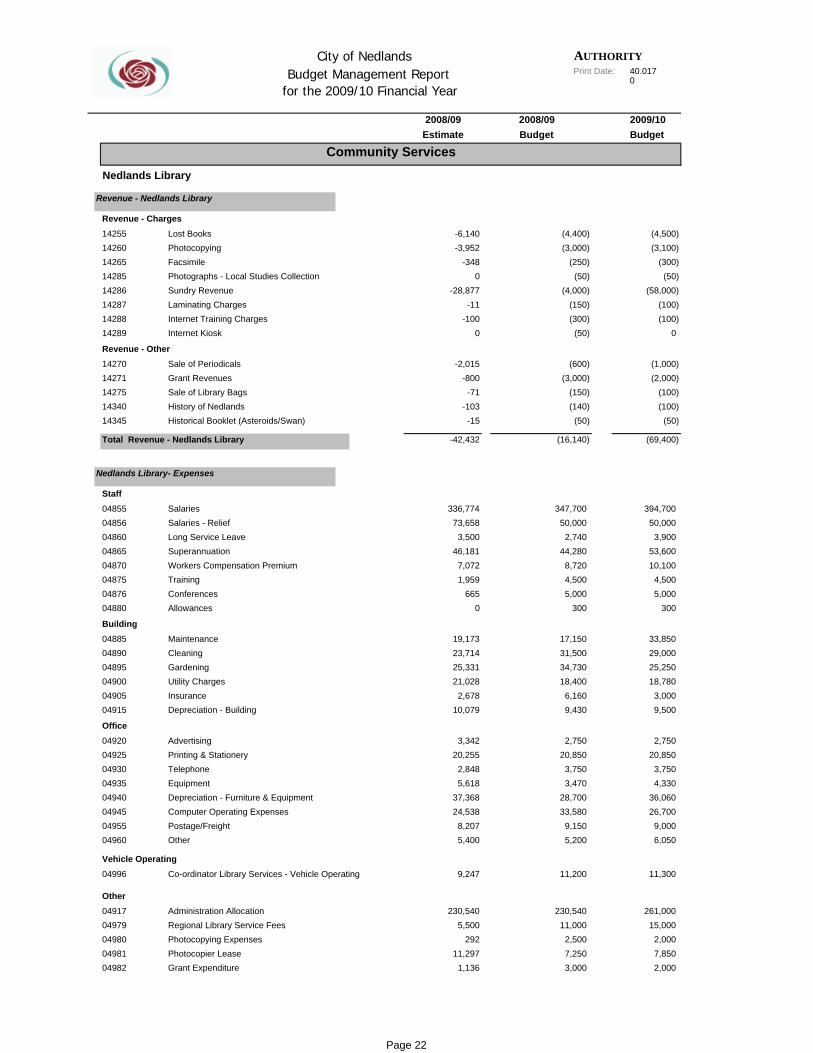
AUTHORITYPrint Date: 40,017
0
City of Nedlands Budget Management Report
for the 2009/10 Financial Year
2008/09 2008/09 2009/10Estimate Budget Budget
14255 -6,14014260 -3,95214265 -34814285 014286 -28,87714287 -1114288 -10014289 0
14270 -2,01514271 -80014275 -7114340 -10314345 -15
-42,432
04855 336,77404856 73,65804860 3,50004865 46,18104870 7,07204875 1,95904876 66504880 0
04885 19,17304890 23,71404895 25,33104900 21,02804905 2,67804915 10,079
04920 3,34204925 20,25504930 2,84804935 5,61804940 37,36804945 24,53804955 8,20704960 5,400
04996 9,247
04917 230,54004979 5,50004980 29204981 11,29704982 1,136
(58,000)(50)
(300)(3,100)
(69,400)
(50)(100)(100)
(2,000)(1,000)
0(100)
29,00033,850
3005,0004,500
10,10053,600
3,900
4,3303,750
20,8502,750
9,5003,000
18,78025,250
11,300
6,0509,000
26,70036,060
(100)
7,8502,000
15,000261,000
Revenue - ChargesLost Books (4,400)
Community Services
Nedlands Library
Revenue - Nedlands Library
(4,500)Photocopying (3,000)Facsimile (250)Photographs - Local Studies Collection (50)Sundry Revenue (4,000)
Internet Kiosk (50)
Revenue - Other
Laminating Charges (150)Internet Training Charges (300)
Sale of Periodicals (600)Grant Revenues (3,000)Sale of Library Bags (150)History of Nedlands (140)Historical Booklet (Asteroids/Swan) (50)
Total Revenue - Nedlands Library (16,140)
Nedlands Library- Expenses
StaffSalaries 347,700 394,700Salaries - Relief 50,000 50,000Long Service Leave 2,740Superannuation 44,280Workers Compensation Premium 8,720Training 4,500
BuildingMaintenance 17,150
Conferences 5,000Allowances 300
Cleaning 31,500Gardening 34,730
Depreciation - Building 9,430
Office
Utility Charges 18,400Insurance 6,160
Advertising 2,750Printing & Stationery 20,850Telephone 3,750Equipment 3,470Depreciation - Furniture & Equipment 28,700Computer Operating Expenses 33,580
Vehicle OperatingCo-ordinator Library Services - Vehicle Operating 11,200
Postage/Freight 9,150Other 5,200
OtherAdministration Allocation 230,540Regional Library Service Fees 11,000Photocopying Expenses 2,500Photocopier Lease 7,250Grant Expenditure 3,000 2,000
Page 22

AUTHORITYPrint Date: 40,017
0
City of Nedlands Budget Management Report
for the 2009/10 Financial Year
2008/09 2008/09 2009/10Estimate Budget Budget
04985 3,12904990 52,930
04995 4,75605005 5,14205007 66605008 2505009 3,65605012 005014 98205015 2,640
05019 6,98605020 2,88105023 12,99105024 5,588
1,039,772
997,340
4,0005,030
50,45012,050
1004,500
2001,500
1,085,530
1,154,930
5,0008,5003,0006,000
3,3001,180
Book Repairs & Replacement 6,050
Community ServicesNedlands Library
Local Stock - Resources 50,450
Children's Resources 4,780Promotions 3,990WAMA Benchmarking Consultancy 1,500Library Alarm Monitoring 500Catering 4,500
Library Security 3,000
Local Studies
WESROC Information Project 500Library Volunteer Expenses 1,440
Consultants Fees 8,000Historical Collection 3,000Local Studies Projects 7,500Local History Projects 4,000
Total Nedlands Library- Expenses 1,052,760
TOTAL Operating Expenditure Net 1,036,620
Page 23
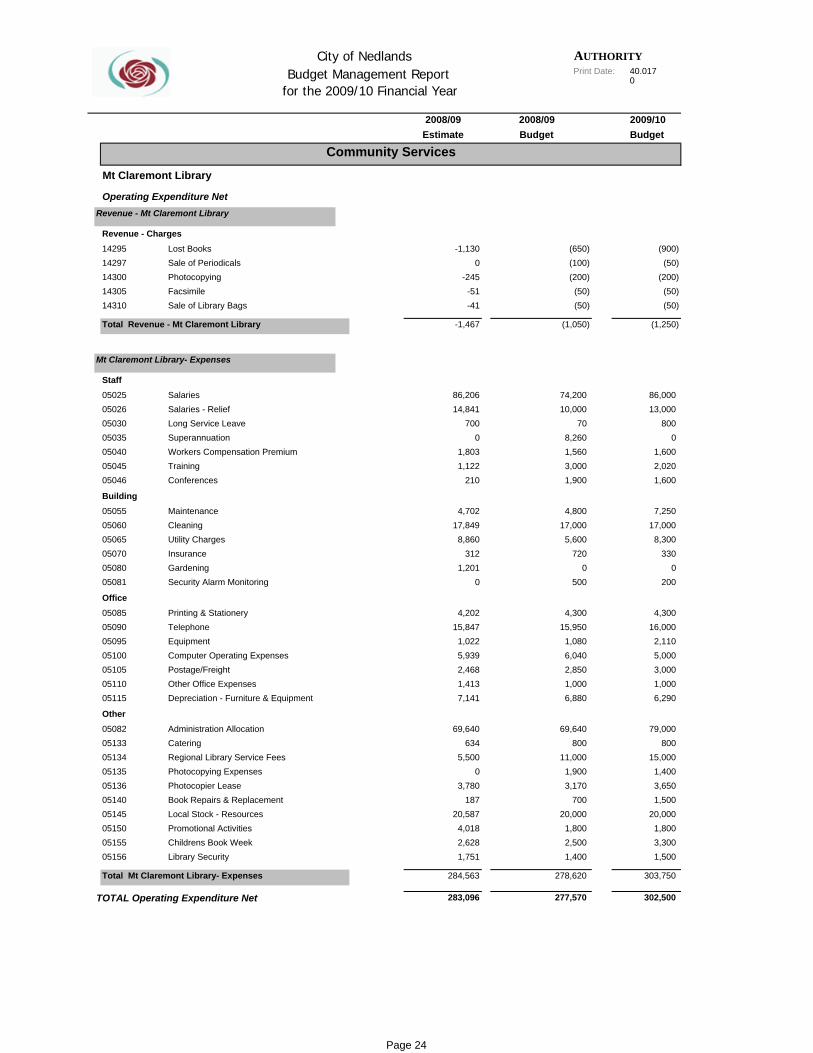
AUTHORITYPrint Date: 40,017
0
City of Nedlands Budget Management Report
for the 2009/10 Financial Year
2008/09 2008/09 2009/10Estimate Budget Budget
14295 -1,13014297 014300 -24514305 -5114310 -41
-1,467
05025 86,20605026 14,84105030 70005035 005040 1,80305045 1,12205046 210
05055 4,70205060 17,84905065 8,86005070 31205080 1,20105081 0
05085 4,20205090 15,84705095 1,02205100 5,93905105 2,46805110 1,41305115 7,141
05082 69,64005133 63405134 5,50005135 005136 3,78005140 18705145 20,58705150 4,01805155 2,62805156 1,751
284,563
283,096
0800
13,00086,000
(1,250)
(50)(50)
(200)(50)
7,250
1,6002,0201,600
5,0002,110
16,0004,300
2000
3308,300
17,000
3,6501,400
15,000800
79,000
6,2901,0003,000
Revenue - ChargesLost Books (650)
Community Services
Mt Claremont Library
Operating Expenditure NetRevenue - Mt Claremont Library
(900)Sale of Periodicals (100)Photocopying (200)Facsimile (50)Sale of Library Bags (50)
StaffSalaries 74,200
Total Revenue - Mt Claremont Library (1,050)
Mt Claremont Library- Expenses
Salaries - Relief 10,000Long Service Leave 70Superannuation 8,260Workers Compensation Premium 1,560
BuildingMaintenance 4,800
Training 3,000Conferences 1,900
Cleaning 17,000Utility Charges 5,600
Security Alarm Monitoring 500
Office
Insurance 720Gardening 0
Printing & Stationery 4,300Telephone 15,950Equipment 1,080Computer Operating Expenses 6,040
Depreciation - Furniture & Equipment 6,880
Other
Postage/Freight 2,850Other Office Expenses 1,000
Administration Allocation 69,640Catering 800Regional Library Service Fees 11,000Photocopying Expenses 1,900Photocopier Lease 3,170Book Repairs & Replacement 700
TOTAL Operating Expenditure Net 277,570
Childrens Book Week 2,500Library Security 1,400
1,80020,000
1,500
Total Mt Claremont Library- Expenses 278,620
Local Stock - Resources 20,000Promotional Activities 1,800
302,500
303,750
1,5003,300
Page 24
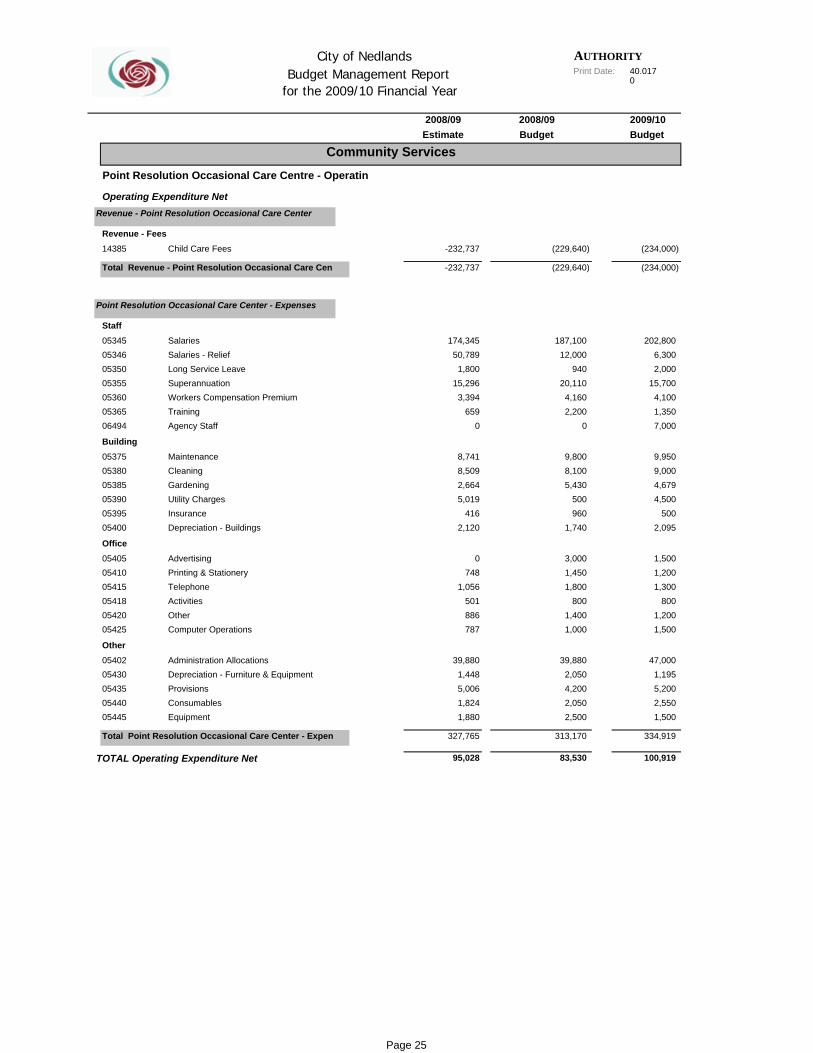
AUTHORITYPrint Date: 40,017
0
City of Nedlands Budget Management Report
for the 2009/10 Financial Year
2008/09 2008/09 2009/10Estimate Budget Budget
14385 -232,737
-232,737
05345 174,34505346 50,78905350 1,80005355 15,29605360 3,39405365 65906494 0
05375 8,74105380 8,50905385 2,66405390 5,01905395 41605400 2,120
05405 005410 74805415 1,05605418 50105420 88605425 787
05402 39,88005430 1,44805435 5,00605440 1,82405445 1,880
327,765
95,028
2,0006,300
202,800
(234,000)
7,0001,3504,100
15,700
4,5004,6799,0009,950
1,2001,500
2,095500
2,5505,2001,195
47,000
1,5001,200
8001,300
100,919
334,919
1,500
Revenue - FeesChild Care Fees (229,640)
Community Services
Point Resolution Occasional Care Centre - Operatin
Operating Expenditure NetRevenue - Point Resolution Occasional Care Center
(234,000)
StaffSalaries 187,100
Total Revenue - Point Resolution Occasional Care Cen (229,640)
Point Resolution Occasional Care Center - Expenses
Salaries - Relief 12,000Long Service Leave 940Superannuation 20,110Workers Compensation Premium 4,160
BuildingMaintenance 9,800
Training 2,200Agency Staff 0
Cleaning 8,100Gardening 5,430
Depreciation - Buildings 1,740
Office
Utility Charges 500Insurance 960
Advertising 3,000Printing & Stationery 1,450Telephone 1,800Activities 800
OtherAdministration Allocations 39,880
Other 1,400Computer Operations 1,000
Depreciation - Furniture & Equipment 2,050Provisions 4,200Consumables 2,050Equipment 2,500
Total Point Resolution Occasional Care Center - Expen 313,170
TOTAL Operating Expenditure Net 83,530
Page 25
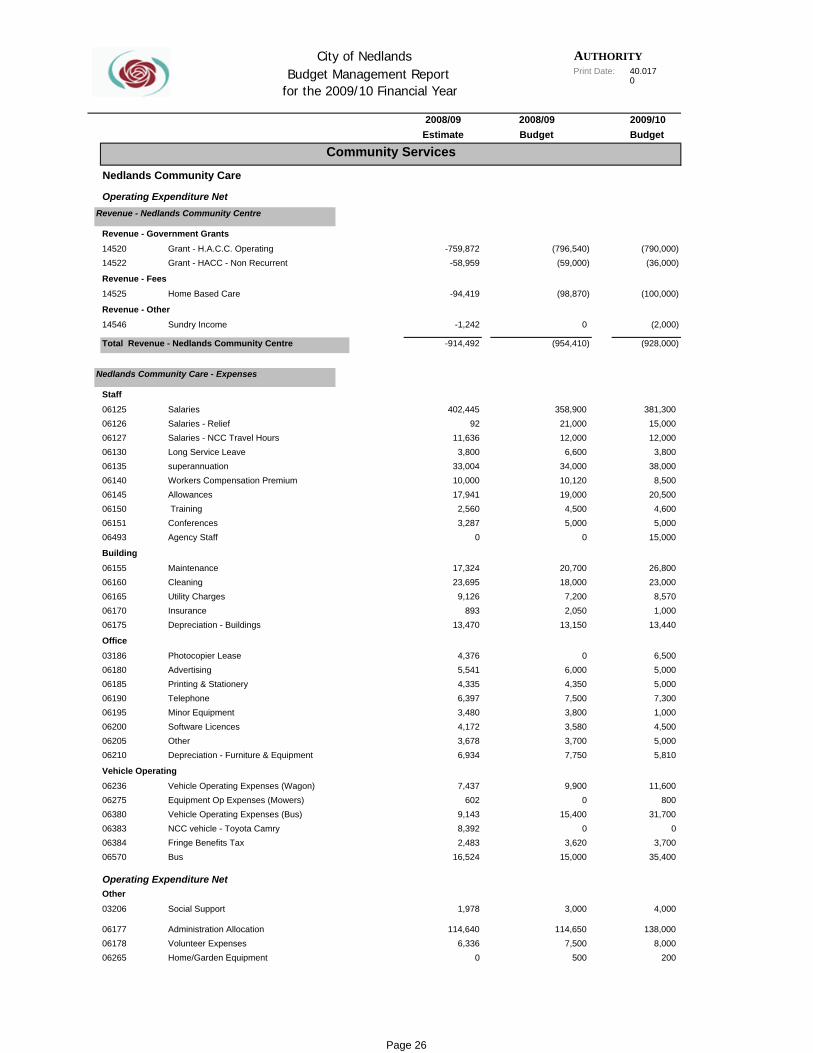
AUTHORITYPrint Date: 40,017
0
City of Nedlands Budget Management Report
for the 2009/10 Financial Year
2008/09 2008/09 2009/10Estimate Budget Budget
14520 -759,87214522 -58,959
14525 -94,419
14546 -1,242
-914,492
06125 402,44506126 9206127 11,63606130 3,80006135 33,00406140 10,00006145 17,94106150 2,56006151 3,28706493 0
06155 17,32406160 23,69506165 9,12606170 89306175 13,470
03186 4,37606180 5,54106185 4,33506190 6,39706195 3,48006200 4,17206205 3,67806210 6,934
06236 7,43706275 60206380 9,14306383 8,39206384 2,48306570 16,524
03206 1,978
06177 114,64006178 6,33606265 0
(790,000)
Community Services
(928,000)
(2,000)
(100,000)
(36,000)
3,80012,00015,000
381,300
4,60020,500
8,50038,000
23,00026,800
15,0005,000
6,500
13,4401,0008,570
80011,600
5,8105,0004,5001,0007,3005,0005,000
Nedlands Community Care
Operating Expenditure NetRevenue - Nedlands Community Centre
Revenue - Government GrantsGrant - H.A.C.C. Operating (796,540)Grant - HACC - Non Recurrent (59,000)
Revenue - OtherSundry Income 0
Revenue - FeesHome Based Care (98,870)
StaffSalaries 358,900
Total Revenue - Nedlands Community Centre (954,410)
Nedlands Community Care - Expenses
Salaries - Relief 21,000Salaries - NCC Travel Hours 12,000Long Service Leave 6,600superannuation 34,000Workers Compensation Premium 10,120Allowances 19,000
Agency Staff 0
Building
Training 4,500Conferences 5,000
Maintenance 20,700Cleaning 18,000
Depreciation - Buildings 13,150
Office
Utility Charges 7,200Insurance 2,050
Photocopier Lease 0Advertising 6,000Printing & Stationery 4,350Telephone 7,500Minor Equipment 3,800Software Licences 3,580
Vehicle OperatingVehicle Operating Expenses (Wagon) 9,900
Other 3,700Depreciation - Furniture & Equipment 7,750
Equipment Op Expenses (Mowers) 0Vehicle Operating Expenses (Bus) 15,400 31,700NCC vehicle - Toyota Camry 0Fringe Benefits Tax 3,620 3,700
0
Bus 15,000 35,400
2008,000
138,000
4,0003,000
Administration Allocation 114,650
OtherSocial Support
Volunteer Expenses 7,500Home/Garden Equipment 500
Operating Expenditure Net
Page 26
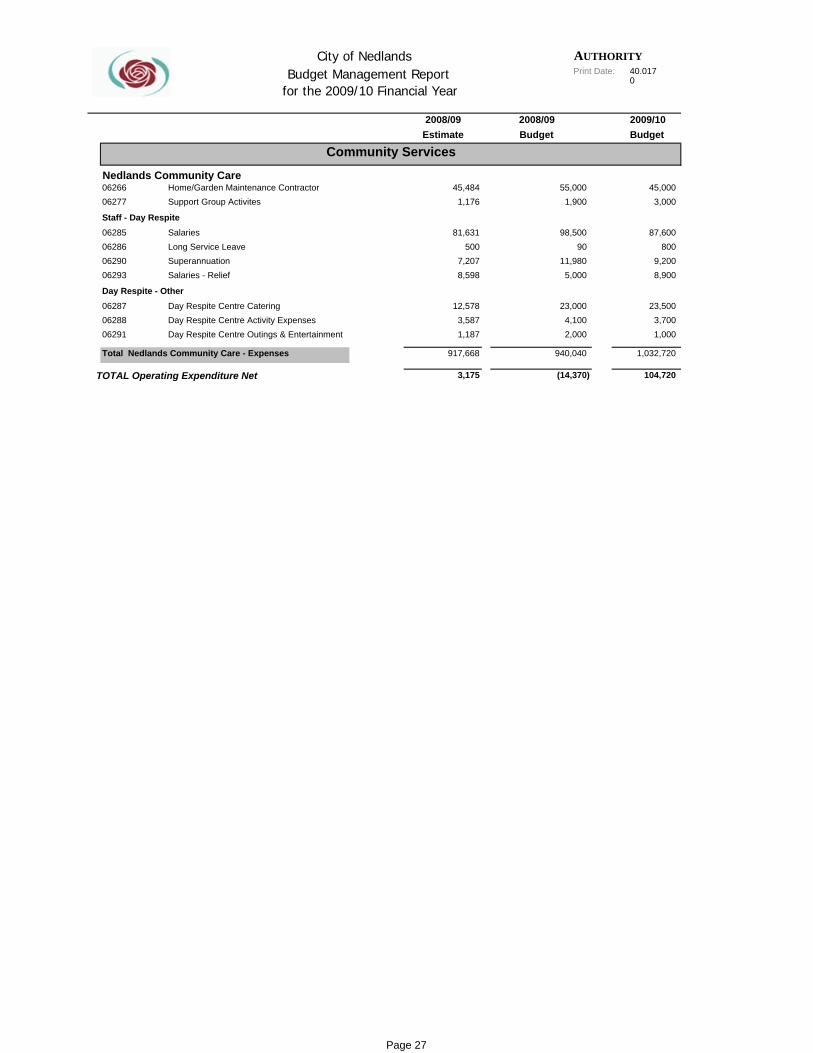
AUTHORITYPrint Date: 40,017
0
City of Nedlands Budget Management Report
for the 2009/10 Financial Year
2008/09 2008/09 2009/10Estimate Budget Budget
06266 45,48406277 1,176
06285 81,63106286 50006290 7,20706293 8,598
06287 12,57806288 3,58706291 1,187
917,668
3,175
80087,600
3,00045,000
3,70023,500
8,9009,200
Staff - Day RespiteSalaries 98,500
Home/Garden Maintenance Contractor 55,000Support Group Activites 1,900
Community Services
Salaries - Relief 5,000
Day Respite - Other
Long Service Leave 90Superannuation 11,980
Day Respite Centre Catering 23,000Day Respite Centre Activity Expenses 4,100
104,720TOTAL Operating Expenditure Net (14,370)
Day Respite Centre Outings & Entertainment 2,000
Total Nedlands Community Care - Expenses 940,040 1,032,720
1,000
P 33 f 73
Nedlands Community Care
Page 27
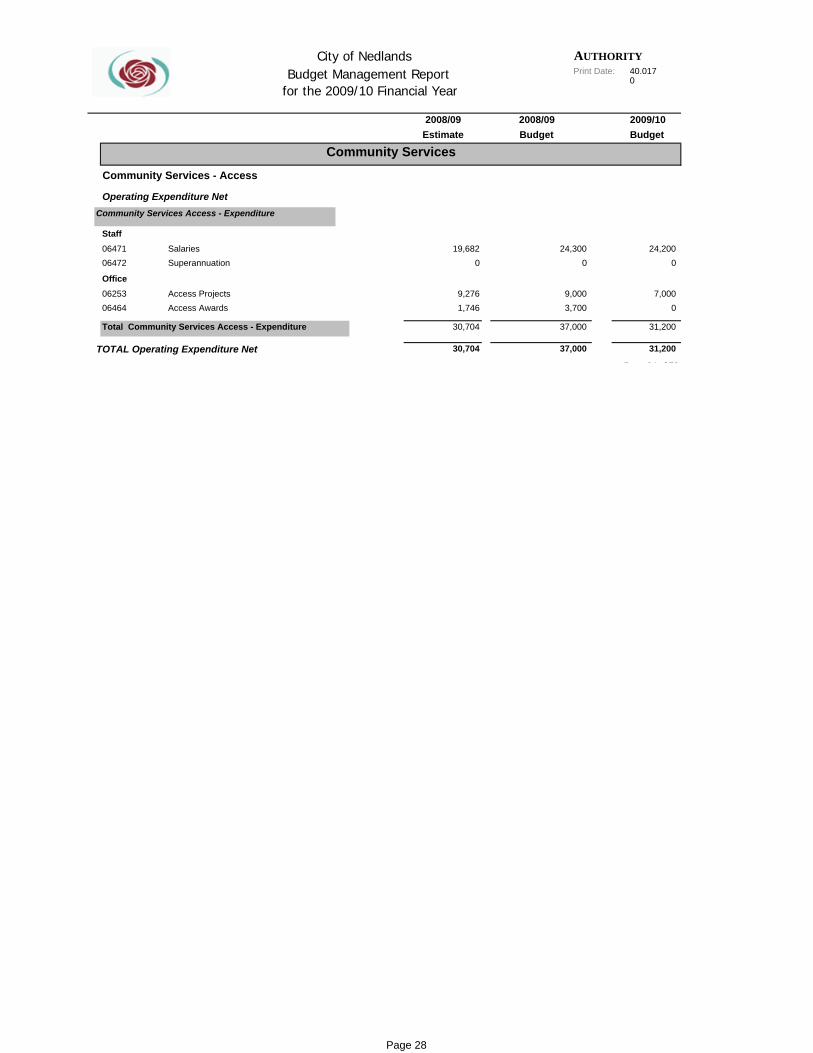
AUTHORITYPrint Date: 40,017
0
City of Nedlands Budget Management Report
for the 2009/10 Financial Year
2008/09 2008/09 2009/10Estimate Budget Budget
06471 19,68206472 0
06253 9,27606464 1,746
30,704
30,704
7,000
024,200
Community Services
SuperannuationSalaries 24,300
31,200
31,200
0
Community Services - Access
Operating Expenditure NetCommunity Services Access - Expenditure
Staff
0
TOTAL Operating Expenditure Net 37,000
Access Awards 3,700
Total Community Services Access - Expenditure 37,000
OfficeAccess Projects 9,000
P 34 f 73
Page 28
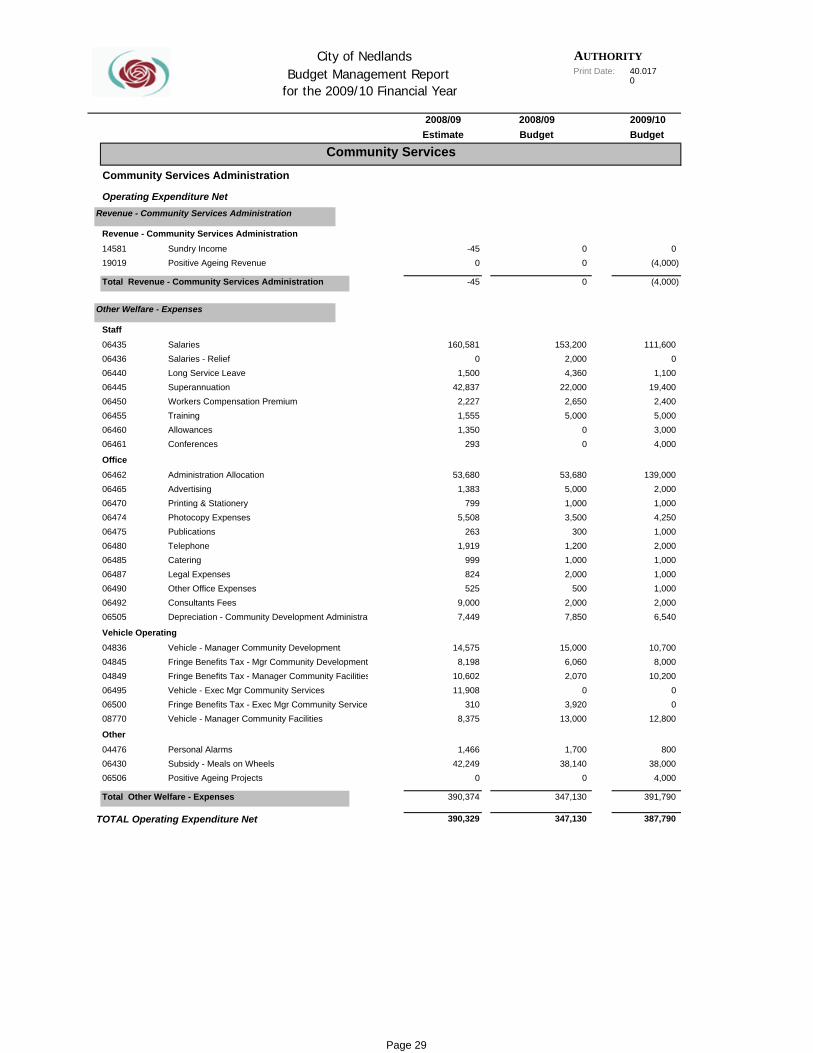
AUTHORITYPrint Date: 40,017
0
City of Nedlands Budget Management Report
for the 2009/10 Financial Year
2008/09 2008/09 2009/10Estimate Budget Budget
14581 -4519019 0
-45
06435 160,58106436 006440 1,50006445 42,83706450 2,22706455 1,55506460 1,35006461 293
06462 53,68006465 1,38306470 79906474 5,50806475 26306480 1,91906485 99906487 82406490 52506492 9,00006505 7,449
04836 14,57504845 8,19804849 10,60206495 11,90806500 31008770 8,375
04476 1,46606430 42,24906506 0
390,374
390,329
4,0003,0005,0002,400
19,4001,100
(4,000)
(4,000)
111,600
1,0001,0002,0001,0004,2501,0002,000
139,000
00
10,2008,000
10,700
6,5402,0001,000
Revenue - Community Services AdministrationSundry Income 0
Community Services
Community Services Administration
Operating Expenditure NetRevenue - Community Services Administration
0Positive Ageing Revenue 0
Total Revenue - Community Services Administration 0
Other Welfare - Expenses
StaffSalaries 153,200Salaries - Relief 2,000 0Long Service Leave 4,360Superannuation 22,000Workers Compensation Premium 2,650Training 5,000
OfficeAdministration Allocation 53,680
Allowances 0Conferences 0
Advertising 5,000Printing & Stationery 1,000Photocopy Expenses 3,500Publications 300Telephone 1,200Catering 1,000Legal Expenses 2,000Other Office Expenses 500
Vehicle OperatingVehicle - Manager Community Development 15,000
Consultants Fees 2,000Depreciation - Community Development Administrat 7,850
Fringe Benefits Tax - Mgr Community Development 6,060Fringe Benefits Tax - Manager Community Facilities 2,070
13,000
Other
Vehicle - Exec Mgr Community Services 0Fringe Benefits Tax - Exec Mgr Community Services 3,920
12,800
Positive Ageing Projects 0
Total Other Welfare - Expenses 347,130
Personal Alarms 1,700Subsidy - Meals on Wheels 38,140
Vehicle - Manager Community Facilities
38,000800
TOTAL Operating Expenditure Net 347,130 387,790
391,790
4,000
Page 29
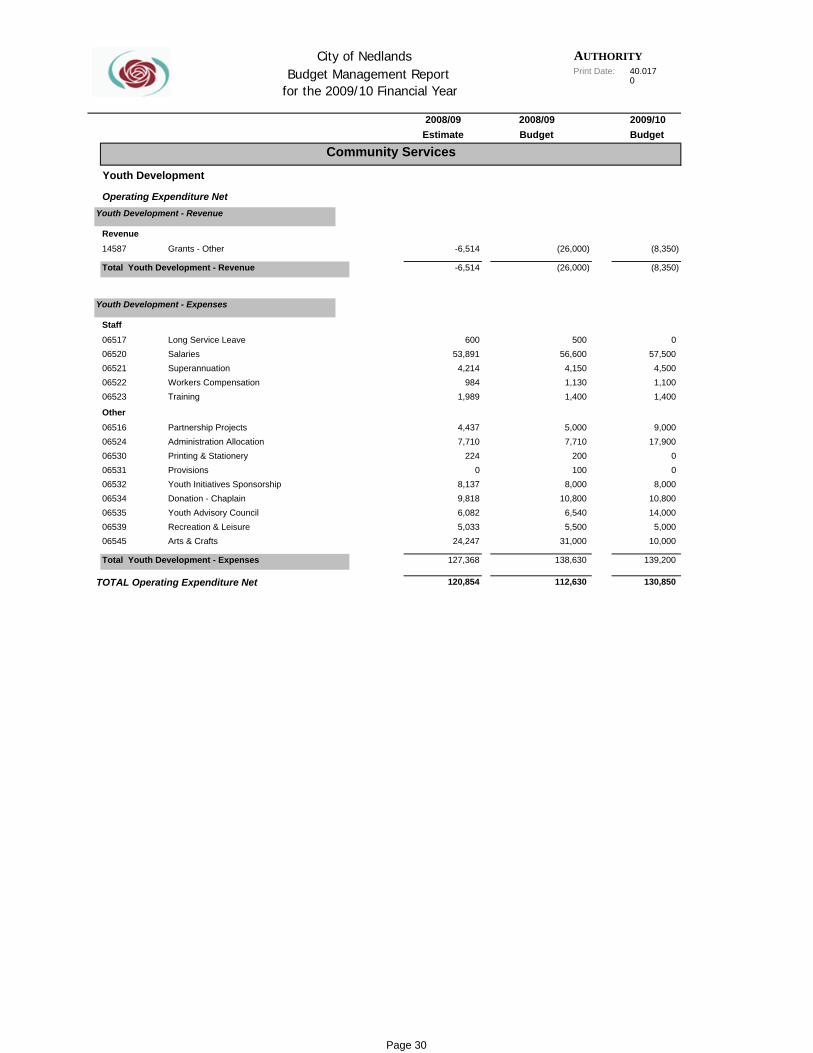
AUTHORITYPrint Date: 40,017
0
City of Nedlands Budget Management Report
for the 2009/10 Financial Year
2008/09 2008/09 2009/10Estimate Budget Budget
14587 -6,514
-6,514
06517 60006520 53,89106521 4,21406522 98406523 1,989
06516 4,43706524 7,71006530 22406531 006532 8,13706534 9,81806535 6,08206539 5,03306545 24,247
127,368
120,854
57,5000
(8,350)
(8,350)
9,000
1,4001,1004,500
10,0005,000
14,00010,800
8,00000
17,900
RevenueGrants - Other (26,000)
Community Services
Youth Development
Operating Expenditure NetYouth Development - Revenue
StaffLong Service Leave 500
Total Youth Development - Revenue (26,000)
Youth Development - Expenses
Salaries 56,600Superannuation 4,150
OtherPartnership Projects 5,000
Workers Compensation 1,130Training 1,400
Administration Allocation 7,710Printing & Stationery 200Provisions 100Youth Initiatives Sponsorship 8,000Donation - Chaplain 10,800Youth Advisory Council 6,540Recreation & Leisure 5,500Arts & Crafts 31,000
Total Youth Development - Expenses 138,630
TOTAL Operating Expenditure Net 112,630 130,850
139,200
Page 30

AUTHORITYPrint Date: 40,017
0
City of Nedlands Budget Management Report
for the 2009/10 Financial Year
2008/09 2008/09 2009/10Estimate Budget Budget
14597 -11,689
-11,689
06540 71,92506541 6,63506542 1,15706544 81706547 006575 917
03187 57206555 26,99006557 46606558 19606559 006560 006561 4,09206562 006563 1,61106564 76506565 28506566 2,04306568 2,35206572 1,227
122,052
110,363
(26,000)
(26,000)
Community Services
0200400
27,500
Volunteers - Expenses
700
3,0001,200
820
Grant Funding (20,000)
Total Revenue - Volunteers (20,000)
Volunteer Service
Operating Expenditure NetRevenue - Volunteers
Revenue - Volunteers
StaffSalaries 73,000 92,500Superannuation 5,730 9,000Workers Compensation Premium 1,290 1,800Training 1,200
OfficePhotocopier Lease 0
Salaries - Relief 2,400Conferences - Volunteer Services 5,400
Administration Allocation 26,990Printing & Stationery 1,840Telephone 240Equipment 300Computer Operations 0Advertising 2,800Promotions 650Other 1,440
Insurance 0
Volunteer Training 300Volunteer Travel 350
1,300500
TOTAL Operating Expenditure Net 108,380
Depreciation - Furniture & Equipment 1,010
Total Volunteers - Expenses 128,380
Volunteer Catering 3,440450500
1,0050
2,800
120,805
146,805
1,2301,900
Page 31
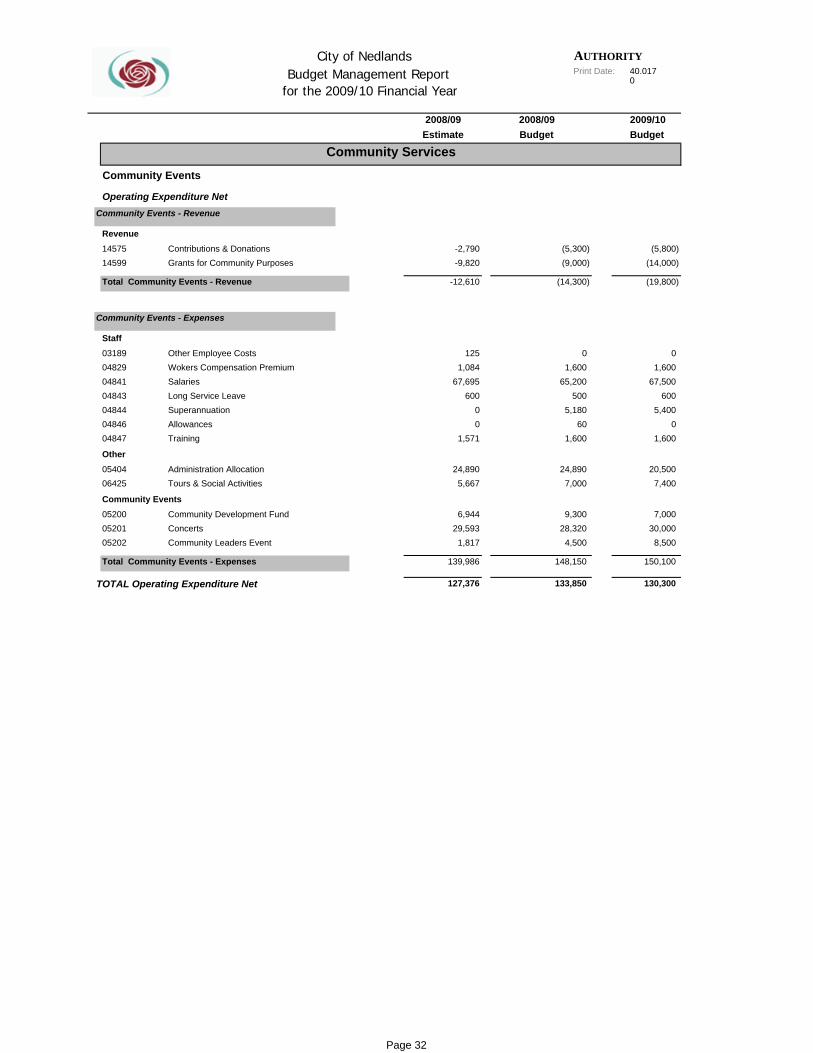
AUTHORITYPrint Date: 40,017
0
City of Nedlands Budget Management Report
for the 2009/10 Financial Year
2008/09 2008/09 2009/10Estimate Budget Budget
14575 -2,79014599 -9,820
-12,610
03189 12504829 1,08404841 67,69504843 60004844 004846 004847 1,571
05404 24,89006425 5,667
05200 6,94405201 29,59305202 1,817
139,986
127,376
RevenueContributions & Donations (5,300)
Community Services
Community Events
Operating Expenditure NetCommunity Events - Revenue
Grants for Community Purposes (9,000)
Total Community Events - Revenue (14,300)
Wokers Compensation Premium 1,600 1,600
Community Events - Expenses
StaffOther Employee Costs 0
Salaries 65,200Long Service Leave 500Superannuation 5,180Allowances 60
24,890Tours & Social Activities 7,000
Training 1,600
Other
Total Community Events - Expenses 148,150
TOTAL Operating Expenditure Net 133,850
Concerts 28,320Community Leaders Event 4,500
Community Events
(14,000)(5,800)
Community Development Fund 9,300
Administration Allocation
5,400600
67,500
(19,800)
0
0
7,000
7,40020,500
1,600
130,300
150,100
8,50030,000
Page 32

AUTHORITYPrint Date: 40,017
0
City of Nedlands Budget Management Report
for the 2009/10 Financial Year
2008/09 2008/09 2009/10Estimate Budget Budget
01224 1,000
01531 58,26701533 70001534 001536 97101538 69501846 8,945
01491 11,48101494 001495 20,94901498 44,52008904 1,204
148,735
148,735
Community Services
Corporate Support & Media
Operating Expenditure NetCorporate Support & Media - Expenses
Media Liason - StaffSalaries 58,200
Corporate Support & Media - StaffTraining 1,000
Long Service Leave 1,500Superannuation 6,100
Consultancy 15,000
Other Expenses
Workers Compensation 1,300Training 1,000
Post Column 40,000
Communications Strategy 12,400Customer Needs Survey 0
TOTAL Operating Expenditure Net 160,300 159,700
Hampden Road Banners Maintenance 6,000
Total Corporate Support & Media - Expenses 160,300
Public Relations 17,800
6,300600
57,700
0
12,000
10,0001,0001,100
6,00020,00015,00030,000
159,700
Page 33
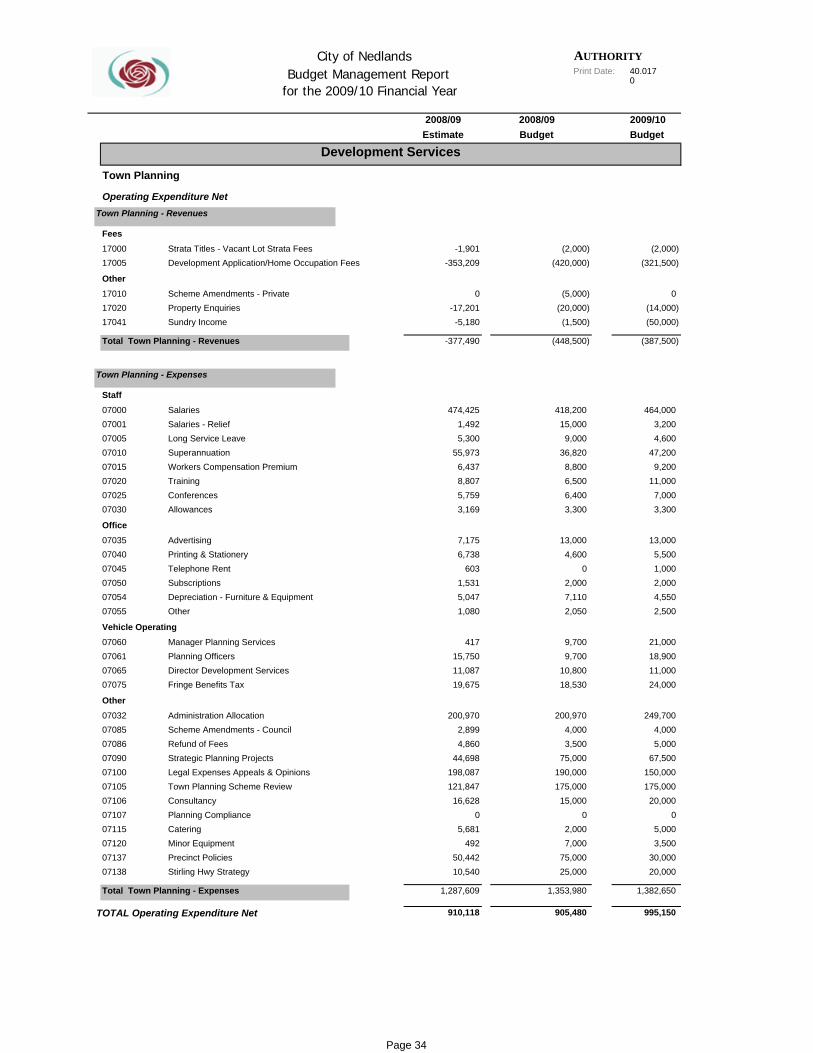
AUTHORITYPrint Date: 40,017
0
City of Nedlands Budget Management Report
for the 2009/10 Financial Year
2008/09 2008/09 2009/10Estimate Budget Budget
17000 -1,90117005 -353,209
17010 017020 -17,20117041 -5,180
-377,490
07000 474,42507001 1,49207005 5,30007010 55,97307015 6,43707020 8,80707025 5,75907030 3,169
07035 7,17507040 6,73807045 60307050 1,53107054 5,04707055 1,080
07060 41707061 15,75007065 11,08707075 19,675
07032 200,97007085 2,89907086 4,86007090 44,69807100 198,08707105 121,84707106 16,62807107 007115 5,68107120 49207137 50,44207138 10,540
1,287,609
910,118
0
(321,500)(2,000)
Development Services
Town Planning
Operating Expenditure NetTown Planning - Revenues
Development Application/Home Occupation Fees (420,000)
Other
FeesStrata Titles - Vacant Lot Strata Fees (2,000)
Scheme Amendments - Private (5,000)Property Enquiries (20,000)Sundry Income (1,500)
Total Town Planning - Revenues (448,500)
Town Planning - Expenses
StaffSalaries 418,200 464,000Salaries - Relief 15,000 3,200Long Service Leave 9,000Superannuation 36,820Workers Compensation Premium 8,800Training 6,500
OfficeAdvertising 13,000
Conferences 6,400Allowances 3,300
Printing & Stationery 4,600Telephone Rent 0
Other 2,050
Vehicle Operating
Subscriptions 2,000Depreciation - Furniture & Equipment 7,110
Manager Planning Services 9,700Planning Officers 9,700
OtherAdministration Allocation 200,970
Director Development Services 10,800Fringe Benefits Tax 18,530
Scheme Amendments - Council 4,000Refund of Fees 3,500
(14,000)
Stirling Hwy Strategy 25,000
Total Town Planning - Expenses 1,353,980
Minor Equipment 7,000Precinct Policies 75,000
Planning Compliance
(387,500)
(50,000)
TOTAL Operating Expenditure Net 905,480 995,150
0Catering 2,000
Town Planning Scheme Review 175,000
11,0009,200
47,2004,600
5,50013,000
3,3007,000
2,5004,5502,0001,000
18,90021,000
Consultancy 15,000
Strategic Planning Projects 75,000Legal Expenses Appeals & Opinions 190,000
24,00011,000
67,5005,0004,000
249,700
175,000150,000
3,5005,000
020,000
20,00030,000
1,382,650
Page 34
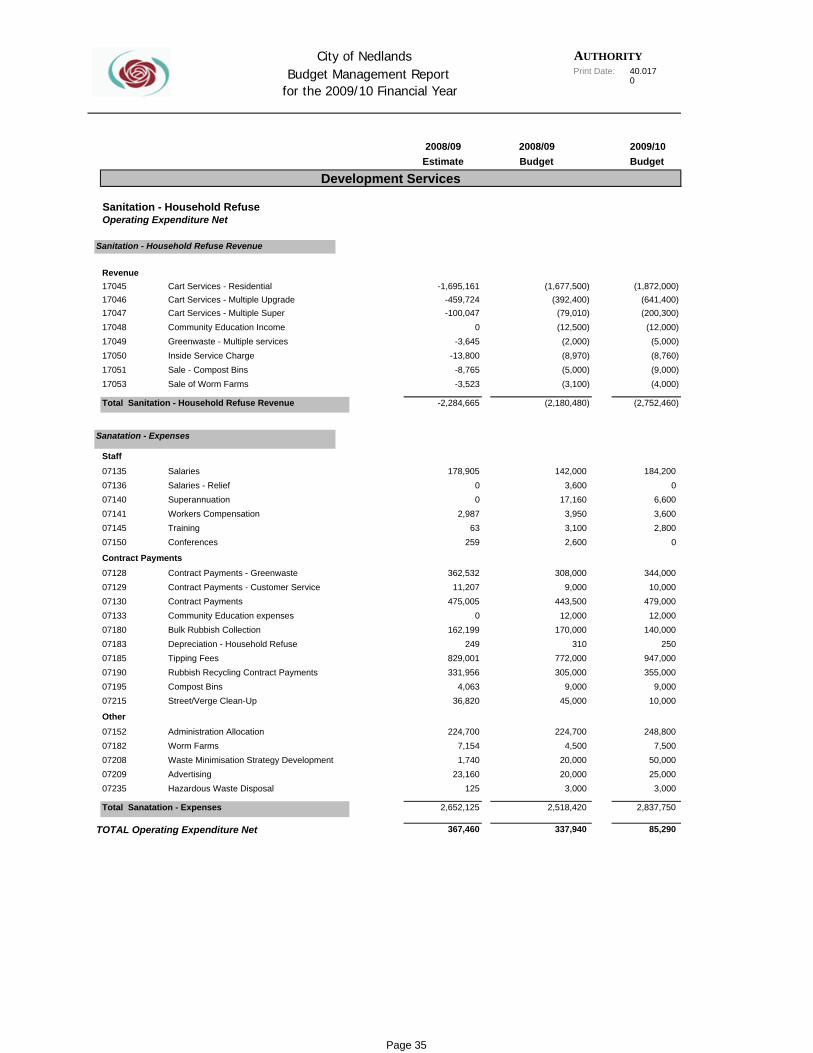
AUTHORITYPrint Date: 40,017
0
City of Nedlands Budget Management Report
for the 2009/10 Financial Year
2008/09 2008/09 2009/10Estimate Budget Budget
17045 -1,695,16117046 -459,72417047 -100,04717048 017049 -3,64517050 -13,80017051 -8,76517053 -3,523
-2,284,665
07135 178,90507136 007140 007141 2,98707145 6307150 259
07128 362,53207129 11,20707130 475,00507133 007180 162,19907183 24907185 829,00107190 331,95607195 4,06307215 36,820
07152 224,70007182 7,15407208 1,74007209 23,16007235 125
2,652,125
367,460
RevenueCart Services - Residential (1,677,500)
Development Services
Sanitation - Household RefuseOperating Expenditure Net
Sanitation - Household Refuse Revenue
Cart Services - Multiple Upgrade (392,400)Cart Services - Multiple Super (79,010)Community Education Income (12,500)Greenwaste - Multiple services (2,000)Inside Service Charge (8,970)Sale - Compost Bins (5,000)Sale of Worm Farms (3,100)
Total Sanitation - Household Refuse Revenue (2,180,480)
Salaries - Relief 3,600 0
Sanatation - Expenses
StaffSalaries 142,000
Superannuation 17,160Workers Compensation 3,950
Contract PaymentsContract Payments - Greenwaste 308,000
Training 3,100Conferences 2,600
Contract Payments - Customer Service 9,000Contract Payments 443,500Community Education expenses 12,000Bulk Rubbish Collection 170,000Depreciation - Household Refuse 310Tipping Fees 772,000
Street/Verge Clean-Up 45,000
Other
Rubbish Recycling Contract Payments 305,000Compost Bins 9,000
Advertising 20,000
Administration Allocation 224,700Worm Farms 4,500
TOTAL Operating Expenditure Net 337,940
Hazardous Waste Disposal 3,000
Total Sanatation - Expenses 2,518,420
Waste Minimisation Strategy Development 20,000
(200,300)(641,400)
(1,872,000)
(9,000)(8,760)(5,000)
(12,000)
3,6006,600
(2,752,460)
(4,000)
184,200
02,800
10,000344,000
479,000
140,00012,000
50,000
947,000250
10,0009,000
355,000
7,500248,800
85,290
2,837,750
3,00025,000
Page 35

AUTHORITYPrint Date: 40,017
0
City of Nedlands Budget Management Report
for the 2009/10 Financial Year
2008/09 2008/09 2009/10Estimate Budget Budget
17011 017095 -27,86517100 -13,28417106 -11,59117110 -24,81117111 -1,75917112 017113 -137
-79,448
07240 135,93807241 13,31007245 1,50007250 38,78507255 4,14307260 3,67907265 94907275 1,852
07110 10,66707277 102,16007280 2,56507285 35107290 1,78307300 4,86607305 30107310 1,96607311 67507315 8,46407316 72807335 92,91507336 20407357 0
07026 007122 44,55107139 2,483
07320 18,05907325 8,54707330 12,368
07345 2,92407354 2,49707355 11,148
530,377
450,929
RevenuesTravelsmart - Employment Contributions (26,000)
Development Services
Sustainability & Preventitive Services
Operating Expenditure NetSustainability & Preventitive Services - Revenues
Dining Room Licenses (26,000)Other Licenses (5,000)Sundry Income (1,000)Fines & Penalties (1,000)Rat Baiting Revenue (5,000)Foodsafe Merchandise (1,000)Health Service Charge (1,000)
Total Sustainability & Preventitive Services - Revenues (66,000)
Salaries - Relief 9,500 9,500
Sustainability & Preventitive Services - Expenses
StaffSalaries 151,900
Long Service Leave 2,500Superannuation 18,900Workers Compensation Premium 3,100Training 10,000
Office ExpensesSustainability Planning 5,000
Allowances 2,000Conferences 3,200
Administration Allocation 102,160Advertising 5,000Printing & Stationery 1,100Telephone 3,000Legal Expenses 5,000Other 800Minor Equipment 1,000IT Data Integration with Authority 3,000Contaminated Site Monitoring 32,000Health Promotion 1,000Depreciation - Sustainability & Preventive Service 152,550Foodsafe Merchandise 1,000
Travel Smart Study 56,100
Corporate Waste Reduction Programes 22,000
Travel Smart
Analytical Expenses 13,500
Pest Control 5,000Rat Baiting 3,000
Fringe Benefits Tax 10,550
Total Sustainability & Preventitive Services - Expenses 670,160
Pest Control
Manager Sustainable Nedlands 9,700Environmental Health Officer 8,600
Travel Smart Initiatives
TOTAL Operating Expenditure Net 604,160 600,400
28,000
Vehicle Operating Expenses
Superannuation 0
156,800
(26,000)
(5,000)(5,000)(5,000)
(27,000)
(72,100)
(1,000)(1,000)(2,100)
10,0006,800
42,0001,500
149,00021,500
3,2002,000
5,0002,5001,0007,000
17,0003,0001,0001,300
01,000
92,6005,000
10,700
25,00049,000
0
3,0009,500
12,40012,200
672,500
12,000
Page 36
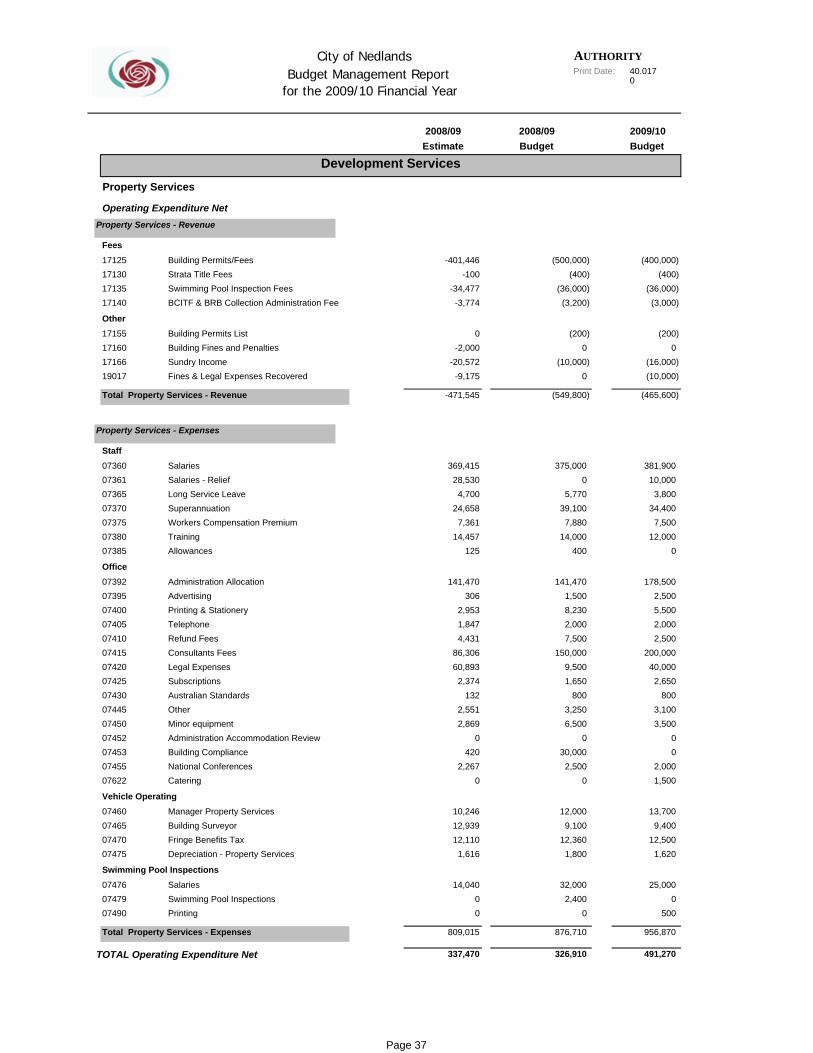
AUTHORITYPrint Date: 40,017
0
City of Nedlands Budget Management Report
for the 2009/10 Financial Year
2008/09 2008/09 2009/10Estimate Budget Budget
17125 -401,44617130 -10017135 -34,47717140 -3,774
17155 017160 -2,00017166 -20,57219017 -9,175
-471,545
07360 369,41507361 28,53007365 4,70007370 24,65807375 7,36107380 14,45707385 125
07392 141,47007395 30607400 2,95307405 1,84707410 4,43107415 86,30607420 60,89307425 2,37407430 13207445 2,55107450 2,86907452 007453 42007455 2,26707622 0
07460 10,24607465 12,93907470 12,11007475 1,616
07476 14,04007479 007490 0
809,015
337,470
P 46 f 73
FeesBuilding Permits/Fees (500,000)
Development Services
Property Services
Operating Expenditure NetProperty Services - Revenue
BCITF & BRB Collection Administration Fee (3,200)
Other
Strata Title Fees (400)Swimming Pool Inspection Fees (36,000)
Building Permits List (200)Building Fines and Penalties 0Sundry Income (10,000)Fines & Legal Expenses Recovered 0
StaffSalaries 375,000
Total Property Services - Revenue (549,800)
Property Services - Expenses
Salaries - Relief 0Long Service Leave 5,770Superannuation 39,100Workers Compensation Premium 7,880
OfficeAdministration Allocation 141,470
Training 14,000Allowances 400
Advertising 1,500Printing & Stationery 8,230Telephone 2,000Refund Fees 7,500Consultants Fees 150,000Legal Expenses 9,500Subscriptions 1,650Australian Standards 800Other 3,250Minor equipment 6,500
Catering 0
Administration Accommodation Review 0Building Compliance 30,000
TOTAL Operating Expenditure Net 326,910
Printing 0
Total Property Services - Expenses 876,710
Salaries 32,000
9,10012,360
12,000
2,400
1,800
5000
25,000
1,620
Swimming Pool Inspections
Depreciation - Property Services
Swimming Pool Inspections
Building SurveyorFringe Benefits Tax
(400)(400,000)
0(200)
(3,000)(36,000)
381,900
(465,600)
(10,000)(16,000)
7,50034,400
3,80010,000
2,500178,500
012,000
2,0005,500
200,0002,500
Vehicle OperatingManager Property Services
National Conferences 2,500
3,100800
2,65040,000
2,00000
3,500
9,40013,700
1,500
12,500
491,270
956,870
Page 37
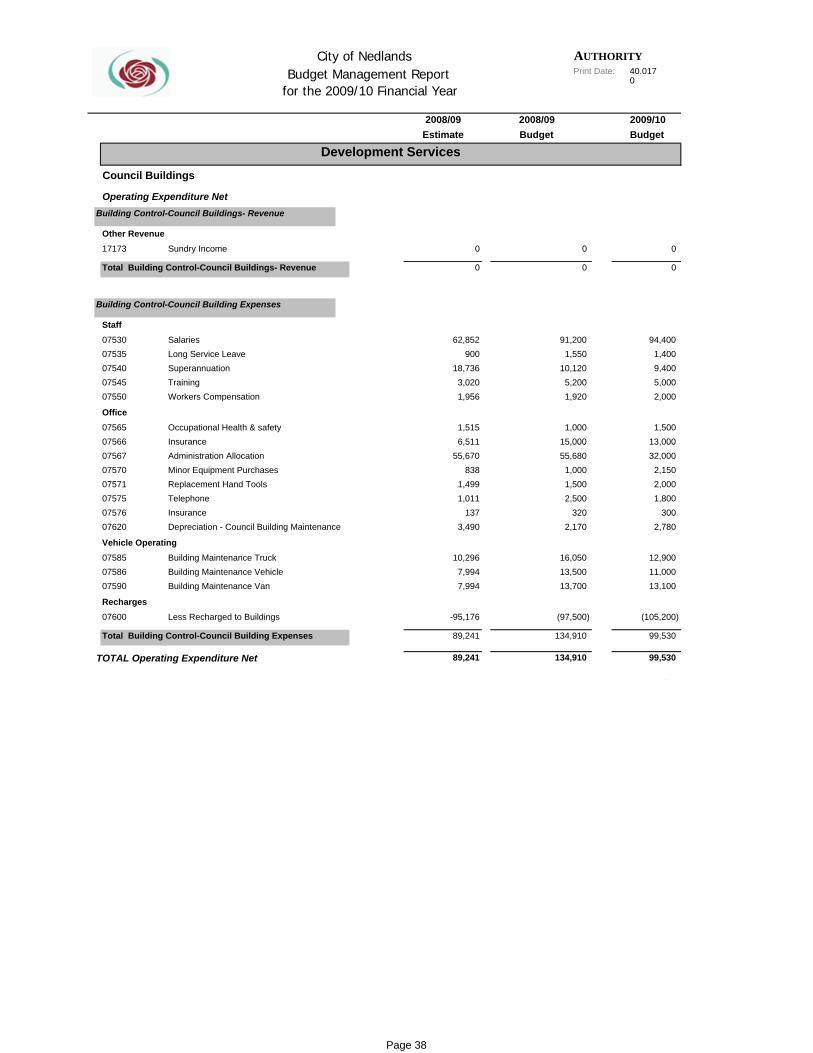
AUTHORITYPrint Date: 40,017
0
City of Nedlands Budget Management Report
for the 2009/10 Financial Year
2008/09 2008/09 2009/10Estimate Budget Budget
17173 0
0
07530 62,85207535 90007540 18,73607545 3,02007550 1,956
07565 1,51507566 6,51107567 55,67007570 83807571 1,49907575 1,01107576 13707620 3,490
07585 10,29607586 7,99407590 7,994
07600 -95,176
89,241
89,241
Council Buildings
Operating Expenditure NetBuilding Control-Council Buildings- Revenue
Other RevenueSundry Income 0
Total Building Control-Council Buildings- Revenue 0
Long Service Leave 1,550
Building Control-Council Building Expenses
StaffSalaries 91,200
Workers Compensation 1,920
Office
Superannuation 10,120Training 5,200
Occupational Health & safety 1,000Insurance 15,000Administration Allocation 55,680Minor Equipment Purchases 1,000Replacement Hand Tools 1,500Telephone 2,500Insurance 320Depreciation - Council Building Maintenance 2,170
Total Building Control-Council Building Expenses 134,910
TOTAL Operating Expenditure Net 134,910
RechargesLess Recharged to Buildings (97,500)
Building Maintenance Vehicle 13,500
P 50 f 73
Building Maintenance Van 13,700
Vehicle OperatingBuilding Maintenance Truck 16,050
94,400
Development Services
0
2,0005,0009,400
0
1,400
2,15032,00013,000
1,500
2,780300
1,8002,000
(105,200)
13,10011,00012,900
99,530
99,530
Page 38

AUTHORITYPrint Date: 40,017
0
City of Nedlands Budget Management Report
for the 2009/10 Financial Year
2008/09 2008/09 2009/10Estimate Budget Budget
14035 -46,38514320 -6,28817185 -7,28017190 -7,00317205 -43,672
-110,628
04220 26404221 1,25104225 5,000
05160 6,70905165 21,83005170 48205175 86005190 13,650
07735 8007738 97
07625 41007630 1,05907635 75007640 116
07665 79007670 18207675 1,56307680 60
07685 1,50207690 26007695 15007700 94
07705 3,88907710 4,37407720 3,16307725 82807730 5,171
07645 1,02307650 2,81607655 1,84007660 173
Rental IncomeTawarri (51,000)
Development Services
Property Management
Operating Expenditure NetProperty Management - Revenues
Gallop House (6,760)11 Sayer Street (7,280)91 Wood Street - Mayo House (9,360)Flats - 67 Stirling Highway (Maisonettes) (39,000)
TawarriBuilding Maintenance 2,250
Total Property Management - Revenues (113,400)
Property Management - Expenses
Gallop HouseMaintenance 2,800
Insurance 2,880Depreciation - Buildings 5,000
Gardening 29,280Utility Charges 200Insurance 2,000Depreciation - Building 13,650
Insurance Premium 220
11 Sayer Street
Tom Fricker HouseMaintenance 500
Building Maintenance 2,750Utility Charges 720
118 Wood StreetBuilding Maintenance 1,800
Depreciation - Buildings 750Insurance Premium 270
Insurance Premium 270
Flat 8a Webster Street (Drabble House)
Utility Charges 180Depreciation - Buildings 1,530
Building Maintenance 1,700Utility Charges 0Depreciation - Buildings 150Insurance Premium 220
Depreciation - Buildings 3,170
Flats - 67 Stirling hwy (Maisonettes)Building Maintenance 4,600
91 Wood Street
Insurance Premium 1,900Agents Commission 0
Utility Charges 3,000
Building Maintenance 1,050Utility Charges 2,600Depreciation - Buildings 1,530Insurance Premium 260
(3,400)(55,000)
(9,500)(7,280)
1,4002,000
(110,180)
(35,000)
53013,000
1,525
5,000
1101,000
19,500950
1,0603,075
150750
1902,350
2601,400
701,540
21,350
110150
4,400
2,175
0900
3,170
1901,8002,970
Page 39
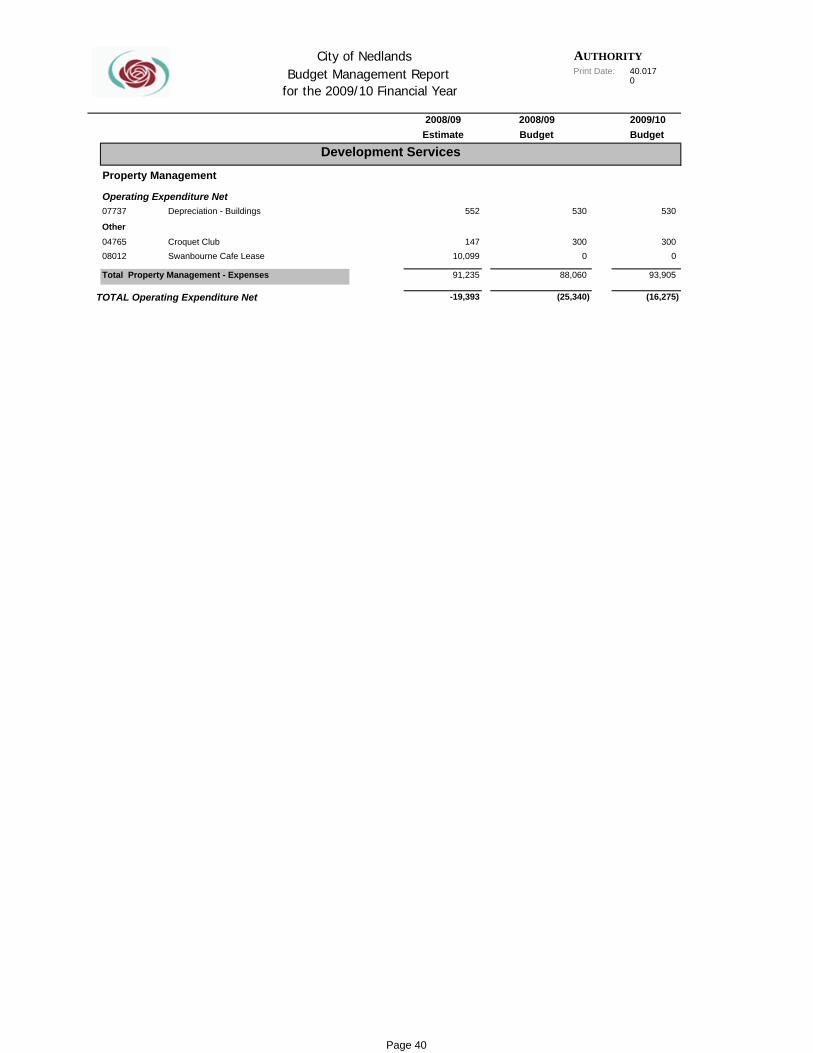
AUTHORITYPrint Date: 40,017
0
City of Nedlands Budget Management Report
for the 2009/10 Financial Year
2008/09 2008/09 2009/10Estimate Budget Budget
07737 552
04765 14708012 10,099
91,235
-19,393
530
Other
Development Services
Total Property Management - Expenses 88,060
TOTAL Operating Expenditure Net (25,340)
Croquet Club 300Swanbourne Cafe Lease 0
Depreciation - Buildings 530
Property Management
Operating Expenditure Net
(16,275)
93,905
0300
Page 40
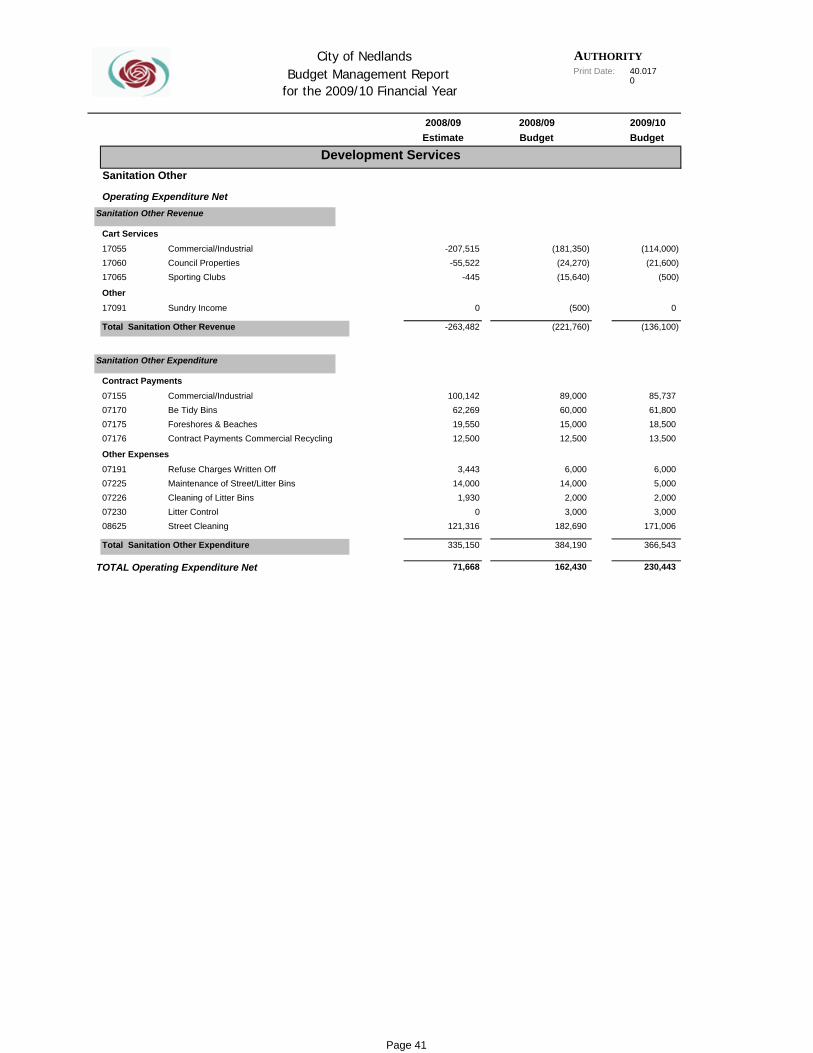
AUTHORITYPrint Date: 40,017
0
City of Nedlands Budget Management Report
for the 2009/10 Financial Year
2008/09 2008/09 2009/10Estimate Budget Budget
17055 -207,51517060 -55,52217065 -445
17091 0
-263,482
07155 100,14207170 62,26907175 19,55007176 12,500
07191 3,44307225 14,00007226 1,93007230 008625 121,316
335,150
71,668
Cart ServicesCommercial/Industrial (181,350)
Sanitation Other
Operating Expenditure NetSanitation Other Revenue
OtherSundry Income (500)
Council Properties (24,270)Sporting Clubs (15,640)
Contract PaymentsCommercial/Industrial 89,000
Total Sanitation Other Revenue (221,760)
Sanitation Other Expenditure
Contract Payments Commercial Recycling 12,500
Other Expenses
Be Tidy Bins 60,000Foreshores & Beaches 15,000
2,000Litter Control 3,000
Refuse Charges Written Off 6,000Maintenance of Street/Litter Bins 14,000
TOTAL Operating Expenditure Net 162,430
Street Cleaning 182,690
Total Sanitation Other Expenditure 384,190
Cleaning of Litter Bins
0
(500)(21,600)
(114,000)
18,50061,80085,737
(136,100)
2,0005,0006,000
13,500
230,443
366,543
171,0063,000
Development Services
Page 41
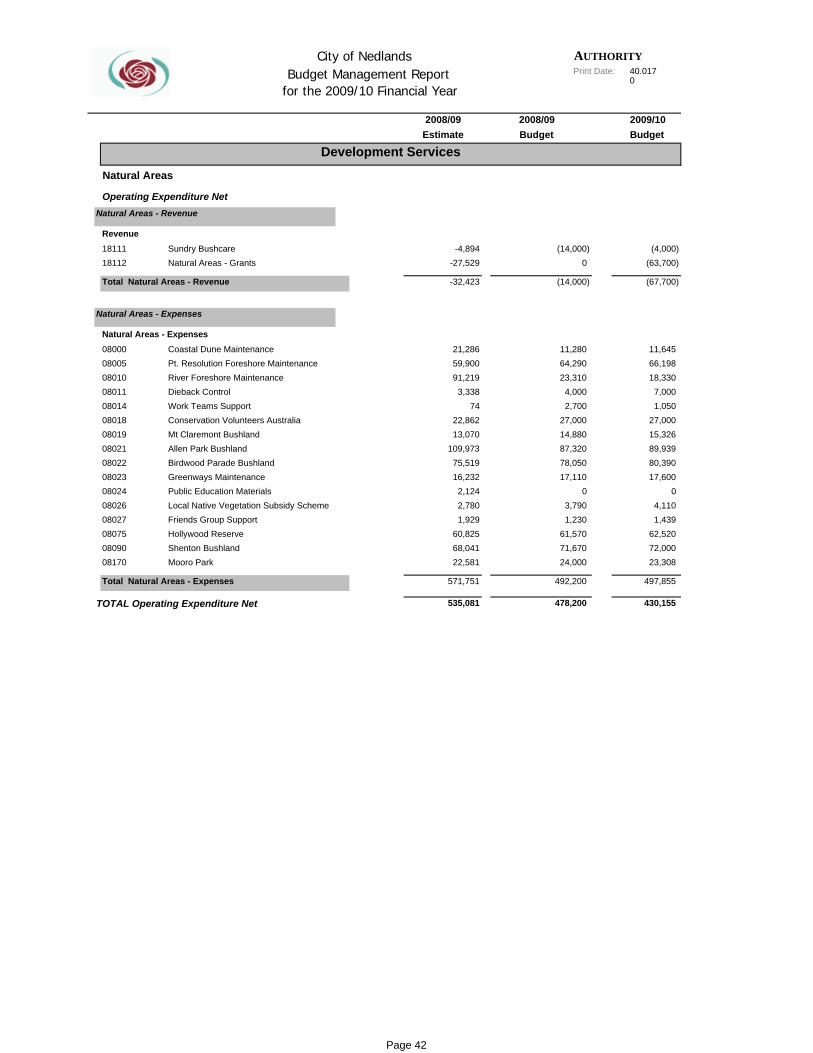
AUTHORITYPrint Date: 40,017
0
City of Nedlands Budget Management Report
for the 2009/10 Financial Year
2008/09 2008/09 2009/10Estimate Budget Budget
18111 -4,89418112 -27,529
-32,423
08000 21,28608005 59,90008010 91,21908011 3,33808014 7408018 22,86208019 13,07008021 109,97308022 75,51908023 16,23208024 2,12408026 2,78008027 1,92908075 60,82508090 68,04108170 22,581
571,751
535,081
Public Education Materials 0
Natural Areas
Operating Expenditure NetNatural Areas - Revenue
RevenueSundry Bushcare (14,000)Natural Areas - Grants 0
Natural Areas - ExpensesCoastal Dune Maintenance 11,280
Total Natural Areas - Revenue (14,000)
Natural Areas - Expenses
Pt. Resolution Foreshore Maintenance 64,290River Foreshore Maintenance 23,310Dieback Control 4,000Work Teams Support 2,700Conservation Volunteers Australia 27,000Mt Claremont Bushland 14,880
Local Native Vegetation Subsidy Scheme 3,790
Allen Park Bushland 87,320Birdwood Parade Bushland 78,050
Total Natural Areas - Expenses 492,200
Shenton Bushland 71,670Mooro Park 24,000
Friends Group Support 1,230
TOTAL Operating Expenditure Net 478,200
Hollywood Reserve 61,570
Greenways Maintenance 17,110
Development Services
(67,700)
(63,700)(4,000)
7,00018,33066,19811,645
89,93915,32627,000
1,050
1,4394,110
17,60080,390
0
497,855
23,30872,00062,520
430,155
Page 42
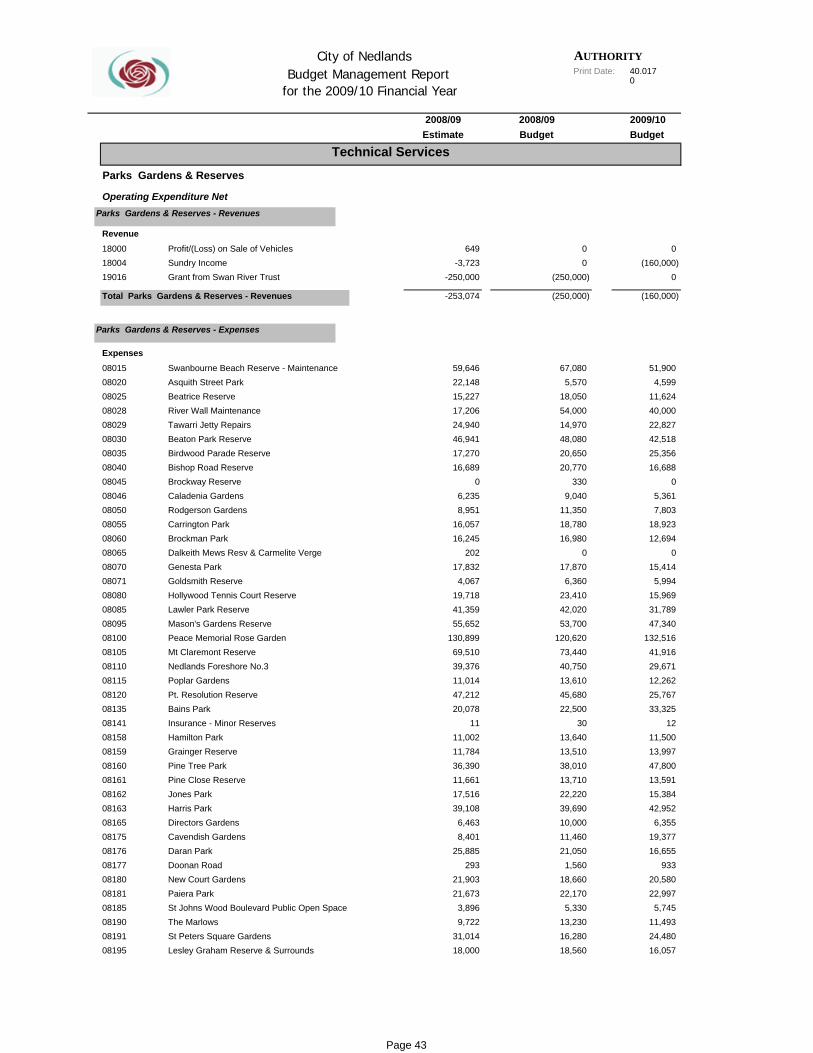
AUTHORITYPrint Date: 40,017
0
City of Nedlands Budget Management Report
for the 2009/10 Financial Year
2008/09 2008/09 2009/10Estimate Budget Budget
18000 64918004 -3,72319016 -250,000
-253,074
08015 59,64608020 22,14808025 15,22708028 17,20608029 24,94008030 46,94108035 17,27008040 16,68908045 008046 6,23508050 8,95108055 16,05708060 16,24508065 20208070 17,83208071 4,06708080 19,71808085 41,35908095 55,65208100 130,89908105 69,51008110 39,37608115 11,01408120 47,21208135 20,07808141 1108158 11,00208159 11,78408160 36,39008161 11,66108162 17,51608163 39,10808165 6,46308175 8,40108176 25,88508177 29308180 21,90308181 21,67308185 3,89608190 9,72208191 31,01408195 18,000
Operating Expenditure NetParks Gardens & Reserves - Revenues
Total Parks Gardens & Reserves - Revenues (250,000)
Sundry Income 0Grant from Swan River Trust (250,000)
RevenueProfit/(Loss) on Sale of Vehicles
Expenses P 58 f 73
Parks Gardens & Reserves - Expenses
0
Technical Services
Parks Gardens & Reserves
Swanbourne Beach Reserve - Maintenance 67,080Asquith Street Park 5,570Beatrice Reserve 18,050River Wall Maintenance 54,000Tawarri Jetty Repairs 14,970Beaton Park Reserve 48,080Birdwood Parade Reserve 20,650Bishop Road Reserve 20,770Brockway Reserve 330Caladenia Gardens 9,040Rodgerson Gardens 11,350Carrington Park 18,780Brockman Park 16,980Dalkeith Mews Resv & Carmelite Verge 0Genesta Park 17,870Goldsmith Reserve 6,360Hollywood Tennis Court Reserve 23,410Lawler Park Reserve 42,020Mason's Gardens Reserve 53,700Peace Memorial Rose Garden 120,620Mt Claremont Reserve 73,440Nedlands Foreshore No.3 40,750Poplar Gardens 13,610Pt. Resolution Reserve 45,680Bains Park 22,500Insurance - Minor Reserves 30Hamilton Park 13,640Grainger Reserve 13,510Pine Tree Park 38,010Pine Close Reserve 13,710Jones Park 22,220Harris Park 39,690Directors Gardens 10,000Cavendish Gardens 11,460Daran Park 21,050Doonan Road 1,560New Court Gardens 18,660Paiera Park 22,170St Johns Wood Boulevard Public Open Space 5,330The Marlows 13,230St Peters Square Gardens 16,280Lesley Graham Reserve & Surrounds 18,560
0(160,000)
0
11,6244,599
51,900
(160,000)
25,35642,51822,82740,000
7,8035,361
016,688
15,4140
12,69418,923
47,34031,78915,969
5,994
12,26229,67141,916
132,516
11,50012
33,32525,767
15,38413,59147,80013,997
16,65519,377
6,35542,952
5,74522,99720,580
933
16,05724,48011,493
Page 43
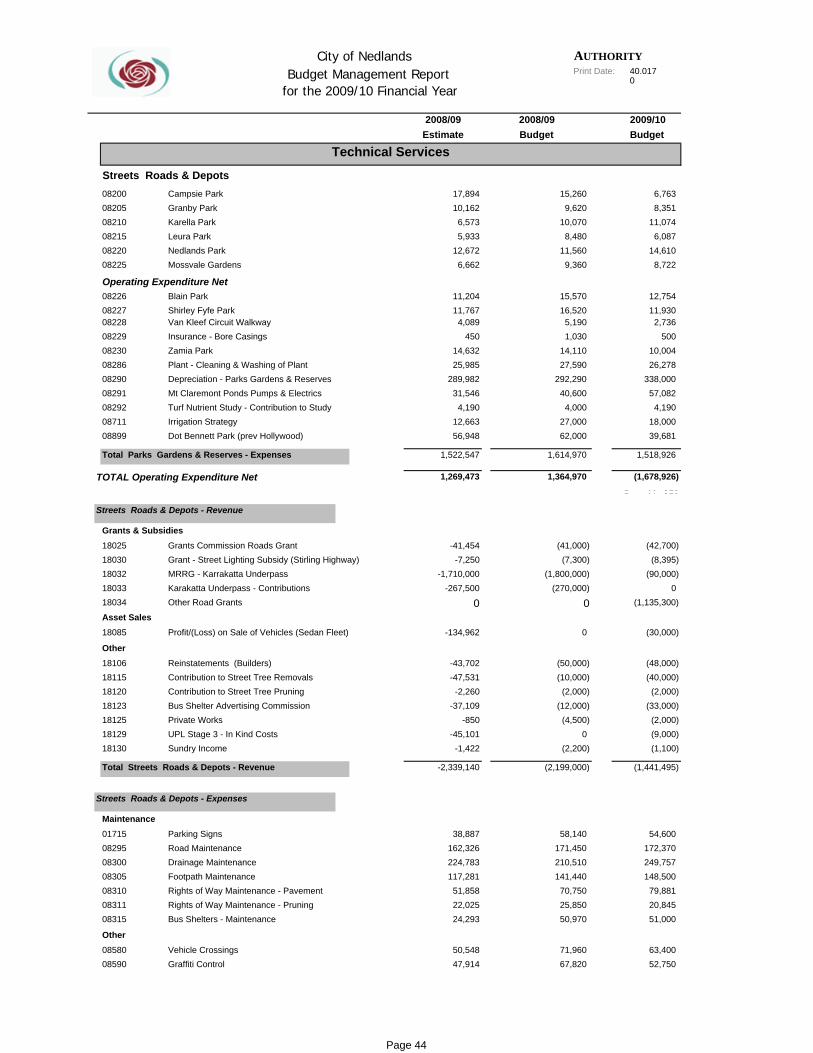
AUTHORITYPrint Date: 40,017
0
City of Nedlands Budget Management Report
for the 2009/10 Financial Year
2008/09 2008/09 2009/10Estimate Budget Budget
08200 17,89408205 10,16208210 6,57308215 5,93308220 12,67208225 6,662
08226 11,20408227 11,76708228 4,08908229 45008230 14,63208286 25,98508290 289,98208291 31,54608292 4,19008711 12,66308899 56,948
1,522,547
1,269,473
18025 -41,45418030 -7,25018032 -1,710,00018033 -267,50018034 Other Road Grants 0 0
18085 -134,962
18106 -43,70218115 -47,53118120 -2,26018123 -37,10918125 -85018129 -45,10118130 -1,422
-2,339,140
01715 38,88708295 162,32608300 224,78308305 117,28108310 51,85808311 22,02508315 24,293
08580 50,54808590 47,914
(1,135,300)
Blain Park 15,570Shirley Fyfe Park 16,520
Nedlands Park 11,560Mossvale Gardens 9,360
Karella Park
5,190 2,736
10,0708,480
15,2609,620
27,590Depreciation - Parks Gardens & Reserves 292,290
Insurance - Bore Casings 1,030Zamia Park 14,110
27,000Dot Bennett Park (prev Hollywood) 62,000
Mt Claremont Ponds Pumps & Electrics 40,600Turf Nutrient Study - Contribution to Study 4,000
P 60 f 73
Total Parks Gardens & Reserves - Expenses 1,614,970
TOTAL Operating Expenditure Net 1,364,970
Irrigation Strategy
6,763
14,6106,087
11,0748,351
500
11,93012,754
8,722
Technical Services
4,19057,082
338,00026,27810,004
P 61 f 73
Streets Roads & Depots
Operating Expenditure Net
Streets Roads & Depots - Revenue
Grants & Subsidies
Plant - Cleaning & Washing of Plant
Van Kleef Circuit Walkway
Leura Park
Campsie ParkGranby Park
Grants Commission Roads Grant (41,000)Grant - Street Lighting Subsidy (Stirling Highway) (7,300)MRRG - Karrakatta Underpass (1,800,000)Karakatta Underpass - Contributions (270,000)
OtherReinstatements (Builders) (50,000)
Asset SalesProfit/(Loss) on Sale of Vehicles (Sedan Fleet) 0
Contribution to Street Tree Removals (10,000)Contribution to Street Tree Pruning (2,000)Bus Shelter Advertising Commission (12,000)Private Works (4,500)UPL Stage 3 - In Kind Costs 0Sundry Income (2,200)
MaintenanceParking Signs 58,140
Total Streets Roads & Depots - Revenue (2,199,000)
Streets Roads & Depots - Expenses
Road Maintenance 171,450Drainage Maintenance 210,510Footpath Maintenance 141,440Rights of Way Maintenance - Pavement 70,750
OtherVehicle Crossings 71,960
Rights of Way Maintenance - Pruning 25,850Bus Shelters - Maintenance 50,970
Graffiti Control 67,820
18,000
1,518,926
39,681
(90,000)(8,395)
(42,700)
(1,678,926)
(40,000)(48,000)
(30,000)
0
(2,000)(33,000)
(1,441,495)
(1,100)(9,000)(2,000)
148,500249,757172,370
54,600
52,75063,400
51,00020,84579,881
Page 44
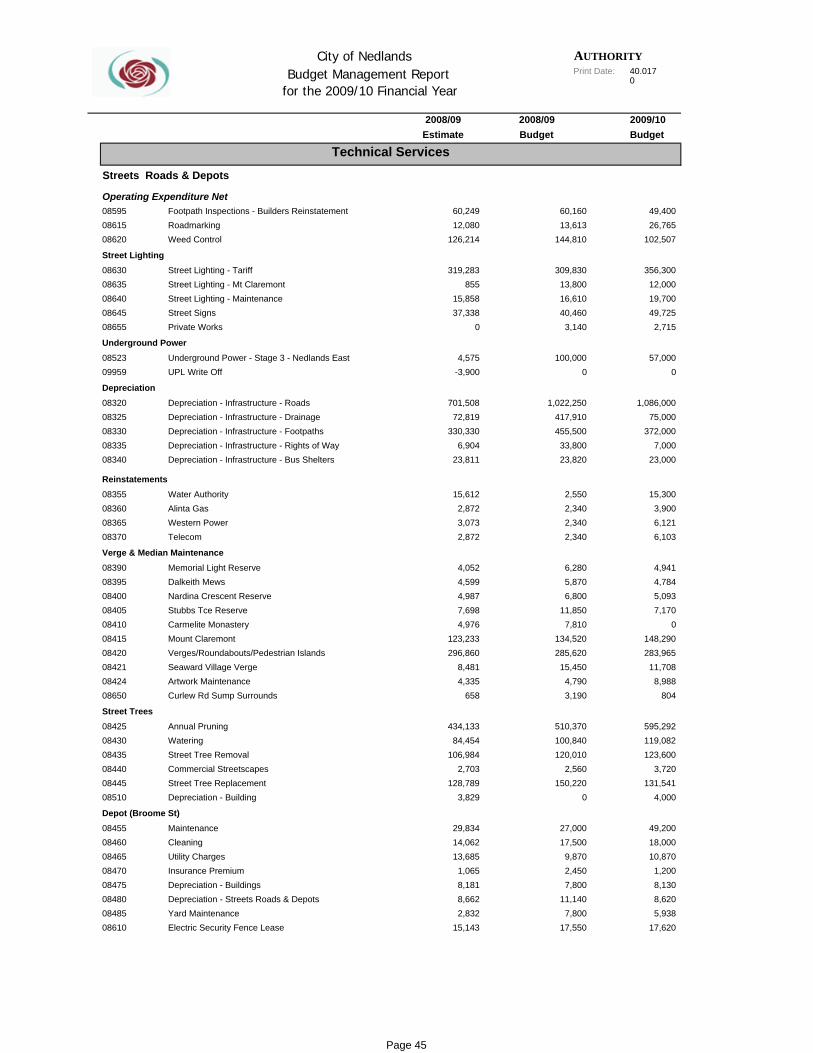
AUTHORITYPrint Date: 40,017
0
City of Nedlands Budget Management Report
for the 2009/10 Financial Year
2008/09 2008/09 2009/10Estimate Budget Budget
08595 60,24908615 12,08008620 126,214
08630 319,28308635 85508640 15,85808645 37,33808655 0
08523 4,57509959 -3,900
08320 701,50808325 72,81908330 330,33008335 6,90408340 23,811
08355 15,61208360 2,87208365 3,07308370 2,872
08390 4,05208395 4,59908400 4,98708405 7,69808410 4,97608415 123,23308420 296,86008421 8,48108424 4,33508650 658
08425 434,13308430 84,45408435 106,98408440 2,70308445 128,78908510 3,829
08455 29,83408460 14,06208465 13,68508470 1,06508475 8,18108480 8,66208485 2,83208610 15,143
Footpath Inspections - Builders Reinstatement 60,160
Street LightingStreet Lighting - Tariff 309,830
Roadmarking 13,613Weed Control 144,810
Street Lighting - Mt Claremont 13,800Street Lighting - Maintenance 16,610Street Signs 40,460Private Works 3,140
Depreciation - Infrastructure - Footpaths 455,500Depreciation - Infrastructure - Rights of Way 33,800
Depreciation - Infrastructure - Roads 1,022,250Depreciation - Infrastructure - Drainage 417,910
UPL Write Off
Depreciation - Infrastructure - Bus Shelters 23,820 23,000
0
Depreciation
Underground PowerUnderground Power - Stage 3 - Nedlands East 100,000
2,550Alinta Gas 2,340
ReinstatementsWater Authority
Verge & Median MaintenanceMemorial Light Reserve 6,280
Western Power 2,340Telecom 2,340
Dalkeith Mews 5,870Nardina Crescent Reserve 6,800Stubbs Tce Reserve 11,850Carmelite Monastery 7,810Mount Claremont 134,520Verges/Roundabouts/Pedestrian Islands 285,620
Curlew Rd Sump Surrounds 3,190
Street Trees
Seaward Village Verge 15,450Artwork Maintenance 4,790
Annual Pruning 510,370Watering 100,840Street Tree Removal 120,010Commercial Streetscapes 2,560
Depot (Broome St)Maintenance 27,000
Street Tree Replacement 150,220Depreciation - Building 0
Cleaning 17,500Utility Charges 9,870Insurance Premium 2,450Depreciation - Buildings 7,800
Electric Security Fence Lease 17,550
Depreciation - Streets Roads & Depots 11,140Yard Maintenance 7,800
102,50726,76549,400
49,72519,70012,000
356,300
1,086,000
057,000
2,715
15,300
7,000372,000
75,000
4,941
6,1036,1213,900
07,1705,0934,784
8,98811,708
283,965148,290
123,600119,082595,292
804
49,200
4,000131,541
3,720
17,6205,9388,6208,1301,200
10,87018,000
Technical Services
Streets Roads & Depots
Operating Expenditure Net
Page 45

AUTHORITYPrint Date: 40,017
0
City of Nedlands Budget Management Report
for the 2009/10 Financial Year
2008/09 2008/09 2009/10Estimate Budget Budget
08316 43608490 3,63208492 83,015
3,873,585
1,534,445
Disposal of Waste Material 75,190
Total Streets Roads & Depots - Expenses 5,082,503
Bus Shelters - Insurance 1,000Maintenance 4,860
TOTAL Operating Expenditure Net 2,883,503 3,397,820
Depot (John 23rd)500
4,839,315
98,0004,620
P 65 f 73
Operating Expenditure Net
Technical Services
Streets Roads & Depots
Page 46
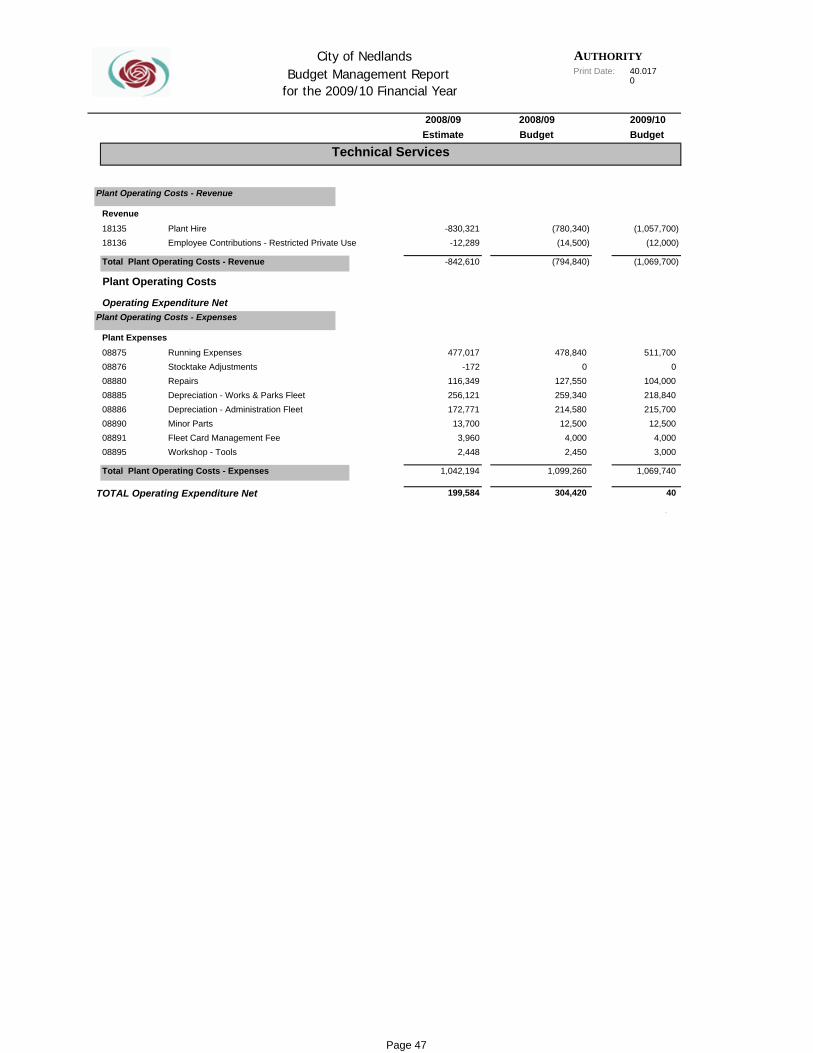
AUTHORITYPrint Date: 40,017
0
City of Nedlands Budget Management Report
for the 2009/10 Financial Year
2008/09 2008/09 2009/10Estimate Budget Budget
18135 -830,32118136 -12,289
-842,610
08875 477,01708876 -17208880 116,34908885 256,12108886 172,77108890 13,70008891 3,96008895 2,448
1,042,194
199,584
(1,057,700)
Technical Services
Plant Hire (780,340)
0511,700
(1,069,700)
(12,000)
12,500215,700218,840104,000
40
1,069,740
3,0004,000
Plant Operating Costs - Revenue
Revenue
Plant ExpensesRunning Expenses 478,840
Total Plant Operating Costs - Revenue (794,840)
Plant Operating Costs - Expenses
Plant Operating Costs
Operating Expenditure Net
Stocktake Adjustments 0Repairs 127,550Depreciation - Works & Parks Fleet 259,340Depreciation - Administration Fleet 214,580Minor Parts 12,500Fleet Card Management Fee 4,000
TOTAL Operating Expenditure Net 304,420
Workshop - Tools 2,450
Total Plant Operating Costs - Expenses 1,099,260
P 66 f 73
Employee Contributions - Restricted Private Use (14,500)
Page 47
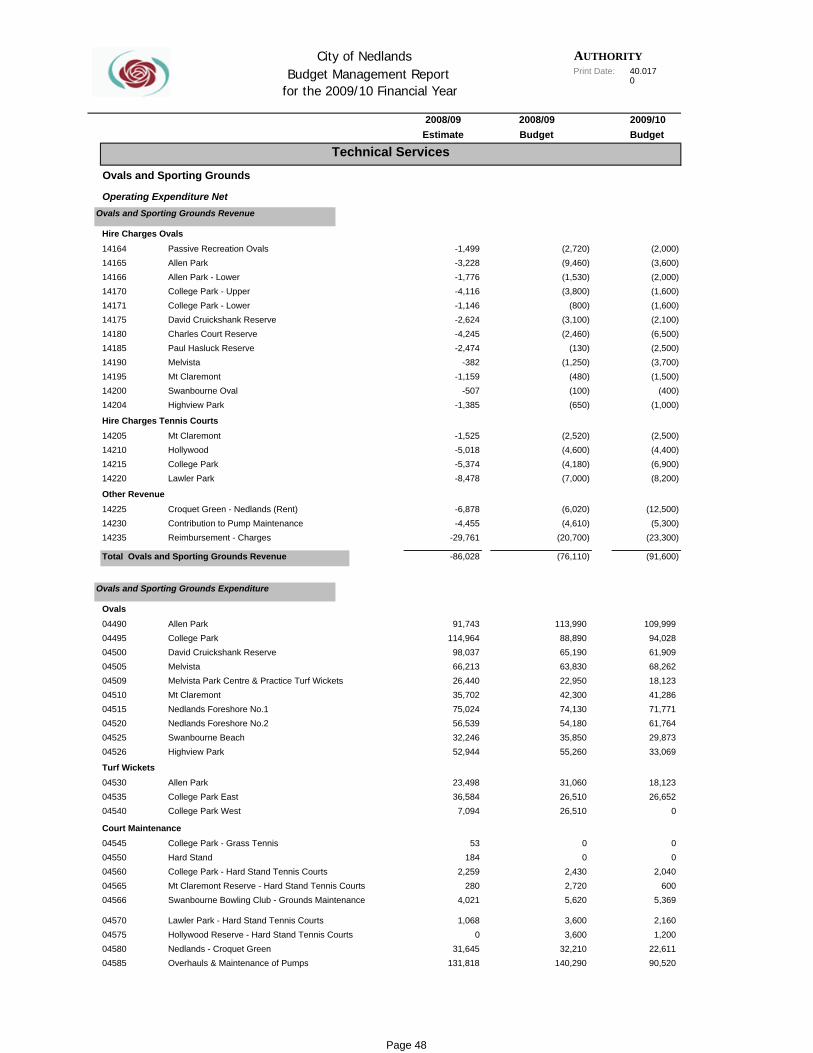
AUTHORITYPrint Date: 40,017
0
City of Nedlands Budget Management Report
for the 2009/10 Financial Year
2008/09 2008/09 2009/10Estimate Budget Budget
14164 -1,49914165 -3,22814166 -1,77614170 -4,11614171 -1,14614175 -2,62414180 -4,24514185 -2,47414190 -38214195 -1,15914200 -50714204 -1,385
14205 -1,52514210 -5,01814215 -5,37414220 -8,478
14225 -6,87814230 -4,45514235 -29,761
-86,028
04490 91,74304495 114,96404500 98,03704505 66,21304509 26,44004510 35,70204515 75,02404520 56,53904525 32,24604526 52,944
04530 23,49804535 36,58404540 7,094
04545 5304550 18404560 2,25904565 28004566 4,021
04570 1,06804575 004580 31,64504585 131,818
(1,600)(2,000)(3,600)(2,000)
(2,500)(6,500)(2,100)(1,600)
(1,000)(400)
(1,500)(3,700)
(8,200)(6,900)(4,400)(2,500)
(91,600)
(23,300)(5,300)
(12,500)
68,26261,90994,028
109,999
61,76471,77141,28618,123
26,65218,123
33,06929,873
2,04000
0
Hire Charges OvalsPassive Recreation Ovals (2,720)
Technical Services
Ovals and Sporting Grounds
Operating Expenditure NetOvals and Sporting Grounds Revenue
Allen Park (9,460)Allen Park - Lower (1,530)College Park - Upper (3,800)College Park - Lower (800)David Cruickshank Reserve (3,100)Charles Court Reserve (2,460)Paul Hasluck Reserve (130)Melvista (1,250)
Highview Park (650)
Hire Charges Tennis Courts
Mt Claremont (480)Swanbourne Oval (100)
Mt Claremont (2,520)Hollywood (4,600)
Other RevenueCroquet Green - Nedlands (Rent) (6,020)
College Park (4,180)Lawler Park (7,000)
Contribution to Pump Maintenance (4,610)Reimbursement - Charges (20,700)
OvalsAllen Park 113,990
Total Ovals and Sporting Grounds Revenue (76,110)
Ovals and Sporting Grounds Expenditure
College Park 88,890David Cruickshank Reserve 65,190Melvista 63,830Melvista Park Centre & Practice Turf Wickets 22,950Mt Claremont 42,300Nedlands Foreshore No.1 74,130
Highview Park 55,260
Turf Wickets
Nedlands Foreshore No.2 54,180Swanbourne Beach 35,850
1,200
College Park West 26,510
Allen Park 31,060College Park East 26,510
2,160
5,369600
90,52022,611
0Hard Stand 0
Mt Claremont Reserve - Hard Stand Tennis Courts 2,720Swanbourne Bowling Club - Grounds Maintenance 5,620
Lawler Park - Hard Stand Tennis Courts 3,600
Court MaintenanceCollege Park - Grass Tennis
College Park - Hard Stand Tennis Courts 2,430
Overhauls & Maintenance of Pumps 140,290
Hollywood Reserve - Hard Stand Tennis Courts 3,600Nedlands - Croquet Green 32,210
Page 48
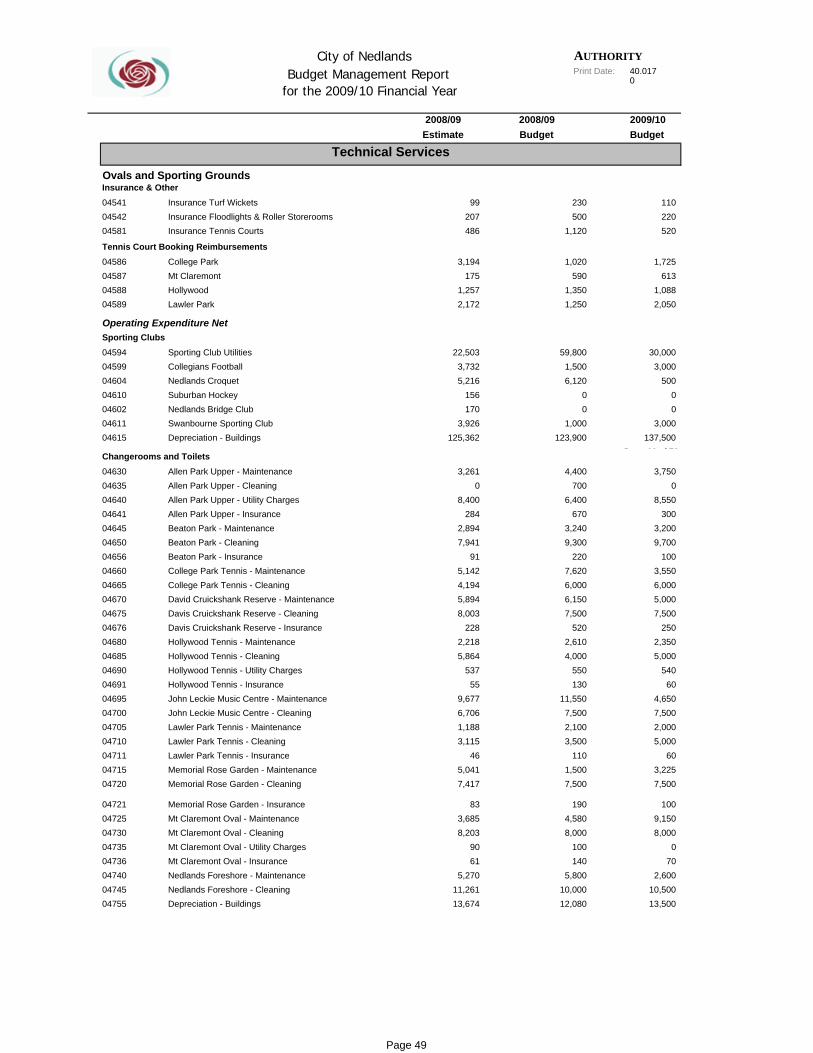
AUTHORITYPrint Date: 40,017
0
City of Nedlands Budget Management Report
for the 2009/10 Financial Year
2008/09 2008/09 2009/10Estimate Budget Budget
04541 9904542 20704581 486
04586 3,19404587 17504588 1,25704589 2,172
04594 22,50304599 3,73204604 5,21604610 15604602 17004611 3,92604615 125,362
04630 3,26104635 004640 8,40004641 28404645 2,89404650 7,94104656 9104660 5,14204665 4,19404670 5,89404675 8,00304676 22804680 2,21804685 5,86404690 53704691 5504695 9,67704700 6,70604705 1,18804710 3,11504711 4604715 5,04104720 7,417
04721 8304725 3,68504730 8,20304735 9004736 6104740 5,27004745 11,26104755 13,674
Nedlands Bridge Club 0
5003,000
30,000
1,725
2,0501,088
613
P 68 f 73137,500
3,000
00
5405,000
1009,700
6,0003,550
2,350250
7,5005,000
7,5003,225
605,000
08,0009,150
100
13,50010,500
2,60070
220110
520
Insurance & Other
Insurance Tennis Courts 1,120
Tennis Court Booking Reimbursements
Insurance Turf Wickets 230Insurance Floodlights & Roller Storerooms 500
College Park 1,020Mt Claremont 590
Sporting ClubsSporting Club Utilities 59,800
Hollywood 1,350Lawler Park 1,250
Collegians Football 1,500Nedlands Croquet 6,120Suburban Hockey 0
Swanbourne Sporting Club 1,000Depreciation - Buildings 123,900
3,200300
8,5500
3,7504,400Allen Park Upper - Cleaning
2,0007,5004,650
60
700
Changerooms and ToiletsAllen Park Upper - Maintenance
Allen Park Upper - Utility Charges 6,400Allen Park Upper - Insurance 670Beaton Park - Maintenance 3,240Beaton Park - Cleaning 9,300Beaton Park - Insurance 220College Park Tennis - Maintenance 7,620College Park Tennis - Cleaning 6,000David Cruickshank Reserve - Maintenance 6,150Davis Cruickshank Reserve - Cleaning 7,500Davis Cruickshank Reserve - Insurance 520Hollywood Tennis - Maintenance 2,610Hollywood Tennis - Cleaning 4,000Hollywood Tennis - Utility Charges 550Hollywood Tennis - Insurance 130John Leckie Music Centre - Maintenance 11,550John Leckie Music Centre - Cleaning 7,500Lawler Park Tennis - Maintenance 2,100Lawler Park Tennis - Cleaning 3,500Lawler Park Tennis - Insurance 110Memorial Rose Garden - Maintenance 1,500Memorial Rose Garden - Cleaning 7,500
Memorial Rose Garden - Insurance 190Mt Claremont Oval - Maintenance 4,580Mt Claremont Oval - Cleaning 8,000Mt Claremont Oval - Utility Charges 100Mt Claremont Oval - Insurance 140
Depreciation - Buildings 12,080
Nedlands Foreshore - Maintenance 5,800Nedlands Foreshore - Cleaning 10,000
Ovals and Sporting Grounds
Operating Expenditure Net
Technical Services
Page 49
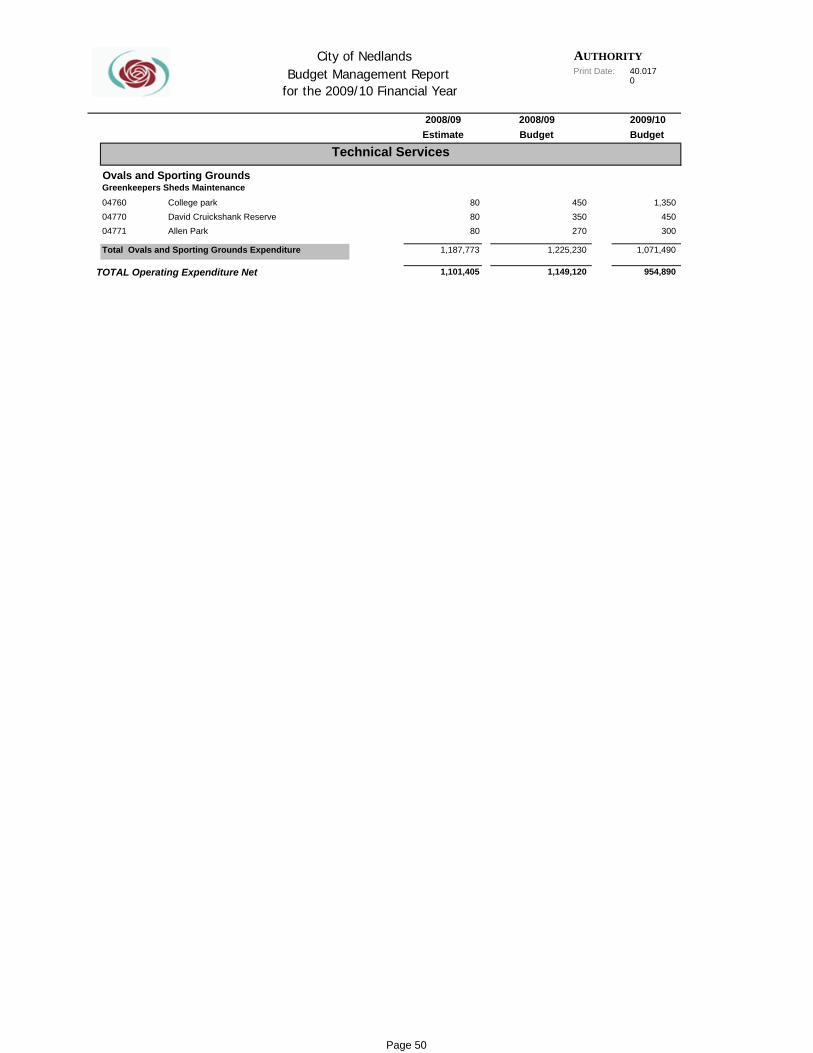
AUTHORITYPrint Date: 40,017
0
City of Nedlands Budget Management Report
for the 2009/10 Financial Year
2008/09 2008/09 2009/10Estimate Budget Budget
04760 8004770 8004771 80
1,187,773
1,101,405
1,071,490
300450
1,350
954,890
Greenkeepers Sheds MaintenanceCollege park 450David Cruickshank Reserve 350
TOTAL Operating Expenditure Net 1,149,120
Allen Park 270
Total Ovals and Sporting Grounds Expenditure 1,225,230
Technical Services
Ovals and Sporting Grounds
Page 50
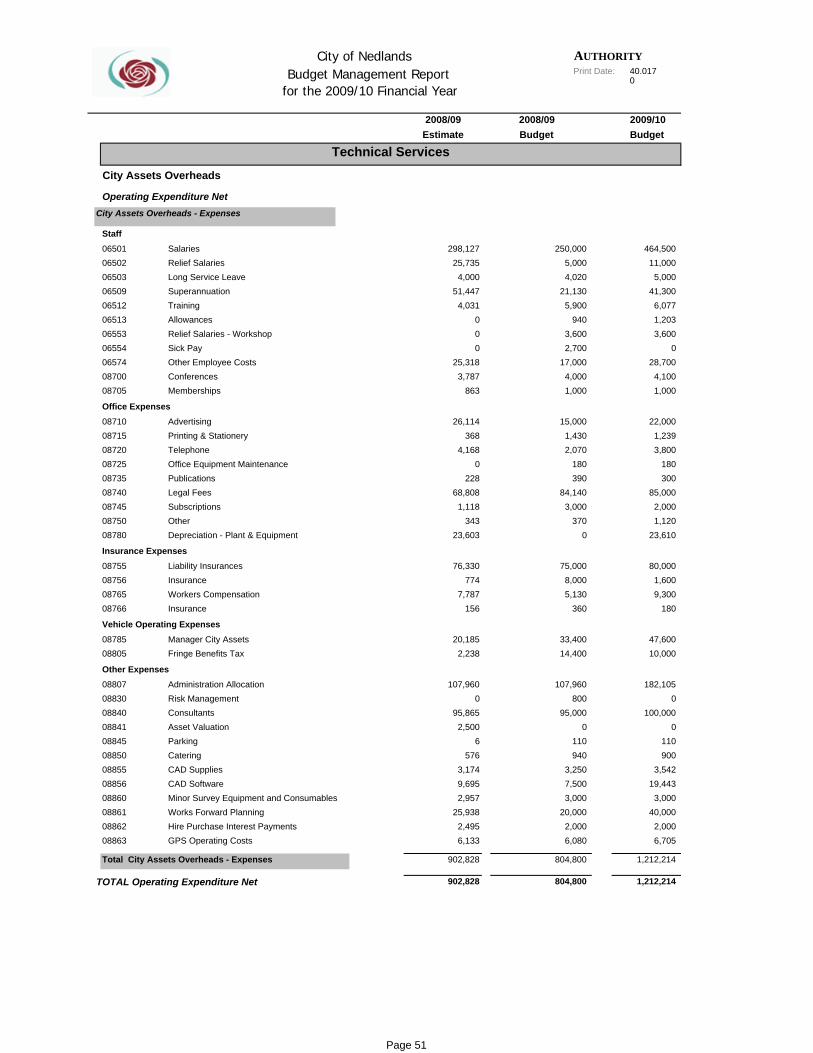
AUTHORITYPrint Date: 40,017
0
City of Nedlands Budget Management Report
for the 2009/10 Financial Year
2008/09 2008/09 2009/10Estimate Budget Budget
06501 298,12706502 25,73506503 4,00006509 51,44706512 4,03106513 006553 006554 006574 25,31808700 3,78708705 863
08710 26,11408715 36808720 4,16808725 008735 22808740 68,80808745 1,11808750 34308780 23,603
08755 76,33008756 77408765 7,78708766 156
08785 20,18508805 2,238
08807 107,96008830 008840 95,86508841 2,50008845 608850 57608855 3,17408856 9,69508860 2,95708861 25,93808862 2,49508863 6,133
902,828
902,828
300180
3,800
6,07741,300
5,00011,000
3,600
1,239
23,6101,1202,000
85,000
1809,3001,600
80,000
0182,105
10,00047,600
900110
0100,000
40,0003,000
19,4433,542
1,212,214
1,212,214
6,7052,000
22,000
1,203
1,0004,100
28,7000
StaffSalaries 250,000
Technical Services
City Assets Overheads
Operating Expenditure NetCity Assets Overheads - Expenses
464,500Relief Salaries 5,000Long Service Leave 4,020Superannuation 21,130Training 5,900Allowances 940Relief Salaries - Workshop 3,600Sick Pay 2,700Other Employee Costs 17,000
Office ExpensesAdvertising 15,000
Conferences 4,000Memberships 1,000
Printing & Stationery 1,430Telephone 2,070Office Equipment Maintenance 180Publications 390Legal Fees 84,140Subscriptions 3,000
Insurance ExpensesLiability Insurances 75,000
Other 370Depreciation - Plant & Equipment 0
Insurance 360
Vehicle Operating Expenses
Insurance 8,000Workers Compensation 5,130
Other ExpensesAdministration Allocation 107,960
Manager City Assets 33,400Fringe Benefits Tax 14,400
Risk Management 800Consultants 95,000Asset Valuation 0Parking 110Catering 940CAD Supplies 3,250CAD Software 7,500Minor Survey Equipment and Consumables 3,000
Total City Assets Overheads - Expenses 804,800
Works Forward Planning 20,000Hire Purchase Interest Payments 2,000
TOTAL Operating Expenditure Net 804,800
GPS Operating Costs 6,080
Page 51

AUTHORITYPrint Date: 40,017
0
City of Nedlands Budget Management Report
for the 2009/10 Financial Year
2008/09 2008/09 2009/10Estimate Budget Budget
06511 27,22708550 45208660 225,12408661 008662 17,23608665 23,67408670 143,33908675 38,98808680 165,58108685 65,09508690 41908691 2,67308692 008706 15,143
08486 6,80508693 28,43008694 2,63908696 15,36608697 1,79608698 7608699 67,92008701 50008702 3,75608709 605,13008908 6,035
03202 008703 20,15108786 9,20108790 9,425
08704 008707 508708 3,06608810 11,19408811 2,91508815 4208820 1,77808825 3,20908826 2,92708835 1,21908870 -2,619,95608871 0
-1,091,421
-1,091,421
6,0001,500
16,5007,000
4,0001,000
155,20015,600
14,000
3,690454,100
3,000500
10,000100500
3,00012,000
3,40050
0
27,20012,00020,000
(636,310)
0(1,929,000)
1,2003,6503,6002,400
600
34,000
30,0000
174,7000
31,200
3,0001,000
57,000180,000
StaffWorkers Compensation 30,350
Technical Services
Infrastructure Services Overheads
Operating Expenditure NetInfrastructure Services Overheads - Expenses
Fringe Benefits Tax 0Salaries 250,000Salaries - Relief 12,180Relief Salaries - Works & Parks 70,220Long Service Leave 48,000Superannuation 156,880
Allowances 1,000
Sick Pay 39,140Holiday Pay 167,690
Other Employee Costs 300
Office
Conferences 3,000Memberships 1,000
Training 64,740
Photocopier Lease 4,230Advertising 16,500Printing & Stationery 3,490Telephone 5,480
1,700Subscriptions 350
Office Equipment Maintenance 200Publications 100
Office Information Technology 6,500
Vehicle Operating Expenses
Other 3,100Administration Allocation 605,130
Legal Fees
Vehicle - Executive Manager Technical Services 10,500Fringe Benefits Tax 5,450
Other ExpensesRisk Managment 300
Vehicle - Works Co-ordinator 0Manager Infrastructure Services 10,000
Parking 90Catering 3,400Protective Clothing 10,200Protective Clothing - Works 3,000Occupational Health 1,120Two Way Radio Maintenance 1,400Expendable Stores 4,000Expendable Stores - Works 2,000Minor Tools 1,000Less Allocated to Works and Services (2,174,600)
TOTAL Operating Expenditure Net (713,260)
Less Relief Salaries Allocated to Works & Services (82,400)
Total Infrastructure Services Overheads - Expenses (713,260)
(636,310)
Page 52
Capital Works Programme
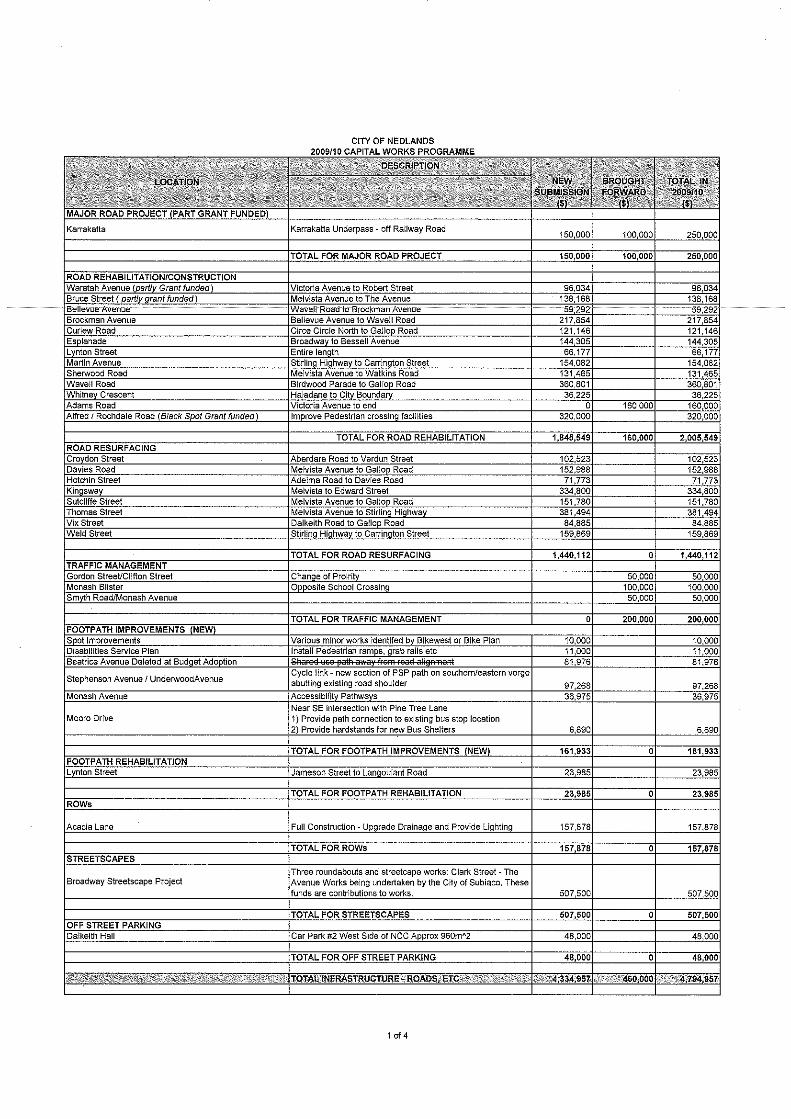

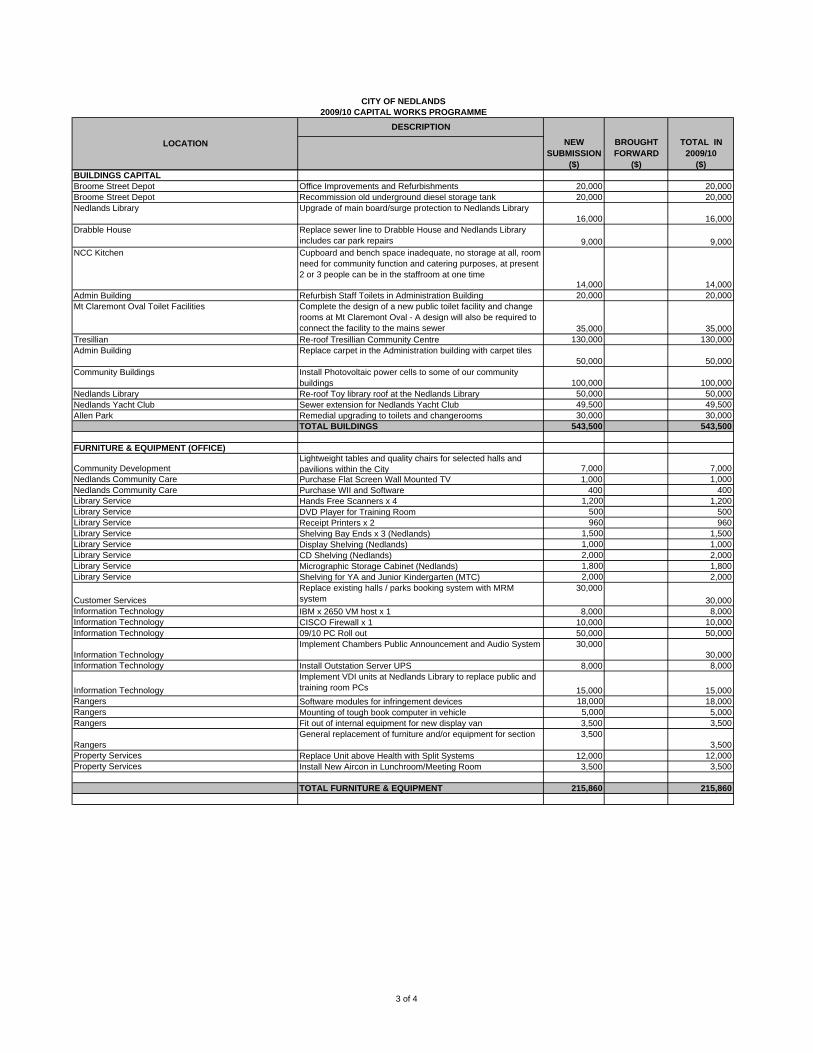
CITY OF NEDLANDS2009/10 CAPITAL WORKS PROGRAMME
BROUGHT FORWARD
($)
TOTAL IN 2009/10
($)
LOCATION NEW SUBMISSION
($)
DESCRIPTION
BUILDINGS CAPITALBroome Street Depot Office Improvements and Refurbishments 20,000 20,000Broome Street Depot Recommission old underground diesel storage tank 20,000 20,000Nedlands Library Upgrade of main board/surge protection to Nedlands Library
16,000 16,000Drabble House Replace sewer line to Drabble House and Nedlands Library
includes car park repairs 9,000 9,000NCC Kitchen Cupboard and bench space inadequate, no storage at all, room
need for community function and catering purposes, at present 2 or 3 people can be in the staffroom at one time
14,000 14,000Admin Building Refurbish Staff Toilets in Administration Building 20,000 20,000Mt Claremont Oval Toilet Facilities Complete the design of a new public toilet facility and change
rooms at Mt Claremont Oval - A design will also be required to connect the facility to the mains sewer 35,000 35,000
Tresillian Re-roof Tresillian Community Centre 130,000 130,000Admin Building Replace carpet in the Administration building with carpet tiles
50,000 50,000Community Buildings Install Photovoltaic power cells to some of our community
buildings 100,000 100,000Nedlands Library Re-roof Toy library roof at the Nedlands Library 50,000 50,000Nedlands Yacht Club Sewer extension for Nedlands Yacht Club 49,500 49,500Allen Park 30,000 30,000
TOTAL BUILDINGS 543,500 543,500
FURNITURE & EQUIPMENT (OFFICE)
Community DevelopmentLightweight tables and quality chairs for selected halls and pavilions within the City 7,000 7,000
Nedlands Community Care Purchase Flat Screen Wall Mounted TV 1,000 1,000Nedlands Community Care Purchase WII and Software 400 400Library Service Hands Free Scanners x 4 1,200 1,200Library Service DVD Player for Training Room 500 500Library Service Receipt Printers x 2 960 960Library Service Shelving Bay Ends x 3 (Nedlands) 1,500 1,500Library Service Display Shelving (Nedlands) 1,000 1,000Library Service CD Shelving (Nedlands) 2,000 2,000Library Service Micrographic Storage Cabinet (Nedlands) 1,800 1,800Library Service Shelving for YA and Junior Kindergarten (MTC) 2,000 2,000
Customer ServicesReplace existing halls / parks booking system with MRM system
30,00030,000
Information Technology IBM x 2650 VM host x 1 8,000 8,000Information Technology CISCO Firewall x 1 10,000 10,000Information Technology 09/10 PC Roll out 50,000 50,000
Information TechnologyImplement Chambers Public Announcement and Audio System 30,000
30,000Information Technology Install Outstation Server UPS 8,000 8,000
Information TechnologyImplement VDI units at Nedlands Library to replace public and training room PCs 15,000 15,000
Rangers Software modules for infringement devices 18,000 18,000Rangers Mounting of tough book computer in vehicle 5,000 5,000Rangers Fit out of internal equipment for new display van 3,500 3,500
RangersGeneral replacement of furniture and/or equipment for section 3,500
3,500Property Services Replace Unit above Health with Split Systems 12,000 12,000Property Services Install New Aircon in Lunchroom/Meeting Room 3,500 3,500
TOTAL FURNITURE & EQUIPMENT 215,860 215,860
Remedial upgrading to toilets and changerooms
3 of 4
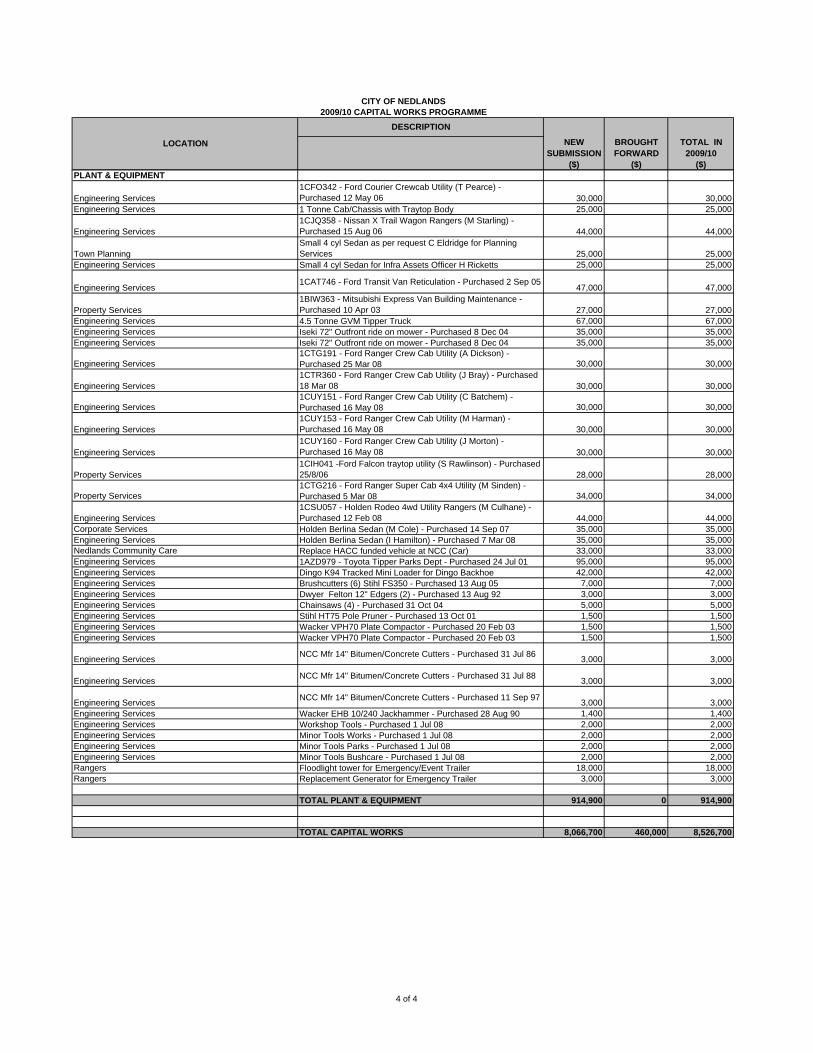
CITY OF NEDLANDS2009/10 CAPITAL WORKS PROGRAMME
BROUGHT FORWARD
($)
TOTAL IN 2009/10
($)
LOCATION NEW SUBMISSION
($)
DESCRIPTION
PLANT & EQUIPMENT
Engineering Services1CFO342 - Ford Courier Crewcab Utility (T Pearce) - Purchased 12 May 06 30,000 30,000
Engineering Services 1 Tonne Cab/Chassis with Traytop Body 25,000 25,000
Engineering Services1CJQ358 - Nissan X Trail Wagon Rangers (M Starling) - Purchased 15 Aug 06 44,000 44,000
Town PlanningSmall 4 cyl Sedan as per request C Eldridge for Planning Services 25,000 25,000
Engineering Services Small 4 cyl Sedan for Infra Assets Officer H Ricketts 25,000 25,000
Engineering Services1CAT746 - Ford Transit Van Reticulation - Purchased 2 Sep 05
47,000 47,000
Property Services1BIW363 - Mitsubishi Express Van Building Maintenance - Purchased 10 Apr 03 27,000 27,000
Engineering Services 4.5 Tonne GVM Tipper Truck 67,000 67,000Engineering Services Iseki 72" Outfront ride on mower - Purchased 8 Dec 04 35,000 35,000Engineering Services Iseki 72" Outfront ride on mower - Purchased 8 Dec 04 35,000 35,000
Engineering Services1CTG191 - Ford Ranger Crew Cab Utility (A Dickson) - Purchased 25 Mar 08 30,000 30,000
Engineering Services1CTR360 - Ford Ranger Crew Cab Utility (J Bray) - Purchased 18 Mar 08 30,000 30,000
Engineering Services1CUY151 - Ford Ranger Crew Cab Utility (C Batchem) - Purchased 16 May 08 30,000 30,000
Engineering Services1CUY153 - Ford Ranger Crew Cab Utility (M Harman) - Purchased 16 May 08 30,000 30,000
Engineering Services1CUY160 - Ford Ranger Crew Cab Utility (J Morton) - Purchased 16 May 08 30,000 30,000
Property Services1CIH041 -Ford Falcon traytop utility (S Rawlinson) - Purchased 25/8/06 28,000 28,000
Property Services1CTG216 - Ford Ranger Super Cab 4x4 Utility (M Sinden) - Purchased 5 Mar 08 34,000 34,000
Engineering Services1CSU057 - Holden Rodeo 4wd Utility Rangers (M Culhane) - Purchased 12 Feb 08 44,000 44,000
Corporate Services Holden Berlina Sedan (M Cole) - Purchased 14 Sep 07 35,000 35,000Engineering Services Holden Berlina Sedan (I Hamilton) - Purchased 7 Mar 08 35,000 35,000Nedlands Community Care Replace HACC funded vehicle at NCC (Car) 33,000 33,000Engineering Services 1AZD979 - Toyota Tipper Parks Dept - Purchased 24 Jul 01 95,000 95,000Engineering Services Dingo K94 Tracked Mini Loader for Dingo Backhoe 42,000 42,000Engineering Services Brushcutters (6) Stihl FS350 - Purchased 13 Aug 05 7,000 7,000Engineering Services Dwyer Felton 12" Edgers (2) - Purchased 13 Aug 92 3,000 3,000Engineering Services Chainsaws (4) - Purchased 31 Oct 04 5,000 5,000Engineering Services Stihl HT75 Pole Pruner - Purchased 13 Oct 01 1,500 1,500Engineering Services Wacker VPH70 Plate Compactor - Purchased 20 Feb 03 1,500 1,500Engineering Services Wacker VPH70 Plate Compactor - Purchased 20 Feb 03 1,500 1,500
Engineering Services NCC Mfr 14" Bitumen/Concrete Cutters - Purchased 31 Jul 86 3,000 3,000
Engineering Services NCC Mfr 14" Bitumen/Concrete Cutters - Purchased 31 Jul 88 3,000 3,000
Engineering Services NCC Mfr 14" Bitumen/Concrete Cutters - Purchased 11 Sep 97 3,000 3,000Engineering Services Wacker EHB 10/240 Jackhammer - Purchased 28 Aug 90 1,400 1,400Engineering Services Workshop Tools - Purchased 1 Jul 08 2,000 2,000Engineering Services Minor Tools Works - Purchased 1 Jul 08 2,000 2,000Engineering Services Minor Tools Parks - Purchased 1 Jul 08 2,000 2,000Engineering Services Minor Tools Bushcare - Purchased 1 Jul 08 2,000 2,000Rangers Floodlight tower for Emergency/Event Trailer 18,000 18,000Rangers Replacement Generator for Emergency Trailer 3,000 3,000
TOTAL PLANT & EQUIPMENT 914,900 0 914,900
TOTAL CAPITAL WORKS 8,066,700 460,000 8,526,700
4 of 4
Fees and Charges
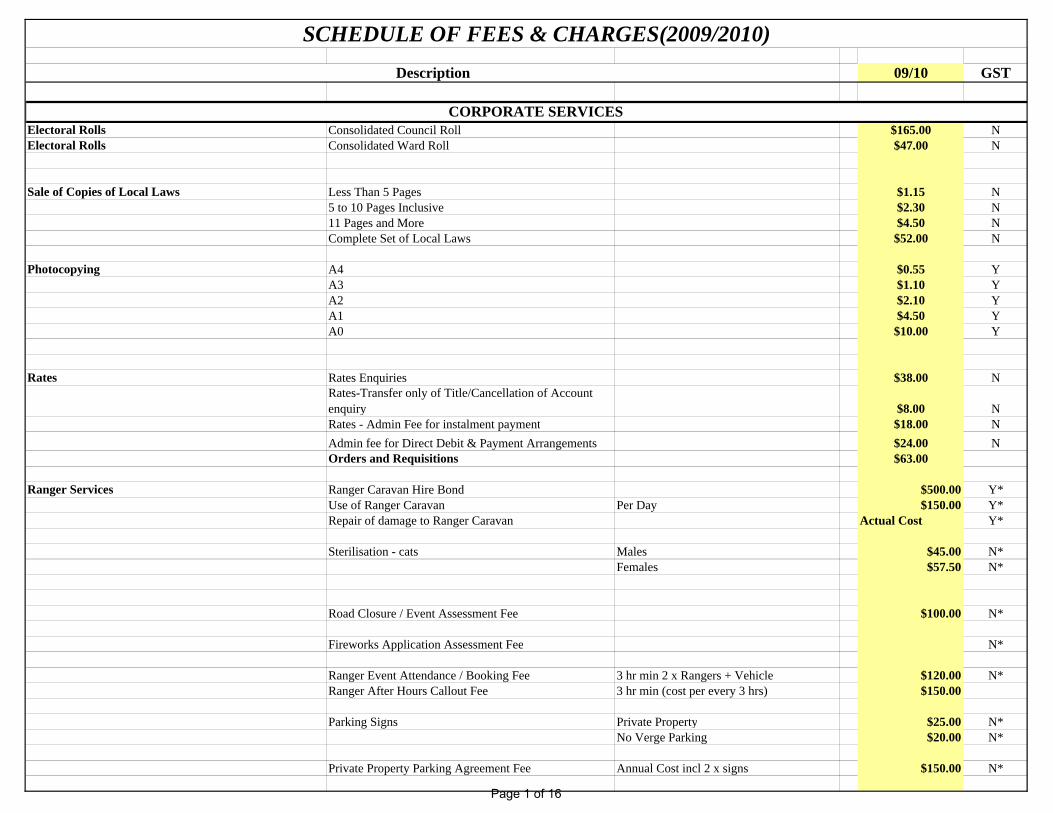
09/10 GST
Electoral Rolls Consolidated Council Roll $165.00 NElectoral Rolls Consolidated Ward Roll $47.00 N
Sale of Copies of Local Laws Less Than 5 Pages $1.15 N5 to 10 Pages Inclusive $2.30 N11 Pages and More $4.50 NComplete Set of Local Laws $52.00 N
Photocopying A4 $0.55 YA3 $1.10 YA2 $2.10 YA1 $4.50 YA0 $10.00 Y
Rates Rates Enquiries $38.00 NRates-Transfer only of Title/Cancellation of Account enquiry $8.00 NRates - Admin Fee for instalment payment $18.00 NAdmin fee for Direct Debit & Payment Arrangements $24.00 NOrders and Requisitions $63.00
Ranger Services Ranger Caravan Hire Bond $500.00 Y*Use of Ranger Caravan Per Day $150.00 Y*Repair of damage to Ranger Caravan Actual Cost Y*
Sterilisation - cats Males $45.00 N*Females $57.50 N*
Road Closure / Event Assessment Fee $100.00 N*
Fireworks Application Assessment Fee N*
Ranger Event Attendance / Booking Fee 3 hr min 2 x Rangers + Vehicle $120.00 N*Ranger After Hours Callout Fee 3 hr min (cost per every 3 hrs) $150.00
Parking Signs Private Property $25.00 N*No Verge Parking $20.00 N*
Private Property Parking Agreement Fee Annual Cost incl 2 x signs $150.00 N*
SCHEDULE OF FEES & CHARGES(2009/2010)Description
CORPORATE SERVICES
Page 1 of 16

09/10 GST
SCHEDULE OF FEES & CHARGES(2009/2010)Description
Parking Permits Residential - First Permit $0.00Residential - Additional Permits $10.00 N*Visitor Parking Permit $20.00 N*Temporary Parking Permit (3mth) $80.00 N*
Impounded Vehicles Impound Fee Per Vehicle $120.00 N*Impound Charge Per Vehicle / Per Day $10.00 N*
Impounded Dogs Impound Fee Per Dog $100.00 N*Impound Charge Per Dog / Per Day $25.00 N*Dog Surrender Fee $70.00 N*
Impounded Equipment and Materials Impound Fee per item $100.00 N*Daily Storage Fee per item $10.00 N*Impound Fee per m3 $50.00 N*Daily Storage Fee per m3 $10.00 N*
Application for 2+ dogs at premises or kennel Initial Application Fee $150.00 N*Renewal Fee $50.00 N*
Room Hire Yoga Room Hourly $27.00 Y(Short-term) 1/2 Day (6 hrs) $121.00 Y
1 Day $174.00 Y2 Days $209.00 Y3 Days $260.00 Y4 Days $278.00 Y5 Days $305.00 Y6 Days $313.00 YWeekly $365.00 Y
Rooms (Craft, Sitting, Front, or Verandah) each Hourly $20.50 Y1/2 Day (6 hrs) $92.00 Y1 Day $132.00 Y2 Days $159.00 Y3 Days $198.00 Y4 Days $211.00 Y5 Days $231.00 Y6 Days $237.50 YWeekly $276.50 Y
Tresillian
Page 2 of 16
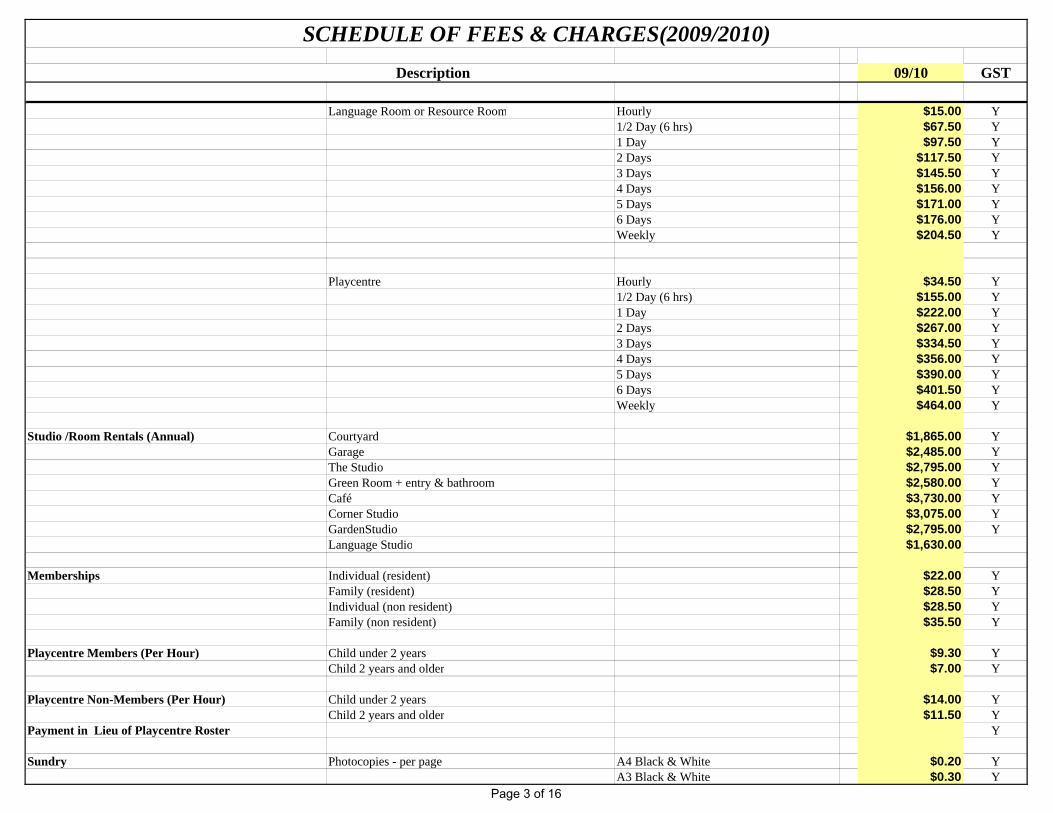
09/10 GST
SCHEDULE OF FEES & CHARGES(2009/2010)Description
Language Room or Resource Room Hourly $15.00 Y1/2 Day (6 hrs) $67.50 Y1 Day $97.50 Y2 Days $117.50 Y3 Days $145.50 Y4 Days $156.00 Y5 Days $171.00 Y6 Days $176.00 YWeekly $204.50 Y
Playcentre Hourly $34.50 Y1/2 Day (6 hrs) $155.00 Y1 Day $222.00 Y2 Days $267.00 Y3 Days $334.50 Y4 Days $356.00 Y5 Days $390.00 Y6 Days $401.50 YWeekly $464.00 Y
Studio /Room Rentals (Annual) Courtyard $1,865.00 YGarage $2,485.00 YThe Studio $2,795.00 YGreen Room + entry & bathroom $2,580.00 YCafé $3,730.00 YCorner Studio $3,075.00 YGardenStudio $2,795.00 YLanguage Studio $1,630.00
Memberships Individual (resident) $22.00 YFamily (resident) $28.50 YIndividual (non resident) $28.50 YFamily (non resident) $35.50 Y
Playcentre Members (Per Hour) Child under 2 years $9.30 YChild 2 years and older $7.00 Y
Playcentre Non-Members (Per Hour) Child under 2 years $14.00 YChild 2 years and older $11.50 Y
Payment in Lieu of Playcentre Roster Y
Sundry Photocopies - per page A4 Black & White $0.20 YA3 Black & White $0.30 Y
Page 3 of 16
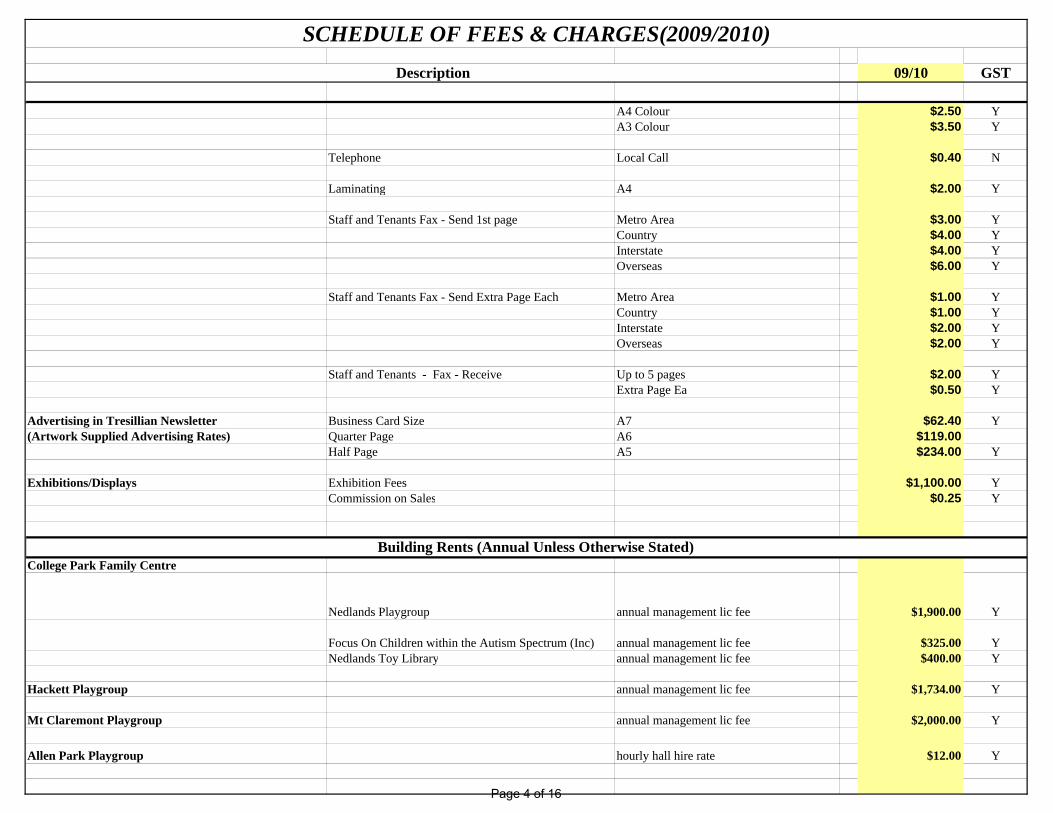
09/10 GST
SCHEDULE OF FEES & CHARGES(2009/2010)Description
A4 Colour $2.50 YA3 Colour $3.50 Y
Telephone Local Call $0.40 N
Laminating A4 $2.00 Y
Staff and Tenants Fax - Send 1st page Metro Area $3.00 YCountry $4.00 YInterstate $4.00 YOverseas $6.00 Y
Staff and Tenants Fax - Send Extra Page Each Metro Area $1.00 YCountry $1.00 YInterstate $2.00 YOverseas $2.00 Y
Staff and Tenants - Fax - Receive Up to 5 pages $2.00 YExtra Page Ea $0.50 Y
Advertising in Tresillian Newsletter Business Card Size A7 $62.40 Y(Artwork Supplied Advertising Rates) Quarter Page A6 $119.00
Half Page A5 $234.00 Y
Exhibitions/Displays Exhibition Fees $1,100.00 YCommission on Sales $0.25 Y
College Park Family Centre
Nedlands Playgroup annual management lic fee $1,900.00 Y
Focus On Children within the Autism Spectrum (Inc) annual management lic fee $325.00 YNedlands Toy Library annual management lic fee $400.00 Y
Hackett Playgroup annual management lic fee $1,734.00 Y
Mt Claremont Playgroup annual management lic fee $2,000.00 Y
Allen Park Playgroup hourly hall hire rate $12.00 Y
Building Rents (Annual Unless Otherwise Stated)
Page 4 of 16
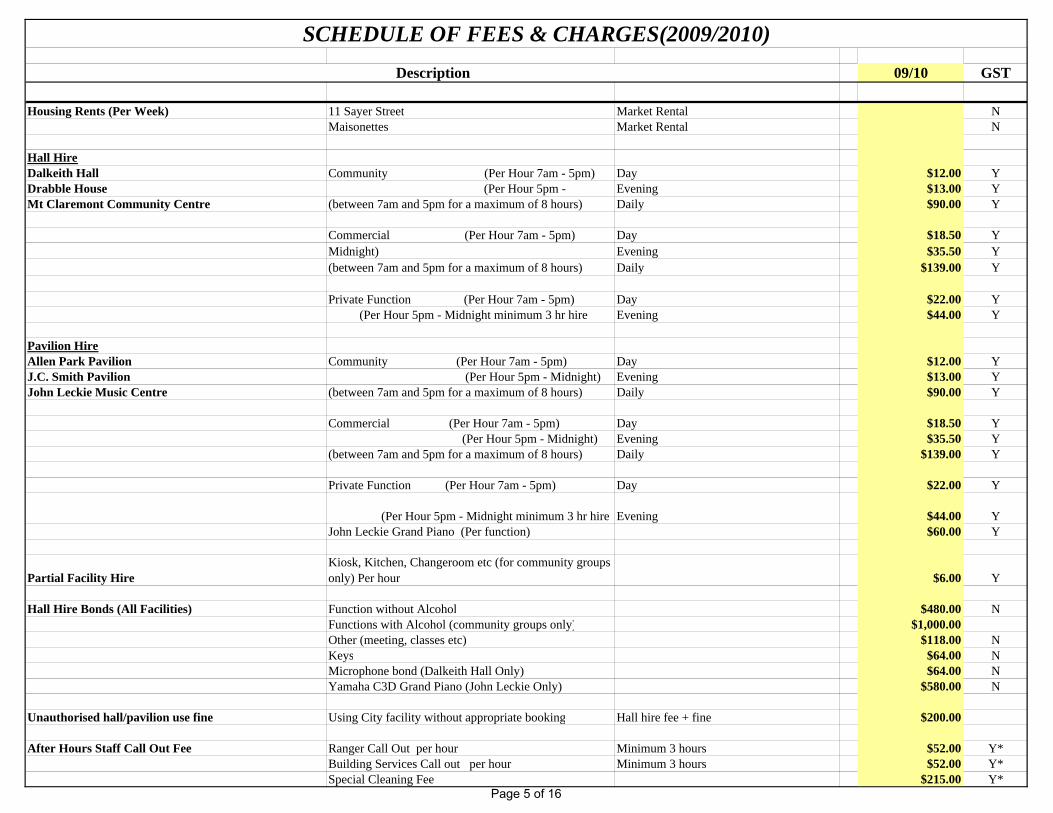
09/10 GST
SCHEDULE OF FEES & CHARGES(2009/2010)Description
Housing Rents (Per Week) 11 Sayer Street Market Rental NMaisonettes Market Rental N
Hall HireDalkeith Hall Community (Per Hour 7am - 5pm) Day $12.00 YDrabble House (Per Hour 5pm - Evening $13.00 YMt Claremont Community Centre (between 7am and 5pm for a maximum of 8 hours) Daily $90.00 Y
Commercial (Per Hour 7am - 5pm) Day $18.50 YMidnight) Evening $35.50 Y(between 7am and 5pm for a maximum of 8 hours) Daily $139.00 Y
Private Function (Per Hour 7am - 5pm) Day $22.00 Y (Per Hour 5pm - Midnight minimum 3 hr hire Evening $44.00 Y
Pavilion HireAllen Park Pavilion Community (Per Hour 7am - 5pm) Day $12.00 YJ.C. Smith Pavilion (Per Hour 5pm - Midnight) Evening $13.00 YJohn Leckie Music Centre (between 7am and 5pm for a maximum of 8 hours) Daily $90.00 Y
Commercial (Per Hour 7am - 5pm) Day $18.50 Y (Per Hour 5pm - Midnight) Evening $35.50 Y
(between 7am and 5pm for a maximum of 8 hours) Daily $139.00 Y
Private Function (Per Hour 7am - 5pm) Day $22.00 Y
(Per Hour 5pm - Midnight minimum 3 hr hire Evening $44.00 YJohn Leckie Grand Piano (Per function) $60.00 Y
Partial Facility HireKiosk, Kitchen, Changeroom etc (for community groups only) Per hour $6.00 Y
Hall Hire Bonds (All Facilities) Function without Alcohol $480.00 NFunctions with Alcohol (community groups only) $1,000.00Other (meeting, classes etc) $118.00 NKeys $64.00 NMicrophone bond (Dalkeith Hall Only) $64.00 NYamaha C3D Grand Piano (John Leckie Only) $580.00 N
Unauthorised hall/pavilion use fine Using City facility without appropriate booking Hall hire fee + fine $200.00
After Hours Staff Call Out Fee Ranger Call Out per hour Minimum 3 hours $52.00 Y*Building Services Call out per hour Minimum 3 hours $52.00 Y*Special Cleaning Fee $215.00 Y*
Page 5 of 16

09/10 GST
SCHEDULE OF FEES & CHARGES(2009/2010)Description
Point Resolution Occasional Care Centre Daily $54.00 N
Sessional Morning $33.00 NAfternoon $33.00 N
Administration Fee (Annual) $30.00 N
Late Fee (Late Collecting Child) $15.00 N
Nedlands Elderly Persons Home Support ServiceEligible clients- Income - Single 0 - $39, 351; couple 0 - $65,793 $10.00 NEligible Clients - income - Single - $39,352 - $49,999; Couple $65, 794 - $79, 999 $15.00 NEligible Clients - income - Single - over $50,000; Couple - over $80,000 $26.00 N
Unit cost***Eligible Clients - Income Single 0 - $39, 351; couple 0 - $65,793 $35.00 NEligible Clients - income - Single - $39,352 - $49,999; Couple $65, 794 - $79, 999 $42.00 NEligible Clients - income - Single - over $50,000; Couple - over $80,000 $95.00 N
$5 x unit cost*Maximum of 6 hours per week of service available per client in all income categories** Unit of service is a single service provided within a specified timeframe*** Unit cost is used to describe the actual cost of providing a unit of service, calculated annually using the formula specified in the HACC Safeguards Policy
Day Respite Centre Full Day (includes meal @ $6.50 and transport) Per Day $15.00 NSuggested Transport Donation Return Trip $7.00 N
One Way $4.00 N
Aged and Disabled Fees
Fee / Unit of Service**
Fee Limit / Week
Childrens Services Fees
Page 6 of 16
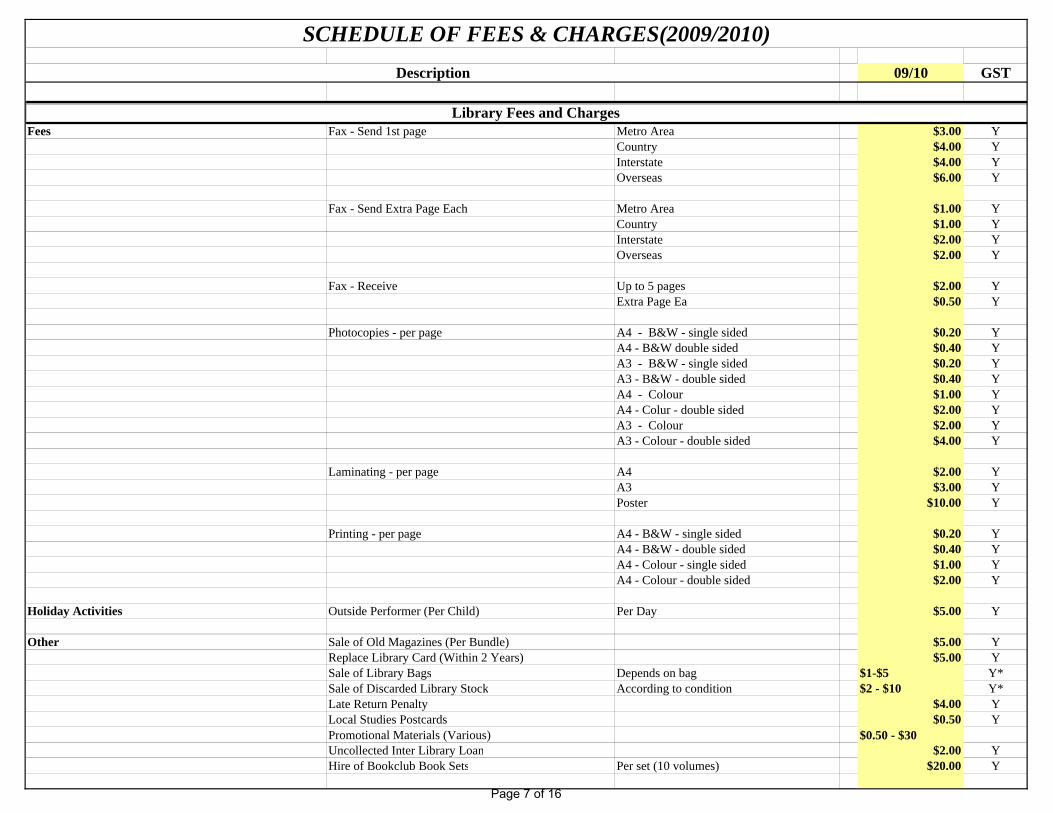
09/10 GST
SCHEDULE OF FEES & CHARGES(2009/2010)Description
Fees Fax - Send 1st page Metro Area $3.00 YCountry $4.00 YInterstate $4.00 YOverseas $6.00 Y
Fax - Send Extra Page Each Metro Area $1.00 YCountry $1.00 YInterstate $2.00 YOverseas $2.00 Y
Fax - Receive Up to 5 pages $2.00 YExtra Page Ea $0.50 Y
Photocopies - per page A4 - B&W - single sided $0.20 YA4 - B&W double sided $0.40 YA3 - B&W - single sided $0.20 YA3 - B&W - double sided $0.40 YA4 - Colour $1.00 YA4 - Colur - double sided $2.00 YA3 - Colour $2.00 YA3 - Colour - double sided $4.00 Y
Laminating - per page A4 $2.00 YA3 $3.00 YPoster $10.00 Y
Printing - per page A4 - B&W - single sided $0.20 YA4 - B&W - double sided $0.40 YA4 - Colour - single sided $1.00 YA4 - Colour - double sided $2.00 Y
Holiday Activities Outside Performer (Per Child) Per Day $5.00 Y
Other Sale of Old Magazines (Per Bundle) $5.00 YReplace Library Card (Within 2 Years) $5.00 YSale of Library Bags Depends on bag $1-$5 Y*Sale of Discarded Library Stock According to condition $2 - $10 Y*Late Return Penalty $4.00 YLocal Studies Postcards $0.50 YPromotional Materials (Various) $0.50 - $30Uncollected Inter Library Loan $2.00 YHire of Bookclub Book Sets Per set (10 volumes) $20.00 Y
Library Fees and Charges
Page 7 of 16
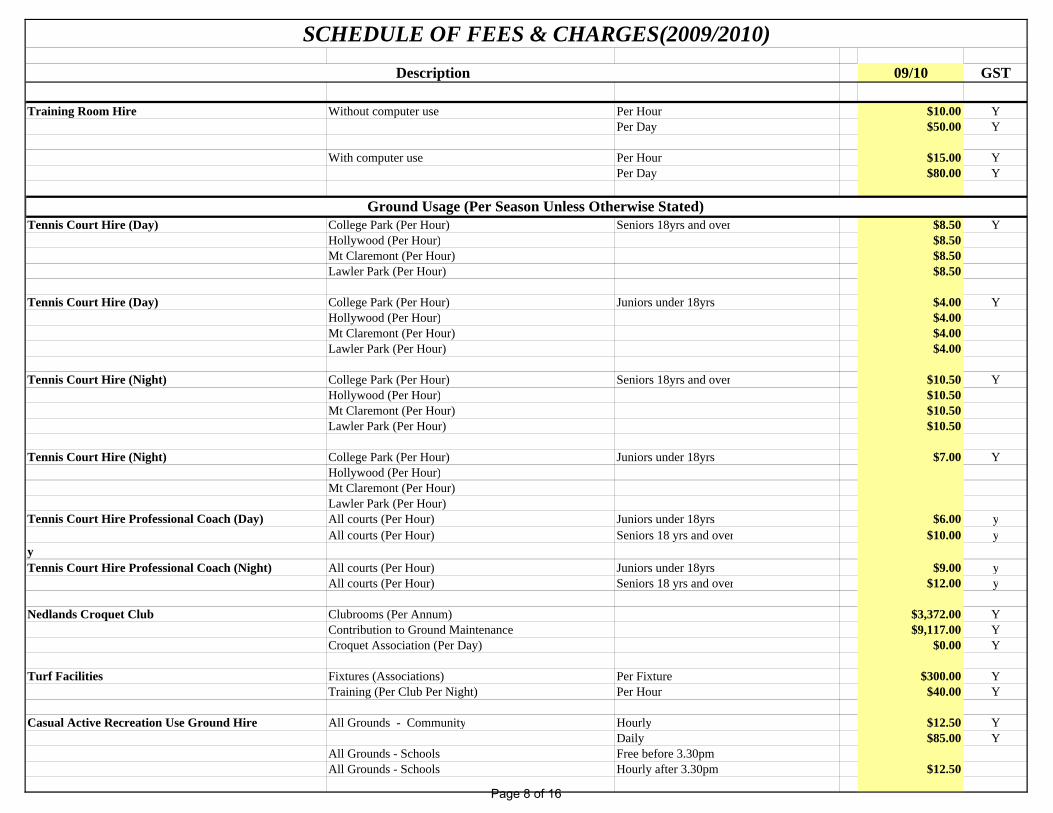
09/10 GST
SCHEDULE OF FEES & CHARGES(2009/2010)Description
Training Room Hire Without computer use Per Hour $10.00 YPer Day $50.00 Y
With computer use Per Hour $15.00 YPer Day $80.00 Y
Tennis Court Hire (Day) College Park (Per Hour) Seniors 18yrs and over $8.50 YHollywood (Per Hour) $8.50Mt Claremont (Per Hour) $8.50Lawler Park (Per Hour) $8.50
Tennis Court Hire (Day) College Park (Per Hour) Juniors under 18yrs $4.00 YHollywood (Per Hour) $4.00Mt Claremont (Per Hour) $4.00Lawler Park (Per Hour) $4.00
Tennis Court Hire (Night) College Park (Per Hour) Seniors 18yrs and over $10.50 YHollywood (Per Hour) $10.50Mt Claremont (Per Hour) $10.50Lawler Park (Per Hour) $10.50
Tennis Court Hire (Night) College Park (Per Hour) Juniors under 18yrs $7.00 YHollywood (Per Hour)Mt Claremont (Per Hour)Lawler Park (Per Hour)
Tennis Court Hire Professional Coach (Day) All courts (Per Hour) Juniors under 18yrs $6.00 yAll courts (Per Hour) Seniors 18 yrs and over $10.00 y
yTennis Court Hire Professional Coach (Night) All courts (Per Hour) Juniors under 18yrs $9.00 y
All courts (Per Hour) Seniors 18 yrs and over $12.00 y
Nedlands Croquet Club Clubrooms (Per Annum) $3,372.00 YContribution to Ground Maintenance $9,117.00 YCroquet Association (Per Day) $0.00 Y
Turf Facilities Fixtures (Associations) Per Fixture $300.00 YTraining (Per Club Per Night) Per Hour $40.00 Y
Casual Active Recreation Use Ground Hire All Grounds - Community Hourly $12.50 YDaily $85.00 Y
All Grounds - Schools Free before 3.30pmAll Grounds - Schools Hourly after 3.30pm $12.50
Ground Usage (Per Season Unless Otherwise Stated)
Page 8 of 16

09/10 GST
SCHEDULE OF FEES & CHARGES(2009/2010)Description
All Grounds - Commercial Hourly $20.00 YDaily $150.00 Y
Casual Passive Recreation Use Ground Hire All Grounds - Non Resident - Community Hourly $12.50 YDaily $85.00 Y
All Grounds - Non Resident - Commercial Hourly $20.00 YDaily $150.00 Y
Commercial Filming Charge Hourly $20.00 YDaily $150.00 Y
Ground Key Bond (all grounds use) $60.00 N
Administration Labour Rate Parks 2 x people + truck $85.00 N(All Per/Hr Rates, working hours) Rangers 1 x person + vehicle $40.00 N
Building 1 x person + vehicle $45.00 N
Contributions to Bore Maintenance Dalkeith Bowling Club $745.00 YHollywood Bowling Club $745.00 YDalkeith Tennis Club $1,490.00 YNedlands Tennis Club $745.00 YAllen Park Tennis Club $1,490.00 Y
Reserve Access Reserve Access Fee Minimum cost of: $65.00 YReserve Access Bond Minimum cost of: $610.00 N
Senior Team Ground Hire - fixtured game days only All Grounds - per day, per reserve $11.00 Y
Supply, Installation, Removal, Storage and Maintenance of one set of goals Rugby Goals $1,250.00 Y
Senior Aussie Rules Goals $1,535.00 Y
Installation, Removal, Storage and Maintenance of one set of goals Hockey Goals $310.00 Y
Senior Soccer Goals $960.00 Y
Preparation of Turf Cricket Wicket/s College Park East (1x centre wicket) $1,280.00 YCollege Park West (1x centre wicket) $1,280.00 YAllen Park (1x centre wicket & 1 x practice bloc $3,900.00 Y
Purchase, Delivery and Spreading of Red Dirt for Baseball Mounds and Bases $330.00 Y
Electricity Costs to Operate Oval Floodlights per Hour per Oval Charles Court Reserve $2.75 Y
Paul Hasluck Reserve $0.75 YPage 9 of 16

09/10 GST
SCHEDULE OF FEES & CHARGES(2009/2010)Description
Melvista Oval (new) $6.35 YDC Cruickshank Reserve $1.75 YMt Claremont Oval $1.05 YAllen Park Upper Oval $3.25 YCollege Park Upper Oval $1.95 YCollege Park Lower Oval $1.40 YHighview Oval $1.75 Y
Additional Lawn Mowing Per Session Per Oval $190.00 Y
Initial Set Up and Linemarking Per Field Per Sport Rugby $100.00 YJunior Aussie Rules $50.00 YSenior Aussie Rules $77.00 YHockey $77.00 YSenior Soccer $100.00 YJunior Soccer $50.00 YBaseball $95.00 YTball $60.00 Y
Junior Team Ground Hire - fixtured game days only All Grounds - per day, per reserve $5.50 Y
Supply, Installation, Removal, Storage and Maintenance of one set of goals Rugby Goals $620.00 Y
Senior Aussie Rules Goals $770.00 Y
Installation, Removal, Storage and Maintenance of one set of goals Hockey Goals $155.00 Y
Senior Soccer Goals $480.00 Y
Preparation of Turf Cricket Wicket/s College Park East (1x centre wicket) $640.00 YCollege Park West (1x centre wicket) $640.00 YAllen Park (1x centre wicket & 1 x practice bloc $2,000.00 Y
Purchase, Delivery and Spreading of Red Dirt for Baseball Mounds and Bases $165.00 Y
Electricity Costs to Operate Oval Floodlights per Hour per Oval Charles Court Reserve $1.30 Y
Paul Hasluck Reserve $0.40 YMelvista Oval (new) $3.10 YDC Cruickshank Reserve $0.80 YMt Claremont Oval $0.45 YAllen Park Upper Oval $1.70 YCollege Park Upper Oval $1.00 Y
Page 10 of 16
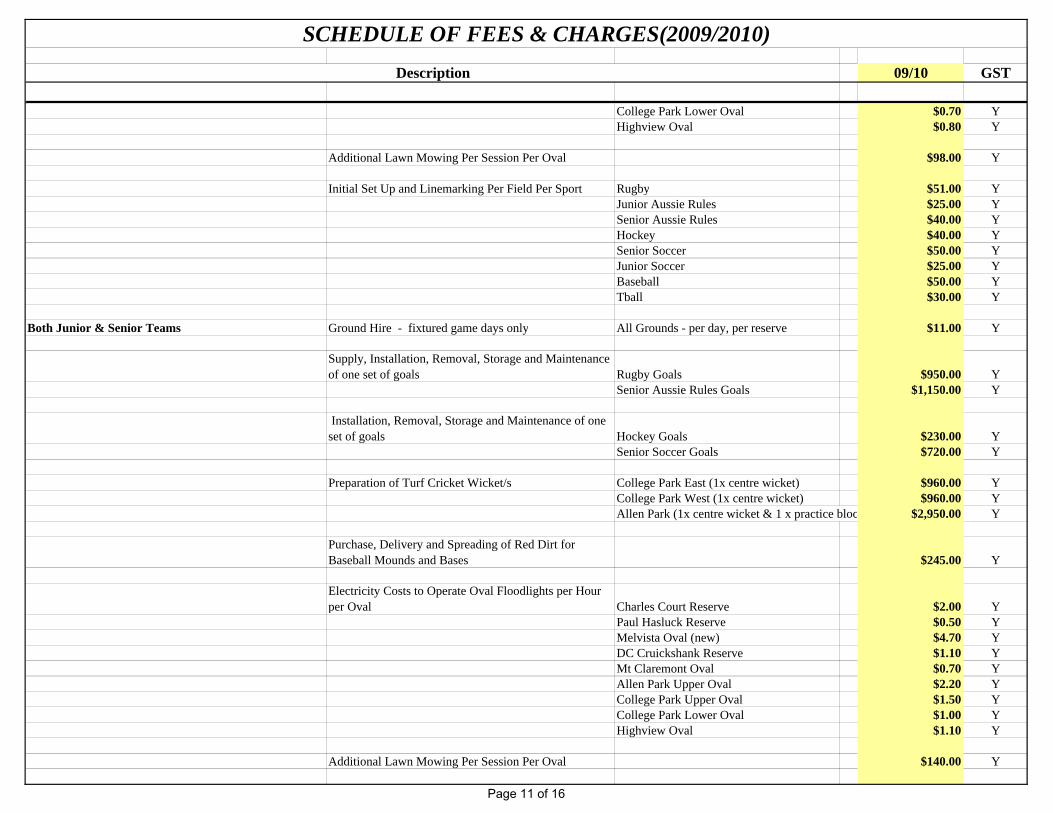
09/10 GST
SCHEDULE OF FEES & CHARGES(2009/2010)Description
College Park Lower Oval $0.70 YHighview Oval $0.80 Y
Additional Lawn Mowing Per Session Per Oval $98.00 Y
Initial Set Up and Linemarking Per Field Per Sport Rugby $51.00 YJunior Aussie Rules $25.00 YSenior Aussie Rules $40.00 YHockey $40.00 YSenior Soccer $50.00 YJunior Soccer $25.00 YBaseball $50.00 YTball $30.00 Y
Both Junior & Senior Teams Ground Hire - fixtured game days only All Grounds - per day, per reserve $11.00 Y
Supply, Installation, Removal, Storage and Maintenance of one set of goals Rugby Goals $950.00 Y
Senior Aussie Rules Goals $1,150.00 Y
Installation, Removal, Storage and Maintenance of one set of goals Hockey Goals $230.00 Y
Senior Soccer Goals $720.00 Y
Preparation of Turf Cricket Wicket/s College Park East (1x centre wicket) $960.00 YCollege Park West (1x centre wicket) $960.00 YAllen Park (1x centre wicket & 1 x practice bloc $2,950.00 Y
Purchase, Delivery and Spreading of Red Dirt for Baseball Mounds and Bases $245.00 Y
Electricity Costs to Operate Oval Floodlights per Hour per Oval Charles Court Reserve $2.00 Y
Paul Hasluck Reserve $0.50 YMelvista Oval (new) $4.70 YDC Cruickshank Reserve $1.10 YMt Claremont Oval $0.70 YAllen Park Upper Oval $2.20 YCollege Park Upper Oval $1.50 YCollege Park Lower Oval $1.00 YHighview Oval $1.10 Y
Additional Lawn Mowing Per Session Per Oval $140.00 Y
Page 11 of 16
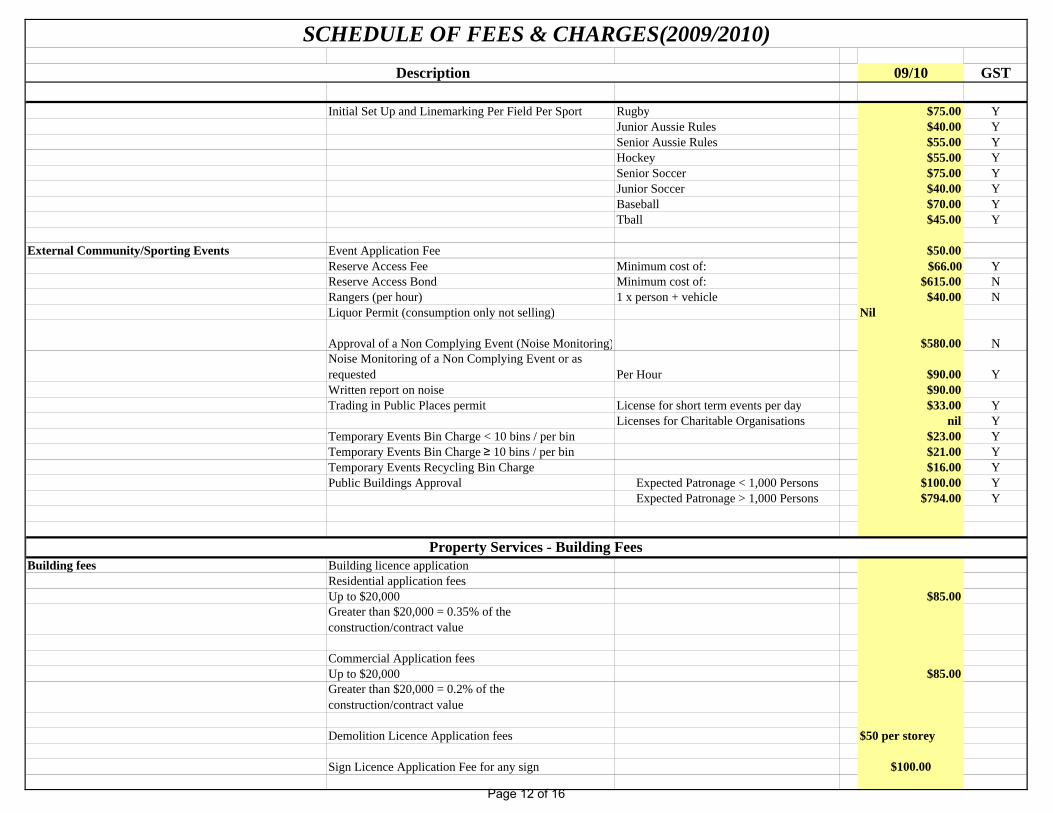
09/10 GST
SCHEDULE OF FEES & CHARGES(2009/2010)Description
Initial Set Up and Linemarking Per Field Per Sport Rugby $75.00 YJunior Aussie Rules $40.00 YSenior Aussie Rules $55.00 YHockey $55.00 YSenior Soccer $75.00 YJunior Soccer $40.00 YBaseball $70.00 YTball $45.00 Y
External Community/Sporting Events Event Application Fee $50.00Reserve Access Fee Minimum cost of: $66.00 YReserve Access Bond Minimum cost of: $615.00 NRangers (per hour) 1 x person + vehicle $40.00 NLiquor Permit (consumption only not selling) Nil
Approval of a Non Complying Event (Noise Monitoring) $580.00 NNoise Monitoring of a Non Complying Event or as requested Per Hour $90.00 YWritten report on noise $90.00Trading in Public Places permit License for short term events per day $33.00 Y
Licenses for Charitable Organisations nil YTemporary Events Bin Charge < 10 bins / per bin $23.00 YTemporary Events Bin Charge ≥ 10 bins / per bin $21.00 YTemporary Events Recycling Bin Charge $16.00 YPublic Buildings Approval Expected Patronage < 1,000 Persons $100.00 Y
Expected Patronage > 1,000 Persons $794.00 Y
Building fees Building licence applicationResidential application feesUp to $20,000 $85.00Greater than $20,000 = 0.35% of the construction/contract value
Commercial Application feesUp to $20,000 $85.00Greater than $20,000 = 0.2% of the construction/contract value
Demolition Licence Application fees $50 per storey
Sign Licence Application Fee for any sign $100.00
Property Services - Building Fees
Page 12 of 16
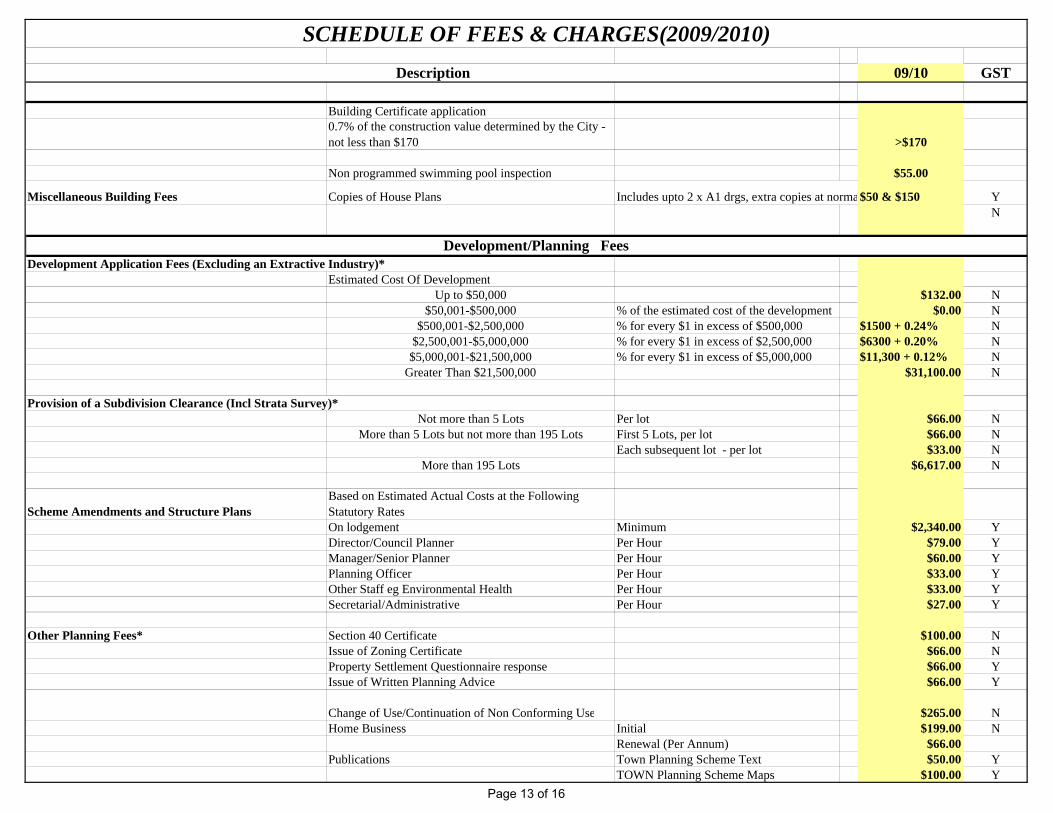
09/10 GST
SCHEDULE OF FEES & CHARGES(2009/2010)Description
Building Certificate application 0.7% of the construction value determined by the City - not less than $170 >$170
Non programmed swimming pool inspection $55.00
Miscellaneous Building Fees Copies of House Plans Includes upto 2 x A1 drgs, extra copies at norma$50 & $150 YN
Development Application Fees (Excluding an Extractive Industry)*Estimated Cost Of Development
Up to $50,000 $132.00 N$50,001-$500,000 % of the estimated cost of the development $0.00 N
$500,001-$2,500,000 % for every $1 in excess of $500,000 $1500 + 0.24% N$2,500,001-$5,000,000 % for every $1 in excess of $2,500,000 $6300 + 0.20% N$5,000,001-$21,500,000 % for every $1 in excess of $5,000,000 $11,300 + 0.12% N
Greater Than $21,500,000 $31,100.00 N
Provision of a Subdivision Clearance (Incl Strata Survey)*Not more than 5 Lots Per lot $66.00 N
More than 5 Lots but not more than 195 Lots First 5 Lots, per lot $66.00 NEach subsequent lot - per lot $33.00 N
More than 195 Lots $6,617.00 N
Scheme Amendments and Structure PlansBased on Estimated Actual Costs at the Following Statutory RatesOn lodgement Minimum $2,340.00 YDirector/Council Planner Per Hour $79.00 YManager/Senior Planner Per Hour $60.00 YPlanning Officer Per Hour $33.00 YOther Staff eg Environmental Health Per Hour $33.00 YSecretarial/Administrative Per Hour $27.00 Y
Other Planning Fees* Section 40 Certificate $100.00 NIssue of Zoning Certificate $66.00 NProperty Settlement Questionnaire response $66.00 YIssue of Written Planning Advice $66.00 Y
Change of Use/Continuation of Non Conforming Use $265.00 NHome Business Initial $199.00 N
Renewal (Per Annum) $66.00Publications Town Planning Scheme Text $50.00 Y
TOWN Planning Scheme Maps $100.00 Y
Development/Planning Fees
Page 13 of 16
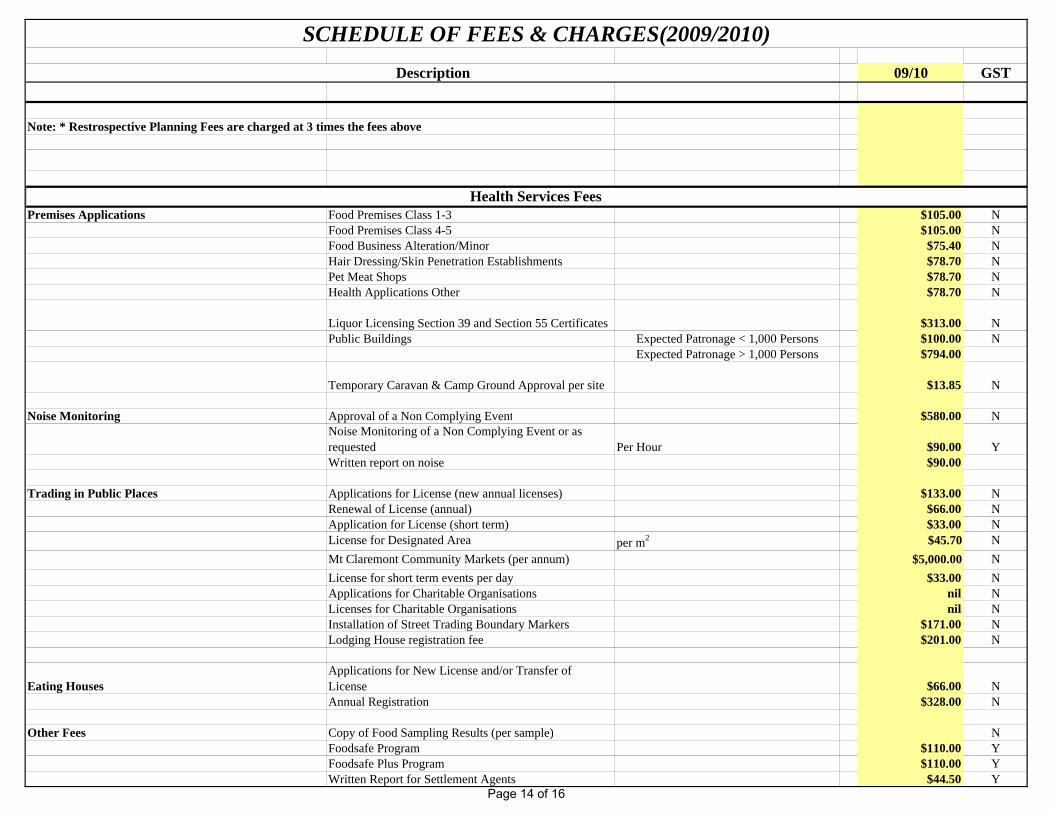
09/10 GST
SCHEDULE OF FEES & CHARGES(2009/2010)Description
Note: * Restrospective Planning Fees are charged at 3 times the fees above
Premises Applications Food Premises Class 1-3 $105.00 NFood Premises Class 4-5 $105.00 NFood Business Alteration/Minor $75.40 NHair Dressing/Skin Penetration Establishments $78.70 NPet Meat Shops $78.70 NHealth Applications Other $78.70 N
Liquor Licensing Section 39 and Section 55 Certificates $313.00 NPublic Buildings Expected Patronage < 1,000 Persons $100.00 N
Expected Patronage > 1,000 Persons $794.00
Temporary Caravan & Camp Ground Approval per site $13.85 N
Noise Monitoring Approval of a Non Complying Event $580.00 NNoise Monitoring of a Non Complying Event or as requested Per Hour $90.00 YWritten report on noise $90.00
Trading in Public Places Applications for License (new annual licenses) $133.00 NRenewal of License (annual) $66.00 NApplication for License (short term) $33.00 NLicense for Designated Area per m2 $45.70 NMt Claremont Community Markets (per annum) $5,000.00 NLicense for short term events per day $33.00 NApplications for Charitable Organisations nil NLicenses for Charitable Organisations nil NInstallation of Street Trading Boundary Markers $171.00 NLodging House registration fee $201.00 N
Eating HousesApplications for New License and/or Transfer of License $66.00 NAnnual Registration $328.00 N
Other Fees Copy of Food Sampling Results (per sample) NFoodsafe Program $110.00 YFoodsafe Plus Program $110.00 YWritten Report for Settlement Agents $44.50 Y
Health Services Fees
Page 14 of 16
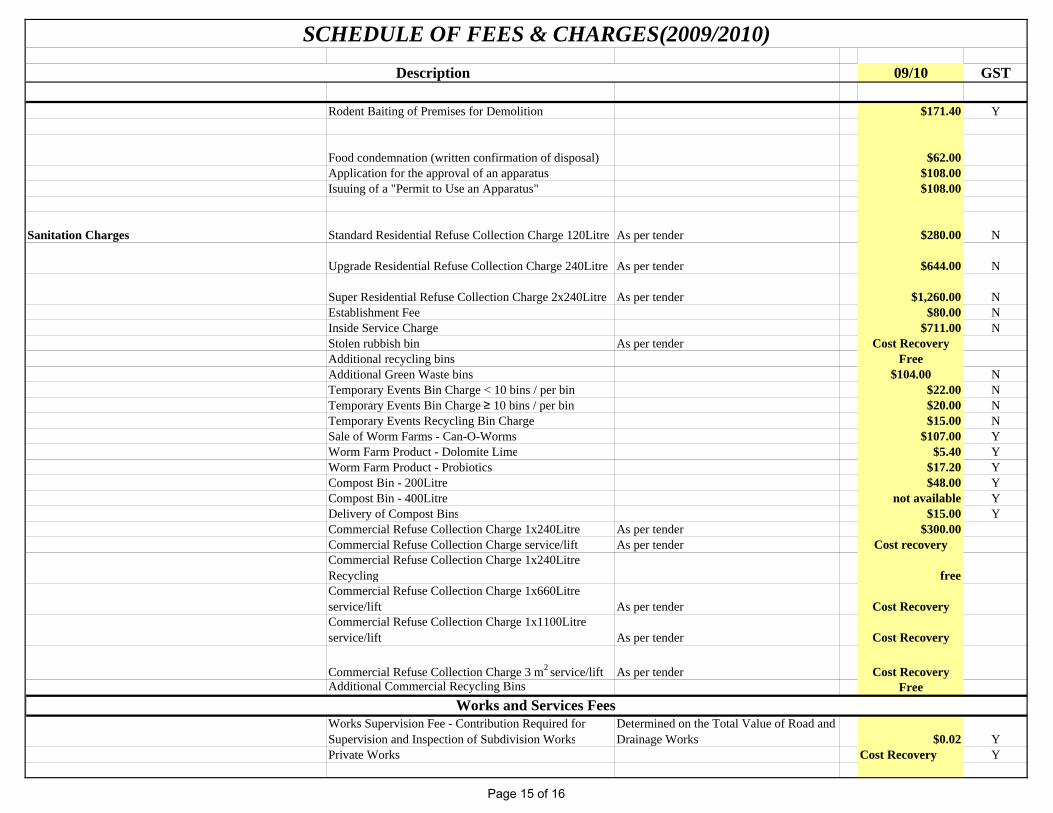
09/10 GST
SCHEDULE OF FEES & CHARGES(2009/2010)Description
Rodent Baiting of Premises for Demolition $171.40 Y
Food condemnation (written confirmation of disposal) $62.00Application for the approval of an apparatus $108.00Isuuing of a "Permit to Use an Apparatus" $108.00
Sanitation Charges Standard Residential Refuse Collection Charge 120Litre As per tender $280.00 N
Upgrade Residential Refuse Collection Charge 240Litre As per tender $644.00 N
Super Residential Refuse Collection Charge 2x240Litre As per tender $1,260.00 NEstablishment Fee $80.00 NInside Service Charge $711.00 NStolen rubbish bin As per tender Cost RecoveryAdditional recycling bins FreeAdditional Green Waste bins $104.00 NTemporary Events Bin Charge < 10 bins / per bin $22.00 NTemporary Events Bin Charge ≥ 10 bins / per bin $20.00 NTemporary Events Recycling Bin Charge $15.00 NSale of Worm Farms - Can-O-Worms $107.00 YWorm Farm Product - Dolomite Lime $5.40 YWorm Farm Product - Probiotics $17.20 YCompost Bin - 200Litre $48.00 YCompost Bin - 400Litre not available YDelivery of Compost Bins $15.00 YCommercial Refuse Collection Charge 1x240Litre As per tender $300.00Commercial Refuse Collection Charge service/lift As per tender Cost recoveryCommercial Refuse Collection Charge 1x240Litre Recycling freeCommercial Refuse Collection Charge 1x660Litre service/lift As per tender Cost RecoveryCommercial Refuse Collection Charge 1x1100Litre service/lift As per tender Cost Recovery
Commercial Refuse Collection Charge 3 m2 service/lift As per tender Cost RecoveryAdditional Commercial Recycling Bins Free
Works Supervision Fee - Contribution Required for Supervision and Inspection of Subdivision Works
Determined on the Total Value of Road and Drainage Works $0.02 Y
Private Works Cost Recovery Y
Works and Services Fees
Page 15 of 16
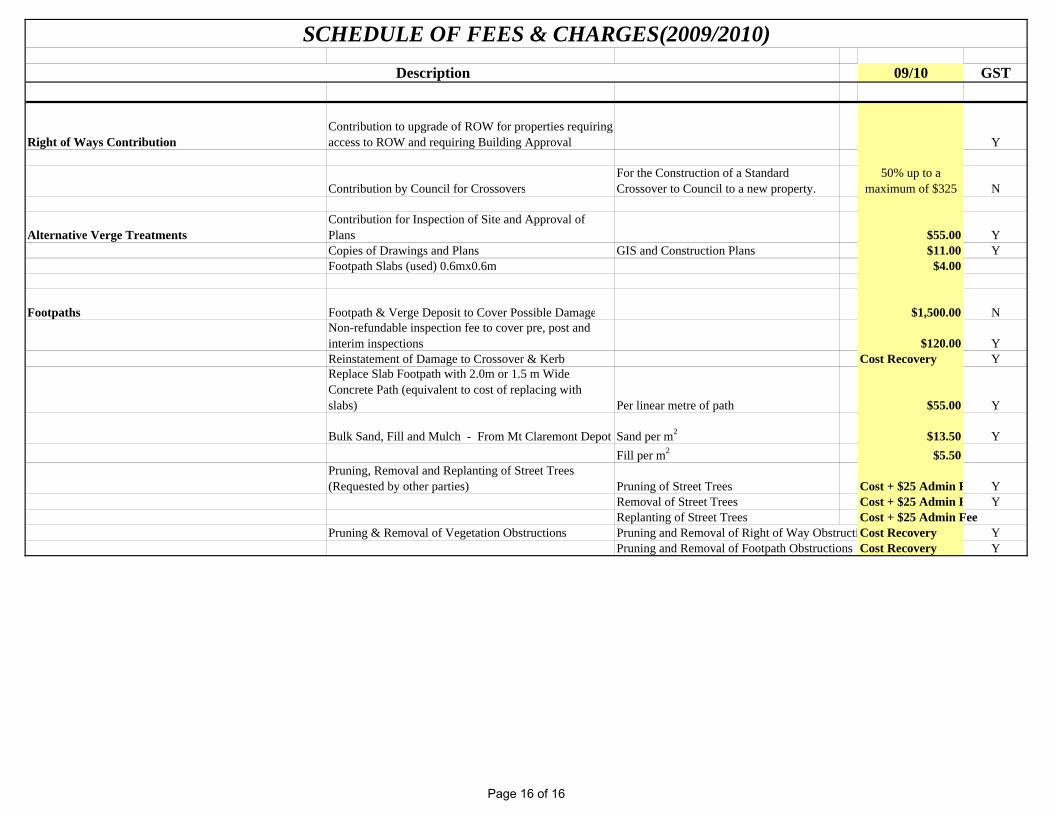
09/10 GST
SCHEDULE OF FEES & CHARGES(2009/2010)Description
Right of Ways ContributionContribution to upgrade of ROW for properties requiring access to ROW and requiring Building Approval Y
Contribution by Council for CrossoversFor the Construction of a Standard Crossover to Council to a new property.
50% up to a maximum of $325 N
Alternative Verge TreatmentsContribution for Inspection of Site and Approval of Plans $55.00 YCopies of Drawings and Plans GIS and Construction Plans $11.00 YFootpath Slabs (used) 0.6mx0.6m $4.00
Footpaths Footpath & Verge Deposit to Cover Possible Damage $1,500.00 NNon-refundable inspection fee to cover pre, post and interim inspections $120.00 YReinstatement of Damage to Crossover & Kerb Cost Recovery YReplace Slab Footpath with 2.0m or 1.5 m Wide Concrete Path (equivalent to cost of replacing with slabs) Per linear metre of path $55.00 Y
Bulk Sand, Fill and Mulch - From Mt Claremont Depot Sand per m2 $13.50 YFill per m2 $5.50
Pruning, Removal and Replanting of Street Trees (Requested by other parties) Pruning of Street Trees Cost + $25 Admin F Y
Removal of Street Trees Cost + $25 Admin F YReplanting of Street Trees Cost + $25 Admin Fee
Pruning & Removal of Vegetation Obstructions Pruning and Removal of Right of Way ObstructiCost Recovery YPruning and Removal of Footpath Obstructions Cost Recovery Y
Page 16 of 16