Embed Size (px)
Citation preview
Annual Automotive Workshop Business Performance and Confidence Research
Baseline Report
2018
Prepared for: AAAA
Prepared by: ACA Research

Content
1. Objectives & Methodology
2. Sample Profile
3. Research Results
• Business Performance
• Business Challenges
• Specialisation & Servicing Trends
• Market Perceptions
• AAAA Membership
4. Key Insights
Objectives & Methodology
4
Research Objectives
The overarching goal of the research is to assess Mechanics’ sentiment
around workshop performance and management, as well as current and future trends in the market.
The specific research objectives of this study are to:
• Understand how workshops are performing and the outlook for the future.
• Understand how mechanics currently manage their business.
• Identify current and future market trends.
• Understand the business strategies that mechanics are adopting going forwards.
• Understand the business challenges that mechanics are likely to face in future.
• Explore current levels of AAAA membership and the aspects of membership that are viewed most positively.

5
Sample
• A total of 250 decision-makers within independent automotive service & repair workshops across
Australia participated in the research.
• Quotas were set to ensure subgroup analysis would be possible by state:
Fieldwork
• A quantitative telephone methodology was used.
• Interviews were completed between 14th March and 27th April 2018.
Methodology
State Quota
Sydney 45
Rest of NSW/ACT 30
Melbourne 36
Rest of Vic, TAS 24
Brisbane 30
Rest of QLD 20
Adelaide 18
Rest of SA/NT 12
Perth 21
Rest of WA 14
TOTAL SAMPLE 250

Sample Profile

7The sample is proportionately distributed across the country, allowing for robust analysis by state
Base: All respondents (n=250)S4. Where is your business located?
Our sample includes workshops across all states, including a good split of metro and regional areas
Business location
QLD
20%
NSW
30%
VIC/TAS
24%
SA/NT
12%
WA
14%
Regional/Rural
Metro
61%
39%
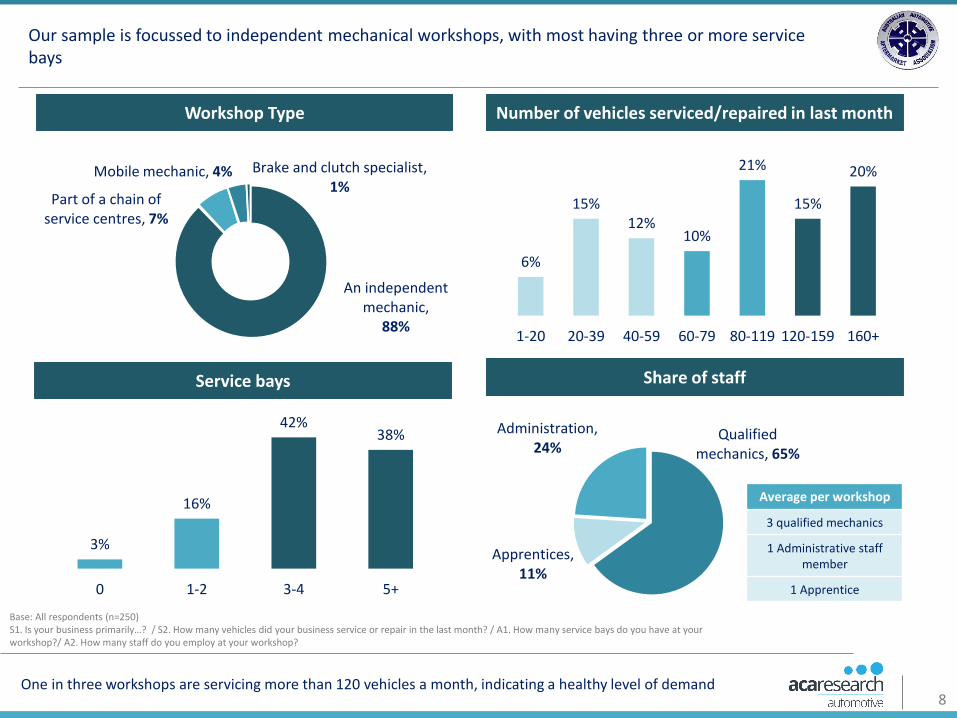
8One in three workshops are servicing more than 120 vehicles a month, indicating a healthy level of demand
Base: All respondents (n=250)S1. Is your business primarily…? / S2. How many vehicles did your business service or repair in the last month? / A1. How many service bays do you have at your workshop?/ A2. How many staff do you employ at your workshop?
Our sample is focussed to independent mechanical workshops, with most having three or more service bays
An independent mechanic,
88%
Part of a chain of service centres, 7%
Mobile mechanic, 4% Brake and clutch specialist, 1%
Service bays
Workshop Type
3%
16%
42%38%
0 1-2 3-4 5+
Number of vehicles serviced/repaired in last month
6%
15%12%
10%
21%
15%
20%
1-20 20-39 40-59 60-79 80-119 120-159 160+
Share of staff
Qualified mechanics, 65%
Apprentices, 11%
Administration, 24%
Average per workshop
3 qualified mechanics
1 Administrative staff member
1 Apprentice
Business Performance
10
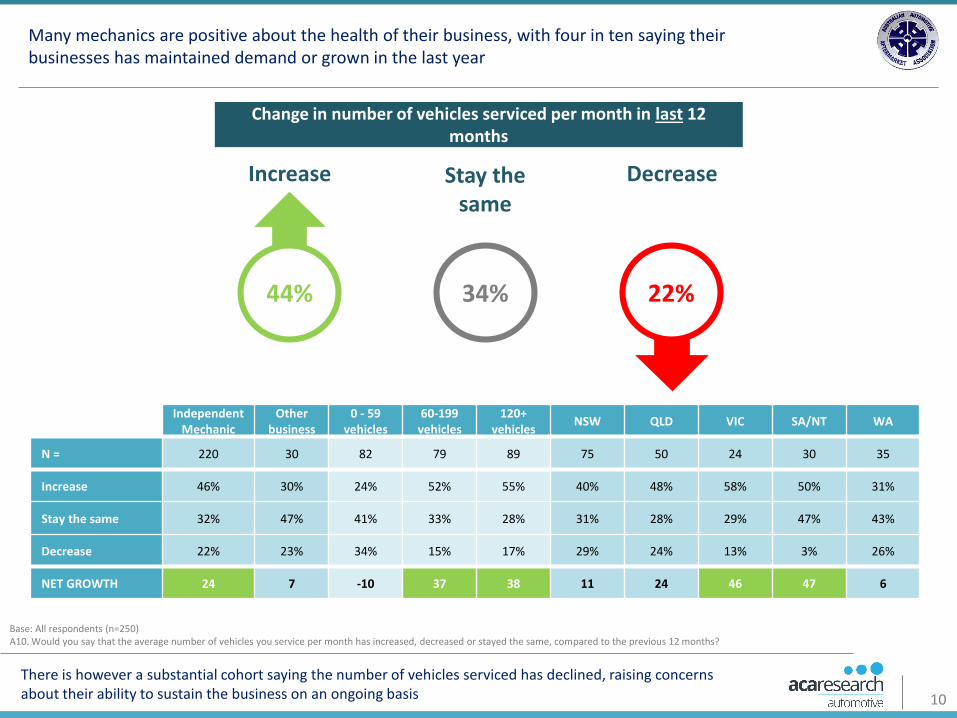
There is however a substantial cohort saying the number of vehicles serviced has declined, raising concerns about their ability to sustain the business on an ongoing basis
Base: All respondents (n=250)A10. Would you say that the average number of vehicles you service per month has increased, decreased or stayed the same, compared to the previous 12 months?
Many mechanics are positive about the health of their business, with four in ten saying their businesses has maintained demand or grown in the last year
Change in number of vehicles serviced per month in last 12 months
44% 34% 22%
Increase Stay the same
Decrease
Independent Mechanic
Other business
0 - 59 vehicles
60-199 vehicles
120+ vehicles
NSW QLD VIC SA/NT WA
N = 220 30 82 79 89 75 50 24 30 35
Increase 46% 30% 24% 52% 55% 40% 48% 58% 50% 31%
Stay the same 32% 47% 41% 33% 28% 31% 28% 29% 47% 43%
Decrease 22% 23% 34% 15% 17% 29% 24% 13% 3% 26%
NET GROWTH 24 7 -10 37 38 11 24 46 47 6

11
Mechanics seem to feel more confident in their future prospects, although more than half still see the business as generally static over this period
Base: All respondents (n=250)A11. Looking ahead 12 months, would you say that the average number of vehicles you service per month will increase, decrease or stay the same?
Looking to the future, mechanics are however more optimistic about the outlook for the year ahead, with just under half expecting demand to grow further
Expected change in number of vehicles serviced per month in next 12 months
48% 45% 6%
Increase Stay the same
Decrease
Independent Mechanic
Other business
0 - 59 vehicles
60-199 vehicles
120+ vehicles
NSW QLD VIC SA/NT WA
N = 220 30 82 79 89 75 50 24 30 35
Increase 48% 50% 37% 53% 55% 41% 58% 50% 50% 49%
Stay the same 46% 40% 50% 47% 39% 51% 36% 50% 47% 43%
Decrease 6% 10% 13% 0% 6% 8% 6% 0% 3% 9%
NET GROWTH 42 40 23 53 49 33 52 50 47 40
12
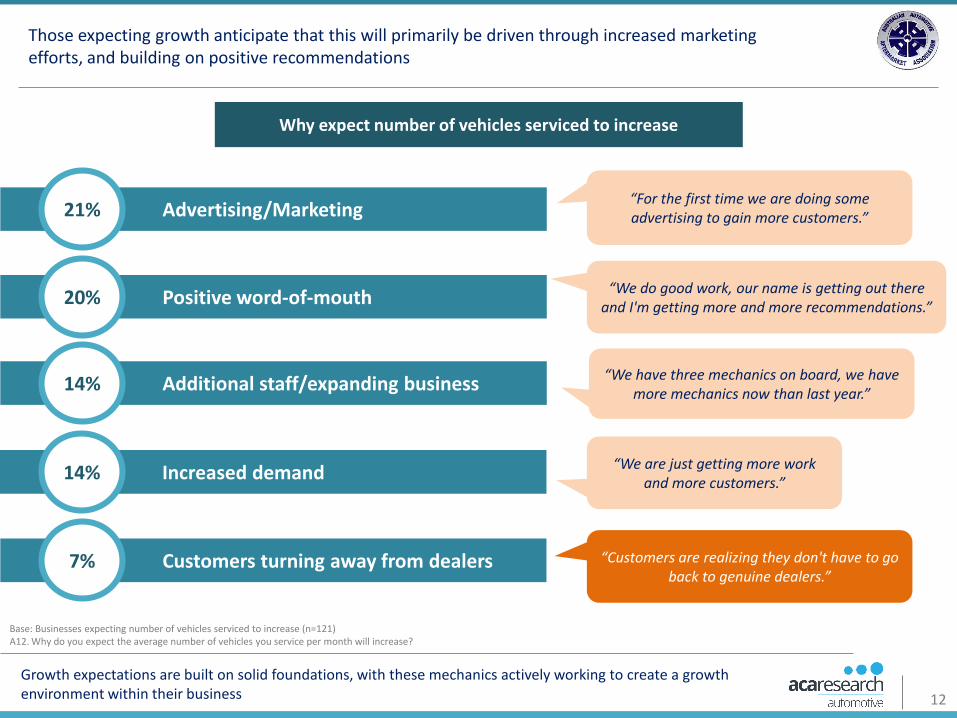
Growth expectations are built on solid foundations, with these mechanics actively working to create a growth environment within their business
Base: Businesses expecting number of vehicles serviced to increase (n=121)A12. Why do you expect the average number of vehicles you service per month will increase?
Those expecting growth anticipate that this will primarily be driven through increased marketing efforts, and building on positive recommendations
Why expect number of vehicles serviced to increase
Advertising/Marketing21%
Positive word-of-mouth20%
Additional staff/expanding business14%
Increased demand14%
Customers turning away from dealers7%
“For the first time we are doing some advertising to gain more customers.”
“We do good work, our name is getting out there and I'm getting more and more recommendations.”
“Customers are realizing they don't have to go back to genuine dealers.”
“We have three mechanics on board, we have more mechanics now than last year.”
“We are just getting more work and more customers.”
13
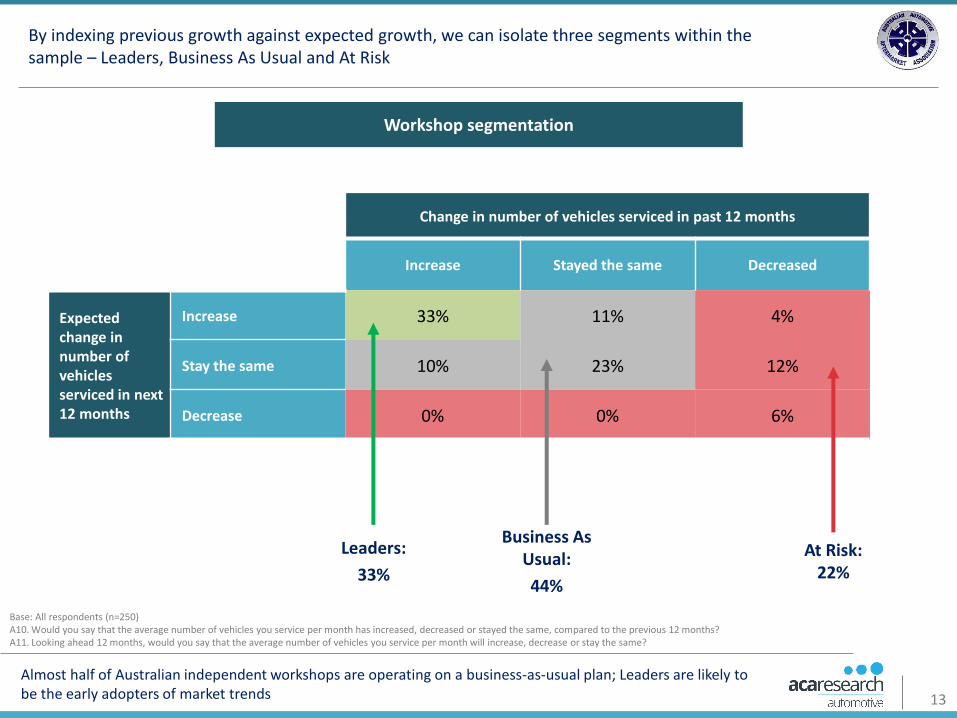
Almost half of Australian independent workshops are operating on a business-as-usual plan; Leaders are likely to be the early adopters of market trends
Base: All respondents (n=250)A10. Would you say that the average number of vehicles you service per month has increased, decreased or stayed the same, compared to the previous 12 months? A11. Looking ahead 12 months, would you say that the average number of vehicles you service per month will increase, decrease or stay the same?
By indexing previous growth against expected growth, we can isolate three segments within the sample – Leaders, Business As Usual and At Risk
Workshop segmentation
Change in number of vehicles serviced in past 12 months
Increase Stayed the same Decreased
Expected change in number of vehicles serviced in next 12 months
Increase 33% 11% 4%
Stay the same 10% 23% 12%
Decrease 0% 0% 6%
Leaders:
33%
Business As Usual:
44%
At Risk: 22%

14Leaders are more effective at generating higher levels of business within their workshop
Base: All respondents (n=250); Leaders (n=83); Business As Usual (n=110); At Risk (n=57) S1. Is your business primarily…? / S2. How many vehicles did your business service or repair in the last month? / A2. How many staff do you employ at your workshops?/ S4. Where is your business located?
By profiling each segment we see that the Leaders skew larger, whereas At Risk are more likely to work in smaller operations
Segment Profiles
Leaders Business As Usual At Risk
Type of Business
Independent Mechanic 90% 86% 88%
Other Business 10% 14% 12%
Number of vehicles serviced
1-59 vehicles 14% 36% 53%
60-199 vehicles 37% 33% 21%
120+ vehicles 48% 31% 26%
Service Bays
0-2 12% 18% 22%
3-4 42% 47% 33%
5+ 46% 35% 35%
Annual Turnover*
<$499,999 37% 48% 67%
$500,000 - $999,999 31% 33% 16%
$1,000,000+ 31% 19% 16%
*Excluding those who answered ‘prefer not to say’

15Leaders and Business As Usual appear slightly more effective at picking up business customers
Base: All respondents (n=250); Leaders (n=83); Business As Usual (n=110); At Risk (n=57) S4. Where is your business located?/ C3. What proportion of your turnover comes from the following sources?
At Risk workshops are more likely to be found in metro areas, typically sourcing a higher proportion of their business from private customers
Segment Profiles
Leaders Business As Usual At Risk
Regional/Metro
Metro 59% 59% 67%
Regional 41% 41% 33%
State
NSW 25% 28% 40%
VIC 30% 22% 19%
QLD 19% 20% 21%
SA/NT 16% 15% 2%
WA 10% 15% 18%
Source of Business
Private 71% 74% 76%
Business 21% 20% 17%
Government 2% 2% 2%
Referrals from workshops 5% 5% 5%

16
Leaders potentially have more structured administrative systems, but also employ higher numbers of qualified or apprentice mechanics
Base: All respondents (n=250); Leaders (n=83); Business As Usual (n=110); At Risk (n=57) S3. What is your role in the business?/ C1. What is your age? / A2. How many staff do you employ at your workshop?
Leaders also skew younger, but are less likely to be the business owner
Segment Profiles
Leaders Business As Usual At Risk
Role within Business
Owner 70% 77% 81%
Manager 18% 11% 16%
Admin / accounts 11% 7% 4%
Mechanic 0% 5% 0%
Age*
18-35 17% 11% 4%
36-45 31% 22% 21%
46-55 40% 35% 47%
56+ 13% 33% 28%
Average number employees
Qualified mechanics 3 3 2
Apprentices 1 0 1
Administration 1 1 1
Total 5 4 4
*Excluding those who answered ‘prefer not to say’

Business Challenges
18
FINANCES
INDUSTRY COMPETITION
KEEPING UP WITH TECH
STAFFING
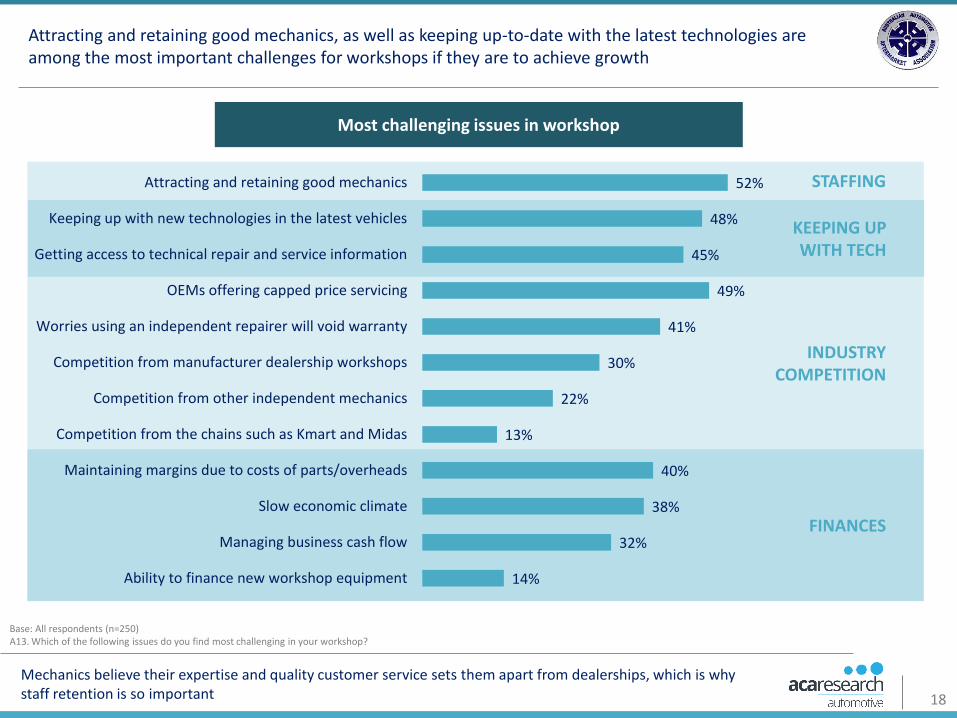
Mechanics believe their expertise and quality customer service sets them apart from dealerships, which is why staff retention is so important
Base: All respondents (n=250)A13. Which of the following issues do you find most challenging in your workshop?
Attracting and retaining good mechanics, as well as keeping up-to-date with the latest technologies are among the most important challenges for workshops if they are to achieve growth
Most challenging issues in workshop
52%
48%
45%
49%
41%
30%
22%
13%
40%
38%
32%
14%
Attracting and retaining good mechanics
Keeping up with new technologies in the latest vehicles
Getting access to technical repair and service information
OEMs offering capped price servicing
Worries using an independent repairer will void warranty
Competition from manufacturer dealership workshops
Competition from other independent mechanics
Competition from the chains such as Kmart and Midas
Maintaining margins due to costs of parts/overheads
Slow economic climate
Managing business cash flow
Ability to finance new workshop equipment

19
At Risk blame external factors for business declines, potentially indicating that they may not be taking action to overcome the issues they are facing
Base: All respondents (n=250); Leaders (n=83); Business As Usual (n=110); At Risk (n=57) A13. Which of the following issues do you find most challenging in your workshop?
Staff retention is a particularly important challenge to overcome for Leaders, whereas At Risk are more likely to be worried about competition from dealerships and a slowing economy
Most challenging issues in workshop
Leaders Business As Usual At Risk
Staffing
Attracting and retaining good mechanics 58% 49% 51%
Technology
Keeping up with new technologies in the latest vehicles 46% 49% 49%
Getting access to technical repair and service information 47% 43% 46%
Industry Competition
OEMs offering capped price servicing 49% 52% 44%
Customers worrying that using an independent repairer will void their warranty 49% 33% 44%
Competition from manufacturer dealership workshops 27% 24% 49%
Competition from other independent mechanics 22% 20% 28%
Competition from the chains such as Kmart and Midas 10% 16% 11%
Finances
Maintaining margins due to increased costs of parts and overheads 36% 41% 42%
Slow economic climate 28% 37% 54%
Managing business cash flow 33% 34% 30%
Ability to finance new workshop equipment 10% 15% 18%
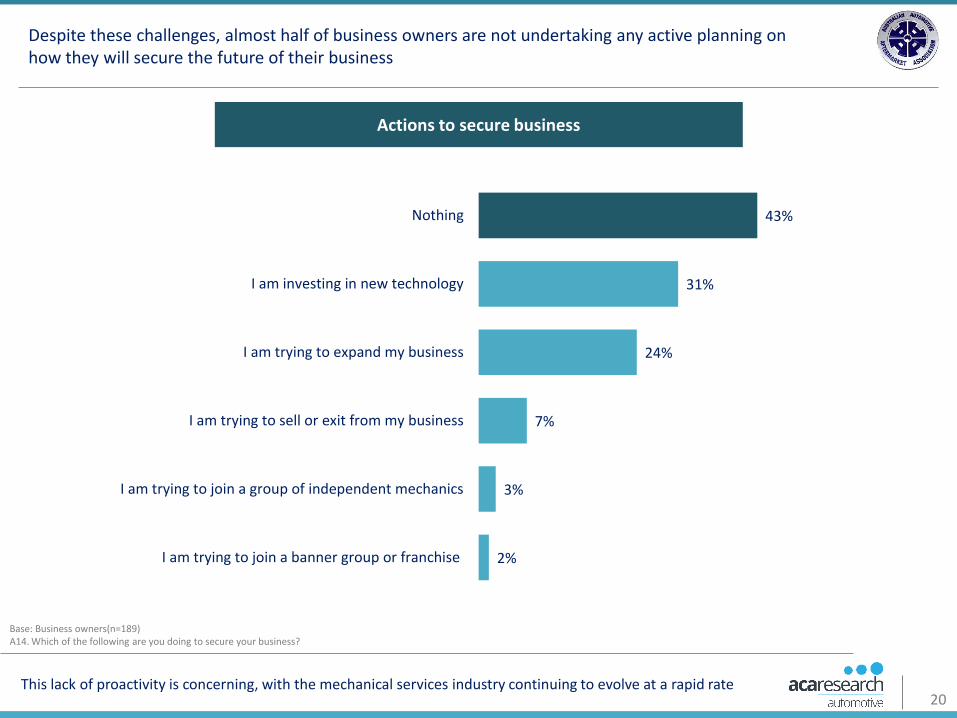
20This lack of proactivity is concerning, with the mechanical services industry continuing to evolve at a rapid rate
Base: Business owners(n=189)A14. Which of the following are you doing to secure your business?
Despite these challenges, almost half of business owners are not undertaking any active planning on how they will secure the future of their business
Actions to secure business
43%
31%
24%
7%
3%
2%
Nothing
I am investing in new technology
I am trying to expand my business
I am trying to sell or exit from my business
I am trying to join a group of independent mechanics
I am trying to join a banner group or franchise

21Leaders are proactive in their business plans, while At Risk appear to be preparing for the worst
Base: Business owners(n=189); Leaders (n=58); Business As Usual (n=85); At Risk (n=46) A14. Which of the following are you doing to secure your business?
Leaders are however more likely to have plans in place to achieve business growth, which could explain their greater optimism about business health
Actions to secure business
33%
40% 40%
9% 10%
5%
52%
26%
15%
5%2% 1%
39%
28%
22%
11%13%
2%
Nothing I am investing innew technology
I am trying toexpand my business
I am trying to sellor exit frommy business
I am trying tojoin a group ofindependent
mechanics
I am trying tojoin a banner
group or franchise
Leaders Business As Usual At Risk
22
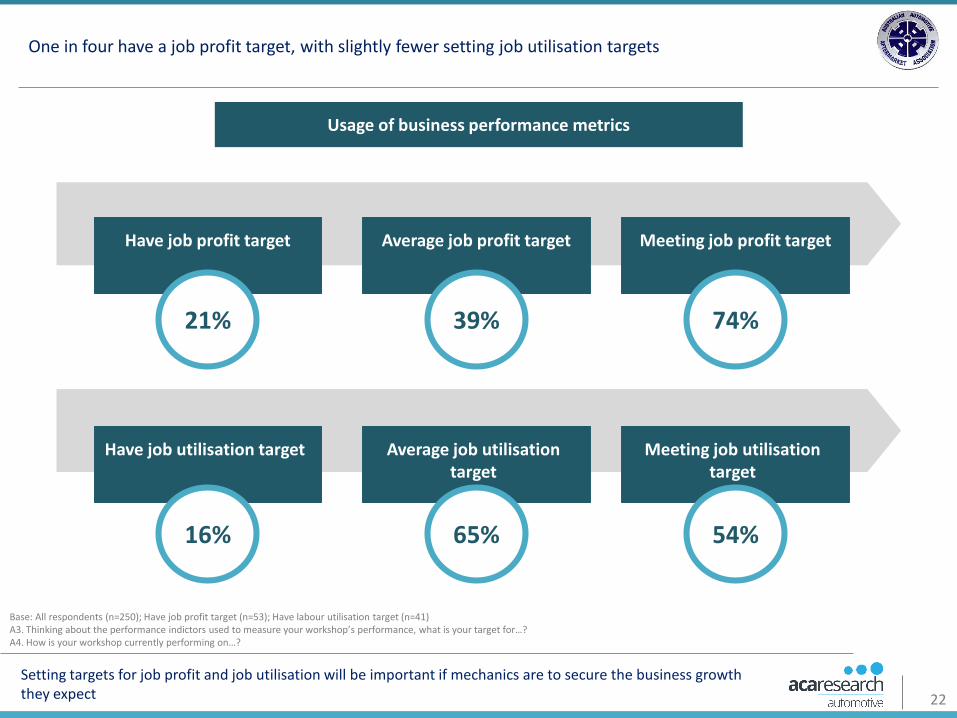
Setting targets for job profit and job utilisation will be important if mechanics are to secure the business growth they expect
Base: All respondents (n=250); Have job profit target (n=53); Have labour utilisation target (n=41)A3. Thinking about the performance indictors used to measure your workshop’s performance, what is your target for…?A4. How is your workshop currently performing on…?
One in four have a job profit target, with slightly fewer setting job utilisation targets
Usage of business performance metrics
Have job profit target
21%
Average job profit target
39%
Meeting job profit target
74%
Have job utilisation target
16%
Average job utilisation target
65%
Meeting job utilisation target
54%
23
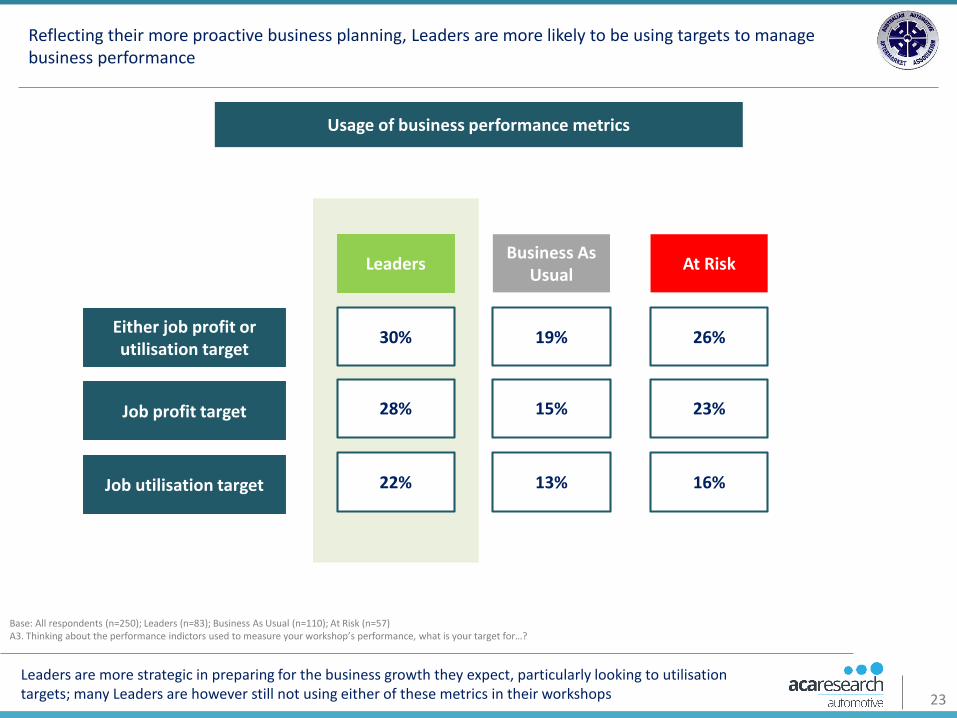
Leaders are more strategic in preparing for the business growth they expect, particularly looking to utilisation targets; many Leaders are however still not using either of these metrics in their workshops
Base: All respondents (n=250); Leaders (n=83); Business As Usual (n=110); At Risk (n=57) A3. Thinking about the performance indictors used to measure your workshop’s performance, what is your target for…?
Reflecting their more proactive business planning, Leaders are more likely to be using targets to manage business performance
Usage of business performance metrics
Either job profit or utilisation target
Job profit target
Job utilisation target
LeadersBusiness As
UsualAt Risk
30% 19% 26%
28% 15% 23%
22% 13% 16%
24
Succession plan in place
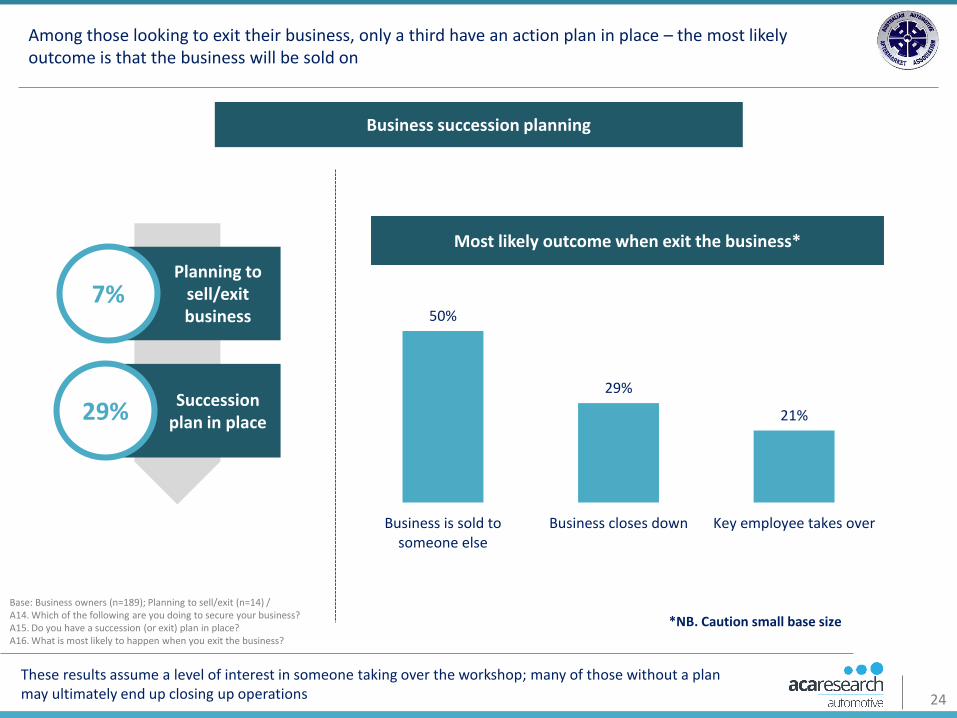
These results assume a level of interest in someone taking over the workshop; many of those without a plan may ultimately end up closing up operations
Base: Business owners (n=189); Planning to sell/exit (n=14) /A14. Which of the following are you doing to secure your business?A15. Do you have a succession (or exit) plan in place?A16. What is most likely to happen when you exit the business?
Among those looking to exit their business, only a third have an action plan in place – the most likely outcome is that the business will be sold on
Business succession planning
50%
29%
21%
Business is sold tosomeone else
Business closes down Key employee takes over
Planning to sell/exit business
7%
29%
Most likely outcome when exit the business*
*NB. Caution small base size
25
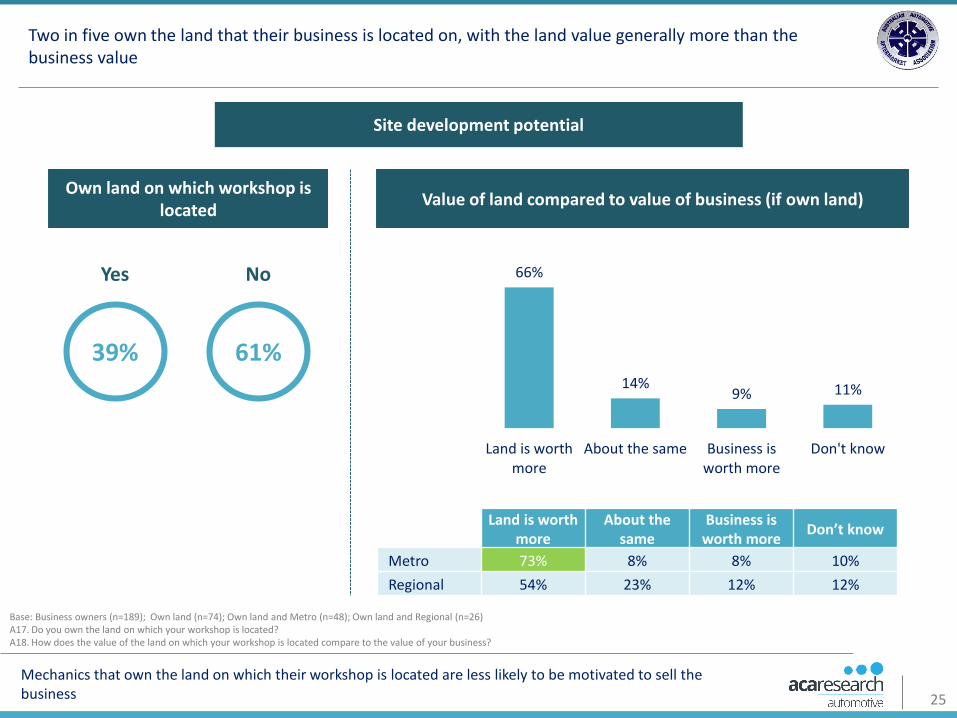
66%
14%9% 11%
Land is worthmore
About the same Business isworth more
Don't know
Mechanics that own the land on which their workshop is located are less likely to be motivated to sell the business
Base: Business owners (n=189); Own land (n=74); Own land and Metro (n=48); Own land and Regional (n=26)A17. Do you own the land on which your workshop is located?A18. How does the value of the land on which your workshop is located compare to the value of your business?
Two in five own the land that their business is located on, with the land value generally more than the business value
Site development potential
Own land on which workshop is located
39%
Yes
61%
No
Value of land compared to value of business (if own land)
Land is worth more
About the same
Business is worth more
Don’t know
Metro 73% 8% 8% 10%
Regional 54% 23% 12% 12%

Specialisation & Servicing Trends

27
Half of those who specialise claim three or more areas however, suggesting it could be more of a marketing position than a genuine specialisation
Base: All respondents (n=250) ; Have specialism (n=127)A8. Which of the following types of vehicle does your workshop specialise in servicing or repairing?
Half of independent workshops claim a specialisation, equally distributed between 4x4s, diesel and European brands
Workshop specialisation
38% 36% 34%
10%
49%
4x4/4 Wheel Drive Diesel European brands Hybrid/ electric None of the above
34%
1 2 3 4
16% 33% 17%
Number of specialisms (among those with a specialism)
28
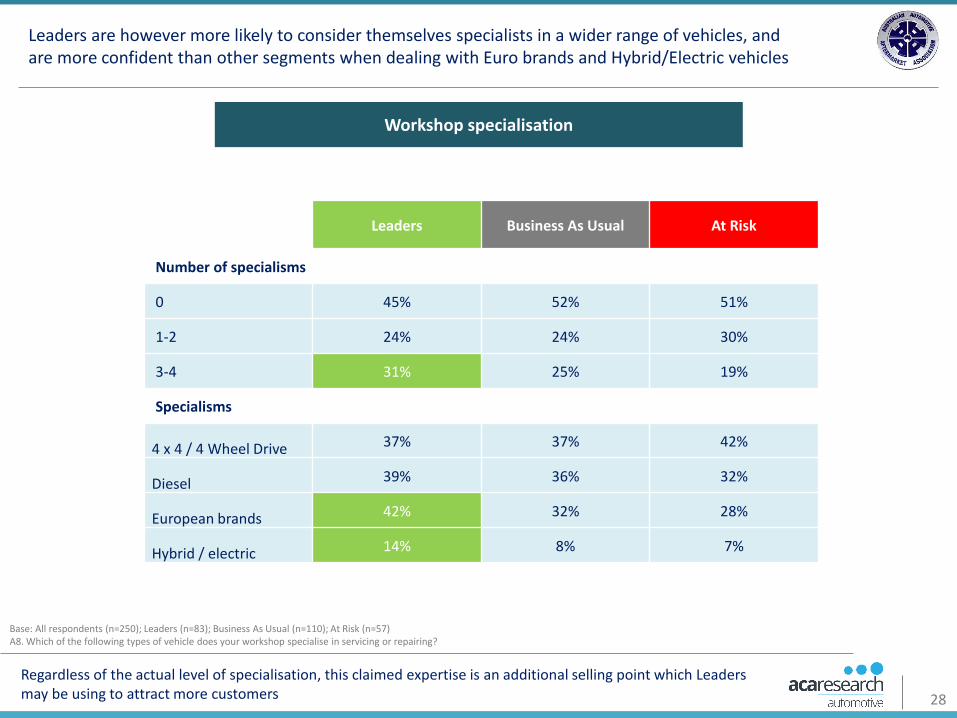
Regardless of the actual level of specialisation, this claimed expertise is an additional selling point which Leaders may be using to attract more customers
Base: All respondents (n=250); Leaders (n=83); Business As Usual (n=110); At Risk (n=57)A8. Which of the following types of vehicle does your workshop specialise in servicing or repairing?
Leaders are however more likely to consider themselves specialists in a wider range of vehicles, and are more confident than other segments when dealing with Euro brands and Hybrid/Electric vehicles
Workshop specialisation
Leaders Business As Usual At Risk
Number of specialisms
0 45% 52% 51%
1-2 24% 24% 30%
3-4 31% 25% 19%
Specialisms
4 x 4 / 4 Wheel Drive 37% 37% 42%
Diesel 39% 36% 32%
European brands 42% 32% 28%
Hybrid / electric 14% 8% 7%

29Servicing demands reflect the changing profile of the Australian car parc
Base: All respondents (n=250)A9. What trends are you seeing in your workshop in terms of the types of vehicle or service you are being asked to undertake?
Mechanics report increasing demand from customers for work on Diesels, European brands and 4x4s
Trends in types of vehicle being asked to undertake
4%
7%
3%
11%
32%
34%
45%
77%
64%
59%
52%
12%
Diesel
European brands
4x4/ 4 wheel drive
Hybrid/electric
Less No change More
49
52
60
NET growth
1

30
Leaders (and to an extent Business As Usual) appear to be successfully picking up share in the growing sectors of the market
Base: All respondents (n=250); Leaders (n=83); Business As Usual (n=110); At Risk (n=57)A9. What trends are you seeing in your workshop in terms of the types of vehicle or service you are being asked to undertake?
Leaders in particular have noticed growth, particularly reporting an upsurge in demand for servicing Diesel and European vehicles
Trends in types of vehicle being asked to undertake
Less No change More
Decline LeadersBusiness As Usual
At Risk LeadersBusiness As
UsualAt Risk Leaders
Business As Usual
At Risk
Diesel 5% 3% 4% 20% 34% 46% 75% 64% 51%
European 7% 5% 11% 31% 31% 42% 61% 64% 47%
4x4/4 Wheel Drive 5% 1% 4% 41% 45% 49% 54% 54% 47%
Hybrid/Electric 11% 12% 11% 73% 78% 81% 16% 10% 9%

31
Given the growth in diesel vehicles within the Australian car parc, they are underrepresented within national chain workshops
ACA Mechanics Insights Survey / Base: All respondents (n=250)/ A7. What proportion of the vehicles serviced in your workshop in 2017 were…?ACA Workshop Benchmarking Data/ Base: Combined data from 3 workshops
Independent workshops are picking up a higher share of diesel vehicles than national chains
Petrol, 59%
Diesel, 36%
LPG, 4%
Hybrid / electric, 2%
Type of vehicles serviced 2017:Independent Mechanics Insights
Type of vehicles serviced 2017: Chain Workshop Benchmarking
Petrol, 79%
Diesel, 20%
Other, 1%

32The focus on specialisation among Leaders lines up with this trend in vehicles serviced
Base: All respondents (n=250); Leaders (n=83); Business As Usual (n=110); At Risk (n=57)A6. How has this changed over the past five years?
Independent mechanics also report a change in the age of vehicles being serviced, with two thirds of Leaders reporting younger vehicles in their workshop than previously
Change in age of vehicles serviced over past five years
44% 26% 20%
Vehicles serviced getting younger
No changeVehicles serviced
getting older
61% 29% 10%
35% 43% 23%
39% 32% 30%
All
Leaders
Business As Usual
At Risk

33
The fact that a third of vehicles being serviced are within warranty periods (<5 years) supports the argument that some proportion of customers are turning away from dealerships
AAAA Customer Insights survey/ Base: All respondents (n=1499)/ Q3. Roughly, what year is the car?ACA Mechanics Insights survey/ Base: All respondents (n=250)/ A5. Approximately what percentage of the vehicles serviced in your business in 2017 were in the following age brackets?ACA Workshop Benchmarking Data/ Base: Combined data from 4 workshops
This is reflected in benchmarking data, with independent workshops more likely to service younger vehicles than national chains
Age of customer vehicles (customer reported) Age of vehicles serviced (workshops)
12%
19%24%
19%
26%
<3 years 3 to <5years
5 to <7years
7 to <10years
>10 years
<3 years3 to <5 years
5- <7 years
7- <10 years
>10 years
Independent Mechanics 13% 22% 26% 19% 20%
Chain Workshops
8% 11% 23% 16% 52%
14% 16% 15% 16%
39%
<3 years 3 to <5years
5 to <7years
7 to <10years
>10 years

34
Leaders are again the most successful at attracting customers with newer vehicles (requiring higher value services)
Base: All respondents (n=250); Leaders (n=83); Business As Usual (n=110); At Risk (n=57); 0-59 (n= 82); 60-199 (n=79); 120+ (n=89)A5. Approximately what percentage of the vehicles serviced in your business in 2017 were in the following age brackets?
Leaders and larger workshops are more likely to be servicing vehicles within warranty
Age of vehicles serviced
LeadersBusiness As
UsualAt Risk 0-59 vehicles 60-199 vehicles 120+ vehicles
<3 years 14% 13% 11% 11% 11% 15%
3 to <5 years 25% 22% 20% 20% 21% 26%
5- <7 years 24% 25% 32% 25% 29% 25%
7- <10 years 18% 18% 21% 20% 18% 19%
>10 years 19% 22% 16% 24% 21% 14%
<5 years 39% 35% 31% 31% 32% 42%
>5 years 61% 65% 69% 69% 68% 58%

35Leaders have established customer trust in their ability to conduct services under warranty
ACA Workshop Benchmarking Data/ Base: Combined data from 3 workshopsBase: All respondents (n=250); Leaders (n=83); Business As Usual (n=110); At Risk (n=57)A9. What trends are you seeing in your workshop in terms of the types of vehicle or service you are being asked to undertake?
Reflecting the reported age of vehicles, logbook servicing and servicing for warranty also appear to be on an upward trajectory
Trends in Logbook / warranty servicing
5%
10%
52%
56%
43%
34%
Logbook servicing
Servicing for warranty
Less No change More
Less No change More
LeadersBusiness As
UsualAt Risk Leaders
Business As Usual
At Risk LeadersBusiness As
UsualAt Risk
Log book servicing 4% 5% 7% 40% 56% 60% 57% 38% 33%
Servicing for warranty
8% 6% 18% 48% 59% 63% 43% 35% 19%
38
NET growth
24
31% of chain workshop jobs
are logbook services

Market Perceptions
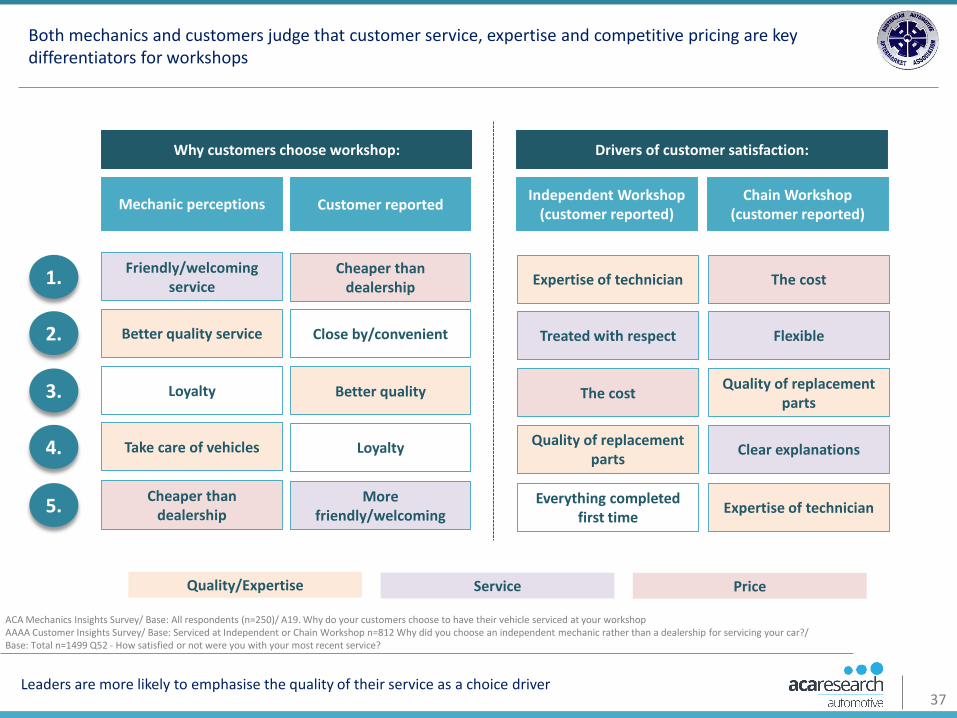
37Leaders are more likely to emphasise the quality of their service as a choice driver
ACA Mechanics Insights Survey/ Base: All respondents (n=250)/ A19. Why do your customers choose to have their vehicle serviced at your workshopAAAA Customer Insights Survey/ Base: Serviced at Independent or Chain Workshop n=812 Why did you choose an independent mechanic rather than a dealership for servicing your car?/ Base: Total n=1499 Q52 - How satisfied or not were you with your most recent service?
Both mechanics and customers judge that customer service, expertise and competitive pricing are key differentiators for workshops
Mechanic perceptions
Friendly/welcoming service 1.
Better quality service2.
Loyalty3.
Take care of vehicles4.
Cheaper than dealership5.
Customer reported
Cheaper than dealership
Close by/convenient
Better quality
Loyalty
More friendly/welcoming
Why customers choose workshop:
Chain Workshop (customer reported)
Independent Workshop (customer reported)
Drivers of customer satisfaction:
The cost
Flexible
Quality of replacement parts
Clear explanations
Expertise of technician
Expertise of technician
Treated with respect
The cost
Quality of replacement parts
Everything completed first time
Quality/Expertise Service Price
38
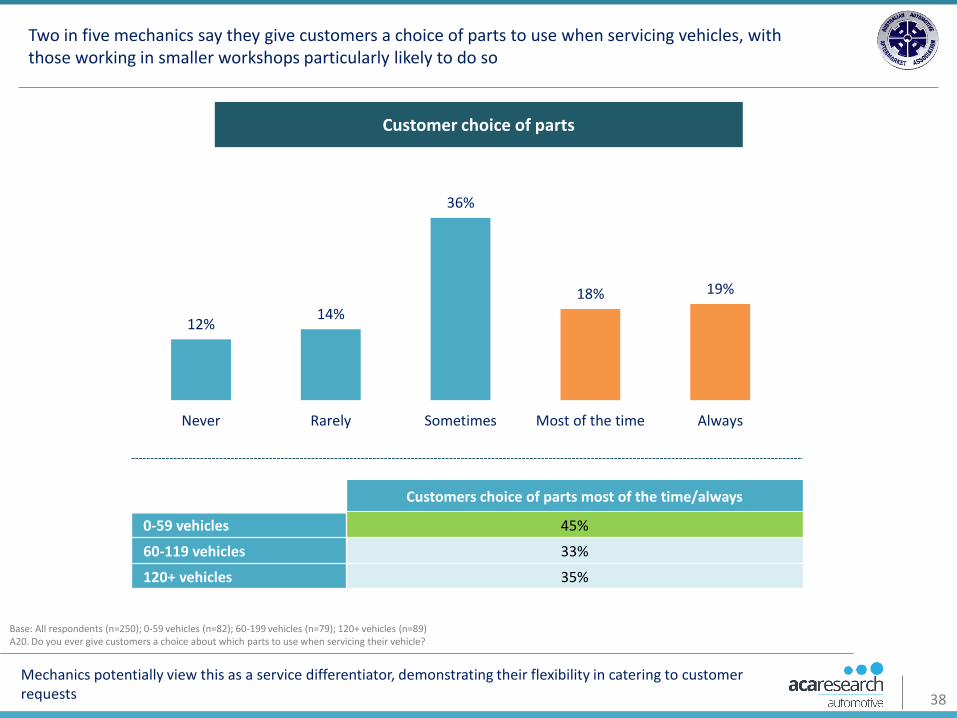
Mechanics potentially view this as a service differentiator, demonstrating their flexibility in catering to customer requests
Base: All respondents (n=250); 0-59 vehicles (n=82); 60-199 vehicles (n=79); 120+ vehicles (n=89)A20. Do you ever give customers a choice about which parts to use when servicing their vehicle?
Two in five mechanics say they give customers a choice of parts to use when servicing vehicles, with those working in smaller workshops particularly likely to do so
Customer choice of parts
12%14%
36%
18% 19%
Never Rarely Sometimes Most of the time Always
Customers choice of parts most of the time/always
0-59 vehicles 45%
60-119 vehicles 33%
120+ vehicles 35%

39
ACA Mechanics Insight Survey/ Base: All respondents (n=250)/ A21. Do your customers ever ask you to fit parts that they supply themselves?AAAA Customer Insights Survey/ Base: Additional work done (n-310)/ Q29. How di you get the parts?
A high proportion of independent mechanics also say they will fit parts that customers supply
Customer supply of parts
Customers ask for parts they supply to be fitted
77% 15% 8%
Yes we fit parts customers supply
Yes, but we do not fit parts
customers supply No
Source of parts at last service (customer reported)
7% 93%
Sourced parts myself
Mechanic sourced parts
However, the proportion of customers reporting they source parts themselves remains low, with most unlikely to go to this level of effort
40
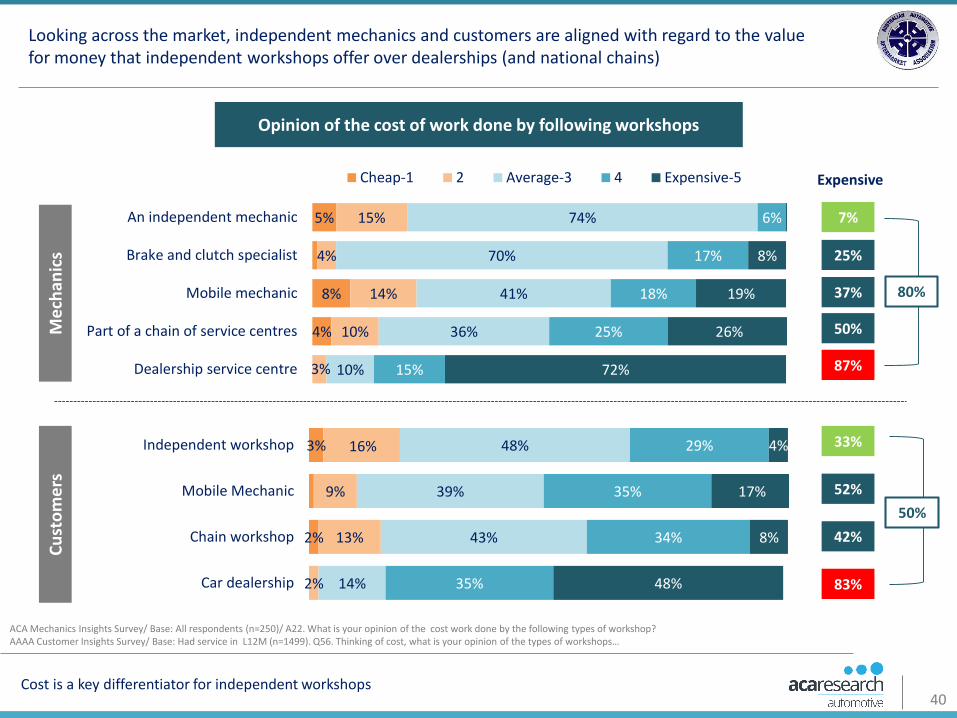
ACA Mechanics Insights Survey/ Base: All respondents (n=250)/ A22. What is your opinion of the cost work done by the following types of workshop?AAAA Customer Insights Survey/ Base: Had service in L12M (n=1499). Q56. Thinking of cost, what is your opinion of the types of workshops…
Looking across the market, independent mechanics and customers are aligned with regard to the value for money that independent workshops offer over dealerships (and national chains)
Opinion of the cost of work done by following workshops
4%
8%
5%
3%
10%
14%
4%
15%
10%
36%
41%
70%
74%
15%
25%
18%
17%
6%
72%
26%
19%
8%
Dealership service centre
Part of a chain of service centres
Mobile mechanic
Brake and clutch specialist
An independent mechanic
Cheap-1 2 Average-3 4 Expensive-5
7%
25%
50%
87%
37%
Expensive
3%
2%
16%
9%
13%
2%
48%
39%
43%
14%
29%
35%
34%
35%
4%
17%
8%
48%
Independent workshop
Mobile Mechanic
Chain workshop
Car dealership
33%
52%
83%
42%
Me
chan
ics
Cu
sto
me
rs
80%
50%
Cost is a key differentiator for independent workshops

41Workshops should not assume that their expertise and quality of work is a given for customers
Base: All respondents (n=250)/ A23. What is your opinion of the quality work done by the following types of workshop?AAAA Customer Insights Survey/ Base: Had service in L12M (n=1499). Q56. Thinking of quality, what is your opinion of the types of workshops…
Customers and mechanics are also in agreement that independent workshops offer a better quality of work than dealerships (but customers see a smaller gap than mechanics)
Opinion of the quality of work done by following workshops
9%
6%
6%
3%
6%
24%
21%
20%
36%
54%
46%
55%
58%
42%
31%
17%
14%
13%
19%
8%
4%
4%
2%
An independent mechanic
Brake and clutch specialist
Dealership service centre
Mobile mechanic
Part of a chain of service centres
Very poor Poor Fair Good Excellent
61%
40%
18%
15%
21%
Good/Excellent
2%
2%
5%
7%
6%
22%
25%
40%
48%
53%
49%
45%
41%
23%
19%
7%
4%
Independent workshop
Car dealership
Chain workshop
Mobile mechanic
76%
68%
45%
52%
Me
chan
ics
Cu
sto
me
rs
40%
8%

AAAA Membership

43The AAAA’s position as an advocate for independent workshops is clearly valued in the marketplace
Base: All AAAA members (n=30)A25. What do you consider to be the main benefits of being a member of the AAAA?
AAAA members appreciated the information they receive from AAAA about the latest industry trends, and also value AAAA’s action in lobbying for their interests
Benefits of AAAA membership
AAAA helps mechanics stay up-to-date with what is happening in the market
Mechanics also appreciate the fact that AAAA is standing up for their interests
“The magazine is great for new
trends”
“By working closely with the people down there we are getting a right of repair and getting a voice for the
independents, AAAA are helping to reduce that gap.”
“They support independents in our fight for the right to access information.”
“They give good access to legal advice, they are the unspoken voice for the mechanical trade, good work
on the right of choice & access to information.”
“We get online updates on what's going on in
the industry”
“They keep us informed and they are the only ones in the industry
doing it”
Key Insights

45
While some independent workshops will fail as part of the natural business cycle, it is important for the Australian aftermarket to work as an industry to support less knowledgeable operators, ensuring they have the tools and information required to support their business.
Leaders are seeing the success of their efforts in two key areas within their business:
The vehicles they are servicing are getting younger, including a substantial proportion of vehicles aged under 5 years old (within warranty)
They are seeing increases in the volumes of logbook servicing and services for warranty they are being asked to complete
Leaders are effectively gaining the trust of their customers, particularly those who ask them to services vehicles in warranty. Case studies may be an effective communications tool to demonstrate how to successfully differentiate and compete against dealership workshops.
Mechanics generally have an intuitive, rather than data-driven sense of the factors drawing customers to independent workshops. Results also show the importance of ‘local’ or ‘convenient’ in an independent workshop’s marketing and strategy.
AAAA should develop content that helps independent workshops leverage their knowledge of and engagement with the local community as a point of differentiation. AAAA should also utilise car parc insights (e.g. high LCV or EV volumes), to help workshops build local area-driven campaigns.
Key Insights – Enabling A Competitive Industry
While many workshops have seen growth in the last year (and expect demand to grow further over the next year), there are a significant proportion who are either standing still or even declining. Those workshops which are most optimistic about the future (Leaders) are more likely to be investing in technology and marketing, as well as using business performance metrics.
The AAAA should promote communications about the benefits of using business performance metrics, as well as providing industry benchmarks for members to compared themselves against.
46
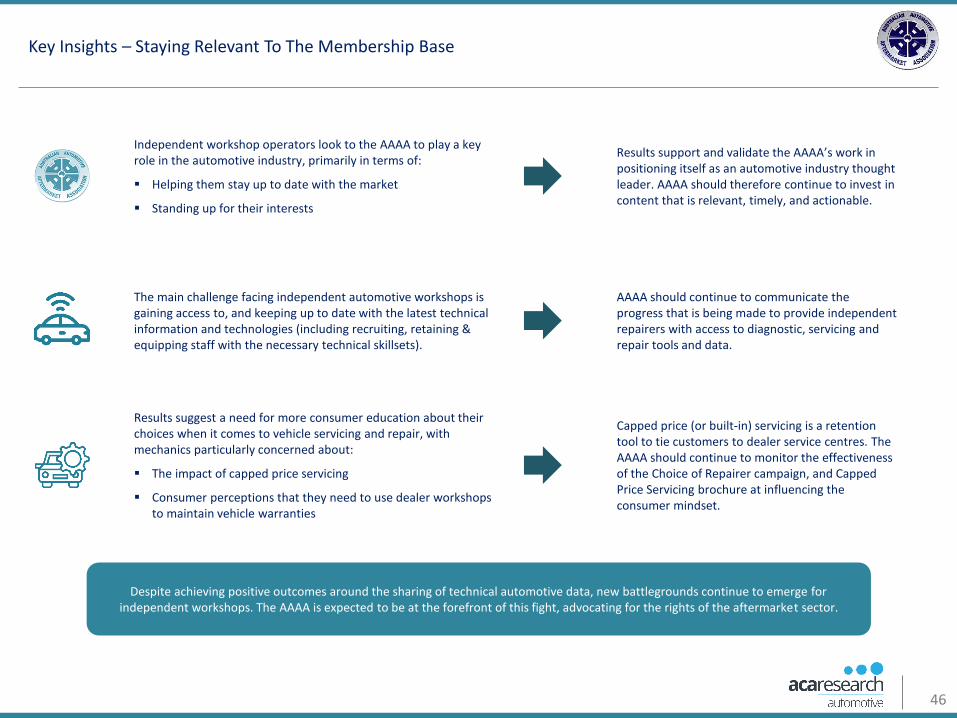
Key Insights – Staying Relevant To The Membership Base
Results suggest a need for more consumer education about their choices when it comes to vehicle servicing and repair, with mechanics particularly concerned about:
The impact of capped price servicing
Consumer perceptions that they need to use dealer workshops to maintain vehicle warranties
Capped price (or built-in) servicing is a retention tool to tie customers to dealer service centres. The AAAA should continue to monitor the effectiveness of the Choice of Repairer campaign, and Capped Price Servicing brochure at influencing the consumer mindset.
The main challenge facing independent automotive workshops is gaining access to, and keeping up to date with the latest technical information and technologies (including recruiting, retaining & equipping staff with the necessary technical skillsets).
AAAA should continue to communicate the progress that is being made to provide independent repairers with access to diagnostic, servicing and repair tools and data.
Despite achieving positive outcomes around the sharing of technical automotive data, new battlegrounds continue to emerge forindependent workshops. The AAAA is expected to be at the forefront of this fight, advocating for the rights of the aftermarket sector.
Independent workshop operators look to the AAAA to play a key role in the automotive industry, primarily in terms of:
Helping them stay up to date with the market
Standing up for their interests
Results support and validate the AAAA’s work in positioning itself as an automotive industry thought leader. AAAA should therefore continue to invest in content that is relevant, timely, and actionable.


![[Arnold Goldman] the Monster Makers Mask Makers](https://img.pdfslide.us/doc/110x75/5695d4df1a28ab9b02a31e8f/arnold-goldman-the-monster-makers-mask-makers.jpg)